2022 HP Envy 16 laptop review: For multimedia, gamers, creators, and everyone in between
The Envy 16 replaces last year's 15.6-inch Envy 15 by moving to a new 16-inch form factor alongside the latest Intel 12th gen CPUs and Nvidia and Intel discrete graphics options. Unlike the less expensive Pavilion series, the Envy series is home to higher-end prosumer models with generally higher performance, fewer plastics, and better build quality.
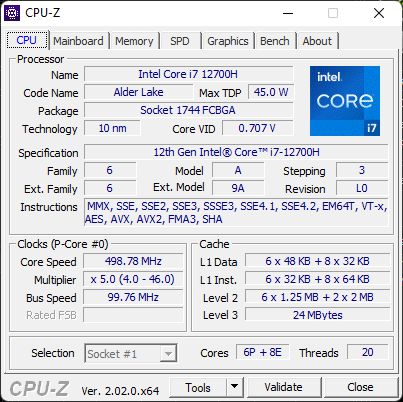
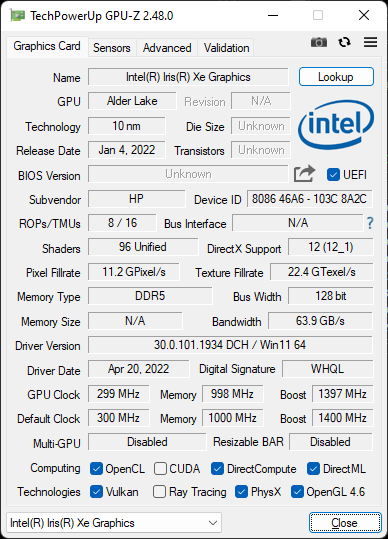
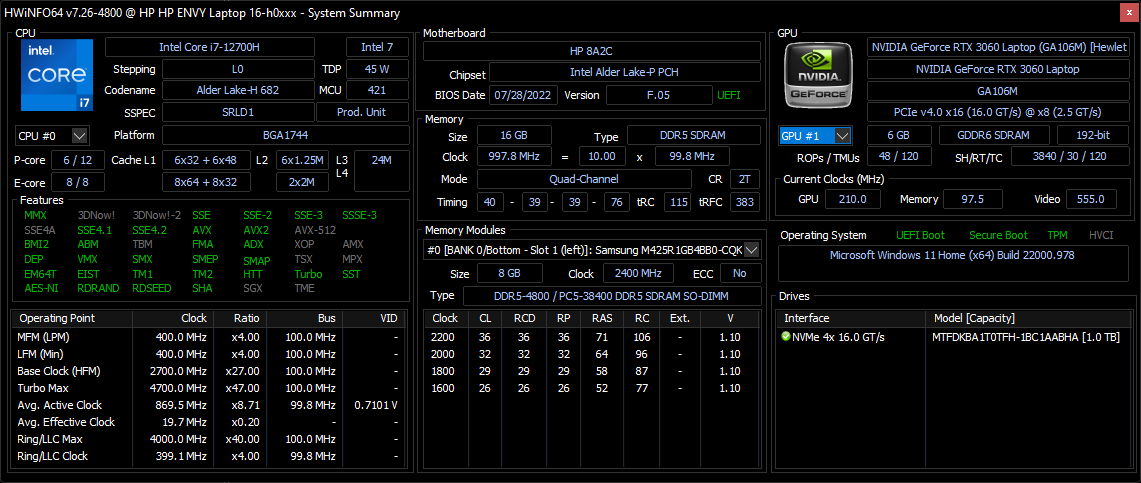
Our specific configuration is a high-end SKU with the Core i7-12700H, GeForce RTX 3060, and 2400p OLED touchscreen for approximately $1700 USD. Other configurations are available with the slower Core i5-12500H, faster i9-12900H, Intel Arc A370M graphics, or 1600p IPS display ranging from $1180 to $2380 USD.
Alternatives to the Envy 16 include other high-end prosumer laptops like the Dell XPS 15 series, MacBook Pro 16, Huawei MateBook 16s, or the LG Gram 16.
More HP reviews:
Potential Competitors in Comparison
Rating | Date | Model | Weight | Height | Size | Resolution | Price |
|---|---|---|---|---|---|---|---|
| 86.9 % v7 (old) | 09 / 2022 | HP Envy 16 h0112nr i7-12700H, GeForce RTX 3060 Laptop GPU | 2.3 kg | 19.8 mm | 16.00" | 3840x2400 | |
| 88.4 % v7 (old) | 09 / 2022 | Lenovo ThinkBook 16 G4+ IAP i7-12700H, GeForce RTX 2050 Mobile | 1.8 kg | 16.5 mm | 16.00" | 2560x1600 | |
| 83.7 % v7 (old) | 06 / 2022 | MSI Creator Z16P B12UHST i9-12900H, GeForce RTX 3080 Ti Laptop GPU | 2.4 kg | 20.4 mm | 16.00" | 2560x1600 | |
| 82.6 % v7 (old) | 11 / 2021 | Dell Inspiron 16 Plus 7610-MHJ8F i7-11800H, UHD Graphics Xe 32EUs (Tiger Lake-H) | 2 kg | 19 mm | 16.00" | 3072x1920 | |
| 93.2 % v7 (old) | 11 / 2021 | Apple MacBook Pro 16 2021 M1 Pro M1 Pro, M1 Pro 16-Core GPU | 2.2 kg | 16.8 mm | 16.20" | 3456x2234 | |
| 86.4 % v7 (old) | 07 / 2022 | Huawei MateBook 16s i7 i7-12700H, Iris Xe G7 96EUs | 2 kg | 17.8 mm | 16.00" | 2520x1680 |
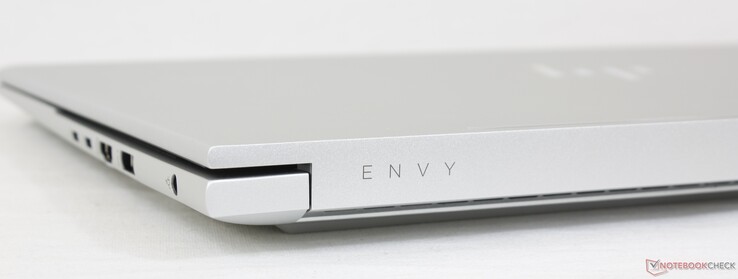
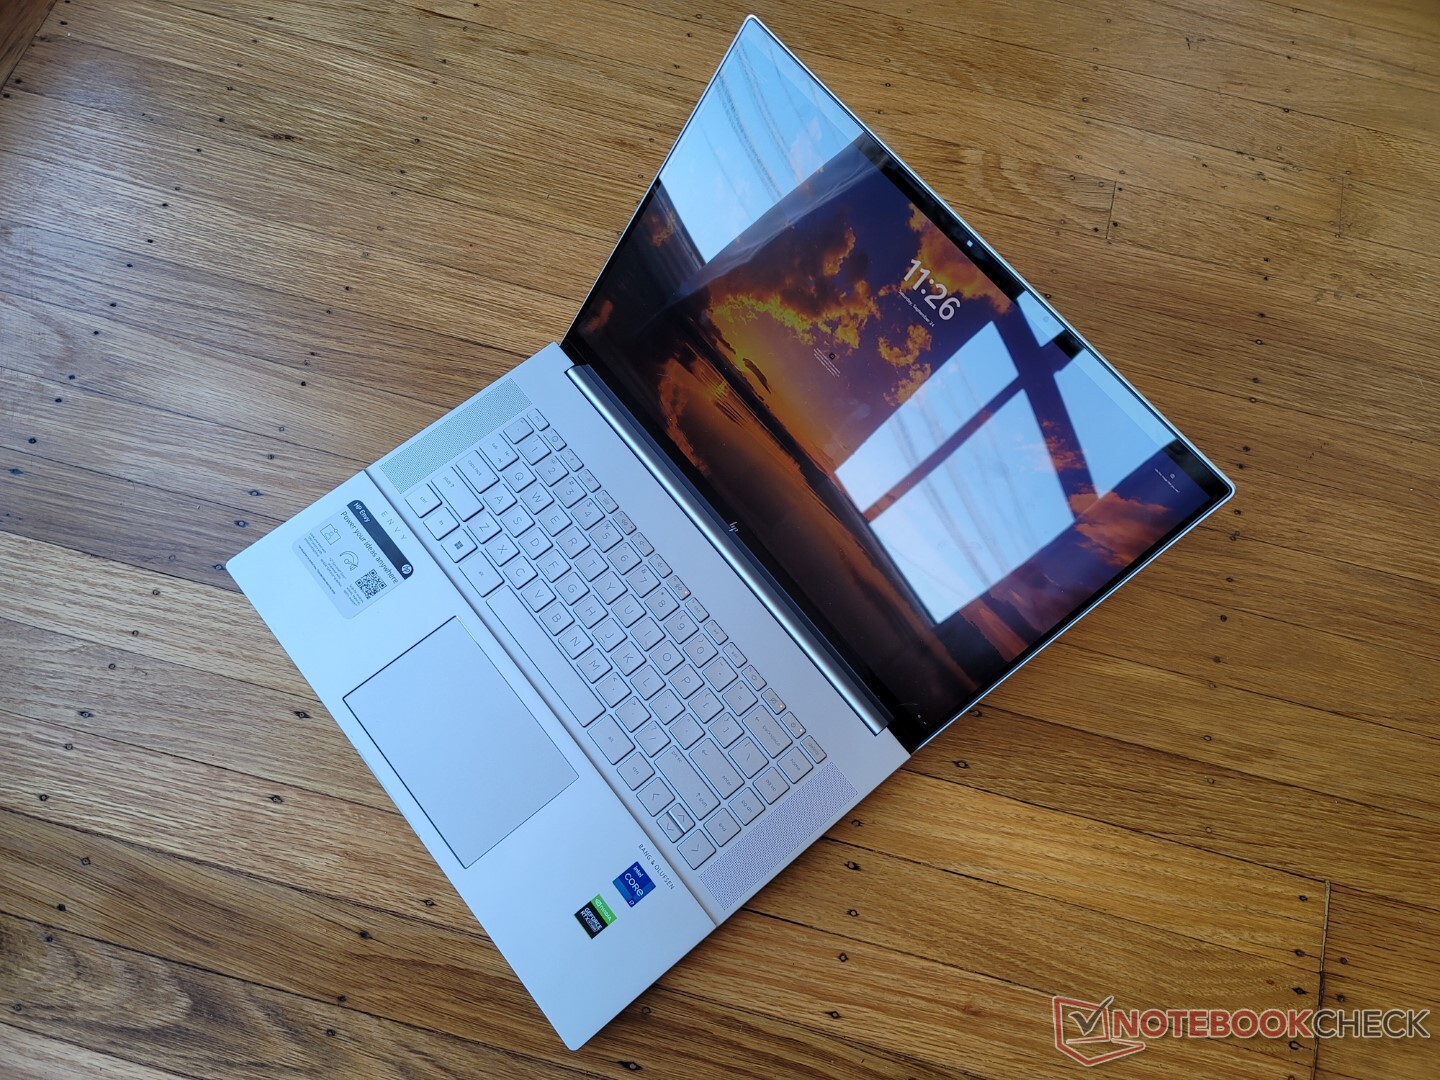
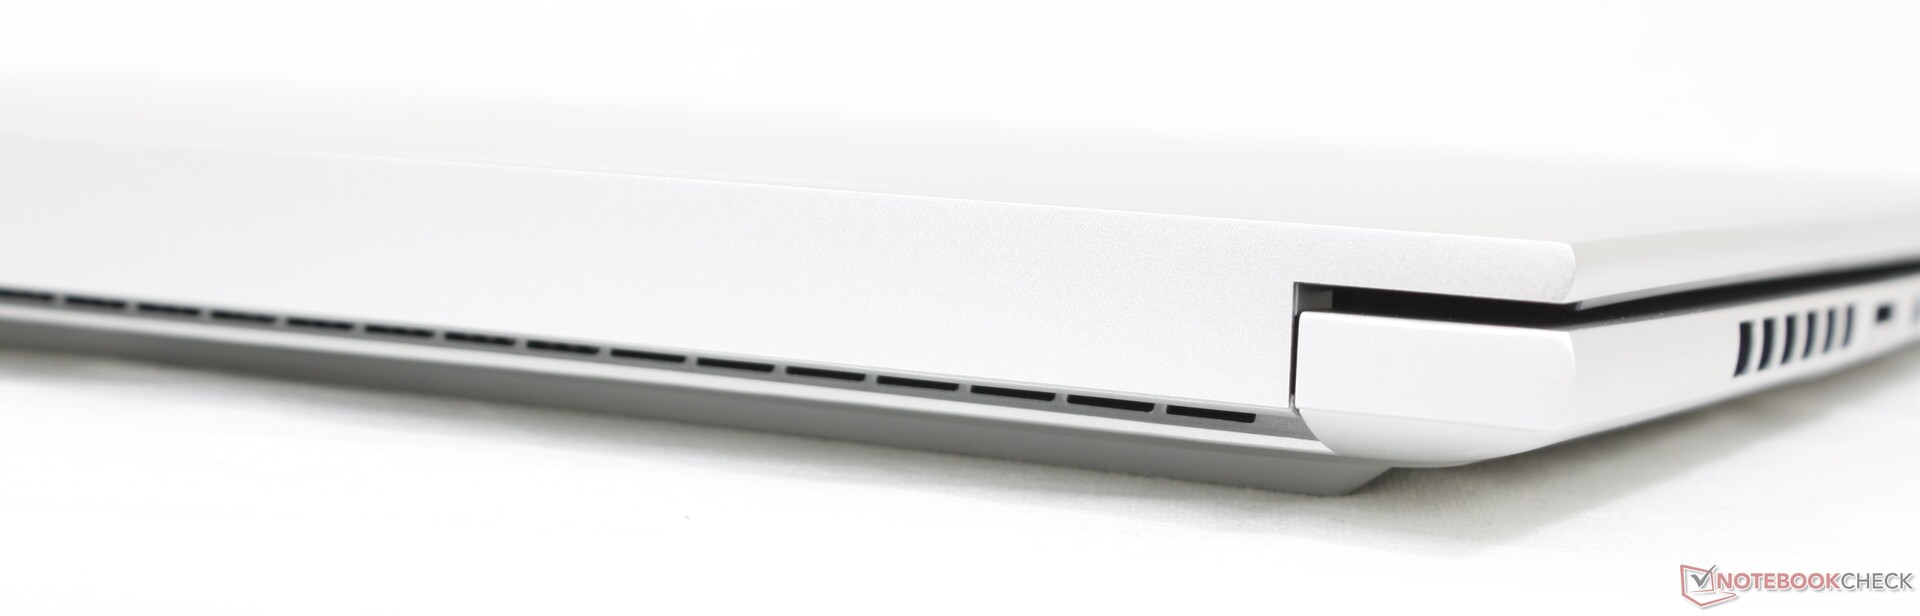
Case — Same Colors With Lots Of Tweaks
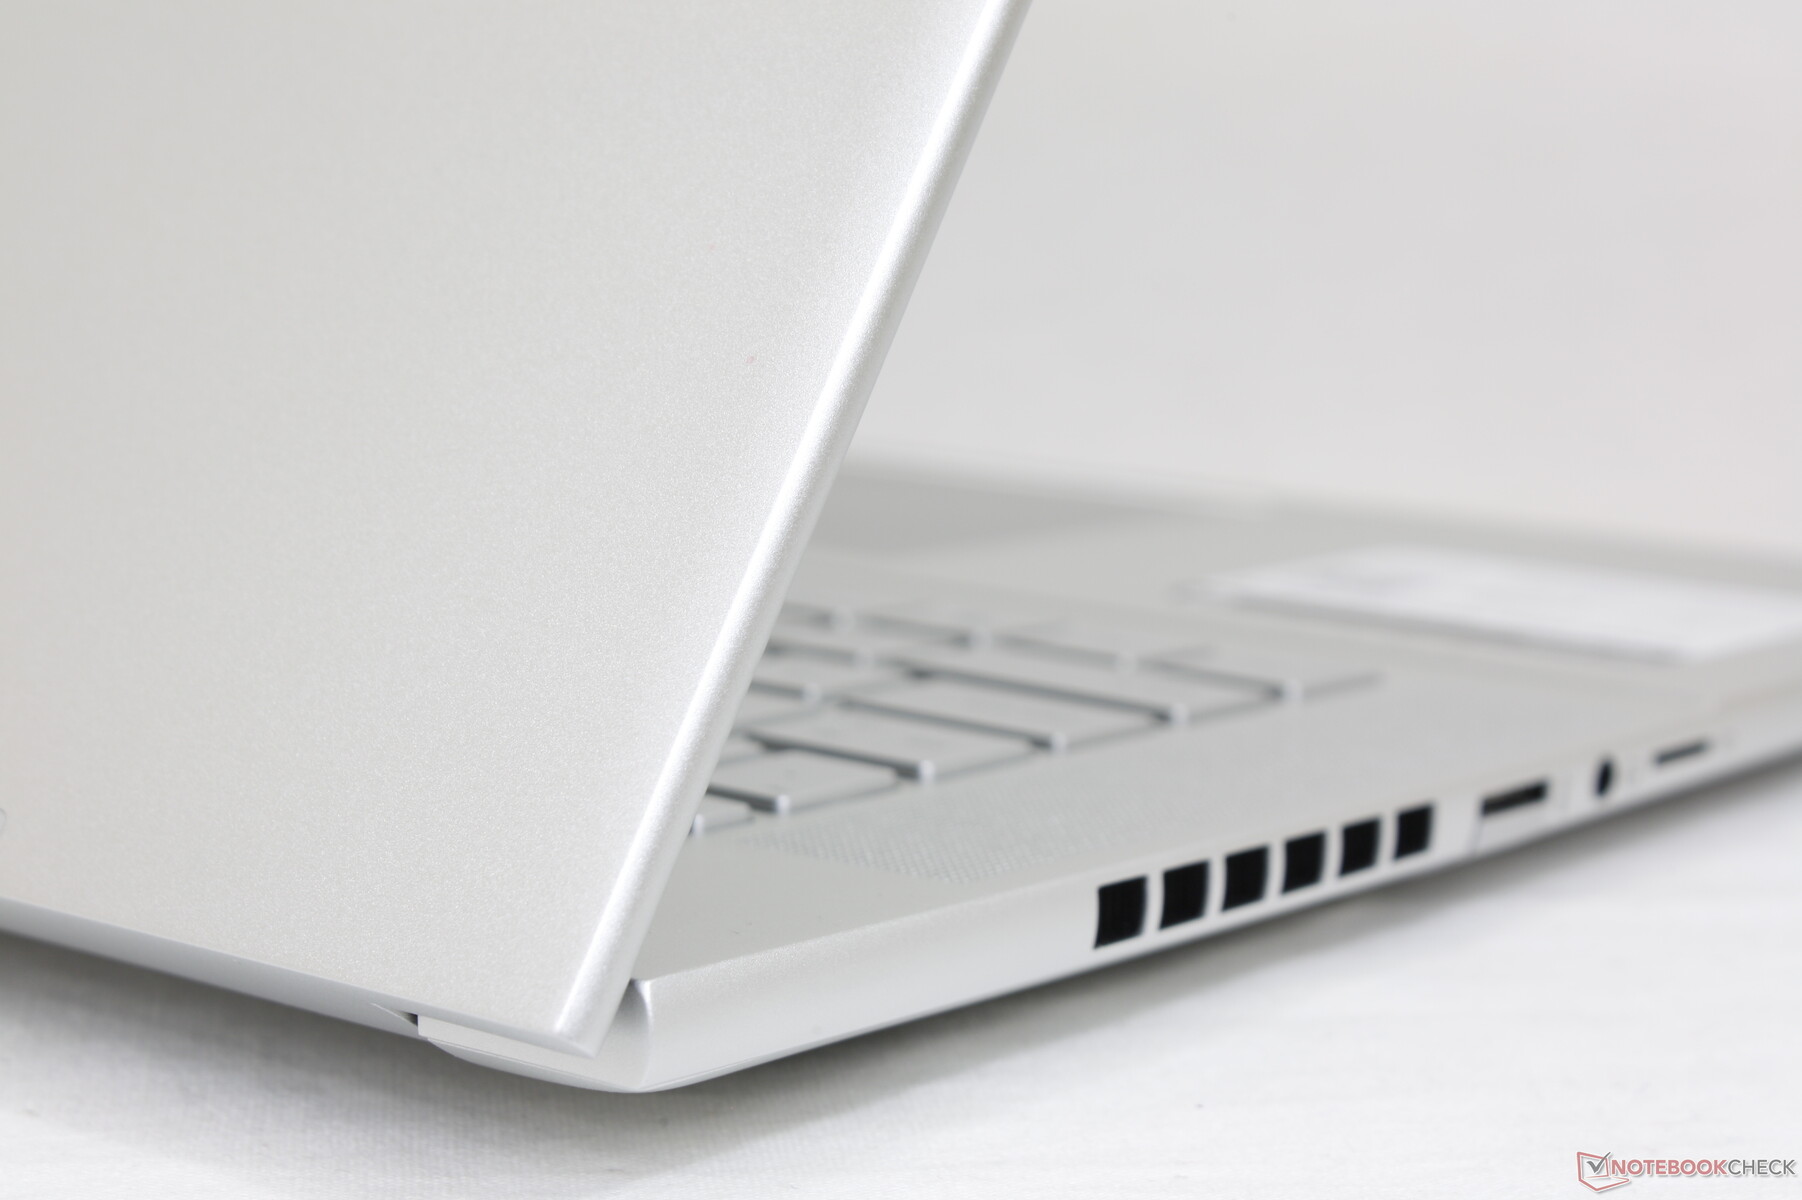
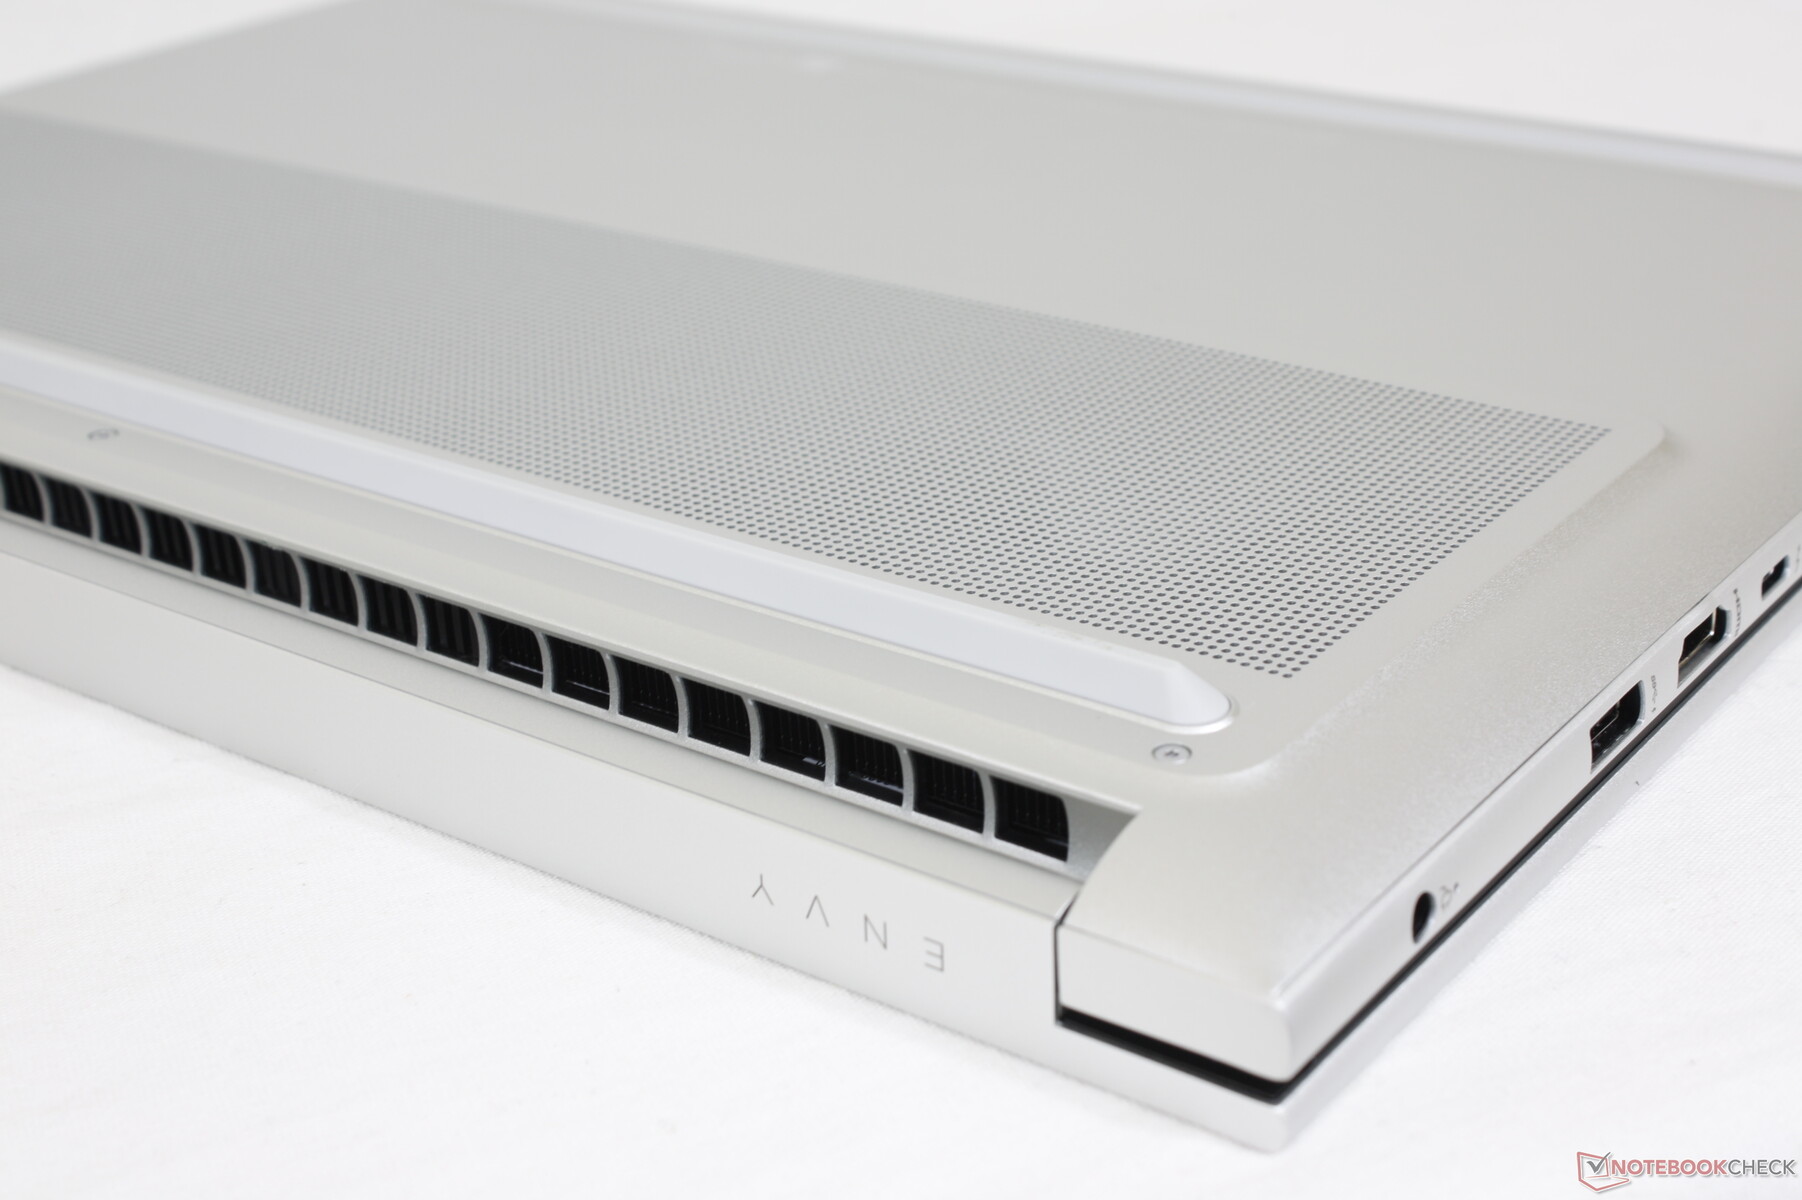
The Envy 16 may look like the Envy 15 at first glance because of their similar color schemes, but there are actually numerous changes both inside and out. Most noticeably, the Envy 16 is rounder along its edges and corners as opposed to the sharper and flatter Envy 15 design. Meanwhile, the ventilation portion of the bottom panel is raised instead of flat as shown by the pictures below. The palm rest deck and speaker grilles have also been redesigned. Some of these changes seem to be superficial while others should improve the cooling capabilities of the model.
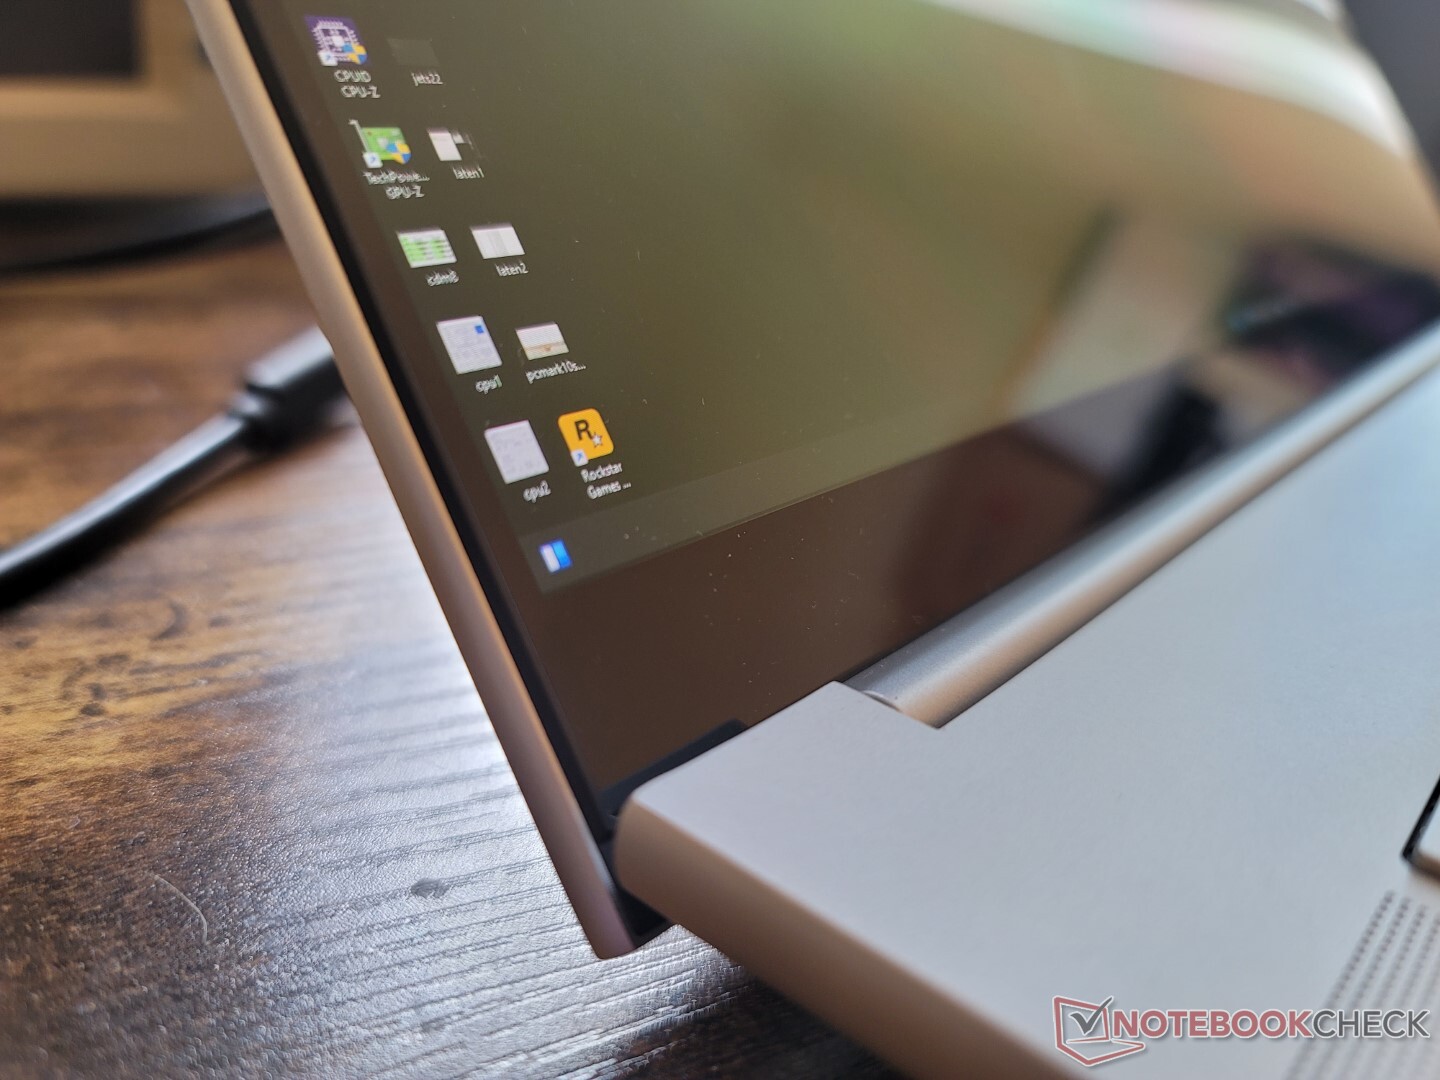
Chassis quality remains just as strong as the 2020 Envy 15 despite the size increase. The base exhibits only minor twisting and warping and the lid is quite rigid because of the edge-to-edge glass and aluminum backing. The hinges could have been stiffer, however, as the lid teeters when adjusting angles more so than on the ZenBook Pro series or Razer Blade 15.

The 2022 model is thicker, heavier, and larger than the 2020 model as shown by the comparison chart below. The bigger size is perhaps not unexpected given the jump from a 15.6-inch form factor to a 16-inch one. Even so, the HP is still slightly bigger and heavier than many competing 16-inch multimedia laptops including the MacBook Pro 16, Huawei MateBook 16s, or Dell Inspiron 16 Plus 7610.
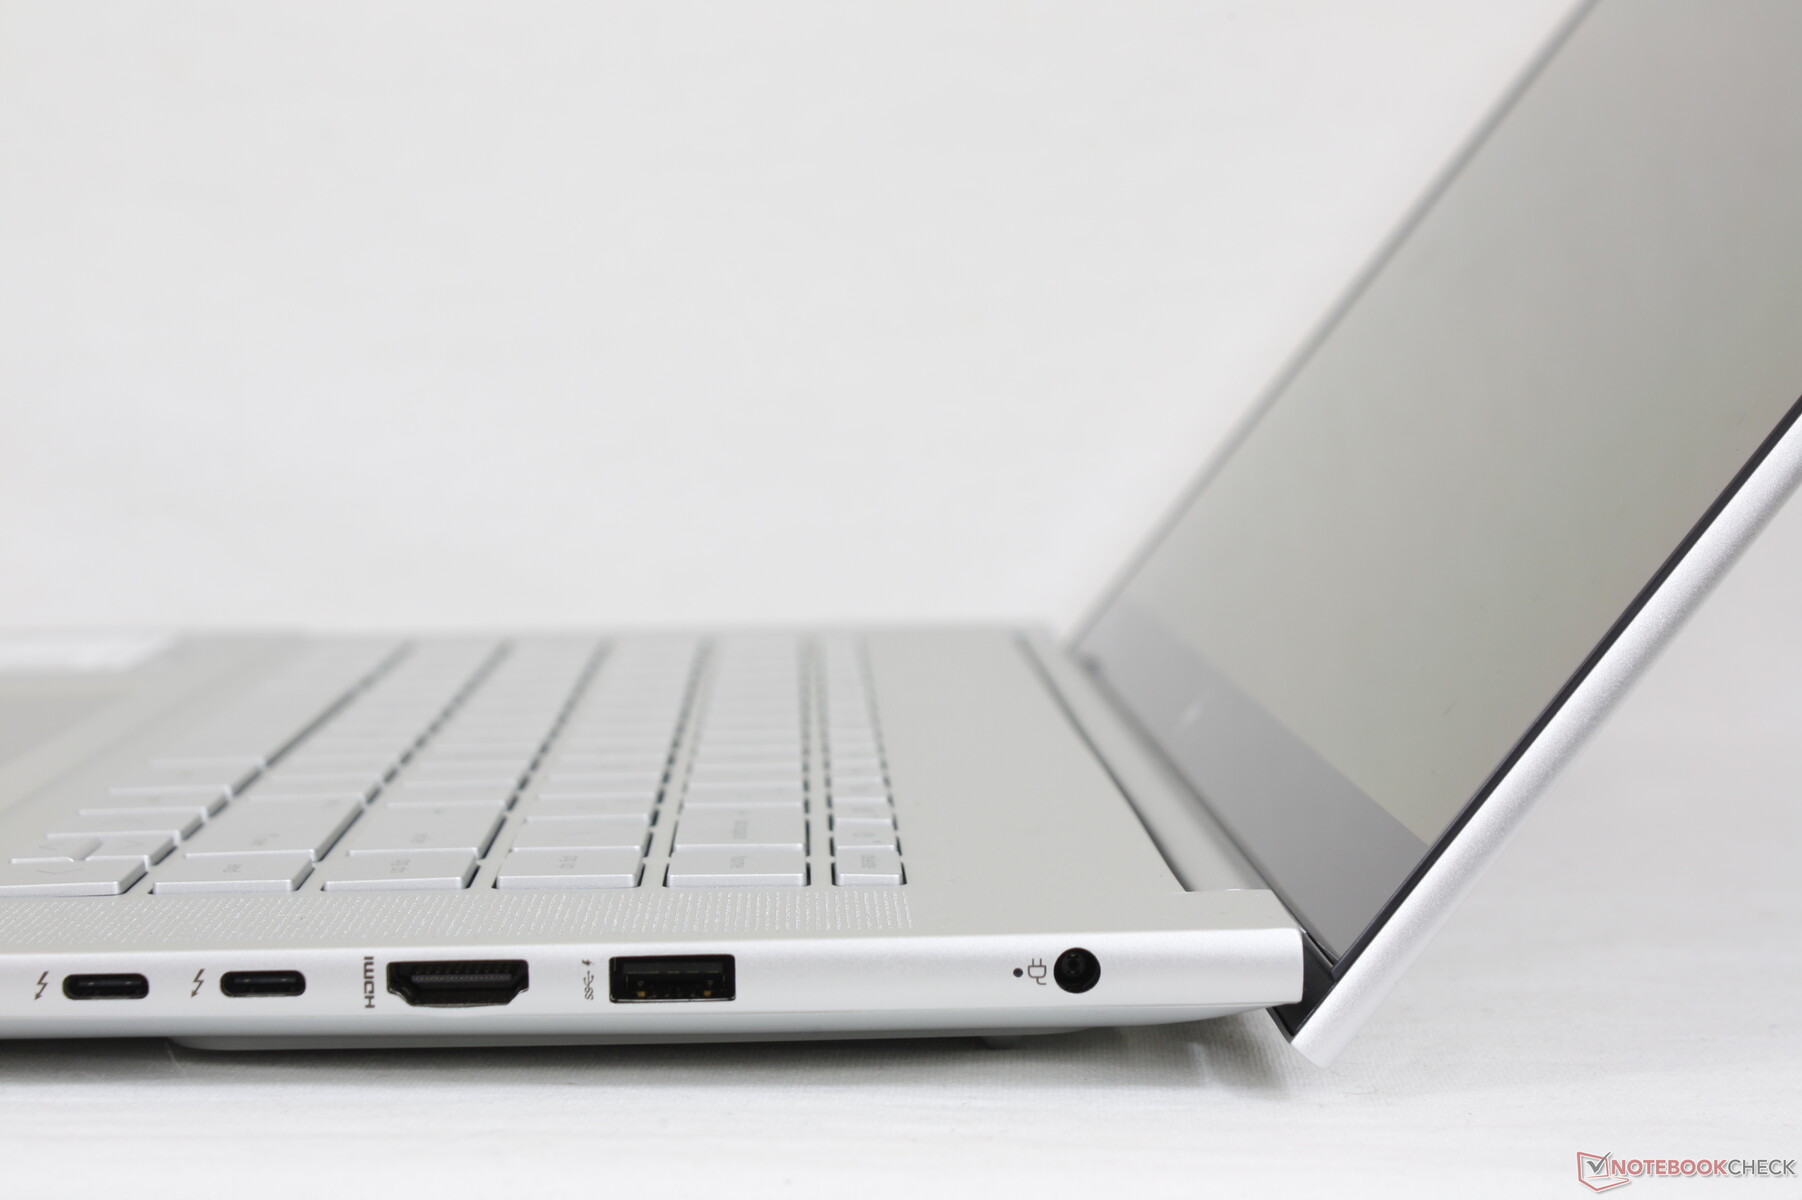
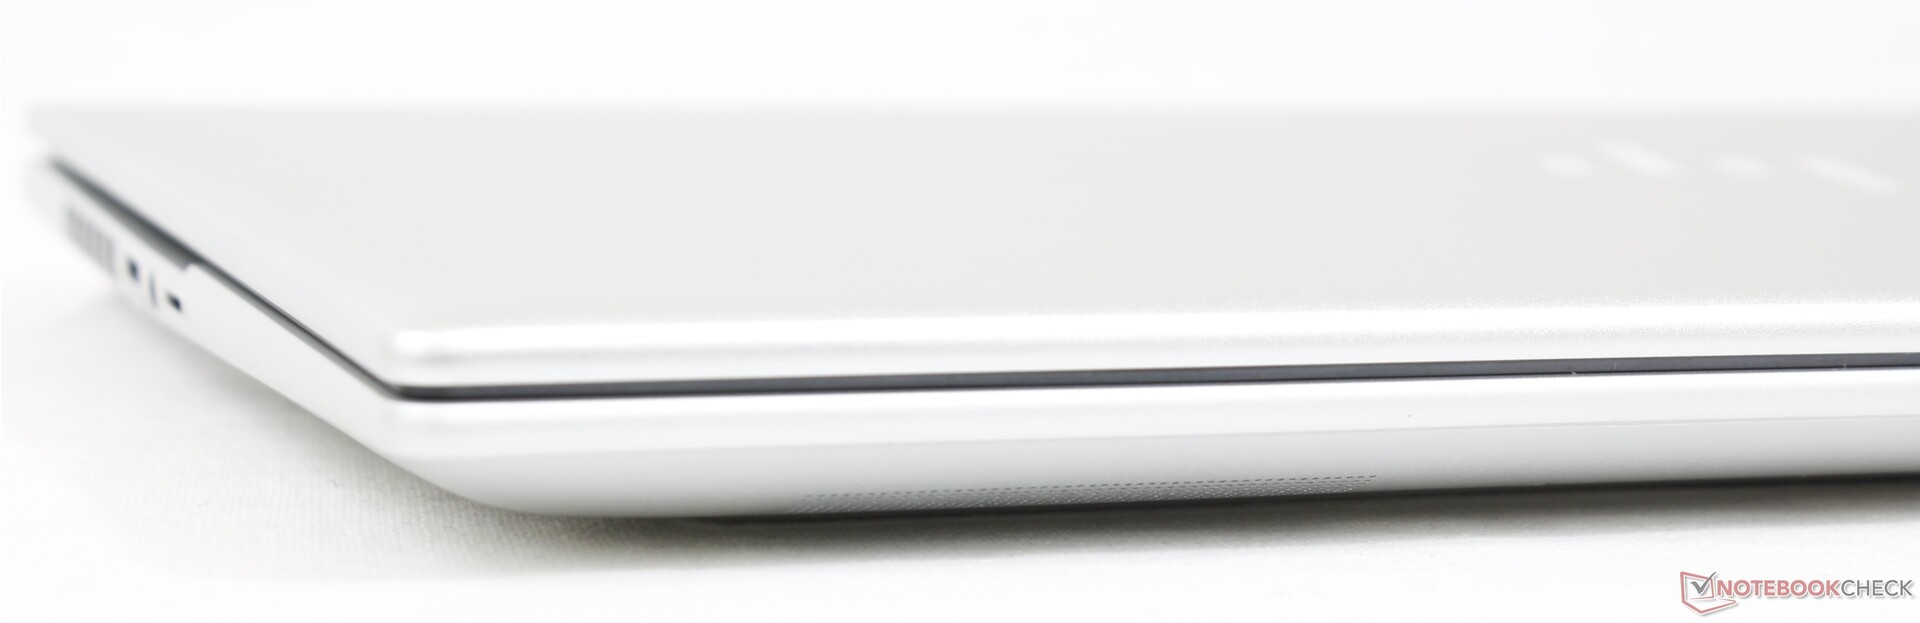
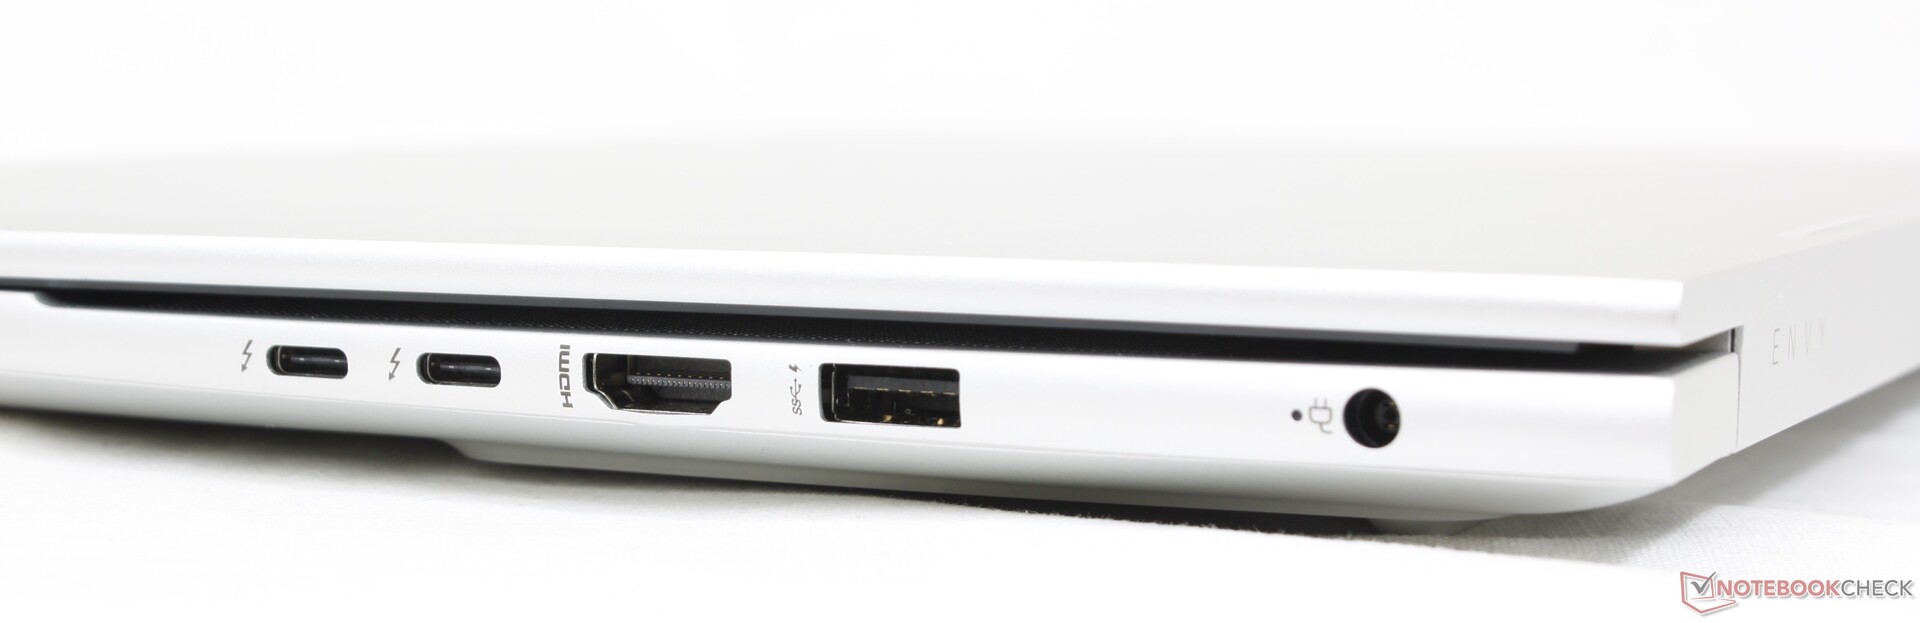
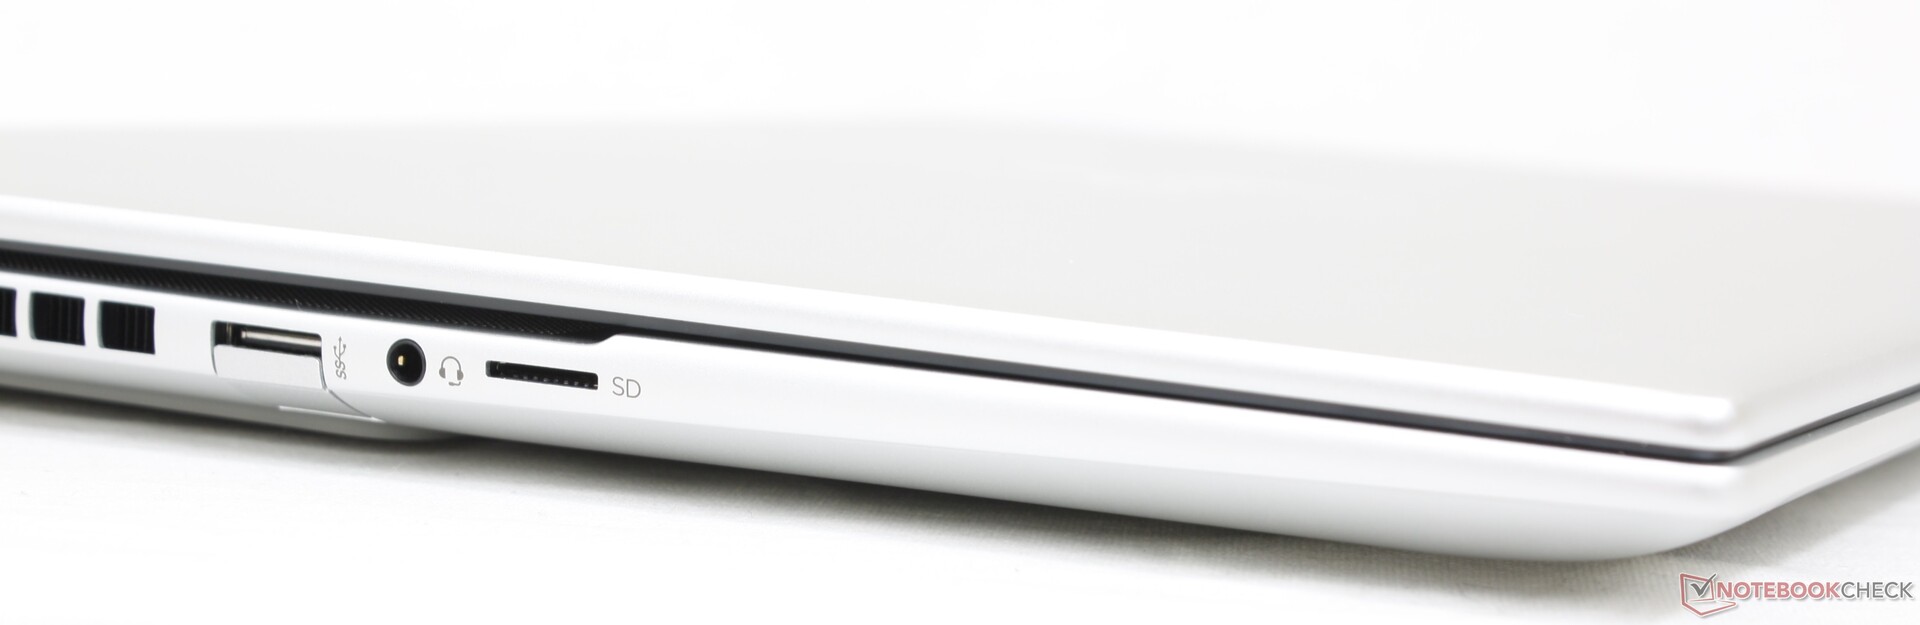
Connectivity — Thunderbolt 4 Support Standard
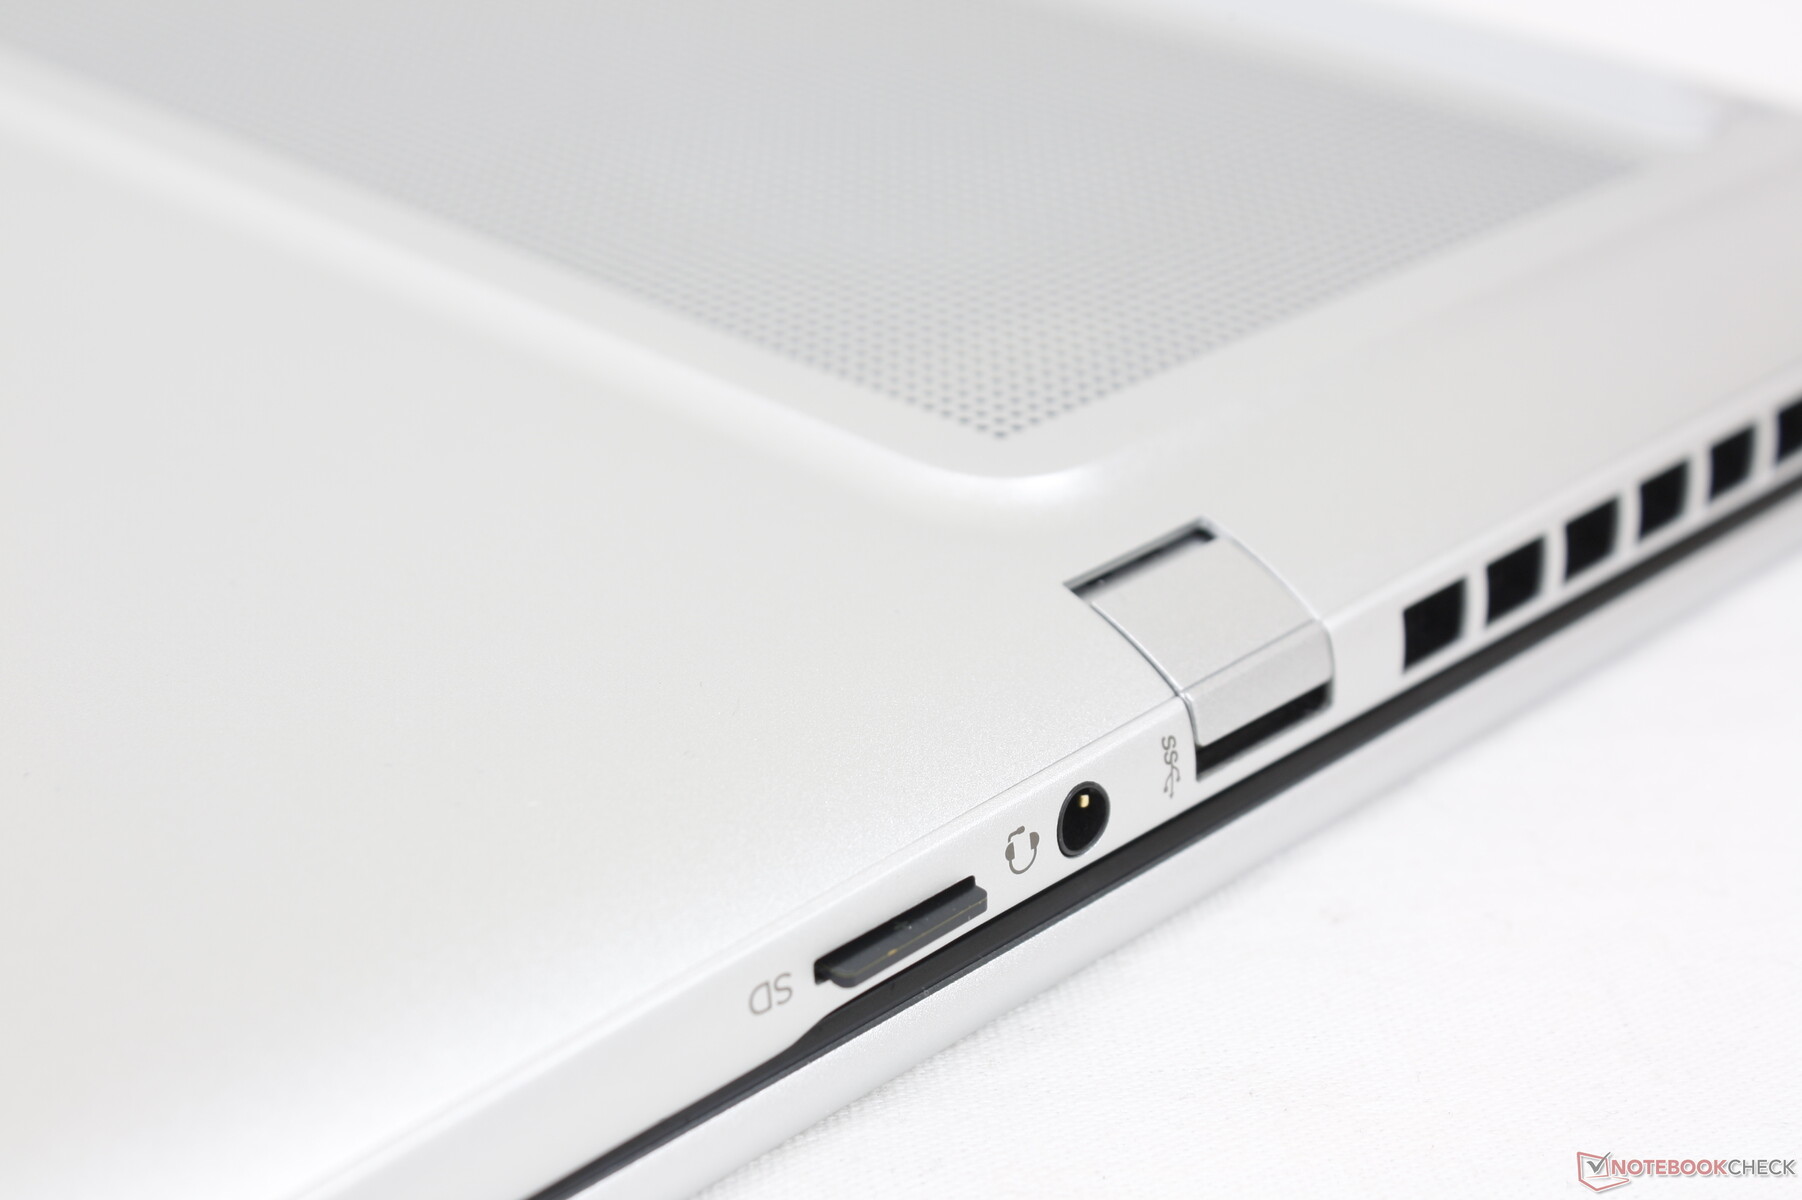
All the ports from the 2020 Envy 15 have returned on this 2022 revision albeit rearranged. The majority of the ports are now along the right edge of the chassis instead of the left for better or worse. There is annoyingly still no Kensington lock slot.
SD Card Reader
Transfer rates from the integrated MicroSD reader are average. Moving 1 GB of pictures from our UHS-II test card to desktop takes about 17 seconds.
| SD Card Reader | |
| average JPG Copy Test (av. of 3 runs) | |
| Apple MacBook Pro 16 2021 M1 Pro (Angelbird AV Pro V60) | |
| Lenovo ThinkBook 16 G4+ IAP (Angelbird AV Pro V60) | |
| MSI Creator Z16P B12UHST (AV PRO microSD 128 GB V60) | |
| HP Envy 16 h0112nr (AV Pro SD microSD 128 GB V60) | |
| Dell Inspiron 16 Plus 7610-MHJ8F (AV Pro SD microSD 128 GB V60) | |
| maximum AS SSD Seq Read Test (1GB) | |
| Lenovo ThinkBook 16 G4+ IAP (Angelbird AV Pro V60) | |
| HP Envy 16 h0112nr (AV Pro SD microSD 128 GB V60) | |
| Dell Inspiron 16 Plus 7610-MHJ8F (AV Pro SD microSD 128 GB V60) | |
Communication
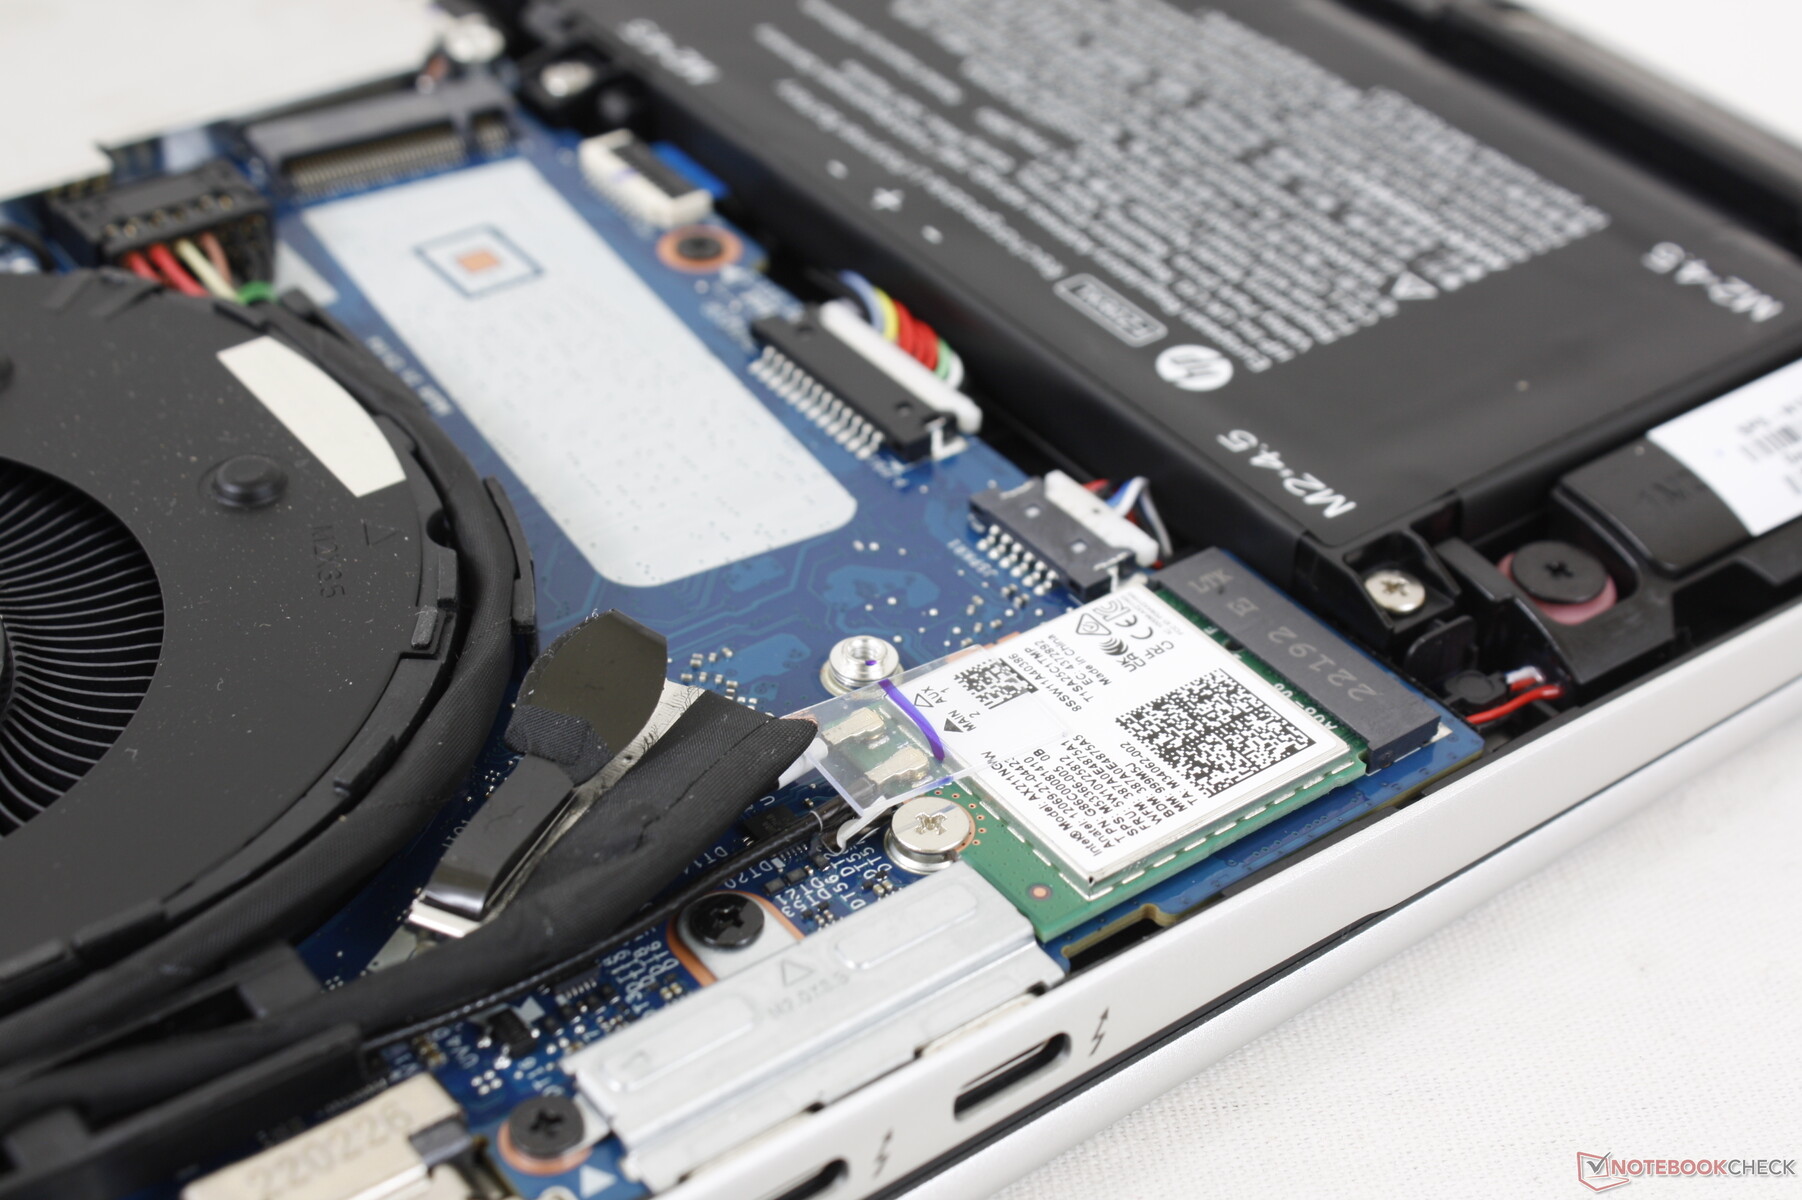
An Intel AX211 comes standard for Wi-Fi 6E and Bluetooth 5.2 connectivity. We experienced no reliability issues when paired to our 6 GHz network.
| Networking | |
| iperf3 transmit AX12 | |
| Dell Inspiron 16 Plus 7610-MHJ8F | |
| Apple MacBook Pro 16 2021 M1 Pro | |
| iperf3 receive AX12 | |
| Dell Inspiron 16 Plus 7610-MHJ8F | |
| Apple MacBook Pro 16 2021 M1 Pro | |
| iperf3 receive AXE11000 6GHz | |
| Huawei MateBook 16s i7 | |
| HP Envy 16 h0112nr | |
| iperf3 receive AXE11000 | |
| MSI Creator Z16P B12UHST | |
| Lenovo ThinkBook 16 G4+ IAP | |
| Apple MacBook Pro 16 2021 M1 Pro | |
| iperf3 transmit AXE11000 6GHz | |
| Huawei MateBook 16s i7 | |
| HP Envy 16 h0112nr | |
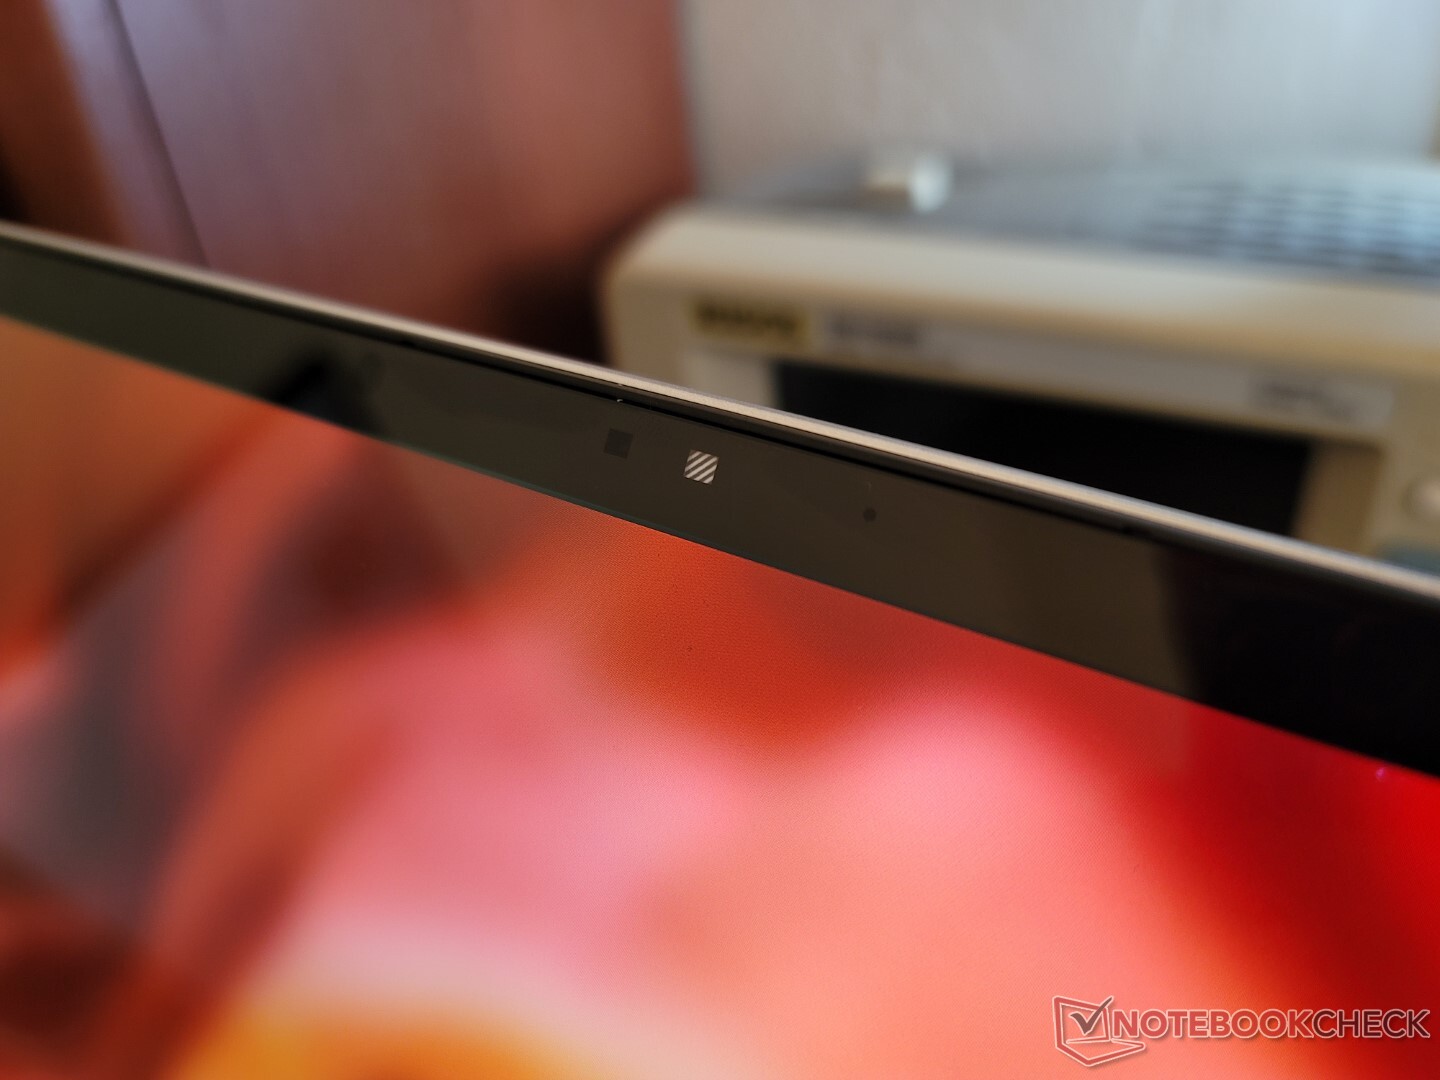
Webcam — 5 MP!
The system integrates a 5 MP camera similar to the latest Spectre and EliteBook models. Image quality is noticeably sharper than on most other laptops where 1 MP and 2 MP webcams are still the norm.
A webcam shutter comes standard as well as IR for Hello support.


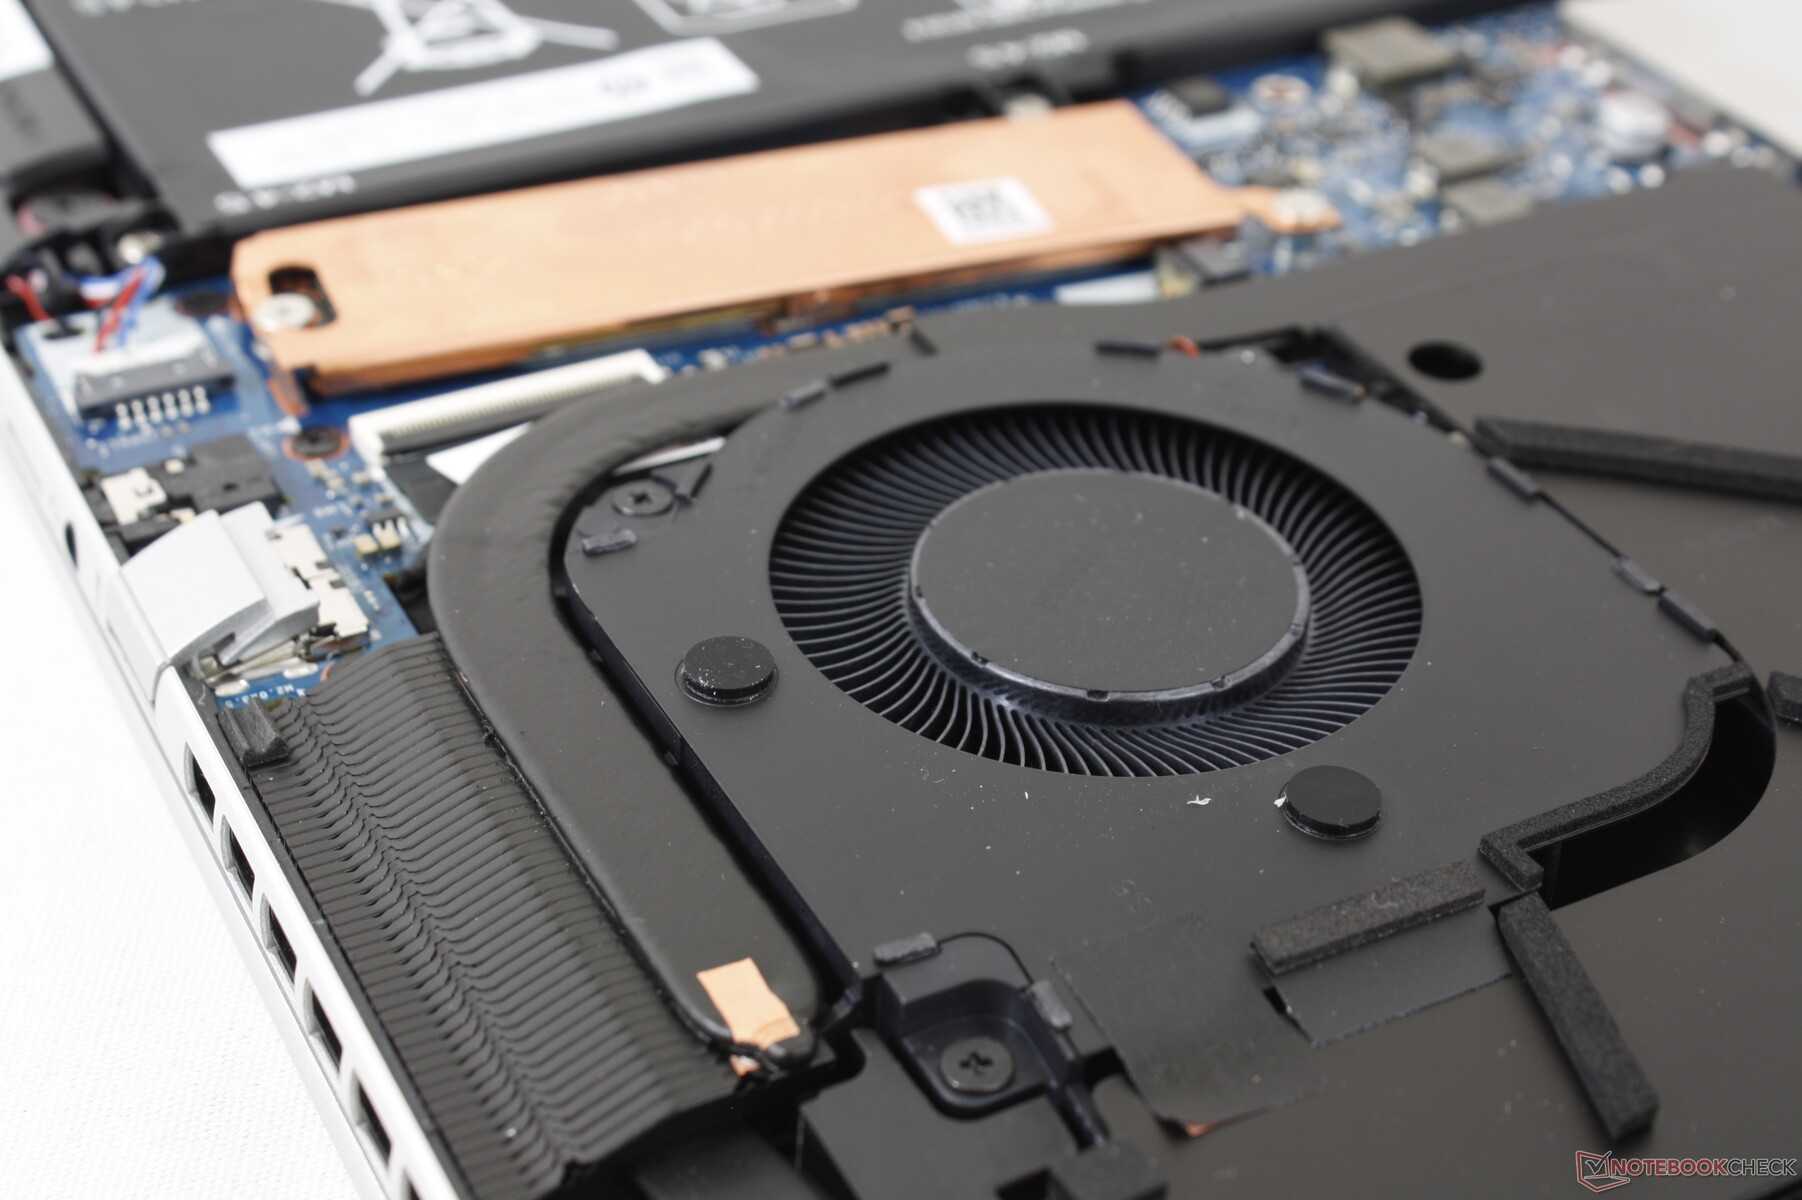
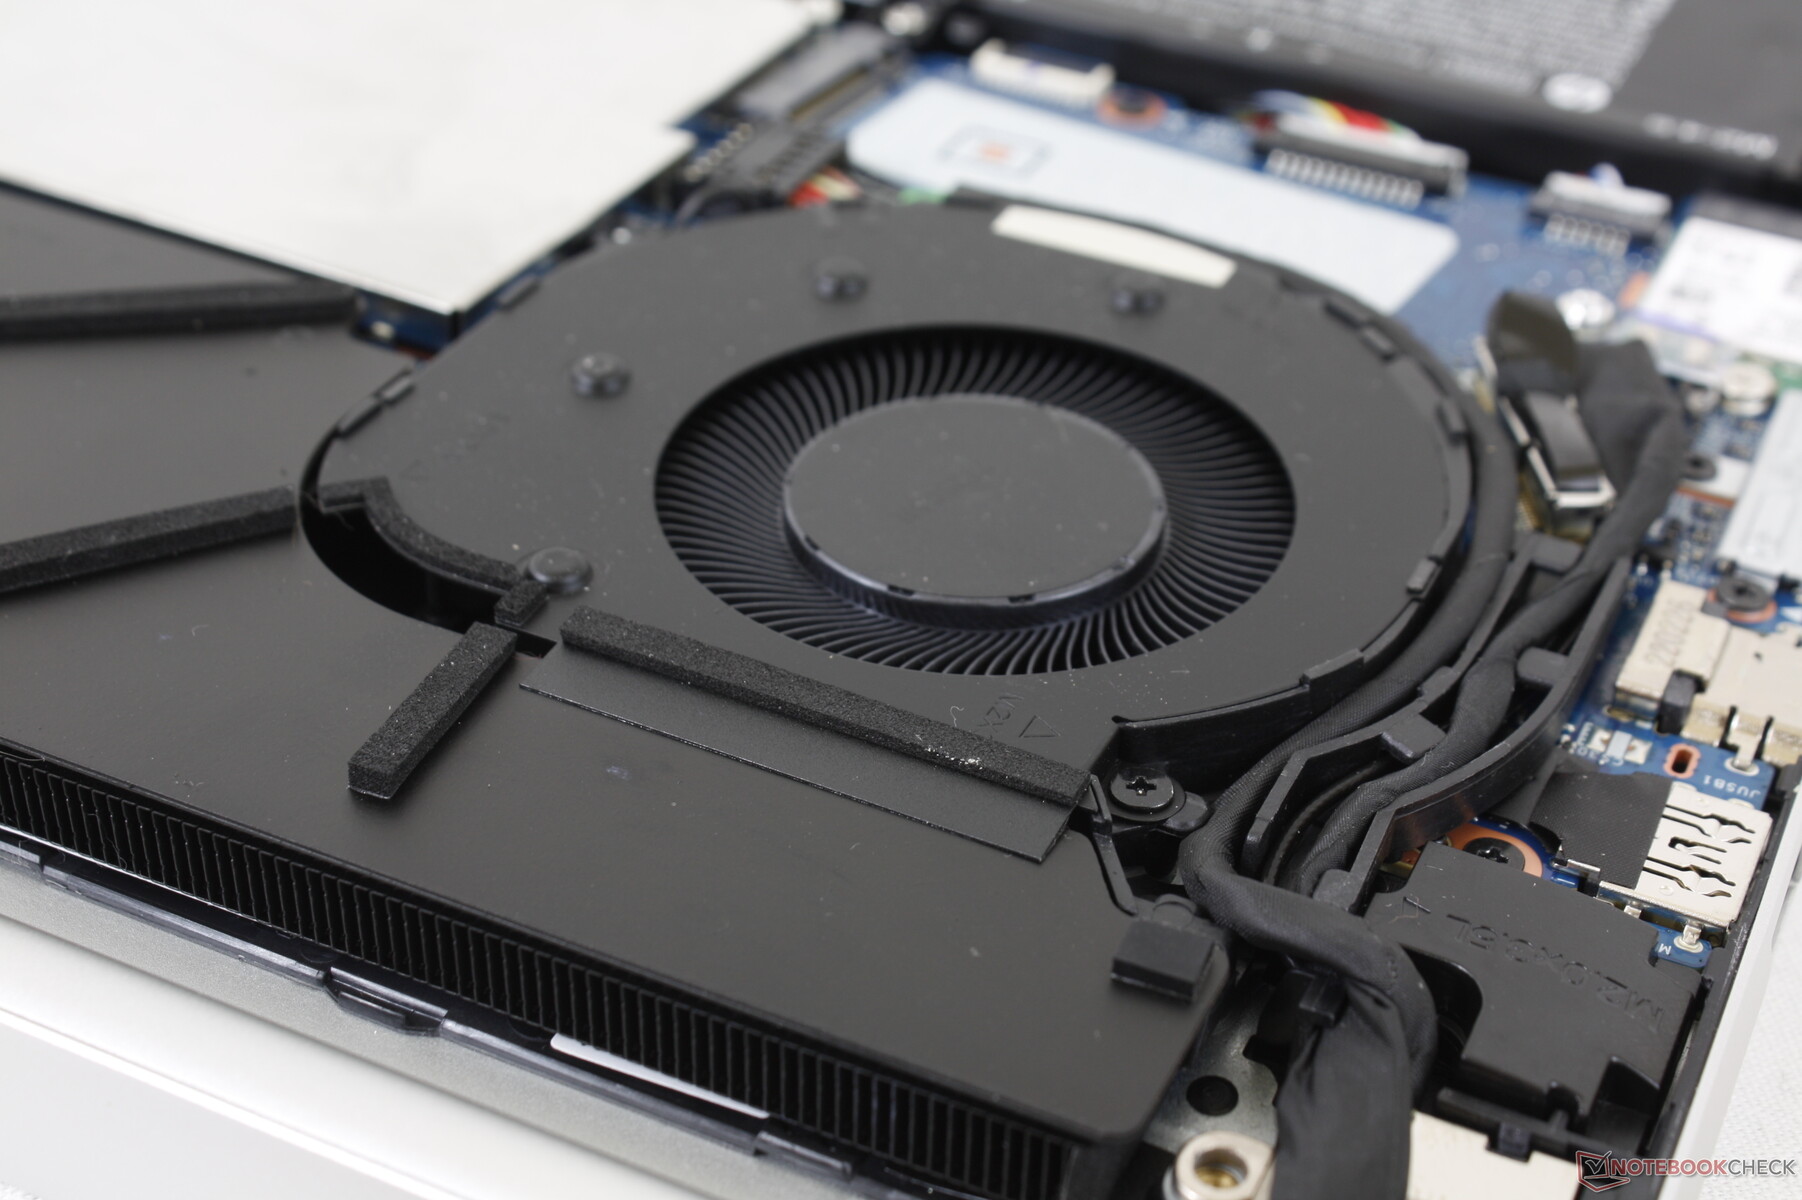
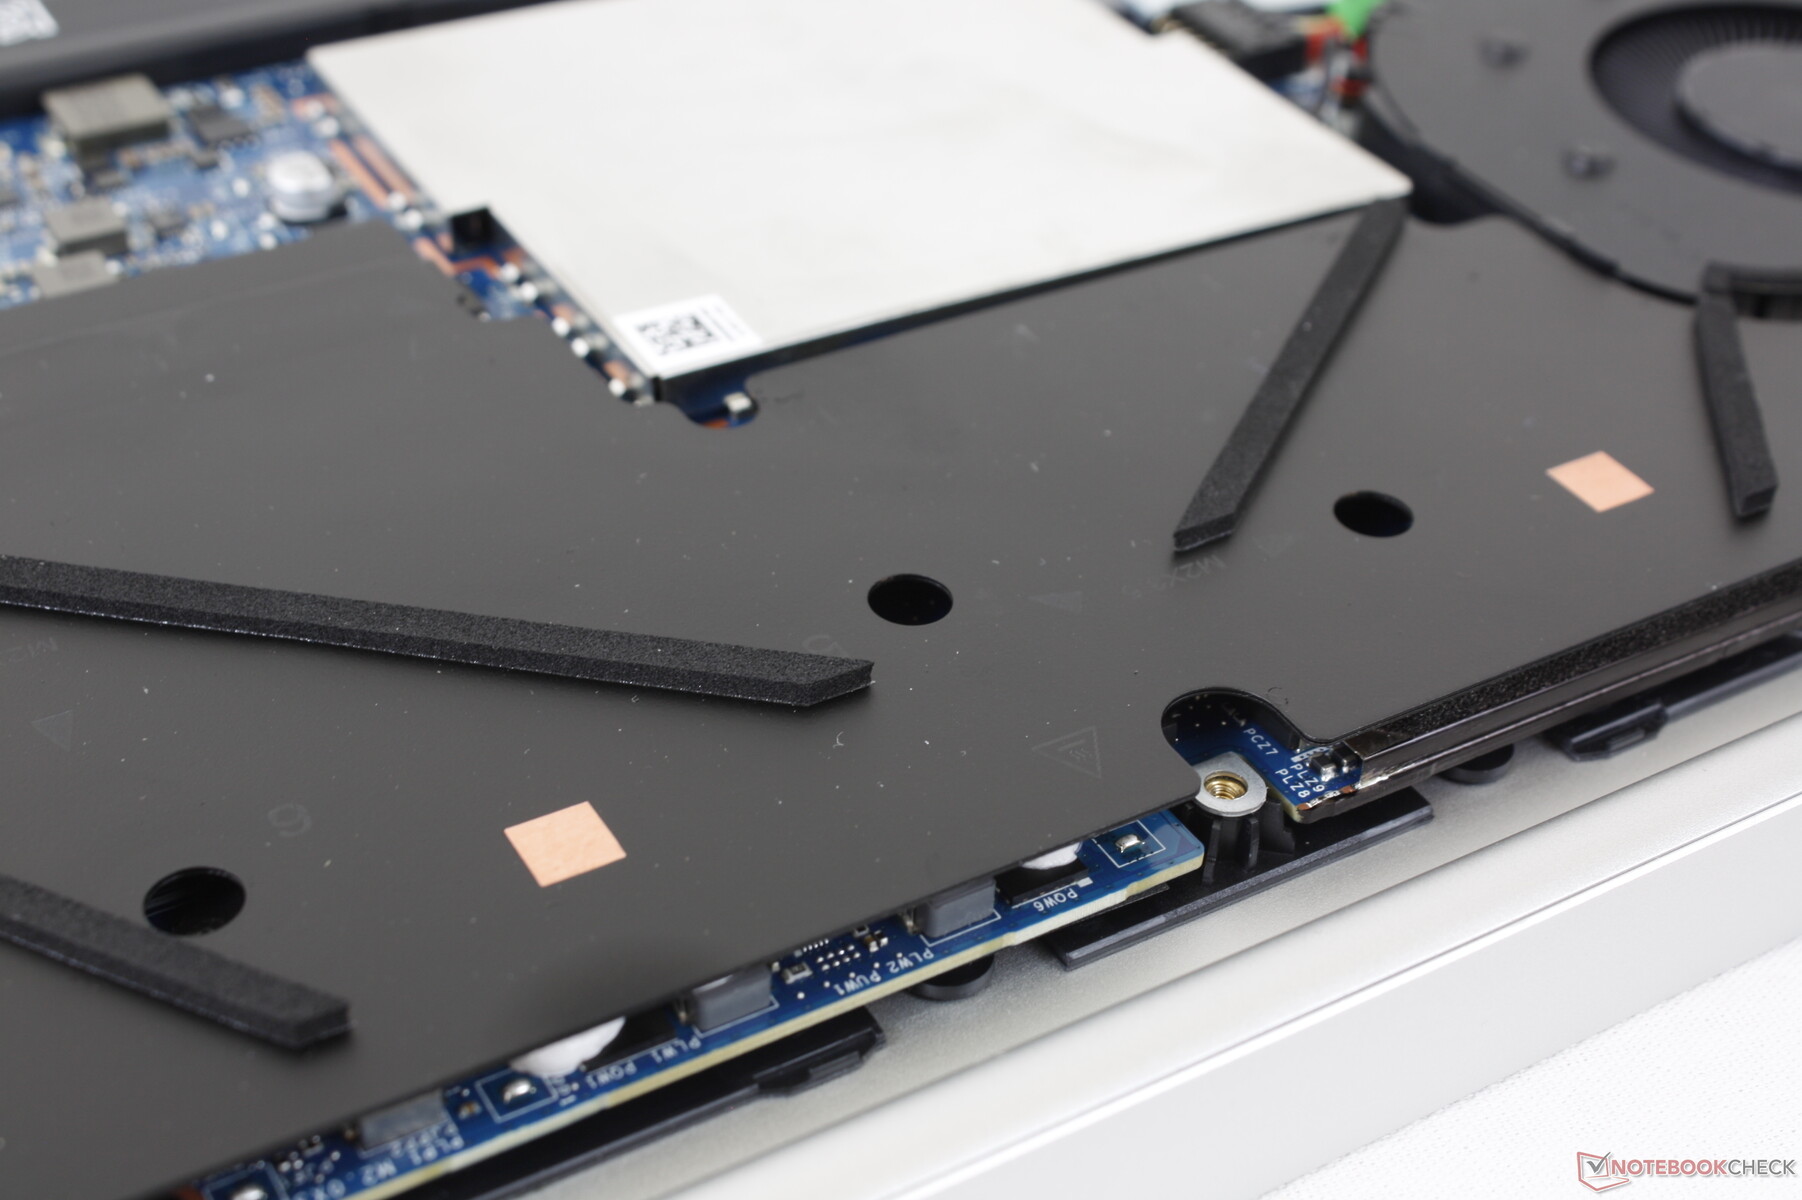
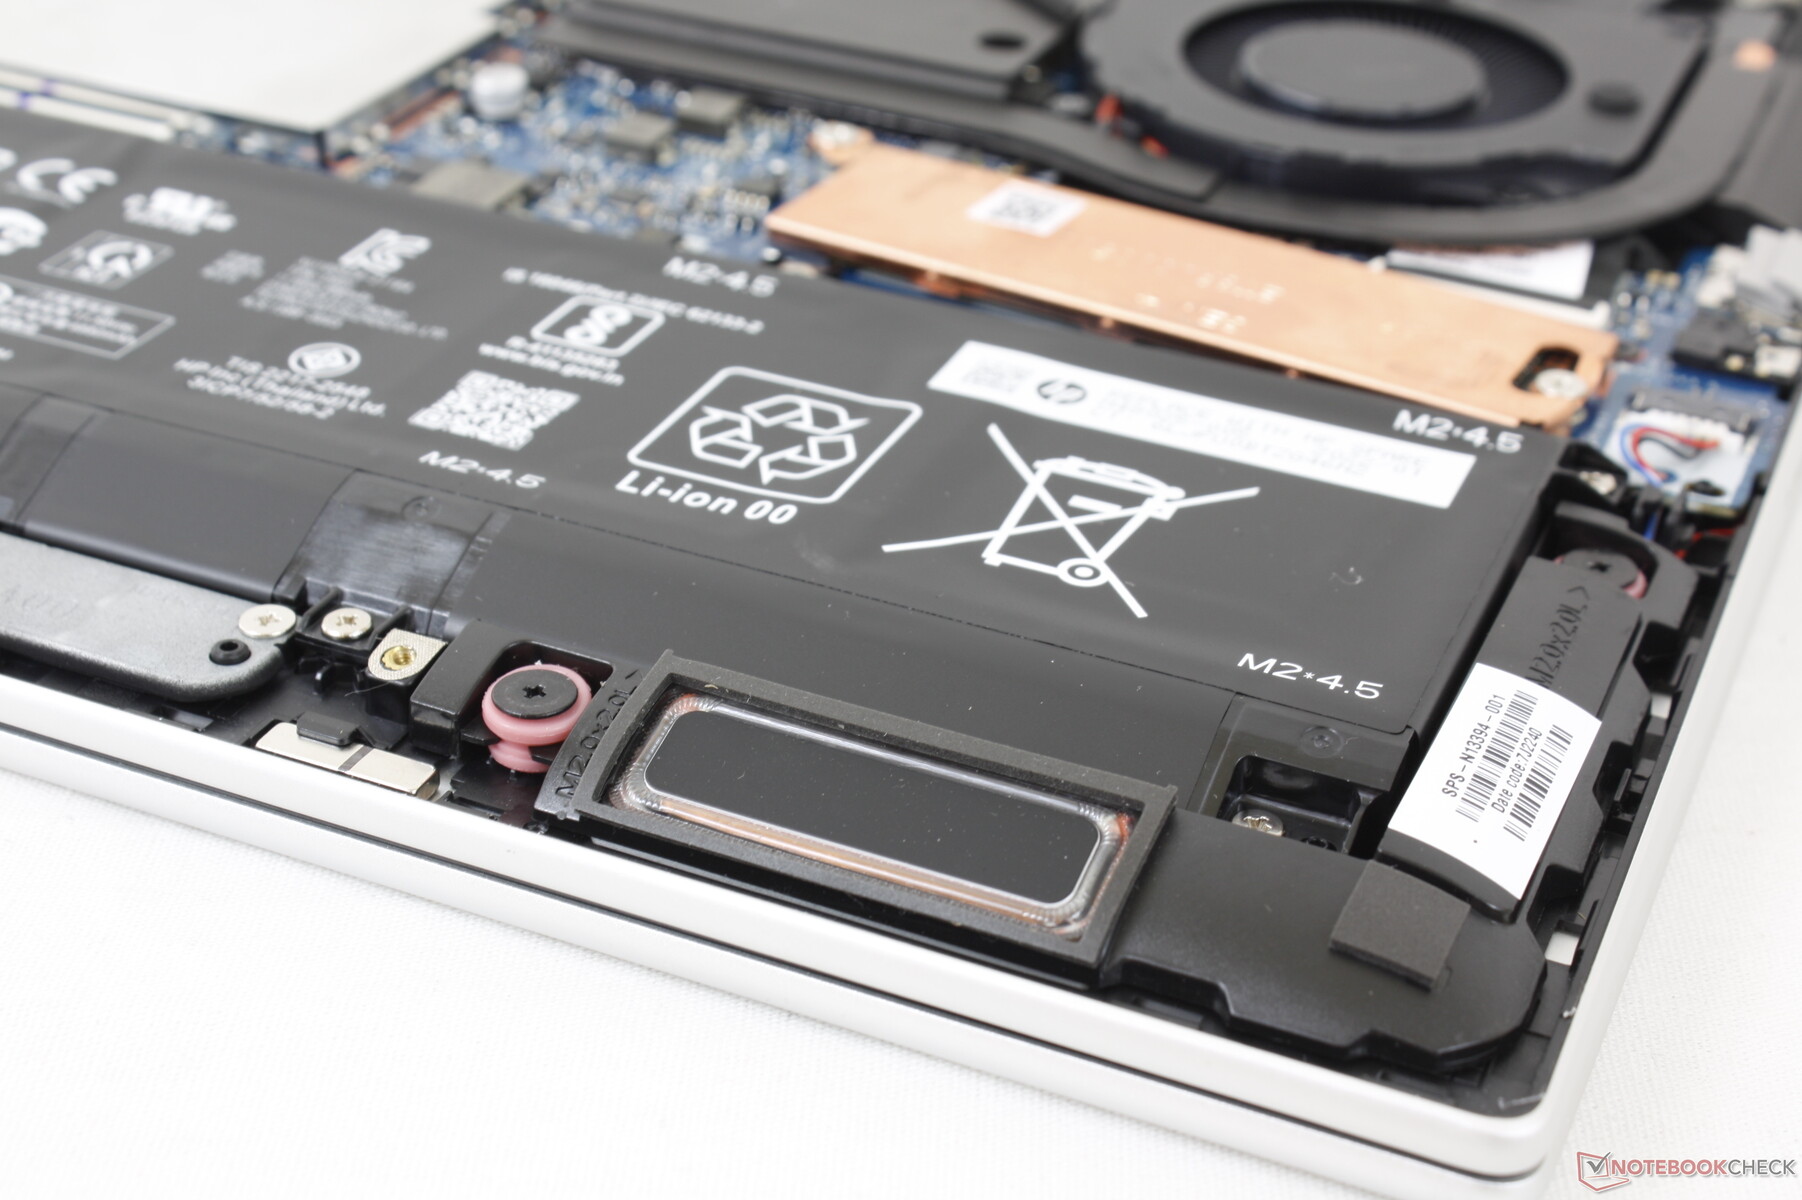
Maintenance
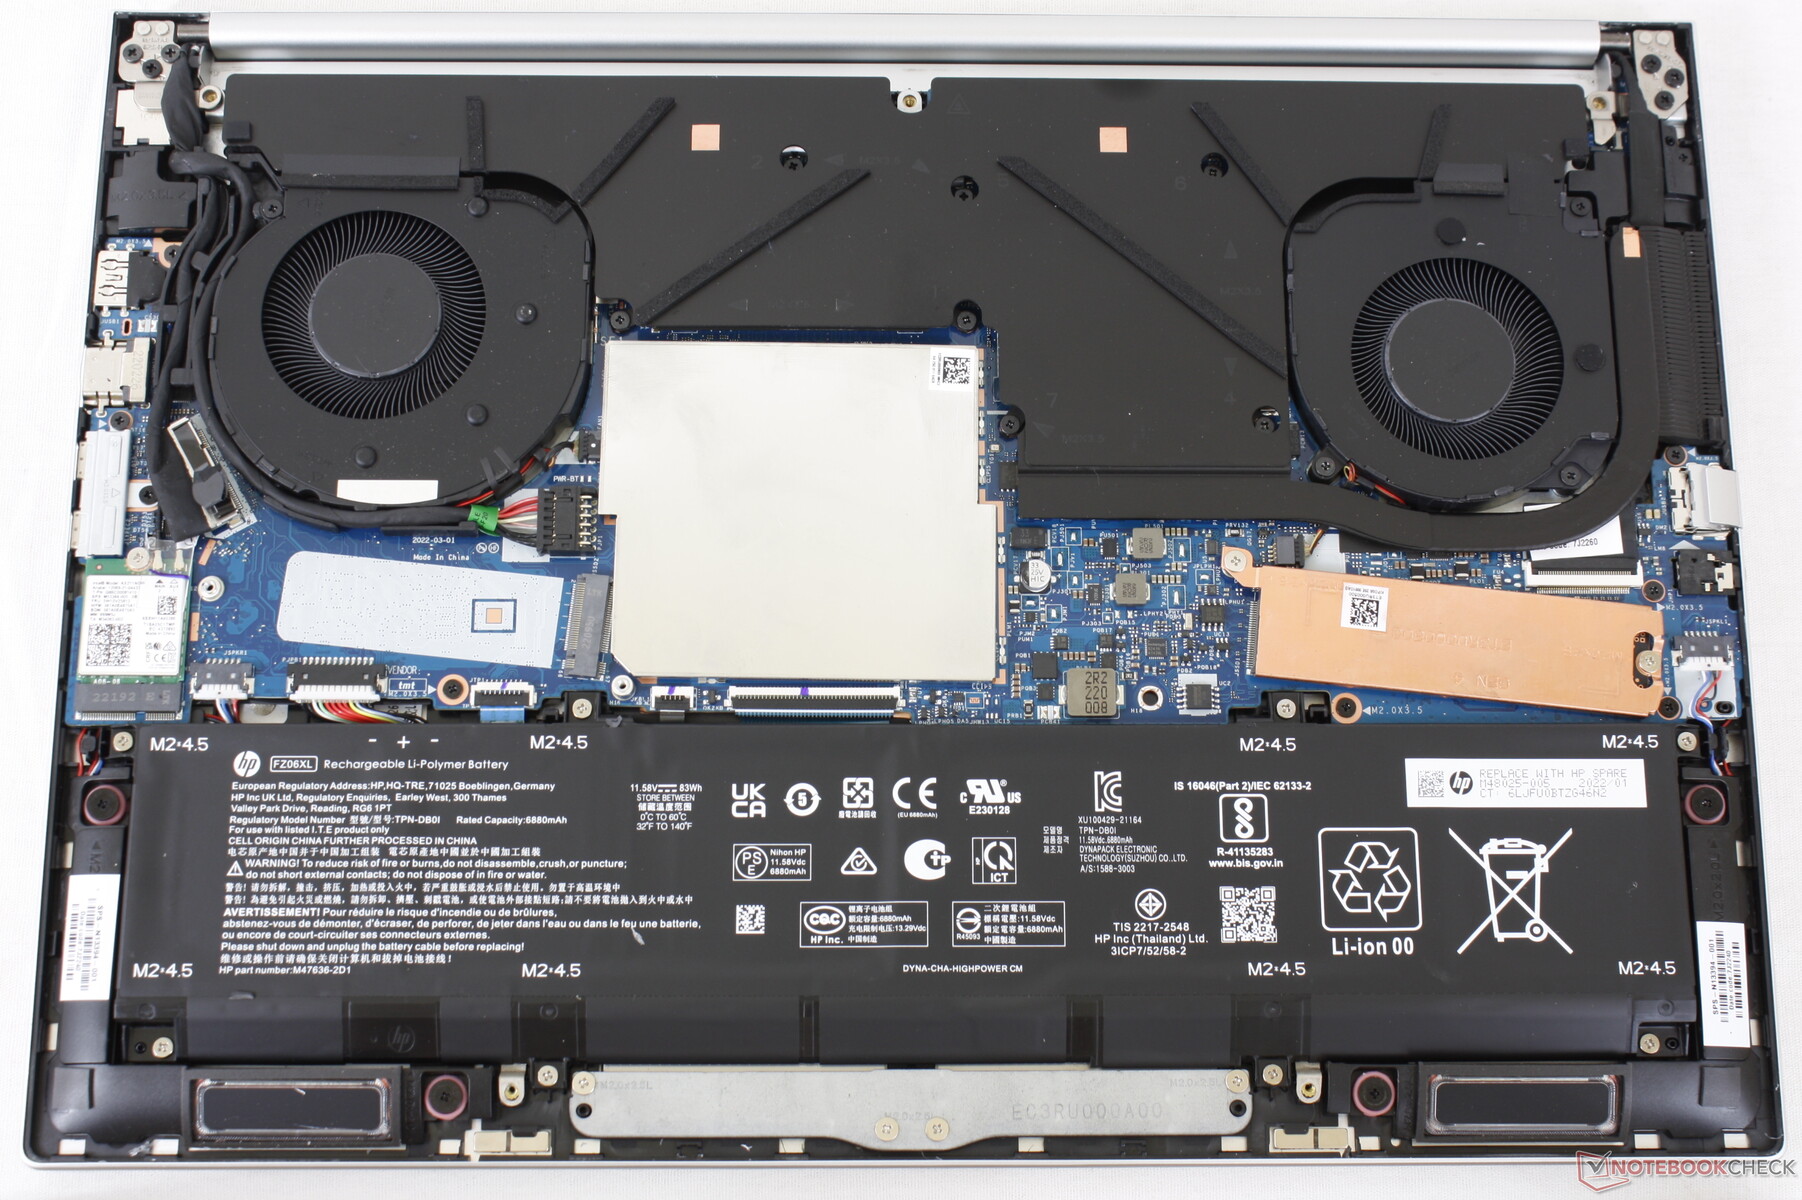
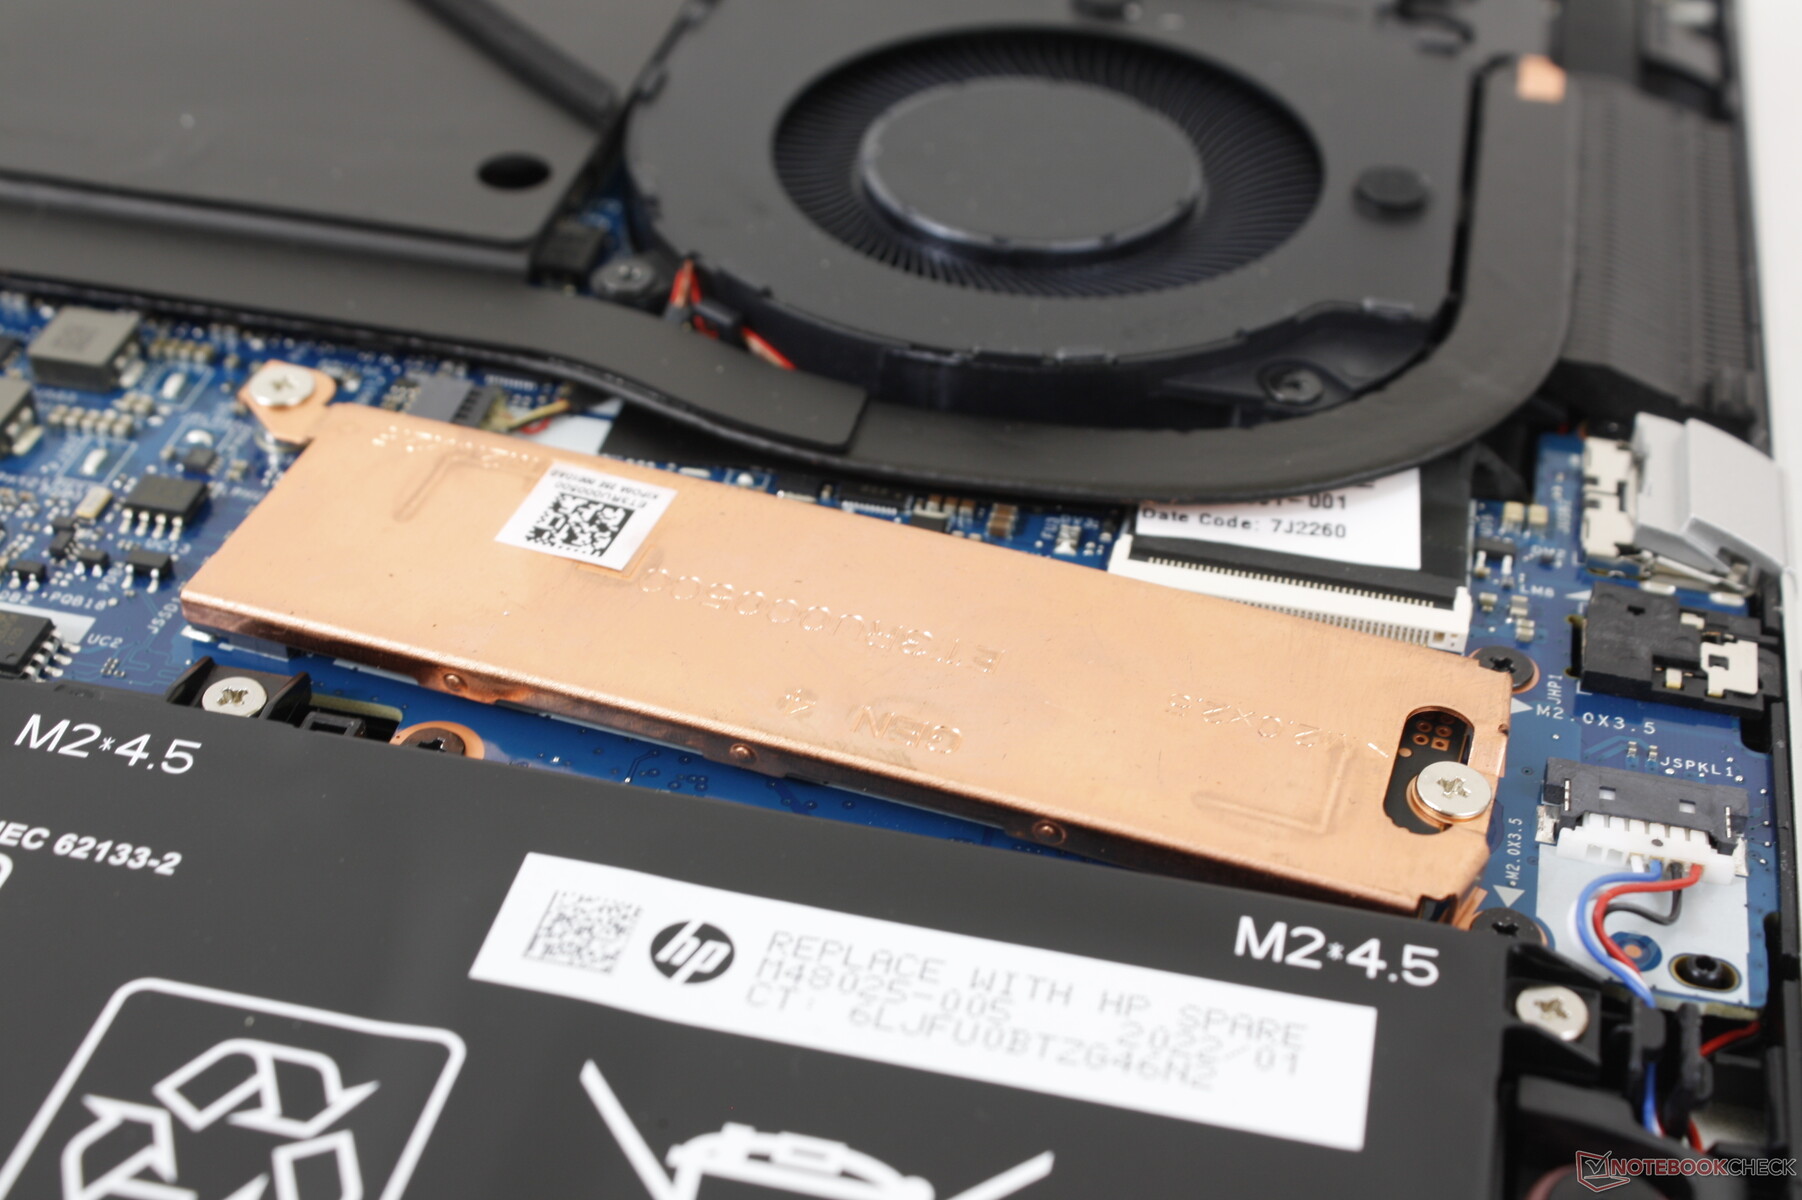
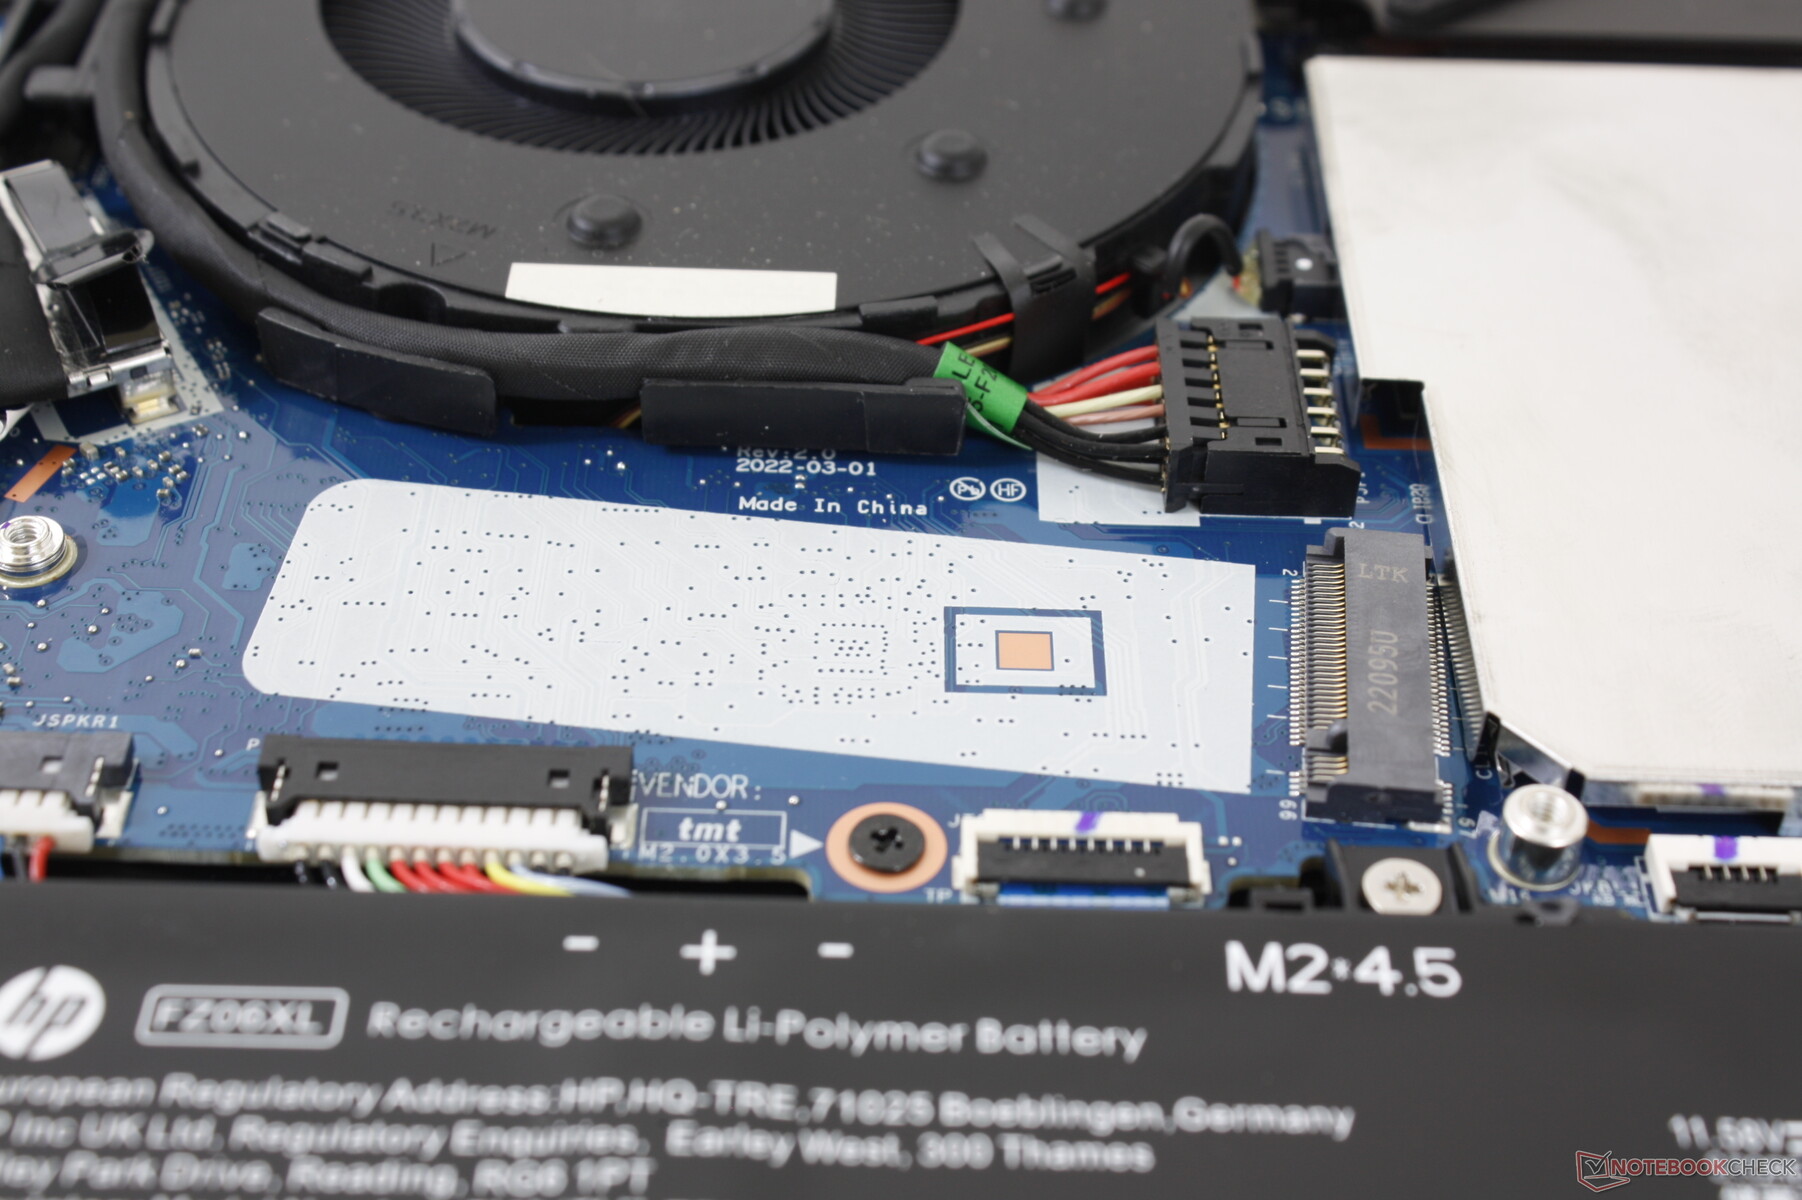
The bottom panel is secured by just 5 Torx screws for easy servicing. In fact, HP has a very helpful YouTube video on how to disassemble the laptop step by step. Users can access the 2x SODIMM slots, 2x storage slots, and WLAN module once inside.
Accessories and Warranty
There are no extras in the retail box beyond the AC adapter and paperwork. The usual one-year limited warranty applies if purchased in the US.
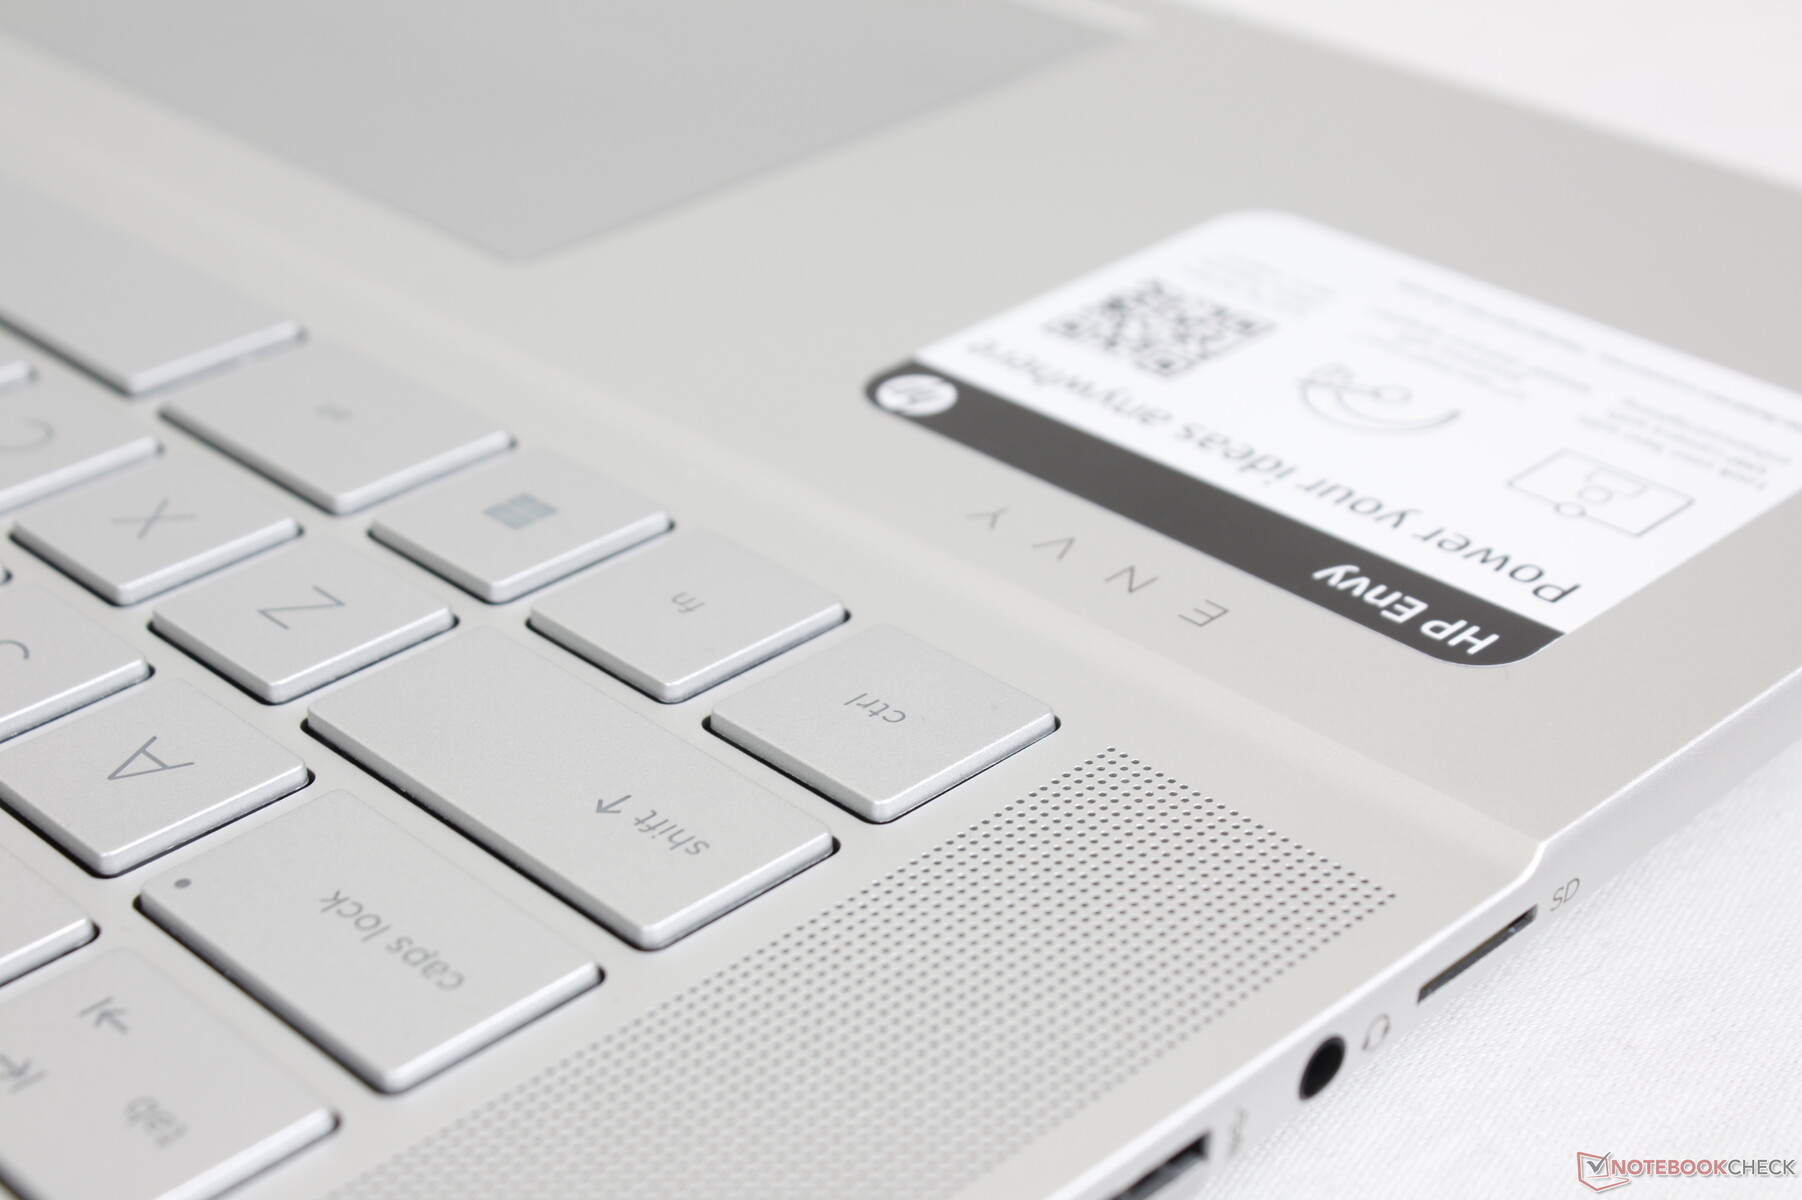
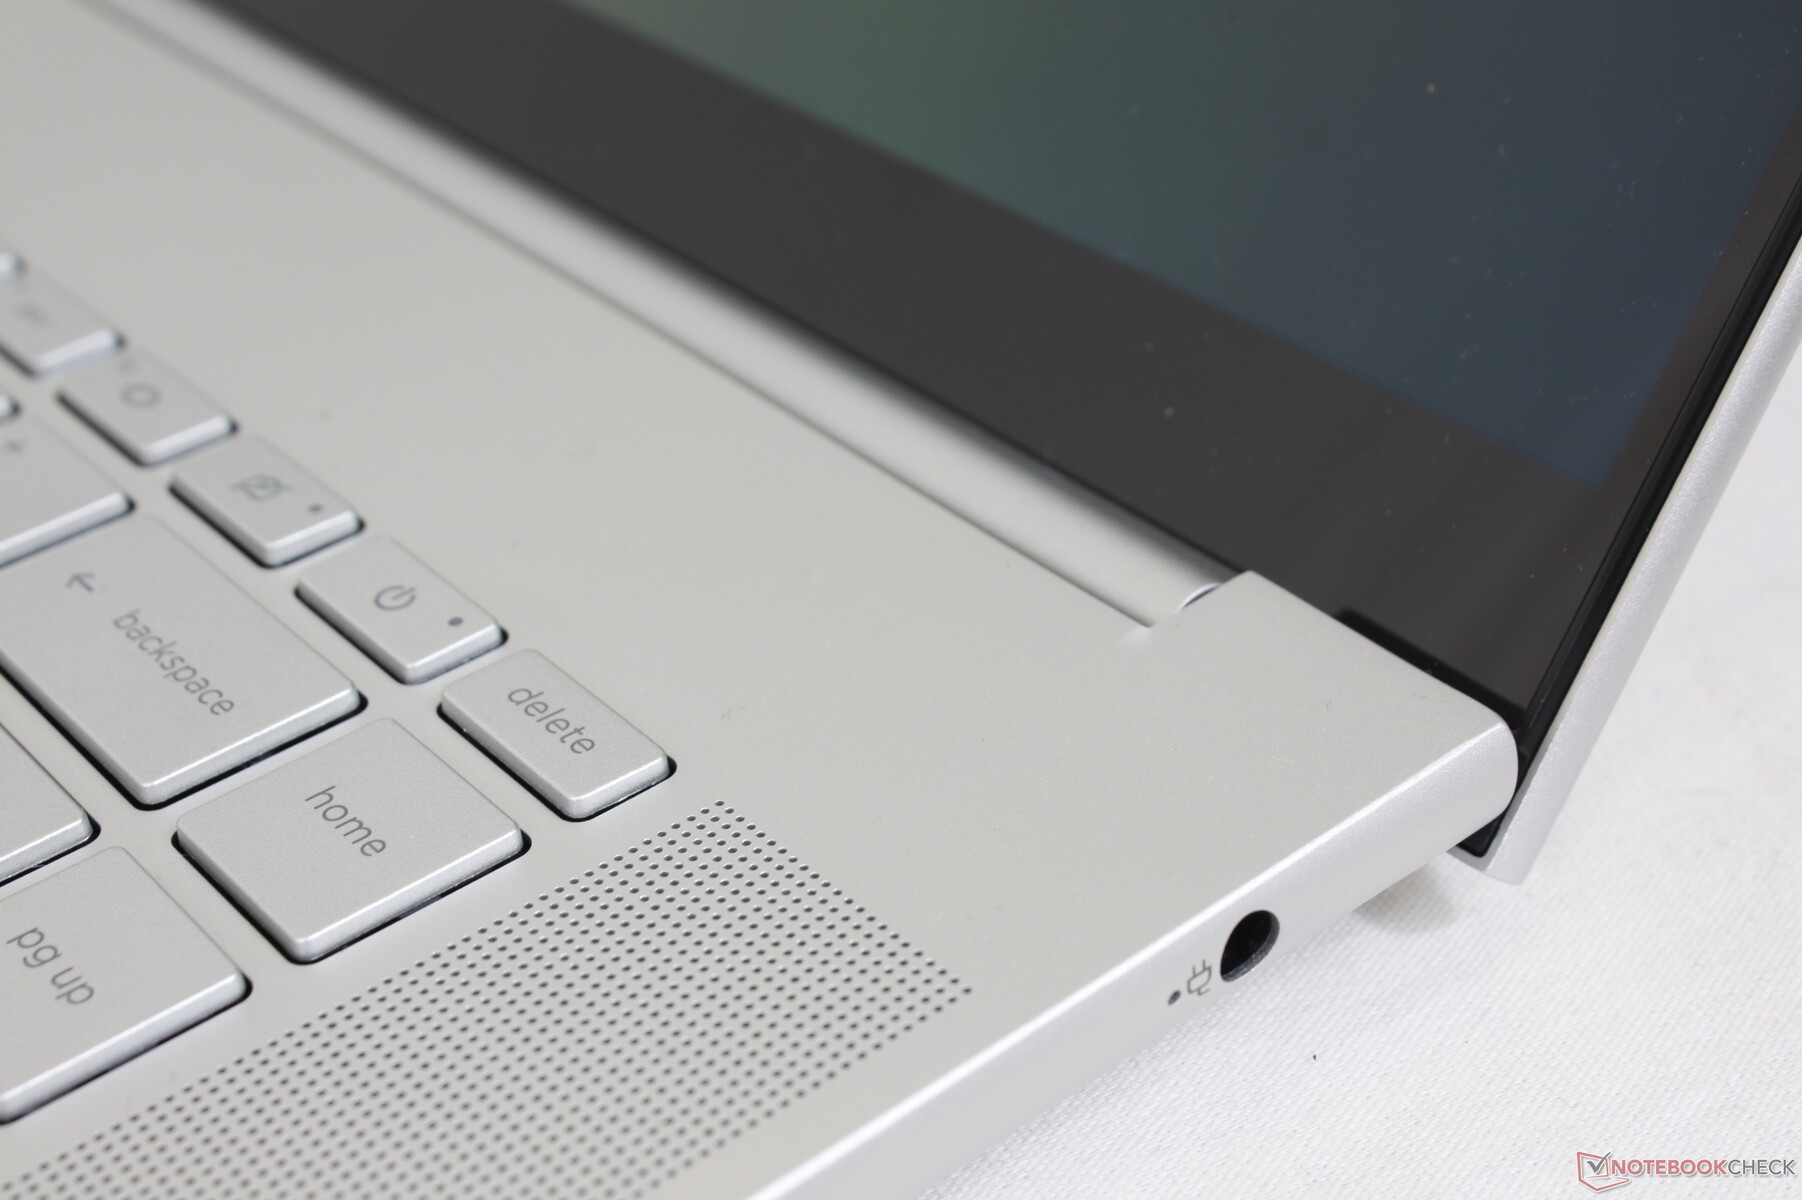
Input Devices — Bigger Touchpad, Familiar Keyboard
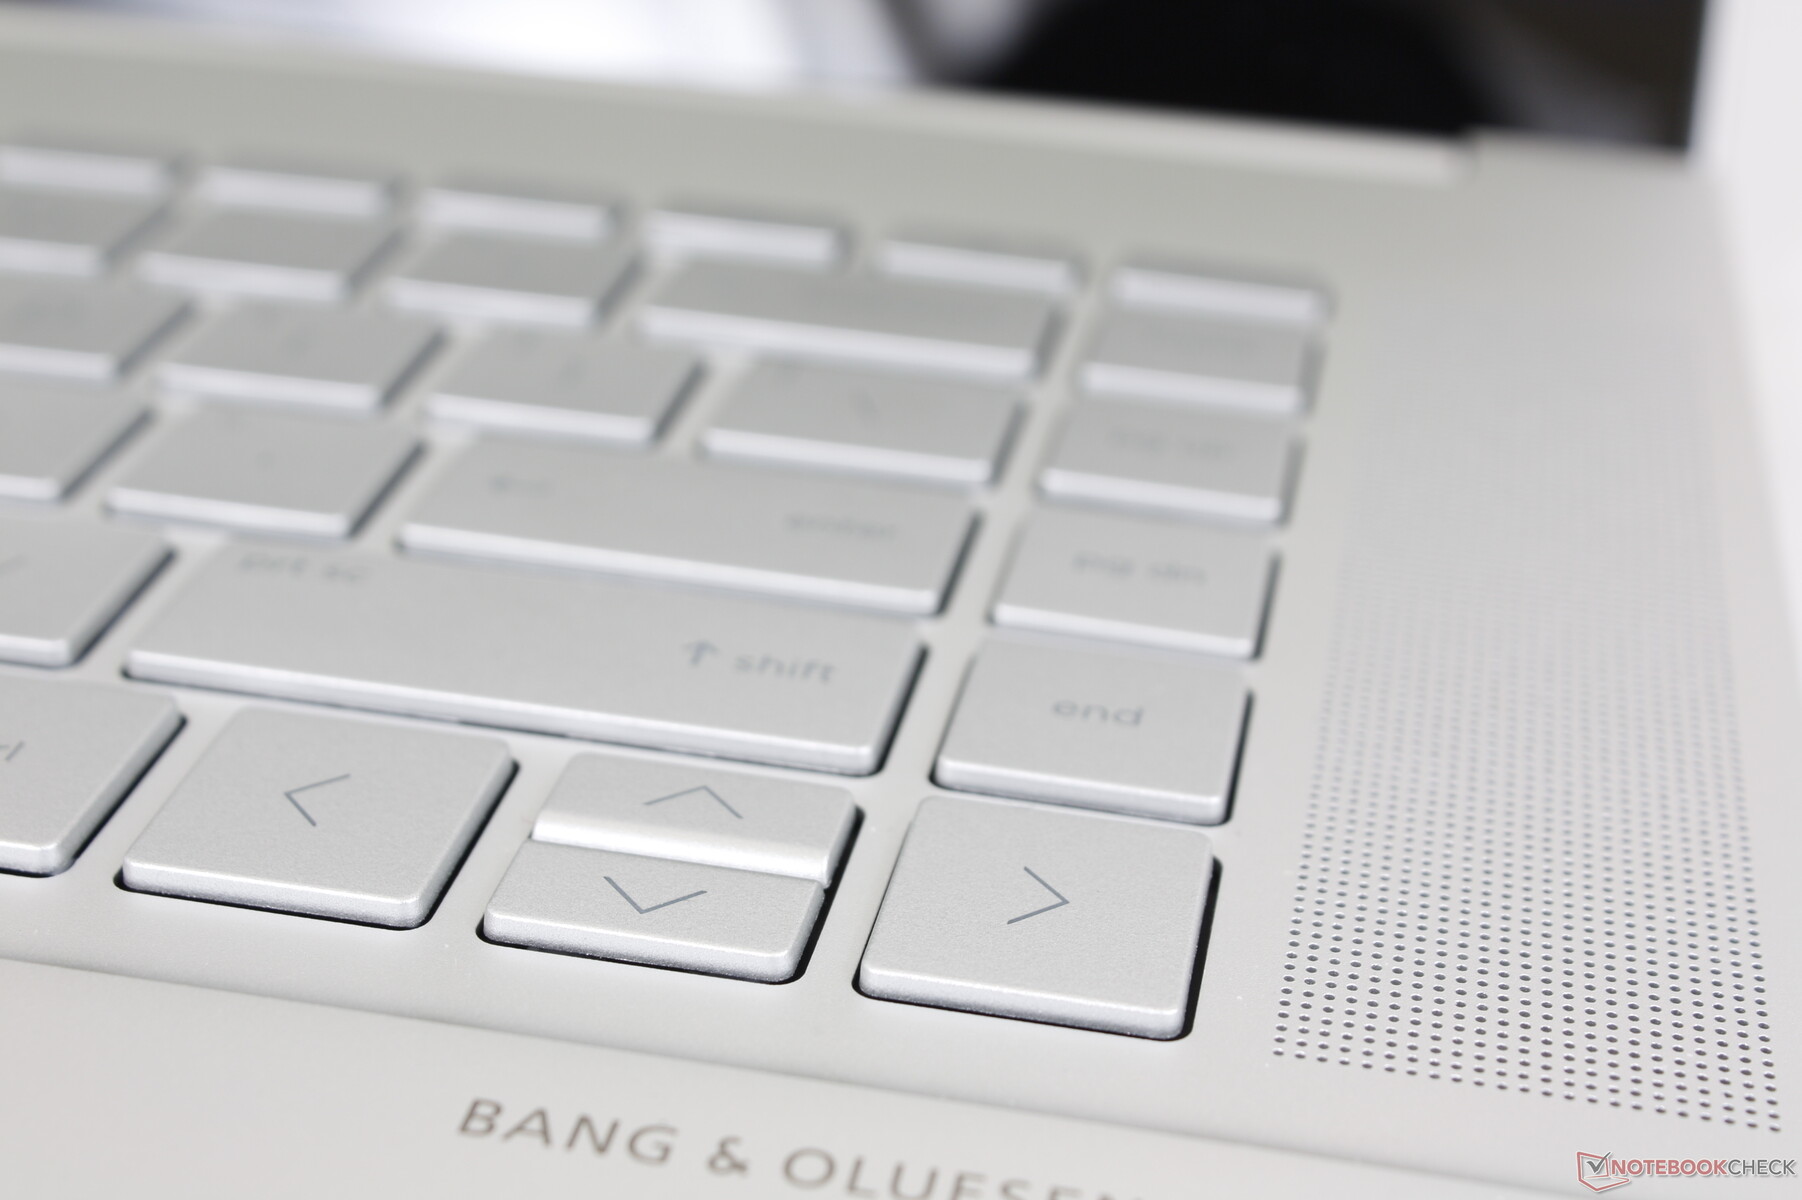
Keyboard
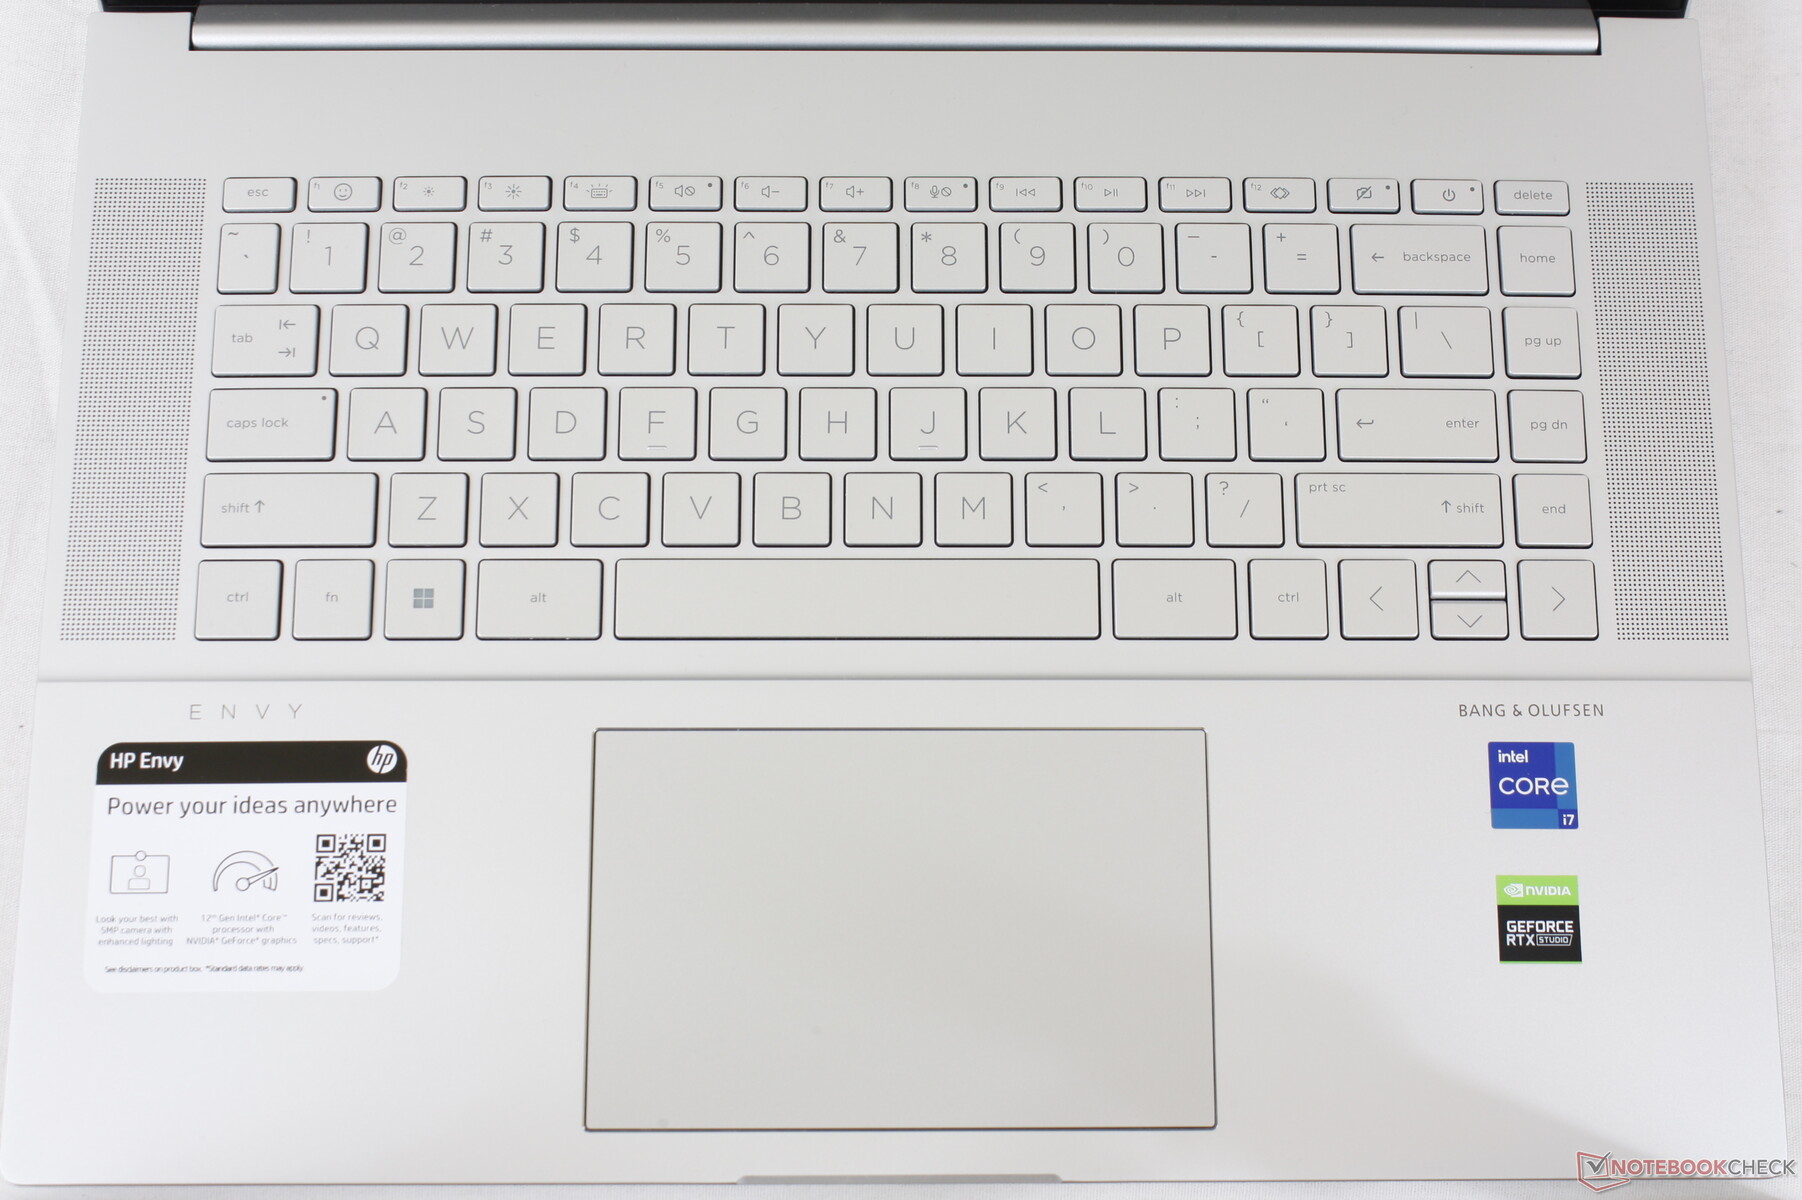
HP has made no changes to the feedback or feel of the keyboard when compared to the 2020 Envy 15. On one hand, users who are accustomed to Envy keyboards won't have any problems, but on the other hand, we would have preferred a typing experience closer to the firmer and more satisfying keys of a Spectre 15 or EliteBook model.
There are two minor superficial changes worth mentioning. The secondary function of the F12 key has now been changed to a 'System Event Utility' function which is essentially a Quick Launch key for HP Command Center, Omen Gaming Hub, myHP, and HP Palette. Secondly, the secondary function of the F1 key now launches a popup for selecting emojis and GIFs much like on the latest Pavilion.
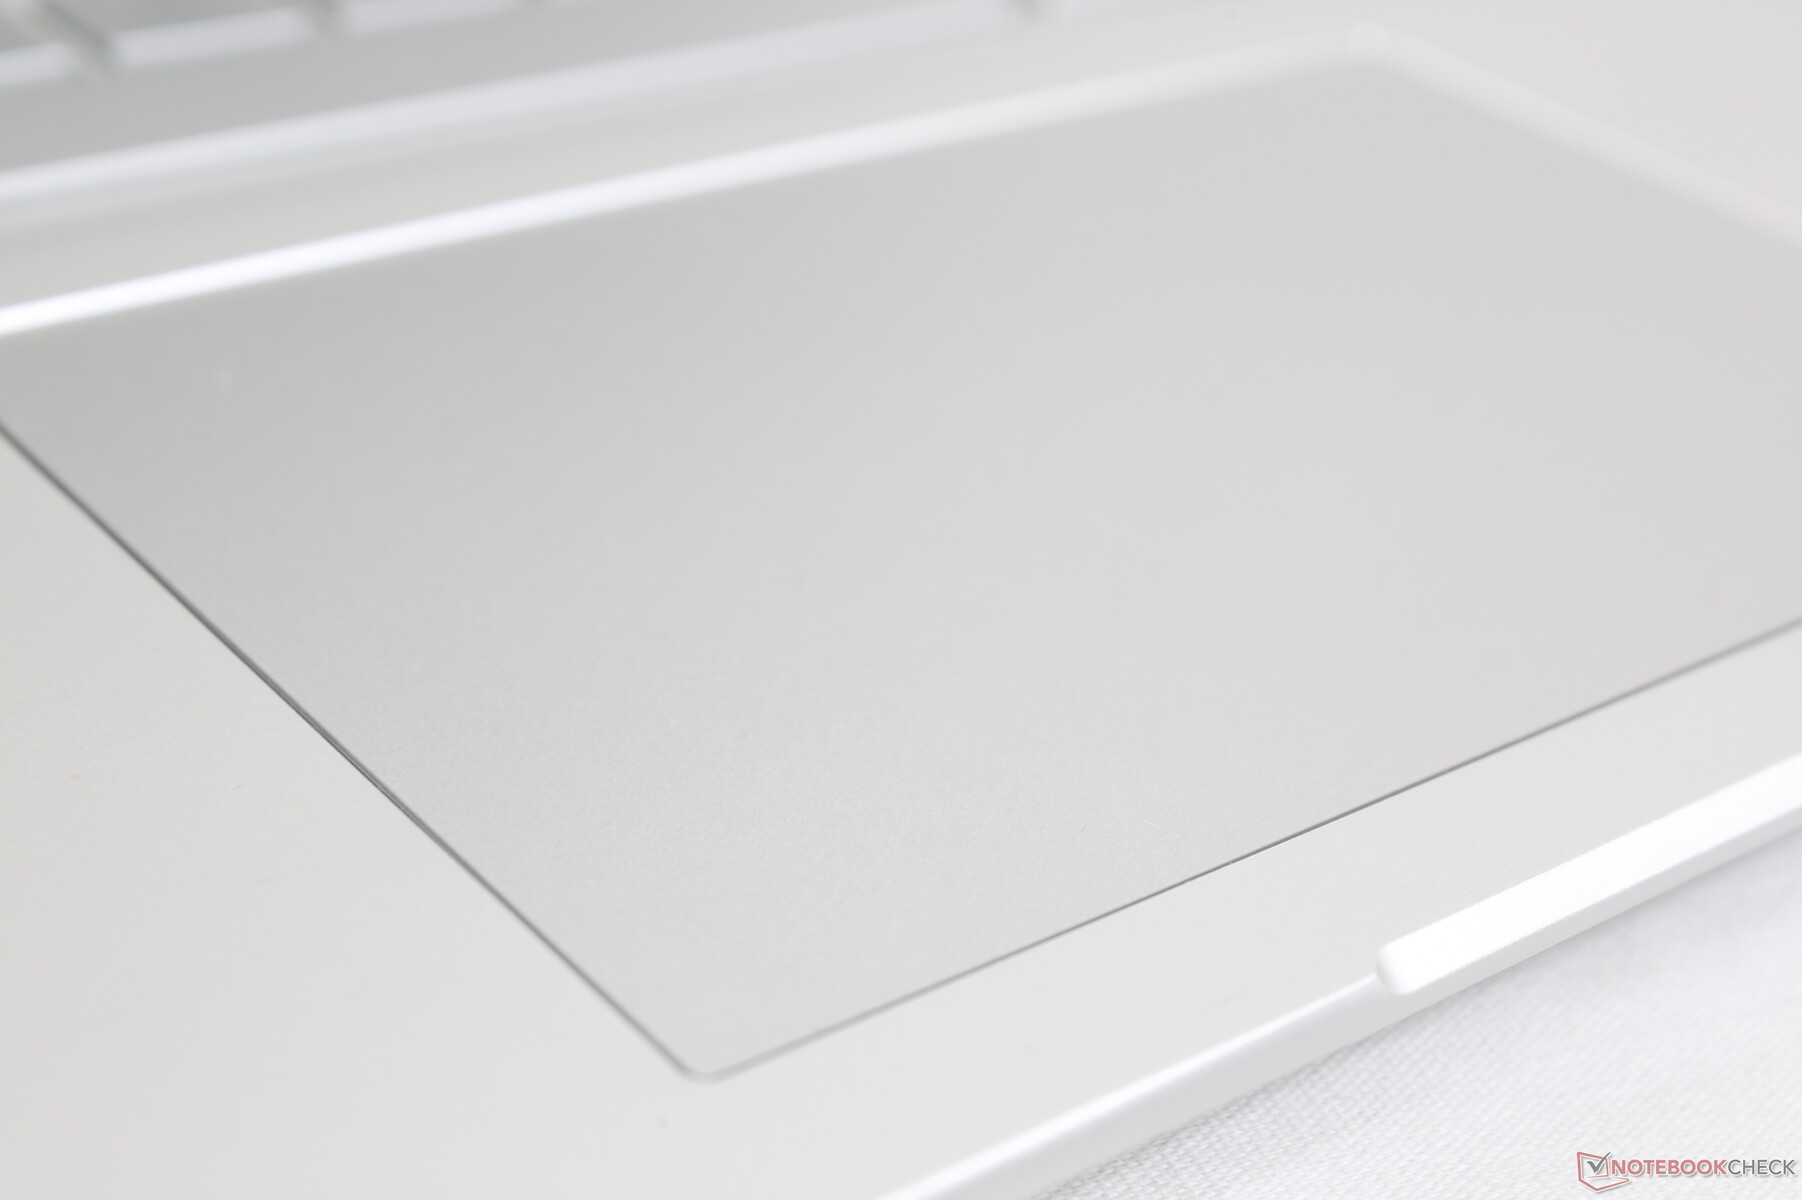
Touchpad
The clickpad is larger than the clickpad on the outgoing Envy 15 (12.5 x 8 cm vs. 11.5 x 7.5 cm). The surface is smooth and almost textureless with just minimal sticking if gliding at slower speeds for more accurate clicks. Meanwhile, feedback when clicking on the clickpad is relatively soft and quiet for a spongy feel. A stronger and more satisfying click would have made the clickpad easier to use.

Display — IPS or OLED?
There are two display options available:
- 2560 x 1600, 120 Hz, IPS, 100% sRGB
- 3840 x 2400, 60 Hz, OLED, 100% P3
Our measurements below reflect only the OLED option. Its main advantages include the deeper colors, pitch black contrast ratio, and significantly faster black-white and gray-gray response times over IPS at the cost of higher power consumption and screen flickering that may affect a small subset of users.
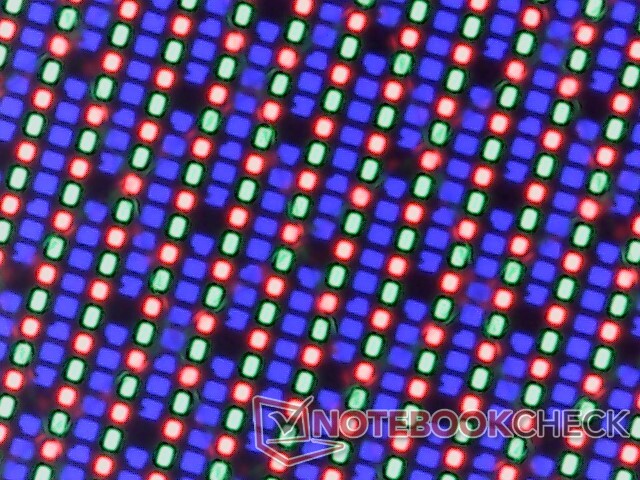
Image quality is sharp but with noticeable color grains which become more apparent when displaying white colors at high brightness settings. The IPS option may be preferable for those who don't need P3 colors since the 120 Hz refresh rate offers a much smoother experience.

| |||||||||||||||||||||||||
Brightness Distribution: 97 %
Center on Battery: 328.8 cd/m²
Contrast: ∞:1 (Black: 0 cd/m²)
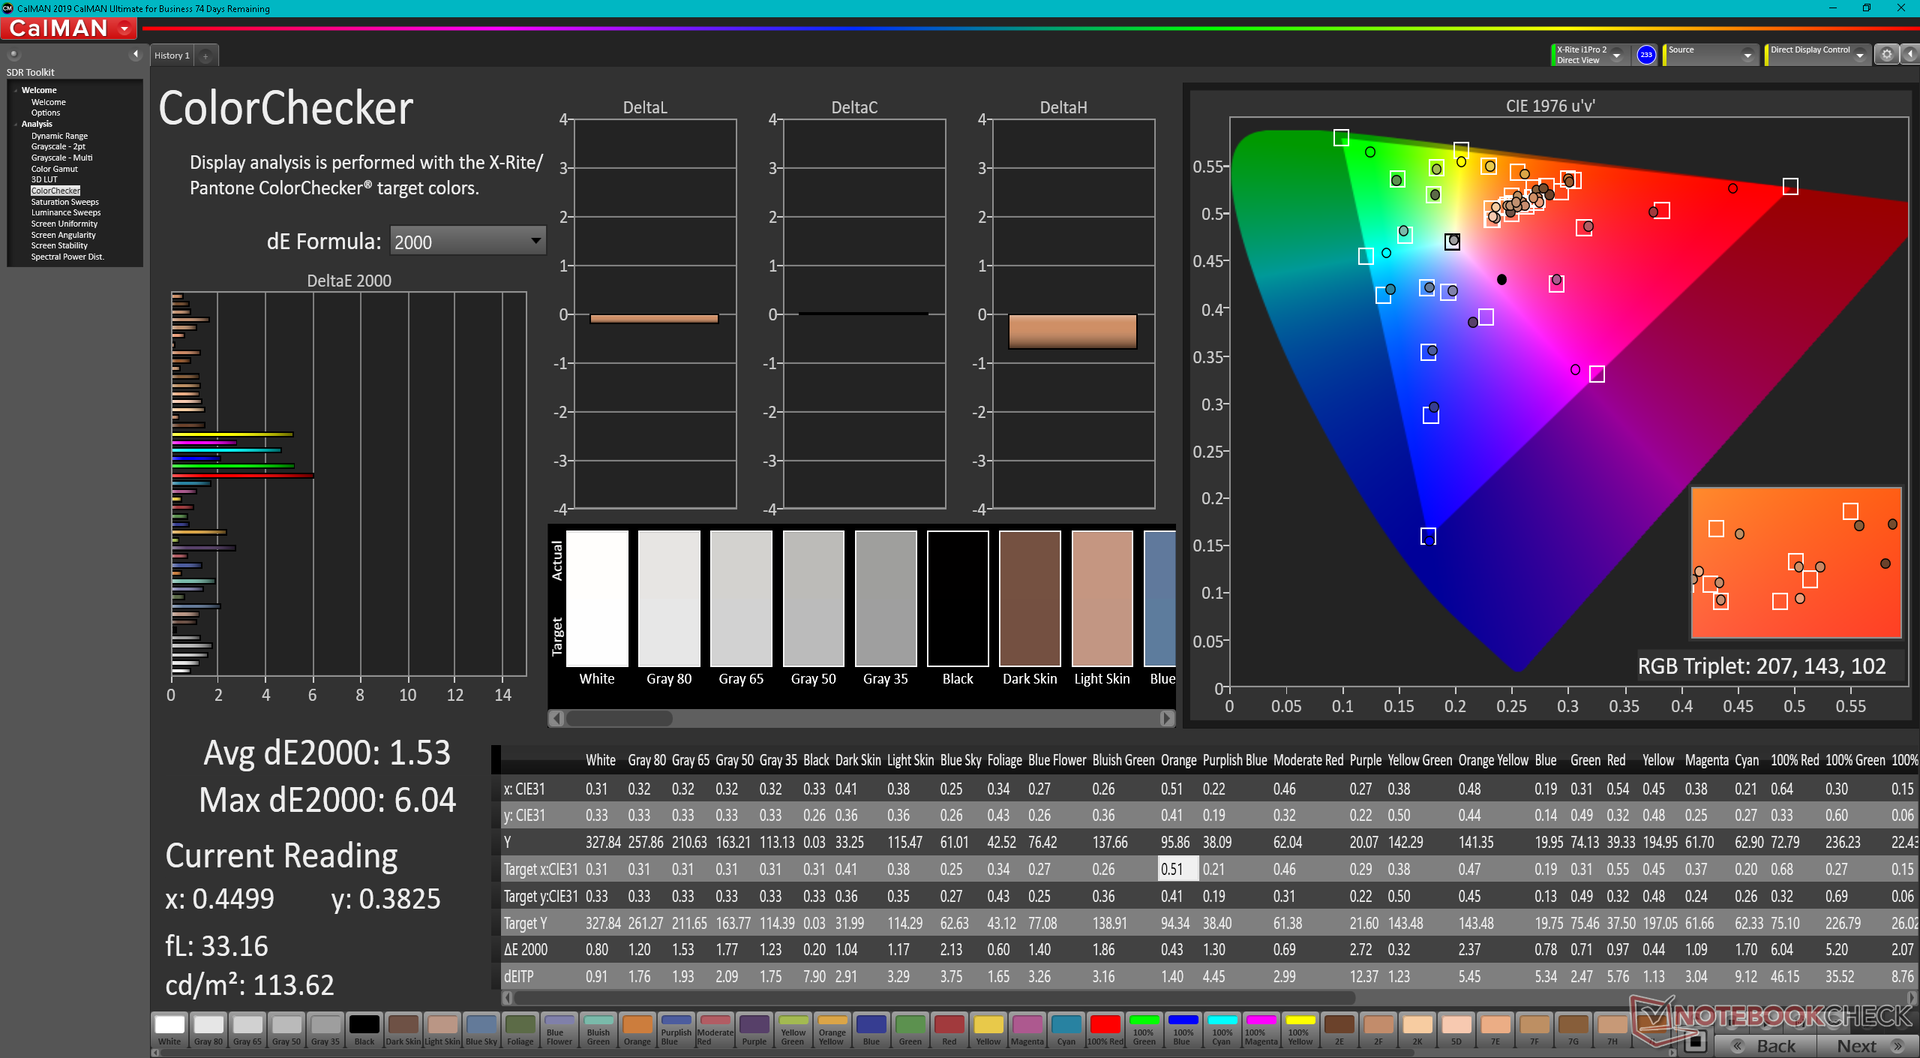
ΔE ColorChecker Calman: 1.53 | ∀{0.5-29.43 Ø4.71}
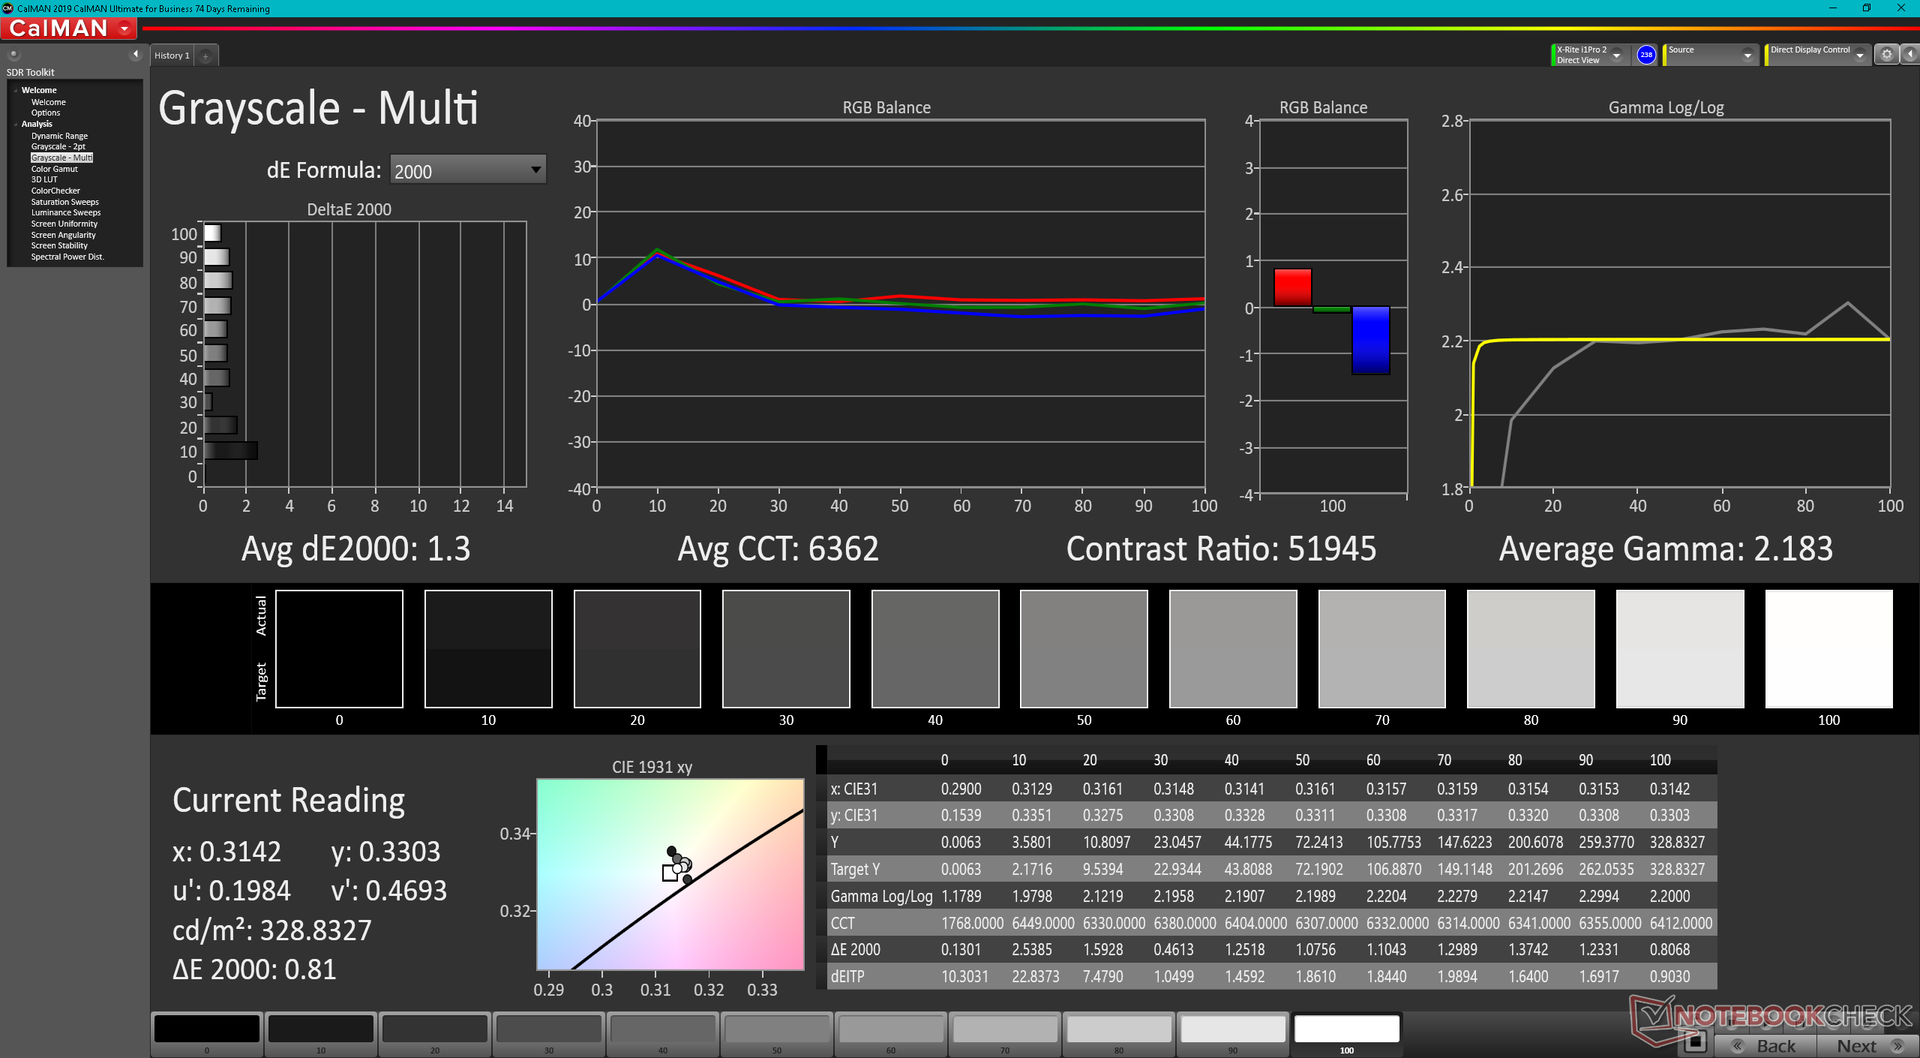
ΔE Greyscale Calman: 1.3 | ∀{0.09-98 Ø4.96}
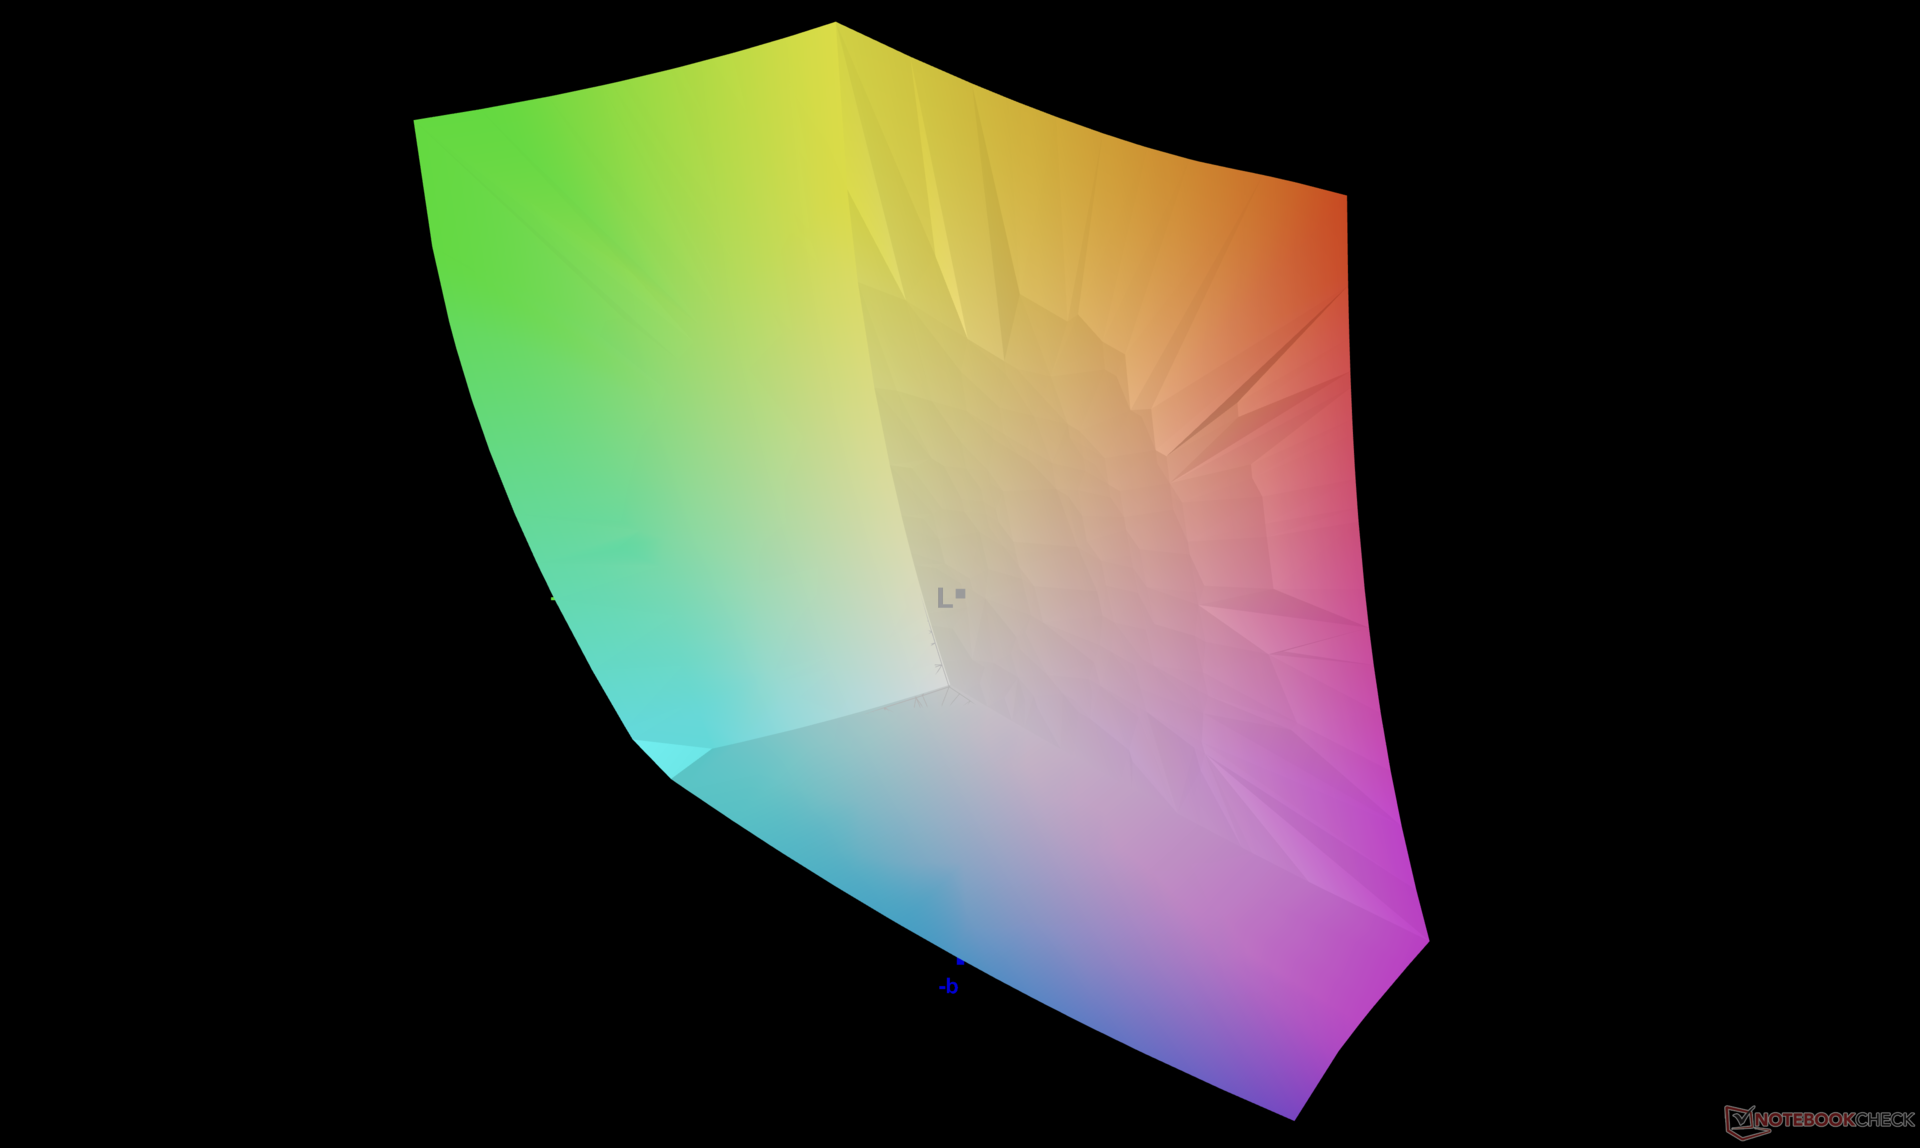
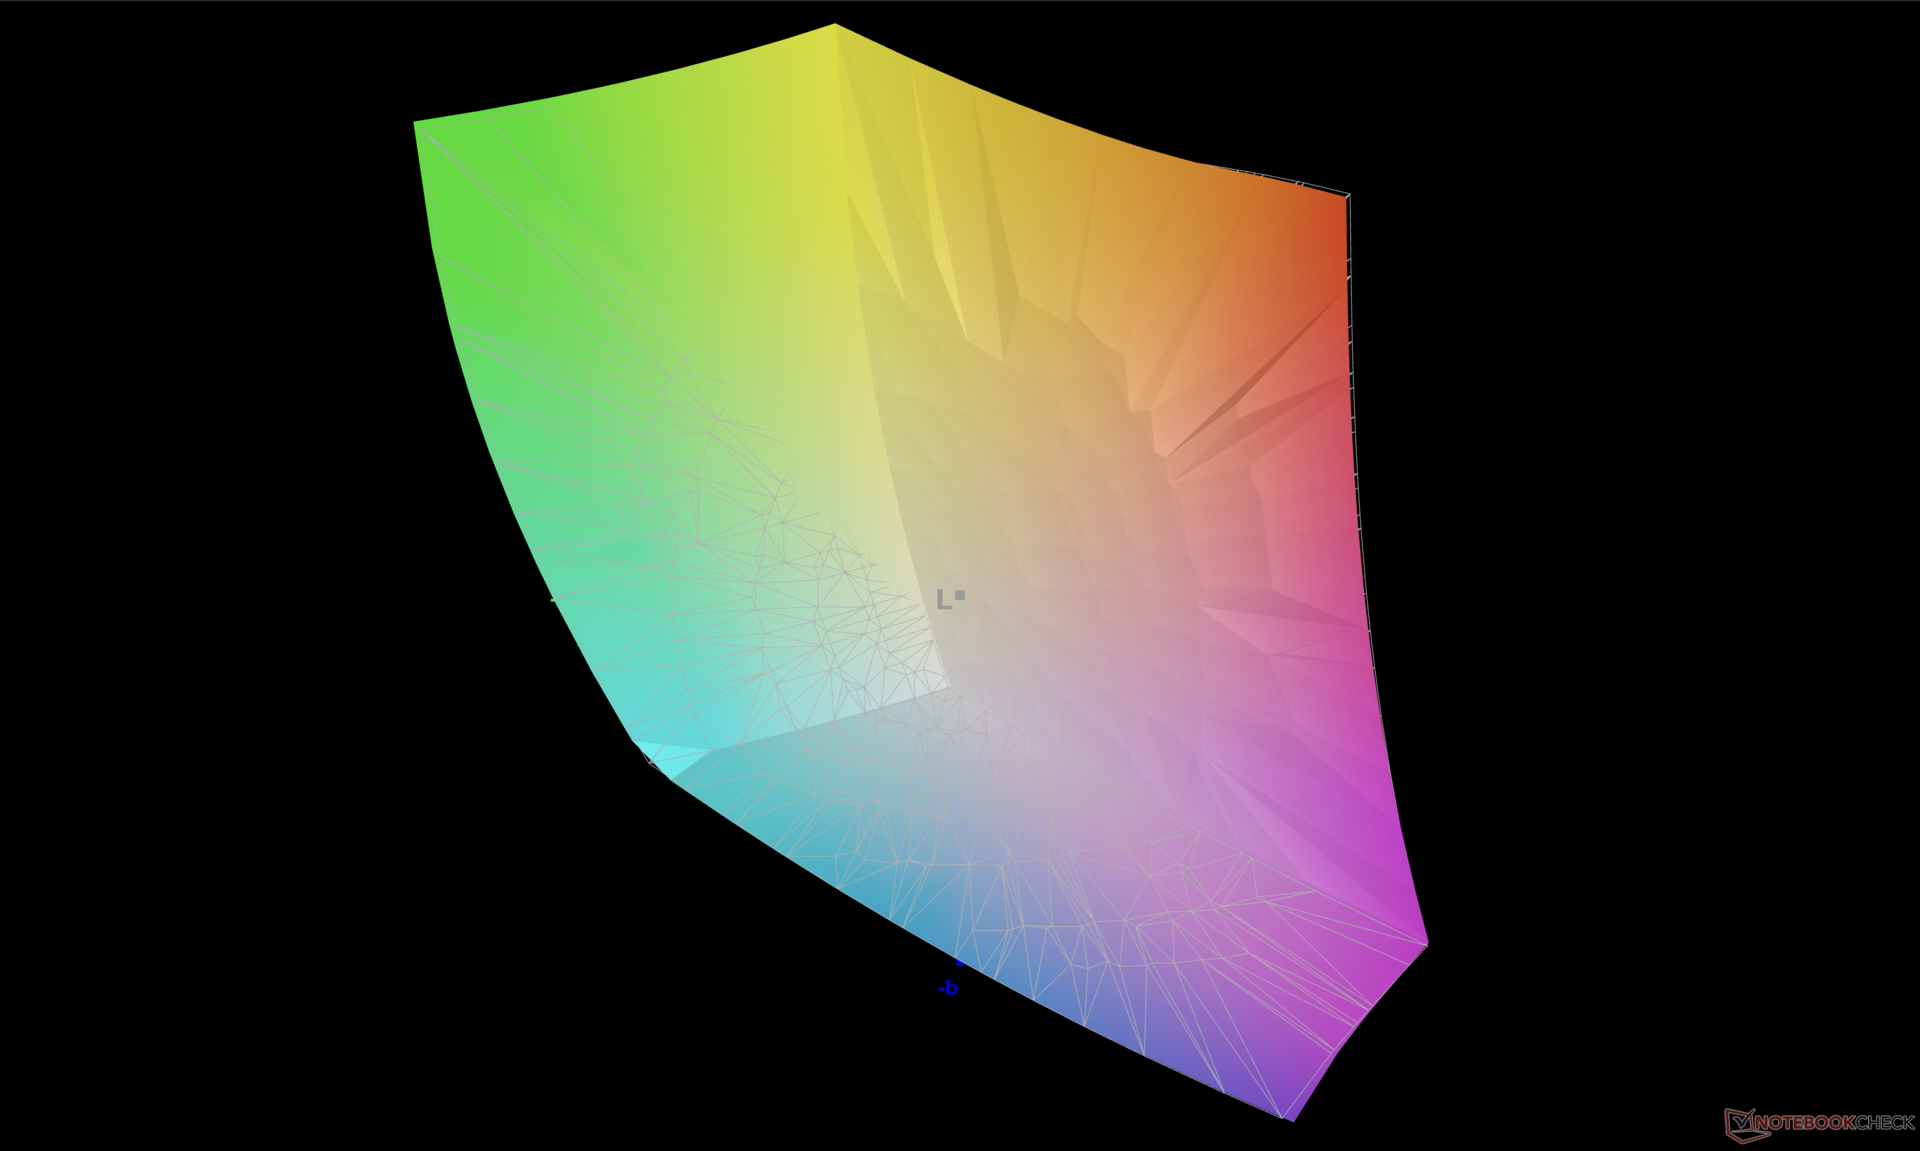
88% AdobeRGB 1998 (Argyll 3D)
100% sRGB (Argyll 3D)
99.3% Display P3 (Argyll 3D)
Gamma: 2.18
CCT: 6362 K
| HP Envy 16 h0112nr Samsung SDC4174, OLED, 3840x2400, 16" | Lenovo ThinkBook 16 G4+ IAP LEN160WQXGA, IPS, 2560x1600, 16" | MSI Creator Z16P B12UHST AUOD298, IPS True Pixel (~100% DCI-P3), 2560x1600, 16" | Dell Inspiron 16 Plus 7610-MHJ8F AU Optronics B160QAN, AUO9F91, IPS, 3072x1920, 16" | Apple MacBook Pro 16 2021 M1 Pro Liquid Retina XDR, Mini-LED, 3456x2234, 16.2" | Huawei MateBook 16s i7 BOE XS TV160DKT-NH0, IPS, 2520x1680, 16" | |
|---|---|---|---|---|---|---|
| Display | -17% | -1% | -13% | 0% | -21% | |
| Display P3 Coverage (%) | 99.3 | 69.6 -30% | 97.6 -2% | 75 -24% | 99.1 0% | 64.5 -35% |
| sRGB Coverage (%) | 100 | 97.5 -2% | 99.9 0% | 100 0% | 100 0% | 96.7 -3% |
| AdobeRGB 1998 Coverage (%) | 88 | 71.7 -19% | 86.8 -1% | 76 -14% | 88 0% | 66.6 -24% |
| Response Times | -1160% | -391% | -2092% | -3381% | -1403% | |
| Response Time Grey 50% / Grey 80% * (ms) | 2 ? | 32.7 ? -1535% | 12.9 ? -545% | 54 ? -2600% | 42.8 ? -2040% | 35.7 ? -1685% |
| Response Time Black / White * (ms) | 1.9 ? | 16.8 ? -784% | 6.4 ? -237% | 32 ? -1584% | 91.6 ? -4721% | 23.2 ? -1121% |
| PWM Frequency (Hz) | 240.4 ? | 14880 | ||||
| Screen | -36% | -17% | -37% | 15% | 13% | |
| Brightness middle (cd/m²) | 328.8 | 371 13% | 428 30% | 290 -12% | 514 56% | 311 -5% |
| Brightness (cd/m²) | 332 | 357 8% | 394 19% | 285 -14% | 497 50% | 319 -4% |
| Brightness Distribution (%) | 97 | 91 -6% | 86 -11% | 88 -9% | 95 -2% | 91 -6% |
| Black Level * (cd/m²) | 0.23 | 0.42 | 0.21 | 0.02 | 0.17 | |
| Colorchecker dE 2000 * | 1.53 | 2.6 -70% | 1.67 -9% | 2.57 -68% | 1.4 8% | 1 35% |
| Colorchecker dE 2000 max. * | 6.04 | 4.4 27% | 5.71 5% | 4.78 21% | 2.8 54% | 1.7 72% |
| Greyscale dE 2000 * | 1.3 | 3.7 -185% | 3.1 -138% | 3.14 -142% | 2.3 -77% | 1.5 -15% |
| Gamma | 2.18 101% | 2.32 95% | 2.195 100% | 2.34 94% | 2.27 97% | 2.15 102% |
| CCT | 6362 102% | 7271 89% | 6498 100% | 6408 101% | 6792 96% | 6432 101% |
| Contrast (:1) | 1613 | 1019 | 1381 | 25700 | 1829 | |
| Colorchecker dE 2000 calibrated * | 1.3 | 0.71 | 1.89 | 0.8 | ||
| Total Average (Program / Settings) | -404% /
-235% | -136% /
-81% | -714% /
-404% | -1122% /
-607% | -470% /
-254% |
* ... smaller is better
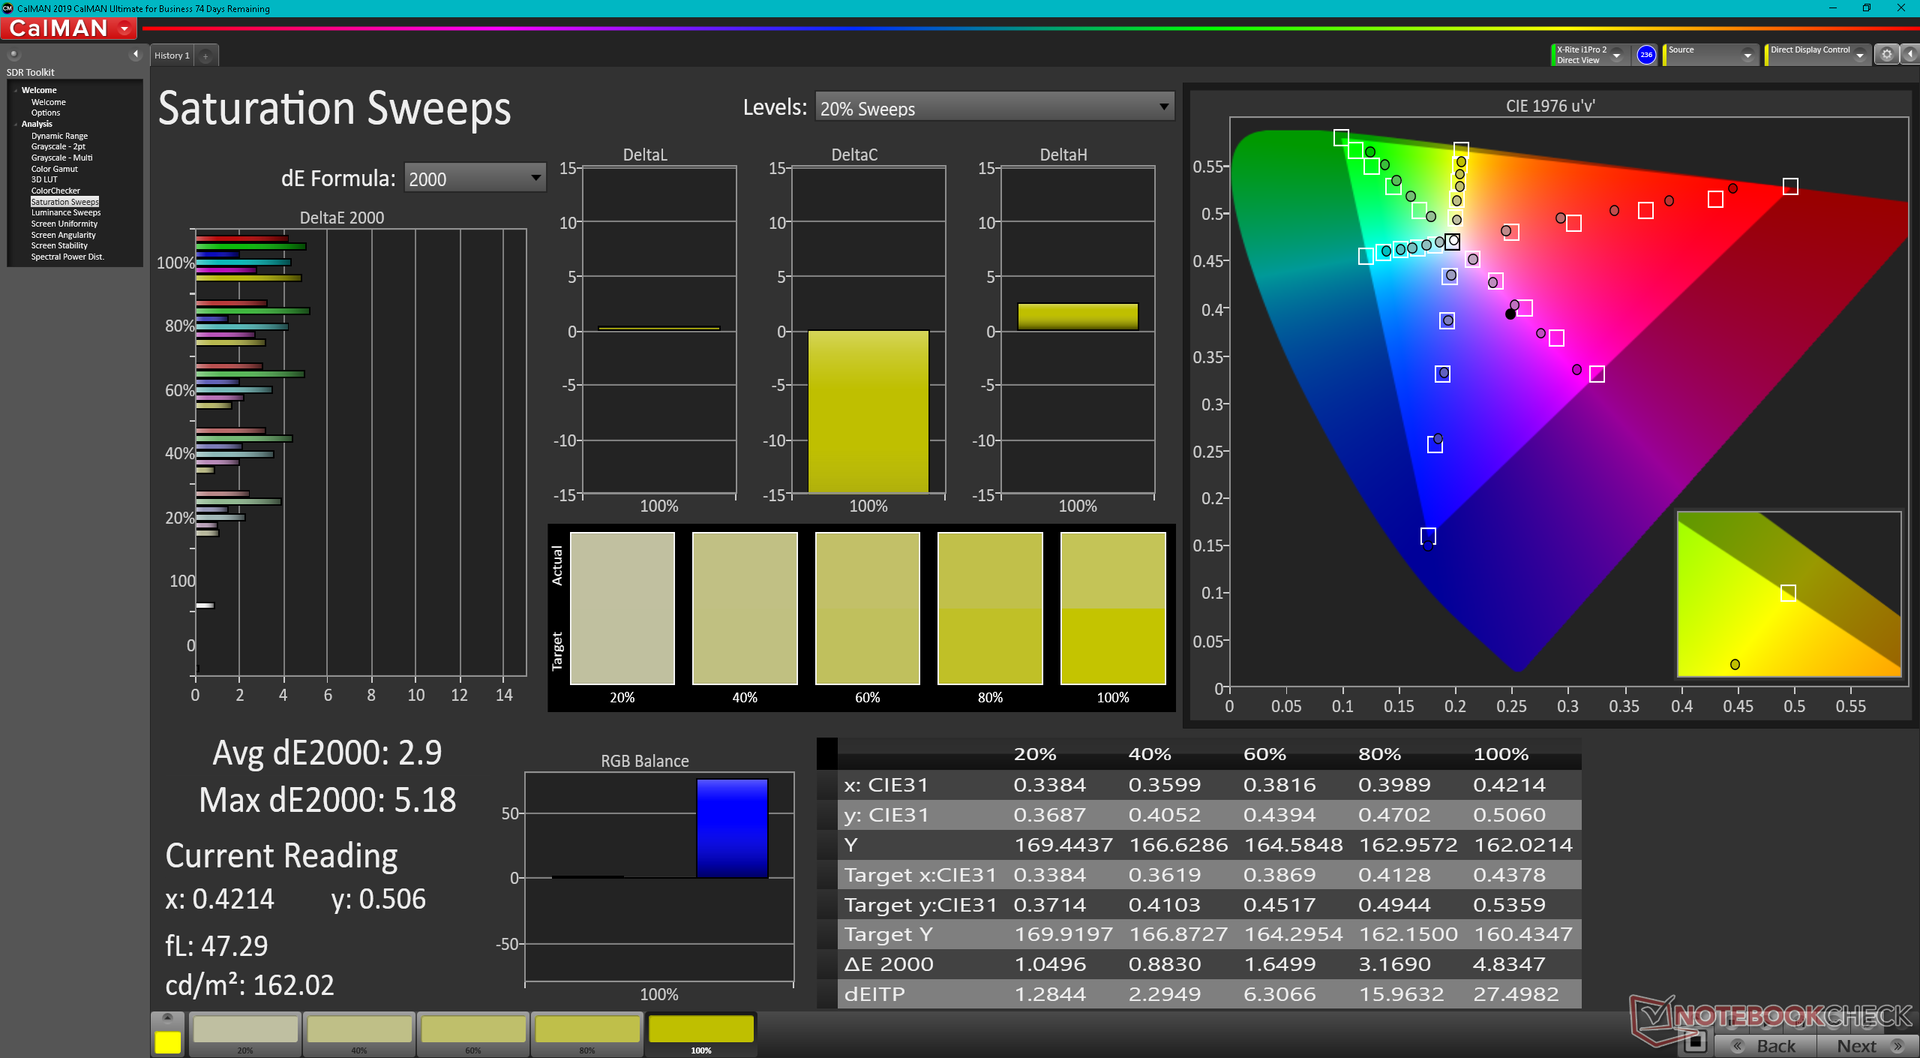
The panel is calibrated out of the box against the P3 standard with average grayscale and color DeltaE values of only 1.3 and 1.53, respectively. Colors appear to be more inaccurate at higher saturation levels than lower saturation levels.
Display Response Times
| ↔ Response Time Black to White | ||
|---|---|---|
| 1.9 ms ... rise ↗ and fall ↘ combined | ↗ 0.8 ms rise | 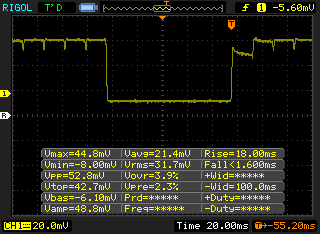 |
| ↘ 1.1 ms fall | ||
| The screen shows very fast response rates in our tests and should be very well suited for fast-paced gaming. In comparison, all tested devices range from 0.1 (minimum) to 240 (maximum) ms. » 11 % of all devices are better. This means that the measured response time is better than the average of all tested devices (19.8 ms). | ||
| ↔ Response Time 50% Grey to 80% Grey | ||
| 2 ms ... rise ↗ and fall ↘ combined | ↗ 1 ms rise | 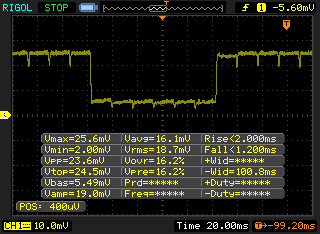 |
| ↘ 1 ms fall | ||
| The screen shows very fast response rates in our tests and should be very well suited for fast-paced gaming. In comparison, all tested devices range from 0.165 (minimum) to 636 (maximum) ms. » 10 % of all devices are better. This means that the measured response time is better than the average of all tested devices (30.9 ms). | ||
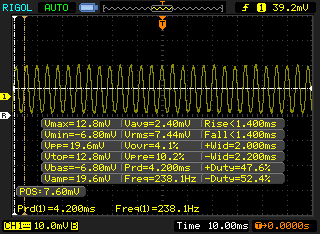
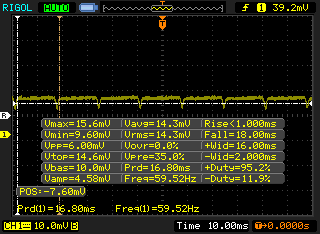
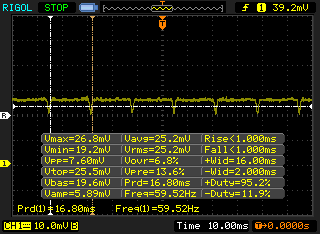
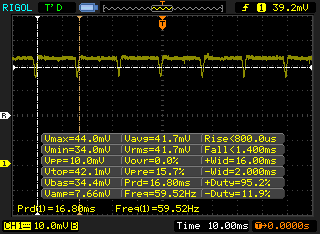
Screen Flickering / PWM (Pulse-Width Modulation)
| Screen flickering / PWM detected | 240.4 Hz | ≤ 100 % brightness setting |  |
The display backlight flickers at 240.4 Hz (worst case, e.g., utilizing PWM) Flickering detected at a brightness setting of 100 % and below. There should be no flickering or PWM above this brightness setting. The frequency of 240.4 Hz is relatively low, so sensitive users will likely notice flickering and experience eyestrain at the stated brightness setting and below. In comparison: 52 % of all tested devices do not use PWM to dim the display. If PWM was detected, an average of 7744 (minimum: 5 - maximum: 343500) Hz was measured. | |||
Flickering or pulse-width modulation is present on all brightness levels much like on the OLED panels for the latest Asus VivoBook or ZenBook laptops. The frequency is 240.4 Hz from 0 to 40 percent brightness and 60 Hz from 41 to 100 percent brightness.

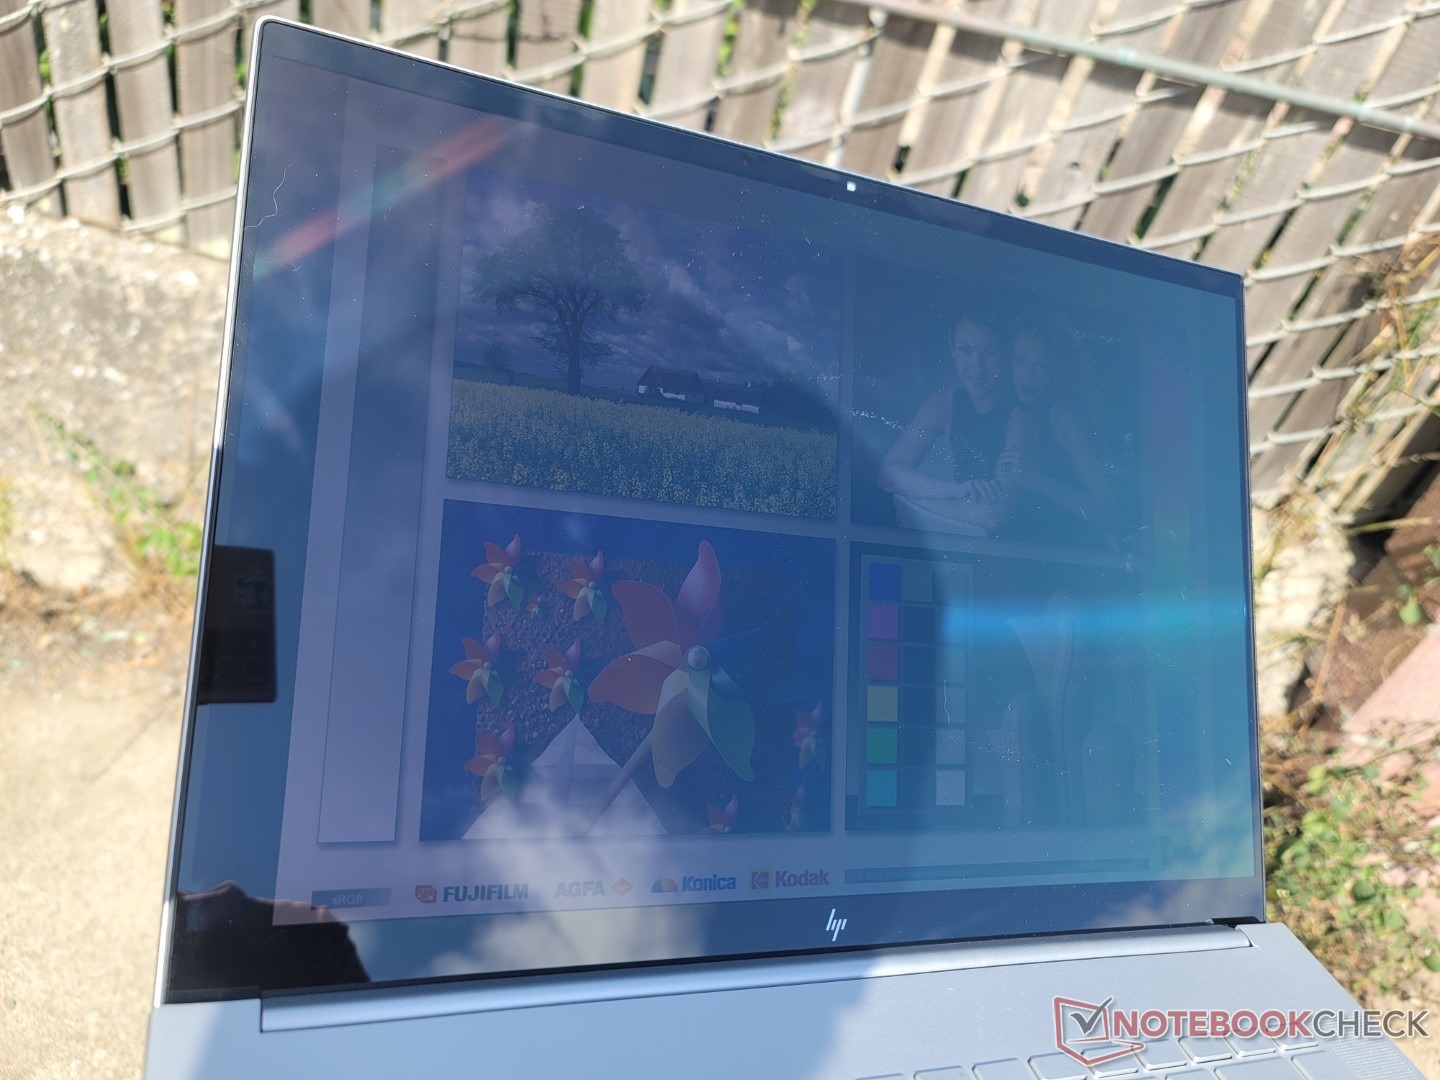
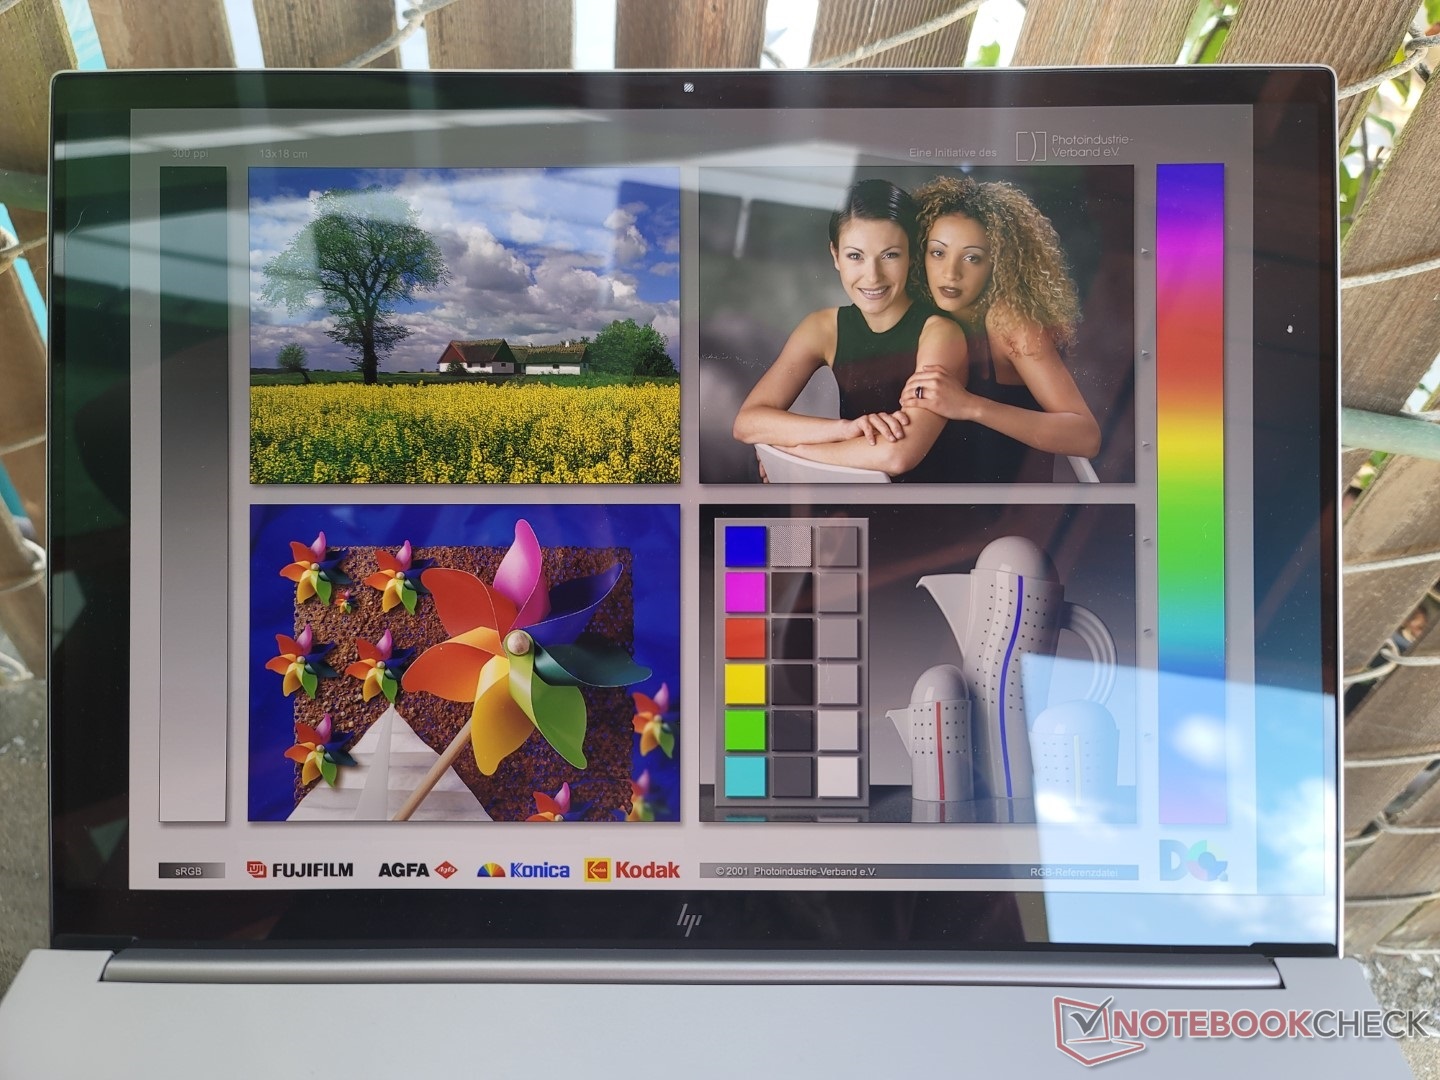
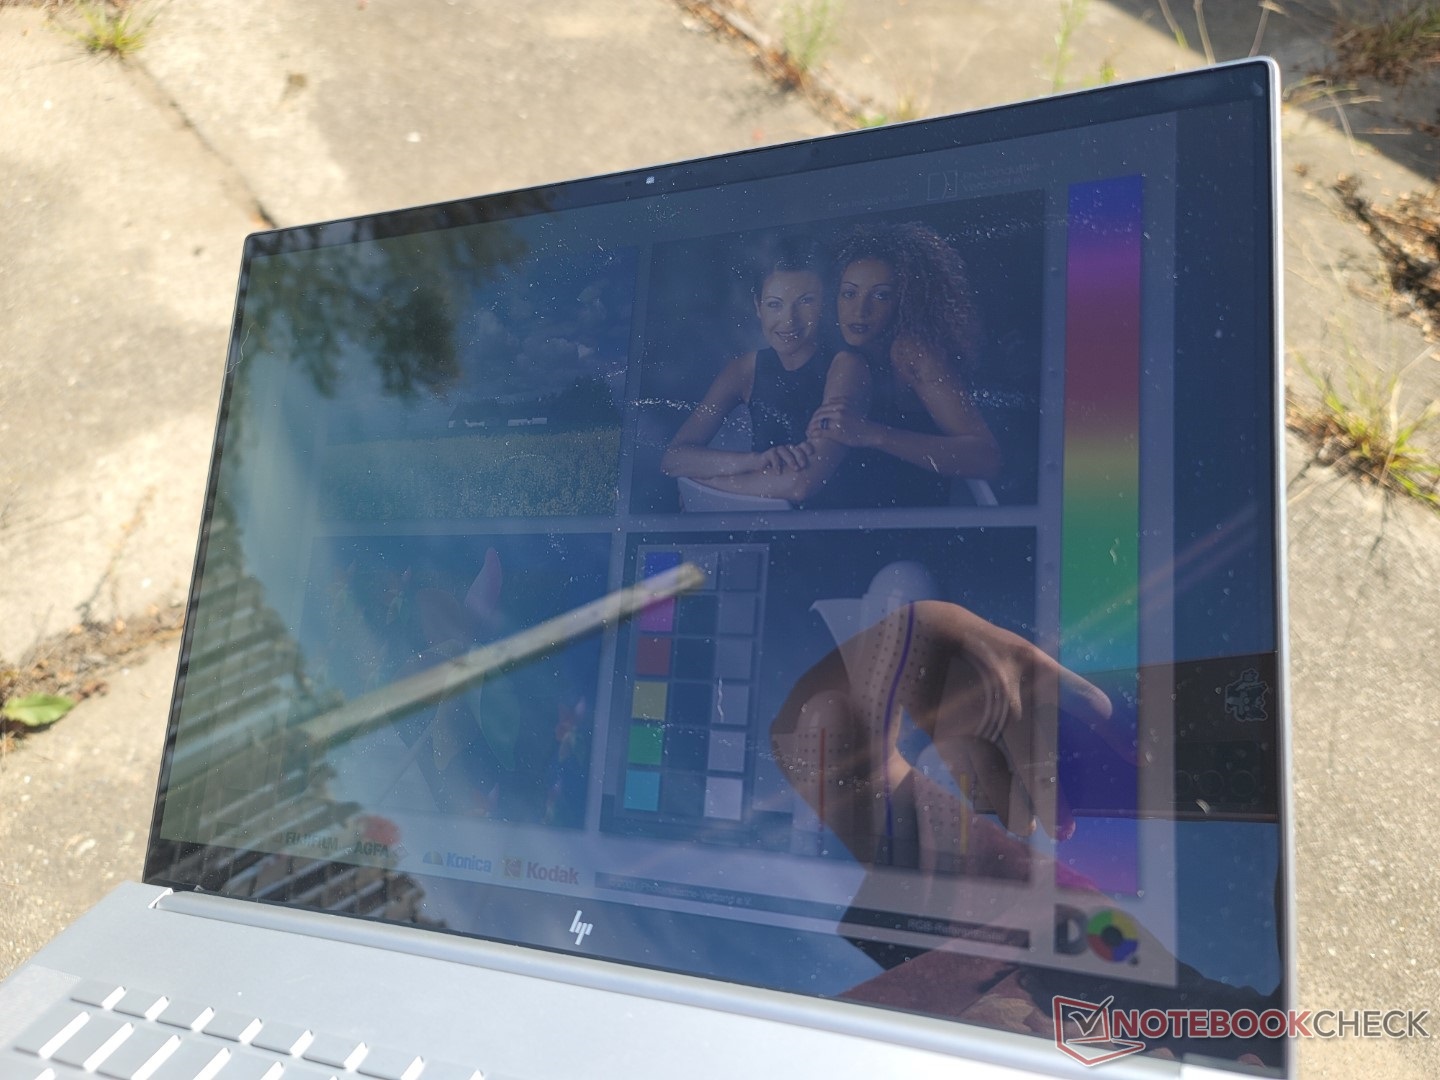
Glare is unavoidable in most outdoor conditions. The glossy display is not nearly as bright as the display on the MacBook Pro 16. At just above 320 nits maximum, this is one of the dimmer OLED panels in the market.
Performance — Intel 12th Gen Core H

Testing Conditions
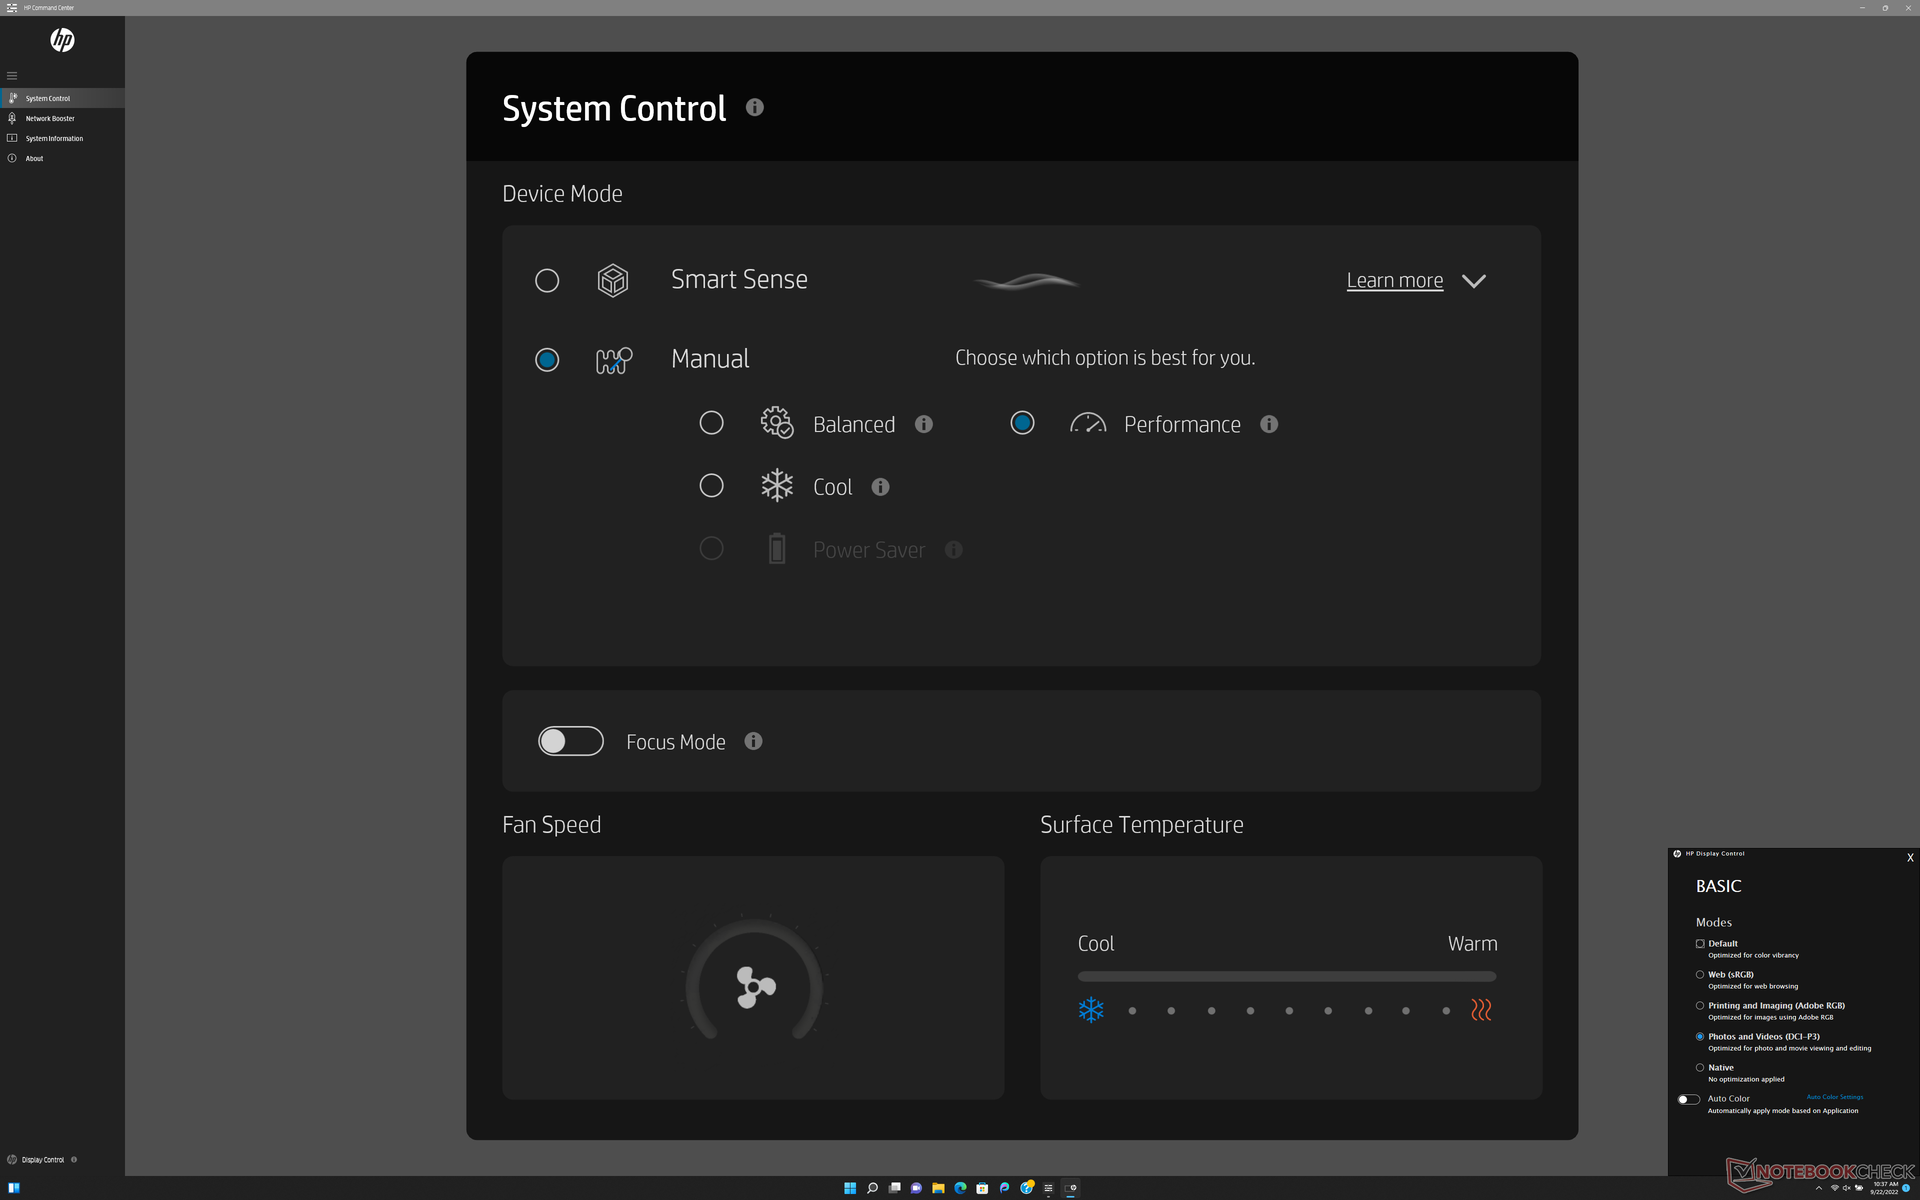
We set our unit to Performance mode via both Windows and the HP Command Center software prior to running any benchmarks below. HP Command Center is the hub for controlling power profiles and display colors as shown by the screenshot below.
Processor
Multi-thread performance is about 15 percent slower than the average laptop in our database equipped with the same Core i7-12700H CPU. The Lenovo Legion Slim 7 16, for example, is able to run the same processor faster even after accounting for any throttling. Nonetheless, performance is still significantly better than the 10th gen Core i7-10750H in the 2020 Envy 15 by about 60 percent.
Upgrading to the Core i9-12900H SKU is expected to boost multi-thread performance by as much as 30 to 40 percent over our Core i7-12700H SKU.
Cinebench R15 Multi Loop
Cinebench R23: Multi Core | Single Core
Cinebench R15: CPU Multi 64Bit | CPU Single 64Bit
Blender: v2.79 BMW27 CPU
7-Zip 18.03: 7z b 4 | 7z b 4 -mmt1
Geekbench 5.5: Multi-Core | Single-Core
HWBOT x265 Benchmark v2.2: 4k Preset
LibreOffice : 20 Documents To PDF
R Benchmark 2.5: Overall mean
Cinebench R23: Multi Core | Single Core
Cinebench R15: CPU Multi 64Bit | CPU Single 64Bit
Blender: v2.79 BMW27 CPU
7-Zip 18.03: 7z b 4 | 7z b 4 -mmt1
Geekbench 5.5: Multi-Core | Single-Core
HWBOT x265 Benchmark v2.2: 4k Preset
LibreOffice : 20 Documents To PDF
R Benchmark 2.5: Overall mean
* ... smaller is better
AIDA64: FP32 Ray-Trace | FPU Julia | CPU SHA3 | CPU Queen | FPU SinJulia | FPU Mandel | CPU AES | CPU ZLib | FP64 Ray-Trace | CPU PhotoWorxx
| Performance rating | |
| Lenovo ThinkBook 16 G4+ IAP | |
| HP Envy 16 h0112nr | |
| MSI Creator Z16P B12UHST | |
| Average Intel Core i7-12700H | |
| Dell Inspiron 16 Plus 7610-MHJ8F | |
| Huawei MateBook 16s i7 | |
| AIDA64 / FP32 Ray-Trace | |
| Lenovo ThinkBook 16 G4+ IAP | |
| HP Envy 16 h0112nr | |
| Average Intel Core i7-12700H (2585 - 17957, n=64) | |
| Dell Inspiron 16 Plus 7610-MHJ8F | |
| MSI Creator Z16P B12UHST | |
| Huawei MateBook 16s i7 | |
| AIDA64 / FPU Julia | |
| Lenovo ThinkBook 16 G4+ IAP | |
| HP Envy 16 h0112nr | |
| Dell Inspiron 16 Plus 7610-MHJ8F | |
| Average Intel Core i7-12700H (12439 - 90760, n=64) | |
| MSI Creator Z16P B12UHST | |
| Huawei MateBook 16s i7 | |
| AIDA64 / CPU SHA3 | |
| Dell Inspiron 16 Plus 7610-MHJ8F | |
| Lenovo ThinkBook 16 G4+ IAP | |
| Average Intel Core i7-12700H (833 - 4242, n=64) | |
| MSI Creator Z16P B12UHST | |
| HP Envy 16 h0112nr | |
| Huawei MateBook 16s i7 | |
| AIDA64 / CPU Queen | |
| MSI Creator Z16P B12UHST | |
| Lenovo ThinkBook 16 G4+ IAP | |
| HP Envy 16 h0112nr | |
| Average Intel Core i7-12700H (57923 - 103202, n=63) | |
| Huawei MateBook 16s i7 | |
| Dell Inspiron 16 Plus 7610-MHJ8F | |
| AIDA64 / FPU SinJulia | |
| MSI Creator Z16P B12UHST | |
| Lenovo ThinkBook 16 G4+ IAP | |
| Average Intel Core i7-12700H (3249 - 9939, n=64) | |
| Dell Inspiron 16 Plus 7610-MHJ8F | |
| HP Envy 16 h0112nr | |
| Huawei MateBook 16s i7 | |
| AIDA64 / FPU Mandel | |
| Lenovo ThinkBook 16 G4+ IAP | |
| Dell Inspiron 16 Plus 7610-MHJ8F | |
| HP Envy 16 h0112nr | |
| Average Intel Core i7-12700H (7135 - 44760, n=64) | |
| MSI Creator Z16P B12UHST | |
| Huawei MateBook 16s i7 | |
| AIDA64 / CPU AES | |
| Dell Inspiron 16 Plus 7610-MHJ8F | |
| HP Envy 16 h0112nr | |
| MSI Creator Z16P B12UHST | |
| Average Intel Core i7-12700H (31839 - 144360, n=64) | |
| Lenovo ThinkBook 16 G4+ IAP | |
| Huawei MateBook 16s i7 | |
| AIDA64 / CPU ZLib | |
| MSI Creator Z16P B12UHST | |
| Lenovo ThinkBook 16 G4+ IAP | |
| Average Intel Core i7-12700H (305 - 1171, n=64) | |
| HP Envy 16 h0112nr | |
| Dell Inspiron 16 Plus 7610-MHJ8F | |
| Huawei MateBook 16s i7 | |
| AIDA64 / FP64 Ray-Trace | |
| Lenovo ThinkBook 16 G4+ IAP | |
| HP Envy 16 h0112nr | |
| Average Intel Core i7-12700H (1437 - 9692, n=64) | |
| Dell Inspiron 16 Plus 7610-MHJ8F | |
| MSI Creator Z16P B12UHST | |
| Huawei MateBook 16s i7 | |
| AIDA64 / CPU PhotoWorxx | |
| Huawei MateBook 16s i7 | |
| MSI Creator Z16P B12UHST | |
| Lenovo ThinkBook 16 G4+ IAP | |
| HP Envy 16 h0112nr | |
| Average Intel Core i7-12700H (12863 - 52207, n=64) | |
| Dell Inspiron 16 Plus 7610-MHJ8F | |
System Performance
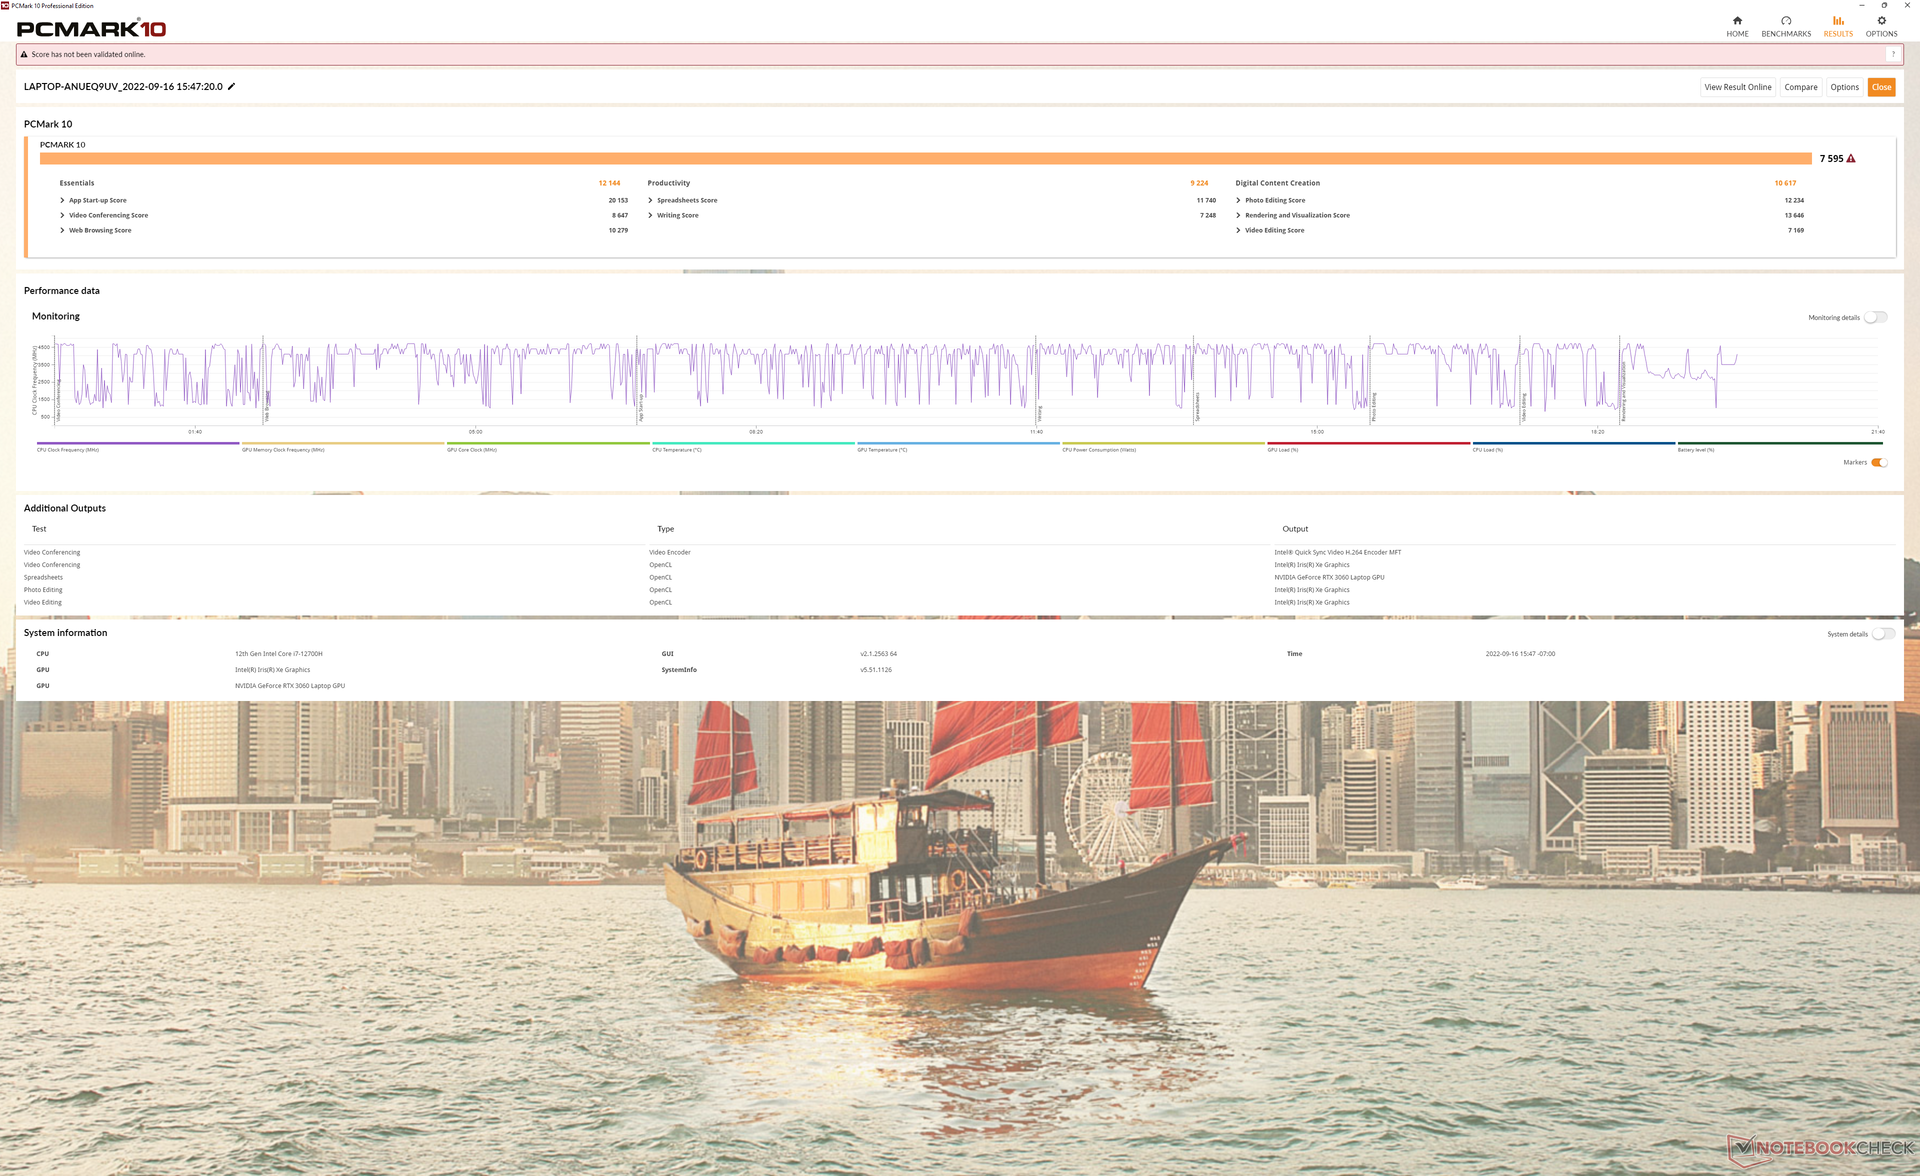
PCMark results are consistently ahead of the 2020 Envy 15 by wide margins. We suspect that the move away from Intel Optane played a big part in the boost in scores.
CrossMark: Overall | Productivity | Creativity | Responsiveness
| PCMark 10 / Score | |
| MSI Creator Z16P B12UHST | |
| HP Envy 16 h0112nr | |
| Average Intel Core i7-12700H, NVIDIA GeForce RTX 3060 Laptop GPU (5986 - 8156, n=12) | |
| Huawei MateBook 16s i7 | |
| HP Envy 15-ep0098nr | |
| Dell Inspiron 16 Plus 7610-MHJ8F | |
| PCMark 10 / Essentials | |
| HP Envy 16 h0112nr | |
| Huawei MateBook 16s i7 | |
| MSI Creator Z16P B12UHST | |
| Average Intel Core i7-12700H, NVIDIA GeForce RTX 3060 Laptop GPU (9289 - 12144, n=12) | |
| Dell Inspiron 16 Plus 7610-MHJ8F | |
| HP Envy 15-ep0098nr | |
| PCMark 10 / Productivity | |
| MSI Creator Z16P B12UHST | |
| HP Envy 16 h0112nr | |
| Average Intel Core i7-12700H, NVIDIA GeForce RTX 3060 Laptop GPU (6161 - 10362, n=12) | |
| Huawei MateBook 16s i7 | |
| HP Envy 15-ep0098nr | |
| Dell Inspiron 16 Plus 7610-MHJ8F | |
| PCMark 10 / Digital Content Creation | |
| MSI Creator Z16P B12UHST | |
| Average Intel Core i7-12700H, NVIDIA GeForce RTX 3060 Laptop GPU (8950 - 12554, n=12) | |
| HP Envy 16 h0112nr | |
| Huawei MateBook 16s i7 | |
| HP Envy 15-ep0098nr | |
| Dell Inspiron 16 Plus 7610-MHJ8F | |
| CrossMark / Overall | |
| Huawei MateBook 16s i7 | |
| HP Envy 16 h0112nr | |
| Average Intel Core i7-12700H, NVIDIA GeForce RTX 3060 Laptop GPU (1649 - 2017, n=11) | |
| Lenovo ThinkBook 16 G4+ IAP | |
| Apple MacBook Pro 16 2021 M1 Pro | |
| CrossMark / Productivity | |
| Huawei MateBook 16s i7 | |
| HP Envy 16 h0112nr | |
| Average Intel Core i7-12700H, NVIDIA GeForce RTX 3060 Laptop GPU (1536 - 1958, n=11) | |
| Lenovo ThinkBook 16 G4+ IAP | |
| Apple MacBook Pro 16 2021 M1 Pro | |
| CrossMark / Creativity | |
| Apple MacBook Pro 16 2021 M1 Pro | |
| HP Envy 16 h0112nr | |
| Huawei MateBook 16s i7 | |
| Lenovo ThinkBook 16 G4+ IAP | |
| Average Intel Core i7-12700H, NVIDIA GeForce RTX 3060 Laptop GPU (1816 - 2084, n=11) | |
| CrossMark / Responsiveness | |
| Huawei MateBook 16s i7 | |
| Average Intel Core i7-12700H, NVIDIA GeForce RTX 3060 Laptop GPU (1210 - 2207, n=11) | |
| HP Envy 16 h0112nr | |
| Lenovo ThinkBook 16 G4+ IAP | |
| Apple MacBook Pro 16 2021 M1 Pro | |
| PCMark 10 Score | 7595 points | |
Help | ||
| AIDA64 / Memory Copy | |
| Huawei MateBook 16s i7 | |
| Lenovo ThinkBook 16 G4+ IAP | |
| MSI Creator Z16P B12UHST | |
| HP Envy 16 h0112nr | |
| Average Intel Core i7-12700H (25615 - 80511, n=64) | |
| Dell Inspiron 16 Plus 7610-MHJ8F | |
| AIDA64 / Memory Read | |
| Lenovo ThinkBook 16 G4+ IAP | |
| Huawei MateBook 16s i7 | |
| MSI Creator Z16P B12UHST | |
| HP Envy 16 h0112nr | |
| Average Intel Core i7-12700H (25586 - 79442, n=64) | |
| Dell Inspiron 16 Plus 7610-MHJ8F | |
| AIDA64 / Memory Write | |
| MSI Creator Z16P B12UHST | |
| Huawei MateBook 16s i7 | |
| HP Envy 16 h0112nr | |
| Lenovo ThinkBook 16 G4+ IAP | |
| Average Intel Core i7-12700H (23679 - 88660, n=64) | |
| Dell Inspiron 16 Plus 7610-MHJ8F | |
| AIDA64 / Memory Latency | |
| Lenovo ThinkBook 16 G4+ IAP | |
| Huawei MateBook 16s i7 | |
| Dell Inspiron 16 Plus 7610-MHJ8F | |
| MSI Creator Z16P B12UHST | |
| HP Envy 16 h0112nr | |
| Average Intel Core i7-12700H (76.2 - 133.9, n=62) | |
* ... smaller is better
DPC Latency
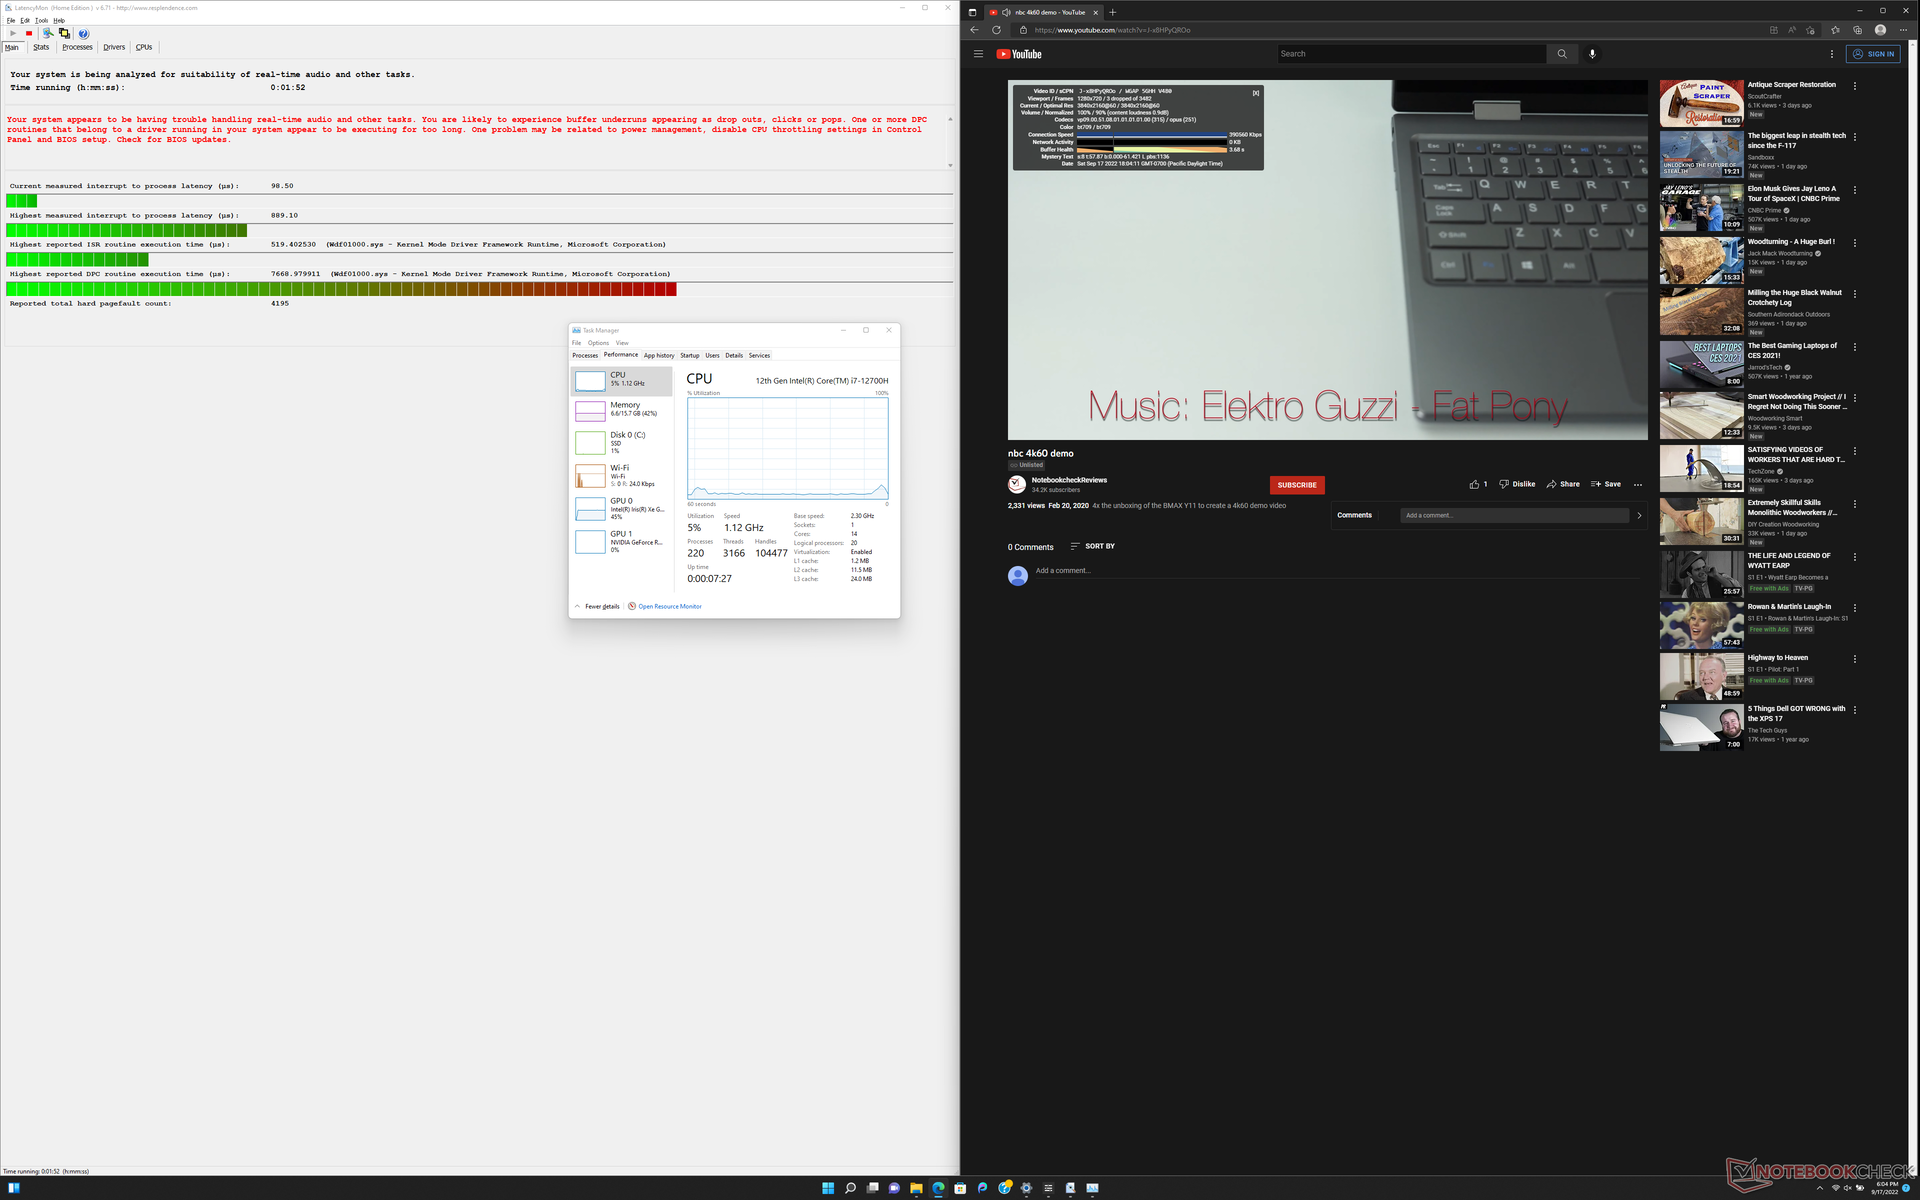
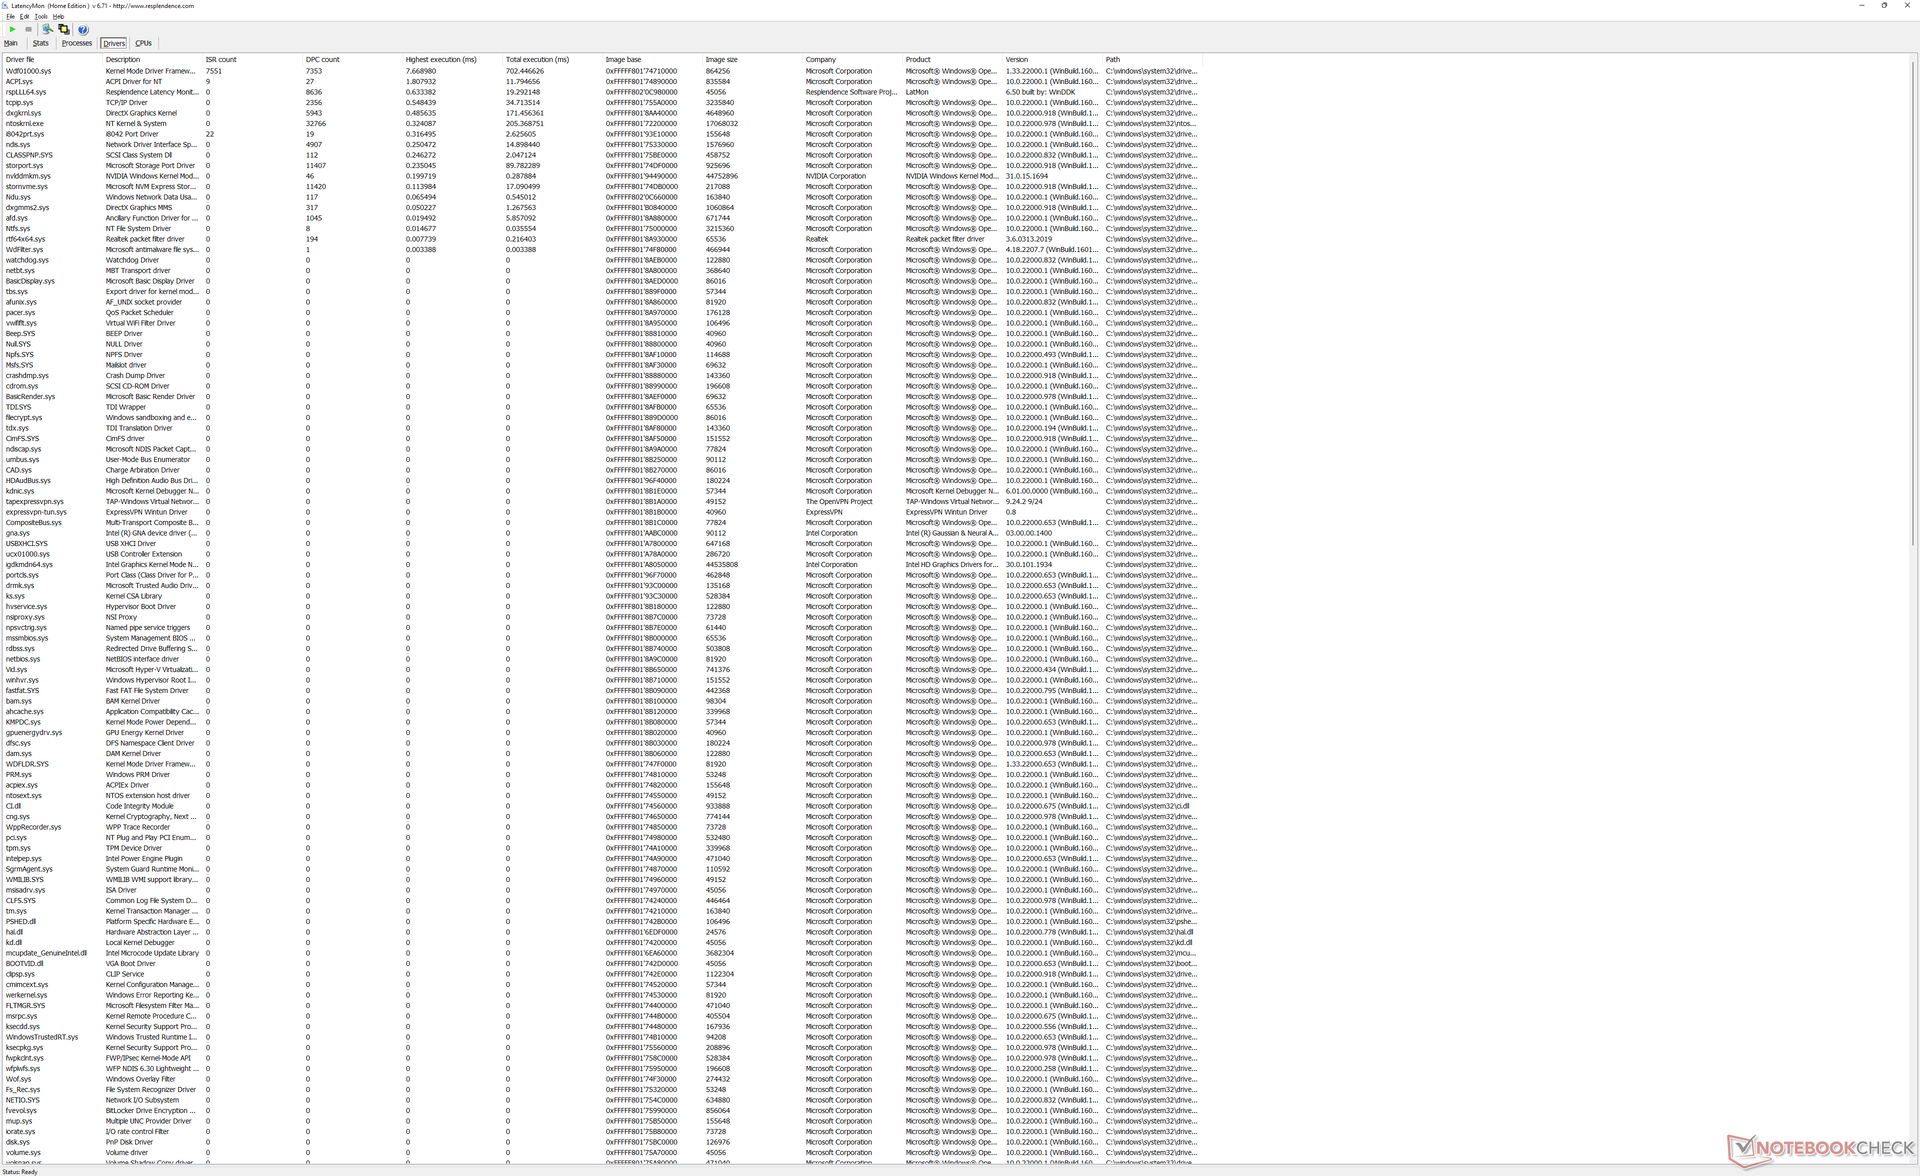
LatencyMon reveals DPC issues when opening multiple browser tabs of our homepage. 4K video playback at 60 FPS is imperfect as well with 3 dropped frames during our minute-long test video.
| DPC Latencies / LatencyMon - interrupt to process latency (max), Web, Youtube, Prime95 | |
| Lenovo ThinkBook 16 G4+ IAP | |
| HP Envy 16 h0112nr | |
| MSI Creator Z16P B12UHST | |
* ... smaller is better
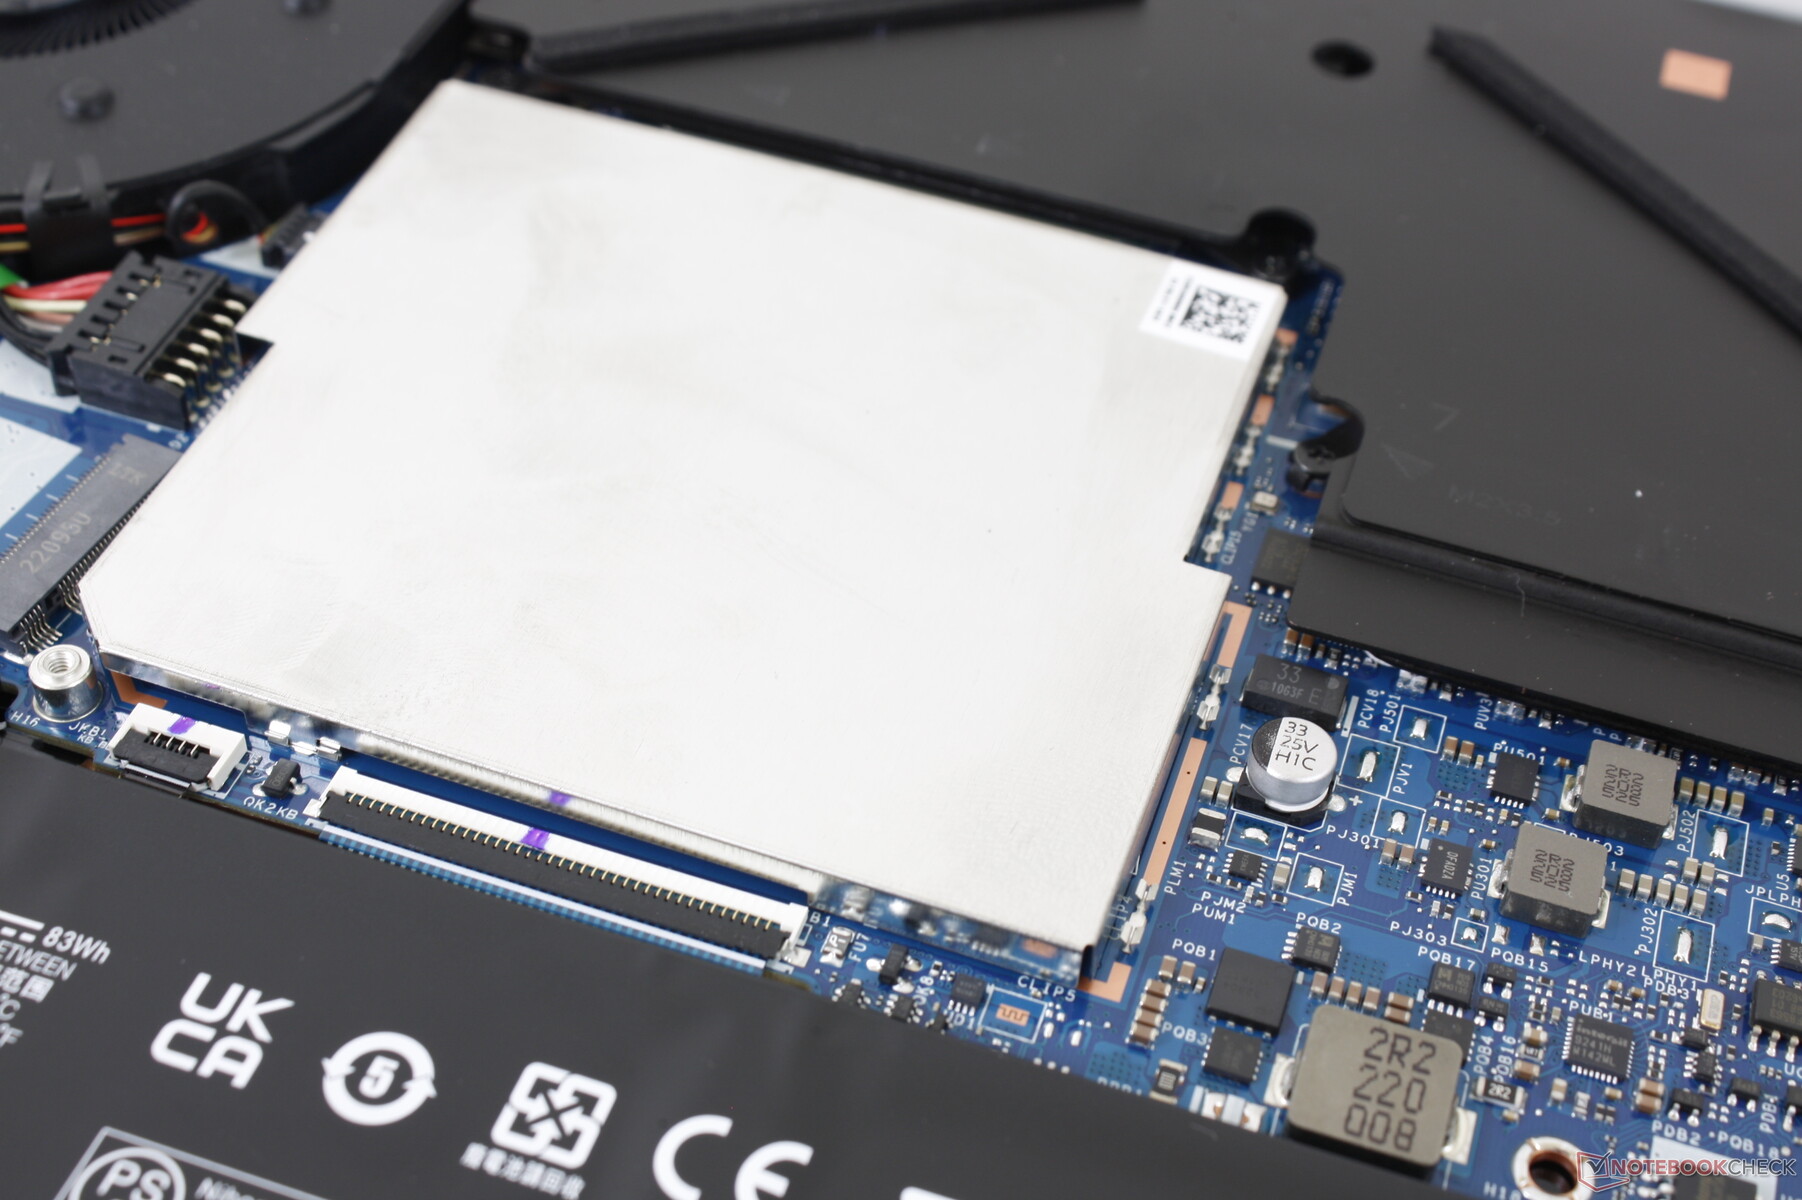
Storage Devices — RAID 0 Support
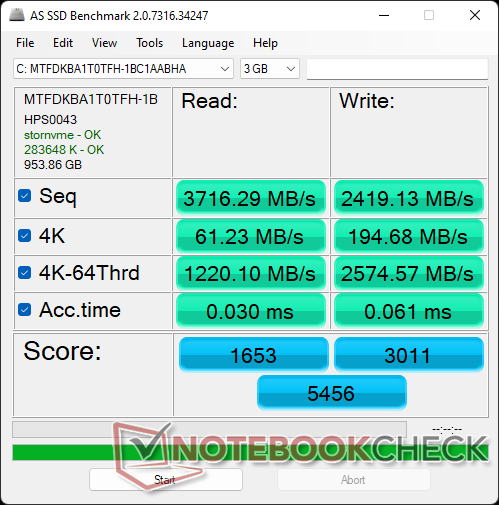
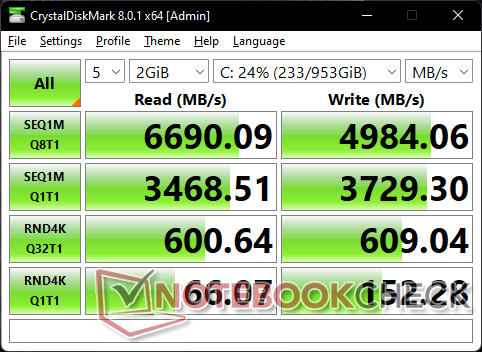
Our test unit ships with the same Micron 3400 PCIe4 x4 NVMe SSD as found on many other high-end systems including the MSI Stealth GS77 or HP Spectre x360 13.5. The drive exhibits no throttling issues on our test unit, but write rates aren't nearly as fast as on the competing Samsung PM9A1 series.
HP includes just one SSD cover despite having two SSD slots. If you plan on installing a second drive, then there's a good chance that it may run at warmer temperatures.

| Drive Performance rating - Percent | |
| MSI Creator Z16P B12UHST | |
| HP Envy 16 h0112nr | |
| Huawei MateBook 16s i7 | |
| Lenovo ThinkBook 16 G4+ IAP | |
| Dell Inspiron 16 Plus 7610-MHJ8F -1! | |
* ... smaller is better
Disk Throttling: DiskSpd Read Loop, Queue Depth 8
GPU Performance — 95 W TGP GeForce RTX 3060
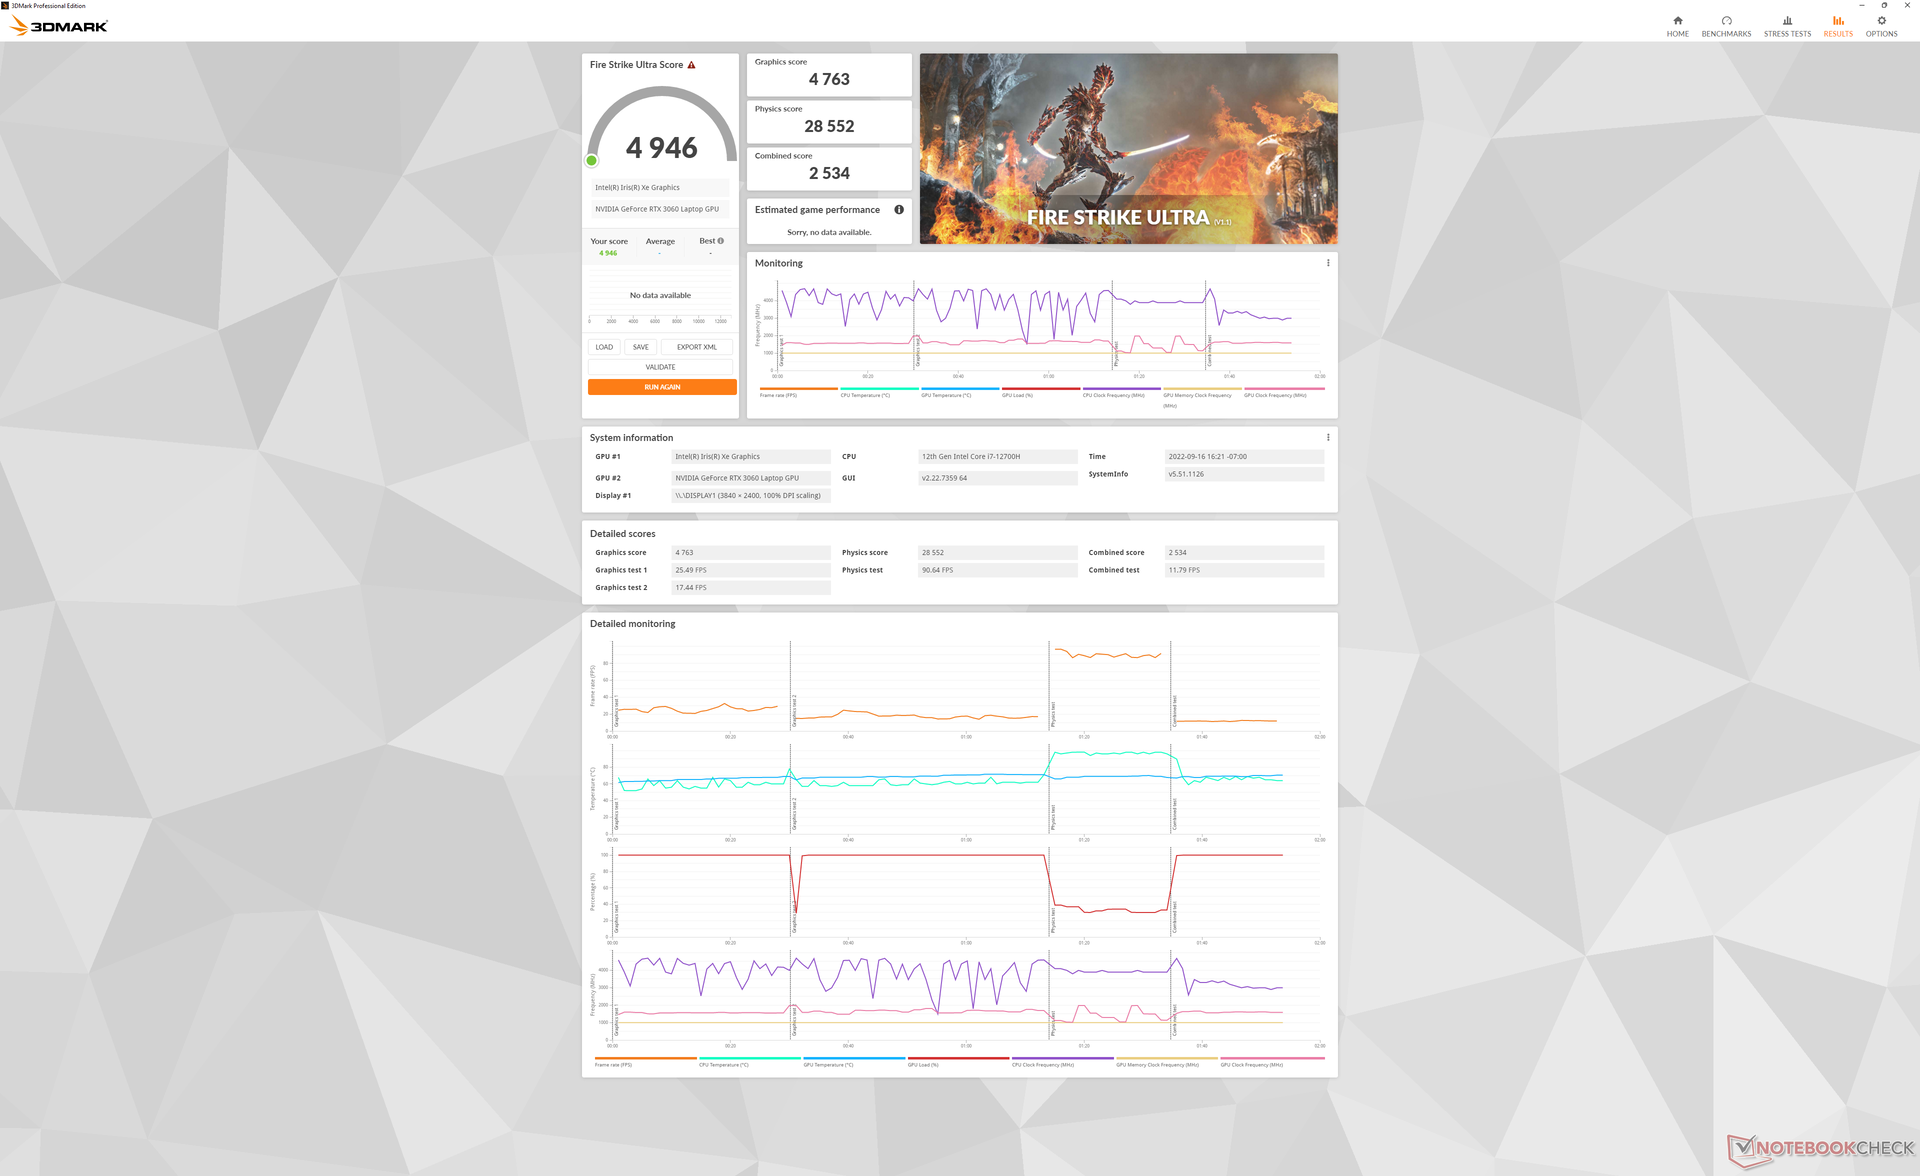
Graphics performance is about 5 percent slower than the average laptop in our database equipped with the same GeForce RTX 3060. The deficit is minor enough that users are unlikely to notice.
Upgrading from the lesser Arc A370M option to the GeForce RTX 3060 will net users over 2x the raw graphics performance.
Running on Balanced mode instead of Performance mode reduces graphics performance by 6 percent for much quieter fans as detailed in our System Noise section.
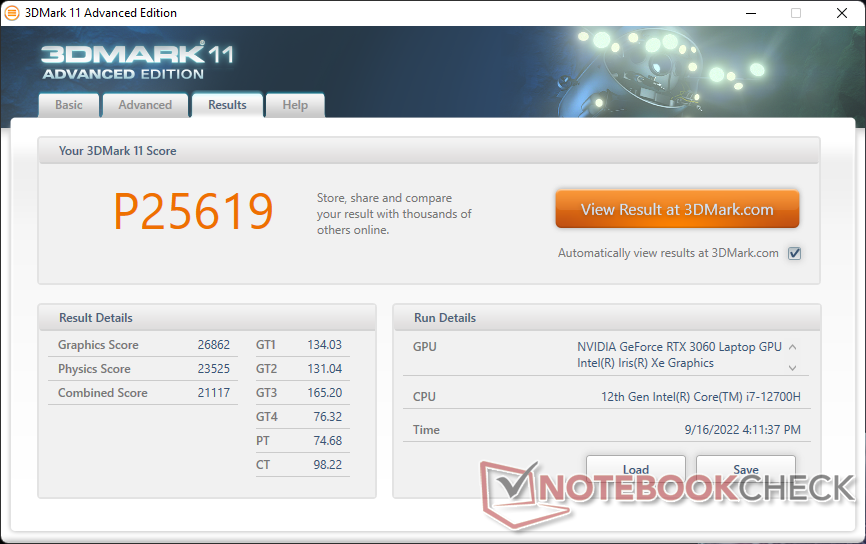
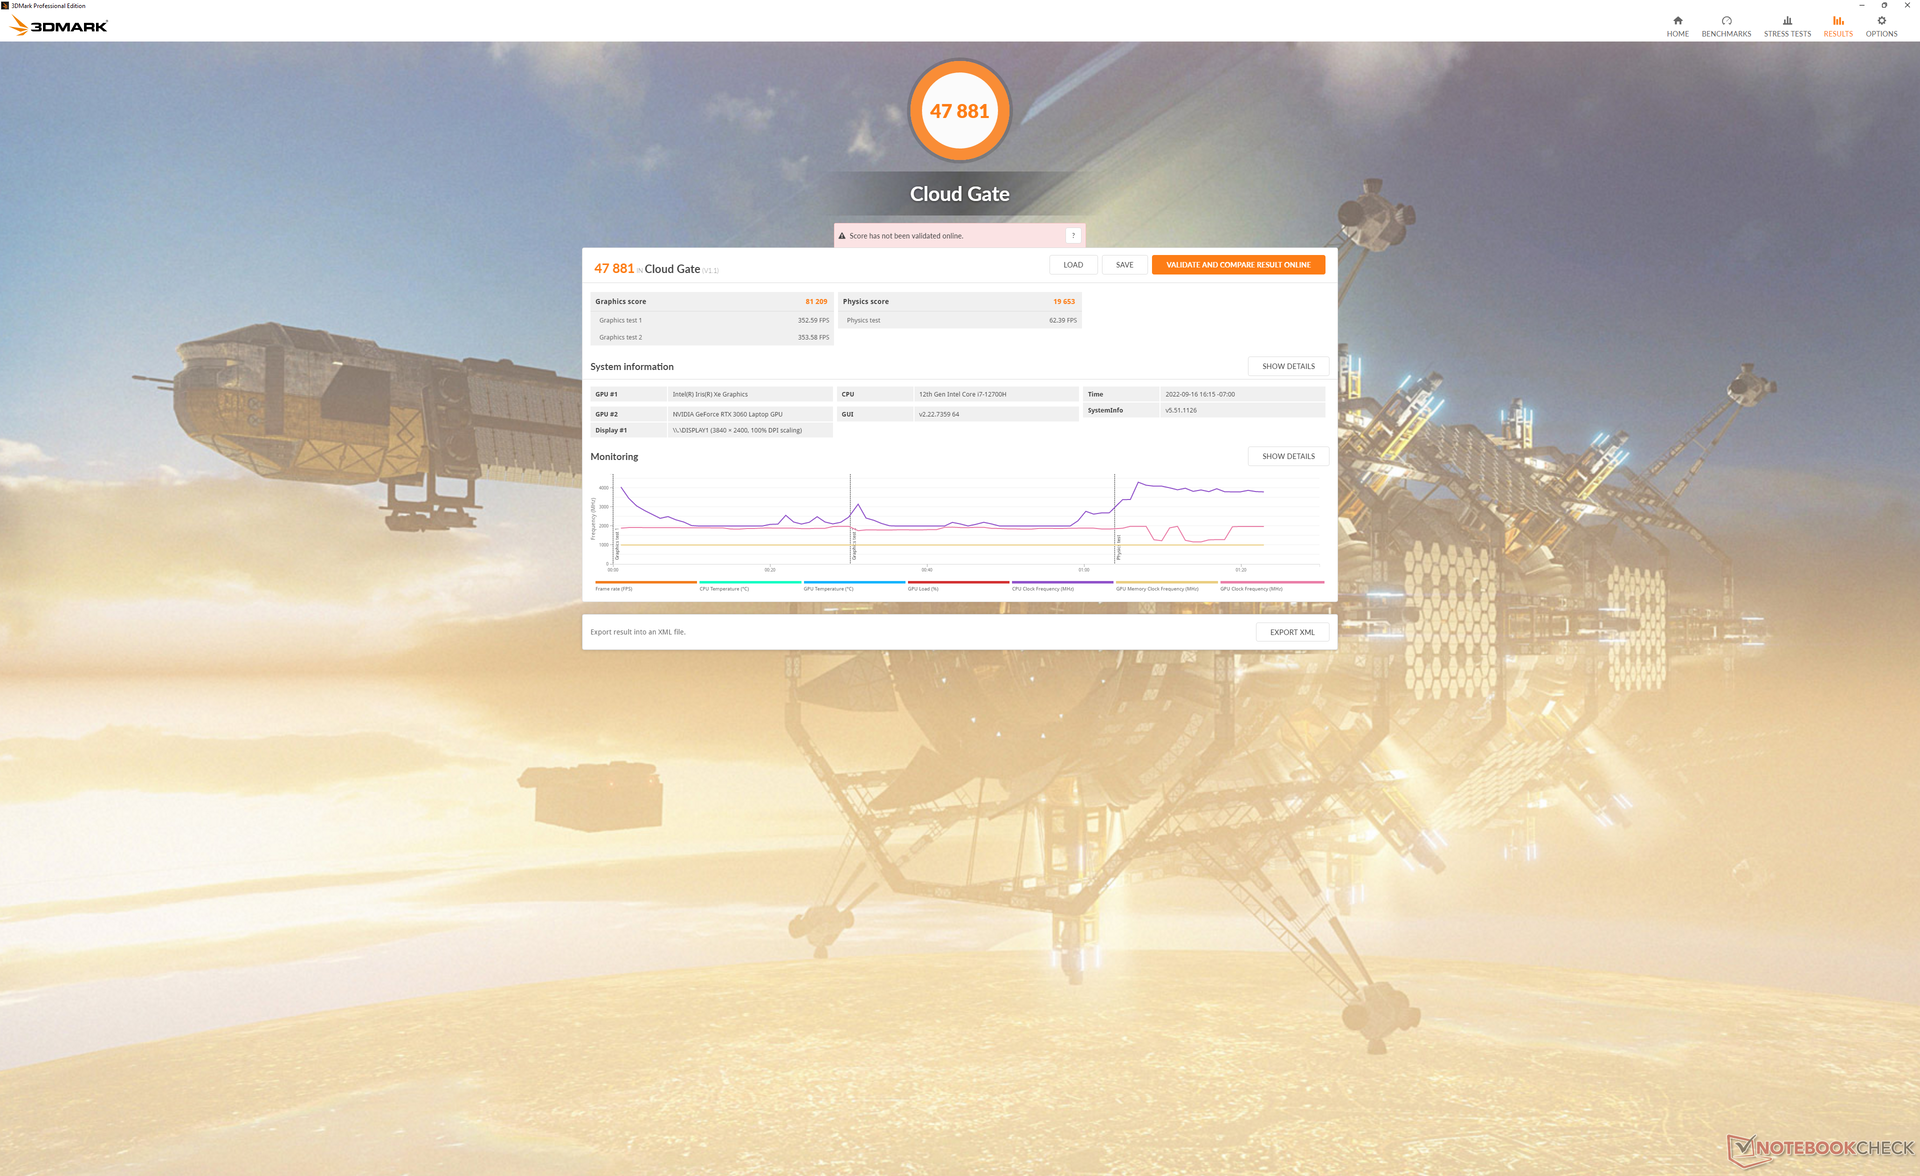

| 3DMark 11 Performance | 25619 points | |
| 3DMark Cloud Gate Standard Score | 47881 points | |
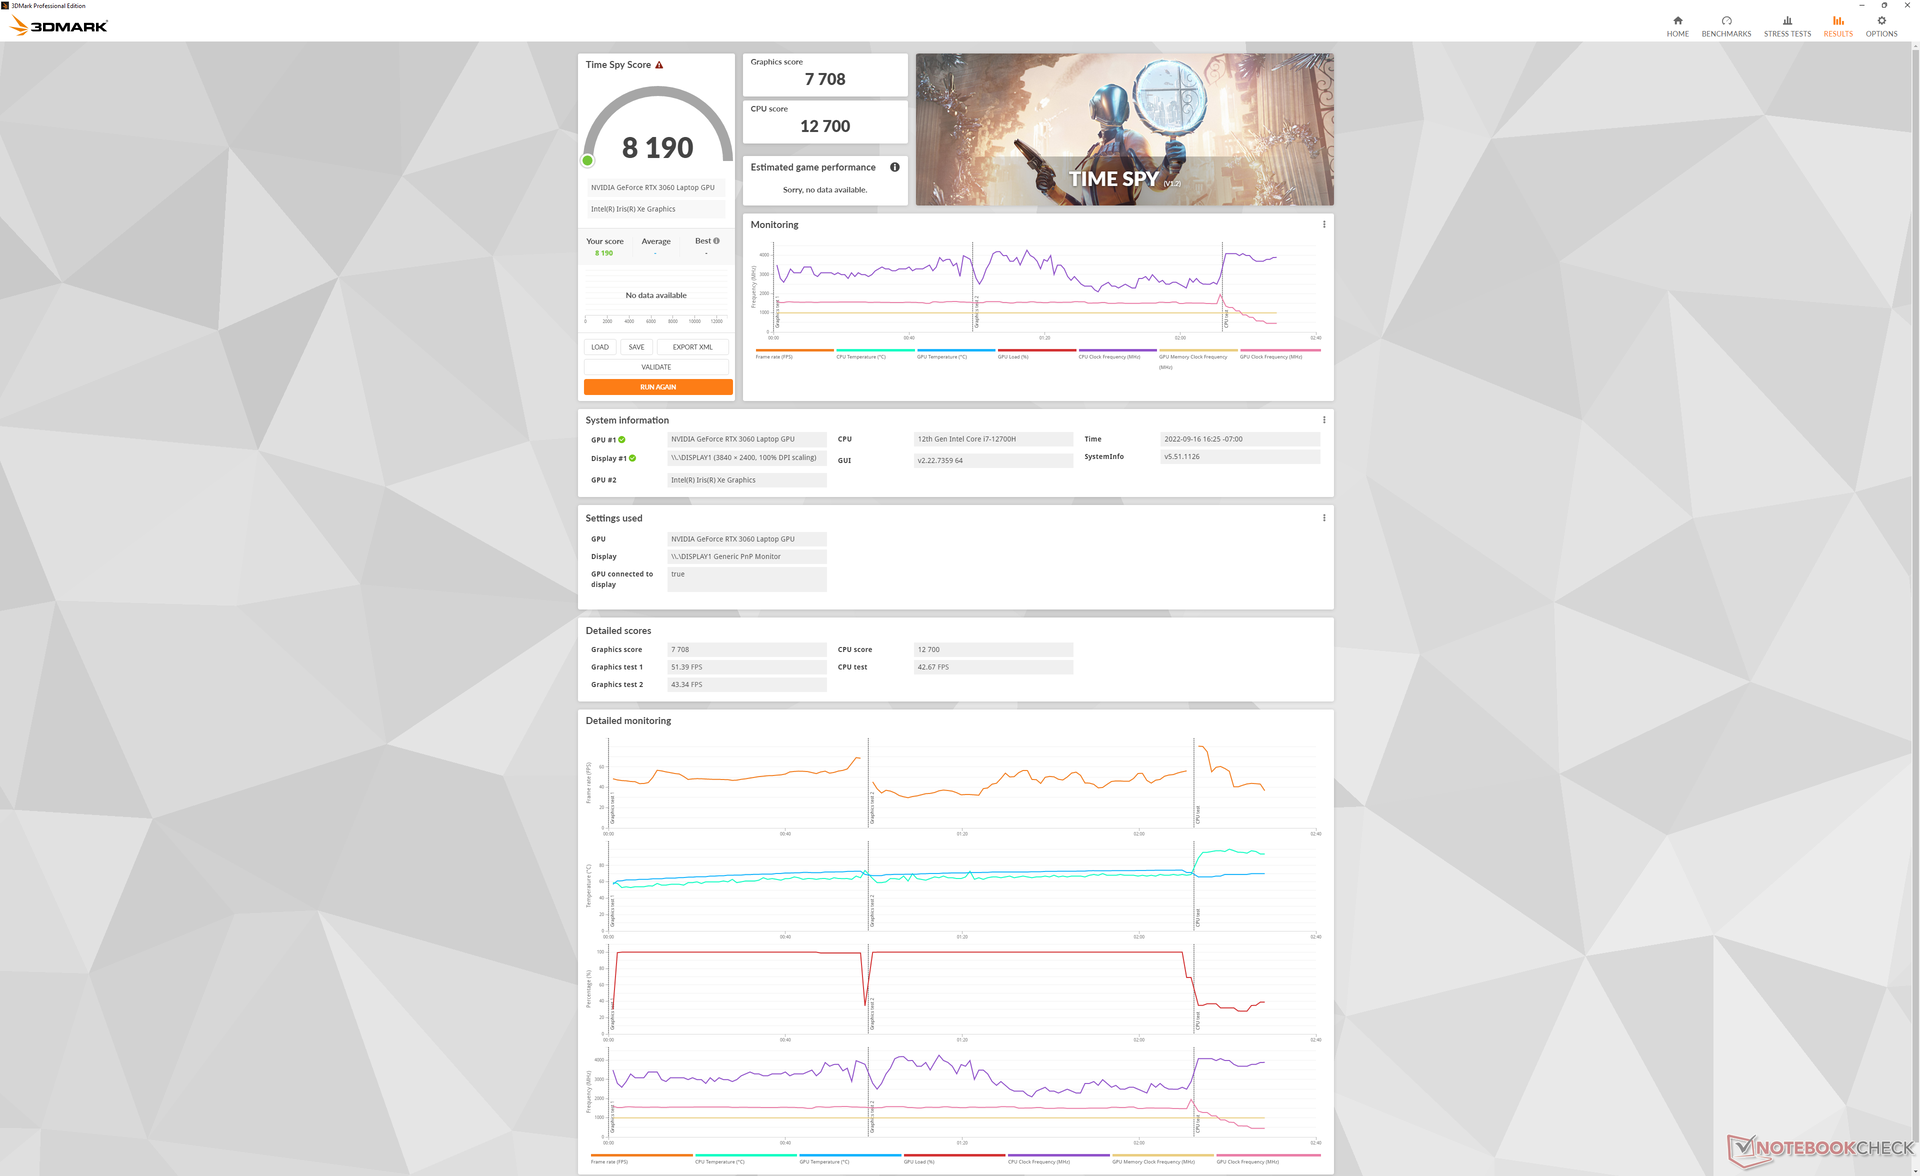
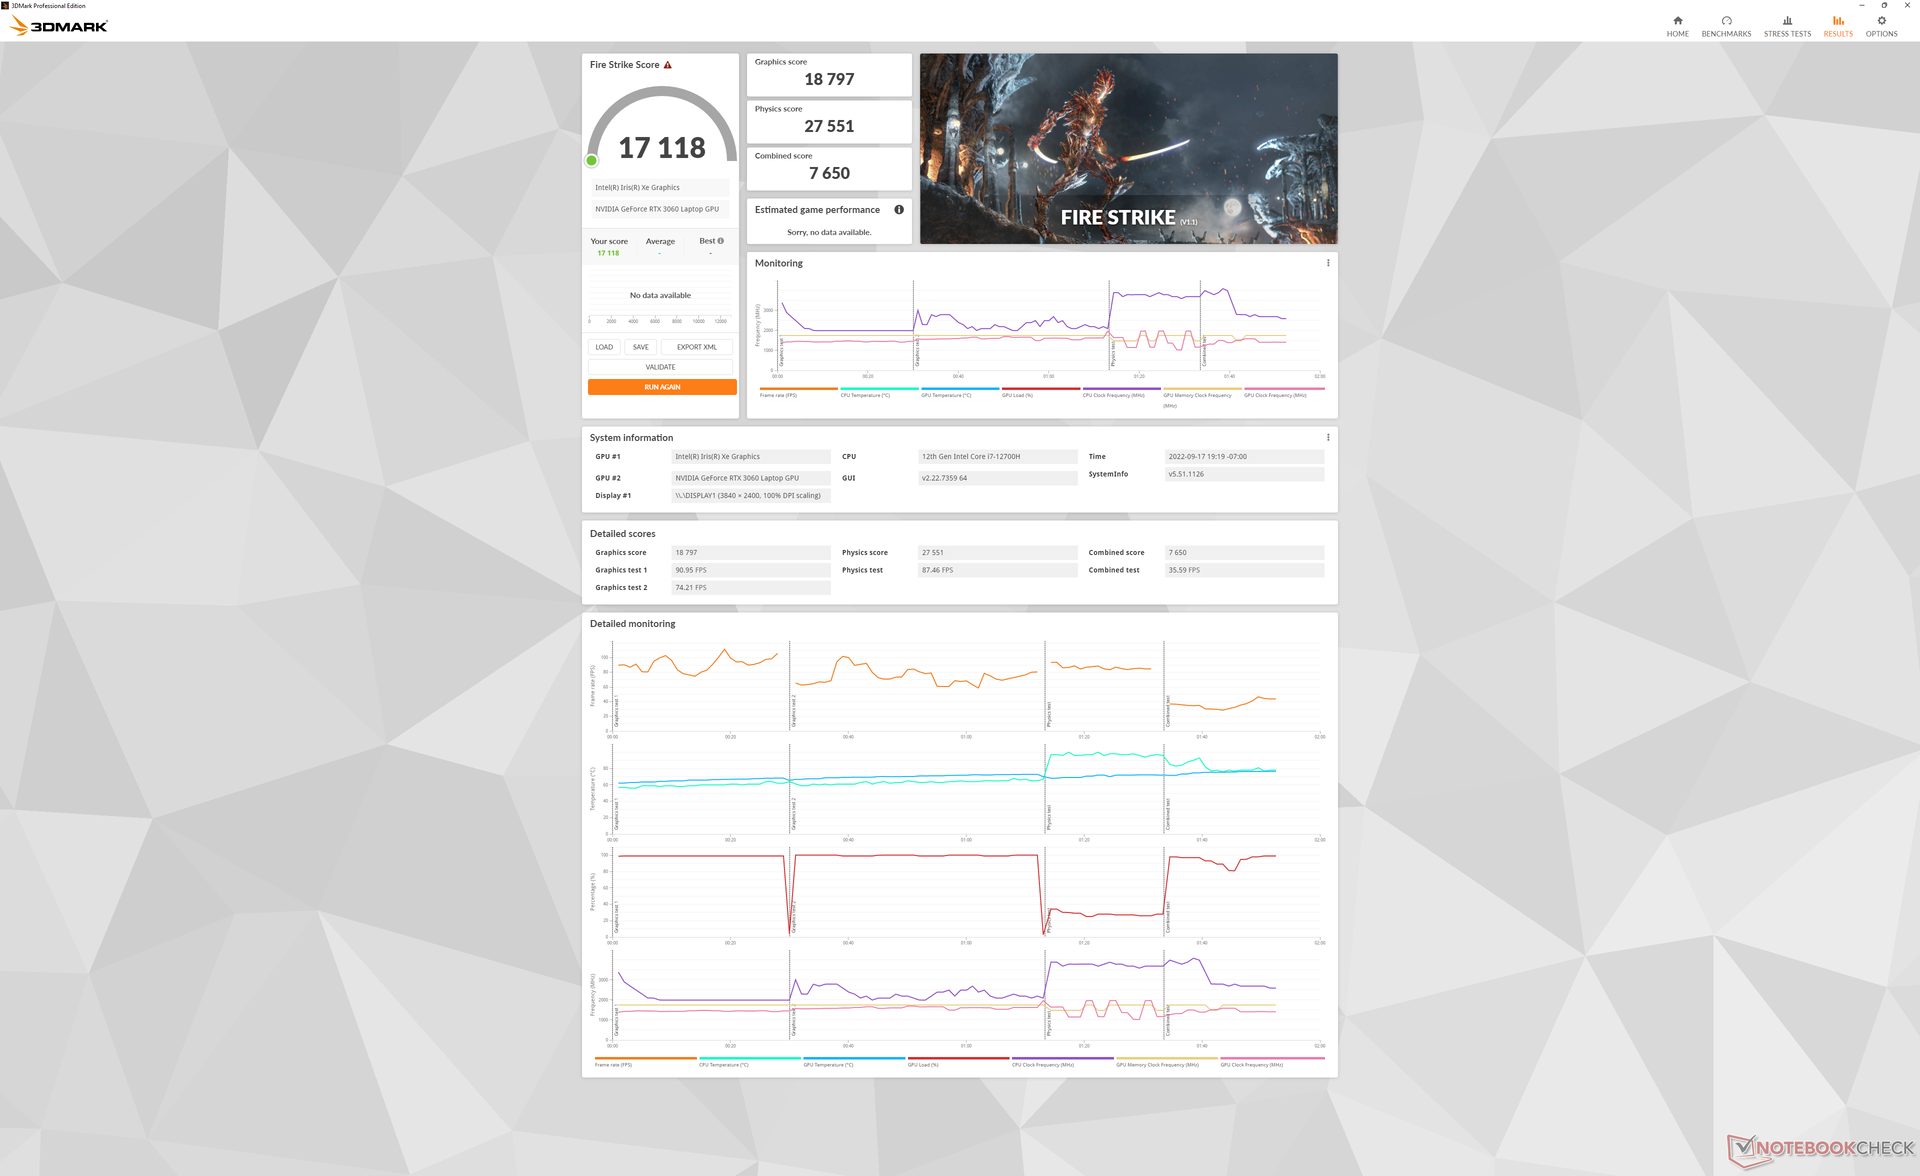
| 3DMark Fire Strike Score | 17118 points | |
| 3DMark Time Spy Score | 8190 points | |
Help | ||
Witcher 3 FPS Chart
| low | med. | high | ultra | QHD | 4K | |
|---|---|---|---|---|---|---|
| GTA V (2015) | 185.6 | 181.2 | 174.1 | 103.3 | 76.7 | |
| The Witcher 3 (2015) | 402.3 | 264 | 161.2 | 82.8 | 55.1 | |
| Dota 2 Reborn (2015) | 180.6 | 164.8 | 149.1 | 139 | 46.9 | |
| Final Fantasy XV Benchmark (2018) | 177.2 | 111.7 | 83.9 | 62 | 34.6 | |
| X-Plane 11.11 (2018) | 140.3 | 127 | 103 | 60.5 | ||
| Strange Brigade (2018) | 418 | 202 | 162 | 140.4 | 103.5 | |
| Cyberpunk 2077 1.6 (2022) | 115.7 | 94.4 | 72.3 | 59.5 | 17.9 |
Emissions
System Noise — As Loud As Many Gaming Laptops
Fan noise tends to pulse if set to the Balanced power profile or higher. Expect the fans to range between 30 and 34 dB(A) against a silent background of 22.8 dB(A) when browsing the web or playing video. Other 16-inch laptops like the Huawei MateBook 16s or MacBook Pro 16 are each able to remain quieter for longer than the Envy 16.
The fans can be as loud as 41 dB(A) when running 3DMark 06 compared to only 26 dB(A) and 34 dB(A) on the aforementioned Apple and Huawei, respectively.
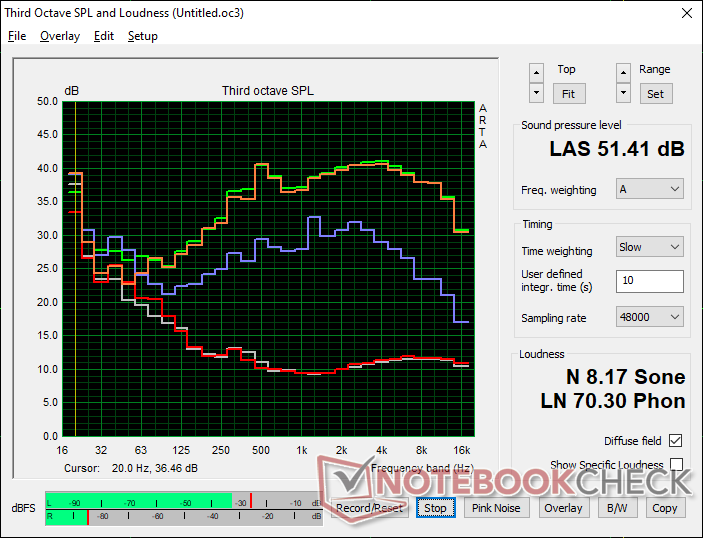
Fan noise becomes even louder at just over 51 dB(A) when running Witcher 3 on Performance mode. This would drop significantly to 41.6 dB(A) if running on Balanced mode instead, but graphics performance would be about 5 to 10 percent slower as mentioned above. Overall, this is a pretty loud laptop if you wish to exploit its performance.
Noise level
| Idle |
| 22.9 / 22.9 / 30.5 dB(A) |
| Load |
| 41.4 / 51.4 dB(A) |
 | ||
30 dB silent 40 dB(A) audible 50 dB(A) loud |
||
min: | ||
| HP Envy 16 h0112nr GeForce RTX 3060 Laptop GPU, i7-12700H, Micron 3400 1TB MTFDKBA1T0TFH | Lenovo ThinkBook 16 G4+ IAP GeForce RTX 2050 Mobile, i7-12700H, Micron 2450 1TB MTFDKCD1T0TFK | MSI Creator Z16P B12UHST GeForce RTX 3080 Ti Laptop GPU, i9-12900H, Samsung PM9A1 MZVL22T0HBLB | Dell Inspiron 16 Plus 7610-MHJ8F UHD Graphics Xe 32EUs (Tiger Lake-H), i7-11800H, OM3PDP3-AD NVMe KDI 512GB | Apple MacBook Pro 16 2021 M1 Pro M1 Pro 16-Core GPU, M1 Pro, Apple SSD AP1024R | Huawei MateBook 16s i7 Iris Xe G7 96EUs, i7-12700H, Silicon Motion PCIe-8 SSD | |
|---|---|---|---|---|---|---|
| Noise | 1% | -5% | -1% | 10% | 9% | |
| off / environment * (dB) | 22.8 | 24.2 -6% | 26 -14% | 26.3 -15% | 24.7 -8% | 24 -5% |
| Idle Minimum * (dB) | 22.9 | 24.2 -6% | 27 -18% | 26.3 -15% | 24.7 -8% | 24 -5% |
| Idle Average * (dB) | 22.9 | 24.2 -6% | 29 -27% | 26.3 -15% | 24.7 -8% | 25.2 -10% |
| Idle Maximum * (dB) | 30.5 | 24.2 21% | 31 -2% | 24.7 19% | 27.2 11% | |
| Load Average * (dB) | 41.4 | 47 -14% | 43 -4% | 33 20% | 26.1 37% | 34.8 16% |
| Witcher 3 ultra * (dB) | 51.1 | 47 8% | 43 16% | 44 14% | 34.8 32% | |
| Load Maximum * (dB) | 51.4 | 47 9% | 46 11% | 49.2 4% | 37.4 27% | 39 24% |
* ... smaller is better
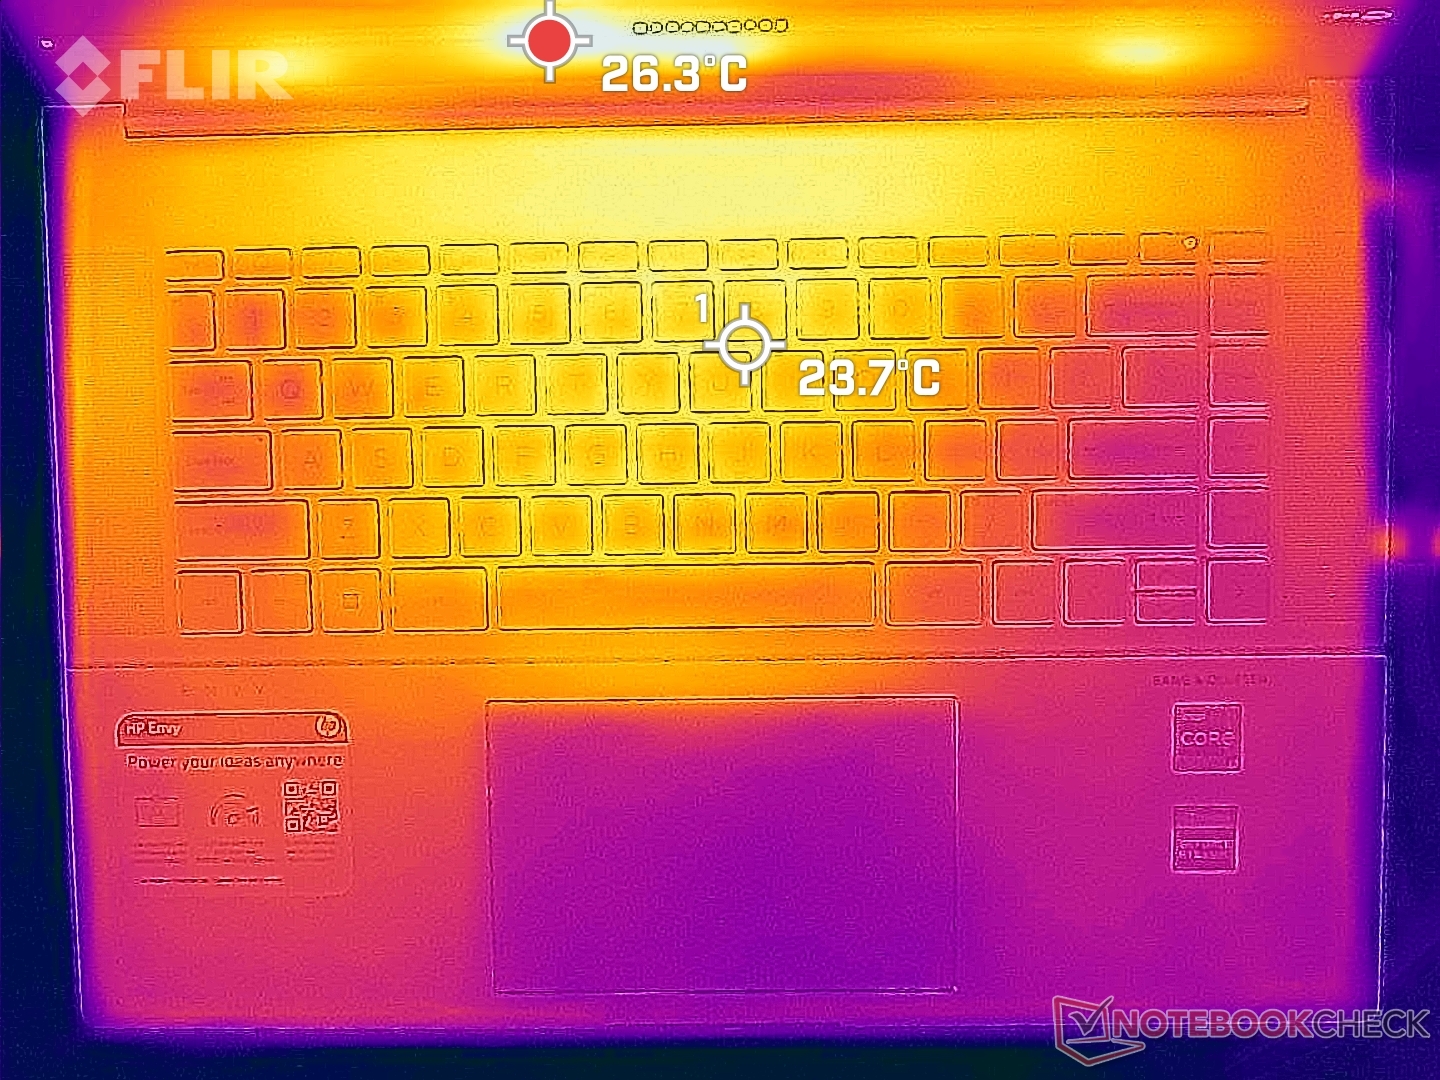
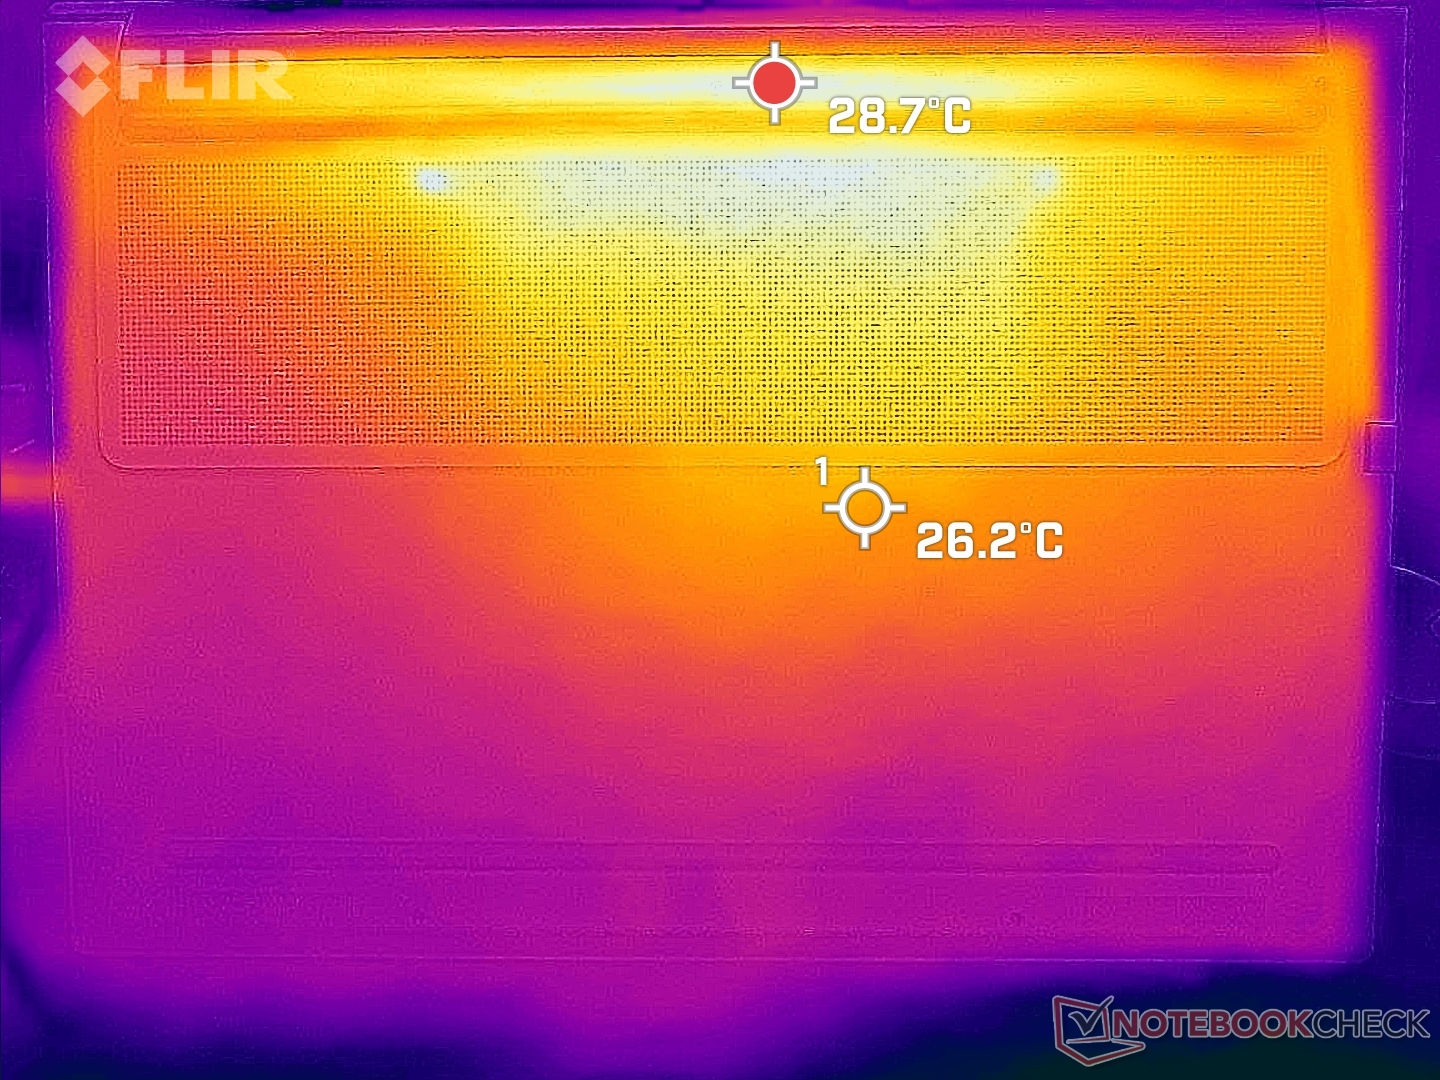
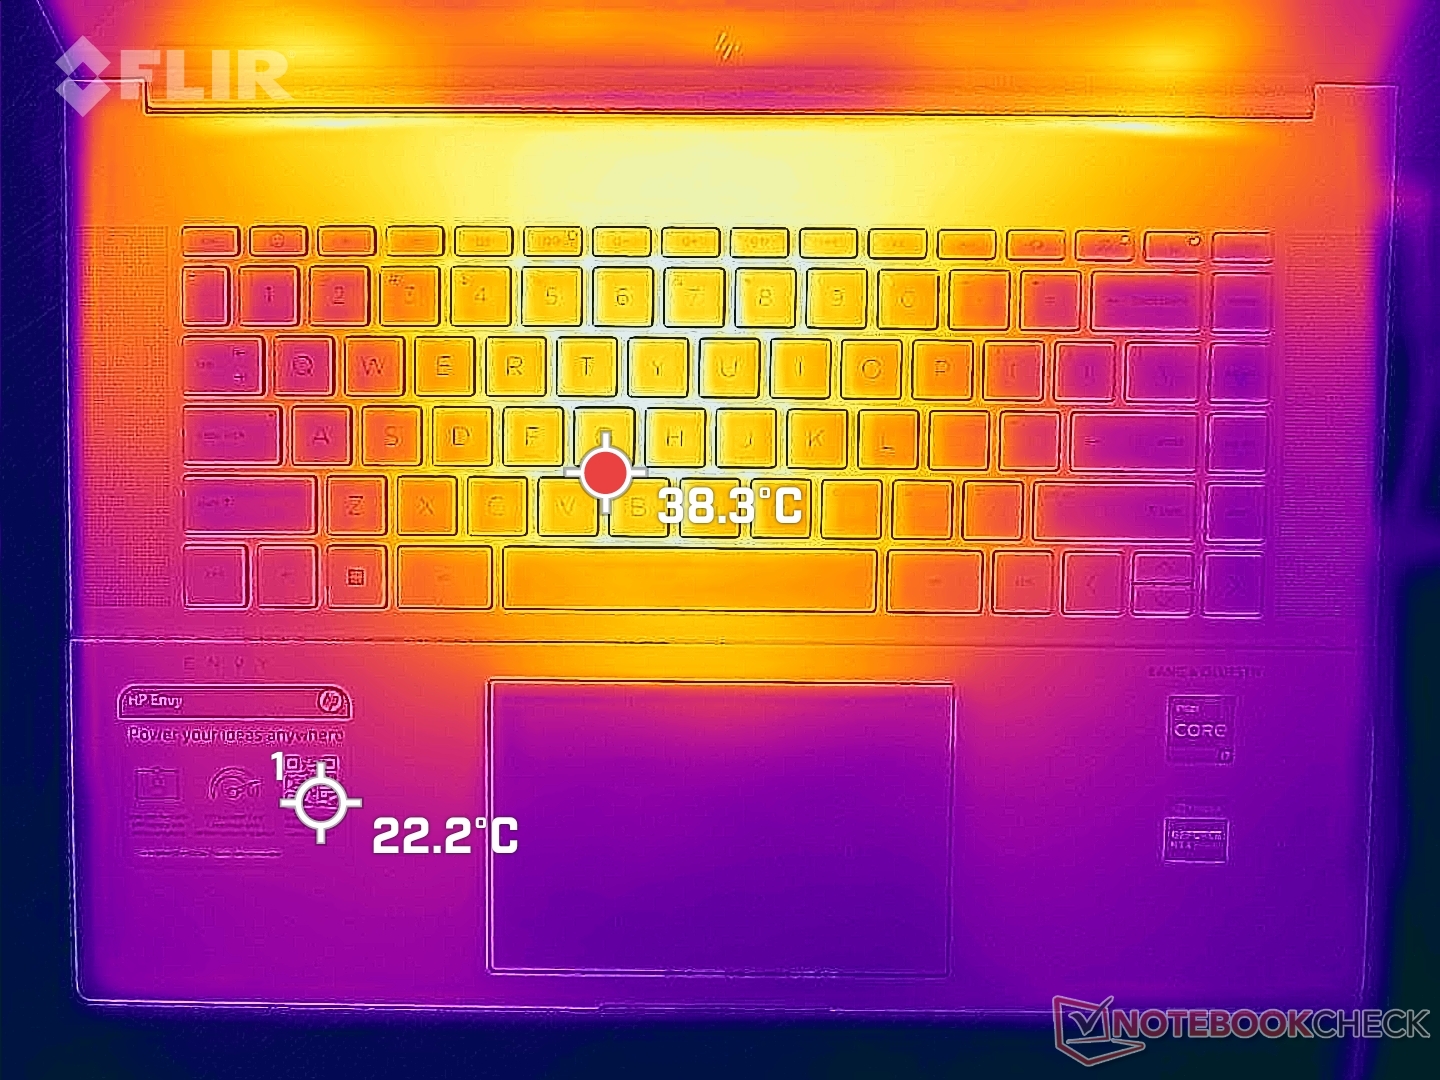
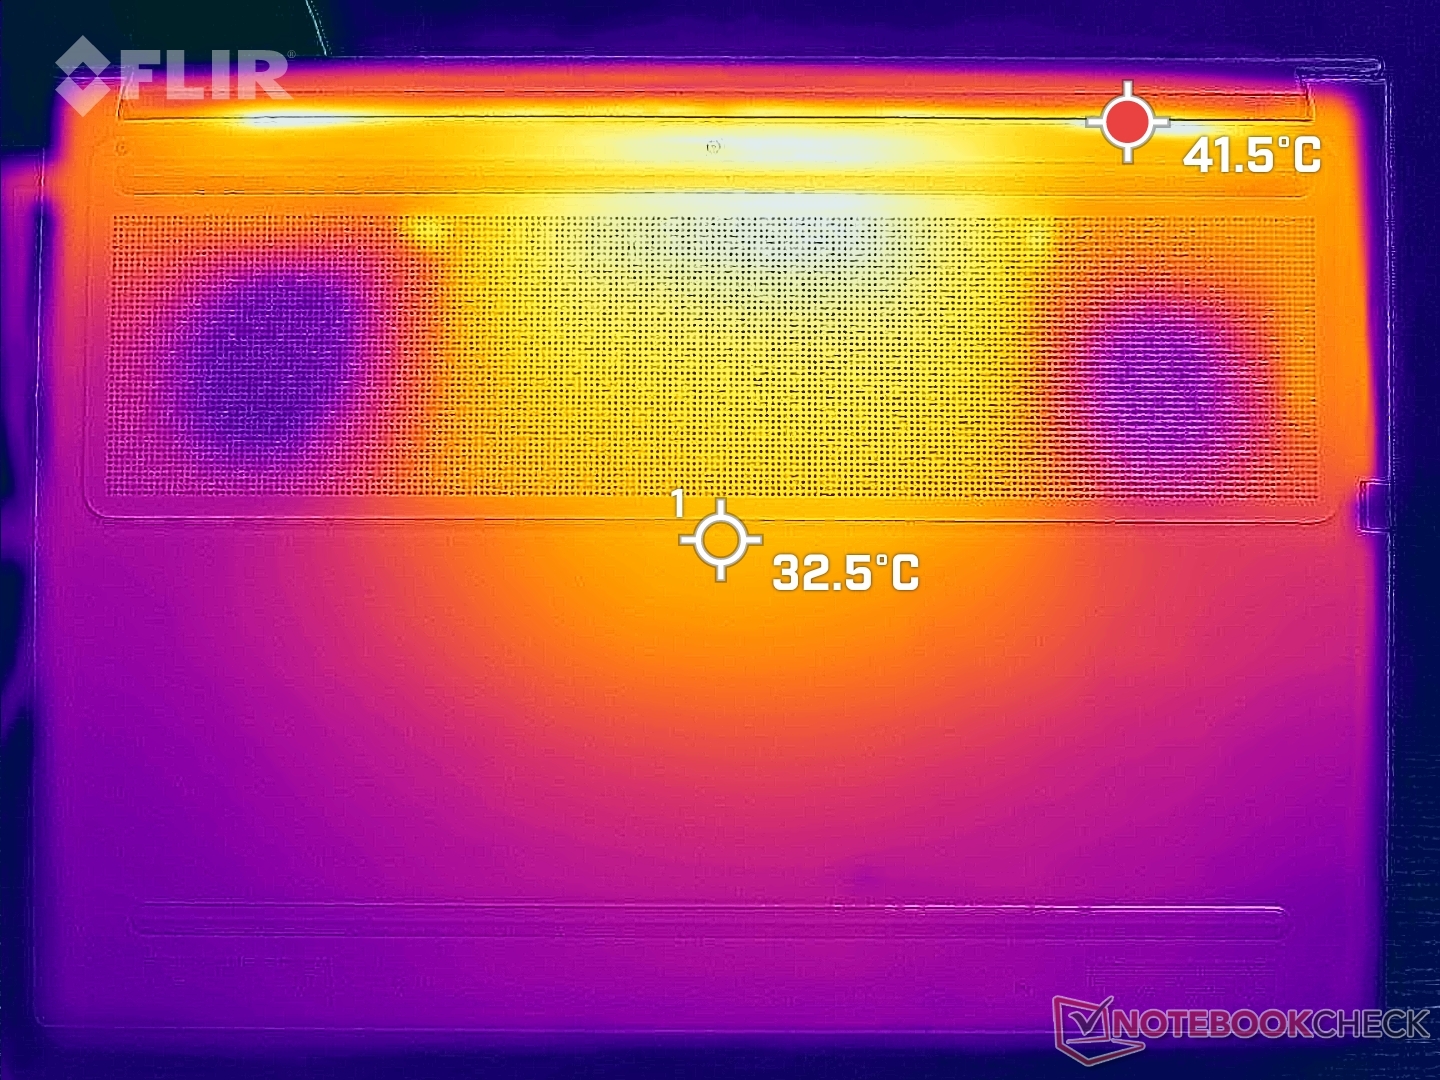
Temperature
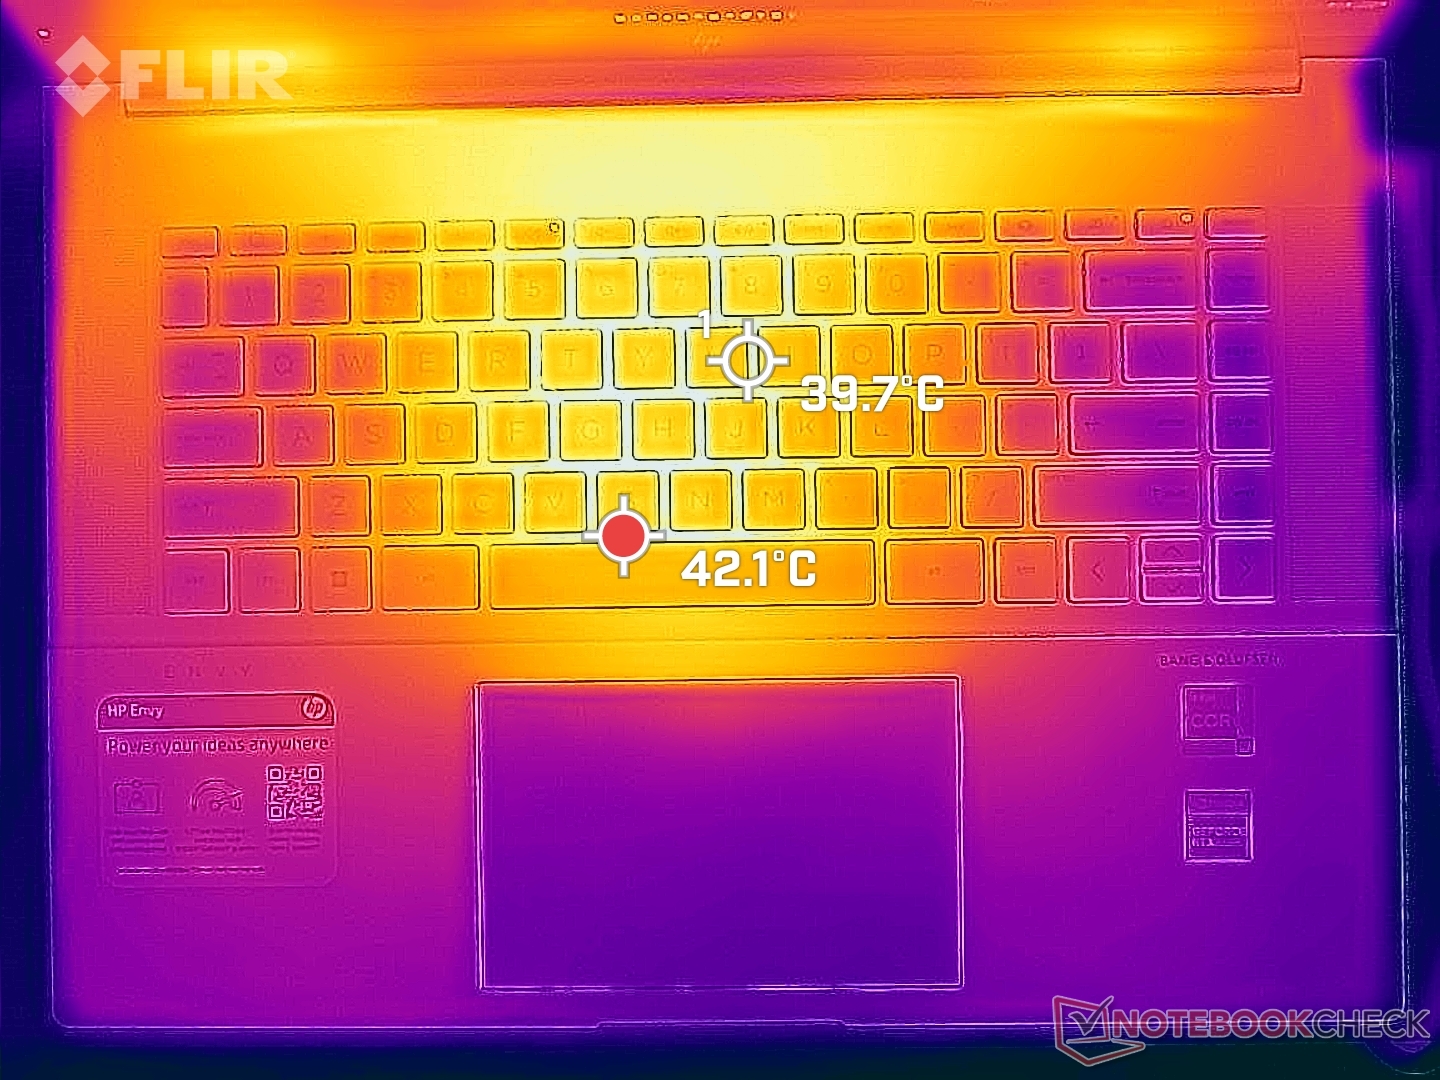
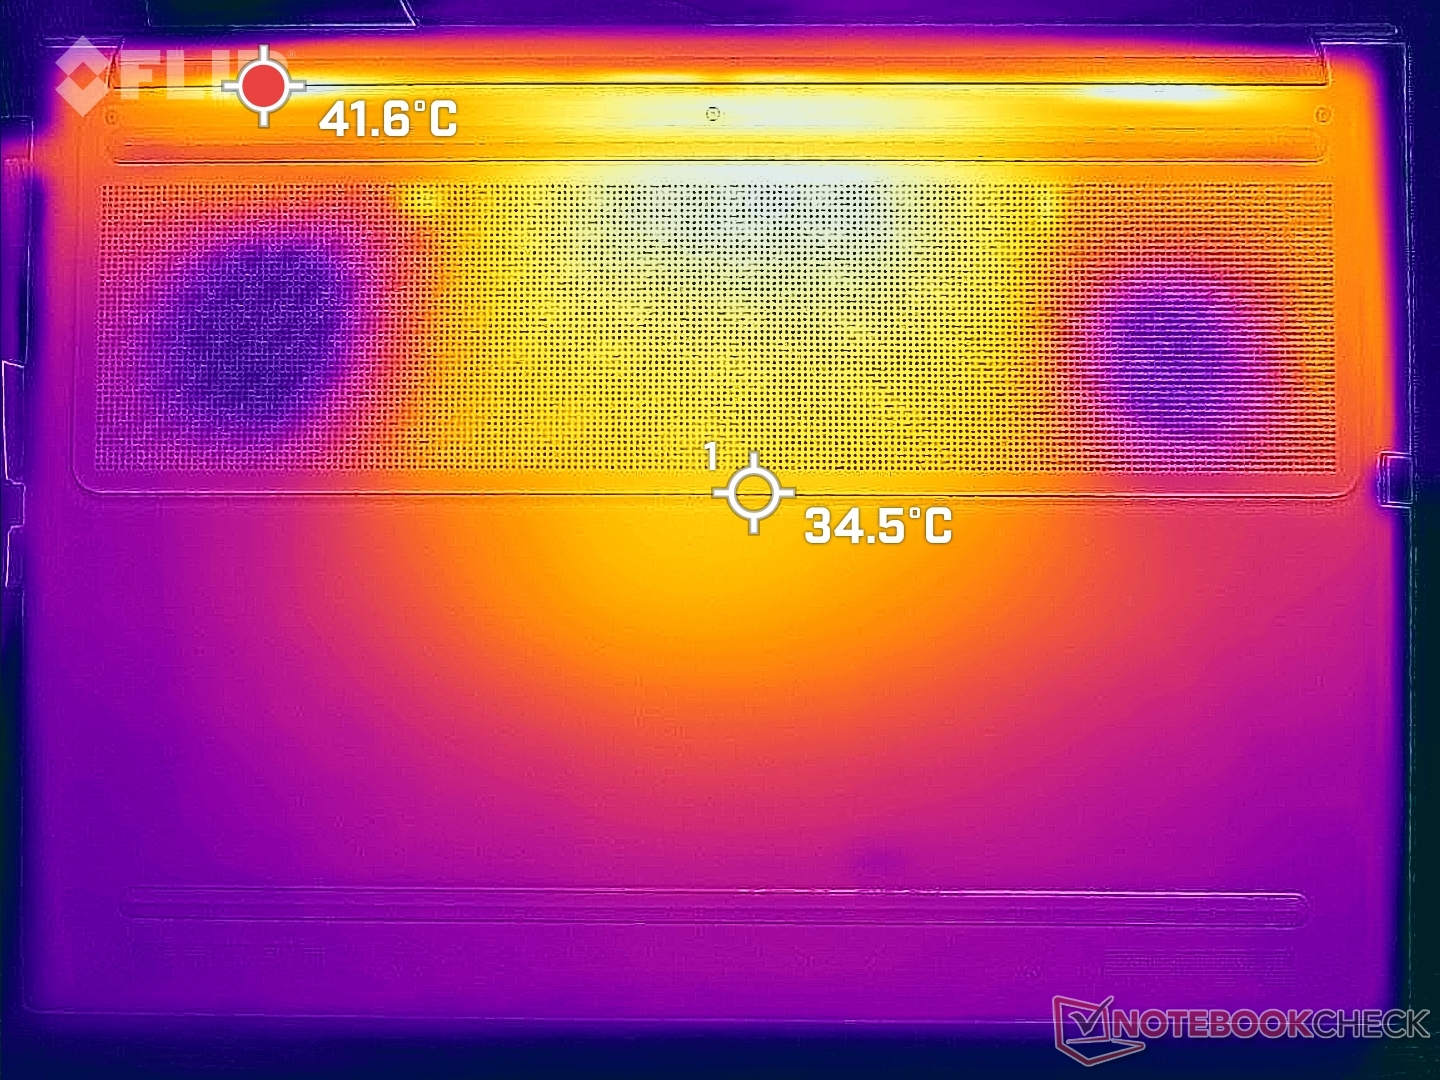
Surface temperatures are quite warm even when idling on desktop with no running applications. Hot spots under these conditions can reach 33 C on both the top and bottom compared to only 26 C on the ThinkBook 16 G4. If running high loads, these same areas can reach over 45 C. The palm rests remain relatively cool, but the bottom can be uncomfortable on the skin.
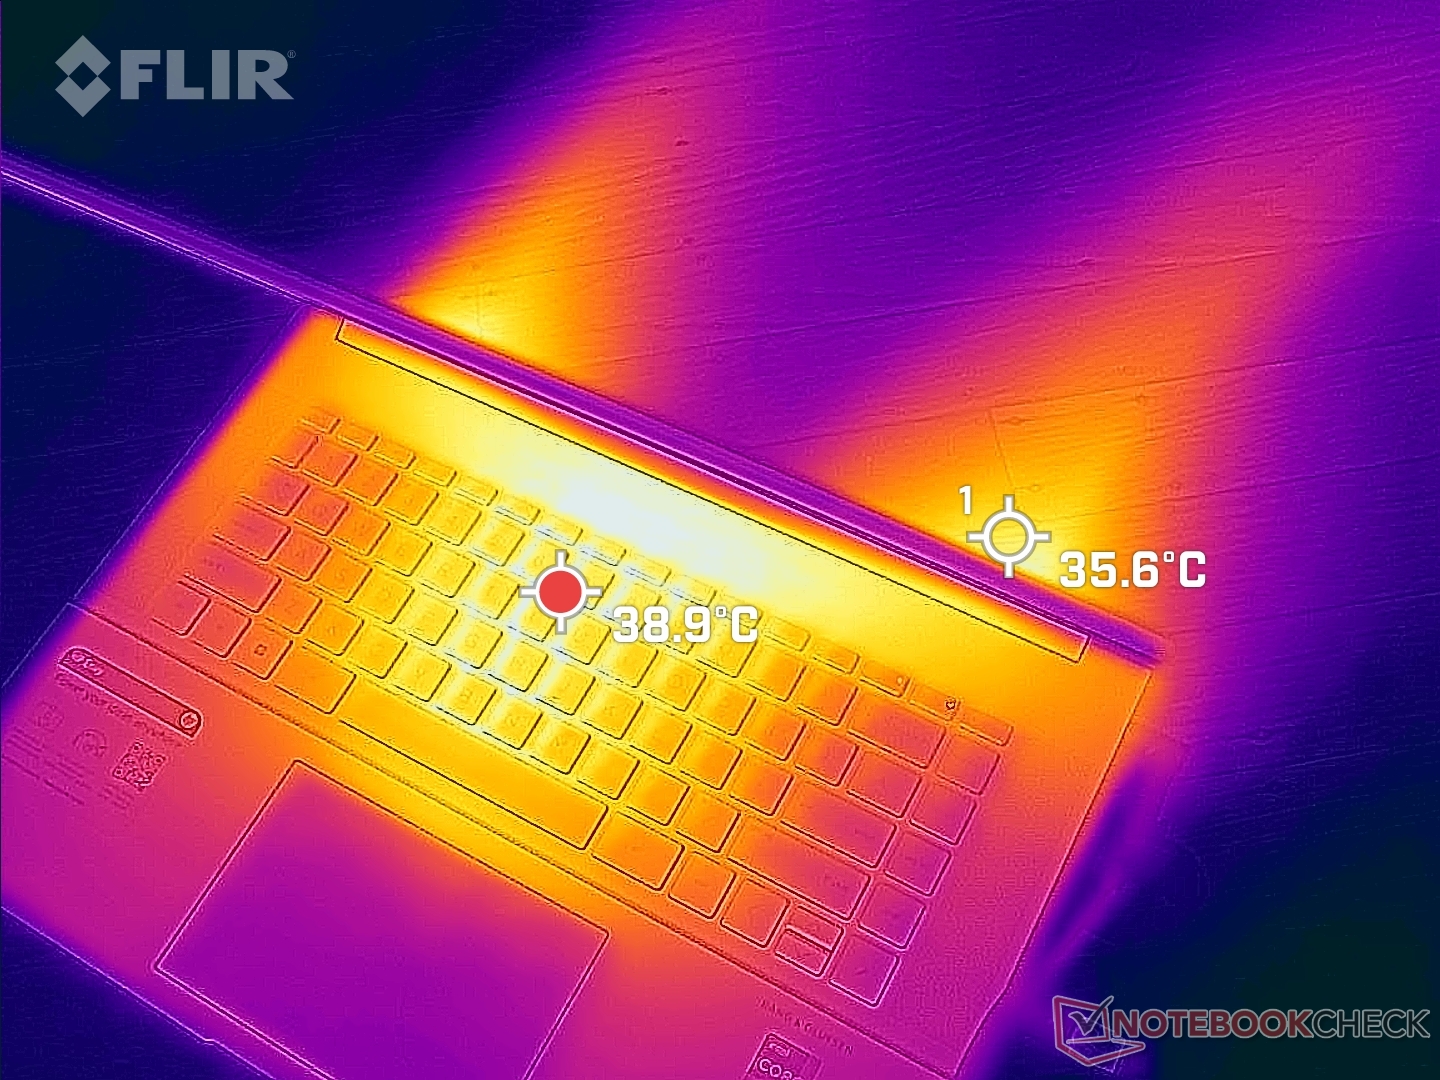
(-) The maximum temperature on the upper side is 45.2 °C / 113 F, compared to the average of 36.8 °C / 98 F, ranging from 21 to 71 °C for the class Multimedia.
(±) The bottom heats up to a maximum of 44 °C / 111 F, compared to the average of 39.1 °C / 102 F
(+) In idle usage, the average temperature for the upper side is 31 °C / 88 F, compared to the device average of 31.3 °C / 88 F.
(±) Playing The Witcher 3, the average temperature for the upper side is 33.6 °C / 92 F, compared to the device average of 31.3 °C / 88 F.
(+) The palmrests and touchpad are cooler than skin temperature with a maximum of 29.8 °C / 85.6 F and are therefore cool to the touch.
(±) The average temperature of the palmrest area of similar devices was 28.7 °C / 83.7 F (-1.1 °C / -1.9 F).
| HP Envy 16 h0112nr Intel Core i7-12700H, NVIDIA GeForce RTX 3060 Laptop GPU | Lenovo ThinkBook 16 G4+ IAP Intel Core i7-12700H, NVIDIA GeForce RTX 2050 Mobile | MSI Creator Z16P B12UHST Intel Core i9-12900H, NVIDIA GeForce RTX 3080 Ti Laptop GPU | Dell Inspiron 16 Plus 7610-MHJ8F Intel Core i7-11800H, Intel UHD Graphics Xe 32EUs (Tiger Lake-H) | Apple MacBook Pro 16 2021 M1 Pro Apple M1 Pro, Apple M1 Pro 16-Core GPU | Huawei MateBook 16s i7 Intel Core i7-12700H, Intel Iris Xe Graphics G7 96EUs | |
|---|---|---|---|---|---|---|
| Heat | 8% | -20% | 4% | 19% | 5% | |
| Maximum Upper Side * (°C) | 45.2 | 42.9 5% | 67 -48% | 43.4 4% | 41 9% | 40.9 10% |
| Maximum Bottom * (°C) | 44 | 50.6 -15% | 69 -57% | 45.1 -3% | 39 11% | 48.3 -10% |
| Idle Upper Side * (°C) | 33.6 | 26 23% | 29 14% | 30.6 9% | 24 29% | 29.2 13% |
| Idle Bottom * (°C) | 32.6 | 26.5 19% | 29 11% | 31.1 5% | 24 26% | 30.4 7% |
* ... smaller is better
Stress Test — Limited Turbo Boost
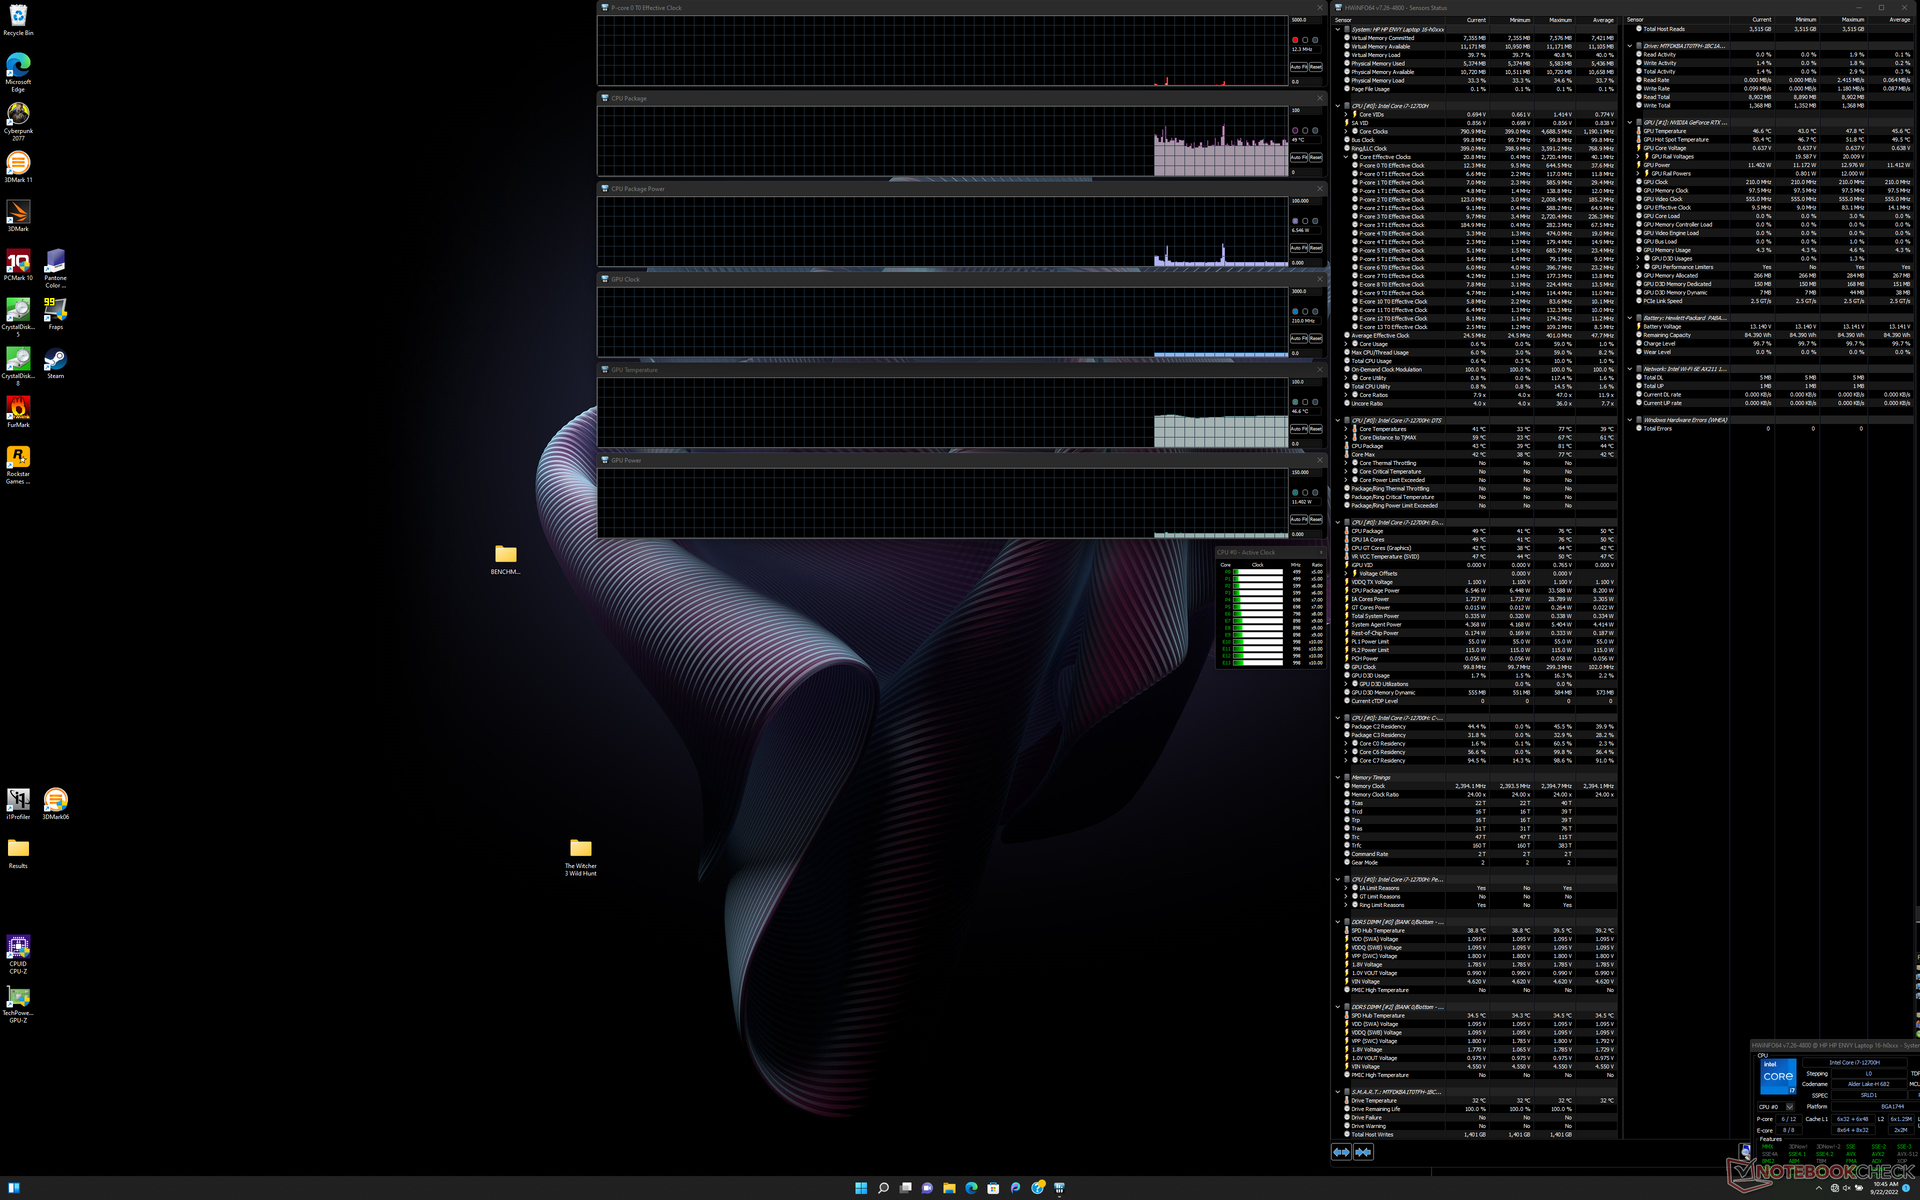
Running Prime95 causes CPU clock rates, temperature, and board power draw to spike to 3.7 GHz, 80 C, and 115 W, respectively, lasting for about 15 seconds. Thereafter, the CPU would drop and stabilize at 2.1 to 2.2 GHz, 66 C, and 55 W, respectively. In comparison, running this same test on the MSI GS77 with the same Core i7-12700H CPU would result in both higher stable clock rates and core temperatures of 2.7 - 3.0 GHz and 96 C, respectively. HP may be taking the safer route with its Envy 16 by running at slower Turbo Boost clock rates in order to keep temperatures lower.
GPU clock rates, temperature, and board power draw would stabilize at 1717 MHz, 74 C, and 94 W, respectively, when running Witcher 3 on Performance mode. This drops to 1542 MHz, 72 C, and 80 W if running the game on Balanced mode instead. Users will have to endure the maximum fan noise of the system if they wish to exploit the GPU to its fullest.
Running on battery power limits performance. A Fire Strike test on batteries would return Physics and Graphics scores of 17295 and 10572 points, respectively, compared to 28353 and 19890 points when on mains.
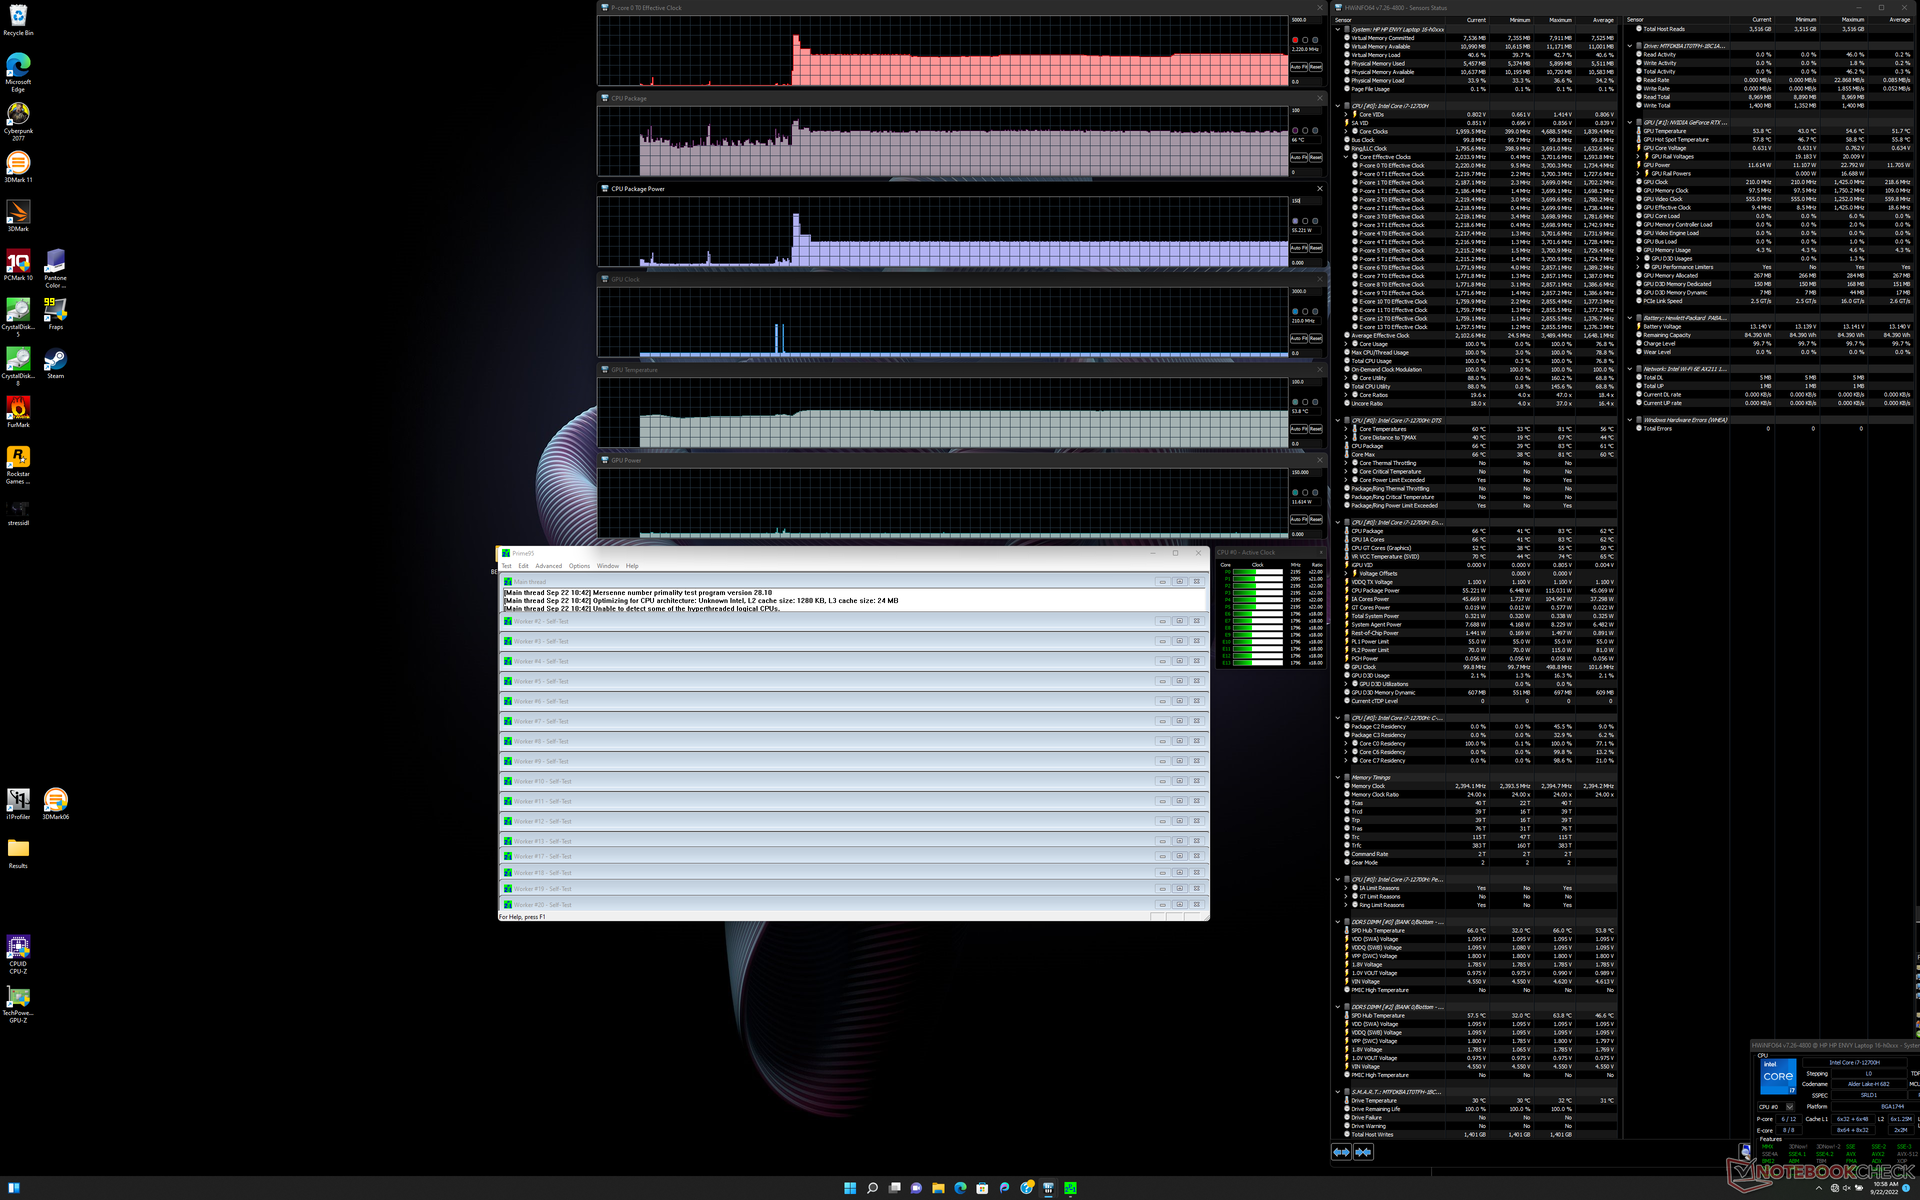
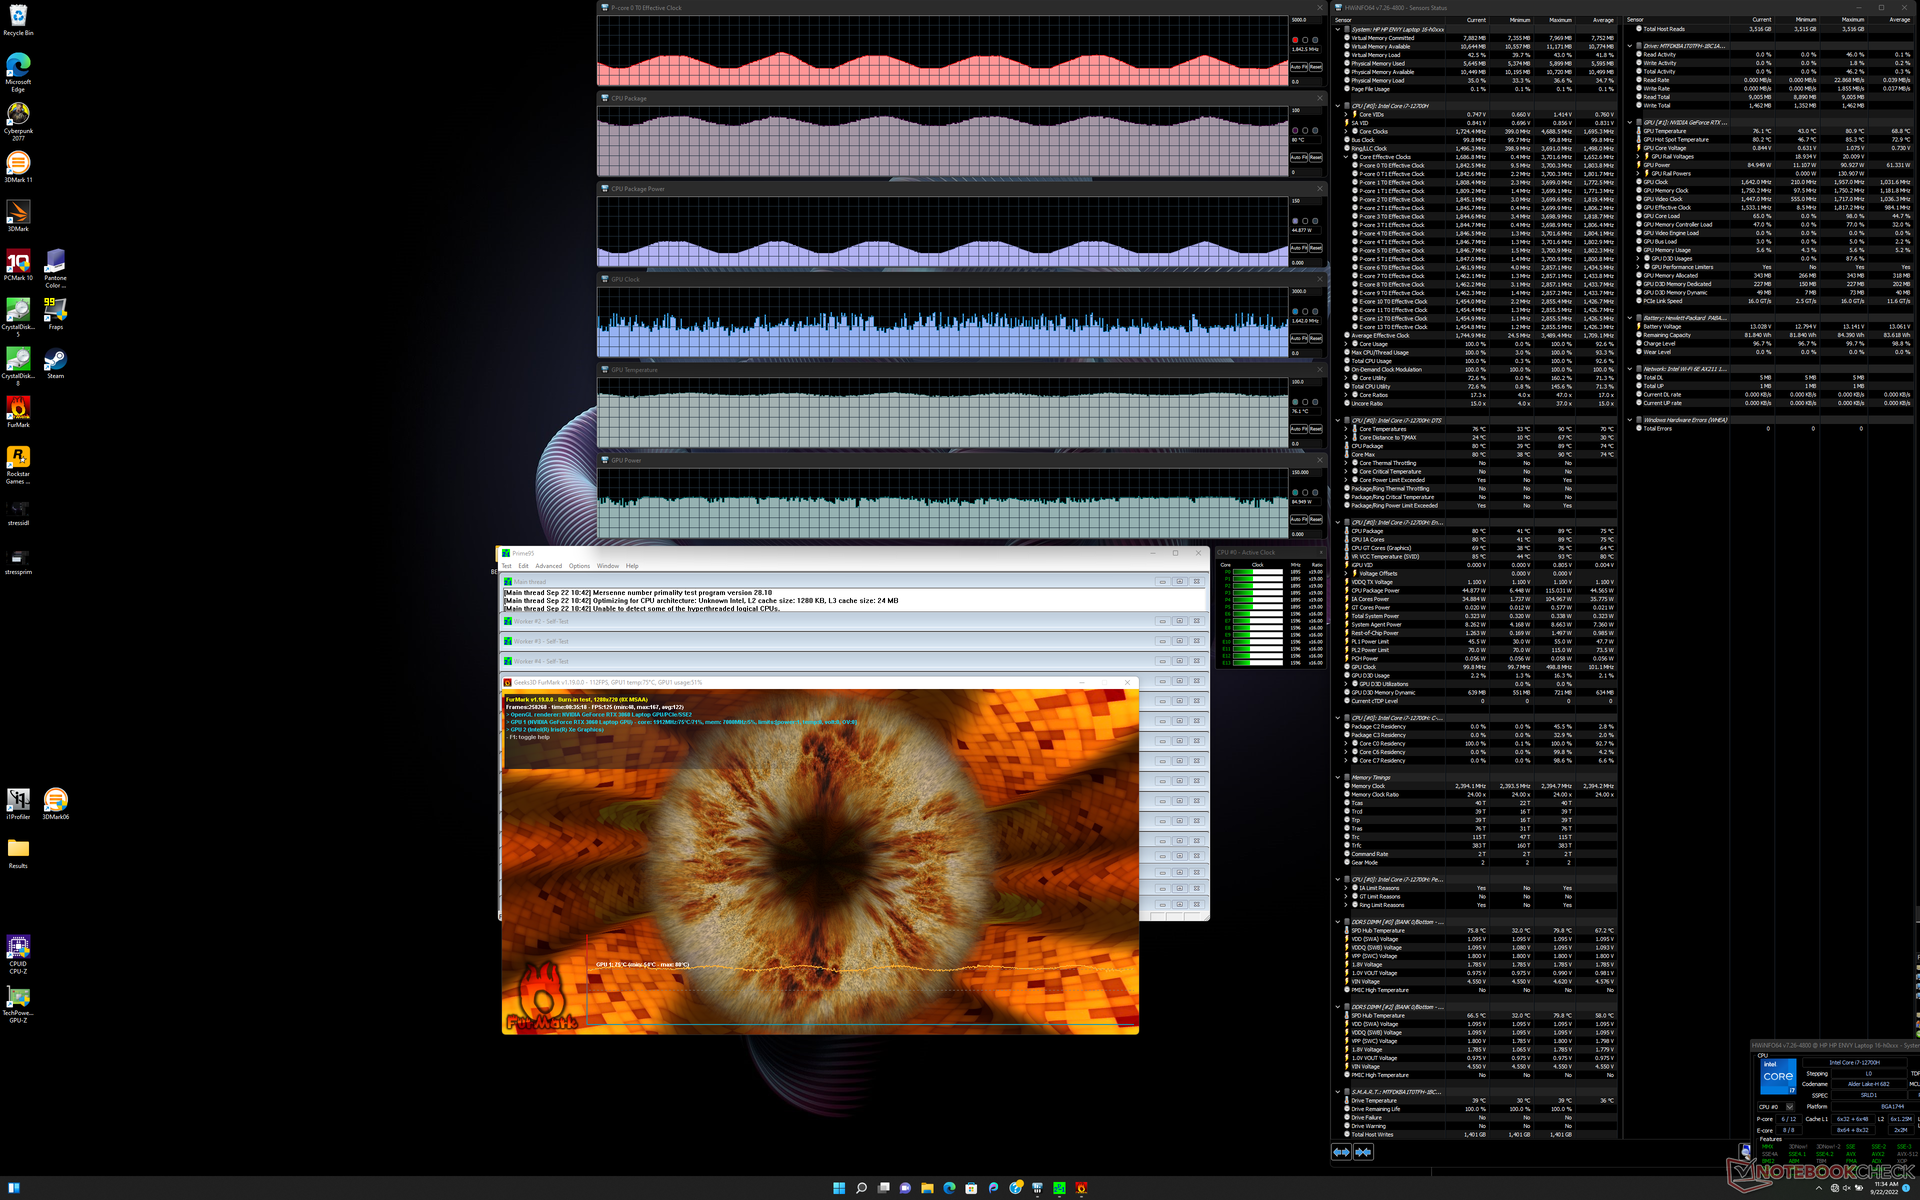
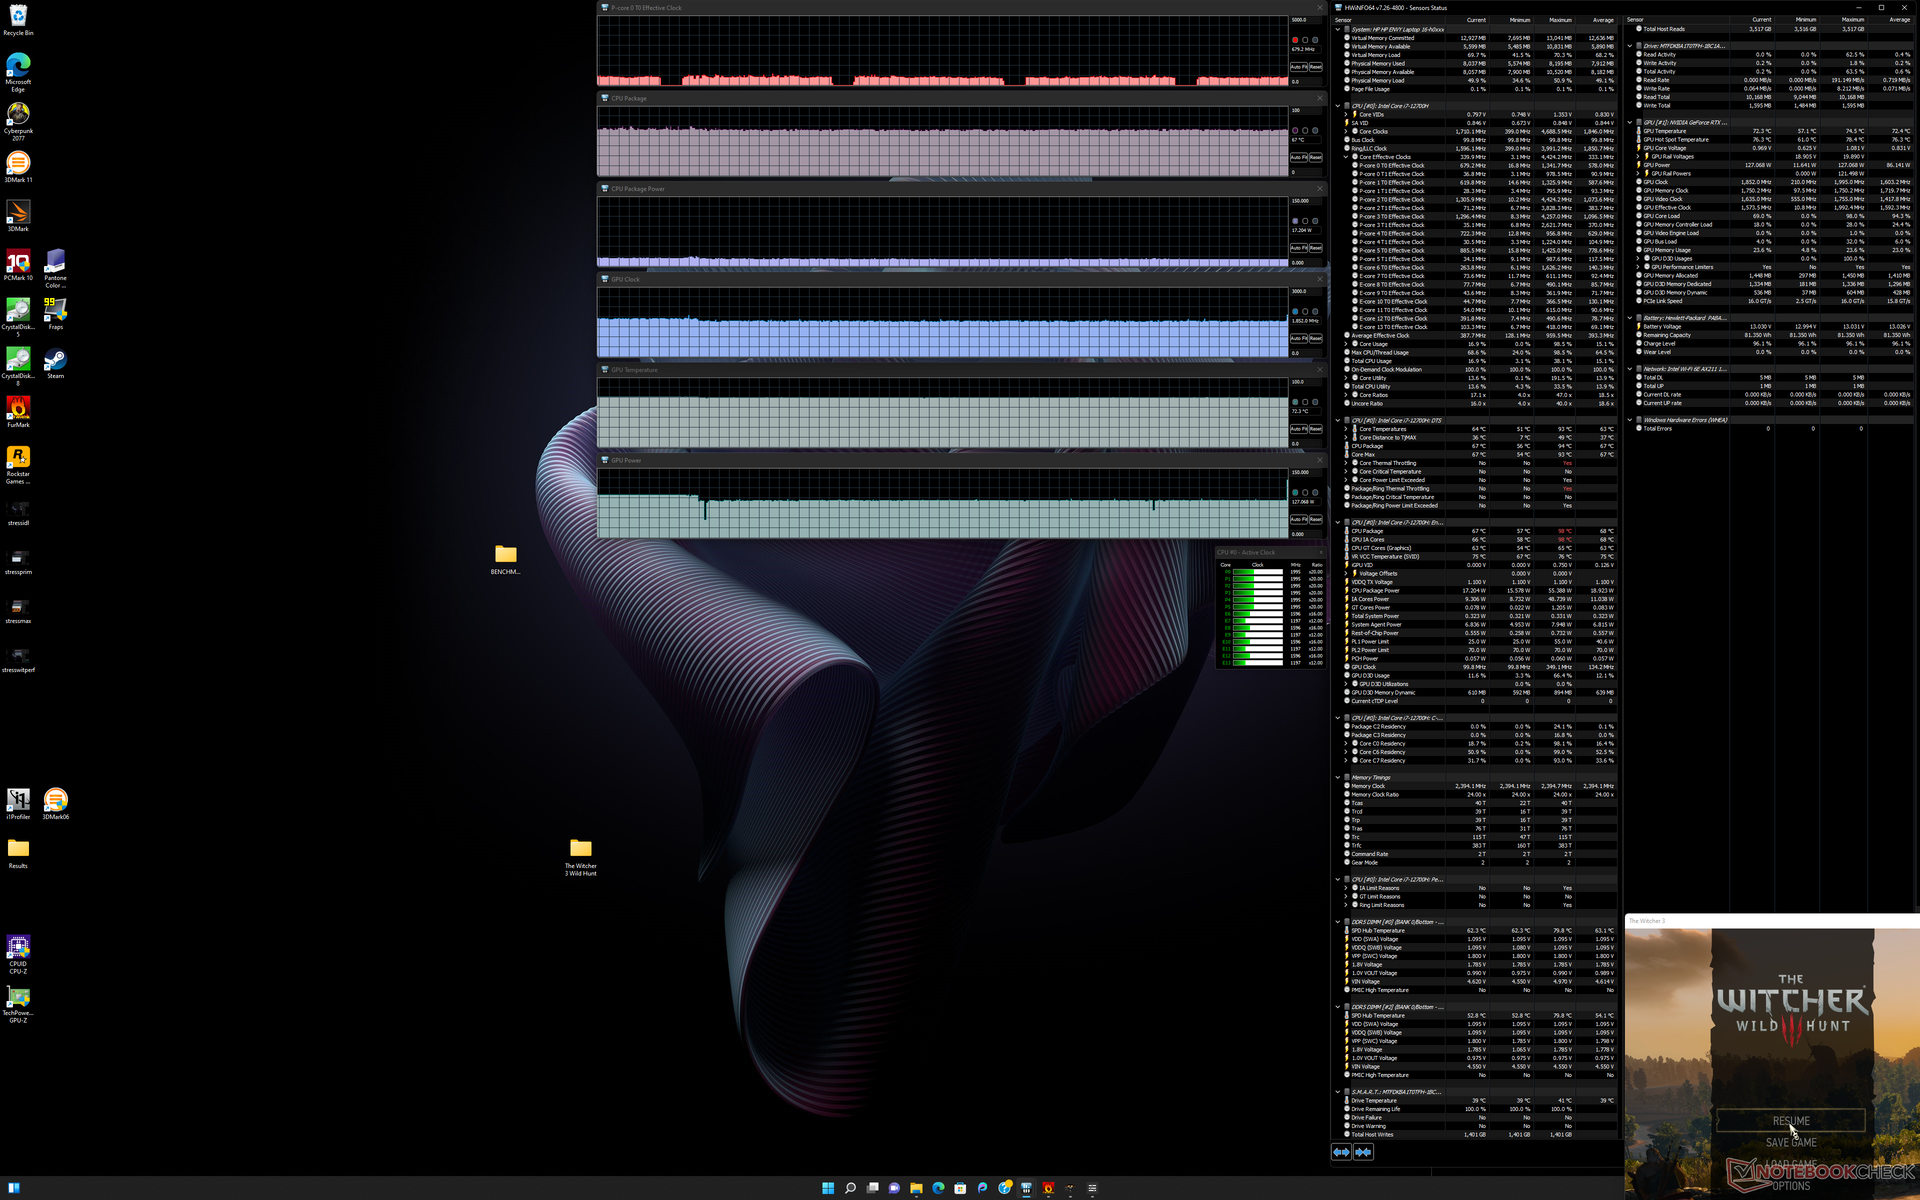
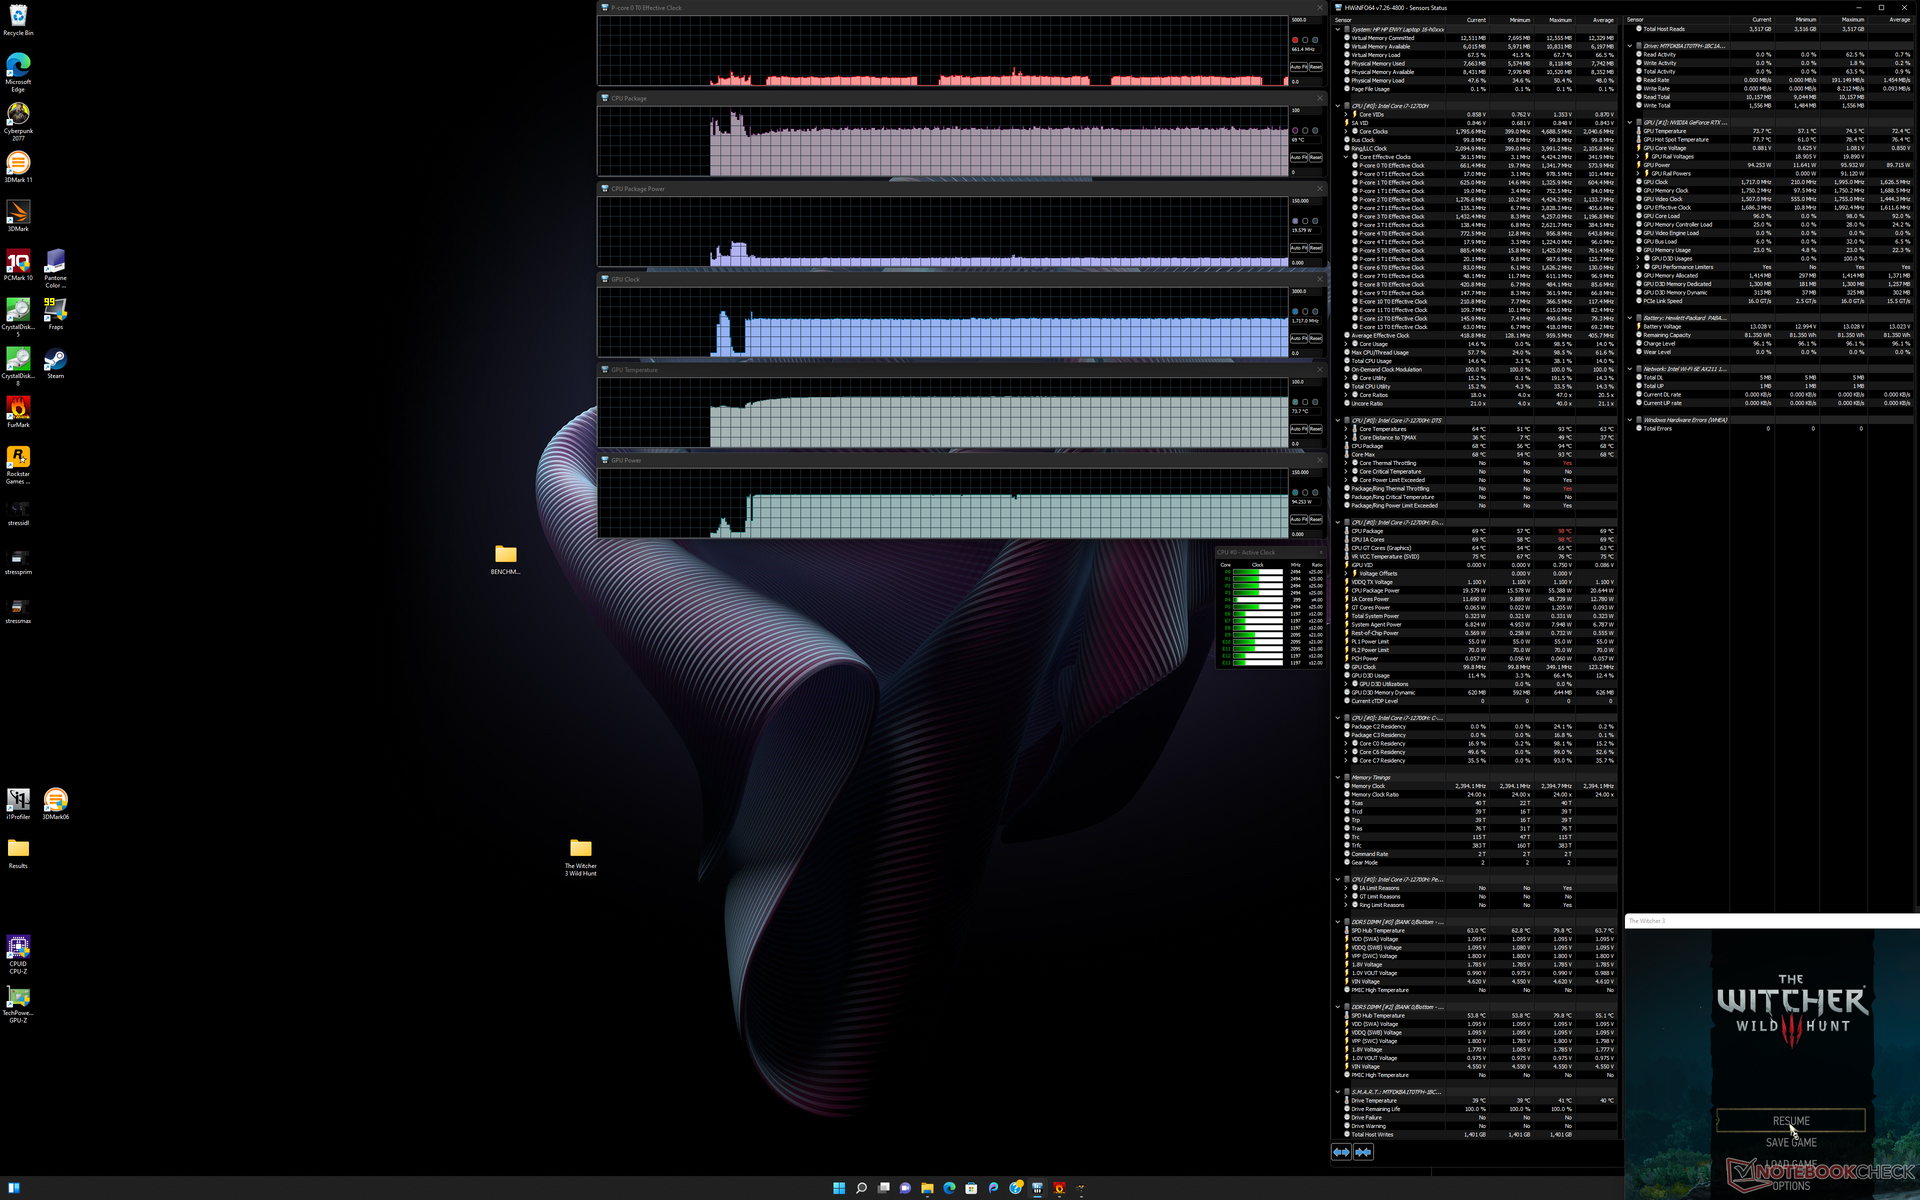
| CPU Clock (GHz) | GPU Clock (MHz) | Average CPU Temperature (°C) | Average GPU Temperature (°C) | |
| System Idle | -- | -- | 49 | 47 |
| Prime95 Stress | 2.1 - 2.2 | -- | 66 | 54 |
| Prime95 + FurMark Stress | 1.2 - 2.2 | ~1642 | 74 - 87 | 76 |
| Witcher 3 Stress (Balanced mode) | 0.67 | 1542 | 67 | 72 |
| Witcher 3 Stress (Performance mode) | 0.67 | 1717 | 69 | 74 |
Speakers
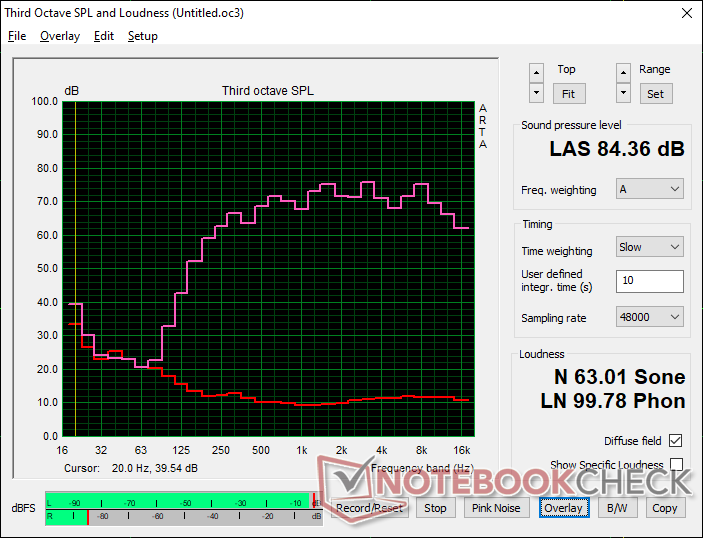
HP Envy 16 h0112nr audio analysis
(+) | speakers can play relatively loud (84.4 dB)
Bass 100 - 315 Hz
(-) | nearly no bass - on average 15.9% lower than median
(±) | linearity of bass is average (12.8% delta to prev. frequency)
Mids 400 - 2000 Hz
(+) | balanced mids - only 3.1% away from median
(+) | mids are linear (5.5% delta to prev. frequency)
Highs 2 - 16 kHz
(+) | balanced highs - only 3.4% away from median
(+) | highs are linear (6.3% delta to prev. frequency)
Overall 100 - 16.000 Hz
(+) | overall sound is linear (12.1% difference to median)
Compared to same class
» 22% of all tested devices in this class were better, 3% similar, 76% worse
» The best had a delta of 5%, average was 17%, worst was 45%
Compared to all devices tested
» 10% of all tested devices were better, 2% similar, 88% worse
» The best had a delta of 4%, average was 23%, worst was 134%
Apple MacBook Pro 16 2021 M1 Pro audio analysis
(+) | speakers can play relatively loud (84.7 dB)
Bass 100 - 315 Hz
(+) | good bass - only 3.8% away from median
(+) | bass is linear (5.2% delta to prev. frequency)
Mids 400 - 2000 Hz
(+) | balanced mids - only 1.3% away from median
(+) | mids are linear (2.1% delta to prev. frequency)
Highs 2 - 16 kHz
(+) | balanced highs - only 1.9% away from median
(+) | highs are linear (2.7% delta to prev. frequency)
Overall 100 - 16.000 Hz
(+) | overall sound is linear (4.6% difference to median)
Compared to same class
» 0% of all tested devices in this class were better, 0% similar, 100% worse
» The best had a delta of 5%, average was 17%, worst was 45%
Compared to all devices tested
» 0% of all tested devices were better, 0% similar, 100% worse
» The best had a delta of 4%, average was 23%, worst was 134%
Energy Management
Power Consumption
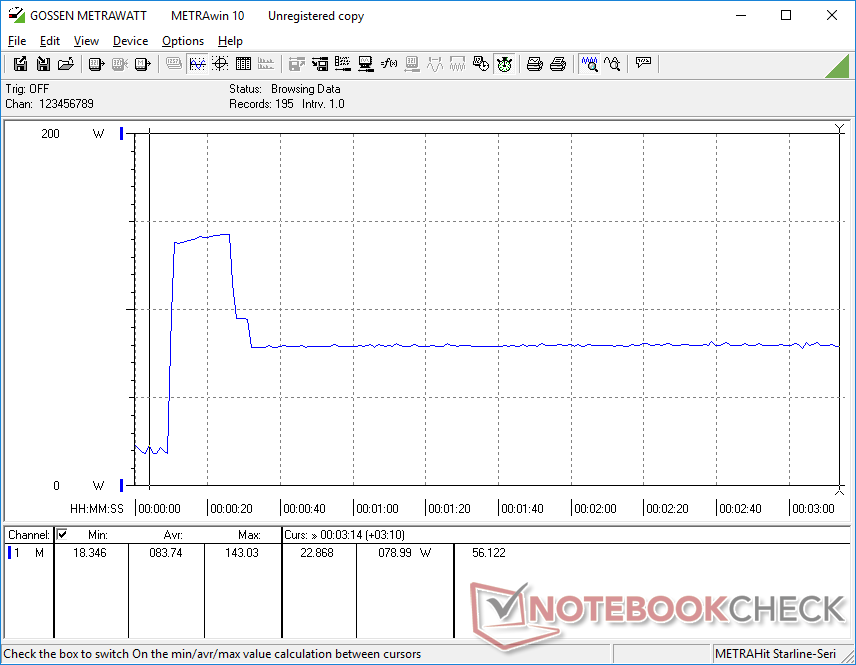
Idling on desktop draws between 10 W and 28 W depending on the brightness level, power profile, and Optimus setting compared to only 9 W to 18 W on the 2020 Envy 15 due to the more demanding OLED panel and 12th gen CPU. Keep in mind that certain colors will demand more power than others on an OLED panel as detailed here.
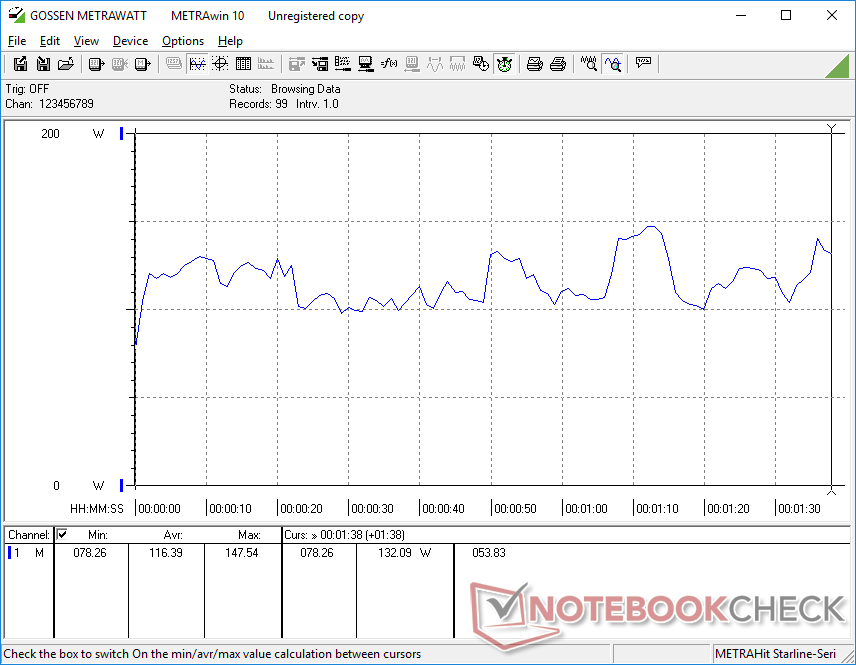
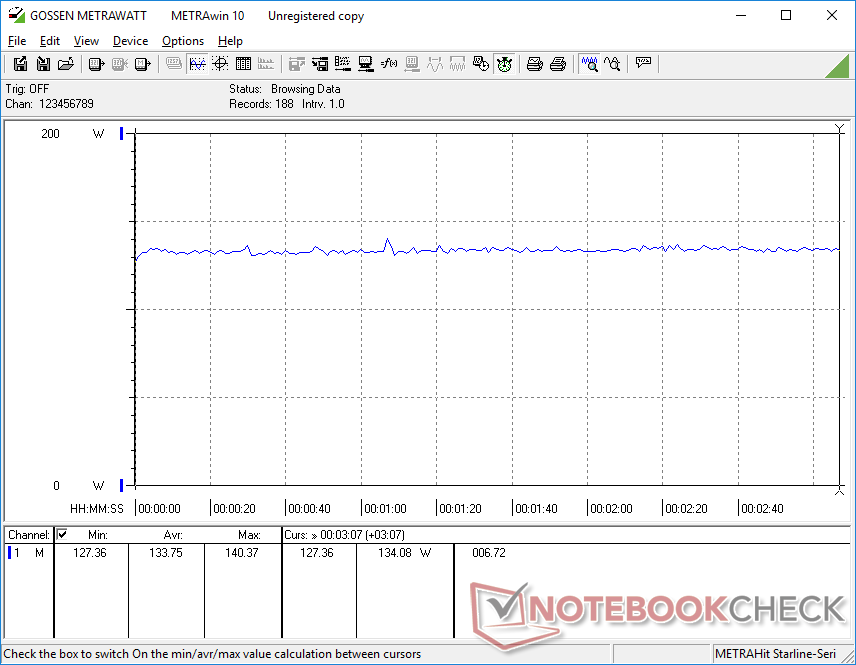
Power consumption when gaming is high at around 134 W to be comparable to the MSI Creator Z16P with the faster Core i9-12900H CPU and RTX 3080 Ti GPU or Lenovo Legion Slim 7 16 with the same Core i7 CPU and GPU. When compared to the 2020 Envy 15, however, consumption is only about 7 percent higher when gaming despite the 20 to 30 percent faster graphics performance for higher performance-per-watt.
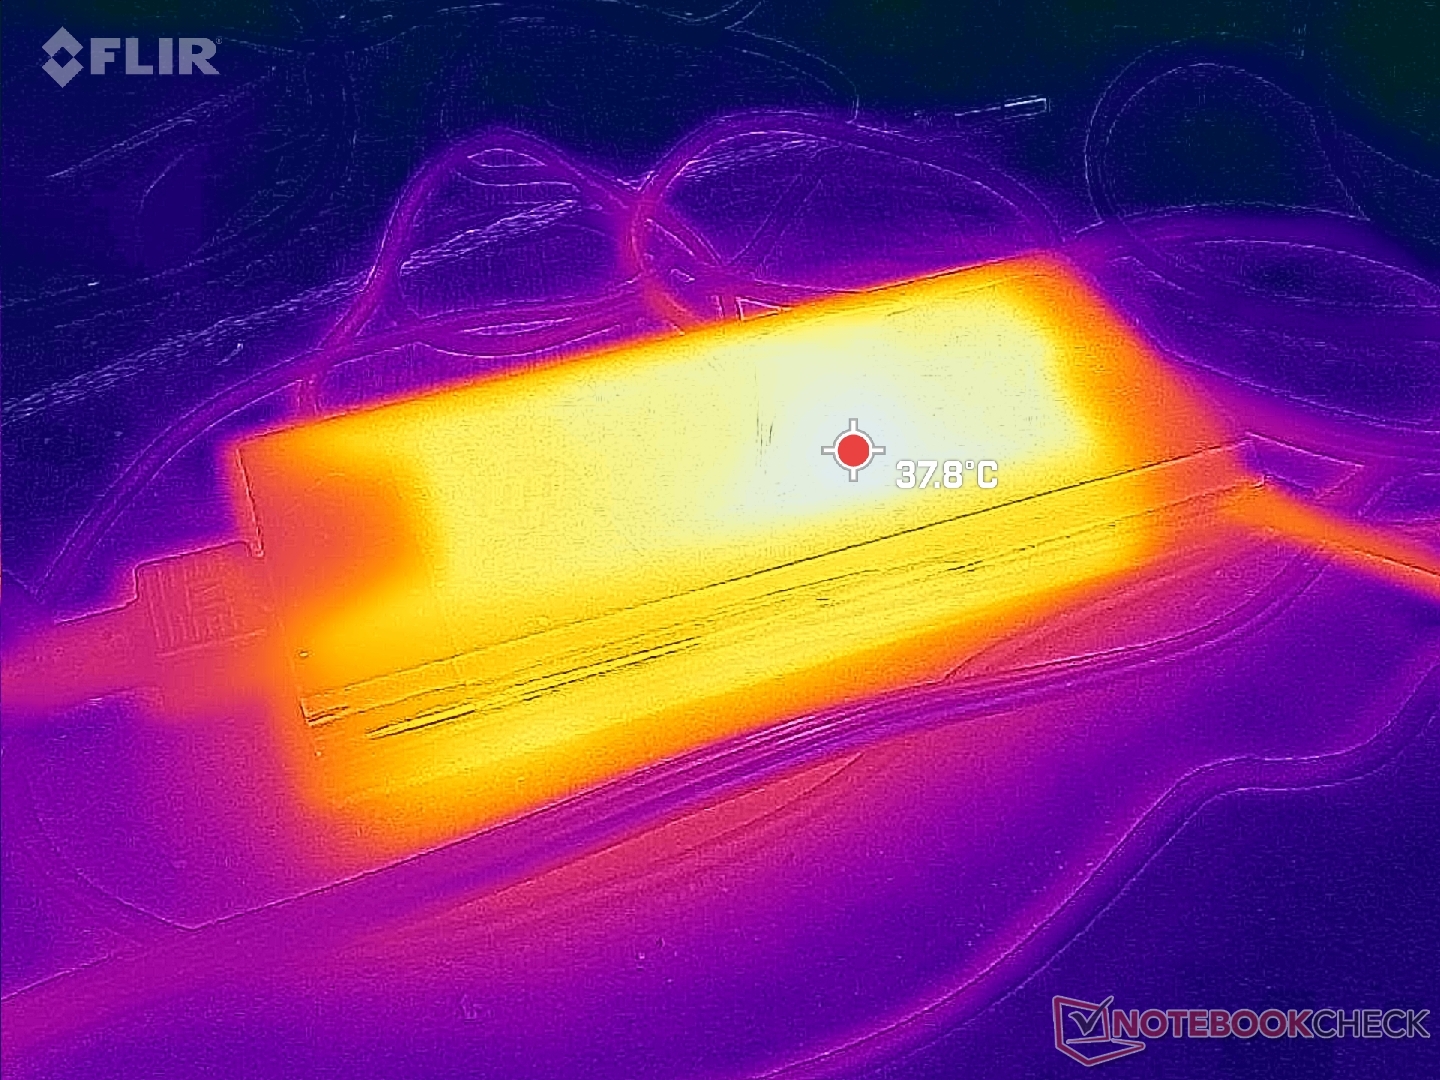
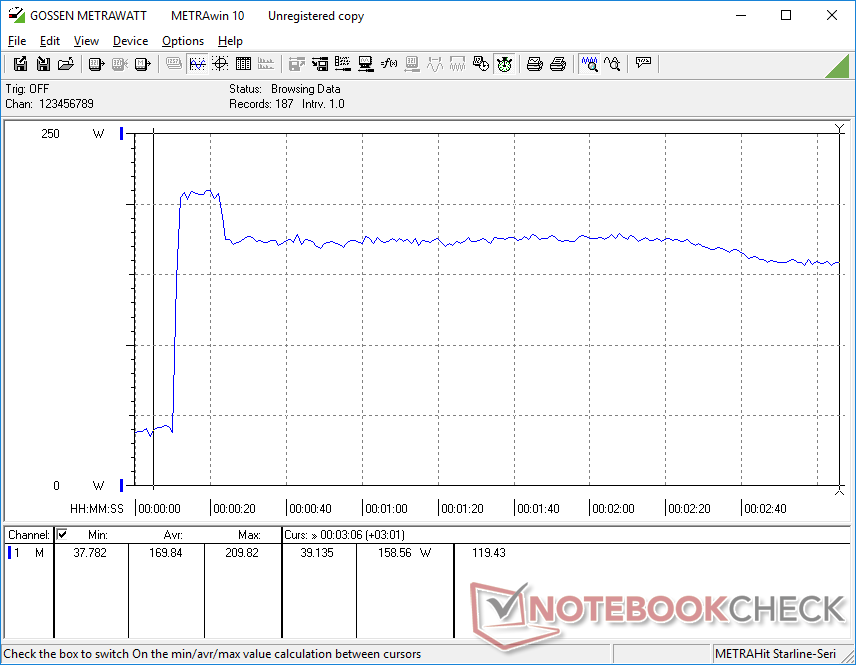
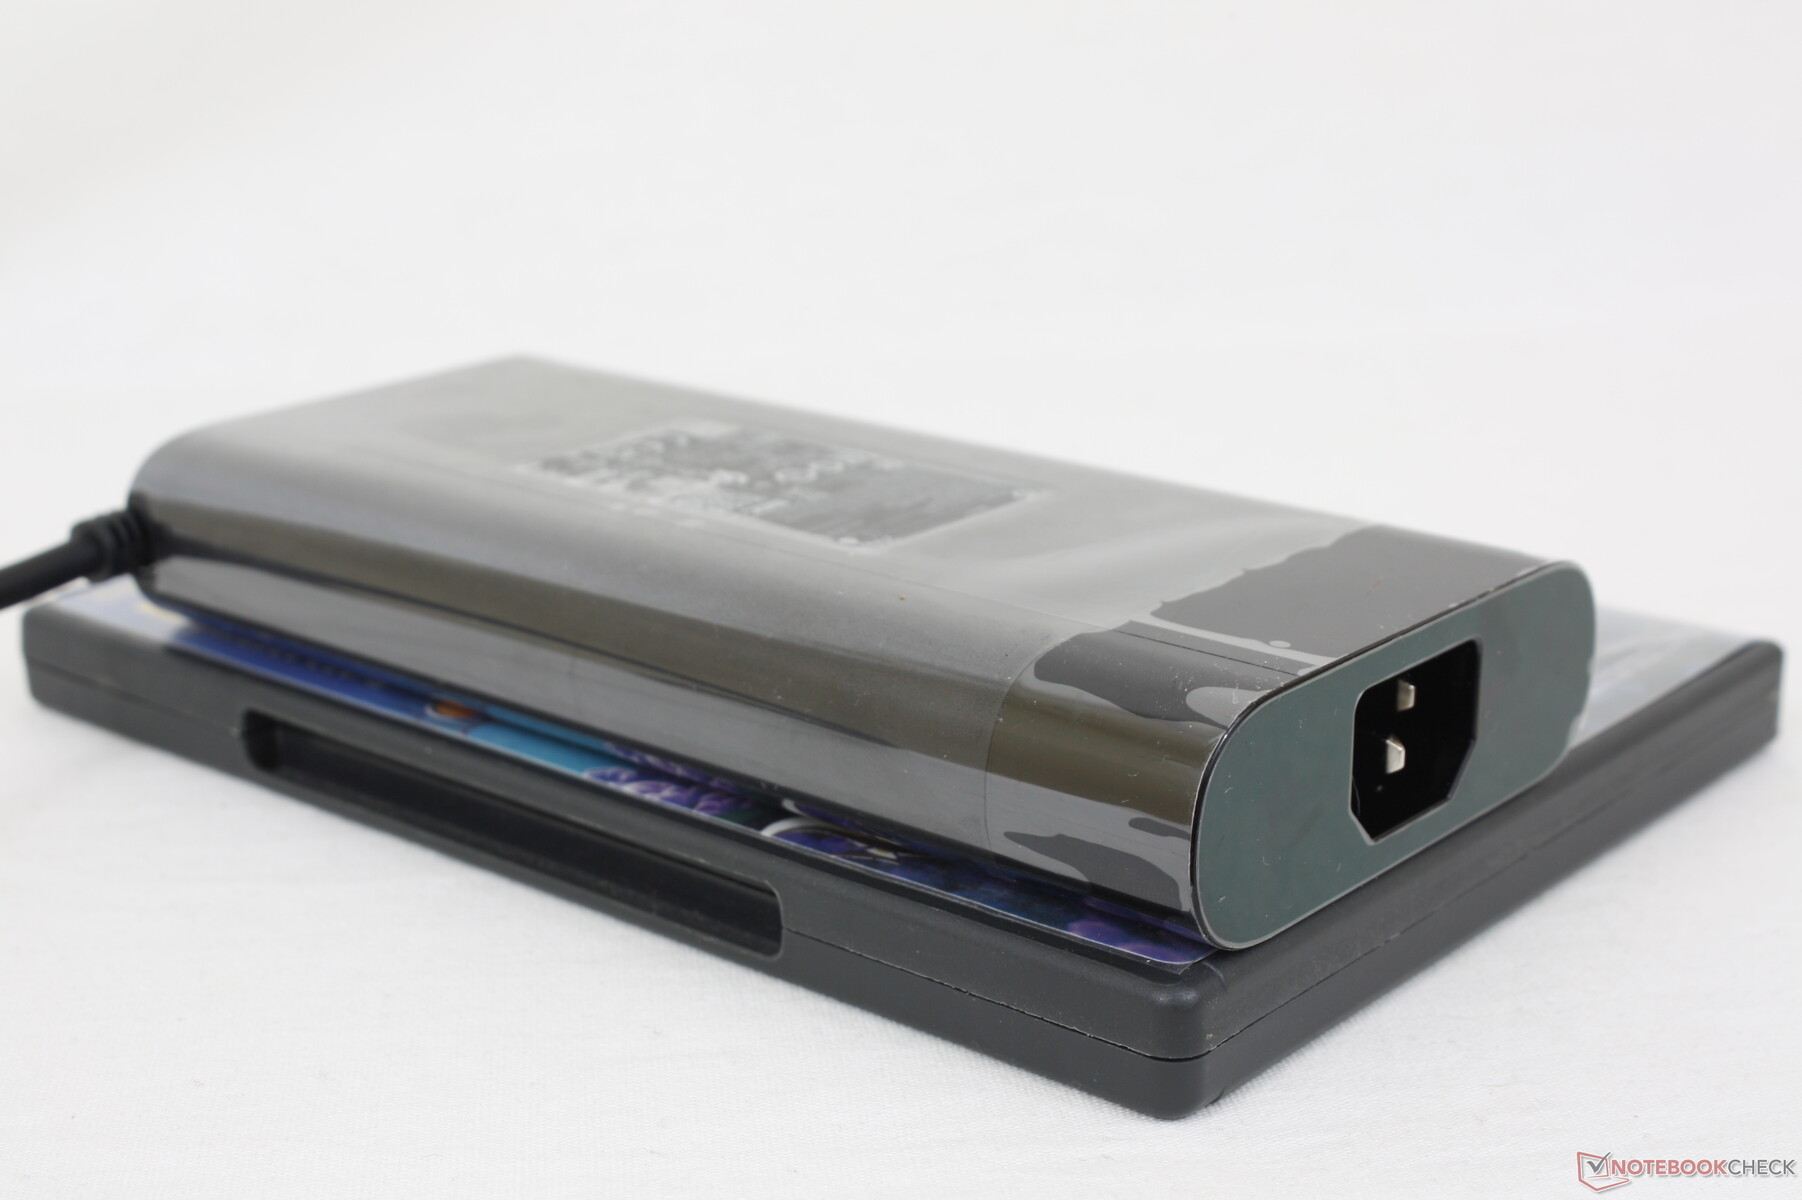
We're able to measure a temporary maximum draw of 209.8 W from the medium-sized (~16.5 x 7.8 x 2.5 cm) 200 W AC adapter when the CPU and GPU are each at 100 percent utilization. Consumption stabilizes at around 160 W if running extreme loads.
| Off / Standby | |
| Idle | |
| Load |
|
Key:
min: | |
| HP Envy 16 h0112nr i7-12700H, GeForce RTX 3060 Laptop GPU, Micron 3400 1TB MTFDKBA1T0TFH, OLED, 3840x2400, 16" | Lenovo ThinkBook 16 G4+ IAP i7-12700H, GeForce RTX 2050 Mobile, Micron 2450 1TB MTFDKCD1T0TFK, IPS, 2560x1600, 16" | MSI Creator Z16P B12UHST i9-12900H, GeForce RTX 3080 Ti Laptop GPU, Samsung PM9A1 MZVL22T0HBLB, IPS True Pixel (~100% DCI-P3), 2560x1600, 16" | Dell Inspiron 16 Plus 7610-MHJ8F i7-11800H, UHD Graphics Xe 32EUs (Tiger Lake-H), OM3PDP3-AD NVMe KDI 512GB, IPS, 3072x1920, 16" | Apple MacBook Pro 16 2021 M1 Pro M1 Pro, M1 Pro 16-Core GPU, Apple SSD AP1024R, Mini-LED, 3456x2234, 16.2" | Huawei MateBook 16s i7 i7-12700H, Iris Xe G7 96EUs, Silicon Motion PCIe-8 SSD, IPS, 2520x1680, 16" | |
|---|---|---|---|---|---|---|
| Power Consumption | 36% | -11% | 50% | 33% | 35% | |
| Idle Minimum * (Watt) | 10 | 5 50% | 11 -10% | 5.4 46% | 5 50% | 6.8 32% |
| Idle Average * (Watt) | 10.9 | 11.2 -3% | 17 -56% | 9.8 10% | 15.1 -39% | 13.2 -21% |
| Idle Maximum * (Watt) | 27.8 | 11.6 58% | 26 6% | 14 50% | 15.5 44% | 13.8 50% |
| Load Average * (Watt) | 116.4 | 89.3 23% | 124 -7% | 44 62% | 54 54% | 75.2 35% |
| Witcher 3 ultra * (Watt) | 133.7 | 83 38% | 133.5 -0% | 44 67% | 56.1 58% | |
| Load Maximum * (Watt) | 209.8 | 102 51% | 212 -1% | 76.8 63% | 90 57% | 90.6 57% |
* ... smaller is better
Power Consumption Witcher 3 / Stresstest
Power Consumption external Monitor
Battery Life
(September 27, 2022 update: HP has confirmed with us that the model can only recharge via USB-C when the unit is powered off. In comparison, every other laptop we've tested with support for PD-in can be recharged while the unit is powered on. Our original text is below.)
WLAN runtime is comparable to the MateBook 16s i7 or ThinkBook 16 G4+ IAP at about 8 hours. Battery capacity remains identical to the 2020 Envy 15 despite the move to a larger screen size.
Charging from empty to full with the included barrel adapter takes approximately 1.5 hours. The system cannot be recharged via USB-C despite what the official specifications may claim. When a 100 W USB-C charger is plugged in, the system would simply give a warning to use a higher capacity charger instead. We've reached out to HP for clarification and will update this section accordingly.
| HP Envy 16 h0112nr i7-12700H, GeForce RTX 3060 Laptop GPU, 83 Wh | Lenovo ThinkBook 16 G4+ IAP i7-12700H, GeForce RTX 2050 Mobile, 71 Wh | MSI Creator Z16P B12UHST i9-12900H, GeForce RTX 3080 Ti Laptop GPU, 90 Wh | Dell Inspiron 16 Plus 7610-MHJ8F i7-11800H, UHD Graphics Xe 32EUs (Tiger Lake-H), 86 Wh | Apple MacBook Pro 16 2021 M1 Pro M1 Pro, M1 Pro 16-Core GPU, 99.6 Wh | Huawei MateBook 16s i7 i7-12700H, Iris Xe G7 96EUs, 84 Wh | |
|---|---|---|---|---|---|---|
| Battery runtime | -1% | -36% | 67% | 114% | 11% | |
| Reader / Idle (h) | 17.8 | 22.5 26% | ||||
| WiFi v1.3 (h) | 7.9 | 8.2 4% | 5.2 -34% | 9.5 20% | 16.9 114% | 8.1 3% |
| Load (h) | 1.6 | 1.5 -6% | 1 -37% | 4.1 156% | 1.9 19% | |
| H.264 (h) | 12.6 | 5.8 | 17.5 | 9.3 | ||
| WiFi (h) | 9.5 |
Pros
Cons
Verdict — Like A Budget MacBook Pro 16
The Envy 16 is faster than the older Envy 15, of course, but some of the drawbacks we mentioned on the Envy 15 have yet to be addressed. There are plenty of improvements such as to the webcam, speakers, wireless, clickpad size, and battery life, but other things like the loud fans, no Kensington lock, spongy clickpad, and relatively weak hinges aren't any better this year. Improving these weak areas would have helped boost the Envy 16 against competitors like the MacBook Pro 16 or Dell Inspiron 16 Plus. The system is also one of the larger and heavier 16-inch laptops in the market which may deter travelers and students.
The HP Envy 16 is almost $1000 cheaper than the base MacBook Pro 16 while offering competitive performance features and colors. It's quite the loud and heavy system, however.
Users who aren't put off by the weight will find the Envy 16 to be a versatile system with the performance, screen size, and colors fit for gaming and editing purposes. We especially appreciate how straightforward it is to add more storage or RAM if needed. If your tasks don't require a lot of horsepower, however, then much lighter 16-inch options should be considered like the LG Gram 16 or Huawei MateBook 16s.
Price and Availability
The Envy 16 is now available across major retailers including Newegg, Best Buy, Costco, Micro Center, and HP.com in various configurations. Our specific configuration can be found on Micro Center for $1700 USD while Intel Arc A370M SKUs can be found elsewhere.
HP Envy 16 h0112nr
- 09/24/2022 v7 (old)
Allen Ngo
Price comparison
