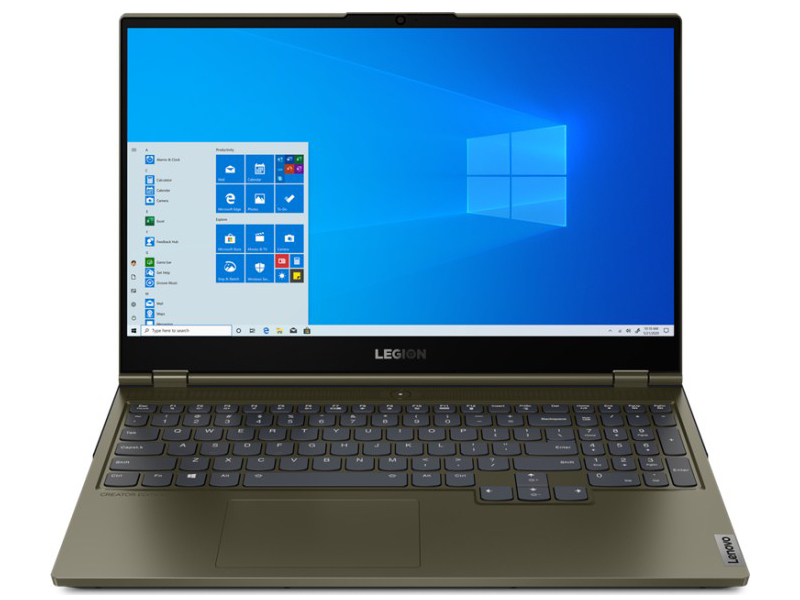
Lenovo Legion C7 15IMH05 Review: All-rounder for gamers and creators with three years of warranty

"A device for creative work”. This is how Lenovo describes the Legion C7 15IMH05 on its own website. This is an accurate description, because the Legion C7 can handle gaming, video editing, image editing and streaming without any problems.
The Legion C7 is competing against the Alienware m15 R4, the Asus ROG Strix G15 G513QR and the Schenker XMG Pro 15. The competing devices have a very similar price tag but come with newer and faster GPUs.
Likely Competitors
Rating | Date | Model | Weight | Height | Size | Resolution | Price |
|---|---|---|---|---|---|---|---|
| 85.5 % v7 (old) | 04 / 2021 | Lenovo Legion C7 15IMH05 82EH0030GE i7-10875H, GeForce RTX 2070 Max-Q | 2.3 kg | 19.9 mm | 15.60" | 1920x1080 | |
| 85.4 % v7 (old) | 04 / 2021 | Alienware m15 R4 i9-10980HK, GeForce RTX 3070 Laptop GPU | 2.3 kg | 20 mm | 15.60" | 1920x1080 | |
| 85 % v7 (old) | 02 / 2021 | Asus ROG Strix G15 G513QR R9 5900HX, GeForce RTX 3070 Laptop GPU | 2.3 kg | 27.2 mm | 15.60" | 1920x1080 | |
| 86 % v7 (old) | 03 / 2021 | Schenker XMG Pro 15 (Early 2021, RTX 3080) i7-10870H, GeForce RTX 3080 Laptop GPU | 2 kg | 19.8 mm | 15.60" | 1920x1080 |
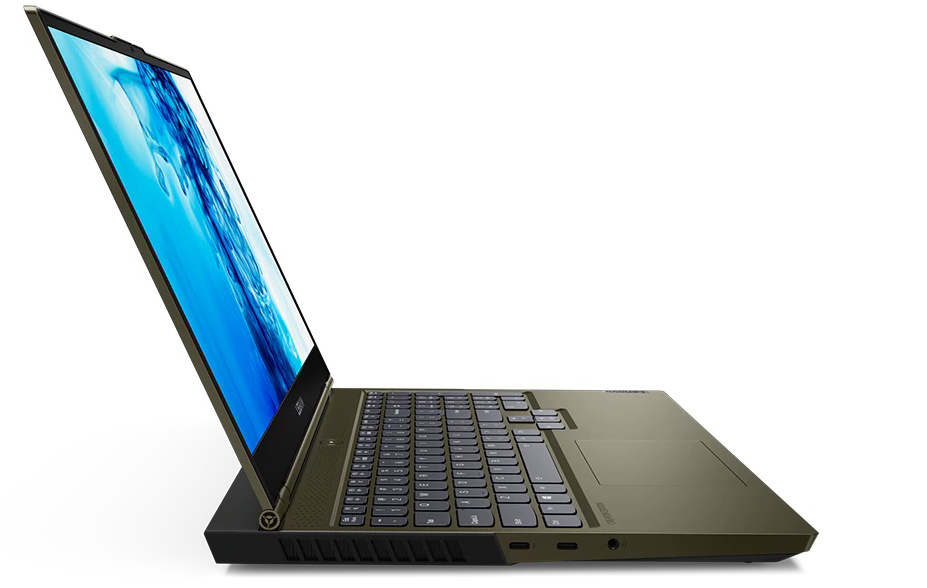
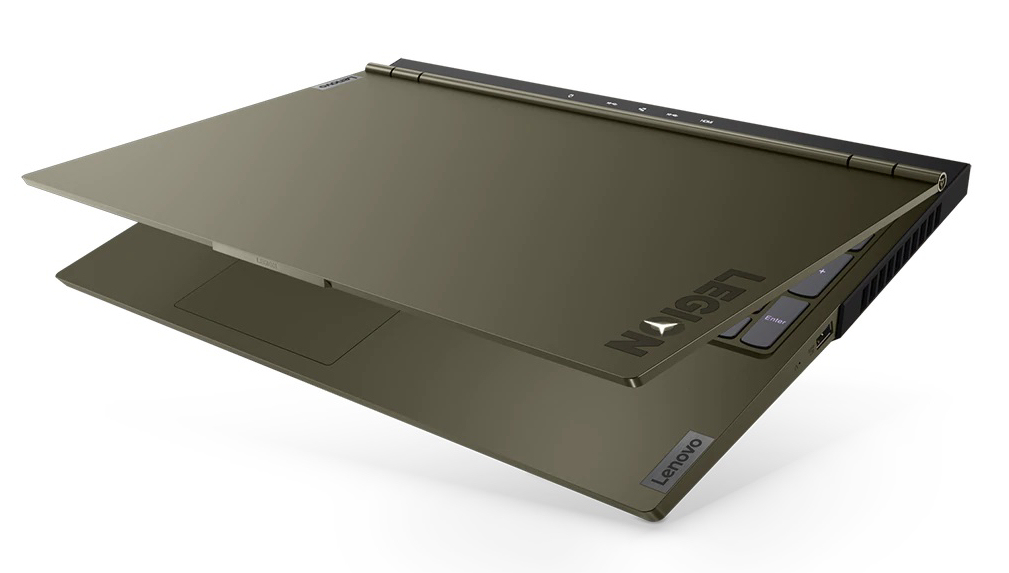
Case & Connectivity - Legion C7 with a Thunderbolt 3 port
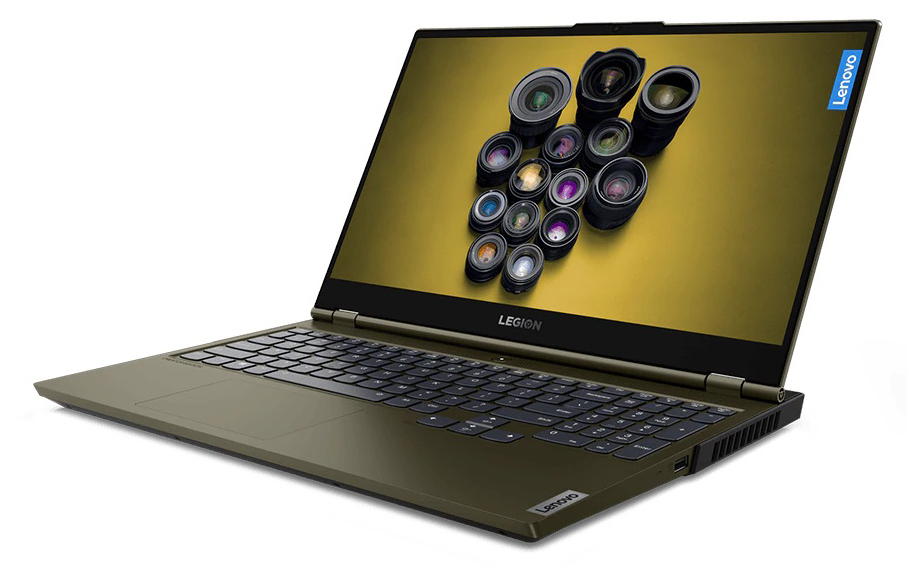
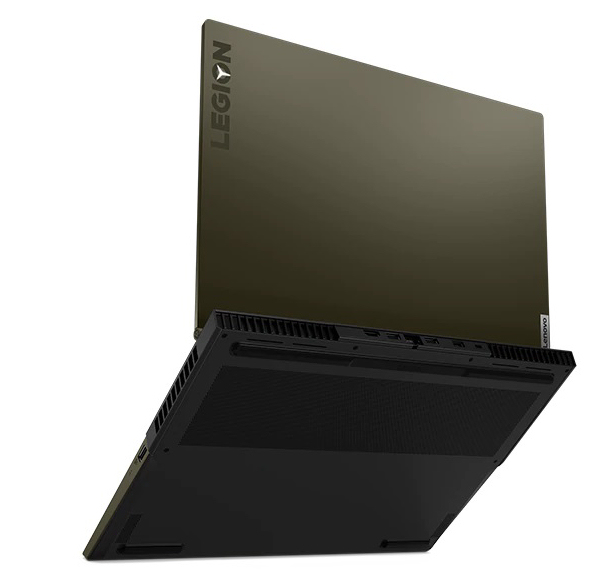
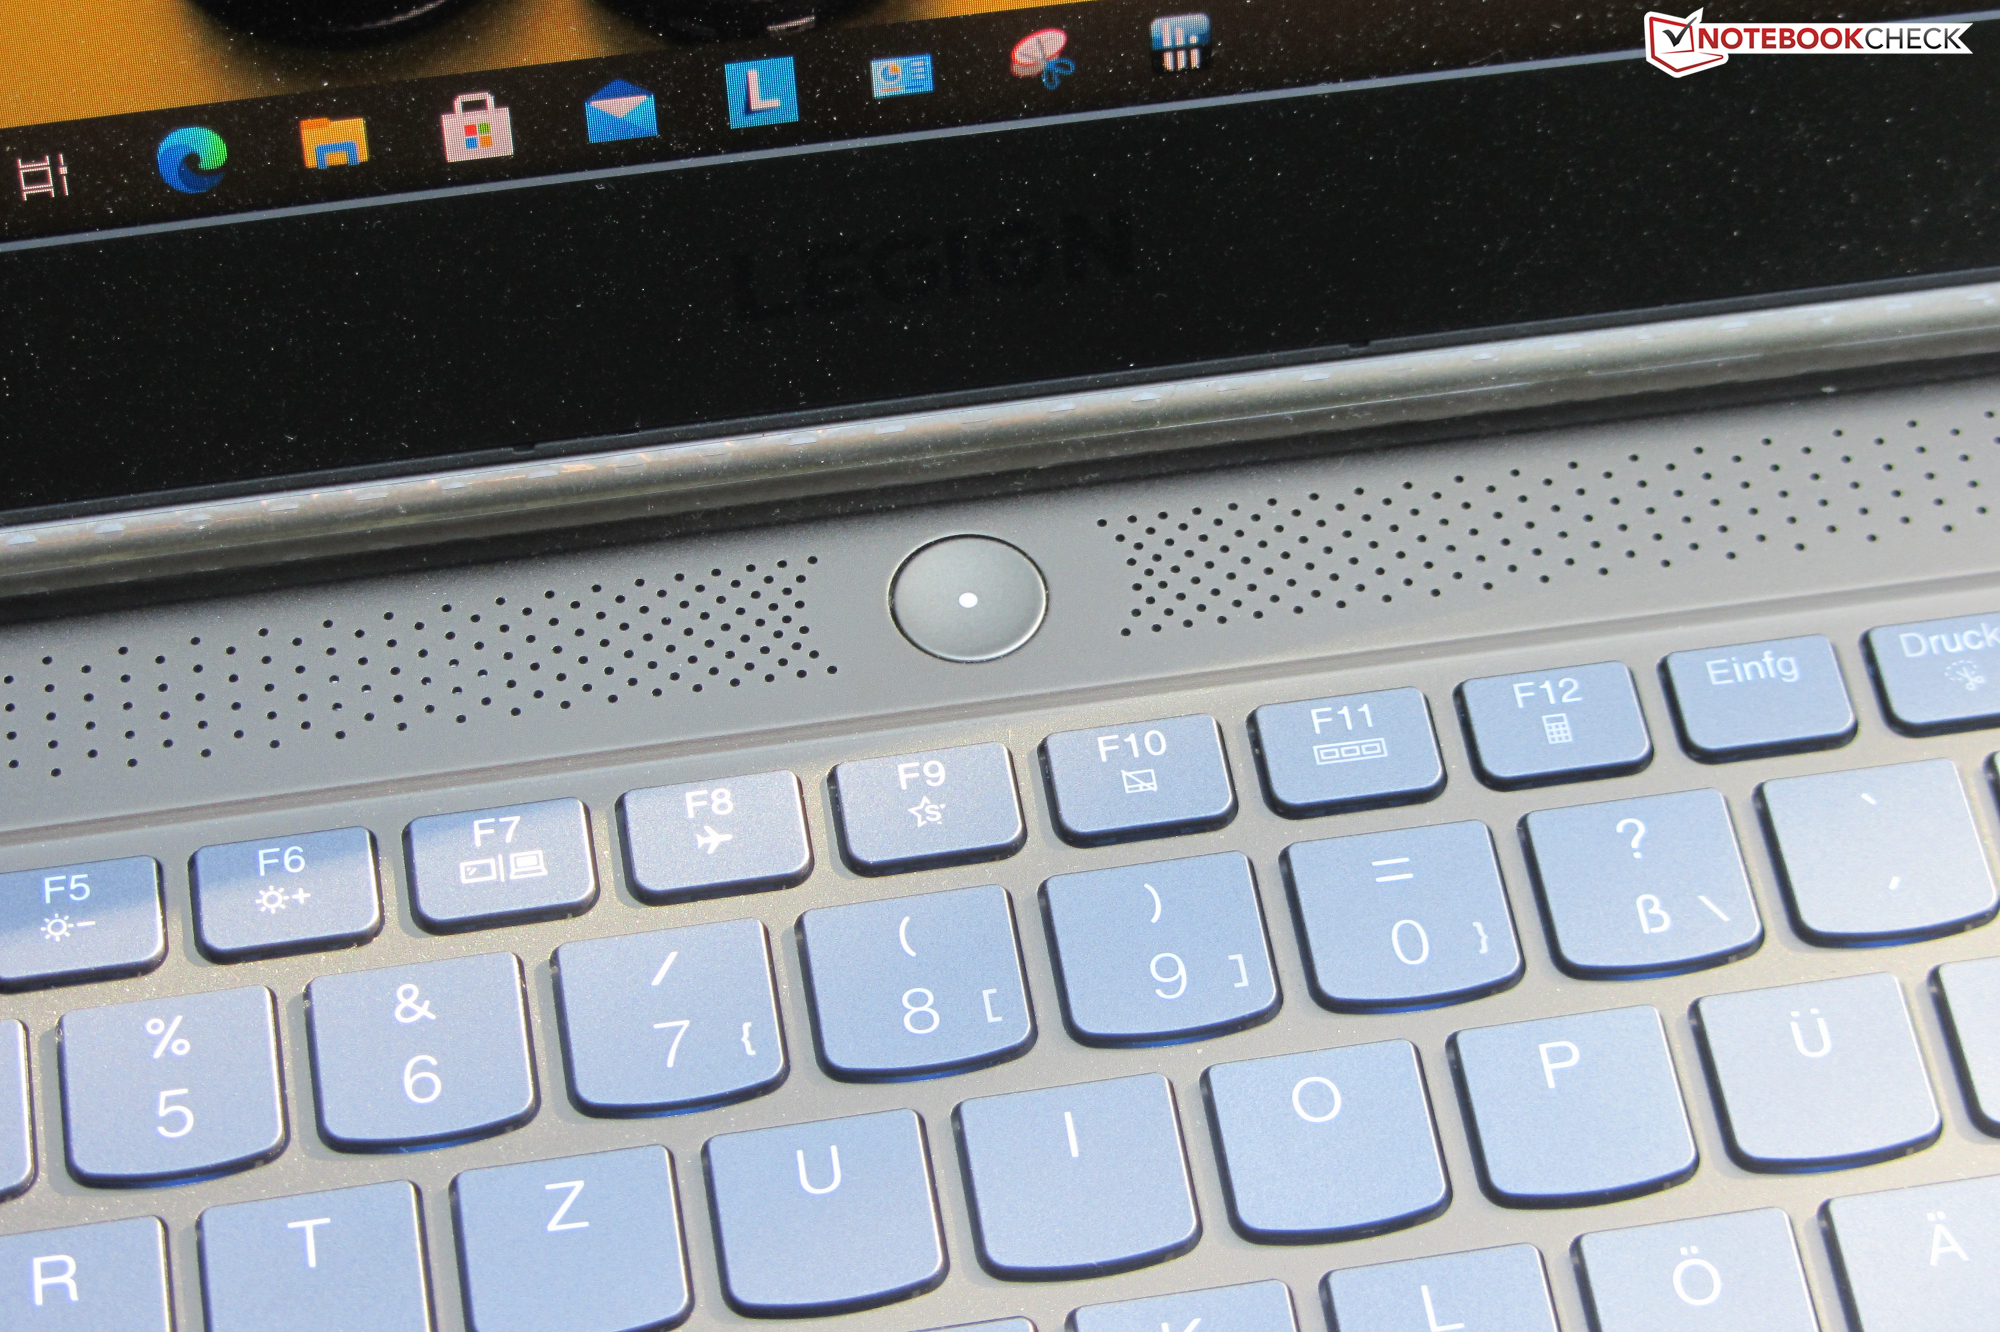
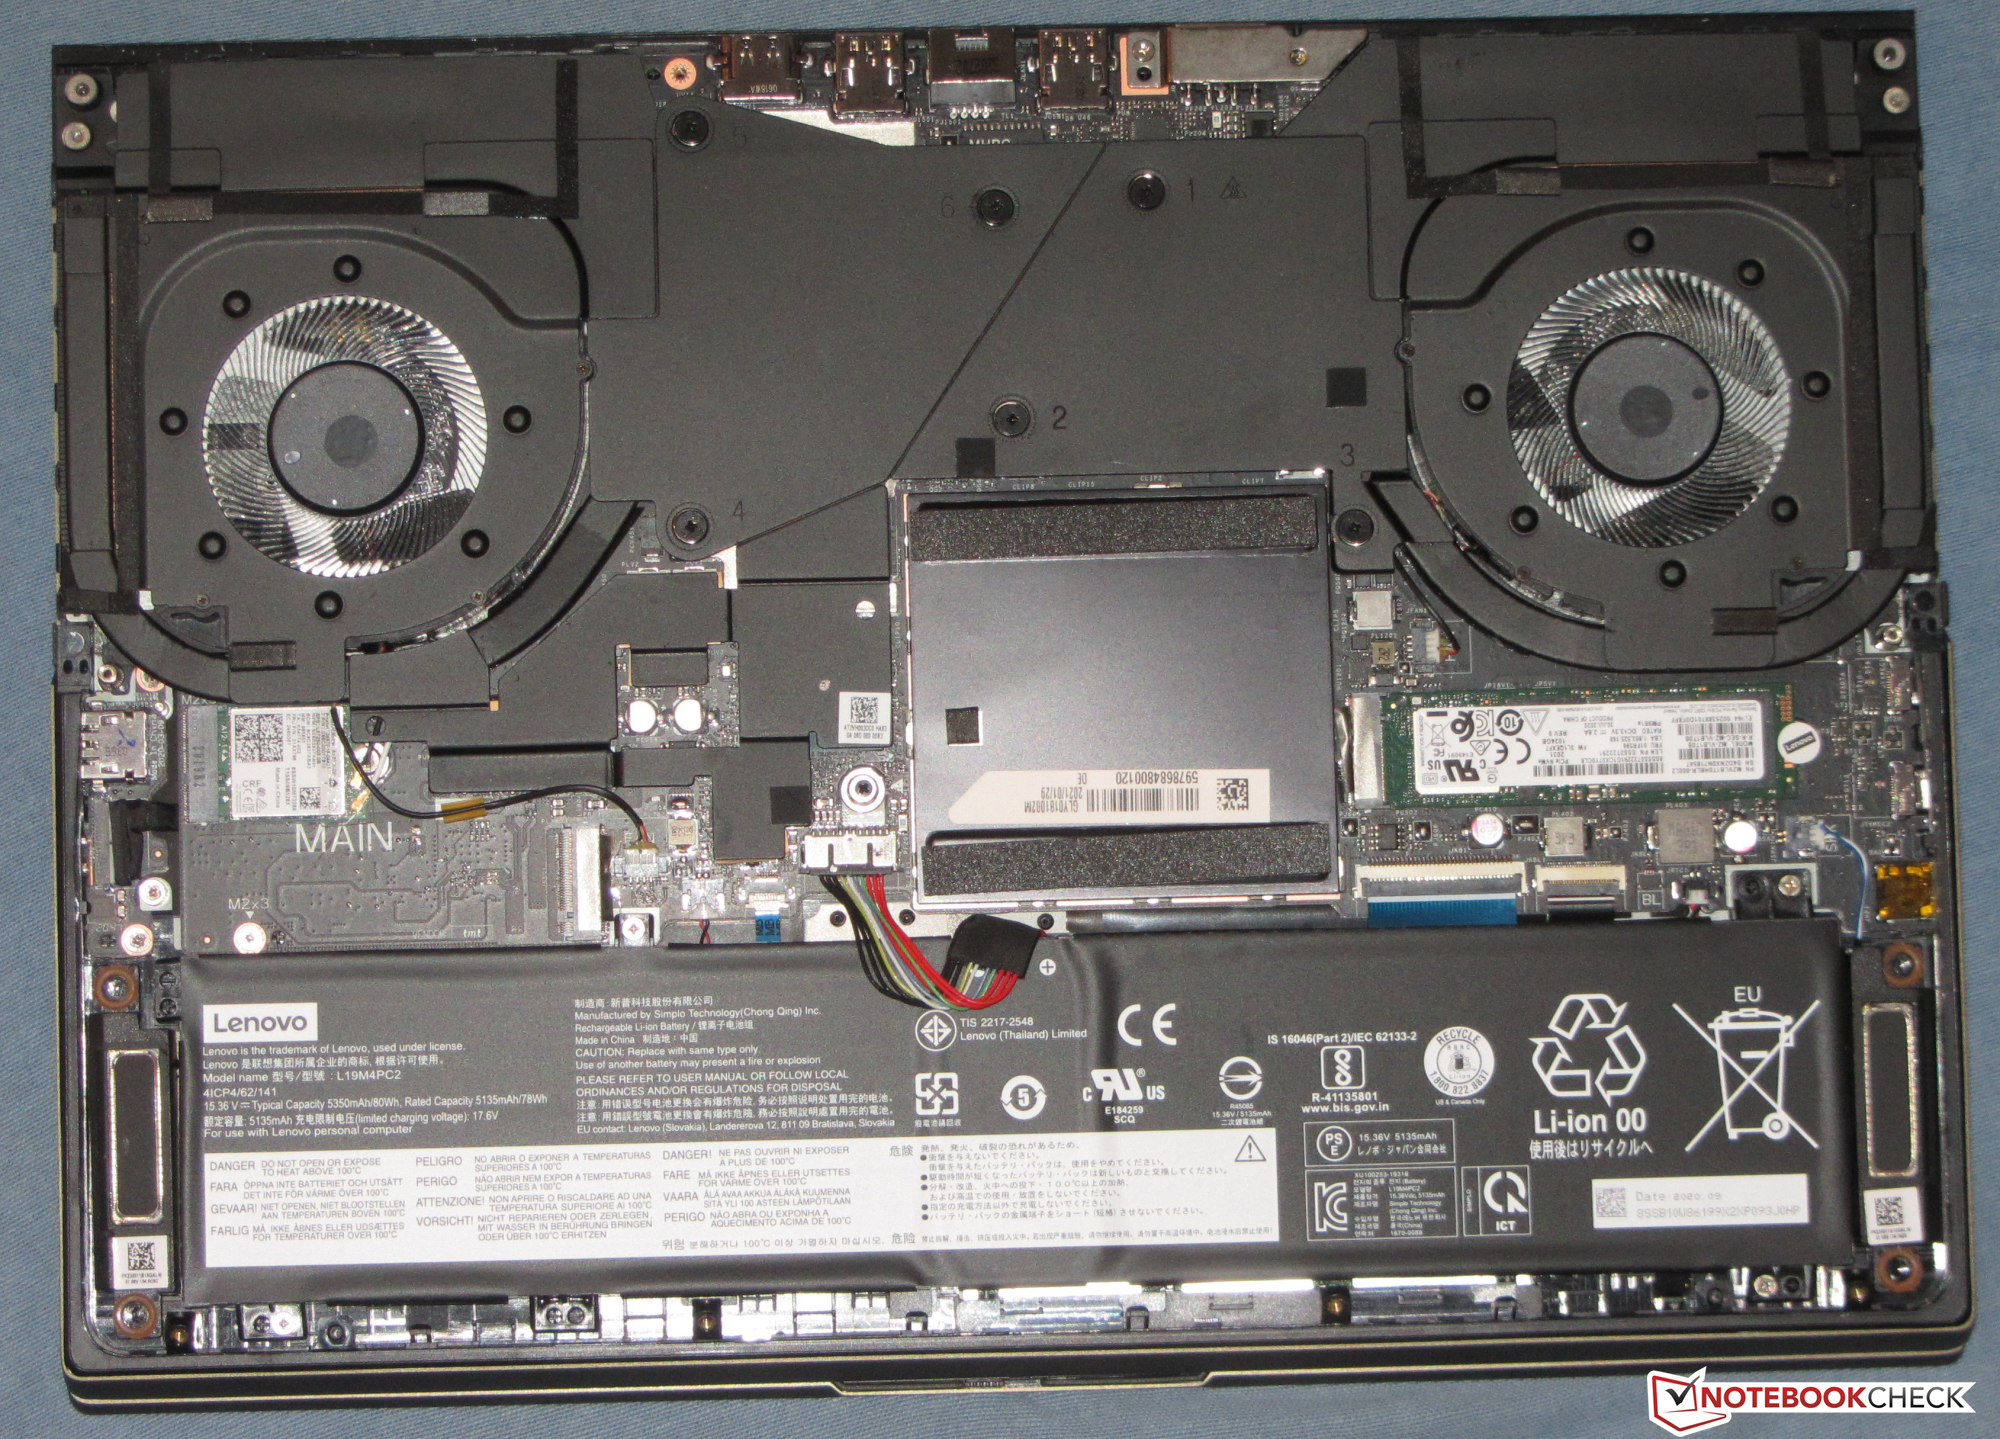
Unlike the Legion 7, which had backlit fan exhausts, the Legion C7 does not feature any RGB lighting. However, the Legion C7 preserves the backlit "Y" in the LEGION logo on the display lid. Both the Legion 7 and the Legion C7 share the same aluminium chassis. The C7 comes in a different colour scheme (Dark Moss), though. The battery is not replaceable. To get to the internal components, users will have to remove the bottom cover.
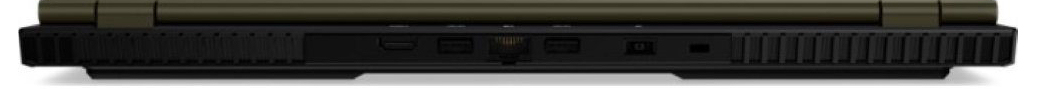
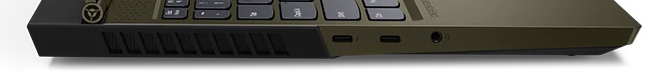
The Lenovo Legion C7 comes with two USB 3.2 Gen 2 Type-A ports and one USB 3.2 Gen 1 Type-A port. There are also two USB-C ports (one Thunderbolt 3 port and one USB 3.2 Gen 1 port). The USB 3.2 Gen 1 Type-C port can be used for charging. It can also output a DisplayPort signal. Moreover, the laptop also features an HDMI port. All in all, the Legion C7 offers two DP outputs and one HDMI output. There is no SD card reader.
The Wi-Fi module comes from Intel (Intel AX201). In addition to the Wi-Fi standards 802.11a, b, g, n and ac, it also supports the new AX standard. The data transfer speeds that we have measured under the optimal conditions (no other Wi-Fi-enabled devices in close proximity, a short distance between the notebook and the server PC) are on a very good level. The Legion C7 supports Bluetooth 5.0.
Connectivity


")
")
 GeForce RTX 3080 Laptop GPU, i7-10870H, Samsung SSD 970 EVO Plus 1TB")
 GeForce RTX 3080 Laptop GPU, i7-10870H, Samsung SSD 970 EVO Plus 1TB")


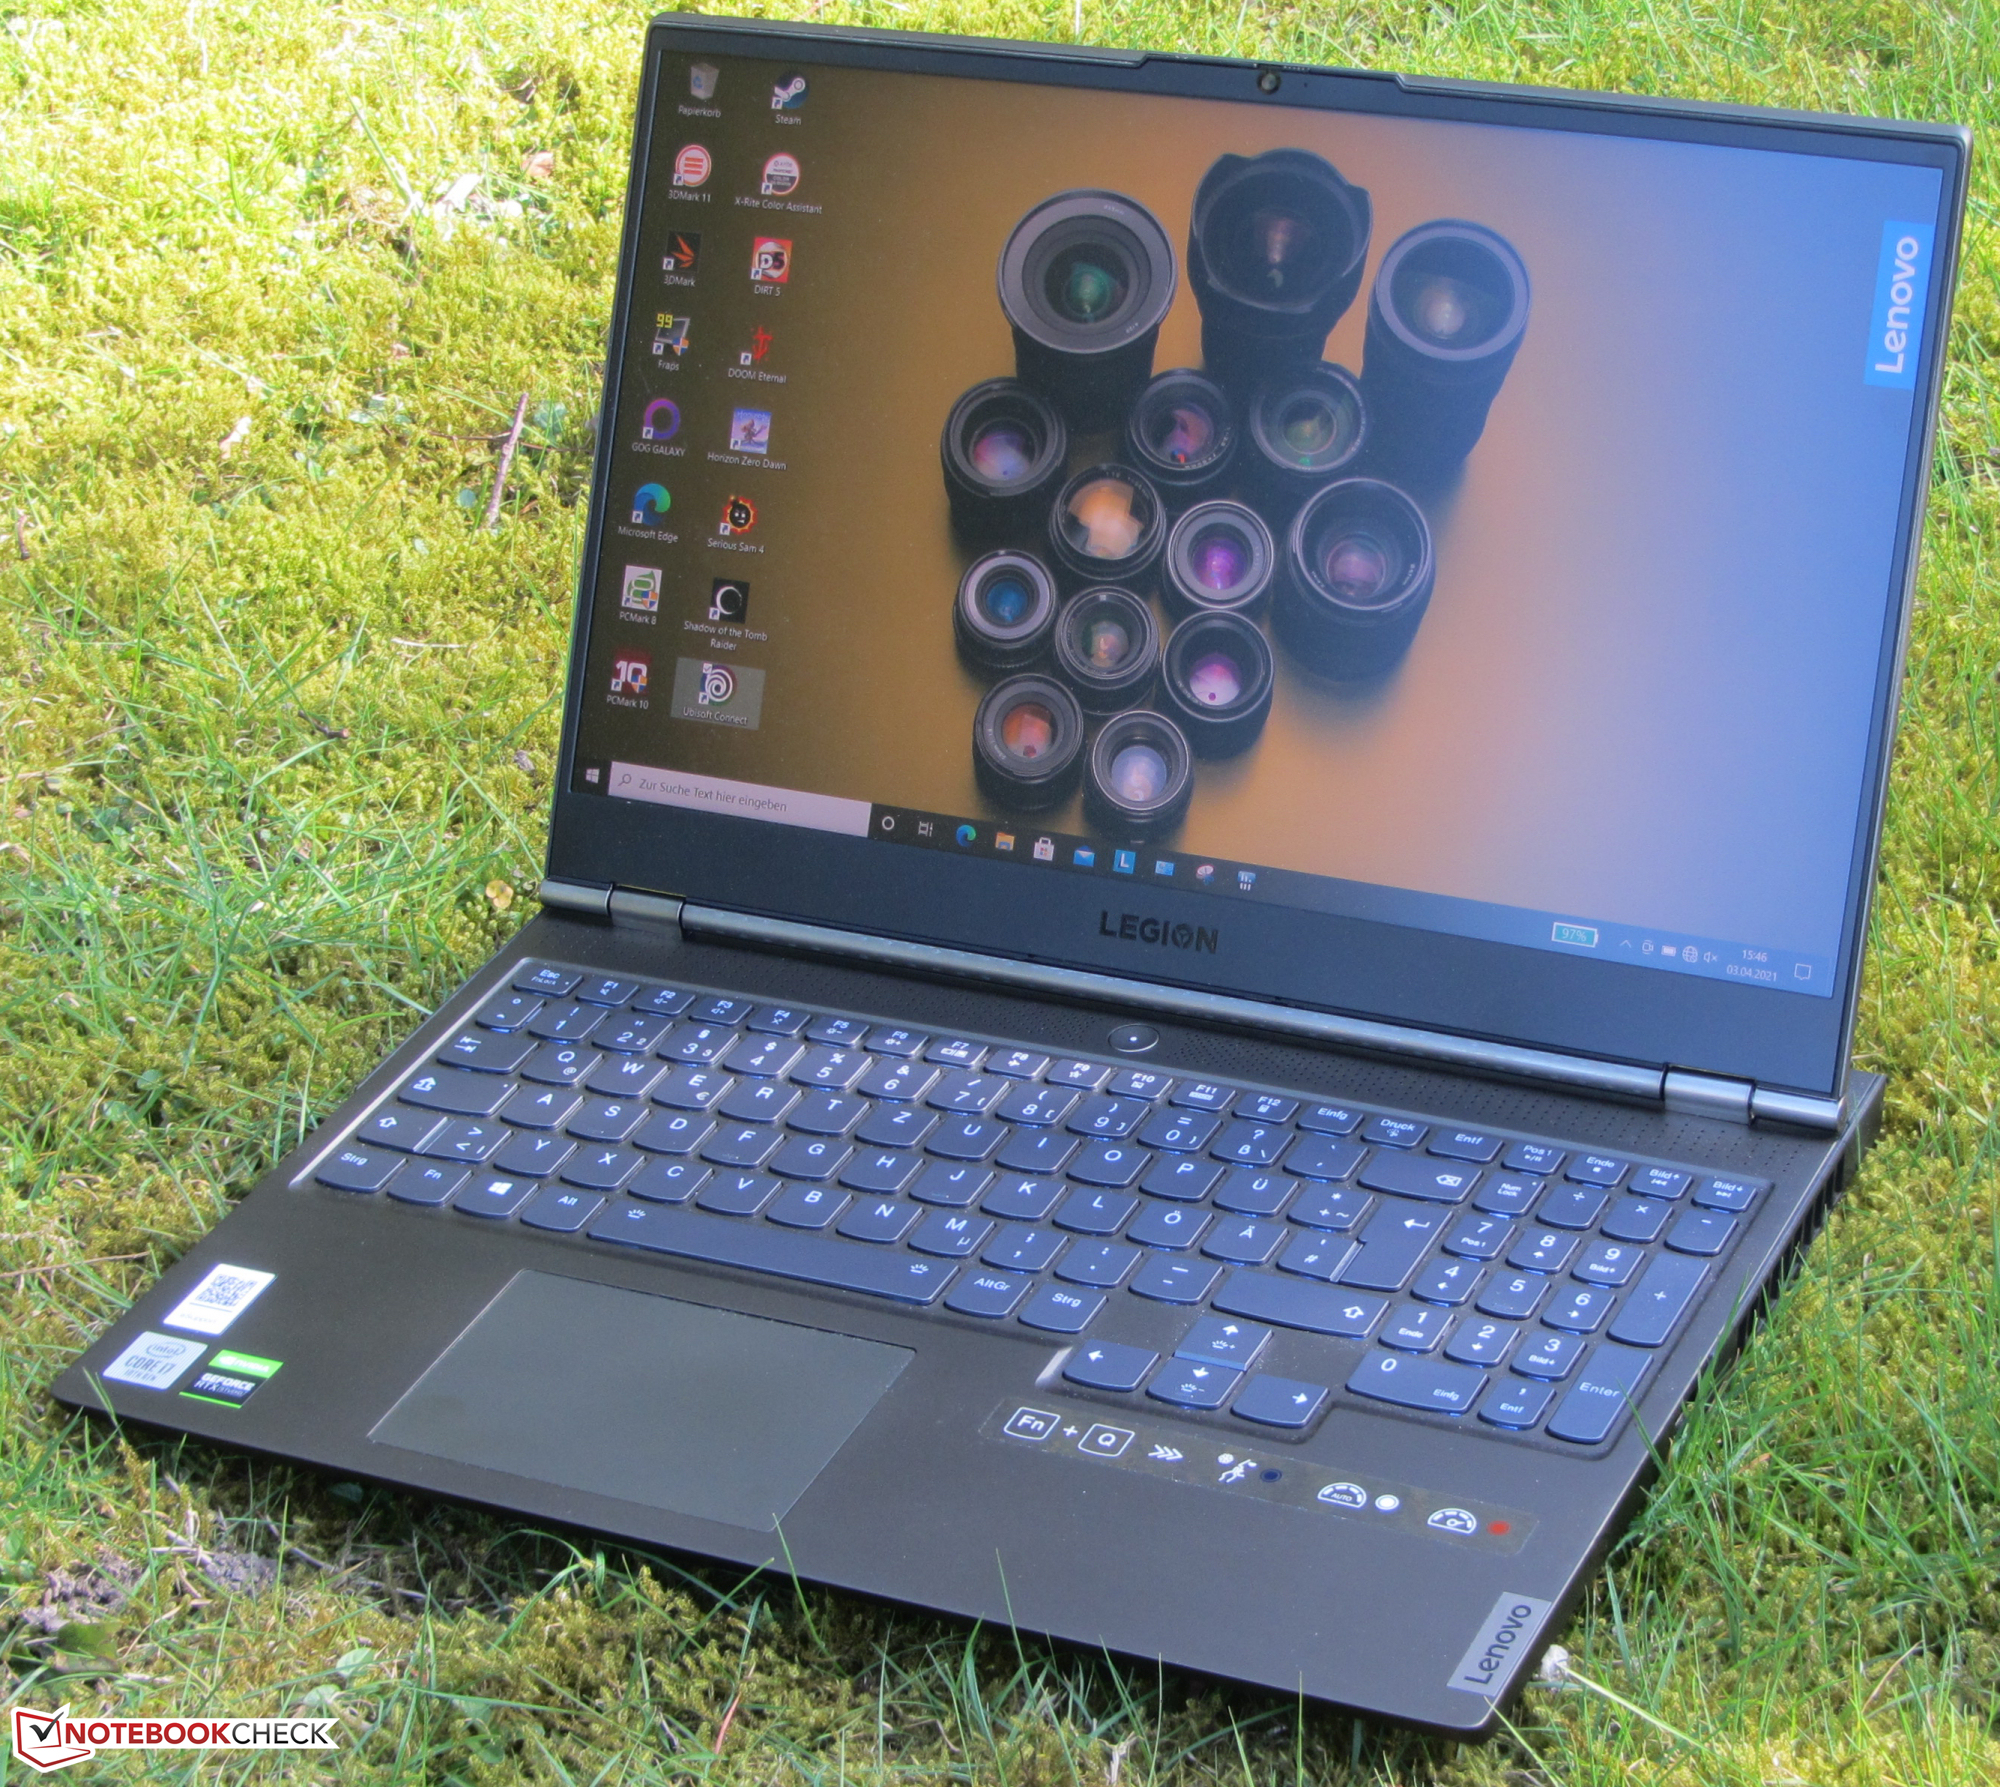
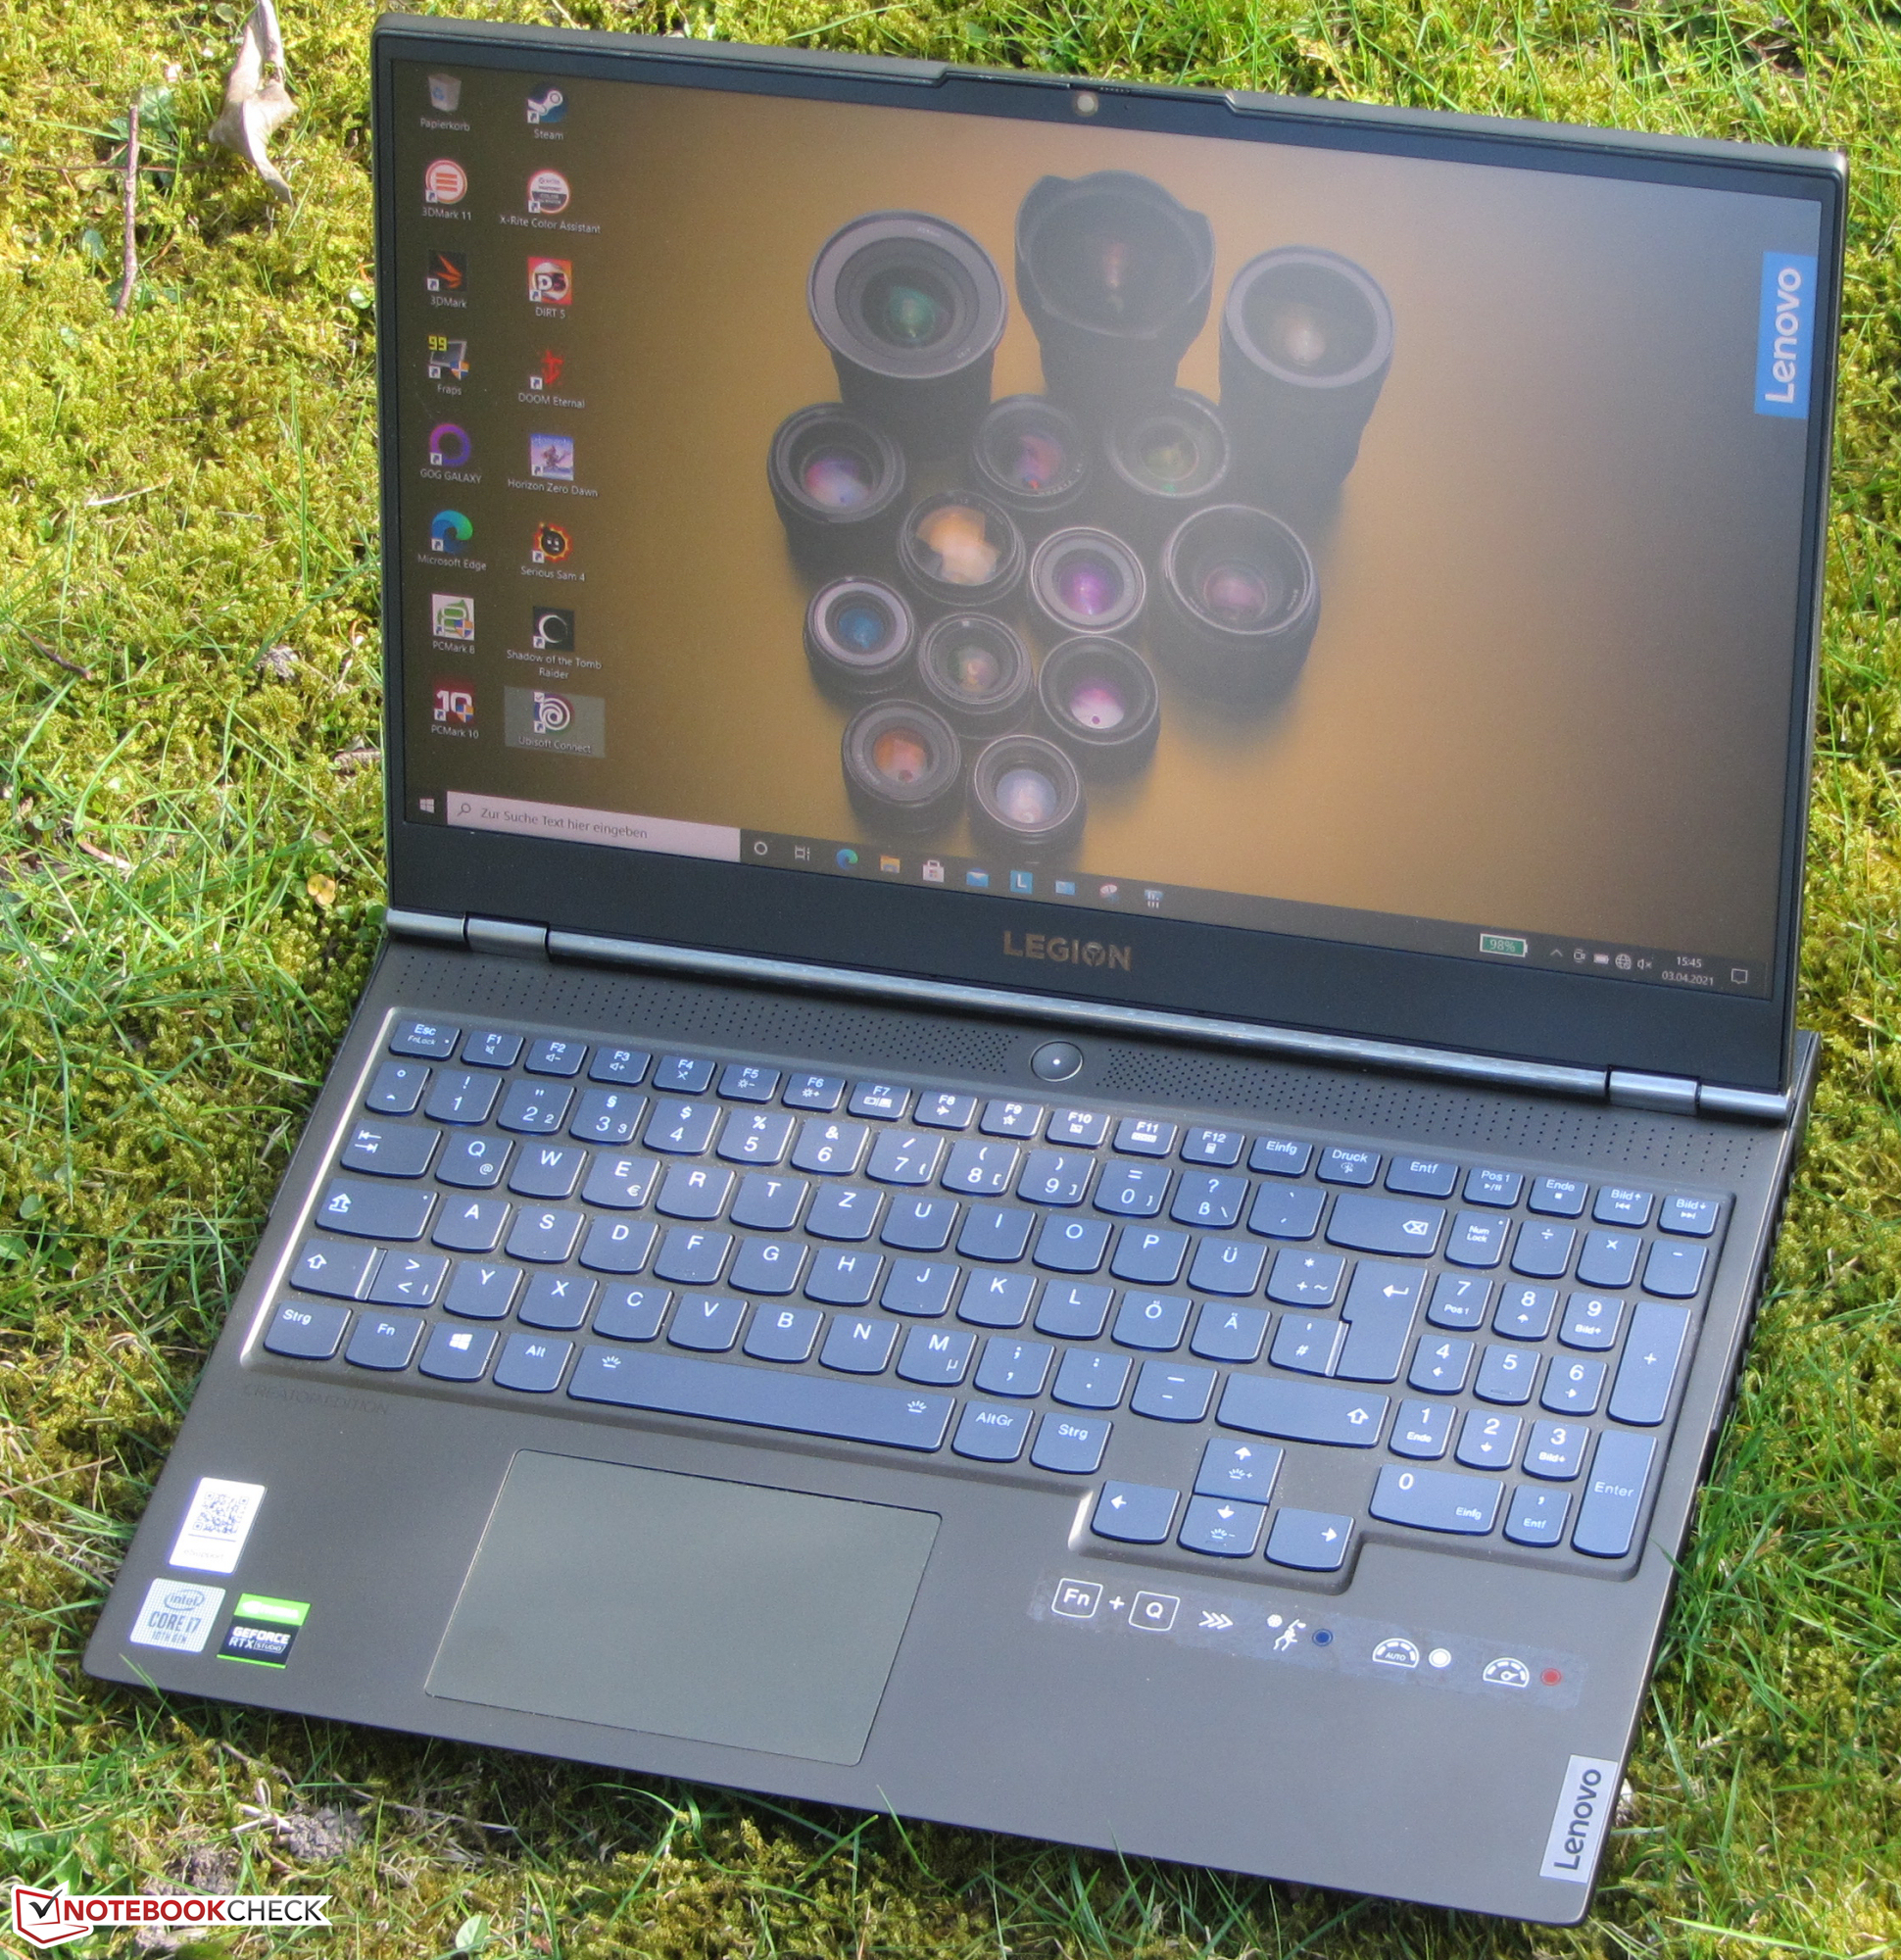
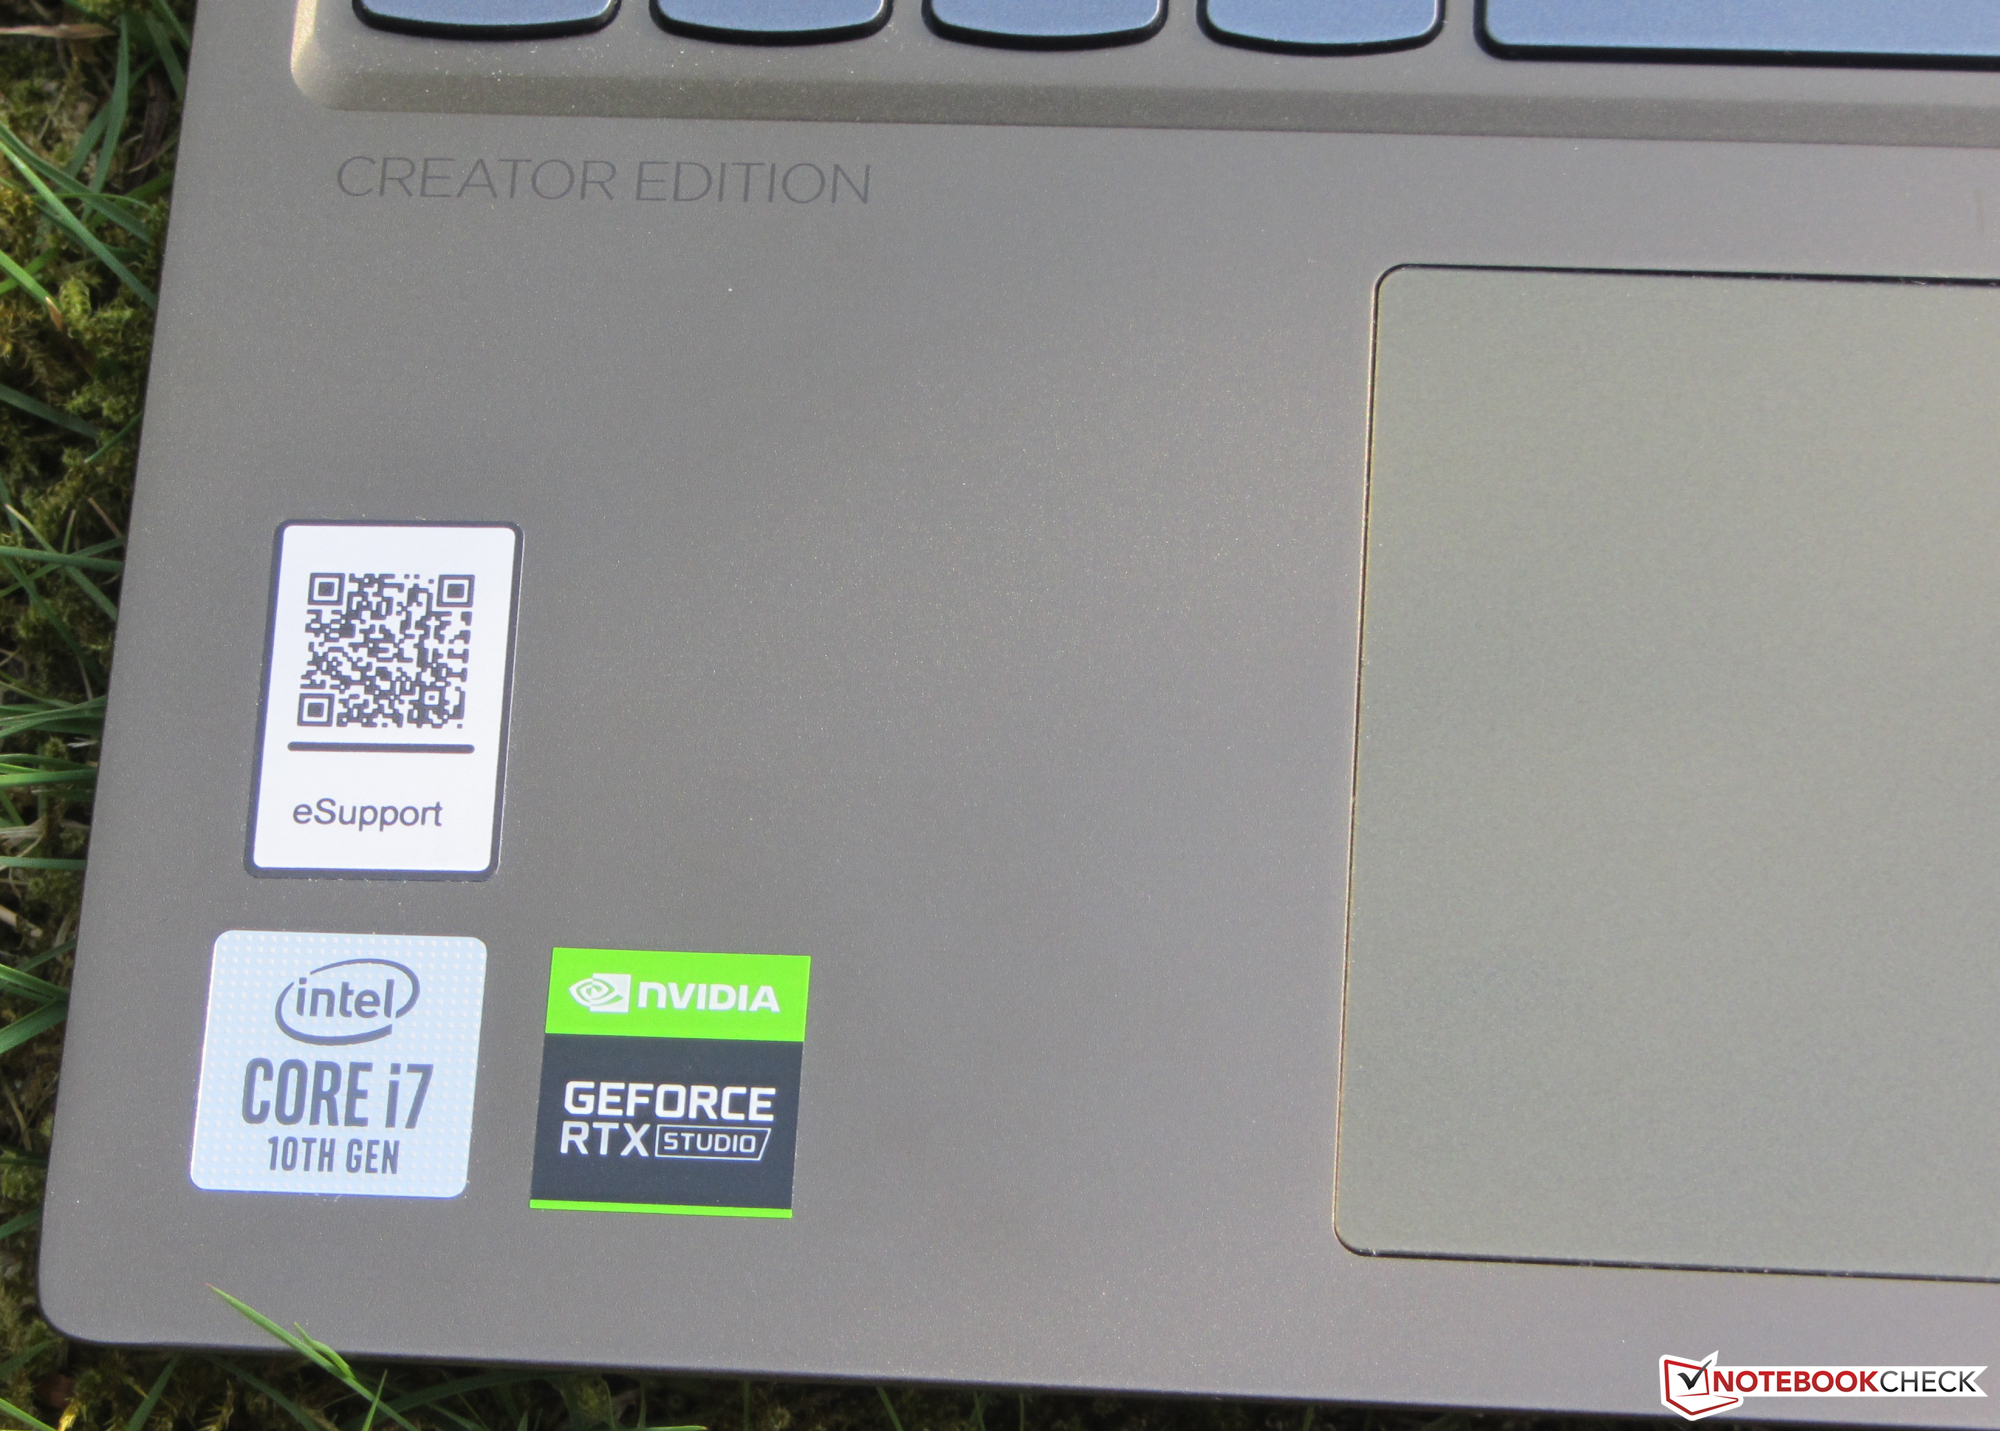
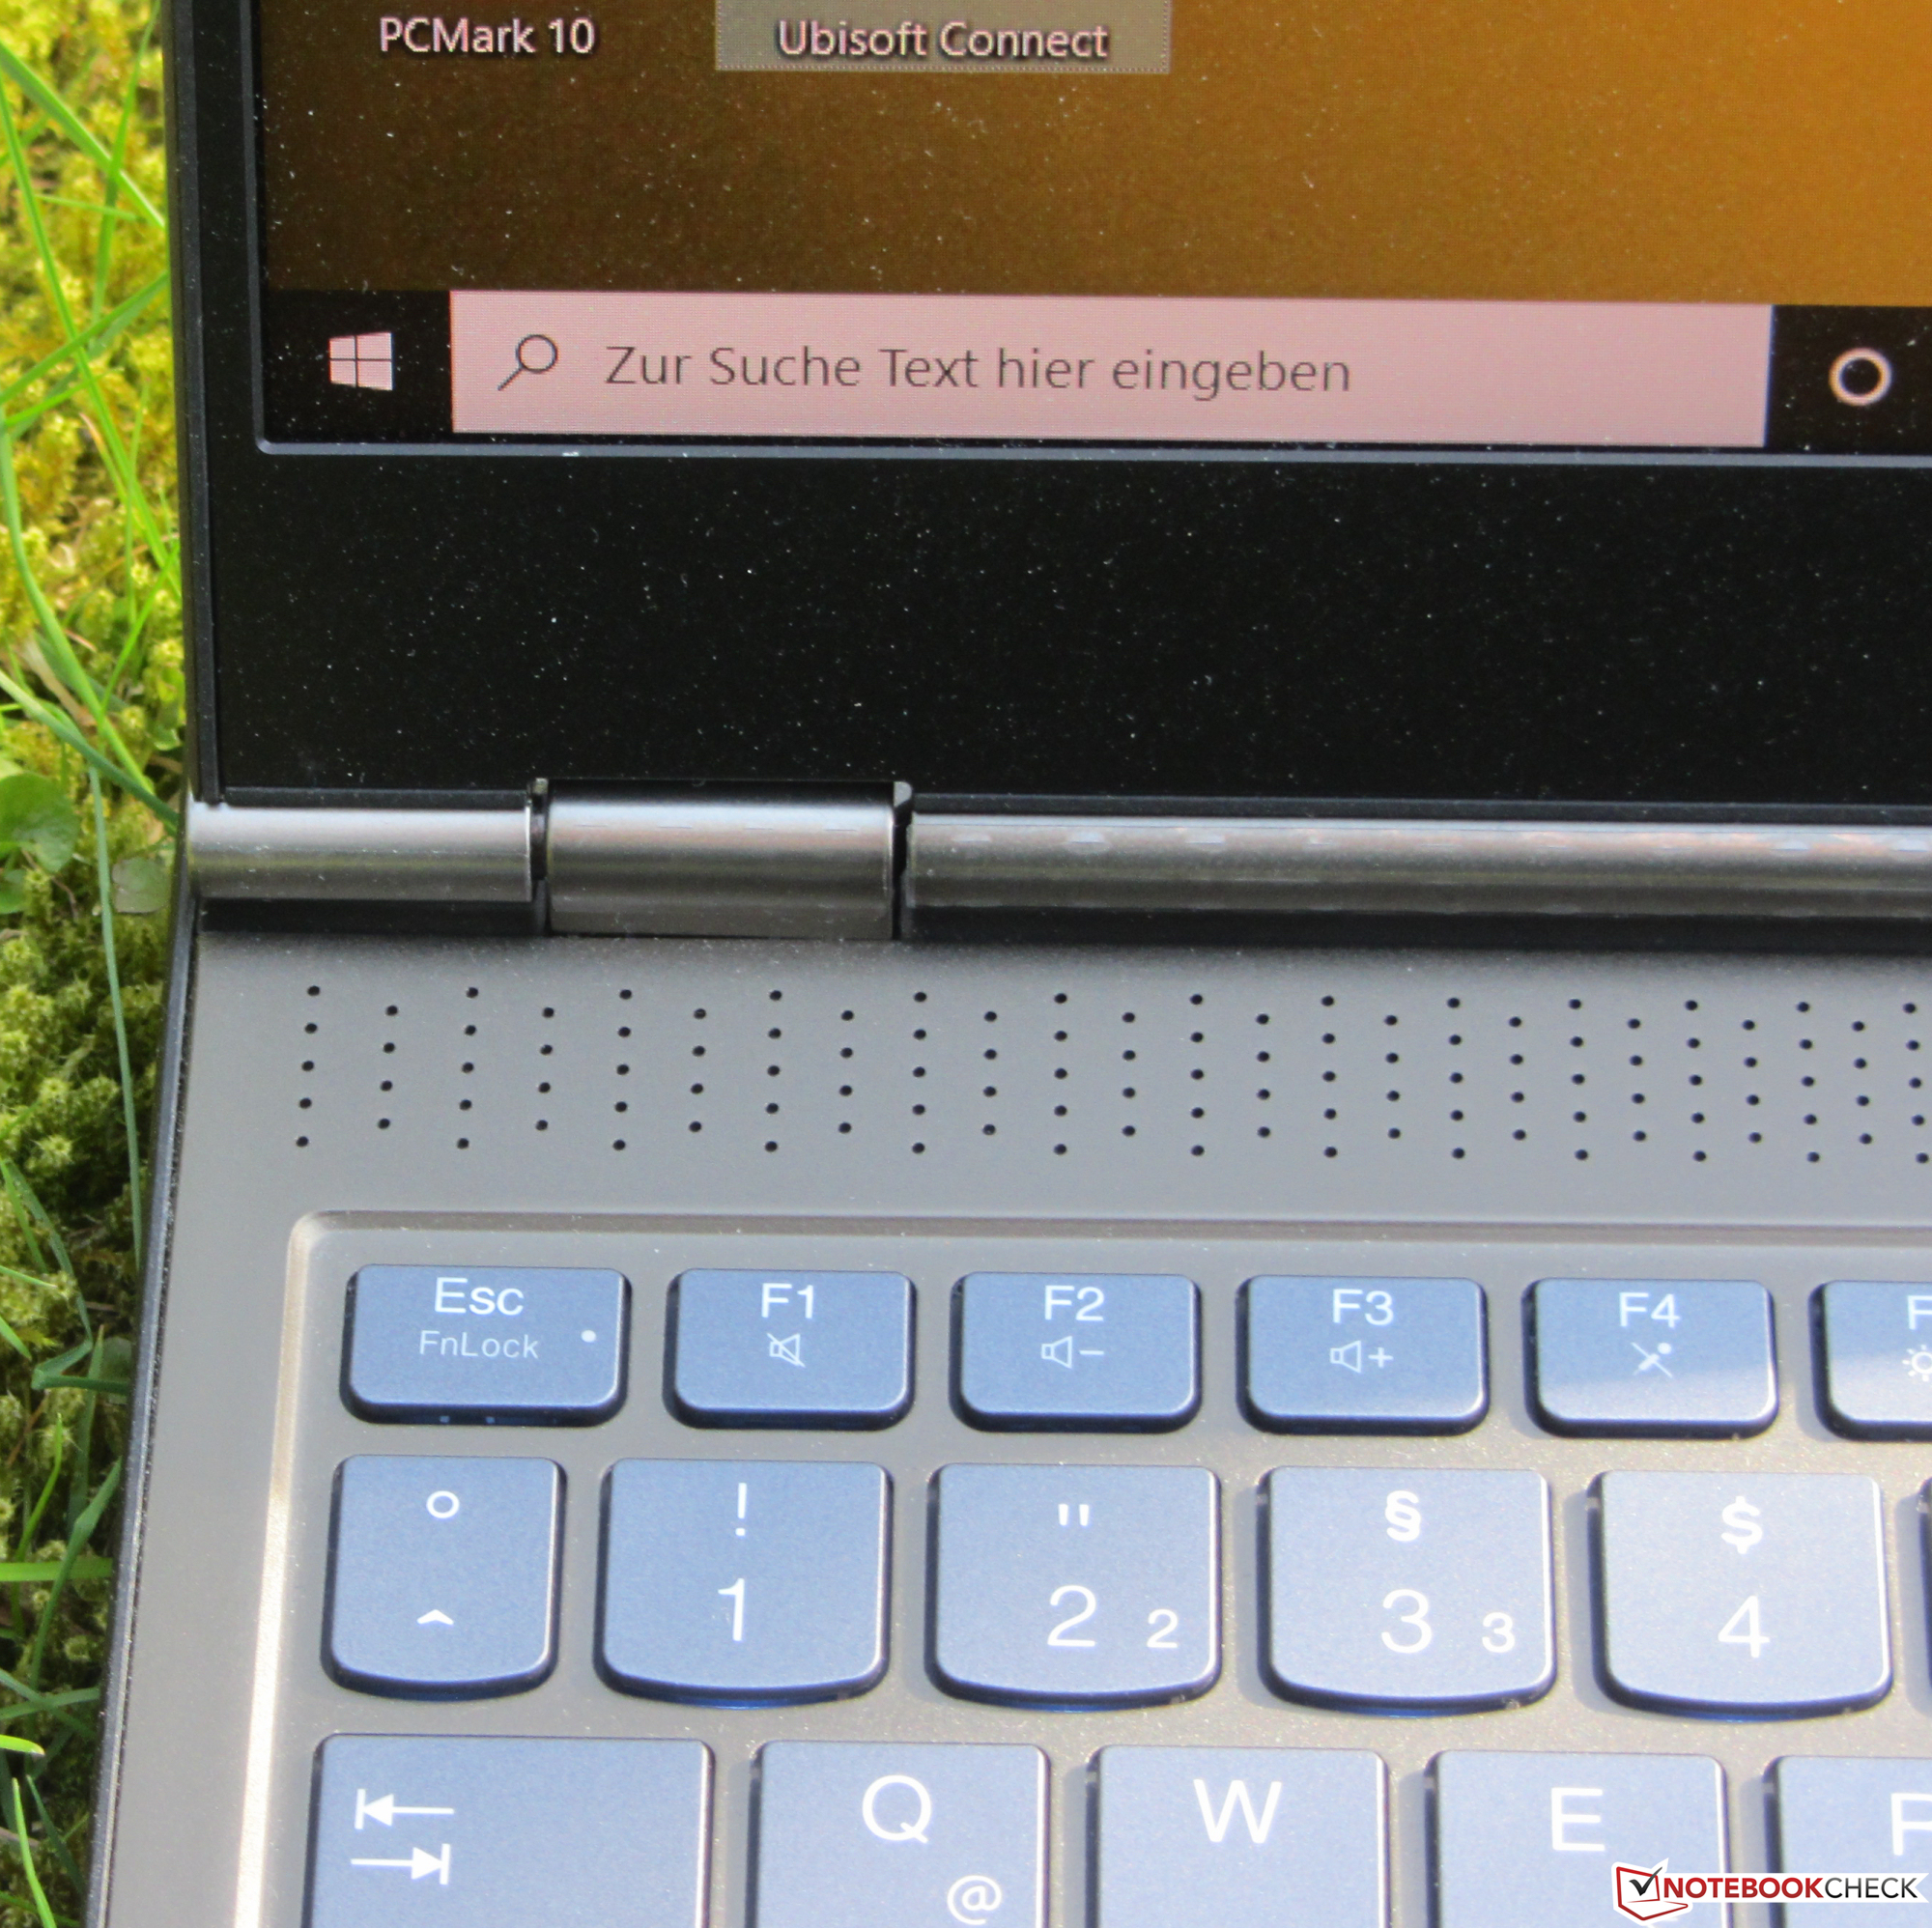
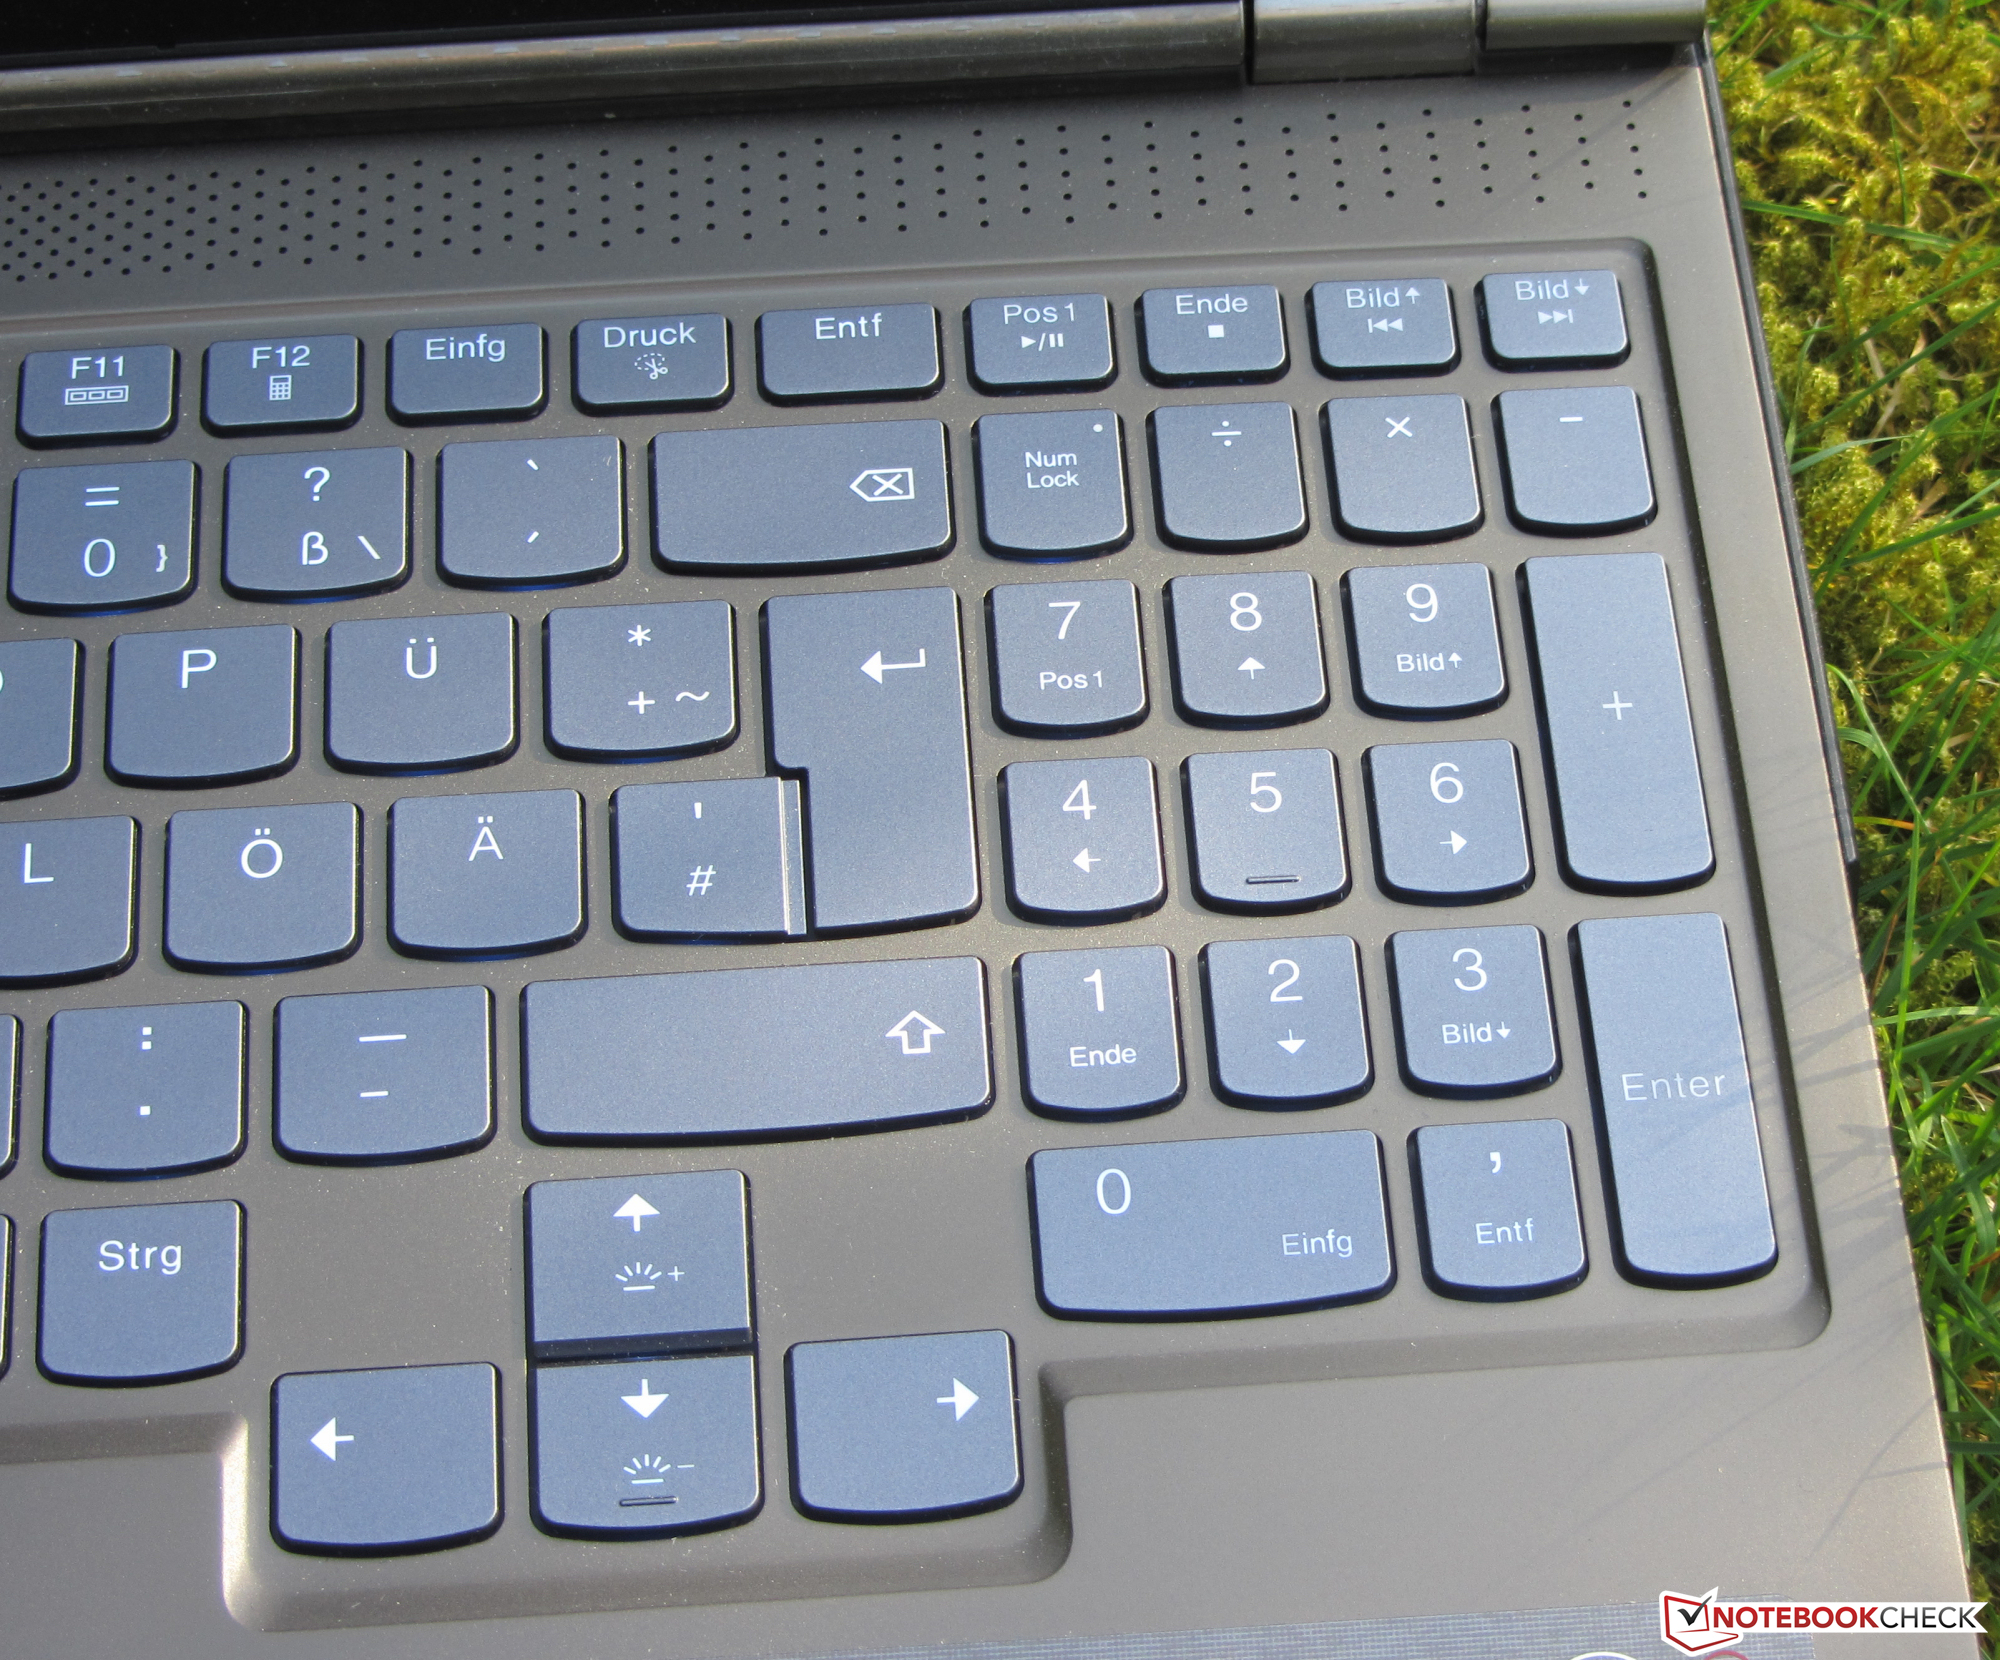
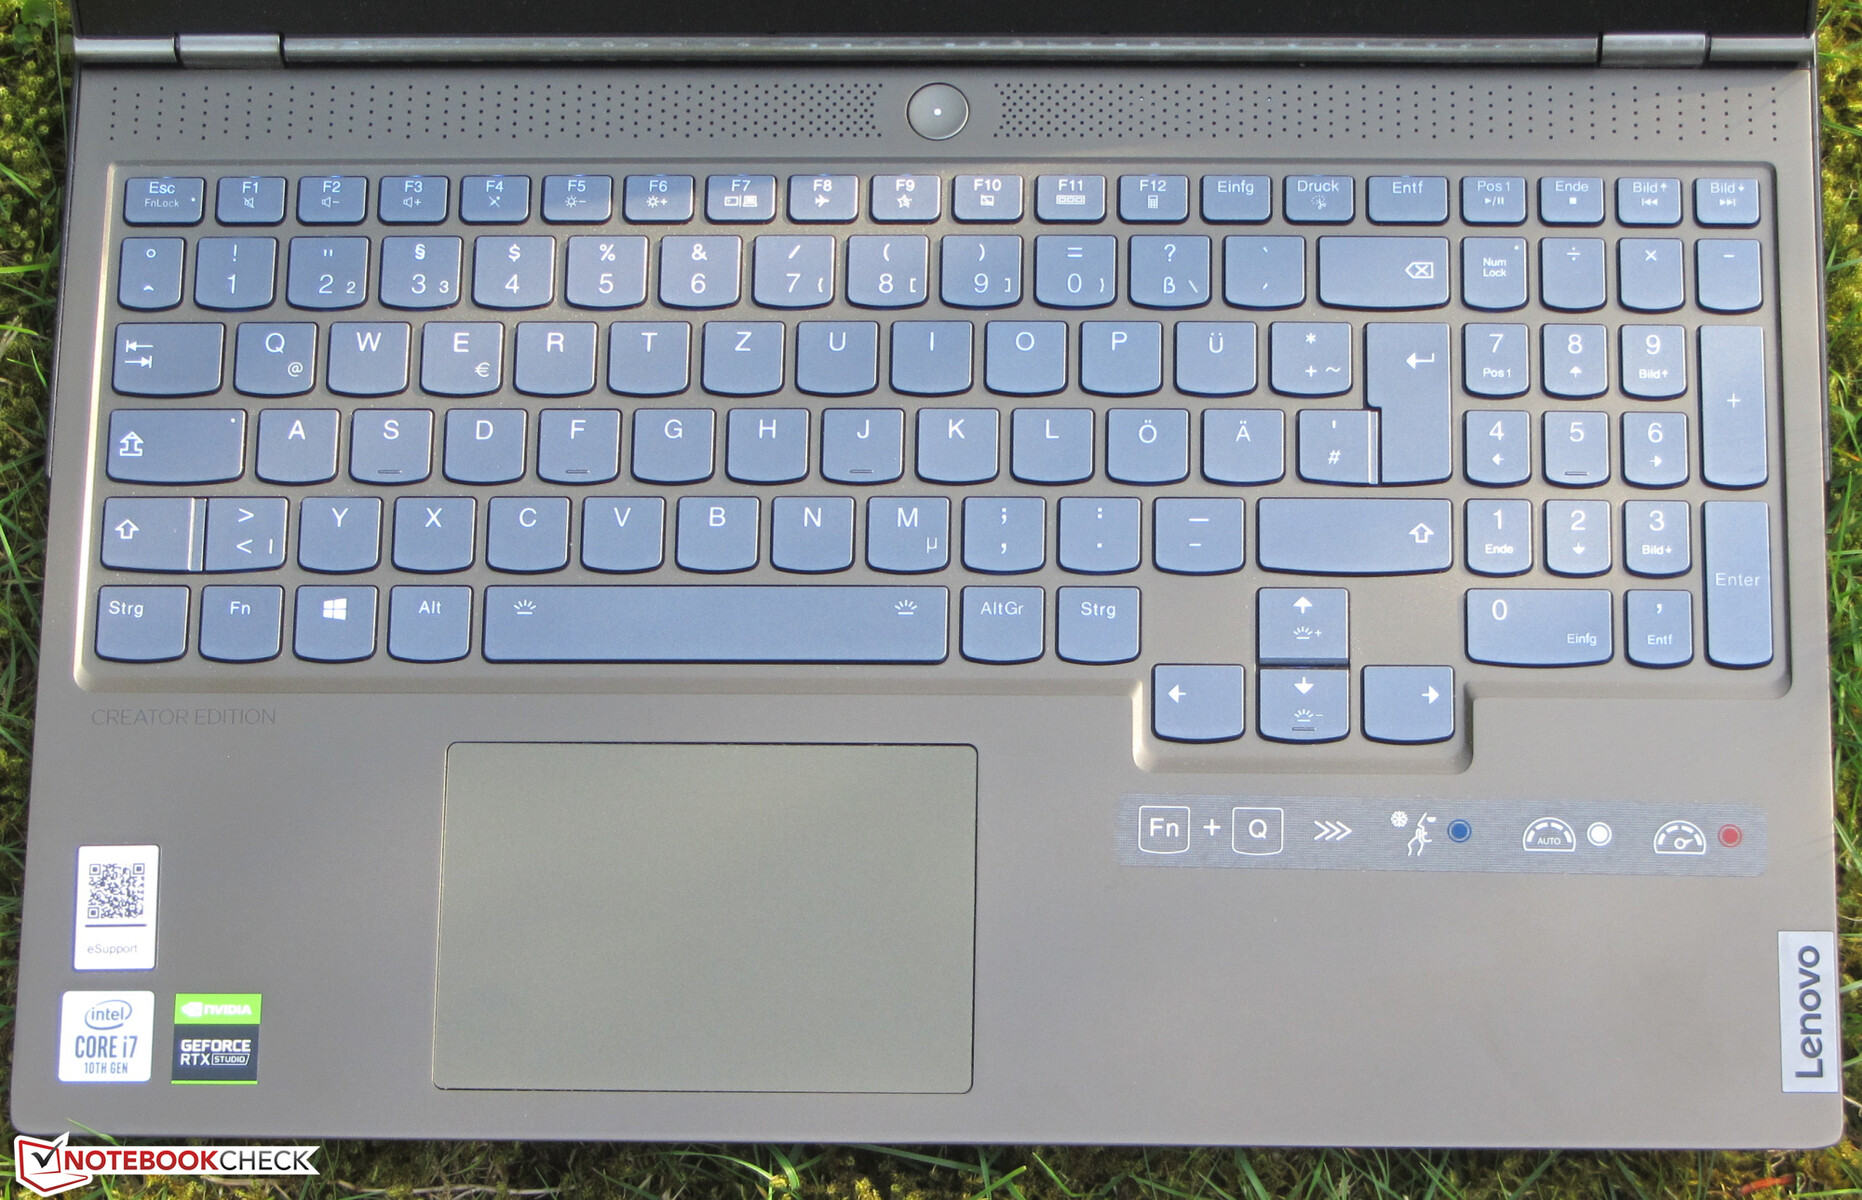
Input Devices - Lenovo laptop with a backlit keyboard
The smooth, flat keys have a short travel distance and a clear actuation point. In our opinion, the keys feel a little too mushy. When typing, the keyboard exhibits some flex. However, this does not prove to be annoying. The backlight offers three brightness levels and can be controlled with two function keys. All in all, Lenovo delivers a decent keyboard.
The multitouch-enabled Clickpad occupies an area of 10.5 x 7 cm (4.1 x 2.8 in). The smooth surface of the pad makes finger-gliding easy. The pad has a short travel distance and a clear actuation point. It has no trouble registering inputs—even in the corners.
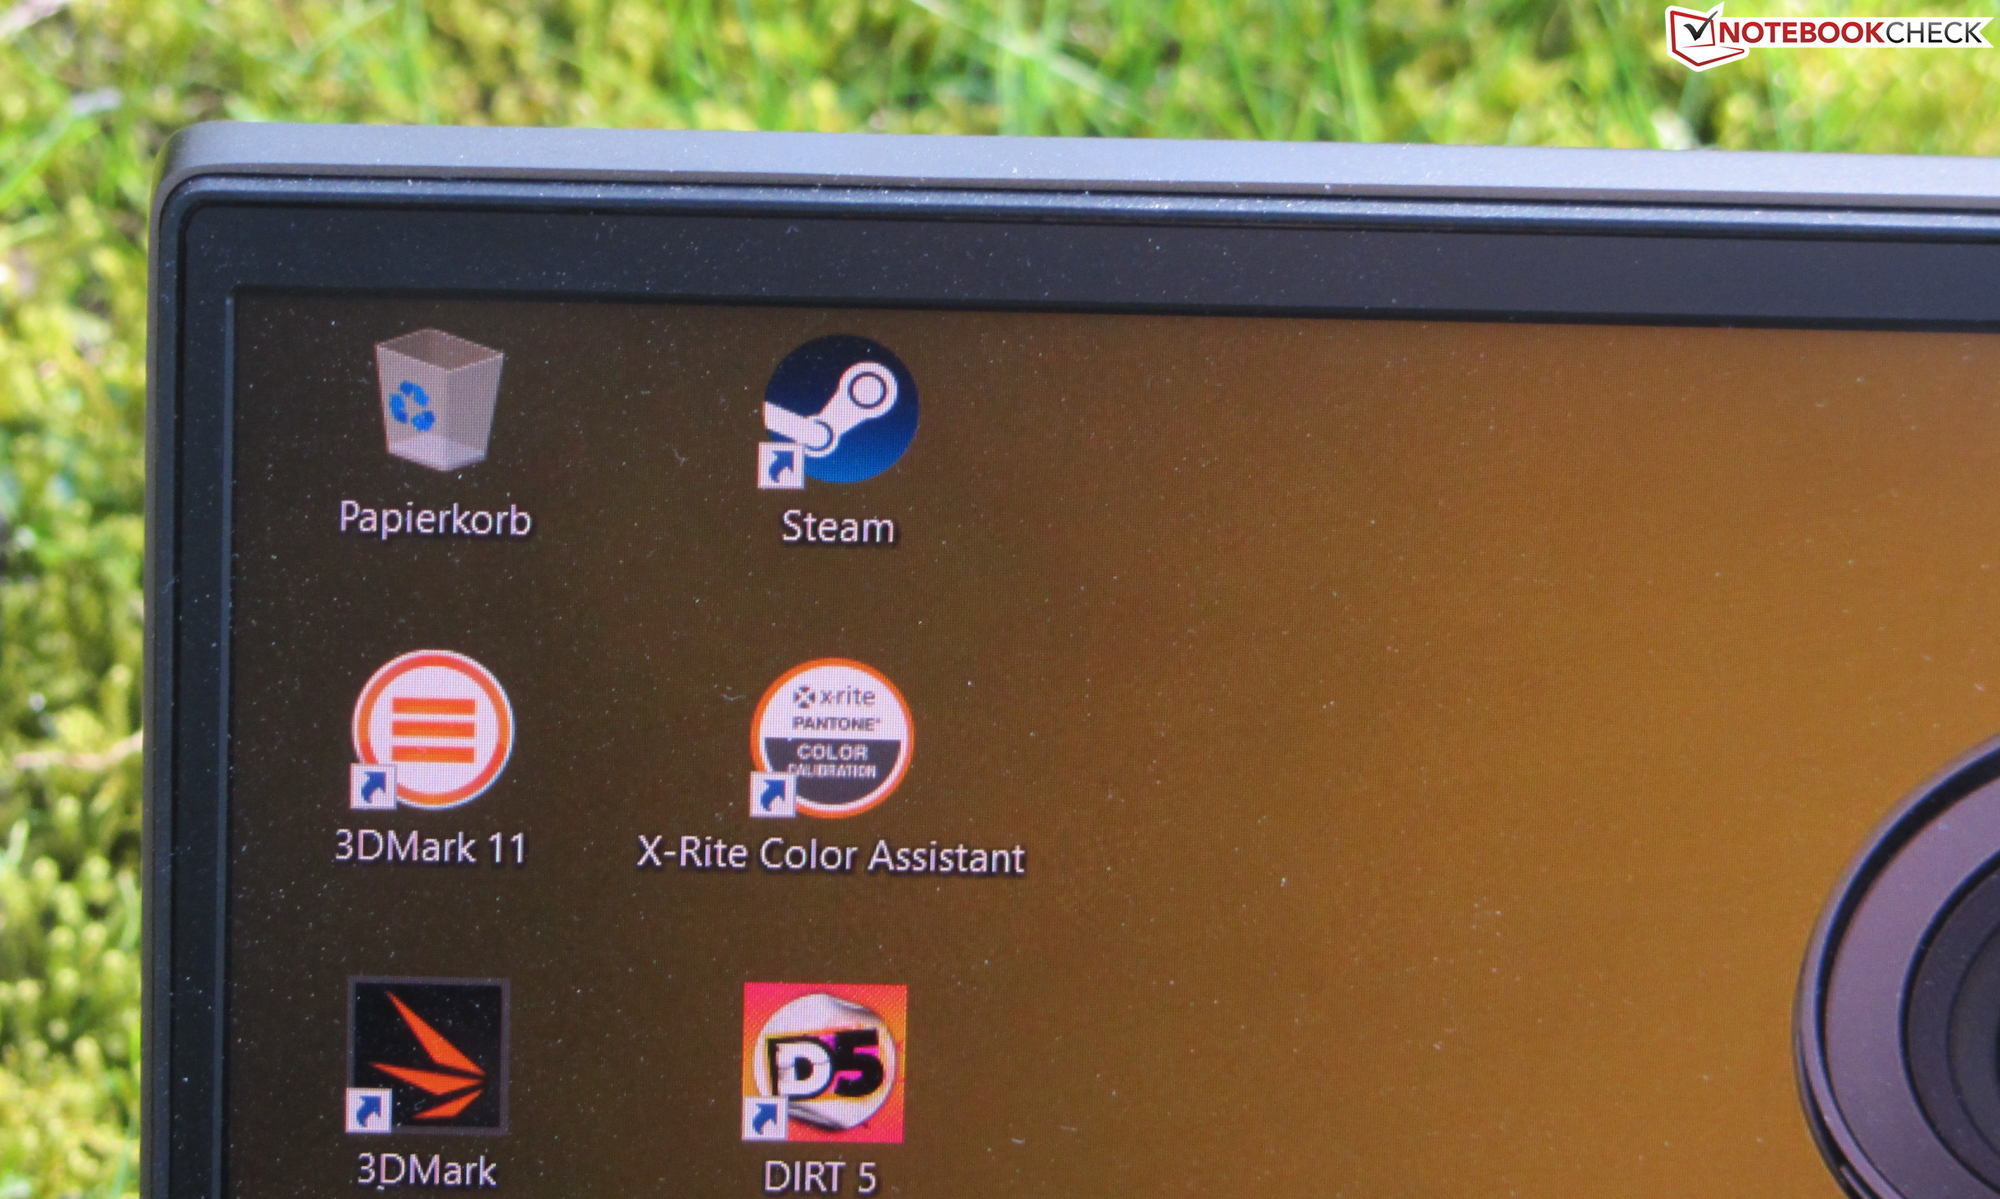
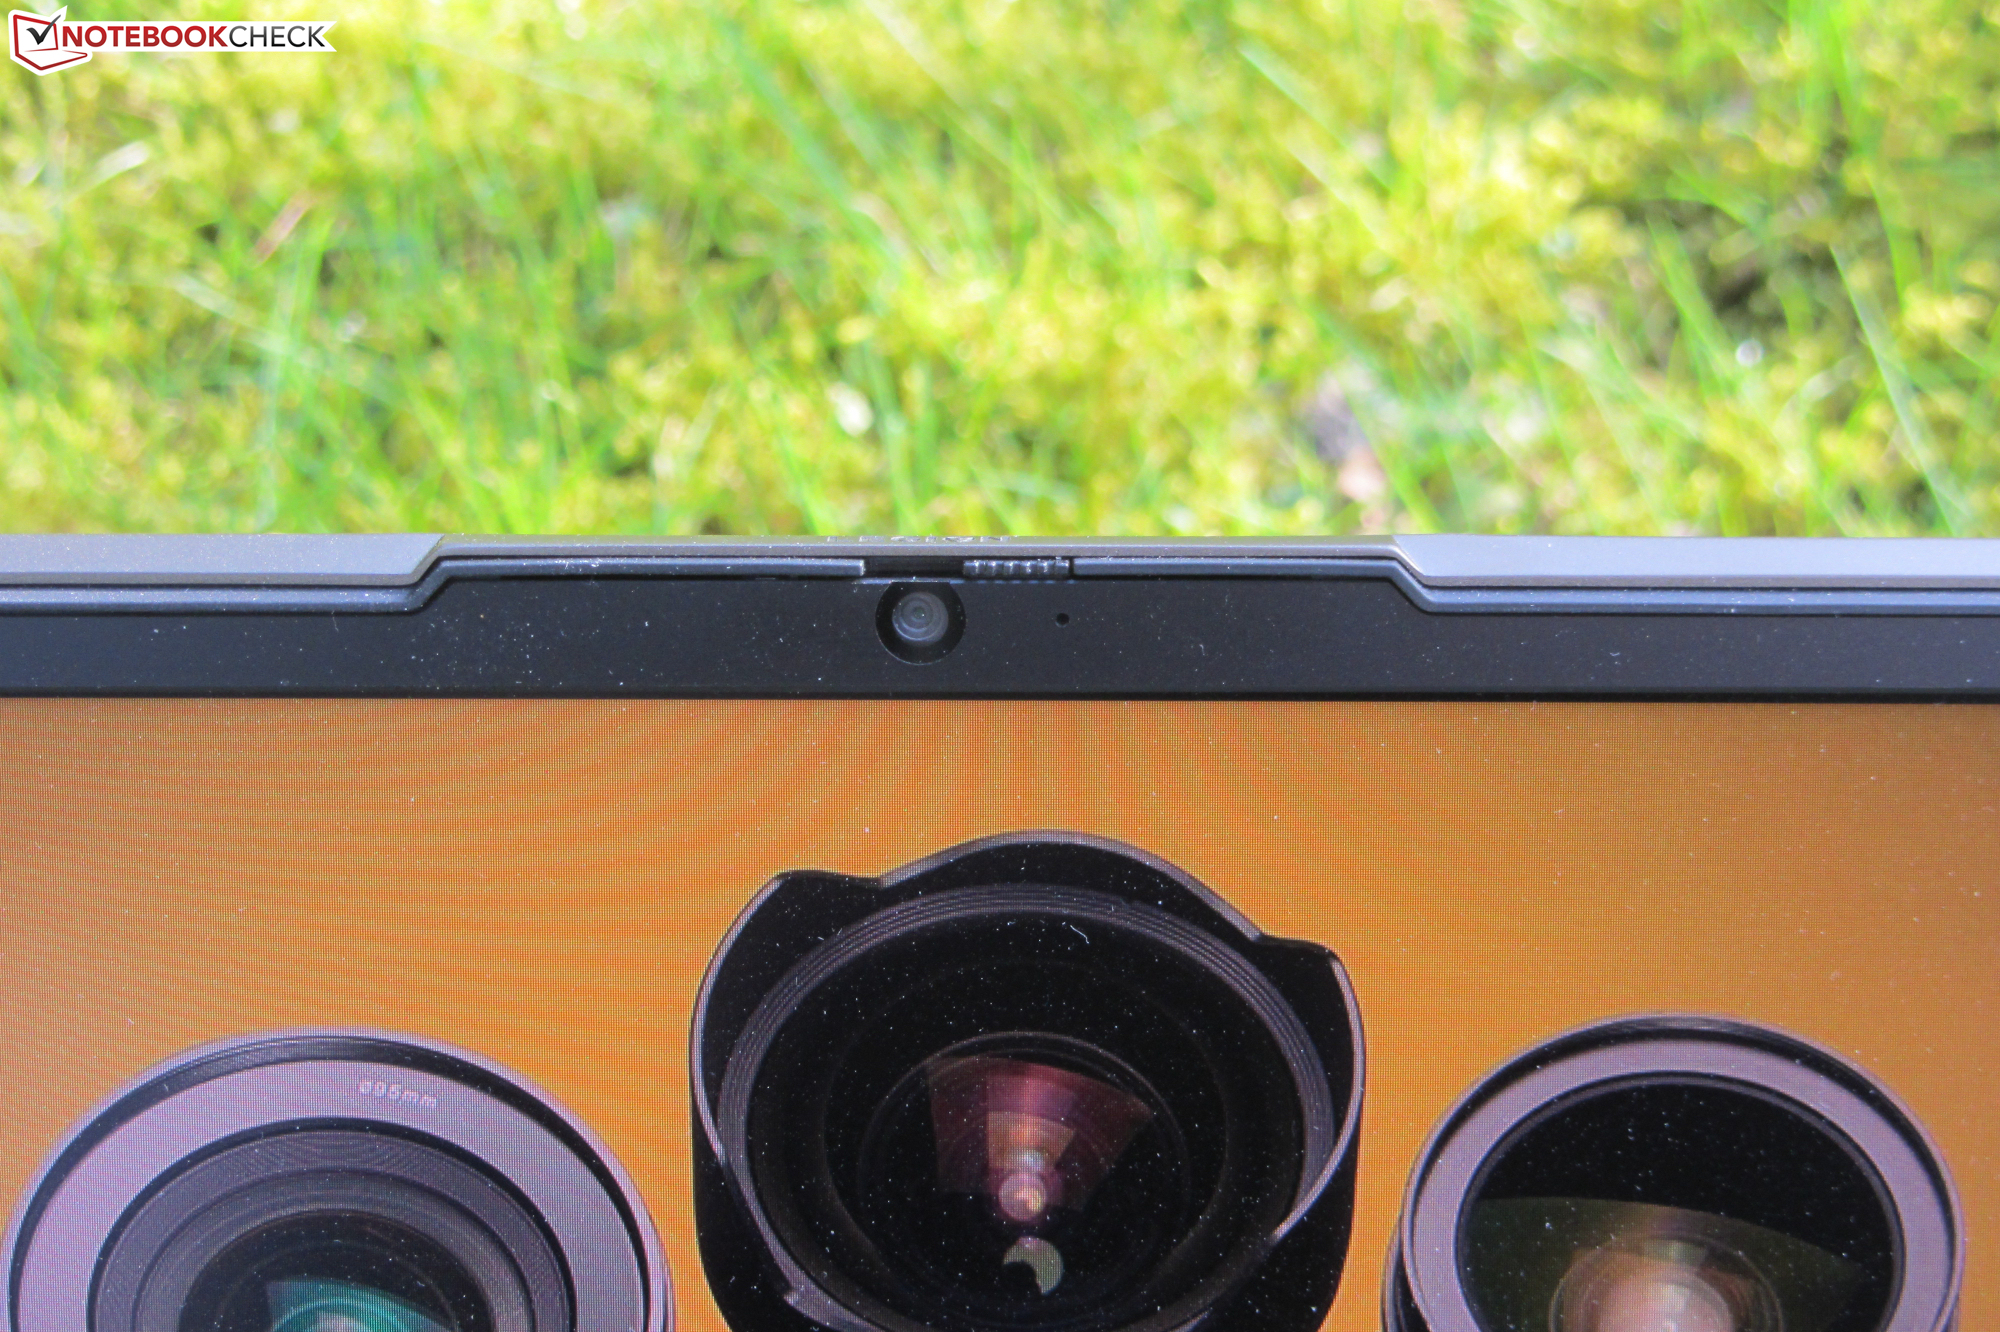
Display - Legion C7 with an IPS panel

The 1080p panel of the Legion C7 offers a good contrast ratio (1048:1) and a good brightness (414.4 cd/m²). On battery power, the maximum brightness falls slightly to 358 cd/m². The 144-Hz panel offers very fast response times. Positive: The display does not use PWM for brightness control. The screen supports Dolby Vision—a variant of HDR.
| |||||||||||||||||||||||||
Brightness Distribution: 87 %
Center on Battery: 358 cd/m²
Contrast: 1048:1 (Black: 0.42 cd/m²)
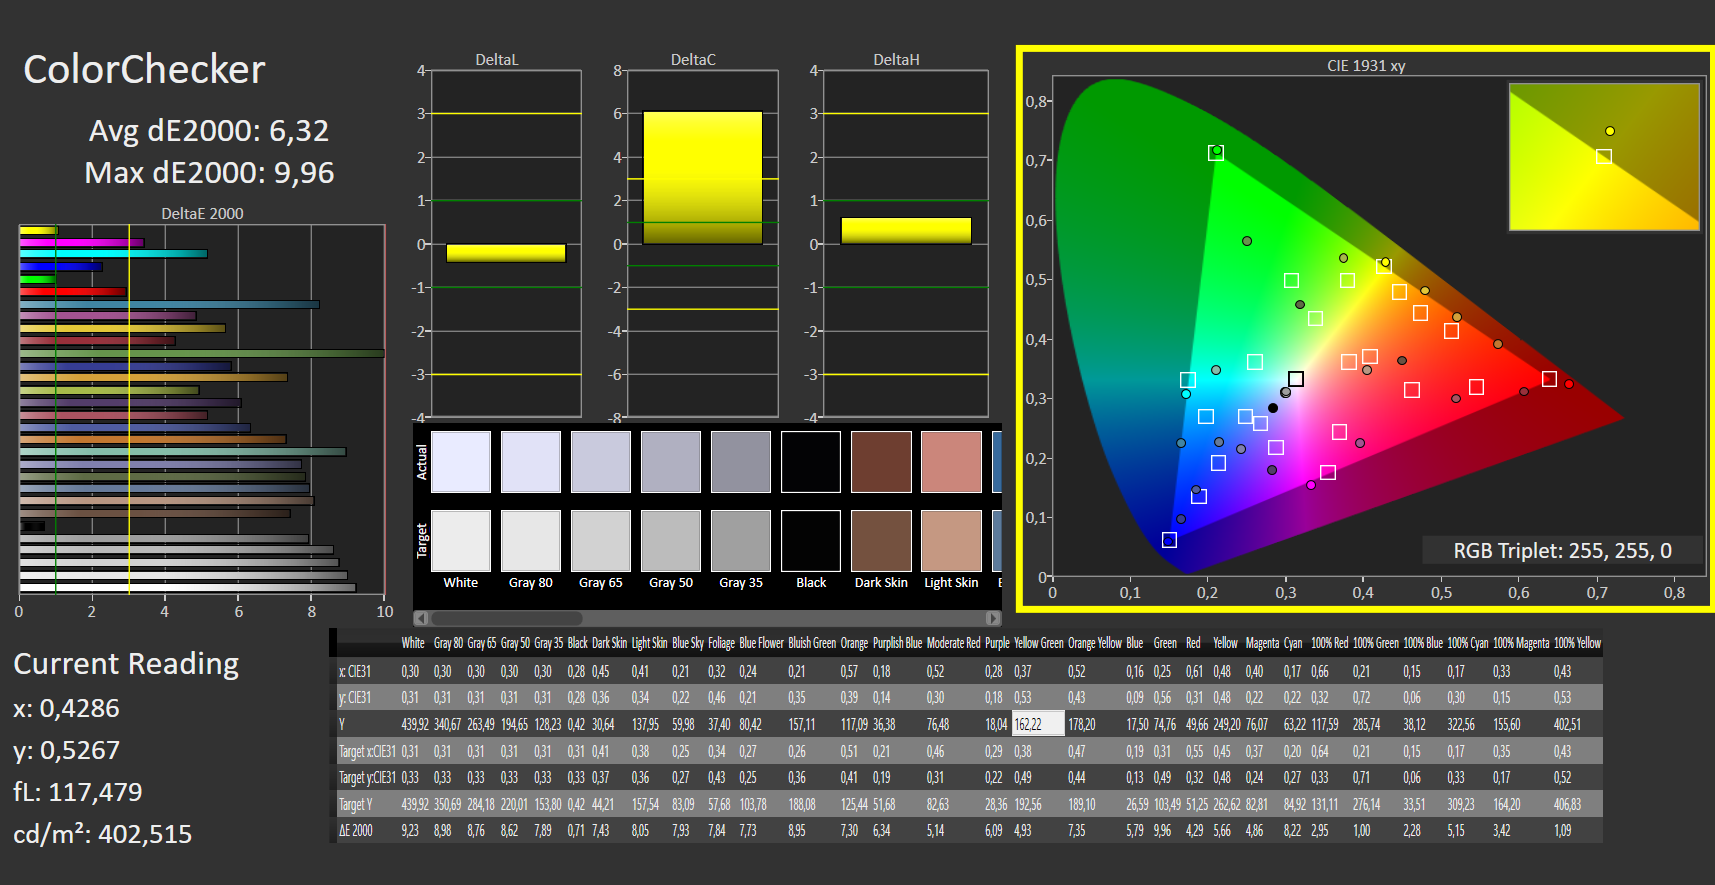
ΔE ColorChecker Calman: 6.32 | ∀{0.5-29.43 Ø4.71}
calibrated: 4.13
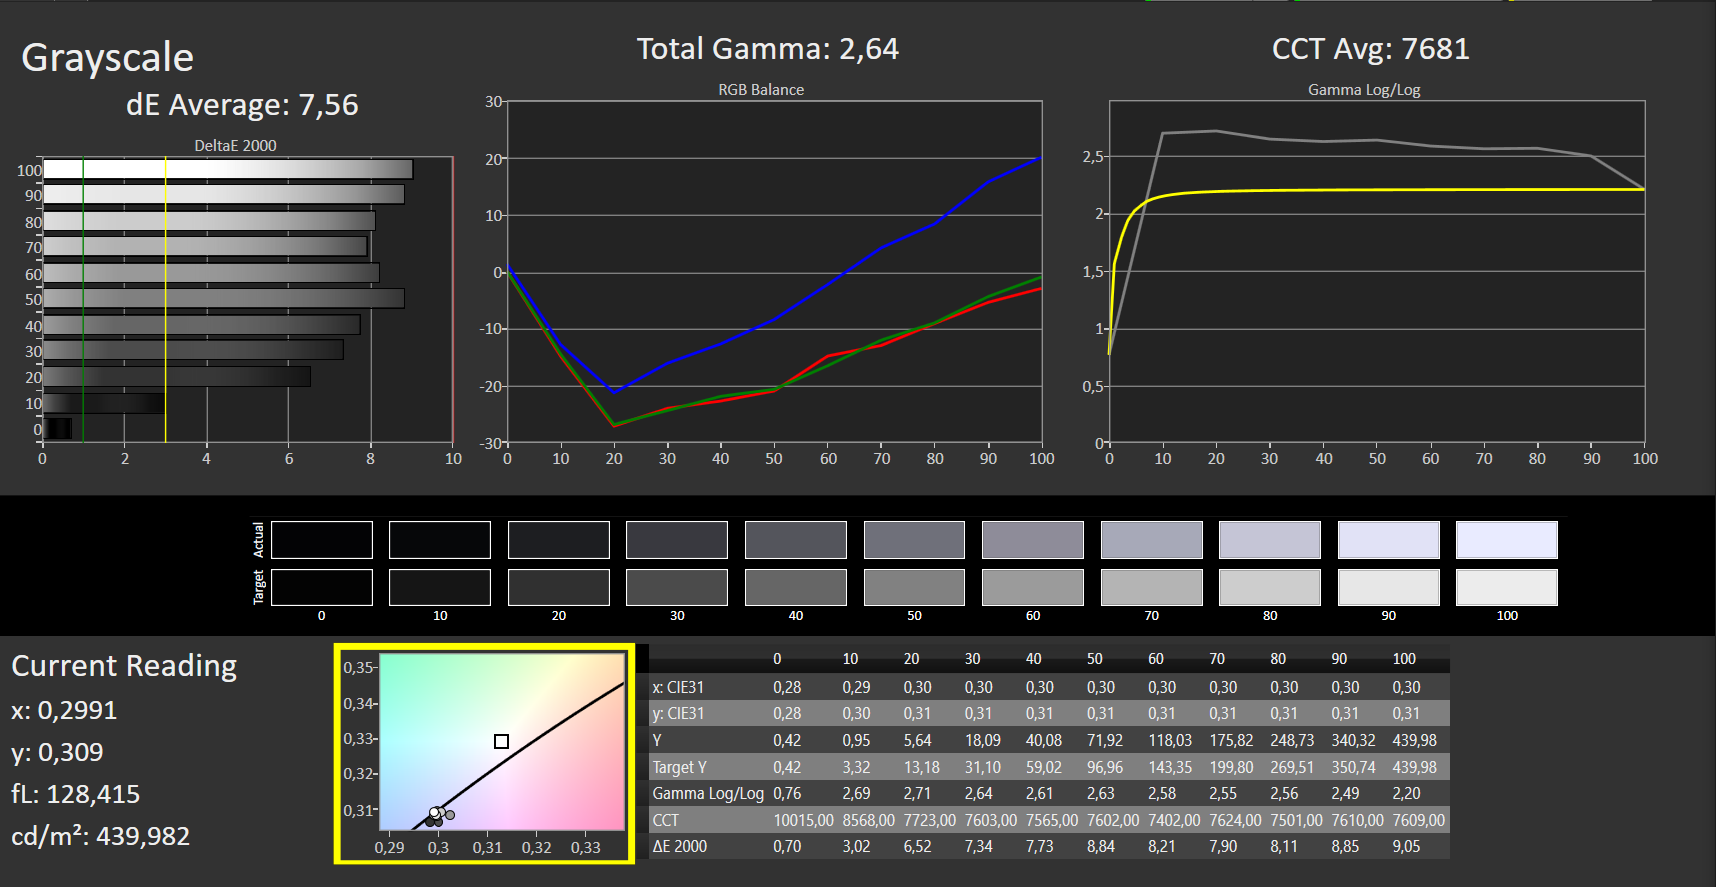
ΔE Greyscale Calman: 7.56 | ∀{0.09-98 Ø4.96}
100% sRGB (Argyll 1.6.3 3D)
88% AdobeRGB 1998 (Argyll 1.6.3 3D)
99.5% AdobeRGB 1998 (Argyll 3D)
99.8% sRGB (Argyll 3D)
91.9% Display P3 (Argyll 3D)
Gamma: 2.64
CCT: 7681 K
| Lenovo Legion C7 15IMH05 82EH0030GE BOW CQ NV156FHM-NY5, IPS, 1920x1080, 15.6" | Alienware m15 R4 LG Philips LGD066E, IPS, 1920x1080, 15.6" | Asus ROG Strix G15 G513QR LQ156M1JW25, IPS, 1920x1080, 15.6" | Schenker XMG Pro 15 (Early 2021, RTX 3080) AU Optronics AUO7A8C (B156HAN12.0), IPS, 1920x1080, 15.6" | Lenovo Legion 7 15IMH05-81YT001VGE AUO048E, IPS, 1920x1080, 15.6" | |
|---|---|---|---|---|---|
| Display | -18% | -21% | -18% | -17% | |
| Display P3 Coverage (%) | 91.9 | 69.4 -24% | 67.7 -26% | 69.2 -25% | 70.3 -24% |
| sRGB Coverage (%) | 99.8 | 99 -1% | 94.3 -6% | 99.7 0% | 99.4 0% |
| AdobeRGB 1998 Coverage (%) | 99.5 | 70.5 -29% | 68.2 -31% | 70.8 -29% | 71.3 -28% |
| Response Times | -93% | -83% | -80% | -62% | |
| Response Time Grey 50% / Grey 80% * (ms) | 14 ? | 7.4 ? 47% | 8.2 ? 41% | 3.6 ? 74% | 8 ? 43% |
| Response Time Black / White * (ms) | 3 ? | 10 ? -233% | 9.2 ? -207% | 10 ? -233% | 8 ? -167% |
| PWM Frequency (Hz) | |||||
| Screen | 22% | 14% | 26% | 32% | |
| Brightness middle (cd/m²) | 440 | 333 -24% | 308 -30% | 327 -26% | 470 7% |
| Brightness (cd/m²) | 414 | 303 -27% | 288 -30% | 335 -19% | 468 13% |
| Brightness Distribution (%) | 87 | 86 -1% | 86 -1% | 89 2% | 85 -2% |
| Black Level * (cd/m²) | 0.42 | 0.29 31% | 0.23 45% | 0.22 48% | 0.21 50% |
| Contrast (:1) | 1048 | 1148 10% | 1339 28% | 1486 42% | 2238 114% |
| Colorchecker dE 2000 * | 6.32 | 1.8 72% | 3.28 48% | 2.18 66% | 3.28 48% |
| Colorchecker dE 2000 max. * | 9.96 | 4.49 55% | 8.51 15% | 4.24 57% | 7.31 27% |
| Colorchecker dE 2000 calibrated * | 4.13 | 1.13 73% | 0.83 80% | 1 76% | 0.8 81% |
| Greyscale dE 2000 * | 7.56 | 1.9 75% | 5 34% | 2.6 66% | 4.49 41% |
| Gamma | 2.64 83% | 2.265 97% | 2.057 107% | 2.123 104% | 2.4 92% |
| CCT | 7681 85% | 6840 95% | 7393 88% | 6815 95% | 7438 87% |
| Color Space (Percent of AdobeRGB 1998) (%) | 88 | 71 -19% | 68 -23% | 71 -19% | 65 -26% |
| Color Space (Percent of sRGB) (%) | 100 | 93 -7% | 90 -10% | 93 -7% | 99 -1% |
| Total Average (Program / Settings) | -30% /
-0% | -30% /
-5% | -24% /
5% | -16% /
11% |
* ... smaller is better
Display Response Times
| ↔ Response Time Black to White | ||
|---|---|---|
| 3 ms ... rise ↗ and fall ↘ combined | ↗ 1 ms rise |  |
| ↘ 2 ms fall | ||
| The screen shows very fast response rates in our tests and should be very well suited for fast-paced gaming. In comparison, all tested devices range from 0.1 (minimum) to 240 (maximum) ms. » 15 % of all devices are better. This means that the measured response time is better than the average of all tested devices (19.8 ms). | ||
| ↔ Response Time 50% Grey to 80% Grey | ||
| 14 ms ... rise ↗ and fall ↘ combined | ↗ 7 ms rise |  |
| ↘ 7 ms fall | ||
| The screen shows good response rates in our tests, but may be too slow for competitive gamers. In comparison, all tested devices range from 0.165 (minimum) to 636 (maximum) ms. » 28 % of all devices are better. This means that the measured response time is better than the average of all tested devices (31 ms). | ||
Screen Flickering / PWM (Pulse-Width Modulation)
| Screen flickering / PWM not detected |  | ||
In comparison: 52 % of all tested devices do not use PWM to dim the display. If PWM was detected, an average of 7757 (minimum: 5 - maximum: 343500) Hz was measured. | |||
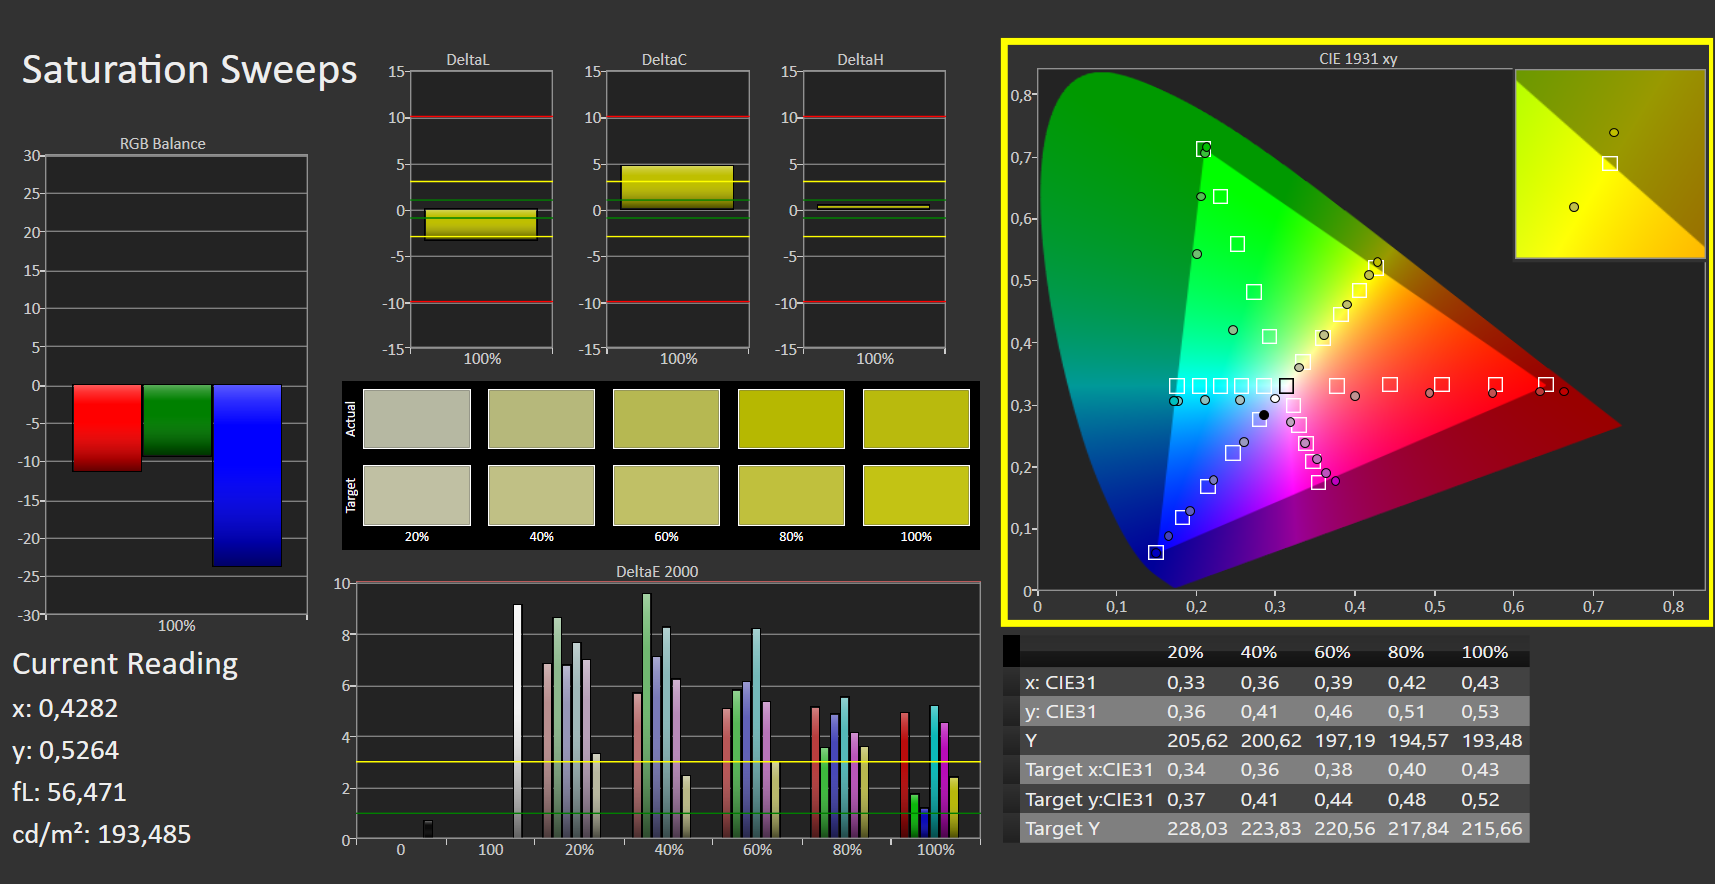
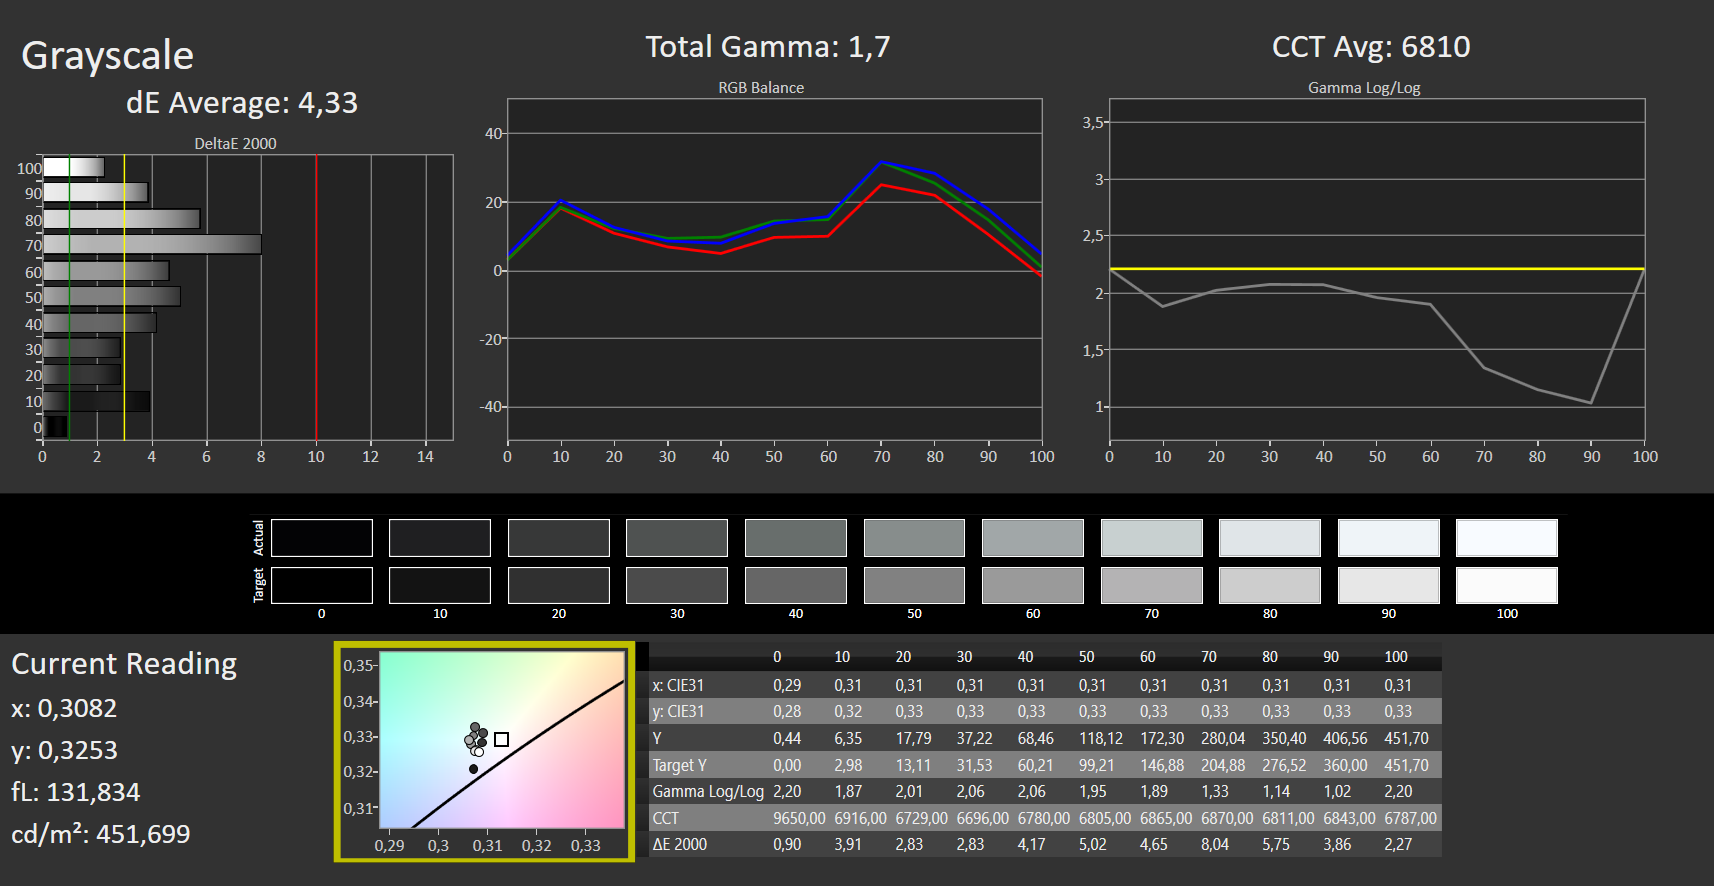
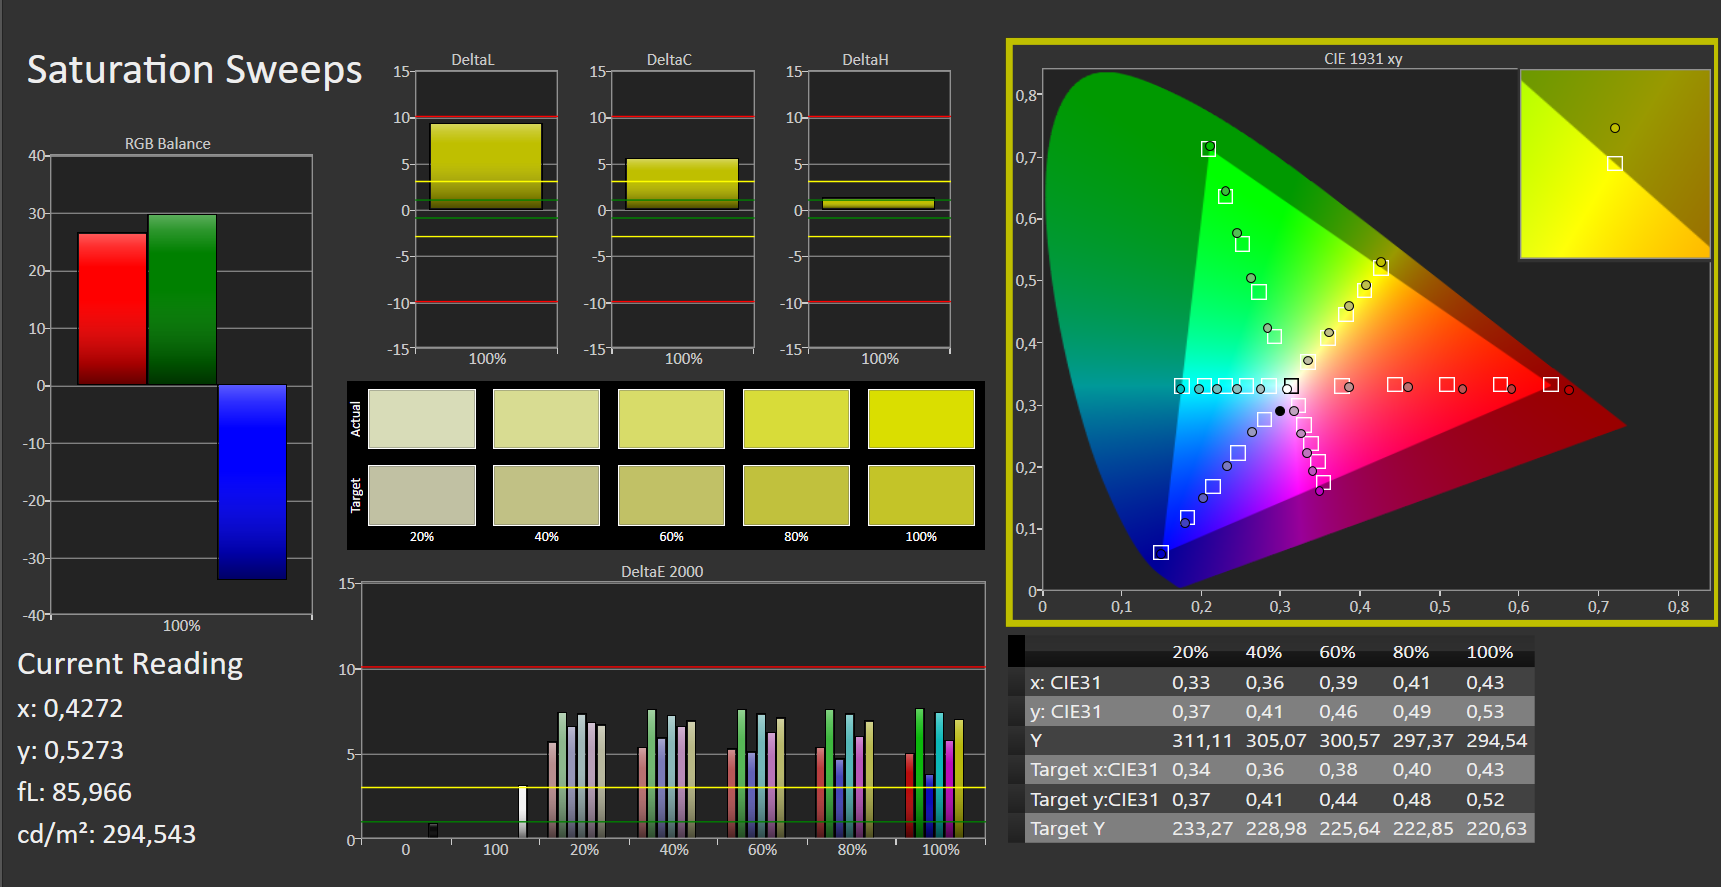
Straight out of the box, the colour reproduction does not impress. We measured a Delta E of 7, which is far away from the ideal value of less than 3. The display does not suffer from a bluish cast. Through calibration, the colour reproduction can be slightly improved: The Delta E falls to 4.1 and the grayscale tracking also improves. The panel covers 100% of the sRGB colour space and 88% of AdobeRGB.

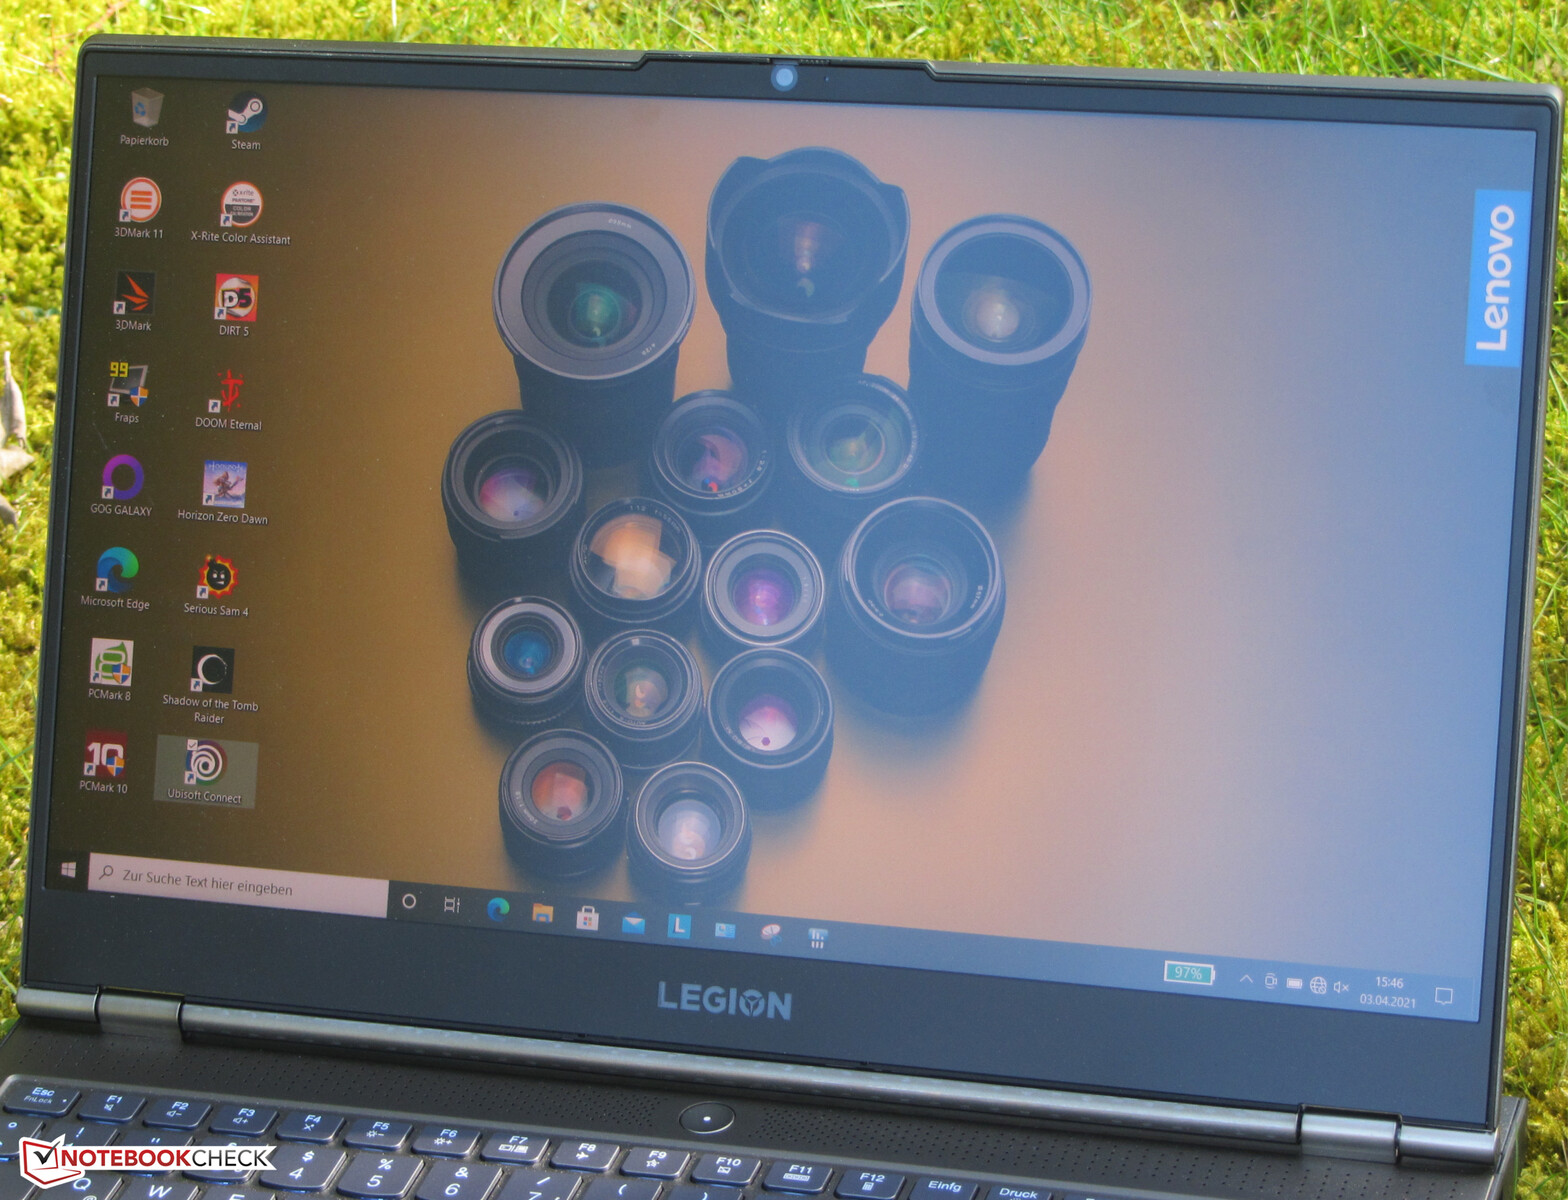
The viewing angles of the IPS panel are very stable. Outdoors, the screen content can be read without any problems. However, in direct sunlight, the legibility decreases significantly.
Performance - Enough for the next few years
The Lenovo Legion Creator 7 15IMH05 is a 15.6-inch gaming notebook. The fact that it never becomes too loud or too hot makes it suitable for other usage scenarios as well.
Review Settings
The notebook offers three power modes: "Auto", "High Performance" and "Quiet". Users can switch between power modes by pressing "Fn" + “Q”. We used the "Auto" mode for our review.
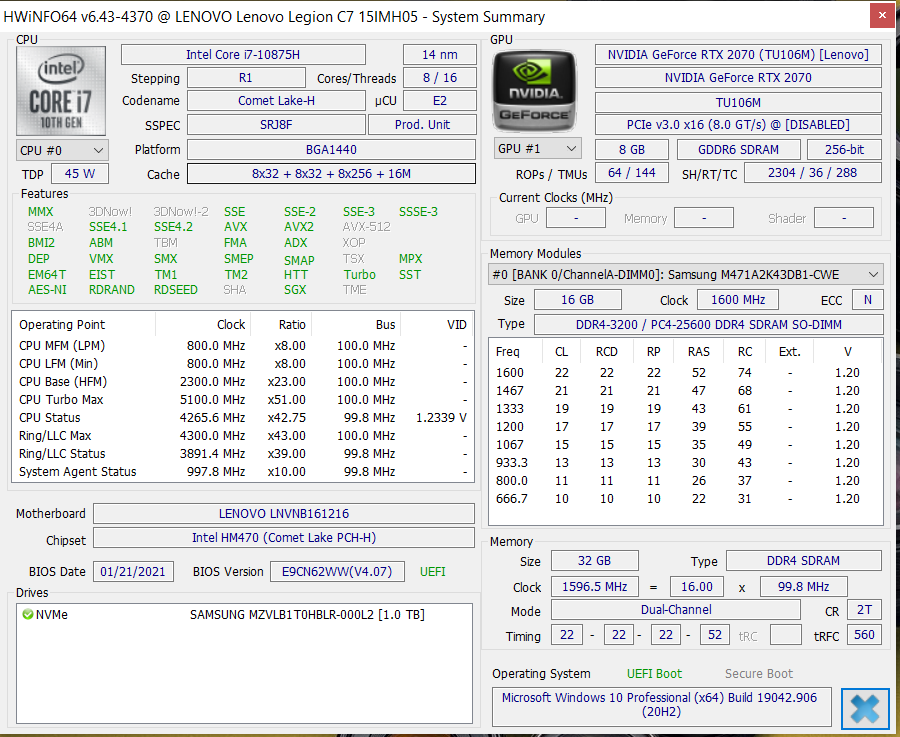
Processor
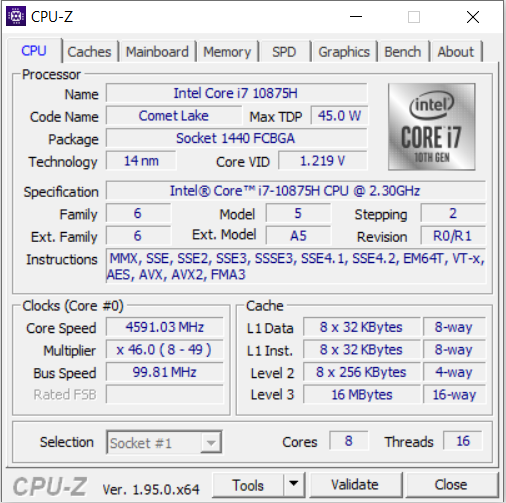
The Core i7-10875H is an octa-core Comet Lake-based processor with a base clock of 2.3 GHz and an all-core boost clock of 4.3 GHz. A single core can boost up to 5.1 GHz. Hyper-threading (two threads per core) is supported.
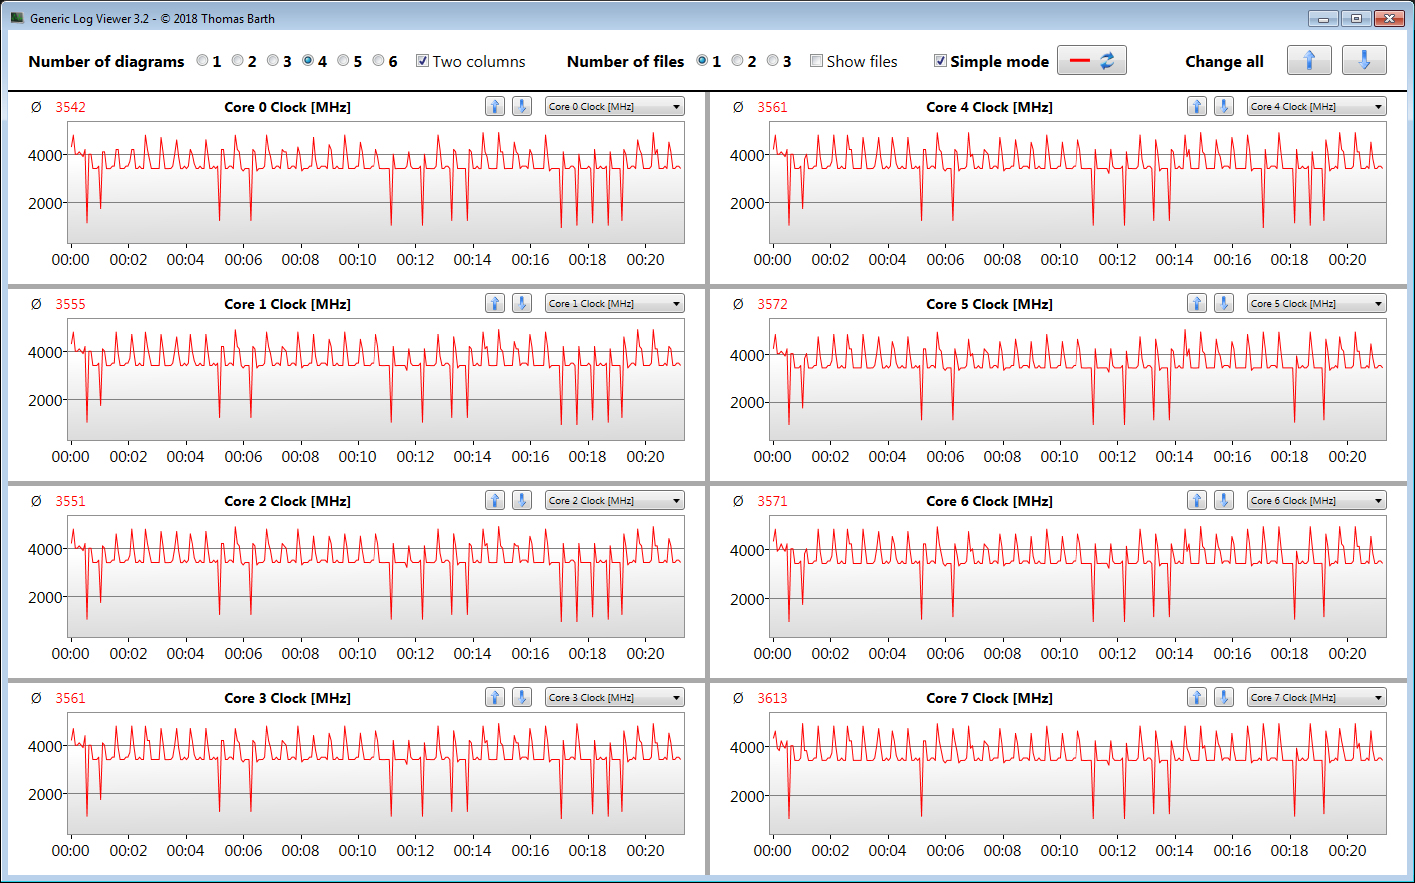
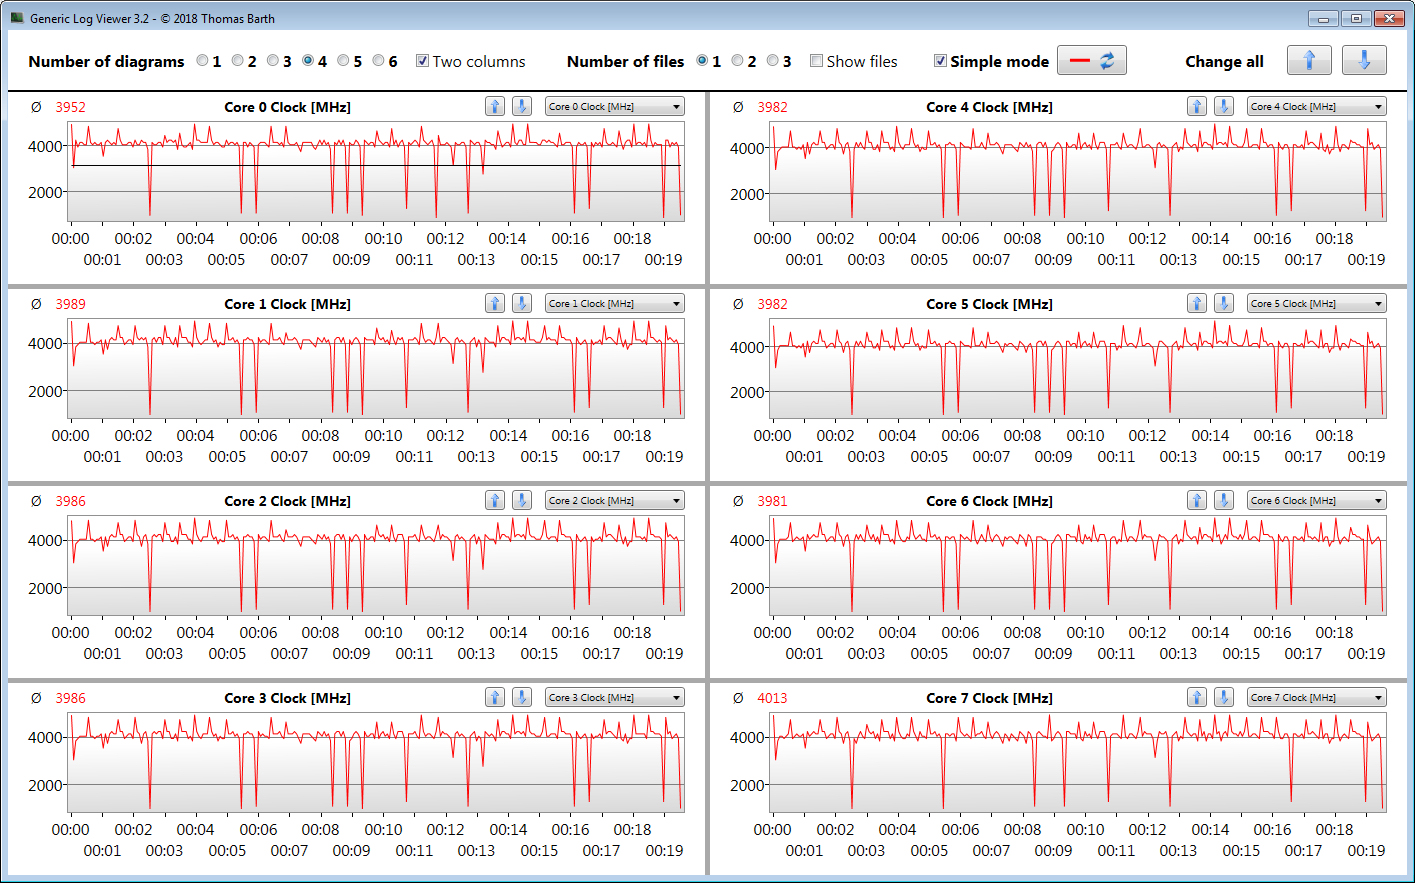
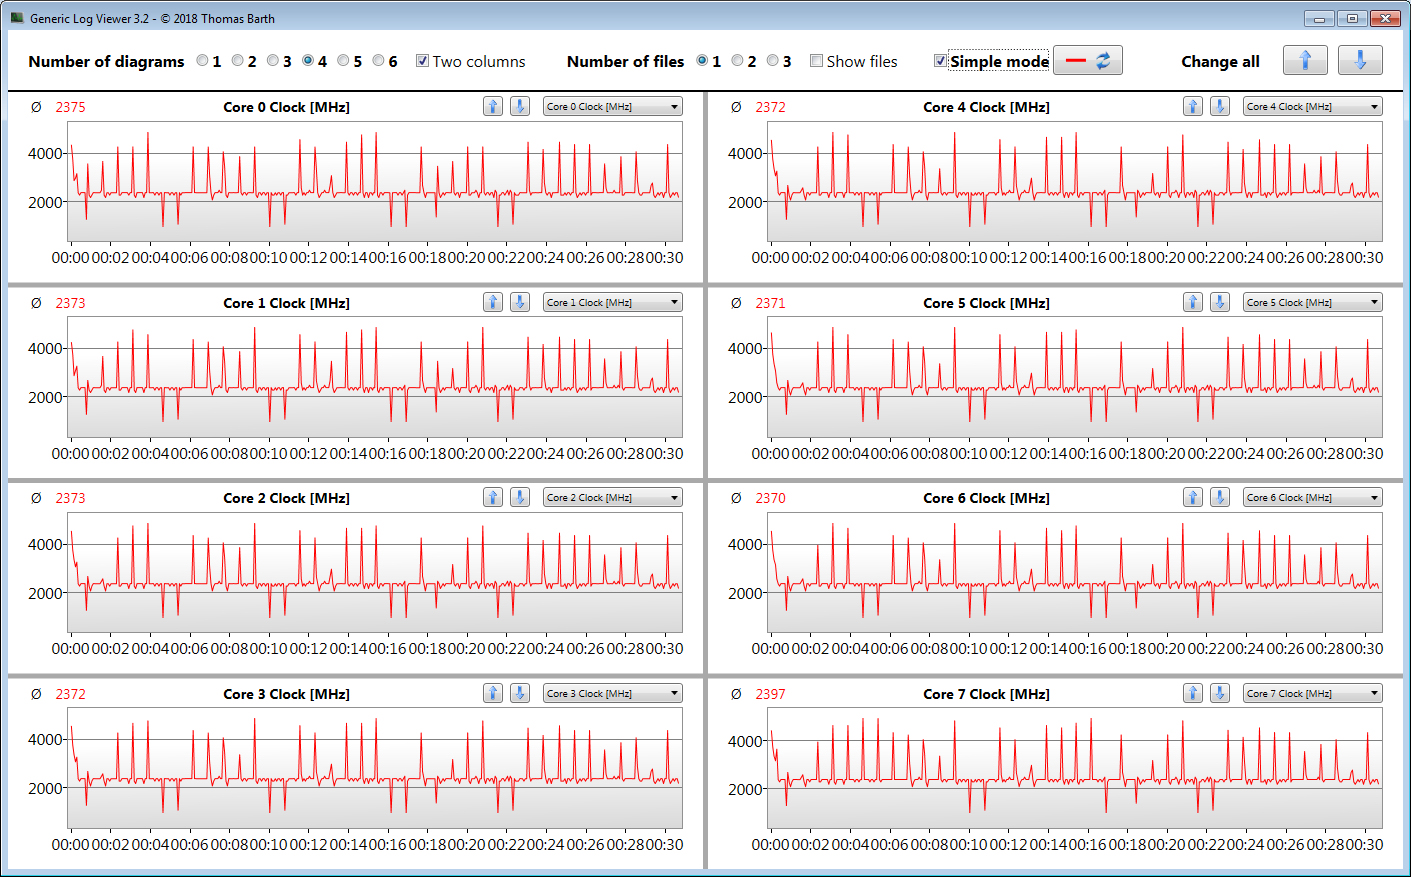
In the multi-core section of Cinebench R15, the CPU runs at 4.2 GHz when the laptop is plugged in and at 2.3 to 3.6 GHz when the notebook runs on battery power. In the single-core portion of Cinebench R15, the processor always runs at 4.2 to 4.8 GHz.

We check whether or not the Turbo Boost technology can be used over an extended period of time by running the multi-core section of the Cinebench R15 benchmark for 30 straight minutes in a continuous loop. We carry out this test with the laptop plugged in. The Turbo Boost is utilised, but not fully. However, in "High Performance" mode, the CPU is able to sustain higher clocks.
| Cinebench R15 | |
| CPU Single 64Bit | |
| Average of class Gaming (188.8 - 350, n=106, last 2 years) | |
| Asus ROG Strix G15 G513QR | |
| Lenovo Legion 7 15IMH05-81YT001VGE | |
| Lenovo Legion C7 15IMH05 82EH0030GE | |
| Average Intel Core i7-10875H (190 - 220, n=37) | |
| Schenker XMG Pro 15 (Early 2021, RTX 3080) | |
| Alienware m15 R4 | |
| Lenovo Legion C7 15IMH05 82EH0030GE (Hoechstleistung) | |
| Lenovo Legion C7 15IMH05 82EH0030GE (Fluestermodus) | |
| CPU Multi 64Bit | |
| Average of class Gaming (1578 - 6330, n=105, last 2 years) | |
| Asus ROG Strix G15 G513QR | |
| Schenker XMG Pro 15 (Early 2021, RTX 3080) | |
| Lenovo Legion C7 15IMH05 82EH0030GE | |
| Lenovo Legion 7 15IMH05-81YT001VGE | |
| Lenovo Legion C7 15IMH05 82EH0030GE (Hoechstleistung) | |
| Alienware m15 R4 | |
| Average Intel Core i7-10875H (1003 - 1833, n=38) | |
| Lenovo Legion C7 15IMH05 82EH0030GE (Fluestermodus) | |
| Blender - v2.79 BMW27 CPU | |
| Lenovo Legion C7 15IMH05 82EH0030GE (Fluestermodus) | |
| Average Intel Core i7-10875H (259 - 535, n=30) | |
| Lenovo Legion C7 15IMH05 82EH0030GE | |
| Schenker XMG Pro 15 (Early 2021, RTX 3080) | |
| Lenovo Legion C7 15IMH05 82EH0030GE (Hoechstleistung) | |
| Alienware m15 R4 | |
| Lenovo Legion 7 15IMH05-81YT001VGE | |
| Asus ROG Strix G15 G513QR | |
| Average of class Gaming (79 - 330, n=104, last 2 years) | |
| 7-Zip 18.03 | |
| 7z b 4 -mmt1 | |
| Average of class Gaming (4199 - 7436, n=105, last 2 years) | |
| Asus ROG Strix G15 G513QR | |
| Lenovo Legion 7 15IMH05-81YT001VGE | |
| Alienware m15 R4 | |
| Lenovo Legion C7 15IMH05 82EH0030GE | |
| Average Intel Core i7-10875H (5071 - 5780, n=31) | |
| Lenovo Legion C7 15IMH05 82EH0030GE (Hoechstleistung) | |
| Schenker XMG Pro 15 (Early 2021, RTX 3080) | |
| Lenovo Legion C7 15IMH05 82EH0030GE (Fluestermodus) | |
| 7z b 4 | |
| Average of class Gaming (33491 - 148086, n=105, last 2 years) | |
| Asus ROG Strix G15 G513QR | |
| Lenovo Legion C7 15IMH05 82EH0030GE (Hoechstleistung) | |
| Lenovo Legion 7 15IMH05-81YT001VGE | |
| Alienware m15 R4 | |
| Lenovo Legion C7 15IMH05 82EH0030GE | |
| Schenker XMG Pro 15 (Early 2021, RTX 3080) | |
| Average Intel Core i7-10875H (29844 - 49562, n=31) | |
| Lenovo Legion C7 15IMH05 82EH0030GE (Fluestermodus) | |
| Cinebench R20 | |
| CPU (Single Core) | |
| Average of class Gaming (442 - 913, n=106, last 2 years) | |
| Asus ROG Strix G15 G513QR | |
| Lenovo Legion 7 15IMH05-81YT001VGE | |
| Lenovo Legion C7 15IMH05 82EH0030GE (Hoechstleistung) | |
| Average Intel Core i7-10875H (430 - 524, n=32) | |
| Lenovo Legion C7 15IMH05 82EH0030GE | |
| Alienware m15 R4 | |
| Schenker XMG Pro 15 (Early 2021, RTX 3080) | |
| Lenovo Legion C7 15IMH05 82EH0030GE (Fluestermodus) | |
| CPU (Multi Core) | |
| Average of class Gaming (4029 - 16433, n=106, last 2 years) | |
| Asus ROG Strix G15 G513QR | |
| Lenovo Legion 7 15IMH05-81YT001VGE | |
| Alienware m15 R4 | |
| Lenovo Legion C7 15IMH05 82EH0030GE (Hoechstleistung) | |
| Average Intel Core i7-10875H (1986 - 4176, n=32) | |
| Schenker XMG Pro 15 (Early 2021, RTX 3080) | |
| Lenovo Legion C7 15IMH05 82EH0030GE | |
| Lenovo Legion C7 15IMH05 82EH0030GE (Fluestermodus) | |
| Geekbench 5.5 | |
| Single-Core | |
| Average of class Gaming (986 - 2474, n=105, last 2 years) | |
| Asus ROG Strix G15 G513QR | |
| Lenovo Legion 7 15IMH05-81YT001VGE | |
| Alienware m15 R4 | |
| Lenovo Legion C7 15IMH05 82EH0030GE | |
| Lenovo Legion C7 15IMH05 82EH0030GE (Hoechstleistung) | |
| Average Intel Core i7-10875H (1233 - 1371, n=29) | |
| Schenker XMG Pro 15 (Early 2021, RTX 3080) | |
| Lenovo Legion C7 15IMH05 82EH0030GE (Fluestermodus) | |
| Multi-Core | |
| Average of class Gaming (6460 - 28263, n=105, last 2 years) | |
| Lenovo Legion 7 15IMH05-81YT001VGE | |
| Lenovo Legion C7 15IMH05 82EH0030GE | |
| Lenovo Legion C7 15IMH05 82EH0030GE (Hoechstleistung) | |
| Alienware m15 R4 | |
| Schenker XMG Pro 15 (Early 2021, RTX 3080) | |
| Average Intel Core i7-10875H (5715 - 8620, n=29) | |
| Asus ROG Strix G15 G513QR | |
| Lenovo Legion C7 15IMH05 82EH0030GE (Fluestermodus) | |
| HWBOT x265 Benchmark v2.2 - 4k Preset | |
| Average of class Gaming (11.5 - 44.4, n=105, last 2 years) | |
| Asus ROG Strix G15 G513QR | |
| Lenovo Legion 7 15IMH05-81YT001VGE | |
| Alienware m15 R4 | |
| Lenovo Legion C7 15IMH05 82EH0030GE (Hoechstleistung) | |
| Lenovo Legion C7 15IMH05 82EH0030GE | |
| Average Intel Core i7-10875H (7.27 - 14.1, n=27) | |
| Schenker XMG Pro 15 (Early 2021, RTX 3080) | |
| Lenovo Legion C7 15IMH05 82EH0030GE (Fluestermodus) | |
| LibreOffice - 20 Documents To PDF | |
| Schenker XMG Pro 15 (Early 2021, RTX 3080) | |
| Lenovo Legion C7 15IMH05 82EH0030GE (Fluestermodus) | |
| Lenovo Legion C7 15IMH05 82EH0030GE | |
| Lenovo Legion 7 15IMH05-81YT001VGE | |
| Asus ROG Strix G15 G513QR | |
| Average Intel Core i7-10875H (30.2 - 84.3, n=30) | |
| Average of class Gaming (33.2 - 88.8, n=105, last 2 years) | |
| Alienware m15 R4 | |
| Lenovo Legion C7 15IMH05 82EH0030GE (Hoechstleistung) | |
| R Benchmark 2.5 - Overall mean | |
| Lenovo Legion C7 15IMH05 82EH0030GE (Fluestermodus) | |
| Schenker XMG Pro 15 (Early 2021, RTX 3080) | |
| Average Intel Core i7-10875H (0.546 - 0.662, n=29) | |
| Lenovo Legion C7 15IMH05 82EH0030GE | |
| Alienware m15 R4 | |
| Lenovo Legion C7 15IMH05 82EH0030GE (Hoechstleistung) | |
| Lenovo Legion 7 15IMH05-81YT001VGE | |
| Asus ROG Strix G15 G513QR | |
| Average of class Gaming (0.3439 - 0.759, n=106, last 2 years) | |
* ... smaller is better
System Performance
The system feels very responsive. Our hardware configuration offers more than enough performance for all usage scenarios—office work, Internet-browsing, gaming, video editing, image editing. Moreover, the Lenovo laptop does very well in the PCMark benchmarks.
| PCMark 8 Home Score Accelerated v2 | 4388 points | |
| PCMark 8 Creative Score Accelerated v2 | 6297 points | |
| PCMark 8 Work Score Accelerated v2 | 5551 points | |
| PCMark 10 Score | 6263 points | |
Help | ||
DPC Latencies
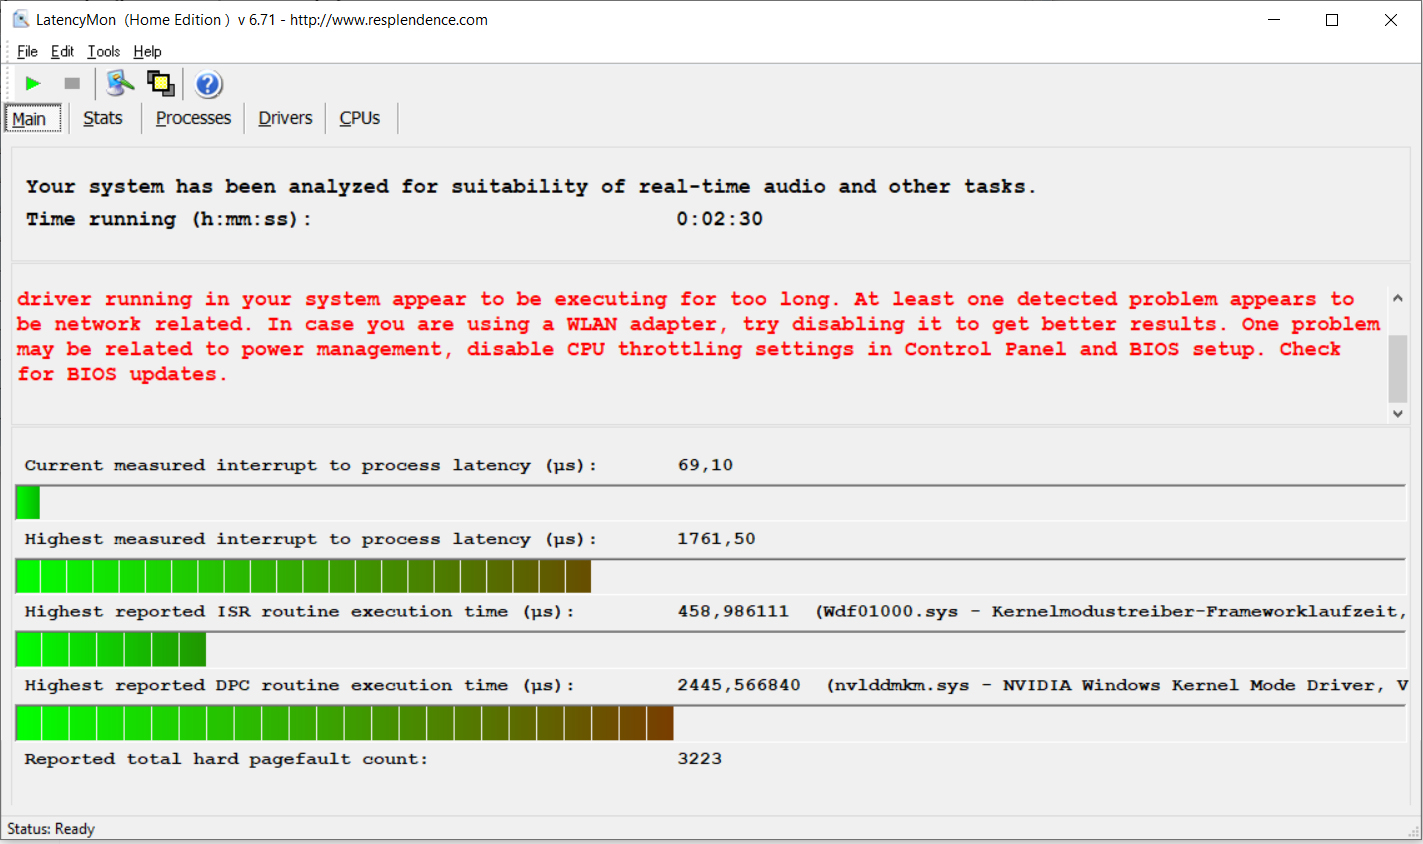
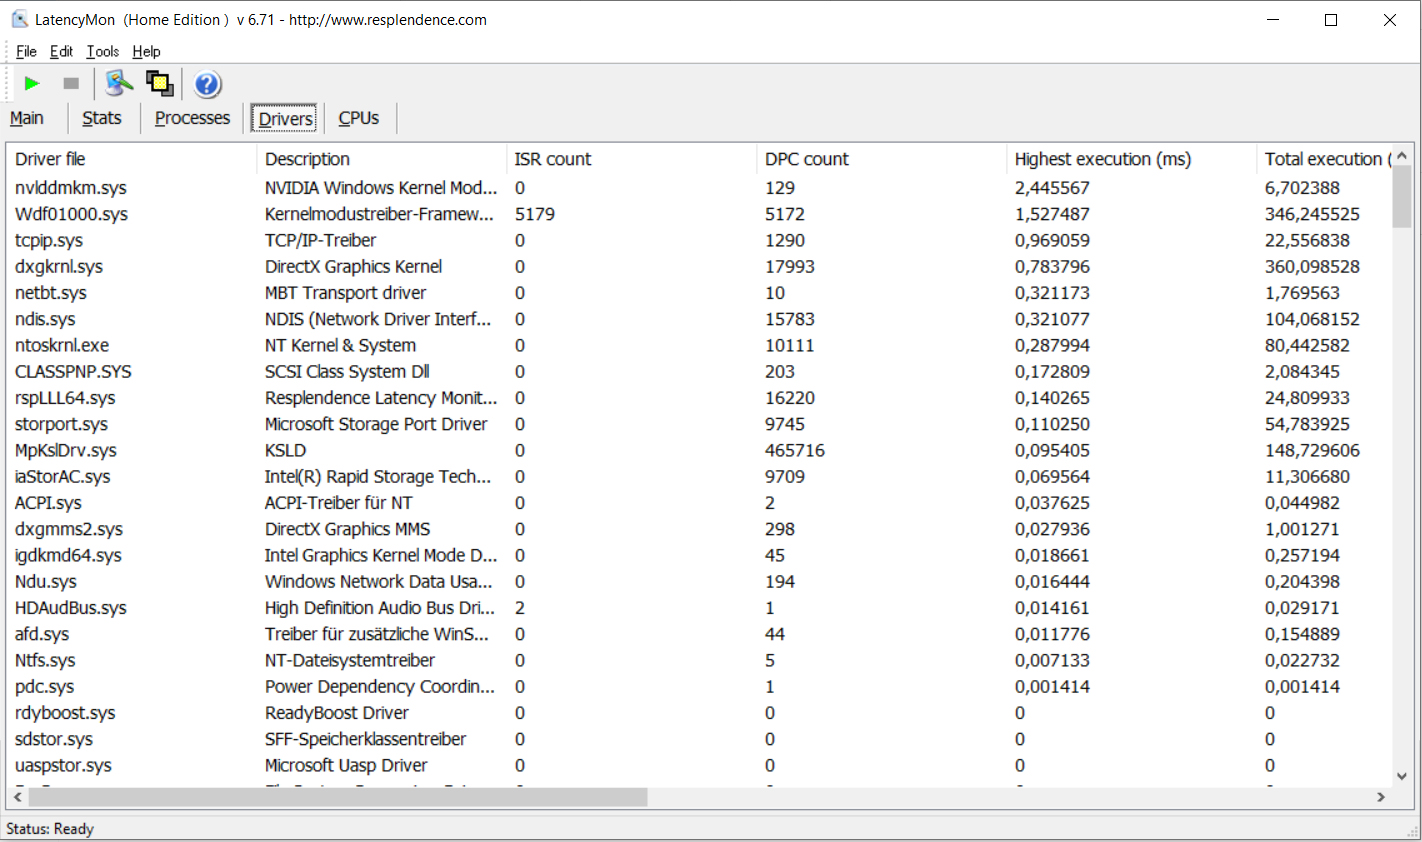
| DPC Latencies / LatencyMon - interrupt to process latency (max), Web, Youtube, Prime95 | |
| Alienware m15 R4 | |
| Lenovo Legion C7 15IMH05 82EH0030GE | |
| Lenovo Legion 7 15IMH05-81YT001VGE | |
| Schenker XMG Pro 15 (Early 2021, RTX 3080) | |
| Asus ROG Strix G15 G513QR | |
* ... smaller is better
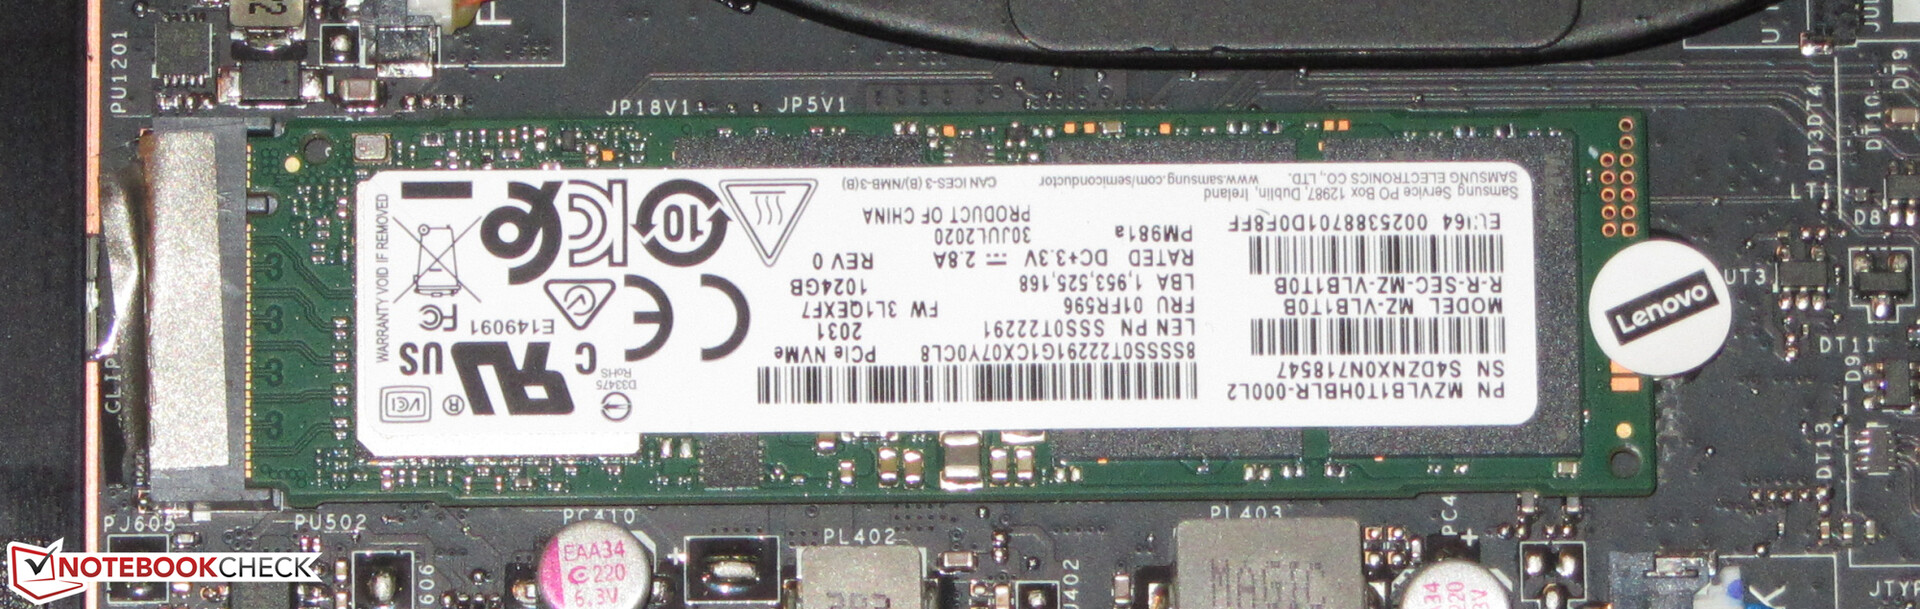
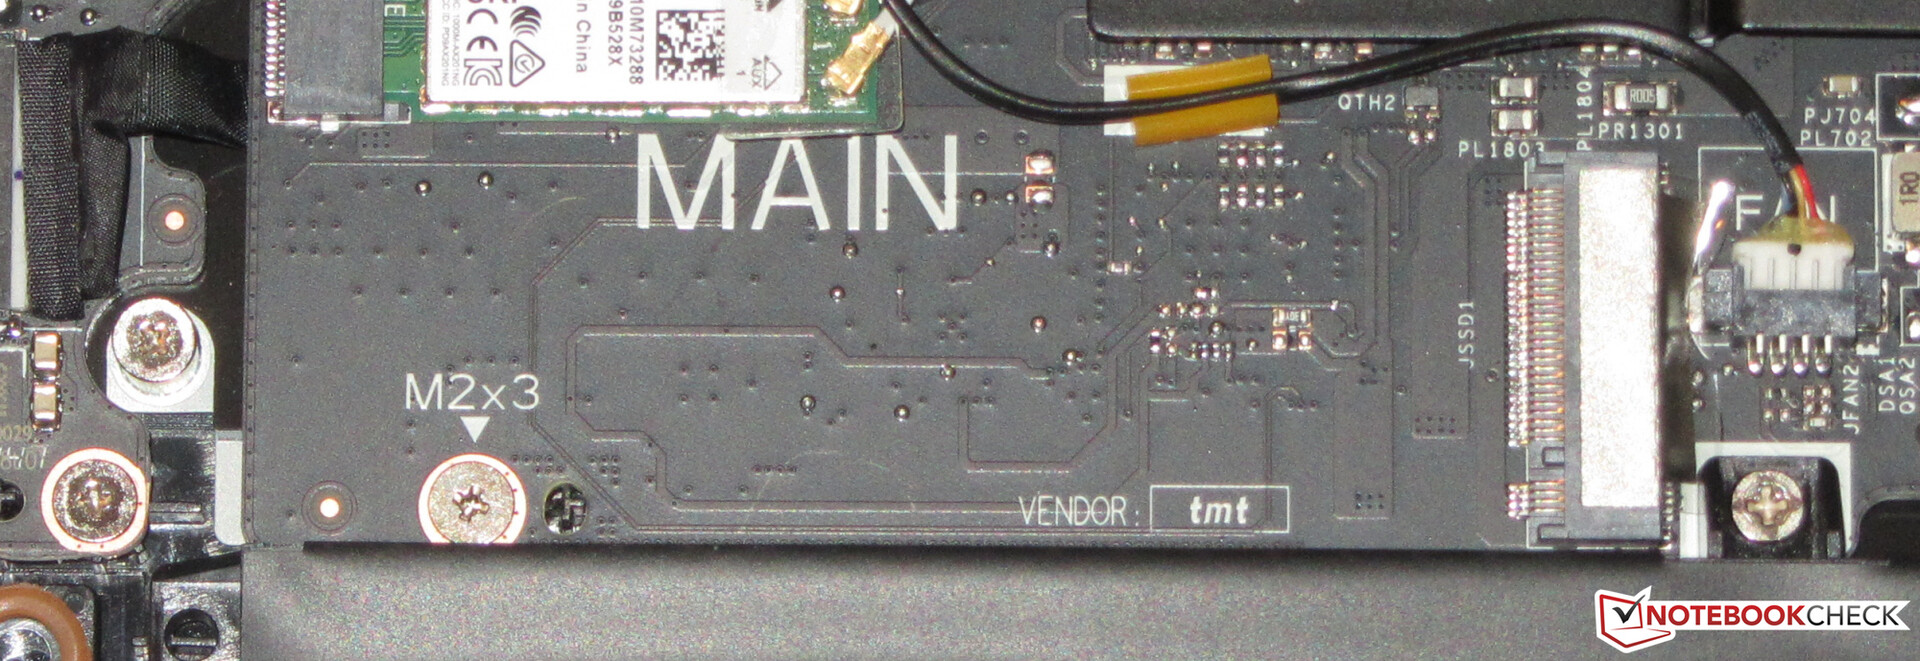
Storage Devices
The Lenovo laptop features an NVMe SSD from Samsung. The SSD comes in the M.2-2280 form-factor and has a capacity of 1 TB. There is an empty slot for another NVMe SSD (M.2-2280).

| Lenovo Legion C7 15IMH05 82EH0030GE Samsung PM981a MZVLB1T0HBLR | Alienware m15 R4 Micron 2300 1TB MTFDHBA1T0TDV | Asus ROG Strix G15 G513QR SK Hynix HFM001TD3JX013N | Schenker XMG Pro 15 (Early 2021, RTX 3080) Samsung SSD 970 EVO Plus 1TB | Lenovo Legion 7 15IMH05-81YT001VGE 2x Samsung PM981a MZVLB1T0HBLR (RAID 0) | Average Samsung PM981a MZVLB1T0HBLR | Average of class Gaming | |
|---|---|---|---|---|---|---|---|
| CrystalDiskMark 5.2 / 6 | 5% | 19% | 9% | 2% | 67% | ||
| Write 4K (MB/s) | 107.9 | 93.7 -13% | 160.9 49% | 110.4 2% | 139.7 ? 29% | 199.6 ? 85% | |
| Read 4K (MB/s) | 48.48 | 48.1 -1% | 54 11% | 55.1 14% | 49.9 ? 3% | 78.6 ? 62% | |
| Write Seq (MB/s) | 2910 | 2785 -4% | 2944 1% | 2036 ? -30% | 3758 ? 29% | ||
| Read Seq (MB/s) | 2015 | 2598 29% | 2781 38% | 2014 ? 0% | 3633 ? 80% | ||
| Write 4K Q32T1 (MB/s) | 413 | 481.9 17% | 495.2 20% | 466.6 13% | 461 ? 12% | 614 ? 49% | |
| Read 4K Q32T1 (MB/s) | 468.9 | 521 11% | 593 26% | 517 10% | 499 ? 6% | 710 ? 51% | |
| Write Seq Q32T1 (MB/s) | 3016 | 3362 11% | 3283 9% | 3424 14% | 2903 ? -4% | 5333 ? 77% | |
| Read Seq Q32T1 (MB/s) | 3533 | 3200 -9% | 3549 0% | 3519 0% | 3479 ? -2% | 7102 ? 101% | |
| Write 4K Q8T8 (MB/s) | 1496 | 1491 ? | 1308 ? | ||||
| Read 4K Q8T8 (MB/s) | 1597 | 1499 ? | 1647 ? | ||||
| AS SSD | -23% | 2% | 24% | 1% | 1% | 52% | |
| Seq Read (MB/s) | 2804 | 2658 -5% | 2881 3% | 2959 6% | 3088 10% | 2553 ? -9% | 5591 ? 99% |
| Seq Write (MB/s) | 2765 | 2769 0% | 1570 -43% | 2521 -9% | 2561 -7% | 2084 ? -25% | 3972 ? 44% |
| 4K Read (MB/s) | 44.96 | 46.07 2% | 52.4 17% | 50.9 13% | 43.01 -4% | 53.1 ? 18% | 71.1 ? 58% |
| 4K Write (MB/s) | 98.3 | 87.2 -11% | 124 26% | 141.1 44% | 102 4% | 131.2 ? 33% | 215 ? 119% |
| 4K-64 Read (MB/s) | 1503 | 1372 -9% | 1334 -11% | 2110 40% | 1549 3% | 1477 ? -2% | 1618 ? 8% |
| 4K-64 Write (MB/s) | 1845 | 1247 -32% | 2189 19% | 2329 26% | 1378 -25% | 1805 ? -2% | 2935 ? 59% |
| Access Time Read * (ms) | 0.058 | 0.052 10% | 0.055 5% | 0.034 41% | 0.051 12% | 0.04983 ? 14% | 0.06364 ? -10% |
| Access Time Write * (ms) | 0.038 | 0.098 -158% | 0.03 21% | 0.026 32% | 0.037 3% | 0.04222 ? -11% | 0.03794 ? -0% |
| Score Read (Points) | 1828 | 1684 -8% | 1675 -8% | 2457 34% | 1901 4% | 1786 ? -2% | 2248 ? 23% |
| Score Write (Points) | 2220 | 1611 -27% | 2470 11% | 2722 23% | 1737 -22% | 2144 ? -3% | 3547 ? 60% |
| Score Total (Points) | 4983 | 4166 -16% | 4943 -1% | 6412 29% | 4583 -8% | 4826 ? -3% | 6872 ? 38% |
| Copy ISO MB/s (MB/s) | 1904 | 1277 -33% | 2275 19% | 2684 41% | 2098 ? 10% | 3168 ? 66% | |
| Copy Program MB/s (MB/s) | 567 | 575 1% | 593 5% | 544 -4% | 500 ? -12% | 981 ? 73% | |
| Copy Game MB/s (MB/s) | 1112 | 1272 14% | 1408 27% | 1116 0% | 1132 ? 2% | 2112 ? 90% | |
| Total Average (Program / Settings) | -9% /
-11% | 2% /
2% | 22% /
22% | 5% /
3% | 2% /
1% | 60% /
57% |
* ... smaller is better
Continuous read speed: DiskSpd Read Loop, Queue Depth 8
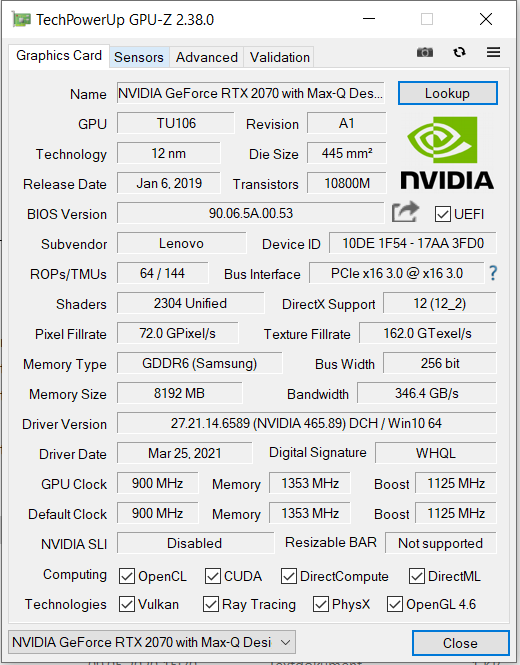
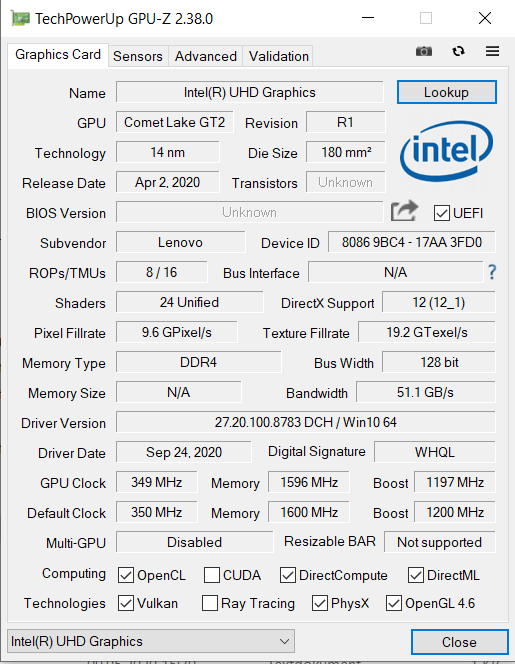
Graphics Card
The GeForce RTX 2070 Max-Q is a gaming GPU for light and thin laptops. The GPU comes with 8 GB of fast GDDR6 memory. The UHD Graphics 630, which is integrated into the Core i7-10875H, is enabled. Nvidia’s Optimus technology is supported. The iGPU can be disabled in the BIOS settings.
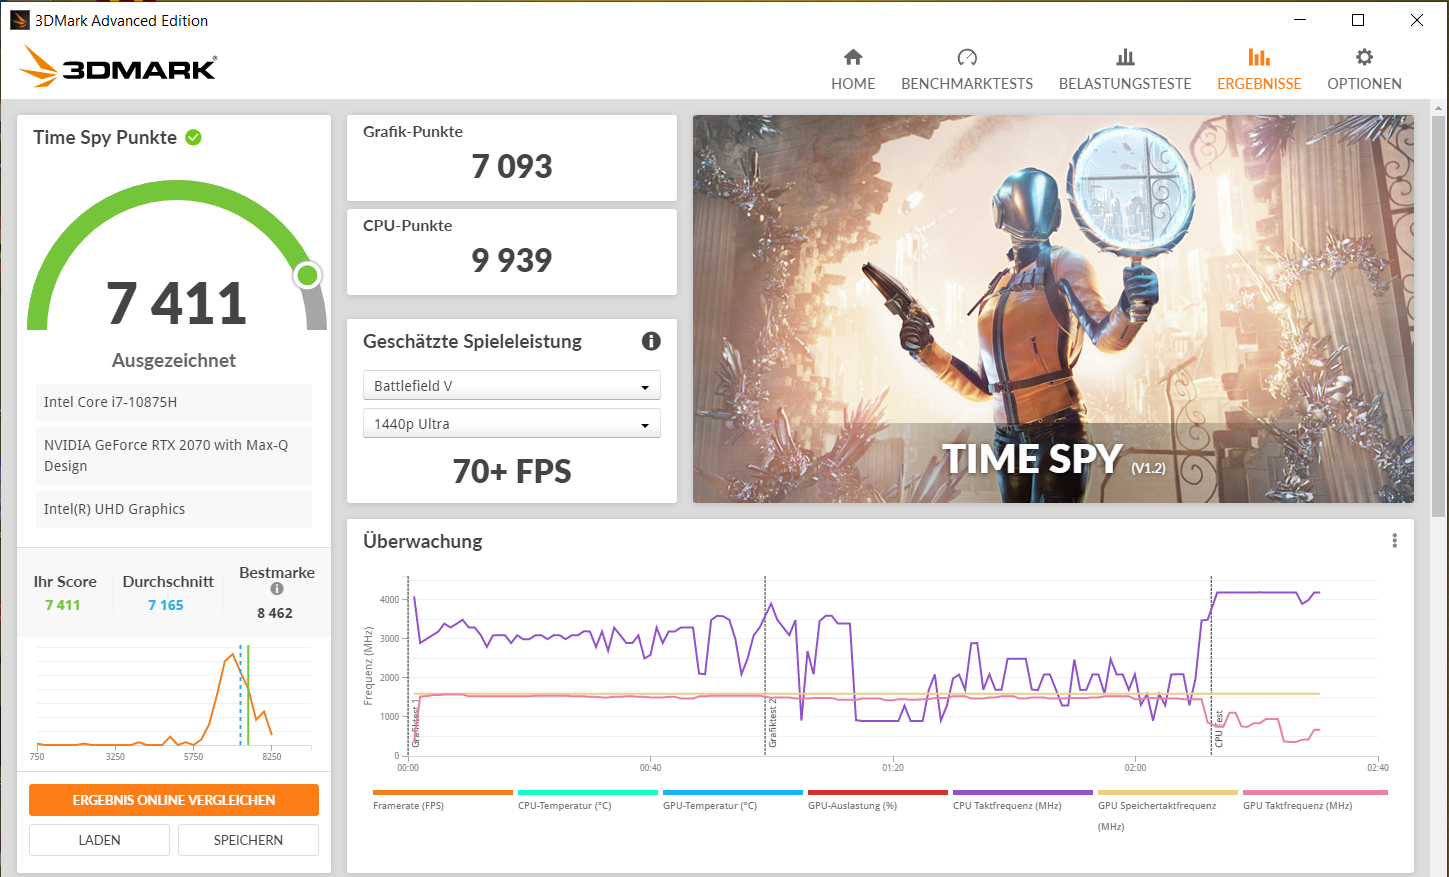
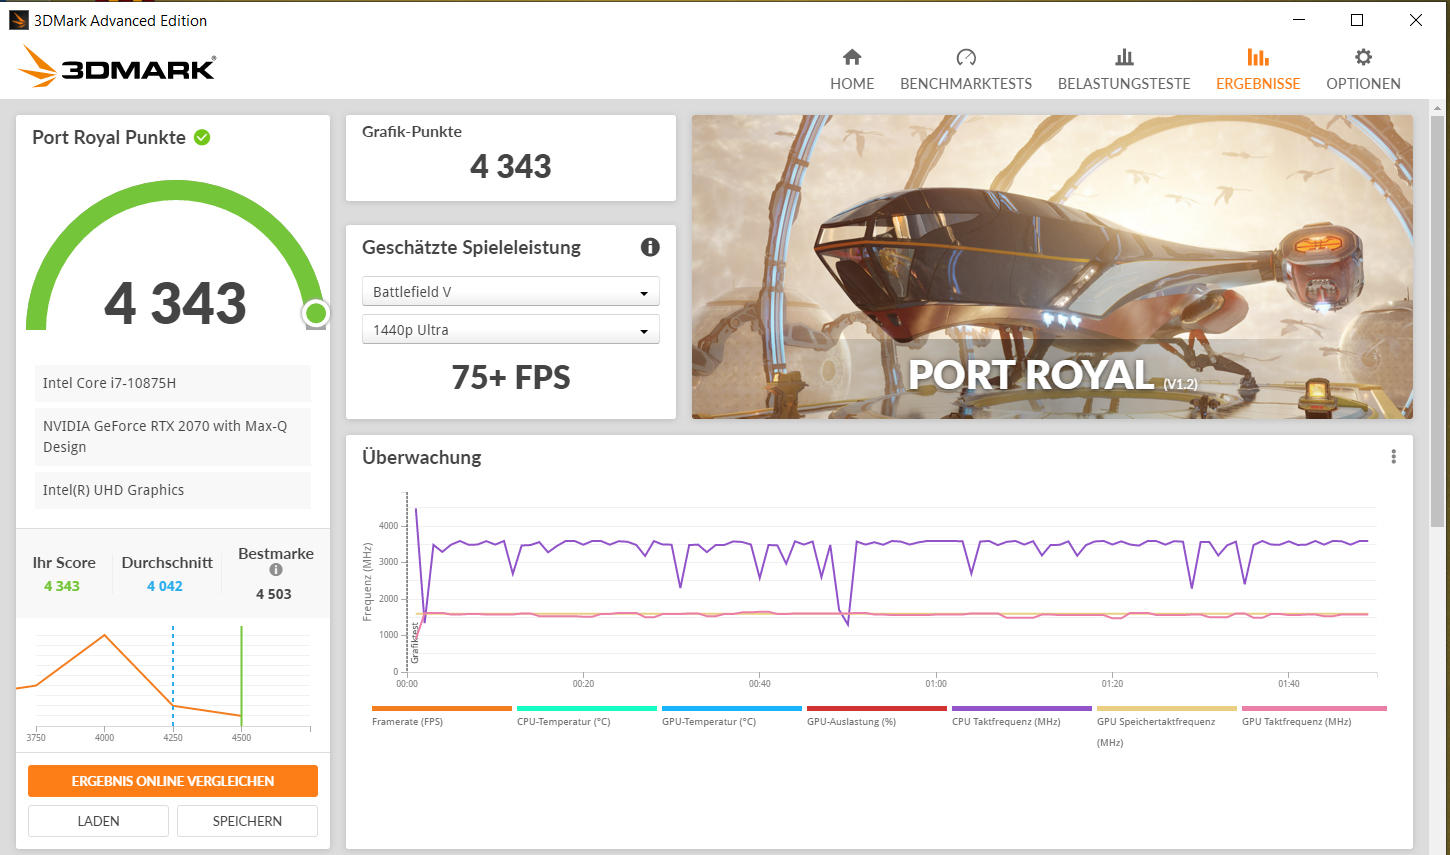
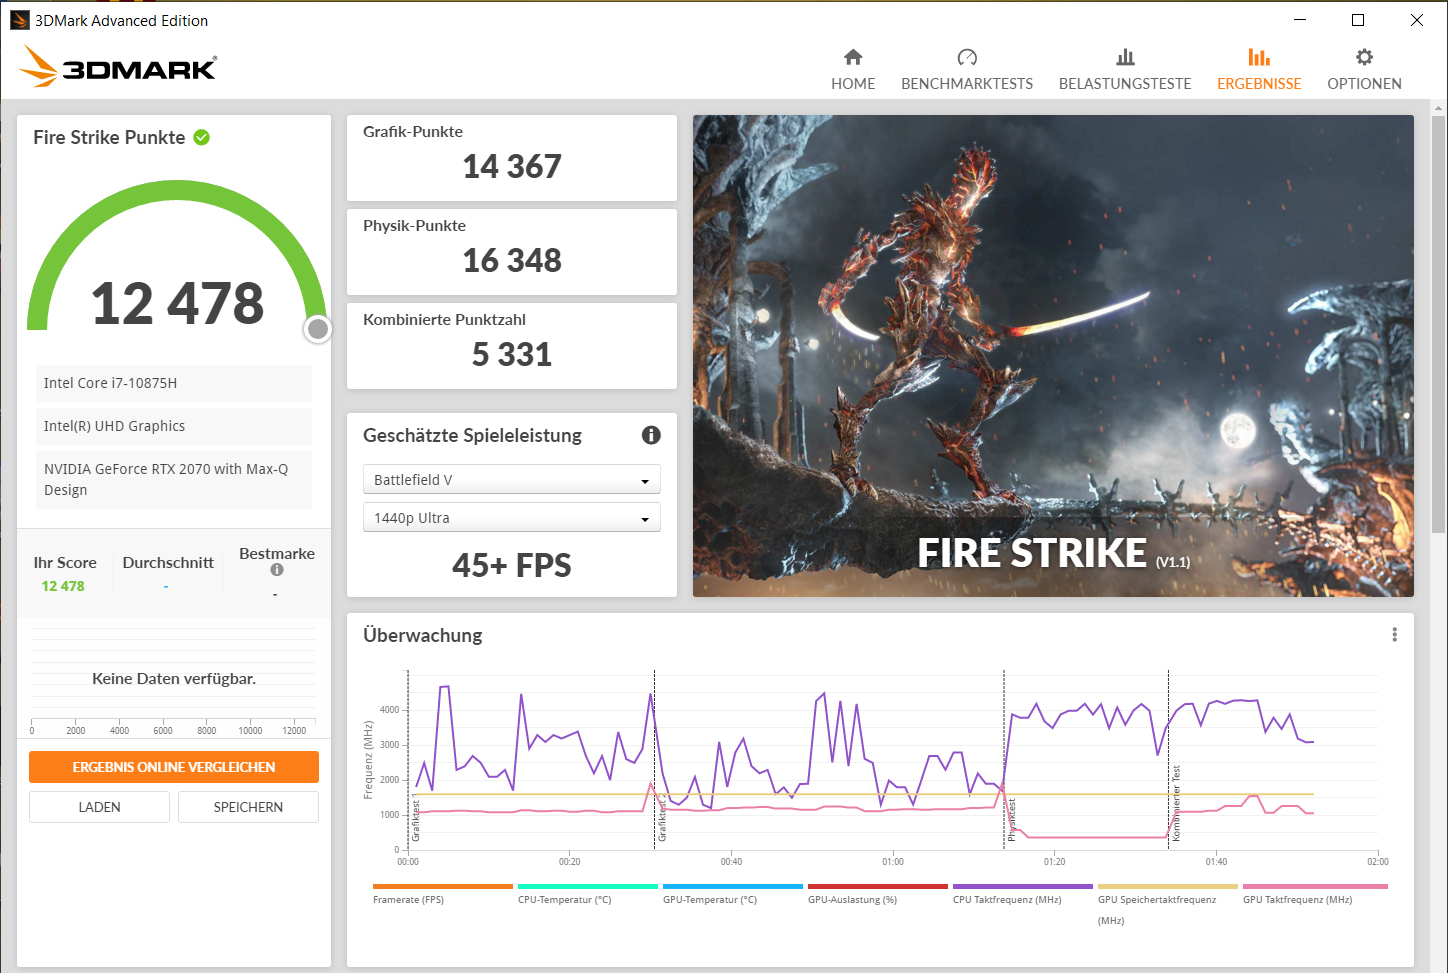
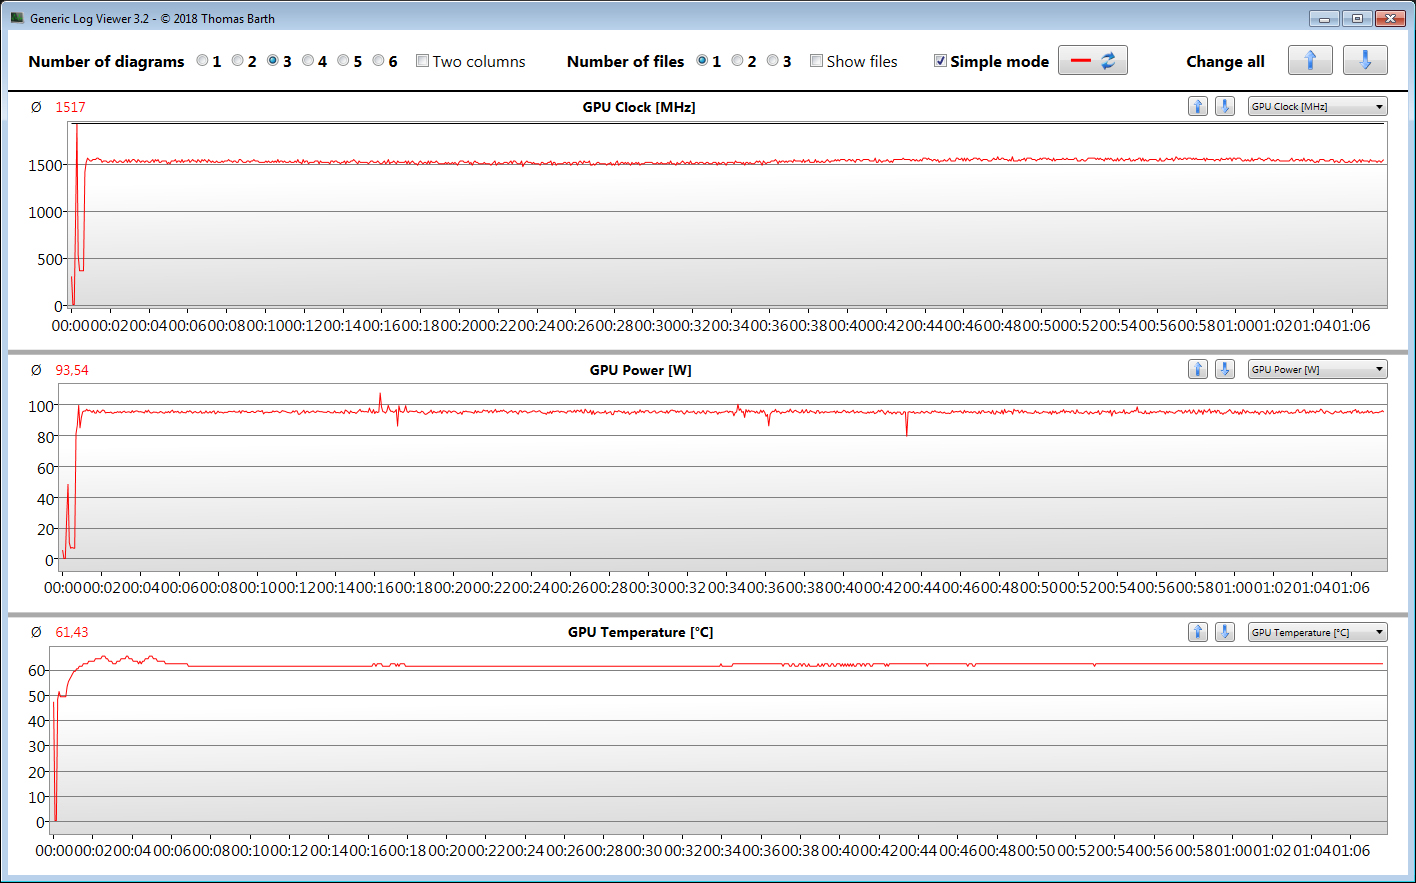
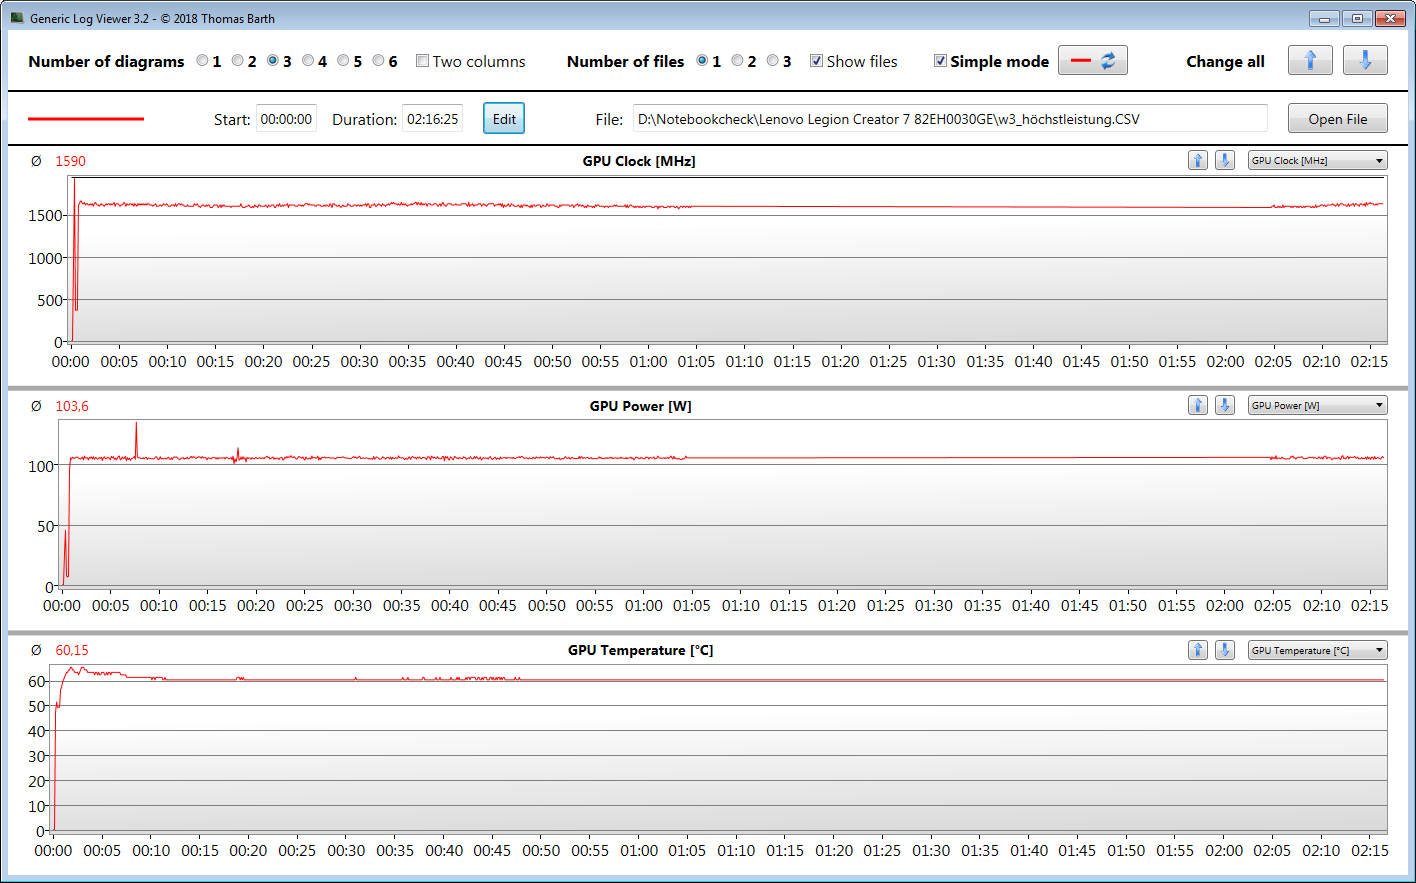
The 3DMark results are on a normal level for this kind of GPU. In "High Performance" mode, the TGP increases slightly (from 94 to 104 watts in the stress test with The Witcher 3), which leads to a boost in frame rates.
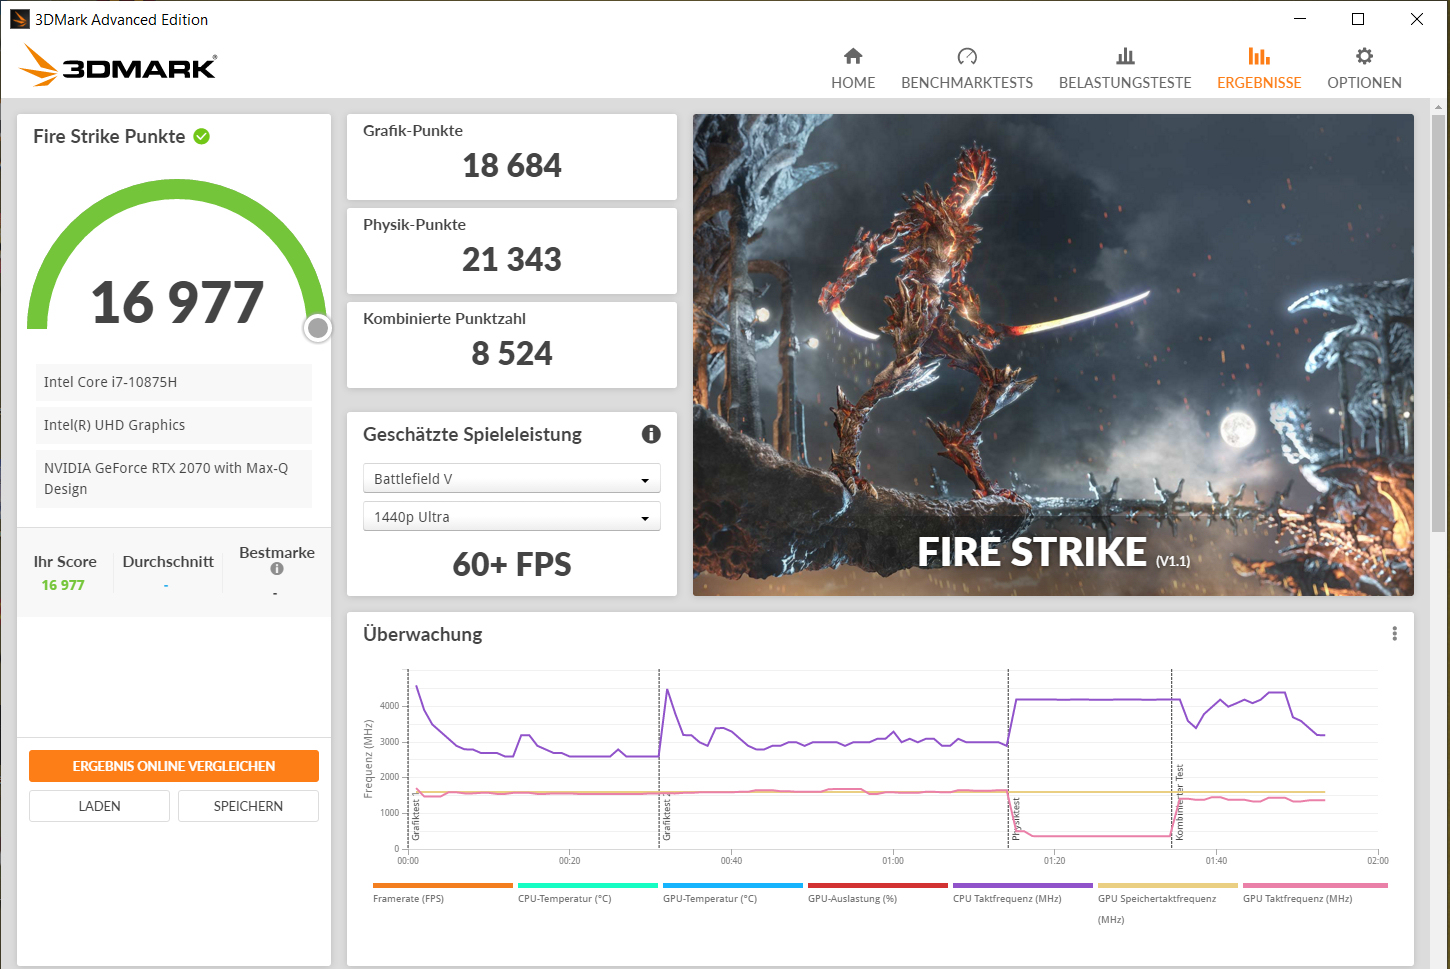


| 3DMark 11 Performance | 22214 points | |
| 3DMark Cloud Gate Standard Score | 45007 points | |
| 3DMark Fire Strike Score | 16977 points | |
| 3DMark Time Spy Score | 7411 points | |
Help | ||
| 3DMark 11 - 1280x720 Performance GPU | |
| Average of class Gaming (21841 - 80022, n=104, last 2 years) | |
| Alienware m15 R4 | |
| Schenker XMG Pro 15 (Early 2021, RTX 3080) | |
| Asus ROG Strix G15 G513QR | |
| Lenovo Legion 7 15IMH05-81YT001VGE | |
| Lenovo Legion C7 15IMH05 82EH0030GE (Hoechstleistung) | |
| Lenovo Legion C7 15IMH05 82EH0030GE | |
| Average NVIDIA GeForce RTX 2070 Max-Q (14723 - 27694, n=31) | |
| 3DMark | |
| 1920x1080 Fire Strike Graphics | |
| Average of class Gaming (12242 - 62849, n=115, last 2 years) | |
| Alienware m15 R4 | |
| Schenker XMG Pro 15 (Early 2021, RTX 3080) | |
| Asus ROG Strix G15 G513QR | |
| Lenovo Legion 7 15IMH05-81YT001VGE | |
| Lenovo Legion C7 15IMH05 82EH0030GE (Hoechstleistung) | |
| Lenovo Legion C7 15IMH05 82EH0030GE | |
| Average NVIDIA GeForce RTX 2070 Max-Q (11563 - 21191, n=31) | |
| 1280x720 Cloud Gate Standard Graphics | |
| Alienware m15 R4 | |
| Average of class Gaming (86886 - 223650, n=60, last 2 years) | |
| Schenker XMG Pro 15 (Early 2021, RTX 3080) | |
| Lenovo Legion C7 15IMH05 82EH0030GE | |
| Average NVIDIA GeForce RTX 2070 Max-Q (39014 - 134255, n=28) | |
| Asus ROG Strix G15 G513QR | |
| 2560x1440 Time Spy Graphics | |
| Average of class Gaming (5012 - 26212, n=115, last 2 years) | |
| Alienware m15 R4 | |
| Asus ROG Strix G15 G513QR | |
| Schenker XMG Pro 15 (Early 2021, RTX 3080) | |
| Lenovo Legion 7 15IMH05-81YT001VGE | |
| Lenovo Legion C7 15IMH05 82EH0030GE (Hoechstleistung) | |
| Lenovo Legion C7 15IMH05 82EH0030GE | |
| Average NVIDIA GeForce RTX 2070 Max-Q (5948 - 8065, n=28) | |
Gaming Performance
The Lenovo laptop can run all current games smoothly at 1080p on the highest setting. To achieve playable frame rates at higher resolutions (for instance, when gaming with an external monitor), the graphics settings will have to be lowered in many cases. In “High Performance” power mode, the gaming performance improves slightly.
| The Witcher 3 - 1920x1080 Ultra Graphics & Postprocessing (HBAO+) | |
| Average of class Gaming (104.7 - 240, n=7, last 2 years) | |
| Alienware m15 R4 | |
| Schenker XMG Pro 15 (Early 2021, RTX 3080) | |
| Asus ROG Strix G15 G513QR | |
| Lenovo Legion 7 15IMH05-81YT001VGE | |
| Lenovo Legion C7 15IMH05 82EH0030GE (Hoechstleistung) | |
| Lenovo Legion C7 15IMH05 82EH0030GE | |
| Average NVIDIA GeForce RTX 2070 Max-Q (56 - 83.8, n=31) | |
| Dota 2 Reborn - 1920x1080 ultra (3/3) best looking | |
| Average of class Gaming (84.8 - 248, n=107, last 2 years) | |
| Alienware m15 R4 | |
| Lenovo Legion 7 15IMH05-81YT001VGE | |
| Lenovo Legion C7 15IMH05 82EH0030GE | |
| Lenovo Legion C7 15IMH05 82EH0030GE (Hoechstleistung) | |
| Average NVIDIA GeForce RTX 2070 Max-Q (105.8 - 126, n=13) | |
| Schenker XMG Pro 15 (Early 2021, RTX 3080) | |
| Lenovo Legion C7 15IMH05 82EH0030GE (Fluestermodus) | |
| Asus ROG Strix G15 G513QR | |
| X-Plane 11.11 - 1920x1080 high (fps_test=3) | |
| Average of class Gaming (55.5 - 143.5, n=109, last 2 years) | |
| Alienware m15 R4 | |
| Lenovo Legion 7 15IMH05-81YT001VGE | |
| Lenovo Legion C7 15IMH05 82EH0030GE (Hoechstleistung) | |
| Lenovo Legion C7 15IMH05 82EH0030GE | |
| Schenker XMG Pro 15 (Early 2021, RTX 3080) | |
| Average NVIDIA GeForce RTX 2070 Max-Q (61.6 - 85.3, n=11) | |
| Lenovo Legion C7 15IMH05 82EH0030GE (Fluestermodus) | |
| Asus ROG Strix G15 G513QR | |
| Far Cry 5 - 1920x1080 Ultra Preset AA:T | |
| Average of class Gaming (70 - 151, n=6, last 2 years) | |
| Lenovo Legion 7 15IMH05-81YT001VGE | |
| Alienware m15 R4 | |
| Lenovo Legion C7 15IMH05 82EH0030GE (Hoechstleistung) | |
| Lenovo Legion C7 15IMH05 82EH0030GE | |
| Asus ROG Strix G15 G513QR | |
| Average NVIDIA GeForce RTX 2070 Max-Q (67 - 101, n=7) | |
| Shadow of the Tomb Raider - 1920x1080 Highest Preset AA:T | |
| Lenovo Legion 7 15IMH05-81YT001VGE | |
| Average of class Gaming (96 - 116, n=2, last 2 years) | |
| Schenker XMG Pro 15 (Early 2021, RTX 3080) | |
| Lenovo Legion C7 15IMH05 82EH0030GE | |
| Average NVIDIA GeForce RTX 2070 Max-Q (57 - 89, n=12) | |
| Dirt 5 - 1920x1080 Ultra High Preset | |
| Lenovo Legion C7 15IMH05 82EH0030GE | |
| Average NVIDIA GeForce RTX 2070 Max-Q (n=1) | |
| Hitman 3 - 1920x1080 Maximum Settings AF:16x | |
| Lenovo Legion C7 15IMH05 82EH0030GE | |
| Average NVIDIA GeForce RTX 2070 Max-Q (n=1) | |
We use the video game known as "The Witcher 3" to check if the frame rates can be maintained consistently over an extended period of time. For this, we run the game on the highest settings at 1080p for one hour. Over the entire run of gameplay, the player-controlled character just stands still. There are no frame rate drops to report.
| low | med. | high | ultra | |
|---|---|---|---|---|
| The Witcher 3 (2015) | 301 | 221 | 130 | 72.4 |
| Dota 2 Reborn (2015) | 155 | 139 | 131 | 125 |
| X-Plane 11.11 (2018) | 115 | 101 | 84.4 | |
| Far Cry 5 (2018) | 160 | 113 | 105 | 99 |
| Shadow of the Tomb Raider (2018) | 144 | 107 | 96 | 86 |
| Serious Sam 4 (2020) | 120 | 82.6 | 73.2 | 59.8 |
| Watch Dogs Legion (2020) | 123 | 88.2 | 77.5 | 51.5 |
| Dirt 5 (2020) | 168 | 92.1 | 75.5 | 56.6 |
| Assassin´s Creed Valhalla (2020) | 102 | 71 | 59 | 53 |
| Immortals Fenyx Rising (2020) | 124 | 84 | 76 | 70 |
| Cyberpunk 2077 1.0 (2020) | 115 | 65 | 54.9 | 47.1 |
| Hitman 3 (2021) | 192.7 | 117.2 | 104.5 | 95.5 |
Emissions & Energy - The Lenovo Laptop can be quiet
System Noise
When idle and under low load, the fans often stand still, which leads to silent operation. Under high load, the fans start to spin really fast. We measured a maximum sound pressure level of 47.7 dB(A).
We recommend using the "Quiet" power mode in day-to-day use. In this mode, the fans stand still even under high loud. However, the Lenovo laptop still offers enough performance for office applications and Internet-browsing.
Noise level
| Idle |
| 24.9 / 24.9 / 24.9 dB(A) |
| Load |
| 34.6 / 47.7 dB(A) |
 | ||
30 dB silent 40 dB(A) audible 50 dB(A) loud |
||
min: | ||
Temperature
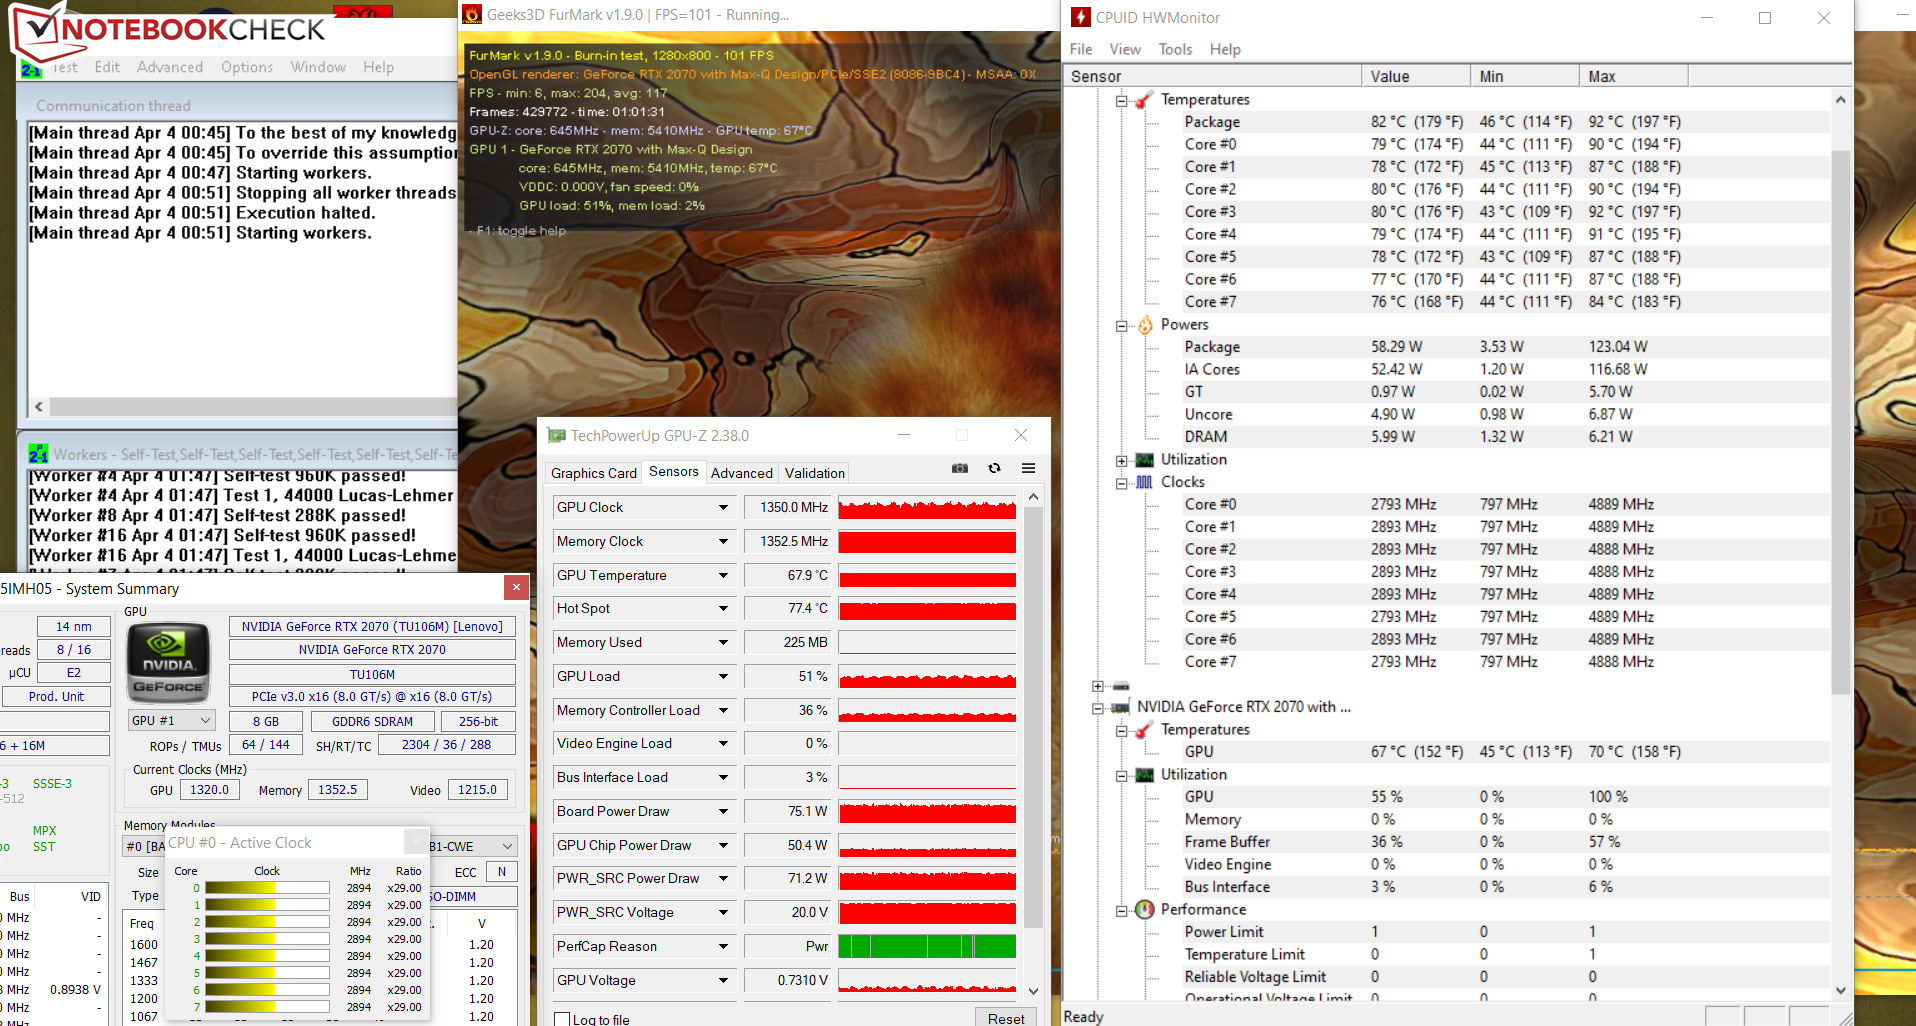
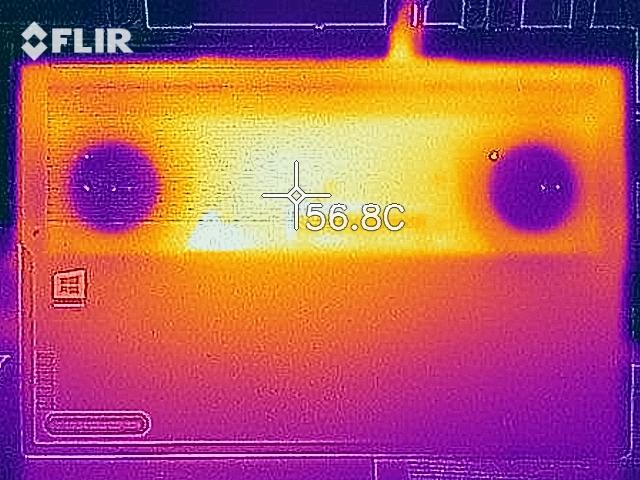
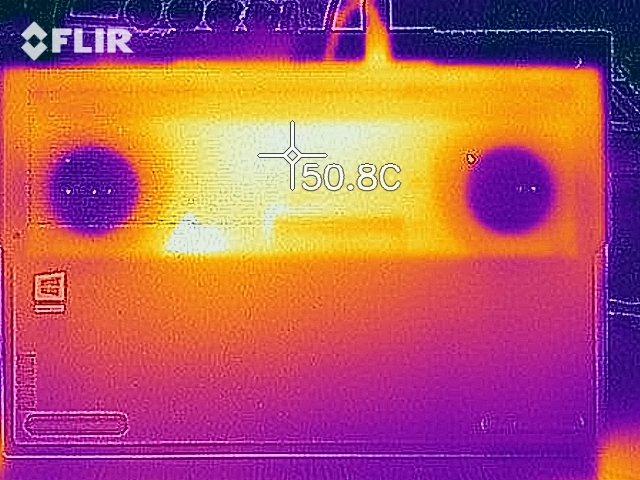
In our stress test (Prime95 and FurMark running continuously for at least one hour), the processor operated at 2.9 GHz when plugged in and 600 to 900 MHz when running on battery power, and the graphics chip ran at 1300 to 1400 MHz when plugged in and 900 to 1100 MHz when running on battery power. The stress test is an extreme case scenario, which is very unlikely to occur in real life. We use it to test system stability under full load.
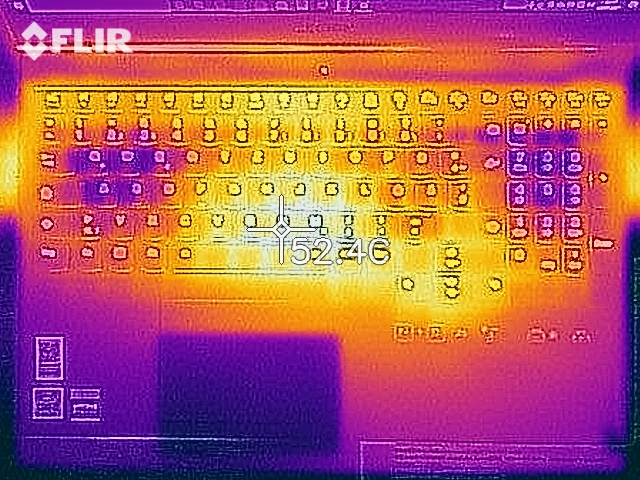
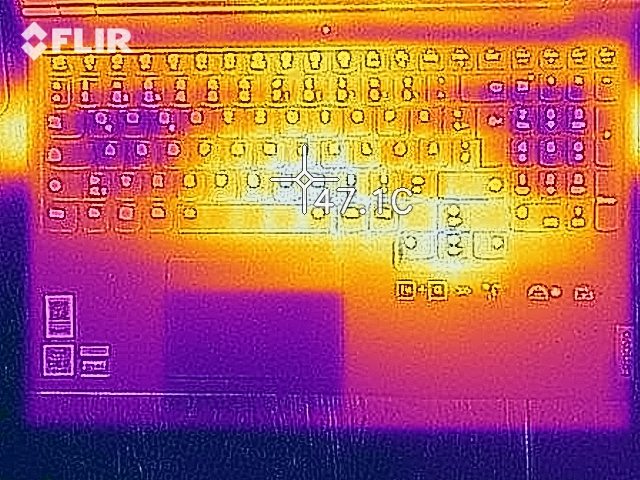
The notebook does not become very hot. During the stress test, the 40-°C (104-°F) mark was exceeded at three measurement points. In the gaming stress test, the surface temperatures were lower. In everyday use, the temperatures are always more than acceptable.
(±) The maximum temperature on the upper side is 41.4 °C / 107 F, compared to the average of 40.4 °C / 105 F, ranging from 21.2 to 68.8 °C for the class Gaming.
(-) The bottom heats up to a maximum of 45.1 °C / 113 F, compared to the average of 43.2 °C / 110 F
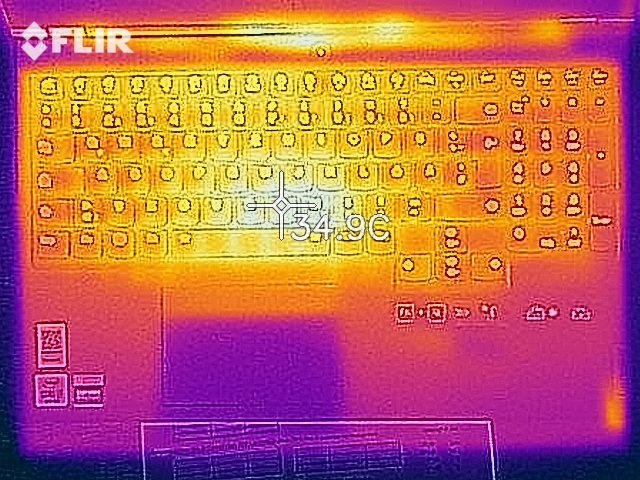
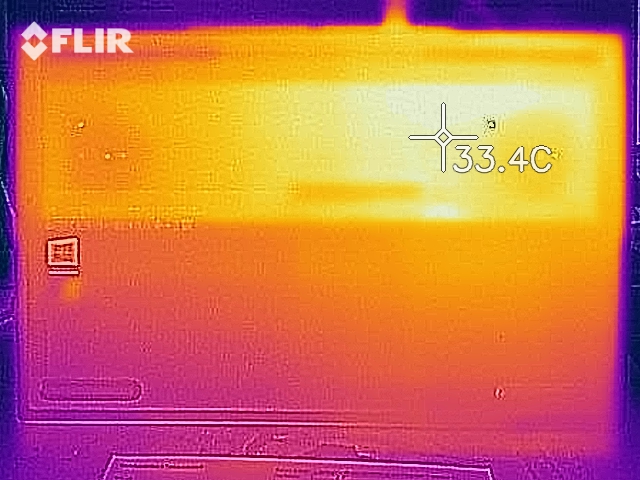
(+) In idle usage, the average temperature for the upper side is 25.4 °C / 78 F, compared to the device average of 33.9 °C / 93 F.
(±) Playing The Witcher 3, the average temperature for the upper side is 33.1 °C / 92 F, compared to the device average of 33.9 °C / 93 F.
(+) The palmrests and touchpad are cooler than skin temperature with a maximum of 30.6 °C / 87.1 F and are therefore cool to the touch.
(±) The average temperature of the palmrest area of similar devices was 28.8 °C / 83.8 F (-1.8 °C / -3.3 F).
Speakers
The stereo speakers sound acceptable, but produce very little bass.
Lenovo Legion C7 15IMH05 82EH0030GE audio analysis
(±) | speaker loudness is average but good (72 dB)
Bass 100 - 315 Hz
(-) | nearly no bass - on average 20.7% lower than median
(±) | linearity of bass is average (10.6% delta to prev. frequency)
Mids 400 - 2000 Hz
(+) | balanced mids - only 3.7% away from median
(+) | mids are linear (5.9% delta to prev. frequency)
Highs 2 - 16 kHz
(+) | balanced highs - only 2.6% away from median
(+) | highs are linear (4.4% delta to prev. frequency)
Overall 100 - 16.000 Hz
(±) | linearity of overall sound is average (15.3% difference to median)
Compared to same class
» 34% of all tested devices in this class were better, 6% similar, 60% worse
» The best had a delta of 6%, average was 18%, worst was 132%
Compared to all devices tested
» 22% of all tested devices were better, 4% similar, 74% worse
» The best had a delta of 4%, average was 23%, worst was 134%
Energy Consumption
When idle, we measured a maximum power consumption of 12.6 watts. During the stress test, the energy consumption peaked at 201 watts. When gaming, the power draw fluctuated between 140 watts and 149 watts, amounting to 144 watts on average. The rated output of the AC adapter is 230 watts.
| Off / Standby | |
| Idle | |
| Load |
|
Key:
min: | |
Battery Life
Our practically oriented Wi-Fi test simulates loads that are consistent with surfing the web. Here, the Lenovo laptop achieves a battery runtime of 5h 51m. In our video test, the Legion C7 lasted 7h and 8m.
| Lenovo Legion C7 15IMH05 82EH0030GE i7-10875H, GeForce RTX 2070 Max-Q, 80 Wh | Alienware m15 R4 i9-10980HK, GeForce RTX 3070 Laptop GPU, 86 Wh | Asus ROG Strix G15 G513QR R9 5900HX, GeForce RTX 3070 Laptop GPU, 90 Wh | Schenker XMG Pro 15 (Early 2021, RTX 3080) i7-10870H, GeForce RTX 3080 Laptop GPU, 73 Wh | Lenovo Legion 7 15IMH05-81YT001VGE i9-10980HK, GeForce RTX 2080 Super Max-Q, 80 Wh | Average of class Gaming | |
|---|---|---|---|---|---|---|
| Battery runtime | -54% | 45% | -5% | -40% | 2% | |
| Reader / Idle (h) | 12.7 | 3.7 -71% | 8.4 -34% | 8.16 ? -36% | ||
| H.264 (h) | 7.1 | 13.5 90% | 5.5 -23% | 1.5 -79% | 8.32 ? 17% | |
| WiFi v1.3 (h) | 5.9 | 2.7 -54% | 7.4 25% | 7.2 22% | 3.4 -42% | 7.11 ? 21% |
| Load (h) | 1.4 | 0.9 -36% | 1.7 21% | 1.6 14% | 1.4 0% | 1.502 ? 7% |
Pros
Cons
Verdict
The Legion C7 does what it is supposed to do: It can run all current games at 1080p on the highest settings. The fact that it never becomes too loud or too hot makes it suitable for other usage scenarios as well.
The Lenovo Legion C7 15IMH05 is a well-rounded notebook for gamers and content creators alike.
Thanks to the Core i7-10875H, GeForce RTX 2070 Max-Q, 32 GB of dual-channel RAM (64 GB max) and a 1 TB SSD, the Lenovo laptop can handle all current applications. If need be, users can put a second NVMe SSD in the device. The Thunderbolt 3 port allows users to connect external GPUs to the notebook.
The battery life for this kind of device is on a good level. The 144-Hz Full HD display offers a matte surface, good viewing angles and fast response times. What is more, it supports Dolby Vision (a variant of HDR) and covers 100% of the sRGB colour space. Both the contrast ratio and the brightness are on a good level. The backlit keyboard is decent. In addition, Lenovo offers three years of warranty for the C7.
Price and Availability
Unfortunately, the Lenovo Legion C7 15IMH05 is currently not available in the US. In the UK, the sibling model Legion Creator 7i sells for £1729.99 on Lenovo’s website.
Lenovo Legion C7 15IMH05 82EH0030GE
- 04/14/2021 v7 (old)
Sascha Mölck
Price comparison

