Alienware m15 R4 gaming laptop in review: Lots of power, short battery life

Since the Alienware m15 R4 only differs from its predecessor, the m15 R3, in terms of hardware, we will only discuss the new features in the following review. Therefore, you can read about the common features in the review of the Alienware m15 R3.
In our test configuration, the m15 R4 faces our chosen competition with an Intel Core i9-10980HK and an Nvidia GeForce RTX 3070 Mobile. However, other laptops from our database can be added for comparison under each section.
Possible contenders in comparison
Rating | Date | Model | Weight | Height | Size | Resolution | Price |
|---|---|---|---|---|---|---|---|
| 85.4 % v7 (old) | 04 / 2021 | Alienware m15 R4 i9-10980HK, GeForce RTX 3070 Laptop GPU | 2.3 kg | 20 mm | 15.60" | 1920x1080 | |
| 84.8 % v7 (old) | 07 / 2020 | Alienware m15 R3 P87F i7-10750H, GeForce RTX 2070 Mobile | 2.3 kg | 19.9 mm | 15.60" | 1920x1080 | |
| 85.1 % v7 (old) | 03 / 2021 | MSI GP76 Leopard 10UG i7-10750H, GeForce RTX 3070 Laptop GPU | 2.9 kg | 26 mm | 17.30" | 1920x1080 | |
| 84.4 % v7 (old) | 07 / 2020 | Asus ROG Strix Scar 15 G532LWS i9-10980HK, GeForce RTX 2070 Super Mobile | 2.4 kg | 24.9 mm | 15.60" | 1920x1080 |
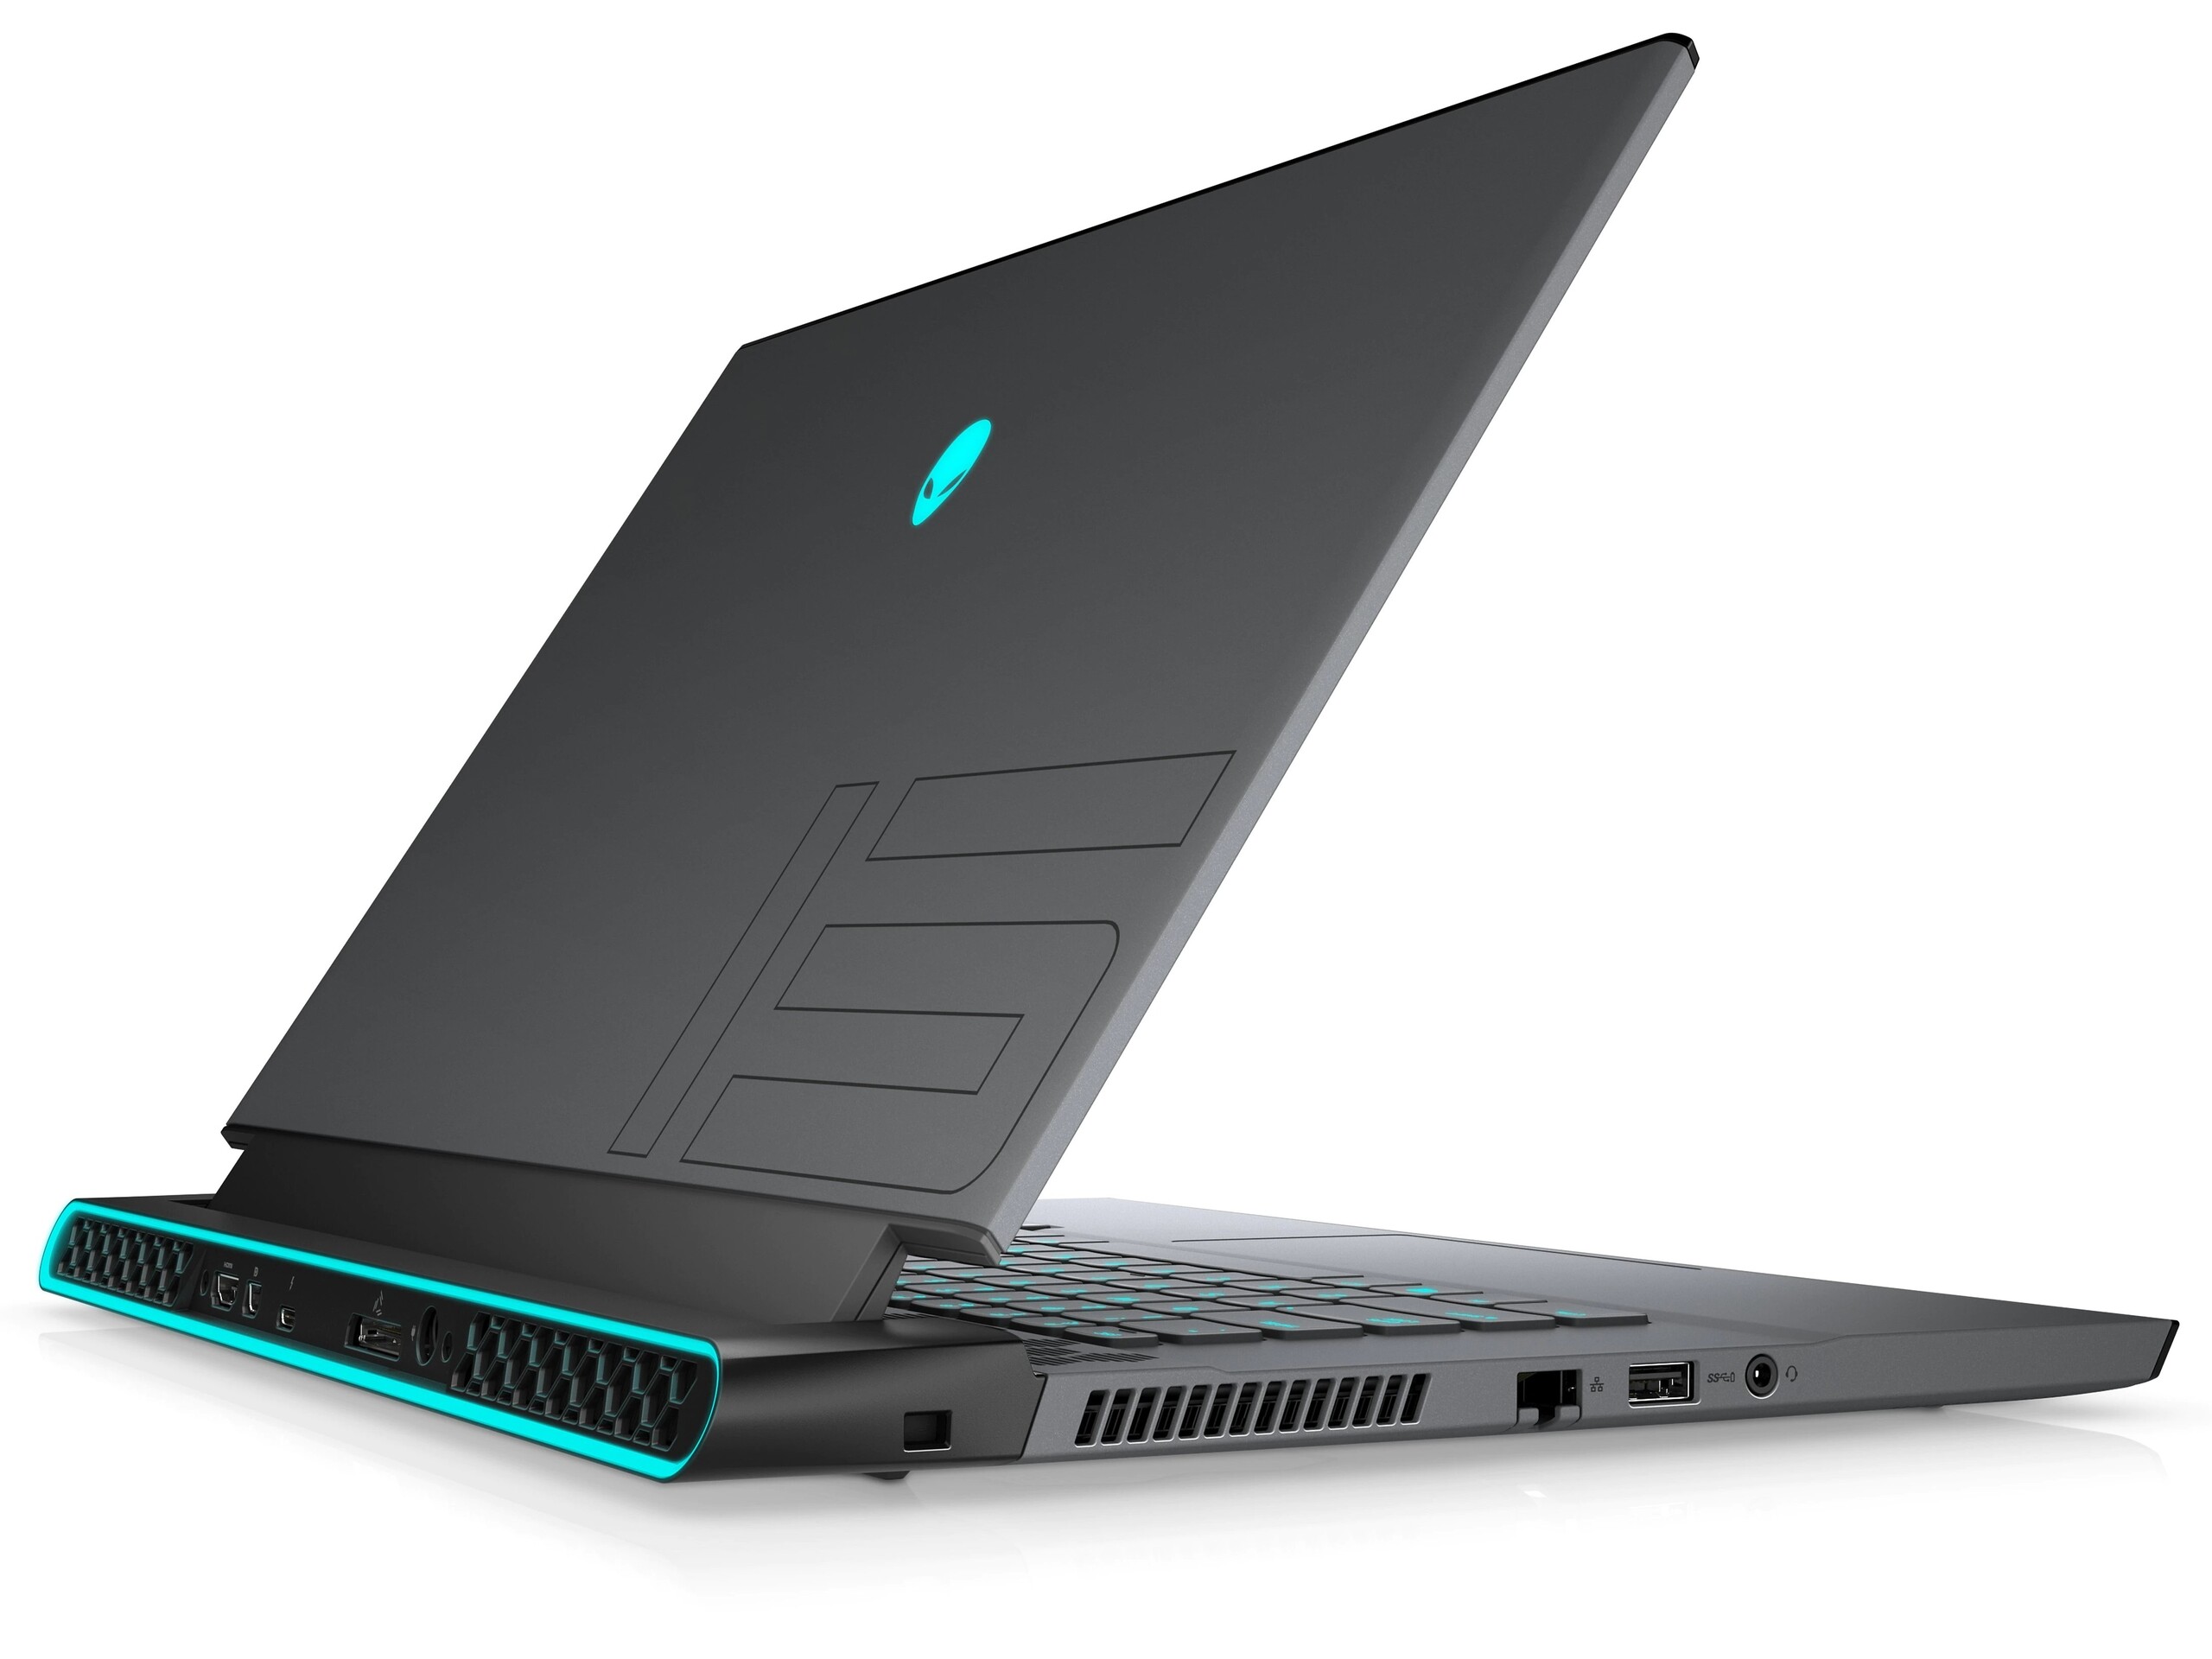
Case - Gaming laptop with strong design
Detailed descriptions of the case and the available ports can be found in the review of the Alienware m15 R3.
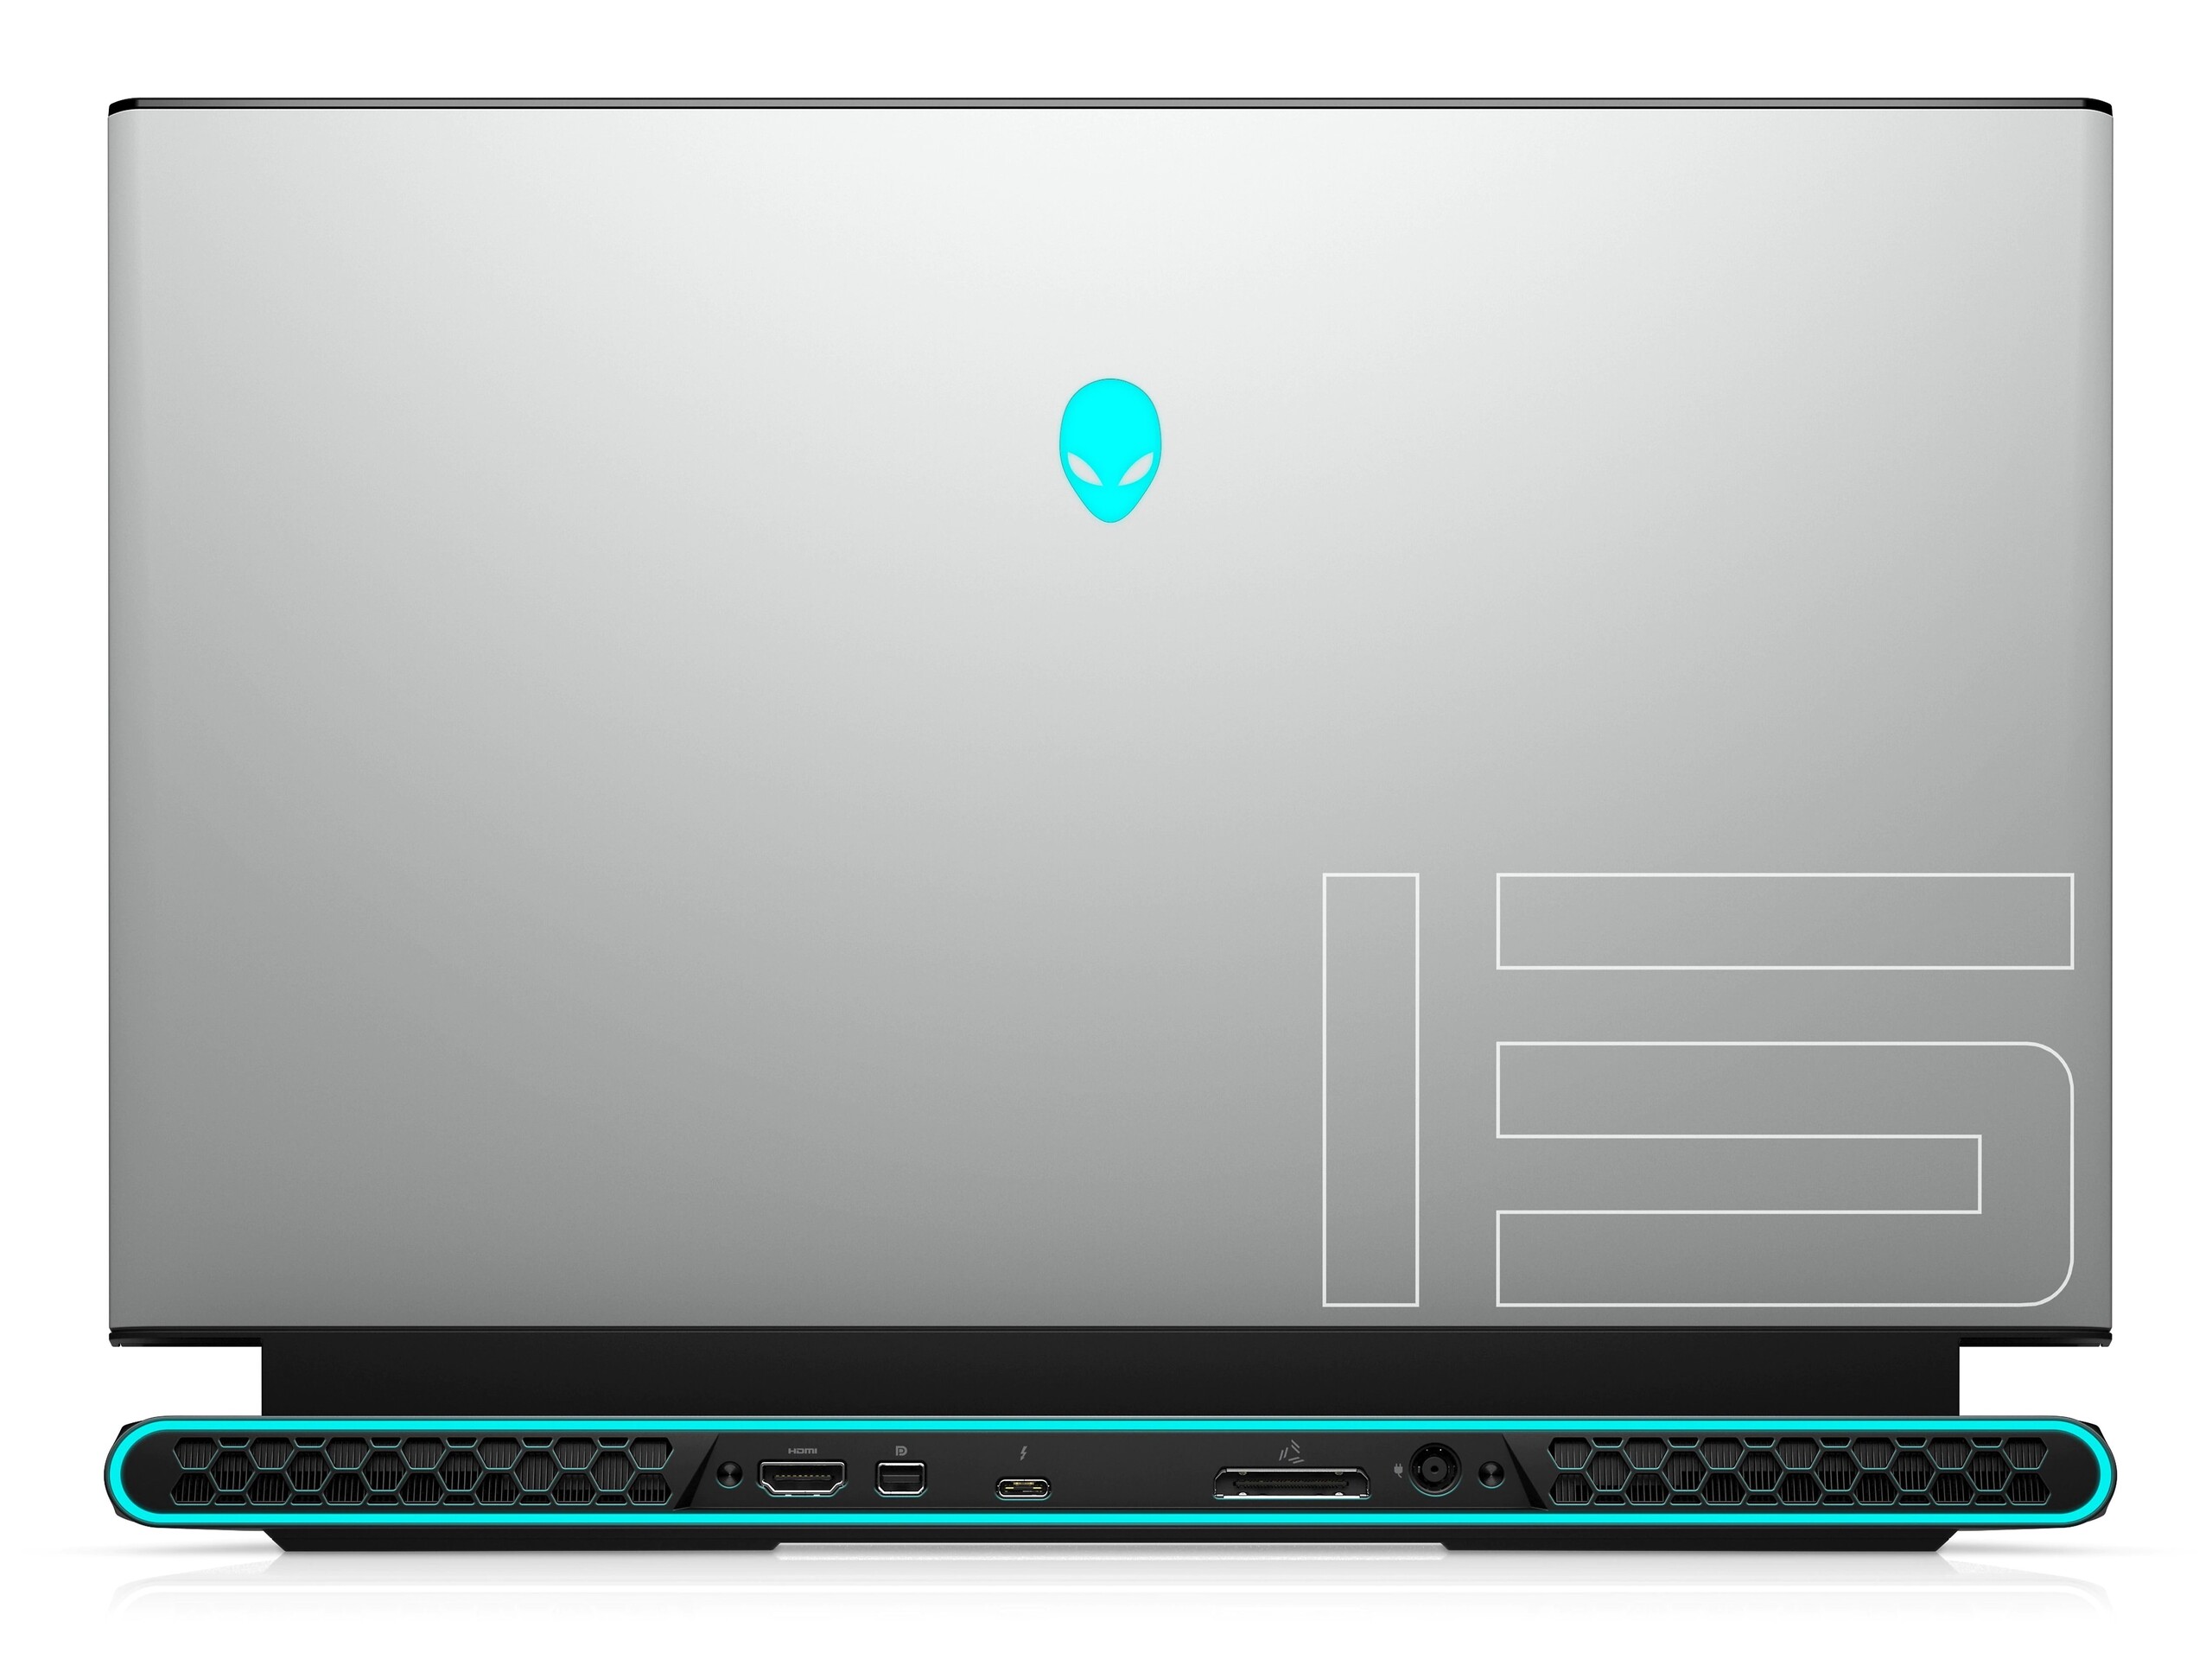

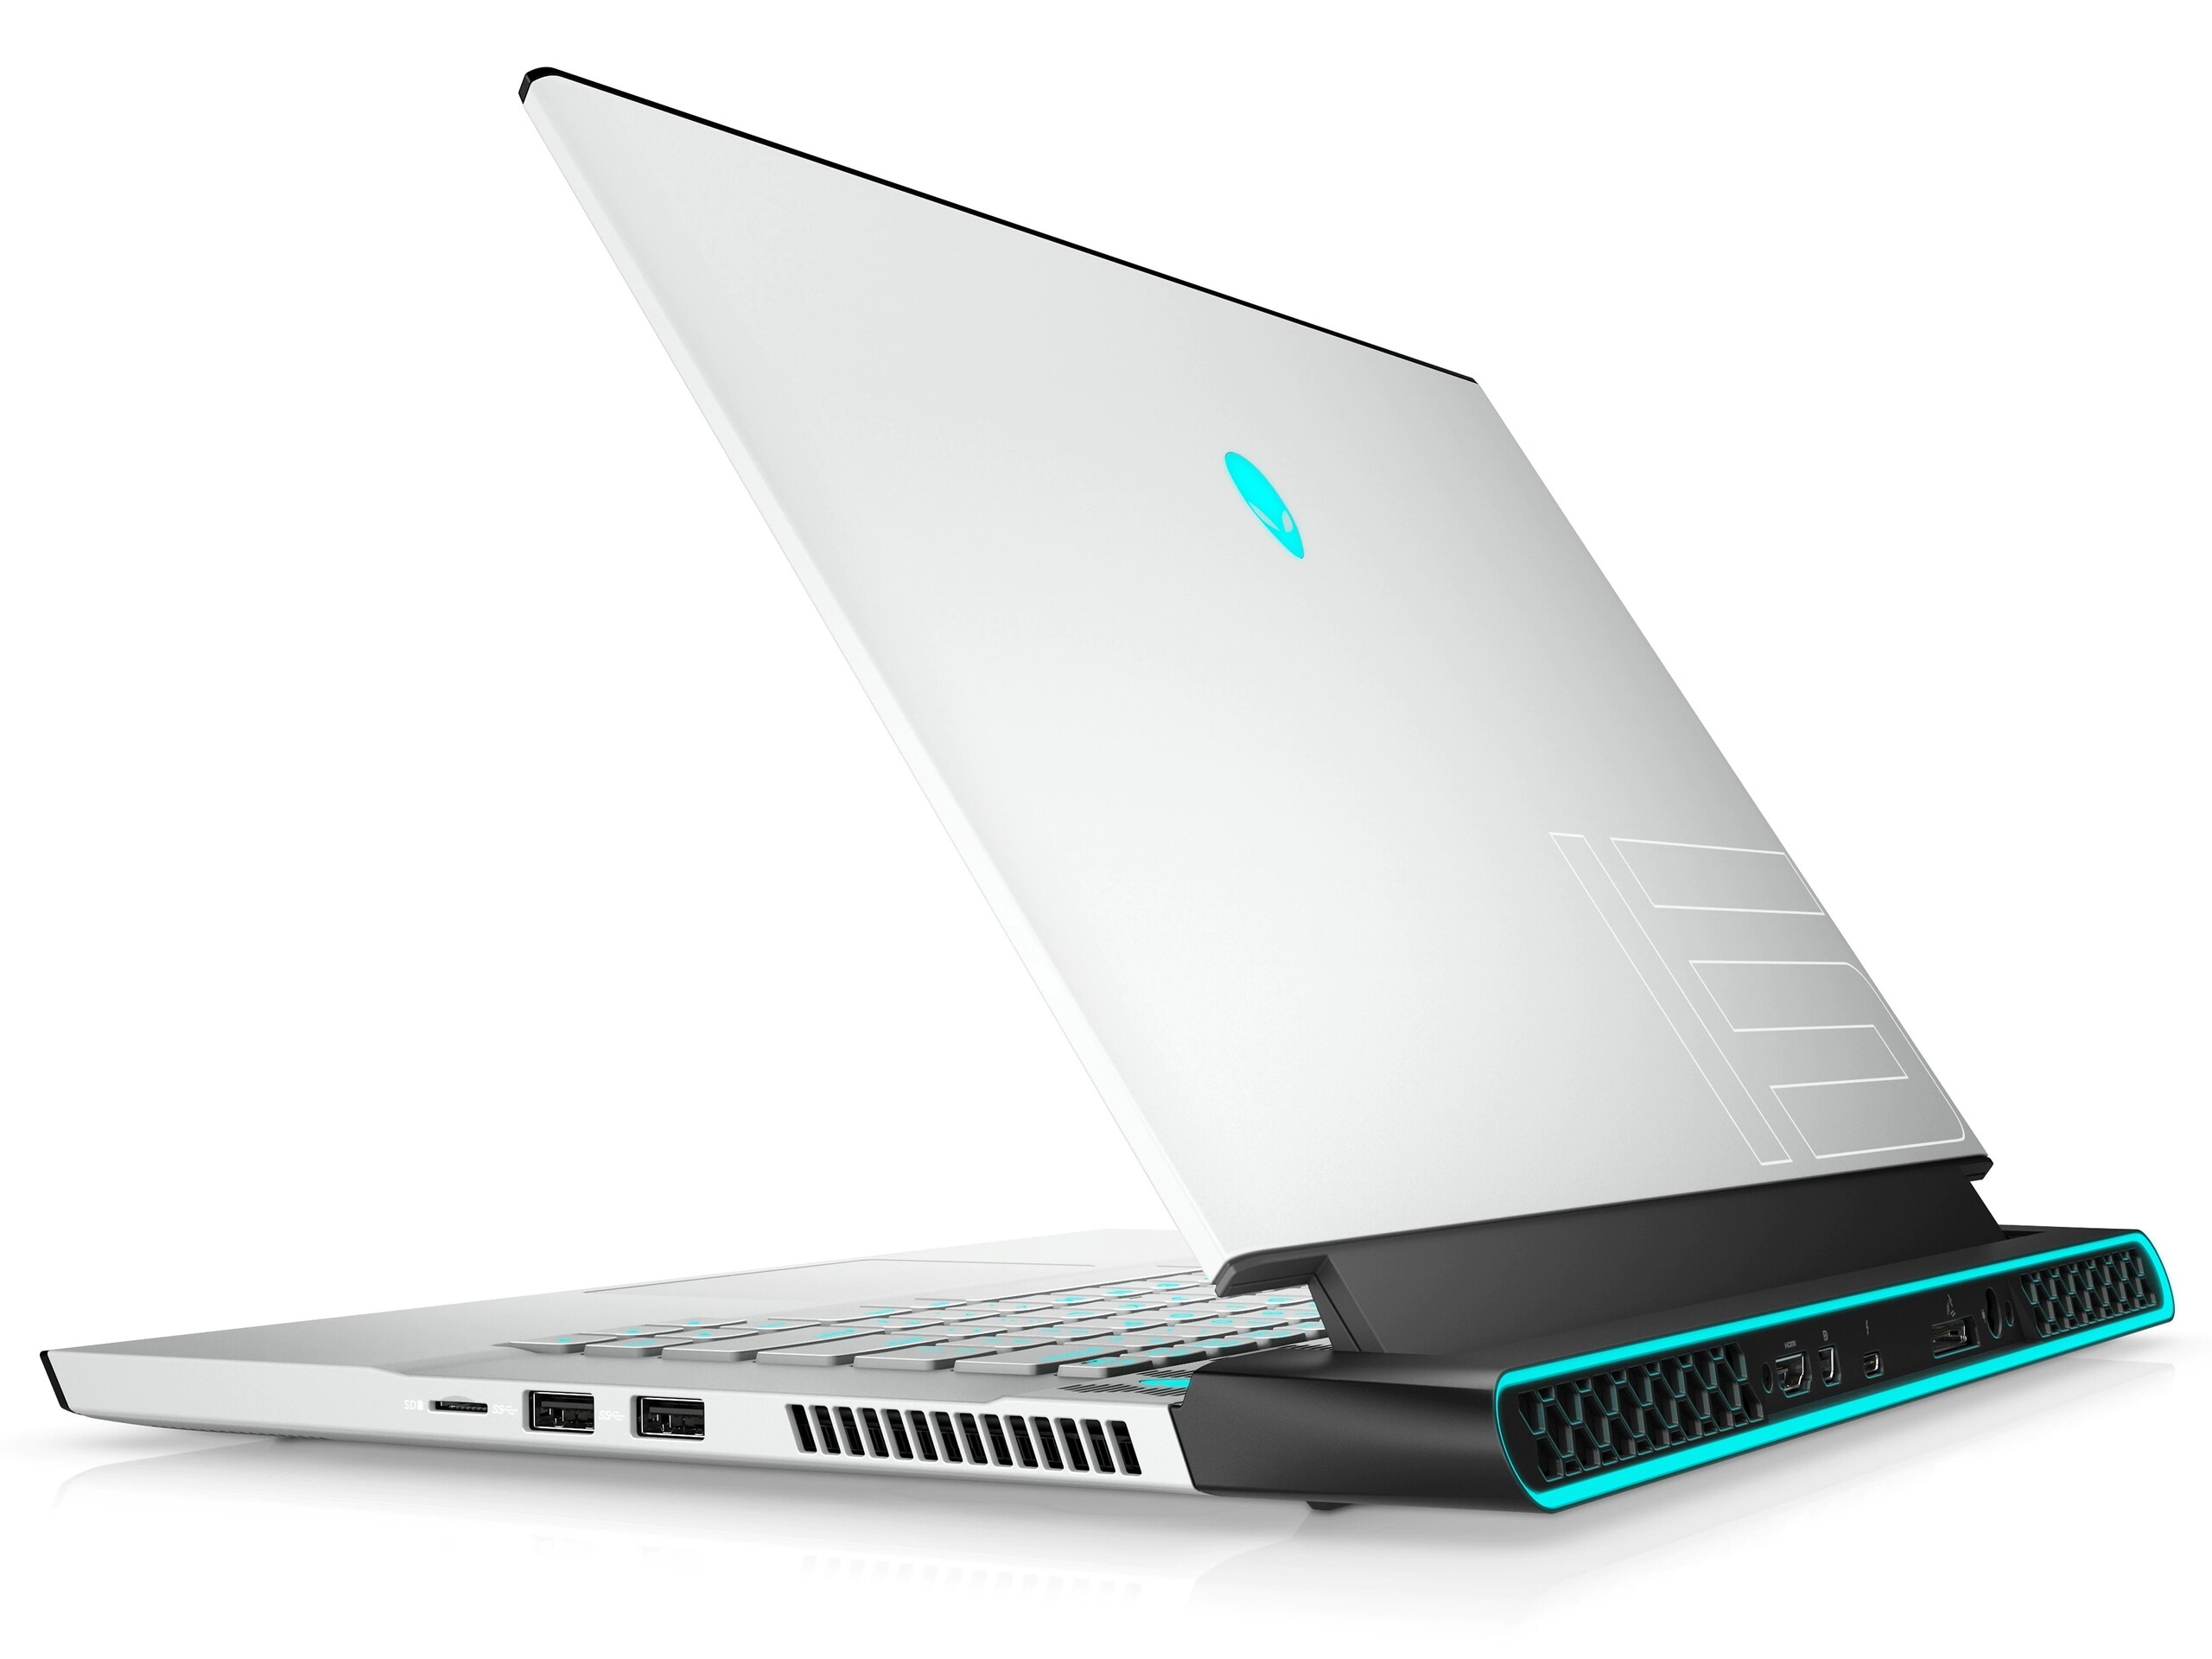
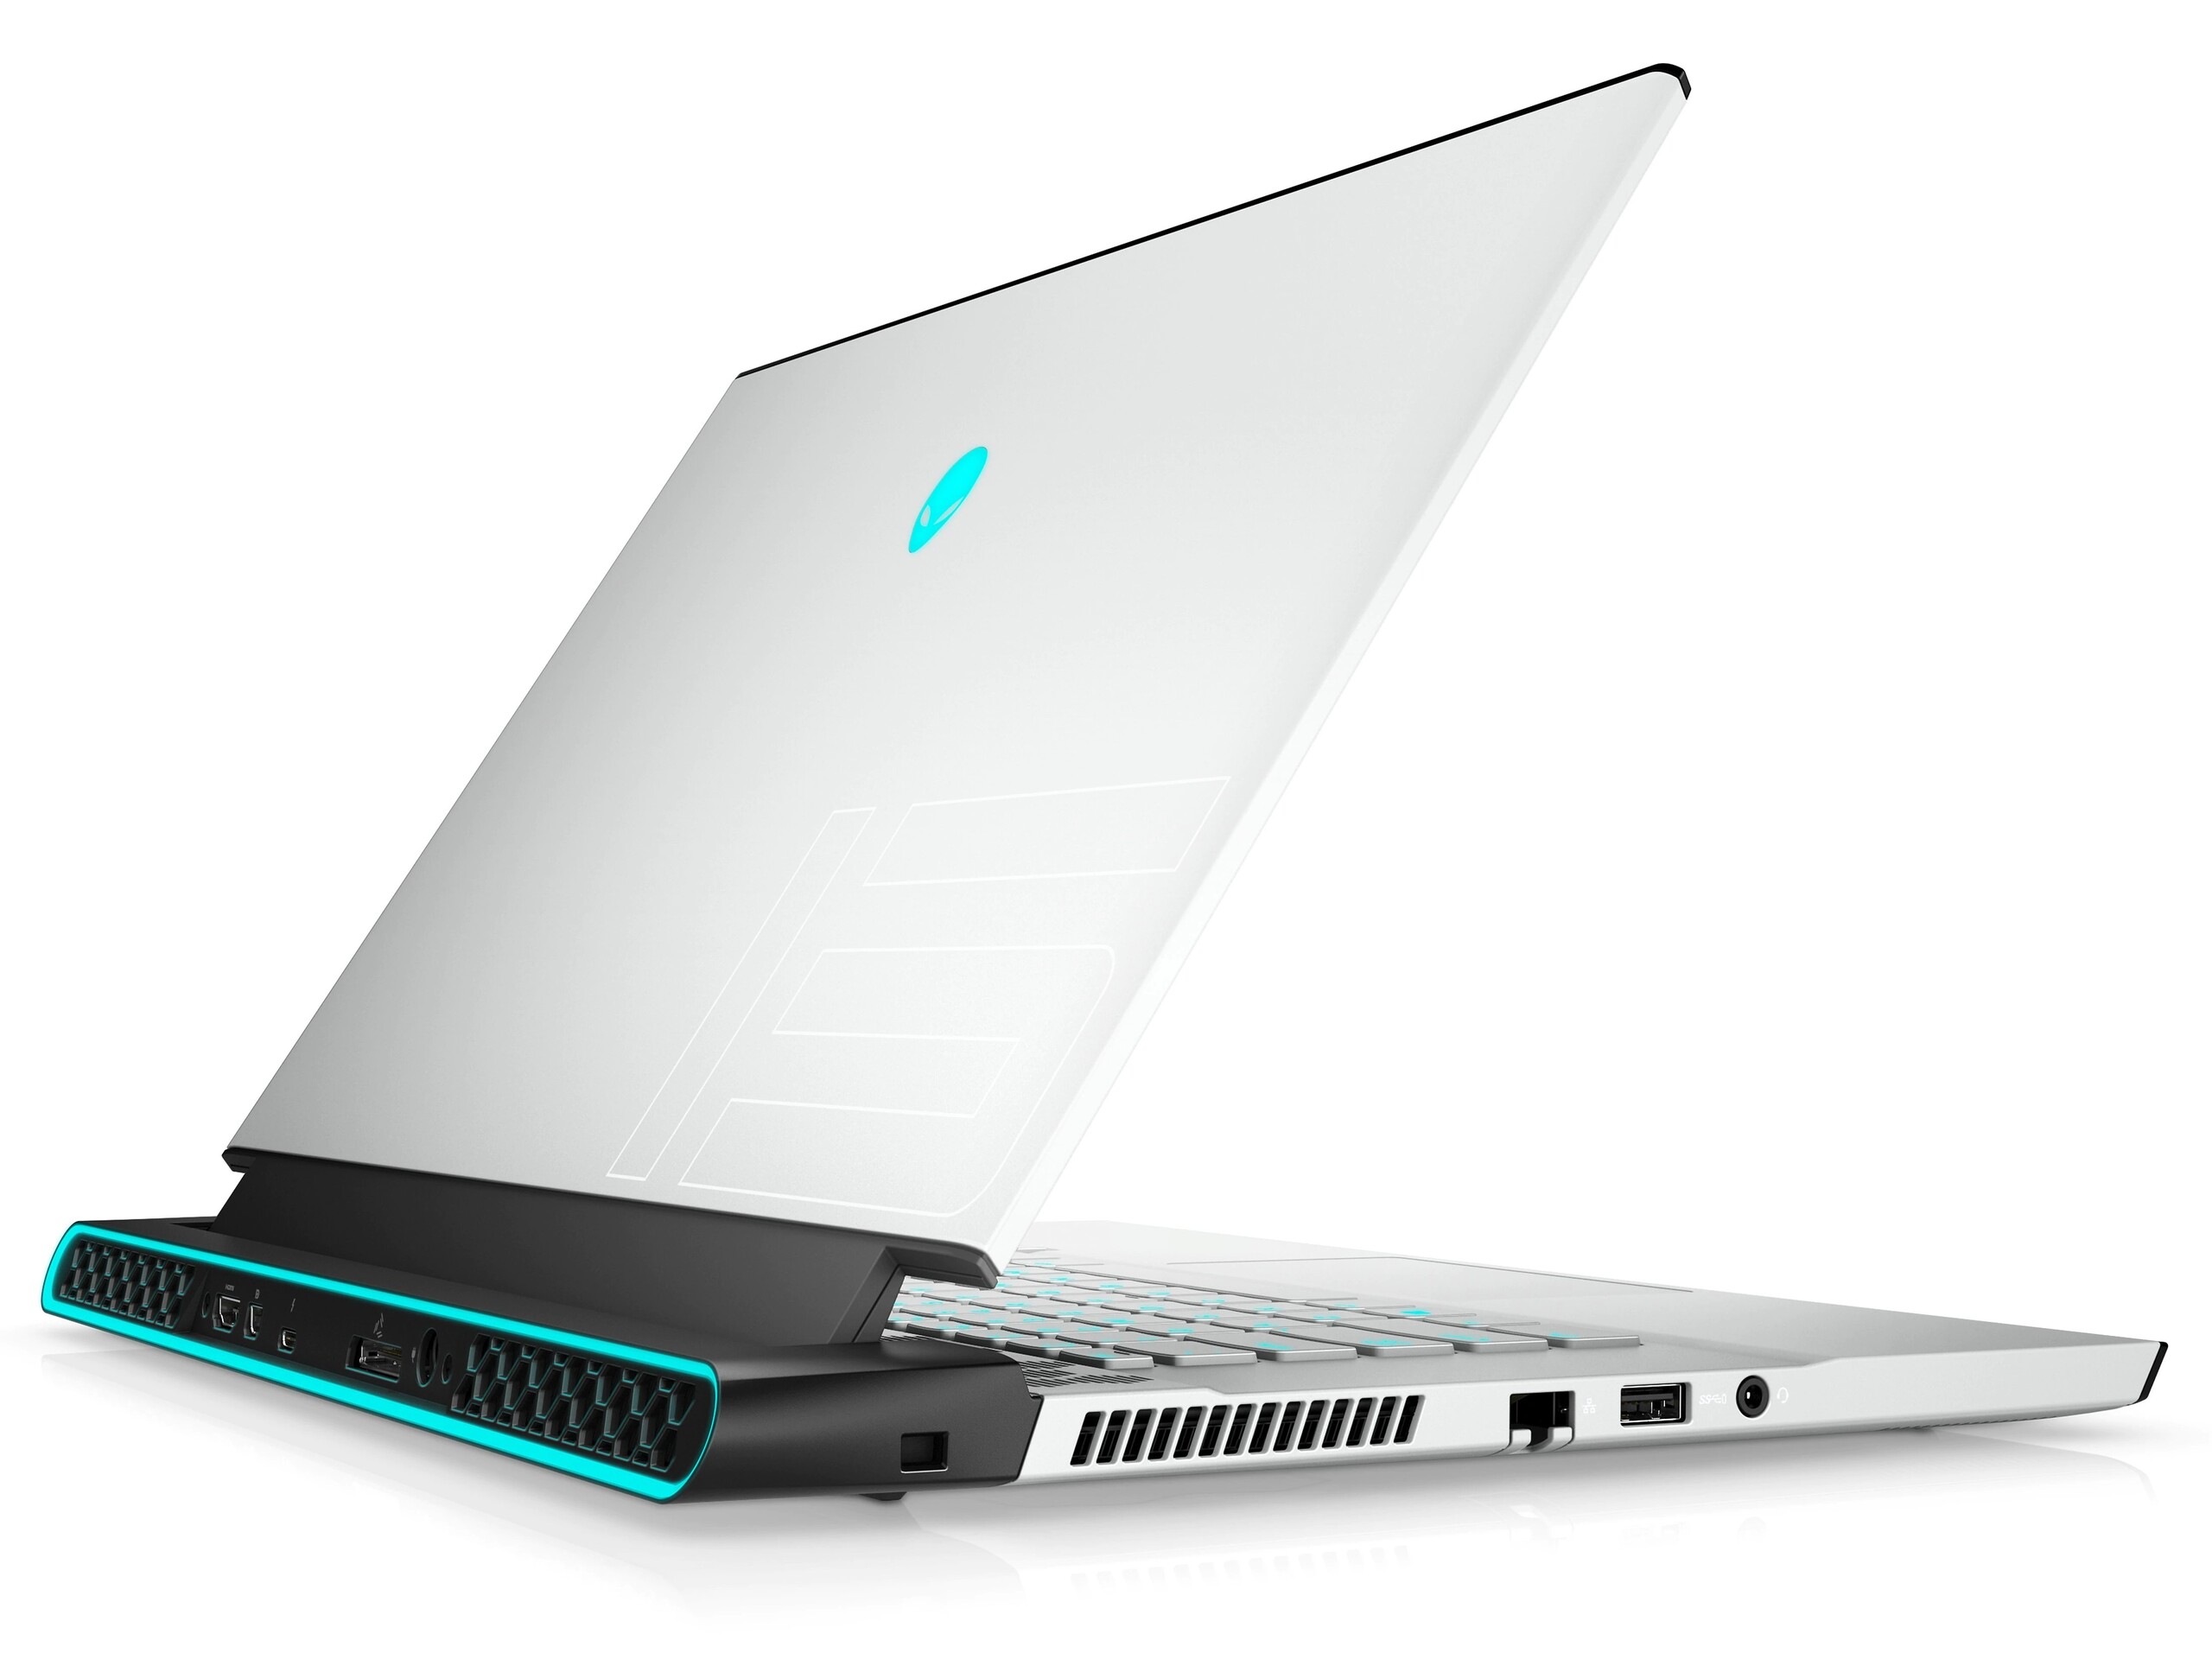
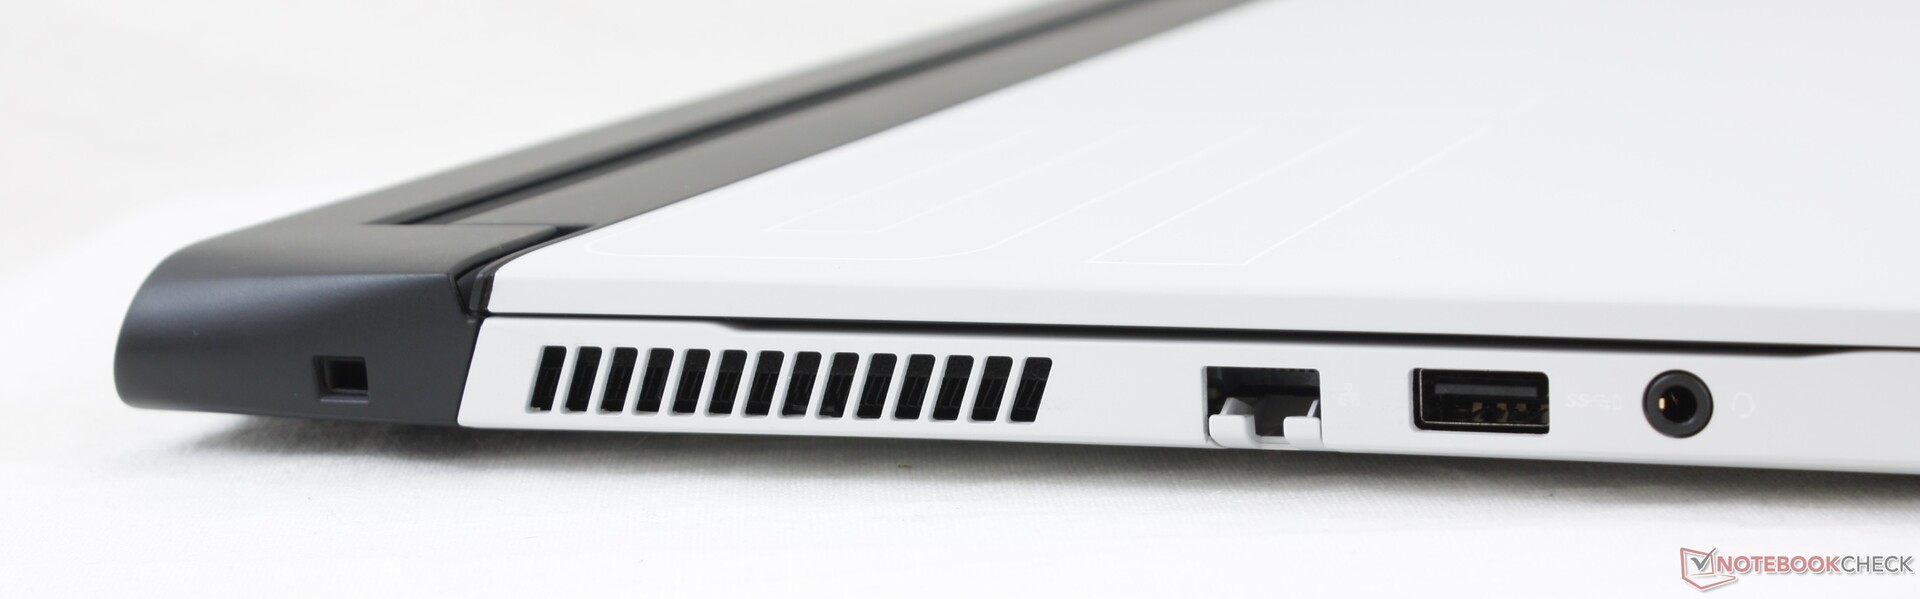
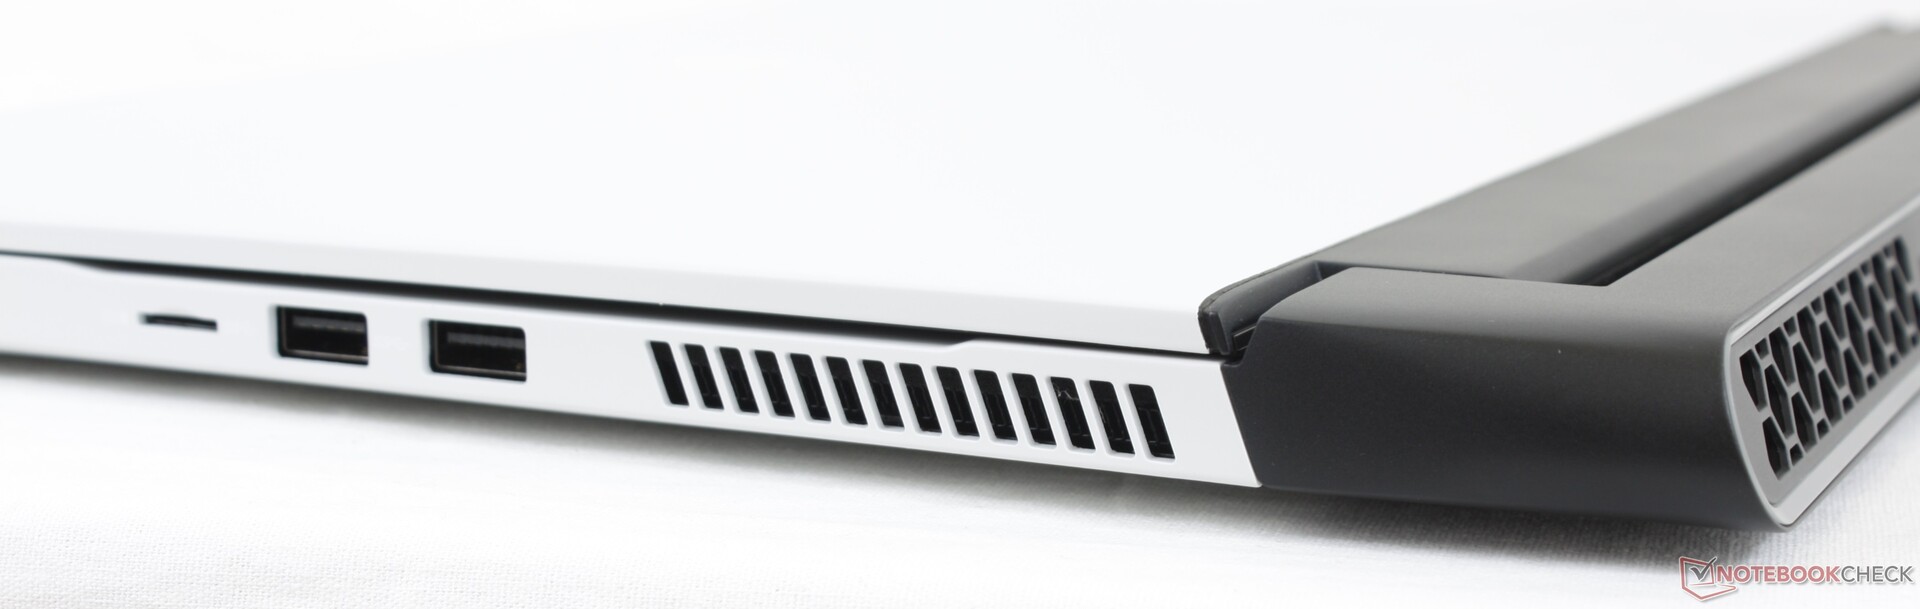
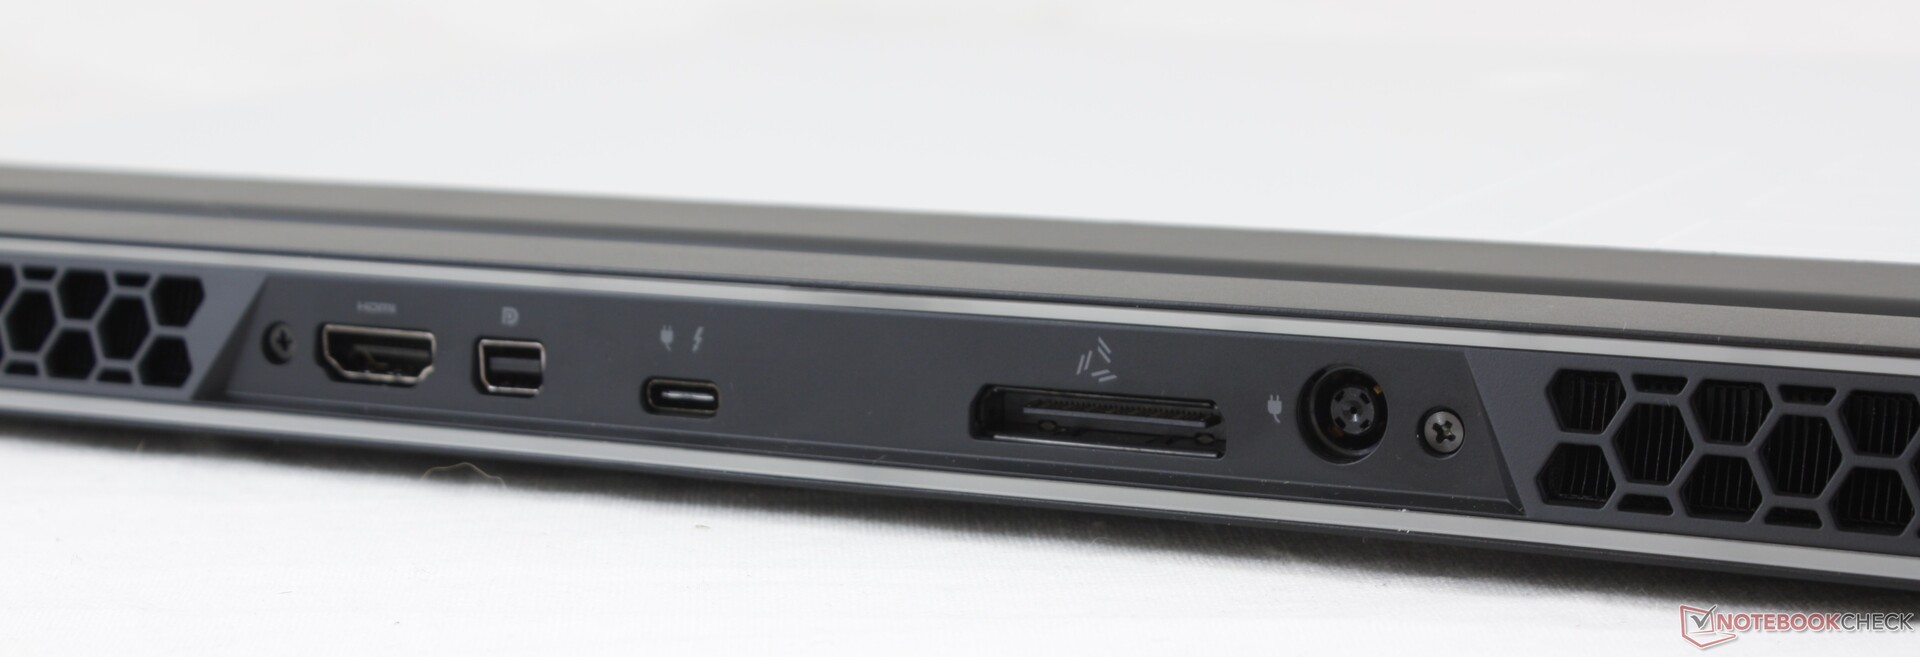
Connectivity - Thunderbolt and fast WLAN in the m15 R4
SD card reader
| SD Card Reader | |
| average JPG Copy Test (av. of 3 runs) | |
| Alienware m15 R4 (AV PRO microSD 128 GB V60) | |
| Alienware m15 R3 P87F (Toshiba Exceria Pro M501 UHS-II) | |
| Average of class Gaming (20.9 - 210, n=54, last 2 years) | |
| maximum AS SSD Seq Read Test (1GB) | |
| Alienware m15 R4 (AV PRO microSD 128 GB V60) | |
| Alienware m15 R3 P87F (Toshiba Exceria Pro M501 UHS-II) | |
| Average of class Gaming (25.5 - 261, n=51, last 2 years) | |
Communication
In combination with our Netgear Nighthawk AX12 reference router, the m15 R4 reaches 1,720 Mb/s for receiving data and 1,540 Mb/s for sending data. As a result, the Killer WLAN module used here achieves even better speeds than was already the case in the Alienware m15 R3. Besides Wi-Fi 6, the m15 R4 also supports Bluetooth 5.1.
Webcam
The 0.9 MP webcam used here delivers the same mediocre image quality that is currently common in most modern laptops.


Accessories
The m15 R4 comes with the laptop itself and a 240-watt power adapter. However, Dell offers numerous other accessories with the Alienware branding on its own website.
Maintenance
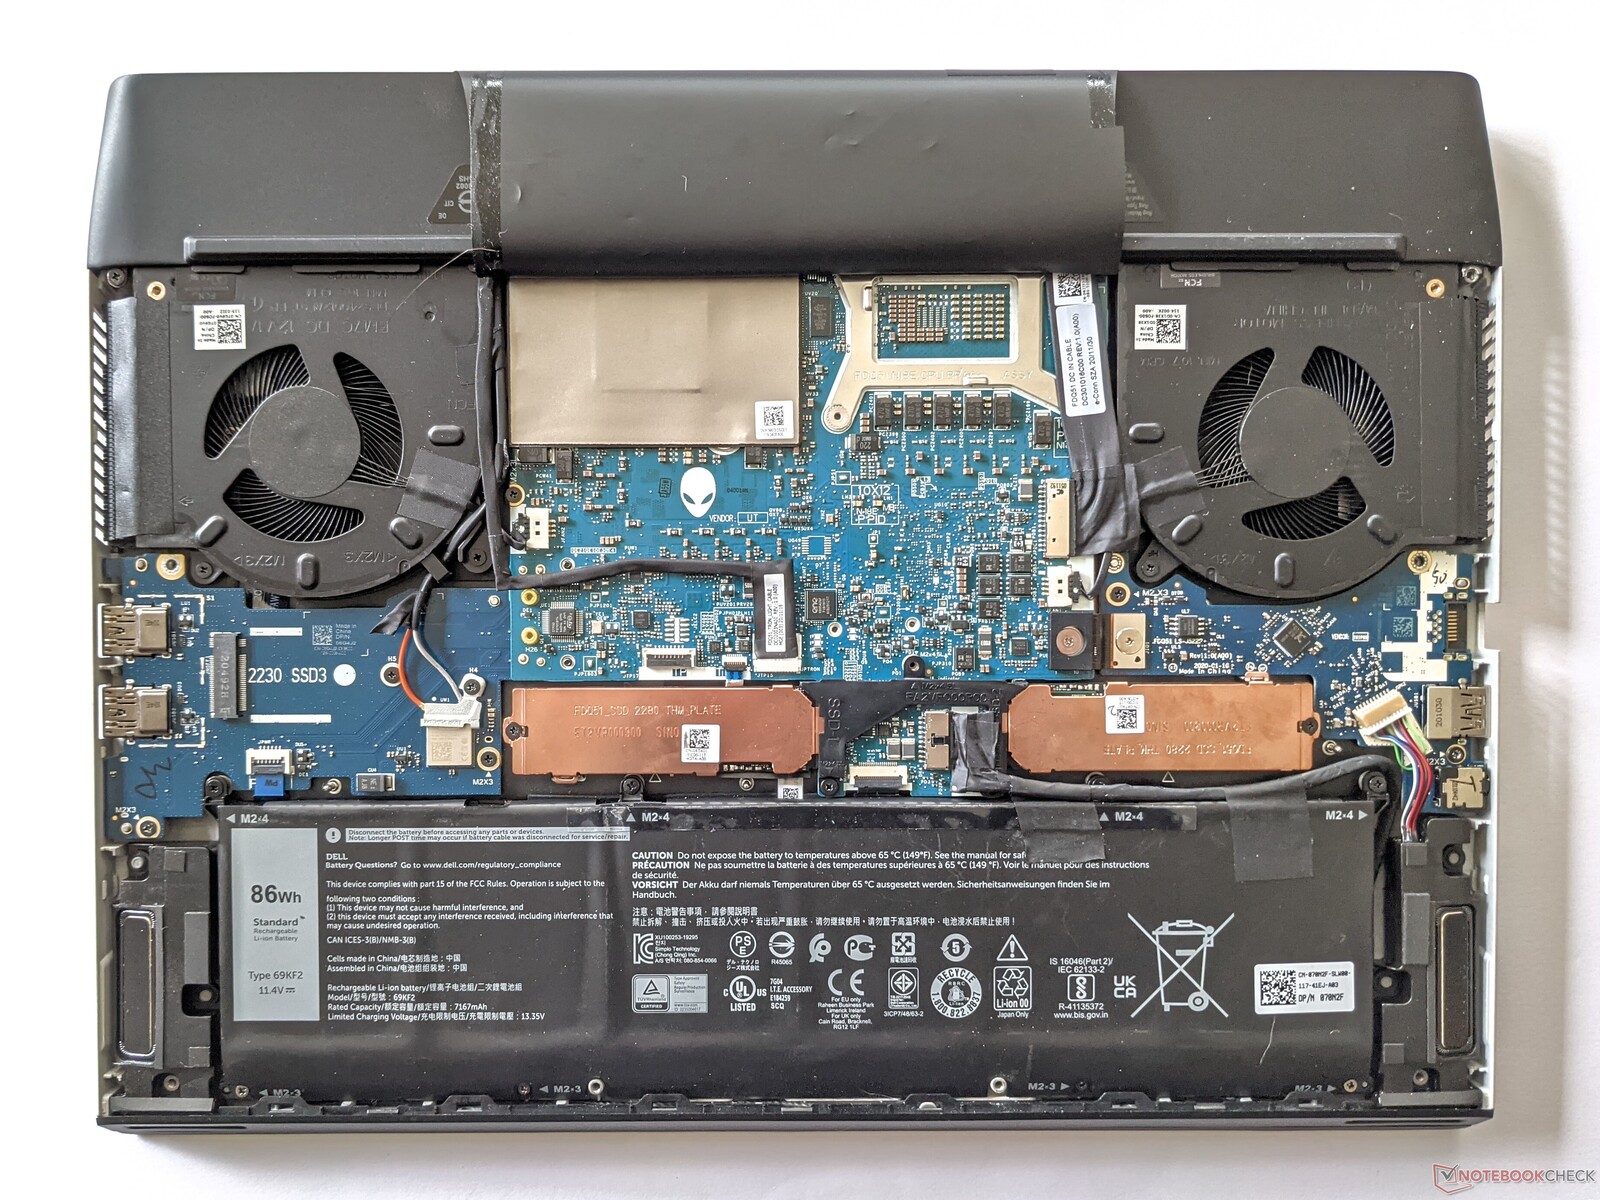
The bottom of the m15 R4 can be opened relatively easily. A total of three M.2 slots for SSDs become accessible here. However, the WLAN module and RAM can't be replaced.
Warranty
Dell grants buyers of the Alienware m15 R4 a warranty period of 12 months. This can be extended up to four years for a fee.
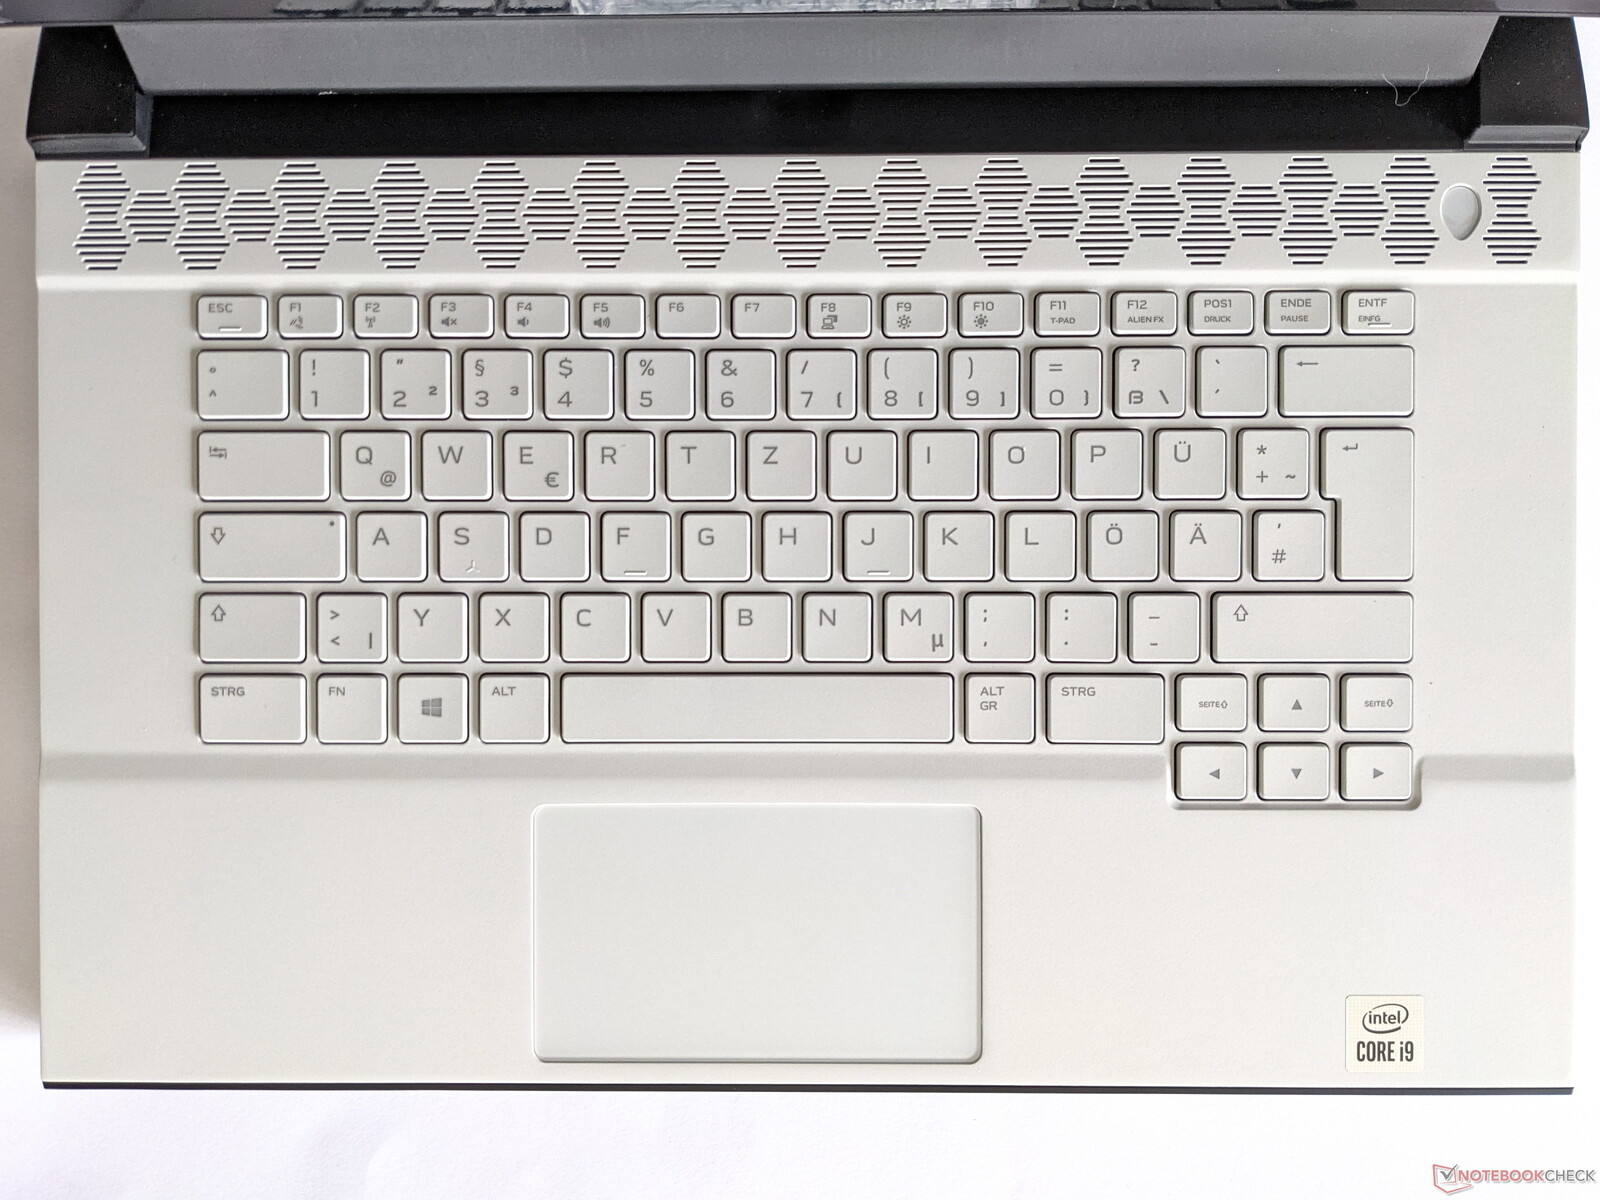
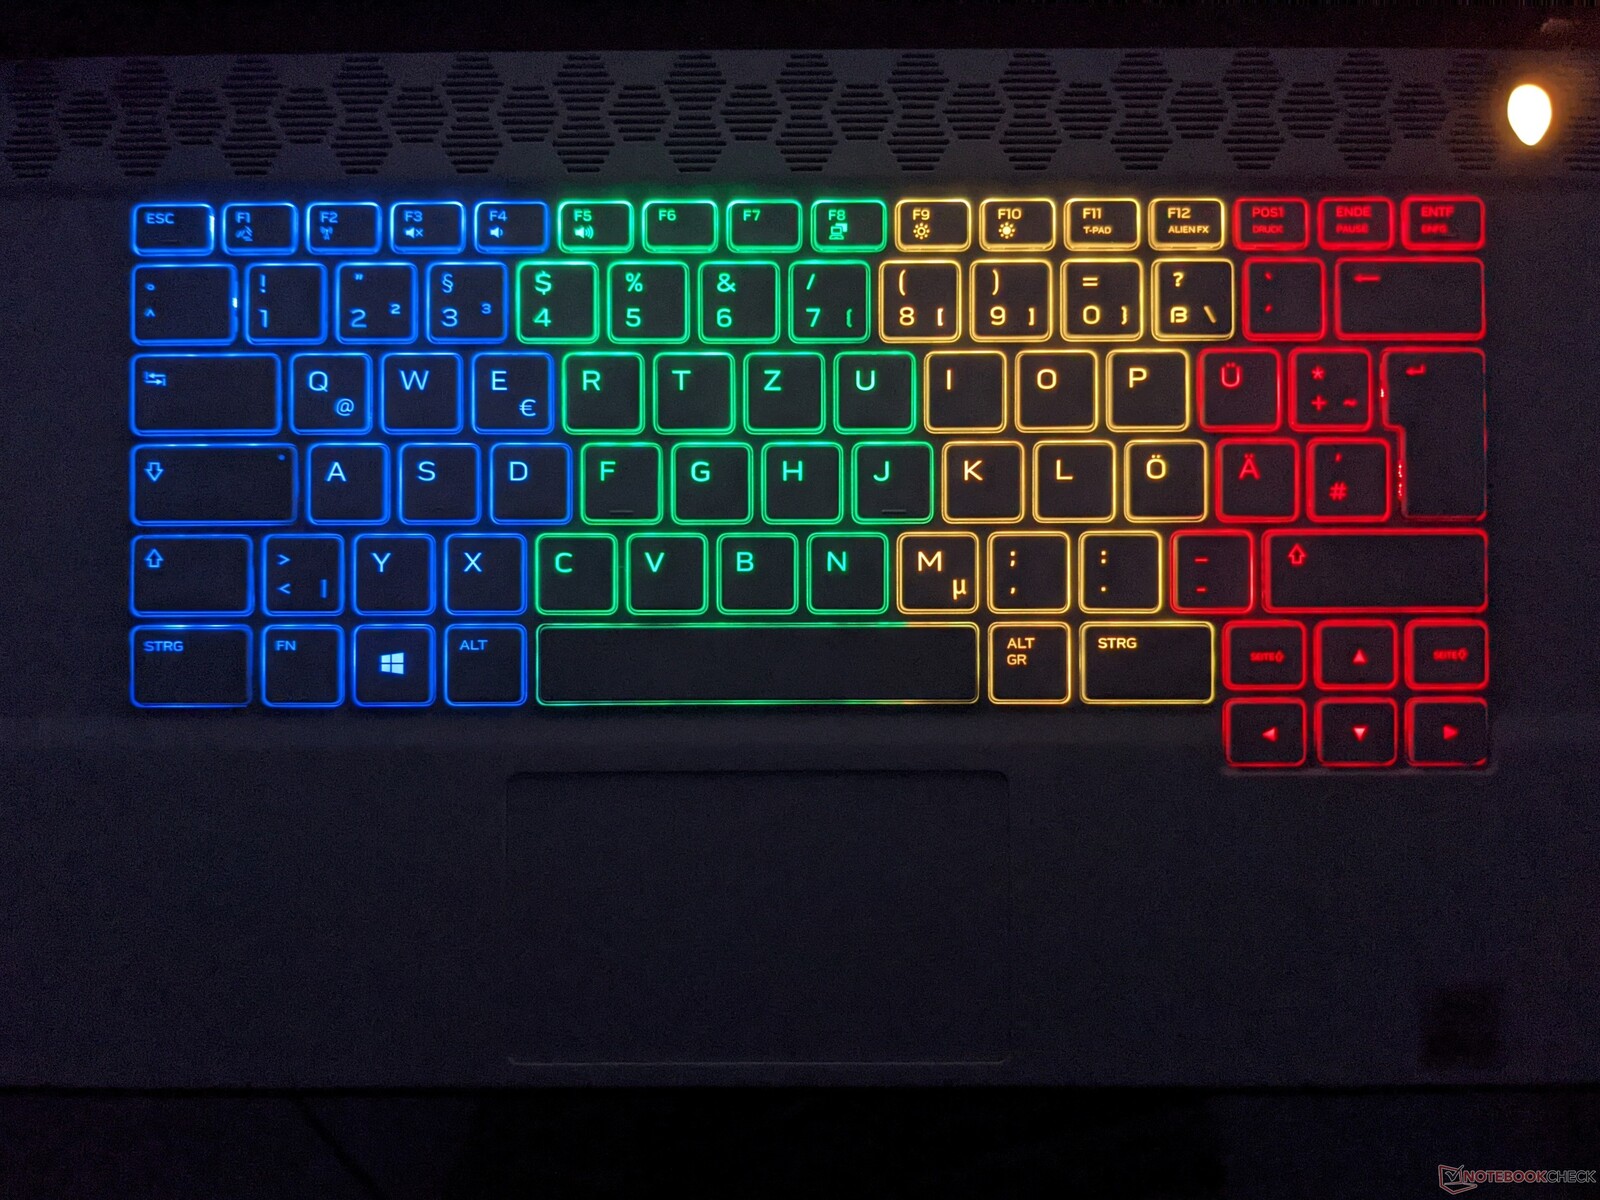
Input devices - Different backlighting options
A detailed description of the input devices can be found in the review of the Alienware m15 R3. Besides the four-zone backlighting presented there, the m15 R4 is also available with single-key backlighting.
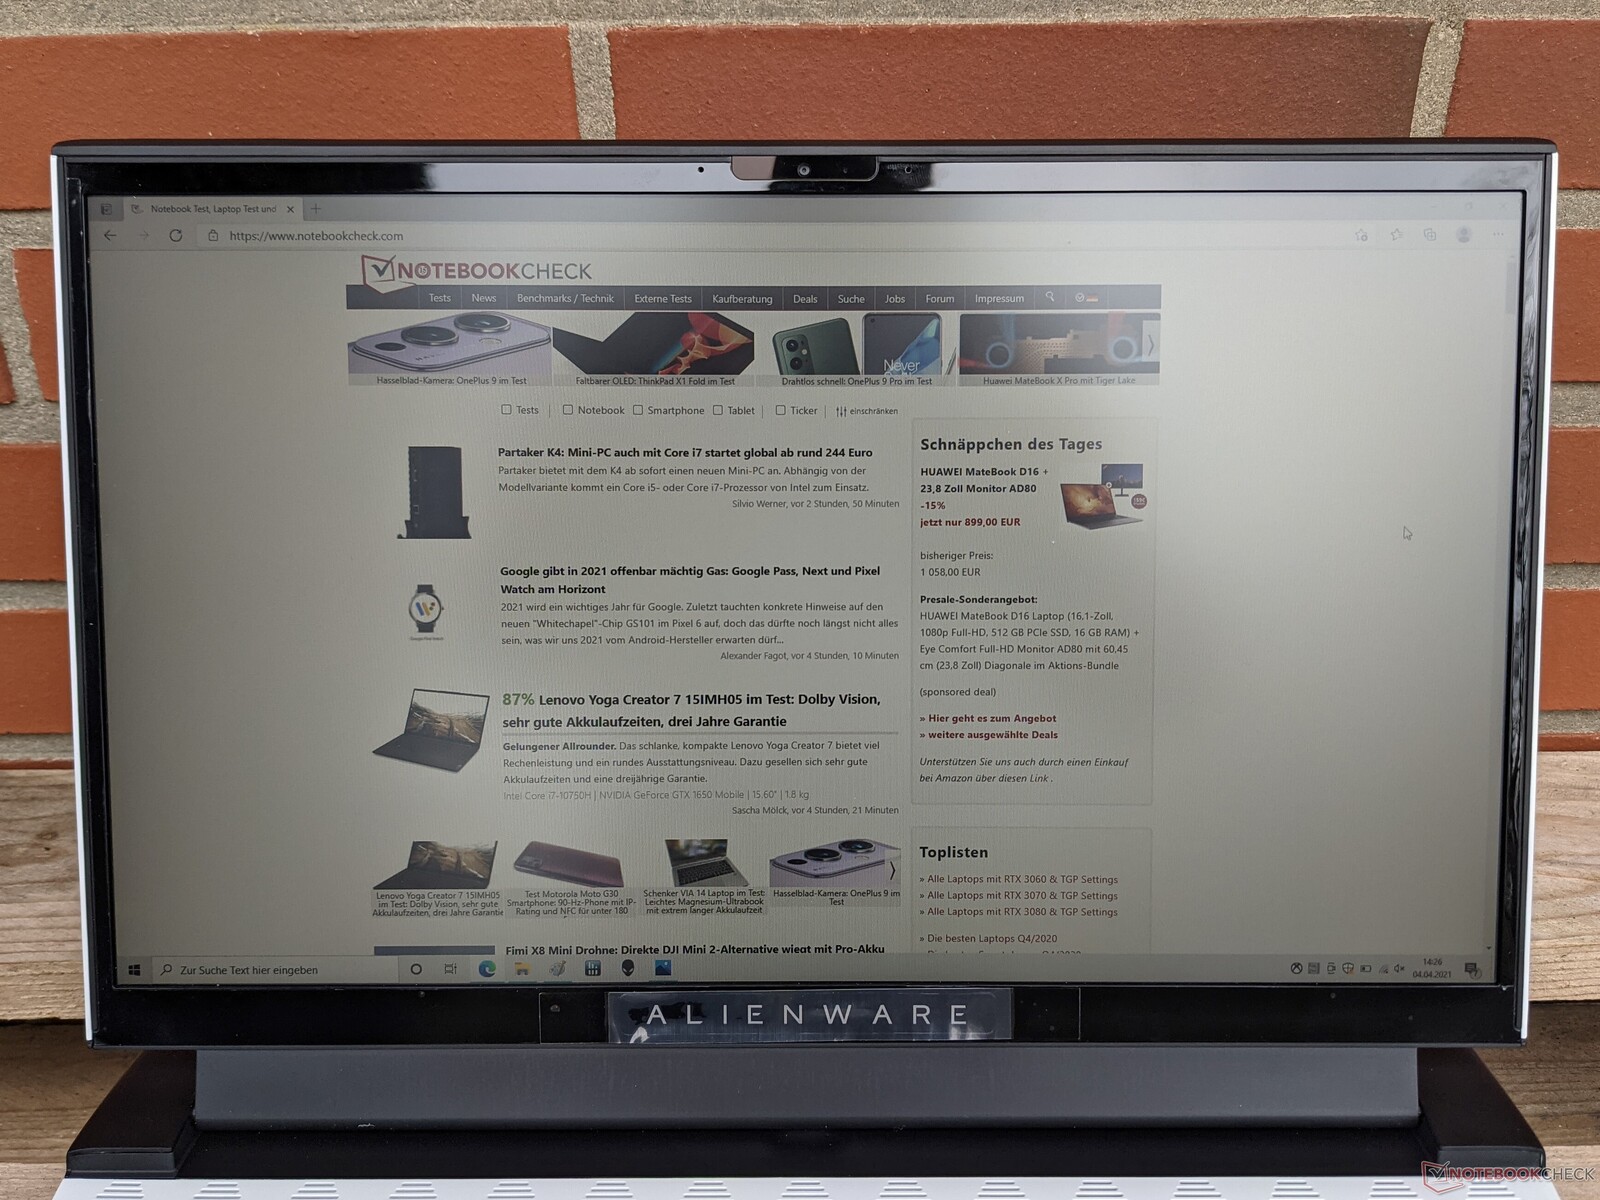
Display - Alienware m15 R4 with 300 Hz panel
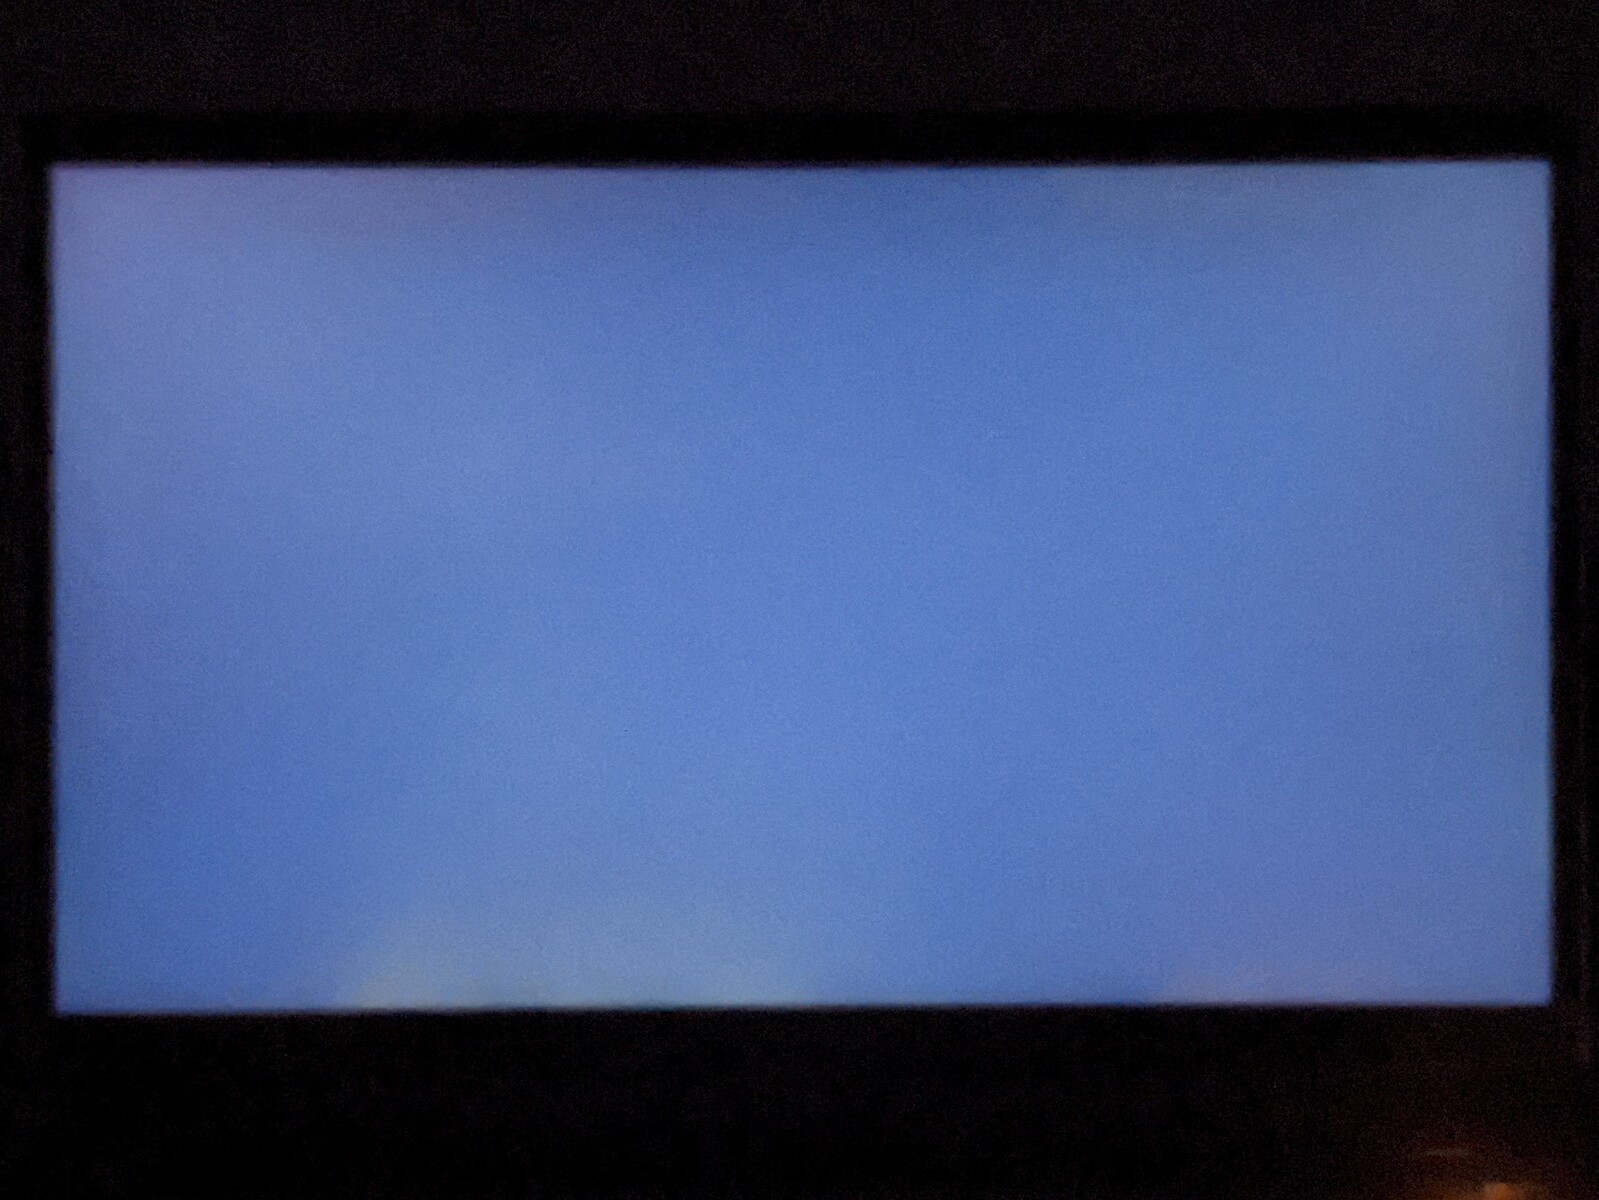
The display of the Alienware 15 R4 consists of a 15.6-inch IPS panel and offers a resolution of 1920x1080 pixels as well as a refresh rate of 300 Hz. Dell specifies a maximum brightness of 300 cd/m², which we also achieved in our measurements. However, the brightness is now lower compared to the m15 R3. In addition, the brightness distribution of 86% is the lowest in our test field.
Dell refrains from using PWM for brightness control, which is convenient for users with sensitive eyes. In addition to the display variant installed here, the m15 R4 is also offered with a 15.6-inch OLED screen with UHD resolution and 60 Hz as well as a Full HD IPS panel with a refresh rate of 144 Hz.
| |||||||||||||||||||||||||
Brightness Distribution: 86 %
Center on Battery: 333 cd/m²
Contrast: 1148:1 (Black: 0.29 cd/m²)
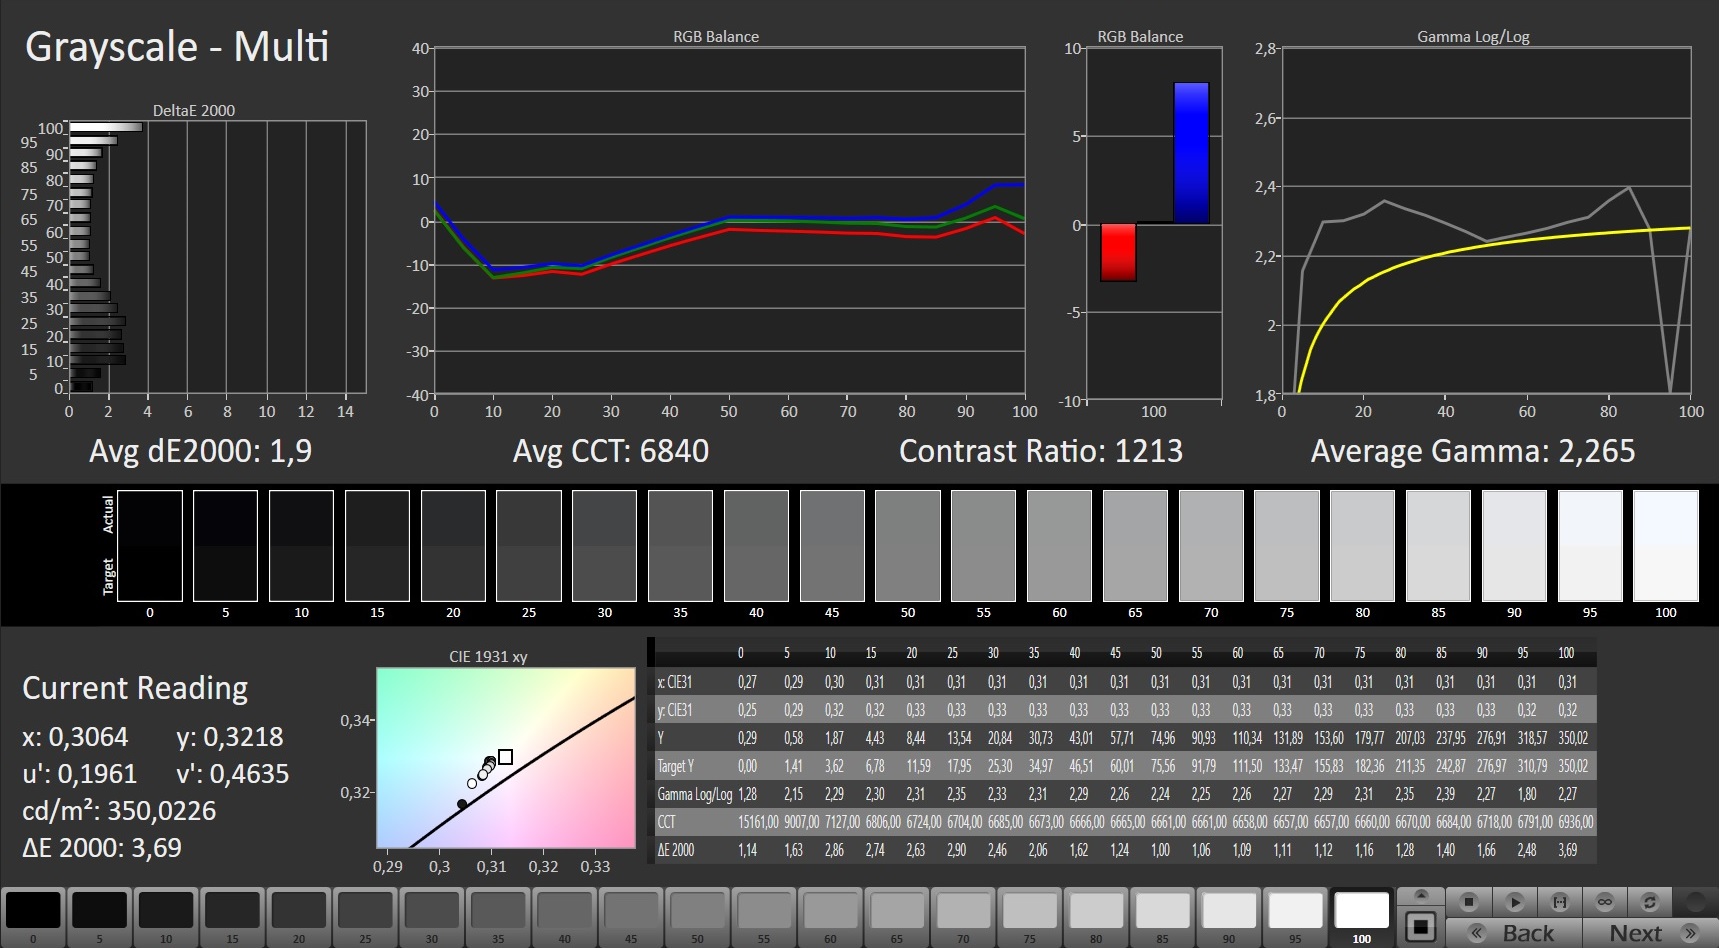
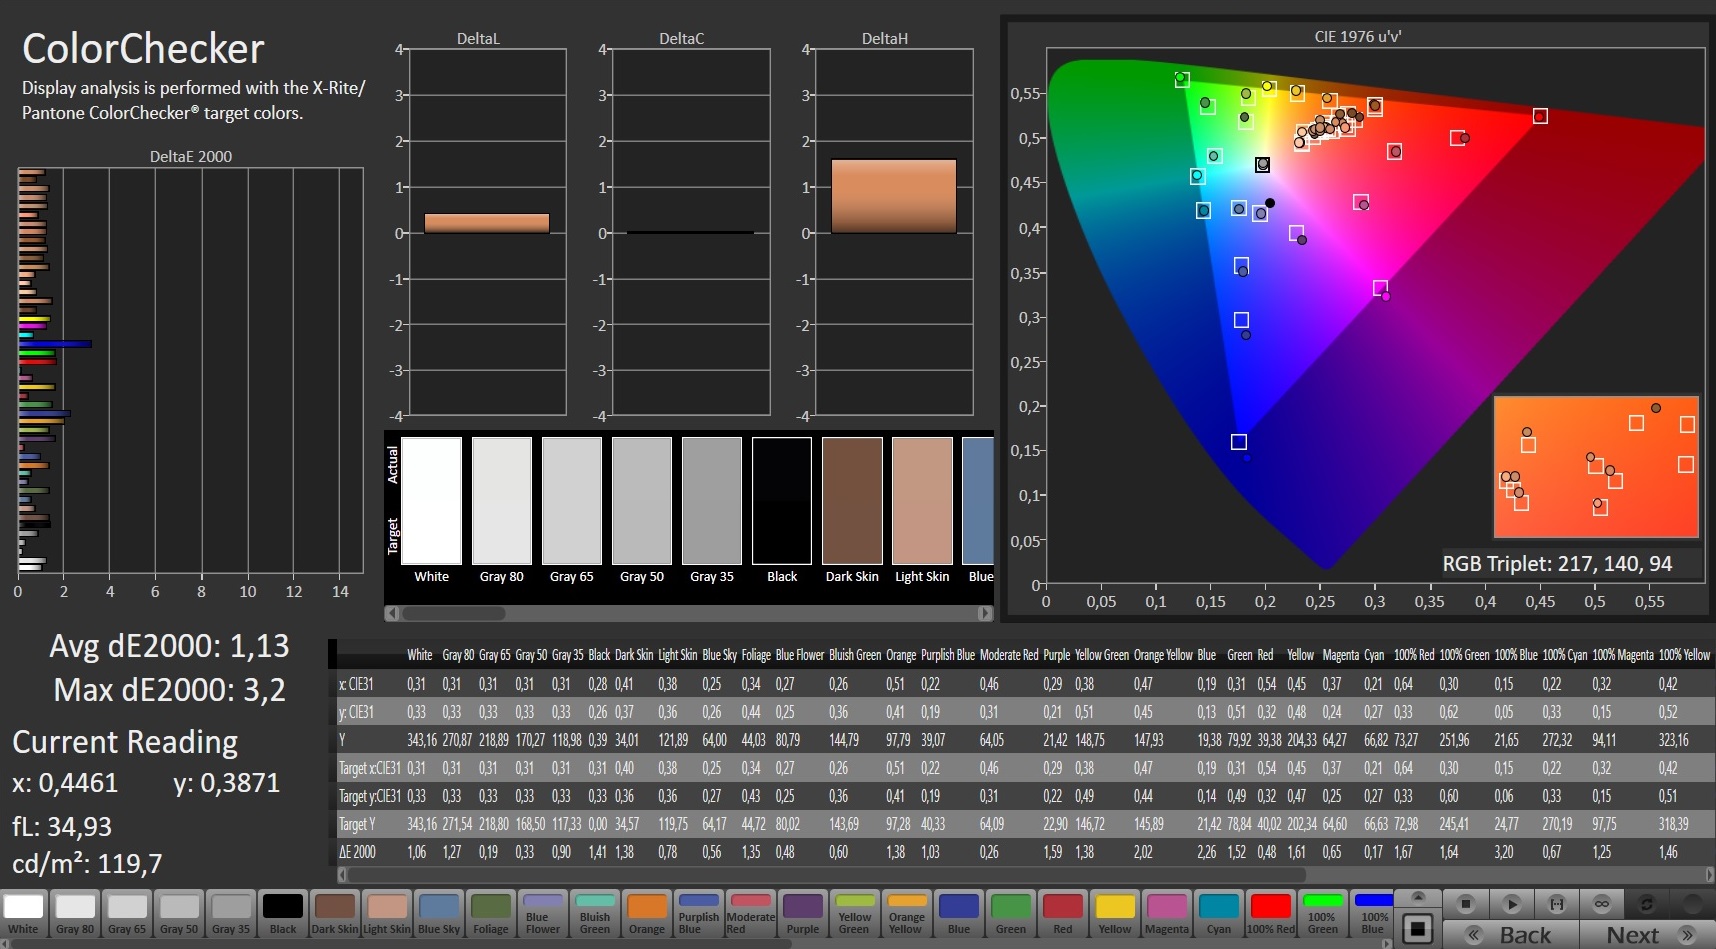
ΔE ColorChecker Calman: 1.8 | ∀{0.5-29.43 Ø4.71}
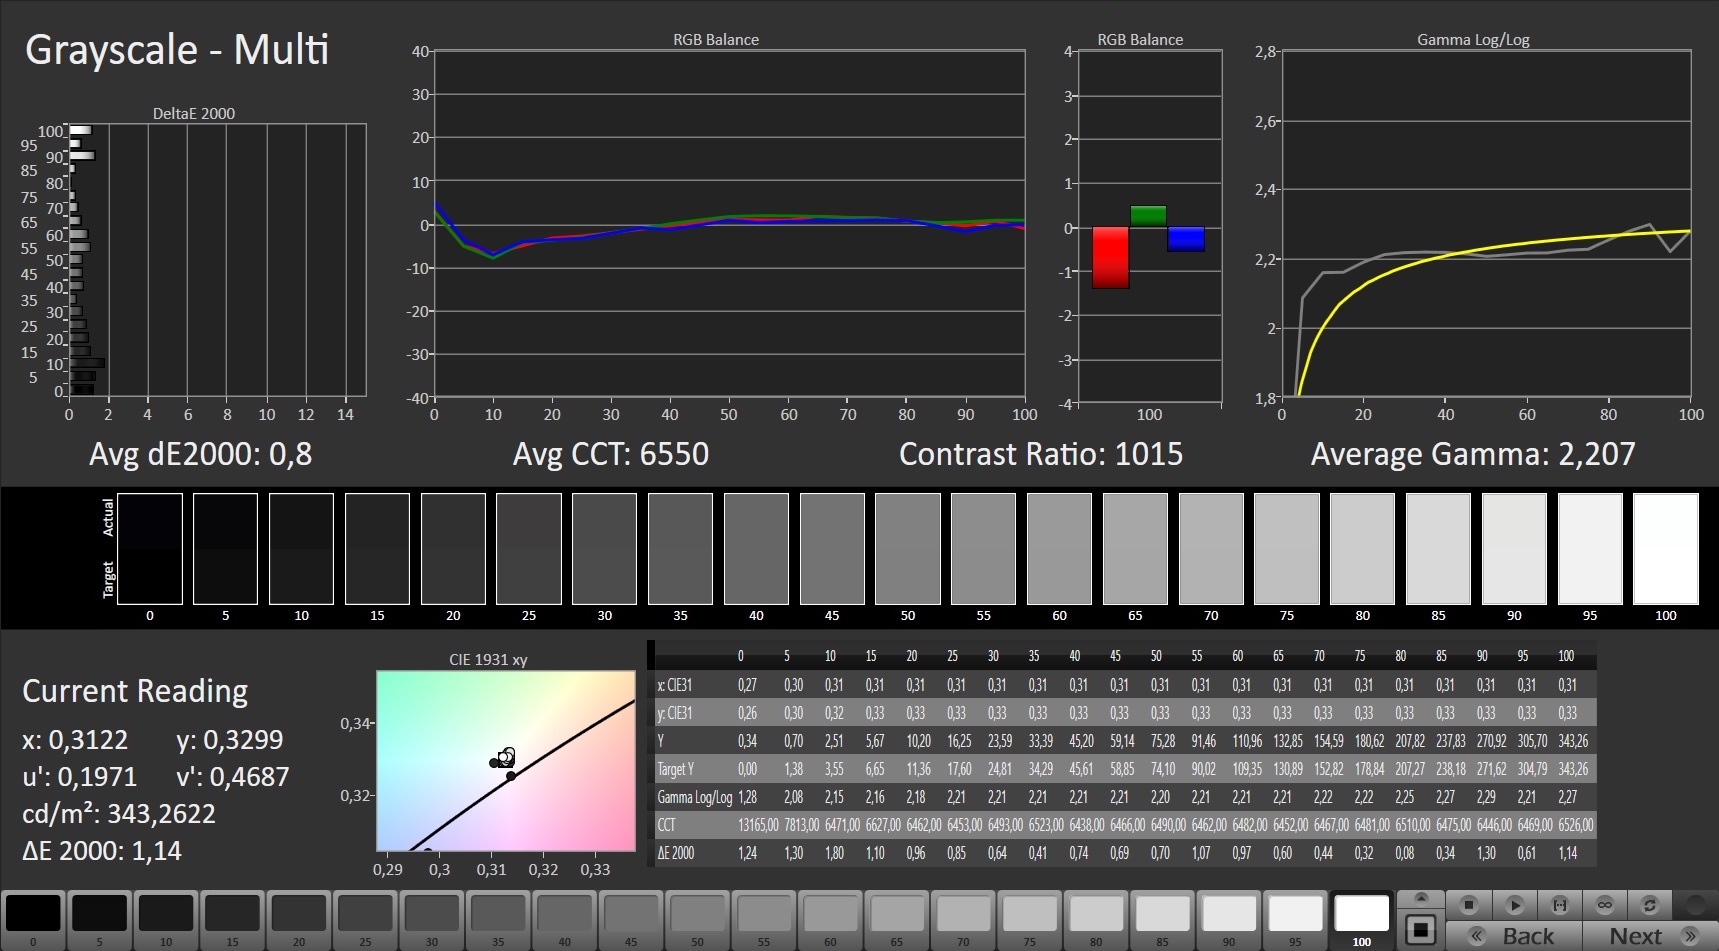
calibrated: 1.13
ΔE Greyscale Calman: 1.9 | ∀{0.09-98 Ø4.96}
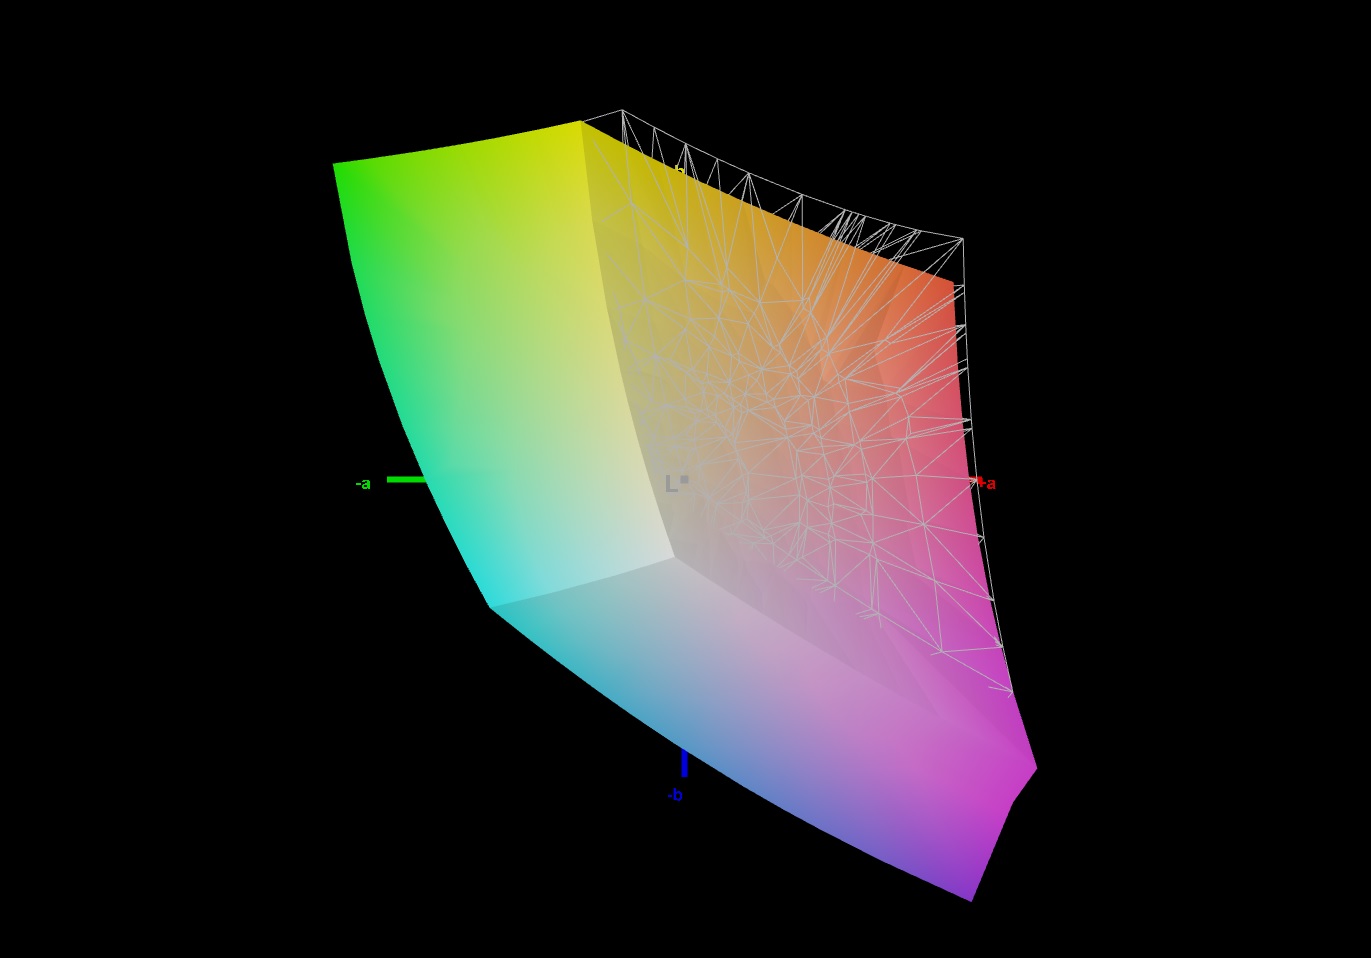
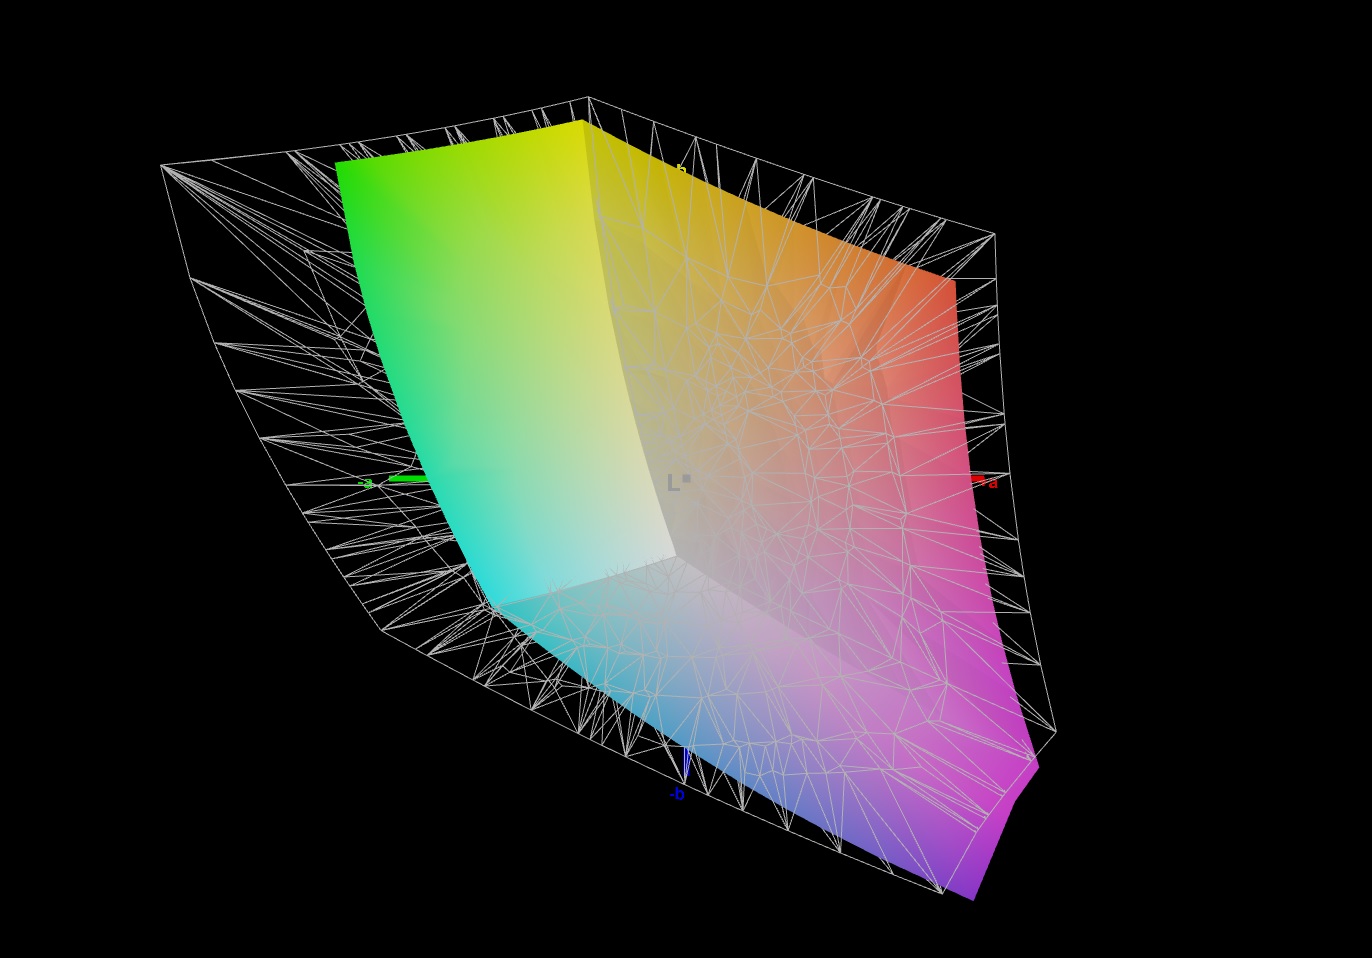
93% sRGB (Argyll 1.6.3 3D)
71% AdobeRGB 1998 (Argyll 1.6.3 3D)
70.5% AdobeRGB 1998 (Argyll 3D)
99% sRGB (Argyll 3D)
69.4% Display P3 (Argyll 3D)
Gamma: 2.265
CCT: 6840 K
| Alienware m15 R4 LG Philips LGD066E, IPS, 1920x1080, 15.6" | Alienware m15 R3 P87F AU Optronics B156HAN, IPS, 1920x1080, 15.6" | MSI GP76 Leopard 10UG Chi Mei CMN176E, IPS, 1920x1080, 17.3" | Asus ROG Strix Scar 15 G532LWS AU Optronics B156HAN12.0, IPS, 1920x1080, 15.6" | |
|---|---|---|---|---|
| Display | -1% | -5% | 1% | |
| Display P3 Coverage (%) | 69.4 | 68.6 -1% | 64.7 -7% | 69.9 1% |
| sRGB Coverage (%) | 99 | 98.9 0% | 96.4 -3% | 99.6 1% |
| AdobeRGB 1998 Coverage (%) | 70.5 | 69.8 -1% | 66.9 -5% | 71.4 1% |
| Response Times | 19% | -4% | -44% | |
| Response Time Grey 50% / Grey 80% * (ms) | 7.4 ? | 4 ? 46% | 7.4 ? -0% | 14.4 ? -95% |
| Response Time Black / White * (ms) | 10 ? | 10.8 ? -8% | 10.8 ? -8% | 9.2 ? 8% |
| PWM Frequency (Hz) | 24510 ? | |||
| Screen | -18% | -3% | 4% | |
| Brightness middle (cd/m²) | 333 | 326.7 -2% | 328 -2% | 307.2 -8% |
| Brightness (cd/m²) | 303 | 316 4% | 314 4% | 301 -1% |
| Brightness Distribution (%) | 86 | 87 1% | 87 1% | 91 6% |
| Black Level * (cd/m²) | 0.29 | 0.33 -14% | 0.29 -0% | 0.21 28% |
| Contrast (:1) | 1148 | 990 -14% | 1131 -1% | 1463 27% |
| Colorchecker dE 2000 * | 1.8 | 2.4 -33% | 1.93 -7% | 1.85 -3% |
| Colorchecker dE 2000 max. * | 4.49 | 6.06 -35% | 4.94 -10% | 3.92 13% |
| Colorchecker dE 2000 calibrated * | 1.13 | 1.51 -34% | 0.68 40% | 1.26 -12% |
| Greyscale dE 2000 * | 1.9 | 3.2 -68% | 2.8 -47% | 2 -5% |
| Gamma | 2.265 97% | 2.13 103% | 2.18 101% | 2.15 102% |
| CCT | 6840 95% | 7129 91% | 7023 93% | 6479 100% |
| Color Space (Percent of AdobeRGB 1998) (%) | 71 | 63.7 -10% | 67 -6% | 65 -8% |
| Color Space (Percent of sRGB) (%) | 93 | 99.2 7% | 89 -4% | 99.7 7% |
| Total Average (Program / Settings) | 0% /
-10% | -4% /
-3% | -13% /
-3% |
* ... smaller is better
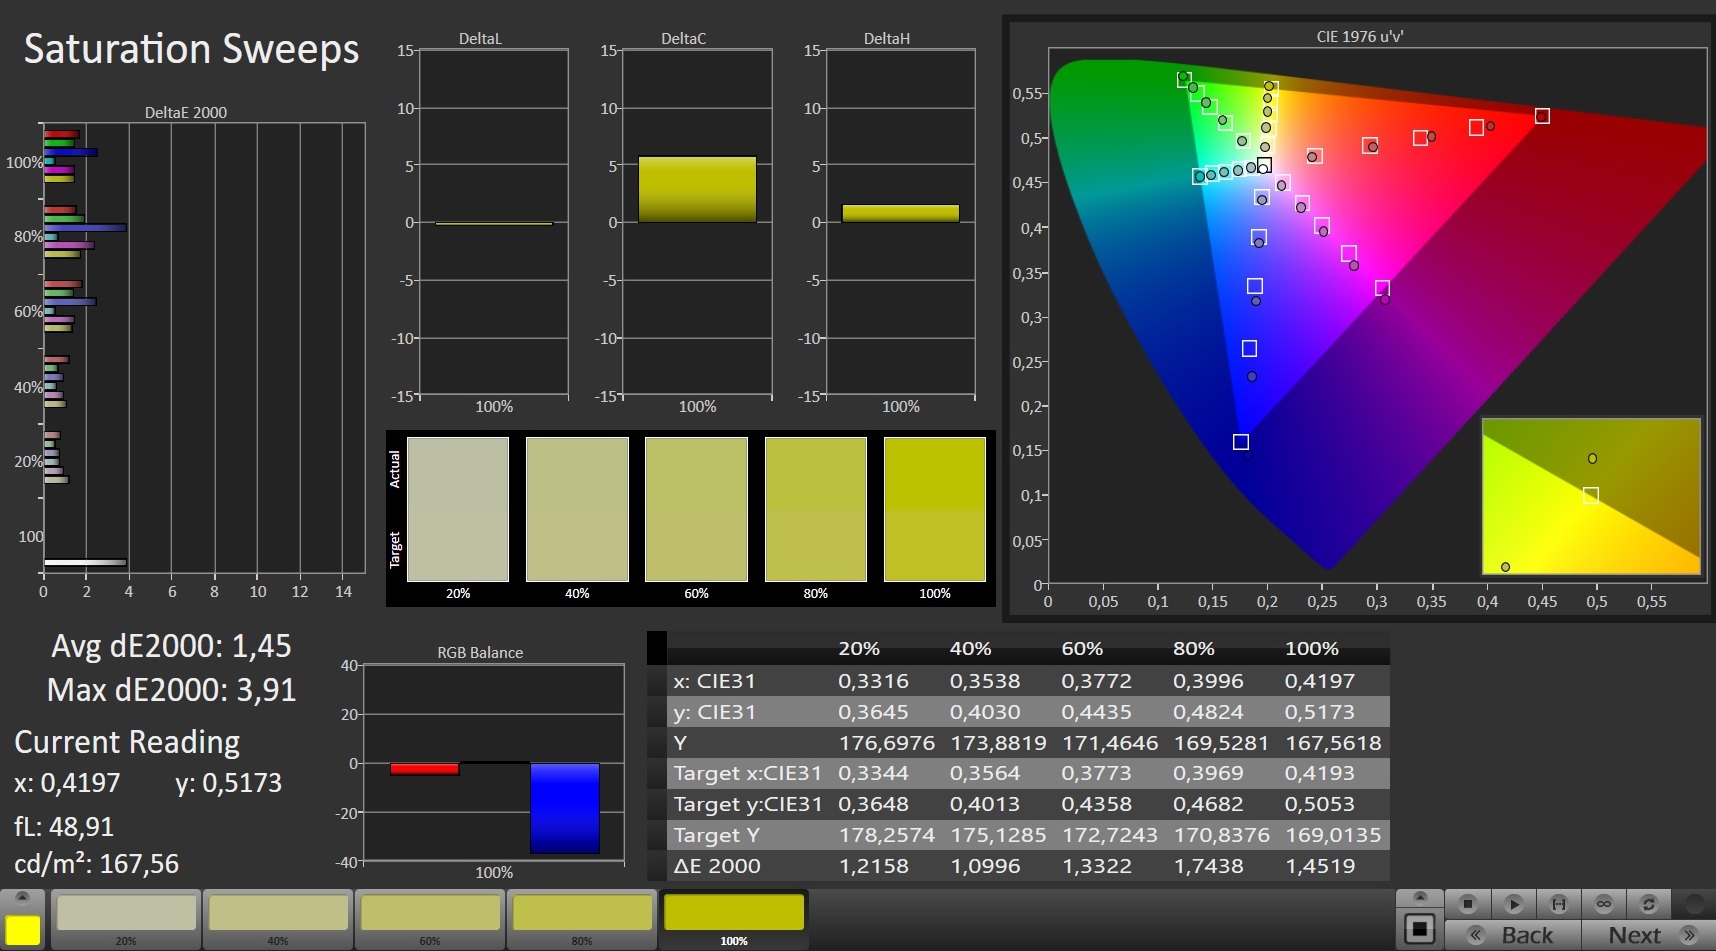
Our measurements show that the Alienware m15 R4 has a good contrast ratio of 1,148:1 and an equally good black level of 0.29 cd/m². In combination with a color-space coverage of 93% (sRGB) and 71% (AdobeRGB), colors look vivid and well separated from each other.
The CalMAN analysis also shows that the display already comes with a low Delta E 2000 deviation of 1.9 out of the box. However, this value can still be improved to 0.8 through calibration. The corresponding ICC file can be downloaded in the window located at the top, to the right of the display's brightness distribution graph.


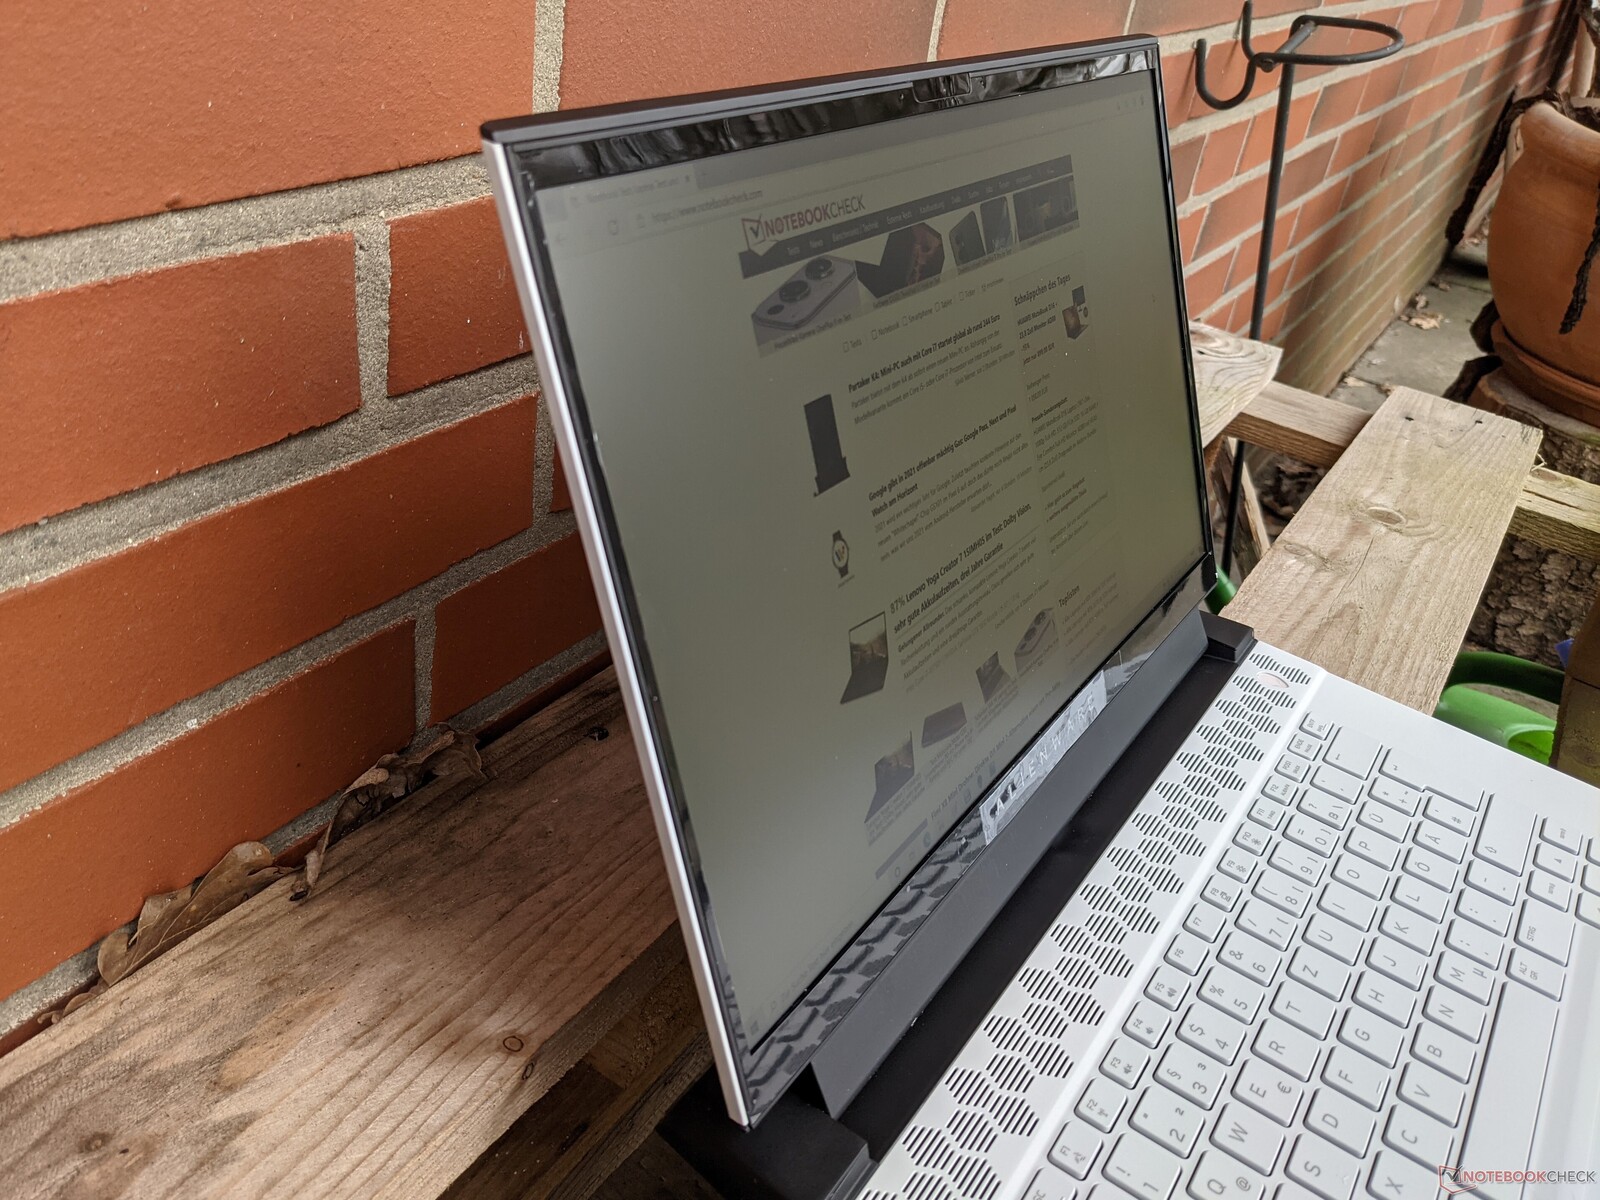
The Alienware m15 R4 can be used easily outdoors as long as places in the shade are preferred. The brightness isn't sufficient to display image content legibly in direct sunlight.
Display Response Times
| ↔ Response Time Black to White | ||
|---|---|---|
| 10 ms ... rise ↗ and fall ↘ combined | ↗ 4.4 ms rise | 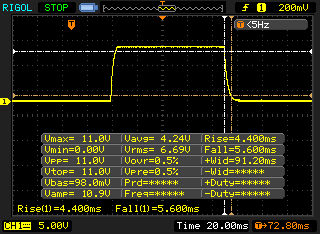 |
| ↘ 5.6 ms fall | ||
| The screen shows good response rates in our tests, but may be too slow for competitive gamers. In comparison, all tested devices range from 0.1 (minimum) to 240 (maximum) ms. » 27 % of all devices are better. This means that the measured response time is better than the average of all tested devices (19.8 ms). | ||
| ↔ Response Time 50% Grey to 80% Grey | ||
| 7.4 ms ... rise ↗ and fall ↘ combined | ↗ 2 ms rise | 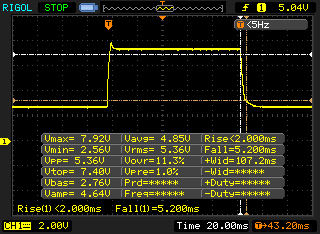 |
| ↘ 5.2 ms fall | ||
| The screen shows very fast response rates in our tests and should be very well suited for fast-paced gaming. In comparison, all tested devices range from 0.165 (minimum) to 636 (maximum) ms. » 20 % of all devices are better. This means that the measured response time is better than the average of all tested devices (31 ms). | ||
Screen Flickering / PWM (Pulse-Width Modulation)
| Screen flickering / PWM not detected | 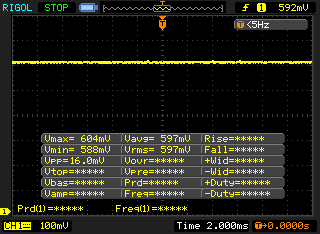 | ||
In comparison: 52 % of all tested devices do not use PWM to dim the display. If PWM was detected, an average of 7754 (minimum: 5 - maximum: 343500) Hz was measured. | |||
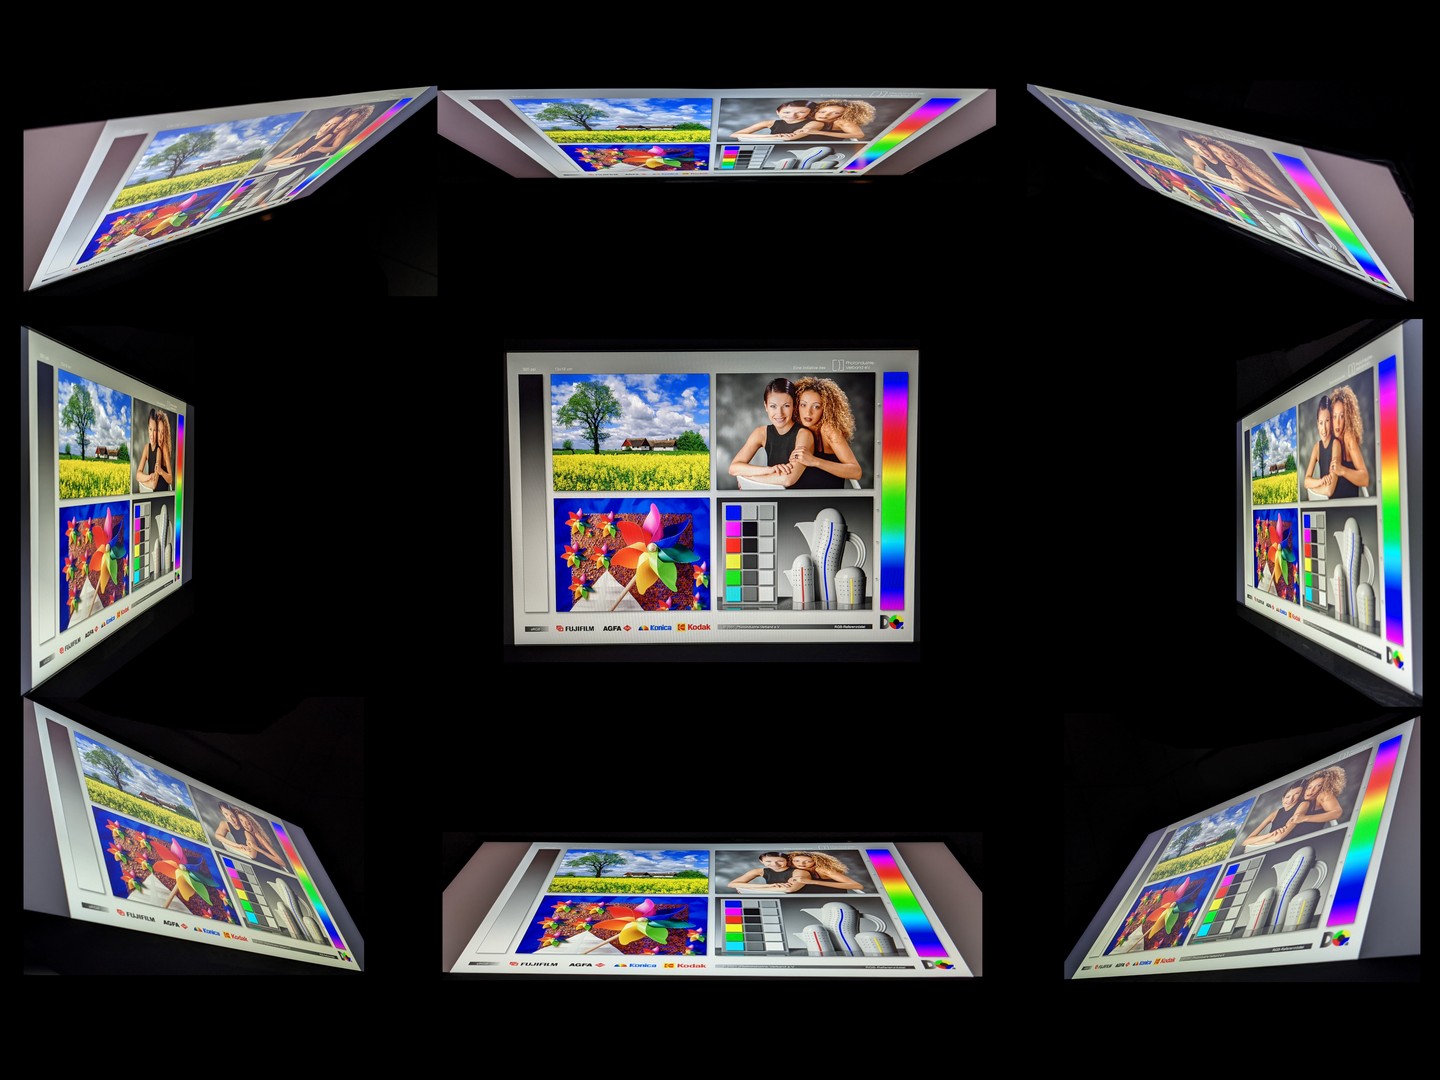
The IPS panel of the Alienware laptop is very viewing-angle stable. Image content can be read from almost any angle without it becoming distorted or being displayed with the wrong colors.
Performance - Strong CPU and powerful graphics unit
Dell targets gamers with a generous budget with the Alienware m15 R4. The available equipment also reflects this; besides the configuration installed here, it's also available with Intel's Core i7-10870H as well as with Nvidia's GeForce RTX 3060 and GeForce RTX 3080. In addition, there are various RAM and storage options.
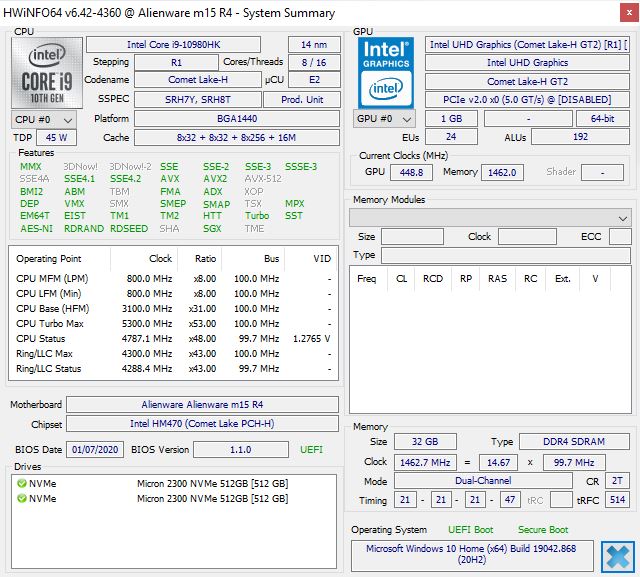
Processor
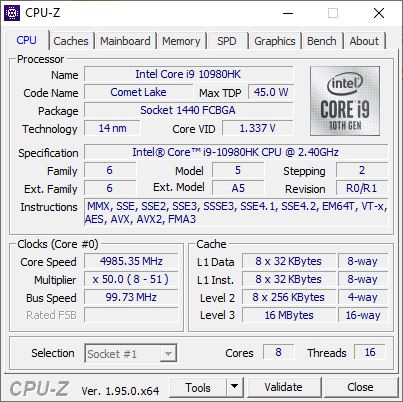
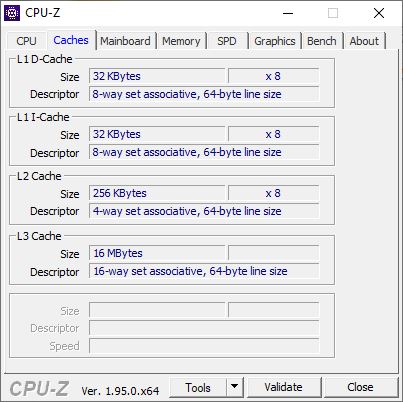
Dell installs an Intel Core i9-10980HK in our test configuration. This octa-core processor belongs to the Comet Lake generation and operates at clock rates between 2.4 and 5.3 GHz. With a TDP of 45 watts, the CPU is suitable for large laptops, and it requires a good cooling system in order to be able to provide its performance consistently over a longer period of time.
Our Cinebench R15 endurance test shows that performance drops by approximately 7% throughout the test period. In the individual disciplines, single-core performance in particular is slightly lower than in the Asus ROG Strix Scar 15, for example, but multi-core performance is almost on par and also increases significantly compared to the Alienware m15 R3.
* ... smaller is better
System performance
In the PCMark 10 test for evaluating system performance, the Alienware m15 R4 can take first place in our test field. In everyday use, this result is reflected in the system that always runs smoothly and launches programs quickly. Accessing files is possible without delays as well. We didn't encounter any micro stuttering or the like during the test period.
Our CPU Benchmarks article shows how other laptops performed in our tests.
| PCMark 10 Score | 6640 points | |
Help | ||
DPC latencies
In the test with LatencyMon, the Alienware m15 R4 shows increased interruption times. Consequently, it's not suitable for real-time applications or similar tasks.
| DPC Latencies / LatencyMon - interrupt to process latency (max), Web, Youtube, Prime95 | |
| Alienware m15 R4 | |
| Asus ROG Strix Scar 15 G532LWS | |
| Alienware m15 R3 P87F | |
| MSI GP76 Leopard 10UG | |
* ... smaller is better
Storage
Dell installs two 1 TB SSDs from Micron in our test model of the Alienware m15 R4. They achieve good read and write rates that are slightly above the competition's level.
Our HDD/SSD Benchmarks article shows the performance that can be expected from other storage devices in comparison.
| Alienware m15 R4 Micron 2300 1TB MTFDHBA1T0TDV | Alienware m15 R3 P87F 2x Micron 2200S 512 GB (RAID 0) | MSI GP76 Leopard 10UG Kingston OM8PCP3512F-AB | Asus ROG Strix Scar 15 G532LWS 2x Intel SSD 660p 1TB SSDPEKNW010T8 (RAID 0) | Average Micron 2300 1TB MTFDHBA1T0TDV | |
|---|---|---|---|---|---|
| CrystalDiskMark 5.2 / 6 | -12% | -27% | -5% | -2% | |
| Write 4K (MB/s) | 93.7 | 67.3 -28% | 143.7 53% | 128.4 37% | 102.5 ? 9% |
| Read 4K (MB/s) | 48.1 | 41.47 -14% | 45.1 -6% | 53.7 12% | 51.8 ? 8% |
| Write Seq (MB/s) | 2785 | 2239 -20% | 978 -65% | 1875 -33% | 2364 ? -15% |
| Read Seq (MB/s) | 2598 | 2112 -19% | 1163 -55% | 2315 -11% | 2106 ? -19% |
| Write 4K Q32T1 (MB/s) | 481.9 | 488.9 1% | 519 8% | 427.2 -11% | 506 ? 5% |
| Read 4K Q32T1 (MB/s) | 521 | 557 7% | 302.7 -42% | 440.7 -15% | 511 ? -2% |
| Write Seq Q32T1 (MB/s) | 3362 | 2654 -21% | 981 -71% | 2793 -17% | 3203 ? -5% |
| Read Seq Q32T1 (MB/s) | 3200 | 3137 -2% | 1983 -38% | 3101 -3% | 3220 ? 1% |
| AS SSD | -37% | -42% | -7% | -1% | |
| Seq Read (MB/s) | 2658 | 2058 -23% | 1659 -38% | 1982 -25% | 2451 ? -8% |
| Seq Write (MB/s) | 2769 | 2316 -16% | 921 -67% | 1444 -48% | 2111 ? -24% |
| 4K Read (MB/s) | 46.07 | 39.72 -14% | 51 11% | 50.3 9% | 49.3 ? 7% |
| 4K Write (MB/s) | 87.2 | 62.9 -28% | 120.1 38% | 120.1 38% | 100 ? 15% |
| 4K-64 Read (MB/s) | 1372 | 1334 -3% | 463.5 -66% | 1016 -26% | 1272 ? -7% |
| 4K-64 Write (MB/s) | 1247 | 1271 2% | 909 -27% | 1351 8% | 1864 ? 49% |
| Access Time Read * (ms) | 0.052 | 0.062 -19% | 0.179 -244% | 0.044 15% | 0.04975 ? 4% |
| Access Time Write * (ms) | 0.098 | 0.388 -296% | 0.032 67% | 0.109 -11% | 0.181 ? -85% |
| Score Read (Points) | 1684 | 1580 -6% | 680 -60% | 1264 -25% | 1566 ? -7% |
| Score Write (Points) | 1611 | 1565 -3% | 1121 -30% | 1615 0% | 2175 ? 35% |
| Score Total (Points) | 4166 | 3968 -5% | 2130 -49% | 3510 -16% | 4532 ? 9% |
| Total Average (Program / Settings) | -25% /
-27% | -35% /
-36% | -6% /
-6% | -2% /
-2% |
* ... smaller is better

Continuous load read: DiskSpd Read Loop, Queue Depth 8
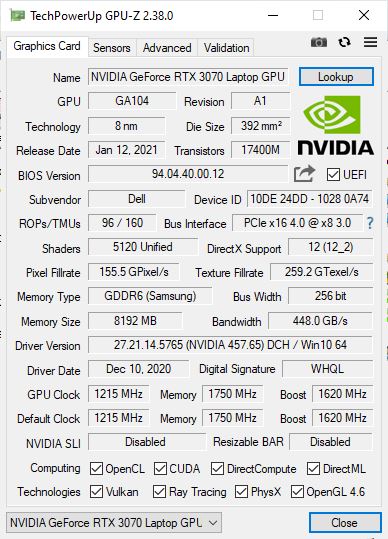
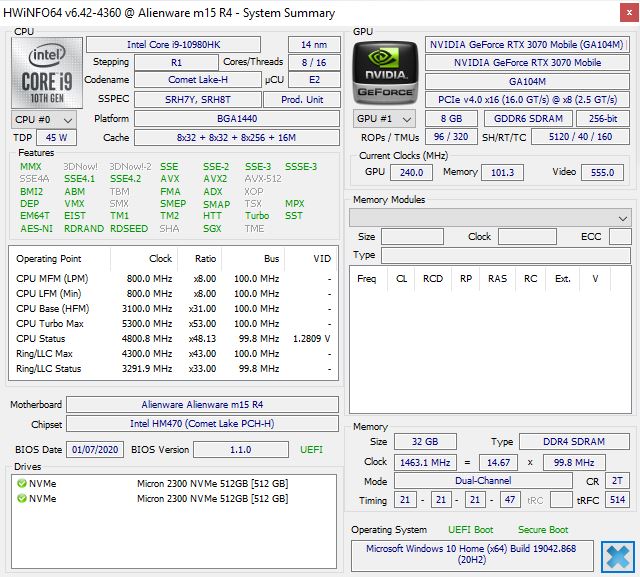
Graphics card
The Nvidia GeForce RTX 3070 Mobile used here is currently one of the most powerful graphics cards for laptops. However, the actual performance depends on the configured TGP, which Dell sets to the maximum at 140 watts. This is also the case with the MSI GP76 Leopard, which is reflected in these two laptops alternating between first and second place in our test field. Compared to the Alienware m15 R3, users can expect a performance increase of up to 43%.
How other graphics cards perform in comparison can be found in our GPU Benchmarks article.
| 3DMark 11 Performance | 27955 points | |
| 3DMark Cloud Gate Standard Score | 50367 points | |
| 3DMark Fire Strike Score | 22429 points | |
| 3DMark Time Spy Score | 10872 points | |
Help | ||
Gaming performance
The Alienware m15 R4 with the Nvidia GeForce RTX 3070 Mobile GPU can virtually run all the latest titles at high frame rates without any problems. Technologies like ray tracing can also be used, although this can lead to frame rates below 60 fps depending on the title.
The performance that can be expected from the graphics unit installed here in other titles can be found in our GPU Benchmarks article.
| The Witcher 3 - 1920x1080 Ultra Graphics & Postprocessing (HBAO+) | |
| Average of class Gaming (104.7 - 240, n=7, last 2 years) | |
| MSI GP76 Leopard 10UG | |
| Alienware m15 R4 | |
| Average NVIDIA GeForce RTX 3070 Laptop GPU (34.9 - 109, n=52) | |
| Asus ROG Strix Scar 15 G532LWS | |
| Alienware m15 R3 P87F | |
| Cyberpunk 2077 1.0 - 1920x1080 Ultra Preset | |
| Alienware m15 R4 | |
| Average NVIDIA GeForce RTX 3070 Laptop GPU (50 - 70.5, n=11) | |
| Far Cry 5 - 1920x1080 Ultra Preset AA:T | |
| Average of class Gaming (70 - 151, n=6, last 2 years) | |
| MSI GP76 Leopard 10UG | |
| Average NVIDIA GeForce RTX 3070 Laptop GPU (89 - 140, n=36) | |
| Alienware m15 R4 | |
Our The Witcher 3 endurance test shows that the gaming performance of the Alienware m15 R4 decreases slightly over longer gaming periods. Consequently, you can definitely experience limitations in very demanding titles after long gaming sessions.
| low | med. | high | ultra | |
|---|---|---|---|---|
| The Witcher 3 (2015) | 101 | |||
| Dota 2 Reborn (2015) | 154 | 142 | 139 | 130 |
| Final Fantasy XV Benchmark (2018) | 67 | 62 | ||
| X-Plane 11.11 (2018) | 124 | 111 | 91.4 | |
| Far Cry 5 (2018) | 107 | |||
| Cyberpunk 2077 1.0 (2020) | 70.5 |
Emissions - Quieter fans in the Alienware laptop
Noise emissions
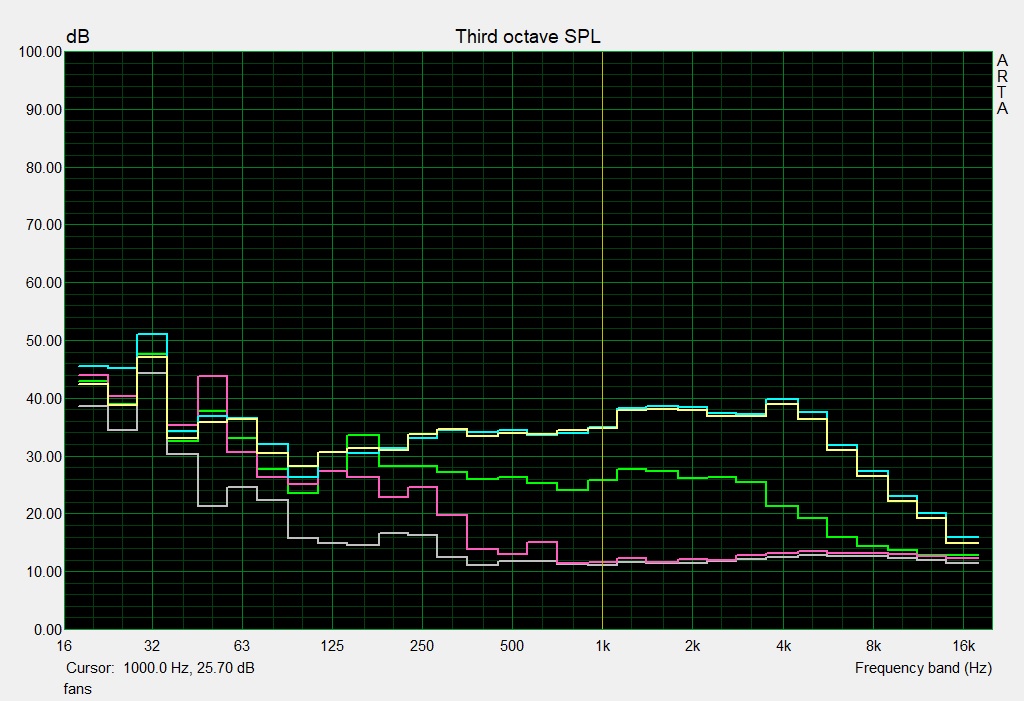
The fans of the Alienware m15 R4 can get quite loud with up to 49 dB(A). However, they are still quieter than those of the predecessor, which reached a fan noise level of up to 59.7 dB(A). Furthermore, the fan noise is a uniform hiss and can be tolerated well as a result.
Occasionally, we could hear a slight whirring noise, which is probably caused by the built-in mass storage device. This occurred both with and without the power adapter connected.
Noise level
| Idle |
| 25 / 26 / 37 dB(A) |
| Load |
| 48 / 49 dB(A) |
 | ||
30 dB silent 40 dB(A) audible 50 dB(A) loud |
||
min: | ||
Temperature
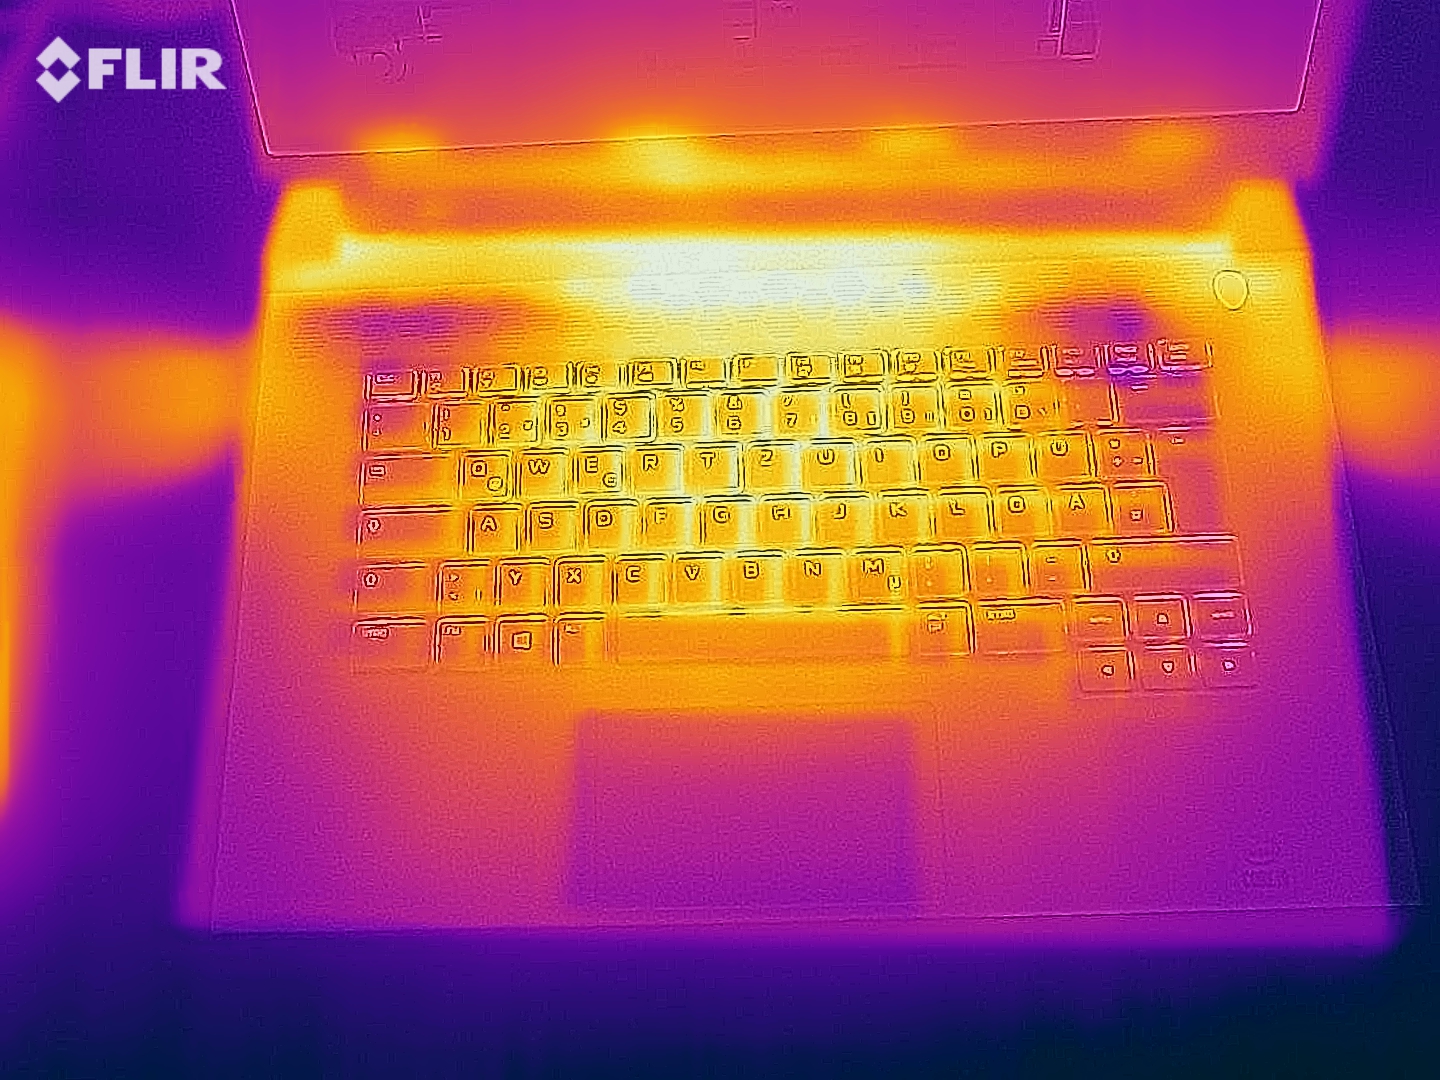
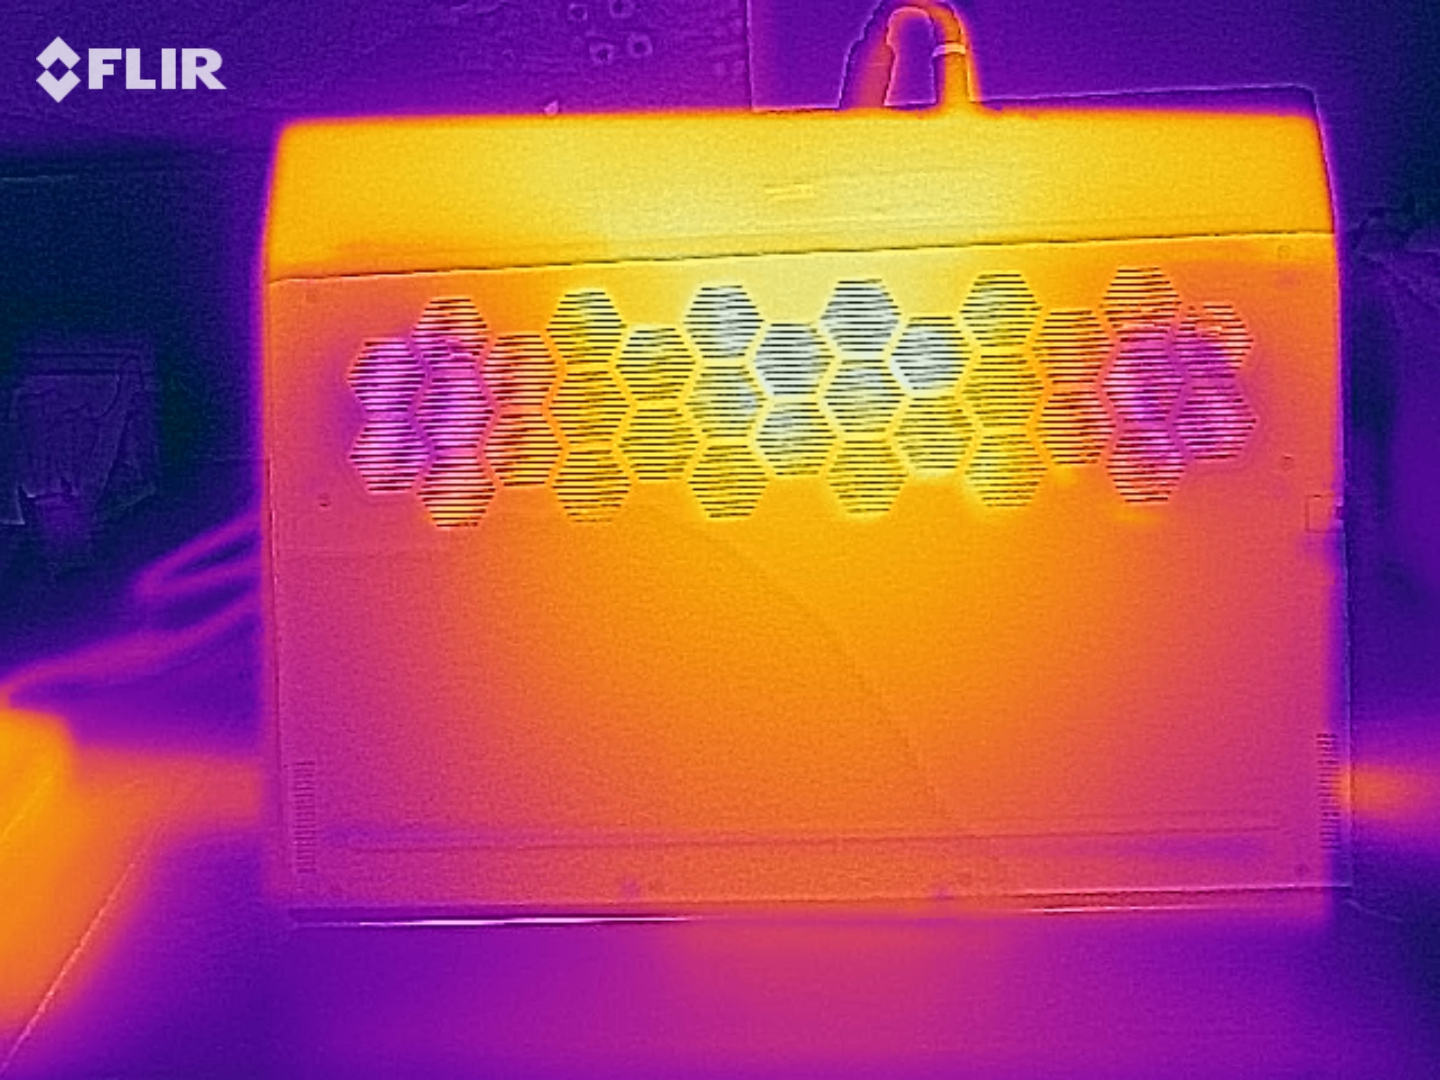
According to our measurements, the surfaces of the Alienware m15 R4 heat up to 60 °C (~140 °F). This means that using the device on the lap, for example, is no longer recommended. Since the warmest point is at the back of the laptop, the palm rests don't heat up quite as much, but they still reach up to 43 °C (~109 °F).
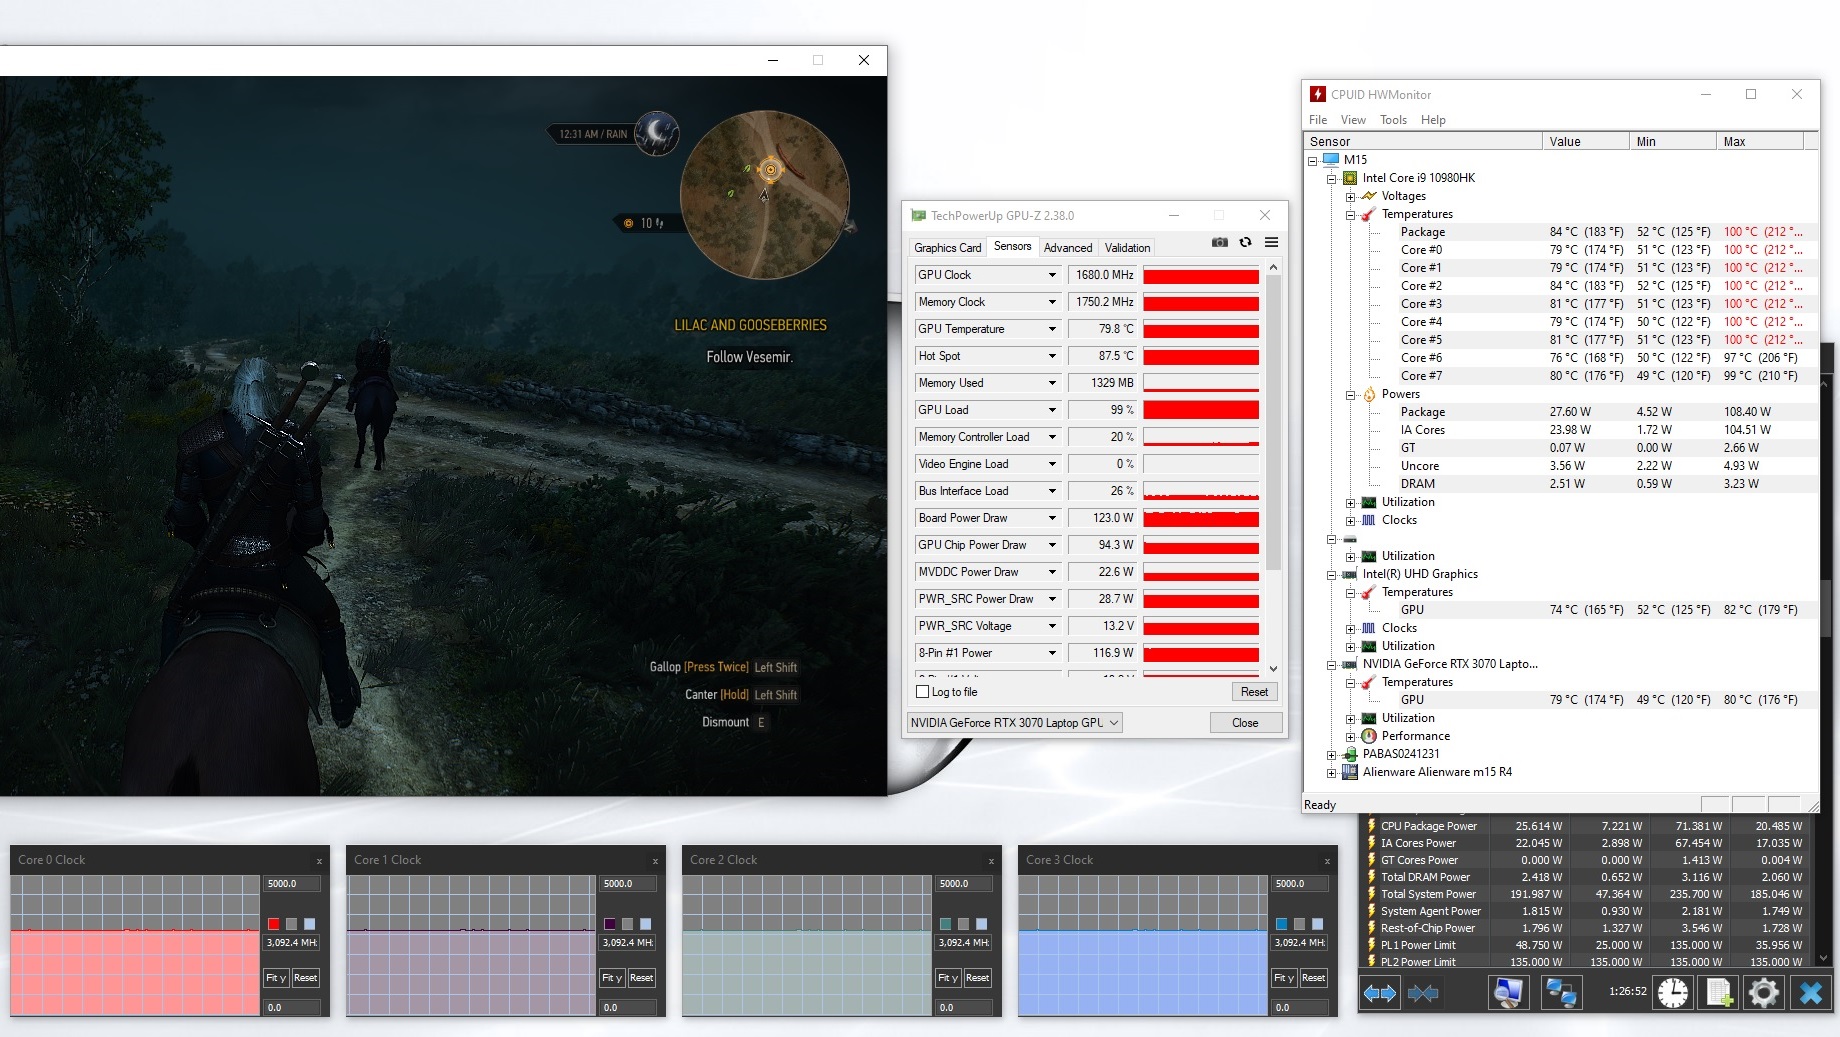
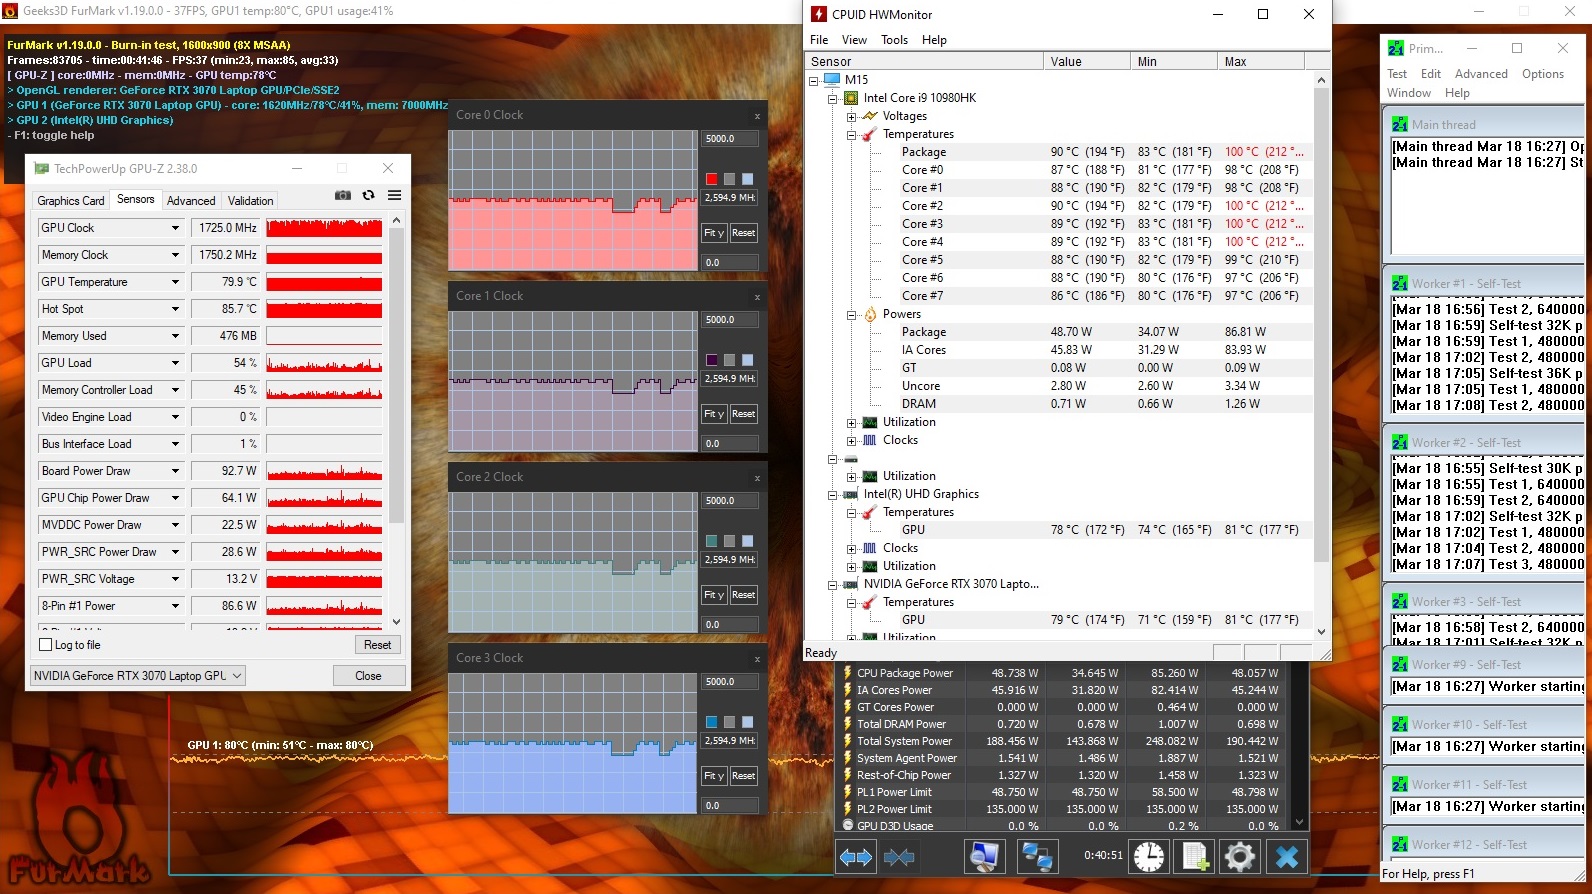
The core temperatures rose up to 100 °C (~212 °F) during our one-hour endurance stress test. The cooling system enabled clock rates of just under 2.6 GHz, meaning that the base clock speed wasn't undercut. During our The Witcher 3 endurance stress test, the clock rates were around 3 GHz. Therefore, users don't have to expect throttling due to excessively high temperatures.
(-) The maximum temperature on the upper side is 60 °C / 140 F, compared to the average of 40.4 °C / 105 F, ranging from 21.2 to 68.8 °C for the class Gaming.
(-) The bottom heats up to a maximum of 60 °C / 140 F, compared to the average of 43.2 °C / 110 F
(-) In idle usage, the average temperature for the upper side is 41 °C / 106 F, compared to the device average of 33.9 °C / 93 F.
(-) Playing The Witcher 3, the average temperature for the upper side is 48.3 °C / 119 F, compared to the device average of 33.9 °C / 93 F.
(-) The palmrests and touchpad can get very hot to the touch with a maximum of 43 °C / 109.4 F.
(-) The average temperature of the palmrest area of similar devices was 28.8 °C / 83.8 F (-14.2 °C / -25.6 F).
Speakers
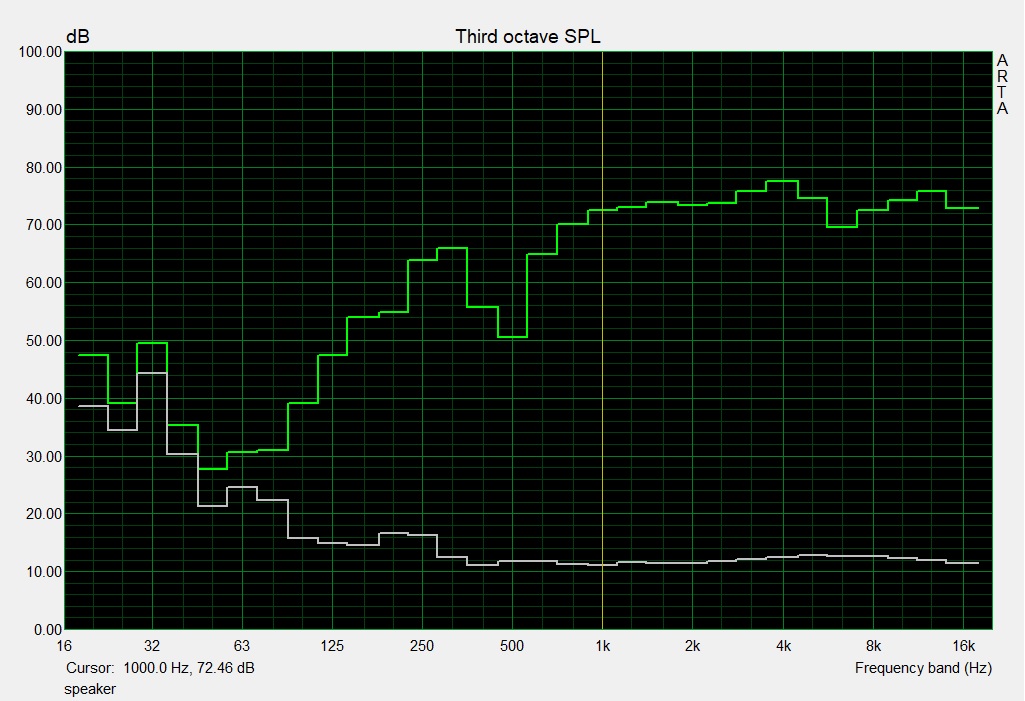
The speakers of the m15 R4 offer a relatively high volume and a sound spectrum with an emphasis on higher tones. Lower tones are still present at medium volume levels, which also makes the Alienware laptop suitable for playing media content. However, headphones or external speakers should be preferred when gaming or in general at higher volumes.
Alienware m15 R4 audio analysis
(+) | speakers can play relatively loud (86 dB)
Bass 100 - 315 Hz
(-) | nearly no bass - on average 18.2% lower than median
(±) | linearity of bass is average (9.6% delta to prev. frequency)
Mids 400 - 2000 Hz
(±) | reduced mids - on average 6.4% lower than median
(±) | linearity of mids is average (8.1% delta to prev. frequency)
Highs 2 - 16 kHz
(+) | balanced highs - only 2.3% away from median
(+) | highs are linear (4% delta to prev. frequency)
Overall 100 - 16.000 Hz
(+) | overall sound is linear (13.4% difference to median)
Compared to same class
» 19% of all tested devices in this class were better, 7% similar, 74% worse
» The best had a delta of 6%, average was 18%, worst was 132%
Compared to all devices tested
» 14% of all tested devices were better, 4% similar, 82% worse
» The best had a delta of 4%, average was 23%, worst was 134%
Asus ROG Strix Scar 15 G532LWS audio analysis
(+) | speakers can play relatively loud (84.1 dB)
Bass 100 - 315 Hz
(±) | reduced bass - on average 9.7% lower than median
(±) | linearity of bass is average (7.8% delta to prev. frequency)
Mids 400 - 2000 Hz
(±) | higher mids - on average 6.4% higher than median
(+) | mids are linear (4.8% delta to prev. frequency)
Highs 2 - 16 kHz
(+) | balanced highs - only 1.9% away from median
(+) | highs are linear (5.5% delta to prev. frequency)
Overall 100 - 16.000 Hz
(+) | overall sound is linear (14.4% difference to median)
Compared to same class
» 27% of all tested devices in this class were better, 7% similar, 66% worse
» The best had a delta of 6%, average was 18%, worst was 132%
Compared to all devices tested
» 18% of all tested devices were better, 4% similar, 78% worse
» The best had a delta of 4%, average was 23%, worst was 134%
Energy management - High energy consumption shortens battery life
Energy consumption
With an average idle power consumption of 39 watts, the m15 R4 is slightly more energy-efficient than the m15 R3. Compared with the rest of our test field, however, the two Alienware laptops show the highest energy consumption.
| Off / Standby | |
| Idle | |
| Load |
|
Key:
min: | |
| Alienware m15 R4 i9-10980HK, GeForce RTX 3070 Laptop GPU | Alienware m15 R3 P87F i7-10750H, GeForce RTX 2070 Mobile | MSI GP76 Leopard 10UG i7-10750H, GeForce RTX 3070 Laptop GPU | Asus ROG Strix Scar 15 G532LWS i9-10980HK, GeForce RTX 2070 Super Mobile | Average of class Gaming | |
|---|---|---|---|---|---|
| Power Consumption | -9% | 36% | 27% | 36% | |
| Idle Minimum * (Watt) | 35 | 34 3% | 12 66% | 8 77% | 13 ? 63% |
| Idle Average * (Watt) | 39 | 48.6 -25% | 16 59% | 9.8 75% | 19 ? 51% |
| Idle Maximum * (Watt) | 48 | 58.2 -21% | 28 42% | 25.8 46% | 24.6 ? 49% |
| Load Average * (Watt) | 135 | 129.4 4% | 92 32% | 169 -25% | 110.7 ? 18% |
| Witcher 3 ultra * (Watt) | 194 | 214.5 -11% | 198 -2% | 201 -4% | |
| Load Maximum * (Watt) | 252 | 257.3 -2% | 210 17% | 271.6 -8% | 259 ? -3% |
* ... smaller is better
Battery life
The Alienware m15 R4 achieves a runtime of just under 3 hours in our practical Wi-Fi test. This is even shorter than the predecessor, which only offered mediocre battery life as well.
| Alienware m15 R4 i9-10980HK, GeForce RTX 3070 Laptop GPU, 86 Wh | Alienware m15 R3 P87F i7-10750H, GeForce RTX 2070 Mobile, 86 Wh | MSI GP76 Leopard 10UG i7-10750H, GeForce RTX 3070 Laptop GPU, 65 Wh | Asus ROG Strix Scar 15 G532LWS i9-10980HK, GeForce RTX 2070 Super Mobile, 66 Wh | Average of class Gaming | |
|---|---|---|---|---|---|
| Battery runtime | 6% | 32% | 89% | 118% | |
| Reader / Idle (h) | 3.7 | 5 35% | 5.6 51% | 8.1 119% | 8.27 ? 124% |
| WiFi v1.3 (h) | 2.7 | 2.8 4% | 4.2 56% | 4.9 81% | 7.11 ? 163% |
| Load (h) | 0.9 | 0.7 -22% | 0.8 -11% | 1.5 67% | 1.502 ? 67% |
Pros
Cons
Verdict - Superior performance
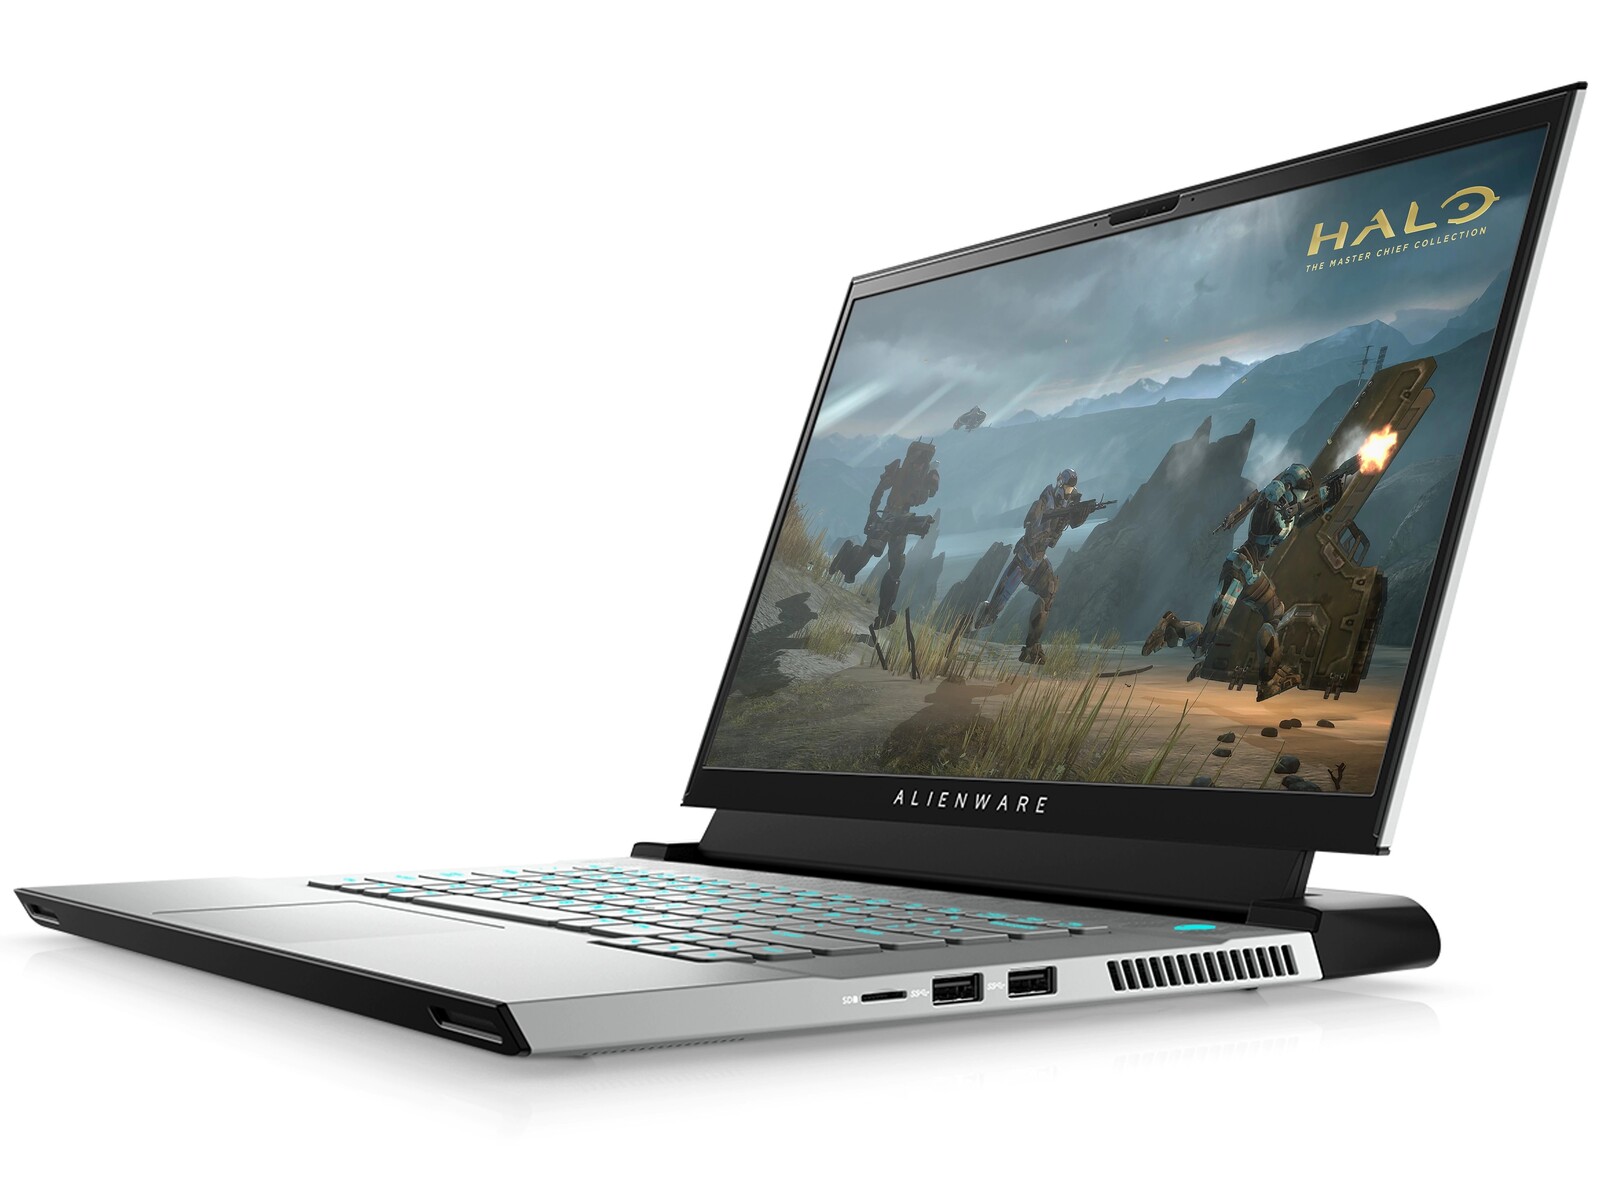
The Alienware m15 R4 remains unchanged in terms of looks, and that's a good thing. The materials are of the usual high quality, and the ports and input devices fulfill their purpose very well. The somewhat limited aperture angle of the display is still present, but there's nothing to criticize apart from that. The hardware upgrade to the powerful Intel Core i9-10980HK and the Nvidia GeForce RTX 3070 Mobile also raise performance to an up-to-date and competitive level.
Dell raises the hardware of the Alienware m15 R4 to the latest standard. While performance is beyond reproach, the high internal temperatures are not.
However, battery life is extremely short due to the high power consumption of the CPU and GPU. Other manufacturers score better here, which spares users from having to make complex adjustments to the energy management settings. Although the fan noise is somewhat lower compared to the Alienware m15 R3, the internal temperatures are still extremely high. While the cooling system still has them under control, it's questionable whether this will continue to be the case on a warm summer day.
Price and availability
At the time of writing, the Alienware m15 R4 is available on Best Buy at a discounted price of $1,899. This is the configuration with the Core i7-10850H, the RTX 3070, 16 GB of RAM, and a 512 GB SSD. You can find this same configuration on Amazon with a 1 TB SSD for around $2,110. Our test configuration with the Intel Core i9-10980HK and 32 GB of RAM is only available on Dell's website.
Alienware m15 R4
- 04/05/2021 v7 (old)
Mike Wobker
Price comparison

