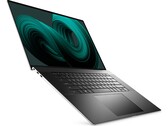
Dell XPS 17 9710 11th Gen Intel Laptop Review: Small Changes That Matter
The first generation XPS 17 9700 was one of the best-looking 17-inch laptops with Core-H and GeForce RTX graphics, but it had some under-the-hood peculiarities that needed to be ironed out. The new XPS 17 9710 addresses the underlying issues while boosting performance by quite the margin.
Intel Core i7-11800H, NVIDIA GeForce RTX 3060 Laptop GPU, 17", 2.5 kg