HP ZBook Studio G7 Laptop Review - The best mobile workstation thanks to vapor chamber and DreamColor?
Slim mobile workstations are very popular and almost every major manufacturer offers corresponding models. HP's ZBook Studio G7 is a direct competitor for devices like the Dell Precision 5550 or Lenovo ThinkPad P1, but these models are limited to GPUs like the Quadro T2000 series. HP on the other hand also offers the Studio G7 with more powerful Quadro RTX Max-Q chips with ray tracing support. Similar to other ZBooks, the manufacturer uses a vapor chamber cooling solution to keep the components cool. In addition to the ZBook Studio G7, HP also offers the ZBook Create, which is equipped with consumer GeForce GPUs instead of the professional Quadro chips.
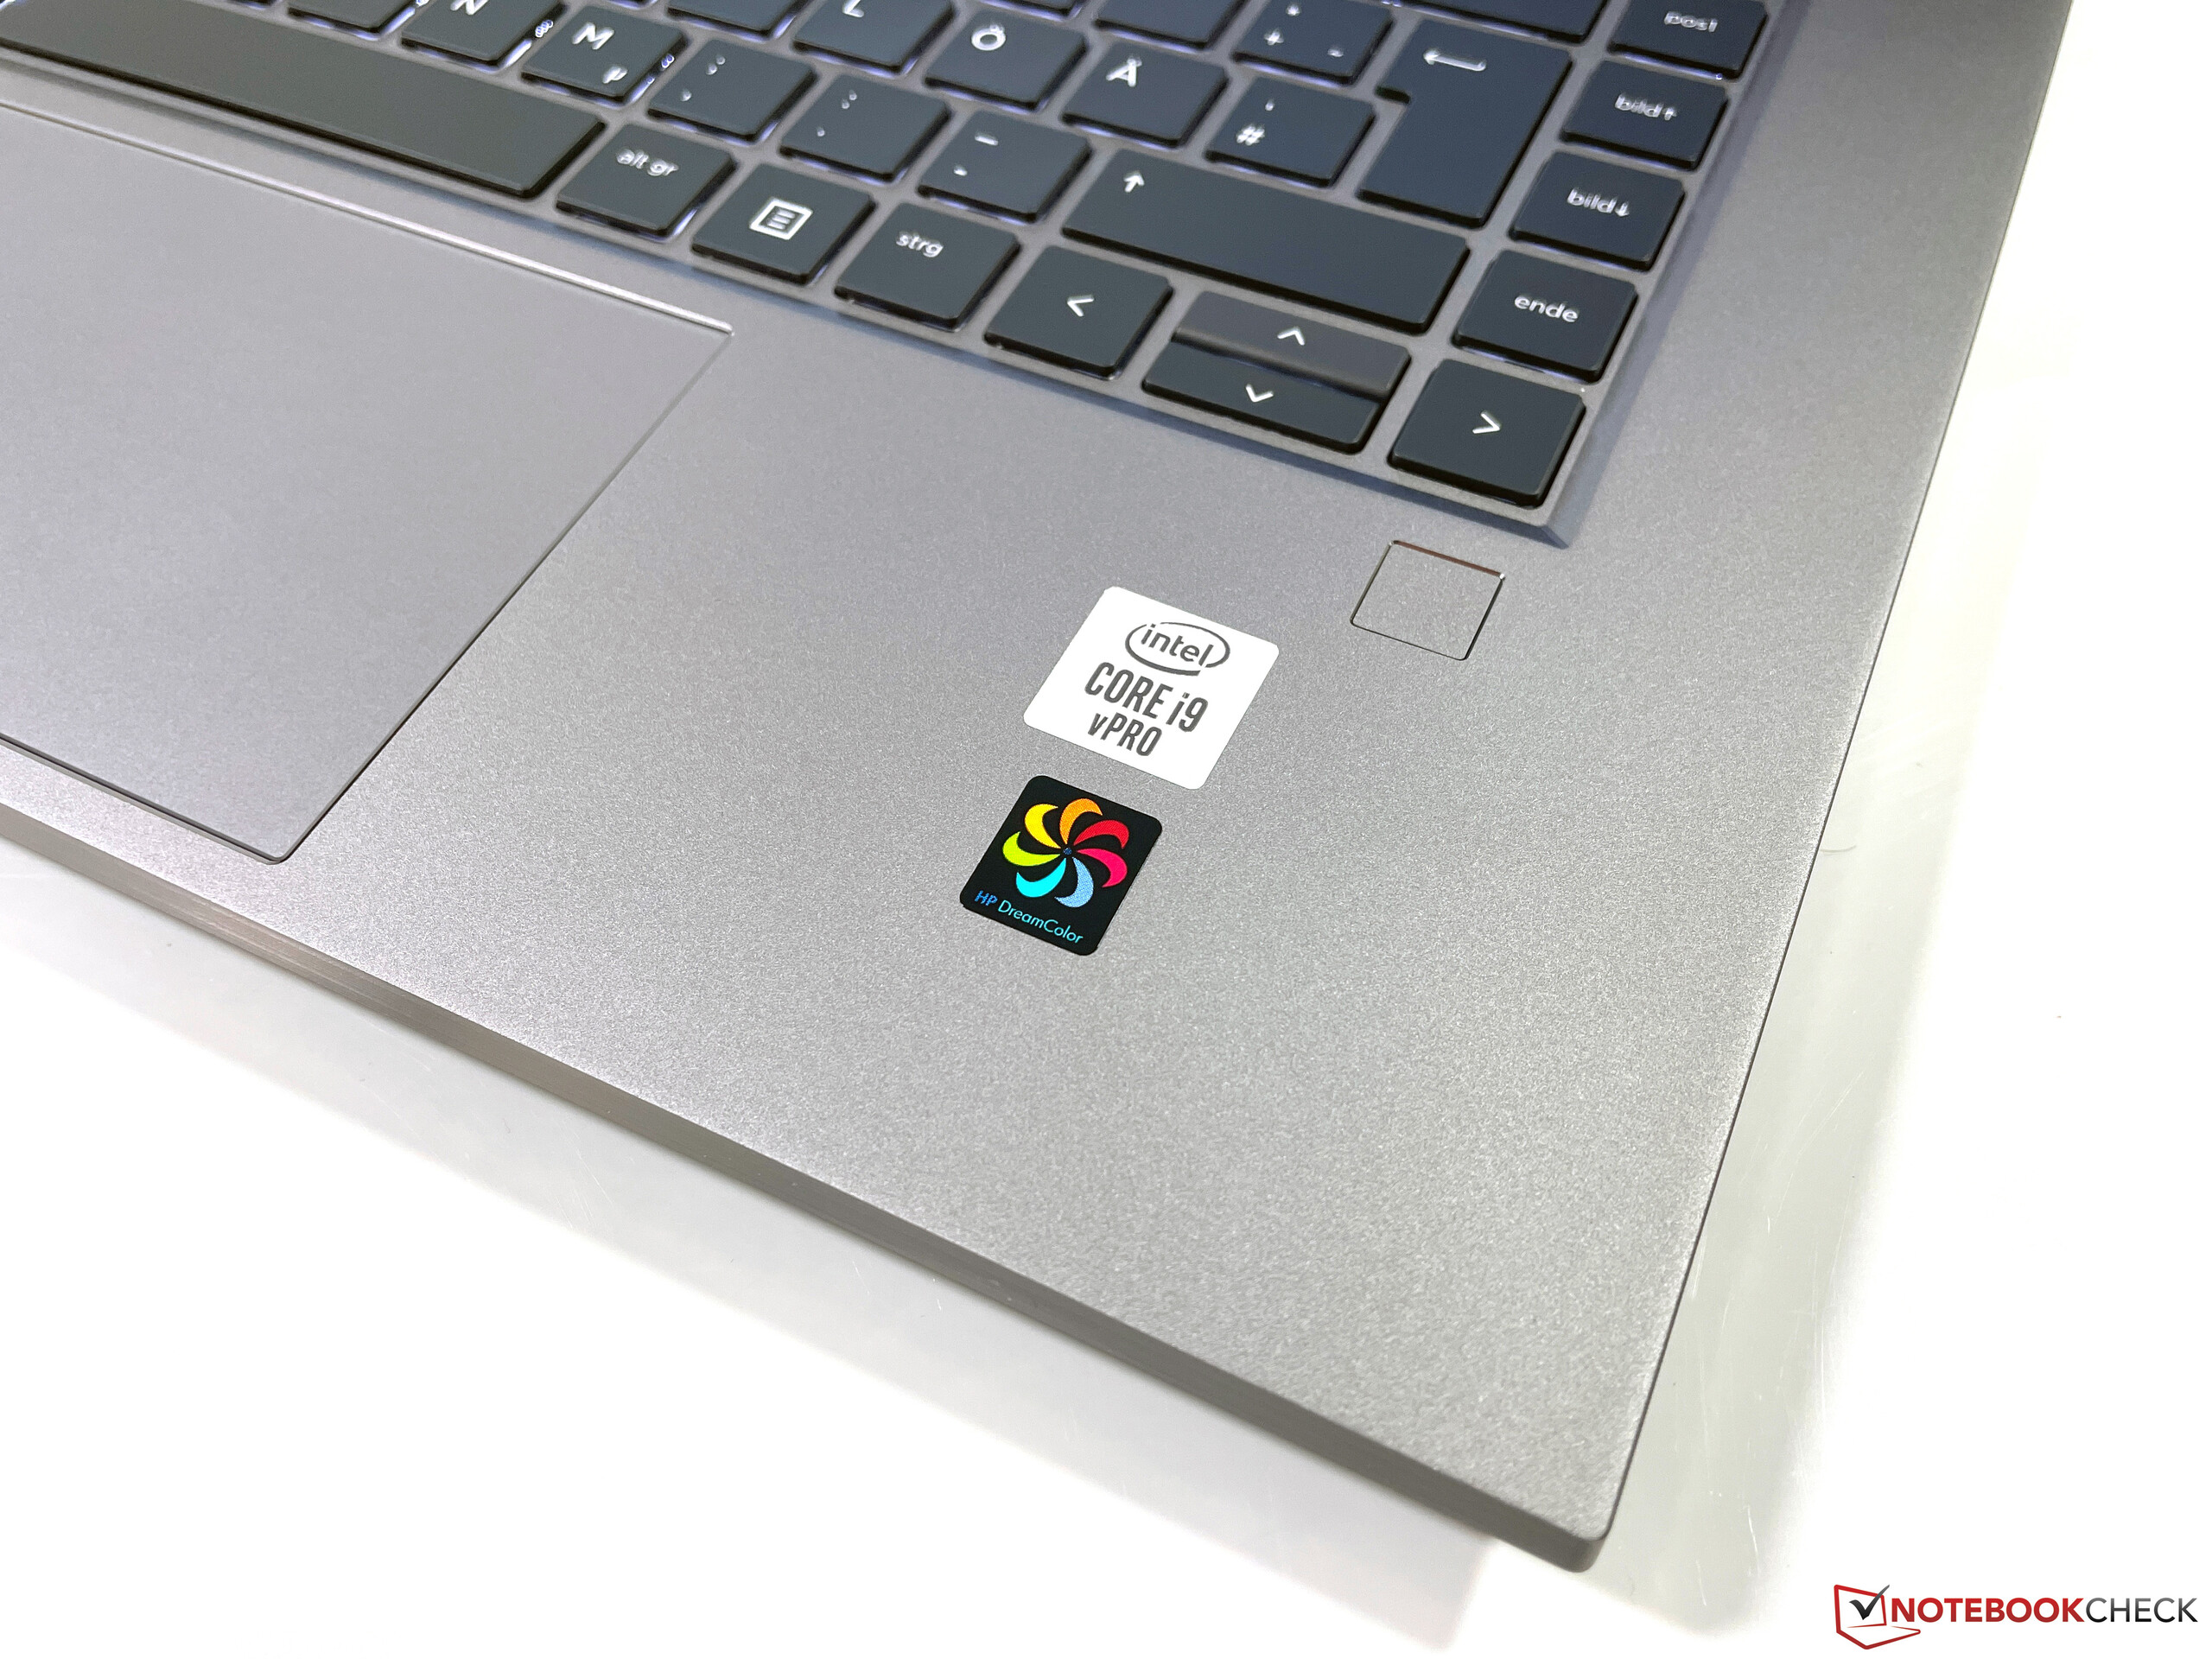
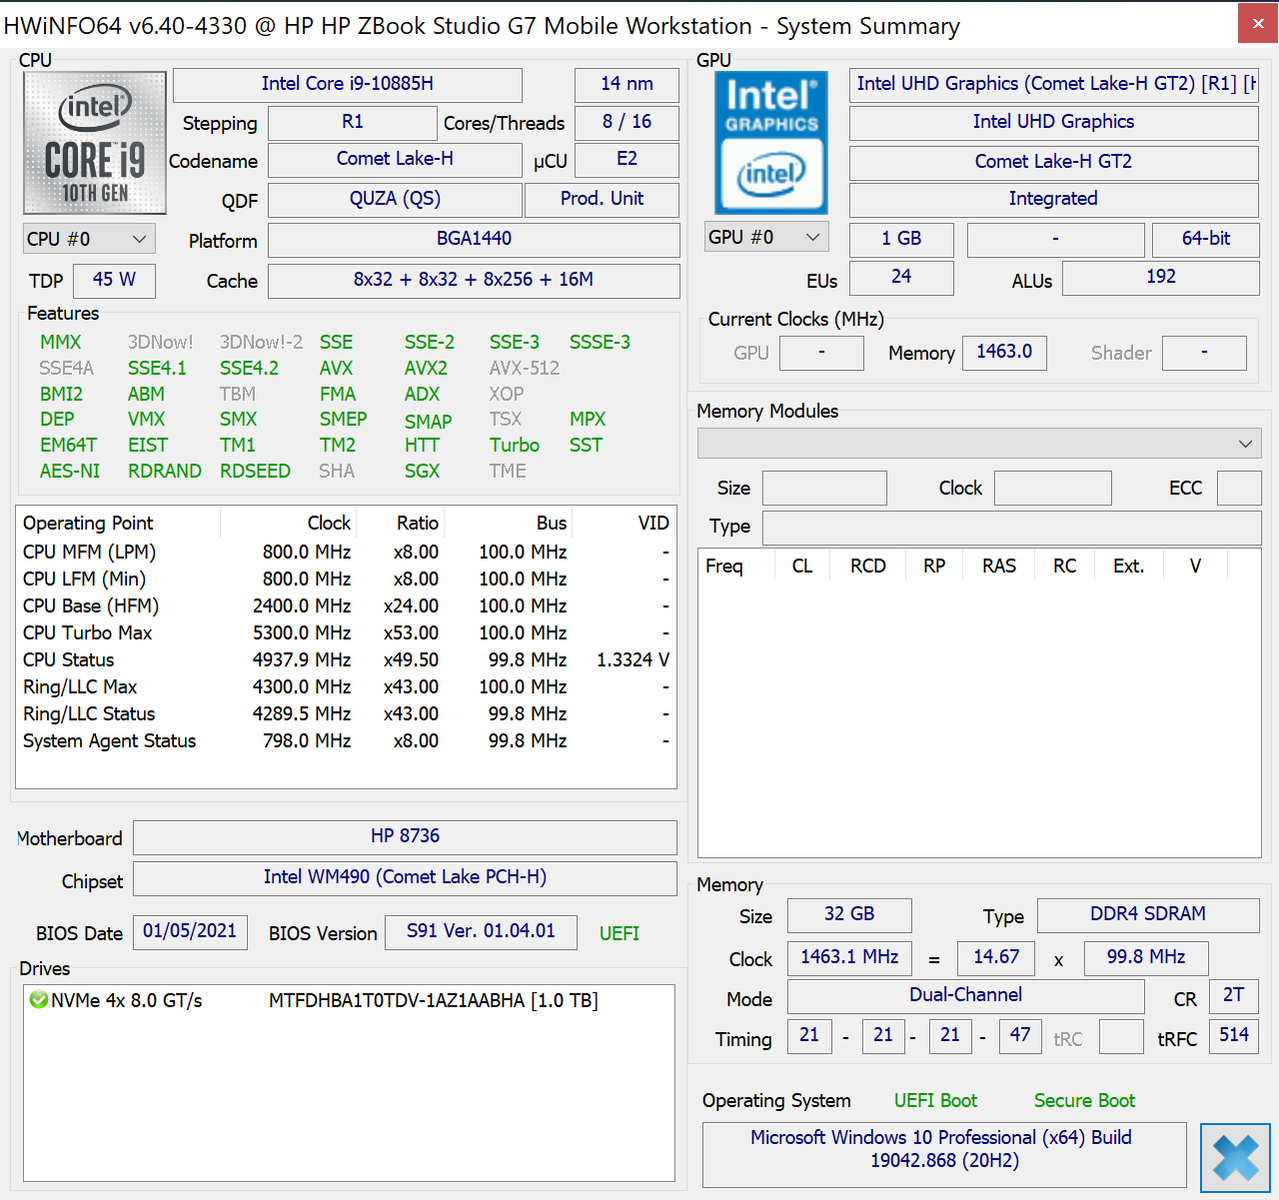
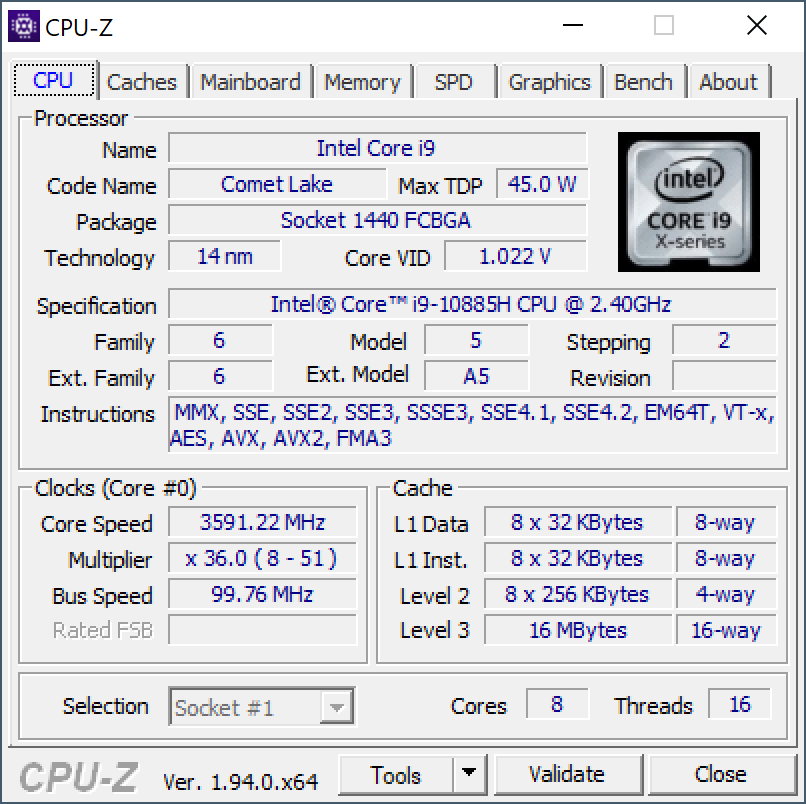
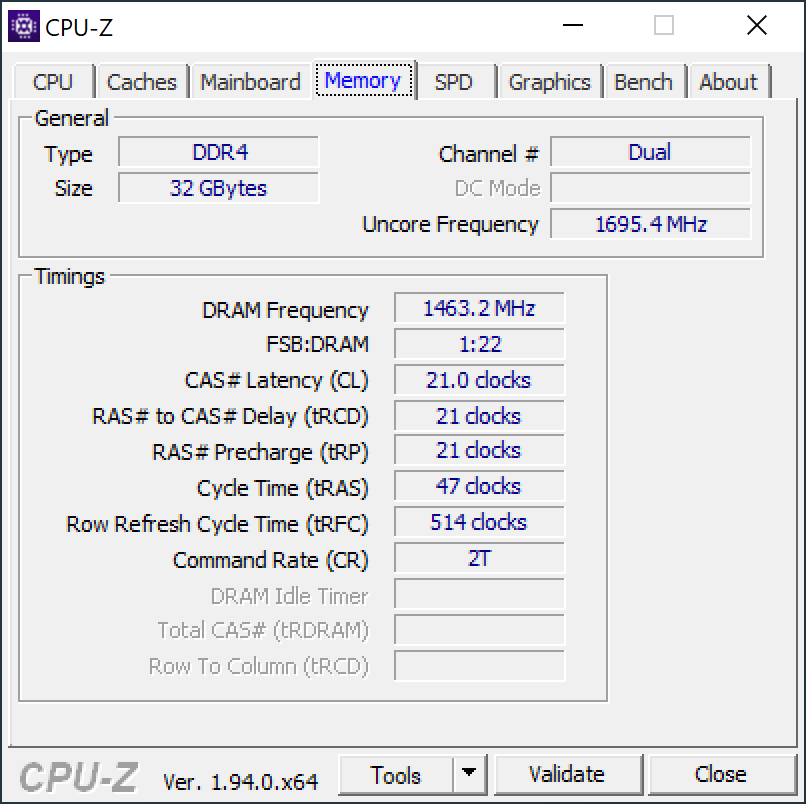
Our test unit is an expensive spec for around 3500 Euros. Customers get an Intel Core i9 CPU, the Quadro RTX 3000 Max-Q GPU from Nvidia, 32 GB RAM, and a 1 TB PCIe-SSD. You also get a new version of HP's DreamColor display with 4K resolution HDR400 support. While previous models targeted the AdobeRGB color gamut, the new version "only" covers the smaller P3 gamut. We want to find out whether the slim ZBook Studio can handle the powerful components or if you should get a thicker workstation like the ZBook Fury 15.
mögliche Konkurrenten im Vergleich
Rating | Date | Model | Weight | Height | Size | Resolution | Price |
|---|---|---|---|---|---|---|---|
| 90.6 % v7 (old) | 03 / 2021 | HP ZBook Studio G7 i9-10885H, Quadro RTX 3000 Max-Q | 2 kg | 18 mm | 15.60" | 3840x2160 | |
| 90.2 % v7 (old) | 01 / 2021 | HP ZBook Fury 15 G7 W-10885M, Quadro RTX 5000 Max-Q | 2.4 kg | 25.9 mm | 15.60" | 3840x2160 | |
| 86.3 % v7 (old) | 08 / 2020 | Dell Precision 5550 P91F i7-10875H, Quadro T2000 Max-Q | 2 kg | 18 mm | 15.60" | 3840x2400 | |
| 87.8 % v7 (old) | 08 / 2019 | Lenovo ThinkPad P1 2019-20QT000RGE i7-9850H, Quadro T1000 (Laptop) | 1.7 kg | 18.4 mm | 15.60" | 1920x1080 | |
| 89.7 % v7 (old) | 12 / 2019 | Apple MacBook Pro 16 2019 i9 5500M i9-9880H, Radeon Pro 5500M | 2 kg | 16.2 mm | 16.00" | 3072x1920 | |
| 87 % v7 (old) | 08 / 2020 | Razer Blade 15 Studio Edition 2020 i7-10875H, Quadro RTX 5000 Max-Q | 2.2 kg | 13.98 mm | 15.60" | 3840x2160 |
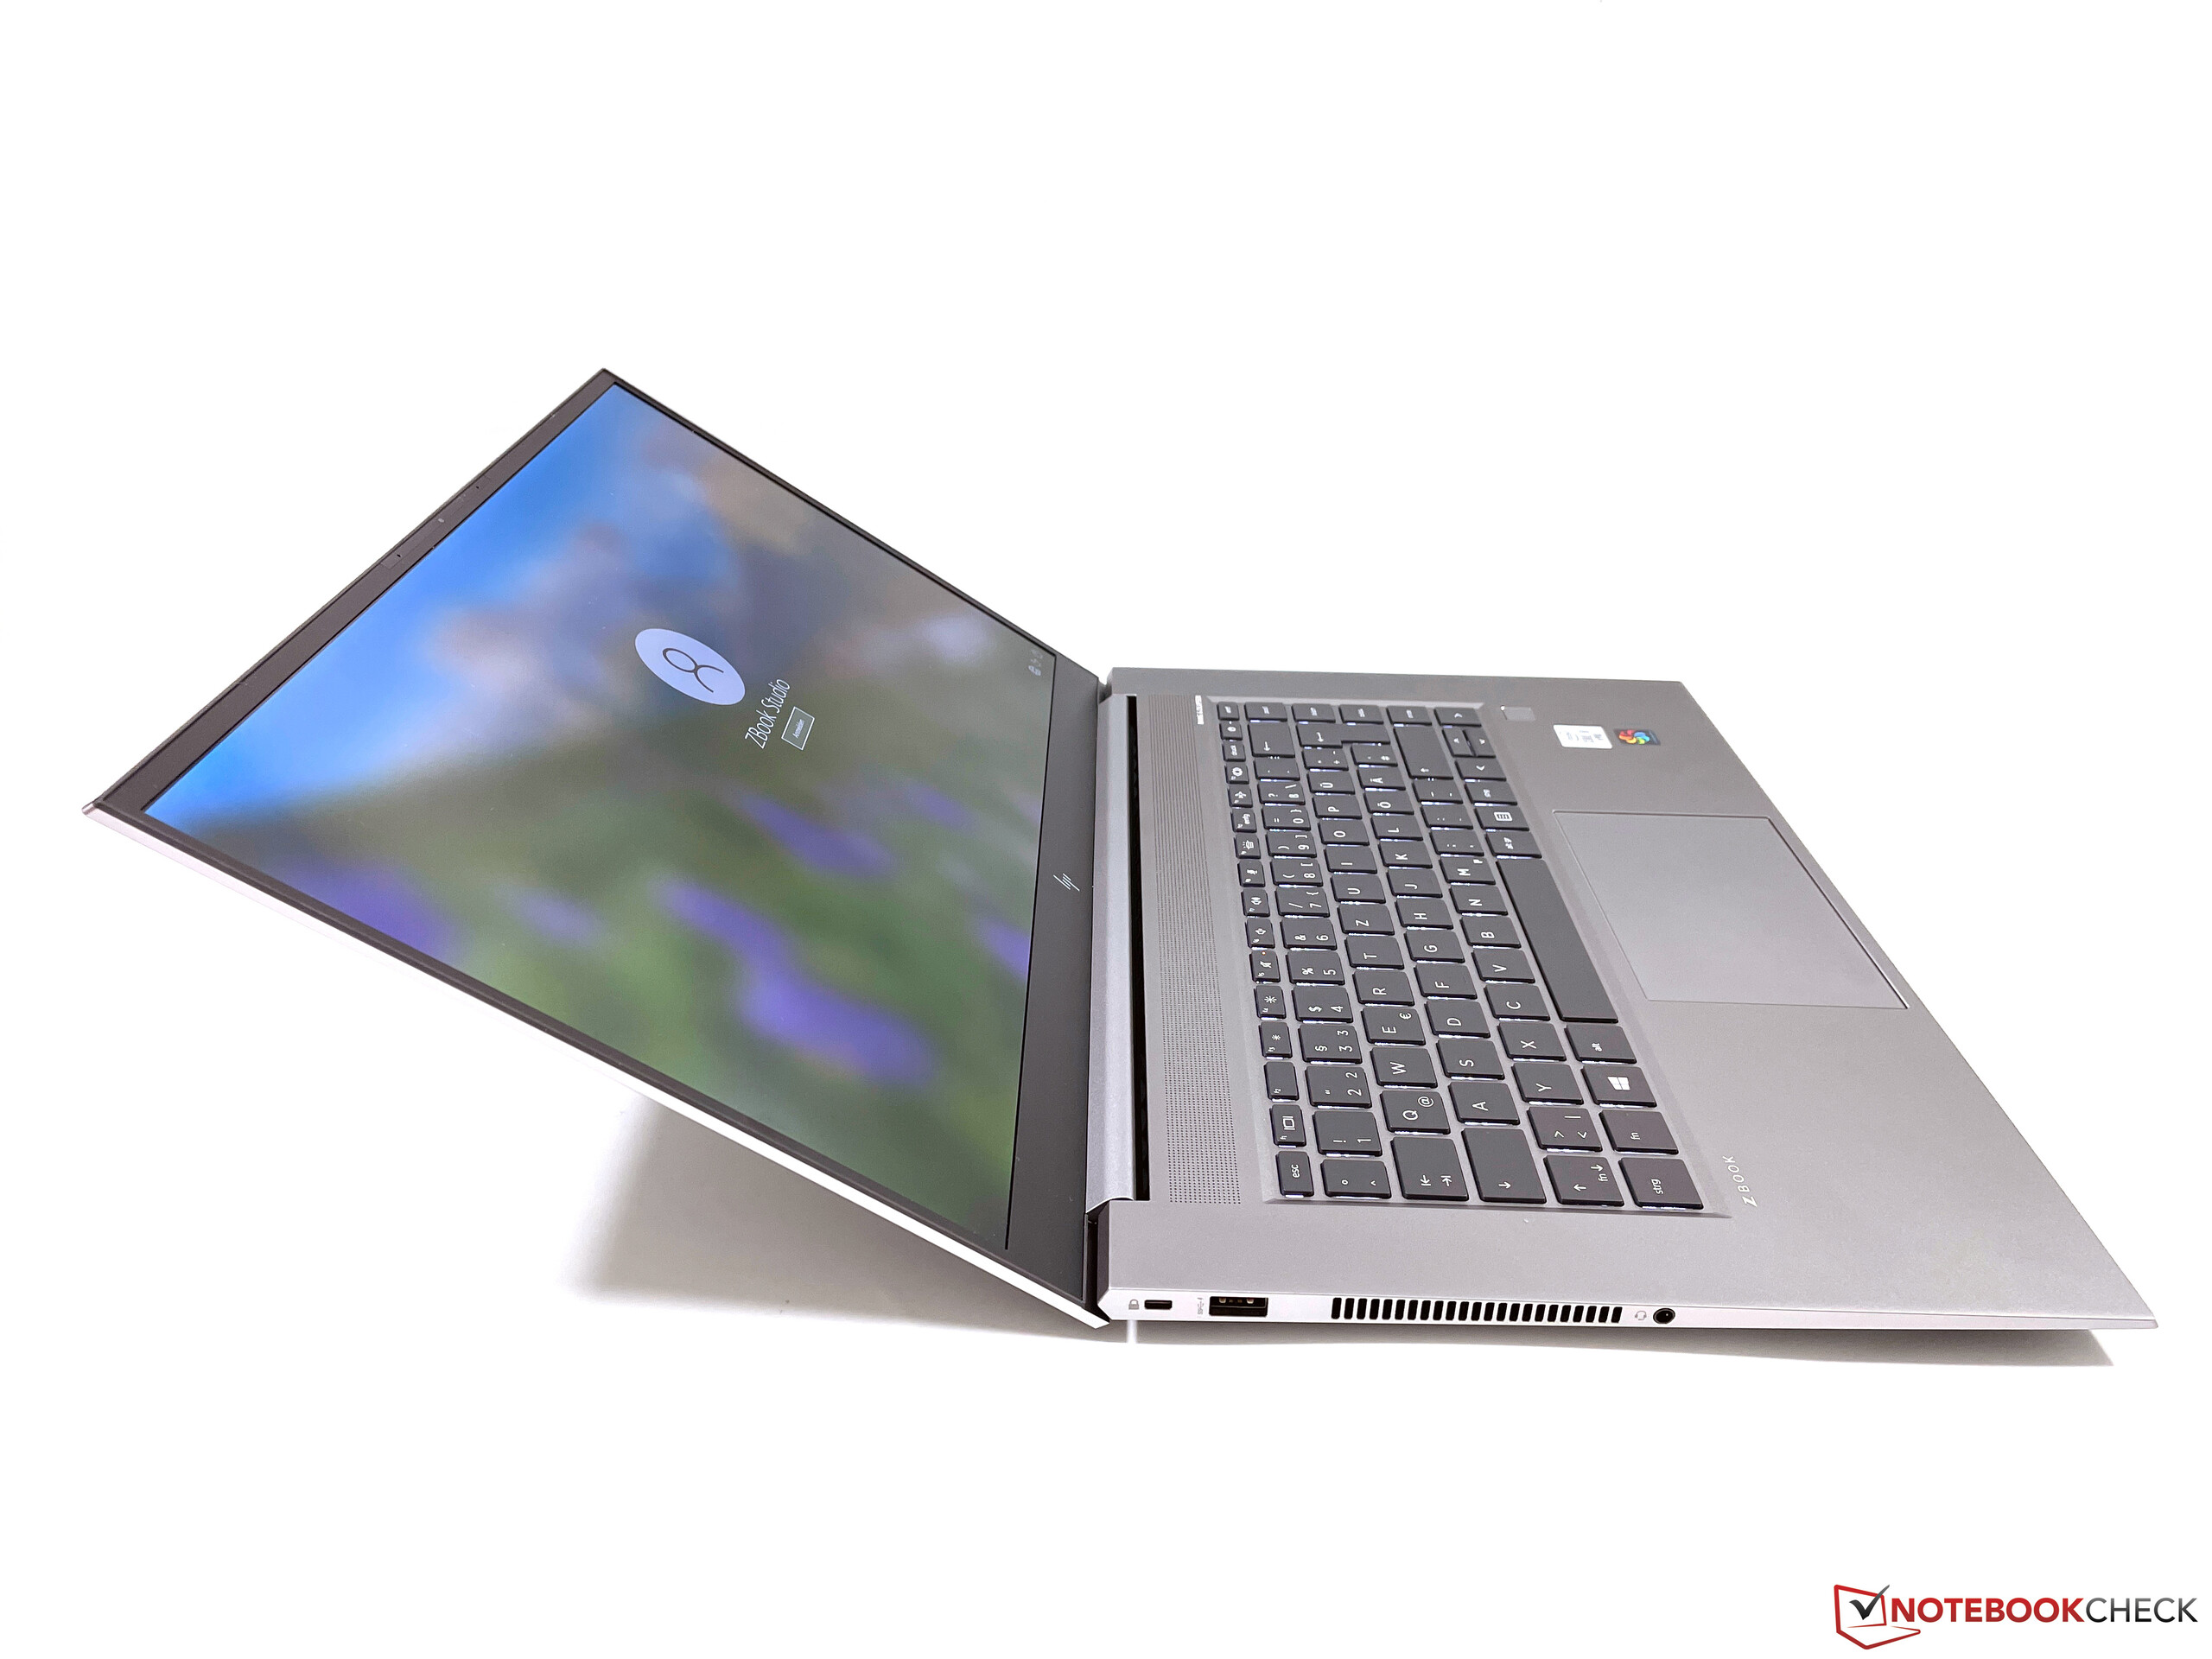
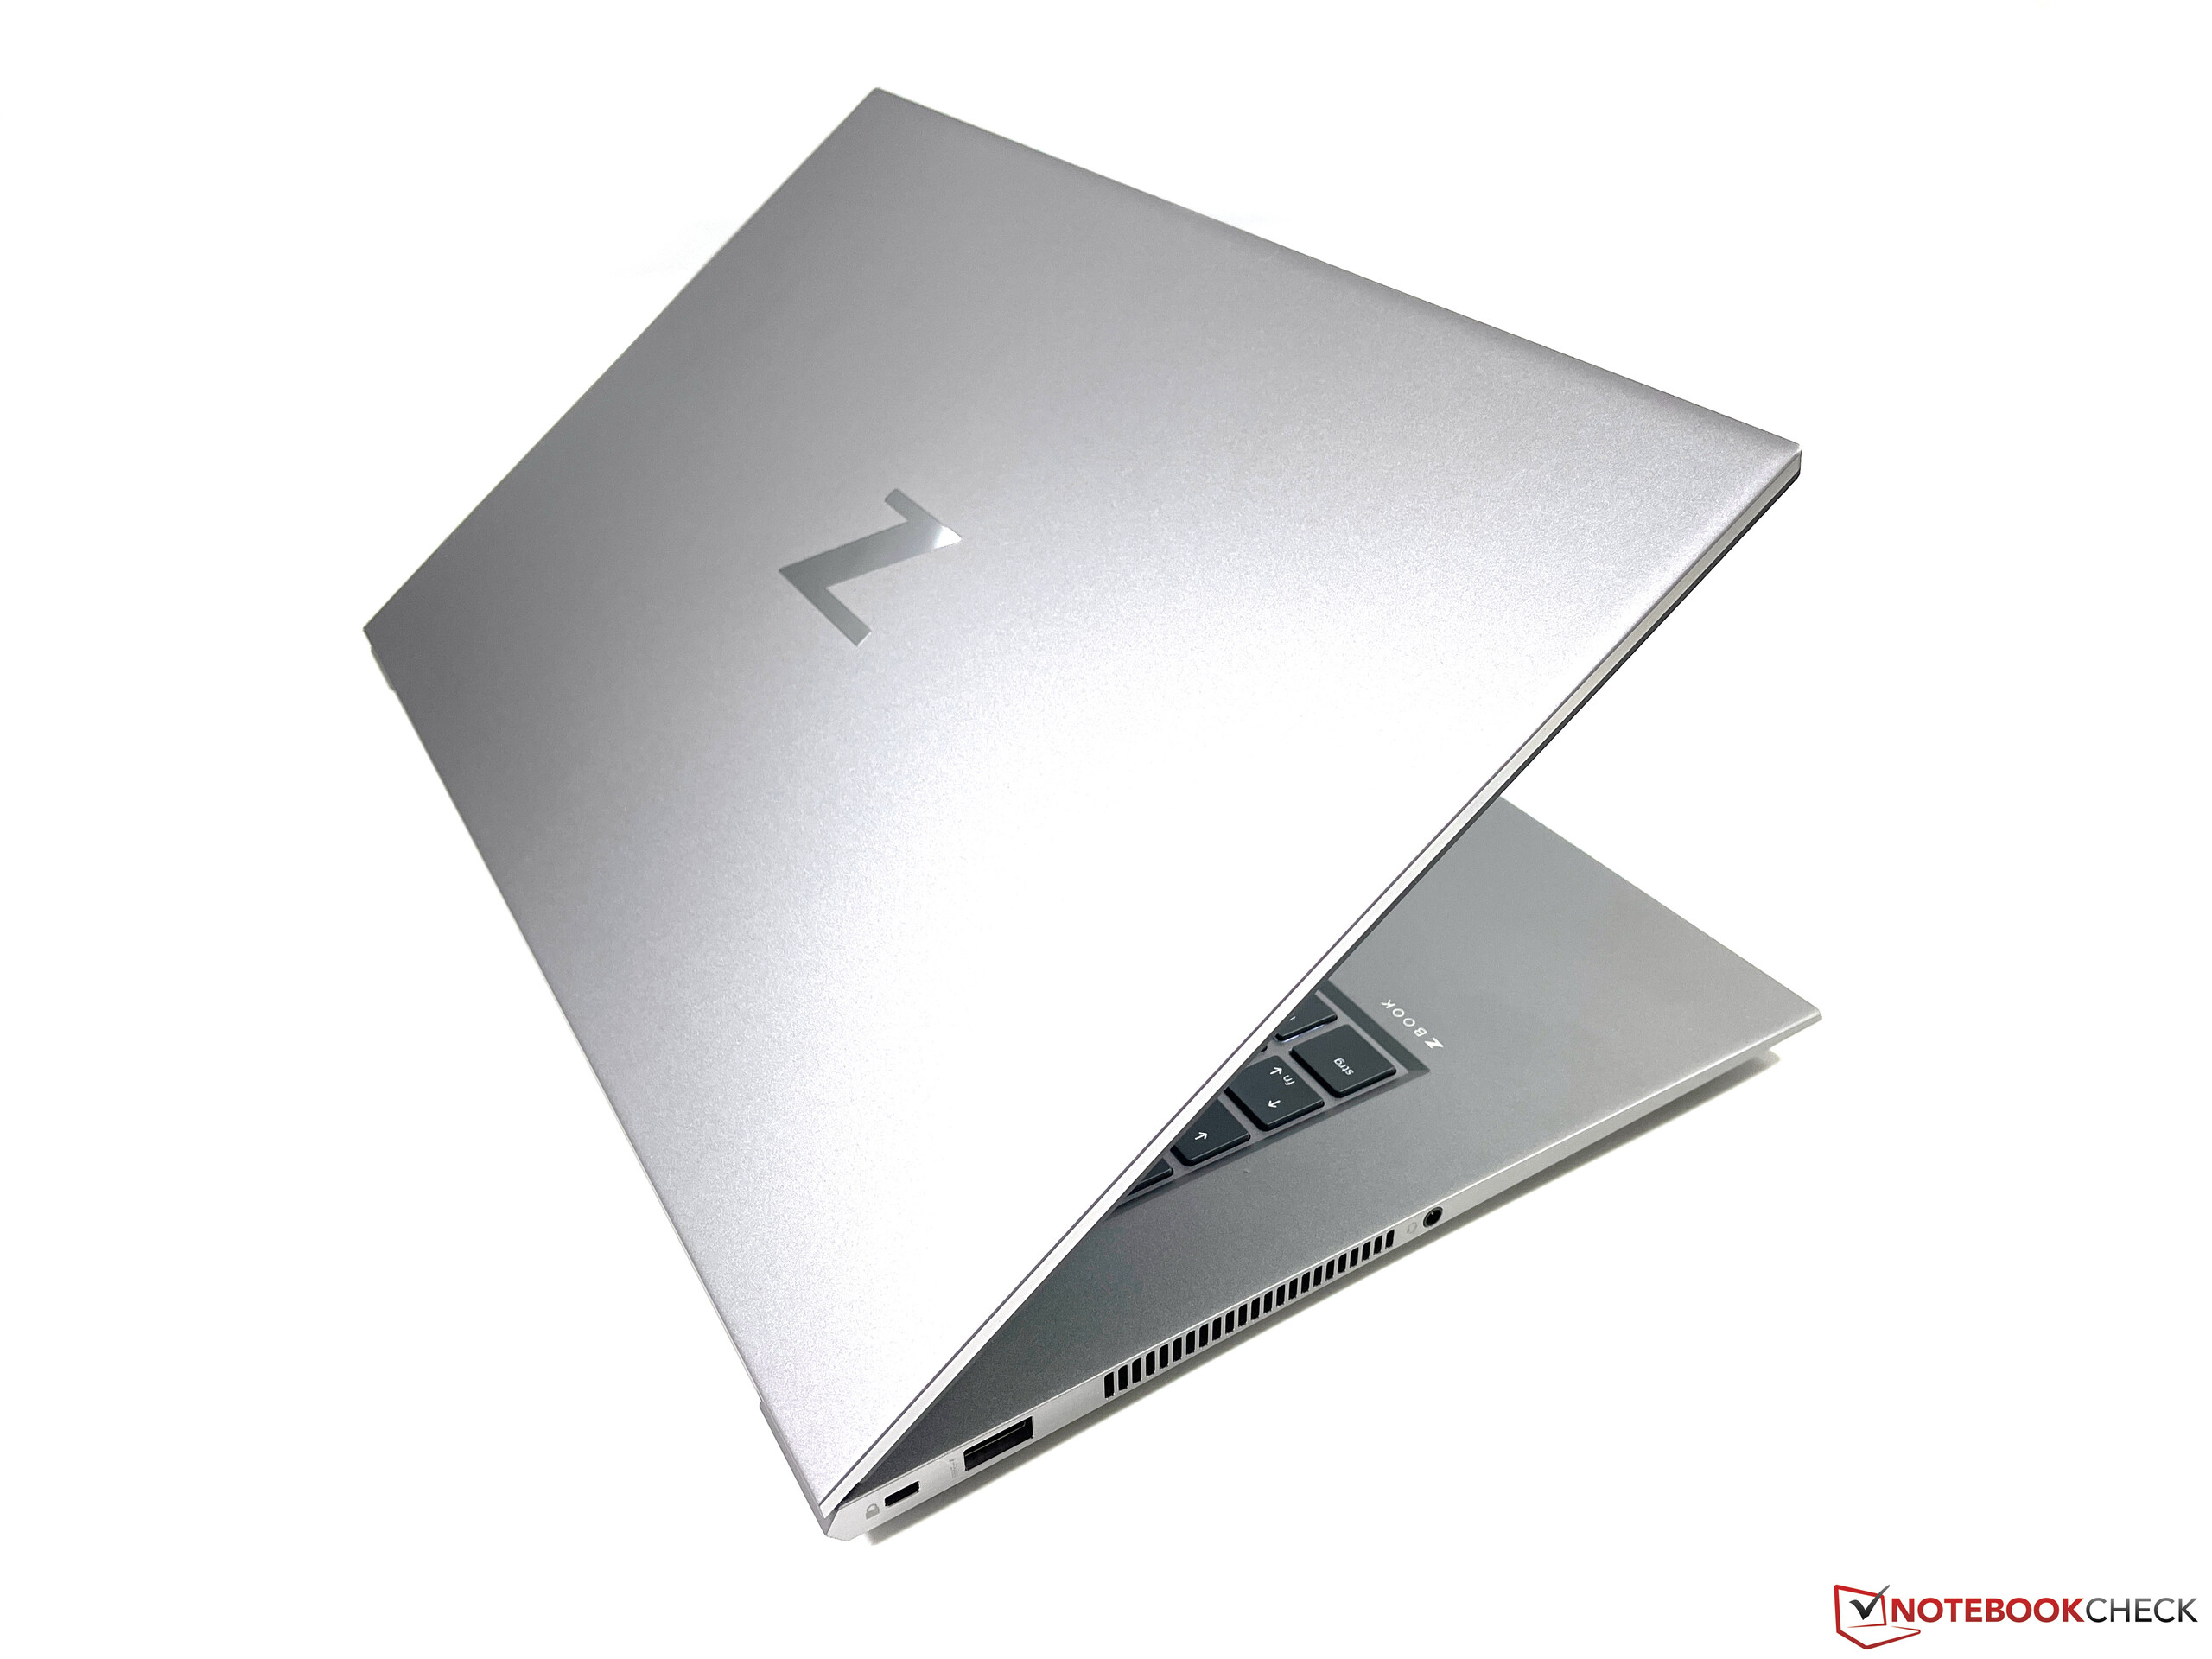
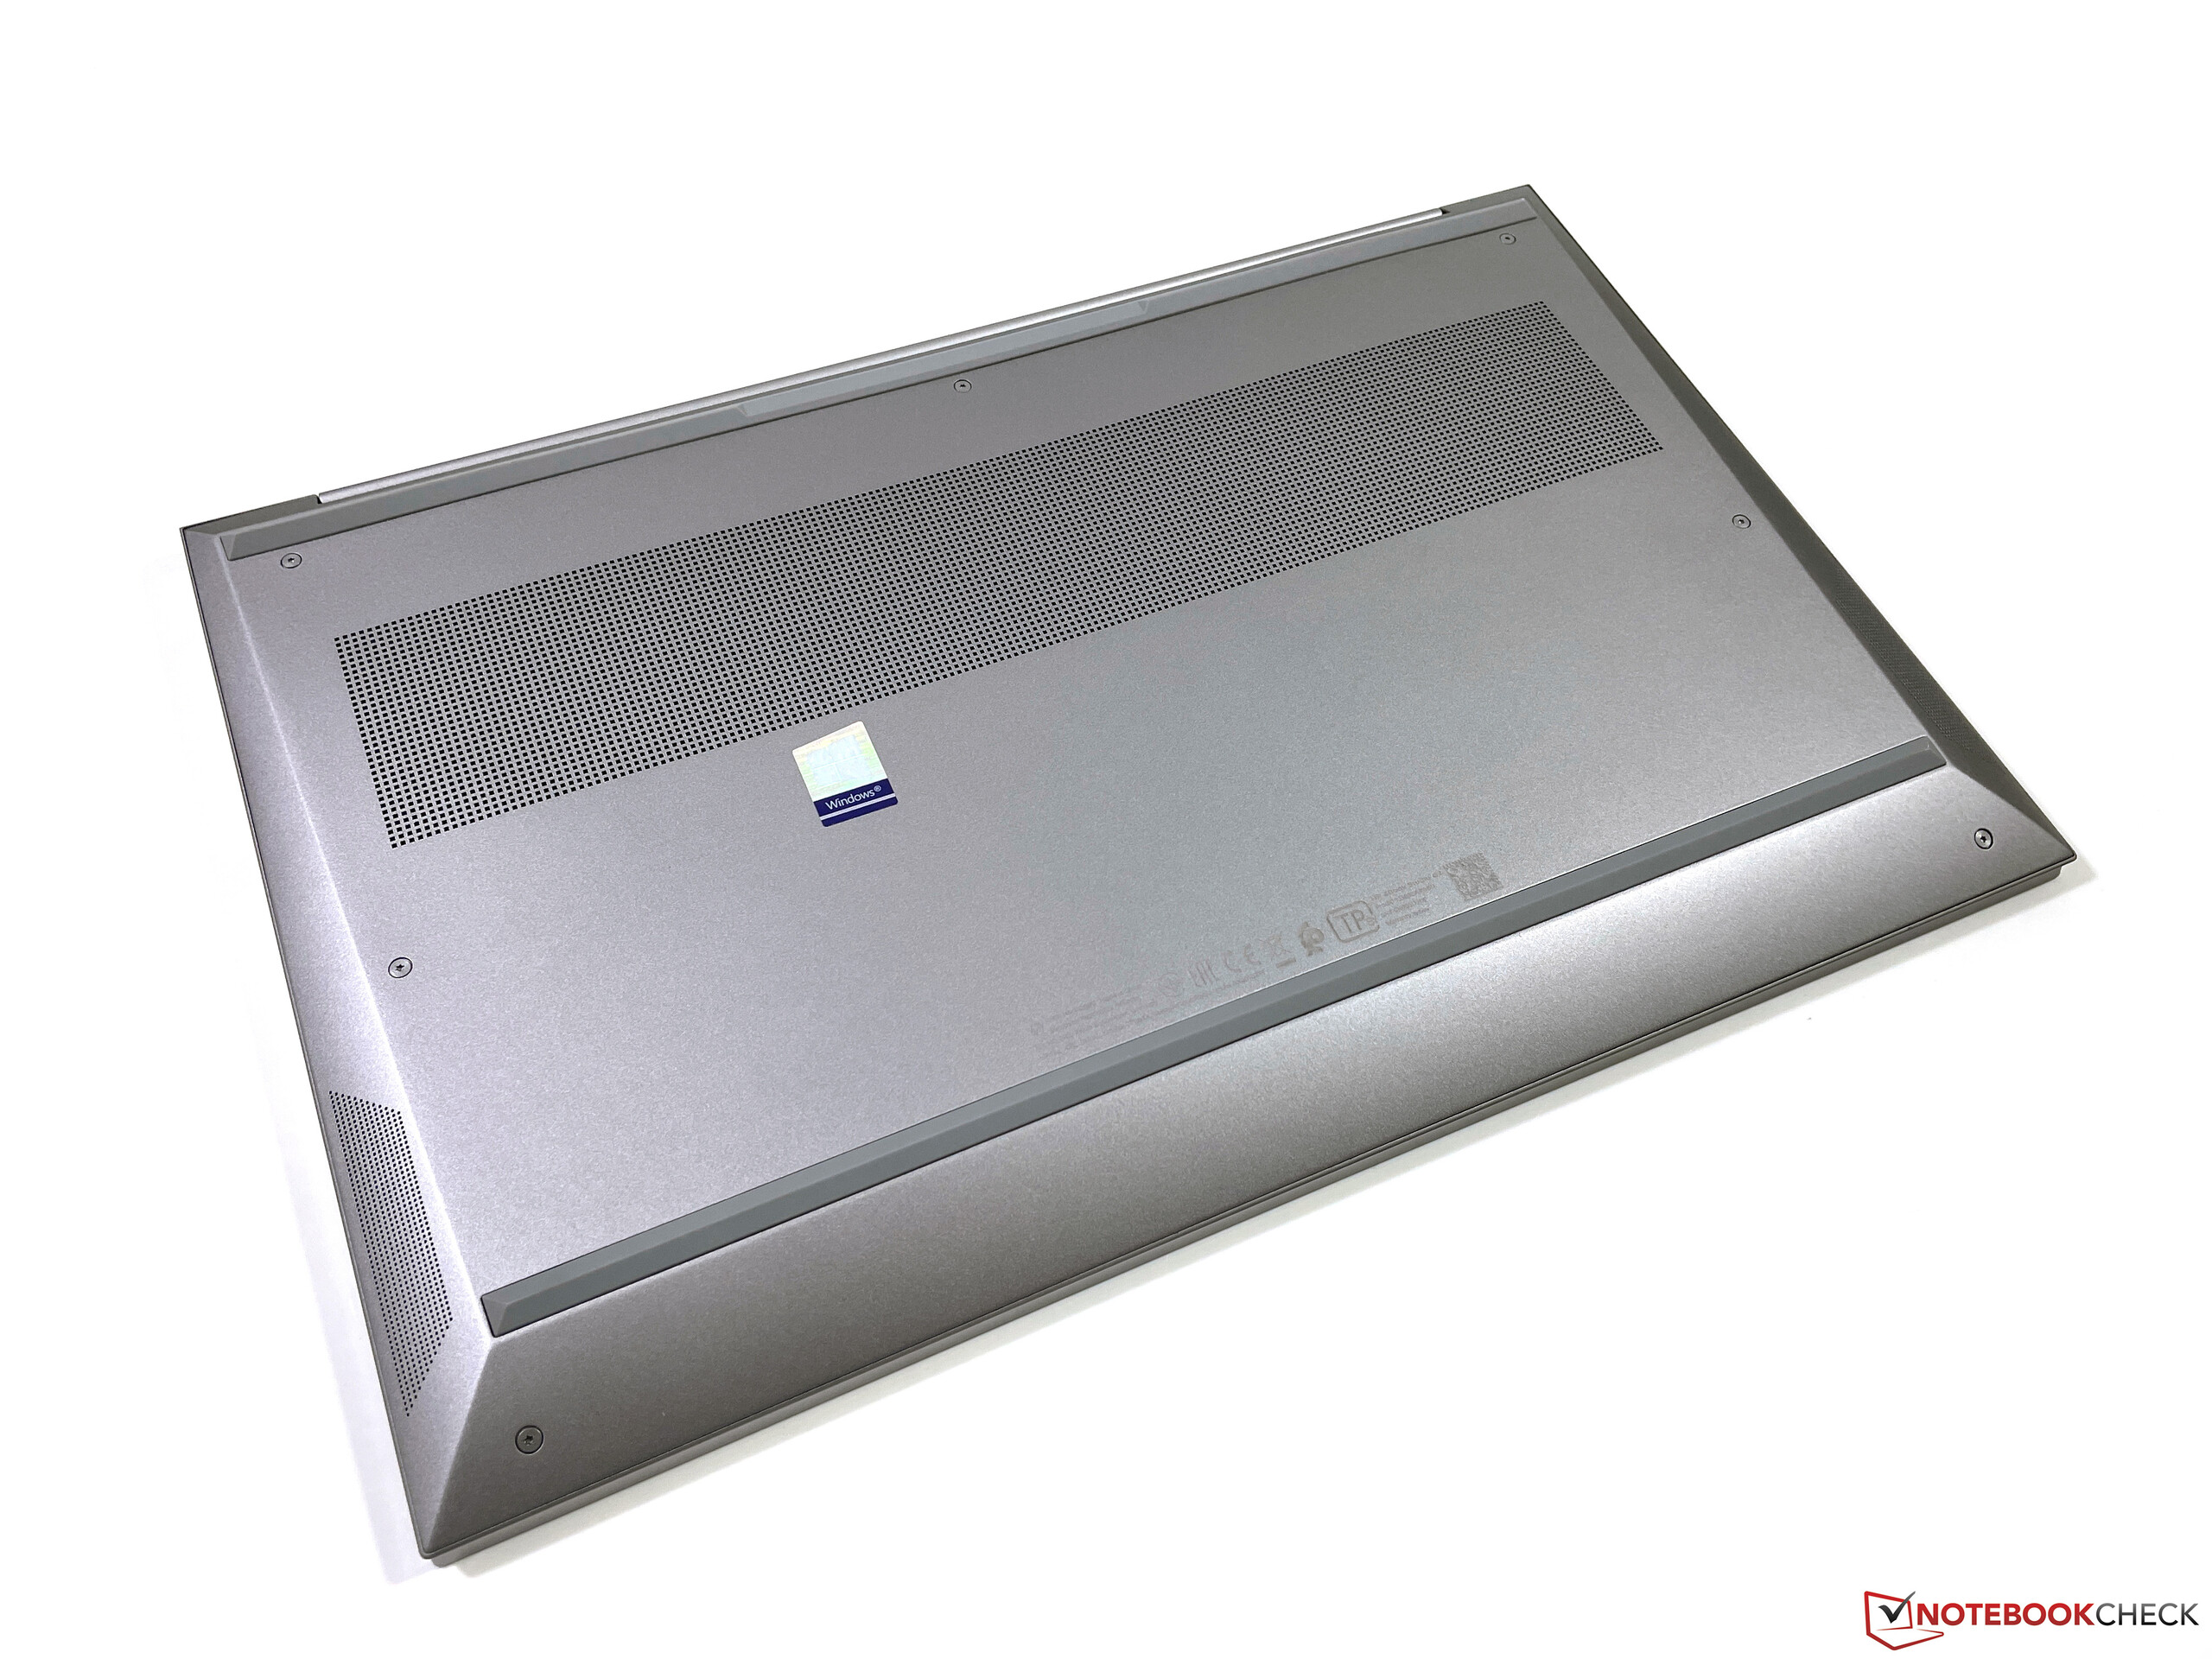
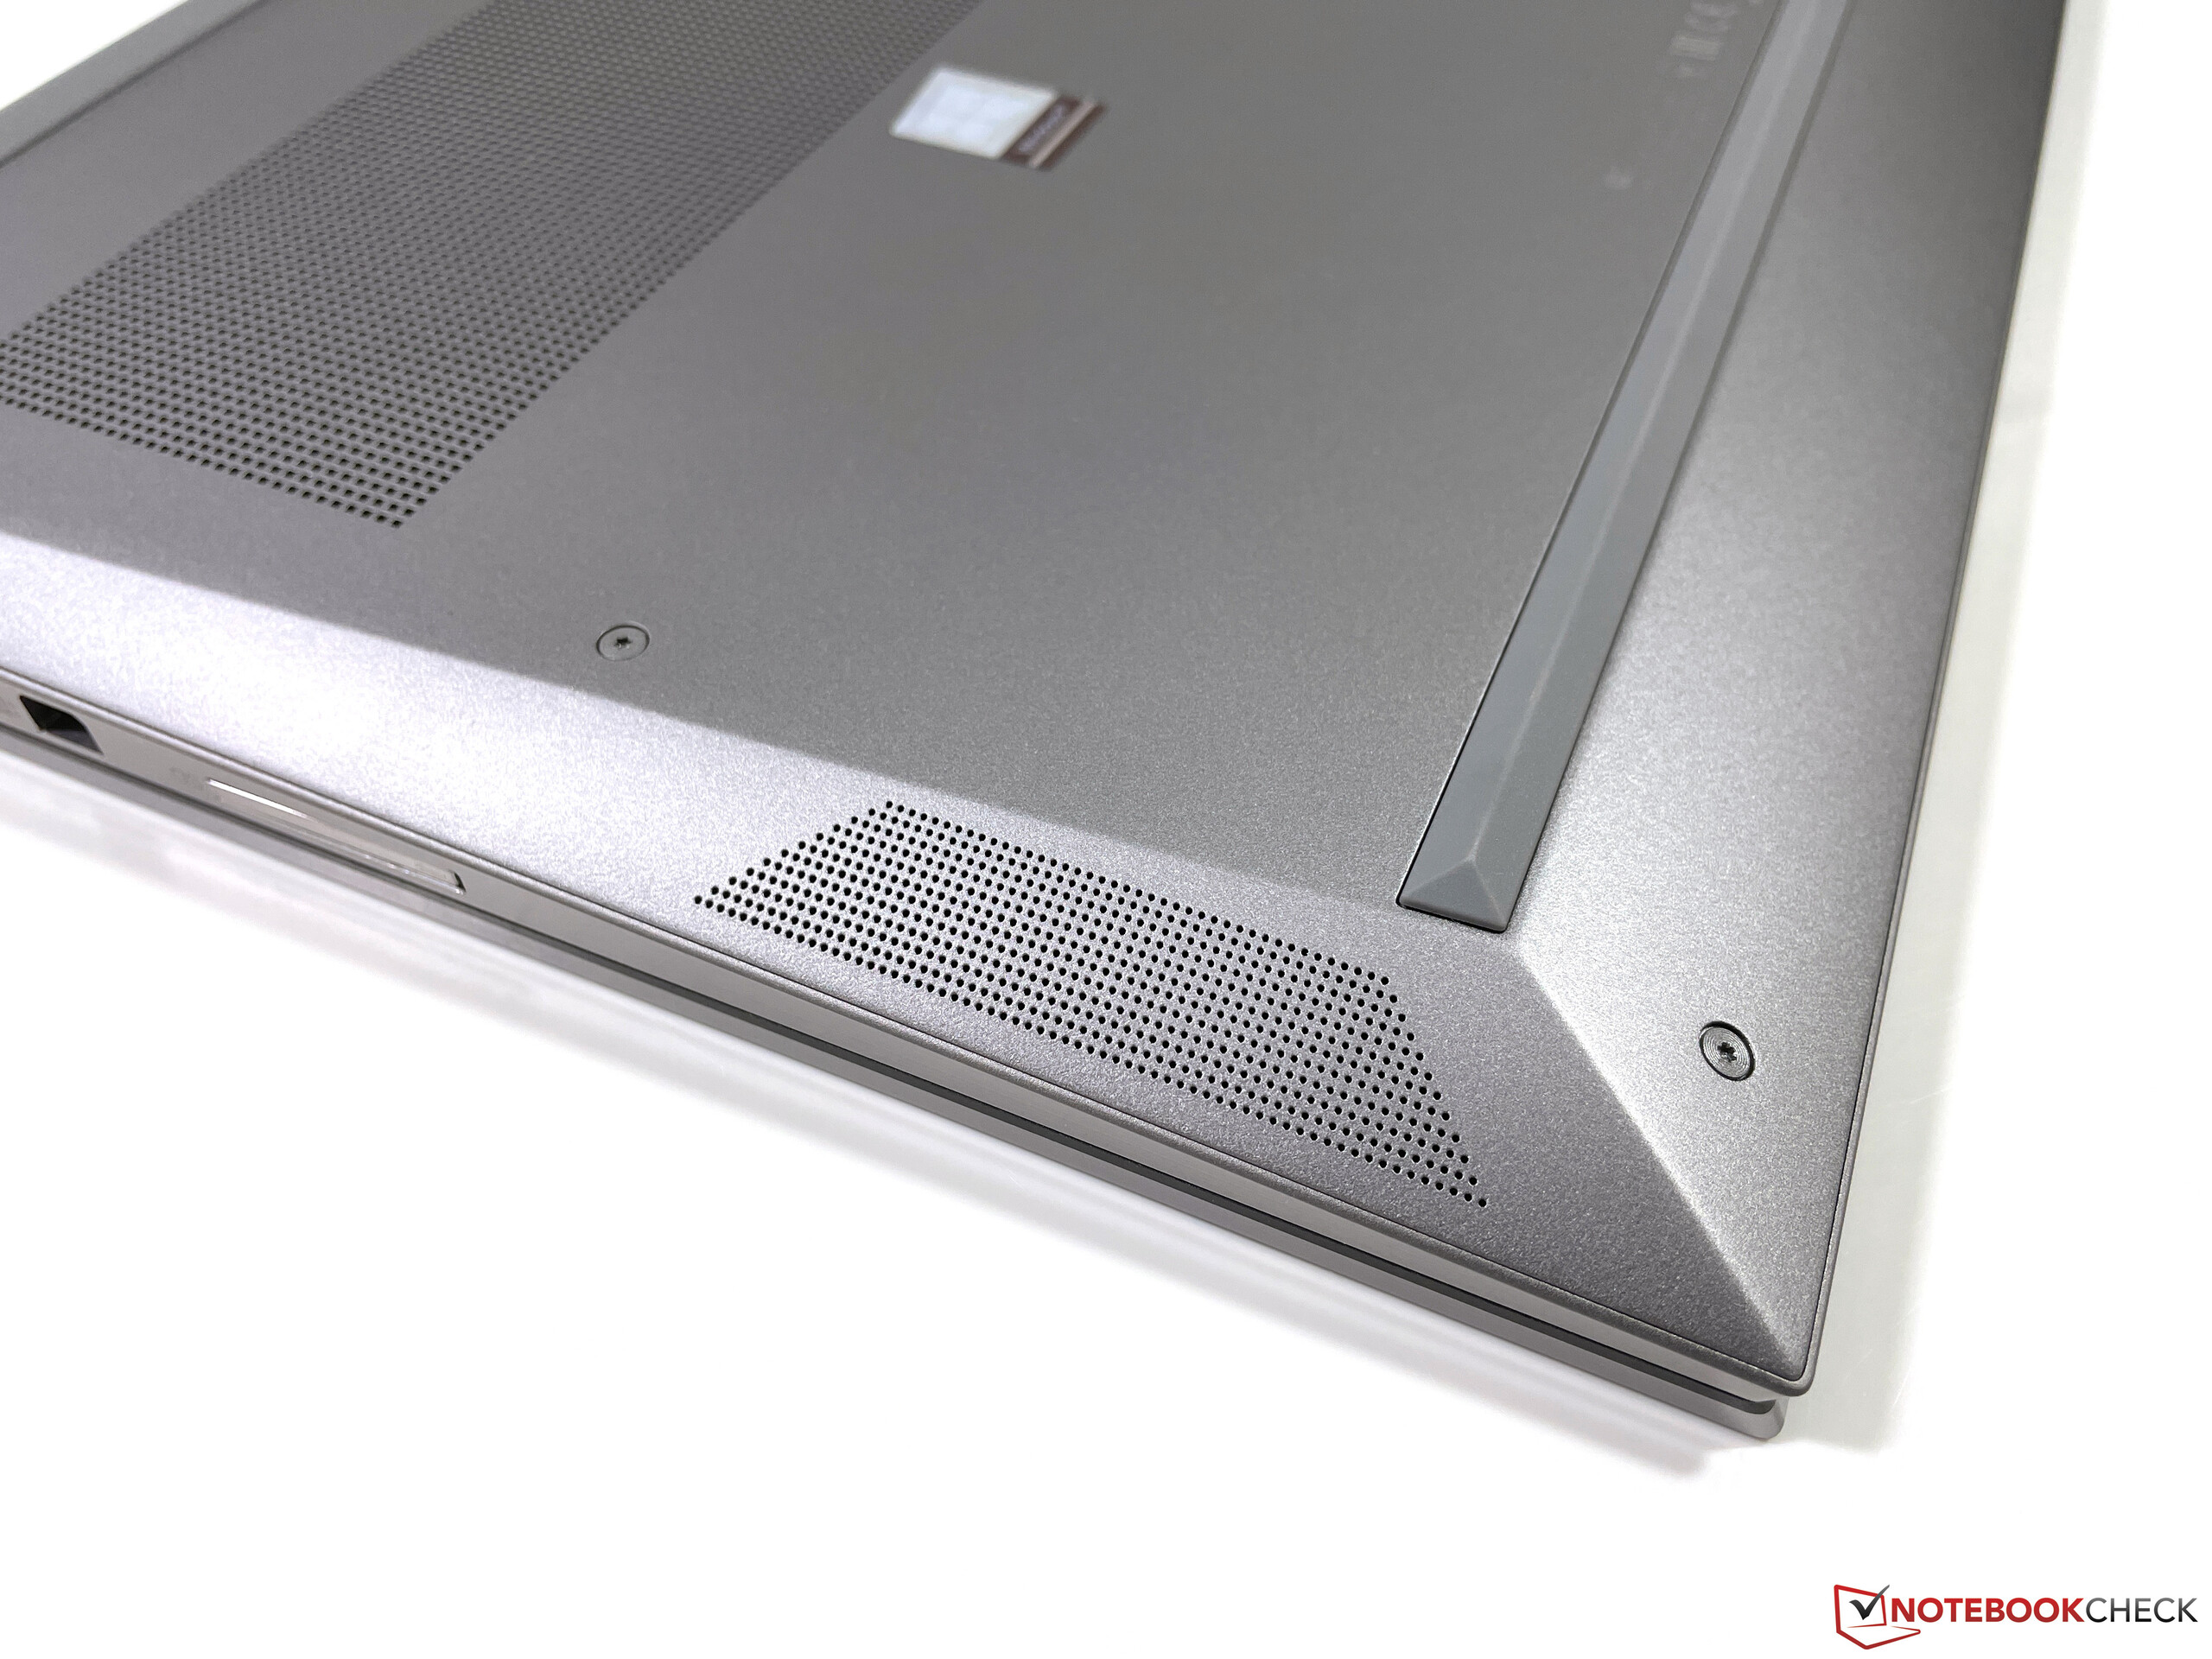
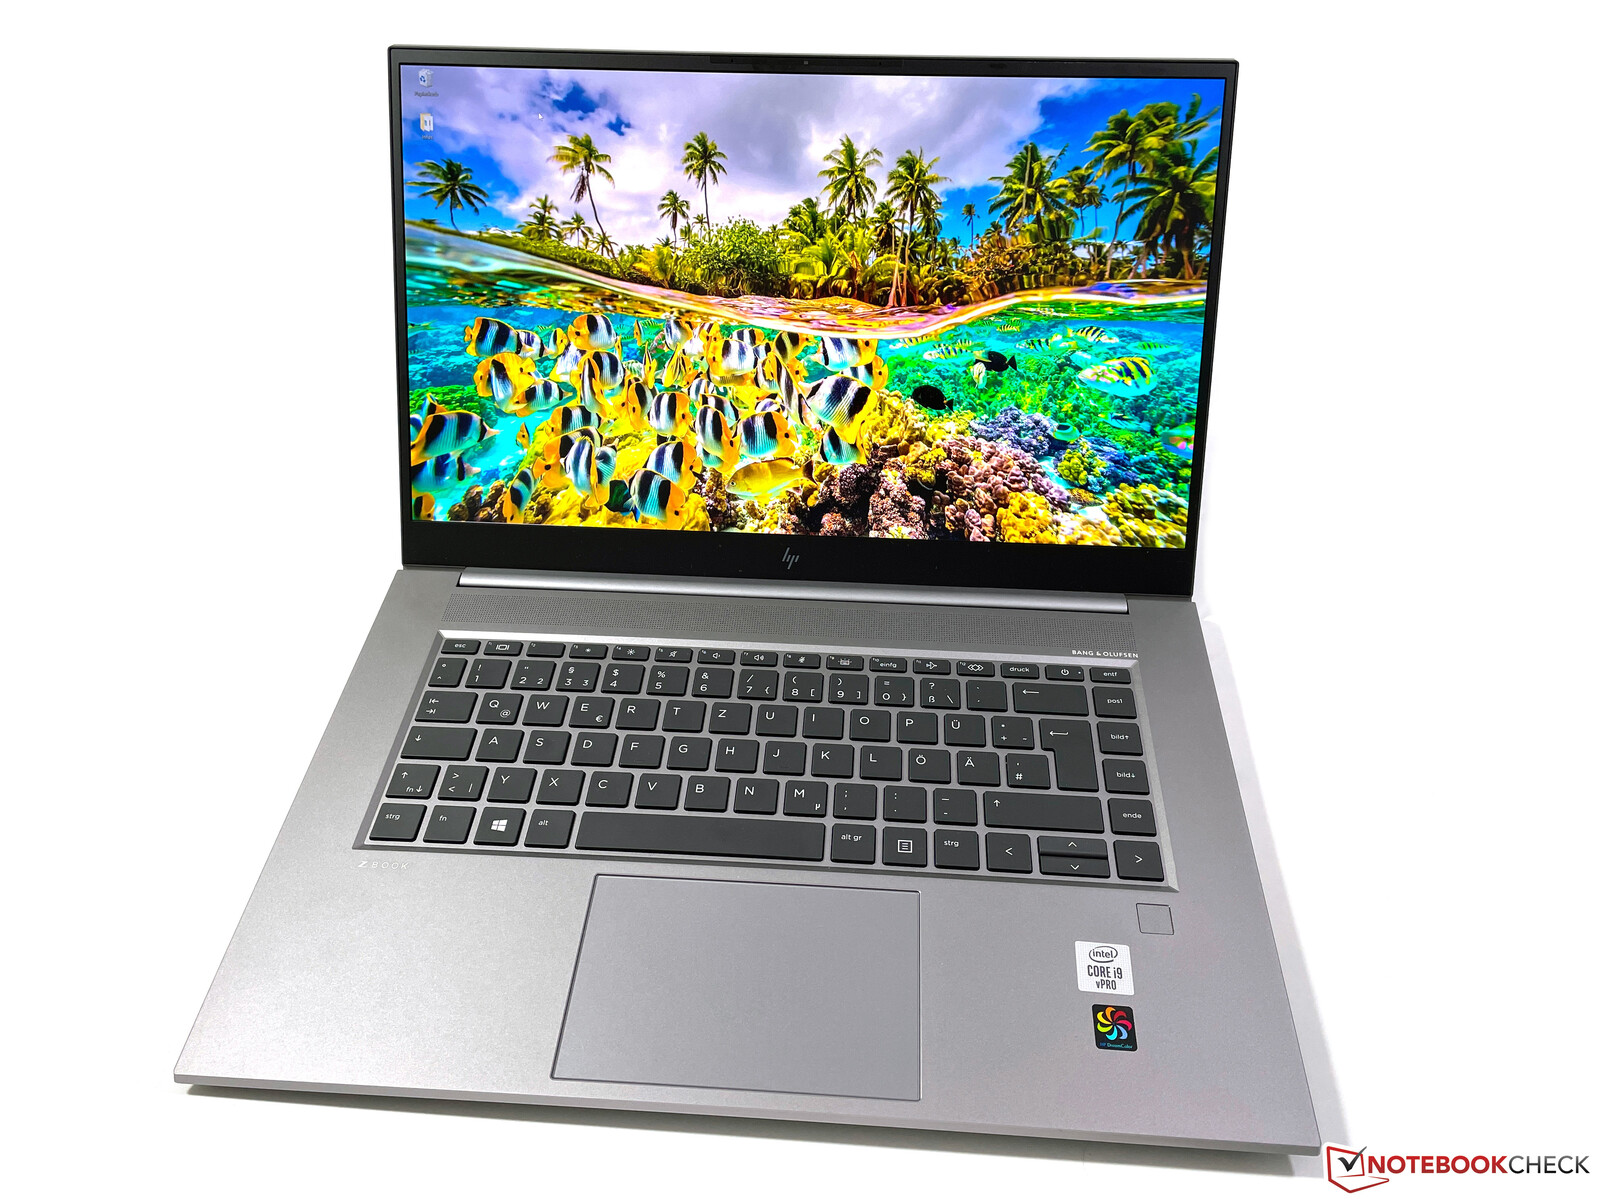
Case - ZBook with new aluminum chassis
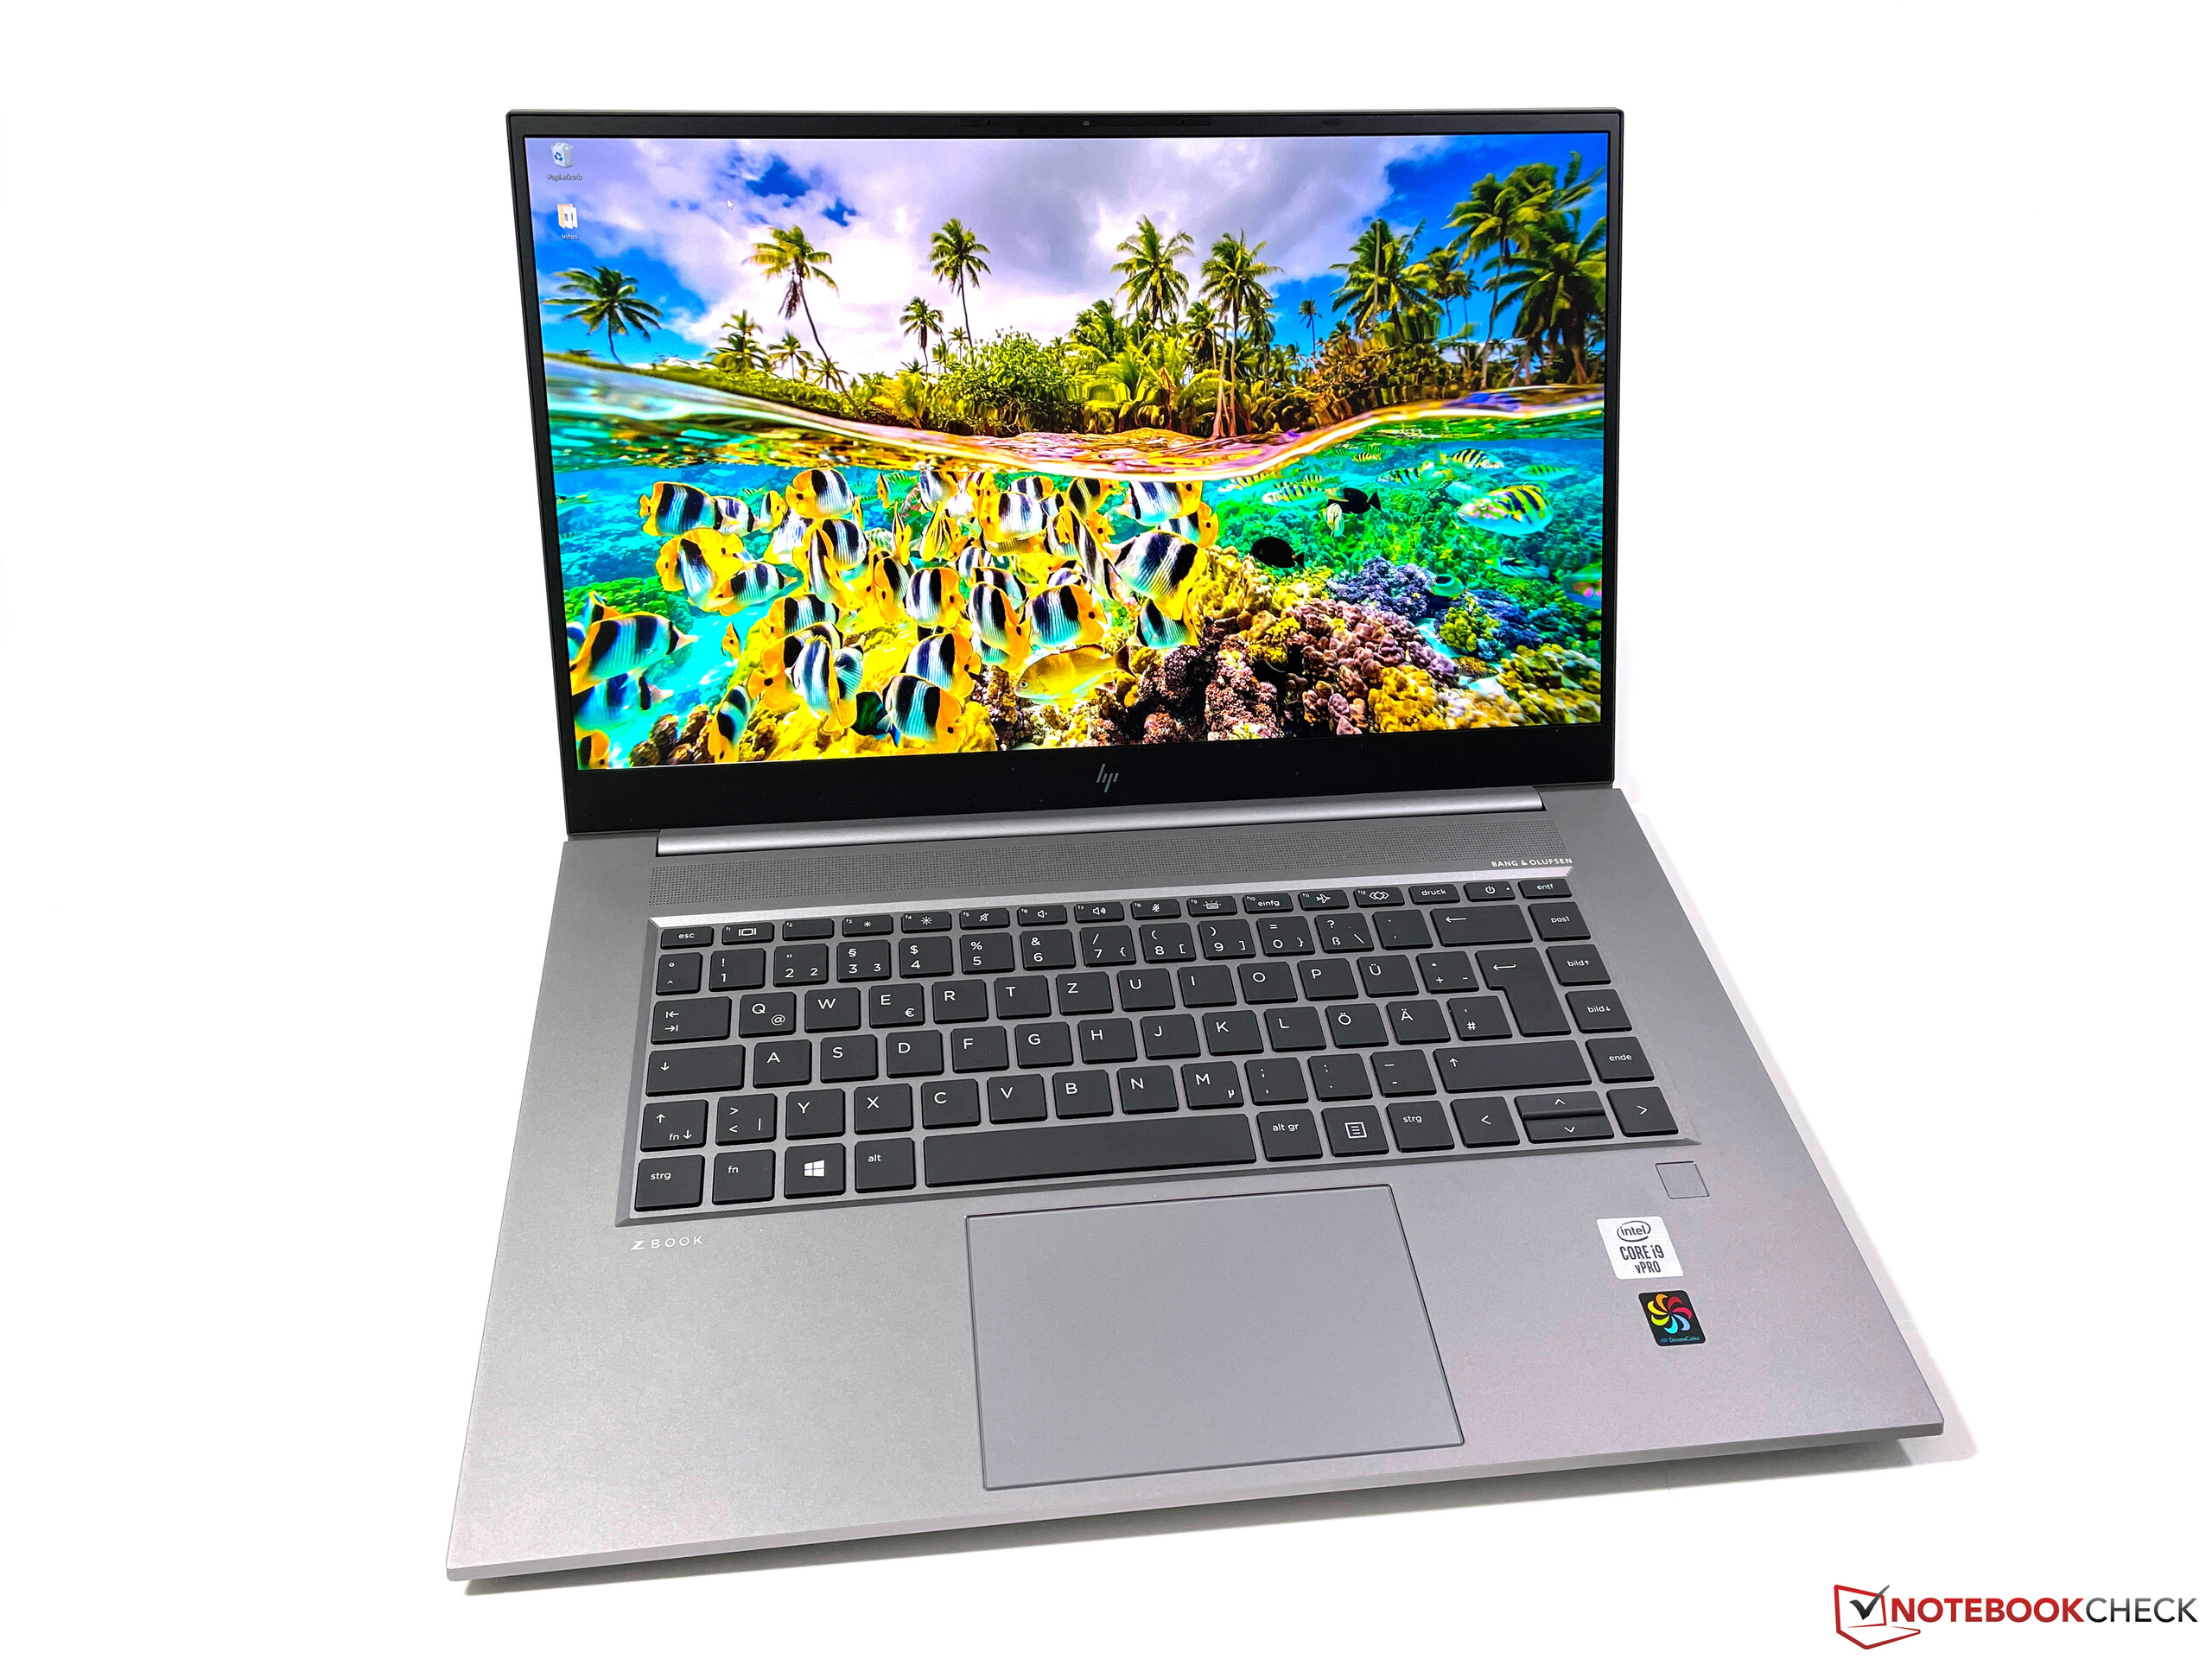
HP completely redesigned the chassis, but still uses an aluminum shell. The gray color scheme did not change, either, so it is instantly recognizable as a ZBook. The polished sides add to the high overall quality impression and the haptic feedback is better compared to the rivals from Dell or Lenovo and comparable to Apple. Fingerprints are not a big problem, either, thanks to the matte surfaces.
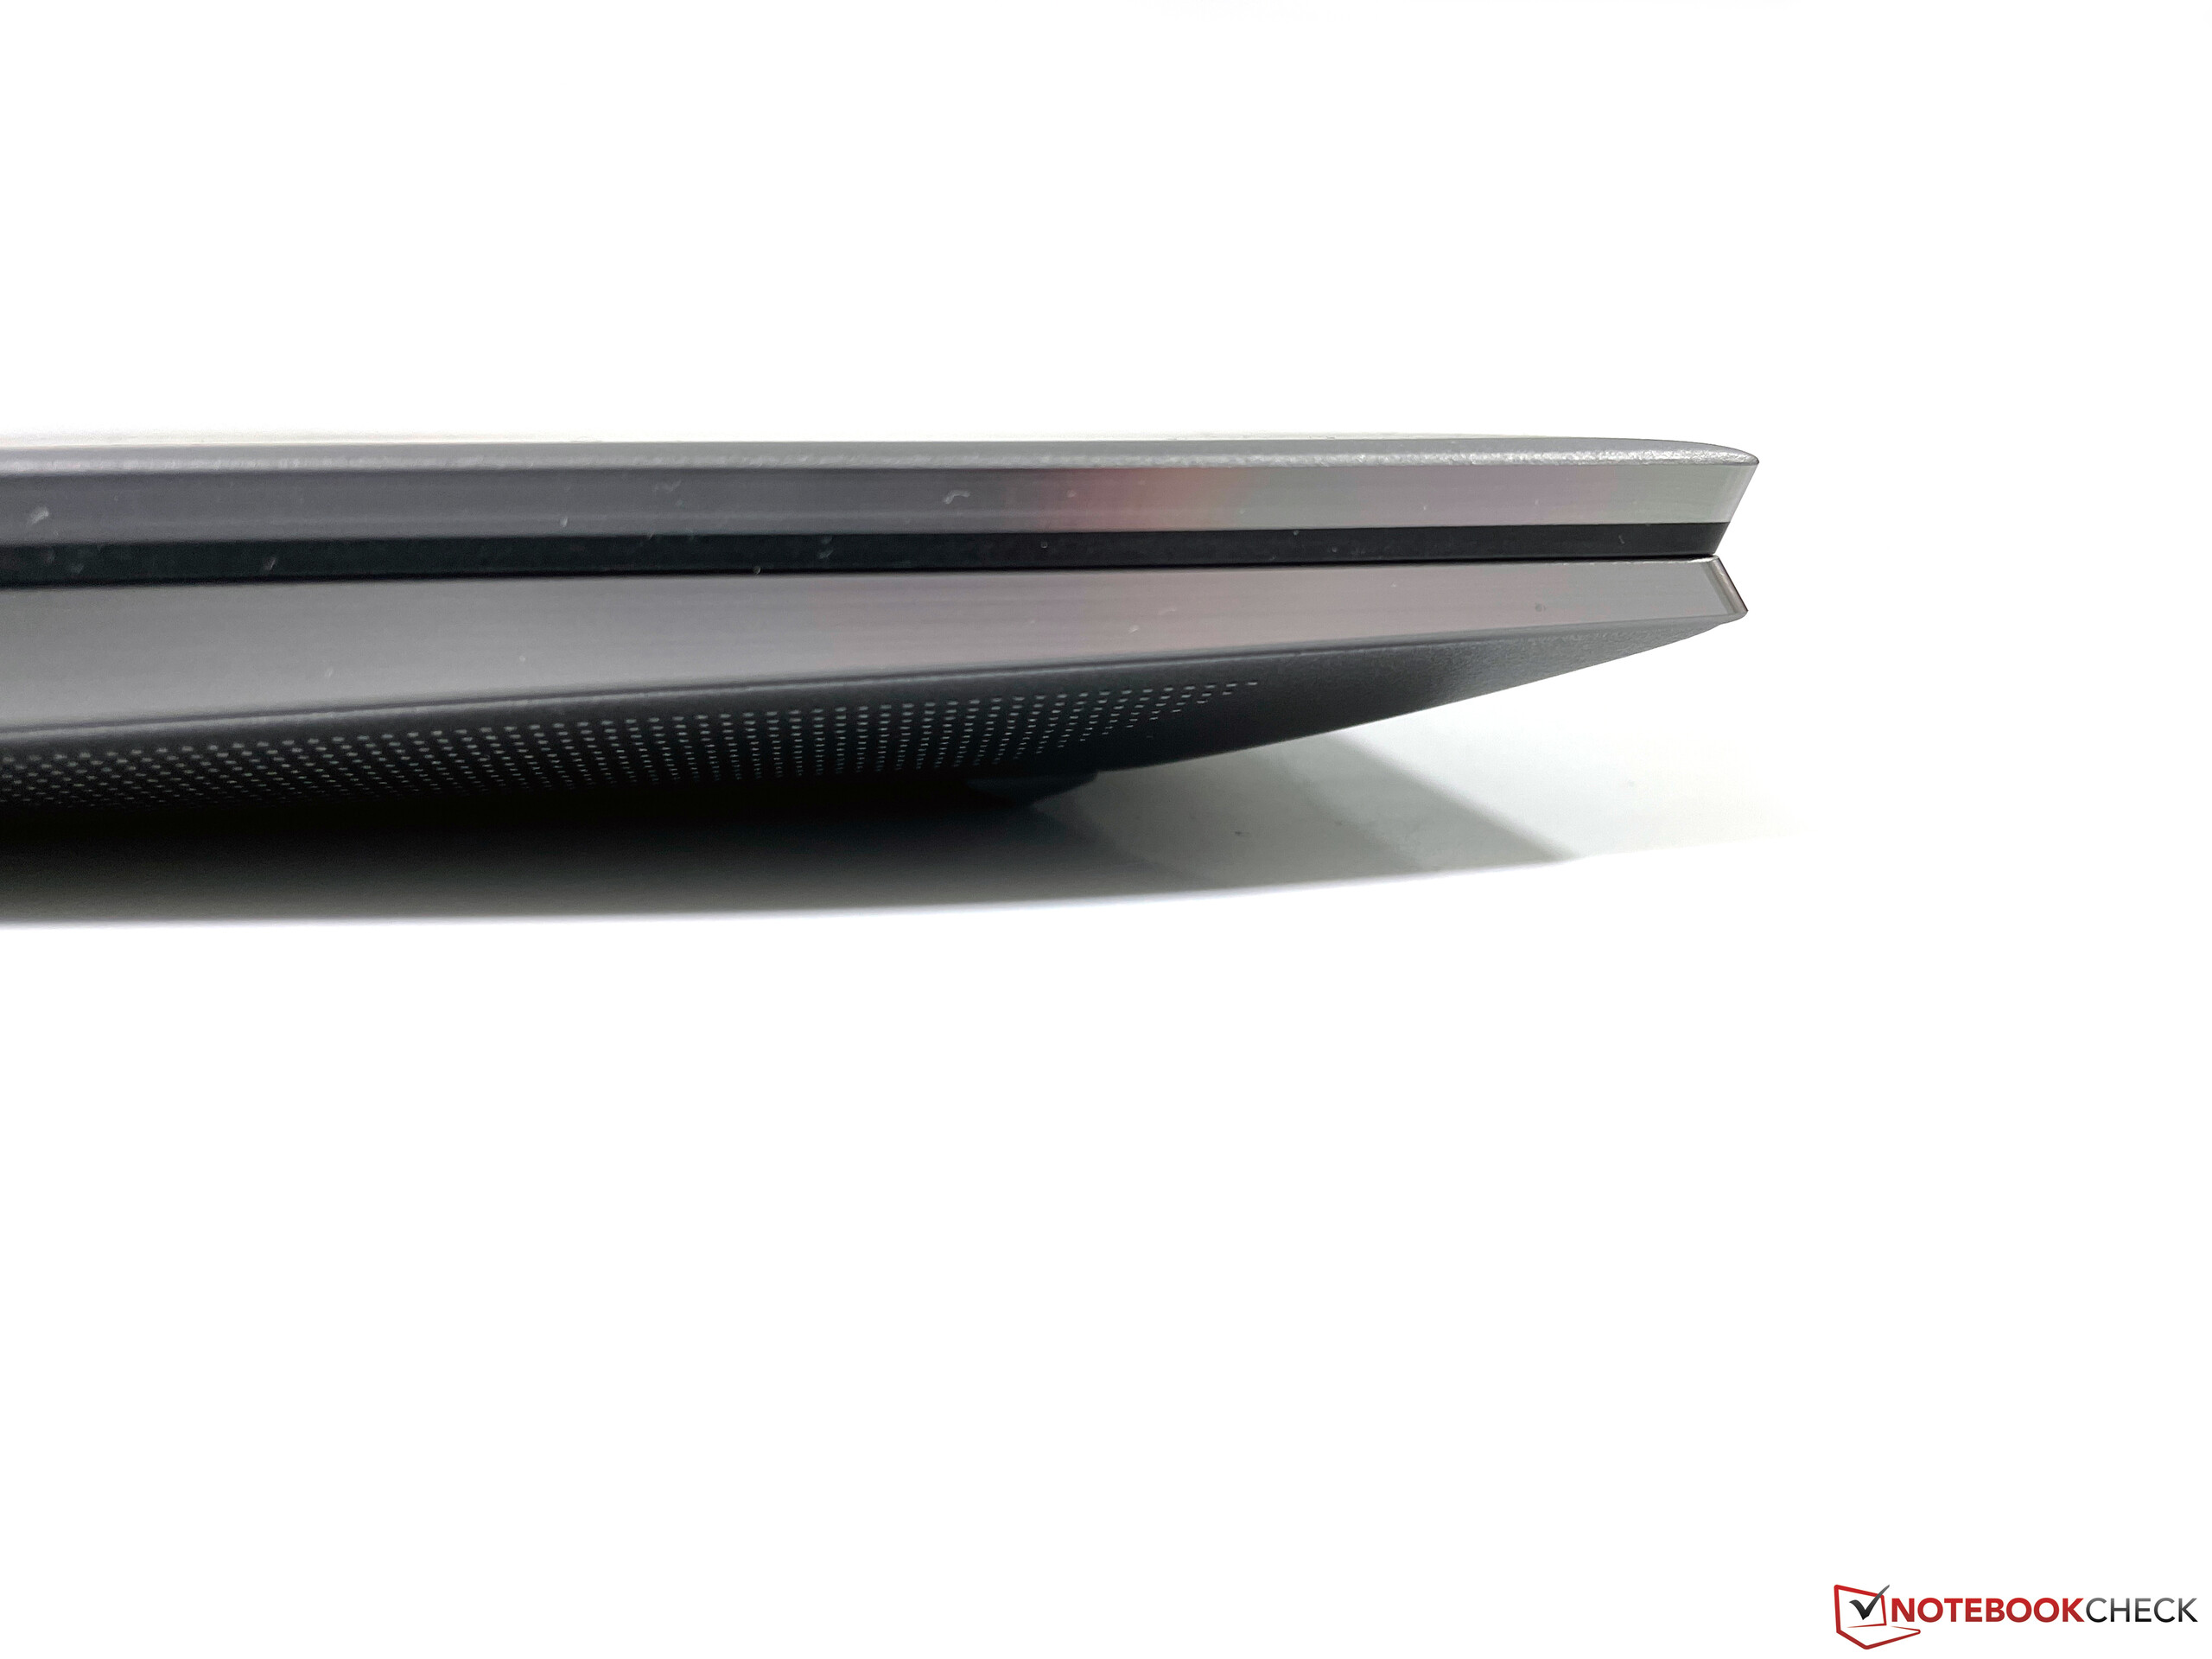
The base unit tapers off towards the front, so the overall devices appears very compact. The stability of the base unit is excellent and we could neither dent the keyboard area, nor produce creaking sounds. HP also adjusted the hinges very well and you can open the lid with one hand. The maximum opening angle is limited to ~145 degrees. The hinges cannot completely prevent some bouncing when you adjust the opening angle.
The display is more flexible than the base unit, but it is no problem and we could not provoke picture distortions even with concentrated pressure. HP also reduced the size of the bezels, but there is still plenty of space underneath the panel and we expect future models to incorporate 16:10 screens.
All the comparison devices are pretty close in terms of footprint. The ZBook Studio is only beaten by the Dell Precision 5550, but the differences are small. The ThinkPad P1 is the biggest, but at the same time also the lightest device. Tipping the scale at ~2 kg, the ZBook is on par with the MacBook Pro 16 and the Precision 5550. HP's ZBook Fury 15 on the other hand is noticeably thicker and heavier.
Connectivity - HP Studio with DisplayPort
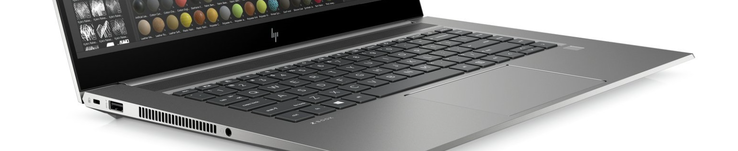
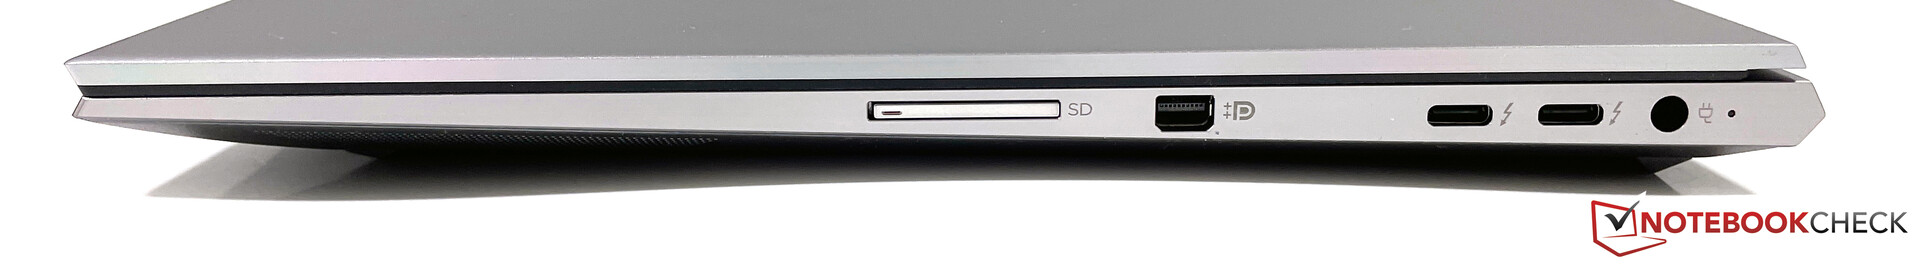
HP includes all important port including USB-C with Thunderbolt 3 as well as a regular USB-A port. The Studio also gets a Mini-DisplayPort, while the ZBook Create with GeForce GPUs is equipped with a full-size HDMI output. The ZBook has a proprietary power connector due to the high consumption figures, but you can also charge the battery via USB-C.
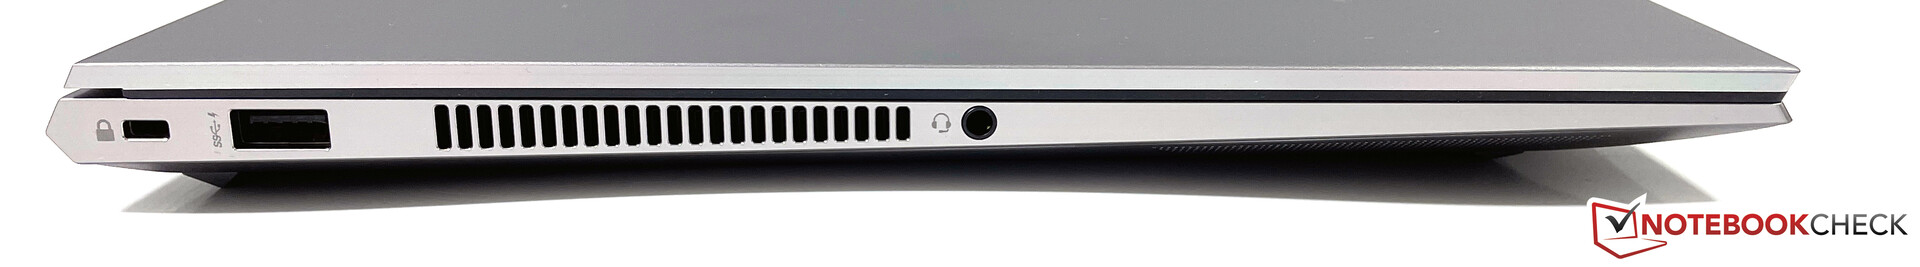
SDCardreader
The ZBook Studio offers a full-size SD-card reader, which is also pretty fast. We determine transfer rates of ~170-180 MB/s with our reference card (AV Pro V60). Inserted cards are not completely flush but protrude by 1 cm.
| SD Card Reader | |
| average JPG Copy Test (av. of 3 runs) | |
| Dell Precision 5550 P91F (Toshiba Exceria Pro SDXC 64 GB UHS-II) | |
| Lenovo ThinkPad P1 2019-20QT000RGE (Toshiba Exceria Pro SDXC 64 GB UHS-II) | |
| HP ZBook Fury 15 G7 (Toshiba Exceria Pro SDXC 64 GB UHS-II) | |
| HP ZBook Studio G7 (AV Pro V60) | |
| Average of class Workstation (49.6 - 681, n=14, last 2 years) | |
| Razer Blade 15 Studio Edition 2020 (Toshiba Exceria Pro SDXC 64 GB UHS-II) | |
| maximum AS SSD Seq Read Test (1GB) | |
| Average of class Workstation (87.6 - 1455, n=14, last 2 years) | |
| HP ZBook Fury 15 G7 (Toshiba Exceria Pro SDXC 64 GB UHS-II) | |
| Lenovo ThinkPad P1 2019-20QT000RGE (Toshiba Exceria Pro SDXC 64 GB UHS-II) | |
| Dell Precision 5550 P91F (Toshiba Exceria Pro SDXC 64 GB UHS-II) | |
| HP ZBook Studio G7 (AV Pro V60) | |
Communication
There is no Ethernet port for wired networks, so you will have to use a Thunderbolt 3 adapter instead. HP also includes the familiar AX201 Wi-Fi module from Intel (Wi-Fi 6), which supports all common standards as well as Bluetooth 5.1.
Our standardized test with the router Netgear Nighthawk RAX 120 determines very good transfer rates between 1.3-1.5 Gbps for the ZBook Studio and we did not experience any issues with the signal quality, either.
Webcam
The webcam offers the usual poor quality with 0.9 MP, but HP does not equip the ZBook Studio G7 with a camera shutter.


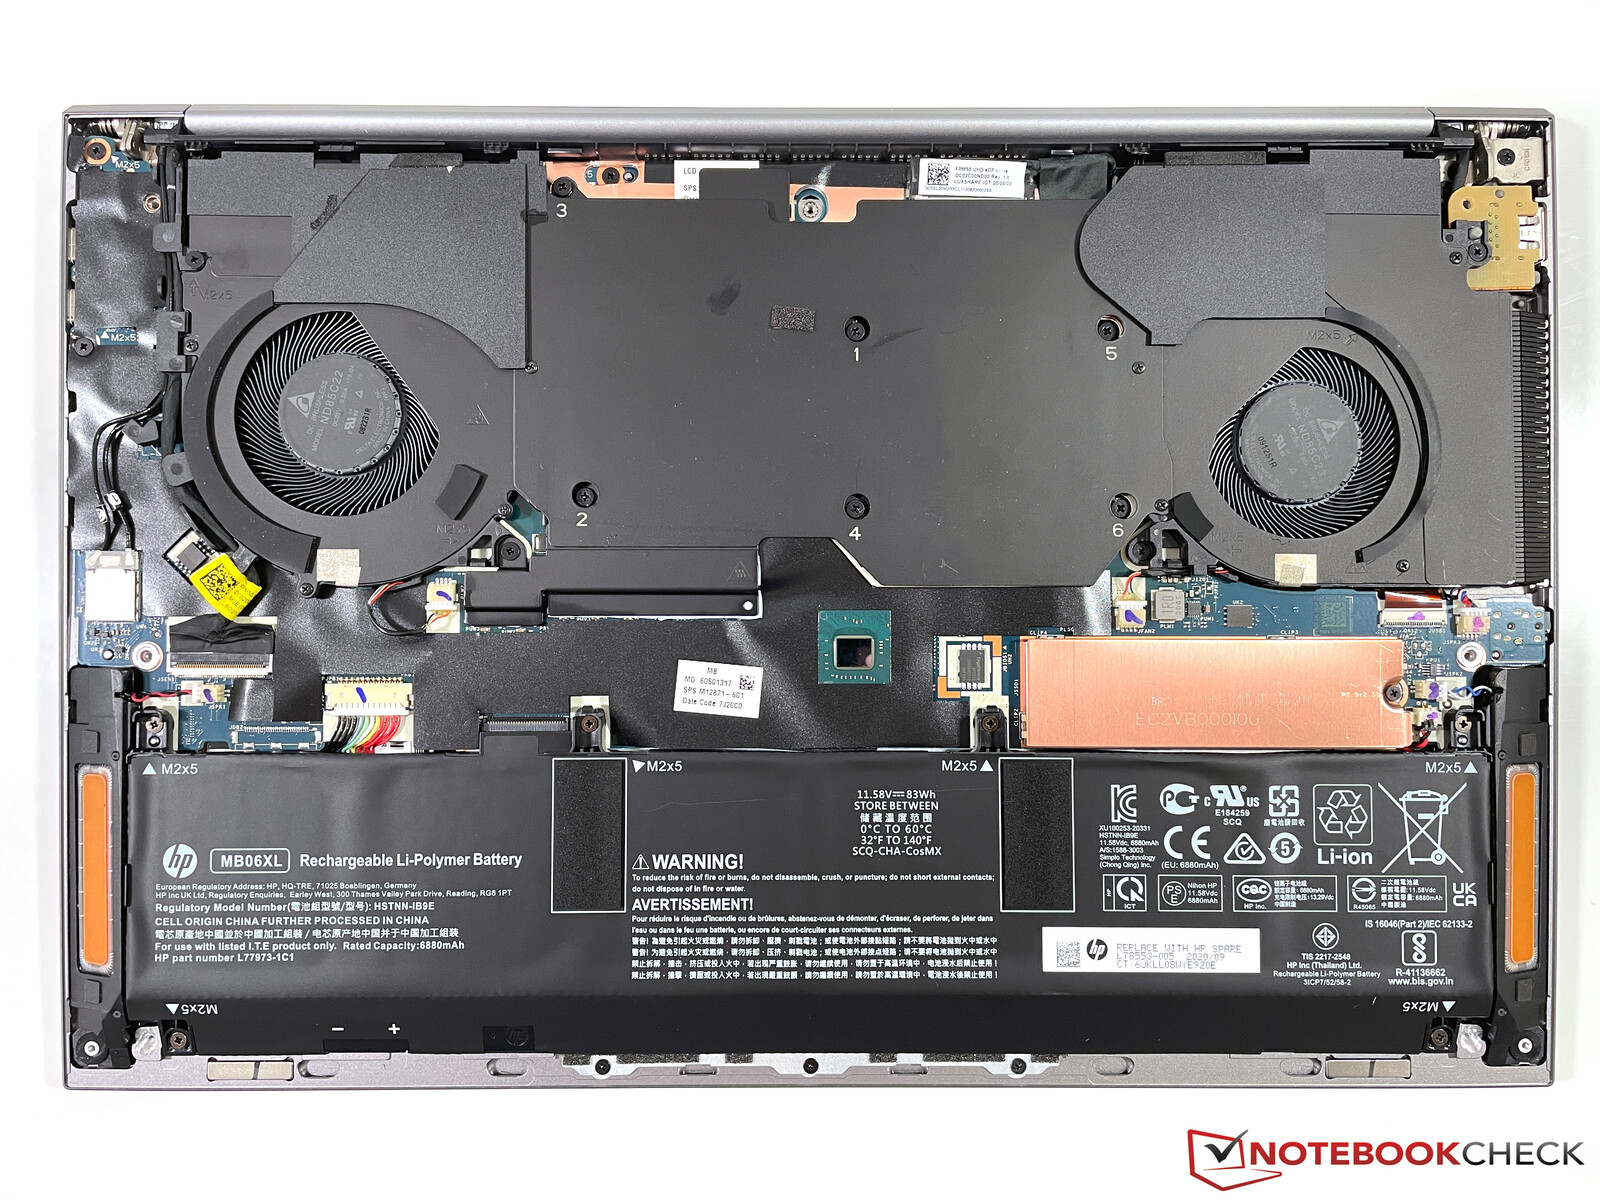
Maintenance
The bottom cover is secured by Torx screws (T5) and is easy to remove. However, there is not much to do on the inside; only the M.2-SSD can be replaced. Both the wireless module as well as the memory are soldered onto the mainboard.
Input Devices
Keyboard
The HP Premium Quiet Keyboard offers a great typing experience with precise key strokes and firm feedback. Besides ThinkPad keyboards, the ZBook keyboards are among the best inputs in the mobile segment and typing longer texts is no problem at all. Except for some larger keys (space bar, return), the typing noise is also very quiet.
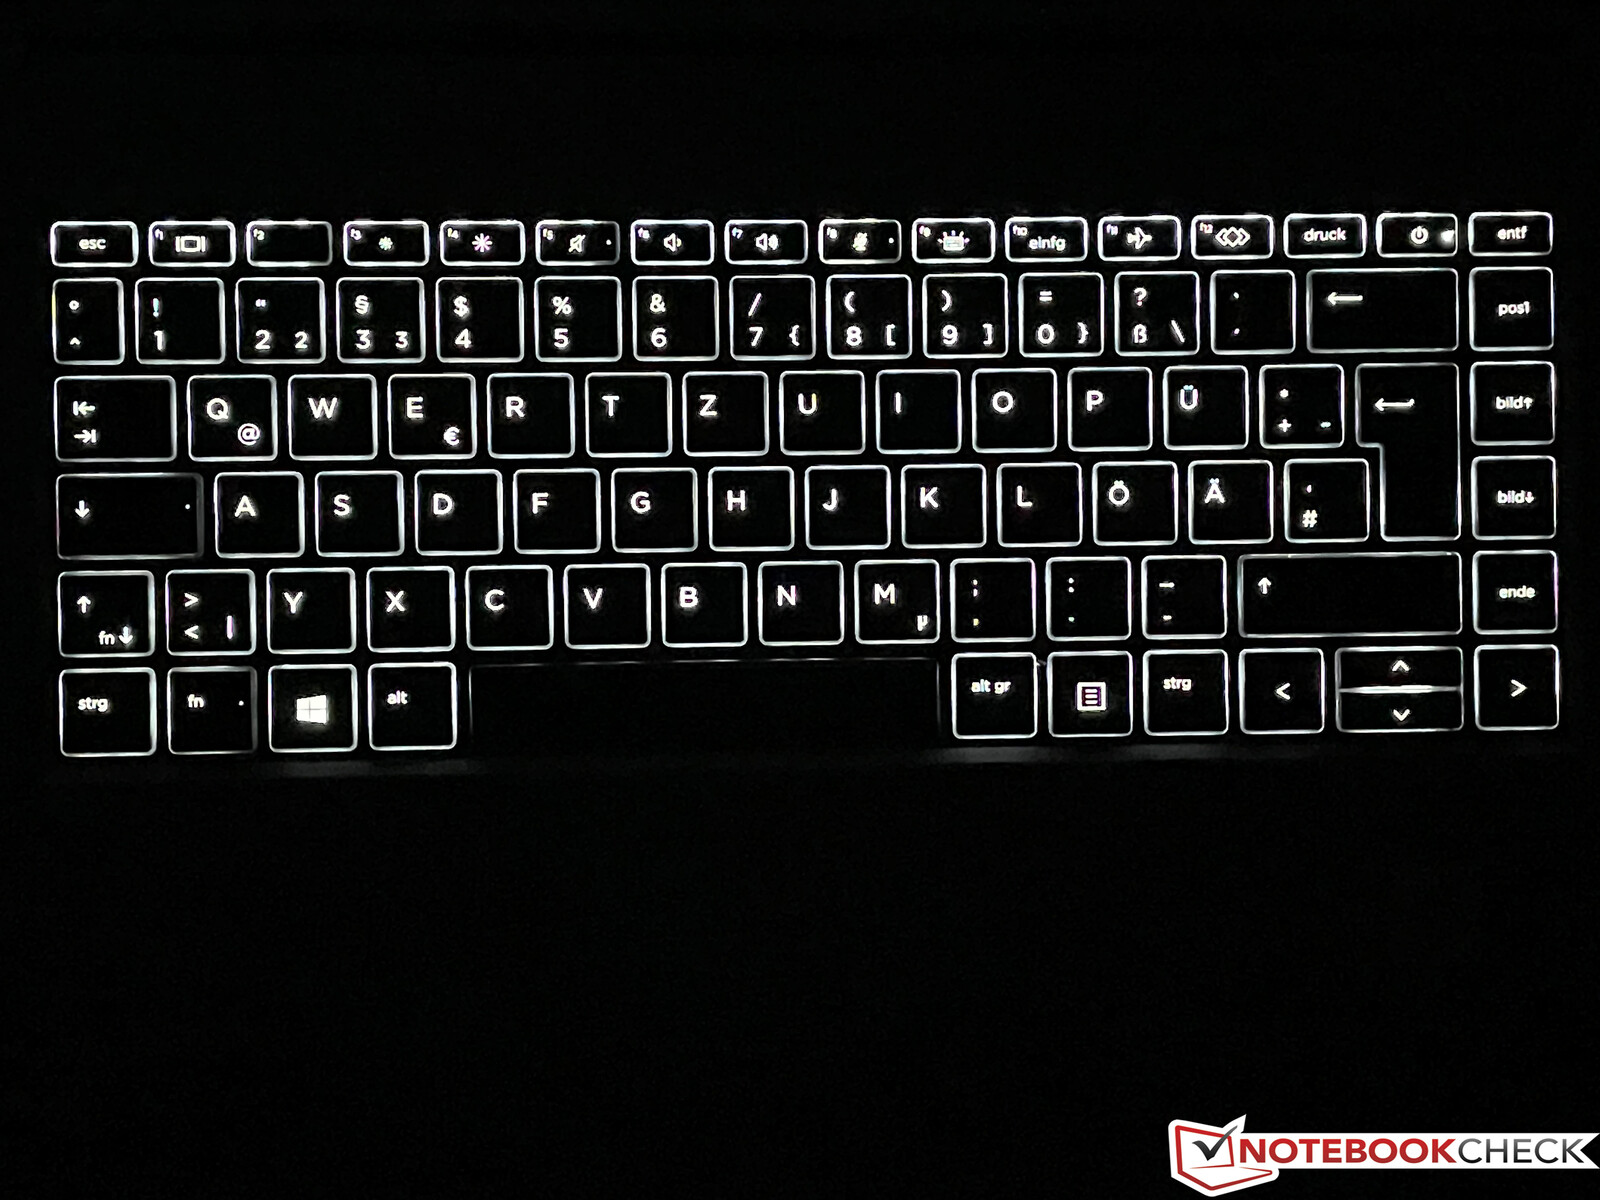
The keyboard offers a two-stage white background illumination and there is a BIOS setting where you can adjust the duration when the illumination is automatically turned off or kept on indefinitely. Similar to other new HP laptops there is a new functionality for the F12 key, which can be configured by the user.
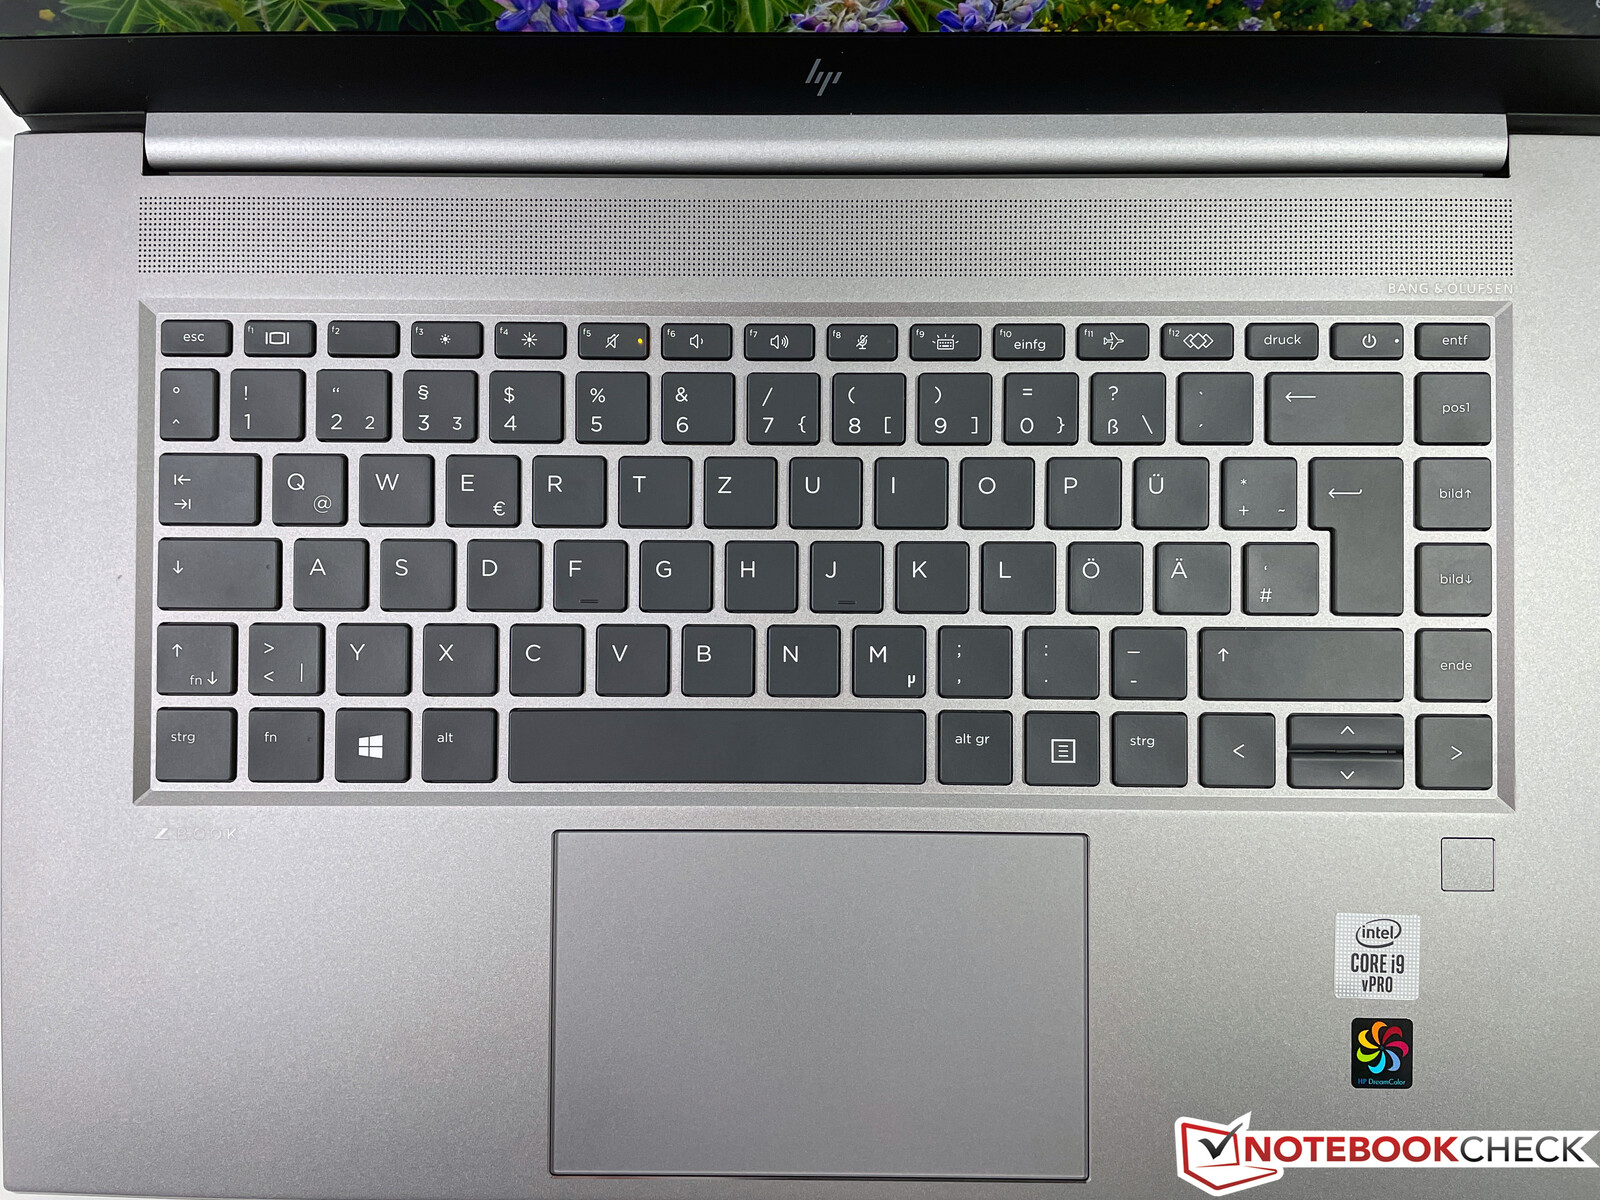
Touchpad
Similar to previous models of the ZBook Studio, HP does not include a Pointstick, so you can only use the smooth clickpad for cursor movements. The size (11.5 x 7.3 cm) is good and it offers excellent gliding capabilities. Contrary to the larger ZBook Fury 15, there are no dedicated mouse buttons. You can click the lower part of the pad, but this results in a pretty loud clicking noise. We preferred tap-to-click during our test period.
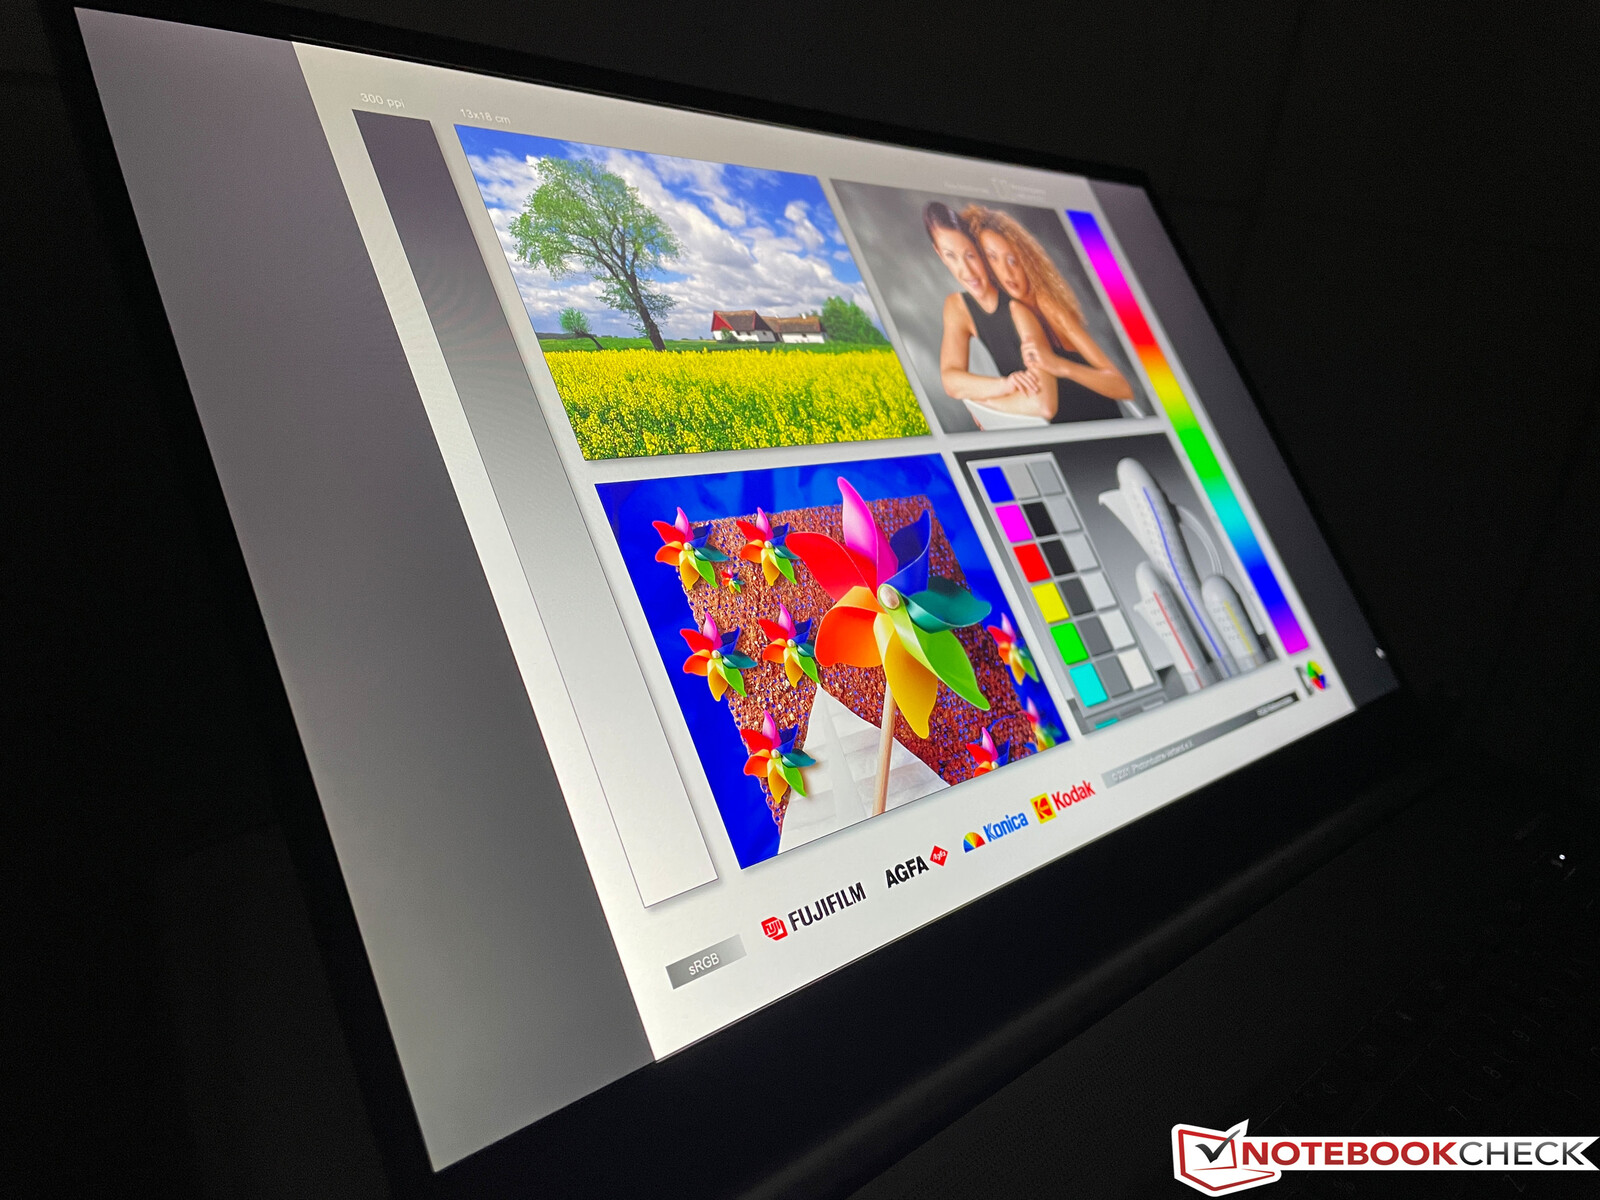
Display - DreamColor 4K

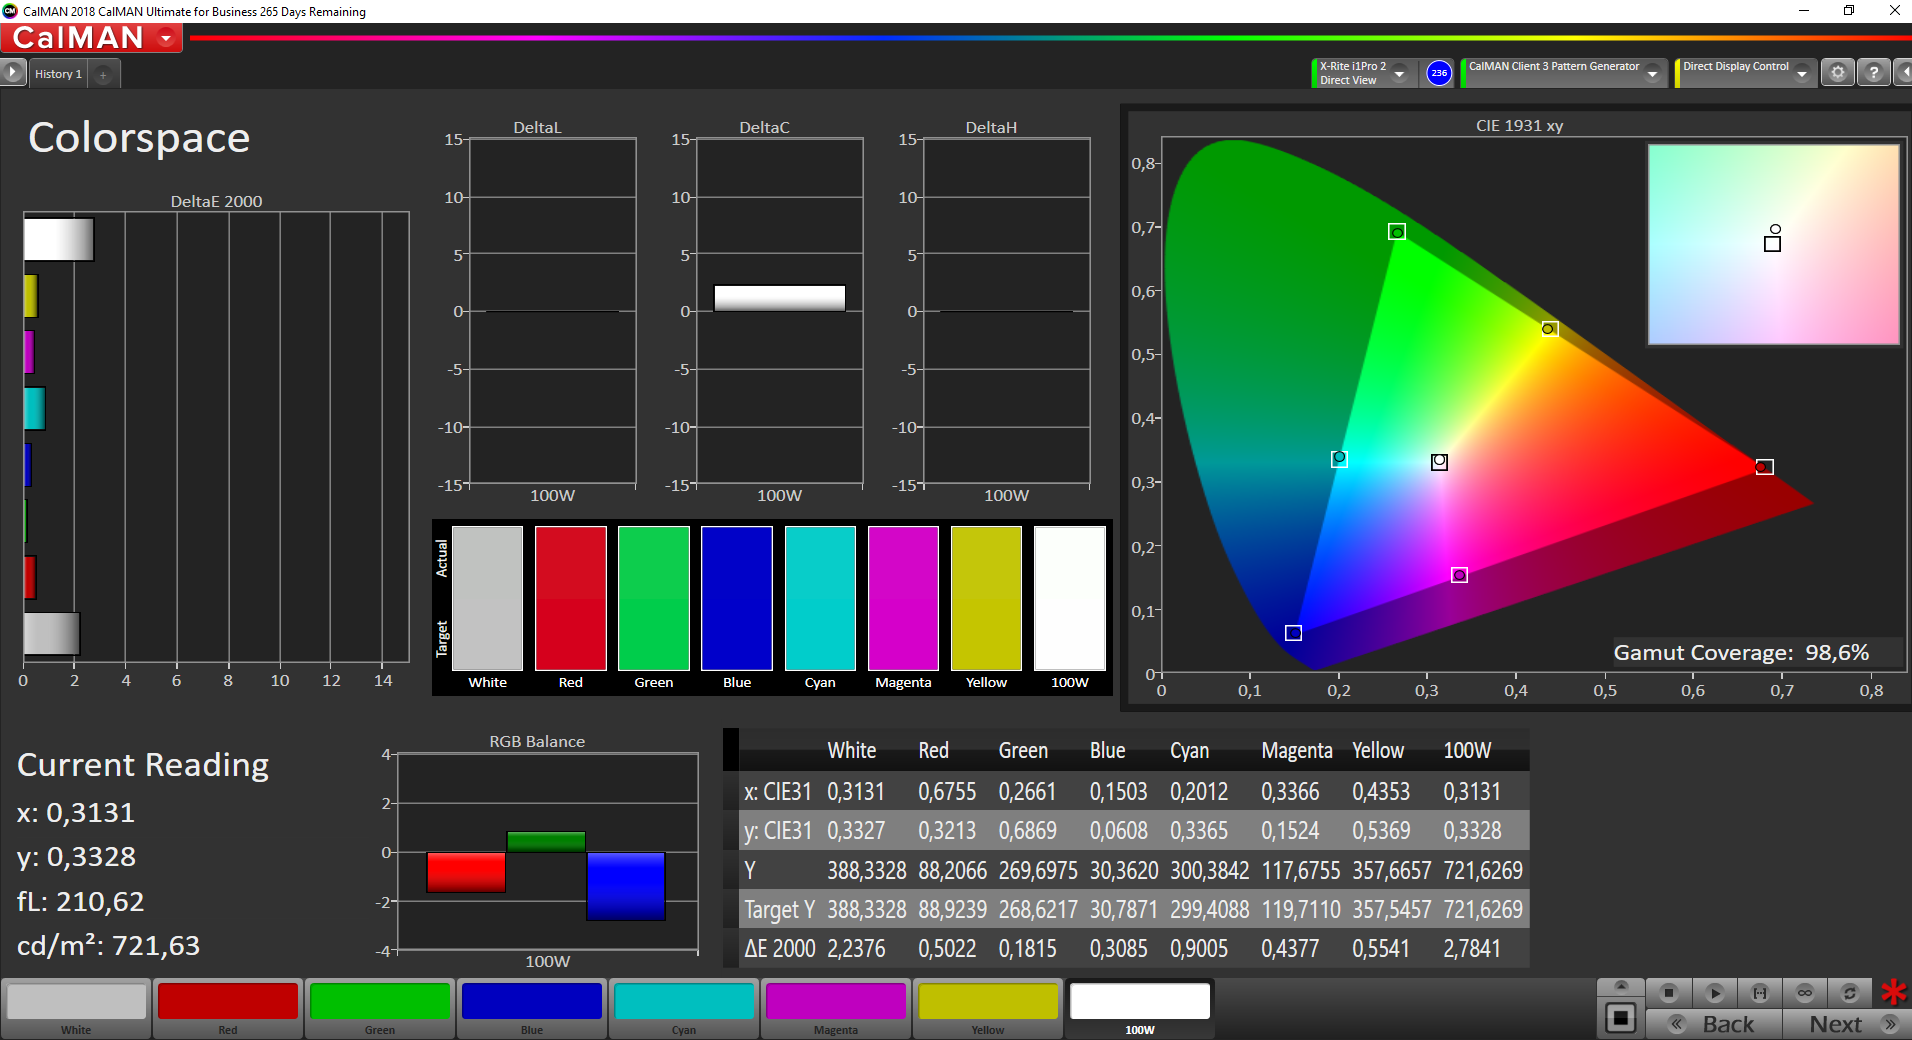
Our test unit is equipped with the optional 4K DreamColor display. HP's DreamColor displays are synonymous with high-quality panels, which offer accurate colors as well as wide color gamuts. However, there has been a change: While previous versions targeted AdobeRGB, it is now the smaller P3 color space.
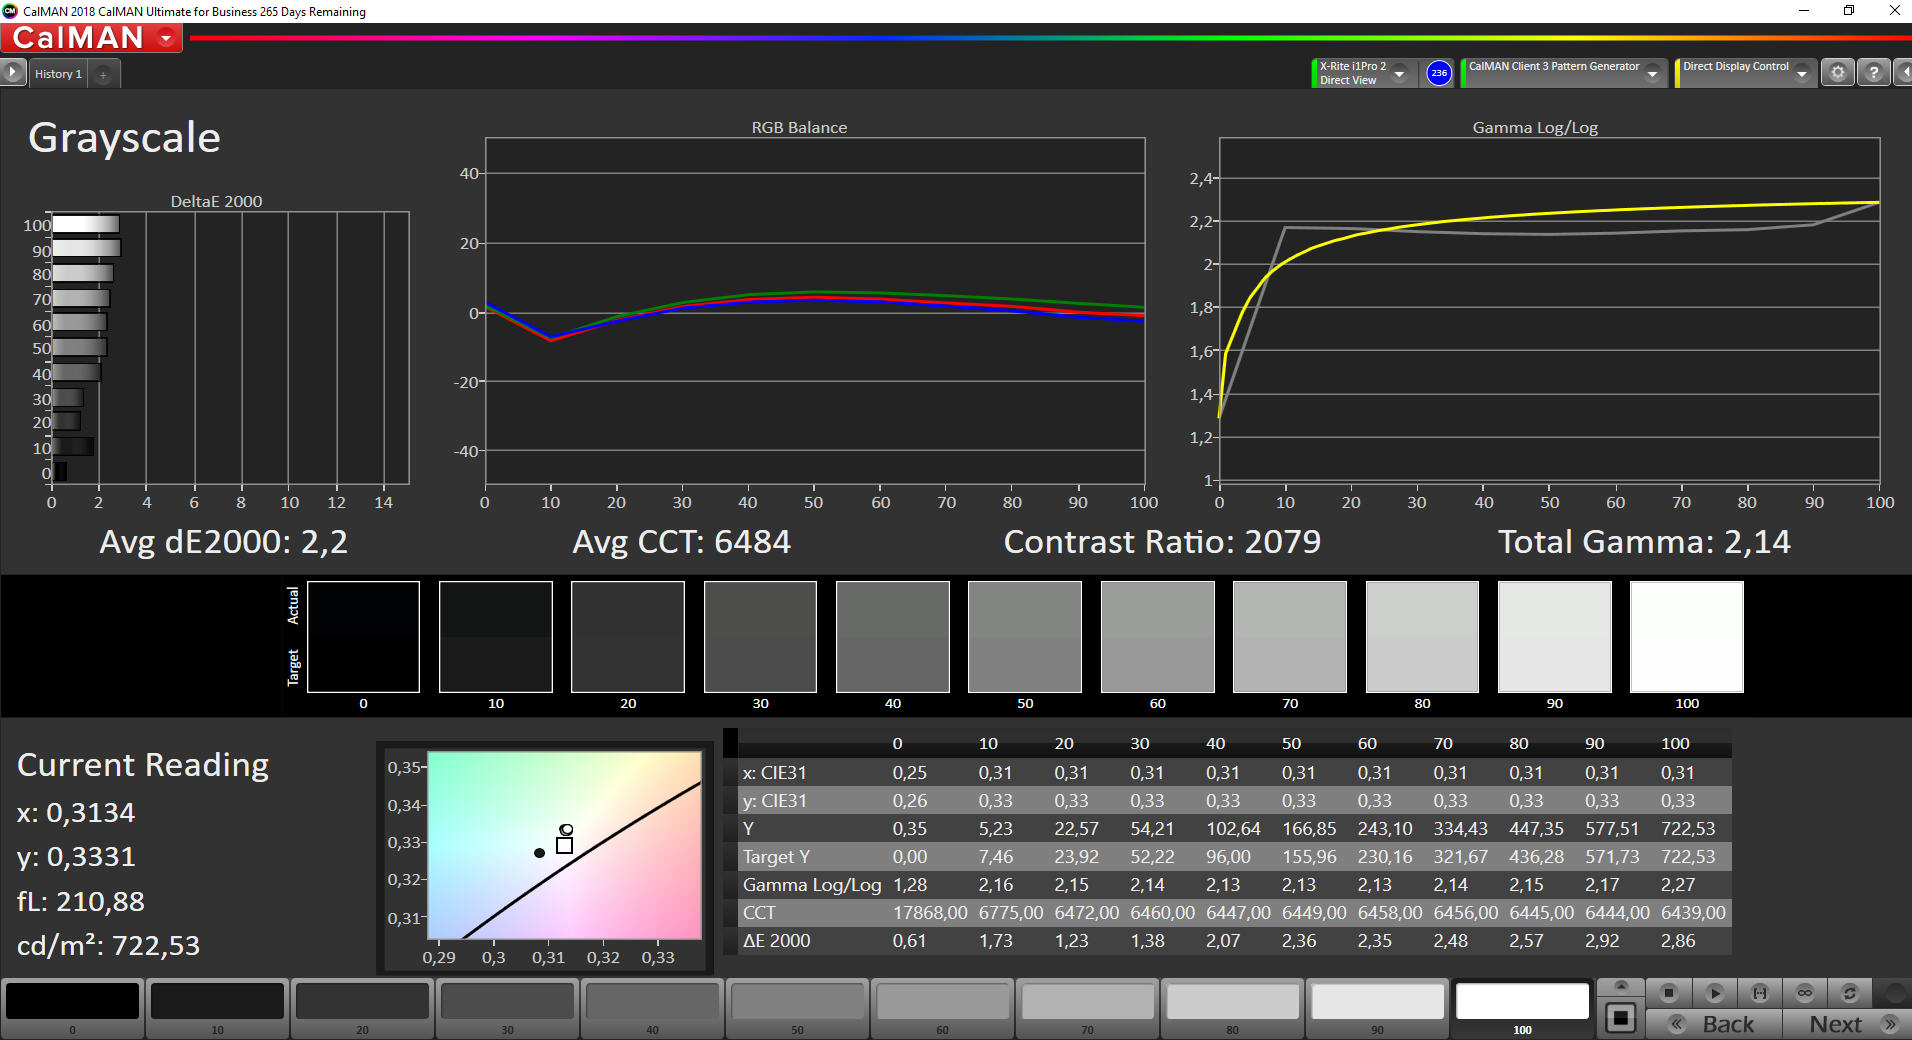
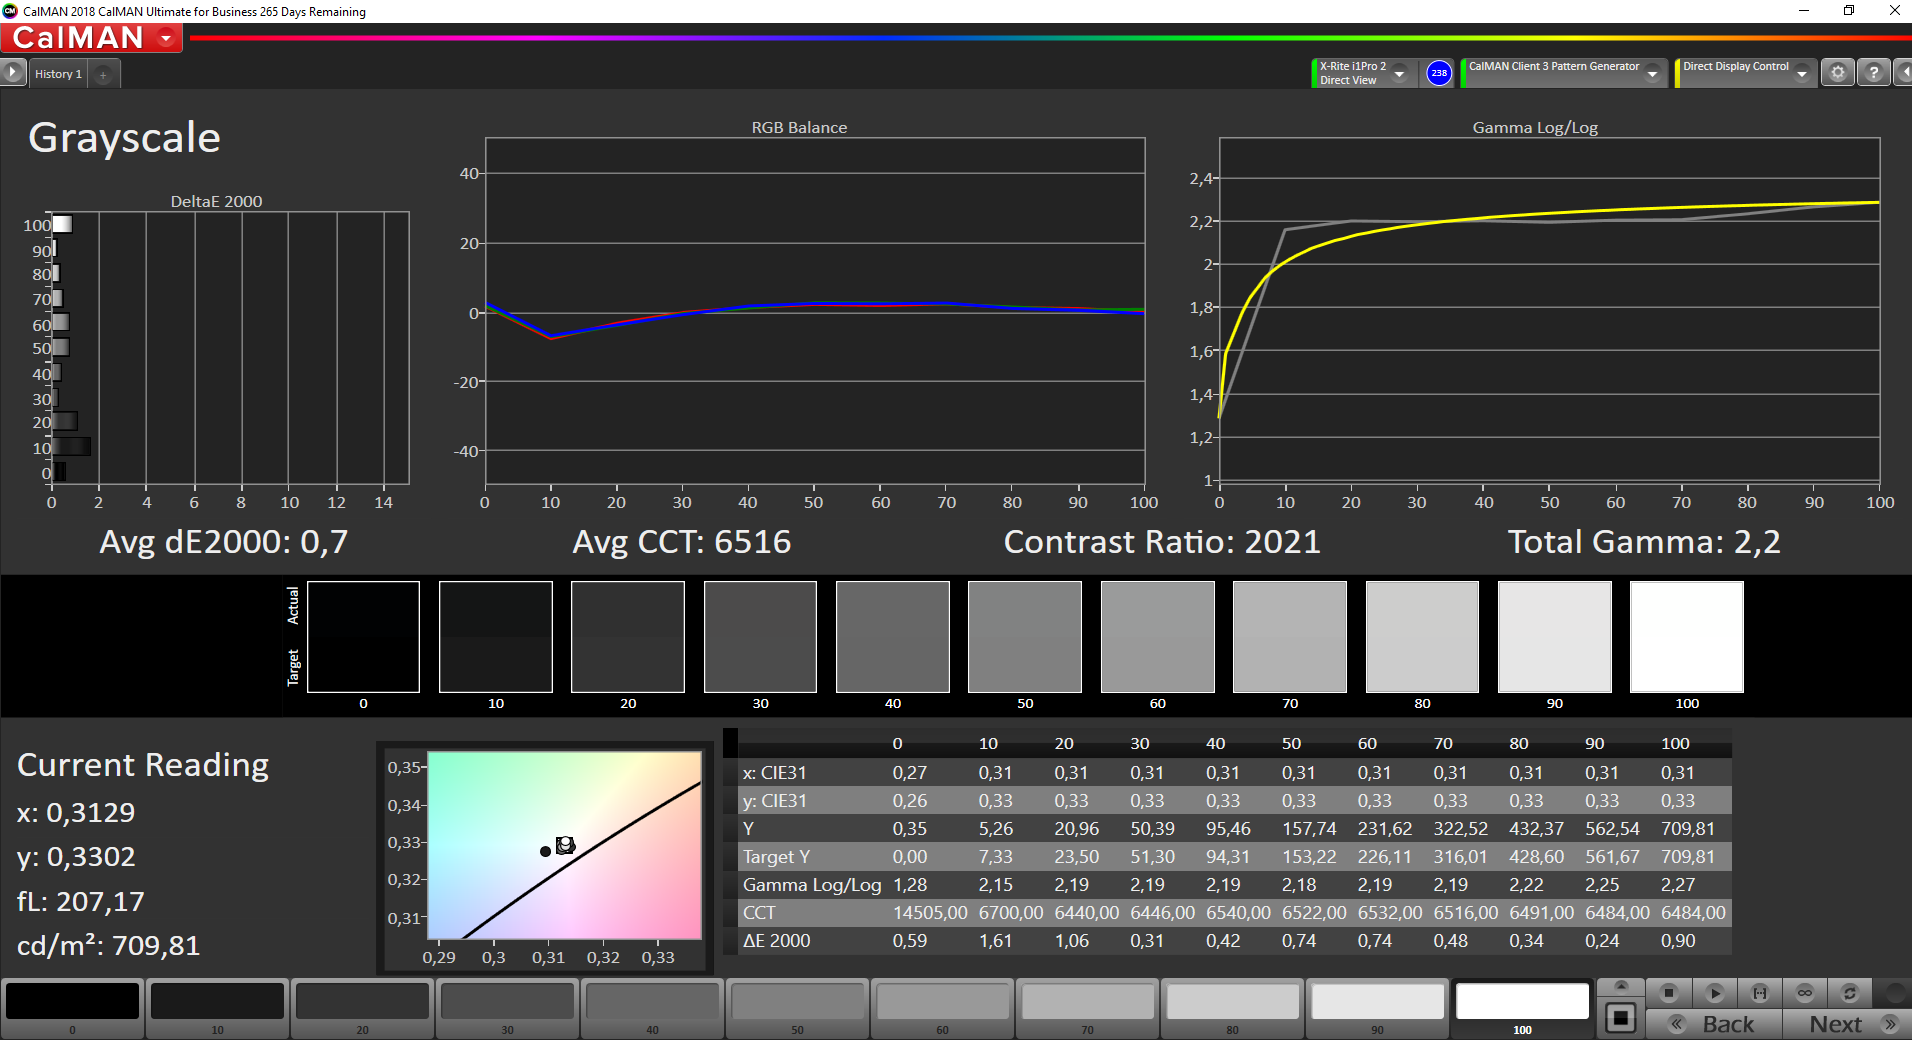
HP advertises a brightness of 600 nits, which is easily surpassed by our unit with a maximum brightness of 736 nits and still more than 700 nits on average. The black value is still okay at 0.35 cd/m² for such a bright panel, which results in an excellent contrast ratio of more than 2000:1. There is hardly any backlight bleeding; you can only notice it slightly at the edges when you use the maximum brightness in combination with a dark picture.
The display is still not perfect. The subjective picture impression is definitely very good, but bright areas still look a bit grainy due to the matte surface. The response times are also very slow, which results in visible ghosting. There is no PWM flickering.
| |||||||||||||||||||||||||
Brightness Distribution: 92 %
Center on Battery: 733 cd/m²
Contrast: 2066:1 (Black: 0.35 cd/m²)
ΔE ColorChecker Calman: 1.4 | ∀{0.5-29.43 Ø4.73}
calibrated: 0.5
ΔE Greyscale Calman: 2 | ∀{0.09-98 Ø4.97}
99.9% sRGB (Argyll 1.6.3 3D)
77.3% AdobeRGB 1998 (Argyll 1.6.3 3D)
86.5% AdobeRGB 1998 (Argyll 3D)
99.9% sRGB (Argyll 3D)
98.2% Display P3 (Argyll 3D)
Gamma: 2.14
CCT: 6484 K
| HP ZBook Studio G7 LGD0661, IPS, 3840x2160, 15.6" | HP ZBook Fury 15 G7 LG Philips LGD0661, IPS, 3840x2160, 15.6" | Dell Precision 5550 P91F Sharp LQ156R1, IPS, 3840x2400, 15.6" | Lenovo ThinkPad P1 2019-20QT000RGE N156HCE-GN1, IPS LED, 1920x1080, 15.6" | Apple MacBook Pro 16 2019 i9 5500M APPA044, IPS, 3072x1920, 16" | Razer Blade 15 Studio Edition 2020 Samsung SDCA029, OLED, 3840x2160, 15.6" | |
|---|---|---|---|---|---|---|
| Display | -2% | 2% | -24% | 5% | ||
| Display P3 Coverage (%) | 98.2 | 95.6 -3% | 89.9 -8% | 62.4 -36% | 99.9 2% | |
| sRGB Coverage (%) | 99.9 | 99.8 0% | 100 0% | 91.5 -8% | 100 0% | |
| AdobeRGB 1998 Coverage (%) | 86.5 | 84.5 -2% | 99.9 15% | 63.4 -27% | 97.3 12% | |
| Response Times | 3% | 14% | 51% | 7% | 91% | |
| Response Time Grey 50% / Grey 80% * (ms) | 56.4 ? | 56 ? 1% | 46 ? 18% | 34.4 ? 39% | 52.4 ? 7% | 4 ? 93% |
| Response Time Black / White * (ms) | 37.6 ? | 36 ? 4% | 34 ? 10% | 14 ? 63% | 34.9 ? 7% | 4 ? 89% |
| PWM Frequency (Hz) | 26040 ? | 131700 | ||||
| Screen | -94% | -131% | -69% | -32% | -19% | |
| Brightness middle (cd/m²) | 723 | 672.8 -7% | 469.8 -35% | 542 -25% | 519 -28% | 380 -47% |
| Brightness (cd/m²) | 707 | 674 -5% | 464 -34% | 528 -25% | 477 -33% | 388 -45% |
| Brightness Distribution (%) | 92 | 89 -3% | 85 -8% | 84 -9% | 86 -7% | 93 1% |
| Black Level * (cd/m²) | 0.35 | 0.5 -43% | 0.42 -20% | 0.41 -17% | 0.39 -11% | 0.018 95% |
| Contrast (:1) | 2066 | 1346 -35% | 1119 -46% | 1322 -36% | 1331 -36% | 21111 922% |
| Colorchecker dE 2000 * | 1.4 | 3.48 -149% | 5.16 -269% | 3.5 -150% | 2.28 -63% | 5.47 -291% |
| Colorchecker dE 2000 max. * | 2.9 | 9.44 -226% | 9.33 -222% | 7.8 -169% | 6.54 -126% | 8.19 -182% |
| Colorchecker dE 2000 calibrated * | 0.5 | 3.03 -506% | 3.75 -650% | 1.3 -160% | 0.86 -72% | 3.04 -508% |
| Greyscale dE 2000 * | 2 | 3.1 -55% | 5.5 -175% | 4.8 -140% | 0.9 55% | 5.3 -165% |
| Gamma | 2.14 103% | 2.04 108% | 2 110% | 2.33 94% | 2145 0% | 2.15 102% |
| CCT | 6484 100% | 6380 102% | 6198 105% | 7690 85% | 6572 99% | 6128 106% |
| Color Space (Percent of AdobeRGB 1998) (%) | 77.3 | 75.2 -3% | 89.2 15% | 58.8 -24% | 78 1% | 86 11% |
| Color Space (Percent of sRGB) (%) | 99.9 | 100 0% | 100 0% | 91.1 -9% | 100 0% | |
| Total Average (Program / Settings) | -31% /
-65% | -38% /
-88% | -14% /
-46% | -13% /
-26% | 26% /
-1% |
* ... smaller is better
The DreamColor software, which includes different color profiles, was not pre-installed on our test unit. The calibration out of the box is still very good and it is not really necessary to calibrate the panel. There is no color cast and all colors are already within the important deviation of 3.
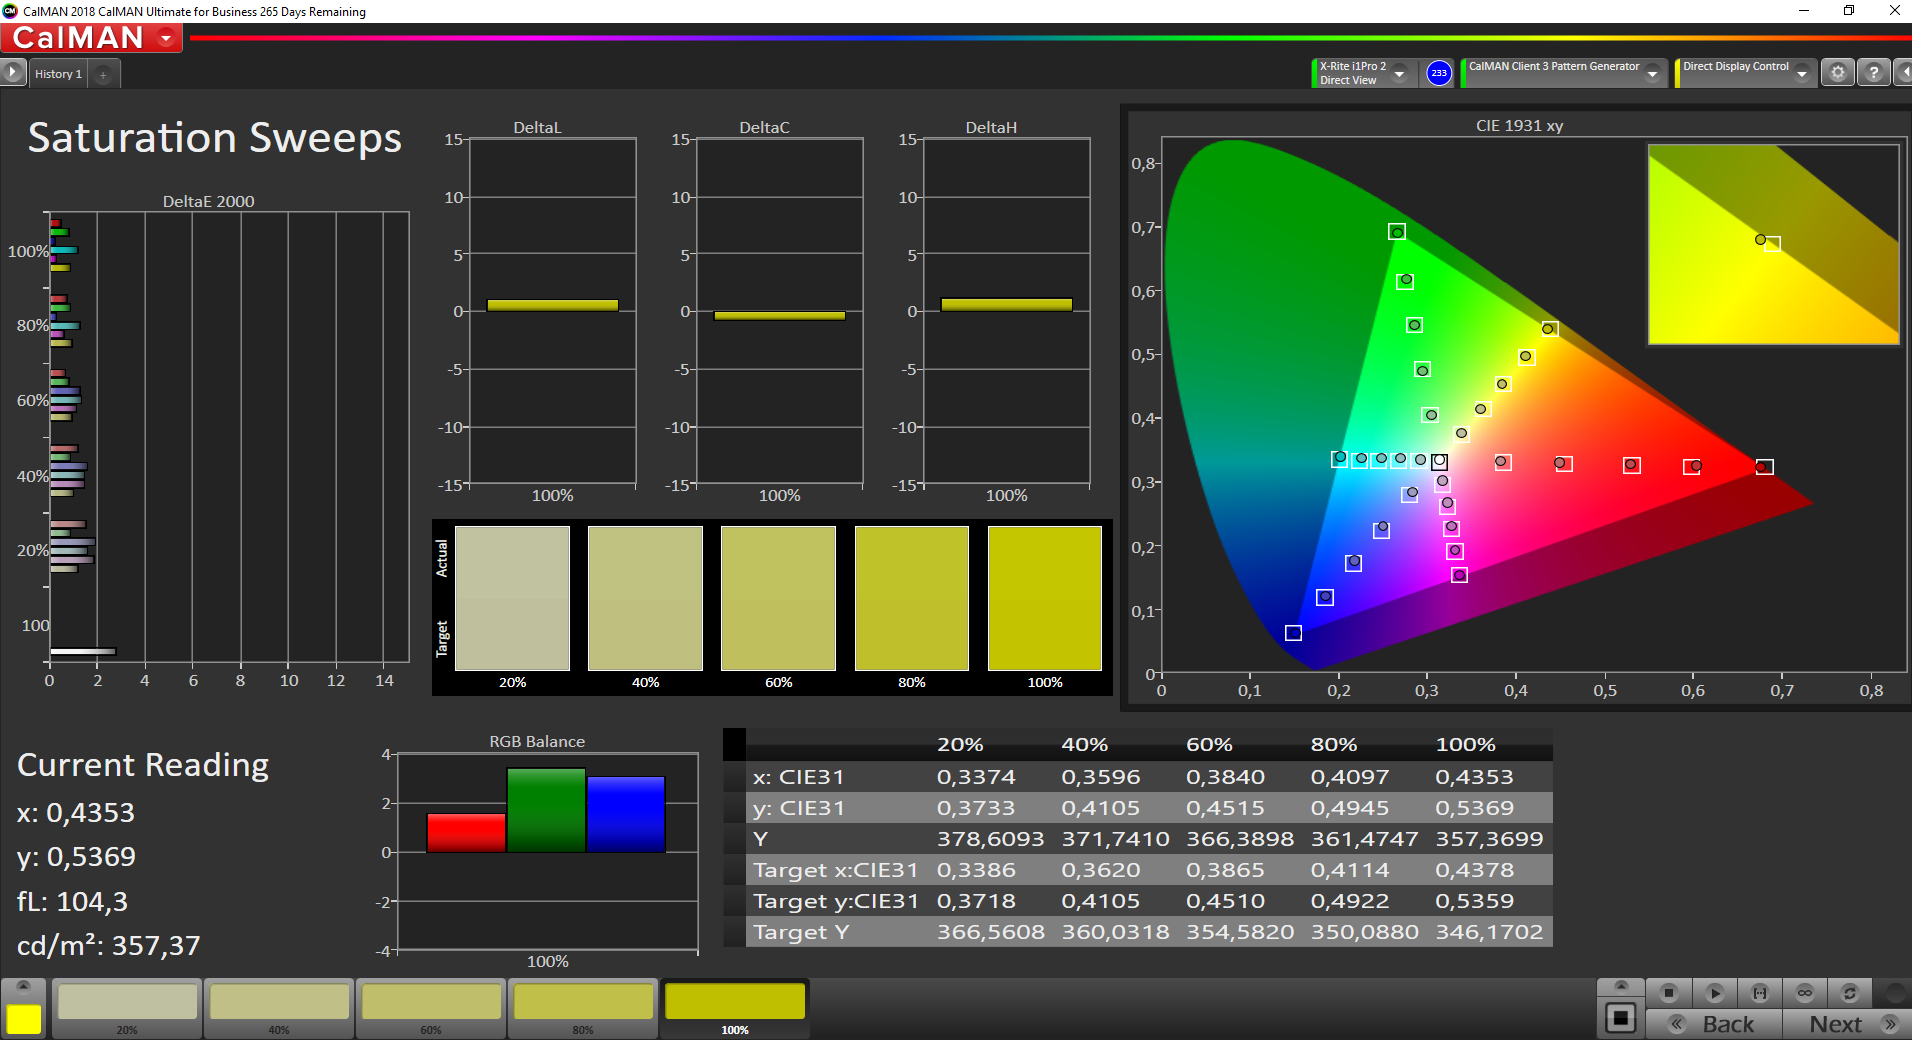
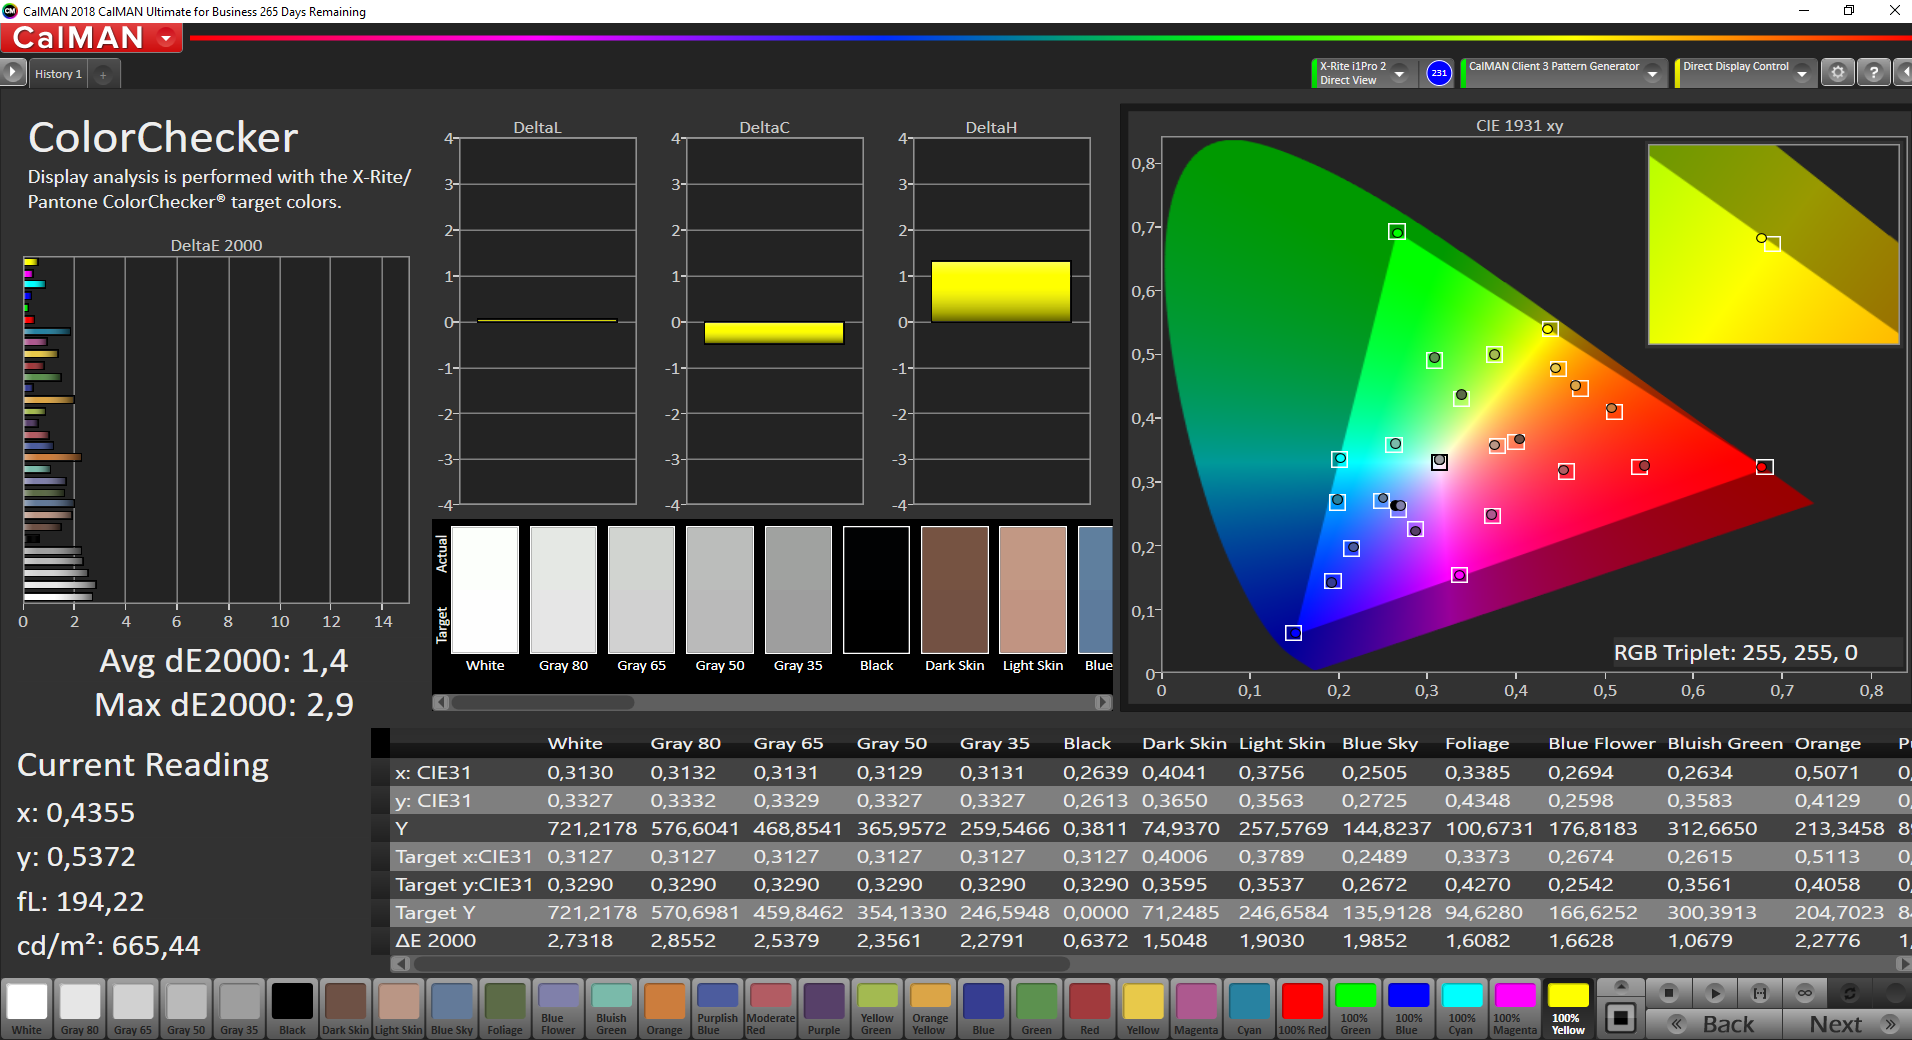
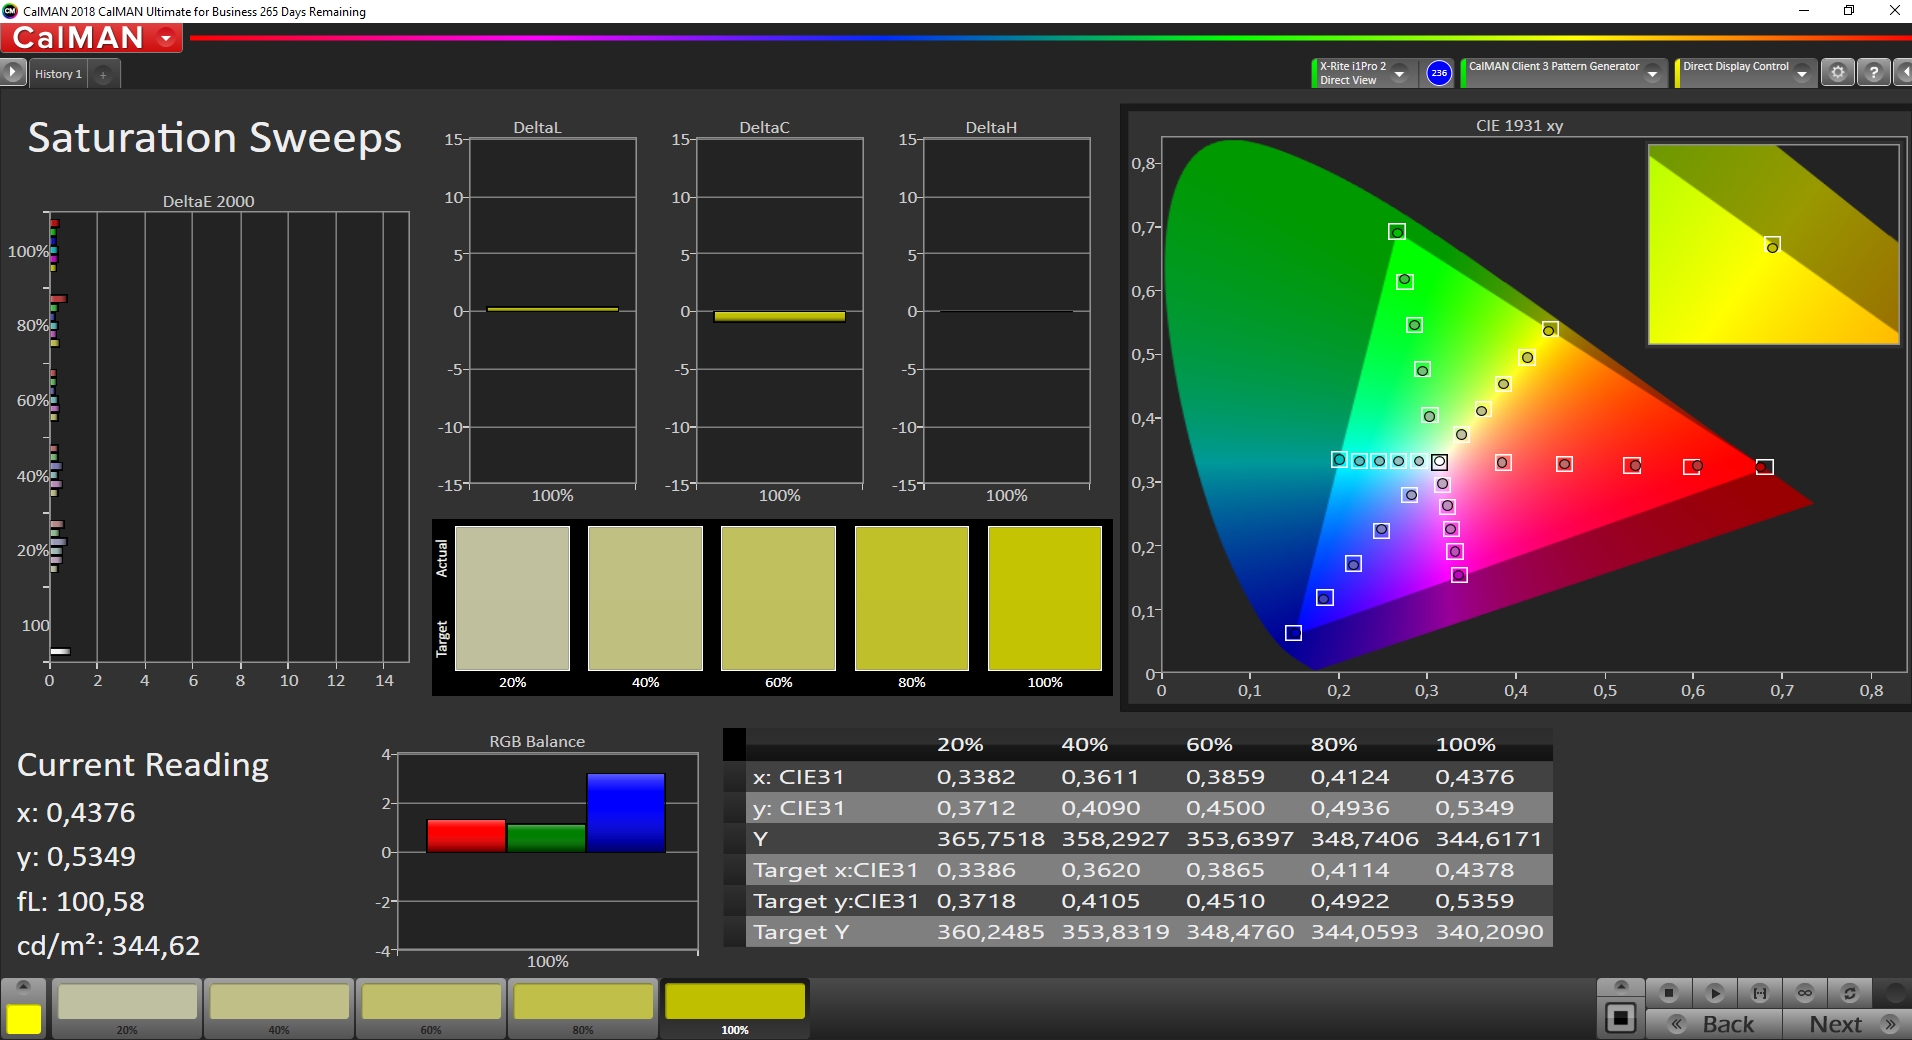
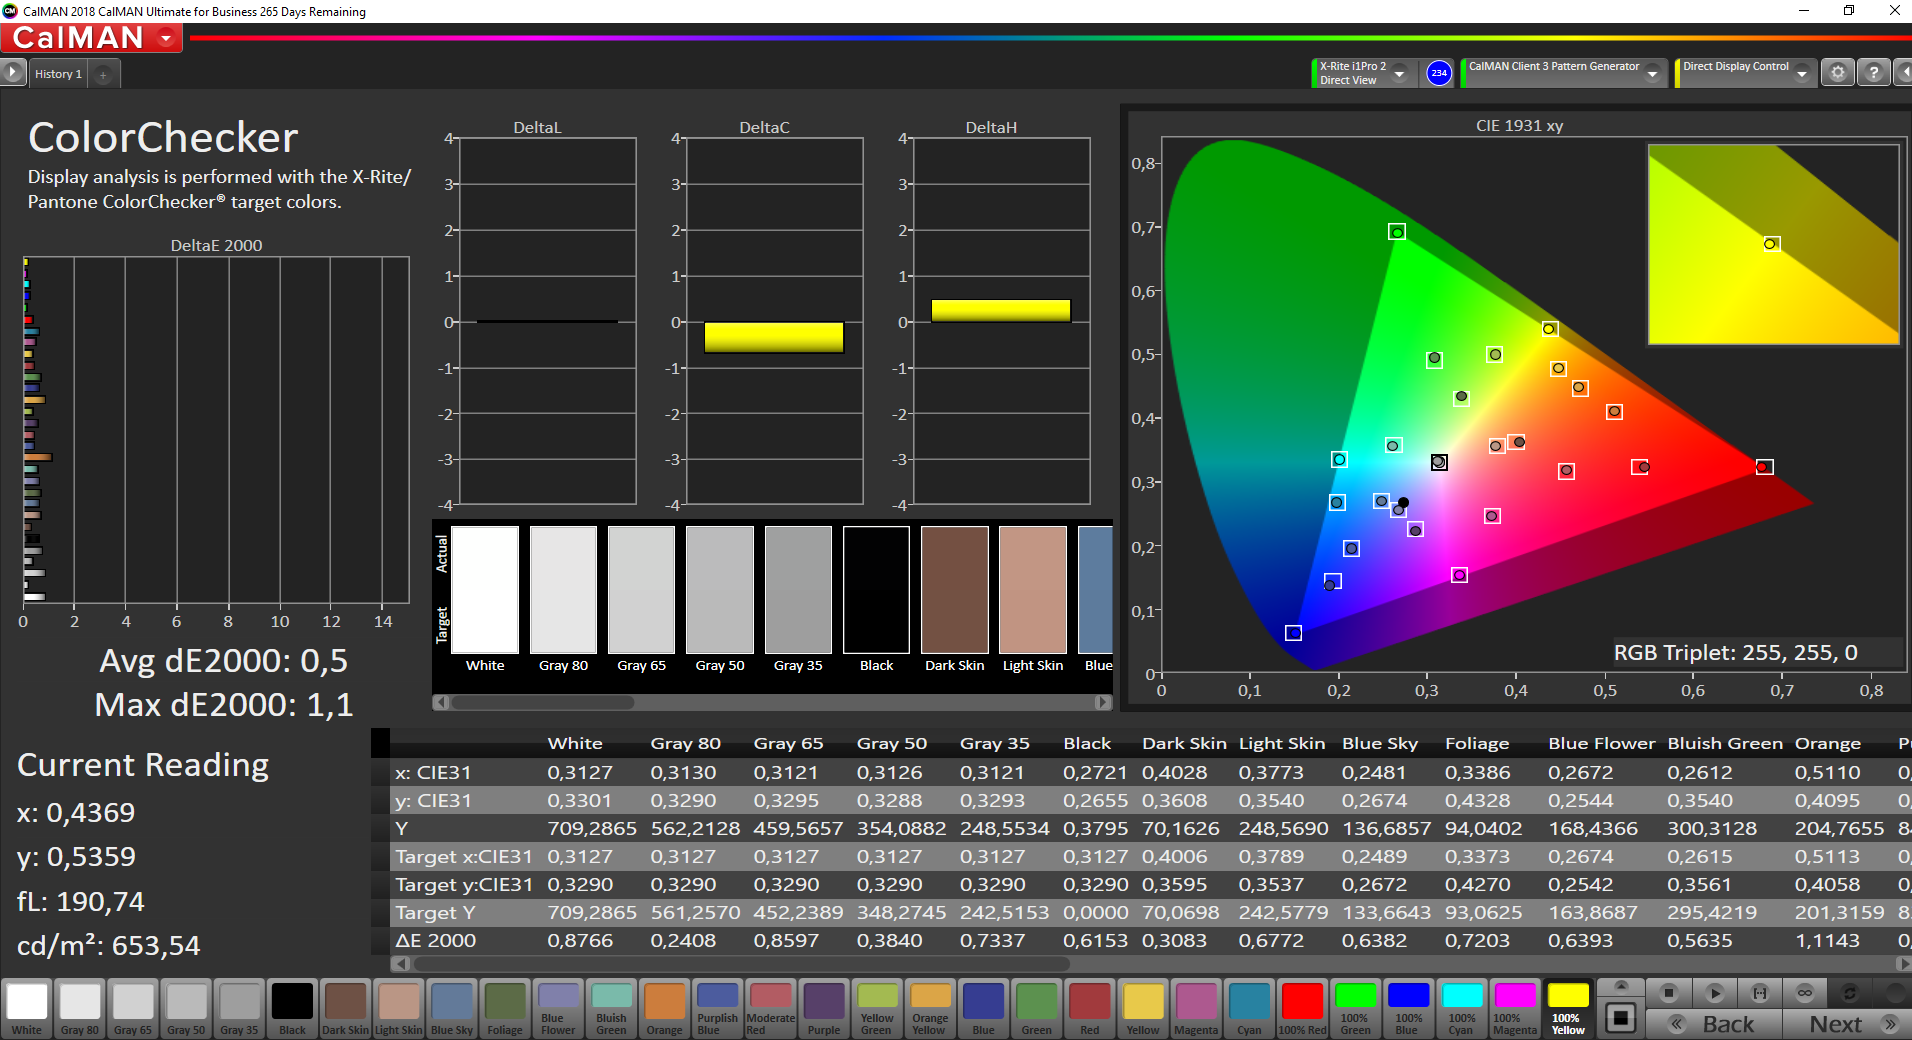
We still tested the calibration and you can slightly improve the color accuracy; the according profile is can be downloaded for free in the box above. We can confirm the P3 color gamut, so HP follows the trend that was introduced by Apple a couple of years ago. From a quality standpoint, this is a step down from previous DreamColor panels, which targeted the wider AdobeRGB color gamut.
Display Response Times
| ↔ Response Time Black to White | ||
|---|---|---|
| 37.6 ms ... rise ↗ and fall ↘ combined | ↗ 19.6 ms rise | 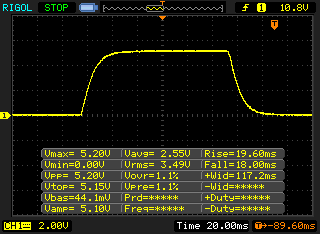 |
| ↘ 18 ms fall | ||
| The screen shows slow response rates in our tests and will be unsatisfactory for gamers. In comparison, all tested devices range from 0.1 (minimum) to 240 (maximum) ms. » 95 % of all devices are better. This means that the measured response time is worse than the average of all tested devices (19.9 ms). | ||
| ↔ Response Time 50% Grey to 80% Grey | ||
| 56.4 ms ... rise ↗ and fall ↘ combined | ↗ 27.6 ms rise | 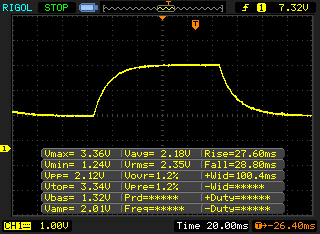 |
| ↘ 28.8 ms fall | ||
| The screen shows slow response rates in our tests and will be unsatisfactory for gamers. In comparison, all tested devices range from 0.165 (minimum) to 636 (maximum) ms. » 93 % of all devices are better. This means that the measured response time is worse than the average of all tested devices (31.1 ms). | ||
Screen Flickering / PWM (Pulse-Width Modulation)
| Screen flickering / PWM not detected |  | ||
In comparison: 52 % of all tested devices do not use PWM to dim the display. If PWM was detected, an average of 7798 (minimum: 5 - maximum: 343500) Hz was measured. | |||
Once you deactivate the power-saving features in Intel's graphics control panel, you can use the maximum brightness on battery power. It is also possible to use the Studio G7 very comfortably in bright environments thanks to the matte surface. There is no criticism for the viewing angle stability of the display.
Performance - Core i9 and Quadro RTX 3000 Max-Q
Processor
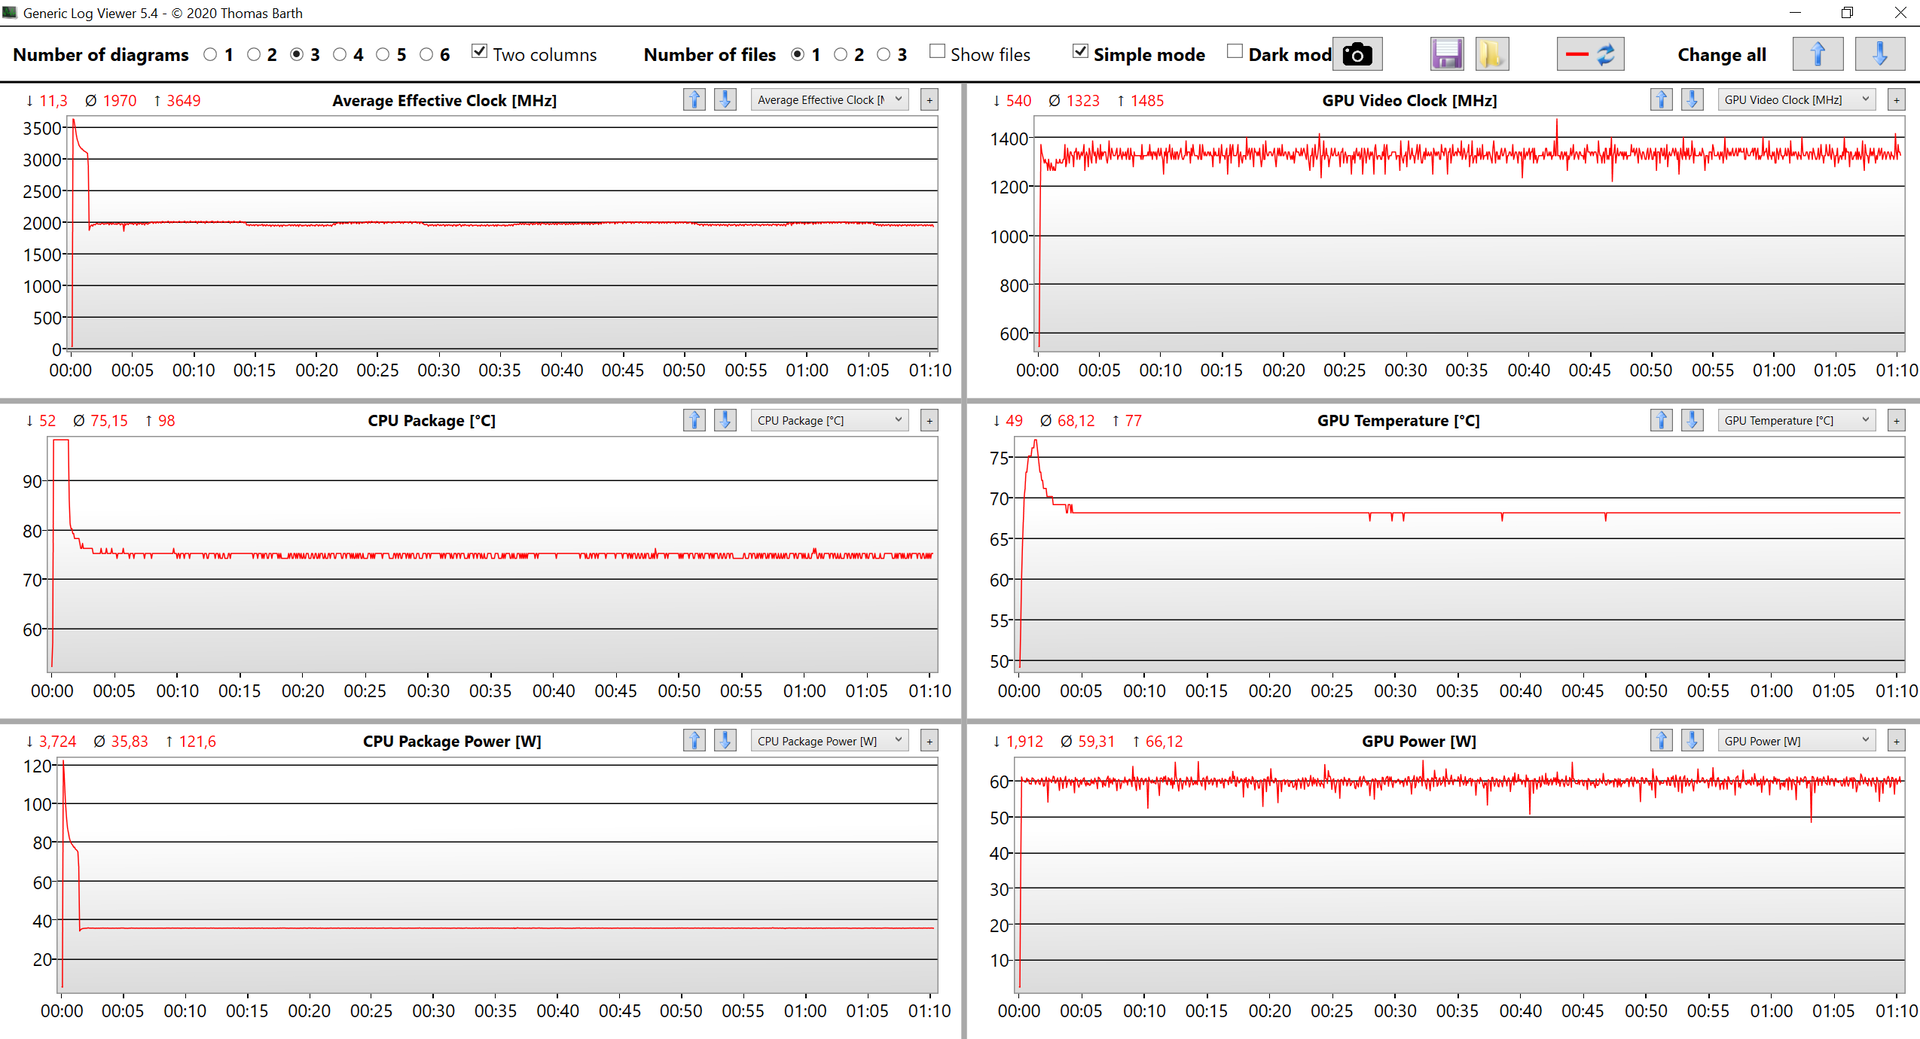
HP offers a couple of 45W Intel processors, but they are still from the familiar Comet Lake generation. Our test unit is equipped with the Core i9-10885H, which can reach up to 5.3 GHz or up to 4.4 GHz, respectively, when you stress all 8 cores simultaneously. HP is very generous in terms of TDP settings at 125W and 70W for sustained workloads. We can hardly see the maximum 125W in the benchmarks, and the consumption quickly drops due to high core temperatures and levels off at 70W, which is sufficient for 8x 3.5 GHz.
The competition uses Intel CPUs as well and the performance of the ZBook Studio G7 is very good. A comparison with AMD CPUs like the Ryzen 7 4800H running at 60W in the XMG Core 15 on the other hand shows that the performance would be much better with Ryzen chips.
The CPU performance is significantly reduced on battery power. The power consumption for the CPU is limited to 35W (8x 2.5 GHz), so the performance drops by ~38% (10074 vs. 6387 points @ CB R23 Multi) when you use all cores.
Cinebench R15: CPU Single 64Bit | CPU Multi 64Bit
Blender: v2.79 BMW27 CPU
7-Zip 18.03: 7z b 4 -mmt1 | 7z b 4
Geekbench 5.5: Single-Core | Multi-Core
HWBOT x265 Benchmark v2.2: 4k Preset
LibreOffice : 20 Documents To PDF
R Benchmark 2.5: Overall mean
Cinebench R23: Single Core | Multi Core
| Cinebench R20 / CPU (Single Core) | |
| Average of class Workstation (671 - 857, n=25, last 2 years) | |
| HP ZBook Studio G7 | |
| HP ZBook Fury 15 G7 | |
| HP ZBook Fury 15 G7 | |
| Dell Precision 5550 P91F | |
| Schenker XMG Core 15 Ampere | |
| Average Intel Core i9-10885H (460 - 513, n=3) | |
| Razer Blade 15 Studio Edition 2020 | |
| Apple MacBook Pro 16 2019 i9 5500M | |
| Apple MacBook Pro 16 2019 i9 5500M | |
| Lenovo ThinkPad P1 2019-20QT000RGE | |
| Cinebench R20 / CPU (Multi Core) | |
| Average of class Workstation (5471 - 15043, n=25, last 2 years) | |
| Schenker XMG Core 15 Ampere | |
| HP ZBook Fury 15 G7 | |
| HP ZBook Fury 15 G7 | |
| HP ZBook Studio G7 | |
| Dell Precision 5550 P91F | |
| Apple MacBook Pro 16 2019 i9 5500M | |
| Apple MacBook Pro 16 2019 i9 5500M | |
| Average Intel Core i9-10885H (2798 - 3762, n=3) | |
| Razer Blade 15 Studio Edition 2020 | |
| Lenovo ThinkPad P1 2019-20QT000RGE | |
| Cinebench R15 / CPU Single 64Bit | |
| Average of class Workstation (191.4 - 328, n=25, last 2 years) | |
| HP ZBook Studio G7 | |
| HP ZBook Fury 15 G7 | |
| HP ZBook Fury 15 G7 | |
| Average Intel Core i9-10885H (197 - 212, n=3) | |
| Dell Precision 5550 P91F | |
| Lenovo ThinkPad P1 2019-20QT000RGE | |
| Razer Blade 15 Studio Edition 2020 | |
| Schenker XMG Core 15 Ampere | |
| Apple MacBook Pro 16 2019 i9 5500M | |
| Apple MacBook Pro 16 2019 i9 5500M | |
| Cinebench R15 / CPU Multi 64Bit | |
| Average of class Workstation (2489 - 5810, n=25, last 2 years) | |
| Schenker XMG Core 15 Ampere | |
| HP ZBook Studio G7 | |
| HP ZBook Fury 15 G7 | |
| HP ZBook Fury 15 G7 | |
| Dell Precision 5550 P91F | |
| Average Intel Core i9-10885H (1264 - 1726, n=3) | |
| Apple MacBook Pro 16 2019 i9 5500M | |
| Apple MacBook Pro 16 2019 i9 5500M | |
| Lenovo ThinkPad P1 2019-20QT000RGE | |
| Razer Blade 15 Studio Edition 2020 | |
| Blender / v2.79 BMW27 CPU | |
| Lenovo ThinkPad P1 2019-20QT000RGE | |
| HP ZBook Fury 15 G7 | |
| Razer Blade 15 Studio Edition 2020 | |
| Dell Precision 5550 P91F | |
| Apple MacBook Pro 16 2019 i9 5500M | |
| Average Intel Core i9-10885H (283 - 348, n=3) | |
| HP ZBook Studio G7 | |
| Schenker XMG Core 15 Ampere | |
| Average of class Workstation (91 - 261, n=25, last 2 years) | |
| 7-Zip 18.03 / 7z b 4 -mmt1 | |
| Average of class Workstation (5126 - 6960, n=25, last 2 years) | |
| HP ZBook Fury 15 G7 | |
| HP ZBook Studio G7 | |
| Average Intel Core i9-10885H (5397 - 5668, n=3) | |
| Dell Precision 5550 P91F | |
| Razer Blade 15 Studio Edition 2020 | |
| Lenovo ThinkPad P1 2019-20QT000RGE | |
| Apple MacBook Pro 16 2019 i9 5500M | |
| Schenker XMG Core 15 Ampere | |
| 7-Zip 18.03 / 7z b 4 | |
| Average of class Workstation (54741 - 116969, n=25, last 2 years) | |
| Schenker XMG Core 15 Ampere | |
| HP ZBook Studio G7 | |
| Average Intel Core i9-10885H (36740 - 42993, n=3) | |
| Dell Precision 5550 P91F | |
| Apple MacBook Pro 16 2019 i9 5500M | |
| Razer Blade 15 Studio Edition 2020 | |
| HP ZBook Fury 15 G7 | |
| Lenovo ThinkPad P1 2019-20QT000RGE | |
| Geekbench 5.5 / Single-Core | |
| Average of class Workstation (1781 - 2183, n=25, last 2 years) | |
| HP ZBook Studio G7 | |
| HP ZBook Fury 15 G7 | |
| Dell Precision 5550 P91F | |
| Average Intel Core i9-10885H (1216 - 1376, n=3) | |
| Razer Blade 15 Studio Edition 2020 | |
| Schenker XMG Core 15 Ampere | |
| Apple MacBook Pro 16 2019 i9 5500M | |
| Geekbench 5.5 / Multi-Core | |
| Average of class Workstation (11542 - 25554, n=25, last 2 years) | |
| Dell Precision 5550 P91F | |
| Schenker XMG Core 15 Ampere | |
| HP ZBook Studio G7 | |
| Razer Blade 15 Studio Edition 2020 | |
| Apple MacBook Pro 16 2019 i9 5500M | |
| Average Intel Core i9-10885H (6529 - 7693, n=3) | |
| HP ZBook Fury 15 G7 | |
| HWBOT x265 Benchmark v2.2 / 4k Preset | |
| Average of class Workstation (14.4 - 40.5, n=25, last 2 years) | |
| Schenker XMG Core 15 Ampere | |
| HP ZBook Studio G7 | |
| Average Intel Core i9-10885H (10.6 - 12.5, n=3) | |
| Apple MacBook Pro 16 2019 i9 5500M | |
| Dell Precision 5550 P91F | |
| Razer Blade 15 Studio Edition 2020 | |
| HP ZBook Fury 15 G7 | |
| Lenovo ThinkPad P1 2019-20QT000RGE | |
| LibreOffice / 20 Documents To PDF | |
| HP ZBook Studio G7 | |
| Apple MacBook Pro 16 2019 i9 5500M | |
| Apple MacBook Pro 16 2019 i9 5500M | |
| HP ZBook Fury 15 G7 | |
| Schenker XMG Core 15 Ampere | |
| Average Intel Core i9-10885H (45.9 - 59.6, n=3) | |
| Average of class Workstation (37.1 - 74.7, n=25, last 2 years) | |
| Razer Blade 15 Studio Edition 2020 | |
| Dell Precision 5550 P91F | |
| R Benchmark 2.5 / Overall mean | |
| Apple MacBook Pro 16 2019 i9 5500M | |
| Apple MacBook Pro 16 2019 i9 5500M | |
| Dell Precision 5550 P91F | |
| Razer Blade 15 Studio Edition 2020 | |
| Schenker XMG Core 15 Ampere | |
| Average Intel Core i9-10885H (0.564 - 0.572, n=3) | |
| HP ZBook Studio G7 | |
| HP ZBook Fury 15 G7 | |
| Average of class Workstation (0.3825 - 0.603, n=25, last 2 years) | |
| Cinebench R23 / Single Core | |
| Average of class Workstation (1712 - 2228, n=25, last 2 years) | |
| HP ZBook Fury 15 G7 | |
| HP ZBook Studio G7 | |
| Average Intel Core i9-10885H (1284 - 1295, n=2) | |
| Schenker XMG Core 15 Ampere | |
| Apple MacBook Pro 16 2019 i9 5500M | |
| Cinebench R23 / Multi Core | |
| Average of class Workstation (14055 - 38520, n=25, last 2 years) | |
| Schenker XMG Core 15 Ampere | |
| HP ZBook Studio G7 | |
| Average Intel Core i9-10885H (8802 - 10074, n=2) | |
| Apple MacBook Pro 16 2019 i9 5500M | |
| Apple MacBook Pro 16 2019 i9 5500M | |
| HP ZBook Fury 15 G7 | |
* ... smaller is better
System Performance
The Studio G7 is a very responsive system thanks to the powerful components, and user inputs are usually executed without any noticeable delays. We did not experience any issues during our review period, either.
| PCMark 10 Score | 5324 points | |
Help | ||
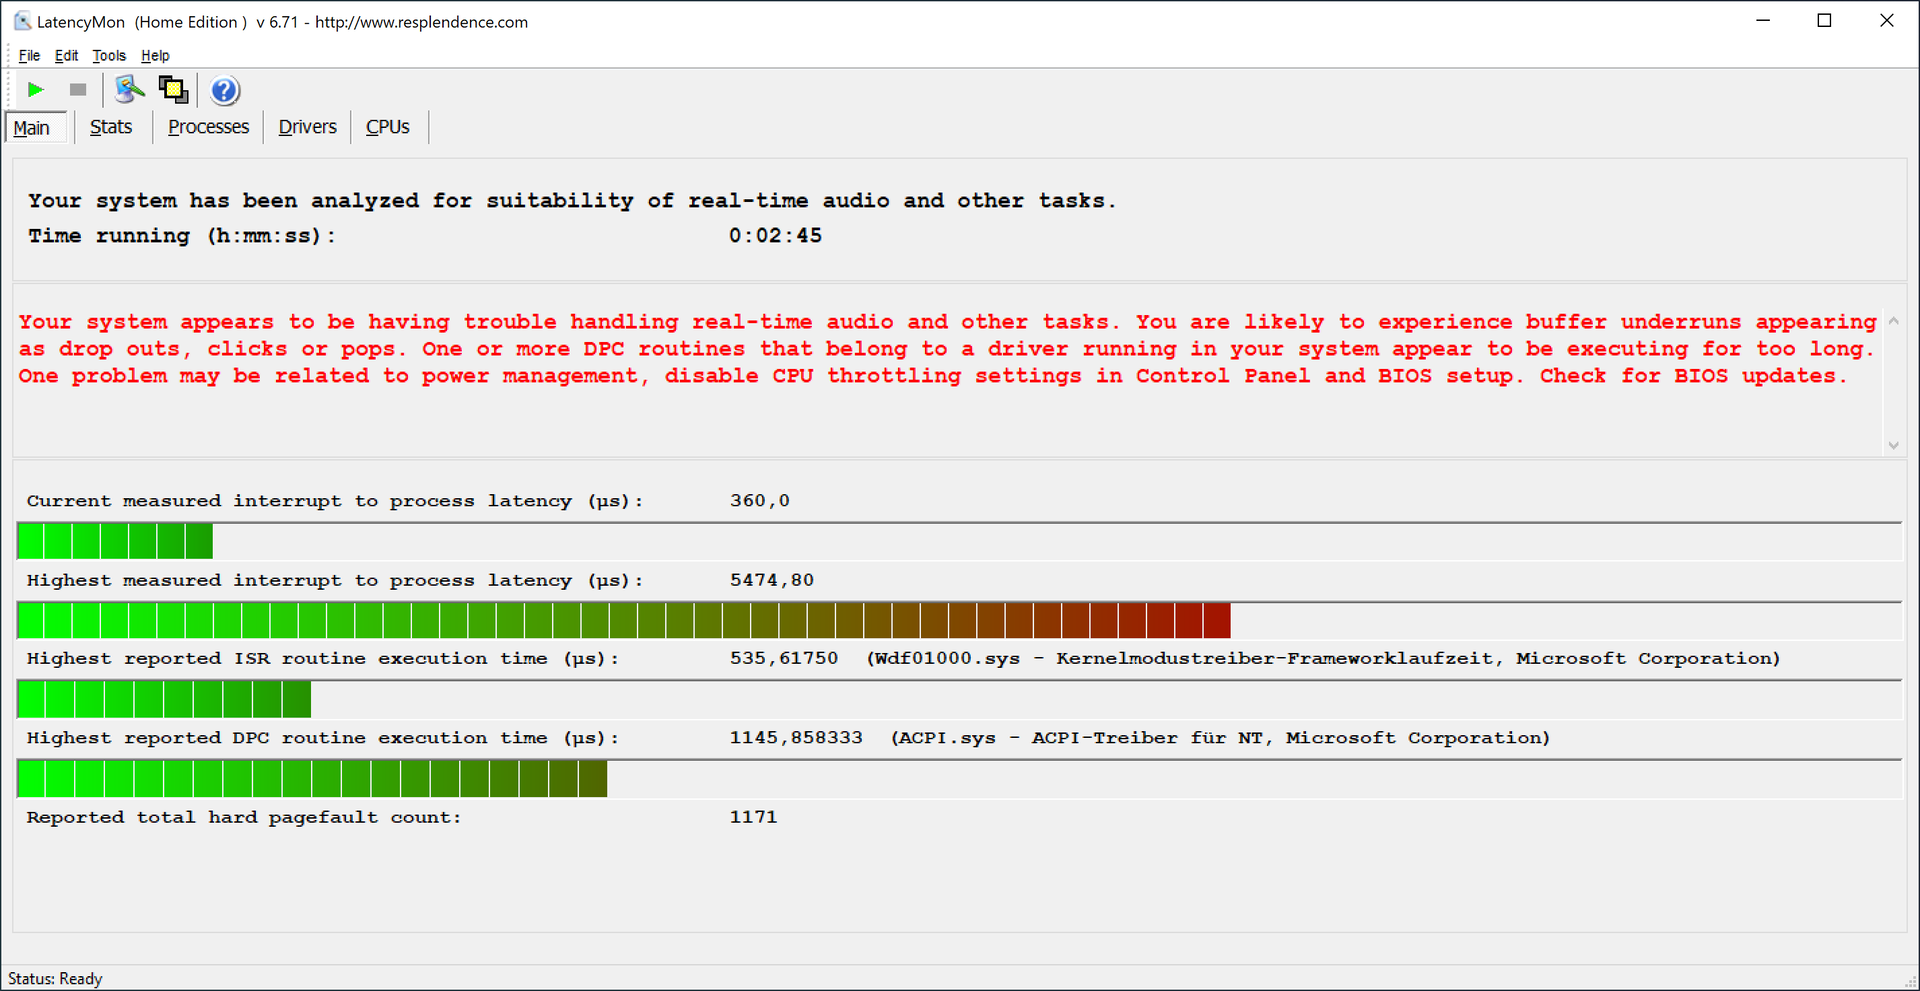
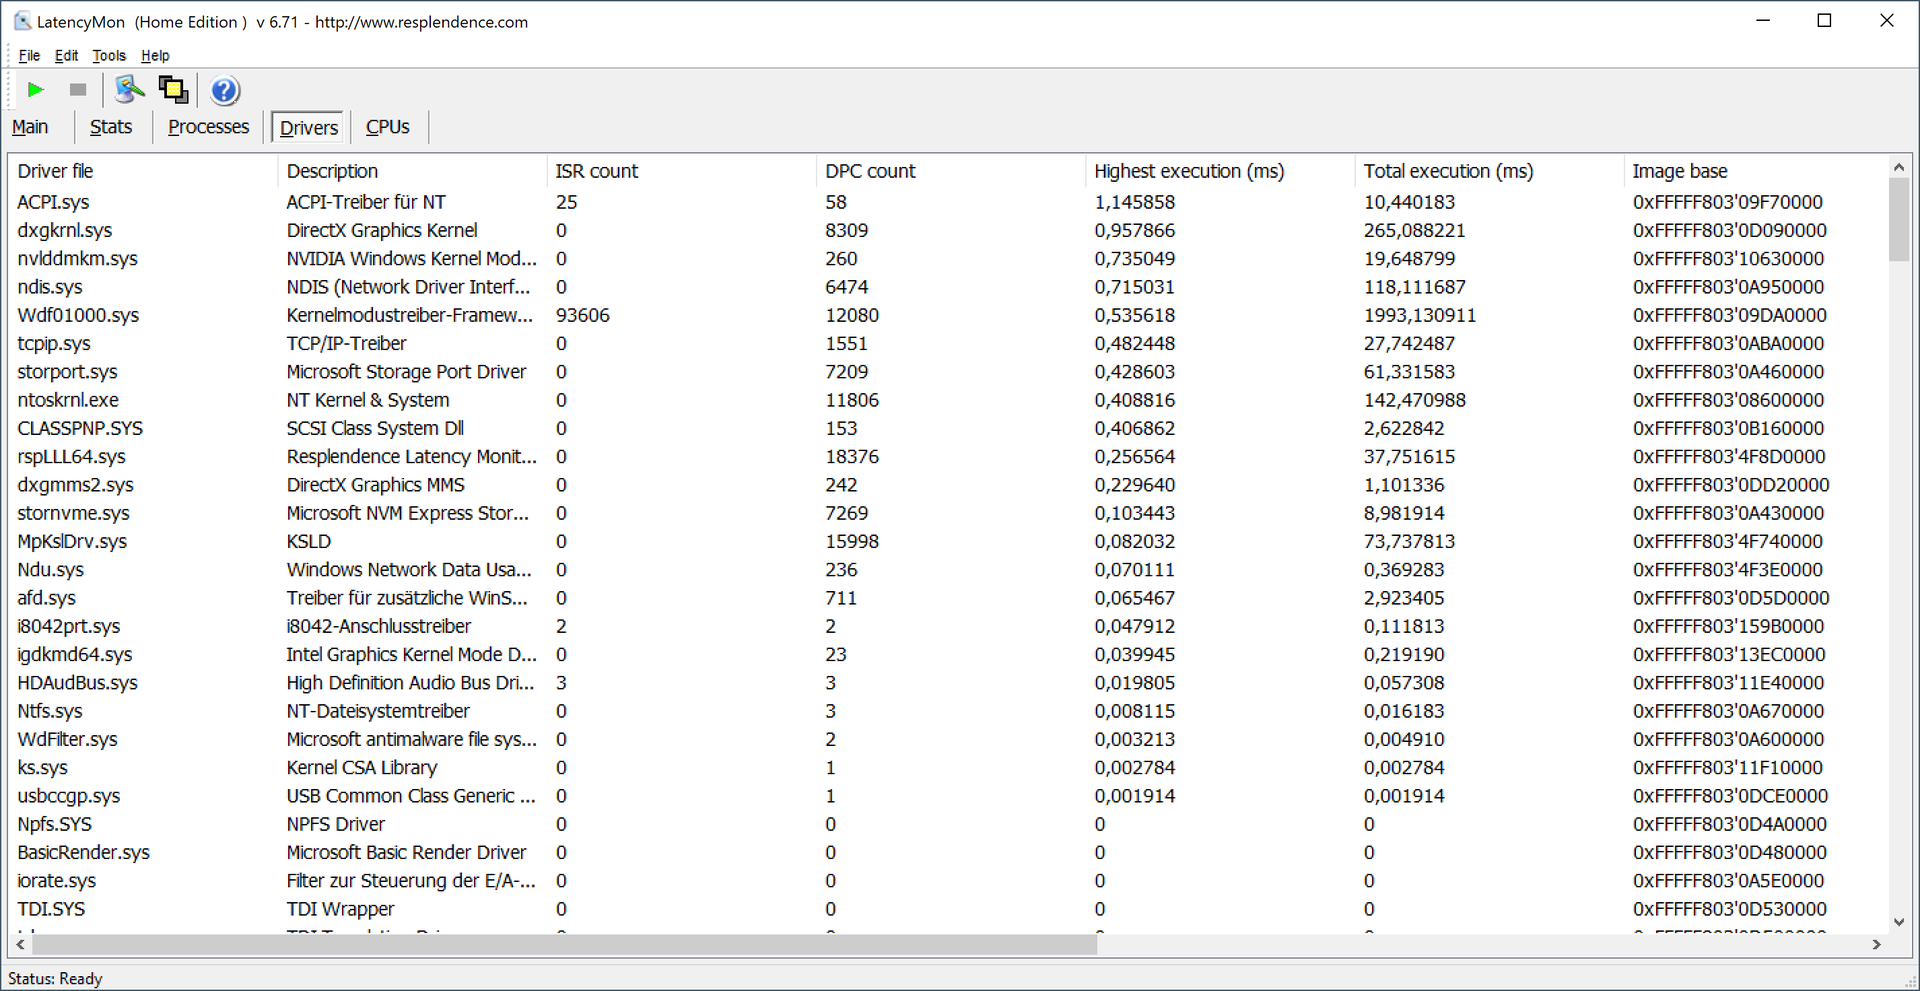
DPC Latency
Our DPC Latency test shows big spikes, so the ZBook Studio is not suited for real-time audio applications. We also saw some dropped frames during 4K video playback on YouTube.
| DPC Latencies / LatencyMon - interrupt to process latency (max), Web, Youtube, Prime95 | |
| HP ZBook Studio G7 | |
| HP ZBook Fury 15 G7 | |
| Razer Blade 15 Studio Edition 2020 | |
| Dell Precision 5550 P91F | |
* ... smaller is better
Storage Devices
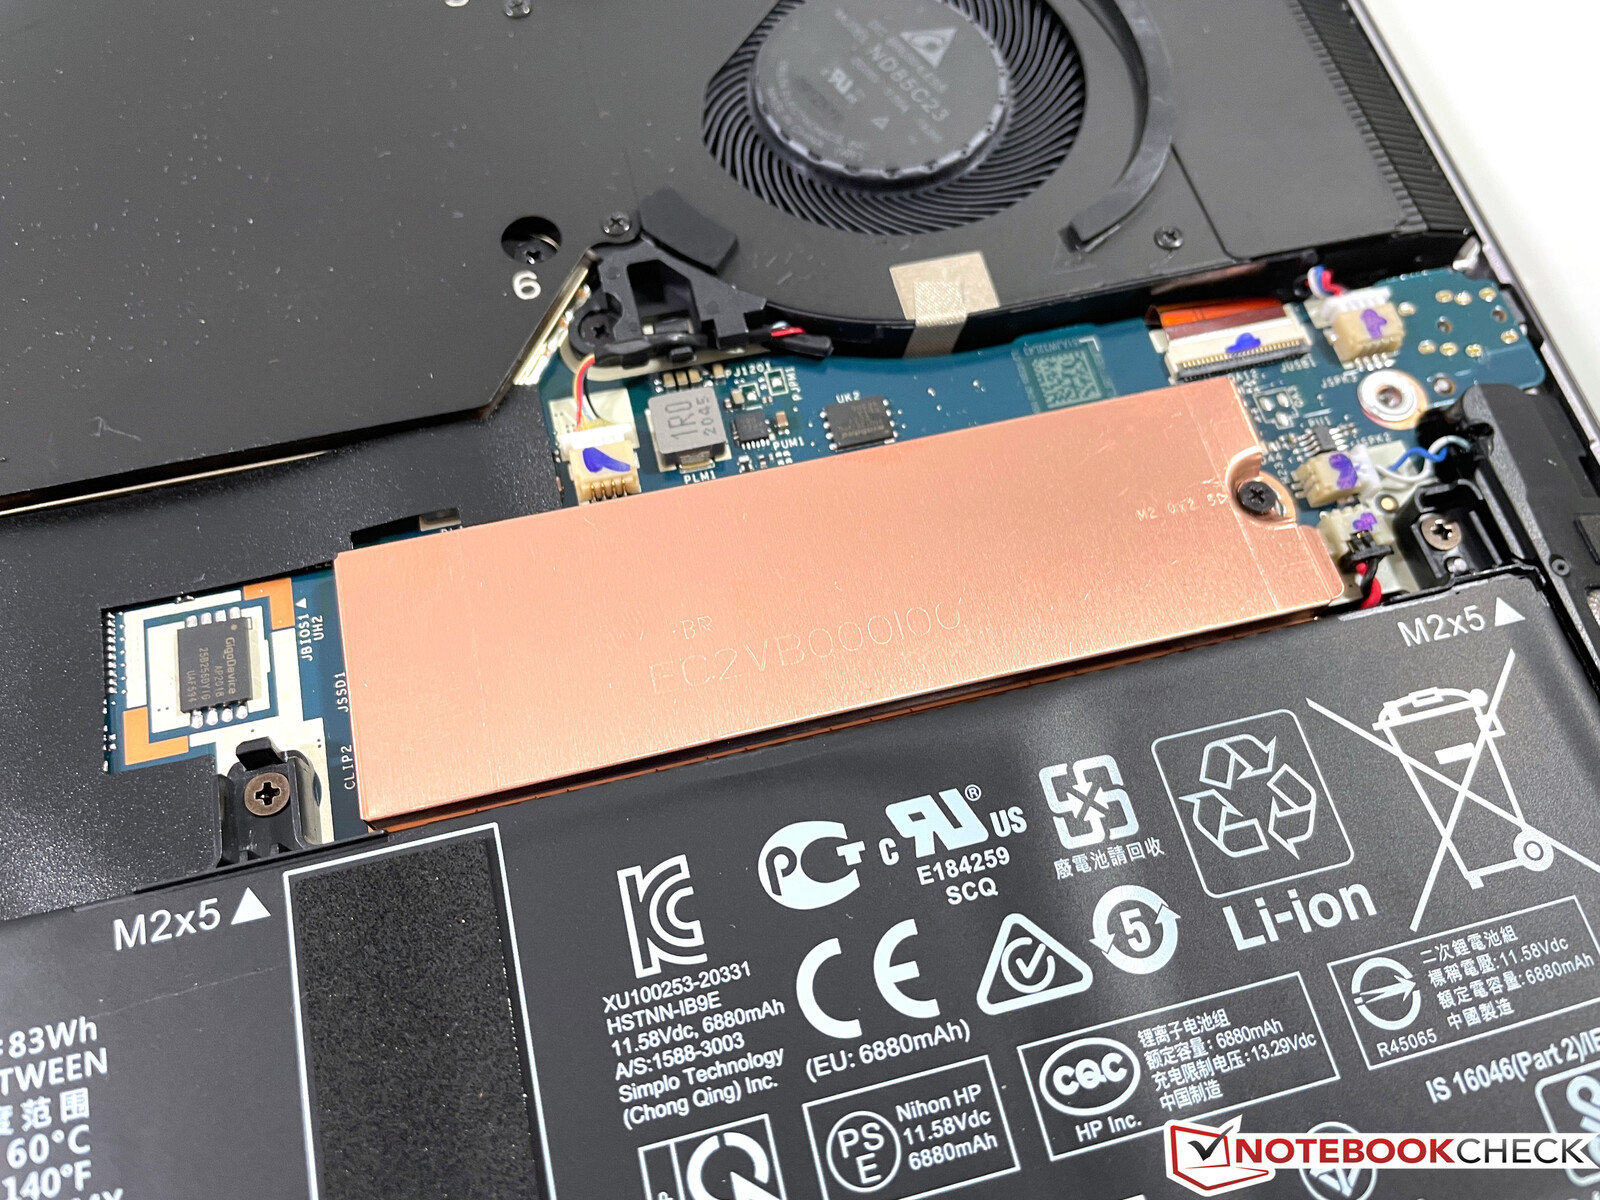
There is a single M.2-2280 slot for SSDs that is attached via PCIe 3.0 x4 interface. Our test unit is equipped with a Micron 2300 and a storage capacity of 1 TB; you can use around 900 GB after the initial setup. The transfer rates of the SSD are very high, only modern PCIe 4.0 drives are much faster.
| HP ZBook Studio G7 Micron 2300 1TB MTFDHBA1T0TDV | HP ZBook Fury 15 G7 Samsung PM981a MZVLB1T0HBLR | Dell Precision 5550 P91F SK Hynix PC601A NVMe 1TB | Lenovo ThinkPad P1 2019-20QT000RGE WDC PC SN720 SDAQNTW-512G | Apple MacBook Pro 16 2019 i9 5500M Apple SSD AP1024 7171 | Razer Blade 15 Studio Edition 2020 Samsung PM981a MZVLB1T0HBLR | Average Micron 2300 1TB MTFDHBA1T0TDV | |
|---|---|---|---|---|---|---|---|
| CrystalDiskMark 5.2 / 6 | 15% | 1% | 13% | -7% | 15% | 15% | |
| Write 4K (MB/s) | 95.5 | 114.1 19% | 122.6 28% | 162.2 70% | 55.5 -42% | 132.9 39% | 102.5 ? 7% |
| Read 4K (MB/s) | 48.99 | 57.2 17% | 42.4 -13% | 43.71 -11% | 16.21 -67% | 46.73 -5% | 51.8 ? 6% |
| Write Seq (MB/s) | 2001 | 2580 29% | 2167 8% | 2441 22% | 1959 -2% | 2214 11% | 2364 ? 18% |
| Read Seq (MB/s) | 1600 | 2527 58% | 1747 9% | 1753 10% | 1763 10% | 2018 26% | 2106 ? 32% |
| Write 4K Q32T1 (MB/s) | 410.2 | 480.2 17% | 388.8 -5% | 397.6 -3% | 398.5 -3% | 478.9 17% | 506 ? 23% |
| Read 4K Q32T1 (MB/s) | 394.7 | 387.6 -2% | 367.3 -7% | 520 32% | 648 64% | 540 37% | 511 ? 29% |
| Write Seq Q32T1 (MB/s) | 3148 | 2996 -5% | 2629 -16% | 2519 -20% | 2727 -13% | 2975 -5% | 3203 ? 2% |
| Read Seq Q32T1 (MB/s) | 3227 | 2853 -12% | 3460 7% | 3448 7% | 3242 0% | 3195 -1% | 3220 ? 0% |
| Write 4K Q8T8 (MB/s) | 1381 | ||||||
| Read 4K Q8T8 (MB/s) | 1371 | ||||||
| AS SSD | 8% | -21% | 55% | 23% | 38% | 39% | |
| Seq Read (MB/s) | 2548 | 2127 -17% | 2039 -20% | 2980 17% | 2531 -1% | 1982 -22% | 2451 ? -4% |
| Seq Write (MB/s) | 1312 | 1296 -1% | 1376 5% | 2094 60% | 2289 74% | 2252 72% | 2111 ? 61% |
| 4K Read (MB/s) | 45.38 | 54.8 21% | 44.11 -3% | 45.05 -1% | 15.85 -65% | 47.13 4% | 49.3 ? 9% |
| 4K Write (MB/s) | 83 | 110.8 33% | 113.3 37% | 155.4 87% | 39.88 -52% | 88.2 6% | 100 ? 20% |
| 4K-64 Read (MB/s) | 935 | 1420 52% | 1094 17% | 1291 38% | 1267 36% | 1481 58% | 1272 ? 36% |
| 4K-64 Write (MB/s) | 2314 | 2012 -13% | 1630 -30% | 1506 -35% | 1749 -24% | 1842 -20% | 1864 ? -19% |
| Access Time Read * (ms) | 0.057 | 0.046 19% | 0.059 -4% | 0.064 -12% | 0.122 -114% | 0.087 -53% | 0.04975 ? 13% |
| Access Time Write * (ms) | 0.098 | 0.099 -1% | 0.99 -910% | 0.024 76% | 0.095 3% | 0.04 59% | 0.181 ? -85% |
| Score Read (Points) | 1235 | 1687 37% | 1342 9% | 1634 32% | 1536 24% | 1726 40% | 1566 ? 27% |
| Score Write (Points) | 2528 | 2253 -11% | 1881 -26% | 1871 -26% | 2018 -20% | 2155 -15% | 2175 ? -14% |
| Score Total (Points) | 4342 | 4770 10% | 3883 -11% | 4300 -1% | 4317 -1% | 4781 10% | 4532 ? 4% |
| Copy ISO MB/s (MB/s) | 3142 | 2779 -12% | 2489 -21% | 2015 -36% | 1995 -37% | 1982 -37% | 2199 ? -30% |
| Copy Program MB/s (MB/s) | 126.1 | 123.3 -2% | 682 441% | 597 373% | 584 363% | 501 297% | 584 ? 363% |
| Copy Game MB/s (MB/s) | 477.4 | 440.8 -8% | 1515 217% | 1449 204% | 1135 138% | 1140 139% | 1274 ? 167% |
| Total Average (Program / Settings) | 12% /
10% | -10% /
-13% | 34% /
40% | 8% /
12% | 27% /
30% | 27% /
30% |
* ... smaller is better

Disk Throttling: DiskSpd Read Loop, Queue Depth 8
GPU Performance - Quadro RTX 3000 Max-Q with 60W
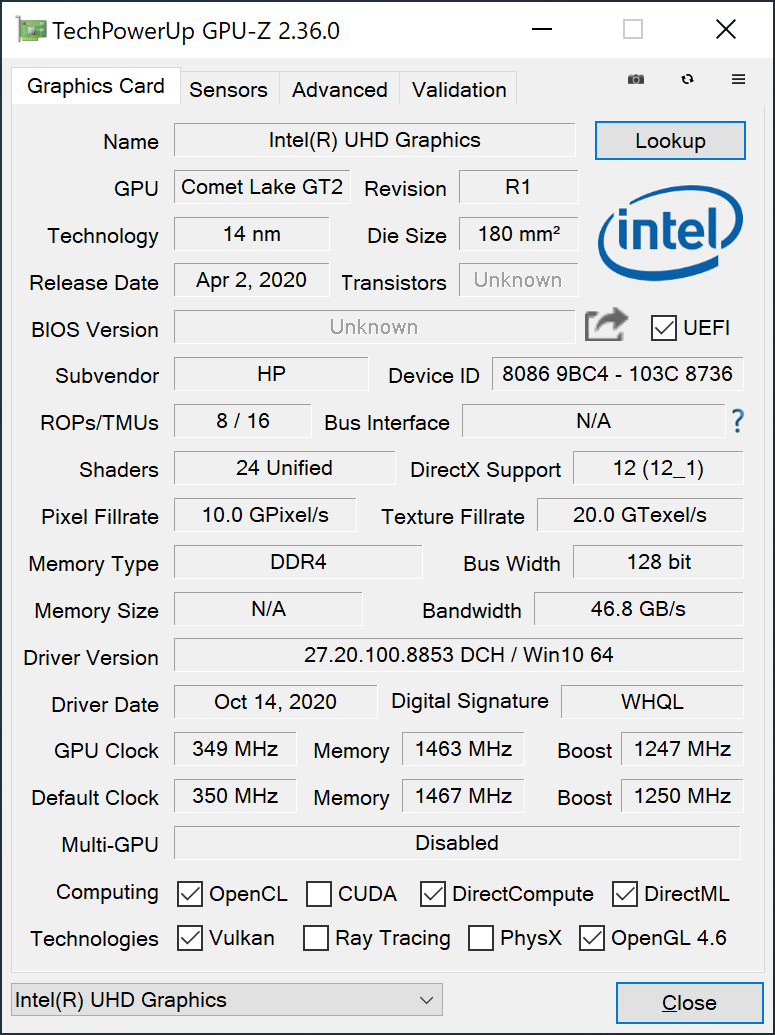
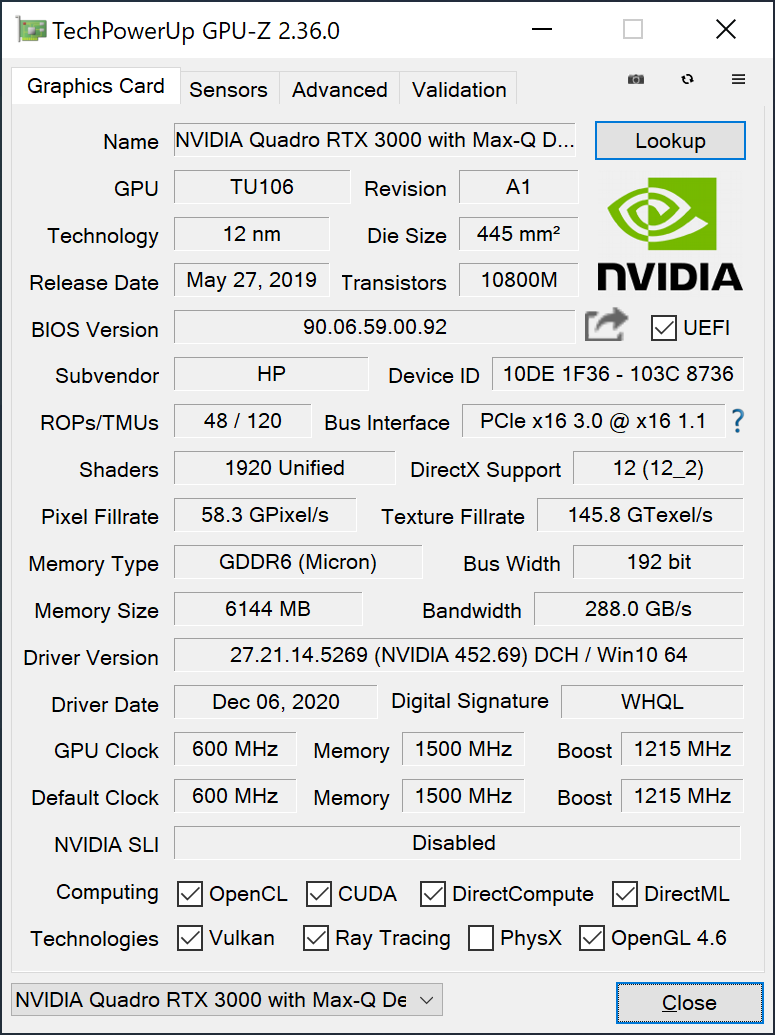
HP uses the efficient Max-Q versions of the Quadro RTX GPUs. The RTX 3000 Max-Q in our test unit is the 60W version, so it is the slowest configuration of this GPU. We expect the two more powerful versions (Quadro RTX 4000/RTX 5000 Max-Q) will also be the slowest versions in terms of TGP.
The GPU runs at up to 1530 MHz during our benchmarks and is usually slightly slower than the average scores in our database for this GPU model. All in all, the results are still good and better compared to the rivals with smaller Quadro GPUs. The performance is also stable; the demanding 3DMark Time Spy stress test is passed at 97.3%.
The GPU performance is heavily reduced on battery power (-64%) and the graphics card is limited to 35W.
Easy workloads are handled by the integrated GPU of the processor. This is definitely an advantage compared to older ZBooks with DreamColor displays, where the iGPU was deactivated.
| 3DMark 11 Performance | 16577 points | |
| 3DMark Fire Strike Score | 12642 points | |
| 3DMark Time Spy Score | 5357 points | |
Help | ||
Gaming Performance
Nvidia's professional drivers handle gaming very well and we did not encounter any compatibility issues during the gaming benchmarks. The gaming performance is roughly comparable with a GeForce RTX 2060 Max-Q, so many modern titles run smoothly in 1080p with high settings. However, the GPU is usually too slow for gaming in the native 4K resolution. The gaming performance is stable and there is no drop in longer gaming sessions.
| The Witcher 3 | |
| 1920x1080 High Graphics & Postprocessing (Nvidia HairWorks Off) | |
| HP ZBook Fury 15 G7 | |
| Razer Blade 15 Studio Edition 2020 | |
| Average of class Workstation (53.4 - 156.4, n=3, last 2 years) | |
| Average NVIDIA Quadro RTX 3000 Max-Q (95.9 - 107.4, n=3) | |
| HP ZBook Studio G7 | |
| Apple MacBook Pro 16 2019 i9 5500M | |
| Dell Precision 5550 P91F | |
| Lenovo ThinkPad P1 2019-20QT000RGE | |
| 1920x1080 Ultra Graphics & Postprocessing (HBAO+) | |
| Razer Blade 15 Studio Edition 2020 | |
| HP ZBook Fury 15 G7 | |
| Average of class Workstation (26.3 - 91.7, n=3, last 2 years) | |
| Average NVIDIA Quadro RTX 3000 Max-Q (48.5 - 57.2, n=3) | |
| HP ZBook Studio G7 | |
| Apple MacBook Pro 16 2019 i9 5500M | |
| Dell Precision 5550 P91F | |
| Lenovo ThinkPad P1 2019-20QT000RGE | |
| low | med. | high | ultra | QHD | 4K | |
|---|---|---|---|---|---|---|
| The Witcher 3 (2015) | 270 | 181 | 97 | 52.1 | 34 | |
| Dota 2 Reborn (2015) | 156 | 141 | 137 | 125 | 71.6 | |
| X-Plane 11.11 (2018) | 107 | 93.9 | 79.5 | 63.5 | ||
| Far Cry 5 (2018) | 143 | 87 | 79 | 75 | 26 | |
| Death Stranding (2020) | 98 | 85 | 79 | 76 | 54 | 29 |
| Horizon Zero Dawn (2020) | 118 | 76 | 65 | 56 | 41 | 23 |
| Watch Dogs Legion (2020) | 110 | 70 | 61 | 33 | 12 | |
| Dirt 5 (2020) | 133 | 71 | 58 | 47 | 37 | 23 |
| Assassin´s Creed Valhalla (2020) | 90 | 60 | 50 | 44 | 19 | |
| Yakuza Like a Dragon (2020) | 131 | 88 | 66 | 59 | 18 | |
| Immortals Fenyx Rising (2020) | 105 | 71 | 63 | 58 | 24 | |
| Cyberpunk 2077 1.0 (2020) | 93 | 52 | 43 | 36 | 10 | |
| Hitman 3 (2021) | 178 | 100 | 86 | 78 | 27 |
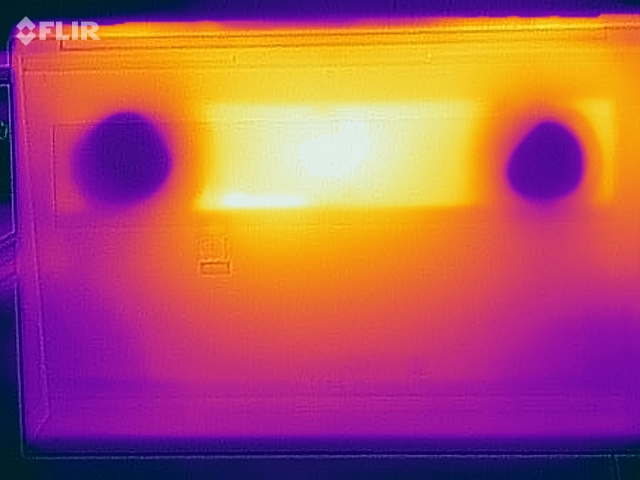
Emissions - Decent temperatures, but loud fans
System Noise
Similar to the larger ZBook Fury 15, the HP Studio G7 is equipped with a vapor chamber cooling. These vapor chambers replace traditional heat pipes and allow better heat dissipation of the processors on a larger cooling surface. The two fans are usually turned off or very quiet at 27.9 dB(A) in light workloads, which is hardly audible at all. Once you increase the stress, like combined CPU/GPU workloads or gaming, the two fans will quickly ramp up and reach the maximum noise level of 46.3 dB(A). This constant murmur is definitely audible, but the frequency is not unpleasant. We would still recommend a headset for longer gaming sessions. We did not notice any electronic sounds like coil whine.
Noise level
| Idle |
| 24.4 / 24.4 / 27.9 dB(A) |
| Load |
| 38.8 / 46.3 dB(A) |
 | ||
30 dB silent 40 dB(A) audible 50 dB(A) loud |
||
min: | ||
| HP ZBook Studio G7 Quadro RTX 3000 Max-Q, i9-10885H, Micron 2300 1TB MTFDHBA1T0TDV | HP ZBook Fury 15 G7 Quadro RTX 5000 Max-Q, W-10885M, Samsung PM981a MZVLB1T0HBLR | Dell Precision 5550 P91F Quadro T2000 Max-Q, i7-10875H, SK Hynix PC601A NVMe 1TB | Lenovo ThinkPad P1 2019-20QT000RGE Quadro T1000 (Laptop), i7-9850H, WDC PC SN720 SDAQNTW-512G | Apple MacBook Pro 16 2019 i9 5500M Radeon Pro 5500M, i9-9880H, Apple SSD AP1024 7171 | Razer Blade 15 Studio Edition 2020 Quadro RTX 5000 Max-Q, i7-10875H, Samsung PM981a MZVLB1T0HBLR | |
|---|---|---|---|---|---|---|
| Noise | -1% | -1% | -5% | -12% | -12% | |
| off / environment * (dB) | 24.4 | 26.4 -8% | 26.2 -7% | 28.8 -18% | 29.8 -22% | 30.1 -23% |
| Idle Minimum * (dB) | 24.4 | 26.4 -8% | 26.2 -7% | 28.8 -18% | 29.9 -23% | 30.1 -23% |
| Idle Average * (dB) | 24.4 | 26.4 -8% | 26.2 -7% | 28.8 -18% | 29.9 -23% | 30.1 -23% |
| Idle Maximum * (dB) | 27.9 | 26.4 5% | 26.2 6% | 28.8 -3% | 29.9 -7% | 30.1 -8% |
| Load Average * (dB) | 38.8 | 31.7 18% | 39.2 -1% | 36.1 7% | 43 -11% | 42.3 -9% |
| Witcher 3 ultra * (dB) | 46.3 | 47 -2% | 39 16% | 45.4 2% | 48.2 -4% | |
| Load Maximum * (dB) | 46.3 | 47 -2% | 50.6 -9% | 36.7 21% | 46.1 -0% | 42.1 9% |
* ... smaller is better
Temperature
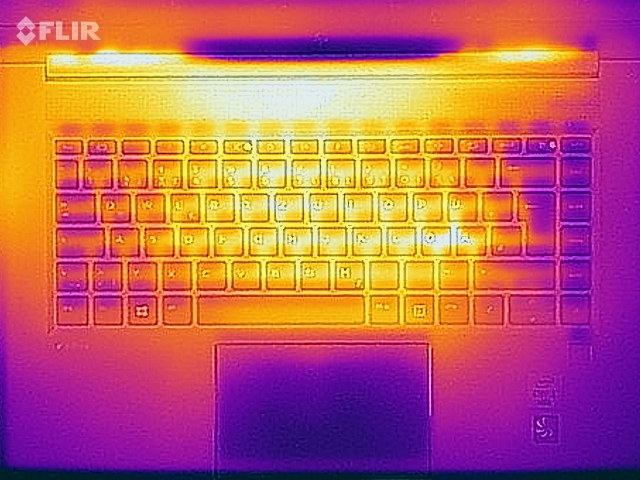
The device gets pretty warm under load and the metal surfaces can be uncomfortable to touch. We measure ~45 °C above the keyboard area and ~50 °C at the bottom, so you should not put the Studio G7 on you lap when you stress it. All in all, the temperatures are still reasonable and the device does not really warm up at all under light workloads.
Our stress test shows that the cooling solution is working at its limits. The graphics card is favored by the system and continues to operate at 60W, while the processor is quickly throttled down to 35W. There is no performance reduction immediately after the stress test. With this observation in mind, it is possible that the more powerful GPU options will not have a significant performance benefit in combined workloads.
(-) The maximum temperature on the upper side is 45.7 °C / 114 F, compared to the average of 38.2 °C / 101 F, ranging from 22.2 to 69.8 °C for the class Workstation.
(-) The bottom heats up to a maximum of 50.6 °C / 123 F, compared to the average of 41.1 °C / 106 F
(+) In idle usage, the average temperature for the upper side is 24.3 °C / 76 F, compared to the device average of 32 °C / 90 F.
(-) Playing The Witcher 3, the average temperature for the upper side is 41.5 °C / 107 F, compared to the device average of 32 °C / 90 F.
(±) The palmrests and touchpad can get very hot to the touch with a maximum of 38.2 °C / 100.8 F.
(-) The average temperature of the palmrest area of similar devices was 27.8 °C / 82 F (-10.4 °C / -18.8 F).
Speakers
There are four speakers (two at the bottom, two above the keyboard) and the produce a very good sound. The maximum volume is high and the result is very rich. HP's laptop can definitely keep up with Apple in this regard. The front of the base unit will vibrate a bit at high volumes though. All in all, the speakers are very enjoyable and they are well-suited for video or music playback.
HP ZBook Studio G7 audio analysis
(+) | speakers can play relatively loud (84.3 dB)
Bass 100 - 315 Hz
(±) | reduced bass - on average 5.6% lower than median
(±) | linearity of bass is average (9.6% delta to prev. frequency)
Mids 400 - 2000 Hz
(+) | balanced mids - only 4.4% away from median
(+) | mids are linear (4.2% delta to prev. frequency)
Highs 2 - 16 kHz
(+) | balanced highs - only 3.2% away from median
(±) | linearity of highs is average (8.8% delta to prev. frequency)
Overall 100 - 16.000 Hz
(+) | overall sound is linear (8.4% difference to median)
Compared to same class
» 1% of all tested devices in this class were better, 2% similar, 96% worse
» The best had a delta of 7%, average was 17%, worst was 35%
Compared to all devices tested
» 2% of all tested devices were better, 1% similar, 97% worse
» The best had a delta of 4%, average was 24%, worst was 134%
Dell Precision 5550 P91F audio analysis
(+) | speakers can play relatively loud (85 dB)
Bass 100 - 315 Hz
(±) | reduced bass - on average 5.7% lower than median
(±) | linearity of bass is average (7.7% delta to prev. frequency)
Mids 400 - 2000 Hz
(+) | balanced mids - only 2.9% away from median
(+) | mids are linear (4.2% delta to prev. frequency)
Highs 2 - 16 kHz
(+) | balanced highs - only 2.3% away from median
(+) | highs are linear (2.6% delta to prev. frequency)
Overall 100 - 16.000 Hz
(+) | overall sound is linear (6.7% difference to median)
Compared to same class
» 0% of all tested devices in this class were better, 1% similar, 99% worse
» The best had a delta of 7%, average was 17%, worst was 35%
Compared to all devices tested
» 1% of all tested devices were better, 0% similar, 99% worse
» The best had a delta of 4%, average was 24%, worst was 134%
Energy Management - 4K panel affects battery runtime
Power Consumption
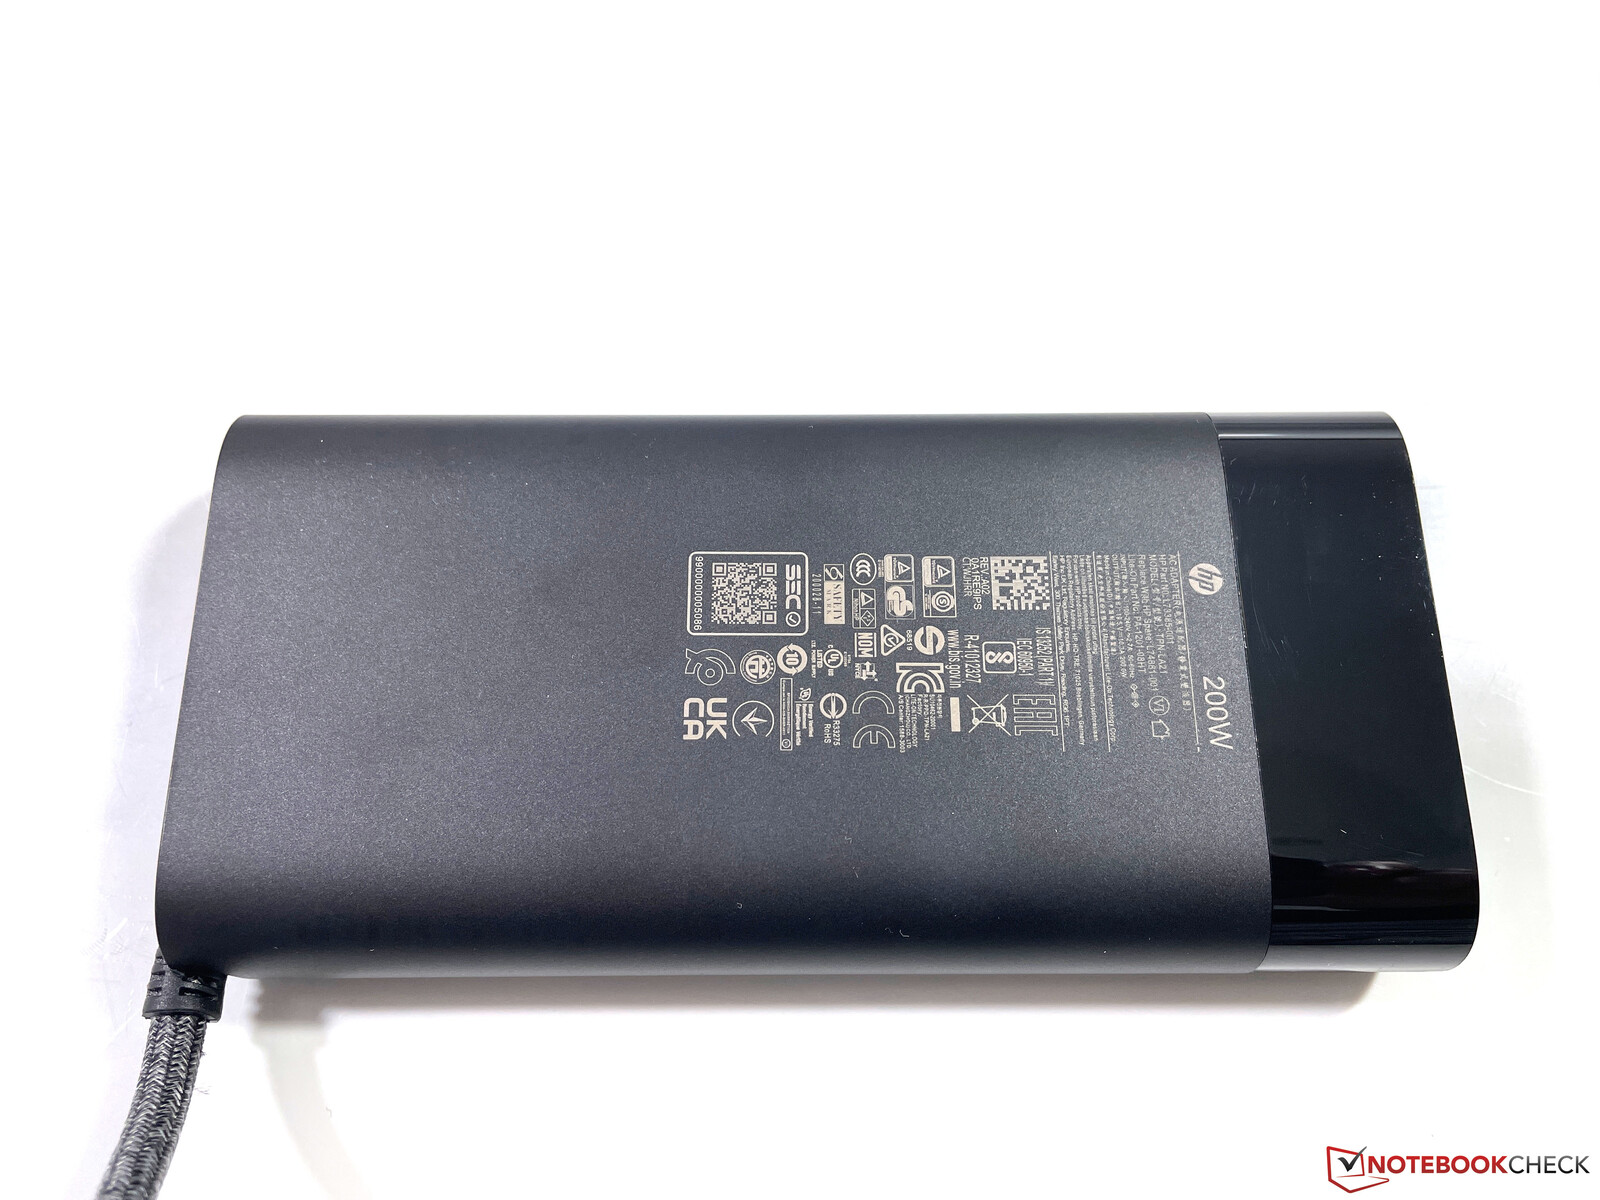
Models of the ZBook Studio G7 with Quadro RTX GPUs are shipped with a more powerful 200W power adapter (15.1 x 7.2 x 2.3 cm), the less powerful model with a 150W adapter. The maximum consumption is 203W, but it will quickly level off at ~134W.
The idle results benefit from the integrated GPU, but the bright 4K screen still consumes quite a lot of power. If you are looking for long battery runtimes we recommend you get the Studio G7 with one of the two 1080p screens. HP optimized the power consumption very well when the device is in standby or tuned off.
| Off / Standby | |
| Idle | |
| Load |
|
Key:
min: | |
| HP ZBook Studio G7 i9-10885H, Quadro RTX 3000 Max-Q, Micron 2300 1TB MTFDHBA1T0TDV, IPS, 3840x2160, 15.6" | HP ZBook Fury 15 G7 W-10885M, Quadro RTX 5000 Max-Q, Samsung PM981a MZVLB1T0HBLR, IPS, 3840x2160, 15.6" | Dell Precision 5550 P91F i7-10875H, Quadro T2000 Max-Q, SK Hynix PC601A NVMe 1TB, IPS, 3840x2400, 15.6" | Lenovo ThinkPad P1 2019-20QT000RGE i7-9850H, Quadro T1000 (Laptop), WDC PC SN720 SDAQNTW-512G, IPS LED, 1920x1080, 15.6" | Apple MacBook Pro 16 2019 i9 5500M i9-9880H, Radeon Pro 5500M, Apple SSD AP1024 7171, IPS, 3072x1920, 16" | Razer Blade 15 Studio Edition 2020 i7-10875H, Quadro RTX 5000 Max-Q, Samsung PM981a MZVLB1T0HBLR, OLED, 3840x2160, 15.6" | Average NVIDIA Quadro RTX 3000 Max-Q | Average of class Workstation | |
|---|---|---|---|---|---|---|---|---|
| Power Consumption | -6% | 13% | -26% | 22% | -39% | -6% | -7% | |
| Idle Minimum * (Watt) | 5.5 | 4.6 16% | 5.6 -2% | 13.7 -149% | 3.7 33% | 13.4 -144% | 7.7 ? -40% | 8.94 ? -63% |
| Idle Average * (Watt) | 13.7 | 13.6 1% | 11.2 18% | 17.5 -28% | 12.1 12% | 18 -31% | 14.6 ? -7% | 13.8 ? -1% |
| Idle Maximum * (Watt) | 16.6 | 21.5 -30% | 18.4 -11% | 20.9 -26% | 17 -2% | 26.1 -57% | 16.9 ? -2% | 17.5 ? -5% |
| Load Average * (Watt) | 118.4 | 113.1 4% | 114 4% | 77.2 35% | 91.5 23% | 115 3% | 111.1 ? 6% | 95 ? 20% |
| Witcher 3 ultra * (Watt) | 120 | 157.5 -31% | 76.7 36% | 103 14% | 145 -21% | |||
| Load Maximum * (Watt) | 203.3 | 199 2% | 134.2 34% | 123.7 39% | 102.3 50% | 165 19% | 173.5 ? 15% | 175.2 ? 14% |
* ... smaller is better
Batttery Runtime
As expected, the battery runtimes are not great, but still decent considering the specs. The 83 Wh battery lasts for almost 8 hours in our Wi-Fi test at 150 nits, but this value drops to just 4.5 hours when we use the maximum display brightness. Video playback at 150 nits (power saver, wireless turned off) is possible for more than 10 hours. The load runtime is just little more than 1.5 hours.
| HP ZBook Studio G7 i9-10885H, Quadro RTX 3000 Max-Q, 83 Wh | HP ZBook Fury 15 G7 W-10885M, Quadro RTX 5000 Max-Q, 94 Wh | Dell Precision 5550 P91F i7-10875H, Quadro T2000 Max-Q, 86 Wh | Lenovo ThinkPad P1 2019-20QT000RGE i7-9850H, Quadro T1000 (Laptop), 80 Wh | Apple MacBook Pro 16 2019 i9 5500M i9-9880H, Radeon Pro 5500M, 99.8 Wh | Razer Blade 15 Studio Edition 2020 i7-10875H, Quadro RTX 5000 Max-Q, 80 Wh | Average of class Workstation | |
|---|---|---|---|---|---|---|---|
| Battery runtime | -5% | 1% | -6% | 2% | -14% | -5% | |
| H.264 (h) | 10.8 | 9.3 -14% | 9.7 -10% | 6.4 -41% | 9.51 ? -12% | ||
| WiFi v1.3 (h) | 7.8 | 8.6 10% | 9 15% | 8.9 14% | 12 54% | 5.7 -27% | 8.53 ? 9% |
| Load (h) | 1.6 | 1.3 -19% | 1.4 -13% | 1.3 -19% | 1 -37% | 2 25% | 1.429 ? -11% |
| Witcher 3 ultra (h) | 0.9 |
Pros
Cons
Verdict - ZBook Studio is a very good mobile workstation
The HP ZBook Studio G7 leaves a very good impression in our review. The build quality of the case is excellent and the whole device has a very premium appearance. The Studio G7 is also one of the few slim workstations with powerful Quadro RTX GPUs from Nvidia, so the support ray tracing. The competitors from Dell and Lenovo fall behind in this respect. HP also offers the device as ZBook Create G7 with regular GeForce GPUs for content creators.
Our test unit is also equipped with the optional 4K DreamColor display, which is already very accurate out of the box. However, the new version of the DreamColor panel "only" supports the P3 gamut, while previous version supported the wider AdobeRGB gamut. The new panel does have one advantage: The iGPU of the processor can be used, which improves the power consumption. The battery runtime is still affected by the bright 4K screen. The results are okay, but versions of the Studio G7 with 1080p screens would last longer on battery power.
High-quality chassis, very good DreamColor display, and plenty of performance: The ZBook Studio G7 offers more than many rivals and is currently the best mobile workstation you can get.
The ZBook Studio G7 also convinces in other sections: The input devices are very good, the speaker system is one of the best in the mobile segment and the port selection includes all the important stuff, including a fast SD-card reader.
there are still some drawbacks, most of them are linked to the slim construction. The vapor chamber cooling does a good job and can dissipate the heat from the components well, but the two fans are still very loud when you stress the device. The memory is also soldered, and we do not like that on a mobile workstation. HP also waived a mechanical shutter for the webcam and there is no WWAN module, not even as an option.
All in all, the ZBook Studio G7 is ahead of many rivals in terms of GPU performance. The drawbacks are also pretty small, so we can definitely recommend HP's workstation for many usage scenarios. Only real-time audio applications can be a problem due to increased DPC latencies.
Price and Availability
The ZBook Studio G7 in a less expensive SKU is available at Amazon for $2599. You can also configure your laptop on the HP website.
HP ZBook Studio G7
- 03/22/2021 v7 (old)
Andreas Osthoff
Price comparison
