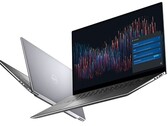
Notebookcheck Logo

NVIDIA Quadro RTX 3000 Max-Q

The Nvidia Quadro RTX 3000 with Max-Q Design is a professional high-end graphics card for powerful laptops and mobile workstations. It is based on the same TU106 chip as the consumer GeForce RTX 2070 (mobile) but with reduced clock speeds, shader count and memory bandwidth. Compared to the normal mobile RTX3000, the Max-Q variants are clocked lower and work in a more efficient state. Currently, we know of three variants with different clock speeds and power consumptions (60, 65 and 70 W).

ModelShaderTGP (W)Base (MHz)Boost (MHz)
Quadro RTX 4000 Desktop230416010051545
Quadro RTX 3000 Mobile1920809451380
Quadro RTX 3000 Max-Q1920708701380
Quadro RTX 4000 Max-Q2304657651305
Quadro RTX 4000 Max-Q2304606001215
GeForce RTX 2070 Mobile2304808851185
GeForce RTX 2070 Mobile23049010801305

The Quadro GPUs offer certified drivers, which are optimized for stability and performance in professional applications (CAD, DCC, medical, prospection, and visualizing applications). The performance in these areas is therefore much better compared to corresponding consumer GPUs.

Features

NVIDIA manufacturers the TU106 chip on a 12 nm FinFET process and includes features like Deep Learning Super Sampling (DLSS) and Real-Time Ray Tracing (RTRT), which should combine to create more realistic lighting effects than older GPUs based on the company's Pascal architecture (if the games support it). The Quadro RTX 3000 is also DisplayPort 1.4 ready, while there is also support for HDMI 2.0b, HDR, Simultaneous Multi-Projection (SMP) and H.265 video en/decoding (PlayReady 3.0).

Performance

In professional applications, the Quadro RTX 3000 Max-Q can be faster GeForce RTX 2070 Max-Q due to the optimized drivers and bigger VRAM. When gaming with the RTX 3000, the slower clock speeds and less frequently updated drivers should hinder the performance compared to the GeForce variant.

The still relatively high power consumption of the RTX3000 Max-Q makes the card most suited for big  laptops. However, we should see thinner designs with the Max-Q variants than the regular RTX 3000.

Quadro Turing Series

Quadro RTX 6000 (Laptop) compare 4608 @ 1.28 - 1.46 GHz384 Bit @ 14000 MHz
Quadro RTX 5000 (Laptop) compare 3072 @ 1.04 - 1.55 GHz256 Bit @ 14000 MHz
Quadro RTX 5000 Max-Q compare 3072 @ 0.6 - 1.35 GHz256 Bit @ 14000 MHz
Quadro RTX 4000 (Laptop) compare 2560 @ 1.11 - 1.56 GHz256 Bit @ 14000 MHz
Quadro RTX 4000 Max-Q compare 2560 @ 0.78 - 1.38 GHz256 Bit @ 14000 MHz
Quadro RTX 3000 (Laptop) compare 1920 @ 0.95 - 1.38 GHz192 Bit @ 14000 MHz
Quadro RTX 3000 Max-Q 1920 @ 0.6 - 1.22 GHz192 Bit @ 14000 MHz
Quadro T2000 (Laptop) compare 1024 @ 1.58 - 1.79 GHz128 Bit @ 8000 MHz
Quadro T2000 Max-Q compare 1024 @ 0.93 - 1.5 GHz128 Bit @ 8000 MHz
T1200 Laptop GPU compare 1024 @ 0.86 - 1.43 GHz128 Bit @ 10000 MHz
Quadro T1000 (Laptop) compare 768 @ 1.4 - 1.46 GHz128 Bit @ 8000 MHz
Quadro T1000 Max-Q compare 768 @ 0.8 - 1.46 GHz128 Bit @ 8000 MHz
T600 Laptop GPU compare 896 @ 1.4 GHz128 Bit @ 10000 MHz
T550 Laptop GPU compare 1024 @ 1.07 - 1.67 GHz64 Bit @ 12000 MHz
T500 Laptop GPU compare 896 @ 1.37 - 1.7 GHz64 Bit @ 10000 MHz
T600 compare 640 @ 0.74 - 1.34 GHz128 Bit @ 10000 MHz
CodenameN19E-Q1 MAX-Q
ArchitectureTuring
Pipelines1920 - unified
Core Speed600 - 870 - 1215 - 1380 (Boost) MHz
Memory Speed14000 MHz
Memory Bus Width192 Bit
Memory TypeGDDR6
Max. Amount of Memory6 GB
Shared Memoryno
APIDirectX 12_1, OpenGL 4.6
Power Consumption60 - 70 Watt
Transistor Count10.8 Billion
technology12 nm
FeaturesDLSS, Raytraycing, VR Ready, G-SYNC, Vulkan, Multi Monitor
Notebook Sizelarge
Date of Announcement27.05.2019

Benchmarks

Performance Rating - 3DMark 11 + Fire Strike + Time Spy
6.2 pt (19%)
SPECviewperf 12
specvp12 sw-03 +
specvp12 snx-02 +
specvp12 showcase-01 +
specvp12 mediacal-01 +
specvp12 maya-04 +
specvp12 energy-01 +
specvp12 creo-01 +
specvp12 catia-04 +
SPECviewperf 13 specvp13 sw-04 +
specvp13 snx-03 +
specvp13 showcase-02 +
specvp13 medical-02 +
specvp13 maya-05 +
specvp13 energy-02 +
specvp13 creo-02 +
specvp13 catia-05 +
specvp13 3dsmax-06 +
SPECviewperf 2020 v1 specvp2020 solidworks-05 1080p +
specvp2020 snx-04 1080p +
specvp2020 medical-03 1080p +
specvp2020 maya-06 1080p +
specvp2020 energy-03 1080p +
specvp2020 creo-03 1080p +
specvp2020 catia-06 1080p +
specvp2020 3dsmax-07 1080p +
Cinebench R10 Cinebench R10 Shading (32bit) +
Cinebench R11.5 Cinebench R11.5 OpenGL 64 Bit +
Cinebench R15
Cinebench R15 OpenGL 64 Bit +
Cinebench R15 OpenGL Ref. Match 64 Bit +
- Range of benchmark values for this graphics card
- Average benchmark values for this graphics card
* Smaller numbers mean a higher performance

Game Benchmarks

The following benchmarks stem from our benchmarks of review laptops. The performance depends on the used graphics memory, clock rate, processor, system settings, drivers, and operating systems. So the results don't have to be representative for all laptops with this GPU. For detailed information on the benchmark results, click on the fps number.

Hitman 3

Hitman 3

2021
low 1280x720
178  fps    + Compare
med. 1920x1080
100  fps    + Compare
high 1920x1080
86  fps    + Compare
ultra 1920x1080
78  fps    + Compare
4K 3840x2160
27  fps    + Compare
» With all tested laptops playable in detail settings ultra.
low 1280x720
93  fps    + Compare
med. 1920x1080
52  fps    + Compare
high 1920x1080
43  fps    + Compare
ultra 1920x1080
36  fps    + Compare
4K 3840x2160
10  fps    + Compare
» With all tested laptops playable in detail settings ultra.
Immortals Fenyx Rising