Dell Precision 5750 Workstation Review: The XPS 17 For Professionals
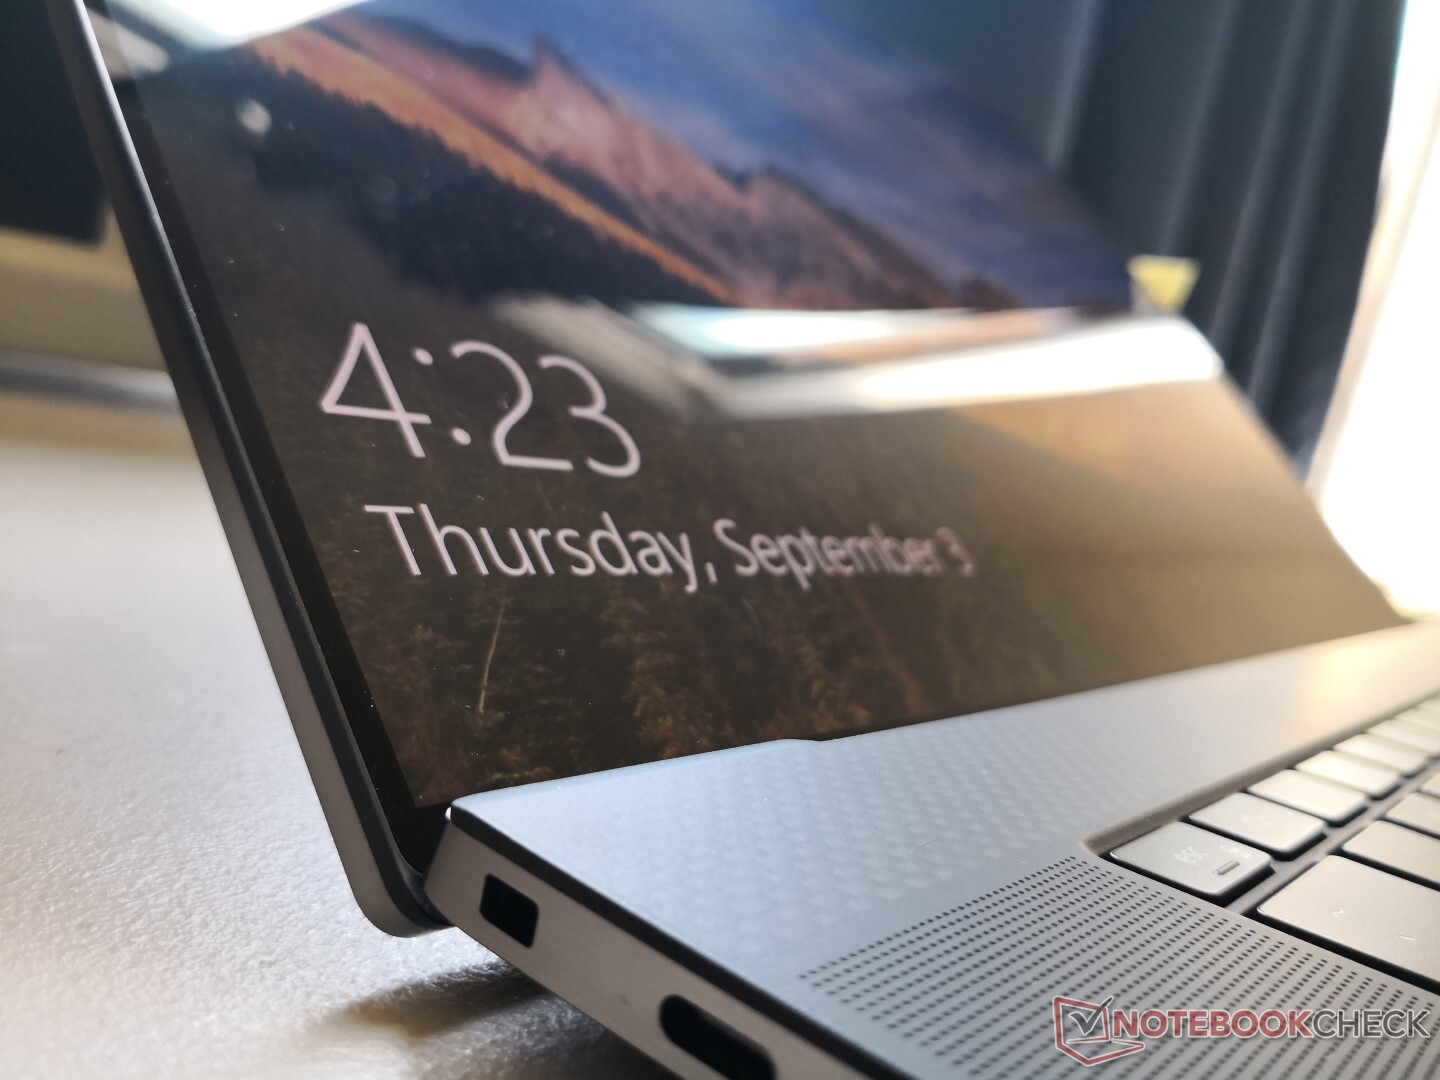
Much like how the 15.6-inch Precision 5550 is the workstation version of the XPS 15 9500, the 17.3-inch Precision 5750 is the workstation version of the XPS 17 9700. We recommend checking out our review on the XPS 17 as all our existing comments on the chassis and its physical features also apply here on the Precision 5750.
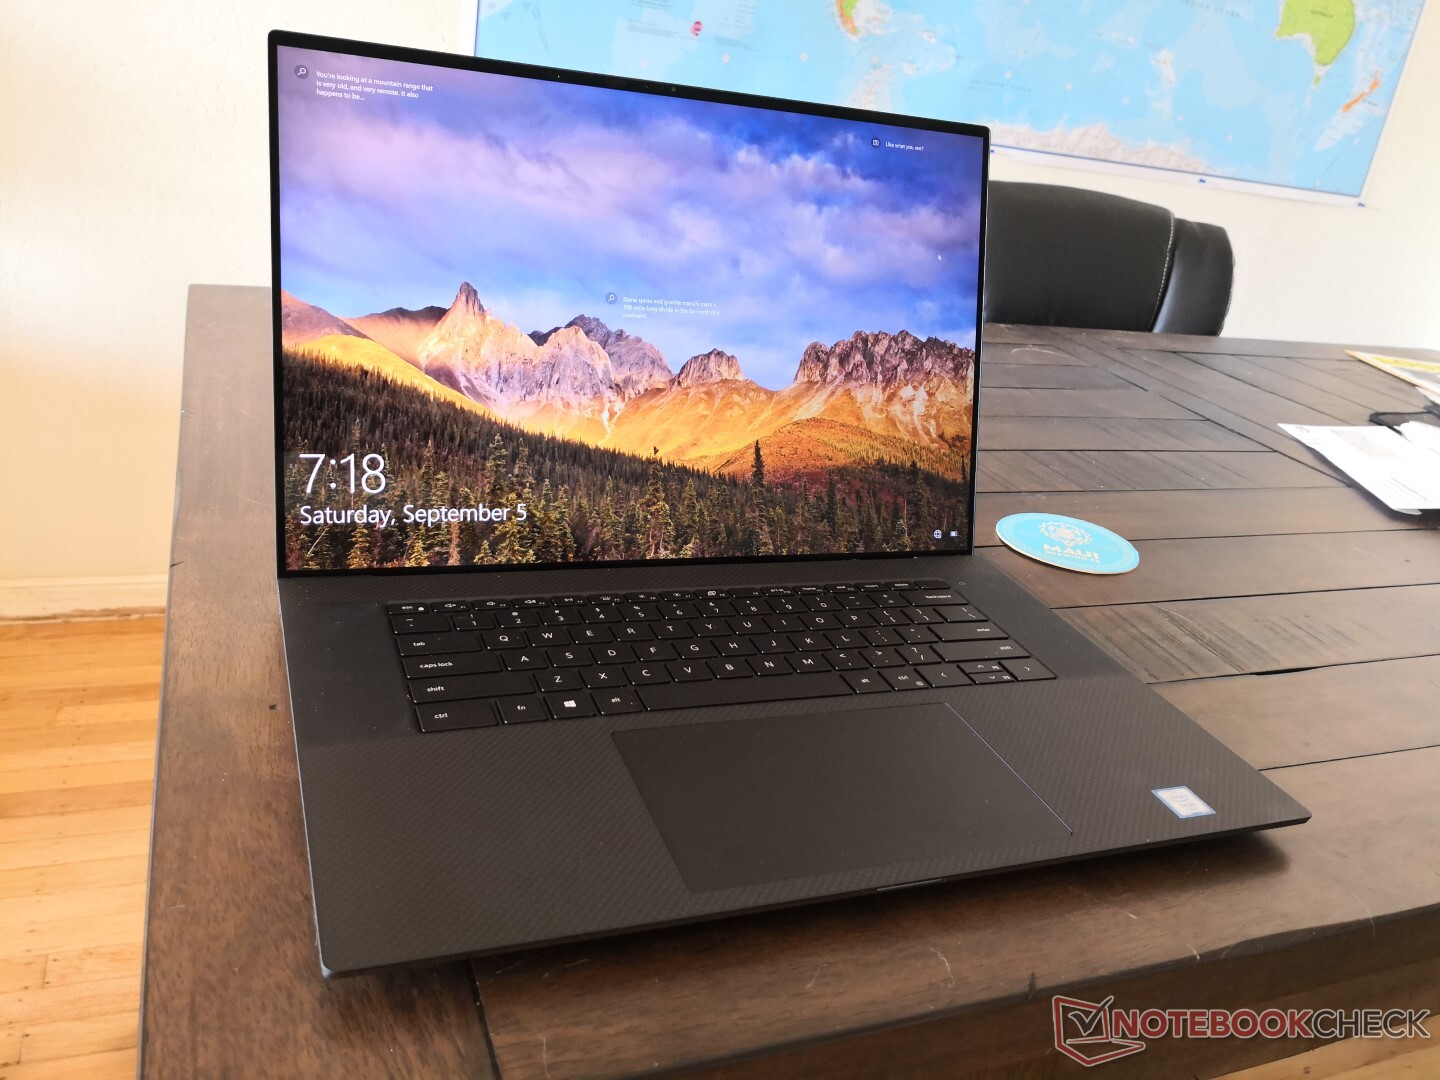
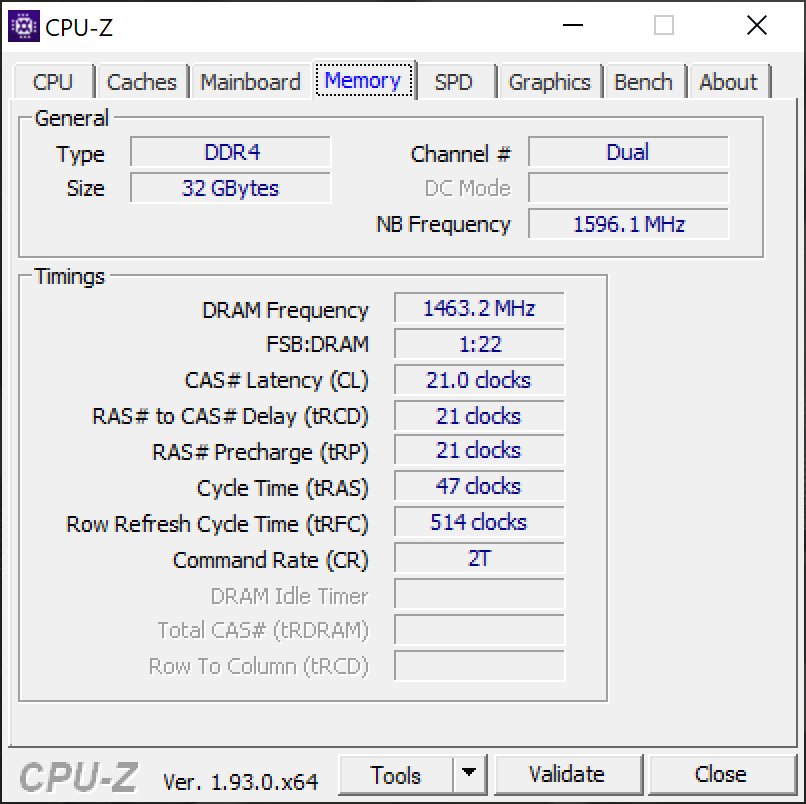
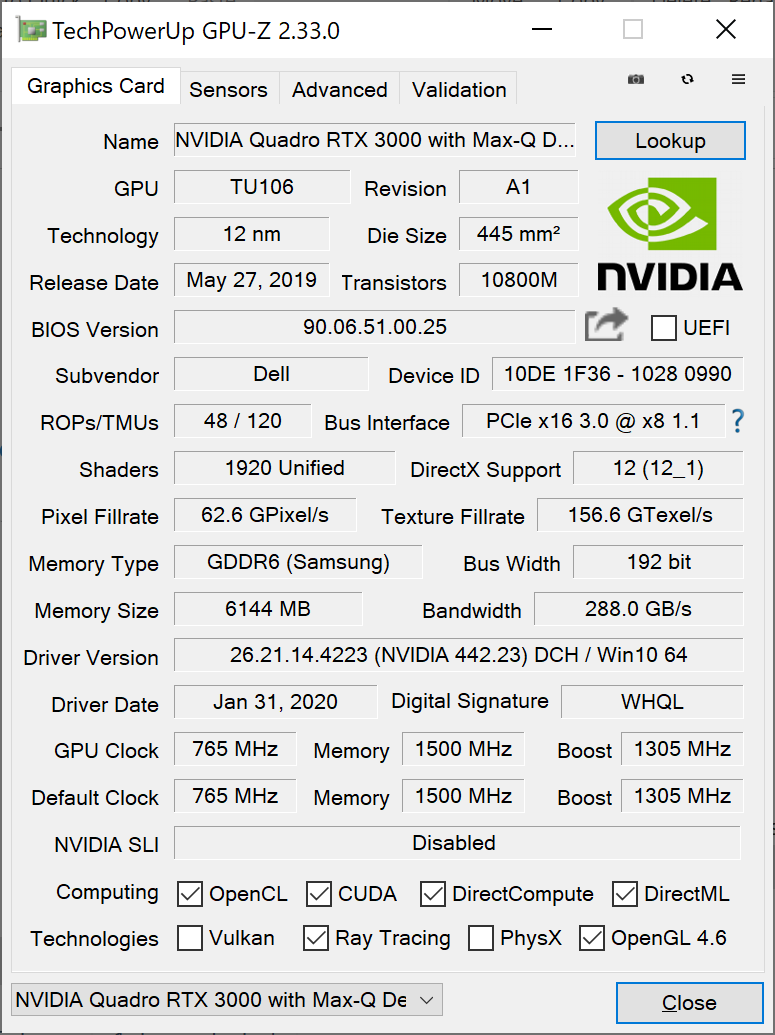
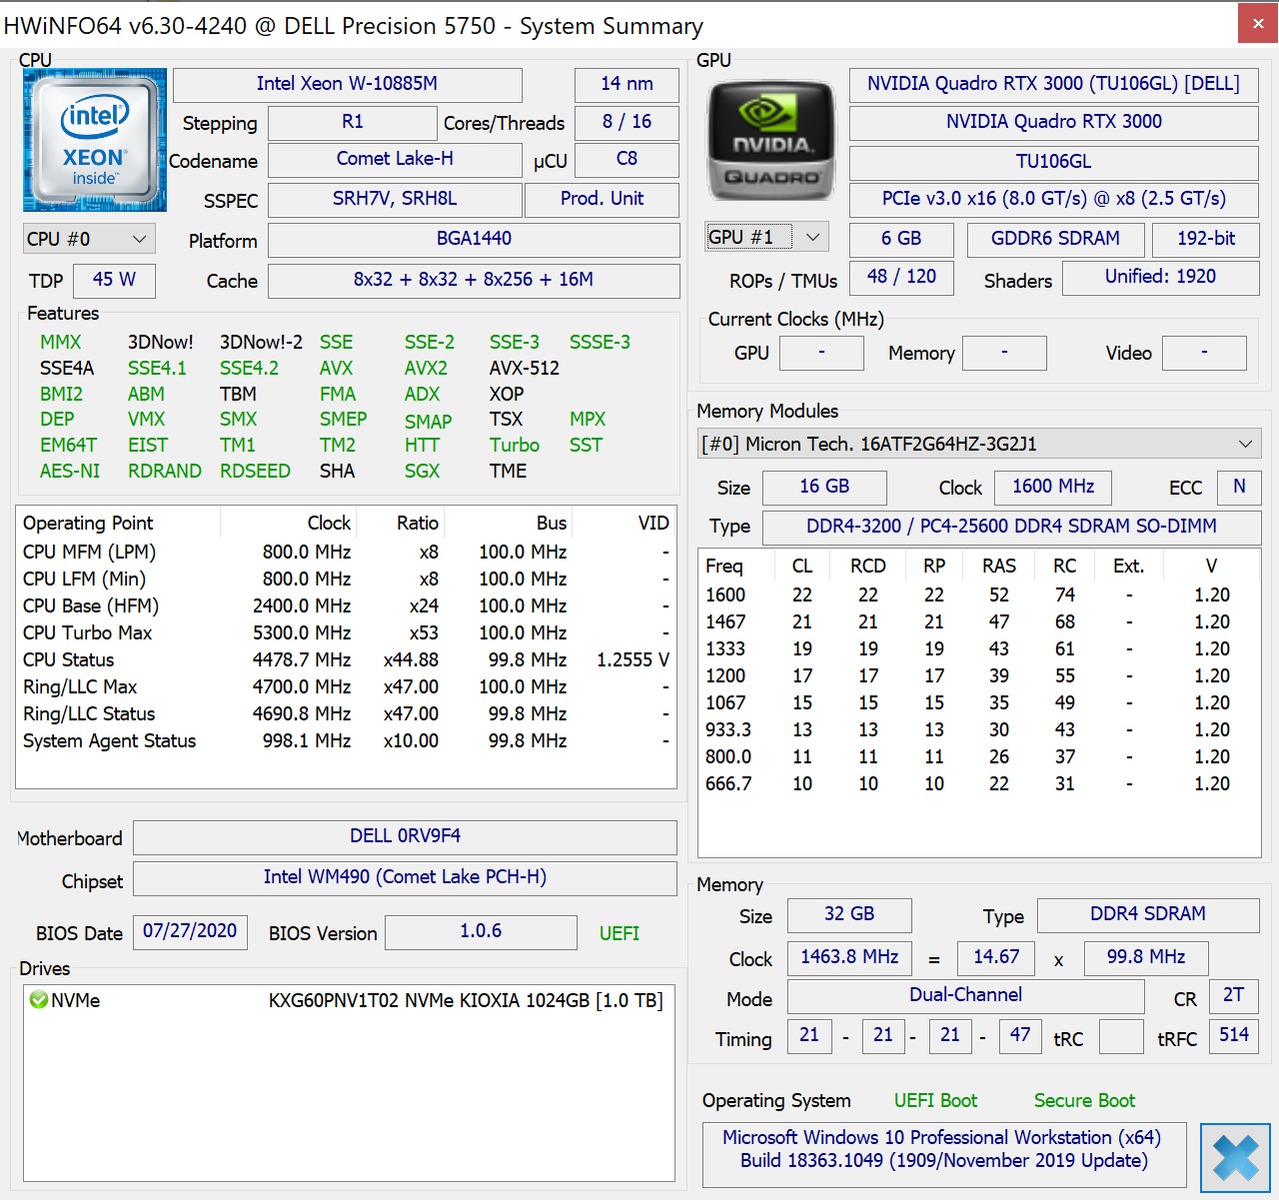
Our unit is a top-end configuration with the Xeon W-10885M CPU, Quadro RTX 3000 Max-Q GPU, 16:10 2400p glossy touchscreen, and 32 GB DDR4 RAM for approximately $3800 USD. Lesser SKUs with the Core i5-10400H, integrated UHD Graphics 630, 1200p matte display, and 8 GB of RAM are also available for much less.
The Precision 5750 competes against 17.3-inch ultra-thin workstations like the MSI WS75, Razer Blade Pro Studio, or the Asus ProArt StudioBook series.
More Dell reviews:
Rating | Date | Model | Weight | Height | Size | Resolution | Price |
|---|---|---|---|---|---|---|---|
| 87 % v7 (old) | 09 / 2020 | Dell Precision 5000 5750 P92F W-10885M, Quadro RTX 3000 Max-Q | 2.5 kg | 19.5 mm | 17.00" | 3840x2400 | |
| 86.4 % v7 (old) | 05 / 2020 | Asus ProArt StudioBook Pro 17 W700G3T i7-9750H, Quadro RTX 3000 Max-Q | 2.5 kg | 18.4 mm | 17.00" | 1920x1200 | |
| 83.8 % v7 (old) | 06 / 2019 | MSI WS75 9TL-636 i7-9750H, Quadro RTX 4000 (Laptop) | 2.3 kg | 18.95 mm | 17.30" | 1920x1080 | |
| 85.7 % v7 (old) | 05 / 2019 | Dell Precision 7730 i7-8850H, Quadro P3200 | 3.3 kg | 30 mm | 17.30" | 1920x1080 | |
| 86.6 % v7 (old) | 12 / 2019 | Lenovo ThinkPad P73-20QR002DGE i7-9850H, Quadro RTX 3000 (Laptop) | 3.5 kg | 31 mm | 17.30" | 1920x1080 | |
| 84.8 % v7 (old) | 11 / 2019 | MSI WE75 9TK i7-9750H, Quadro RTX 3000 (Laptop) | 2.6 kg | 27.5 mm | 17.30" | 1920x1080 |
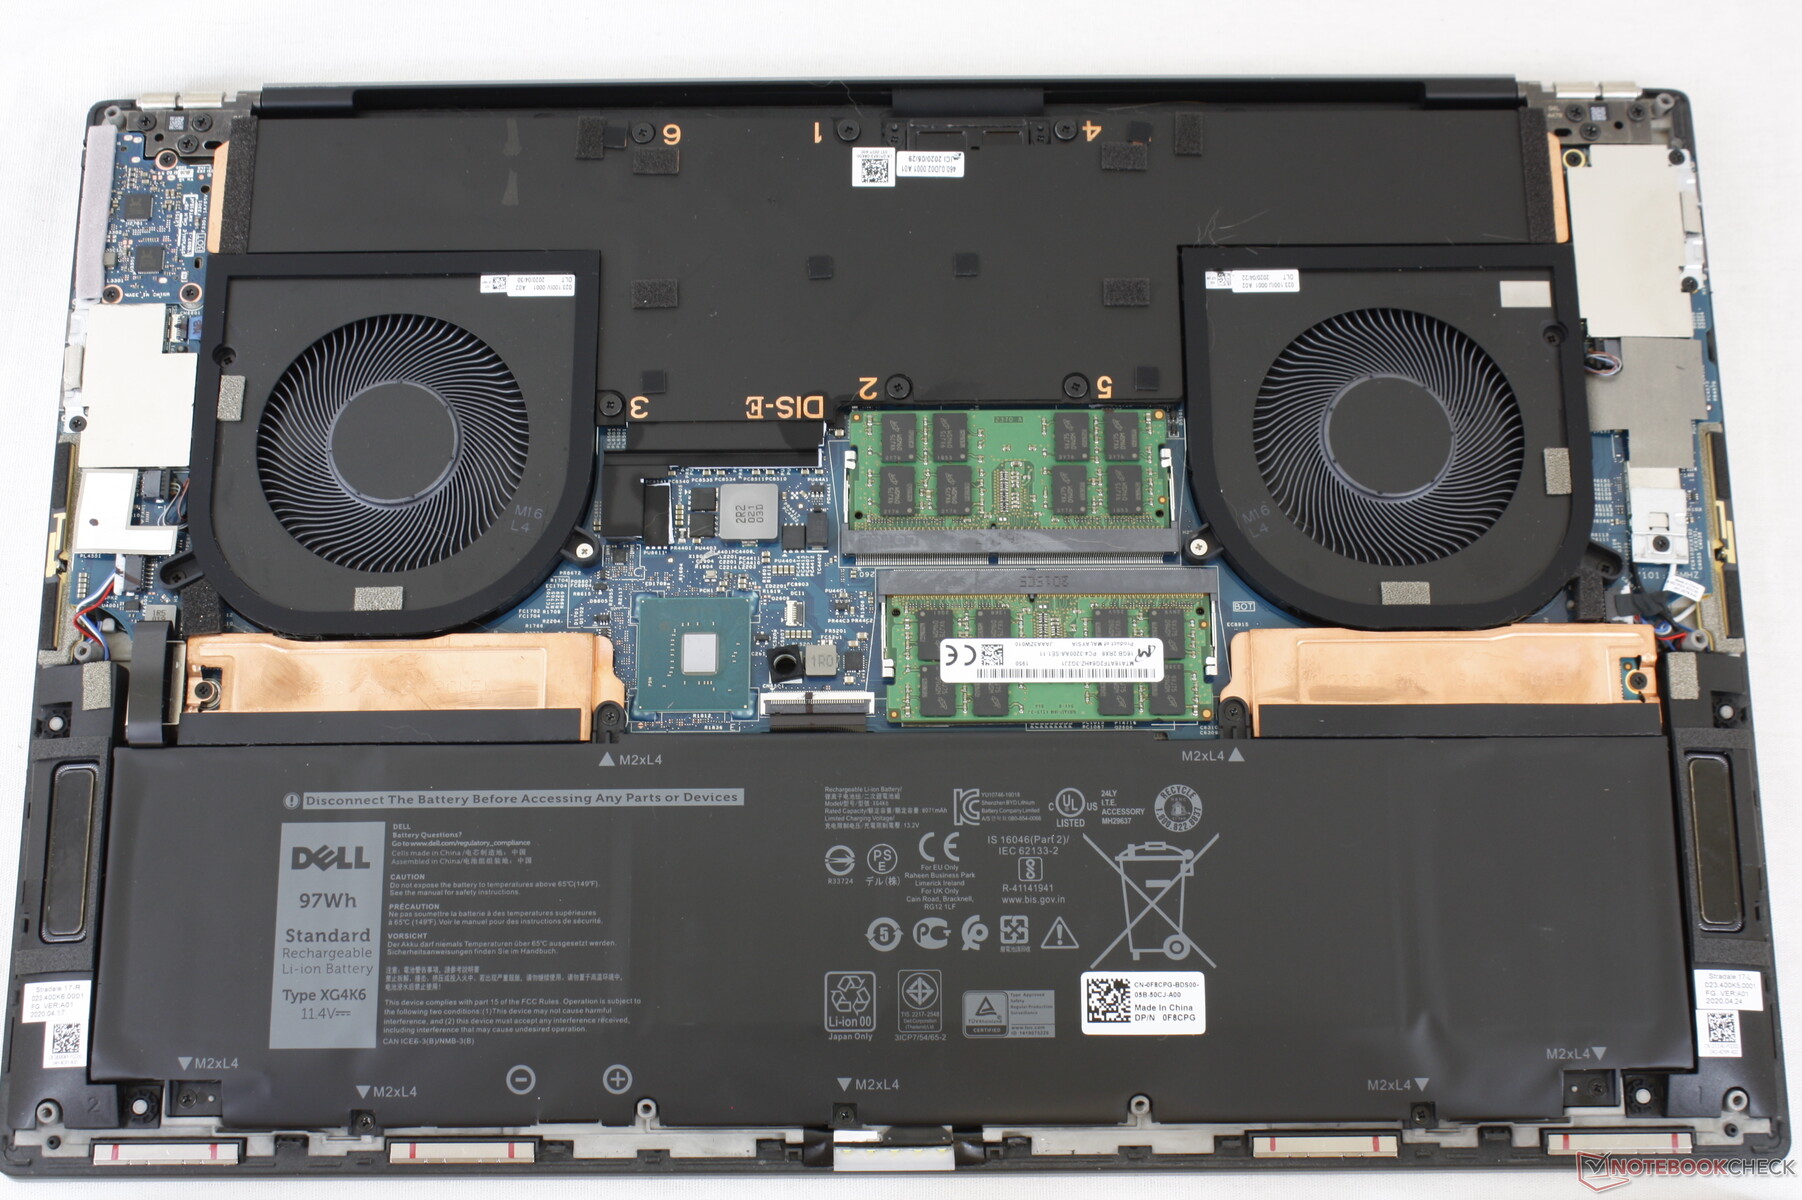
Case
Connectivity
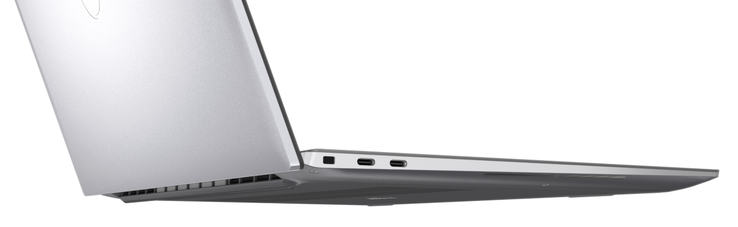
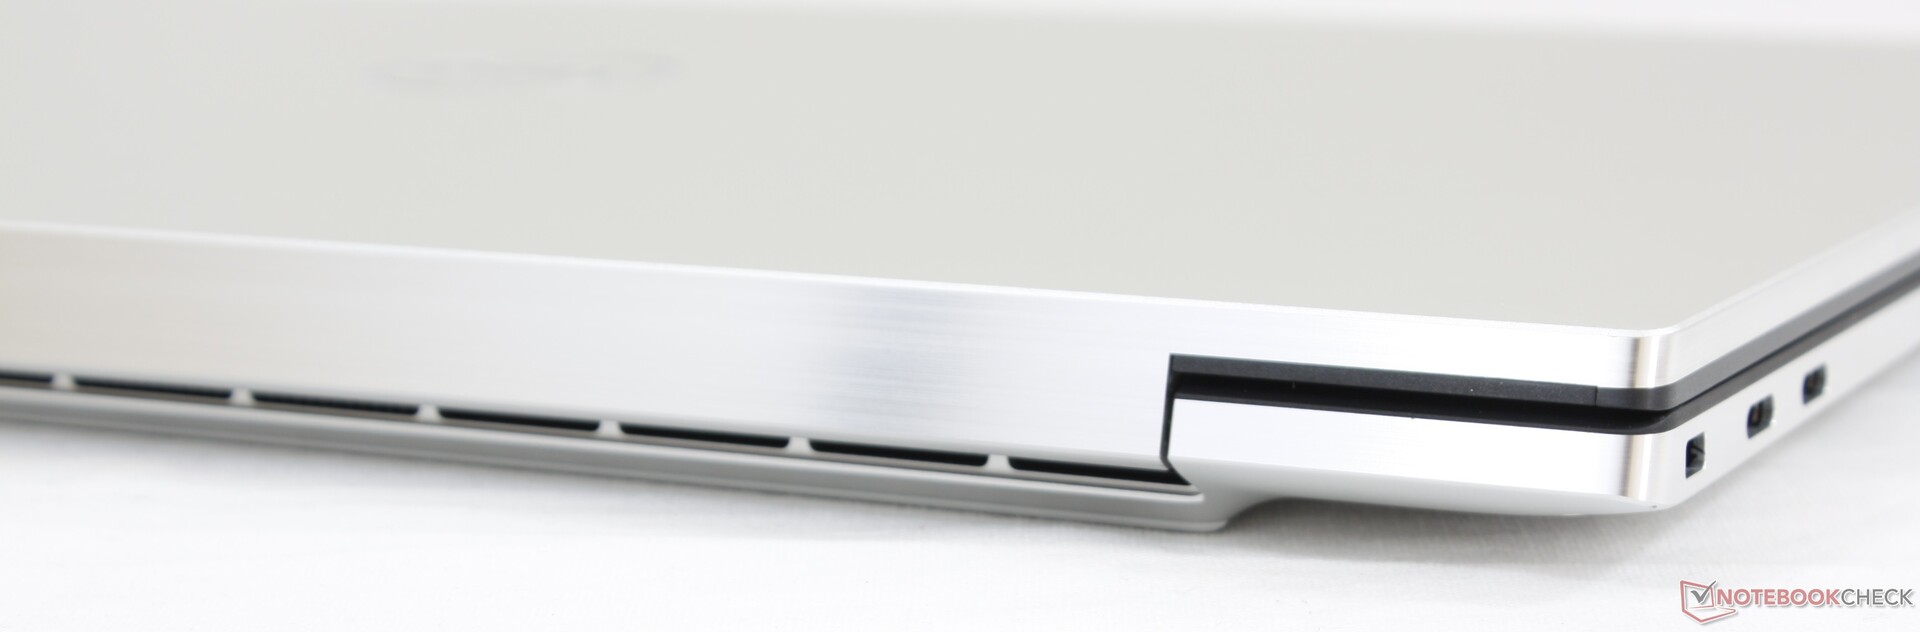
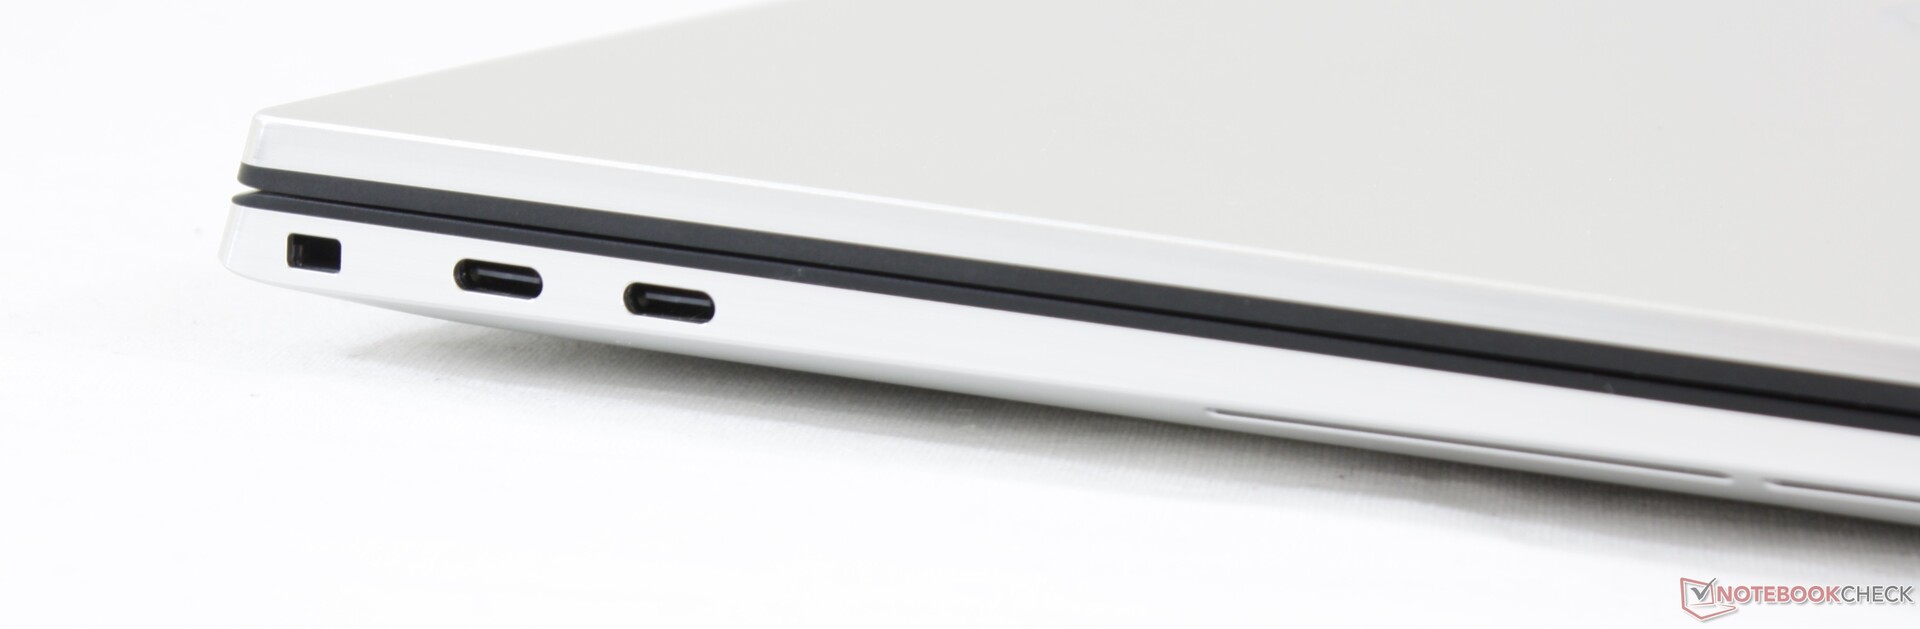
Port options are either disappointing or amazing depending on what you're looking for. If you like having 4x Thunderbolt 3 ports, then this Precision has got you covered. If you want HDMI, RJ-45 or USB-A, then be prepared to rely on adapters or docking stations. Every other workstation in this size category offers a wider variety of integrated ports than the Precision 5750.
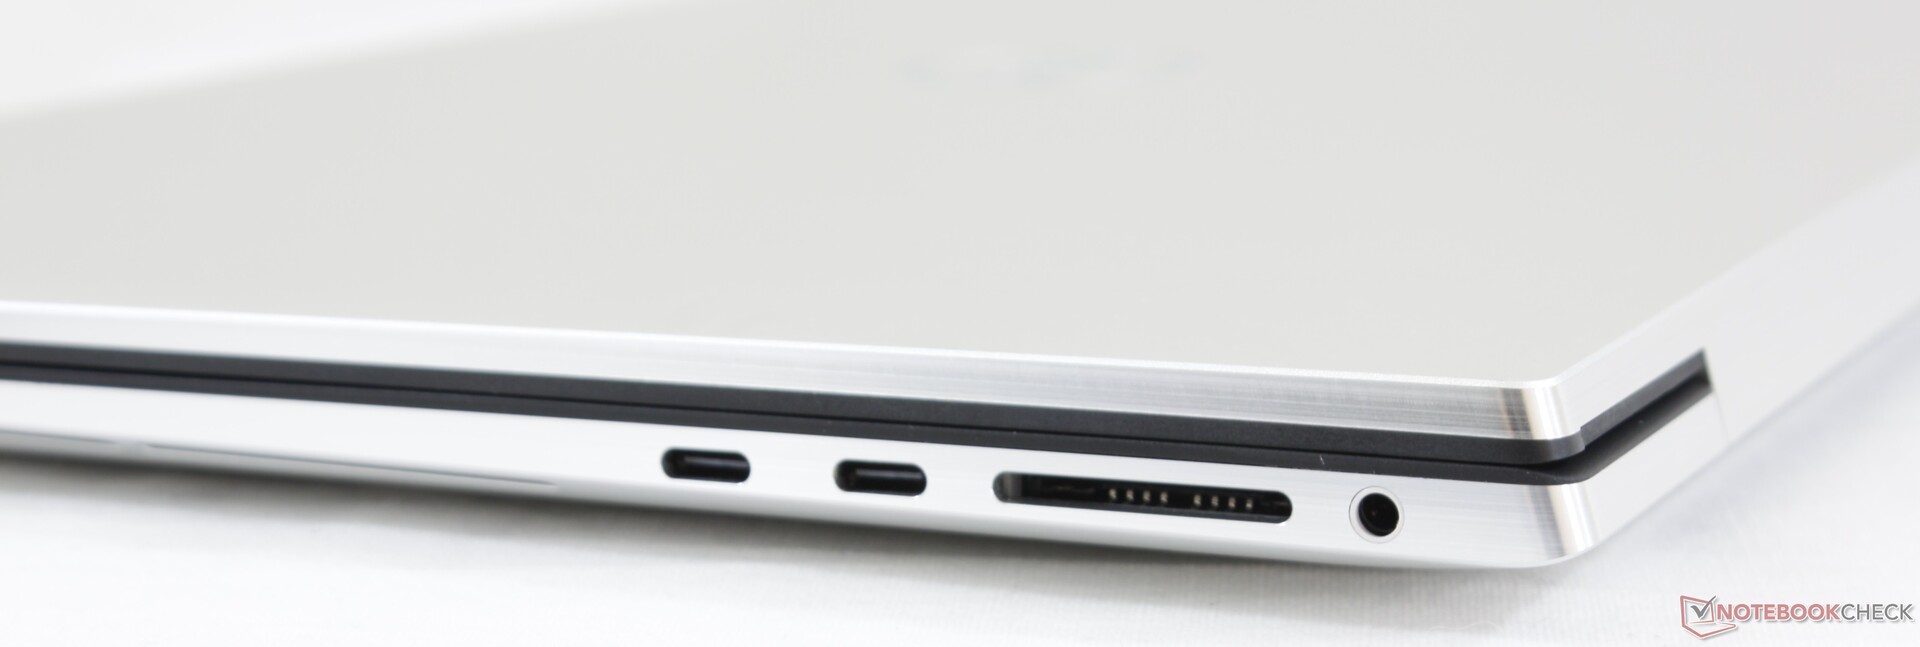
SD Card Reader
Transfer rates from the integrated SD card reader are very fast. Moving 1 GB of pictures from our UHS-II test card to desktop takes about 7 seconds.
| SD Card Reader | |
| average JPG Copy Test (av. of 3 runs) | |
| Dell Precision 7730 (Toshiba Exceria Pro SDXC 64 GB UHS-II) | |
| Lenovo ThinkPad P73-20QR002DGE (Toshiba Exceria Pro SDXC 64 GB UHS-II) | |
| Asus ProArt StudioBook Pro 17 W700G3T (Toshiba Exceria Pro SDXC 64 GB UHS-II) | |
| MSI WS75 9TL-636 (Toshiba Exceria Pro M501 64 GB UHS-II) | |
| Dell Precision 5000 5750 P92F (Toshiba Exceria Pro SDXC 64 GB UHS-II) | |
| MSI WE75 9TK (Toshiba Exceria Pro SDXC 64 GB UHS-II) | |
| maximum AS SSD Seq Read Test (1GB) | |
| Asus ProArt StudioBook Pro 17 W700G3T (Toshiba Exceria Pro SDXC 64 GB UHS-II) | |
| Dell Precision 7730 (Toshiba Exceria Pro SDXC 64 GB UHS-II) | |
| MSI WS75 9TL-636 (Toshiba Exceria Pro M501 64 GB UHS-II) | |
| Lenovo ThinkPad P73-20QR002DGE (Toshiba Exceria Pro SDXC 64 GB UHS-II) | |
| Dell Precision 5000 5750 P92F (Toshiba Exceria Pro SDXC 64 GB UHS-II) | |
| MSI WE75 9TK (Toshiba Exceria Pro SDXC 64 GB UHS-II) | |
Communication
The Intel AX201 comes standard for Wi-Fi 6 connectivity. We experienced no issues when connected to our Netgear RAX200 test router.
Webcam


Security
The same security features available on the Precision 5550 can be found here on the Precision 5750 including the Proximity sensor for hands-free ExpressSign-in. There is still no webcam shutter at all which we think was an oversight from Dell during the design phase of the XPS 17/Precision 5750 chassis.
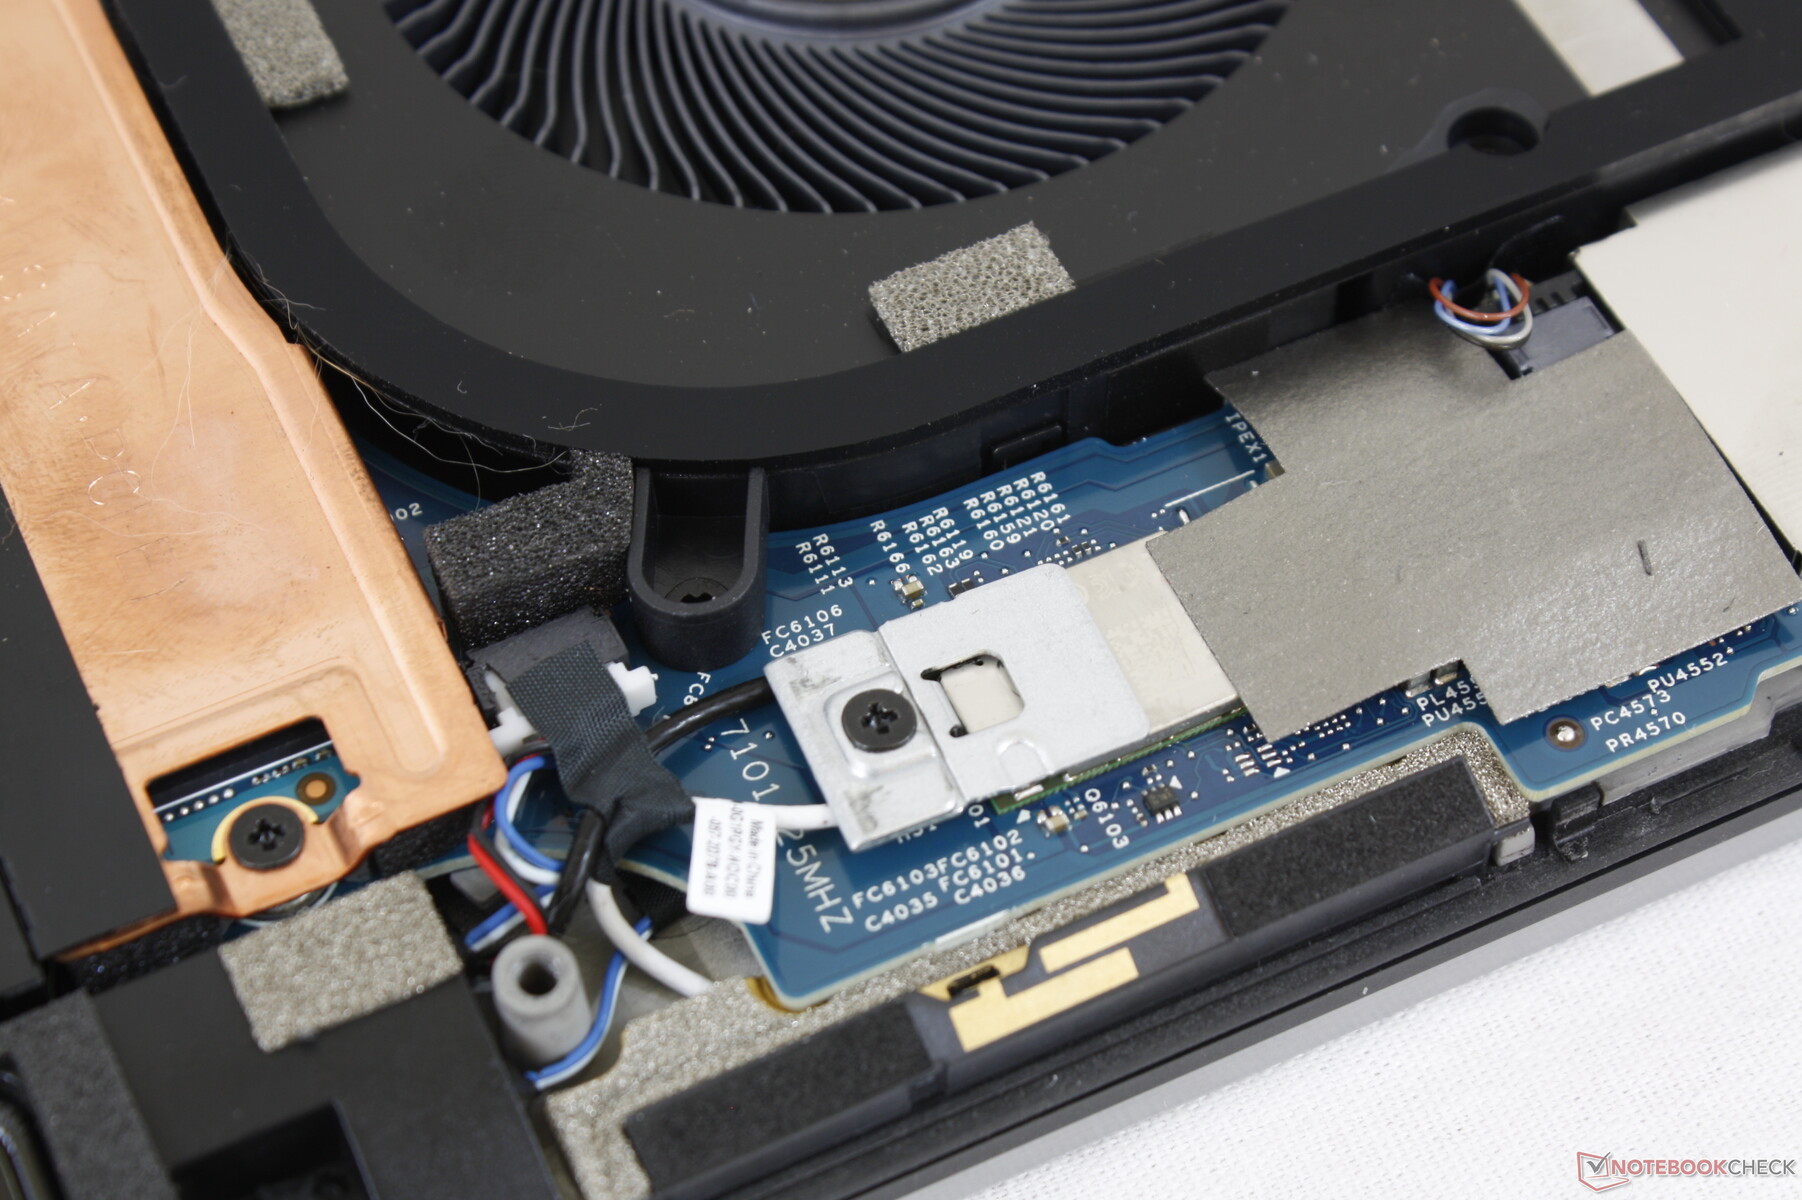
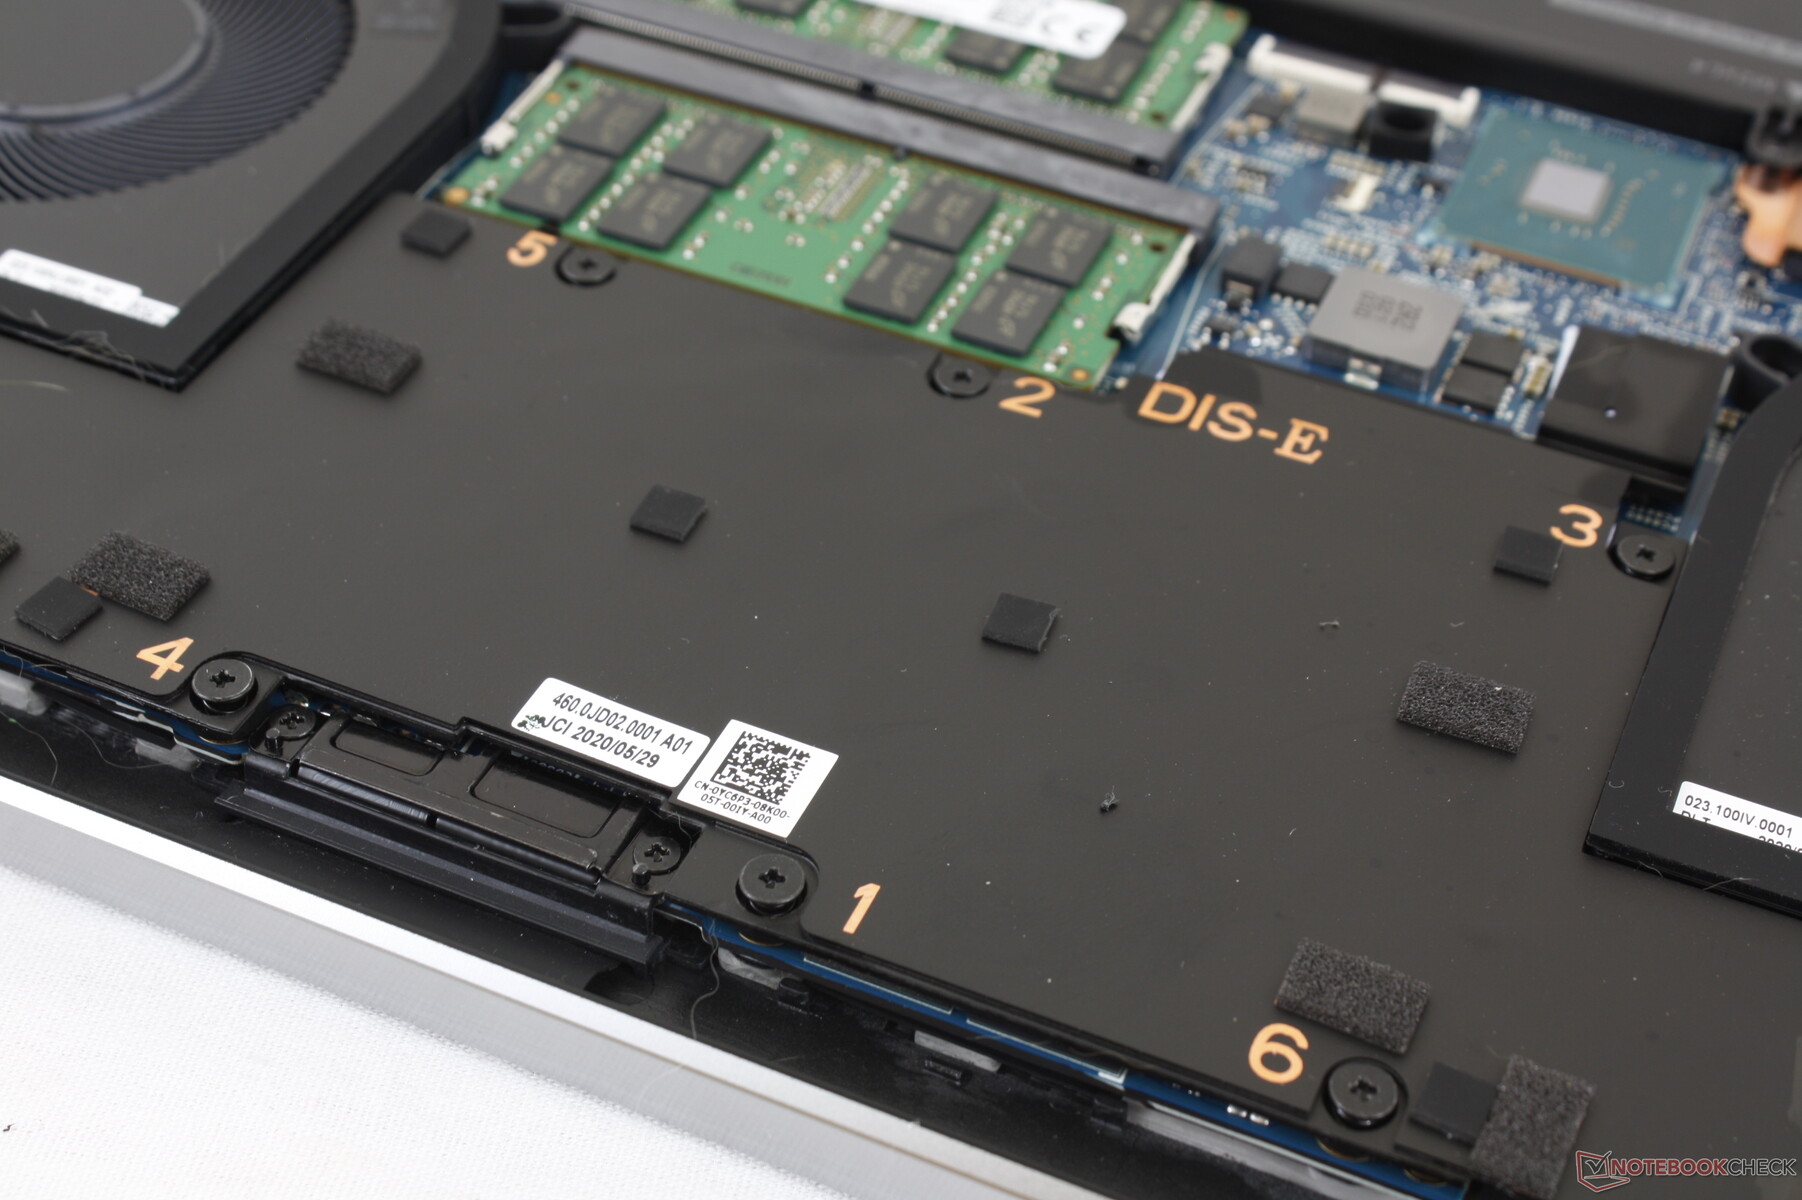
Maintenance
Accessories and Warranty
A USB-C to HDMI and USB-A adapter is included in every box. Standard warranty is one year only compared to three years on traditional full-size workstations like the Precision 7550.
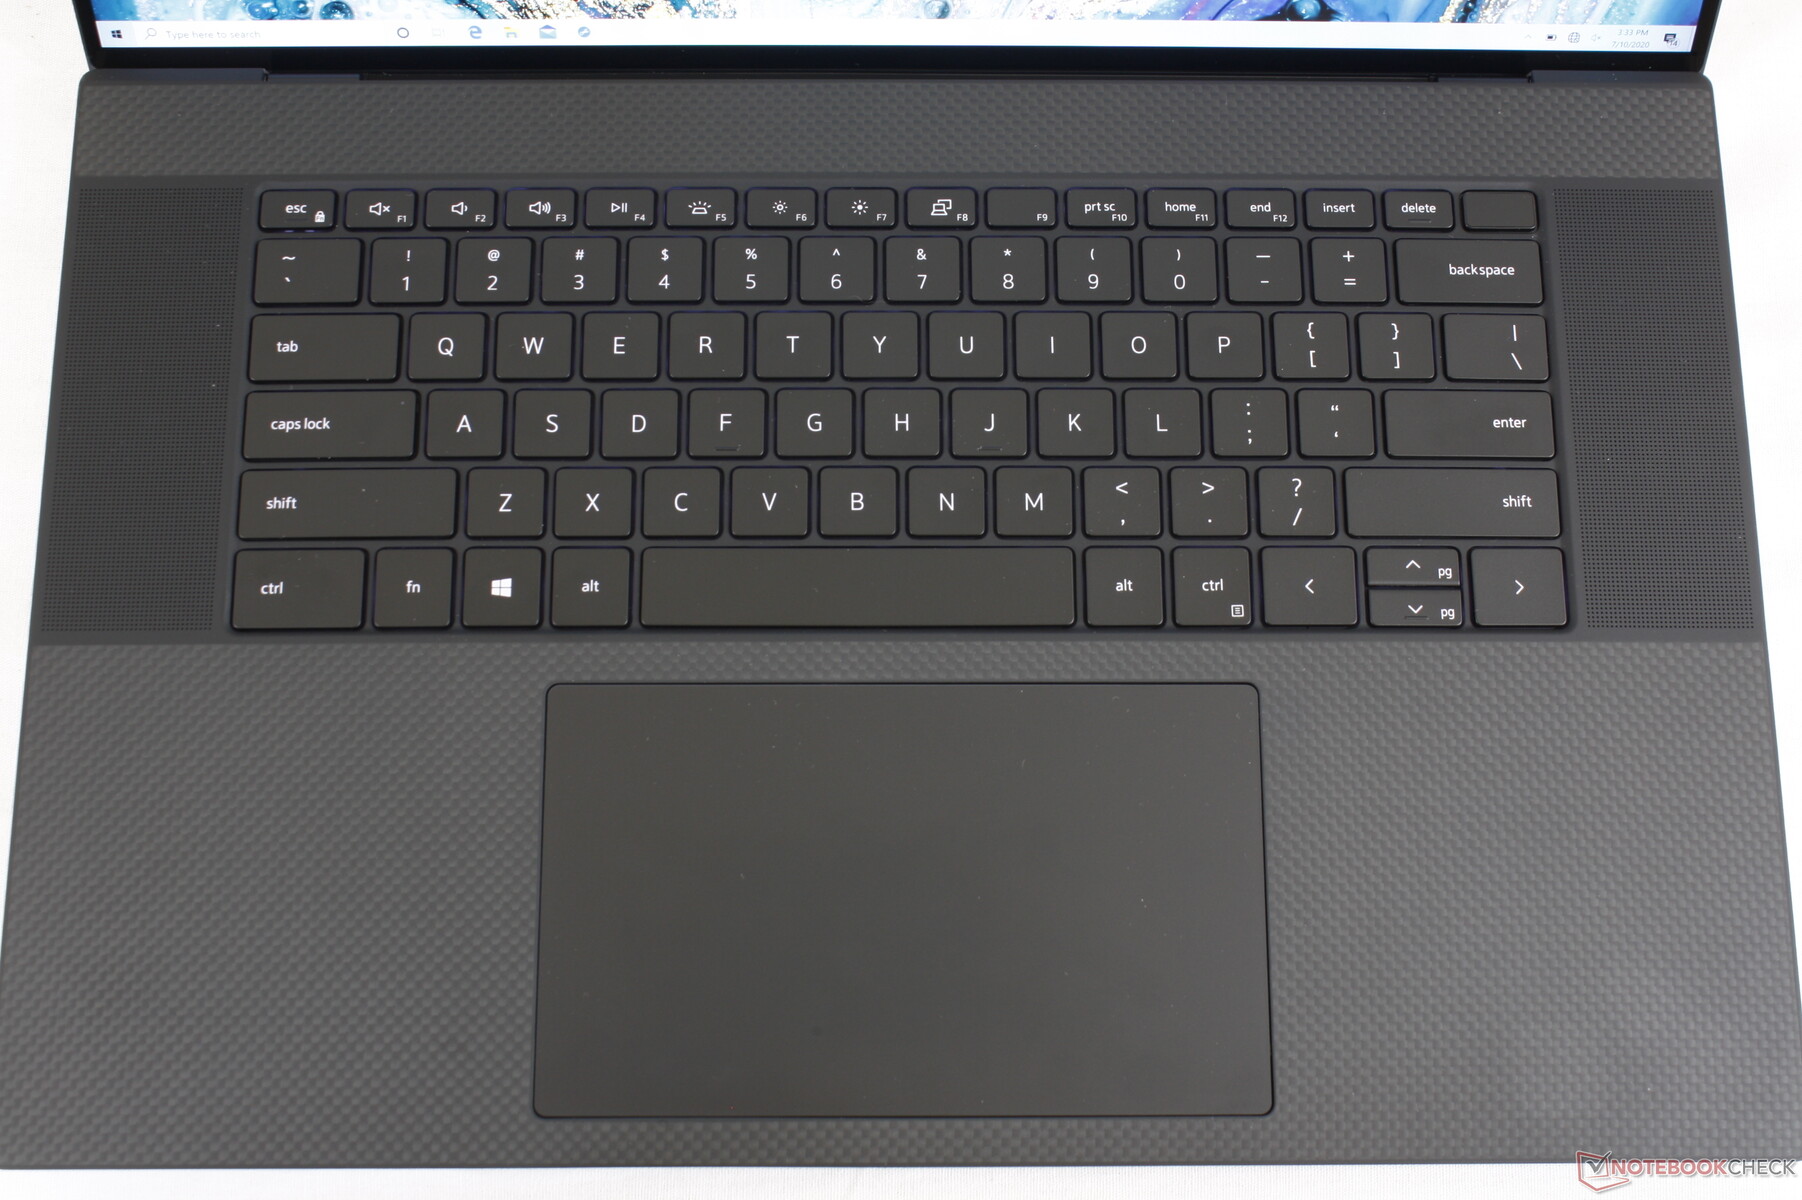
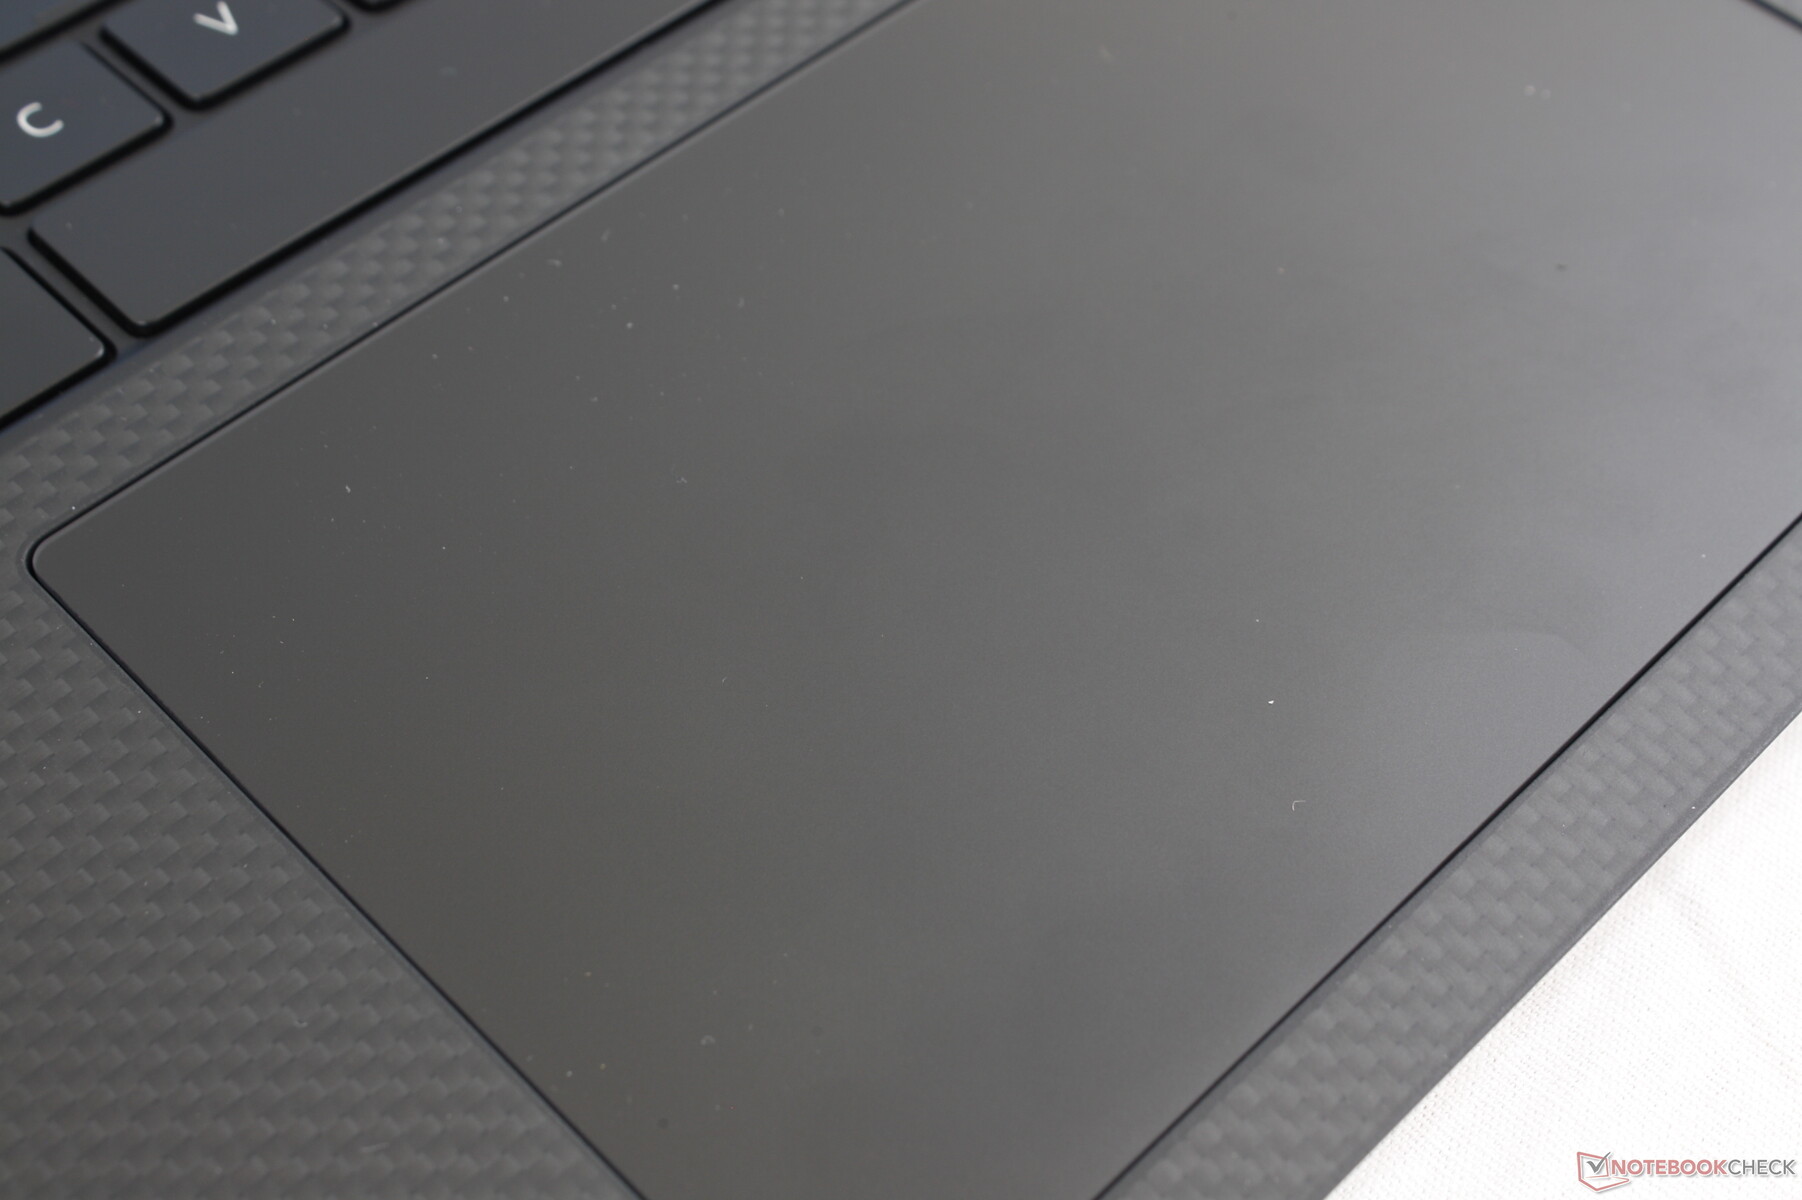
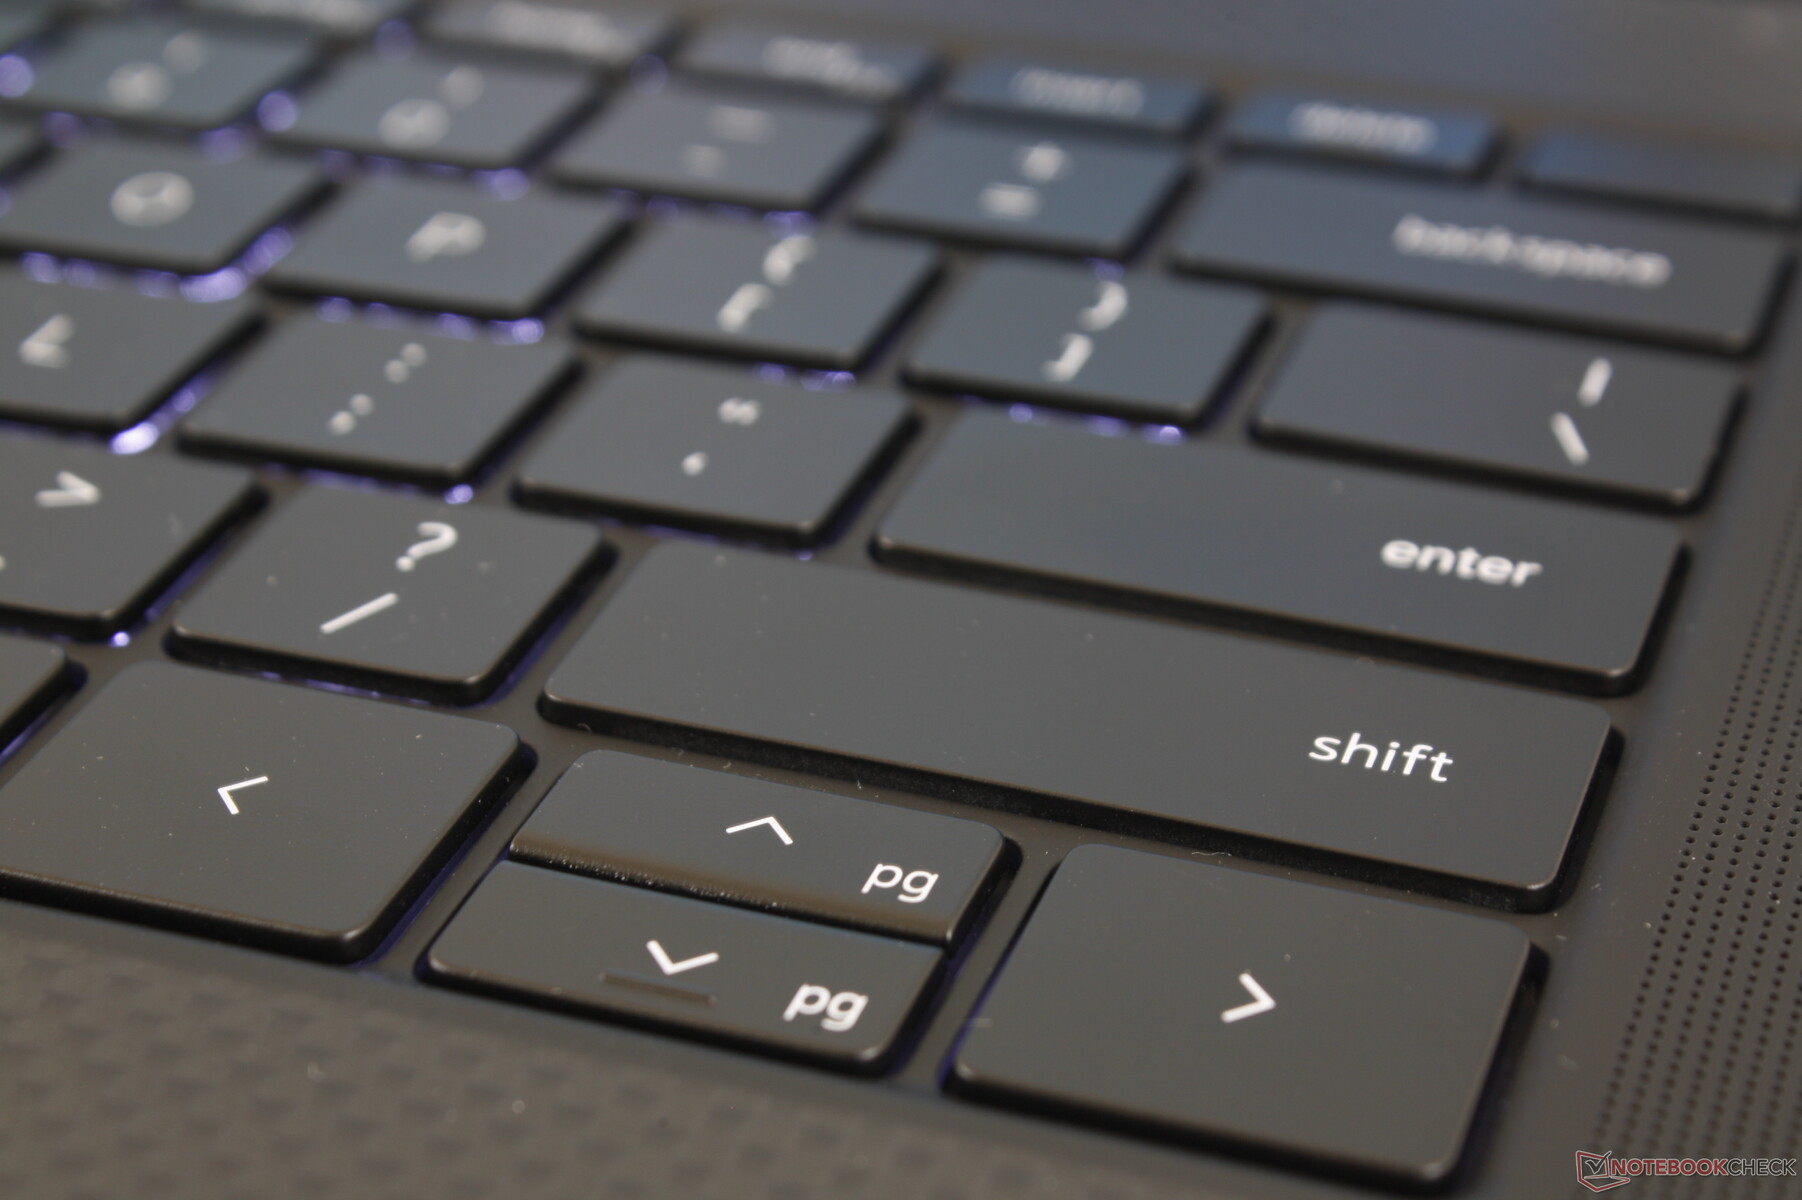
Input Devices

Display
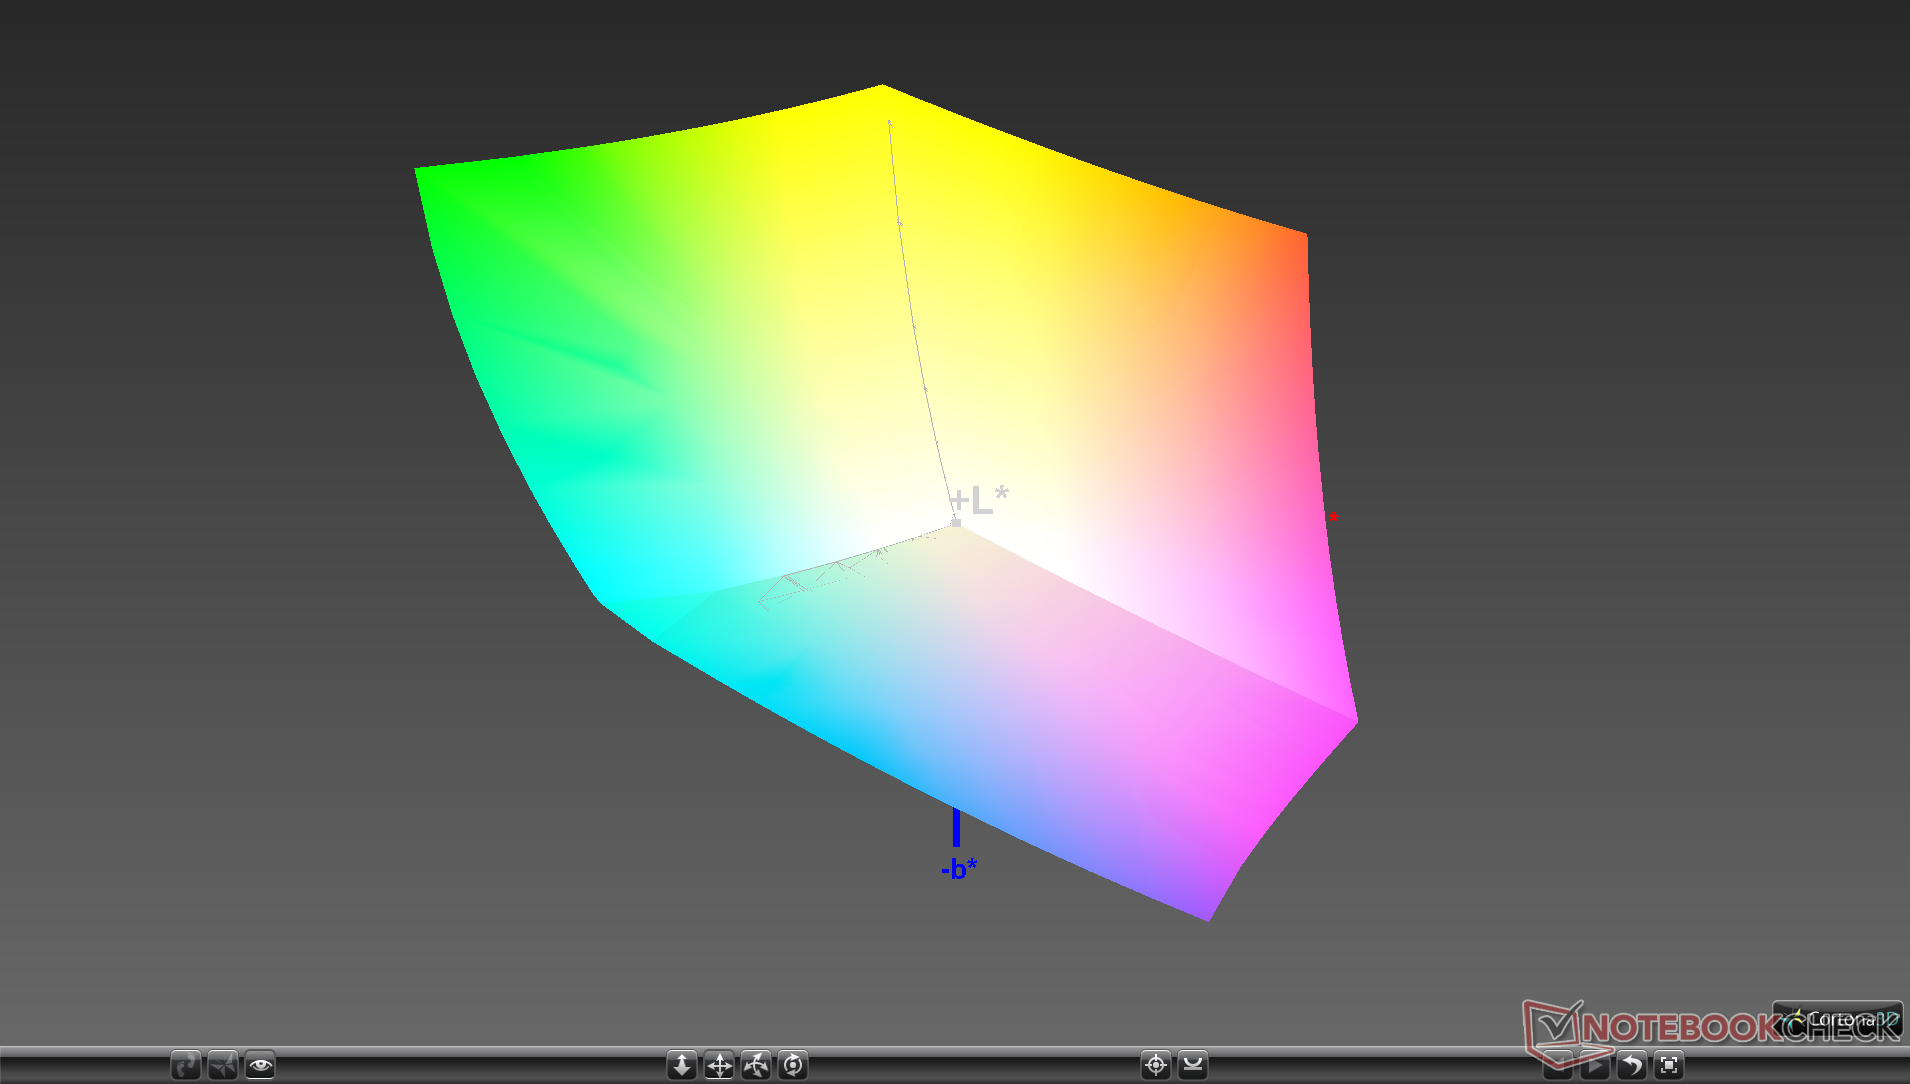
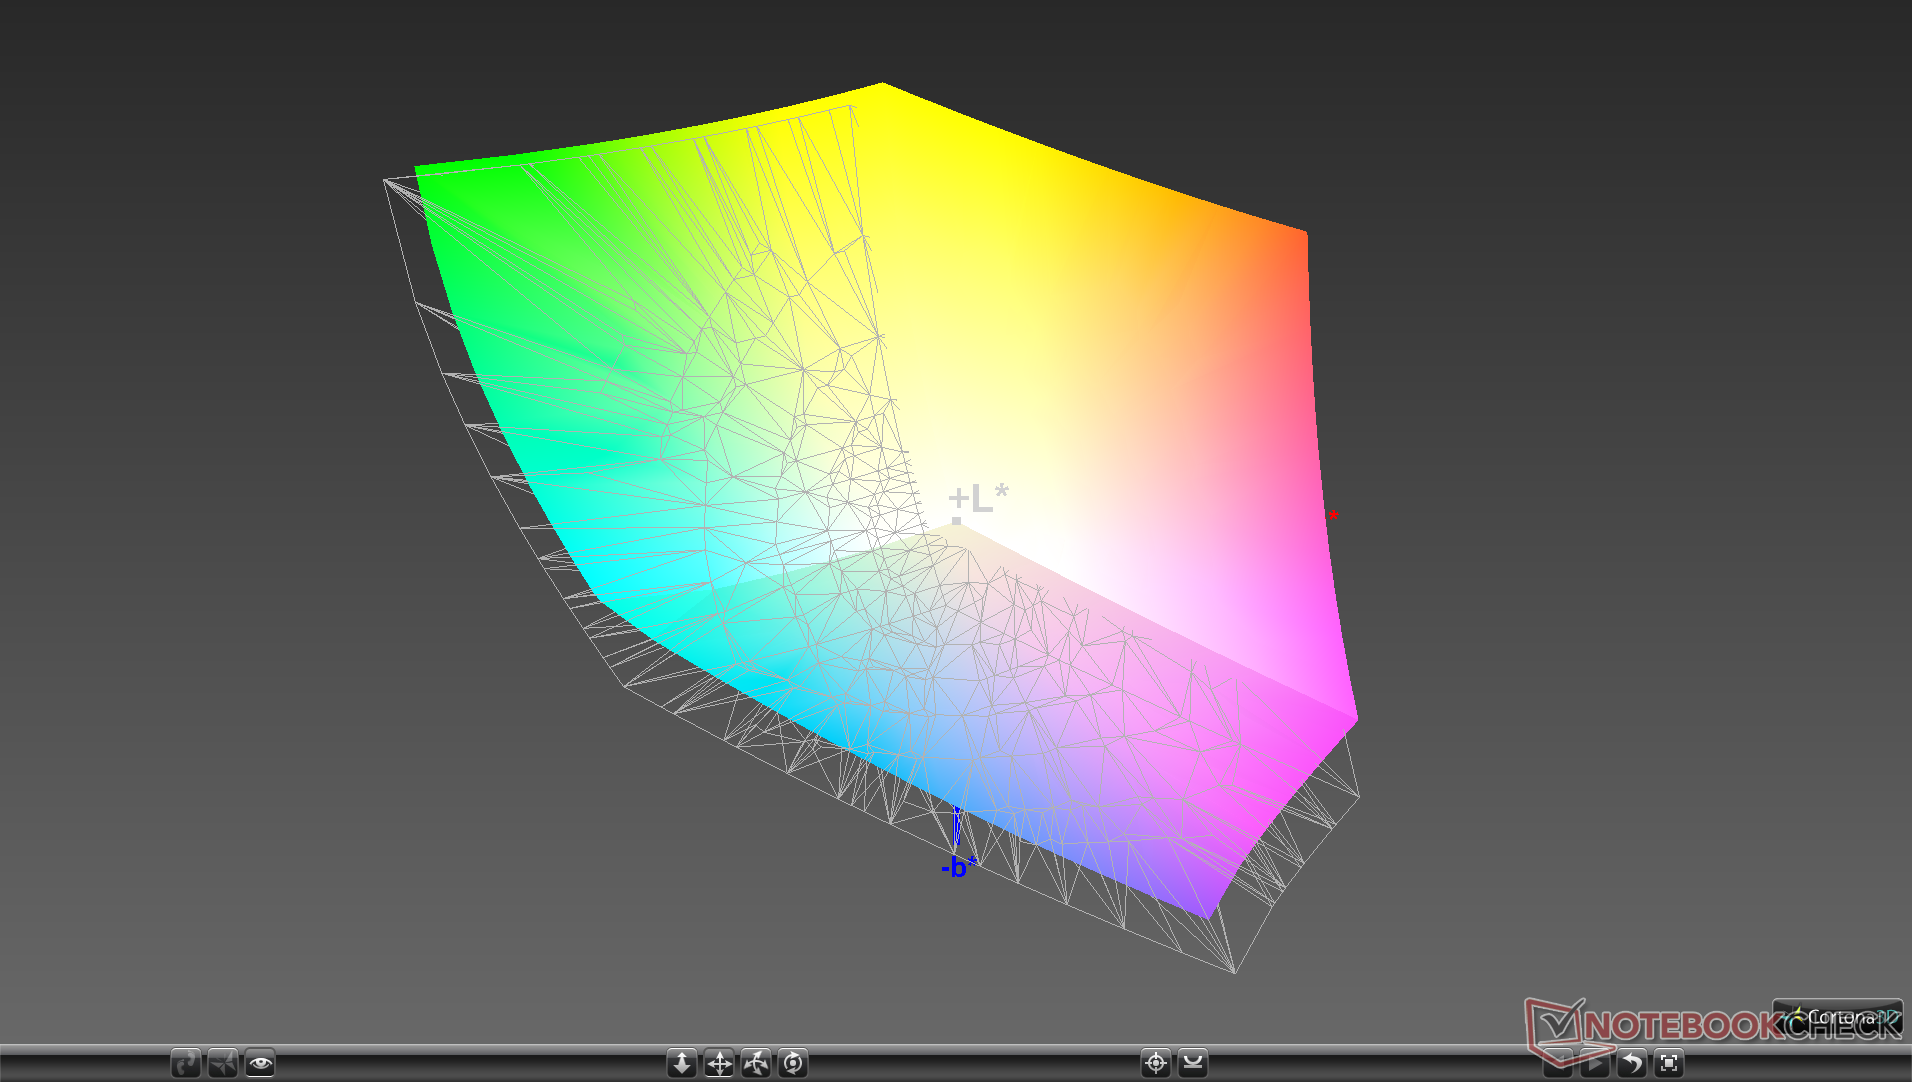
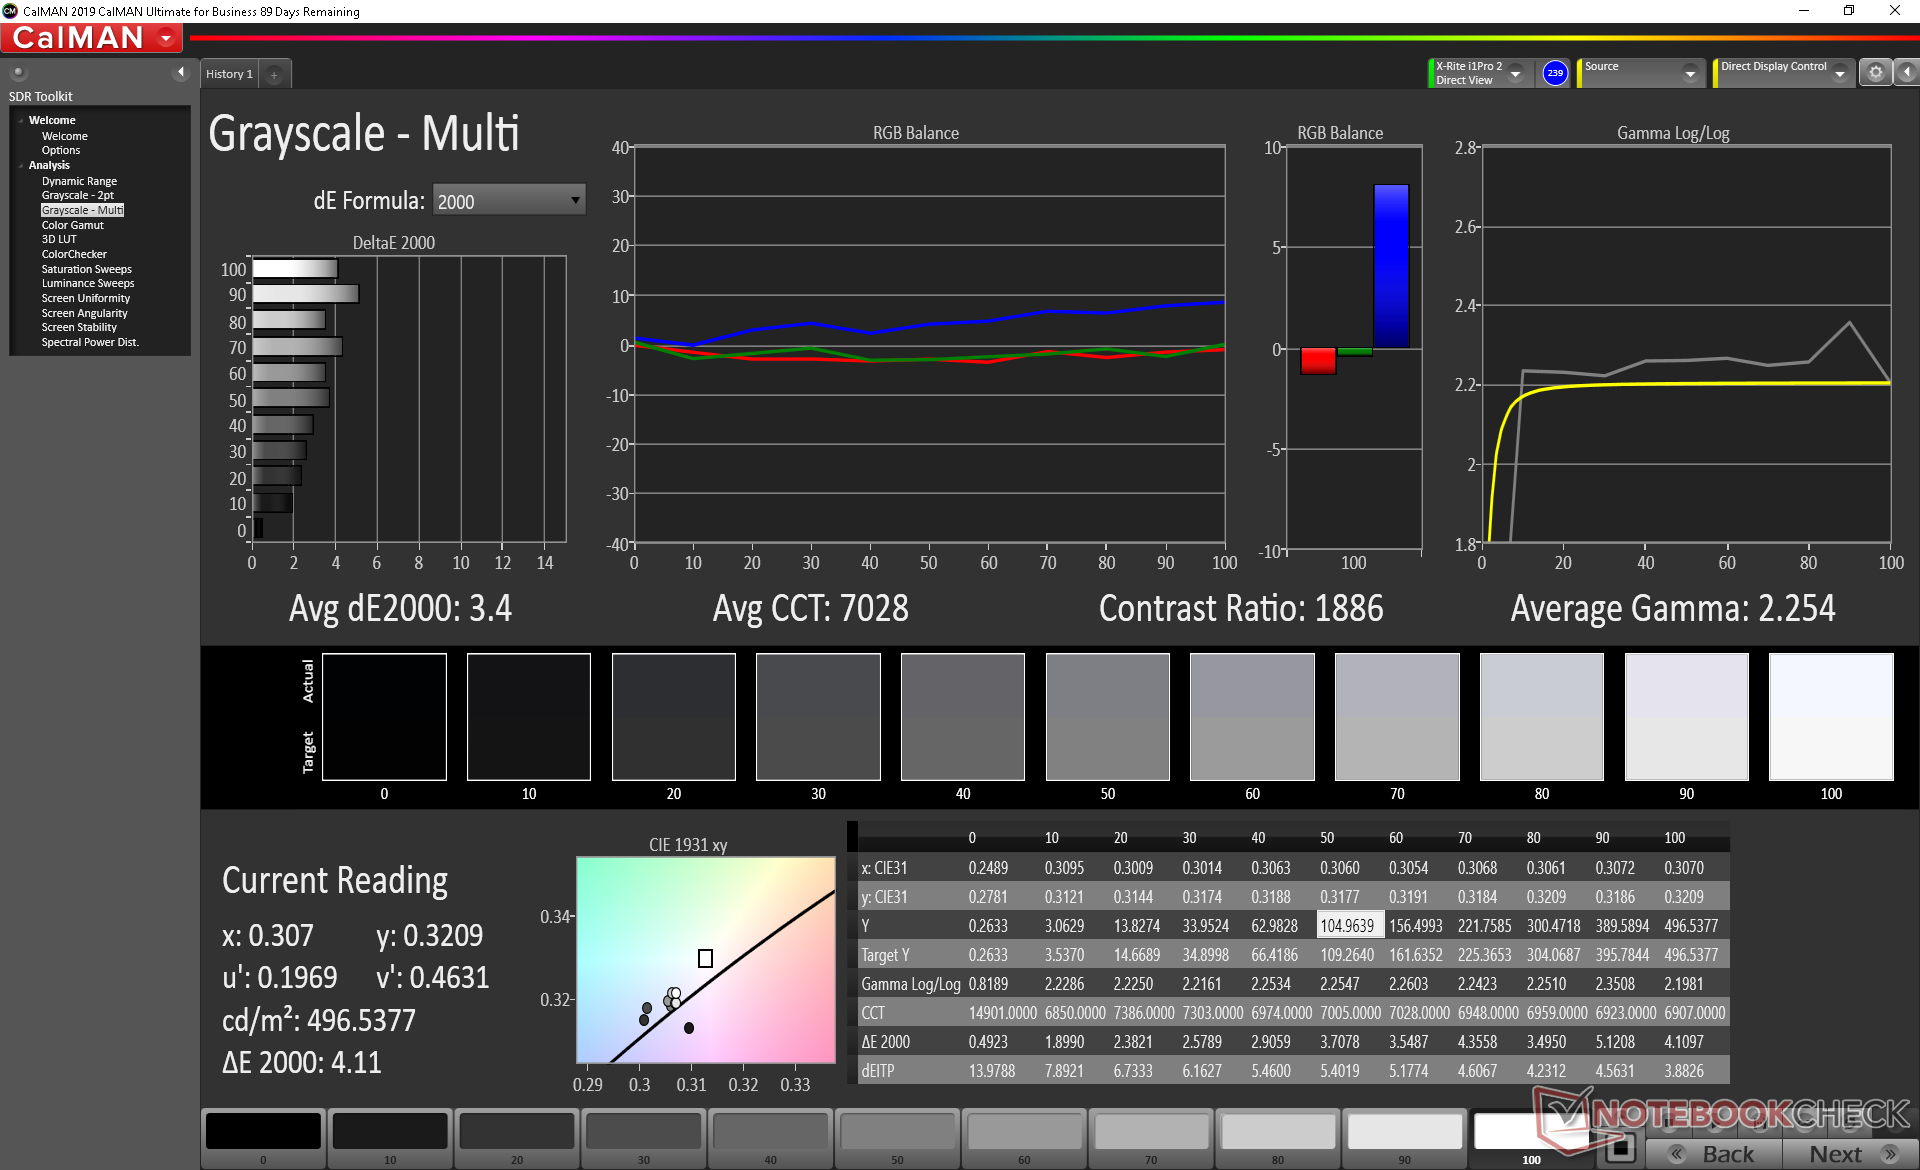
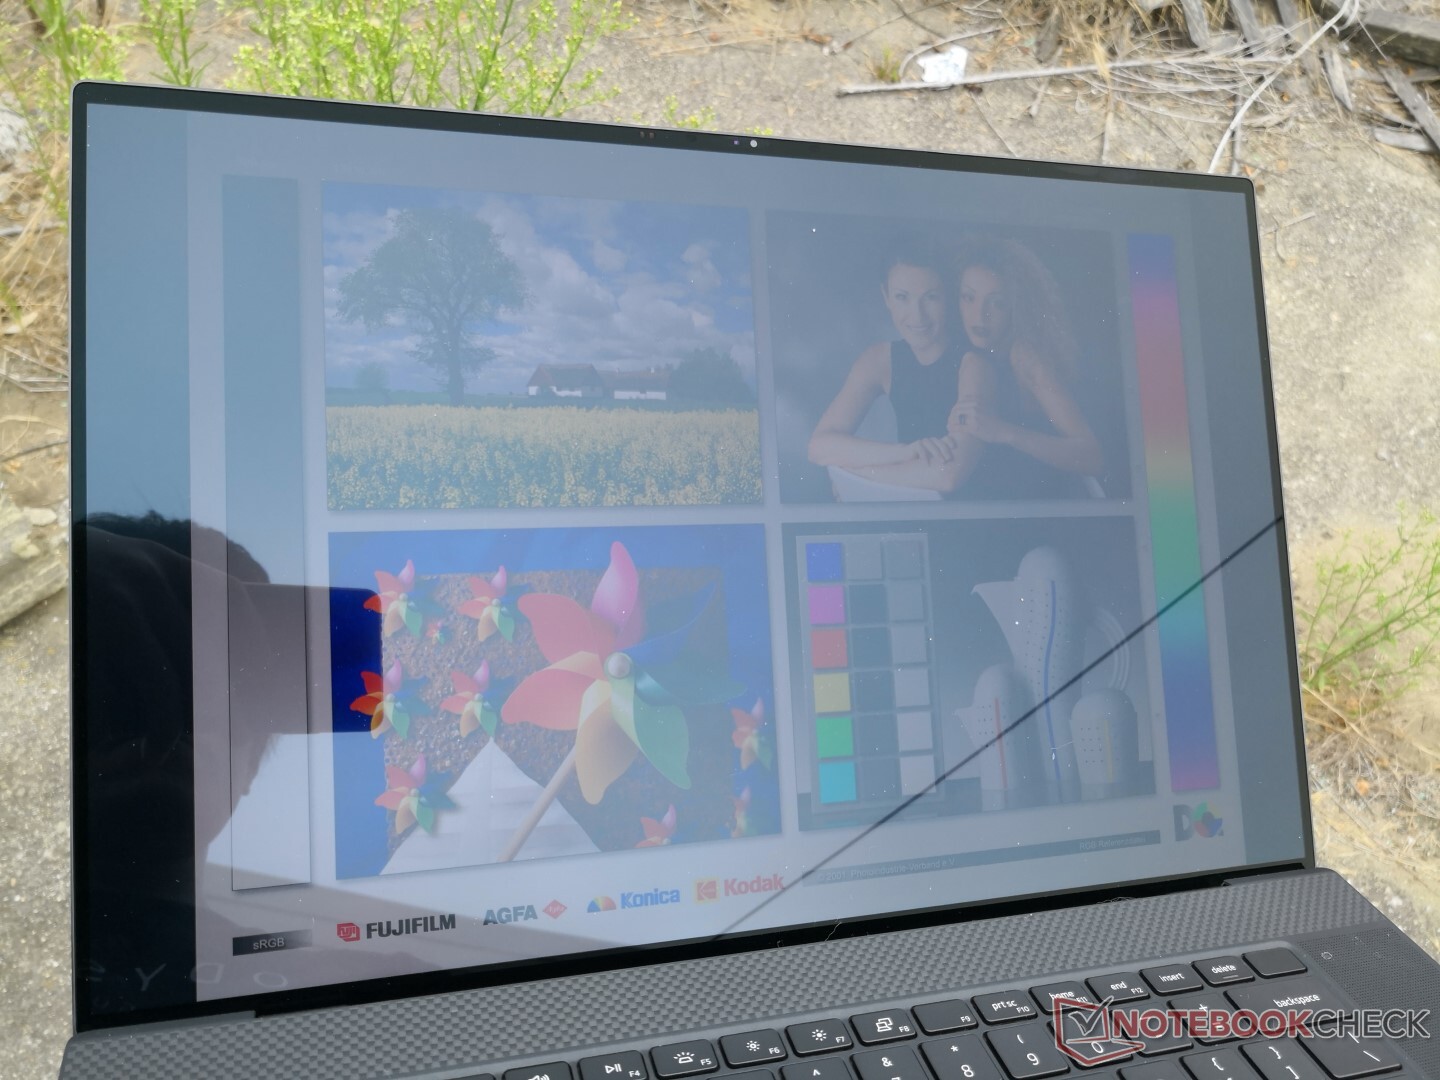
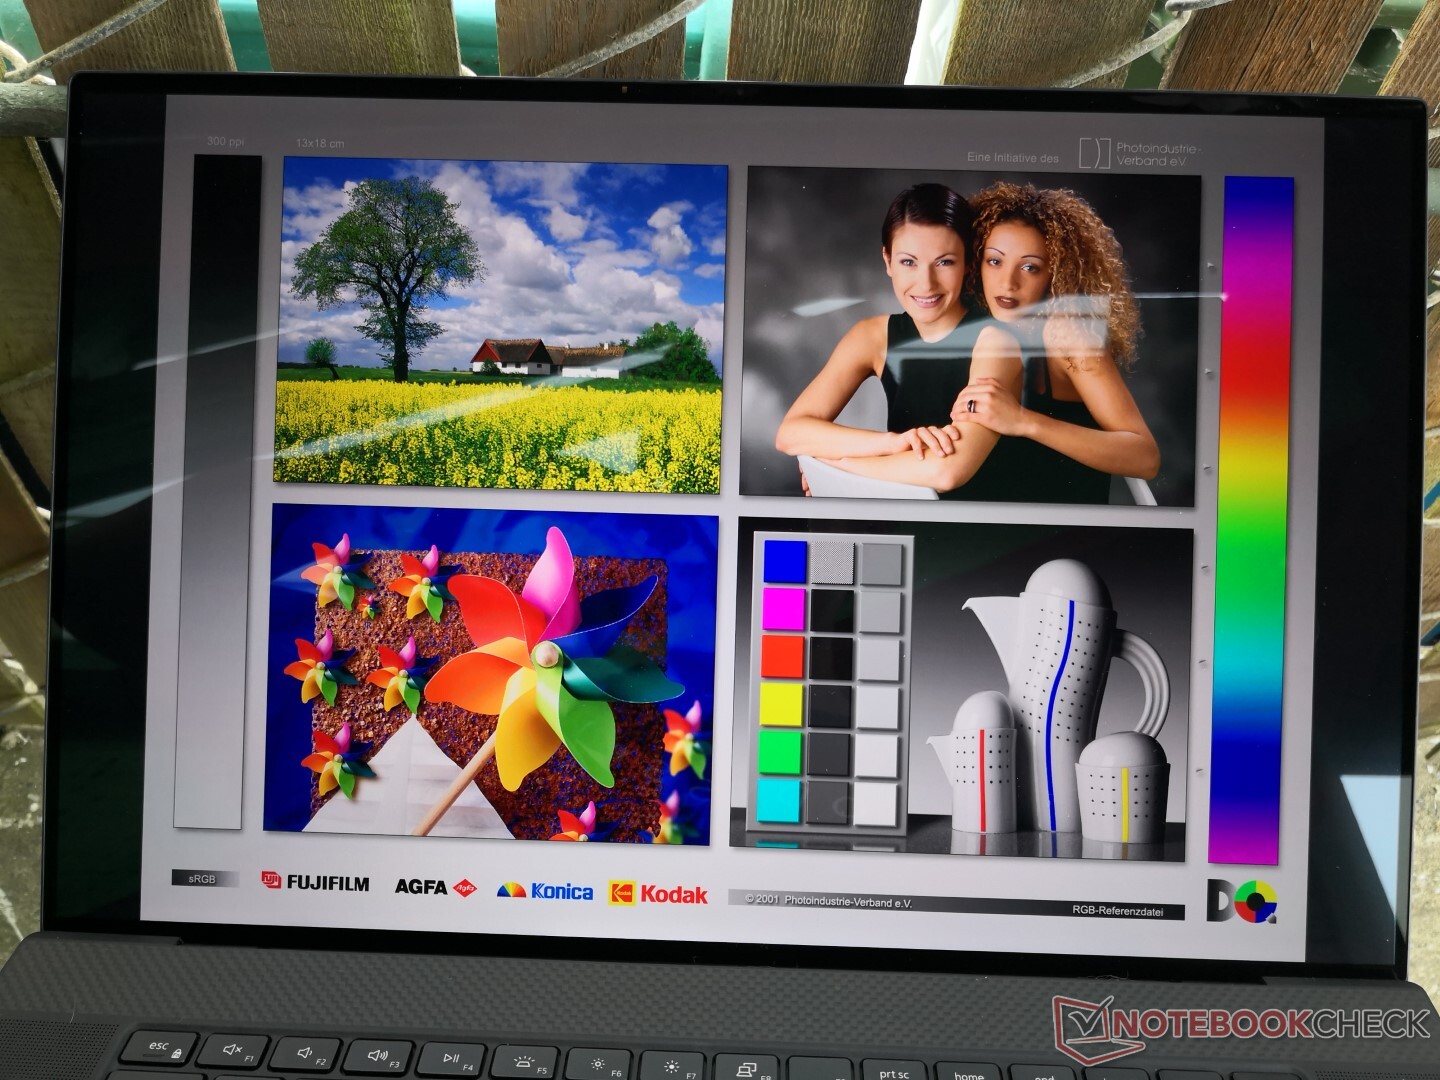
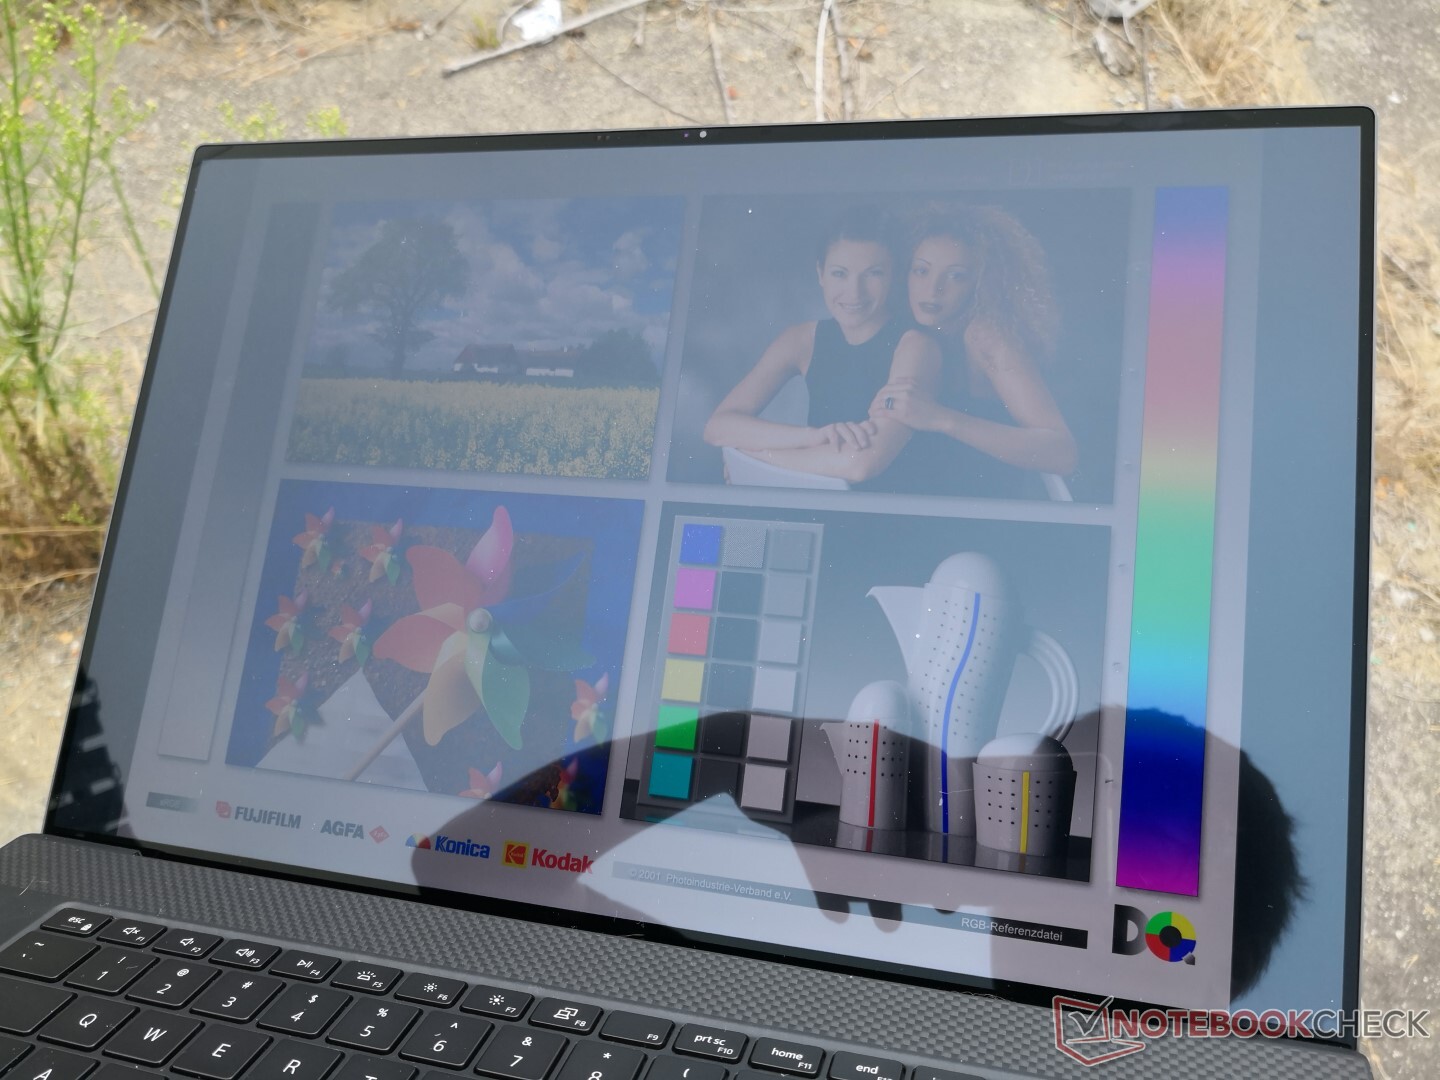
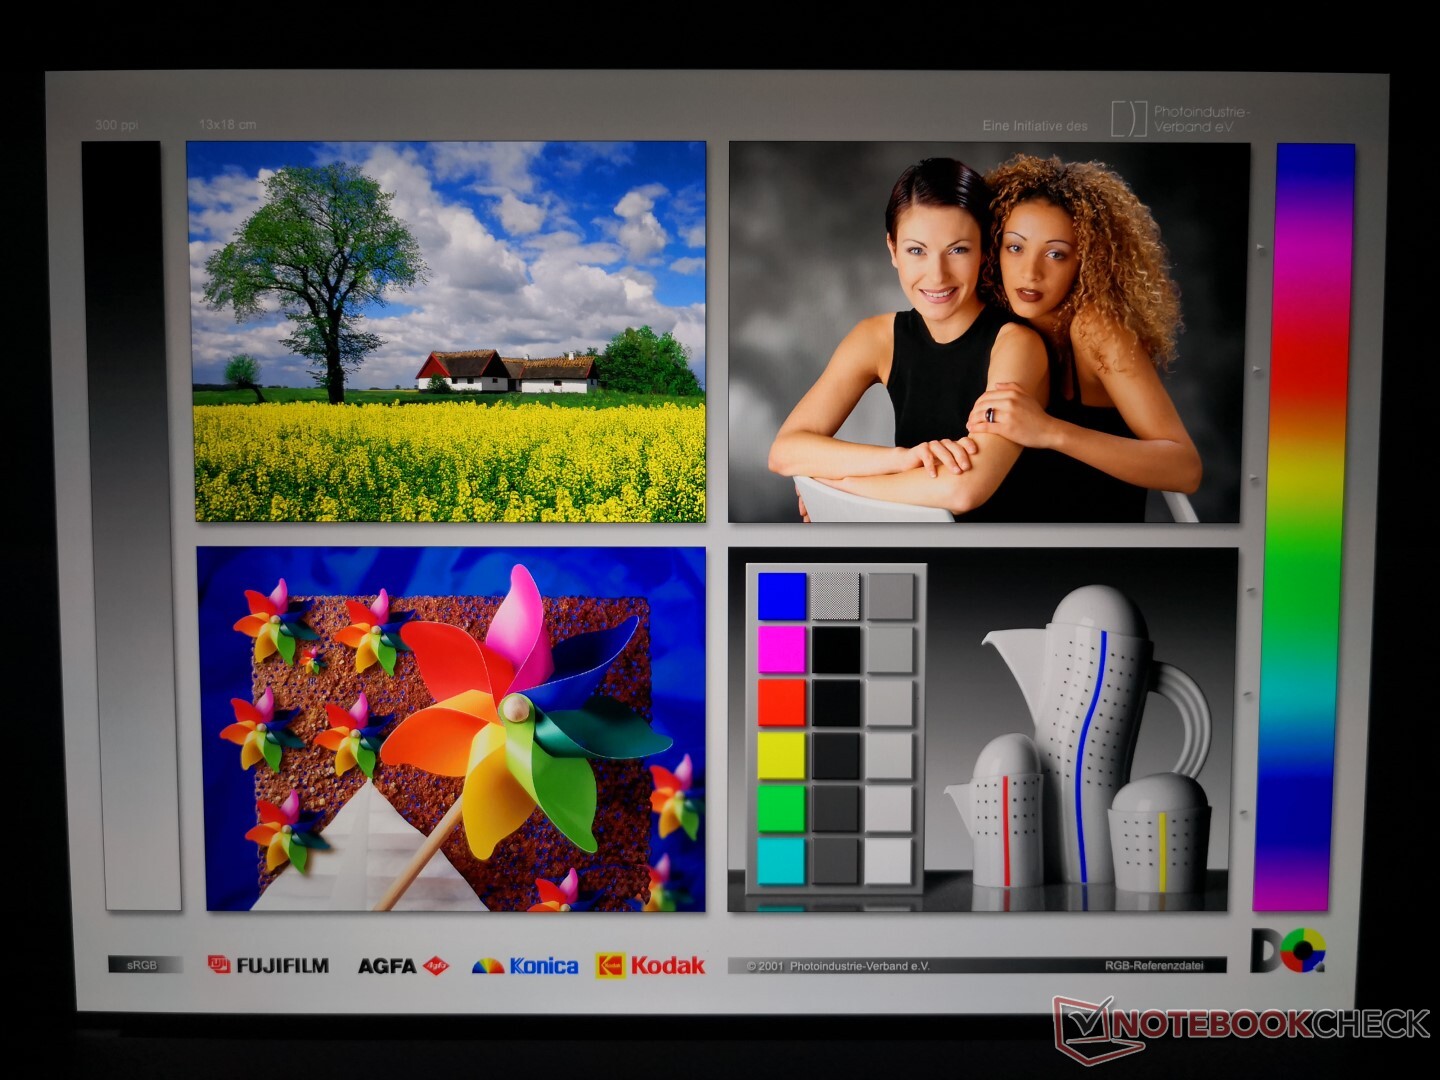
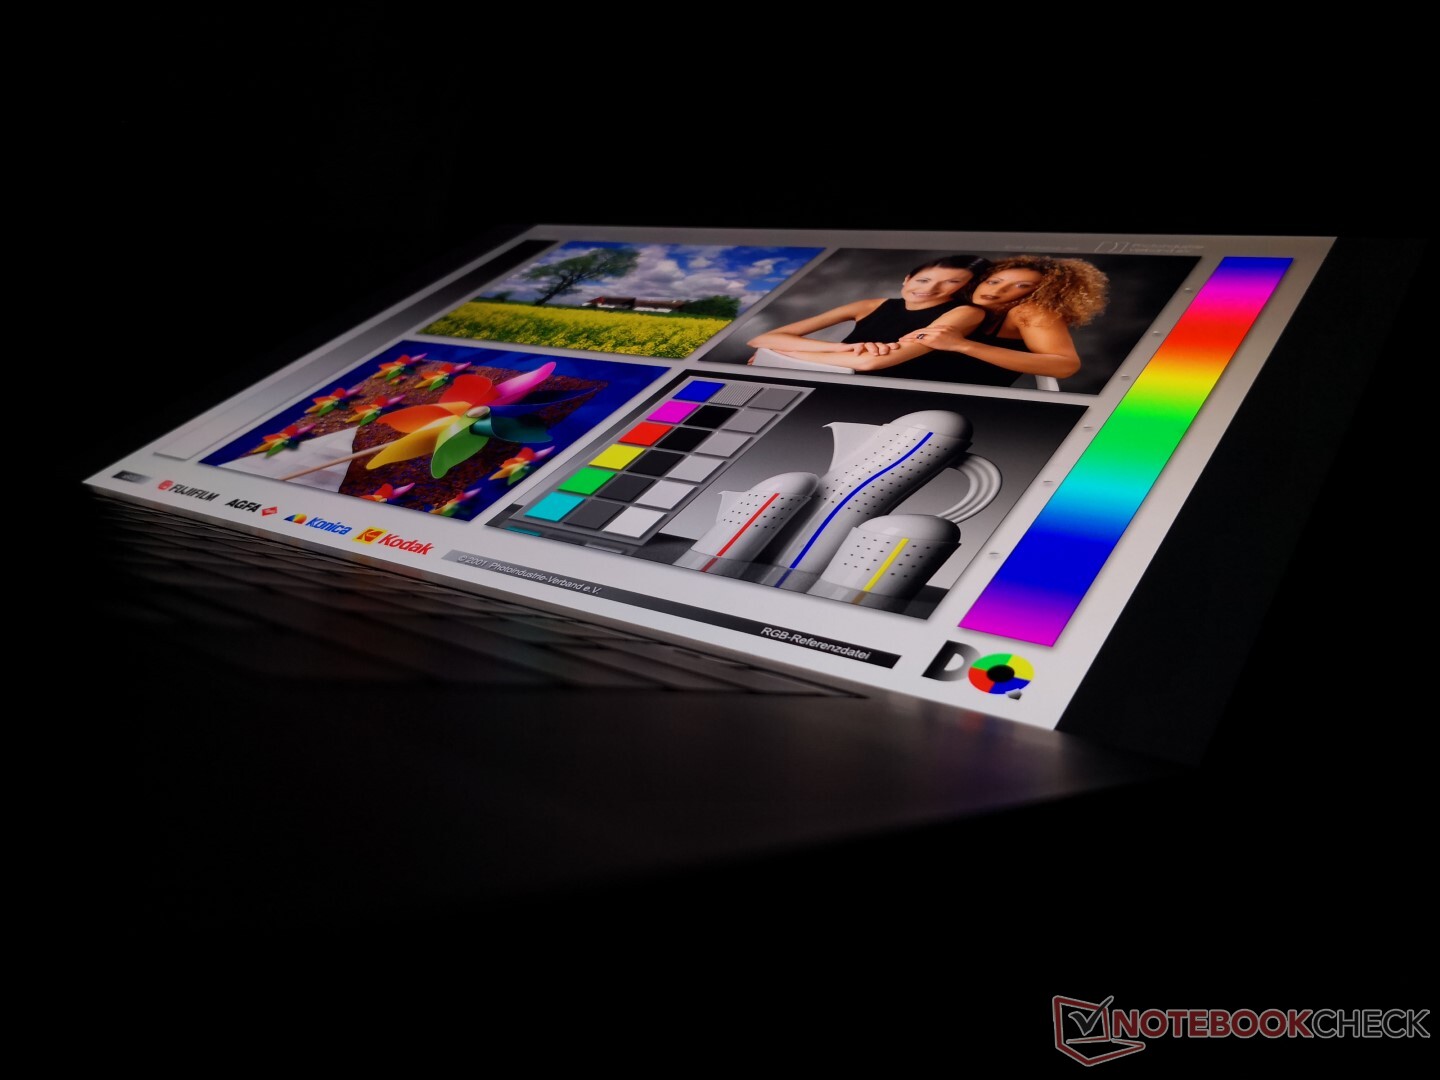
Dell uses the same Sharp LQ170R1 IPS panel and SHP14D6 controller for both the XPS 17 and Precision 5750 for the same visual experience between the two models. When compared to the displays on most other workstations, the XPS 17 offers an uncommon 16:10 aspect ratio with both touchscreen and crisper images due to the glossy overlay. It's also brighter at almost 500 nits compared to the ~300 nit average.
Response times are relatively slow for noticeable ghosting, but that is common on 4K laptop panels.


| |||||||||||||||||||||||||
Brightness Distribution: 90 %
Center on Battery: 483.8 cd/m²
Contrast: 1308:1 (Black: 0.37 cd/m²)
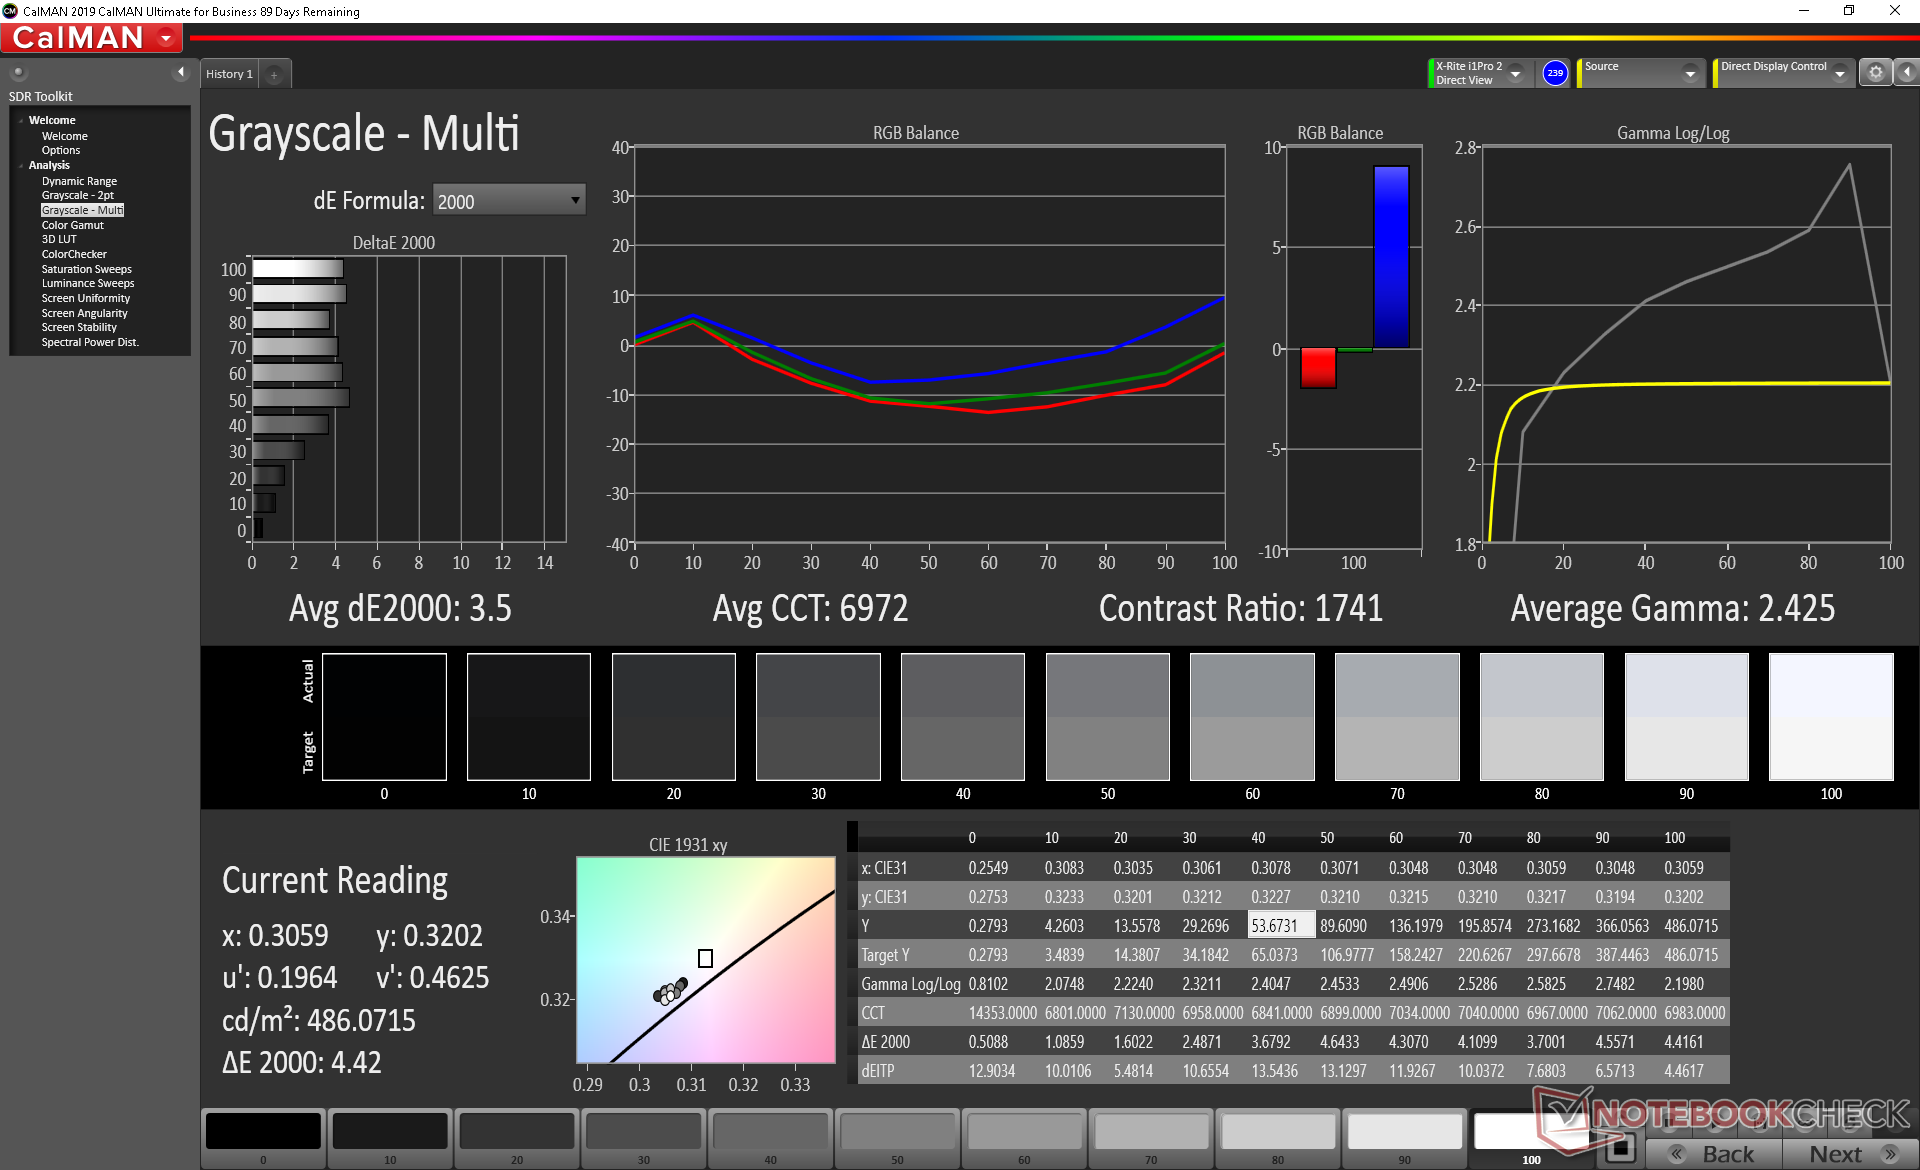
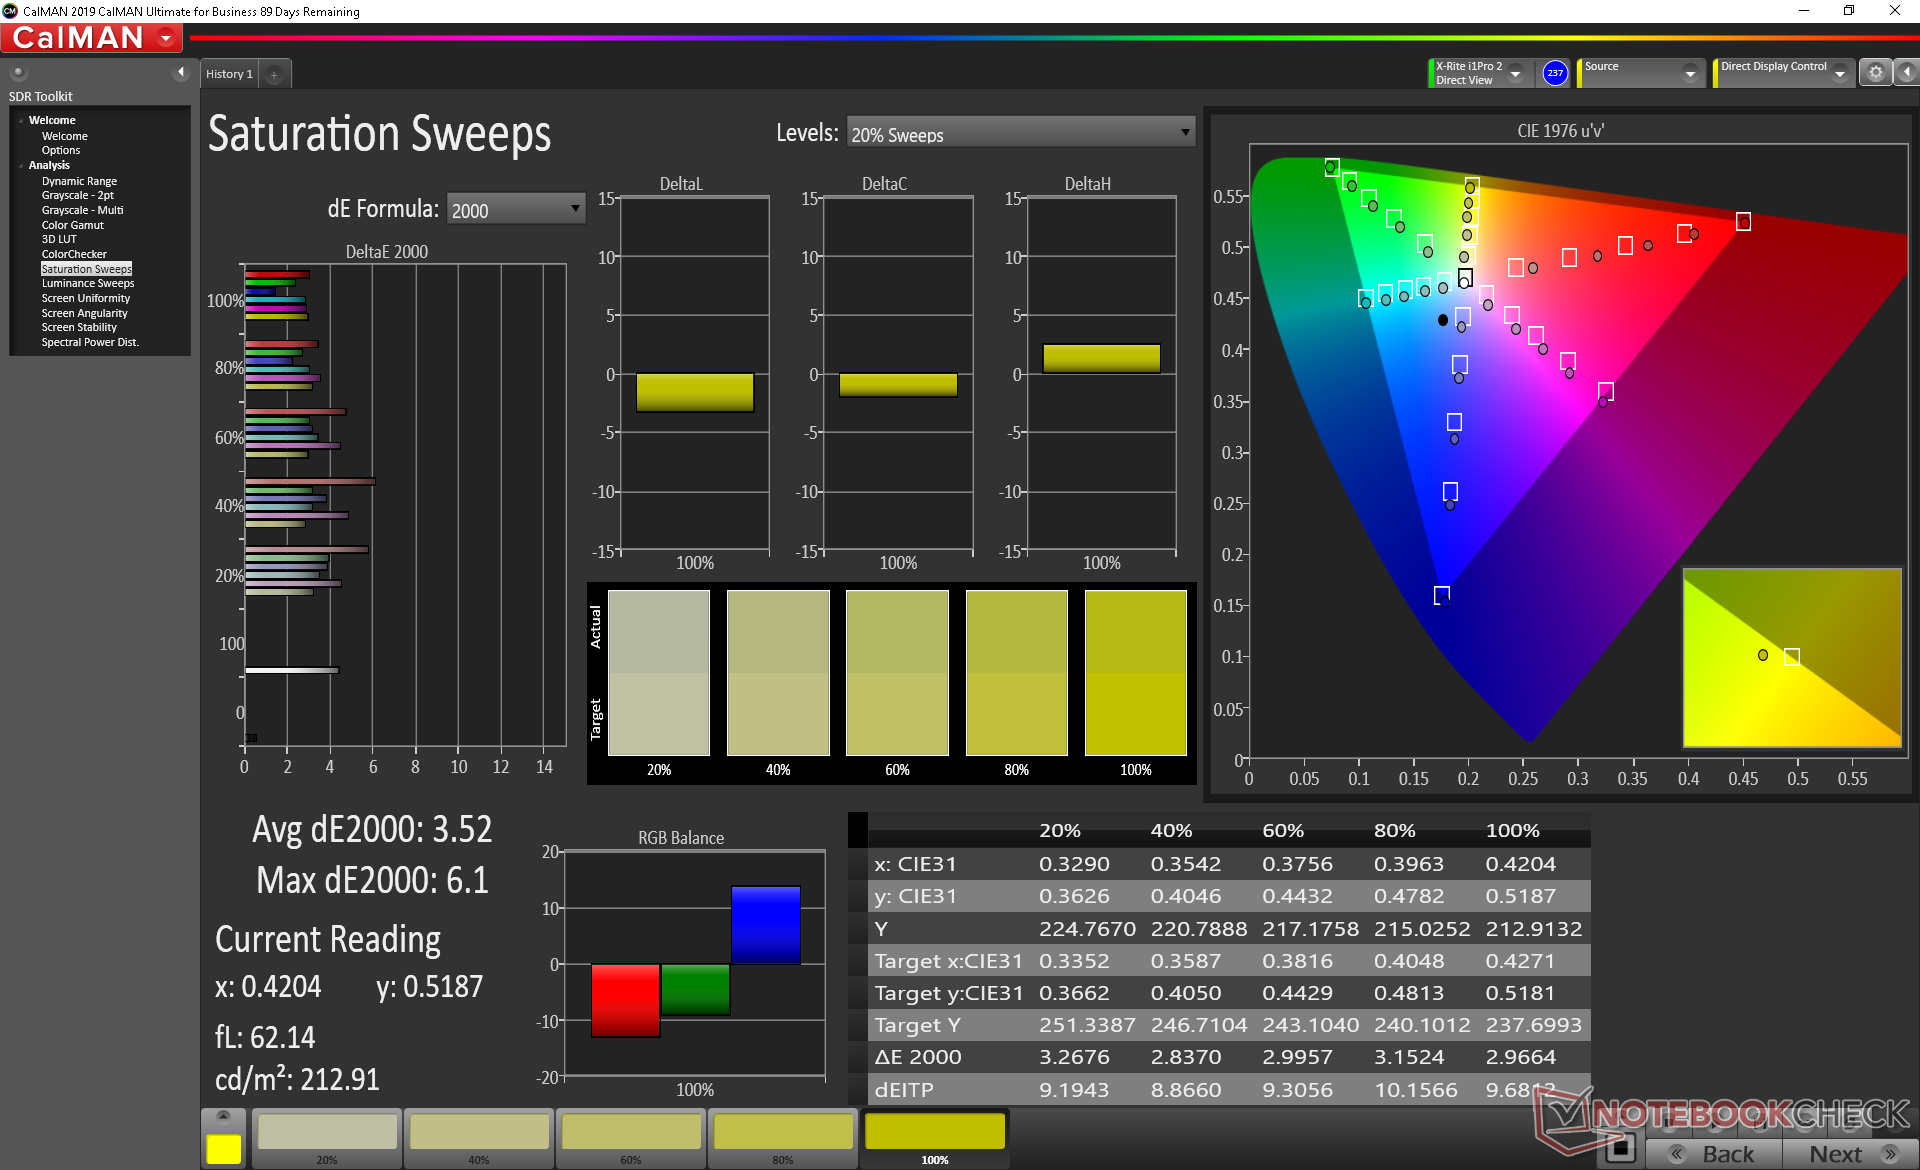
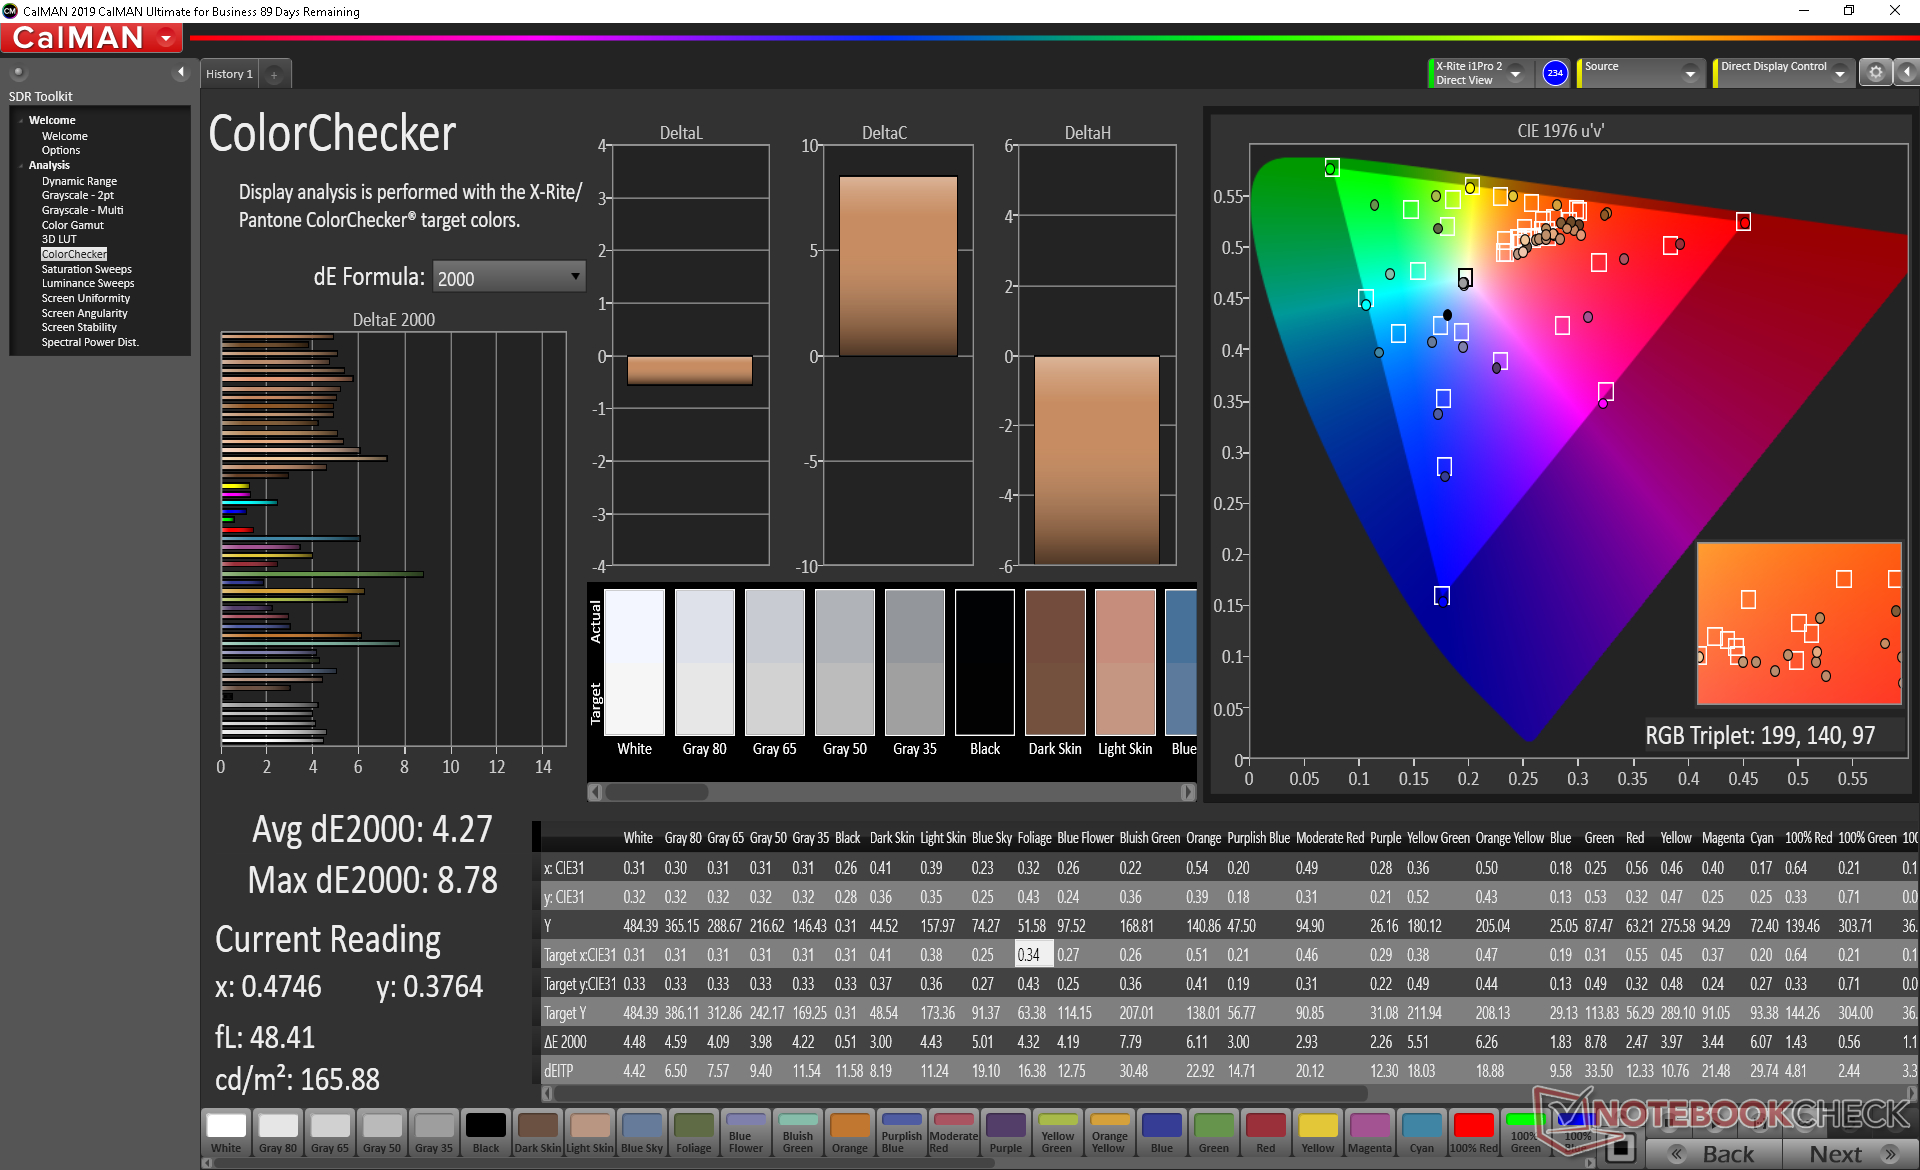
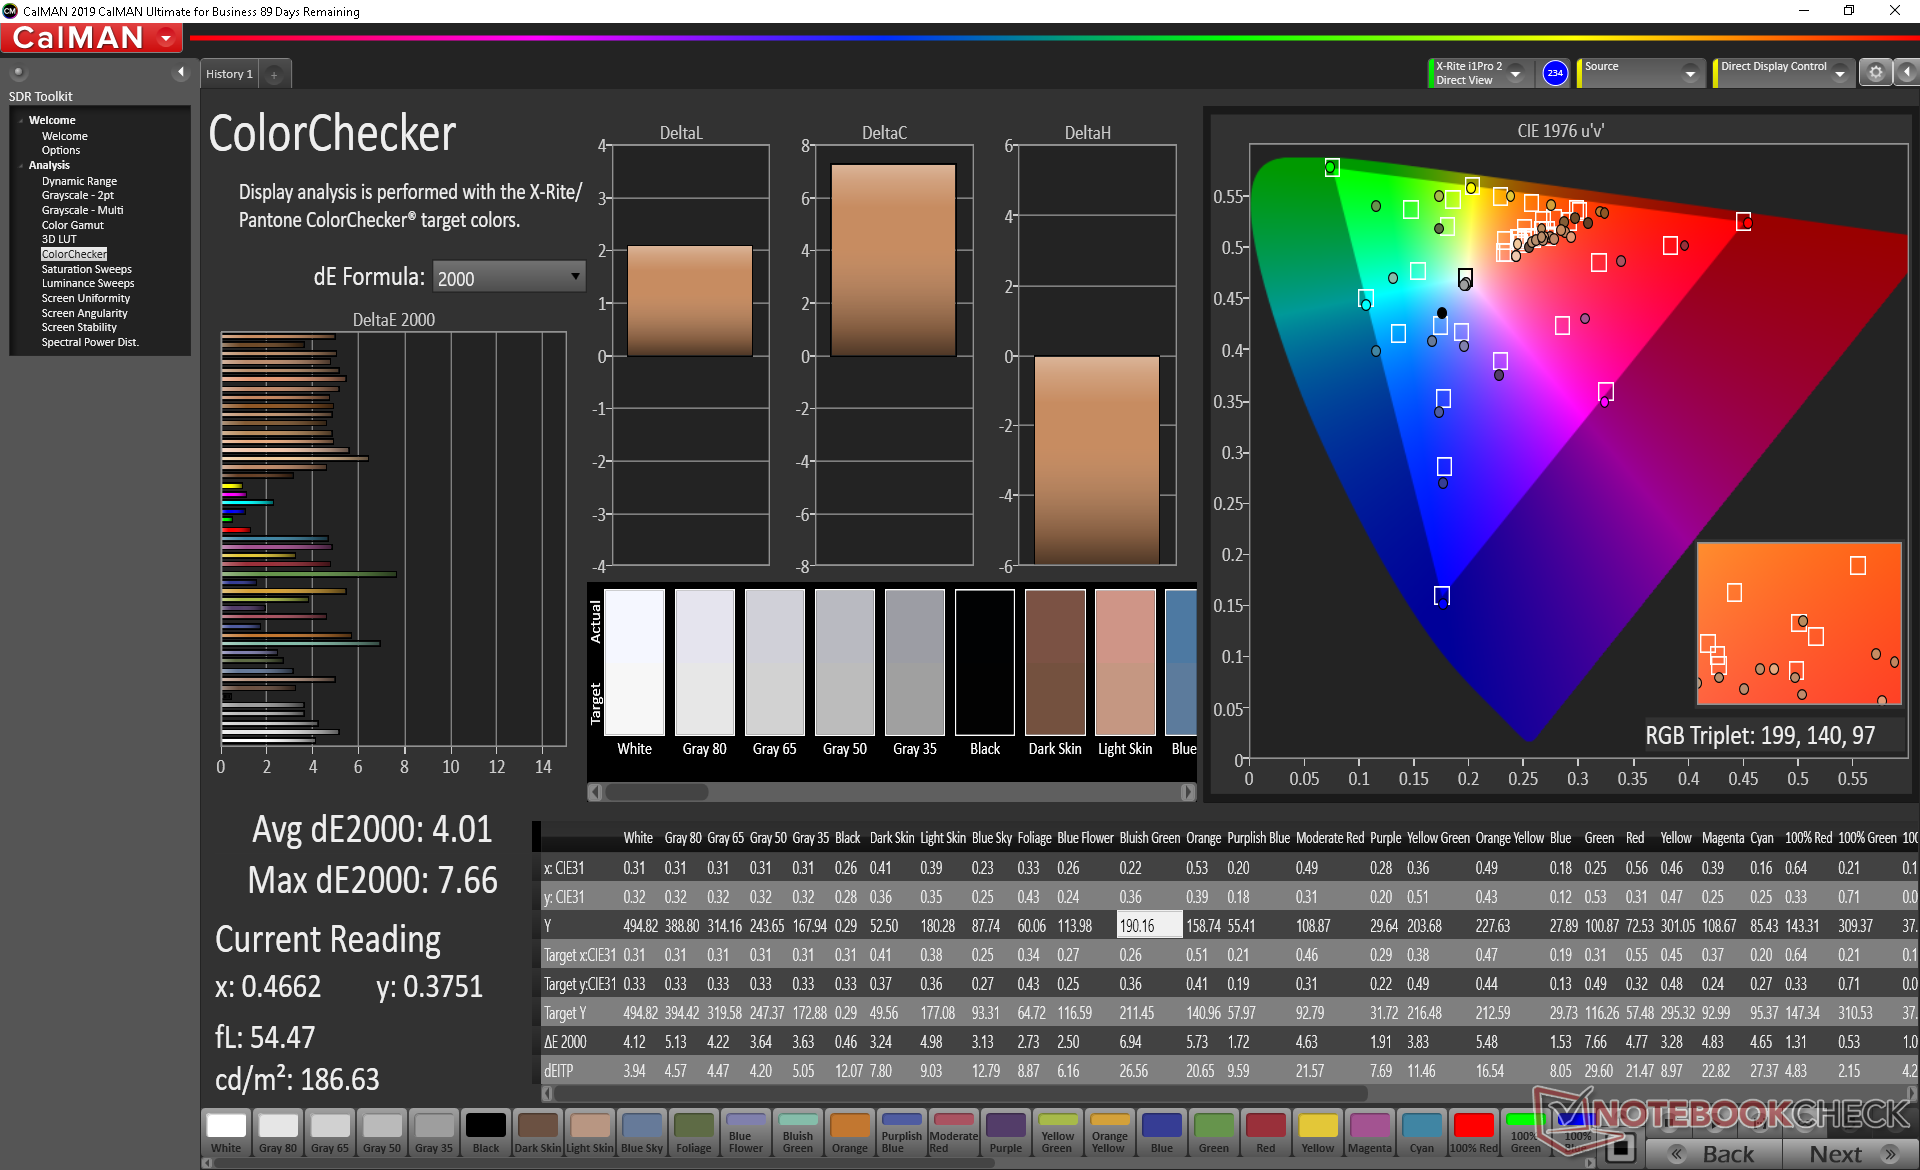
ΔE ColorChecker Calman: 4.27 | ∀{0.5-29.43 Ø4.72}
calibrated: 4.01
ΔE Greyscale Calman: 3.5 | ∀{0.09-98 Ø4.97}
99.9% sRGB (Argyll 1.6.3 3D)
86.7% AdobeRGB 1998 (Argyll 1.6.3 3D)
97.7% AdobeRGB 1998 (Argyll 3D)
99.7% sRGB (Argyll 3D)
83.6% Display P3 (Argyll 3D)
Gamma: 2.43
CCT: 1741 K
| Dell Precision 5000 5750 P92F Sharp LQ170R1, IPS, 17", 3840x2400 | Asus ProArt StudioBook Pro 17 W700G3T 170PUW1-A00, IPS, 17", 1920x1200 | MSI WS75 9TL-636 B173HAN04.2, IPS, 17.3", 1920x1080 | Dell Precision 7730 B173HAN01.3, IPS LED, 17.3", 1920x1080 | Lenovo ThinkPad P73-20QR002DGE N173HCE-E31, IPS LED, 17.3", 1920x1080 | MSI WE75 9TK AU Optronics B173HAN04.2, IPS, 17.3", 1920x1080 | |
|---|---|---|---|---|---|---|
| Display | 1% | -22% | -20% | -19% | -23% | |
| Display P3 Coverage (%) | 83.6 | 96.2 15% | 64.5 -23% | 65 -22% | 67.5 -19% | 63.2 -24% |
| sRGB Coverage (%) | 99.7 | 99.8 0% | 91.1 -9% | 93.4 -6% | 94.2 -6% | 89.9 -10% |
| AdobeRGB 1998 Coverage (%) | 97.7 | 84.7 -13% | 65.8 -33% | 66.3 -32% | 67.8 -31% | 64.3 -34% |
| Response Times | 7% | 11% | -7% | 11% | 17% | |
| Response Time Grey 50% / Grey 80% * (ms) | 41.2 ? | 41.2 ? -0% | 39.2 ? 5% | 48.8 ? -18% | 40 ? 3% | 30.8 ? 25% |
| Response Time Black / White * (ms) | 34 ? | 29.6 ? 13% | 28.4 ? 16% | 32.8 ? 4% | 28 ? 18% | 31.2 ? 8% |
| PWM Frequency (Hz) | 25000 ? | |||||
| Screen | 17% | -3% | 12% | -12% | 0% | |
| Brightness middle (cd/m²) | 483.8 | 323 -33% | 300 -38% | 322 -33% | 333 -31% | 287.3 -41% |
| Brightness (cd/m²) | 457 | 308 -33% | 288 -37% | 316 -31% | 310 -32% | 280 -39% |
| Brightness Distribution (%) | 90 | 88 -2% | 86 -4% | 84 -7% | 83 -8% | 89 -1% |
| Black Level * (cd/m²) | 0.37 | 0.36 3% | 0.25 32% | 0.24 35% | 0.39 -5% | 0.26 30% |
| Contrast (:1) | 1308 | 897 -31% | 1200 -8% | 1342 3% | 854 -35% | 1105 -16% |
| Colorchecker dE 2000 * | 4.27 | 1.1 74% | 3.9 9% | 2.2 48% | 4.4 -3% | 2.98 30% |
| Colorchecker dE 2000 max. * | 8.78 | 3.3 62% | 6 32% | 4.6 48% | 7.5 15% | 5.08 42% |
| Colorchecker dE 2000 calibrated * | 4.01 | 0.8 80% | 2.3 43% | 1.9 53% | 2 50% | 3.06 24% |
| Greyscale dE 2000 * | 3.5 | 0.8 77% | 4.3 -23% | 1.6 54% | 5.1 -46% | 3 14% |
| Gamma | 2.43 91% | 2.23 99% | 2.2 100% | 2.19 100% | 2.39 92% | 2.28 96% |
| CCT | 1741 373% | 6479 100% | 7391 88% | 6621 98% | 7061 92% | 6993 93% |
| Color Space (Percent of AdobeRGB 1998) (%) | 86.7 | 75.7 -13% | 59.2 -32% | 60.4 -30% | 61.1 -30% | 58.1 -33% |
| Color Space (Percent of sRGB) (%) | 99.9 | 99.8 0% | 91 -9% | 93.3 -7% | 94 -6% | 89.5 -10% |
| Total Average (Program / Settings) | 8% /
12% | -5% /
-5% | -5% /
4% | -7% /
-10% | -2% /
-2% |
* ... smaller is better
Color space covers all of sRGB and approximately 87 percent of the 3D AdobeRGB space which is standard for most 4K UHD panels. Lesser FHD options typically cover about 60 percent of AdobeRGB only.
X-Rite measurements show a decently calibrated display out of the box. Calibrating the panel further ourselves would improve colors and RGB balance, but only by slight margins.

Display Response Times
| ↔ Response Time Black to White | ||
|---|---|---|
| 34 ms ... rise ↗ and fall ↘ combined | ↗ 20 ms rise | 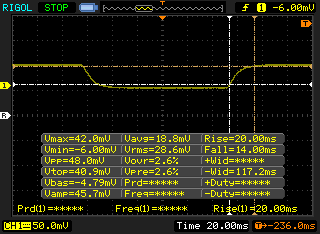 |
| ↘ 14 ms fall | ||
| The screen shows slow response rates in our tests and will be unsatisfactory for gamers. In comparison, all tested devices range from 0.1 (minimum) to 240 (maximum) ms. » 91 % of all devices are better. This means that the measured response time is worse than the average of all tested devices (19.8 ms). | ||
| ↔ Response Time 50% Grey to 80% Grey | ||
| 41.2 ms ... rise ↗ and fall ↘ combined | ↗ 18.4 ms rise | 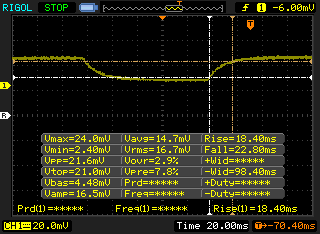 |
| ↘ 22.8 ms fall | ||
| The screen shows slow response rates in our tests and will be unsatisfactory for gamers. In comparison, all tested devices range from 0.165 (minimum) to 636 (maximum) ms. » 66 % of all devices are better. This means that the measured response time is worse than the average of all tested devices (31 ms). | ||
Screen Flickering / PWM (Pulse-Width Modulation)
| Screen flickering / PWM not detected | 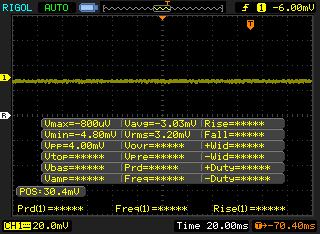 | ||
In comparison: 52 % of all tested devices do not use PWM to dim the display. If PWM was detected, an average of 7747 (minimum: 5 - maximum: 343500) Hz was measured. | |||
Outdoor visibility is better than many other 17-inch workstations due to the brighter backlight. However, glare from the glossy panel negates much of that advantage. Users cannot configure both matte and 4K UHD simultaneously.

Performance
There are plenty of CPU options including the Core i5-10400H, i7-10750H, i7-10850H, i7-10875H, i9-10885H, Xeon W-10855M, and Xeon W-10885M. Users who want vPro support should avoid the i7-10750H while users who want ECC RAM support should consider only the Xeon options.
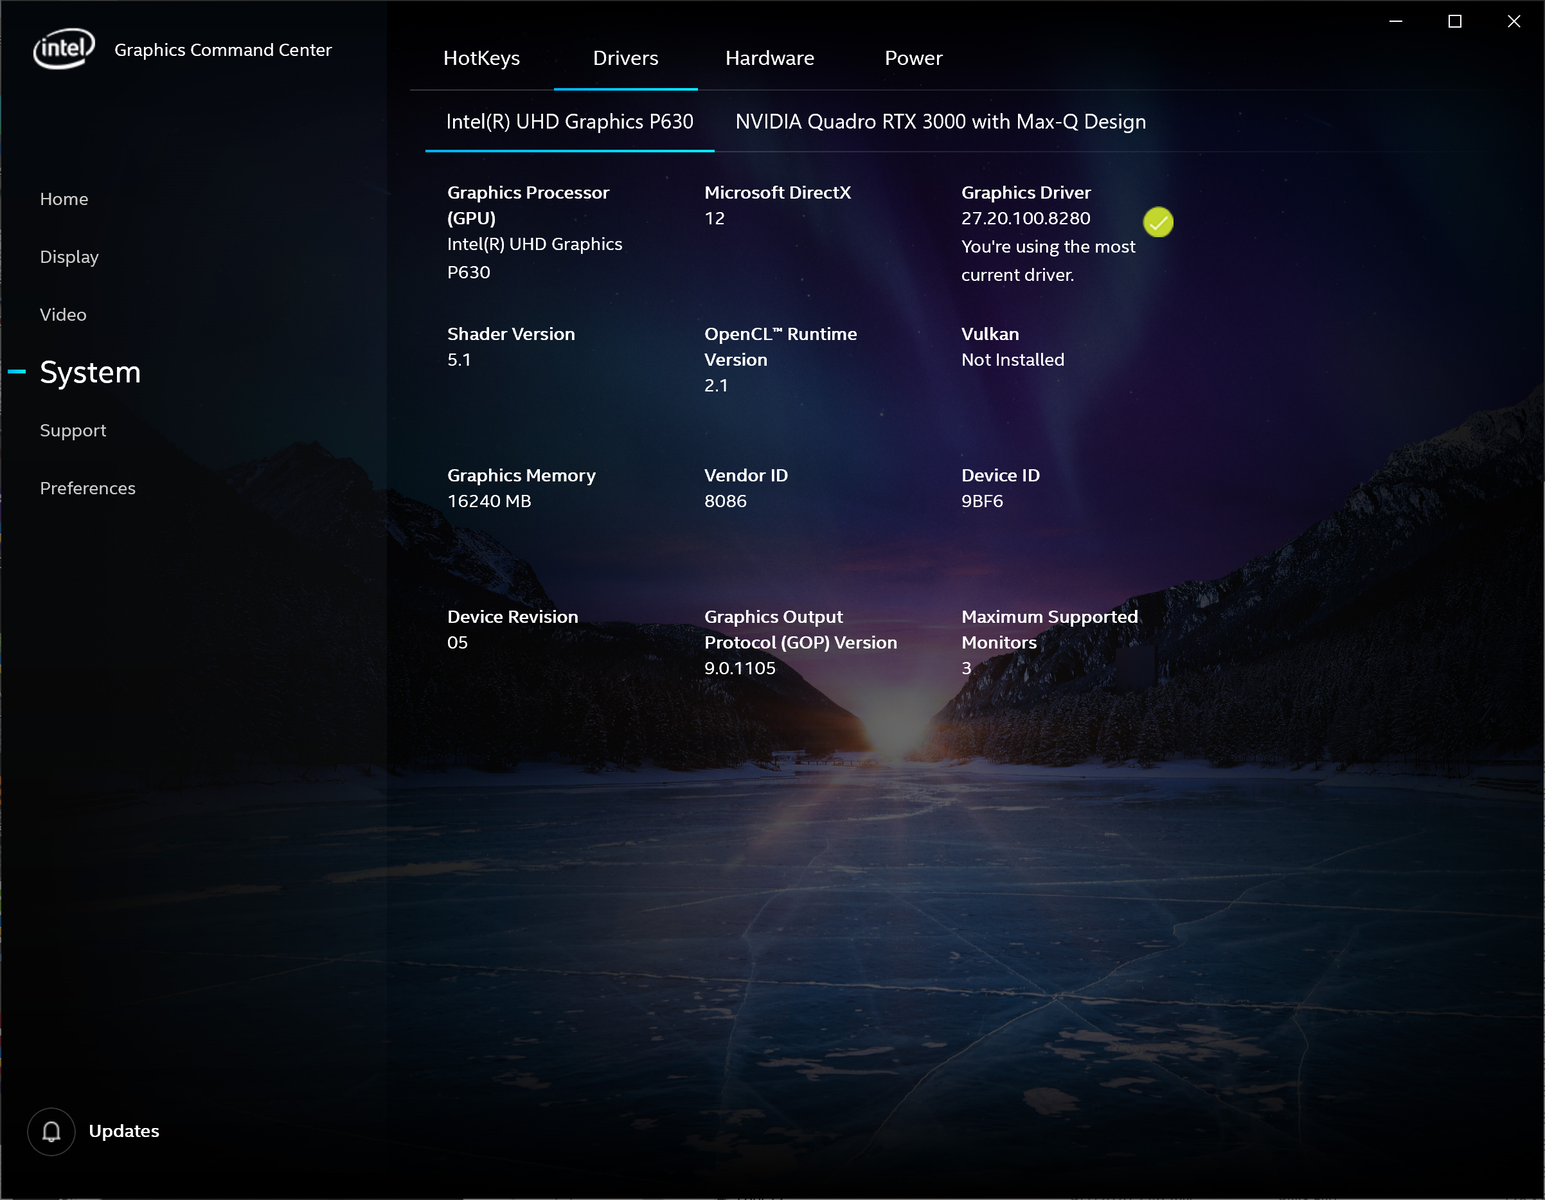
Graphics options include integrated UHD Graphics 630 only or the Quadro T2000 or Quadro RTX 3000 Max-Q with Optimus. RAM can be configured up to 64 GB or just half if configured with ECC instead.
We ran all performance benchmarks below on Dell's Ultra Performance mode for the best possible scores.
Processor
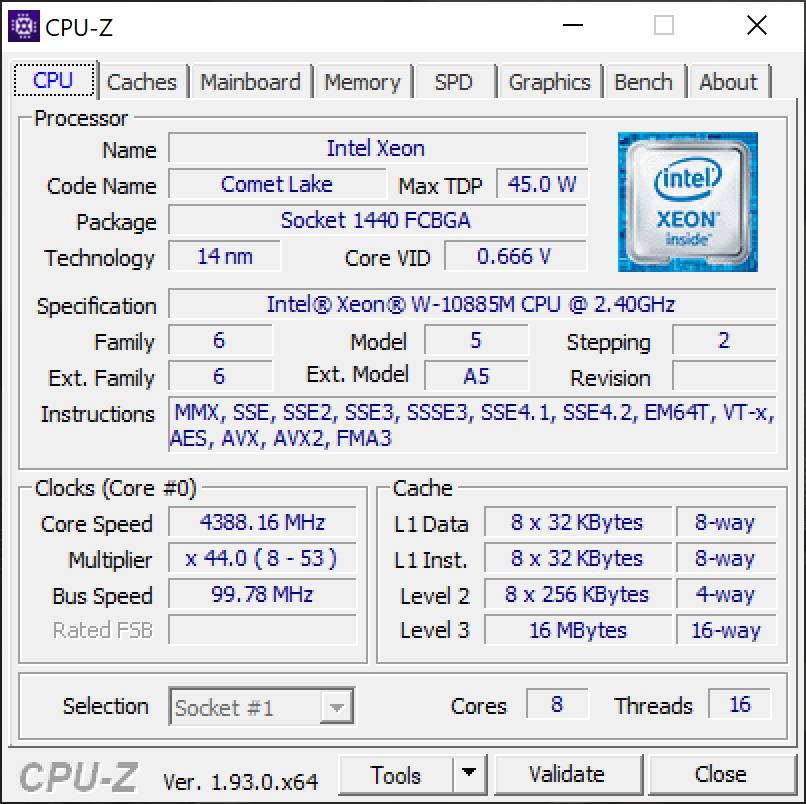
The Xeon W-10885M in both our Precision 5750 and 7550 test units return similar results to the Core i9-10980HK in the MSI WS66. Certain laptops with the Core i9 are able to run faster such as Dell's own Alienware m17 R3, but the difference is only about 12 percent. We're able to observe a performance dip of about 9 percent over time when running CineBench R15 xT in a loop due to the limitations of the overlying cooling system.
See our dedicated page on the Xeon W-10885M for more technical information and benchmark comparisons. Upgrading from the quad-core Core i5-10400H base option to our octa-core Xeon W will net about 90 percent faster multi-thread performance.
Cinebench R15: CPU Multi 64Bit | CPU Single 64Bit
Blender: v2.79 BMW27 CPU
7-Zip 18.03: 7z b 4 -mmt1 | 7z b 4
Geekbench 5.5: Single-Core | Multi-Core
HWBOT x265 Benchmark v2.2: 4k Preset
LibreOffice : 20 Documents To PDF
R Benchmark 2.5: Overall mean
| HWBOT x265 Benchmark v2.2 / 4k Preset | |
| Corsair One i160 | |
| Dell Precision 5000 5750 P92F | |
| Eluktronics RP-17 | |
| MSI WS66 10TMT-207US | |
| Average Intel Xeon W-10885M (8.89 - 13.6, n=3) | |
| Dell Precision 5550 P91F | |
| MSI GS66 Stealth 10SE-045 | |
| Dell Precision 7730 | |
| Lenovo ThinkPad P73-20QR002DGE | |
| Acer ConceptD 3 Pro CN315-71P-73W1 | |
| Dell XPS 15 9500 Core i5 | |
| LibreOffice / 20 Documents To PDF | |
| Dell XPS 15 9500 Core i5 | |
| MSI GS66 Stealth 10SE-045 | |
| Eluktronics RP-17 | |
| Acer ConceptD 9 Pro | |
| Acer ConceptD 3 Pro CN315-71P-73W1 | |
| Average Intel Xeon W-10885M (44.4 - 58.1, n=3) | |
| Dell Precision 5000 5750 P92F | |
| MSI WS66 10TMT-207US | |
| Dell Precision 5550 P91F | |
| R Benchmark 2.5 / Overall mean | |
| Acer ConceptD 3 Pro CN315-71P-73W1 | |
| Dell XPS 15 9500 Core i5 | |
| MSI GS66 Stealth 10SE-045 | |
| Dell Precision 5550 P91F | |
| Eluktronics RP-17 | |
| MSI WS66 10TMT-207US | |
| Dell Precision 5000 5750 P92F | |
| Average Intel Xeon W-10885M (0.551 - 0.57, n=3) | |
* ... smaller is better
System Performance
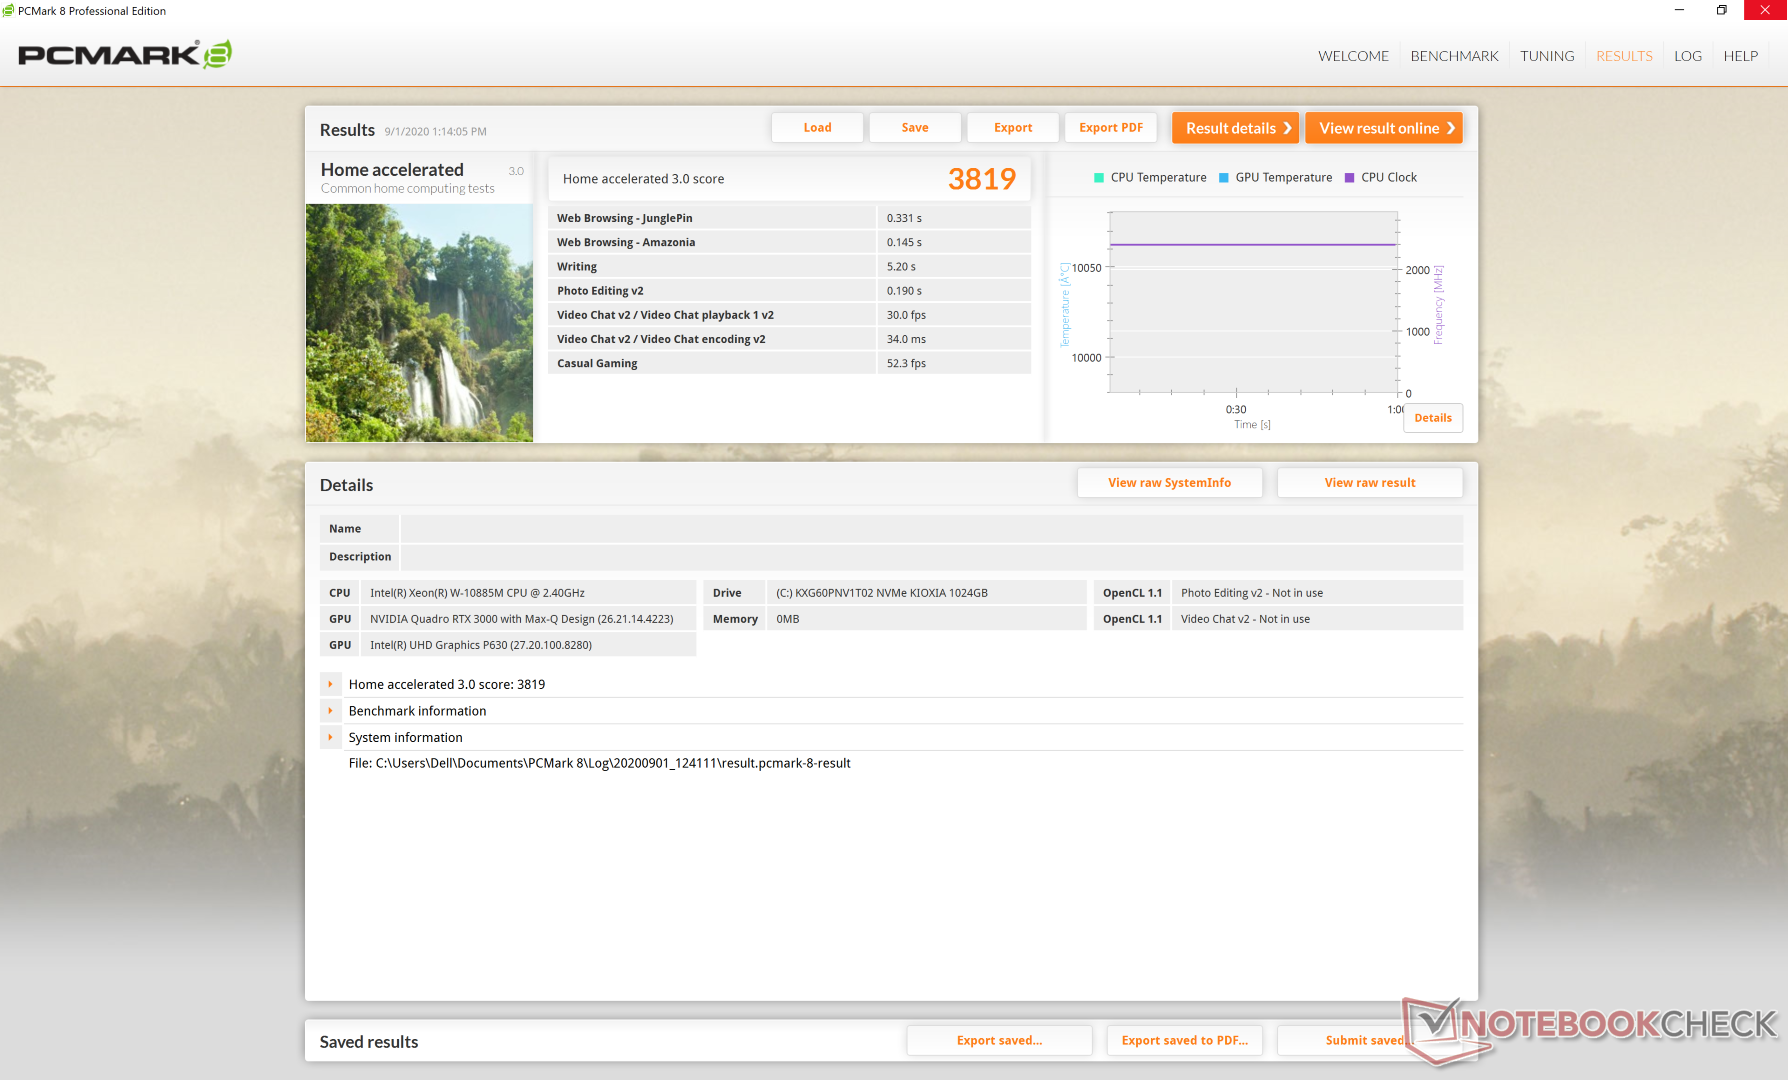
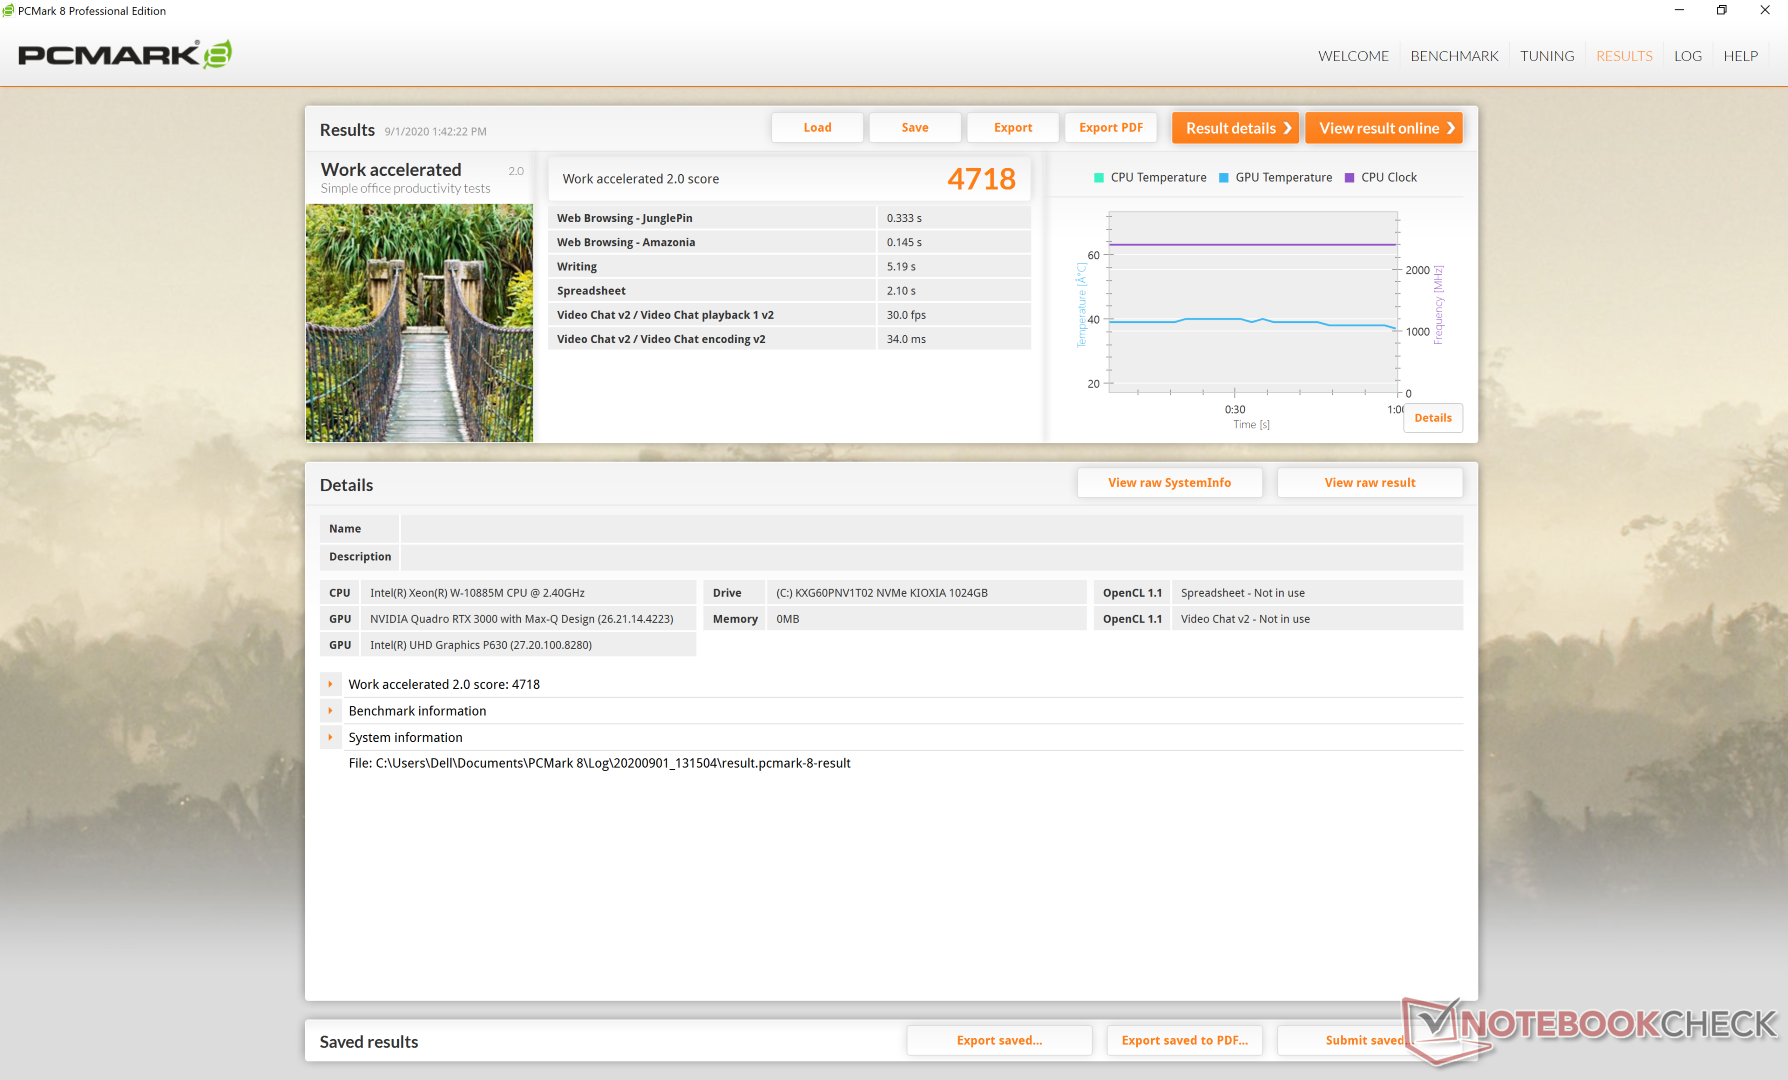
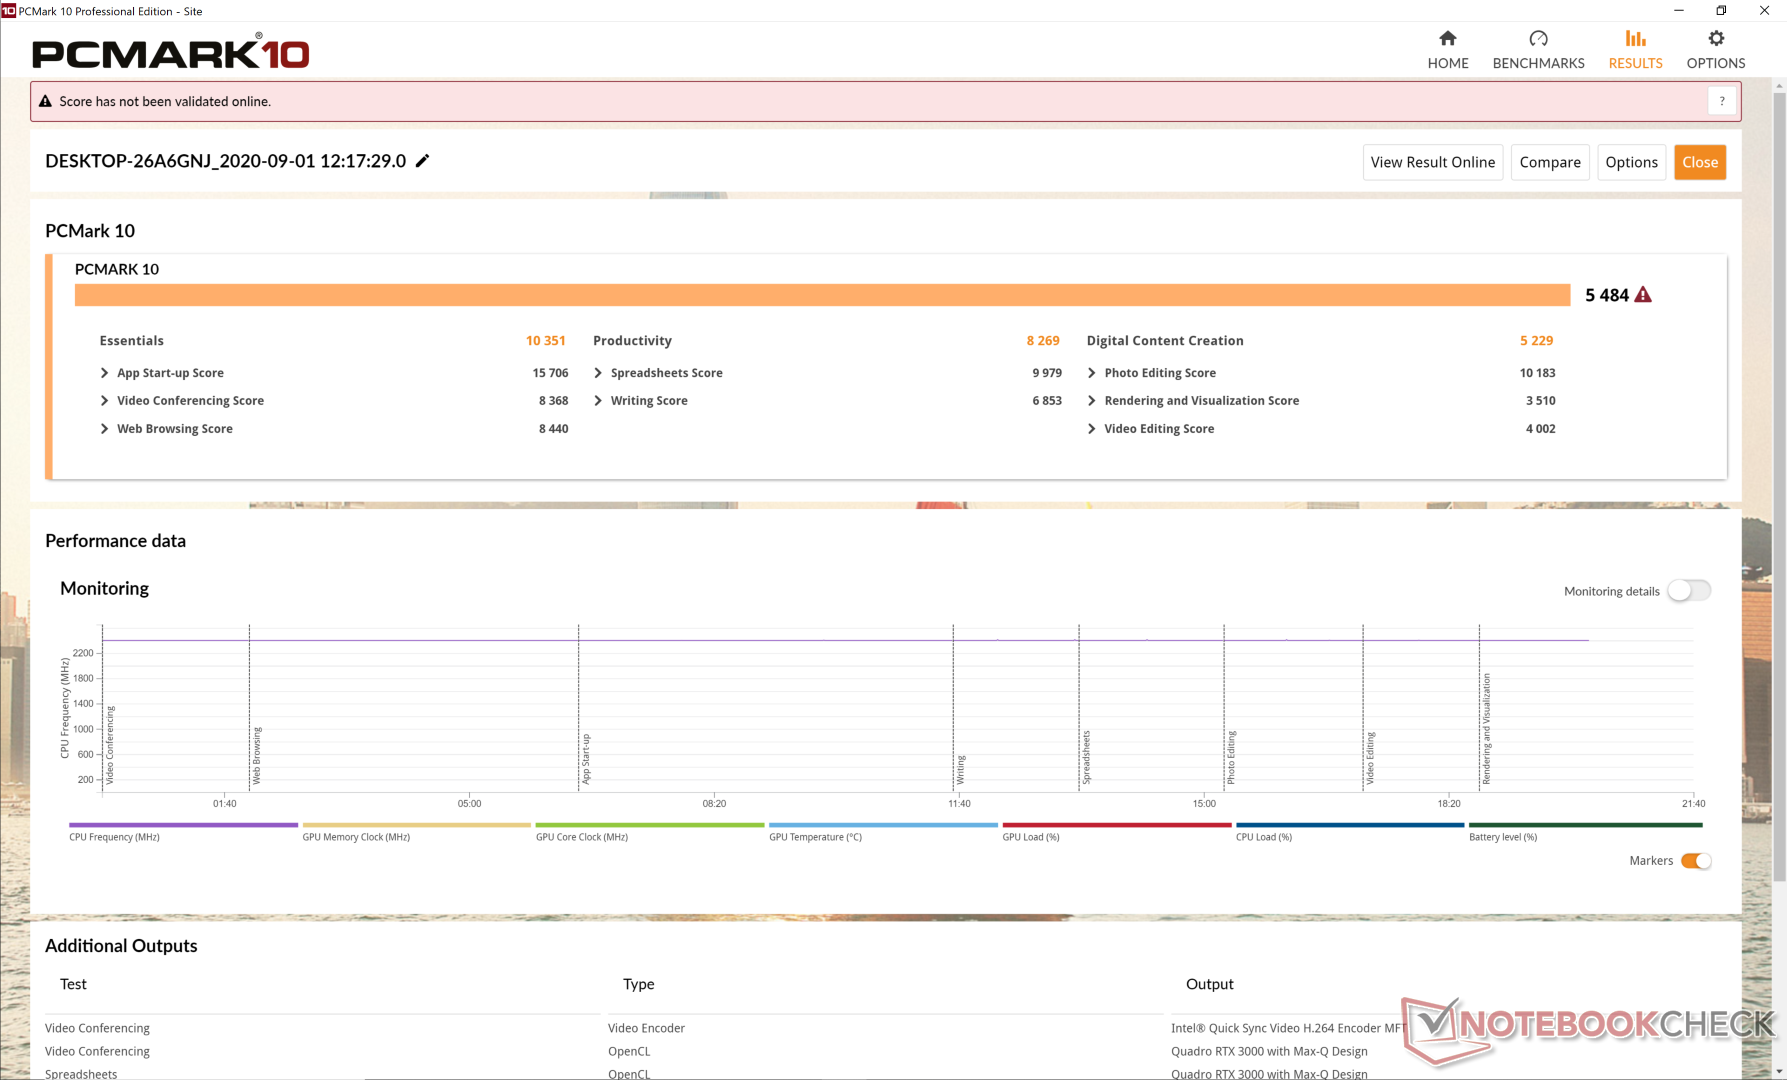
| PCMark 8 Home Score Accelerated v2 | 3819 points | |
| PCMark 8 Work Score Accelerated v2 | 4718 points | |
| PCMark 10 Score | 5484 points | |
Help | ||
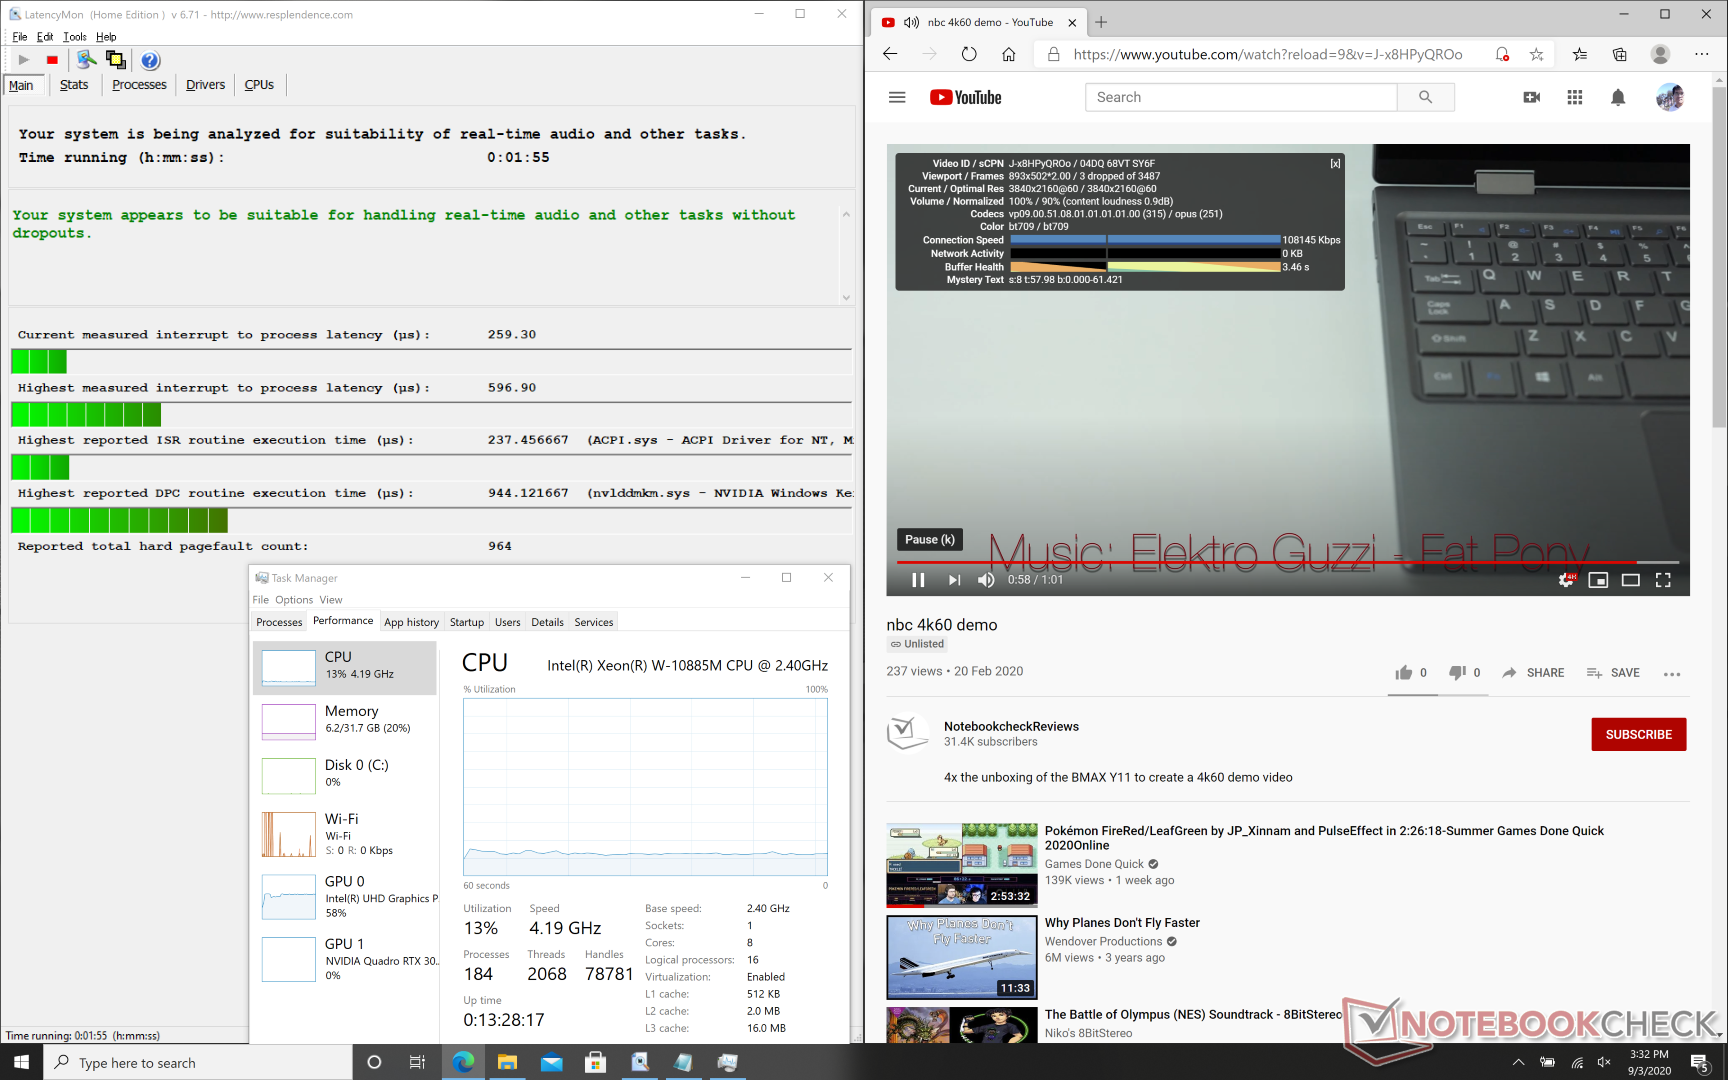
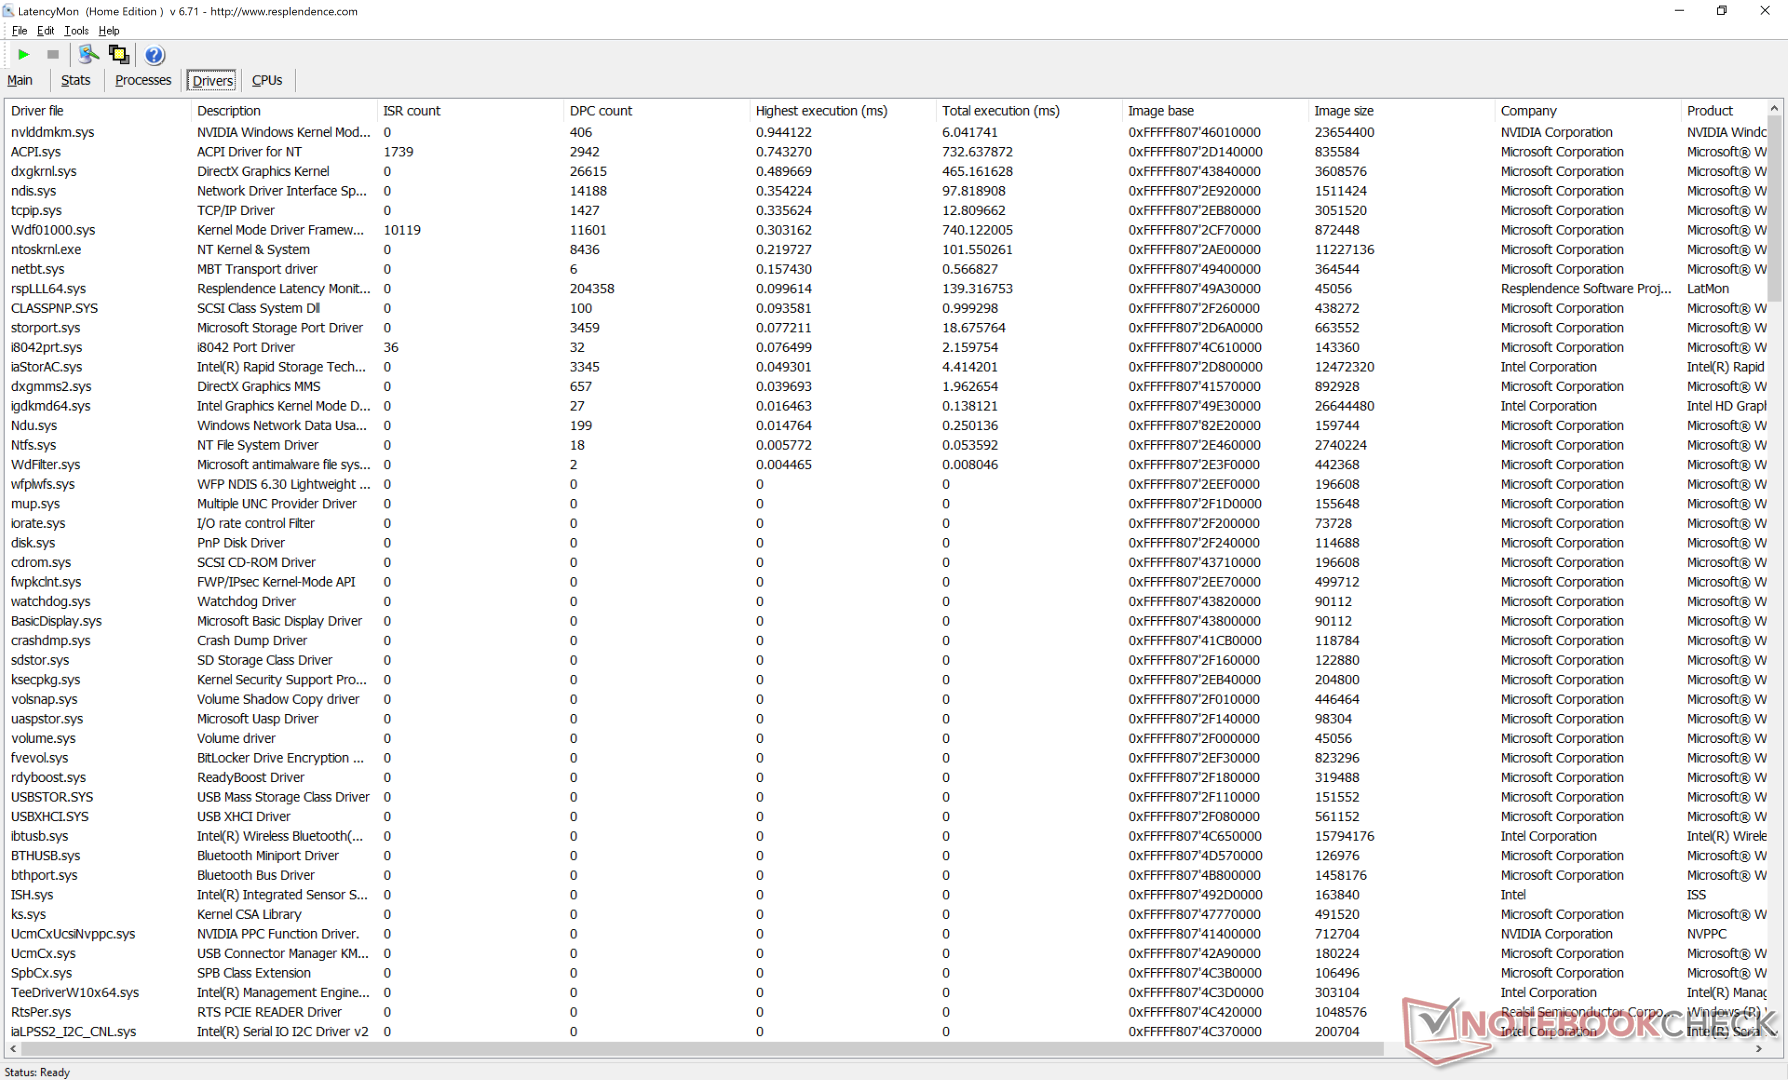
DPC Latency
LatencyMon shows no major DPC latency issues in contrast to what we observed on the Precision 7550. Interestingly, we recorded three dropped frames during our minute-long 4K60 video test.
| DPC Latencies / LatencyMon - interrupt to process latency (max), Web, Youtube, Prime95 | |
| Dell Precision 7550 | |
| MSI WS66 10TMT-207US | |
| Eluktronics RP-17 | |
| Acer ConceptD 3 Pro CN315-71P-73W1 | |
| Acer ConceptD 9 Pro | |
| Razer Blade 15 Studio Edition 2020 | |
| Dell Precision 5000 5750 P92F | |
| Dell Precision 5550 P91F | |
* ... smaller is better
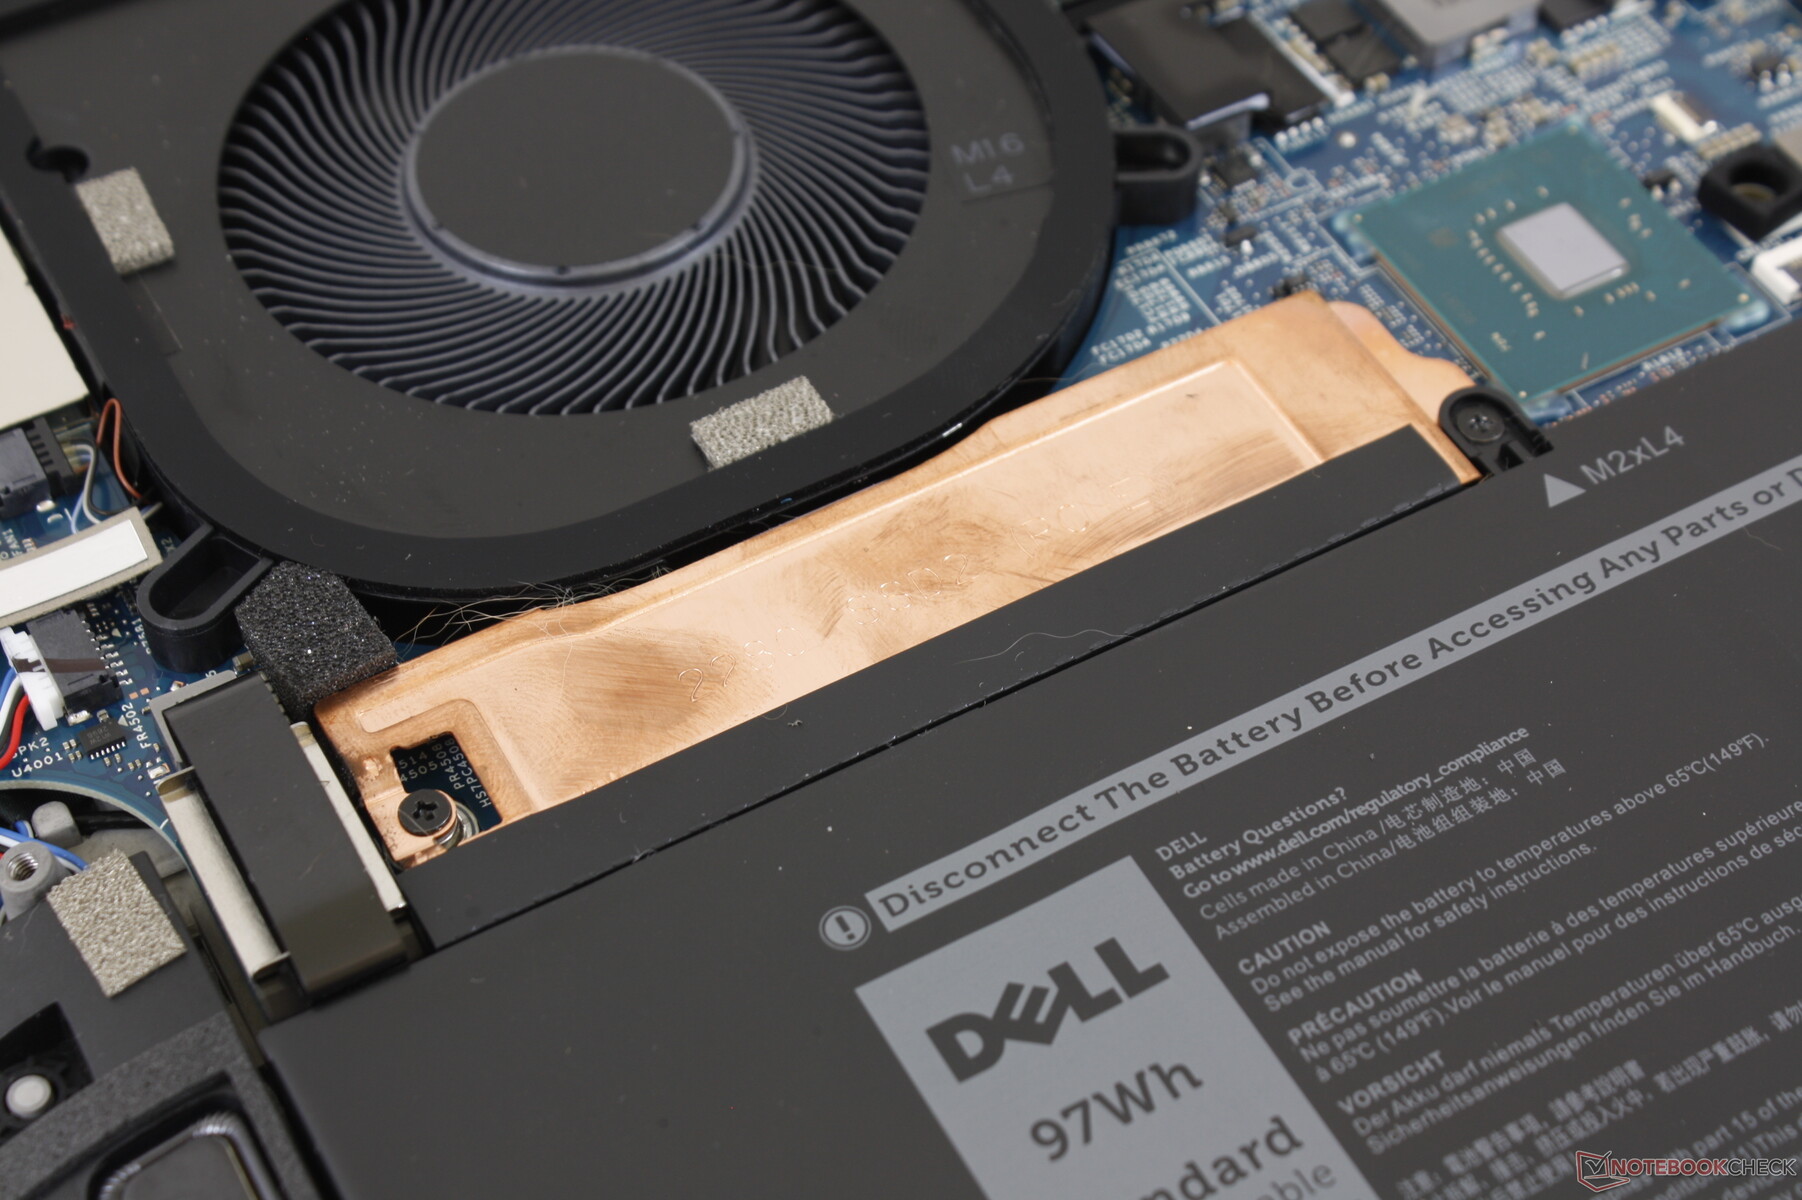
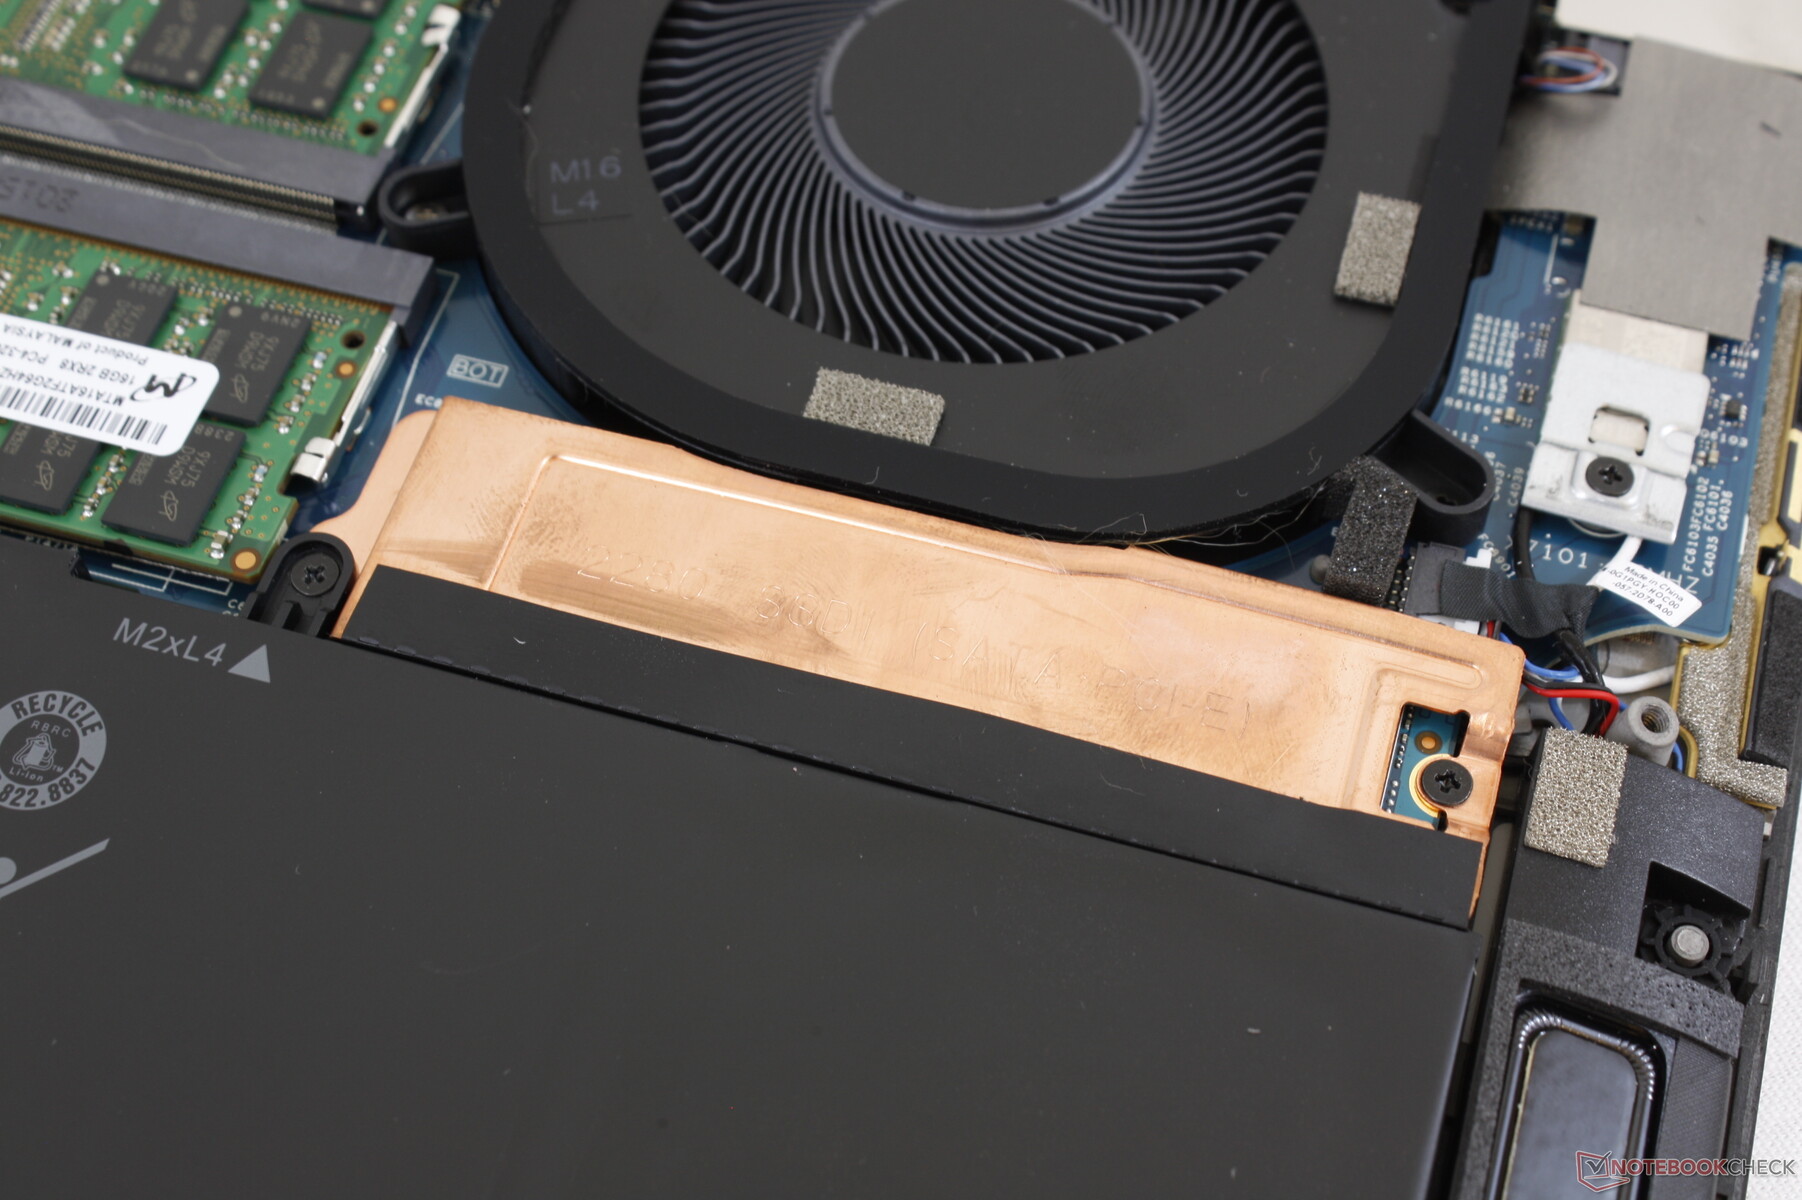
Storage Devices
Our unit comes with a Toshiba Kioxia XG6 as opposed to the Micron 2200S on our XPS 17. Unlike the Razer Blade Studio series which uses Samsung SSDs almost exclusively, it's more difficult to know what will ship with your Dell Precision since Dell likes to source from a handful of manufacturers. Nonetheless, the Toshiba XG6 is still a high-end SSD with transfer rates comparable to the Samsung PM981.
See our table of HDDs and SSDs for more technical information and benchmarks.
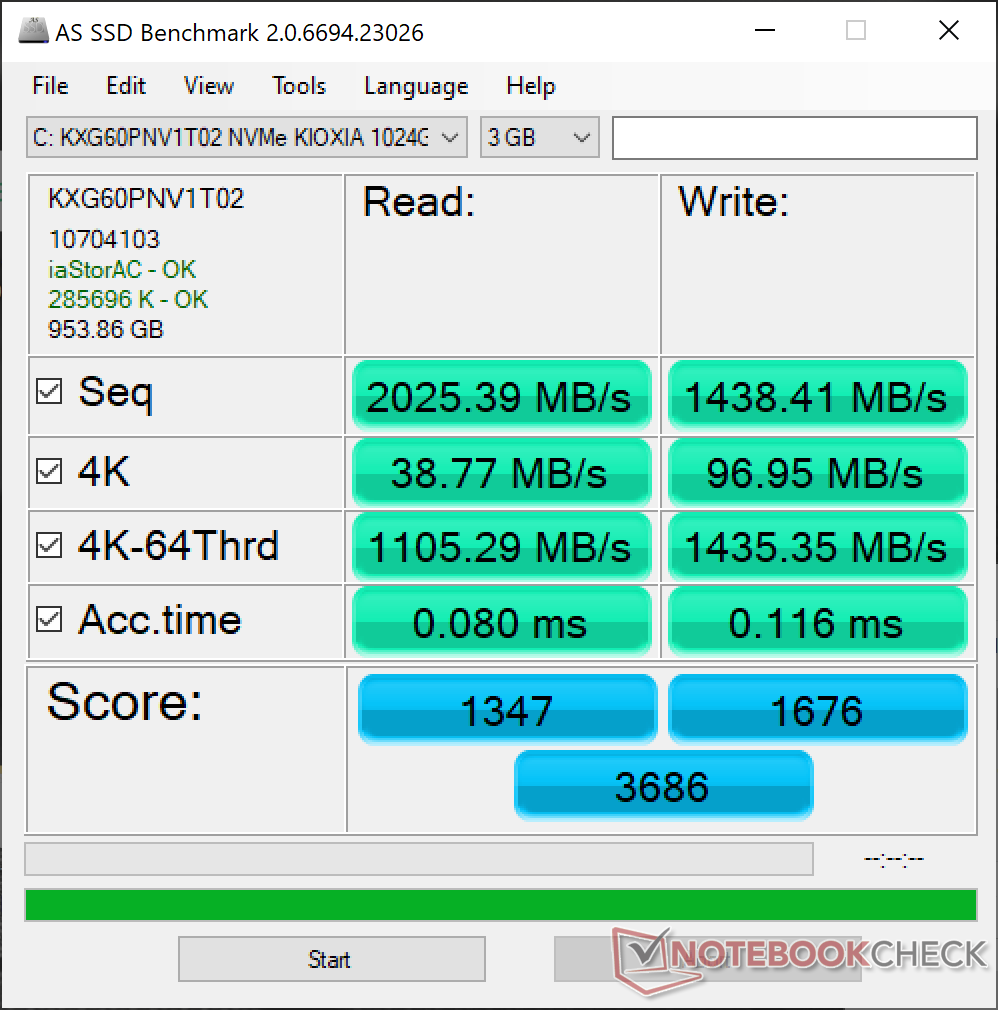
| Dell Precision 5000 5750 P92F Toshiba Kioxia XG6 KXG60PNV1T02 | Asus ProArt StudioBook Pro 17 W700G3T Samsung SSD PM981 MZVLB1T0HALR | MSI WS75 9TL-636 Samsung SSD PM981 MZVLB1T0HALR | Dell Precision 7730 Samsung SSD PM981 MZVLB512HAJQ | Lenovo ThinkPad P73-20QR002DGE Intel SSD Pro 7600p SSDPEKKF512G8L | MSI WE75 9TK Samsung SSD PM981 MZVLB512HAJQ | |
|---|---|---|---|---|---|---|
| AS SSD | 44% | 23% | 15% | 3% | 7% | |
| Seq Read (MB/s) | 2025 | 2958 46% | 870 -57% | 2697 33% | 2693 33% | 1308 -35% |
| Seq Write (MB/s) | 1438 | 2350 63% | 2247 56% | 1789 24% | 1542 7% | 1871 30% |
| 4K Read (MB/s) | 38.77 | 56.6 46% | 53.4 38% | 50.5 30% | 62.6 61% | 48.35 25% |
| 4K Write (MB/s) | 96.9 | 106.1 9% | 123.2 27% | 105.9 9% | 149.5 54% | 106.6 10% |
| 4K-64 Read (MB/s) | 1105 | 1836 66% | 1673 51% | 1139 3% | 871 -21% | 1510 37% |
| 4K-64 Write (MB/s) | 1435 | 1789 25% | 1826 27% | 1714 19% | 1006 -30% | 1715 20% |
| Access Time Read * (ms) | 0.08 | 0.061 24% | 0.05 37% | 0.061 24% | 0.058 27% | 0.103 -29% |
| Access Time Write * (ms) | 0.116 | 0.036 69% | 0.033 72% | 0.037 68% | 0.067 42% | 0.106 9% |
| Score Read (Points) | 1347 | 2189 63% | 1813 35% | 1460 8% | 1203 -11% | 1689 25% |
| Score Write (Points) | 1676 | 2130 27% | 2173 30% | 1999 19% | 1309 -22% | 2008 20% |
| Score Total (Points) | 3686 | 5411 47% | 4989 35% | 4168 13% | 3088 -16% | 4594 25% |
| Copy ISO MB/s (MB/s) | 2609 | 3154 21% | 3259 25% | 1716 -34% | 2343 -10% | |
| Copy Program MB/s (MB/s) | 740 | 533 -28% | 435.6 -41% | 542 -27% | 526 -29% | |
| Copy Game MB/s (MB/s) | 1624 | 1349 -17% | 1273 -22% | 1375 -15% | 1506 -7% | |
| CrystalDiskMark 5.2 / 6 | 19% | -1% | -7% | 16% | 19% | |
| Write 4K (MB/s) | 103.5 | 147.6 43% | 103.5 0% | 103.2 0% | 154.3 49% | 135.4 31% |
| Read 4K (MB/s) | 44.56 | 47.57 7% | 41.88 -6% | 41.39 -7% | 66.4 49% | 56.6 27% |
| Write Seq (MB/s) | 1934 | 2222 15% | 1931 0% | 1880 -3% | 1561 -19% | 1972 2% |
| Read Seq (MB/s) | 1937 | 2543 31% | 1286 -34% | 2350 21% | 2460 27% | 2101 8% |
| Write 4K Q32T1 (MB/s) | 372.9 | 459.2 23% | 414.3 11% | 282.3 -24% | 438 17% | 527 41% |
| Read 4K Q32T1 (MB/s) | 358.9 | 515 43% | 470.2 31% | 314.3 -12% | 568 58% | 578 61% |
| Write Seq Q32T1 (MB/s) | 2894 | 2167 -25% | 2393 -17% | 1881 -35% | 1581 -45% | 1985 -31% |
| Read Seq Q32T1 (MB/s) | 3082 | 3430 11% | 3425 11% | 3216 4% | 2724 -12% | 3358 9% |
| Write 4K Q8T8 (MB/s) | 1484 | 1000 | ||||
| Read 4K Q8T8 (MB/s) | 1536 | 928 | ||||
| Total Average (Program / Settings) | 32% /
33% | 11% /
15% | 4% /
7% | 10% /
8% | 13% /
11% |
* ... smaller is better

Disk Throttling: DiskSpd Read Loop, Queue Depth 8
GPU Performance
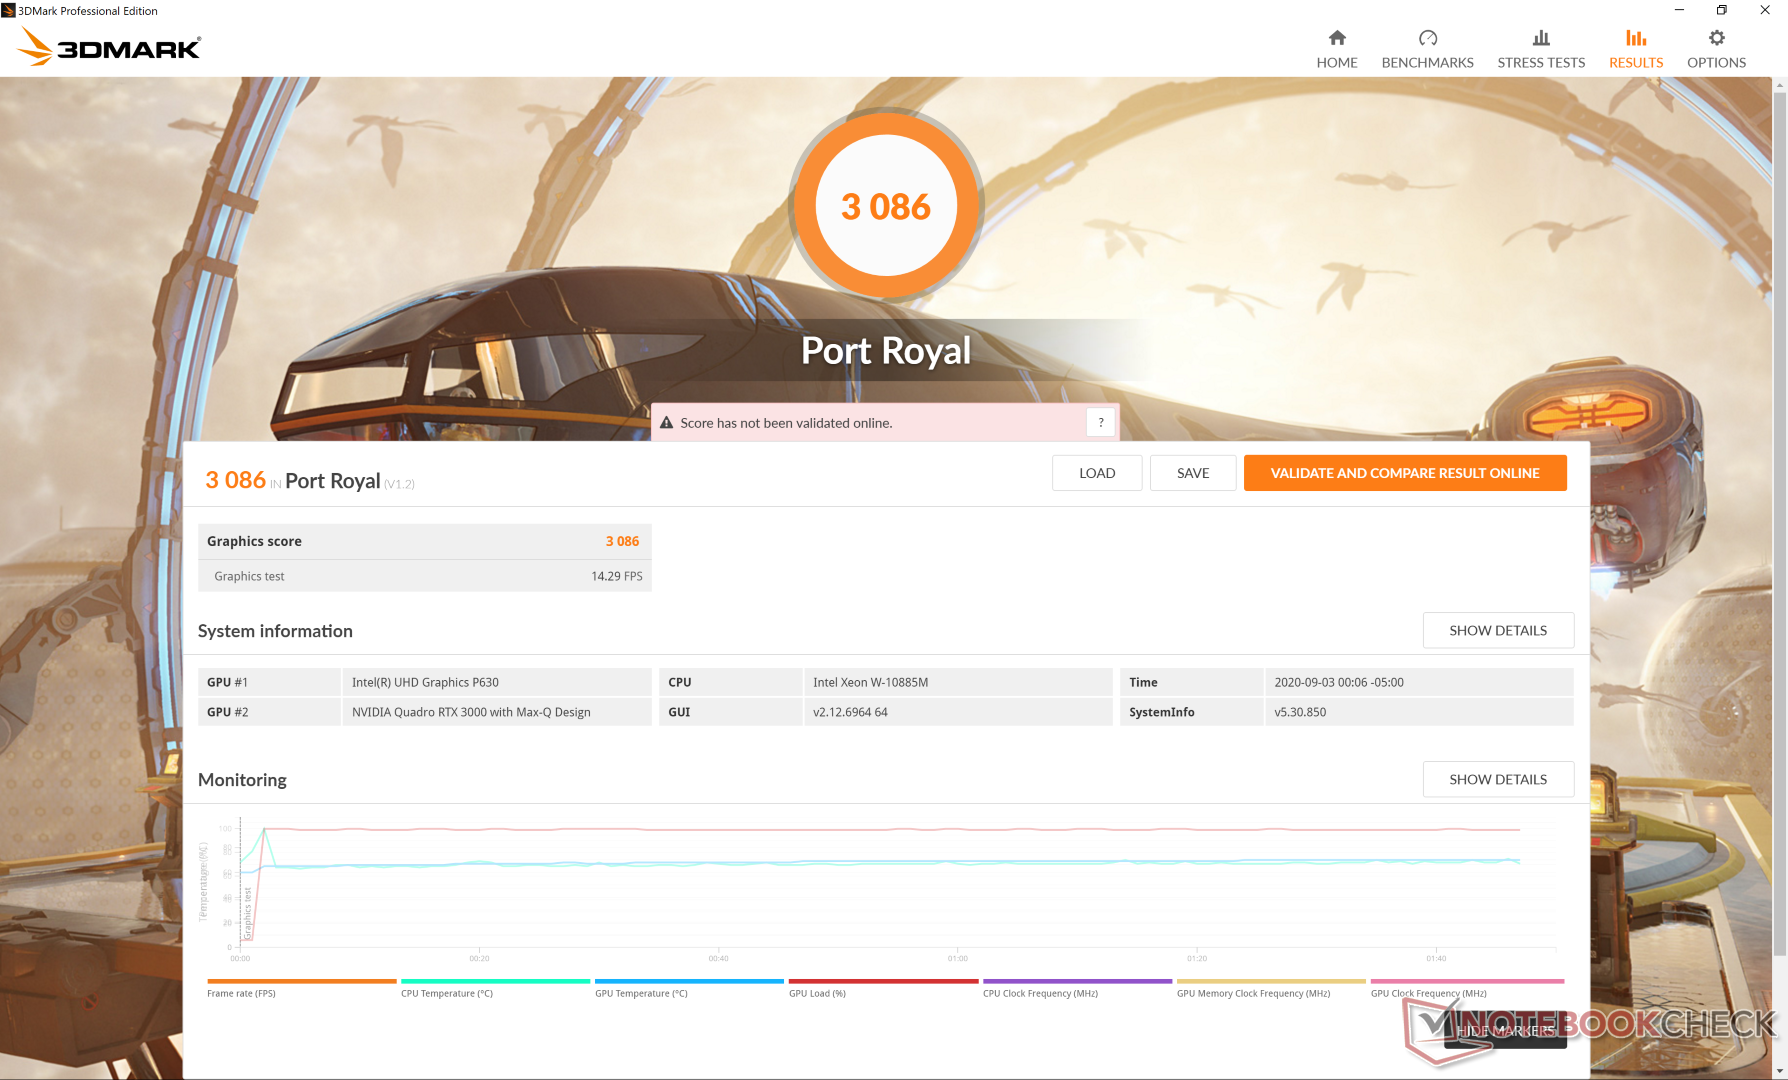
Raw graphics performance is most similar to the consumer mobile GeForce GTX 1660 Ti but with hardware-accelerated RT features. Interestingly, Specviewperf shows our Quadro RTX 3000 Max-Q outperforming the standard mobile Quadro RTX 3000 in the Lenovo ThinkPad P73 more often than not. Opting for the lesser Quadro T2000 configuration will result in a 40 percent dip in graphics performance. We cannot confirm if the lesser T2000 option will the standard Quadro T2000 or the Quadro T2000 Max-Q.
See our dedicated page on the Quadro RTX 3000 Max-Q for more technical information and benchmark comparisons.
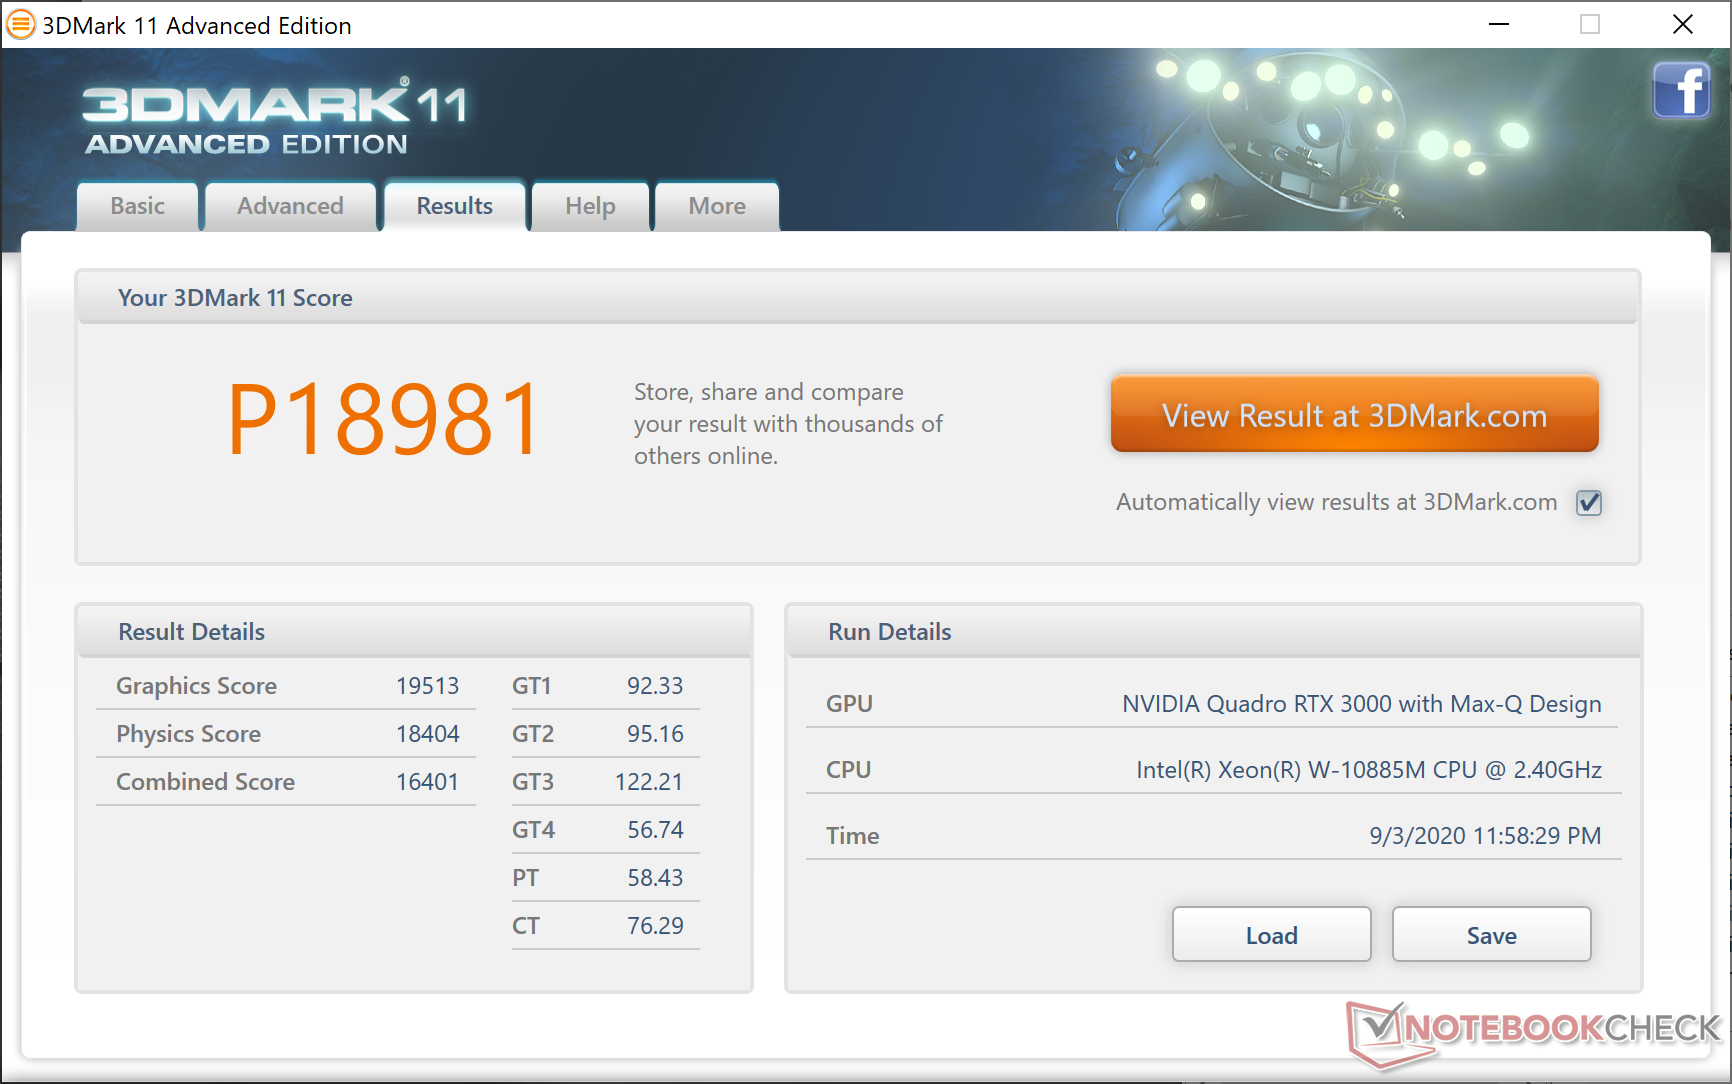
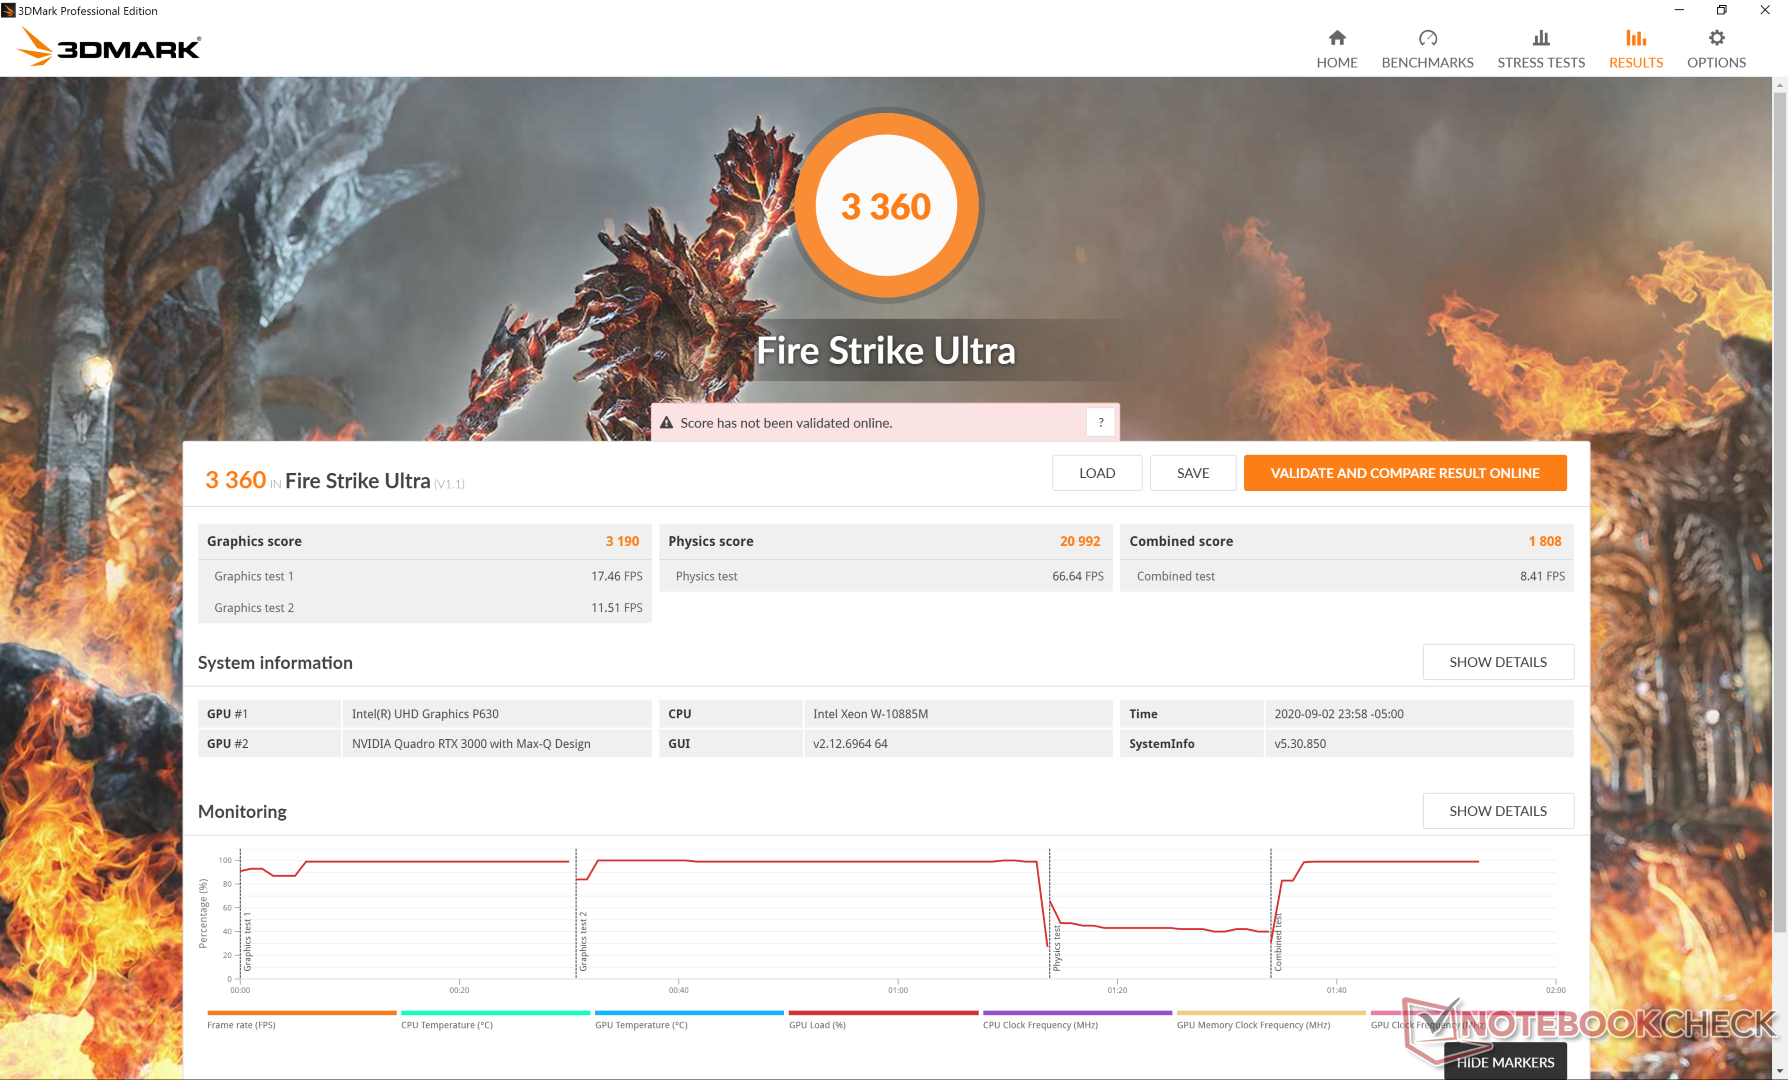
| 3DMark 11 Performance | 18981 points | |
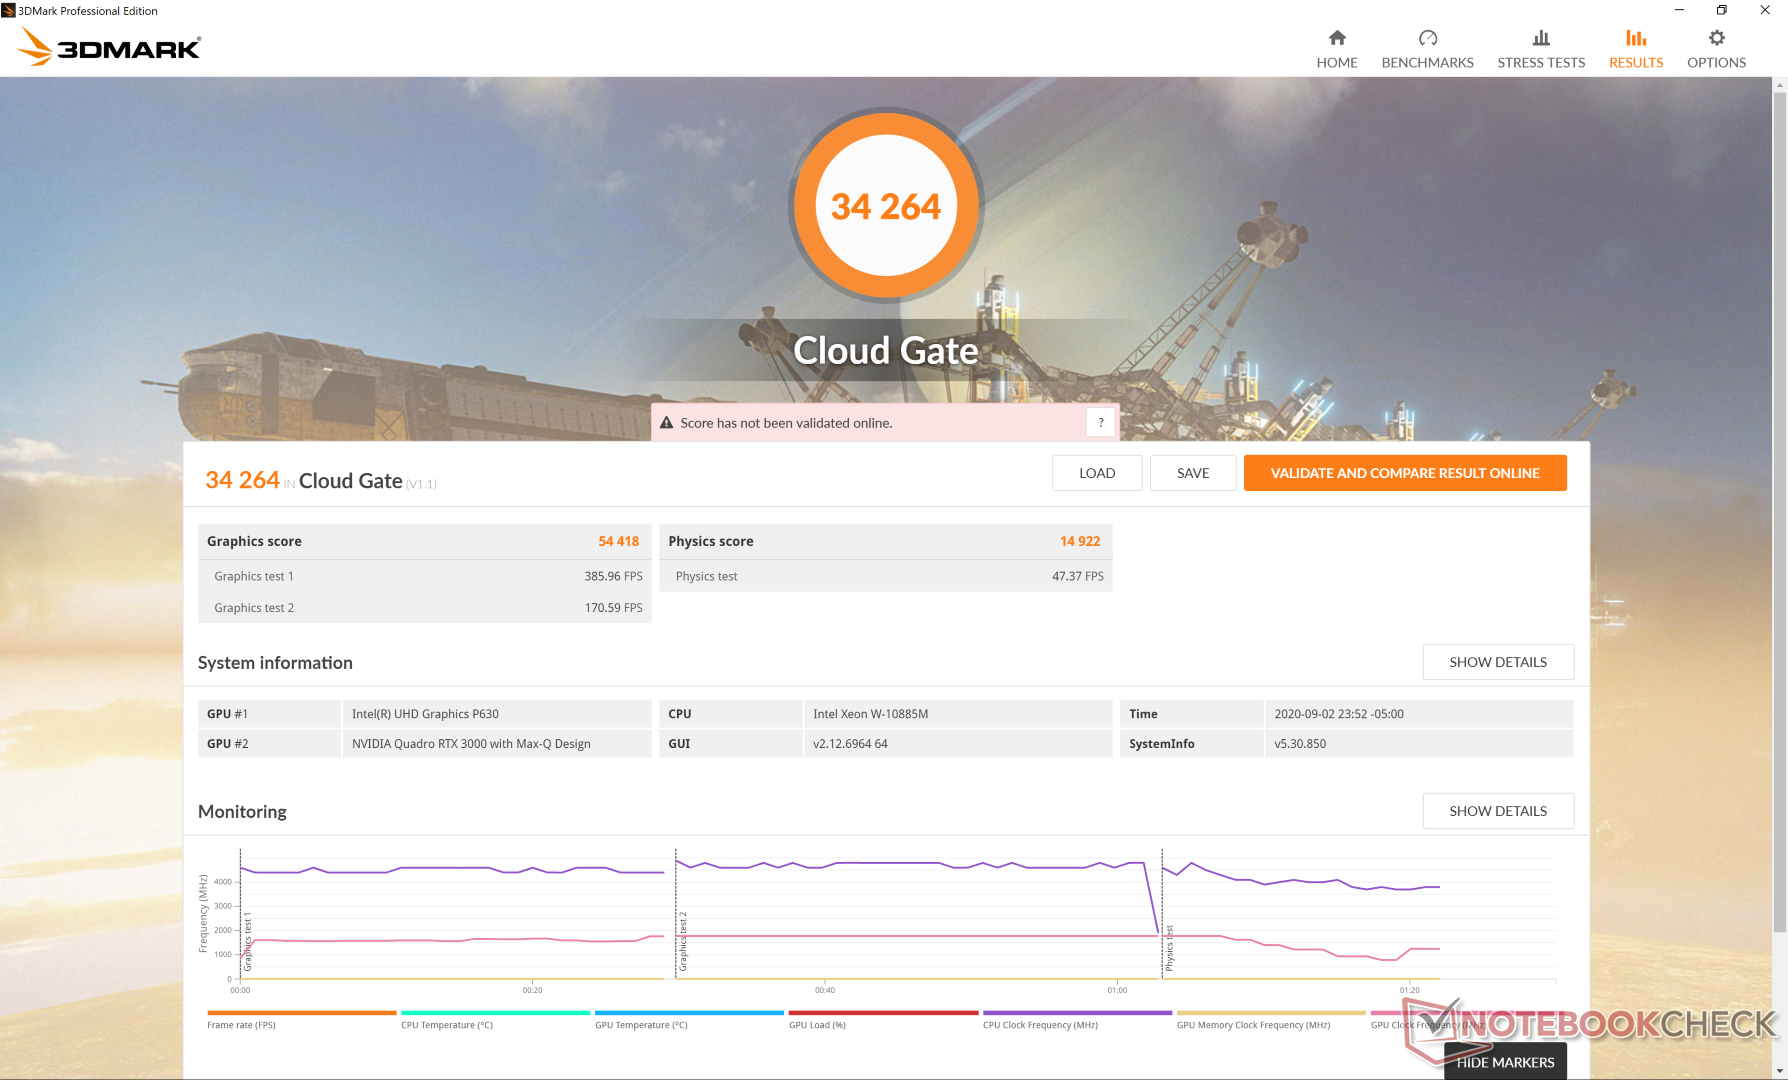
| 3DMark Cloud Gate Standard Score | 34264 points | |
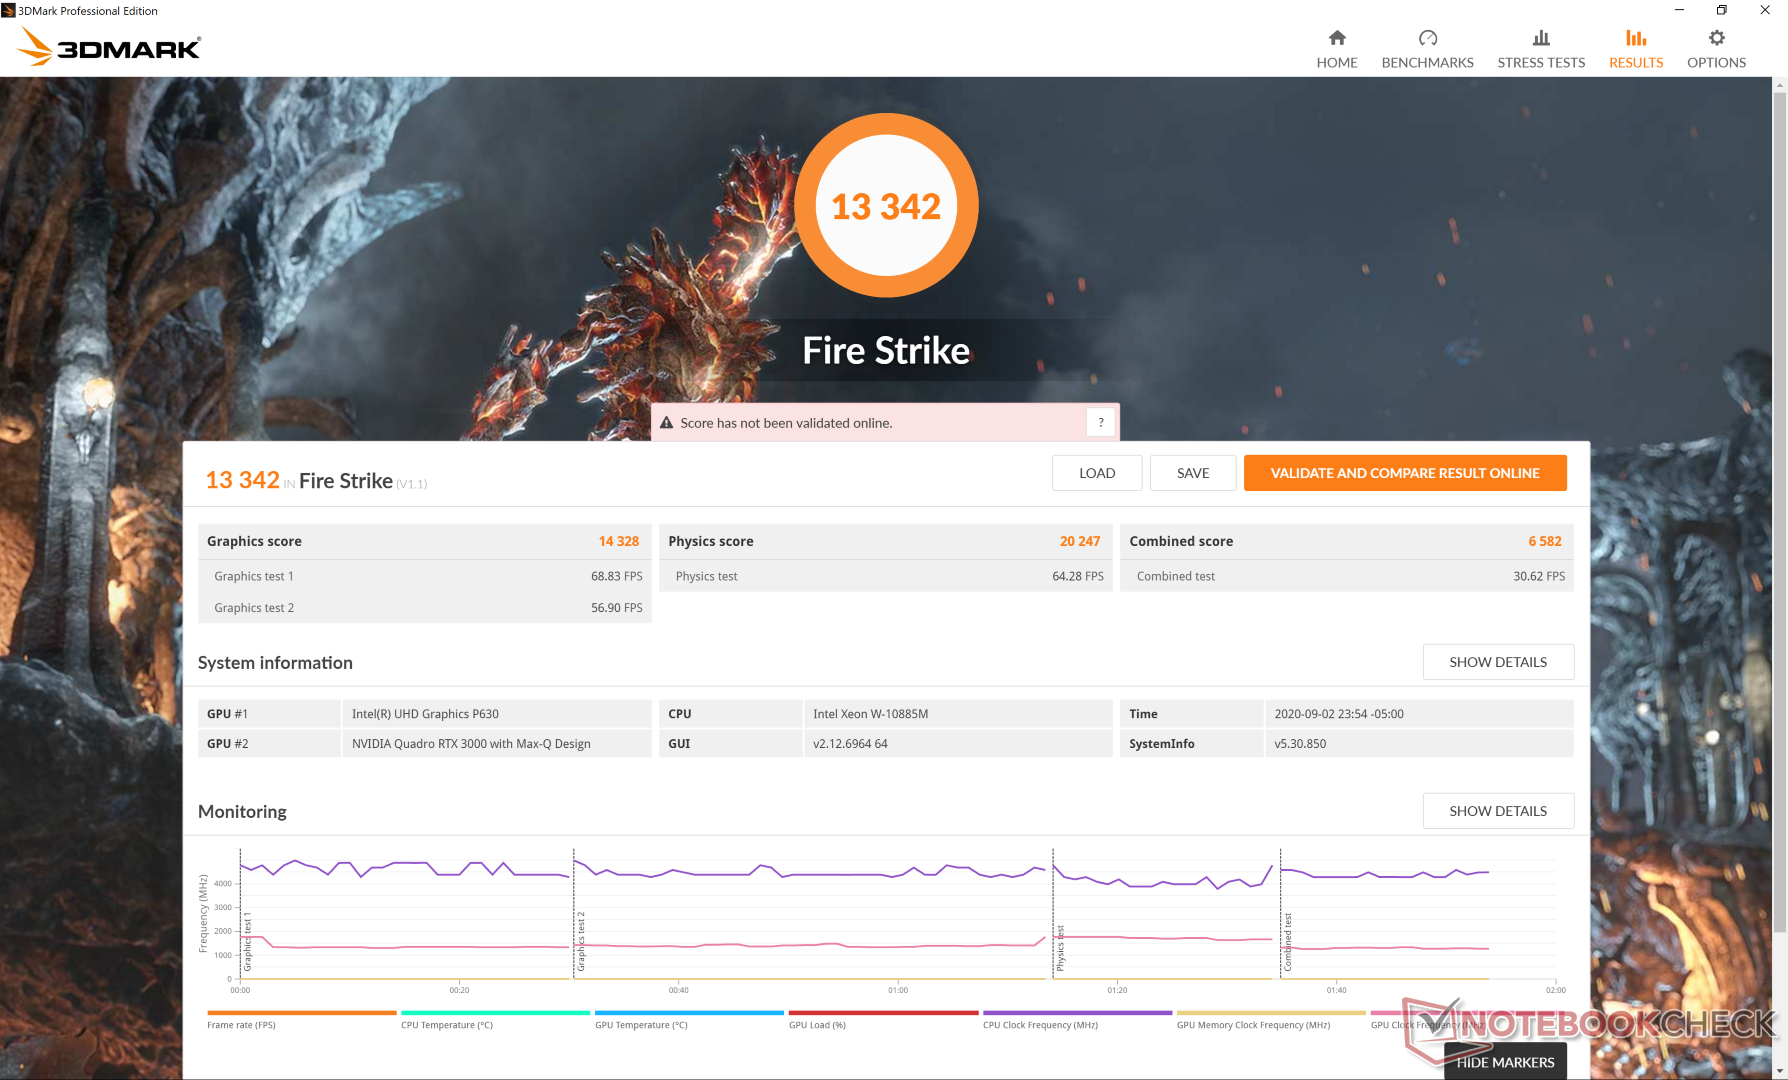
| 3DMark Fire Strike Score | 13342 points | |
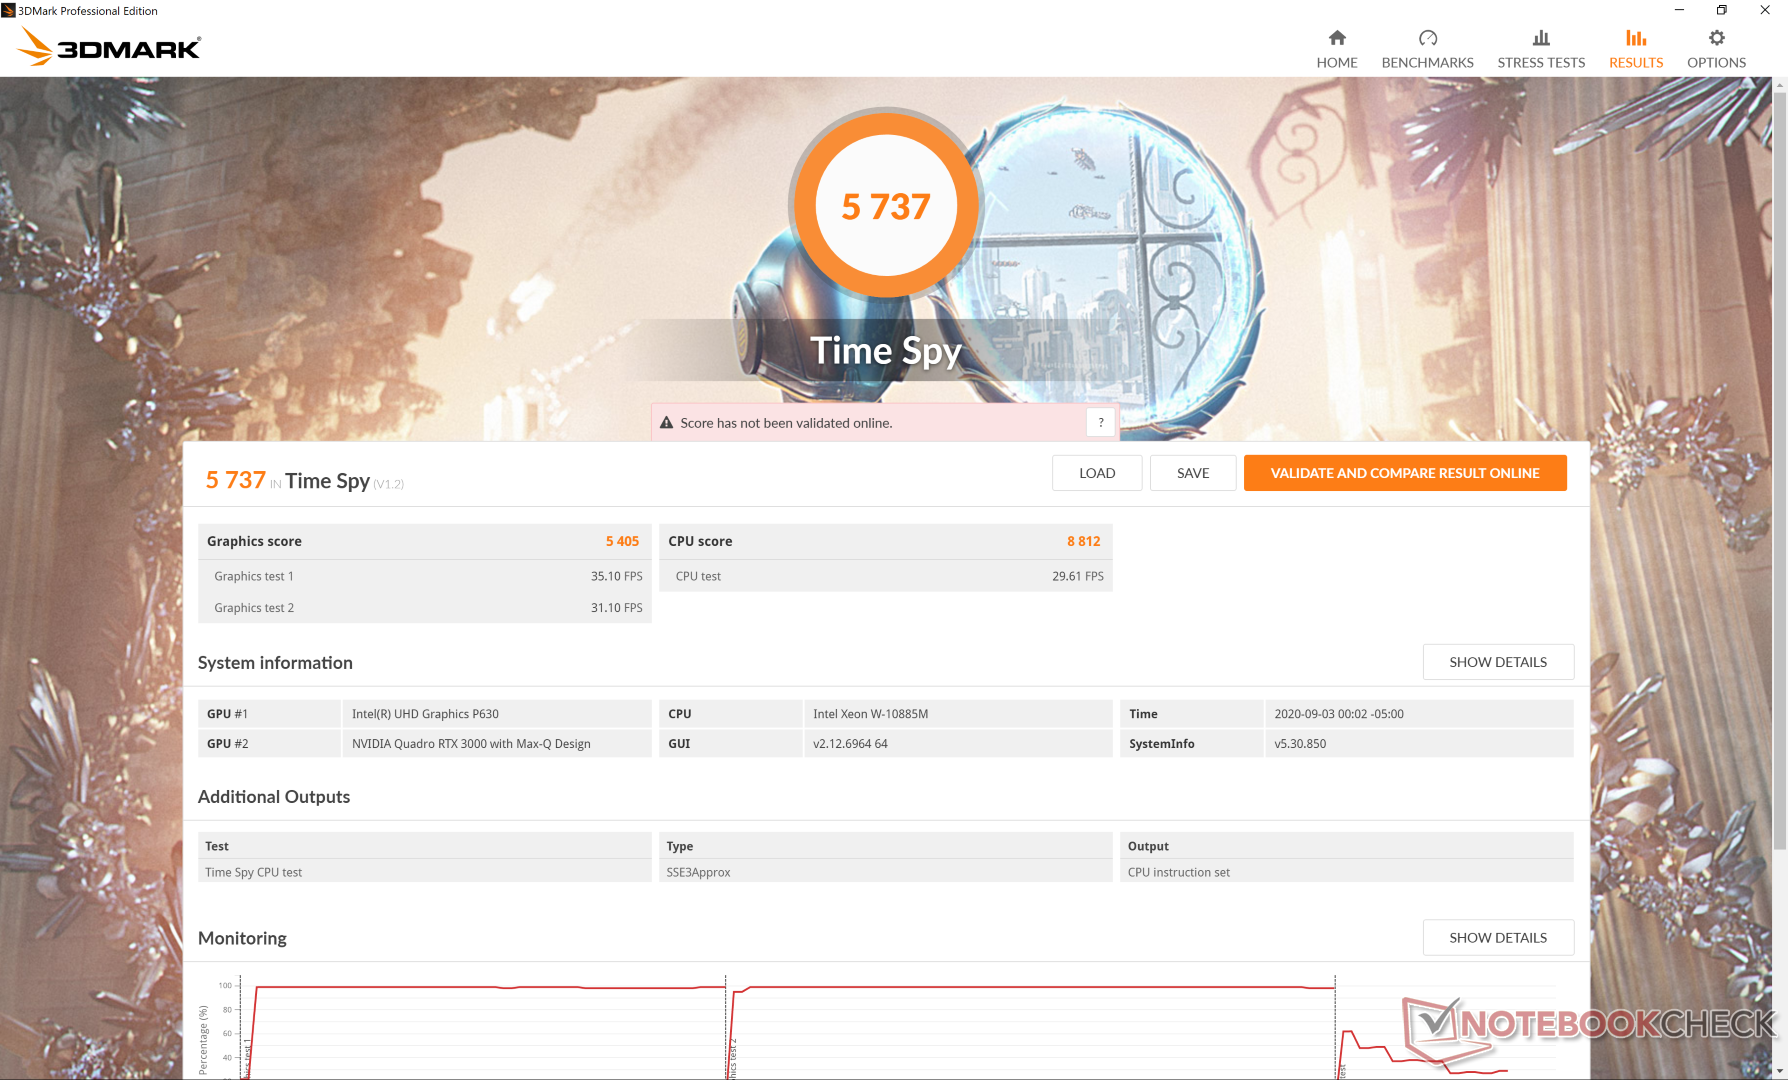
| 3DMark Time Spy Score | 5737 points | |
Help | ||
| low | med. | high | ultra | QHD | 4K | |
|---|---|---|---|---|---|---|
| The Witcher 3 (2015) | 304.7 | 189.4 | 107.4 | 57.2 | 36.5 | |
| Dota 2 Reborn (2015) | 145 | 133 | 126 | 120 | 77.6 | |
| Final Fantasy XV Benchmark (2018) | 149 | 79.1 | 59.5 | 43.8 | 25.9 | |
| X-Plane 11.11 (2018) | 117 | 106 | 85.8 | 67.6 |
Emissions
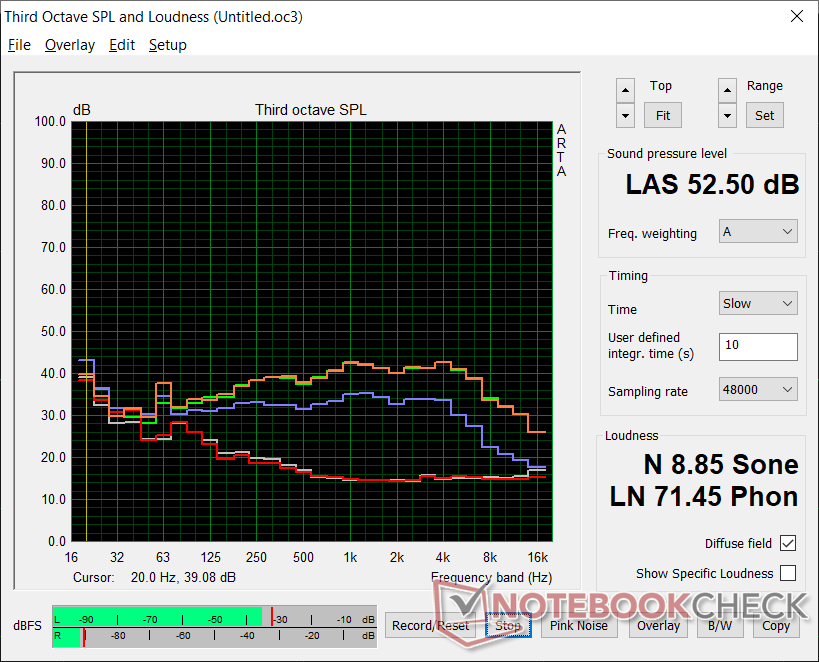
System Noise

| Dell Precision 5000 5750 P92F Quadro RTX 3000 Max-Q, W-10885M, Toshiba Kioxia XG6 KXG60PNV1T02 | Asus ProArt StudioBook Pro 17 W700G3T Quadro RTX 3000 Max-Q, i7-9750H, Samsung SSD PM981 MZVLB1T0HALR | MSI WS75 9TL-636 Quadro RTX 4000 (Laptop), i7-9750H, Samsung SSD PM981 MZVLB1T0HALR | Dell Precision 7730 Quadro P3200, i7-8850H, Samsung SSD PM981 MZVLB512HAJQ | Lenovo ThinkPad P73-20QR002DGE Quadro RTX 3000 (Laptop), i7-9850H, Intel SSD Pro 7600p SSDPEKKF512G8L | MSI WE75 9TK Quadro RTX 3000 (Laptop), i7-9750H, Samsung SSD PM981 MZVLB512HAJQ | |
|---|---|---|---|---|---|---|
| Noise | 11% | 2% | 6% | 12% | 1% | |
| off / environment * (dB) | 27.5 | 29.4 -7% | 29.4 -7% | 29.7 -8% | 29.3 -7% | 28.5 -4% |
| Idle Minimum * (dB) | 27.5 | 29.4 -7% | 29.4 -7% | 29.7 -8% | 29.3 -7% | 29 -5% |
| Idle Average * (dB) | 27.5 | 29.9 -9% | 30.1 -9% | 29.7 -8% | 29.3 -7% | 29 -5% |
| Idle Maximum * (dB) | 27.5 | 29.9 -9% | 30.9 -12% | 29.7 -8% | 29.3 -7% | 31.5 -15% |
| Load Average * (dB) | 44.8 | 31.6 29% | 40.7 9% | 31.4 30% | 30.2 33% | 32 29% |
| Witcher 3 ultra * (dB) | 52.5 | 31.6 40% | 41.9 20% | 37.9 28% | 30.7 42% | 44.7 15% |
| Load Maximum * (dB) | 52.5 | 31.6 40% | 42.7 19% | 44.2 16% | 33.1 37% | 56.5 -8% |
* ... smaller is better
Noise level
| Idle |
| 27.5 / 27.5 / 27.5 dB(A) |
| Load |
| 44.8 / 52.5 dB(A) |
 | ||
30 dB silent 40 dB(A) audible 50 dB(A) loud |
||
min: | ||
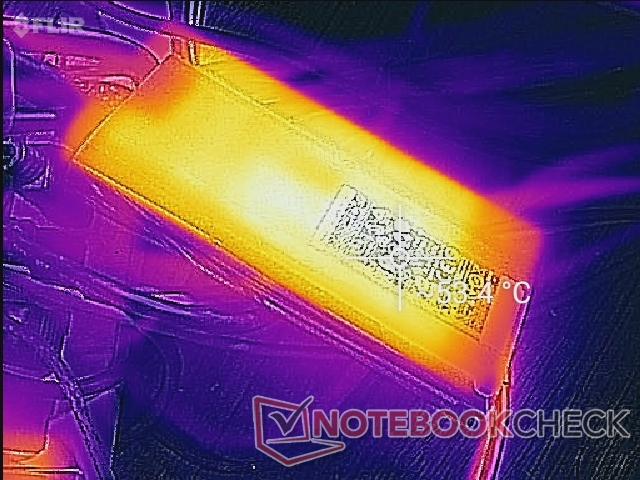
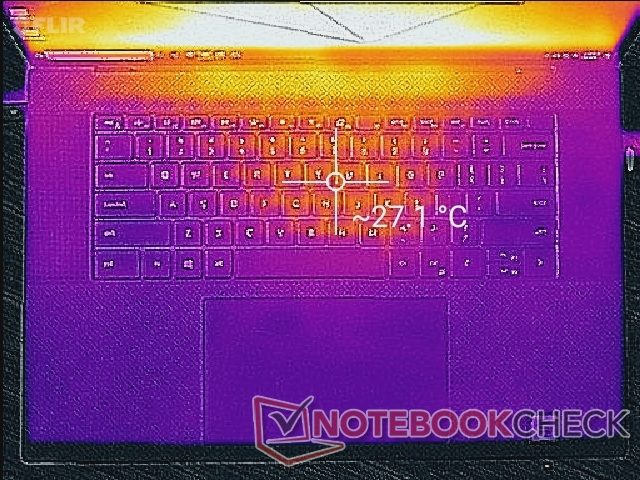
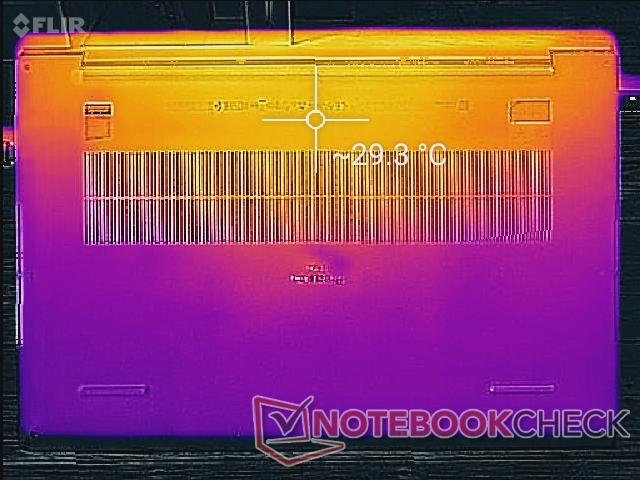
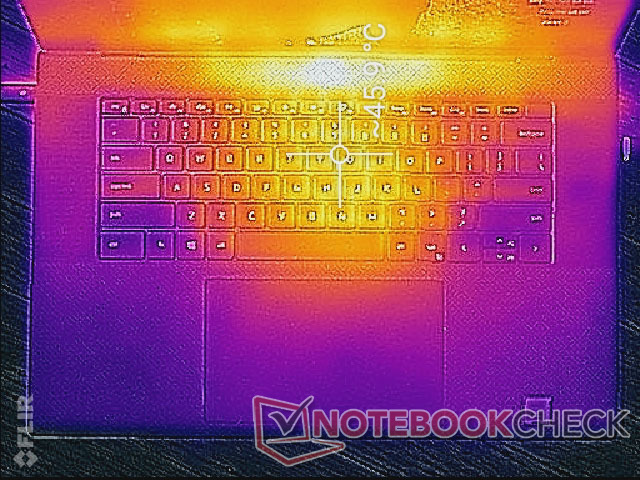
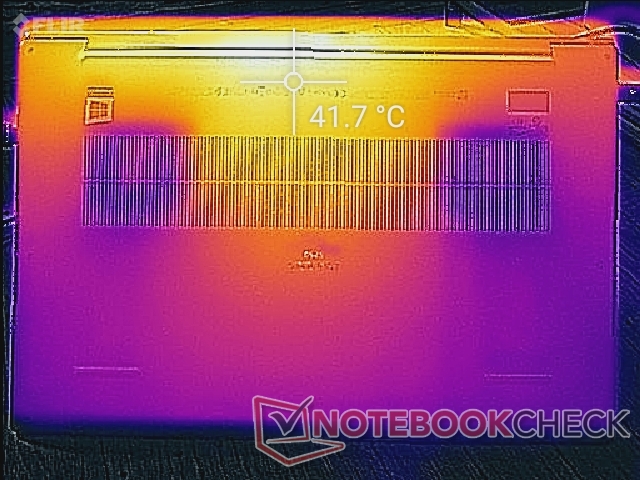
Temperature
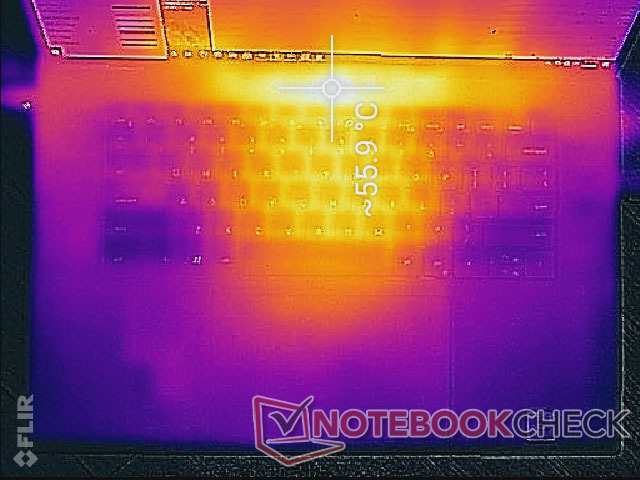
Surface temperature development is symmetrical with hot spots near the keyboard center and rear. When under high loads, the keyboard center can reach over 46 C which is not all that different from what we observed on the thicker Asus ProArt StudioBook Pro 17. Nonetheless, the MSI WS66 10TMT is able to run slightly cooler and with much more powerful Quadro RTX 5000 Max-Q.
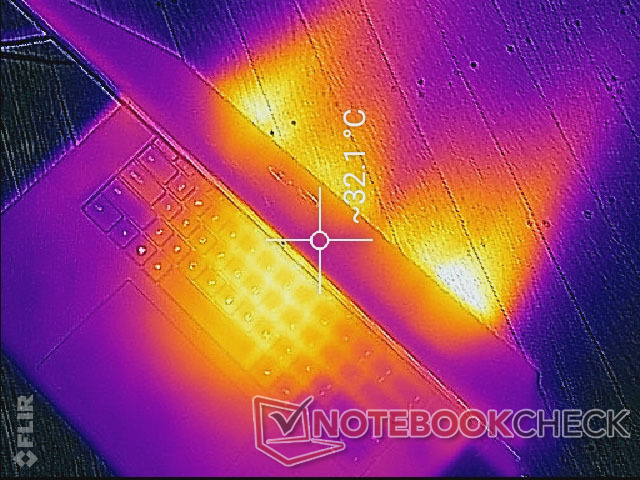
(-) The maximum temperature on the upper side is 55.6 °C / 132 F, compared to the average of 38.2 °C / 101 F, ranging from 22.2 to 69.8 °C for the class Workstation.
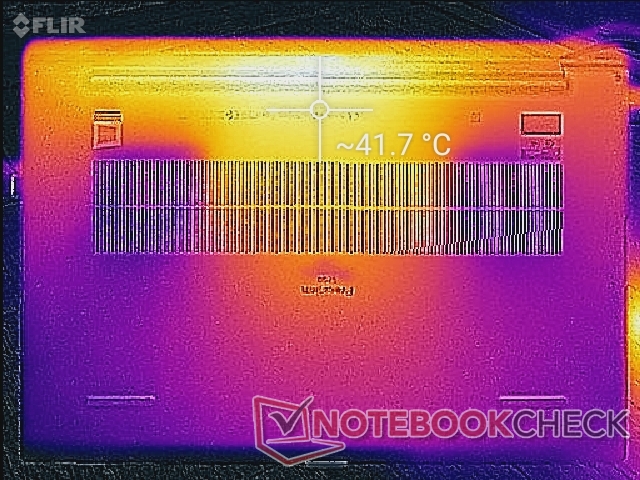
(±) The bottom heats up to a maximum of 42 °C / 108 F, compared to the average of 41.1 °C / 106 F
(+) In idle usage, the average temperature for the upper side is 25.2 °C / 77 F, compared to the device average of 32 °C / 90 F.
(±) Playing The Witcher 3, the average temperature for the upper side is 36 °C / 97 F, compared to the device average of 32 °C / 90 F.
(+) The palmrests and touchpad are reaching skin temperature as a maximum (33.6 °C / 92.5 F) and are therefore not hot.
(-) The average temperature of the palmrest area of similar devices was 27.8 °C / 82 F (-5.8 °C / -10.5 F).
Stress Test
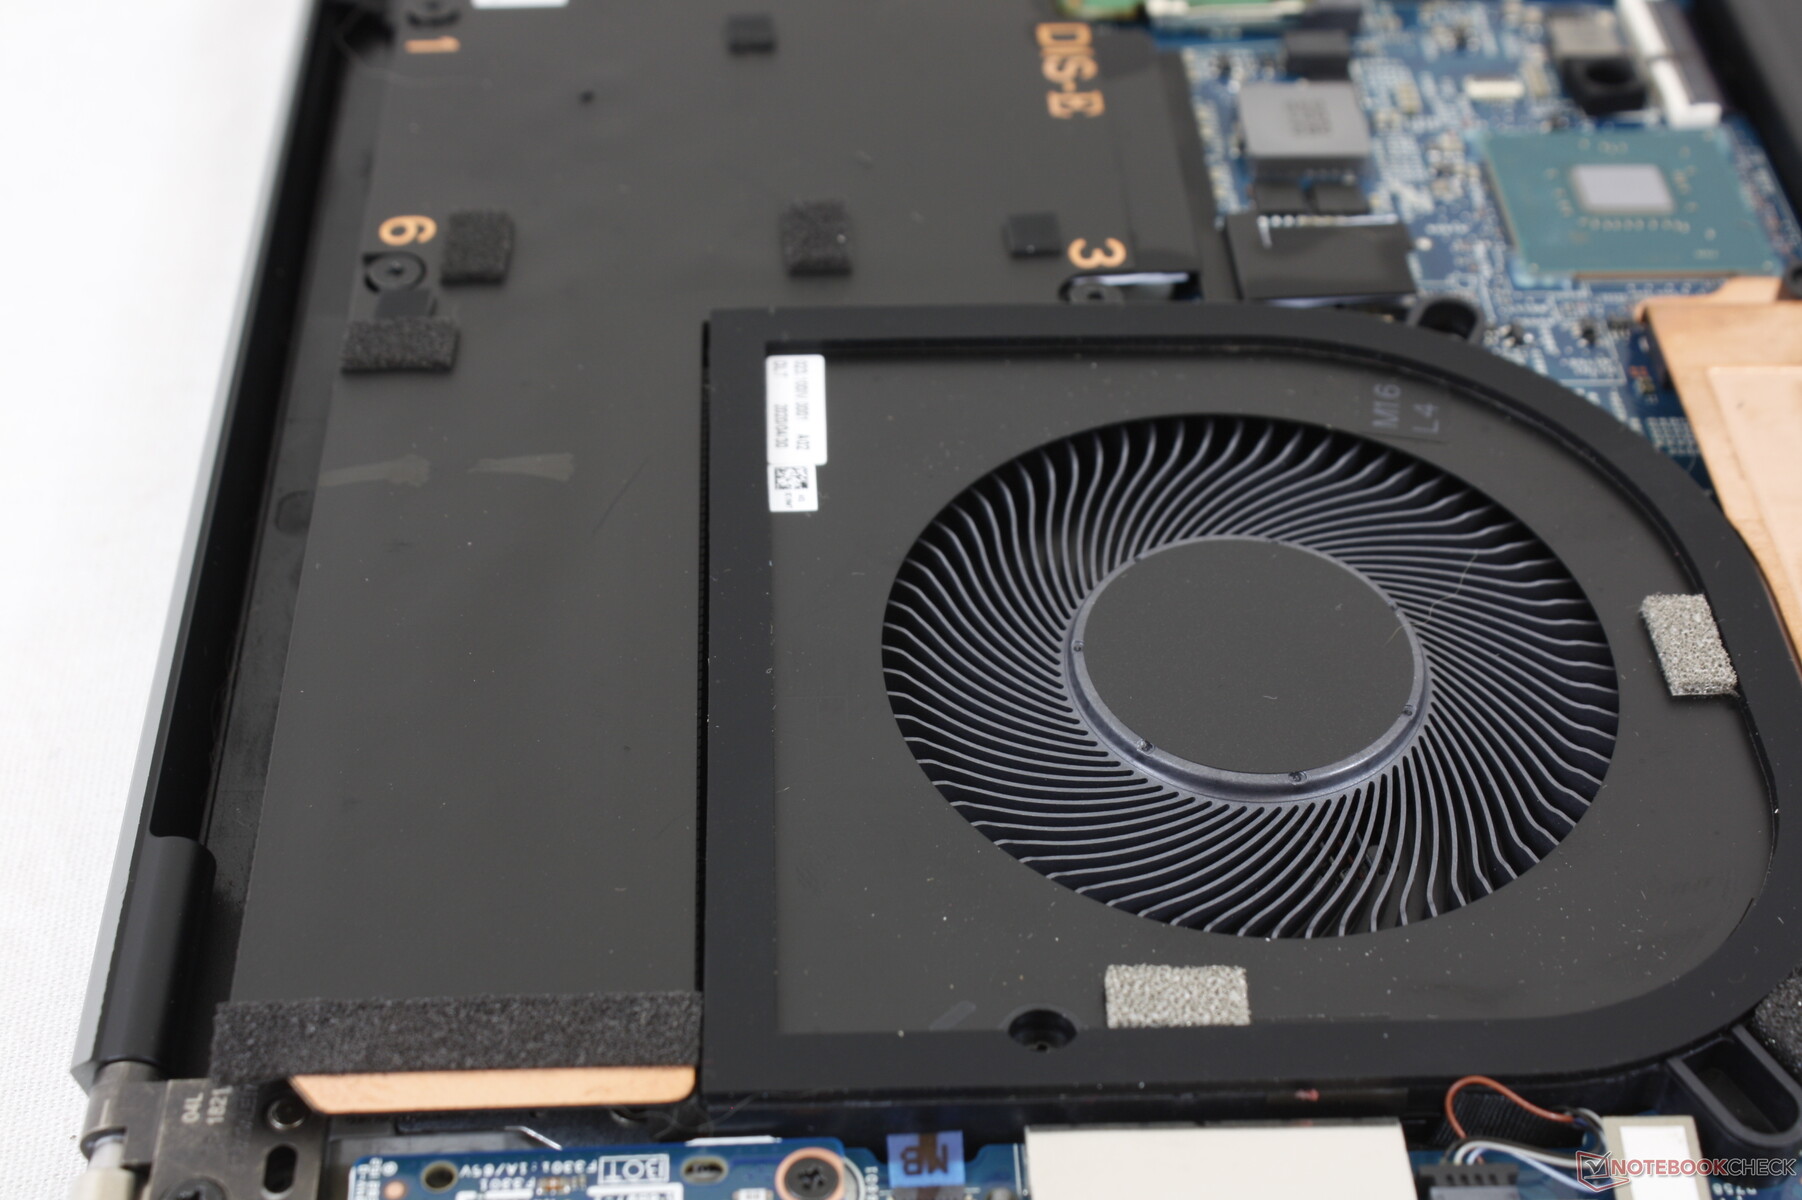
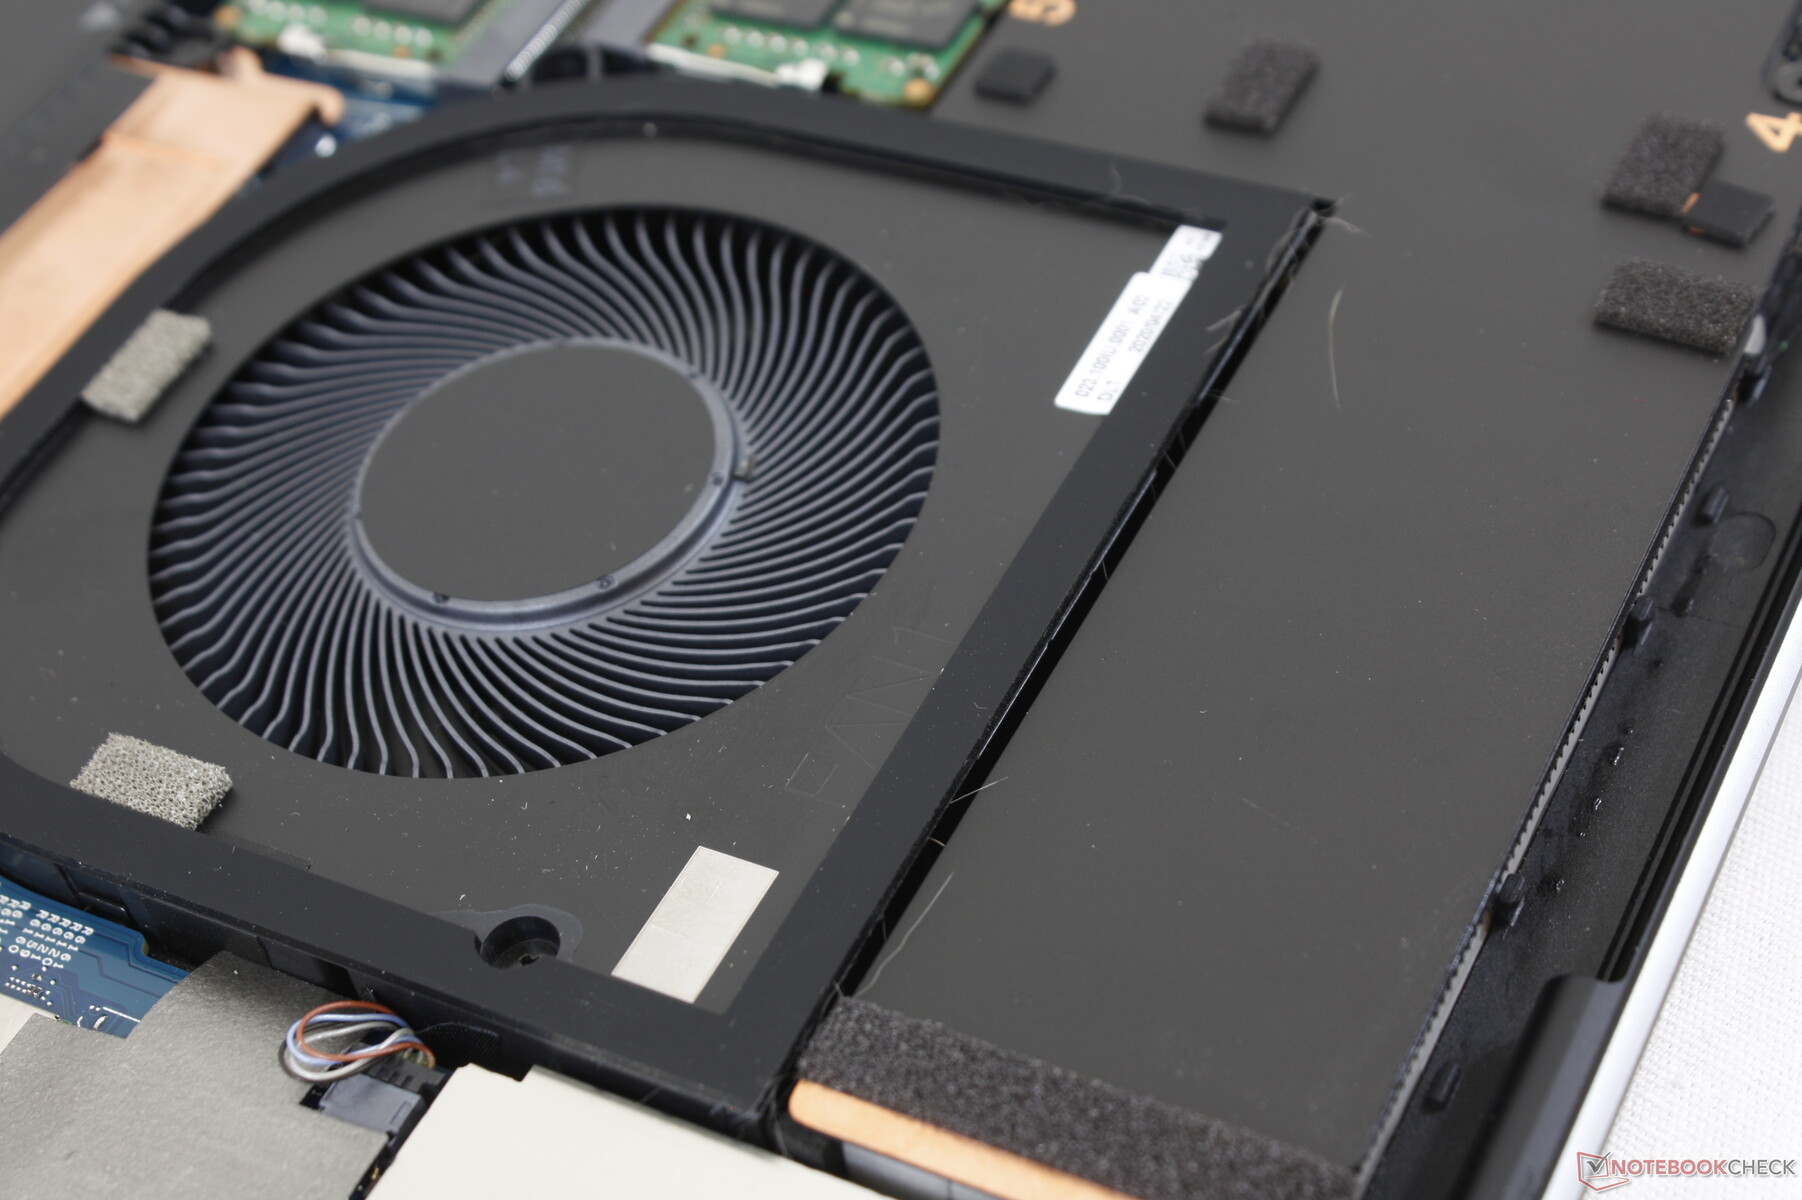
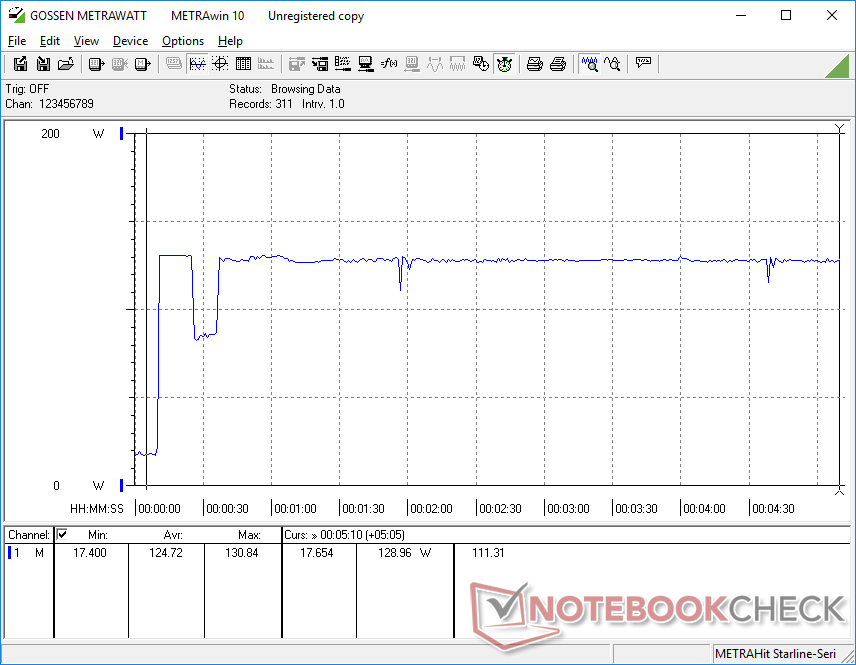
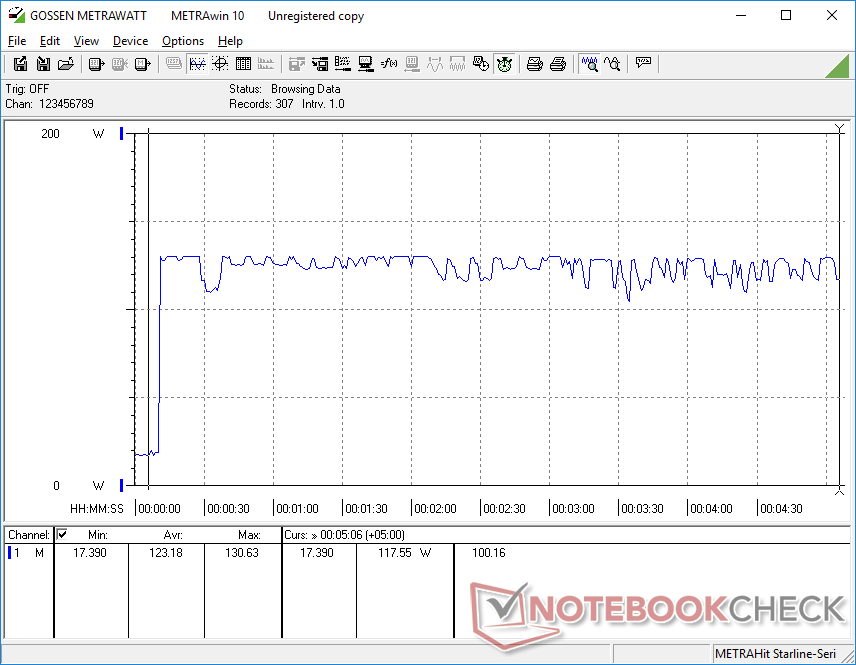
When running Prime95 to stress the CPU, clock rates would boost to 4.3 GHz for only the first few seconds until core temperature reaches 99 C. The processor would then fall to 3.5 GHz and 84 C temporarily before jumping back up and stabilizing at 3.7 to 3.8 GHz and 93 C. Top-end XPS configurations aren't afraid to run their processors at temperatures much warmer than the competition and the Precision 5750 is no different.
When running Prime95 and FurMark simultaneously, GPU clock rates would fluctuate wildly between 930 and 1770 MHz whereas other laptops are more constant. We suspect that this is because its performance is being limited by the 130 W AC adapter as detailed in our Power Consumption section below.
Running on battery power will limit performance. A Fire Strike test on batteries would return Physics and Graphics scores of 15189 and 4404 points, respectively, compared to 20247 and 14328 points when on mains.
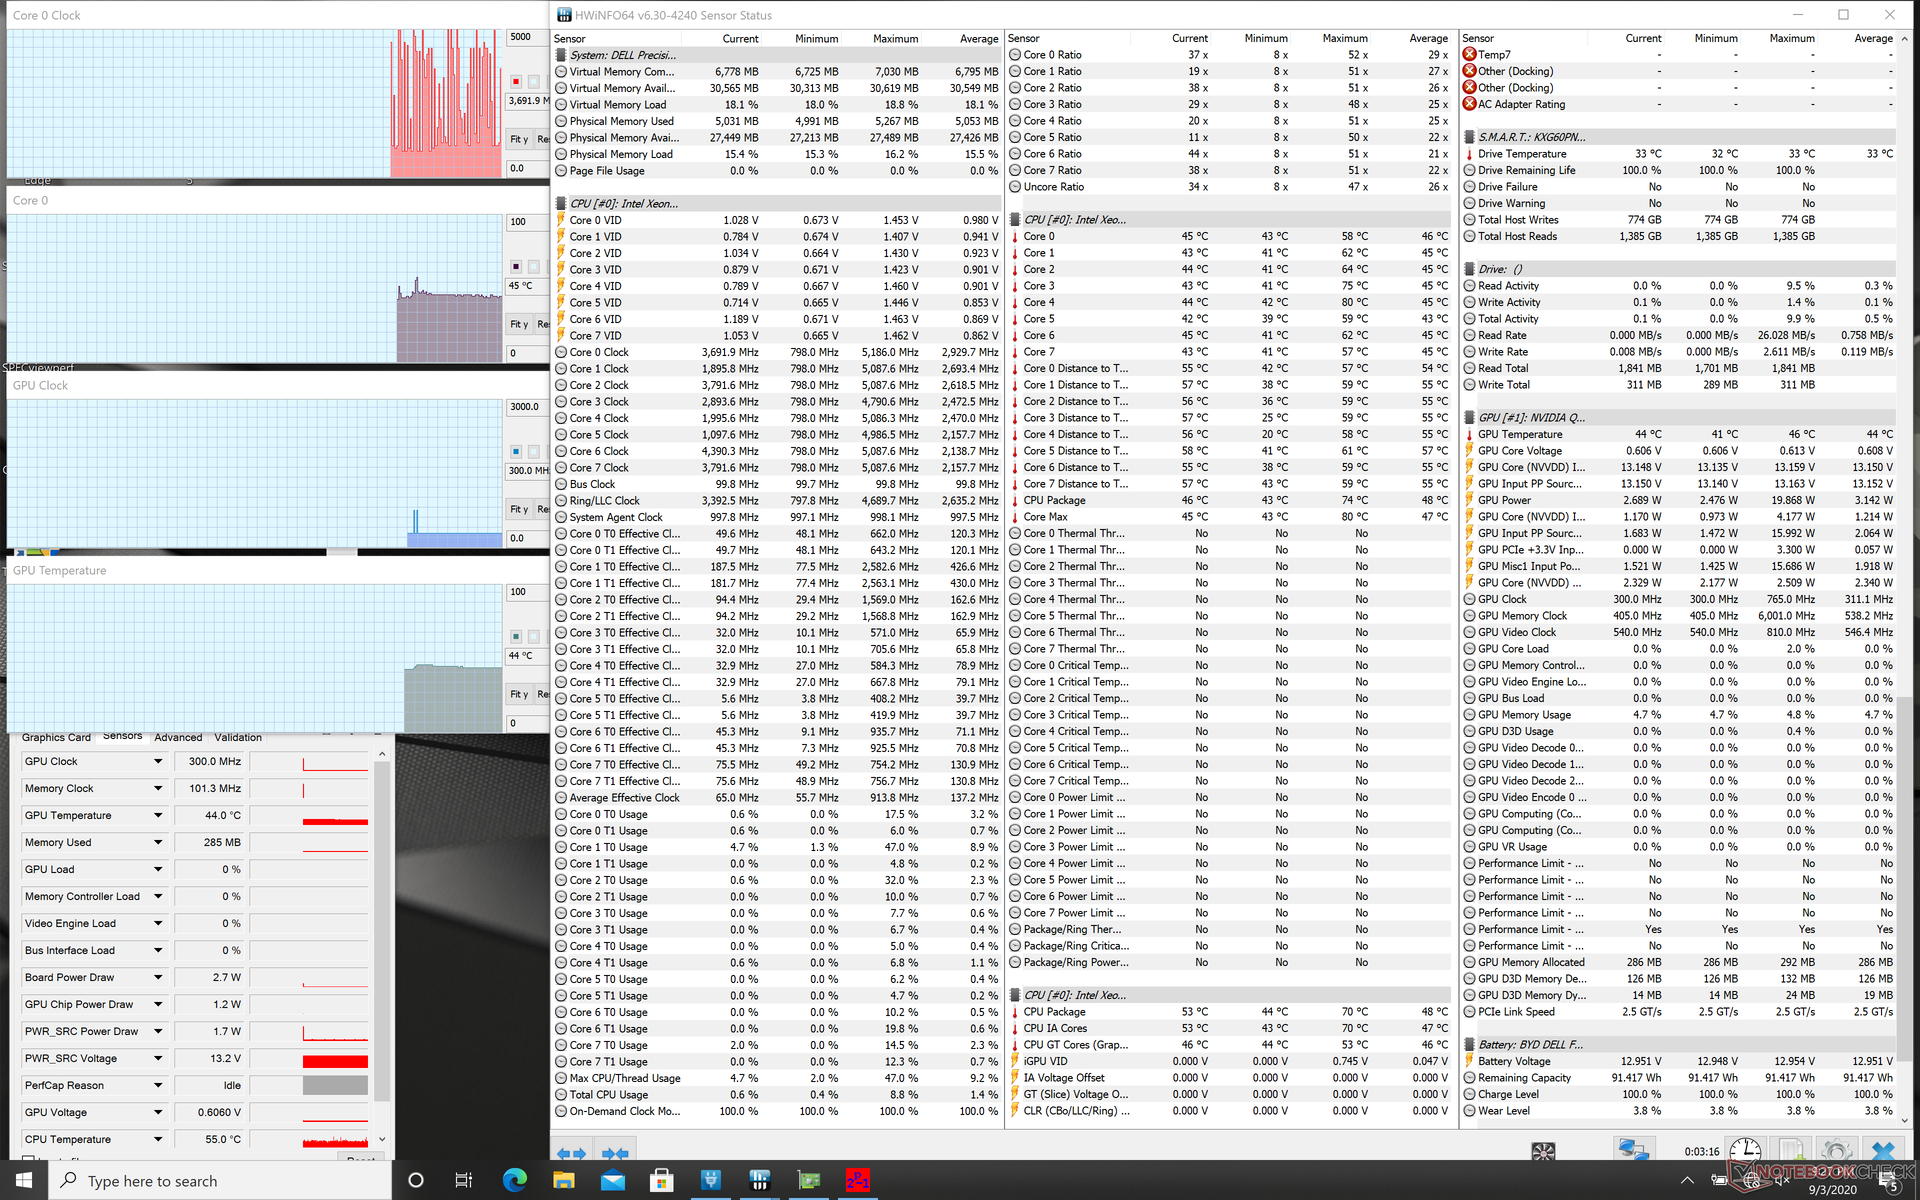
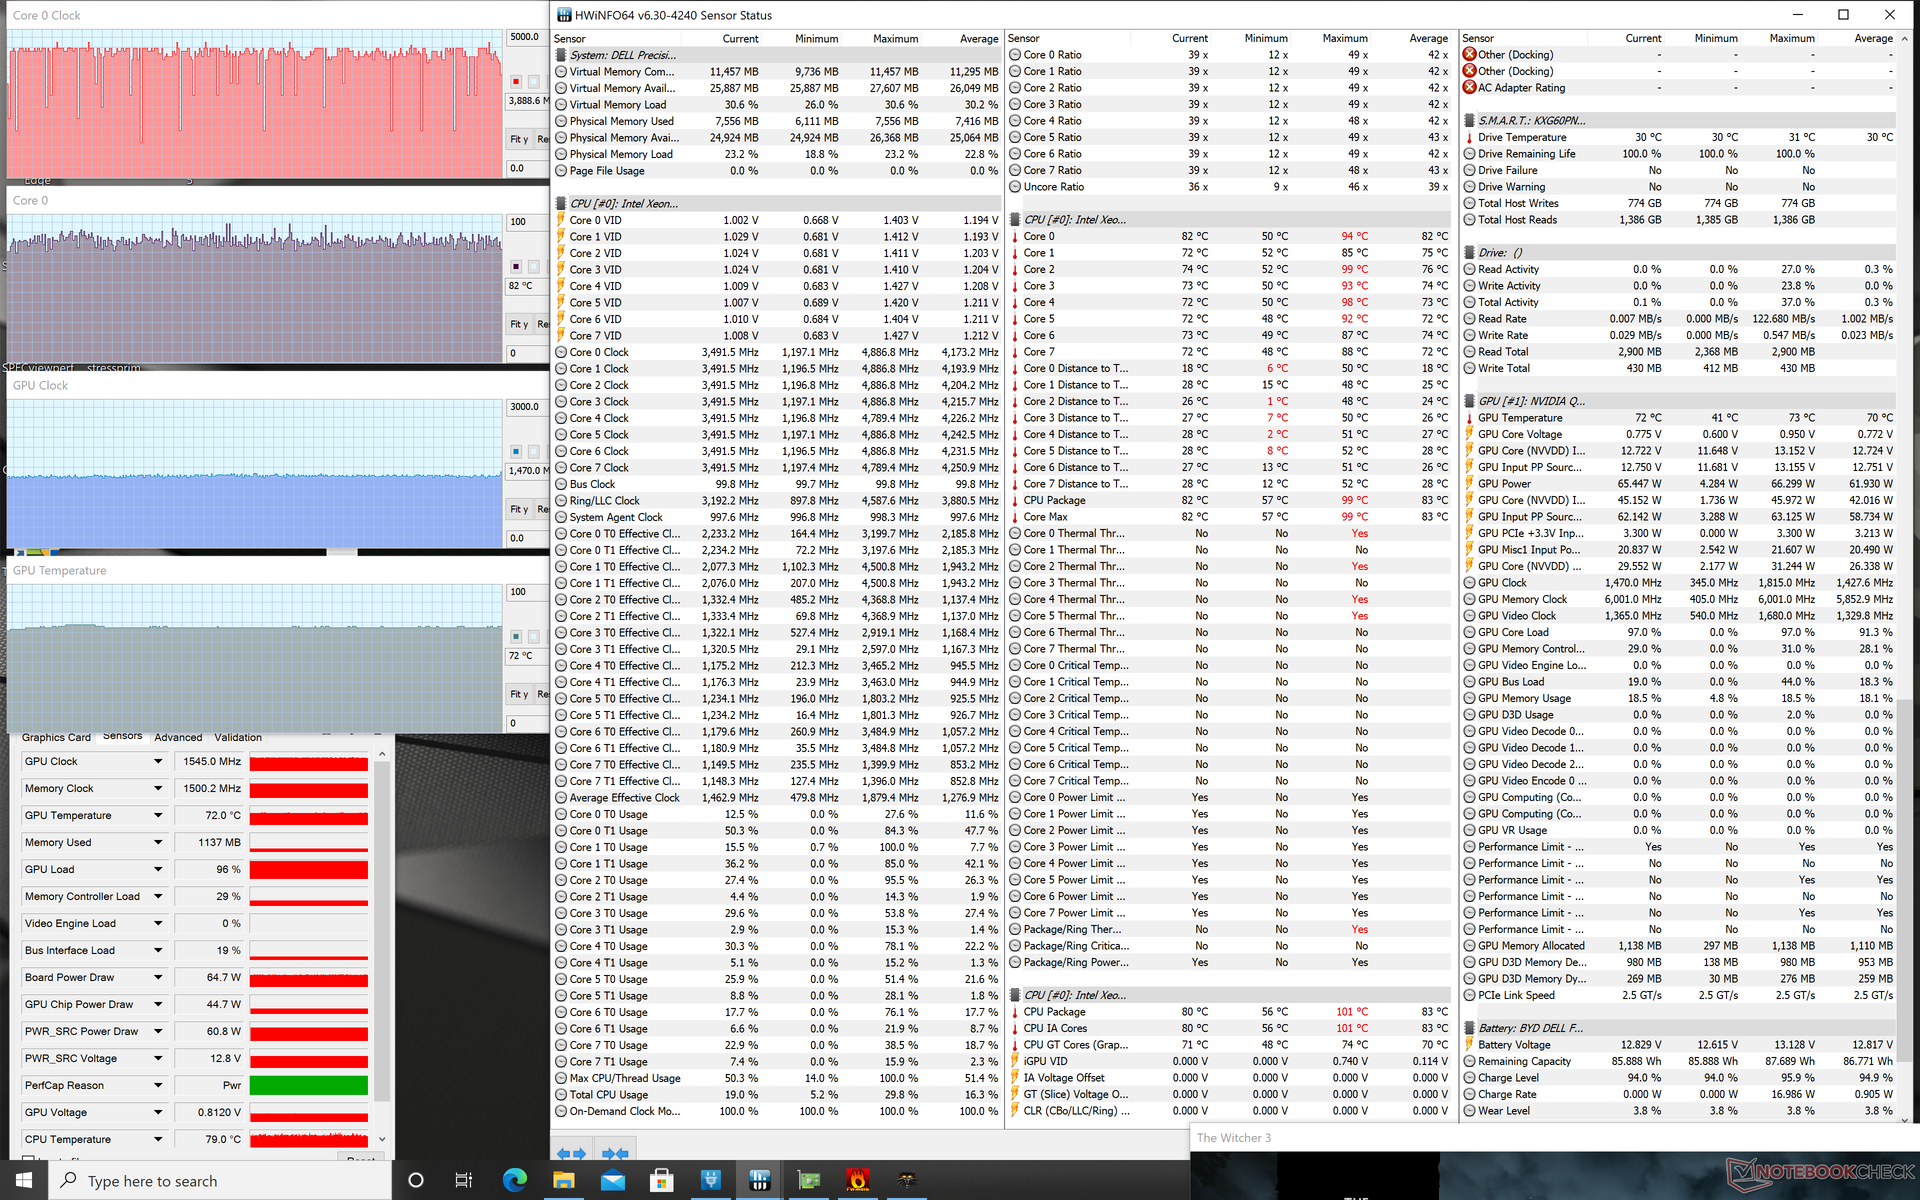
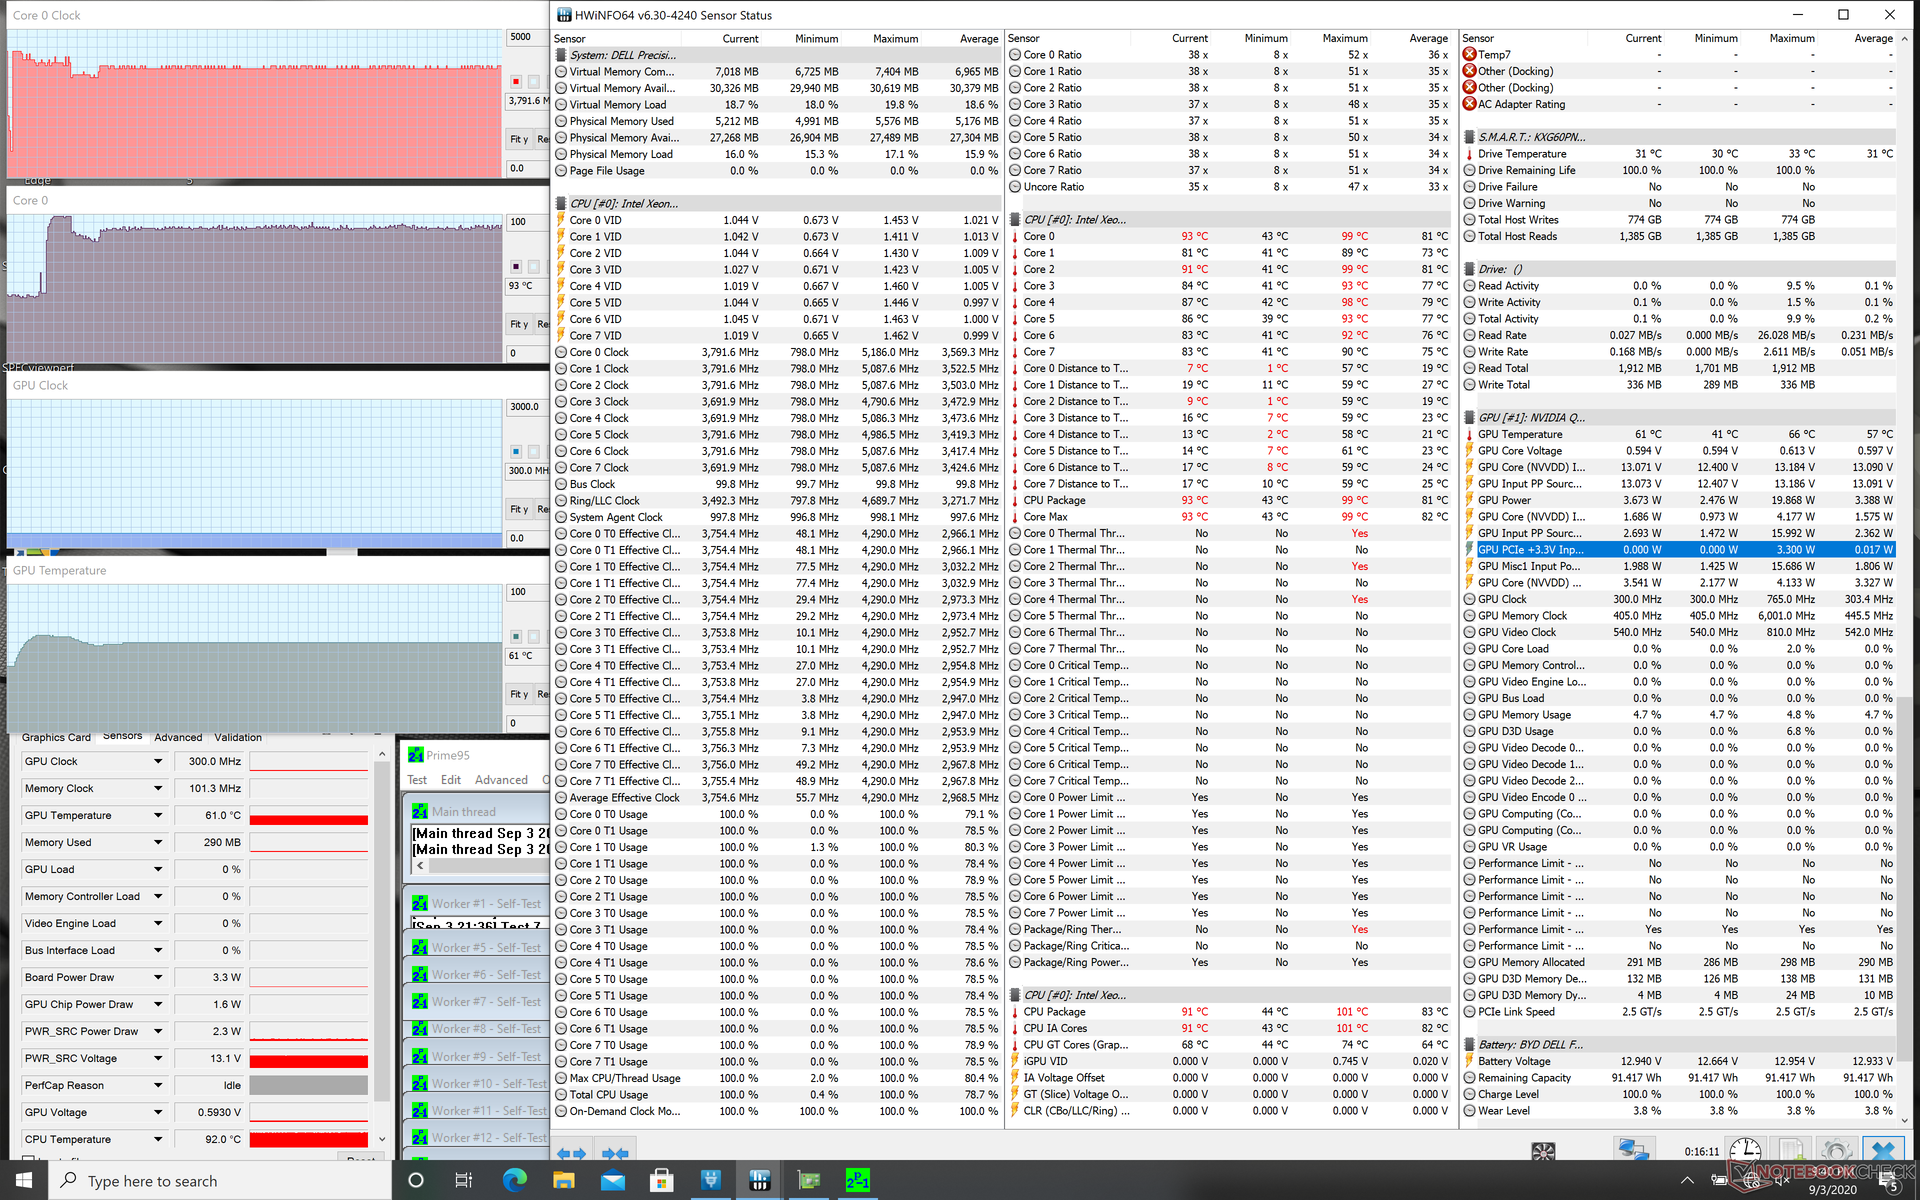
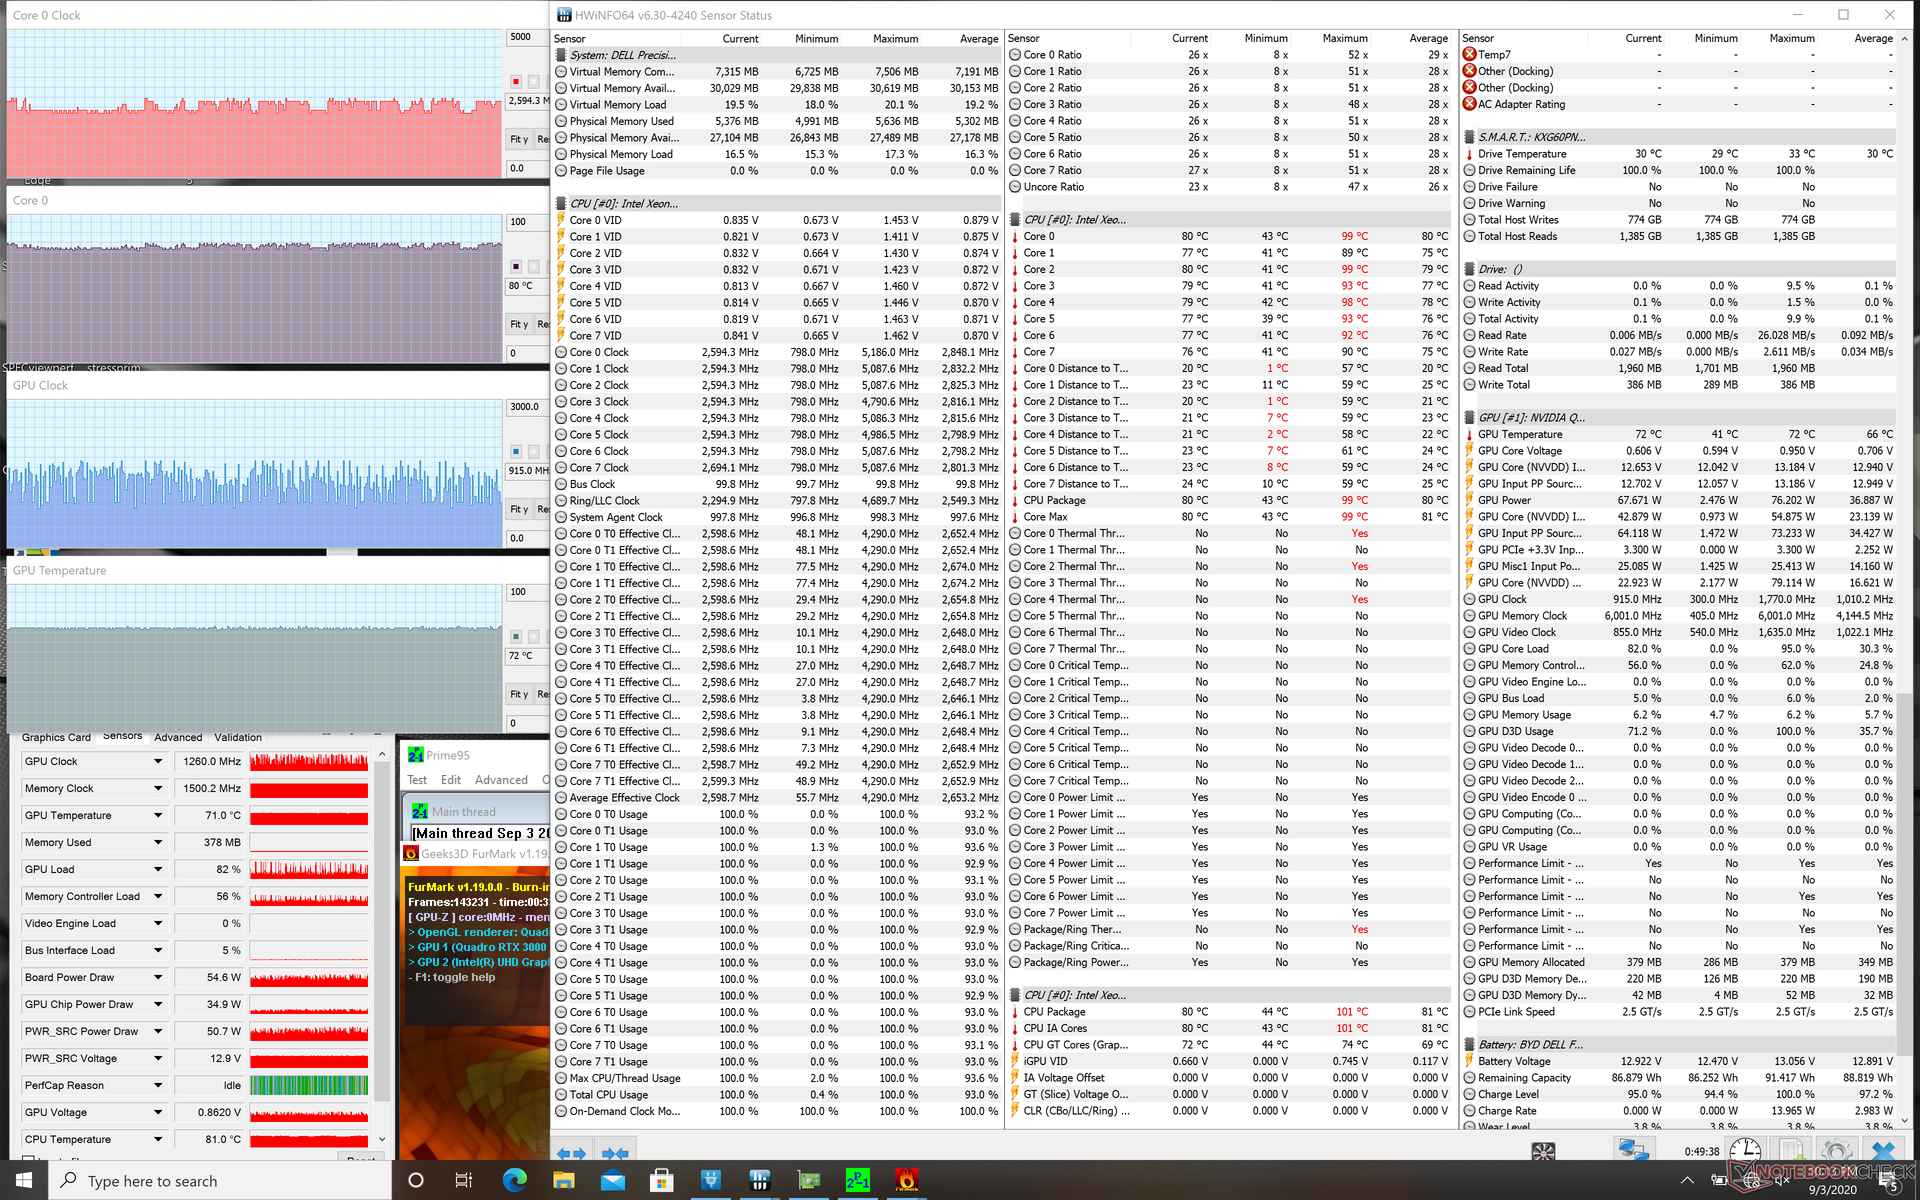
| CPU Clock (GHz) | GPU Clock (MHz) | Average CPU Temperature (°C) | Average GPU Temperature (°C) | |
| System Idle | -- | -- | 45 | 44 |
| Prime95 Stress | 3.7 - 3.8 | -- | 93 | 61 |
| Prime95 + FurMark Stress | 2.3 - 2.6 | 930 - 1770 | 78 - 81 | 70 |
| Witcher 3 Stress | ~4.2 | 1545 | ~82 | 72 |
Speakers
")

Dell Precision 5000 5750 P92F audio analysis
(+) | speakers can play relatively loud (85.6 dB)
Bass 100 - 315 Hz
(±) | reduced bass - on average 7.4% lower than median
(±) | linearity of bass is average (8.7% delta to prev. frequency)
Mids 400 - 2000 Hz
(+) | balanced mids - only 3.6% away from median
(+) | mids are linear (3.8% delta to prev. frequency)
Highs 2 - 16 kHz
(±) | higher highs - on average 5.3% higher than median
(+) | highs are linear (5.6% delta to prev. frequency)
Overall 100 - 16.000 Hz
(+) | overall sound is linear (10.5% difference to median)
Compared to same class
» 7% of all tested devices in this class were better, 6% similar, 87% worse
» The best had a delta of 7%, average was 17%, worst was 35%
Compared to all devices tested
» 5% of all tested devices were better, 1% similar, 93% worse
» The best had a delta of 4%, average was 23%, worst was 134%
Apple MacBook 12 (Early 2016) 1.1 GHz audio analysis
(+) | speakers can play relatively loud (83.6 dB)
Bass 100 - 315 Hz
(±) | reduced bass - on average 11.3% lower than median
(±) | linearity of bass is average (14.2% delta to prev. frequency)
Mids 400 - 2000 Hz
(+) | balanced mids - only 2.4% away from median
(+) | mids are linear (5.5% delta to prev. frequency)
Highs 2 - 16 kHz
(+) | balanced highs - only 2% away from median
(+) | highs are linear (4.5% delta to prev. frequency)
Overall 100 - 16.000 Hz
(+) | overall sound is linear (10.2% difference to median)
Compared to same class
» 7% of all tested devices in this class were better, 2% similar, 90% worse
» The best had a delta of 5%, average was 18%, worst was 53%
Compared to all devices tested
» 5% of all tested devices were better, 1% similar, 94% worse
» The best had a delta of 4%, average was 23%, worst was 134%
Energy Management
Power Consumption
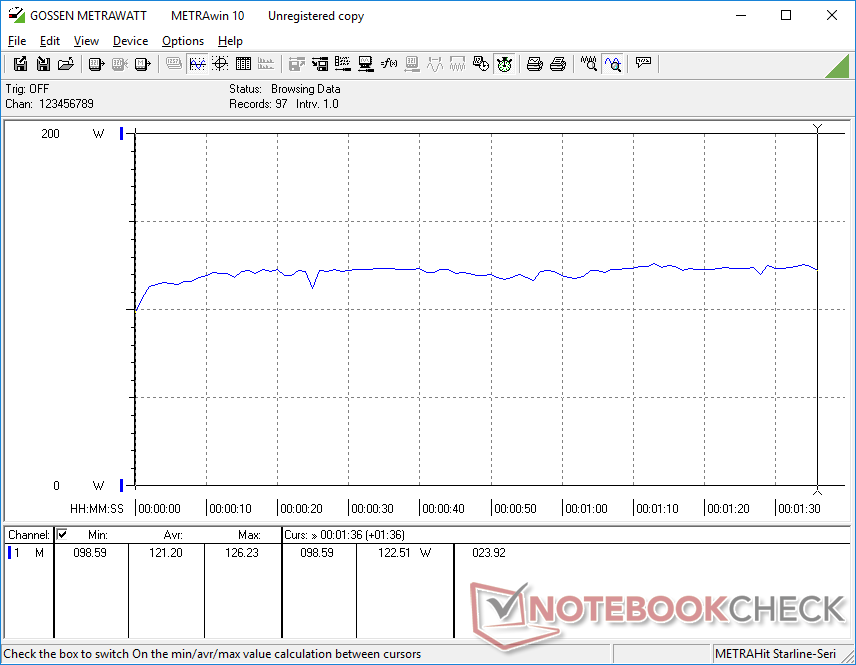
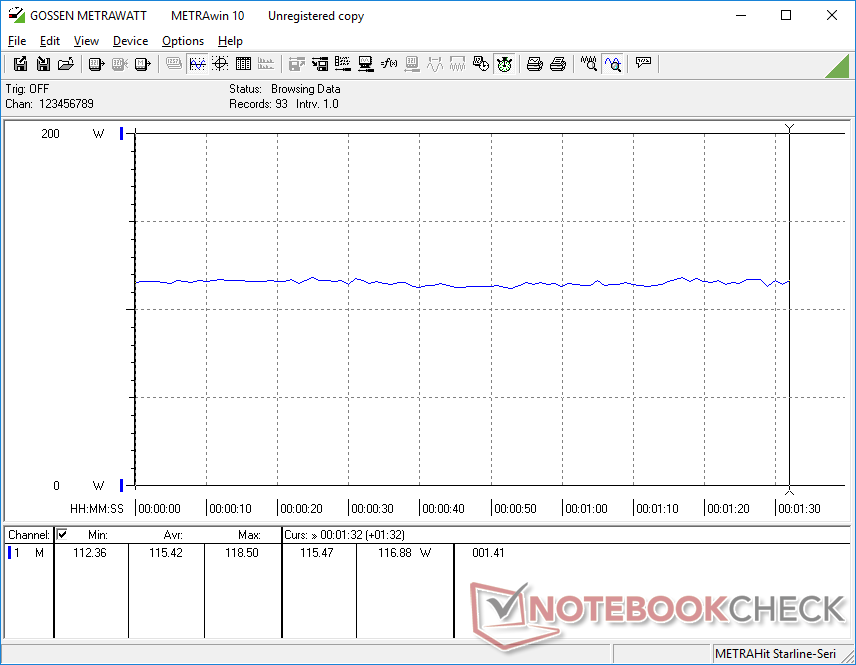
Idling on desktop consumes about 6 W minimum or up to 17 W when on the High Performance profile with the Quadro GPU active. When running high loads like games, consumption averages about 115 W or 25 percent less than the ThinkPad P53 equipped with the full-power Quadro RTX 3000.
Maximum consumption when running extreme loads is lower than expected due to the relatively small (~14.3 x 6.5 x 2.3 cm) 130 W AC adapter. In comparison, the Asus ProArt StudioBook Pro 17 comes with the same GPU and yet it is able to draw over 180 W because of its larger AC adapter. Thus, the Precision 5750 isn't well suited for running extreme processing loads for extended periods as exemplified by the fluctuating GPU clock rates in our Stress Test section above. The battery will also charge very slowly when under such loads due to the low 130 W ceiling. We experienced no major battery discharging issues when connected to an AC outlet unlike on some early XPS 17 units.
| Off / Standby | |
| Idle | |
| Load |
|
Key:
min: | |
| Dell Precision 5000 5750 P92F W-10885M, Quadro RTX 3000 Max-Q, Toshiba Kioxia XG6 KXG60PNV1T02, IPS, 3840x2400, 17" | Asus ProArt StudioBook Pro 17 W700G3T i7-9750H, Quadro RTX 3000 Max-Q, Samsung SSD PM981 MZVLB1T0HALR, IPS, 1920x1200, 17" | MSI WS75 9TL-636 i7-9750H, Quadro RTX 4000 (Laptop), Samsung SSD PM981 MZVLB1T0HALR, IPS, 1920x1080, 17.3" | Dell Precision 7730 i7-8850H, Quadro P3200, Samsung SSD PM981 MZVLB512HAJQ, IPS LED, 1920x1080, 17.3" | Lenovo ThinkPad P73-20QR002DGE i7-9850H, Quadro RTX 3000 (Laptop), Intel SSD Pro 7600p SSDPEKKF512G8L, IPS LED, 1920x1080, 17.3" | MSI WE75 9TK i7-9750H, Quadro RTX 3000 (Laptop), Samsung SSD PM981 MZVLB512HAJQ, IPS, 1920x1080, 17.3" | |
|---|---|---|---|---|---|---|
| Power Consumption | -17% | -47% | -25% | -13% | -30% | |
| Idle Minimum * (Watt) | 6.3 | 11.3 -79% | 16.4 -160% | 10.1 -60% | 8.9 -41% | 12.1 -92% |
| Idle Average * (Watt) | 14.2 | 16 -13% | 21.6 -52% | 18 -27% | 12.8 10% | 18.4 -30% |
| Idle Maximum * (Watt) | 17.3 | 16.8 3% | 22.9 -32% | 19.7 -14% | 16.4 5% | 18.8 -9% |
| Load Average * (Watt) | 121.2 | 93.6 23% | 88 27% | 89.6 26% | 108.4 11% | 95.1 22% |
| Witcher 3 ultra * (Watt) | 115.4 | 106 8% | 137 -19% | 134 -16% | 153 -33% | 135.5 -17% |
| Load Maximum * (Watt) | 130.7 | 186.6 -43% | 193 -48% | 204 -56% | 166 -27% | 203.7 -56% |
* ... smaller is better
Battery Life
Runtimes are long owing to the large battery capacity and support for Optimus. We're able to record just shy of 11 hours of real-world WLAN use when browsing the web at 150 nits brightness on the Balanced power profile.
Recharging from empty to full capacity takes about 2 hours.
| Dell Precision 5000 5750 P92F W-10885M, Quadro RTX 3000 Max-Q, 97 Wh | Asus ProArt StudioBook Pro 17 W700G3T i7-9750H, Quadro RTX 3000 Max-Q, 57 Wh | MSI WS75 9TL-636 i7-9750H, Quadro RTX 4000 (Laptop), 82 Wh | Dell Precision 7730 i7-8850H, Quadro P3200, 92 Wh | Lenovo ThinkPad P73-20QR002DGE i7-9850H, Quadro RTX 3000 (Laptop), 99 Wh | MSI WE75 9TK i7-9750H, Quadro RTX 3000 (Laptop), 65 Wh | |
|---|---|---|---|---|---|---|
| Battery runtime | -35% | -38% | -41% | -17% | -50% | |
| Reader / Idle (h) | 18.2 | 12.6 -31% | 11 -40% | |||
| WiFi v1.3 (h) | 10.9 | 5.9 -46% | 6.6 -39% | 5.6 -49% | 11.1 2% | 4.9 -55% |
| Load (h) | 2.2 | 1.7 -23% | 1.2 -45% | 1.5 -32% | 1.4 -36% | 1 -55% |
Pros
Cons
Verdict
The Precision 5750 is for users who don't need any of the auxiliary features of the larger Precision 7750 and would rather omit them completely in favor of a thinner, sleeker, and more portable design. If you travel a lot and don't mind a barebones system that's part Ultrabook and part workstation, then this Precision fulfills that role. It's recommended to have Thunderbolt 3 monitors and docking stations to make the most of the system.
Aside from the hardware sacrifices, there are a few other drawbacks to keep in mind. Firstly, it's unfortunate that the base warranty is only 12 months compared to 36 months on the larger Precision 7750 almost as if Dell is viewing the Precision 5550 as the inferior model. Secondly, CPU temperatures will be quite high and with a slower battery recharge rate when running demanding loads. The latter is due to the small 130 W AC adapter which favors portability over higher output. It's apparent that Dell has designed the system to excel at "bursty" workloads whereas the larger and more powerful Precision 7550/7570 will do better at sustained workloads. And lastly, the lack of any sort of webcam shutter is strange to see on a chassis design this new.
The Precision 5750 is purposefully light on hardware features in favor of a more portable design. If you want a more travel-friendly 17-inch workstation, then the Precision 5750 will do the trick.
Dell Precision 5000 5750 P92F
- 09/07/2020 v7 (old)
Allen Ngo
Price comparison
