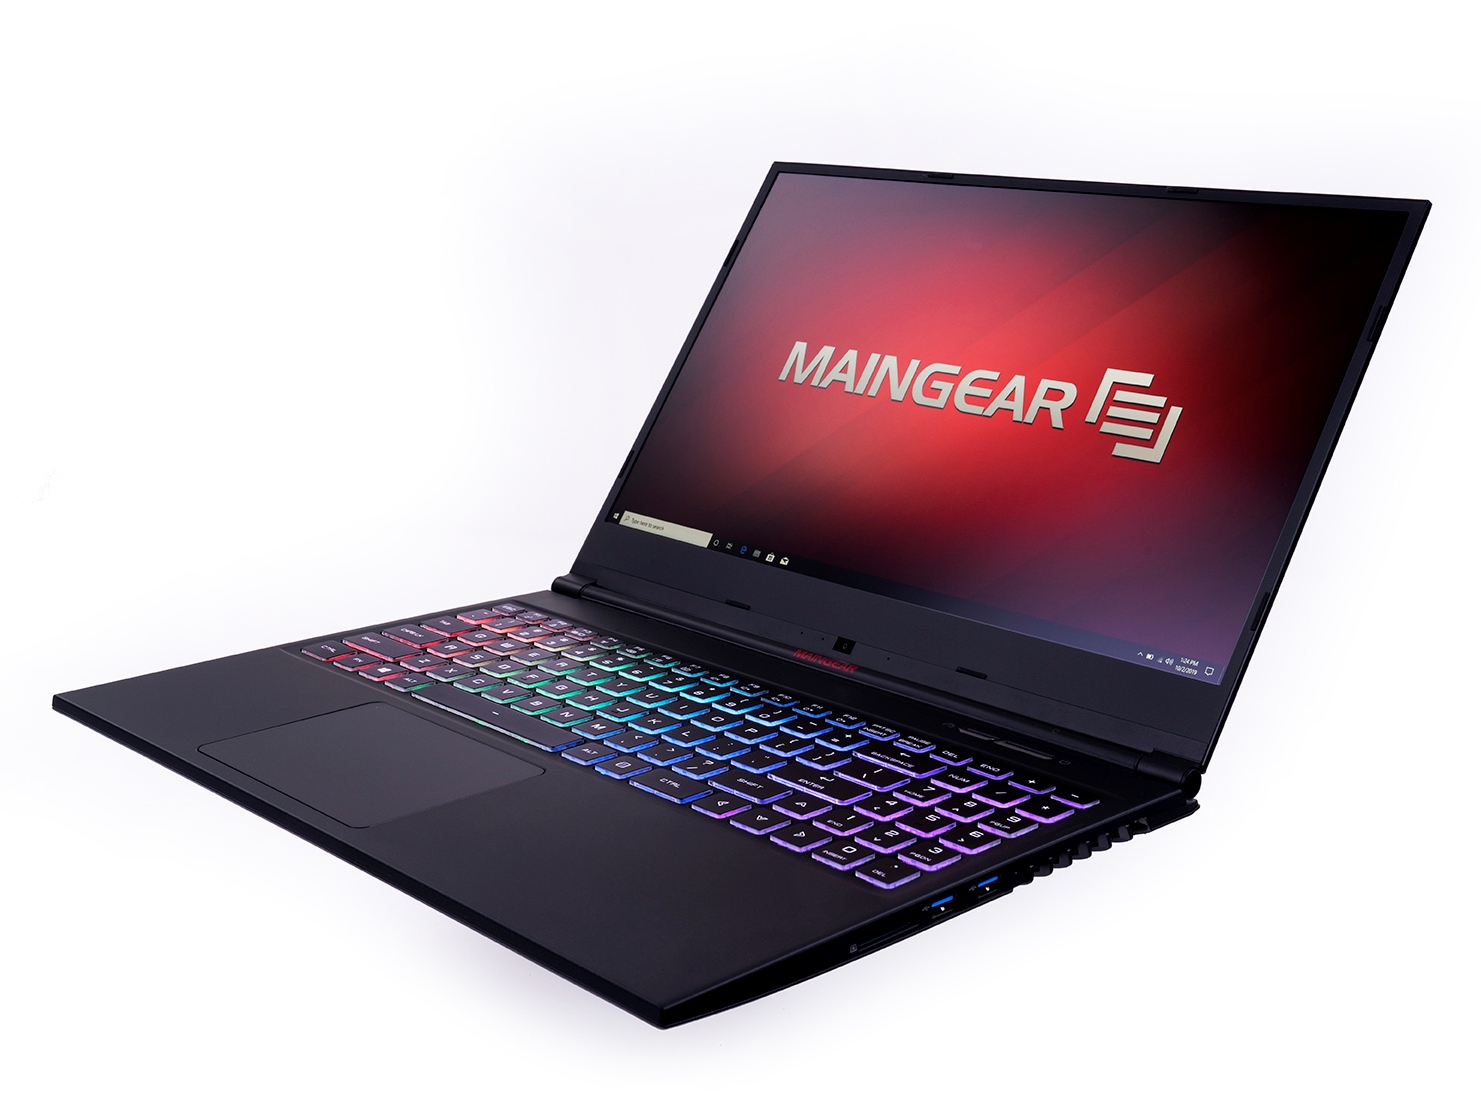
Maingear Vector 15 Laptop Review: Gaming All-rounder
The mid-range Maingear Vector comes just a few weeks after the launch of the higher-end Maingear Element. Unlike the latter and its GeForce RTX graphics, the less expensive Vector ships with the GeForce GTX 1660 Ti in a different chassis design. We suspect it to be a Tongfang chassis because of its physical similarities to the Schenker XMG Neo 15.
Currently, the Vector only comes in one major configuration with the Core i7-9750H CPU, GTX 1660 Ti GPU, and 144 Hz 1080p display with no other options. Storage and RAM can be configured as usual. The $1500 Vector competes directly with other thin-and-light mid-range 15.6-inch gaming laptops like the Razer Blade 15 GTX 1660 Ti, Lenovo Legion Y740-15, HP Omen 15, Aorus 15, Asus ROG Strix III, and the Dell G7 15.
Rating | Date | Model | Weight | Height | Size | Resolution | Price |
|---|---|---|---|---|---|---|---|
| 81.1 % v7 (old) | 11 / 2019 | Maingear Vector 15 i7-9750H, GeForce GTX 1660 Ti Mobile | 1.9 kg | 19.8 mm | 15.60" | 1920x1080 | |
| 80.8 % v7 (old) | 10 / 2019 | MSI GL65 9SEK i7-9750H, GeForce RTX 2060 Mobile | 2.3 kg | 27.5 mm | 15.60" | 1920x1080 | |
| 84.8 % v7 (old) | 10 / 2019 | Lenovo Legion Y740-15ICHg i7-9750H, GeForce RTX 2070 Max-Q | 2.3 kg | 25 mm | 15.60" | 1920x1080 | |
| 84.2 % v7 (old) | 09 / 2019 | Razer Blade 15 GTX 1660 Ti i7-9750H, GeForce GTX 1660 Ti Mobile | 2.1 kg | 19.9 mm | 15.60" | 1920x1080 | |
| 82.9 % v7 (old) | 10 / 2019 | Asus ROG Zephyrus M15 GU502GU-XB74 i7-9750H, GeForce GTX 1660 Ti Mobile | 2 kg | 18.9 mm | 15.60" | 1920x1080 |
Case
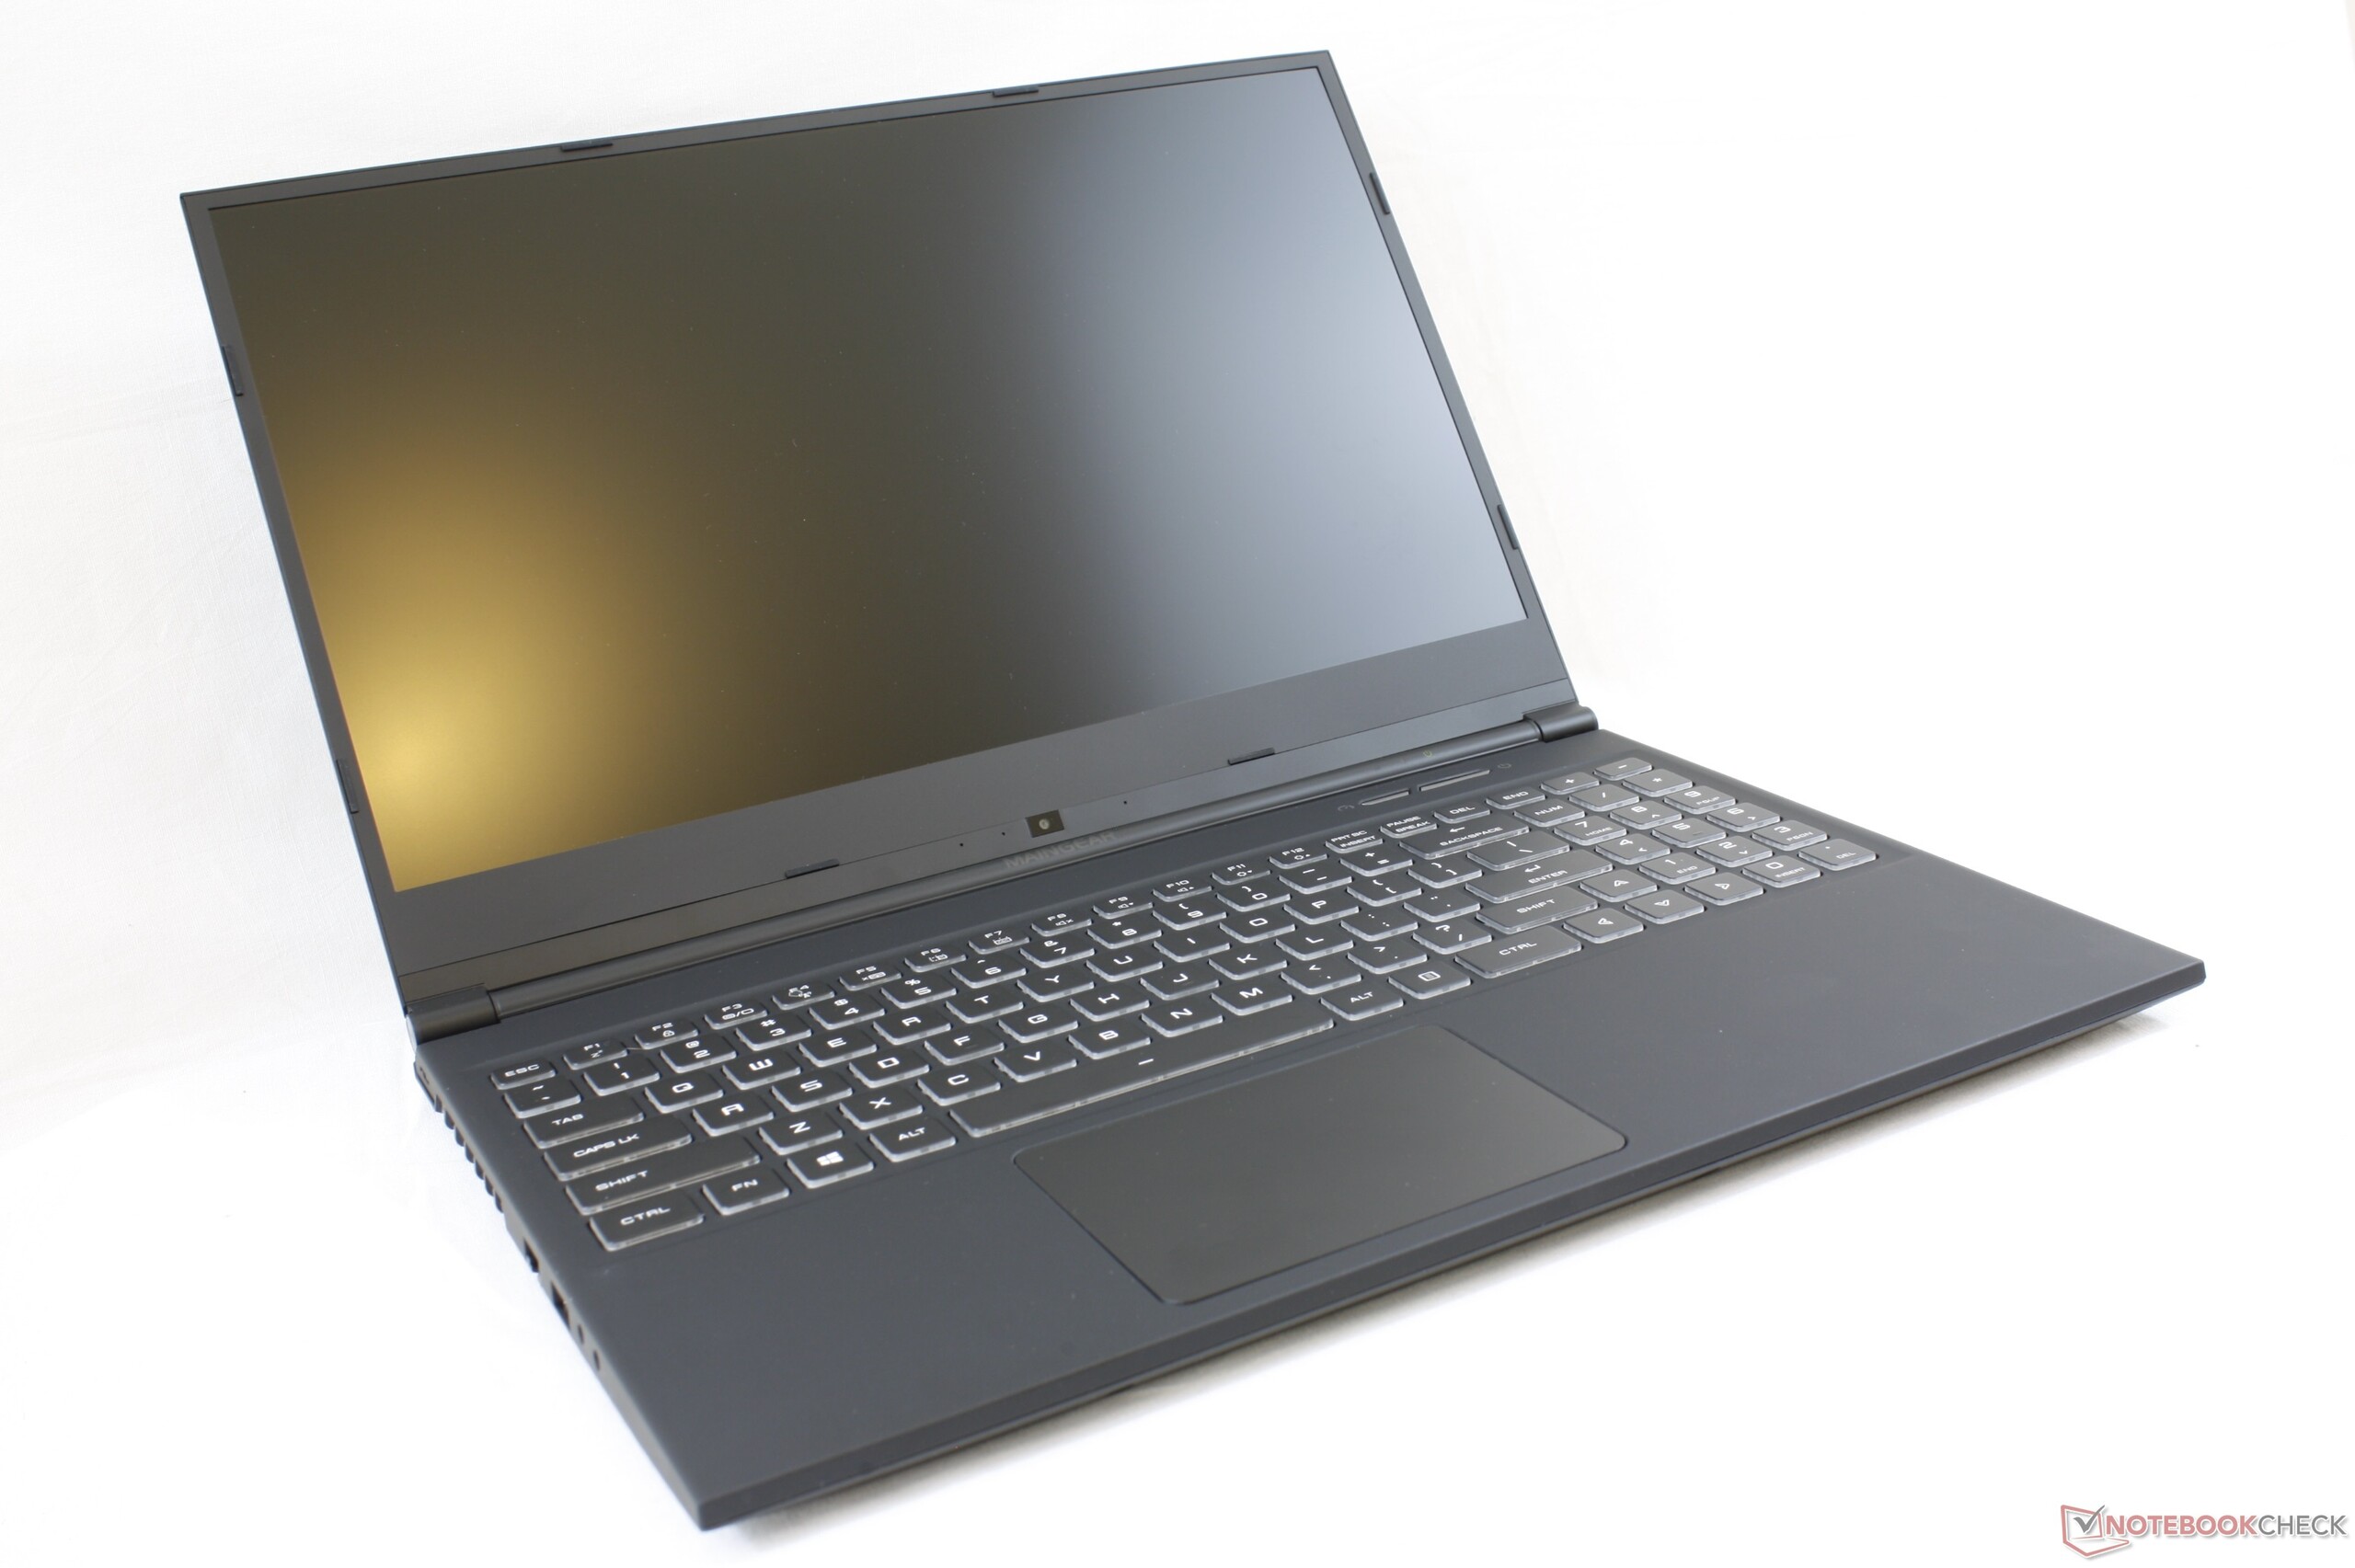
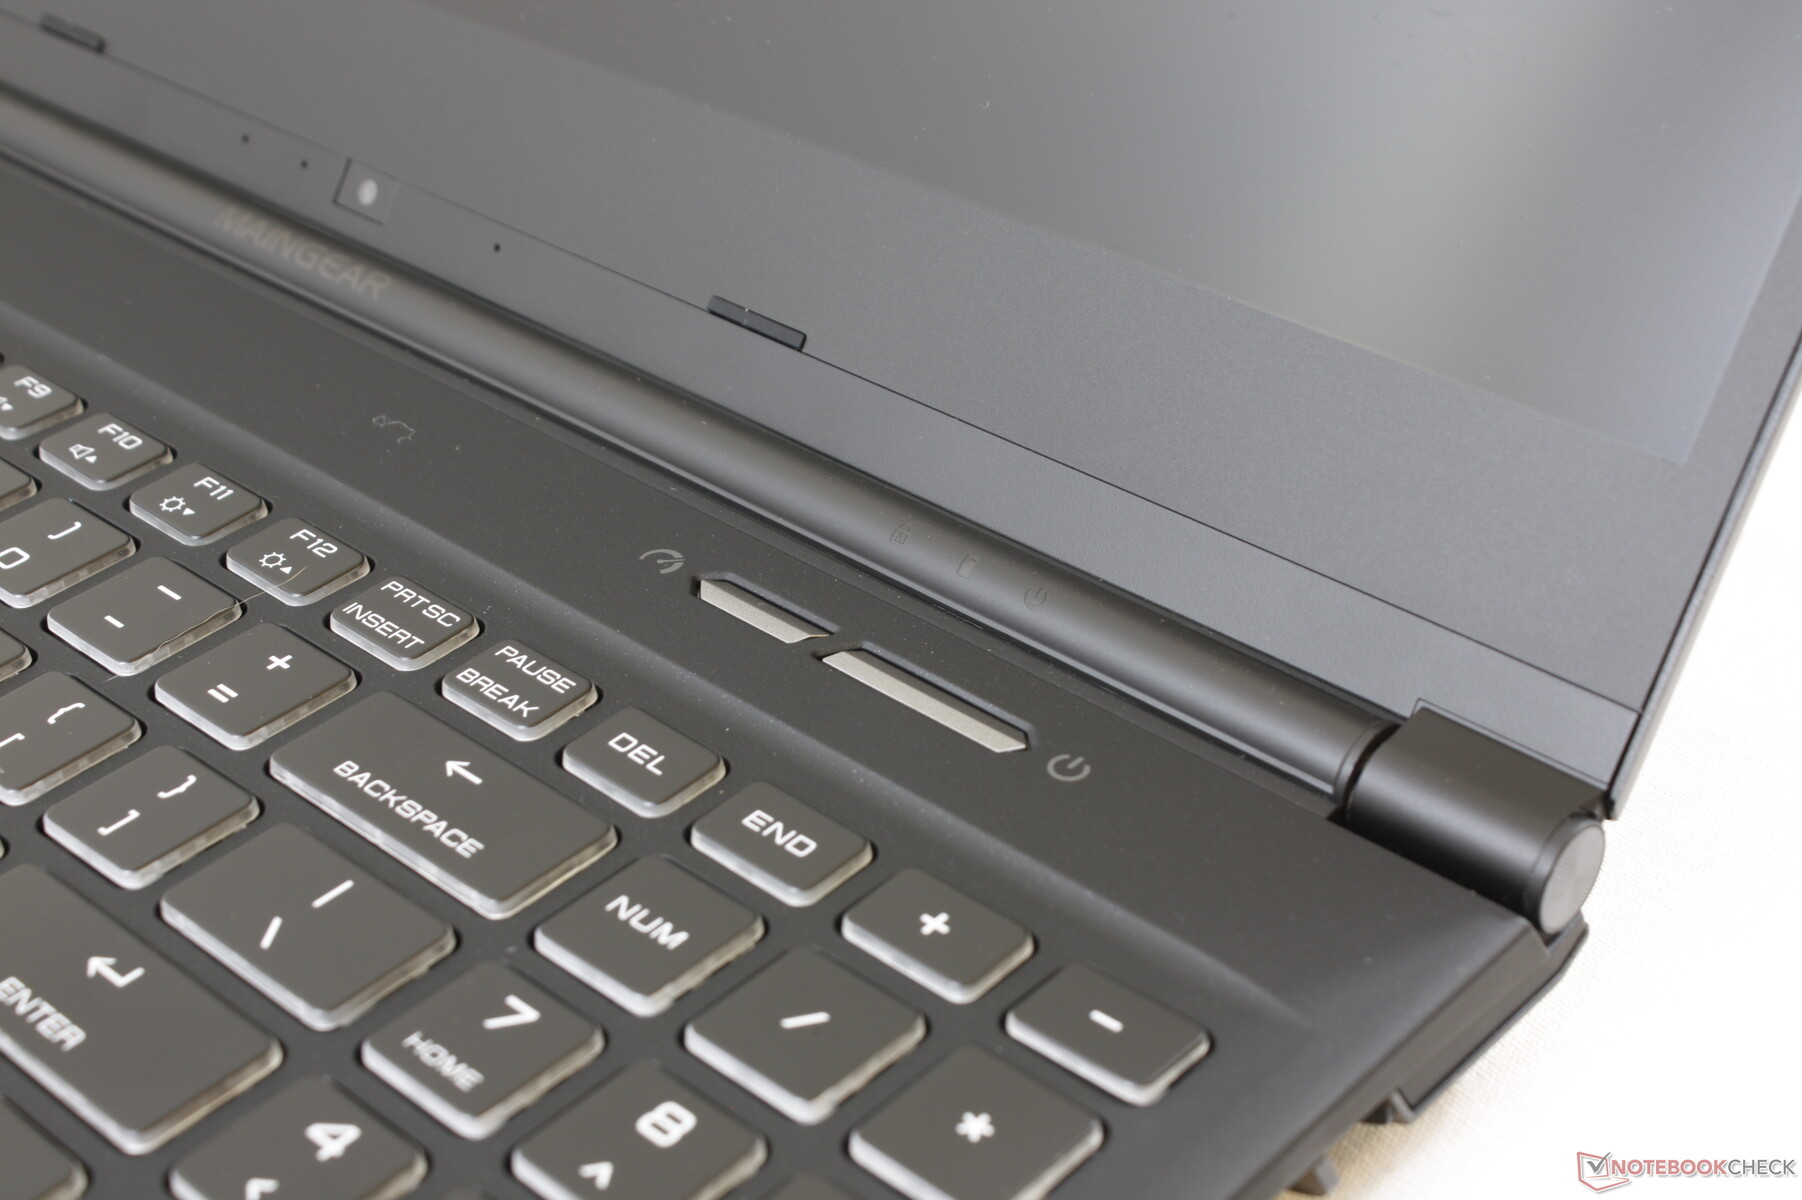
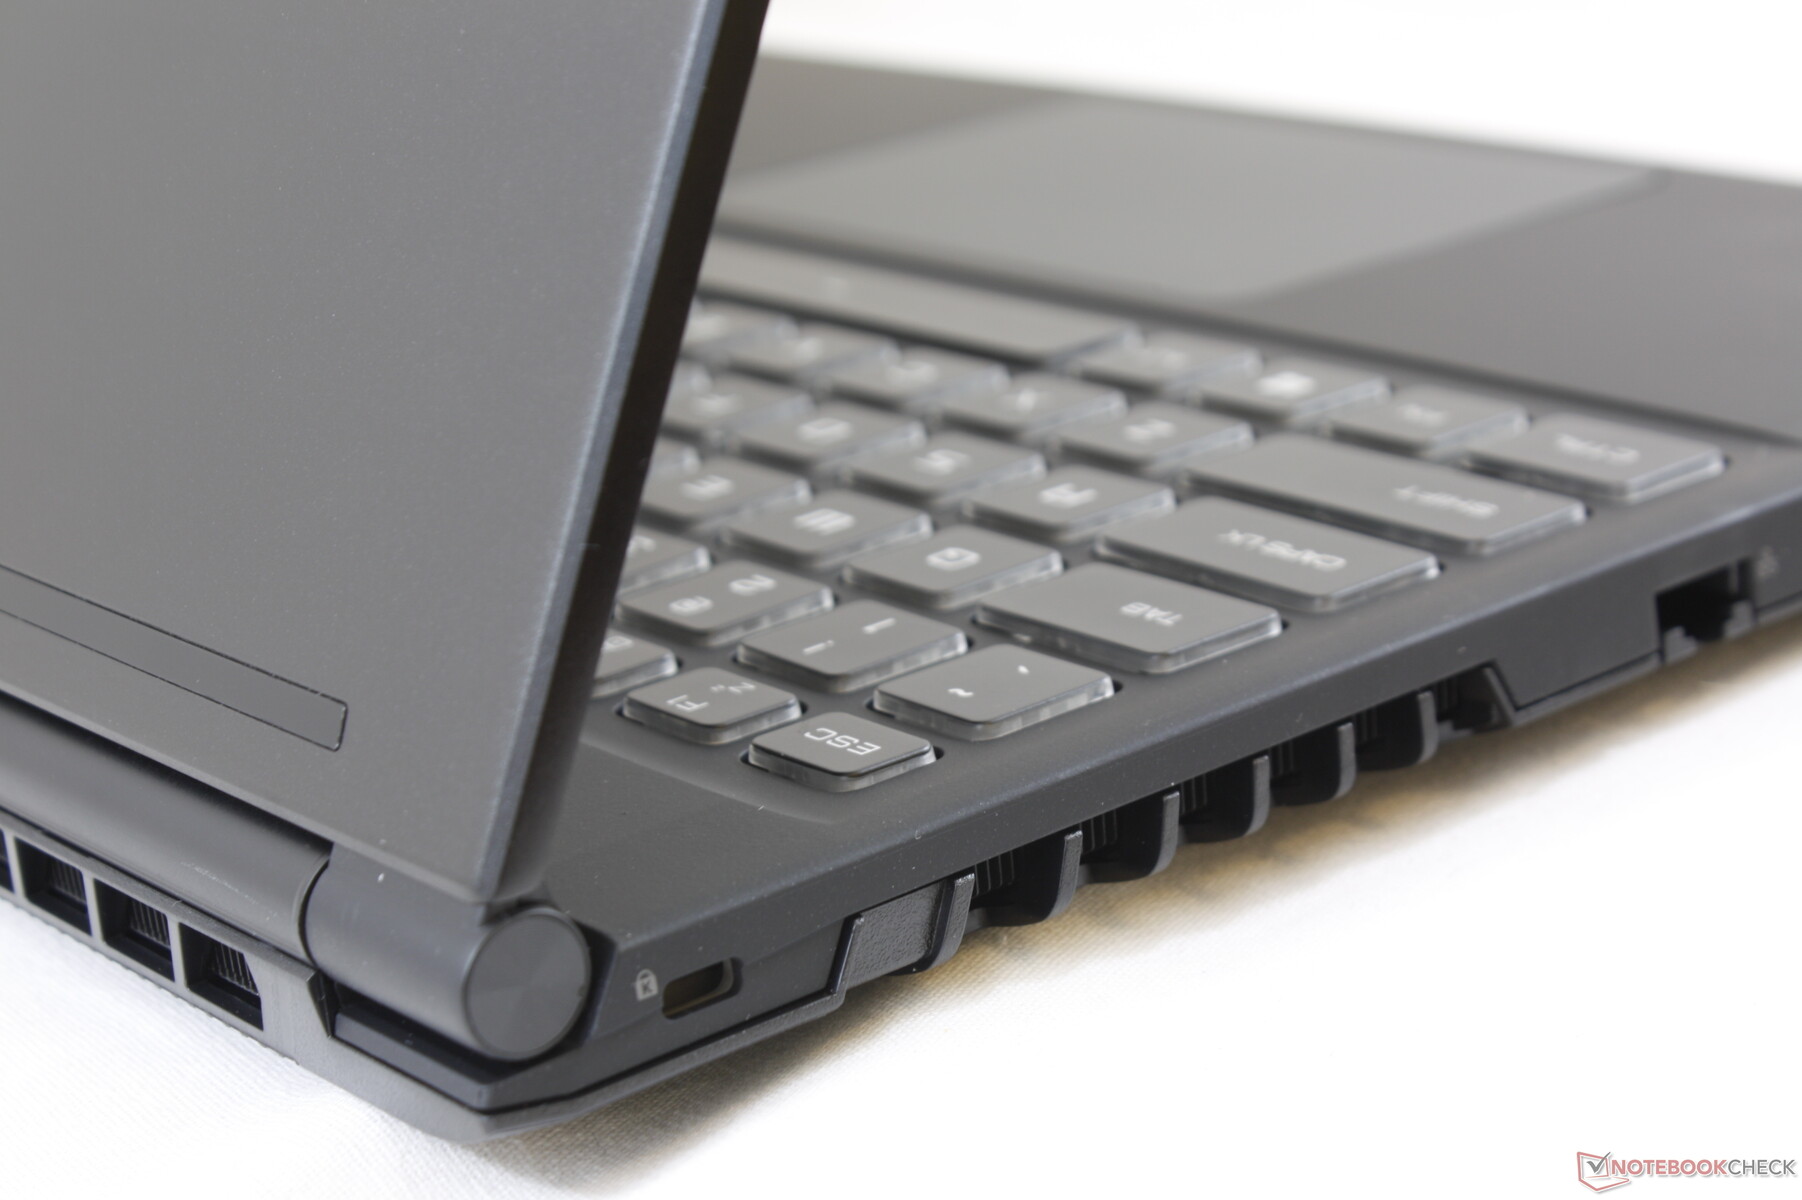
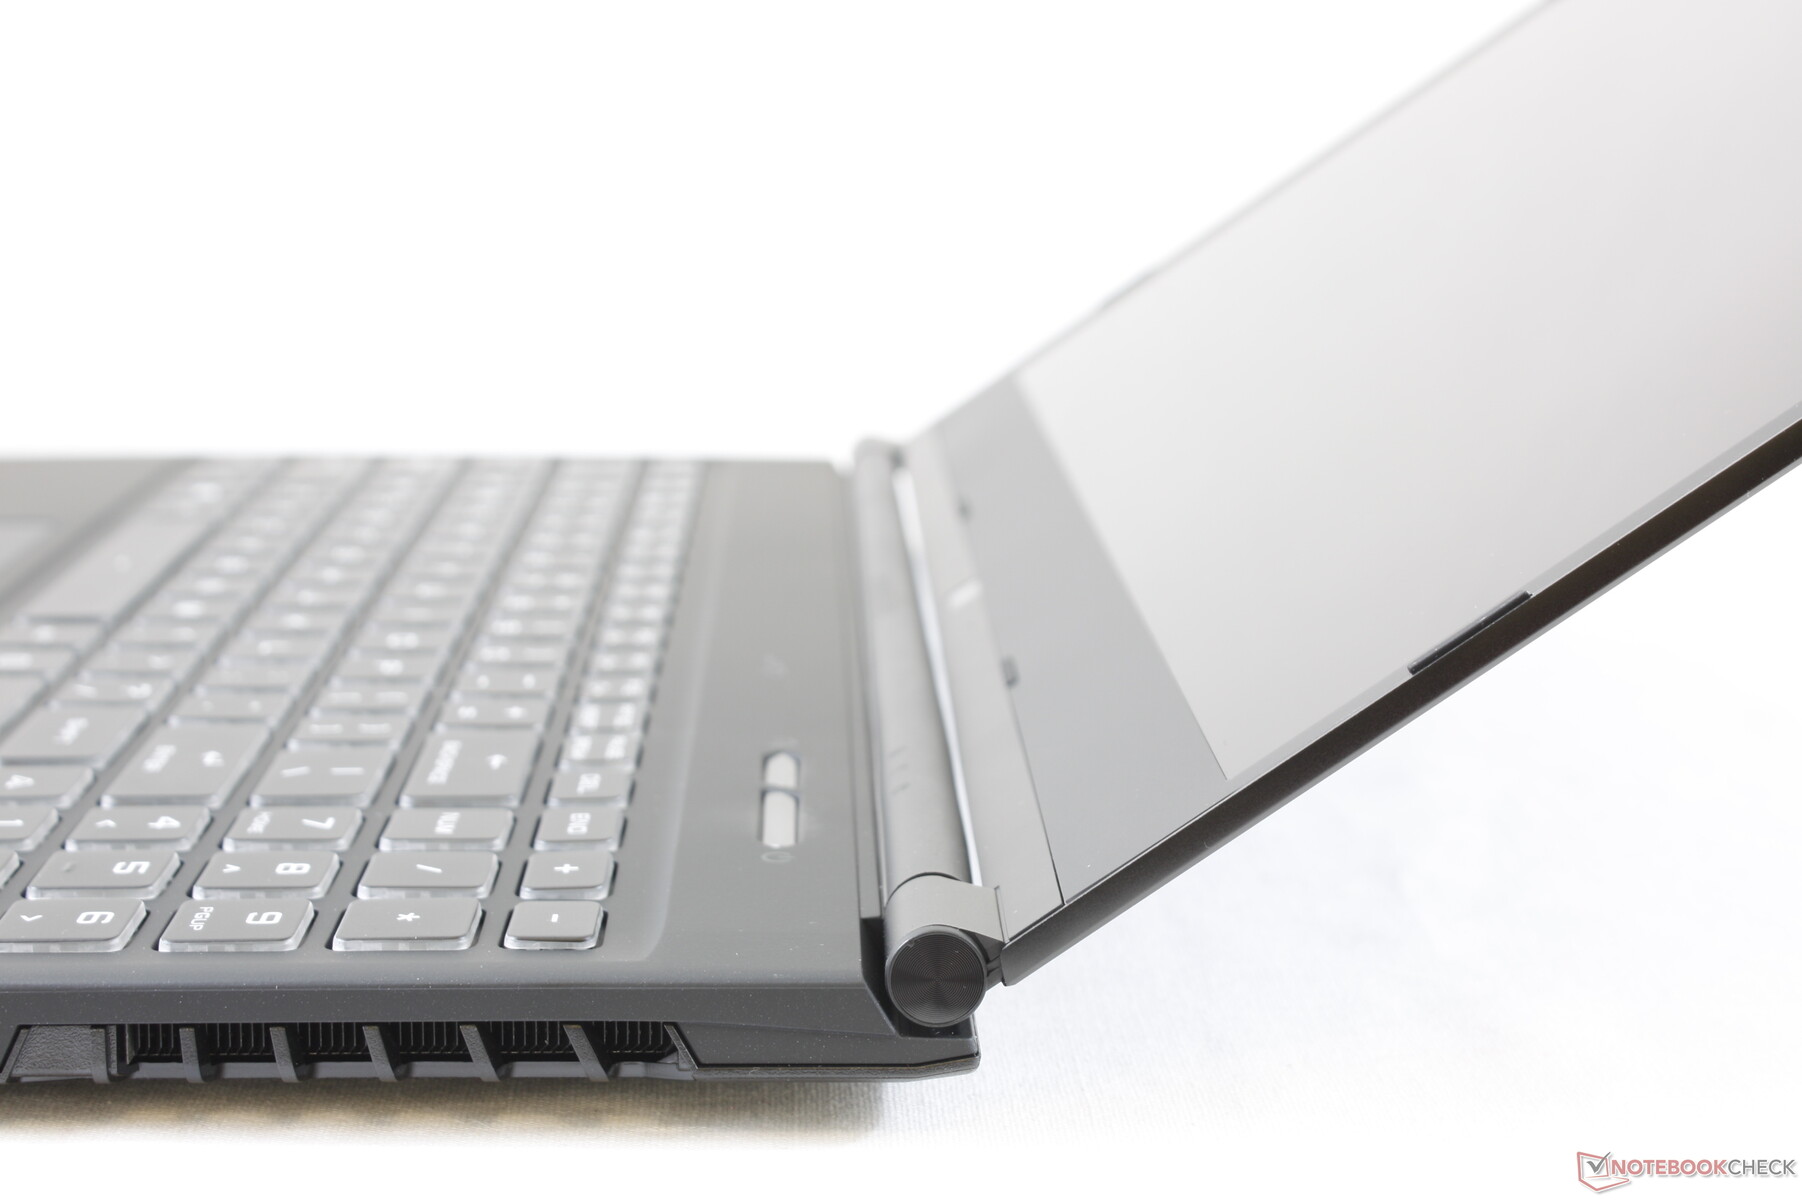
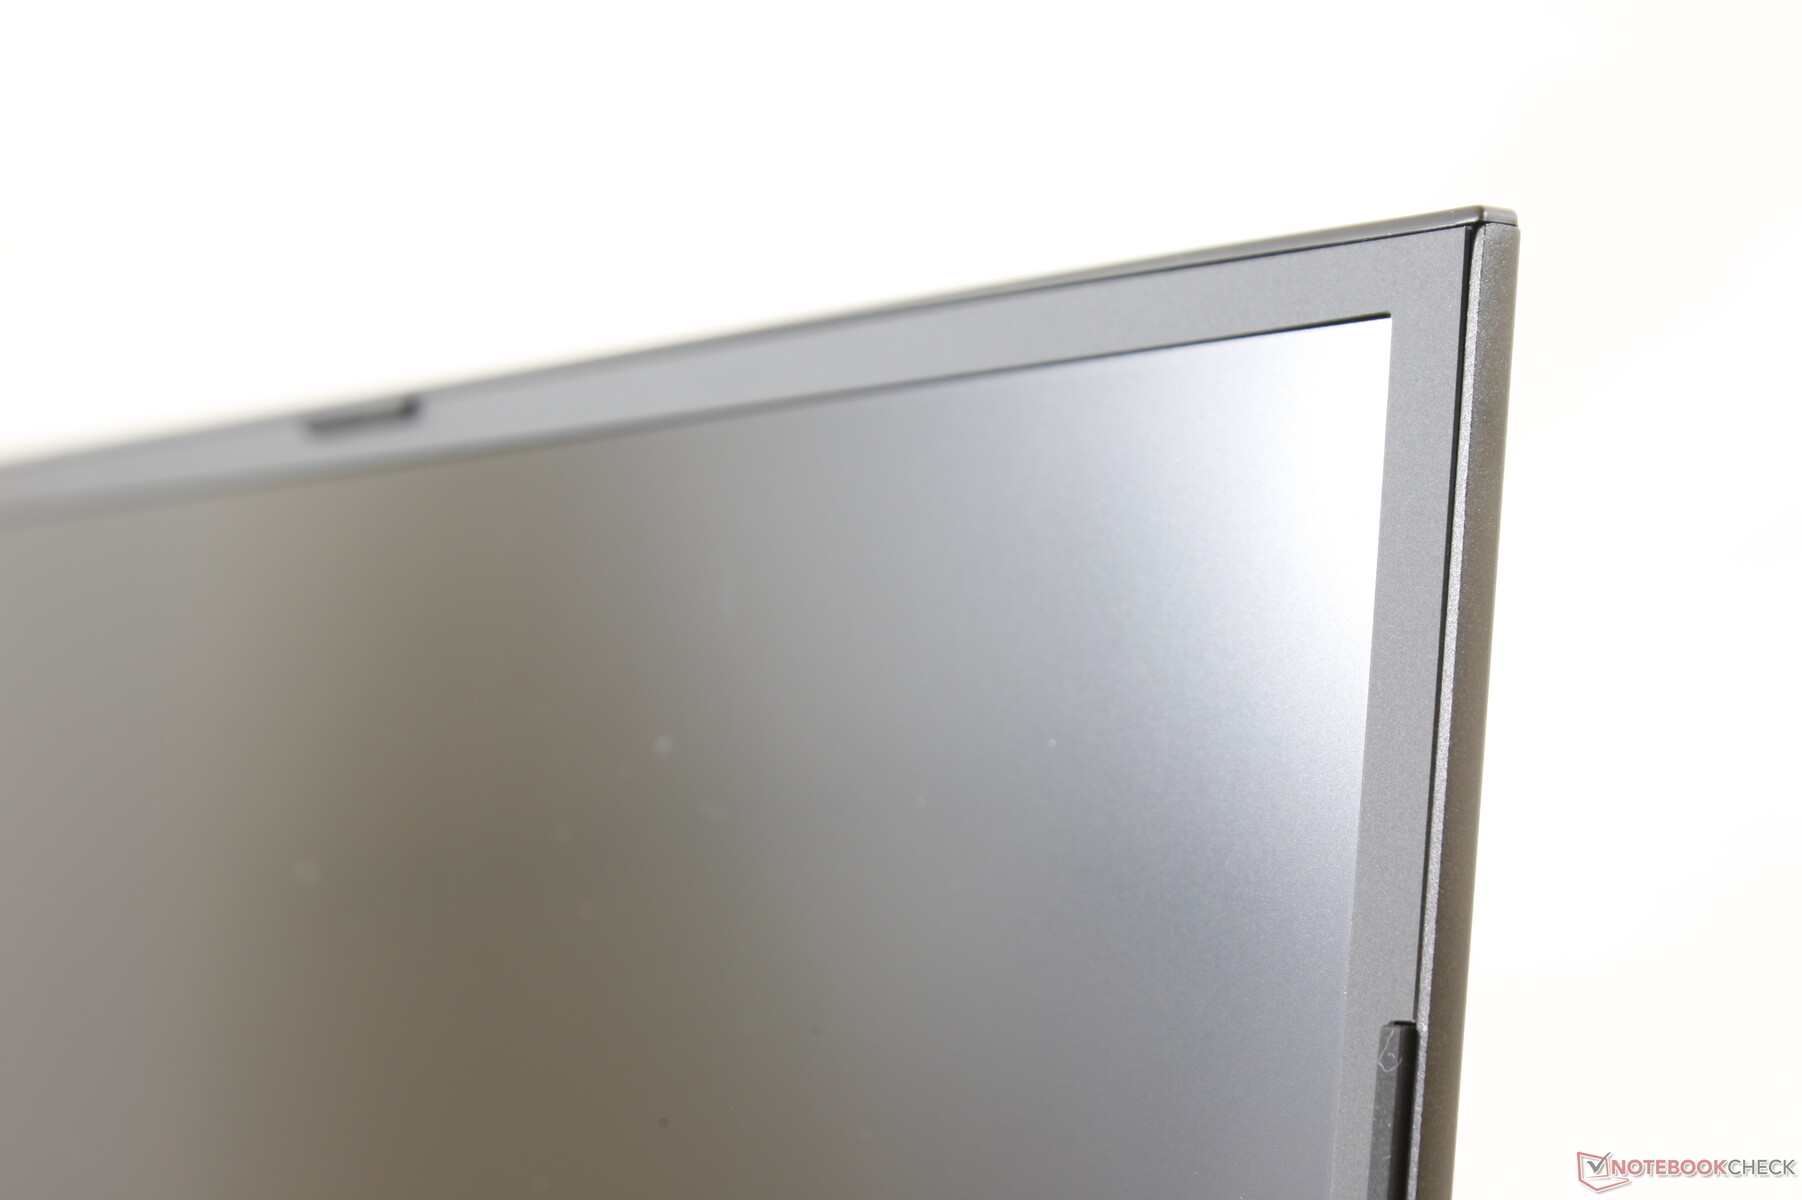
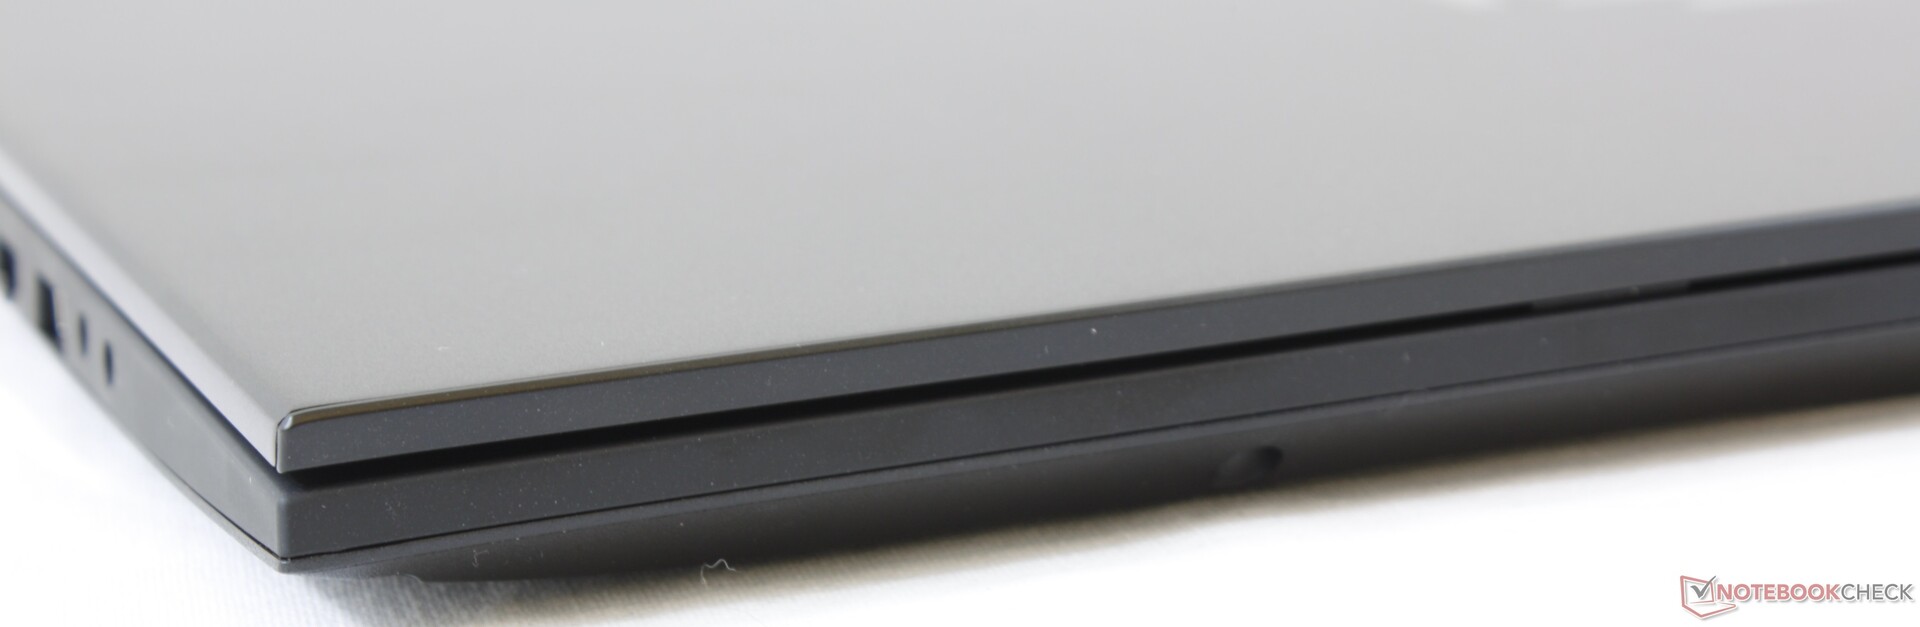
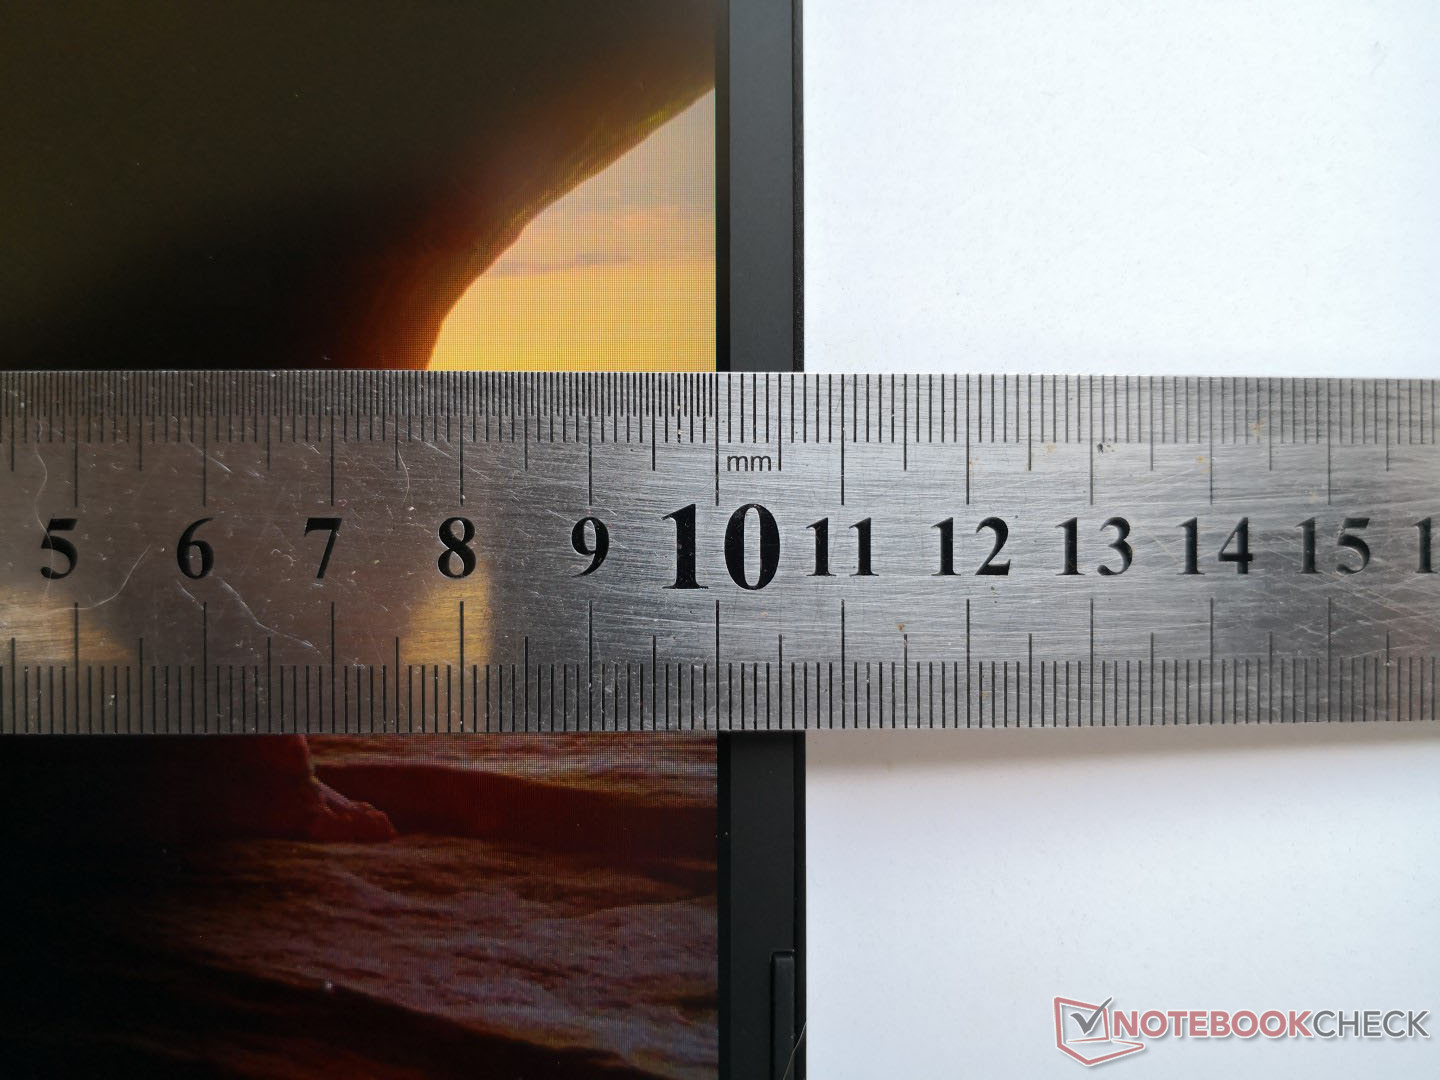
The smooth matte chassis may look great, but it's a step down compared to the Asus ROG Strix III, Alienware m15 R2 or Razer Blade 15. The lid and hinges in particular are weaker and more susceptible to twisting and teetering, respectively. It's still better than on the Lenovo Legion Y540/Y740, but not by much.
Thankfully, the base is firmer with only slight warping and creaking when attempting to twist its edges and surfaces. It's still not as rigid as the aforementioned heavier Asus or Razer, however.
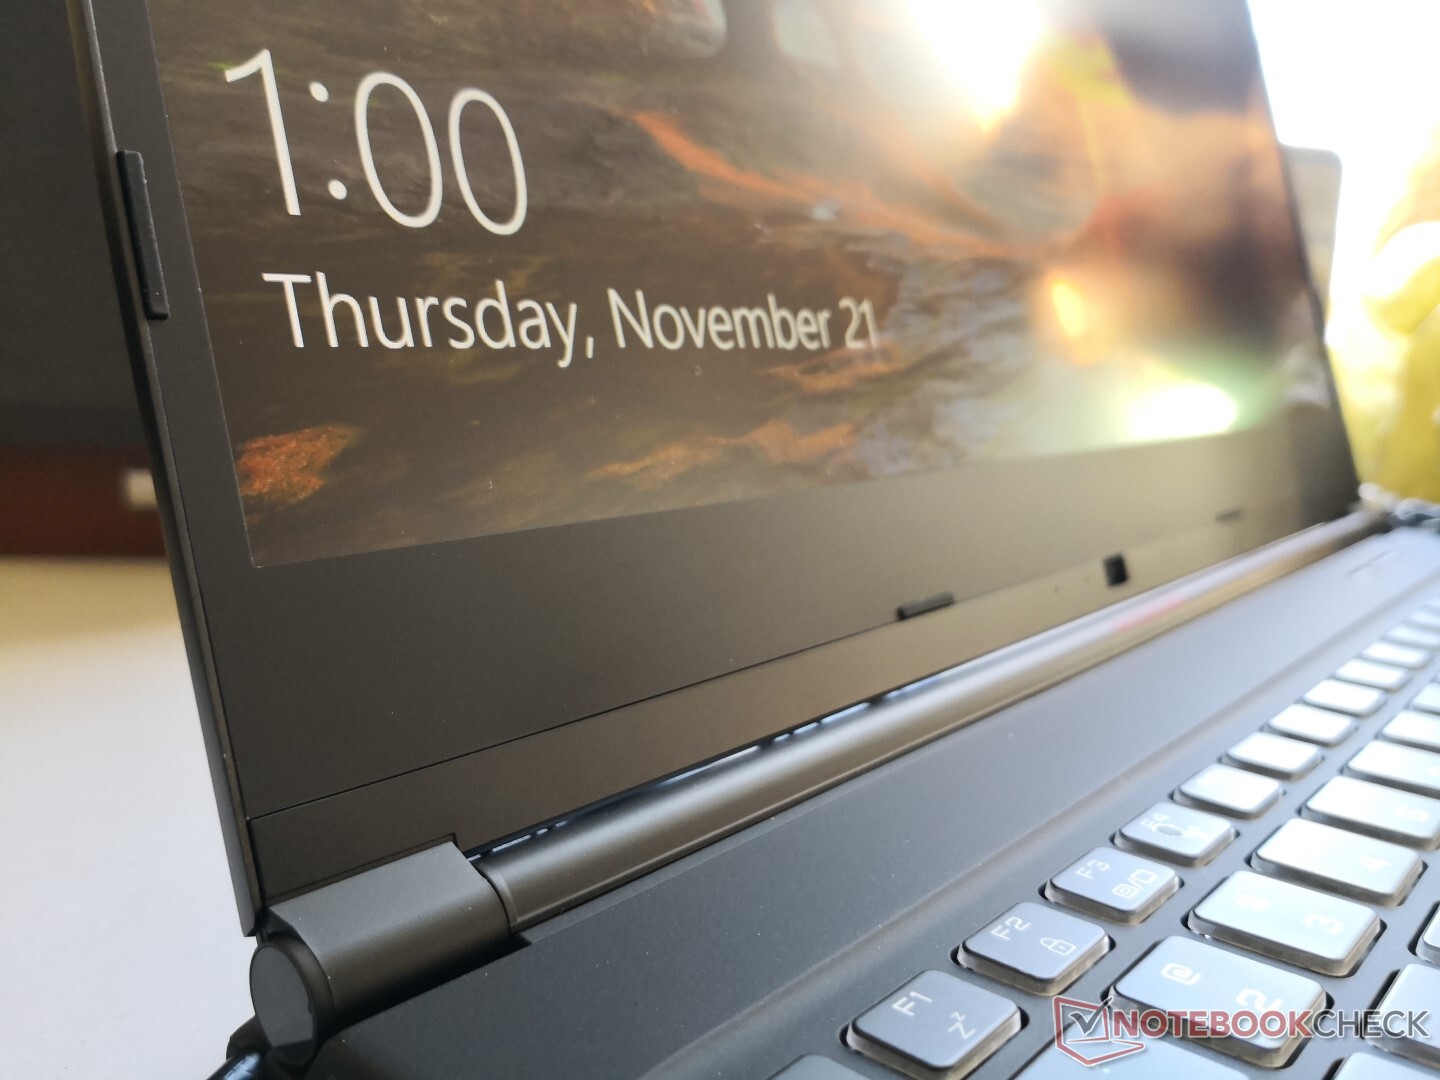
The webcam is disappointingly along the bottom edge instead of the top edge of the screen. The latest Dell XPS 15 7590 is proof that it's possible to have both narrow bezels and proper webcam positioning and so there is no excuse for the Vector to do the same.
The system weighs slightly less than many of its direct competitors by about 100 to 200 grams. Overall size is between that of the Razer Blade 15 GTX 1660 Ti and Asus Zephyrus M GU502.
Connectivity
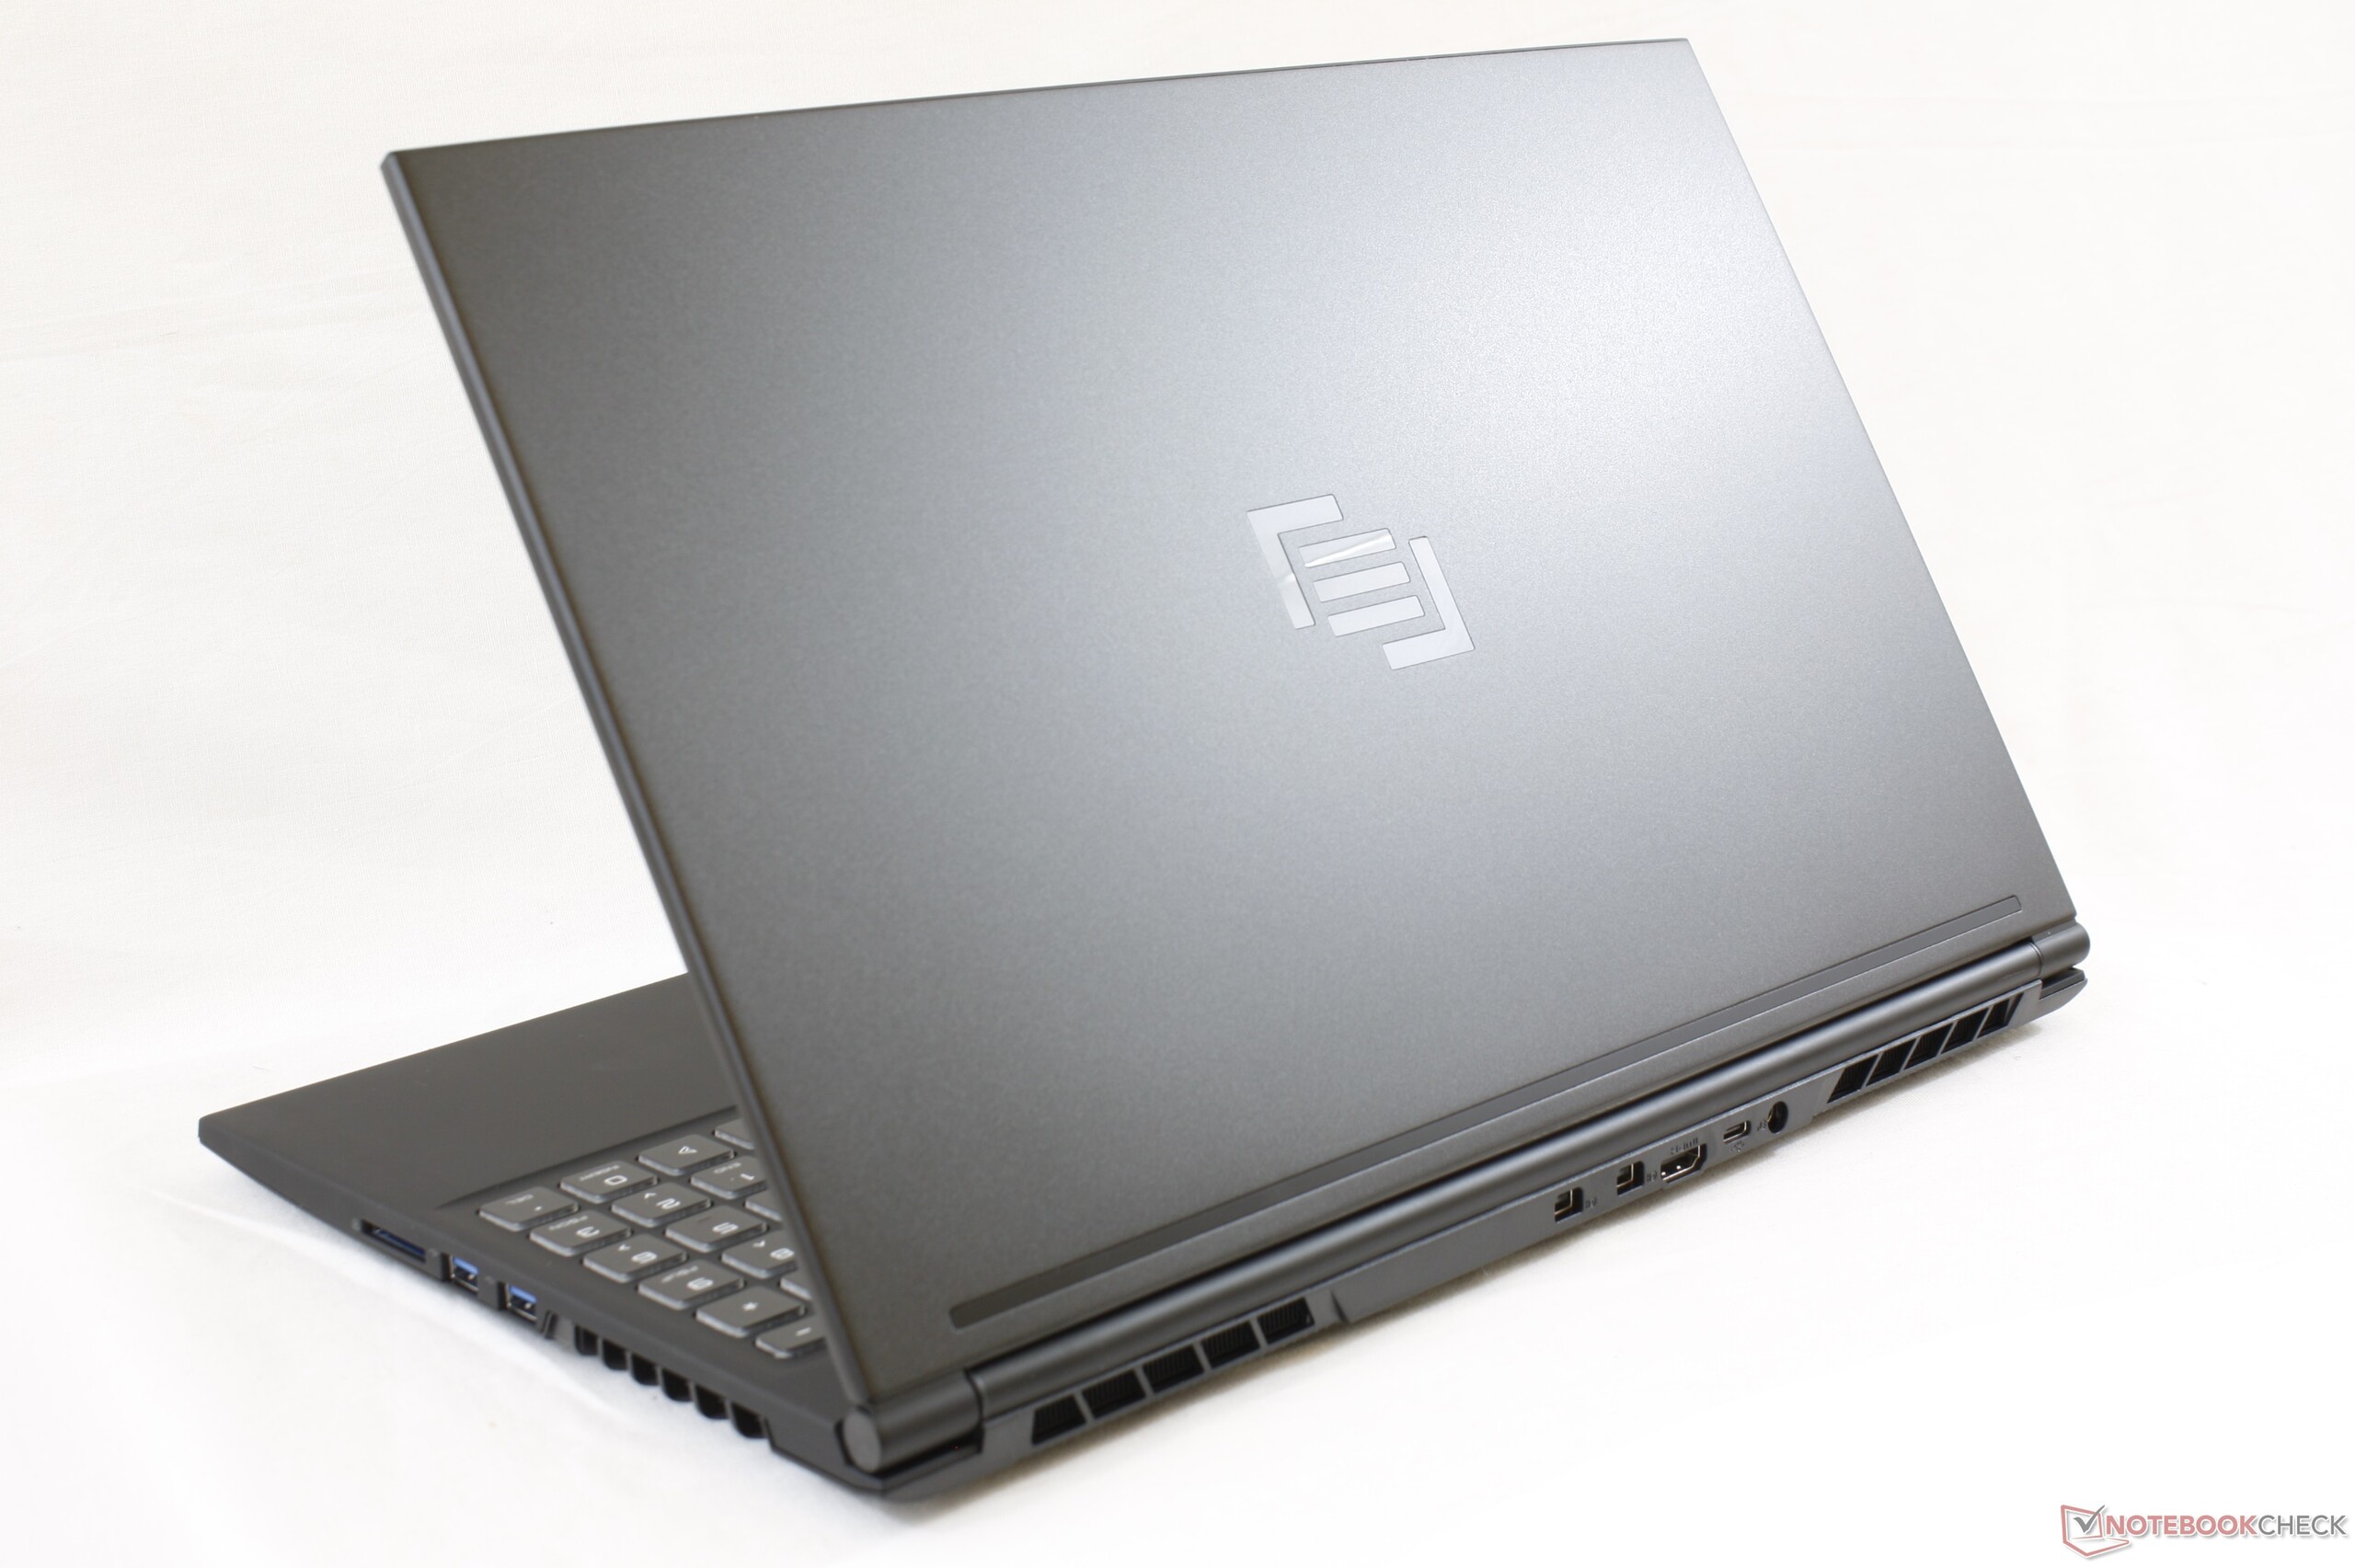
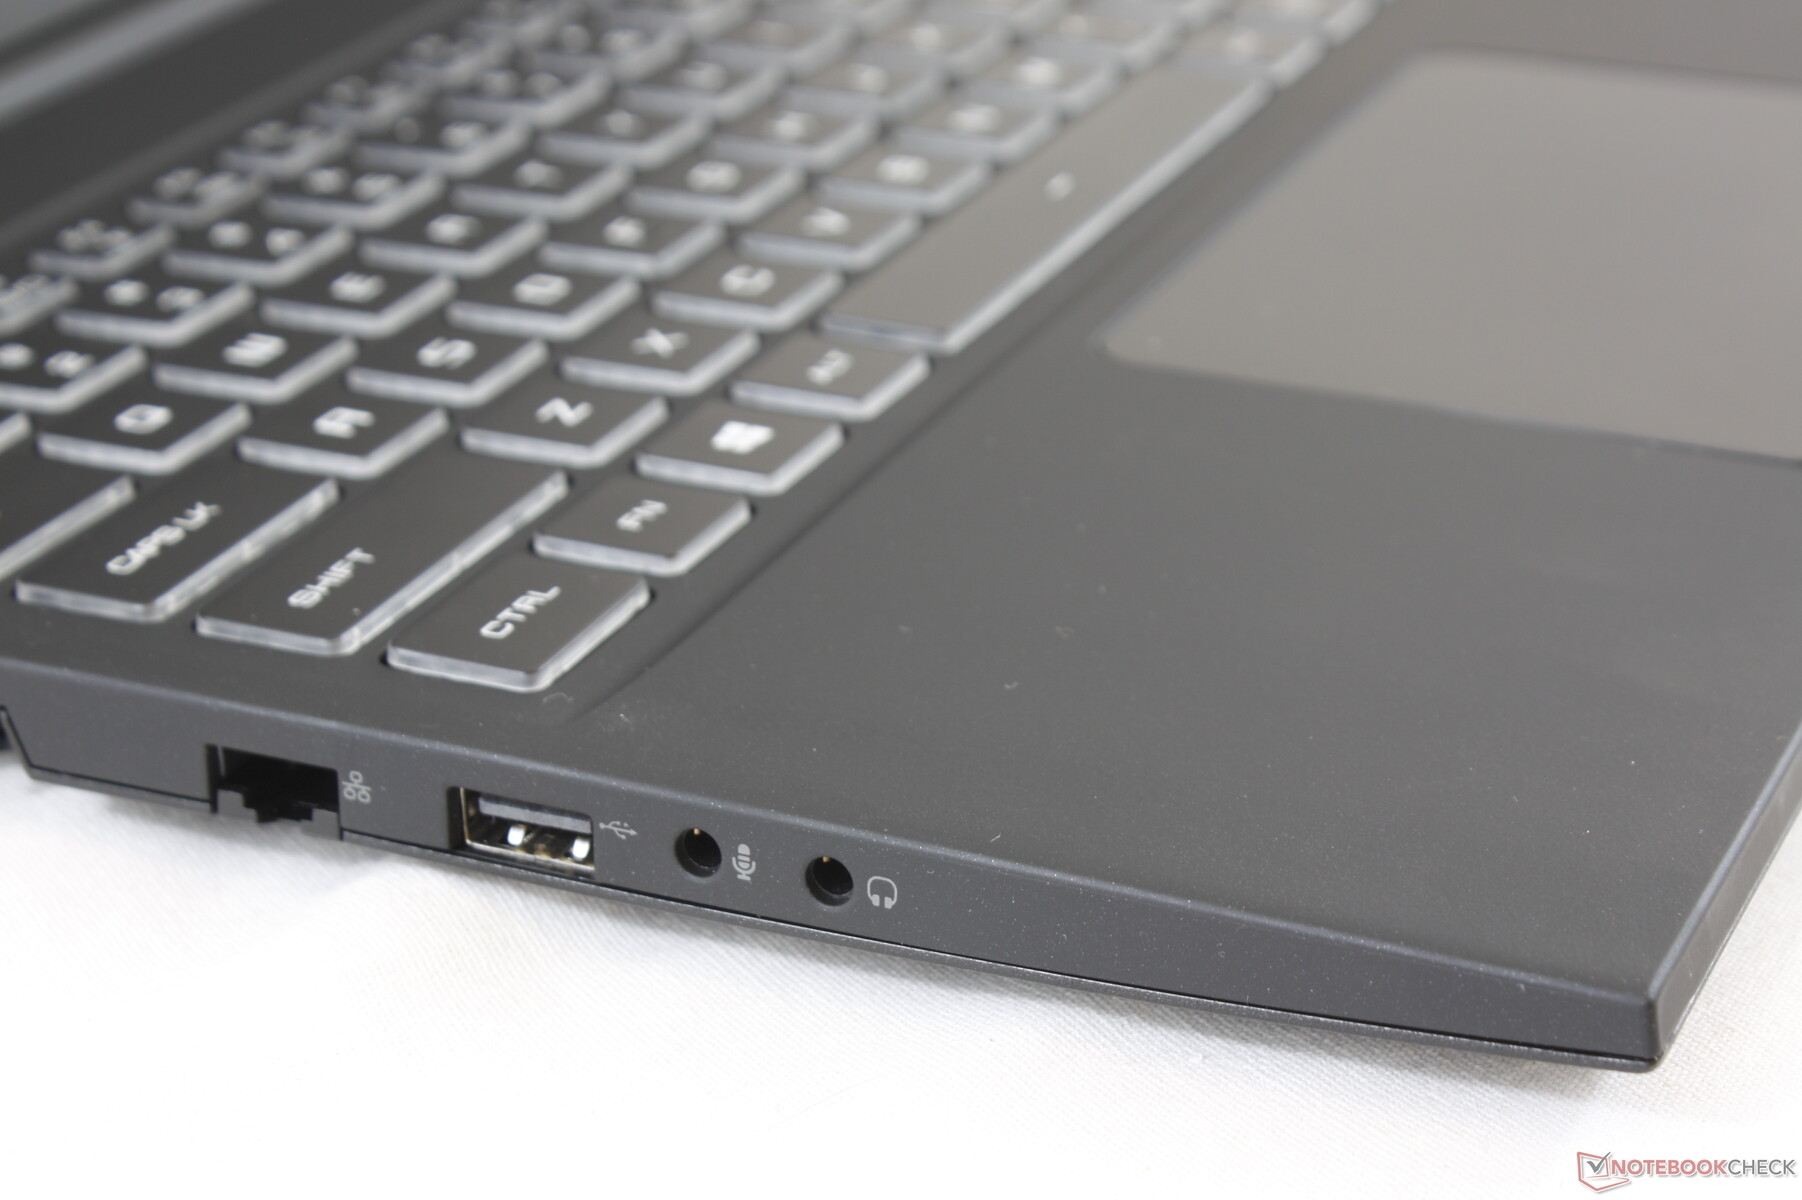
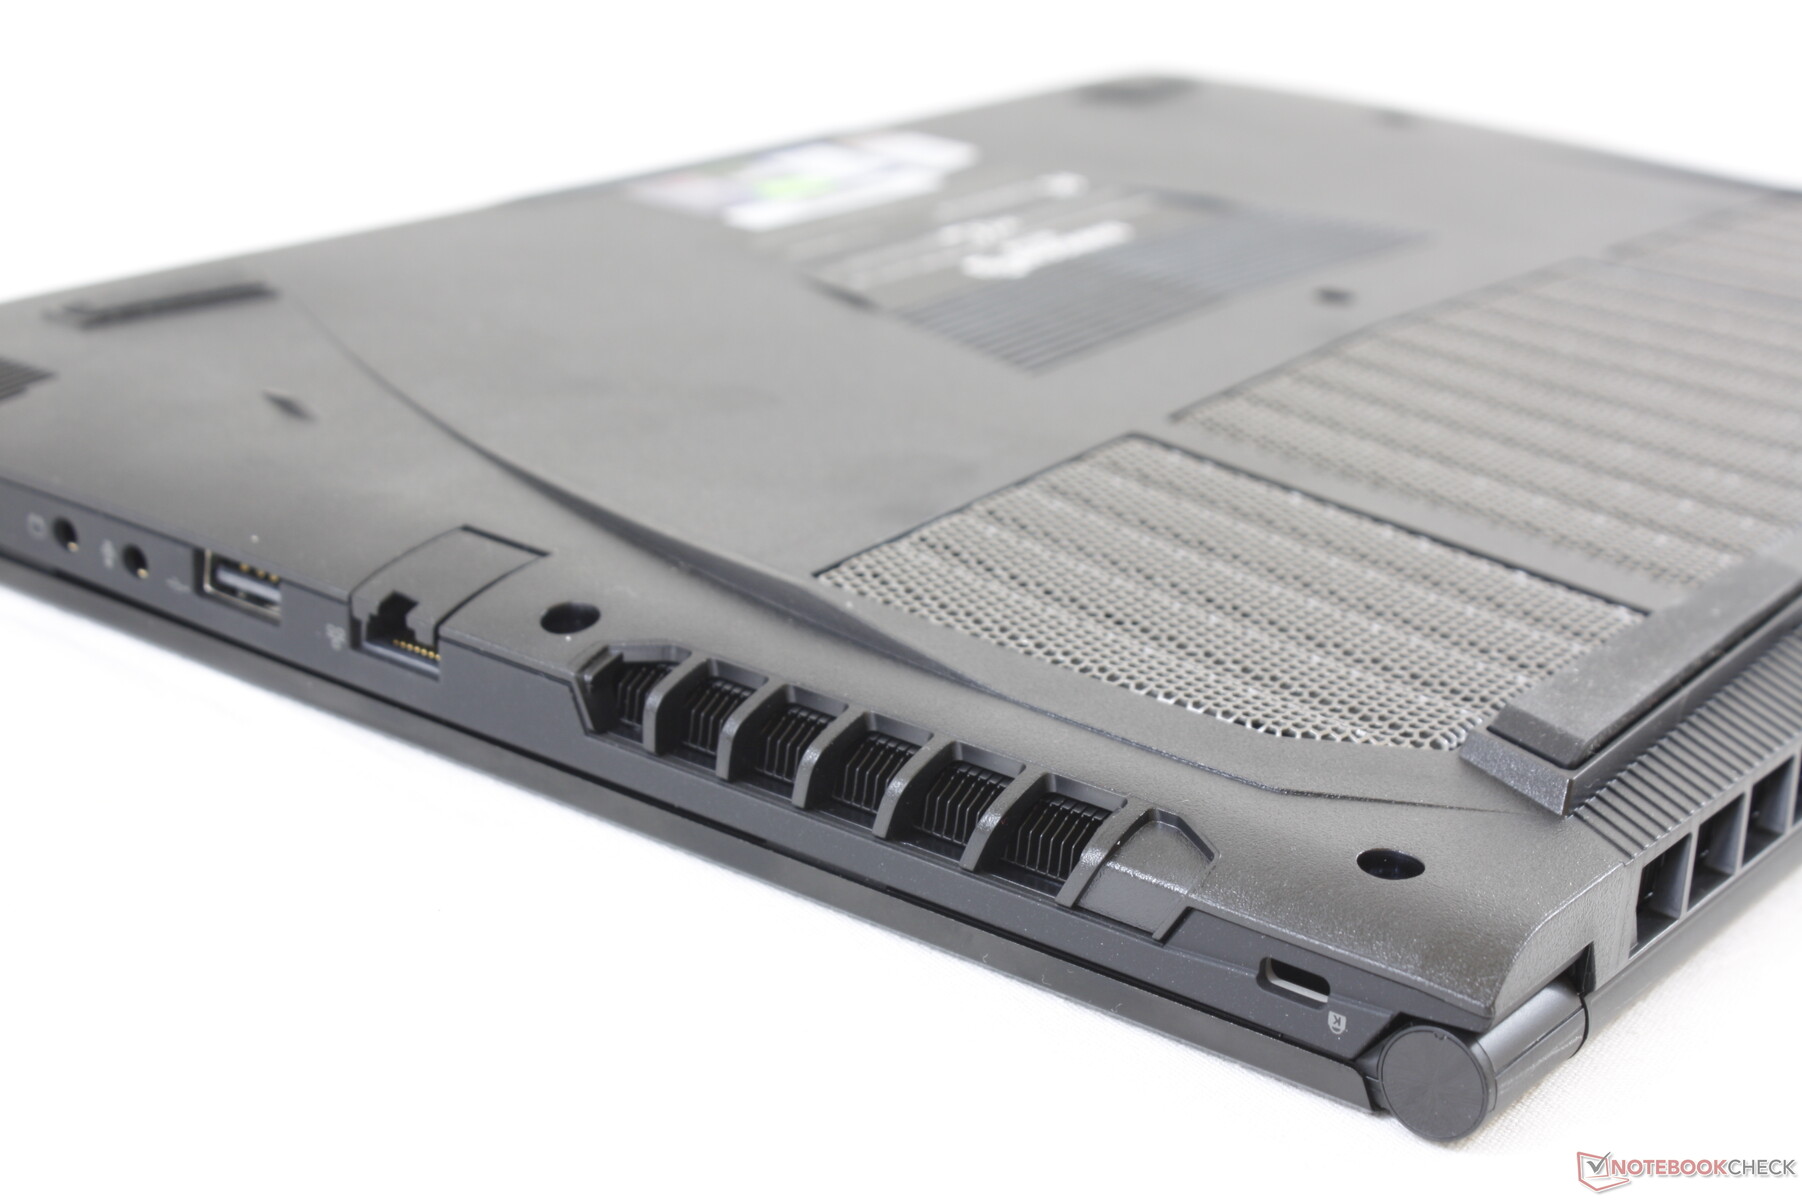
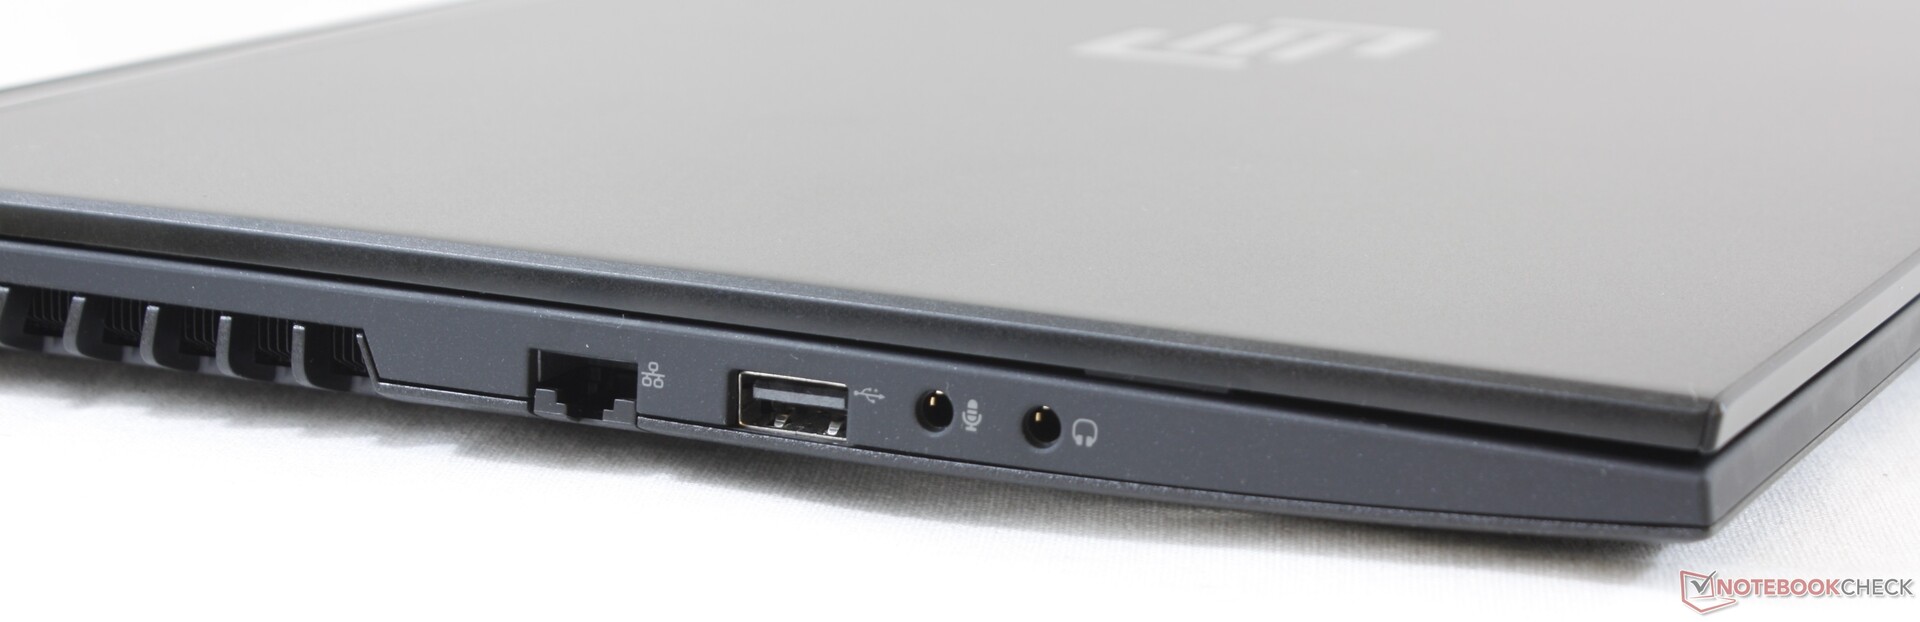
While there are plenty of port options, port positioning is a mixed bag. The ports along the sides are too close upfront while the ports on the rear are both difficult to reach and tightly packed. Thunderbolt 3 is also missing as Maingear is reserving this for the Element instead.
USB Type-C Power Delivery is not supported meaning that you cannot recharge the system via USB Type-C.
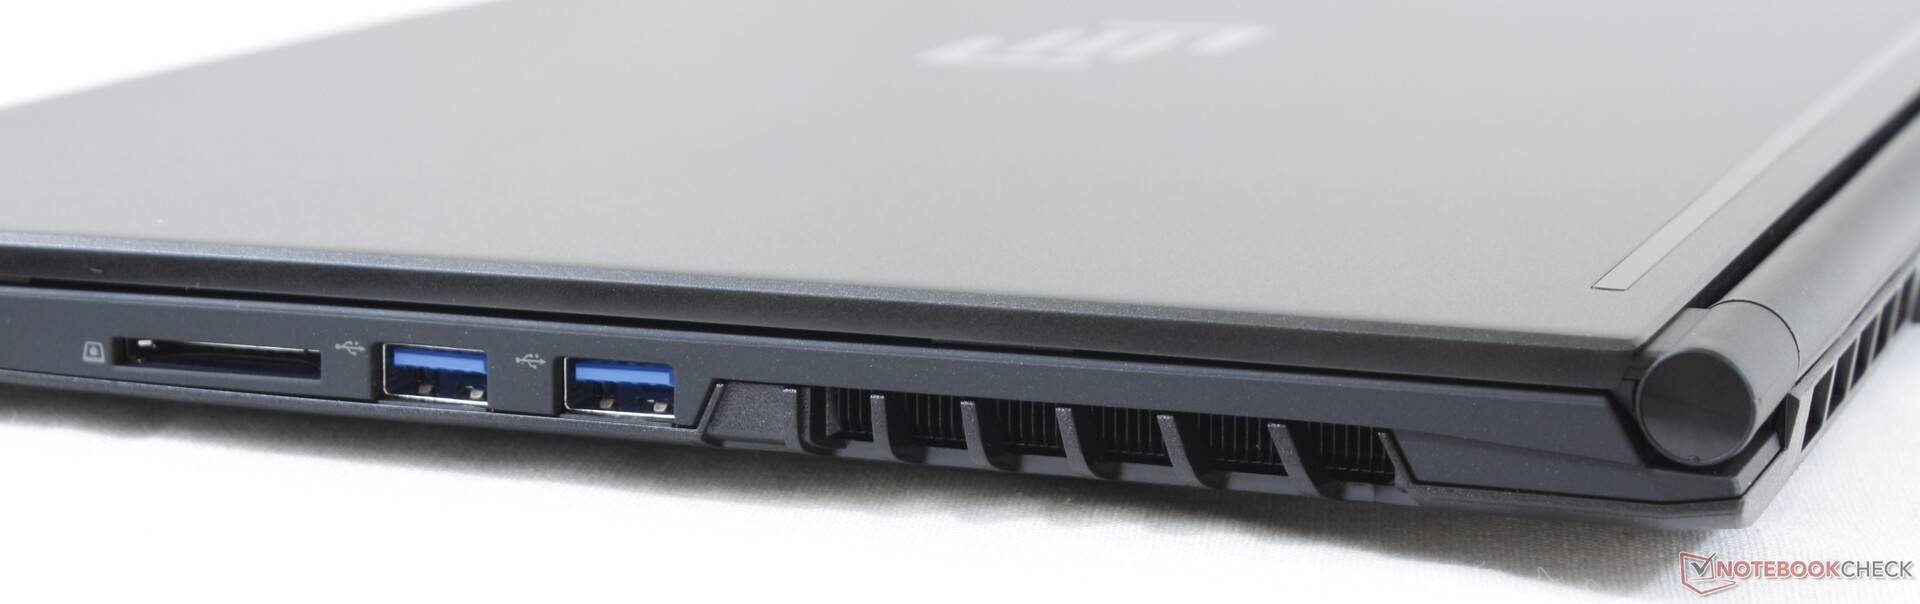

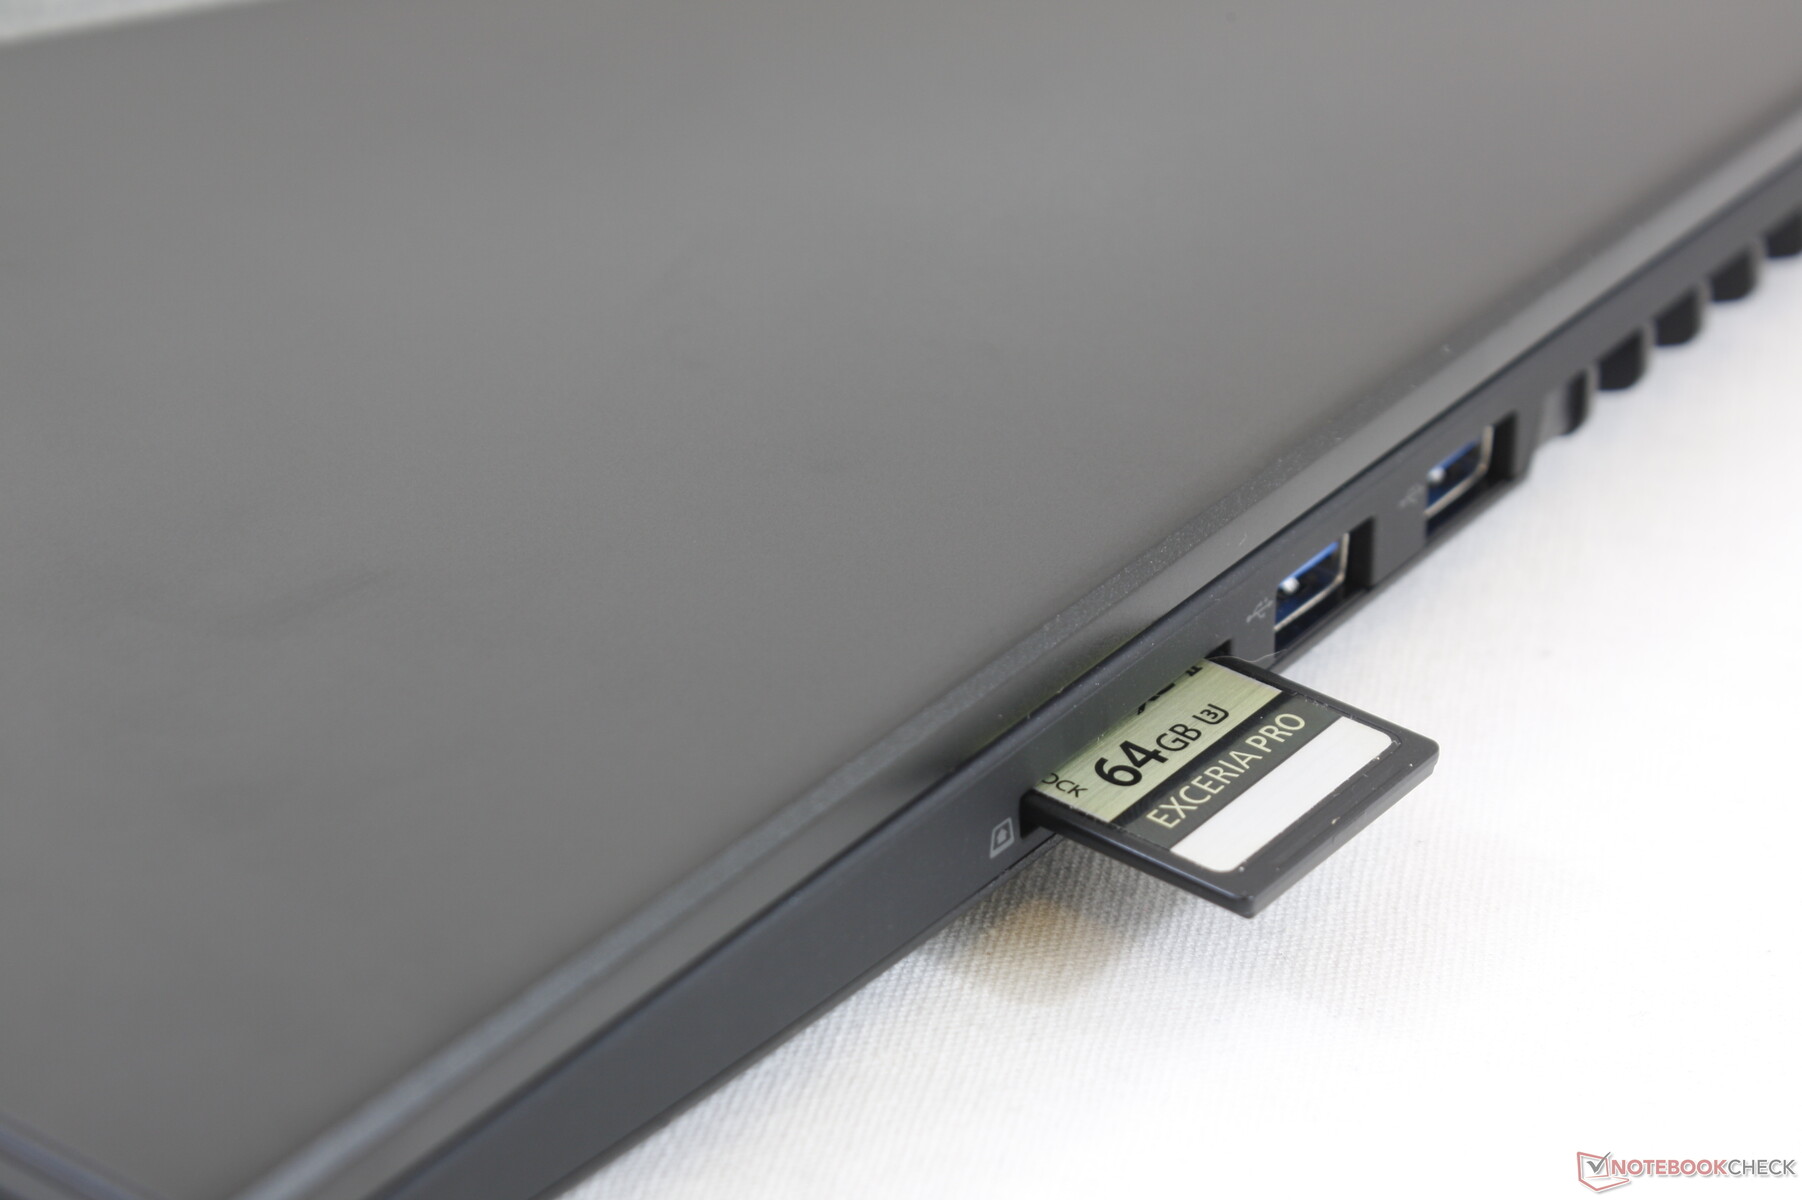
SD Card Reader
Not only is the integrated card reader slow, but it isn't spring-loaded either. Moving 1 GB of pictures from our UHS-II test card to desktop takes about 38 seconds compared to under 8 seconds on the XPS 15.
| SD Card Reader | |
| average JPG Copy Test (av. of 3 runs) | |
| Dell XPS 15 7590 9980HK GTX 1650 (Toshiba Exceria Pro SDXC 64 GB UHS-II) | |
| Maingear Vector 15 (Toshiba Exceria Pro SDXC 64 GB UHS-II) | |
| MSI GL65 9SEK (Toshiba Exceria Pro SDXC 64 GB UHS-II) | |
| maximum AS SSD Seq Read Test (1GB) | |
| Dell XPS 15 7590 9980HK GTX 1650 (Toshiba Exceria Pro SDXC 64 GB UHS-II) | |
| Maingear Vector 15 (Toshiba Exceria Pro SDXC 64 GB UHS-II) | |
| MSI GL65 9SEK (Toshiba Exceria Pro SDXC 64 GB UHS-II) | |
Communication
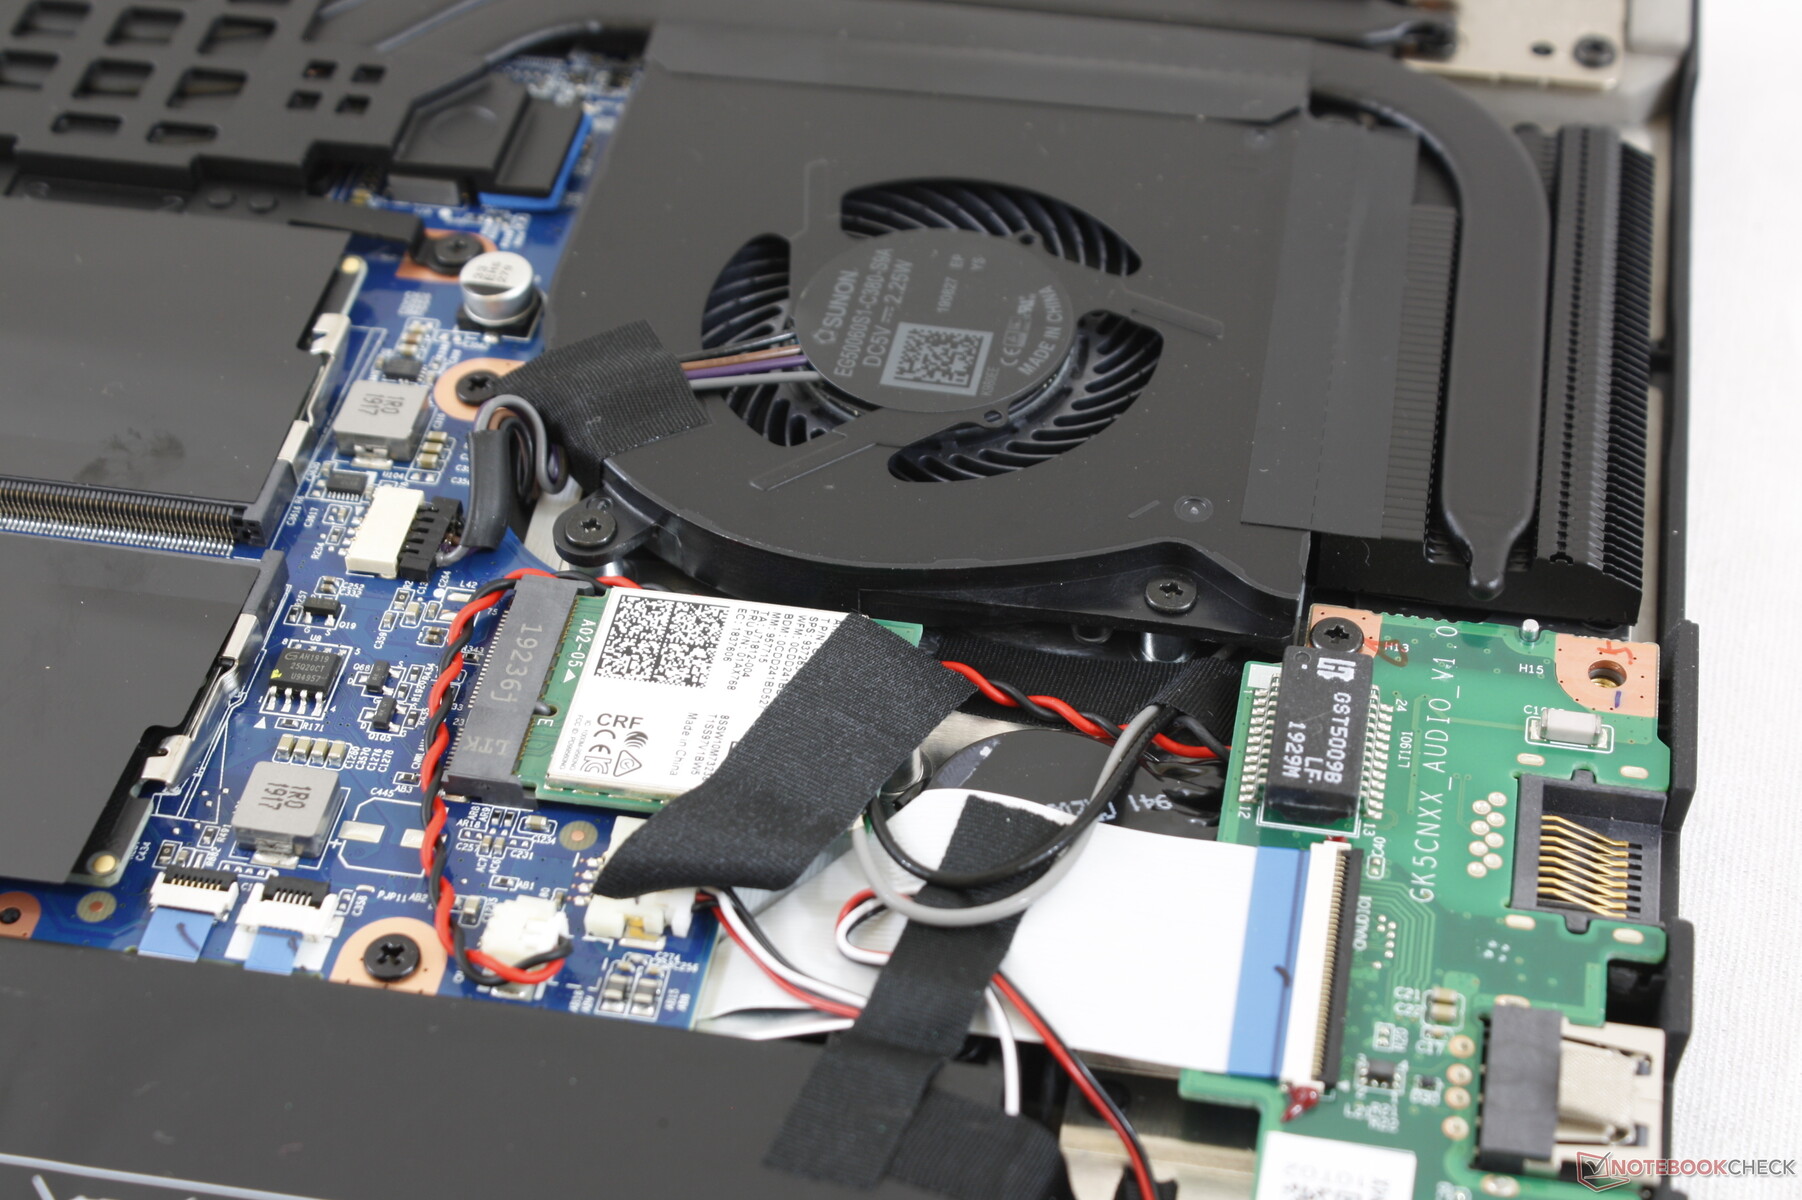
The Intel 9560 module is included for 802.11ac Wi-Fi 5 speeds and integrated Bluetooth 5.0. In contrast, the Element ships with the faster Intel AX200 Wi-Fi 6 module. We experienced no connectivity issues during our time with the test unit.
| Networking | |
| iperf3 transmit AX12 | |
| MSI Prestige 15 A10SC | |
| Razer Blade 15 GTX 1660 Ti | |
| Lenovo Legion Y740-15ICHg | |
| Alienware m15 R2 P87F | |
| iperf3 receive AX12 | |
| MSI Prestige 15 A10SC | |
| Alienware m15 R2 P87F | |
| Razer Blade 15 GTX 1660 Ti | |
| Lenovo Legion Y740-15ICHg | |
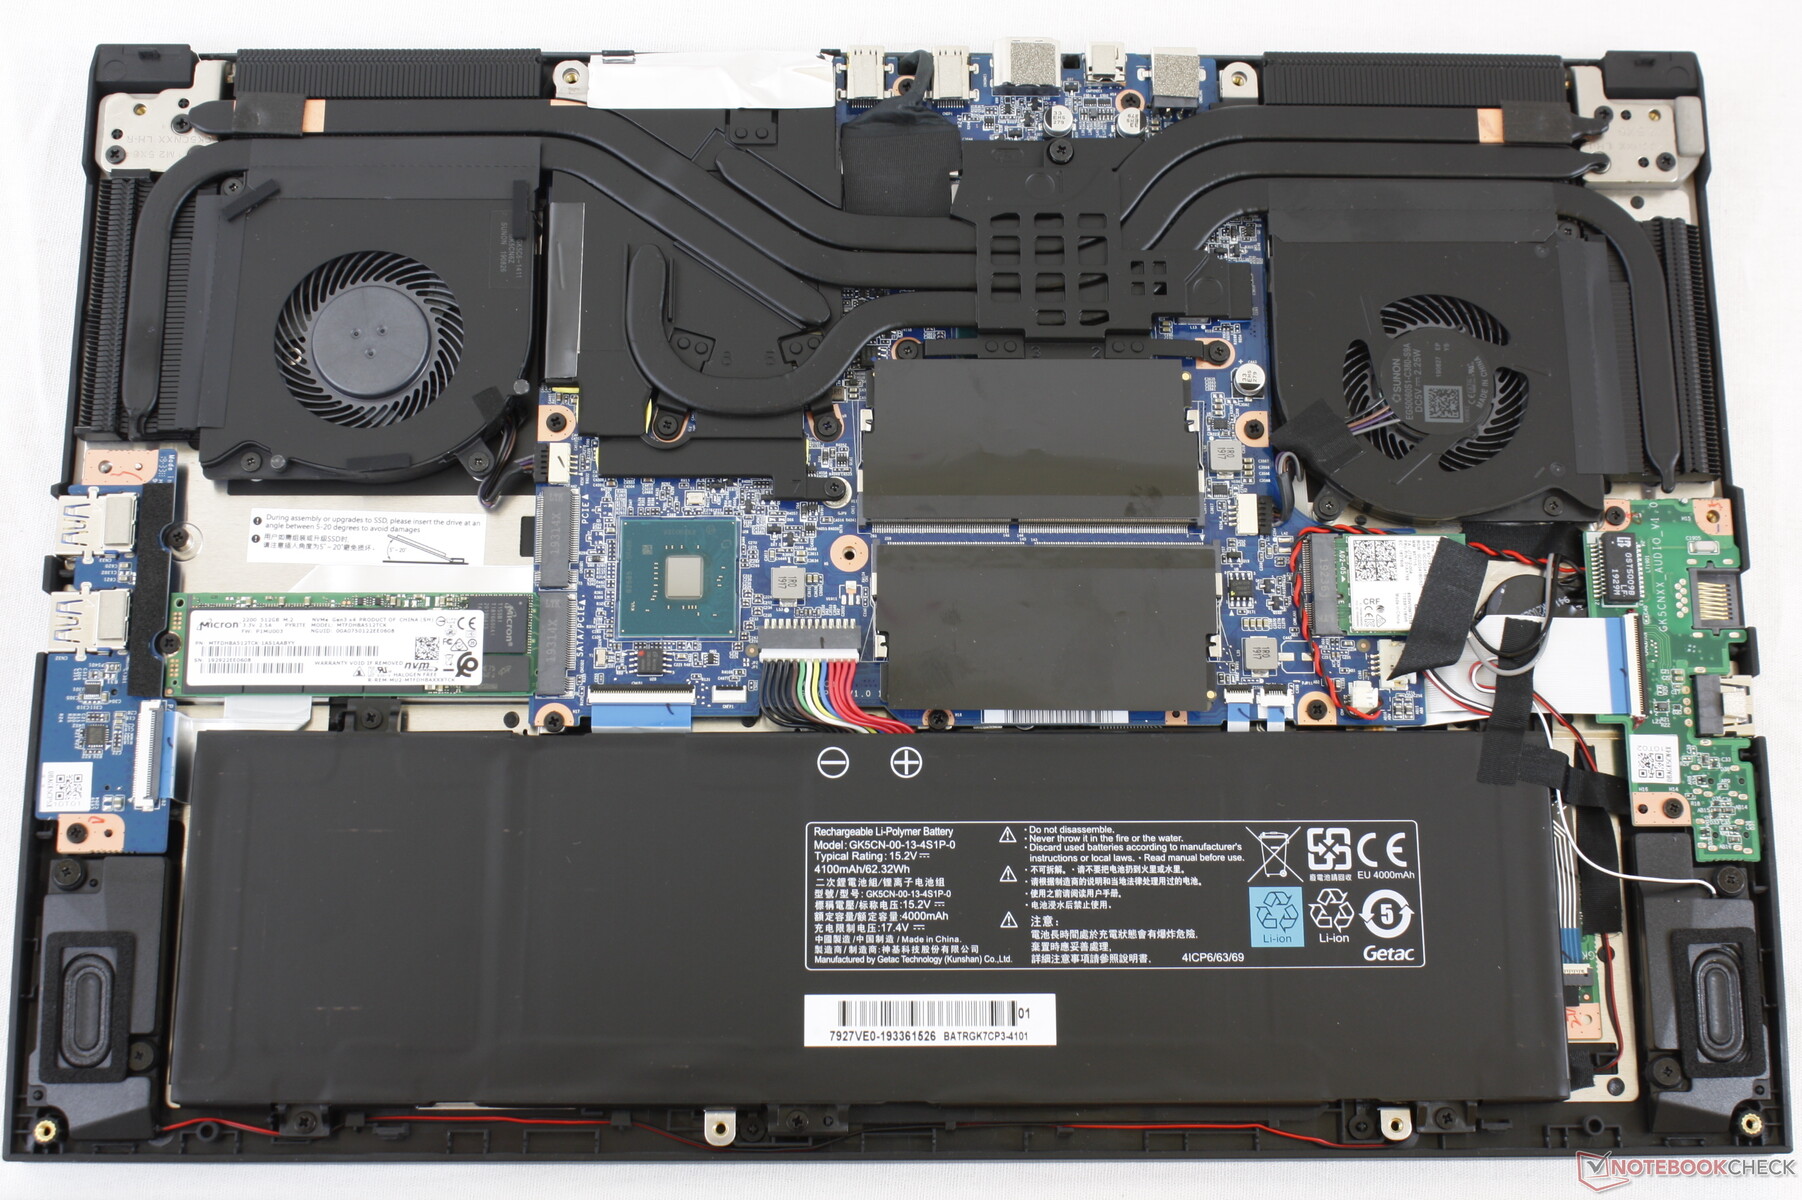
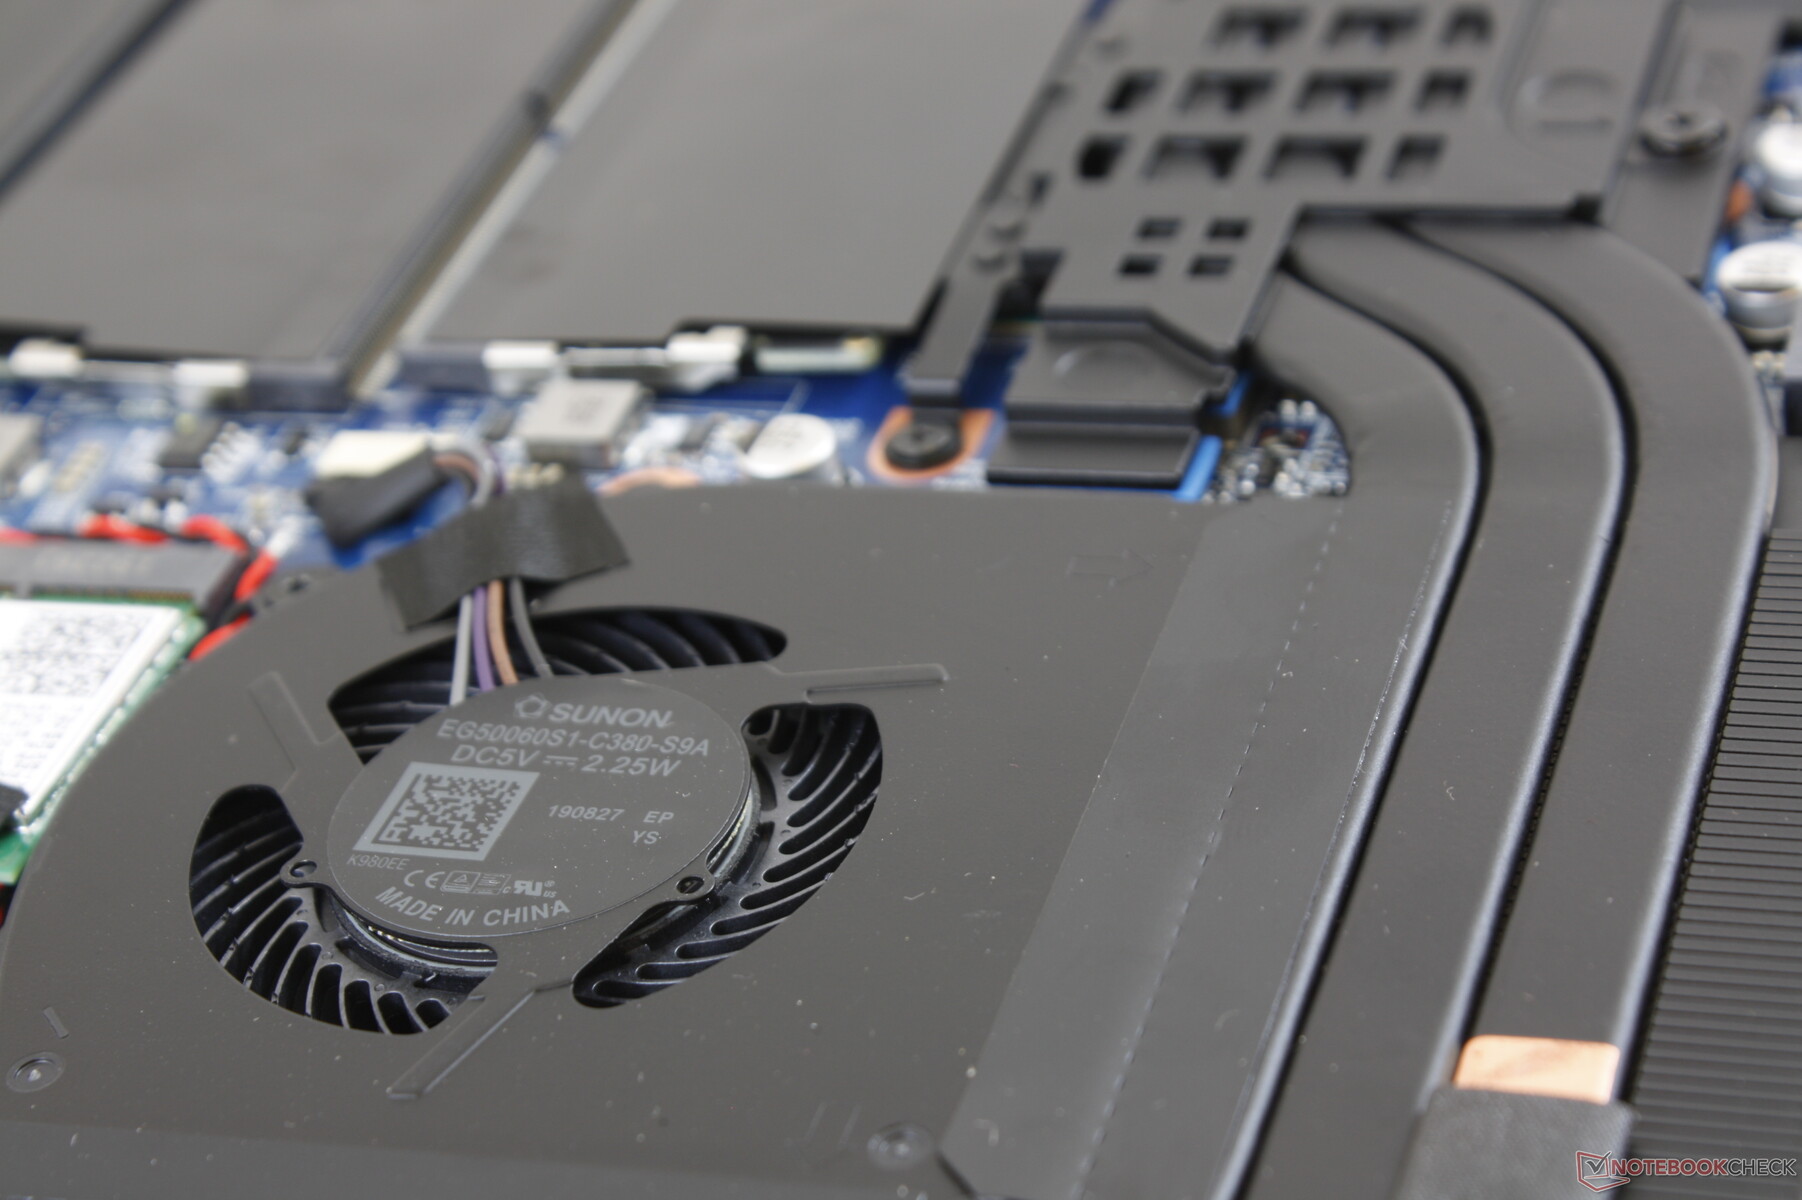
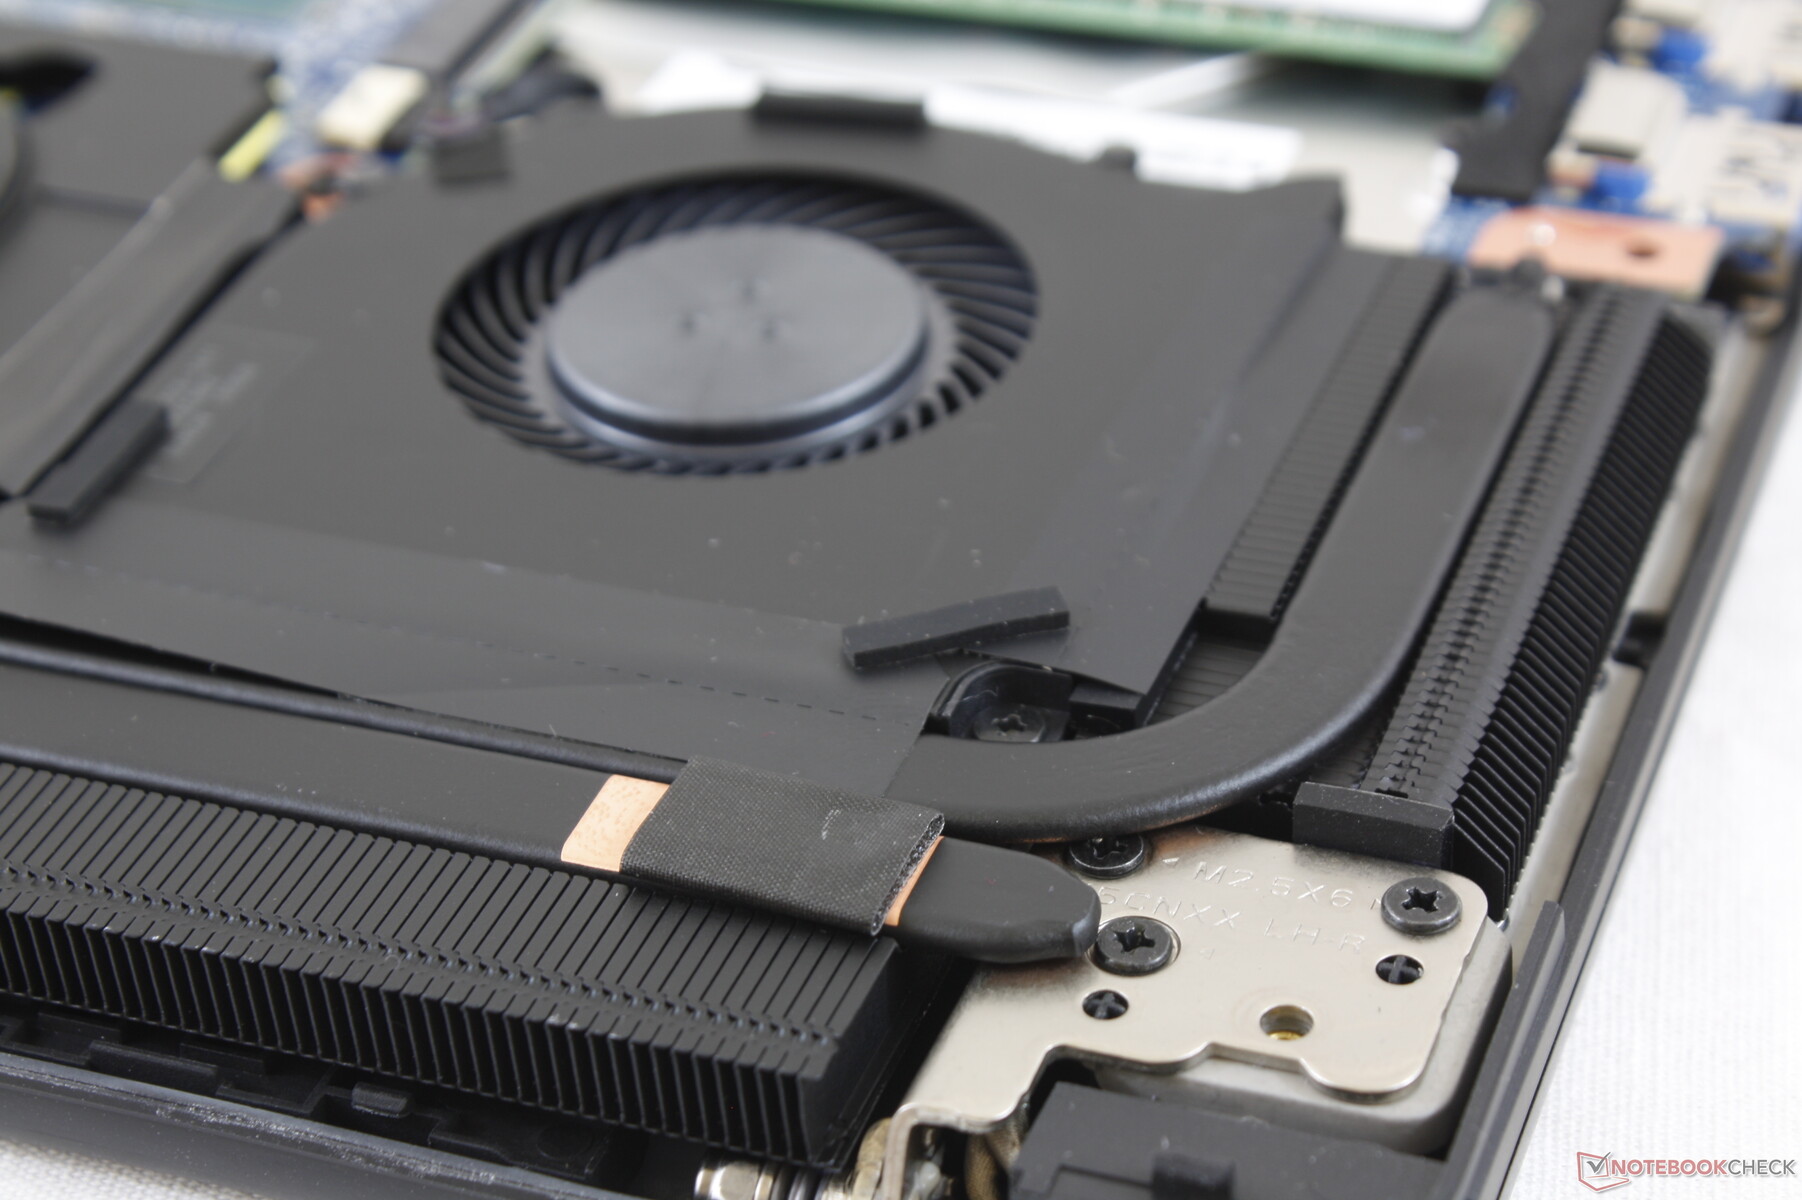
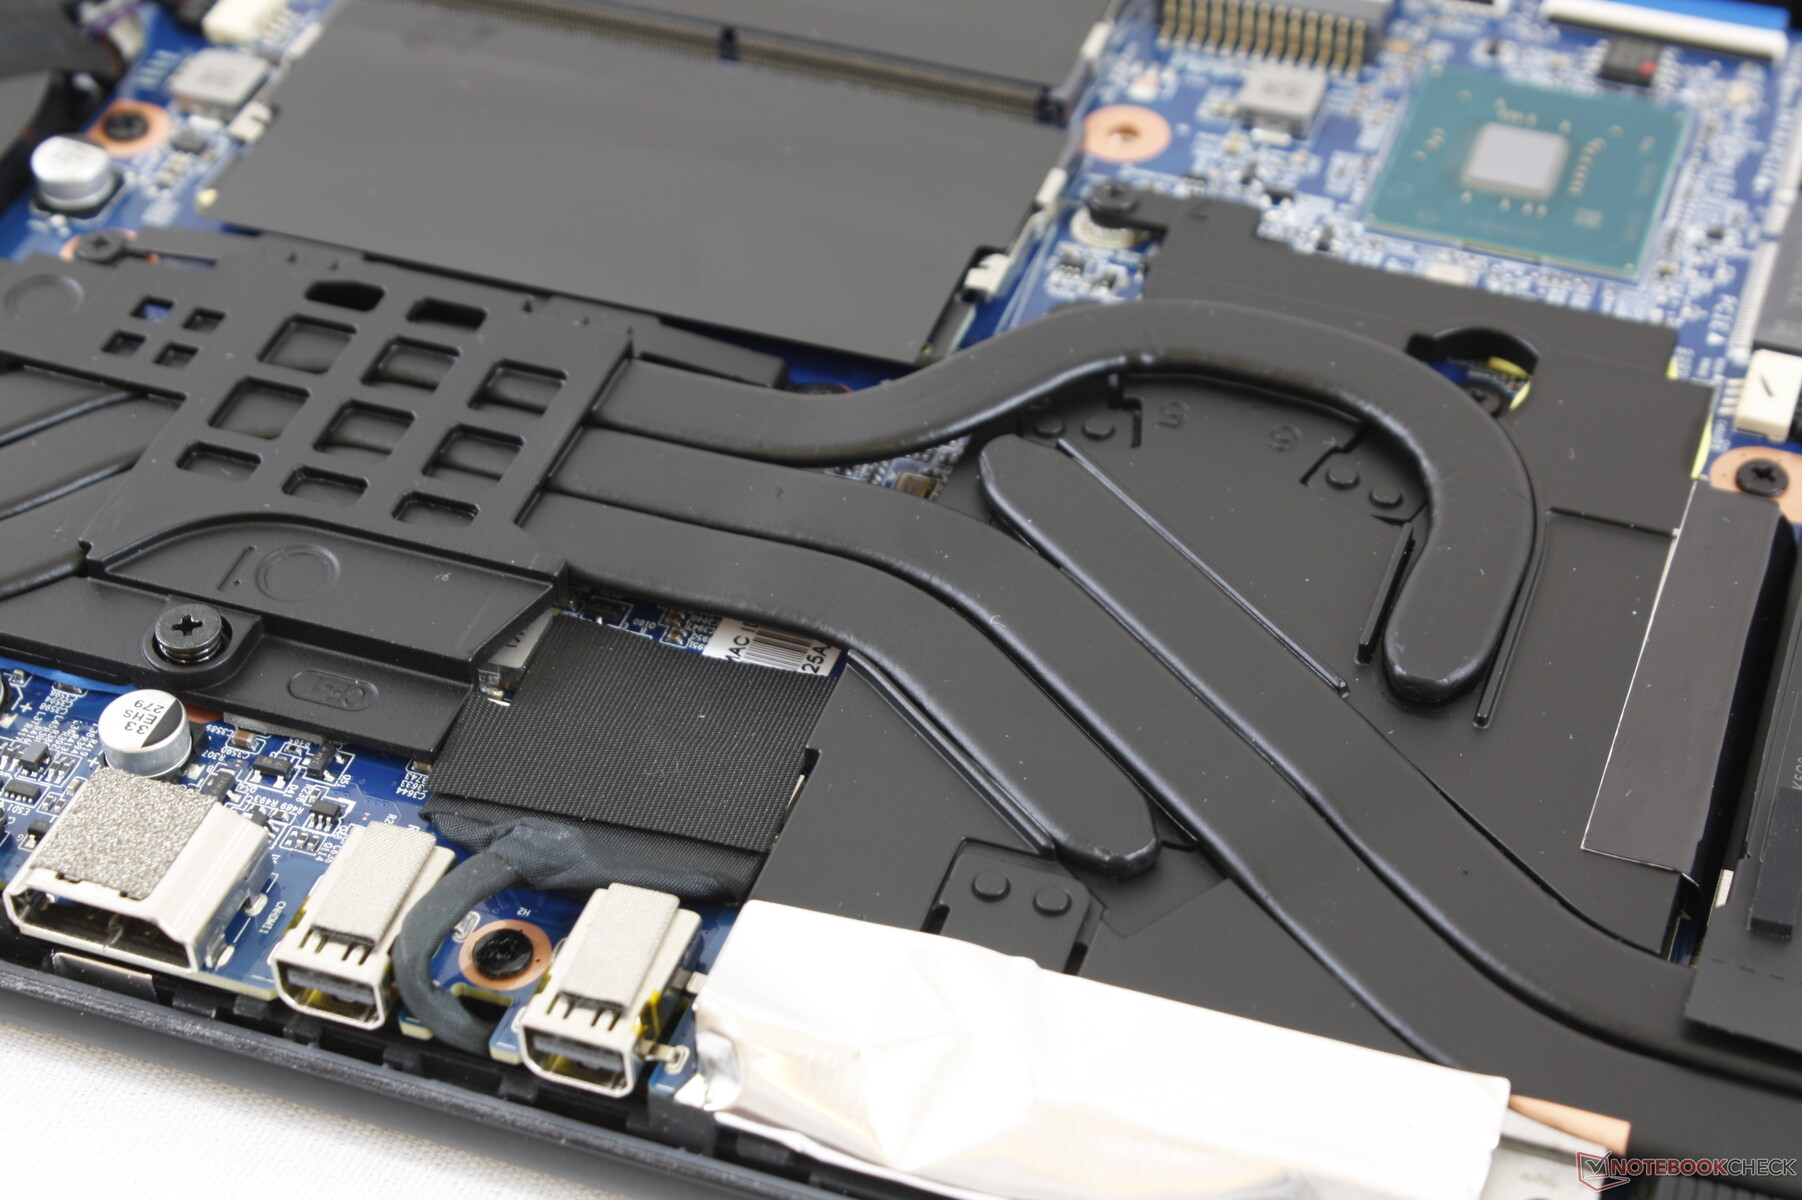
Maintenance
The bottom panel is secured by 11 Philips screws for easy servicing. The rear edges can be tricky to detach at first and so we recommend being extra careful.
Accessories and Warranty
There are no extras in the box outside of the usual paperwork and AC adapter.
Maingear throws in accidental damage protection alongside the usual one-year limited warranty.
Input Devices
Keyboard
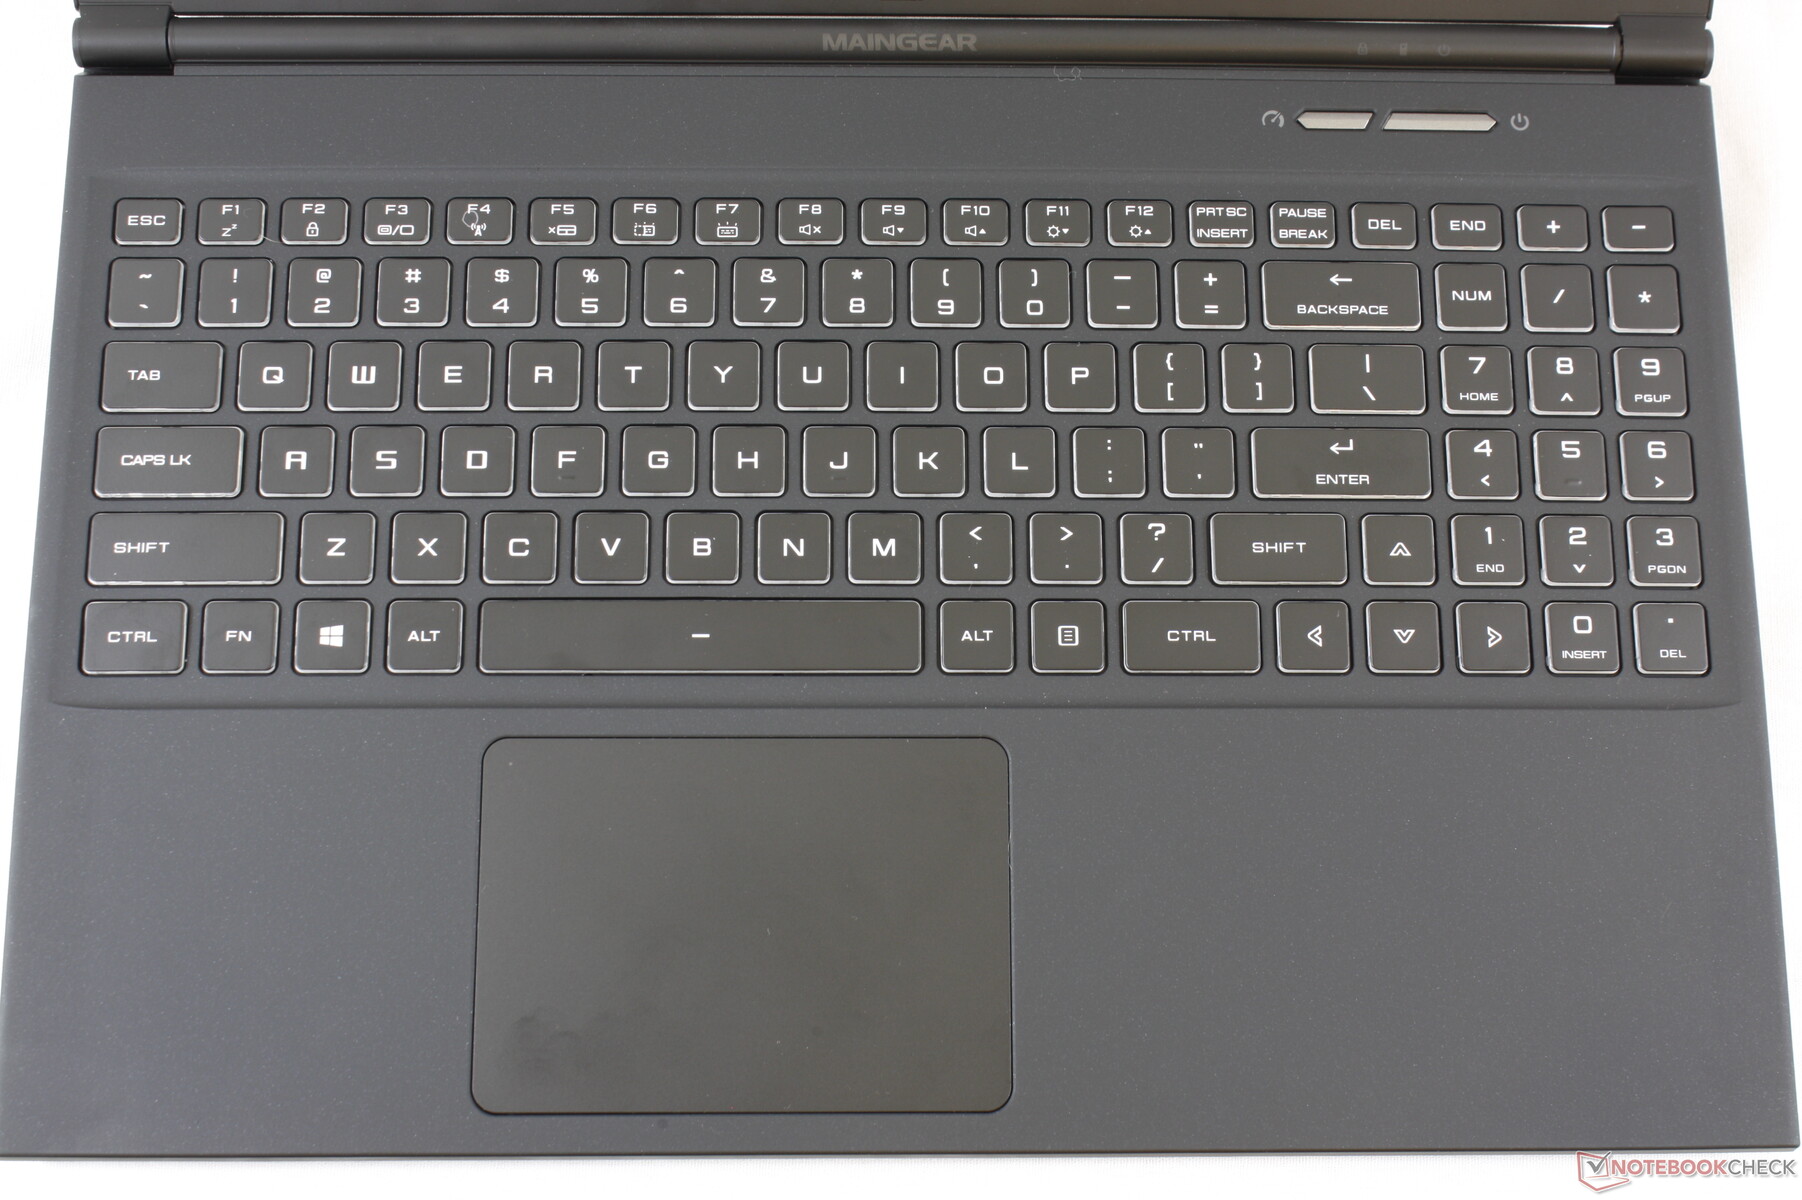
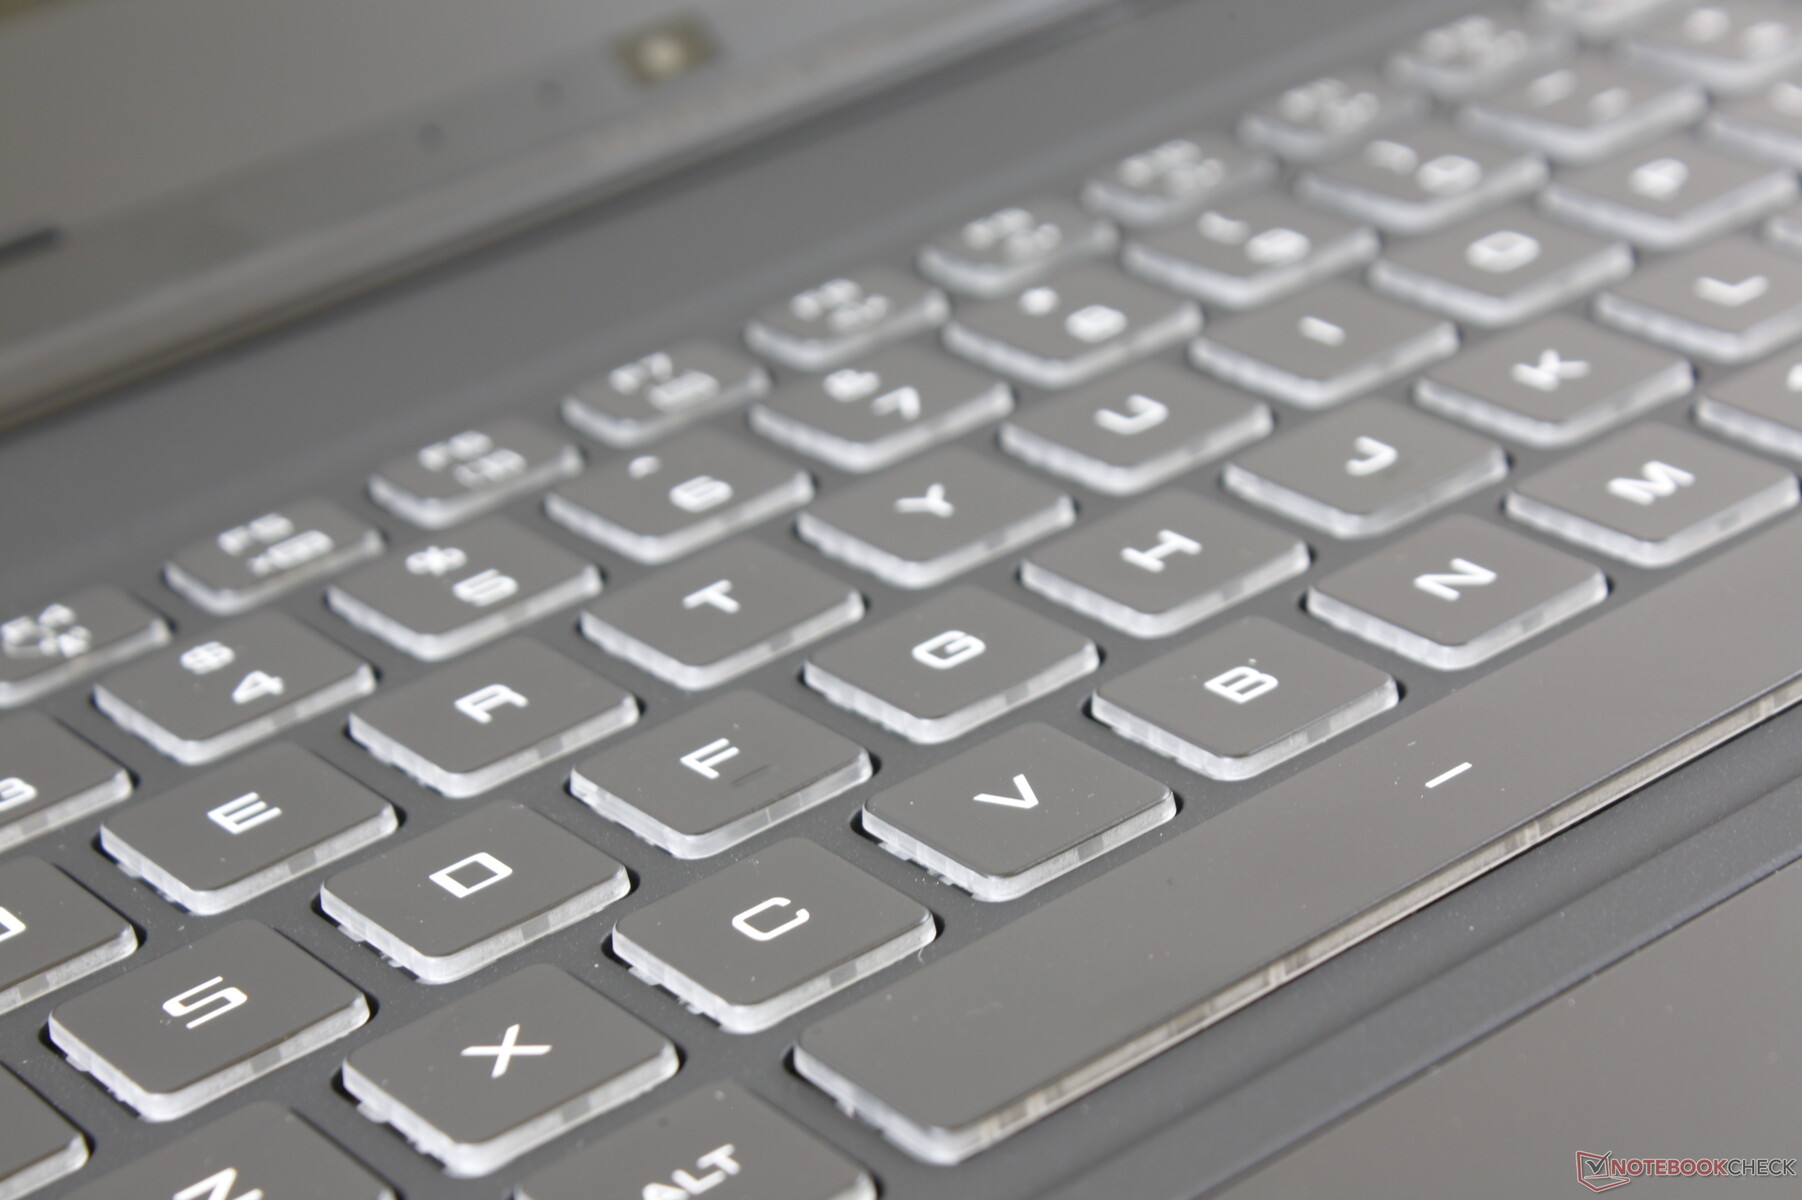
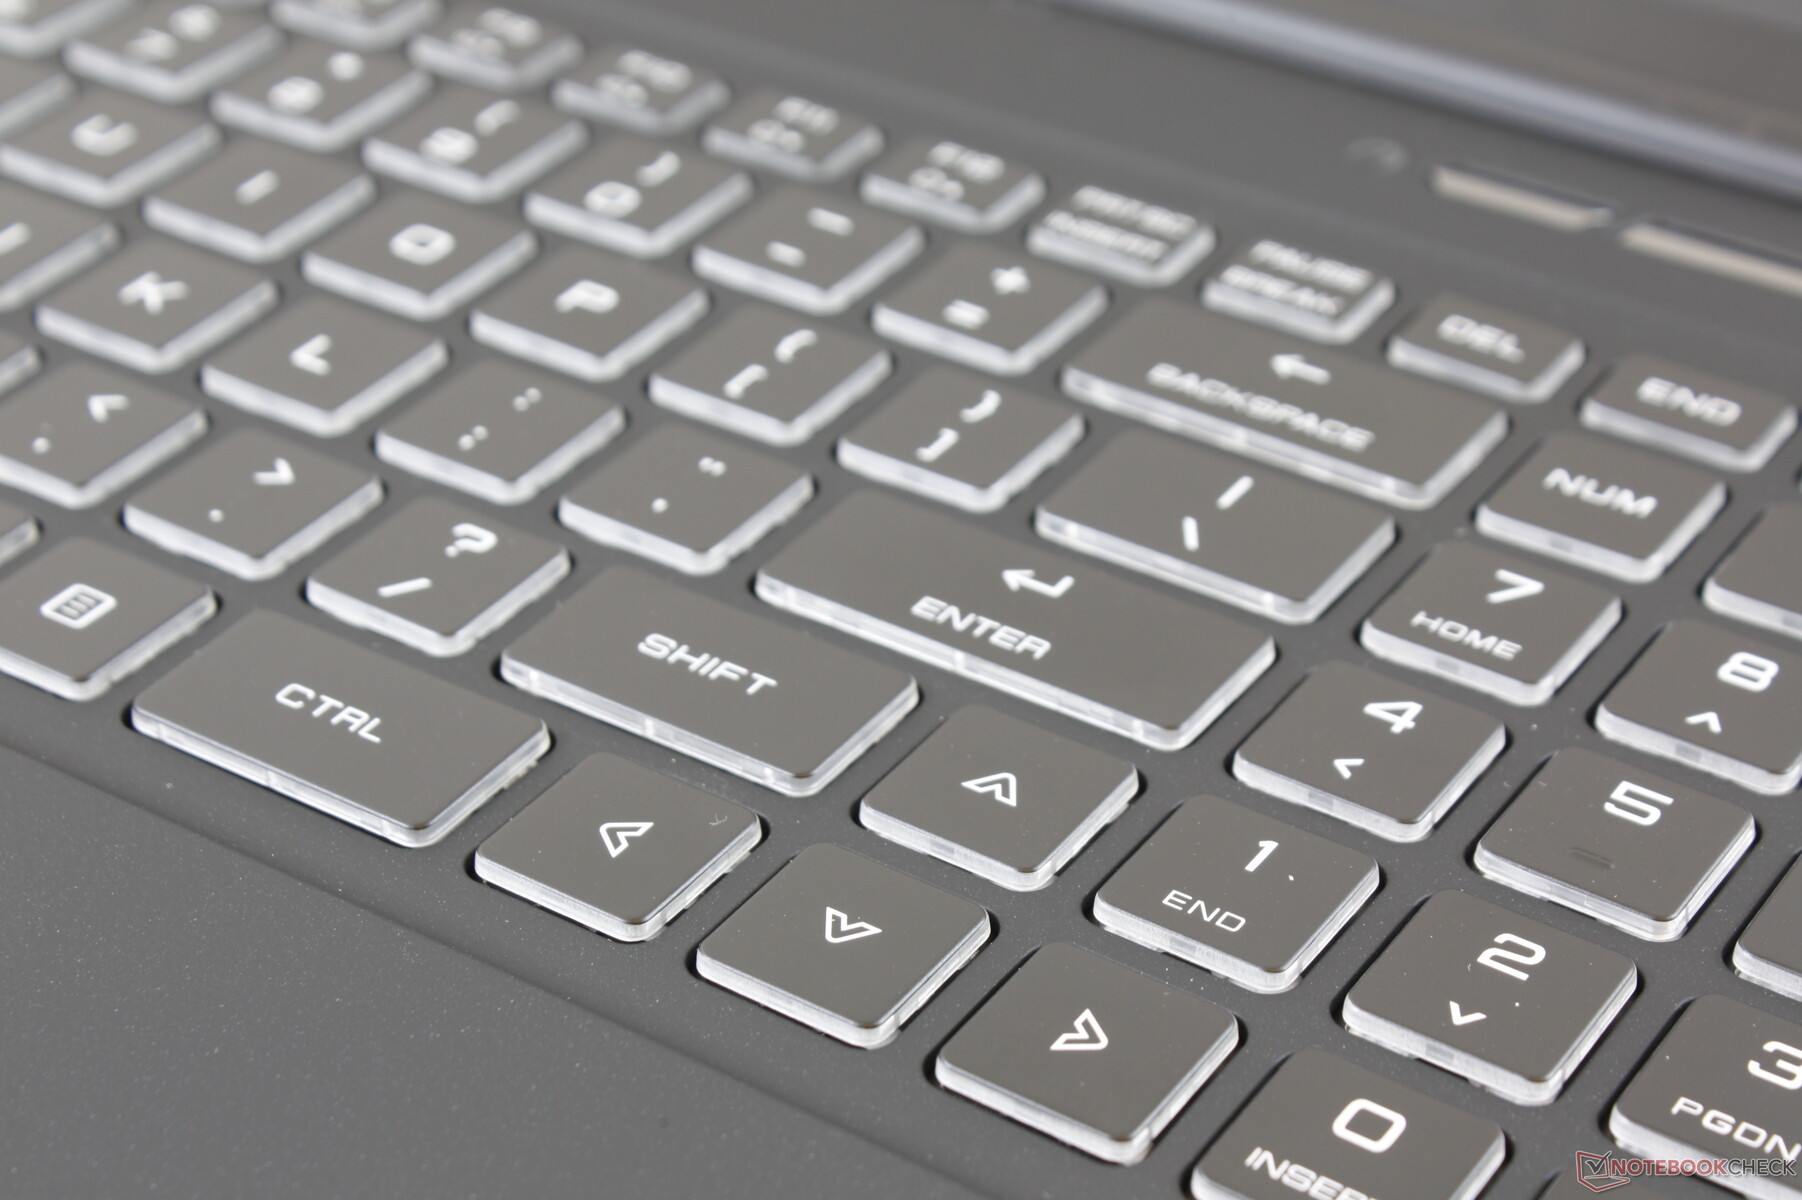
Unlike on most other laptops, the QWERTY keys, NumPad keys, and Arrow keys on the Vector are all equal in size for a more uniform typing experience. The relatively firm feedback and quiet clatter are just slightly softer than on the MSI GE75 or GE65. A quad-zone RGB backlight is included in contrast to the per-key RGB lighting of the Element.
Touchpad
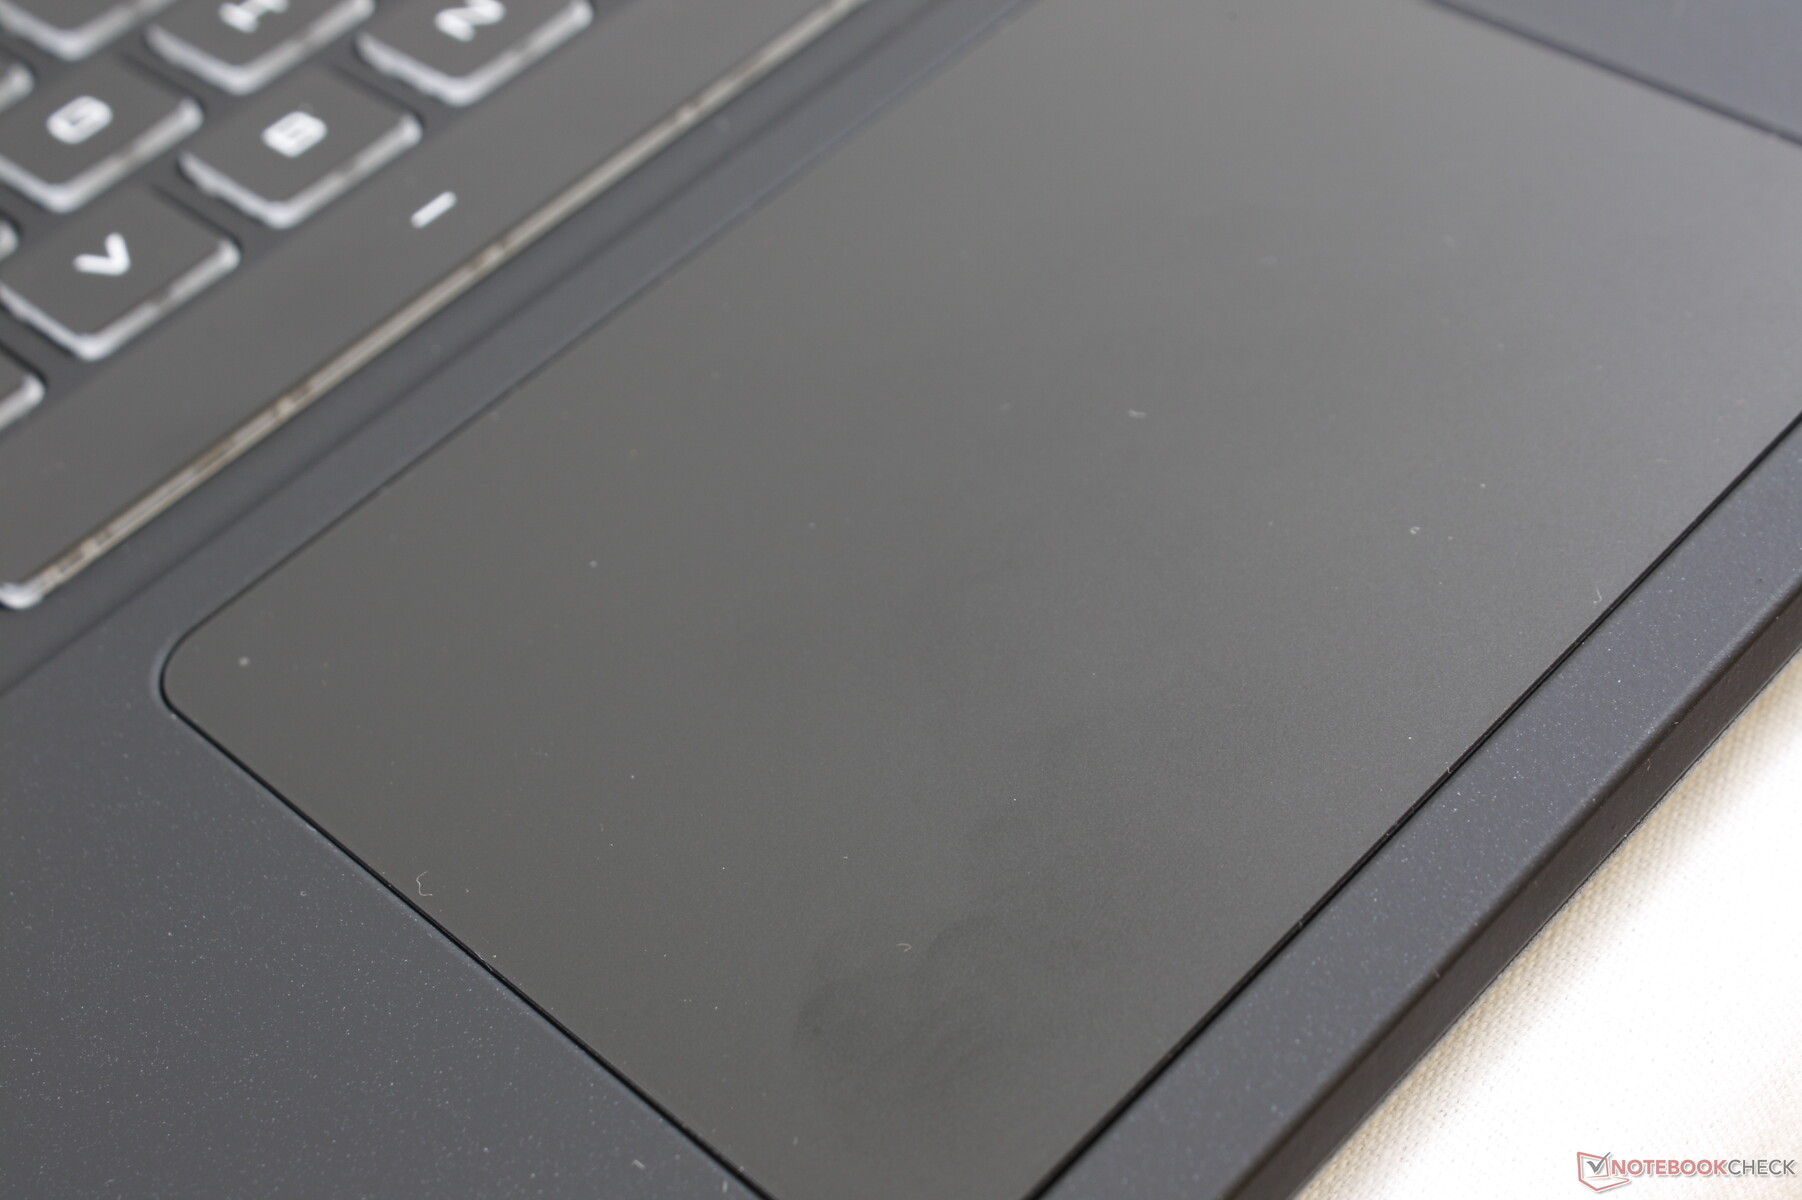
The Precision-enabled clickpad (10.5 x 7.5 cm) is slightly smaller than the clickpad on the Dell XPS 15 (10.5 x 8.5 cm). Gliding is smooth and only sticky when moving at slow speeds for increased precision. The integrated mouse keys, however, are far too weak and spongy.
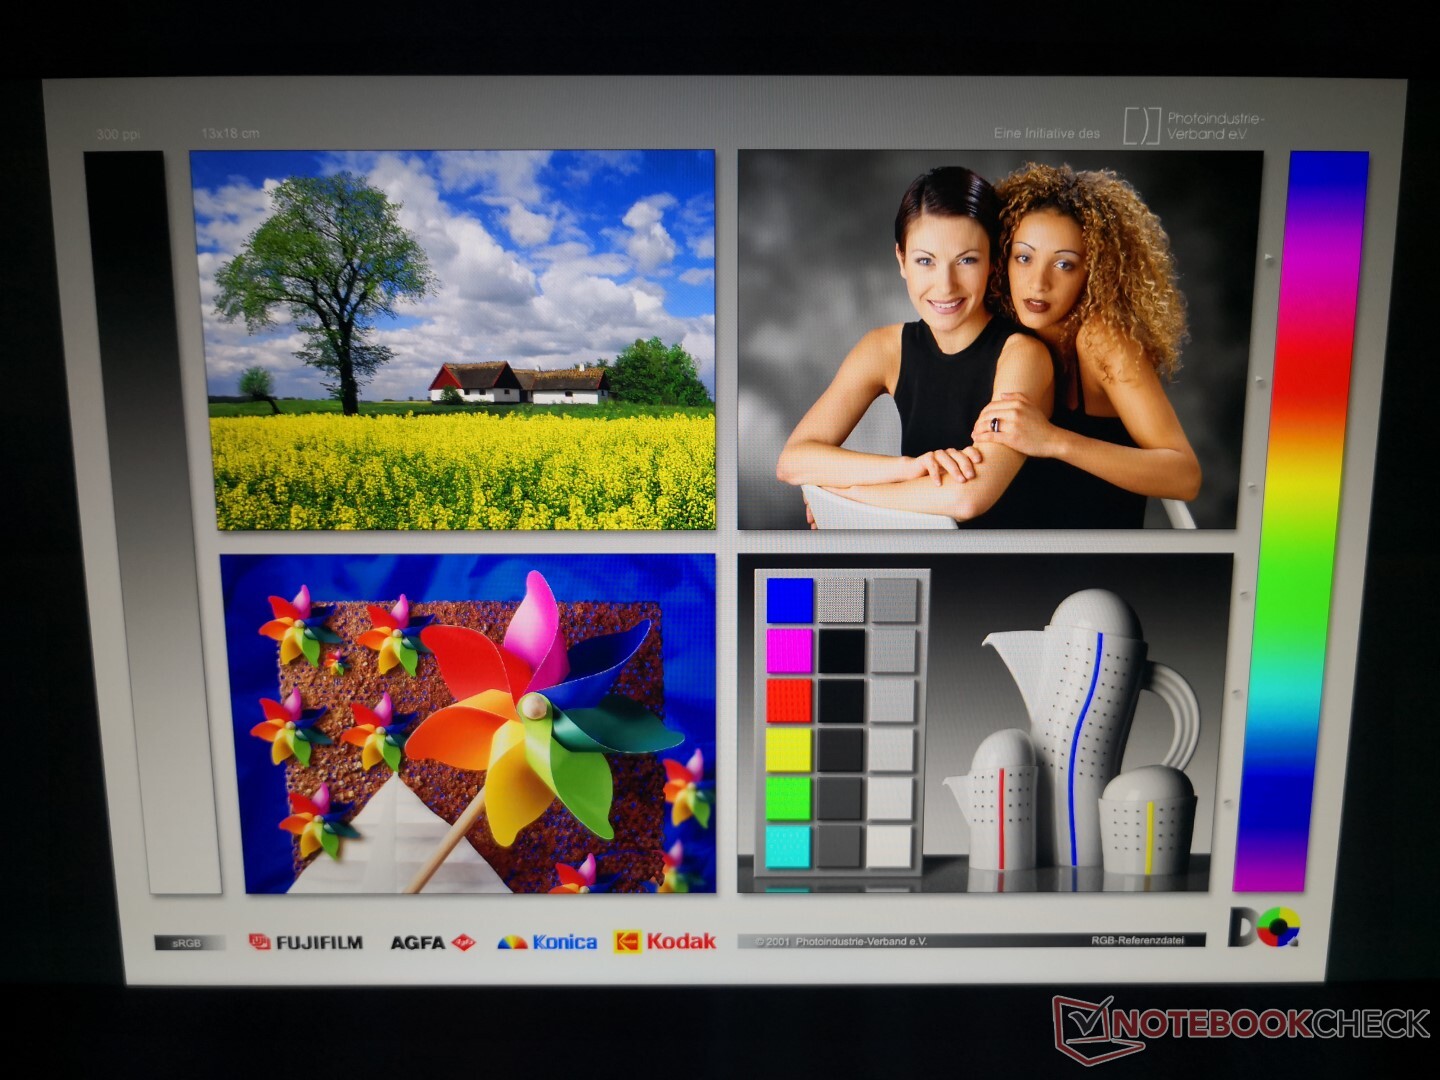
Display
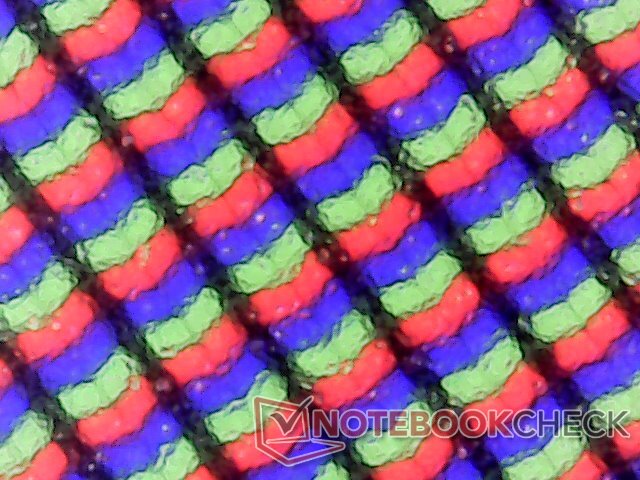
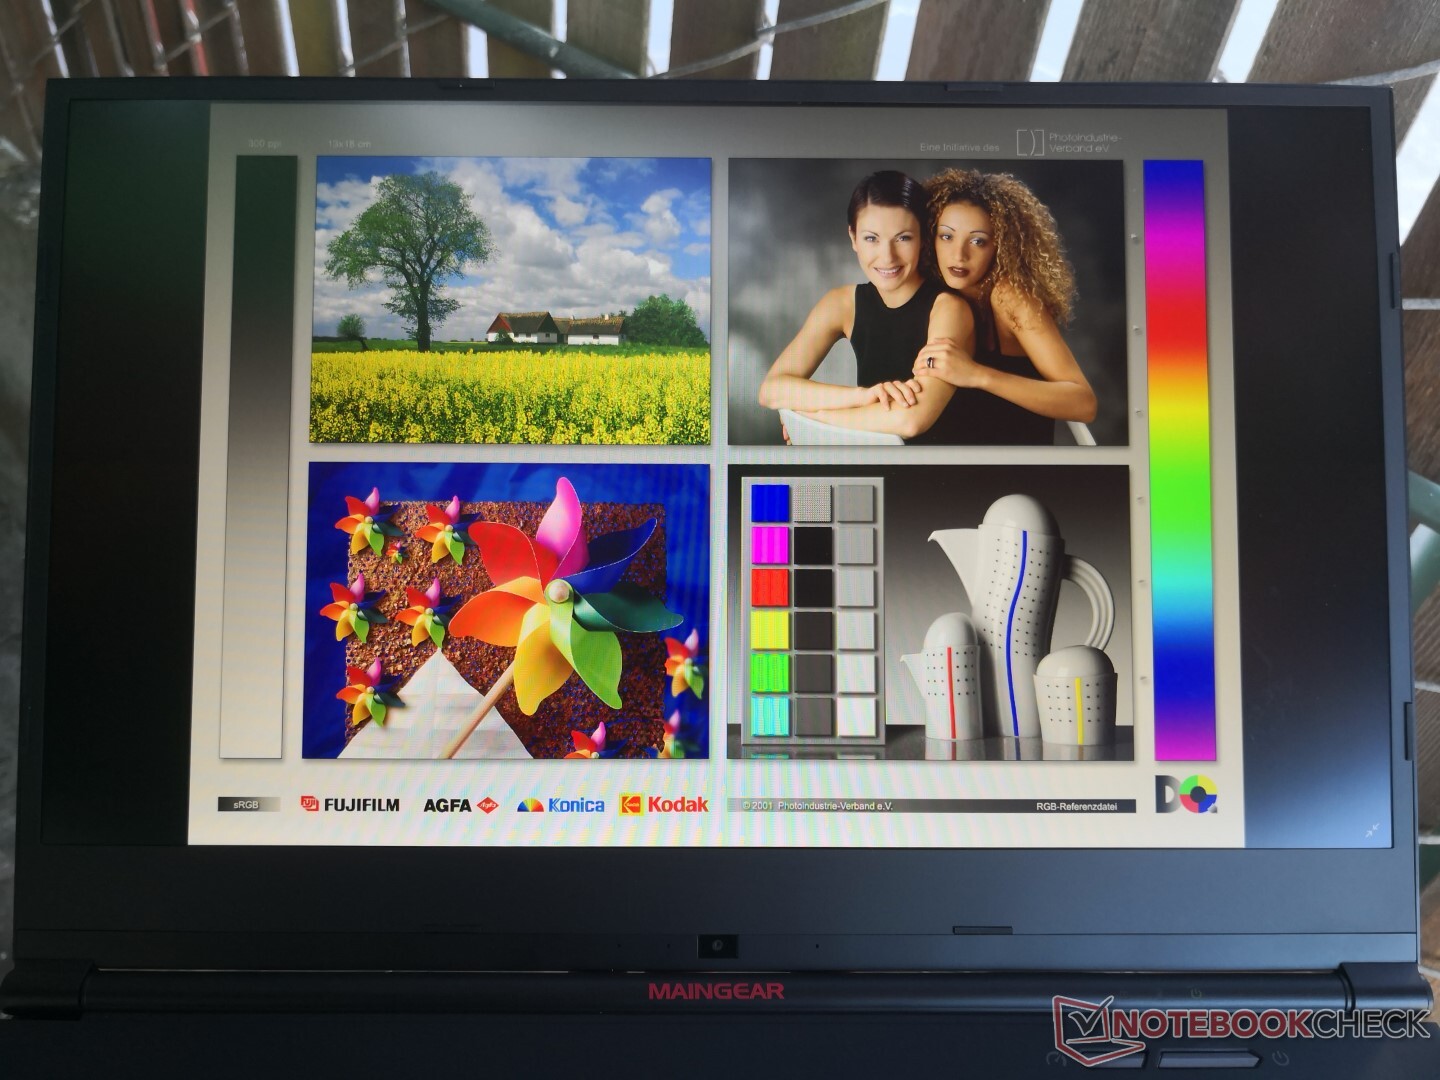
The LG Philips LP156WFG-SPB2 IPS panel on the Vector can also be found on the competing Lenovo Legion Y540 and Aorus 15 series. Thus, display characteristics like the wide color space, decent contrast ratio, and fast response times are similar between these laptops. This is a high quality panel with minimal graininess and it's hard to turn back to regular 60 Hz panels once you become accustomed to the super-smooth 144 Hz refresh rate. The 60 Hz panel on the cheap MSI GL65, for example, offers noticeably slower response times and poorer colors.
| |||||||||||||||||||||||||
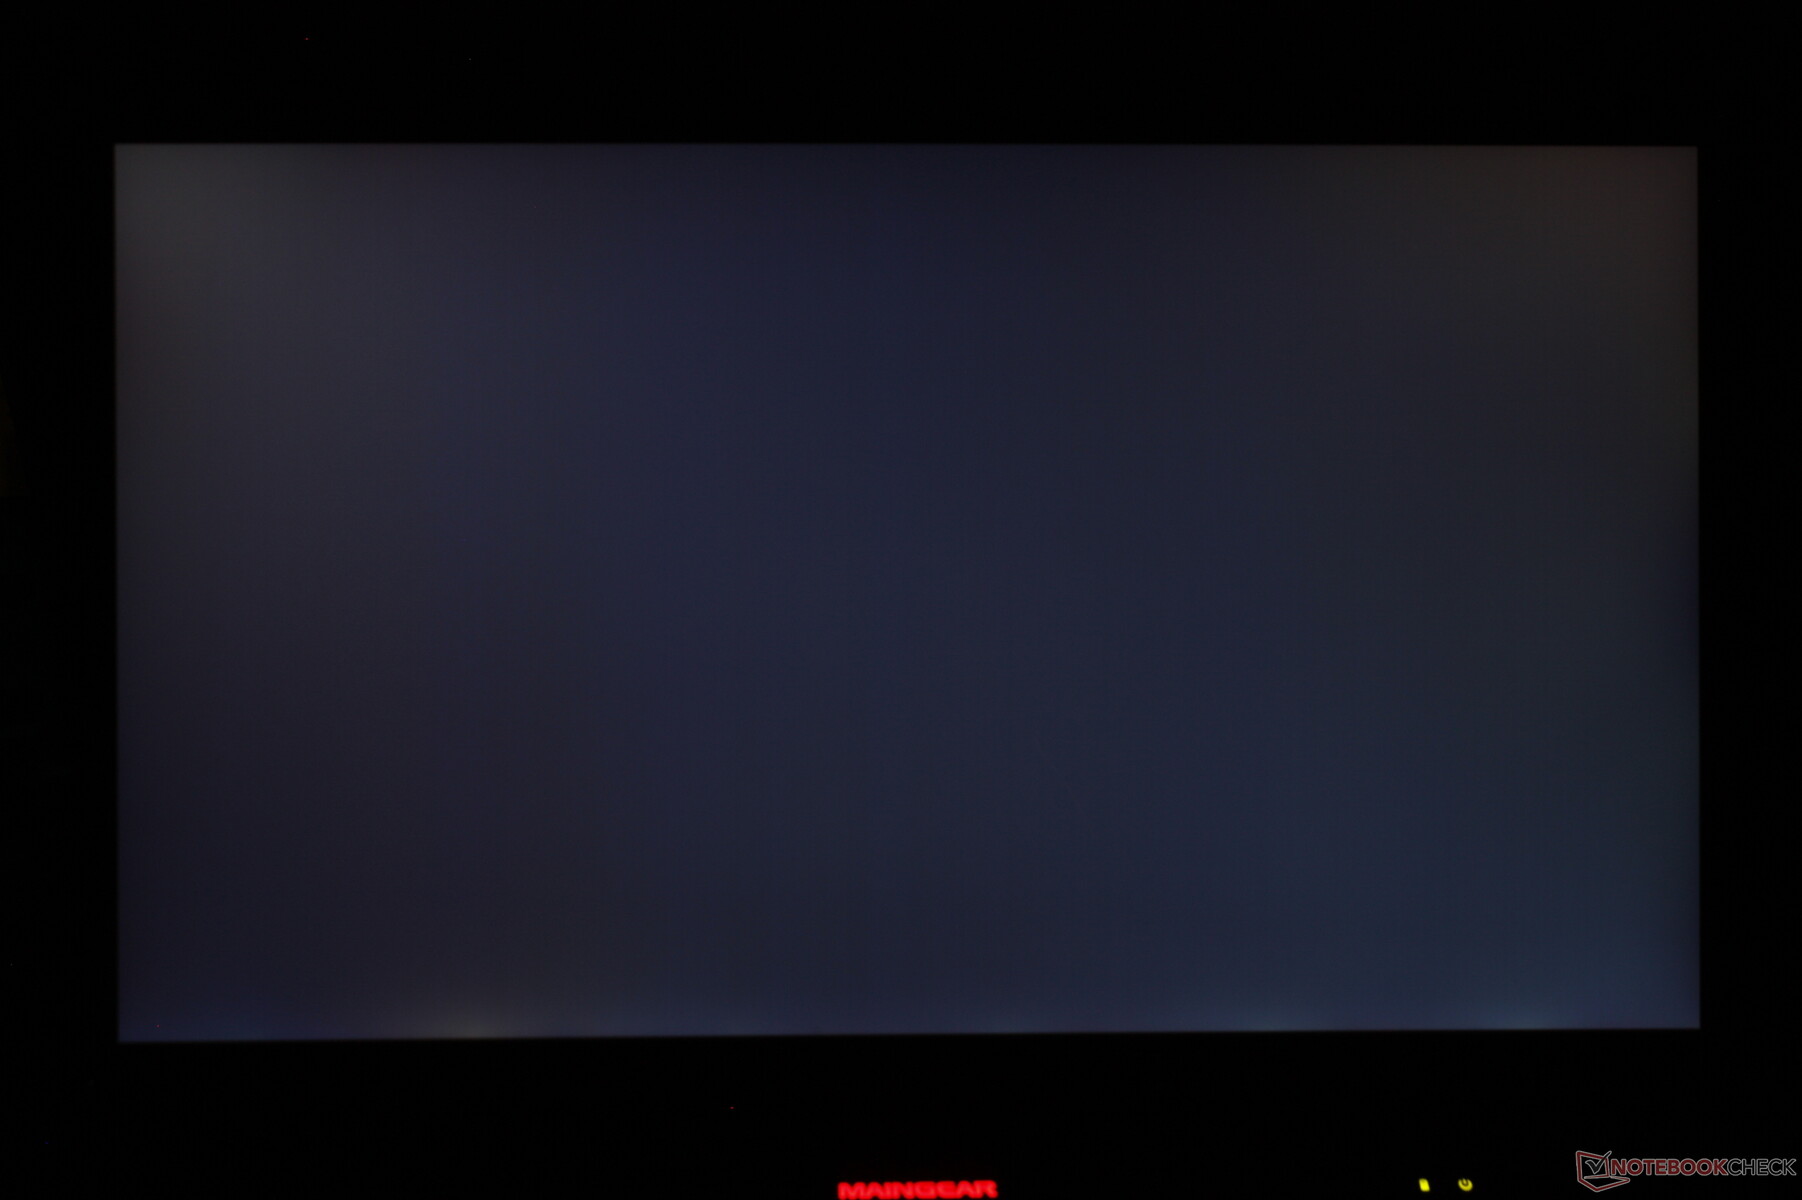
Brightness Distribution: 82 %
Center on Battery: 297.9 cd/m²
Contrast: 876:1 (Black: 0.34 cd/m²)
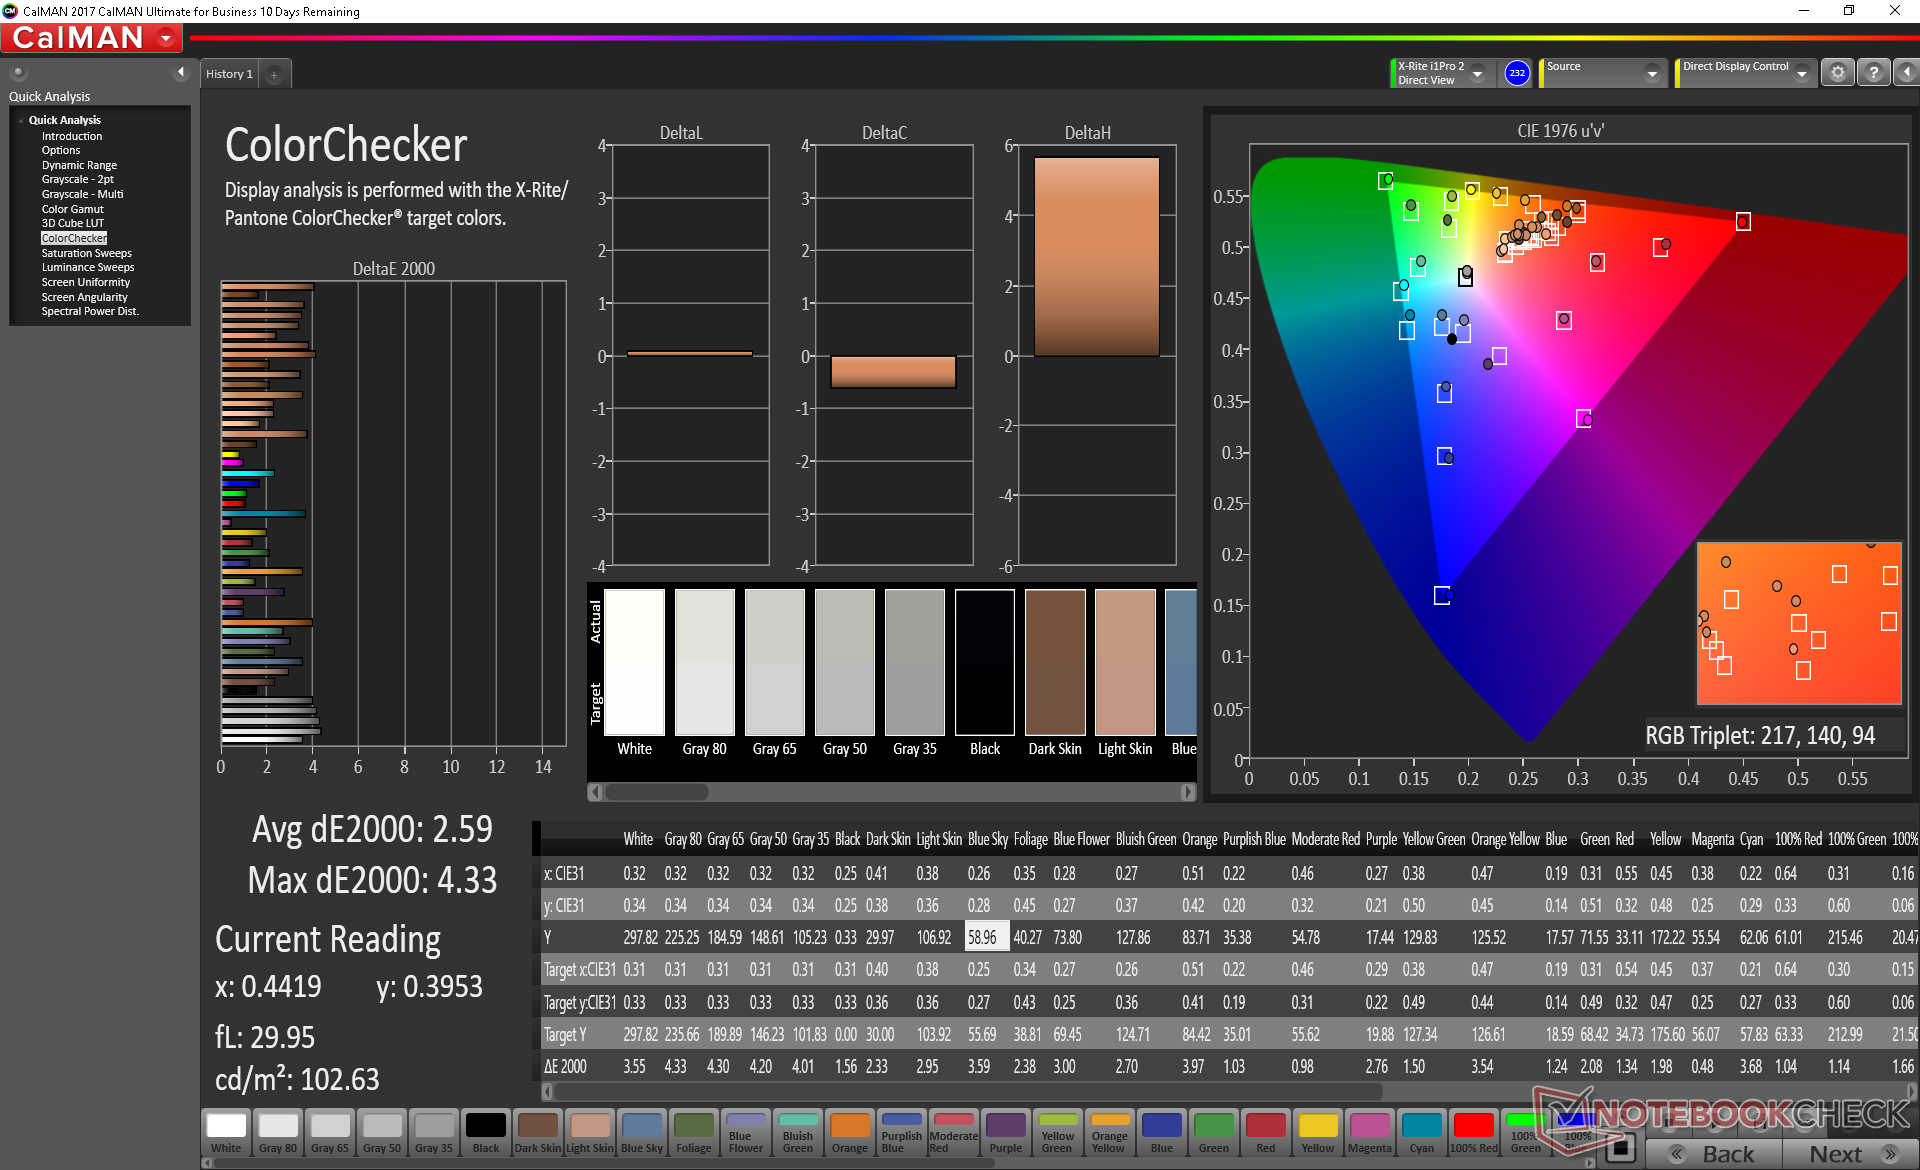
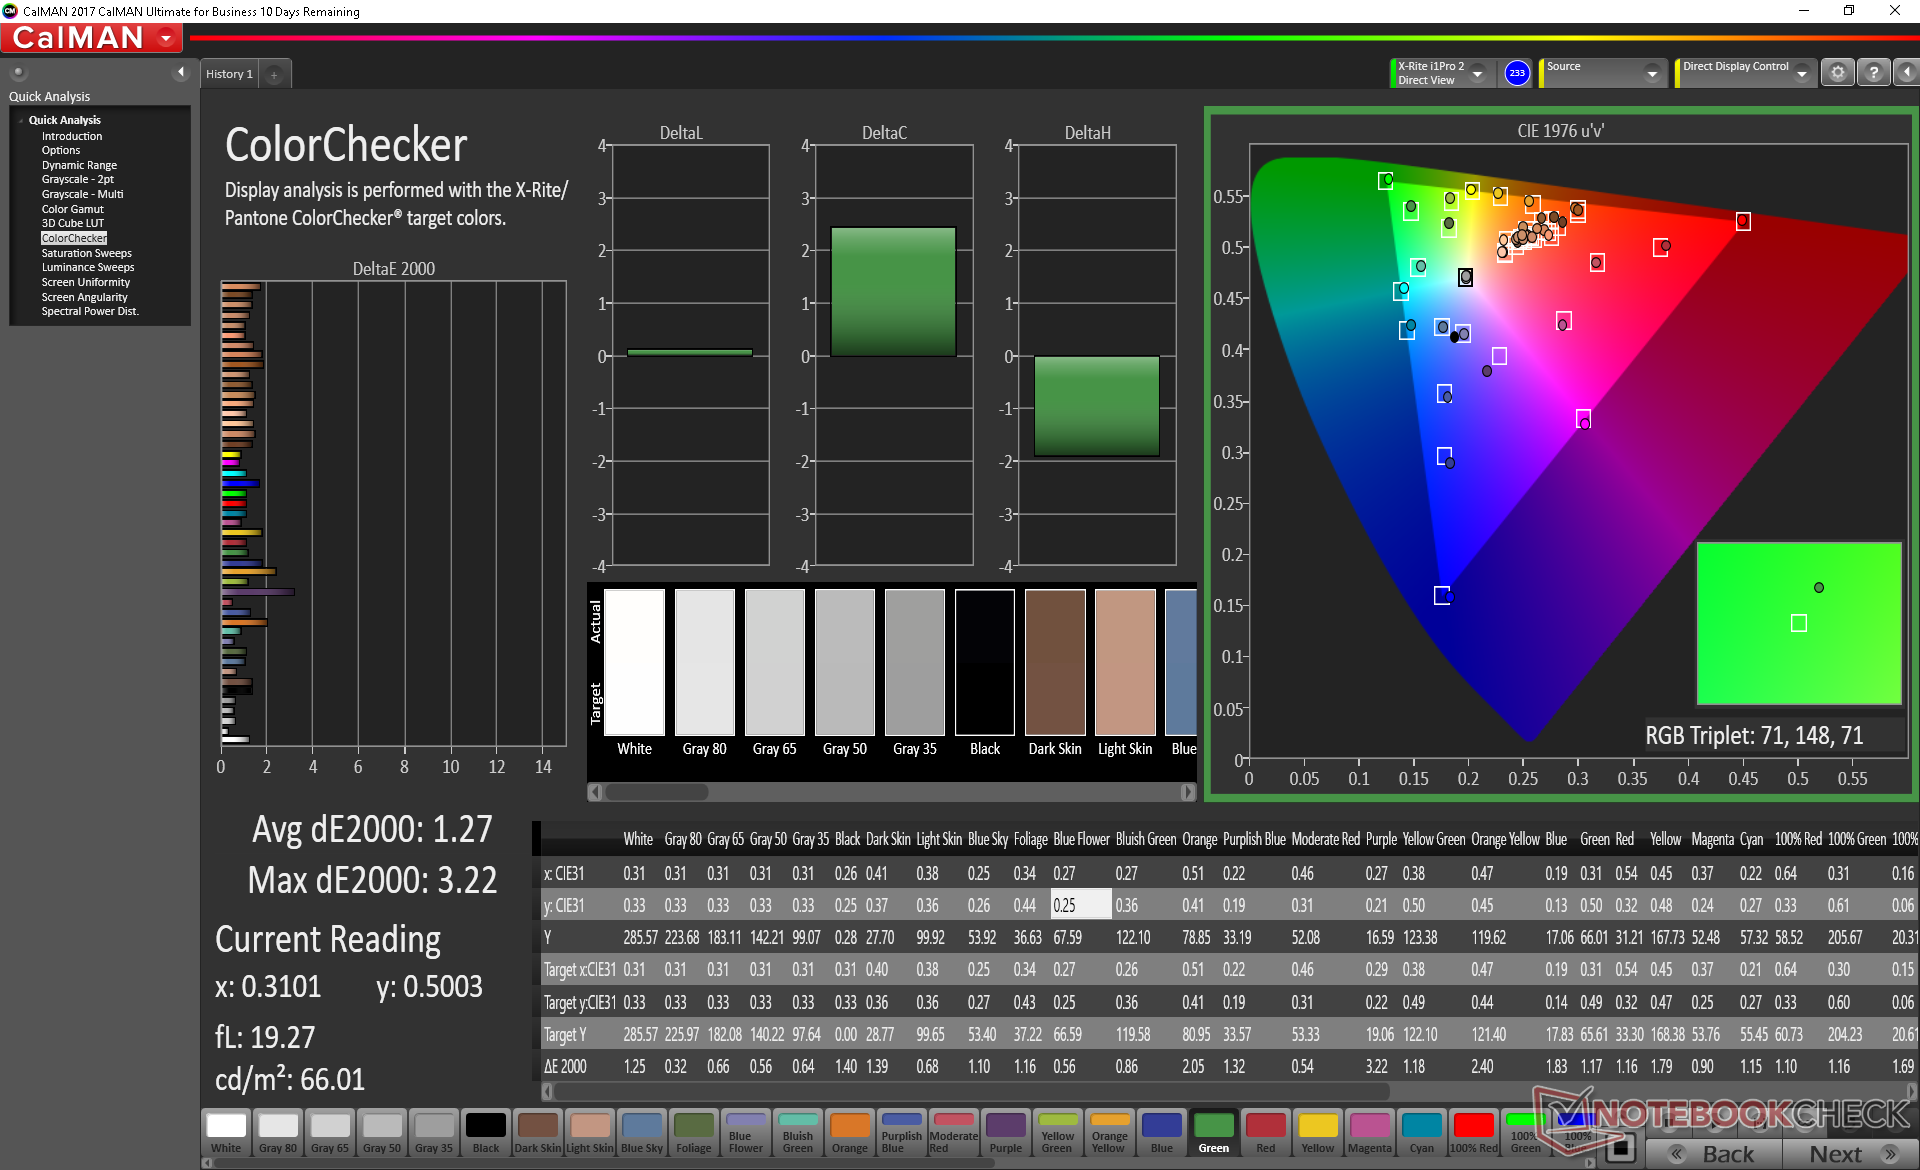
ΔE ColorChecker Calman: 2.59 | ∀{0.5-29.43 Ø4.71}
calibrated: 1.27
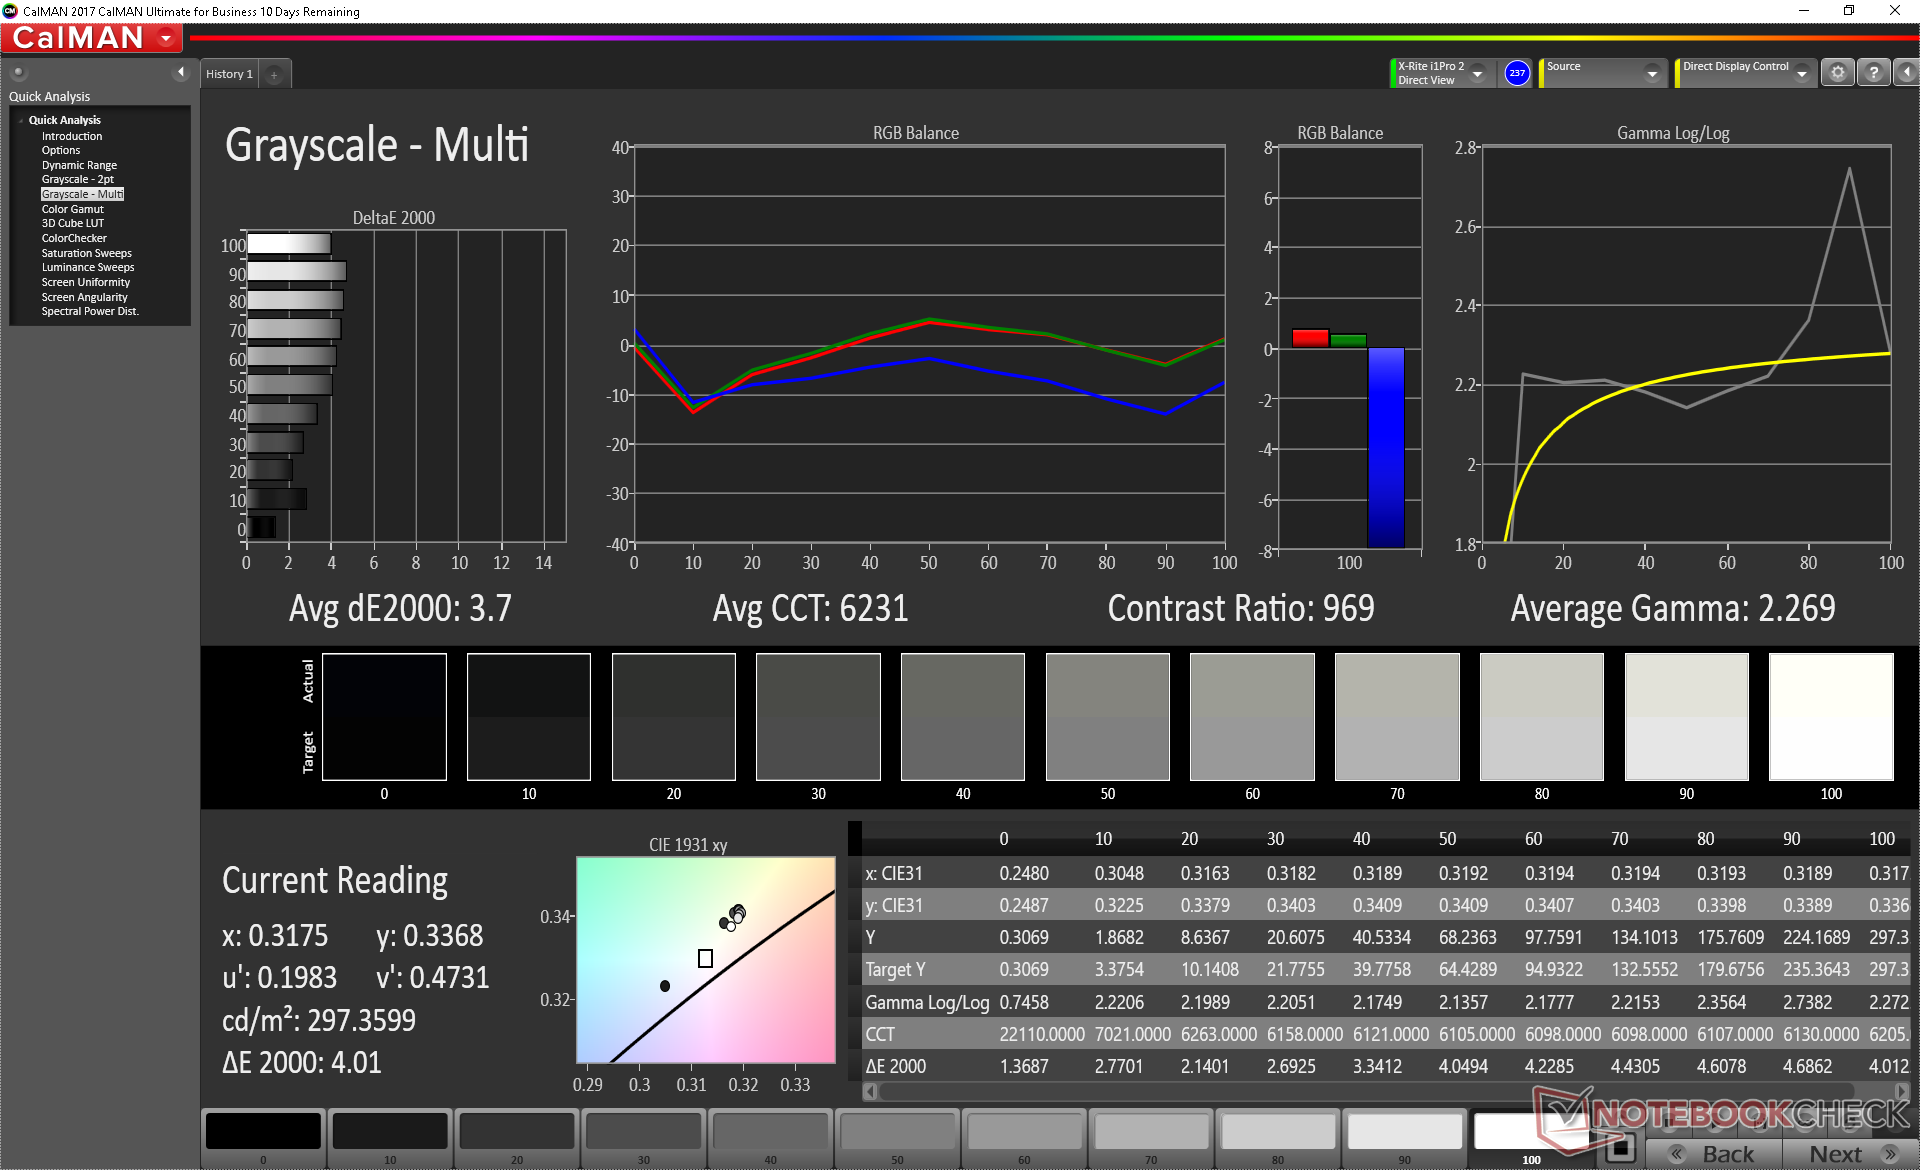
ΔE Greyscale Calman: 3.7 | ∀{0.09-98 Ø4.96}
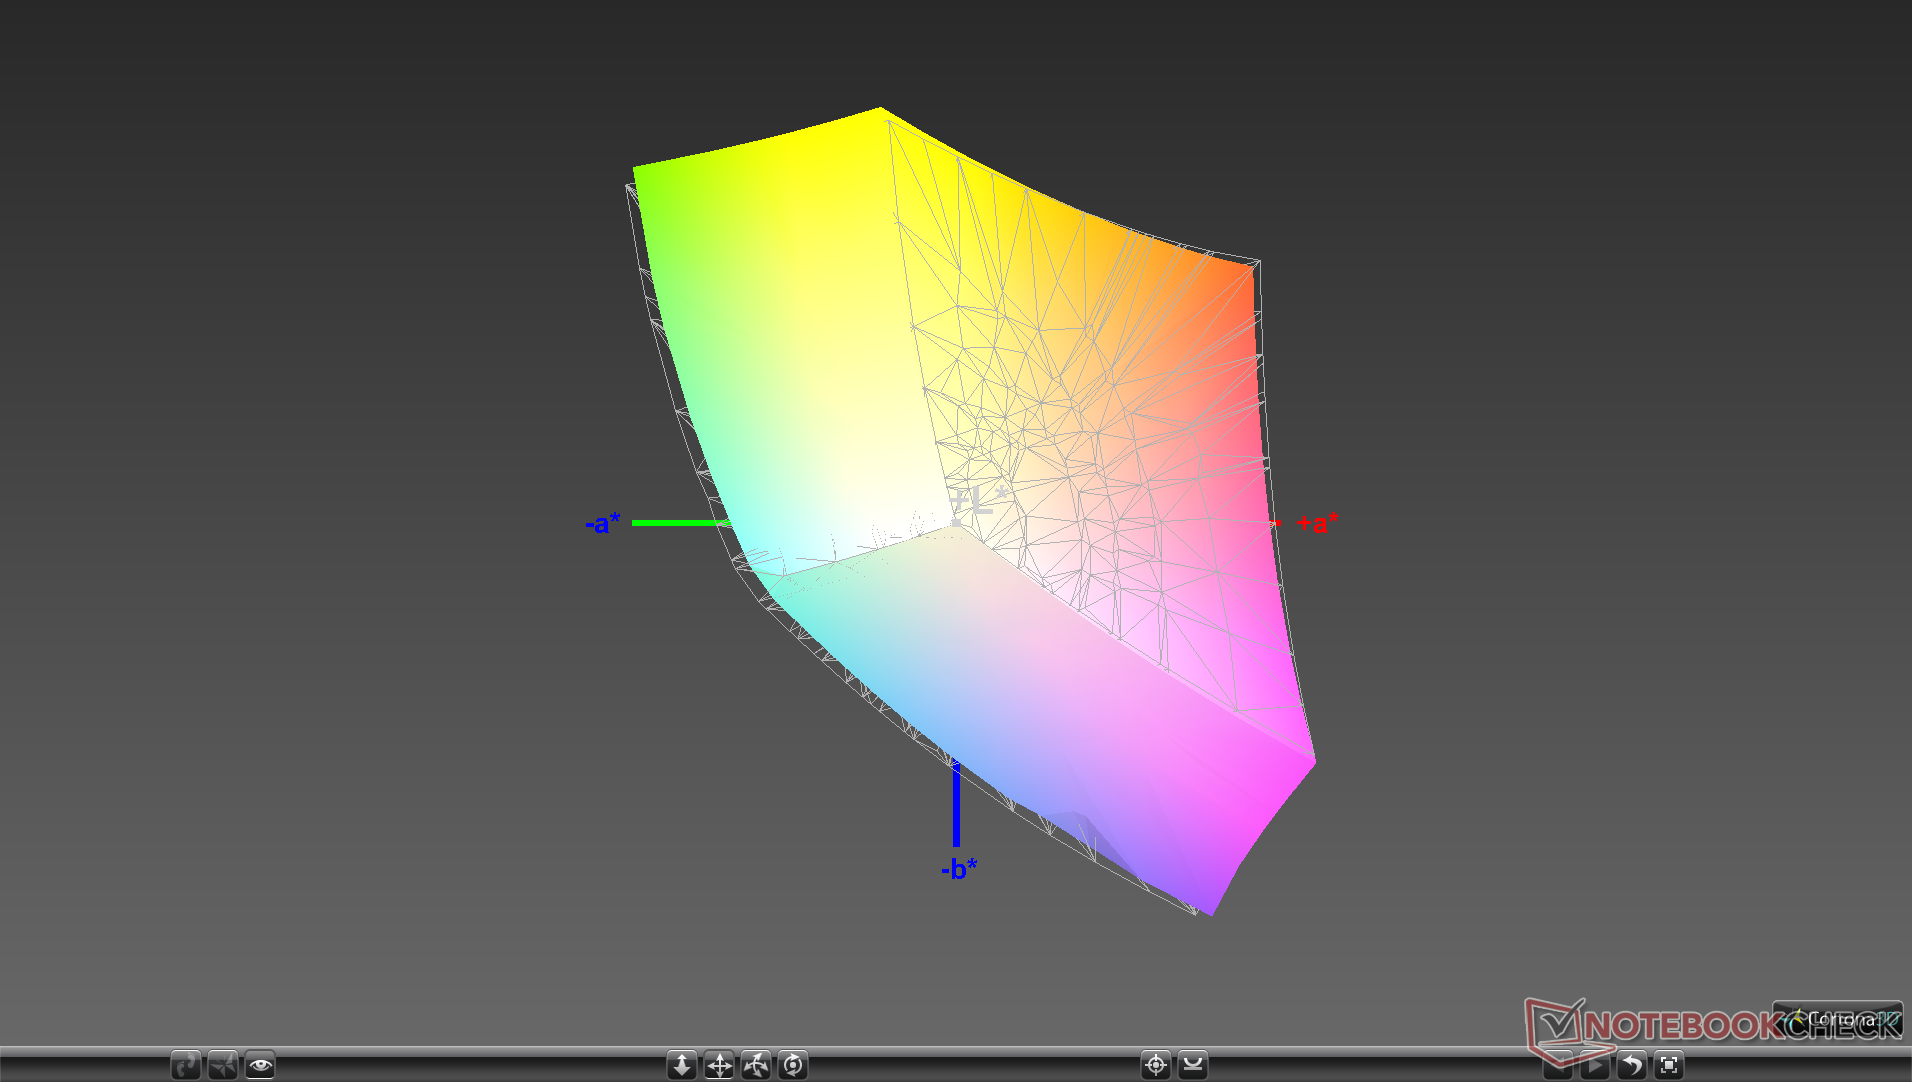
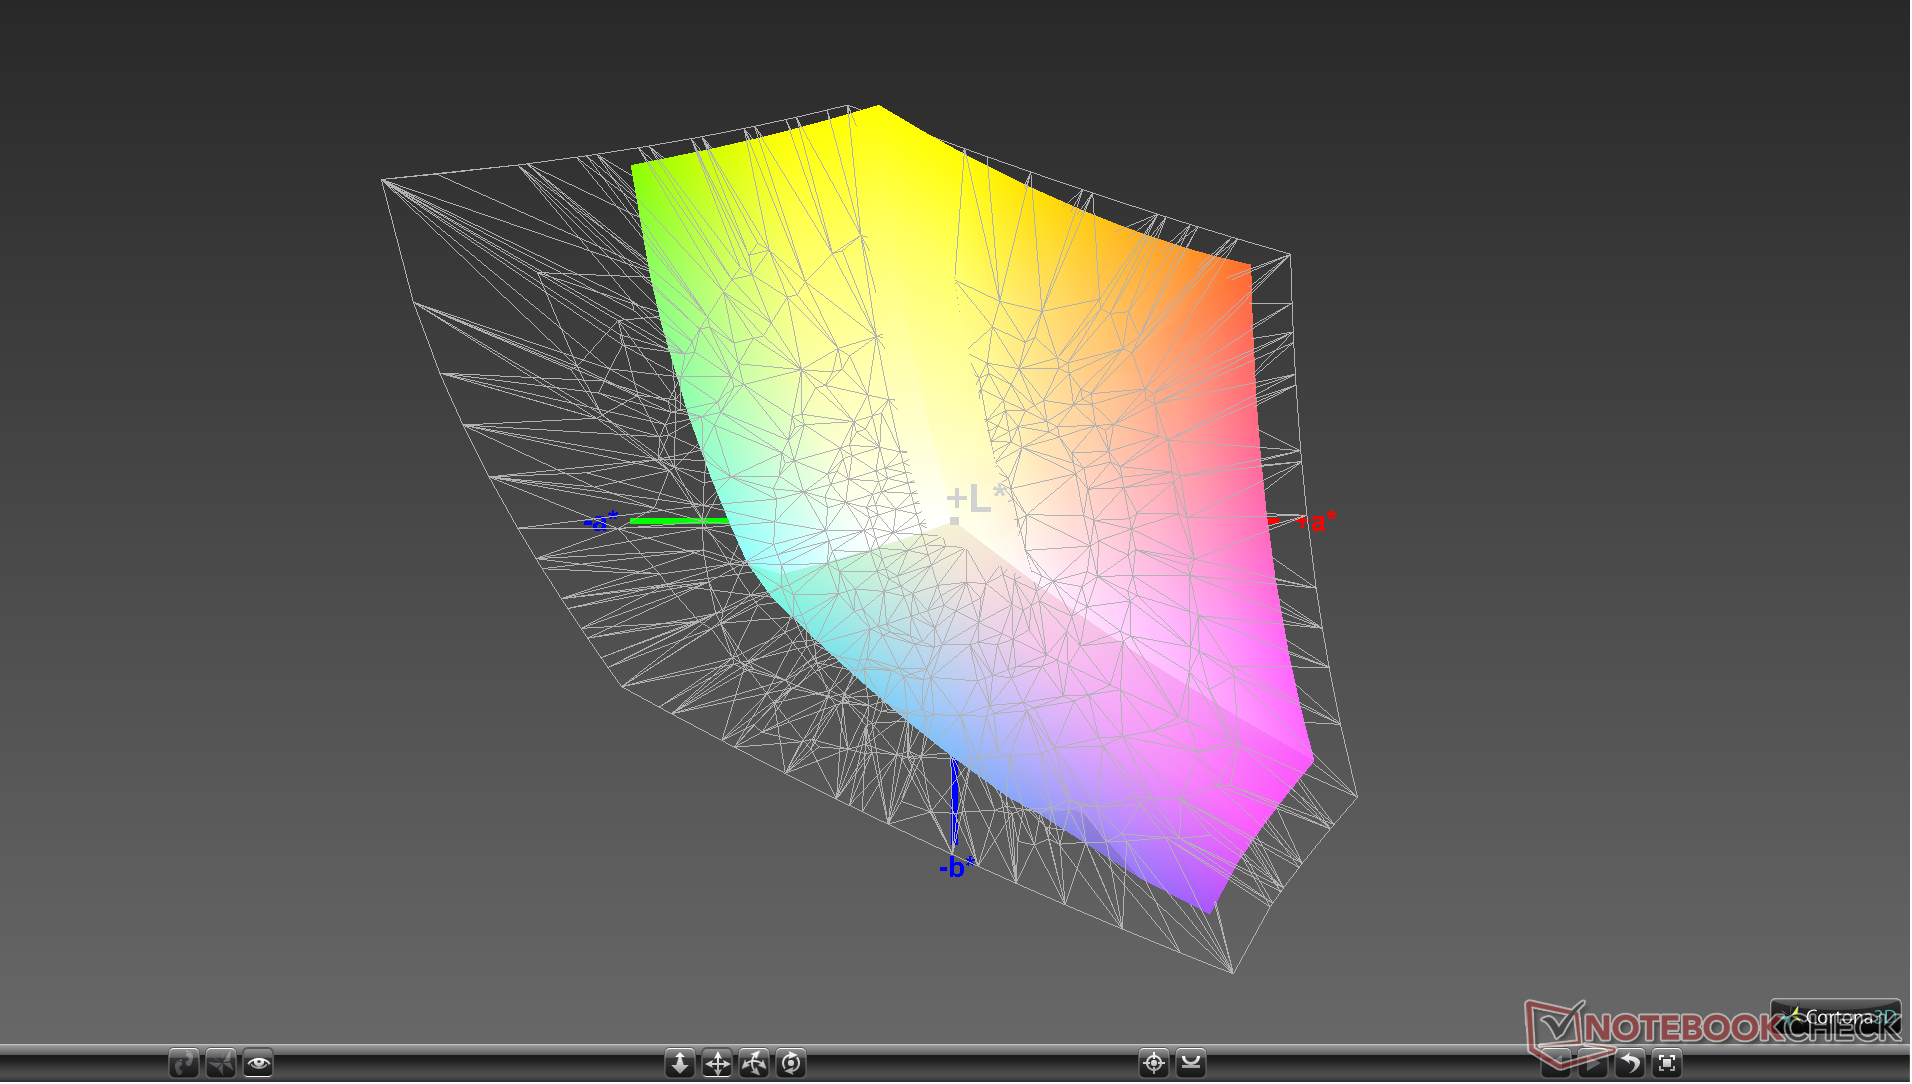
95.3% sRGB (Argyll 1.6.3 3D)
61.1% AdobeRGB 1998 (Argyll 1.6.3 3D)
66.8% AdobeRGB 1998 (Argyll 3D)
95.4% sRGB (Argyll 3D)
65% Display P3 (Argyll 3D)
Gamma: 2.27
CCT: 6231 K
| Maingear Vector 15 LG Philips LP156WFG-SPB2, IPS, 15.6", 1920x1080 | MSI GL65 9SEK AU Optronics B156HAN13.0, IPS, 15.6", 1920x1080 | Lenovo Legion Y740-15ICHg BOE NV156FHM-N4J, IPS, 15.6", 1920x1080 | Razer Blade 15 GTX 1660 Ti BOE NV156FHM-N4K, IPS, 15.6", 1920x1080 | Alienware m15 R2 P87F Sharp LQ156M1, IPS, 15.6", 1920x1080 | Asus ROG Zephyrus M15 GU502GU-XB74 AU Optronics B156HAN08.2, IPS, 15.6", 1920x1080 | |
|---|---|---|---|---|---|---|
| Display | -43% | 0% | -1% | -0% | -1% | |
| Display P3 Coverage (%) | 65 | 36.63 -44% | 67.7 4% | 65.3 0% | 65.3 0% | 66.5 2% |
| sRGB Coverage (%) | 95.4 | 55 -42% | 91.6 -4% | 91.8 -4% | 95.1 0% | 90.8 -5% |
| AdobeRGB 1998 Coverage (%) | 66.8 | 37.85 -43% | 67.1 0% | 66.5 0% | 65.9 -1% | 66.5 0% |
| Response Times | -88% | 3% | 21% | 16% | 50% | |
| Response Time Grey 50% / Grey 80% * (ms) | 14.8 ? | 26.4 ? -78% | 19 ? -28% | 13.6 ? 8% | 16.4 ? -11% | 6.4 ? 57% |
| Response Time Black / White * (ms) | 15.2 ? | 30 ? -97% | 10 ? 34% | 10 ? 34% | 8.8 ? 42% | 8.8 ? 42% |
| PWM Frequency (Hz) | 200 ? | 23810 ? | ||||
| Screen | -62% | 15% | -19% | -38% | -21% | |
| Brightness middle (cd/m²) | 297.9 | 277.3 -7% | 477 60% | 312.7 5% | 324.2 9% | 297.7 0% |
| Brightness (cd/m²) | 271 | 256 -6% | 431 59% | 305 13% | 304 12% | 280 3% |
| Brightness Distribution (%) | 82 | 86 5% | 84 2% | 90 10% | 90 10% | 84 2% |
| Black Level * (cd/m²) | 0.34 | 0.2 41% | 0.175 49% | 0.27 21% | 0.38 -12% | 0.43 -26% |
| Contrast (:1) | 876 | 1387 58% | 2726 211% | 1158 32% | 853 -3% | 692 -21% |
| Colorchecker dE 2000 * | 2.59 | 5.25 -103% | 4.17 -61% | 4.57 -76% | 5.01 -93% | 3.13 -21% |
| Colorchecker dE 2000 max. * | 4.33 | 19.43 -349% | 6.97 -61% | 6.81 -57% | 12.7 -193% | 7.1 -64% |
| Colorchecker dE 2000 calibrated * | 1.27 | 4.39 -246% | 2.51 -98% | 2.91 -129% | 1.64 -29% | 3.06 -141% |
| Greyscale dE 2000 * | 3.7 | 3.5 5% | 3.49 6% | 4.3 -16% | 7.9 -114% | 1.9 49% |
| Gamma | 2.27 97% | 2.1 105% | 2.5 88% | 2.29 96% | 2.35 94% | 2.23 99% |
| CCT | 6231 104% | 6895 94% | 7076 92% | 7098 92% | 8455 77% | 6325 103% |
| Color Space (Percent of AdobeRGB 1998) (%) | 61.1 | 35 -43% | 60 -2% | 59.4 -3% | 60.8 0% | 59.2 -3% |
| Color Space (Percent of sRGB) (%) | 95.3 | 55 -42% | 91 -5% | 91.3 -4% | 95.5 0% | 90.5 -5% |
| Total Average (Program / Settings) | -64% /
-62% | 6% /
10% | 0% /
-10% | -7% /
-24% | 9% /
-8% |
* ... smaller is better
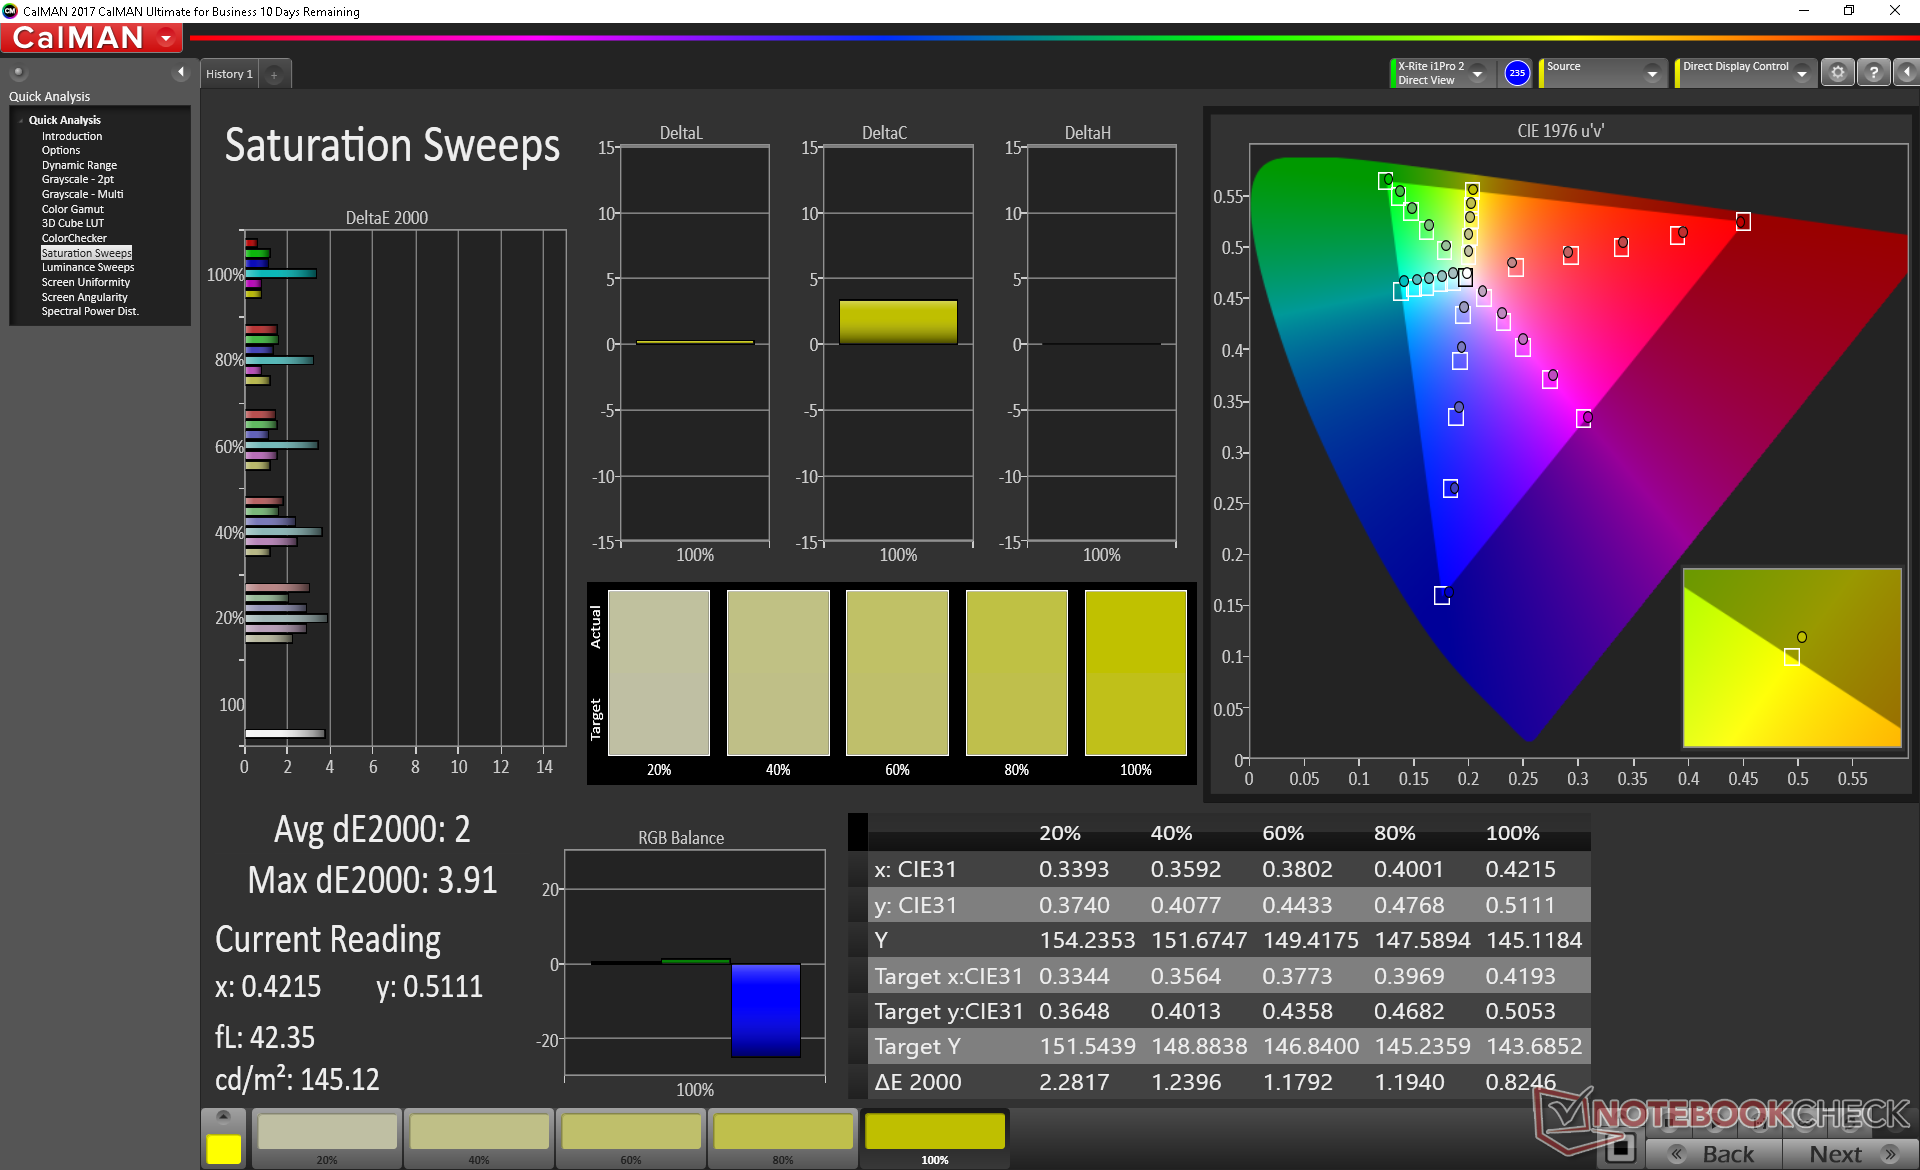
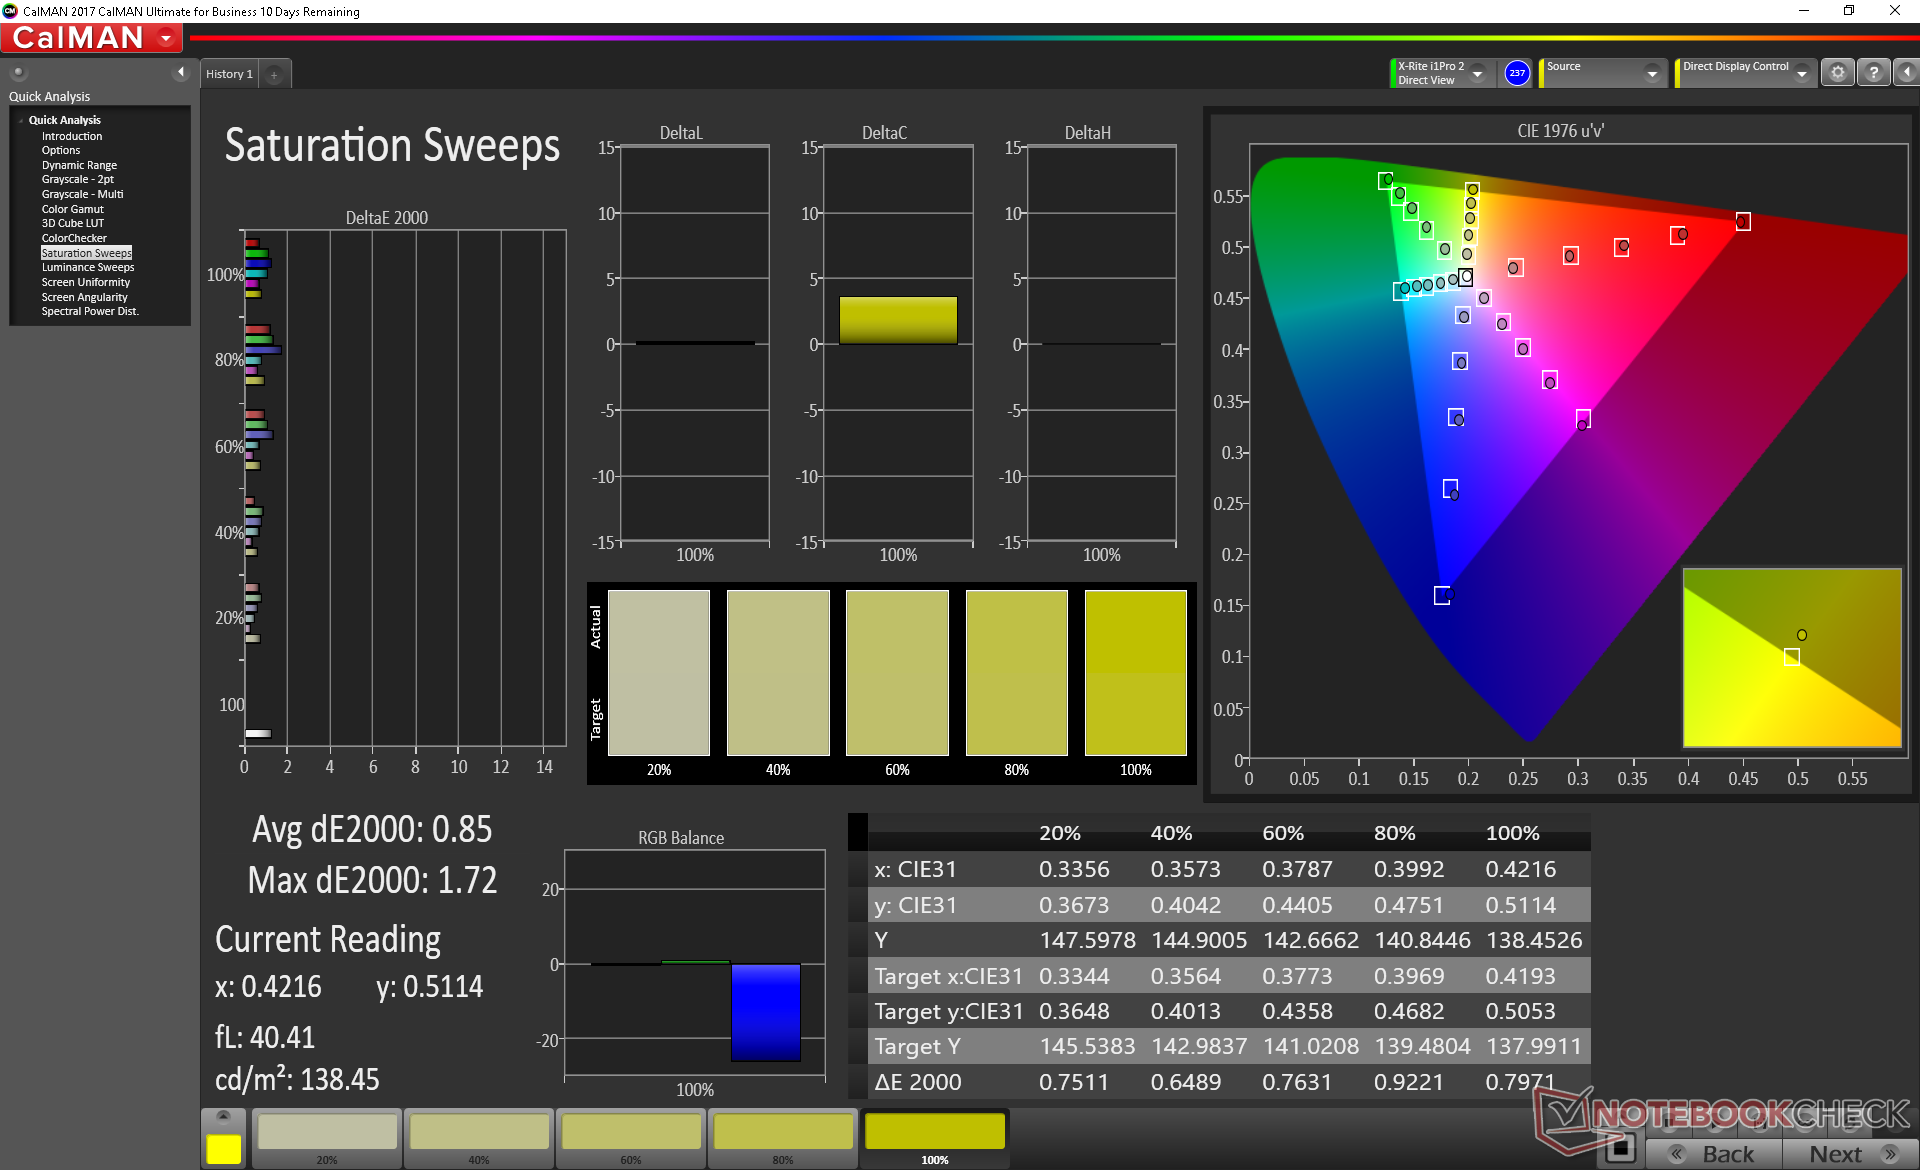
Like pretty much all 144 Hz laptop panels currently in the market, color space covers approximately 95 percent of sRGB and 61 percent of AdobeRGB. Users who want wider gamuts would have to consider certain 4K UHD or OLED options instead.
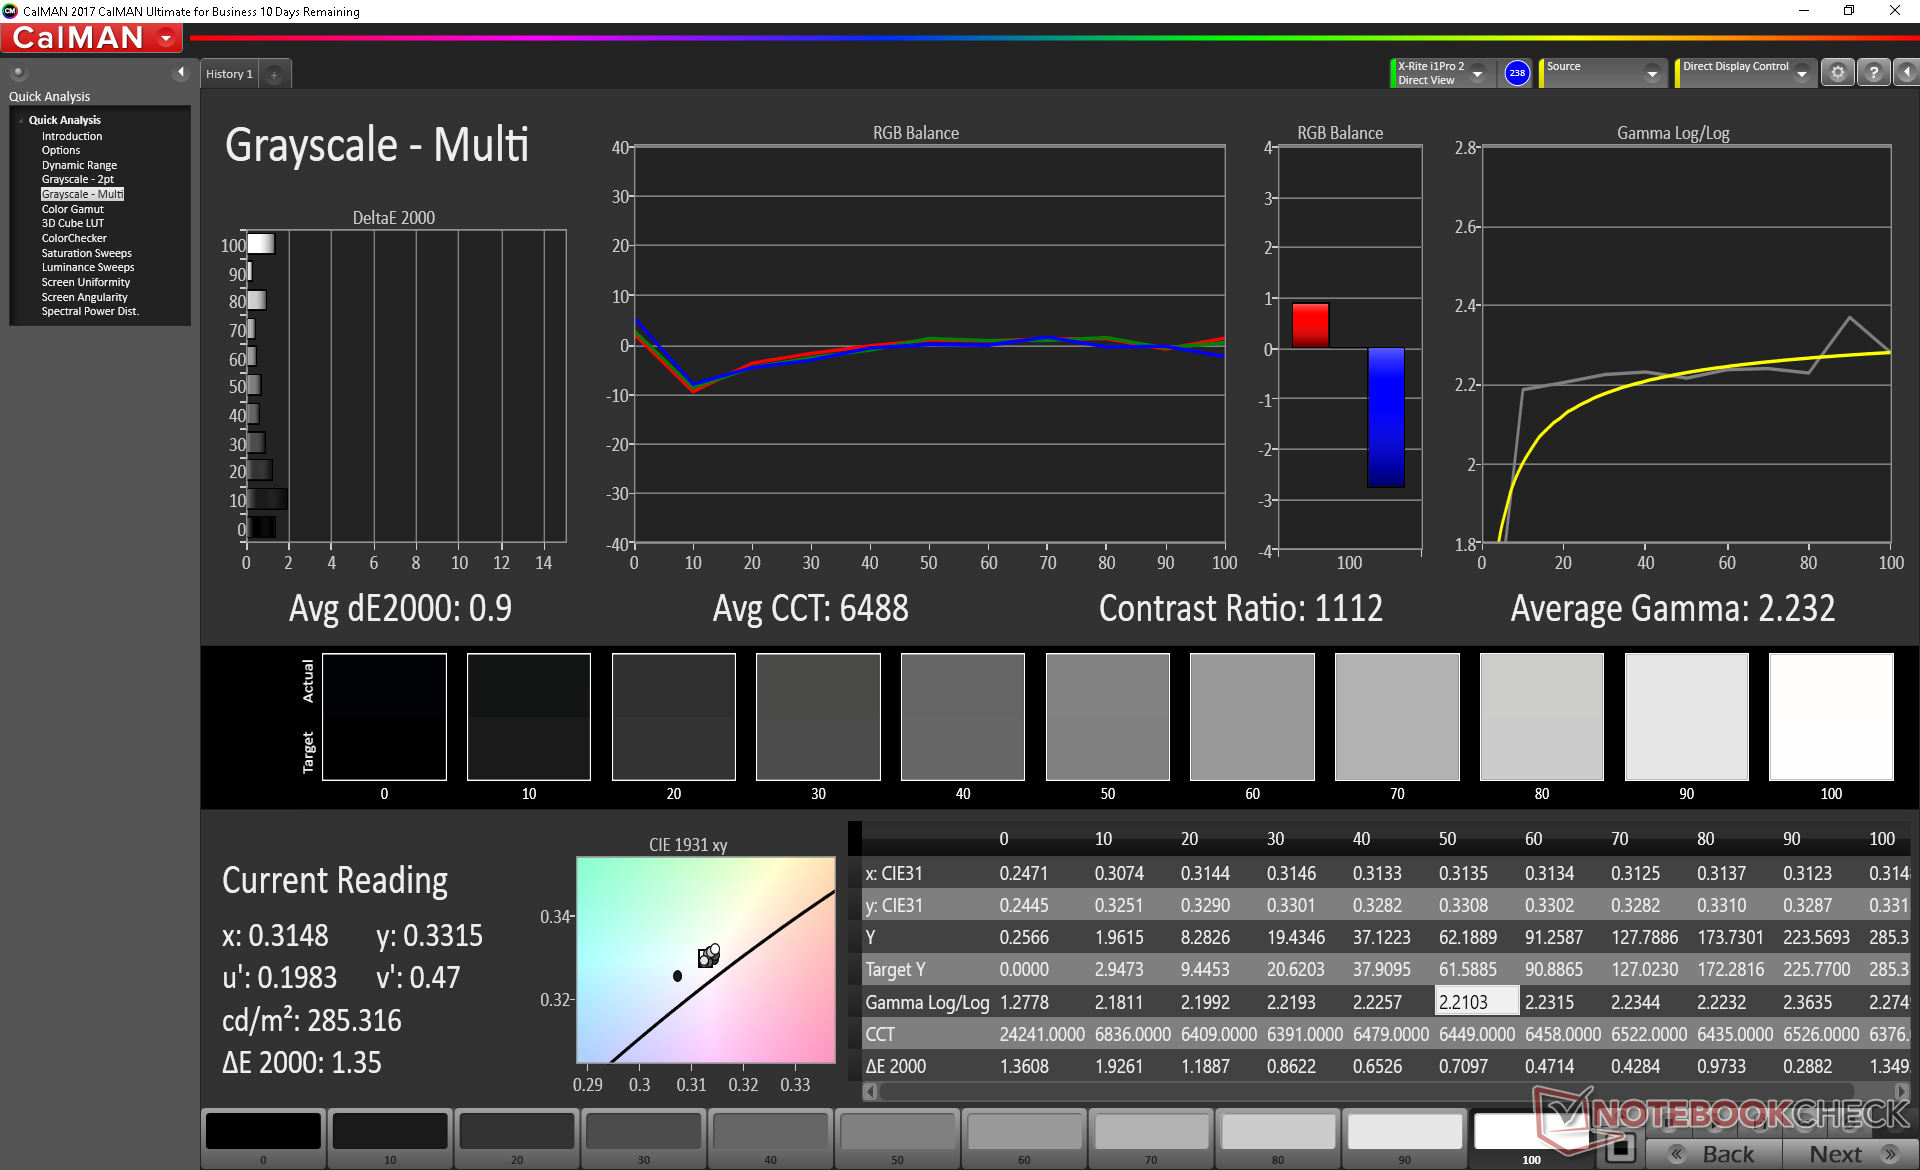
Further measurements with an X-Rite colorimeter show color temperature to be slightly on the warm side. Once calibrated, however, grayscale and colors become very accurate with average DeltaE values of just 0.9 and 1.27, respectively.
Display Response Times
| ↔ Response Time Black to White | ||
|---|---|---|
| 15.2 ms ... rise ↗ and fall ↘ combined | ↗ 9.2 ms rise | 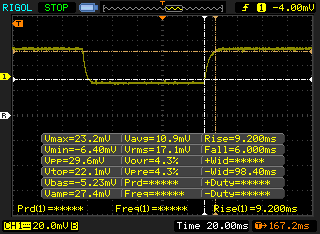 |
| ↘ 6 ms fall | ||
| The screen shows good response rates in our tests, but may be too slow for competitive gamers. In comparison, all tested devices range from 0.1 (minimum) to 240 (maximum) ms. » 37 % of all devices are better. This means that the measured response time is better than the average of all tested devices (19.8 ms). | ||
| ↔ Response Time 50% Grey to 80% Grey | ||
| 14.8 ms ... rise ↗ and fall ↘ combined | ↗ 7.2 ms rise | 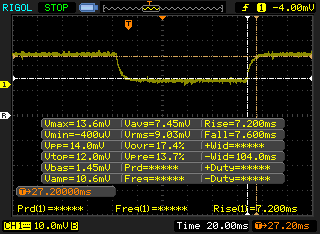 |
| ↘ 7.6 ms fall | ||
| The screen shows good response rates in our tests, but may be too slow for competitive gamers. In comparison, all tested devices range from 0.165 (minimum) to 636 (maximum) ms. » 29 % of all devices are better. This means that the measured response time is better than the average of all tested devices (31 ms). | ||
Screen Flickering / PWM (Pulse-Width Modulation)
| Screen flickering / PWM not detected | 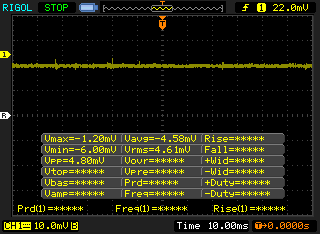 | ||
In comparison: 52 % of all tested devices do not use PWM to dim the display. If PWM was detected, an average of 7757 (minimum: 5 - maximum: 343500) Hz was measured. | |||
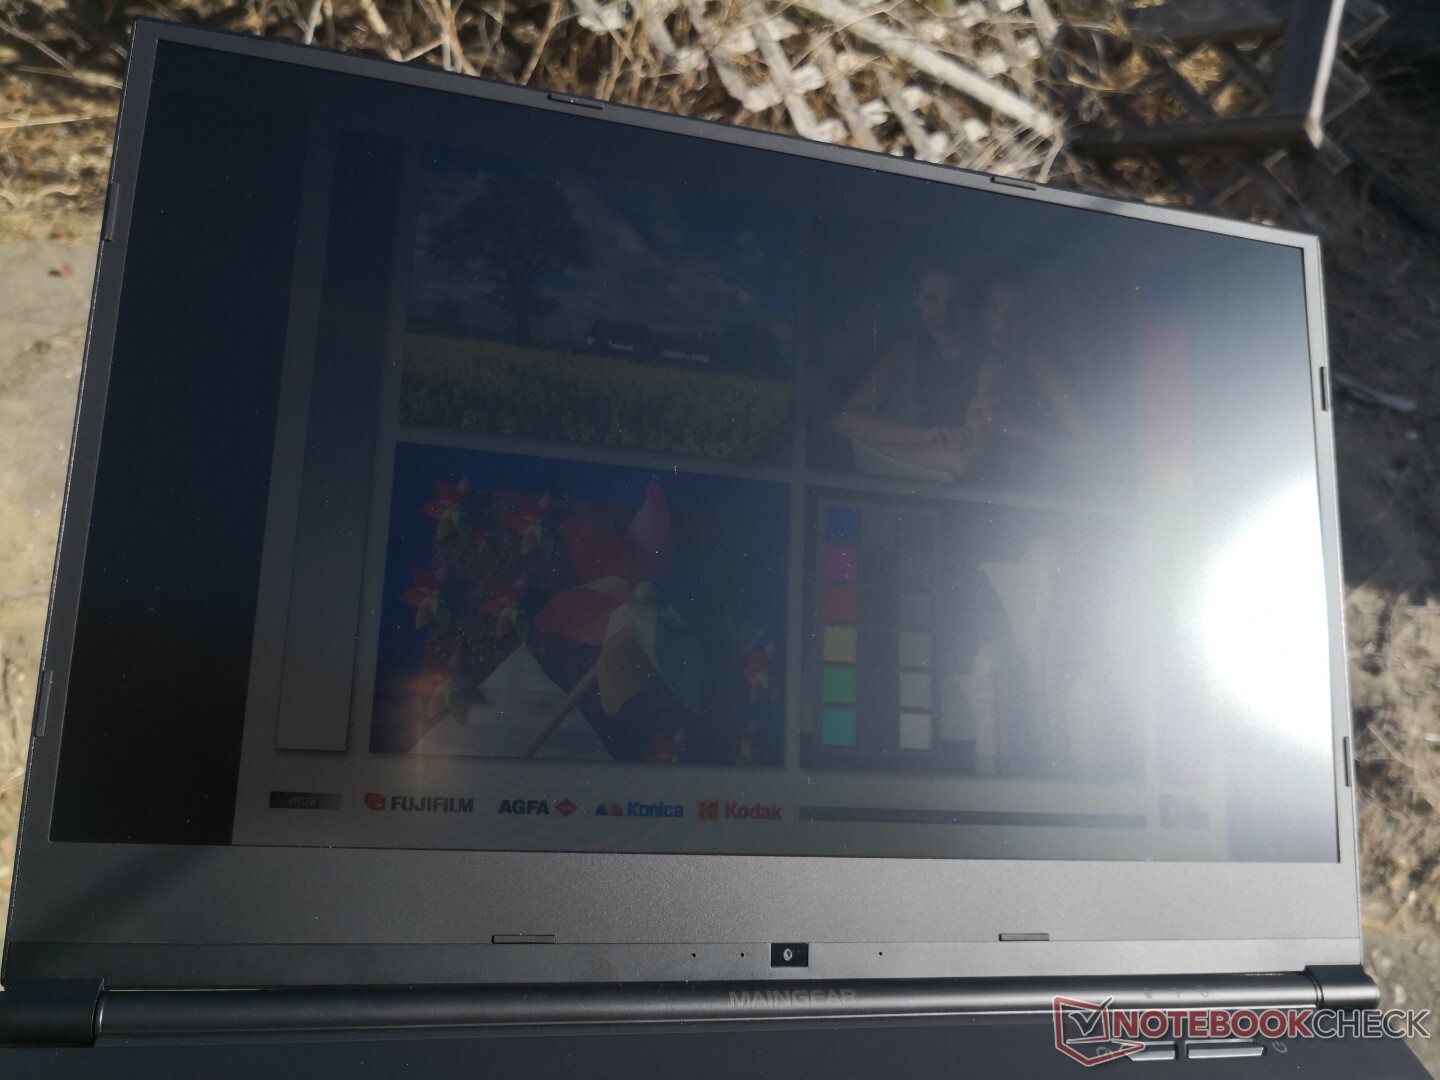
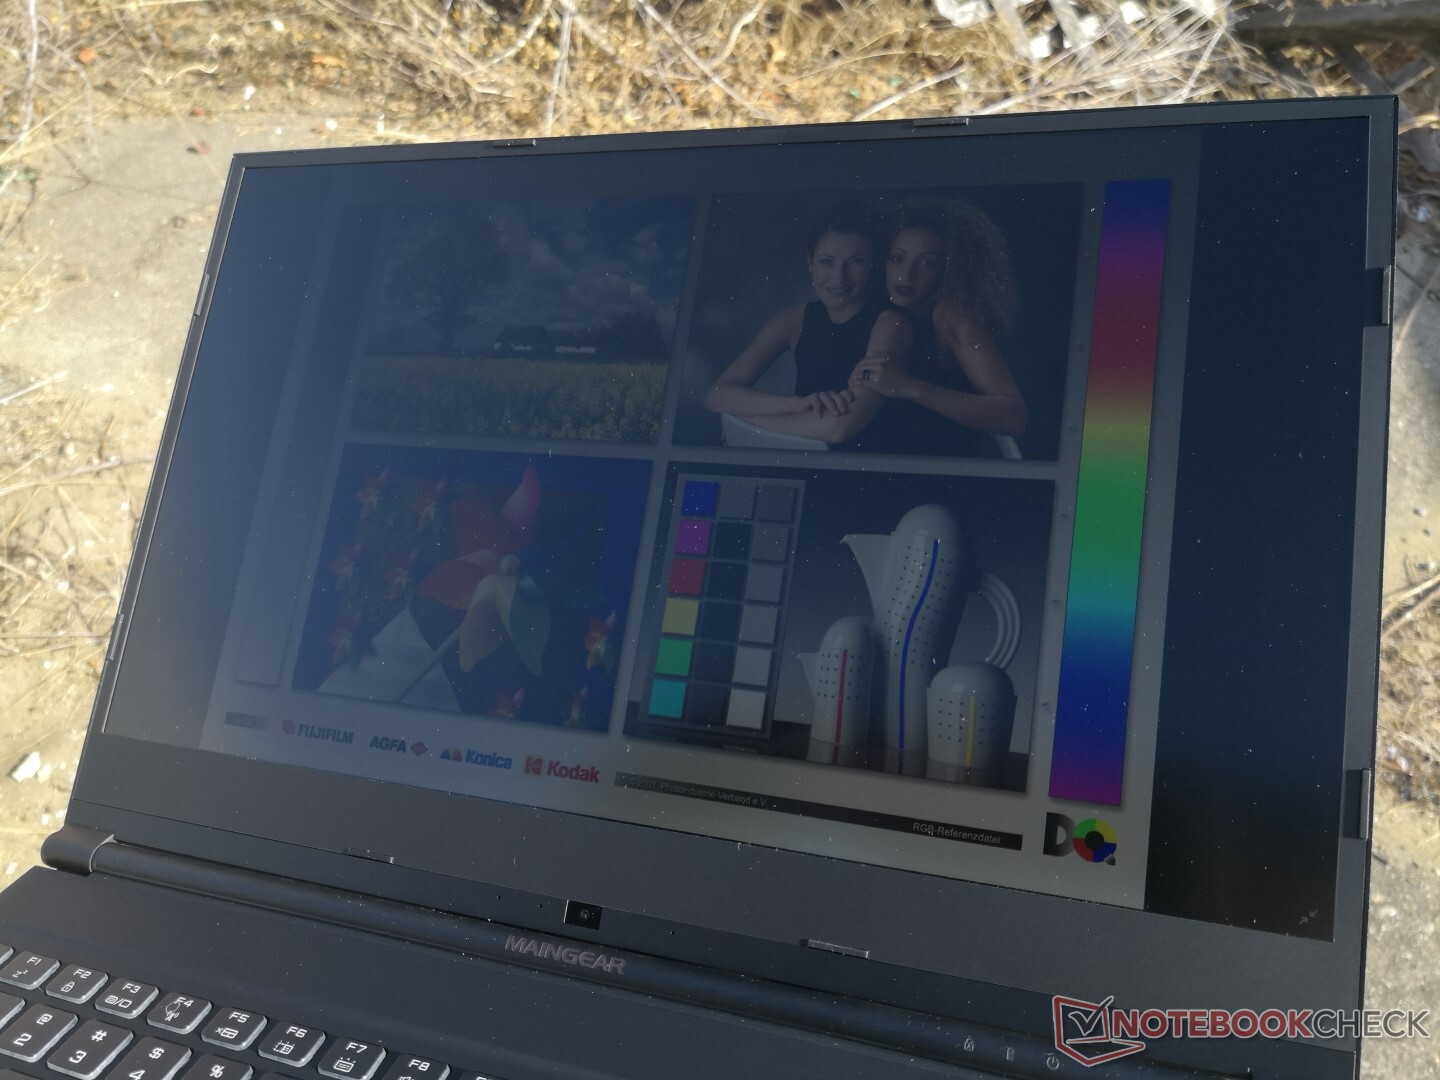
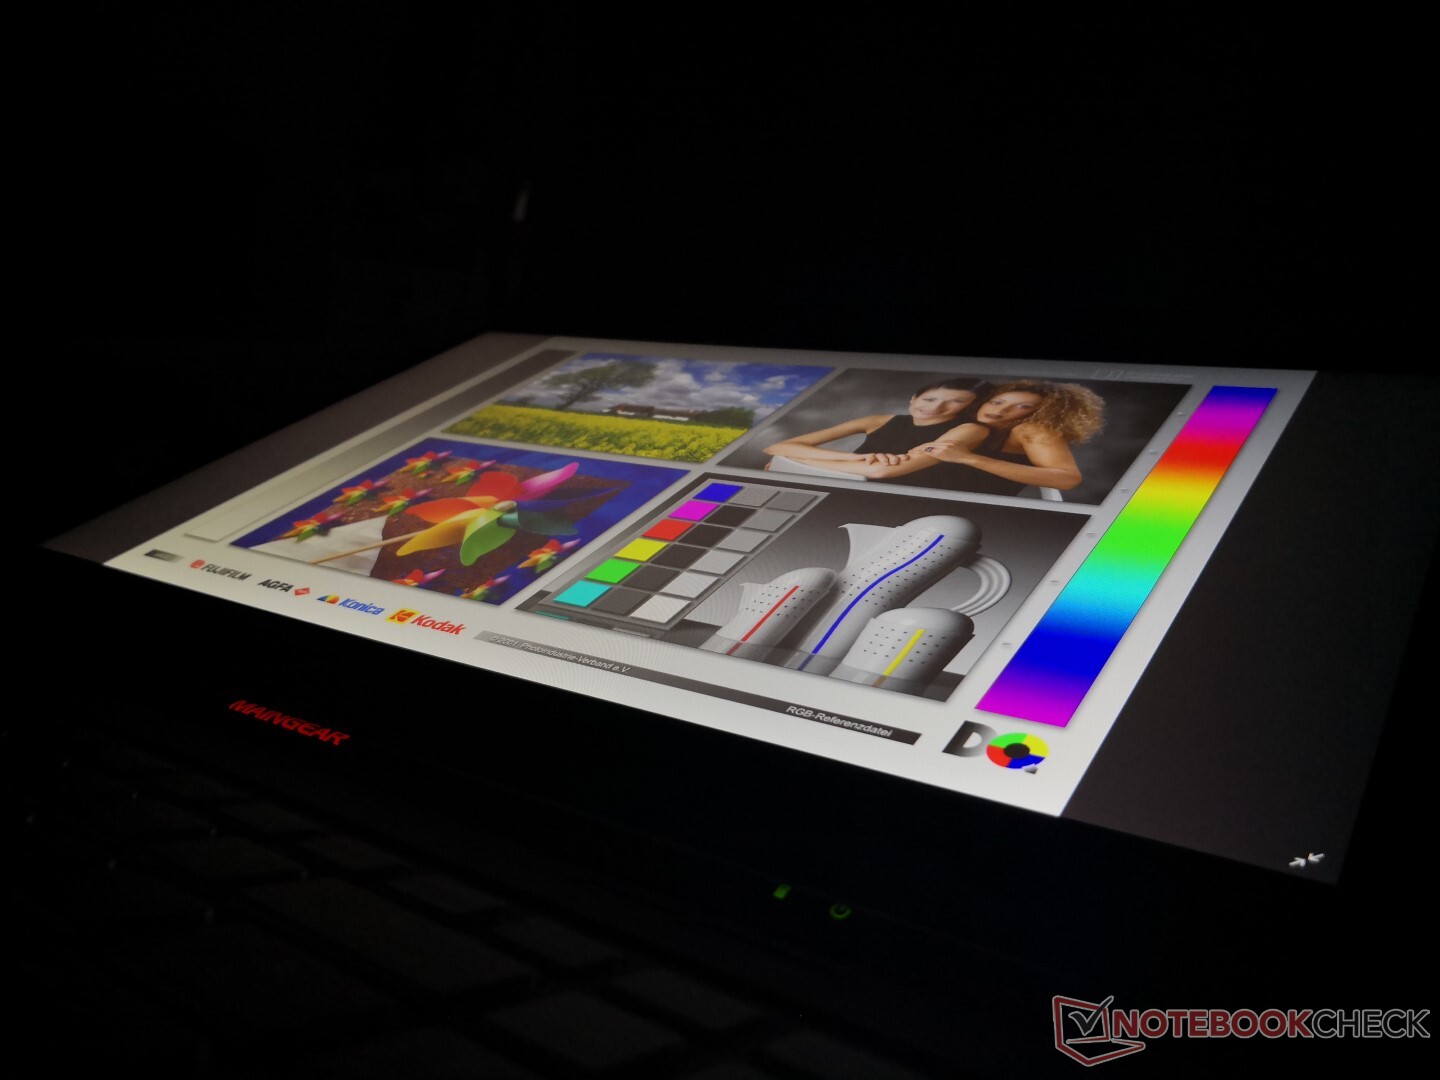
Since the 300-nit backlight is pretty much standard across most gaming laptops, outdoor visibility with the Vector offers nothing out of the ordinary. We recommend staying under shade whenever possible as anything brighter will overwhelm the matte screen.
Performance
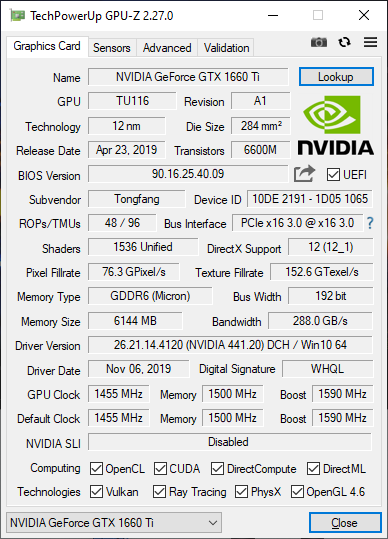
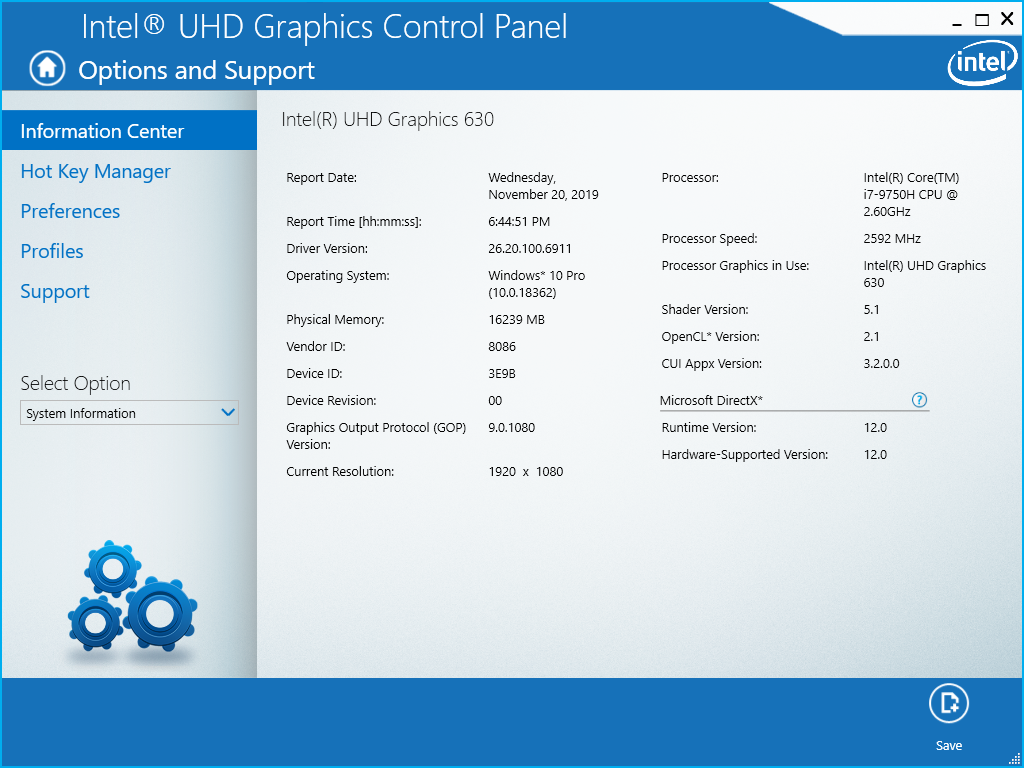
The Core i7-9750H and GeForce GTX 1660 Ti are mid-range gaming laptop specs. Nvidia Optimus comes standard to automatically exclude G-Sync options.
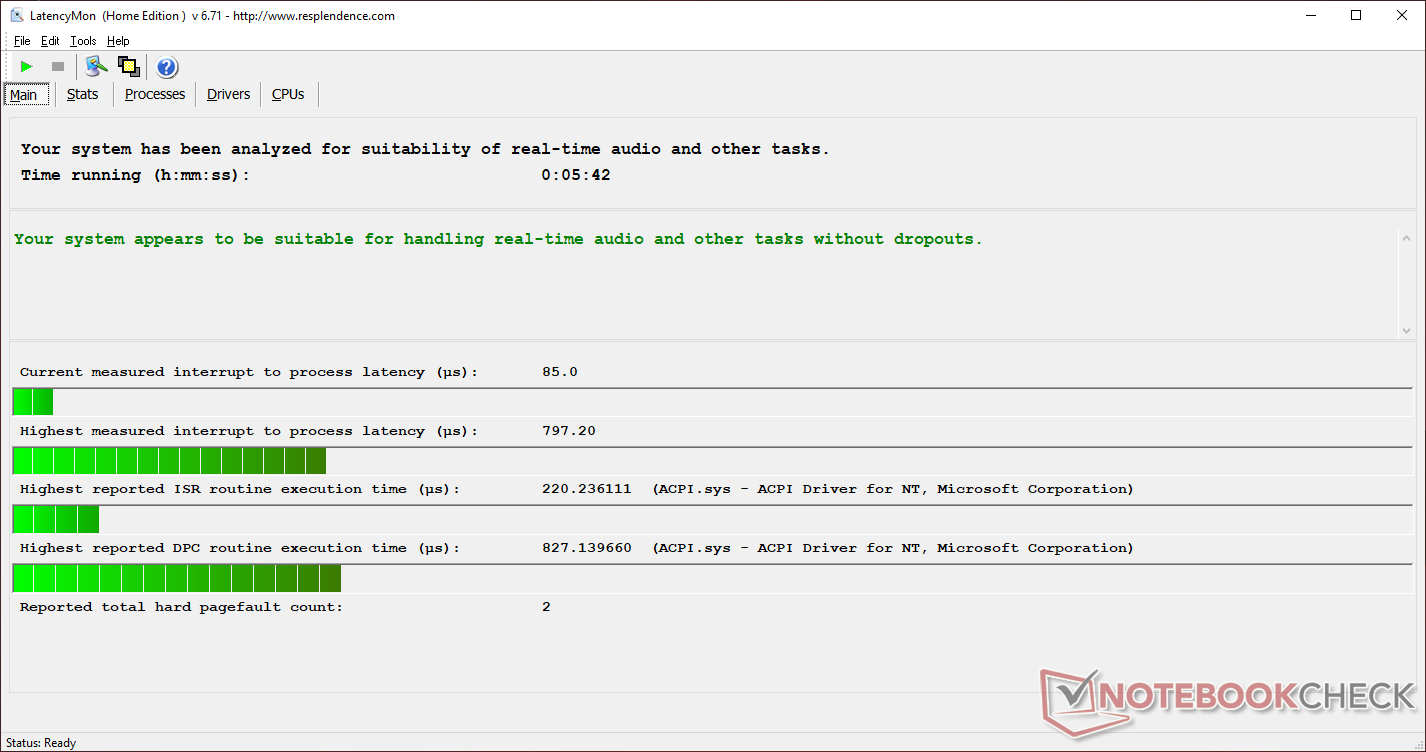
LatencyMon shows no DPC latency issues even when wireless is enabled.
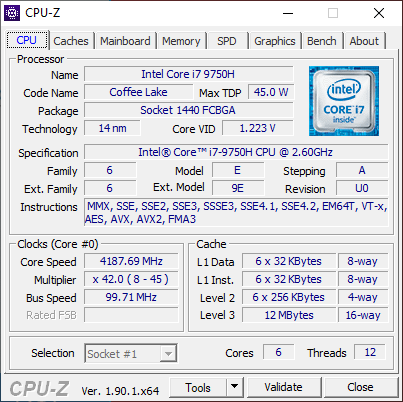
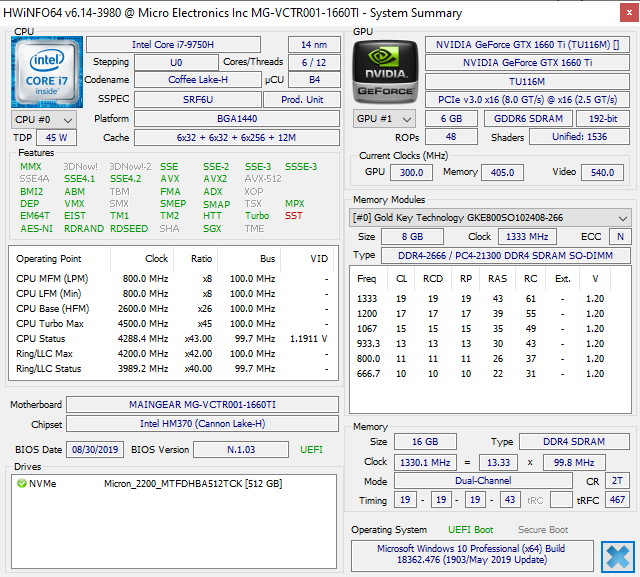
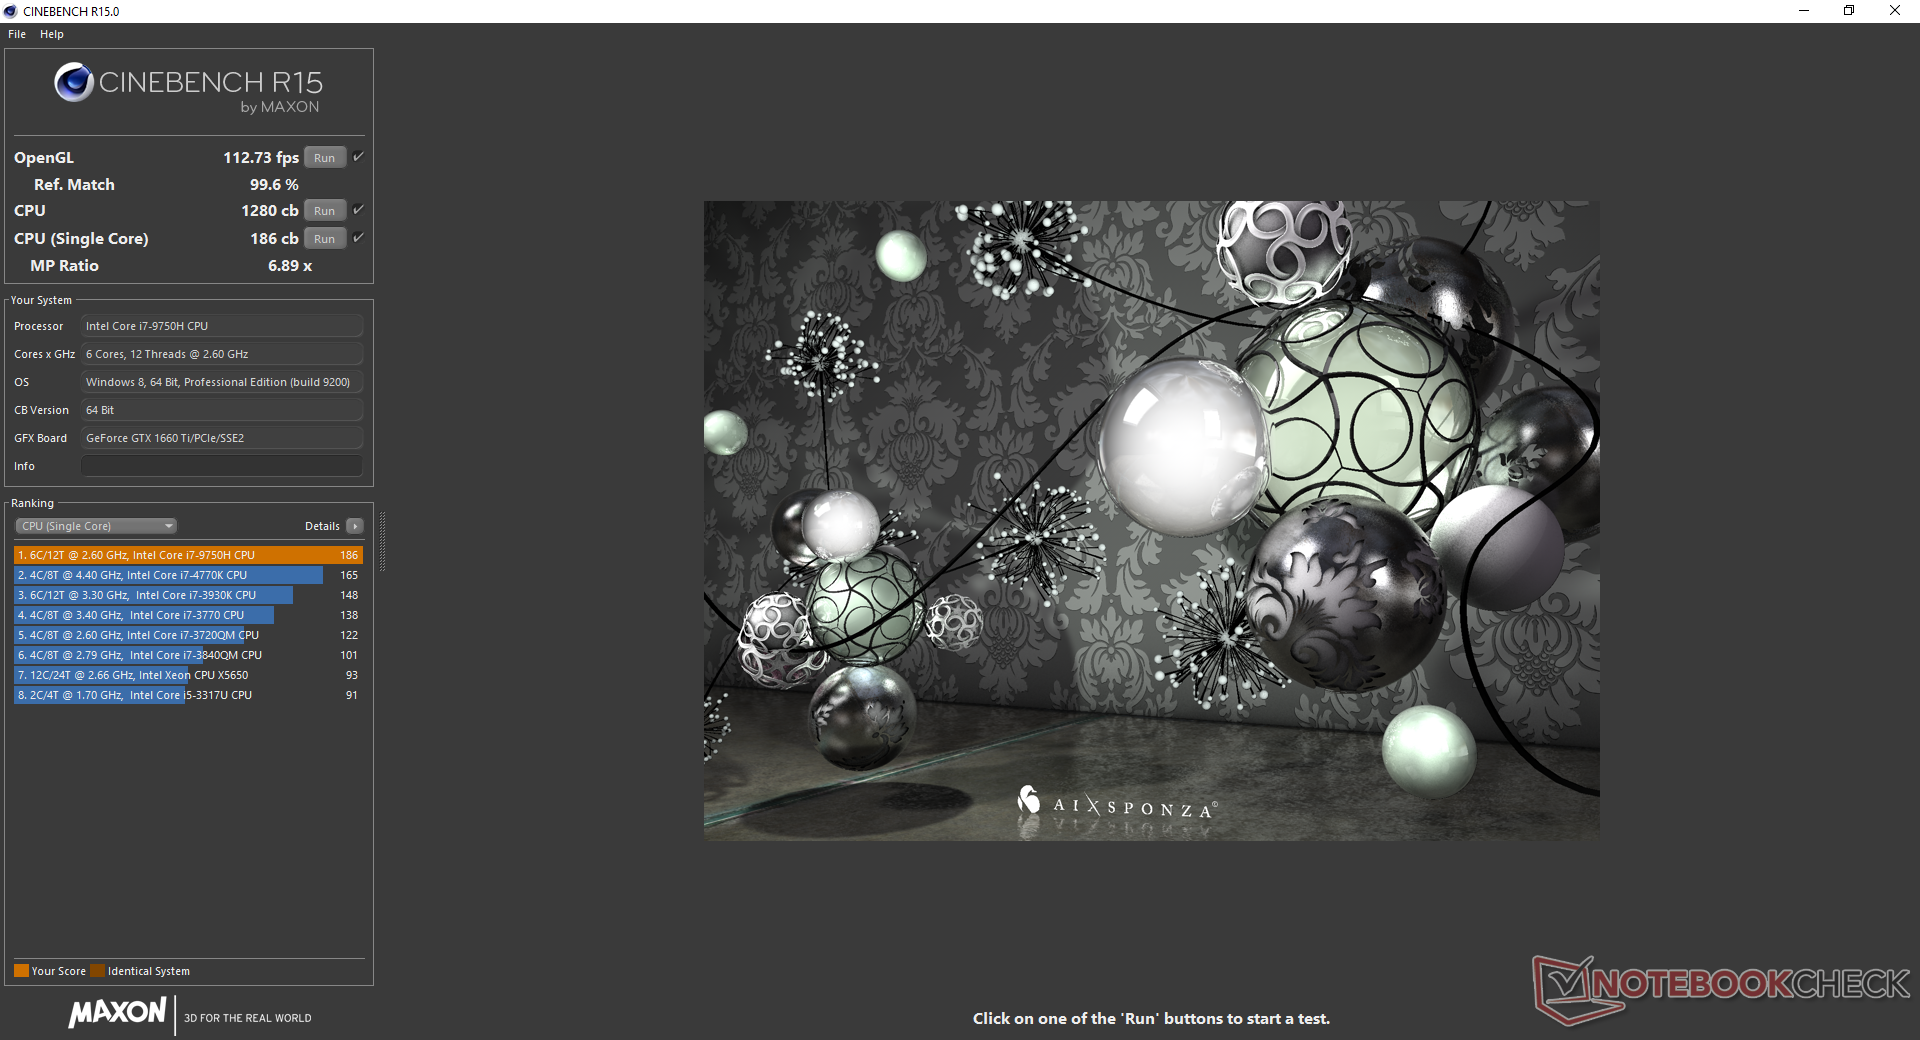
Processor
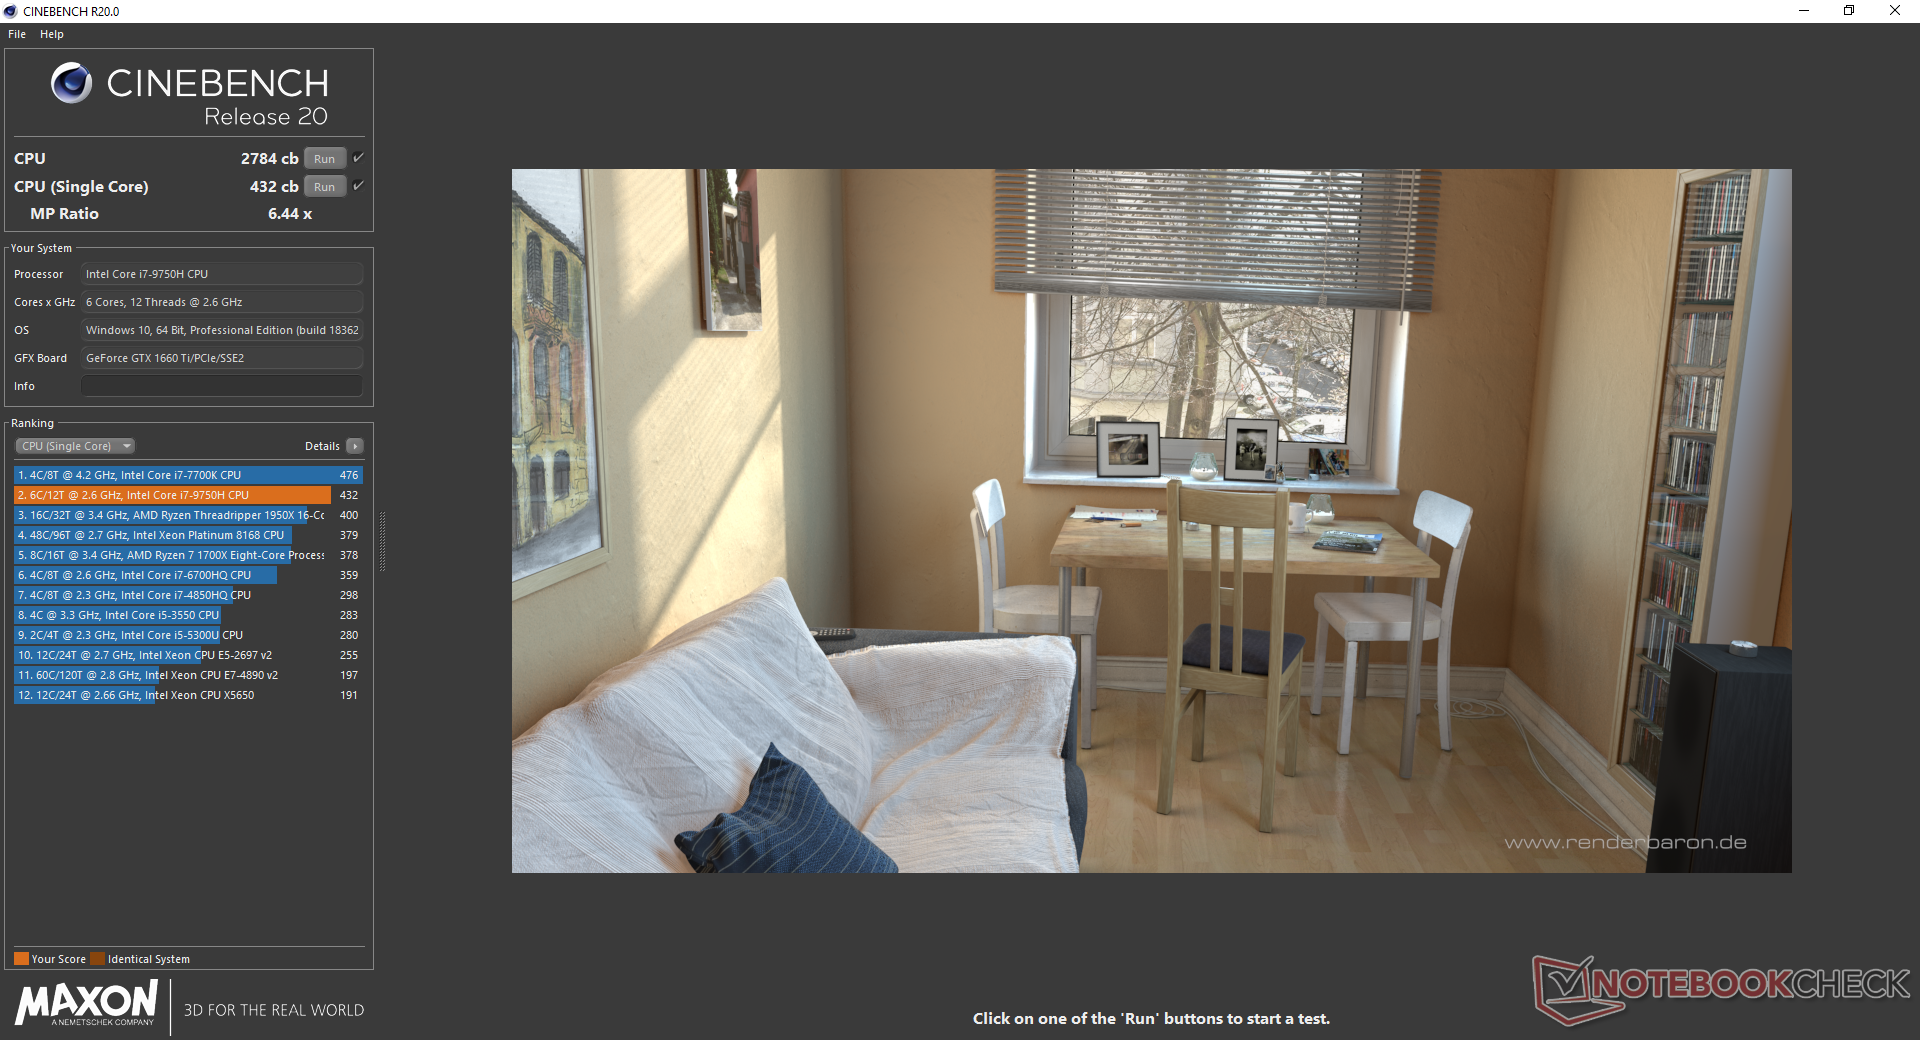
CPU performance is excellent and above average when compared to other laptops with the same Core i7-9750H CPU. Turbo Boost sustainability is also better than most; when running CineBench R15 Multi-Thread in a loop, performance would drop by only about 7 percent over time.
See our dedicated page on the Core i7-9750H for more technical information and benchmark comparisons.
System Performance
PCMark benchmarks rank our Maingear in the same ballpark as other mid-range to high-end gaming laptops. We experienced no software or hardware issues during our time with the test unit.
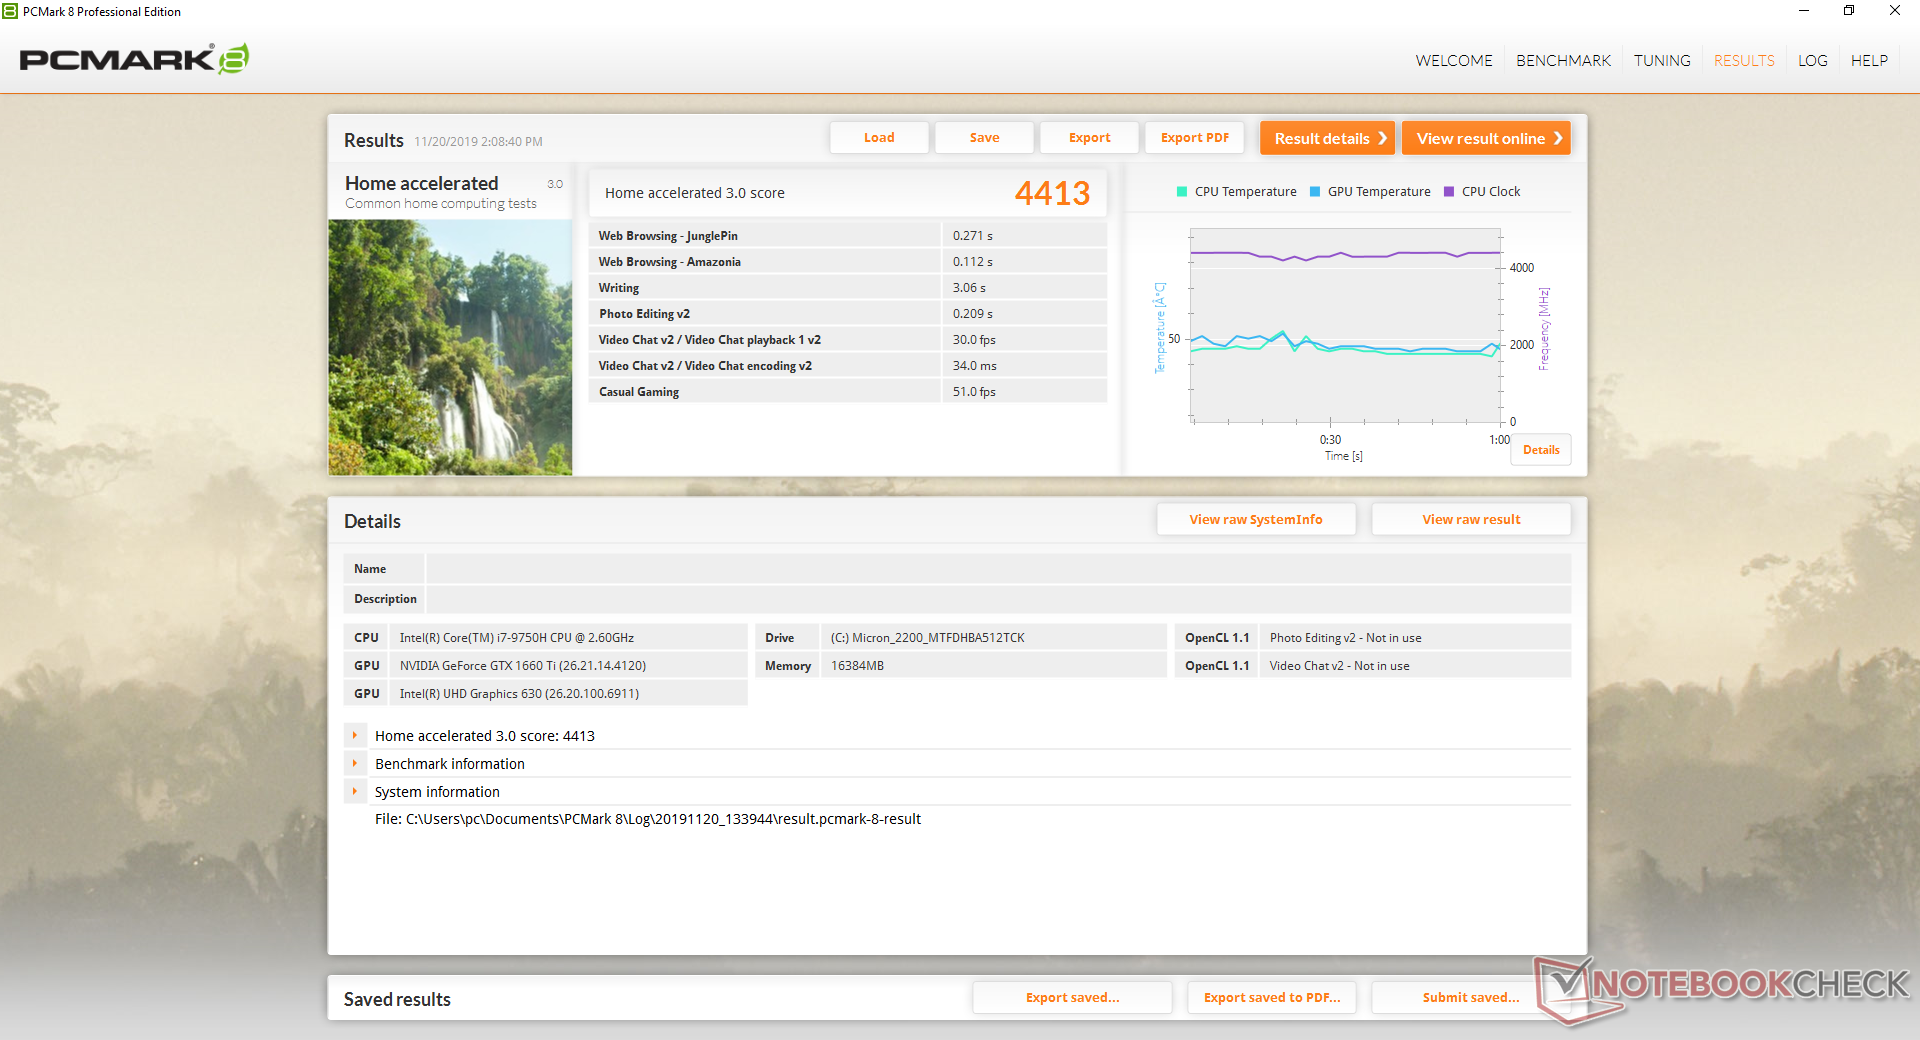
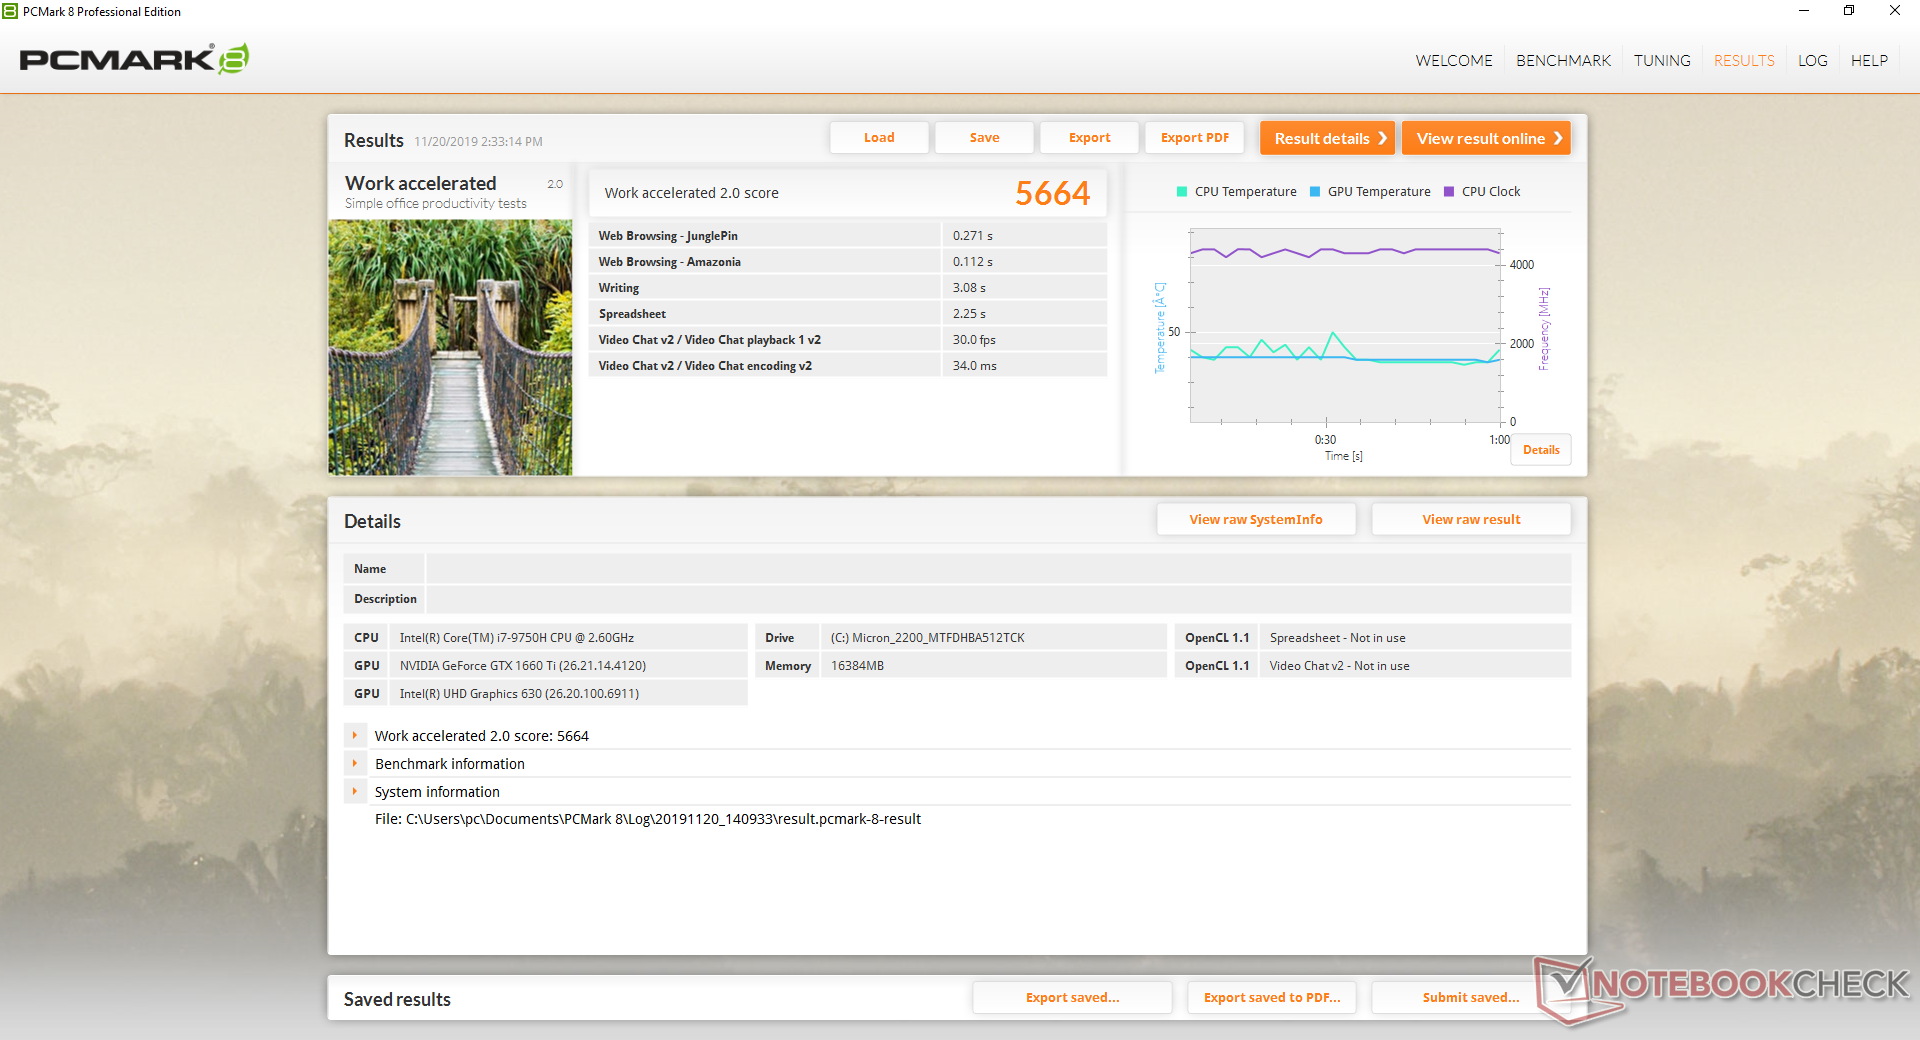
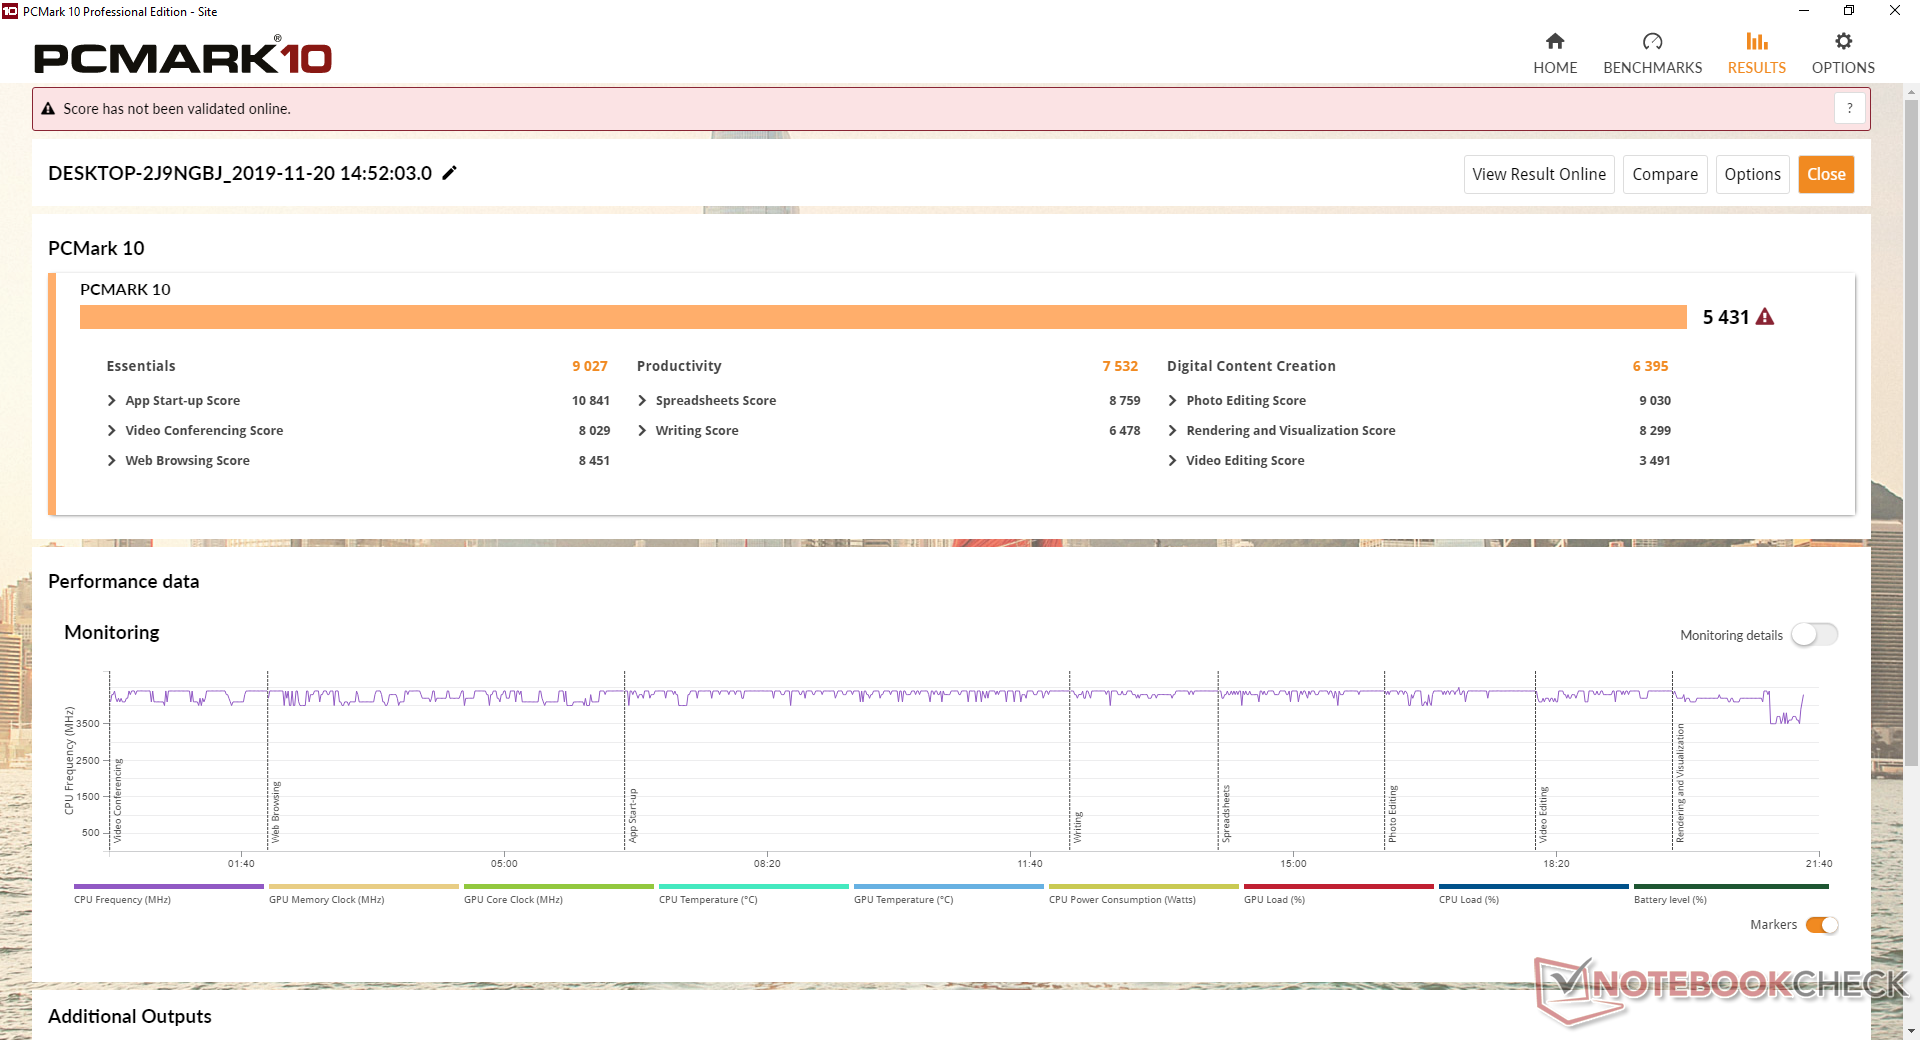
| PCMark 8 Home Score Accelerated v2 | 4413 points | |
| PCMark 8 Work Score Accelerated v2 | 5664 points | |
| PCMark 10 Score | 5431 points | |
Help | ||
Storage Devices
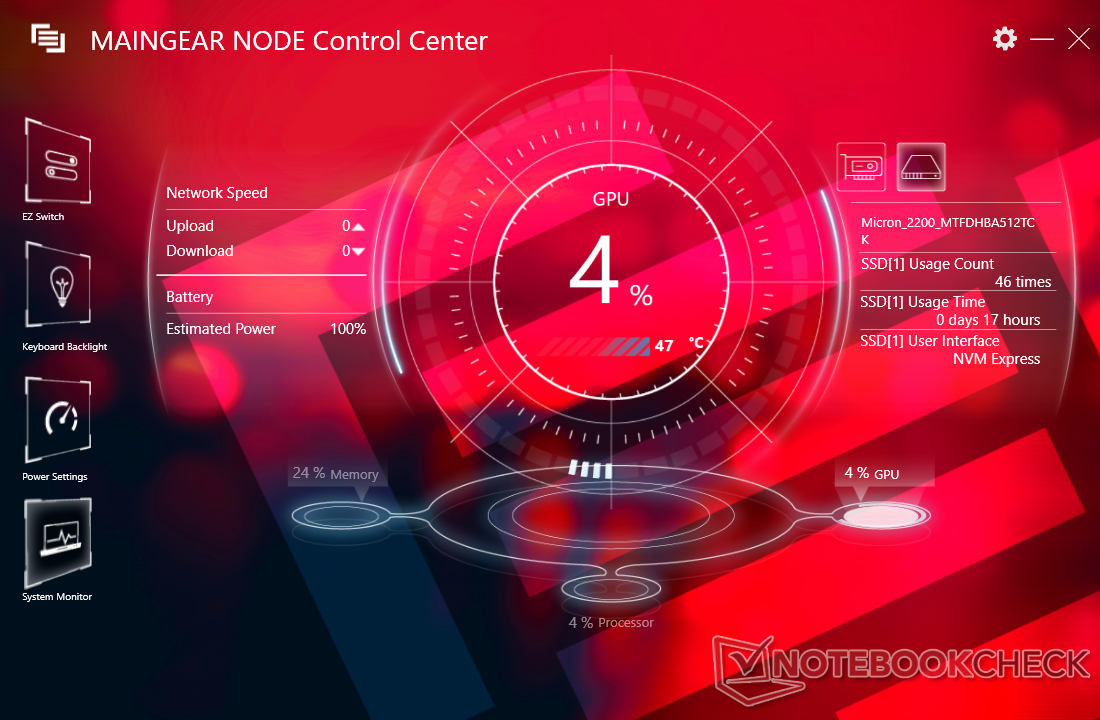
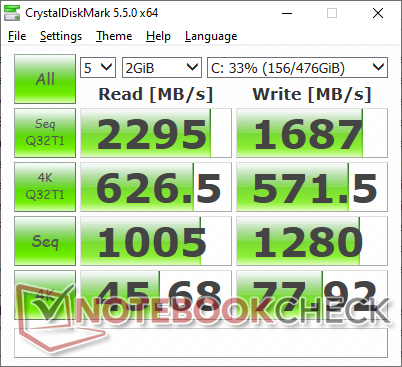
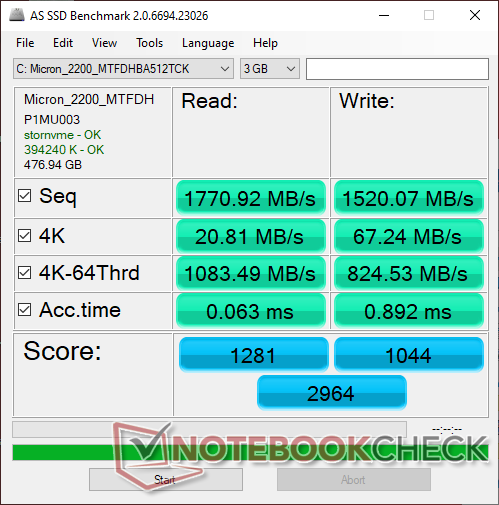
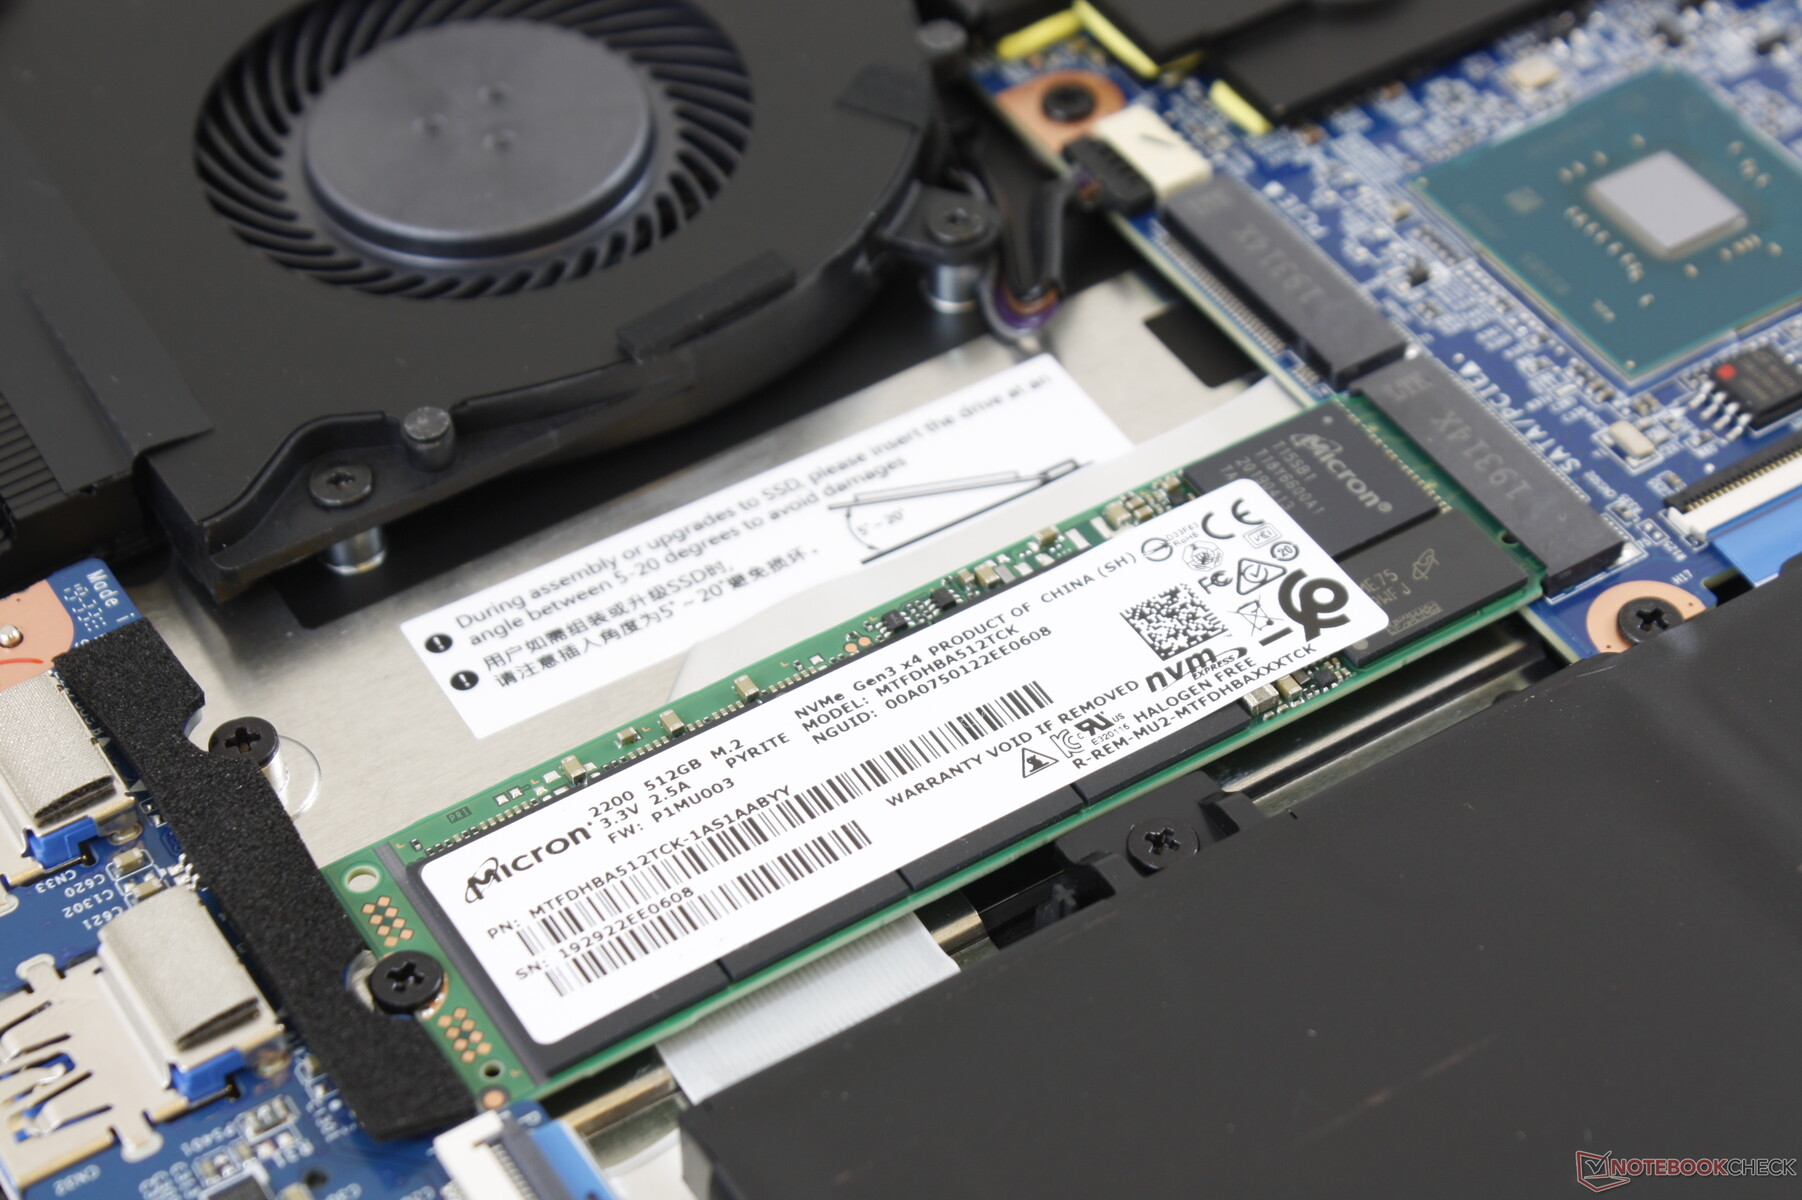
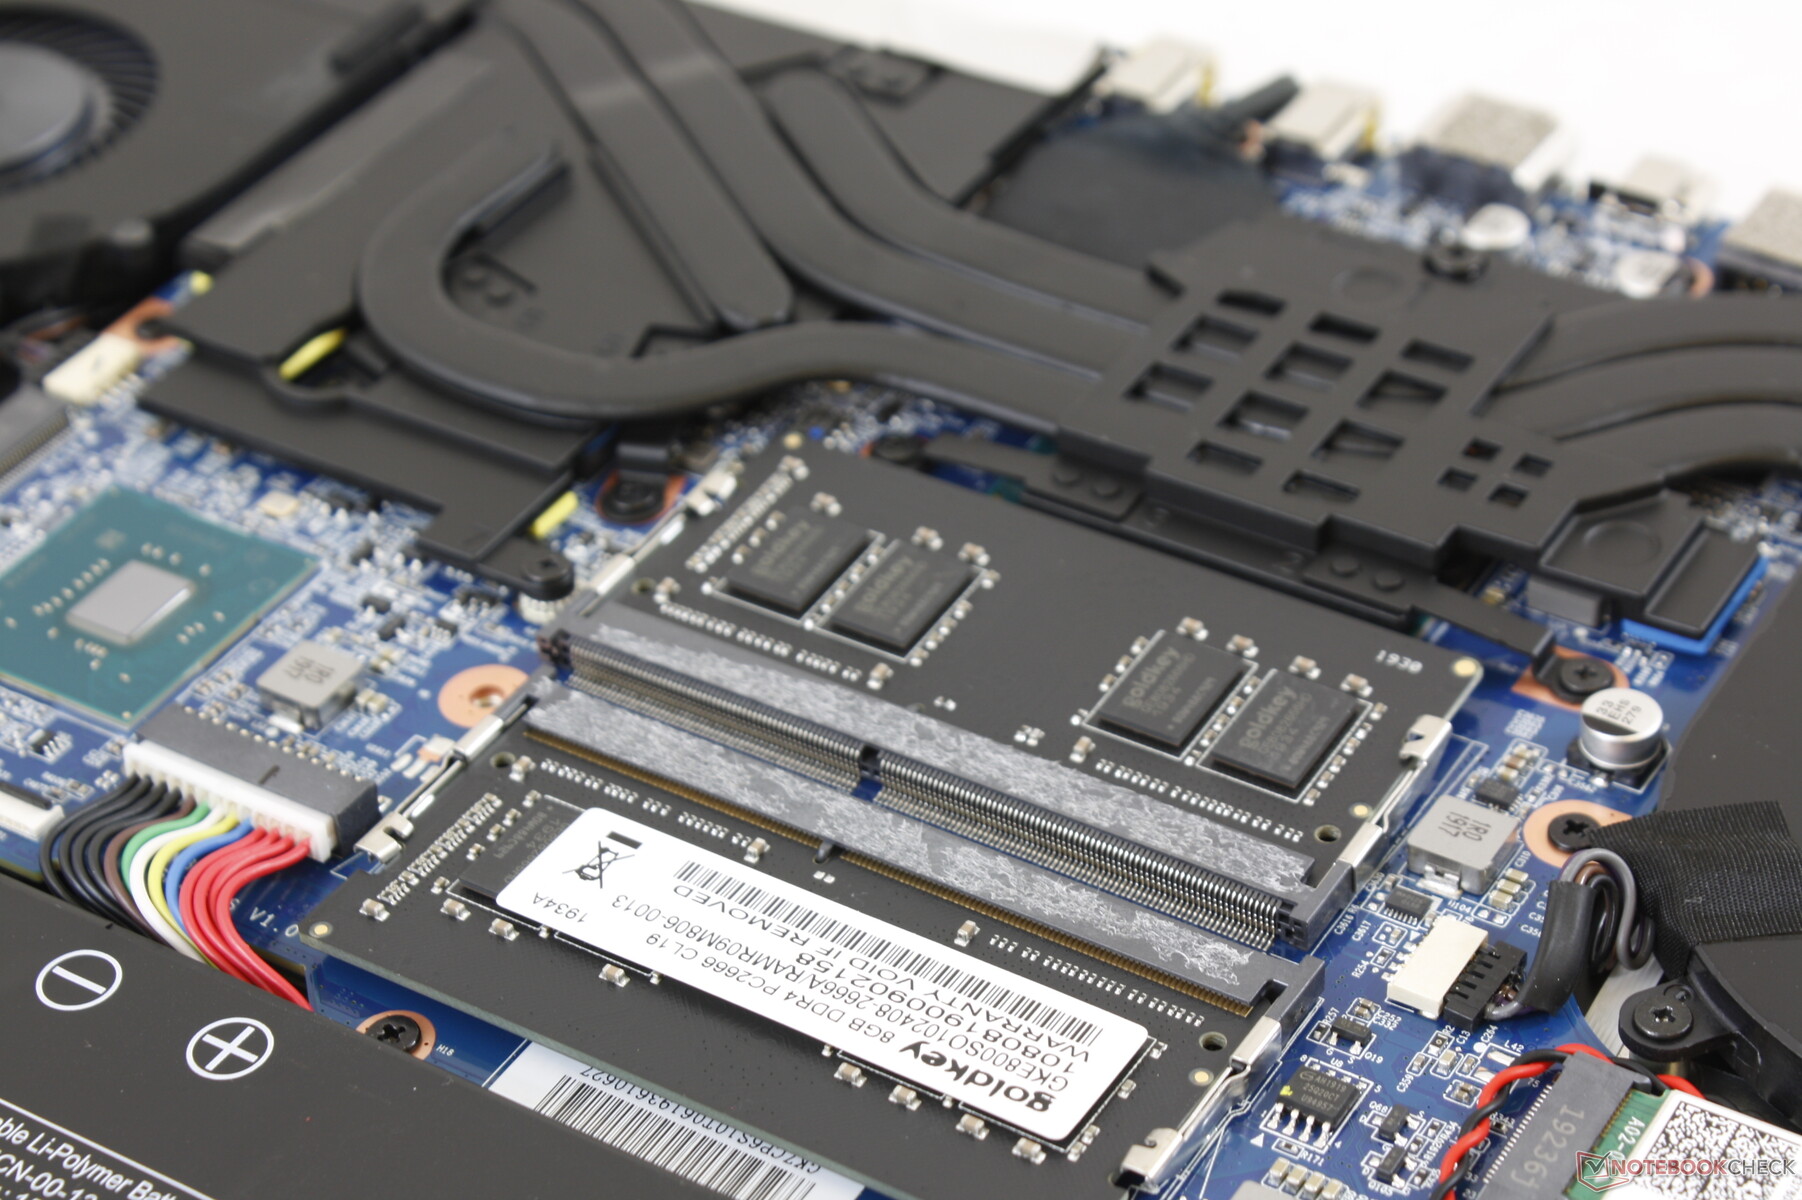
Users can install up to two M.2 drives with support for NVMe. The Micron 2200 drive in our unit returns excellent sequential read and write rates that come close to the more expensive Samsung PM981. Write rates of smaller 4K blocks, however, are consistently slower.
| Maingear Vector 15 | MSI GL65 9SEK WDC PC SN520 SDAPNUW-512G | Lenovo Legion Y740-15ICHg WDC PC SN520 SDAPMUW-128G | Razer Blade 15 GTX 1660 Ti Samsung SSD PM981 MZVLB256HAHQ | Alienware m15 R2 P87F 2x Toshiba XG6 KXG60ZNV512G (RAID 0) | Asus ROG Zephyrus M15 GU502GU-XB74 Intel SSD 660p SSDPEKNW512G8 | |
|---|---|---|---|---|---|---|
| AS SSD | 1% | -30% | 23% | 32% | -7% | |
| Seq Read (MB/s) | 1771 | 1315 -26% | 1372 -23% | 1829 3% | 1925 9% | 1221 -31% |
| Seq Write (MB/s) | 1520 | 1378 -9% | 746 -51% | 1315 -13% | 2371 56% | 911 -40% |
| 4K Read (MB/s) | 20.81 | 25.31 22% | 35.42 70% | 51.3 147% | 37.2 79% | 48.24 132% |
| 4K Write (MB/s) | 67.2 | 118.2 76% | 99.9 49% | 106 58% | 108.9 62% | 99.2 48% |
| 4K-64 Read (MB/s) | 1083 | 839 -23% | 302.1 -72% | 917 -15% | 1177 9% | 321.4 -70% |
| 4K-64 Write (MB/s) | 825 | 720 -13% | 191.4 -77% | 1212 47% | 1135 38% | 744 -10% |
| Access Time Read * (ms) | 0.063 | 0.116 -84% | 0.132 -110% | 0.063 -0% | 0.065 -3% | 0.071 -13% |
| Access Time Write * (ms) | 0.892 | 0.091 90% | 0.037 96% | 0.104 88% | 0.108 88% | 0.139 84% |
| Score Read (Points) | 1281 | 996 -22% | 475 -63% | 1152 -10% | 1407 10% | 492 -62% |
| Score Write (Points) | 1044 | 976 -7% | 366 -65% | 1450 39% | 1481 42% | 934 -11% |
| Score Total (Points) | 2964 | 2485 -16% | 1065 -64% | 3177 7% | 3633 23% | 1681 -43% |
| Copy ISO MB/s (MB/s) | 1506 | 1279 -15% | 1062 -29% | 1539 2% | 2073 38% | 906 -40% |
| Copy Program MB/s (MB/s) | 606 | 889 47% | 426 -30% | 513 -15% | 576 -5% | 486.6 -20% |
| Copy Game MB/s (MB/s) | 1319 | 1218 -8% | 650 -51% | 1150 -13% | 1426 8% | 952 -28% |
| CrystalDiskMark 5.2 / 6 | 8% | -26% | 16% | 46% | 6% | |
| Write 4K (MB/s) | 77.9 | 150.2 93% | 134.2 72% | 135 73% | 108.8 40% | 156 100% |
| Read 4K (MB/s) | 45.68 | 43.46 -5% | 37.72 -17% | 41.1 -10% | 45.41 -1% | 60.7 33% |
| Write Seq (MB/s) | 1280 | 1412 10% | 389.2 -70% | 1427 11% | 2467 93% | 968 -24% |
| Read Seq (MB/s) | 1005 | 1340 33% | 1030 2% | 1494 49% | 2456 144% | 1619 61% |
| Write 4K Q32T1 (MB/s) | 572 | 482.2 -16% | 238.9 -58% | 494.9 -13% | 532 -7% | 485 -15% |
| Read 4K Q32T1 (MB/s) | 627 | 535 -15% | 343.9 -45% | 578 -8% | 590 -6% | 337.3 -46% |
| Write Seq Q32T1 (MB/s) | 1687 | 1454 -14% | 789 -53% | 1417 -16% | 2801 66% | 969 -43% |
| Read Seq Q32T1 (MB/s) | 2295 | 1744 -24% | 1502 -35% | 3251 42% | 3172 38% | 1825 -20% |
| Write 4K Q8T8 (MB/s) | 293.4 | |||||
| Read 4K Q8T8 (MB/s) | 405.8 | |||||
| Total Average (Program / Settings) | 5% /
3% | -28% /
-28% | 20% /
21% | 39% /
37% | -1% /
-3% |
* ... smaller is better

GPU Performance
The mobile GTX 1660 Ti is about 10 percent slower than the "proper" GTX 1660 Ti for desktop. Keep in mind that overall performance will be very close to the mobile RTX 2060 when RTX-specific features are disabled.
Interestingly, Shadow of the Tomb Raider would fail to launch despite being on the latest drivers at the time of review. Otherwise, the GTX 1660 Ti is powerful enough to run the latest titles at 1080p60 on Medium settings. To better exploit the 144 Hz panel, however, you'll have to lower the graphical settings even further or play more undemanding games like Rocket League, DOTA 2, or Overwatch.
See our dedicated page on the GTX 1660 Ti for more technical information and gaming benchmarks.
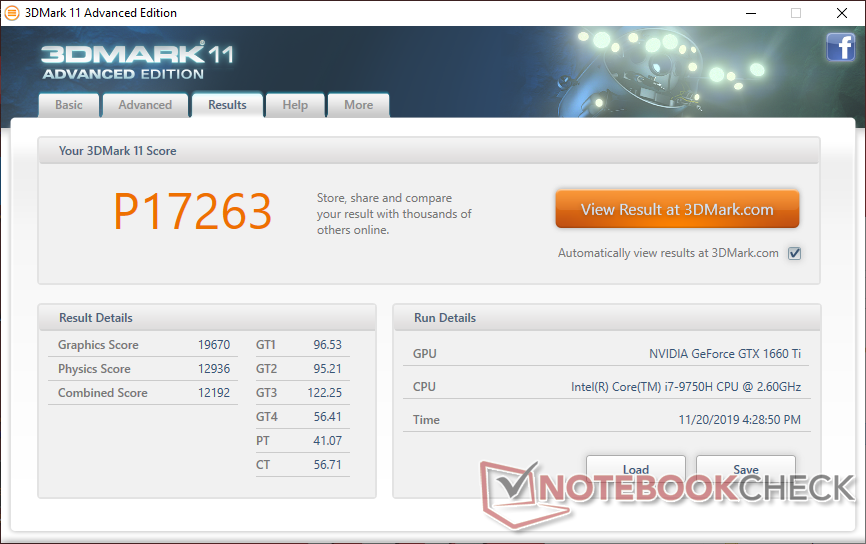
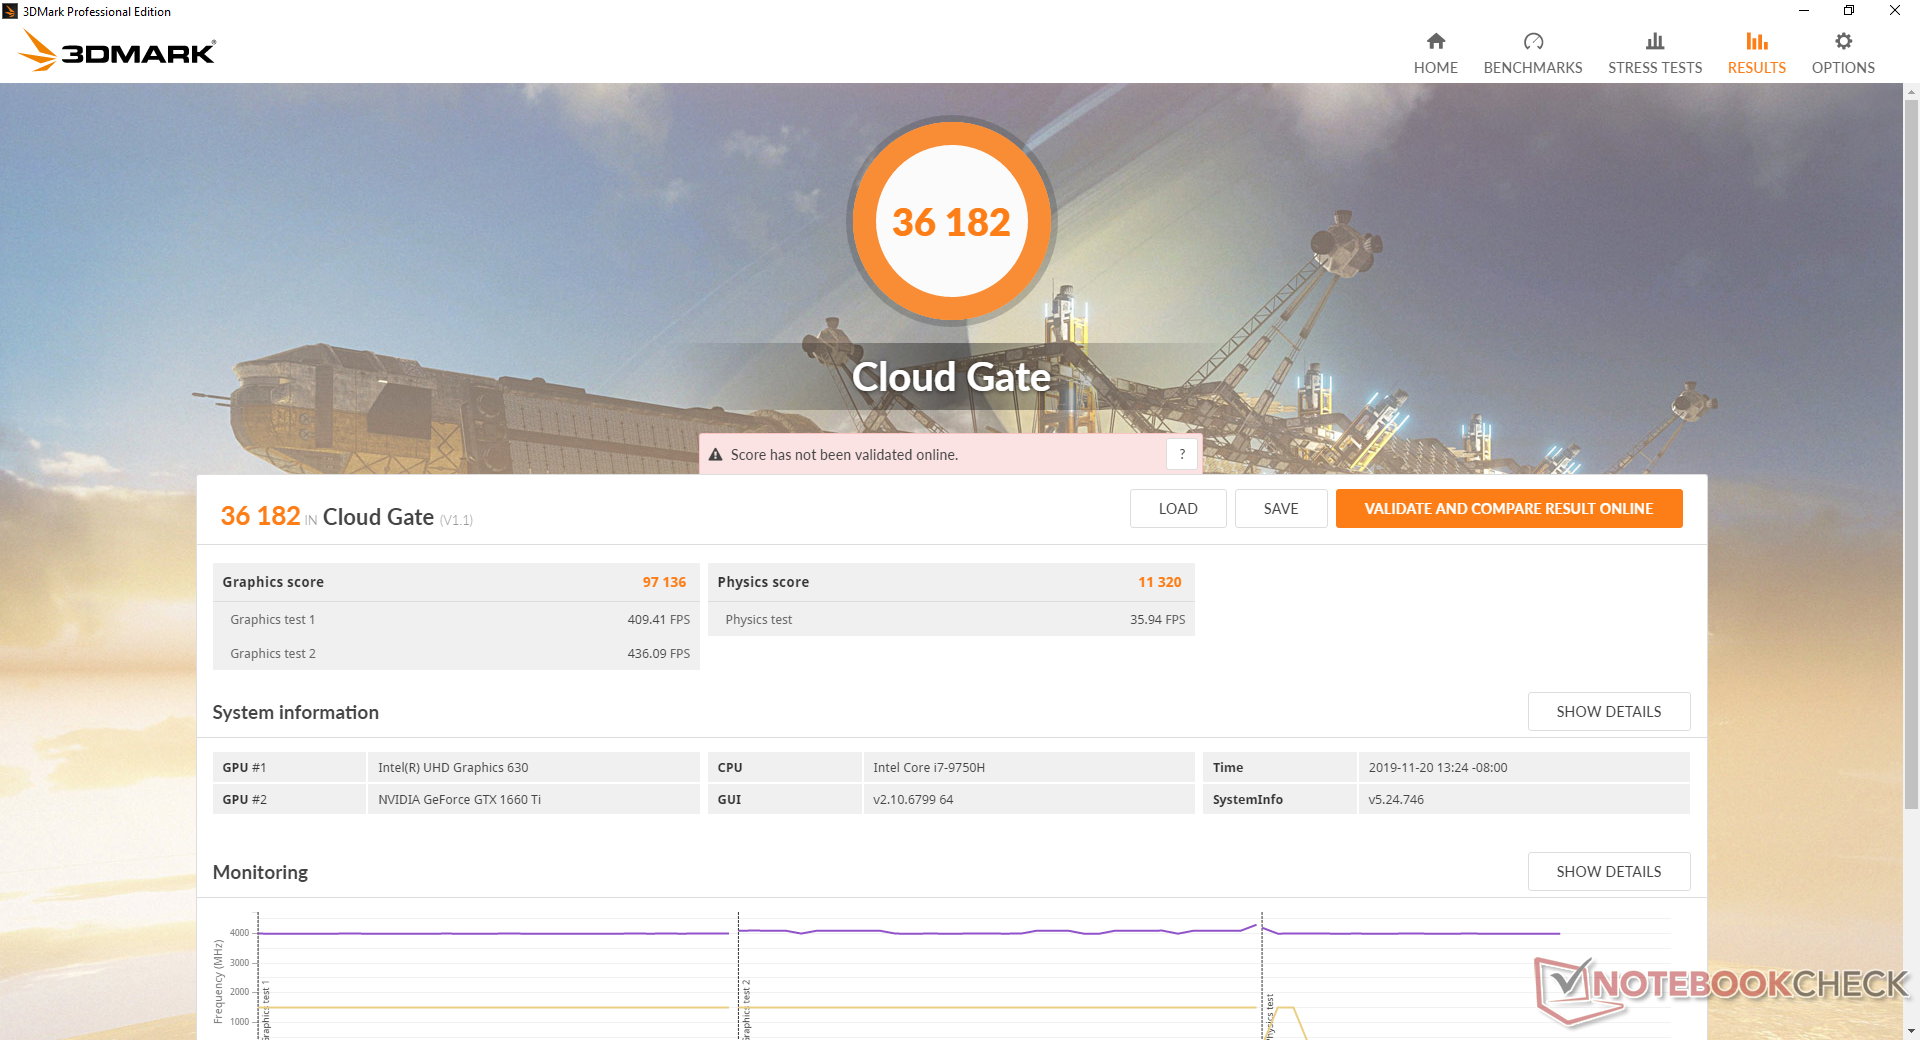
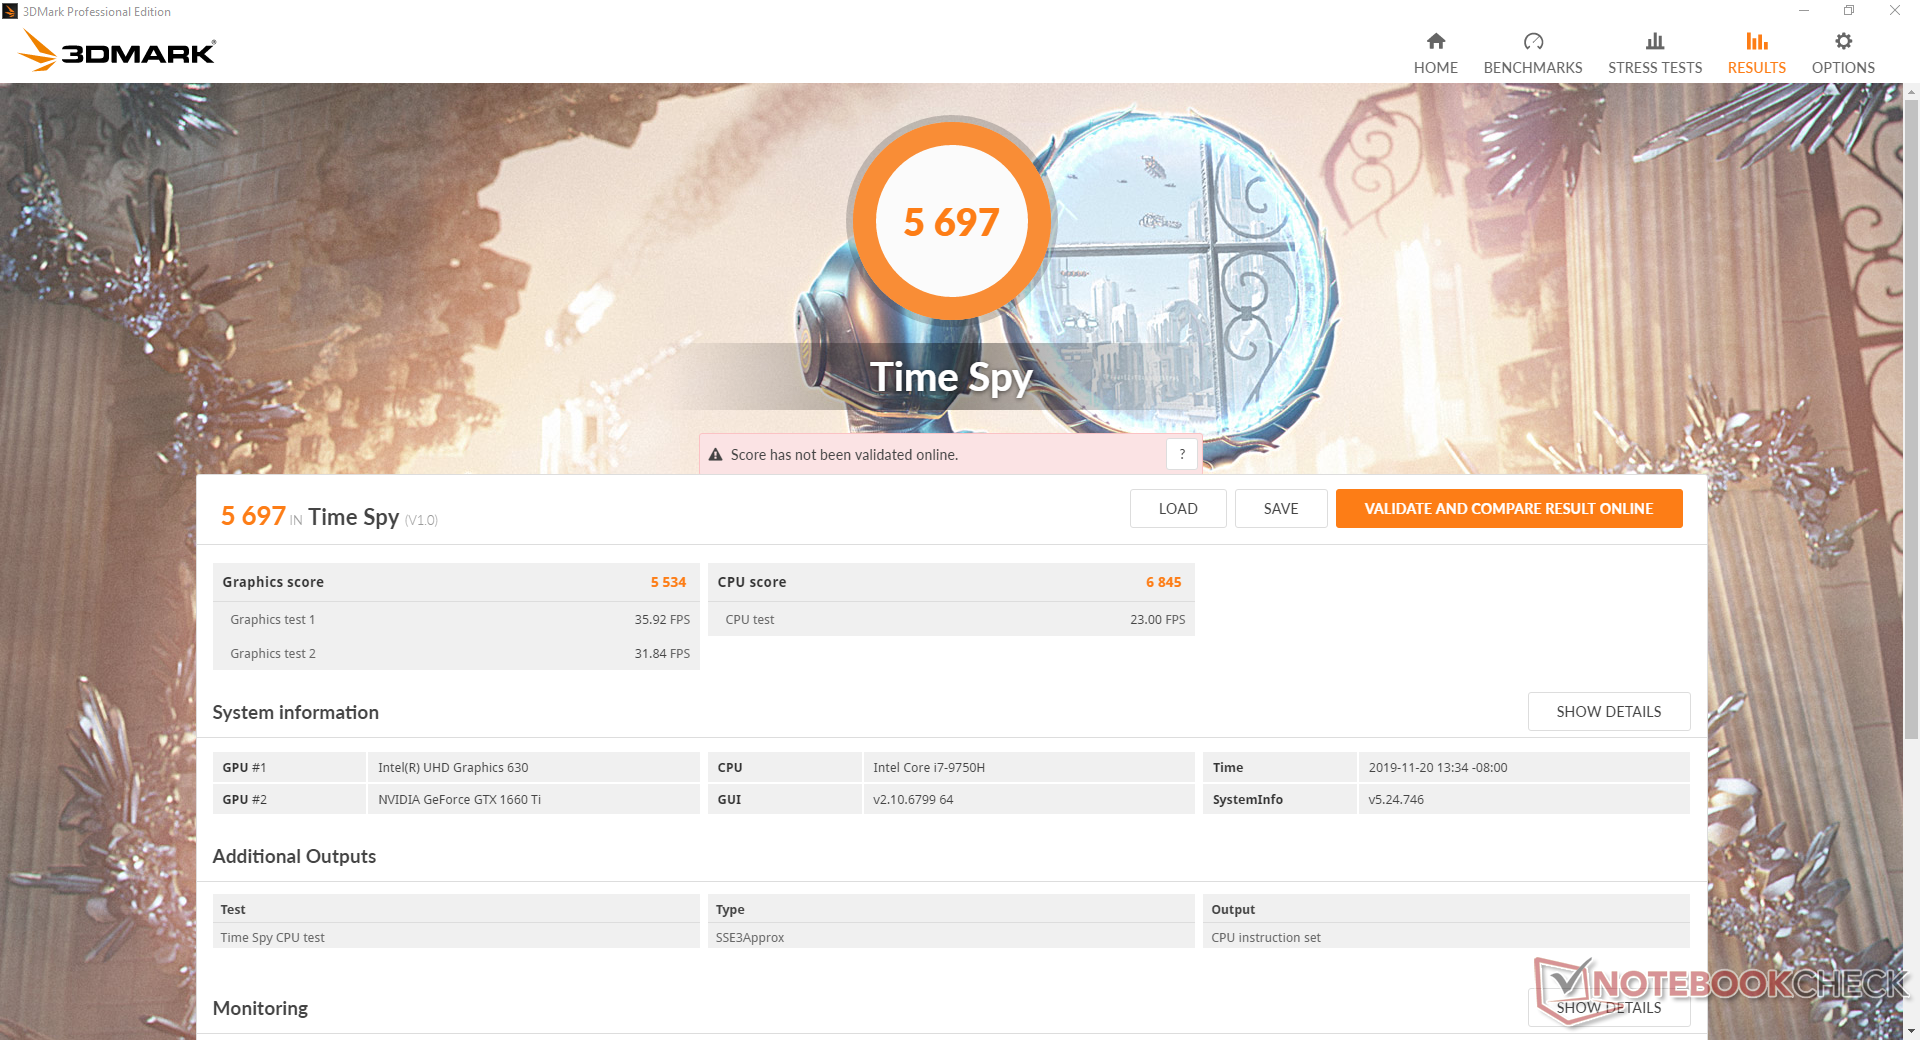
| 3DMark 11 Performance | 17263 points | |
| 3DMark Cloud Gate Standard Score | 36182 points | |
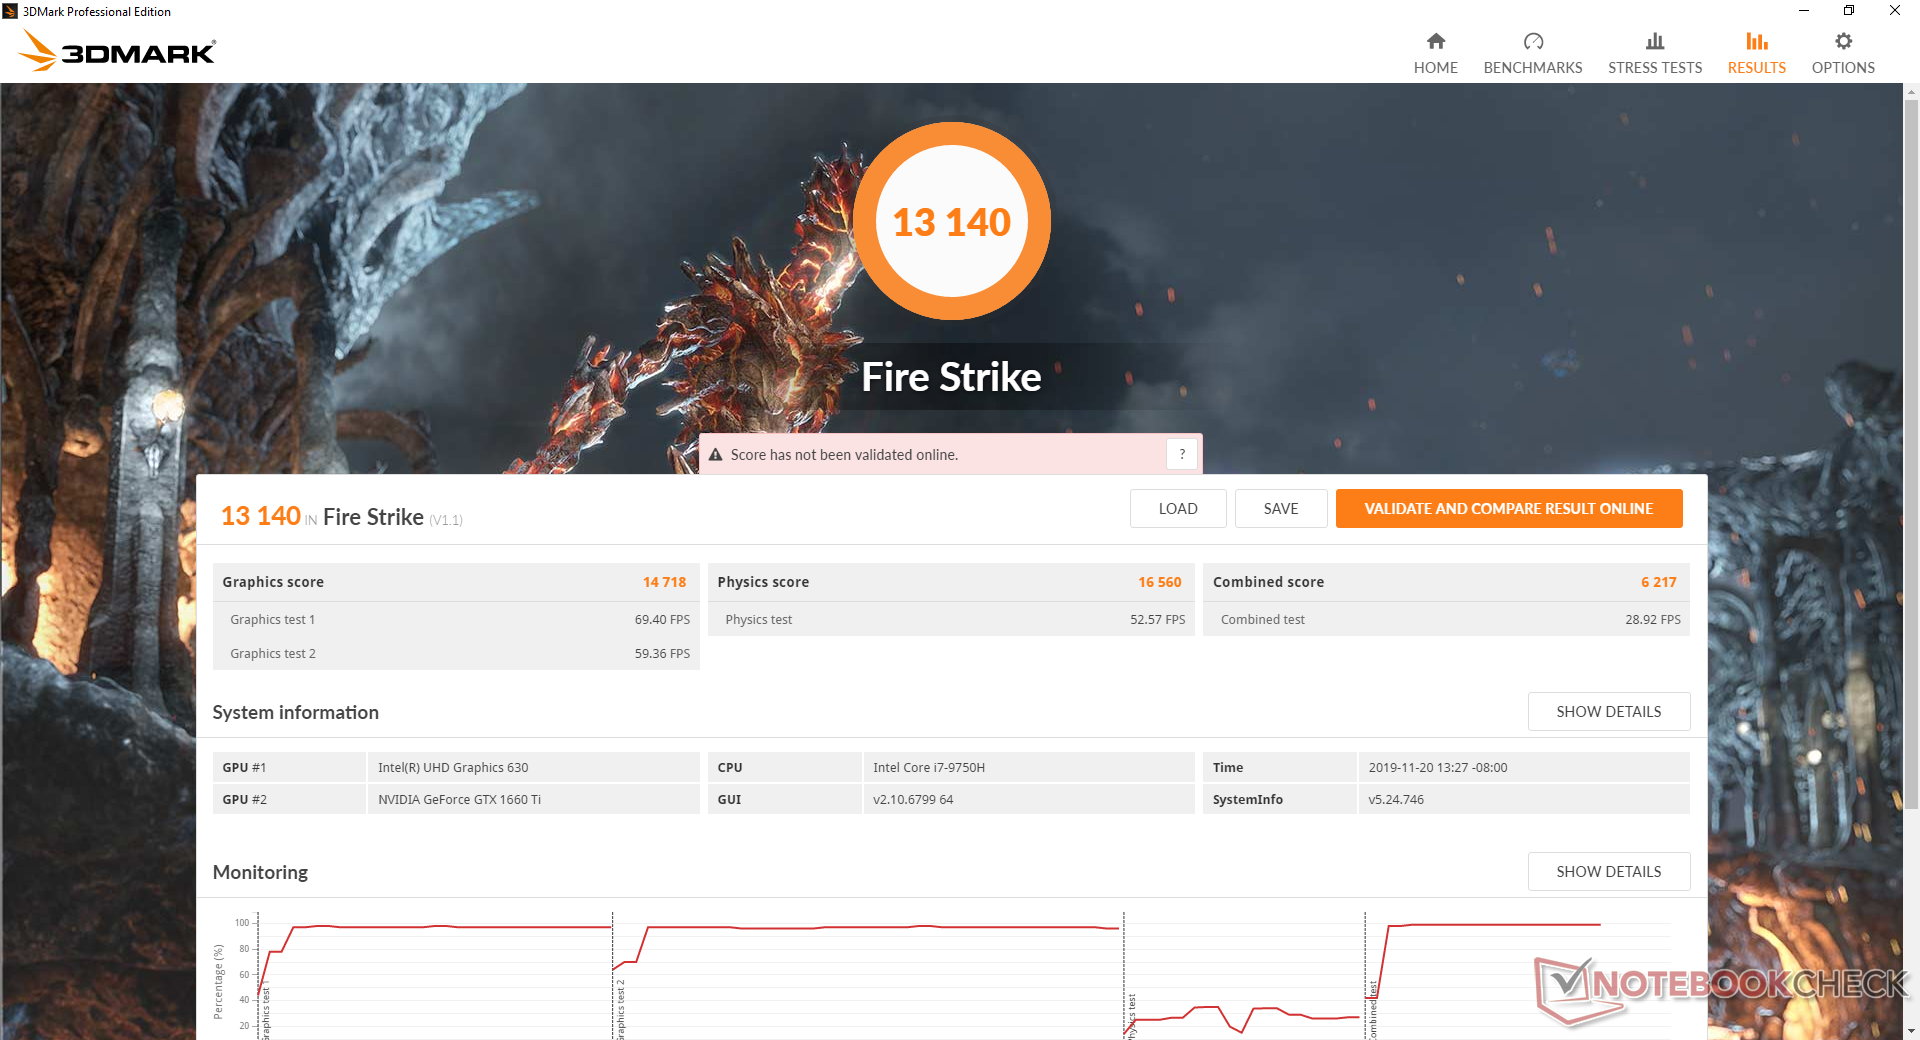
| 3DMark Fire Strike Score | 13140 points | |
| 3DMark Time Spy Score | 5697 points | |
Help | ||
| low | med. | high | ultra | |
|---|---|---|---|---|
| BioShock Infinite (2013) | 277.4 | 248.5 | 226.8 | 137.4 |
| The Witcher 3 (2015) | 253 | 176.3 | 110.7 | 61.3 |
Emissions
System Noise
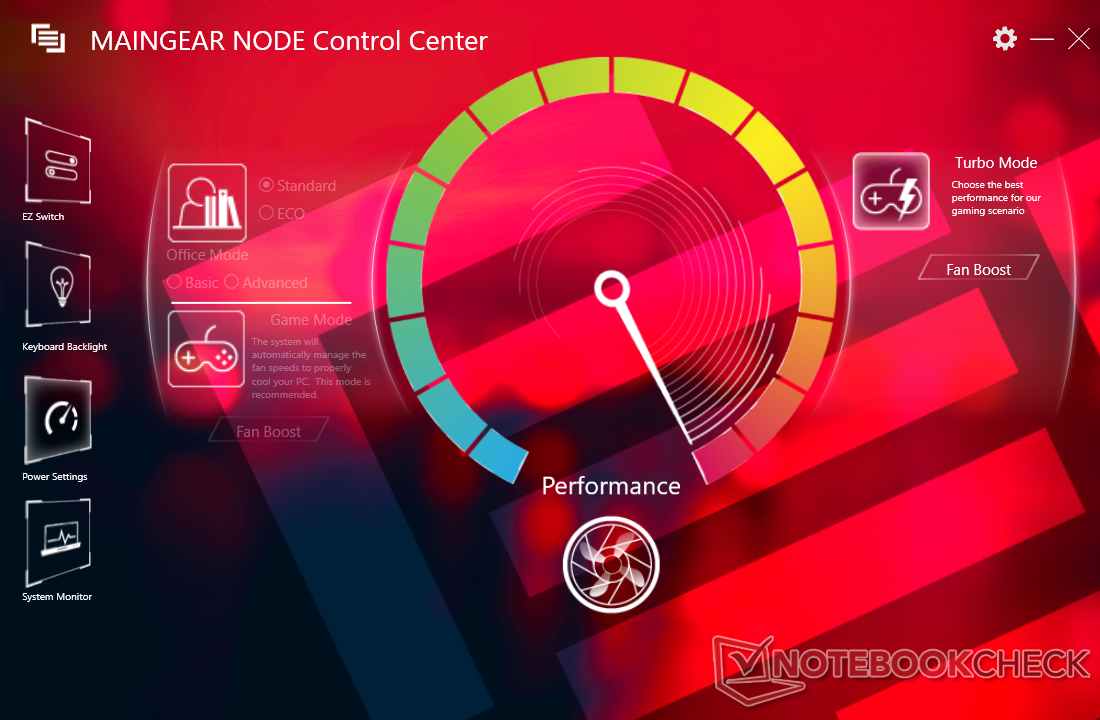
The Vector is silent when idling on desktop, but any sort of low-medium loads like browsing, streaming, or application launching will bump fan noise to 33.7 dB(A) when not in Office mode. Thus, we don't recommend Turbo mode or Game mode if the horsepower is not needed in order to keep fan noise in check.
Running Witcher 3 results in a constant fan noise of 53.5 dB(A) when in Turbo mode or Game mode. This is louder than most other gaming laptops including the more powerful Lenovo Legion Y740 or Alienware m15 each equipped with GeForce RTX graphics.
We can notice no coil whine or electronic noise from our test unit.
| Maingear Vector 15 GeForce GTX 1660 Ti Mobile, i7-9750H | MSI GL65 9SEK GeForce RTX 2060 Mobile, i7-9750H, WDC PC SN520 SDAPNUW-512G | Lenovo Legion Y740-15ICHg GeForce RTX 2070 Max-Q, i7-9750H, WDC PC SN520 SDAPMUW-128G | Razer Blade 15 GTX 1660 Ti GeForce GTX 1660 Ti Mobile, i7-9750H, Samsung SSD PM981 MZVLB256HAHQ | Alienware m15 R2 P87F GeForce RTX 2080 Max-Q, i7-9750H, 2x Toshiba XG6 KXG60ZNV512G (RAID 0) | Asus ROG Zephyrus M15 GU502GU-XB74 GeForce GTX 1660 Ti Mobile, i7-9750H, Intel SSD 660p SSDPEKNW512G8 | |
|---|---|---|---|---|---|---|
| Noise | -7% | 1% | 0% | -10% | -2% | |
| off / environment * (dB) | 28.7 | 28.1 2% | 30 -5% | 28.5 1% | 28.3 1% | 28.2 2% |
| Idle Minimum * (dB) | 28.7 | 31.4 -9% | 31.3 -9% | 30.3 -6% | 28.5 1% | 28.7 -0% |
| Idle Average * (dB) | 28.7 | 31.5 -10% | 31.3 -9% | 30.5 -6% | 28.5 1% | 30.5 -6% |
| Idle Maximum * (dB) | 33.7 | 33.5 1% | 31.3 7% | 30.5 9% | 49 -45% | 31 8% |
| Load Average * (dB) | 36.7 | 49.3 -34% | 42 -14% | 41 -12% | 49 -34% | 39 -6% |
| Witcher 3 ultra * (dB) | 53.5 | 51.3 4% | 42.1 21% | 48 10% | 49 8% | 54.2 -1% |
| Load Maximum * (dB) | 55.4 | 58 -5% | 46.5 16% | 51.9 6% | 55 1% | 59.6 -8% |
* ... smaller is better
Noise level
| Idle |
| 28.7 / 28.7 / 33.7 dB(A) |
| Load |
| 36.7 / 55.4 dB(A) |
 | ||
30 dB silent 40 dB(A) audible 50 dB(A) loud |
||
min: | ||
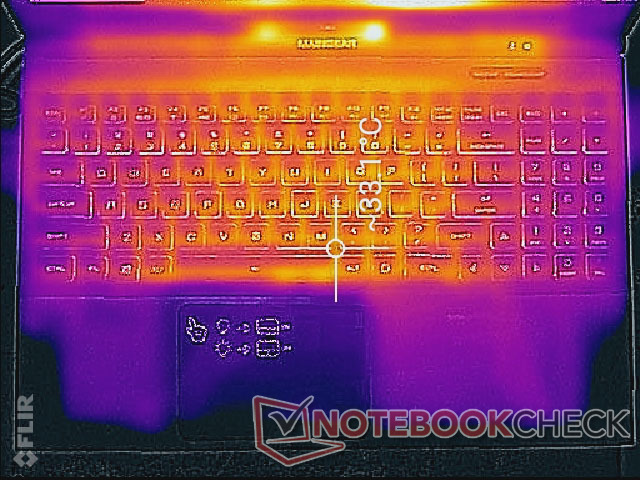
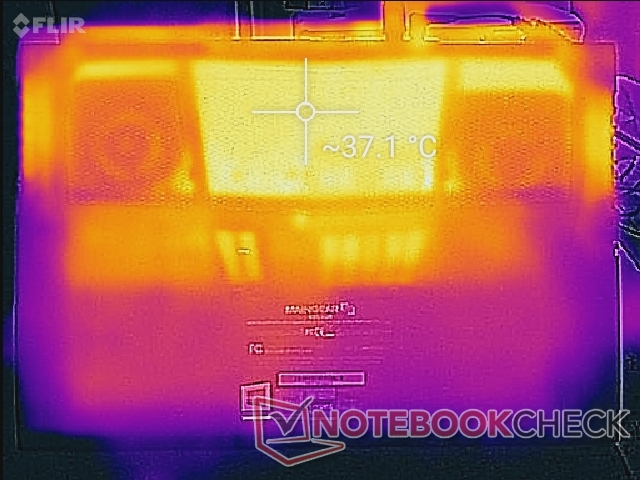
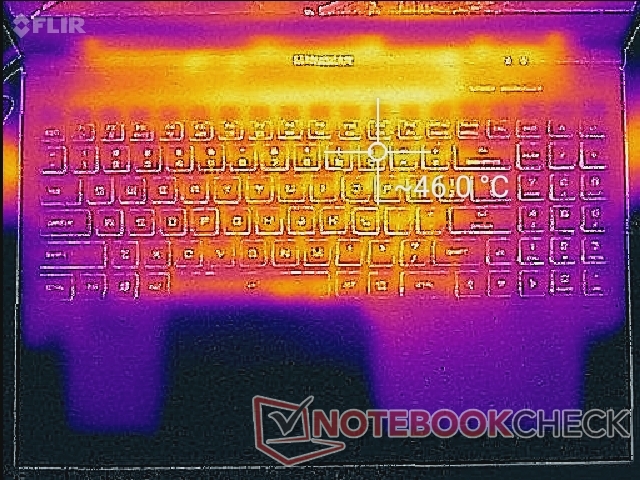
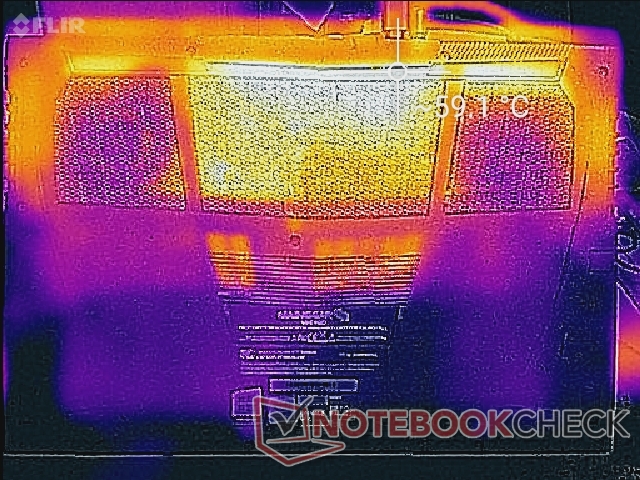
Temperature
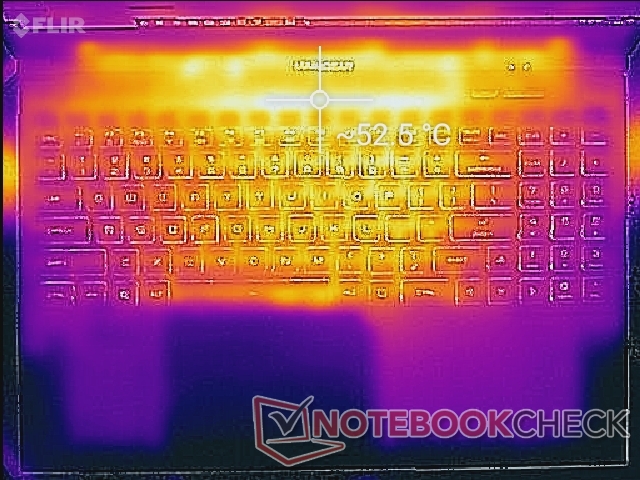
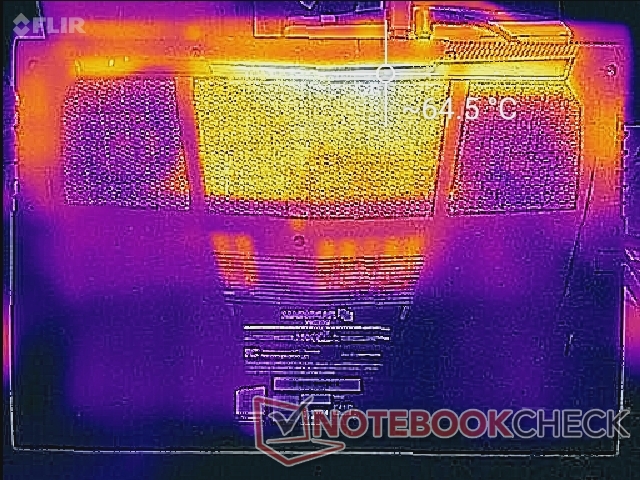
Surface temperatures are warmest towards the center of the notebook. When gaming or running high loads, hot spots can become as warm as 56 C to 53 C or even 64 C on the underside of the system. The palm rests, WASD keys, and NumPad keys will thankfully remain relatively cool. However, be sure to not block any of the large ventilation grilles along the bottom and rear of the chassis.
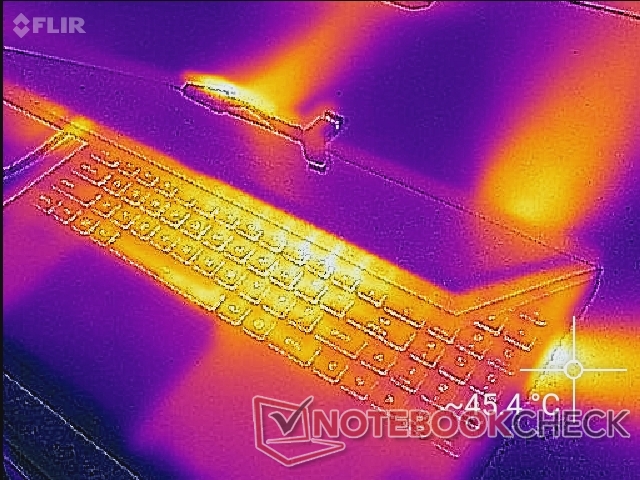
(-) The maximum temperature on the upper side is 53.2 °C / 128 F, compared to the average of 40.4 °C / 105 F, ranging from 21.2 to 68.8 °C for the class Gaming.
(-) The bottom heats up to a maximum of 64 °C / 147 F, compared to the average of 43.2 °C / 110 F
(+) In idle usage, the average temperature for the upper side is 29.8 °C / 86 F, compared to the device average of 33.9 °C / 93 F.
(±) Playing The Witcher 3, the average temperature for the upper side is 35.3 °C / 96 F, compared to the device average of 33.9 °C / 93 F.
(+) The palmrests and touchpad are cooler than skin temperature with a maximum of 27.6 °C / 81.7 F and are therefore cool to the touch.
(±) The average temperature of the palmrest area of similar devices was 28.8 °C / 83.8 F (+1.2 °C / 2.1 F).
Stress Test
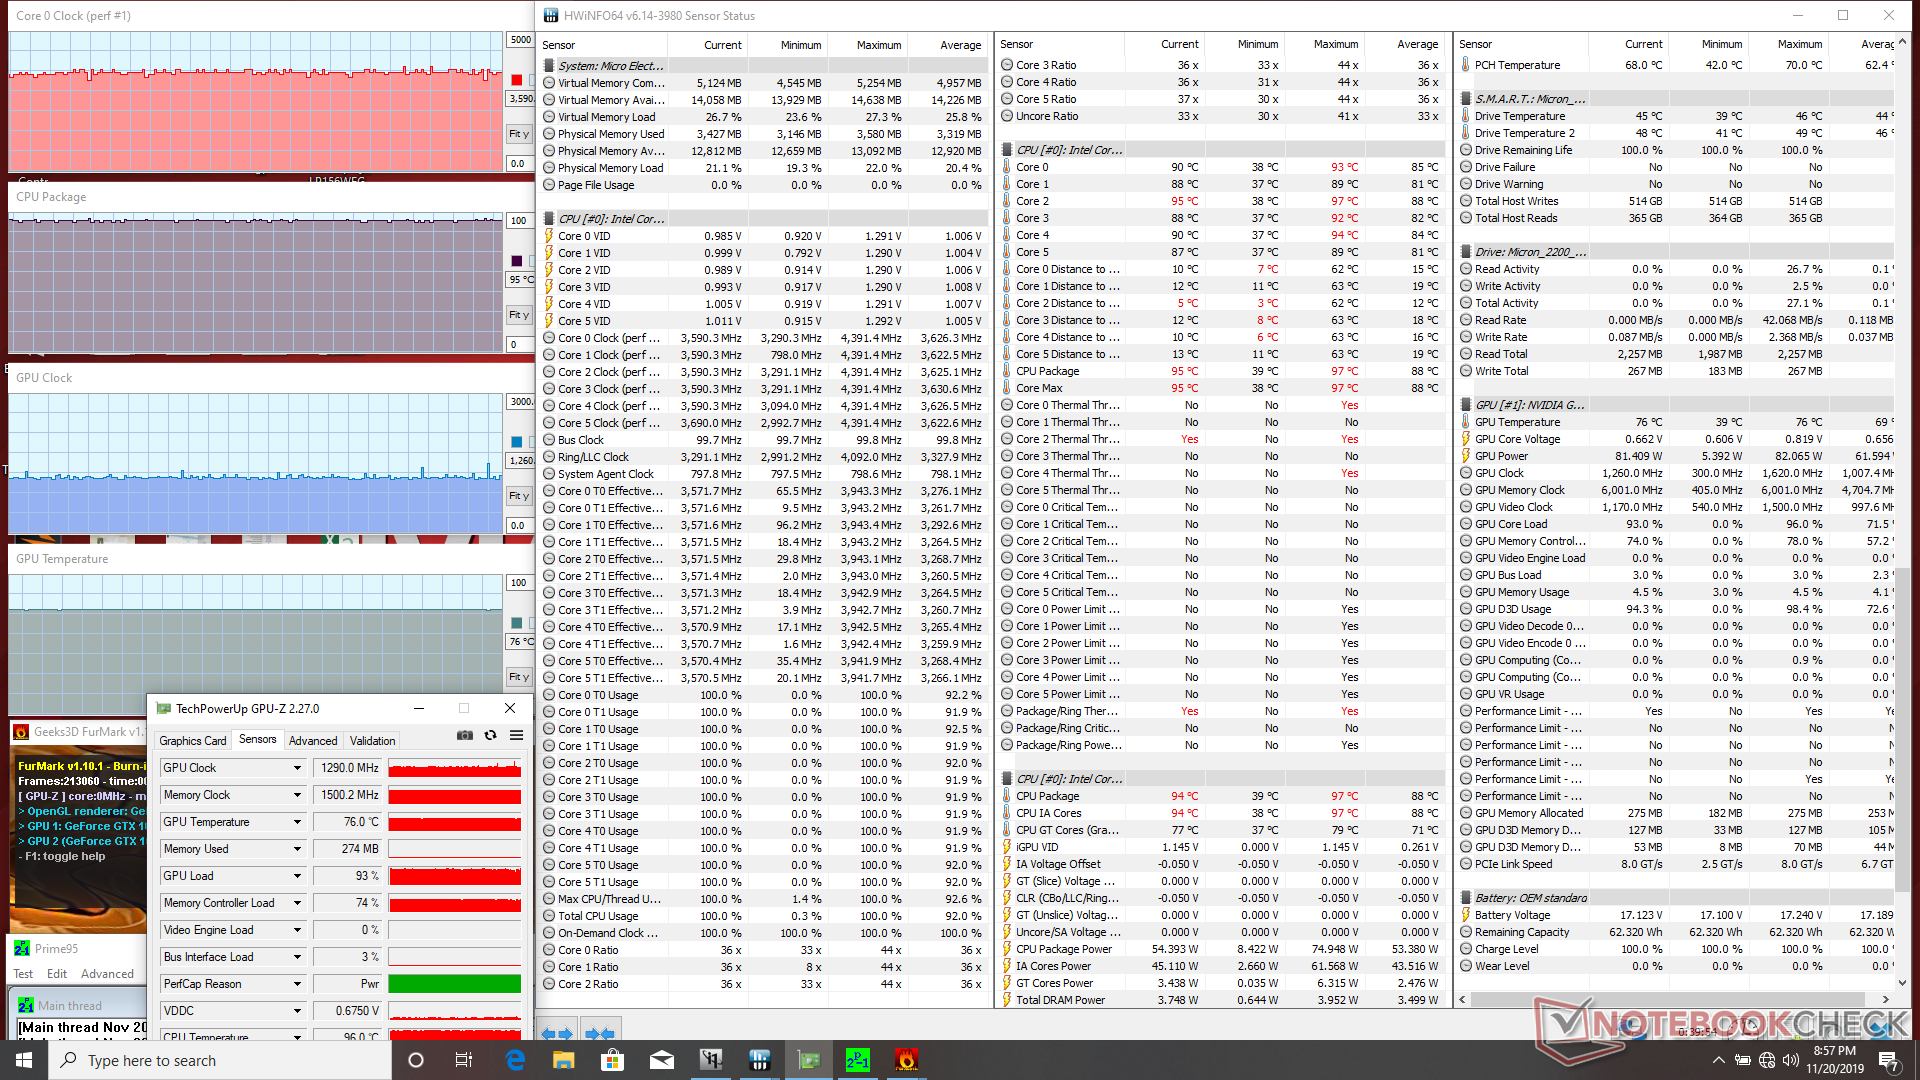
We stress the laptop with synthetic loads to identify for any potential throttling or stability issues. When running Prime95, clock rates would spike up to 4 GHz for the first few seconds until hitting a core temperature of 87 C. Thereafter, clock rates drop to about 3.5 GHz in order to maintain a cooler core temperature of 79 C. CPU temperatures will plateau at 95 C when running both Prime95 and FurMark simultaneously.
Running Witcher 3 in Turbo Mode results in stable CPU and GPU temperatures of 87 C and 79 C, respectively. Running the same test in Game Mode will result in cooler core temperatures albeit at slower GPU clock rates as shown by our screenshots and table below.
Performance drops if running on battery power even when set to High Performance mode. A 3DMark Fire Strike run on batteries returns Physics and Graphics scores of 9451 and 2994 points, respectively, compared to 16560 and 14718 points when on mains.
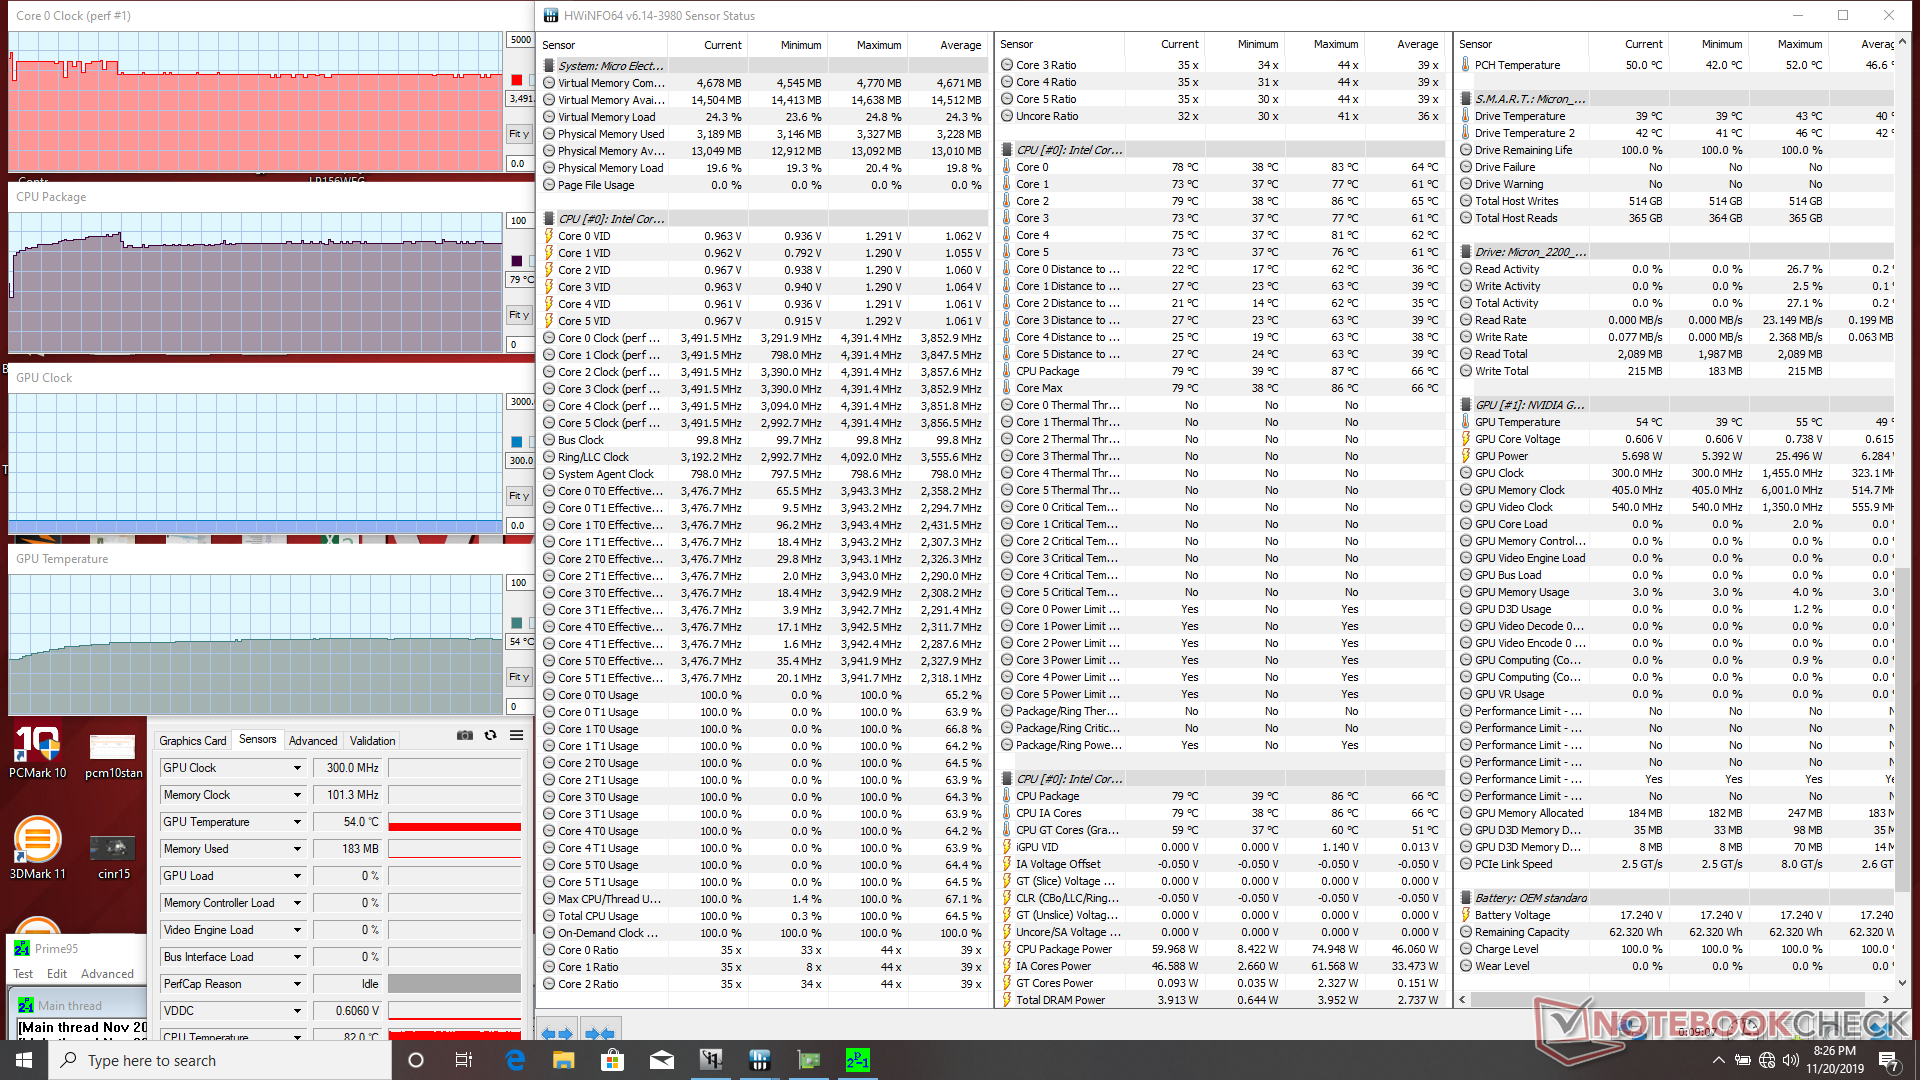
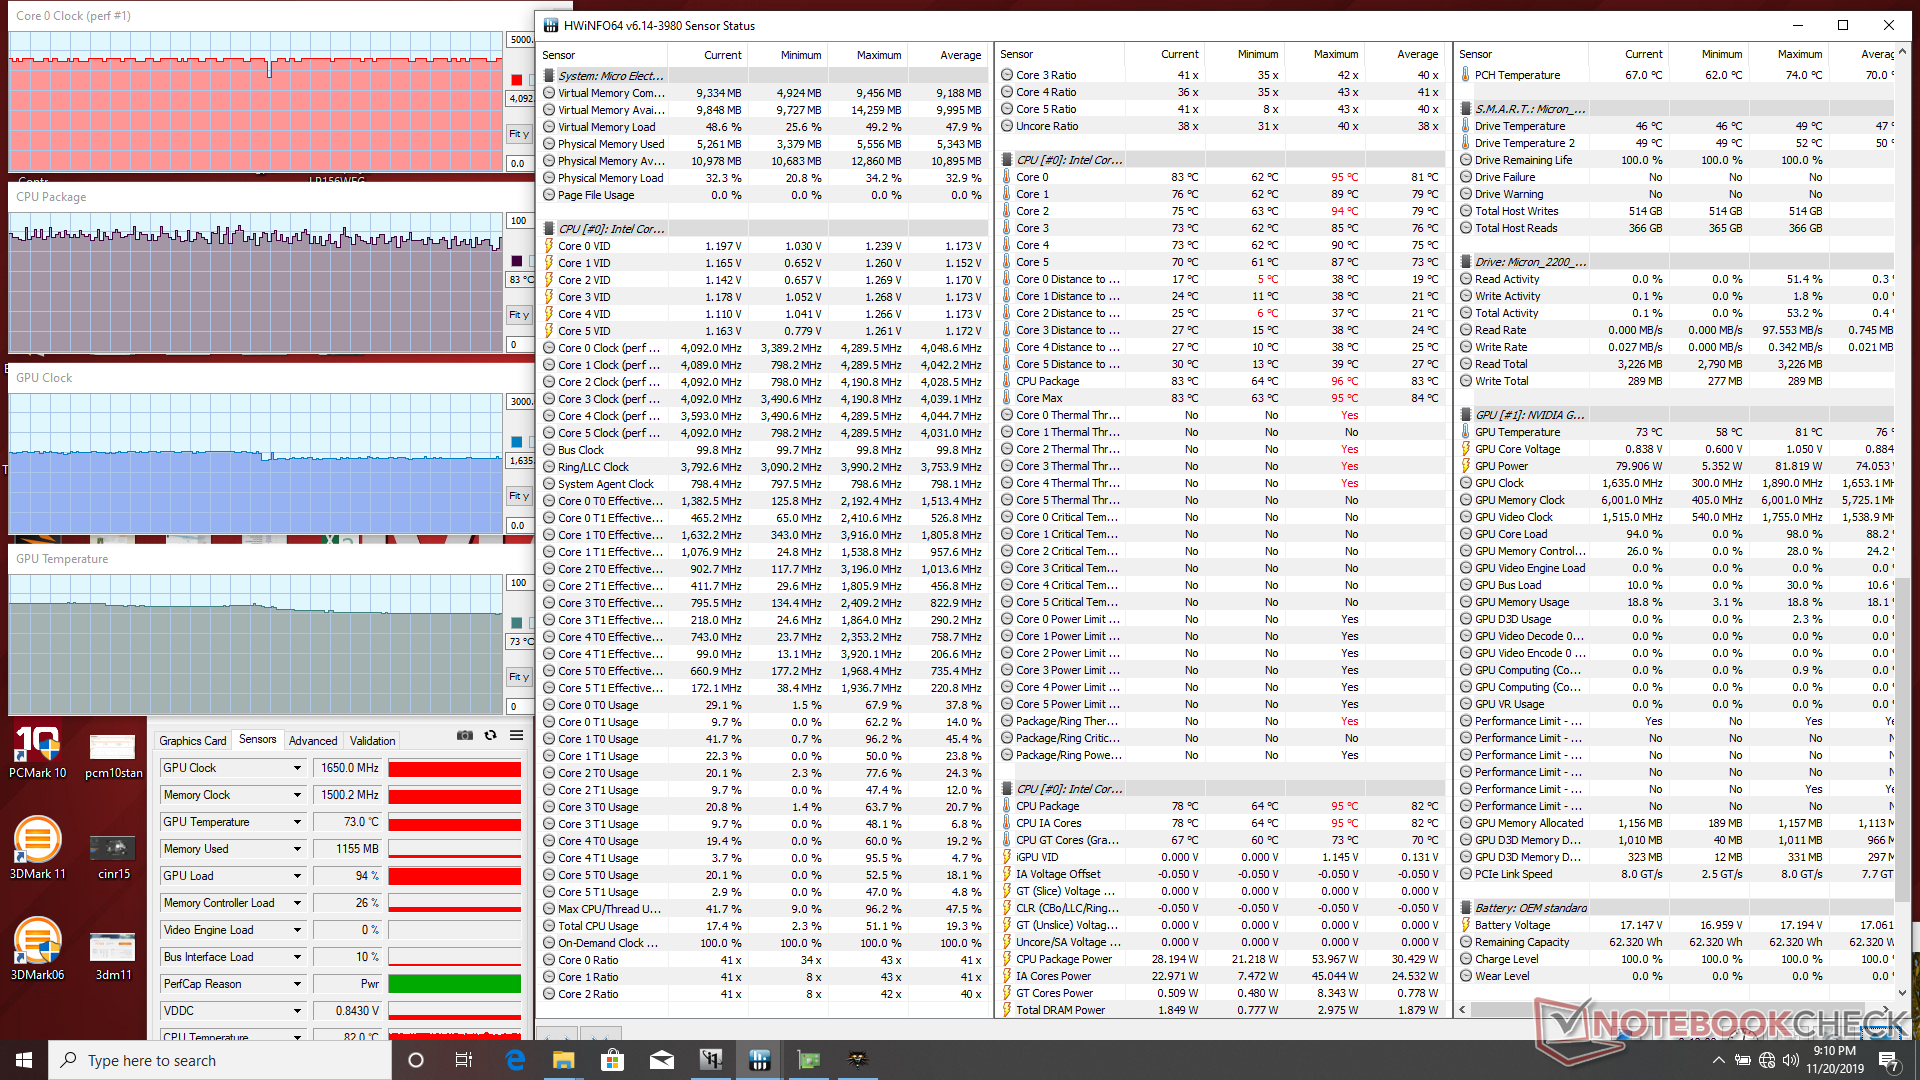

| CPU Clock (GHz) | GPU Clock (MHz) | Average CPU Temperature (°C) | Average GPU Temperature (°C) | |
| System Idle | -- | -- | 39 | 39 |
| Prime95 Stress | 3.5 | -- | 79 | 54 |
| Prime95 + FurMark Stress | ~3.6 | 1260 | 95 | 76 |
| Witcher 3 Stress (Game Mode) | ~4.0 | 1635 | ~83 | 73 |
| Witcher 3 Stress (Turbo Mode) | ~4.0 | 1770 | ~87 | 79 |
Speakers


Maingear Vector 15 audio analysis
(±) | speaker loudness is average but good (75.3 dB)
Bass 100 - 315 Hz
(-) | nearly no bass - on average 19.2% lower than median
(±) | linearity of bass is average (13% delta to prev. frequency)
Mids 400 - 2000 Hz
(±) | higher mids - on average 5.8% higher than median
(±) | linearity of mids is average (12.9% delta to prev. frequency)
Highs 2 - 16 kHz
(+) | balanced highs - only 3.6% away from median
(±) | linearity of highs is average (10.3% delta to prev. frequency)
Overall 100 - 16.000 Hz
(-) | overall sound is not linear (33.8% difference to median)
Compared to same class
» 98% of all tested devices in this class were better, 1% similar, 1% worse
» The best had a delta of 6%, average was 18%, worst was 132%
Compared to all devices tested
» 93% of all tested devices were better, 1% similar, 6% worse
» The best had a delta of 4%, average was 23%, worst was 134%
Apple MacBook 12 (Early 2016) 1.1 GHz audio analysis
(+) | speakers can play relatively loud (83.6 dB)
Bass 100 - 315 Hz
(±) | reduced bass - on average 11.3% lower than median
(±) | linearity of bass is average (14.2% delta to prev. frequency)
Mids 400 - 2000 Hz
(+) | balanced mids - only 2.4% away from median
(+) | mids are linear (5.5% delta to prev. frequency)
Highs 2 - 16 kHz
(+) | balanced highs - only 2% away from median
(+) | highs are linear (4.5% delta to prev. frequency)
Overall 100 - 16.000 Hz
(+) | overall sound is linear (10.2% difference to median)
Compared to same class
» 7% of all tested devices in this class were better, 2% similar, 90% worse
» The best had a delta of 5%, average was 18%, worst was 53%
Compared to all devices tested
» 5% of all tested devices were better, 1% similar, 94% worse
» The best had a delta of 4%, average was 23%, worst was 134%
Energy Management
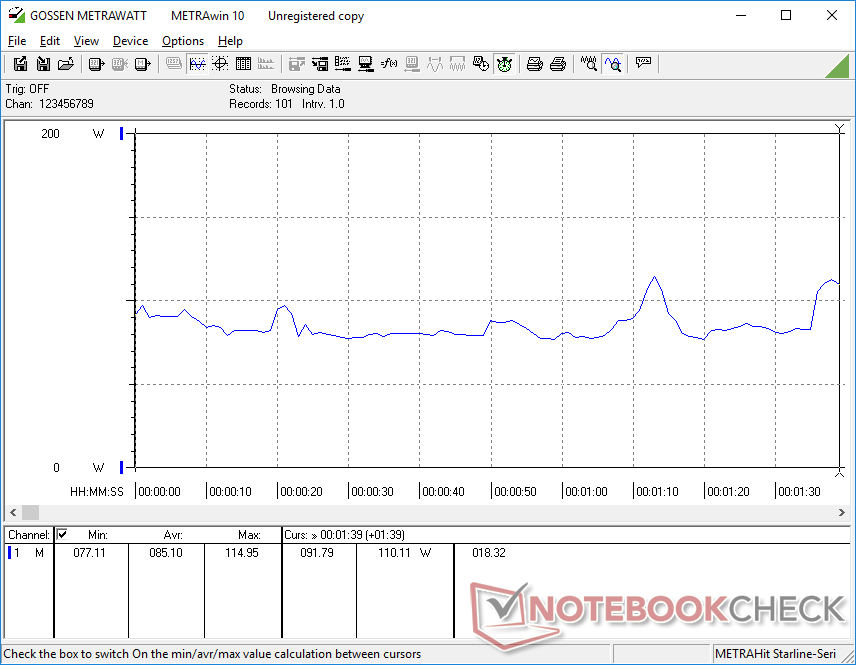
Power Consumption
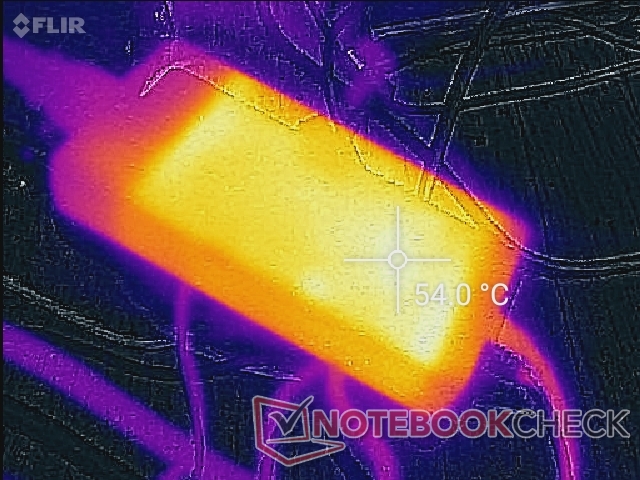
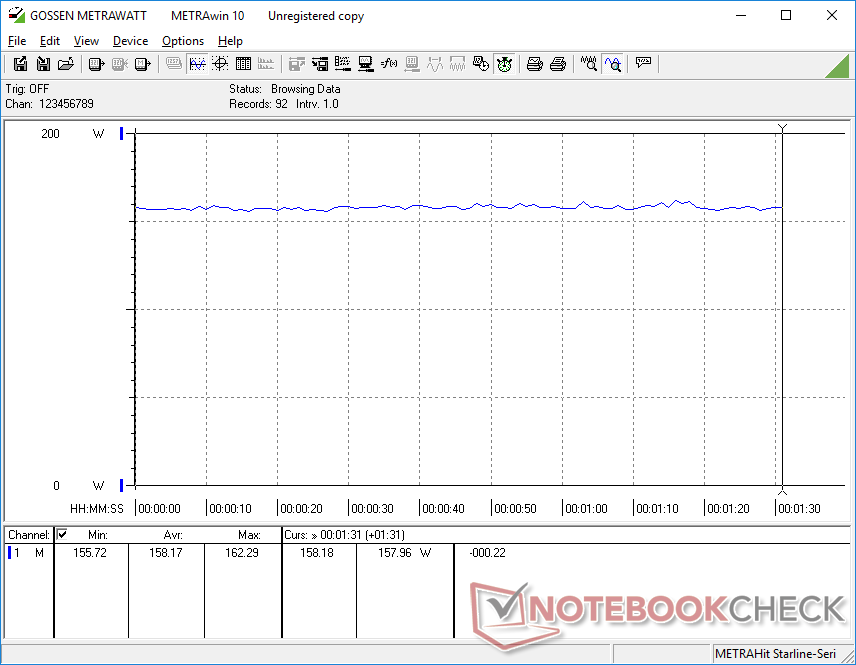
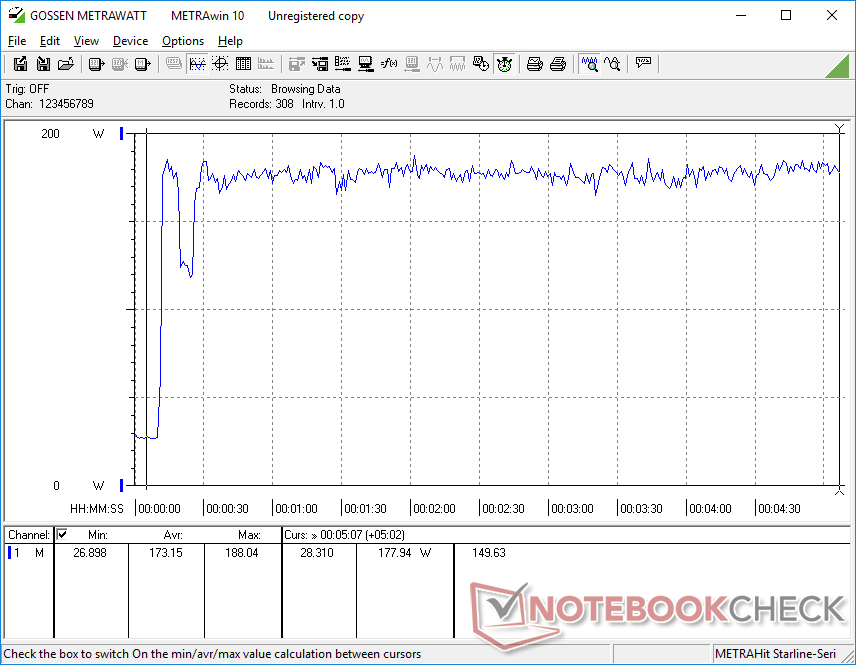
Idling on desktop consumes anywhere between 16 W and 27 W to be noticeably more efficient than what we recorded on many competing systems including the MSI GL65 or Asus Zephyrus M GU502. When gaming, however, consumption is where we expect it to be at about 158 W. The RTX 2080 Max-Q offers about 50 percent more graphics performance for roughly 15 percent higher power consumption.
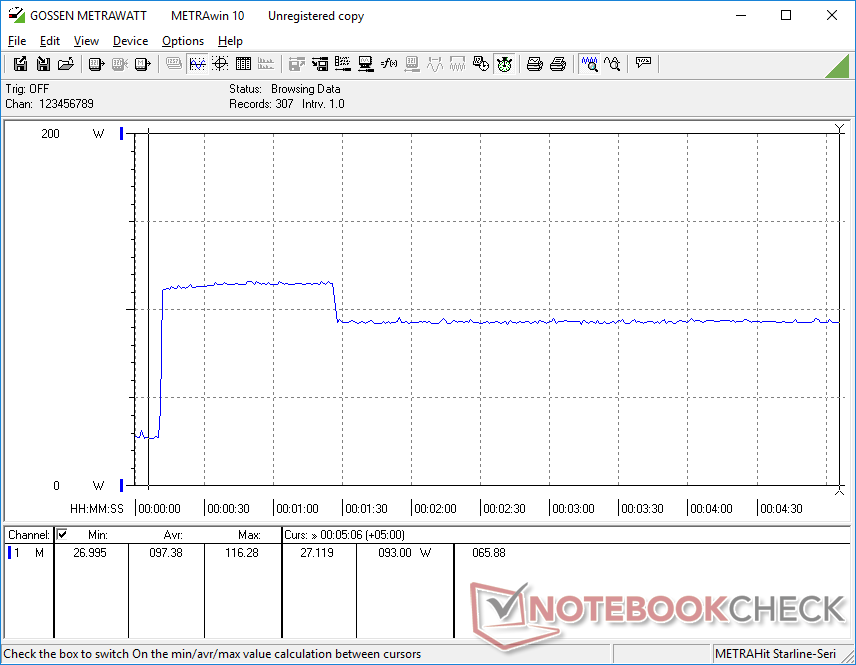
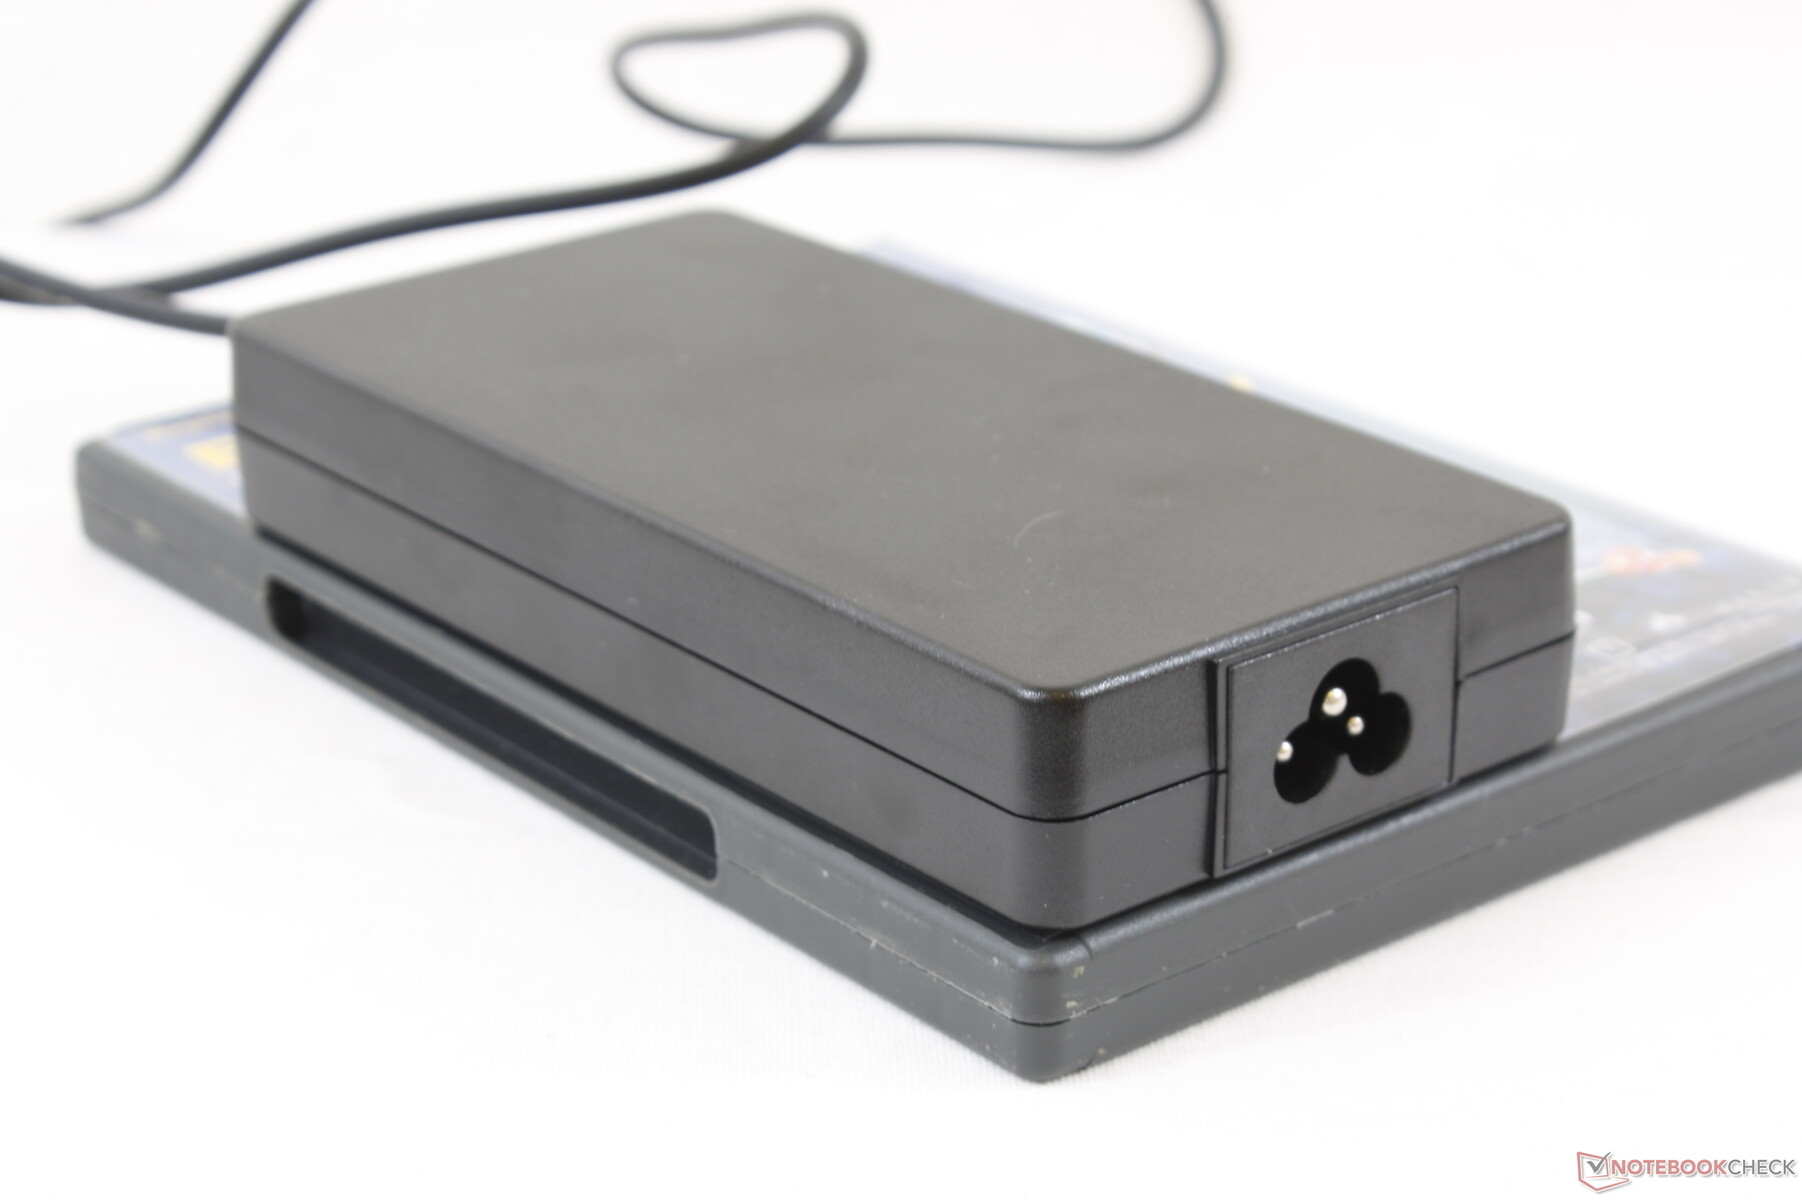
We're able to record a maximum draw of 188 W from the medium-sized ()()() 180 W AC adapter when running both Prime95 and FurMark simultaneously. Keep in mind that charging will slow to a crawl if running extreme processing loads.
| Off / Standby | |
| Idle | |
| Load |
|
Key:
min: | |
| Maingear Vector 15 i7-9750H, GeForce GTX 1660 Ti Mobile, , IPS, 1920x1080, 15.6" | MSI GL65 9SEK i7-9750H, GeForce RTX 2060 Mobile, WDC PC SN520 SDAPNUW-512G, IPS, 1920x1080, 15.6" | Lenovo Legion Y740-15ICHg i7-9750H, GeForce RTX 2070 Max-Q, WDC PC SN520 SDAPMUW-128G, IPS, 1920x1080, 15.6" | Razer Blade 15 GTX 1660 Ti i7-9750H, GeForce GTX 1660 Ti Mobile, Samsung SSD PM981 MZVLB256HAHQ, IPS, 1920x1080, 15.6" | Alienware m15 R2 P87F i7-9750H, GeForce RTX 2080 Max-Q, 2x Toshiba XG6 KXG60ZNV512G (RAID 0), IPS, 1920x1080, 15.6" | Asus ROG Zephyrus M15 GU502GU-XB74 i7-9750H, GeForce GTX 1660 Ti Mobile, Intel SSD 660p SSDPEKNW512G8, IPS, 1920x1080, 15.6" | |
|---|---|---|---|---|---|---|
| Power Consumption | -61% | -13% | -17% | -49% | -26% | |
| Idle Minimum * (Watt) | 16.2 | 41 -153% | 22.2 -37% | 18.7 -15% | 19 -17% | 17.6 -9% |
| Idle Average * (Watt) | 21.1 | 45.3 -115% | 24.9 -18% | 30.7 -45% | 40.5 -92% | 24.7 -17% |
| Idle Maximum * (Watt) | 26.4 | 47.1 -78% | 30.6 -16% | 33.9 -28% | 52 -97% | 56.3 -113% |
| Load Average * (Watt) | 85.1 | 94.9 -12% | 101 -19% | 93.4 -10% | 132.3 -55% | 111.1 -31% |
| Witcher 3 ultra * (Watt) | 158.2 | 149.4 6% | 143 10% | 158.9 -0% | 183.3 -16% | 149 6% |
| Load Maximum * (Watt) | 188 | 214.2 -14% | 186 1% | 195.3 -4% | 217.2 -16% | 170 10% |
* ... smaller is better
Battery Life
Expect just over 6 hours of real-world WLAN use from the internal 62 Wh battery when set to the Balanced power profile. Results are better than the average gaming laptop and comparable to the Razer Blade 15 GTX 1660 Ti.
Recharging from empty to full capacity takes about 2 hours.
| Maingear Vector 15 i7-9750H, GeForce GTX 1660 Ti Mobile, 62 Wh | MSI GL65 9SEK i7-9750H, GeForce RTX 2060 Mobile, 51 Wh | Lenovo Legion Y740-15ICHg i7-9750H, GeForce RTX 2070 Max-Q, 57 Wh | Razer Blade 15 GTX 1660 Ti i7-9750H, GeForce GTX 1660 Ti Mobile, 65 Wh | Alienware m15 R2 P87F i7-9750H, GeForce RTX 2080 Max-Q, 76 Wh | Asus ROG Zephyrus M15 GU502GU-XB74 i7-9750H, GeForce GTX 1660 Ti Mobile, 76 Wh | |
|---|---|---|---|---|---|---|
| Battery runtime | -37% | -50% | -8% | -8% | -25% | |
| WiFi v1.3 (h) | 6 | 3.8 -37% | 3 -50% | 5.5 -8% | 5.5 -8% | 4.5 -25% |
| Reader / Idle (h) | 4.4 | 9.2 | 7.1 | |||
| Load (h) | 1 | 0.7 | 1.7 |
Pros
Cons
Verdict
Why purchase the Vector 15 over more well-known models from Asus, MSI, Lenovo, Dell, or others? The Maingear system excels at being lighter and easier to service than some of its closest competitors. Most MSI laptops, for example, require breaking a factory sticker just to add RAM while the Alienware m15 R2 doesn't even allow for any memory upgrades. If you'll be traveling a lot and still want the ability to service the laptop on your own, then the Vector may be the best option.
The weak speakers, average hinges, spongy clickpad, and flexible chassis are probably the worst aspects of the Vector that could use some attention for any future iterations. Fan noise when gaming is quite loud as well even for a gaming laptop. Firmer and more rigid alternatives from the Asus Zephyrus series, Alienware m15 series, or Razer Blade 15 series feel more luxurious albeit at slightly higher prices.
Excellent performance and 144 Hz display for such a light gaming laptop. Great for gamers constantly on-the-go if you can deal with the spongy clickpad and subpar webcam positioning.
Maingear Vector 15
- 11/24/2019 v7 (old)
Allen Ngo
Price comparison
