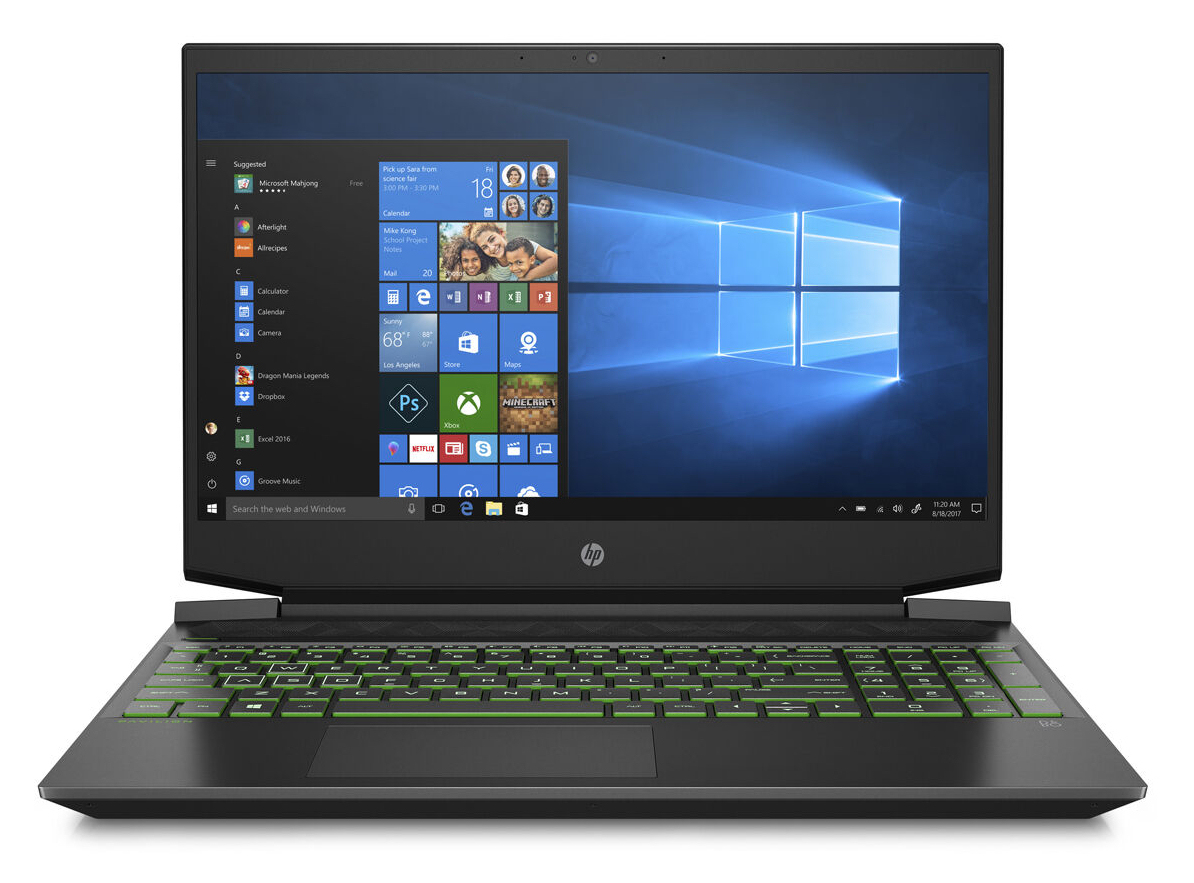
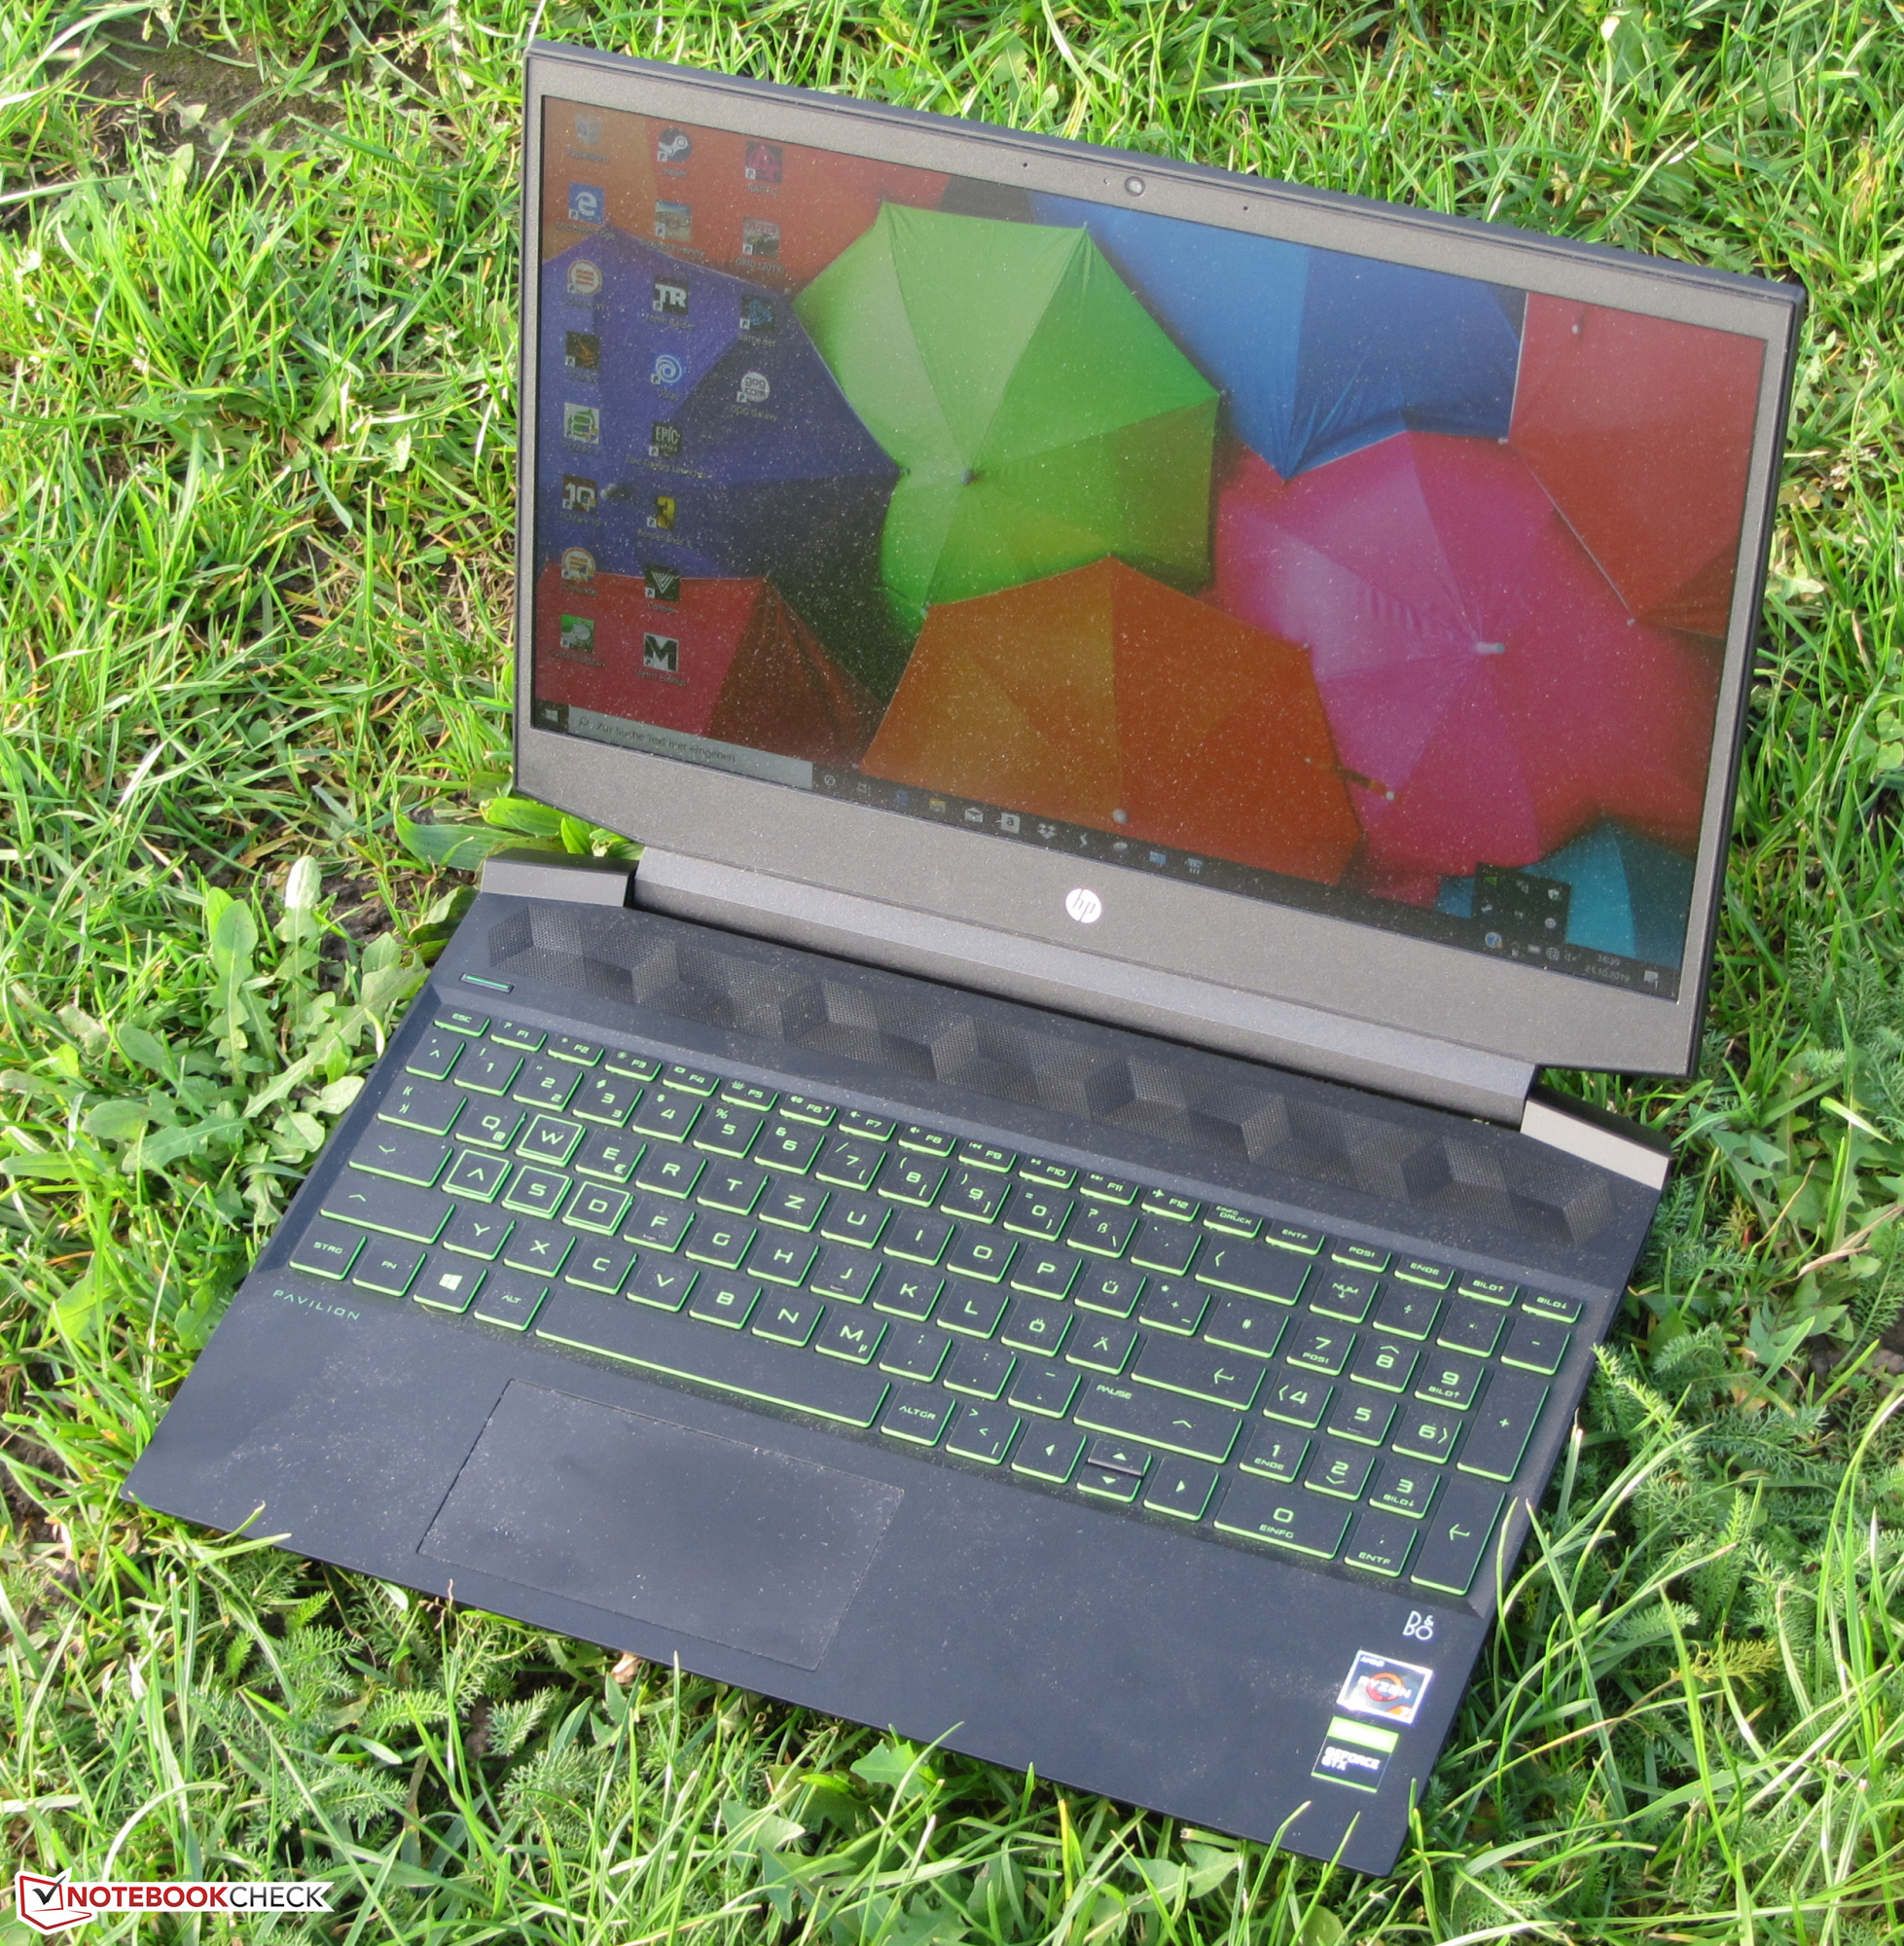
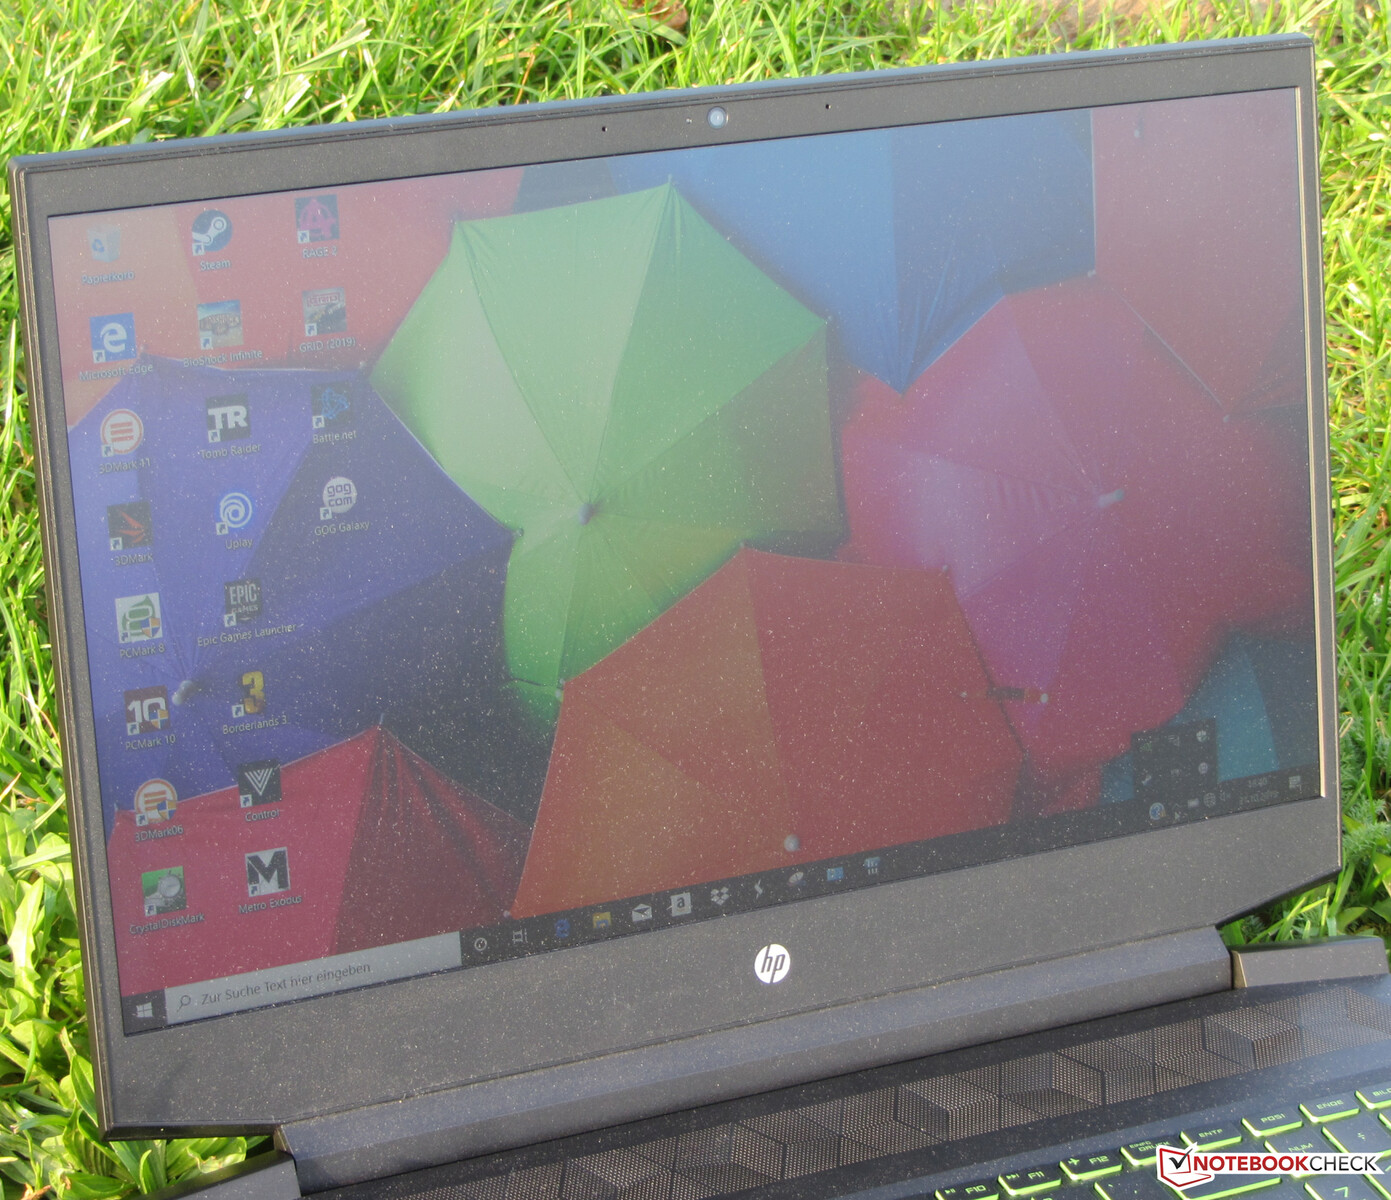
HP Pavilion Gaming 15 in Review: HP's 15.6-inch laptop combines gaming prowess and stamina

The Pavilion Gaming 15 series consists of 15.6-inch gaming laptops with mid-range graphics chips. It is a more budget version of HP's Omen series. Due to this, Nvidia GeForce RTX GPUs are exclusive to the latter. The test model we received is powered by a Ryzen 7 3750H APU and a GeForce GTX 1660 Ti Max-Q GPU. Competitors include devices such as the Dell G5 15 5590, Acer Aspire Nitro 5 and the Lenovo Legion Y540-15IRH.
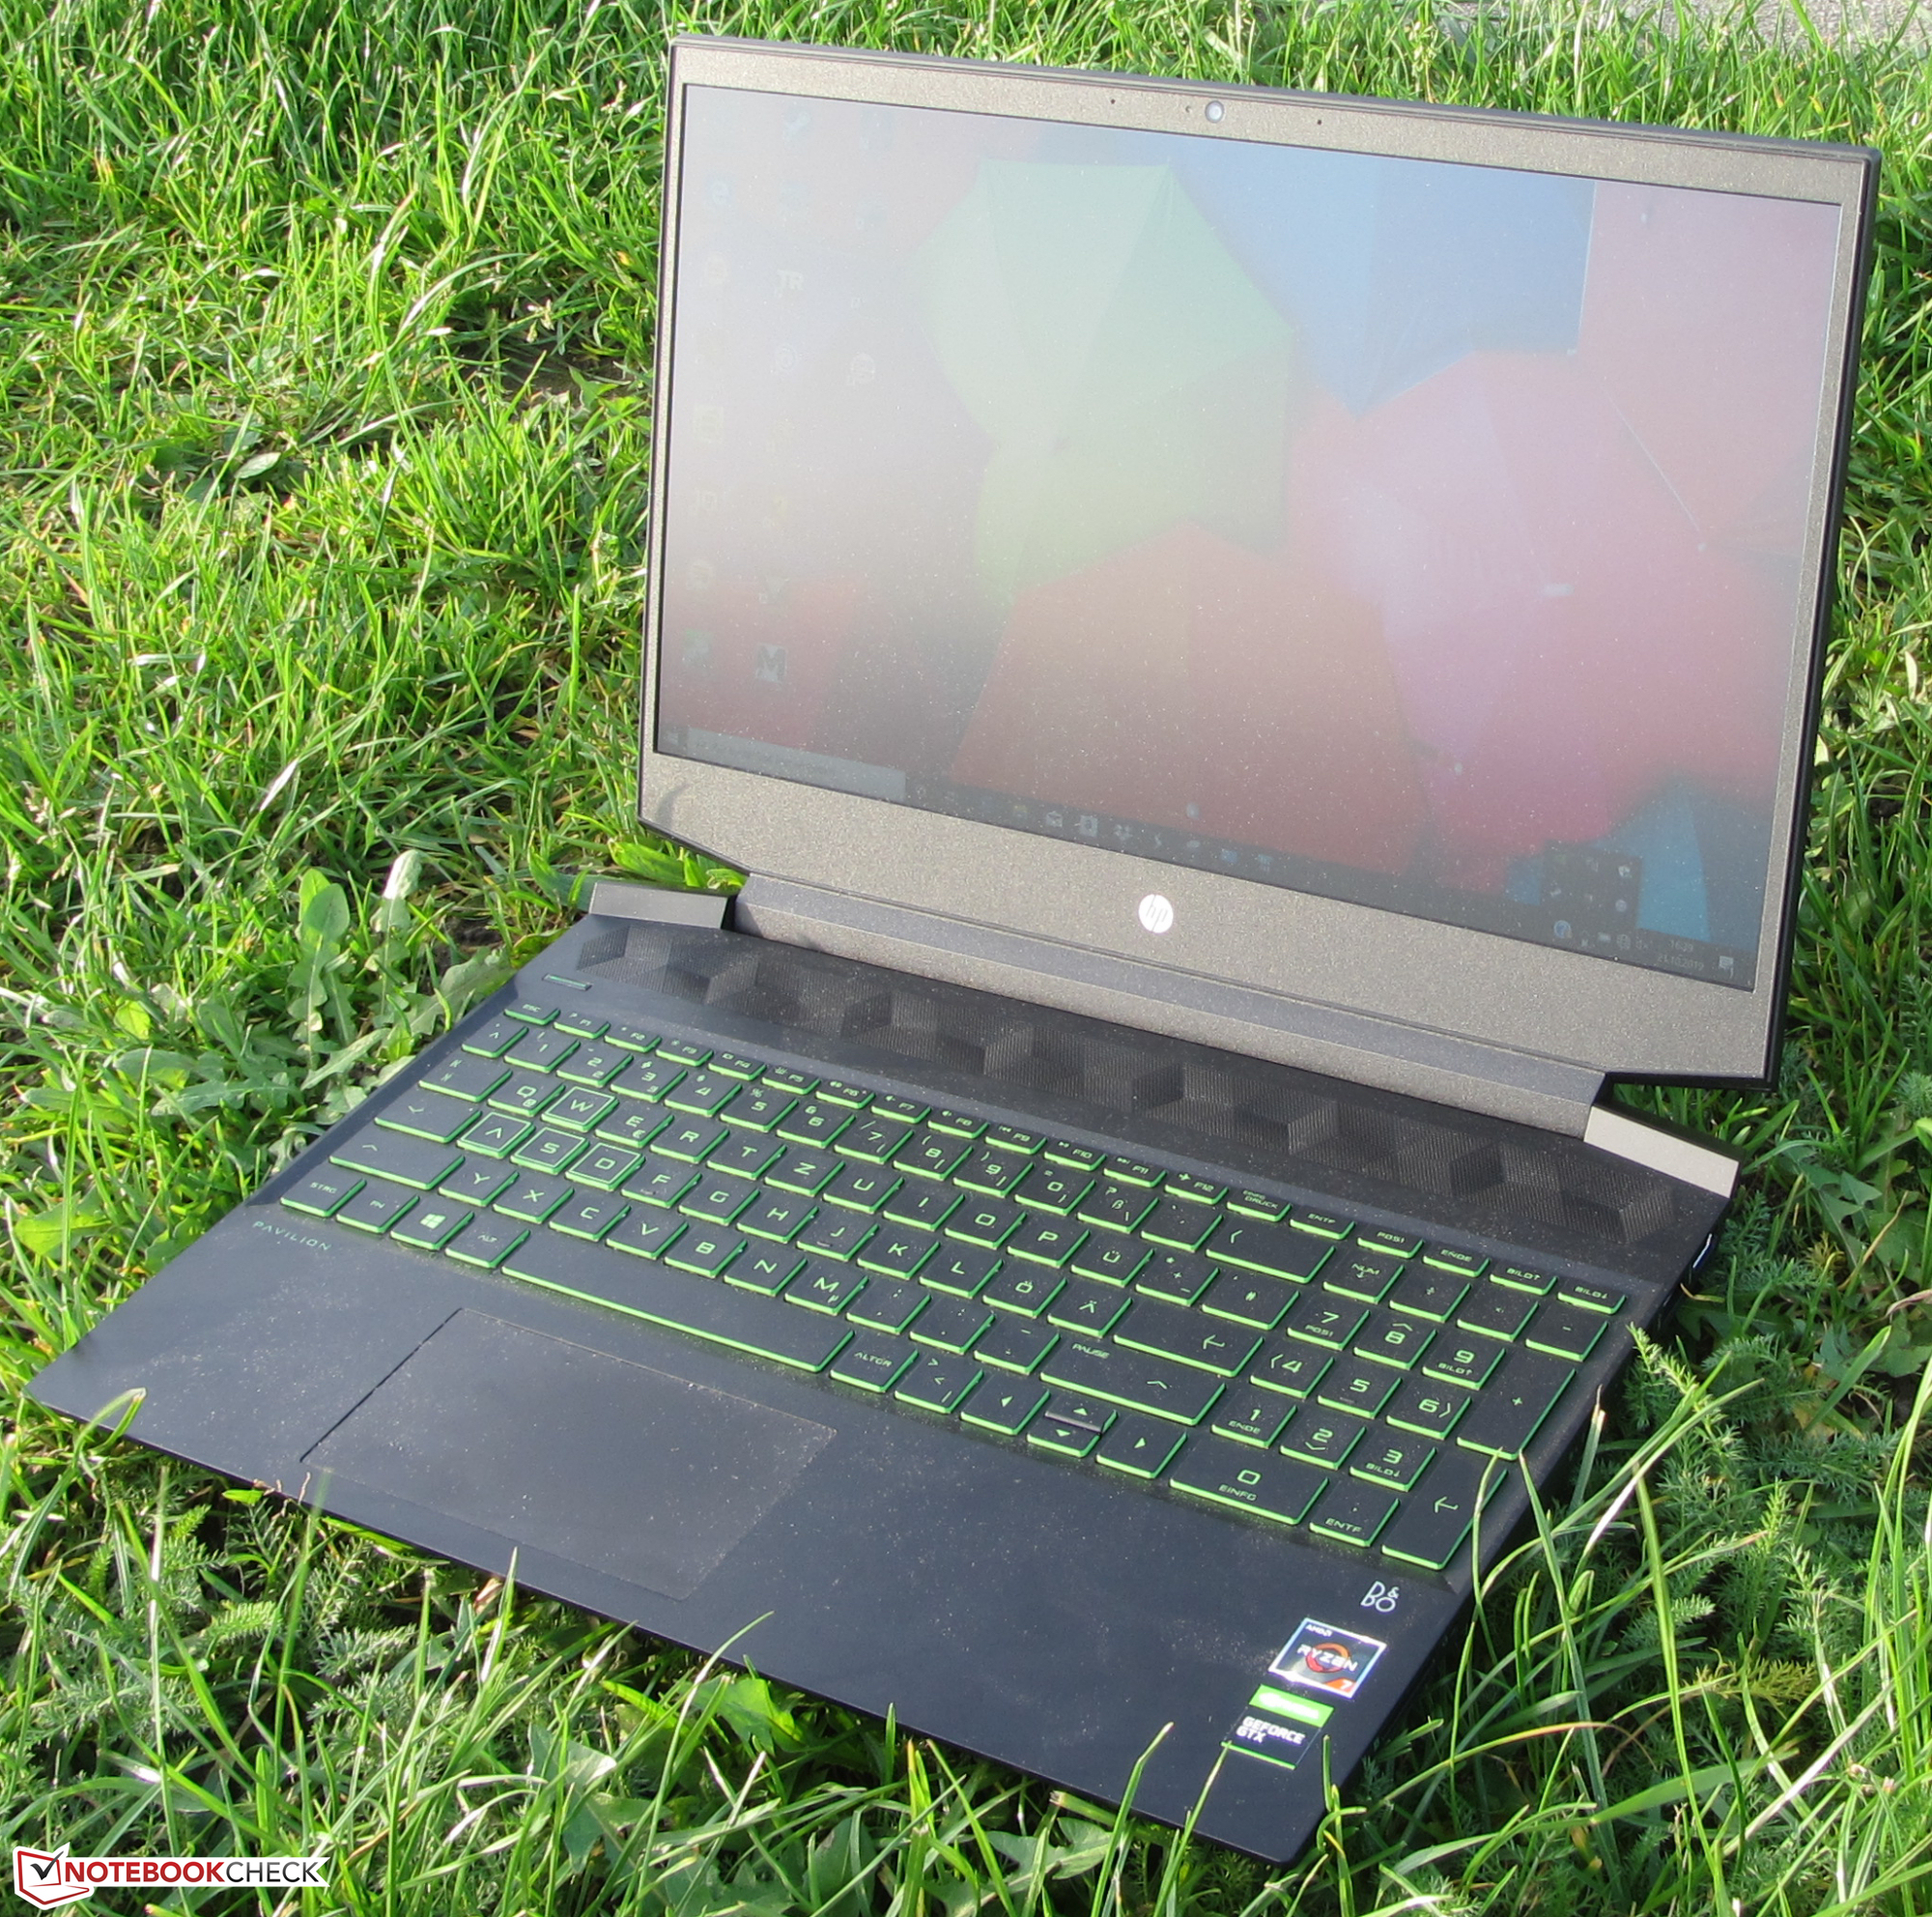
Since the Pavilion Gaming 15 is physically identical with the Gaming Pavilion 15 that we have already tested, we will not revisit the chassis, connectivity, input devices and speakers - unless there were changes. The relevant information can be found in our existing review of the Gaming Pavilion 15.
Rating | Date | Model | Weight | Height | Size | Resolution | Price |
|---|---|---|---|---|---|---|---|
| 79.7 % v7 (old) | 10 / 2019 | HP Pavilion Gaming 15-ec0017ng R7 3750H, GeForce GTX 1660 Ti Max-Q | 2.3 kg | 23.5 mm | 15.60" | 1920x1080 | |
| 83.9 % v7 (old) | 08 / 2019 | HP Gaming Pavilion 15-dk0009ng i7-9750H, GeForce GTX 1660 Ti Max-Q | 2.4 kg | 23.4 mm | 15.60" | 1920x1080 | |
| 79.6 % v7 (old) | 10 / 2019 | Dell G5 15 5590-PCNJJ i5-9300H, GeForce GTX 1650 Mobile | 2.7 kg | 23.7 mm | 15.60" | 1920x1080 | |
| 82.3 % v7 (old) | 08 / 2019 | Lenovo Legion Y540-15IRH-81SX00B2GE i7-9750H, GeForce GTX 1660 Ti Mobile | 2.2 kg | 26 mm | 15.60" | 1920x1080 | |
| 82.5 % v6 (old) | 05 / 2019 | Acer Aspire Nitro 5 AN515-54-53Z2 i5-9300H, GeForce GTX 1650 Mobile | 2.2 kg | 27 mm | 15.60" | 1920x1080 |
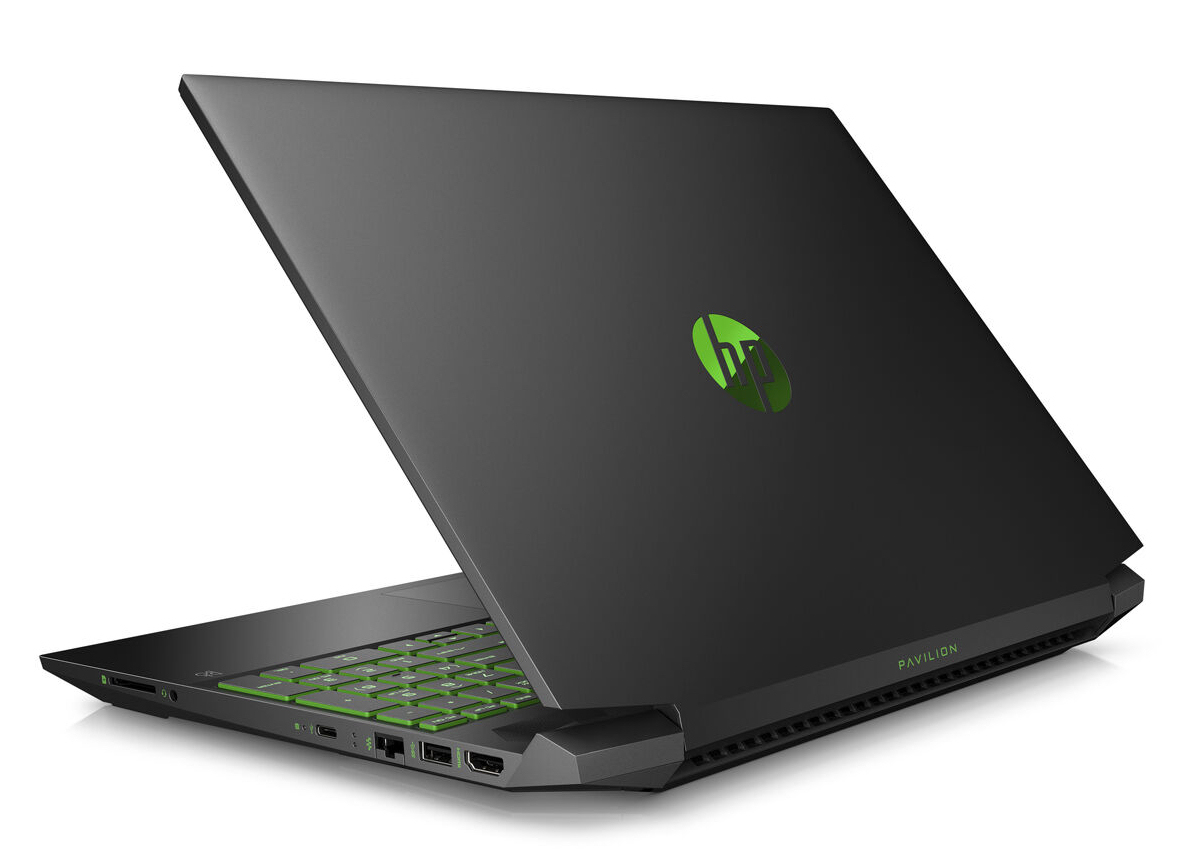
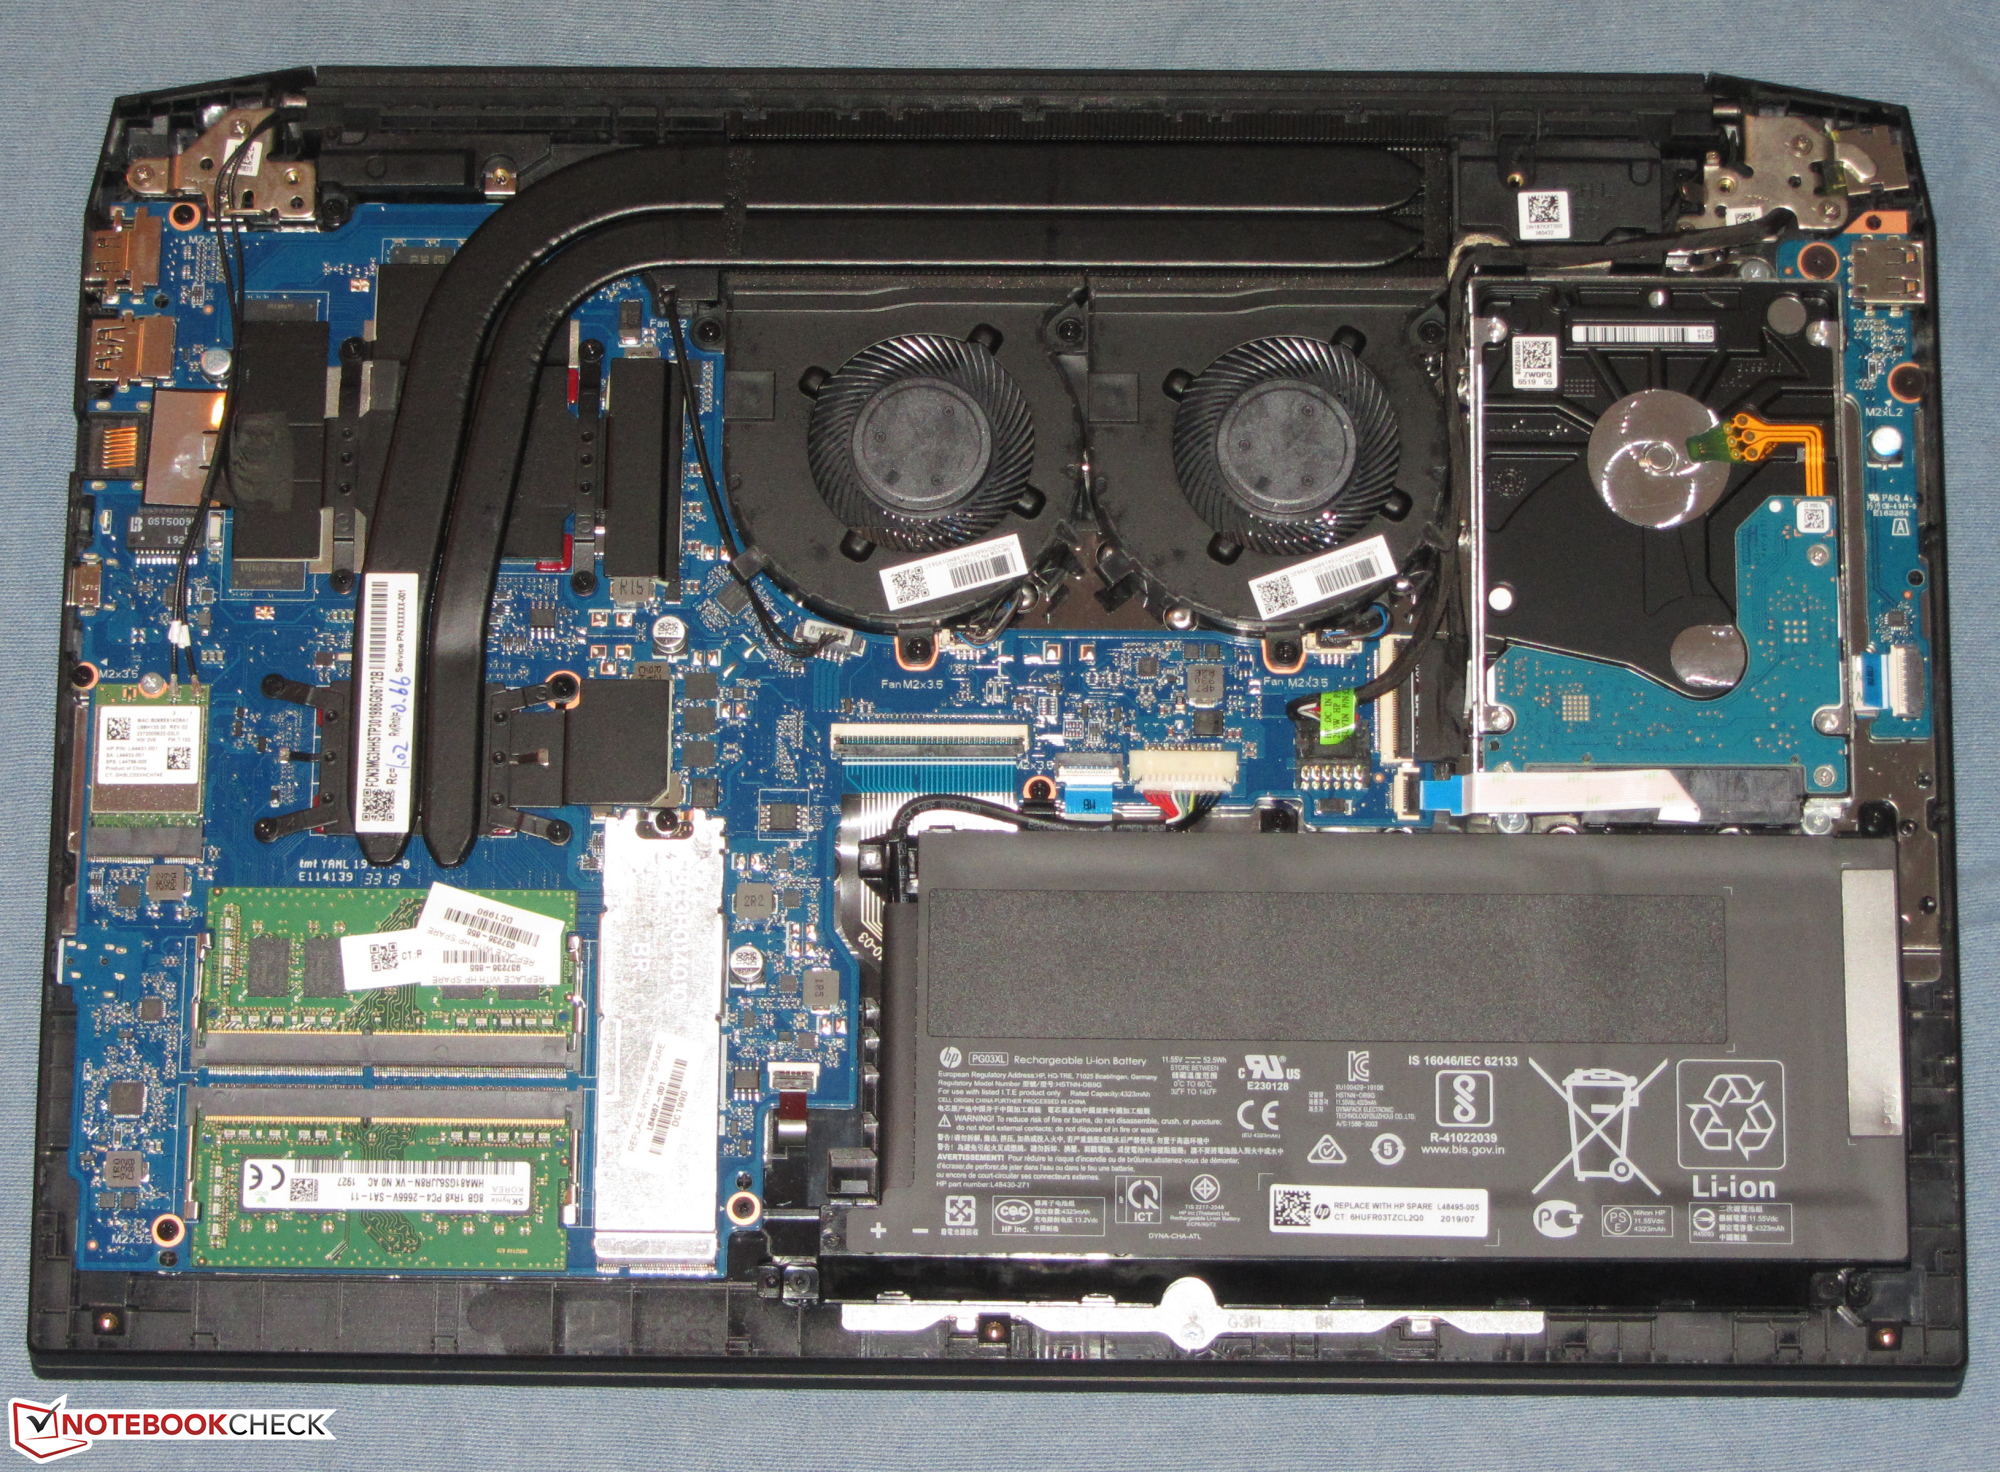
Case - Pavilion Chassis with Some Changes
The chassis of the laptop is mostly identical to the predecessor's. However, there are a few differences. Firstly, the hinges are farther apart. Secondly, the exhaust vent has been moved to the area between the two hinges. The positive consequence: The bottom plate can now be removed more easily.
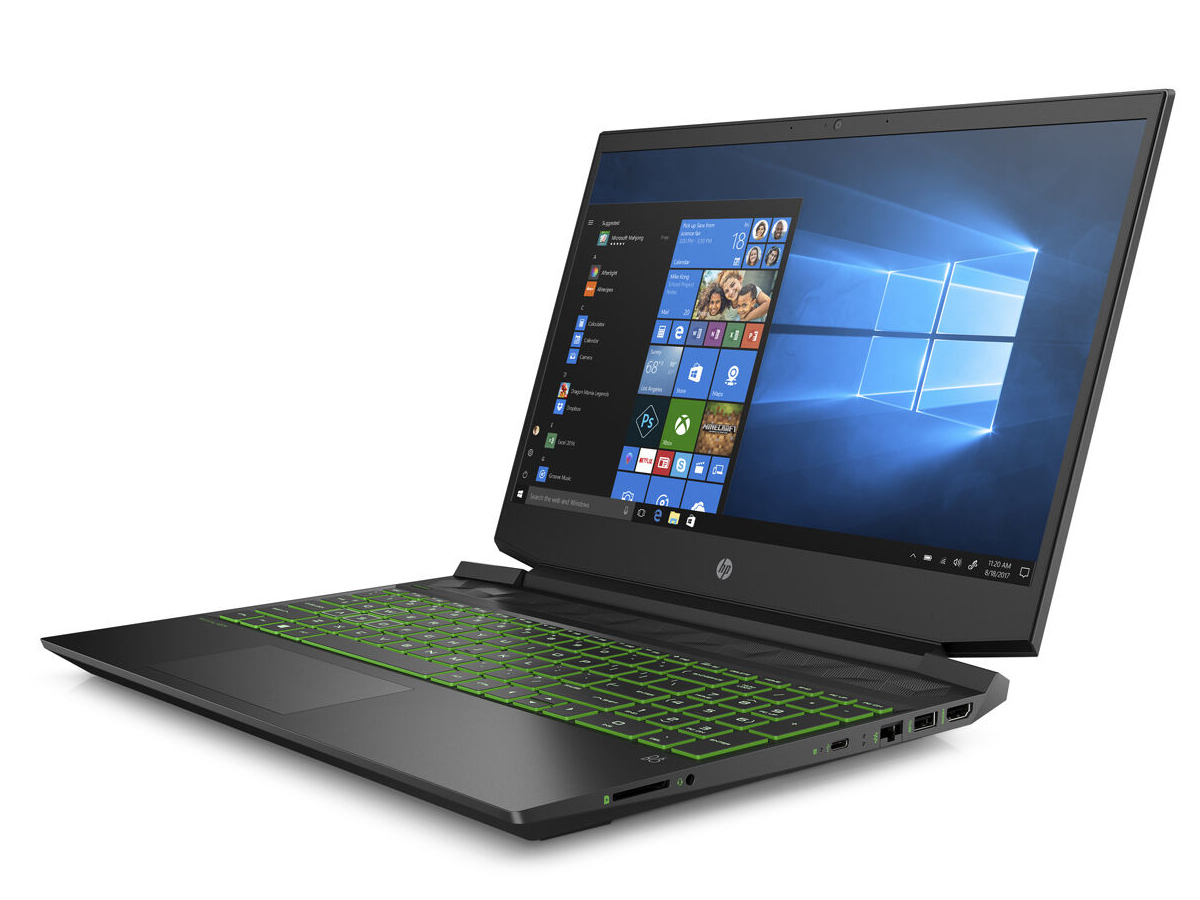
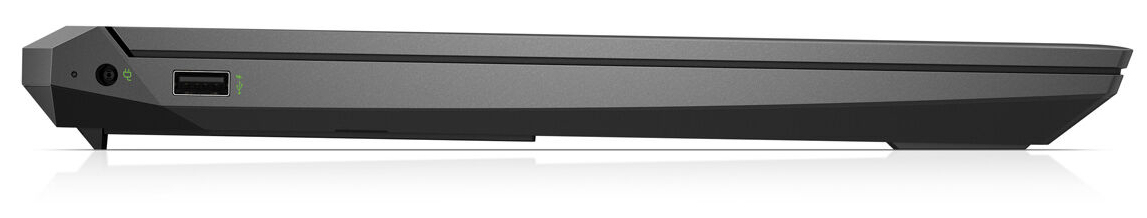
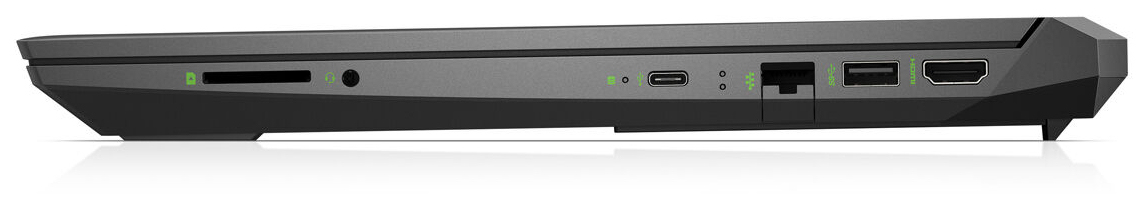
Connectivity - HP Gaming Laptop without Thunderbolt 3
In terms of port selection, there are differences compared to the predecessor as well. For one, HP has omitted one USB Type-A port on our test device. Furthermore, the USB Type-C port adheres to the USB 3.2 Gen 1 standard (predecessor: USB 3.2 Gen 2). The port layout is different as well.
| SD Card Reader | |
| average JPG Copy Test (av. of 3 runs) | |
| Average of class Gaming (20.9 - 210, n=55, last 2 years) | |
| HP Gaming Pavilion 15-dk0009ng (Toshiba Exceria Pro SDXC 64 GB UHS-II) | |
| HP Pavilion Gaming 15-ec0017ng (Toshiba Exceria Pro SDXC 64 GB UHS-II) | |
| Dell G5 15 5590-PCNJJ (Toshiba Exceria Pro SDXC 64 GB UHS-II) | |
| maximum AS SSD Seq Read Test (1GB) | |
| Average of class Gaming (25.5 - 261, n=52, last 2 years) | |
| HP Gaming Pavilion 15-dk0009ng (Toshiba Exceria Pro SDXC 64 GB UHS-II) | |
| HP Pavilion Gaming 15-ec0017ng (Toshiba Exceria Pro SDXC 64 GB UHS-II) | |
| Dell G5 15 5590-PCNJJ (Toshiba Exceria Pro SDXC 64 GB UHS-II) | |
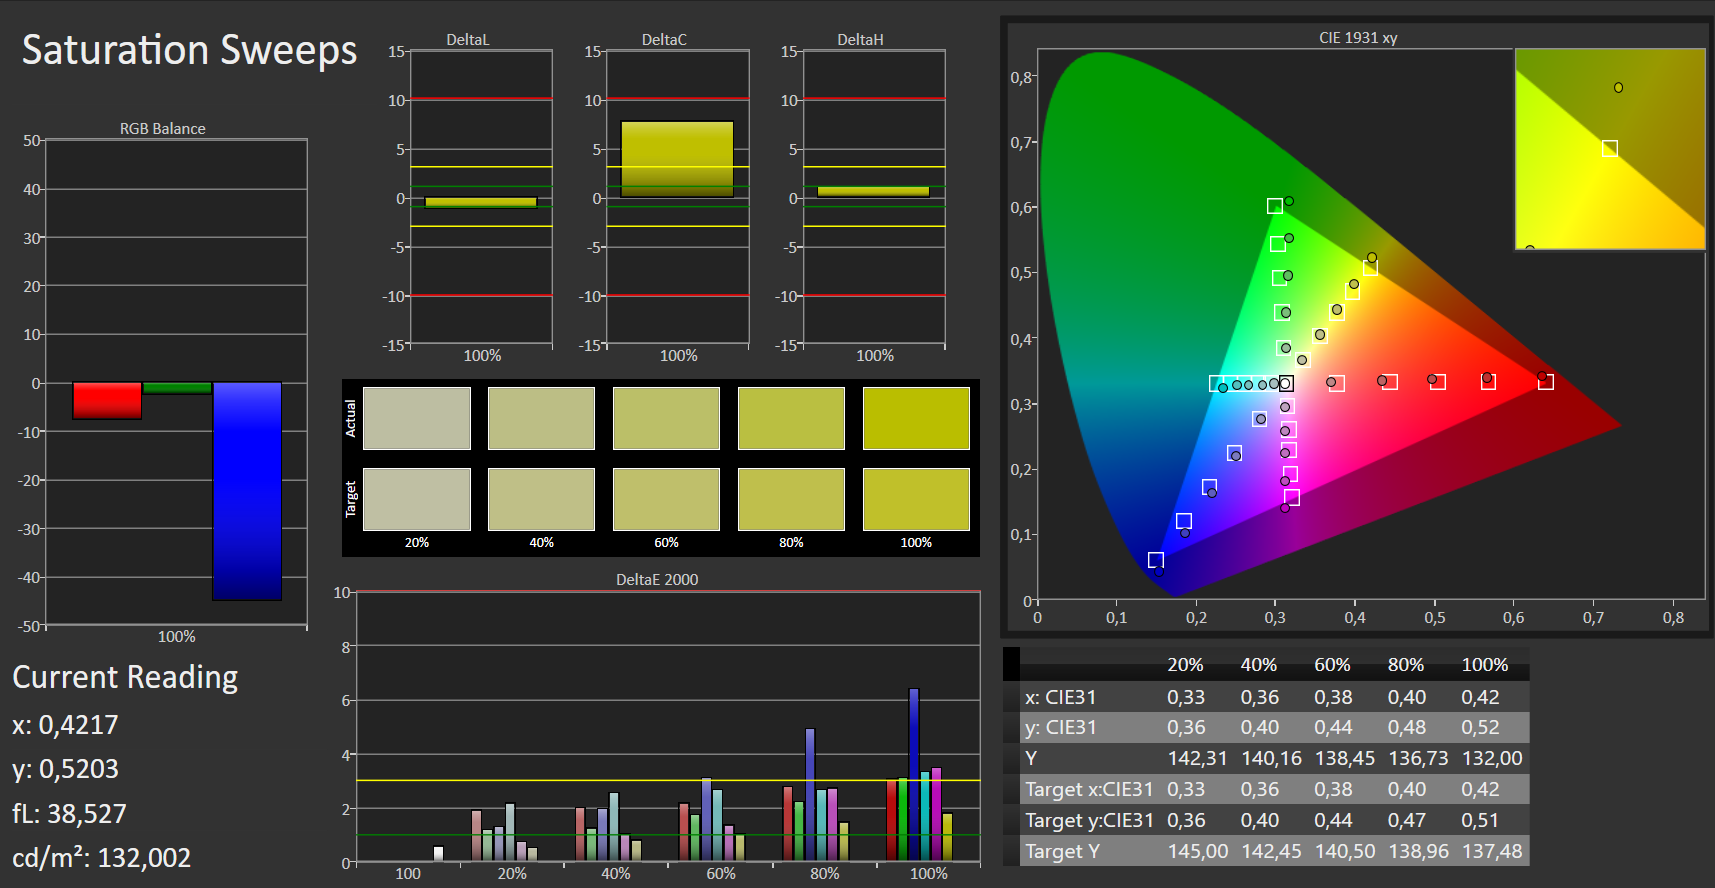
Display - IPS on Board
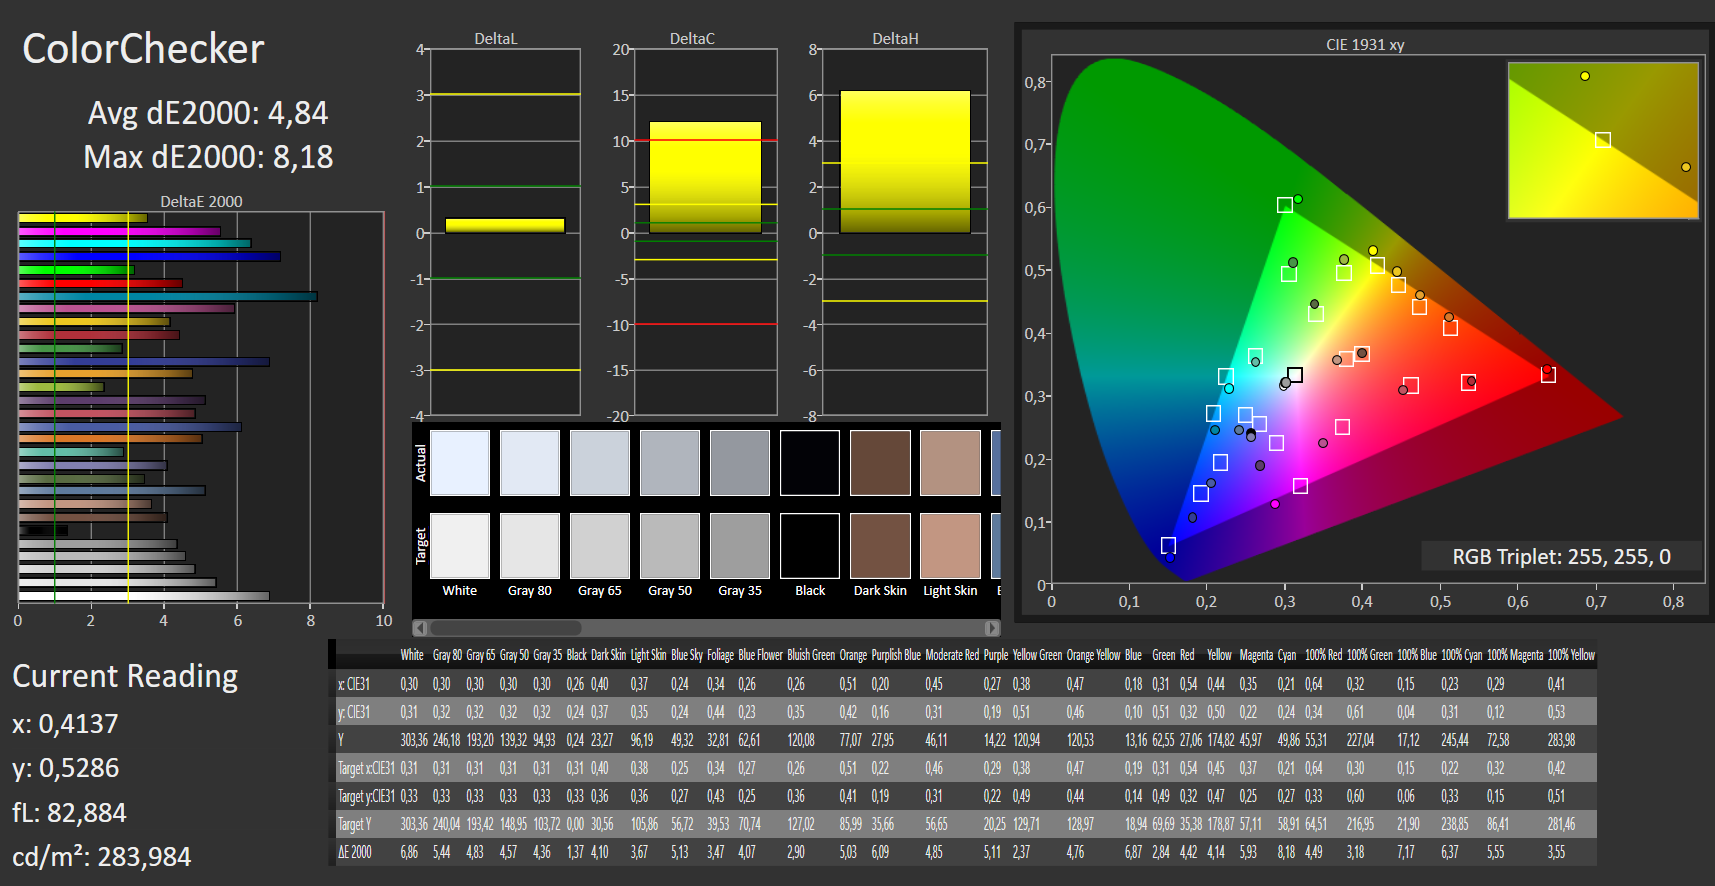
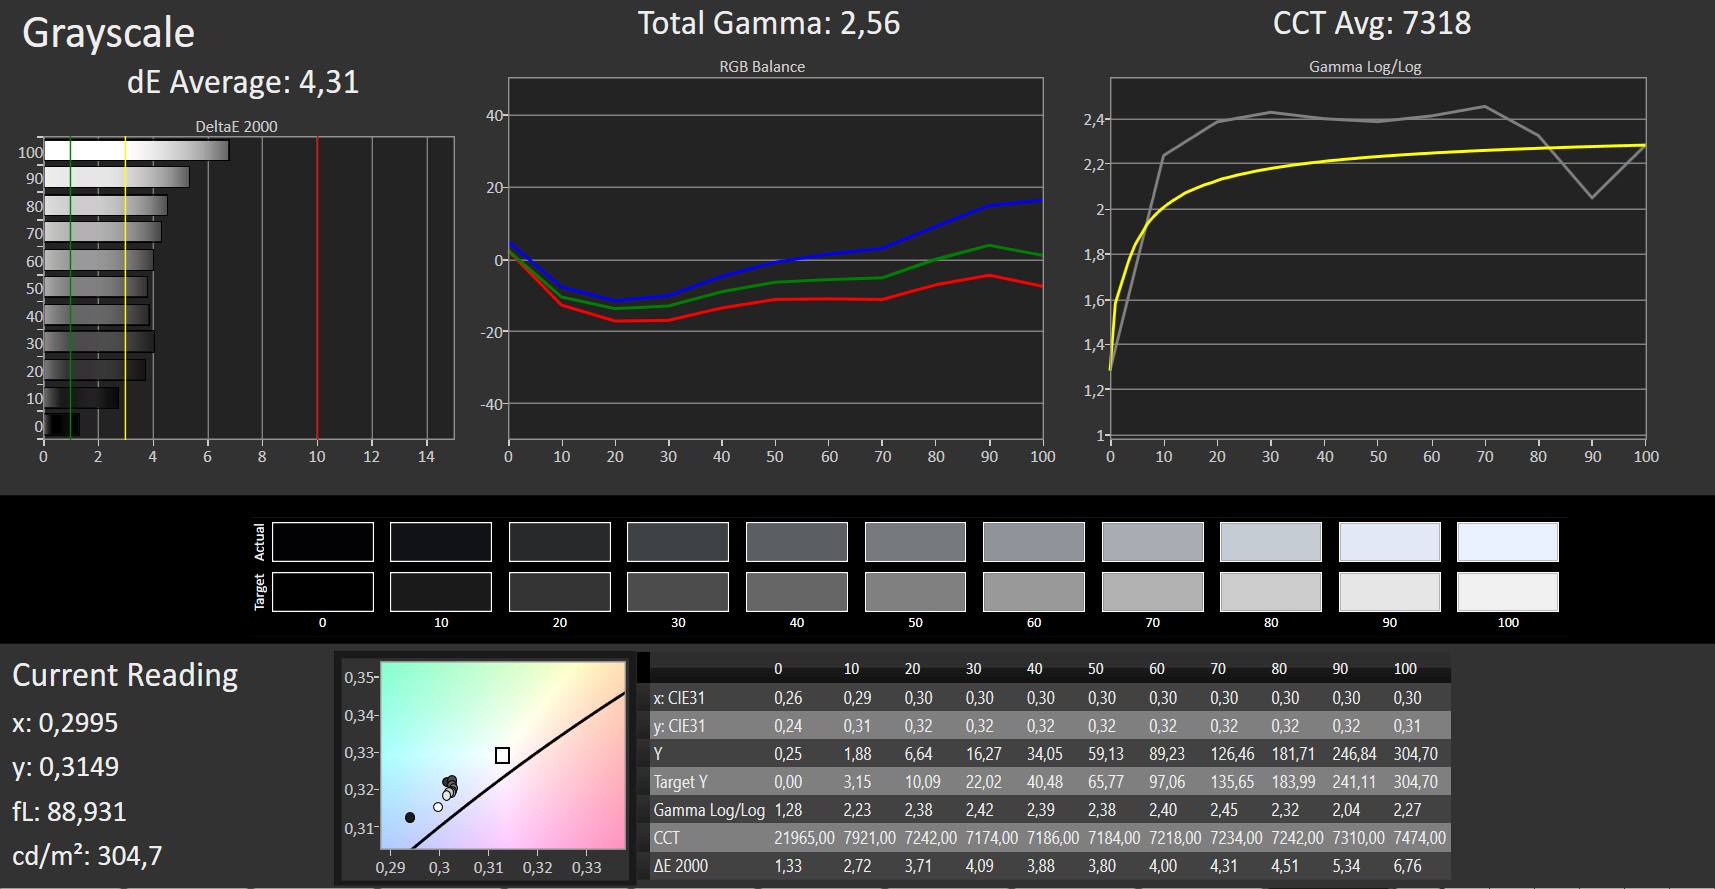
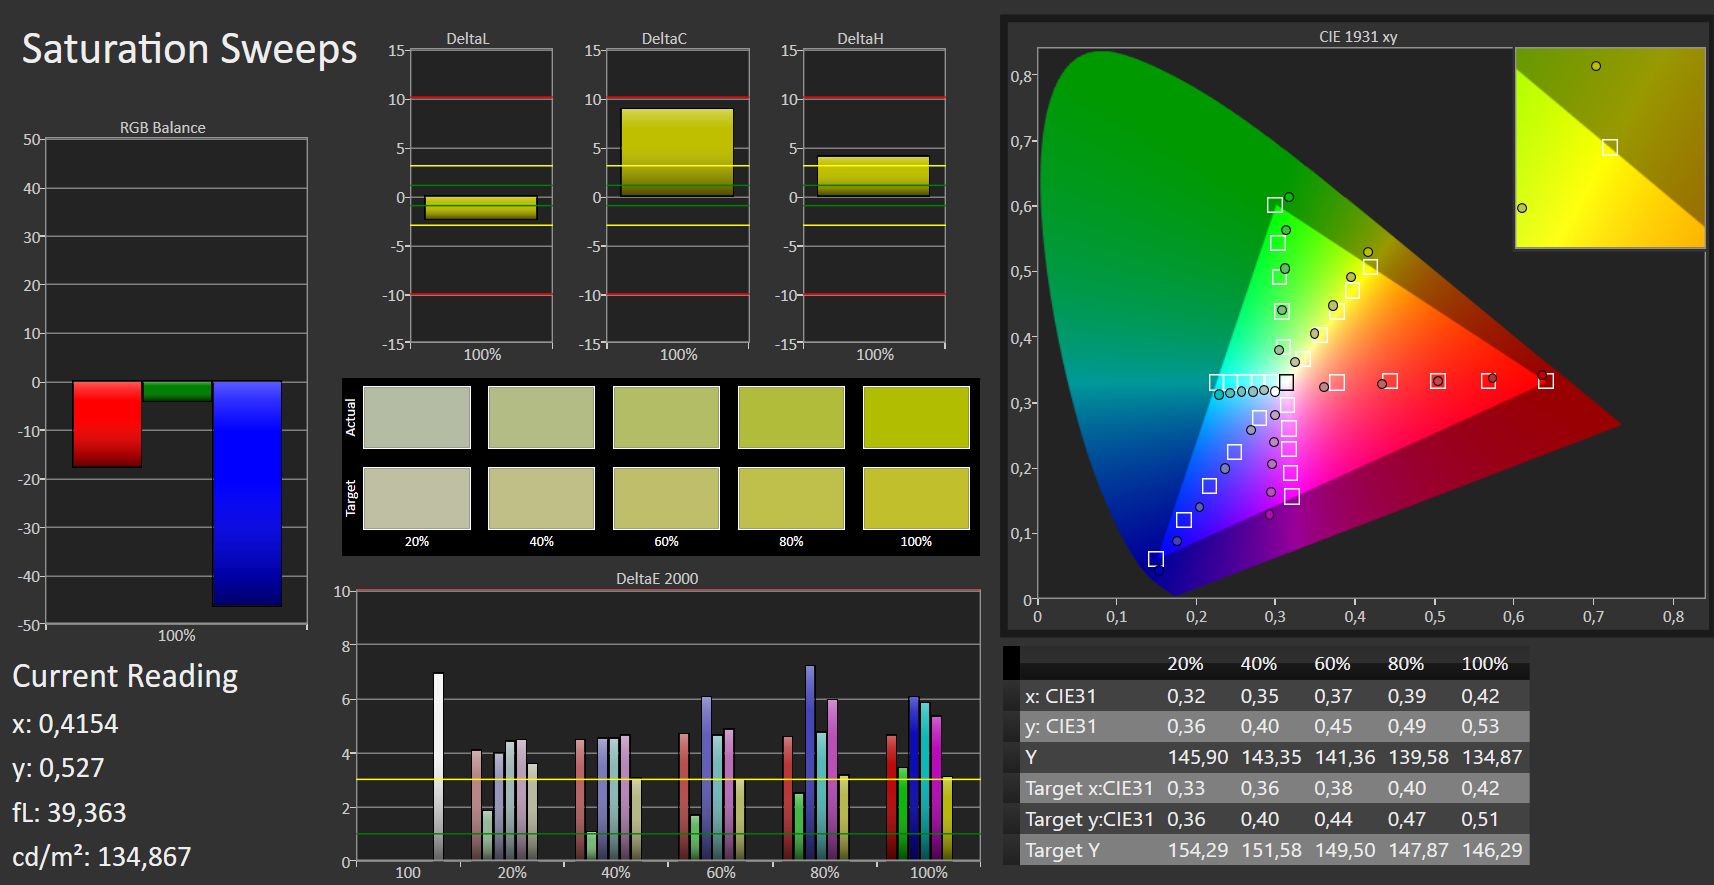
The matte 15.6-inch display of the Pavilion 15 has a native resolution of 1920x1080 pixels. While it offers a good contrast ratio (1,208:1), the brightness (290.7 cd/m²) - relative to the price of the laptop - is on the lower end. Here, we usually like to see values of 300 cd/m² or more. Positive: The display does not exhibit PWM flickering.


| |||||||||||||||||||||||||
Brightness Distribution: 84 %
Center on Battery: 302 cd/m²
Contrast: 1208:1 (Black: 0.25 cd/m²)
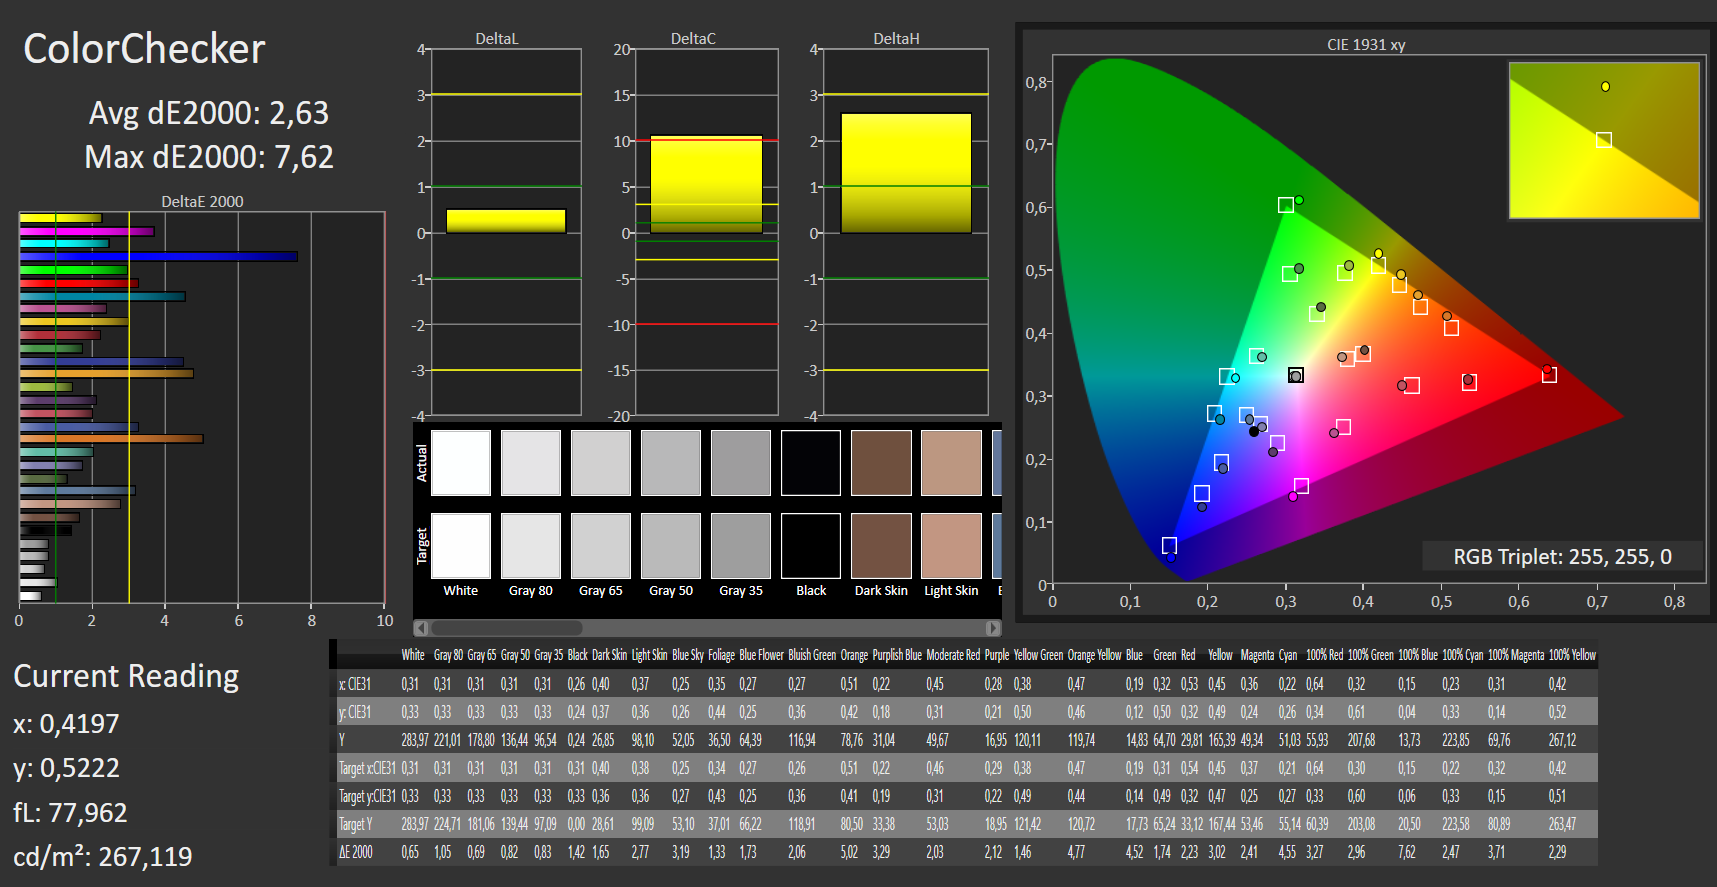
ΔE ColorChecker Calman: 4.84 | ∀{0.5-29.43 Ø4.73}
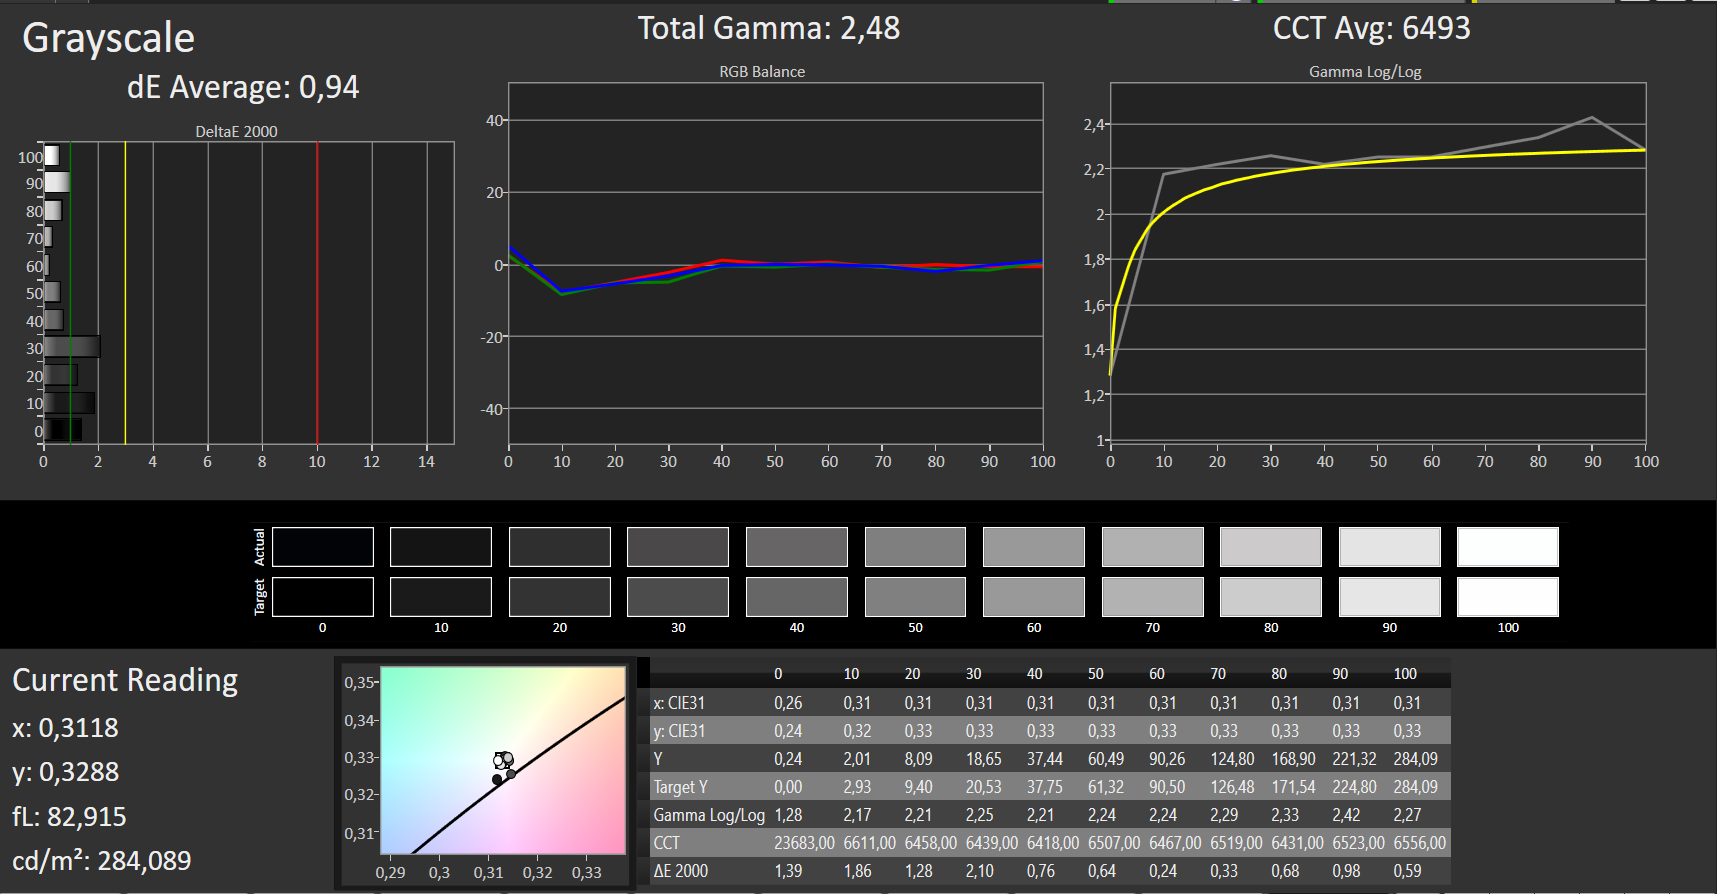
calibrated: 2.63
ΔE Greyscale Calman: 4.31 | ∀{0.09-98 Ø4.97}
89% sRGB (Argyll 1.6.3 3D)
58% AdobeRGB 1998 (Argyll 1.6.3 3D)
63.8% AdobeRGB 1998 (Argyll 3D)
89.2% sRGB (Argyll 3D)
62.8% Display P3 (Argyll 3D)
Gamma: 2.56
CCT: 7318 K
| HP Pavilion Gaming 15-ec0017ng IPS, 1920x1080, 15.6" | HP Gaming Pavilion 15-dk0009ng IPS, 1920x1080, 15.6" | Dell G5 15 5590-PCNJJ IPS, 1920x1080, 15.6" | Lenovo Legion Y540-15IRH-81SX00B2GE IPS, 1920x1080, 15.6" | Acer Aspire Nitro 5 AN515-54-53Z2 IPS, 1920x1080, 15.6" | |
|---|---|---|---|---|---|
| Display | 4% | 32% | 2% | -38% | |
| Display P3 Coverage (%) | 62.8 | 64.2 2% | 83.1 32% | 63.6 1% | 37.97 -40% |
| sRGB Coverage (%) | 89.2 | 95.1 7% | 99.9 12% | 91.7 3% | 57 -36% |
| AdobeRGB 1998 Coverage (%) | 63.8 | 65.8 3% | 96.8 52% | 65.2 2% | 39.23 -39% |
| Response Times | 62% | -12% | 69% | 2% | |
| Response Time Grey 50% / Grey 80% * (ms) | 40 ? | 16.4 ? 59% | 48 ? -20% | 8.8 ? 78% | 42 ? -5% |
| Response Time Black / White * (ms) | 29 ? | 10.4 ? 64% | 30 ? -3% | 12 ? 59% | 26.8 ? 8% |
| PWM Frequency (Hz) | |||||
| Screen | 19% | -22% | 4% | -10% | |
| Brightness middle (cd/m²) | 302 | 345 14% | 234 -23% | 299 -1% | 238 -21% |
| Brightness (cd/m²) | 291 | 324 11% | 216 -26% | 290 0% | 226 -22% |
| Brightness Distribution (%) | 84 | 86 2% | 87 4% | 89 6% | 83 -1% |
| Black Level * (cd/m²) | 0.25 | 0.42 -68% | 0.22 12% | 0.29 -16% | 0.27 -8% |
| Contrast (:1) | 1208 | 821 -32% | 1064 -12% | 1031 -15% | 881 -27% |
| Colorchecker dE 2000 * | 4.84 | 1.3 73% | 6.52 -35% | 3.7 24% | 4.11 15% |
| Colorchecker dE 2000 max. * | 8.18 | 2.8 66% | 10.58 -29% | 7 14% | 6.89 16% |
| Colorchecker dE 2000 calibrated * | 2.63 | 1.1 58% | 3.56 -35% | 2 24% | 3.76 -43% |
| Greyscale dE 2000 * | 4.31 | 1.2 72% | 5.33 -24% | 4.1 5% | 1.78 59% |
| Gamma | 2.56 86% | 2.31 95% | 2.86 77% | 2.19 100% | 2.41 91% |
| CCT | 7318 89% | 6476 100% | 5983 109% | 7166 91% | 6311 103% |
| Color Space (Percent of AdobeRGB 1998) (%) | 58 | 60.5 4% | 36 -38% | 59.3 2% | 36 -38% |
| Color Space (Percent of sRGB) (%) | 89 | 94.9 7% | 57 -36% | 91.5 3% | 57 -36% |
| Total Average (Program / Settings) | 28% /
21% | -1% /
-11% | 25% /
12% | -15% /
-14% |
* ... smaller is better
We were able to measure a DeltaE2000 color deviation value of 4.84 ex-factory. Hence, the display misses the target value (DeltaE of less than 3). A calibration attempt addresses this directly and slightly improves the display's accuracy. The calibration produces a lower color deviation of 2.63 and a more balanced grayscale. The display does not fully cover the AdobeRGB (58%) or sRGB (89%) color spaces.
Display Response Times
| ↔ Response Time Black to White | ||
|---|---|---|
| 29 ms ... rise ↗ and fall ↘ combined | ↗ 16 ms rise | 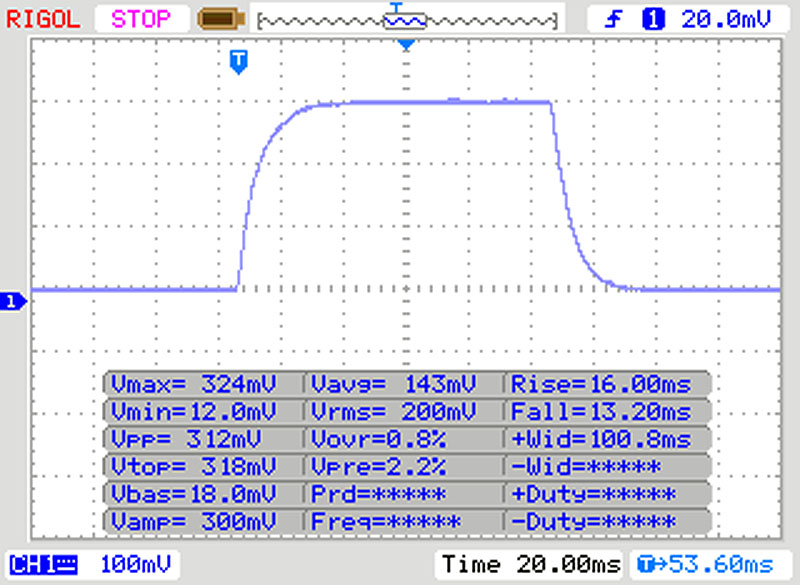 |
| ↘ 13 ms fall | ||
| The screen shows relatively slow response rates in our tests and may be too slow for gamers. In comparison, all tested devices range from 0.1 (minimum) to 240 (maximum) ms. » 77 % of all devices are better. This means that the measured response time is worse than the average of all tested devices (19.9 ms). | ||
| ↔ Response Time 50% Grey to 80% Grey | ||
| 40 ms ... rise ↗ and fall ↘ combined | ↗ 19 ms rise | 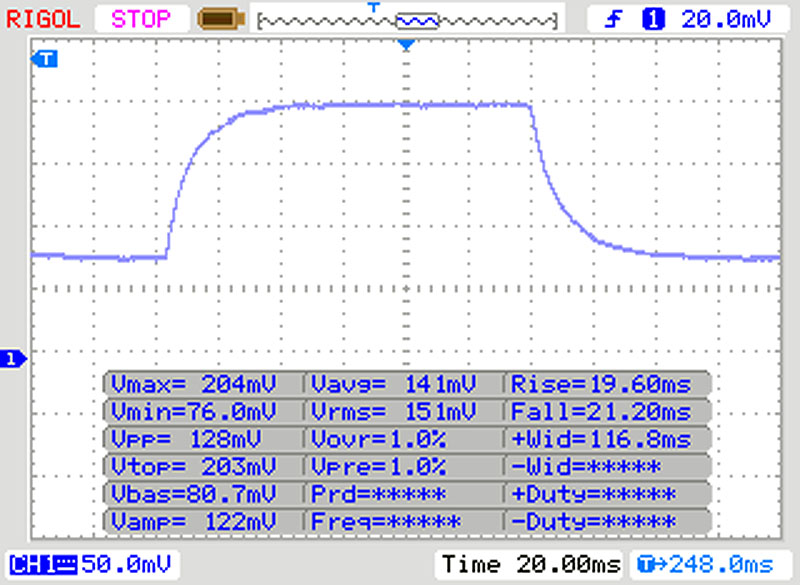 |
| ↘ 21 ms fall | ||
| The screen shows slow response rates in our tests and will be unsatisfactory for gamers. In comparison, all tested devices range from 0.165 (minimum) to 636 (maximum) ms. » 61 % of all devices are better. This means that the measured response time is worse than the average of all tested devices (31.1 ms). | ||
Screen Flickering / PWM (Pulse-Width Modulation)
| Screen flickering / PWM not detected |  | ||
In comparison: 52 % of all tested devices do not use PWM to dim the display. If PWM was detected, an average of 7801 (minimum: 5 - maximum: 343500) Hz was measured. | |||
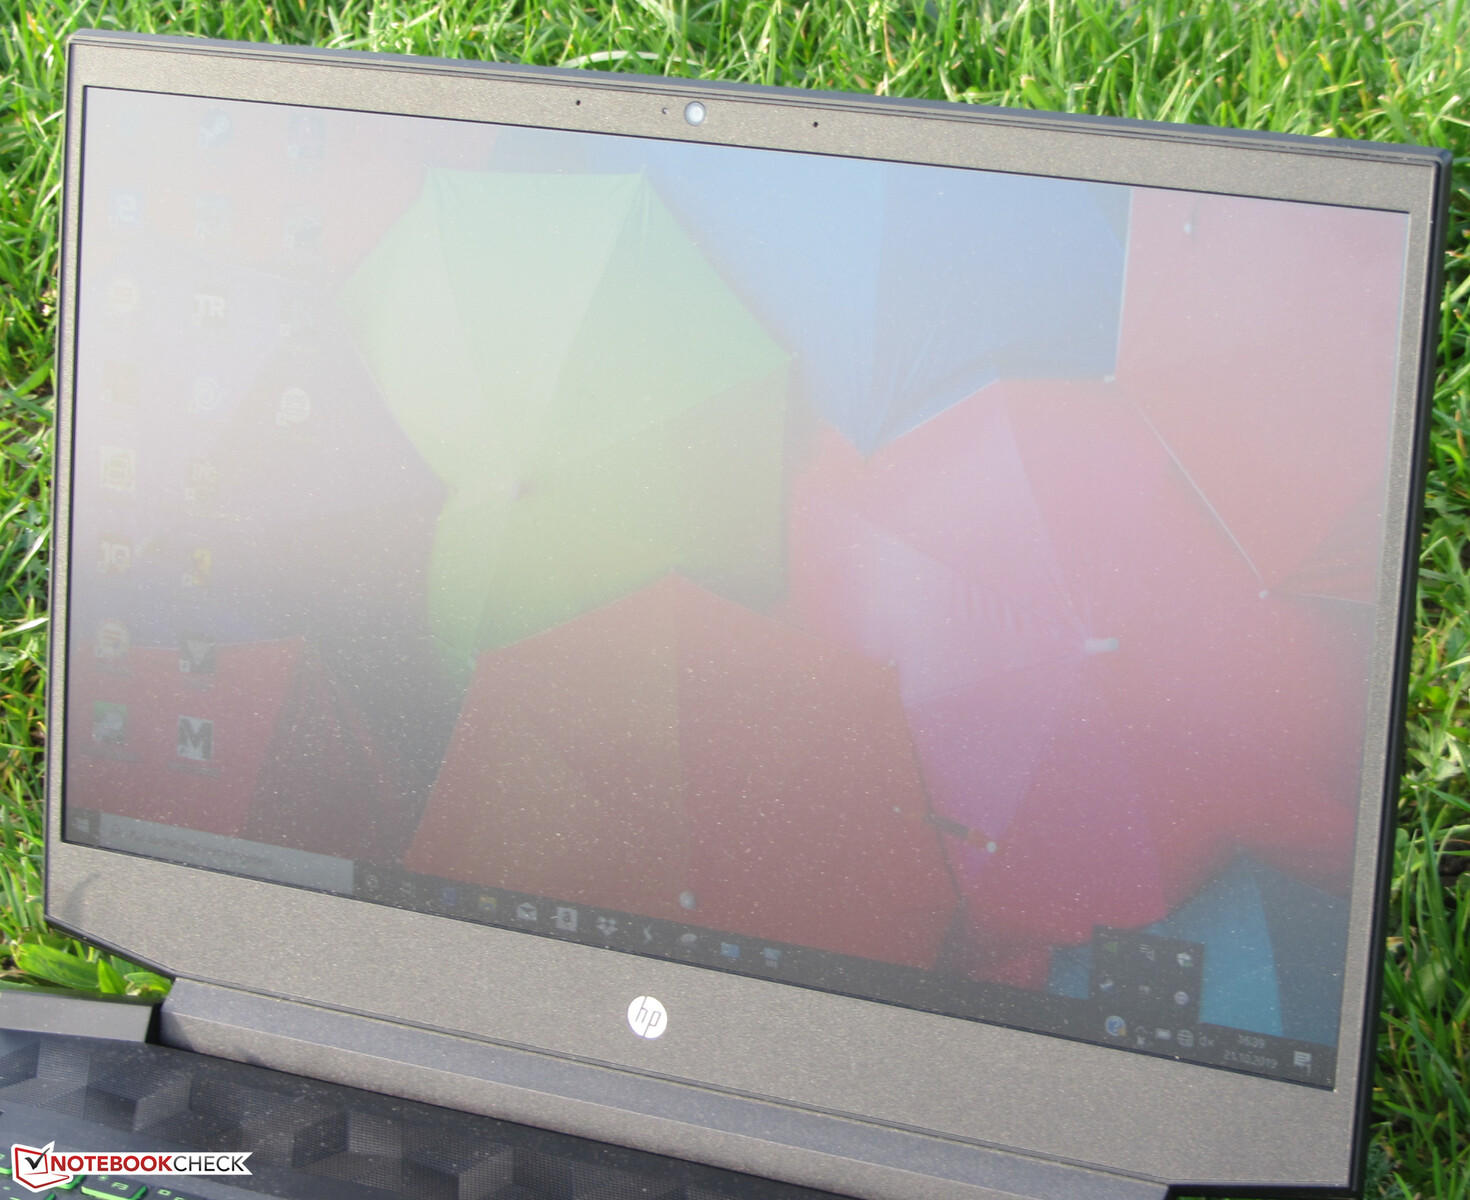
HP fits the 15.6-inch laptop with an IPS panel that offers good viewing angles. This allows users to read the screen's content from any position they choose. Outdoors, the screen's content is only discernible when the sun does not shine too brightly.

Performance - HP Laptop with Midrange Hardware
HP's 15.6-inch gaming laptop is able to display all of the latest titles smoothly, while also creating good impressions in other areas of application. Our test model can be purchased for about 1,150 Euros (~$1,276). Other configurations are available as well. The base model starts at 650 Euros (~$721) and comes with a Ryzen 5 3550H APU and a GeForce GTX 1050 GPU.
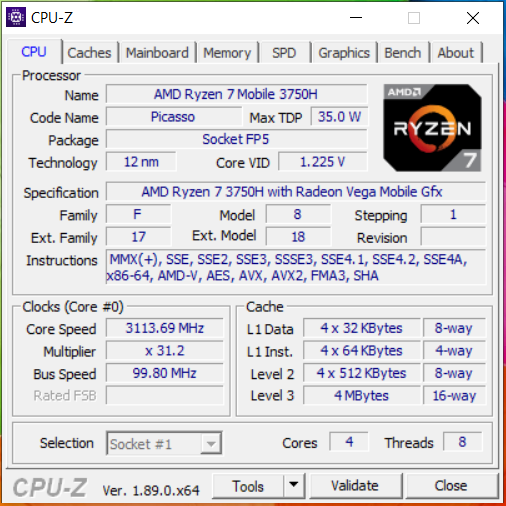

Processor
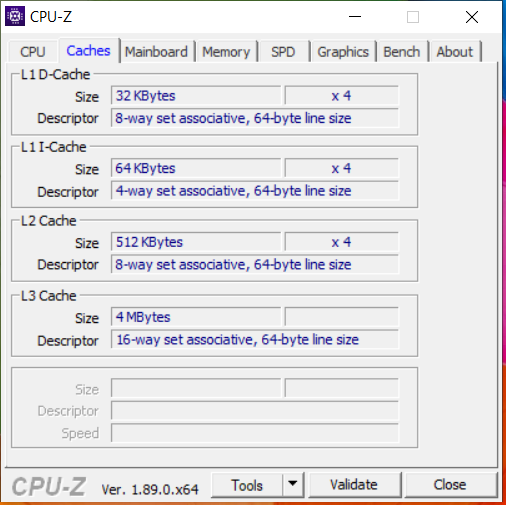
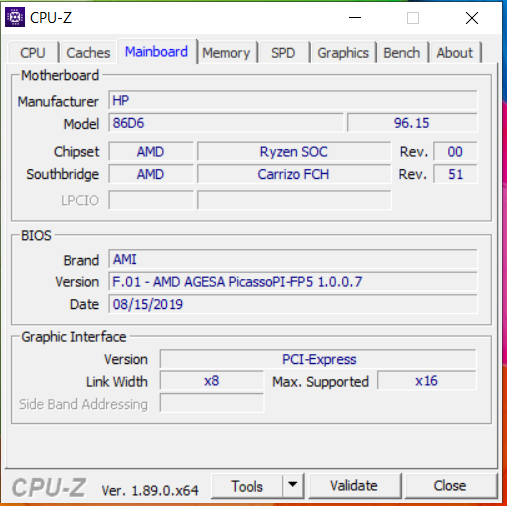
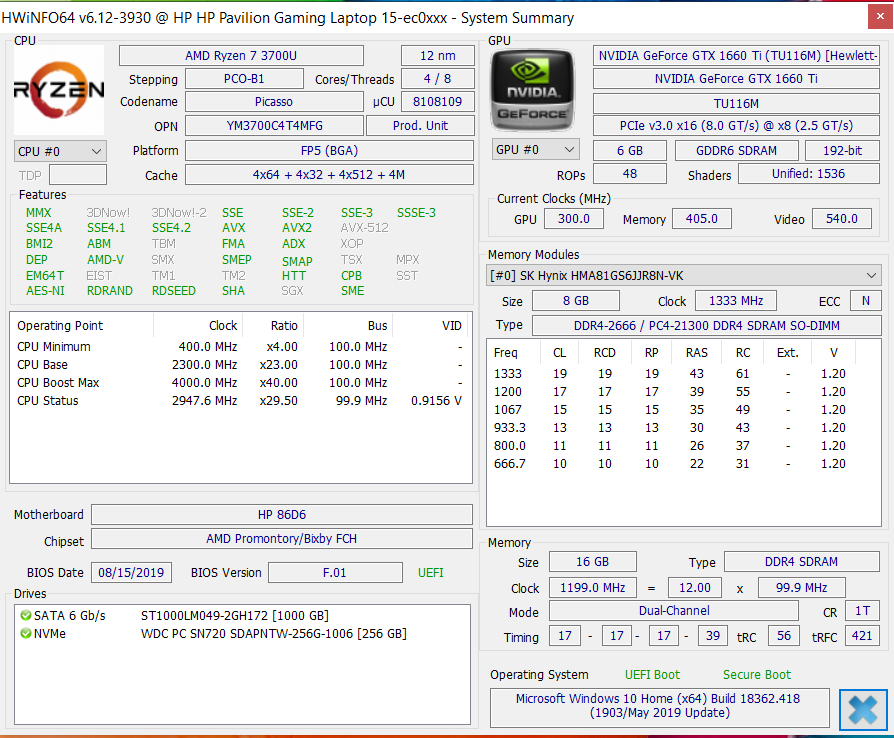
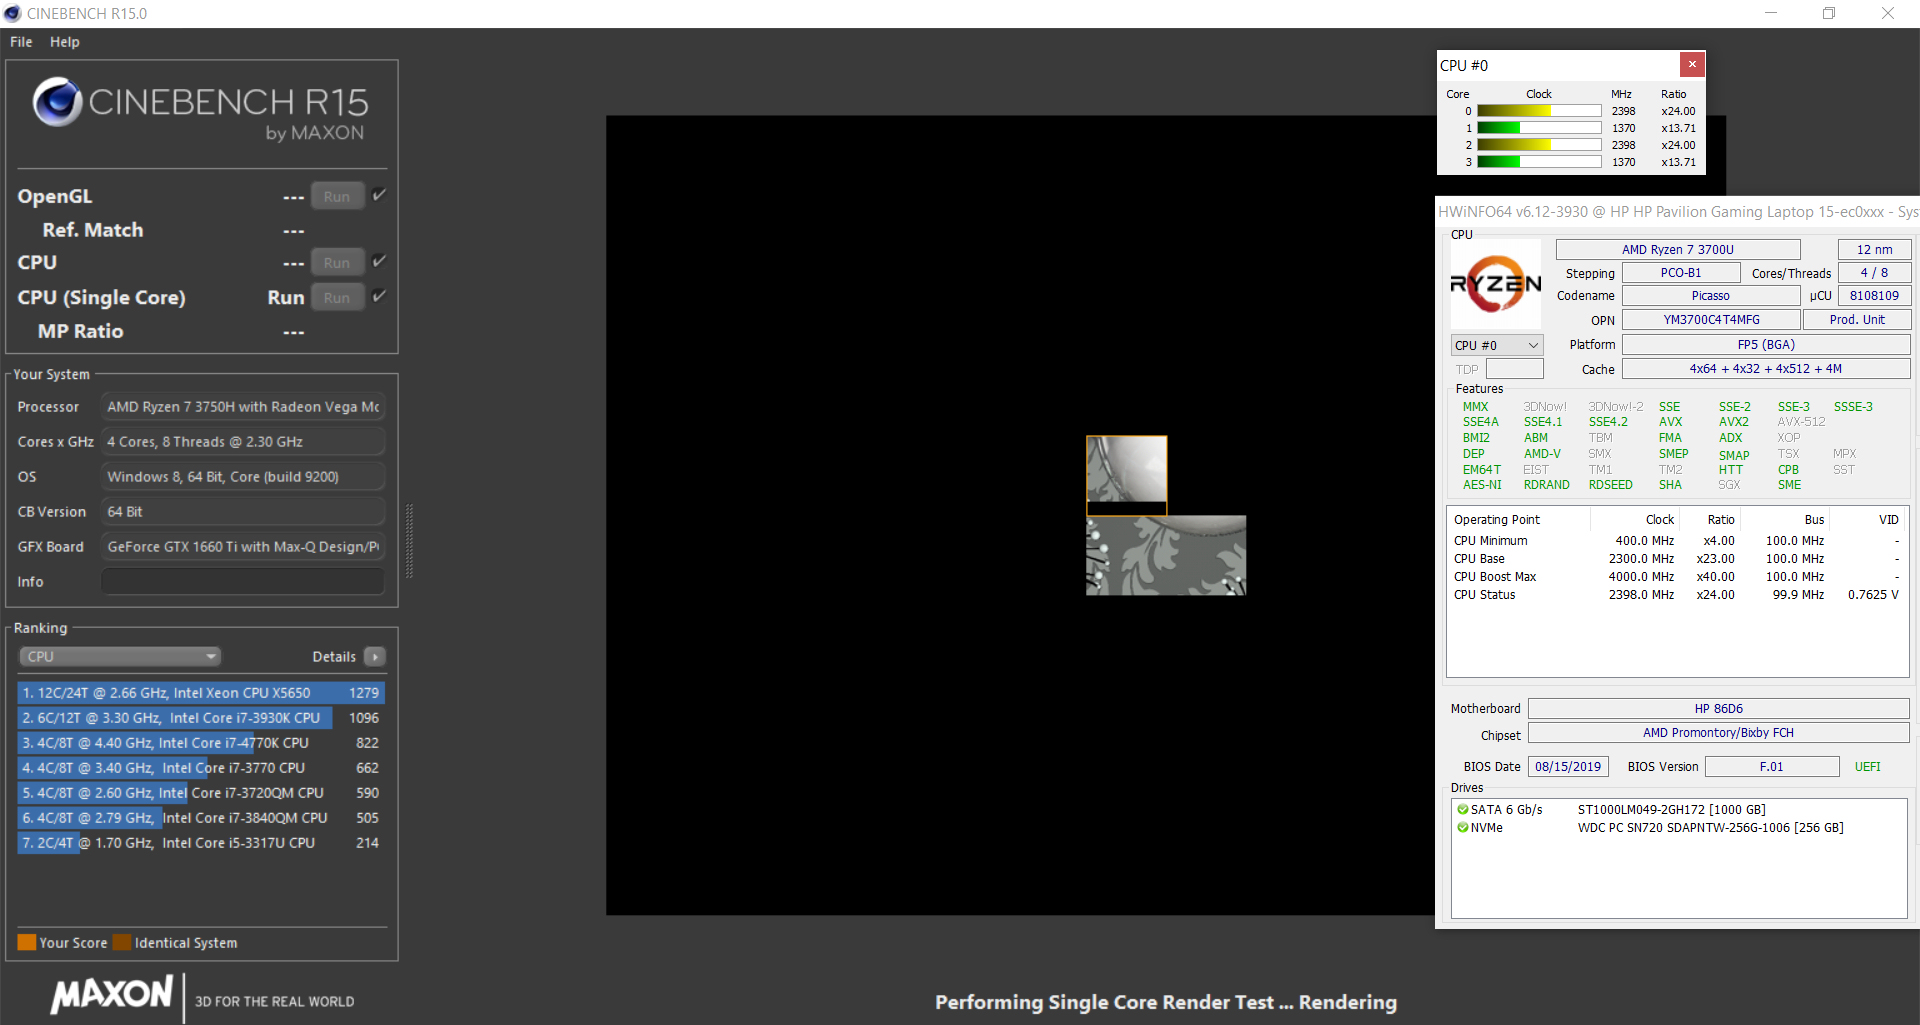
The Pavilion is powered by a Ryzen 7 3750H (Picasso) APU from AMD. The CPU part of the APU contains a four-core processor with a base clock frequency of 2.3 GHz. An increase to up to 4 GHz is possible via Turbo.
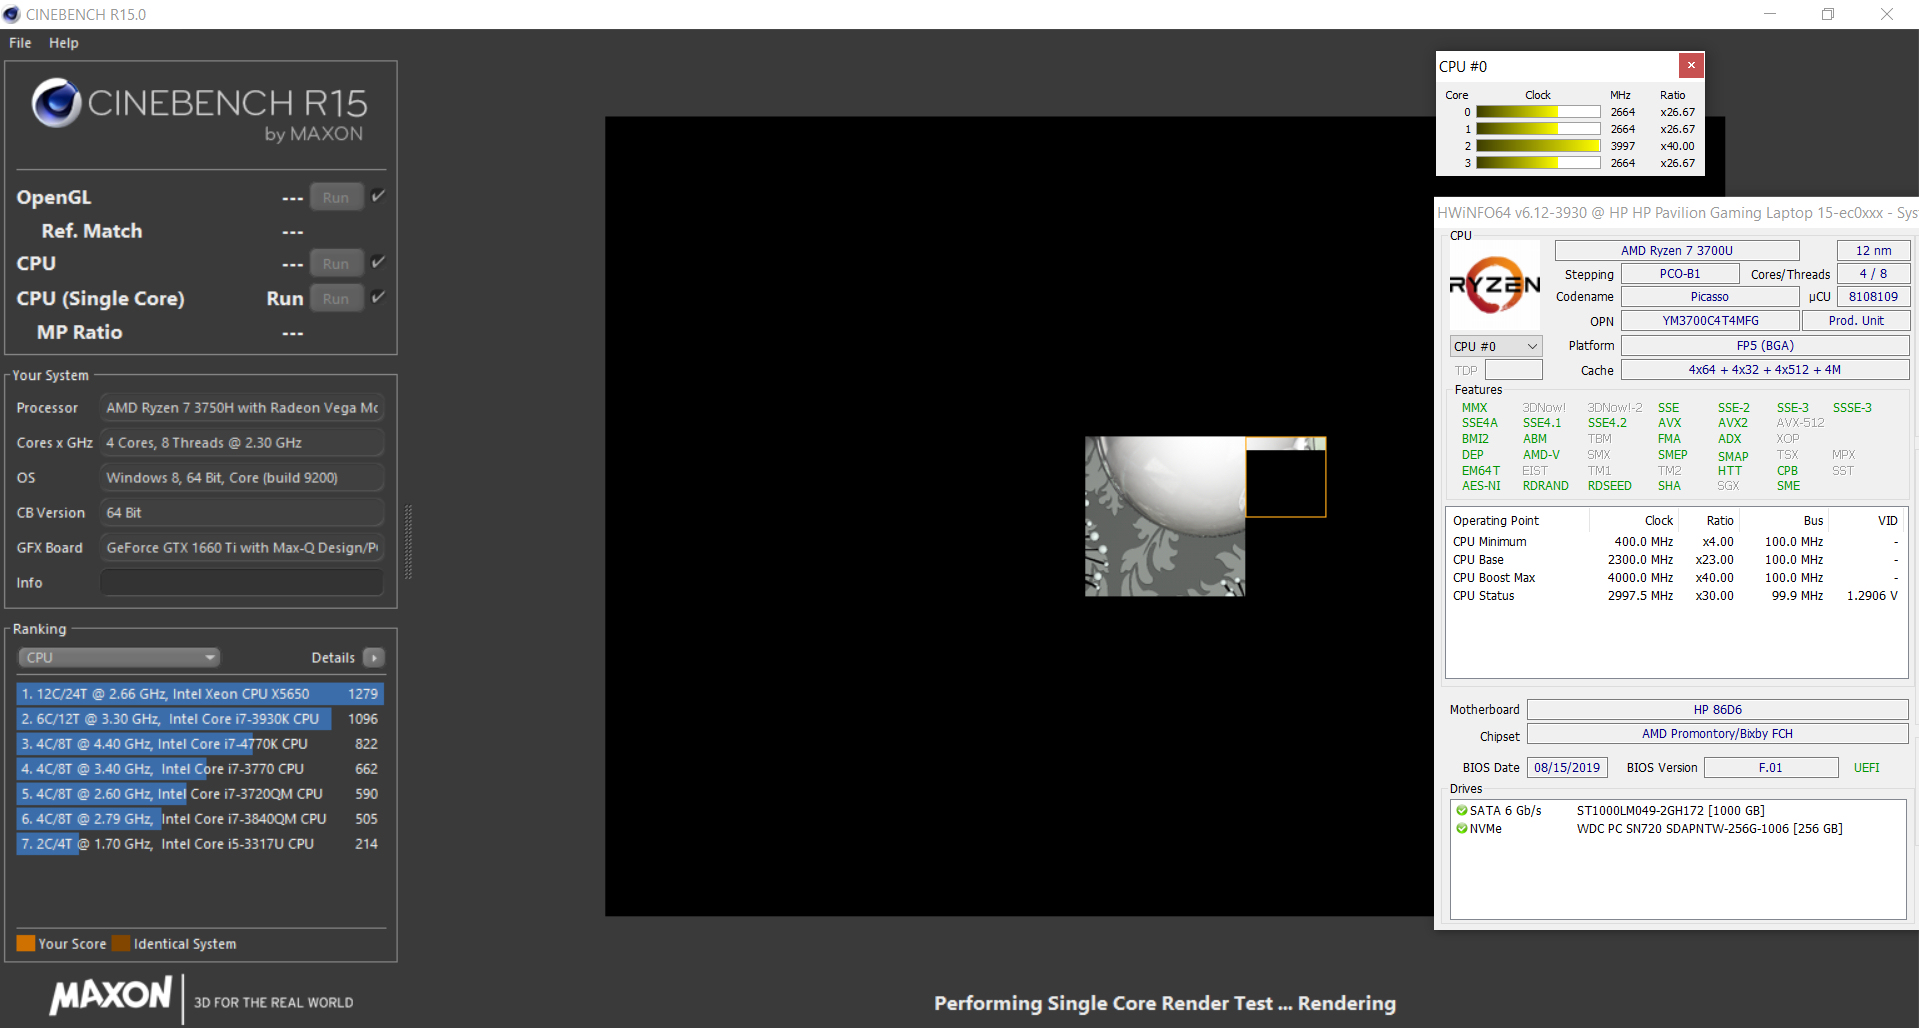
At the start of the Cinebench multithread test, the processor runs at 3.8 to 3.9 GHz. Afterwards, the clock speed falls to 3.6 to 3.7 GHz. During the single-thread tests, the clock speeds range from 2.7 to 4 GHz. The aforementioned values assume that the laptop is connected to a power supply. In battery mode, the multithread tests temporarily run at 2.4 GHz. The processor then accelerates to 3 to 3.1 GHz. During single-thread tests, the clock speeds range from 1.4 to 2.4 GHz.
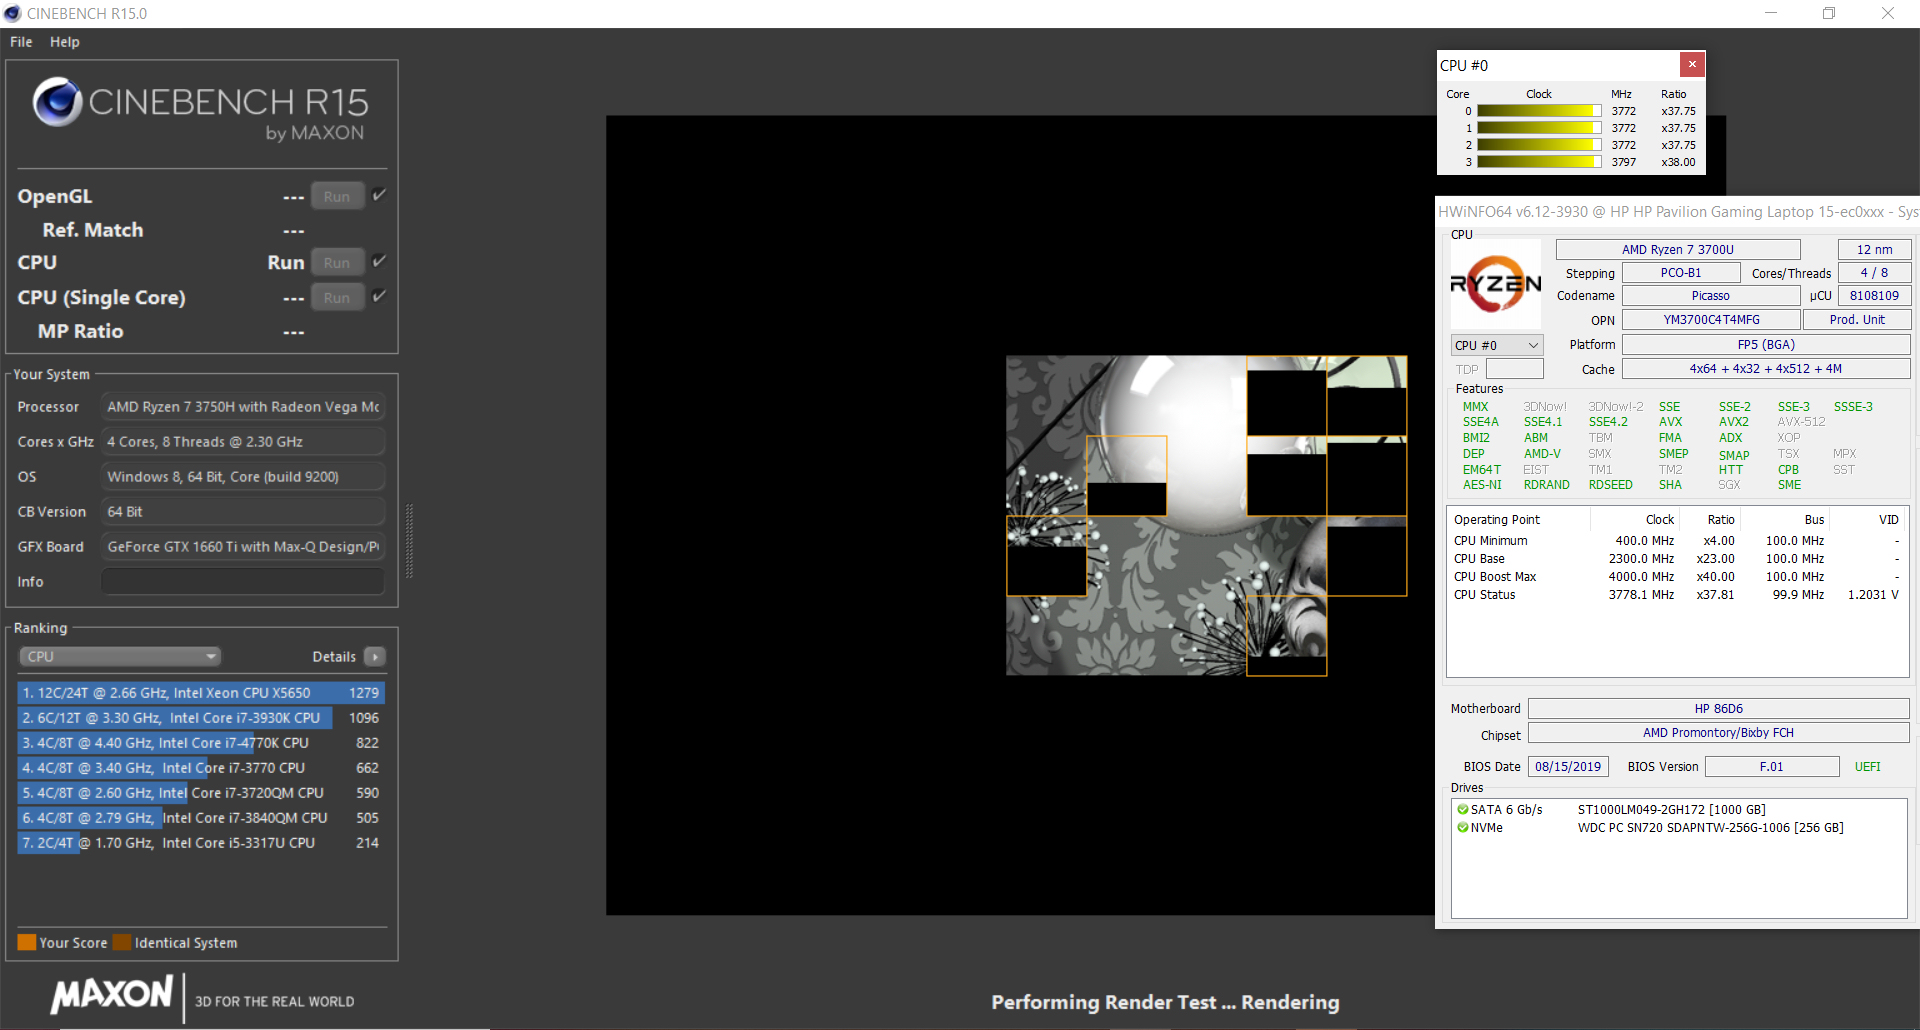
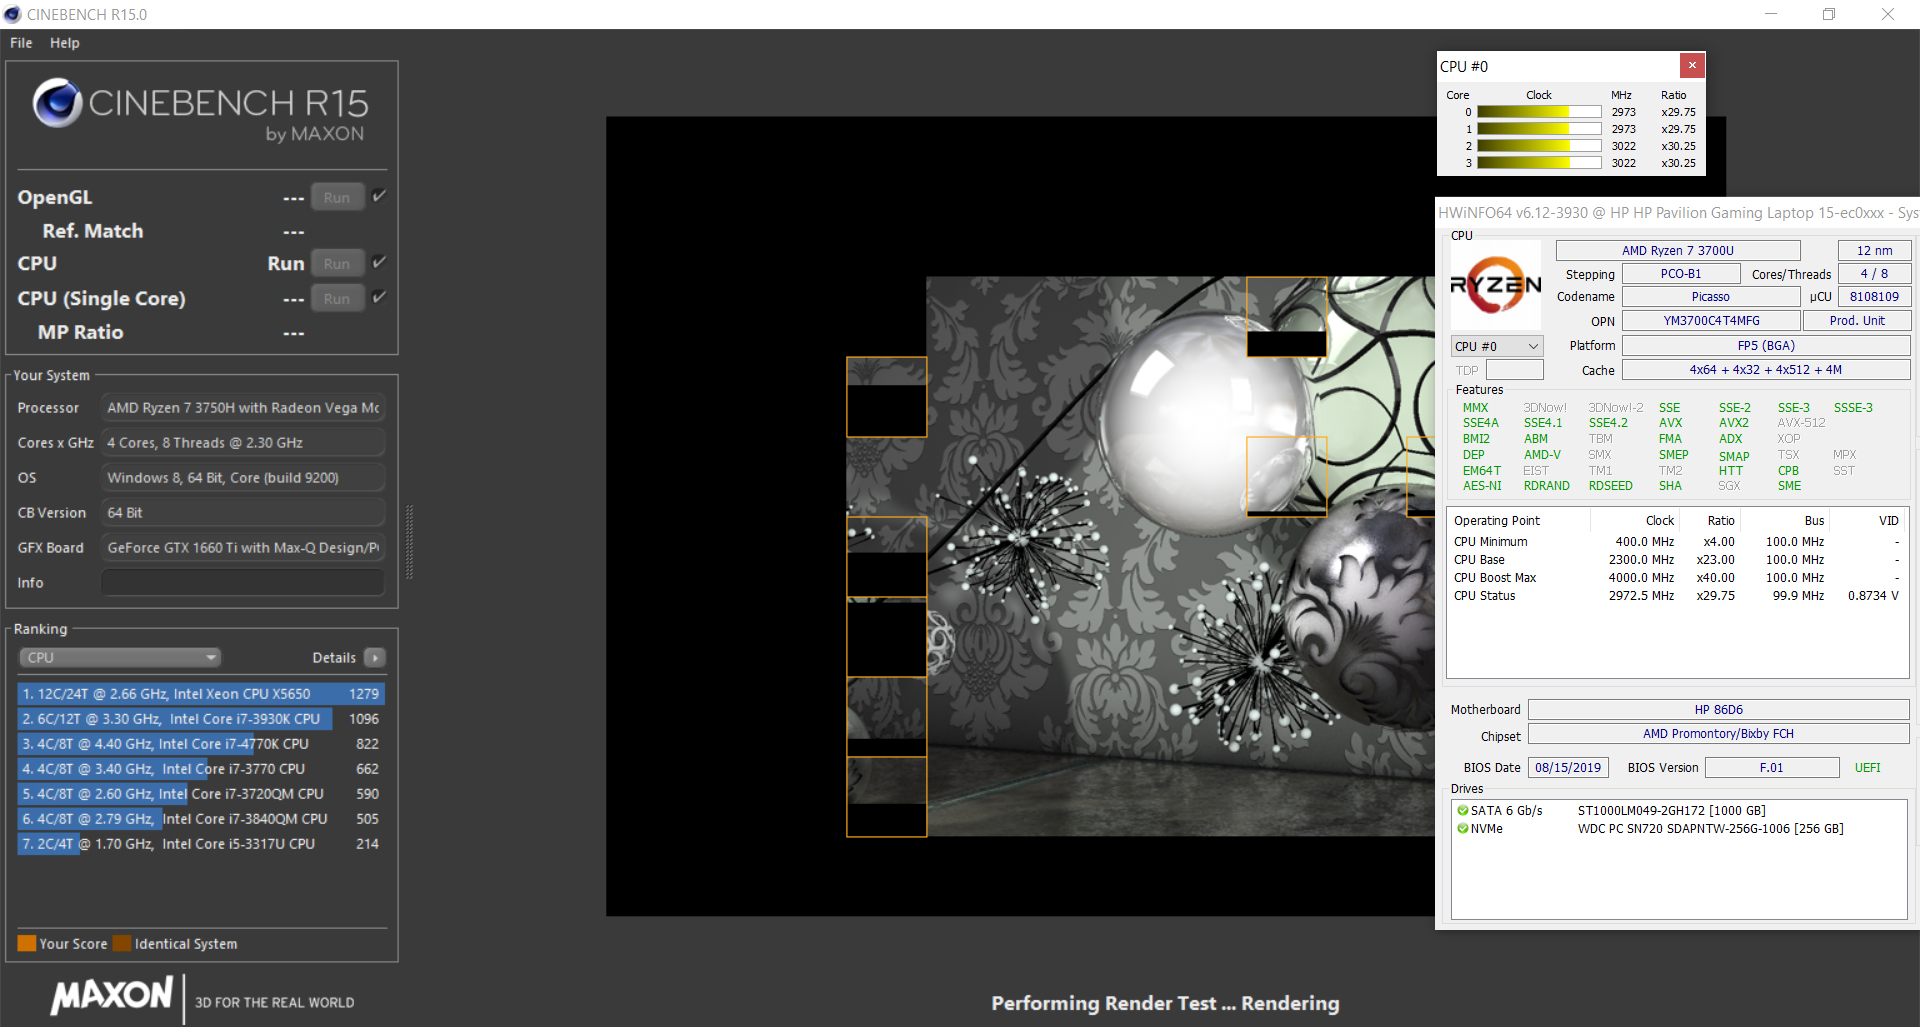
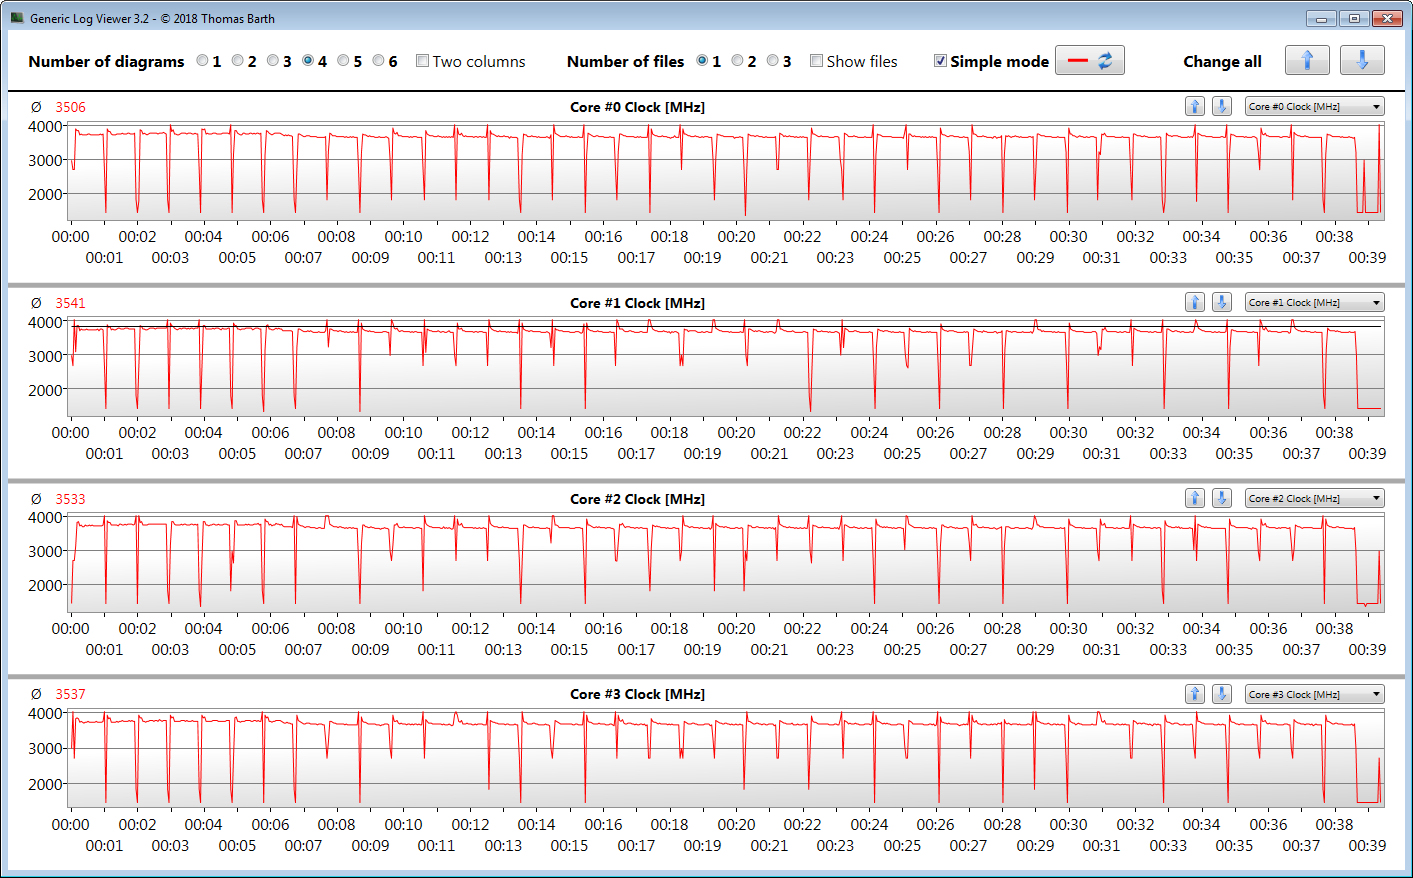
By running the multithread test of Cinebench's R15 benchmark in a loop for at least 30 minutes, we ascertain whether the CPU Turbo is permanently active while the laptop is on mains. The scores drop slightly by the eighth loop and stay on a constant level for the remainder of the test. Meanwhile, the CPU Turbo is active.
| Geekbench 3 | |
| 32 Bit Multi-Core Score | |
| HP Gaming Pavilion 15-dk0009ng | |
| HP Pavilion Gaming 15-ec0017ng | |
| Average AMD Ryzen 7 3750H (14478 - 15019, n=2) | |
| 32 Bit Single-Core Score | |
| HP Gaming Pavilion 15-dk0009ng | |
| HP Pavilion Gaming 15-ec0017ng | |
| Average AMD Ryzen 7 3750H (3717 - 3819, n=2) | |
| Mozilla Kraken 1.1 - Total | |
| Lenovo Legion Y540-15IRH-81SX00B2GE | |
| Asus TUF FX505DY (Edge 44.17763.1.0) | |
| Average AMD Ryzen 7 3750H (1132 - 1228, n=4) | |
| Asus TUF FX505DT-EB73 (Edge 44.17763.1.0) | |
| HP Pavilion Gaming 15-ec0017ng (Edge 44) | |
| HP Gaming Pavilion 15-dk0009ng (Edge 44) | |
| Average of class Gaming (391 - 590, n=106, last 2 years) | |
| Octane V2 - Total Score | |
| Average of class Gaming (87588 - 139447, n=31, last 2 years) | |
| HP Gaming Pavilion 15-dk0009ng (Edge 44) | |
| Lenovo Legion Y540-15IRH-81SX00B2GE | |
| HP Pavilion Gaming 15-ec0017ng (Edge 44) | |
| Asus TUF FX505DT-EB73 (Edge 44.17763.1.0) | |
| Average AMD Ryzen 7 3750H (29949 - 30714, n=4) | |
| Asus TUF FX505DY (Edge 44.17763.1.0) | |
| JetStream 1.1 - 1.1 Total | |
| Average of class Gaming (518 - 647, n=6, last 2 years) | |
| HP Gaming Pavilion 15-dk0009ng (Edge 44) | |
| HP Pavilion Gaming 15-ec0017ng (Edge 44) | |
| Asus TUF FX505DT-EB73 (Edge 44.17763.1.0) | |
| Average AMD Ryzen 7 3750H (205 - 220, n=5) | |
| Lenovo Legion Y540-15IRH-81SX00B2GE | |
| Asus TUF FX505DY (Edge 44.17763.1.0) | |
* ... smaller is better
System Performance
The HP laptop offers enough performance for all common workloads. Furthermore, the dedicated graphics chip makes playing games possible. The system also achieves good results in the PCMark benchmarks. It runs quickly and smoothly and we did not encounter any issues.
| PCMark 8 Home Score Accelerated v2 | 3944 points | |
| PCMark 8 Creative Score Accelerated v2 | 3987 points | |
| PCMark 8 Work Score Accelerated v2 | 4967 points | |
| PCMark 10 Score | 4565 points | |
Help | ||
Storage Solution
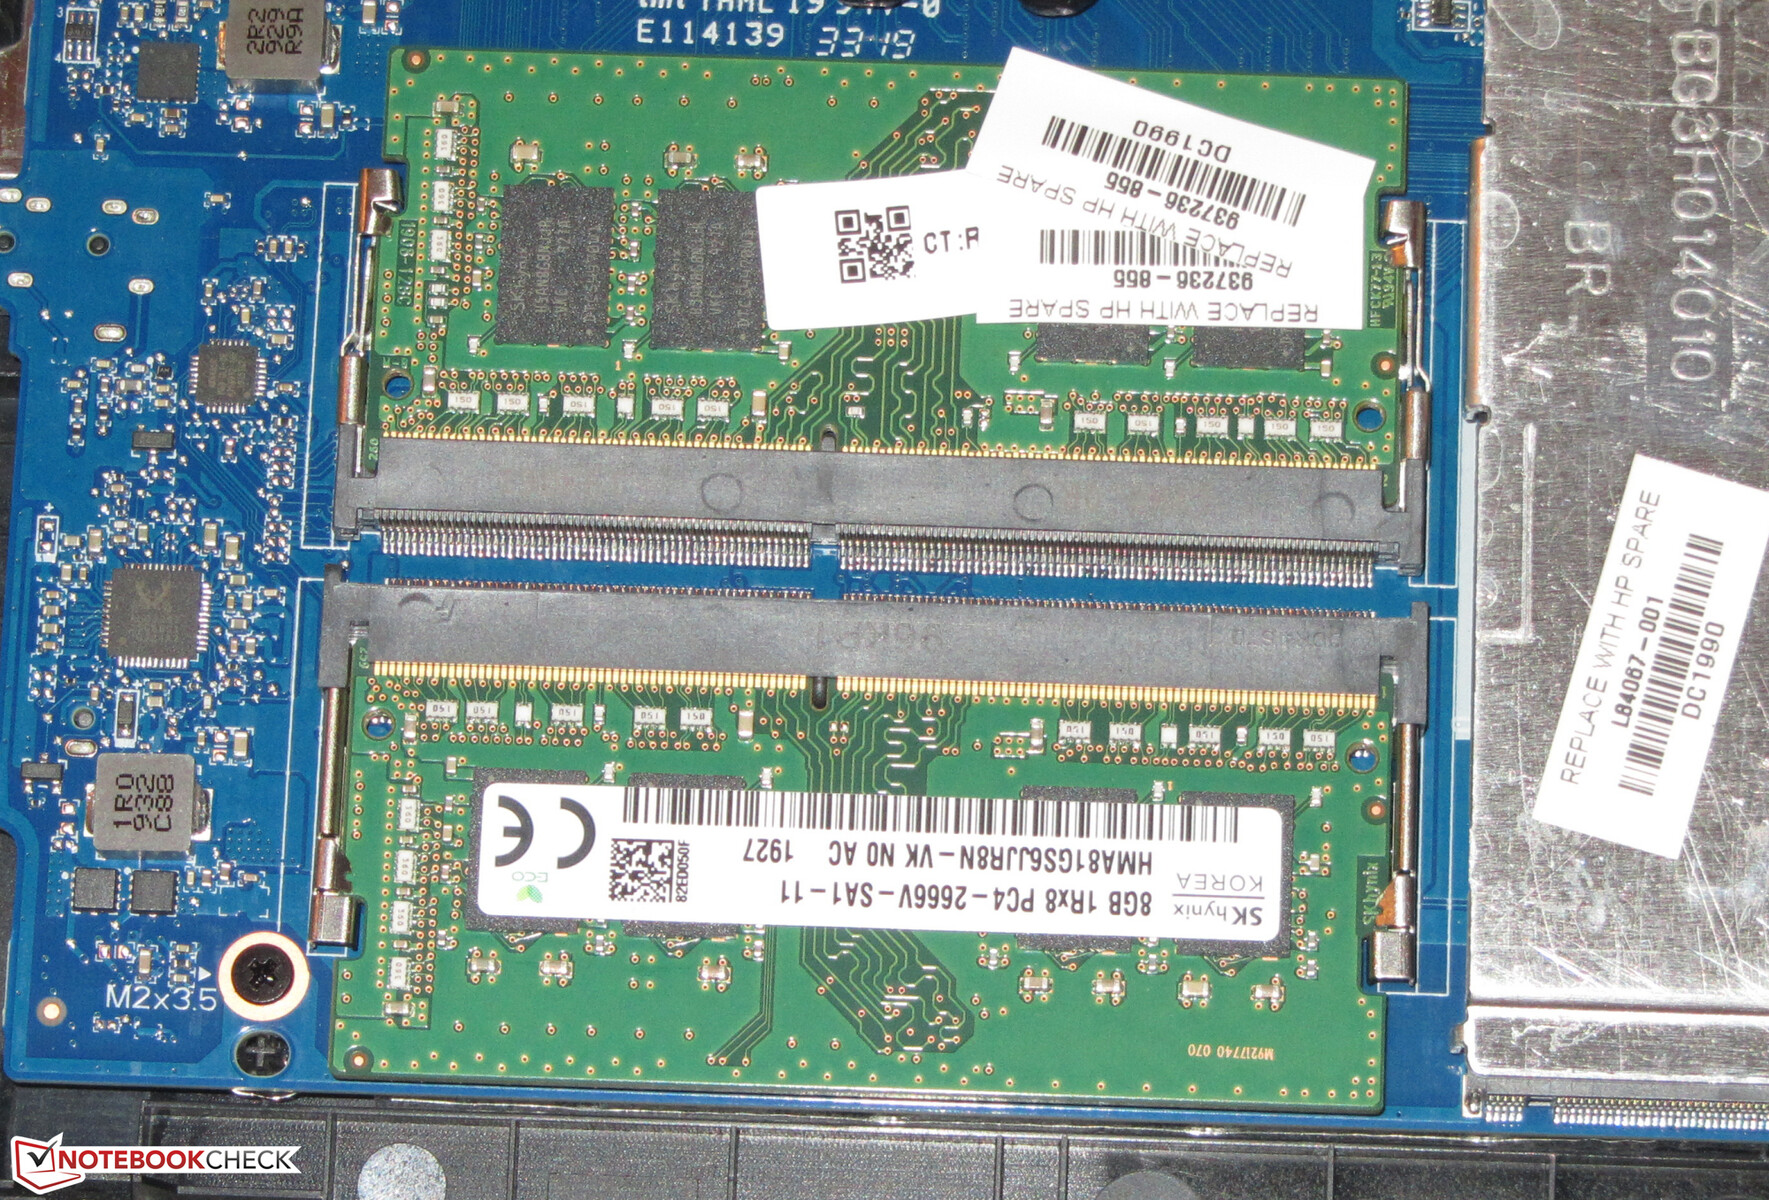
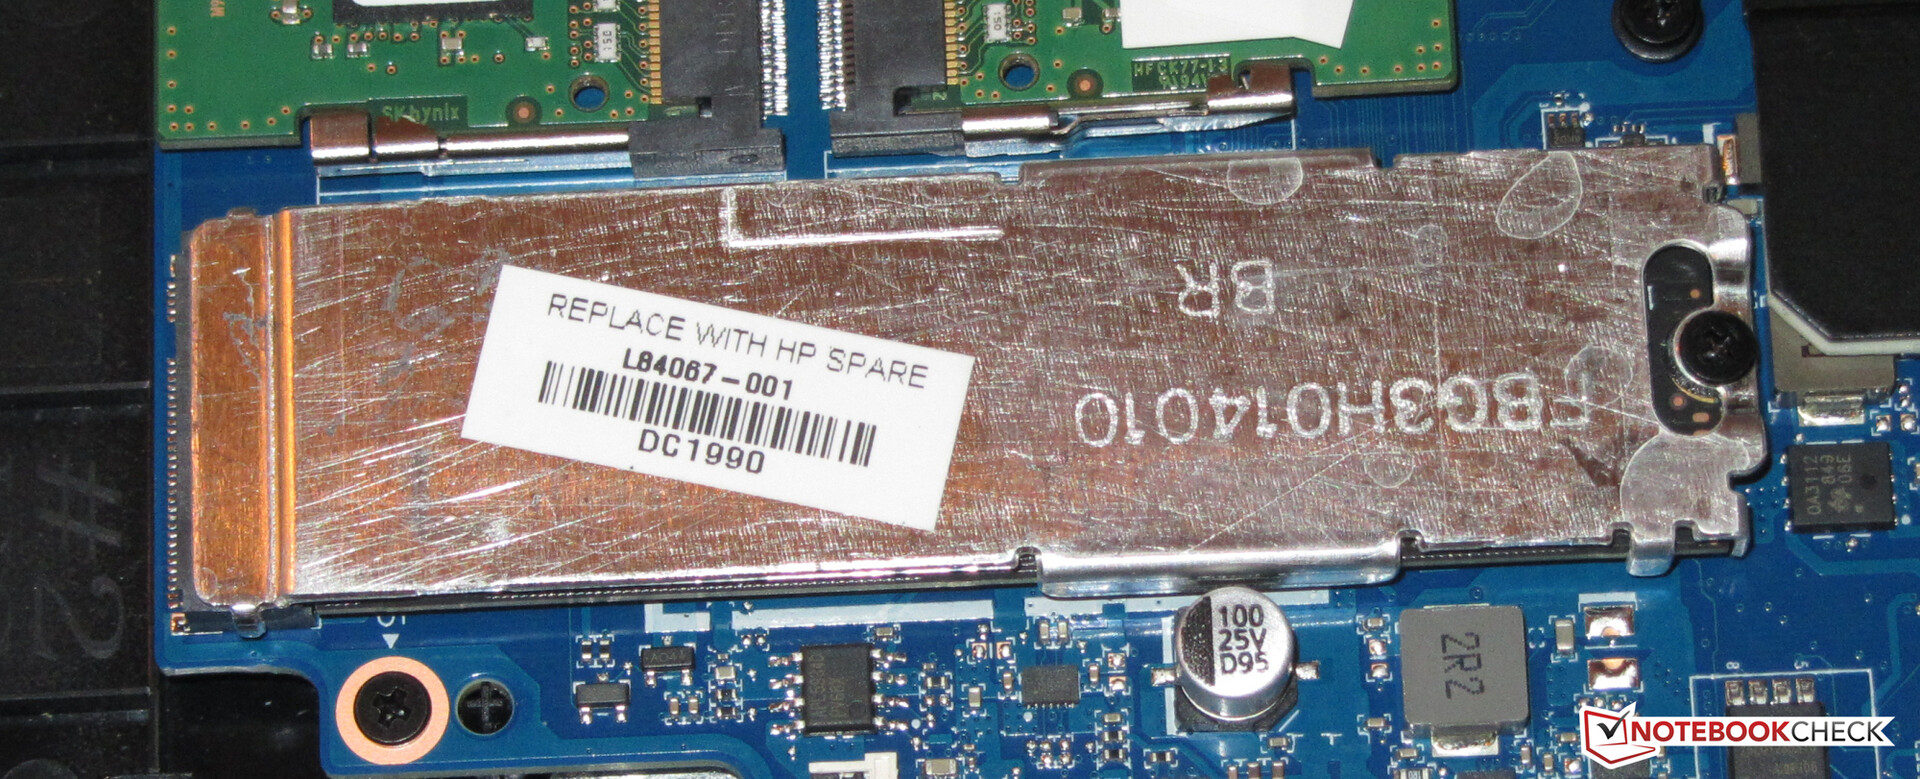
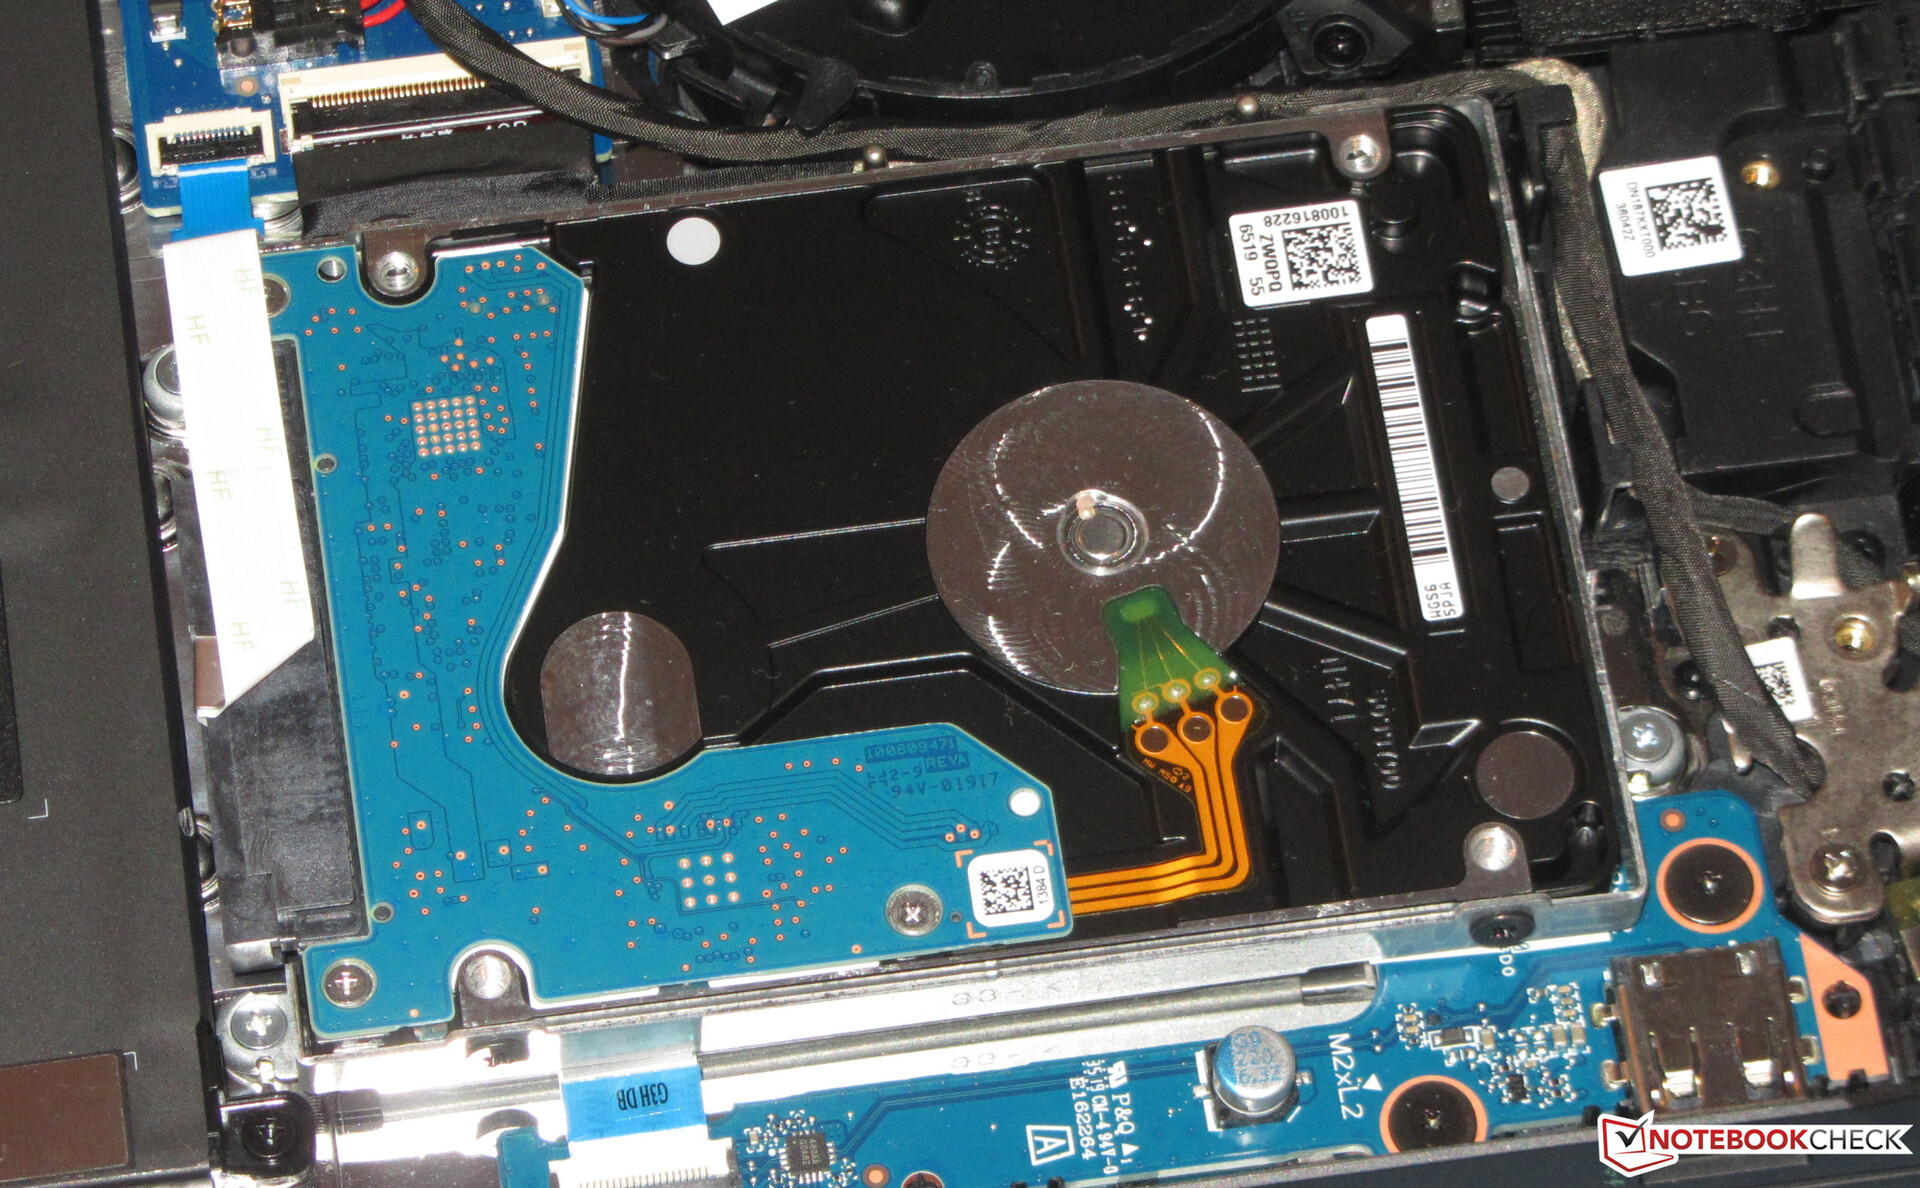
A Western Digital NVMe SSD (M.2-2280 form factor) serves as the system drive and offers a capacity of 256 GB (193 GB of which is available to users). The SSD's data transfer rates are good. An additional 2.5-inch hard drive (1 TB, 7200 RPM) ensures that the gaming laptop has enough storage space available.

| HP Pavilion Gaming 15-ec0017ng WDC PC SN720 SDAPNTW-256G | HP Gaming Pavilion 15-dk0009ng Samsung SSD PM981 MZVLB256HAHQ | Dell G5 15 5590-PCNJJ KBG30ZMS128G | Lenovo Legion Y540-15IRH-81SX00B2GE WDC PC SN720 SDAPNTW-512G | Acer Aspire Nitro 5 AN515-54-53Z2 WDC PC SN520 SDAPNUW-512G | Average WDC PC SN720 SDAPNTW-256G | |
|---|---|---|---|---|---|---|
| CrystalDiskMark 5.2 / 6 | -8% | -61% | 20% | -14% | 0% | |
| Write 4K (MB/s) | 148 | 100 -32% | 65.3 -56% | 158.8 7% | 109.1 -26% | 148 ? 0% |
| Read 4K (MB/s) | 43.73 | 31.39 -28% | 29.71 -32% | 29.11 -33% | 42.05 -4% | 43.7 ? 0% |
| Write Seq (MB/s) | 1617 | 1308 -19% | 128.8 -92% | 1584 -2% | 1457 -10% | 1617 ? 0% |
| Read Seq (MB/s) | 1753 | 1083 -38% | 859 -51% | 1694 -3% | 1421 -19% | 1753 ? 0% |
| Write 4K Q32T1 (MB/s) | 246.3 | 362.9 47% | 95.8 -61% | 536 118% | 287.8 17% | 246 ? 0% |
| Read 4K Q32T1 (MB/s) | 368 | 425.7 16% | 197.6 -46% | 363.9 -1% | 317.9 -14% | 368 ? 0% |
| Write Seq Q32T1 (MB/s) | 1618 | 1411 -13% | 132.5 -92% | 2536 57% | 1455 -10% | 1618 ? 0% |
| Read Seq Q32T1 (MB/s) | 3027 | 3240 7% | 1208 -60% | 3458 14% | 1739 -43% | 3027 ? 0% |
GPU Performance
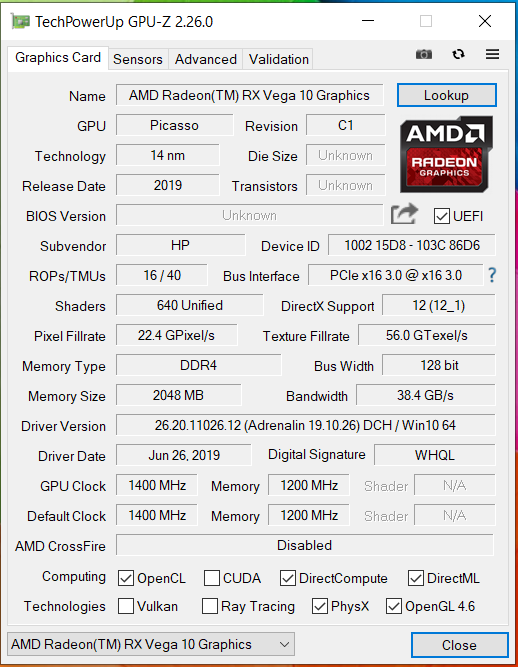
The GeForce GTX 1660 Ti Max-Q GPU (TDP: 60 watts) is a more energy-efficient version of the regular GTX 1660 Ti (TDP: 80 watts). The midrange GPU is based on the Turing architecture. As opposed to RTX-2000 series graphics chips, it lacks both ray-tracing and tensor cores. The GPU has access to fast GDDR6 graphics memory (6,144 GB).
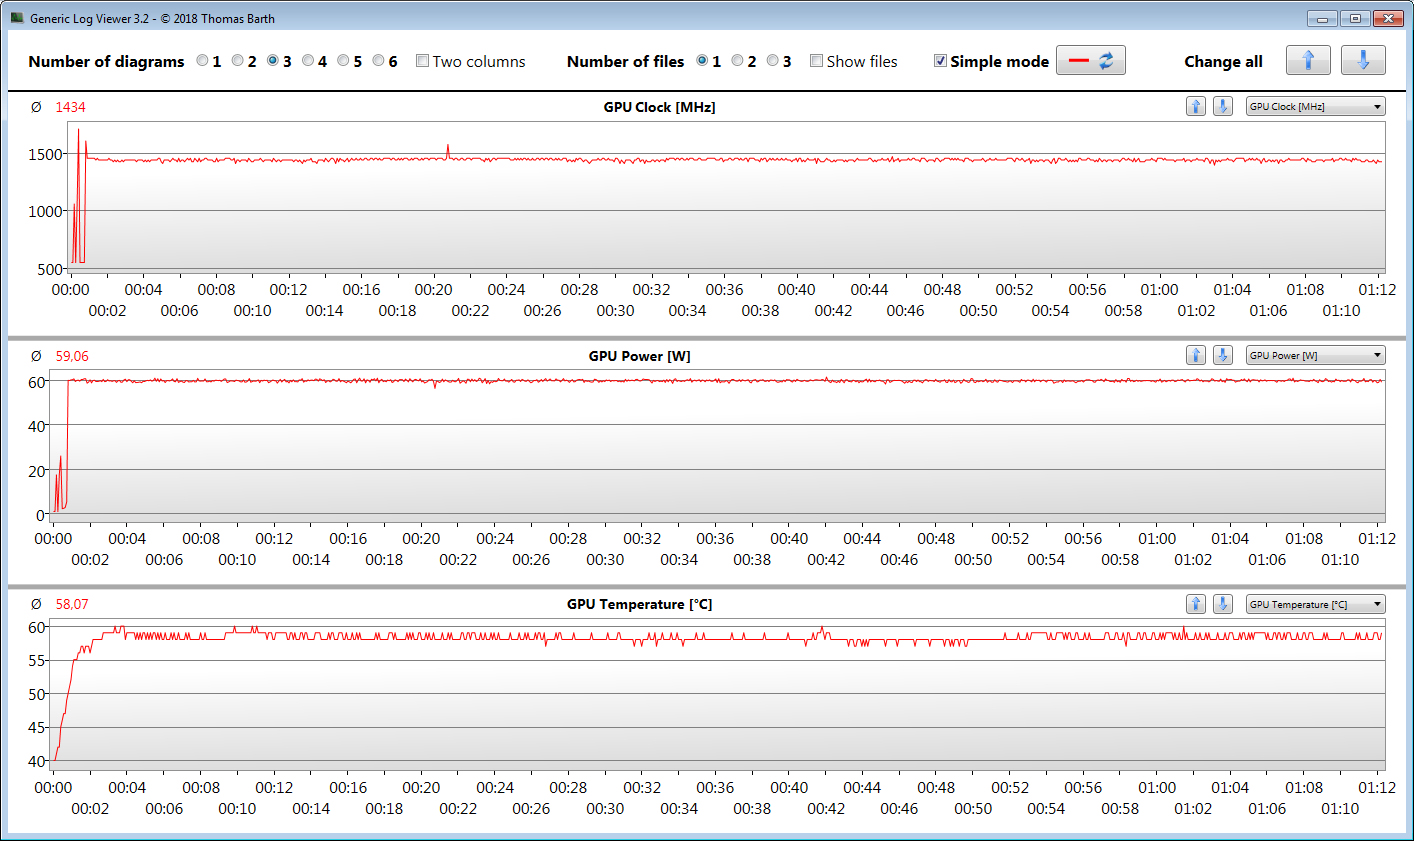
The GTX 1660 Ti Max-Q operates at a base clock frequency of 1,140 MHz. GPU Boost allows for an increased clock speed of up to 1,335 MHz. While the GPU is below a predefined temperature and/or energy consumption threshold, even higher clock rates are possible. This allows the GPU to complete our The Witcher 3 test with an average clock speed of 1,434 MHz. Meanwhile, the peak clock speed was 1,710 MHz.
The results of our 3DMark benchmarks were in line with our expectations for this GPU. The Radeon RX Vega 10, which is integrated into the APU, is enabled and the laptop uses Nvidia's graphics-switching technology Optimus.
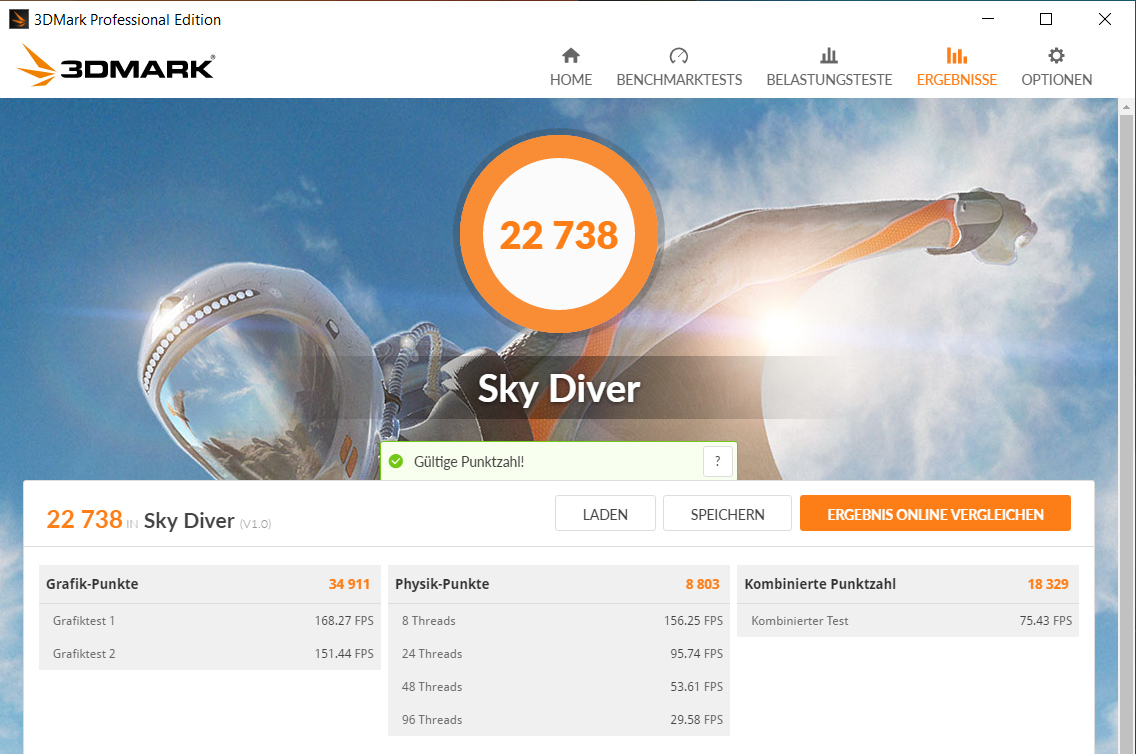
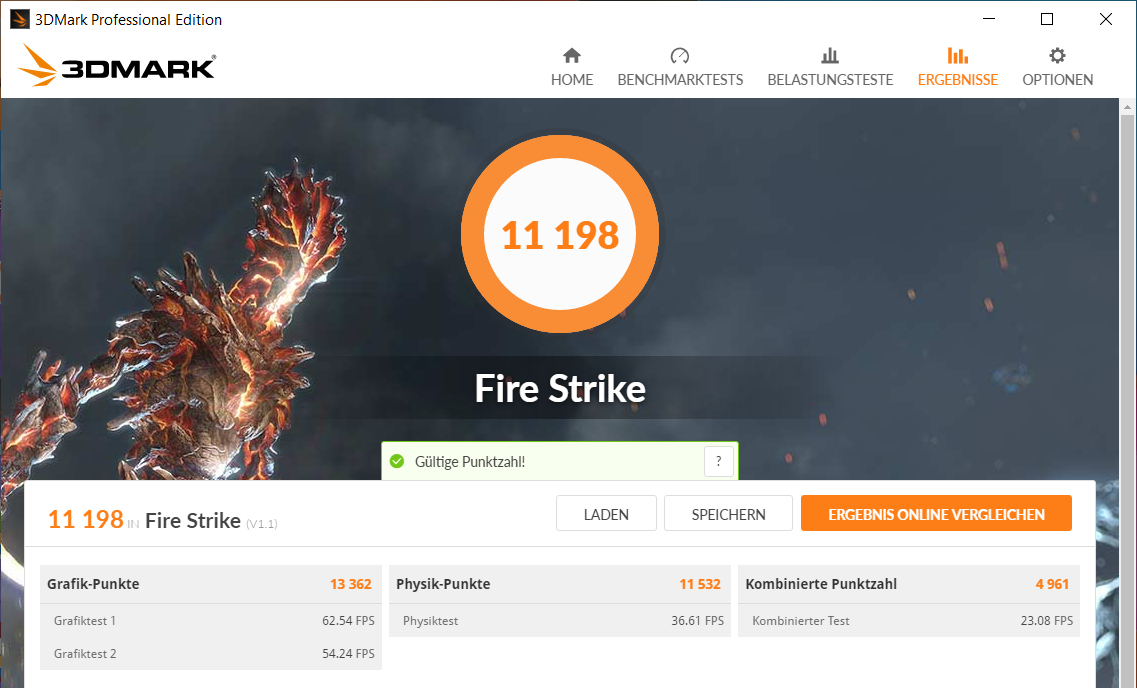
| 3DMark 06 Standard Score | 25038 points | |
| 3DMark 11 Performance | 14271 points | |
| 3DMark Ice Storm Standard Score | 77644 points | |
| 3DMark Cloud Gate Standard Score | 24182 points | |
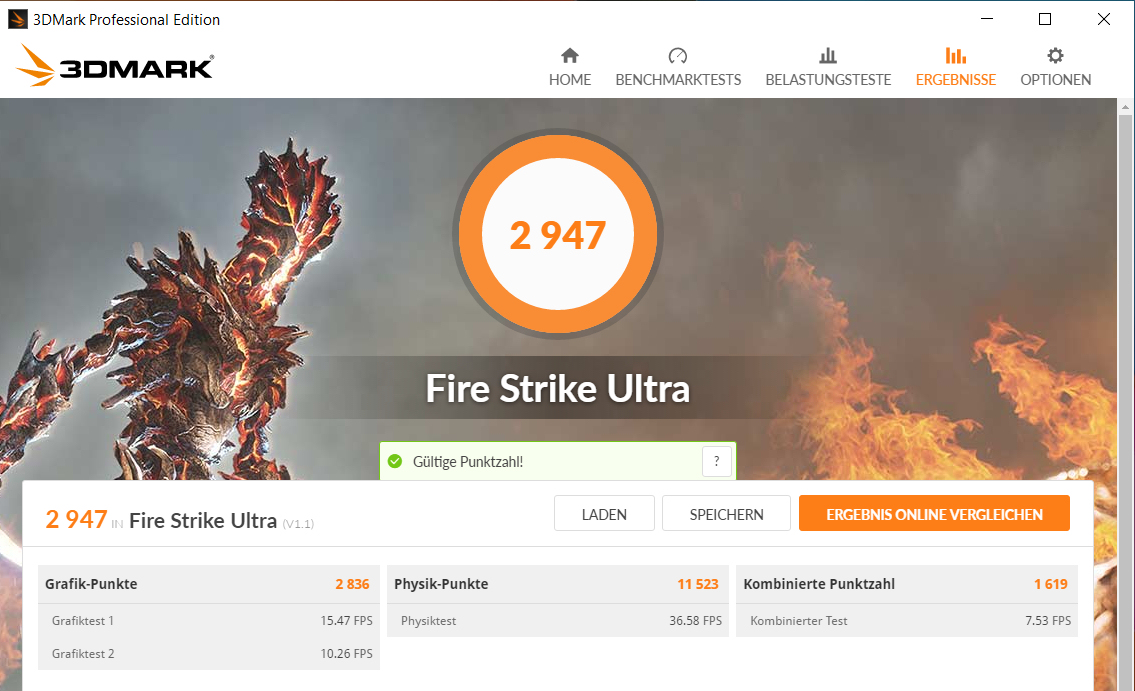
| 3DMark Fire Strike Score | 11198 points | |
| 3DMark Time Spy Score | 4842 points | |
Help | ||
Gaming Performance
The hardware inside of the Pavilion Gaming is able to display all of the games in our database smoothly at Full HD resolution with high to partially maxed-out settings. Resolutions above Full HD are possible (when using an appropriate external screen), although in that case, concessions in terms of graphics quality have to be made.
| Metro Exodus - 1920x1080 High Quality AF:16x | |
| Average NVIDIA GeForce GTX 1660 Ti Max-Q (45.1 - 49.1, n=3) | |
| HP Pavilion Gaming 15-ec0017ng | |
| Dell G5 15 5590-PCNJJ | |
| Rocket League - 1920x1080 High Quality AA:High FX | |
| Acer Aspire Nitro 5 AN517-51-7887 | |
| HP Pavilion Gaming 15-ec0017ng | |
| Average NVIDIA GeForce GTX 1660 Ti Max-Q (141.7 - 173.7, n=2) | |
| Dell G5 15 5590-PCNJJ | |
| Asus TUF FX505DT-EB73 | |
In order to determine whether the frame rates remain consistent over a prolonged period, we ran The Witcher 3 for about 60 minutes at Full HD resolution and maximum graphics settings. The character that represents the player was not moved throughout the entire test. We did not notice any dropped frames.
| low | med. | high | ultra | |
|---|---|---|---|---|
| Tomb Raider (2013) | 343.8 | 322.9 | 296.9 | 166.1 |
| BioShock Infinite (2013) | 224.2 | 195.6 | 180.9 | 107.4 |
| The Witcher 3 (2015) | 186.8 | 142.6 | 89.9 | 52.2 |
| Dota 2 Reborn (2015) | 93.3 | 88.7 | 81.4 | 75.7 |
| Rocket League (2017) | 247.4 | 212.1 | 173.7 | |
| X-Plane 11.11 (2018) | 60.6 | 54.5 | 47.8 | |
| World of Tanks enCore (2018) | 376.8 | 215.9 | 117.3 | |
| Shadow of the Tomb Raider (2018) | 82 | 53 | 52 | 49 |
| Assassin´s Creed Odyssey (2018) | 64 | 56 | 51 | 42 |
| Call of Duty Black Ops 4 (2018) | 115.2 | 87.9 | 84.6 | 83.1 |
| Darksiders III (2018) | 135.6 | 85.8 | 77.4 | 72.8 |
| Metro Exodus (2019) | 83.5 | 60 | 45.1 | 36.8 |
| Anthem (2019) | 53.6 | 48.9 | 48.8 | 46.4 |
| Dirt Rally 2.0 (2019) | 181.2 | 102.6 | 88.7 | 57.3 |
| The Division 2 (2019) | 110 | 80 | 66 | 49 |
| Anno 1800 (2019) | 59.6 | 58.7 | 45.3 | 26 |
| Rage 2 (2019) | 146.4 | 76.2 | 65.8 | 64.8 |
| Total War: Three Kingdoms (2019) | 144.1 | 76.5 | 54.7 | 41.1 |
| F1 2019 (2019) | 155 | 119 | 106 | 77 |
| Control (2019) | 158.3 | 63.7 | 47.1 | |
| Borderlands 3 (2019) | 87 | 72.1 | 52.9 | 41.5 |
| FIFA 20 (2019) | 147.9 | 145.4 | 141 | 139.3 |
| Ghost Recon Breakpoint (2019) | 83 | 68 | 65 | 48 |
| GRID 2019 (2019) | 112.9 | 86.5 | 72 | 58.7 |
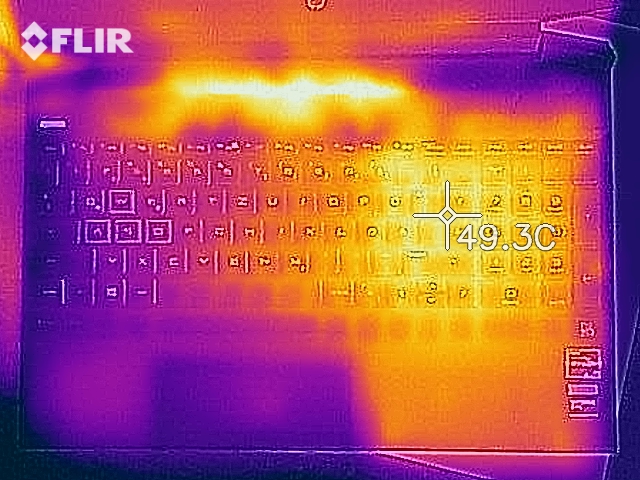
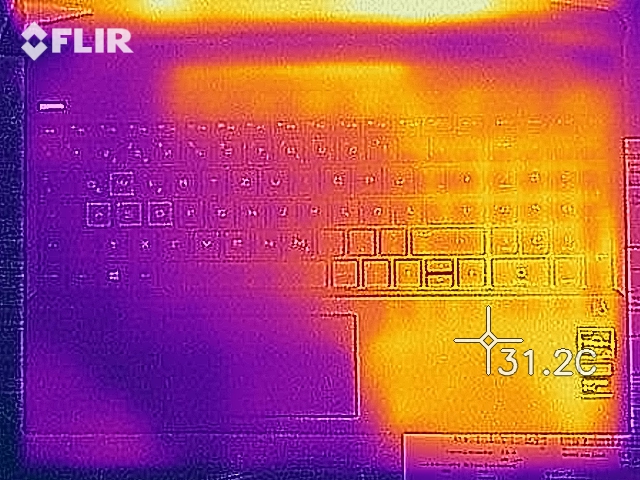
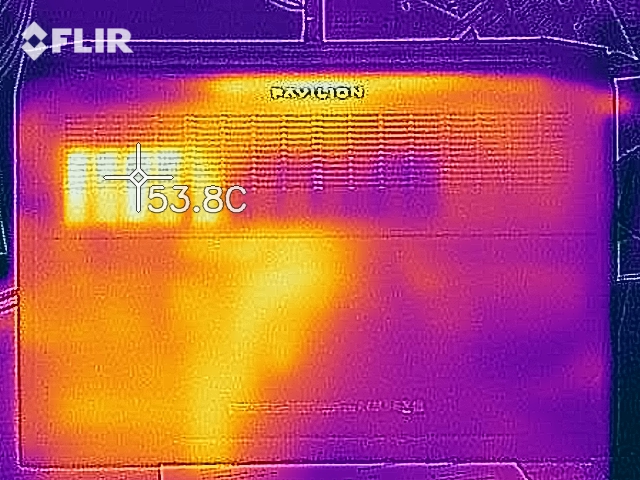
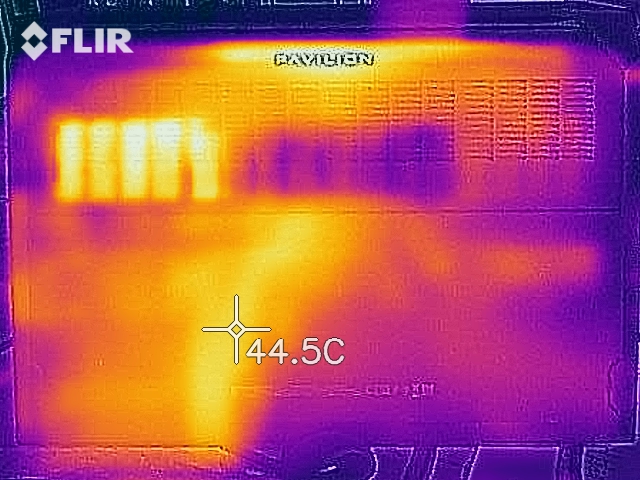
Emissions - The HP Computer Does Not Reach Excessive Temperatures
Noise Emissions
During idle, the fans of the Pavilion constantly spin at a low speed. The resulting fan noise is acceptable, however. Under load, the fans spin-up. During our stress test, the fan noise climbed up to a maximum of 45.5 dB(A). The laptop is slightly quieter while gaming. During our The Witcher 3 test, the fans emitted 43.7 dB(A).
Noise level
| Idle |
| 31.5 / 31.5 / 31.5 dB(A) |
| HDD |
| 31.7 dB(A) |
| Load |
| 41.4 / 45.5 dB(A) |
 | ||
30 dB silent 40 dB(A) audible 50 dB(A) loud |
||
min: | ||
| HP Pavilion Gaming 15-ec0017ng R7 3750H, GeForce GTX 1660 Ti Max-Q | HP Gaming Pavilion 15-dk0009ng i7-9750H, GeForce GTX 1660 Ti Max-Q | Dell G5 15 5590-PCNJJ i5-9300H, GeForce GTX 1650 Mobile | Lenovo Legion Y540-15IRH-81SX00B2GE i7-9750H, GeForce GTX 1660 Ti Mobile | Acer Aspire Nitro 5 AN515-54-53Z2 i5-9300H, GeForce GTX 1650 Mobile | Average NVIDIA GeForce GTX 1660 Ti Max-Q | Average of class Gaming | |
|---|---|---|---|---|---|---|---|
| Noise | 12% | -7% | 5% | -3% | 5% | 6% | |
| off / environment * (dB) | 30.2 | 28.2 7% | 30 1% | 29.3 3% | 30 1% | 28.3 ? 6% | 24.1 ? 20% |
| Idle Minimum * (dB) | 31.5 | 29.3 7% | 31 2% | 29.3 7% | 30 5% | 29.2 ? 7% | 25.8 ? 18% |
| Idle Average * (dB) | 31.5 | 29.3 7% | 32 -2% | 29.3 7% | 31 2% | 29.5 ? 6% | 27.5 ? 13% |
| Idle Maximum * (dB) | 31.5 | 29.3 7% | 35 -11% | 29.3 7% | 33 -5% | 30.4 ? 3% | 30 ? 5% |
| Load Average * (dB) | 41.4 | 32.3 22% | 49 -18% | 35.7 14% | 46 -11% | 37.3 ? 10% | 43.1 ? -4% |
| Witcher 3 ultra * (dB) | 43.7 | 34 22% | 47 -8% | 44.2 -1% | 46 -5% | ||
| Load Maximum * (dB) | 45.5 | 41.2 9% | 53 -16% | 45.6 -0% | 49 -8% | 46.1 ? -1% | 54 ? -19% |
* ... smaller is better
Temperature
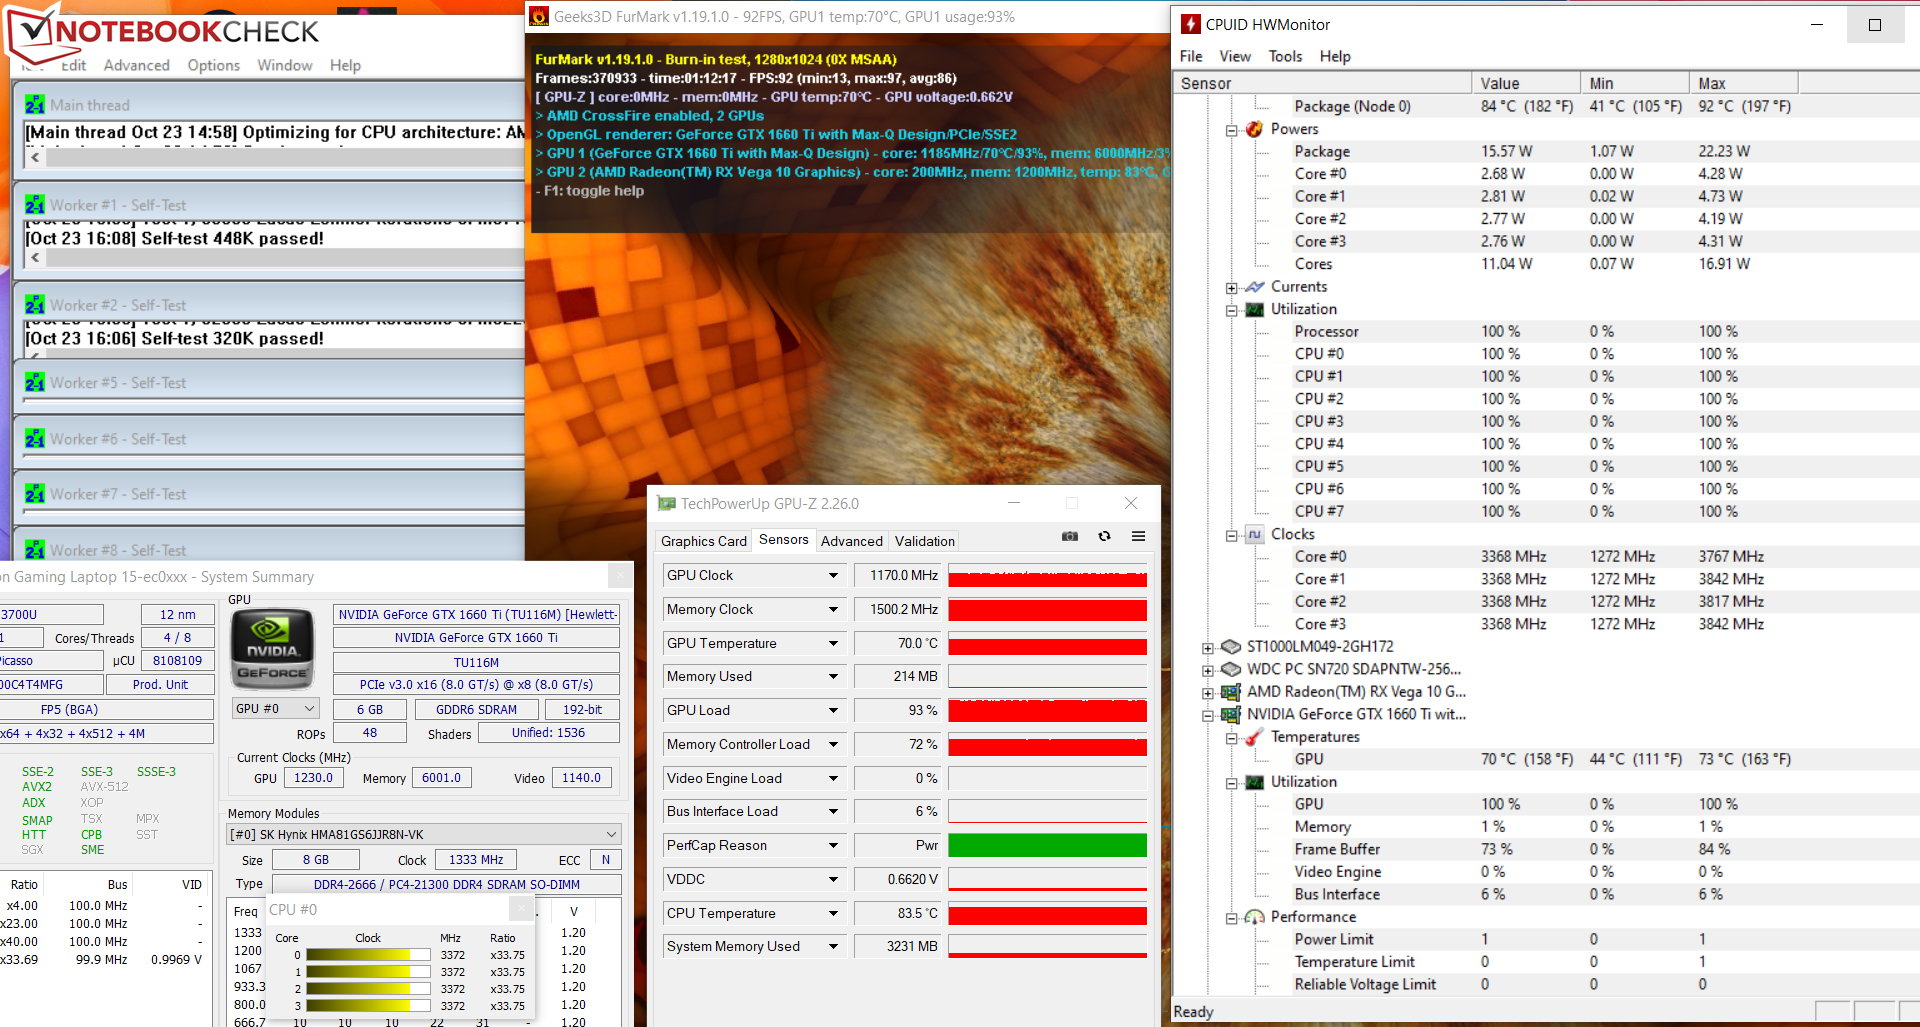
The processor of the Pavilion completes our stress test (running Prime95 and FurMark for at least an hour) with a clock speed of 3.4 GHz while on mains. Meanwhile, the clock rate of the GPU ranges from 1,100 to 1,200 MHz. In battery mode, the CPU runs at 2.9 to 3.2 GHz, while the GPU clock ranges from 1,600 to 1,700 MHz. The stress test is an extreme scenario that does not occur during daily use. We use this test to determine whether the system is stable under maximum load.
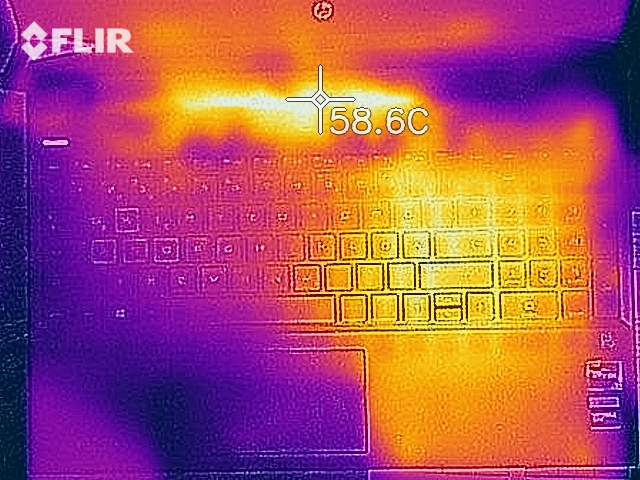
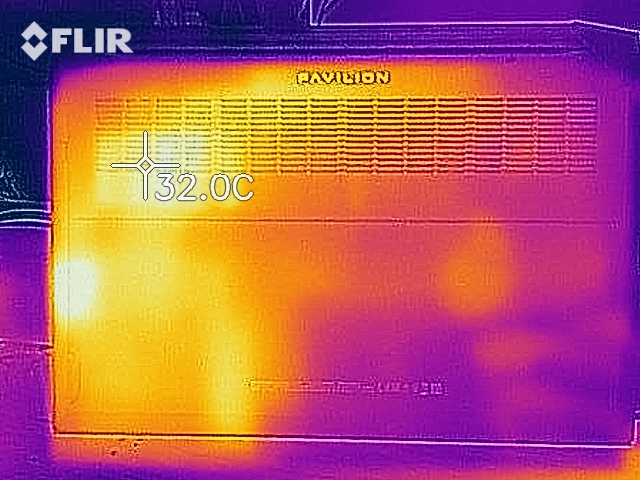
The laptop does not reach critically high temperatures. During the stress test, we were able to record three hot spots with a temperature in excess of 40 °C. During our The Witcher 3 test (the game runs at Full HD resolution and maximum settings), the temperatures were lower. During day-to-day use, the temperatures remain well within their expected ranges.
(±) The maximum temperature on the upper side is 44.8 °C / 113 F, compared to the average of 40.4 °C / 105 F, ranging from 21.2 to 68.8 °C for the class Gaming.
(±) The bottom heats up to a maximum of 40.8 °C / 105 F, compared to the average of 43.2 °C / 110 F
(+) In idle usage, the average temperature for the upper side is 23.5 °C / 74 F, compared to the device average of 33.9 °C / 93 F.
(+) Playing The Witcher 3, the average temperature for the upper side is 30.5 °C / 87 F, compared to the device average of 33.9 °C / 93 F.
(±) The palmrests and touchpad can get very hot to the touch with a maximum of 37.1 °C / 98.8 F.
(-) The average temperature of the palmrest area of similar devices was 28.8 °C / 83.8 F (-8.3 °C / -15 F).
| HP Pavilion Gaming 15-ec0017ng R7 3750H, GeForce GTX 1660 Ti Max-Q | HP Gaming Pavilion 15-dk0009ng i7-9750H, GeForce GTX 1660 Ti Max-Q | Dell G5 15 5590-PCNJJ i5-9300H, GeForce GTX 1650 Mobile | Lenovo Legion Y540-15IRH-81SX00B2GE i7-9750H, GeForce GTX 1660 Ti Mobile | Acer Aspire Nitro 5 AN515-54-53Z2 i5-9300H, GeForce GTX 1650 Mobile | Average NVIDIA GeForce GTX 1660 Ti Max-Q | Average of class Gaming | |
|---|---|---|---|---|---|---|---|
| Heat | -5% | -10% | -27% | -4% | -15% | -18% | |
| Maximum Upper Side * (°C) | 44.8 | 46.7 -4% | 49 -9% | 42.7 5% | 47 -5% | 46.6 ? -4% | 45.2 ? -1% |
| Maximum Bottom * (°C) | 40.8 | 53.7 -32% | 55 -35% | 52.7 -29% | 50 -23% | 49.4 ? -21% | 48.2 ? -18% |
| Idle Upper Side * (°C) | 25.4 | 23.8 6% | 25 2% | 33.1 -30% | 24 6% | 30.1 ? -19% | 31.1 ? -22% |
| Idle Bottom * (°C) | 26.6 | 23.7 11% | 26 2% | 41 -54% | 25 6% | 31 ? -17% | 34.3 ? -29% |
* ... smaller is better
Speakers
HP Pavilion Gaming 15-ec0017ng audio analysis
(-) | not very loud speakers (68 dB)
Bass 100 - 315 Hz
(-) | nearly no bass - on average 22.5% lower than median
(±) | linearity of bass is average (10.5% delta to prev. frequency)
Mids 400 - 2000 Hz
(+) | balanced mids - only 1.7% away from median
(±) | linearity of mids is average (8.4% delta to prev. frequency)
Highs 2 - 16 kHz
(+) | balanced highs - only 4.4% away from median
(±) | linearity of highs is average (8.1% delta to prev. frequency)
Overall 100 - 16.000 Hz
(±) | linearity of overall sound is average (23.8% difference to median)
Compared to same class
» 86% of all tested devices in this class were better, 5% similar, 10% worse
» The best had a delta of 6%, average was 18%, worst was 132%
Compared to all devices tested
» 71% of all tested devices were better, 6% similar, 22% worse
» The best had a delta of 4%, average was 24%, worst was 134%
Lenovo Legion Y540-15IRH-81SX00B2GE audio analysis
(±) | speaker loudness is average but good (77.4 dB)
Bass 100 - 315 Hz
(-) | nearly no bass - on average 17.7% lower than median
(±) | linearity of bass is average (11.6% delta to prev. frequency)
Mids 400 - 2000 Hz
(+) | balanced mids - only 3.7% away from median
(+) | mids are linear (4.5% delta to prev. frequency)
Highs 2 - 16 kHz
(+) | balanced highs - only 3.3% away from median
(+) | highs are linear (5.9% delta to prev. frequency)
Overall 100 - 16.000 Hz
(±) | linearity of overall sound is average (18.1% difference to median)
Compared to same class
» 57% of all tested devices in this class were better, 8% similar, 35% worse
» The best had a delta of 6%, average was 18%, worst was 132%
Compared to all devices tested
» 38% of all tested devices were better, 8% similar, 54% worse
» The best had a delta of 4%, average was 24%, worst was 134%
Energy Management - Long-Lasting Gaming Laptop
Energy Consumption
We were able to record a maximum energy consumption of 10.2 watts during idle. During our stress test, this value increases to up to 140.5 watts. The actual consumption while gaming is lower, however. In our The Witcher 3 test, we measured an average power consumption of around 107 watts. The AC adapter is rated for 200 watts.
| Off / Standby | |
| Idle | |
| Load |
|
Key:
min: | |
| HP Pavilion Gaming 15-ec0017ng R7 3750H, GeForce GTX 1660 Ti Max-Q | HP Gaming Pavilion 15-dk0009ng i7-9750H, GeForce GTX 1660 Ti Max-Q | Dell G5 15 5590-PCNJJ i5-9300H, GeForce GTX 1650 Mobile | Lenovo Legion Y540-15IRH-81SX00B2GE i7-9750H, GeForce GTX 1660 Ti Mobile | Acer Aspire Nitro 5 AN515-54-53Z2 i5-9300H, GeForce GTX 1650 Mobile | Average NVIDIA GeForce GTX 1660 Ti Max-Q | Average of class Gaming | |
|---|---|---|---|---|---|---|---|
| Power Consumption | -39% | -6% | -108% | -8% | -24% | -142% | |
| Idle Minimum * (Watt) | 3.4 | 6.8 -100% | 4 -18% | 14.5 -326% | 5 -47% | 5.16 ? -52% | 13.3 ? -291% |
| Idle Average * (Watt) | 7.6 | 10.7 -41% | 7 8% | 18.5 -143% | 7 8% | 8.51 ? -12% | 19 ? -150% |
| Idle Maximum * (Watt) | 10.2 | 12.5 -23% | 12 -18% | 20 -96% | 11 -8% | 14.6 ? -43% | 24.5 ? -140% |
| Load Average * (Watt) | 73 | 87.2 -19% | 95 -30% | 81.6 -12% | 89 -22% | 76.4 ? -5% | 108.1 ? -48% |
| Witcher 3 ultra * (Watt) | 107 | 121 -13% | 86 20% | 132 -23% | 90 16% | ||
| Load Maximum * (Watt) | 140.5 | 191.4 -36% | 135 4% | 208.1 -48% | 132 6% | 151.4 ? -8% | 254 ? -81% |
* ... smaller is better
Battery Life
In our Wi-Fi test, which aims to mirror real-world conditions, the HP laptop achieves a runtime of 8:00 h. This test consists of a simulated web-browsing load and is performed with the help of a script. The preparations include selecting the balanced profile, disabling energy conservation features and setting the display's brightness to approximately 150 cd/m². In our video test, the 15.6-inch HP device lasts 8:28 h. Here, we play the short film Big Buck Bunny (H.264 codec, 1920x1080 pixels) in a loop. For this test, the energy-saver profile was selected and wireless as well as energy conservation features were disabled; the display brightness was, again, reduced to 150 cd/m².
| HP Pavilion Gaming 15-ec0017ng R7 3750H, GeForce GTX 1660 Ti Max-Q, 52.5 Wh | HP Gaming Pavilion 15-dk0009ng i7-9750H, GeForce GTX 1660 Ti Max-Q, 52.5 Wh | Dell G5 15 5590-PCNJJ i5-9300H, GeForce GTX 1650 Mobile, 60 Wh | Lenovo Legion Y540-15IRH-81SX00B2GE i7-9750H, GeForce GTX 1660 Ti Mobile, 57 Wh | Acer Aspire Nitro 5 AN515-54-53Z2 i5-9300H, GeForce GTX 1650 Mobile, 57 Wh | Average of class Gaming | |
|---|---|---|---|---|---|---|
| Battery runtime | -29% | 25% | -47% | 14% | -10% | |
| Reader / Idle (h) | 13.7 | 8.7 -36% | 14.5 6% | 4 -71% | 17.4 27% | 8.71 ? -36% |
| H.264 (h) | 8.5 | 5.3 -38% | 8.26 ? -3% | |||
| WiFi v1.3 (h) | 8 | 4.8 -40% | 8 0% | 2.4 -70% | 8.1 1% | 7.01 ? -12% |
| Load (h) | 1.3 | 1.3 0% | 2.2 69% | 1.3 0% | 1.5 15% | 1.47 ? 13% |
| Witcher 3 ultra (h) | 1 |
Pros
Cons
Verdict
Hewlett Packard equips the Pavilion Gaming 15 with a Ryzen 7 3750H APU and a GeForce GTX 1660 Ti Max-Q GPU. Together, they are able to smoothly run all of the games currently in our database. In most cases, Full HD resolution and high to maximum graphics settings can be selected.
With the Pavilion Gaming 15-ec0017ng, HP has a fairly well-rounded gaming laptop on offer. However, it is not without its flaws.
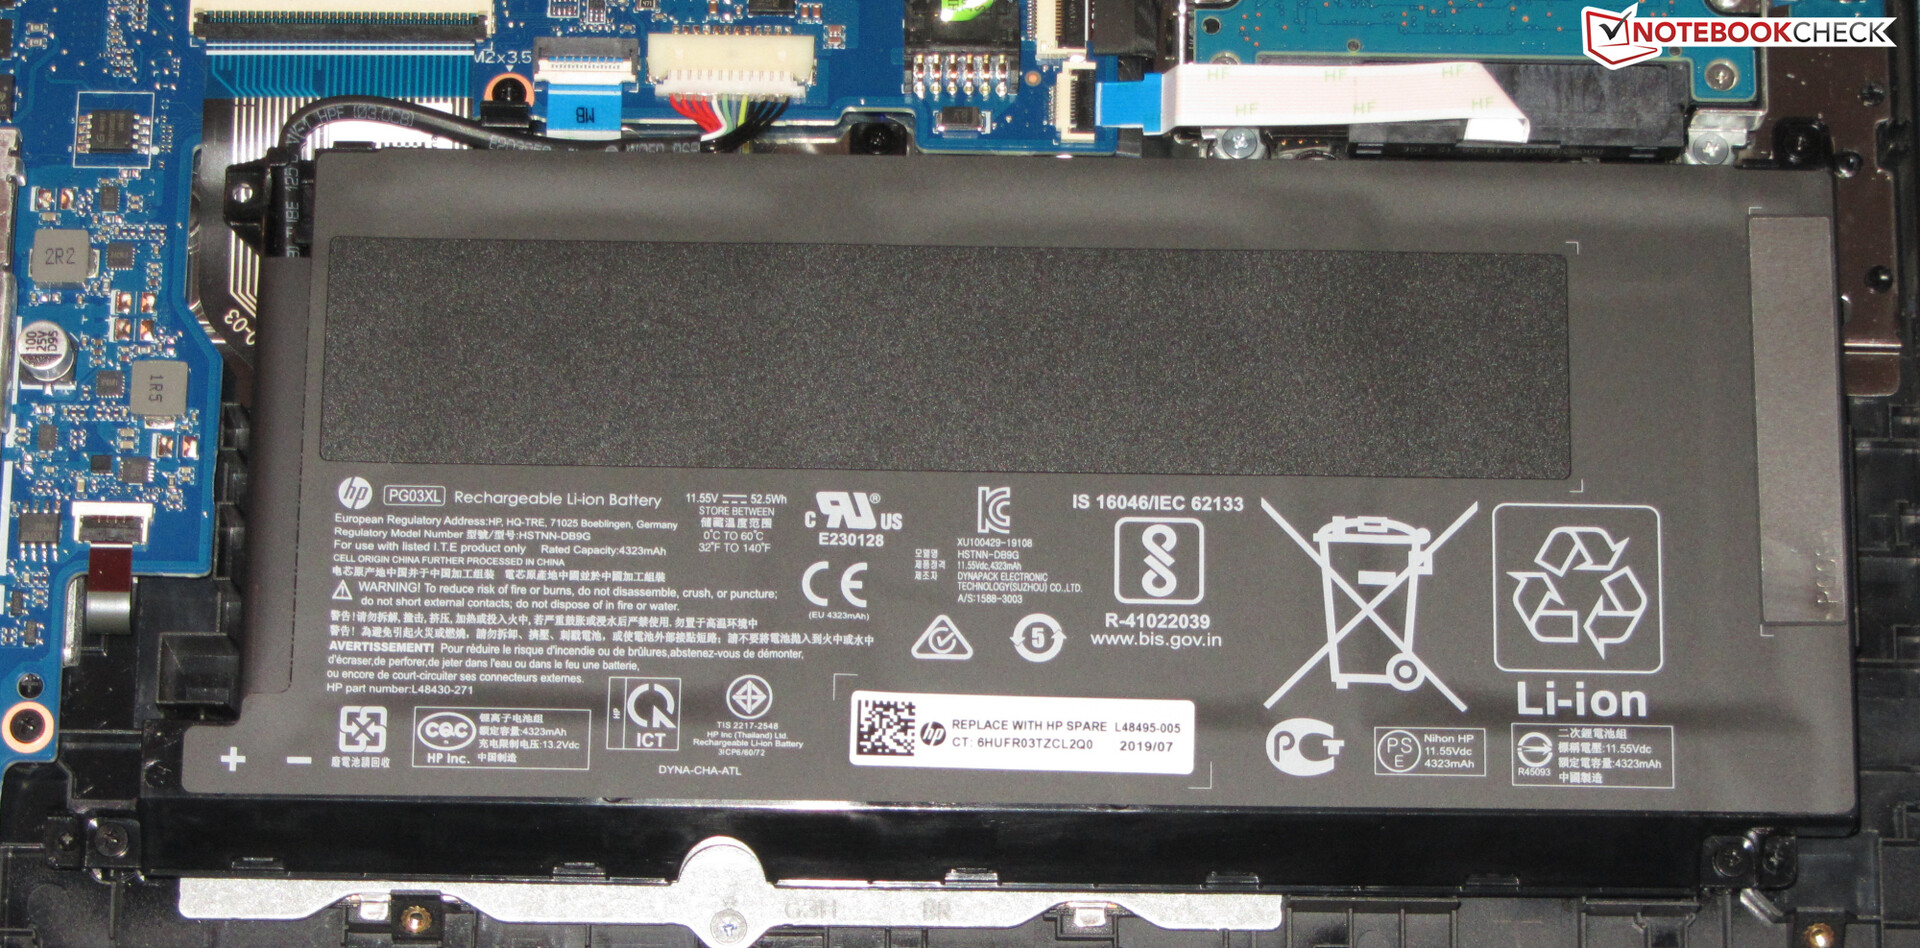
A fast NVMe SSD facilitates fast and smooth system operation. Thanks to the additional 1-TB HDD, the laptop does not lack storage space either. Both of the storage drives can be swapped. Upgrading the storage solution requires removing the bottom panel of the chassis.
The matte IPS display shines with good viewing angles, a good contrast ratio and good color accuracy. While the maximum brightness of the display is acceptable, a higher brightness level would be desirable, particularly at this price point.
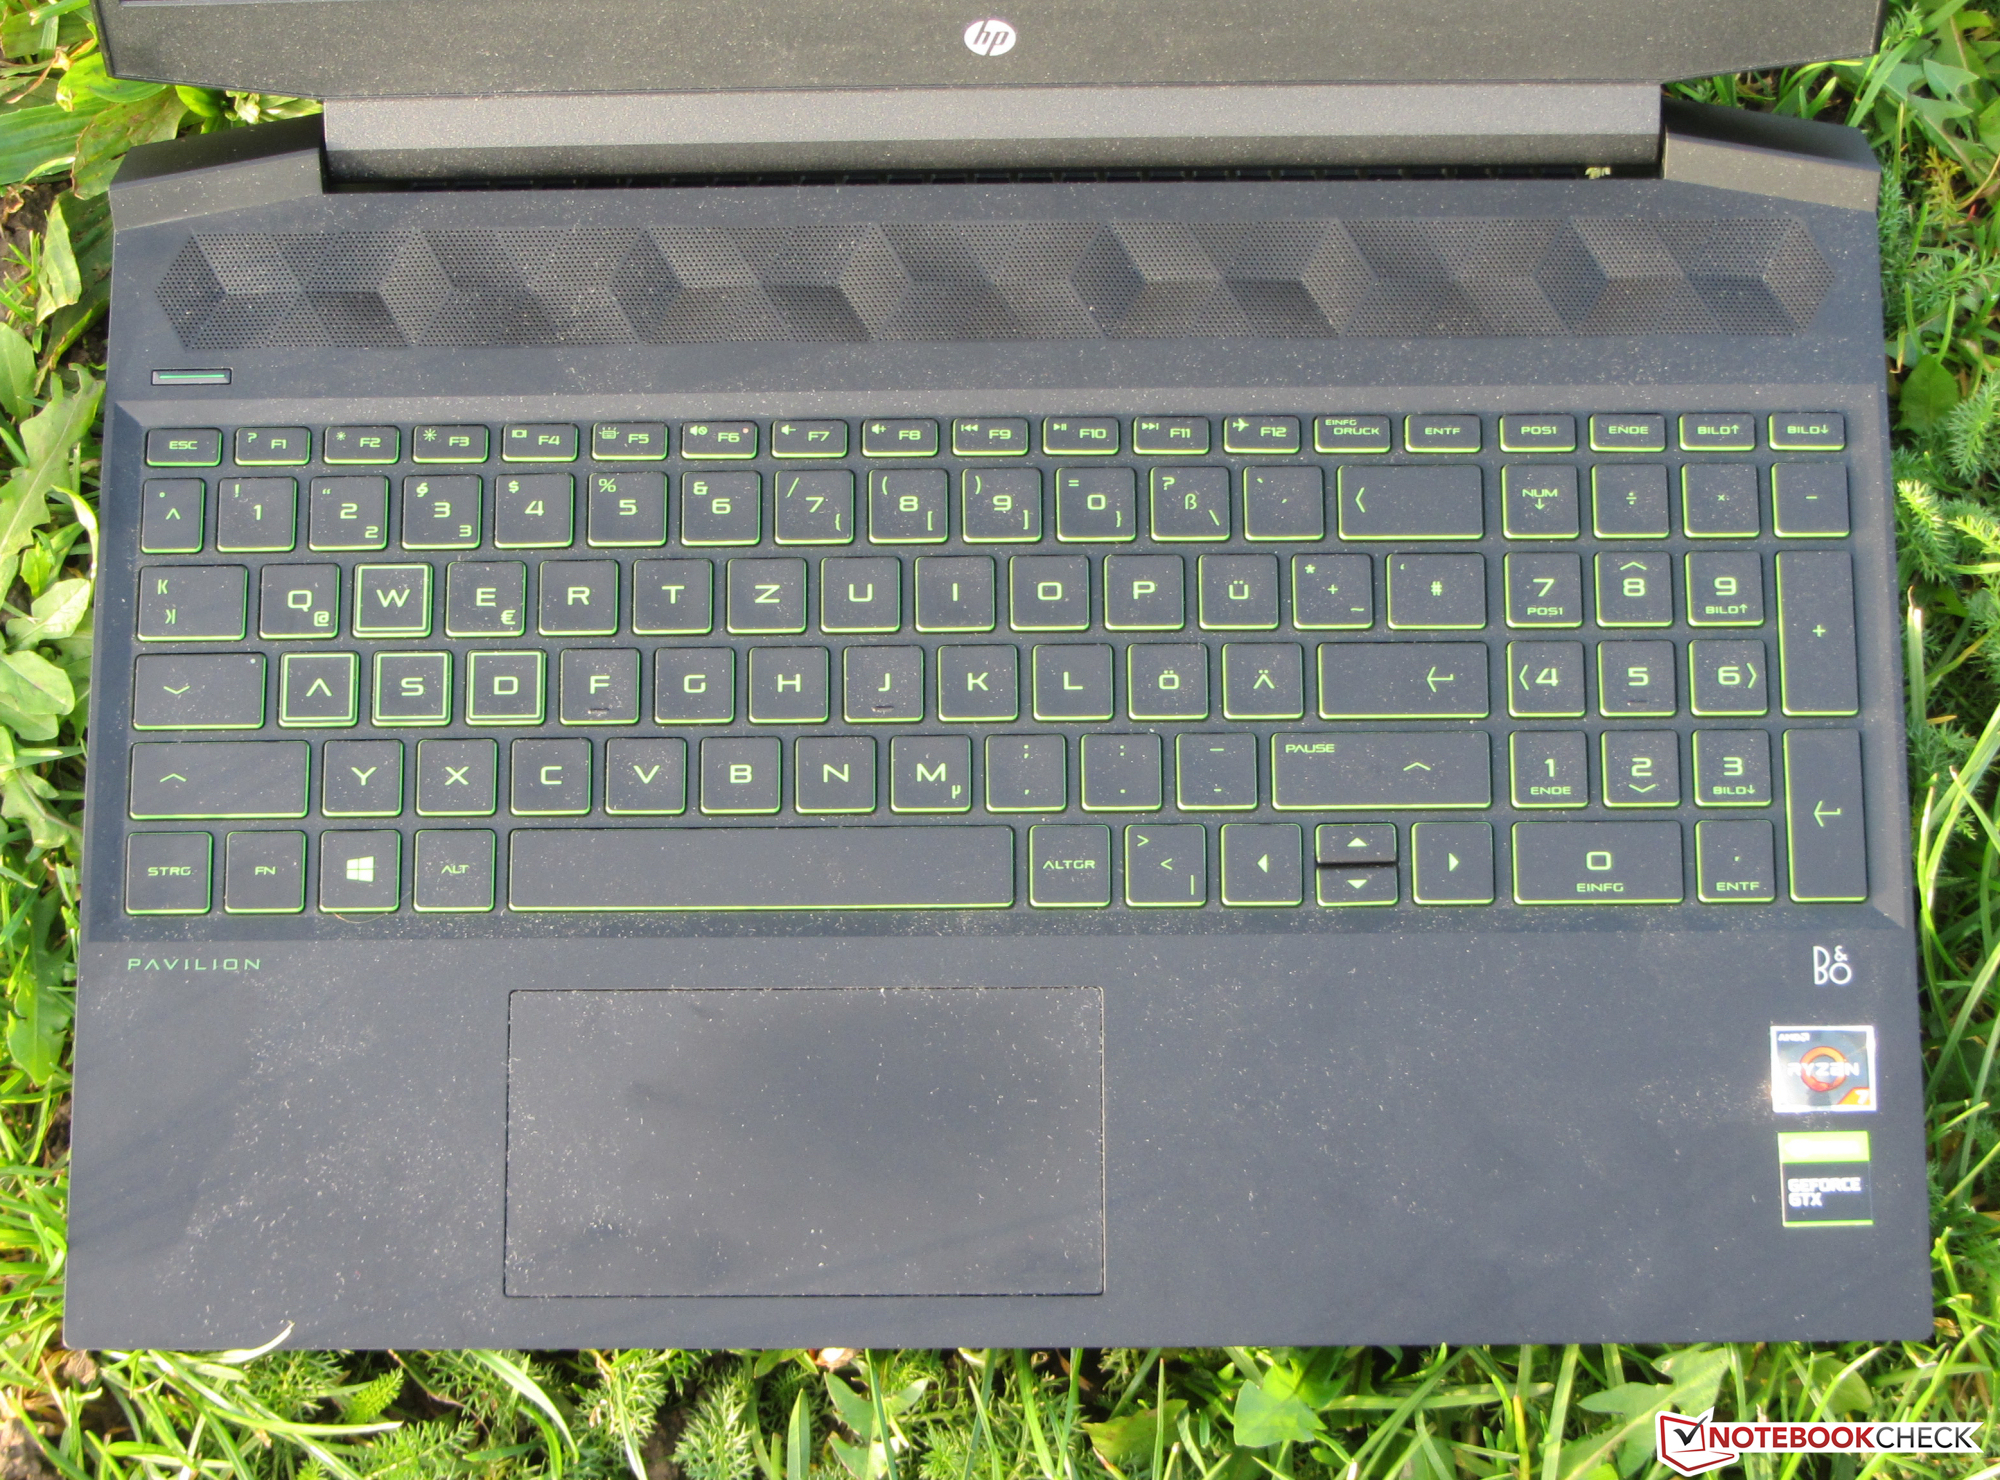
The battery running times are surprisingly long. The Pavilion lasts significantly longer than most office laptops. The chiclet keyboard (backlit, two brightness levels) has proven itself to be suitable for daily use. The port selection is not exactly vast, although most of the basics are covered. We do regret the absence of a Thunderbolt 3 port, however. Unfortunately, HP only grants users of the system a one-year warranty.
HP Pavilion Gaming 15-ec0017ng
- 10/27/2019 v7 (old)
Sascha Mölck
Price comparison

