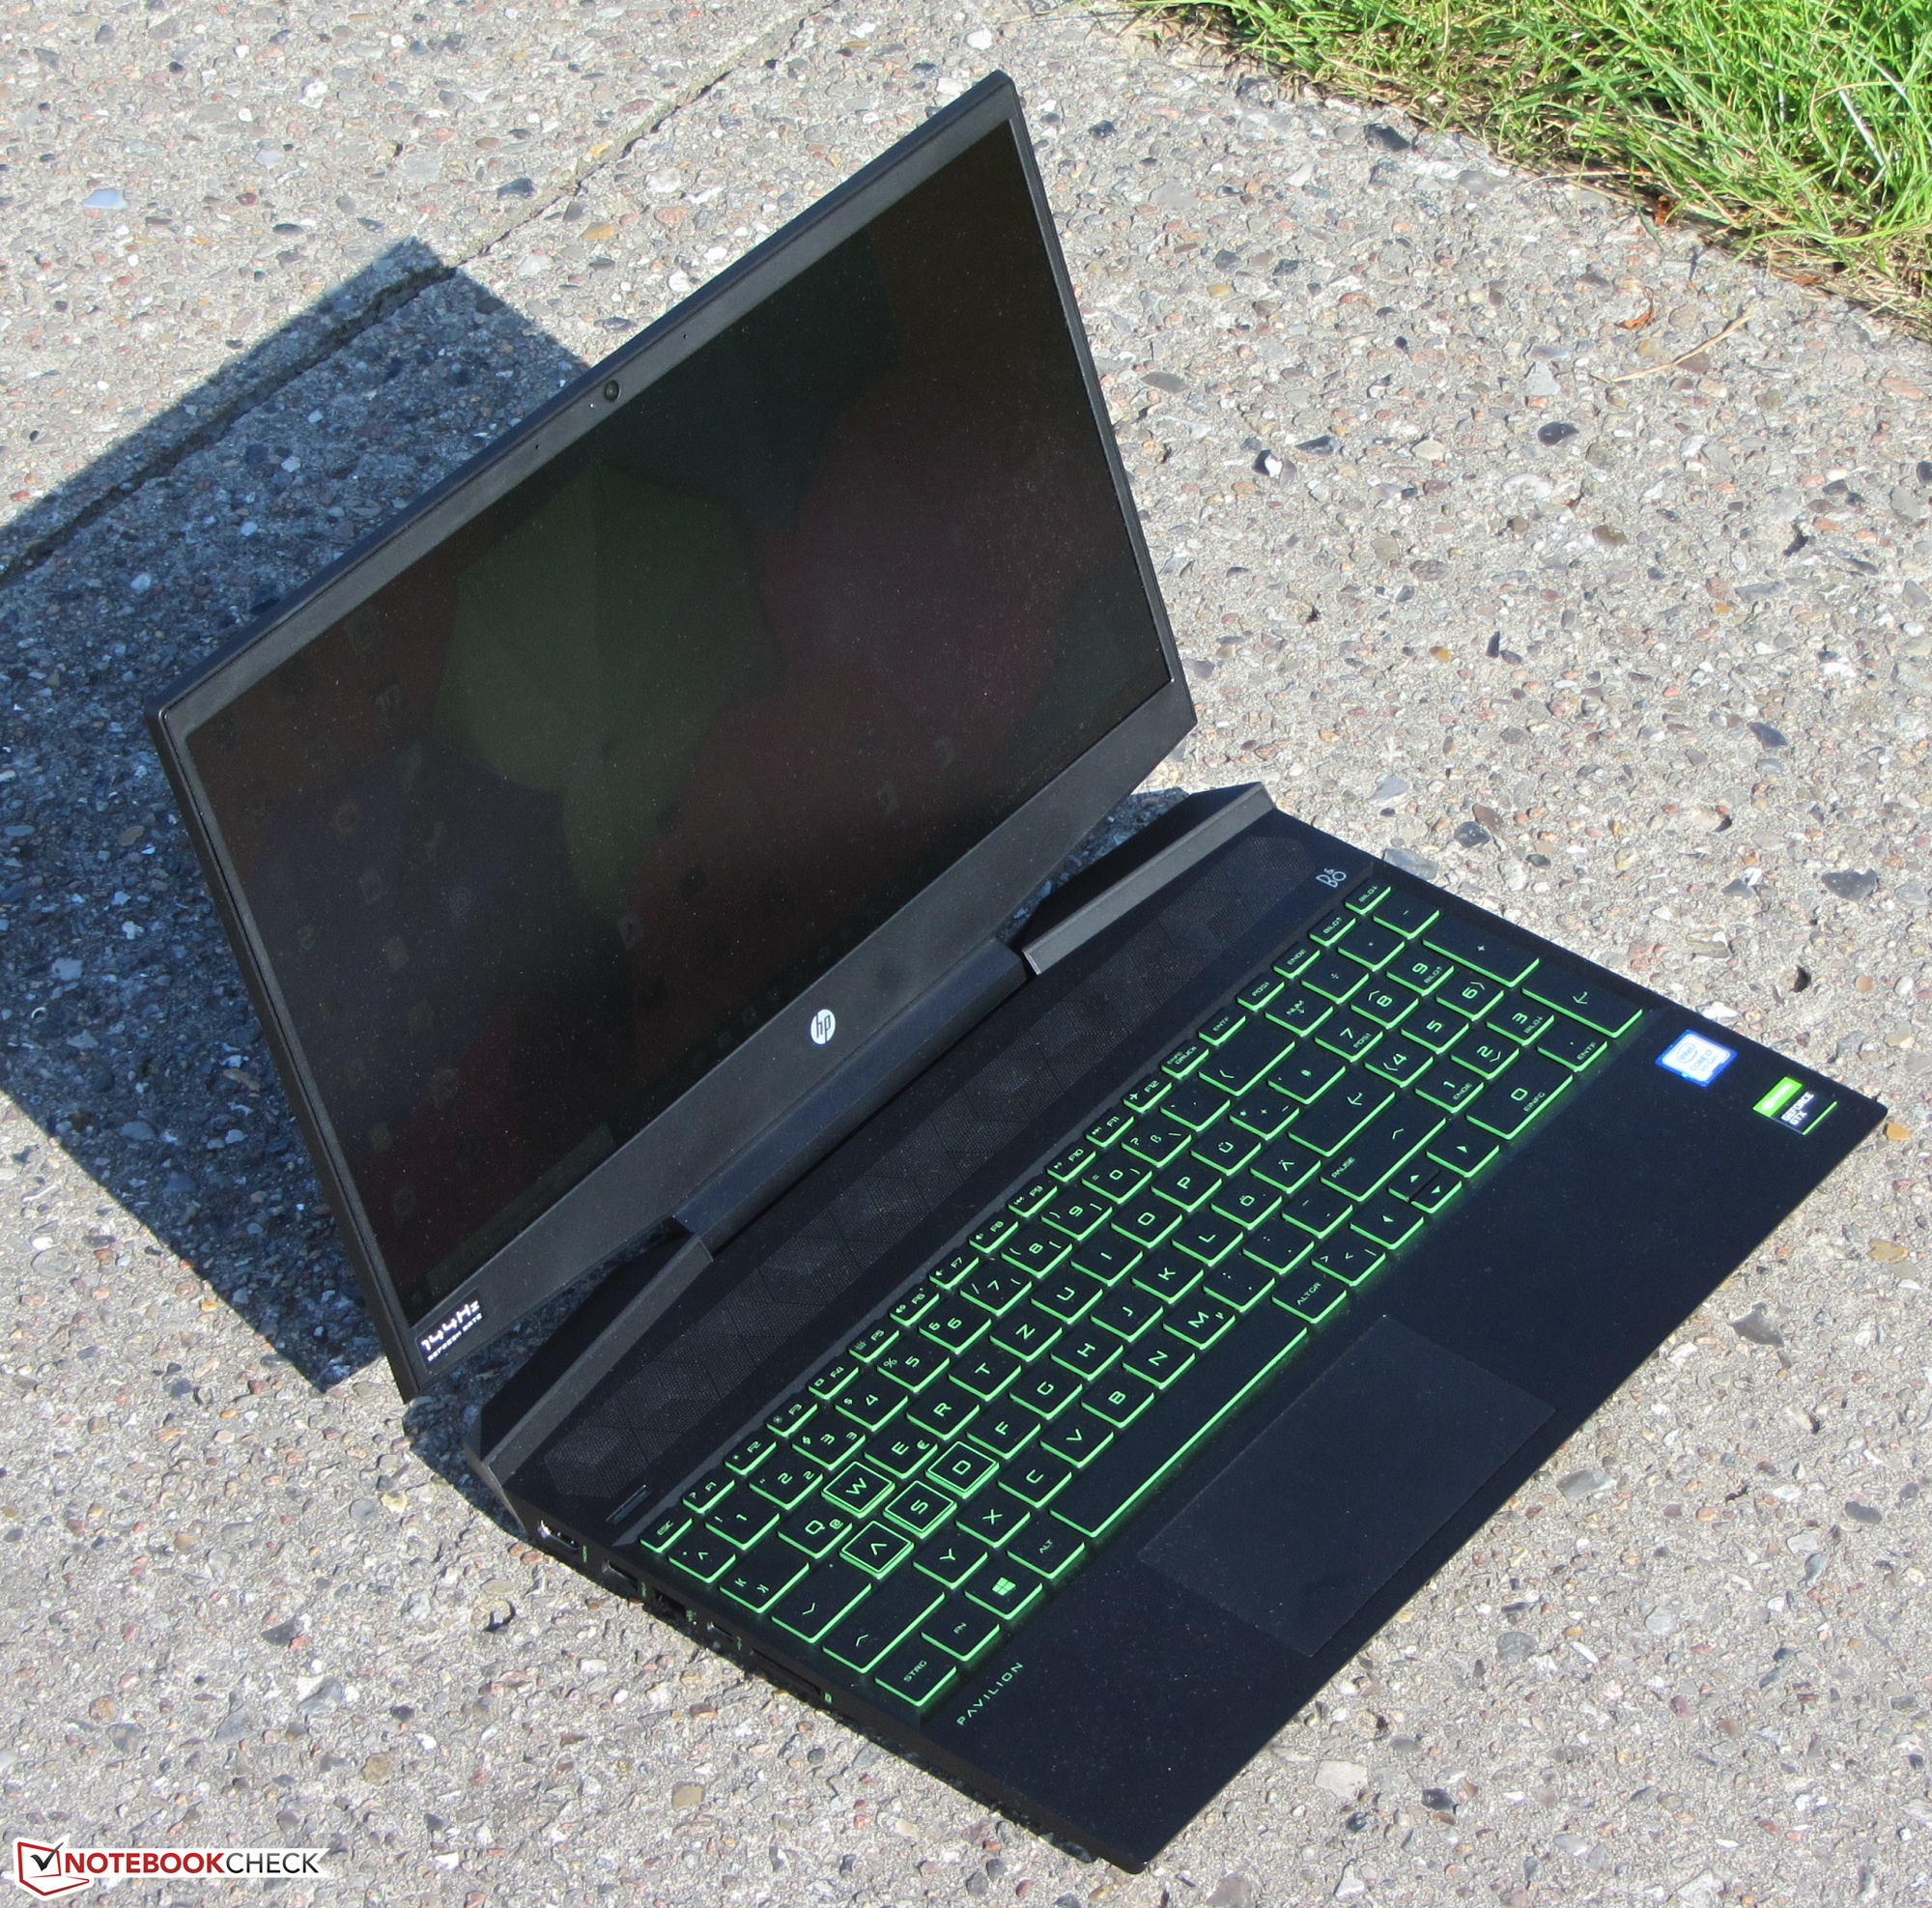
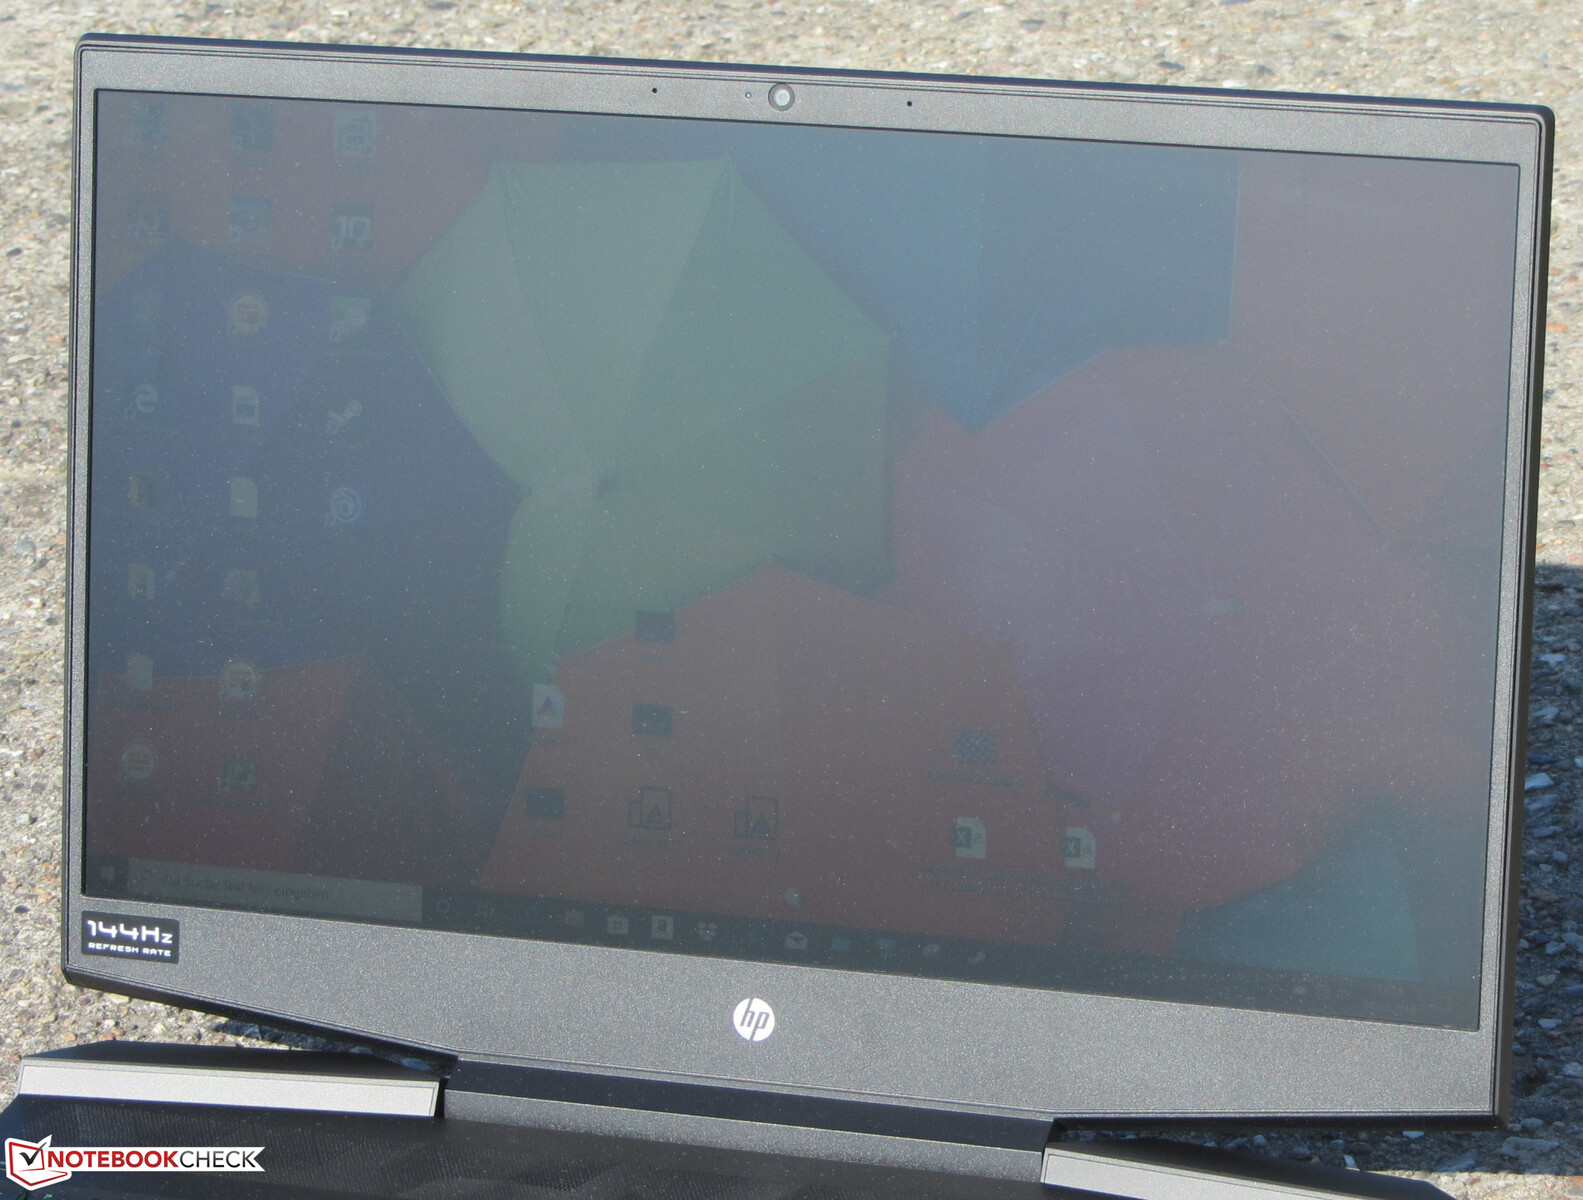
HP Gaming Pavilion 15 Laptop Review: A powerful yet pleasingly quiet gaming laptop

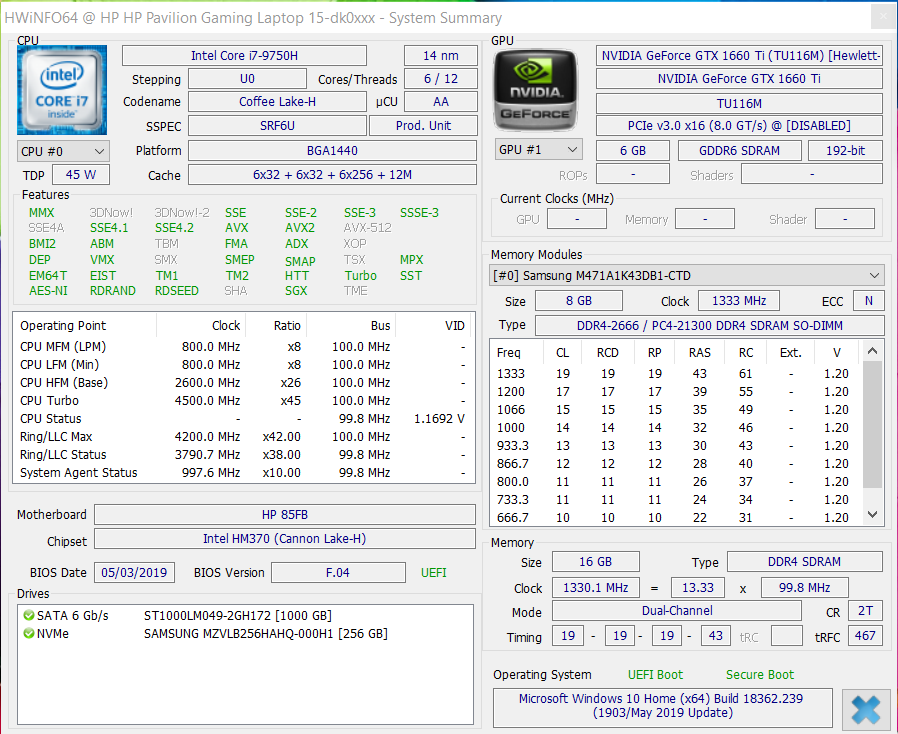
HP Inc, the PC and printer element of the former Hewlett-Packard, has refreshed its Pavilion Gaming range. The laptops sit below its OMEN line and consequentially should offer better value for money than something like an OMEN 15. However, the Gaming Pavilion 15 only comes with NVIDIA GeForce GTX 1050 to GeForce GTX 1660 Ti GPUs, with the RTX 20 series being reserved for OMEN laptops. Our Gaming Pavilion 15 review unit has an Intel Core i7-9750H processor and a GeForce GTX 1660 Ti Max-Q GPU, which is the more power-efficient version of the GeForce GTX 1660 Ti. We recently reviewed its 17-inch sibling, which comes with the same CPU and GPU. Imaginatively, HP calls this the Pavilion Gaming 17.
The Gaming Pavilion 15 configuration that we are testing currently retails for around 1,400 Euros (~US$1,547). We have chosen to compare the Gaming Pavilion 15 against the ASUS ROG Zephyrus G GA502DU, CUK Model Z, Dell G5 15 5590, Lenovo Legion Y530 and the Medion Erazer X6805.
Case
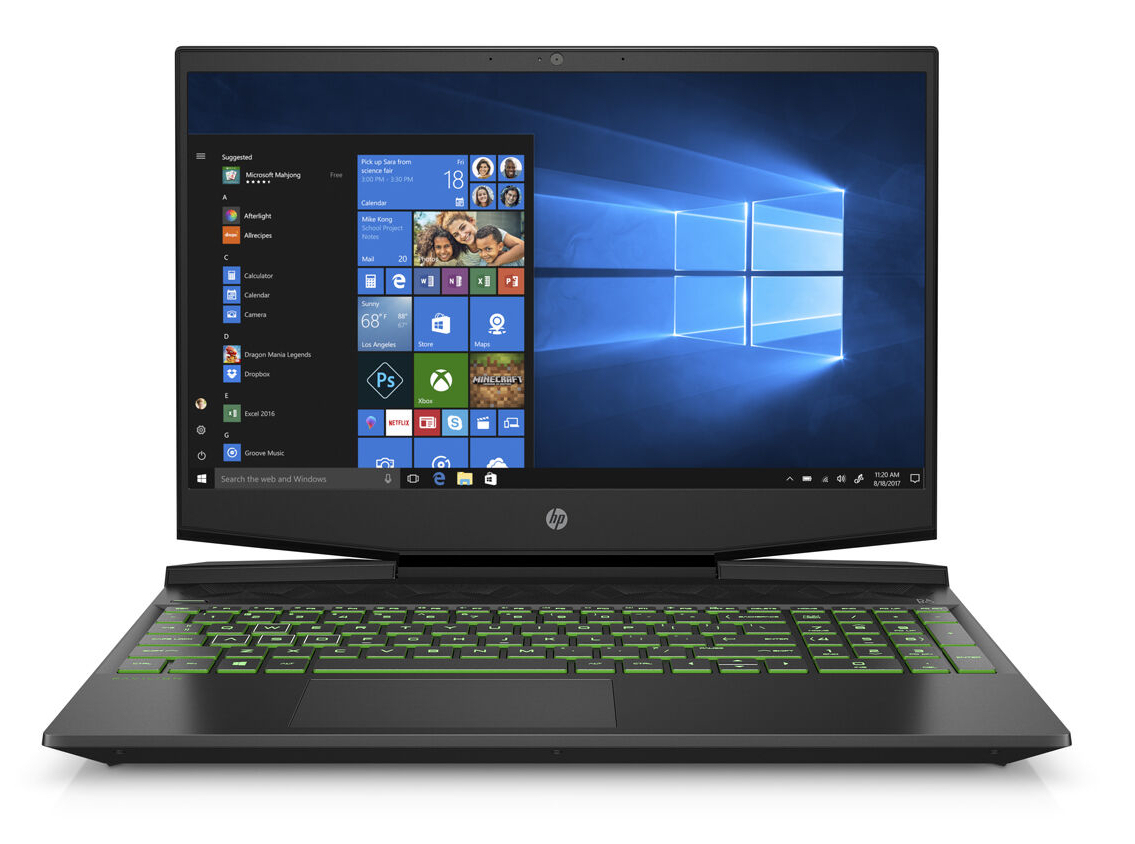
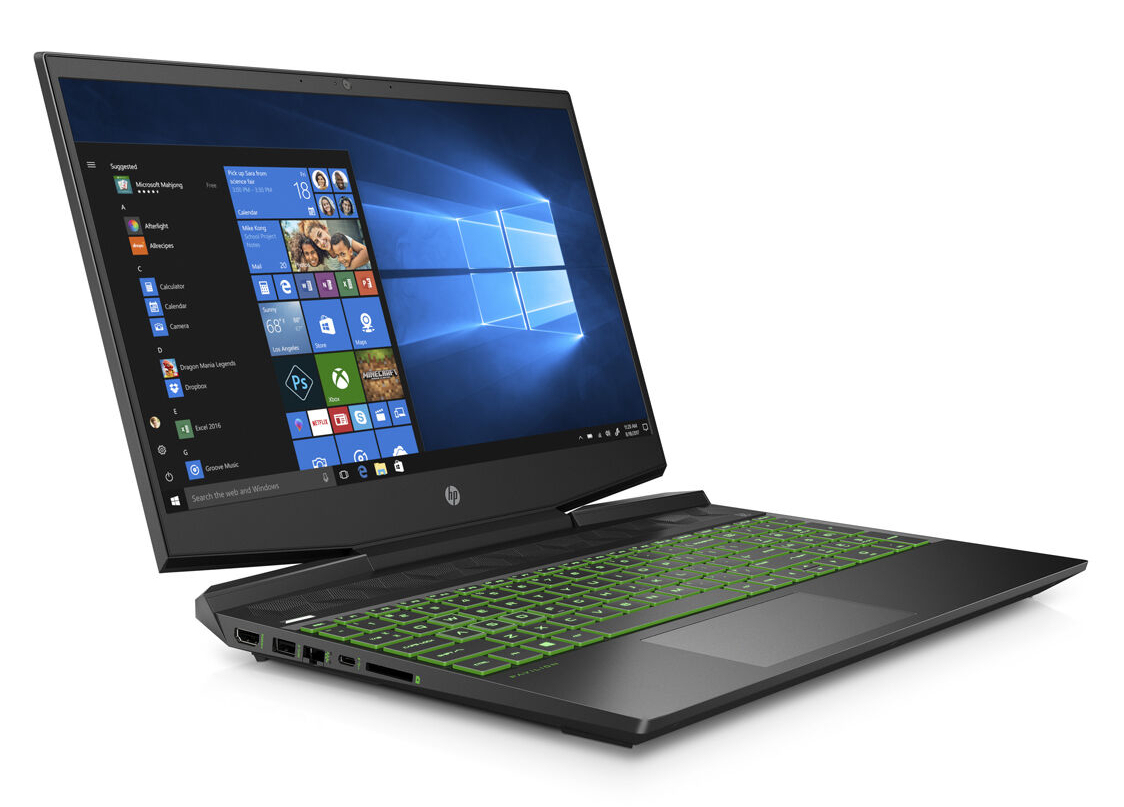
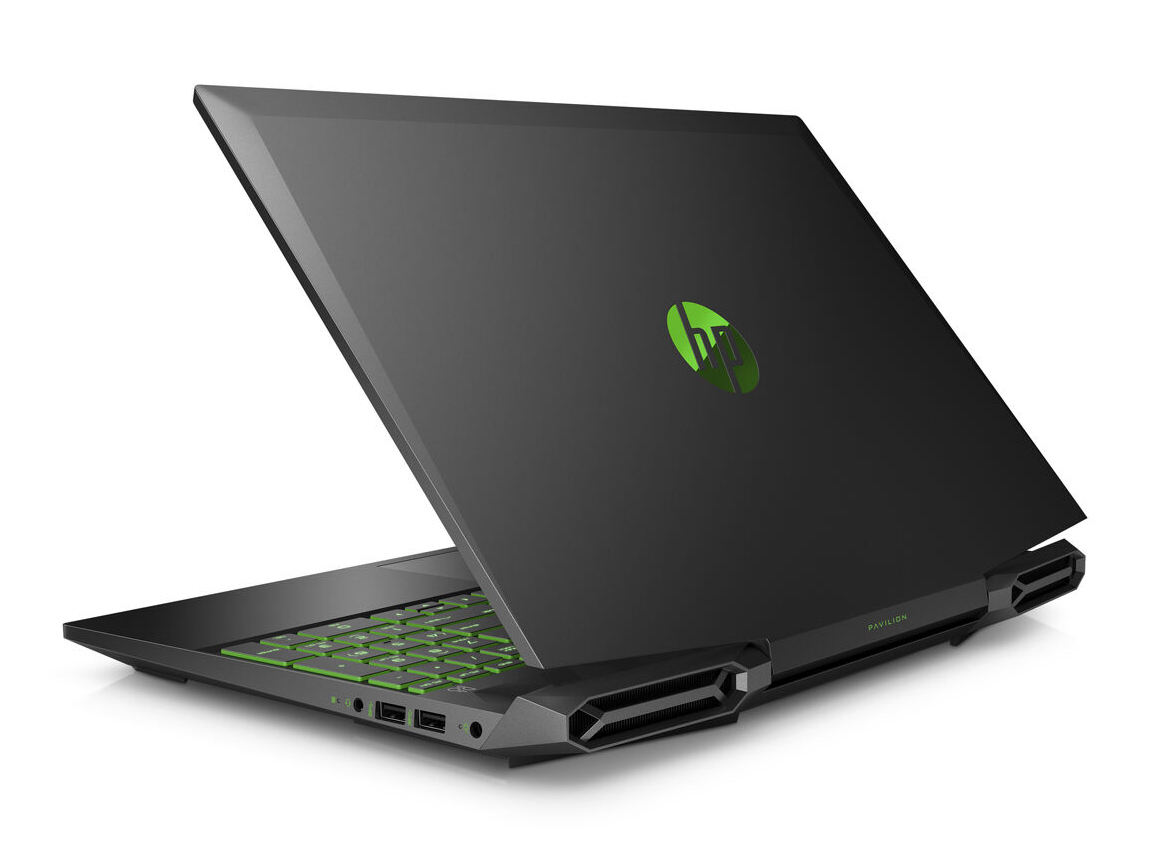
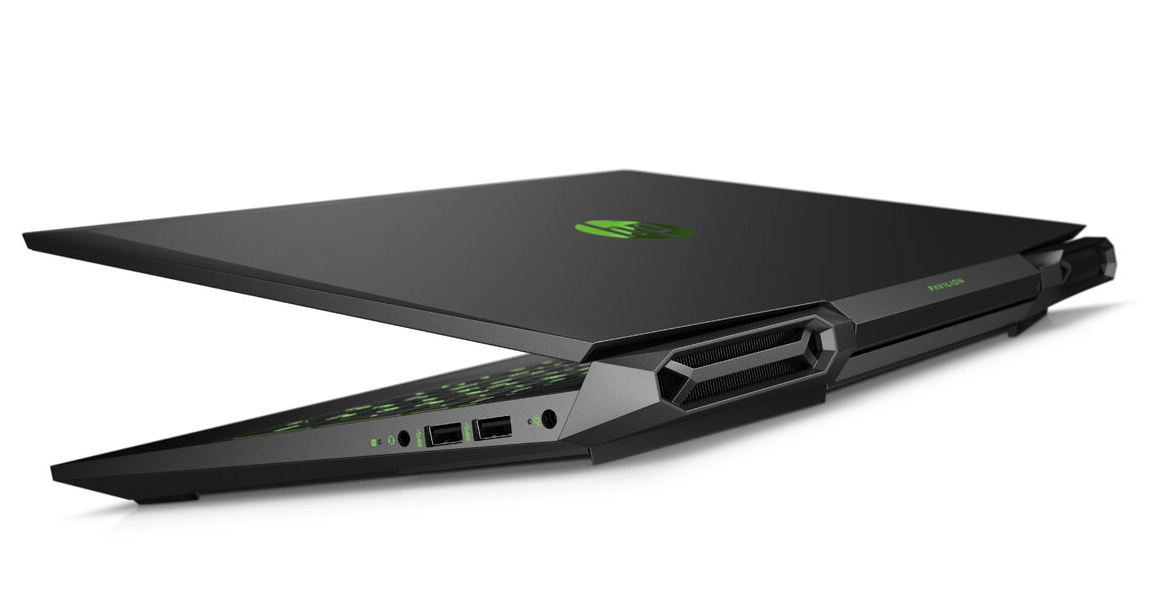
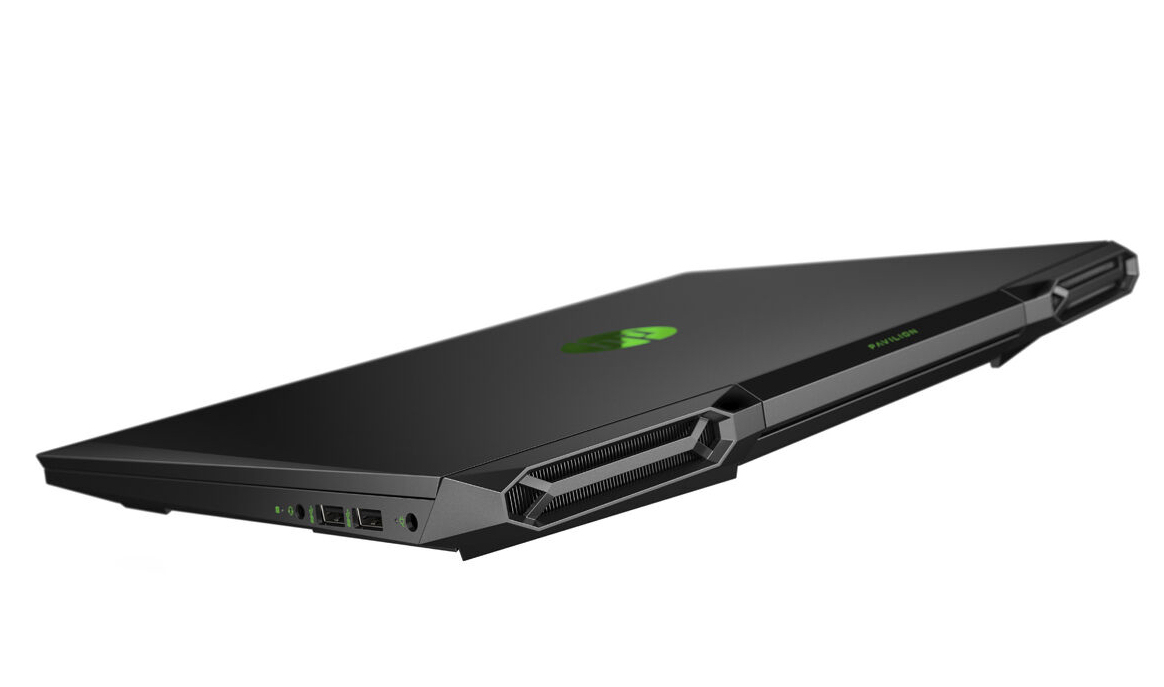
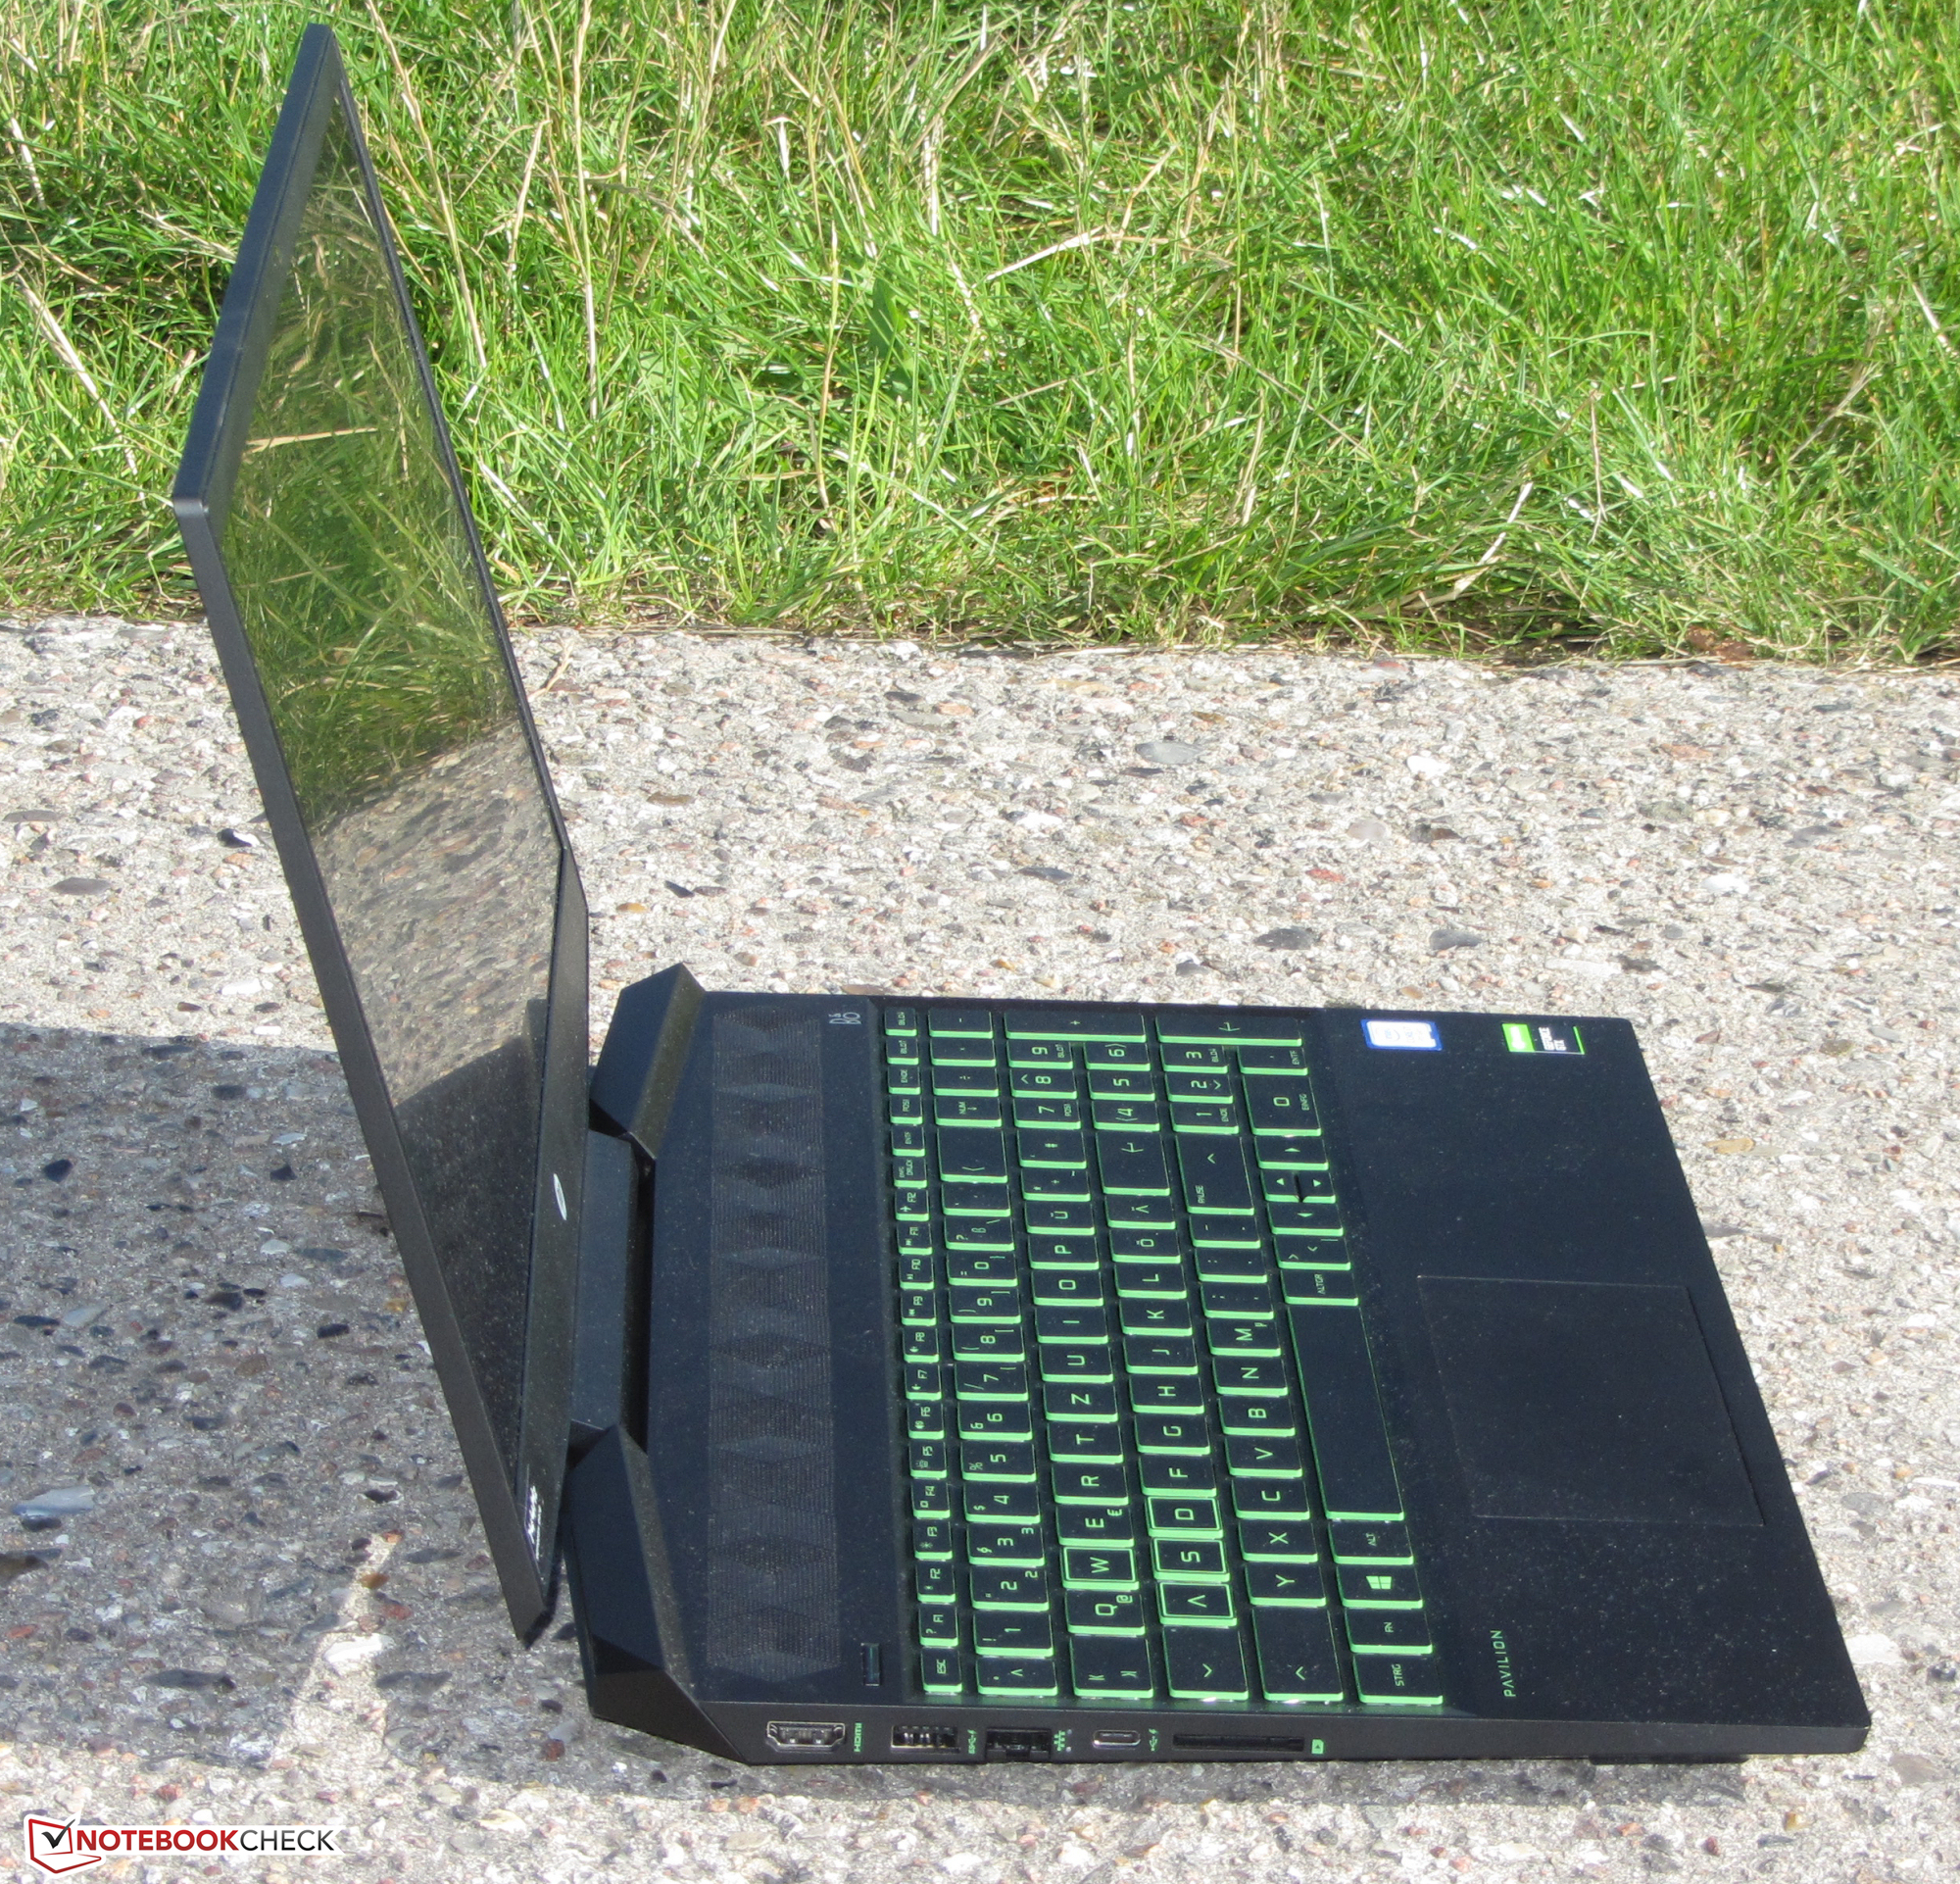
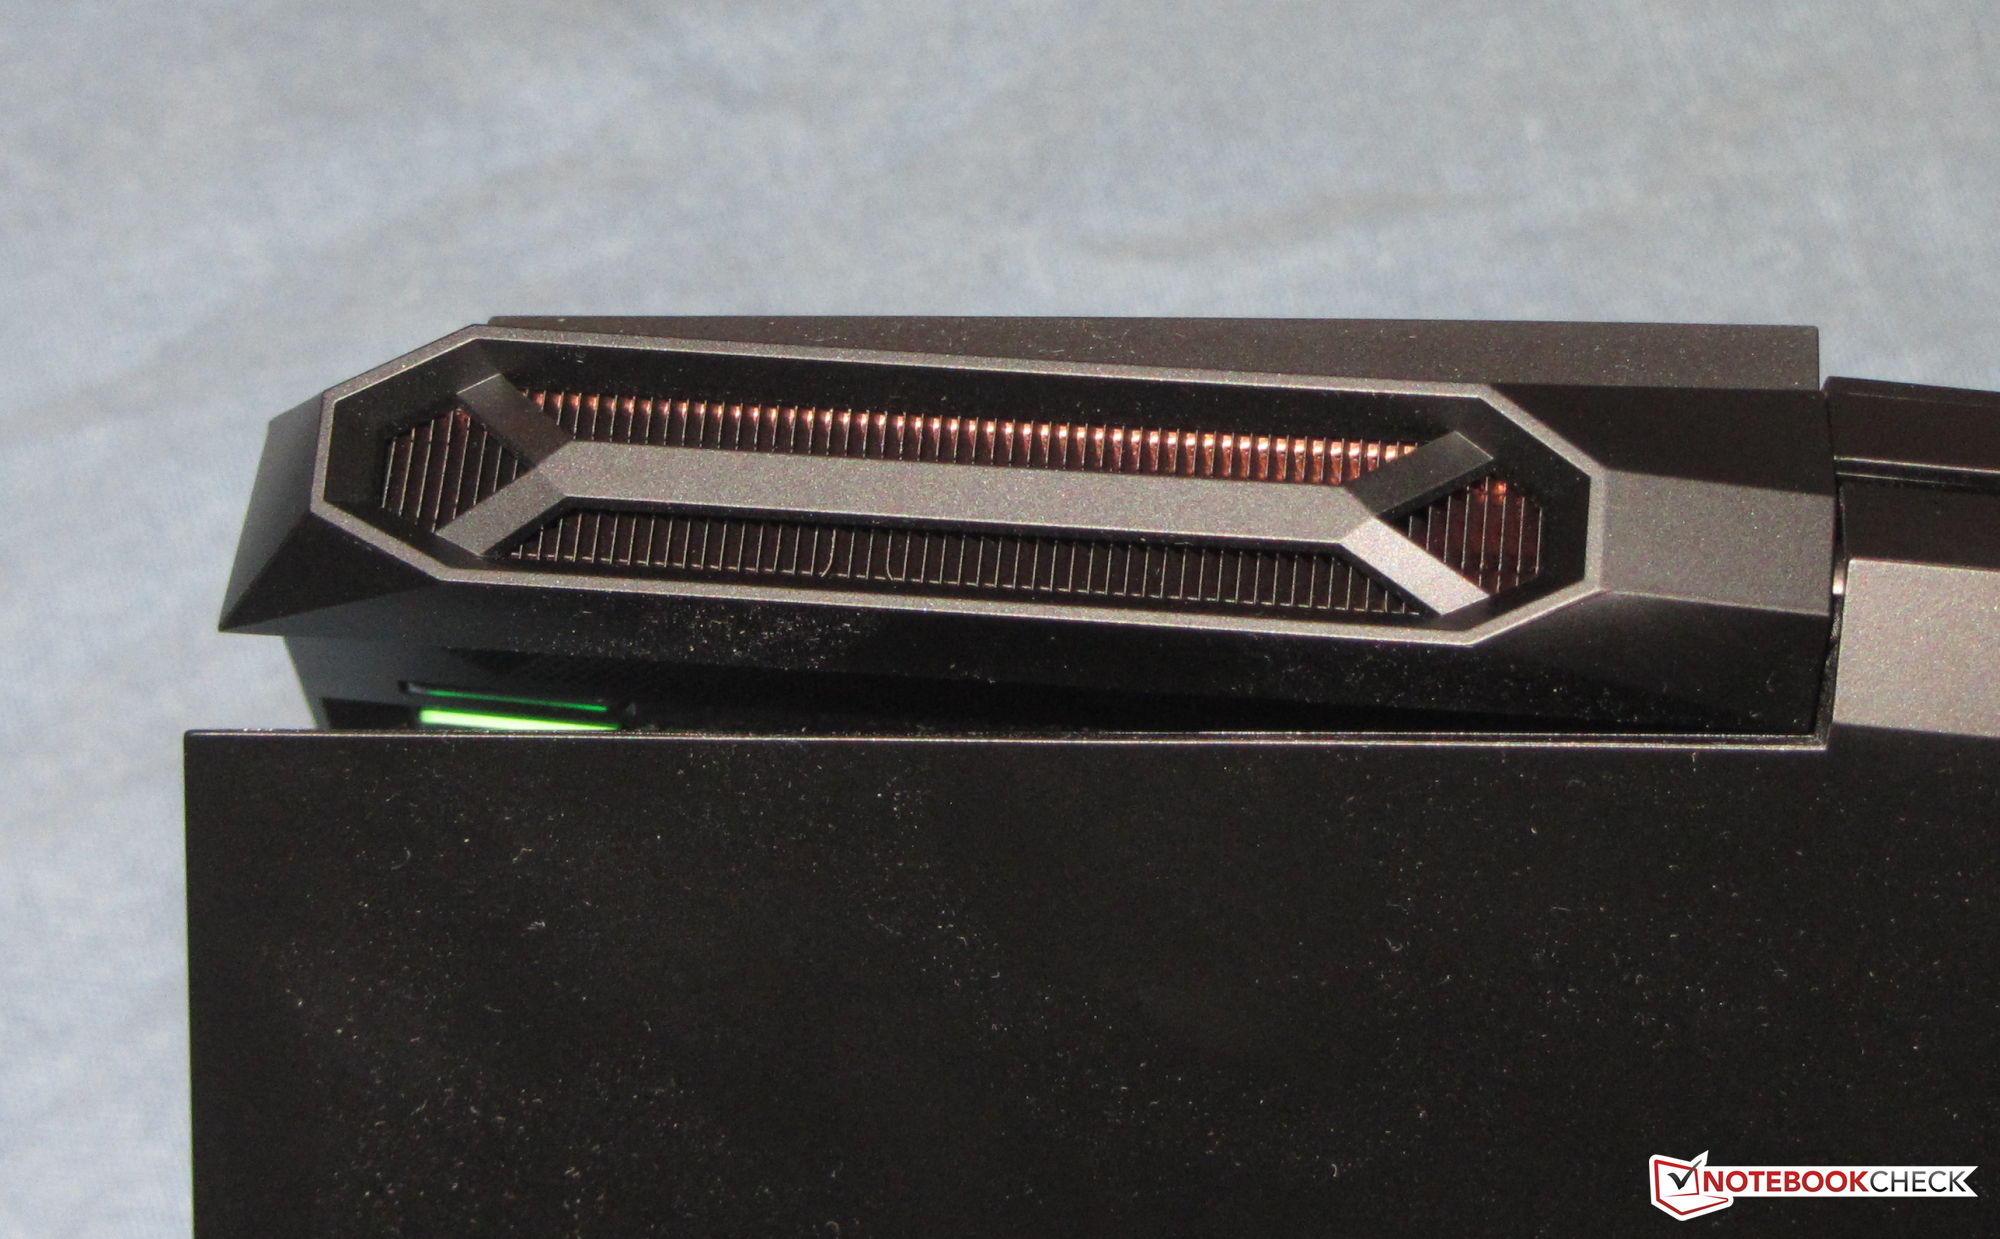
The Gaming Pavilion 15 has a redesigned case compared to the ones that HP uses on its other Pavilion laptops. Nonetheless, our review unit bears a certain resemblance to its predecessor, with the Gaming Pavilion 15 having a matte, black plastic chassis. HP calls this Shadow Black, which it contrasts with several green areas, including the keyboard. The most striking design feature is the air outlet on the back though, in our opinion.
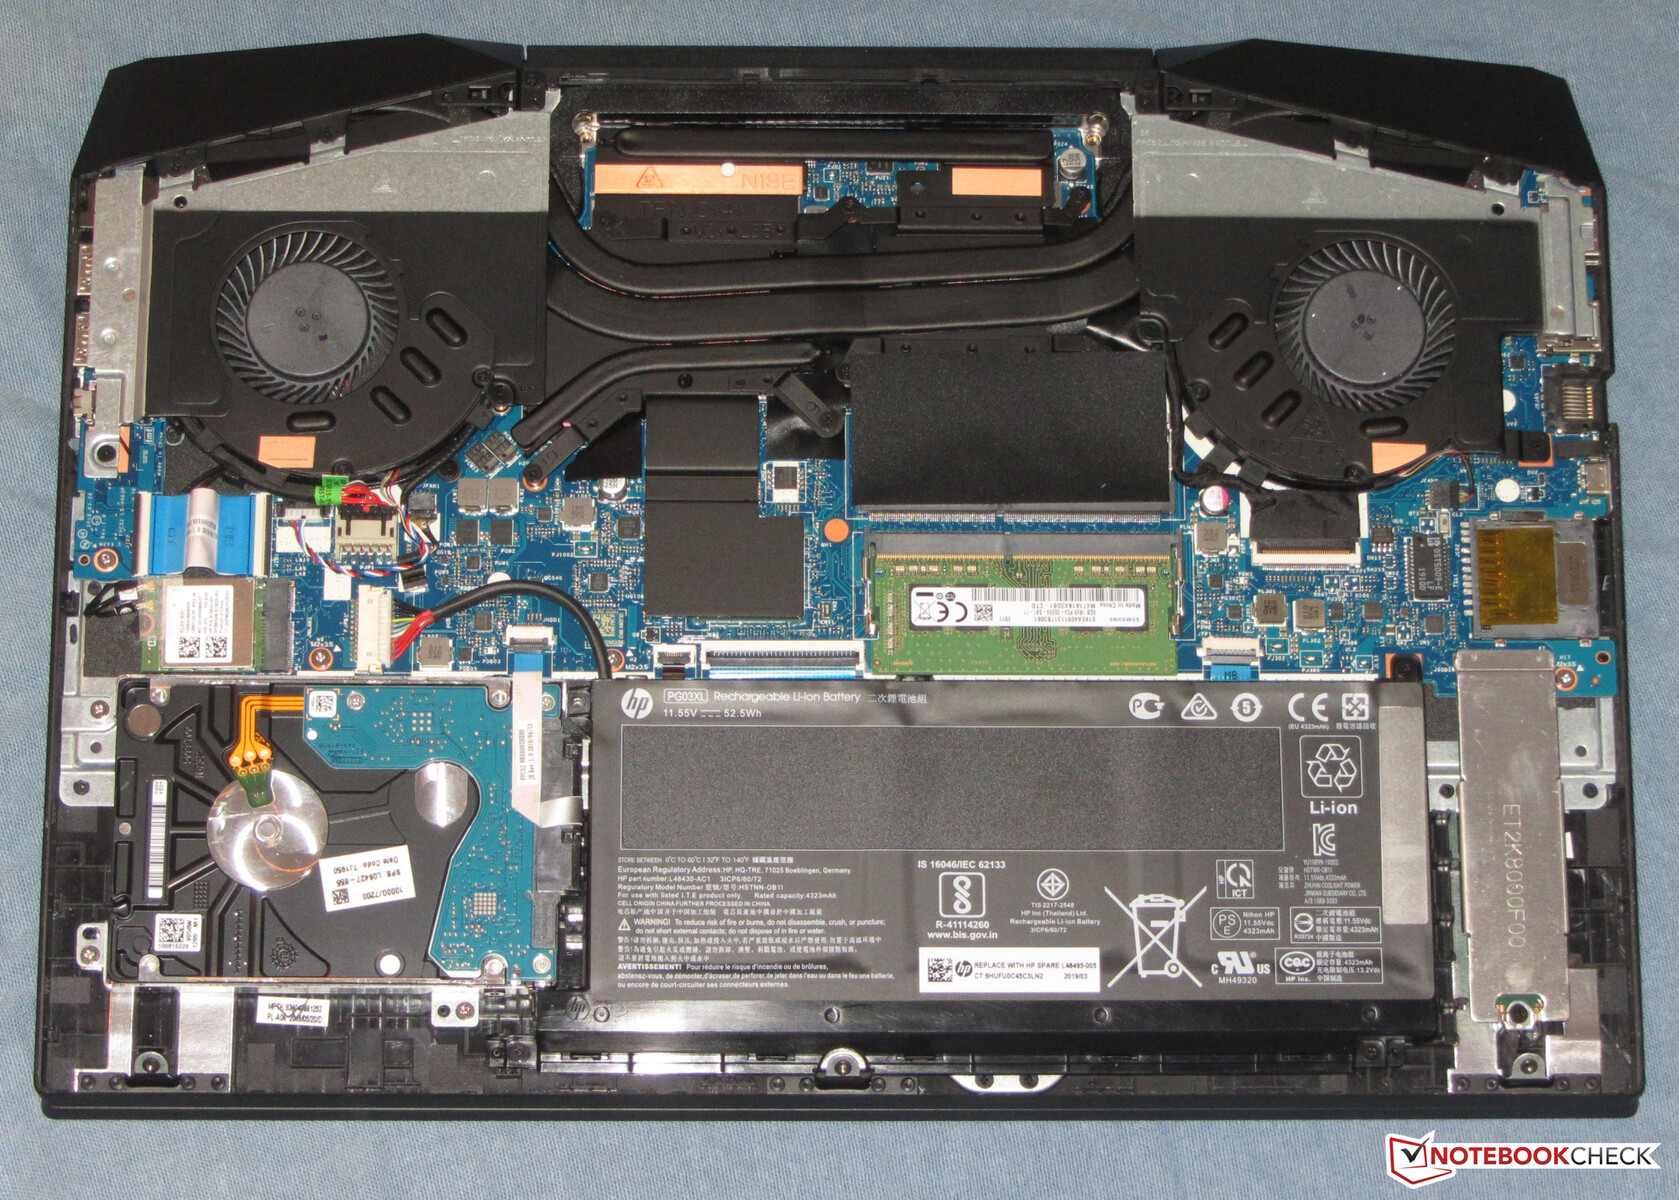
The device does not have a maintenance cover nor is the battery removable. Instead, accessing the battery or other internal components requires removing the bottom case; more on that in the Maintenance section of this review.
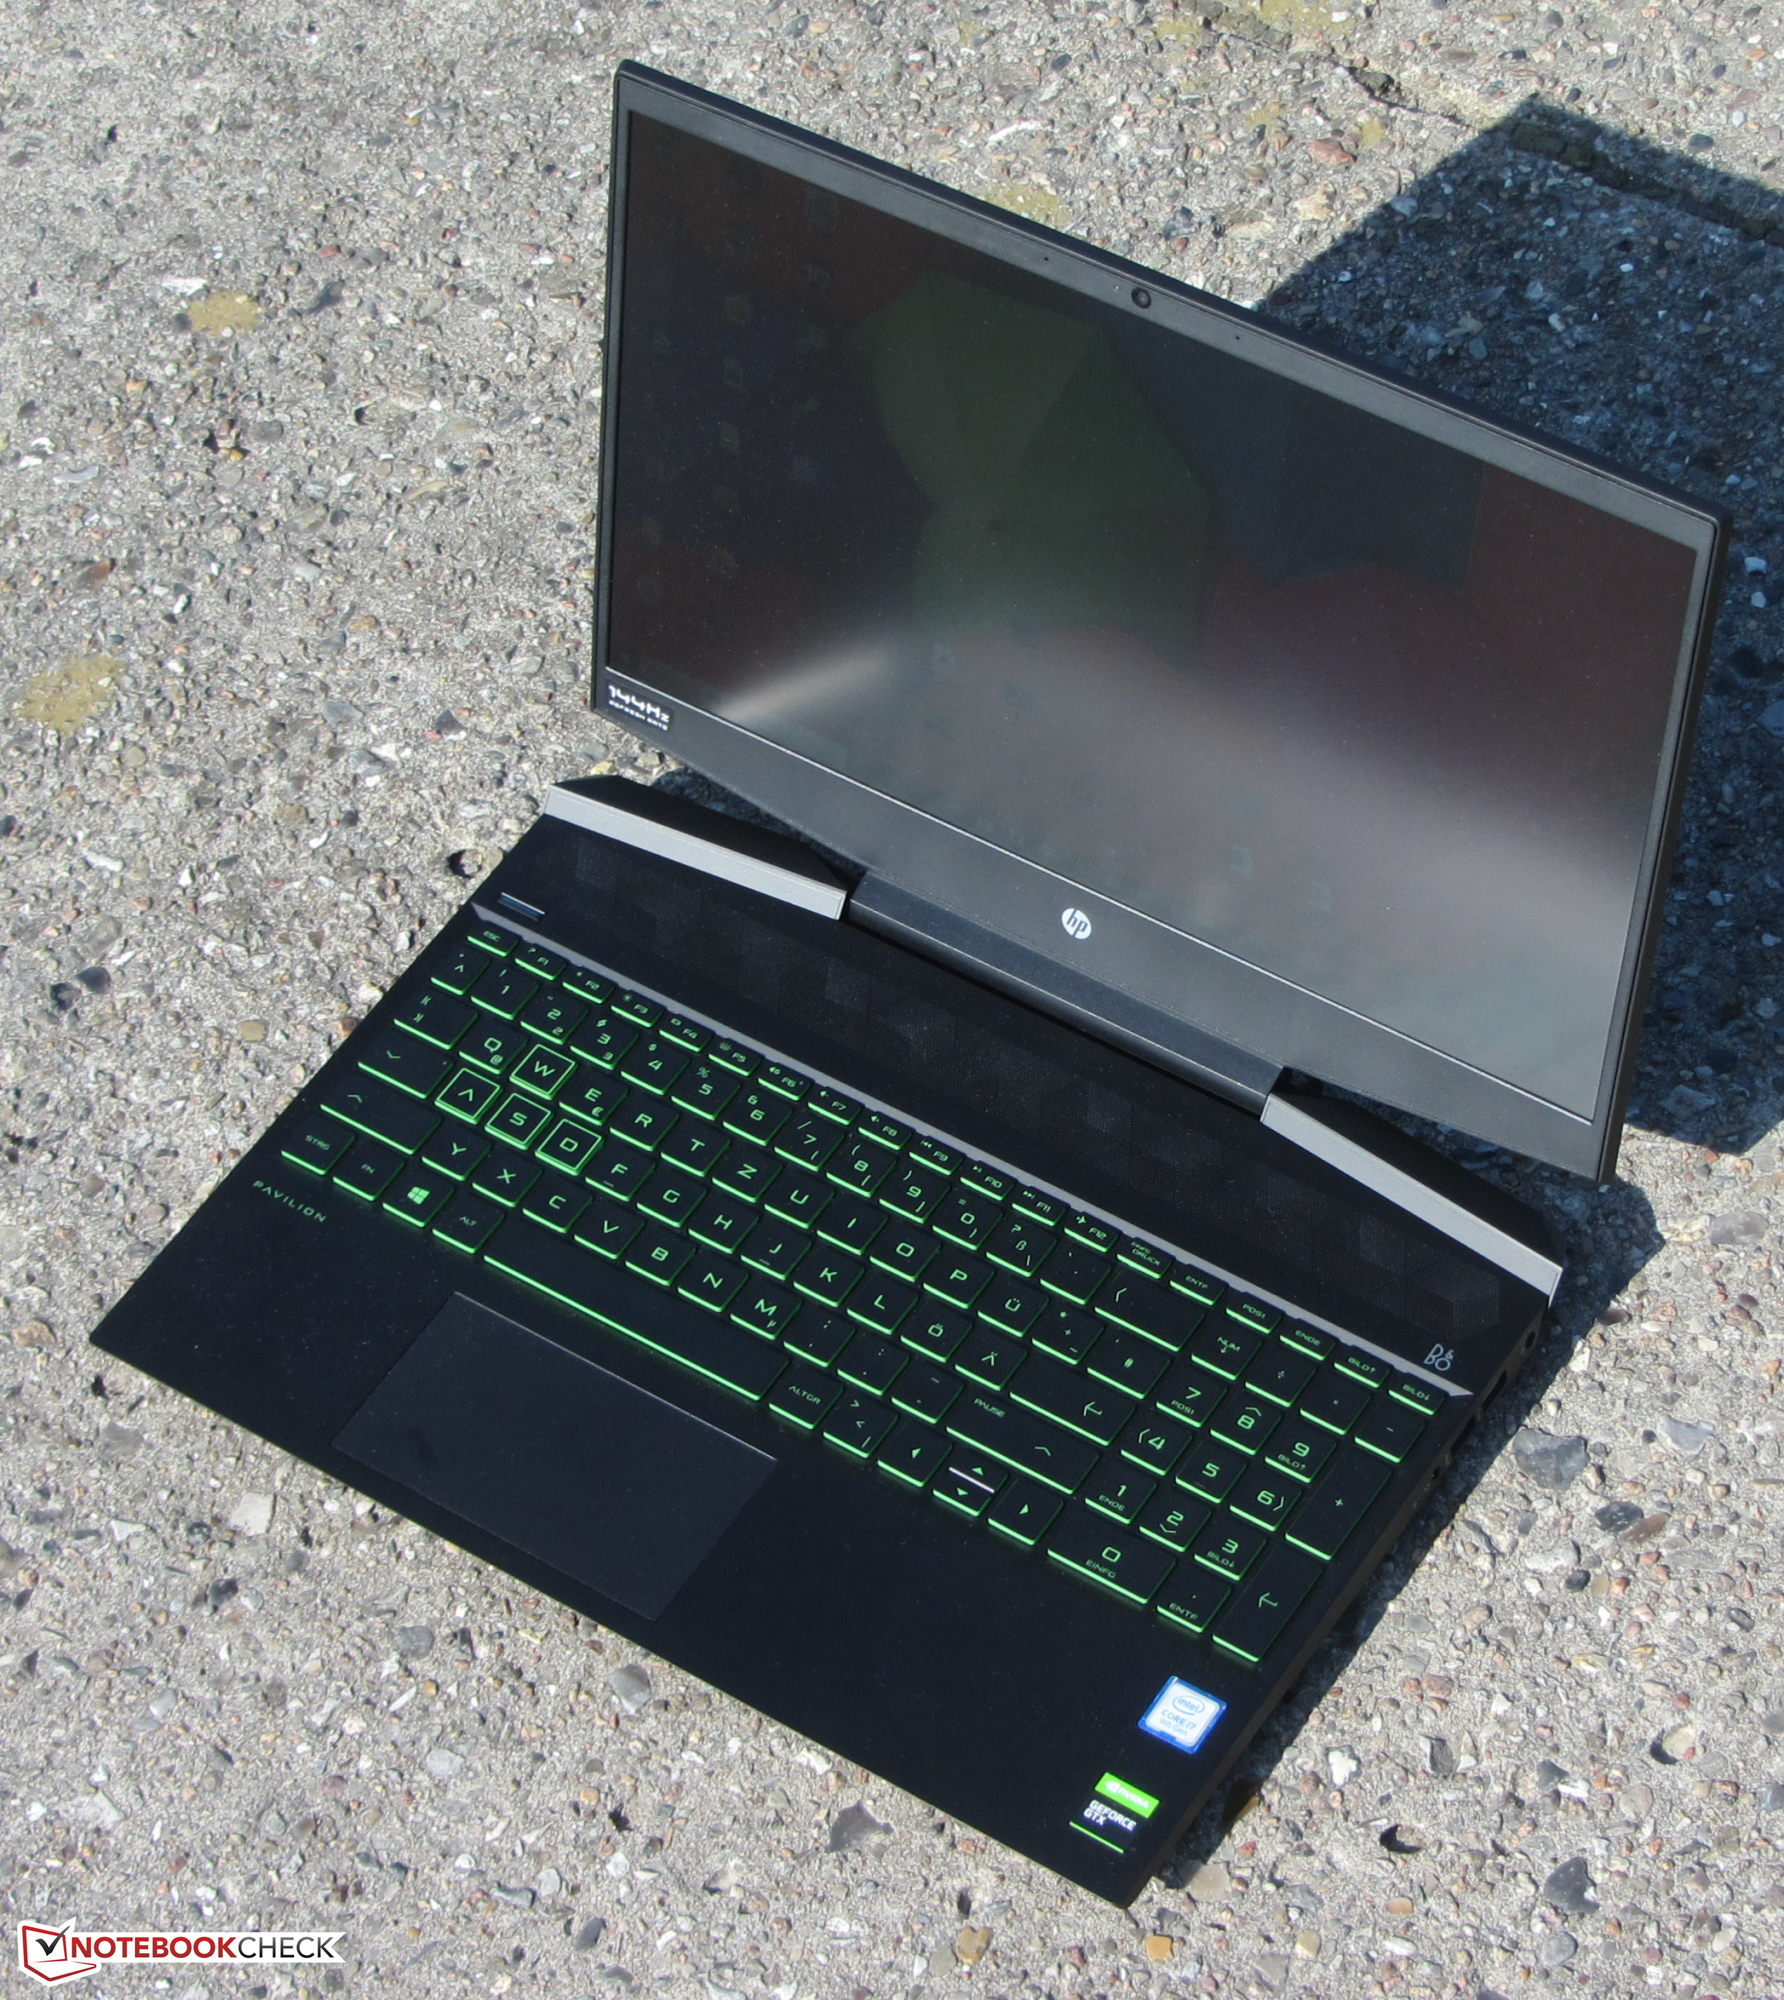
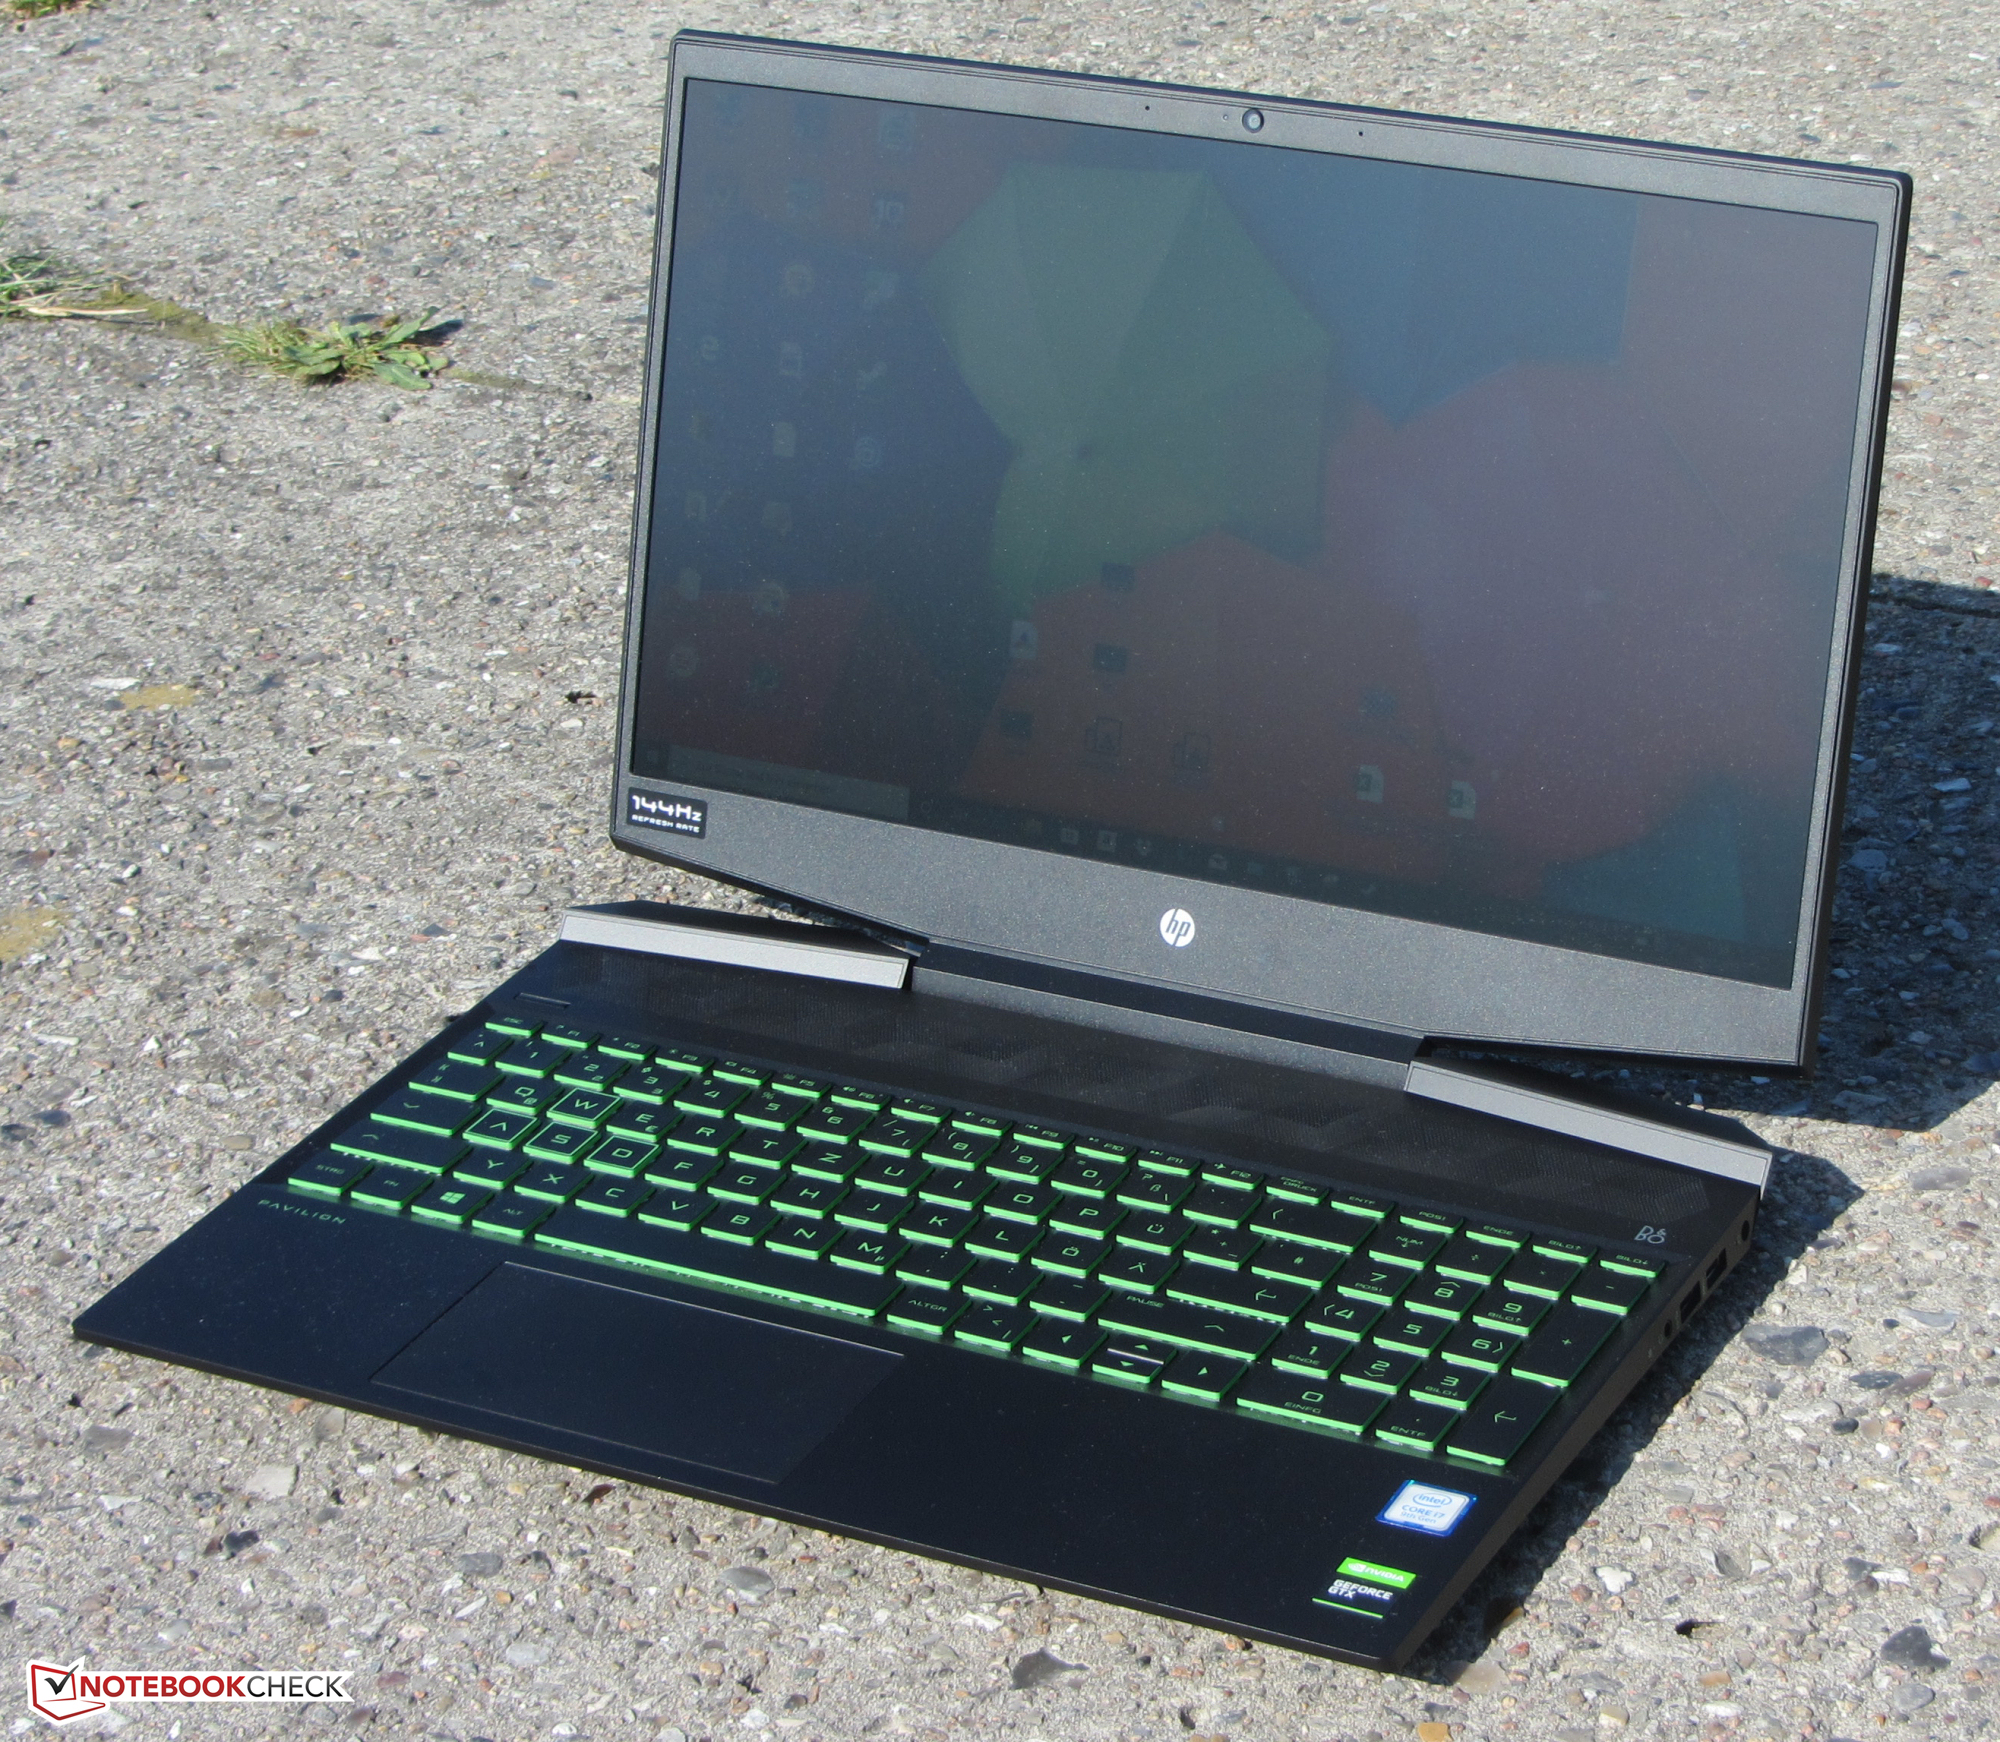
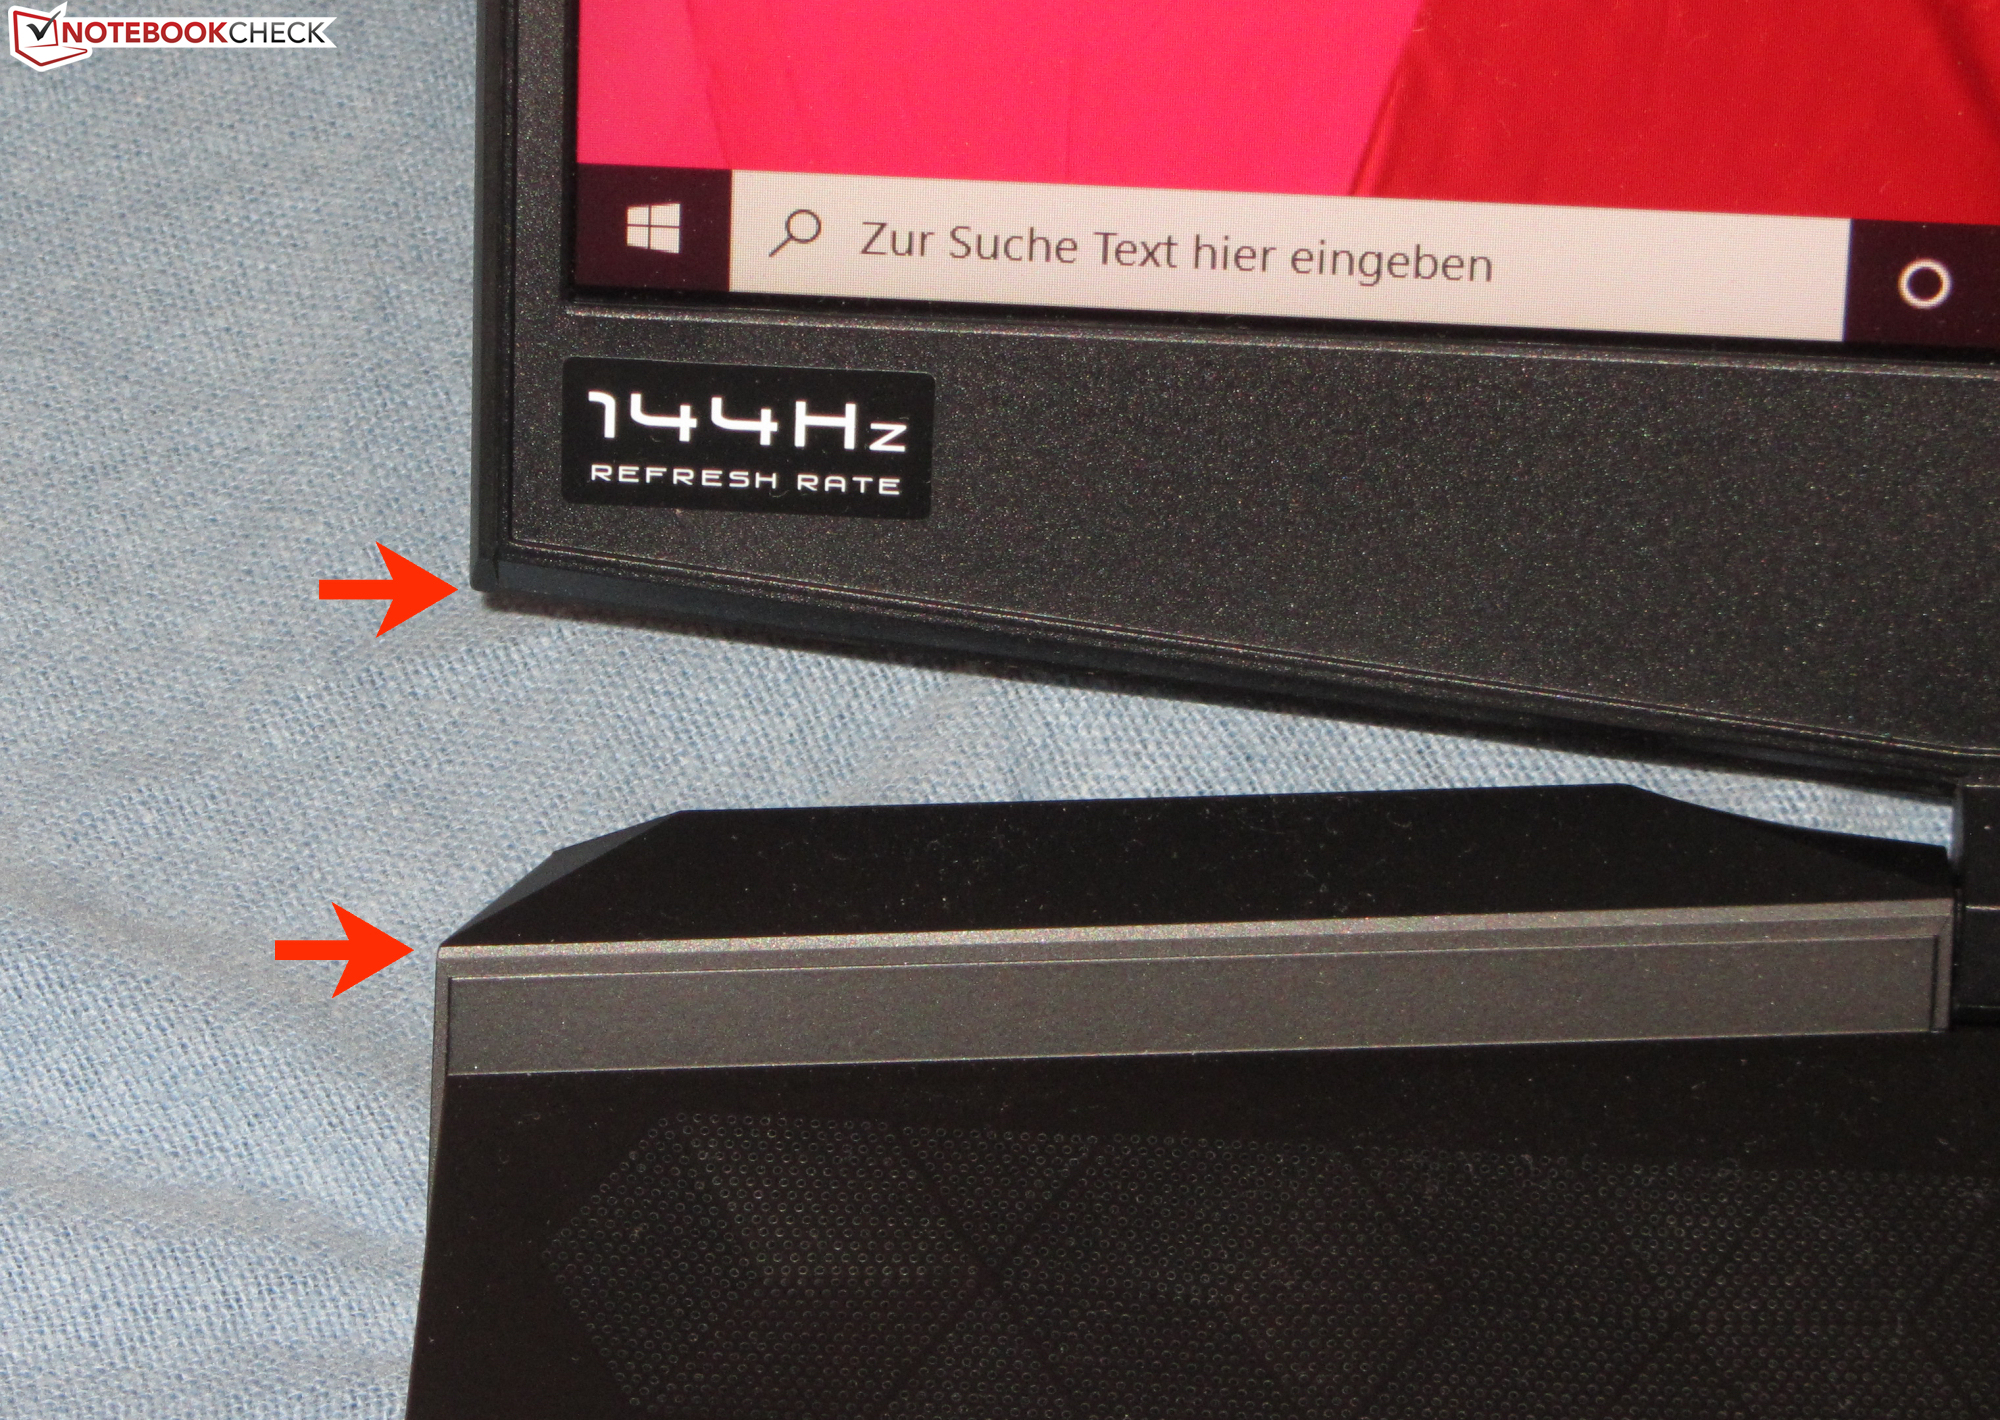
Our review unit is well built, with there being evenly tight gaps between materials. However, the bottom edges of the display lid are overly sharp, to the point where they could injure someone. The lid is too easy to twist for our liking though, and the hinges cannot prevent the display from teetering if we are typing. Our review unit is robust at least, with the lid absorbing our best efforts to deform the display. We could not deform the base either no matter how hard we tried. We like that the display can be opened with one hand too, although its maximum opening angle of about 130° is rather shallow.
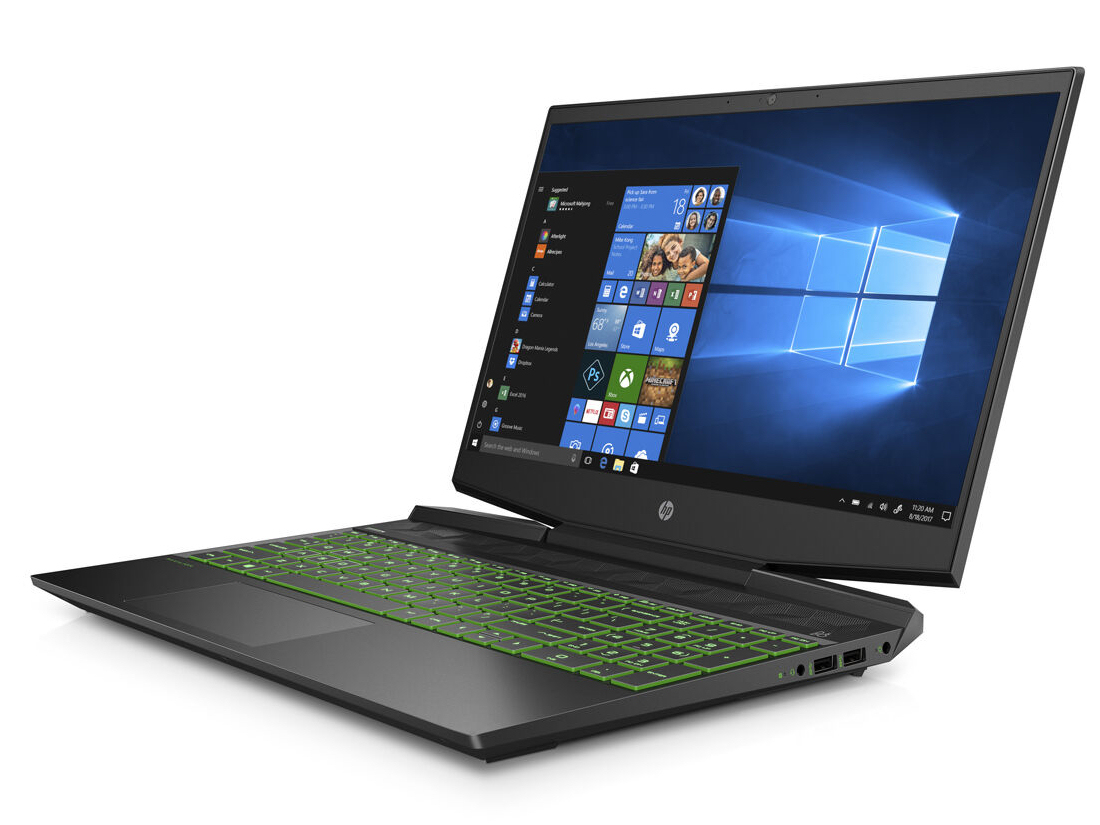
Our review unit is slightly compacter, sleeker and lighter than its predecessor, with it weighing 2.4 kg and being 23.4 mm thick. This makes it thinner and lighter than all but the CUK Model Z and Zephyrus G GA502DU of our comparison devices too.
Connectivity
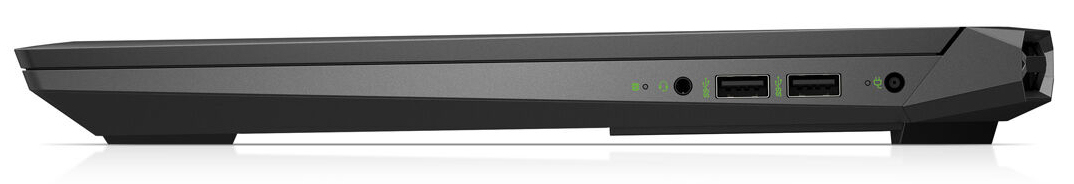
The Gaming Pavilion 15 has a good selection of ports, with four USB 3.2 ports including one Type-C Gen 2, which also supports DisplayPort out with an appropriate adapter. By contrast, the three Type-A ports operate on the slightly older Gen 1 standard. There is also an HDMI 2.0 port, a 3.5 mm combined headphone and microphone jack, a Gigabit Ethernet port and a cable lock slot. HP has positioned all the ports along the right and left-hand sides of the device, but no cables should obstruct you while using a wired or wireless external mouse.
Our only gripe is that HP chose not to include a Thunderbolt 3 port. While its use is essentially limited to hooking up an external GPU, Thunderbolt 3 has become a standard among modern gaming laptops, so its exclusion seems rather odd here.
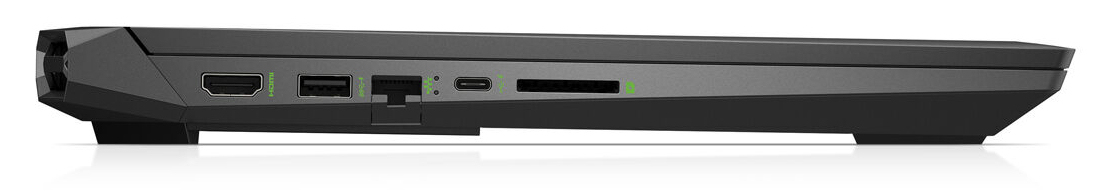
SD Card Reader
The SD card reader in our review unit not only swallows SD cards completely but also keeps them locked in place. It appears that HP has equipped the device with a USB 3.0 reader, which averaged around 75 MB/s transfer speeds with our Toshiba Exceria Pro SDXC 64 GB UHS-II reference card.
| SD Card Reader | |
| average JPG Copy Test (av. of 3 runs) | |
| Average of class Gaming (20.9 - 210, n=54, last 2 years) | |
| CUK Model Z GK5CQ7Z (Toshiba Exceria Pro SDXC 64 GB UHS-II) | |
| HP Gaming Pavilion 15-dk0009ng (Toshiba Exceria Pro SDXC 64 GB UHS-II) | |
| Dell G5 15 5590 (Toshiba Exceria Pro SDXC 64 GB UHS-II) | |
| Medion Erazer X6805-MD61085 (Toshiba Exceria Pro SDXC 64 GB UHS-II) | |
| maximum AS SSD Seq Read Test (1GB) | |
| Average of class Gaming (25.5 - 261, n=51, last 2 years) | |
| CUK Model Z GK5CQ7Z (Toshiba Exceria Pro SDXC 64 GB UHS-II) | |
| HP Gaming Pavilion 15-dk0009ng (Toshiba Exceria Pro SDXC 64 GB UHS-II) | |
| Medion Erazer X6805-MD61085 (Toshiba Exceria Pro SDXC 64 GB UHS-II) | |
| Dell G5 15 5590 (Toshiba Exceria Pro SDXC 64 GB UHS-II) | |
Communication
HP has equipped our review unit with a Realtek RTL8822BE Wi-Fi module. The chip supports all modern Wi-Fi standards up to 802.11ac and Bluetooth 4.2. The chip averaged over 600 Mb/s in our iperf3 Client Wi-Fi tests thanks to its two antennas, which puts it well above average for gaming laptops and on par with the Intel Wireless-AC 9560. Incidentally, the Gigabit Ethernet chip is also from Realtek, specifically the RTL8168/8111 family. It also worked well during our tests.
Accessories
HP only includes a power supply in the box, along with a quick-start poster and some warranty information. Our review unit arrived with no other accessories.
Maintenance
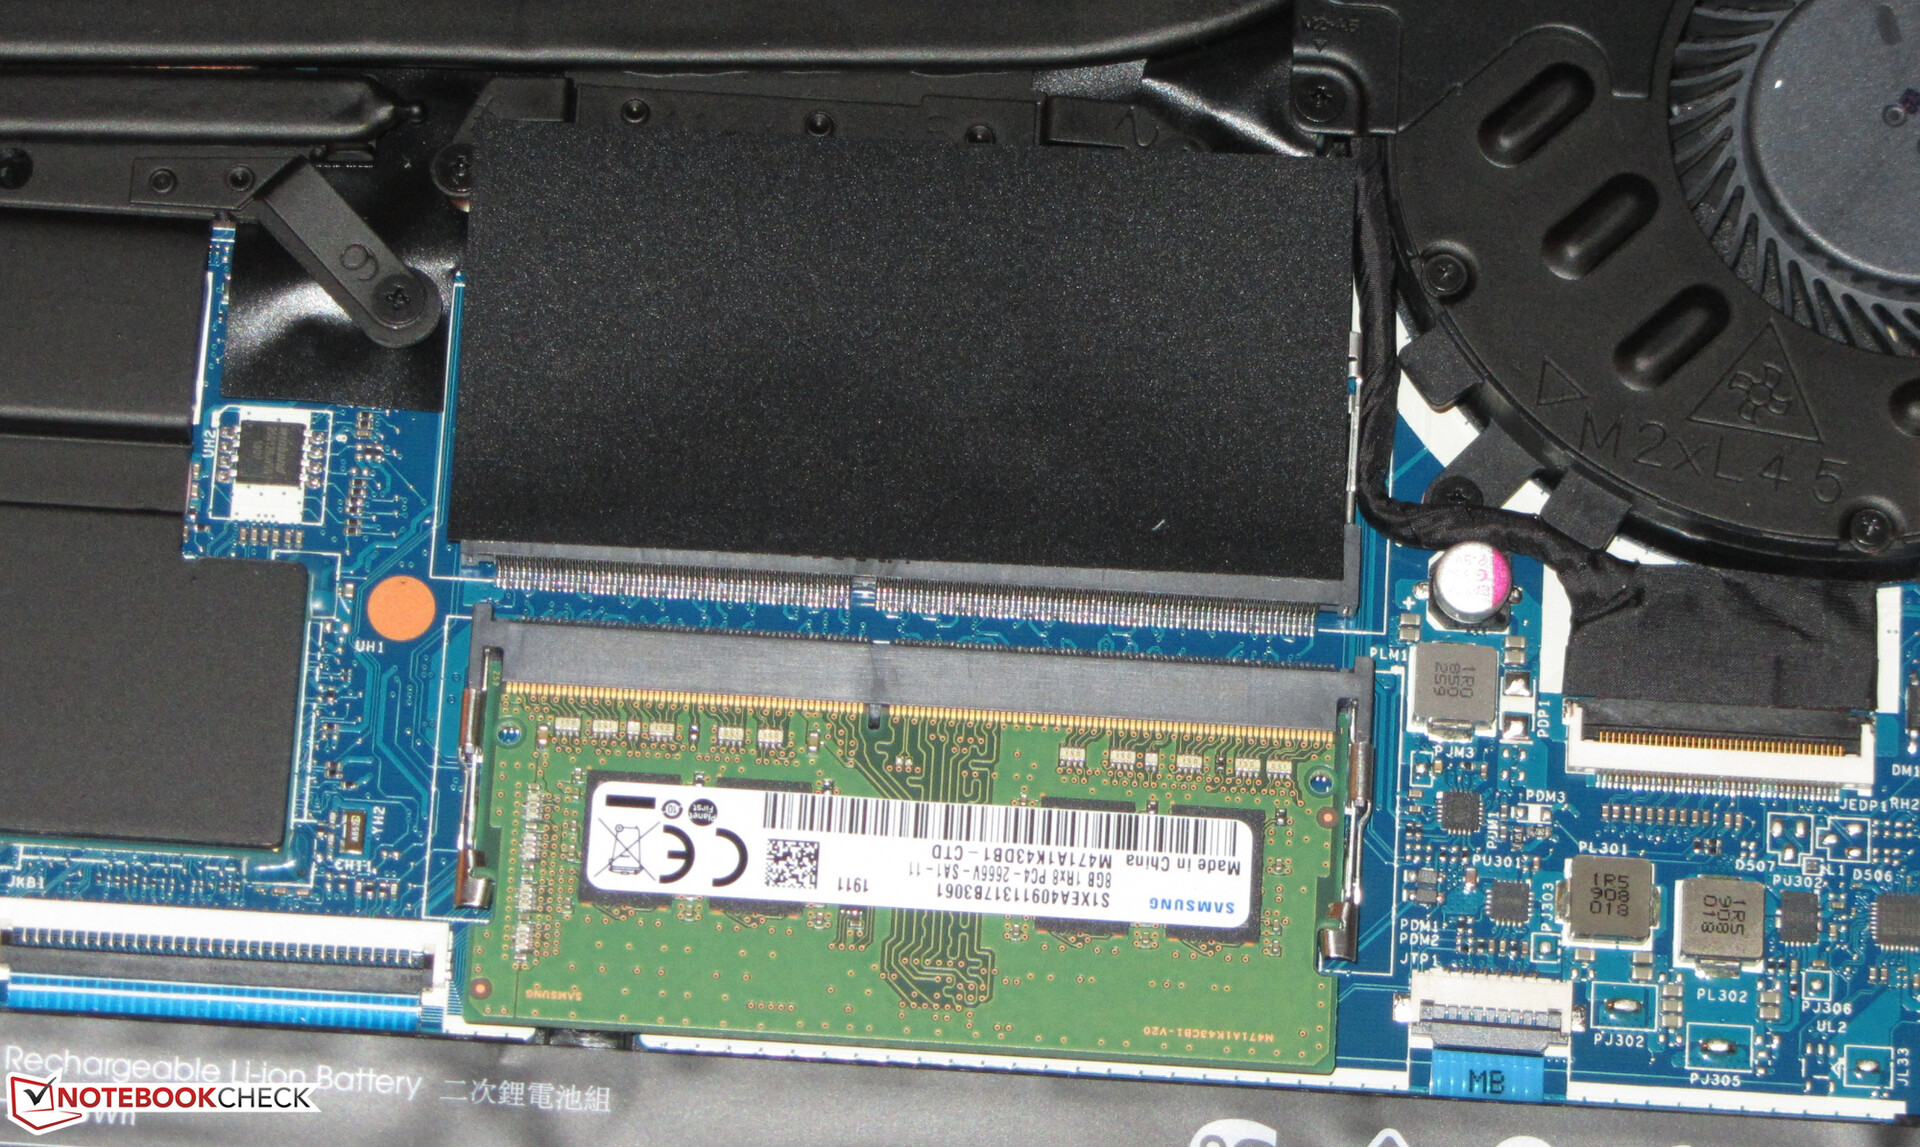
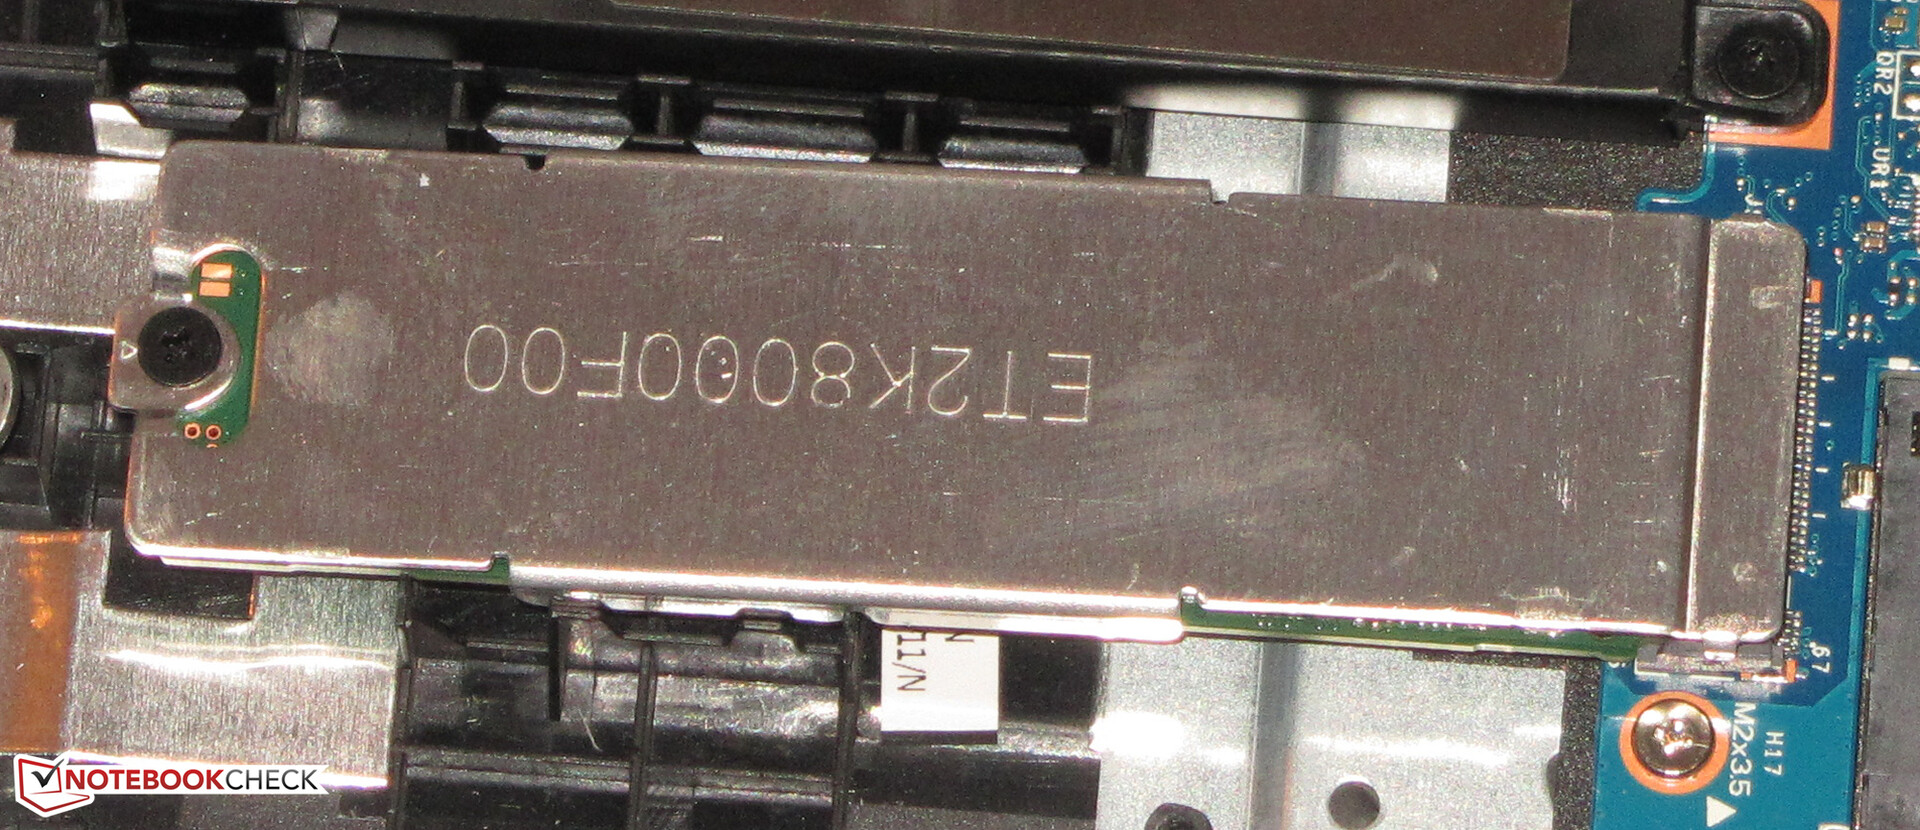
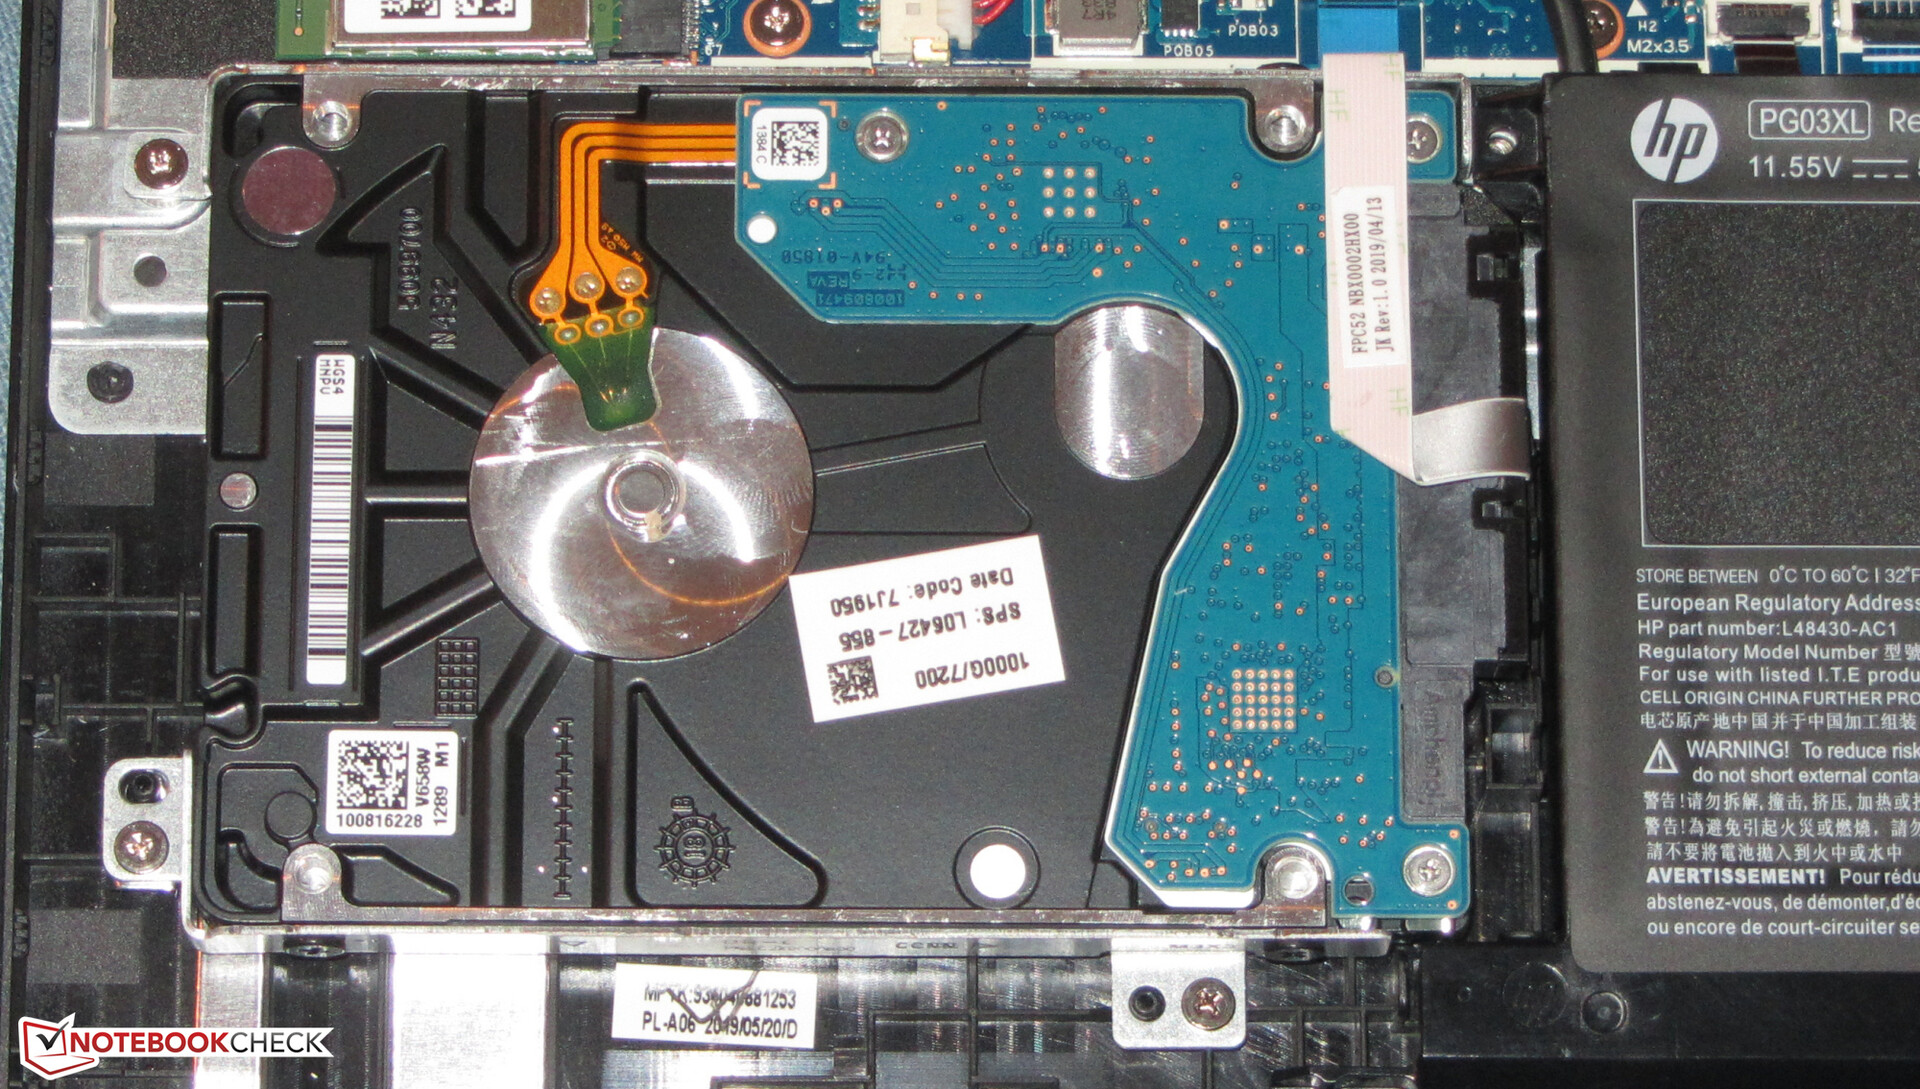
As we mentioned earlier, the Gaming Pavilion 15 does not have a maintenance cover, so accessing the internal components requires removing the bottom plate. This is not too onerous by modern HP laptop standards, unlike the HP Spectre x360 13t and its fragile rubber strips with hidden screws, but we would still recommend taking care prying the bottom case from the chassis once you have removed the several screws securing the two pieces together. A small plastic spatula, or spudger, would do. Once you have removed the bottom panel, then you will be greeted by all the major components including the two RAM modules, HDD and SSD.
Warranty
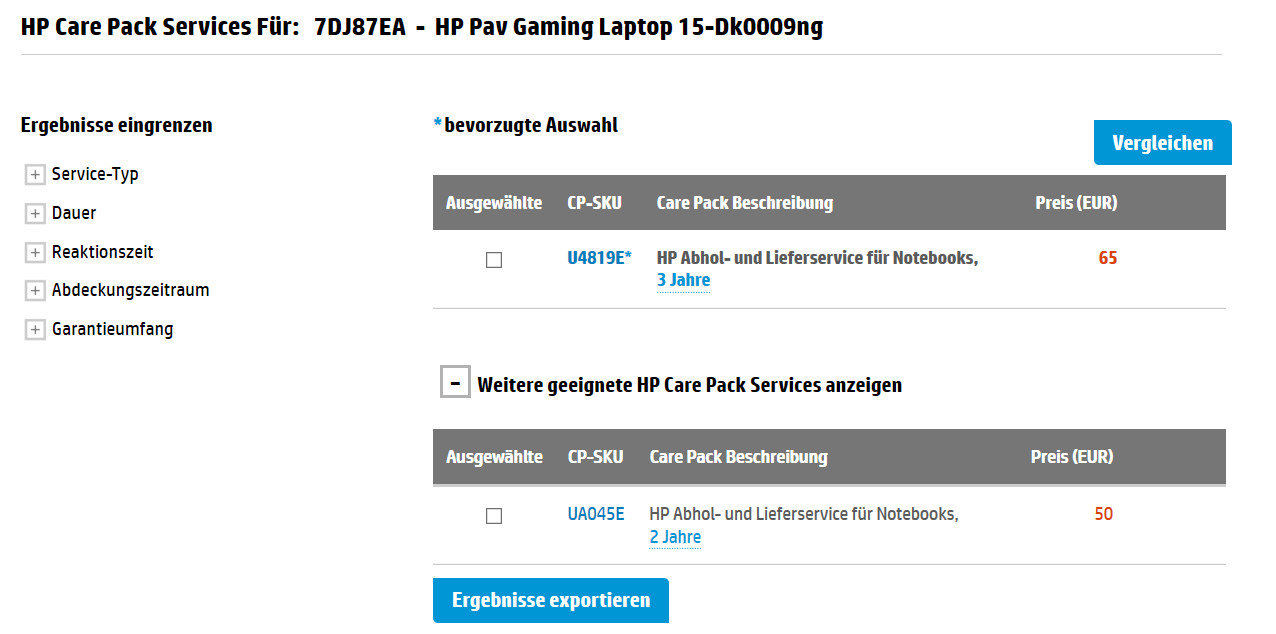
Disappointingly, the Gaming Pavilion 15 comes with just a one-year warranty by default. HP sells extended warranty coverage though, which it markets as Care Packs. The company currently offers the Gaming Pavilion 15 with either two- or three-year extensions that it sells for 50 Euros (~US$55) and 65 Euros (~US$72), respectively. Care Packs include pickup and delivery, for reference.
Please see our Guarantees, Return Policies & Warranties FAQ for country-specific information.
Input Devices
Keyboard
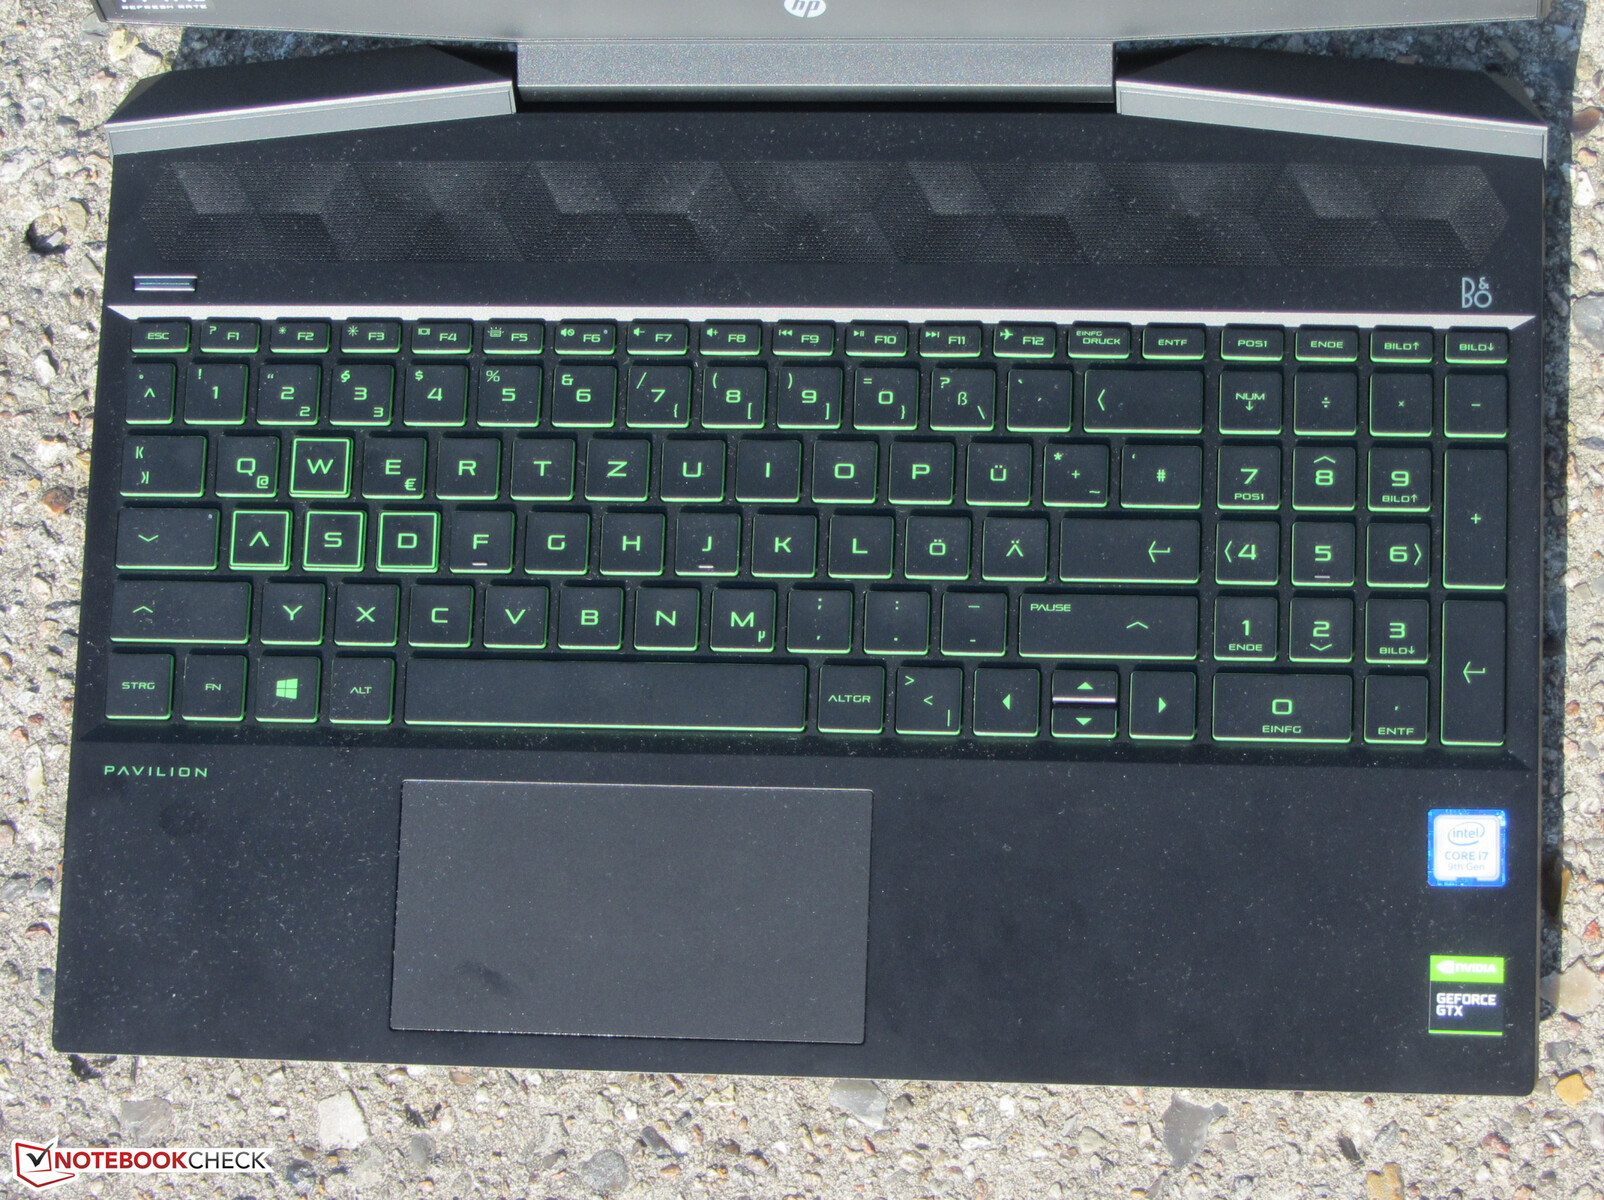
HP equips the Gaming Pavilion 15 with a six-row chiclet keyboard including a number pad. The primary keys measure 15 x 15 mm and are easily distinguishable from each other thanks to their bright green lettering. The keys have a smooth action and have a medium lift with clear pressure points. The resistance should be crisper for our tastes though, while the keyboard deck gives away a bit when we type. We did not find this overly disturbing during our tests though. HP includes a two-level keyboard backlighting too, which has a dedicated function button. In short, the Gaming Pavilion 15 has a decent keyboard.
Trackpad
The Gaming Pavilion 15 has a multitouch trackpad too, which measures 11.4 x 5 cm. The trackpad has a smooth finish on which it is easy to perform multi-finger gestures, which is aided by its size. The one in our review unit responds precisely to inputs even into the corners of its surface. The trackpad integrates two mouse buttons, which have tactile pressure points and deliver an audible click when pressed.
Display
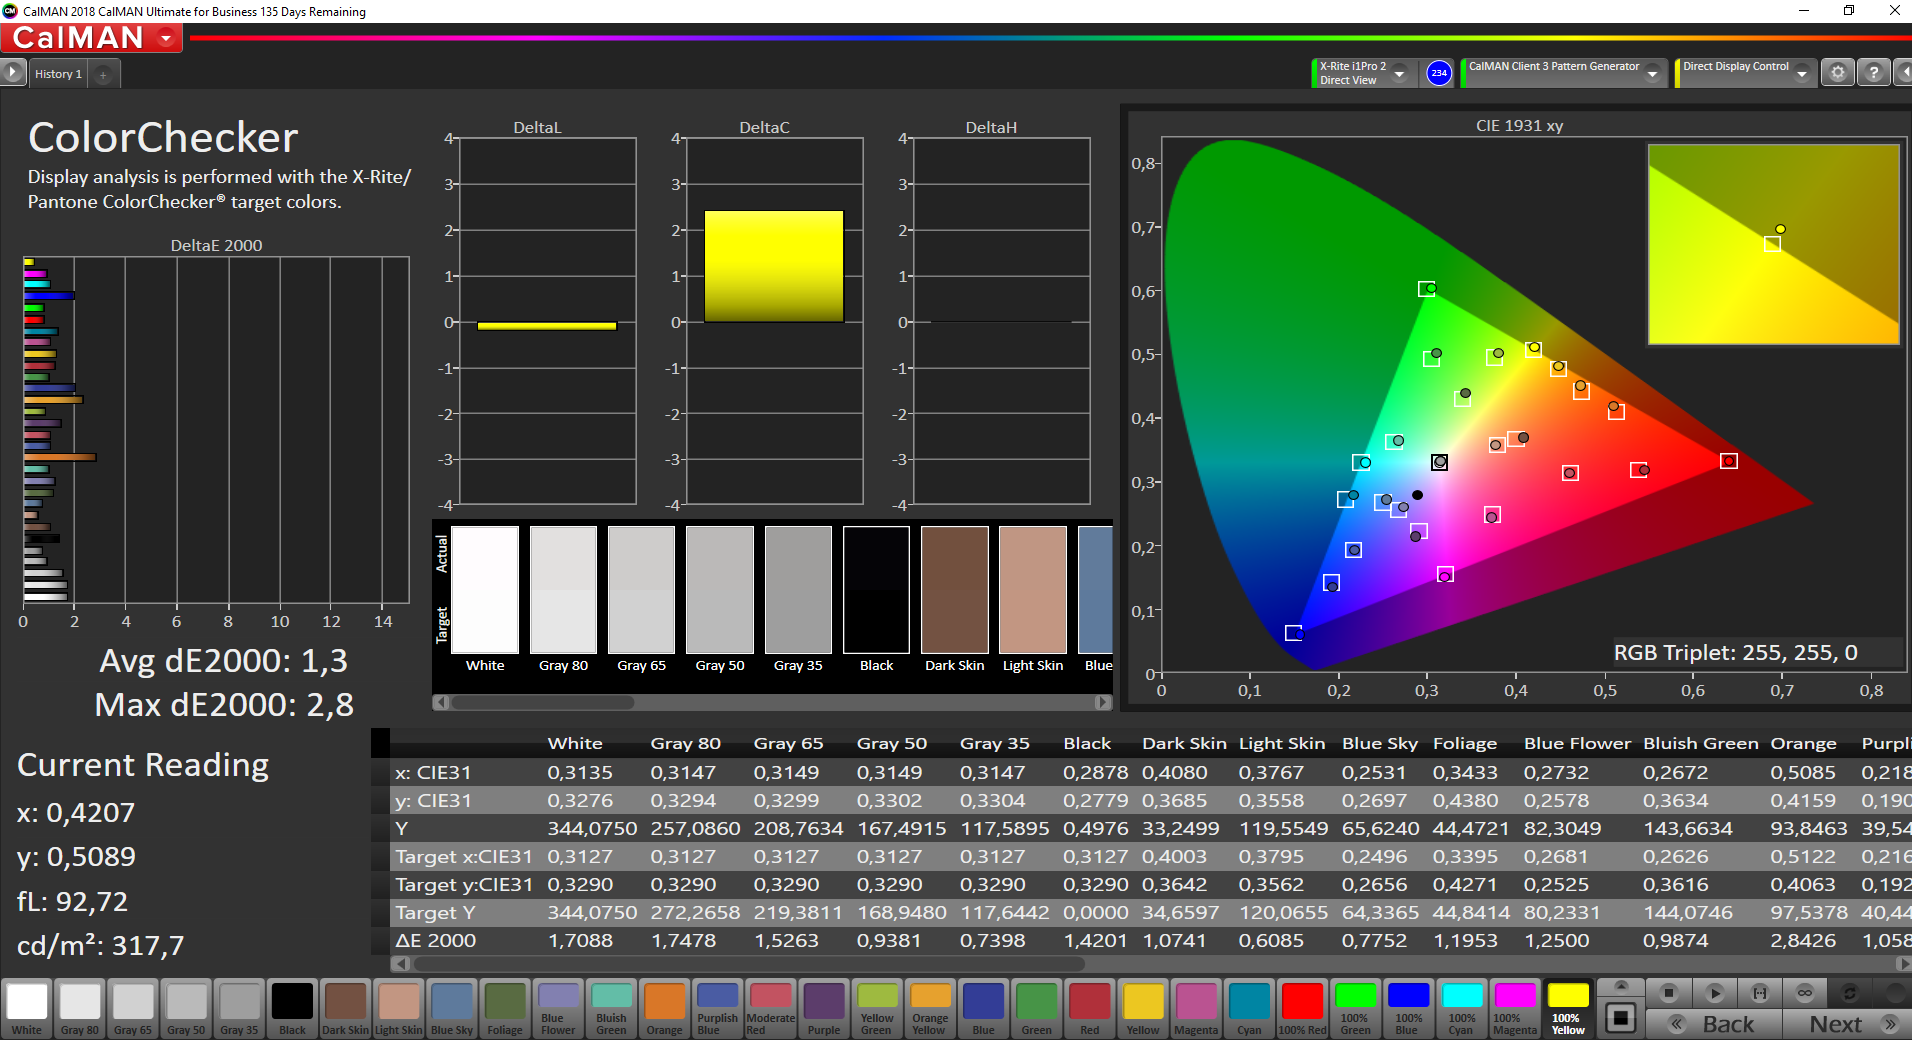
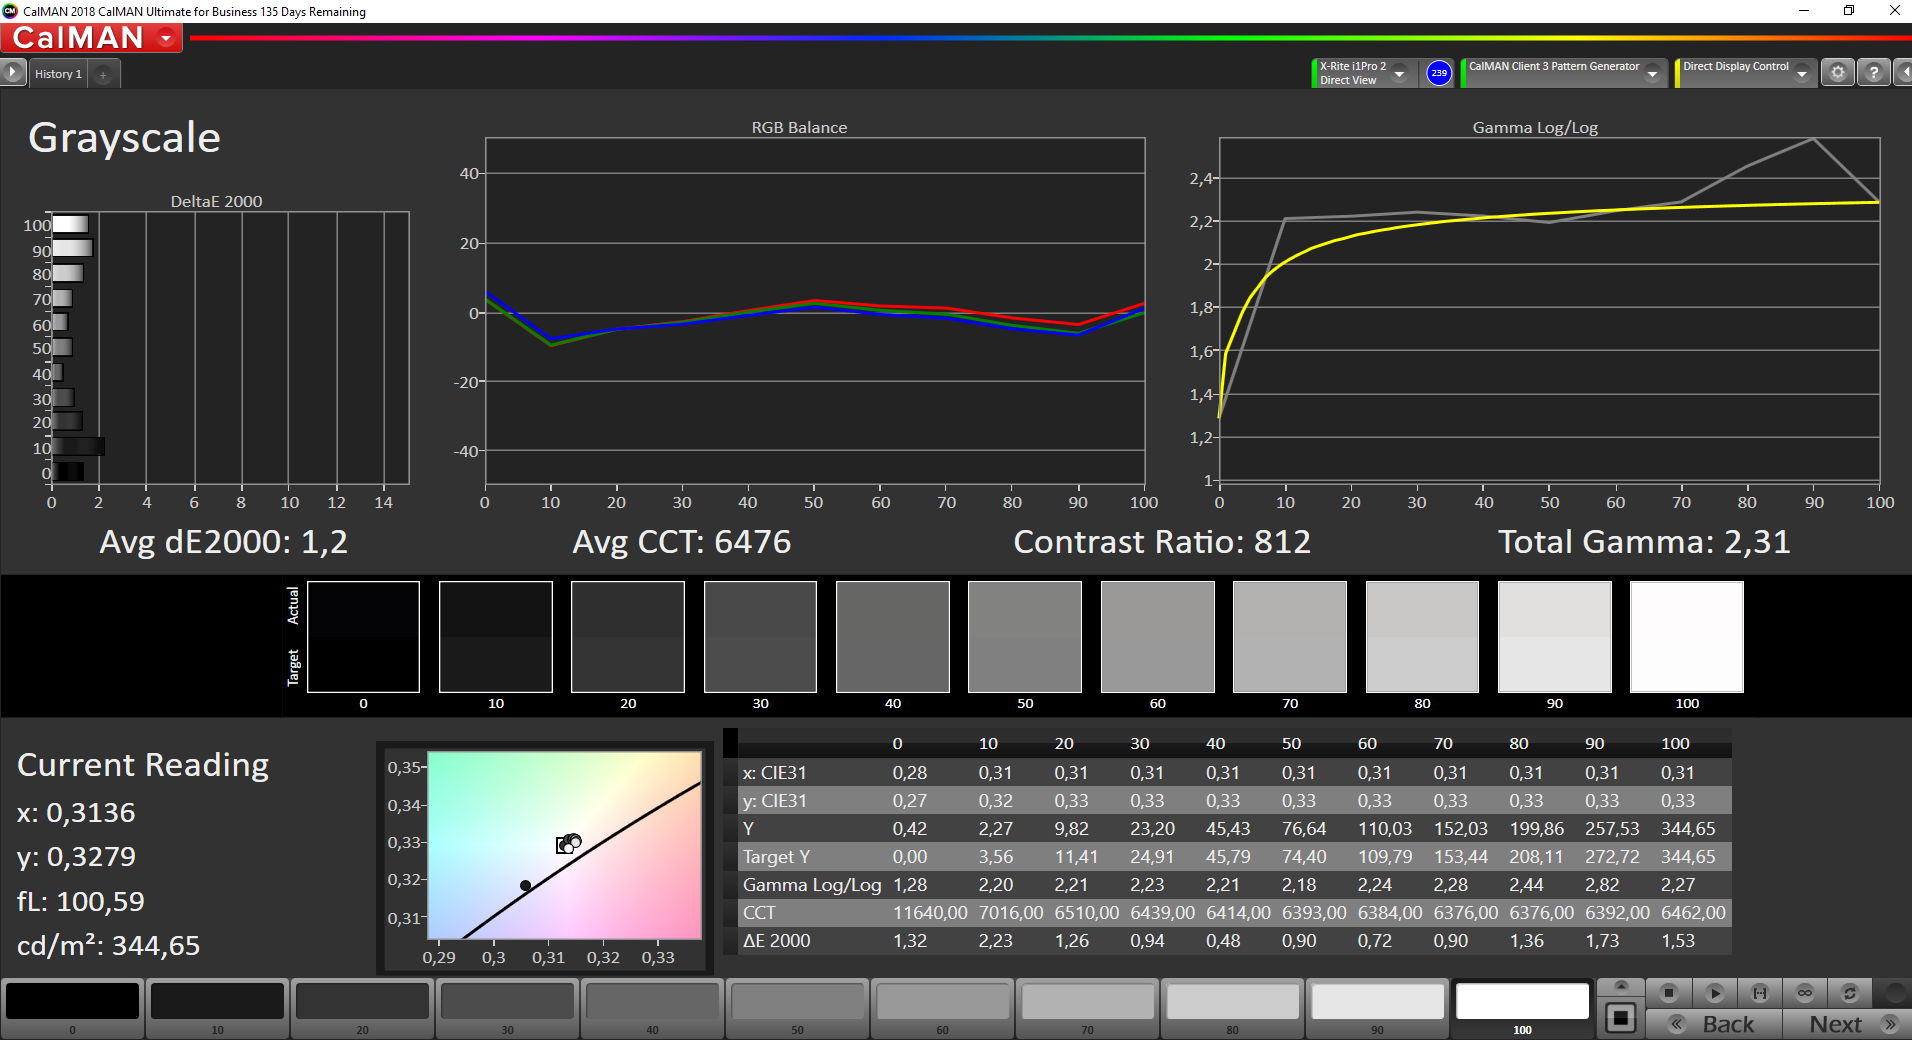
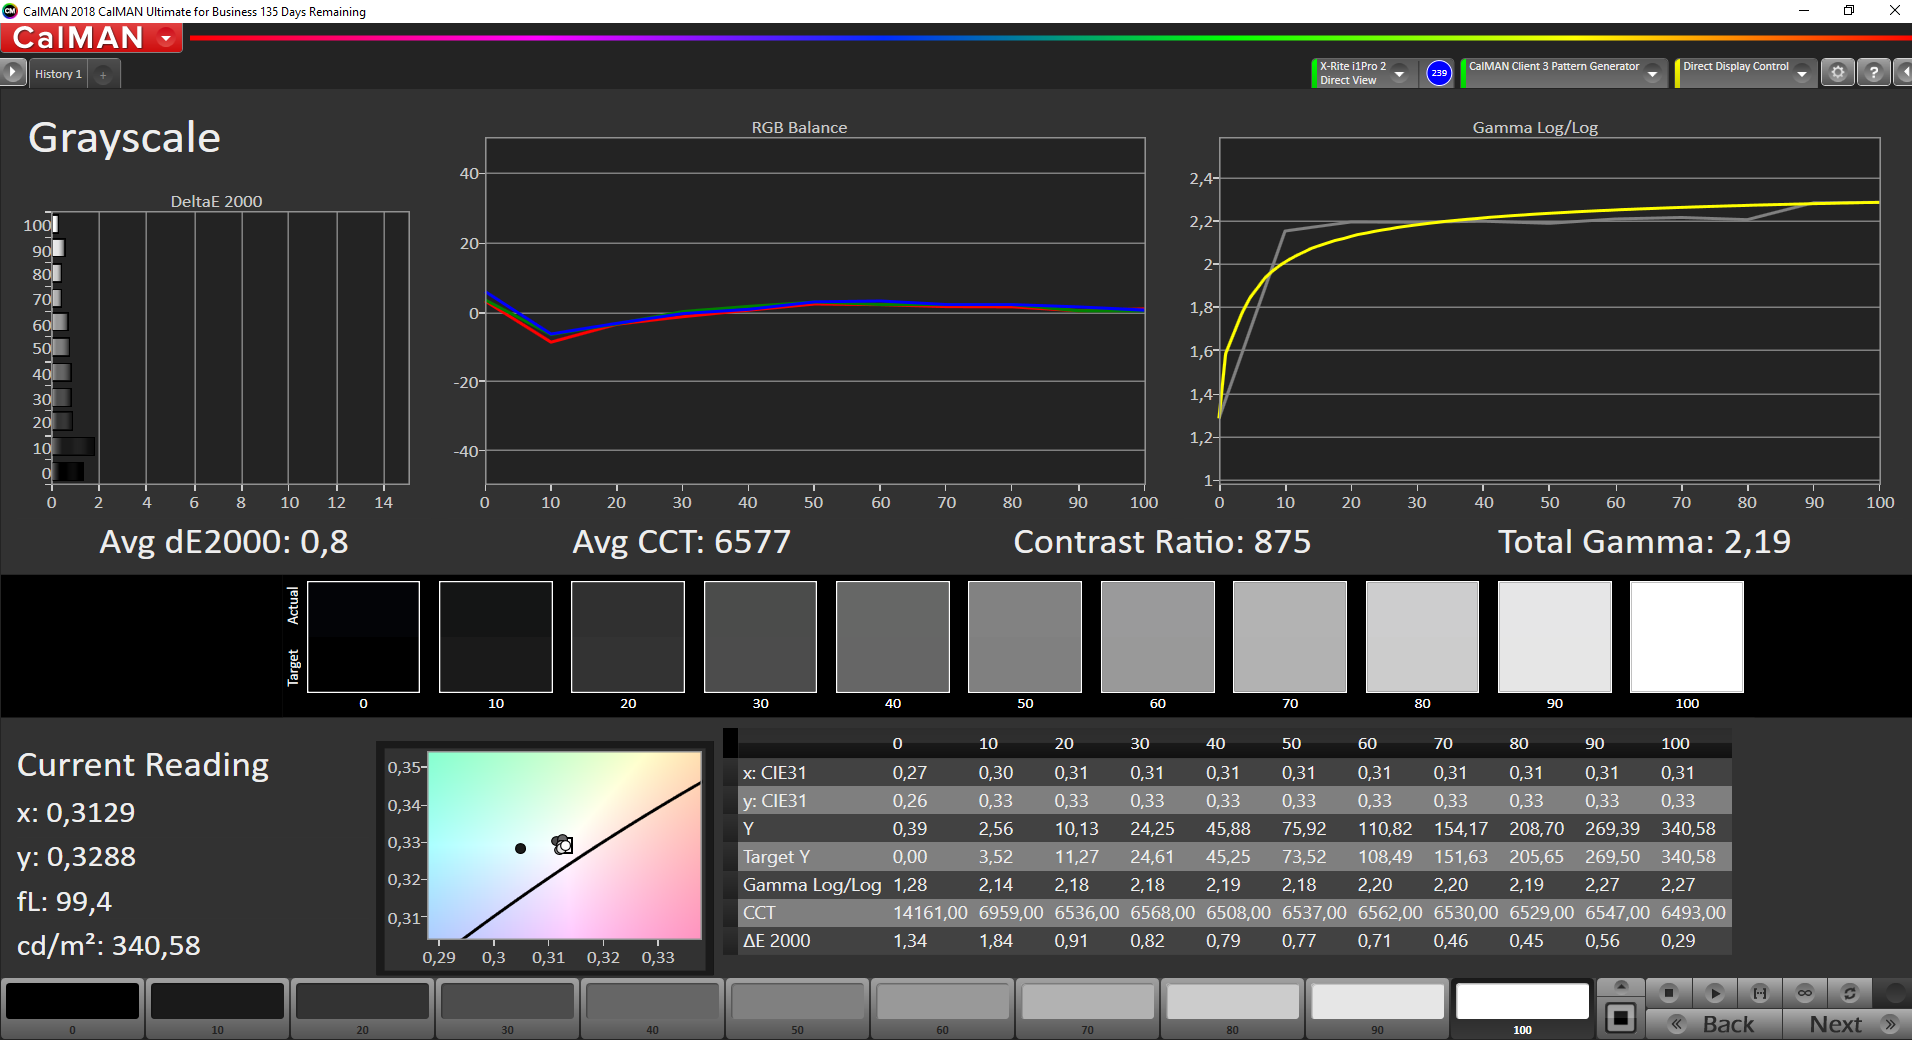
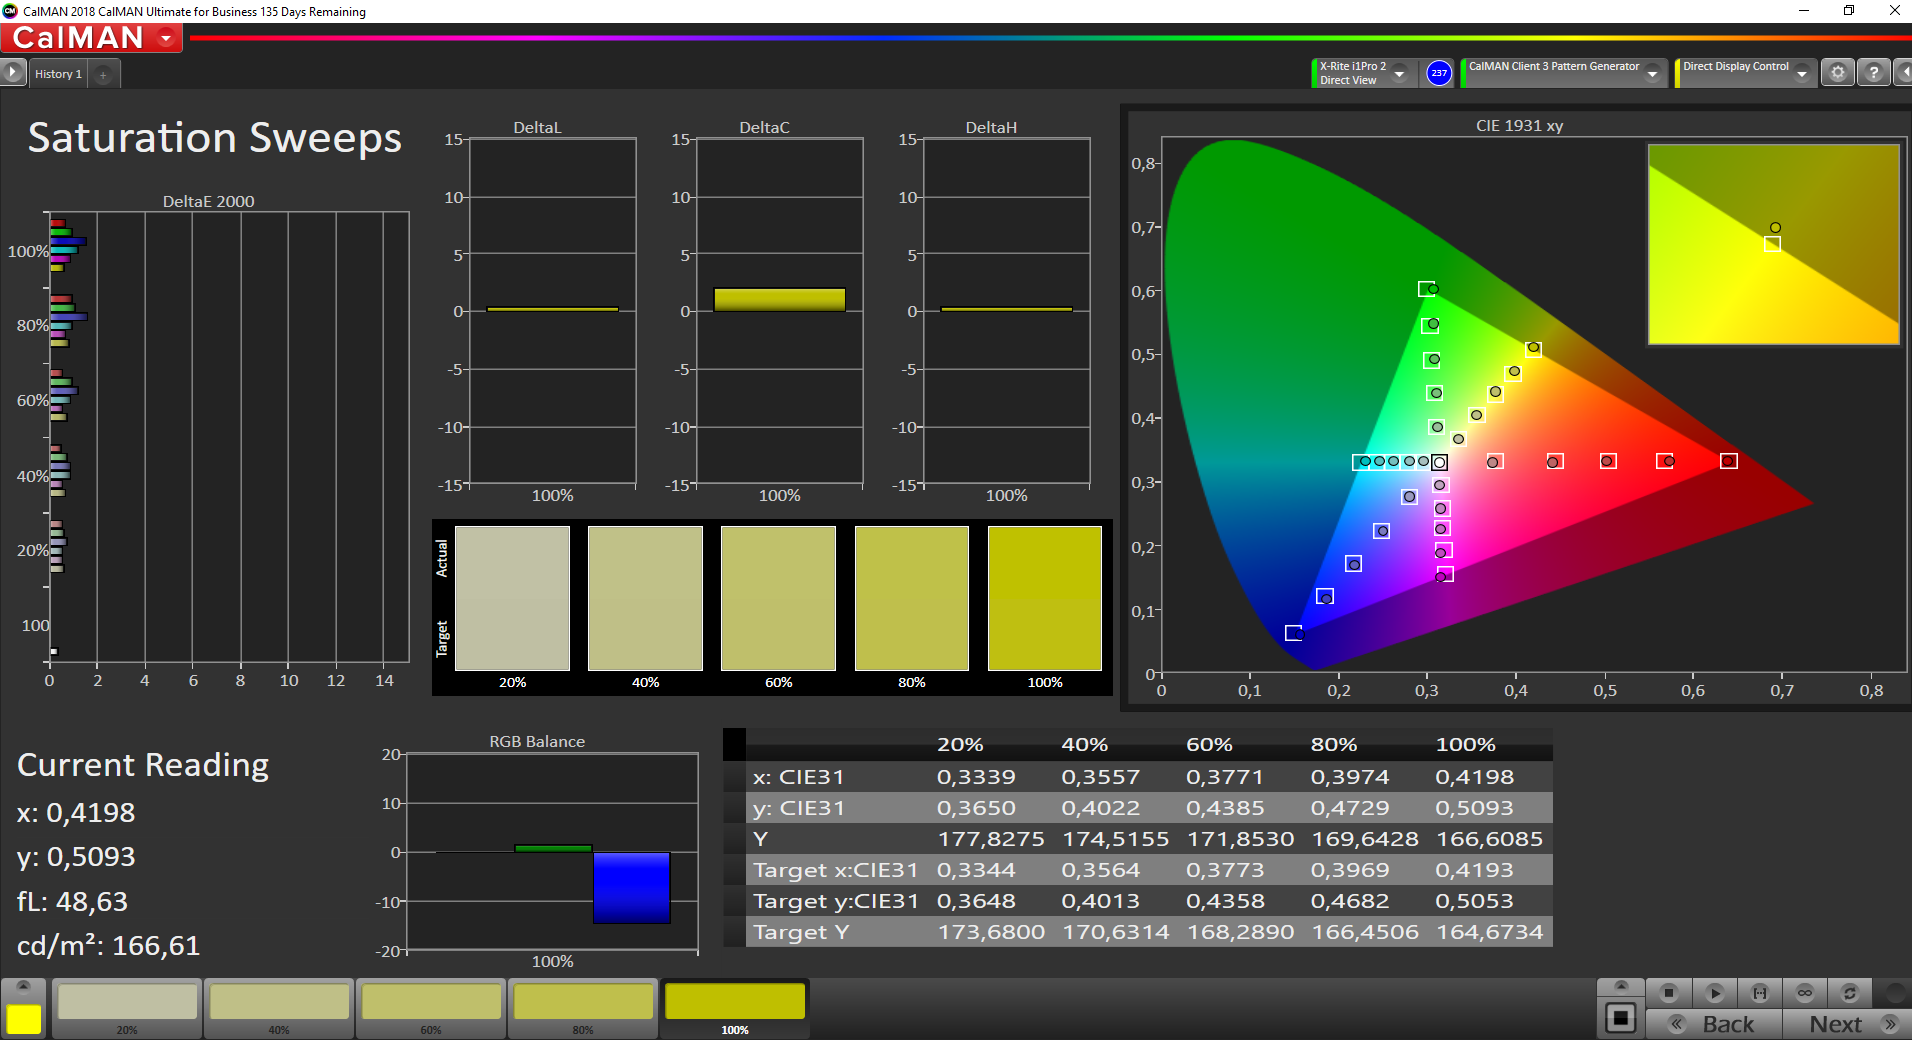
The Gaming Pavilion 15 has, as its name suggests, a 15.6-inch display. The IPS panel operates natively at 1920x1080 and has a 144 Hz refresh rate. Our review unit achieved an average maximum brightness of 324 cd/m² according to X-Rite i1Pro 2, making it the brightest screen in our comparison table below. Unfortunately, the display suffers from a comparatively high black value that we measured at 0.42 cd/m², which limits the contrast ratio to a measly 821:1. Only one of our comparison devices has a ratio higher than 1,000:1, which is something we would expect from any class of laptop costing US$1,500. The panel has short responses times though, which will please gamers, as will the lack of pulse-width modulation (PWM).

| |||||||||||||||||||||||||
Brightness Distribution: 86 %
Center on Battery: 346 cd/m²
Contrast: 821:1 (Black: 0.42 cd/m²)
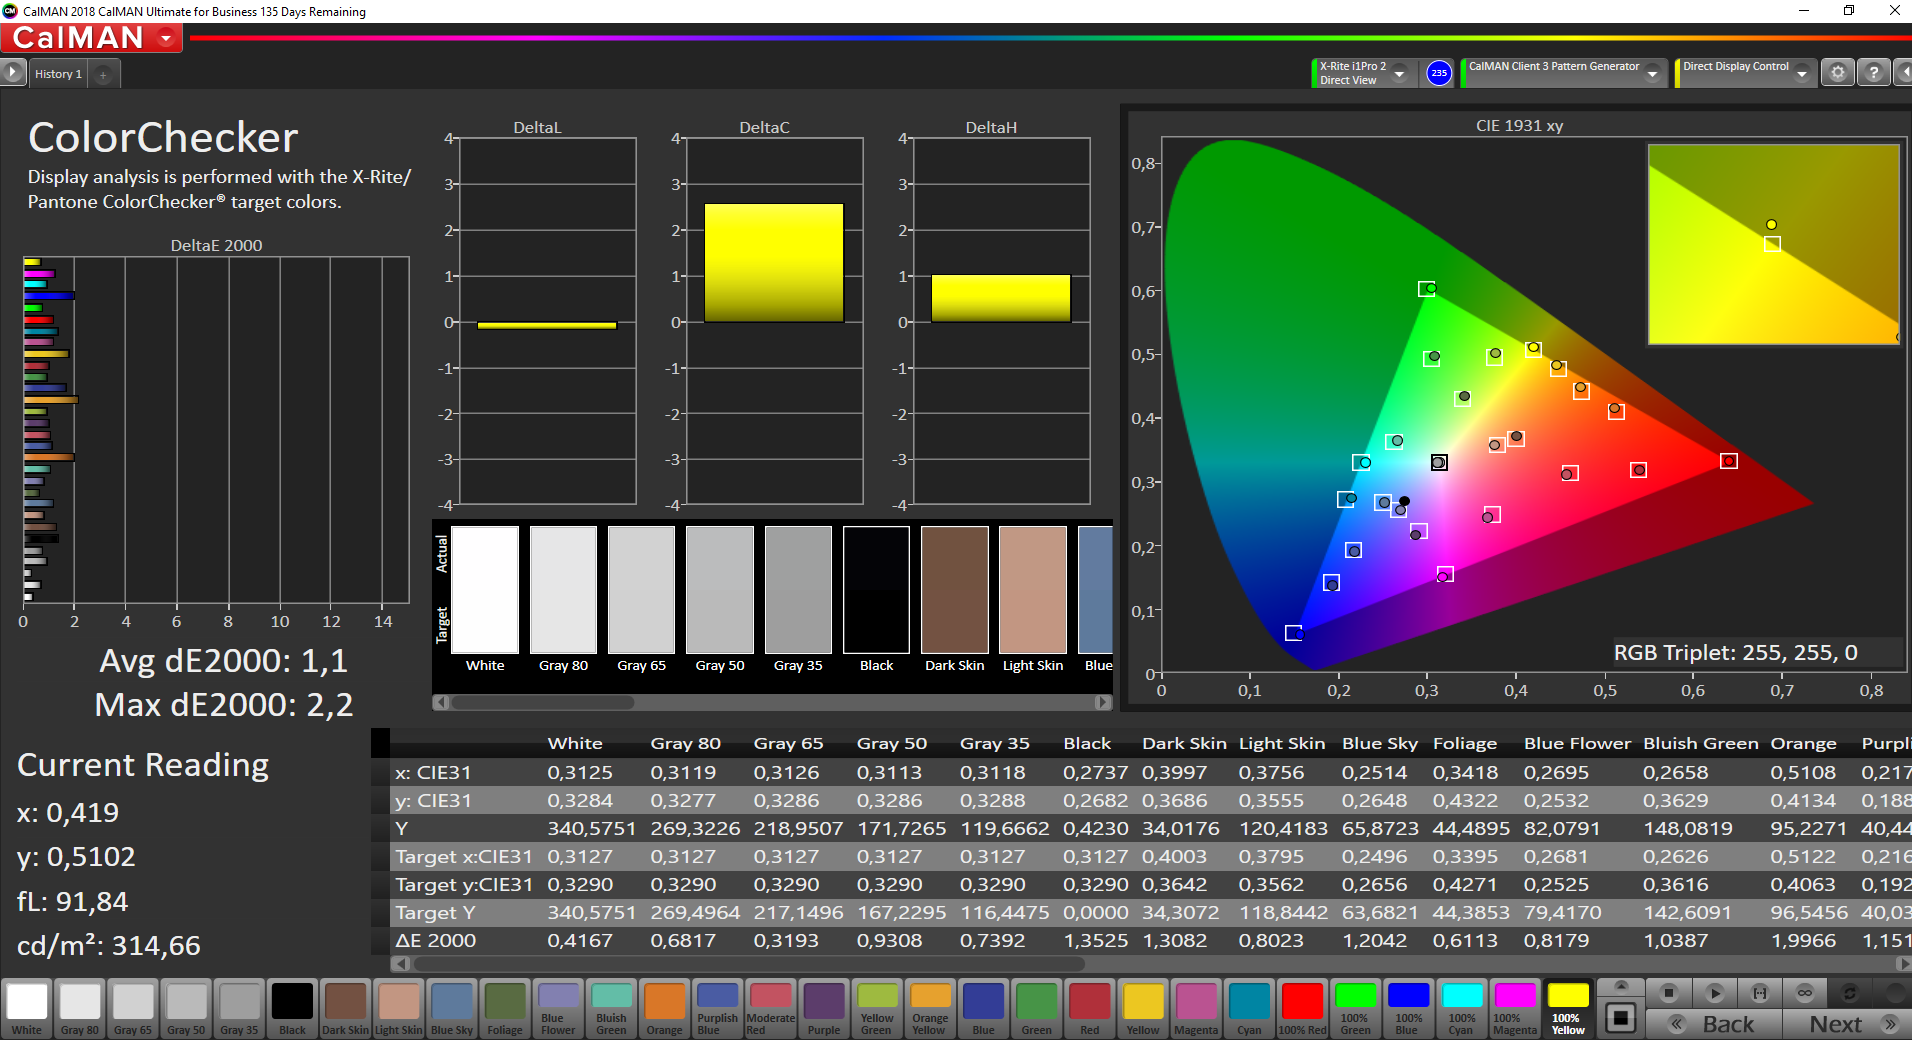
ΔE ColorChecker Calman: 1.3 | ∀{0.5-29.43 Ø4.71}
calibrated: 1.1
ΔE Greyscale Calman: 1.2 | ∀{0.09-98 Ø4.96}
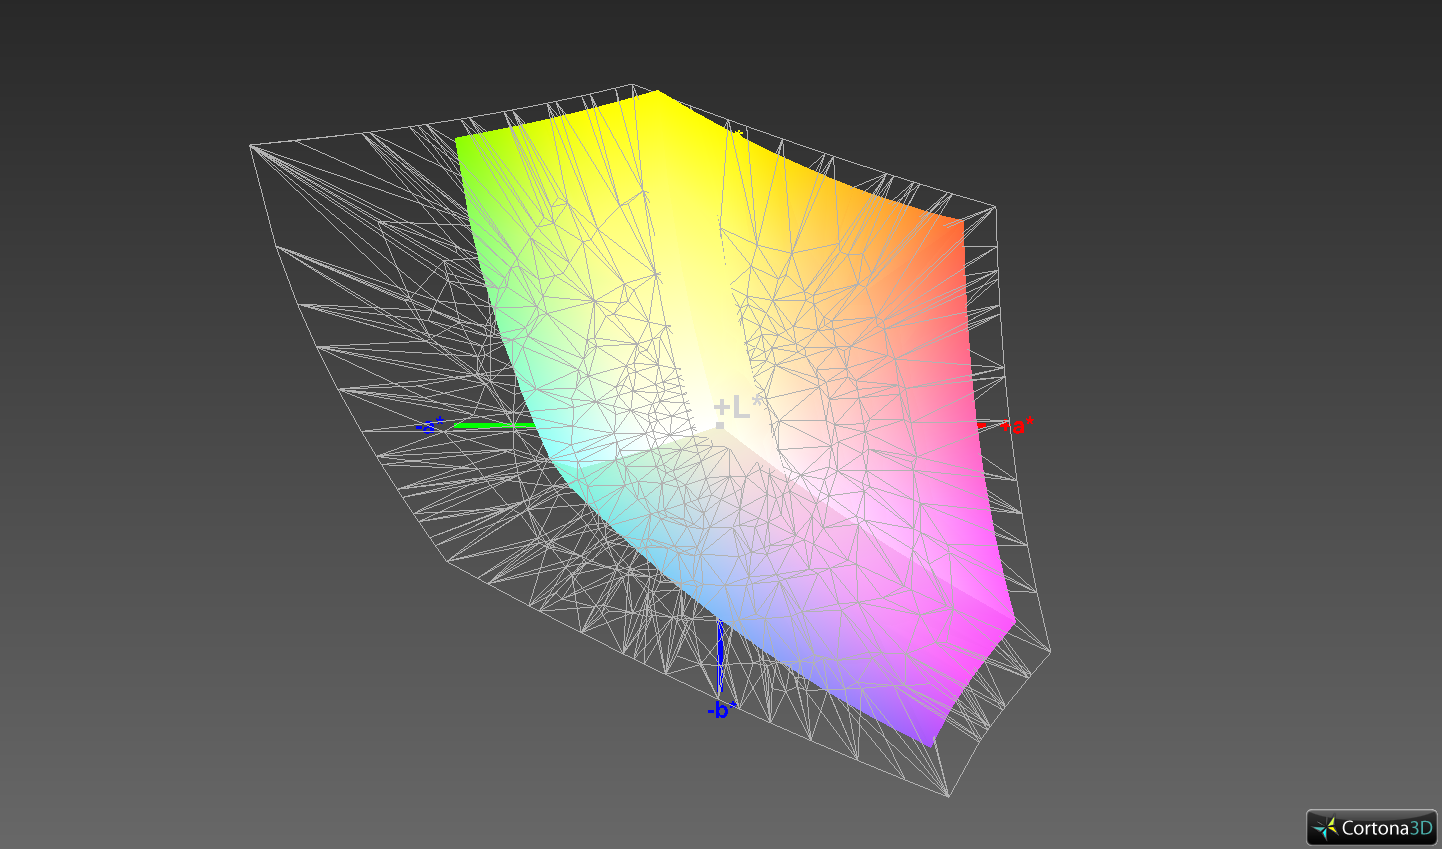
94.9% sRGB (Argyll 1.6.3 3D)
60.5% AdobeRGB 1998 (Argyll 1.6.3 3D)
65.8% AdobeRGB 1998 (Argyll 3D)
95.1% sRGB (Argyll 3D)
64.2% Display P3 (Argyll 3D)
Gamma: 2.31
CCT: 6476 K
| HP Gaming Pavilion 15-dk0009ng IPS, 1920x1080, 15.6" | CUK Model Z GK5CQ7Z IPS, 1920x1080, 15.6" | Dell G5 15 5590 IPS, 1920x1080, 15.6" | Asus ROG Zephyrus G15 GA502DU IPS, 1920x1080, 15.6" | Lenovo Legion Y530-15ICH IPS, 1920x1080, 15.6" | Medion Erazer X6805-MD61085 IPS, 1920x1080, 15.6" | |
|---|---|---|---|---|---|---|
| Display | -1% | -38% | -37% | -3% | -7% | |
| Display P3 Coverage (%) | 64.2 | 64.5 0% | 39.26 -39% | 40.33 -37% | 62.5 -3% | 63.8 -1% |
| sRGB Coverage (%) | 95.1 | 93 -2% | 59.1 -38% | 60.6 -36% | 93 -2% | 82.4 -13% |
| AdobeRGB 1998 Coverage (%) | 65.8 | 65.7 0% | 40.56 -38% | 41.69 -37% | 63.8 -3% | 60.3 -8% |
| Response Times | 1% | -181% | -138% | 2% | -158% | |
| Response Time Grey 50% / Grey 80% * (ms) | 16.4 ? | 13.6 ? 17% | 45 ? -174% | 34 ? -107% | 15 ? 9% | 38.4 ? -134% |
| Response Time Black / White * (ms) | 10.4 ? | 12 ? -15% | 30 ? -188% | 28 ? -169% | 11 ? -6% | 29.2 ? -181% |
| PWM Frequency (Hz) | 21280 ? | 20490 ? | ||||
| Screen | -44% | -181% | -117% | -70% | -91% | |
| Brightness middle (cd/m²) | 345 | 306.8 -11% | 234 -32% | 240.1 -30% | 305 -12% | 270 -22% |
| Brightness (cd/m²) | 324 | 309 -5% | 219 -32% | 231 -29% | 284 -12% | 269 -17% |
| Brightness Distribution (%) | 86 | 87 1% | 82 -5% | 85 -1% | 83 -3% | 86 0% |
| Black Level * (cd/m²) | 0.42 | 0.38 10% | 0.17 60% | 0.34 19% | 0.52 -24% | 0.32 24% |
| Contrast (:1) | 821 | 807 -2% | 1376 68% | 706 -14% | 587 -29% | 844 3% |
| Colorchecker dE 2000 * | 1.3 | 3.16 -143% | 8.6 -562% | 4.2 -223% | 3.63 -179% | 5.1 -292% |
| Colorchecker dE 2000 max. * | 2.8 | 6.05 -116% | 17.49 -525% | 17.8 -536% | 8.18 -192% | 9.25 -230% |
| Colorchecker dE 2000 calibrated * | 1.1 | 2.4 -118% | 4.06 -269% | 4.09 -272% | 1.31 -19% | 3.25 -195% |
| Greyscale dE 2000 * | 1.2 | 2.3 -92% | 8.55 -613% | 2.8 -133% | 4.77 -297% | 4.16 -247% |
| Gamma | 2.31 95% | 2.17 101% | 3.02 73% | 2.2 100% | 2.54 87% | 2.53 87% |
| CCT | 6476 100% | 6557 99% | 7802 83% | 6925 94% | 7500 87% | 6860 95% |
| Color Space (Percent of AdobeRGB 1998) (%) | 60.5 | 60 -1% | 37 -39% | 38.4 -37% | 59 -2% | 54 -11% |
| Color Space (Percent of sRGB) (%) | 94.9 | 92.6 -2% | 59 -38% | 60.4 -36% | 93 -2% | 82 -14% |
| Total Average (Program / Settings) | -15% /
-30% | -133% /
-154% | -97% /
-105% | -24% /
-49% | -85% /
-84% |
* ... smaller is better
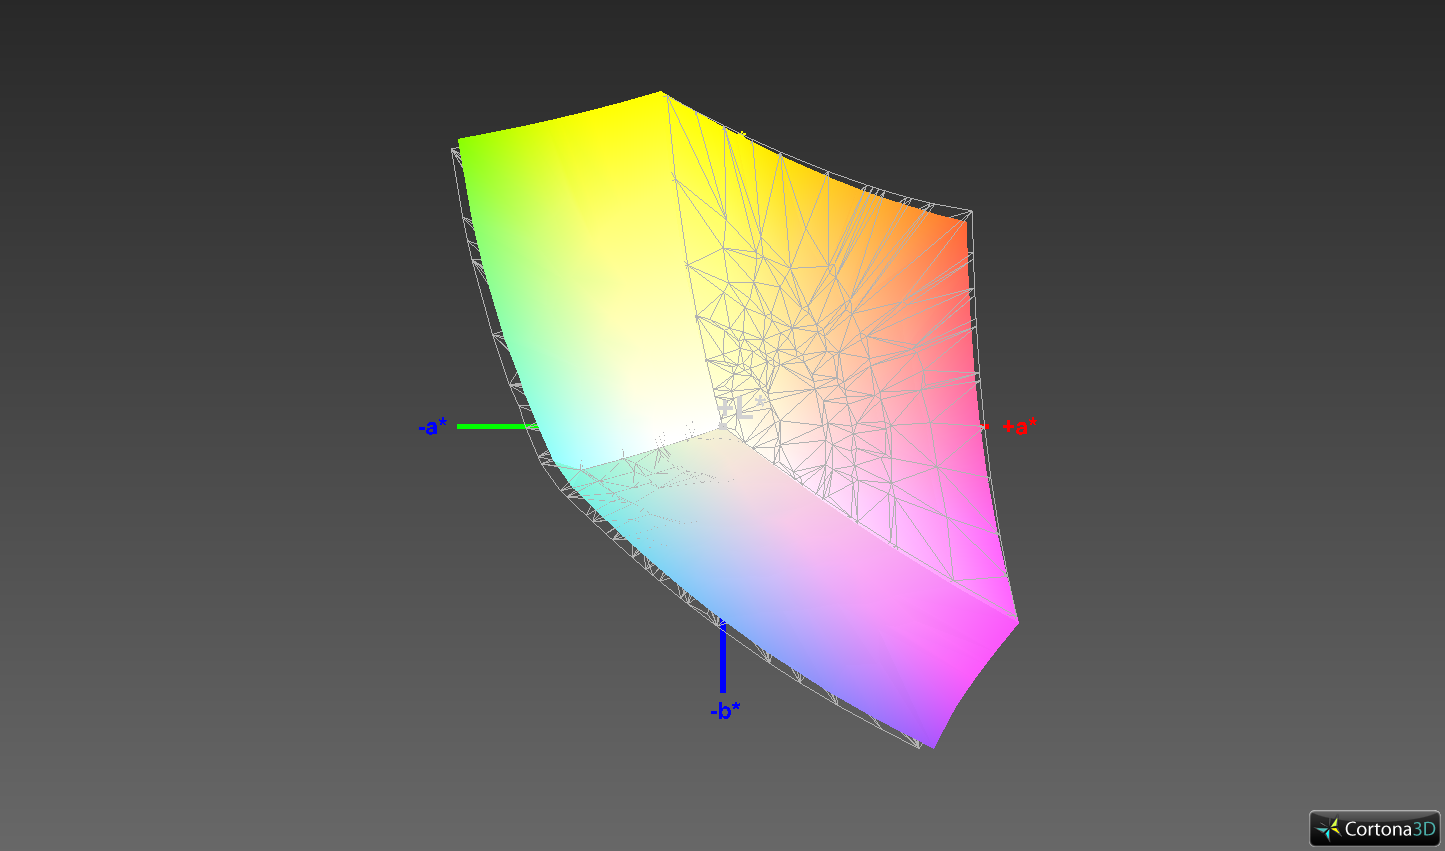
HP colour calibrates the display at the factory and has done a good job according to our tests. We measured DeltaE 2000 colours and greyscale deviations of just 1.3 and 1.2, respectively, which are better than the ideal values of 3. While the human eye cannot perceive the difference between a deviation of 3 and 1.2 or 1.3, it can notice colour tints. Thankfully, the display in our review unit is not afflicted by a tint, with its colour temperature being within 25 K of our ideal value of 6500 K.
We tried further calibrating the display but only managed a minimal improvement in deviations, with colours and greyscale both dropping to 1.1. We have included our calibrated ICC profile in the box above our comparison table should you wish to use it, but most people will not notice the difference between our calibration and the one done at the factory. Also, we would only recommend applying our ICC profile to the same display as the one in our review unit. OEMs often use multiple display partners for their devices, which is worth checking before you apply our profile to your Gaming Pavilion 15. The display also covers 94.9% of sRGB and 60.5% of AdobeRGB, making it colour accurate enough for hobbyist level photo and video-editing.

Display Response Times
| ↔ Response Time Black to White | ||
|---|---|---|
| 10.4 ms ... rise ↗ and fall ↘ combined | ↗ 5.2 ms rise | 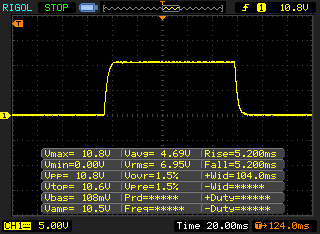 |
| ↘ 5.2 ms fall | ||
| The screen shows good response rates in our tests, but may be too slow for competitive gamers. In comparison, all tested devices range from 0.1 (minimum) to 240 (maximum) ms. » 28 % of all devices are better. This means that the measured response time is better than the average of all tested devices (19.8 ms). | ||
| ↔ Response Time 50% Grey to 80% Grey | ||
| 16.4 ms ... rise ↗ and fall ↘ combined | ↗ 8.4 ms rise | 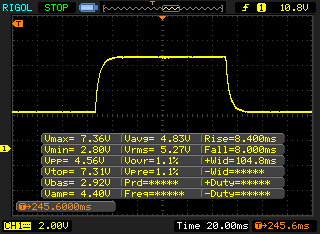 |
| ↘ 8 ms fall | ||
| The screen shows good response rates in our tests, but may be too slow for competitive gamers. In comparison, all tested devices range from 0.165 (minimum) to 636 (maximum) ms. » 31 % of all devices are better. This means that the measured response time is better than the average of all tested devices (30.9 ms). | ||
Screen Flickering / PWM (Pulse-Width Modulation)
| Screen flickering / PWM not detected | 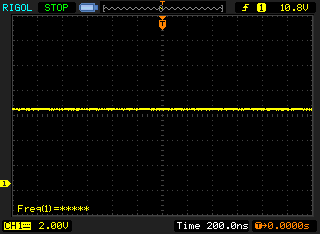 | ||
In comparison: 52 % of all tested devices do not use PWM to dim the display. If PWM was detected, an average of 7741 (minimum: 5 - maximum: 343500) Hz was measured. | |||
The Gaming Pavilion 15 is usable outdoors, but only when direct sunlight is not shining at it. The matte display diffuses reflections nicely, but it cannot get bright enough to overcome the sun’s luminosity, making it look washed-out and difficult to read. In short, we would recommend using the device in the shade where possible.
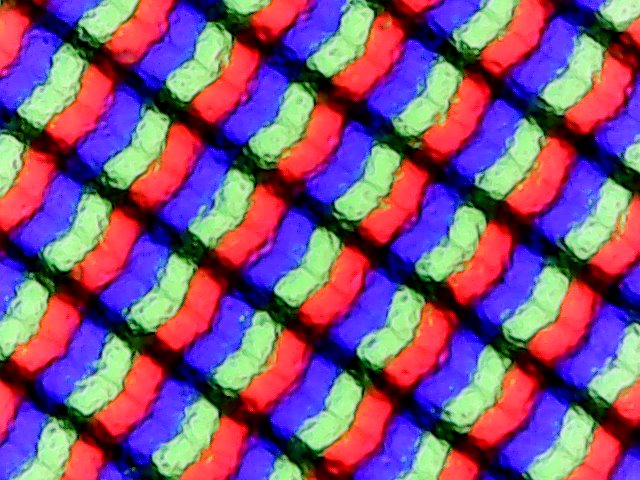
The IPS panel has stable viewing angles, with the display remaining readable from practically every angle. However, there are some brightness and colour distortions at acute viewing angle, as the photo montage below demonstrates.

Performance
The Core i7-9750H and GeForce GTX 1660 Ti Max-Q-powered Gaming Pavilion 15 is powerful enough to handle all modern triple-A games. The configuration retails for around 1,400 Euros (~US$1,547), but there are cheaper versions should you not want to drop that much on a gaming laptop. The cheapest model currently costs just 700 Euros (~US$774), which HP equips with a Core i5-9300H processor and a GeForce GTX 1050 GPU.
Processor
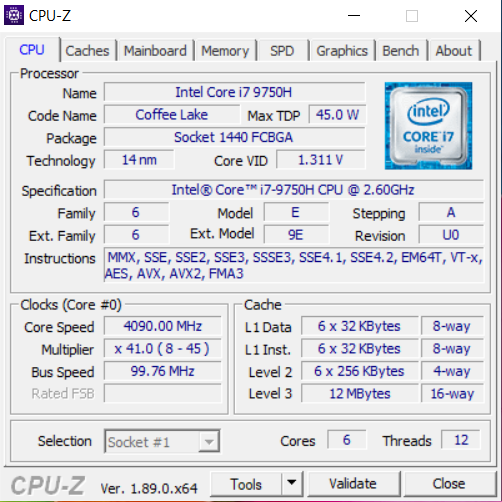
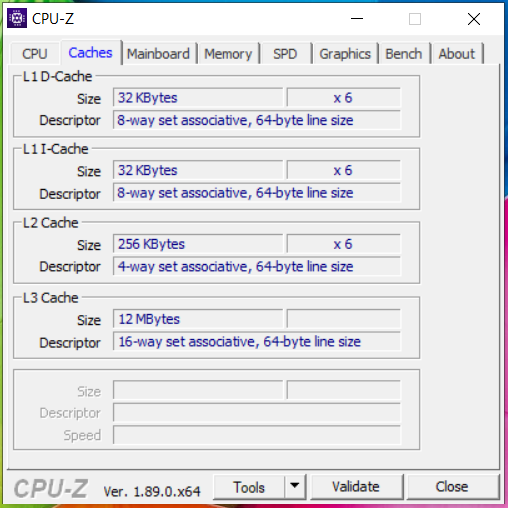
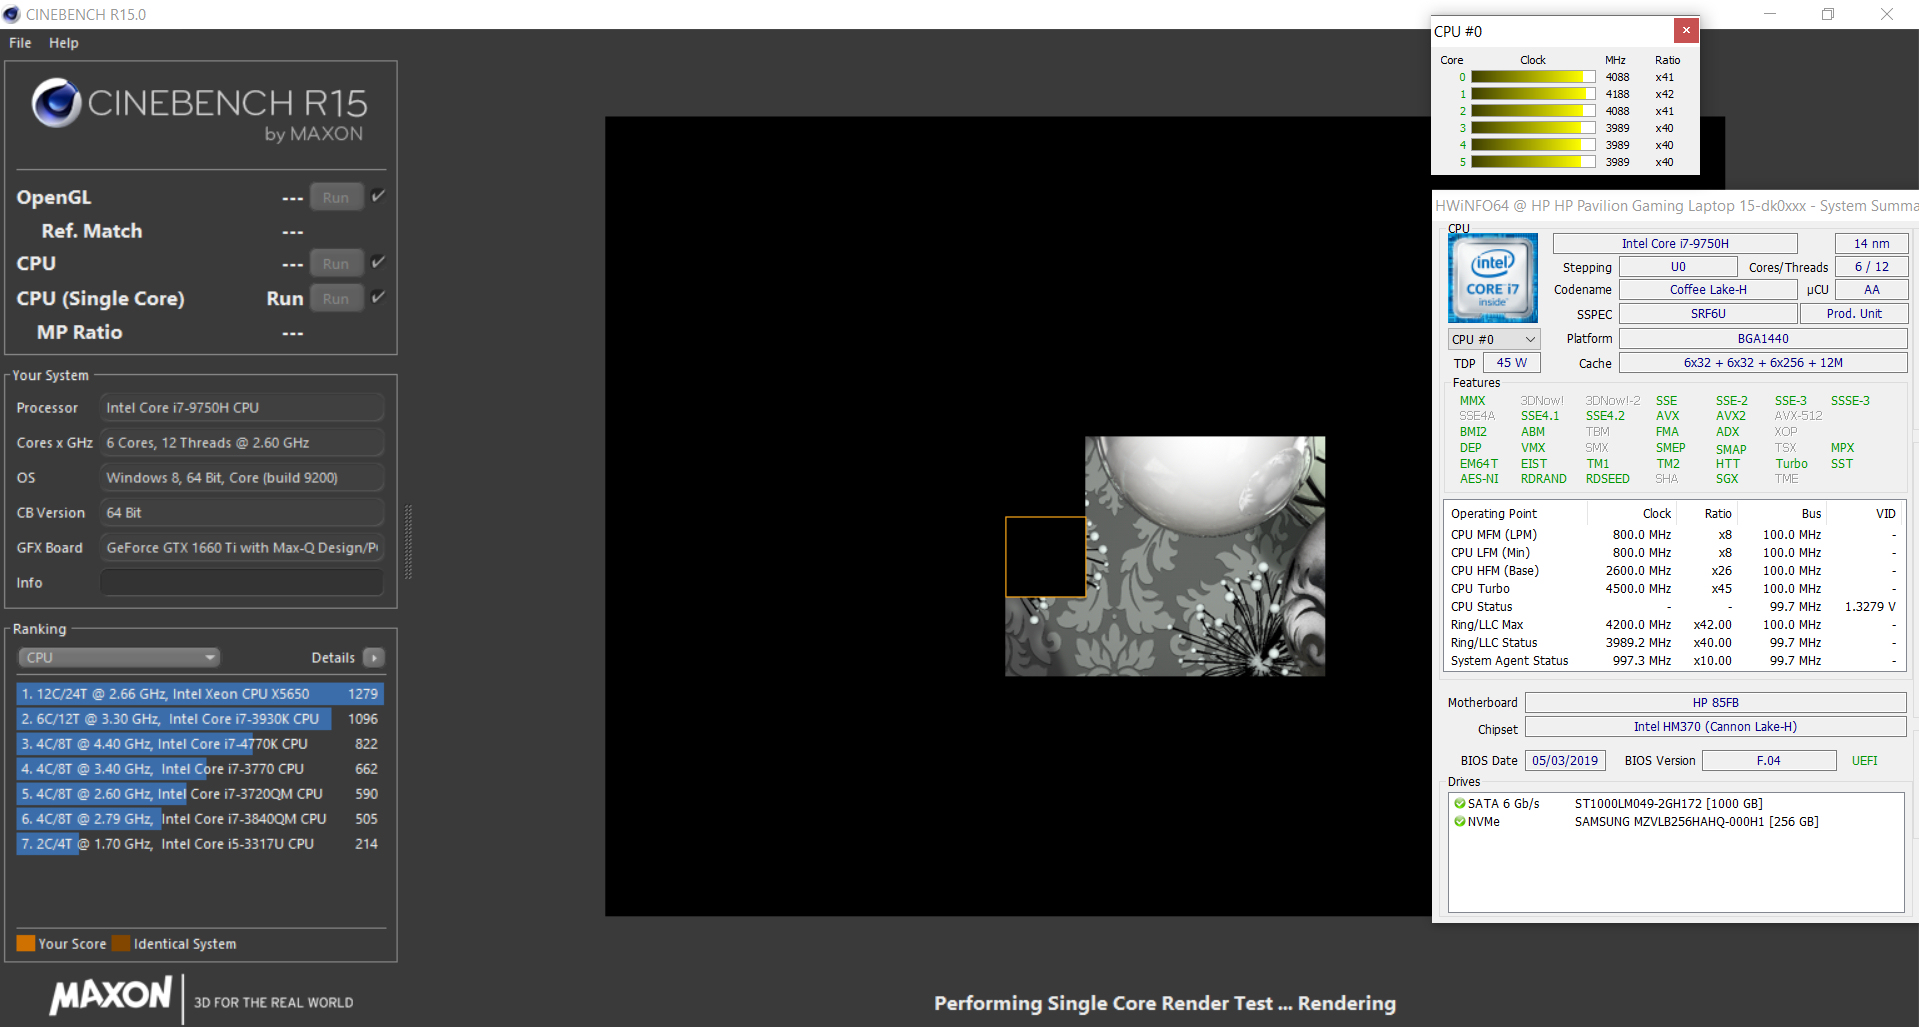
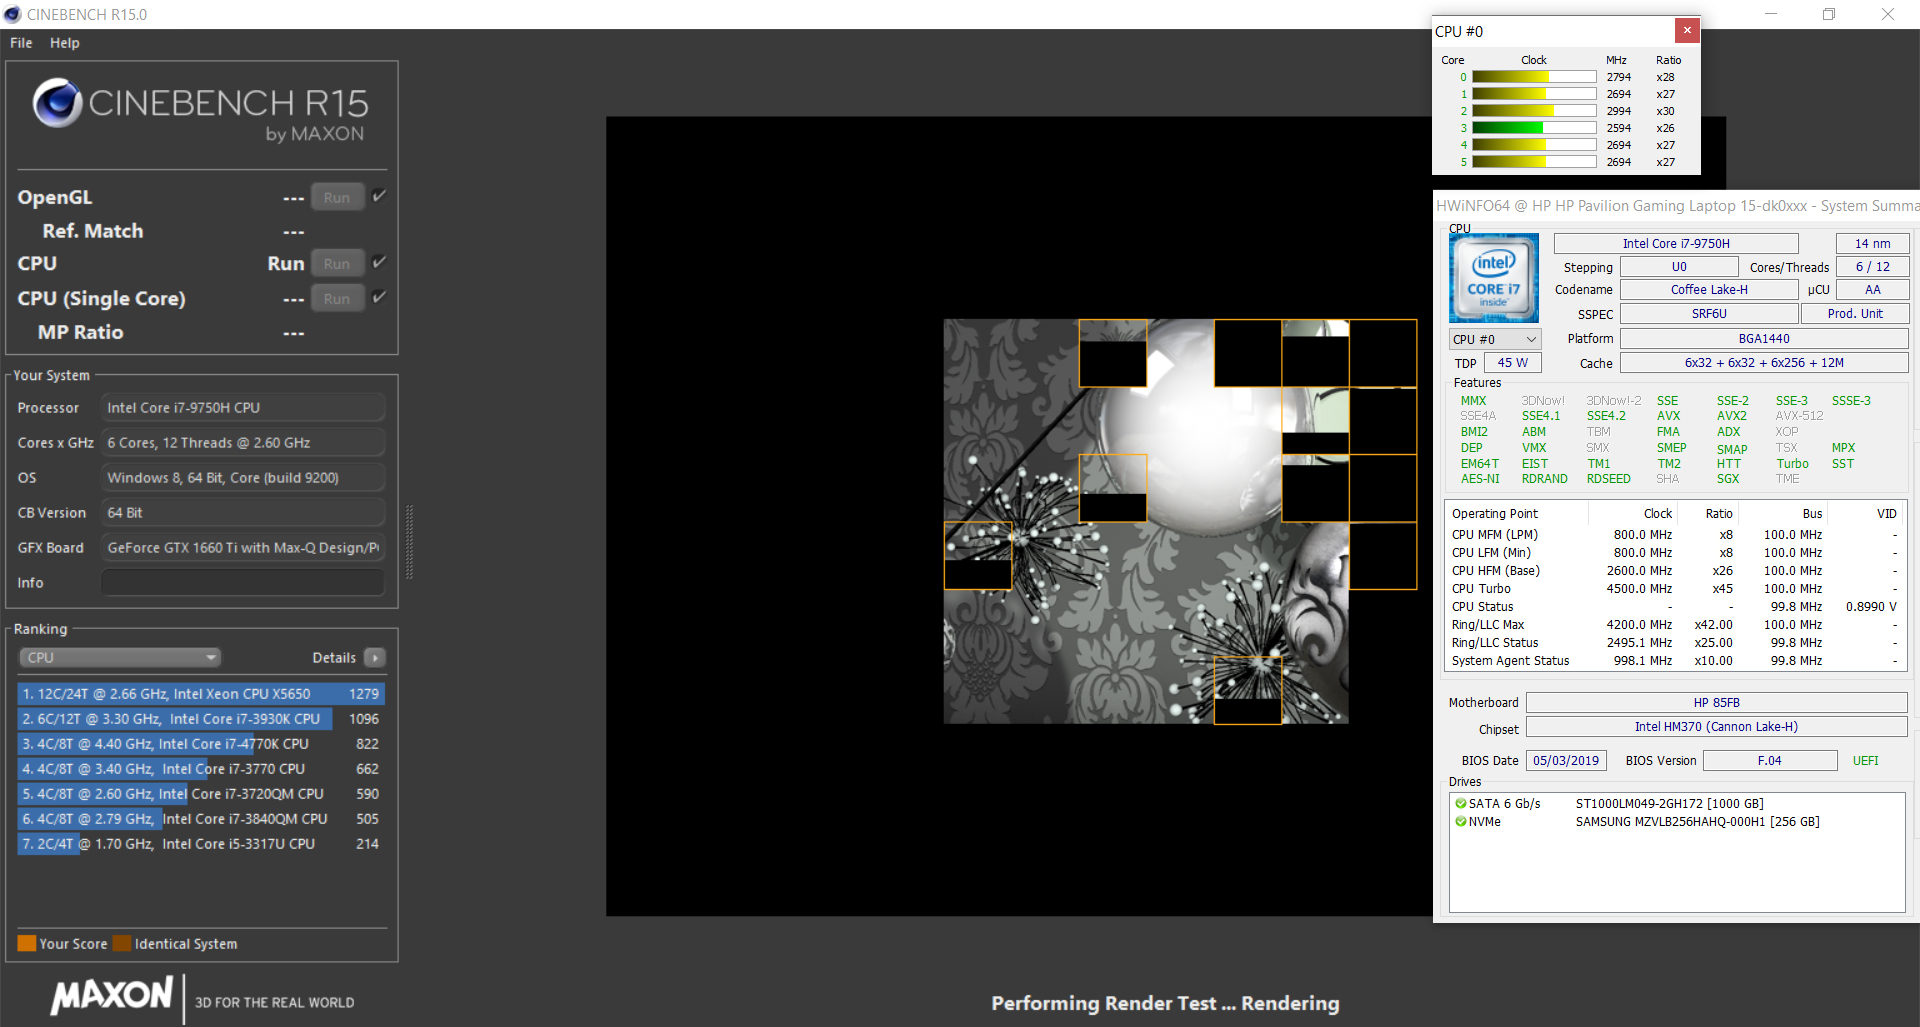
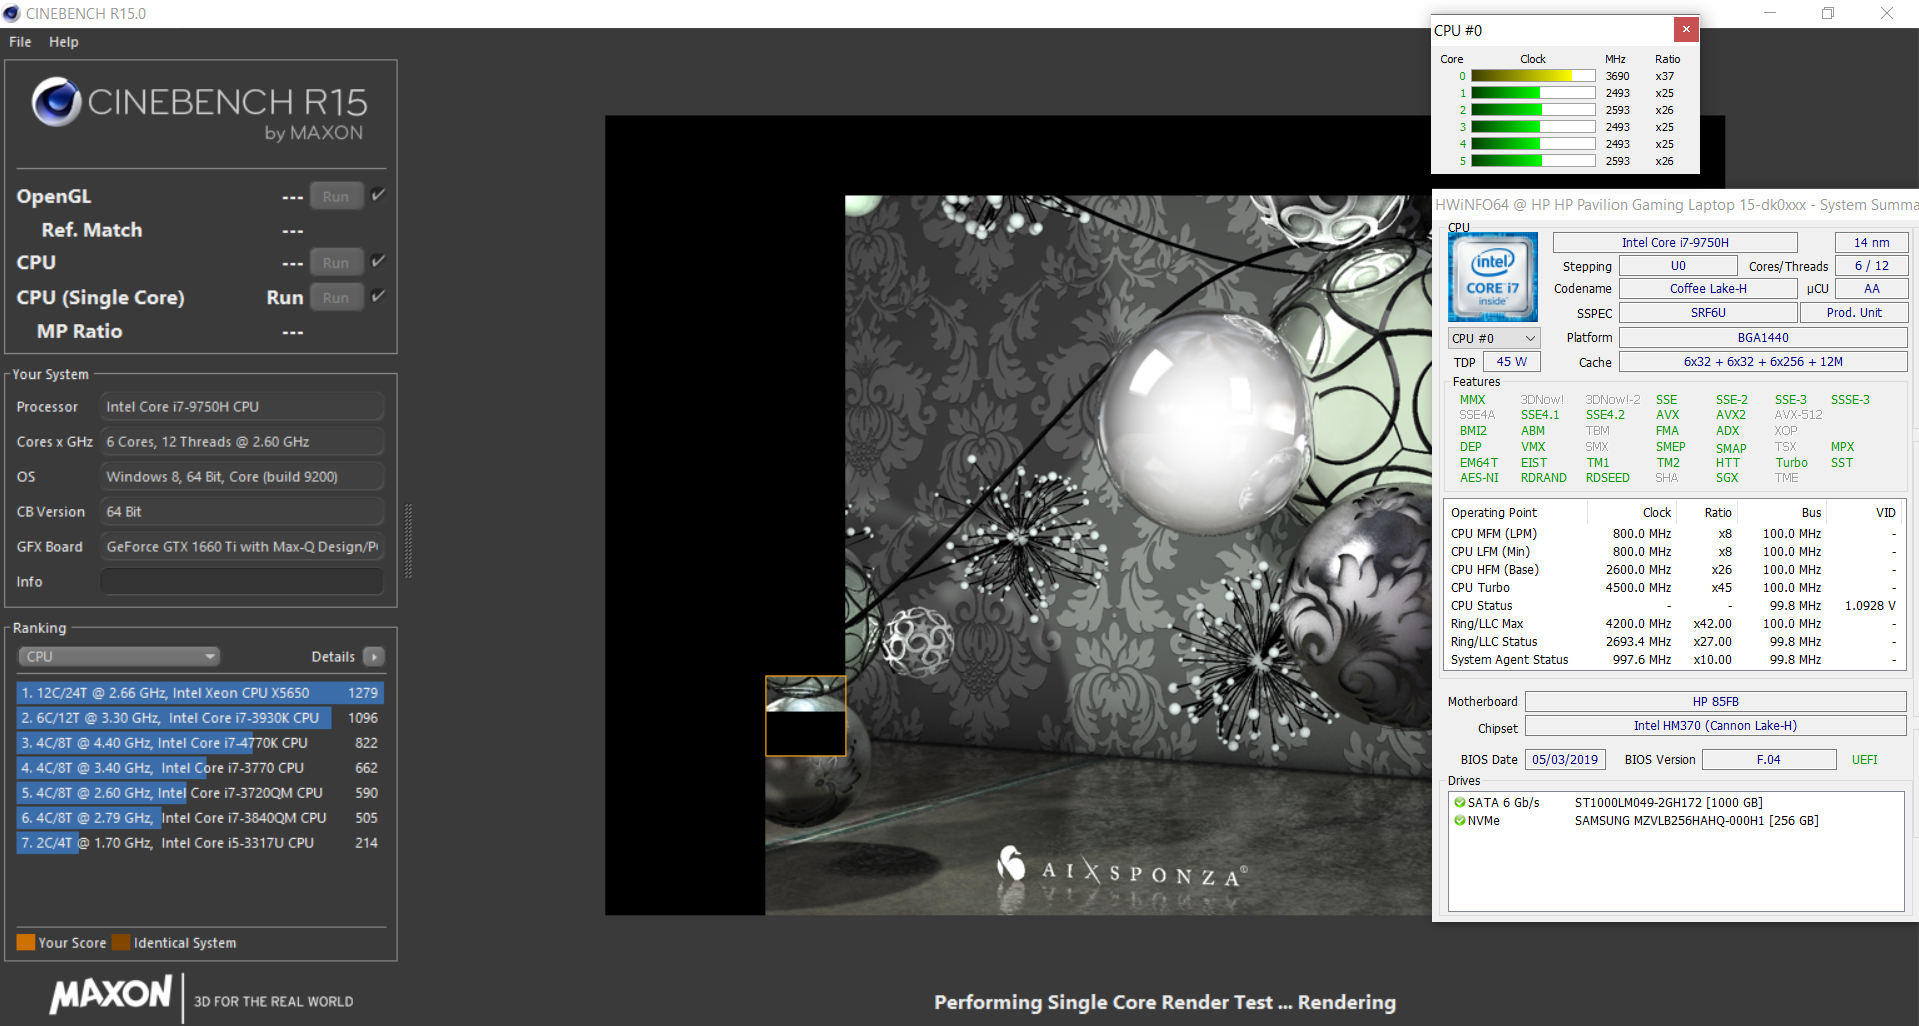
The Core i7-9750H succeeds the Core i7-8750H, a popular hexa-core processor found in many of last year’s gaming and multimedia laptops. The Core i7-9750H is also a hexa-core chip that Intel bases on its Coffee Lake Refresh and offers slightly higher clock speeds than its predecessor. The CPU has a 2.6 GHz base clock that it can boost up to 4 GHz on all cores thanks to Intel Turbo Boost. It can also get 100 MHz faster for every core that is not in use, with it reaching 4.5 GHz on a single core.
Our review unit can briefly keep its CPU at 4 GHz in Cinebench R15 Multi 64Bit before it drops to between 3 GHz and 3.3 GHz. Conversely, we recorded the CPU fluctuating between 4.0 and 4.5 GHz throughout the corresponding single-core benchmark. The Gaming Pavilion 15 can still reach 4.5 GHz in single-threaded tasks on battery, but it occasionally drops to 2.5 GHz. The same applies during multithreaded tasks too, although the CPU could only peak at 2.9 GHz during our tests.
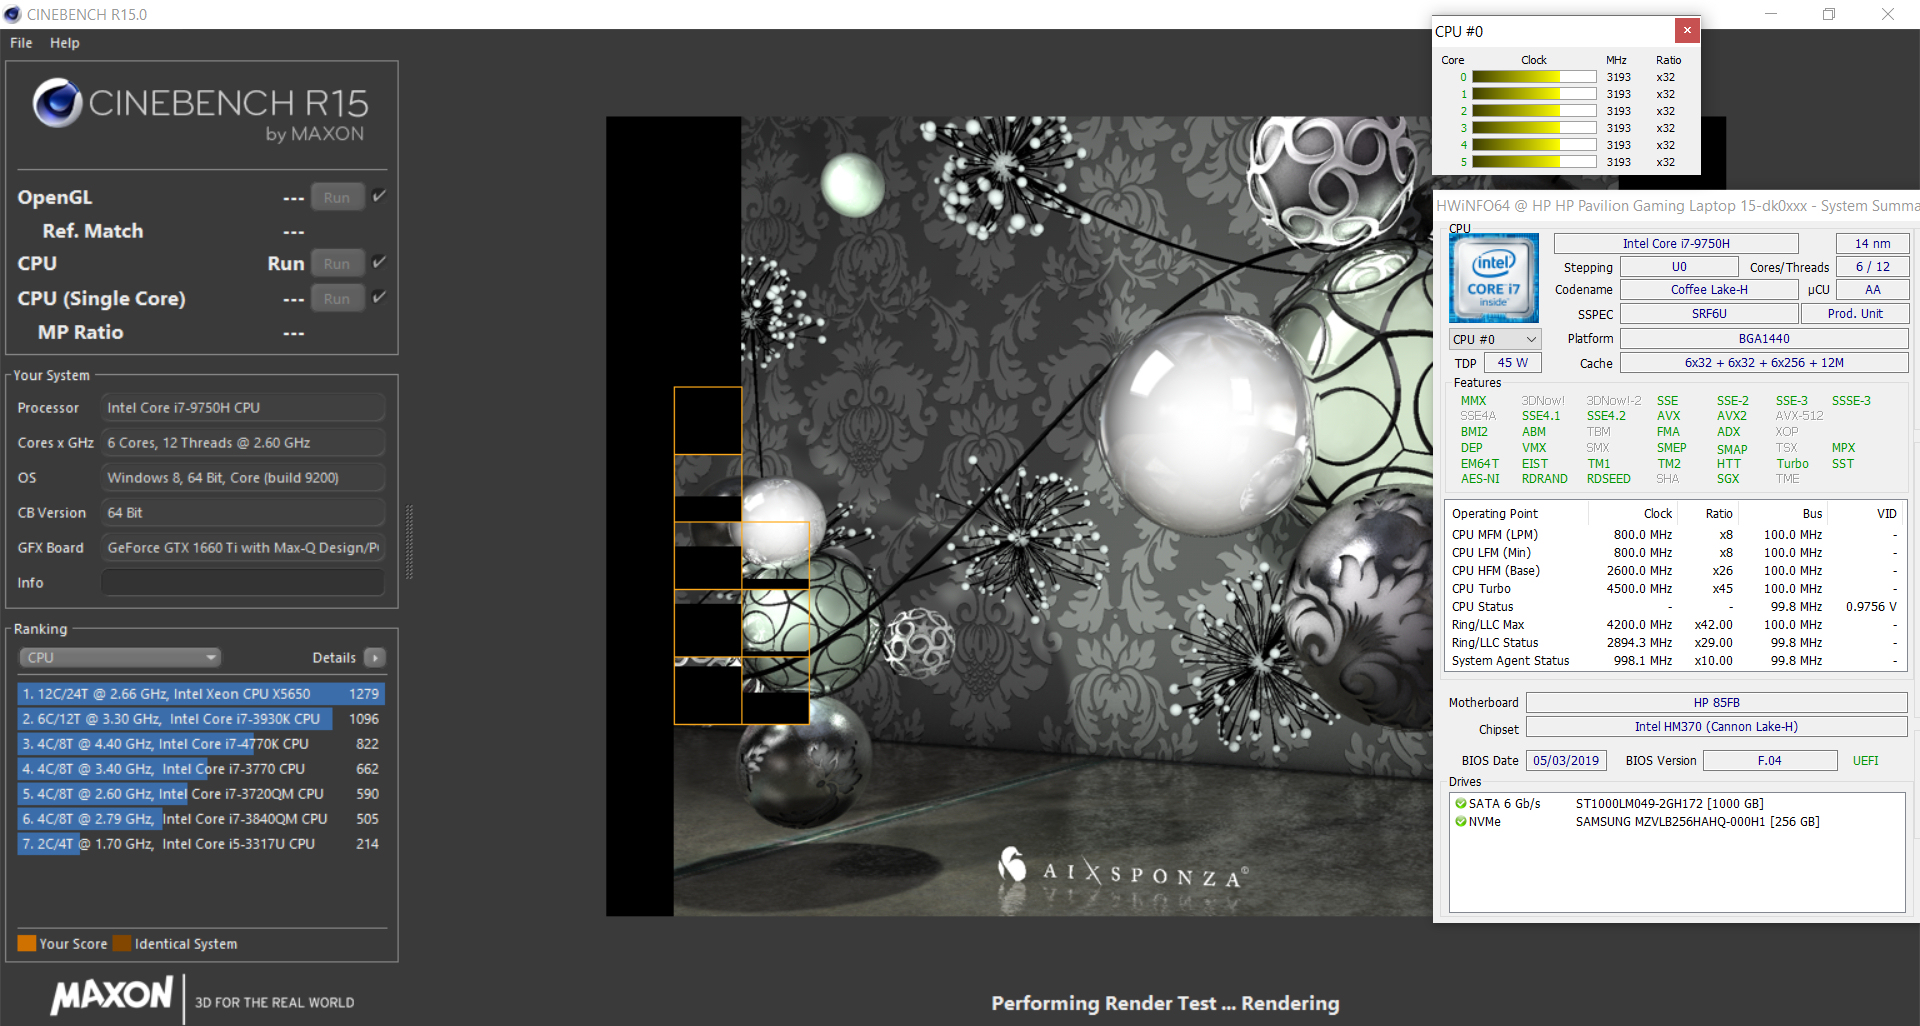
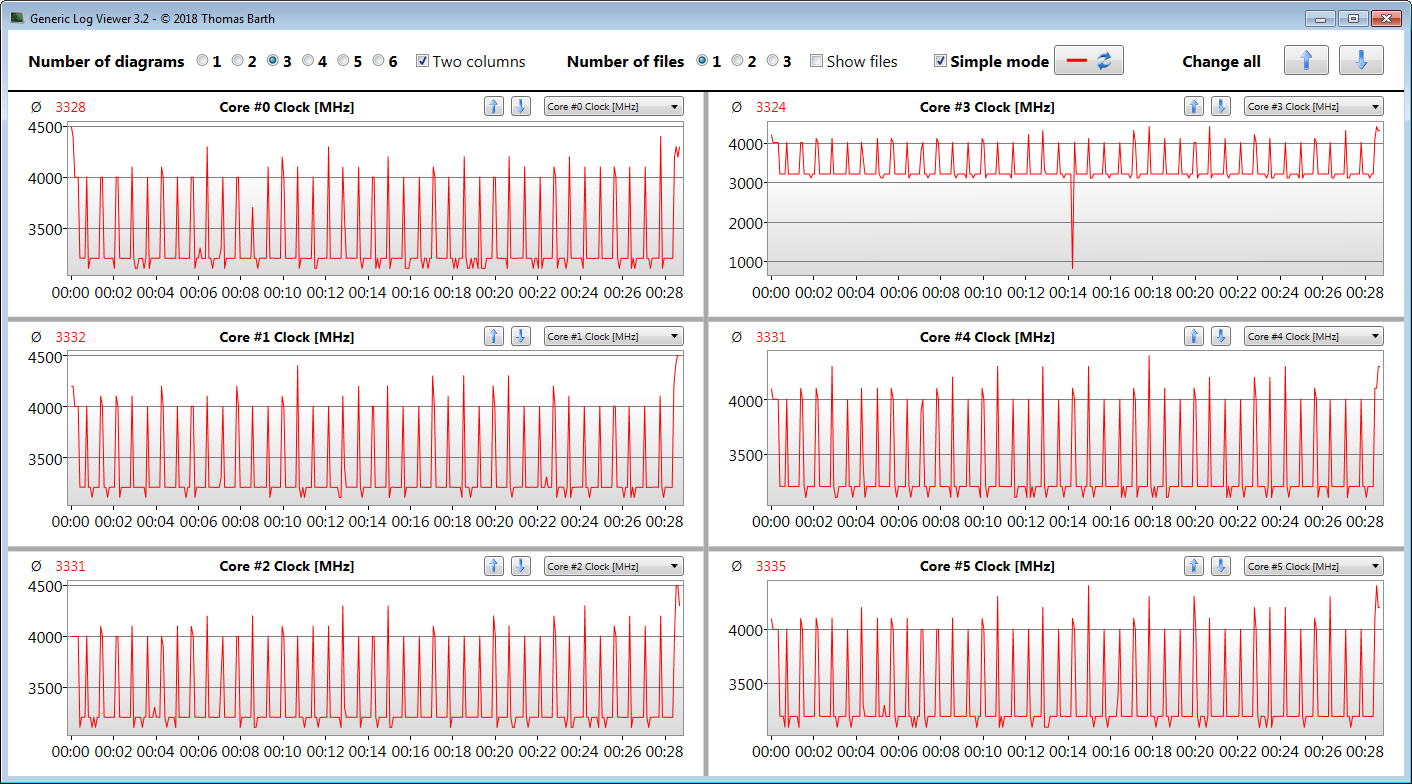
We also subjected our review unit to a looped CB R15 Multi 64Bit benchmark to see how well it maintained its performance under sustained load. We left the benchmark running for 30 minutes and recorded each successive benchmark result. Scores dropped by around 10% between the first and second run-through, although they then stabilised at around 1,030 points, with scores fluctuating between 1,020 and 1,042 points. The CPU engaged its Turbo Boost throughout the loop, but it could not maintain peak multi-core clock speeds.
In short, the Gaming Pavilion 15 has disappointing multi-core performance, as the graph below demonstrates. The device even scores below average in its best run and consistently scored around 150 points fewer than the CUK Model Z in our CB R15 loop. The Gaming Pavilion 15 and Pavilion Gaming 17 perform similarly in this regard, with both underwhelming in CB R15 Multi 64Bit.
| Geekbench 3 | |
| 32 Bit Multi-Core Score | |
| HP Gaming Pavilion 15-dk0009ng | |
| Average Intel Core i7-9750H (21185 - 23587, n=8) | |
| Dell G5 15 5590 | |
| 32 Bit Single-Core Score | |
| HP Gaming Pavilion 15-dk0009ng | |
| Average Intel Core i7-9750H (4137 - 4428, n=8) | |
| Dell G5 15 5590 | |
| Mozilla Kraken 1.1 - Total | |
| Dell G5 15 5590 (Edge 44) | |
| HP Gaming Pavilion 15-dk0009ng (Edge 44) | |
| Average Intel Core i7-9750H (845 - 1713, n=54) | |
| Lenovo Legion Y530-15ICH | |
| Average of class Gaming (391 - 590, n=100, last 2 years) | |
| Octane V2 - Total Score | |
| Average of class Gaming (93292 - 139447, n=26, last 2 years) | |
| Lenovo Legion Y530-15ICH | |
| HP Gaming Pavilion 15-dk0009ng (Edge 44) | |
| Average Intel Core i7-9750H (22874 - 39708, n=47) | |
| Dell G5 15 5590 (Edge 44) | |
| Asus ROG Zephyrus G15 GA502DU (Edge 44.17763.1.0) | |
| JetStream 1.1 - 1.1 Total | |
| Average of class Gaming (549 - 647, n=2, last 2 years) | |
| HP Gaming Pavilion 15-dk0009ng (Edge 44) | |
| Average Intel Core i7-9750H (212 - 280, n=47) | |
| Dell G5 15 5590 (Edge 44) | |
| Asus ROG Zephyrus G15 GA502DU (Edge 44.17763.1.0) | |
| Lenovo Legion Y530-15ICH | |
* ... smaller is better
System Performance
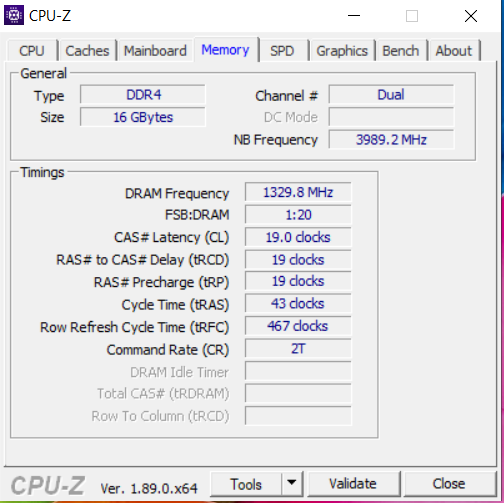
The device performs comparatively well in system benchmarks like PCMark though. A glance at the spec sheet reveals why, with its hexa-core CPU, powerful GPU, dual-channel RAM and fast NVMe SSD all combining to create a nimble system. Our review unit finished second overall in PCMark to the CUK Model Z and scored 8% better than average for its class.
| PCMark 7 Score | 6847 points | |
| PCMark 8 Home Score Accelerated v2 | 4362 points | |
| PCMark 8 Creative Score Accelerated v2 | 4155 points | |
| PCMark 8 Work Score Accelerated v2 | 5608 points | |
| PCMark 10 Score | 5583 points | |
Help | ||
Storage Devices
HP has equipped our review unit with a 256 GB Samsung PM981 SSD, which remains one of the fastest PCIe NVMe drives on the market, as our comparison table below demonstrates. The 256 GB SSD had about 200 GB free when we first booted our review unit, with the remaining space being occupied by the recovery partition and Windows 10 installation. The PM981 is not only considerably faster than SATA III SSDs, which are limited to around 600 MB/s transfer speeds, it delivers better speeds than all but the 2 TB version of the Intel 660p of the drives in our comparison table.
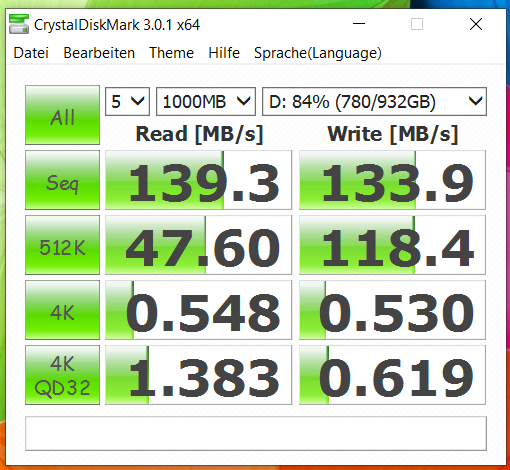
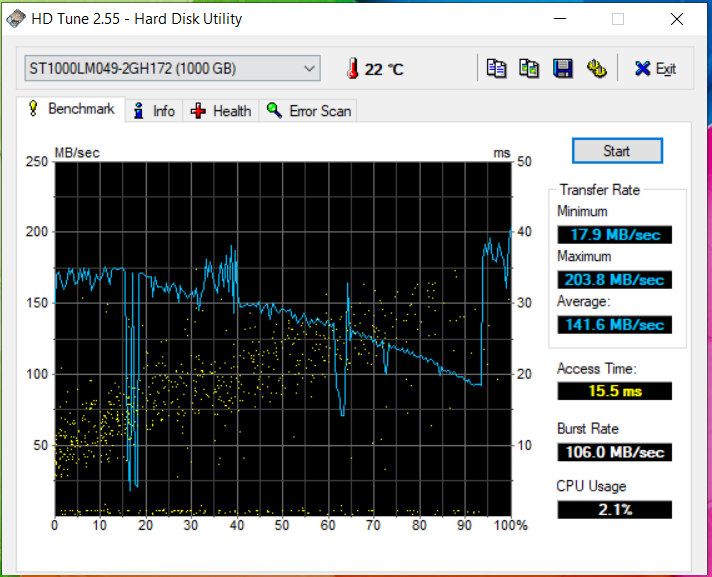
There is a 1 TB Seagate Barracuda HDD too should you need more than 200 GB of storage. The 2.5-inch drive operates at 7,200 RPM and is considerably slower than the PM981, hence why HP preinstalls Windows 10 on the latter rather than the former.

| HP Gaming Pavilion 15-dk0009ng Samsung SSD PM981 MZVLB256HAHQ | CUK Model Z GK5CQ7Z Intel SSD 660p 2TB SSDPEKNW020T8 | Dell G5 15 5590 KBG30ZMS128G | Asus ROG Zephyrus G15 GA502DU Intel SSD 660p SSDPEKNW512G8 | Lenovo Legion Y530-15ICH Samsung SSD PM981 MZVLB256HAHQ | Medion Erazer X6805-MD61085 Samsung PM961 MZVLW256HEHP | Average Samsung SSD PM981 MZVLB256HAHQ | |
|---|---|---|---|---|---|---|---|
| CrystalDiskMark 5.2 / 6 | 37% | -56% | -6% | 2% | -9% | 72% | |
| Write 4K (MB/s) | 100 | 134.4 34% | 64.3 -36% | 132.2 32% | 108.9 9% | 90.3 -10% | 116.1 ? 16% |
| Read 4K (MB/s) | 31.39 | 56.8 81% | 29.3 -7% | 55.5 77% | 40.23 28% | 38.98 24% | 189.5 ? 504% |
| Write Seq (MB/s) | 1308 | 1742 33% | 131.1 -90% | 986 -25% | 1390 6% | 1095 -16% | 1409 ? 8% |
| Read Seq (MB/s) | 1083 | 1687 56% | 776 -28% | 1318 22% | 964 -11% | 777 -28% | 1624 ? 50% |
| Write 4K Q32T1 (MB/s) | 362.9 | 535 47% | 96.8 -73% | 220.3 -39% | 314.2 -13% | 302.7 -17% | 360 ? -1% |
| Read 4K Q32T1 (MB/s) | 425.7 | 639 50% | 198.6 -53% | 315.5 -26% | 369.2 -13% | 352.2 -17% | 396 ? -7% |
| Write Seq Q32T1 (MB/s) | 1411 | 1903 35% | 127.8 -91% | 987 -30% | 1506 7% | 1265 -10% | 1492 ? 6% |
| Read Seq Q32T1 (MB/s) | 3240 | 1849 -43% | 1044 -68% | 1416 -56% | 3446 6% | 3389 5% | 3313 ? 2% |
Graphics Card
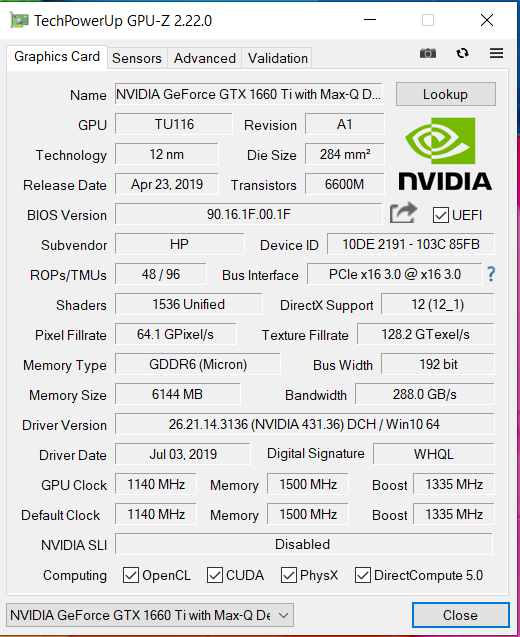
As we mentioned earlier, HP has equipped our review unit with a GeForce GTX 1660 Ti Max-Q, a more power-efficient version of the regular GeForce GTX 1660 Ti that NVIDIA has designed for thin and light laptops. The Max-Q has a 60 W thermal design power (TDP), 20 W shy of the regular GeForce GTX 1660 Ti.
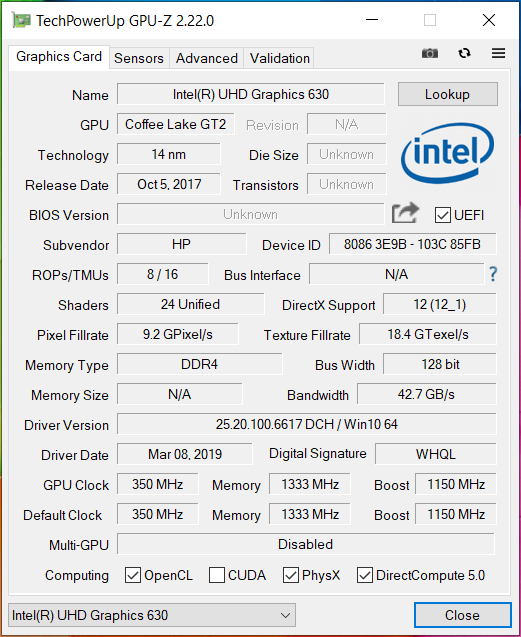
The GeForce GTX 1660 Ti sits in the upper-middle class of laptop gaming GPUs, with NVIDIA basing it on its Turing architecture. However, while the Turing architecture is synonymous with DLSS and ray tracing, the GeForce GTX 1660 Ti has no tensor cores so cannot make use of these new technologies. The Gaming Pavilion 15 supports NVIDIA Optimus though, meaning that it can switch between its NVIDIA GPU and the integrated UHD Graphics 630 to minimise power consumption.
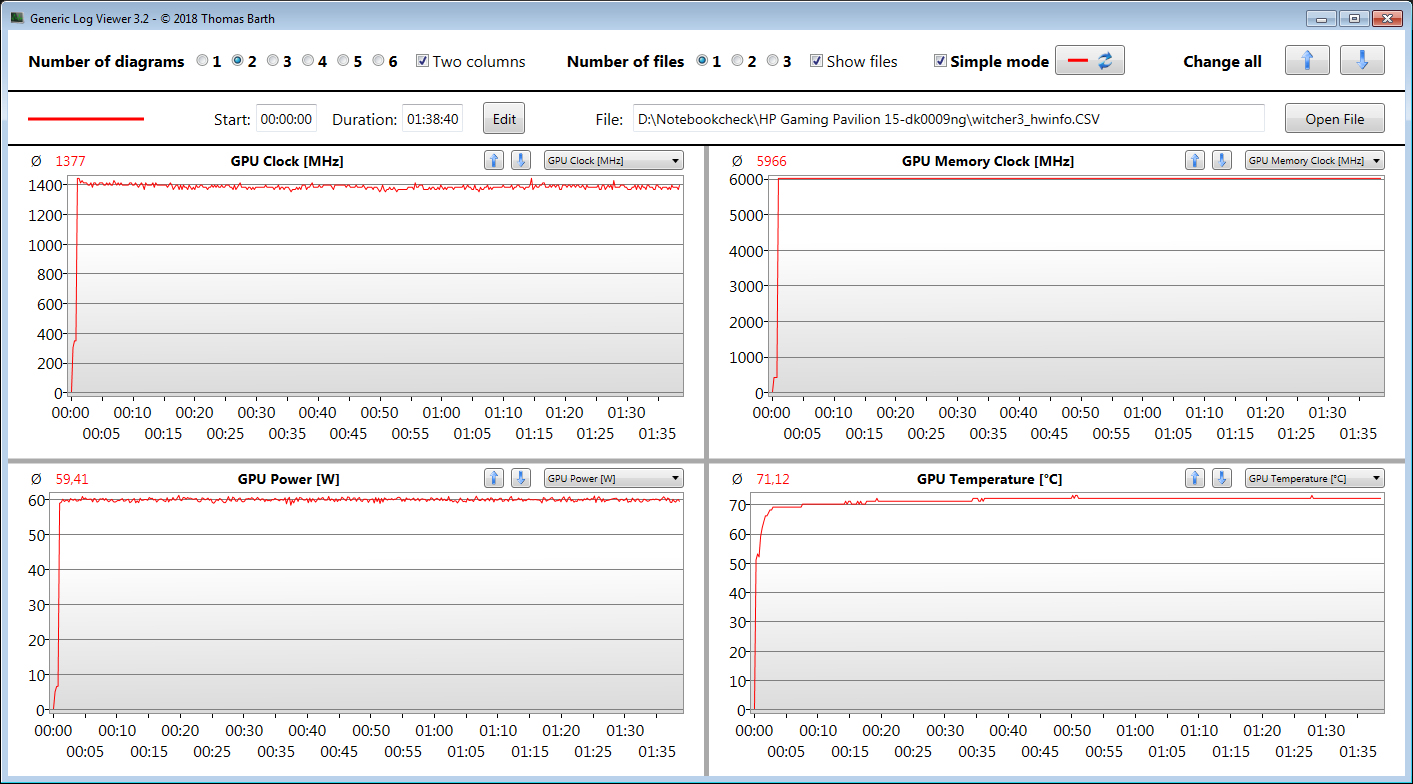
The GeForce GTX 1660 Ti Max-Q supports DirectX 12 and has a 1,140 MHz base clock, which NVIDIA claims it can boost up to 1,335 MHz when required. However, NVIDIA only gives this as a guideline, with the GPU able to reach higher clock speeds if it does not hit its power or temperature limits. The one in our review unit reached a maximum of 1,500 MHz during synthetic benchmarks, for example, although it averaged 1,377 MHz while playing The Witcher 3. NVIDIA pairs the GeForce GTX 1660 Ti Max-Q with 6 GB of fast GDDR6 VRAM.
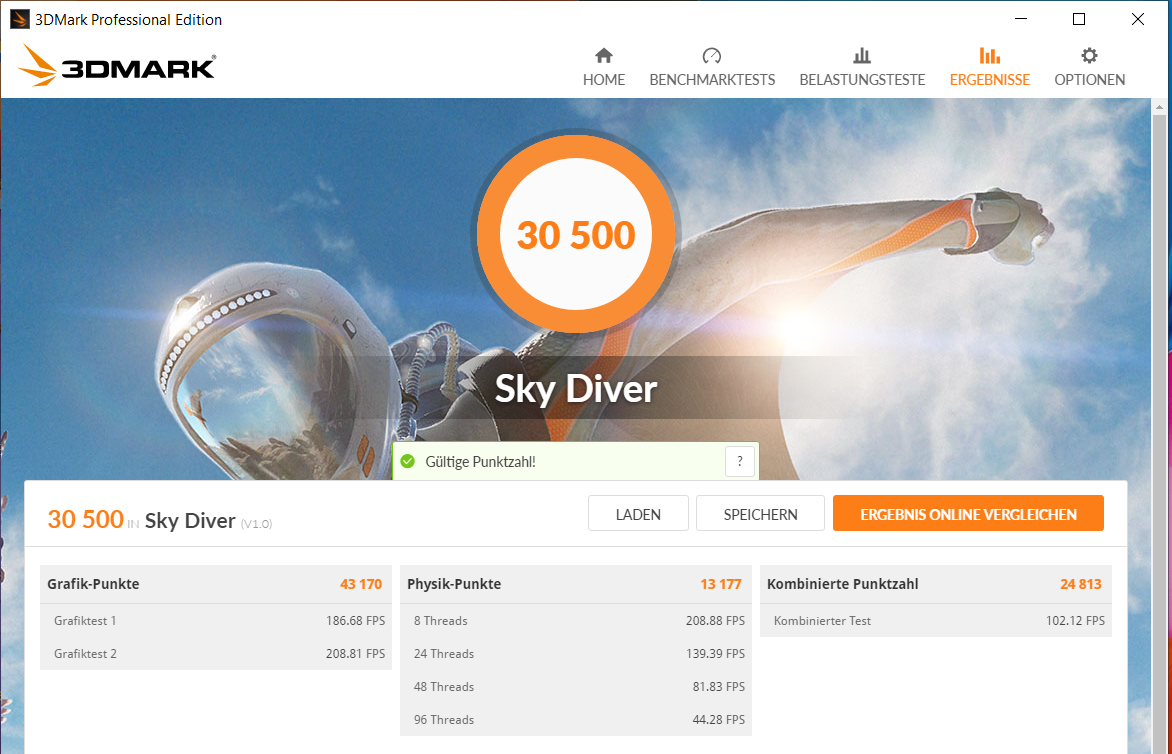
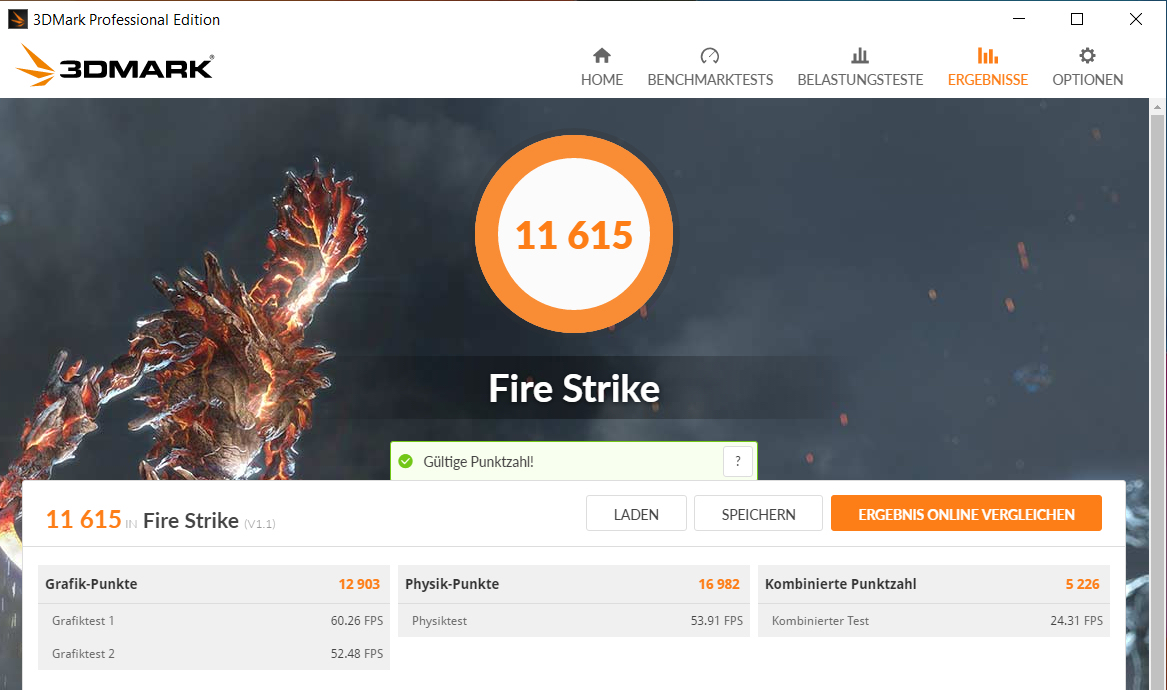
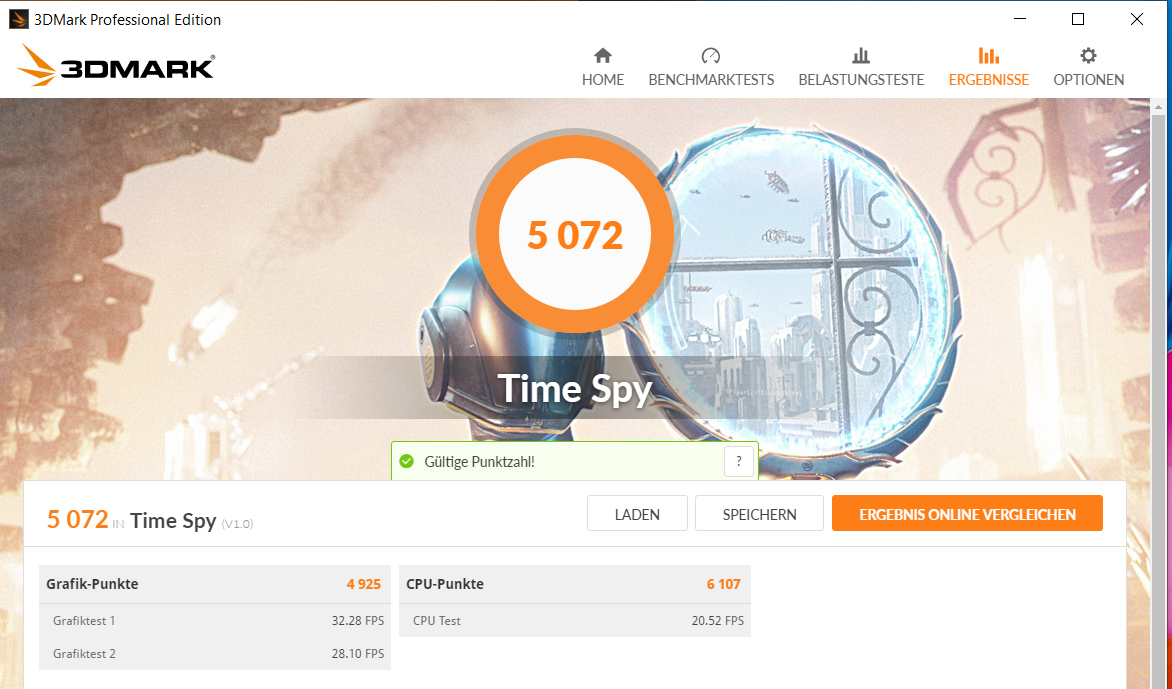
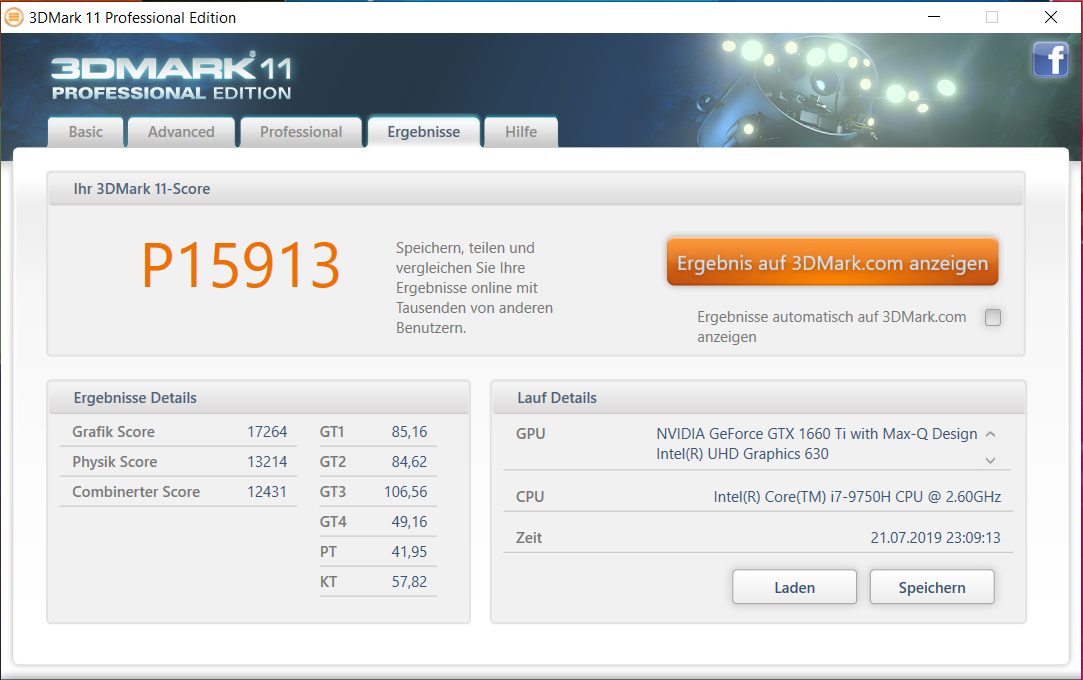
Our review unit performed as expected for a GeForce GTX 1660 Ti Max-Q-powered device in 3DMark. The Gaming Pavilion 15 scored 1% more than the Ryzen 7 3750H-powered GA502DU and just under 20% more than our GeForce GTX 1060 powered comparison devices. However, our review unit throttles the GPU performance by up to 50% when running on battery, effectively curtailing an opportunity of gaming on the go.
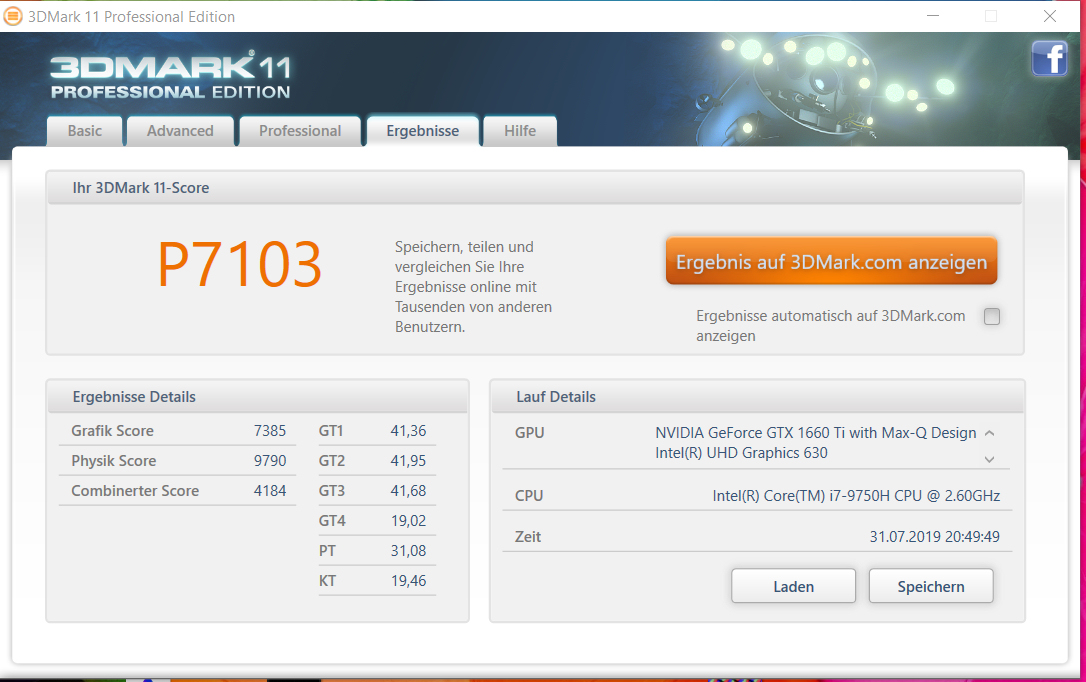
| 3DMark 06 Standard Score | 38536 points | |
| 3DMark 11 Performance | 15913 points | |
| 3DMark Ice Storm Standard Score | 117976 points | |
| 3DMark Cloud Gate Standard Score | 33027 points | |
| 3DMark Fire Strike Score | 11615 points | |
| 3DMark Time Spy Score | 5072 points | |
Help | ||
Gaming Performance
As mentioned earlier, the Gaming Pavilion 15 can handle any modern triple-A game with ease. Our review unit averaged playable frame rates at 1080p and maximum graphics in all but Anno 1800, where it averaged just 33.2 FPS. Dropping the graphics settings to high resulted in it averaging 64.1 FPS though. Overall, the device will play most games at 60 FPS on maximum graphics, but you could make use of its 144 Hz refresh rate display if you reduce the graphics settings to high.
| The Witcher 3 - 1920x1080 Ultra Graphics & Postprocessing (HBAO+) | |
| Average of class Gaming (104.7 - 240, n=7, last 2 years) | |
| CUK Model Z GK5CQ7Z | |
| Dell G5 15 5590 | |
| HP Gaming Pavilion 15-dk0009ng | |
| Average NVIDIA GeForce GTX 1660 Ti Max-Q (44.8 - 53.2, n=7) | |
| Asus ROG Zephyrus G15 GA502DU | |
| Lenovo Legion Y530-15ICH | |
| Medion Erazer X6805-MD61085 | |
| BioShock Infinite - 1920x1080 Ultra Preset, DX11 (DDOF) | |
| CUK Model Z GK5CQ7Z | |
| Dell G5 15 5590 | |
| HP Gaming Pavilion 15-dk0009ng | |
| Average NVIDIA GeForce GTX 1660 Ti Max-Q (102.3 - 130, n=5) | |
| Lenovo Legion Y530-15ICH | |
| Asus ROG Zephyrus G15 GA502DU | |
| Far Cry 5 - 1920x1080 Ultra Preset AA:T | |
| Average of class Gaming (70 - 151, n=6, last 2 years) | |
| Dell G5 15 5590 | |
| HP Gaming Pavilion 15-dk0009ng | |
| Average NVIDIA GeForce GTX 1660 Ti Max-Q (50 - 74, n=2) | |
We also subjected the Gaming Pavilion 15 to an hour-long The Witcher 3 run-through to see how it managed its performance under sustained load. Frame rates fluctuated between 44 and 53 FPS during this test, with the system averaging 49.5 FPS. We did not move the playable character during this test and conducted it with the game running at 1080p and maximum graphics, for reference. The Gaming Pavilion 15 edges the GA502DU by 5 FPS here and is about 10 FPS shy of the GeForce RTX 2060-powered G5 15 5590.
| low | med. | high | ultra | |
|---|---|---|---|---|
| BioShock Infinite (2013) | 294 | 271.9 | 246.8 | 126.3 |
| GTA V (2015) | 161.3 | 151.5 | 114.6 | 59.6 |
| The Witcher 3 (2015) | 243 | 162.6 | 95.2 | 53.1 |
| Rainbow Six Siege (2015) | 232.8 | 200.1 | 163.6 | 148.8 |
| Ghost Recon Wildlands (2017) | 130.4 | 78.1 | 72.4 | 41.5 |
| Final Fantasy XV Benchmark (2018) | 106.4 | 70.3 | 50 | |
| Kingdom Come: Deliverance (2018) | 125.6 | 91.7 | 77.3 | 53.7 |
| X-Plane 11.11 (2018) | 102.3 | 88.1 | 75.4 | |
| Far Cry 5 (2018) | 103 | 84 | 79 | 74 |
| Assassin´s Creed Odyssey (2018) | 90 | 71 | 60 | 44 |
| Battlefield V (2018) | 117.4 | 74.6 | 65.9 | 61 |
| Far Cry New Dawn (2019) | 97 | 81 | 78 | 71 |
| Dirt Rally 2.0 (2019) | 194.2 | 139.9 | 103.2 | 59.2 |
| The Division 2 (2019) | 142 | 87 | 69 | 50 |
| Anno 1800 (2019) | 87.9 | 83.2 | 64.1 | 33.2 |
| Rage 2 (2019) | 154.7 | 70.9 | 58.7 | 58.2 |
| Total War: Three Kingdoms (2019) | 209.4 | 93.1 | 57.1 | 41.6 |
| F1 2019 (2019) | 183 | 140 | 117 | 71 |
Emissions
Fan Noise
HP sets the fans to “always-on" in the BIOS, with the fans whirring at 29.3 dB(A) by default even at idle. The fans will remain silent if you disable this option though. Unfortunately, the disks inside the HDD spin at 29.7 dB(A), so you must remove the drive if you want the Gaming Pavilion 15 to operate silently at idle.
Despite the fans always remaining on by default, they run comparatively quietly under load. We recorded the fans reaching a maximum of 41.2 dB(A) during our stress test, but this drops to 34 dB(A) while playing The Witcher 3 and 37.3 dB(A) in CPU-heavy games. In short, the Gaming Pavilion 15 runs as quietly as its 17-inch sibling.
Noise level
| Idle |
| 29.3 / 29.3 / 29.3 dB(A) |
| HDD |
| 29.7 dB(A) |
| Load |
| 32.3 / 41.2 dB(A) |
 | ||
30 dB silent 40 dB(A) audible 50 dB(A) loud |
||
min: | ||
| HP Gaming Pavilion 15-dk0009ng i7-9750H, GeForce GTX 1660 Ti Max-Q | CUK Model Z GK5CQ7Z i7-9750H, GeForce RTX 2070 Max-Q | Dell G5 15 5590 i7-8750H, GeForce RTX 2060 Mobile | Asus ROG Zephyrus G15 GA502DU R7 3750H, GeForce GTX 1660 Ti Max-Q | Lenovo Legion Y530-15ICH i7-8750H, GeForce GTX 1060 Mobile | Medion Erazer X6805-MD61085 i7-8750H, GeForce GTX 1060 Mobile | Average NVIDIA GeForce GTX 1660 Ti Max-Q | Average of class Gaming | |
|---|---|---|---|---|---|---|---|---|
| Noise | -23% | -13% | -20% | -9% | -20% | -5% | -6% | |
| off / environment * (dB) | 28.2 | 28.6 -1% | 30.4 -8% | 28 1% | 30.2 -7% | 29 -3% | 28.3 ? -0% | 24.1 ? 15% |
| Idle Minimum * (dB) | 29.3 | 30.8 -5% | 30.4 -4% | 29.4 -0% | 30.9 -5% | 29 1% | 29.2 ? -0% | 25.9 ? 12% |
| Idle Average * (dB) | 29.3 | 30.8 -5% | 30.4 -4% | 31.9 -9% | 30.9 -5% | 32 -9% | 29.5 ? -1% | 27.4 ? 6% |
| Idle Maximum * (dB) | 29.3 | 35 -19% | 33.4 -14% | 33 -13% | 31.6 -8% | 35 -19% | 30.4 ? -4% | 30.1 ? -3% |
| Load Average * (dB) | 32.3 | 45 -39% | 42 -30% | 41.2 -28% | 42.3 -31% | 45 -39% | 37.3 ? -15% | 43.7 ? -35% |
| Witcher 3 ultra * (dB) | 34 | 51.6 -52% | 53.8 -58% | 47 -38% | ||||
| Load Maximum * (dB) | 41.2 | 57.8 -40% | 48.7 -18% | 55.7 -35% | 40 3% | 56 -36% | 46.1 ? -12% | 54.3 ? -32% |
* ... smaller is better
Temperature
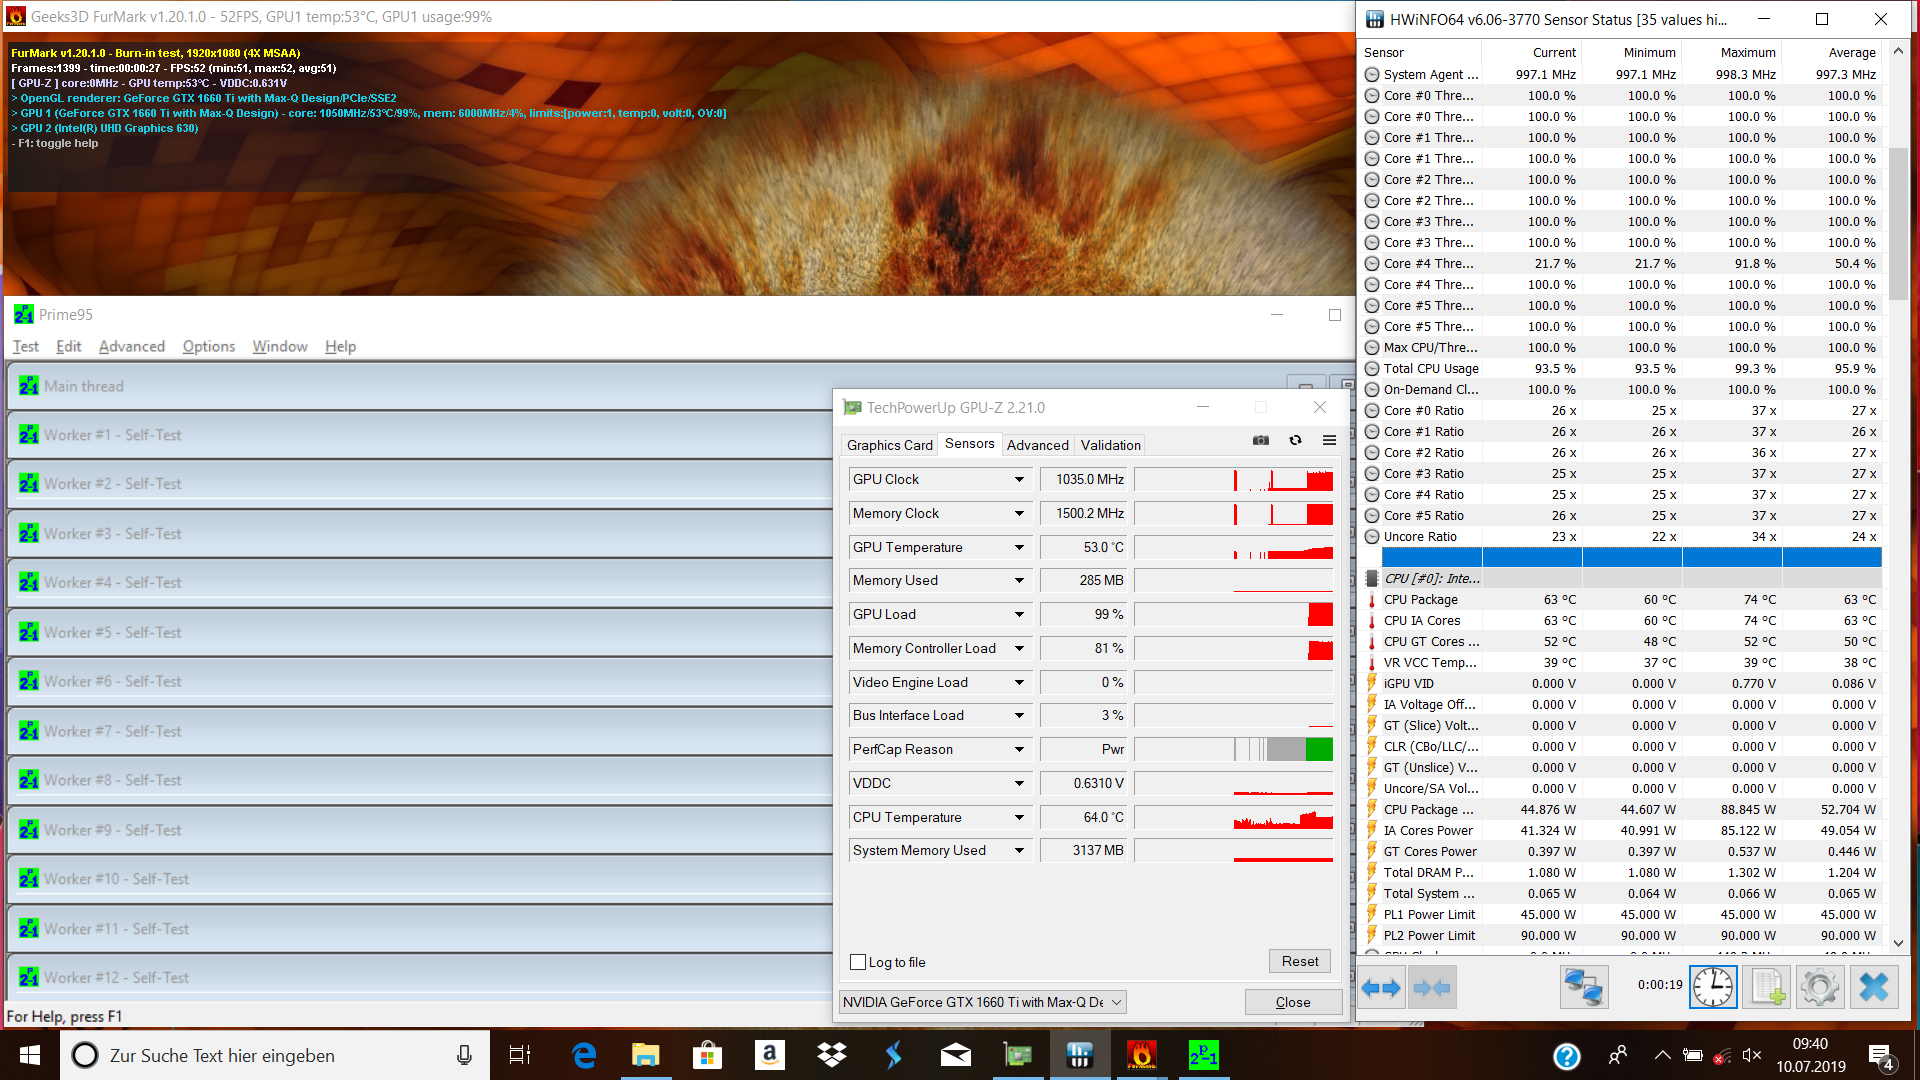
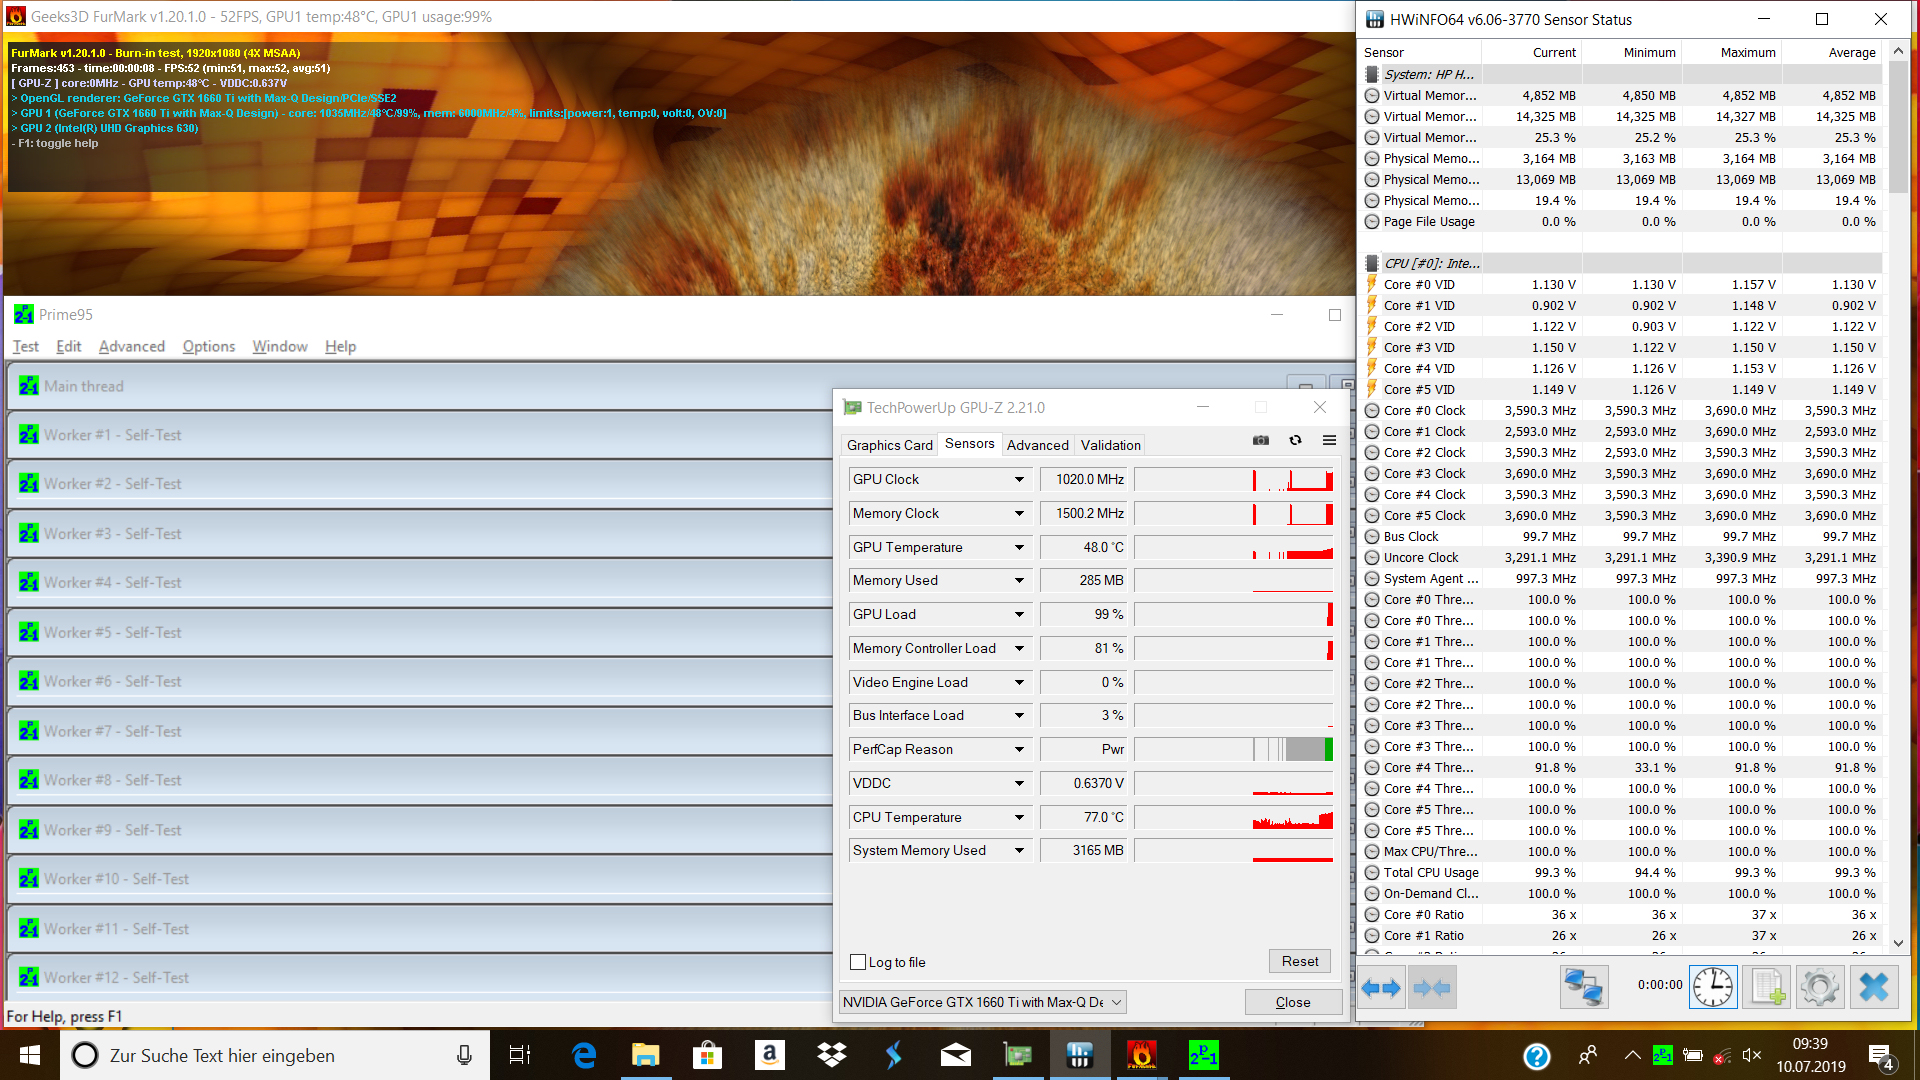
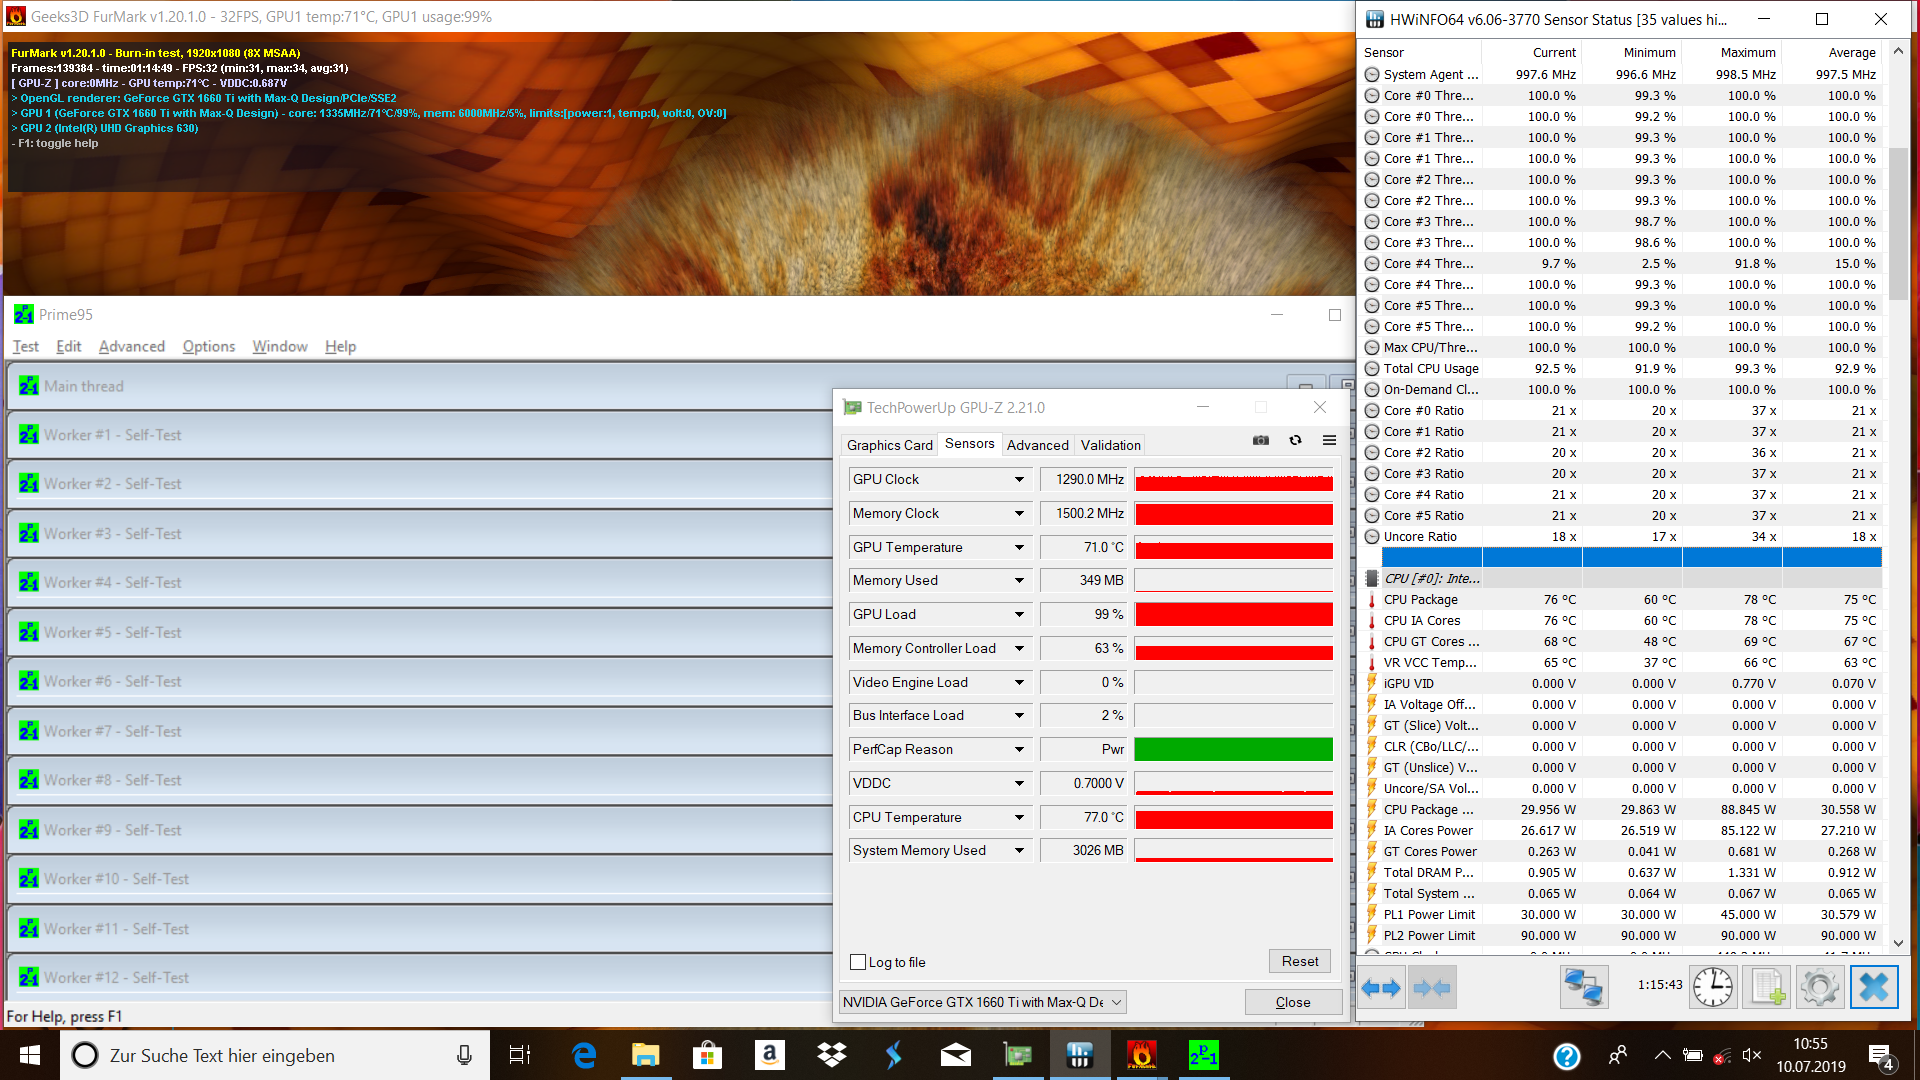
We also stress-tested our review unit with FurMark and Prime95 to see how it fared under extreme load conditions. As our previous tests revealed, the Gaming Pavilion 15 throttles its CPU and GPU when running on battery power. While the CPU initially operated at between 2.5 and 2.6 GHz on mains power, it could only maintain between 800 MHz and 1.1 GHz on battery. Incidentally, the CPU dropped to between 2 and 2.1 GHz on mains power after 10 minutes of stress testing. The GPU initially fluctuates between 1 GHz and 1.1 GHz regardless of its power state, but it only rises when the CPU throttles if it is connected to the mains. Incidentally, the GPU peaked at 1,290 MHz during our stress tests. Overall, you should not experience such heavy throttling even when gaming, as our stress tests push systems to their limits.
The Gaming Pavilion 15 manages its surface temperatures well too, with only one area of the palm rest exceeding 30 °C even during our stress tests. The rest of the top case gets hot while playing games, but not worryingly so. However, one area of the bottom case peaked at 53.7 °C during our stress tests and 52.2 °C while playing The Witcher 3, which will feel uncomfortable to the touch. Hence, we would recommend gaming with the laptop on something like a table or desk rather than on your lap.
(-) The maximum temperature on the upper side is 46.7 °C / 116 F, compared to the average of 40.4 °C / 105 F, ranging from 21.2 to 68.8 °C for the class Gaming.
(-) The bottom heats up to a maximum of 53.7 °C / 129 F, compared to the average of 43.2 °C / 110 F
(+) In idle usage, the average temperature for the upper side is 23.4 °C / 74 F, compared to the device average of 33.9 °C / 93 F.
(-) Playing The Witcher 3, the average temperature for the upper side is 38.8 °C / 102 F, compared to the device average of 33.9 °C / 93 F.
(+) The palmrests and touchpad are reaching skin temperature as a maximum (33.3 °C / 91.9 F) and are therefore not hot.
(-) The average temperature of the palmrest area of similar devices was 28.8 °C / 83.8 F (-4.5 °C / -8.1 F).
| HP Gaming Pavilion 15-dk0009ng i7-9750H, GeForce GTX 1660 Ti Max-Q | CUK Model Z GK5CQ7Z i7-9750H, GeForce RTX 2070 Max-Q | Dell G5 15 5590 i7-8750H, GeForce RTX 2060 Mobile | Asus ROG Zephyrus G15 GA502DU R7 3750H, GeForce GTX 1660 Ti Max-Q | Lenovo Legion Y530-15ICH i7-8750H, GeForce GTX 1060 Mobile | Medion Erazer X6805-MD61085 i7-8750H, GeForce GTX 1060 Mobile | Average NVIDIA GeForce GTX 1660 Ti Max-Q | Average of class Gaming | |
|---|---|---|---|---|---|---|---|---|
| Heat | -38% | -8% | -27% | -5% | -10% | -12% | -15% | |
| Maximum Upper Side * (°C) | 46.7 | 47.2 -1% | 51.5 -10% | 55.8 -19% | 48.4 -4% | 43 8% | 46.6 ? -0% | 45.1 ? 3% |
| Maximum Bottom * (°C) | 53.7 | 65.8 -23% | 48.3 10% | 58.2 -8% | 48 11% | 55 -2% | 49.4 ? 8% | 48.1 ? 10% |
| Idle Upper Side * (°C) | 23.8 | 35.2 -48% | 27.2 -14% | 33.4 -40% | 26.7 -12% | 28 -18% | 30.1 ? -26% | 31 ? -30% |
| Idle Bottom * (°C) | 23.7 | 43 -81% | 27.4 -16% | 33.6 -42% | 26.9 -14% | 30 -27% | 31 ? -31% | 34.2 ? -44% |
* ... smaller is better
Speakers
HP equips the Gaming Pavilion 15 with stereo speakers that fire upwards from behind a perforated cover above the keyboard. The speakers are comparatively quiet by laptops standards, but they still sound reasonably loud thanks to their positioning, as audio does not reflect off other surfaces before reaching your ears as is the case with downward-firing speakers. We would still recommend using external audio equipment like headphones and speakers for a better listening experience though.
HP Gaming Pavilion 15-dk0009ng audio analysis
(±) | speaker loudness is average but good (75.8 dB)
Bass 100 - 315 Hz
(-) | nearly no bass - on average 23.1% lower than median
(±) | linearity of bass is average (11.6% delta to prev. frequency)
Mids 400 - 2000 Hz
(+) | balanced mids - only 2.4% away from median
(+) | mids are linear (5.4% delta to prev. frequency)
Highs 2 - 16 kHz
(+) | balanced highs - only 1.5% away from median
(+) | highs are linear (3.4% delta to prev. frequency)
Overall 100 - 16.000 Hz
(±) | linearity of overall sound is average (19% difference to median)
Compared to same class
» 64% of all tested devices in this class were better, 8% similar, 28% worse
» The best had a delta of 6%, average was 18%, worst was 132%
Compared to all devices tested
» 45% of all tested devices were better, 7% similar, 47% worse
» The best had a delta of 4%, average was 23%, worst was 134%
Power Management
Power Consumption
There are no surprises with power consumption, with the Gaming Pavilion 15 averaging a slightly lower power draw than we expected. Our review unit consumes a minimum of 6.8 W at idle, with it averaging 10.7 W. The system peaked at 191.5 W during our stress tests and 121 W in The Witcher 3, making it considerably more power-hungry than the GA502DU, despite having the GPU. HP includes a 200 W power supply in the box, but our review unit never consumed more than this during our tests, so it will keep the Gaming Pavilion 15 charging even if you push the system to its limits.
| Off / Standby | |
| Idle | |
| Load |
|
Key:
min: | |
| HP Gaming Pavilion 15-dk0009ng i7-9750H, GeForce GTX 1660 Ti Max-Q | CUK Model Z GK5CQ7Z i7-9750H, GeForce RTX 2070 Max-Q | Dell G5 15 5590 i7-8750H, GeForce RTX 2060 Mobile | Asus ROG Zephyrus G15 GA502DU R7 3750H, GeForce GTX 1660 Ti Max-Q | Lenovo Legion Y530-15ICH i7-8750H, GeForce GTX 1060 Mobile | Medion Erazer X6805-MD61085 i7-8750H, GeForce GTX 1060 Mobile | Average NVIDIA GeForce GTX 1660 Ti Max-Q | Average of class Gaming | |
|---|---|---|---|---|---|---|---|---|
| Power Consumption | -101% | 15% | -23% | -5% | -25% | 12% | -66% | |
| Idle Minimum * (Watt) | 6.8 | 23.5 -246% | 3.5 49% | 7.4 -9% | 7.3 -7% | 10 -47% | 5.16 ? 24% | 13.1 ? -93% |
| Idle Average * (Watt) | 10.7 | 28 -162% | 6.9 36% | 8.6 20% | 11.1 -4% | 13 -21% | 8.51 ? 20% | 19 ? -78% |
| Idle Maximum * (Watt) | 12.5 | 32 -156% | 8.5 32% | 39.1 -213% | 12.6 -1% | 21 -68% | 14.6 ? -17% | 24.6 ? -97% |
| Load Average * (Watt) | 87.2 | 102.4 -17% | 127 -46% | 65.9 24% | 109 -25% | 101 -16% | 76.4 ? 12% | 111.3 ? -28% |
| Witcher 3 ultra * (Watt) | 121 | 142.8 -18% | 106.9 12% | 126 -4% | ||||
| Load Maximum * (Watt) | 191.4 | 209 -9% | 179 6% | 141.3 26% | 168 12% | 176 8% | 151.4 ? 21% | 260 ? -36% |
* ... smaller is better
Battery Life
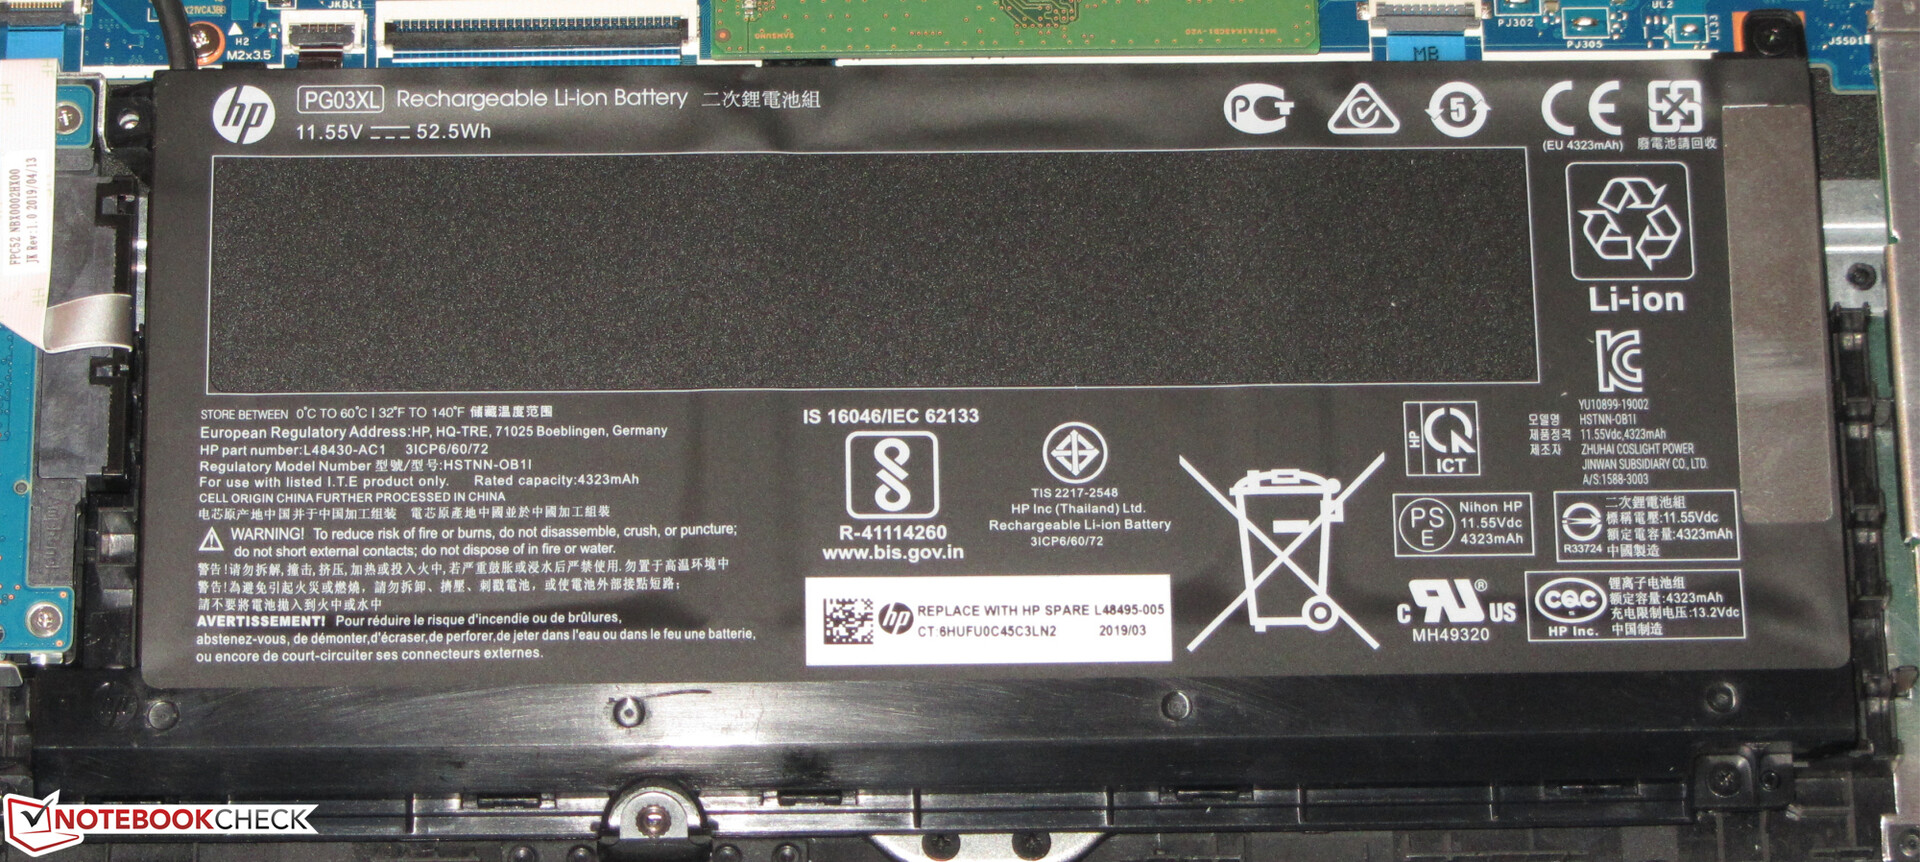
The Gaming Pavilion 15 has a 52.5 Wh battery, which lasted just 4:50 hours in our practical Wi-Fi battery life test, during which we ran a script that simulates the load required to render websites. We also left the system on the Windows 10 balanced power plan and reduced display brightness to 150 cd/m². The battery lasted about 20 minutes longer when playing an H.264-encoded 1080p video with all the radio modules deactivated and the power plan set to “Energy-saving mode". We left the display at 150 cd/m² for this test too.
In short, the Gaming Pavilion 15 has above average battery life for a gaming laptop. However, it falls well short of the G5 15 5590 and GA502DU, although both have considerably larger batteries than the 52.5 Wh cell in the Gaming Pavilion 15.
| HP Gaming Pavilion 15-dk0009ng i7-9750H, GeForce GTX 1660 Ti Max-Q, 52.5 Wh | CUK Model Z GK5CQ7Z i7-9750H, GeForce RTX 2070 Max-Q, 46.74 Wh | Dell G5 15 5590 i7-8750H, GeForce RTX 2060 Mobile, 60 Wh | Asus ROG Zephyrus G15 GA502DU R7 3750H, GeForce GTX 1660 Ti Max-Q, 76 Wh | Lenovo Legion Y530-15ICH i7-8750H, GeForce GTX 1060 Mobile, 52 Wh | Medion Erazer X6805-MD61085 i7-8750H, GeForce GTX 1060 Mobile, 46.7 Wh | Average of class Gaming | |
|---|---|---|---|---|---|---|---|
| Battery runtime | -37% | 76% | 68% | -32% | 5% | 27% | |
| Reader / Idle (h) | 8.7 | 14.8 70% | 15.3 76% | 8.3 -5% | 8.4 -3% | 7.84 ? -10% | |
| H.264 (h) | 5.3 | 8.4 58% | 8.27 ? 56% | ||||
| WiFi v1.3 (h) | 4.8 | 3 -37% | 7.7 60% | 8 67% | 3.8 -21% | 4.5 -6% | 7.08 ? 48% |
| Witcher 3 ultra (h) | 1 | ||||||
| Load (h) | 1.3 | 2.8 115% | 2.1 62% | 0.4 -69% | 1.6 23% | 1.496 ? 15% |
Pros
Cons
Verdict
The HP Gaming Pavilion 15 does what it is supposed to do and brings all modern triple-A games smoothly to its 15.6-inch 1080p display. The Core i7-9750H and GeForce GTX 1660 Ti Max-Q GPU proved to be a powerful pair during our tests and ones that can make use of the 144 Hz panel even on maximum graphics in some games. The Gaming Pavilion 15 runs comparatively quietly, with its fans not overwhelming its speakers when gaming.
A fast NVMe SSD keeps the system running smoothly and quickly too, while you should not run out of space for storing games thanks to the inclusion of a 1 TB HDD. Better still, both drives can be replaced should you want to switch things up, although you must remove the bottom panel to do so.
The HP Gaming Pavilion 15 is a decent all-rounder, about which we have few complaints.
The IPS display scores well not only for its 144 Hz refresh rate but also for its short response times, stable viewing angles, good maximum brightness and excellent colour accuracy. It is not all positive though, as the comparatively high black value results in an underwhelming contrast ratio. We would have expected more from any laptop class at this price.
The Gaming Pavilion 15 will not wow you with its battery life either, with it lasting just 4:50 hours in our practical Wi-Fi test. This should come as no surprise though considering that it has just a 52.6 Wh capacity. Our only other gripes are the lack of Thunderbolt 3, unstable display frame and one-year warranty. However, the keyboard is pleasant to type on, as is the inclusion of backlighting. Likewise, HP has included plenty of ports to keep you going. Overall, the Gaming Pavilion 15 is good value for money at around US$1,500, with its main differentiator being its quiet fans.
HP Gaming Pavilion 15-dk0009ng
- 09/20/2019 v7 (old)
Sascha Mölck
Price comparison

