Dell G5 15 5590 (i7-8750H, RTX 2060, SSD, FHD) Laptop Review

With its diverse G-series (G3, G5, G7), Dell offers gaming laptops that present reasonably priced alternatives to the high-end Alienware gaming laptops. The G5-series aims to cover the midrange segment of the G-series assortment. The review device we were provided with is equipped with a Core i7-8750H processor and the GeForce RTX 2060 GPU. The Lenovo Legion Y530-15ICH, the Acer Aspire Nitro 5 AN515-54 and the HP Omen 15 are among its rivals. We will also take the 17.3-inch MSI GL73 8SE into account as a competitor since it's currently the only laptop in our database that shares the same CPU, GPU, and price level with the Dell G5.
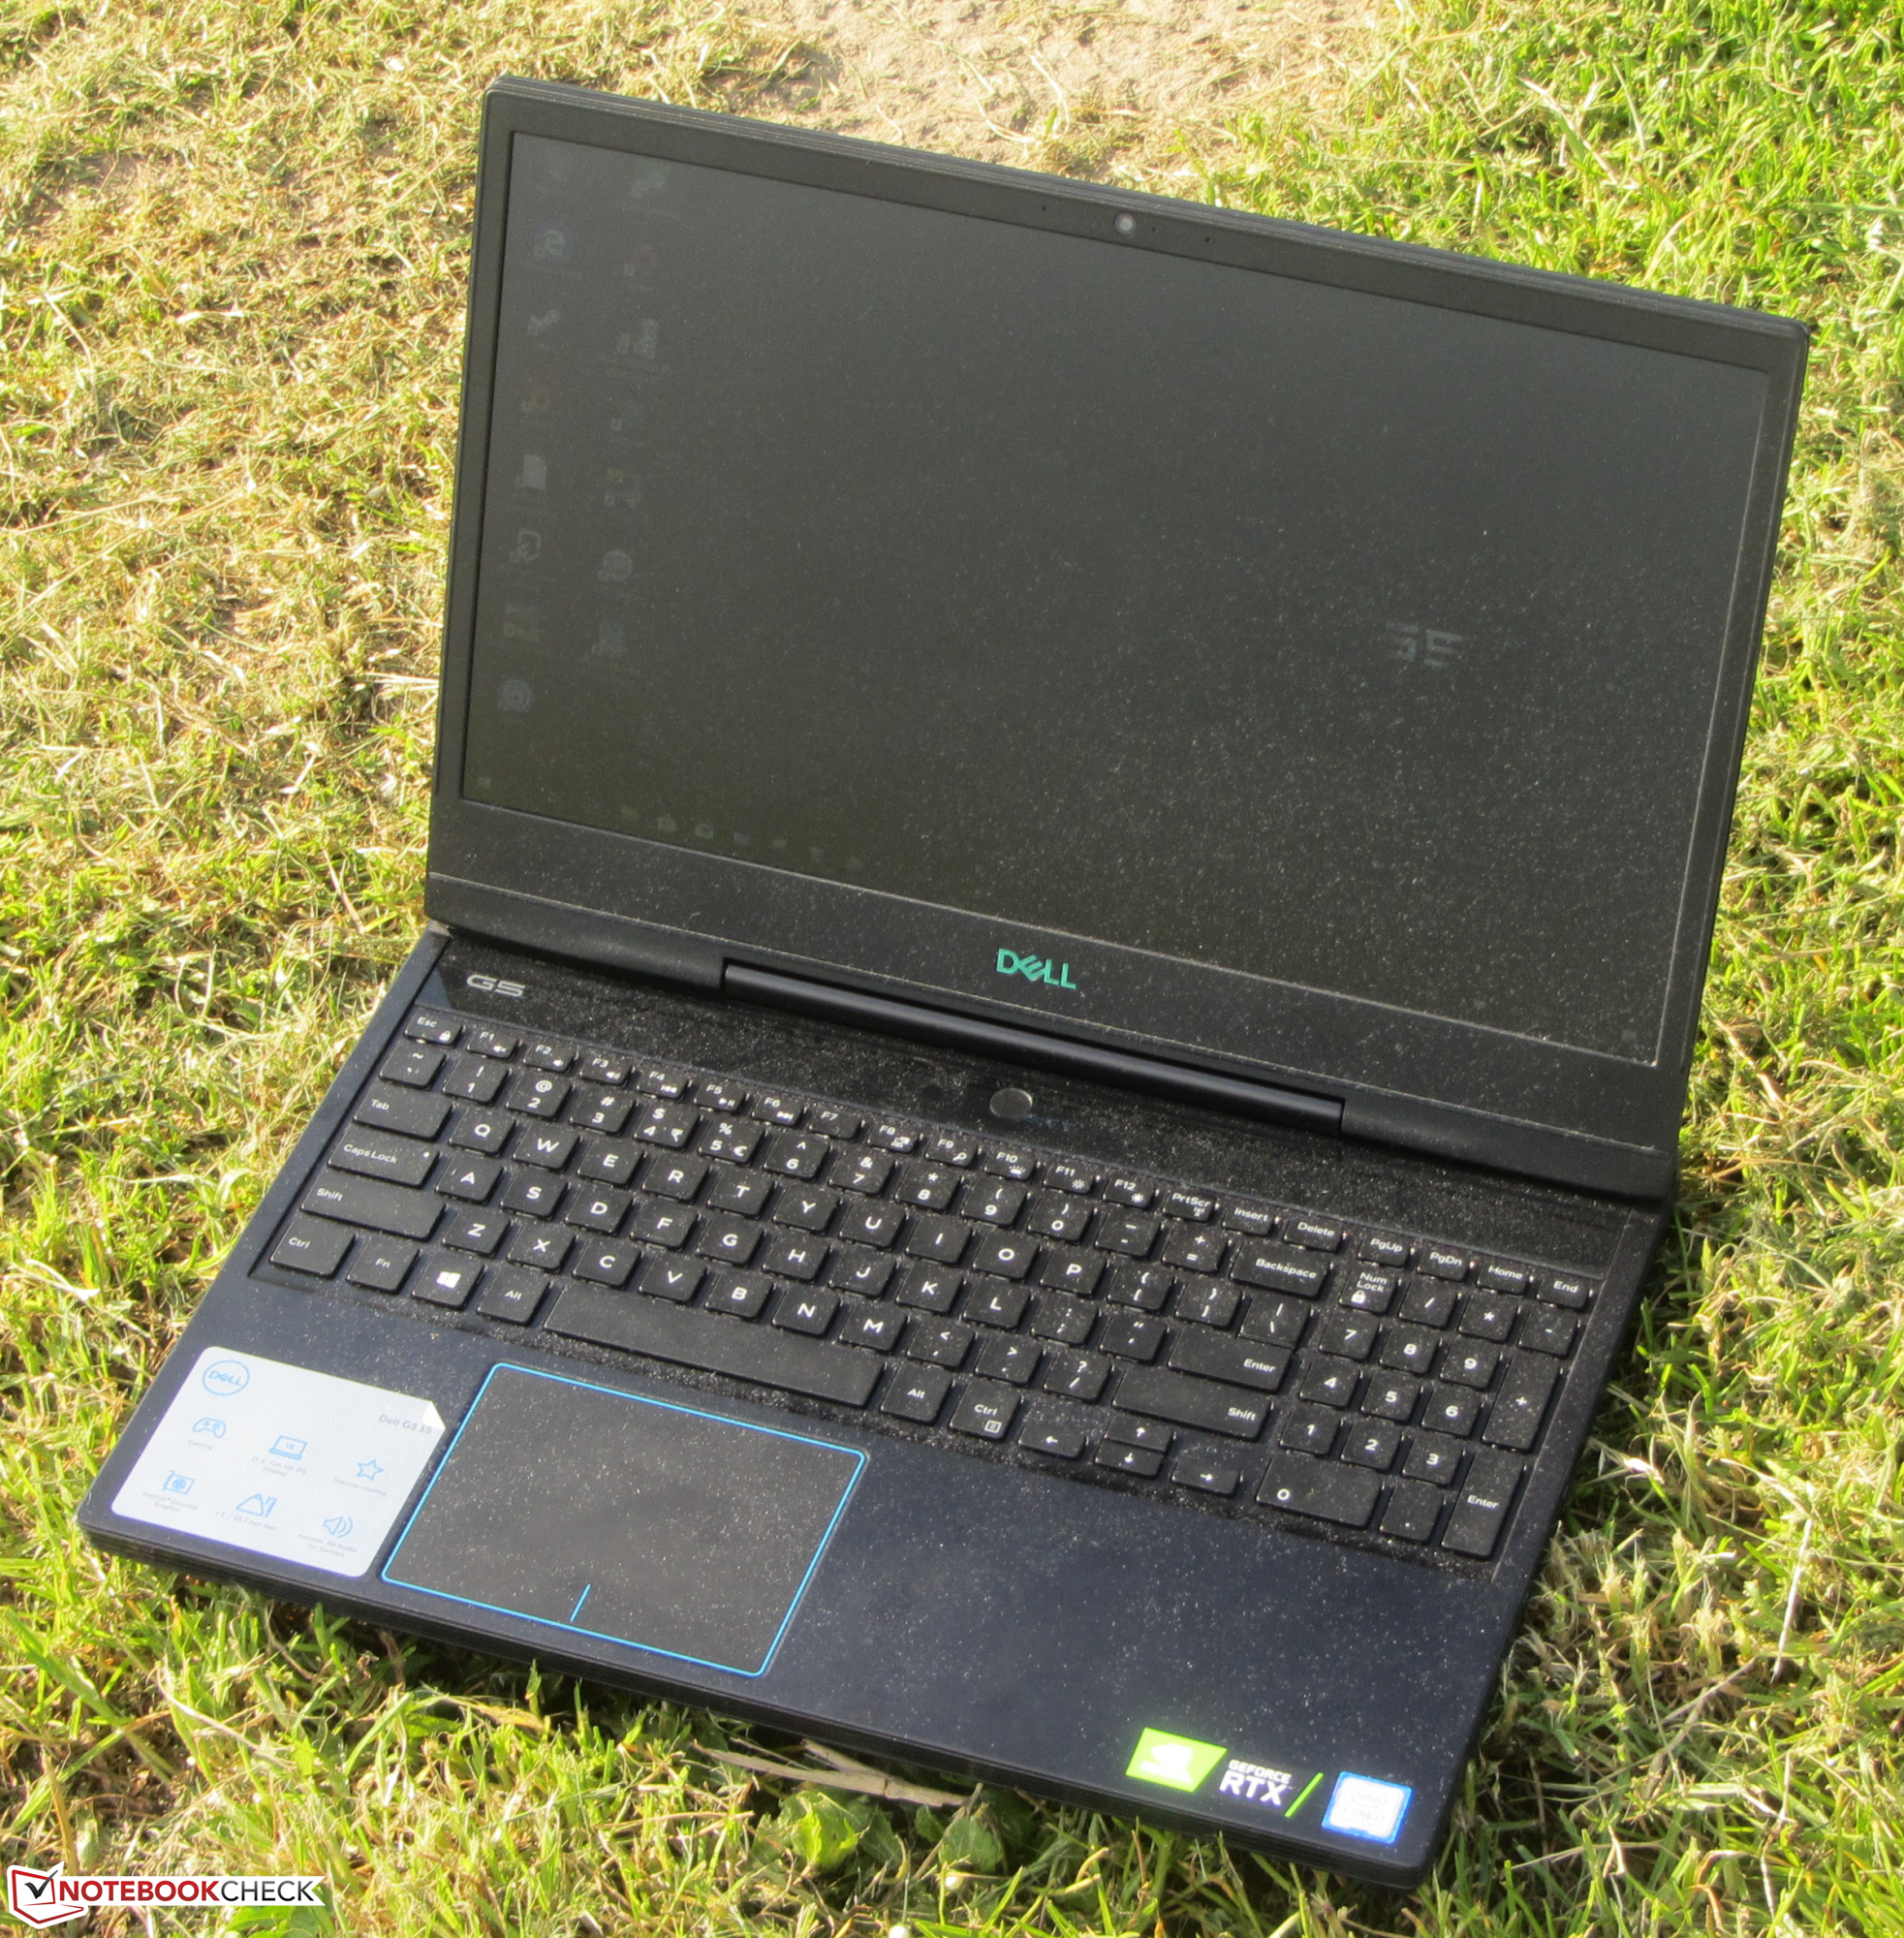
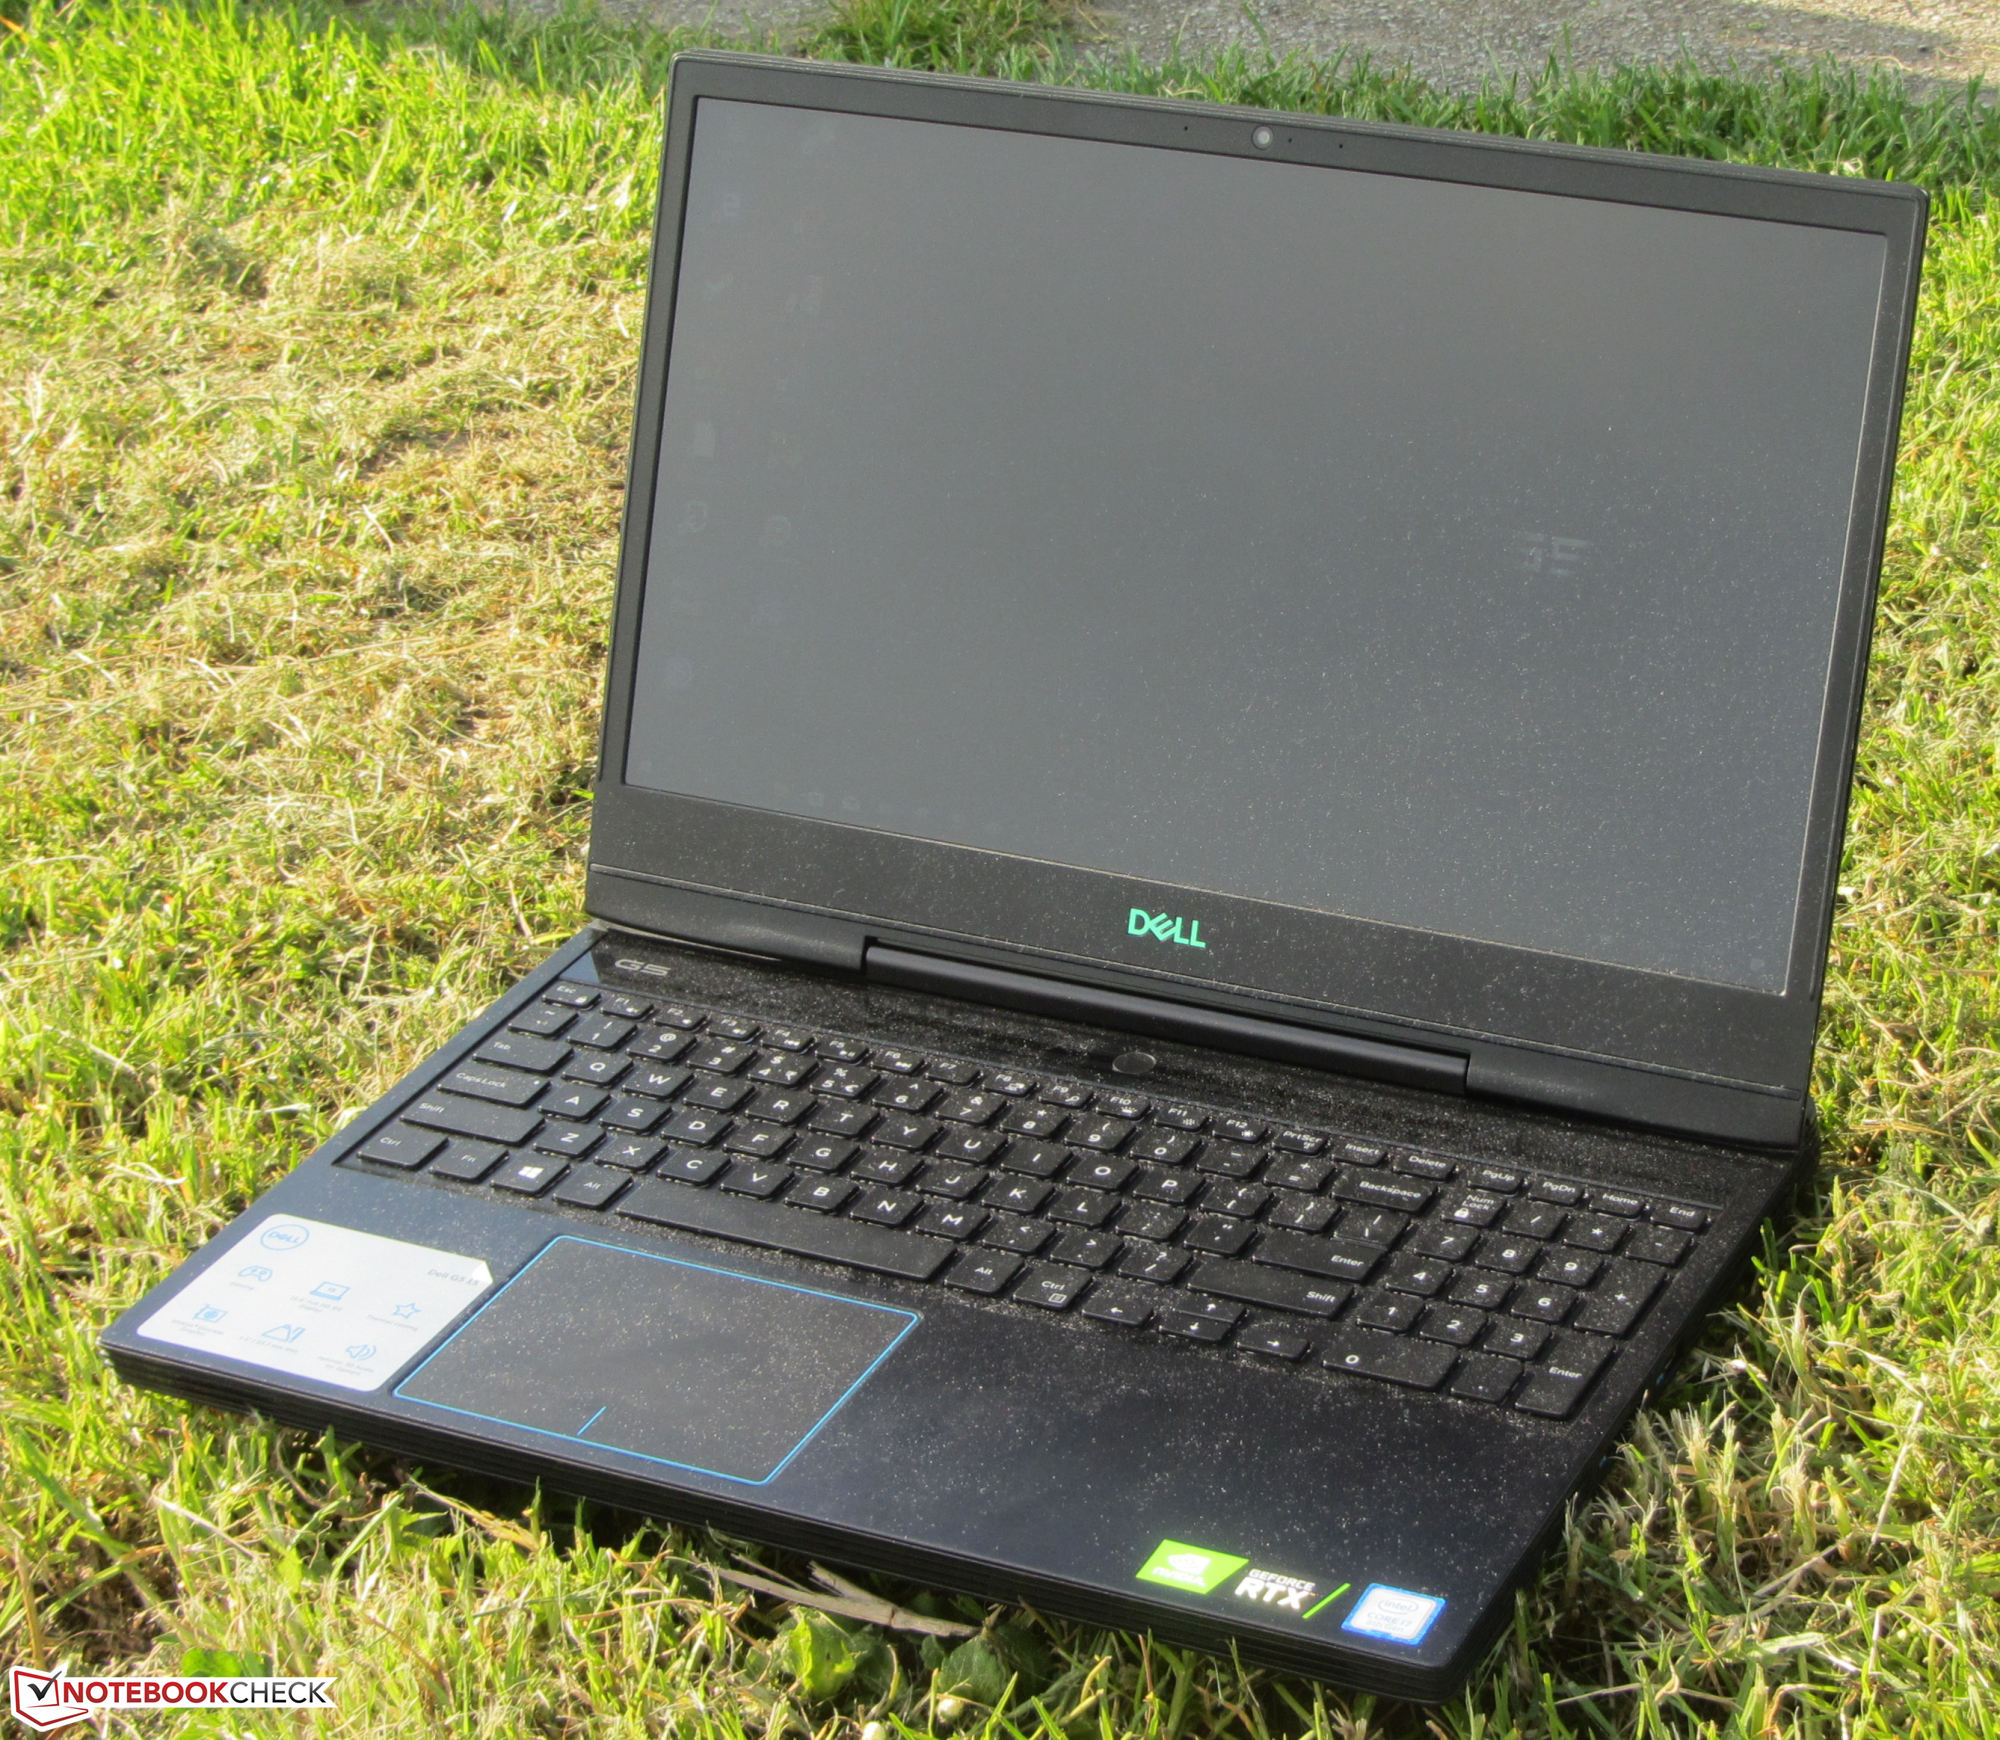
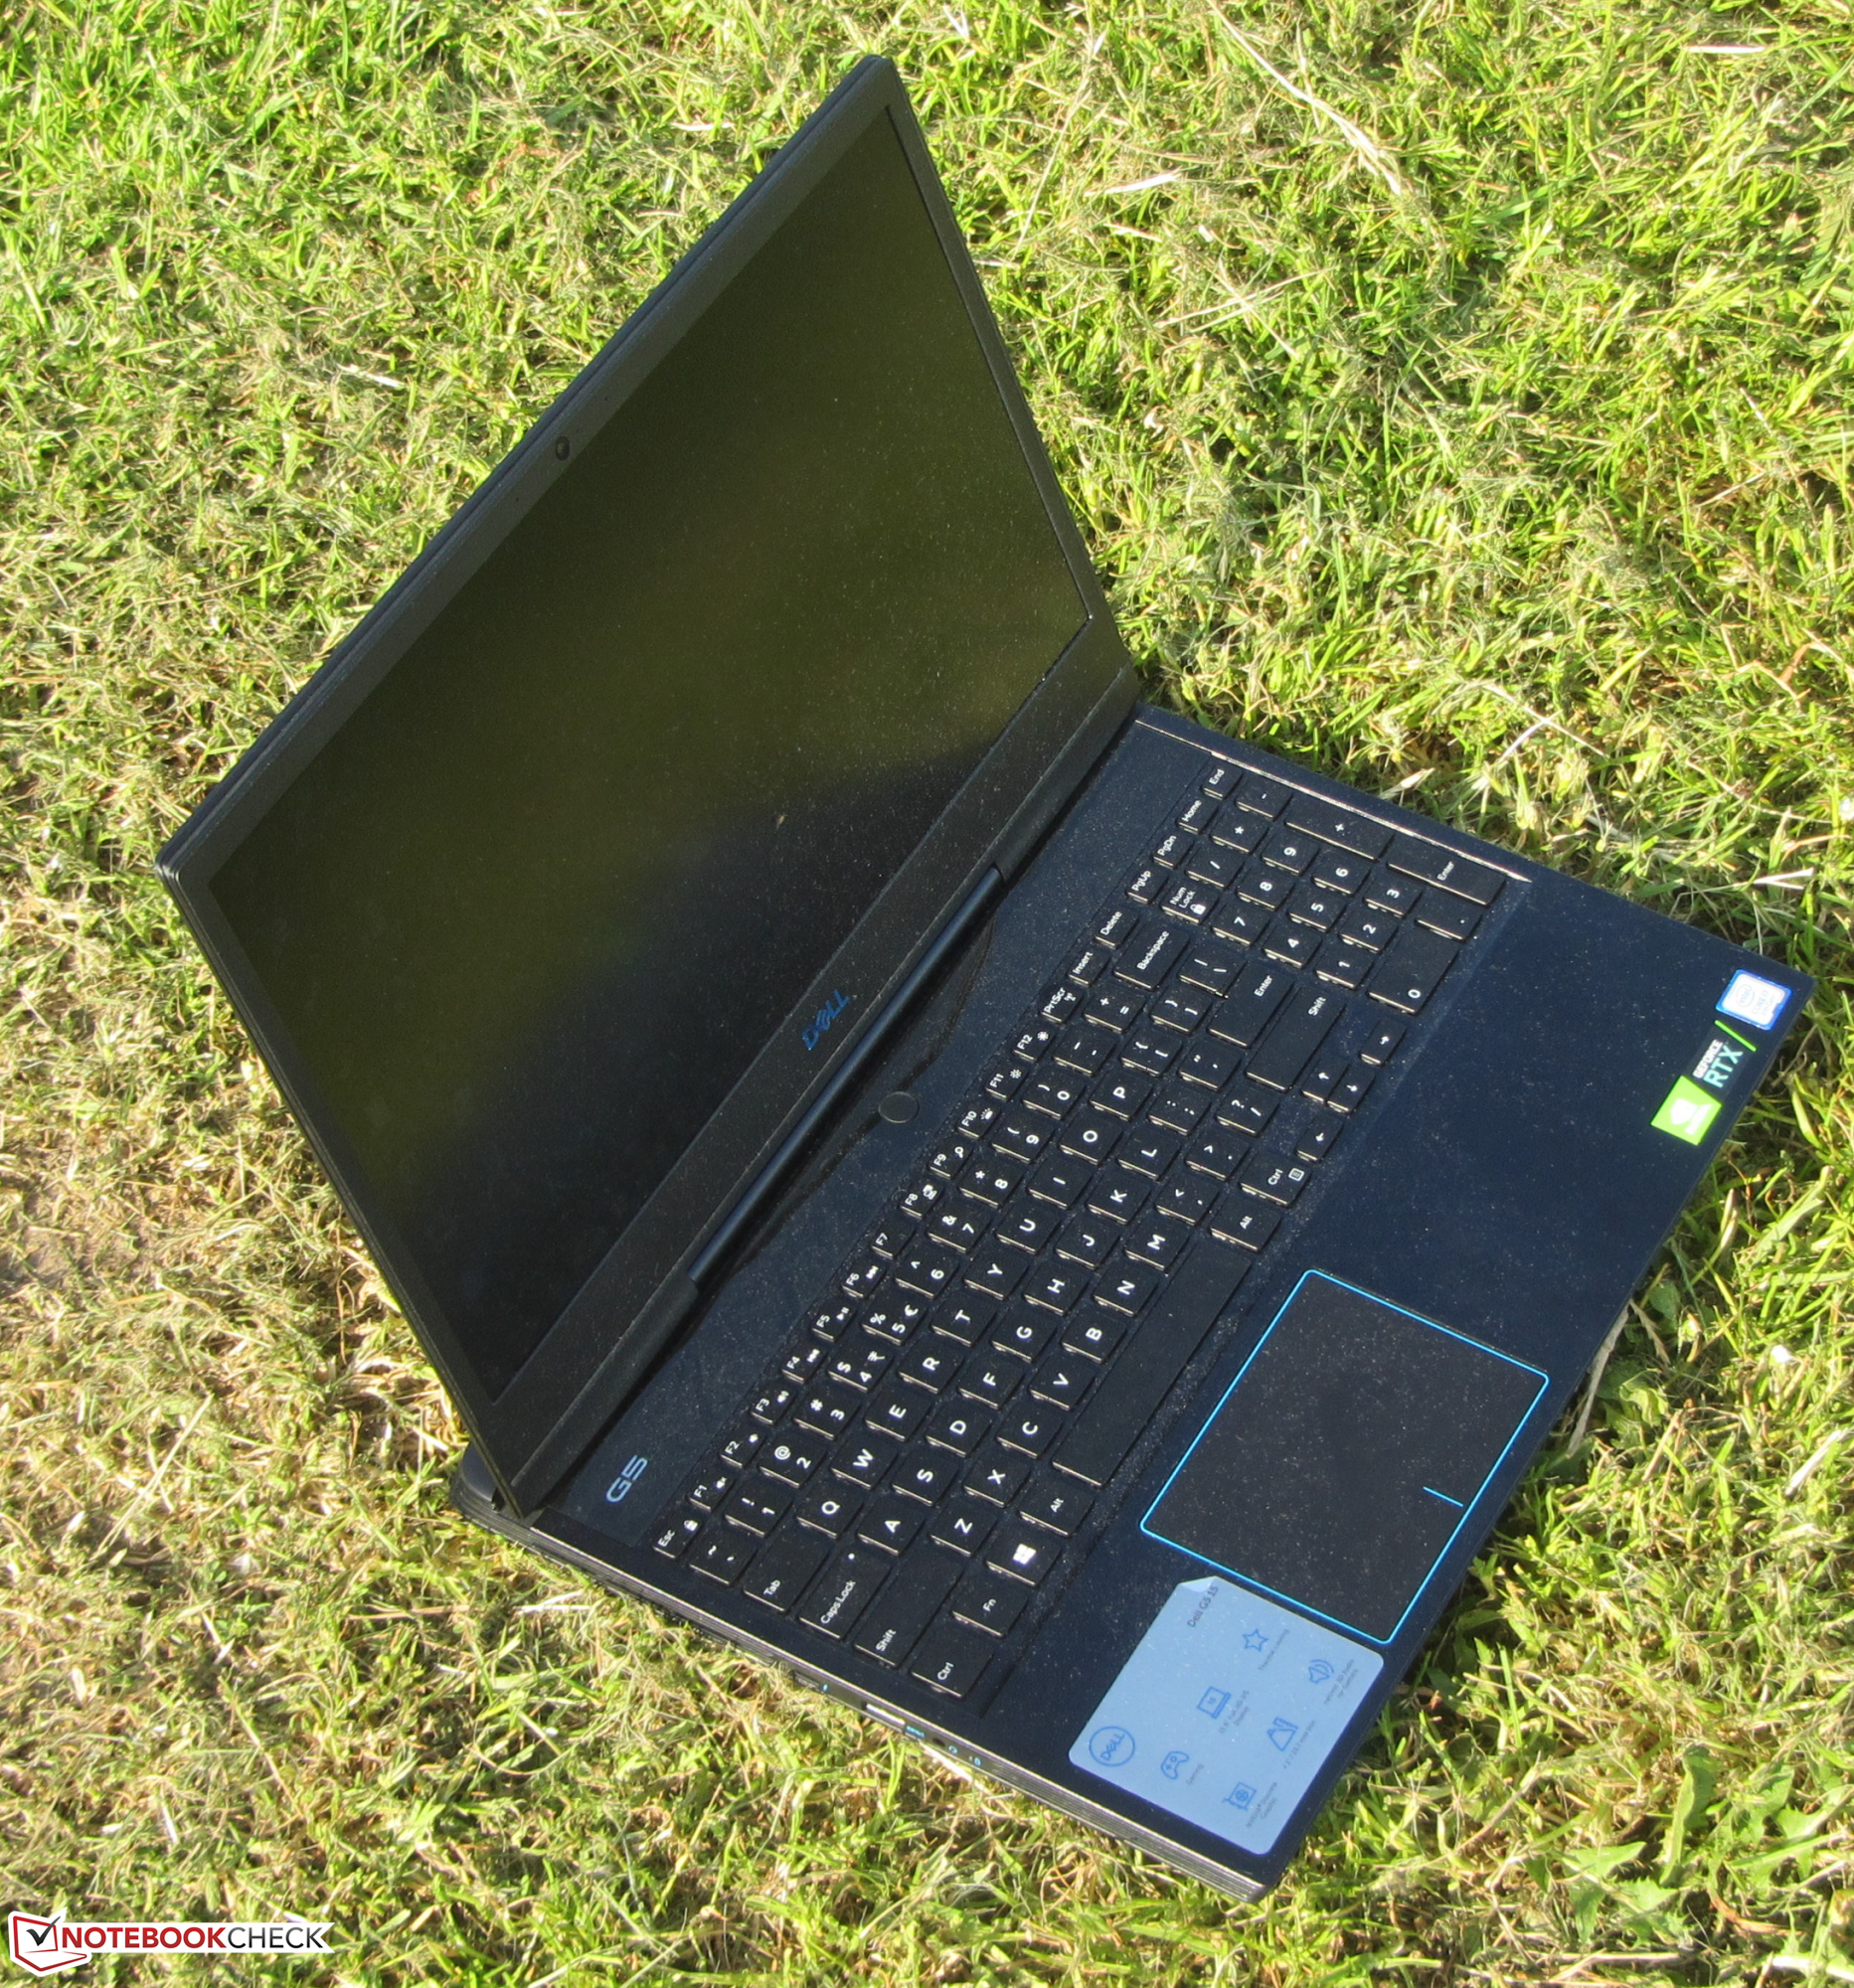
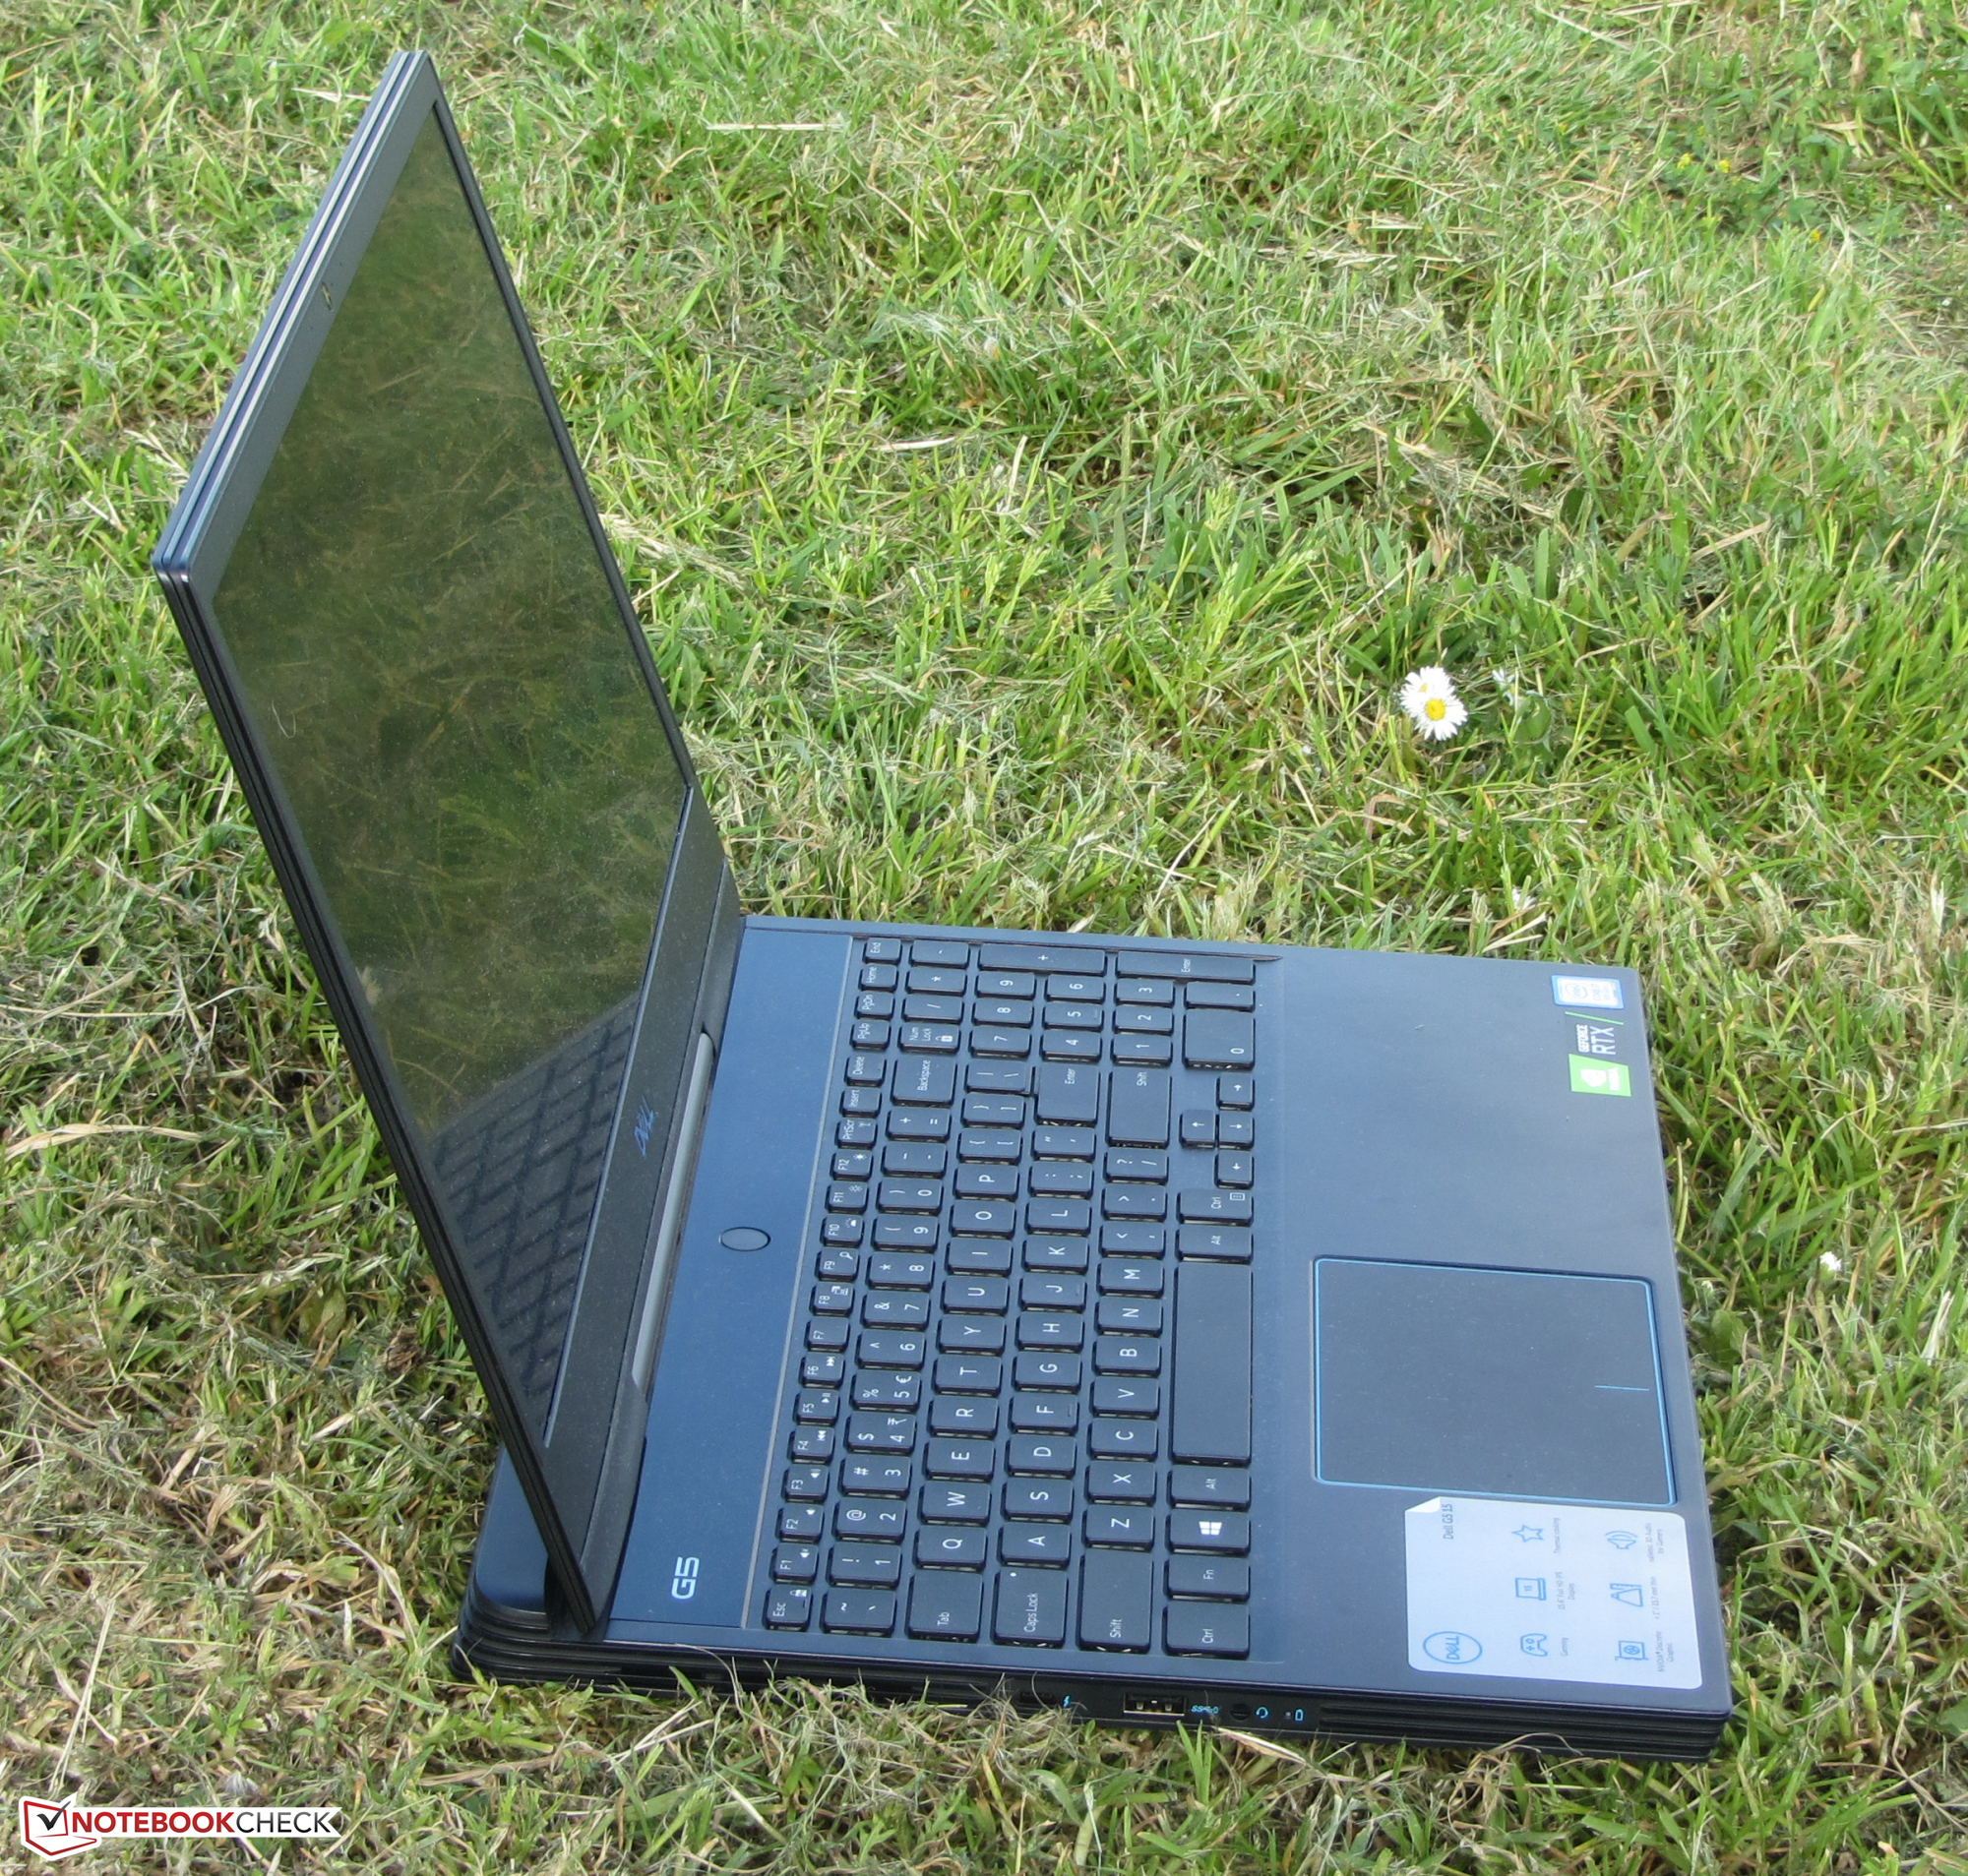
Case - More compact than the predecessor
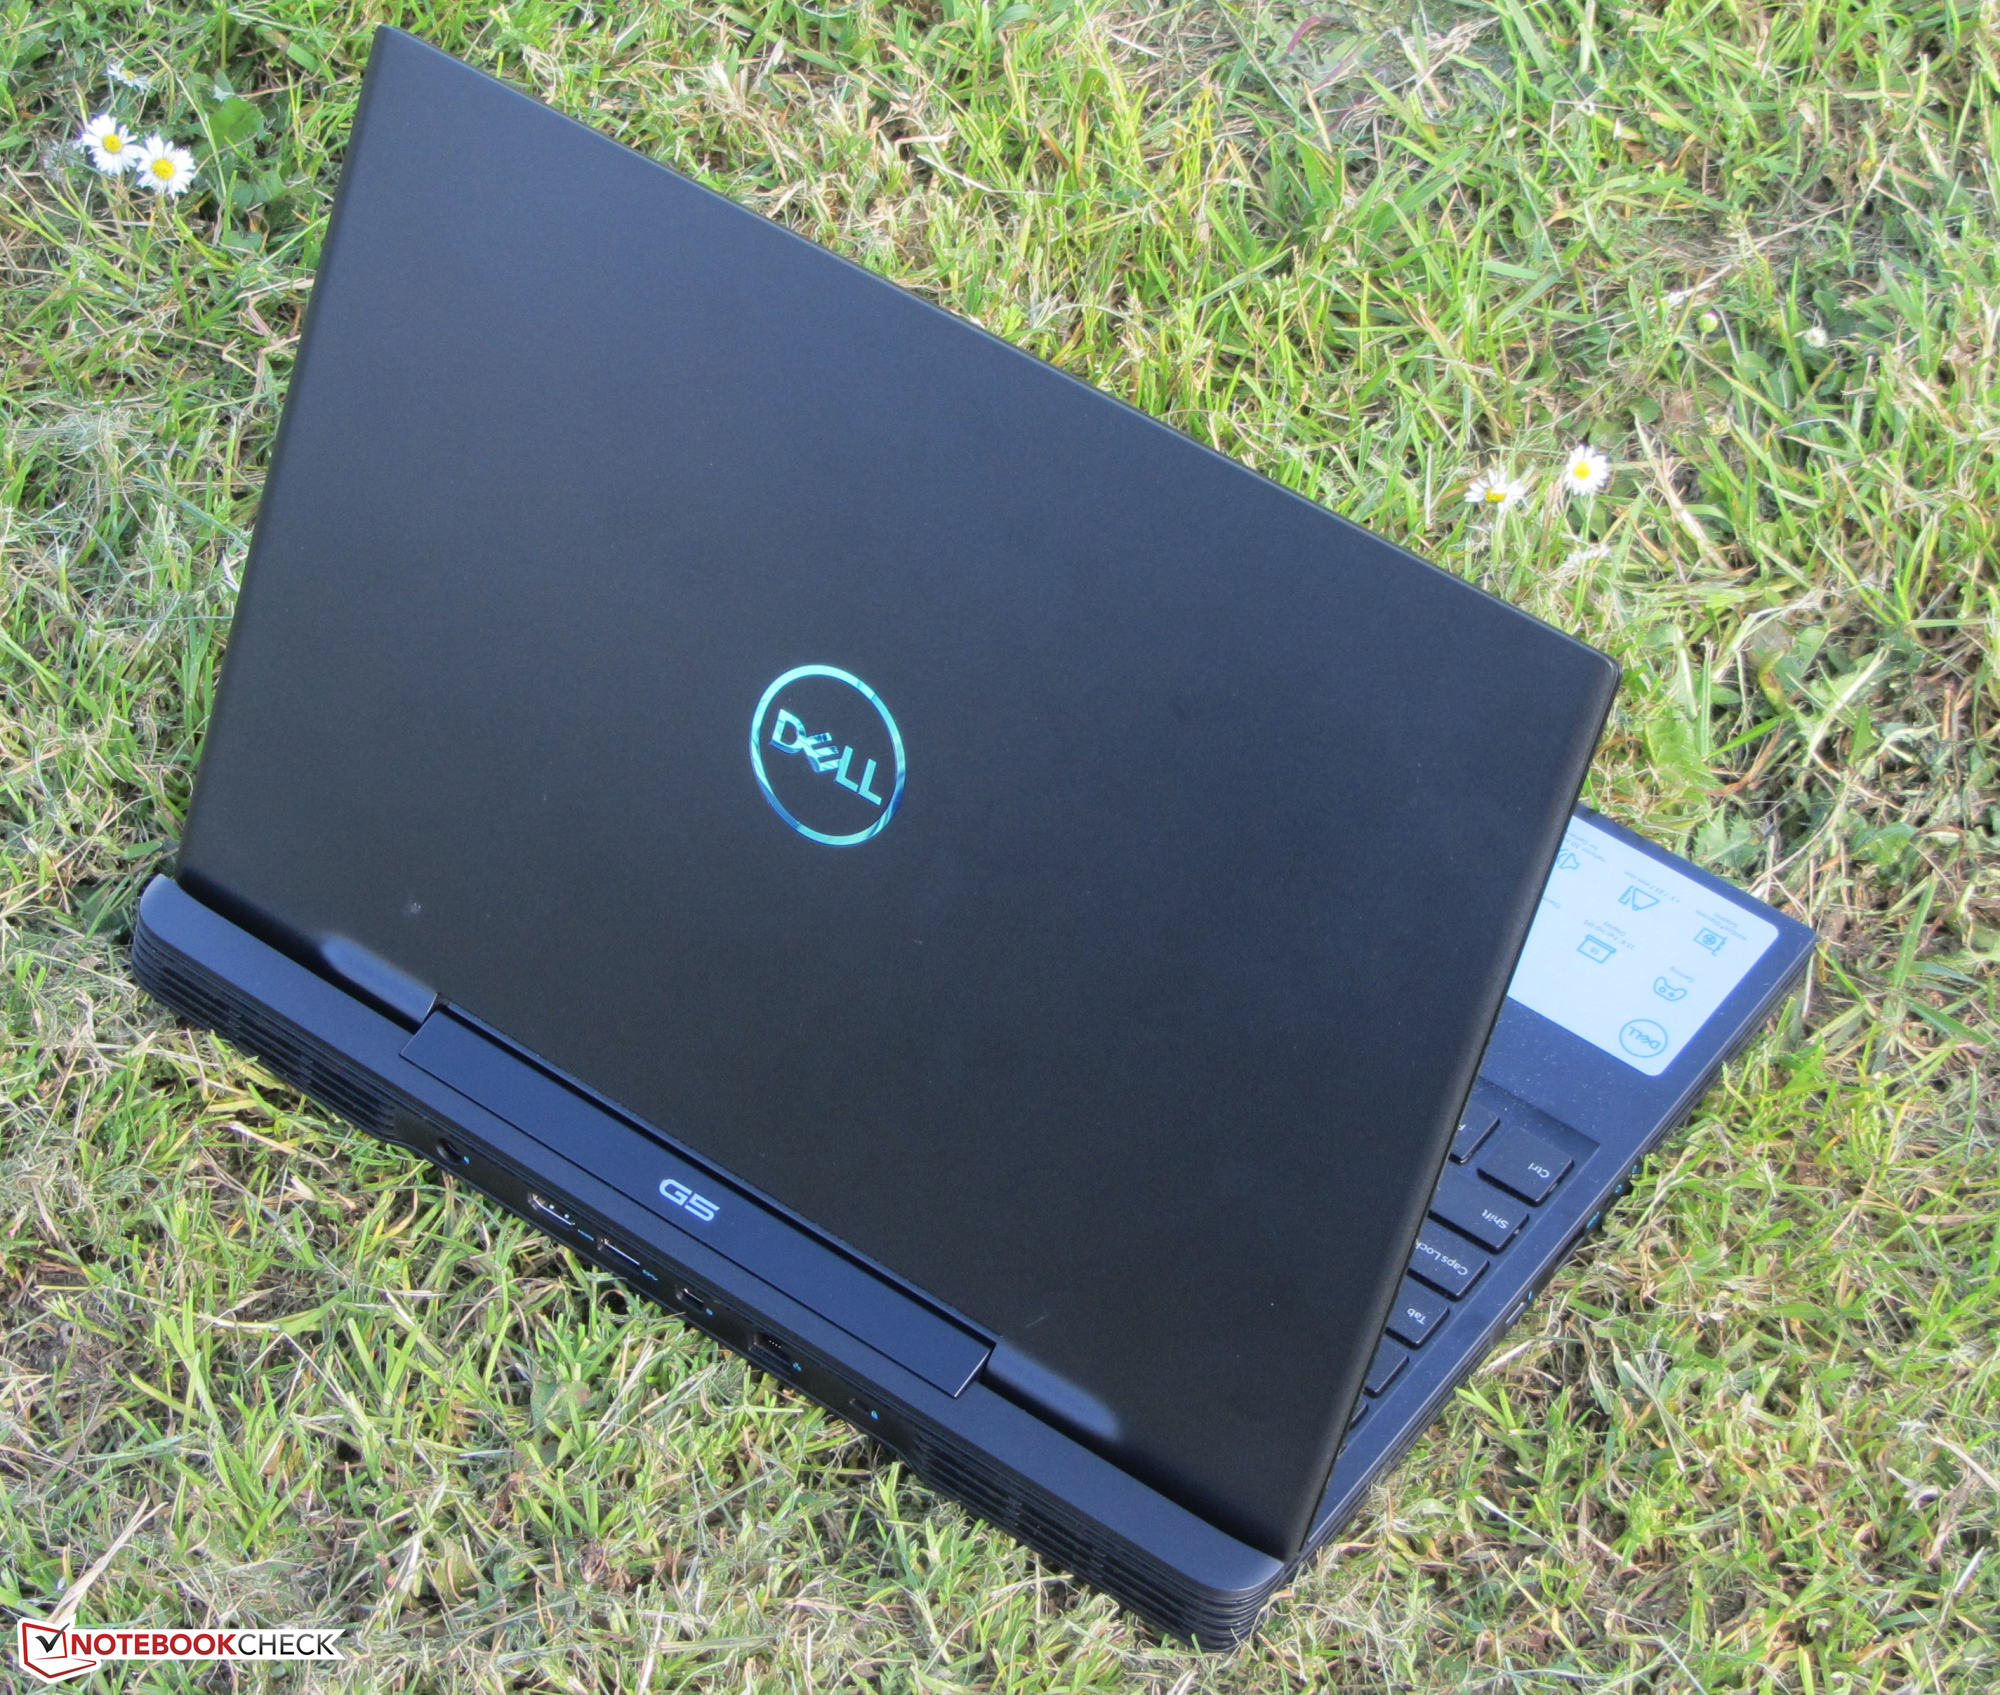
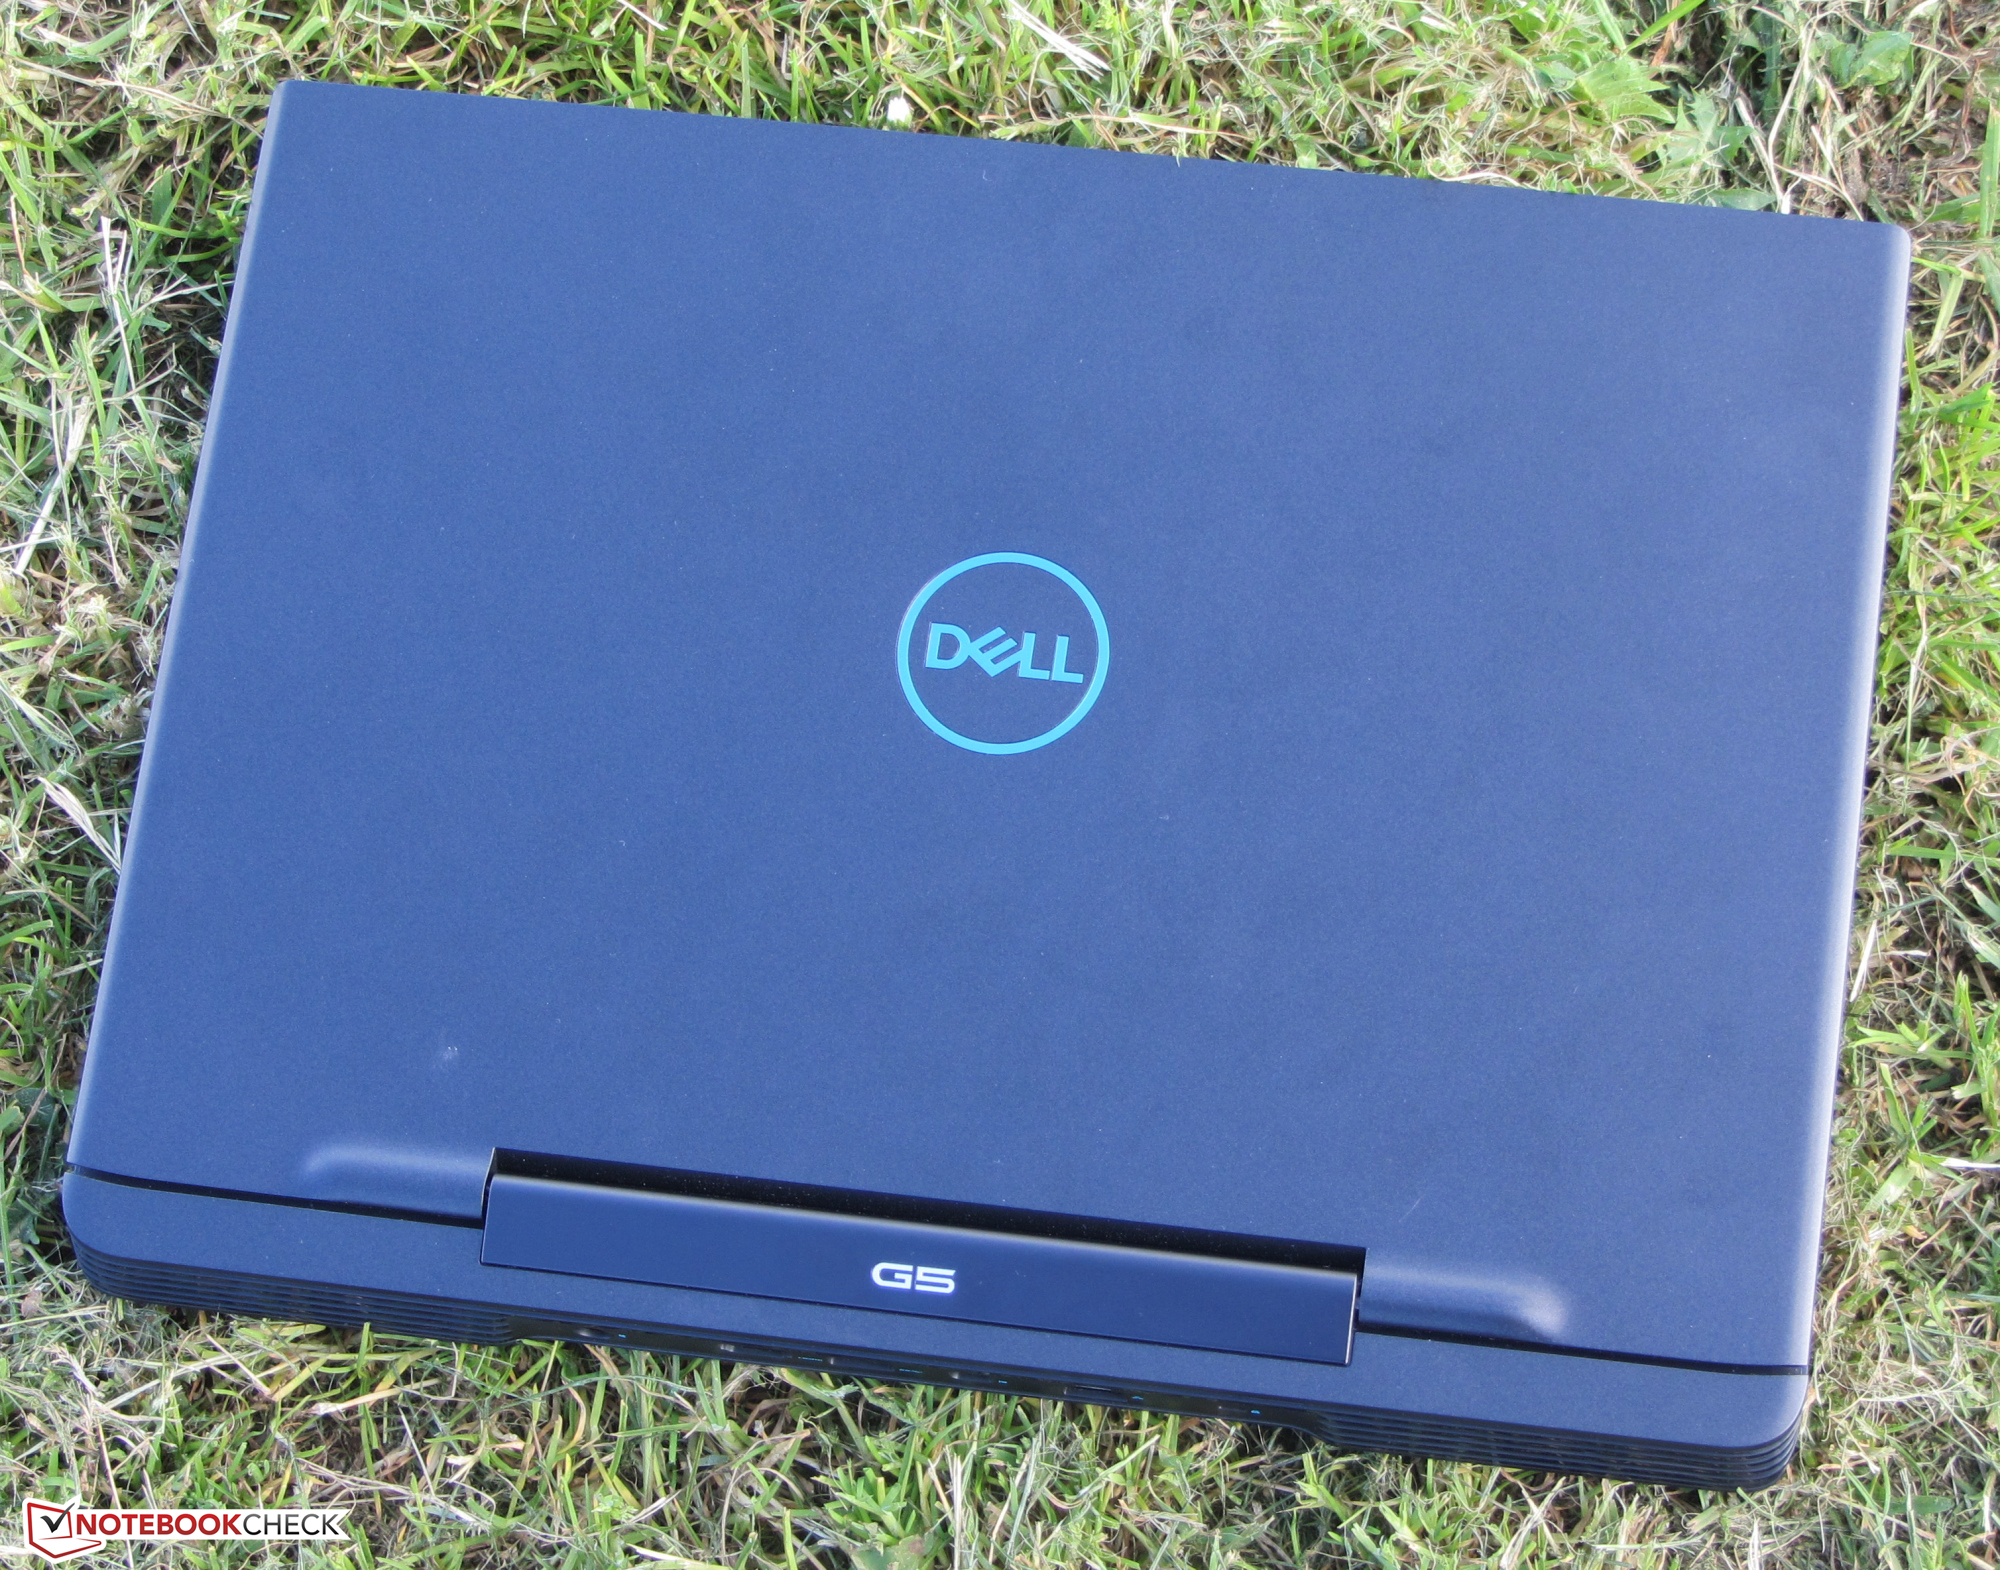
Dell dropped the case of the predecessor and opted for a completely new model with the G5 15 5590, which features a stylish and largely no-frills design. While the larger sides of the case have smooth surfaces, the narrower sides exhibit a groove design. The case is made mostly of plastic. Only the upper side of the base unit uses metal, magnesium, to be specific. Dell chose a matte black color for our review device (Exception: There's a strip above the keyboard, which is made of glossy black plastic). Alternatively, a black-white version is also available. A maintenance hatch isn't available. In order to access the interior, the bottom cover needs to be removed. More on that later.
In regards to workmanship, the laptop doesn't reveal any weaknesses. The gap dimensions are right, and there aren't any perceivable material overhangs. The case's stability also makes quite a good impression. The base unit can be slightly twisted - this is still within limits. The lid can be twisted a bit further. Pressure on the back side of the lid doesn't lead to image distortion. The hinges hold the lid firmly in place. The maximum opening angle is about 140 degrees. The lid can be opened with one hand without issues.
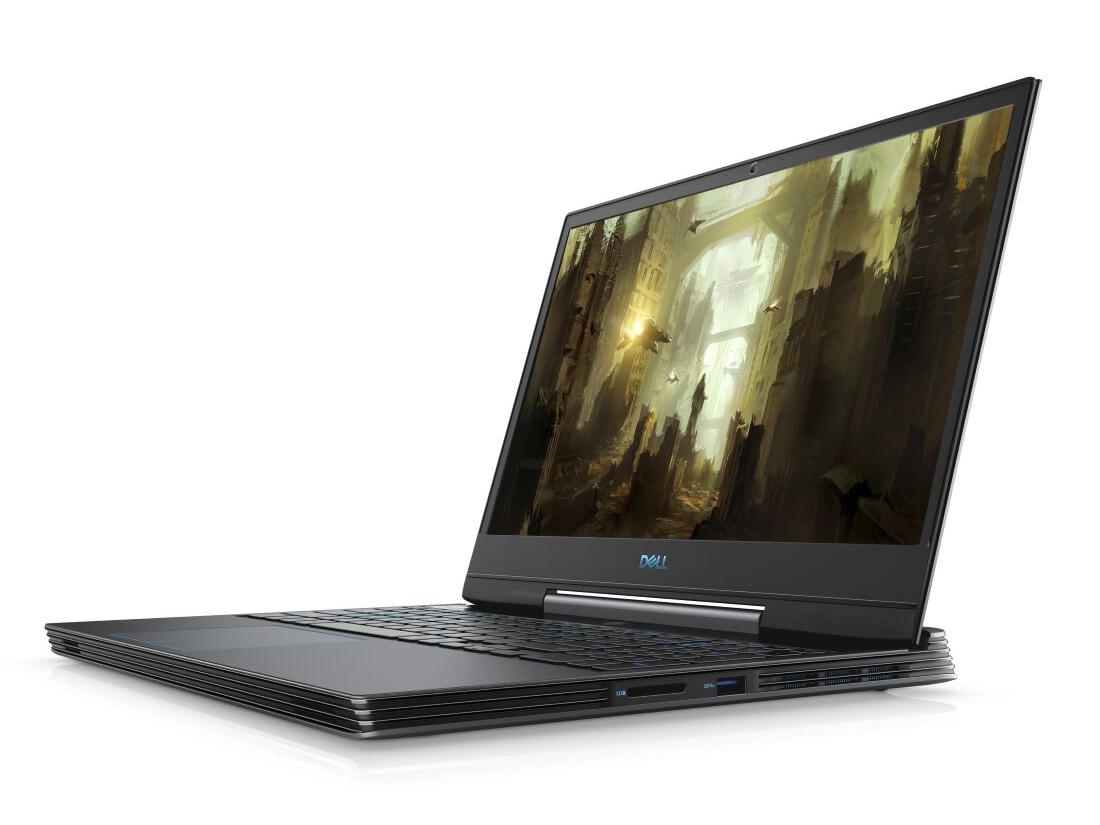
Not only does the G5 differentiate itself from the previous model in terms of looks, but it also comes with a lower weight and a somewhat more compact form factor. However, its rivals are still a bit lighter and more compact than the current G5 incarnation.
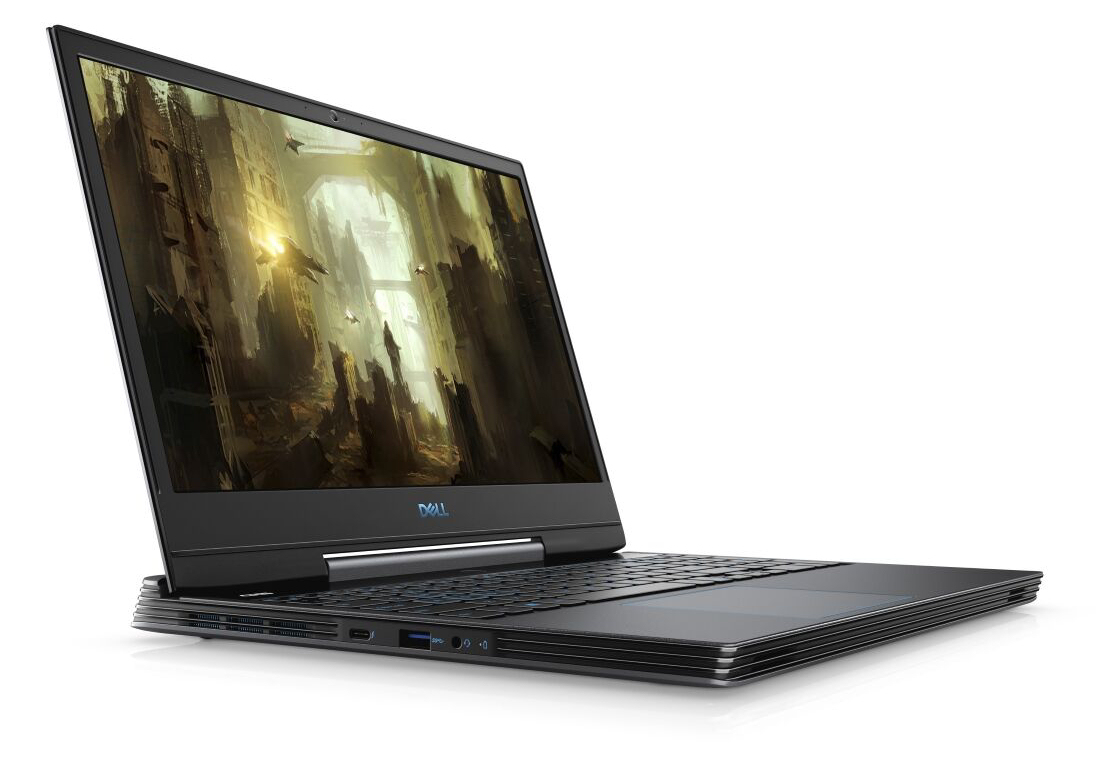
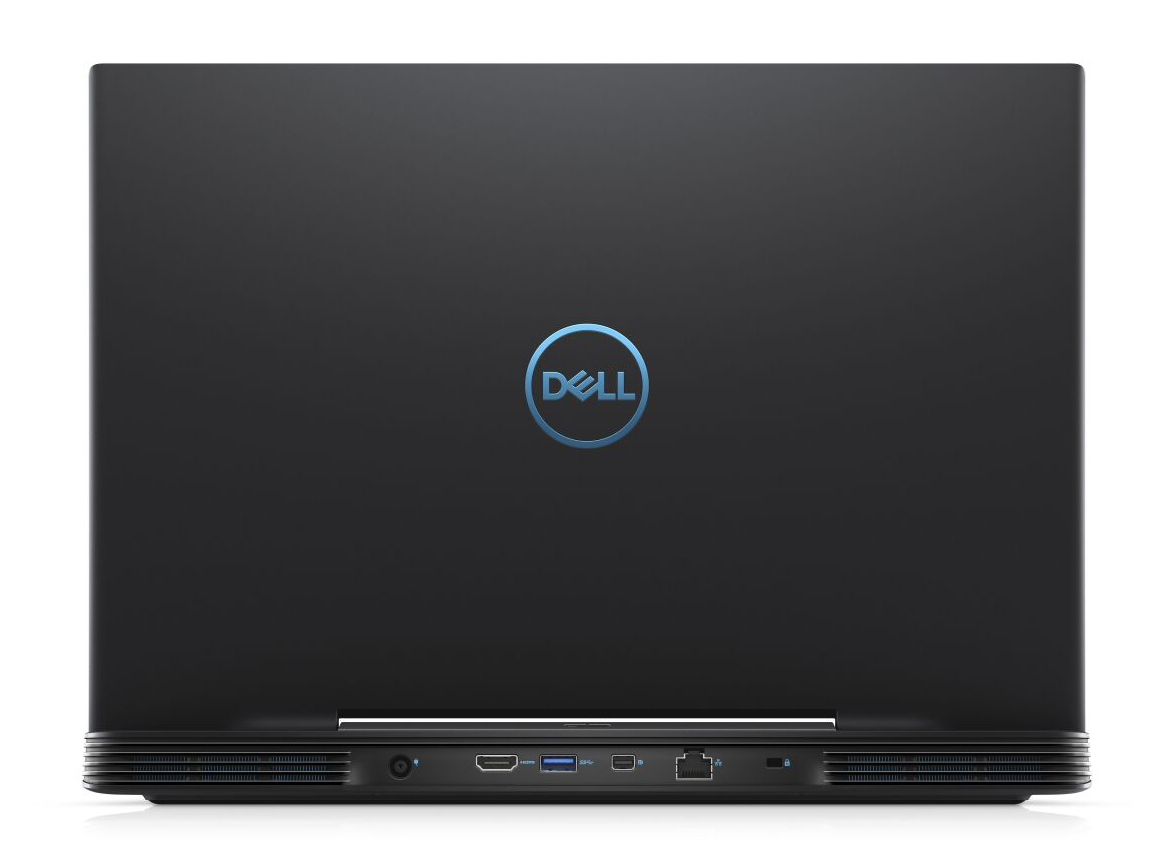
Connectivity - Thunderbolt 3 on board
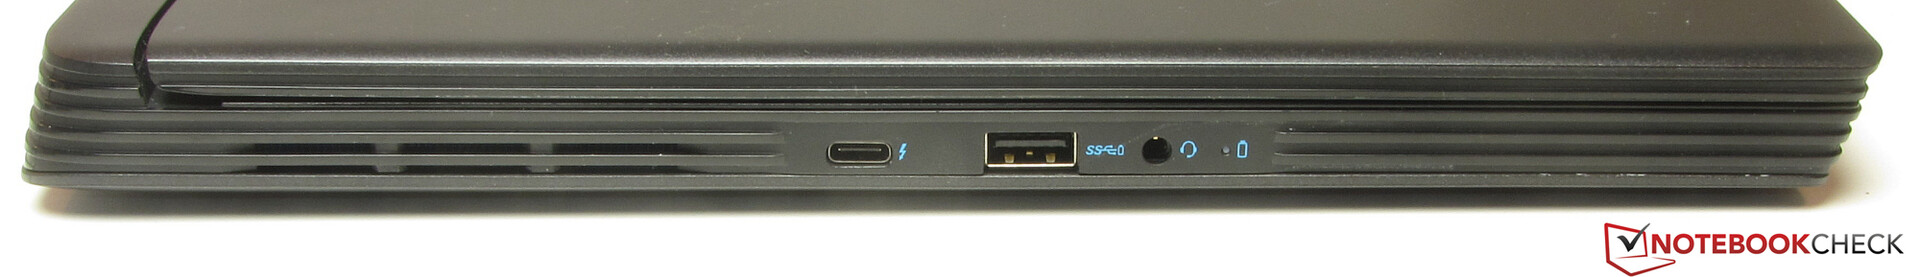
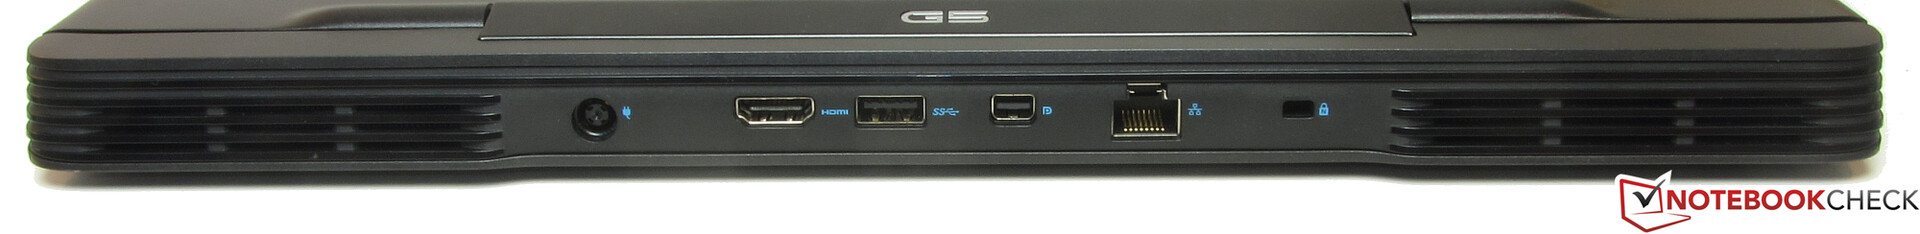
The G5 offers a decent selection of ports. The highlight is the Thunderbolt 3 port, which enables the connection of an external GPU or a docking station, for example, and it can provide an additional video output as well (DisplayPort via USB-C; a separate adapter would be required for this). Nevertheless, the laptop can't be charged through this port since per Thunderbolt 3 specifications, a maximum of 100 Watts can be received. The G5 requires more.
In addition, the laptop comes with three USB 3.2 Gen 1 ports (Type-A). These are joined by an HDMI port and a Mini DisplayPort. This results in the laptop having three video outputs in total. Dell has spread the ports across three sides and has placed them in the center at all times.
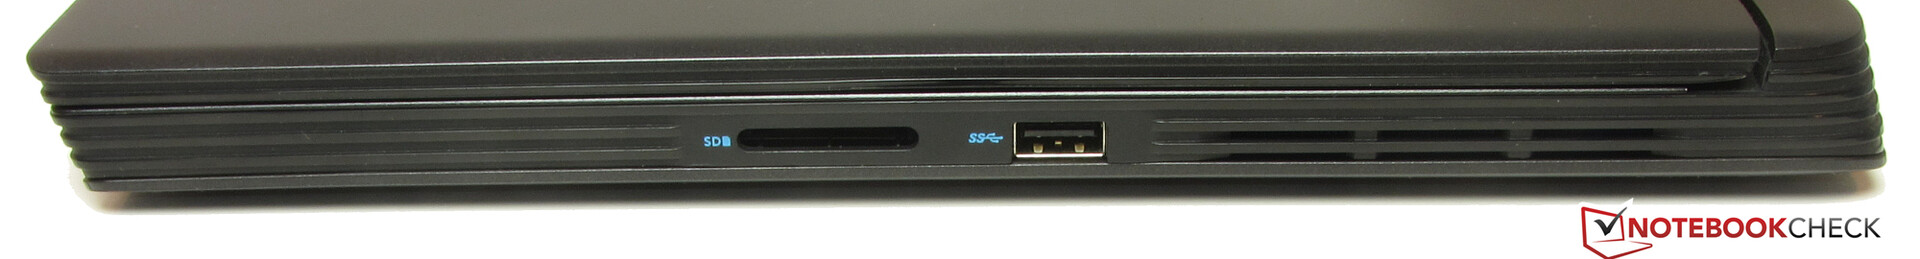
SD card reader
Dell provided the G5 with a full-fledged SD card reader. However, it only fits SD cards halfway, and they stick out by around 15 mm. The model that was used here belongs to the slow representatives of its kind. When copying large data blocks, a maximum transfer rate of 32.2 MB/s was reached. The transfer of 250 jpg files (each of around 5 MB) was done with a speed of 19.1 MB/s. We test memory card readers with a reference card (Toshiba Exceria Pro SDXC 64 GB UHS-II).
| SD Card Reader | |
| average JPG Copy Test (av. of 3 runs) | |
| Average of class Gaming (20.9 - 210, n=54, last 2 years) | |
| HP Pavilion Gaming 15t-cx0000 (Toshiba Exceria Pro SDXC 64 GB UHS-II) | |
| HP Omen 15-dc0015ng (Toshiba Exceria Pro SDXC 64 GB UHS-II) | |
| MSI GL73 8SE-010US (Toshiba Exceria Pro SDXC 64 GB UHS-II) | |
| Dell G5 15 5587 (Toshiba Exceria Pro SDXC 64 GB UHS-II) | |
| Dell G5 15 5590 (Toshiba Exceria Pro SDXC 64 GB UHS-II) | |
| maximum AS SSD Seq Read Test (1GB) | |
| Average of class Gaming (25.5 - 261, n=51, last 2 years) | |
| HP Omen 15-dc0015ng (Toshiba Exceria Pro SDXC 64 GB UHS-II) | |
| HP Pavilion Gaming 15t-cx0000 (Toshiba Exceria Pro SDXC 64 GB UHS-II) | |
| Dell G5 15 5587 (Toshiba Exceria Pro SDXC 64 GB UHS-II) | |
| Dell G5 15 5590 (Toshiba Exceria Pro SDXC 64 GB UHS-II) | |
| MSI GL73 8SE-010US (Toshiba Exceria Pro SDXC 64 GB UHS-II) | |
Communication
The G5 has a Wi-Fi module inside, which uses an Intel chip (Wireless-AC 9560). This supports both the 802.11a/b/g/n Wi-Fi standard and the fast ac standard. The transfer speeds we observed under optimal conditions (no additional Wi-Fi devices nearby, short distance between laptop and server PC) are very good. The module also offers Bluetooth 5 functionality. Wired network connections are handled by a Killer E2500 Gigabit Ethernet Controller. This fulfills its tasks smoothly.
Webcam
The built-in webcam (0.9 MP) produces pictures with a maximum resolution of 1280x720 pixels. The pictures look a bit pale and washed-out.
Accessories
Besides a quick-start guide and a booklet with security information, the G5 doesn't come with any other accessories.
Maintenance
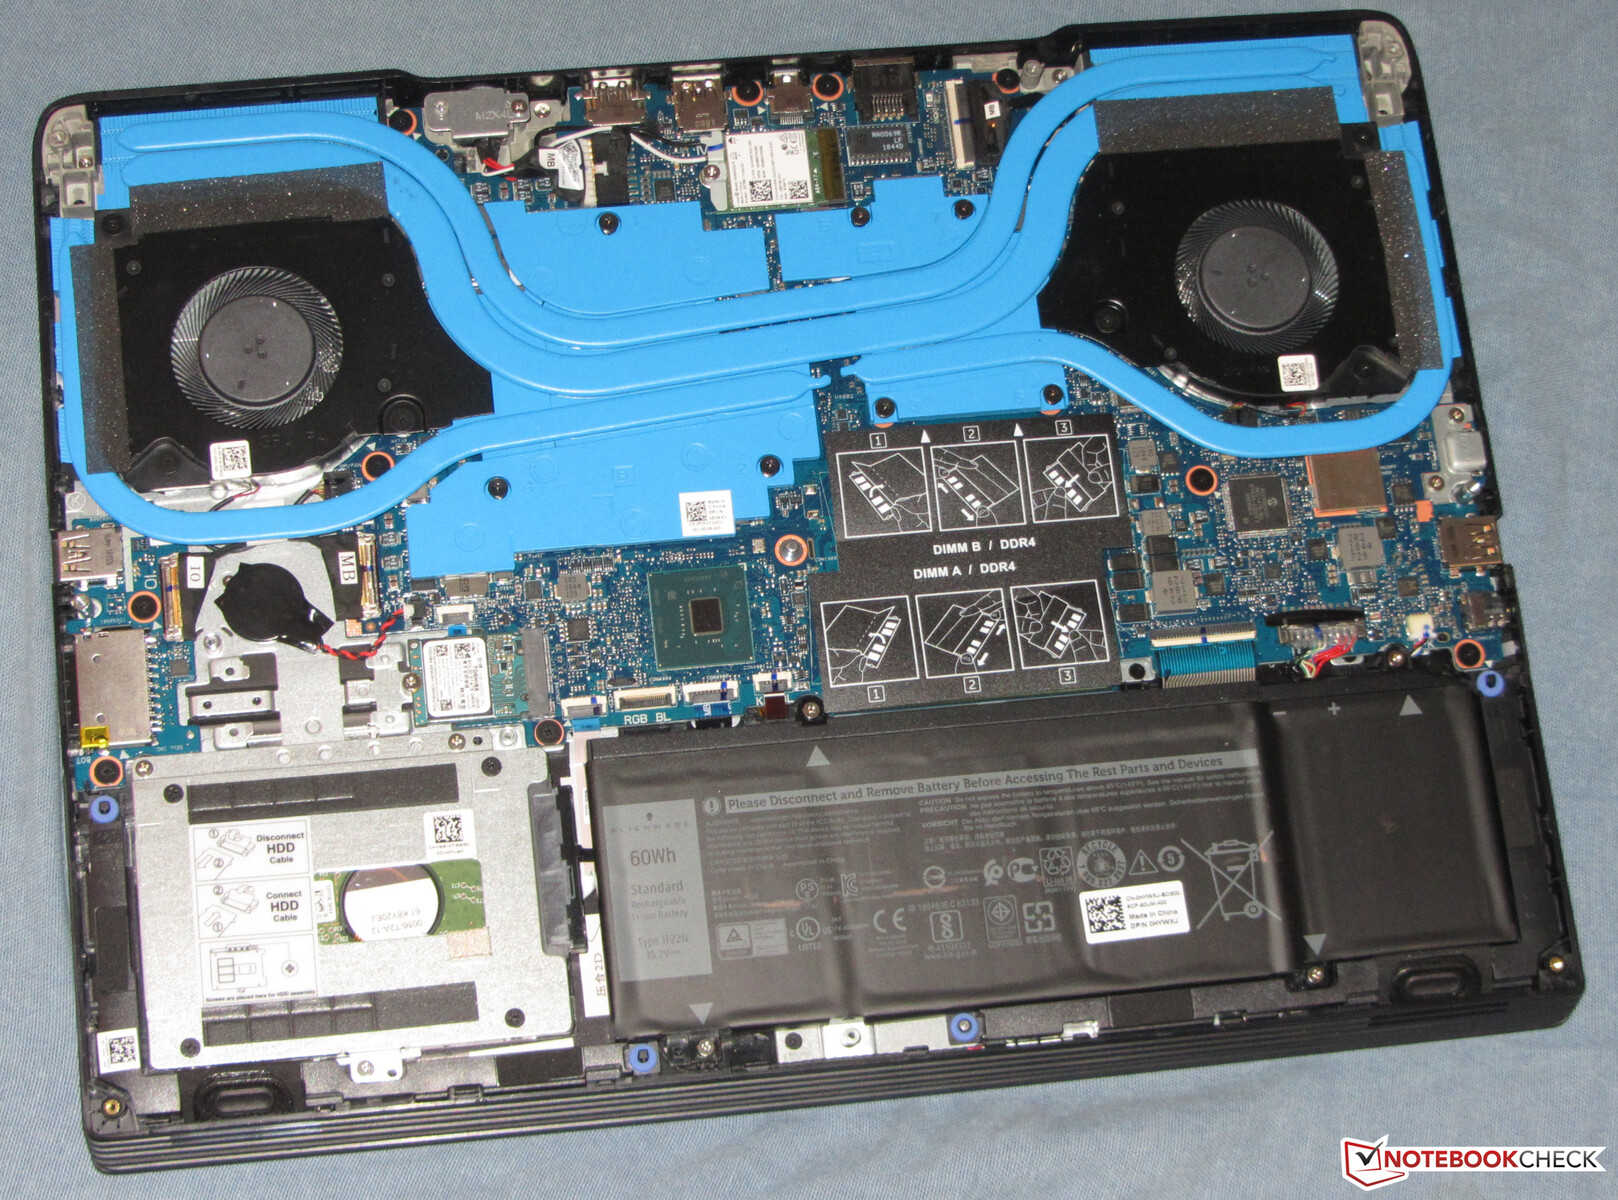
The laptop doesn't offer a maintenance hatch. In order to access the interior, the bottom cover must be removed. This process can be accomplished quite easily. The bottom cover can be detached after removing all screws from the bottom. The clips holding it are not excessively tight. Eventually, a grout finishing tool or a flat spatula may be required to loosen the bottom cover.
Warranty
Dell only honors a one-year warranty on the G5. The length and coverage can be extended. A two-year Premium Support including on-site service costs about 130 Euros (~$146). A three-year Premium Support Plus including on-site service will set you back nearly 310 Euros (~$347).
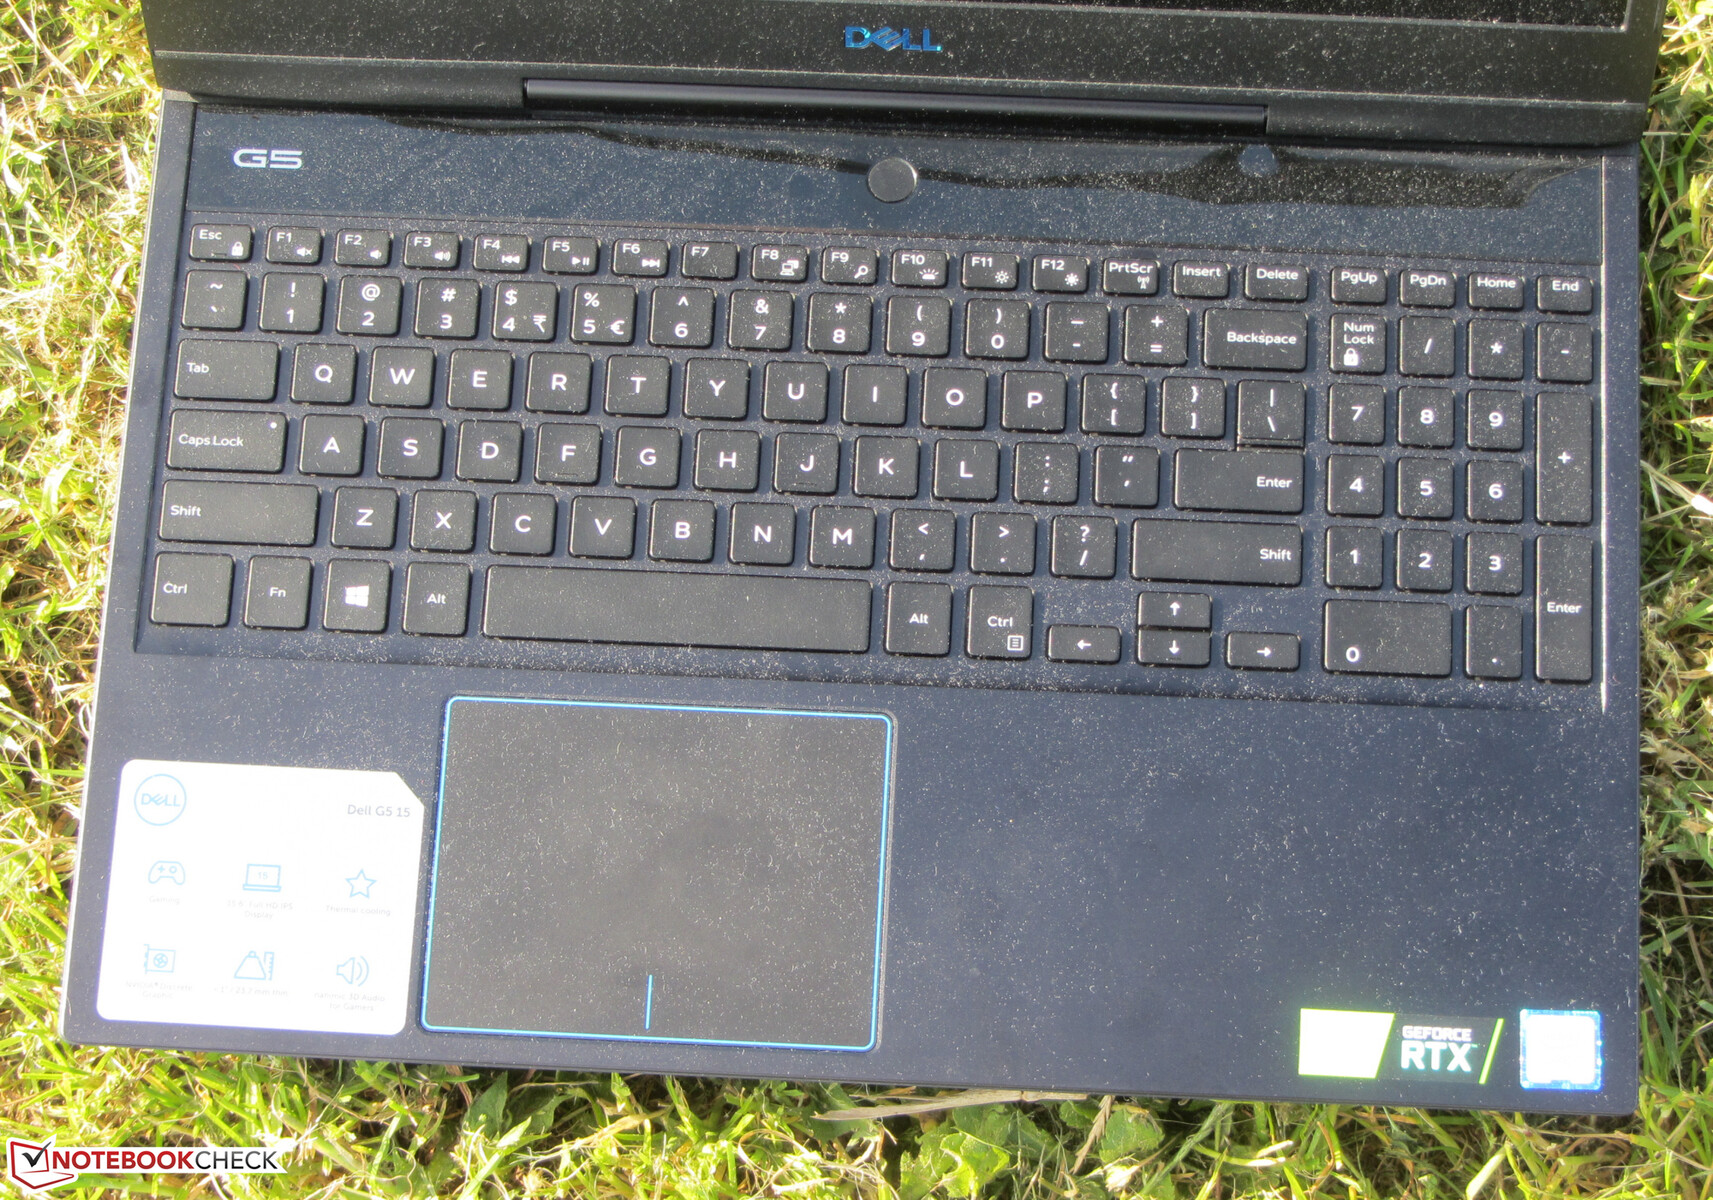
Input devices - Suitable for everyday use
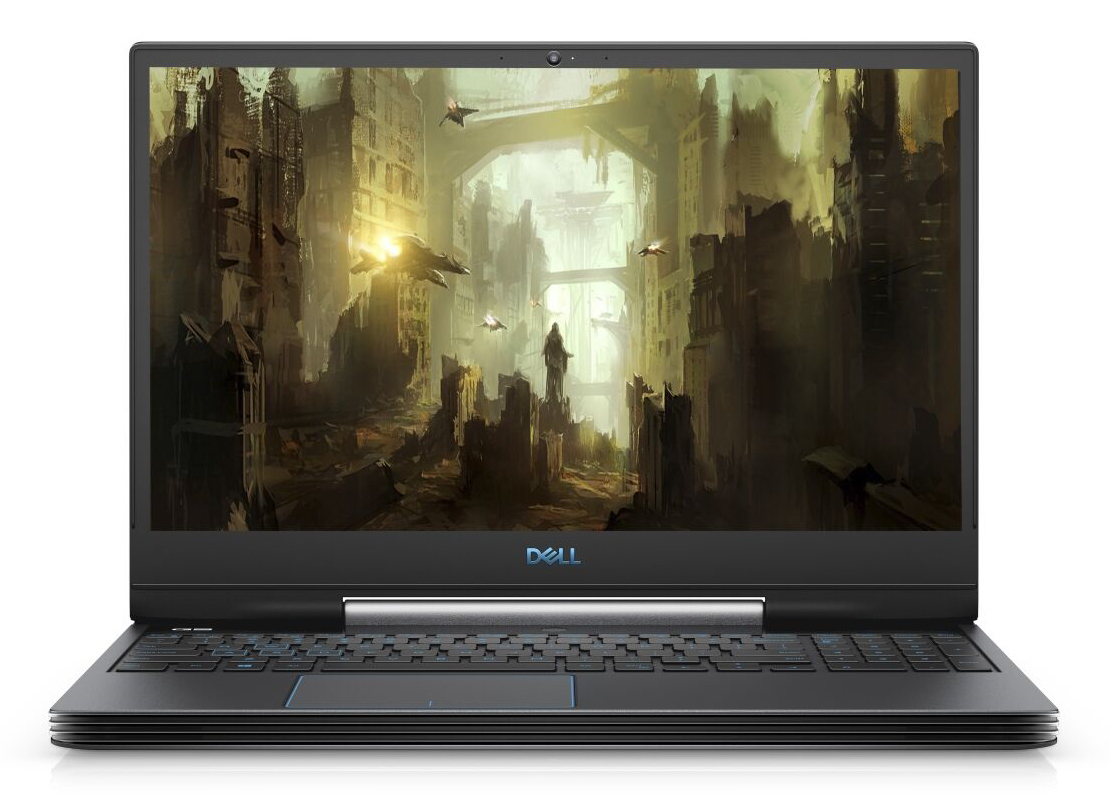
Keyboard
Dell has equipped the G5 with a backlit chiclet keyboard. The flat and slightly roughened keys have a short travel and a clear pressure point. However, we would've liked the resistance to be firmer. The keyboard doesn't give way while typing. The lighting is controlled through a function key. There are two brightness levels. Overall, Dell has delivered a keyboard suited for everyday use here.
Touchpad
The multitouch-capable ClickPad takes up an area of about 10.5 x 8 cm (~4.14 x 3.51 in). This leaves enough room to use gesture control. The smooth surface makes it easy for fingers to glide on it. The pad also reacts to inputs in the corners. It has a short travel and a clear pressure point.
Display - IPS, but dim
The matte 15.6-inch display in the G5 15 5590 has a native resolution of 1920x1080 pixels. While the contrast we measured (1376:1) can be considered to be good, we found the brightness to be too low (219.2 cd/m²). In principle, we consider values above 300 cd/m² and 1000:1, respectively, to be good. But most competitors can't meet these expectations either. While the Lenovo Legion Y530-15ICH and the HP Omen 15 offer brighter displays, they are behind in terms of contrast. The display in the MSI GL73 8SE does indeed fulfill all requirements, but it uses a TN panel and therefore has unstable viewing angles.
The comparatively budget price level of the G5 can be noticed when it comes to response times. These are significantly higher than the ones observed with the Legion or the Omen 15. Positive: The display in the Dell laptop doesn't show any PWM flickering.


| |||||||||||||||||||||||||
Brightness Distribution: 82 %
Center on Battery: 234 cd/m²
Contrast: 1376:1 (Black: 0.17 cd/m²)
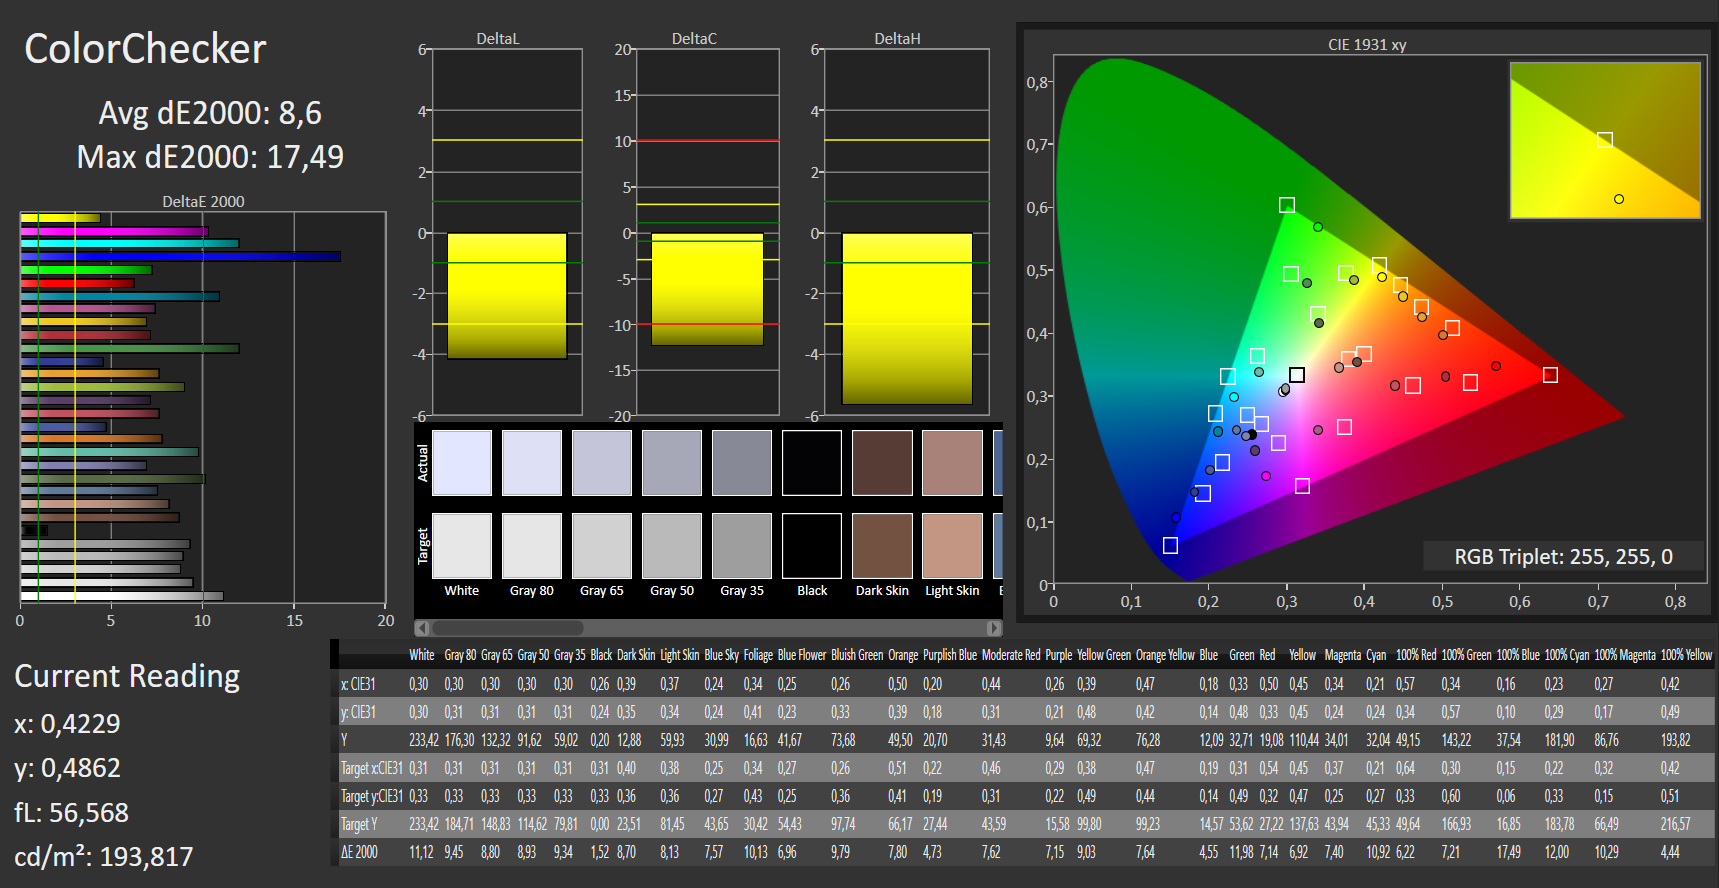
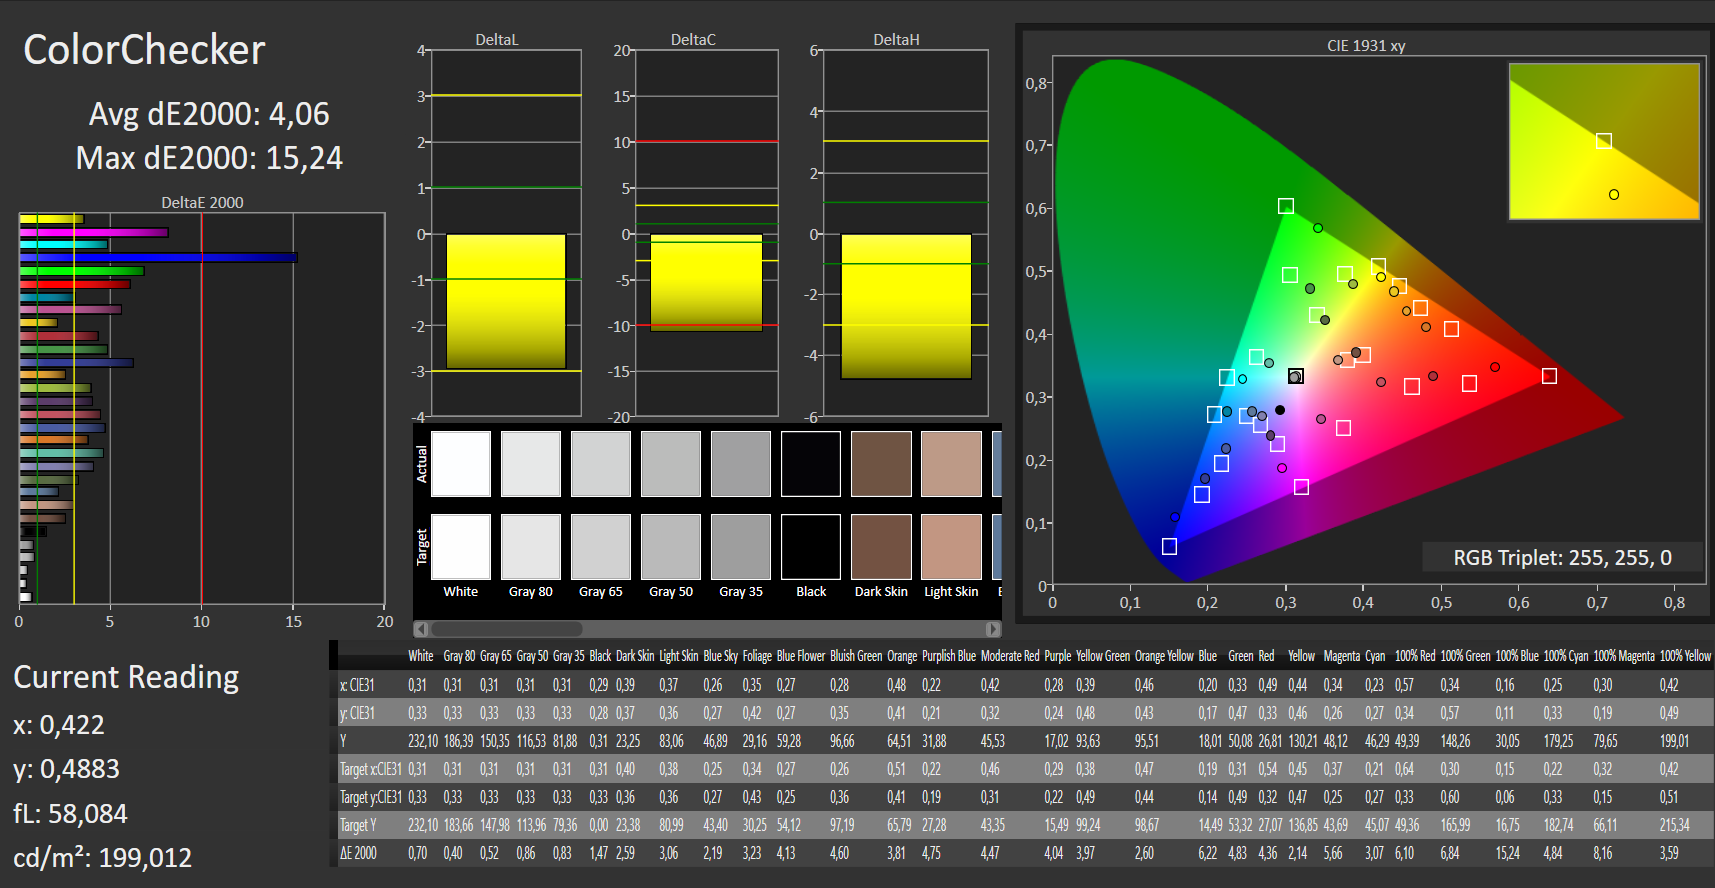
ΔE ColorChecker Calman: 8.6 | ∀{0.5-29.43 Ø4.73}
calibrated: 4.06
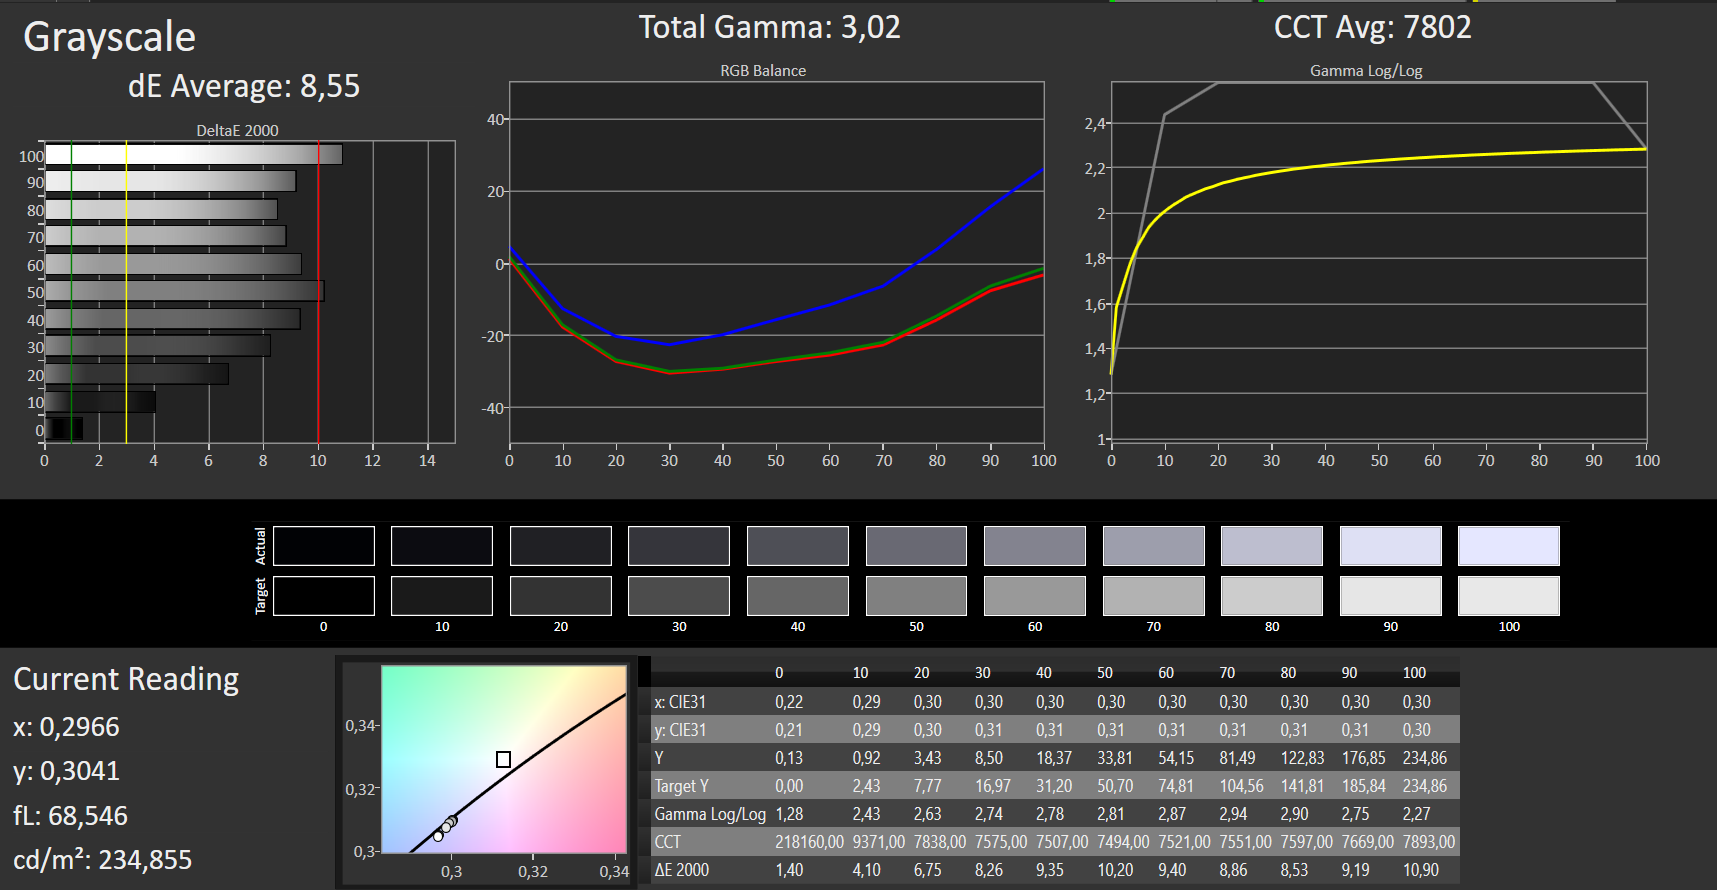
ΔE Greyscale Calman: 8.55 | ∀{0.09-98 Ø4.97}
59% sRGB (Argyll 1.6.3 3D)
37% AdobeRGB 1998 (Argyll 1.6.3 3D)
40.56% AdobeRGB 1998 (Argyll 3D)
59.1% sRGB (Argyll 3D)
39.26% Display P3 (Argyll 3D)
Gamma: 3.02
CCT: 7802 K
| Dell G5 15 5590 IPS, 1920x1080, 15.6" | Dell G5 15 5587 IPS, 1920x1080, 15.6" | Lenovo Legion Y530-15ICH IPS, 1920x1080, 15.6" | HP Omen 15-dc0015ng IPS, 1920x1080, 15.6" | Acer Aspire Nitro 5 AN515-54-53Z2 IPS, 1920x1080, 15.6" | HP Pavilion Gaming 15t-cx0000 IPS, 1920x1080, 15.6" | MSI GL73 8SE-010US TN LED, 1920x1080, 17.3" | |
|---|---|---|---|---|---|---|---|
| Display | -3% | 58% | 61% | -3% | 63% | 104% | |
| Display P3 Coverage (%) | 39.26 | 38.13 -3% | 62.5 59% | 64.2 64% | 37.97 -3% | 66.5 69% | 91.1 132% |
| sRGB Coverage (%) | 59.1 | 56.8 -4% | 93 57% | 93.4 58% | 57 -4% | 91.7 55% | 100 69% |
| AdobeRGB 1998 Coverage (%) | 40.56 | 39.47 -3% | 63.8 57% | 65.1 61% | 39.23 -3% | 67.1 65% | 85.4 111% |
| Response Times | 24% | 65% | 63% | 9% | 62% | 73% | |
| Response Time Grey 50% / Grey 80% * (ms) | 45 ? | 33 ? 27% | 15 ? 67% | 17 ? 62% | 42 ? 7% | 17.6 ? 61% | 12.8 ? 72% |
| Response Time Black / White * (ms) | 30 ? | 24 ? 20% | 11 ? 63% | 11 ? 63% | 26.8 ? 11% | 11.2 ? 63% | 8.2 ? 73% |
| PWM Frequency (Hz) | 25770 ? | ||||||
| Screen | -6% | 13% | 6% | 9% | 26% | 20% | |
| Brightness middle (cd/m²) | 234 | 229 -2% | 305 30% | 317 35% | 238 2% | 357.5 53% | 326.4 39% |
| Brightness (cd/m²) | 219 | 224 2% | 284 30% | 283 29% | 226 3% | 351 60% | 317 45% |
| Brightness Distribution (%) | 82 | 87 6% | 83 1% | 76 -7% | 83 1% | 85 4% | 90 10% |
| Black Level * (cd/m²) | 0.17 | 0.28 -65% | 0.52 -206% | 0.62 -265% | 0.27 -59% | 0.36 -112% | 0.28 -65% |
| Contrast (:1) | 1376 | 818 -41% | 587 -57% | 511 -63% | 881 -36% | 993 -28% | 1166 -15% |
| Colorchecker dE 2000 * | 8.6 | 6.1 29% | 3.63 58% | 2.83 67% | 4.11 52% | 4.19 51% | 7.83 9% |
| Colorchecker dE 2000 max. * | 17.49 | 12.2 30% | 8.18 53% | 5.78 67% | 6.89 61% | 6.97 60% | 13.36 24% |
| Colorchecker dE 2000 calibrated * | 4.06 | 6.12 -51% | 1.31 68% | 3.76 7% | 3.2 21% | 2.83 30% | |
| Greyscale dE 2000 * | 8.55 | 5.68 34% | 4.77 44% | 2 77% | 1.78 79% | 3.5 59% | 10.9 -27% |
| Gamma | 3.02 73% | 2.4 92% | 2.54 87% | 2.28 96% | 2.41 91% | 2.324 95% | 1.97 112% |
| CCT | 7802 83% | 6989 93% | 7500 87% | 6493 100% | 6311 103% | 7028 92% | 11056 59% |
| Color Space (Percent of AdobeRGB 1998) (%) | 37 | 36 -3% | 59 59% | 60 62% | 36 -3% | 60 62% | 75.8 105% |
| Color Space (Percent of sRGB) (%) | 59 | 57 -3% | 93 58% | 93 58% | 57 -3% | 91 54% | 100 69% |
| Total Average (Program / Settings) | 5% /
-2% | 45% /
28% | 43% /
25% | 5% /
7% | 50% /
37% | 66% /
43% |
* ... smaller is better
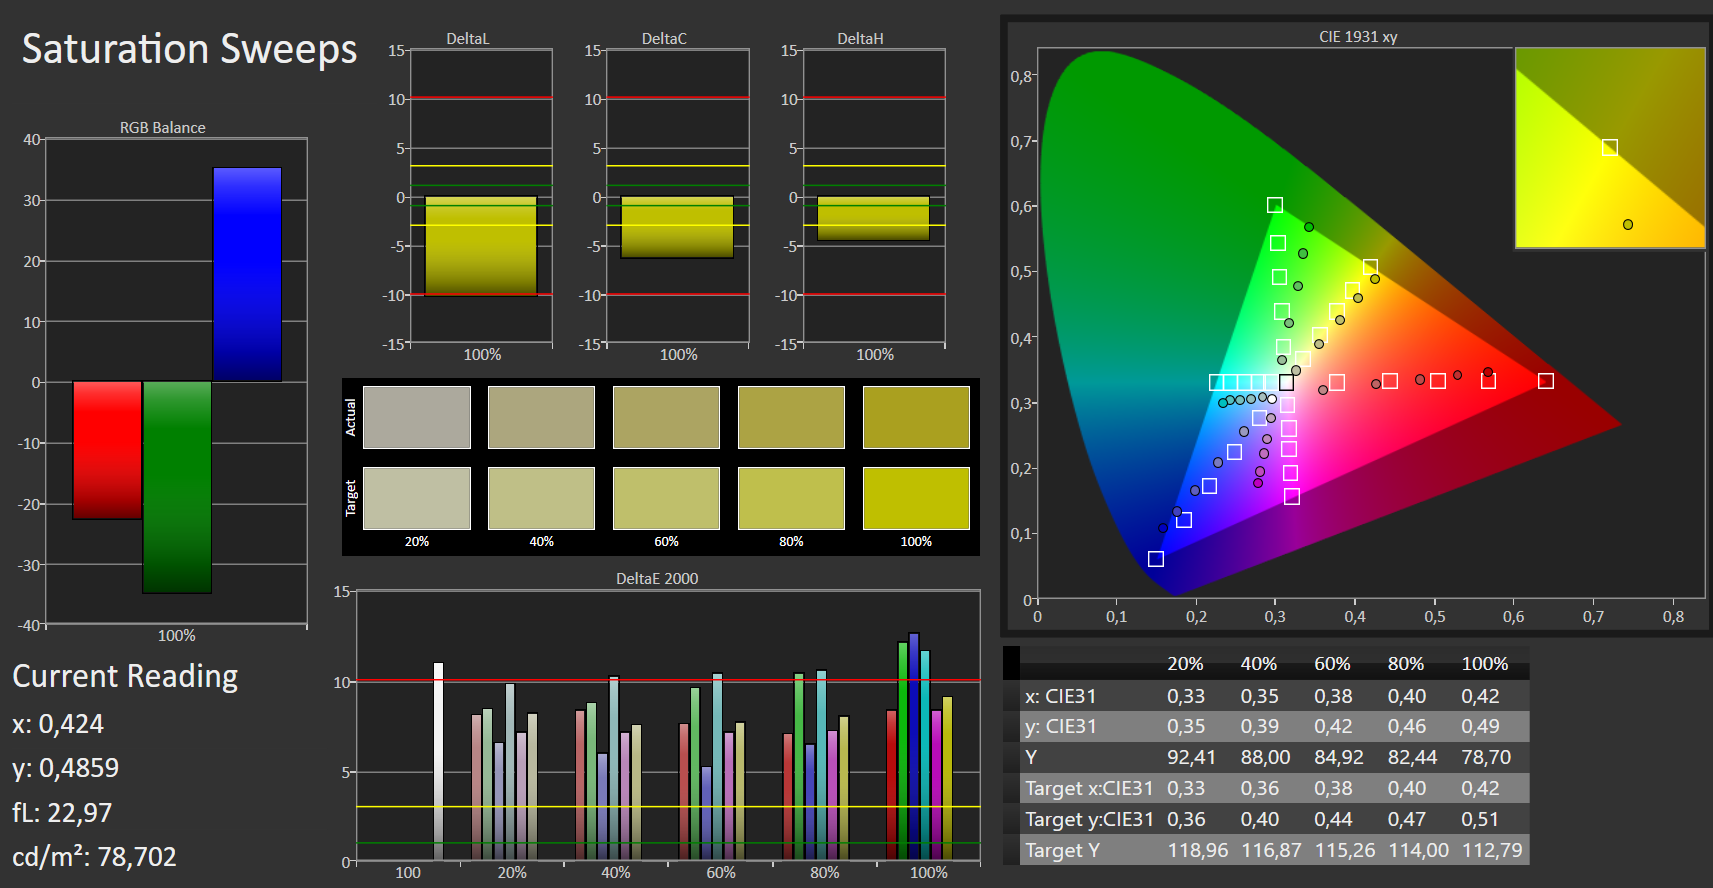
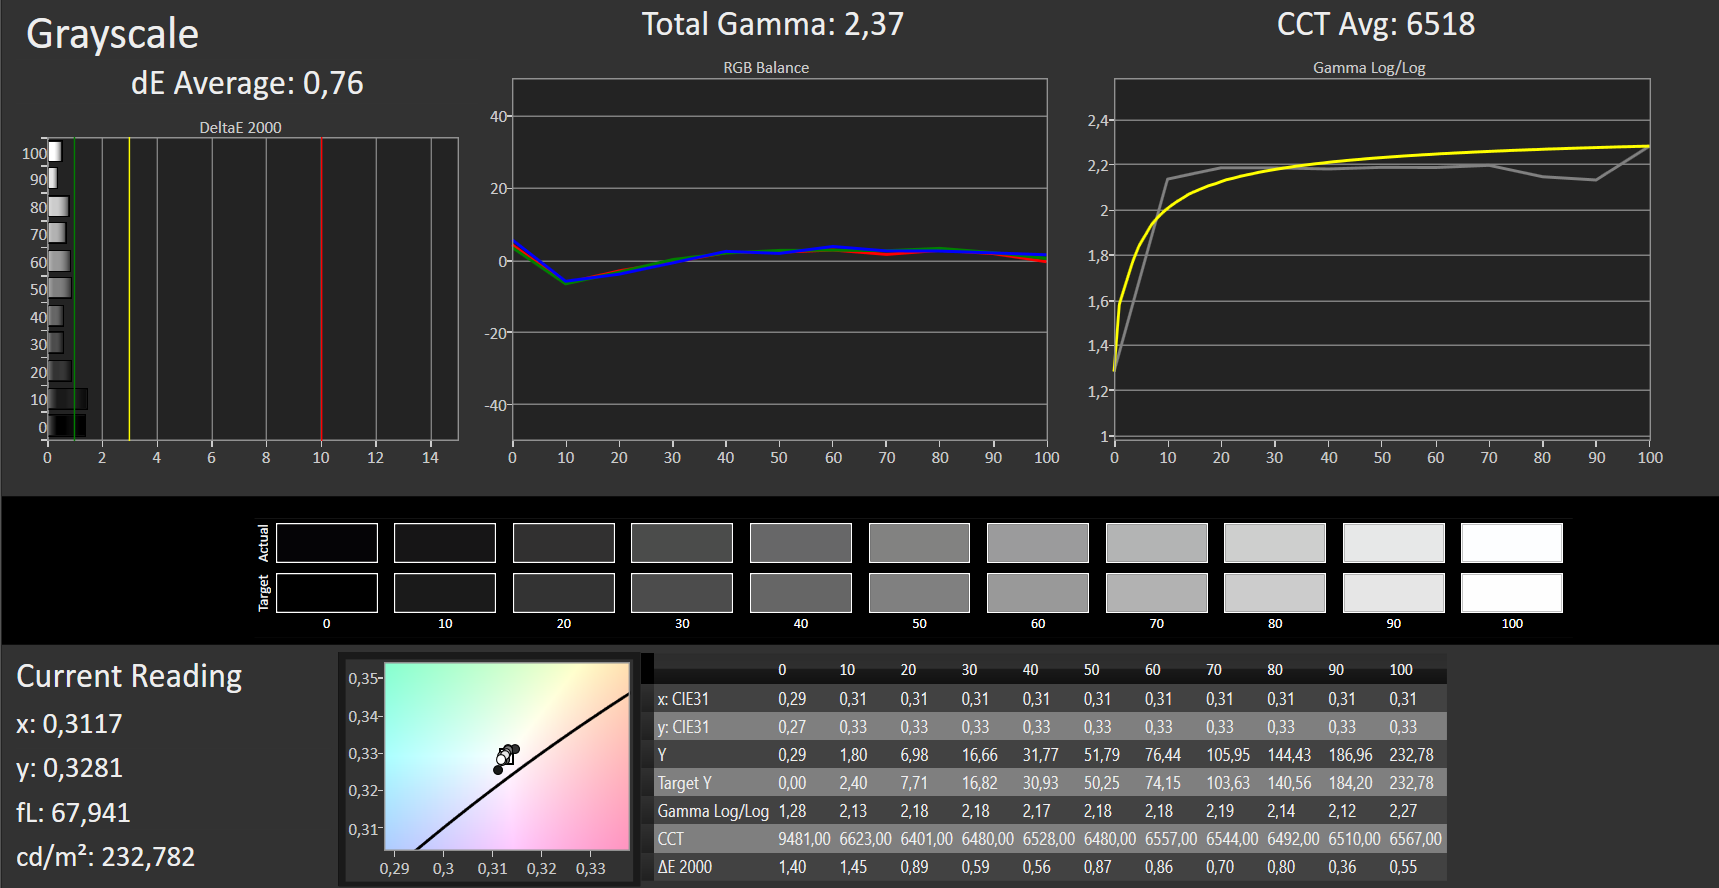
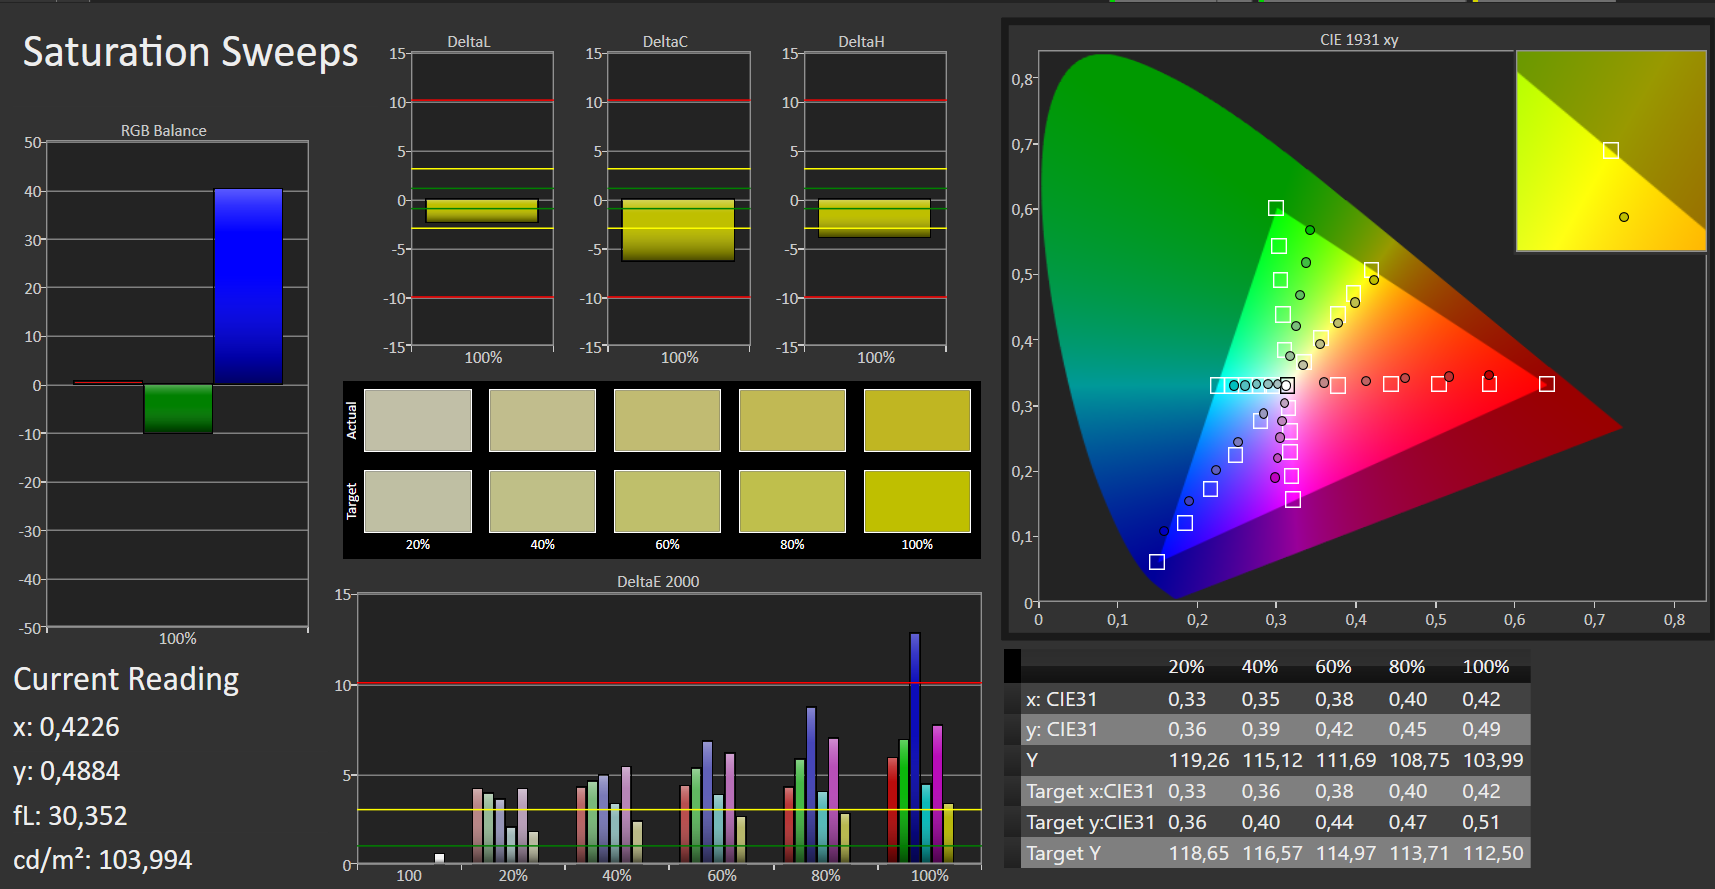
Out of the box, the color reproduction isn't satisfactory. With a Delta-E 2000 color deviation of 8.6, the target value (Delta-E smaller than 3) is very far away. Moreover, the display shows a slight blue tint. An improvement can be achieved through calibration of the display. In this way, the color deviation drops to 4.06; the blue tint disappears and the grayscales become noticeably more balanced. The AdobeRGB and sRGB color-spaces can't be displayed. The coverage rates amount to 37% (AdobeRGB) and 59% (sRGB).
Through the color profile that we have provided, the display's color reproduction can be improved by matching it to our calibration. It's important to make sure that the same display model (manufacturer + model number) as in our review device is built in. Otherwise, the color reproduction can become worse instead of being improved. It's common for laptops of the same model series to use displays from different manufacturers.
Display Response Times
| ↔ Response Time Black to White | ||
|---|---|---|
| 30 ms ... rise ↗ and fall ↘ combined | ↗ 17 ms rise | 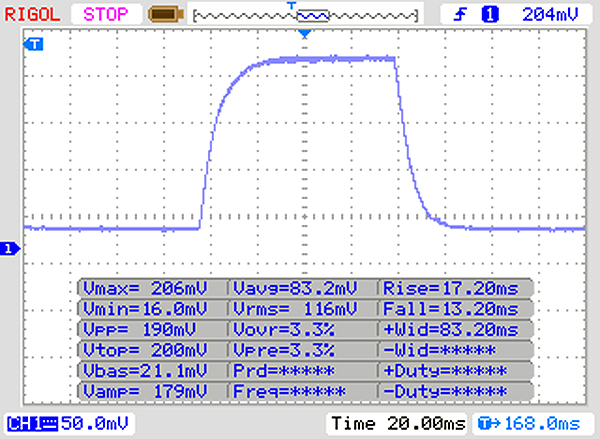 |
| ↘ 13 ms fall | ||
| The screen shows slow response rates in our tests and will be unsatisfactory for gamers. In comparison, all tested devices range from 0.1 (minimum) to 240 (maximum) ms. » 80 % of all devices are better. This means that the measured response time is worse than the average of all tested devices (19.9 ms). | ||
| ↔ Response Time 50% Grey to 80% Grey | ||
| 45 ms ... rise ↗ and fall ↘ combined | ↗ 22 ms rise | 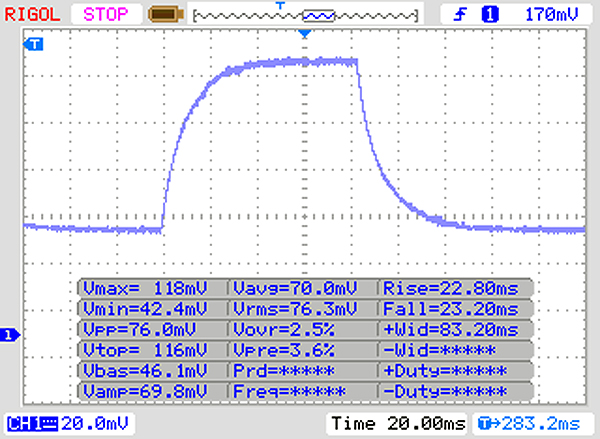 |
| ↘ 23 ms fall | ||
| The screen shows slow response rates in our tests and will be unsatisfactory for gamers. In comparison, all tested devices range from 0.165 (minimum) to 636 (maximum) ms. » 77 % of all devices are better. This means that the measured response time is worse than the average of all tested devices (31.1 ms). | ||
Screen Flickering / PWM (Pulse-Width Modulation)
| Screen flickering / PWM not detected | 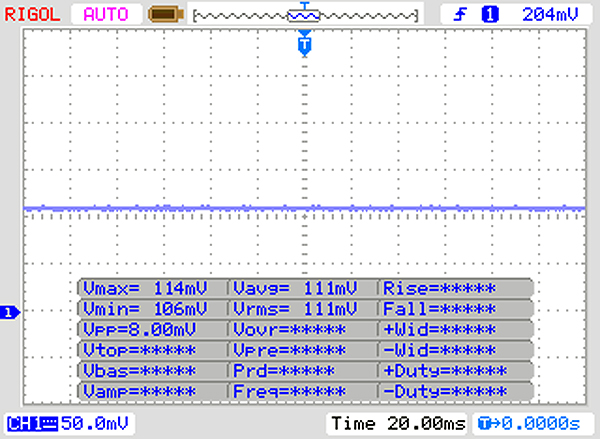 | ||
In comparison: 52 % of all tested devices do not use PWM to dim the display. If PWM was detected, an average of 7794 (minimum: 5 - maximum: 343500) Hz was measured. | |||
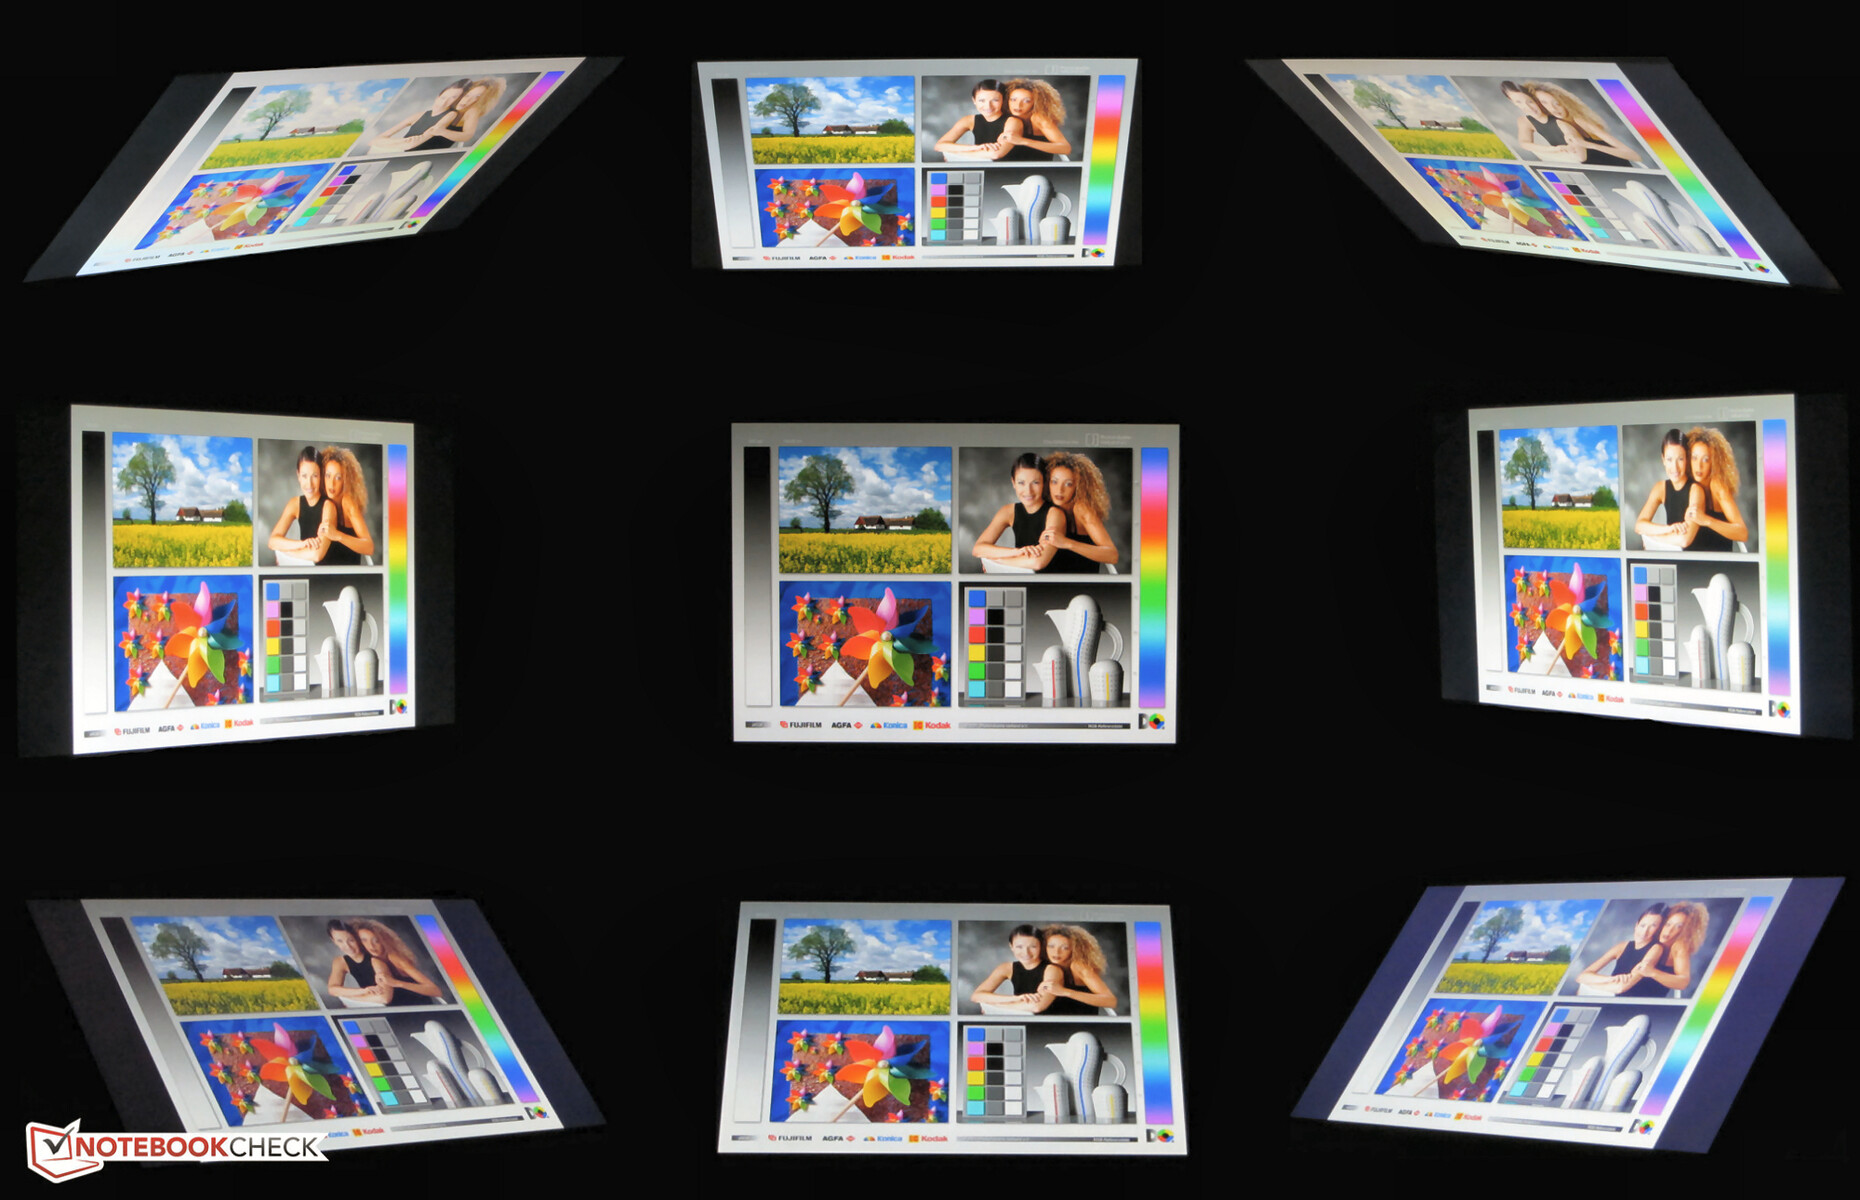
Dell provided the G5 with an IPS panel that shows stable viewing angles. Thus the display is readable from any position. Outdoors, the display's readability goes from poor to impossible due to its low brightness.
Performance - Without shortcomings
Dell delivers with the G5 15 5590 a 15.6-inch gaming laptop that can run all modern computer games smoothly. Our review device currently costs around 1,400 Euros (~$1,567). There are other configuration options available. Prices start at 930 Euros (~$1,041).

Test conditions
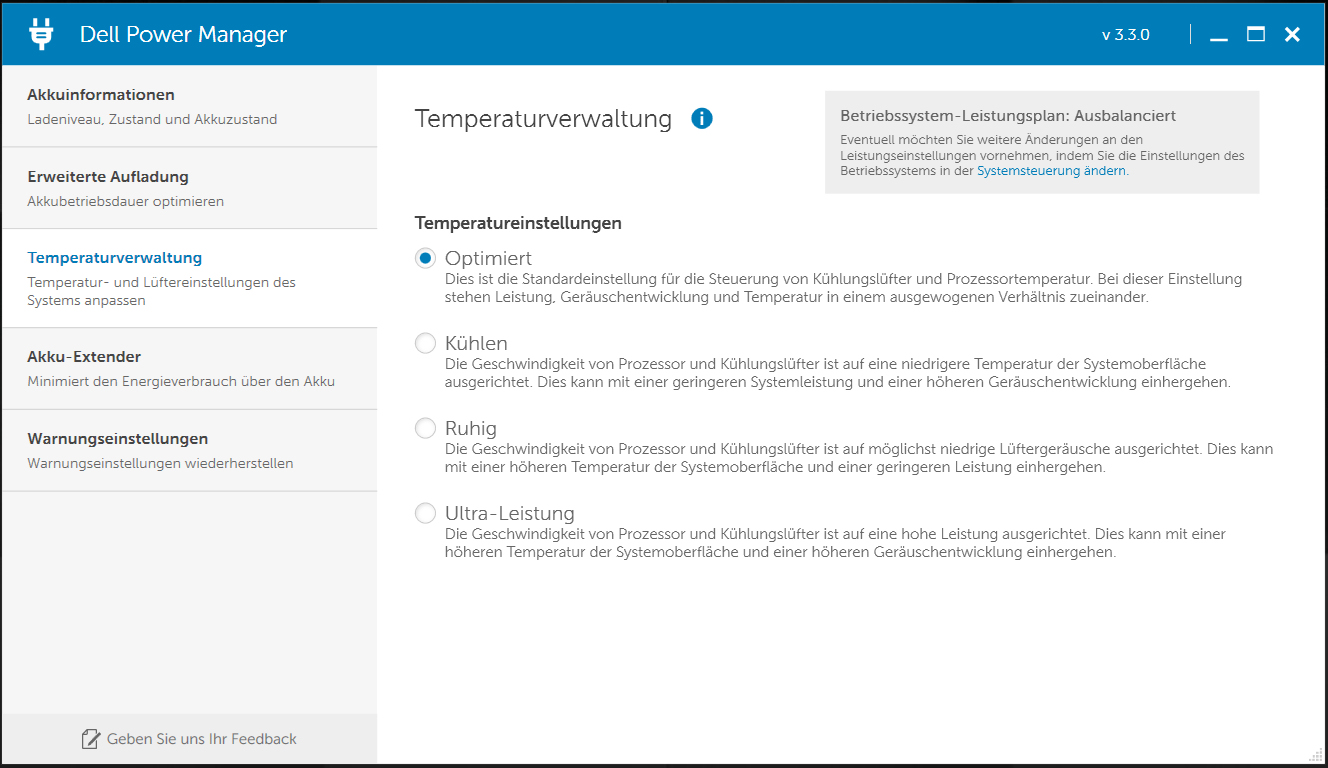
We conducted all our tests using the "Balanced" energy profile from Windows 10. The control panel in Windows doesn't offer any other profiles for the G5. In addition, Dell Power Manager provides further options to influence temperature management. The available alternatives have an effect on the development of noise and performance in the laptop. In this case we chose the "Optimal" option. This option is the best way to go.
Processor
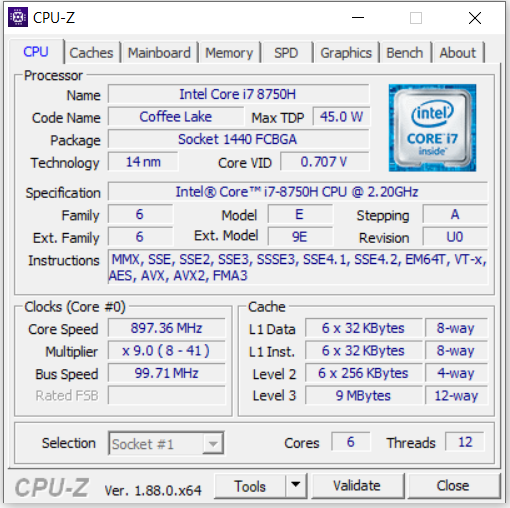
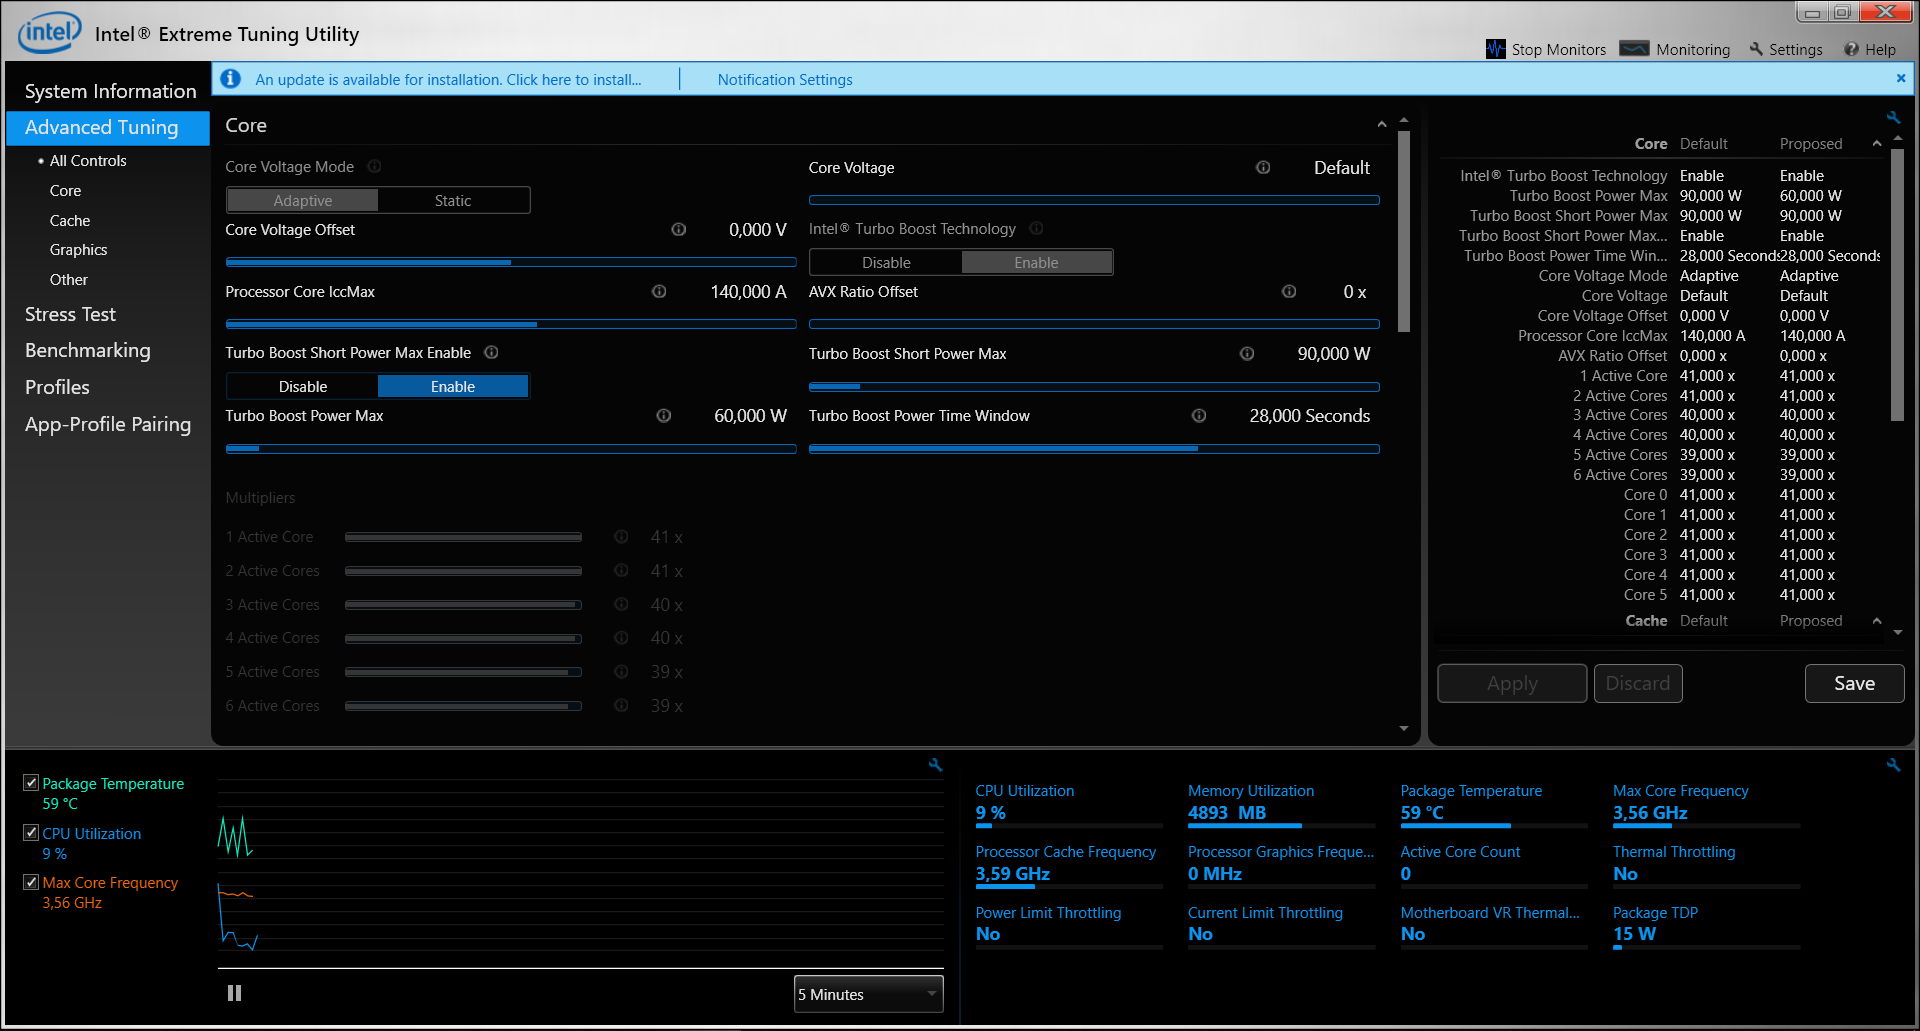
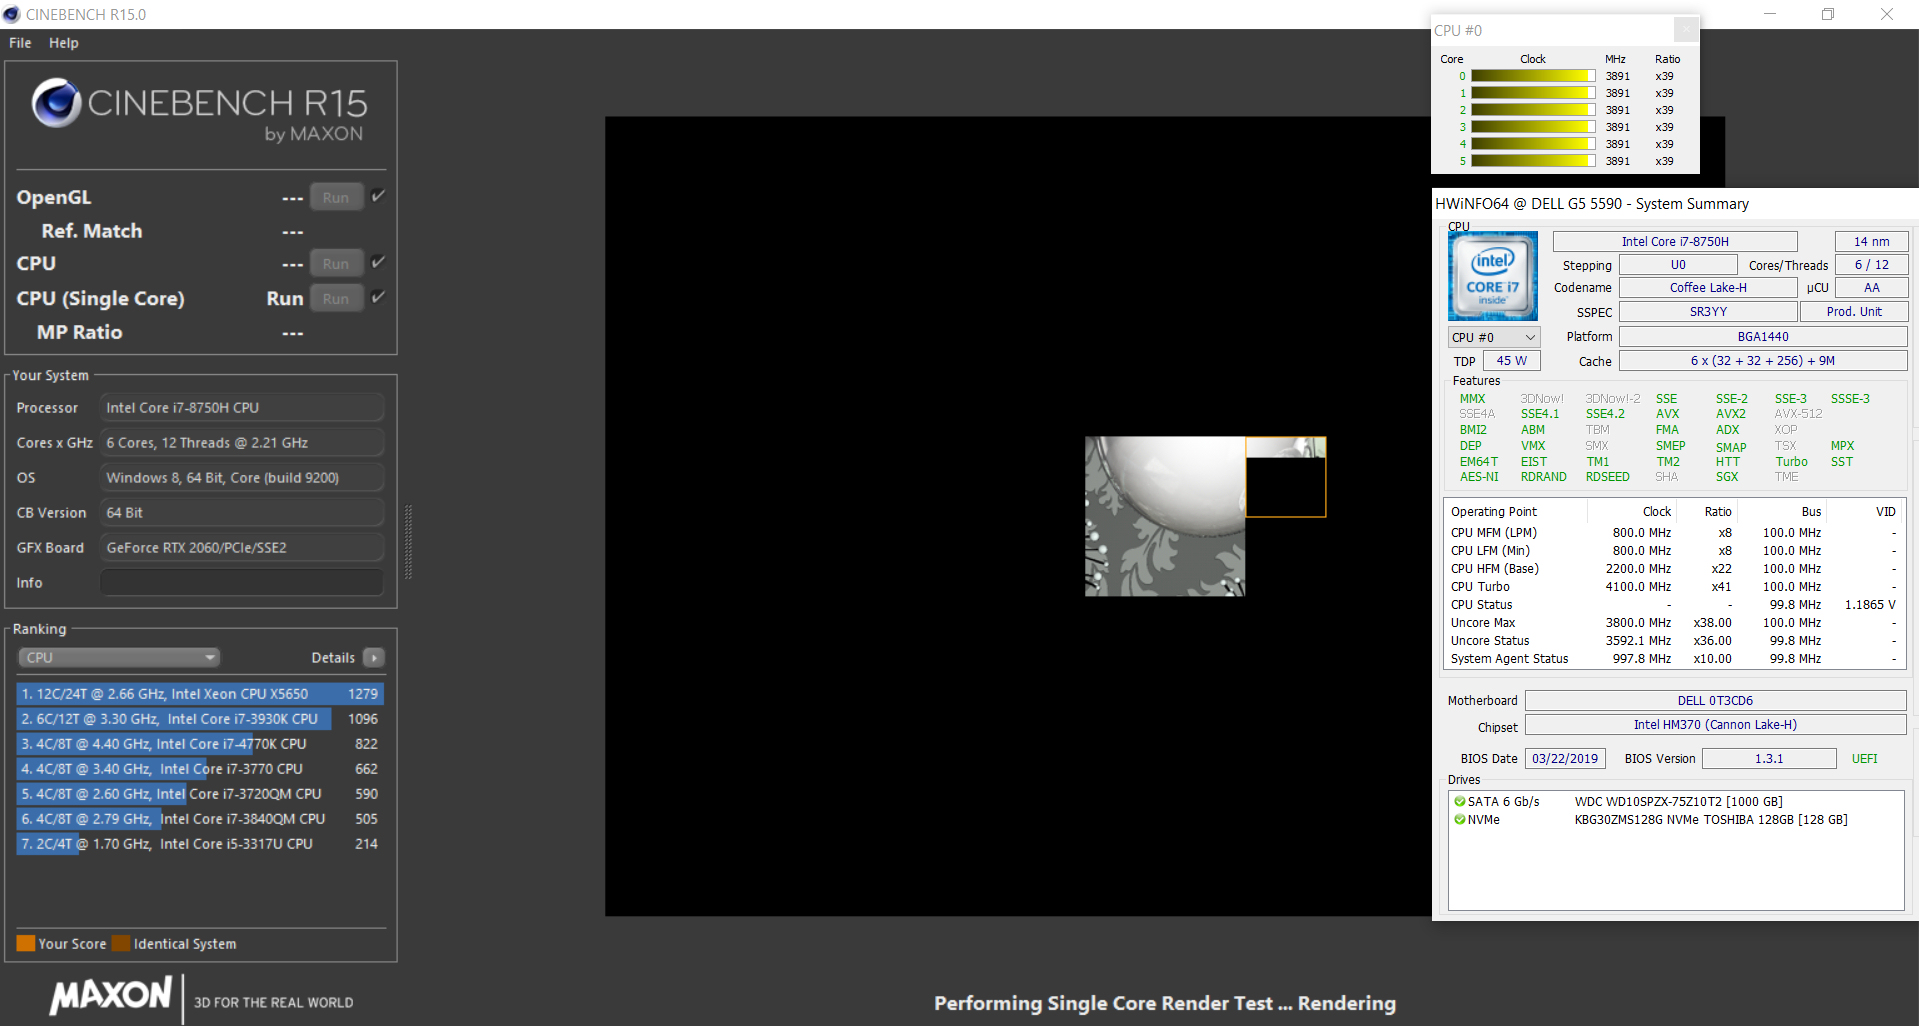
Like many other gaming laptops, the G5 comes with an Intel Core i7-8750H (Coffee Lake) hexa-core processor. The CPU offers a good compromise between computing performance and power requirement. This is a mobile CPU, which has a TDP of 45 Watts. Dell allows a short increase to up to 90 Watts. The Core i7 runs at a base speed of 2.2 GHz. Through Turbo, clock speeds can go up to 3.9 GHz (six cores), 4 GHz (four cores) and 4.1 GHz (one core/two cores), respectively.
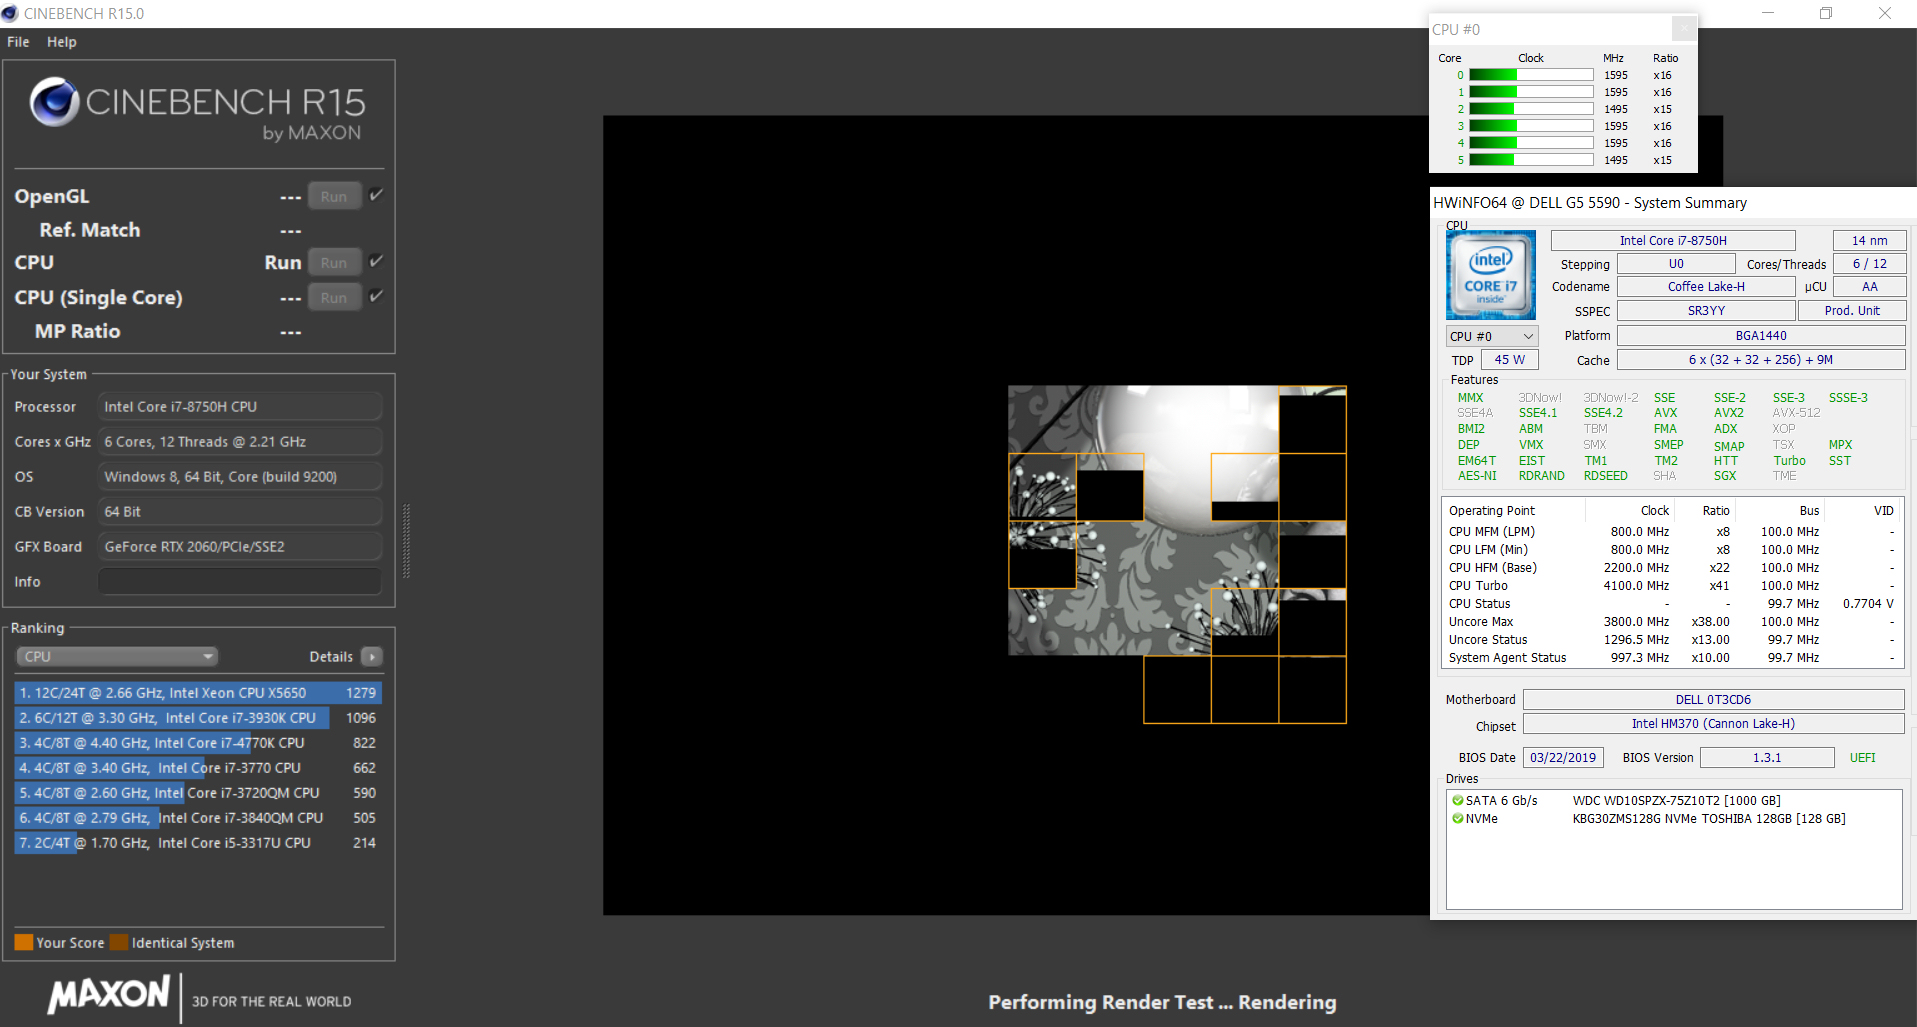
The processor executes the multithread tests of the Cinebench benchmark at 3.6 to 3.9 GHz. The single-thread tests are run at 3.9 GHz. These are the results observed when plugged in. On battery power, the CPU runs at 1.4 to 1.6 GHz (multithread) and 1.2 to 1.8 GHz (single-thread), respectively.
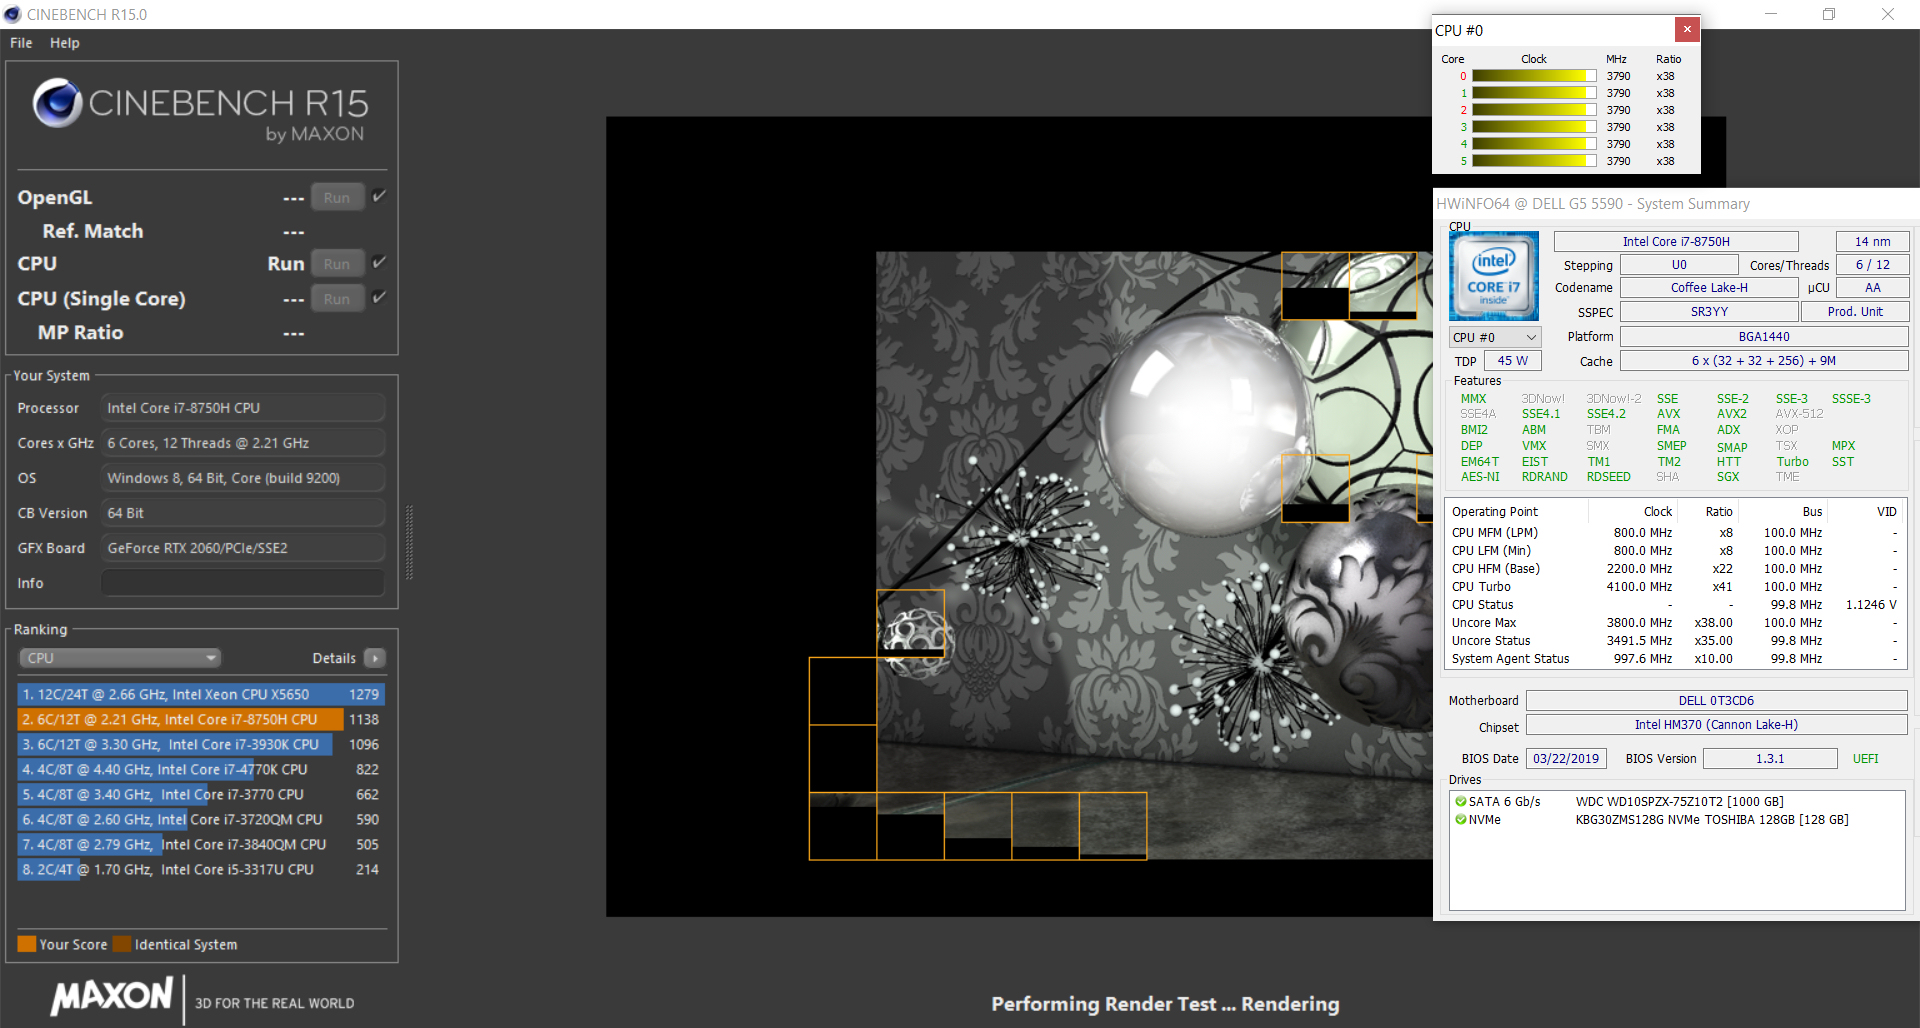
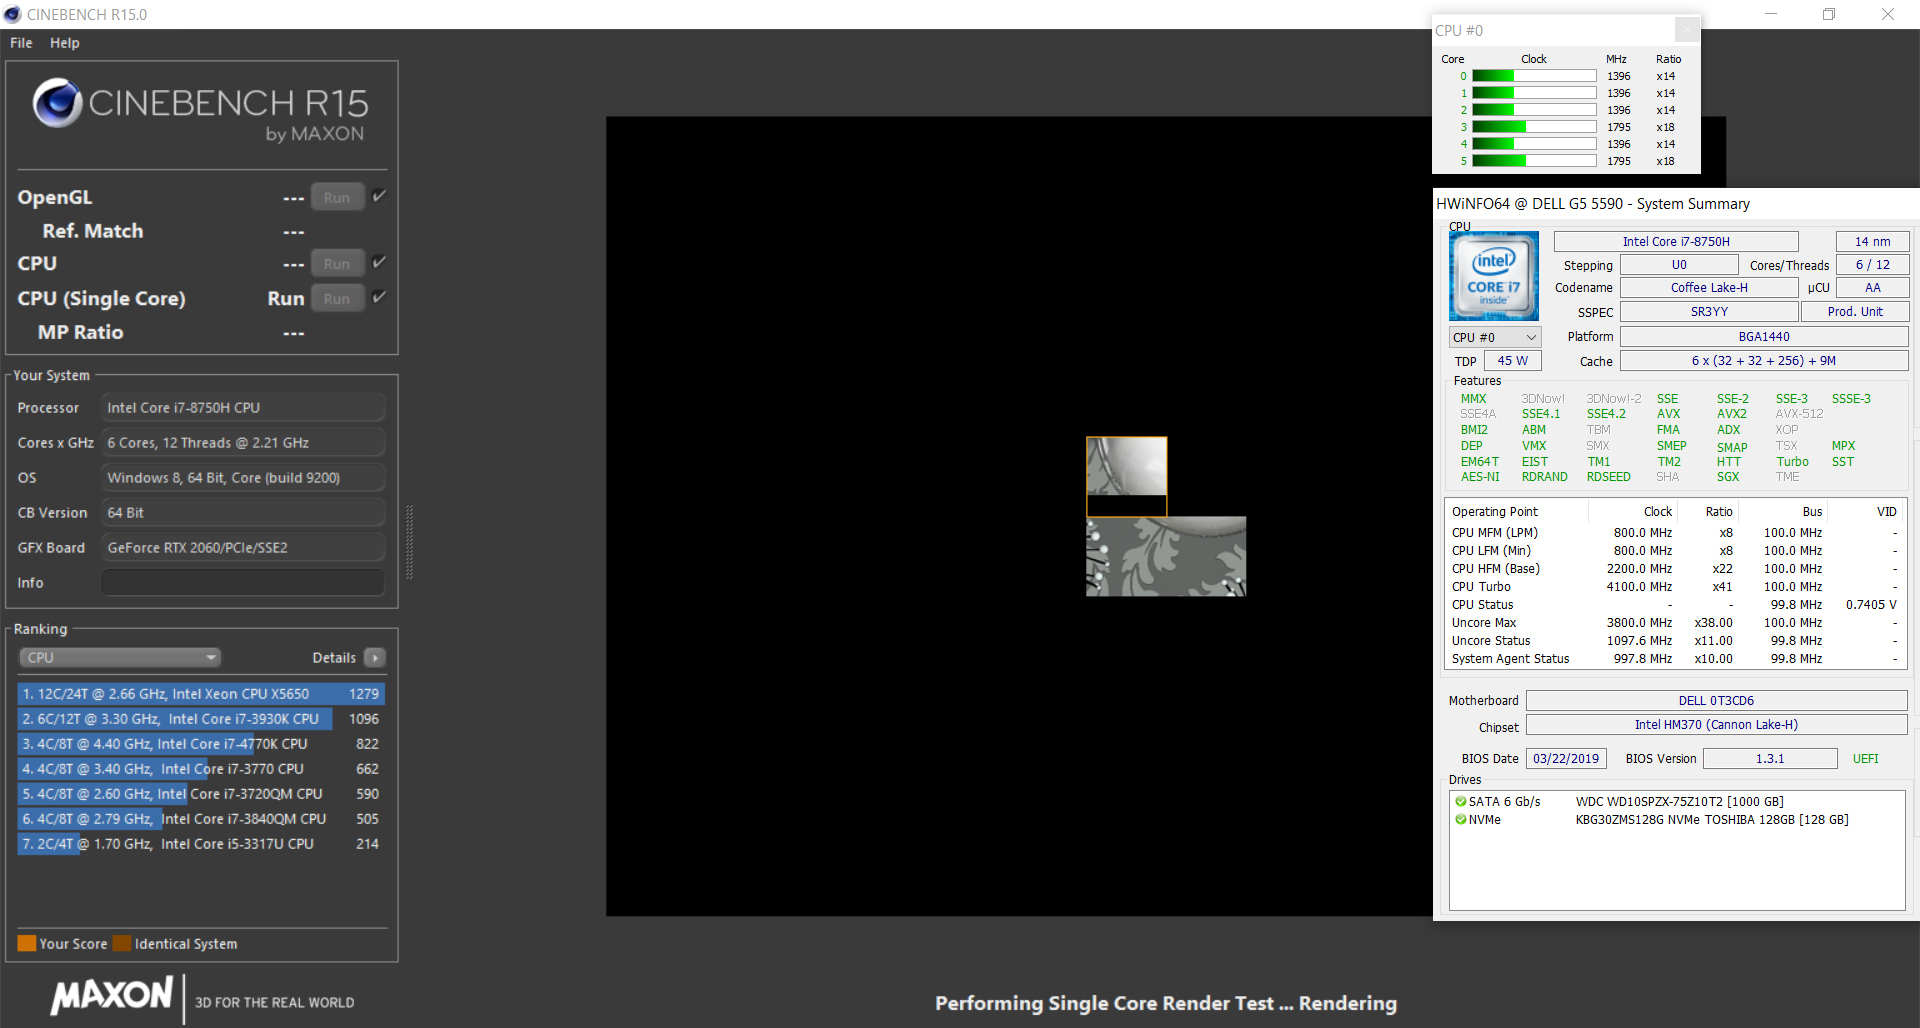
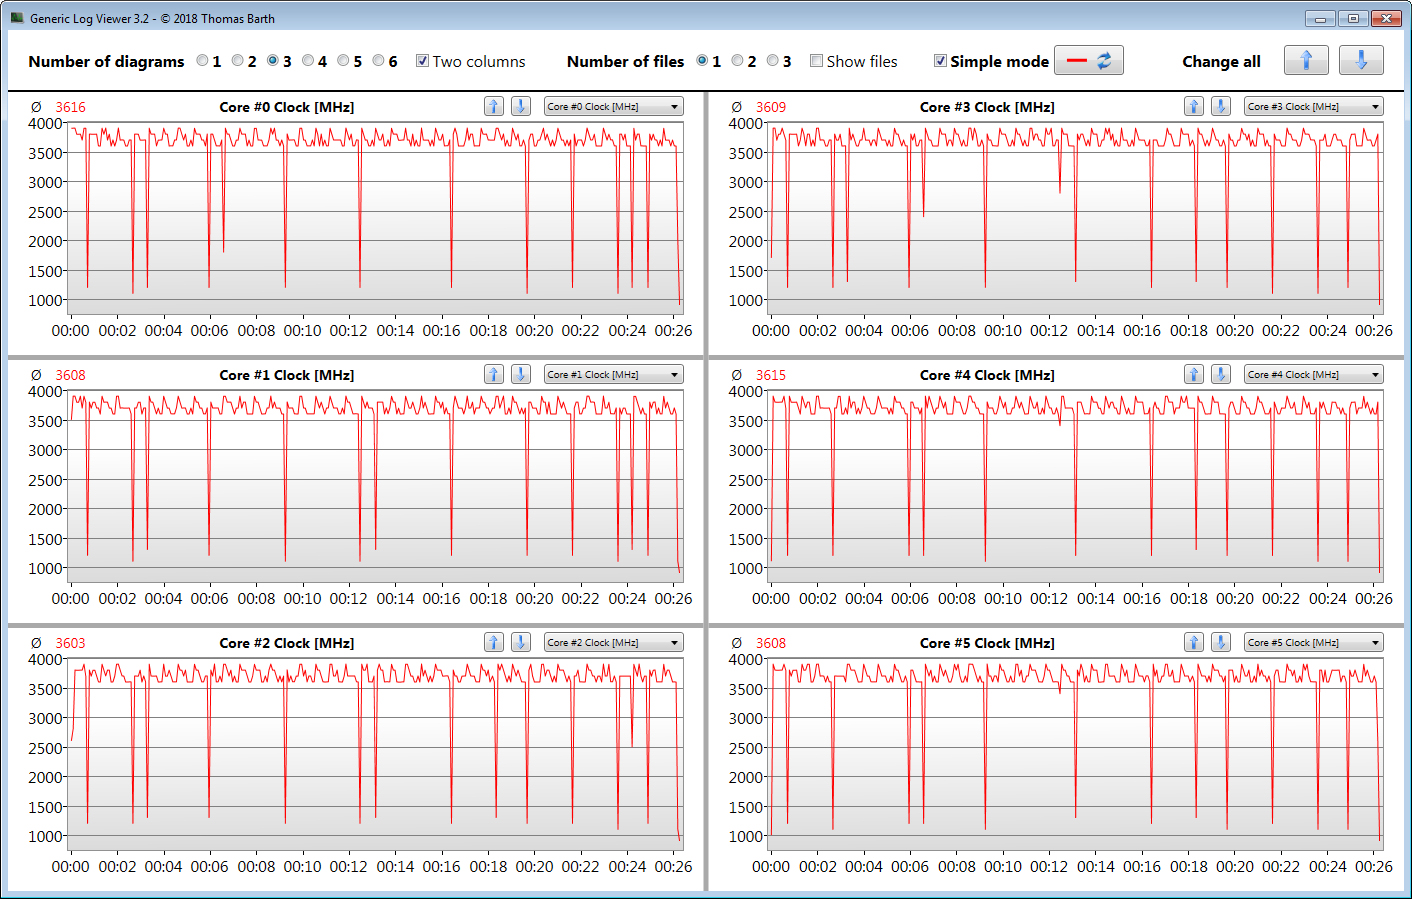
In order to test if the CPU's Turbo is used consistently when plugged in, we let Cinebench's R15 multithread test run for a minimum of 30 minutes in a continuous loop. The results drop a bit from the first to the second run, but then they remain at a largely constant level between 1130 and 1150 points. Turbo is in use.
We ran the CB15 loop several times and varied the options offered by the Dell Power Manager that had to do with temperature management. The "Ultra Performance" option didn't bring any advantages. The results were even minimally worse. The option "Quiet" has clearer effects. The CB15 results are just below 1000 points, and the fans produce significantly less noise.
| Cinebench R10 | |
| Rendering Single 32Bit | |
| Average of class Gaming (7457 - 11779, n=8, last 2 years) | |
| Dell G5 15 5587 | |
| Average Intel Core i7-8750H (6236 - 6645, n=25) | |
| HP Omen 15-dc0015ng | |
| Dell G5 15 5590 | |
| Rendering Multiple CPUs 32Bit | |
| Average of class Gaming (42932 - 81339, n=8, last 2 years) | |
| Dell G5 15 5590 | |
| Average Intel Core i7-8750H (29664 - 35307, n=25) | |
| HP Omen 15-dc0015ng | |
| Dell G5 15 5587 | |
| Cinebench R20 | |
| CPU (Single Core) | |
| Average of class Gaming (442 - 895, n=111, last 2 years) | |
| Average Intel Core i7-8750H (403 - 418, n=6) | |
| Dell G5 15 5590 | |
| CPU (Multi Core) | |
| Average of class Gaming (4029 - 16108, n=111, last 2 years) | |
| Dell G5 15 5590 | |
| Average Intel Core i7-8750H (2142 - 2707, n=6) | |
| Geekbench 3 | |
| 32 Bit Multi-Core Score | |
| HP Omen 15-dc0015ng | |
| Dell G5 15 5590 | |
| Average Intel Core i7-8750H (20725 - 22665, n=13) | |
| 32 Bit Single-Core Score | |
| HP Omen 15-dc0015ng | |
| Average Intel Core i7-8750H (3734 - 4163, n=13) | |
| Dell G5 15 5590 | |
| Geekbench 4.4 | |
| 64 Bit Multi-Core Score | |
| Average of class Gaming (89200 - 97490, n=2, last 2 years) | |
| HP Omen 15-dc0015ng | |
| Average Intel Core i7-8750H (17709 - 23313, n=17) | |
| Dell G5 15 5590 | |
| 64 Bit Single-Core Score | |
| Average of class Gaming (9335 - 9492, n=2, last 2 years) | |
| HP Omen 15-dc0015ng | |
| Average Intel Core i7-8750H (4669 - 5146, n=17) | |
| Dell G5 15 5590 | |
| Mozilla Kraken 1.1 - Total | |
| Dell G5 15 5590 (Edge 44) | |
| MSI GL73 8SE-010US (Edge 42.17134.1.0) | |
| Dell G5 15 5587 (Edge 42.17134.1.0) | |
| Average Intel Core i7-8750H (695 - 1272, n=50) | |
| HP Omen 15-dc0015ng (Edge 44) | |
| Lenovo Legion Y530-15ICH | |
| Average of class Gaming (391 - 590, n=105, last 2 years) | |
| Octane V2 - Total Score | |
| Average of class Gaming (87588 - 139447, n=30, last 2 years) | |
| Lenovo Legion Y530-15ICH | |
| HP Omen 15-dc0015ng (Edge 44) | |
| Dell G5 15 5587 (Edge 42.17134.1.0) | |
| MSI GL73 8SE-010US (Edge 42.17134.1.0) | |
| Average Intel Core i7-8750H (27460 - 44549, n=47) | |
| Dell G5 15 5590 (Edge 44) | |
| JetStream 1.1 - 1.1 Total | |
| Average of class Gaming (518 - 647, n=5, last 2 years) | |
| MSI GL73 8SE-010US (Edge 42.17134.1.0) | |
| Average Intel Core i7-8750H (205 - 299, n=49) | |
| Dell G5 15 5587 (Edge 42.17134.1.0) | |
| Dell G5 15 5590 (Edge 44) | |
| HP Omen 15-dc0015ng (Edge 44) | |
| Lenovo Legion Y530-15ICH | |
* ... smaller is better
System Performance
The G5 doesn't show any deficiencies when it comes to system performance. The hexa-core processor provides more than enough performance, even for tasks beyond gaming - and it should be sufficient for the years to come. The dedicated graphics unit makes it possible to run computer games. The system performs decently and smoothly. We didn't notice any issues. This is joined by very good results on the PCMark benchmarks.

| PCMark 7 Score | 6138 points | |
| PCMark 8 Home Score Accelerated v2 | 4165 points | |
| PCMark 8 Creative Score Accelerated v2 | 4921 points | |
| PCMark 8 Work Score Accelerated v2 | 5291 points | |
| PCMark 10 Score | 5069 points | |
Help | ||
Storage
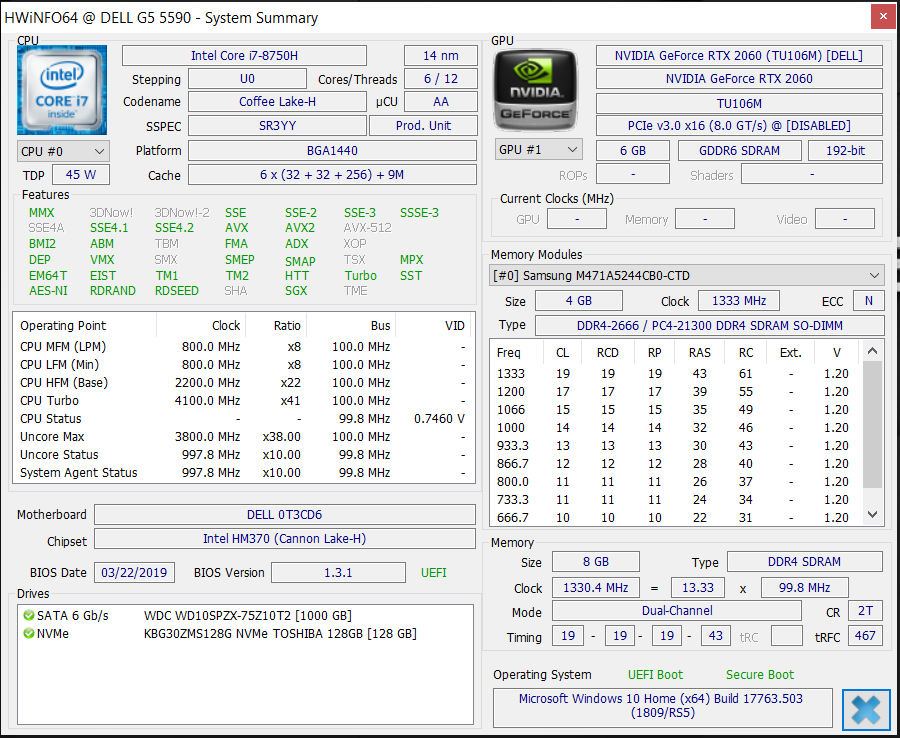
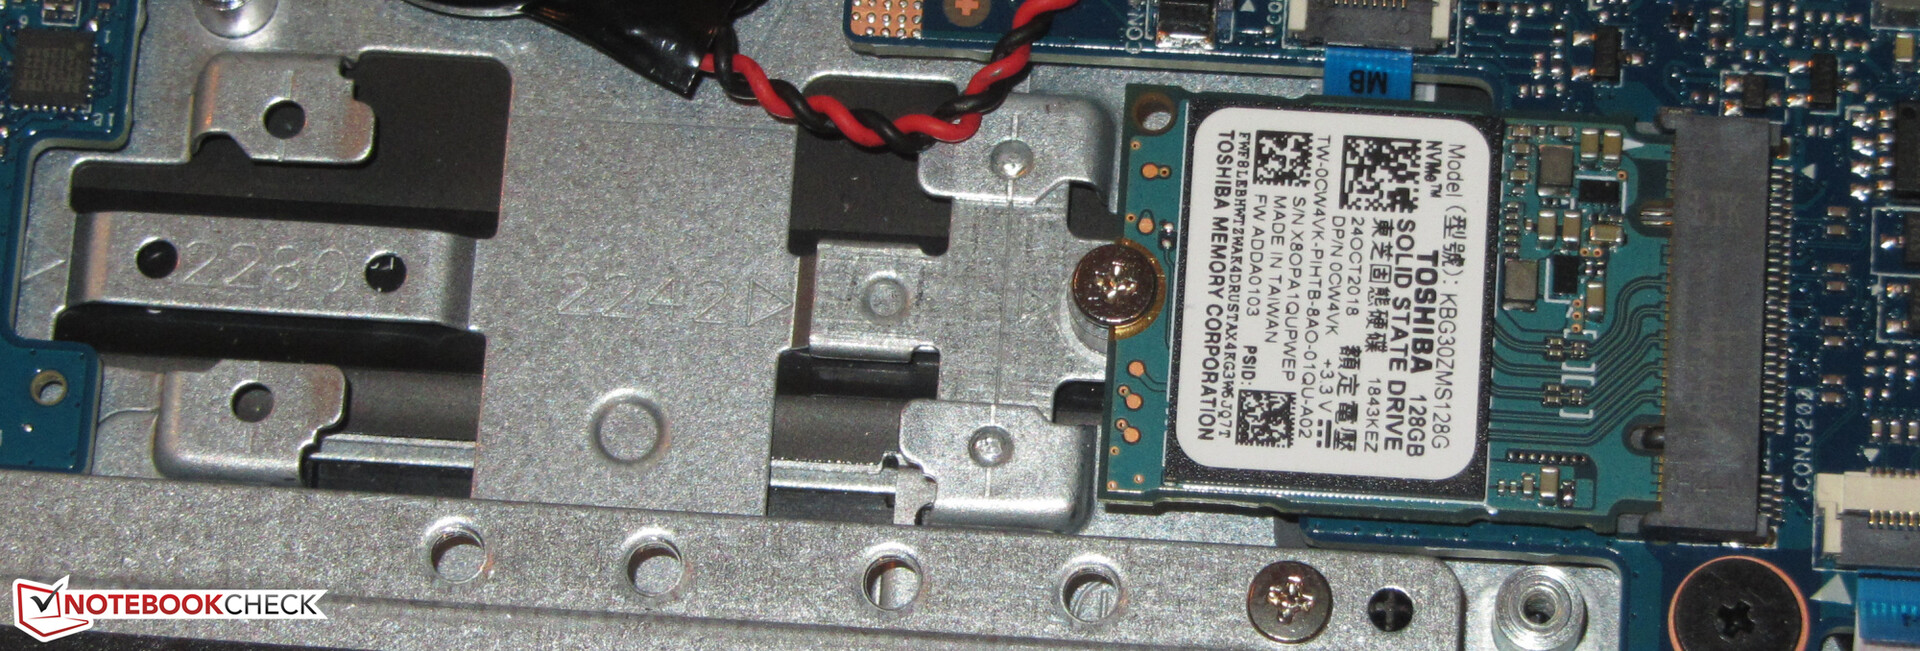
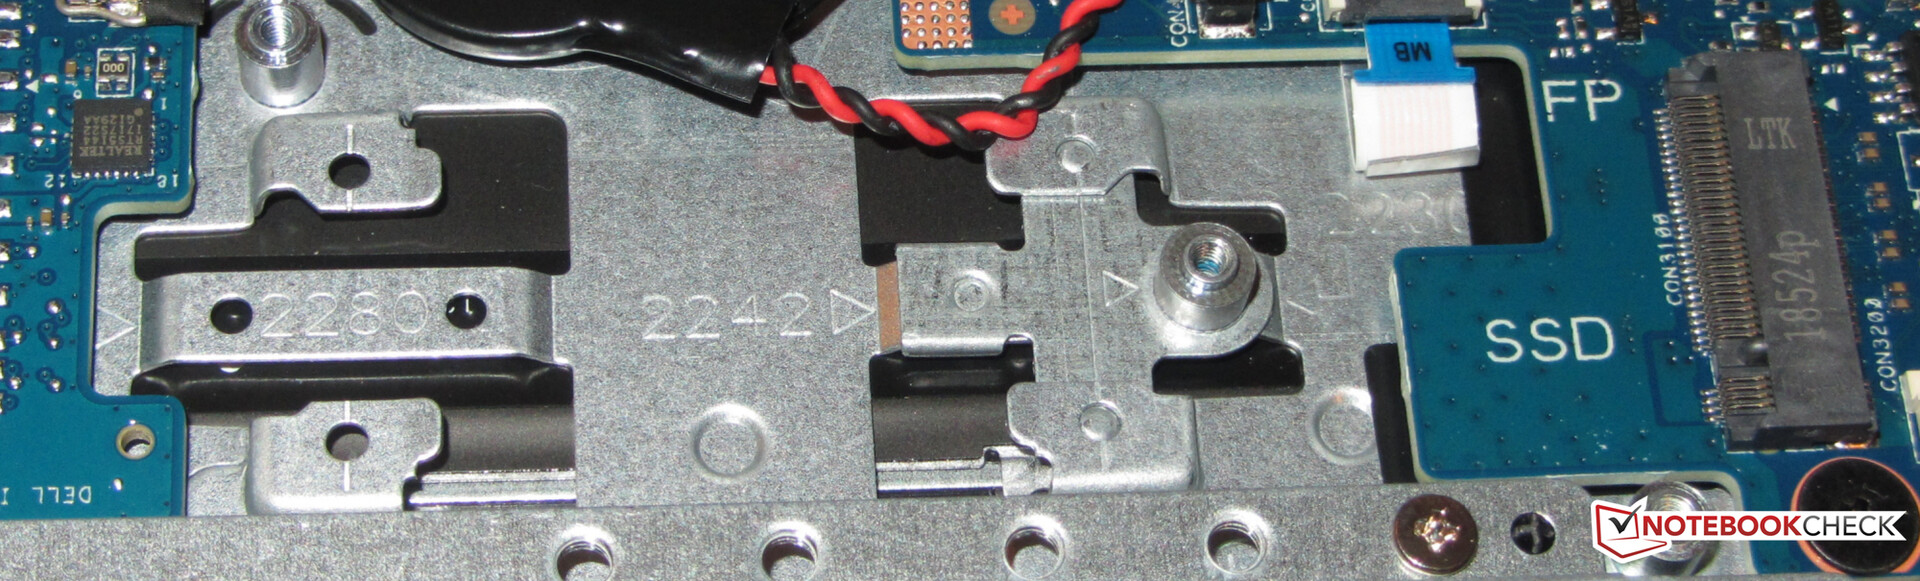
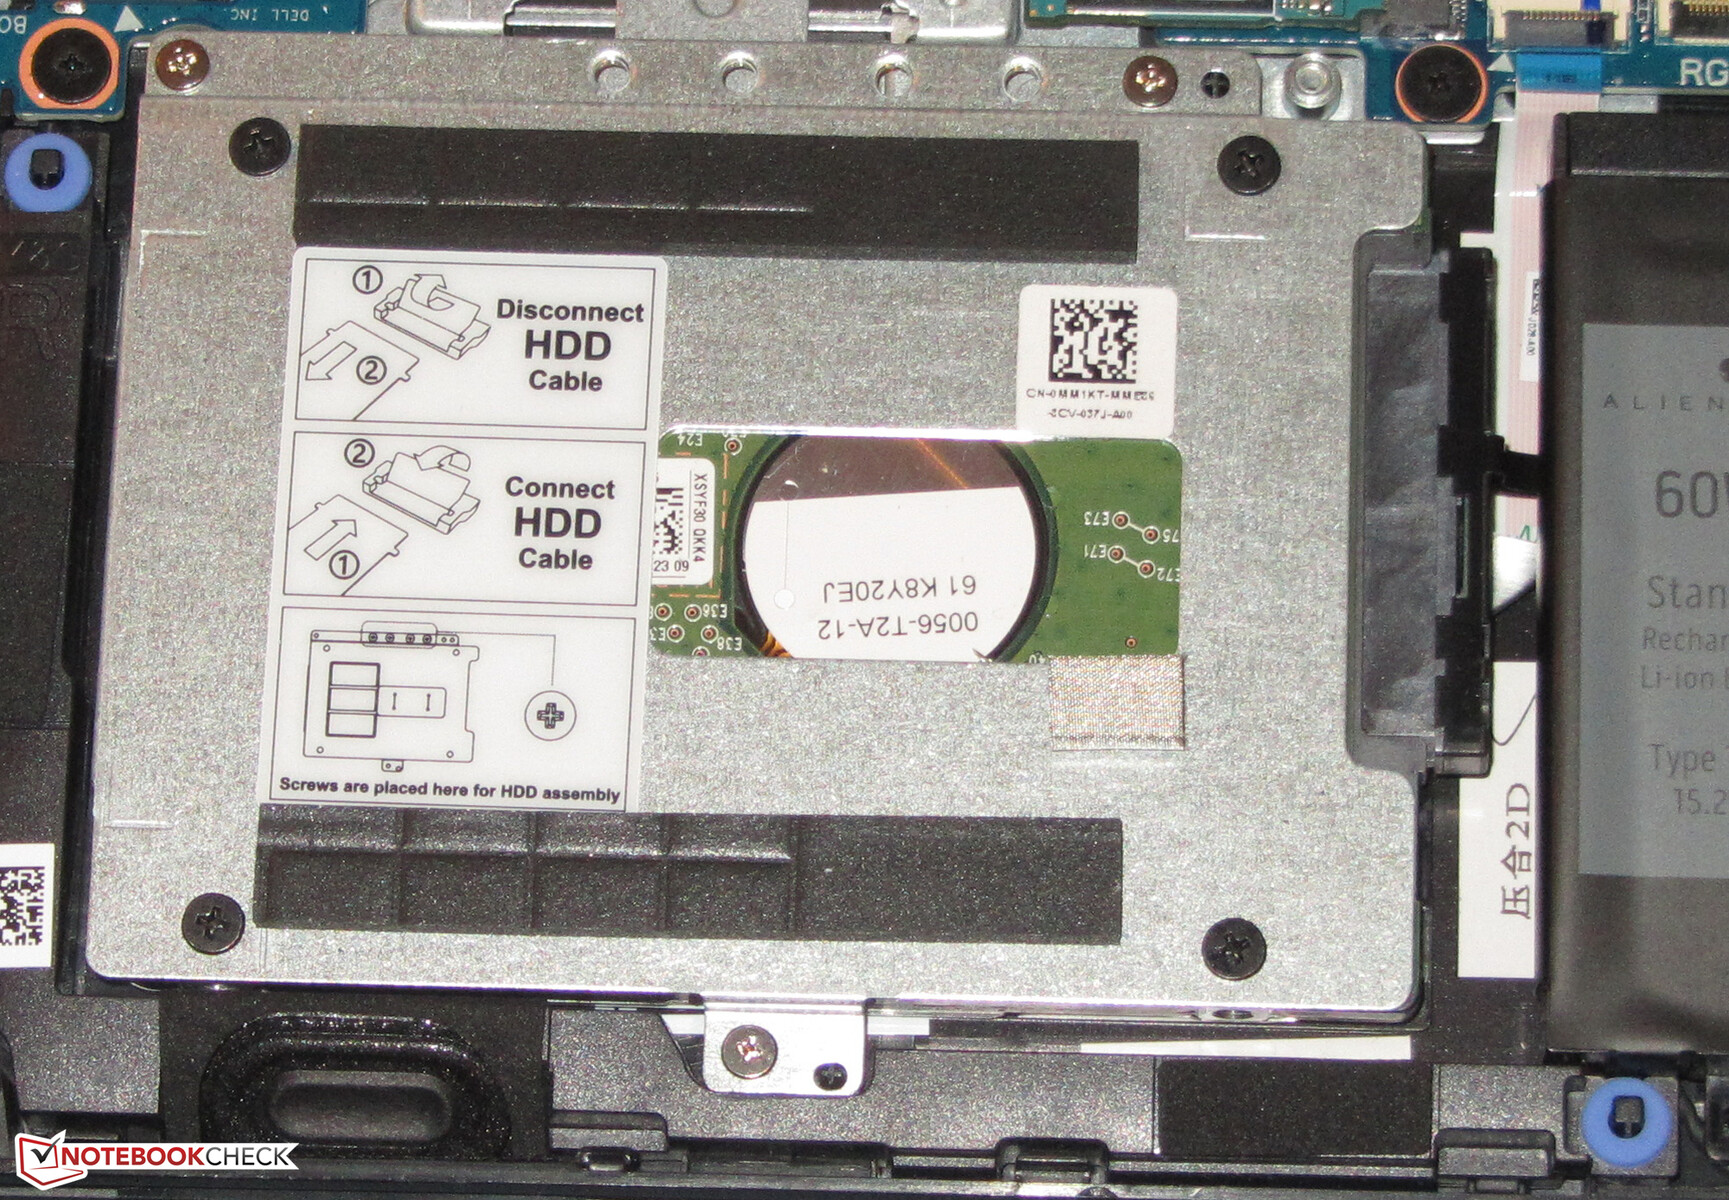
An NVMe SSD from Toshiba is used as system drive. This is an M.2 2230 model. Alternatively, models with the 2242 and 2280 formats can also be used. To do this, the threaded bolt used to screw the SSD would have to be moved. This can be done without issues. The piece of metal on which the bolt is placed is only plugged, not screwed or welded. We tested this.
The SSD has a capacity of 128 GB. Out of this, about 66 GB is usable out of the box. The remainder of storage space is used by the recovery partition and the Windows installation. The SSD delivers decent transfer rates, but it's clearly behind what can be offered by current NVMe SSDs. These SSDs use the PCI Express 3.0 interface, which provides significantly higher transfer speeds than the ones obtained with the SATA III interface (Max. 600 MB/s).
Despite the small SSD, the gaming laptop doesn't lack storage space. Alongside the SSD, Dell has also equipped the G5 with a 2.5-inch hard drive (1 TB, 5400 rpm).


| Dell G5 15 5590 KBG30ZMS128G | Dell G5 15 5587 SK hynix SC311 M.2 | Lenovo Legion Y530-15ICH Samsung SSD PM981 MZVLB256HAHQ | HP Omen 15-dc0015ng Toshiba XG5 KXG50ZNV512G | Acer Aspire Nitro 5 AN515-54-53Z2 WDC PC SN520 SDAPNUW-512G | HP Pavilion Gaming 15t-cx0000 Samsung SSD PM981 MZVLB512HAJQ | Average KBG30ZMS128G | |
|---|---|---|---|---|---|---|---|
| CrystalDiskMark 5.2 / 6 | 17% | 339% | 155% | 321% | 405% | 2% | |
| Write 4K (MB/s) | 64.3 | 67 4% | 108.9 69% | 87.5 36% | 109.1 70% | 129.5 101% | 67 ? 4% |
| Read 4K (MB/s) | 29.3 | 25.8 -12% | 40.23 37% | 16.08 -45% | 42.05 44% | 44.61 52% | 30.8 ? 5% |
| Write Seq (MB/s) | 131.1 | 238 82% | 1390 960% | 614 368% | 1457 1011% | 1268 867% | 129.1 ? -2% |
| Read Seq (MB/s) | 776 | 506 -35% | 964 24% | 1341 73% | 1421 83% | 992 28% | 817 ? 5% |
| Write 4K Q32T1 (MB/s) | 96.8 | 155.2 60% | 314.2 225% | 307.9 218% | 287.8 197% | 535 453% | 95.7 ? -1% |
| Read 4K Q32T1 (MB/s) | 198.6 | 195.8 -1% | 369.2 86% | 358.4 80% | 317.9 60% | 601 203% | 197.6 ? -1% |
| Write Seq Q32T1 (MB/s) | 127.8 | 232.7 82% | 1506 1078% | 525 311% | 1455 1038% | 1938 1416% | 130.3 ? 2% |
| Read Seq Q32T1 (MB/s) | 1044 | 549 -47% | 3446 230% | 3077 195% | 1739 67% | 2306 121% | 1121 ? 7% |
Graphics card
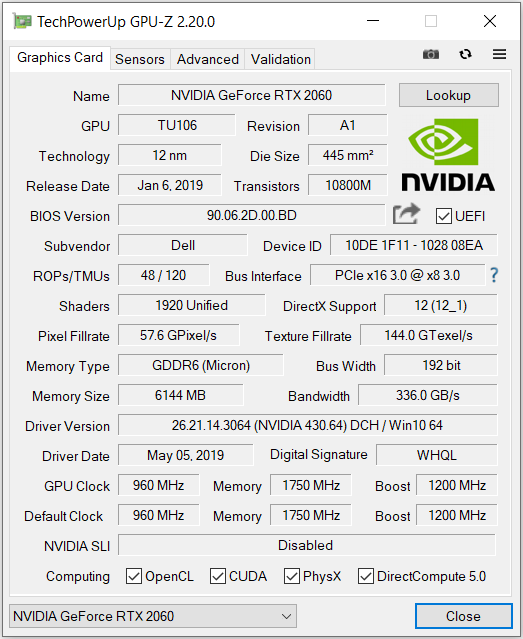
The Dell laptop is equipped with a GeForce RTX 2060 graphics processing unit. The Turing GPU supports DirectX 12 and runs at a base speed of 960 MHz. An increase to up to 1200 MHz is possible through Boost. However, the value can also be exceeded if the GPU temperature doesn't reach a set threshold. The cooling system in the G5 enables an increase in speed to values beyond 1200 MHz. As a result, the GPU went through our The Witcher 3 test with clock speeds between 1400 MHz and 1450 MHz. The RTX 2060 has access to 6144 MB GDDR6 video memory.
The results on the 3D Mark benchmark are normal for the GPU in place. Graphics performance drops significantly on battery power since the GPU only runs at its base speed (300 MHz) here. The options aimed at managing temperature that are provided by Dell Power Manager have no effect on graphics performance.
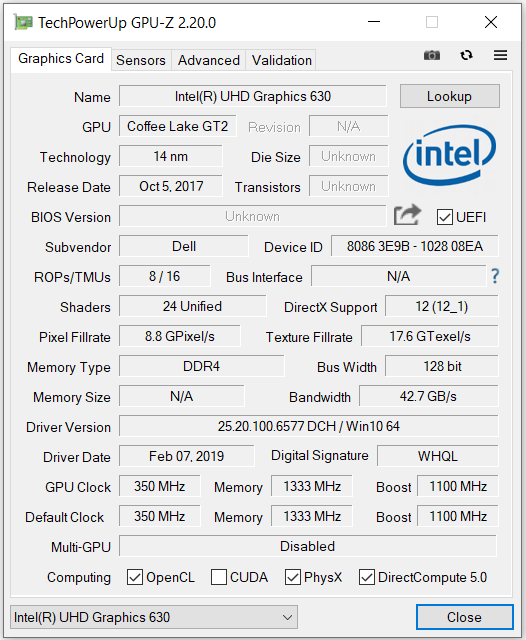
Alongside the RTX 2060, the laptop also comes with Intel's UHD Graphics 630 integrated GPU. Both cores provide a graphics-switching solution (Optimus). Intel's GPU is used for everyday tasks and when the device is on battery power. Nvidia's graphics unit takes care of demanding tasks such as computer games.
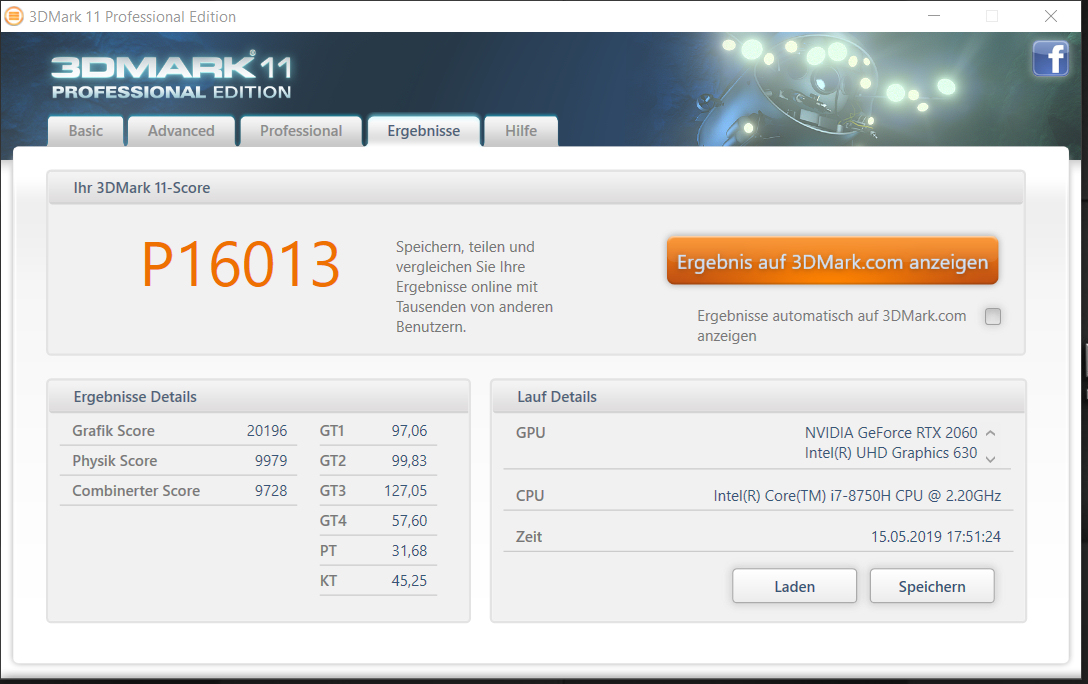
| 3DMark 06 Standard Score | 33034 points | |
| 3DMark 11 Performance | 16013 points | |
| 3DMark Ice Storm Standard Score | 103519 points | |
| 3DMark Cloud Gate Standard Score | 35045 points | |
| 3DMark Fire Strike Score | 13912 points | |
| 3DMark Time Spy Score | 5994 points | |
Help | ||
Gaming Performance
When it comes to gaming, the laptop has no trouble. The built-in hardware allows for all the titles in our database to run smoothly. In all cases, Full HD resolution and high to maximum quality settings can be chosen. When connected to a corresponding display, the GPU can also handle resolutions beyond Full HD. The following applies: The more moderate the hardware requirements of a game are, the higher the quality settings can be set to.
| BioShock Infinite - 1920x1080 Ultra Preset, DX11 (DDOF) | |
| Average NVIDIA GeForce RTX 2060 Mobile (119 - 156, n=17) | |
| HP Omen 15-dc0015ng | |
| Dell G5 15 5590 | |
| Aorus 15 W9 | |
| MSI GL73 8SE-010US | |
| Lenovo Legion Y530-15ICH | |
| Dell G5 15 5587 | |
| HP Pavilion Gaming 15t-cx0000 | |
| The Witcher 3 - 1920x1080 Ultra Graphics & Postprocessing (HBAO+) | |
| Average of class Gaming (95 - 240, n=8, last 2 years) | |
| Average NVIDIA GeForce RTX 2060 Mobile (50.6 - 74, n=40) | |
| Dell G5 15 5590 | |
| Aorus 15 W9 | |
| HP Omen 15-dc0015ng | |
| MSI GL73 8SE-010US | |
| Lenovo Legion Y530-15ICH | |
| Acer Aspire Nitro 5 AN515-54-53Z2 | |
| Dell G5 15 5587 | |
| GTA V - 1920x1080 Highest AA:4xMSAA + FX AF:16x | |
| Average of class Gaming (48.3 - 186.9, n=102, last 2 years) | |
| Average NVIDIA GeForce RTX 2060 Mobile (60 - 70.8, n=5) | |
| HP Omen 15-dc0015ng | |
| Dell G5 15 5590 | |
| Dell G5 15 5587 | |
| Far Cry 5 - 1920x1080 Ultra Preset AA:T | |
| Average of class Gaming (70 - 151, n=10, last 2 years) | |
| Average NVIDIA GeForce RTX 2060 Mobile (76 - 90, n=9) | |
| Dell G5 15 5590 | |
| Dell G5 15 5587 | |
In order to verify that frame rates remain largely constant throughout longer periods of time, we let The Witcher 3 run for around 60 minutes at Full HD resolution and at maximum quality settings. The character was not moved during the entire time. The frame rates fluctuated during the course of the test, but they always remained at a playable level. There were no frame rate drops to be found.
| low | med. | high | ultra | |
|---|---|---|---|---|
| StarCraft 2 (2010) | 419.1 | 188.6 | 181.6 | 159.7 |
| Diablo III (2012) | 222.5 | 197.5 | 200.8 | 173 |
| BioShock Infinite (2013) | 266.3 | 254.9 | 241.9 | 136.9 |
| GTA V (2015) | 156.9 | 150.2 | 116.1 | 64.1 |
| The Witcher 3 (2015) | 235.1 | 173.7 | 105.2 | 60 |
| World of Warships (2015) | 178.4 | 151.7 | 129.3 | 123.7 |
| Ashes of the Singularity (2016) | 71.1 | 65.4 | 64.4 | |
| Civilization 6 (2016) | 152.9 | 116.8 | 92.4 | 90.4 |
| Ark Survival Evolved (2017) | 128.5 | 67.4 | 52.1 | 36.1 |
| The Evil Within 2 (2017) | 79.6 | 53.1 | 53.2 | 53.6 |
| Destiny 2 (2017) | 125.9 | 114.7 | 110.5 | 99.7 |
| Final Fantasy XV Benchmark (2018) | 100.2 | 76.8 | 56.8 | |
| World of Tanks enCore (2018) | 425.6 | 218.2 | 121.7 | |
| Far Cry 5 (2018) | 103 | 85 | 83 | 79 |
| F1 2018 (2018) | 175 | 133 | 103 | 78 |
| Forza Horizon 4 (2018) | 135 | 108 | 107 | 88 |
| Far Cry New Dawn (2019) | 95 | 82 | 79 | 72 |
| Metro Exodus (2019) | 113.2 | 70 | 53.3 | 43.7 |
| The Division 2 (2019) | 128 | 90 | 74 | 57 |
| Anno 1800 (2019) | 79.3 | 73.2 | 63.1 | 36.9 |
| Rage 2 (2019) | 159.2 | 85.6 | 72.9 | 70.5 |
Emissions - No peculiarities
Noise emissions
In idle usage, the fans are often quiet and silence prevails - except for when the 2.5-inch hard drive is accessed. All this ends under load. We measured a sound pressure level of 48.7 dB(A) during our stress test. Under medium load, the level is a bit lower at 37 to 42 dB(A). The "Quiet" temperature management option needs to be chosen within Dell Power Manager in order to get an overall quieter operation. However, this is somewhat at the expense of computing power. Therefore, this option is primarily suitable for office usage.
Noise level
| Idle |
| 30.4 / 30.4 / 33.4 dB(A) |
| Load |
| 42 / 48.7 dB(A) |
 | ||
30 dB silent 40 dB(A) audible 50 dB(A) loud |
||
min: | ||
| Dell G5 15 5590 i7-8750H, GeForce RTX 2060 Mobile | Lenovo Legion Y530-15ICH i7-8750H, GeForce GTX 1060 Mobile | HP Omen 15-dc0015ng i7-8750H, GeForce GTX 1070 Max-Q | Acer Aspire Nitro 5 AN515-54-53Z2 i5-9300H, GeForce GTX 1650 Mobile | HP Pavilion Gaming 15t-cx0000 i7-8750H, GeForce GTX 1060 Max-Q | Dell G5 15 5587 i5-8300H, GeForce GTX 1060 Max-Q | MSI GL73 8SE-010US i7-8750H, GeForce RTX 2060 Mobile | Average NVIDIA GeForce RTX 2060 Mobile | Average of class Gaming | |
|---|---|---|---|---|---|---|---|---|---|
| Noise | 3% | 0% | -2% | 1% | 4% | -2% | 1% | 7% | |
| off / environment * (dB) | 30.4 | 30.2 1% | 30.6 -1% | 30 1% | 28.3 7% | 30.3 -0% | 28.6 6% | 27.9 ? 8% | 24.1 ? 21% |
| Idle Minimum * (dB) | 30.4 | 30.9 -2% | 30.6 -1% | 30 1% | 32.2 -6% | 31.1 -2% | 33.8 -11% | 29 ? 5% | 25.8 ? 15% |
| Idle Average * (dB) | 30.4 | 30.9 -2% | 30.6 -1% | 31 -2% | 32.4 -7% | 31.1 -2% | 34 -12% | 30 ? 1% | 27.4 ? 10% |
| Idle Maximum * (dB) | 33.4 | 31.6 5% | 32.2 4% | 33 1% | 32.4 3% | 34.2 -2% | 34.1 -2% | 33 ? 1% | 30 ? 10% |
| Load Average * (dB) | 42 | 42.3 -1% | 47.2 -12% | 46 -10% | 40.2 4% | 34.9 17% | 36.5 13% | 44 ? -5% | 43 ? -2% |
| Load Maximum * (dB) | 48.7 | 40 18% | 42.3 13% | 49 -1% | 47.2 3% | 44 10% | 52.2 -7% | 51.6 ? -6% | 54 ? -11% |
| Witcher 3 ultra * (dB) | 41.7 | 46 | 45 | 42.7 | 47.8 |
* ... smaller is better
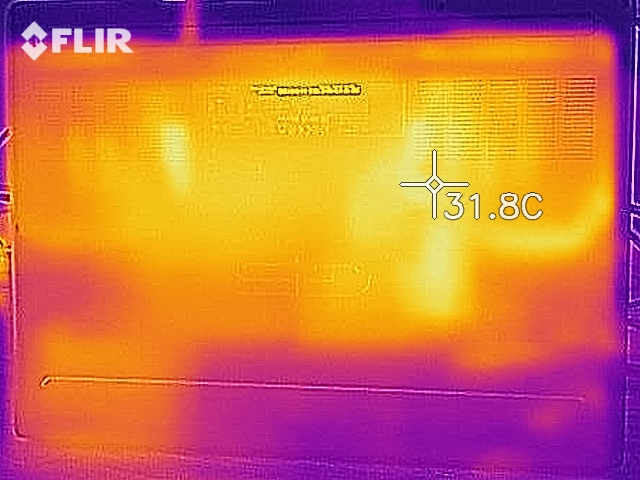
Temperature
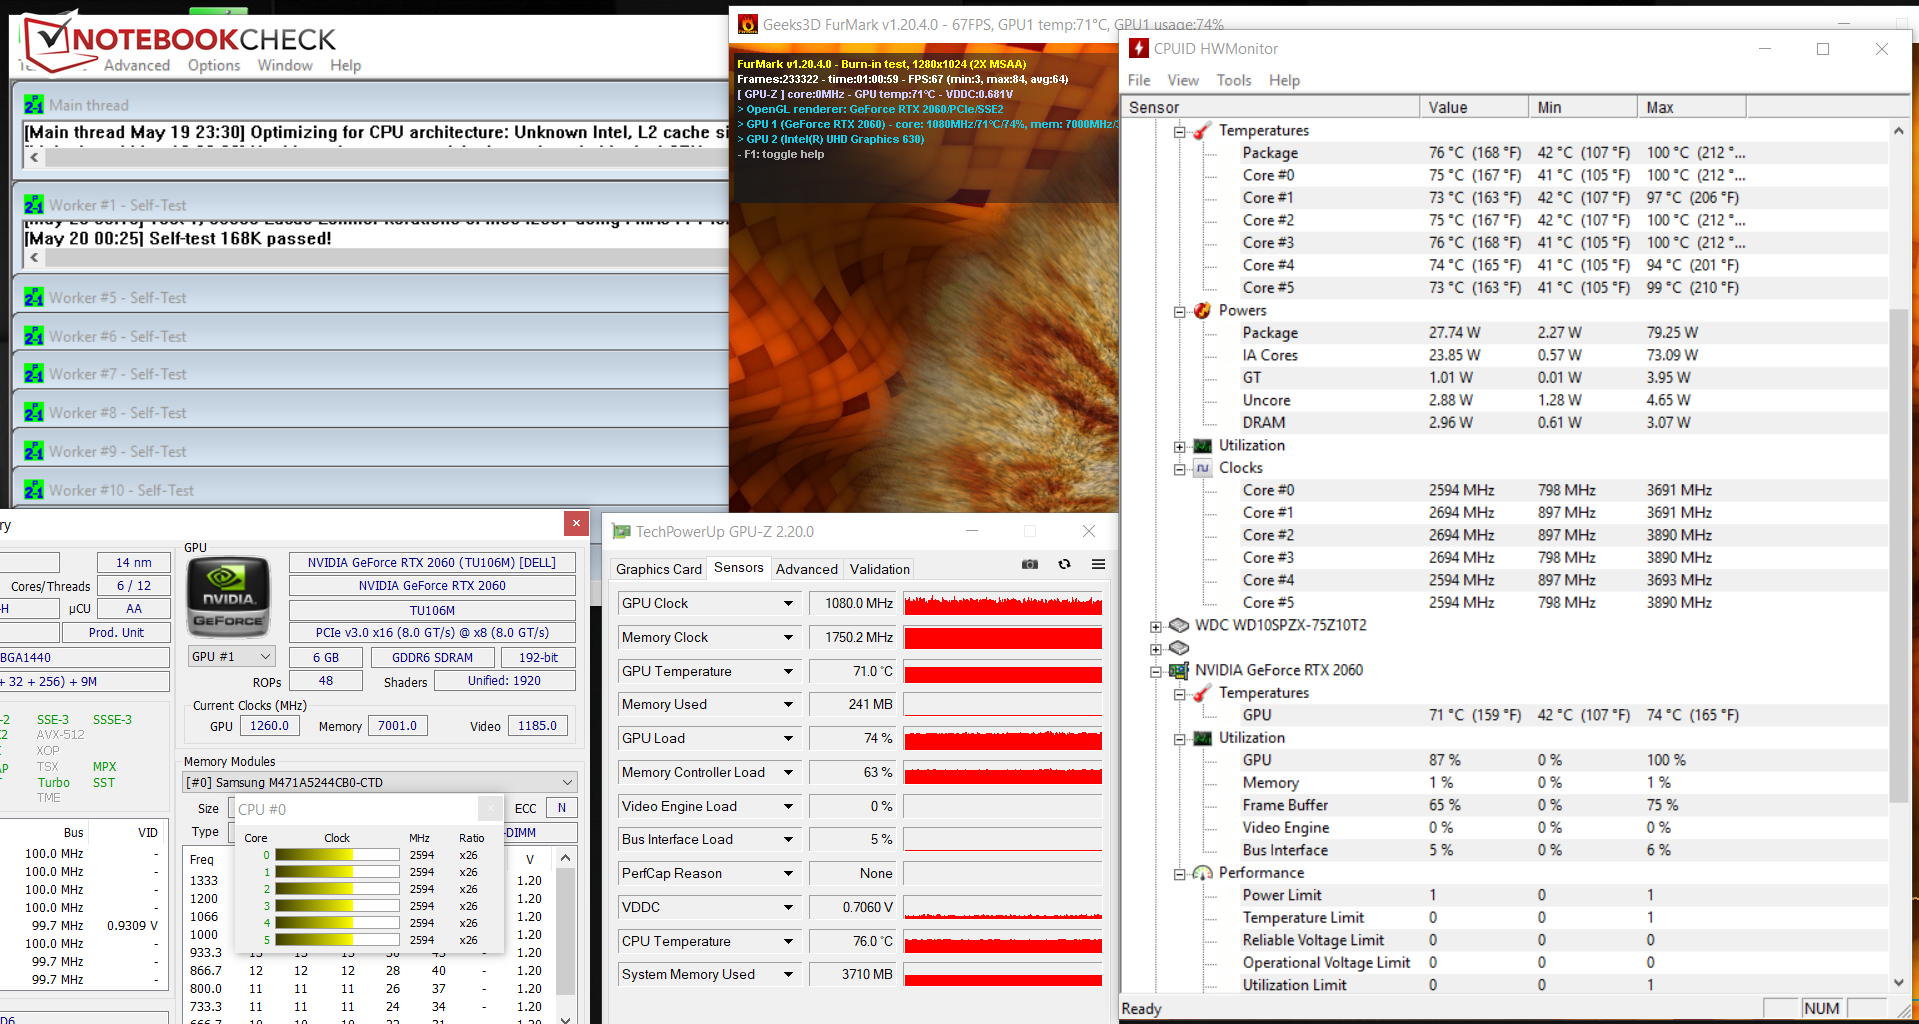
The G5 works through our stress test (Prime95 and FurMark run for at least an hour) differently depending on whether it's plugged in or on battery. When plugged in, the processor runs initially at 3.5 to 3.8 GHz. After some minutes, the clock speed drops to 2.6 to 2.7 GHz. The graphics unit works at speeds between 800 and 1100 MHz. On battery, the CPU speed is reduced to 1.3 to 1.4 GHz; the graphics unit is throttled to 300 MHz. The stress test represents an extreme scenario, which doesn't come up in everyday use. Through this test we can also verify that the system remains stable even under full load.
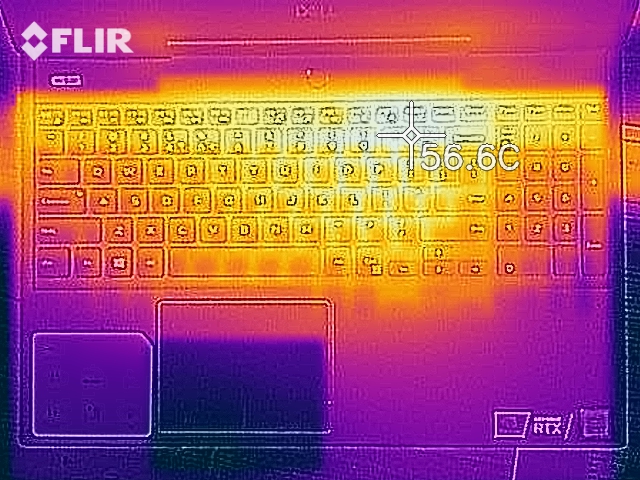
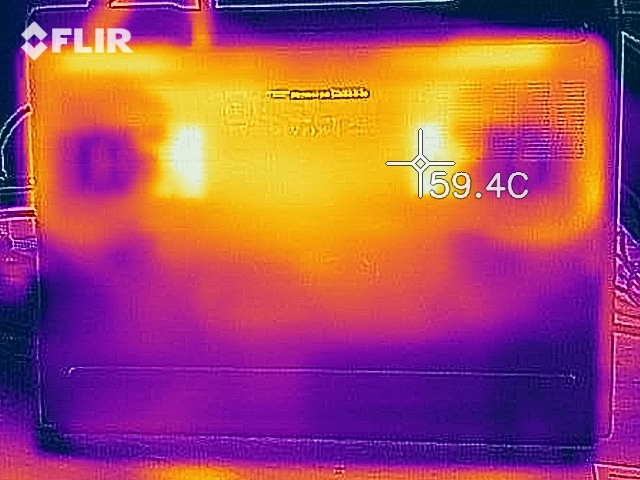
Considering the computing power that the G5 has to offer, heat development in the device is relatively moderate. During our stress test, we only measured a temperature above 50 °C (~122 °F) at one measuring point. In day-to-day operation, the values are in the green area.
(-) The maximum temperature on the upper side is 51.5 °C / 125 F, compared to the average of 40.4 °C / 105 F, ranging from 21.2 to 68.8 °C for the class Gaming.
(-) The bottom heats up to a maximum of 48.3 °C / 119 F, compared to the average of 43.2 °C / 110 F
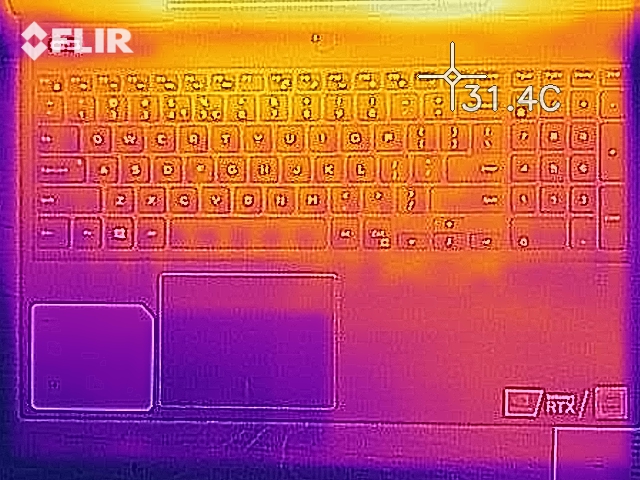
(+) In idle usage, the average temperature for the upper side is 25.8 °C / 78 F, compared to the device average of 33.9 °C / 93 F.
(+) The palmrests and touchpad are cooler than skin temperature with a maximum of 28.8 °C / 83.8 F and are therefore cool to the touch.
(±) The average temperature of the palmrest area of similar devices was 28.8 °C / 83.8 F (0 °C / 0 F).
| Dell G5 15 5590 i7-8750H, GeForce RTX 2060 Mobile | Lenovo Legion Y530-15ICH i7-8750H, GeForce GTX 1060 Mobile | HP Omen 15-dc0015ng i7-8750H, GeForce GTX 1070 Max-Q | Acer Aspire Nitro 5 AN515-54-53Z2 i5-9300H, GeForce GTX 1650 Mobile | HP Pavilion Gaming 15t-cx0000 i7-8750H, GeForce GTX 1060 Max-Q | Dell G5 15 5587 i5-8300H, GeForce GTX 1060 Max-Q | MSI GL73 8SE-010US i7-8750H, GeForce RTX 2060 Mobile | Average NVIDIA GeForce RTX 2060 Mobile | Average of class Gaming | |
|---|---|---|---|---|---|---|---|---|---|
| Heat | 3% | -10% | 7% | -6% | -6% | 6% | -9% | -7% | |
| Maximum Upper Side * (°C) | 51.5 | 48.4 6% | 49.7 3% | 47 9% | 46 11% | 50.2 3% | 47 9% | 47.2 ? 8% | 45.2 ? 12% |
| Maximum Bottom * (°C) | 48.3 | 48 1% | 48 1% | 50 -4% | 52 -8% | 57 -18% | 44.4 8% | 52.7 ? -9% | 48 ? 1% |
| Idle Upper Side * (°C) | 27.2 | 26.7 2% | 32 -18% | 24 12% | 29 -7% | 28.6 -5% | 24.6 10% | 31 ? -14% | 31.1 ? -14% |
| Idle Bottom * (°C) | 27.4 | 26.9 2% | 34 -24% | 25 9% | 33 -20% | 28.9 -5% | 28 -2% | 32.9 ? -20% | 34.2 ? -25% |
* ... smaller is better
Speakers
The stereo speakers in the G5 are placed in the narrow, user-facing side of the base unit. They produce a decent and voluminous sound, which is largely lacking in bass. For a better sound experience, the use of headphones or external speakers is recommended.
Dell G5 15 5590 audio analysis
(-) | not very loud speakers (70.8 dB)
Bass 100 - 315 Hz
(-) | nearly no bass - on average 21.6% lower than median
(±) | linearity of bass is average (13.3% delta to prev. frequency)
Mids 400 - 2000 Hz
(+) | balanced mids - only 1.9% away from median
(+) | mids are linear (4.7% delta to prev. frequency)
Highs 2 - 16 kHz
(+) | balanced highs - only 3.9% away from median
(±) | linearity of highs is average (7.7% delta to prev. frequency)
Overall 100 - 16.000 Hz
(±) | linearity of overall sound is average (18.6% difference to median)
Compared to same class
» 60% of all tested devices in this class were better, 9% similar, 31% worse
» The best had a delta of 6%, average was 18%, worst was 132%
Compared to all devices tested
» 42% of all tested devices were better, 8% similar, 50% worse
» The best had a delta of 4%, average was 24%, worst was 134%
Lenovo Legion Y530-15ICH audio analysis
(-) | not very loud speakers (68.3 dB)
Bass 100 - 315 Hz
(±) | reduced bass - on average 11.5% lower than median
(+) | bass is linear (6.4% delta to prev. frequency)
Mids 400 - 2000 Hz
(±) | higher mids - on average 5% higher than median
(+) | mids are linear (6.9% delta to prev. frequency)
Highs 2 - 16 kHz
(+) | balanced highs - only 3% away from median
(+) | highs are linear (4.6% delta to prev. frequency)
Overall 100 - 16.000 Hz
(±) | linearity of overall sound is average (16% difference to median)
Compared to same class
» 38% of all tested devices in this class were better, 6% similar, 55% worse
» The best had a delta of 6%, average was 18%, worst was 132%
Compared to all devices tested
» 25% of all tested devices were better, 5% similar, 70% worse
» The best had a delta of 4%, average was 24%, worst was 134%
Energy management - Very long-lasting
Energy consumption
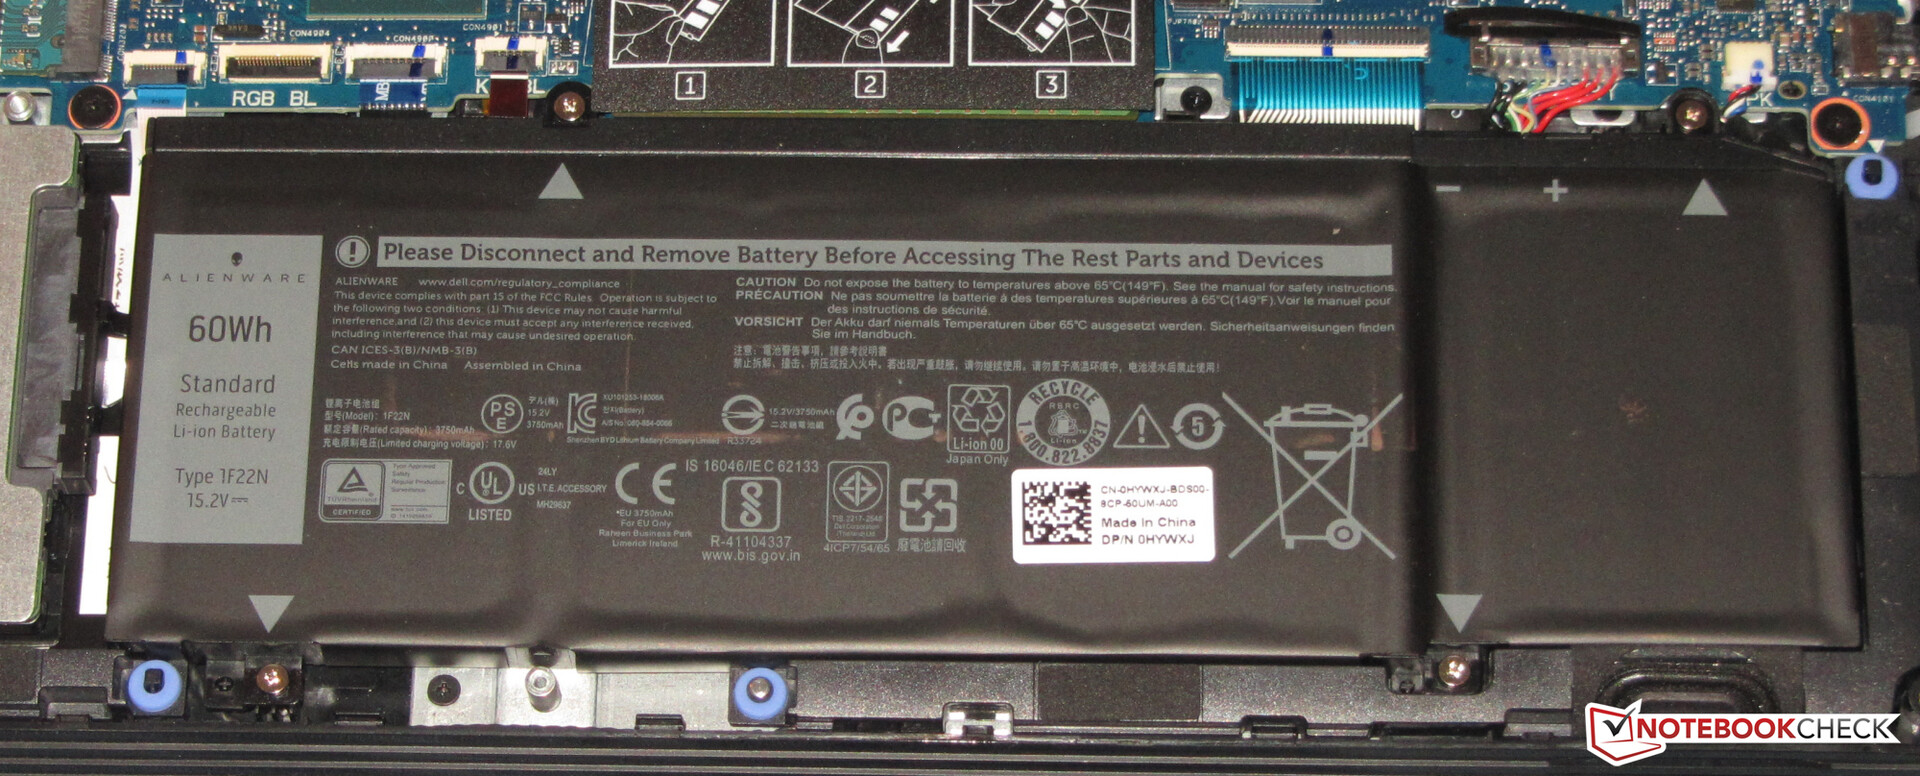
The Dell laptop surprises in idle usage thanks to its low energy consumption. With a maximum of 8.5 Watts, the device not only clearly undercuts all its rivals but also the majority of gaming laptops that we've reviewed so far. Only its predecessor is a close contender. The power consumption increased to up to 179 Watts during our stress test - a normal value for the built-in hardware. The value is lower when gaming. The rated capacity of the included power supply is 180 Watts.
| Off / Standby | |
| Idle | |
| Load |
|
Key:
min: | |
| Dell G5 15 5590 i7-8750H, GeForce RTX 2060 Mobile | Lenovo Legion Y530-15ICH i7-8750H, GeForce GTX 1060 Mobile | HP Omen 15-dc0015ng i7-8750H, GeForce GTX 1070 Max-Q | Acer Aspire Nitro 5 AN515-54-53Z2 i5-9300H, GeForce GTX 1650 Mobile | HP Pavilion Gaming 15t-cx0000 i7-8750H, GeForce GTX 1060 Max-Q | Dell G5 15 5587 i5-8300H, GeForce GTX 1060 Max-Q | MSI GL73 8SE-010US i7-8750H, GeForce RTX 2060 Mobile | Average NVIDIA GeForce RTX 2060 Mobile | Average of class Gaming | |
|---|---|---|---|---|---|---|---|---|---|
| Power Consumption | -40% | -133% | -3% | -27% | -4% | -75% | -109% | -133% | |
| Idle Minimum * (Watt) | 3.5 | 7.3 -109% | 14 -300% | 5 -43% | 6 -71% | 4.9 -40% | 8.8 -151% | 11.5 ? -229% | 13.2 ? -277% |
| Idle Average * (Watt) | 6.9 | 11.1 -61% | 18.2 -164% | 7 -1% | 11.2 -62% | 8.5 -23% | 16.2 -135% | 16.5 ? -139% | 18.9 ? -174% |
| Idle Maximum * (Watt) | 8.5 | 12.6 -48% | 24 -182% | 11 -29% | 13.3 -56% | 9.1 -7% | 18.3 -115% | 23.7 ? -179% | 24.3 ? -186% |
| Load Average * (Watt) | 127 | 109 14% | 143 -13% | 89 30% | 89.2 30% | 90.7 29% | 86.1 32% | 107.5 ? 15% | 108 ? 15% |
| Load Maximum * (Watt) | 179 | 168 6% | 190 -6% | 132 26% | 134.5 25% | 144 20% | 186.4 -4% | 199.7 ? -12% | 254 ? -42% |
| Witcher 3 ultra * (Watt) | 126 | 90 | 101.9 | 110 | 146.7 |
* ... smaller is better
Battery life
In our practical Wi-Fi test the G5 reaches a runtime of 7:43 h. With it we simulate the load caused by accessing websites through the use of a script. We enable the "Balanced" profile, and display brightness is set at around 150 cd/m². The 15.6-incher completed our video test after 8:26 h. Here we let the short film Big Buck Bunny (H.264 encoding, 1920x1080 pixels) run in a loop. We enable the "Balanced" profile, the radio modules are disabled, and display brightness is set at around 150 cd/m².
Overall, the Dell laptop delivers outstanding battery runtimes. Despite an only marginally larger battery (60 Wh vs. 56 Wh), it performs notably better than its predecessor once again.
| Dell G5 15 5590 i7-8750H, GeForce RTX 2060 Mobile, 60 Wh | Dell G5 15 5587 i5-8300H, GeForce GTX 1060 Max-Q, 56 Wh | Lenovo Legion Y530-15ICH i7-8750H, GeForce GTX 1060 Mobile, 52 Wh | HP Omen 15-dc0015ng i7-8750H, GeForce GTX 1070 Max-Q, 70.07 Wh | Acer Aspire Nitro 5 AN515-54-53Z2 i5-9300H, GeForce GTX 1650 Mobile, 57 Wh | HP Pavilion Gaming 15t-cx0000 i7-8750H, GeForce GTX 1060 Max-Q, 70 Wh | MSI GL73 8SE-010US i7-8750H, GeForce RTX 2060 Mobile, 41 Wh | Average of class Gaming | |
|---|---|---|---|---|---|---|---|---|
| Battery runtime | -23% | -60% | -44% | -8% | -36% | -66% | -25% | |
| Reader / Idle (h) | 14.8 | 11.8 -20% | 8.3 -44% | 7.7 -48% | 17.4 18% | 8 -46% | 6.5 -56% | 8.71 ? -41% |
| H.264 (h) | 8.4 | 5.4 -36% | 3.4 -60% | 8.26 ? -2% | ||||
| WiFi v1.3 (h) | 7.7 | 6.5 -16% | 3.8 -51% | 4.6 -40% | 8.1 5% | 6.3 -18% | 2.8 -64% | 7.02 ? -9% |
| Load (h) | 2.8 | 2.2 -21% | 0.4 -86% | 2 -29% | 1.5 -46% | 1.6 -43% | 0.6 -79% | 1.47 ? -47% |
Pros
Cons
Verdict
Dell delivers with the G5 15 5590 a relatively reasonably priced gaming laptop in the 15.6-inch format. It seems overconfident to talk about a reasonably priced or low-priced gaming laptop when we're dealing with a price tag of roughly 1,400 Euros (~$1,567), though. Nevertheless, this description is true. Comparable laptops that offer the same CPU-GPU combination as the G5 can definitely cost a few hundred Euros more.
The Dell laptop does what it's supposed to do: It runs all the games that are found in our database smoothly. The combination of the Core i7-8750H processor and the GeForce RTX 2060 graphics unit will make sure of this for the next years coming. Should the GPU no longer be able to meet the requirements, the possibility of using an external GPU through the Thunderbolt 3 port is available.
Dell offers a decent gaming laptop with the G5 15 5590. However, the relatively favorable price requires some compromises.
An NVMe SSD makes for a fast operating system. The built-in SSD isn't among the fastest SSD models, however. One of the compromises is evident here, which Dell had to accept due to cost reasons. The SSD is joined by a 1 TB 2.5-inch hard drive. Both drives could be swapped out. In order to do this, the bottom cover needs to be removed - not a complicated procedure.
The built-in keyboard proved to be adequate for everyday use. Positive: Keyboard backlighting is available. The outstanding battery life shouldn't be left unmentioned; a lot of office laptops don't provide this.
The matte IPS display in the G5 only scores points with its good contrast and stable viewing angles. The brightness is too low and the response times are too high. The color reproduction isn't a cause for excitement either. The fact that Dell only honors the G5 with a 12-month warranty is something to be criticized. The standard is to offer a two-year warranty.
Dell G5 15 5590
- 09/20/2019 v7 (old)
Sascha Mölck
Price comparison
