Dell G5 15 5590 Laptop Review: 15-inch gaming notebook with a Max-Q GPU

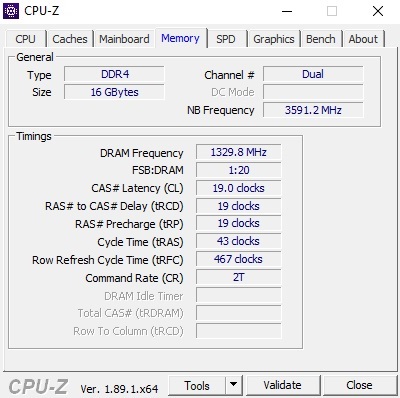
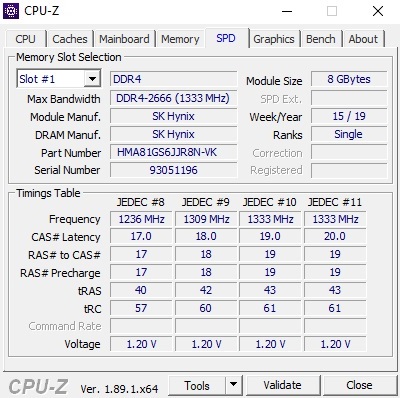
While the recently reviewed G5 15 5590-PCNJJ is a good notebook for occasional gaming, which is in our top 10 of the best budget gaming notebooks, the G5 15 5590-P8RVW is a full-blooded high-end laptop. It offers six cores instead of four and 512 GB of solid state drive storage instead of 128 GB. The amount of RAM has gone from 8 GB to 16 GB (running in dual-channel once again). However, the largest increase in performance comes from the GPU. Max-Q design or not, the Nvidia GeForce RTX 2070 simply crushes the GTX 1650 when it comes to gaming performance, even though both GPUs are based on the same Turing architecture.
The competitors of the G5 15 5590-P8RVW include other 15-inch devices with the Core i7-9750H and the GeForce RTX 2070 (Max-Q) such as the Acer Triton 500, the Gigabyte Aero 15 Classic-XA, the HP Omen X 2S and the Asus Zephyrus S GX502GW. The above-mentioned laptops have been provided to us courtesy of the e-tailer cyberport.de and are included in this review for comparison purposes.
Rating | Date | Model | Weight | Height | Size | Resolution | Price |
|---|---|---|---|---|---|---|---|
| 82.6 % v7 (old) | 10 / 2019 | Dell G5 15 5590-P8RVW i7-9750H, GeForce RTX 2070 Max-Q | 2.8 kg | 23.7 mm | 15.60" | 1920x1080 | |
| 84 % v7 (old) | 08 / 2019 | Acer Predator Triton 500 PT515-51-71PZ i7-9750H, GeForce RTX 2070 Max-Q | 2.1 kg | 18 mm | 15.60" | 1920x1080 | |
| 84 % v7 (old) | 05 / 2019 | Gigabyte Aero 15 Classic-XA i7-9750H, GeForce RTX 2070 Max-Q | 2.1 kg | 19 mm | 15.60" | 1920x1080 | |
| 82.3 % v7 (old) | 09 / 2019 | HP Omen X 2S 15-dg0075cl i7-9750H, GeForce RTX 2070 Max-Q | 2.4 kg | 19.8 mm | 15.60" | 1920x1080 | |
| 81.3 % v7 (old) | 05 / 2019 | Asus Zephyrus S GX502GW i7-9750H, GeForce RTX 2070 Mobile | 2.1 kg | 19 mm | 15.60" | 1920x1080 |
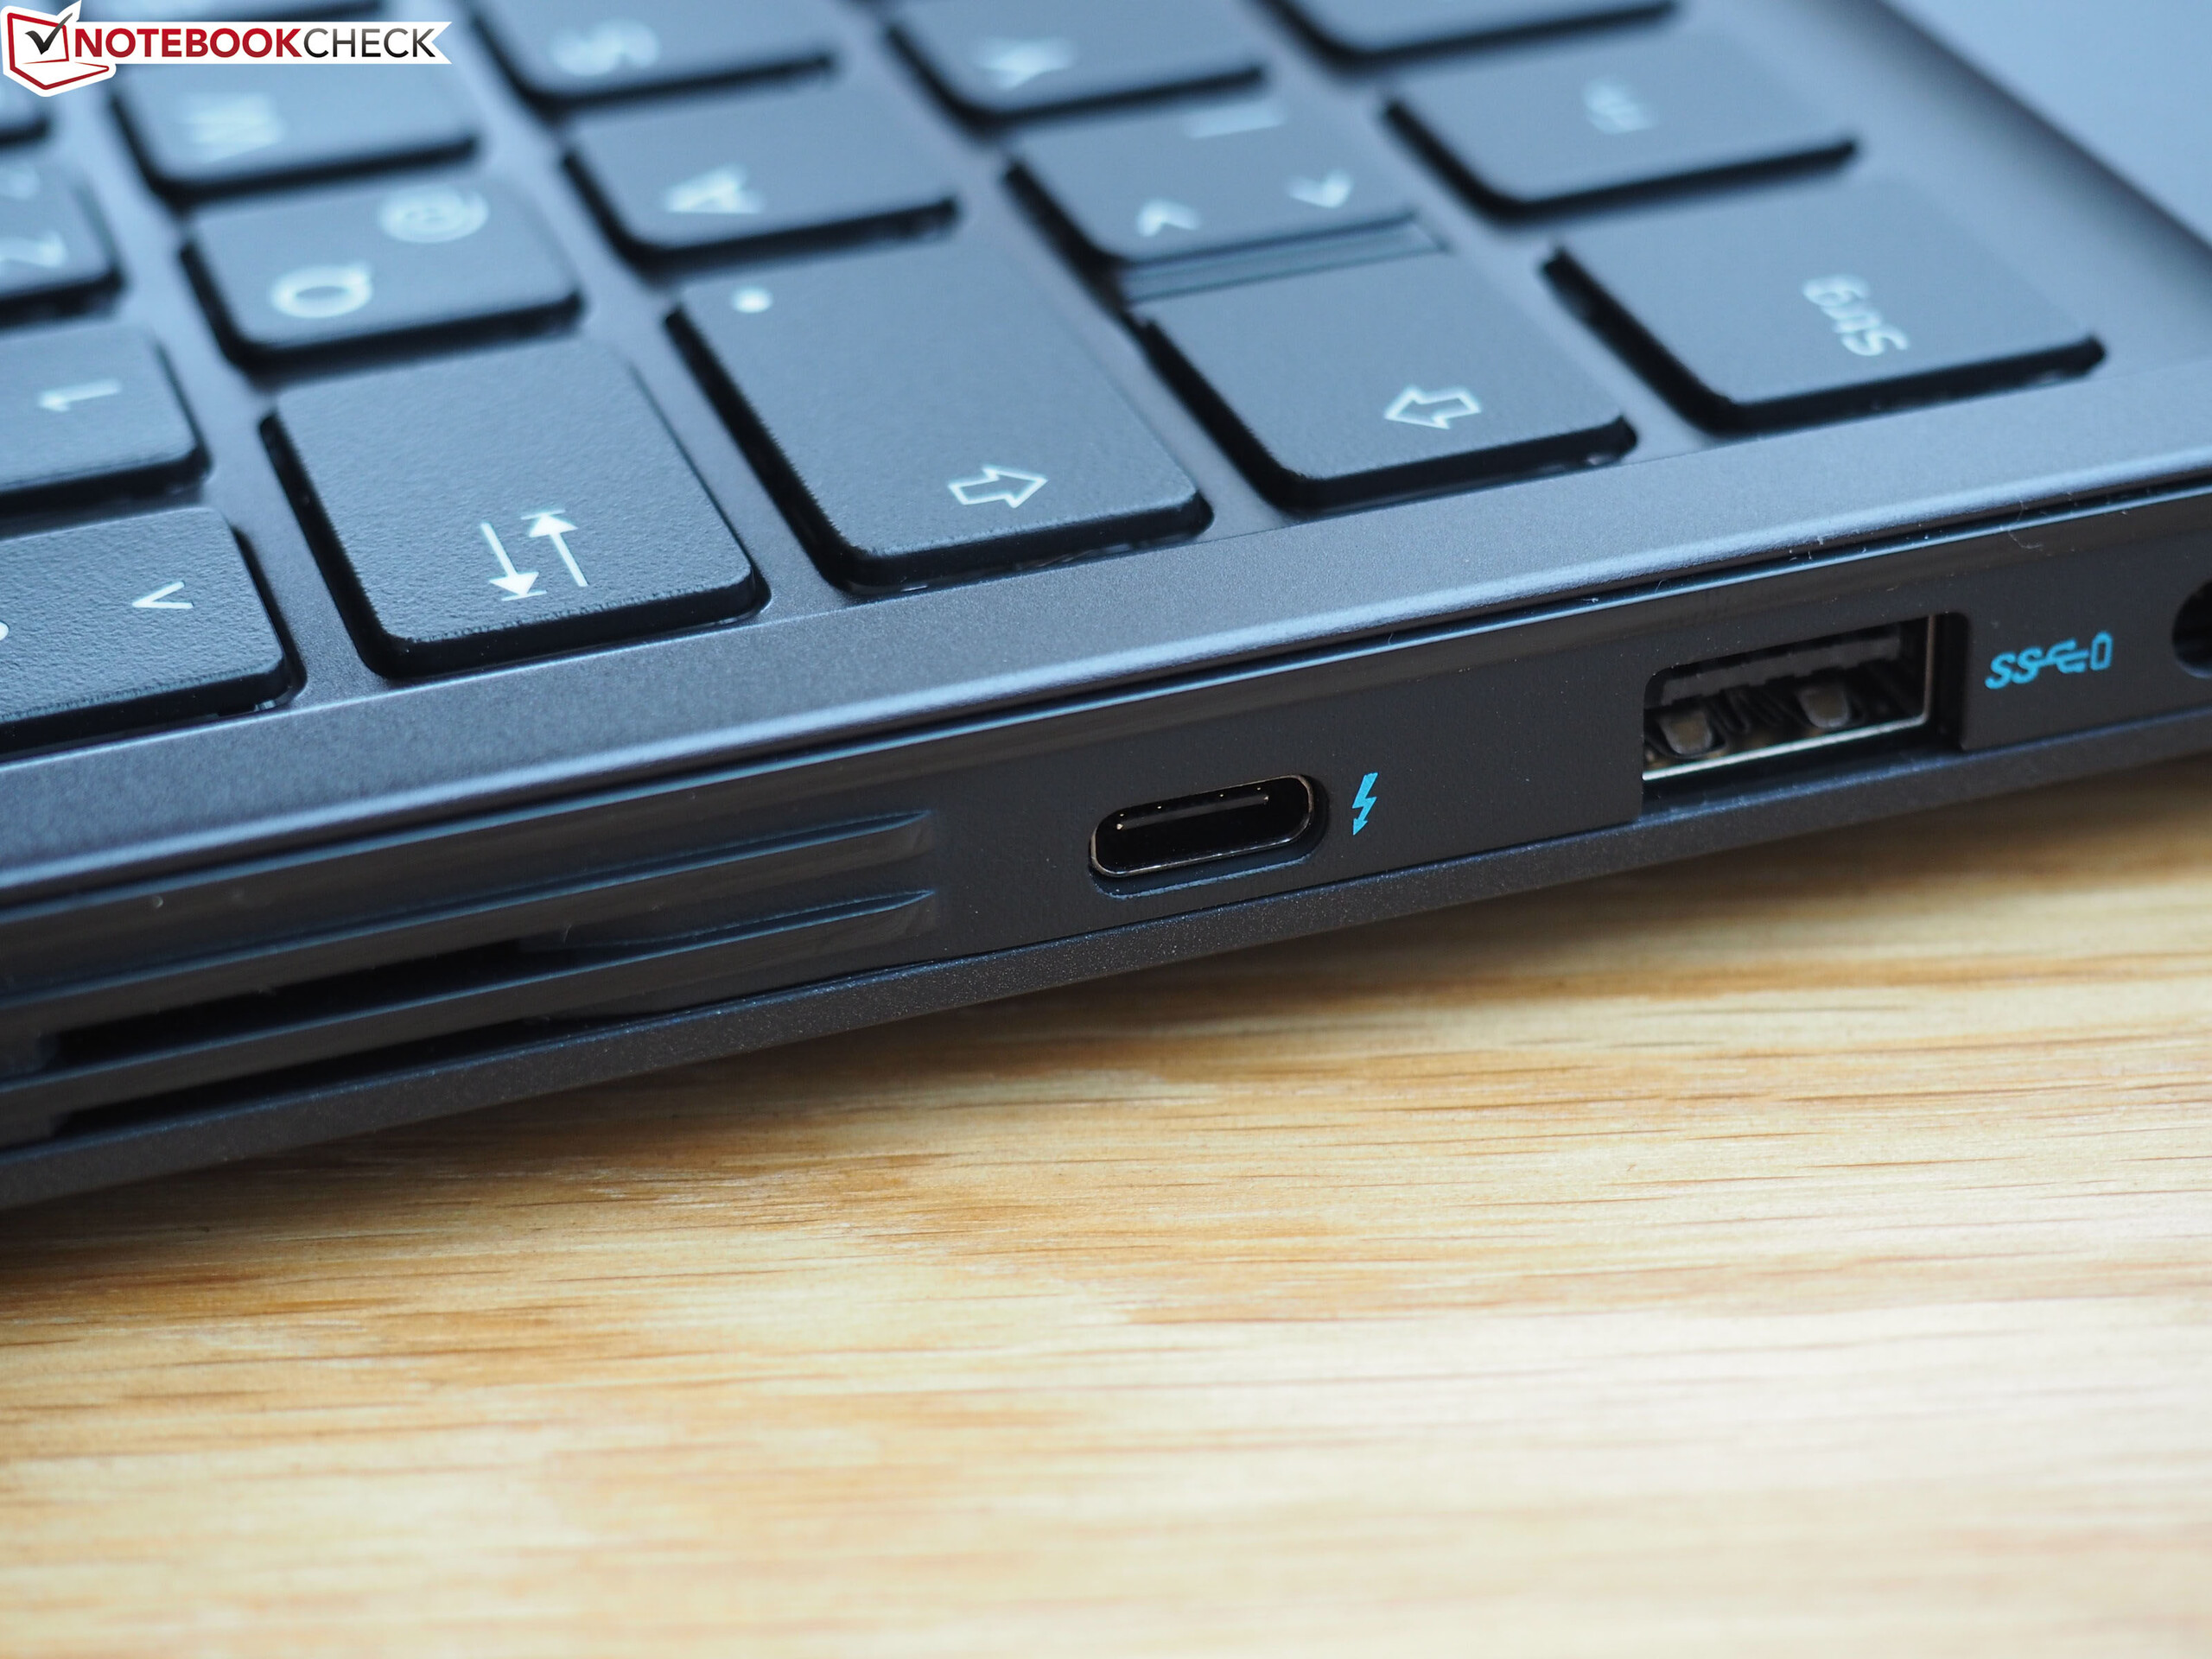
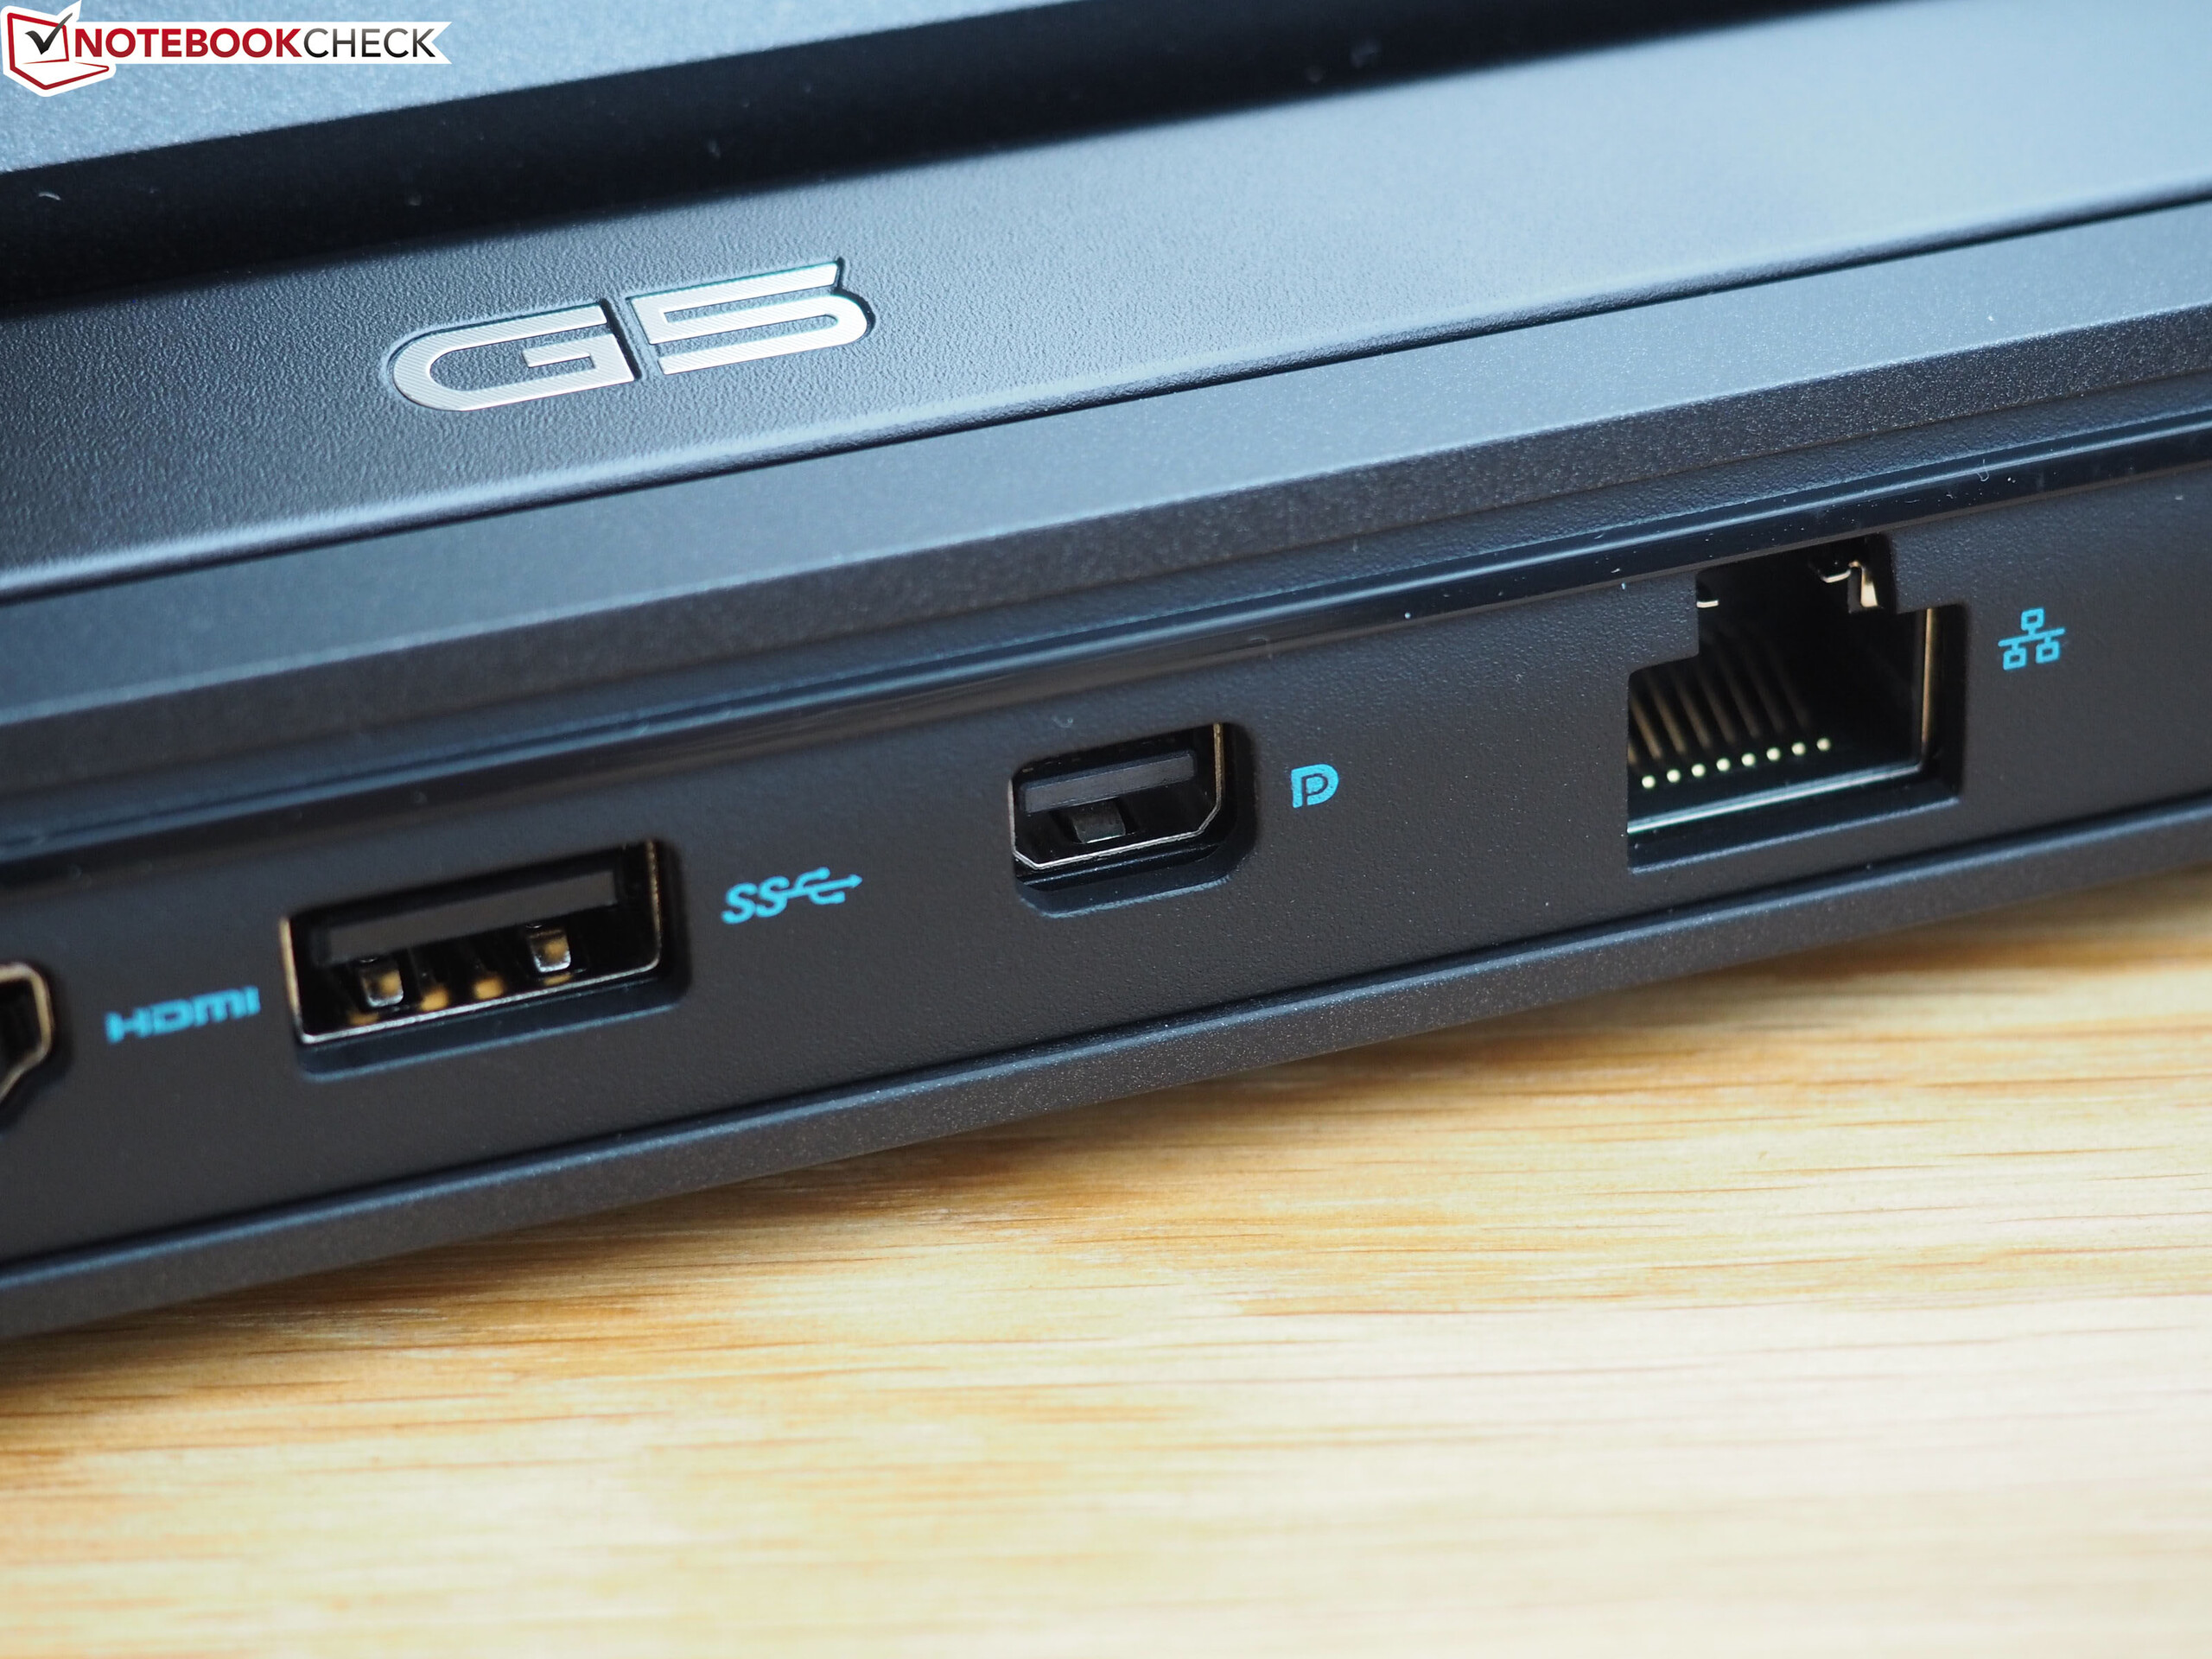
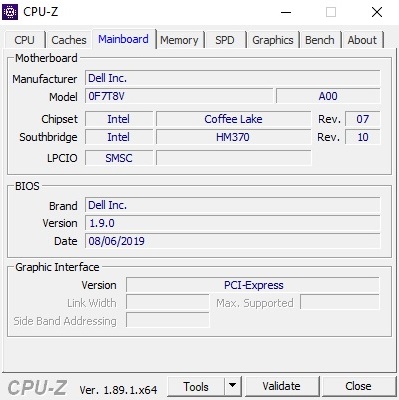
Because the case of the G5 15 5590-P8RVW – with the exception of the color scheme (black instead of white) – is identical to that of the cheaper G5 15 5590-PCNJJ, we shall skip the sections that deal with the case, connectivity, and the input devices. You can find all the appropriate information in the following review. There is a small but important change in terms of ports: The entry-level version has one USB Type-C port that can output a DisplayPort signal, whereas the more expensive model has a Thunderbolt 3 port and a dedicated DisplayPort connector (see photos).
| SD Card Reader | |
| average JPG Copy Test (av. of 3 runs) | |
| Gigabyte Aero 15 Classic-XA (Toshiba Exceria Pro SDXC 64 GB UHS-II) | |
| Average of class Gaming (20.9 - 210, n=54, last 2 years) | |
| Dell G5 15 5590-P8RVW (Toshiba Exceria Pro SDXC 64 GB UHS-II) | |
| maximum AS SSD Seq Read Test (1GB) | |
| Gigabyte Aero 15 Classic-XA (Toshiba Exceria Pro SDXC 64 GB UHS-II) | |
| Average of class Gaming (25.5 - 261, n=51, last 2 years) | |
| Dell G5 15 5590-P8RVW (Toshiba Exceria Pro SDXC 64 GB UHS-II) | |
Display
Besides the ports, Dell has also made some changes to the display of the 5590-P8RVW. This is a good thing, because the 60-Hz screen of the 5590-PCNJJ left a rather mediocre impression, not only because of its low brightness but also because of its poor color-space coverage and long response times.
| |||||||||||||||||||||||||
Brightness Distribution: 83 %
Center on Battery: 291 cd/m²
Contrast: 1323:1 (Black: 0.22 cd/m²)
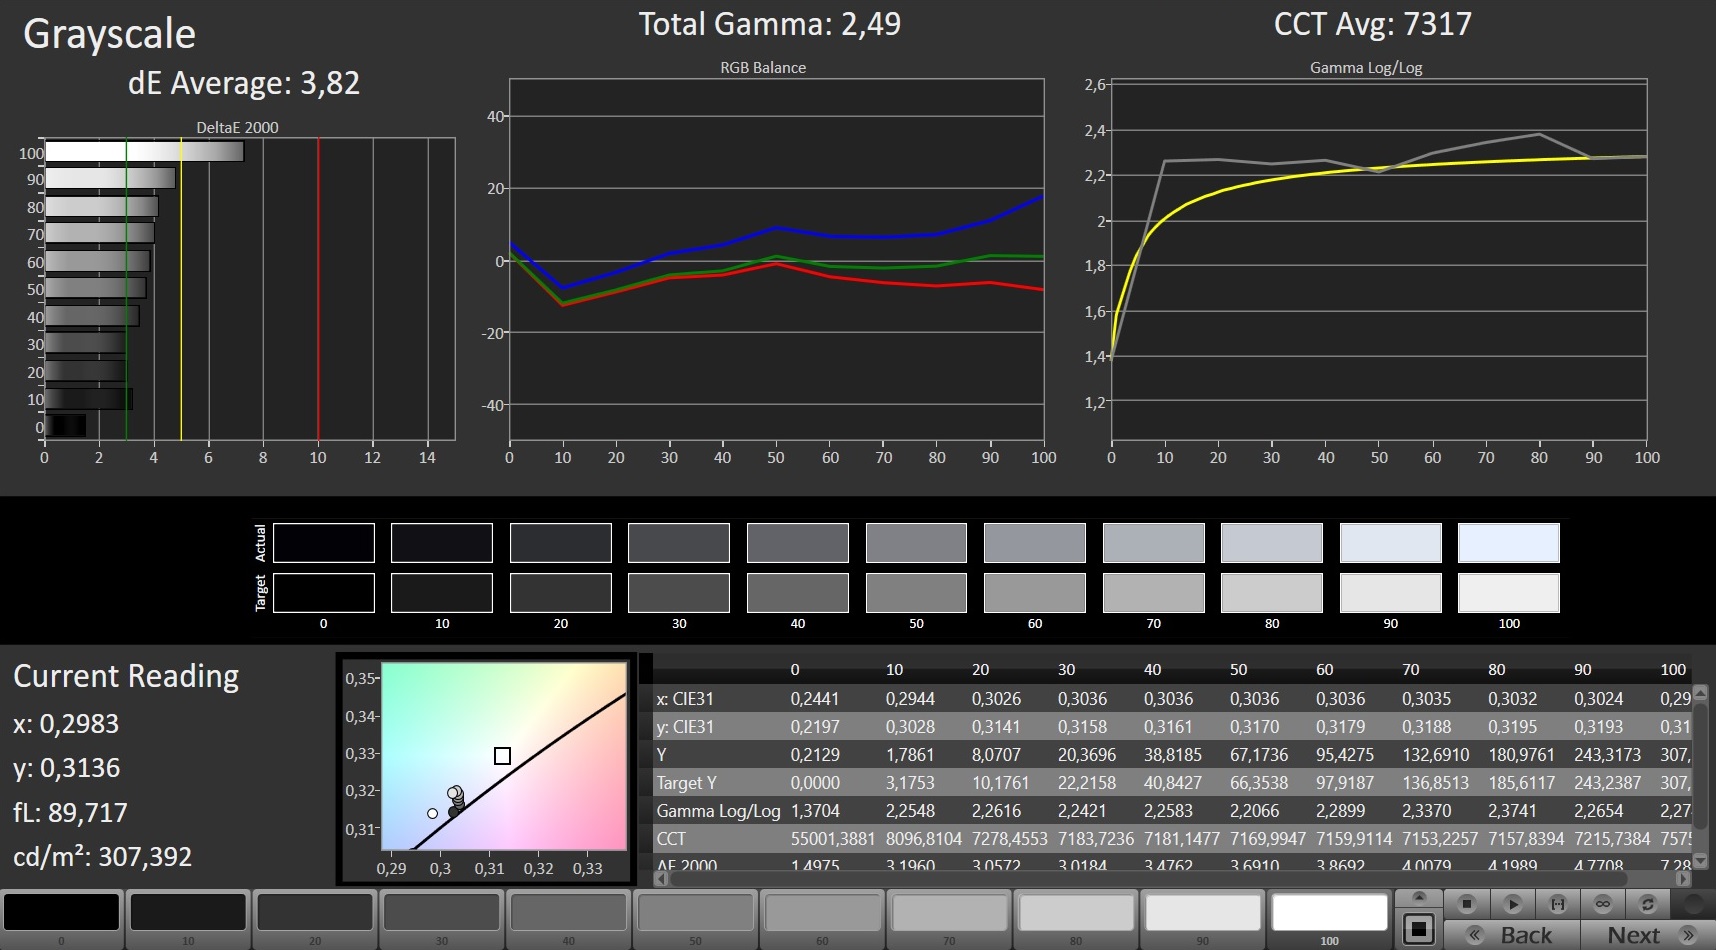
ΔE ColorChecker Calman: 3.95 | ∀{0.5-29.43 Ø4.71}
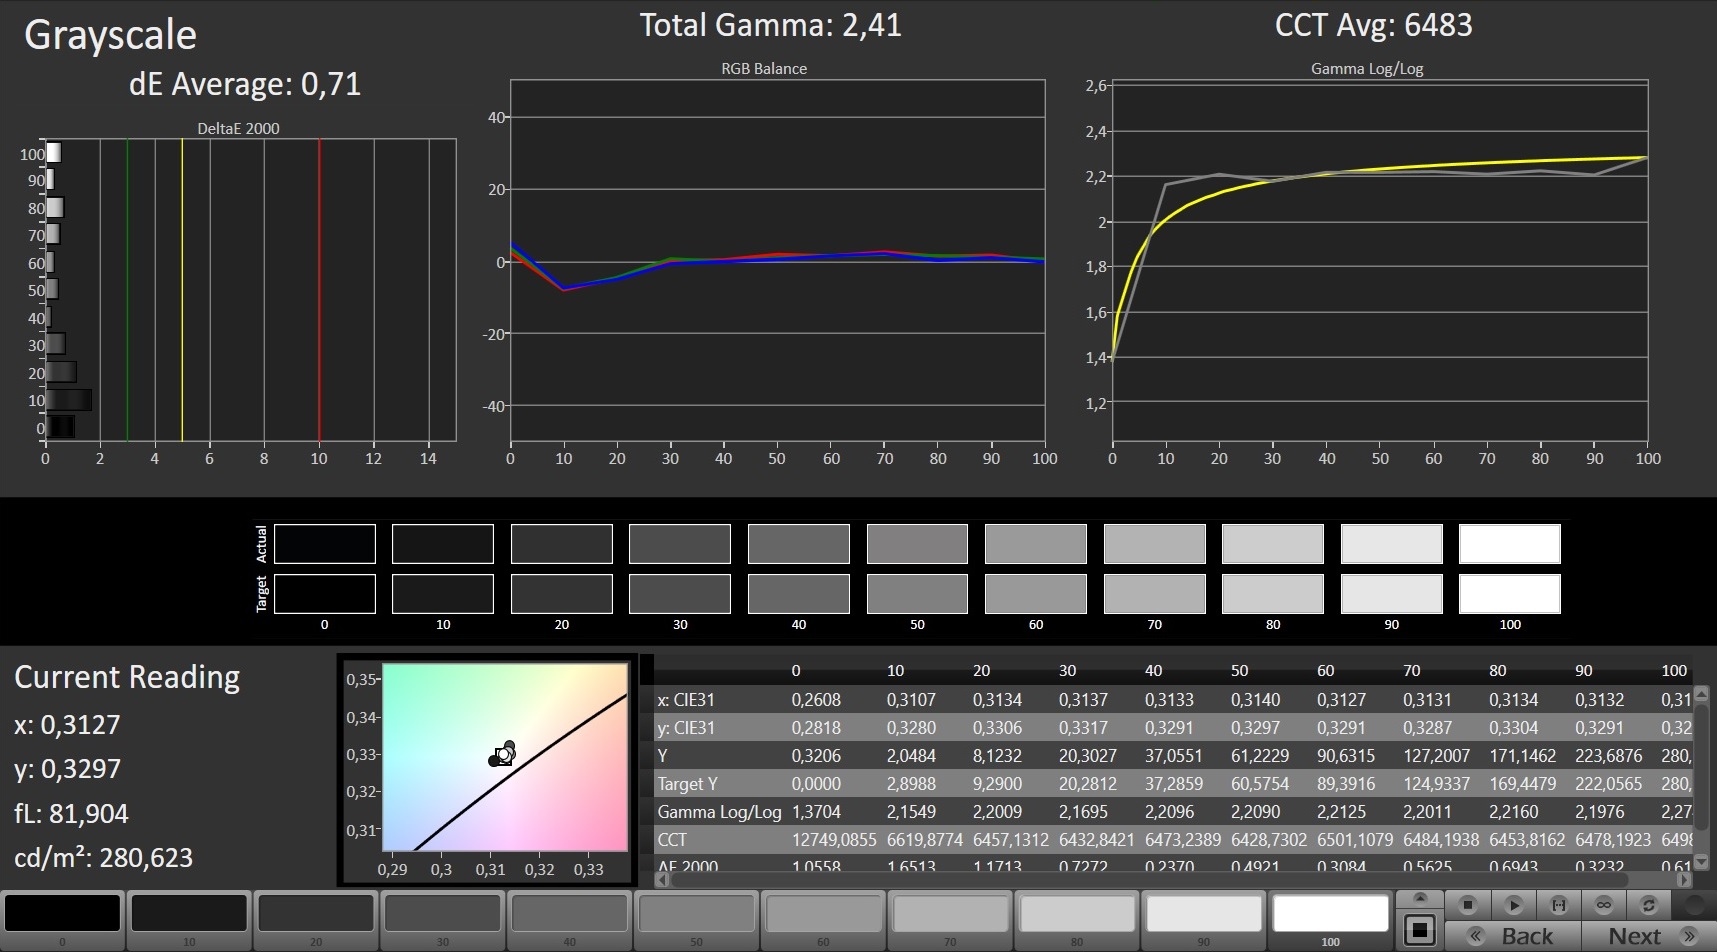
calibrated: 2.05
ΔE Greyscale Calman: 3.82 | ∀{0.09-98 Ø4.96}
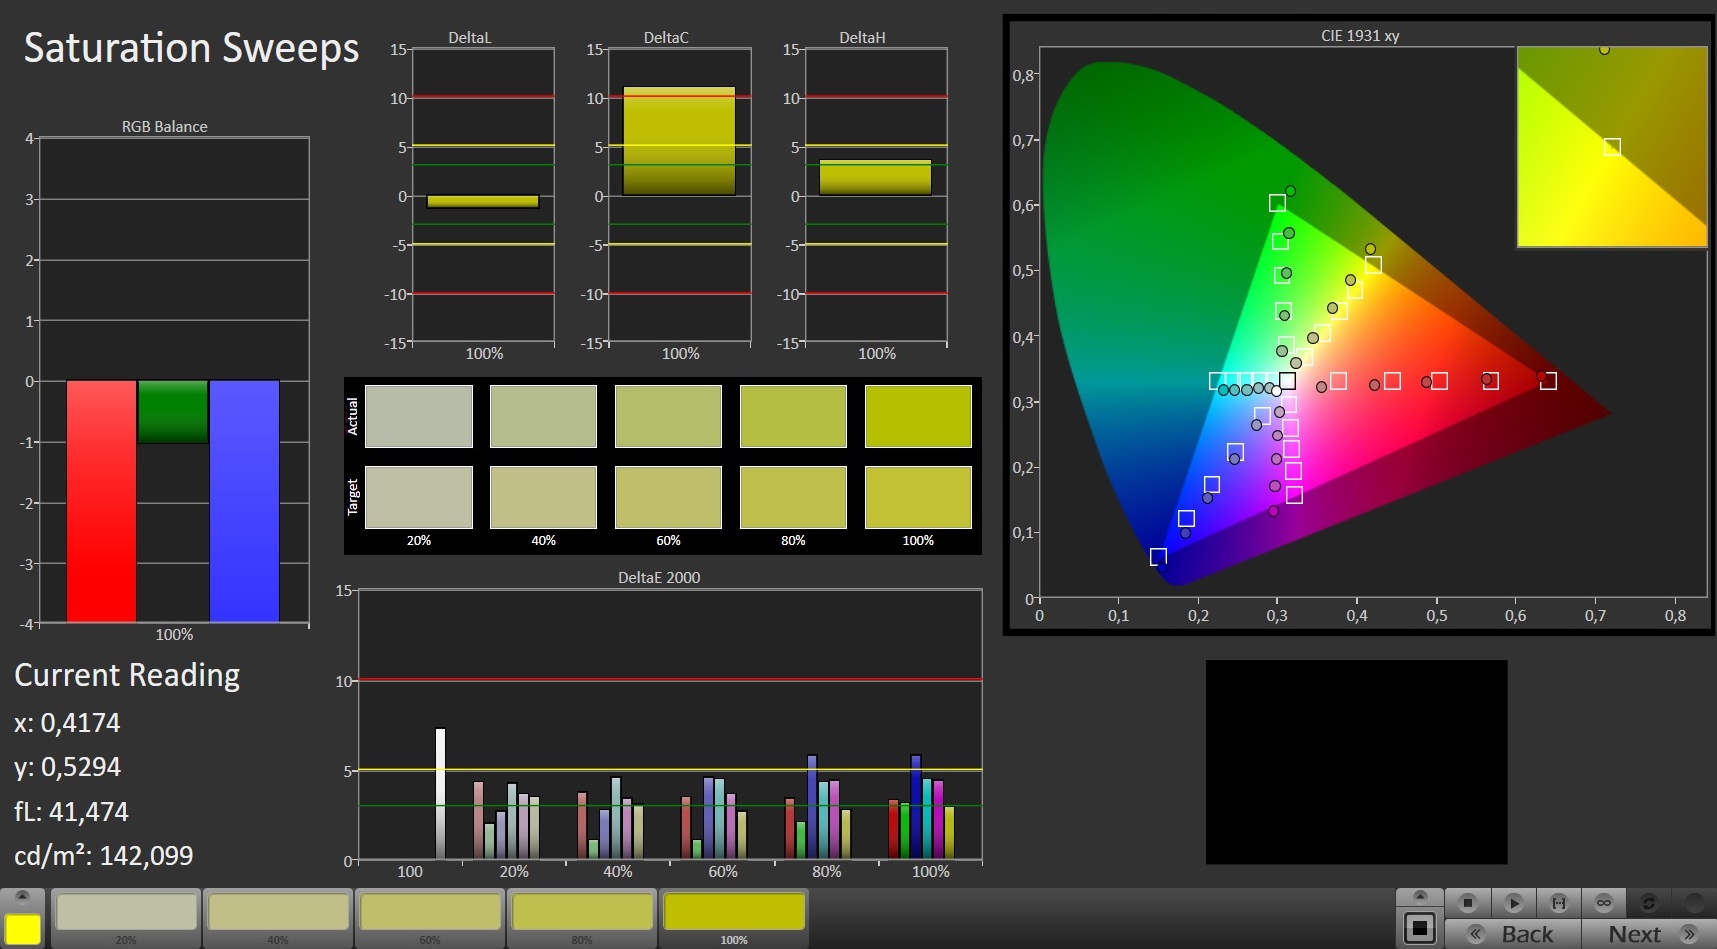
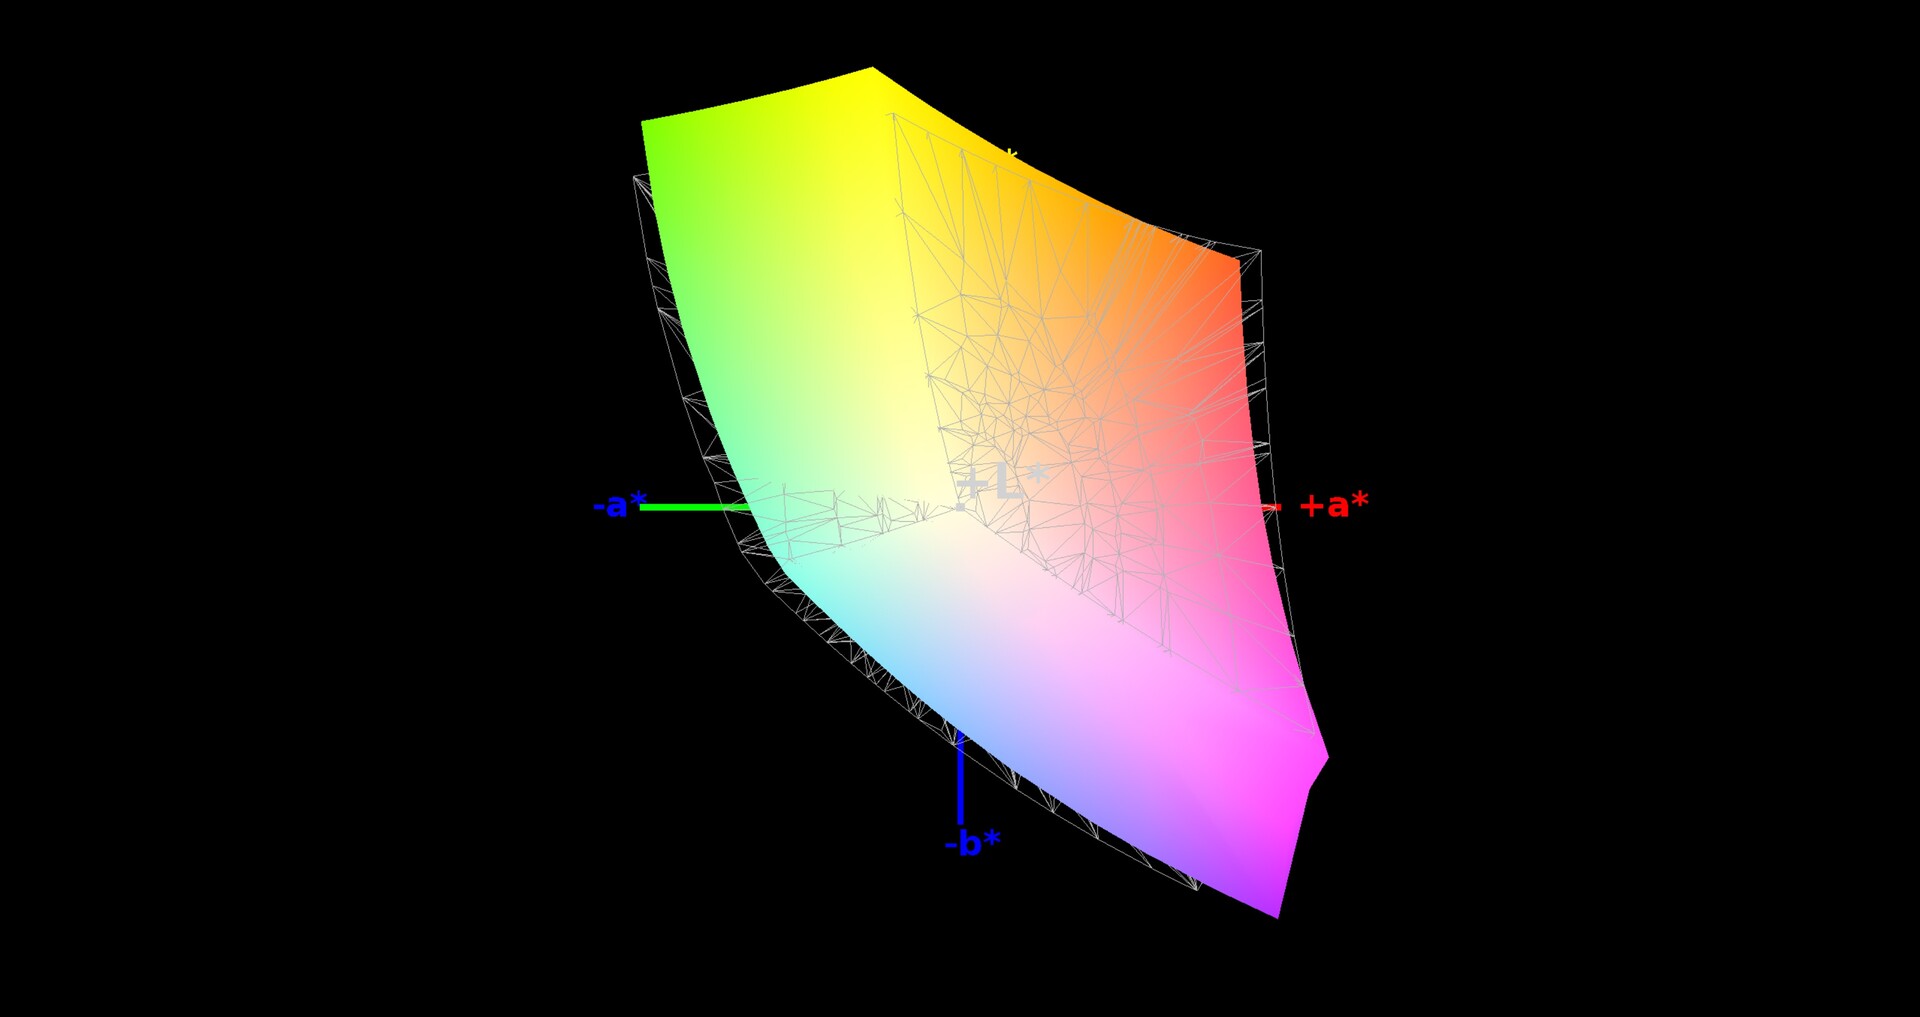
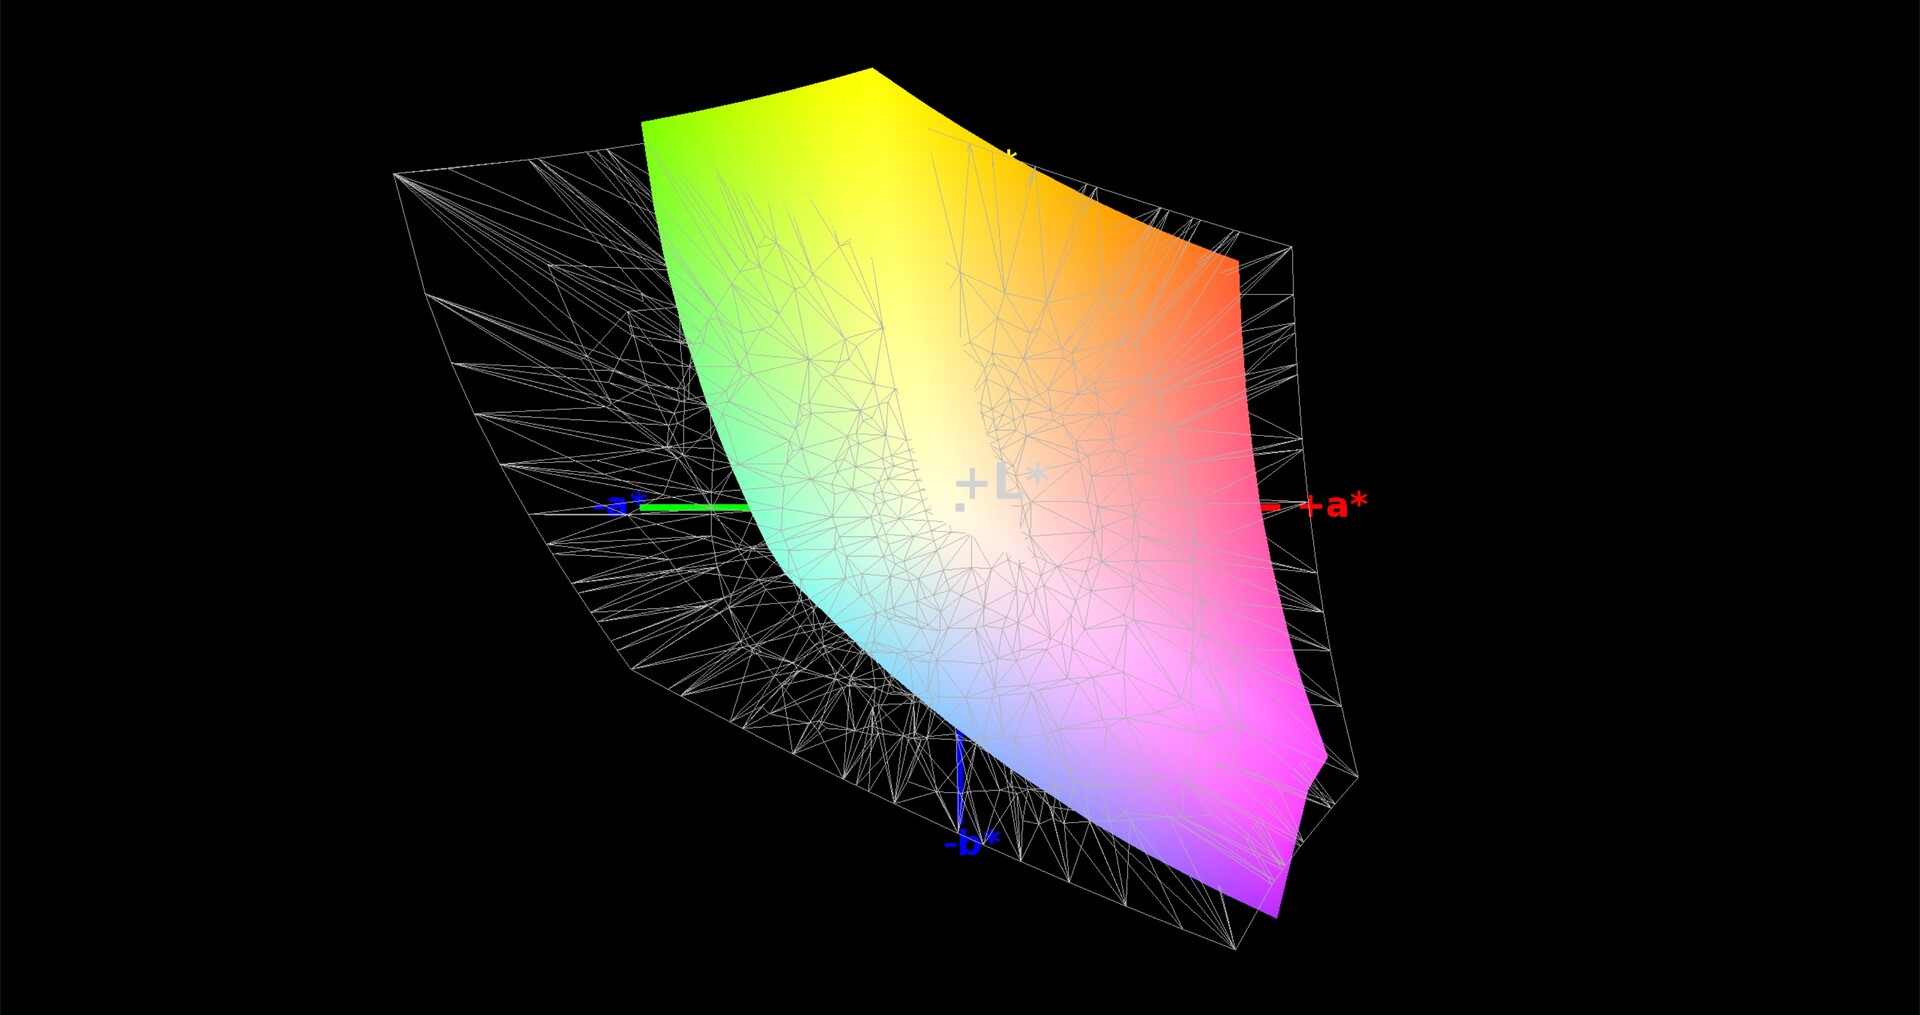
91% sRGB (Argyll 1.6.3 3D)
59% AdobeRGB 1998 (Argyll 1.6.3 3D)
66.7% AdobeRGB 1998 (Argyll 3D)
91.2% sRGB (Argyll 3D)
65.7% Display P3 (Argyll 3D)
Gamma: 2.49
CCT: 7317 K
| Dell G5 15 5590-P8RVW AU Optronics B156HAN (AUO80ED), IPS, 1920x1080 | Acer Predator Triton 500 PT515-51-71PZ NV156FHM-N4K (BOE082A), IPS, 1920x1080 | Gigabyte Aero 15 Classic-XA Sharp LQ156M1JW03 (SHP14C5), IGZO, 1920x1080 | HP Omen X 2S 15-dg0075cl AU Optronics AUO82ED, IPS, 1920x1080 | Asus Zephyrus S GX502GW AU Optronics B156HAN08.2 (AUO82ED), IPS, 1920x1080 | |
|---|---|---|---|---|---|
| Display | -0% | 1% | 1% | -1% | |
| Display P3 Coverage (%) | 65.7 | 64.6 -2% | 65.3 -1% | 66.2 1% | 64.9 -1% |
| sRGB Coverage (%) | 91.2 | 92.6 2% | 95.5 5% | 92.3 1% | 91 0% |
| AdobeRGB 1998 Coverage (%) | 66.7 | 66 -1% | 66.5 0% | 67.2 1% | 65.9 -1% |
| Response Times | 41% | 10% | 12% | 44% | |
| Response Time Grey 50% / Grey 80% * (ms) | 16.4 ? | 5.2 ? 68% | 15.2 ? 7% | 15.2 ? 7% | 7.2 ? 56% |
| Response Time Black / White * (ms) | 12.8 ? | 11.2 ? 13% | 11.2 ? 13% | 10.8 ? 16% | 8.8 ? 31% |
| PWM Frequency (Hz) | 23580 ? | ||||
| Screen | 6% | 3% | -12% | 1% | |
| Brightness middle (cd/m²) | 291 | 288 -1% | 266 -9% | 324.8 12% | 286 -2% |
| Brightness (cd/m²) | 295 | 265 -10% | 248 -16% | 316 7% | 275 -7% |
| Brightness Distribution (%) | 83 | 84 1% | 89 7% | 84 1% | 90 8% |
| Black Level * (cd/m²) | 0.22 | 0.22 -0% | 0.31 -41% | 0.26 -18% | 0.37 -68% |
| Contrast (:1) | 1323 | 1309 -1% | 858 -35% | 1249 -6% | 773 -42% |
| Colorchecker dE 2000 * | 3.95 | 3.22 18% | 2.78 30% | 4.96 -26% | 2.19 45% |
| Colorchecker dE 2000 max. * | 7.46 | 6.26 16% | 5.96 20% | 8.95 -20% | 4.4 41% |
| Colorchecker dE 2000 calibrated * | 2.05 | 1.5 27% | 0.91 56% | 3.23 -58% | 2.27 -11% |
| Greyscale dE 2000 * | 3.82 | 3.43 10% | 3.58 6% | 5 -31% | 2.2 42% |
| Gamma | 2.49 88% | 2.41 91% | 2.46 89% | 2.21 100% | 2.41 91% |
| CCT | 7317 89% | 7290 89% | 7186 90% | 7742 84% | 6405 101% |
| Color Space (Percent of AdobeRGB 1998) (%) | 59 | 60 2% | 62 5% | 59.8 1% | 59 0% |
| Color Space (Percent of sRGB) (%) | 91 | 93 2% | 96 5% | 91.8 1% | 91 0% |
| Total Average (Program / Settings) | 16% /
9% | 5% /
3% | 0% /
-7% | 15% /
6% |
* ... smaller is better
The 144-Hz panel of the 2000-Euro (~$2229) model does better in every aspect. The average screen brightness has increased from a meager 216 cd/m² to about 295 cd/m². The color-space coverage has also increased from 57% of sRGB to 91%, which is why the colors look more saturated and are easier to tell apart.
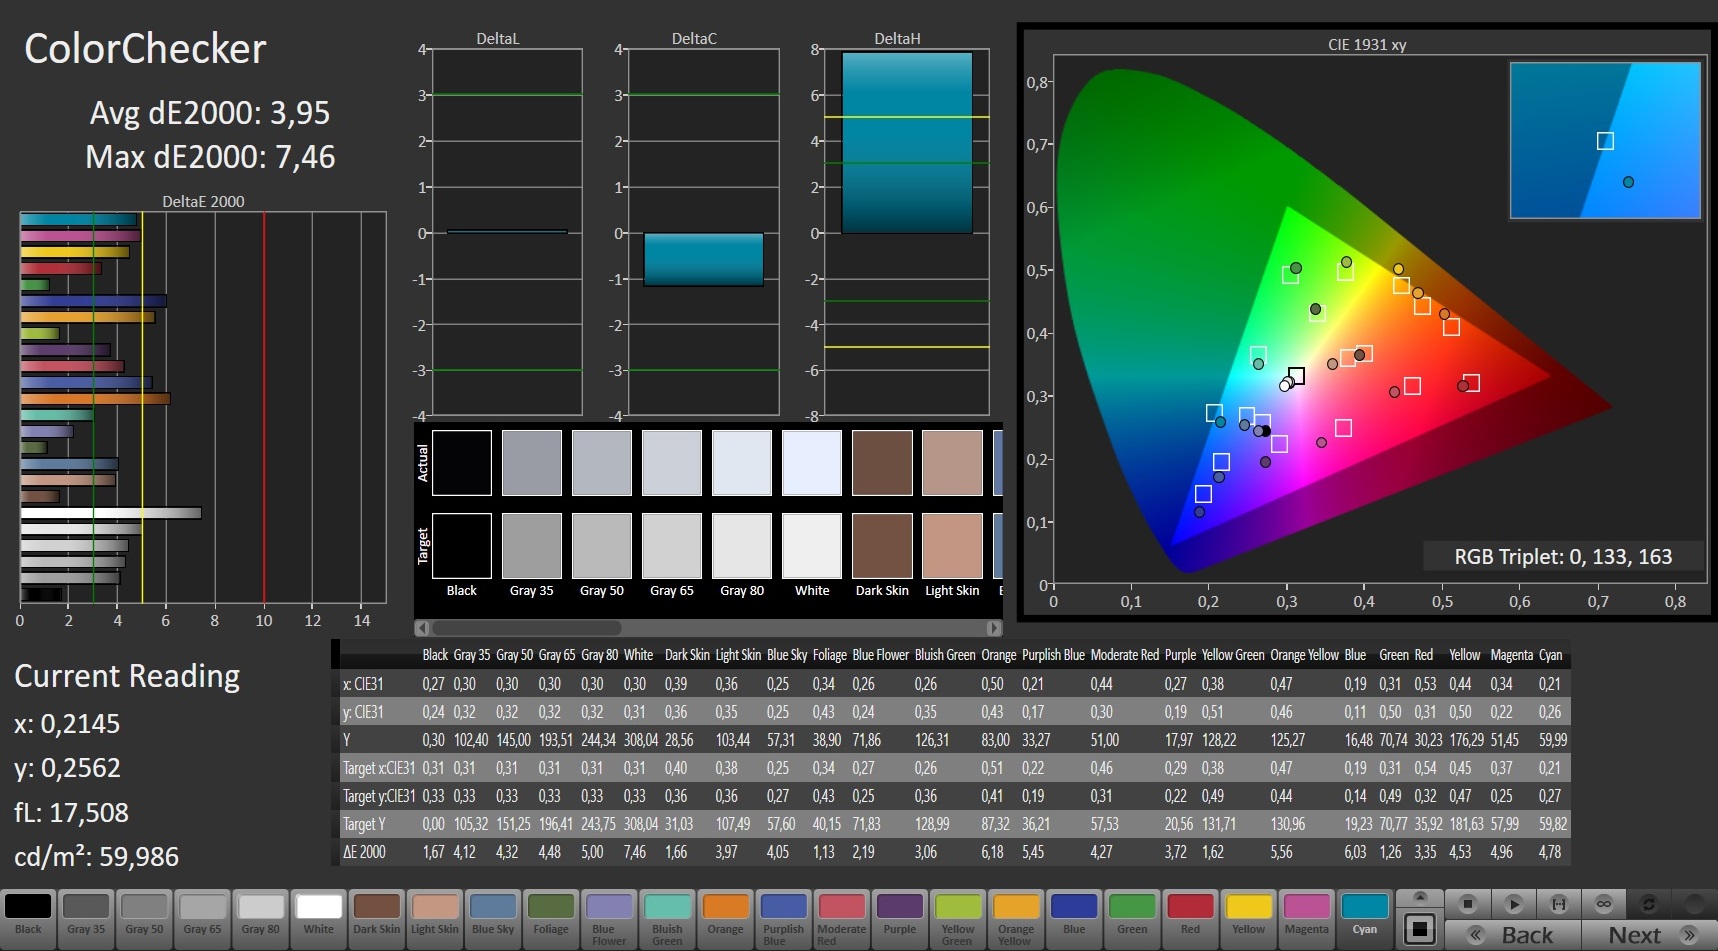
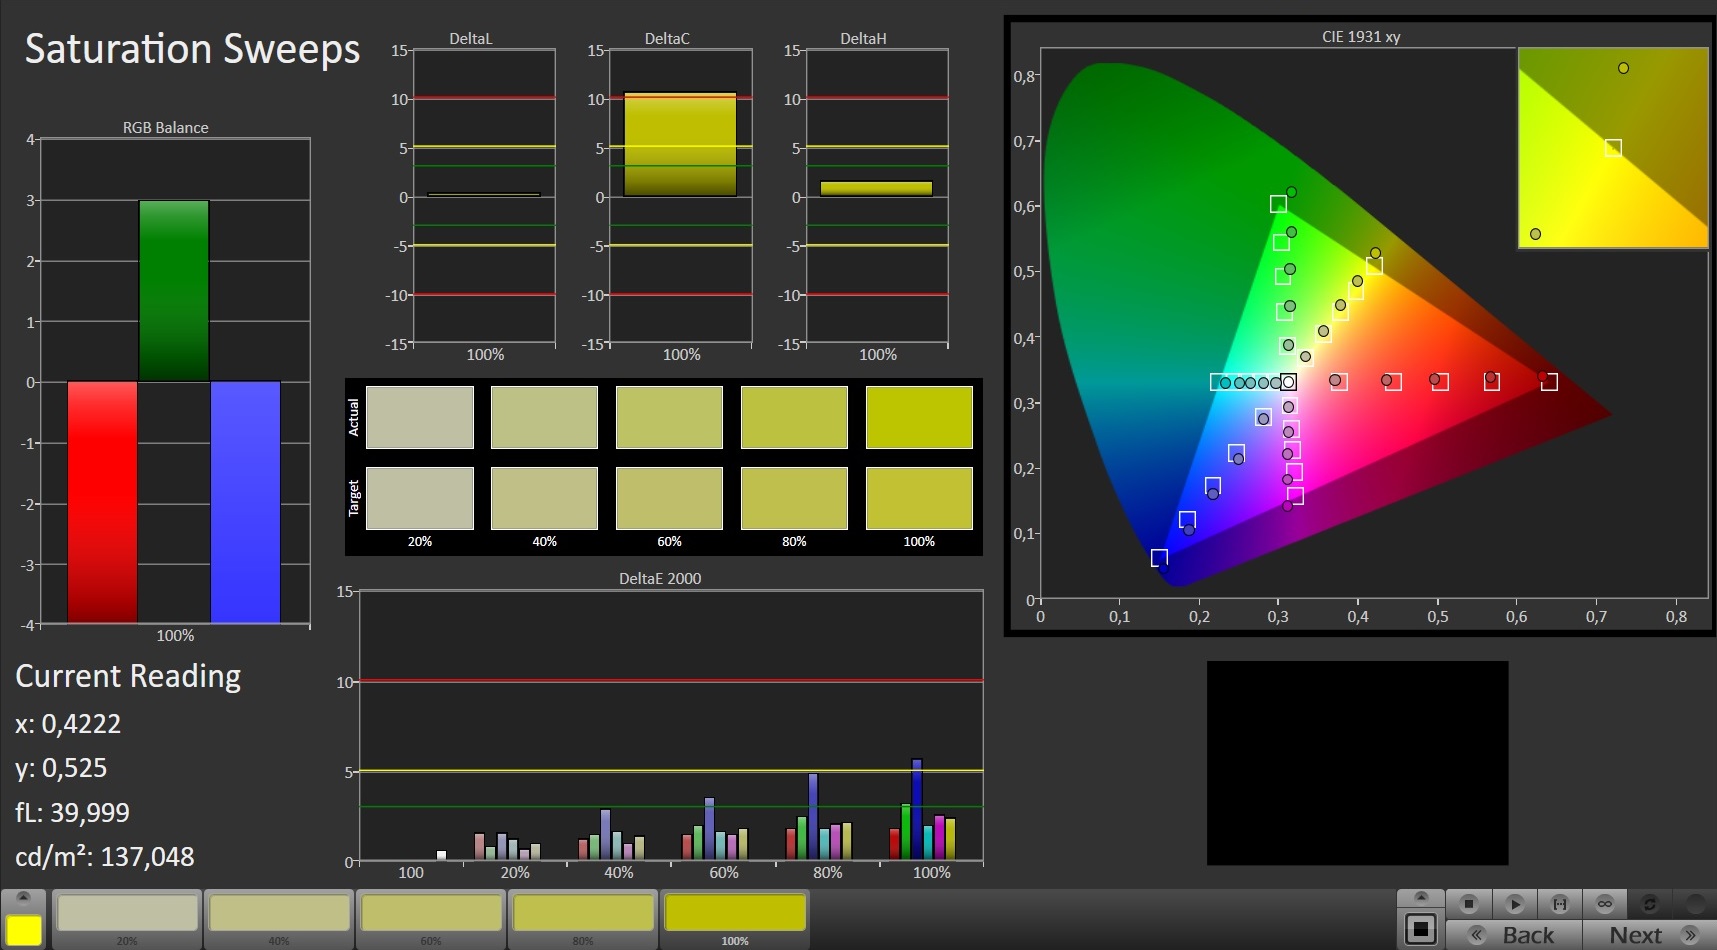
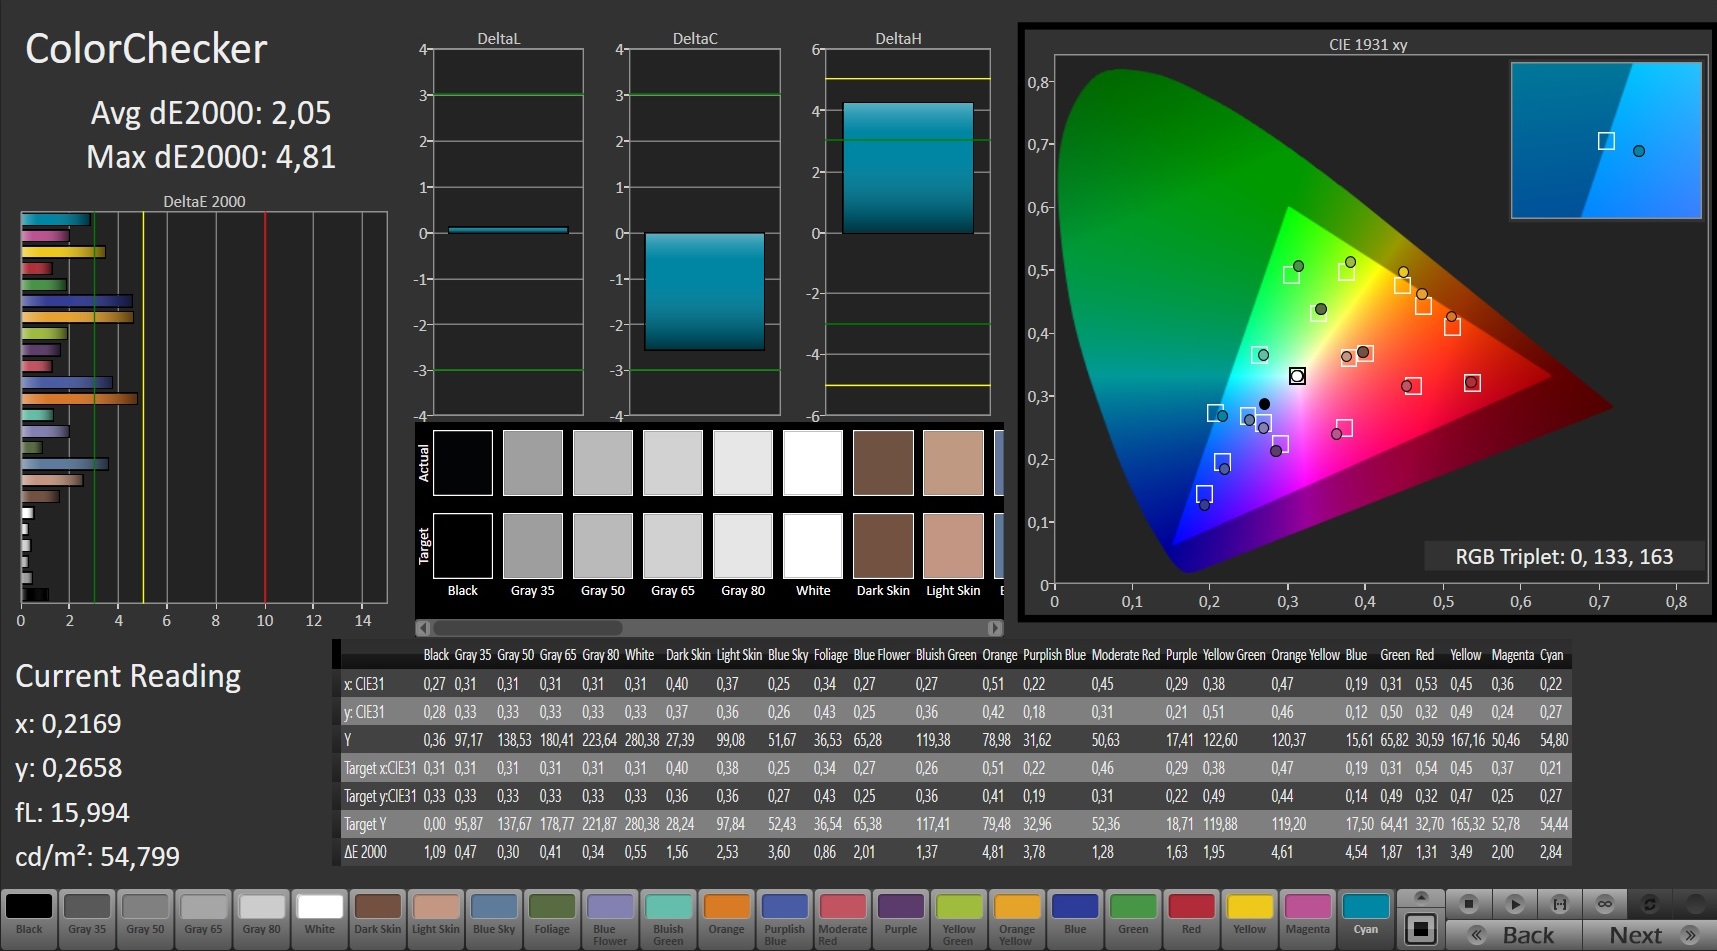
There are also shorter response times to be mentioned. For transitions from black to white, the panel of the 5590-P8RVW needs 13 instead of 30 ms (gray-to-gray transitions take 16 ms vs. 48 ms). The package is rounded off with a higher contrast ratio (1323:1 vs. 1064:1) and a better color reproduction.
Display Response Times
| ↔ Response Time Black to White | ||
|---|---|---|
| 12.8 ms ... rise ↗ and fall ↘ combined | ↗ 7.6 ms rise | 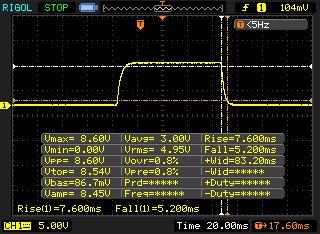 |
| ↘ 5.2 ms fall | ||
| The screen shows good response rates in our tests, but may be too slow for competitive gamers. In comparison, all tested devices range from 0.1 (minimum) to 240 (maximum) ms. » 33 % of all devices are better. This means that the measured response time is better than the average of all tested devices (19.8 ms). | ||
| ↔ Response Time 50% Grey to 80% Grey | ||
| 16.4 ms ... rise ↗ and fall ↘ combined | ↗ 8.4 ms rise | 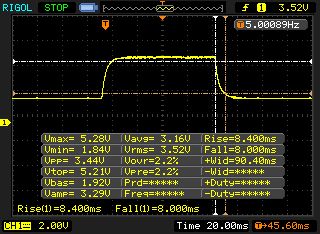 |
| ↘ 8 ms fall | ||
| The screen shows good response rates in our tests, but may be too slow for competitive gamers. In comparison, all tested devices range from 0.165 (minimum) to 636 (maximum) ms. » 31 % of all devices are better. This means that the measured response time is better than the average of all tested devices (30.9 ms). | ||
Screen Flickering / PWM (Pulse-Width Modulation)
| Screen flickering / PWM not detected | 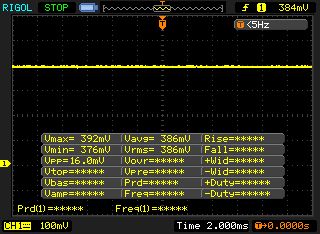 | ||
In comparison: 52 % of all tested devices do not use PWM to dim the display. If PWM was detected, an average of 7741 (minimum: 5 - maximum: 343500) Hz was measured. | |||
Review Conditions
The preinstalled utility known as Command Center offers users the ability to change the thermal profile and configure the energy management. All of our benchmarks were conducted using the “Balanced” profile.


Performance
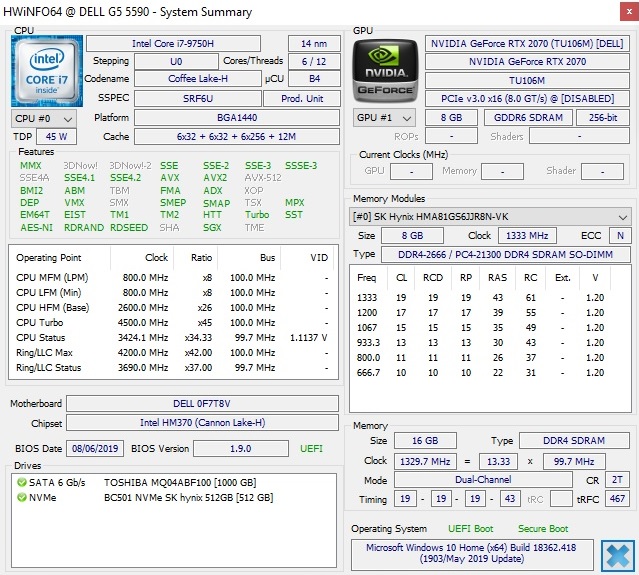
As was previously mentioned, the 5590-P8RVW is a true high-end device. The hexa-core CPU and the GeForce RTX 2070 Max-Q in combination with 16 GB of RAM and an NVMe SSD should provide enough performance even for demanding applications for years to come.
Processor
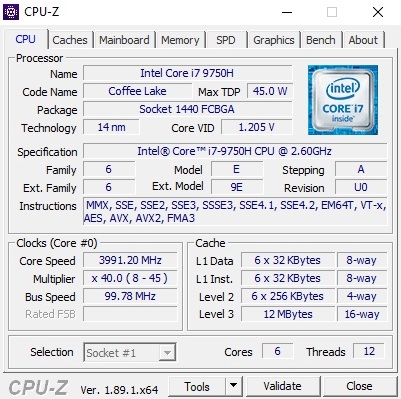
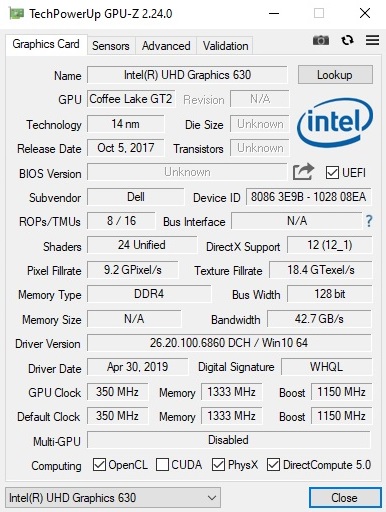
At the moment, Intel’s Core i7-9750H is the processor of choice for powerful gaming laptops. The hexa-core Coffee Lake-based chip has a 45-watt TDP and can process up to 12 threads at the same time thanks to Hyper-Threading.
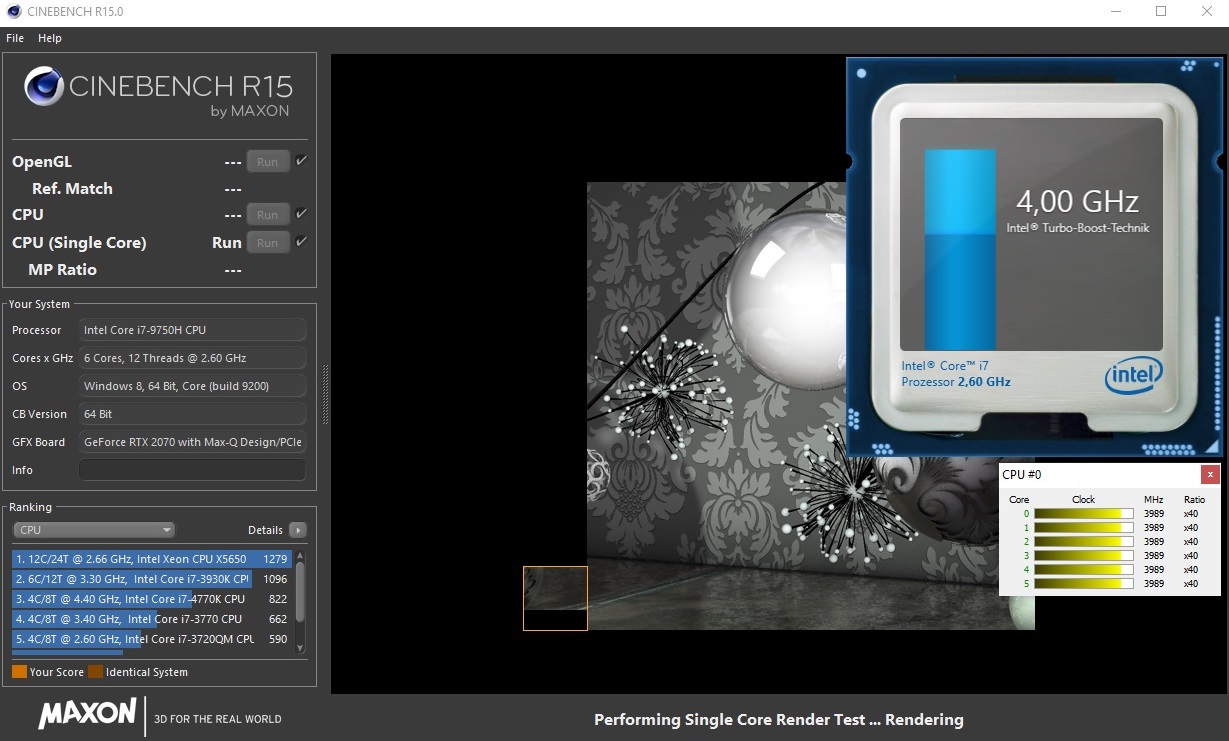
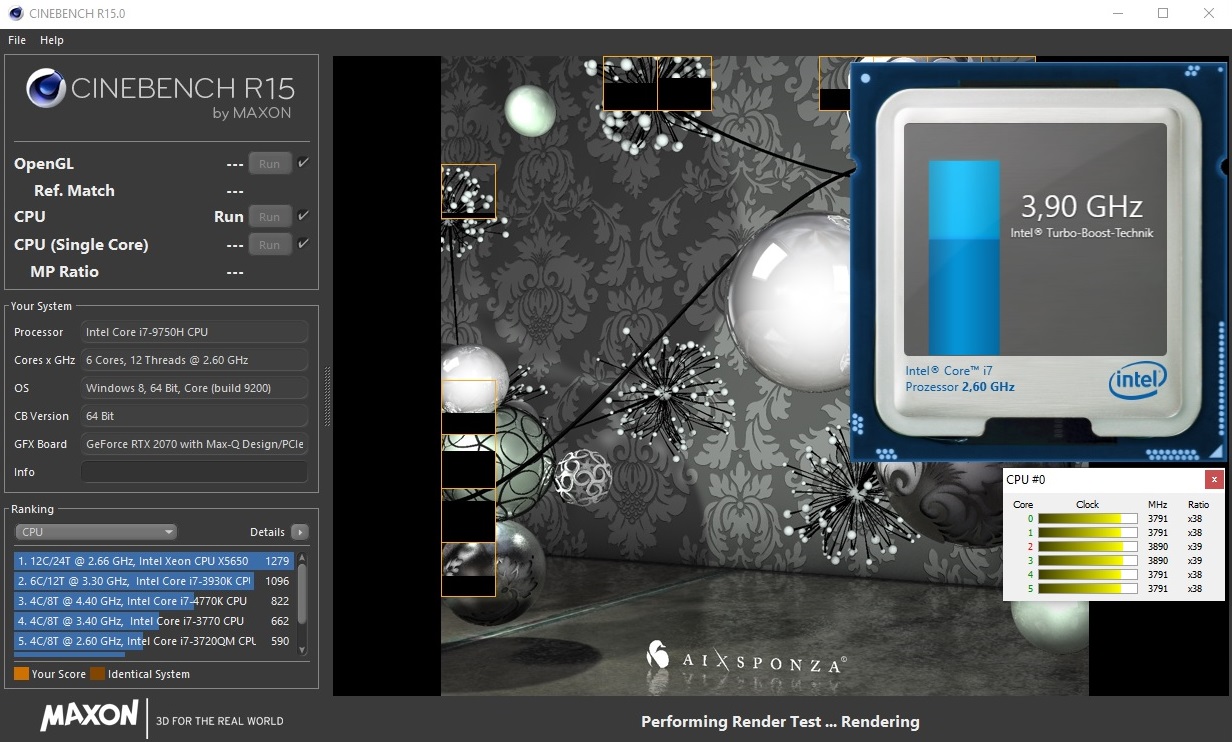
The 14-nm part in the Dell G5 delivers mixed results in our suite of benchmarks. As long as you stress only the CPU, the Turbo boost is utilized, which is why the i7-9750H can boost its frequency up to 4.5 GHz. However, the performance falls by a few percentage points after the first benchmark run in our Cinebench loop (see the graph), but despite that the Dell G5 still does better than the competition.
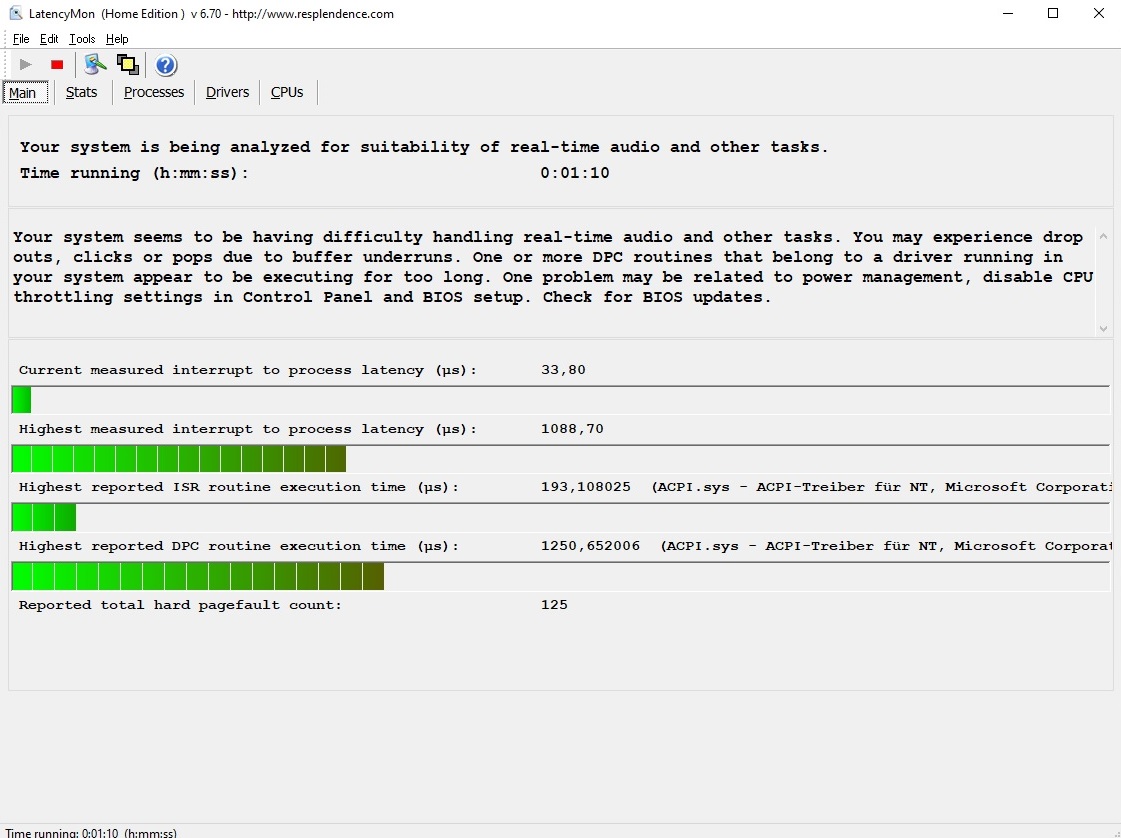
Problems begin when both the CPU and the GPU are taxed at the same time. Just like the 5590-PCNJJ, the processor starts to throttle down under combined loads. In the worst-case scenario, the CPU frequency can drop to as low as 900 MHz, which is something of a black eye for a true high-end notebook. However, the throttling does not always lead to a noticeably lower frame rate when gaming. That being said, Dell should definitely make some improvements here.
System Performance
The G5 15 takes last place in our comparison chart due in no small part to its throttling issues. However, it is only beaten by a very small margin (4 to 10%) and still feels very responsive. Nevertheless, the boot times could have been somewhat shorter (the same can also be said of the shut-down times).
Storage Devices
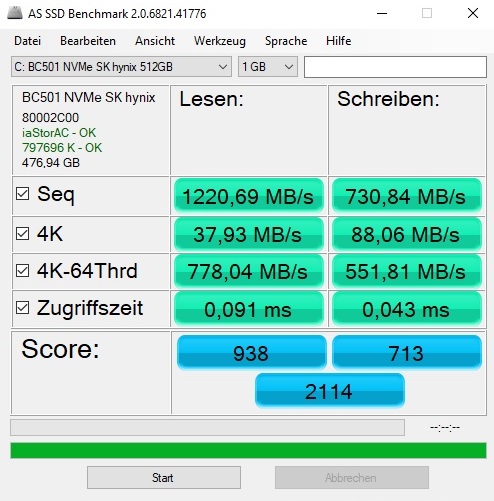
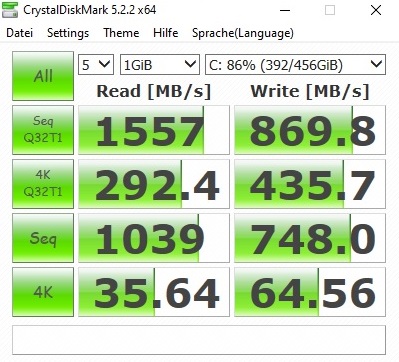
The 64-bit version of Windows 10 Home is located on an M.2 SSD from SK Hynix (BC501). The PCIe/NVMe model offers a good level of performance, but it is a little slower than competing SSDs. It achieves sequential read rates of over 2000 MB/s and sequential write rates of over 1000 MB/s.
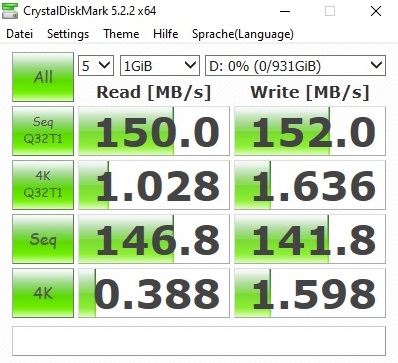
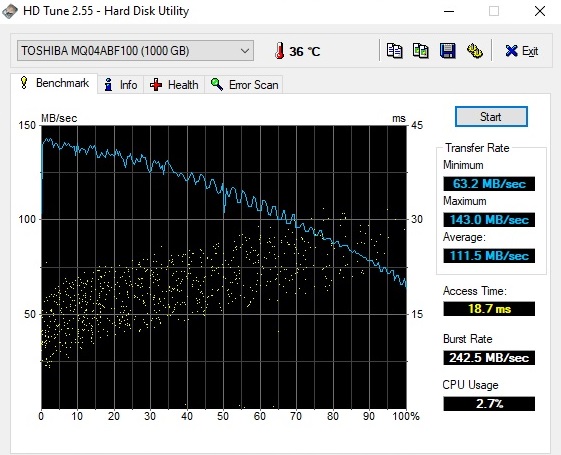
The 512 GB SSD offers enough storage space for several video games. The G5 also features a secondary storage device. It is a 1 TB, 2.5-inch, 5400 RPM hard disk drive from Toshiba, which has sequential read and write rates of about 150 MB/s.
| Dell G5 15 5590-P8RVW SK Hynix BC501 HFM512GDJTNG | Acer Predator Triton 500 PT515-51-71PZ WDC PC SN720 SDAPNTW-512G | Gigabyte Aero 15 Classic-XA Intel SSD 760p SSDPEKKW512G8 | HP Omen X 2S 15-dg0075cl WDC PC SN720 SDAPNTW-1T00 | Asus Zephyrus S GX502GW 2x Intel SSD 660p SSDPEKNW512G8 (RAID 0) | |
|---|---|---|---|---|---|
| CrystalDiskMark 5.2 / 6 | 92% | 76% | 105% | 71% | |
| Write 4K (MB/s) | 64.6 | 108.8 68% | 115.5 79% | 137.4 113% | 97 50% |
| Read 4K (MB/s) | 35.64 | 40.31 13% | 58 63% | 41.37 16% | 49.58 39% |
| Write Seq (MB/s) | 748 | 2488 233% | 1555 108% | 2500 234% | 1838 146% |
| Read Seq (MB/s) | 1039 | 1916 84% | 2590 149% | 1576 52% | 2421 133% |
| Write 4K Q32T1 (MB/s) | 435.7 | 382.4 -12% | 369.3 -15% | 446.7 3% | 326.9 -25% |
| Read 4K Q32T1 (MB/s) | 292.4 | 421.8 44% | 441.7 51% | 522 79% | 372.9 28% |
| Write Seq Q32T1 (MB/s) | 870 | 2542 192% | 1547 78% | 2796 221% | 1894 118% |
| Read Seq Q32T1 (MB/s) | 1557 | 3320 113% | 2969 91% | 3415 119% | 2828 82% |

Graphics Card
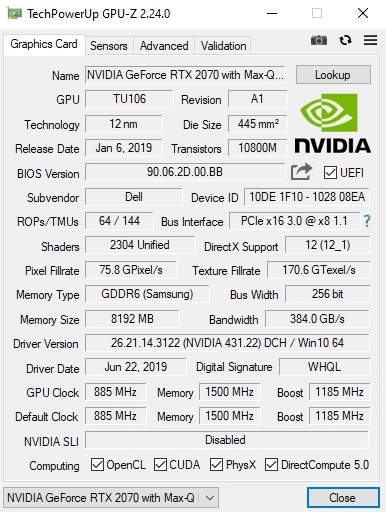
The GeForce RTX 2070 Max-Q is an energy-efficient version of the RTX 2070, which is designed for use in light and thin notebooks. It has 2304 CUDA cores and 8 GB of VRAM (256-bit wide interface). It also supports ray tracing. All in all, this GPU is quite future-proof.
| 3DMark 11 Performance | 18202 points | |
| 3DMark Cloud Gate Standard Score | 36724 points | |
| 3DMark Fire Strike Score | 15046 points | |
| 3DMark Time Spy Score | 6557 points | |
Help | ||
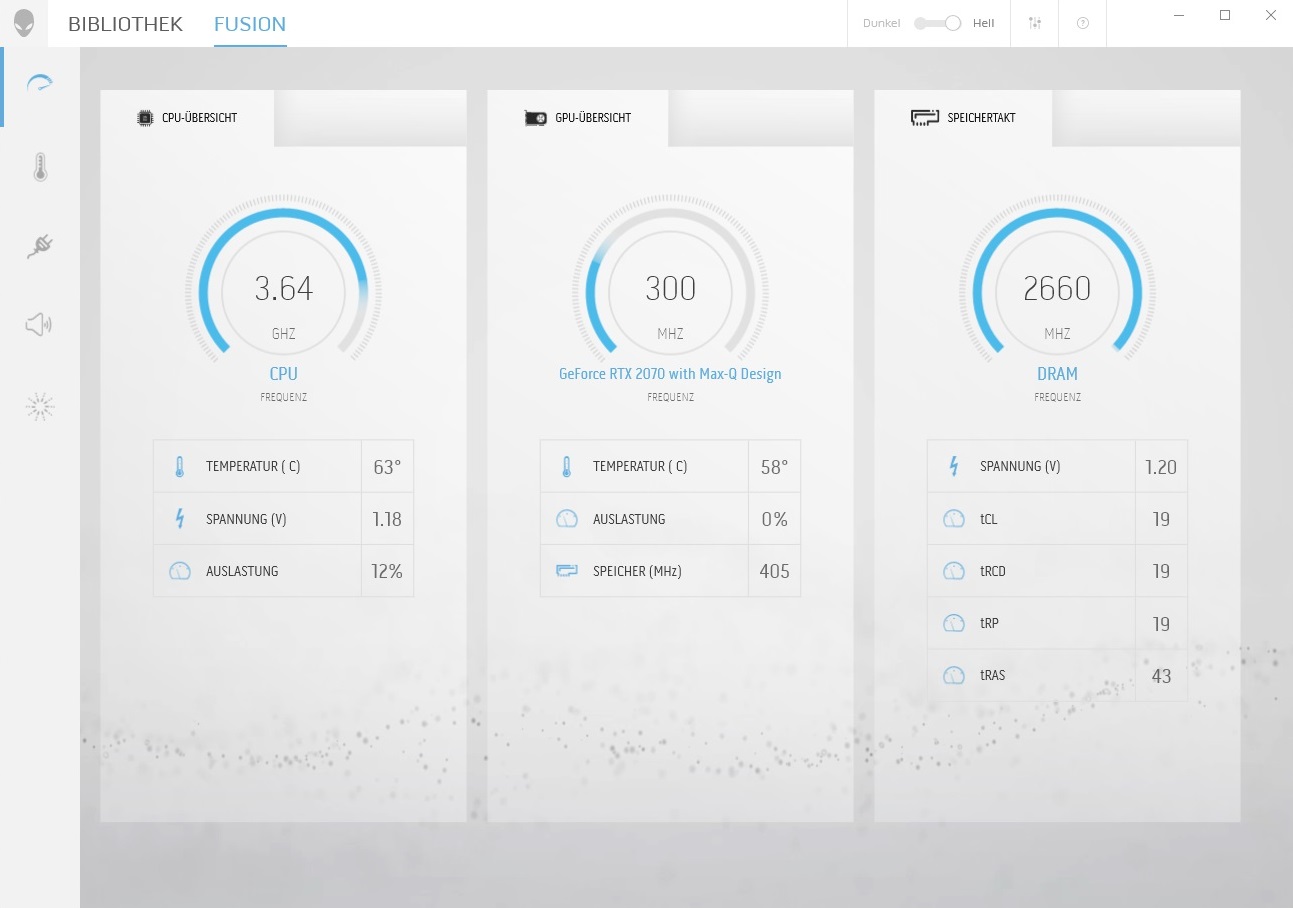
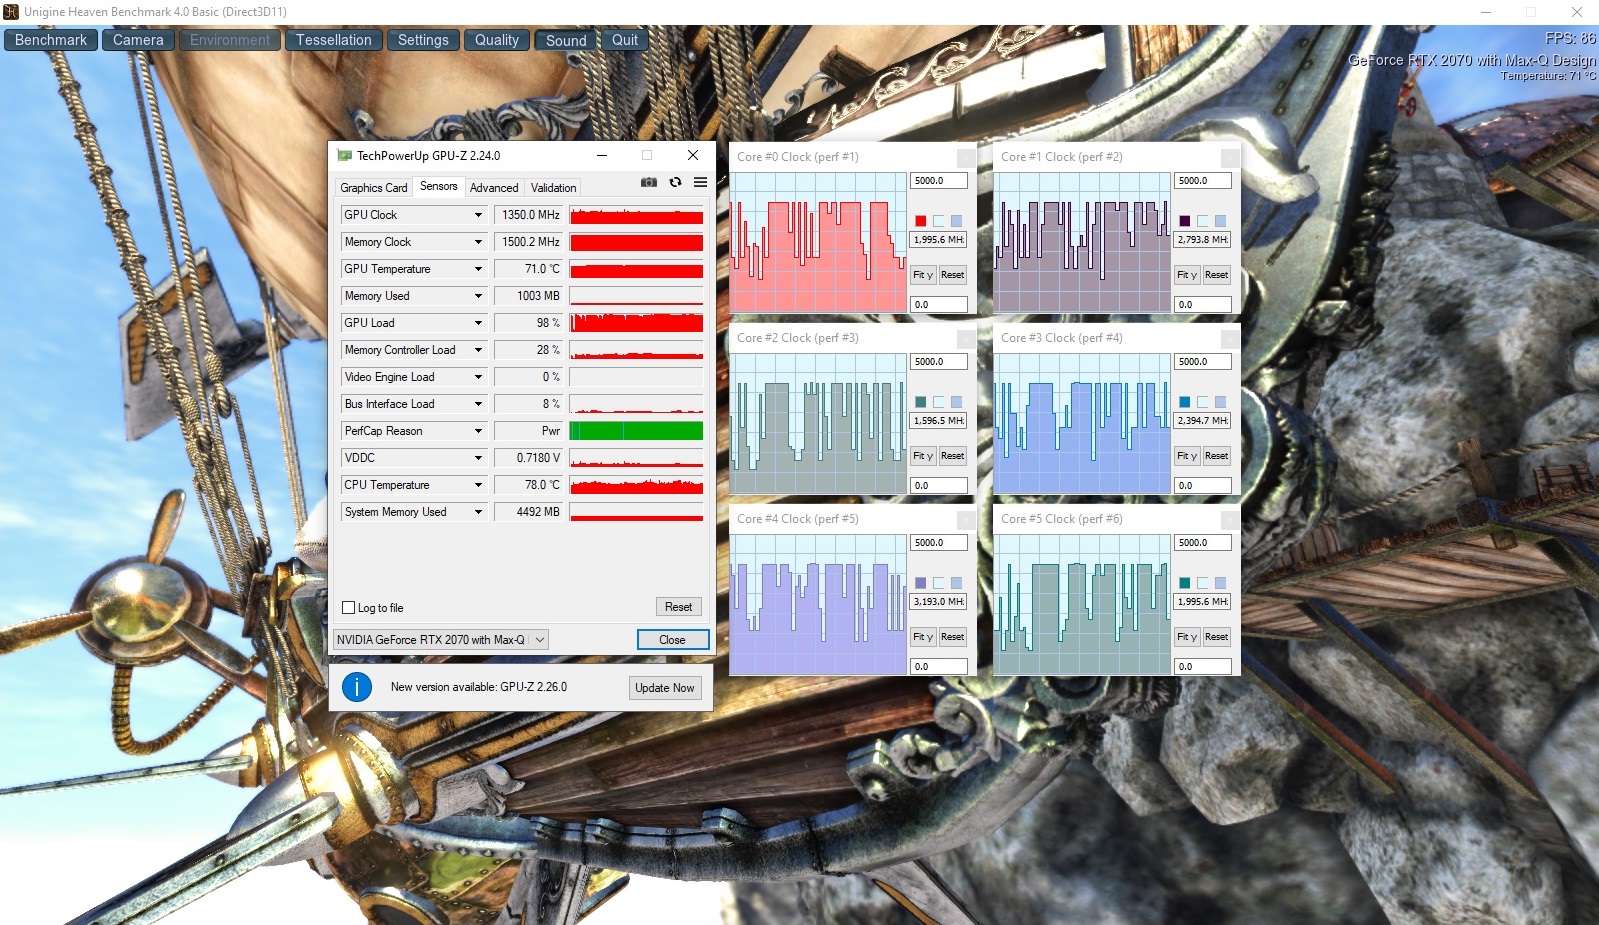
Just like Intel CPUs, Nvidia GPUs can automatically overclock themselves. The RTX 2070 Max-Q has a base clock of 885 MHz, but it can boost to as high as 1800 MHz (in GPU-Z’s render test). When gaming, you can expect to see a boost clock of about 1300 MHz, which is what we saw in the Unigine Heaven 4.0 benchmark and The Witcher 3 – a good result for the RTX 2070 Max-Q. The Dell G5 15 5590 has trouble keeping up with the rest of the competition in 3DMark 11 and 3DMark 13. With the exception of the HP Omen X 2S, all other devices manage to beat the Dell G5 15.
There are no anomalies in the stress test with The Witcher 3 (Full HD/Ultra). The frame rates stayed on the same level throughout the entire 60-minute test. There were no drops in performance.
Gaming Performance
The RTX 2070 Max-Q is powerful enough to be able to run every modern title in Full HD on ultra settings at an almost solid 60 FPS. It also does relatively well at 1440p. However, the DirectX 12 graphics card reaches its limits at 2160p.
| The Witcher 3 - 1920x1080 Ultra Graphics & Postprocessing (HBAO+) | |
| Average of class Gaming (104.7 - 240, n=7, last 2 years) | |
| Asus Zephyrus S GX502GW | |
| HP Omen X 2S 15-dg0075cl | |
| Acer Predator Triton 500 PT515-51-71PZ | |
| Gigabyte Aero 15 Classic-XA | |
| Dell G5 15 5590-P8RVW | |
| low | med. | high | ultra | |
|---|---|---|---|---|
| The Witcher 3 (2015) | 111 | 61.5 | ||
| Apex Legends (2019) | 106 | 105 | ||
| Far Cry New Dawn (2019) | 86 | 78 | ||
| Anthem (2019) | 71.9 | 67.8 | ||
| Dirt Rally 2.0 (2019) | 112 | 68.8 | ||
| Rage 2 (2019) | 74.8 | 71.5 | ||
| F1 2019 (2019) | 130 | 97 | ||
| Control (2019) | 57.4 | |||
| Borderlands 3 (2019) | 65.3 | 51.1 | ||
| FIFA 20 (2019) | 180 | 179 | ||
| Ghost Recon Breakpoint (2019) | 70 | 52 | ||
| GRID 2019 (2019) | 92.6 | 67 |
Emissions
System Noise
When it comes to system noise, the G5 15 leaves a mixed impression. It is very quiet in idle operation. When the notebook is not doing anything, the fans are absolutely still, and the only thing that is audible is the noise made by the spinning hard disk drive. When performing light tasks such as text editing, video-streaming or web-browsing, the fans stand still as well.
The 15-inch notebook produces a lot of noise when gaming (50-52 dB), which is why we recommend using headphones when gaming. The noise levels of the G5 15 are a little higher than those of the competition. However, competing devices are also very loud under load.
Noise level
| Idle |
| 32 / 33 / 34 dB(A) |
| HDD |
| 32 dB(A) |
| Load |
| 50 / 52 dB(A) |
 | ||
30 dB silent 40 dB(A) audible 50 dB(A) loud |
||
min: | ||
| Dell G5 15 5590-P8RVW i7-9750H, GeForce RTX 2070 Max-Q | Acer Predator Triton 500 PT515-51-71PZ i7-9750H, GeForce RTX 2070 Max-Q | Gigabyte Aero 15 Classic-XA i7-9750H, GeForce RTX 2070 Max-Q | HP Omen X 2S 15-dg0075cl i7-9750H, GeForce RTX 2070 Max-Q | Asus Zephyrus S GX502GW i7-9750H, GeForce RTX 2070 Mobile | Average of class Gaming | |
|---|---|---|---|---|---|---|
| Noise | 1% | -3% | 5% | -3% | 13% | |
| off / environment * (dB) | 30 | 30 -0% | 30 -0% | 29 3% | 30 -0% | 24.1 ? 20% |
| Idle Minimum * (dB) | 32 | 30 6% | 31 3% | 30.5 5% | 31 3% | 25.9 ? 19% |
| Idle Average * (dB) | 33 | 33 -0% | 34 -3% | 31.5 5% | 33 -0% | 27.4 ? 17% |
| Idle Maximum * (dB) | 34 | 39 -15% | 39 -15% | 31.5 7% | 38 -12% | 30.1 ? 11% |
| Load Average * (dB) | 50 | 45 10% | 46 8% | 40.6 19% | 50 -0% | 43.7 ? 13% |
| Witcher 3 ultra * (dB) | 50 | 49 2% | 53 -6% | 49.5 1% | 53 -6% | |
| Load Maximum * (dB) | 52 | 51 2% | 55 -6% | 53.4 -3% | 56 -8% | 54.3 ? -4% |
* ... smaller is better
Temperature
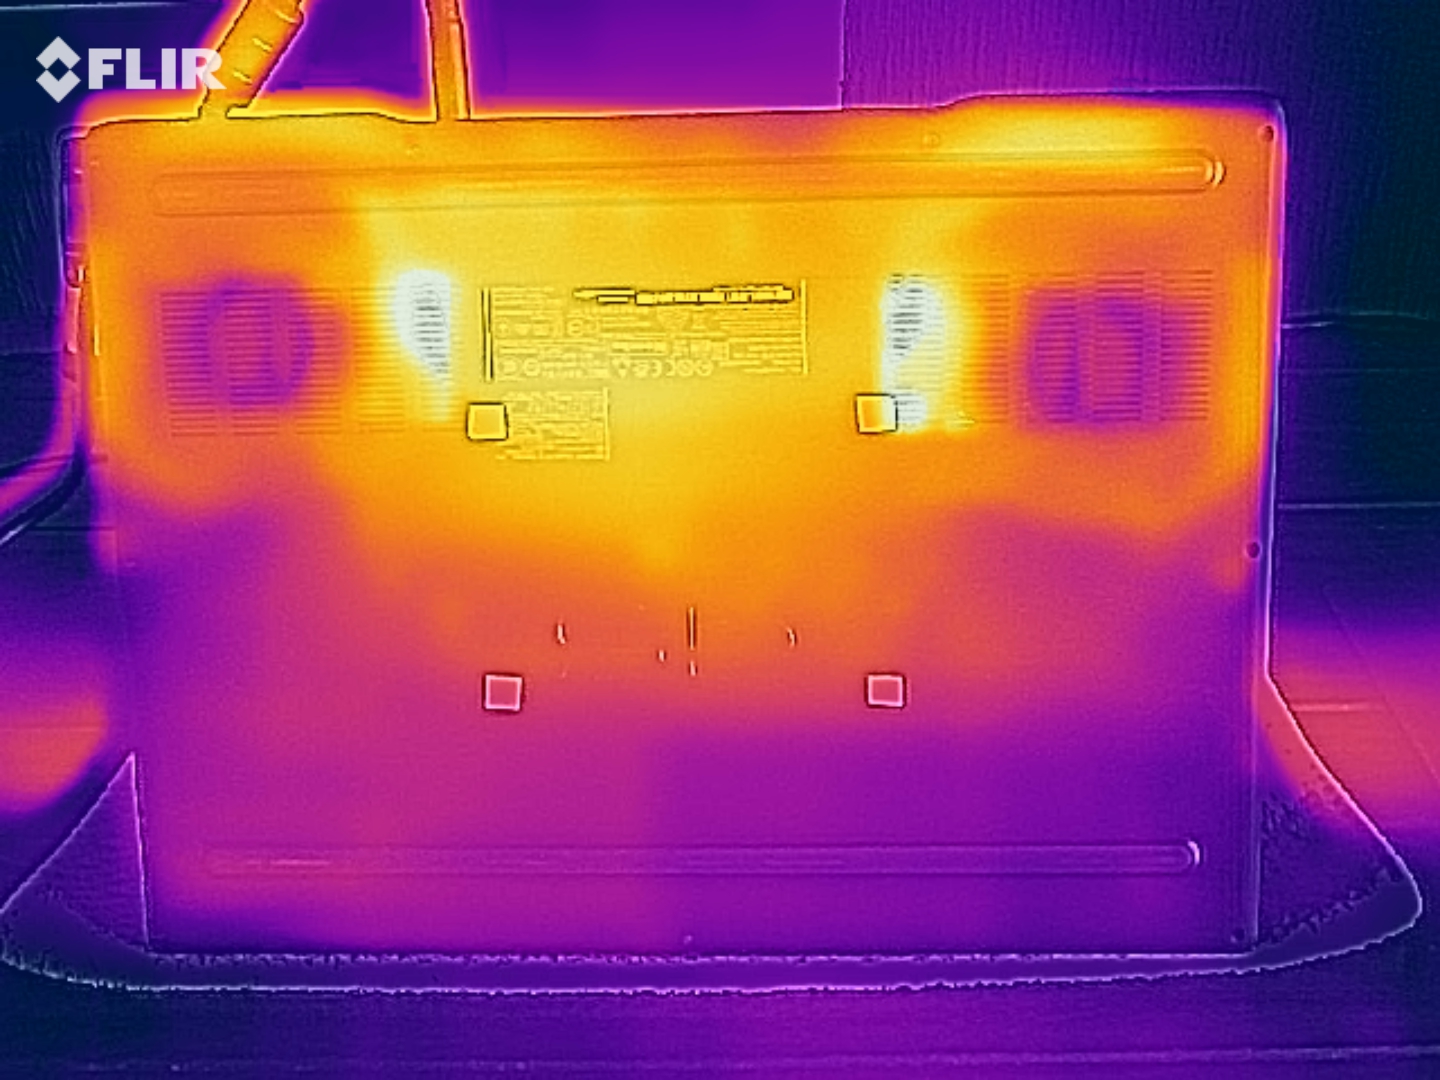
You should not keep the G5 15 5590 on your lap while gaming, because it gets very hot. In our stress test with FurMark and Prime95, the bottom of the device reached 61 °C. The top of the chassis can reach up to 54 °C, which is quite a high temperature. Despite having thinner cases, many competitors remain cooler when gaming. In idle operation, the G5 15 cannot be criticized. Here the surface temperatures are very decent (25 °C at the top and 26 °C at the bottom).
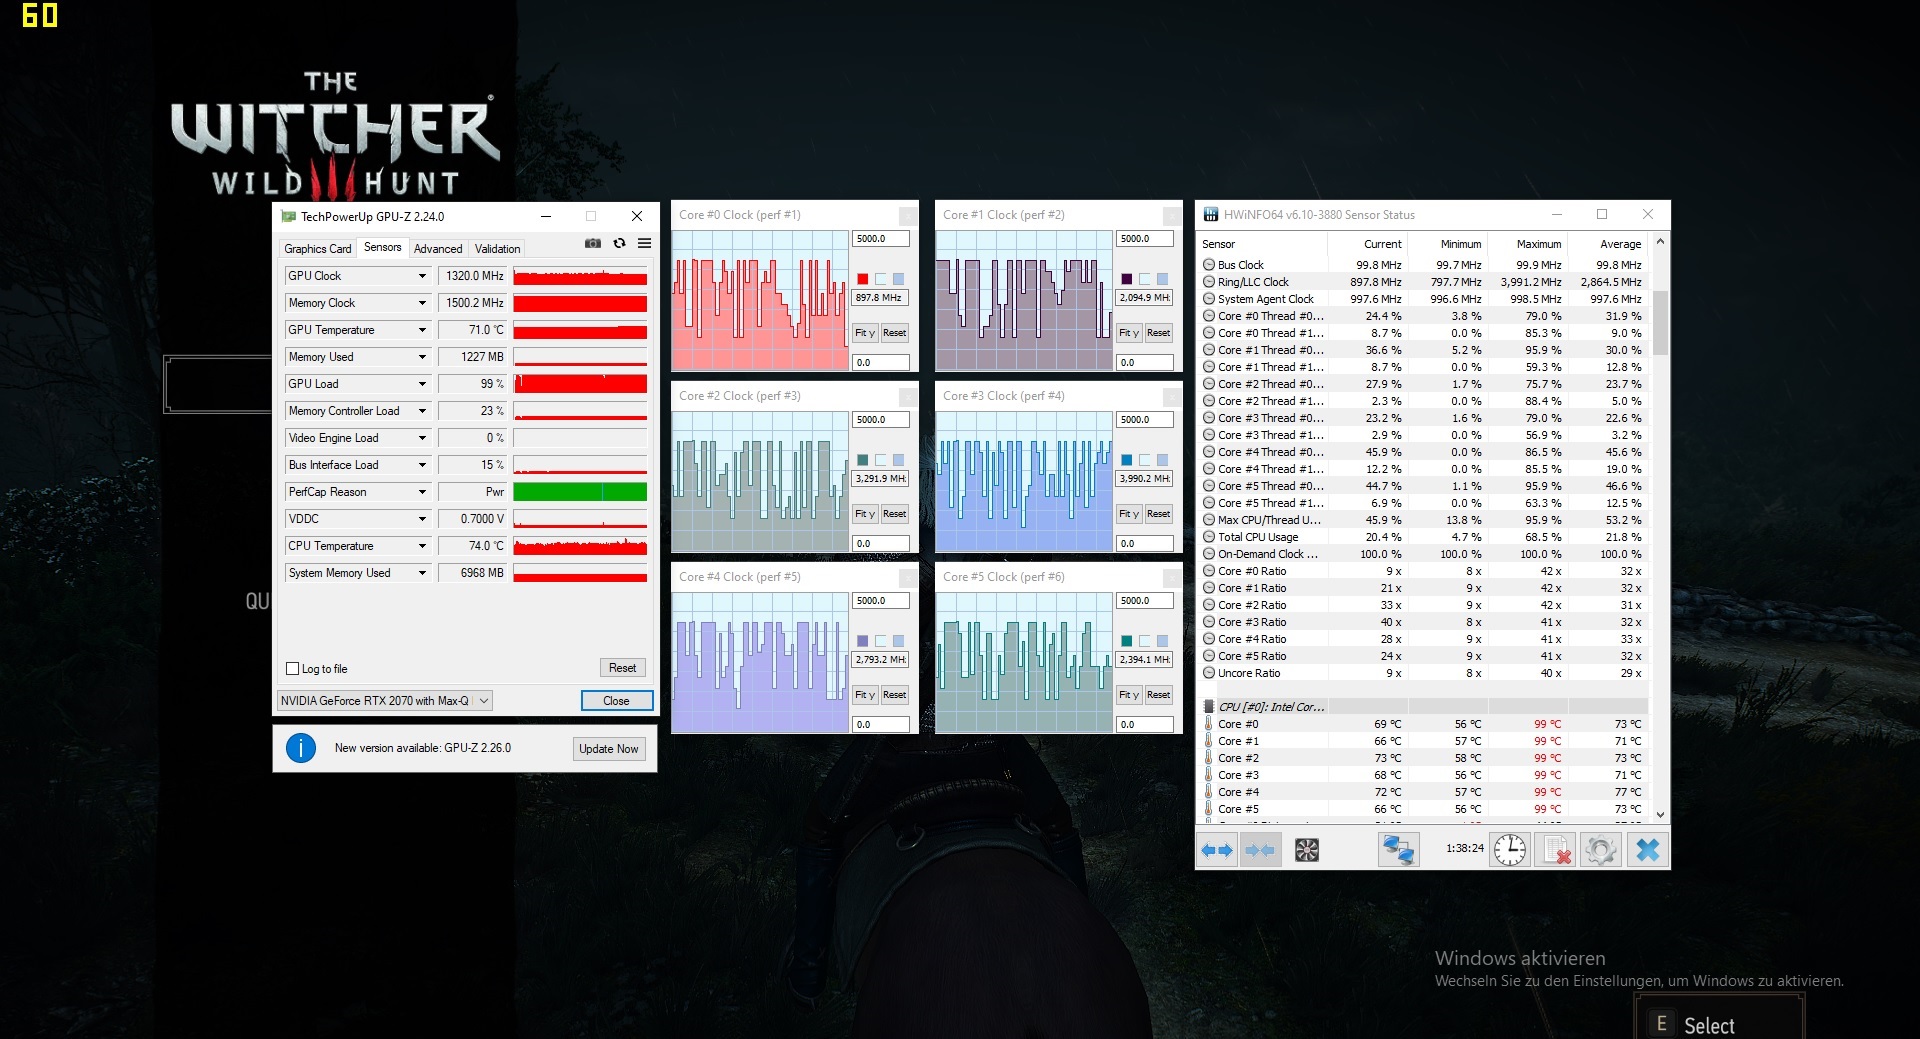
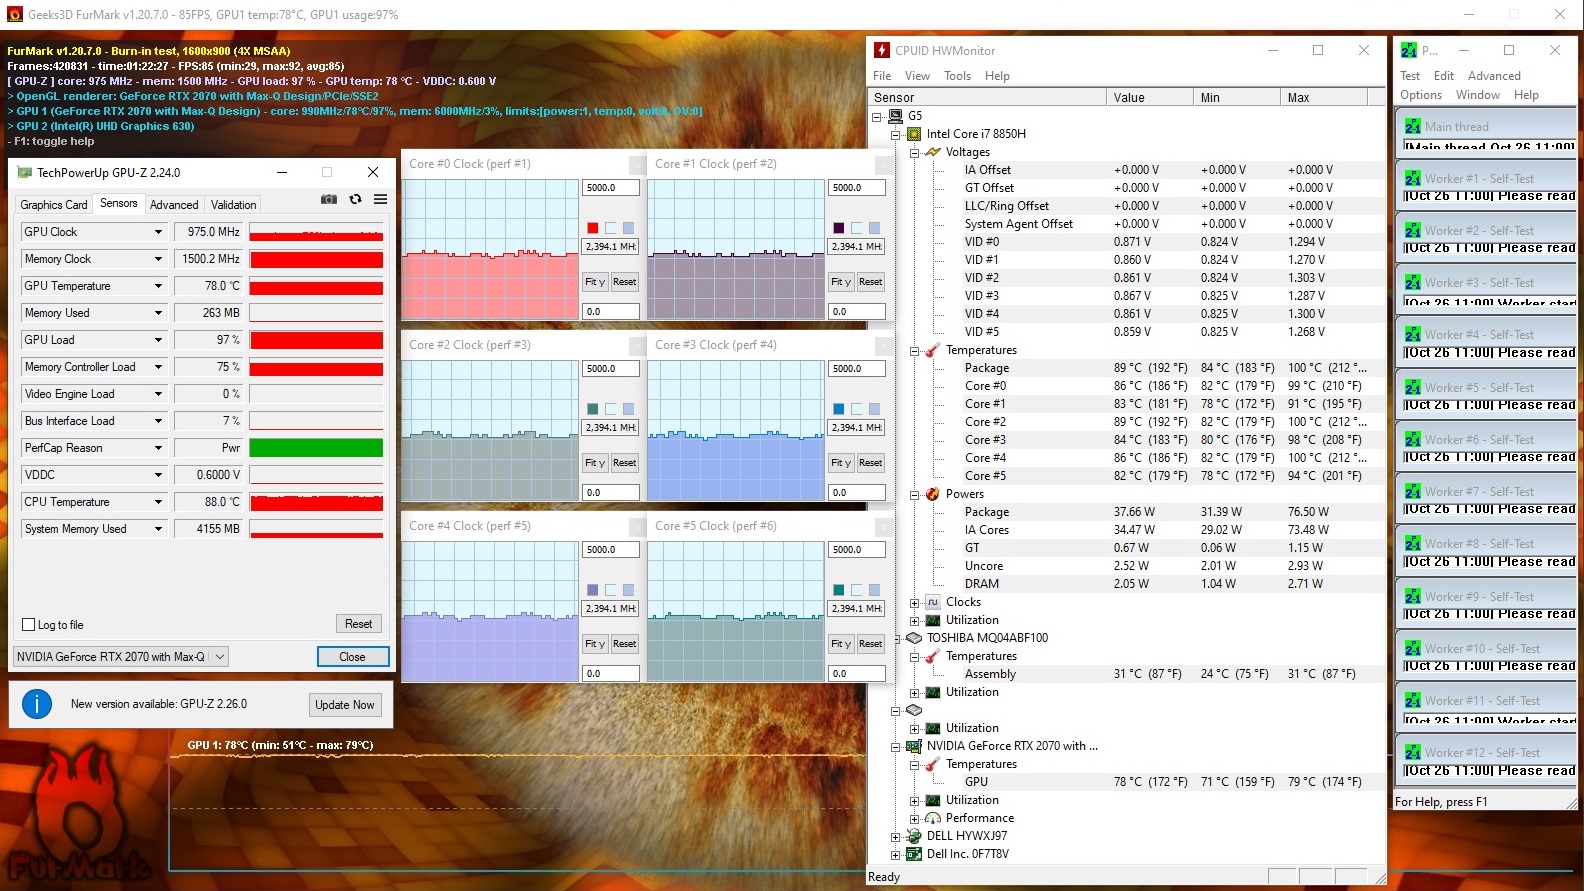
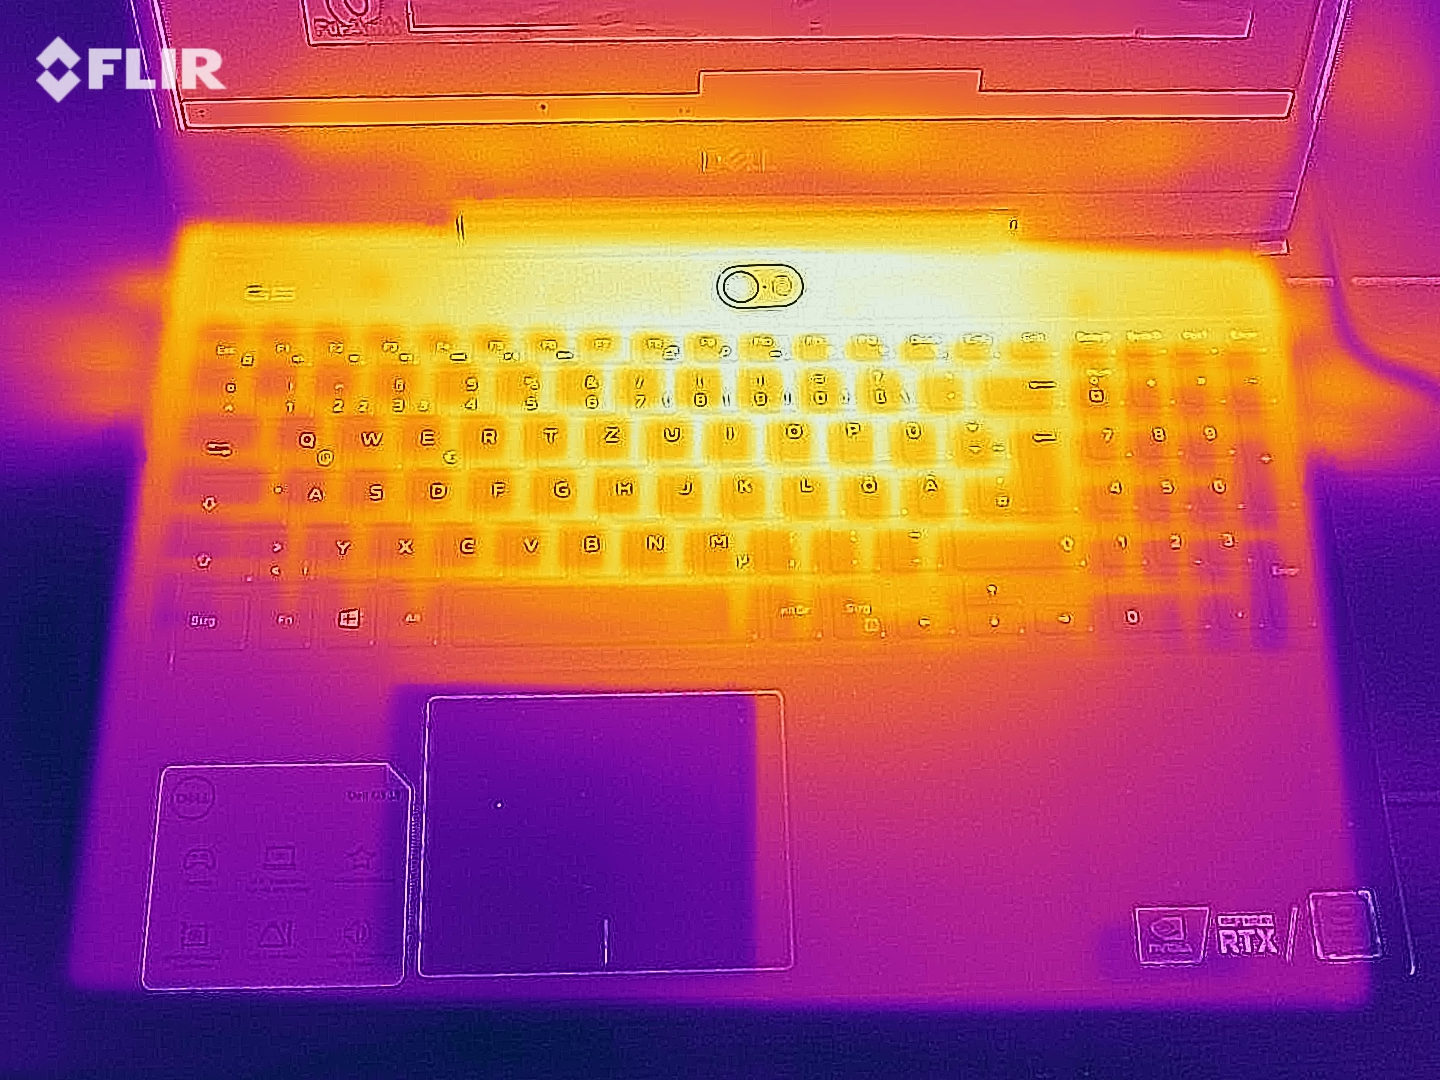
As usual, the internal components get much hotter than the surfaces. Under full load, the GPU hits 79 °C and the CPU reaches 100 °C. When gaming, both the Core i7-9750H and the RTX 2070 Max-Q hover around the 70-°C mark.
(-) The maximum temperature on the upper side is 54 °C / 129 F, compared to the average of 40.4 °C / 105 F, ranging from 21.2 to 68.8 °C for the class Gaming.
(-) The bottom heats up to a maximum of 61 °C / 142 F, compared to the average of 43.2 °C / 110 F
(+) In idle usage, the average temperature for the upper side is 24.7 °C / 76 F, compared to the device average of 33.9 °C / 93 F.
(-) Playing The Witcher 3, the average temperature for the upper side is 40.7 °C / 105 F, compared to the device average of 33.9 °C / 93 F.
(+) The palmrests and touchpad are reaching skin temperature as a maximum (33 °C / 91.4 F) and are therefore not hot.
(-) The average temperature of the palmrest area of similar devices was 28.8 °C / 83.8 F (-4.2 °C / -7.6 F).
| Dell G5 15 5590-P8RVW i7-9750H, GeForce RTX 2070 Max-Q | Acer Predator Triton 500 PT515-51-71PZ i7-9750H, GeForce RTX 2070 Max-Q | Gigabyte Aero 15 Classic-XA i7-9750H, GeForce RTX 2070 Max-Q | HP Omen X 2S 15-dg0075cl i7-9750H, GeForce RTX 2070 Max-Q | Asus Zephyrus S GX502GW i7-9750H, GeForce RTX 2070 Mobile | Average of class Gaming | |
|---|---|---|---|---|---|---|
| Heat | -3% | -13% | -30% | -10% | -5% | |
| Maximum Upper Side * (°C) | 54 | 49 9% | 58 -7% | 48.8 10% | 54 -0% | 45.1 ? 16% |
| Maximum Bottom * (°C) | 61 | 59 3% | 64 -5% | 55 10% | 47 23% | 48.1 ? 21% |
| Idle Upper Side * (°C) | 25 | 28 -12% | 30 -20% | 41 -64% | 33 -32% | 31 ? -24% |
| Idle Bottom * (°C) | 26 | 29 -12% | 31 -19% | 45.6 -75% | 34 -31% | 34.2 ? -32% |
* ... smaller is better
Speakers
Dell G5 15 5590-P8RVW audio analysis
(+) | speakers can play relatively loud (89 dB)
Bass 100 - 315 Hz
(-) | nearly no bass - on average 19.4% lower than median
(±) | linearity of bass is average (10.5% delta to prev. frequency)
Mids 400 - 2000 Hz
(+) | balanced mids - only 3.5% away from median
(+) | mids are linear (4.9% delta to prev. frequency)
Highs 2 - 16 kHz
(±) | reduced highs - on average 5.5% lower than median
(±) | linearity of highs is average (8.6% delta to prev. frequency)
Overall 100 - 16.000 Hz
(±) | linearity of overall sound is average (15.6% difference to median)
Compared to same class
» 36% of all tested devices in this class were better, 6% similar, 58% worse
» The best had a delta of 6%, average was 18%, worst was 132%
Compared to all devices tested
» 23% of all tested devices were better, 5% similar, 72% worse
» The best had a delta of 4%, average was 23%, worst was 134%
Asus Zephyrus S GX502GW audio analysis
(+) | speakers can play relatively loud (90 dB)
Bass 100 - 315 Hz
(±) | reduced bass - on average 12.7% lower than median
(±) | linearity of bass is average (8.5% delta to prev. frequency)
Mids 400 - 2000 Hz
(+) | balanced mids - only 4.5% away from median
(+) | mids are linear (4.1% delta to prev. frequency)
Highs 2 - 16 kHz
(±) | higher highs - on average 6.7% higher than median
(±) | linearity of highs is average (10.8% delta to prev. frequency)
Overall 100 - 16.000 Hz
(+) | overall sound is linear (14.6% difference to median)
Compared to same class
» 28% of all tested devices in this class were better, 8% similar, 65% worse
» The best had a delta of 6%, average was 18%, worst was 132%
Compared to all devices tested
» 19% of all tested devices were better, 4% similar, 77% worse
» The best had a delta of 4%, average was 23%, worst was 134%
Energy Management
Energy Consumption
Thanks to Nvidia’s Optimus technology the 15-inch notebook draws 5 to 23 watts when idle. Under load, the laptop draws between 121 watts and 184 watts. The nominal power draw of the AC adapter is 180 watts (130 watts for the model with the i5-9300H and the GTX 1650).
| Off / Standby | |
| Idle | |
| Load |
|
Key:
min: | |
| Dell G5 15 5590-P8RVW i7-9750H, GeForce RTX 2070 Max-Q | Acer Predator Triton 500 PT515-51-71PZ i7-9750H, GeForce RTX 2070 Max-Q | Gigabyte Aero 15 Classic-XA i7-9750H, GeForce RTX 2070 Max-Q | HP Omen X 2S 15-dg0075cl i7-9750H, GeForce RTX 2070 Max-Q | Asus Zephyrus S GX502GW i7-9750H, GeForce RTX 2070 Mobile | Average of class Gaming | |
|---|---|---|---|---|---|---|
| Power Consumption | -1% | -74% | -230% | -98% | -50% | |
| Idle Minimum * (Watt) | 5 | 7 -40% | 21 -320% | 46 -820% | 24 -380% | 13.1 ? -162% |
| Idle Average * (Watt) | 13 | 12 8% | 23 -77% | 59 -354% | 27 -108% | 19 ? -46% |
| Idle Maximum * (Watt) | 23 | 22 4% | 32 -39% | 65.5 -185% | 33 -43% | 24.6 ? -7% |
| Load Average * (Watt) | 121 | 86 29% | 97 20% | 99.8 18% | 129 -7% | 111.3 ? 8% |
| Witcher 3 ultra * (Watt) | 133 | 144 -8% | 148 -11% | 154.1 -16% | 176 -32% | |
| Load Maximum * (Watt) | 184 | 177 4% | 213 -16% | 222.7 -21% | 216 -17% | 260 ? -41% |
* ... smaller is better
Battery Life
Even though the 5590-P8RVW comes with a larger battery than the 5590-PCNJJ (90 vs. 60 Wh), the 5590-P8RVW has shorter battery life than the 5590-PCNJJ. In Battery Eater (Reader's Test), the 2000-Euro (~$2229) laptop lasted 8.5 hours instead of 14.5 hours with the brightness set to the minimum. In the Wi-Fi test, the laptop lasted 5 h 44 m instead of 8 h 2 m with the brightness set to 150 cd/m². The trend continues in the gaming test, where the 5590-P8RVW shut off after 95 minutes with the brightness set to the maximum. Here the 5590-PCNJJ lasted for 131 minutes.
| Dell G5 15 5590-P8RVW i7-9750H, GeForce RTX 2070 Max-Q, 90 Wh | Acer Predator Triton 500 PT515-51-71PZ i7-9750H, GeForce RTX 2070 Max-Q, Wh | Gigabyte Aero 15 Classic-XA i7-9750H, GeForce RTX 2070 Max-Q, 94.24 Wh | HP Omen X 2S 15-dg0075cl i7-9750H, GeForce RTX 2070 Max-Q, 72 Wh | Asus Zephyrus S GX502GW i7-9750H, GeForce RTX 2070 Mobile, 76 Wh | Average of class Gaming | |
|---|---|---|---|---|---|---|
| Battery runtime | 23% | 39% | -46% | -34% | 3% | |
| Reader / Idle (h) | 8.6 | 11.1 29% | 9.1 6% | 3.7 -57% | 5.9 -31% | 7.84 ? -9% |
| WiFi v1.3 (h) | 5.7 | 8 40% | 7 23% | 2.2 -61% | 3.7 -35% | 7.08 ? 24% |
| Load (h) | 1.6 | 1.6 0% | 3 88% | 1.3 -19% | 1 -37% | 1.496 ? -6% |
| H.264 (h) | 6.8 | 8.27 ? |
Pros
Cons
Verdict
With the exception of battery life, the 2000-Euro (~$2229) Dell G5 15 5590-P8RVW cuts a finer figure than the 1000-Euro (~$1115) G5 15 5590-PCNJJ.
In addition to better performance (processor, graphics card, SSD, etc.) and a Thunderbolt 3 port, the 5590-P8RVW has a much faster display. Unlike the entry-level version, the high-end model’s 144-Hz screen has an okay brightness, usable color reproduction, and shorter response times.
However, the 2000-Euro (~$2229) model has the same flaws as the budget variant, such as the slow card reader and the CPU throttling in 3D applications. These flaws prevent the 15-inch notebook from achieving a higher rating.
Dell G5 15 5590-P8RVW
- 05/14/2020 v7 (old)
Florian Glaser
Price comparison
