Acer Predator Triton 500 Laptop Review: A Lot of Gaming Performance Despite the Slim Case

In order to have a suitable model for (almost) every wallet, Acer offers the Triton 500 in several component variants, which differ primarily with regard to the graphics card. The 15-inch laptop can thus be purchased with a GeForce RTX 2060, RTX 2070 or RTX 2080. But beware: The latter GPUs are not installed as a standard, but as a Max-Q edition (focus on energy efficiency). Unfortunately, this is not mentioned in many online shops and even on the manufacturer's homepage there is little information about it.
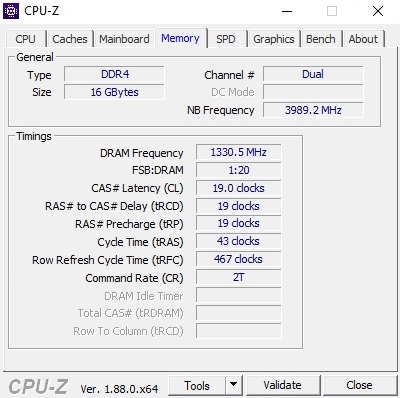
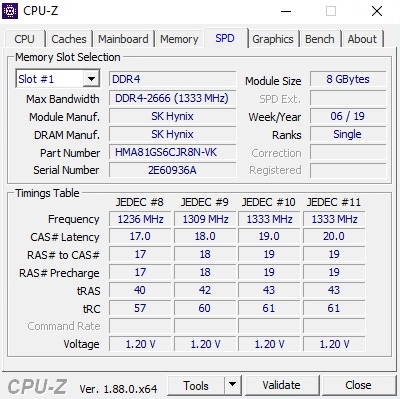
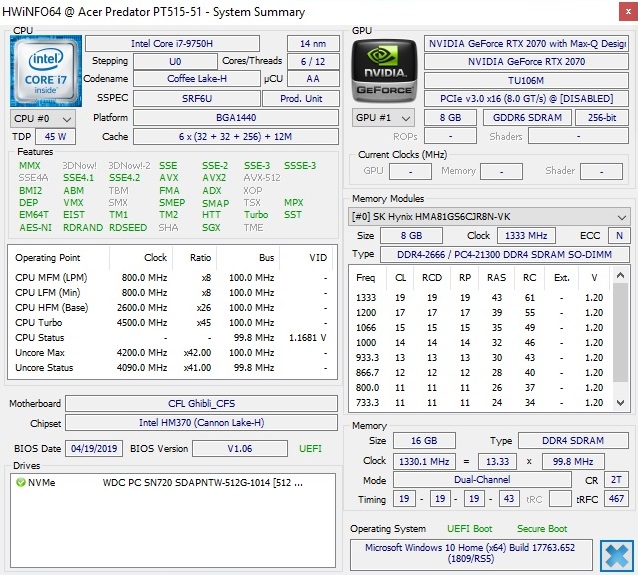
For our test, we chose the mid-priced model PT515-51-71PZ, which costs about 2200 Euros (~$2438). Apart from the GeForce RTX 2070 Max-Q, the laptop comes with a Core i7-9750H, 16 GB of DDR4 RAM (2x 8 GB in dual-channel) and a 512 GB PCIe SSD.
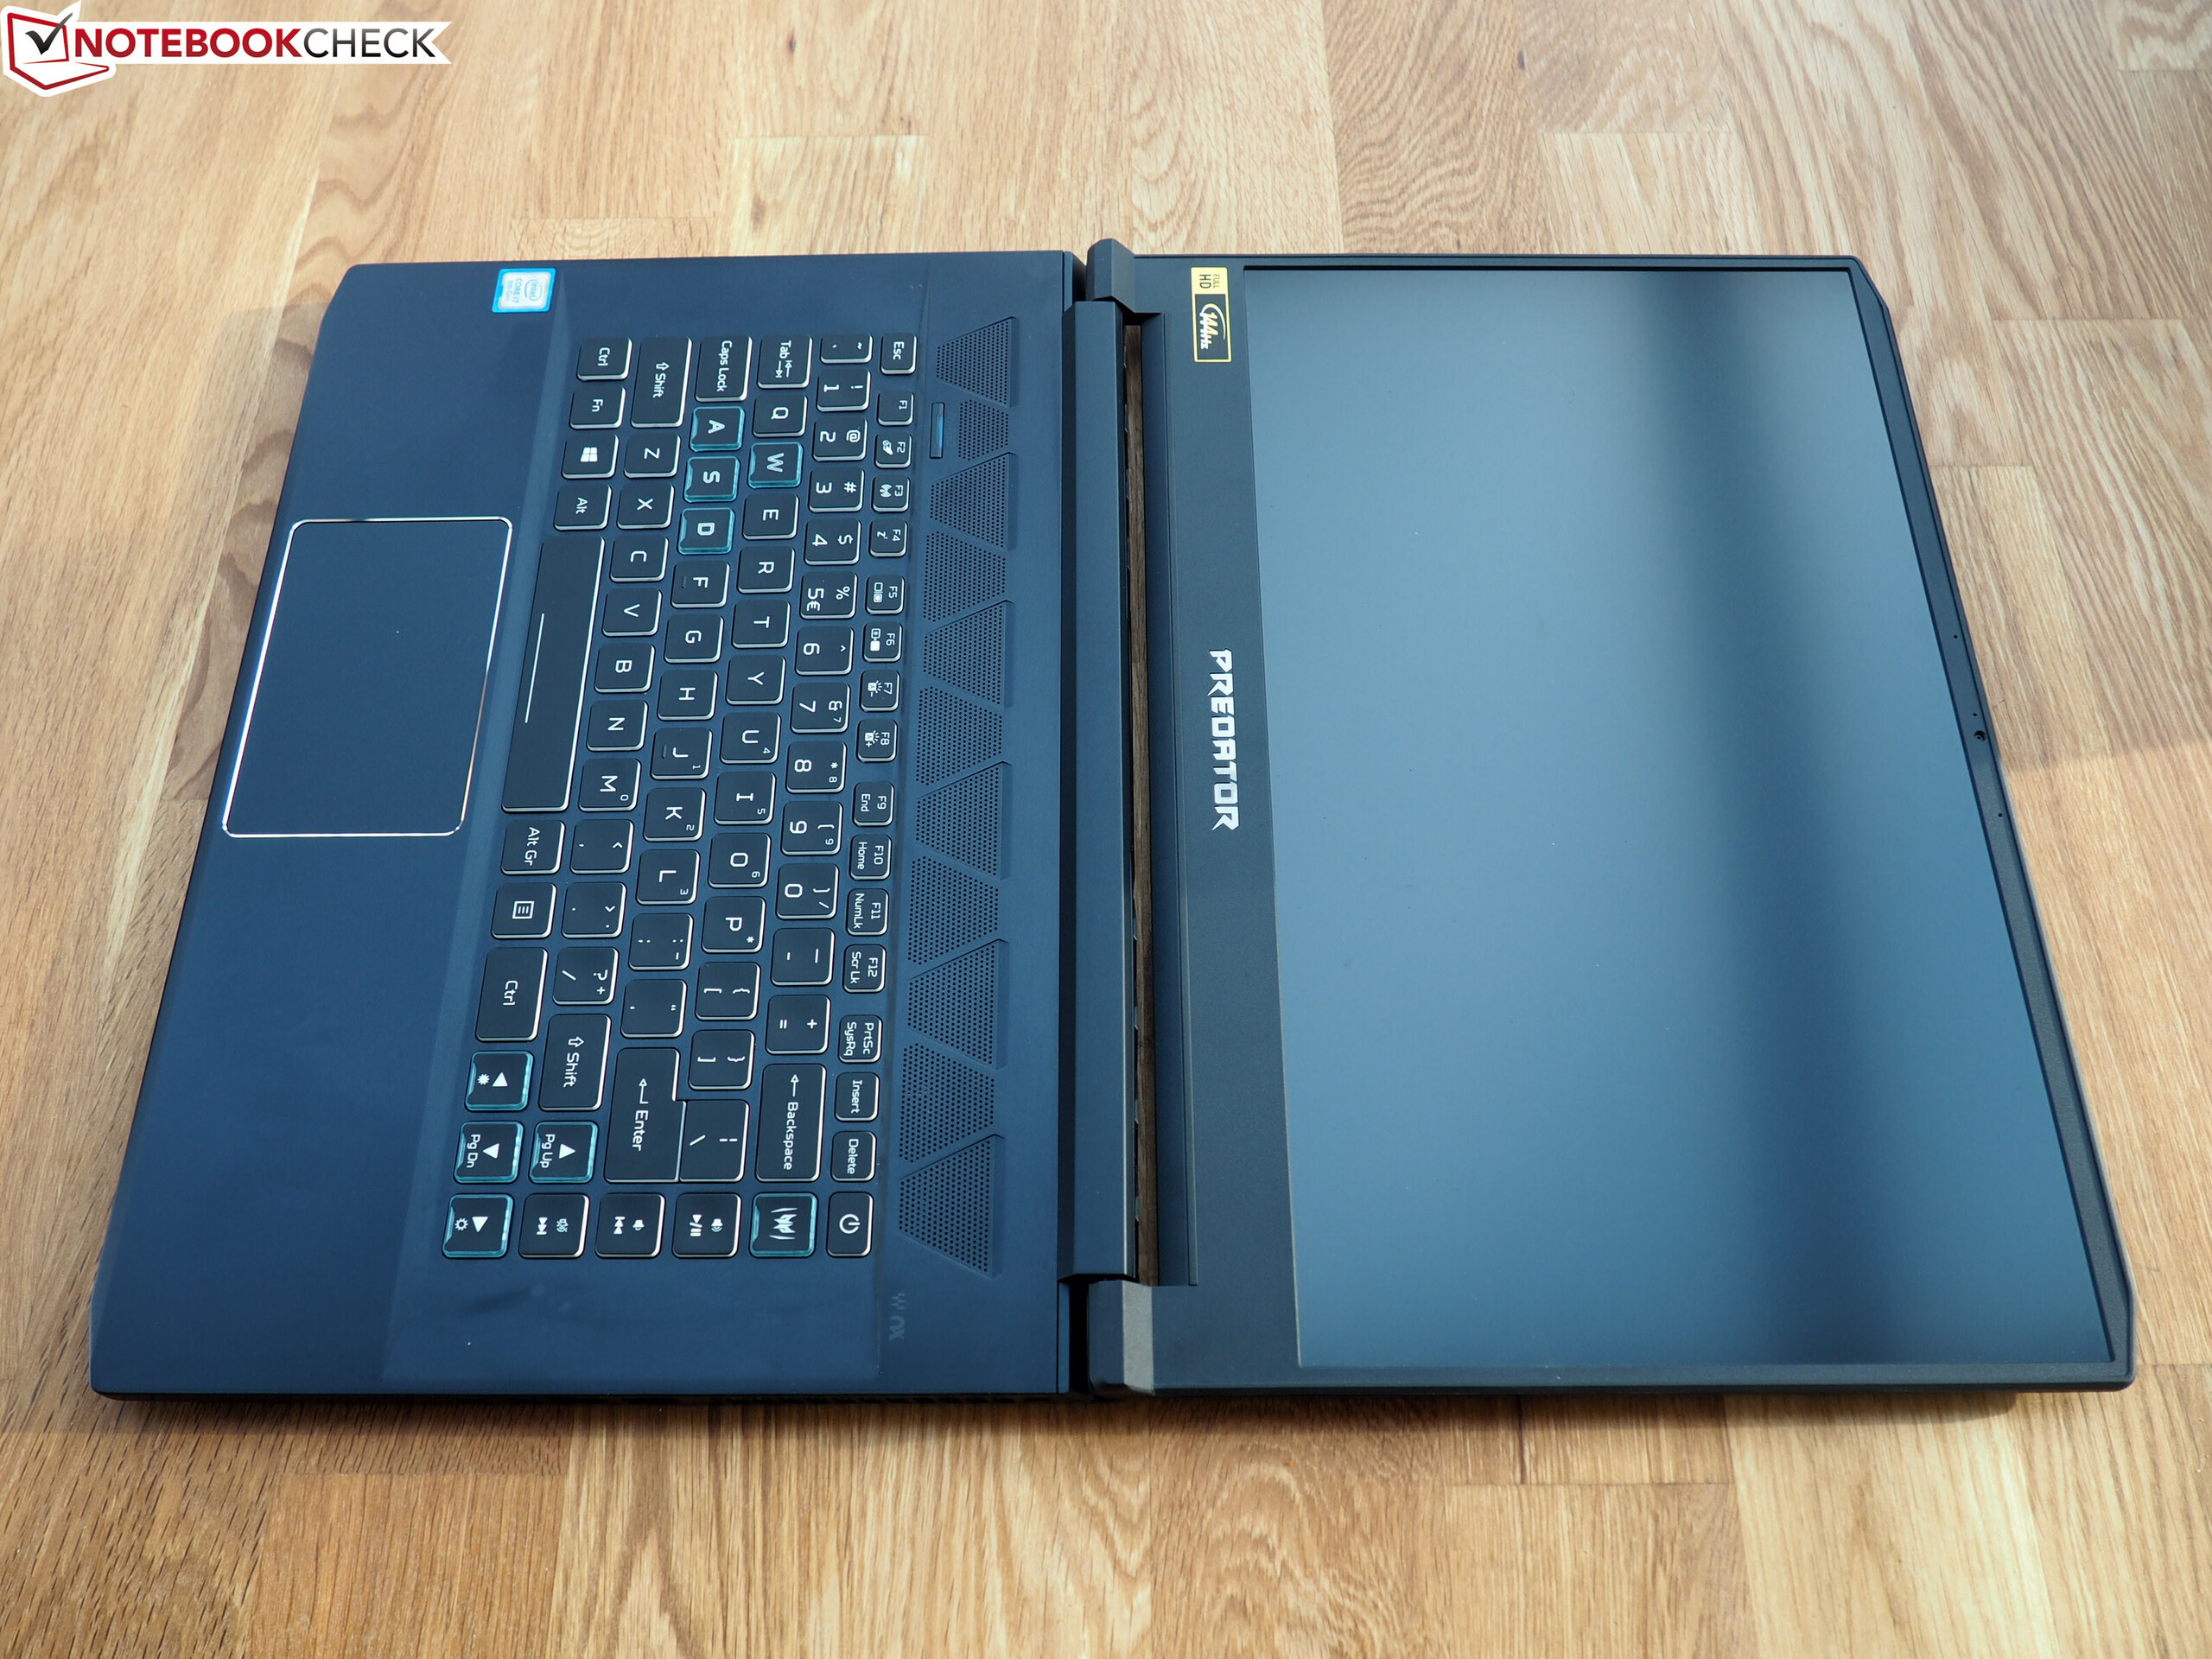
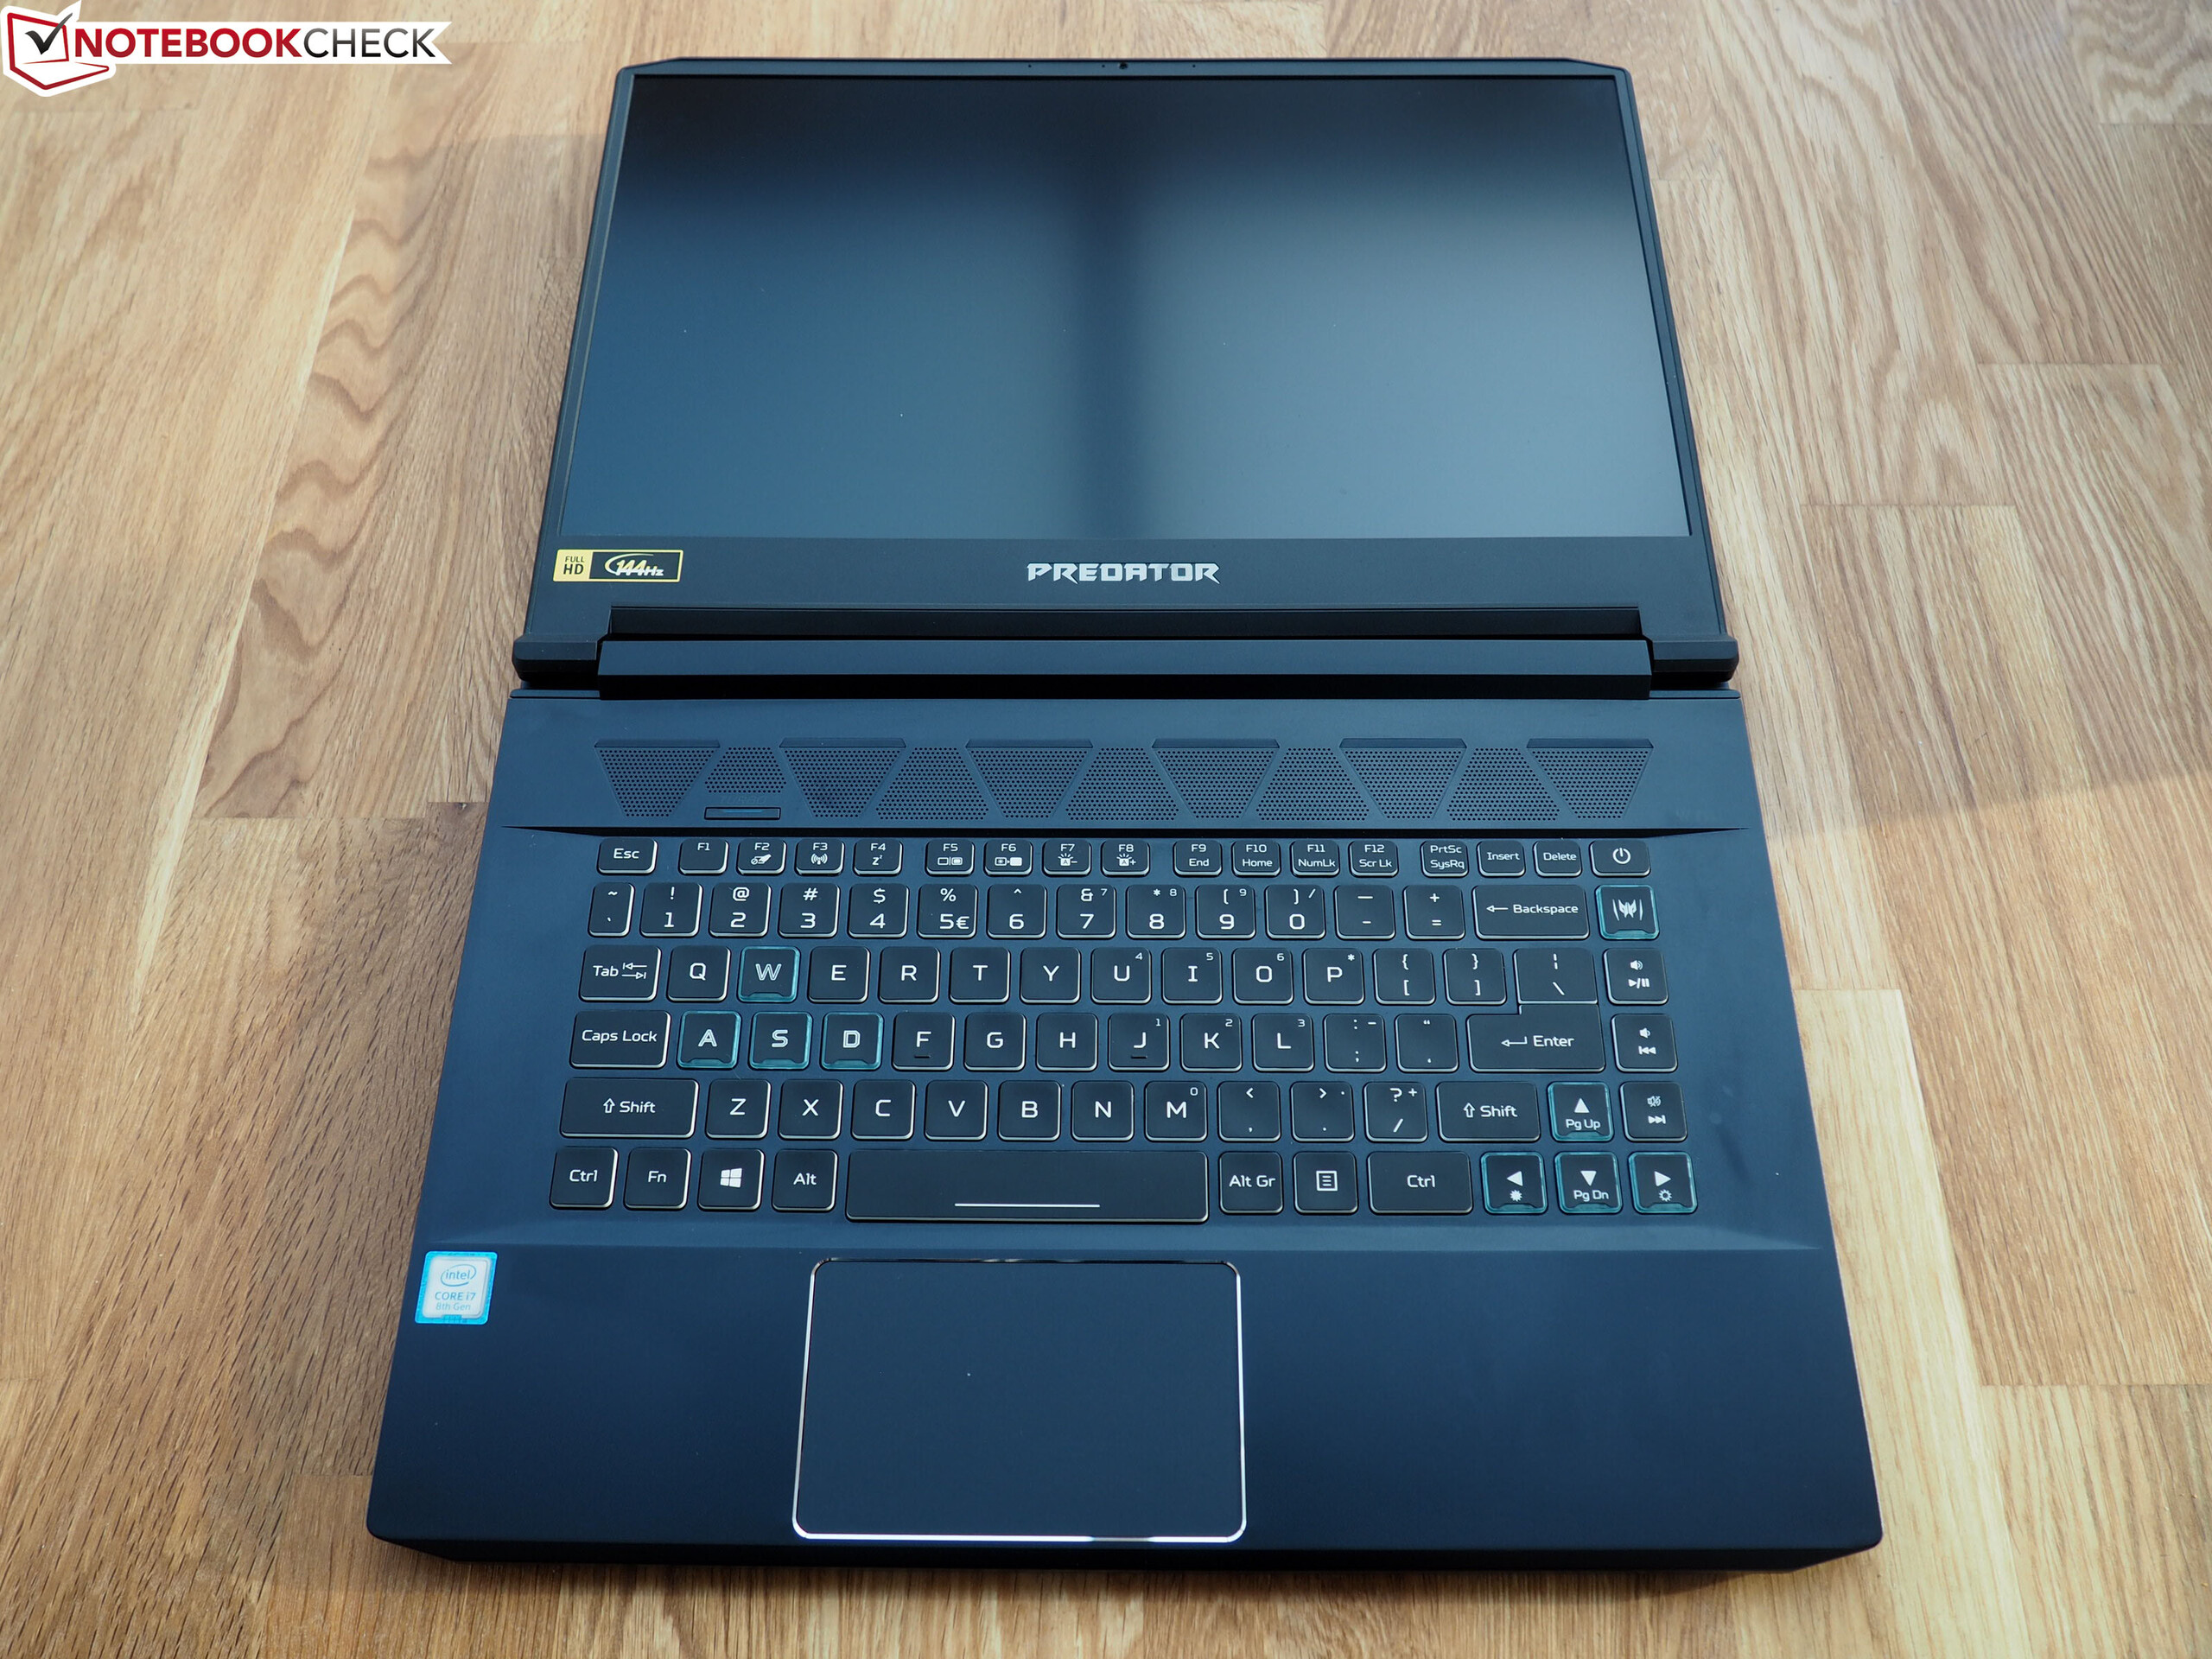
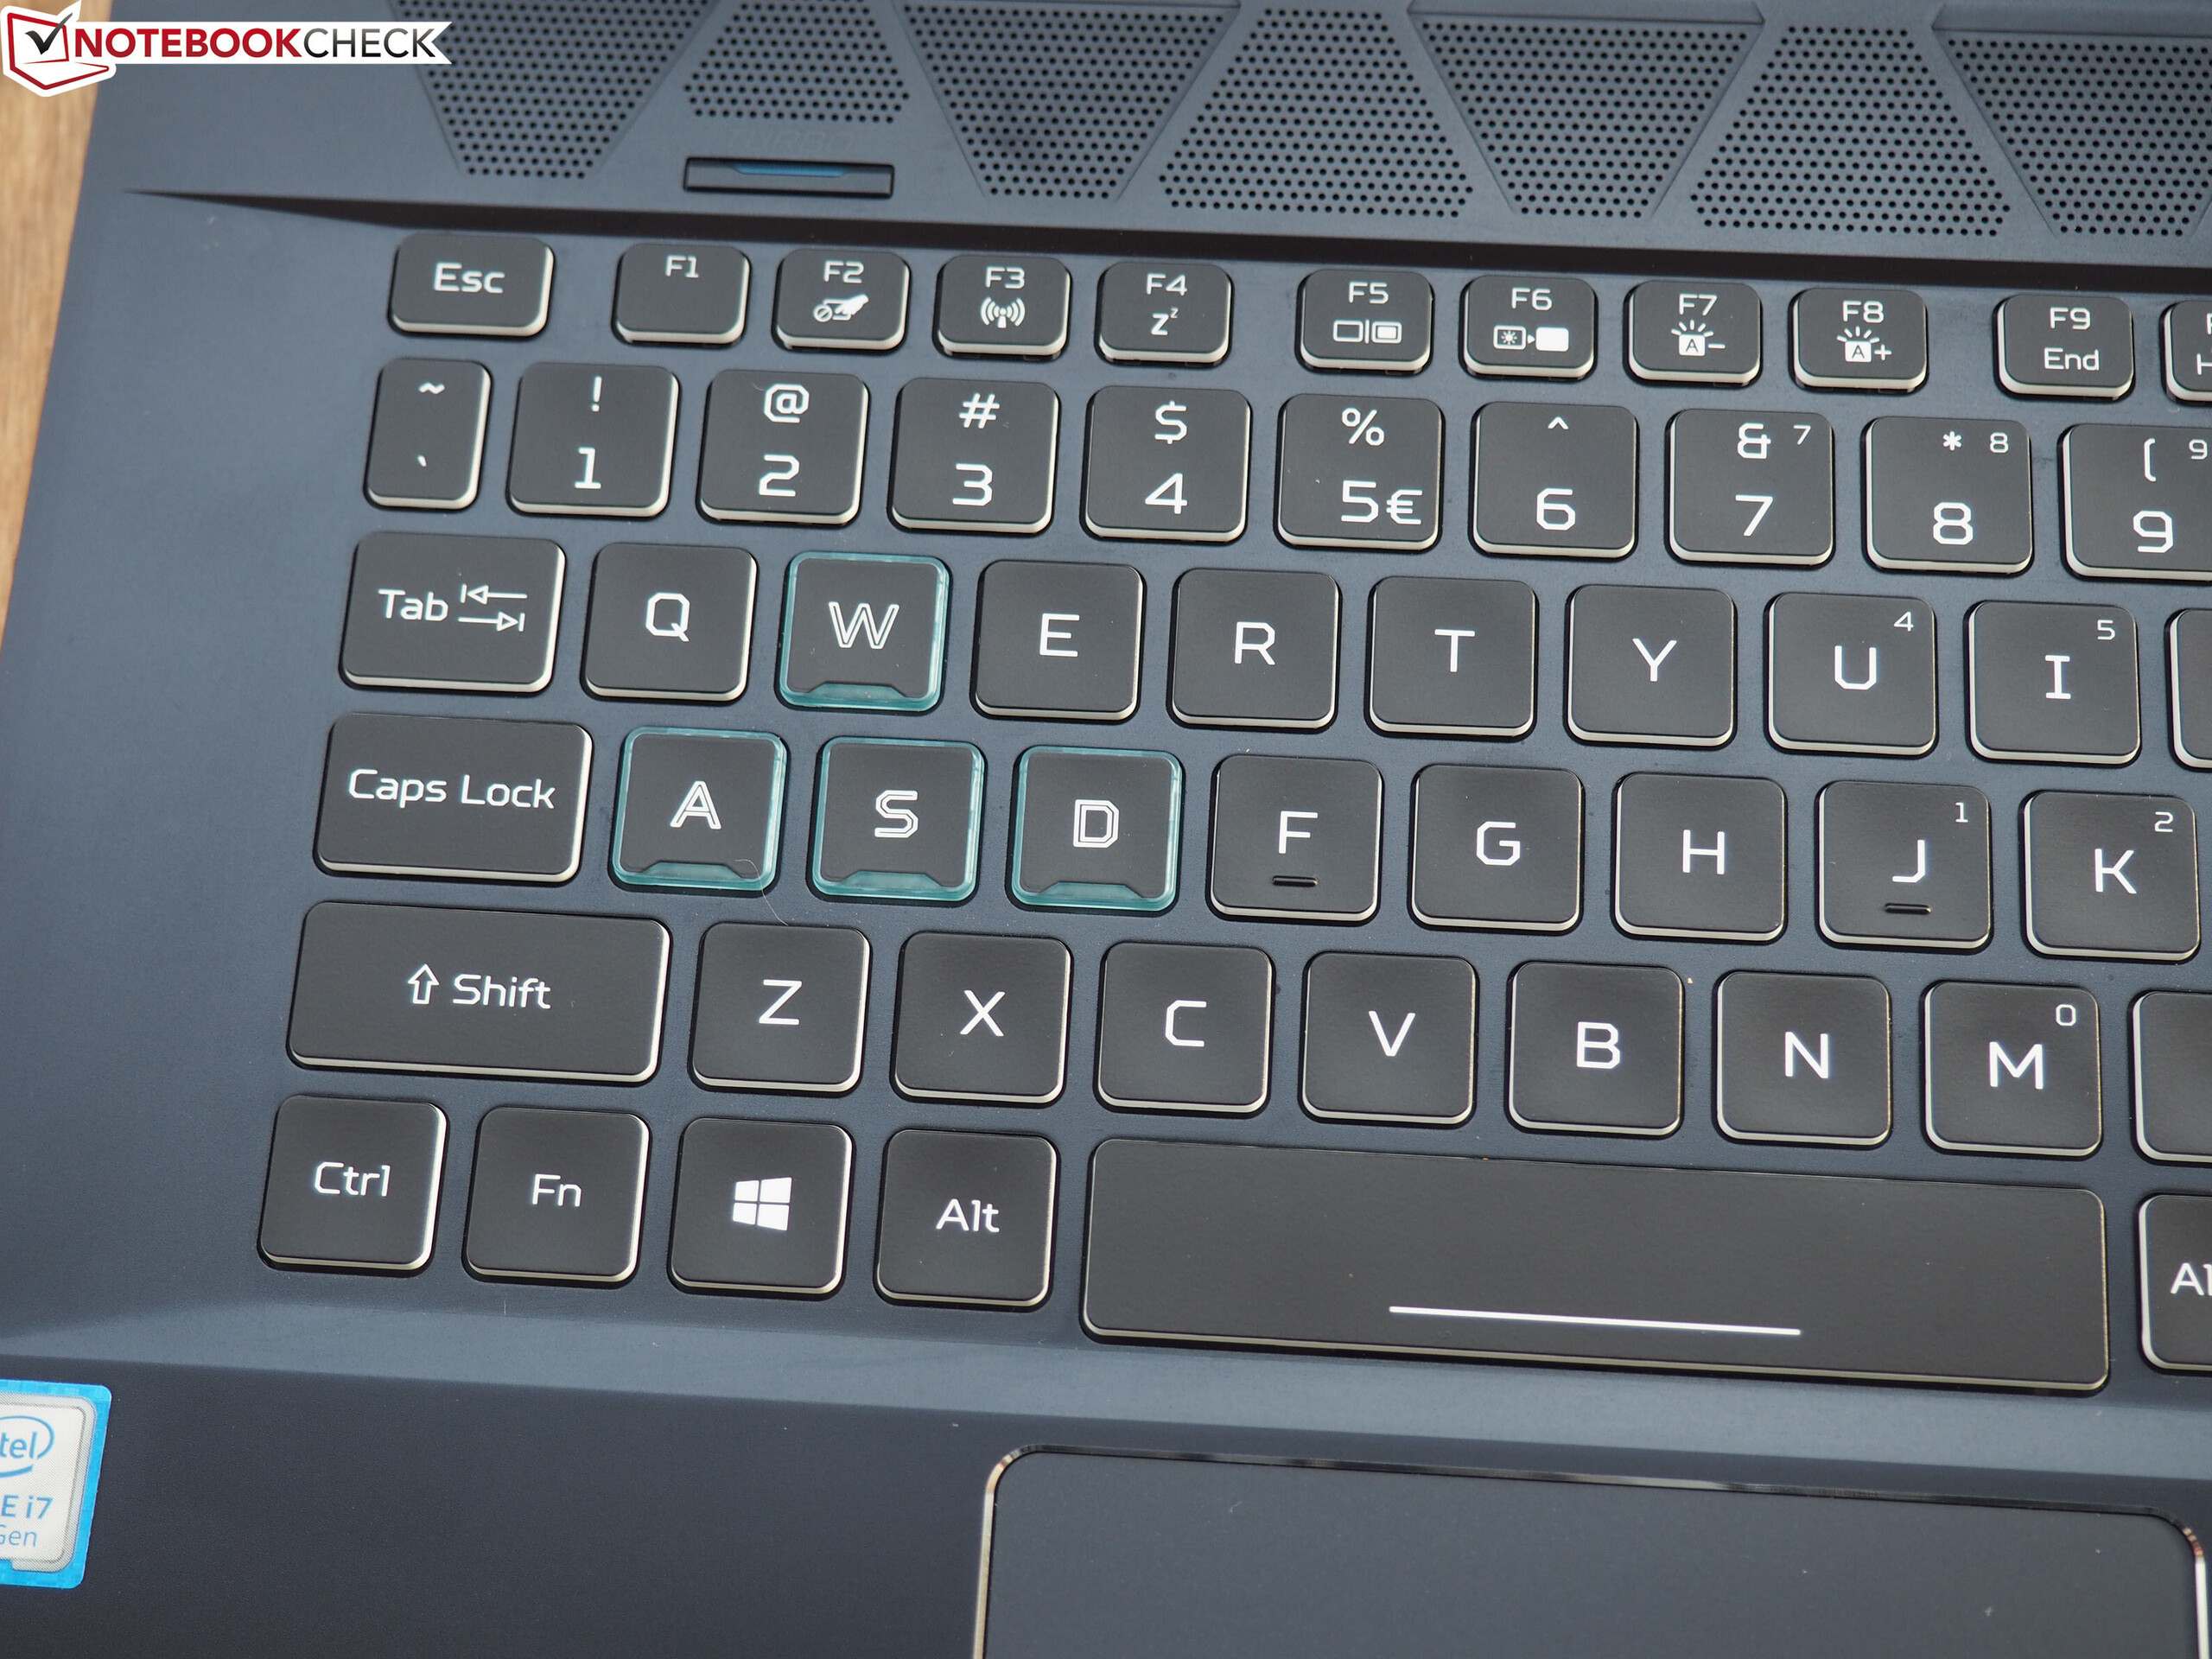
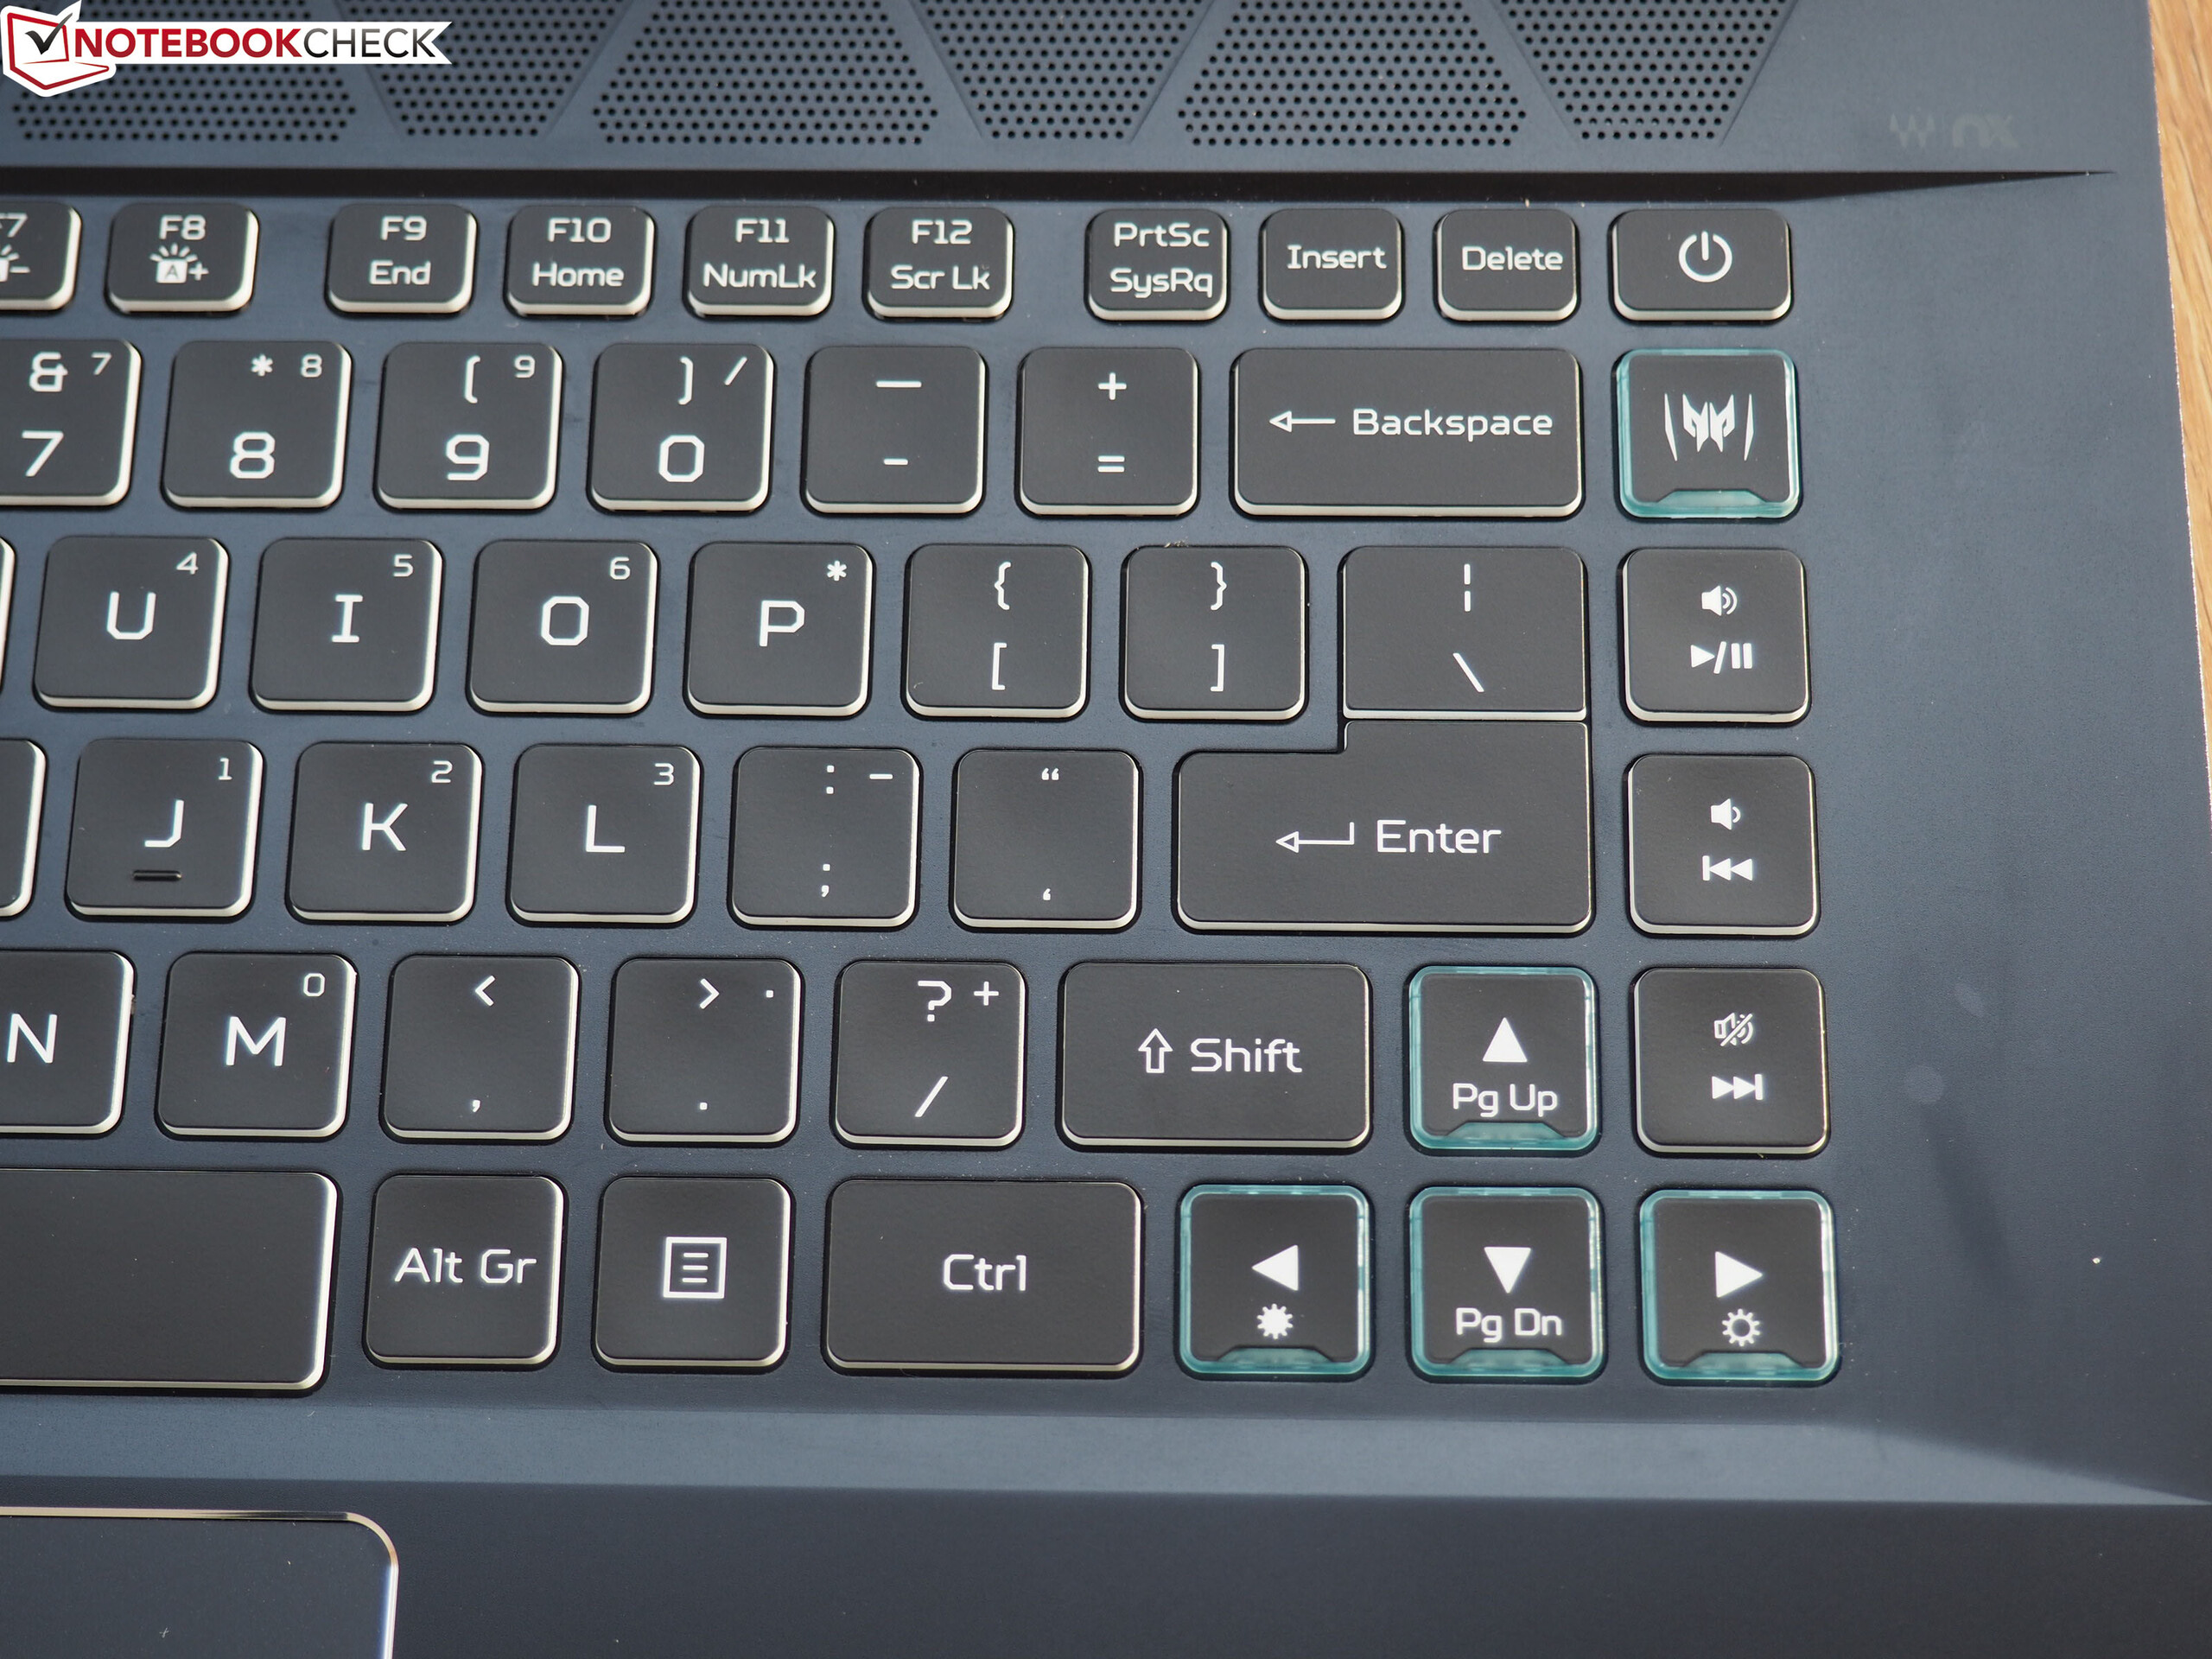
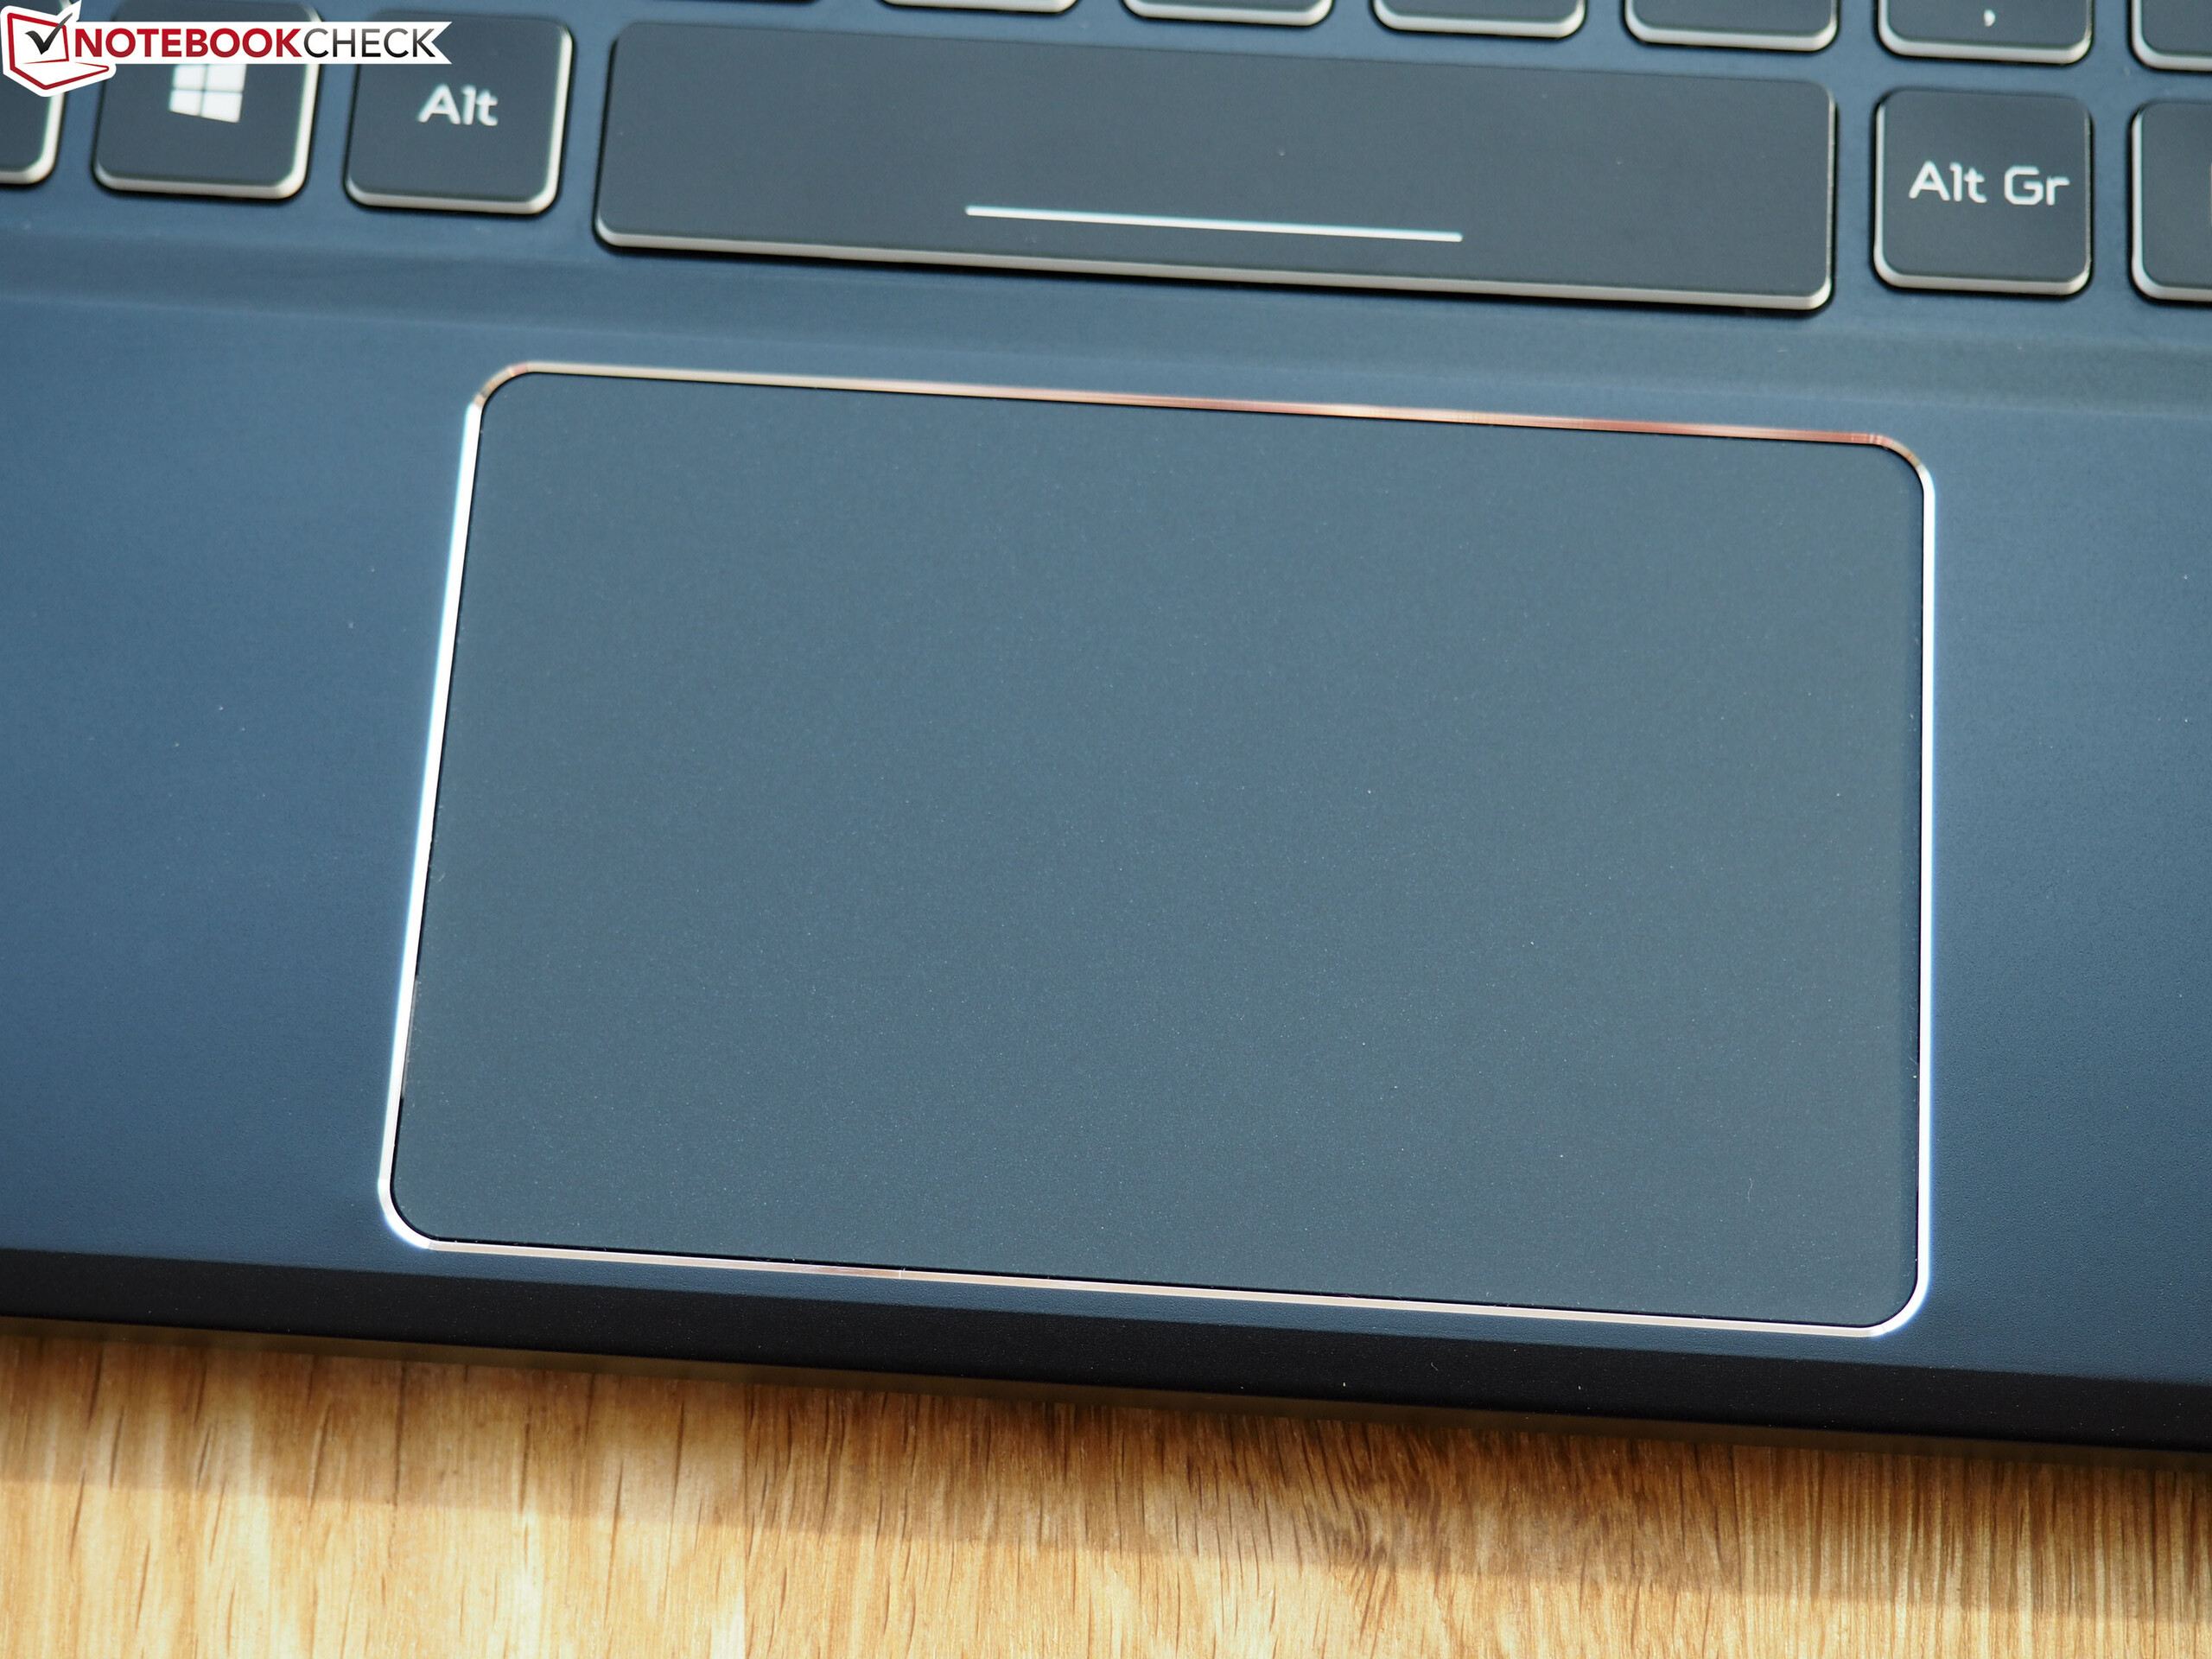
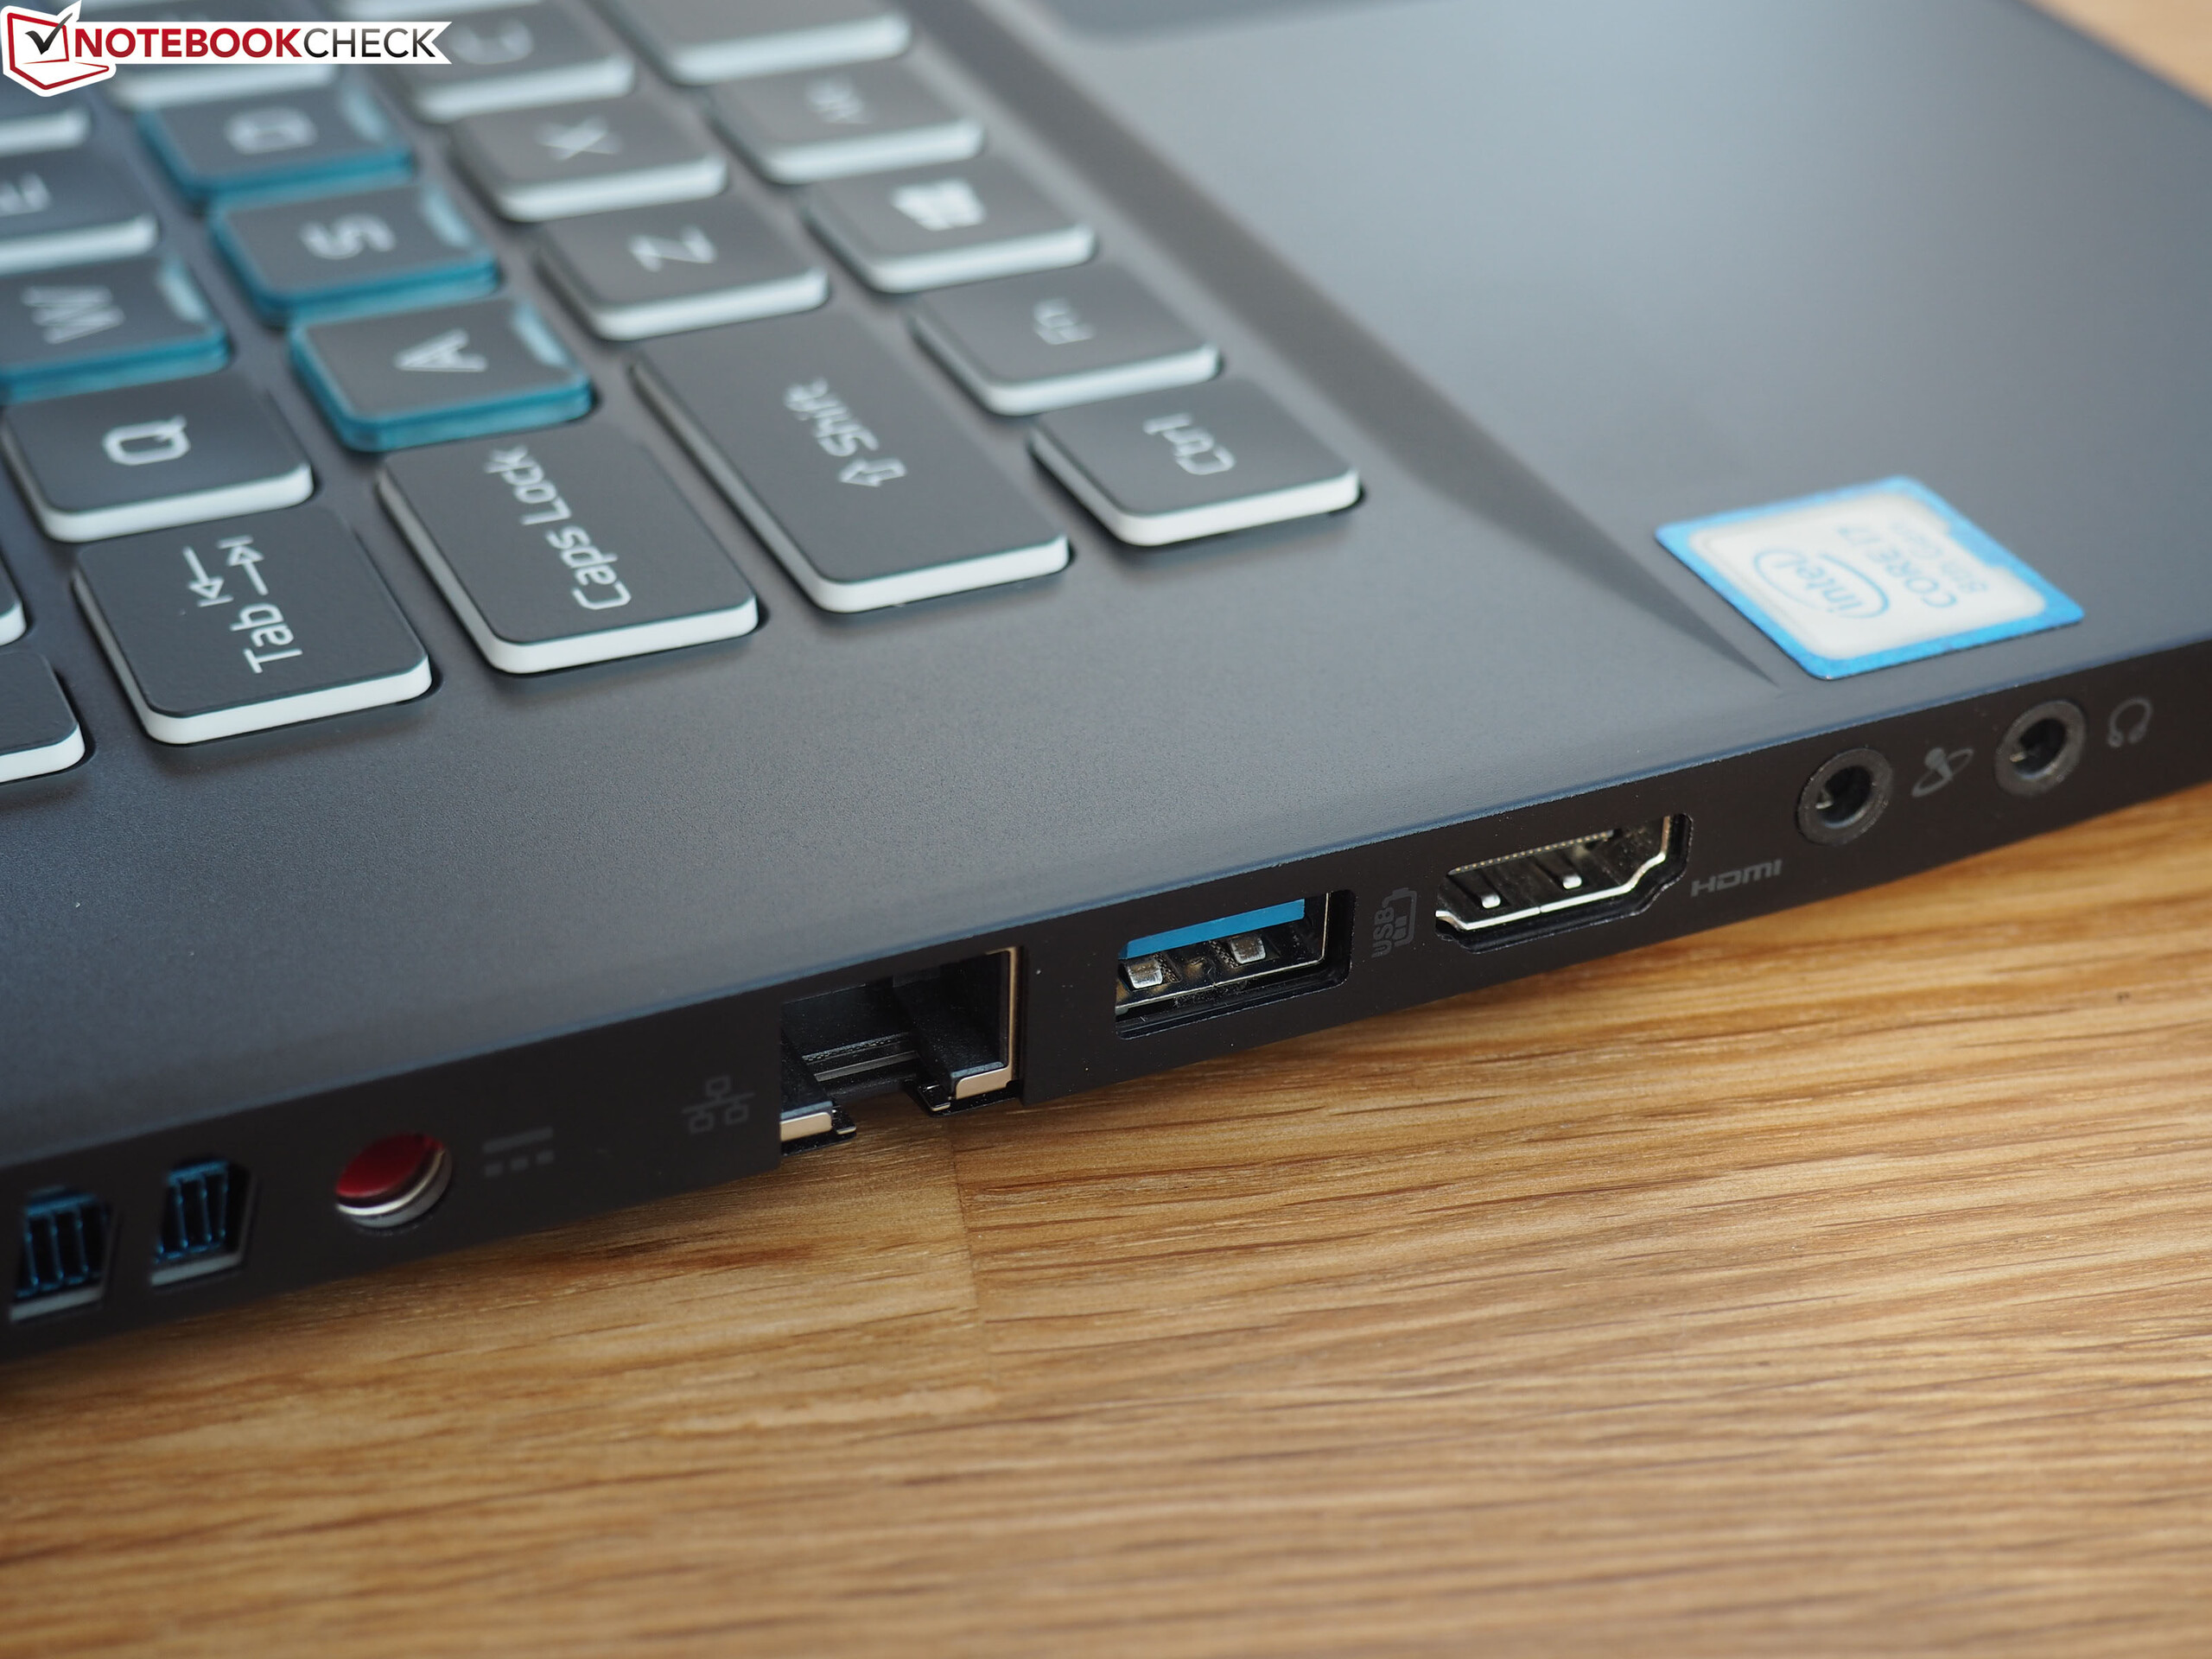
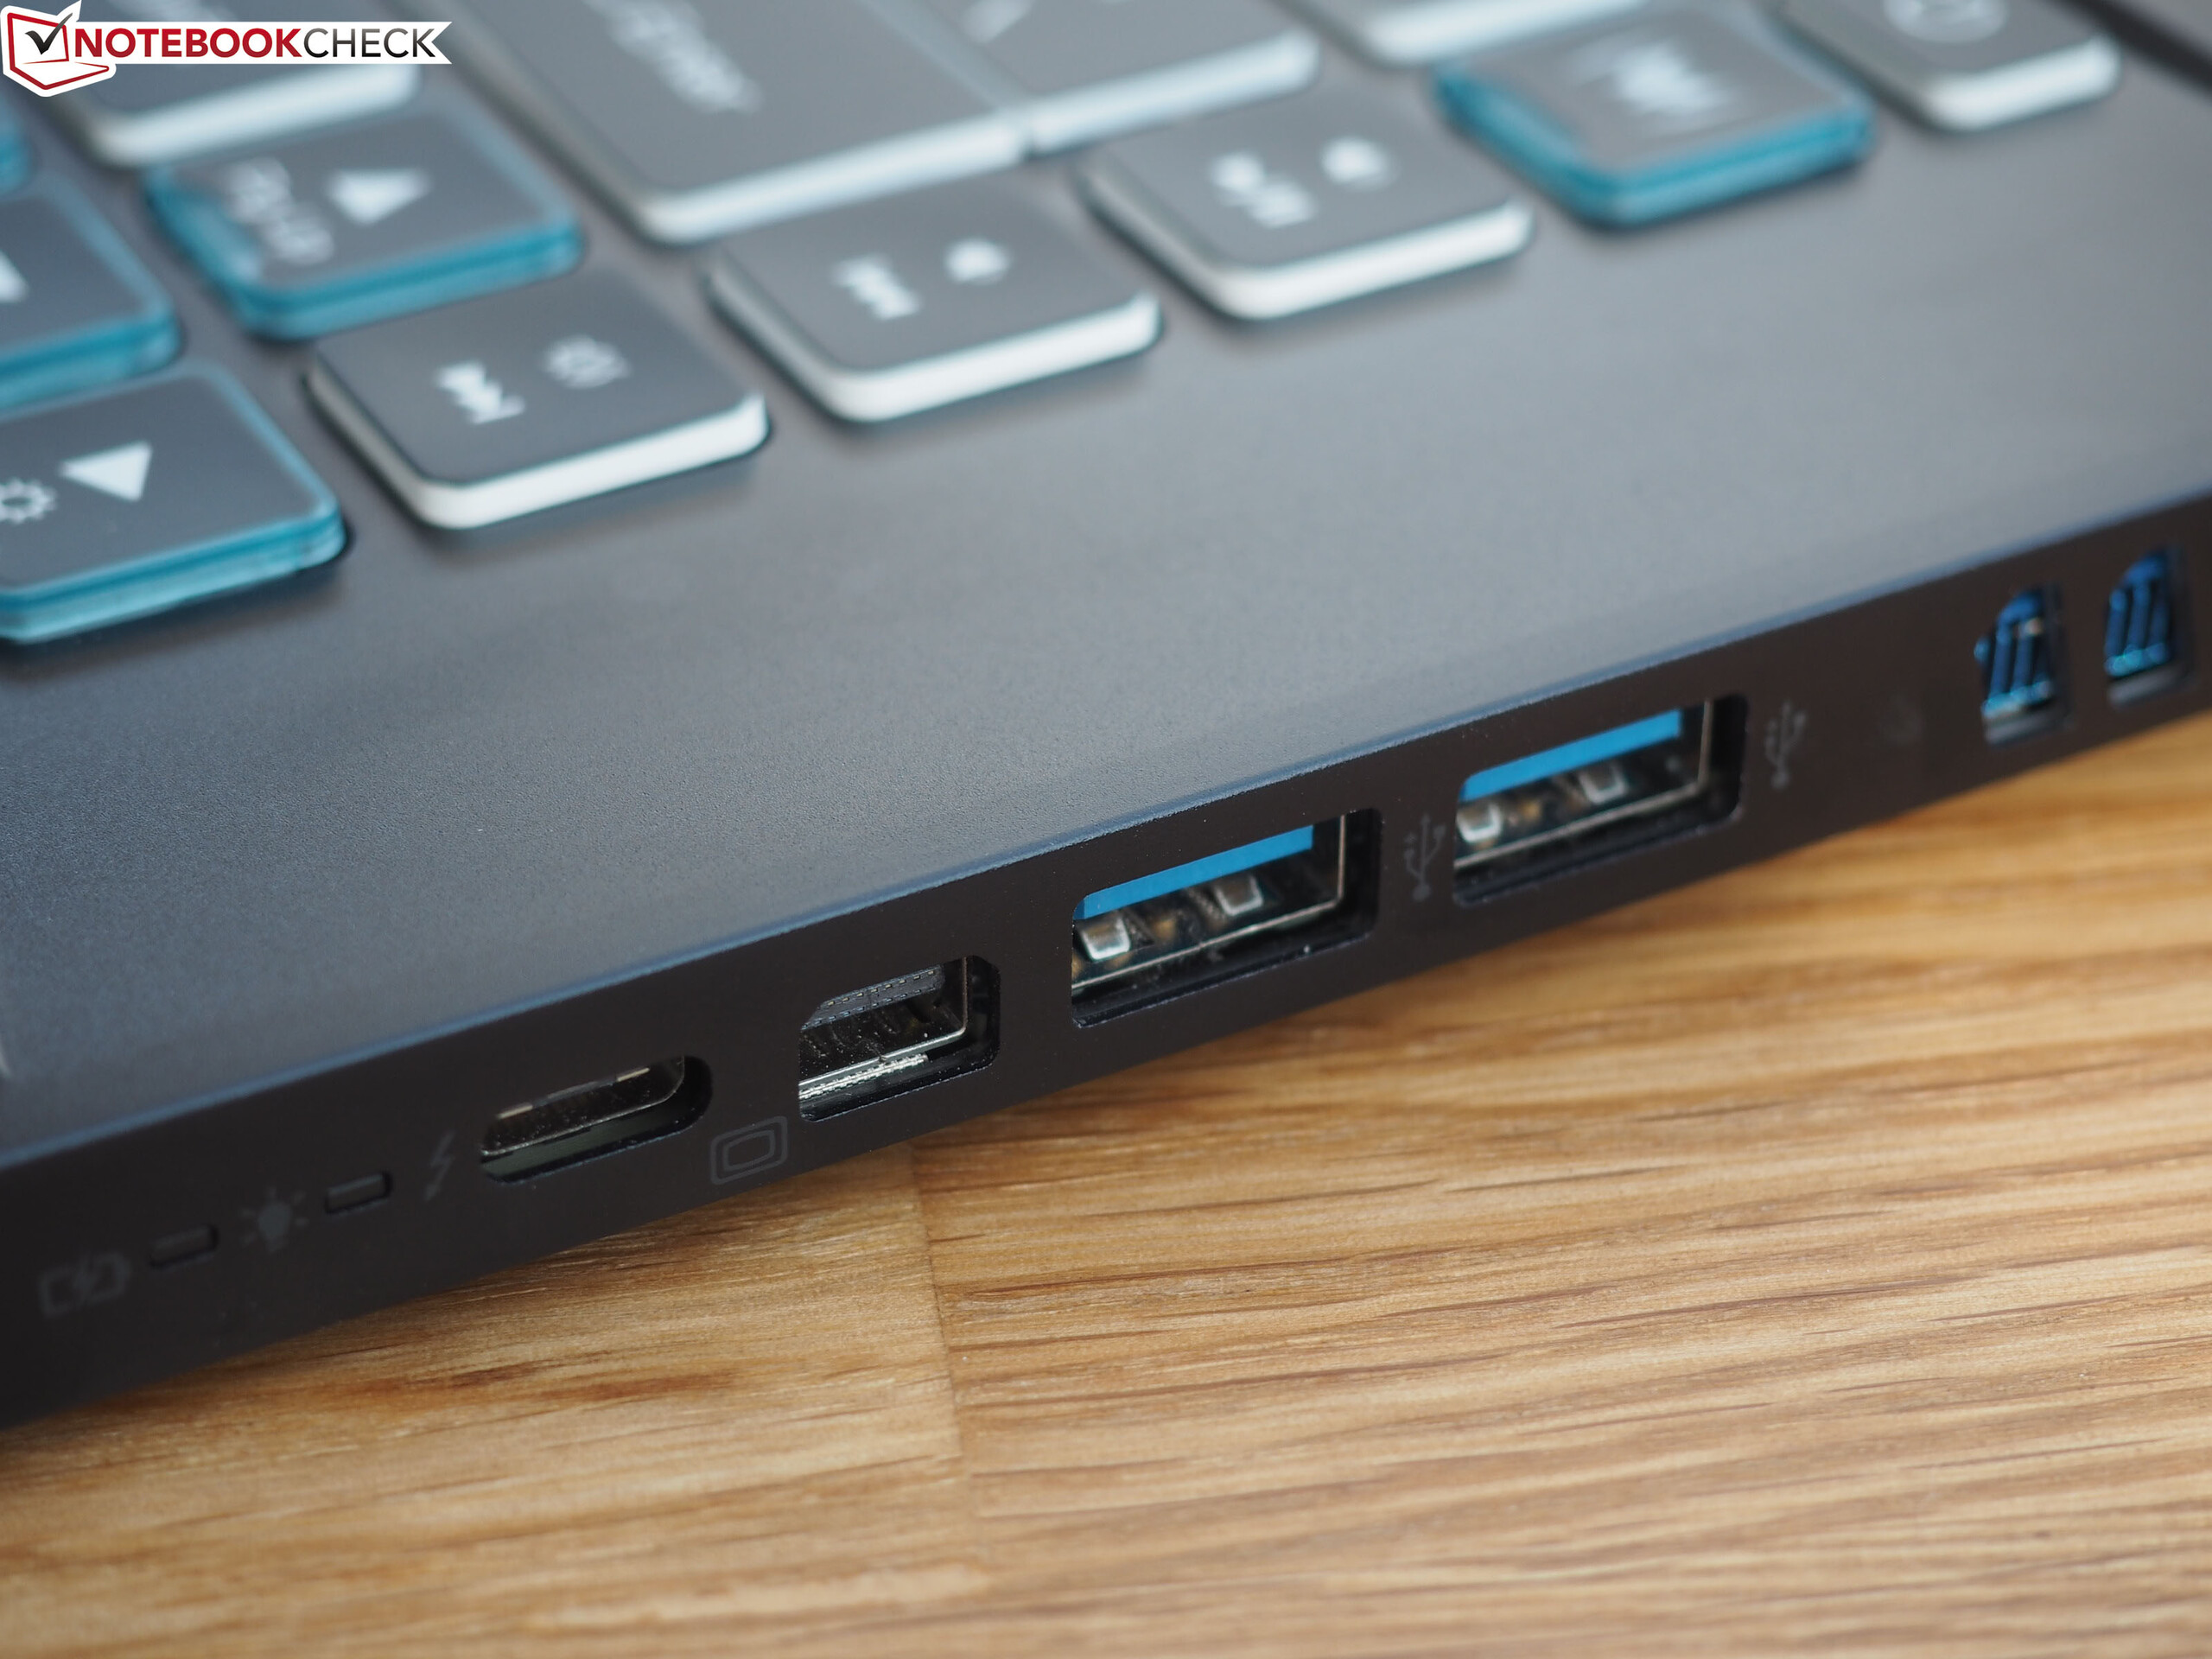
As Acer has not made any changes to the case since the last generation, in this article we will not go into the case, interfaces, and input devices. You will find the corresponding categories in the test report of the predecessor.
The competitors of the Triton 500 include other 15-inch representatives of our Thin & Light Top 10, such as the Gigabyte Aero 15 Classic-XA, the Asus Zephyrus S GX502GW, the MSI GS65 Stealth 9SG and the 2019 edition of the Razer Blade 15.
Display
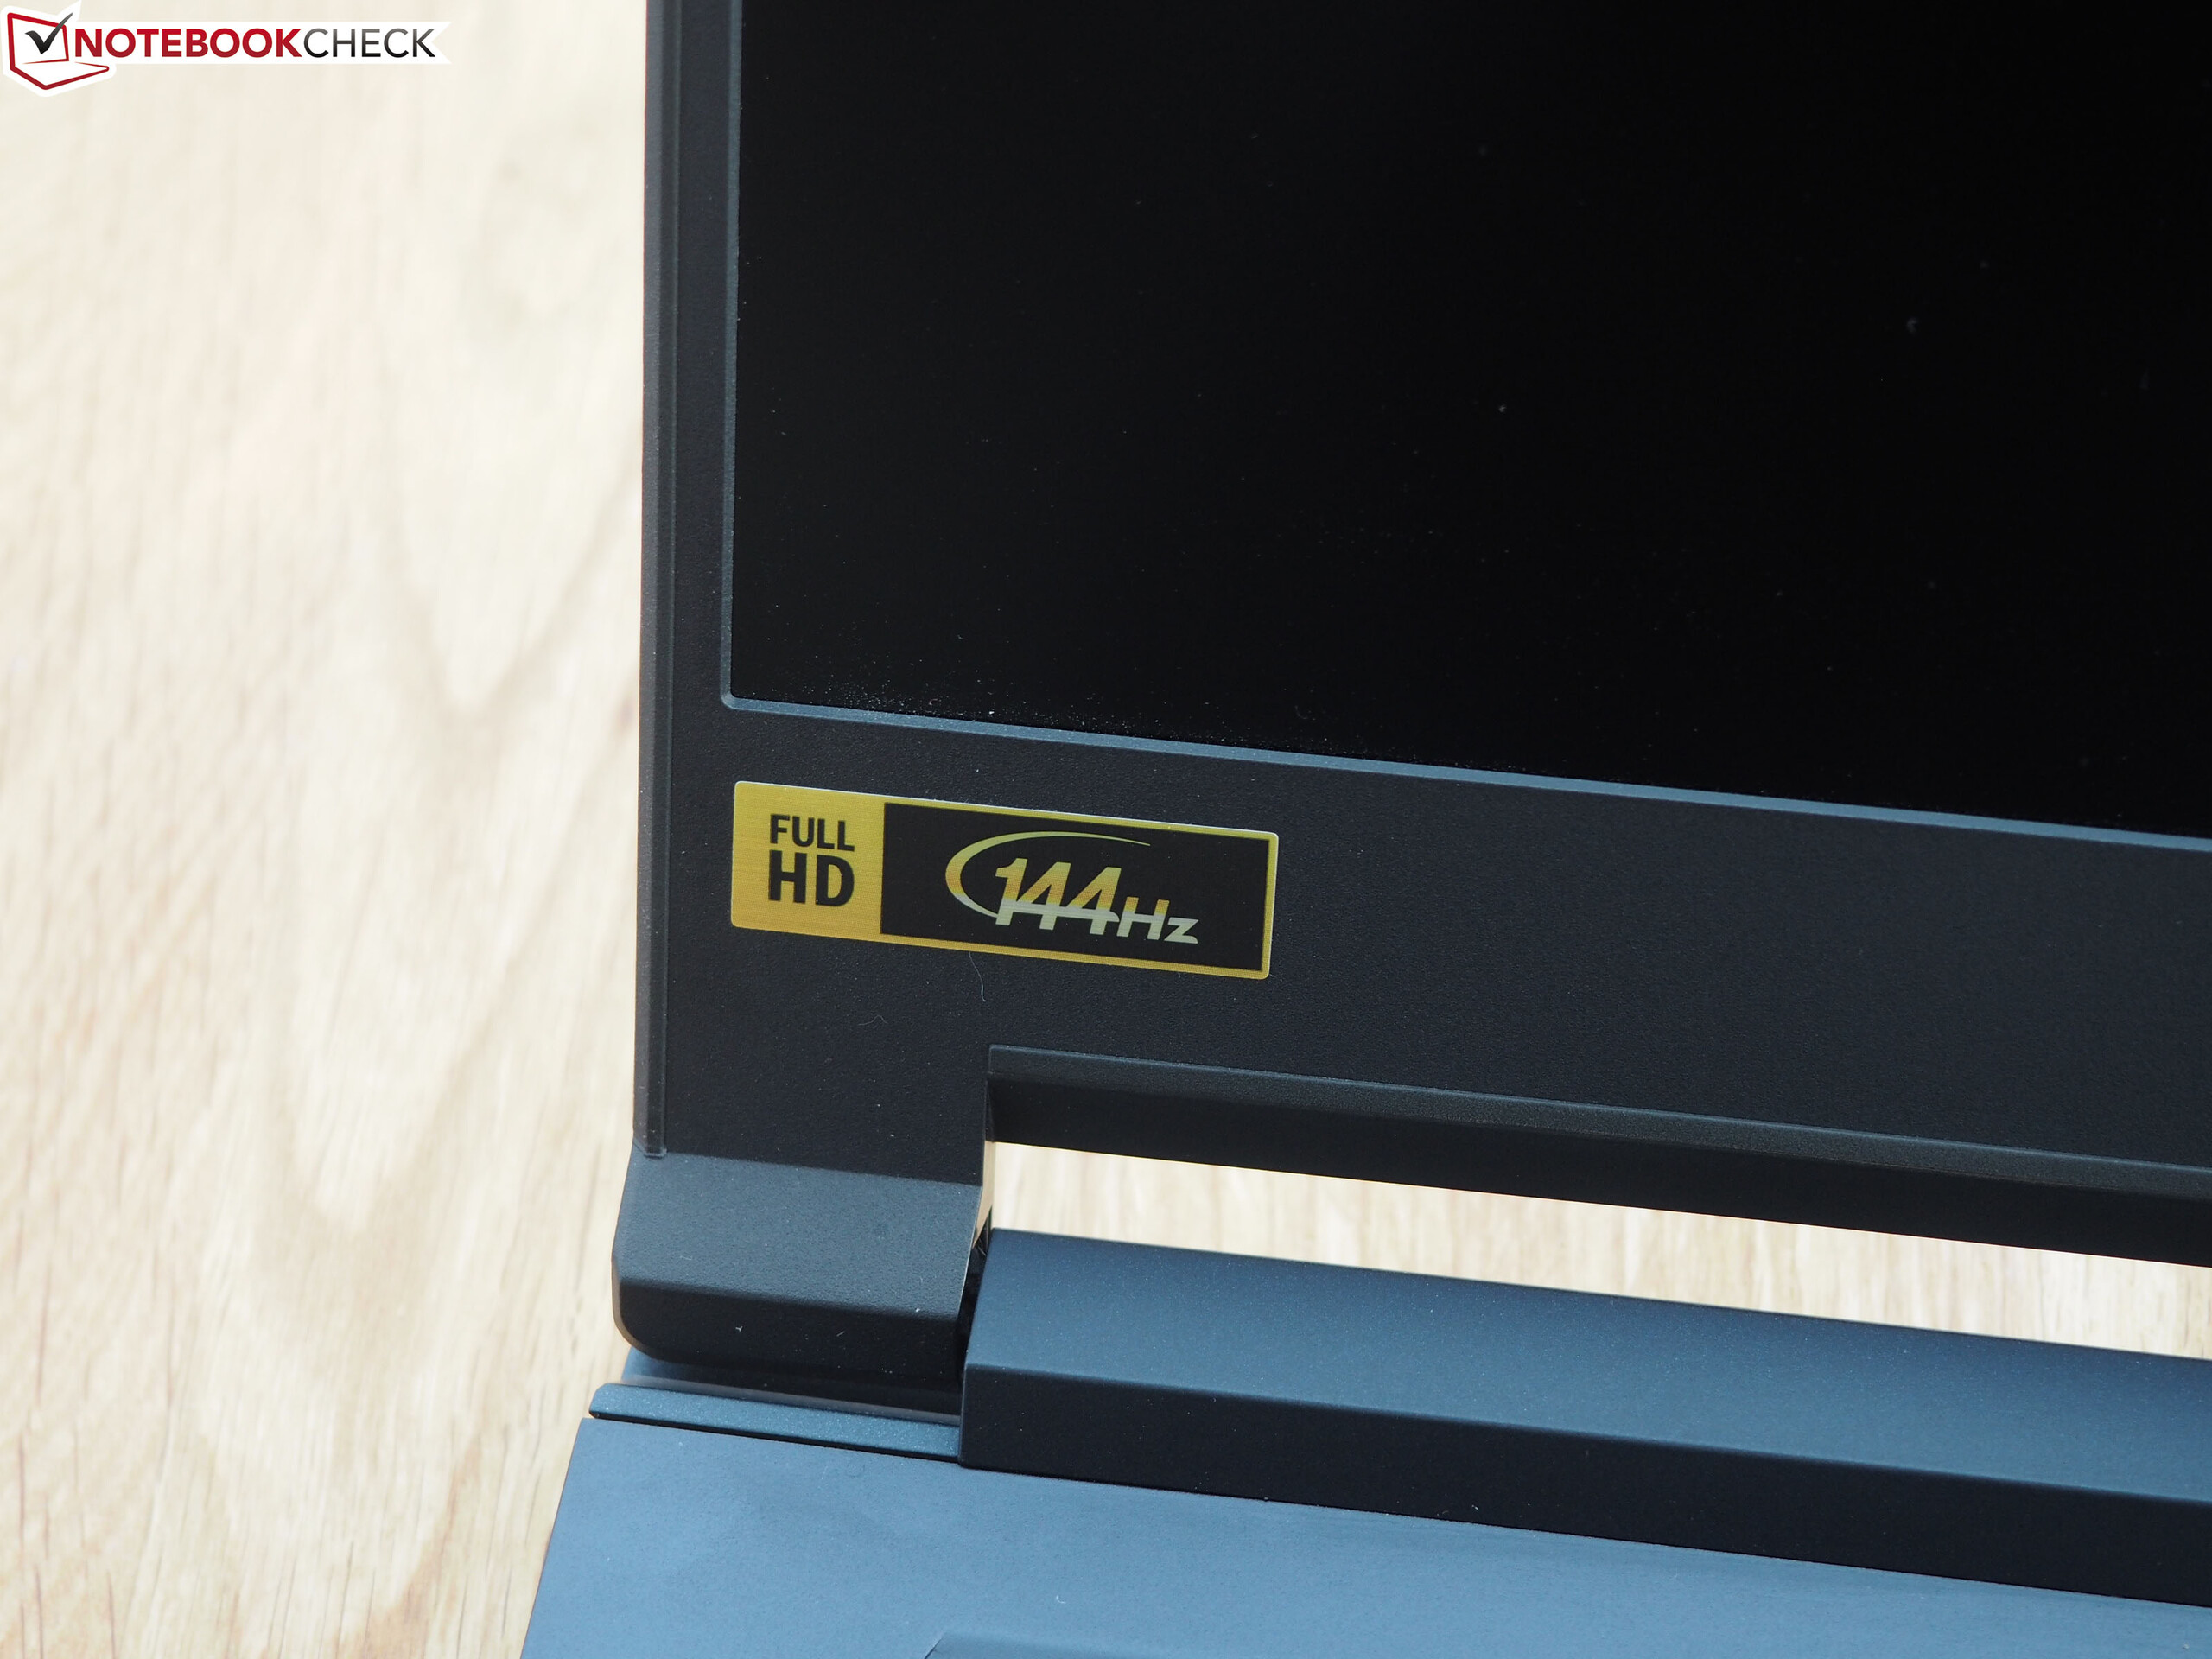
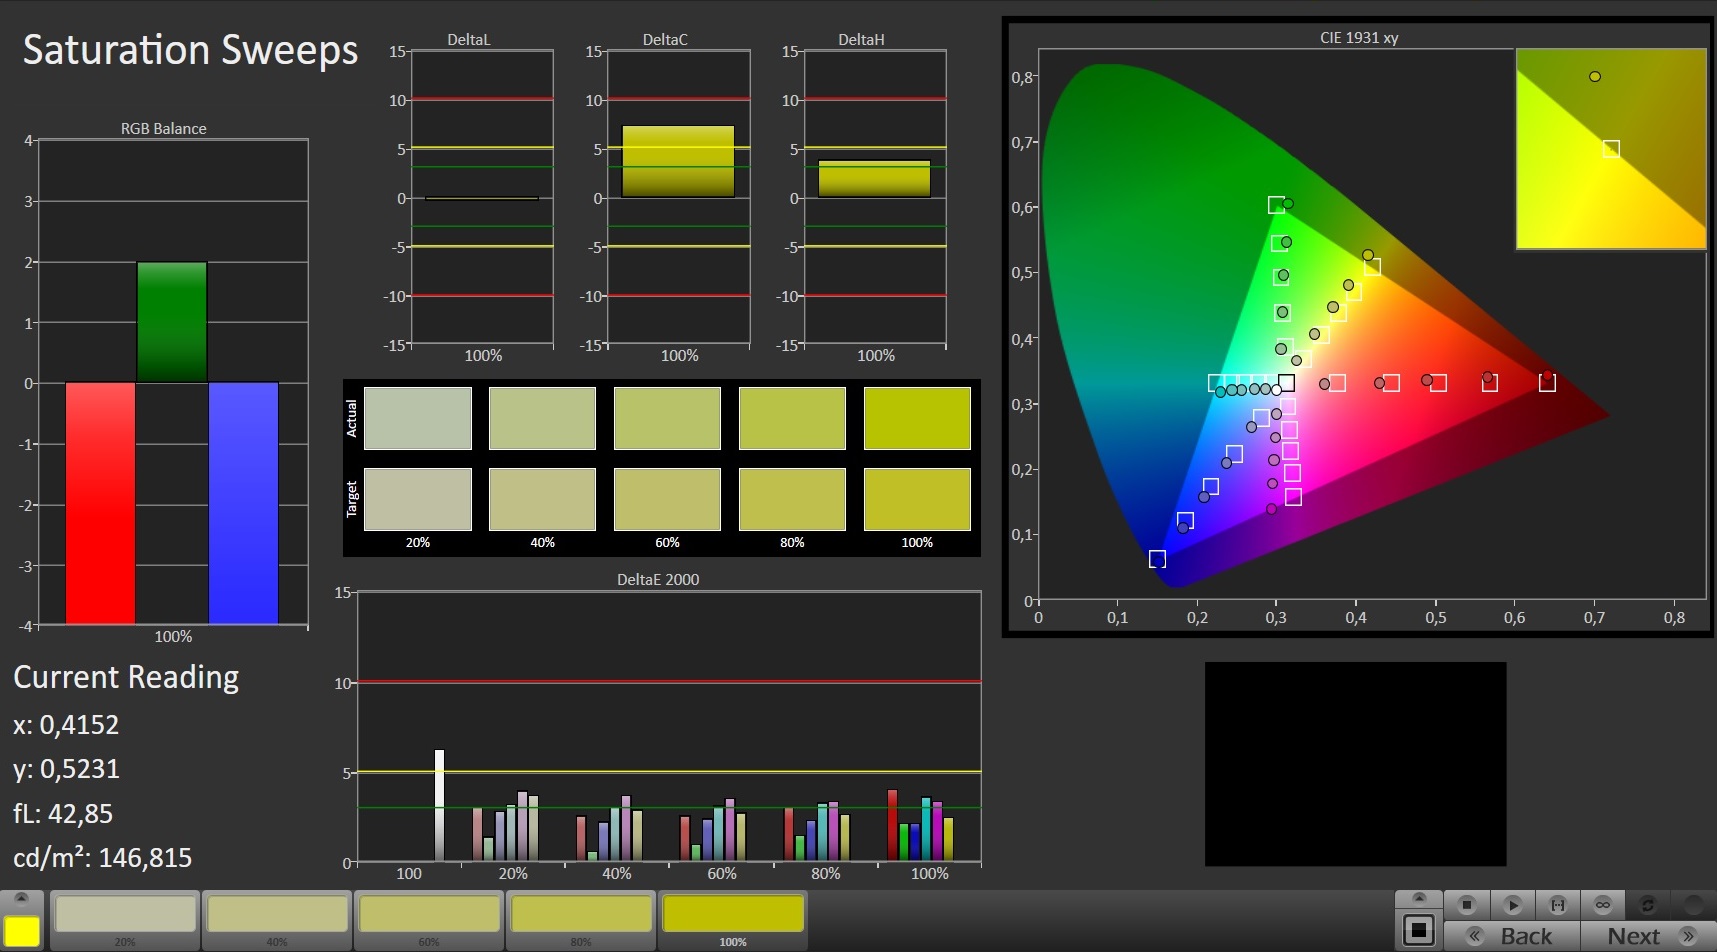
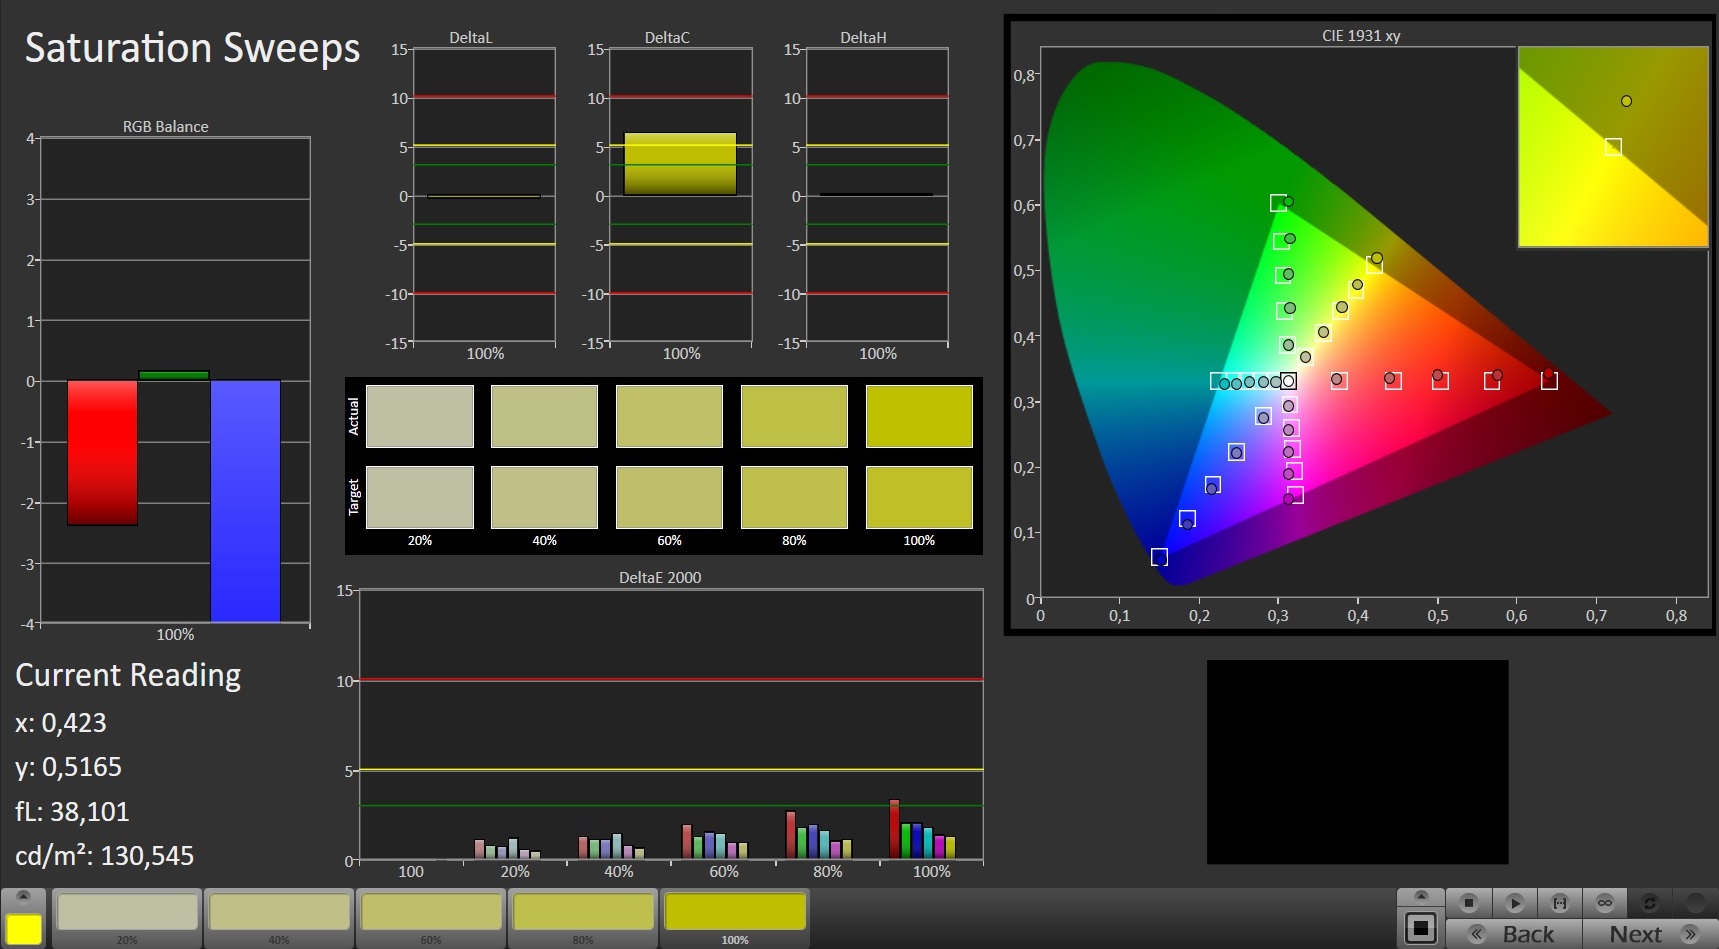
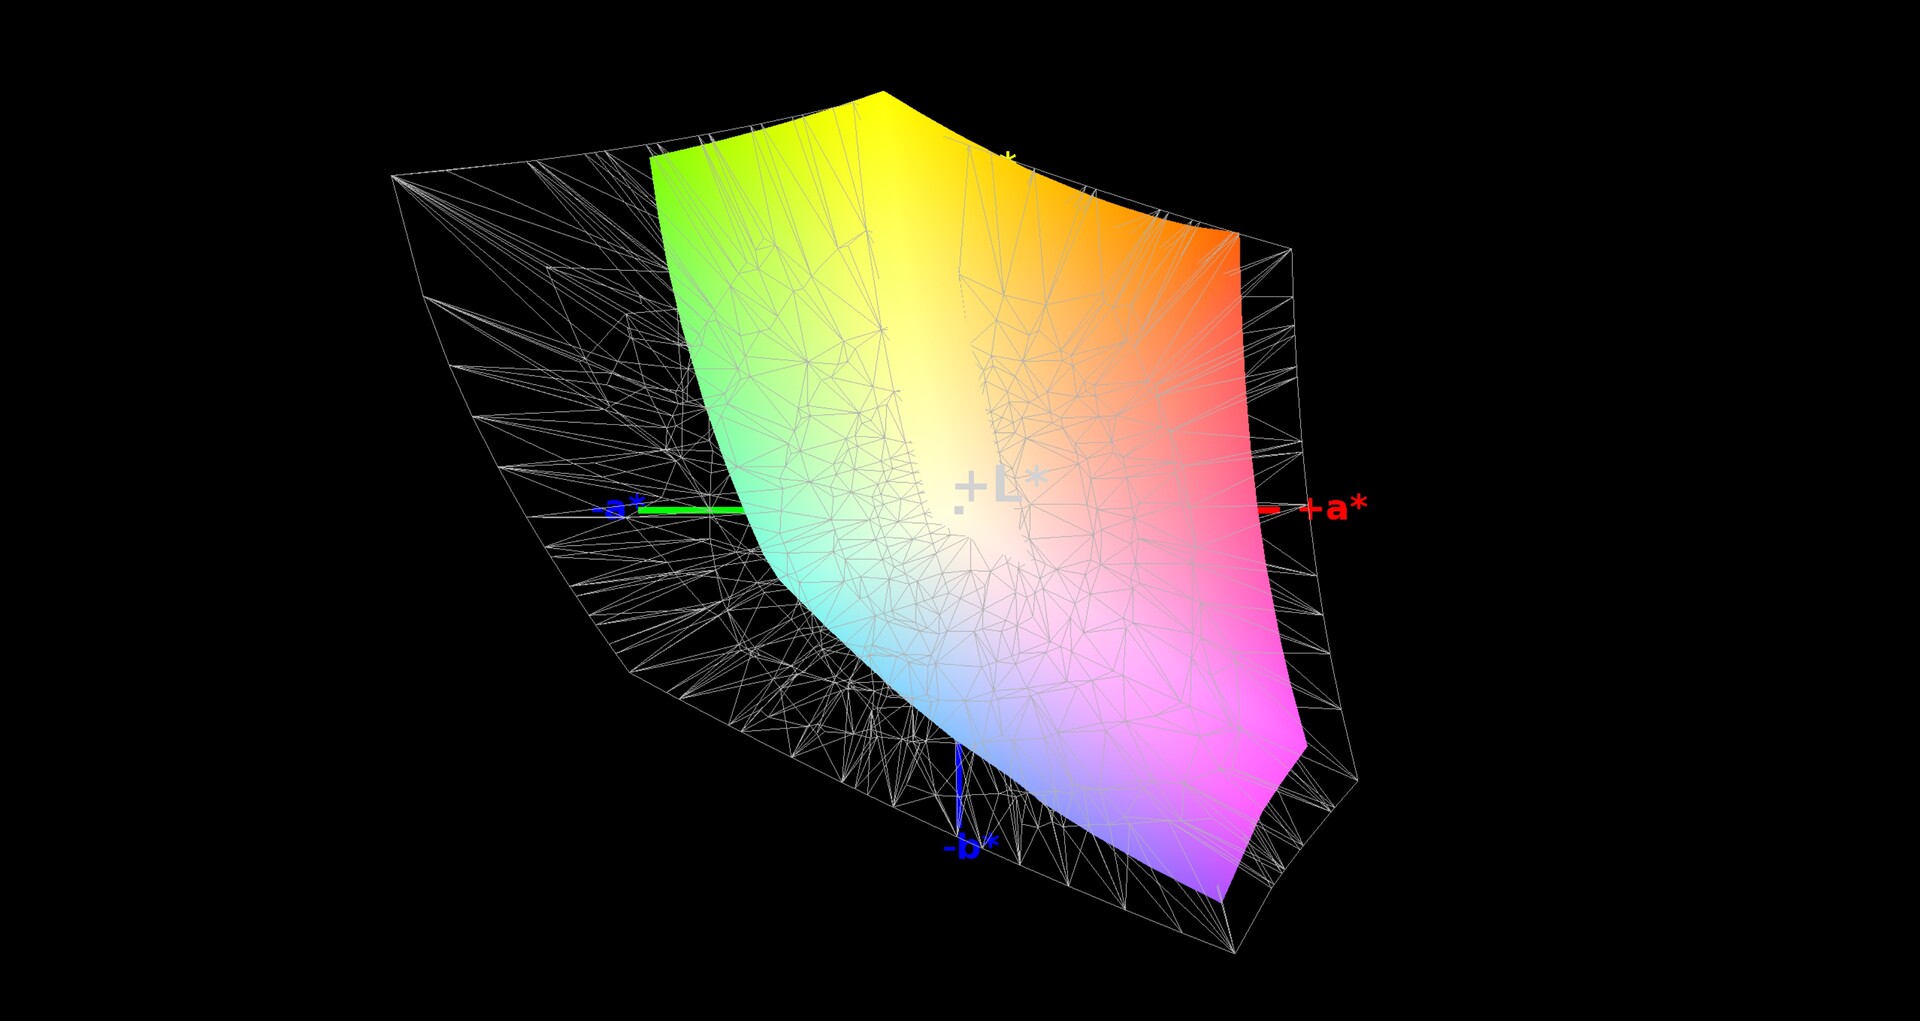
While the case remains unchanged, another panel takes care of the image representation in the new Predator (BOE instead of AU Optronics). Due to the very similar measurements, you can neither speak of a downgrade nor an upgrade. Both 144 Hz displays offer a color space coverage of 93% sRGB and 60% AdobeRGB, which is quite respectable for a gaming notebook and is based on the results of the competition.
| |||||||||||||||||||||||||
Brightness Distribution: 84 %
Center on Battery: 288 cd/m²
Contrast: 1309:1 (Black: 0.22 cd/m²)
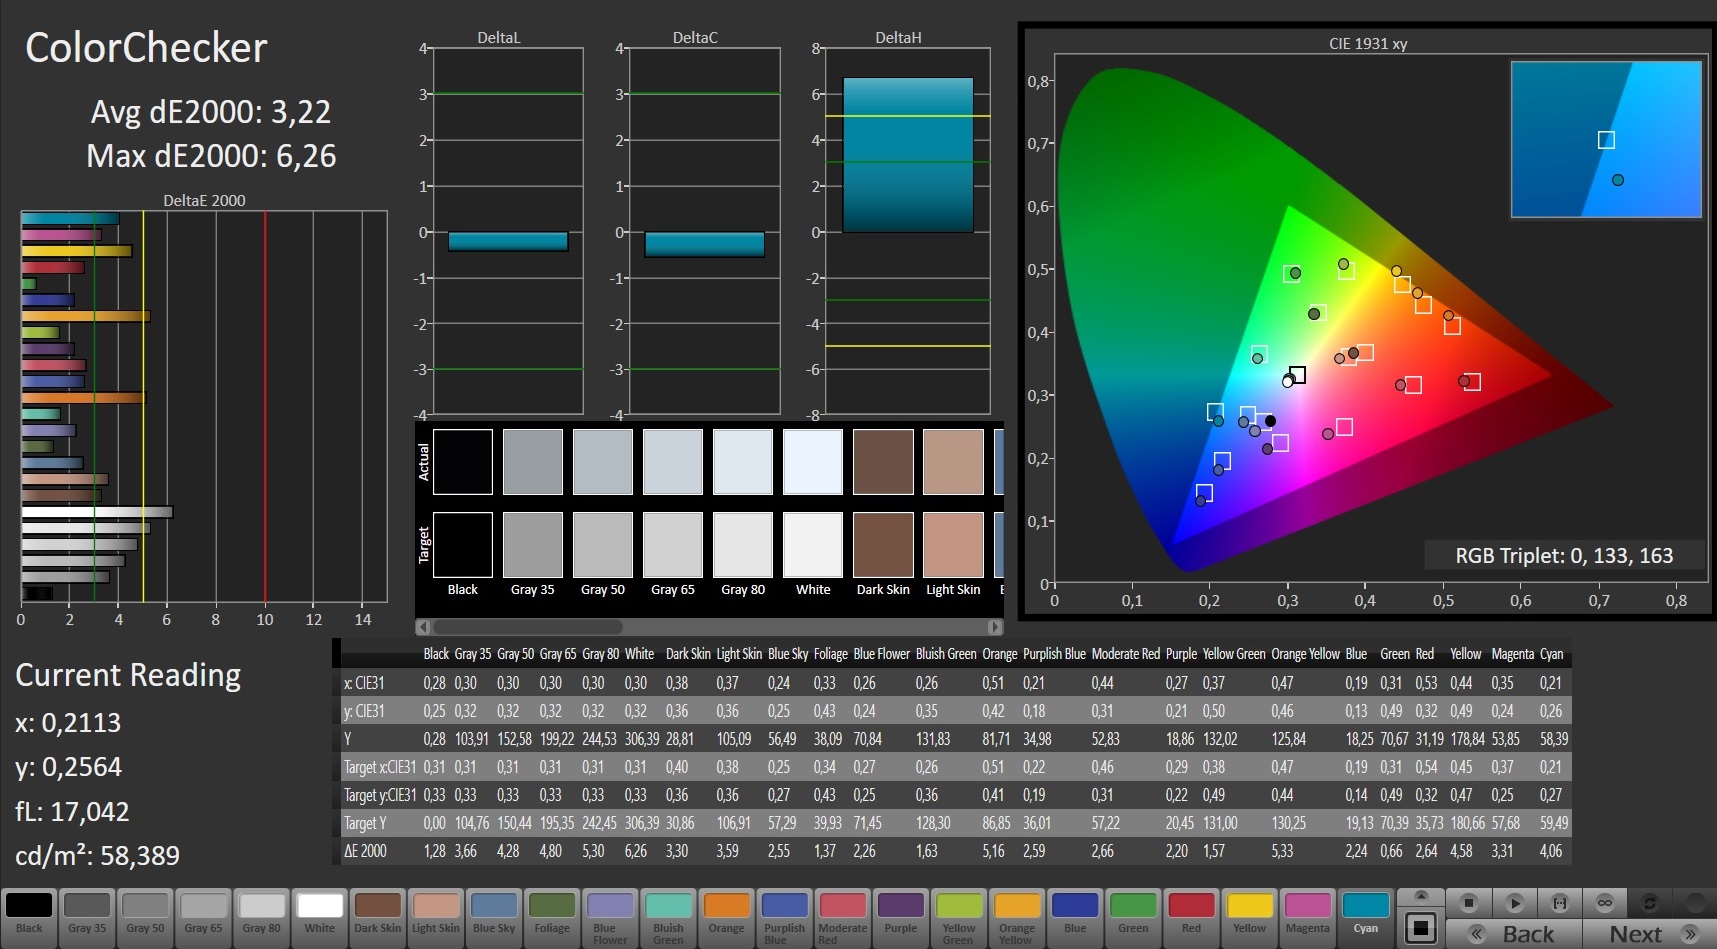
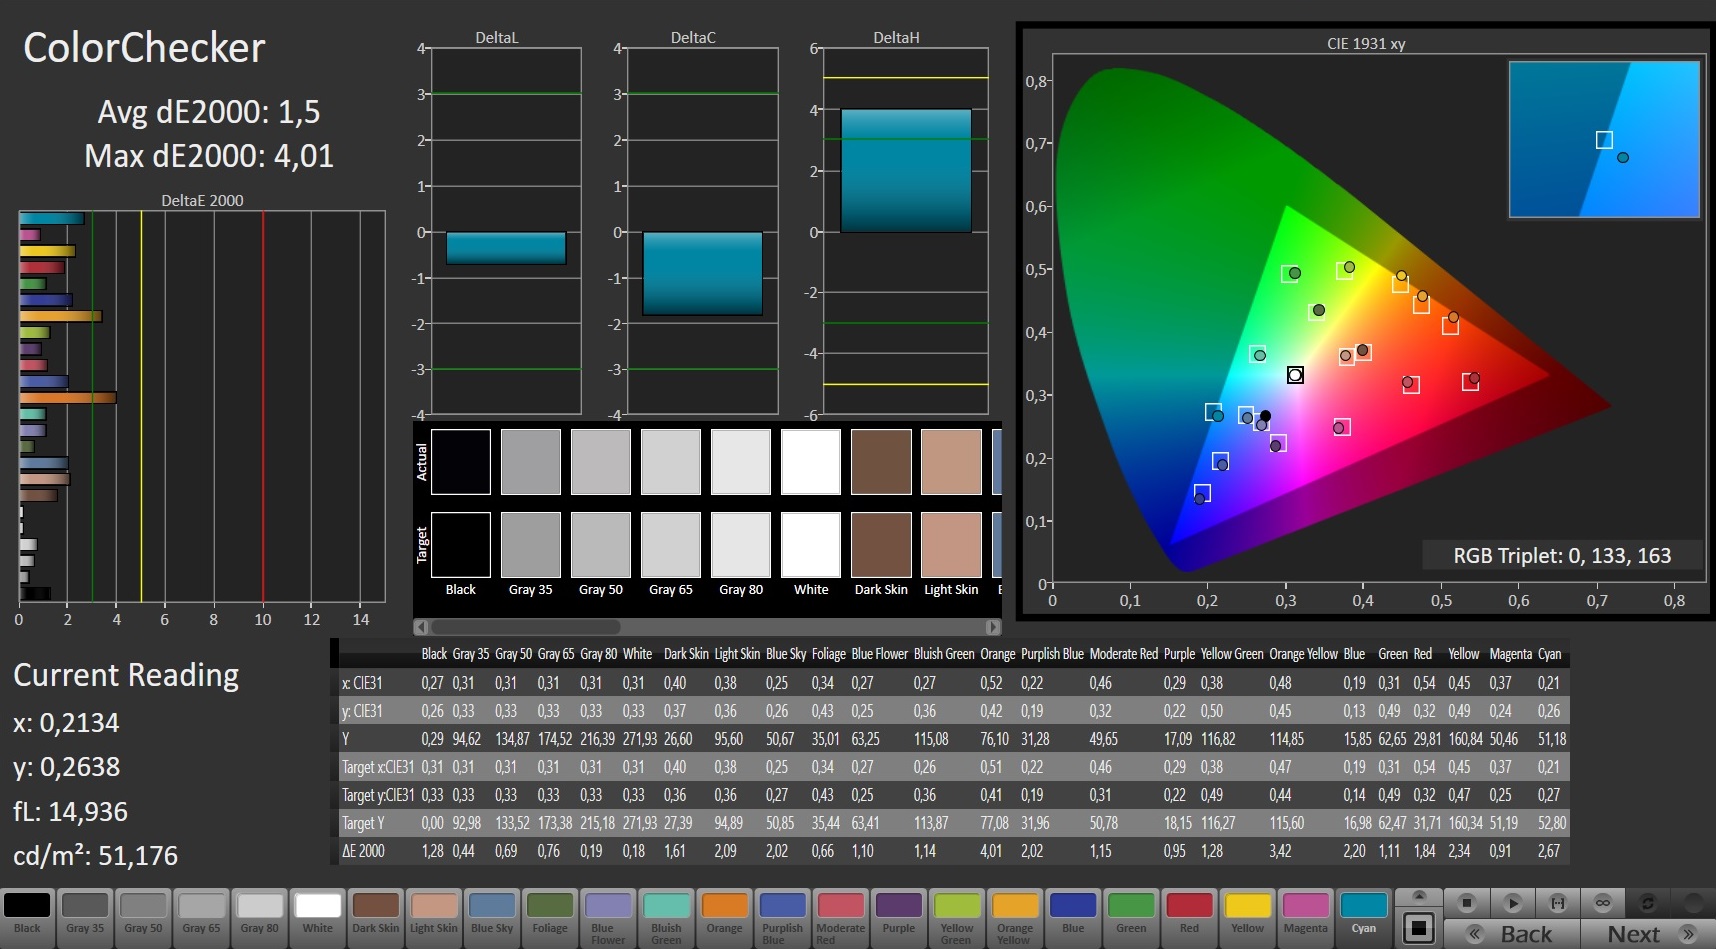
ΔE ColorChecker Calman: 3.22 | ∀{0.5-29.43 Ø4.71}
calibrated: 1.5
ΔE Greyscale Calman: 3.43 | ∀{0.09-98 Ø4.96}
93% sRGB (Argyll 1.6.3 3D)
60% AdobeRGB 1998 (Argyll 1.6.3 3D)
66% AdobeRGB 1998 (Argyll 3D)
92.6% sRGB (Argyll 3D)
64.6% Display P3 (Argyll 3D)
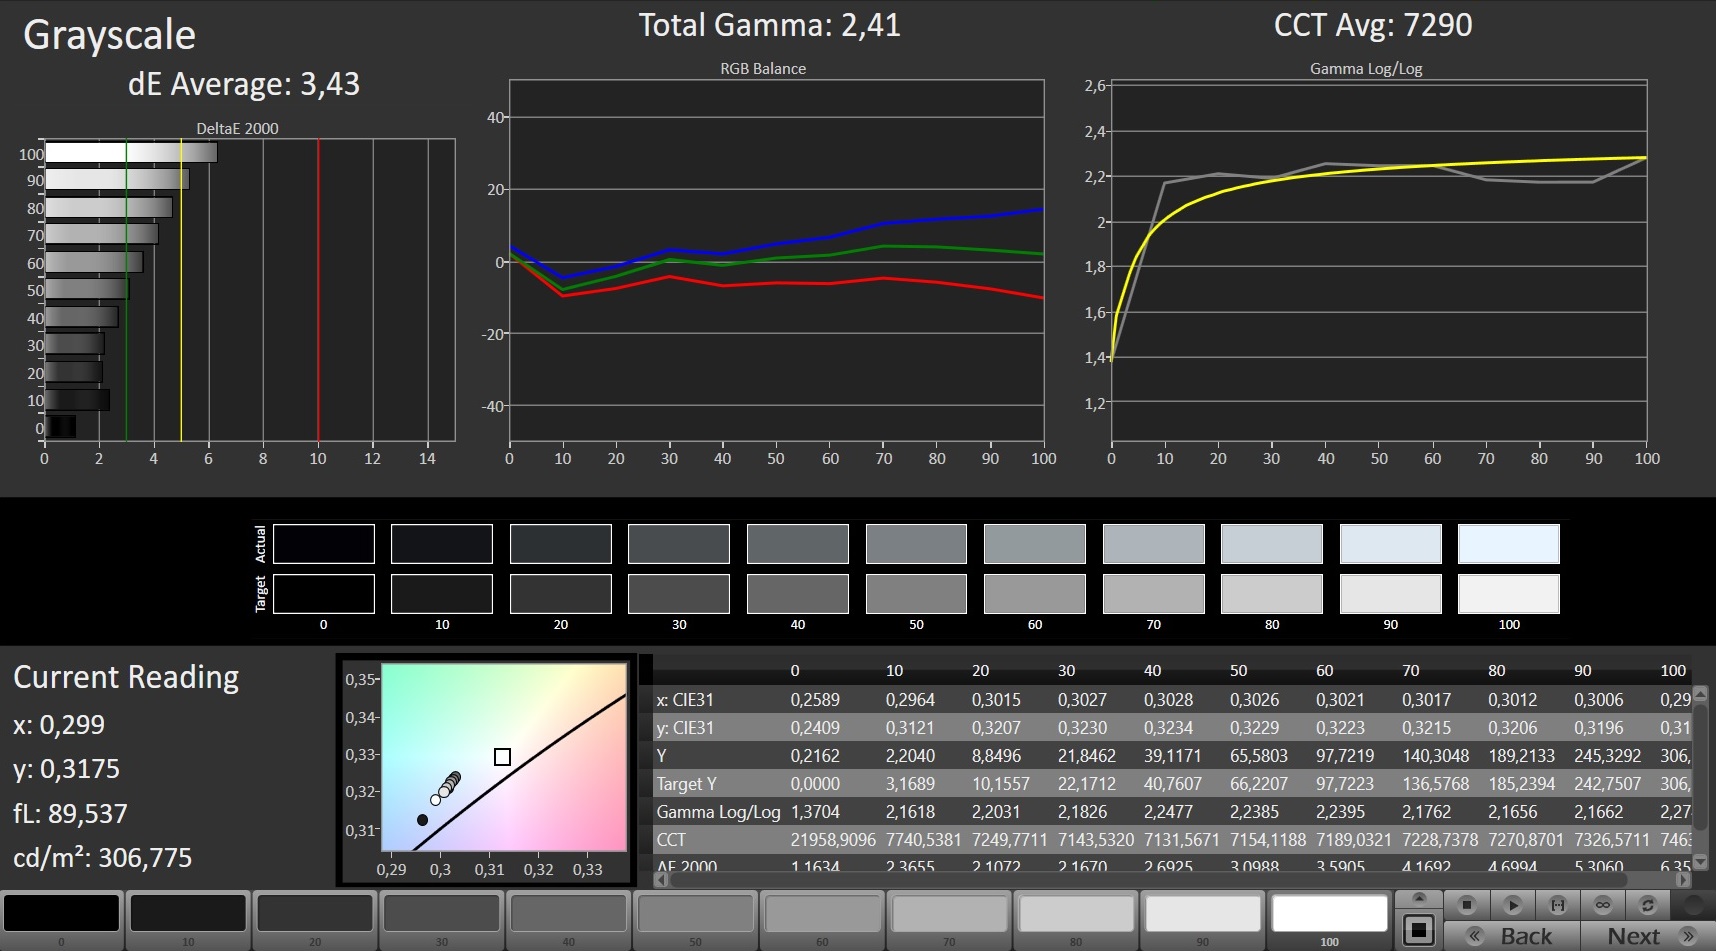
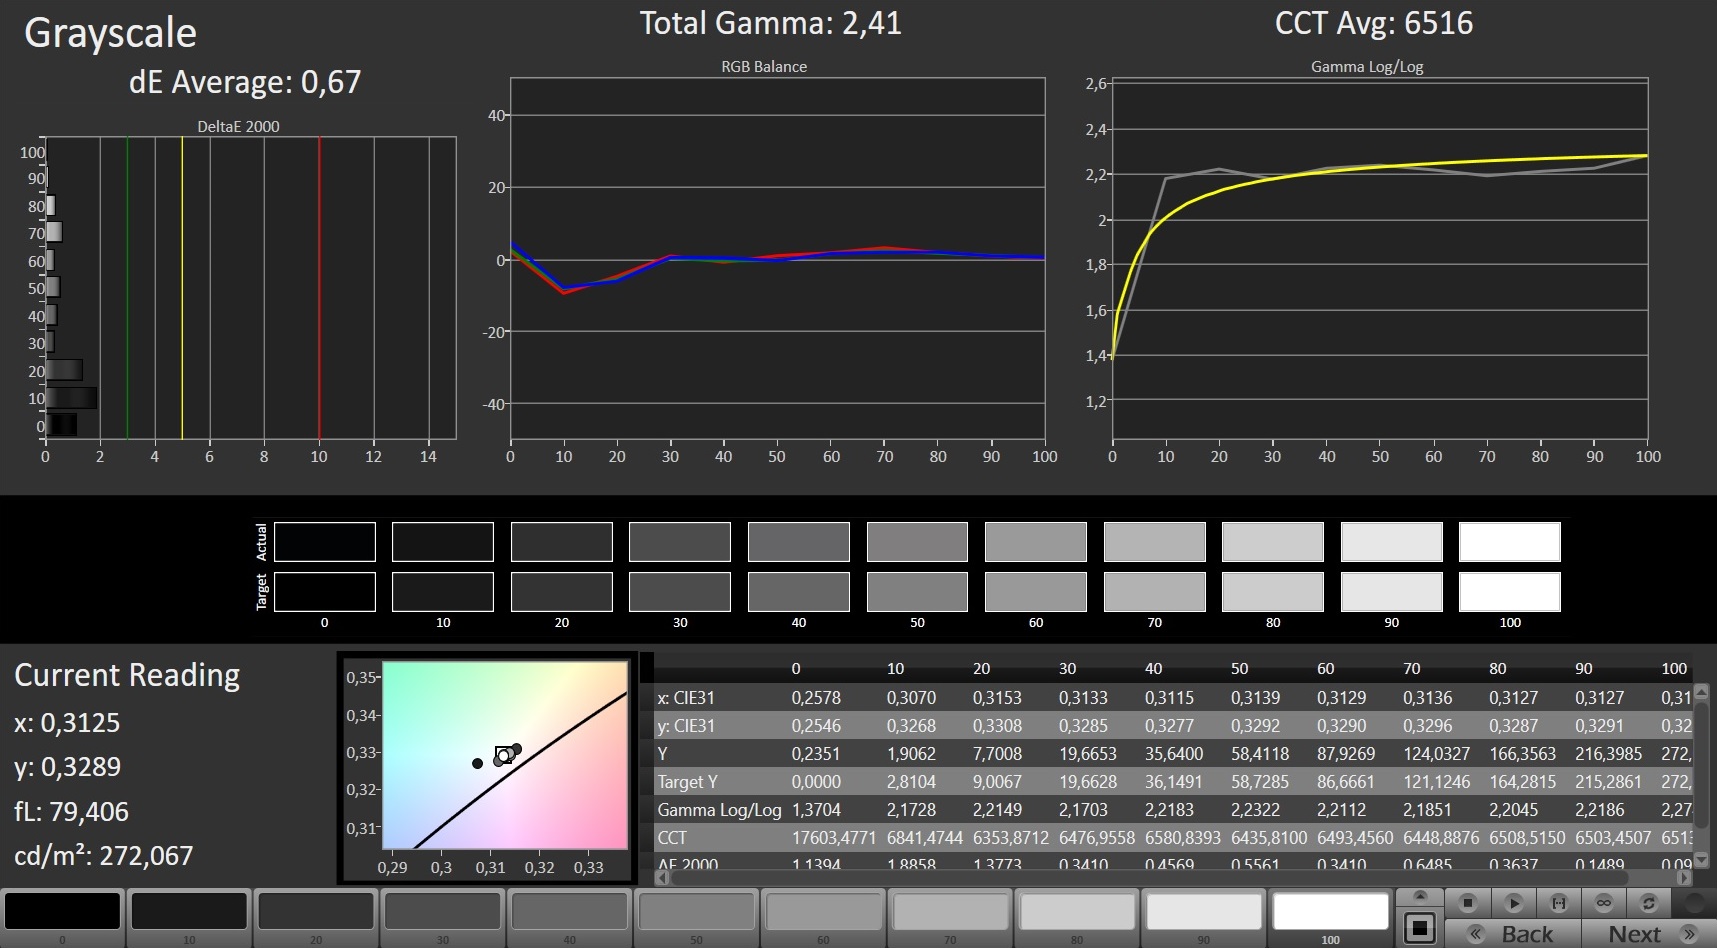
Gamma: 2.41
CCT: 7290 K
| Acer Predator Triton 500 PT515-51-71PZ NV156FHM-N4K (BOE082A), IPS, 1920x1080 | Gigabyte Aero 15 Classic-XA Sharp LQ156M1JW03 (SHP14C5), IGZO, 1920x1080 | Asus Zephyrus S GX502GW AU Optronics B156HAN08.2 (AUO82ED), IPS, 1920x1080 | MSI GS65 Stealth 9SG Sharp LQ156M1JW03 (SHP14C5), IPS, 1920x1080 | Razer Blade 15 RTX 2080 Max-Q Sharp LQ156M1JW03 (SHP14C5), IPS, 1920x1080 | |
|---|---|---|---|---|---|
| Display | 2% | -1% | 5% | 5% | |
| Display P3 Coverage (%) | 64.6 | 65.3 1% | 64.9 0% | 67.6 5% | 66.9 4% |
| sRGB Coverage (%) | 92.6 | 95.5 3% | 91 -2% | 97.5 5% | 98.1 6% |
| AdobeRGB 1998 Coverage (%) | 66 | 66.5 1% | 65.9 0% | 68.9 4% | 68.5 4% |
| Response Times | -96% | -9% | -85% | -70% | |
| Response Time Grey 50% / Grey 80% * (ms) | 5.2 ? | 15.2 ? -192% | 7.2 ? -38% | 13.6 ? -162% | 12.8 ? -146% |
| Response Time Black / White * (ms) | 11.2 ? | 11.2 ? -0% | 8.8 ? 21% | 12 ? -7% | 10.4 ? 7% |
| PWM Frequency (Hz) | 23580 ? | 23260 ? | 23810 ? | ||
| Screen | -2% | -5% | 13% | 10% | |
| Brightness middle (cd/m²) | 288 | 266 -8% | 286 -1% | 282.3 -2% | 293 2% |
| Brightness (cd/m²) | 265 | 248 -6% | 275 4% | 269 2% | 270 2% |
| Brightness Distribution (%) | 84 | 89 6% | 90 7% | 90 7% | 87 4% |
| Black Level * (cd/m²) | 0.22 | 0.31 -41% | 0.37 -68% | 0.32 -45% | 0.29 -32% |
| Contrast (:1) | 1309 | 858 -34% | 773 -41% | 882 -33% | 1010 -23% |
| Colorchecker dE 2000 * | 3.22 | 2.78 14% | 2.19 32% | 1.17 64% | 1.69 48% |
| Colorchecker dE 2000 max. * | 6.26 | 5.96 5% | 4.4 30% | 3.29 47% | 3.37 46% |
| Colorchecker dE 2000 calibrated * | 1.5 | 0.91 39% | 2.27 -51% | 1.06 29% | 1.24 17% |
| Greyscale dE 2000 * | 3.43 | 3.58 -4% | 2.2 36% | 1.3 62% | 2.3 33% |
| Gamma | 2.41 91% | 2.46 89% | 2.41 91% | 2.2 100% | 2.3 96% |
| CCT | 7290 89% | 7186 90% | 6405 101% | 6643 98% | 6758 96% |
| Color Space (Percent of AdobeRGB 1998) (%) | 60 | 62 3% | 59 -2% | 63.8 6% | 63 5% |
| Color Space (Percent of sRGB) (%) | 93 | 96 3% | 91 -2% | 97.5 5% | 98.5 6% |
| Total Average (Program / Settings) | -32% /
-13% | -5% /
-5% | -22% /
-1% | -18% /
-1% |
* ... smaller is better
Despite a slight blue cast, there is little to complain about color accuracy. With a DeltaE deviation of 3.43 (Grayscale) and 3.22 (Color), the Triton 500 is almost ideal. By calibration (our ICC file is available for download above) you can even push the values below 1 and respectively 2.
Thanks to the rather low black value of 0.22 cd / m², the 15-inch model easily breaks the 1000 mark in terms of contrast. The best value in the test field is about 1,300:1. However, the brightness values are not that generous. Although none of the competitors reaches more than 300 cd / m², an average of 265 cd / m² is still a bit low - especially in the outdoor sector (keyword sun).

The 15-inch screen scores with a short reaction time, which should satisfy most gamers. In addition, there is a good viewing angle stability, which can be expected from the IPS technology.
Display Response Times
| ↔ Response Time Black to White | ||
|---|---|---|
| 11.2 ms ... rise ↗ and fall ↘ combined | ↗ 6.8 ms rise | 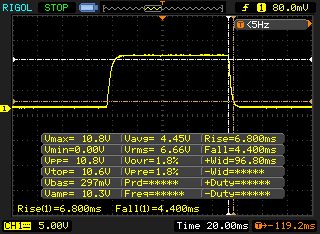 |
| ↘ 4.4 ms fall | ||
| The screen shows good response rates in our tests, but may be too slow for competitive gamers. In comparison, all tested devices range from 0.1 (minimum) to 240 (maximum) ms. » 30 % of all devices are better. This means that the measured response time is better than the average of all tested devices (19.8 ms). | ||
| ↔ Response Time 50% Grey to 80% Grey | ||
| 5.2 ms ... rise ↗ and fall ↘ combined | ↗ 2.6 ms rise | 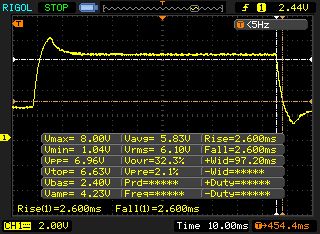 |
| ↘ 2.6 ms fall | ||
| The screen shows very fast response rates in our tests and should be very well suited for fast-paced gaming. In comparison, all tested devices range from 0.165 (minimum) to 636 (maximum) ms. » 18 % of all devices are better. This means that the measured response time is better than the average of all tested devices (30.9 ms). | ||
Screen Flickering / PWM (Pulse-Width Modulation)
| Screen flickering / PWM not detected | 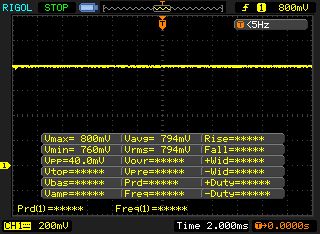 | ||
In comparison: 52 % of all tested devices do not use PWM to dim the display. If PWM was detected, an average of 7744 (minimum: 5 - maximum: 343500) Hz was measured. | |||
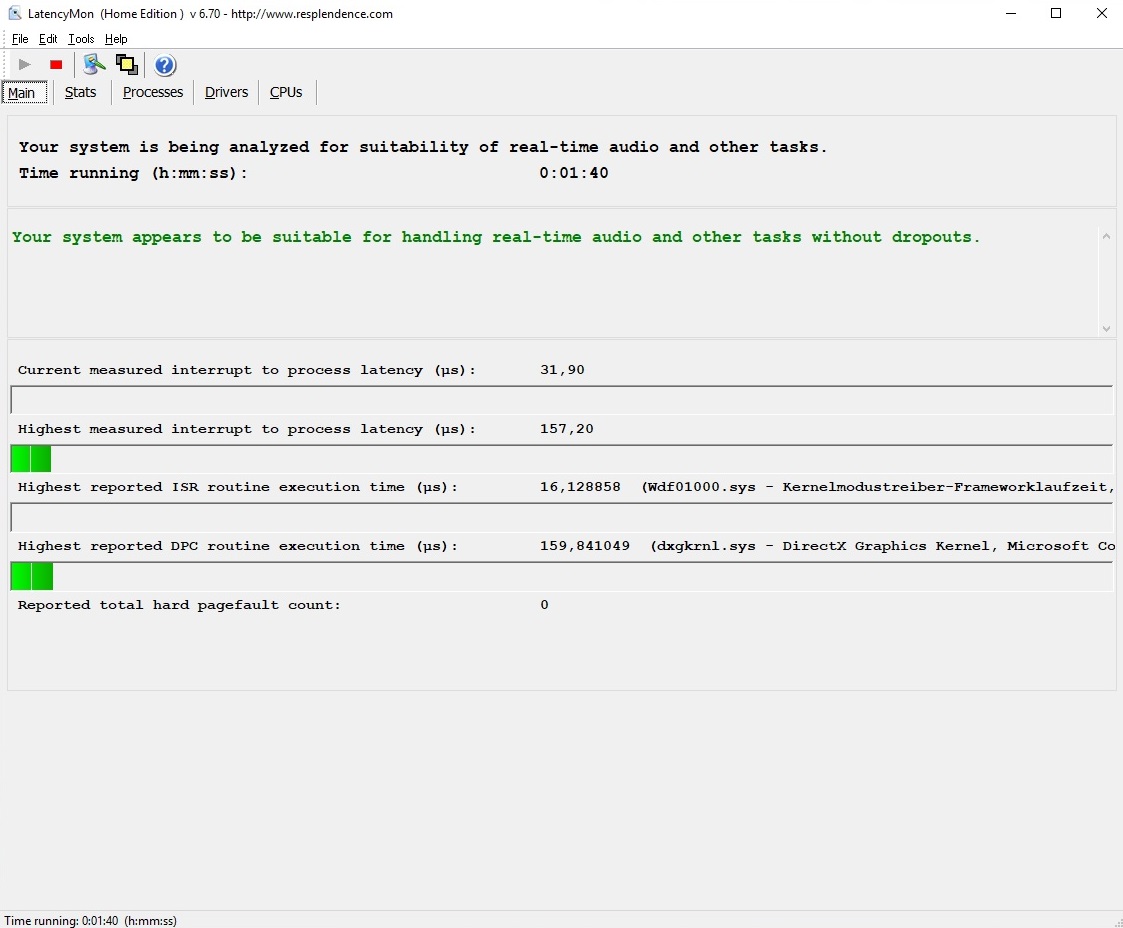
Test Conditions
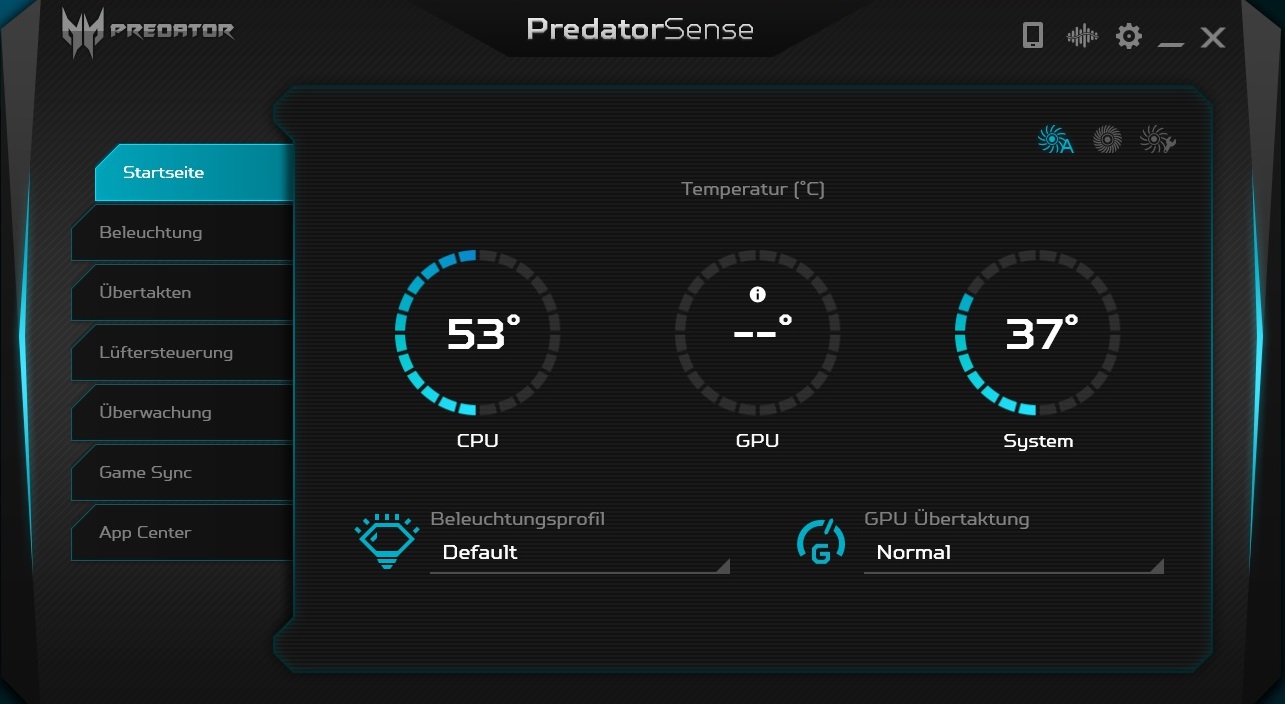
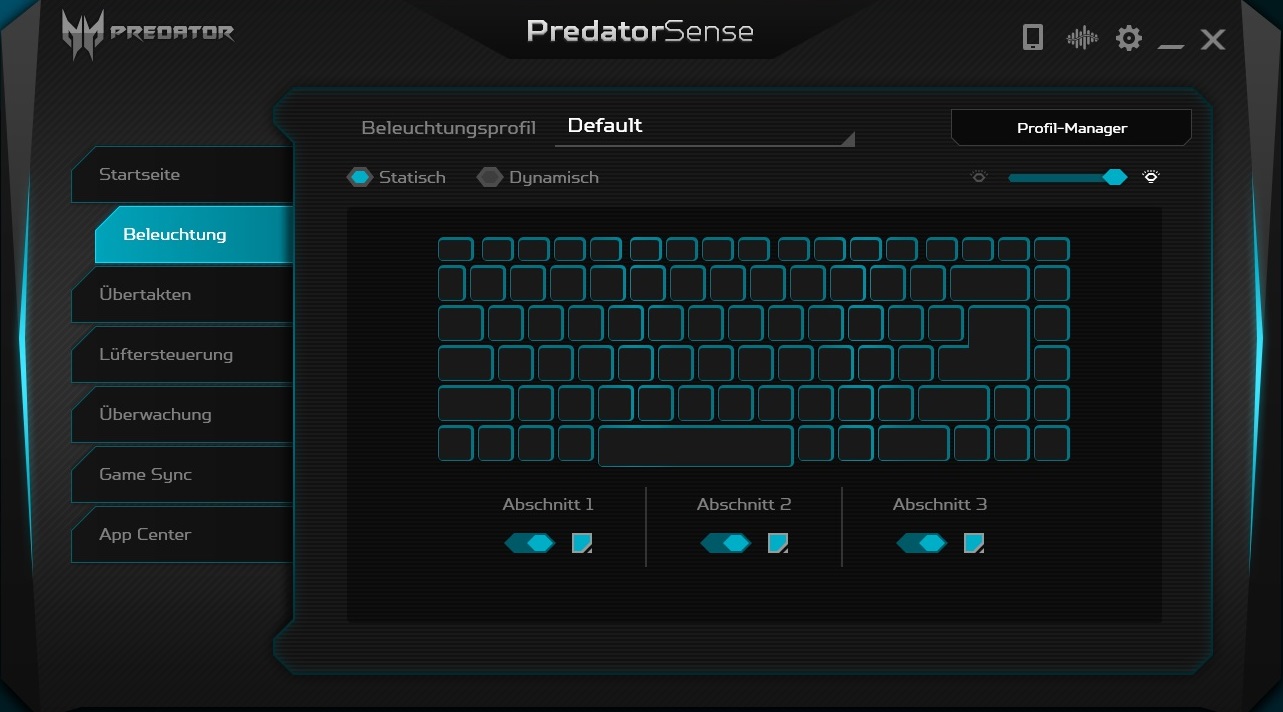
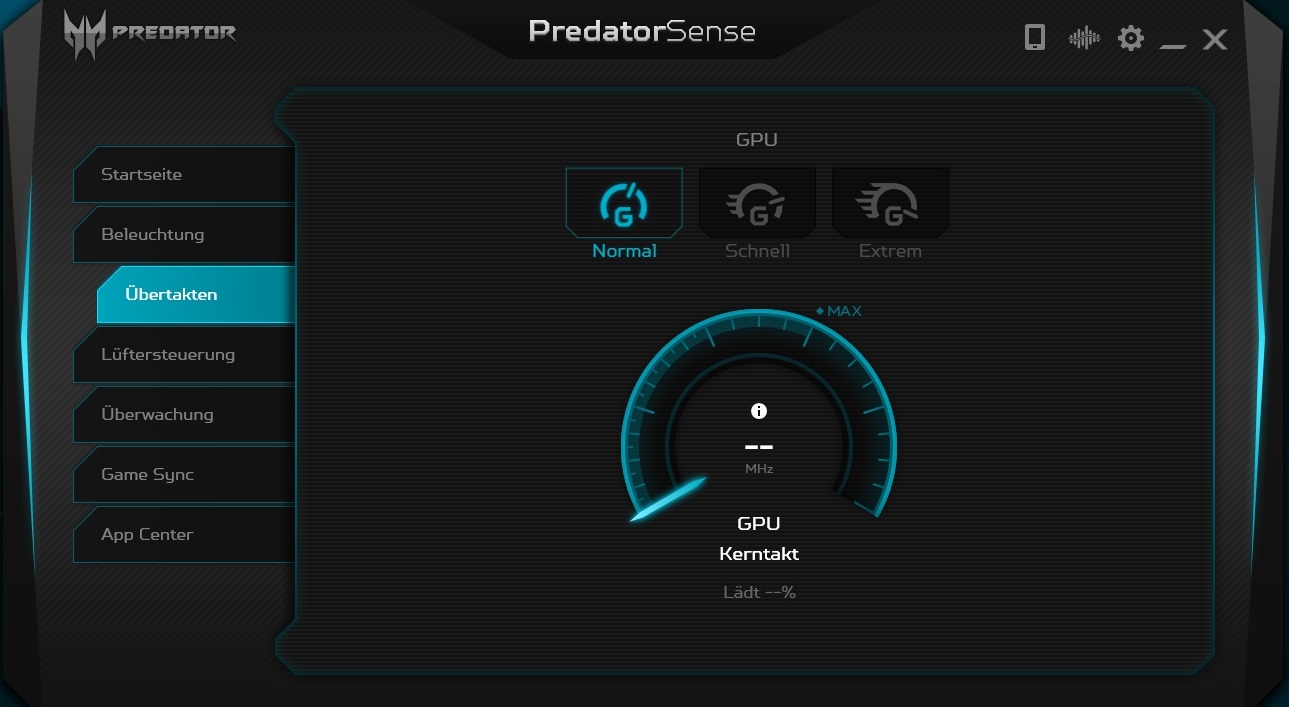
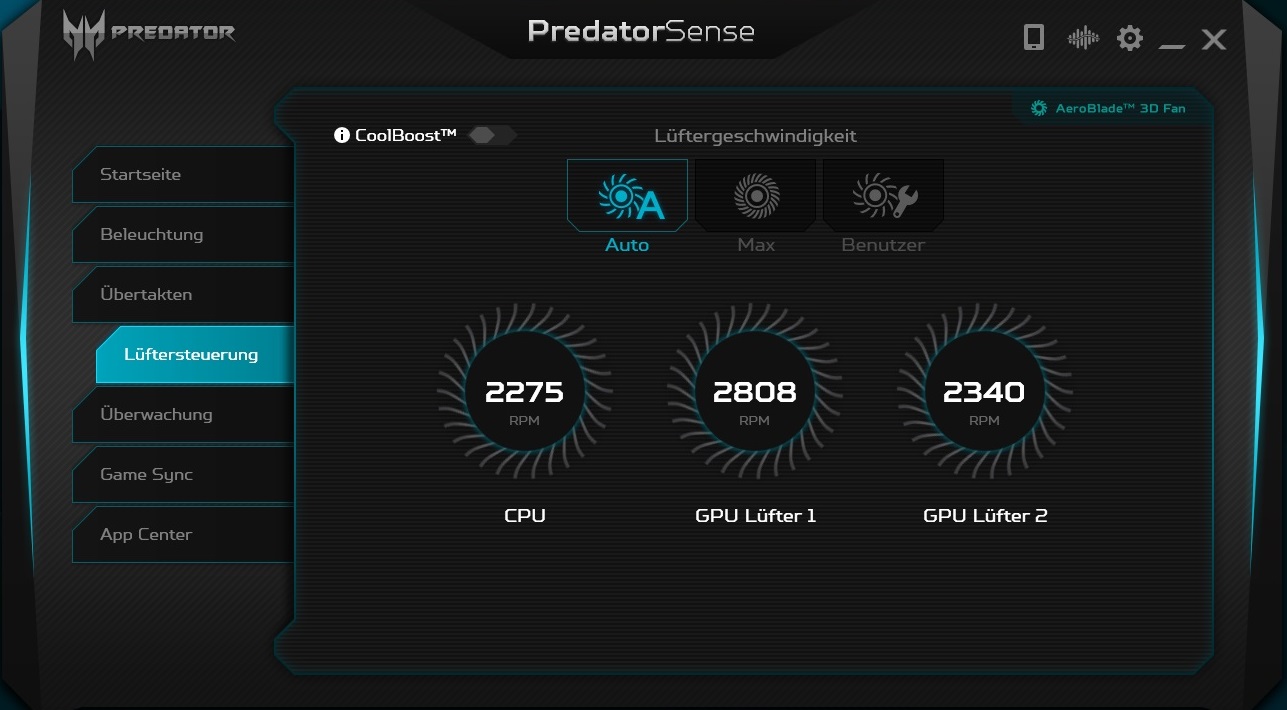
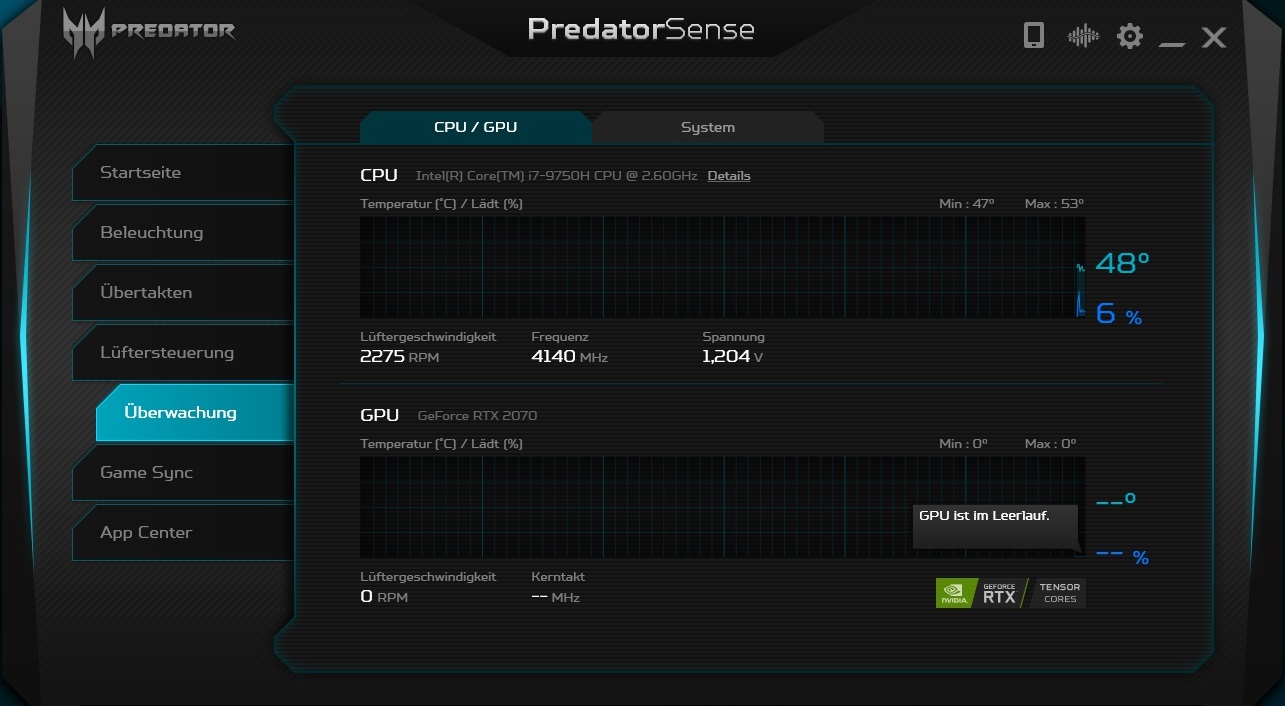
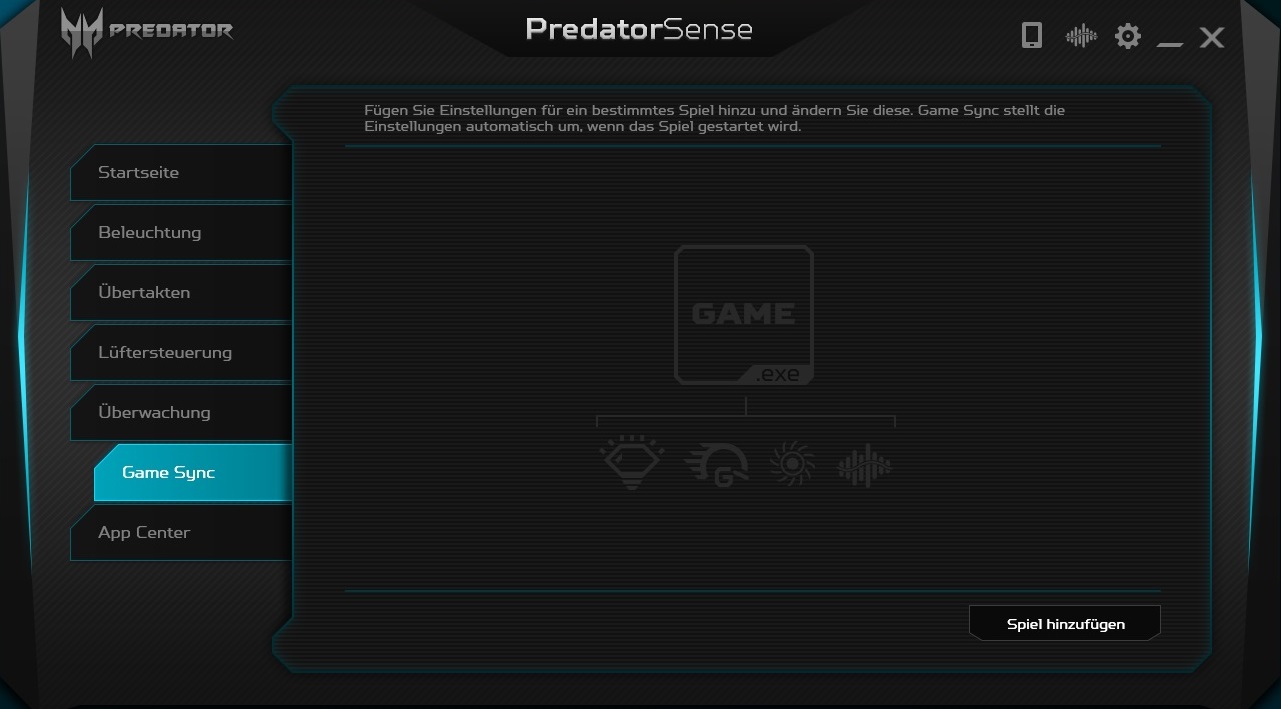
The preinstalled Predator Sense tool not only helps with system monitoring (temperature, clock speeds, fan speed, ...), but also offers the possibility to adjust various settings. All of our tests are based on the fan speed "Auto" and the GPU overclocking "Normal". A really nice fact: In contrast to the last test device, the graphics switch Optimus was already active and did not have to be turned on in the BIOS first. By using the GPU integrated in the processor, Optimus ensures significantly better battery life for undemanding tasks (office, web, video, etc.).
Performance
No matter which configuration option you choose, the Predator Triton 500 is part of the high-end segment. In the test configuration, the mix of 6-core CPU, 16 GB of RAM and PCIe SSD promises a lot of future security. Furthermore, the Nvidia GPU is not likely to reach its limits in the coming years unless you connect an external QHD or UHD display.
Processor
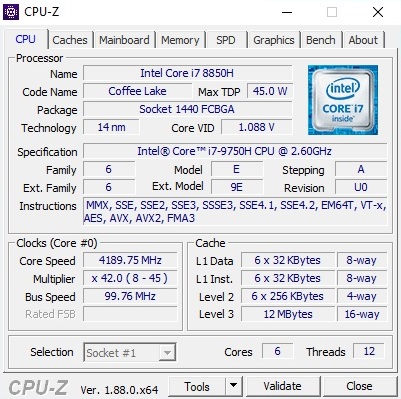
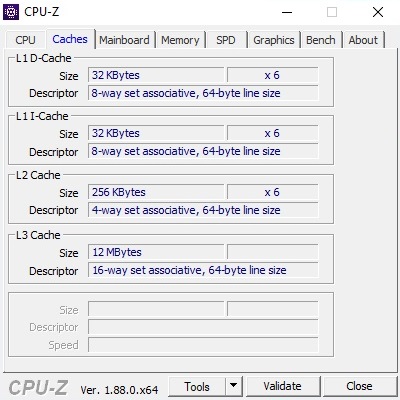
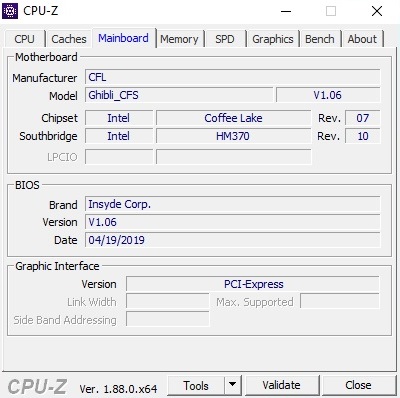
Intel's Core i7-9750H is the new standard processor for powerful gaming notebooks. The hexa-core model from the Coffee Lake series is manufactured in the 14 nm process and is equipped with 12 MB L3 cache (45 watts TDP).
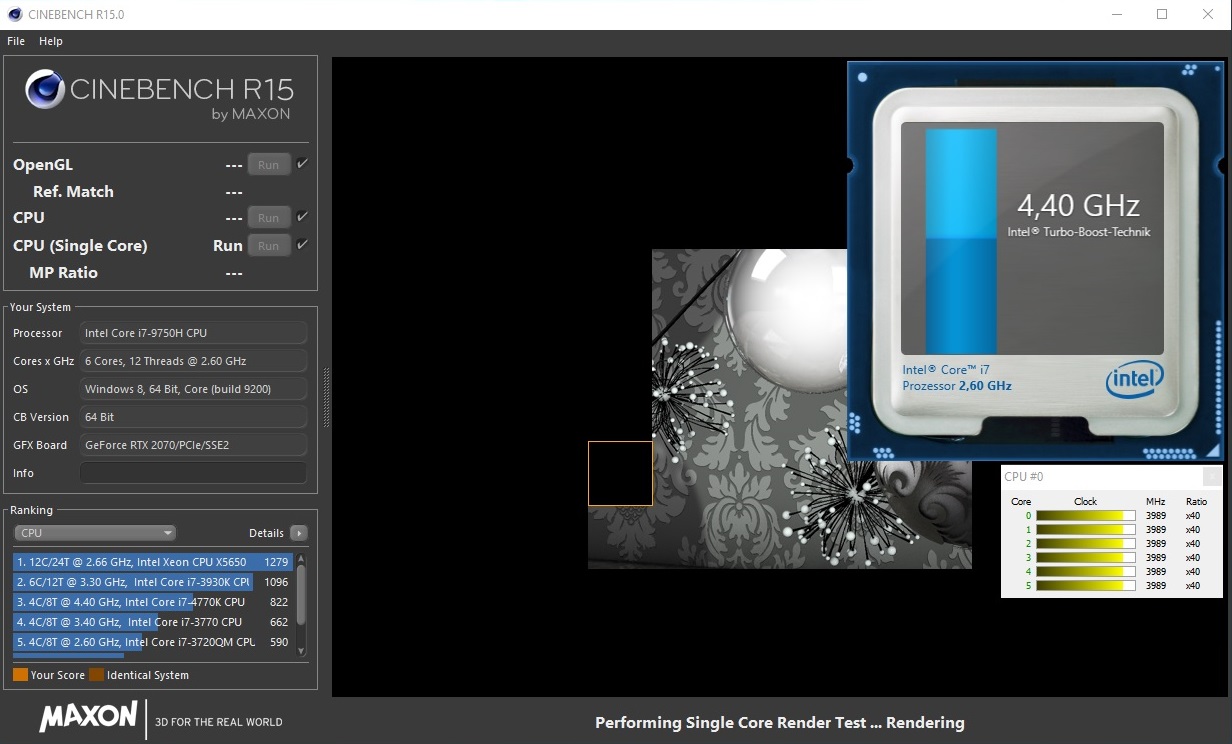
The base frequency is 2.6 GHz, whereas with turbo boost technology (= automatic overclocking) up to 4.5 GHz can be reached. However, this value applies only to single-core load. As common for most laptops, the CPU can only partially unfold its high clock-speed potential when under a longer multi-core load.
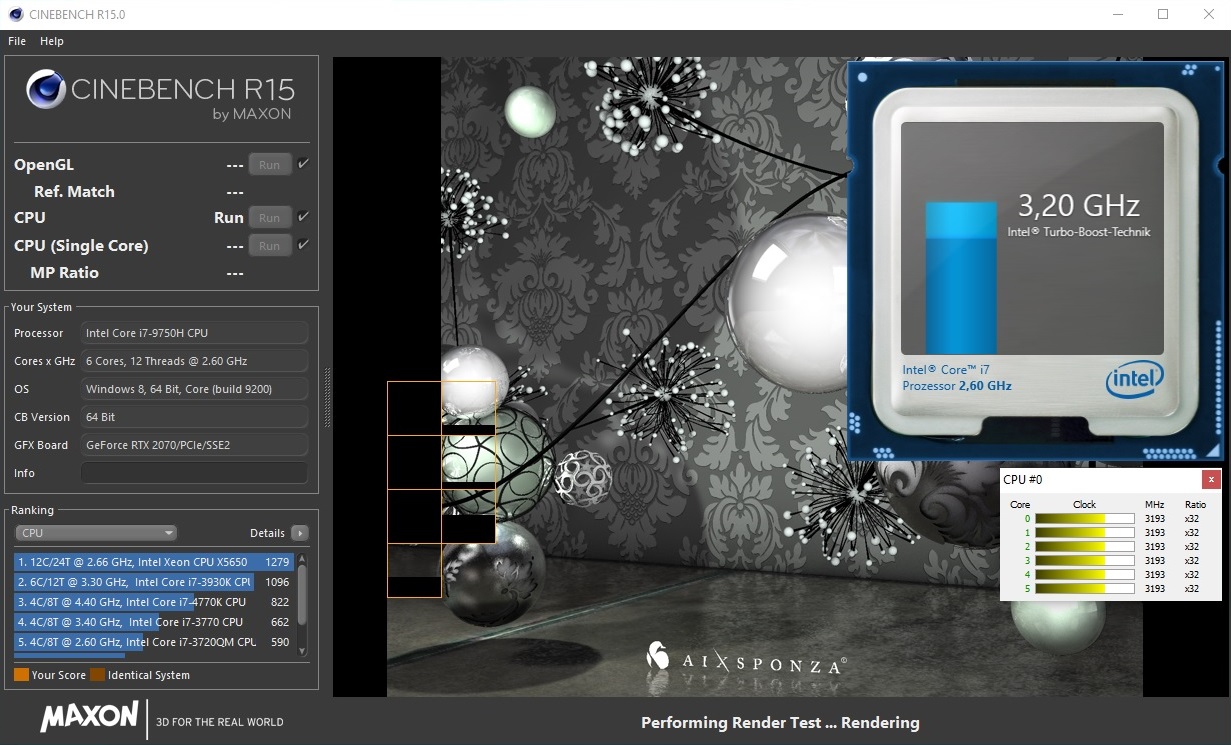
In our Cinebench loop, the speed of the Core i7-9750H dropped by about 10% from the second round on (3.2 GHz on average). However, as already indicated, this fact concerns also the competition. Thus, Acer cannot be blamed. On the contrary: According to the Cinebench R15, the Triton 500 takes the lead after a cold start.
System Performance
Similarly good is the general system performance. When it comes to the PCMark 10, the Predator takes second place among the comparison devices. Subjectively, there were no abnormalities. The system boots pleasantly fast and reacts as one would expect from a current high-end laptop.
| PCMark 10 Score | 5746 points | |
Help | ||
Storage Devices
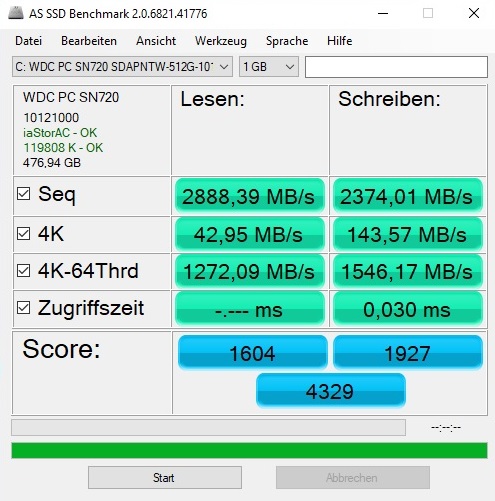
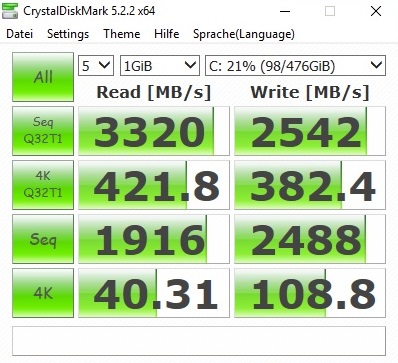
In terms of SSD performance, there are also no unpleasant surprises. The built-in 512 GB model of Western Digital (PC SN720), which is in M.2 format, convinces both in reading and writing with a very good speed. The competition is at a comparable level (see table).
| Acer Predator Triton 500 PT515-51-71PZ WDC PC SN720 SDAPNTW-512G | Gigabyte Aero 15 Classic-XA Intel SSD 760p SSDPEKKW512G8 | Asus Zephyrus S GX502GW 2x Intel SSD 660p SSDPEKNW512G8 (RAID 0) | MSI GS65 Stealth 9SG Samsung SSD PM981 MZVLB512HAJQ | Razer Blade 15 RTX 2080 Max-Q Samsung SSD PM981 MZVLB512HAJQ | |
|---|---|---|---|---|---|
| CrystalDiskMark 5.2 / 6 | 0% | -7% | -9% | 2% | |
| Write 4K (MB/s) | 108.8 | 115.5 6% | 97 -11% | 91.3 -16% | 137.2 26% |
| Read 4K (MB/s) | 40.31 | 58 44% | 49.58 23% | 40.73 1% | 46.82 16% |
| Write Seq (MB/s) | 2488 | 1555 -37% | 1838 -26% | 1915 -23% | 1221 -51% |
| Read Seq (MB/s) | 1916 | 2590 35% | 2421 26% | 2051 7% | 1217 -36% |
| Write 4K Q32T1 (MB/s) | 382.4 | 369.3 -3% | 326.9 -15% | 308.3 -19% | 527 38% |
| Read 4K Q32T1 (MB/s) | 421.8 | 441.7 5% | 372.9 -12% | 417.4 -1% | 614 46% |
| Write Seq Q32T1 (MB/s) | 2542 | 1547 -39% | 1894 -25% | 1922 -24% | 1986 -22% |
| Read Seq Q32T1 (MB/s) | 3320 | 2969 -11% | 2828 -15% | 3395 2% | 3234 -3% |

GPU Performance
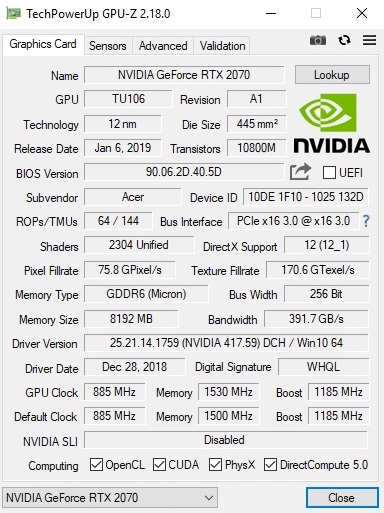
The GeForce RTX 2070 Max-Q is designed for passionate gamers who prefer a lightweight, slim and compact laptop. The DirectX 12 model is from the Turing generation and offers 2,304 shaders and 8 GB of GDDR6 memory (256-bit interface).
| 3DMark 11 Performance | 18996 points | |
| 3DMark Cloud Gate Standard Score | 37505 points | |
| 3DMark Fire Strike Score | 16017 points | |
| 3DMark Time Spy Score | 6709 points | |
Help | ||
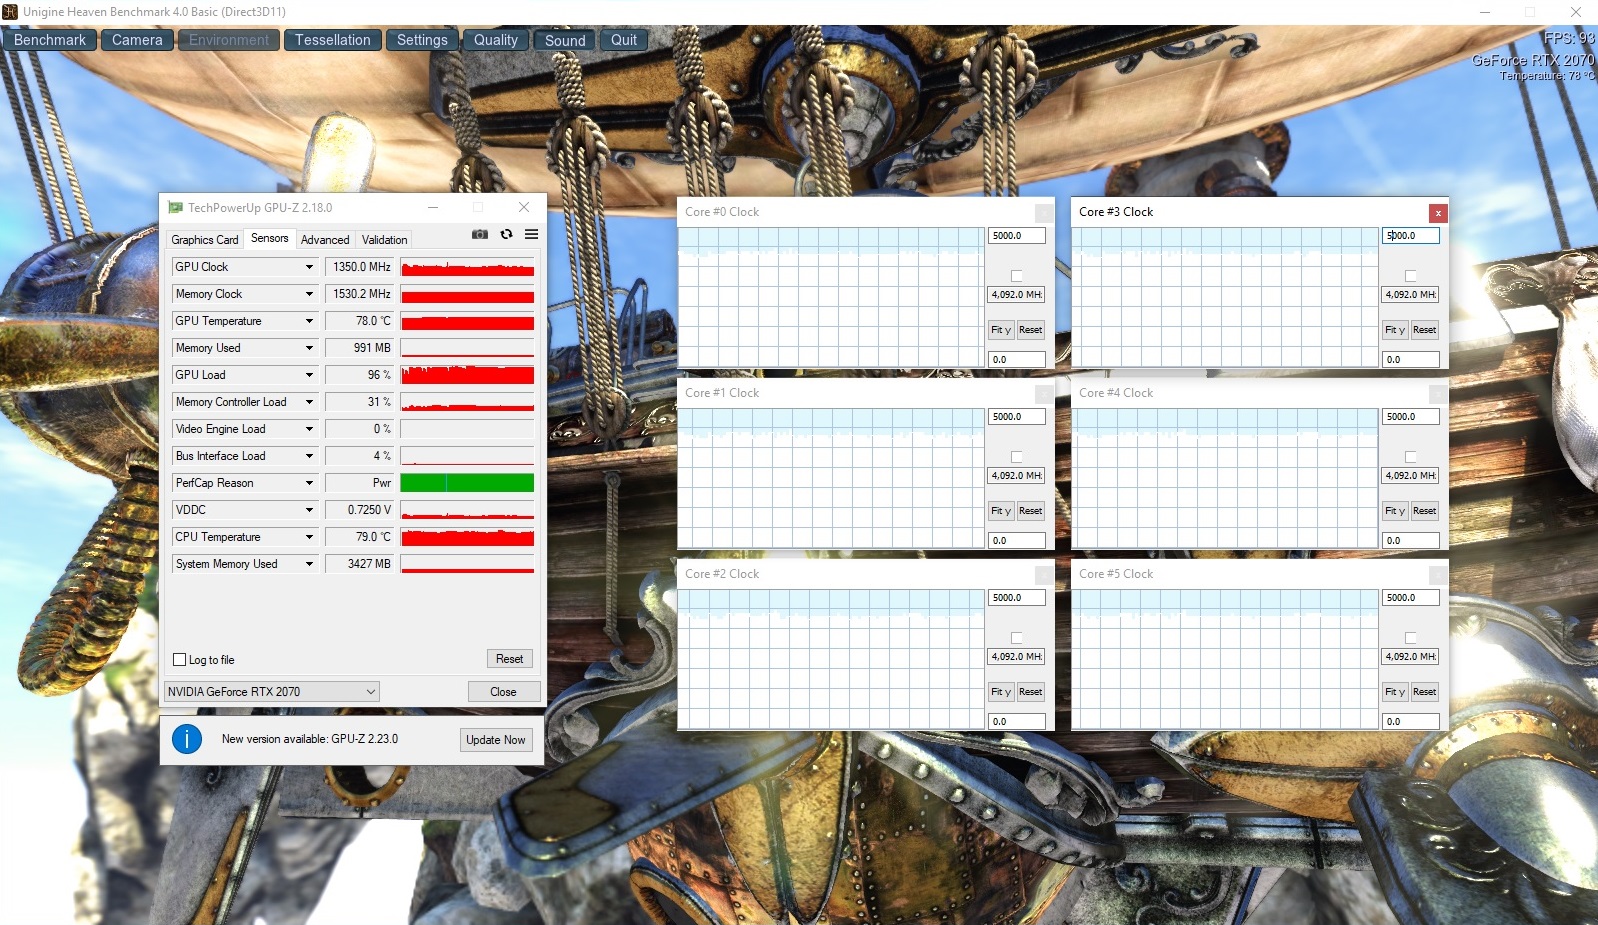
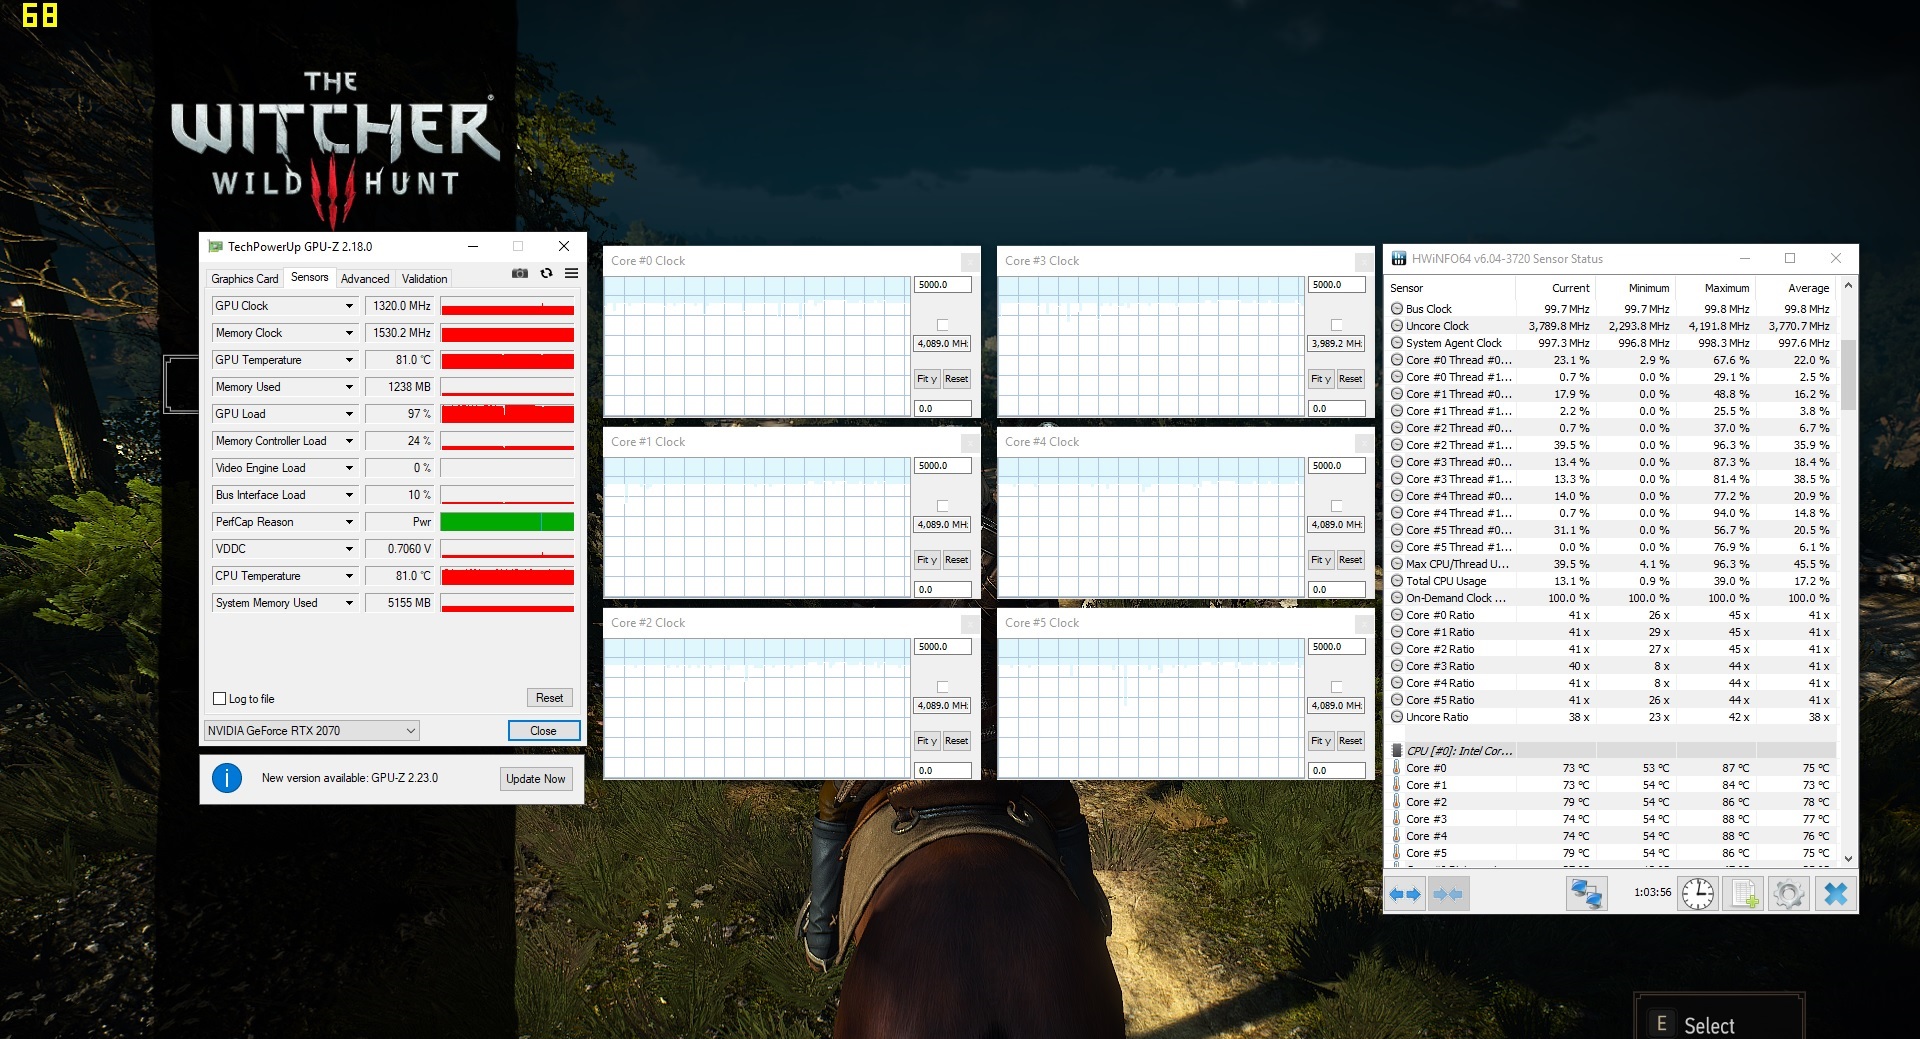
The main difference to the "normal" version is the lower core-clock frequency. Instead of 1215 MHz, the Max-Q version only runs at 885 MHz by default. Following Intel's Turbo Boost, however, the Nvidia GPUs can also overclock automatically. In the render test with the GPU-Z tool, values of up to 1785 MHz could be reached. In the gaming everyday life, however, one should expect around 1300 to 1400 MHz, which represents a relatively good value for the RTX 2070 Max-Q.
The proper clock behavior is also reflected in the benchmarks. Often the Triton 500 is a few percent faster than the Gigabyte Aero 15 Classic-XA with the same GPU. However, the performance level of the "full-fledged" RTX 2070 is still higher, as shown by the Zephyrus S GX502GW. The competition from Asus is at least 5% faster in most cases.
Whether the Acer notebook can keep its GPU clock speed for a longer period, we checked by playing "The Witcher 3" role game for almost 60 minutes at a resolution of 1,920x1,080 and maximum settings. Result: Apart from minor FPS fluctuations, which are common in the course of the test (changing times of day, etc.), the performance remains largely consistent.
Gaming Performance
When using the native resolution, the GeForce RTX 2070 Max-Q has no problems even with computation-intensive games. At high to maximum details, it usually runs smoothly. At 60 FPS, however, this is more an exception than a rule, which is compensated by the adequate 144 Hz technique.
| The Witcher 3 - 1920x1080 Ultra Graphics & Postprocessing (HBAO+) | |
| Average of class Gaming (104.7 - 240, n=7, last 2 years) | |
| Razer Blade 15 RTX 2080 Max-Q | |
| Asus Zephyrus S GX502GW | |
| MSI GS65 Stealth 9SG | |
| Acer Predator Triton 500 PT515-51-71PZ | |
| Gigabyte Aero 15 Classic-XA | |
| low | med. | high | ultra | |
|---|---|---|---|---|
| The Witcher 3 (2015) | 116 | 64.4 | ||
| Apex Legends (2019) | 122 | 122 | ||
| Far Cry New Dawn (2019) | 93 | 82 | ||
| Metro Exodus (2019) | 58.9 | 47.6 | ||
| Anthem (2019) | 81.3 | 75.7 | ||
| Dirt Rally 2.0 (2019) | 129 | 79.1 | ||
| The Division 2 (2019) | 88 | 64 | ||
| Anno 1800 (2019) | 70.6 | 40 | ||
| Rage 2 (2019) | 77.7 | 74.9 | ||
| F1 2019 (2019) | 135 | 103 |
Emissions
System Noise
The noise development leaves us with mixed feelings. In idle mode, the Triton 500 is often quiet as a mouse, but every now and then the fans turn up unnecessarily (in 40 dB direction). Especially in supposedly harmless actions such as Windows Updates, they come up to speed. As an average, our meter read a decent noise level of 33 dB at idle.
Under load, the situation is not unambiguous. Compared to other RTX-2070 laptops, 45 to 51 dB is not that much (the Gigabyte Aero 15 gets louder, for example), but sensitive gamers still have to use a headset while gaming.
Noise level
| Idle |
| 30 / 33 / 39 dB(A) |
| Load |
| 45 / 51 dB(A) |
 | ||
30 dB silent 40 dB(A) audible 50 dB(A) loud |
||
min: | ||
| Acer Predator Triton 500 PT515-51-71PZ GeForce RTX 2070 Max-Q, i7-9750H | Gigabyte Aero 15 Classic-XA GeForce RTX 2070 Max-Q, i7-9750H | Asus Zephyrus S GX502GW GeForce RTX 2070 Mobile, i7-9750H | MSI GS65 Stealth 9SG GeForce RTX 2080 Max-Q, i7-9750H | Razer Blade 15 RTX 2080 Max-Q GeForce RTX 2080 Max-Q, i7-9750H | Average of class Gaming | |
|---|---|---|---|---|---|---|
| Noise | -3% | -4% | 7% | 13% | 12% | |
| off / environment * (dB) | 30 | 30 -0% | 30 -0% | 28.3 6% | 28.3 6% | 24.1 ? 20% |
| Idle Minimum * (dB) | 30 | 31 -3% | 31 -3% | 30.4 -1% | 28.8 4% | 25.9 ? 14% |
| Idle Average * (dB) | 33 | 34 -3% | 33 -0% | 30.5 8% | 28.8 13% | 27.4 ? 17% |
| Idle Maximum * (dB) | 39 | 39 -0% | 38 3% | 30.6 22% | 29 26% | 30.1 ? 23% |
| Load Average * (dB) | 45 | 46 -2% | 50 -11% | 37.6 16% | 33.5 26% | 43.7 ? 3% |
| Witcher 3 ultra * (dB) | 49 | 53 -8% | 53 -8% | 46 6% | 45 8% | |
| Load Maximum * (dB) | 51 | 55 -8% | 56 -10% | 55.1 -8% | 45.2 11% | 54.3 ? -6% |
* ... smaller is better
Temperature
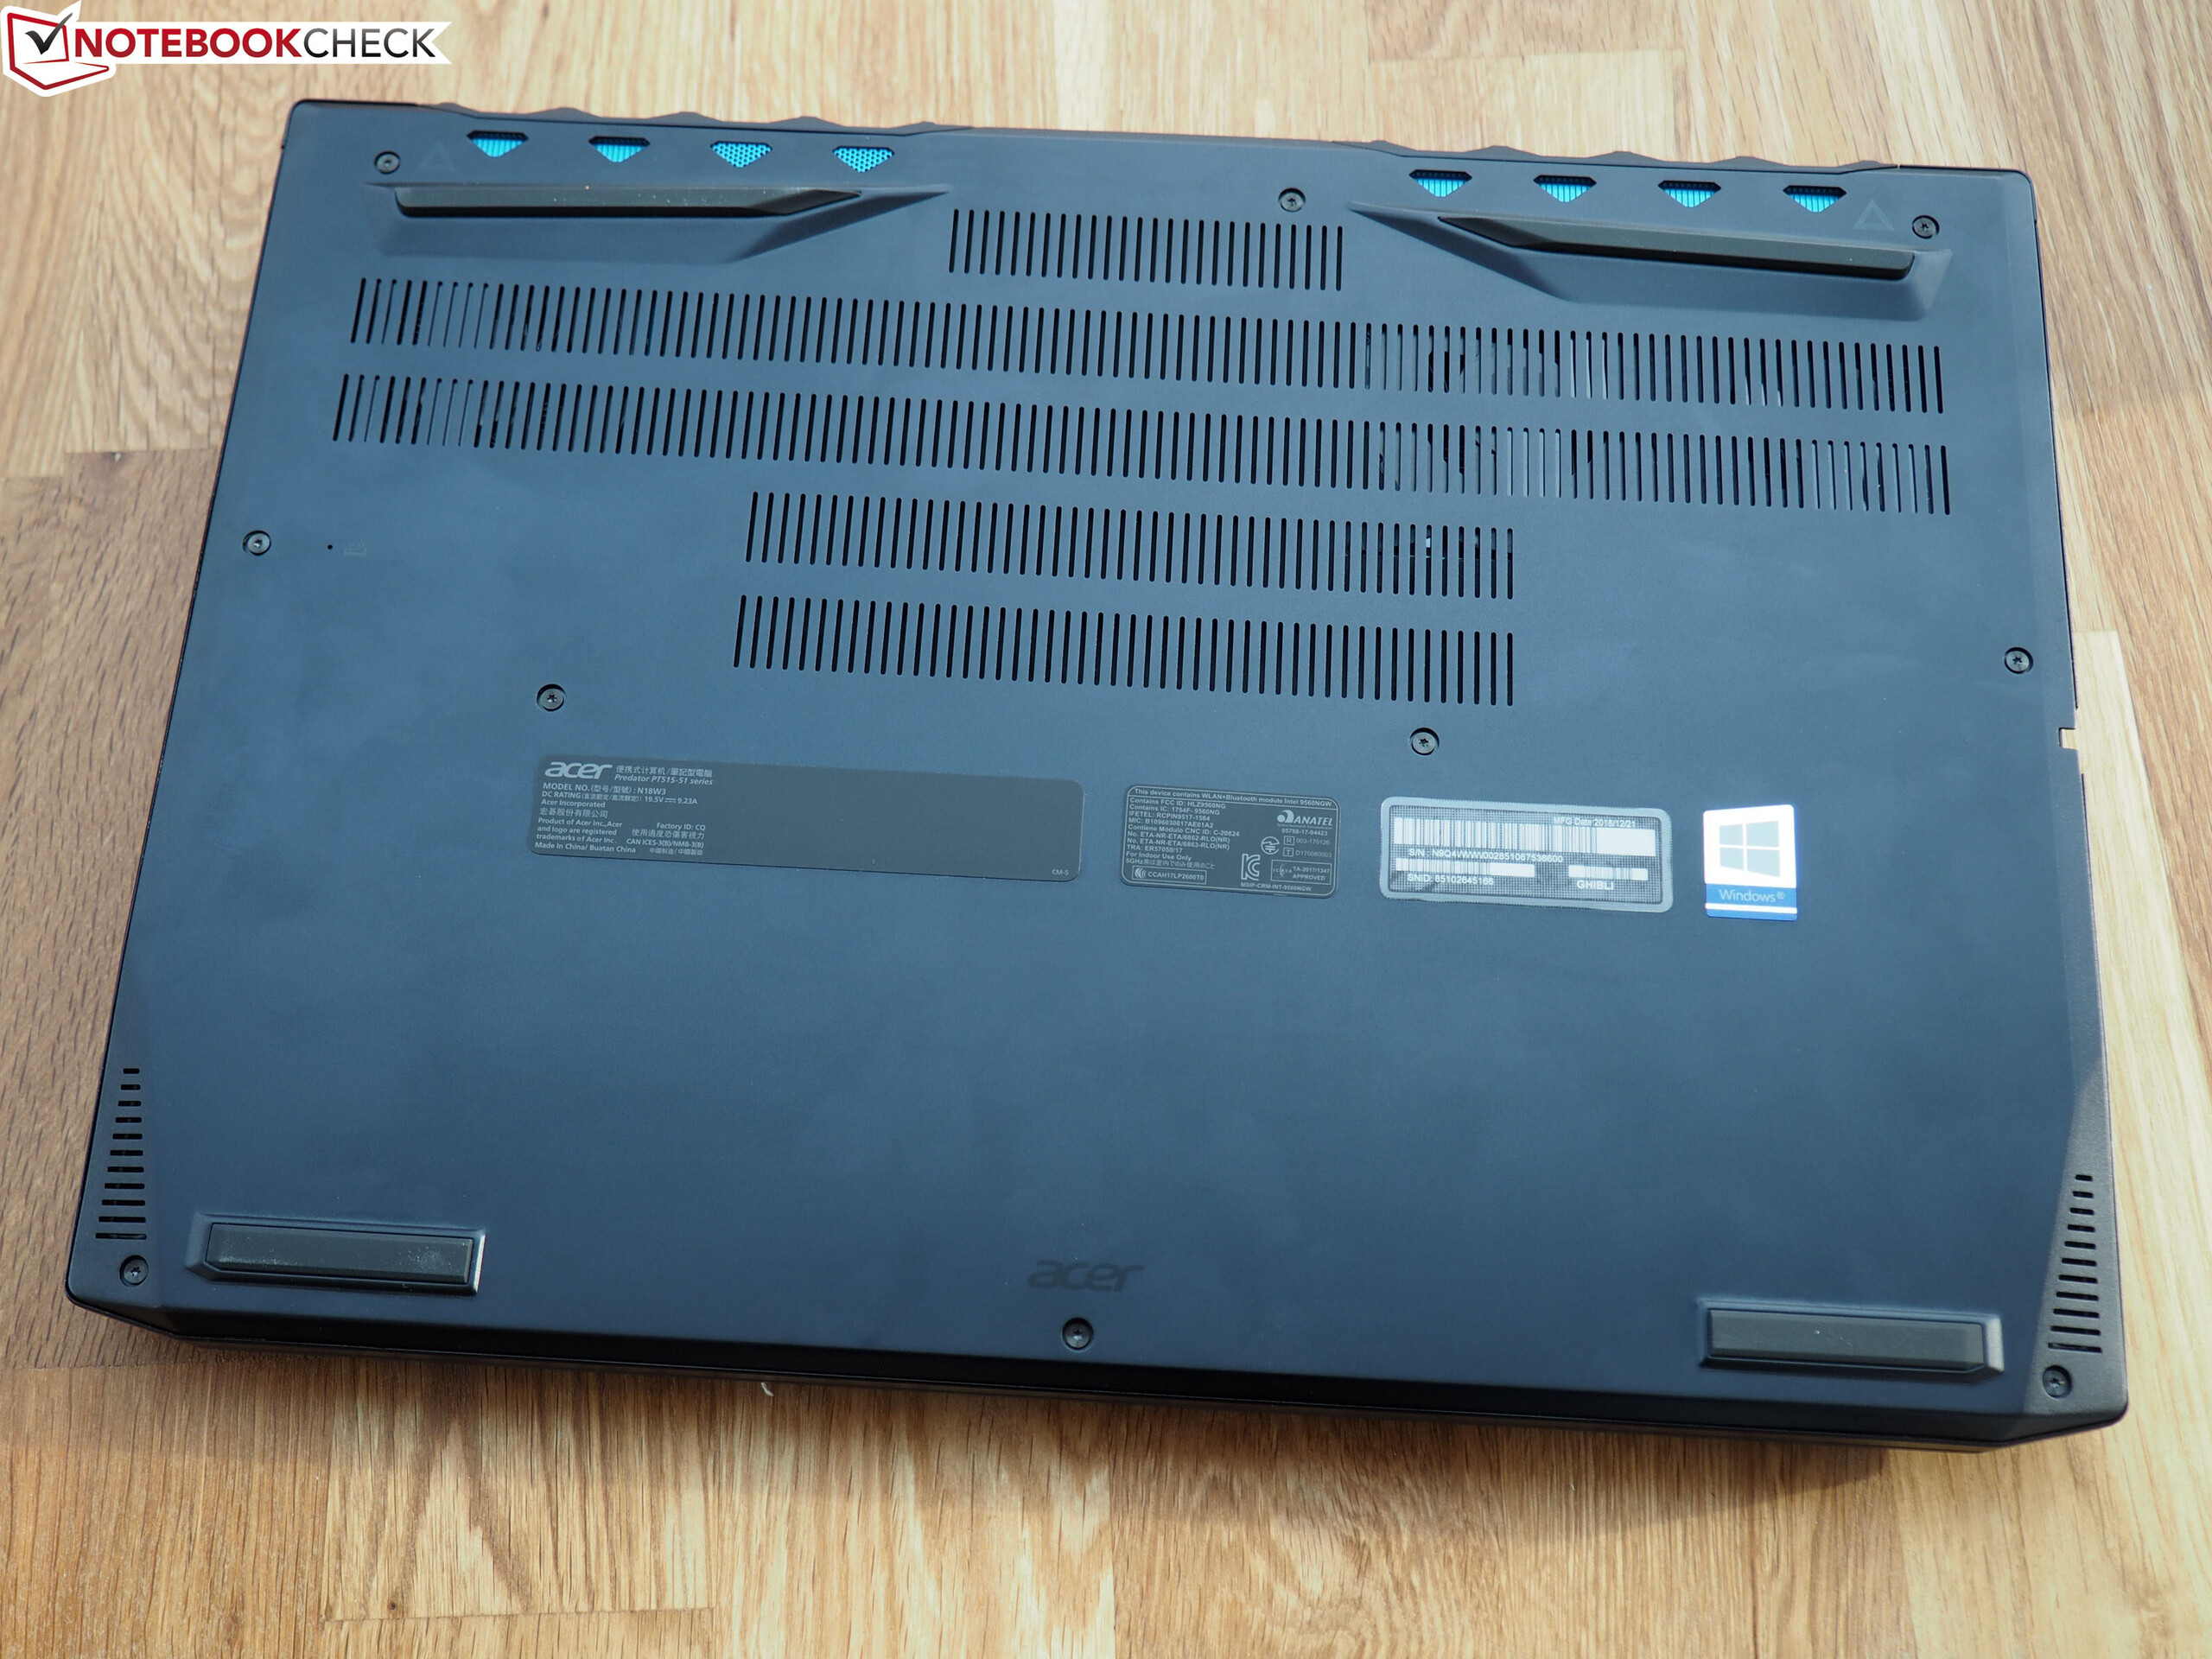
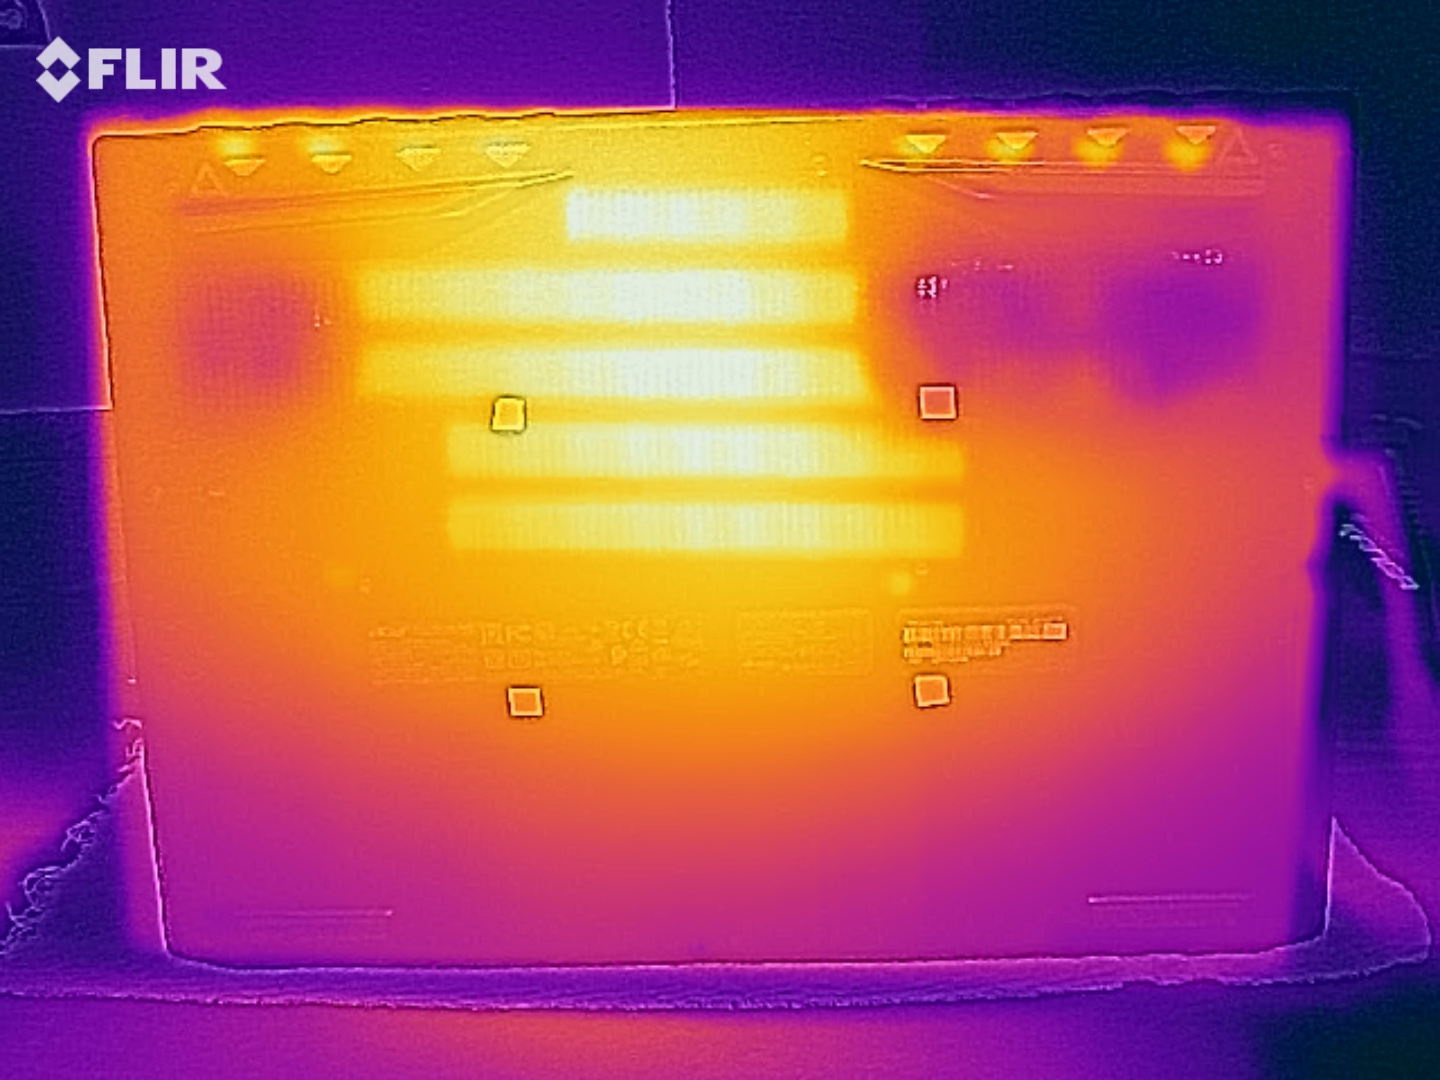
In addition to the volume, the temperatures are also in the midfield. While the top of the case got hot in the stress test (FurMark & Prime95), reaching up to 49 °C (120.2 °F), we were able to measure up to 59 °C (138.2 °F) on the bottom. The device is thus not suitable for gaming sessions on the lap. In the more practical "Witcher 3" test, the values were only slightly lower.

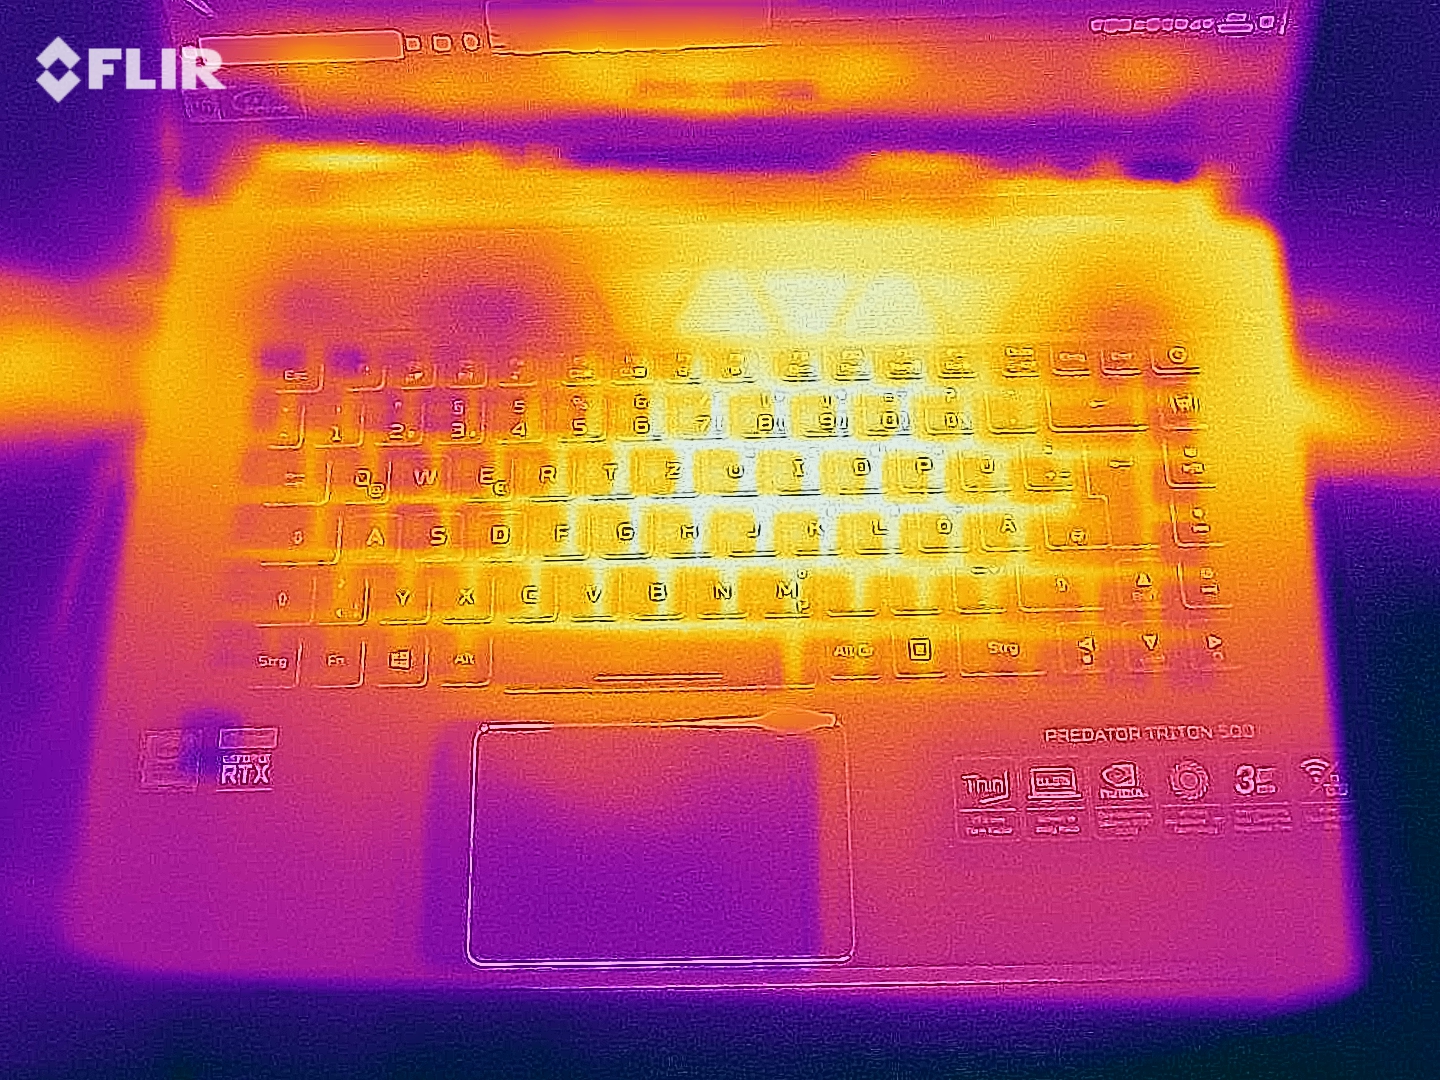
Good: Throttling of the components does not occur even at full load, although the CPU and GPU approach their base clock frequency and hardly use the turbo. At the end of the stress test, the Core i7-9750H and the GeForce RTX 2070 Max-Q made themselves comfortable at around 80 °C (176 °F).
(-) The maximum temperature on the upper side is 49 °C / 120 F, compared to the average of 40.4 °C / 105 F, ranging from 21.2 to 68.8 °C for the class Gaming.
(-) The bottom heats up to a maximum of 59 °C / 138 F, compared to the average of 43.2 °C / 110 F
(+) In idle usage, the average temperature for the upper side is 27.7 °C / 82 F, compared to the device average of 33.9 °C / 93 F.
(-) Playing The Witcher 3, the average temperature for the upper side is 43.2 °C / 110 F, compared to the device average of 33.9 °C / 93 F.
(-) The palmrests and touchpad can get very hot to the touch with a maximum of 43 °C / 109.4 F.
(-) The average temperature of the palmrest area of similar devices was 28.8 °C / 83.8 F (-14.2 °C / -25.6 F).
| Acer Predator Triton 500 PT515-51-71PZ GeForce RTX 2070 Max-Q, i7-9750H | Gigabyte Aero 15 Classic-XA GeForce RTX 2070 Max-Q, i7-9750H | Asus Zephyrus S GX502GW GeForce RTX 2070 Mobile, i7-9750H | MSI GS65 Stealth 9SG GeForce RTX 2080 Max-Q, i7-9750H | Razer Blade 15 RTX 2080 Max-Q GeForce RTX 2080 Max-Q, i7-9750H | Average of class Gaming | |
|---|---|---|---|---|---|---|
| Heat | -10% | -6% | 0% | 3% | -1% | |
| Maximum Upper Side * (°C) | 49 | 58 -18% | 54 -10% | 45.6 7% | 47 4% | 45.1 ? 8% |
| Maximum Bottom * (°C) | 59 | 64 -8% | 47 20% | 53.8 9% | 49.2 17% | 48.1 ? 18% |
| Idle Upper Side * (°C) | 28 | 30 -7% | 33 -18% | 28.6 -2% | 28.6 -2% | 31 ? -11% |
| Idle Bottom * (°C) | 29 | 31 -7% | 34 -17% | 33.2 -14% | 31.4 -8% | 34.2 ? -18% |
* ... smaller is better
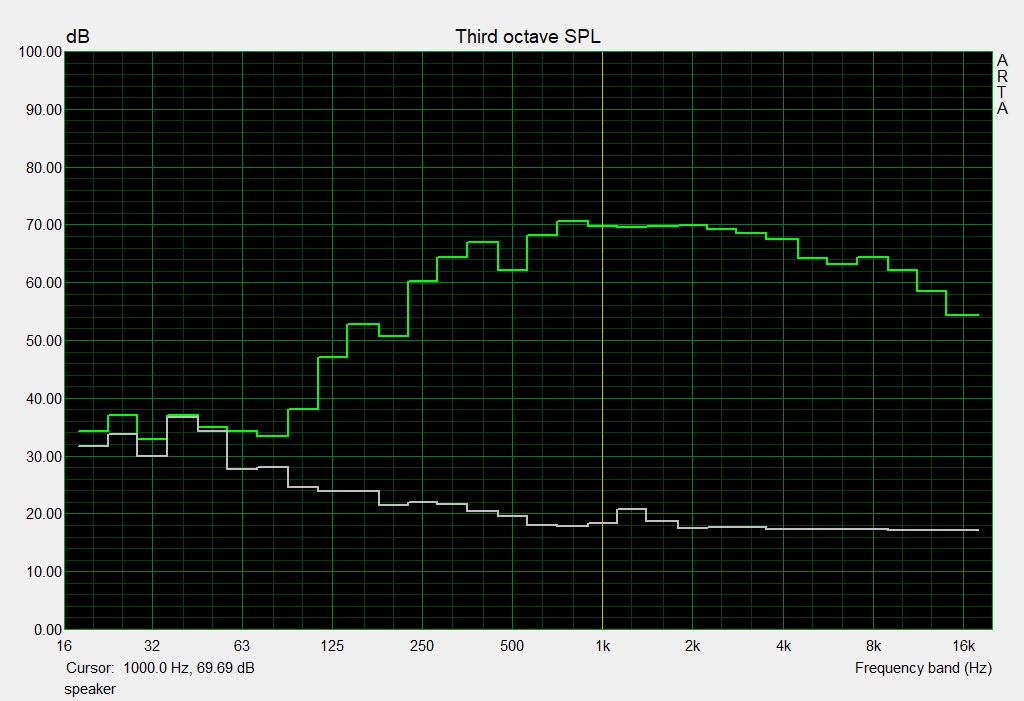
Speakers
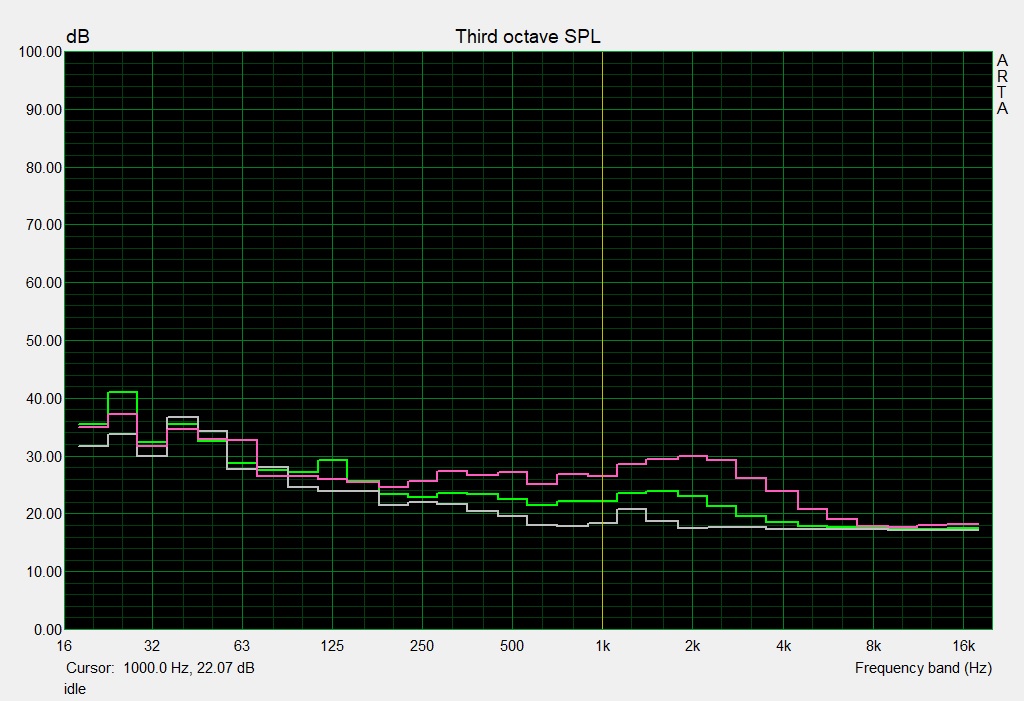
Acer Predator Triton 500 PT515-51-71PZ audio analysis
(±) | speaker loudness is average but good (80 dB)
Bass 100 - 315 Hz
(±) | reduced bass - on average 12.2% lower than median
(±) | linearity of bass is average (12.6% delta to prev. frequency)
Mids 400 - 2000 Hz
(+) | balanced mids - only 4.5% away from median
(+) | mids are linear (4.7% delta to prev. frequency)
Highs 2 - 16 kHz
(+) | balanced highs - only 2.2% away from median
(+) | highs are linear (3.2% delta to prev. frequency)
Overall 100 - 16.000 Hz
(+) | overall sound is linear (14.8% difference to median)
Compared to same class
» 29% of all tested devices in this class were better, 7% similar, 63% worse
» The best had a delta of 6%, average was 18%, worst was 132%
Compared to all devices tested
» 20% of all tested devices were better, 4% similar, 76% worse
» The best had a delta of 4%, average was 23%, worst was 134%
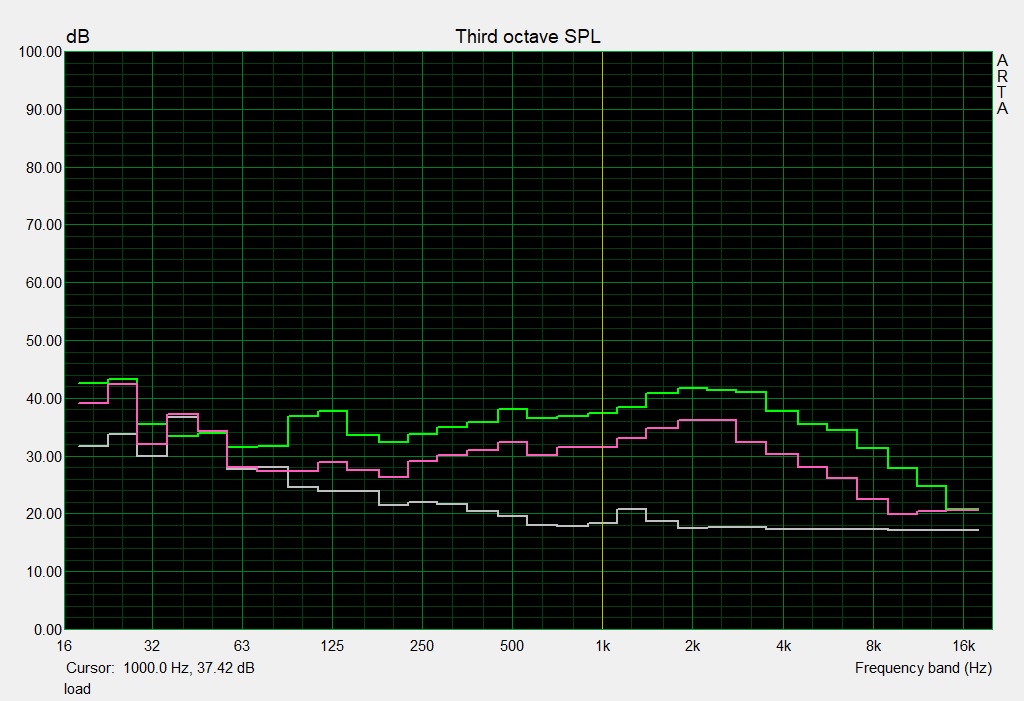
Gigabyte Aero 15 Classic-XA audio analysis
(+) | speakers can play relatively loud (82 dB)
Bass 100 - 315 Hz
(-) | nearly no bass - on average 17% lower than median
(±) | linearity of bass is average (10.2% delta to prev. frequency)
Mids 400 - 2000 Hz
(+) | balanced mids - only 4.7% away from median
(+) | mids are linear (6.2% delta to prev. frequency)
Highs 2 - 16 kHz
(+) | balanced highs - only 2.3% away from median
(+) | highs are linear (5.5% delta to prev. frequency)
Overall 100 - 16.000 Hz
(±) | linearity of overall sound is average (15.5% difference to median)
Compared to same class
» 35% of all tested devices in this class were better, 7% similar, 58% worse
» The best had a delta of 6%, average was 18%, worst was 132%
Compared to all devices tested
» 23% of all tested devices were better, 4% similar, 73% worse
» The best had a delta of 4%, average was 23%, worst was 134%
Energy Management
Power Consumption
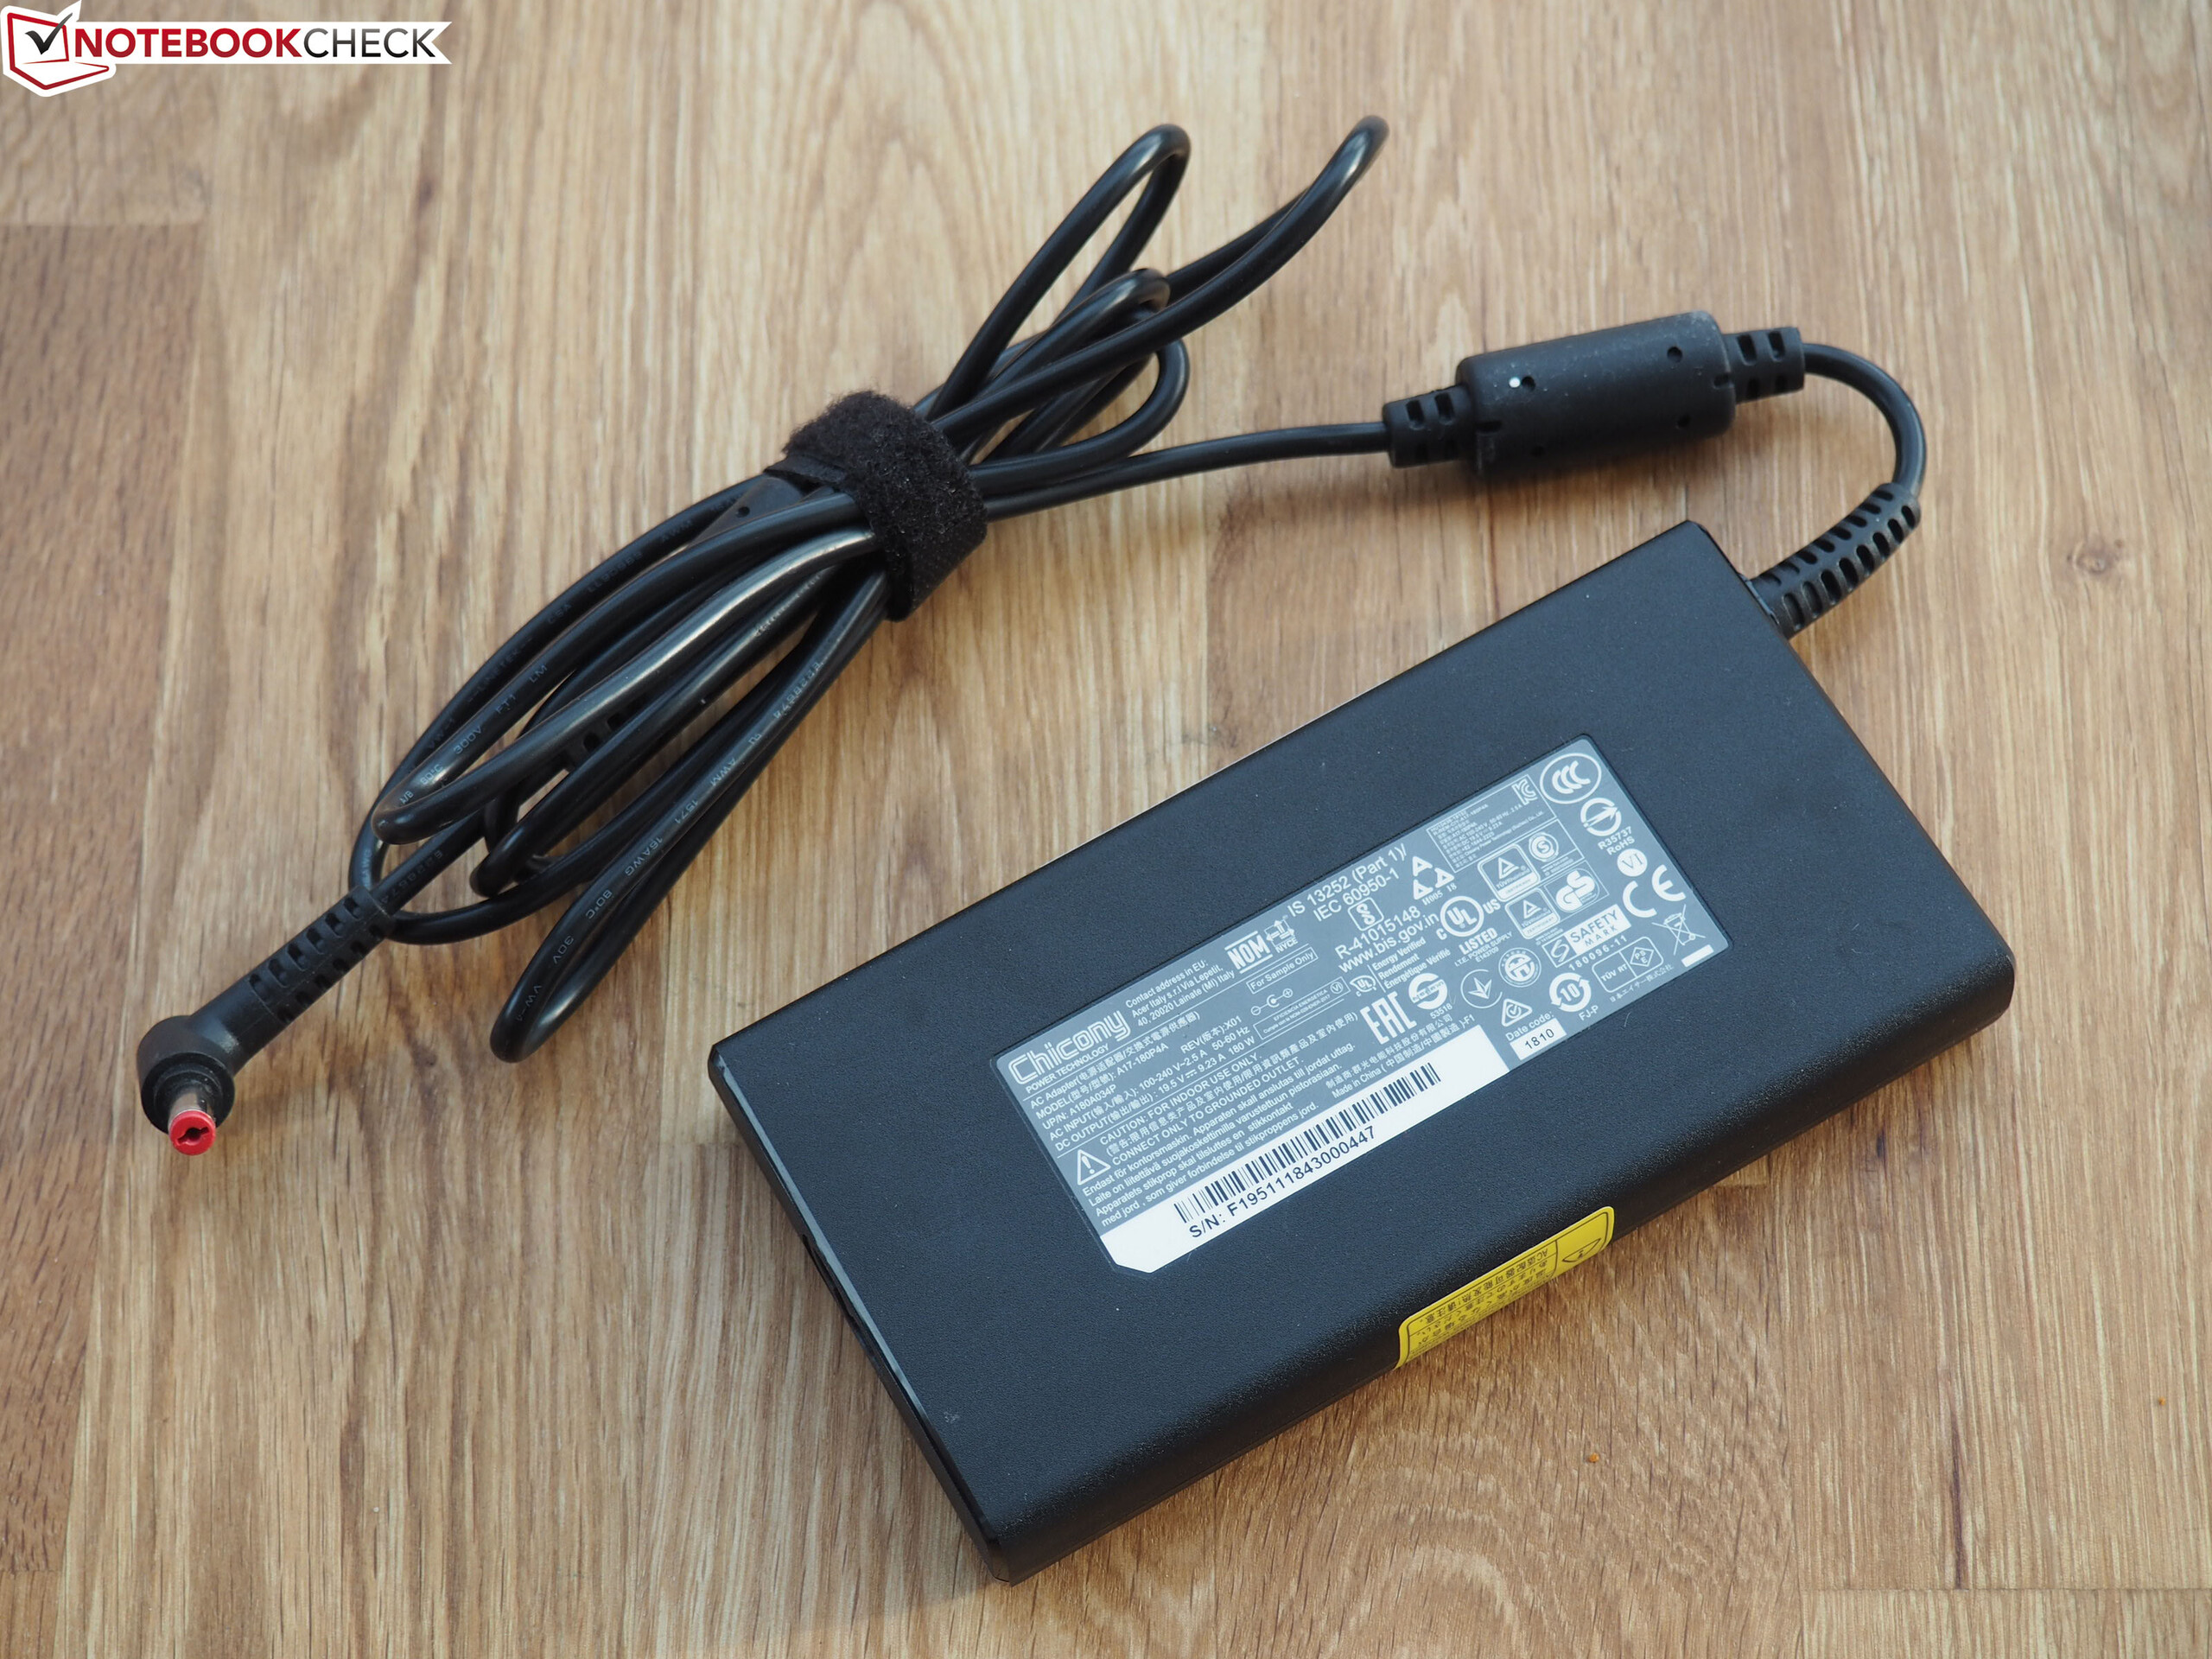
With activated graphics switching, the Triton 500 requires very little energy. 7 to 22 watts of idle consumption make you think of an office or multimedia laptop at first glance. When the Nvidia GPU goes on under load, the power requirement climbs to values between 86 and 177 watts. The included 180-watt power supply is thus sufficient.
| Off / Standby | |
| Idle | |
| Load |
|
Key:
min: | |
| Acer Predator Triton 500 PT515-51-71PZ GeForce RTX 2070 Max-Q, i7-9750H | Gigabyte Aero 15 Classic-XA GeForce RTX 2070 Max-Q, i7-9750H | Asus Zephyrus S GX502GW GeForce RTX 2070 Mobile, i7-9750H | MSI GS65 Stealth 9SG GeForce RTX 2080 Max-Q, i7-9750H | Razer Blade 15 RTX 2080 Max-Q GeForce RTX 2080 Max-Q, i7-9750H | Average of class Gaming | |
|---|---|---|---|---|---|---|
| Power Consumption | -62% | -85% | -51% | -23% | -47% | |
| Idle Minimum * (Watt) | 7 | 21 -200% | 24 -243% | 18.3 -161% | 12.5 -79% | 13.1 ? -87% |
| Idle Average * (Watt) | 12 | 23 -92% | 27 -125% | 22 -83% | 15.3 -28% | 19 ? -58% |
| Idle Maximum * (Watt) | 22 | 32 -45% | 33 -50% | 28.8 -31% | 20.7 6% | 24.6 ? -12% |
| Load Average * (Watt) | 86 | 97 -13% | 129 -50% | 93 -8% | 90.2 -5% | 111.3 ? -29% |
| Witcher 3 ultra * (Watt) | 144 | 148 -3% | 176 -22% | 142.6 1% | 162 -13% | |
| Load Maximum * (Watt) | 177 | 213 -20% | 216 -22% | 215.9 -22% | 209.3 -18% | 260 ? -47% |
* ... smaller is better
Battery Life
The fact that not only the Antichrist, but also a good battery life can be behind the number 666 is proved by the Triton 500 in an impressive manner. Almost 11 hours idle runtime at minimal brightness (Battery Eater tool in "Reader's test" mode) is quite a lot for a gaming laptop. Only the Razer Blade 15 has a higher value (up to 16 hours). Even at medium brightness, respectively utilization, the battery life of the Acer laptop pleases. The device lasted about 8 hours in our WLAN test, which is also a good result. For comparison: The predecessor, which was tested without Optimus, only managed about 3 hours.
| Acer Predator Triton 500 PT515-51-71PZ GeForce RTX 2070 Max-Q, i7-9750H, Wh | Gigabyte Aero 15 Classic-XA GeForce RTX 2070 Max-Q, i7-9750H, 94.24 Wh | Asus Zephyrus S GX502GW GeForce RTX 2070 Mobile, i7-9750H, 76 Wh | MSI GS65 Stealth 9SG GeForce RTX 2080 Max-Q, i7-9750H, 82 Wh | Razer Blade 15 RTX 2080 Max-Q GeForce RTX 2080 Max-Q, i7-9750H, 80 Wh | Average of class Gaming | |
|---|---|---|---|---|---|---|
| Battery runtime | 19% | -46% | -25% | 11% | -15% | |
| Reader / Idle (h) | 11.1 | 9.1 -18% | 5.9 -47% | 15.9 43% | 7.84 ? -29% | |
| WiFi v1.3 (h) | 8 | 7 -12% | 3.7 -54% | 6 -25% | 6.6 -17% | 7.08 ? -11% |
| Load (h) | 1.6 | 3 88% | 1 -37% | 1.7 6% | 1.496 ? -6% | |
| H.264 (h) | 6.8 | 8.27 ? |
Pros
Cons
Verdict
With the Predator Triton 500 Acer sells an elegant and extremely flat gaming notebook without any major flaws.
In all rating categories, the 15-inch laptop earns at least 70%, which speaks for a balanced and well-thought-out system. Our criticisms, which are in the "Cons" list on the right, are rather insignificant.
To get a "very good" as an overall grade, Acer should have put more emphasis on the fan control, for example; this includes the sometimes annoying starts in idle. The maintenance options could also be better. In addition, we miss a card reader.
Acer Predator Triton 500 PT515-51-71PZ
- 05/14/2020 v7 (old)
Florian Glaser
Price comparison
