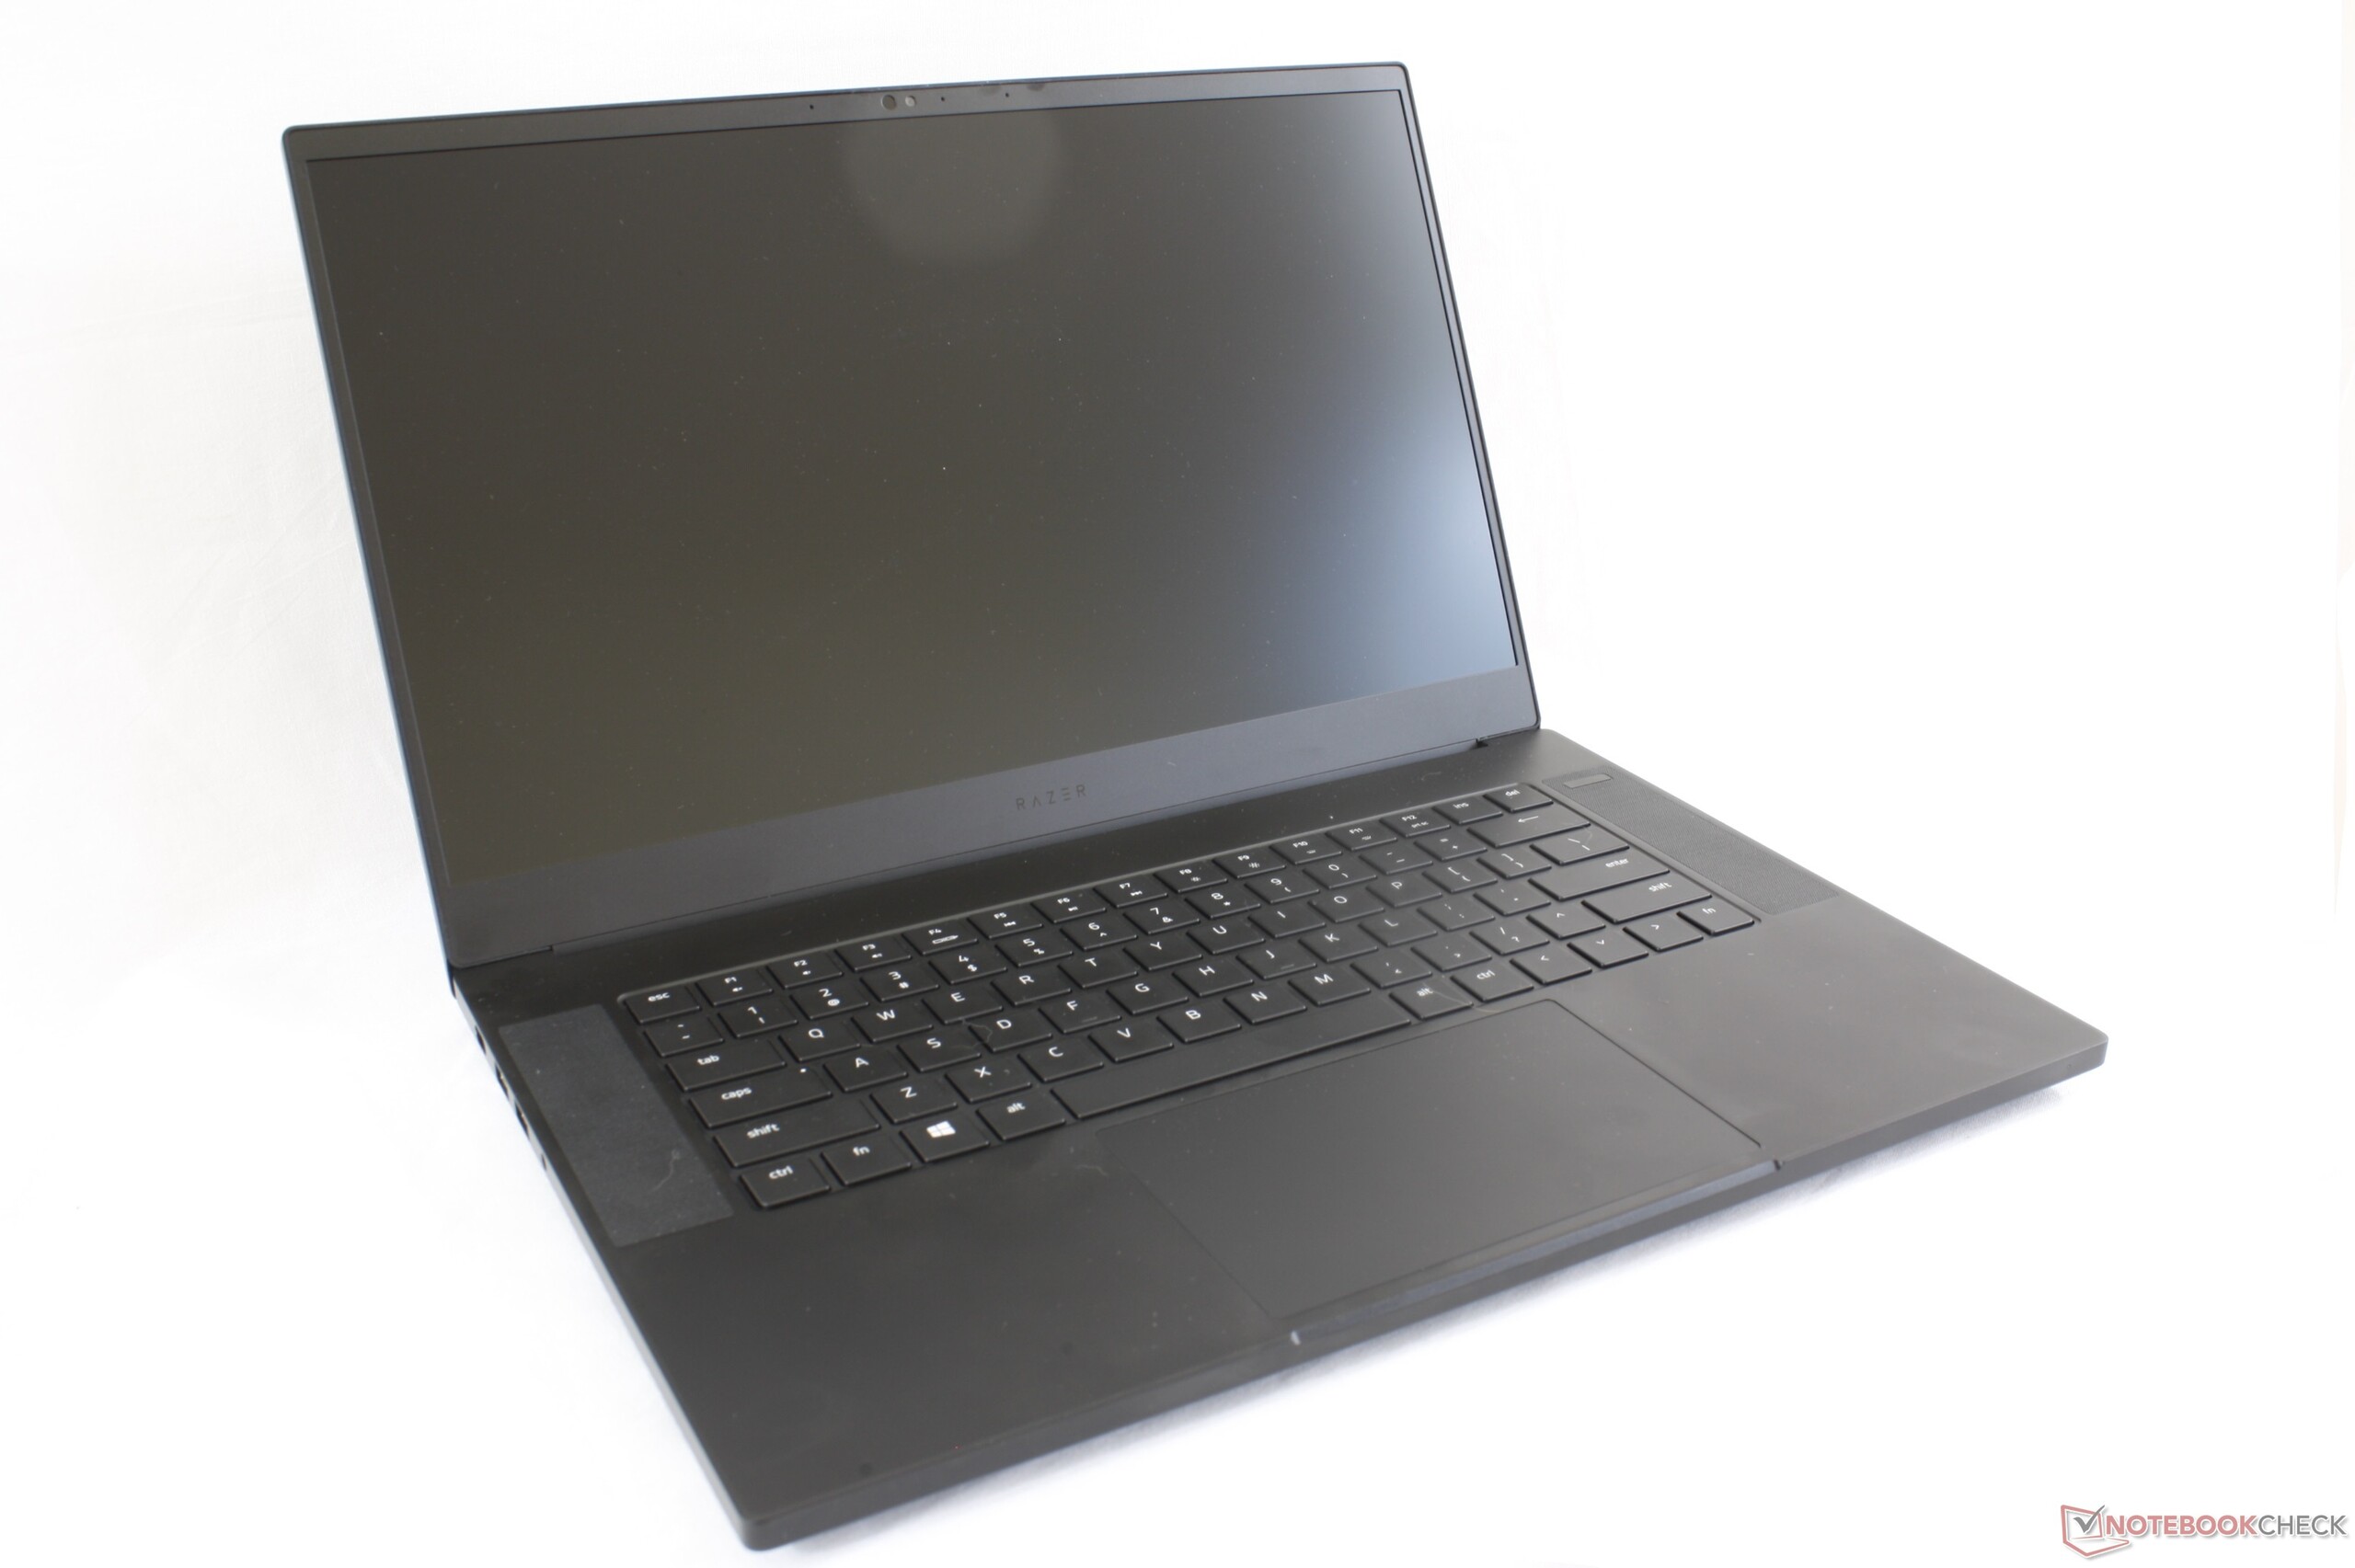
Razer Blade 15 Advanced Model (i7-9750H, RTX 2080 Max-Q, 240 Hz) Laptop Review

Razer is the kind of company that wants to offer the latest in technology as soon as it become available. When Intel announced the arrival of H-series 9th gen Core processors, Razer was one of the first out of the gate with an Intel 9th gen Core i7 offering. The Intel 9th gen Blade 15 supplants the 8th gen Blade 15 while adding two new display options (240 Hz IPS and 60 Hz OLED), faster USB ports (up to 20 Gbps), and faster wireless (802.11ax/Wi-Fi 6) to be one of the most advanced for its category.
Other than the changes above, the Intel 9th gen Blade 15 Advanced Model is physically identical to the Intel 8th gen Blade 15 Advanced Model and so all of our comments on the chassis, keyboard, trackpad, and audio still apply here. GPU options remain identical ranging from the RTX 2060 to the RTX 2070 Max-Q and RTX 2080 Max-Q.
Our test unit today is the higher-end Advanced Model configuration equipped with a Core i7-9750H CPU, RTX 2080 Max-Q CPU, 240 Hz FHD display, and an Intel Wi-Fi 6 AX200 WLAN module for about $3000 USD. Lesser Intel 9th gen configurations with "only" a 144 Hz display are also available starting at $2000 USD. For this review, we'll be comparing our Intel 9th gen Blade 15 Advanced Model to its immediate predecessor to see what kinds of benefits the new CPU and RTX 2080 Max-Q GPU can bring to the table.
Direct competitors include other flagship ultra-thin gaming laptops such as the 15.6-inch MSI GS65, Aorus 15, Lenovo Legion Y740, Acer Predator Triton 700, Alienware m15, Walmart Overpowered 15, and the recently released Asus Zephyrus S GX502.
For more information on the Blade 15 OLED, see our comparison page here.
More Razer Blade reviews:
Case
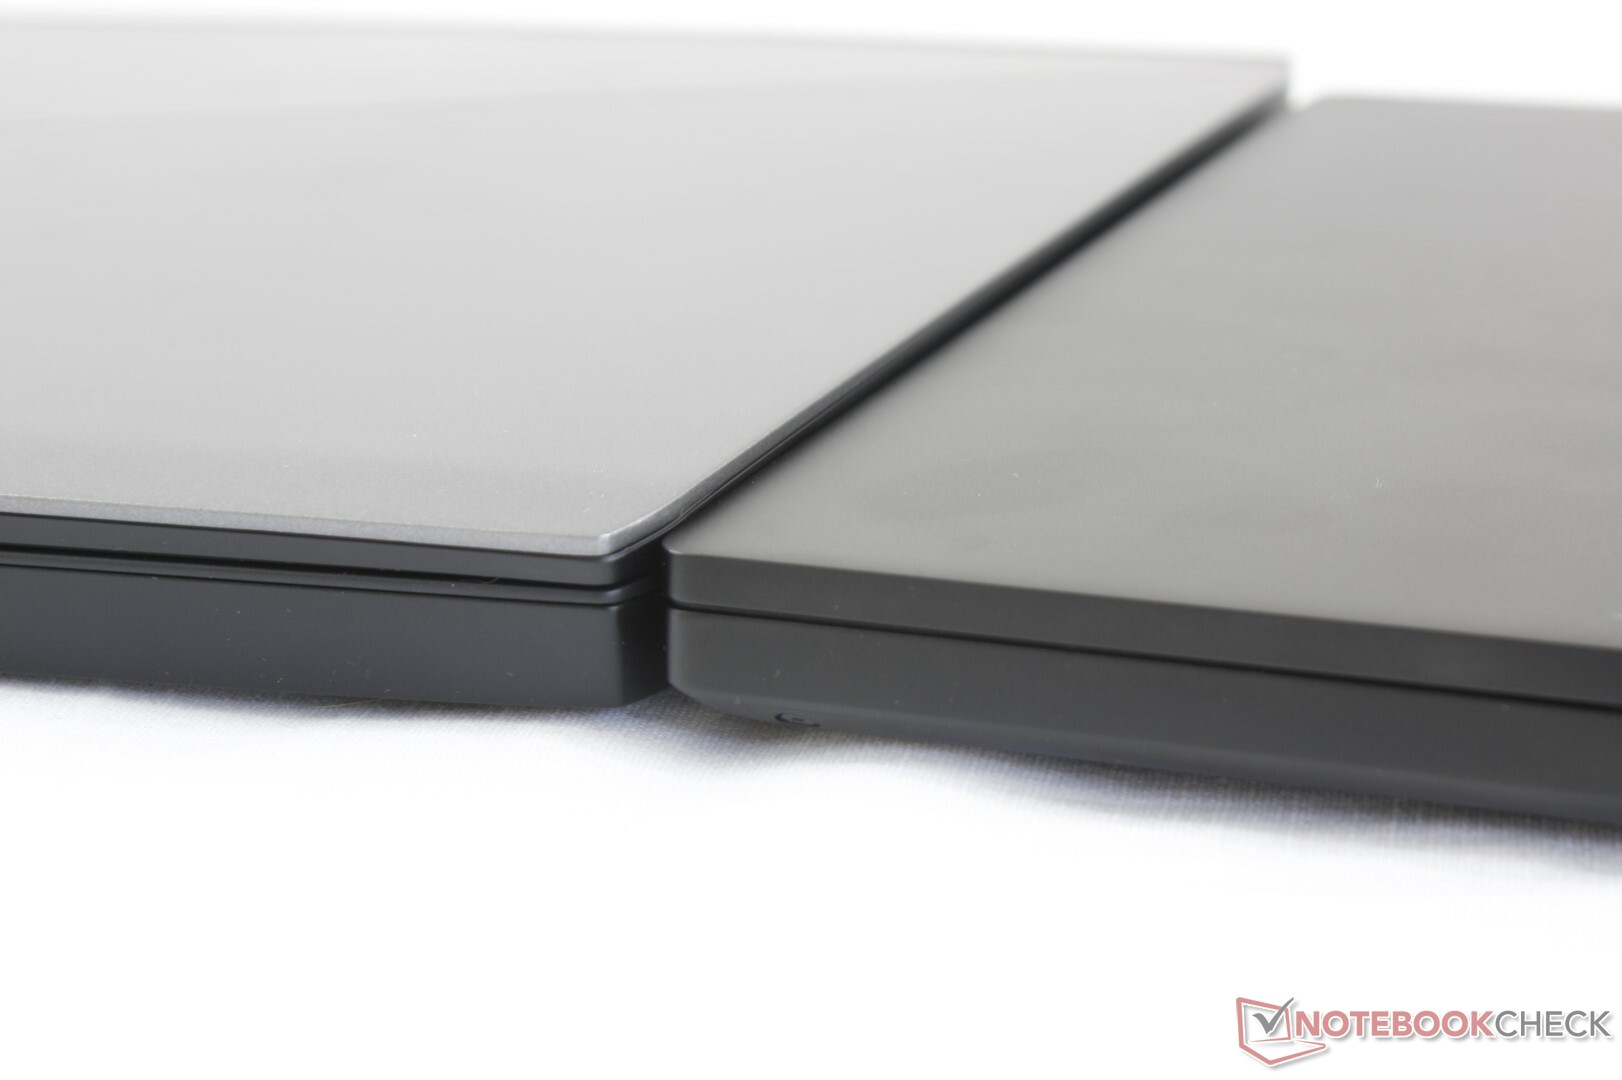
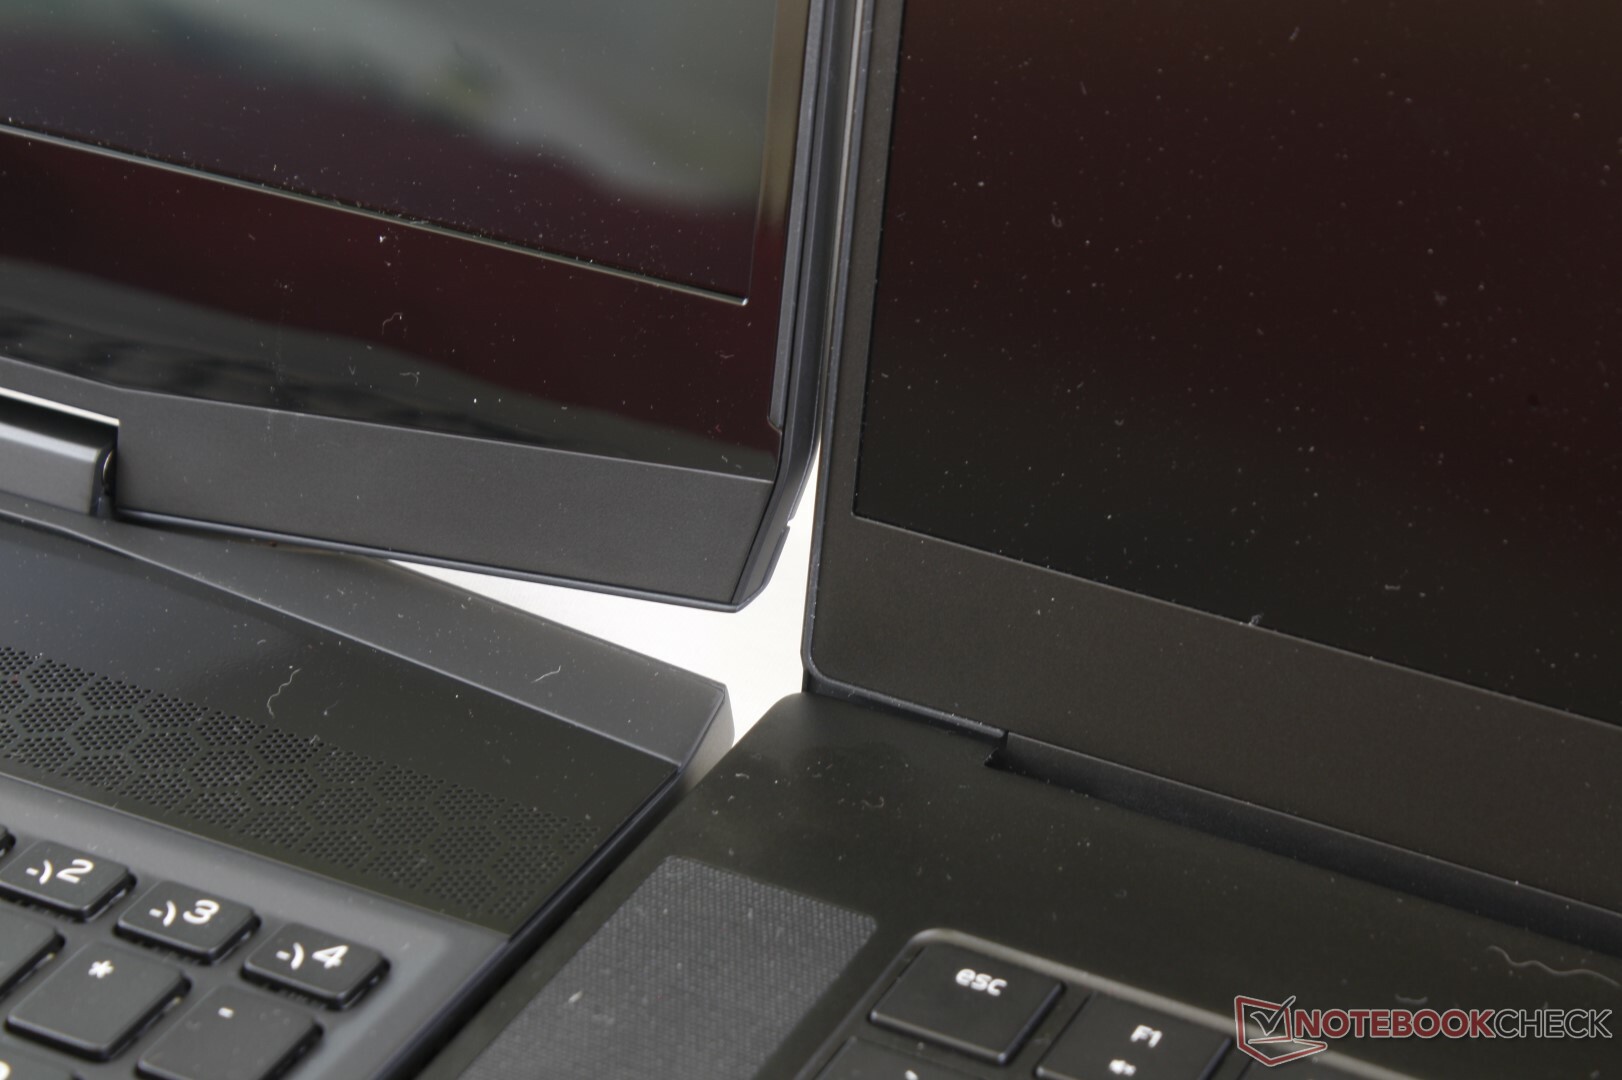
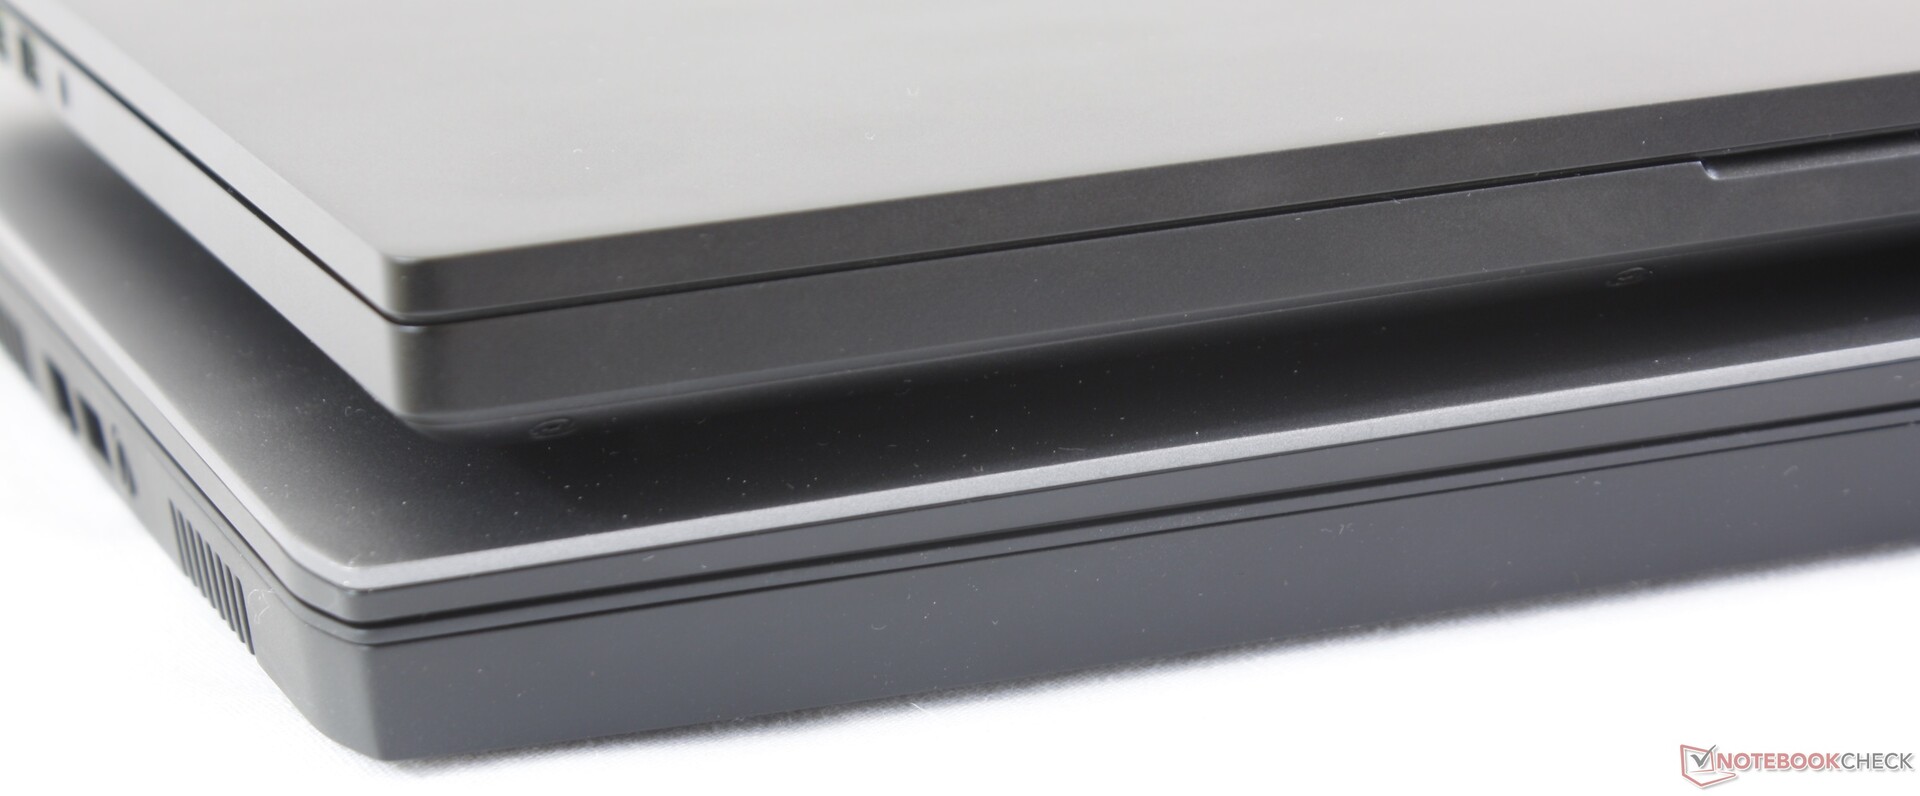
Now a full year old, the Blade 15 chassis is arguably still the one to beat for its terrific balance of minimalism and rigidity. There are indeed more unyielding or lighter alternatives available like the Asus ROG G703 or MSI GS65, respectively, but these systems are either significantly larger (Asus) or have inferior build quality (MSI). The MacBook-like design continues to feel strong without being thick or heavy even in the face of new competitors like the Zephyrus GX502.
Keep in mind that the Blade 15 Base Model will be slightly heavier and thicker with a different set of features than the Advanced Model as detailed here.
Connectivity
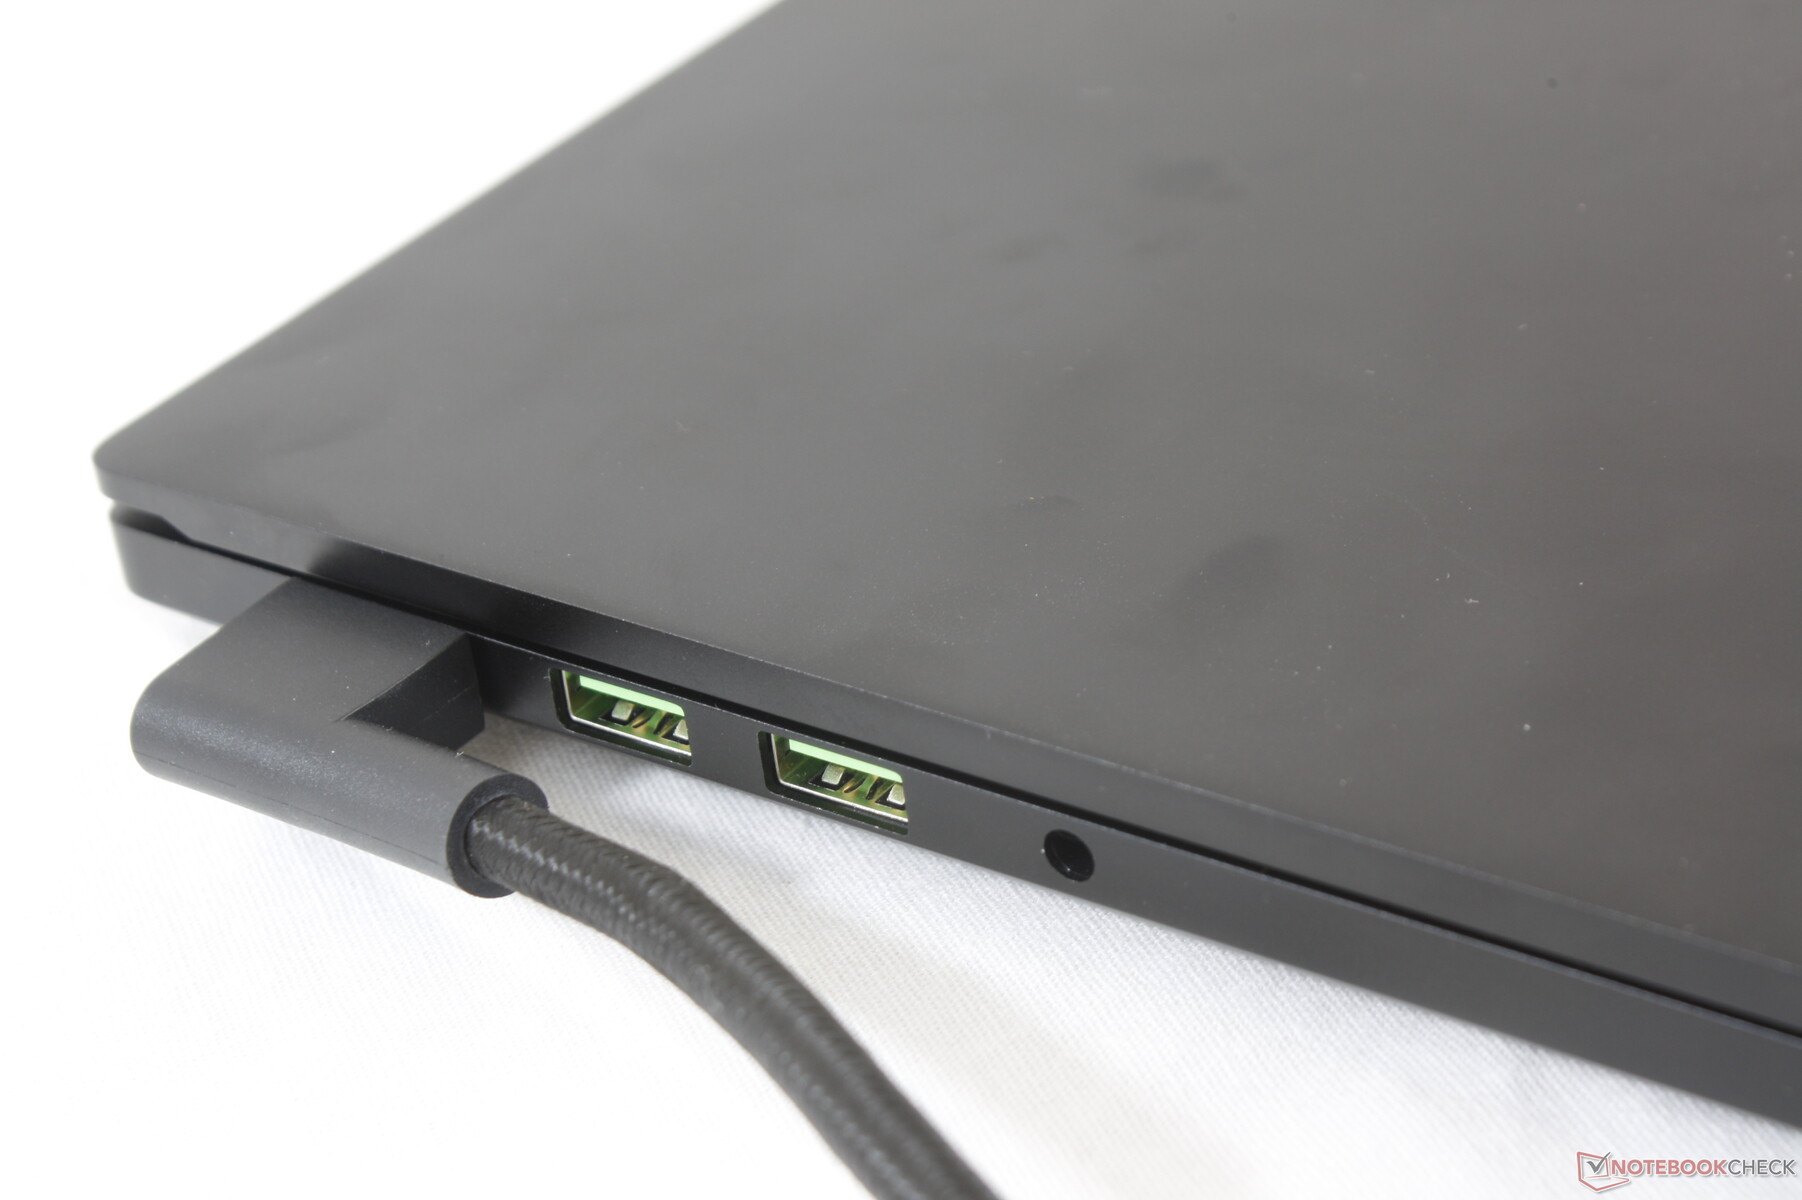
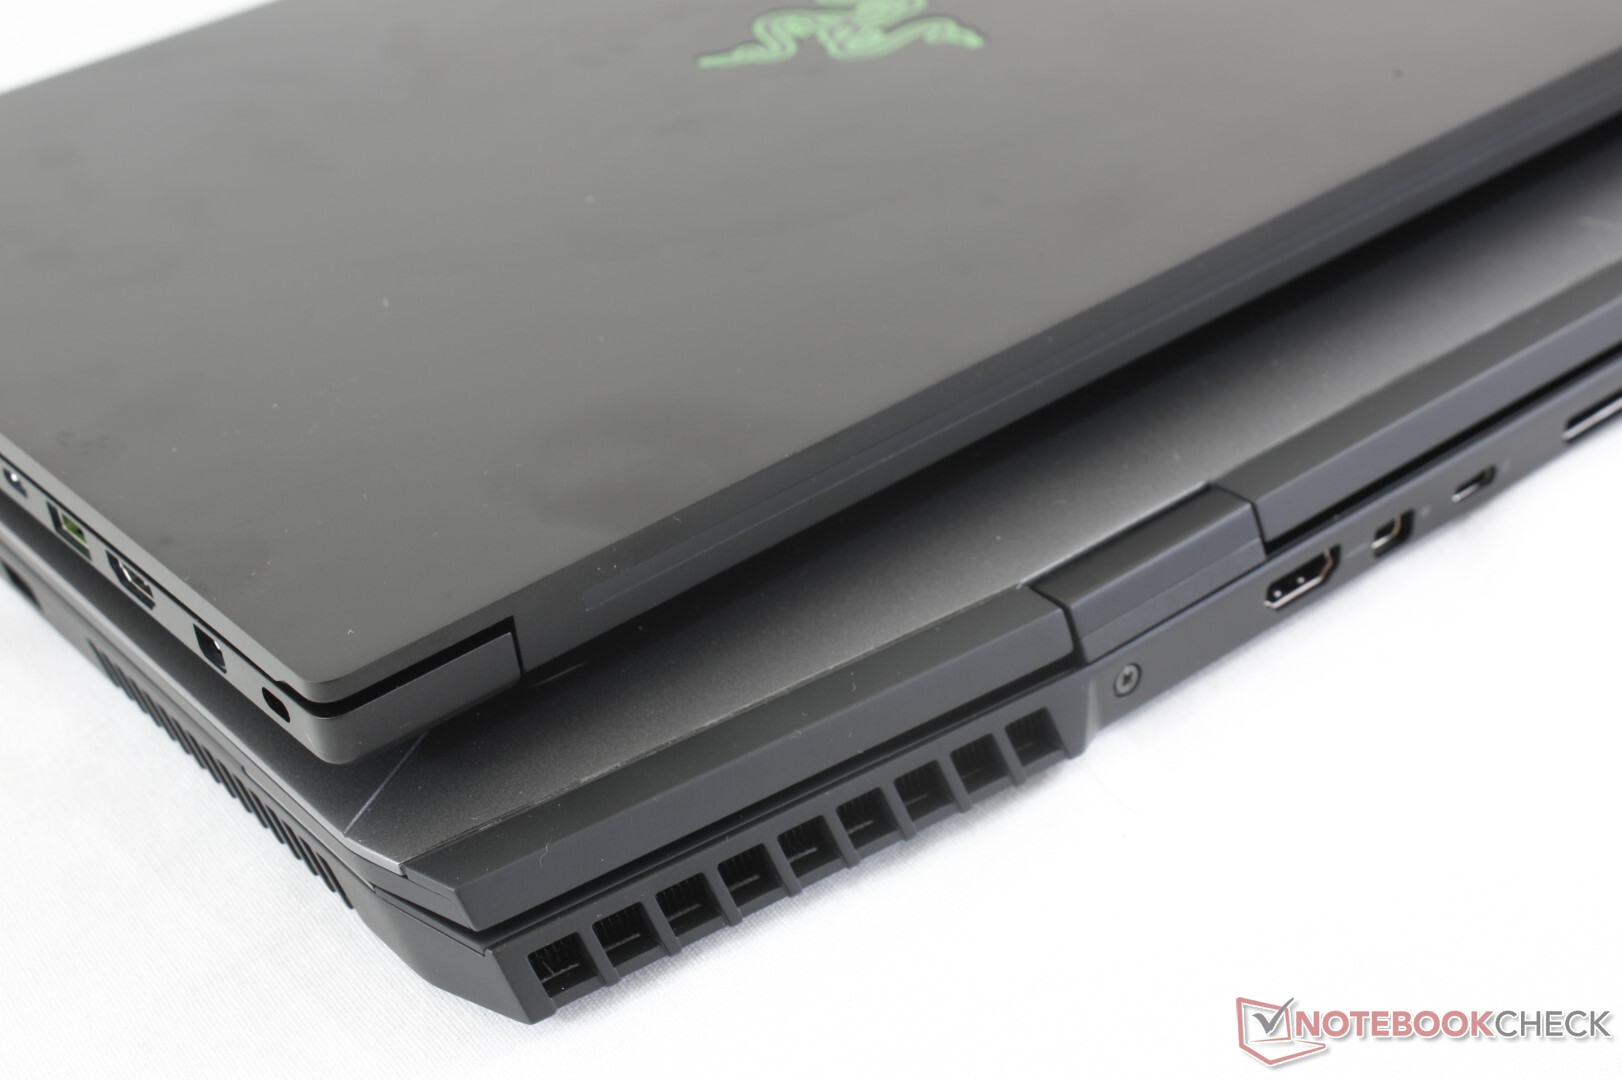
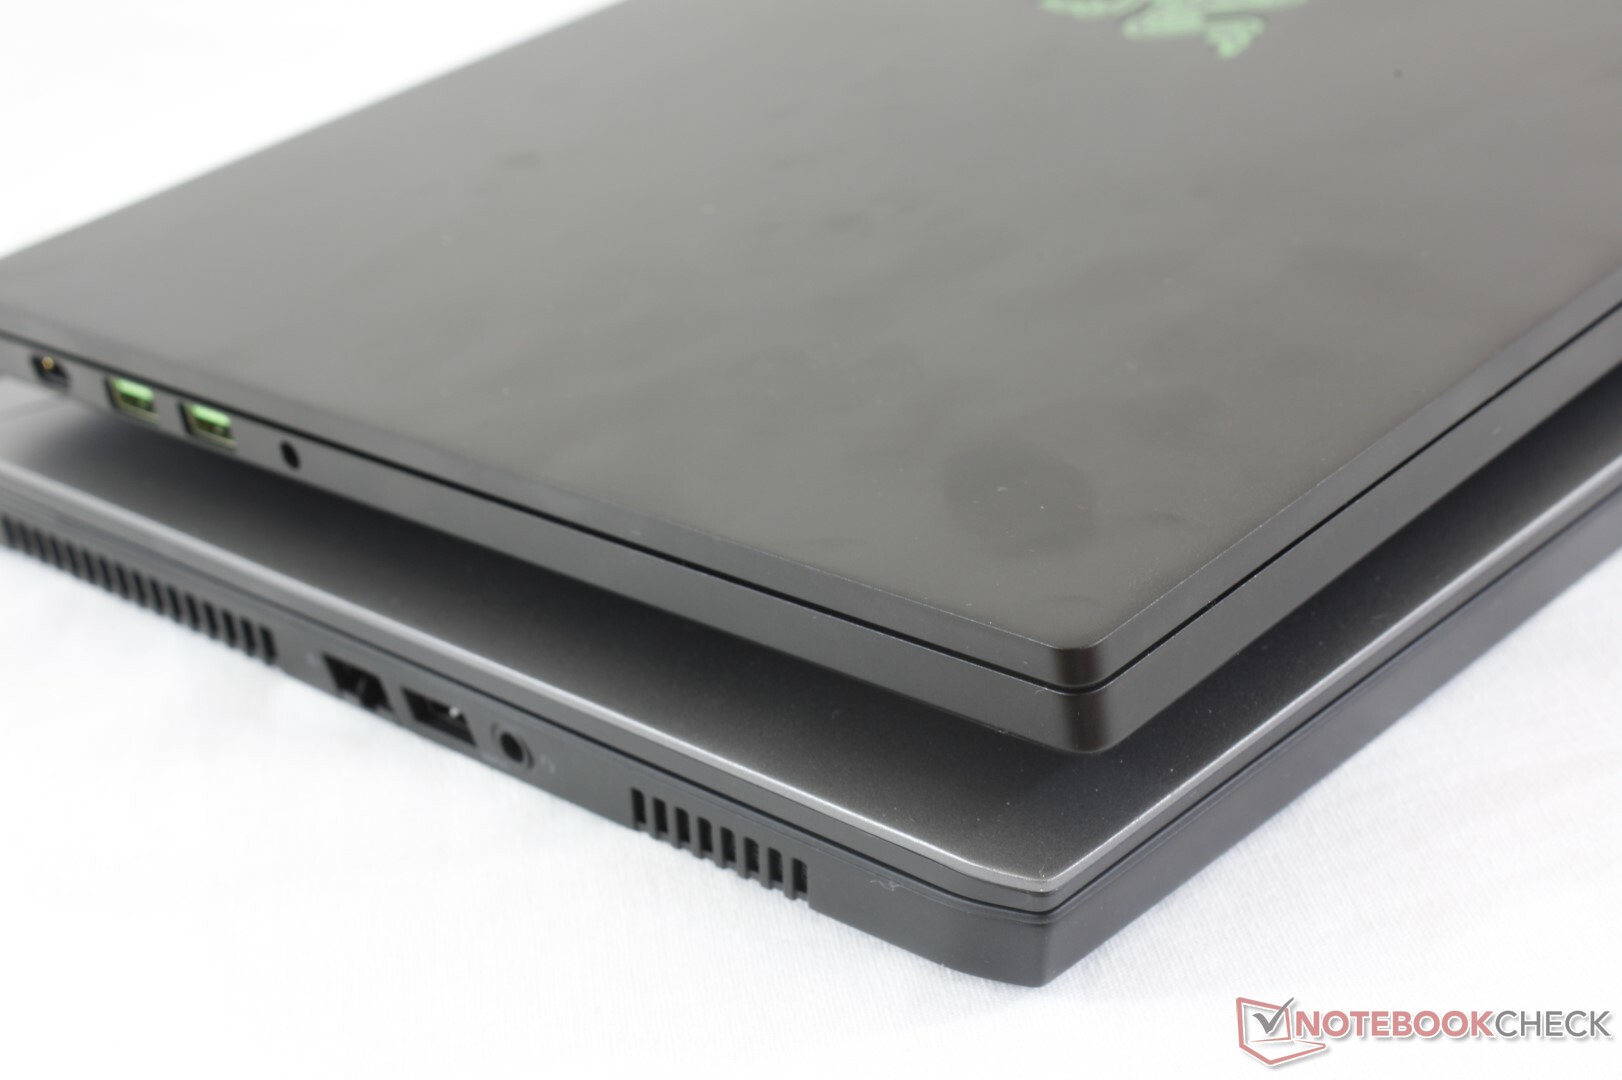
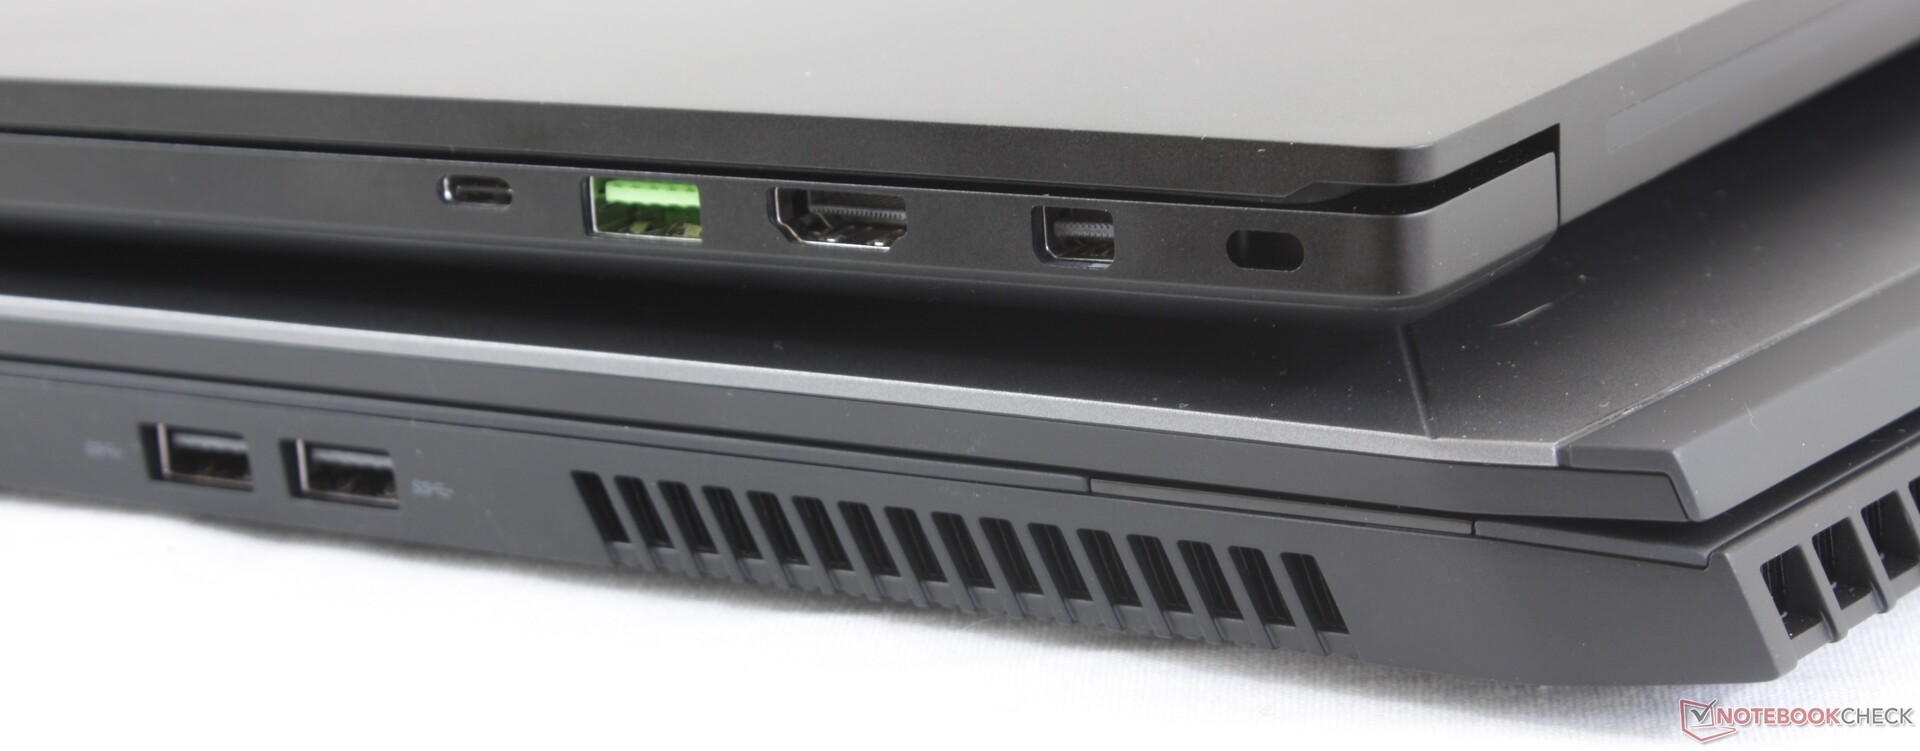
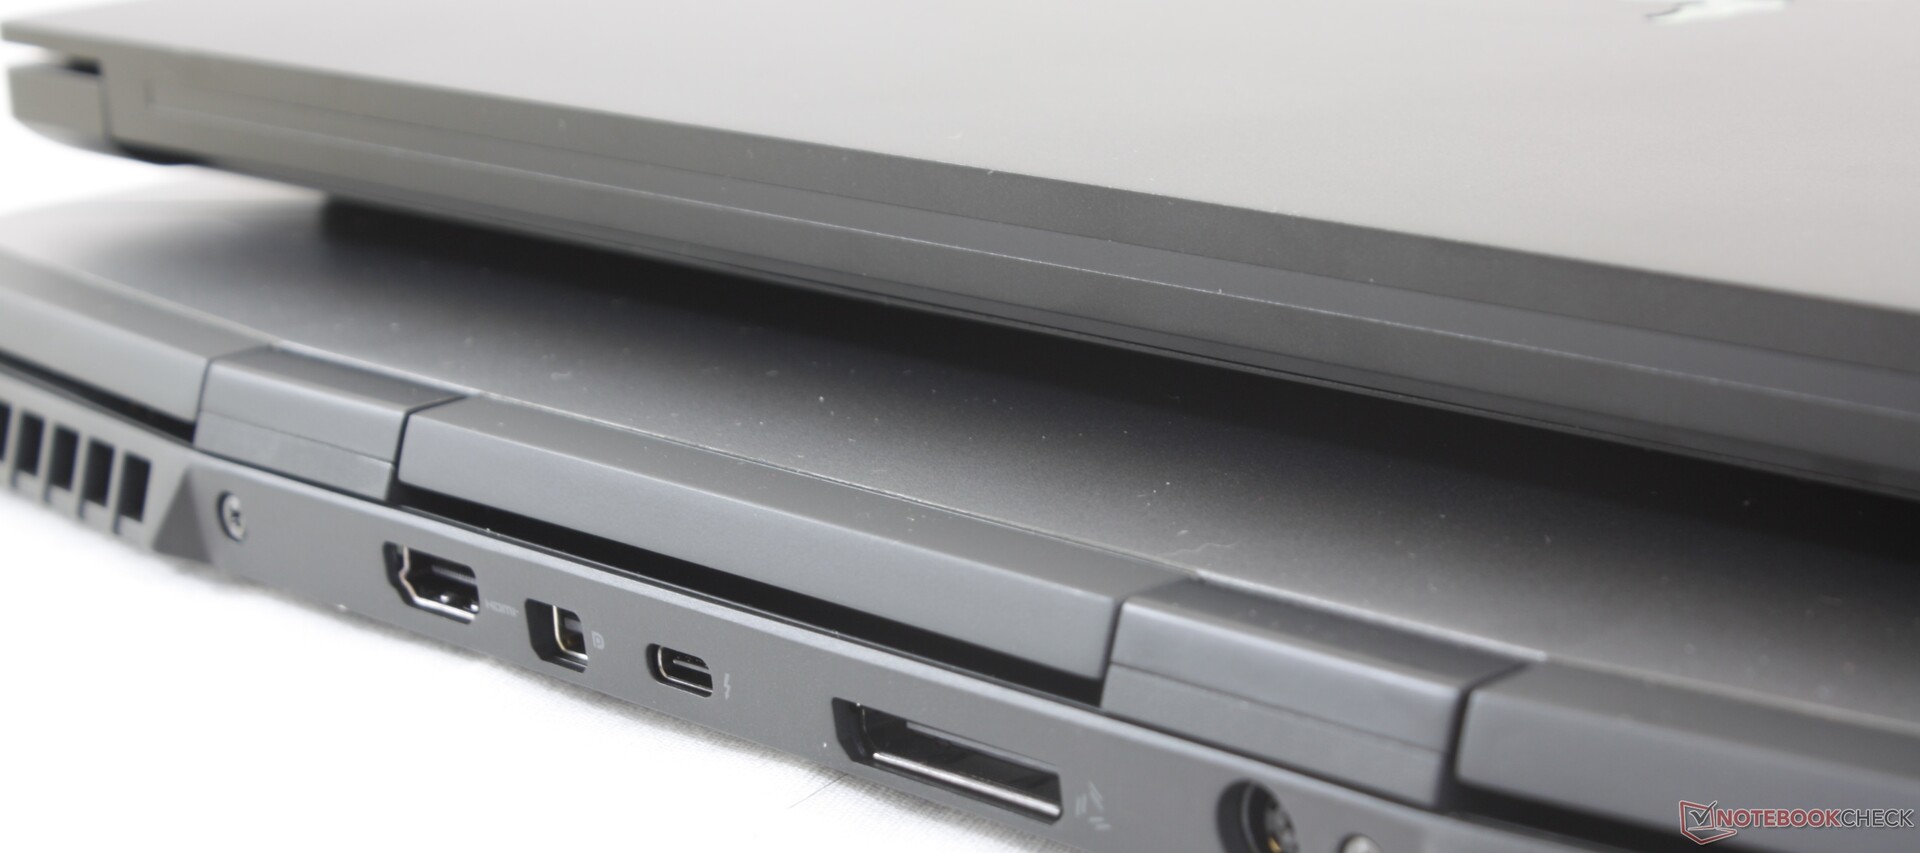
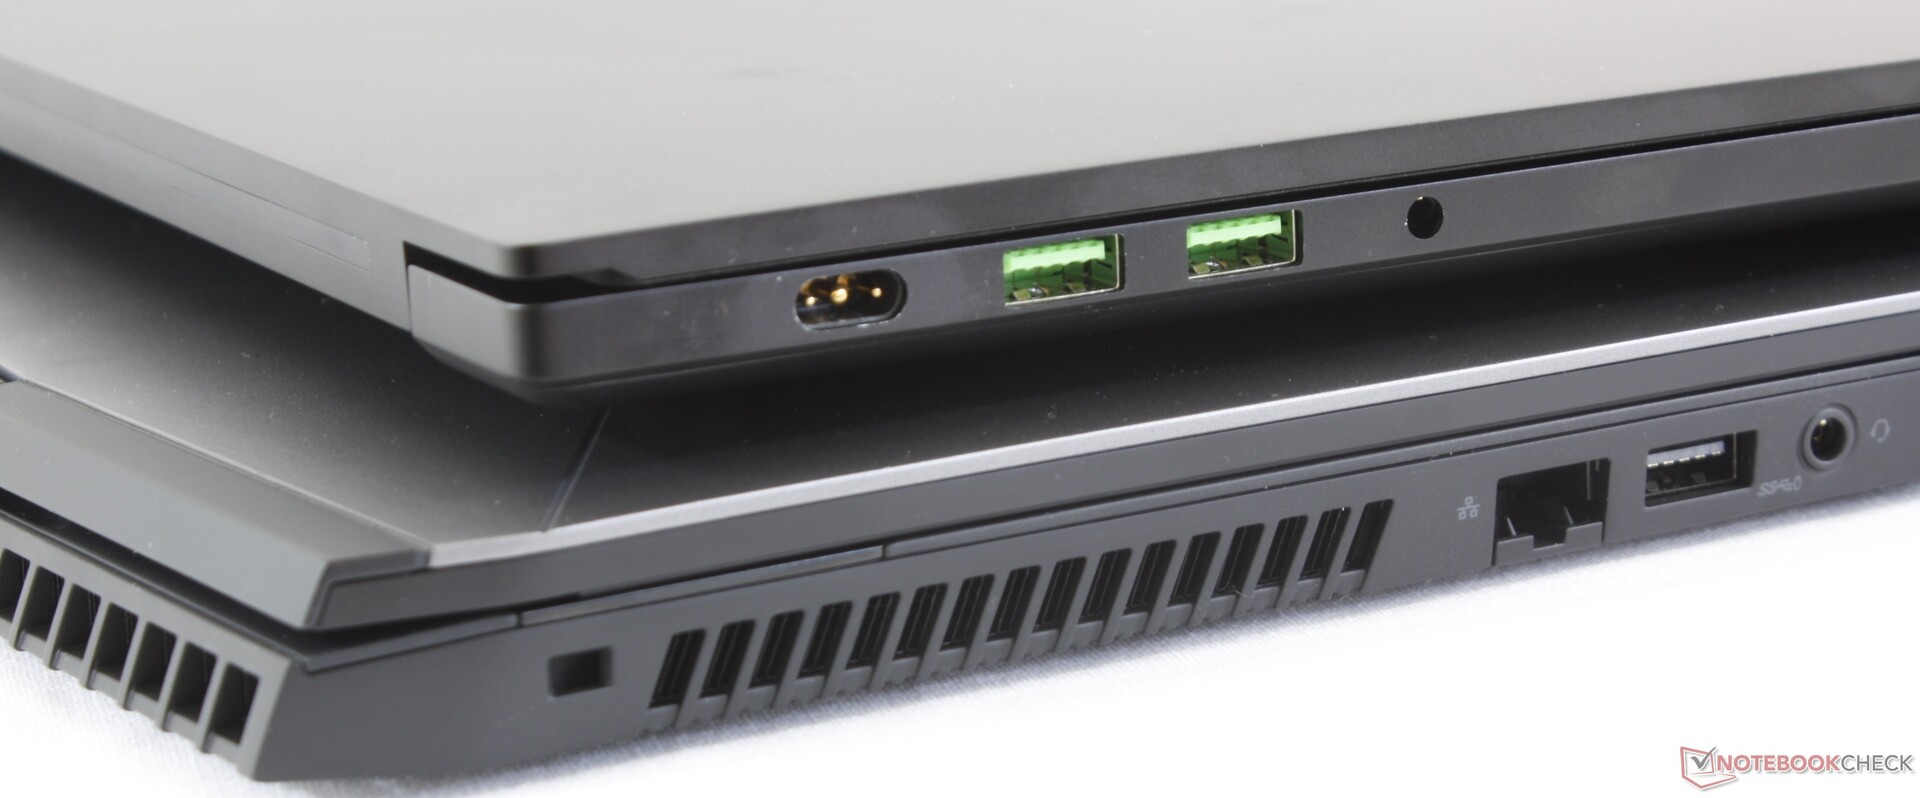
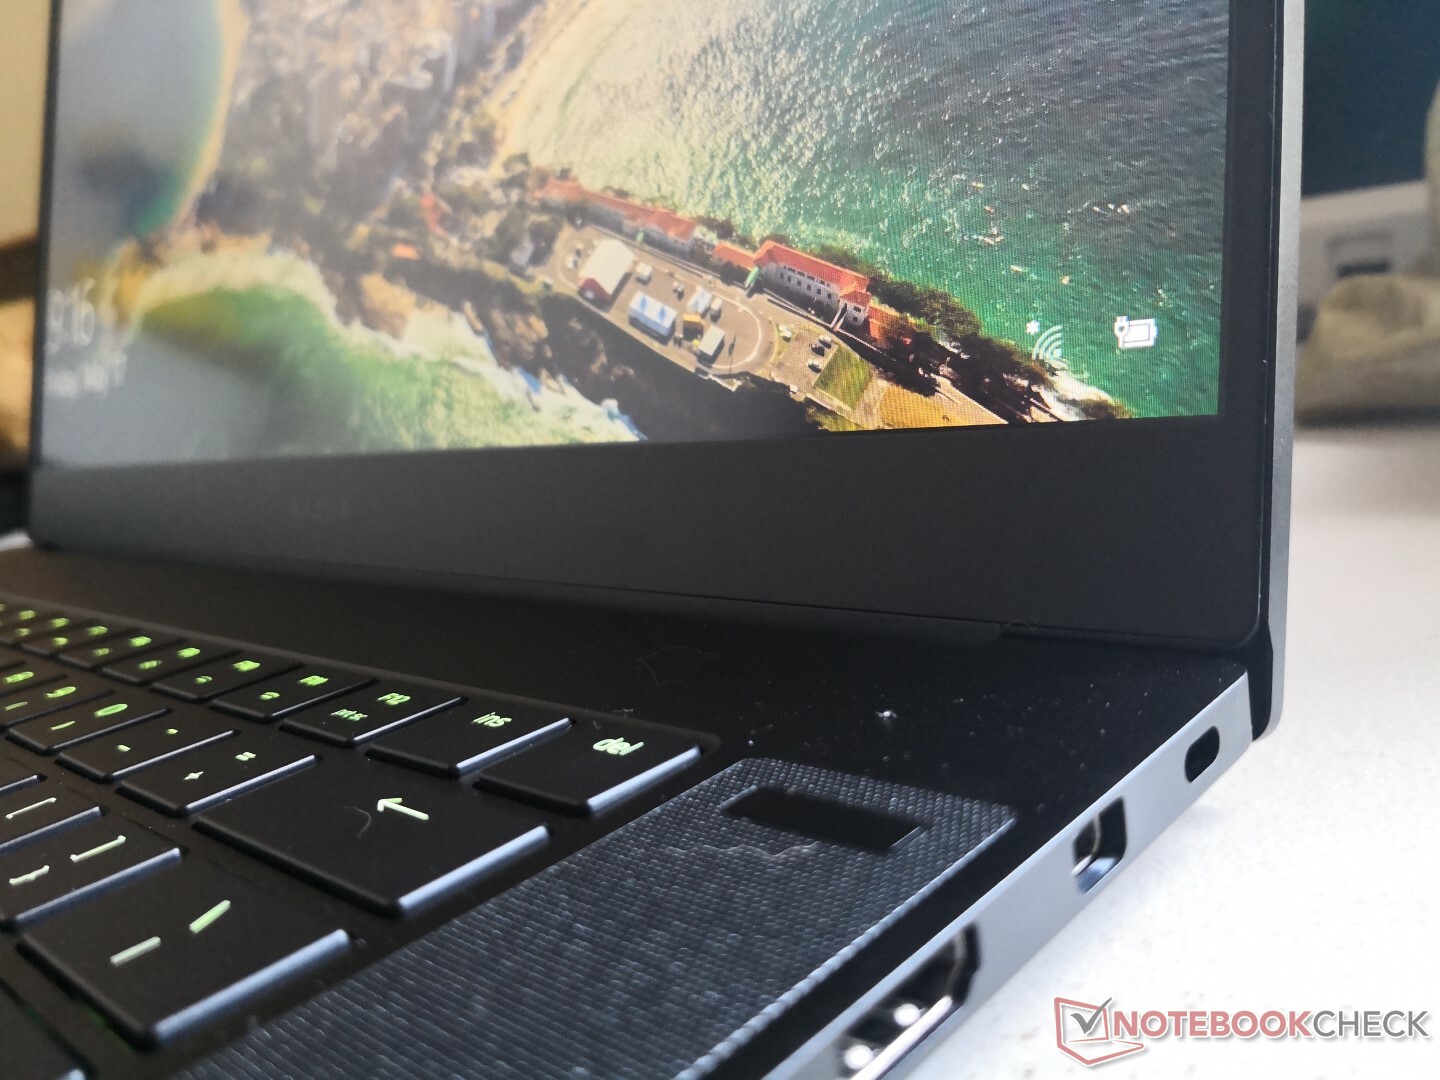
Available ports are identical to last year's Blade 15 Advanced Model with one update: The three USB Type-A ports now support USB 3.2 speeds of up to 20 Gbps whereas the Type-A ports on last year's model support up to 3.1 speeds only.
It's recommend to angle the AC adapter cable towards the rear of the laptop instead of the front or else the two USB ports along the left edge will be blocked as shown by the picture to the right. We've added the Alienware m15 below as a point of reference.
Communication
The Intel 9th gen Blade 15 is one of the first laptops to ship with an Intel Wi-Fi 6 AX200 WLAN module for a theoretical transfer rate of up to 2.4 Gbps. Most WLAN modules shipping today are limited to 1.73 Gbps or lower on 802.11ac. Performance can be faster than what we've recorded below since our server setup is limited by a 1 Gbps line. We suspect that most users don't have routers capable of Wi-Fi 6 either and so the AX200 is more of a future-proof bullet point at the moment.
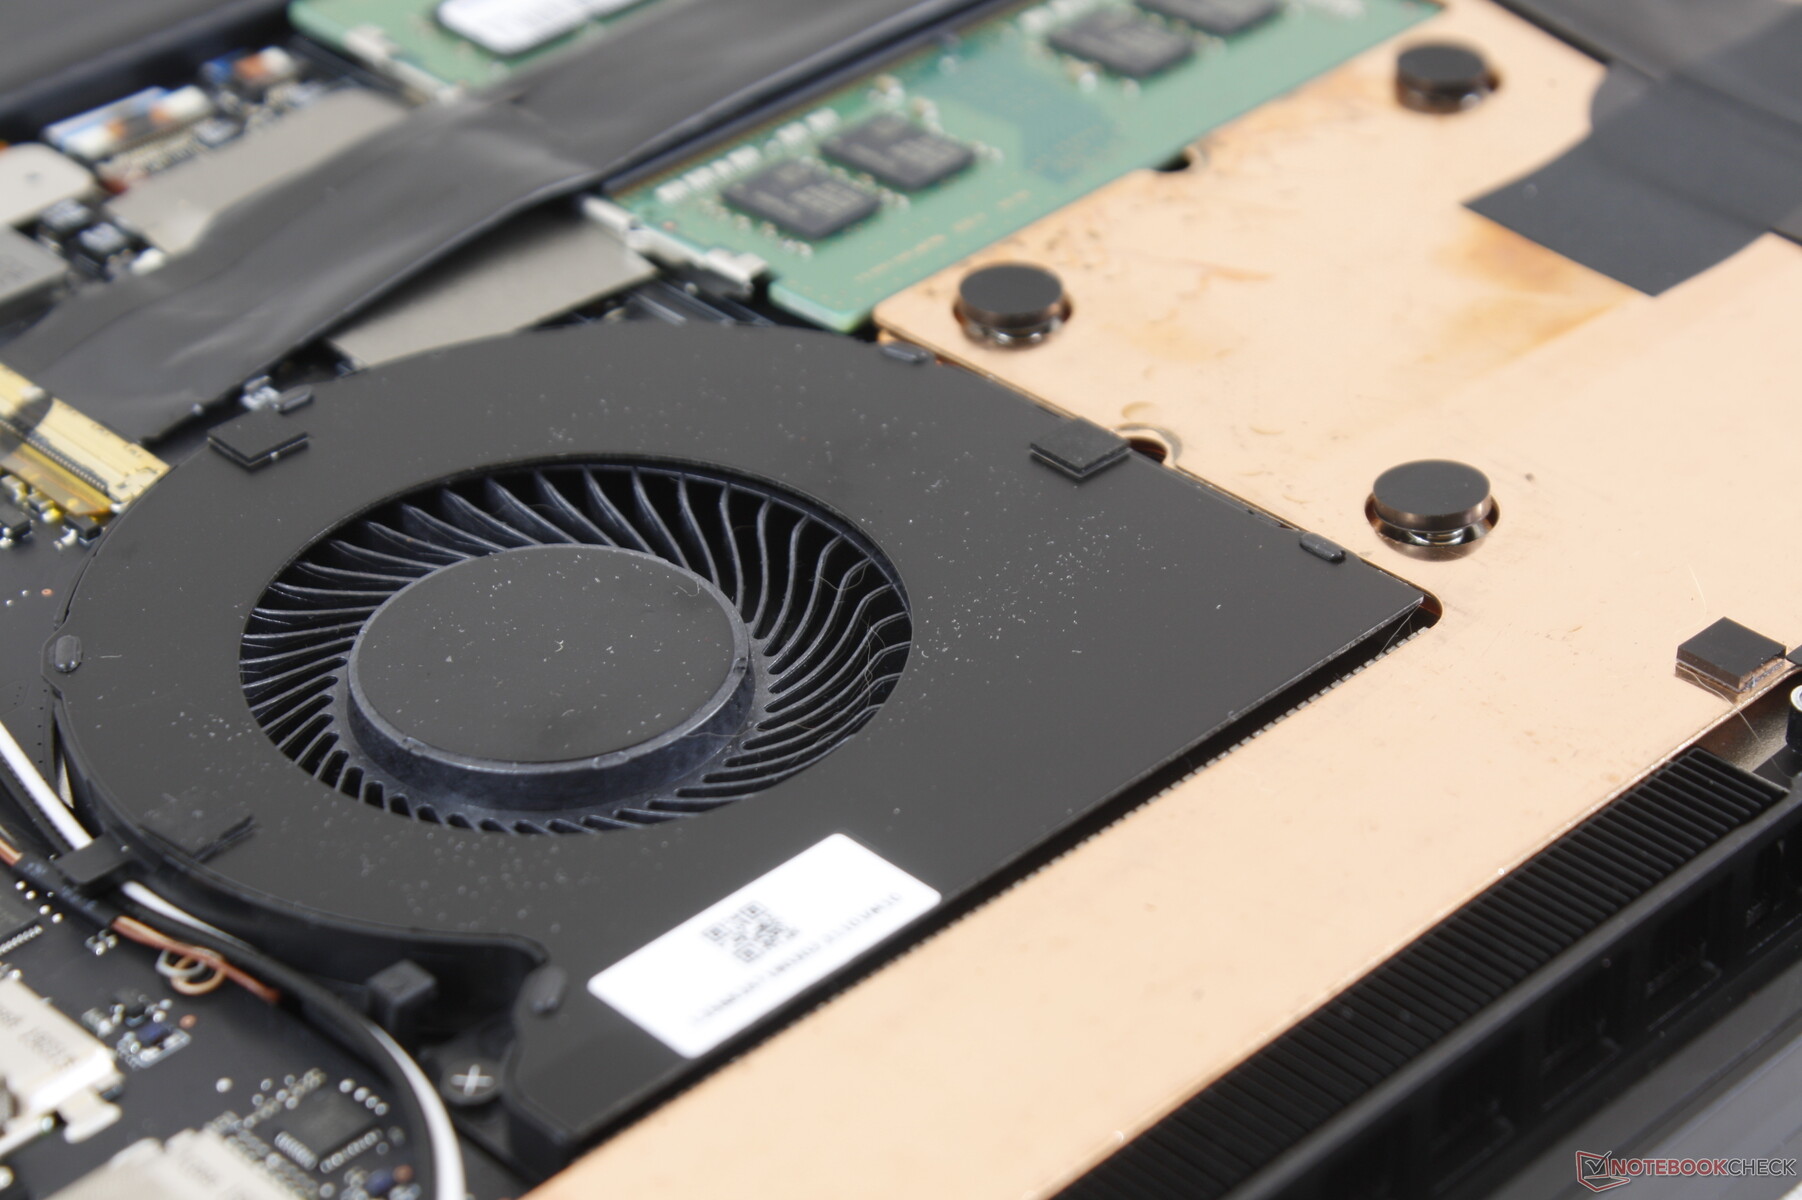
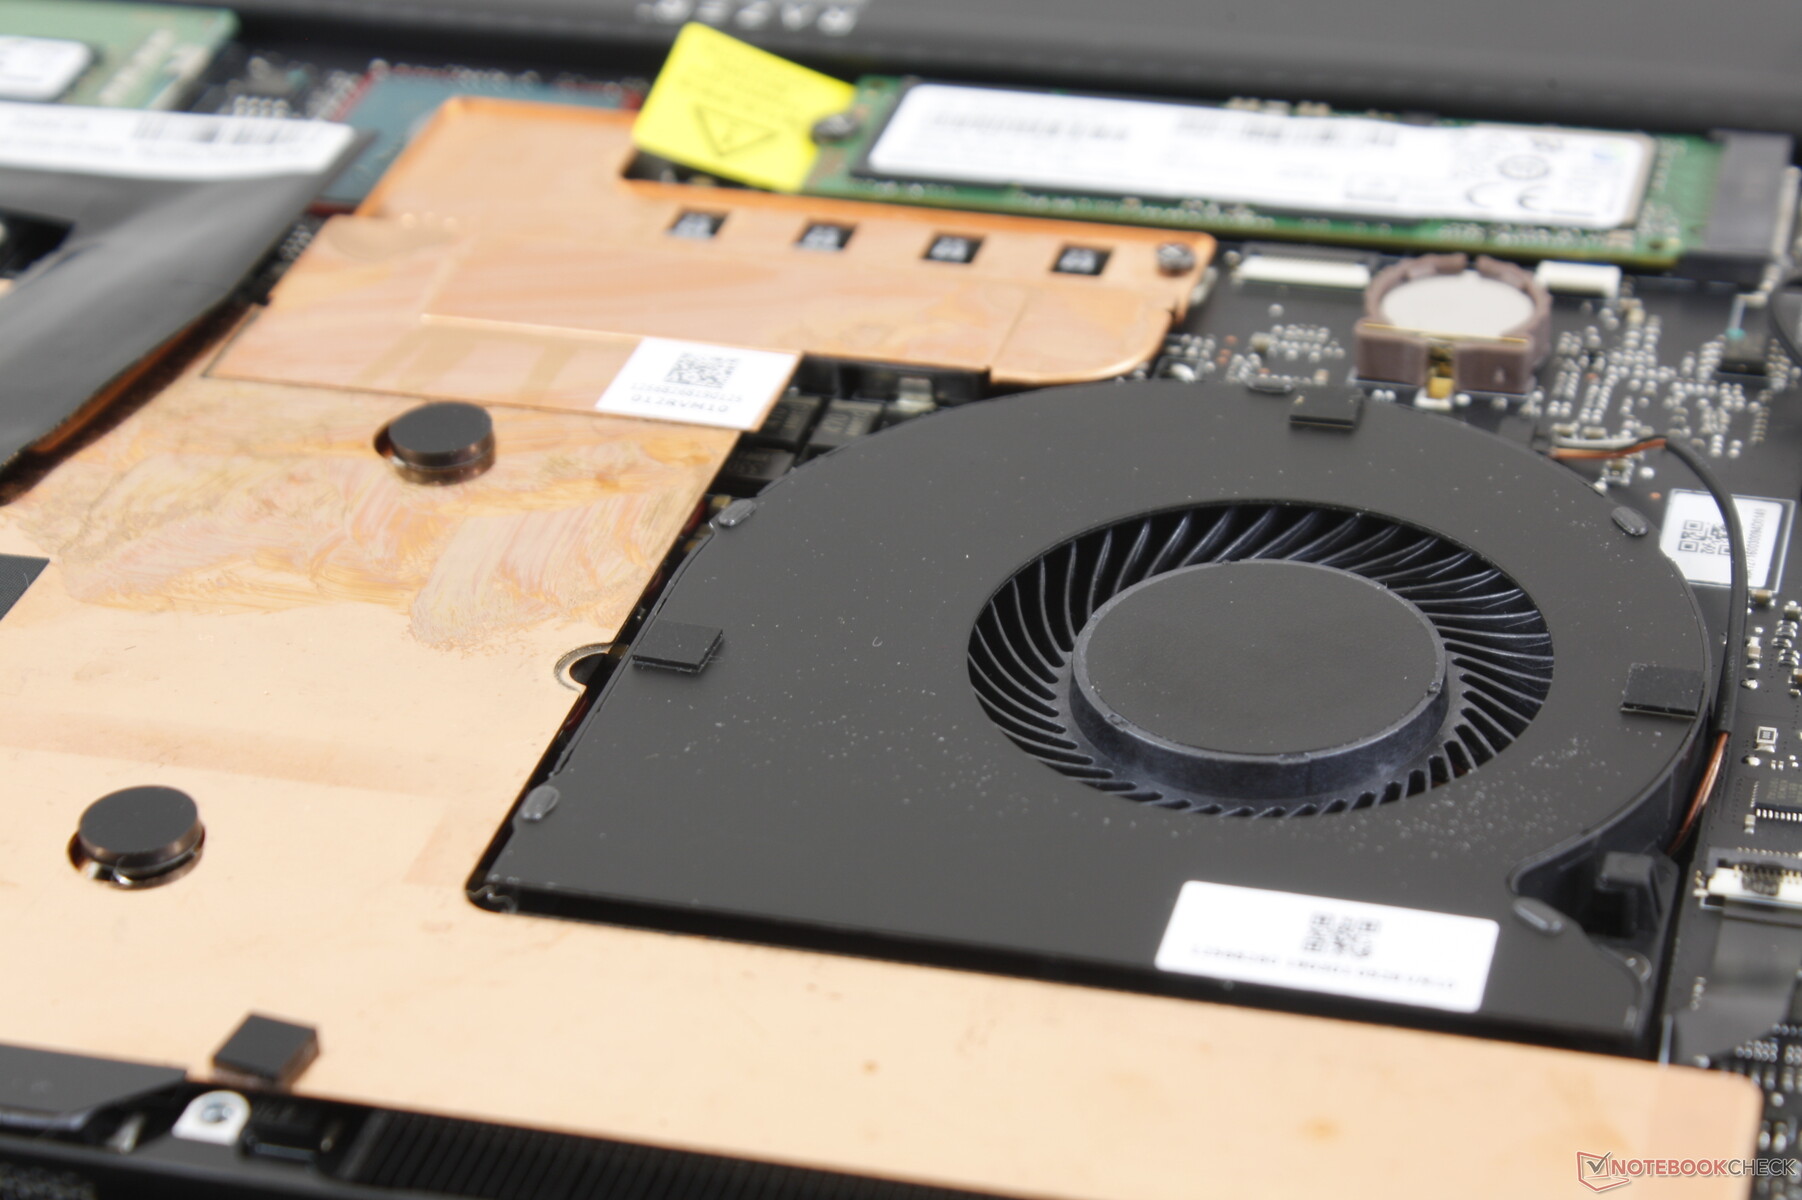
Maintenance
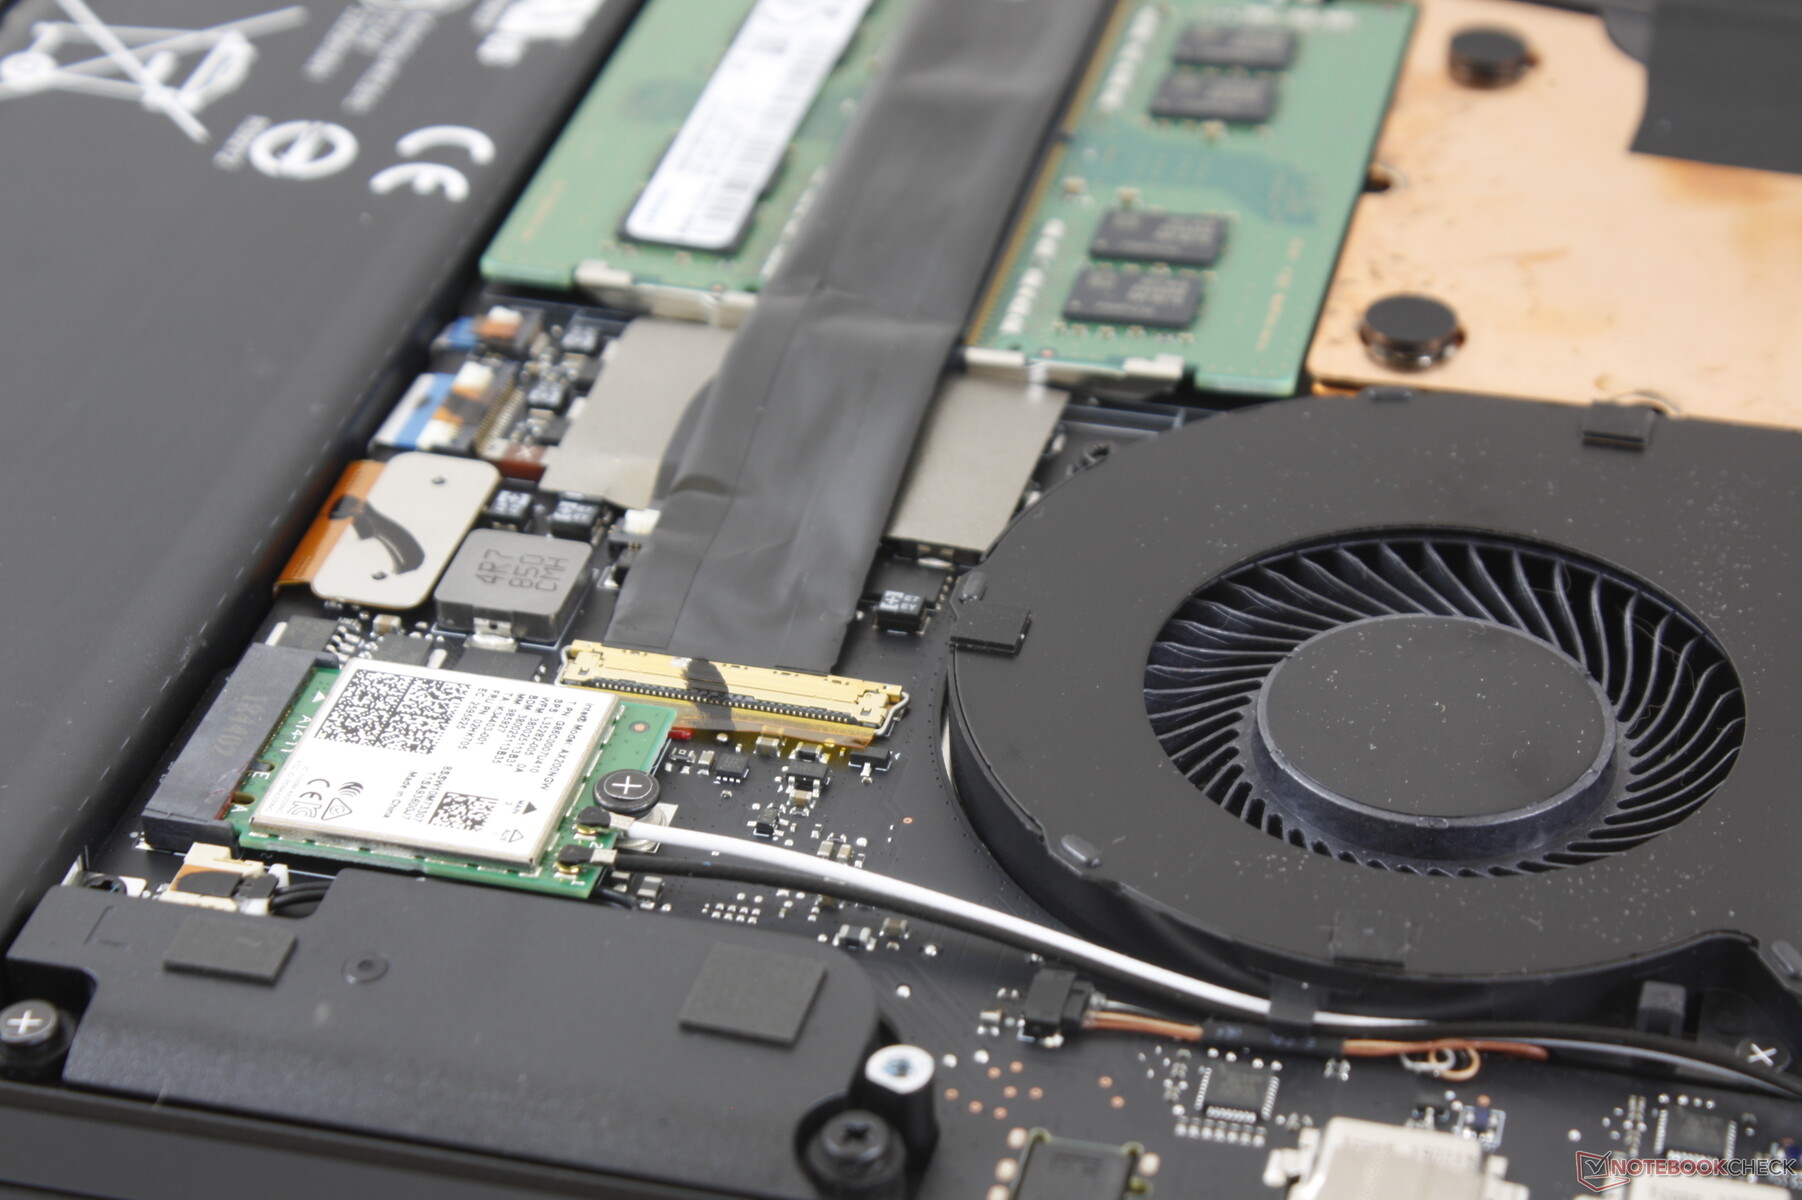
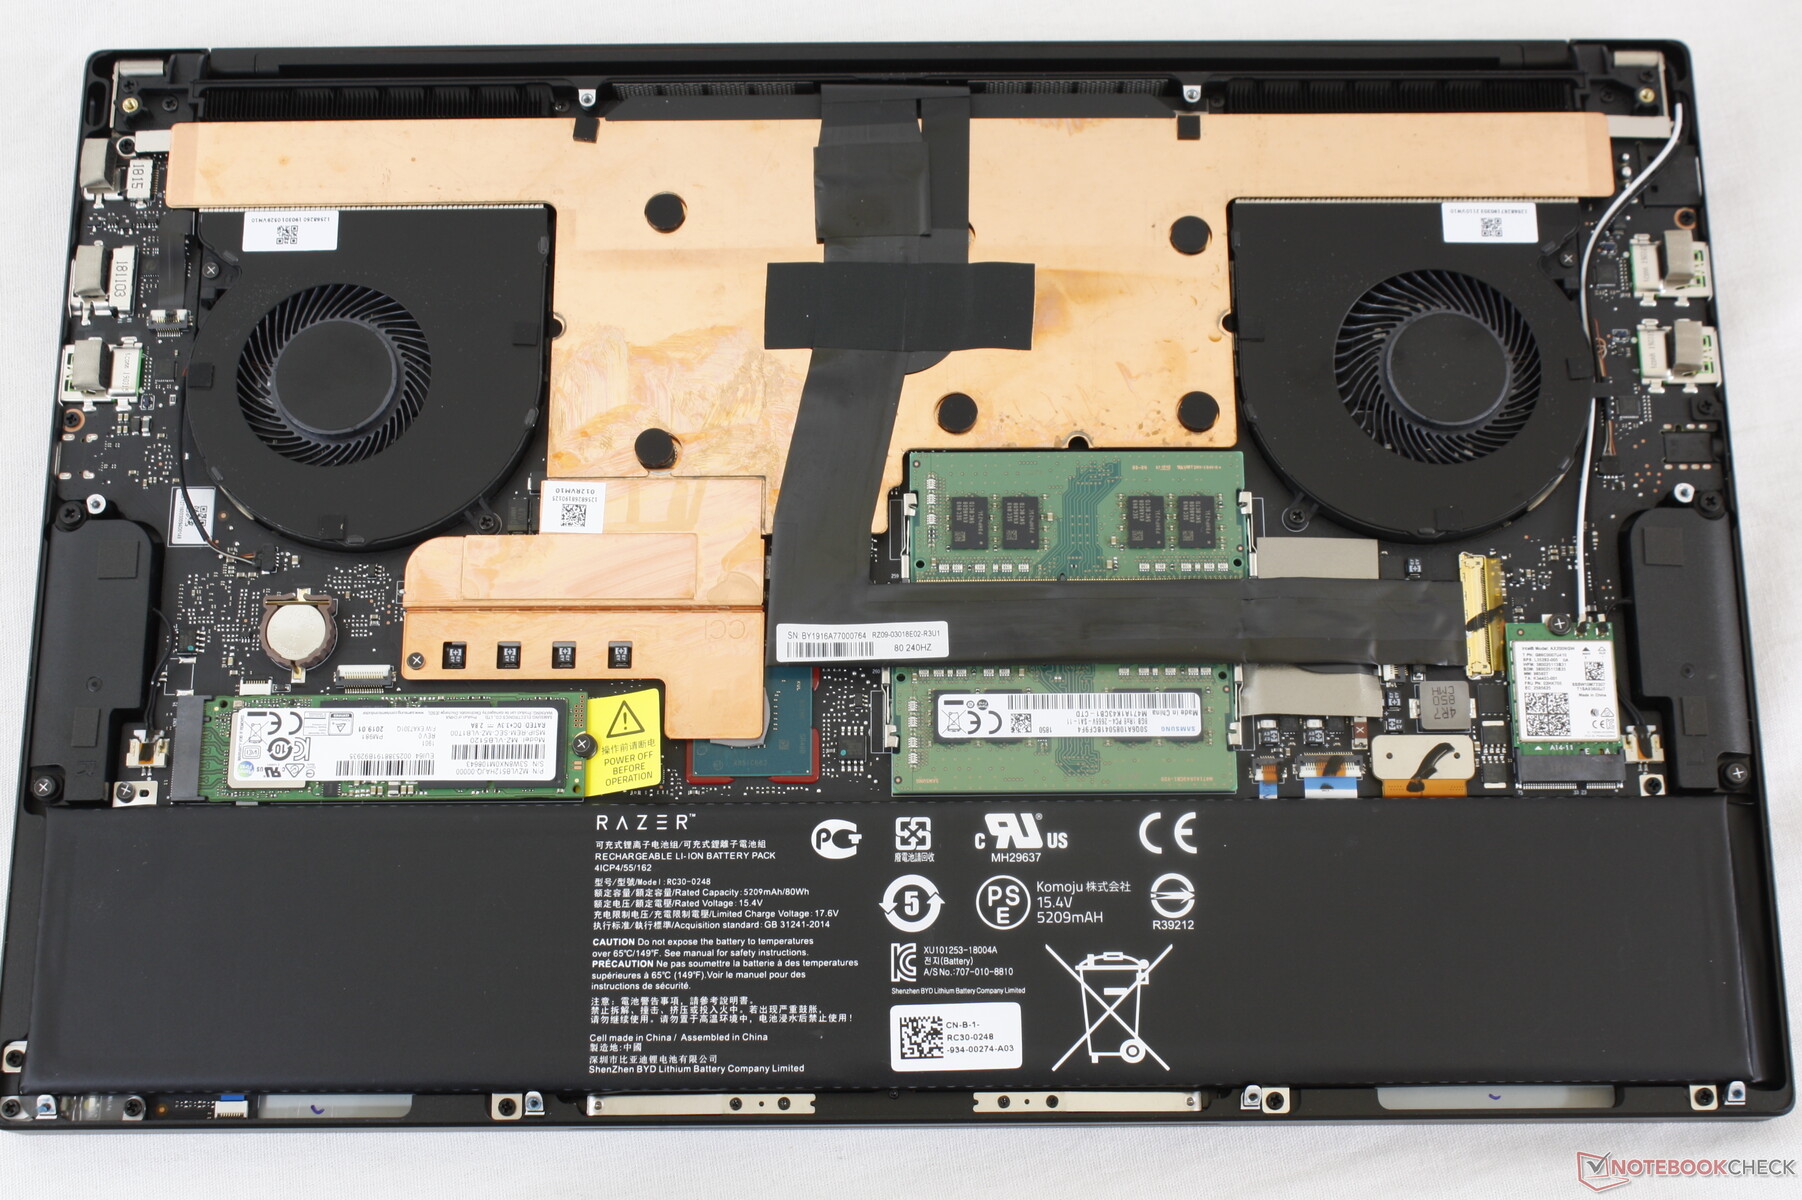
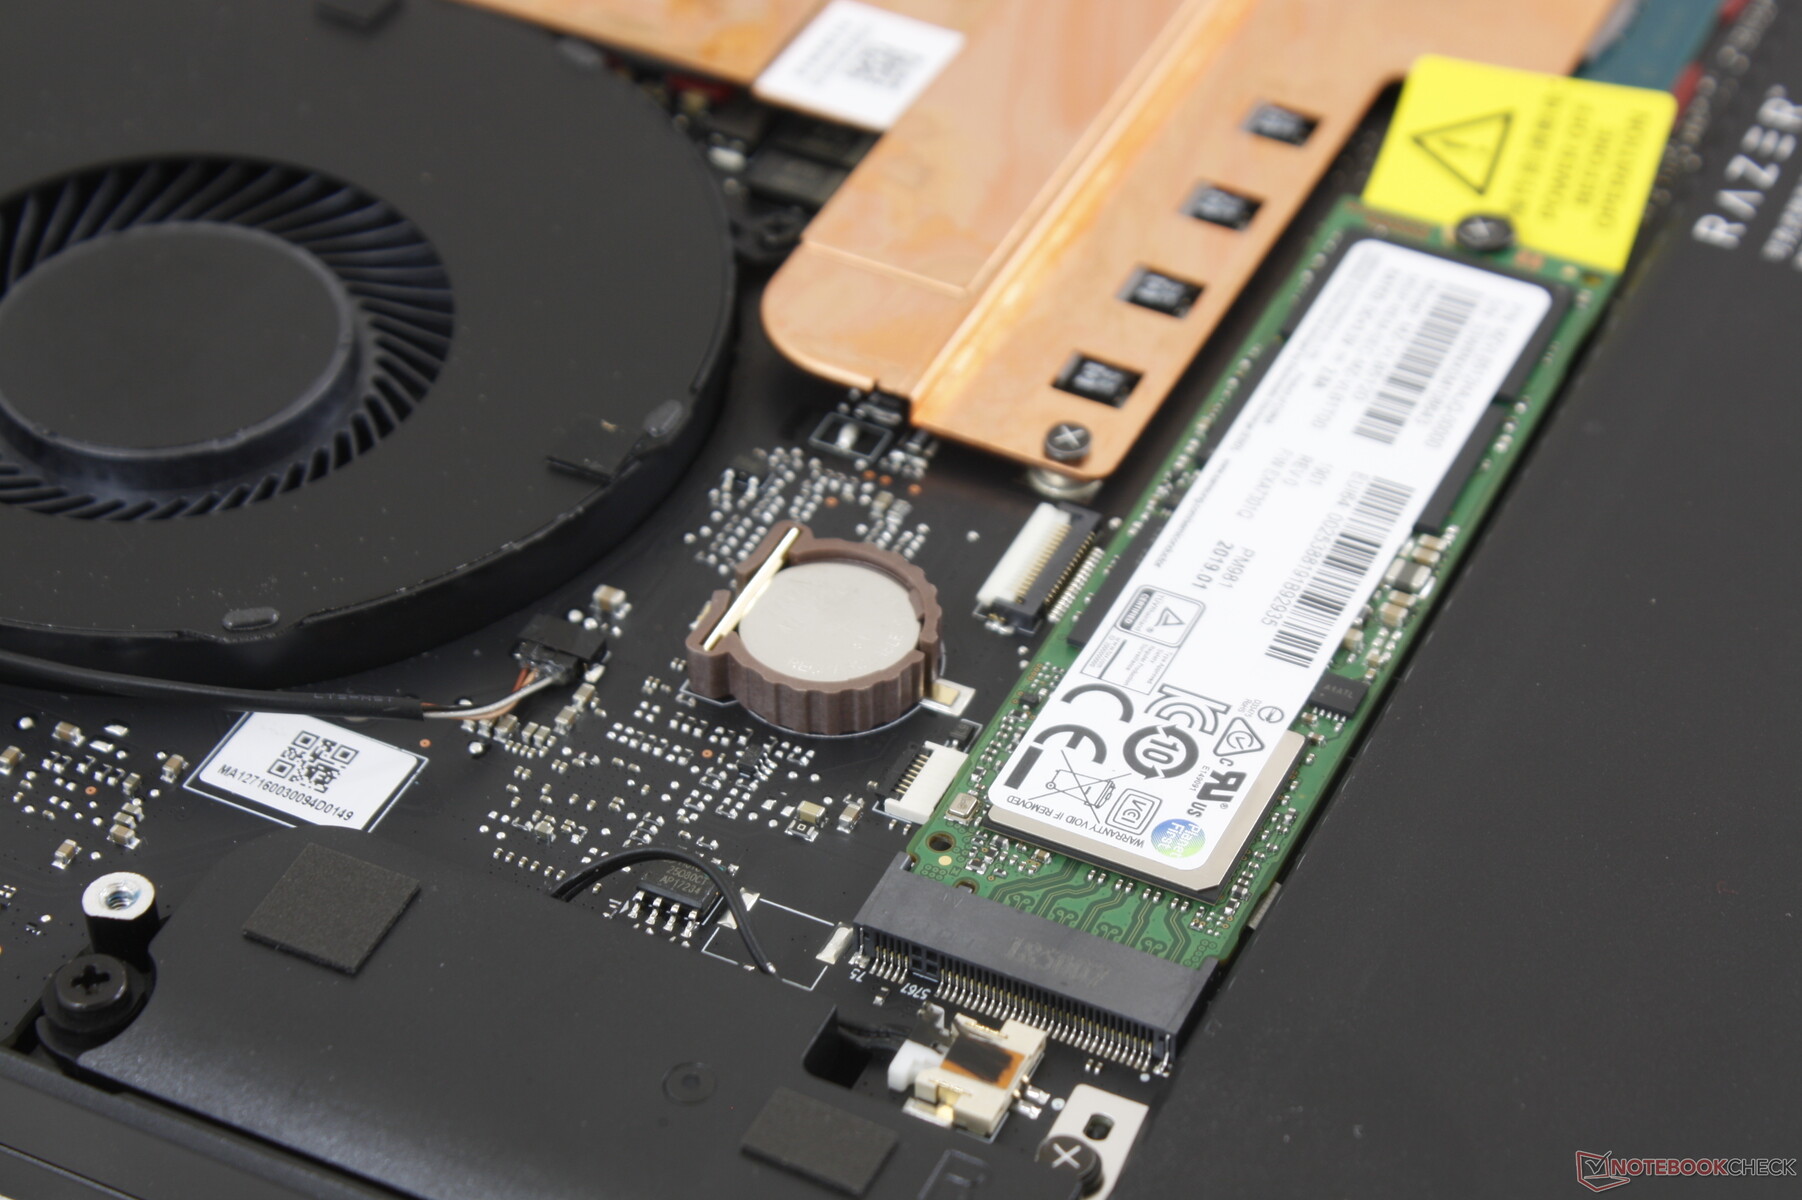
Internal layout has not changed from last year's Blade 15 except that the inconvenient ribbon covering one of the SODIMM slots has been moved for easier servicing. The bottom panel comes off easily after removing the 10 Torx screws.
Software
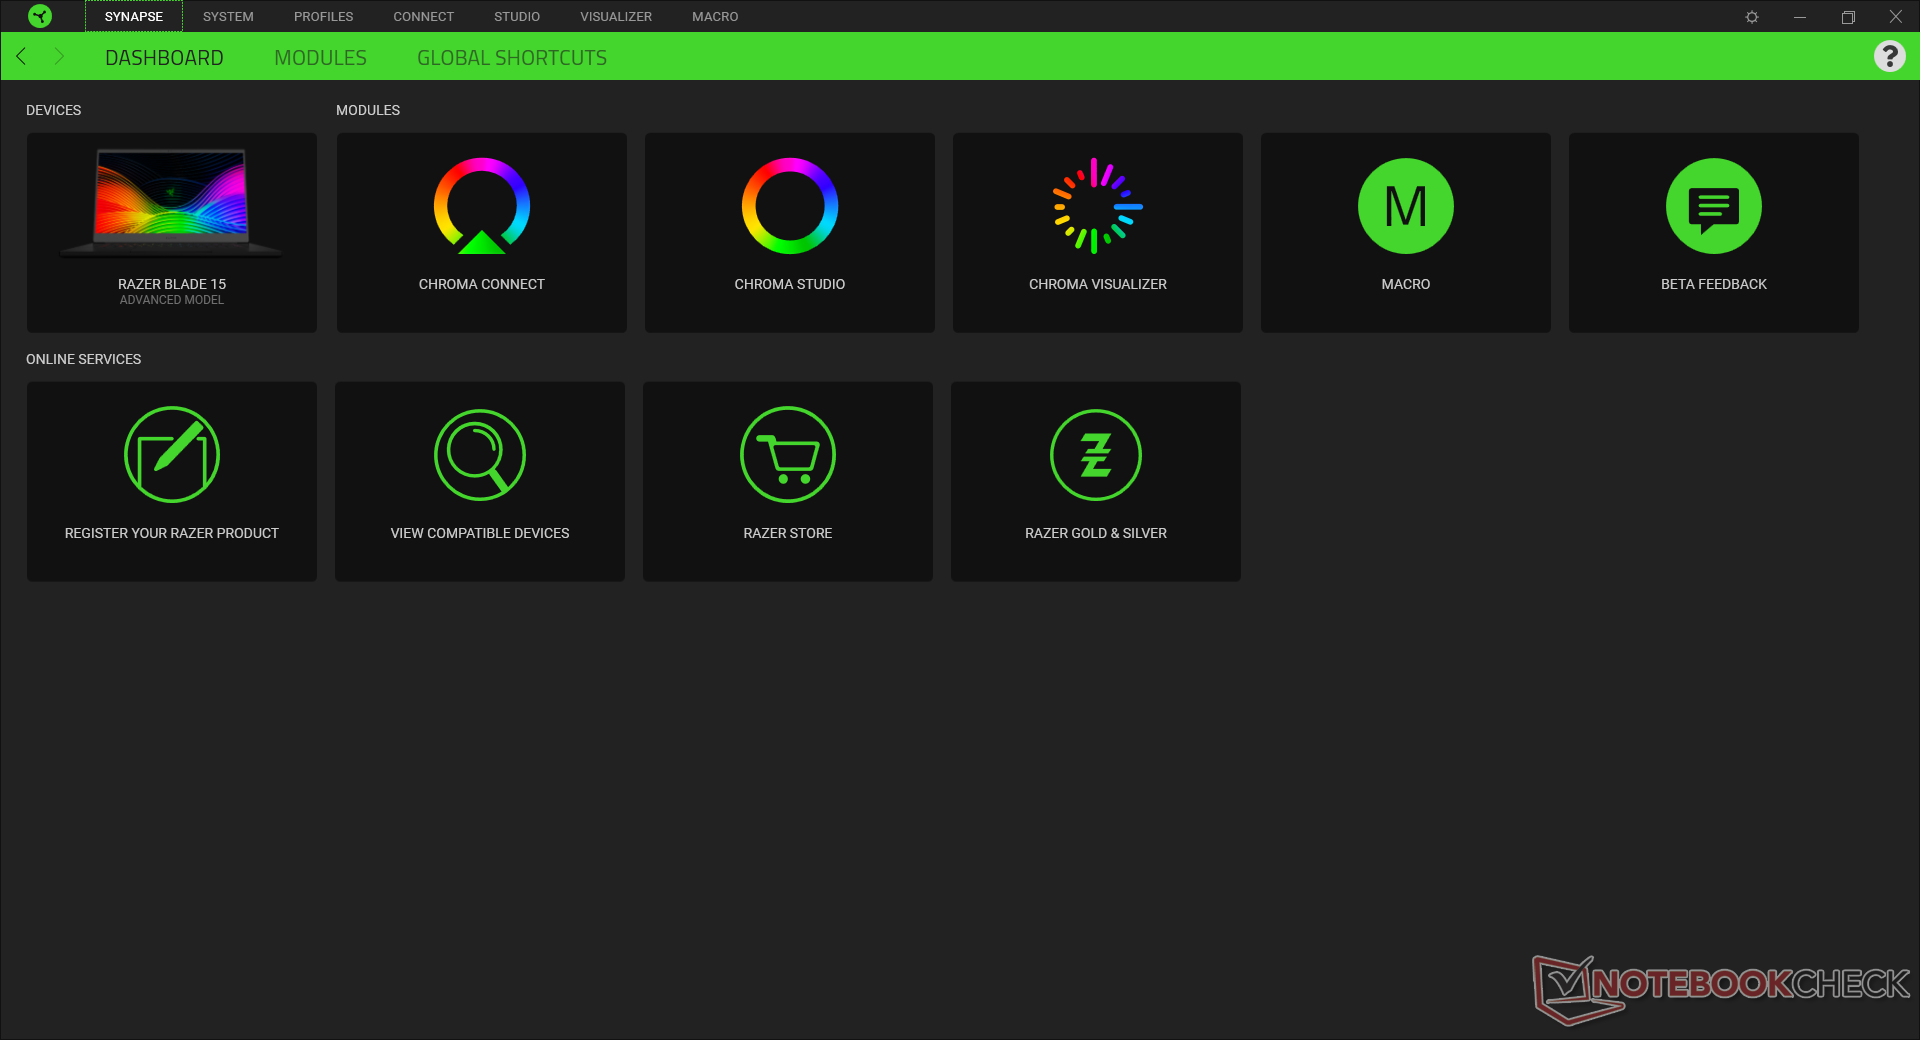
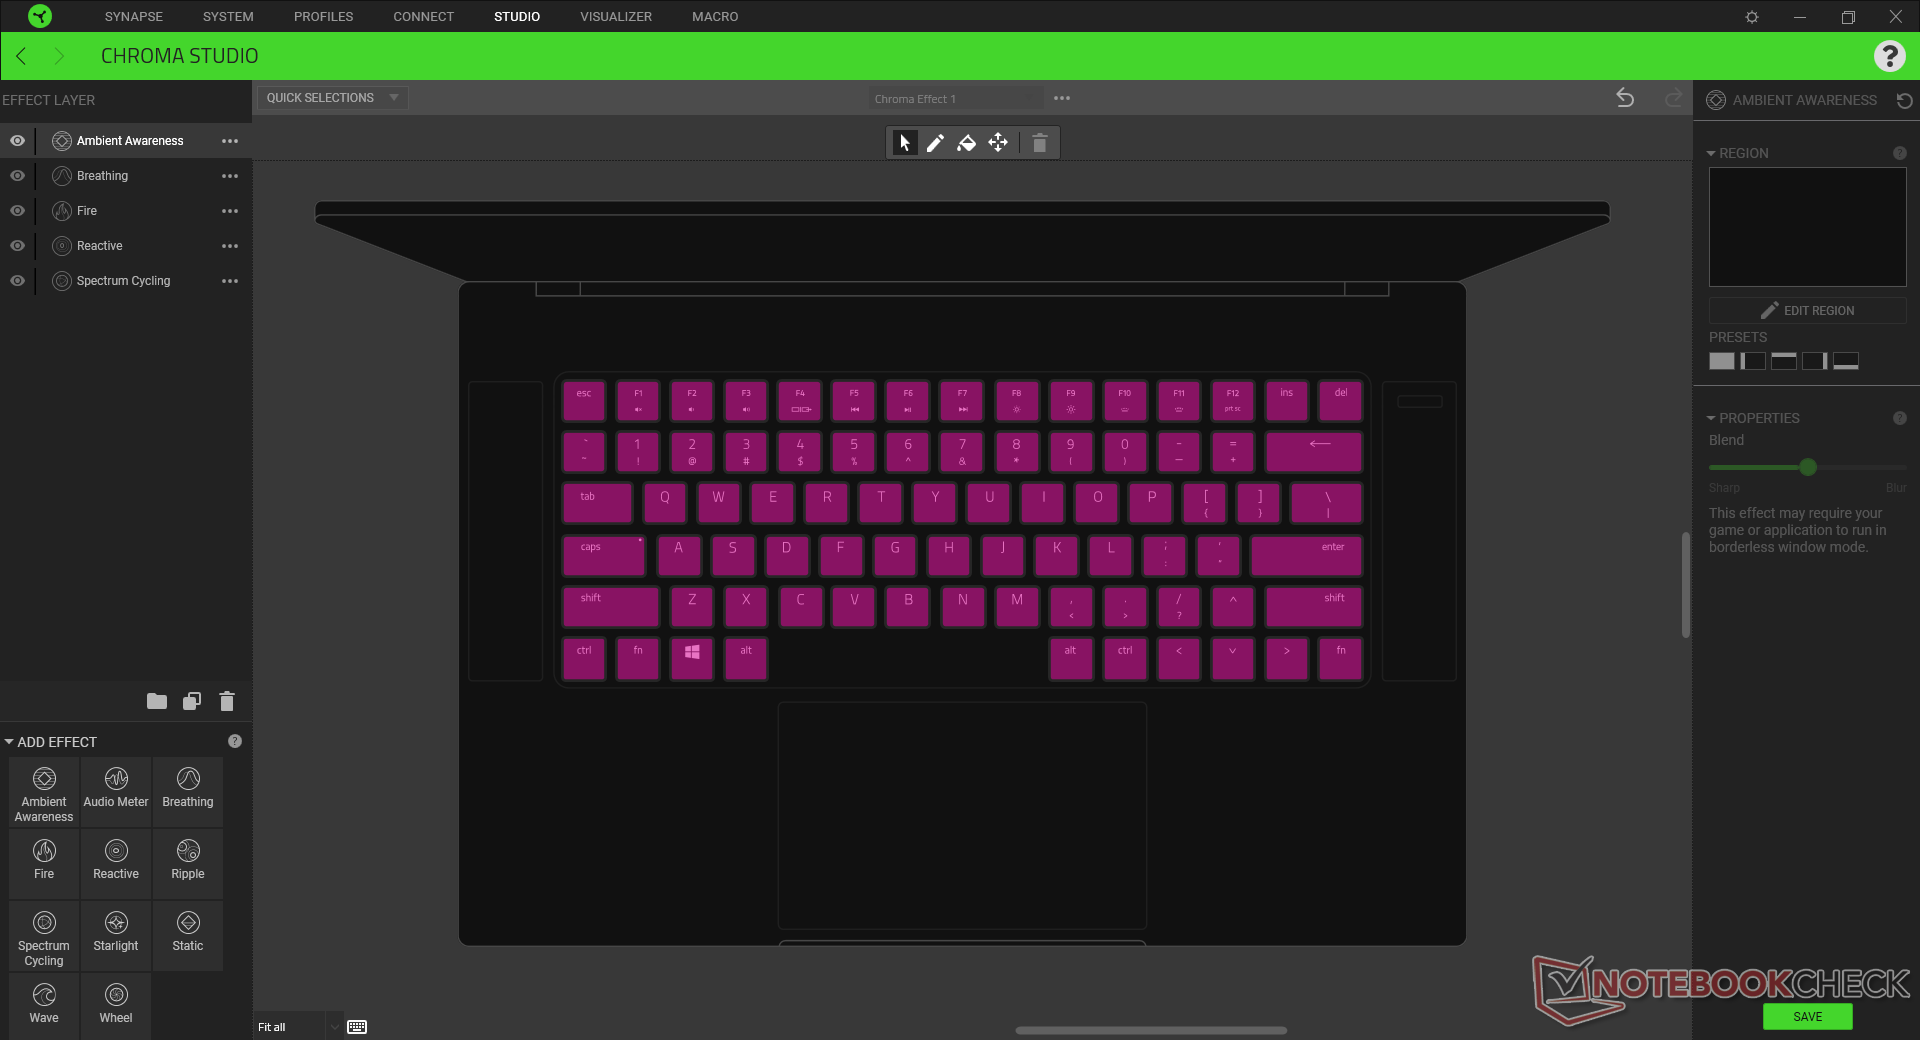
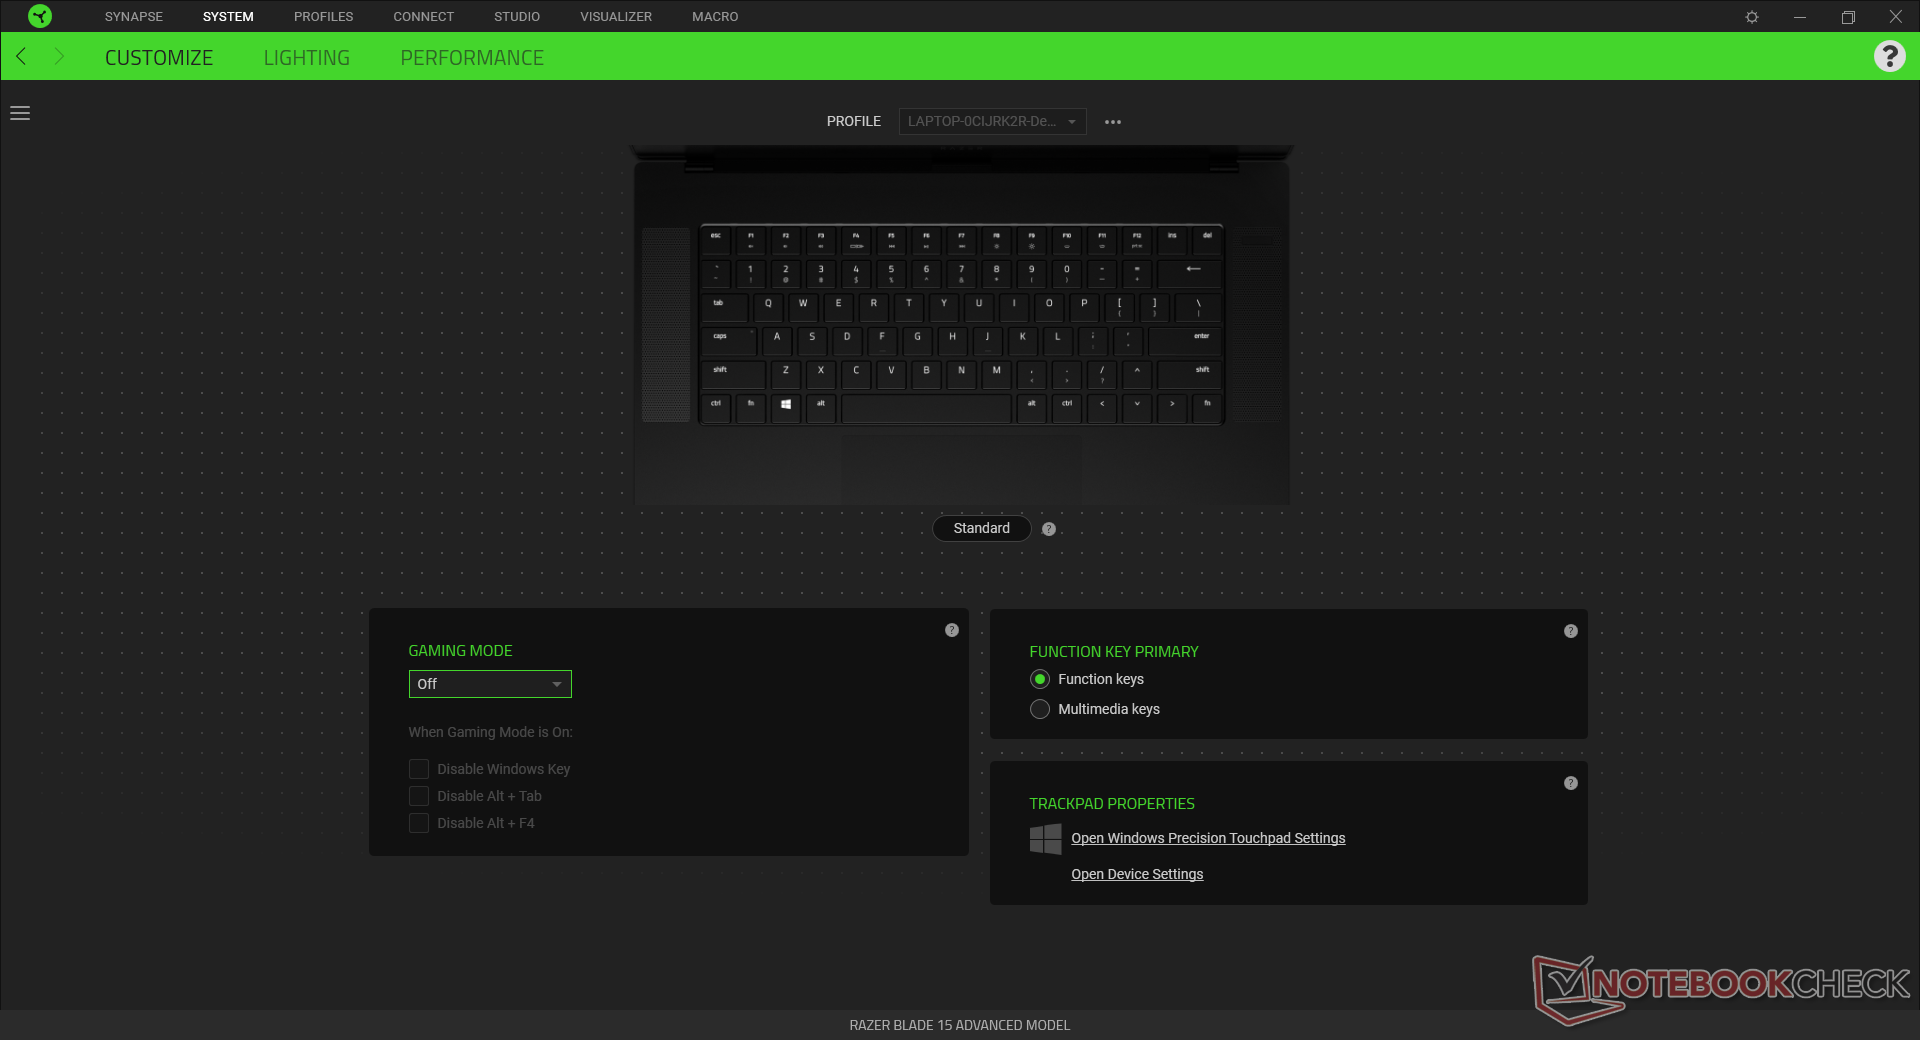
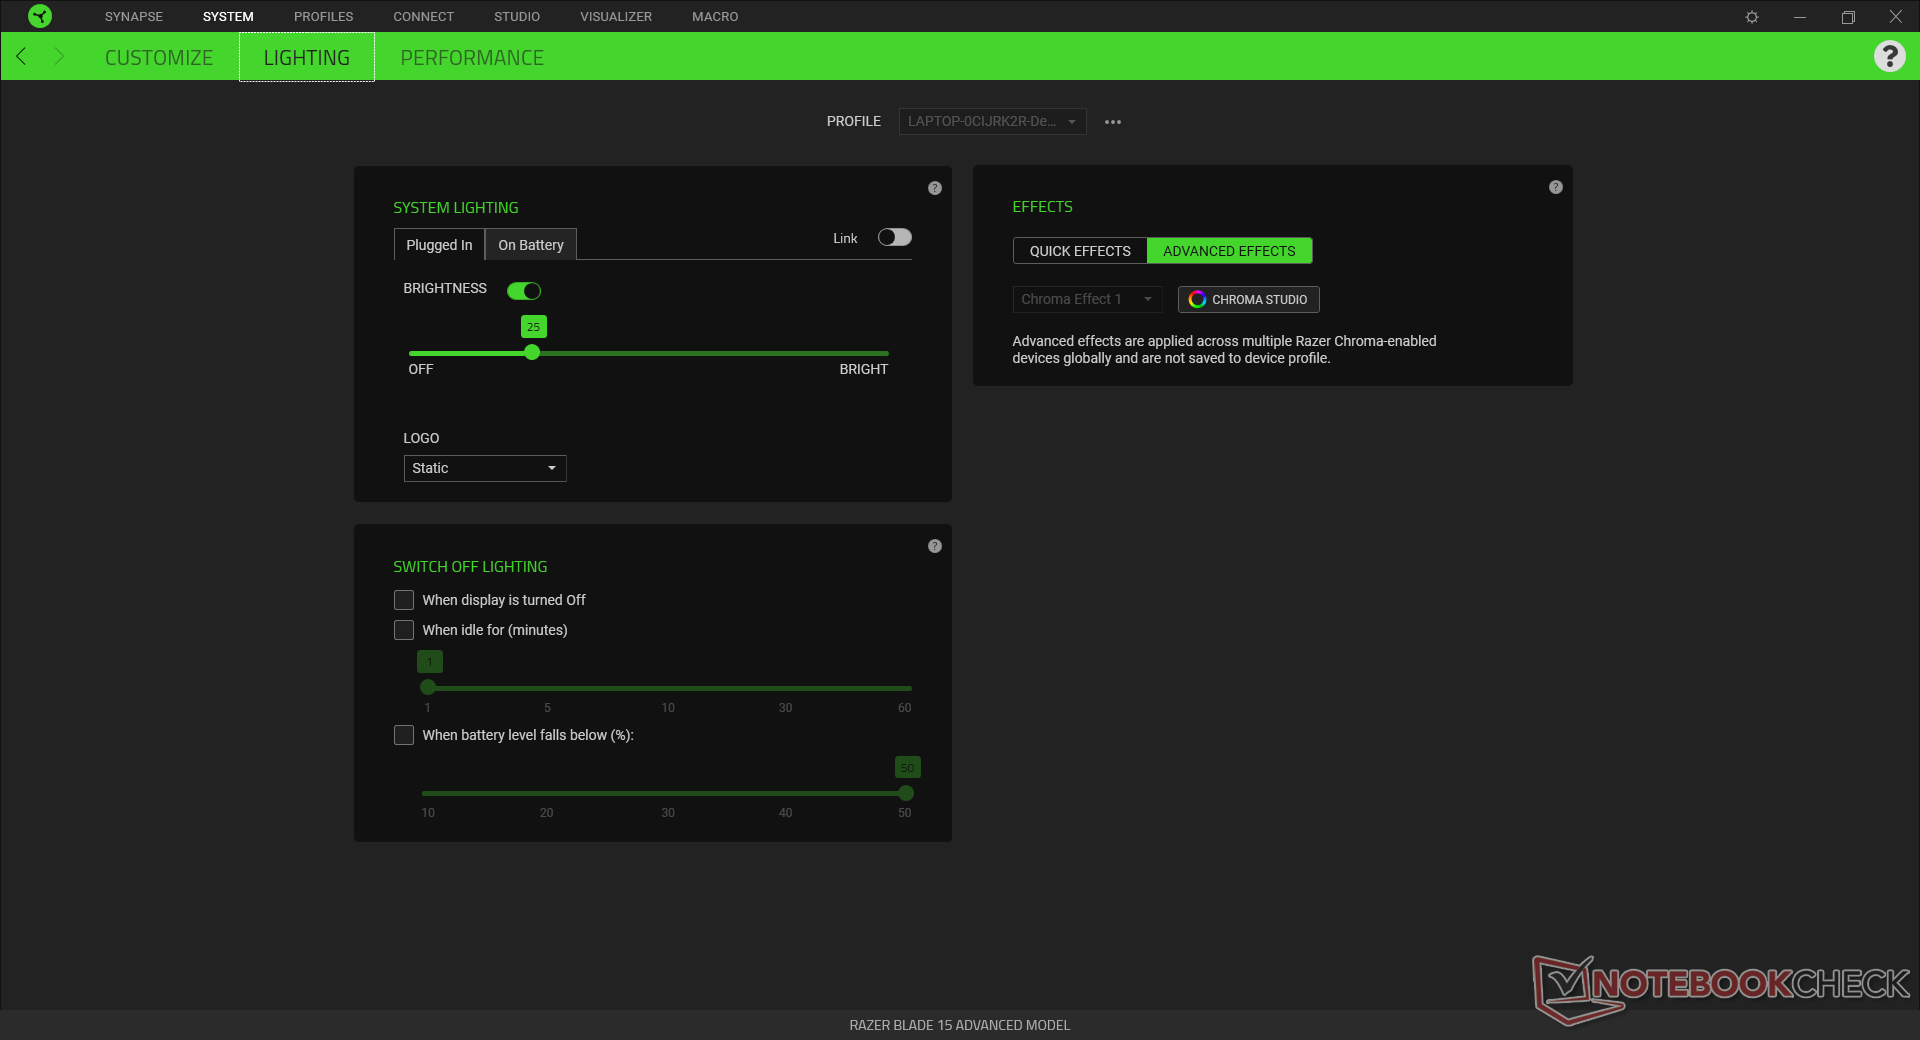
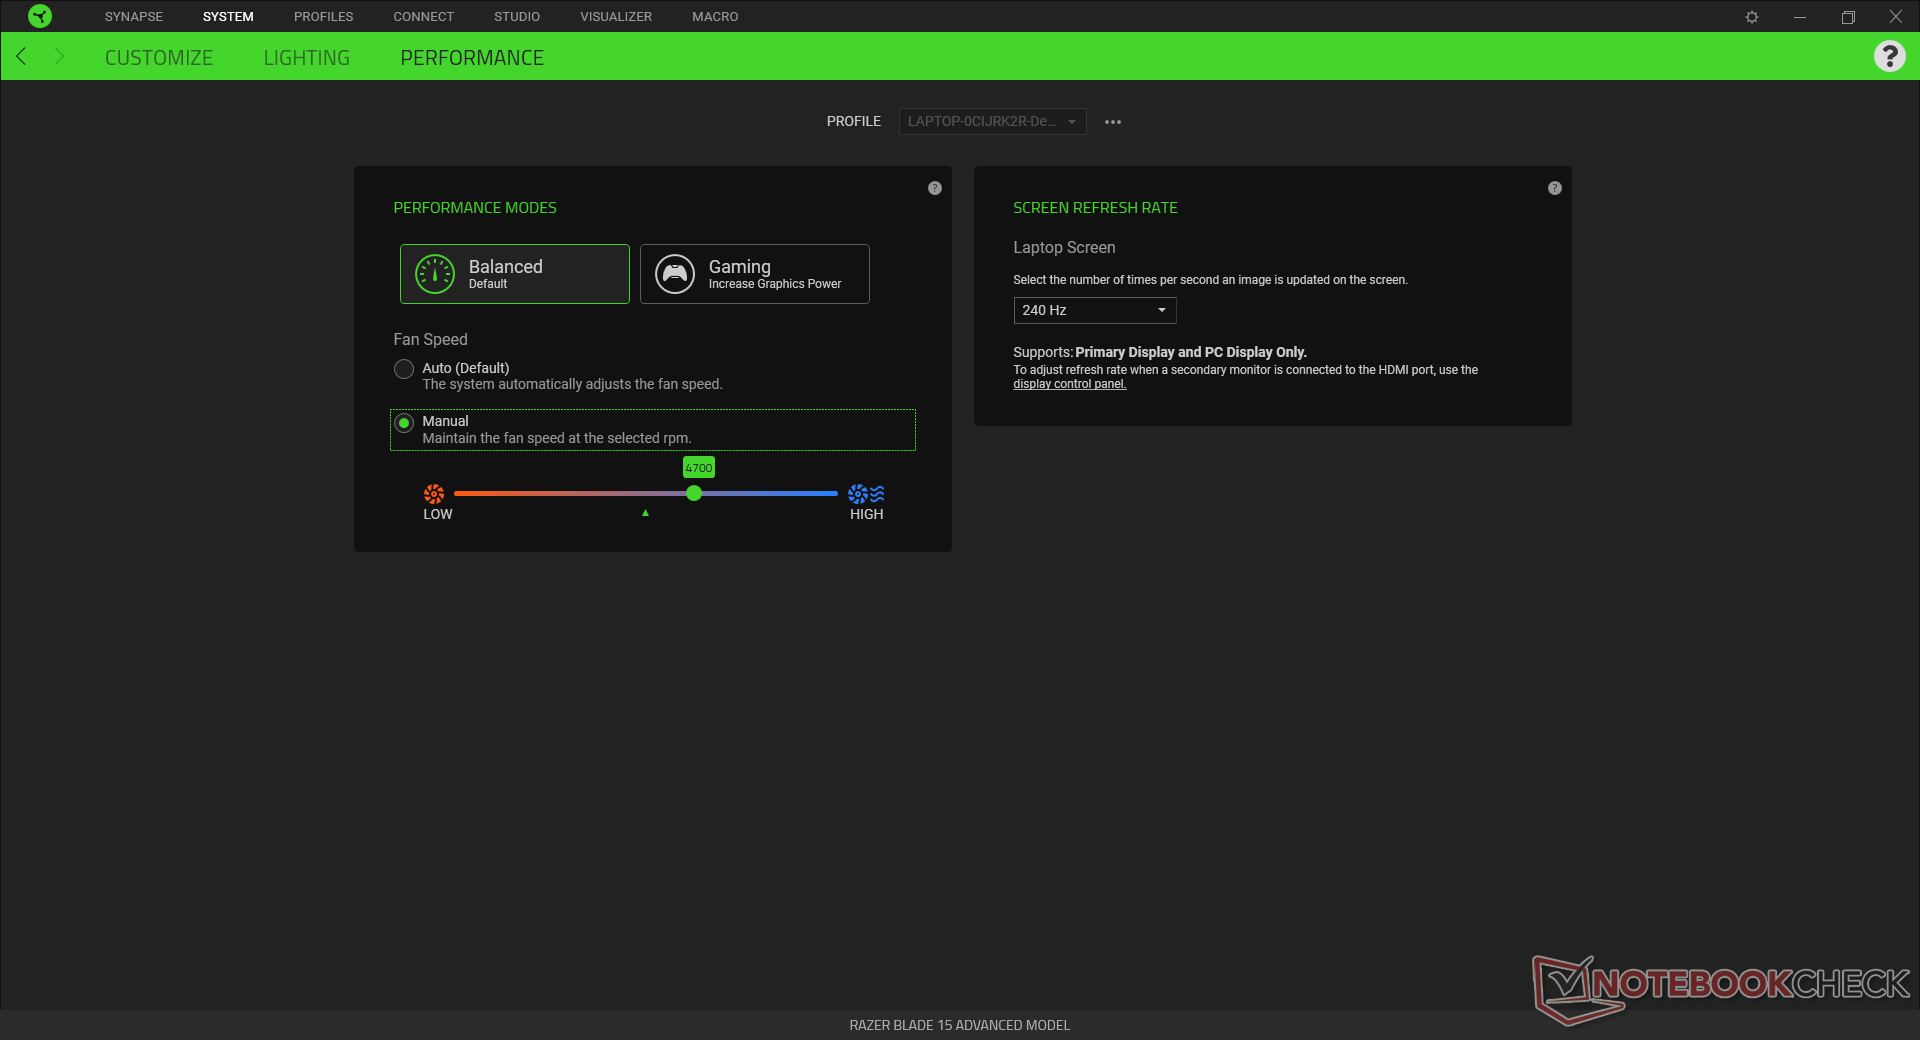
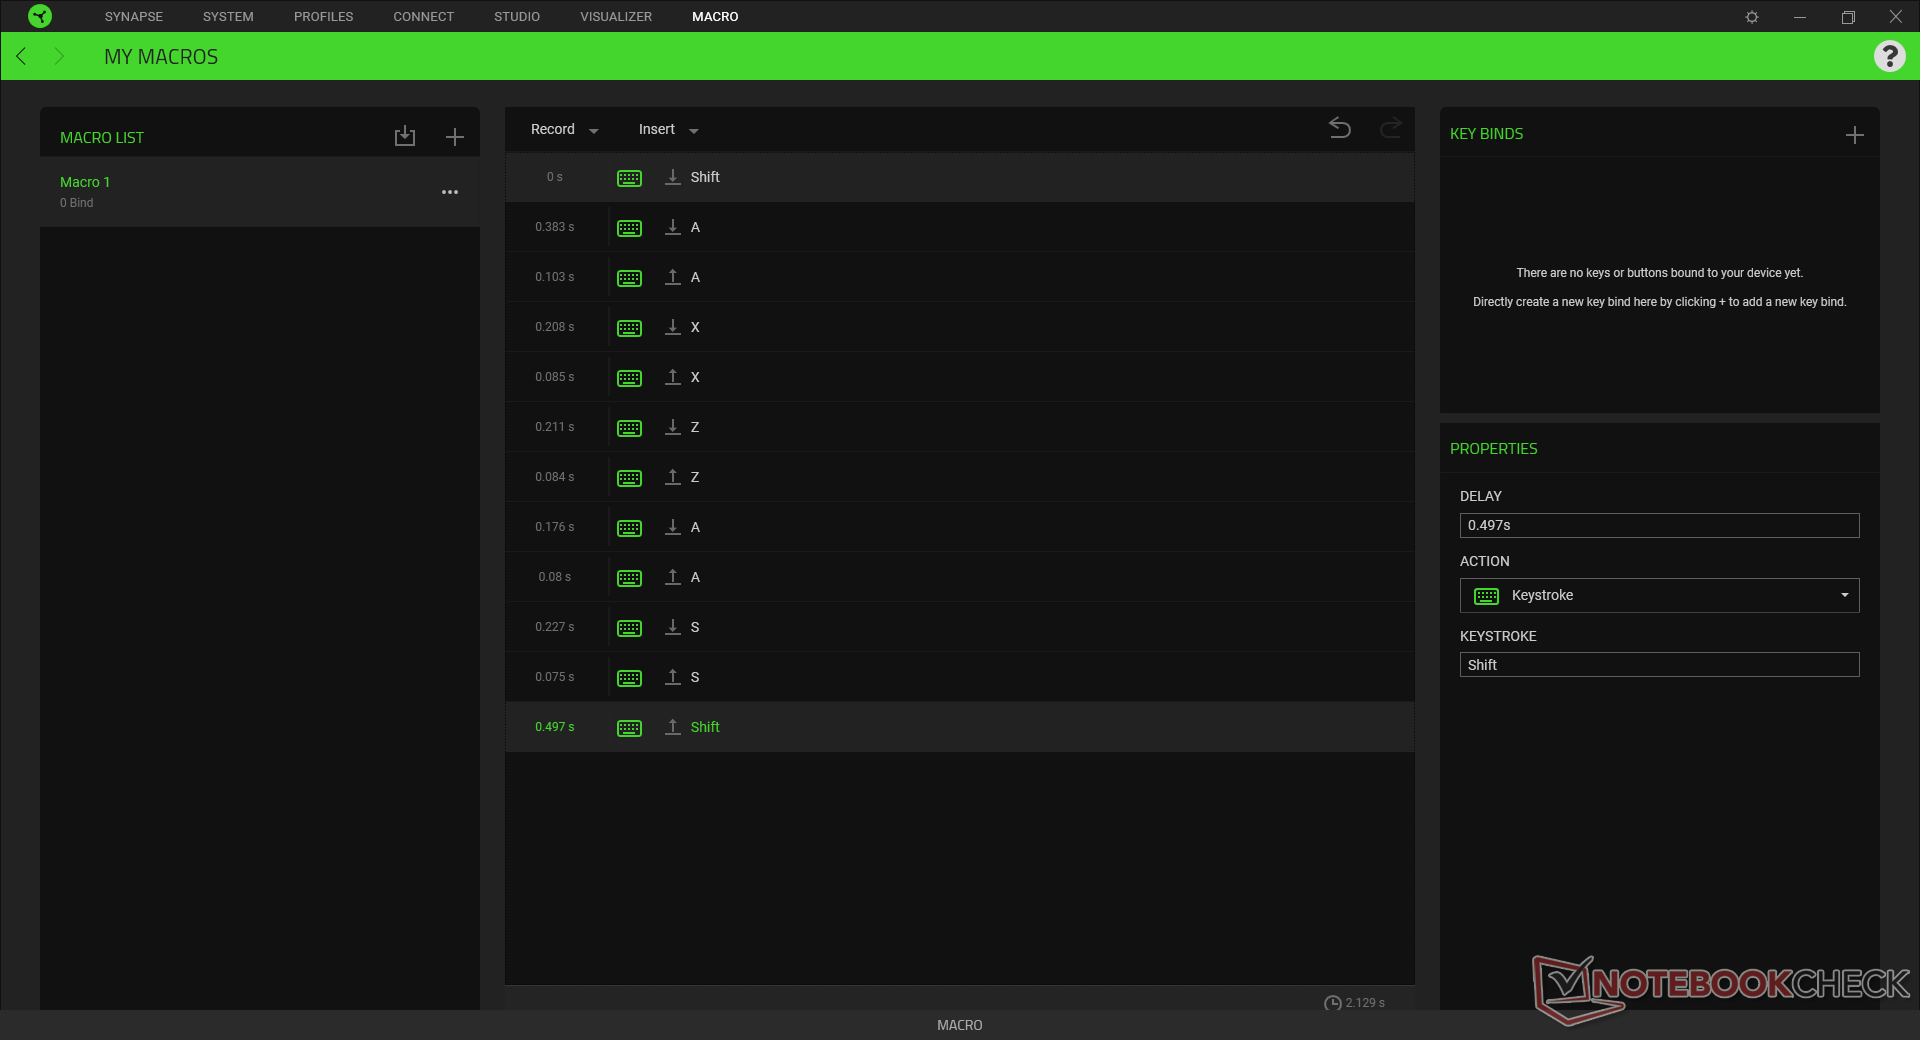
Razer has updated its Synapse software since the last time we checked out the Blade 15. The company has thankfully taken the complaints to heart as the software no longer requires a login to access common features like fan control, keyboard lighting, macros, and performance modes. The software is still missing sensor information like core temperatures, fan RPM, and real-time clock rate monitoring that competitors like MSI Dragon Center and Alienware Command Center have by default.
Accessories and Warranty
Extras in the box include a small set of Razer and Chroma stickers. Perhaps a USB-to-RJ45 adapter would have been a useful freebie to the target gaming audience.
The standard one-year limited warranty applies with options to extend up to three years for an additional $250.
Input Devices
Keyboard and Touchpad
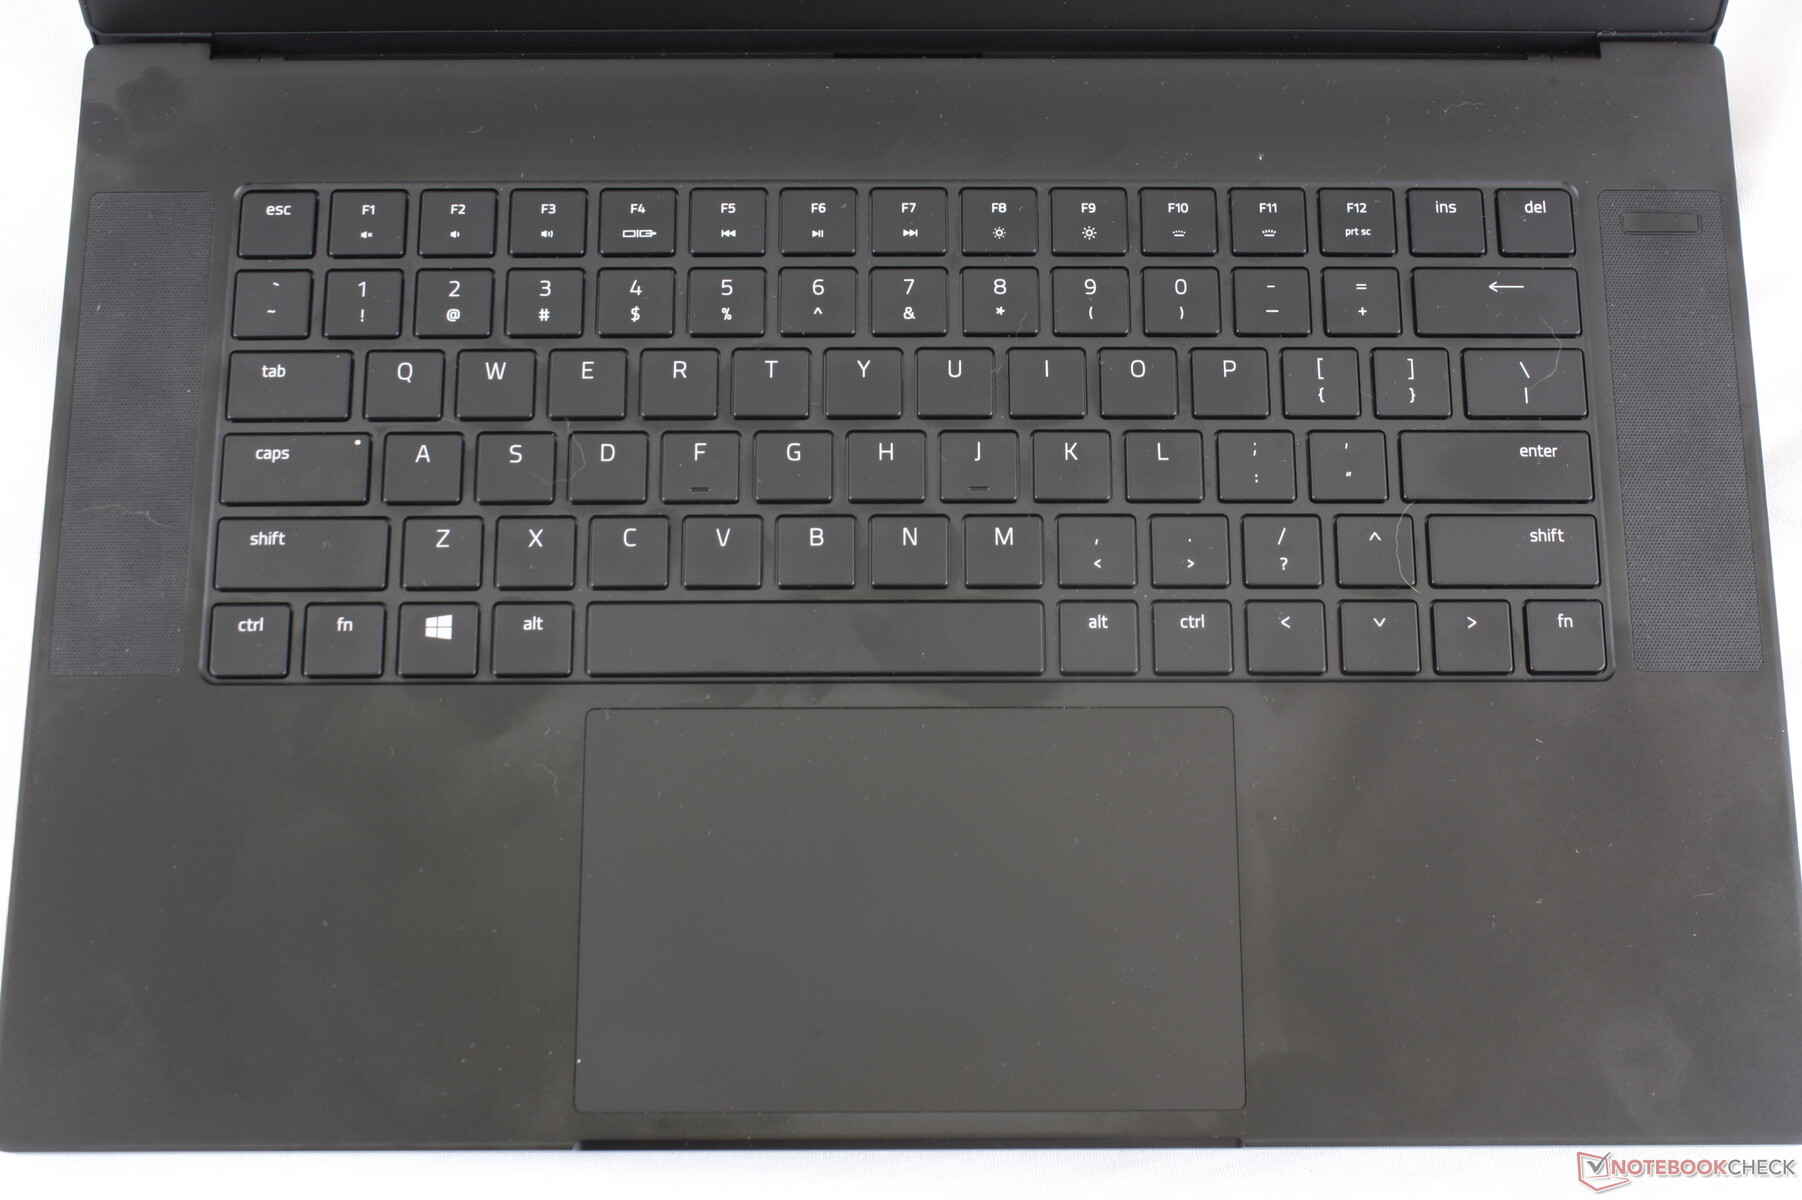
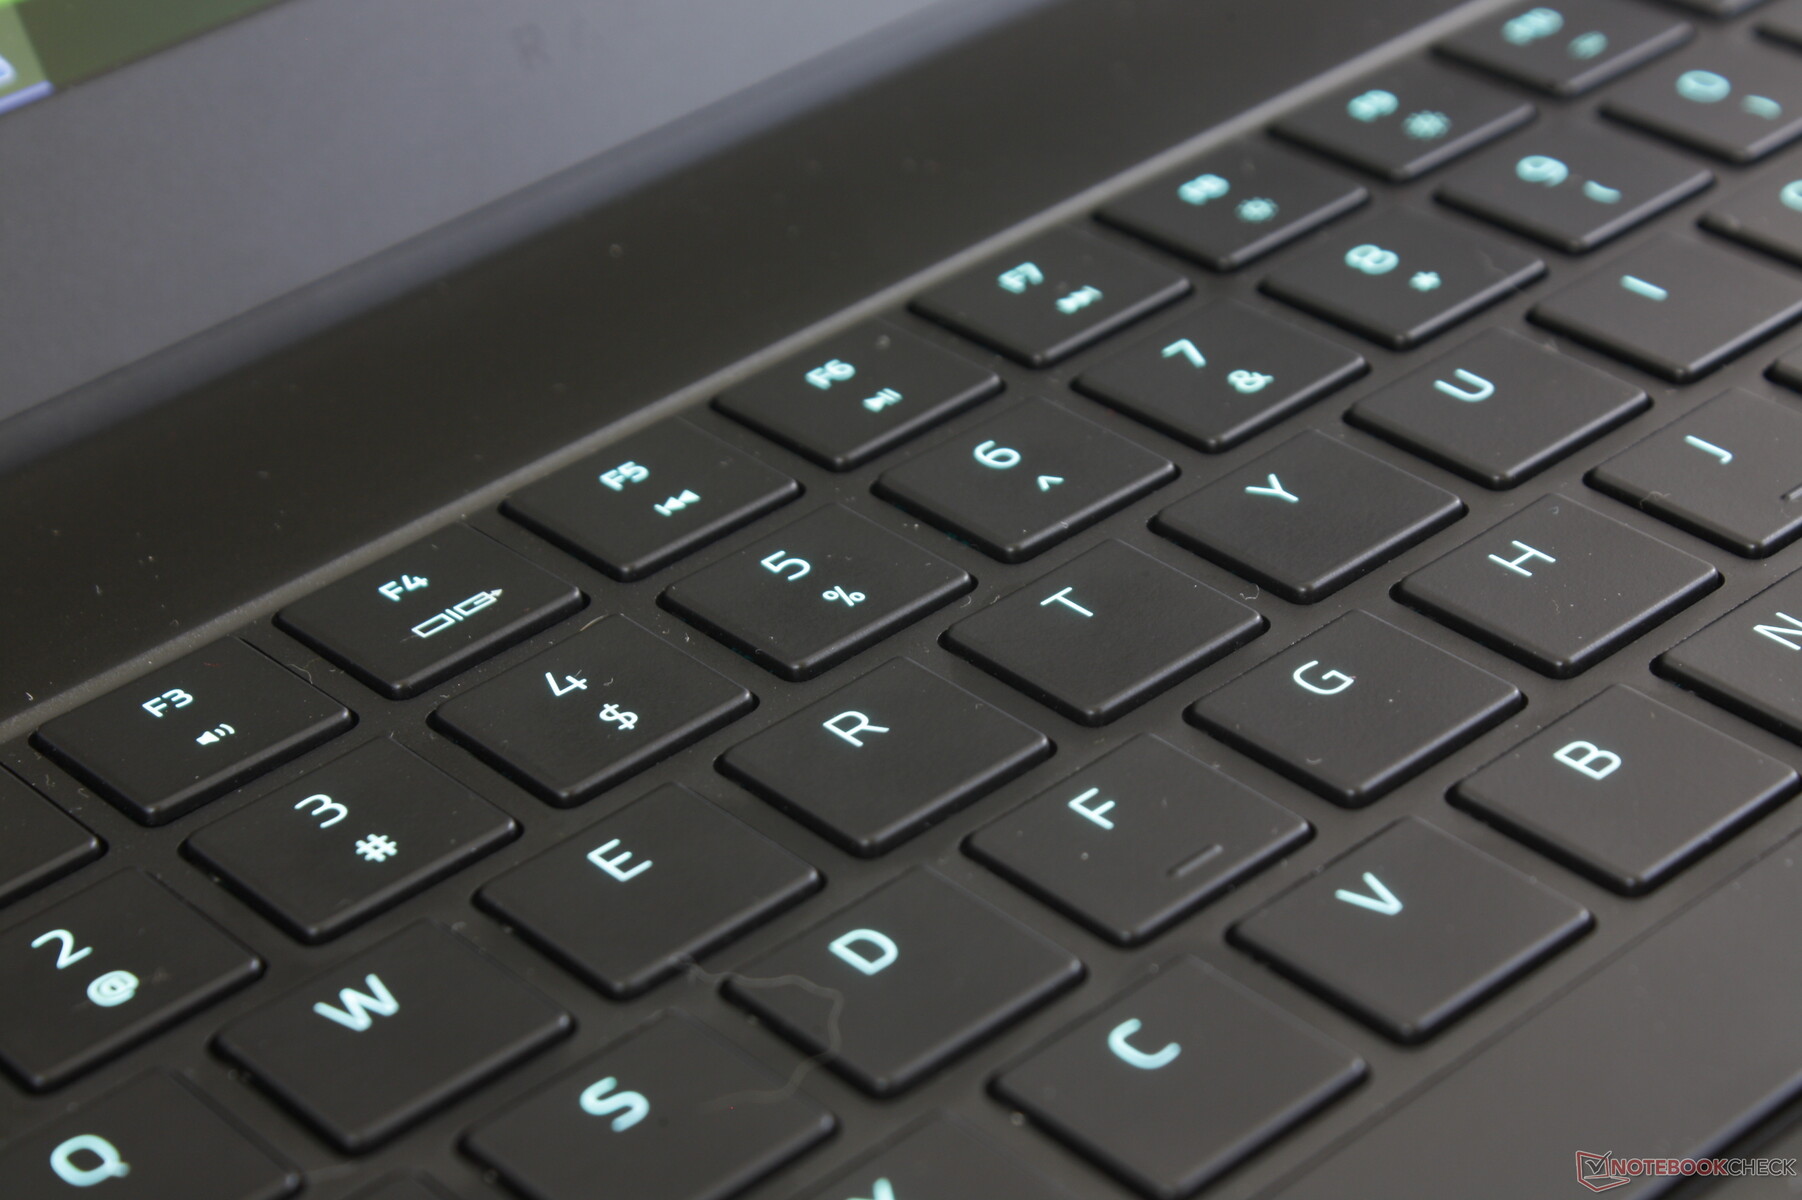
Our existing comments on the keyboard and trackpad apply here. While we still think travel and feedback are too shallow and soft for a gaming laptop, we've spoken to users who are apathetic toward the keyboard or find it just fine for gaming. It's definitely worth checking out a model in person just to get a feel of the keys. Since all Blade 15 and newer Blade Stealth SKUs share the same keyboard with similar chassis designs, you can get a firm grasp of the entire Blade series from a single configuration.
The large clickpad (13 x 8.0 cm) is larger than the ones on the XPS 15 (10.5 x 8.5 cm) and MSI GS65 (10.5 x 7.0 cm). Cursor control is very smooth with no jumping and almost no sticking even if moving at slow speeds. The very high display refresh rate adds to the responsiveness of the trackpad. Unfortunately, the integrated mouse keys are still spongy and in need of an upgrade. It's both easier and more reliable to simply double tap the trackpad surface rather than to depress it to input a mouse click.
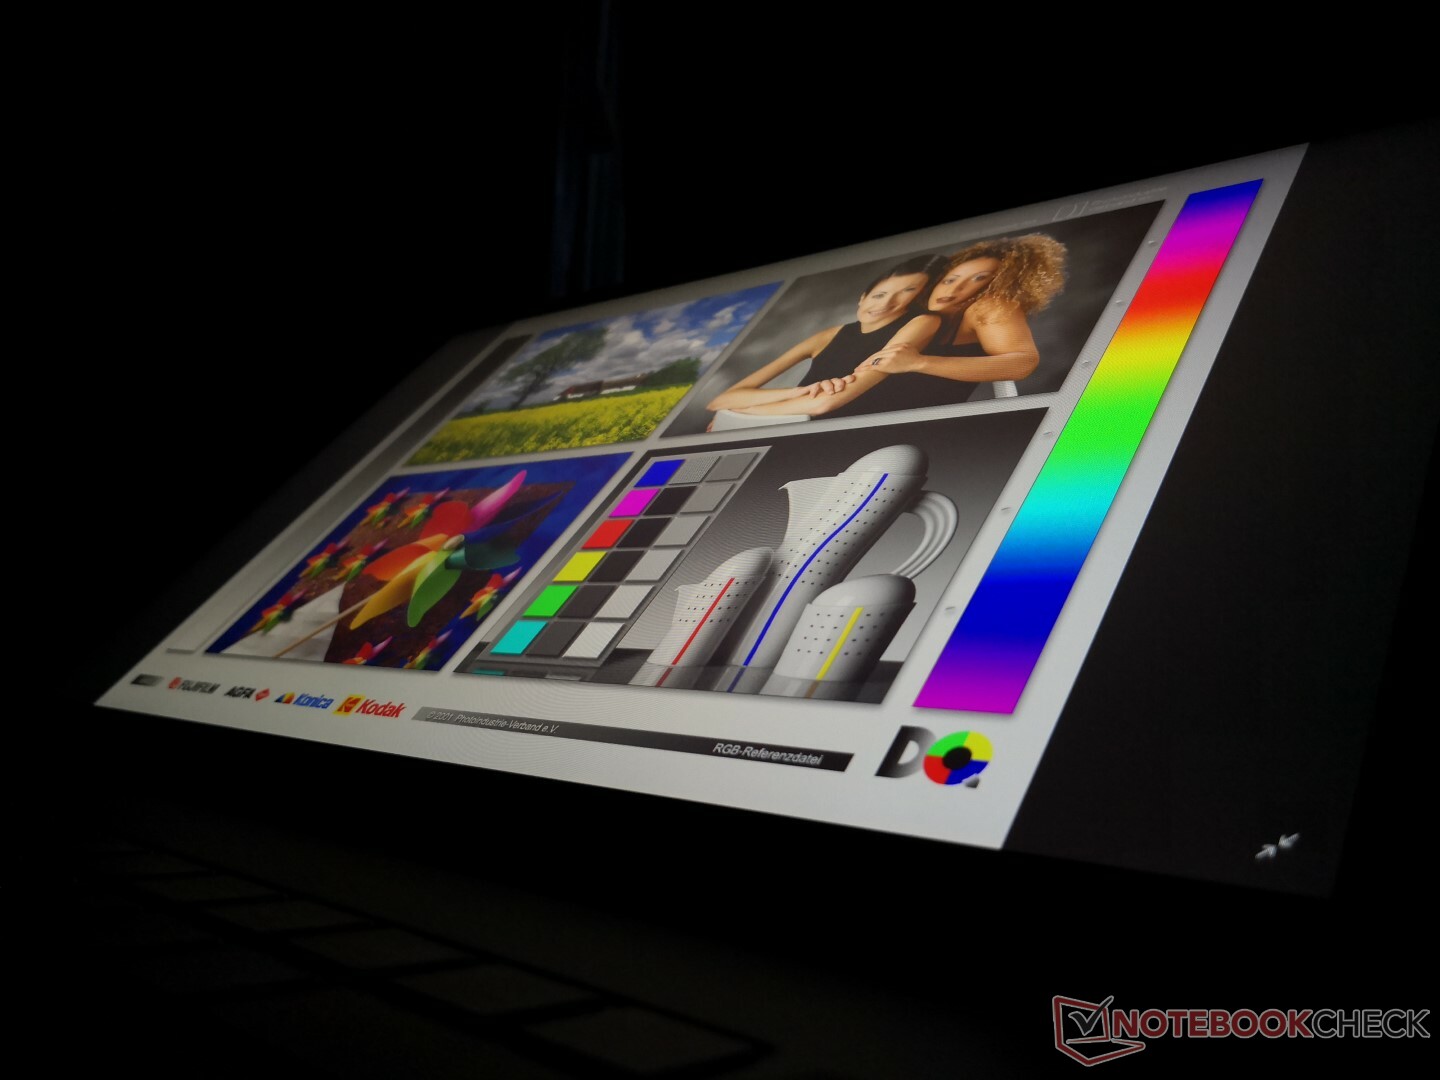
Display
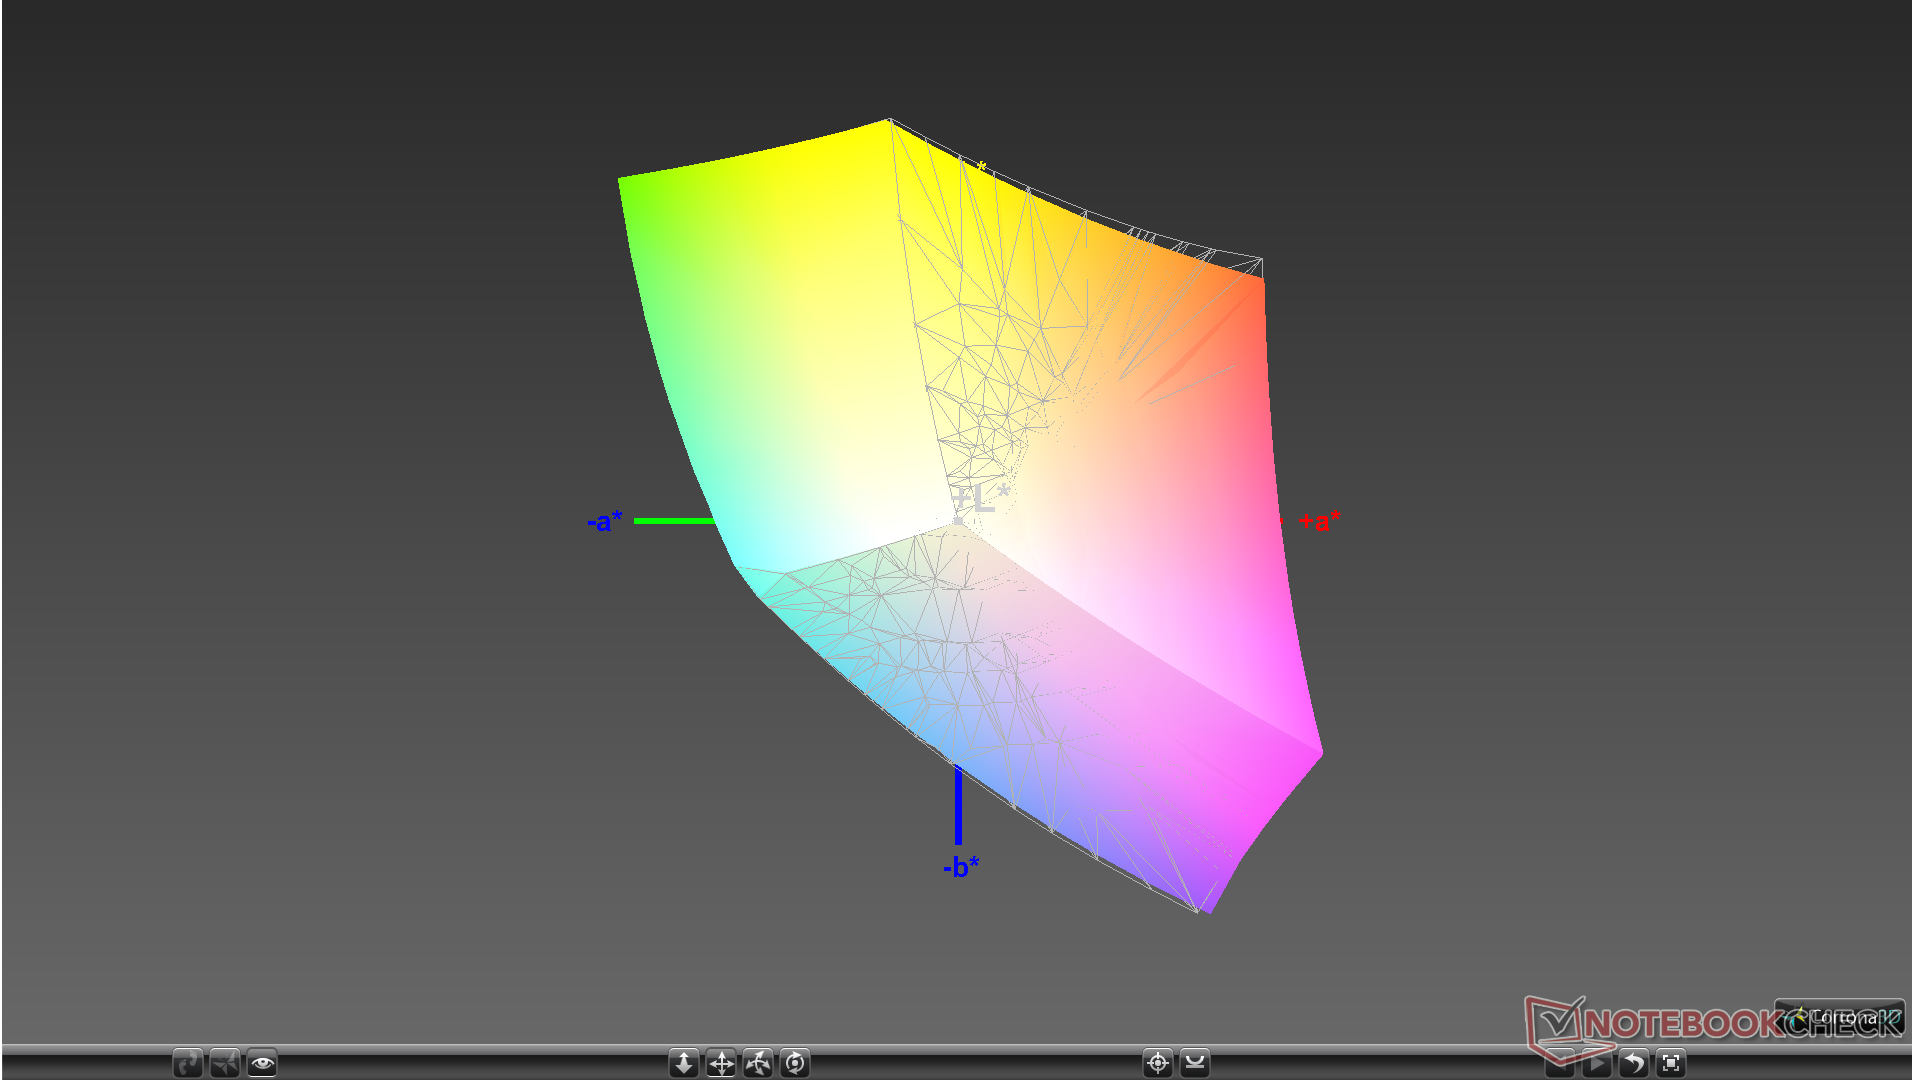
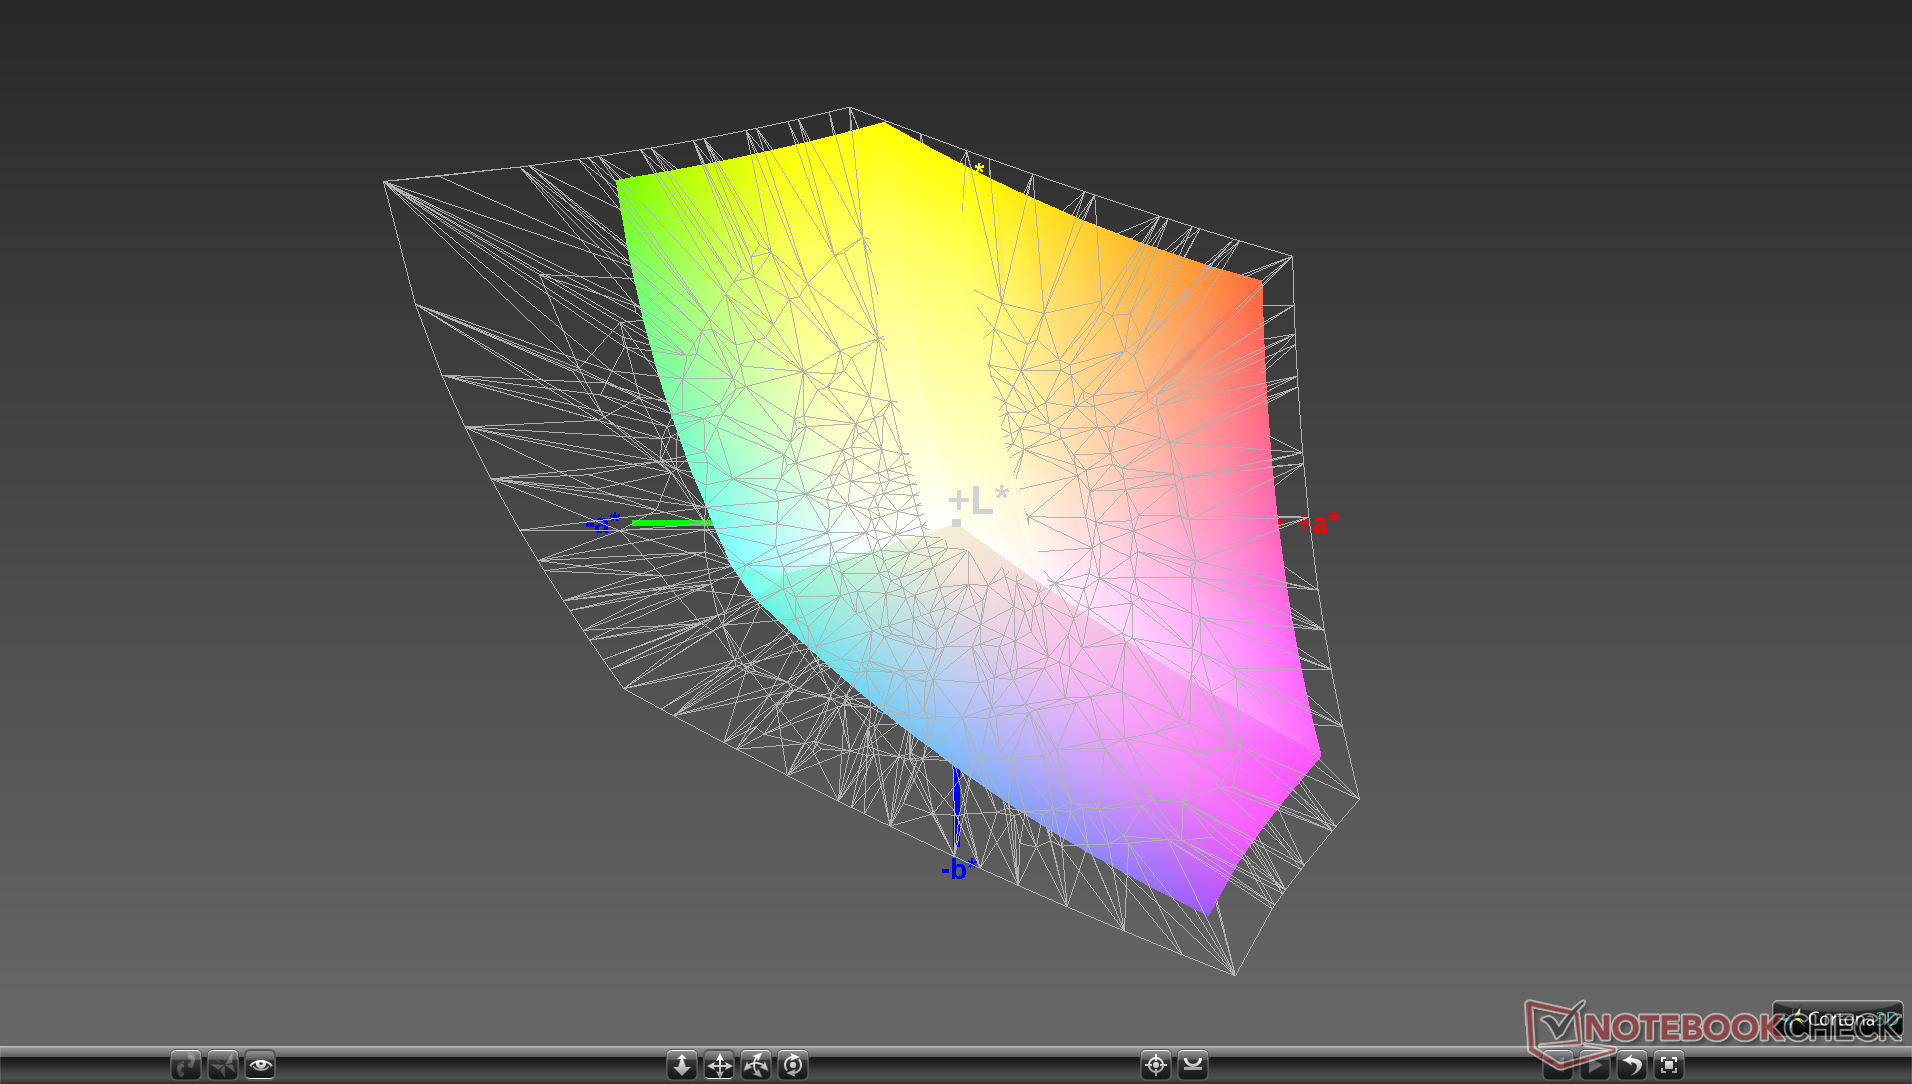
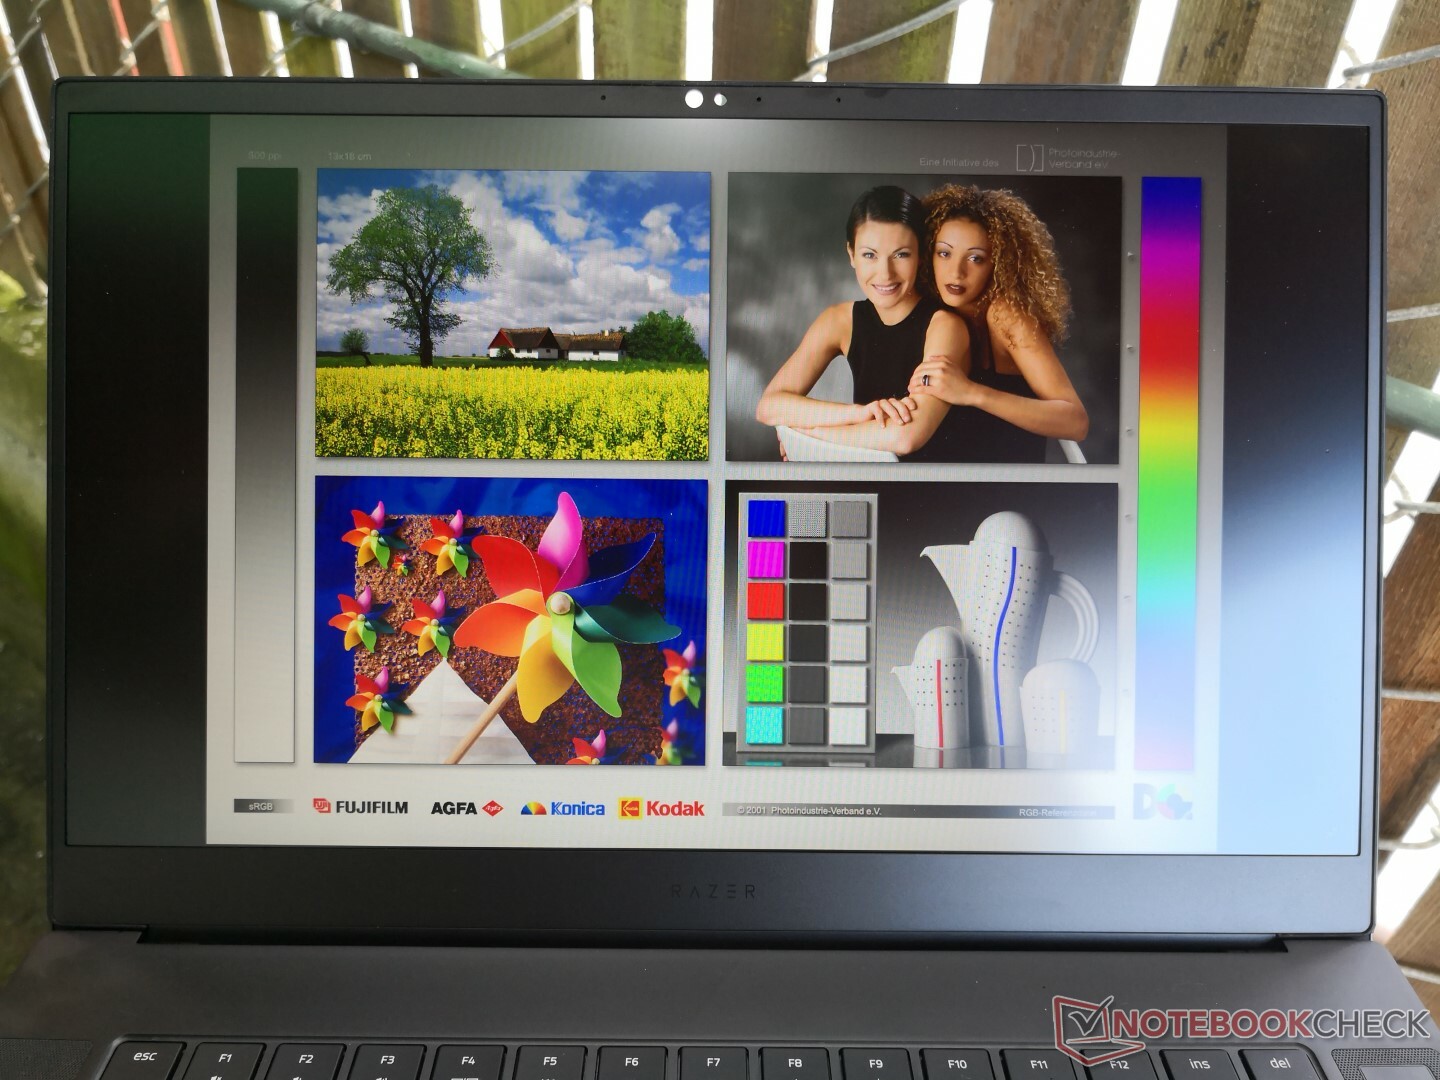
Perhaps more impressive than the CPU update is the new 240 Hz IPS panel. The Blade 15 has one of the widest panel options available for a gaming laptop including 1080p 60 Hz, 1080p 144 Hz, 4K UHD 60 Hz touchscreen, 4K UHD OLED 60 Hz touchscreen, and now 1080p 240 Hz. Razer is sourcing the same LQ156M1JW03 240 Hz panel from Sharp as does the latest Gigabyte Aero 15 Classic and so both laptops share similar display qualities including the excellent contrast, full sRGB color coverage, and fast response times.
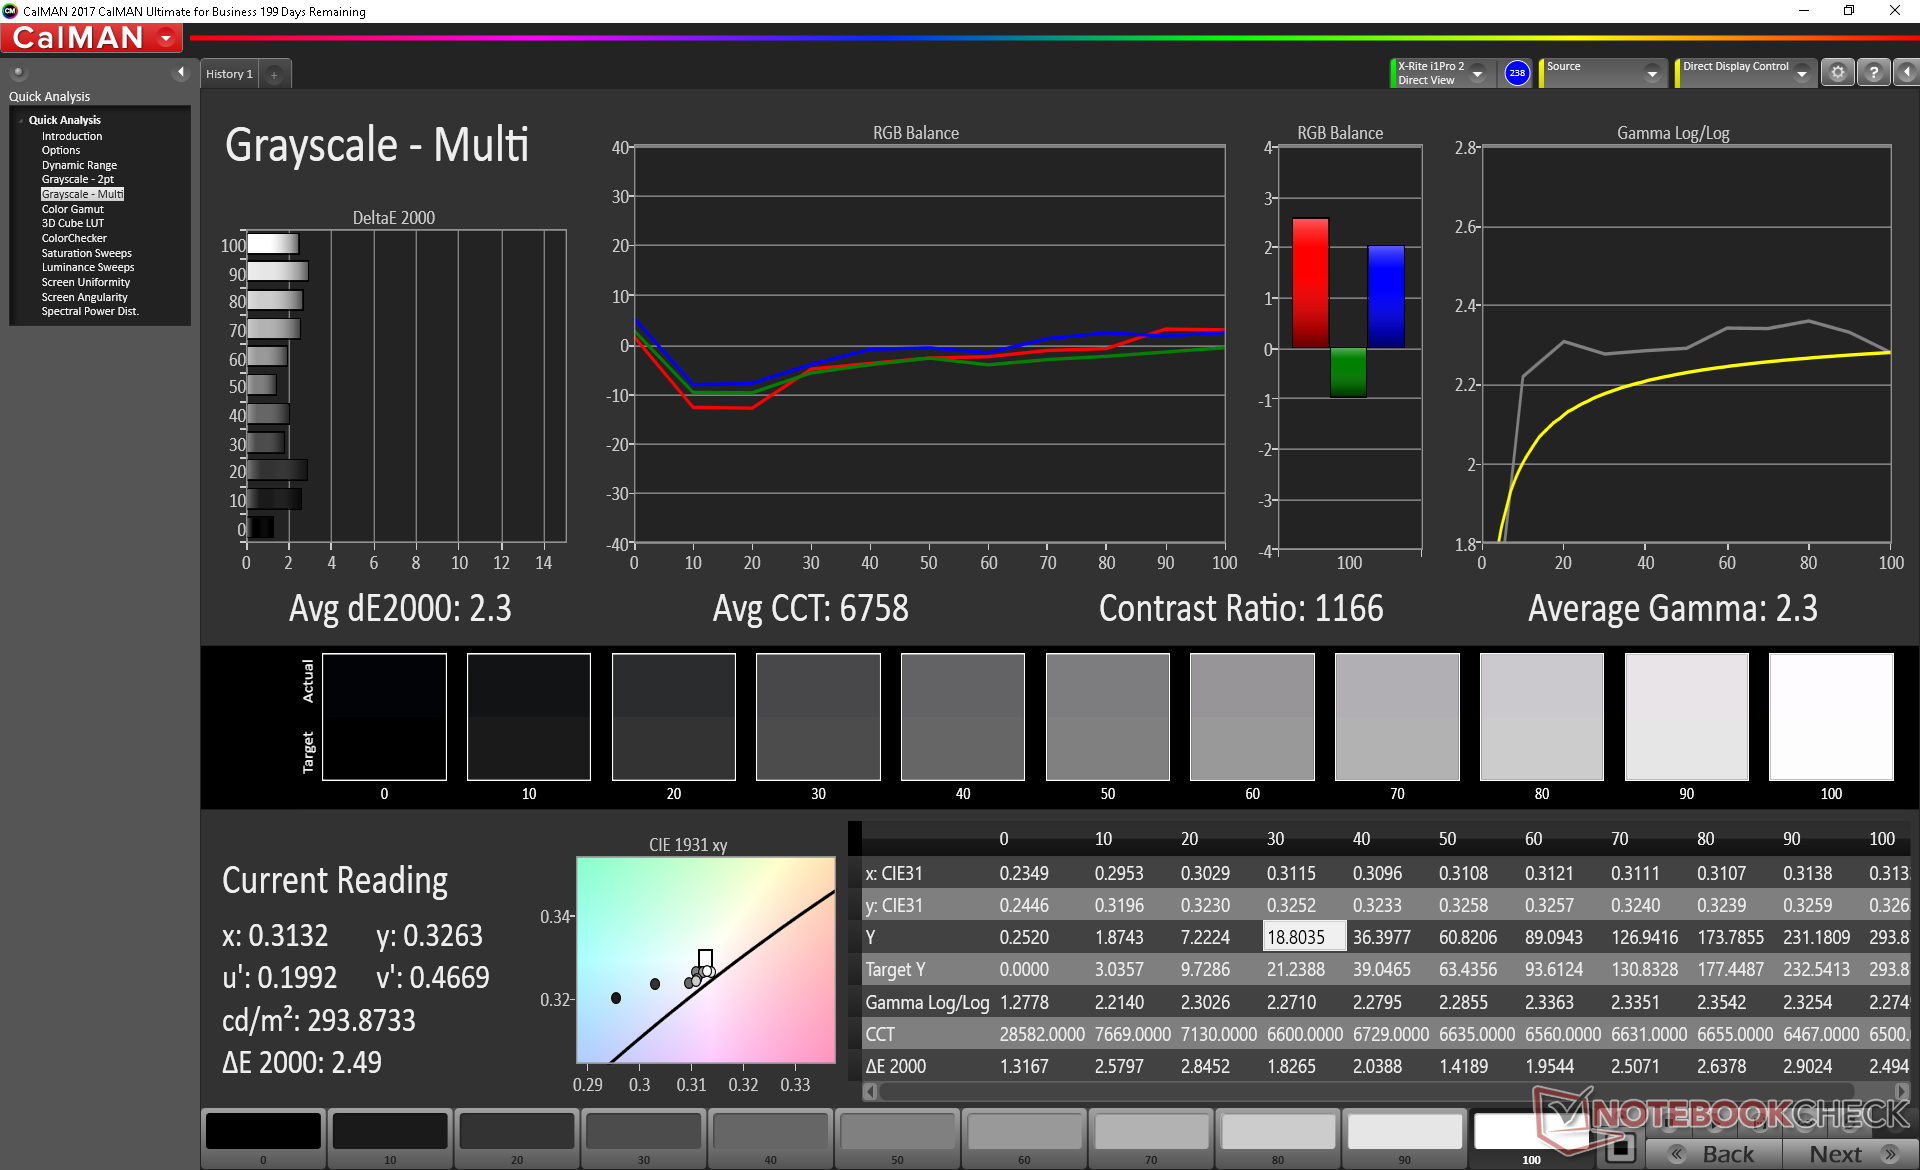
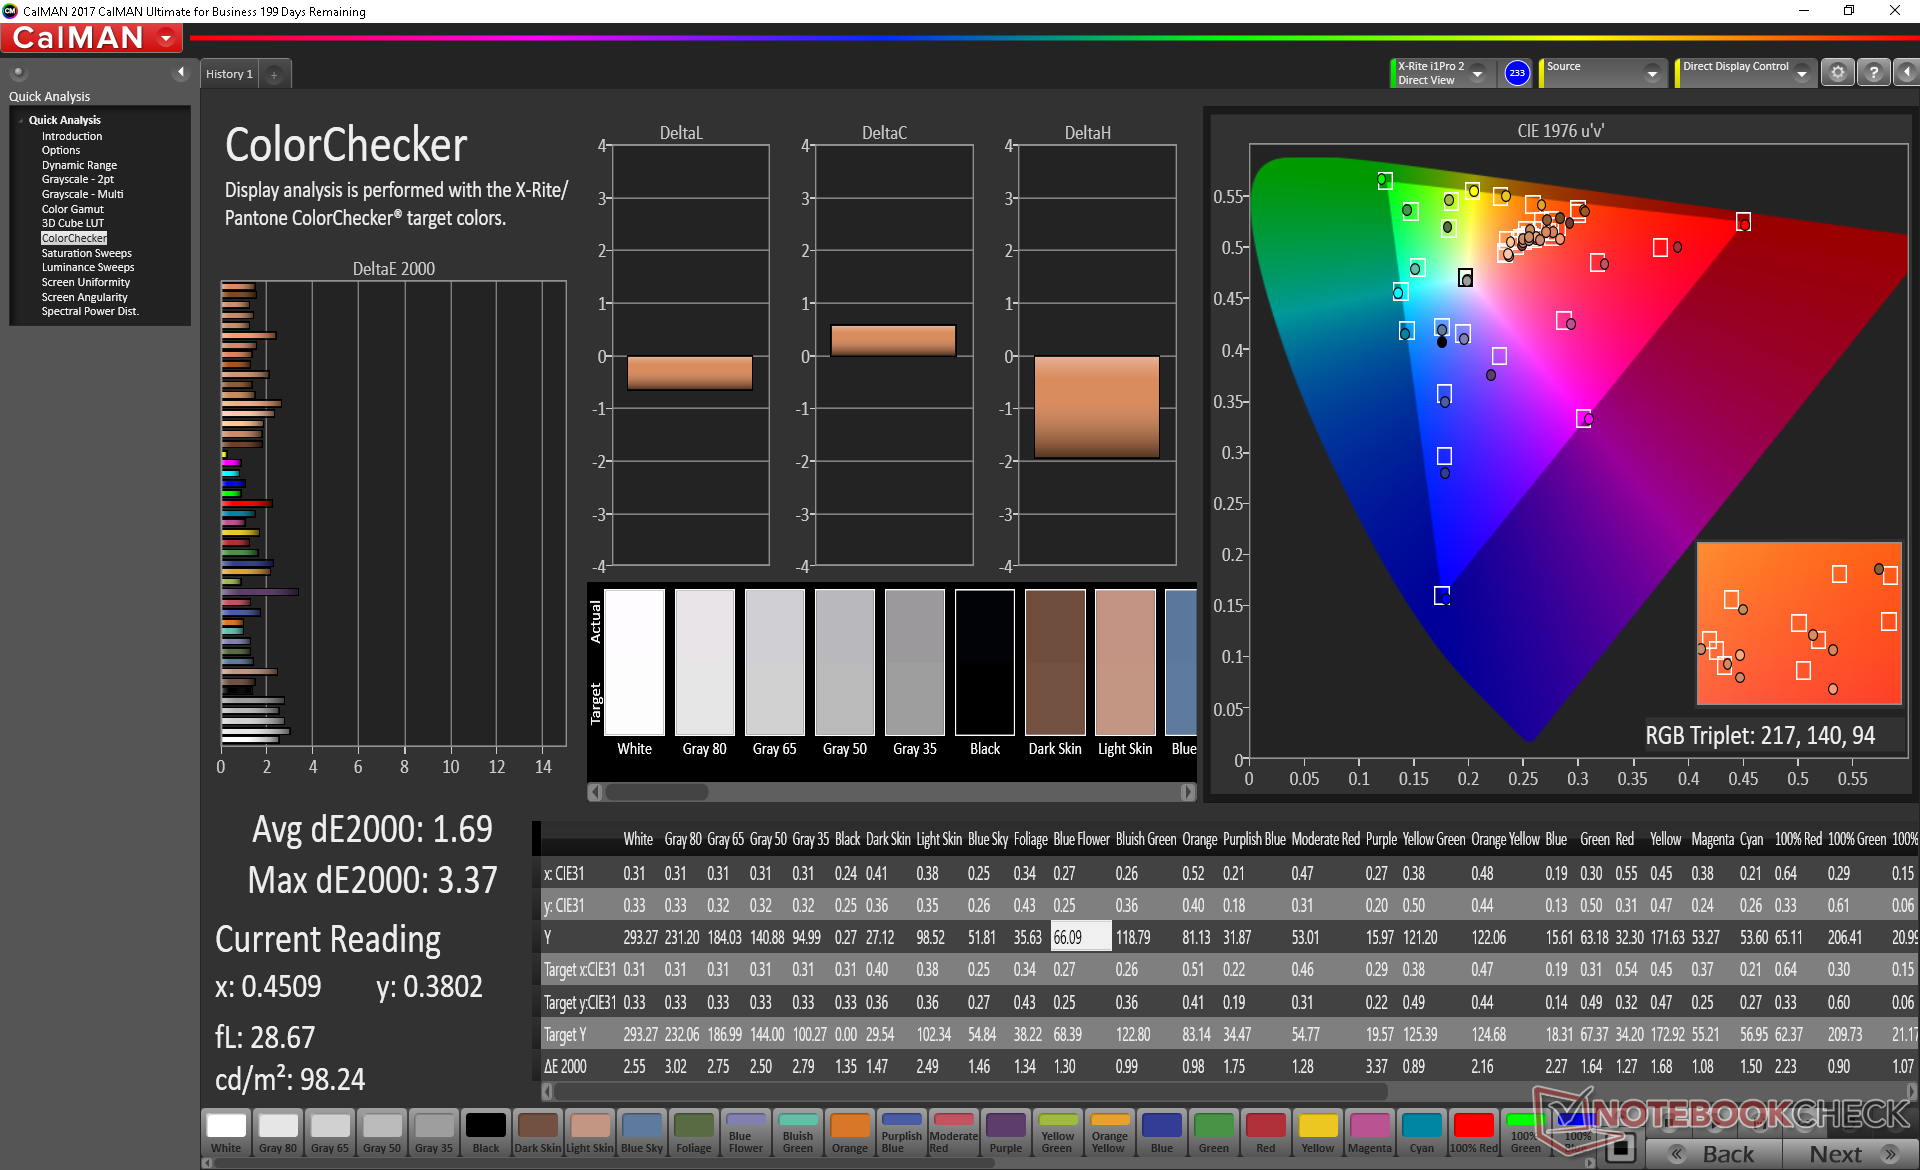
When compared to the 144 Hz LG panel on the Intel 8th gen Blade 15, we're relieved to see that Razer has made no sly compromises for the new 240 Hz refresh rate. Contrast, response times, gamut, and brightness are nearly identical between the two generations. Interestingly, colors are actually slightly more accurate this time around out of the box.
The difference between a 60 Hz and 144 Hz or 240 Hz display is very clear and easy to see even to an untrained set of eyes. The difference between a 144 Hz and 240 Hz panel, however, is difficult to spot. The silky smooth motion can only be so smooth before the law of diminishing returns comes to mind. Gamers have the most to benefit from a native 240 Hz display as there are more frame rates divisors at 240 than 144 when engaging v-sync.
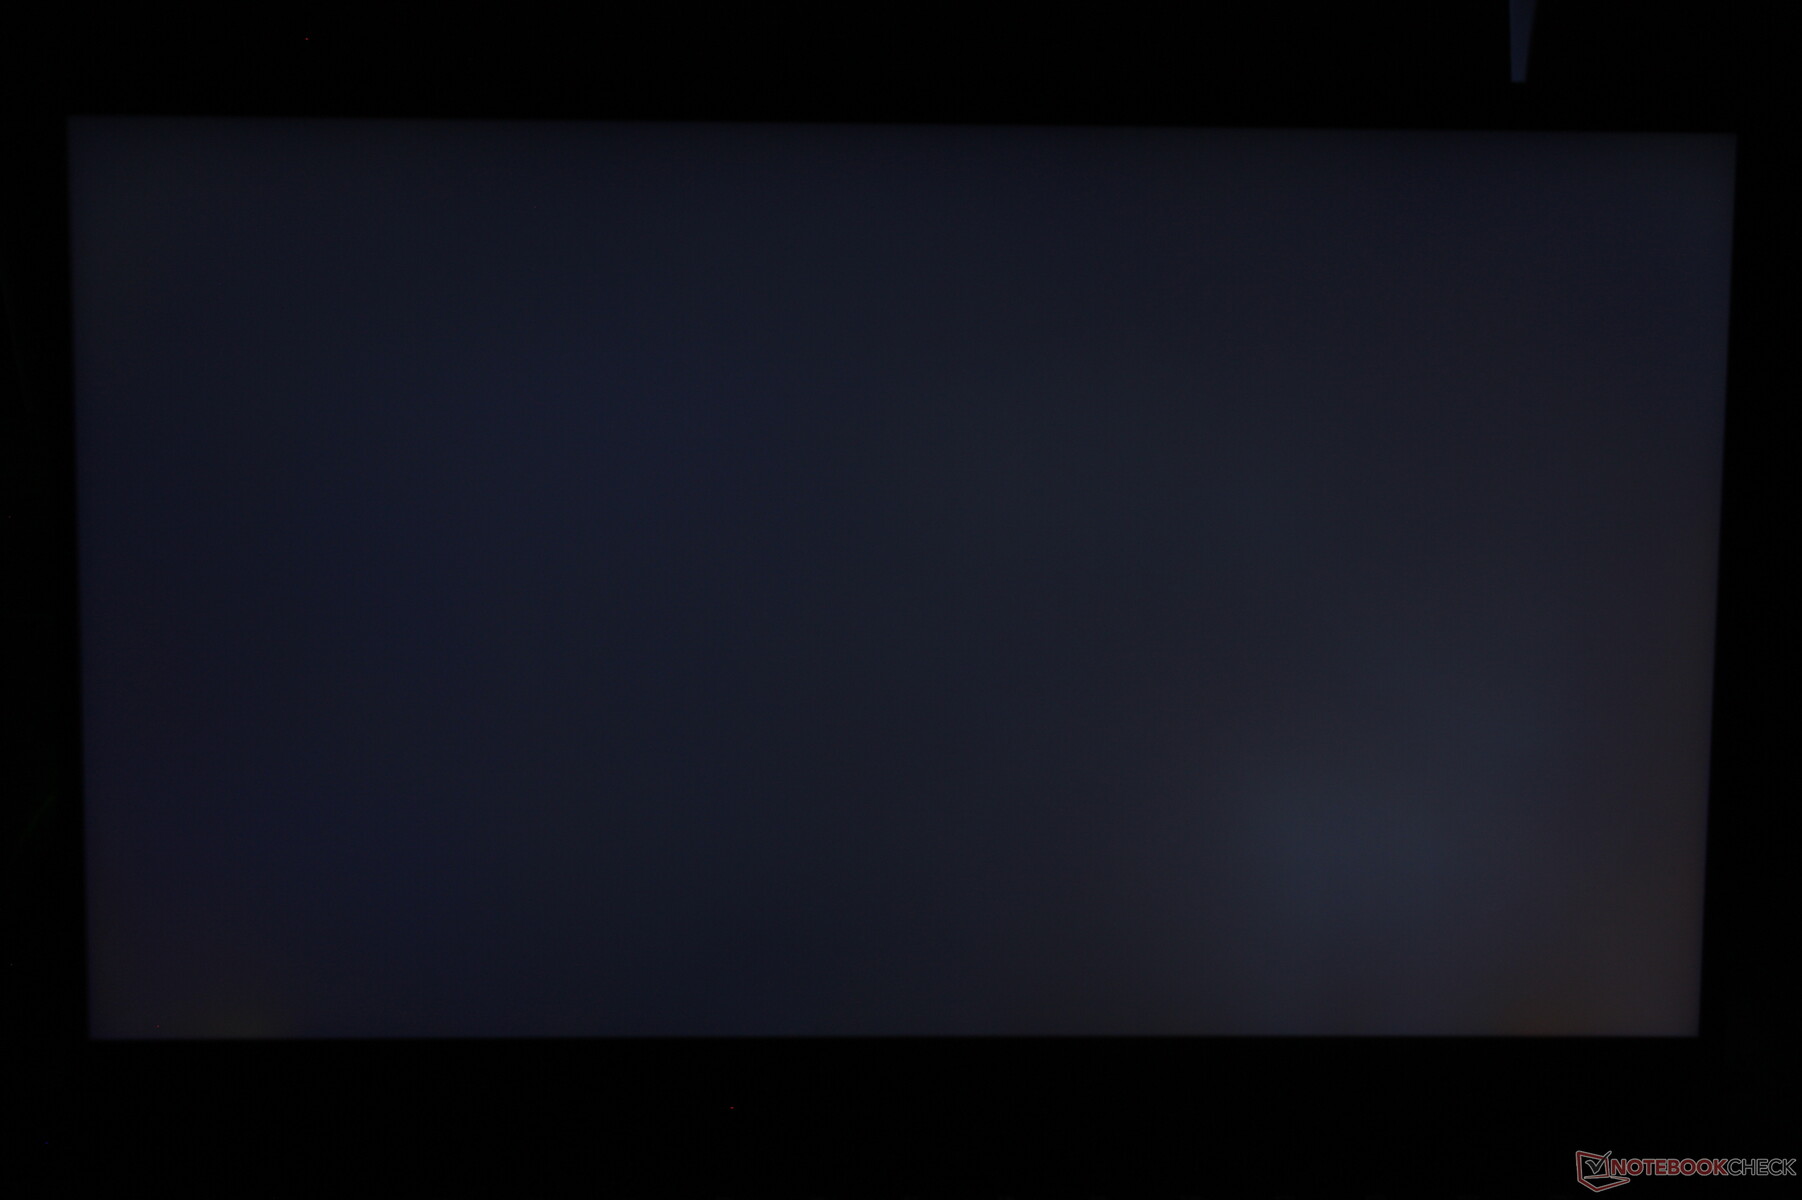
Graininess is minimal and just slightly less sharp than a glossy 1080p screen. Uneven backlight bleeding is also almost non-existent unlike what we observed on the equally expensive MSI GE75. Nonetheless, one particular aspect of the display we can nitpick on is its brightness uniformity. The center of the display is measurably brighter than the edges and corners by about 25 nits which, while not very noticeable or impactful in practice, could be better for a laptop in this price range.

| |||||||||||||||||||||||||
Brightness Distribution: 87 %
Center on Battery: 293 cd/m²
Contrast: 1010:1 (Black: 0.29 cd/m²)
ΔE ColorChecker Calman: 1.69 | ∀{0.5-29.43 Ø4.73}
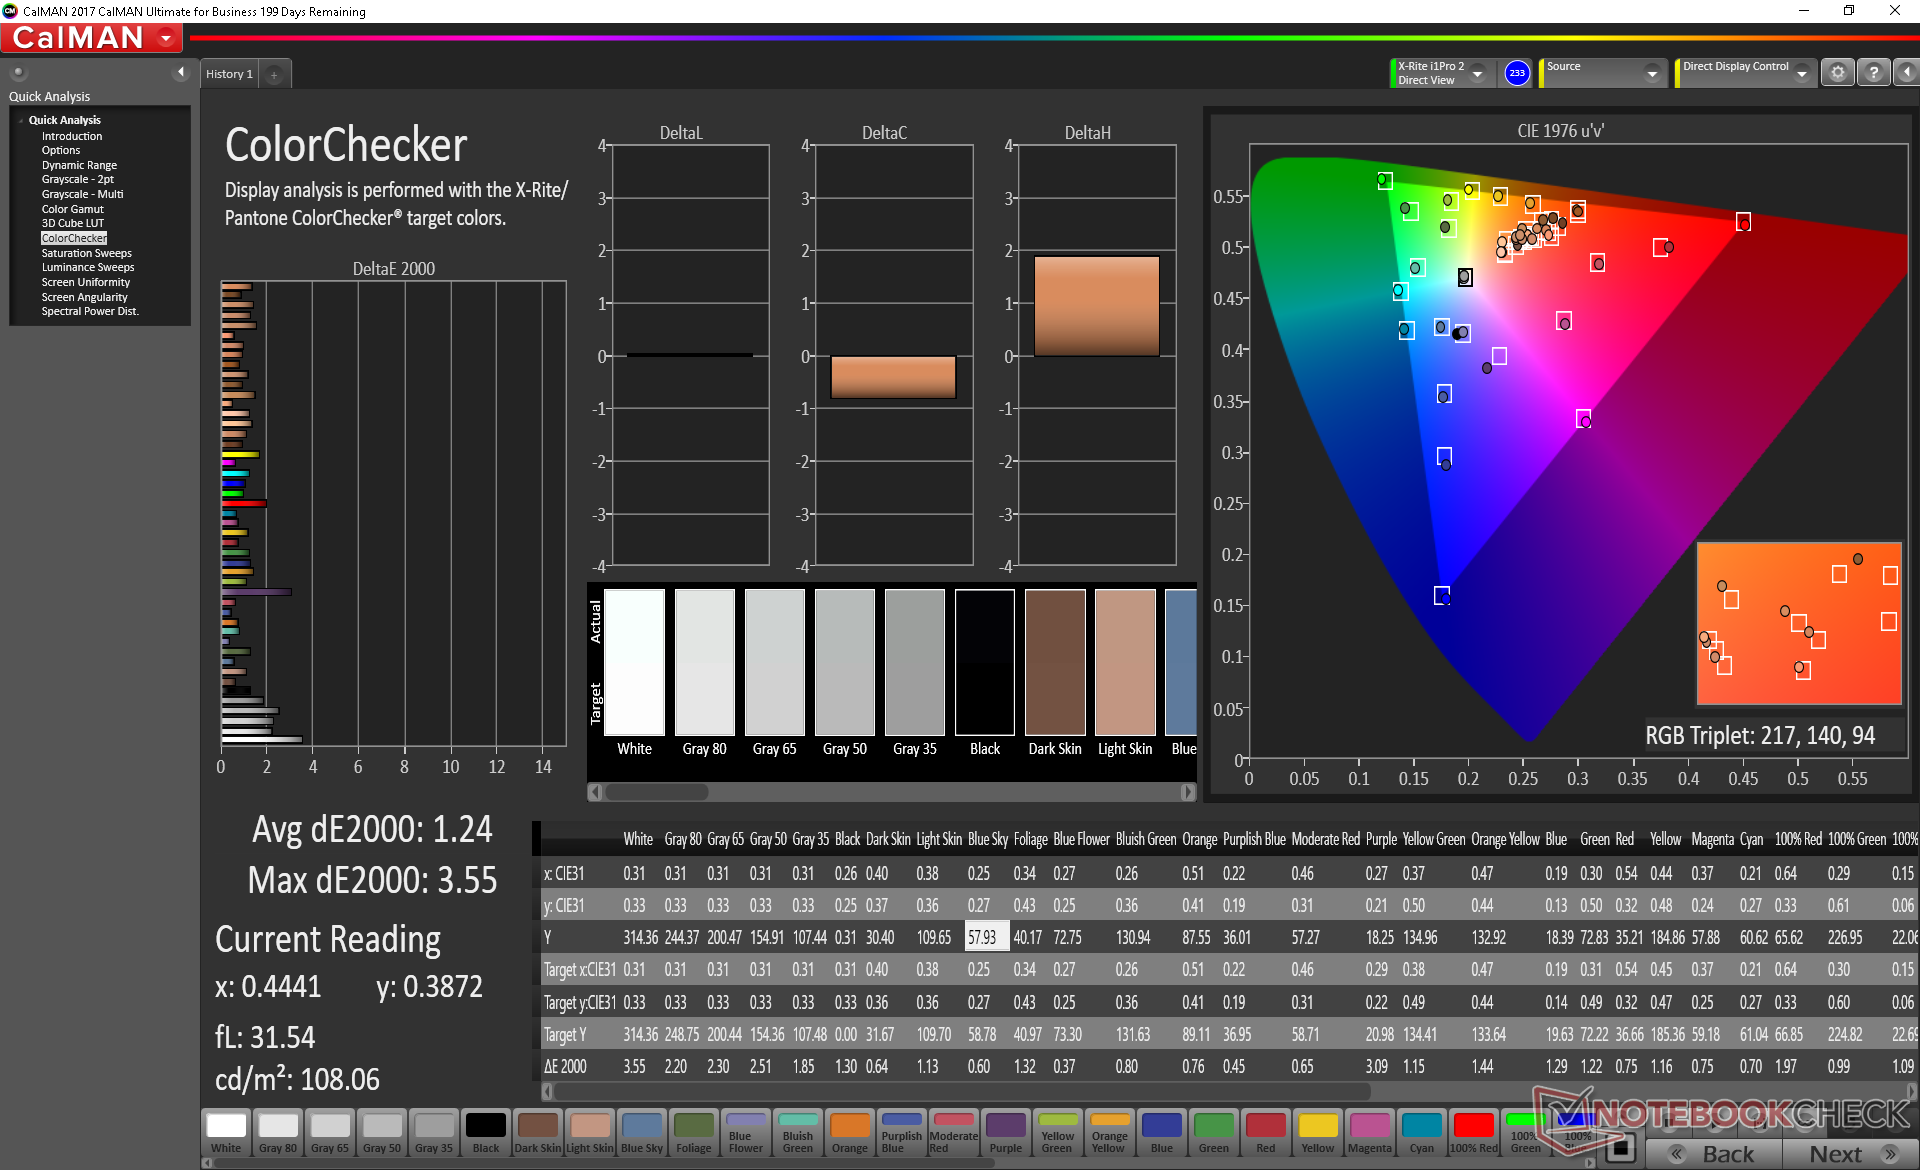
calibrated: 1.24
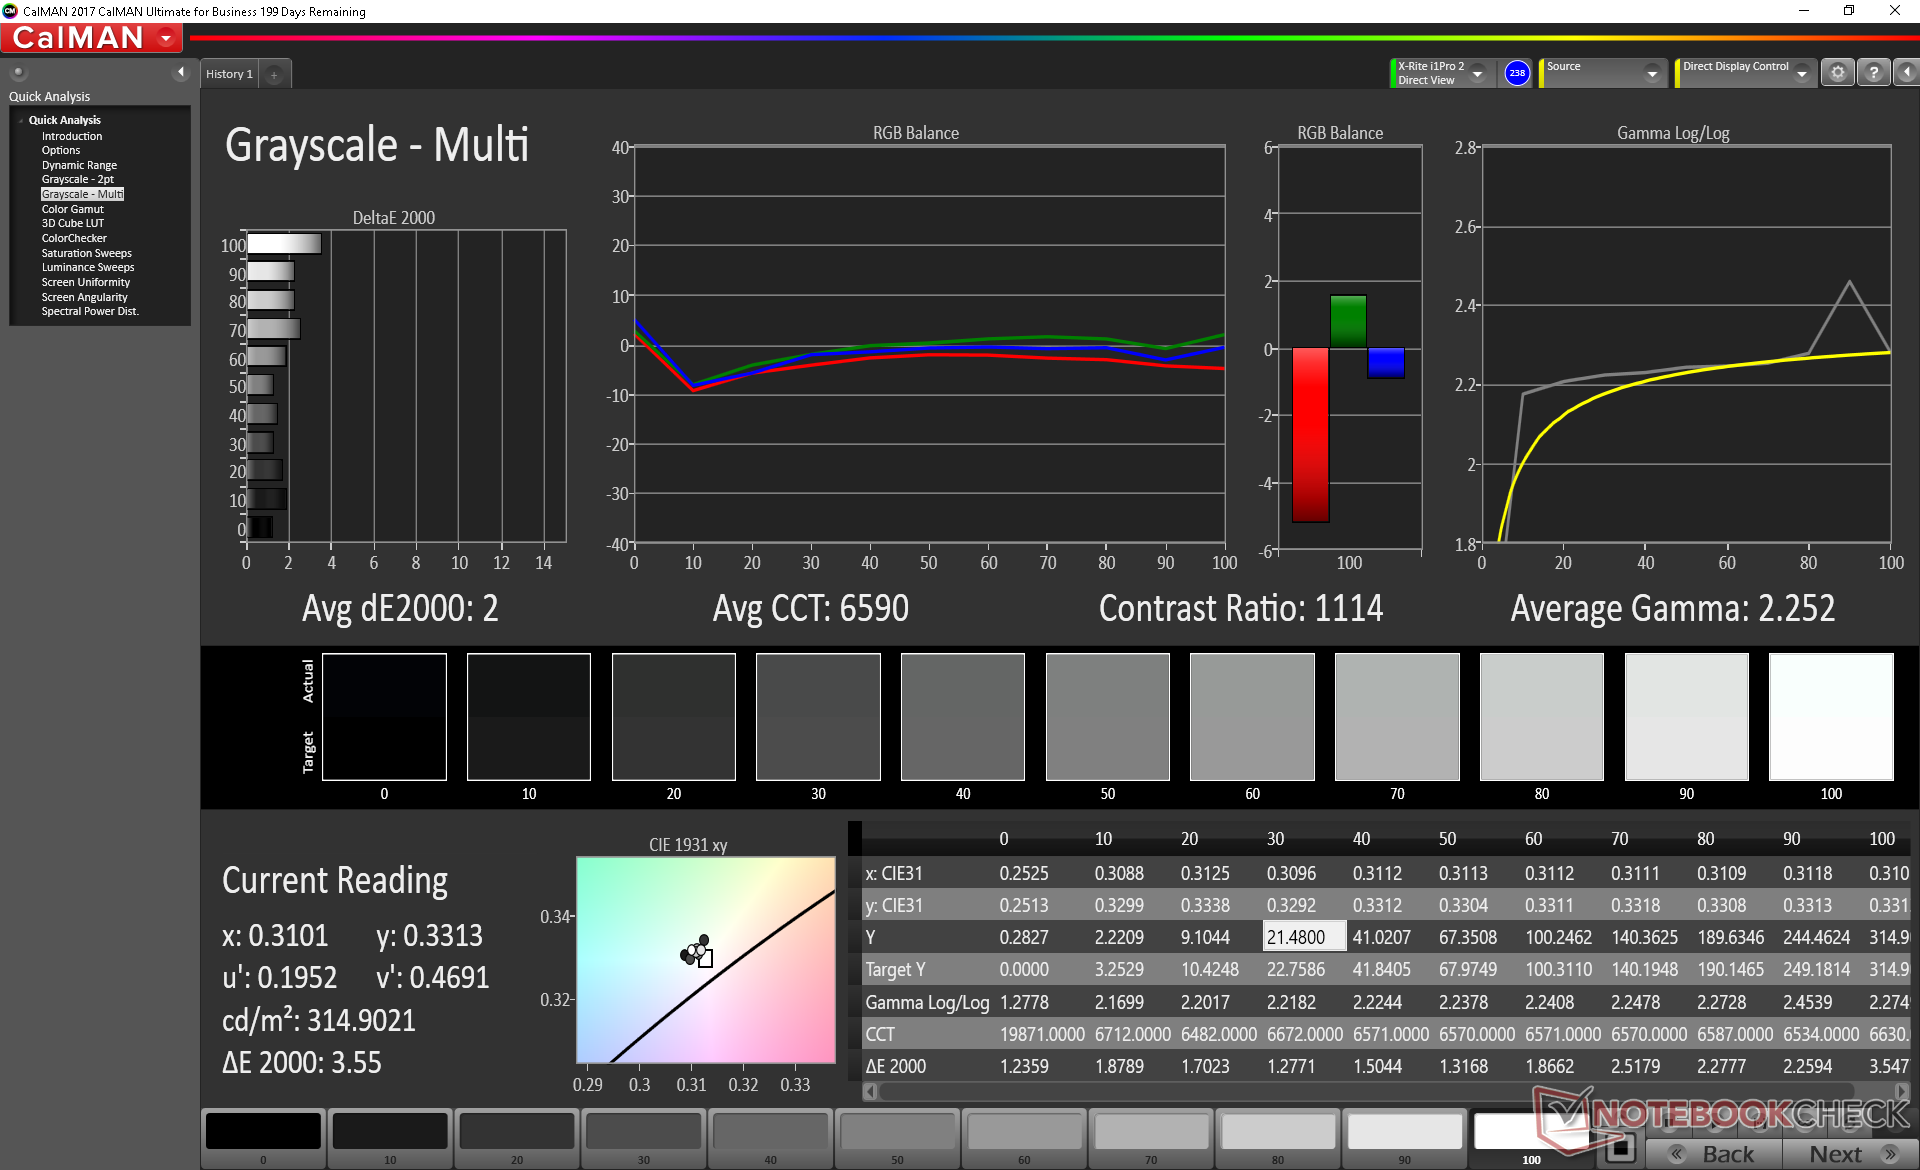
ΔE Greyscale Calman: 2.3 | ∀{0.09-98 Ø4.97}
98.5% sRGB (Argyll 1.6.3 3D)
63% AdobeRGB 1998 (Argyll 1.6.3 3D)
68.5% AdobeRGB 1998 (Argyll 3D)
98.1% sRGB (Argyll 3D)
66.9% Display P3 (Argyll 3D)
Gamma: 2.3
CCT: 6758 K
| Razer Blade 15 RTX 2080 Max-Q Sharp LQ156M1JW03 (SHP14C5), IPS, 15.6", 1920x1080 | Razer Blade 15 RTX 2070 Max-Q LG Philips LGD05C0, IPS, 15.6", 1920x1080 | Alienware m15 GTX 1070 Max-Q AU Optronics B156HAN, IPS, 15.6", 1920x1080 | Asus Zephyrus S GX502GW AU Optronics B156HAN08.2 (AUO82ED), IPS, 15.6", 1920x1080 | Apple MacBook Pro 15 2018 (2.6 GHz, 560X) APPA040, IPS, 15.4", 2880x1800 | MSI GS65 Stealth Thin 8RE-051US AUO80ED, IPS, 15.6", 1920x1080 | |
|---|---|---|---|---|---|---|
| Display | -3% | -7% | -5% | 25% | -3% | |
| Display P3 Coverage (%) | 66.9 | 65.3 -2% | 63.5 -5% | 64.9 -3% | 98.7 48% | 65.8 -2% |
| sRGB Coverage (%) | 98.1 | 94.9 -3% | 89.4 -9% | 91 -7% | 99.9 2% | 92.1 -6% |
| AdobeRGB 1998 Coverage (%) | 68.5 | 66.3 -3% | 64.5 -6% | 65.9 -4% | 86.6 26% | 67 -2% |
| Response Times | -22% | -28% | 30% | -219% | -36% | |
| Response Time Grey 50% / Grey 80% * (ms) | 12.8 ? | 16.8 ? -31% | 18 ? -41% | 7.2 ? 44% | 43.2 ? -238% | 20 ? -56% |
| Response Time Black / White * (ms) | 10.4 ? | 11.6 ? -12% | 12 ? -15% | 8.8 ? 15% | 31.2 ? -200% | 12 ? -15% |
| PWM Frequency (Hz) | 23810 ? | 117000 ? | ||||
| Screen | -19% | -46% | -18% | 33% | -35% | |
| Brightness middle (cd/m²) | 293 | 314.7 7% | 353.6 21% | 286 -2% | 520 77% | 250.9 -14% |
| Brightness (cd/m²) | 270 | 312 16% | 346 28% | 275 2% | 492 82% | 257 -5% |
| Brightness Distribution (%) | 87 | 90 3% | 86 -1% | 90 3% | 88 1% | 83 -5% |
| Black Level * (cd/m²) | 0.29 | 0.38 -31% | 0.3 -3% | 0.37 -28% | 0.39 -34% | 0.32 -10% |
| Contrast (:1) | 1010 | 828 -18% | 1179 17% | 773 -23% | 1333 32% | 784 -22% |
| Colorchecker dE 2000 * | 1.69 | 2.56 -51% | 4.55 -169% | 2.19 -30% | 1.2 29% | 2.77 -64% |
| Colorchecker dE 2000 max. * | 3.37 | 4.89 -45% | 7.91 -135% | 4.4 -31% | 2.3 32% | 5.89 -75% |
| Colorchecker dE 2000 calibrated * | 1.24 | 1.71 -38% | 3.37 -172% | 2.27 -83% | 2.5 -102% | |
| Greyscale dE 2000 * | 2.3 | 3.4 -48% | 4.1 -78% | 2.2 4% | 1.3 43% | 4 -74% |
| Gamma | 2.3 96% | 2.3 96% | 2.27 97% | 2.41 91% | 2.18 101% | 2.27 97% |
| CCT | 6758 96% | 6435 101% | 7434 87% | 6405 101% | 6738 96% | 6901 94% |
| Color Space (Percent of AdobeRGB 1998) (%) | 63 | 60.7 -4% | 57.9 -8% | 59 -6% | 60 -5% | |
| Color Space (Percent of sRGB) (%) | 98.5 | 94.6 -4% | 88.9 -10% | 91 -8% | 92 -7% | |
| Total Average (Program / Settings) | -15% /
-17% | -27% /
-37% | 2% /
-10% | -54% /
-8% | -25% /
-29% |
* ... smaller is better
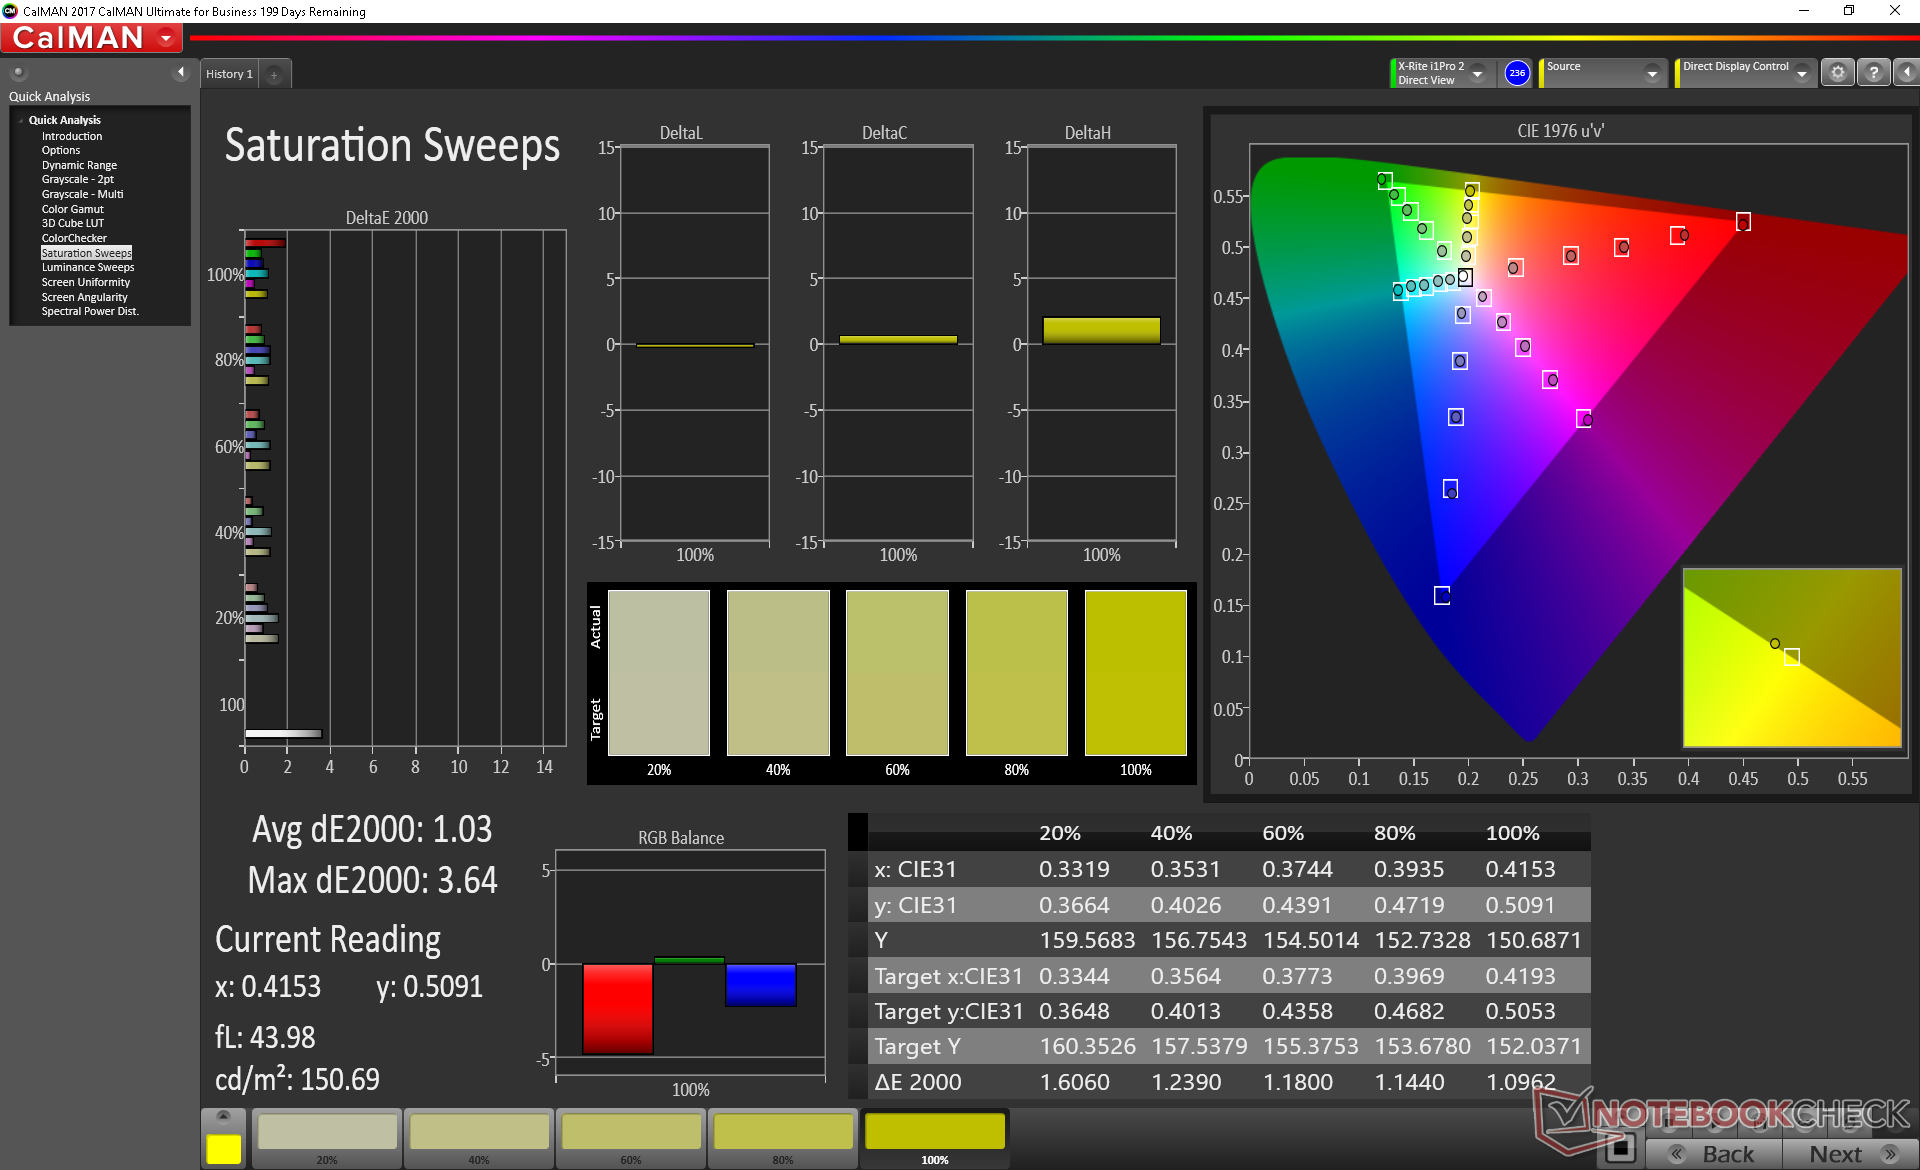
Color space covers the entire sRGB spectrum as advertised. Users who want even wider color coverage may want to consider the 4K UHD or 4K UHD OLED options which promise full AdobeRGB and DCI-P3 coverage, respectively.
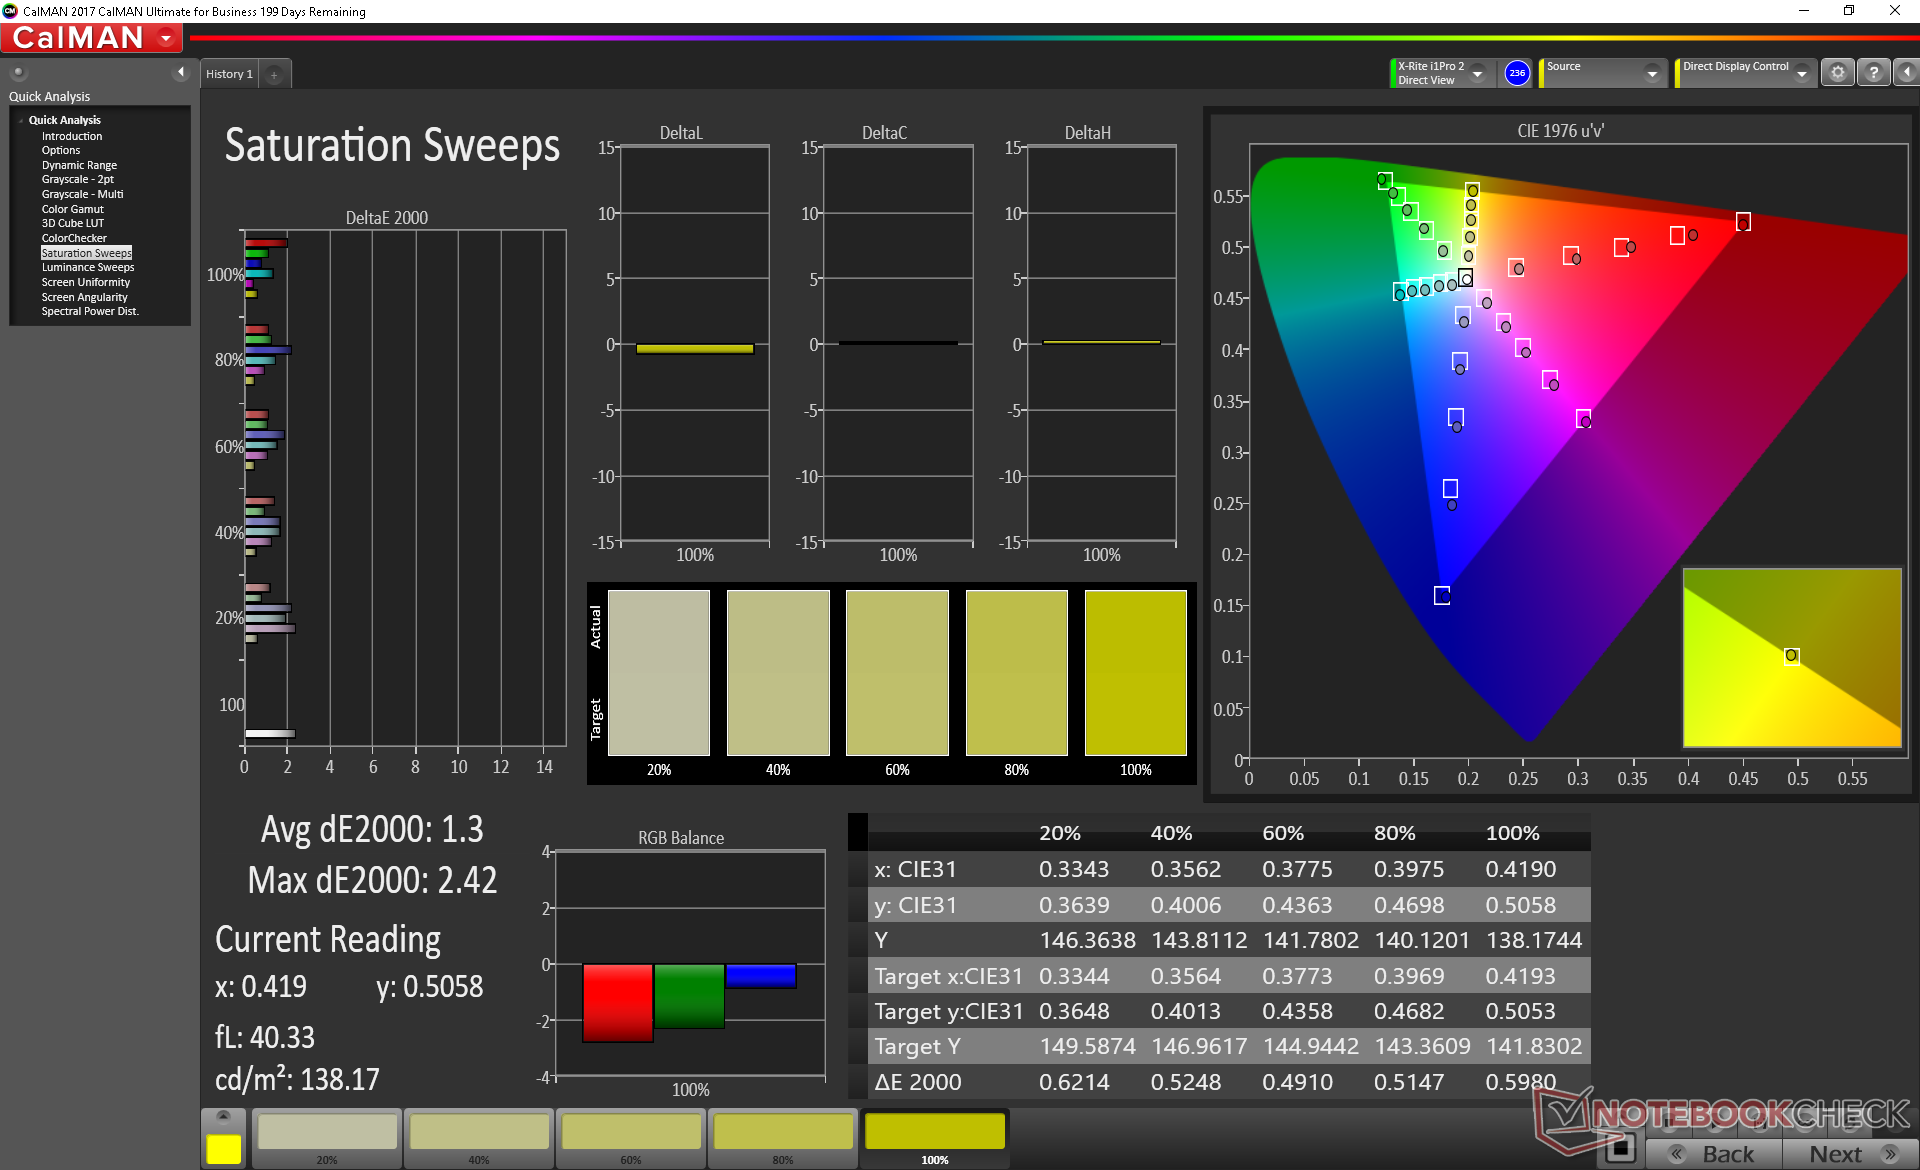
Further measurements with an X-Rite colorimeter show accurate colors and grayscale out of the box. Average grayscale and color DeltaE values sit at just 2.3 and 1.69, respectively. While our own calibration attempts do improve the display even further, the differences are marginal and not necessary for gaming.
Display Response Times
| ↔ Response Time Black to White | ||
|---|---|---|
| 10.4 ms ... rise ↗ and fall ↘ combined | ↗ 6 ms rise | 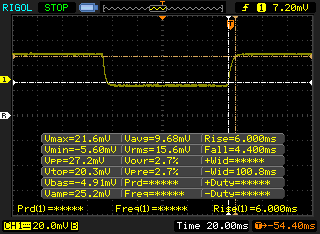 |
| ↘ 4.4 ms fall | ||
| The screen shows good response rates in our tests, but may be too slow for competitive gamers. In comparison, all tested devices range from 0.1 (minimum) to 240 (maximum) ms. » 28 % of all devices are better. This means that the measured response time is better than the average of all tested devices (19.9 ms). | ||
| ↔ Response Time 50% Grey to 80% Grey | ||
| 12.8 ms ... rise ↗ and fall ↘ combined | ↗ 6.8 ms rise | 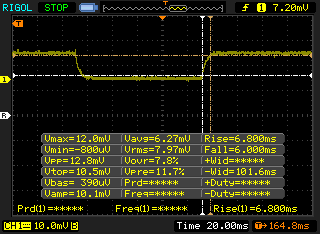 |
| ↘ 6 ms fall | ||
| The screen shows good response rates in our tests, but may be too slow for competitive gamers. In comparison, all tested devices range from 0.165 (minimum) to 636 (maximum) ms. » 26 % of all devices are better. This means that the measured response time is better than the average of all tested devices (31.1 ms). | ||
Screen Flickering / PWM (Pulse-Width Modulation)
| Screen flickering / PWM detected | 23810 Hz | ≤ 10 % brightness setting | 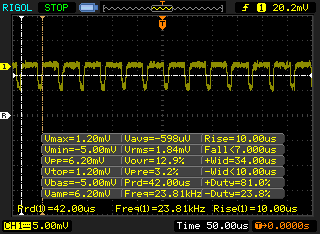 |
The display backlight flickers at 23810 Hz (worst case, e.g., utilizing PWM) Flickering detected at a brightness setting of 10 % and below. There should be no flickering or PWM above this brightness setting. The frequency of 23810 Hz is quite high, so most users sensitive to PWM should not notice any flickering. In comparison: 52 % of all tested devices do not use PWM to dim the display. If PWM was detected, an average of 7798 (minimum: 5 - maximum: 343500) Hz was measured. | |||
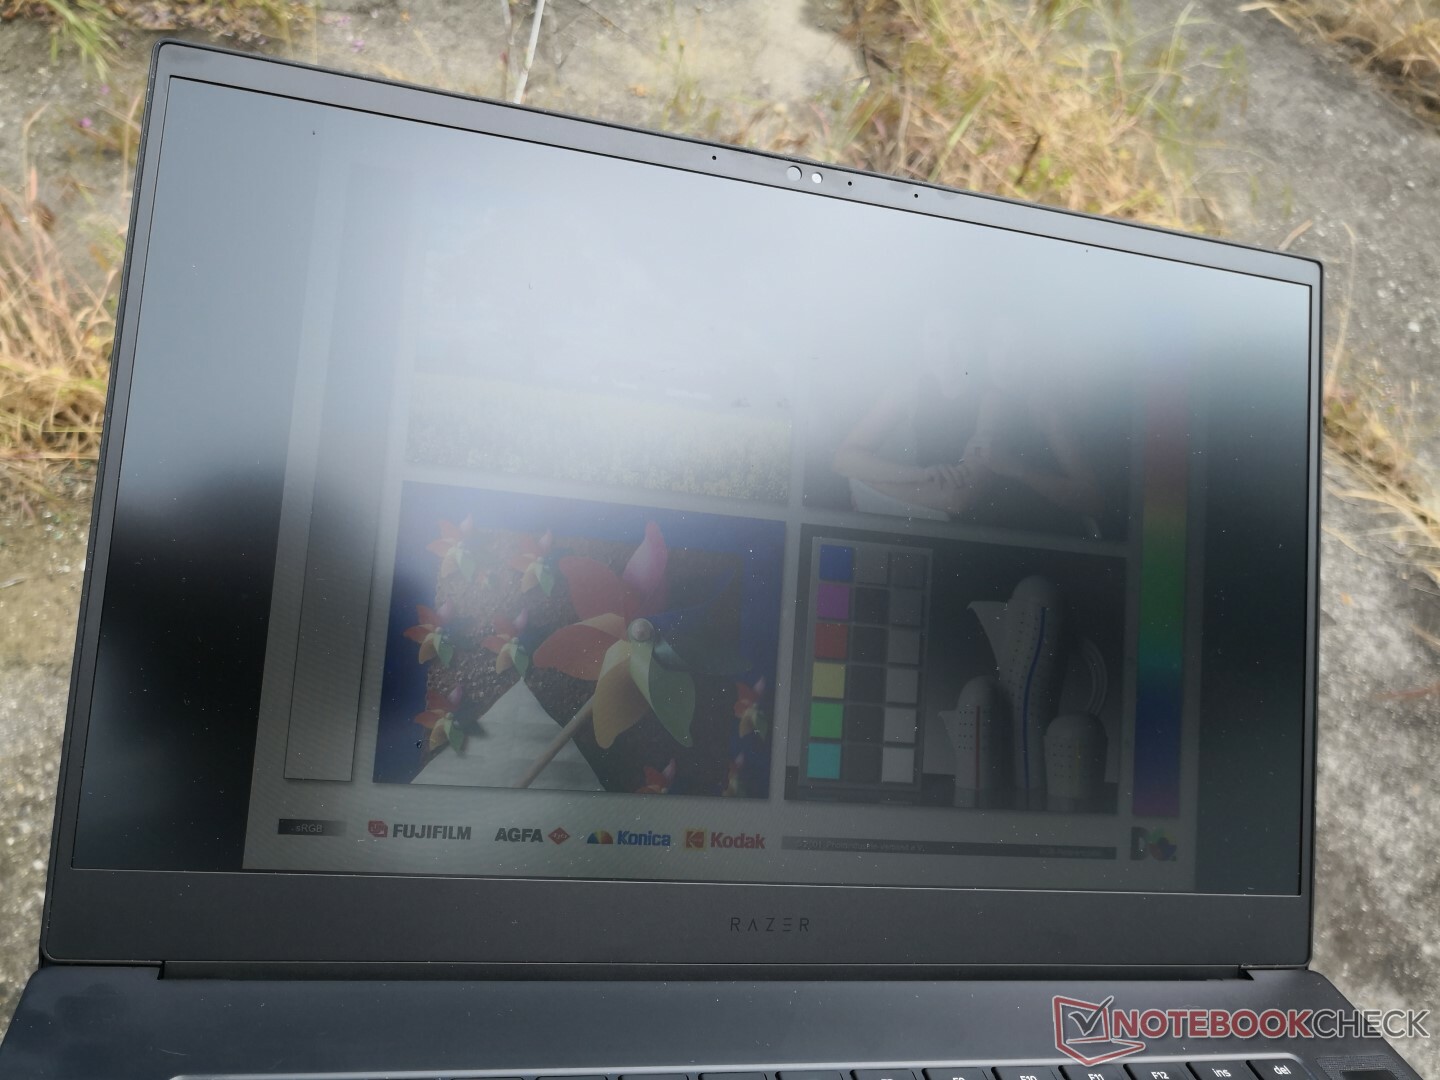
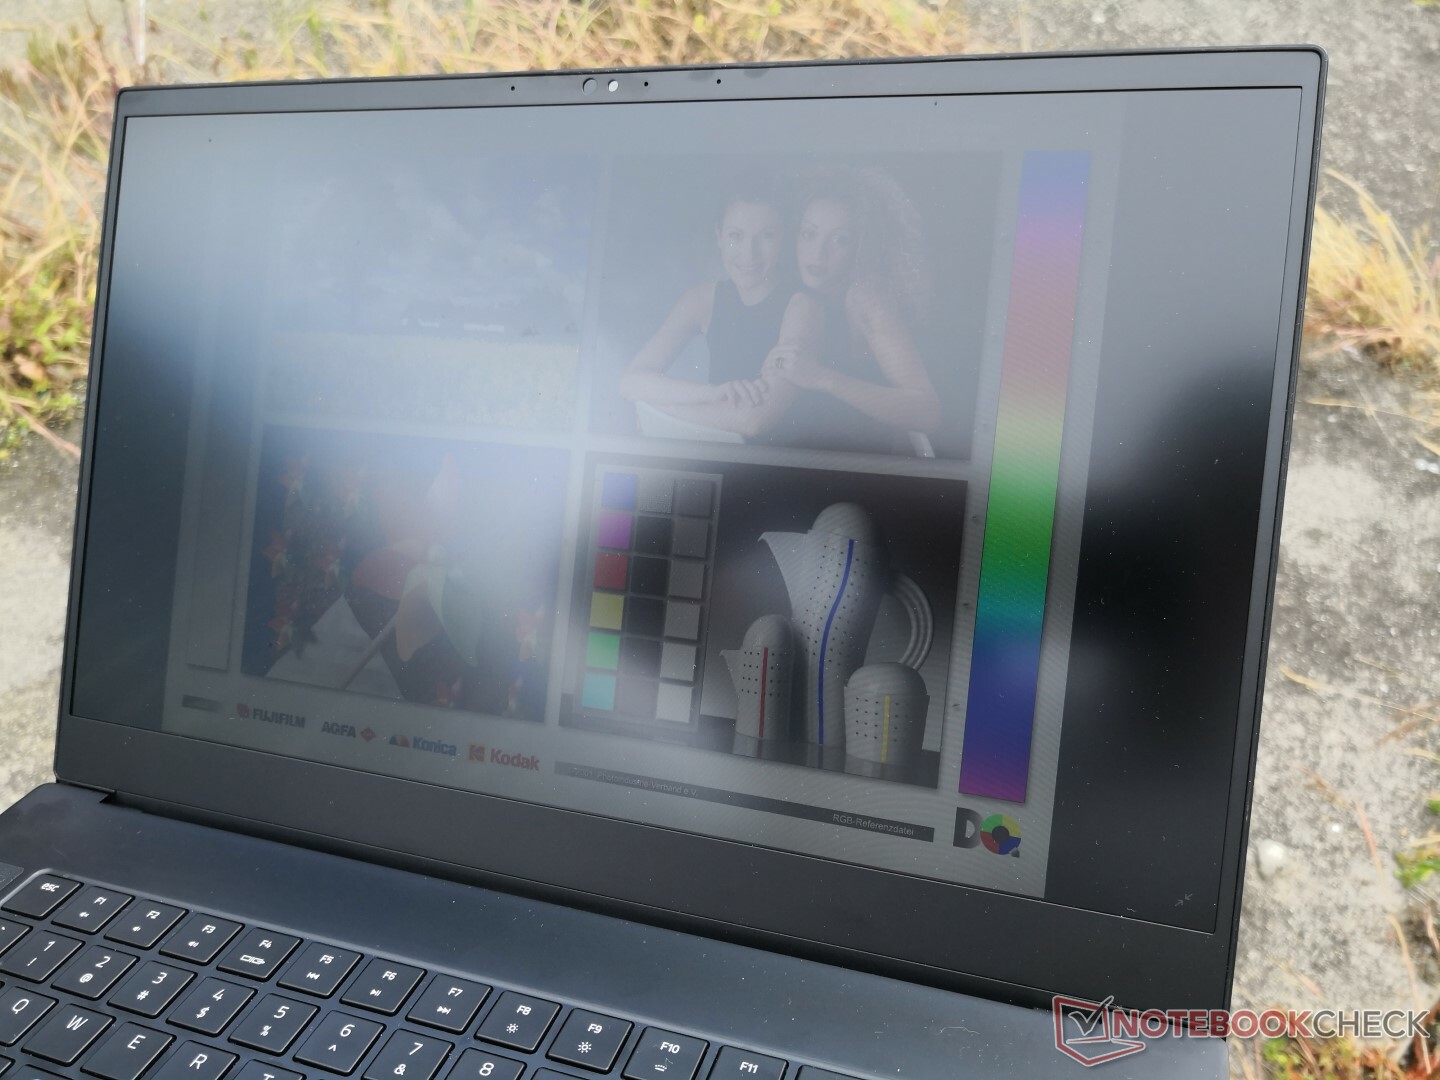
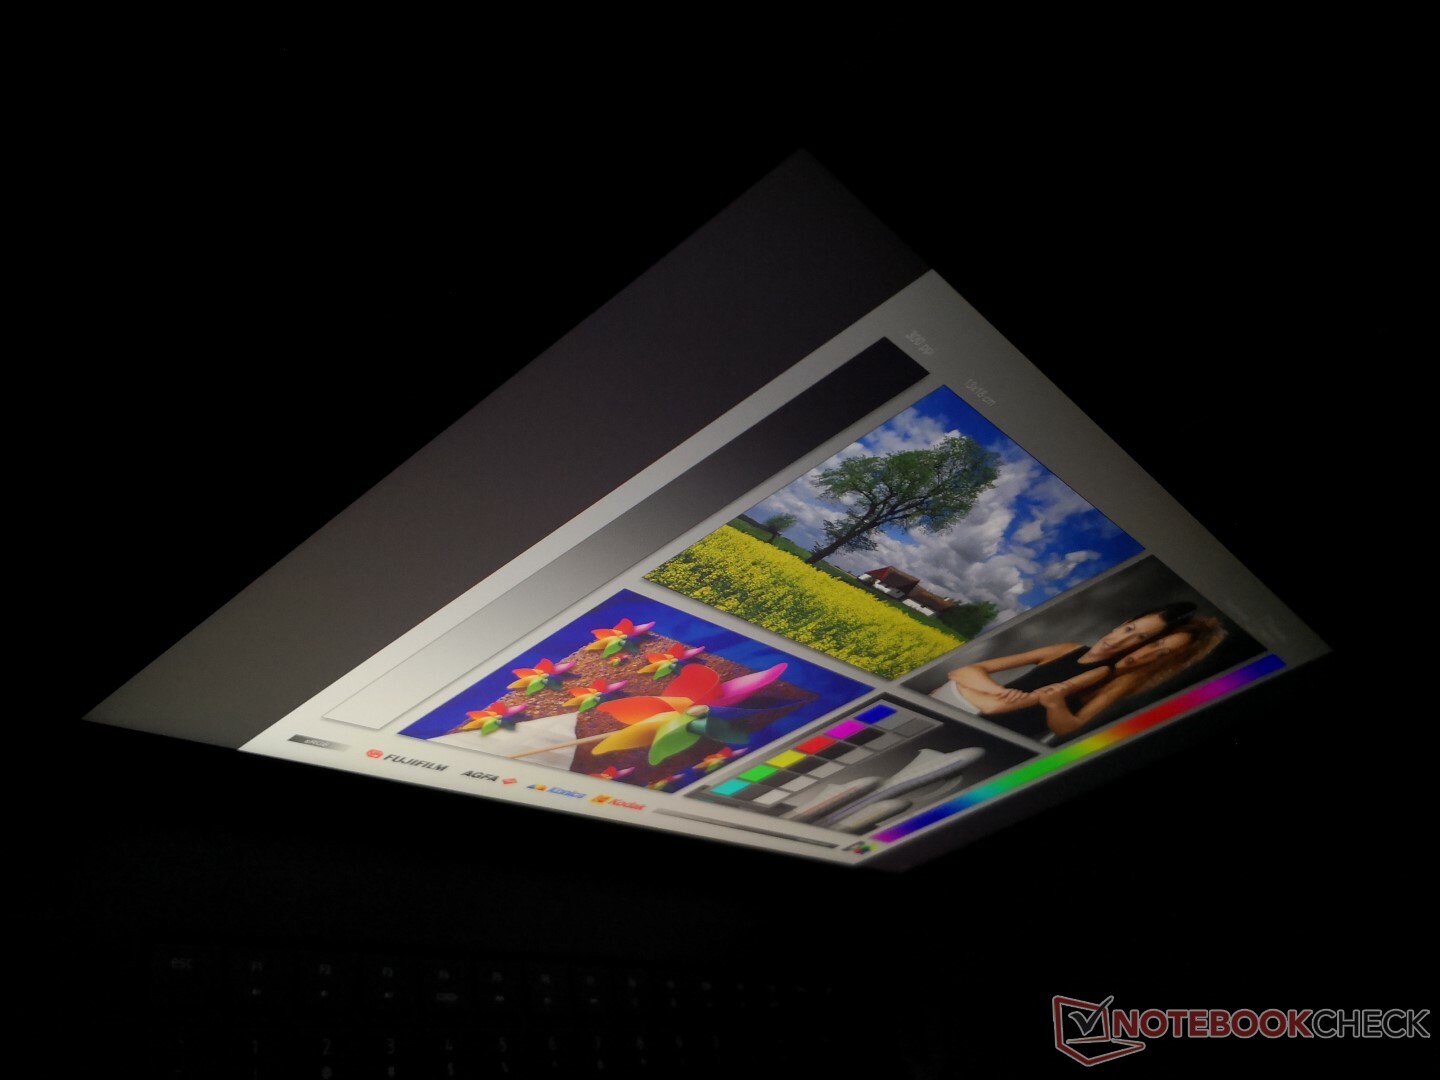
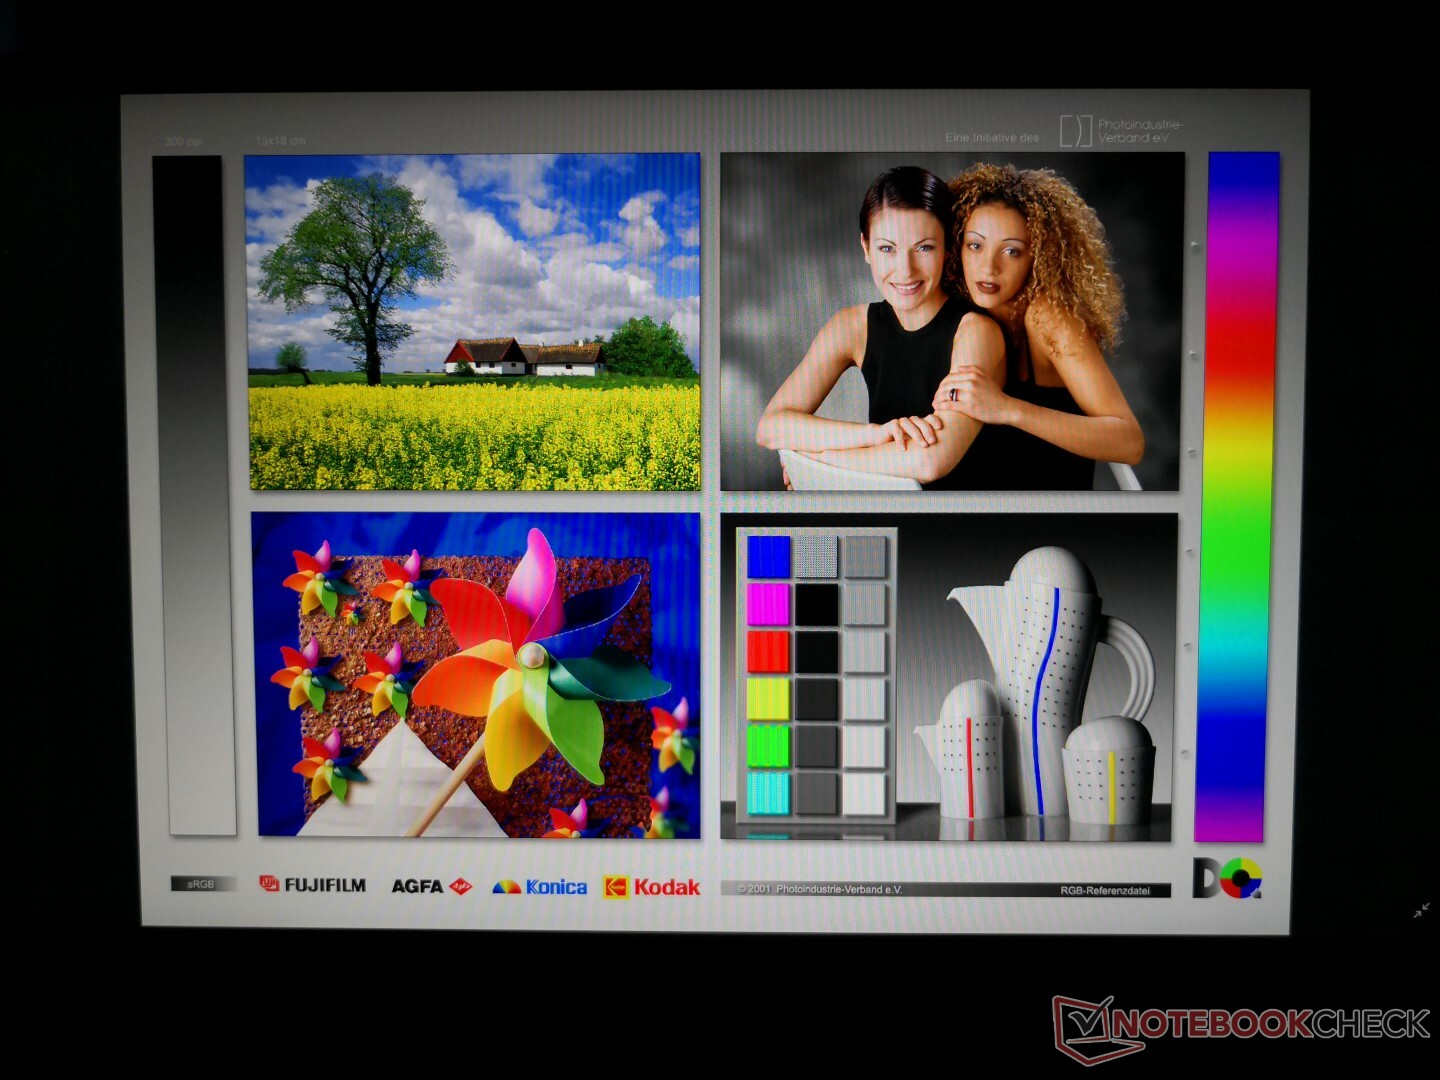
Outdoor visibility is identical to last year's 144 Hz panel since brightness remains the same. Users who value very bright displays may want to consider the MacBook Pro 15, Samsung Notebook 9, or the Huawei MateBook X Pro. Viewing angles are otherwise excellent with only minimal changes in contrast if viewing from extreme angles.
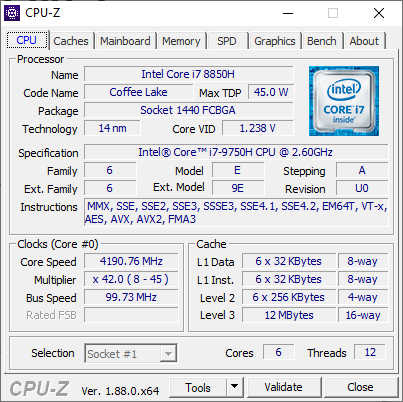
Performance
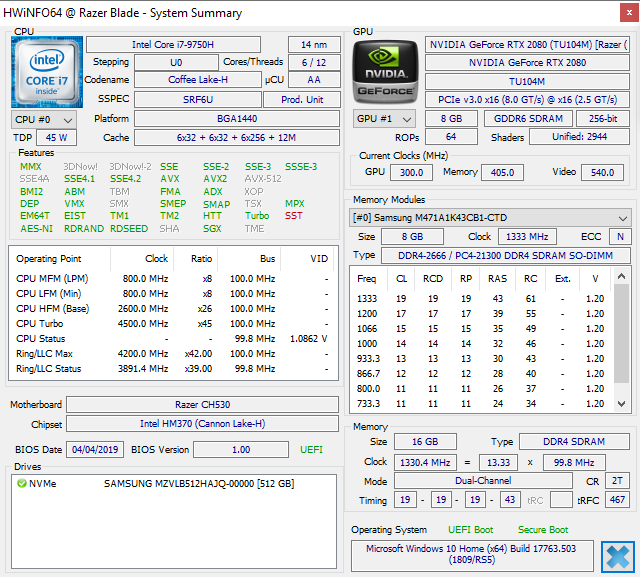
It's only been about a year since the original Blade 15 and the number of SKUs are starting to become a bit confusing. This latest Advanced Model pairs an Nvidia RTX GPU with the brand new Intel Gen 9 Core i7-9750H to supplant last year's gen 8 Coffee Lake-H Core i7-8750H. There are no Core i9-9880H options here as Razer says it doesn't offer enough of a performance boost when gaming to warrant its own SKU. We certainly don't disagree based on our experience with a Core i9-9880H MSI laptop, but we believe its omission on the Blade 15 is also likely related to thermals.
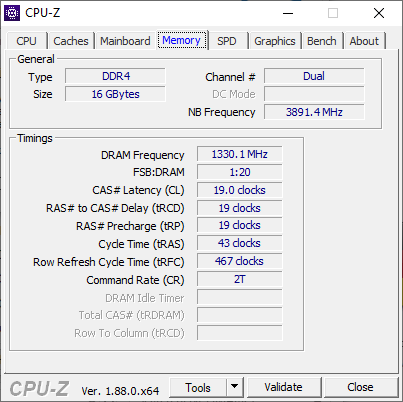
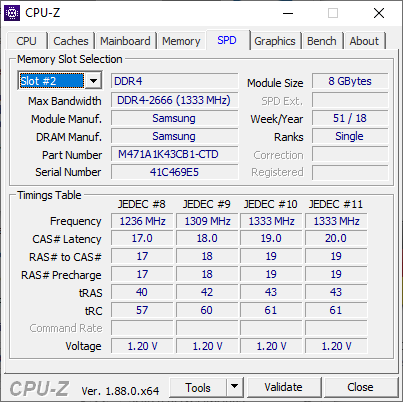
System RAM is overclockable via Intel XMP and expandable up to 64 GB across the two SODIMM slots compared to "only" 32 GB on the Blade 15 Base Model.
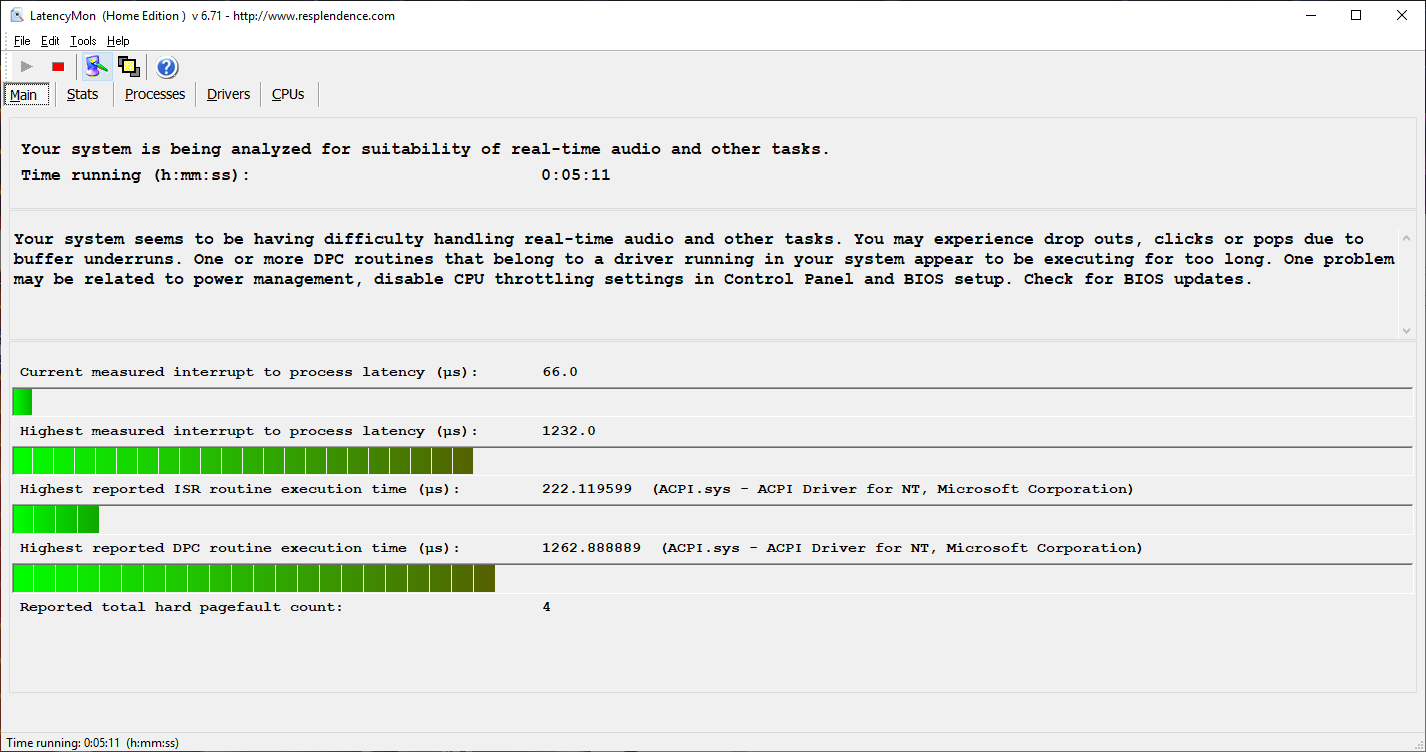
LatencyMon shows poor suitability of real-time audio even with WLAN dsiabled.
Processor
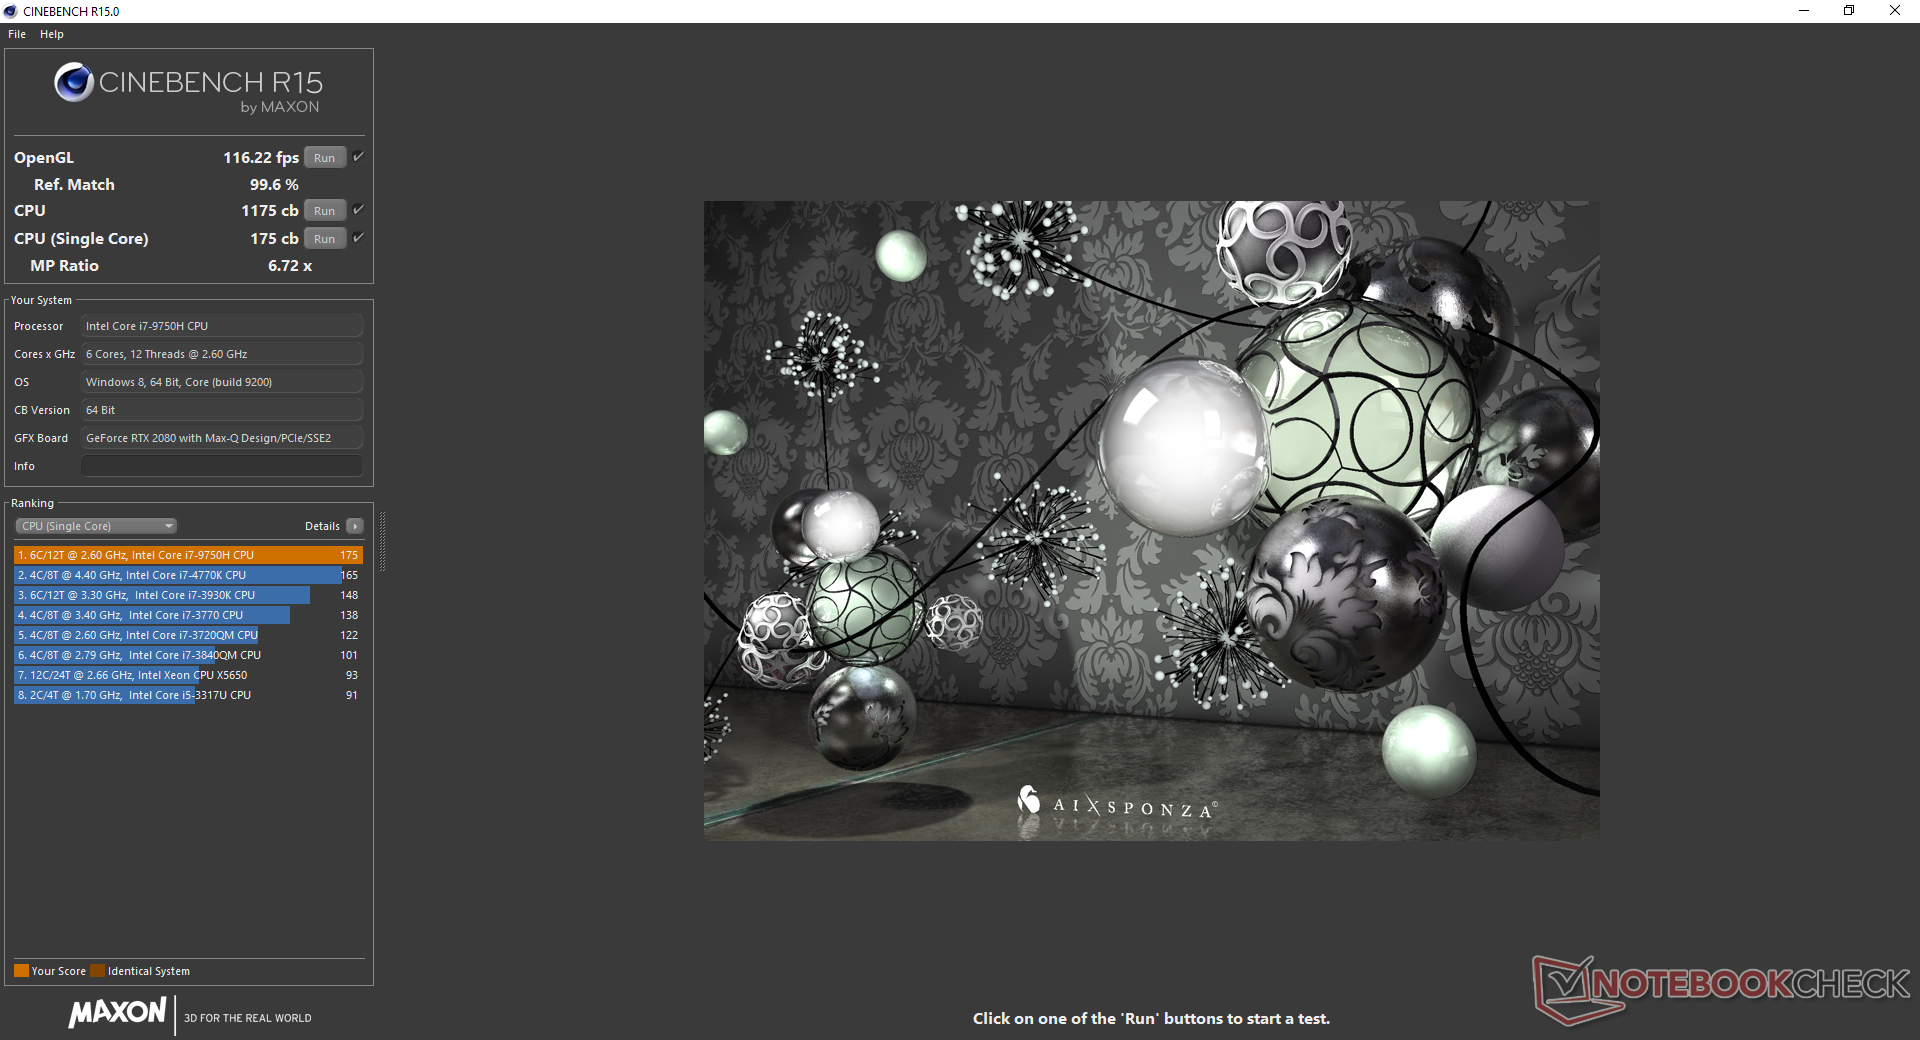
Multi-thread performance is roughly 18 percent faster than the Core i7-8750H in the older Blade 15 Advanced Model according to CineBench R15. When running CineBench R15 Multi-Thread in a loop, we can observe an 11 percent dip in performance to imply that maximum Turbo Boost clock rates are short-lived once again. Even so, the i7-9750H is able to maintain a slight performance advantage over the i7-8750H at all times even after accounting for any throttling as shown by our graph below.
Certain systems with the older Core i7-8750H can run faster than our i7-9750H should it offer better Turbo Boost sustainability. The Alienware m15, for example, is able to maintain a slight lead over the newer i7-9750H in our Razer at the cost of higher core temperatures.
See our dedicated page on the Core i7-9750H for more technical information and benchmark comparisons.
System Performance
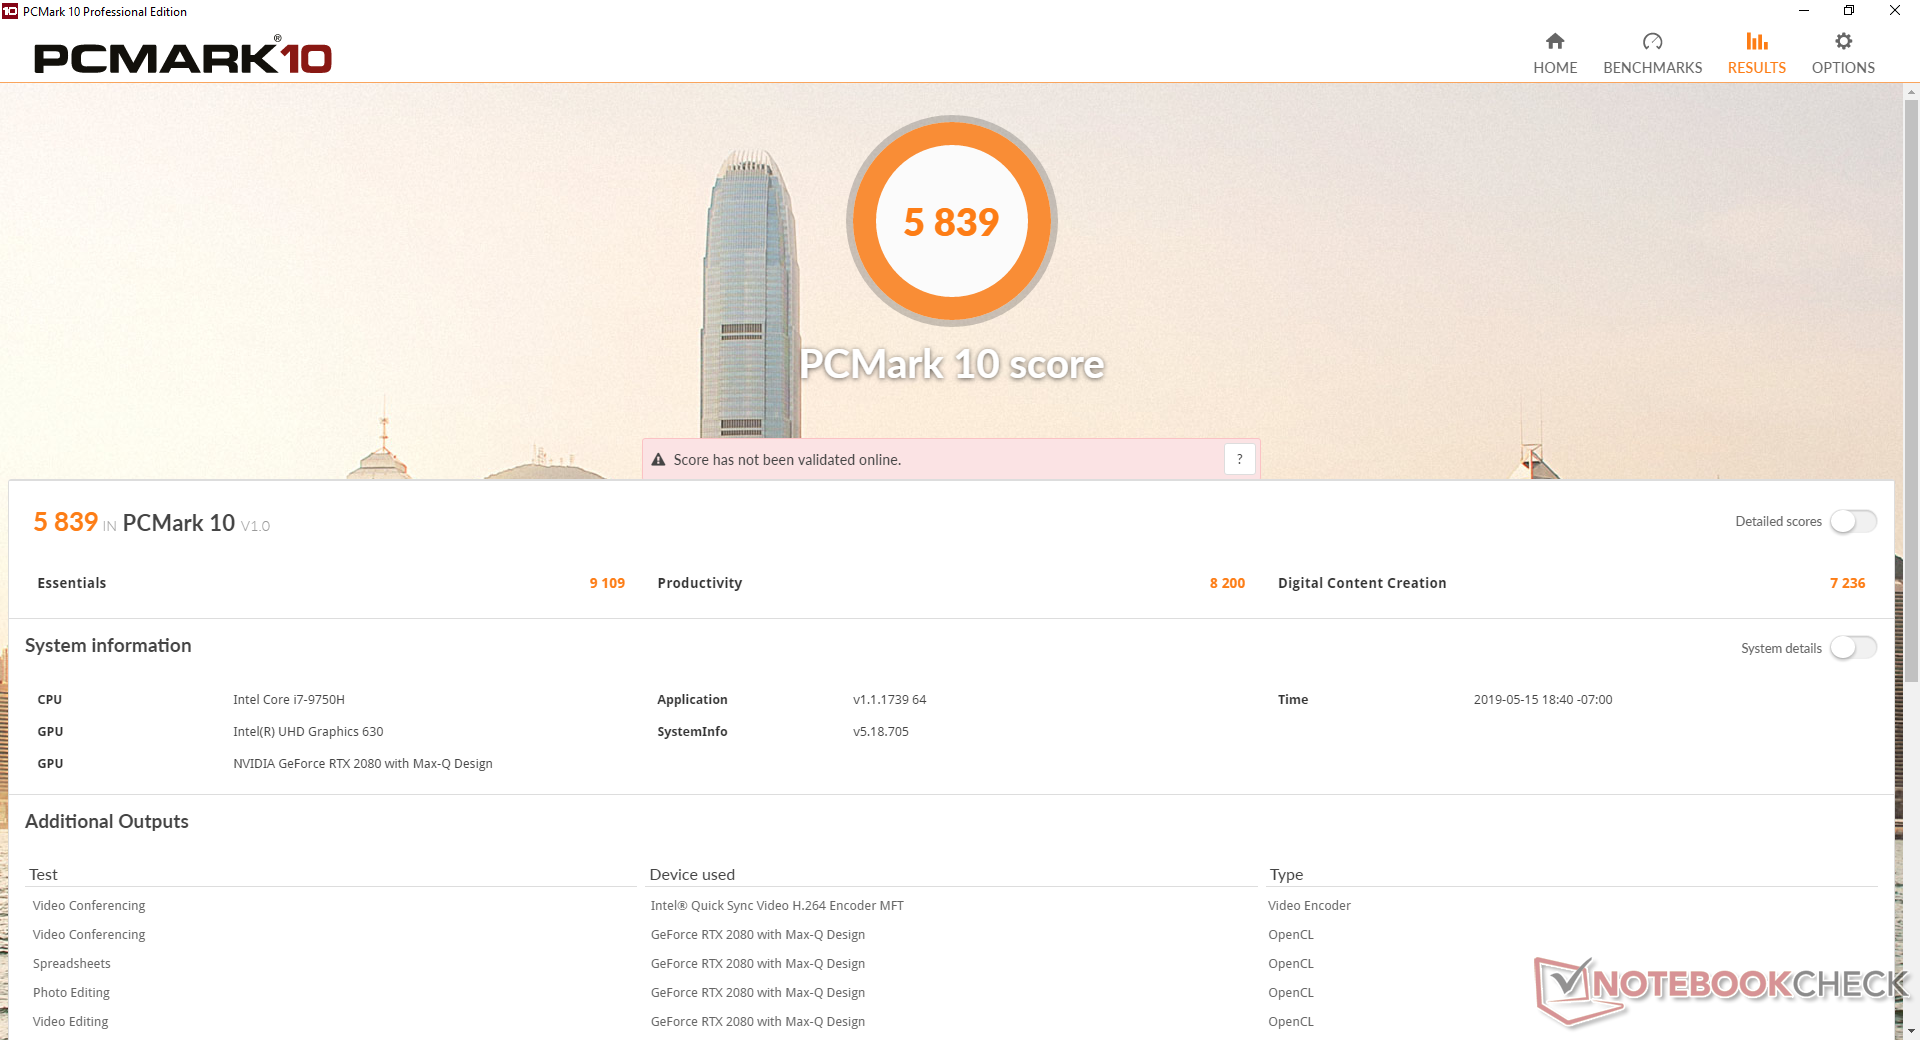
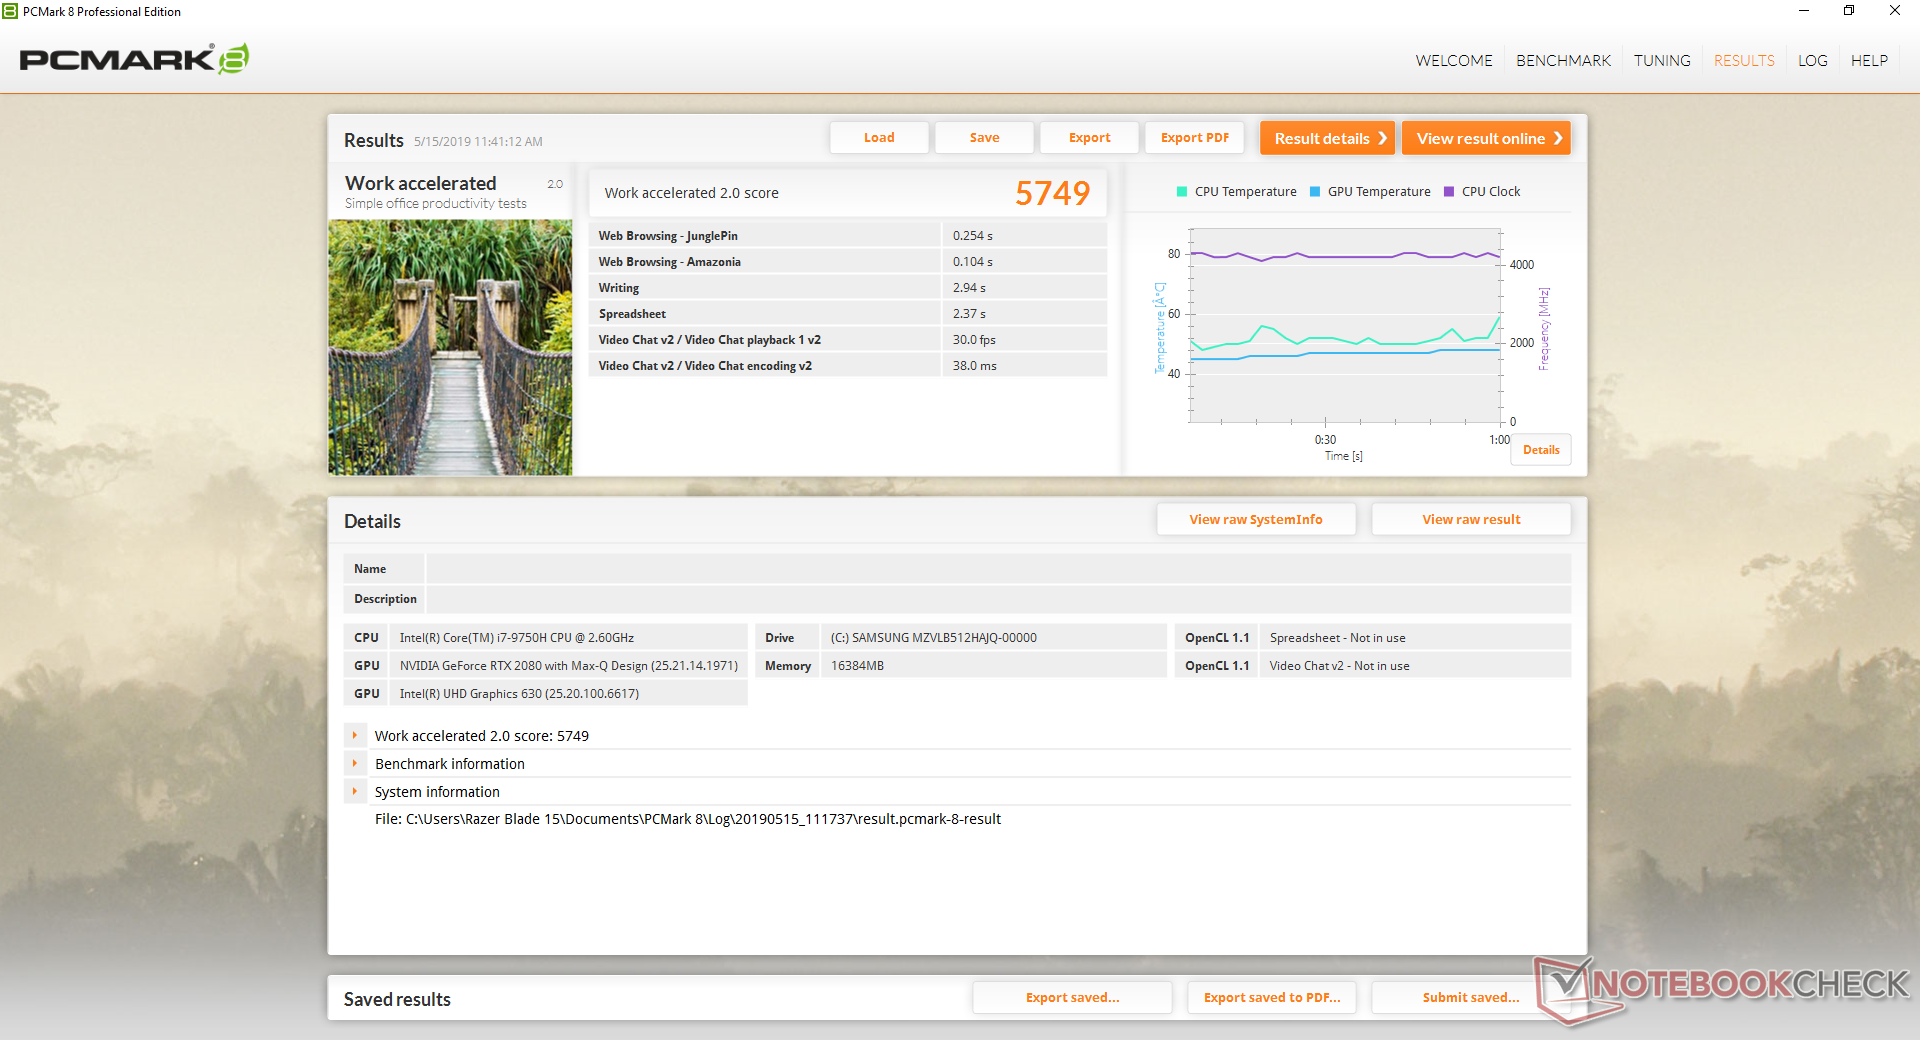
PCMark benchmarks rank our Blade 15 RTX 2080 Max-Q just slightly ahead of the Blade 15 RTX 2070 Max-Q by a few percentage points across the board. Even the Blade Stealth is just 8 percent behind in the Essentials benchmark meaning that users won't notice the performance advantage of the Blade 15 during day-to-day browsing until more demanding tasks are presented.
We experienced no software or hardware issues during our time with the test unit.
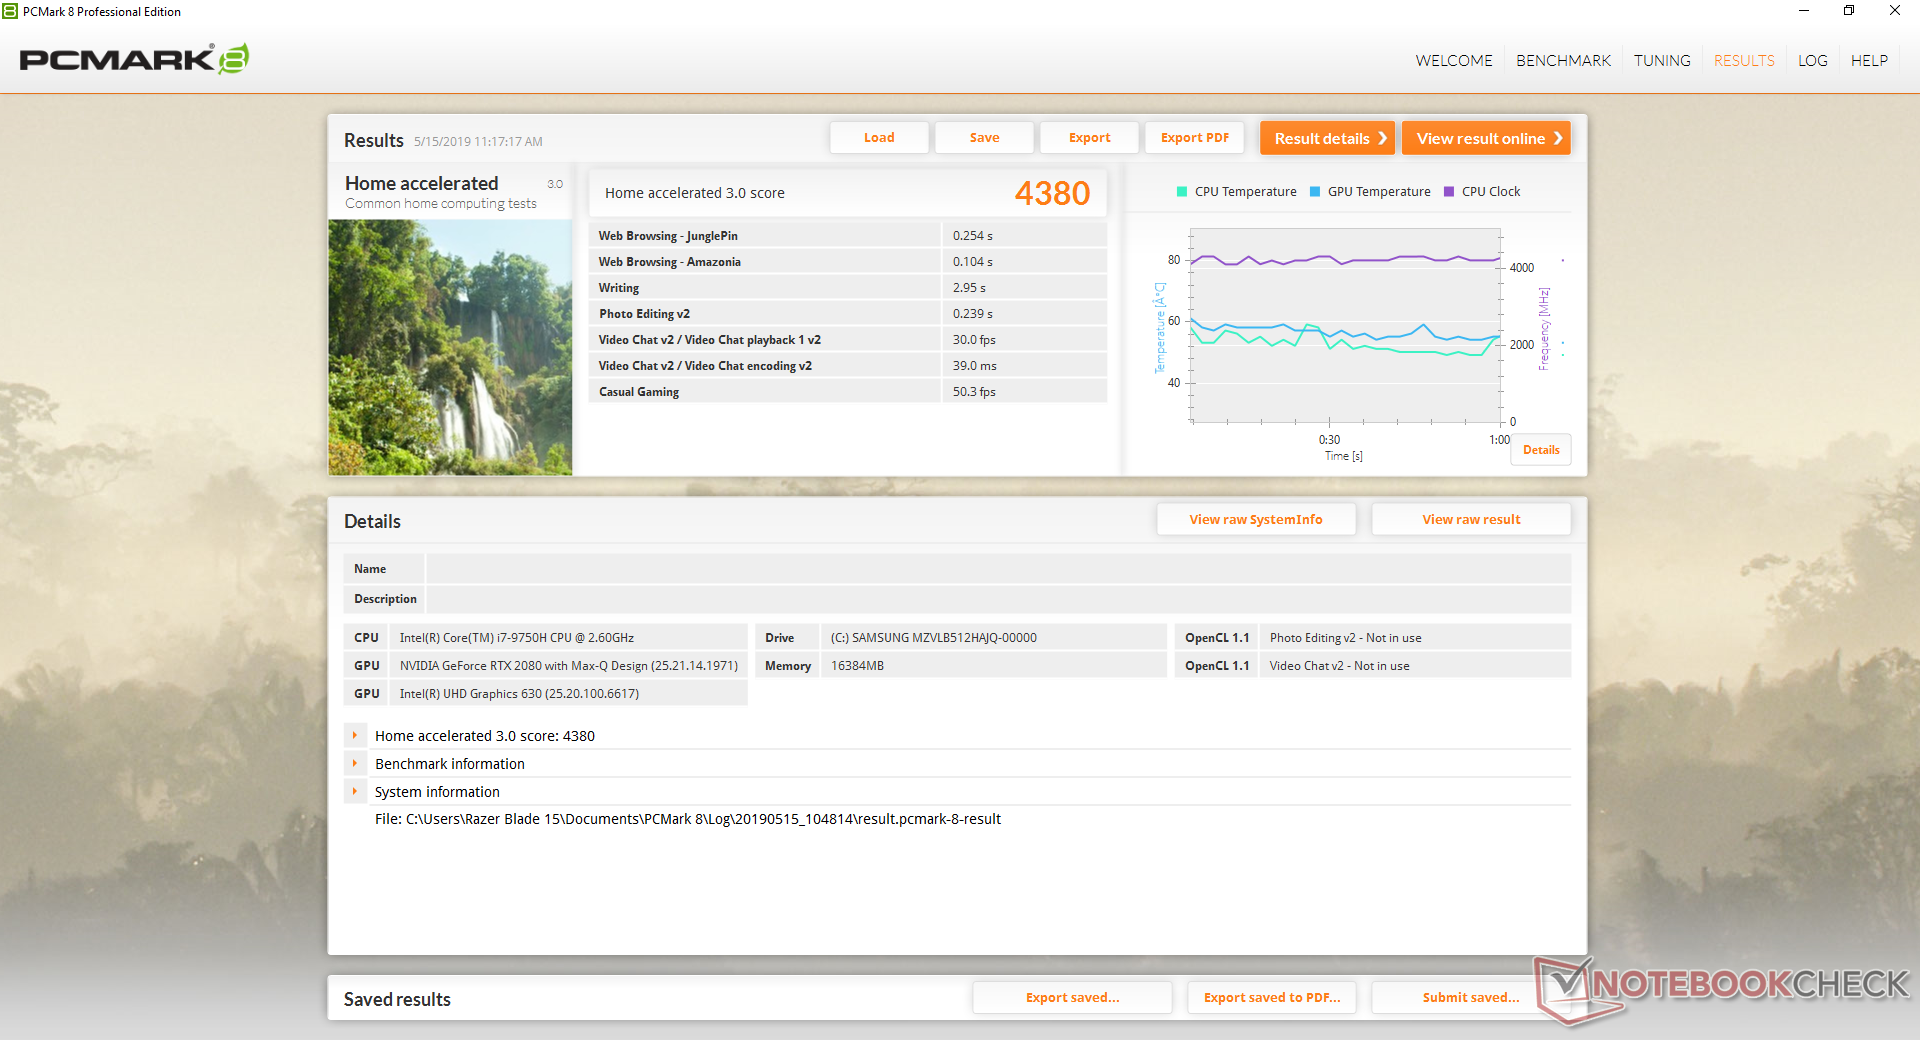
| PCMark 8 Home Score Accelerated v2 | 4380 points | |
| PCMark 8 Work Score Accelerated v2 | 5749 points | |
| PCMark 10 Score | 5839 points | |
Help | ||
Storage Devices
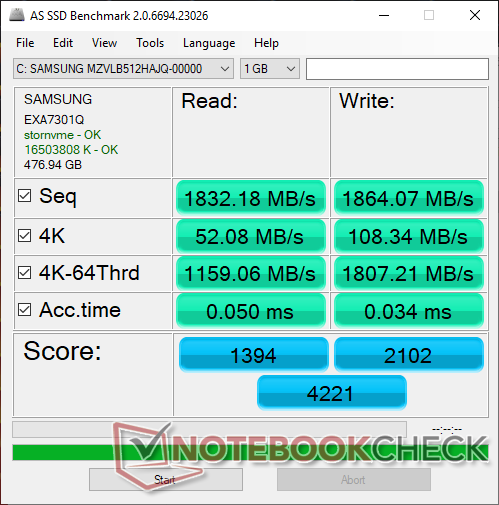
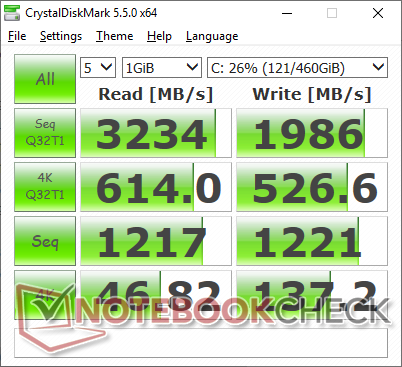
Unlike most other OEMs who source from multiple SSD manufacturers, we respect the fact that Razer sources most if not all of its SSDs from Samsung for its Blade 15 series. This means that you can expect to have a Samsung drive if purchasing a Blade laptop directly from Razer. Samsung drives are typically much faster when it comes to sequential write rates when compared to other NVMe SSDs from Toshiba, Lite-On, or others.
See our table of HDDs and SSDs for more benchmark comparisons.
| Razer Blade 15 RTX 2080 Max-Q Samsung SSD PM981 MZVLB512HAJQ | Razer Blade 15 RTX 2070 Max-Q Samsung SSD PM981 MZVLB512HAJQ | Alienware m15 GTX 1070 Max-Q Toshiba XG5 KXG50ZNV512G | Asus Zephyrus S GX502GW 2x Intel SSD 660p SSDPEKNW512G8 (RAID 0) | Apple MacBook Pro 15 2018 (2.6 GHz, 560X) Apple SSD AP0512 | |
|---|---|---|---|---|---|
| AS SSD | 1% | -43% | -21% | -76% | |
| Seq Read (MB/s) | 1832 | 1840 0% | 1967 7% | 2506 37% | 2239 22% |
| Seq Write (MB/s) | 1864 | 1822 -2% | 1135 -39% | 1712 -8% | 1644 -12% |
| 4K Read (MB/s) | 52.1 | 52.3 0% | 29.17 -44% | 48.32 -7% | 9.46 -82% |
| 4K Write (MB/s) | 108.3 | 110.7 2% | 93.4 -14% | 103.6 -4% | 18.78 -83% |
| 4K-64 Read (MB/s) | 1159 | 1126 -3% | 995 -14% | 624 -46% | 965 -17% |
| 4K-64 Write (MB/s) | 1807 | 1717 -5% | 656 -64% | 1253 -31% | 163.5 -91% |
| Access Time Read * (ms) | 0.05 | 0.047 6% | 0.116 -132% | 0.08 -60% | 0.225 -350% |
| Access Time Write * (ms) | 0.034 | 0.033 3% | 0.063 -85% | 0.04 -18% | |
| Score Read (Points) | 1394 | 1362 -2% | 1221 -12% | 923 -34% | 1199 -14% |
| Score Write (Points) | 2102 | 2010 -4% | 862 -59% | 1528 -27% | 347 -83% |
| Score Total (Points) | 4221 | 4079 -3% | 2667 -37% | 2896 -31% | 2119 -50% |
| Copy ISO MB/s (MB/s) | 2083 | 1975 -5% | 642 -69% | ||
| Copy Program MB/s (MB/s) | 496.5 | 526 6% | 431.5 -13% | ||
| Copy Game MB/s (MB/s) | 977 | 1200 23% | 706 -28% |
* ... smaller is better

GPU Performance
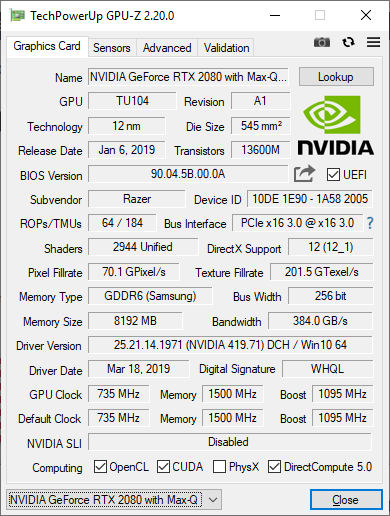
The RTX 2080 Max-Q in the Razer is performing exactly where we expect it to be when compared to the 8 other 2080 Max-Q laptops in our database at the time of writing. Thus, Razer hasn't slyly reduced its performance in any way unlike what we observed on the older 2017 Blade Pro with the GTX 1080. Users can expect about 10 to 20 percent slower performance when compared to a laptop with a regular RTX 2080 and roughly 10 to 17 percent faster performance than the RTX 2070 Max-Q. Anyone upgrading from the old GTX 1060 will see an even greater performance boost by over 2x in DX12 titles.
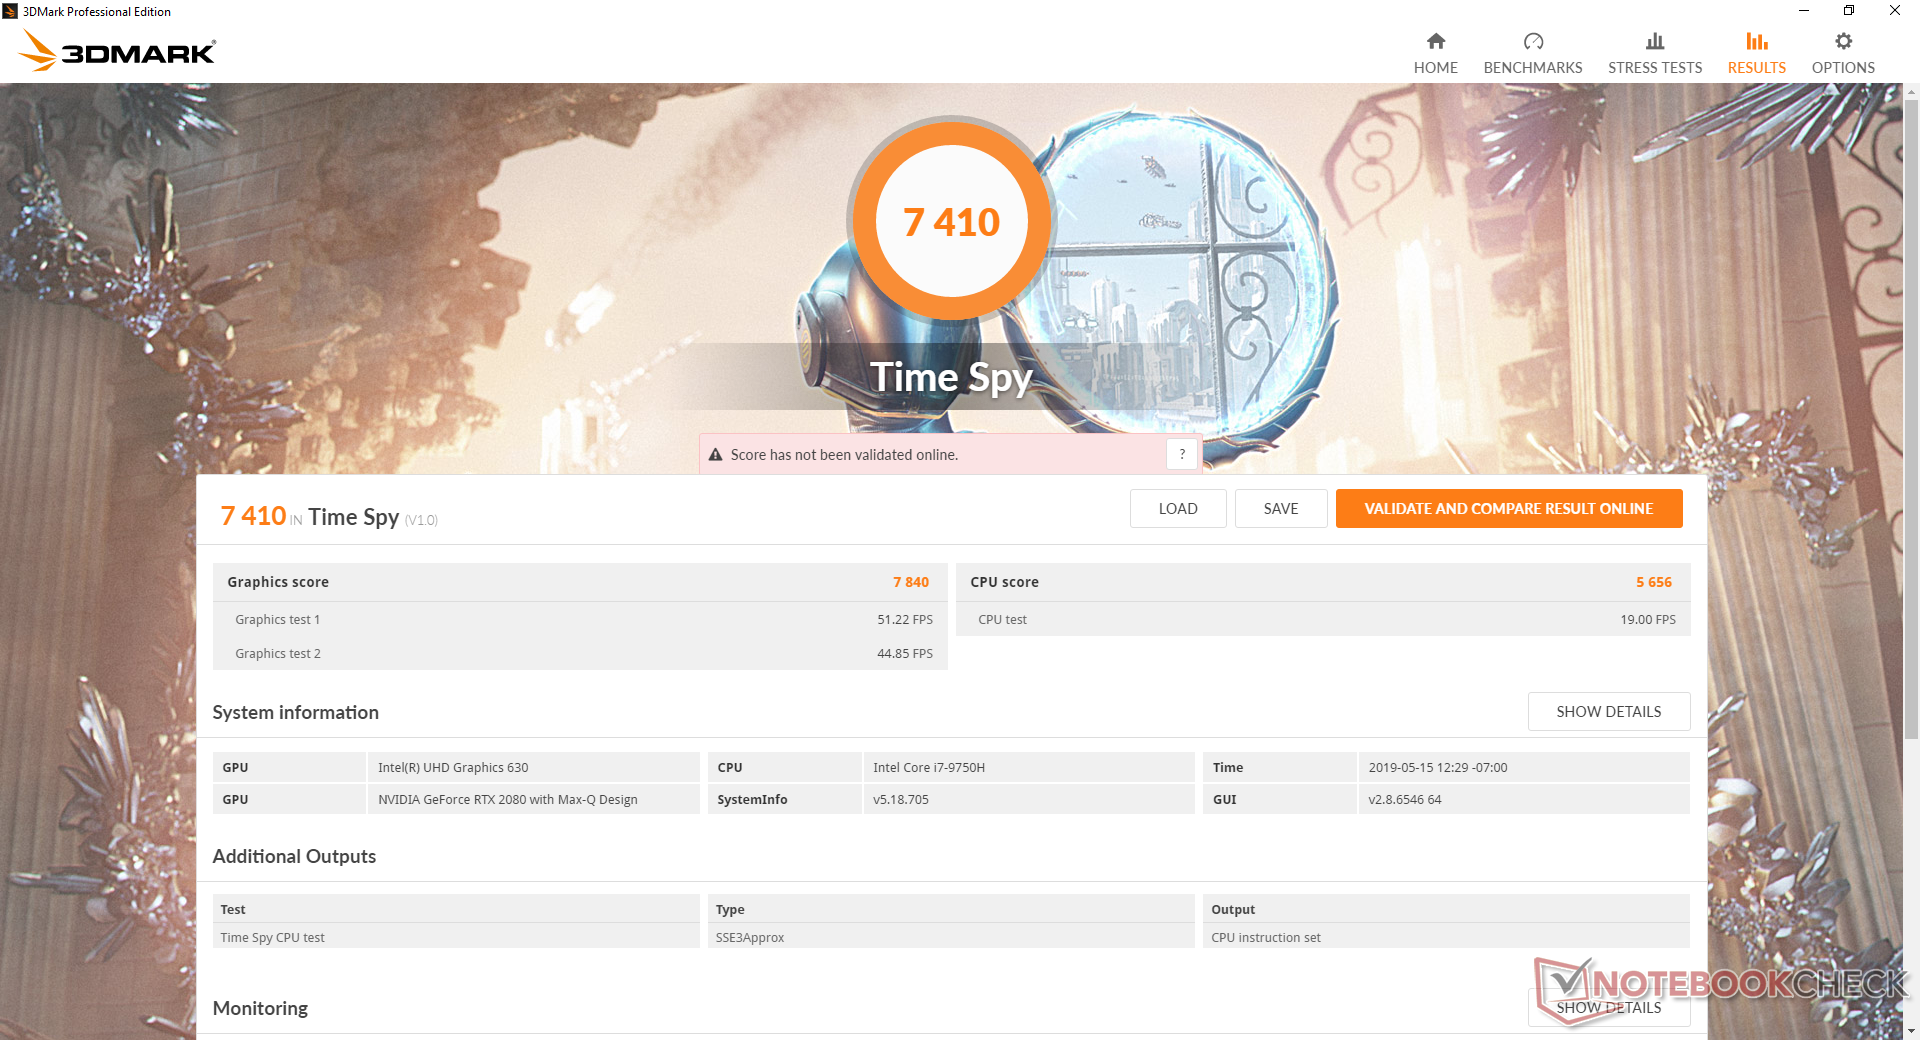
Remember to enable Gaming mode via the Synapse software for maximum performance. This setting is annoyingly independent of the Windows power profiles and so it must be toggled manually. Running 3DMark Time Spy when not in Gaming mode results in a Graphics score of 7250 points compared to 7840 points when Gaming mode is toggled on.
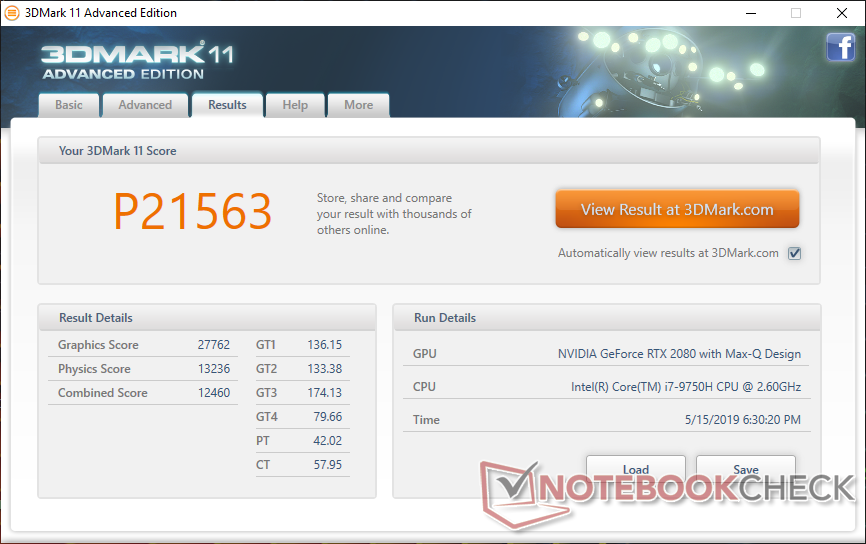

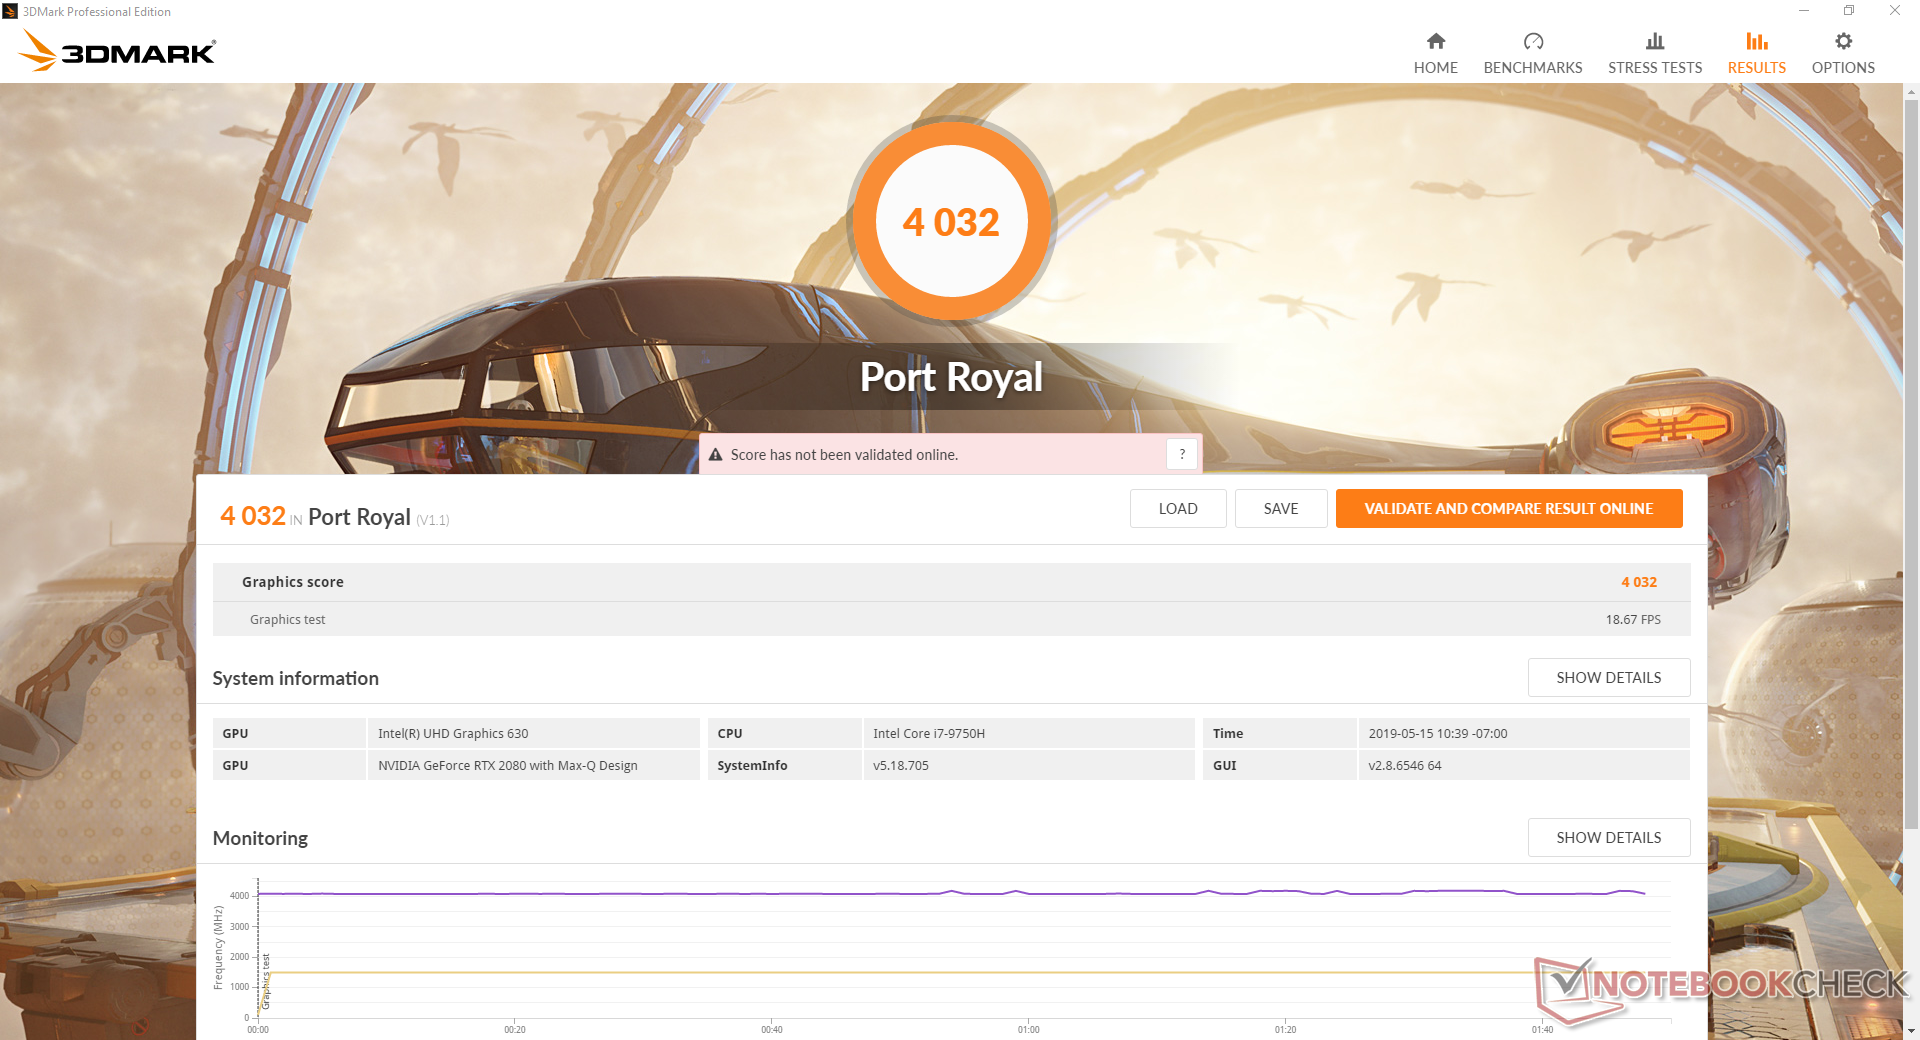
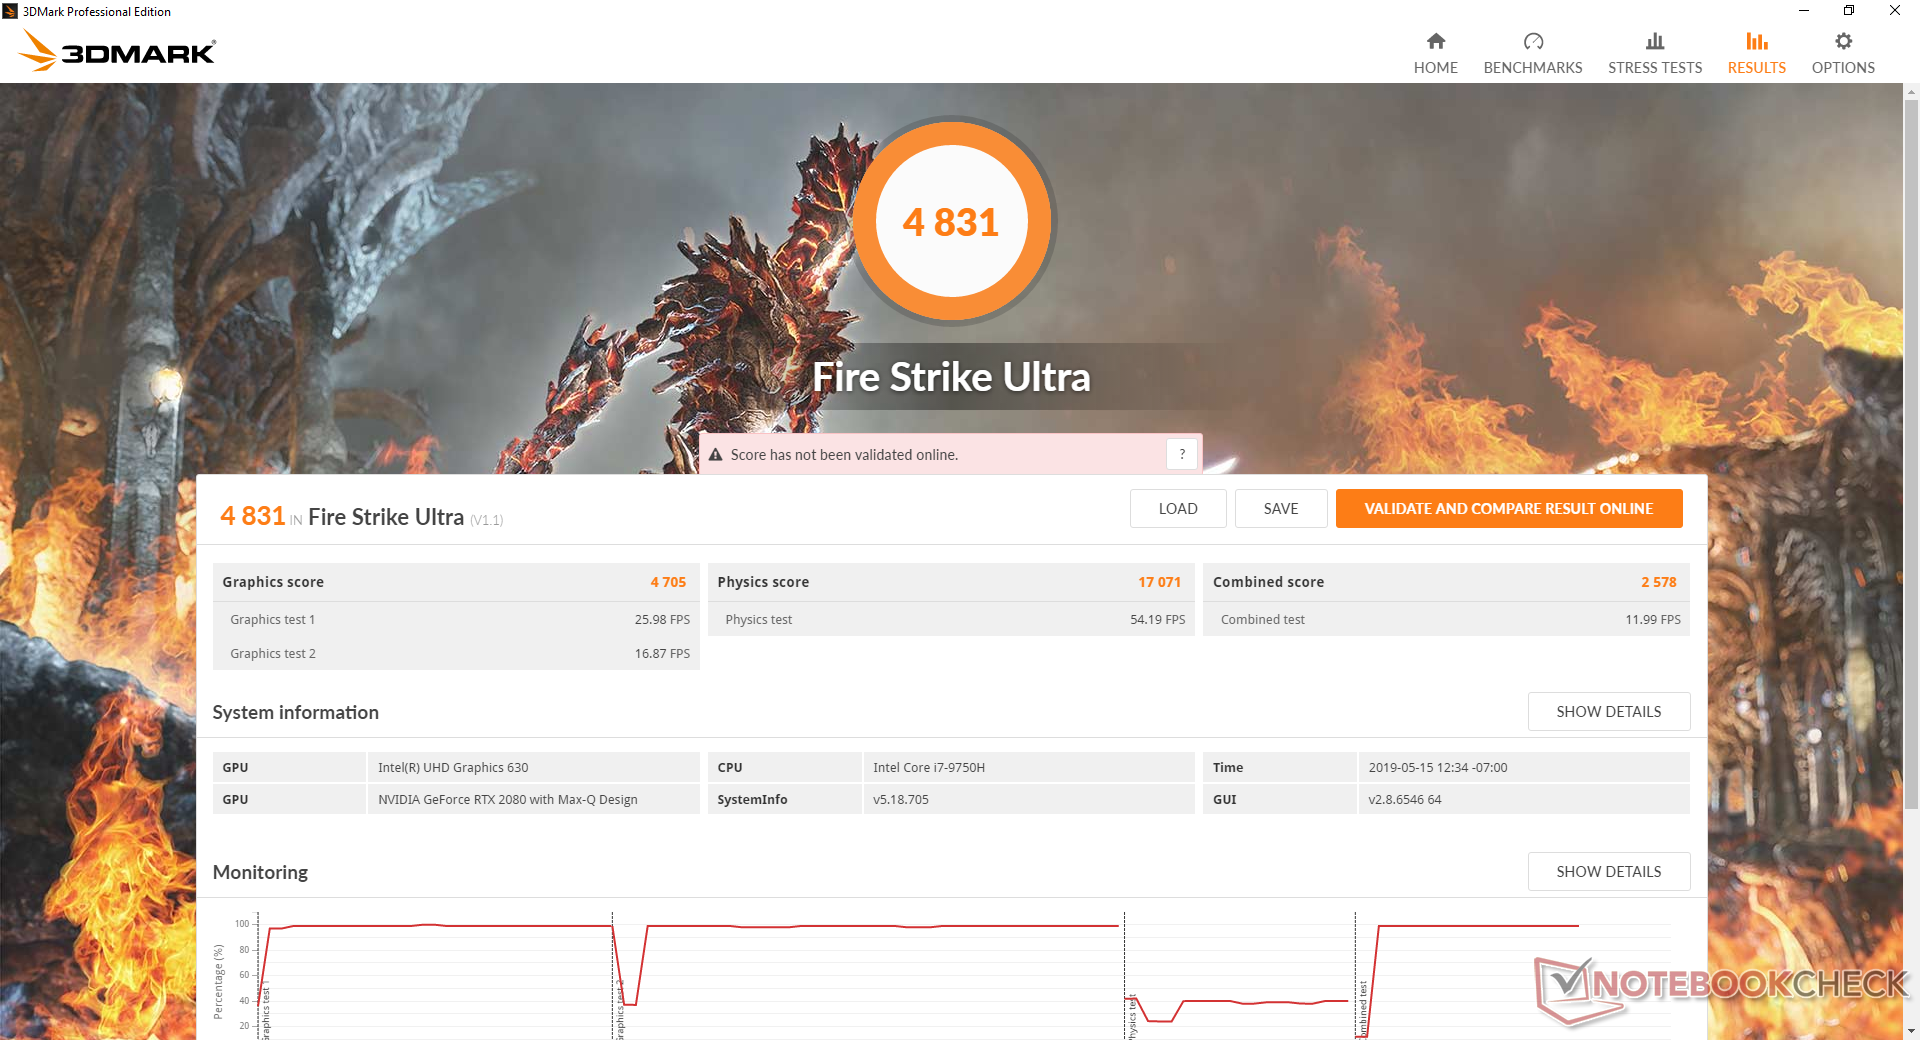
| 3DMark 11 Performance | 21563 points | |
| 3DMark Cloud Gate Standard Score | 32108 points | |
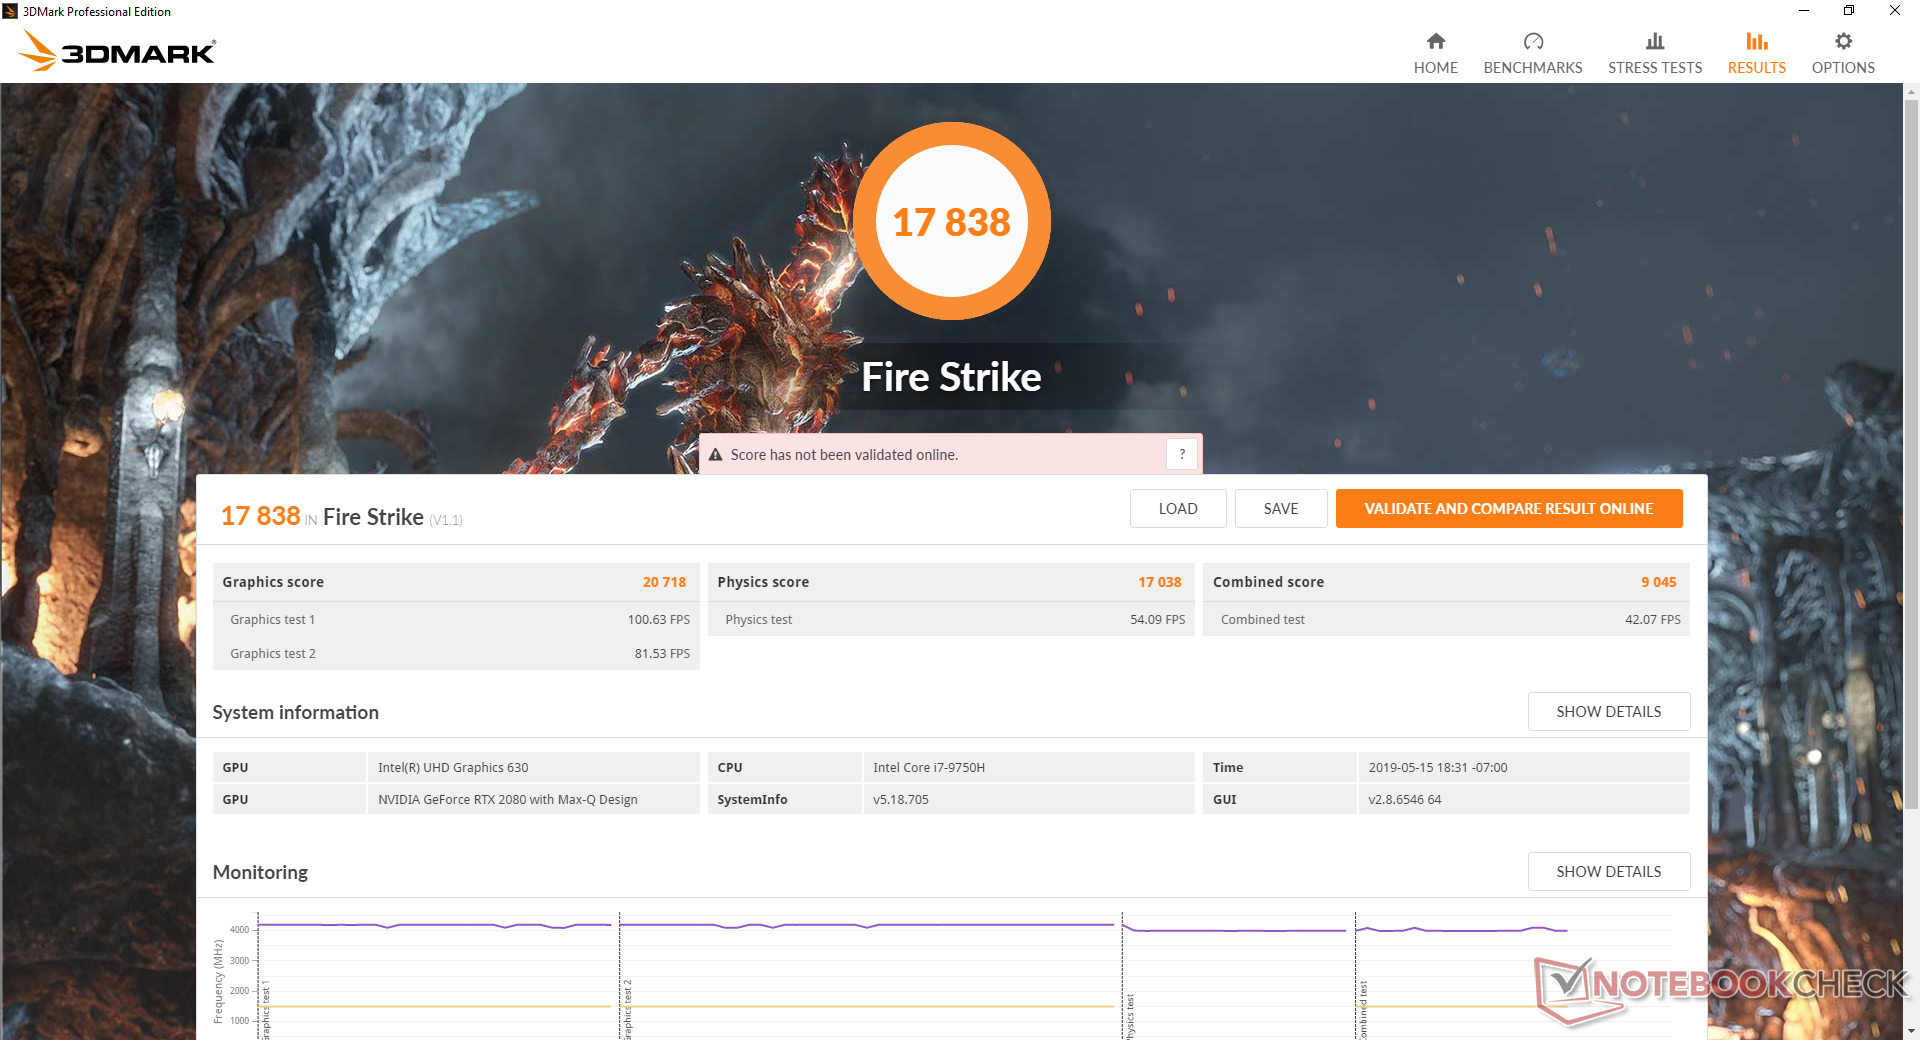
| 3DMark Fire Strike Score | 17838 points | |
| 3DMark Time Spy Score | 7410 points | |
Help | ||
Gaming Performance
Frame rates from our 9th gen Core i7 Intel and RTX 2080 Max-Q Razer laptop are essentially identical to the Asus Zephyrus S GX701GX with the same GPU but an older 8th gen Core i7 Intel. Put simply, the new Intel 9th gen Core i7 CPU won't make much of a difference when gaming despite the 14 to 18 percent gain in multi-thread performance.
Aiming for a stable 240 FPS is unrealistic on most titles save for less demanding titles like Rocket League or Fortnite where Medium 1080p settings are recommended. Users can still exploit the advantages of a 240 Hz panel by aiming for lower frame rates divisible by 240 that would have otherwise been inadvisable on a 60 Hz or 144 Hz panel. For example, users can now lock frame rates at 40, 48, 80, or 120 FPS without introducing screen tearing or requiring G-Sync.
See our dedicated page on the GeForce RTX 2080 Max-Q for more technical information and benchmark comparisons. Idling on Witcher 3 shows no recurring frame drops to suggest no interrupting background activities during gameplay.
| The Witcher 3 - 1920x1080 Ultra Graphics & Postprocessing (HBAO+) | |
| MSI GE75 9SG | |
| Average NVIDIA GeForce RTX 2080 Max-Q (65.7 - 92.7, n=22) | |
| Razer Blade 15 RTX 2080 Max-Q | |
| Razer Blade 15 RTX 2070 Max-Q | |
| Alienware m15 GTX 1070 Max-Q | |
| Schenker Compact 15 | |
| MSI GS65 Stealth Thin 8RE-051US | |
| Acer Aspire Nitro 5 AN515-54-53Z2 | |
| Razer Blade Stealth i7-8565U | |
| low | med. | high | ultra | |
|---|---|---|---|---|
| BioShock Infinite (2013) | 323.8 | 280.2 | 262 | 170 |
| The Witcher 3 (2015) | 273.9 | 227.6 | 146.6 | 78.3 |
| Rise of the Tomb Raider (2016) | 239.5 | 174.7 | 143.8 | 126 |
Emissions
System Noise
Fan noise and behavior have barely changed from the Blade 15 RTX 2070 Max-Q SKU despite having the faster RTX 2080 Max-Q. When gaming, expect a constant fan noise of 42 dB(A) and 45 dB(A) with Gaming mode toggled off and on, respectively. The system is still quieter than what we've recorded on the Alienware m15, Zephyrus S GX502, and Dell XPS 15 when running the same Witcher 3 load.
Fan pulsing is not an issue and we can notice no coil whine from our test unit. At worst, expect a fan noise of just 32.6 dB(A) during everyday tasks like browsing, emailing, or video streaming when on the Power Saver or Balanced profile settings.
| Razer Blade 15 RTX 2080 Max-Q GeForce RTX 2080 Max-Q, i7-9750H, Samsung SSD PM981 MZVLB512HAJQ | Razer Blade 15 RTX 2070 Max-Q GeForce RTX 2070 Max-Q, i7-8750H, Samsung SSD PM981 MZVLB512HAJQ | Alienware m15 GTX 1070 Max-Q GeForce GTX 1070 Max-Q, i7-8750H, Toshiba XG5 KXG50ZNV512G | Asus Zephyrus S GX502GW GeForce RTX 2070 Mobile, i7-9750H, 2x Intel SSD 660p SSDPEKNW512G8 (RAID 0) | Apple MacBook Pro 15 2018 (2.6 GHz, 560X) Radeon Pro 560X, i7-8850H, Apple SSD AP0512 | MSI GS65 Stealth Thin 8RE-051US GeForce GTX 1060 Mobile, i7-8750H, Samsung SSD PM981 MZVLB256HAHQ | Dell XPS 15 9570 Core i9 UHD GeForce GTX 1050 Ti Max-Q, i9-8950HK, Samsung SSD PM981 MZVLB1T0HALR | |
|---|---|---|---|---|---|---|---|
| Noise | -1% | -6% | -22% | -6% | -5% | -2% | |
| off / environment * (dB) | 28.3 | 28.8 -2% | 28.6 -1% | 30 -6% | 29.6 -5% | 28.4 -0% | 28.2 -0% |
| Idle Minimum * (dB) | 28.8 | 28.8 -0% | 28.6 1% | 31 -8% | 30.1 -5% | 28.4 1% | 28.5 1% |
| Idle Average * (dB) | 28.8 | 28.8 -0% | 28.6 1% | 33 -15% | 30.1 -5% | 28.4 1% | 28.6 1% |
| Idle Maximum * (dB) | 29 | 29.4 -1% | 28.6 1% | 38 -31% | 30.1 -4% | 29.6 -2% | 28.8 1% |
| Load Average * (dB) | 33.5 | 35.7 -7% | 40.8 -22% | 50 -49% | 46.8 -40% | 43.5 -30% | 36.2 -8% |
| Witcher 3 ultra * (dB) | 45 | 42.5 6% | 49.6 -10% | 53 -18% | 36 20% | 45.7 -2% | 47.6 -6% |
| Load Maximum * (dB) | 45.2 | 45 -0% | 49.6 -10% | 56 -24% | 46.8 -4% | 45.7 -1% | 47.6 -5% |
* ... smaller is better
Noise level
| Idle |
| 28.8 / 28.8 / 29 dB(A) |
| Load |
| 33.5 / 45.2 dB(A) |
 | ||
30 dB silent 40 dB(A) audible 50 dB(A) loud |
||
min: | ||
Temperature
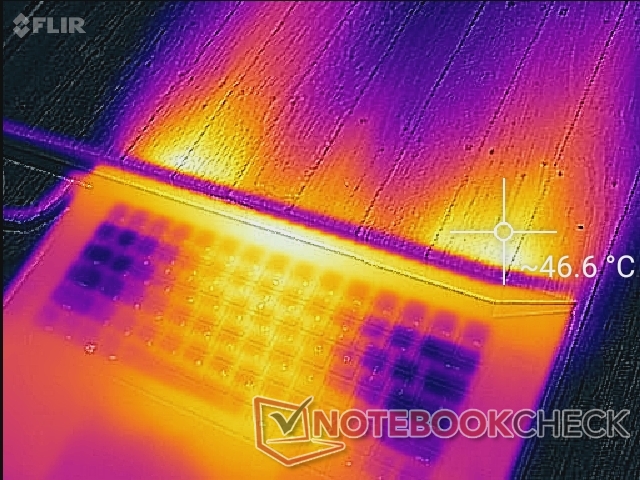
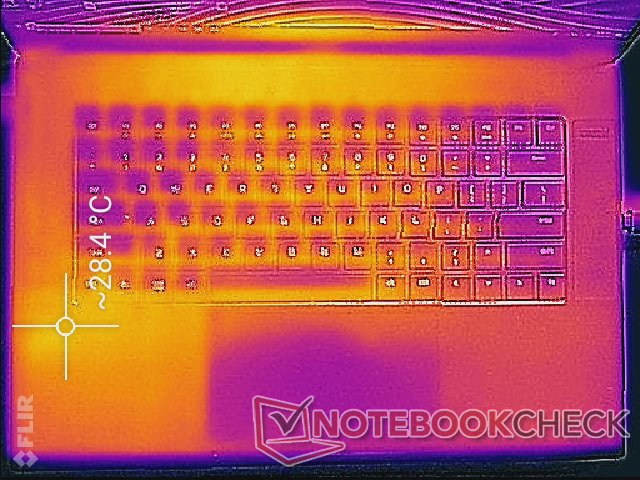
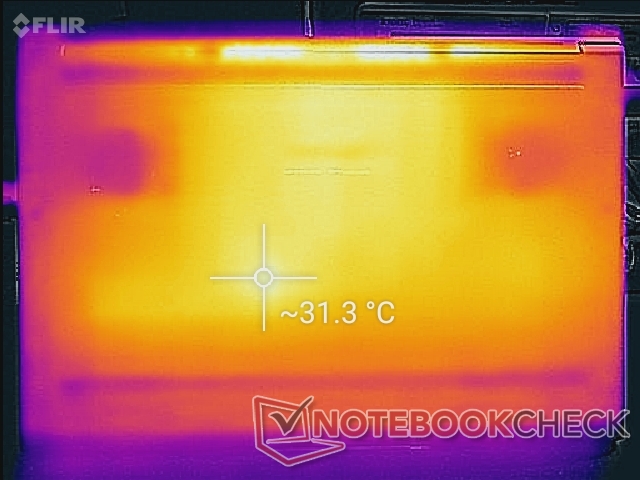
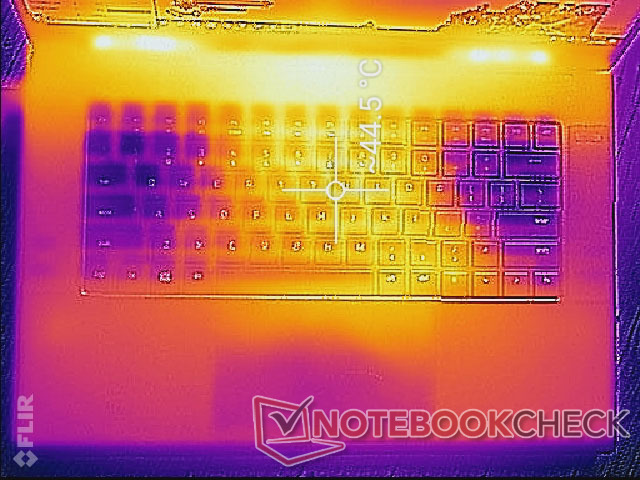
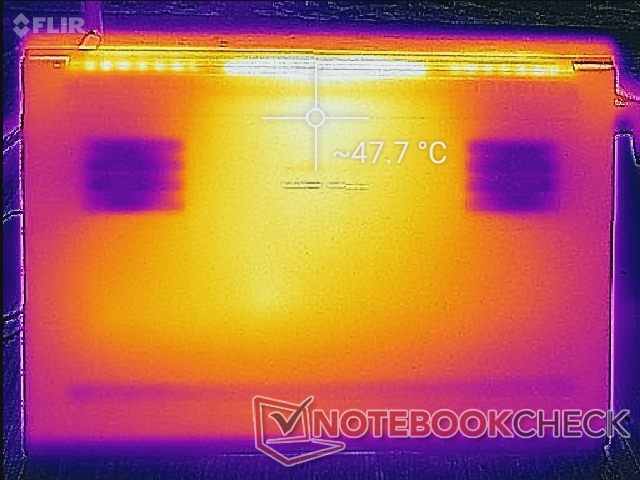
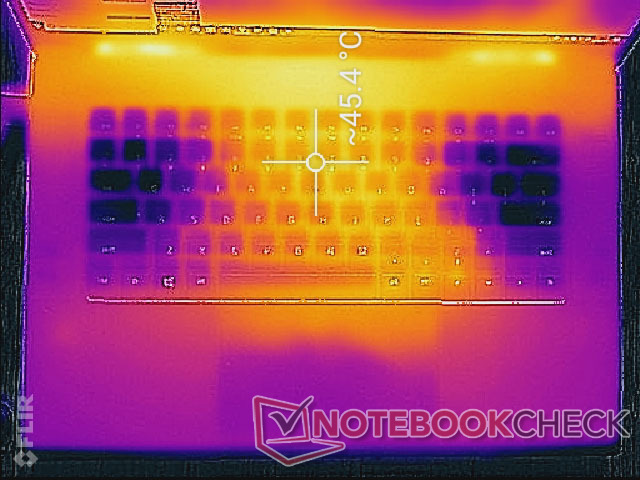
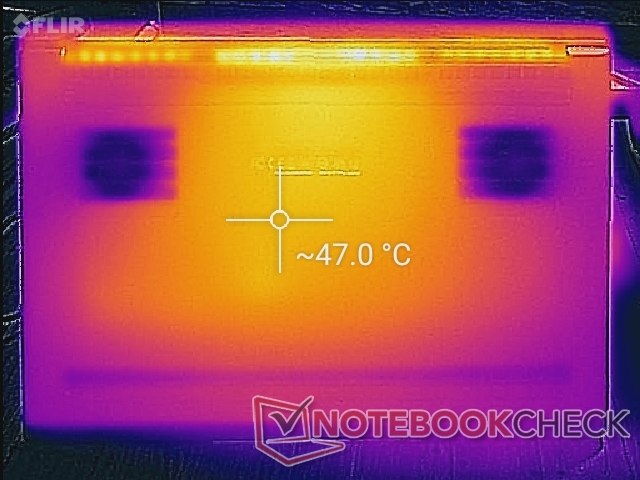
Surface temperatures are essentially identical to the Blade 15 RTX 2070 Max-Q. When under higher processing loads, the palm rests and center of the keyboard can become as warm as 35 C and 44 C, respectively. The hot spots toward the rear of the unit can reach 50 C, but this is thankfully far away from user hands. We appreciate the fact that the fans pull cool air from the WASD keys to keep your fingers cool when gaming. Other laptops with discrete GPUs like the Huawei MateBook 14 are much warmer around this area.
Ventilation grilles line nearly the entire length of the rear of the chassis. Be sure to leave ample airflow around the back when gaming.
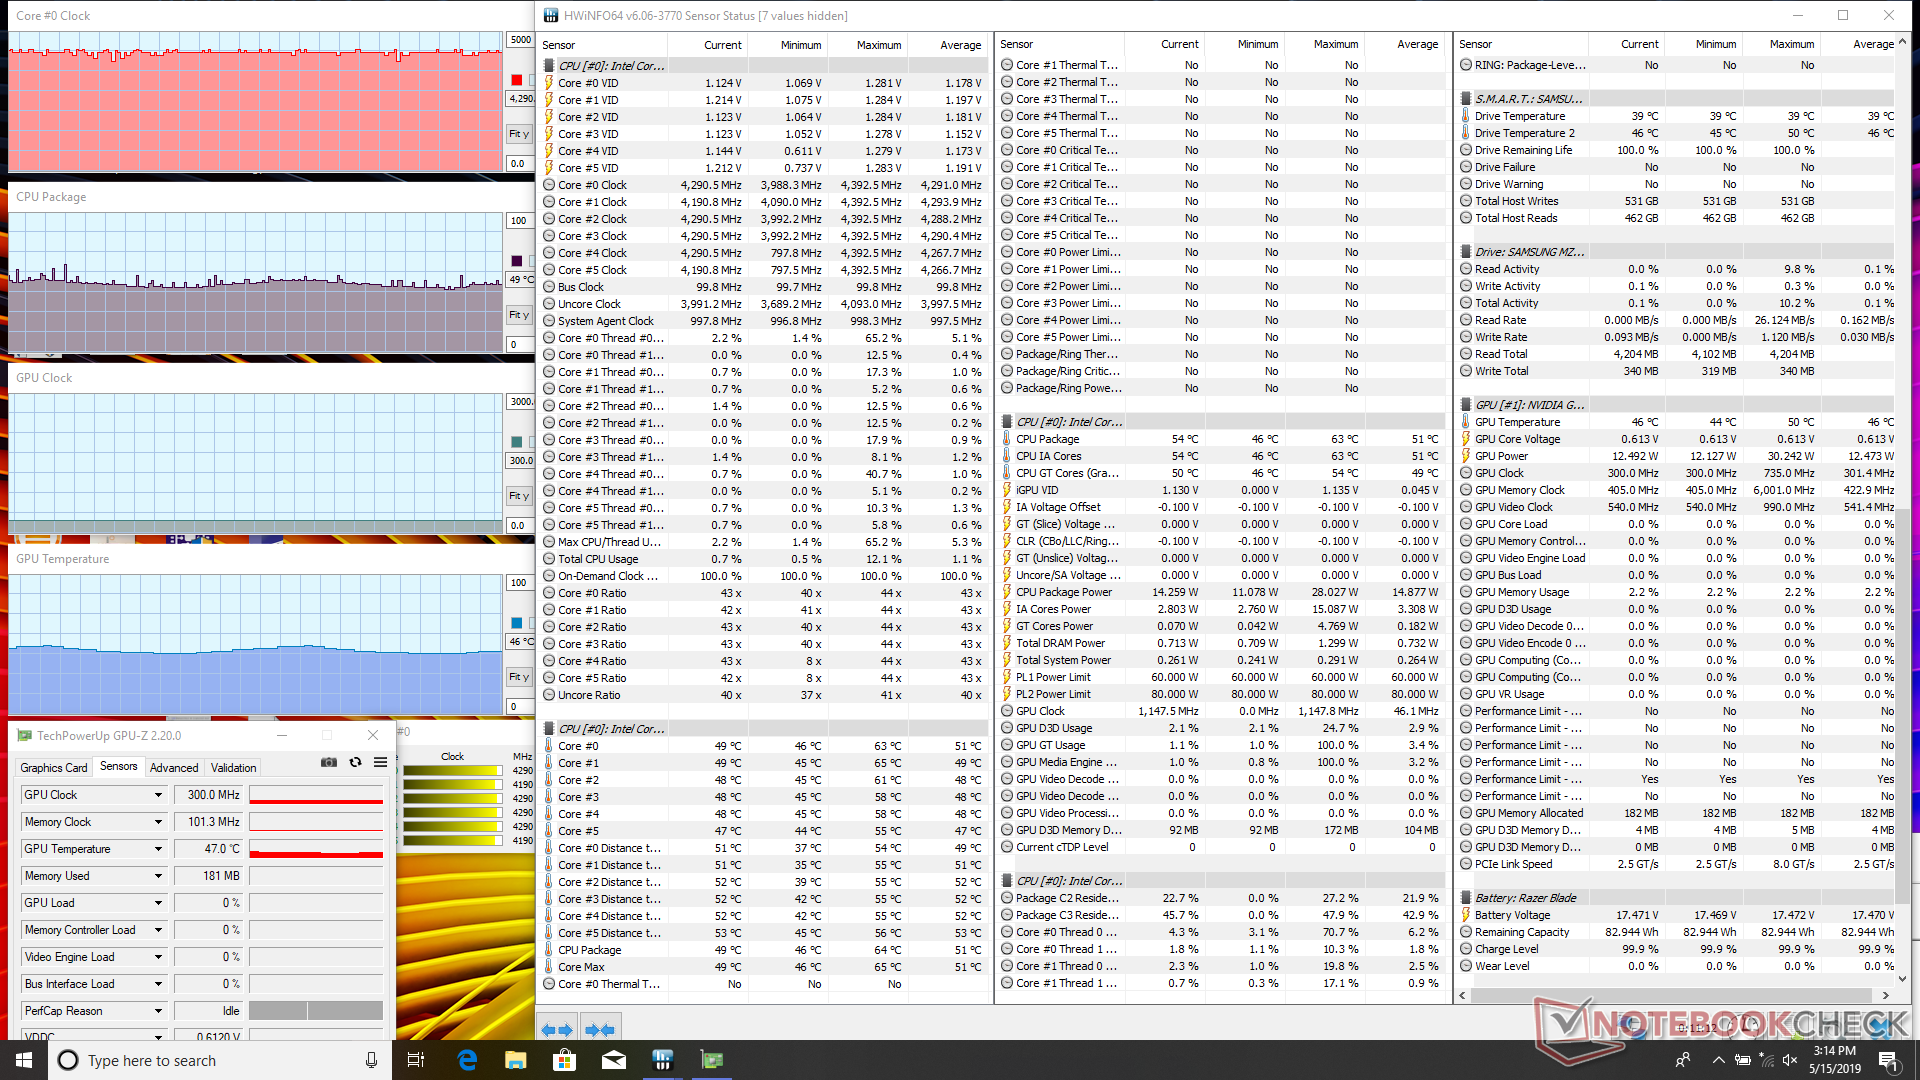
Stress Test
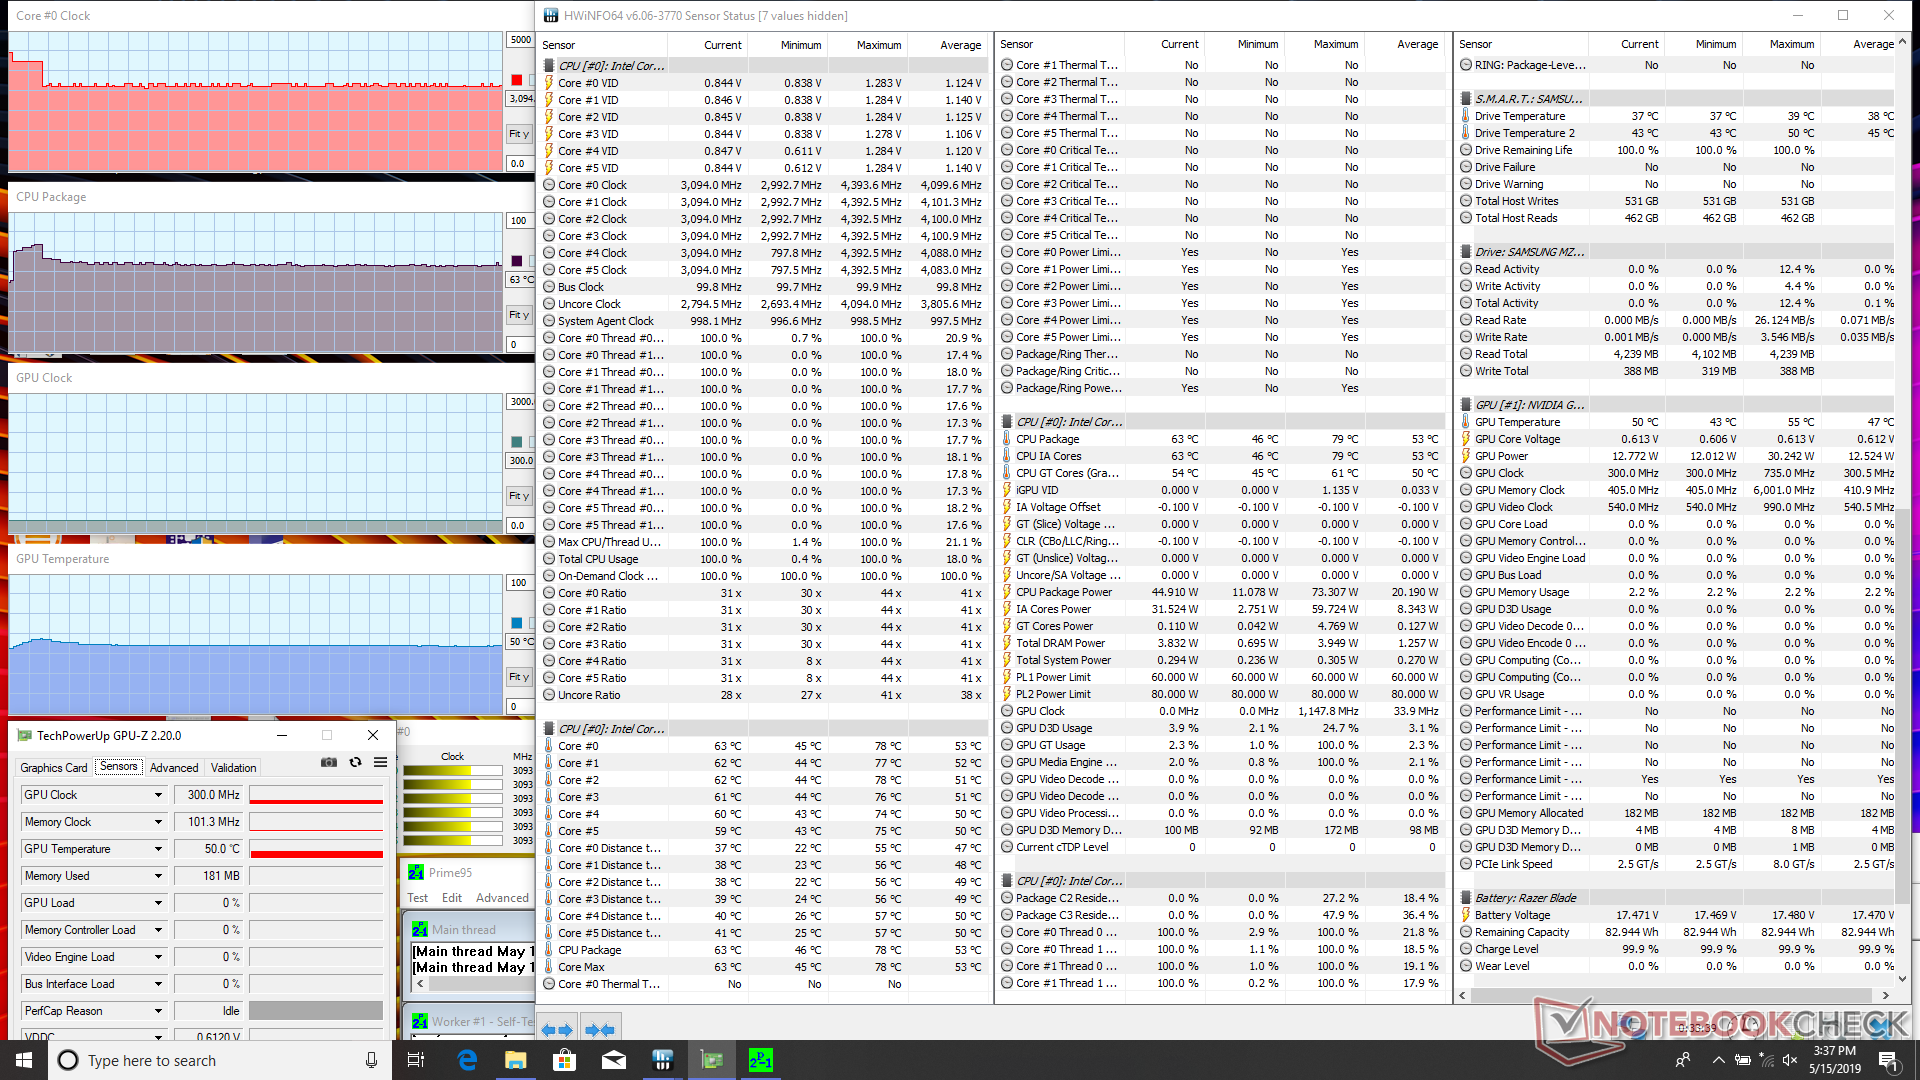
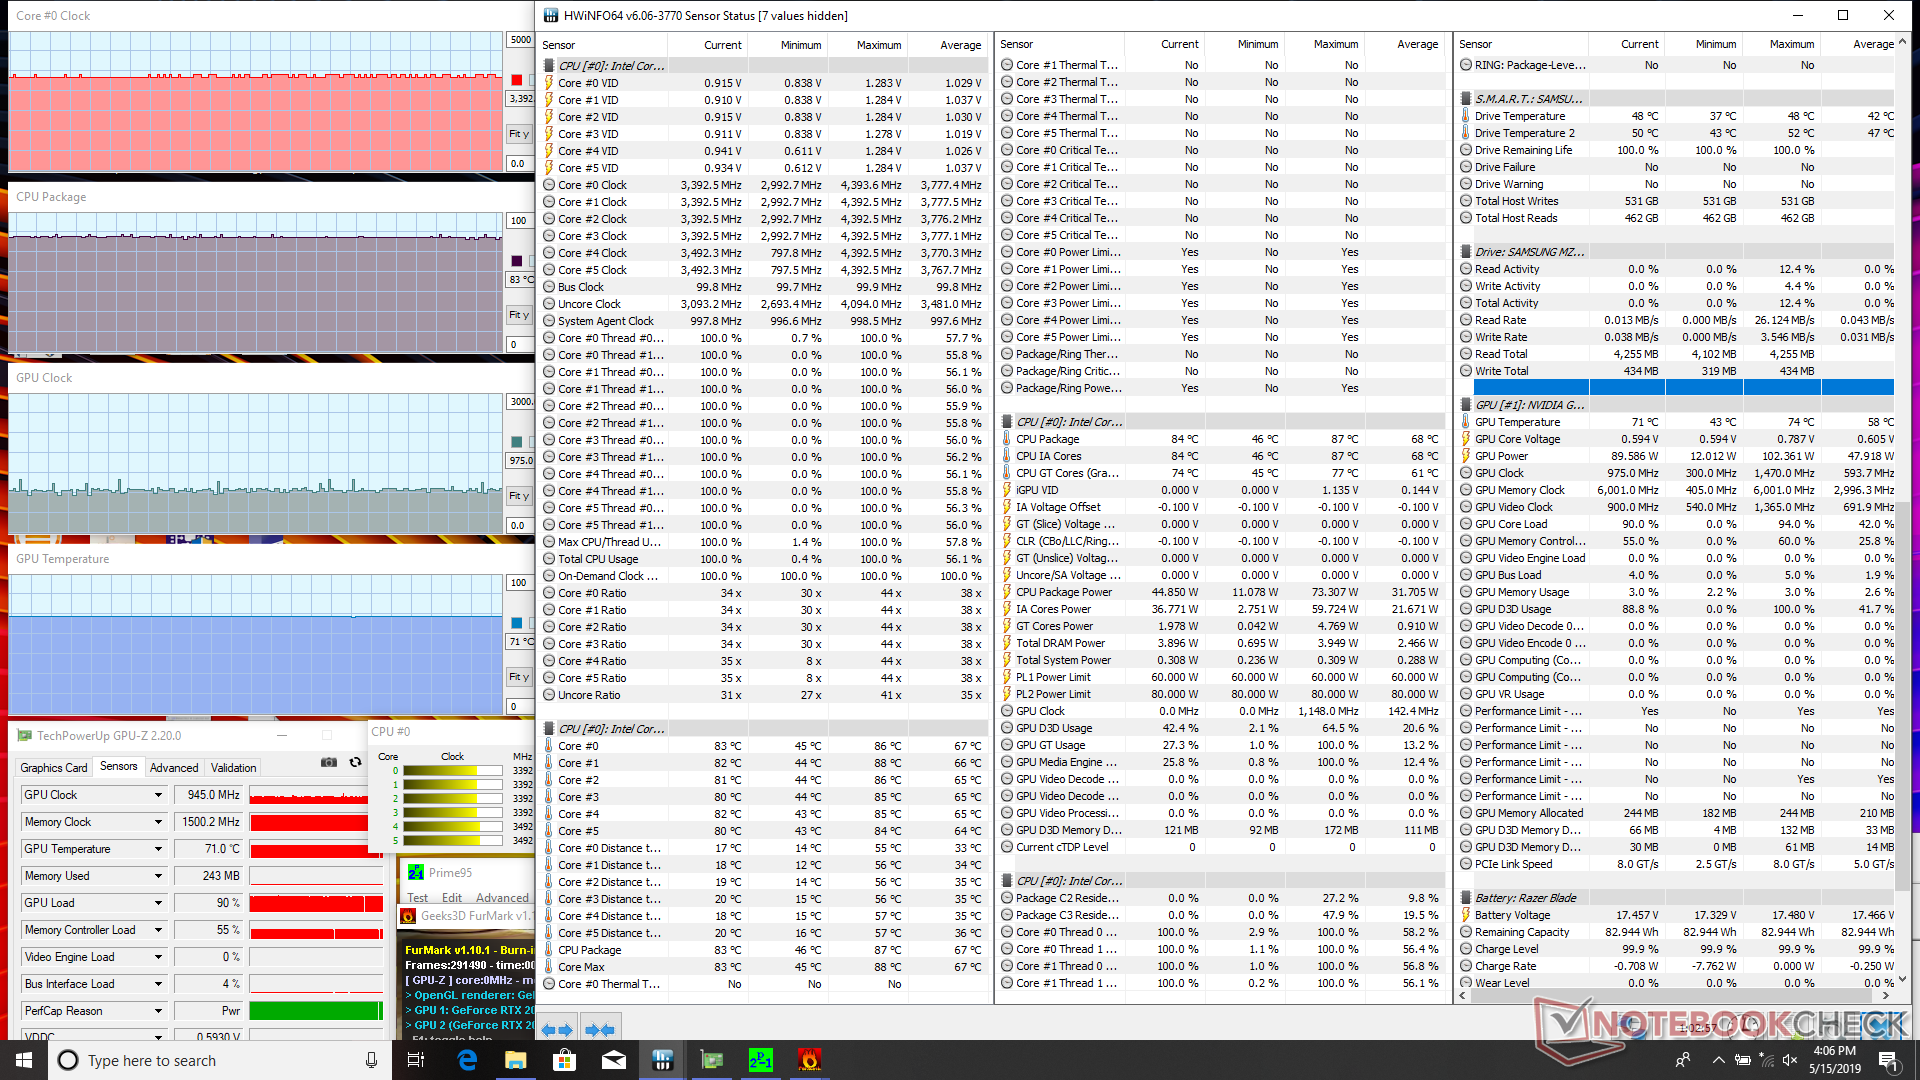
We stress the system with synthetic loads to identify for any potential throttling or stability issues. When running Prime95 to stress the CPU, we can observe an initial clock rate jump to 4.0 GHz until core temperature hits 78 C. Thereafter, clock rates drop and stabilize at 3.1 GHz in order to maintain a cooler core temperature of 63 C. This is cooler than we were expecting as running both Prime95 and FurMark simultaneously will actually cause the CPU to run faster and at higher core temperatures. For reasons unbeknownst to us, the Blade 15 tops out at just 3.1 GHz when running only Prime95 even though it is capable of maintaining faster clock rates.
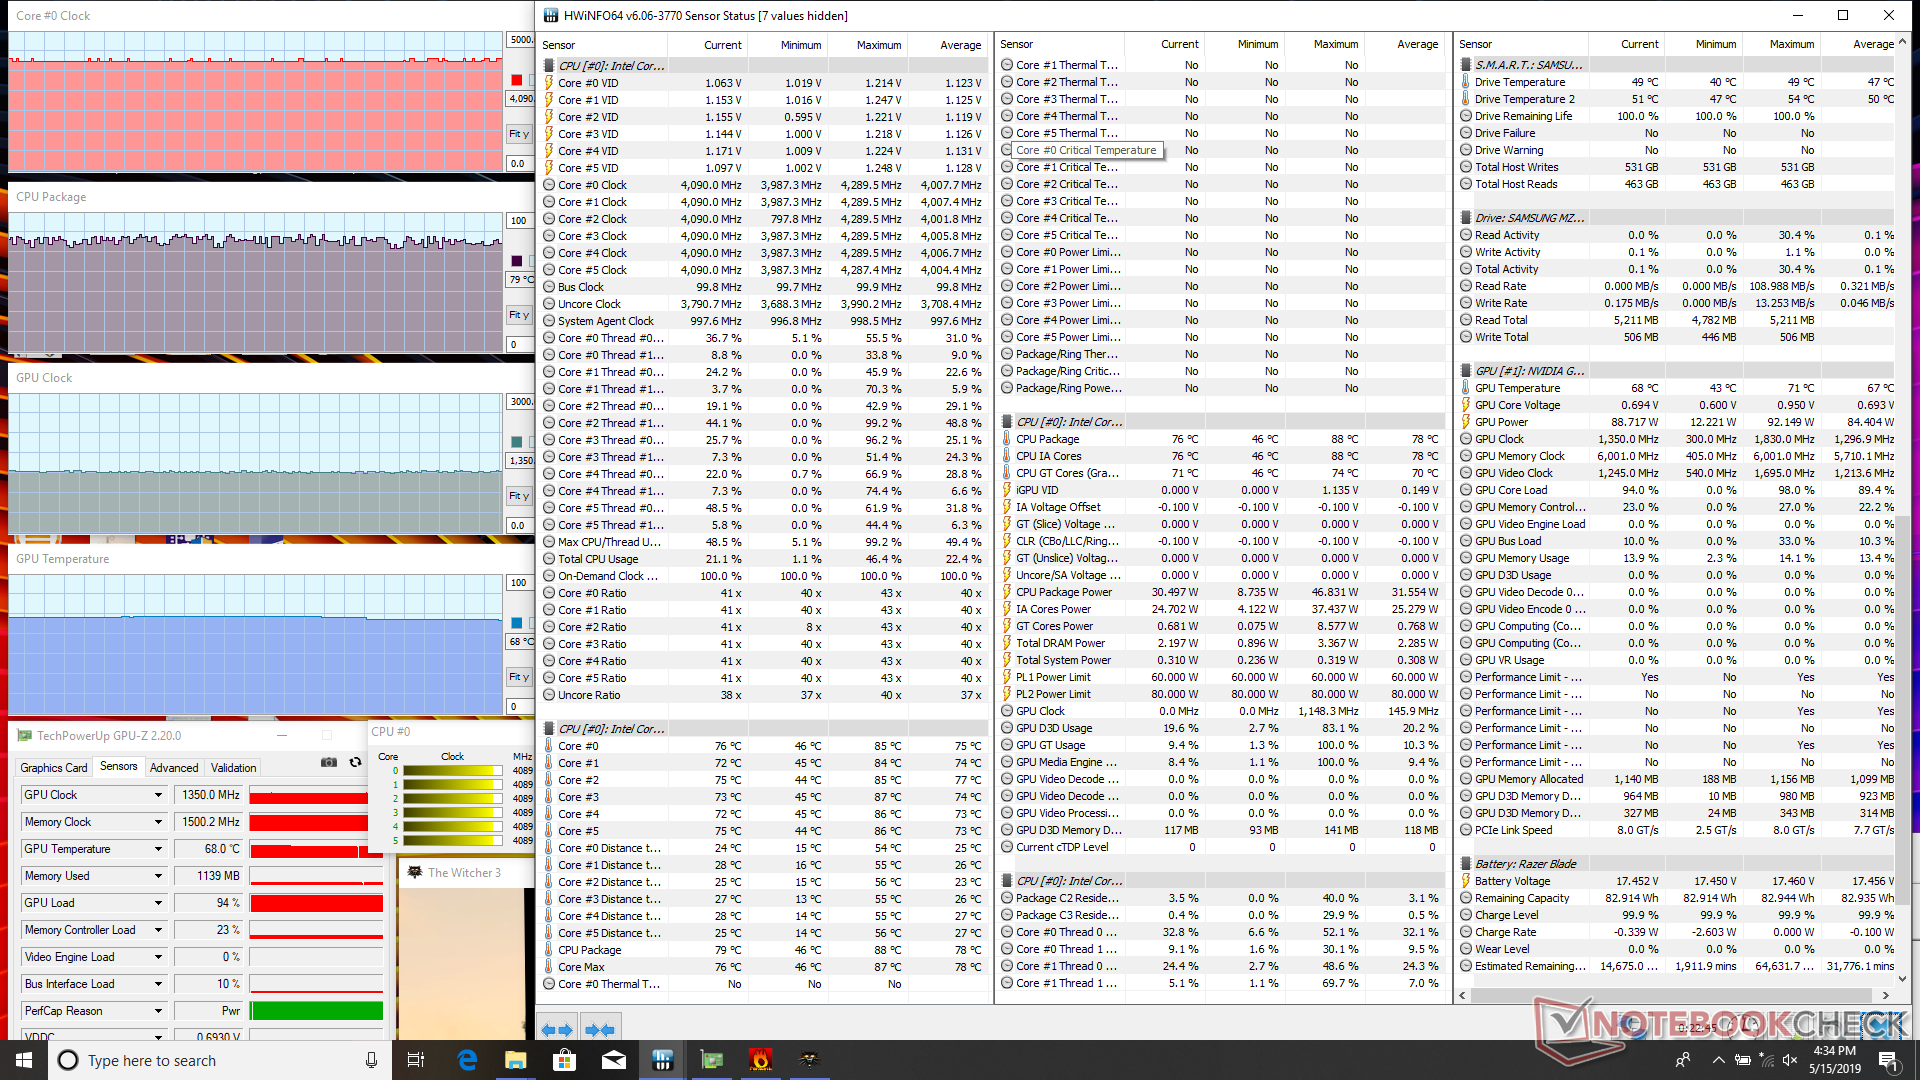
Running Witcher 3 is more representative of real-world gaming loads. The CPU and GPU stabilize at 79 C and 69 C, respectively, compared to 80 C and 74 C on the Blade 15 with RTX 2070 Max-Q when under similar conditions. Clock rates are slower on the RTX 2080 Max-Q when compared to the RTX 2070 Max-Q which it makes up for by having more shader cores.
Running on battery power will still reduce overall performance. A 3DMark Fire Strike run on batteries returns Physics and Graphics scores of 3535 and 11292 points, respectively, compared to 17038 and 20718 points when on mains.
| CPU Clock (GHz) | GPU Clock (MHz) | Average CPU Temperature (°C) | Average GPU Temperature (°C) | |
| System Idle | -- | -- | 49 | 46 |
| Prime95 Stress | 3.1 | -- | 63 | -- |
| Prime95 + FurMark Stress | 3.4 - 3.5 | 945 | 83 | 71 |
| Witcher 3 Stress | 4.1 | 1350 | 79 | 69 |
(-) The maximum temperature on the upper side is 47 °C / 117 F, compared to the average of 40.4 °C / 105 F, ranging from 21.2 to 68.8 °C for the class Gaming.
(-) The bottom heats up to a maximum of 49.2 °C / 121 F, compared to the average of 43.2 °C / 110 F
(+) In idle usage, the average temperature for the upper side is 27.5 °C / 82 F, compared to the device average of 33.9 °C / 93 F.
(±) Playing The Witcher 3, the average temperature for the upper side is 37.5 °C / 100 F, compared to the device average of 33.9 °C / 93 F.
(±) The palmrests and touchpad can get very hot to the touch with a maximum of 36 °C / 96.8 F.
(-) The average temperature of the palmrest area of similar devices was 28.8 °C / 83.8 F (-7.2 °C / -13 F).
Speakers

Razer Blade 15 RTX 2080 Max-Q audio analysis
(+) | speakers can play relatively loud (83.8 dB)
Bass 100 - 315 Hz
(±) | reduced bass - on average 10.7% lower than median
(±) | linearity of bass is average (11.3% delta to prev. frequency)
Mids 400 - 2000 Hz
(±) | higher mids - on average 5.7% higher than median
(+) | mids are linear (5.4% delta to prev. frequency)
Highs 2 - 16 kHz
(±) | reduced highs - on average 6% lower than median
(±) | linearity of highs is average (9.1% delta to prev. frequency)
Overall 100 - 16.000 Hz
(±) | linearity of overall sound is average (21.7% difference to median)
Compared to same class
» 78% of all tested devices in this class were better, 6% similar, 17% worse
» The best had a delta of 6%, average was 18%, worst was 132%
Compared to all devices tested
» 61% of all tested devices were better, 7% similar, 31% worse
» The best had a delta of 4%, average was 24%, worst was 134%
Apple MacBook 12 (Early 2016) 1.1 GHz audio analysis
(+) | speakers can play relatively loud (83.6 dB)
Bass 100 - 315 Hz
(±) | reduced bass - on average 11.3% lower than median
(±) | linearity of bass is average (14.2% delta to prev. frequency)
Mids 400 - 2000 Hz
(+) | balanced mids - only 2.4% away from median
(+) | mids are linear (5.5% delta to prev. frequency)
Highs 2 - 16 kHz
(+) | balanced highs - only 2% away from median
(+) | highs are linear (4.5% delta to prev. frequency)
Overall 100 - 16.000 Hz
(+) | overall sound is linear (10.2% difference to median)
Compared to same class
» 7% of all tested devices in this class were better, 2% similar, 91% worse
» The best had a delta of 5%, average was 18%, worst was 53%
Compared to all devices tested
» 5% of all tested devices were better, 1% similar, 94% worse
» The best had a delta of 4%, average was 24%, worst was 134%
Energy Management
Power Consumption
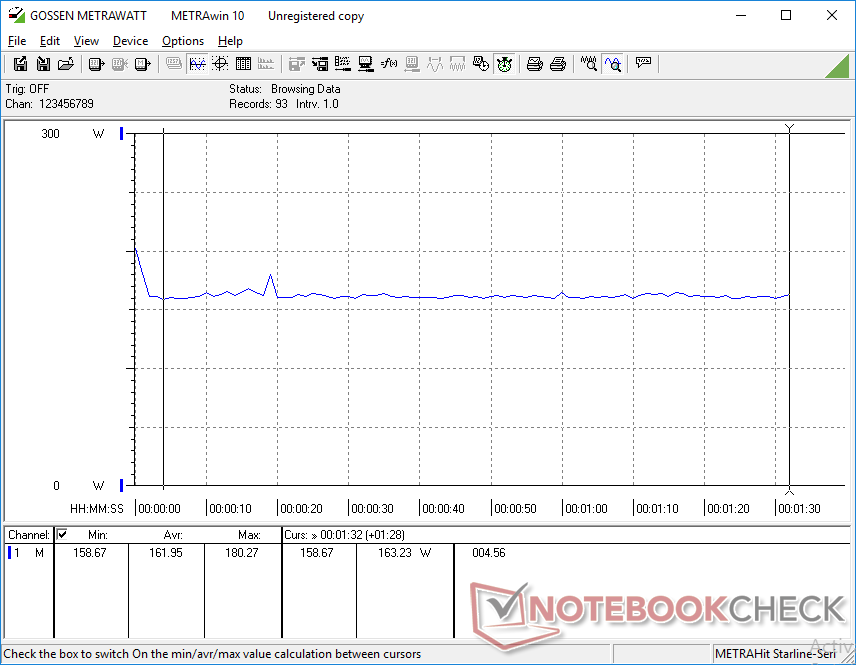
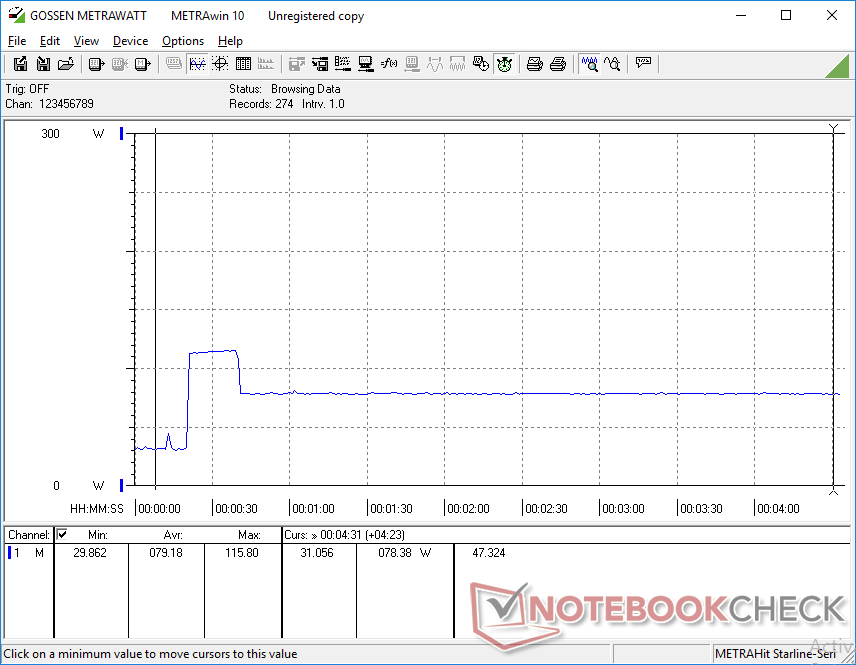
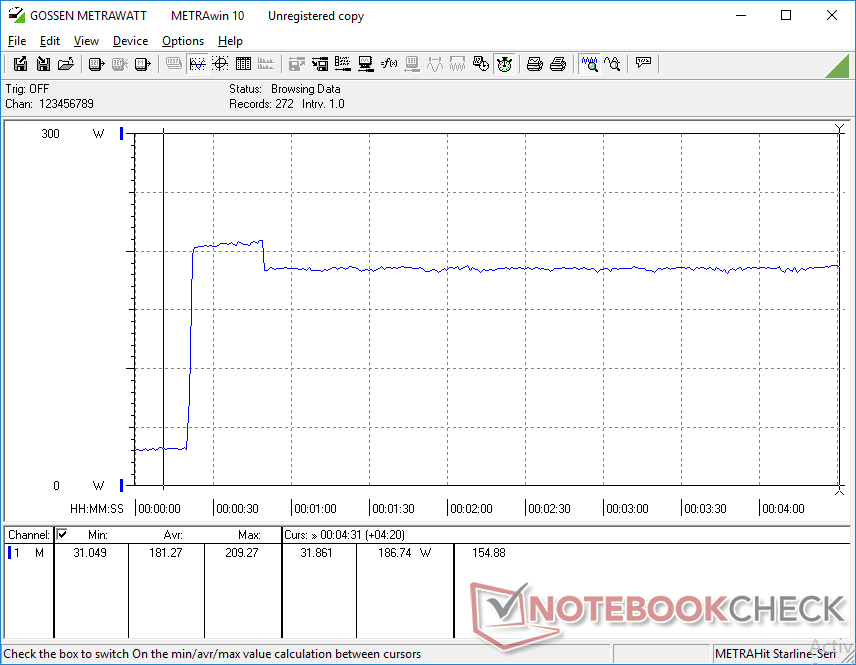
The 240 Hz Blade 15 is more demanding across all tested conditions when compared to the 144 Hz Blade 15 as shown by our table below. Even so, the differences are just a few Watts on average. Running Witcher 3 draws 162 W compared to 155 W on the Blade 15 with the RTX 2070 Max-Q and 176 W on the Asus Zephyrus GX502GW with the slightly slower RTX 2070 Max-P.
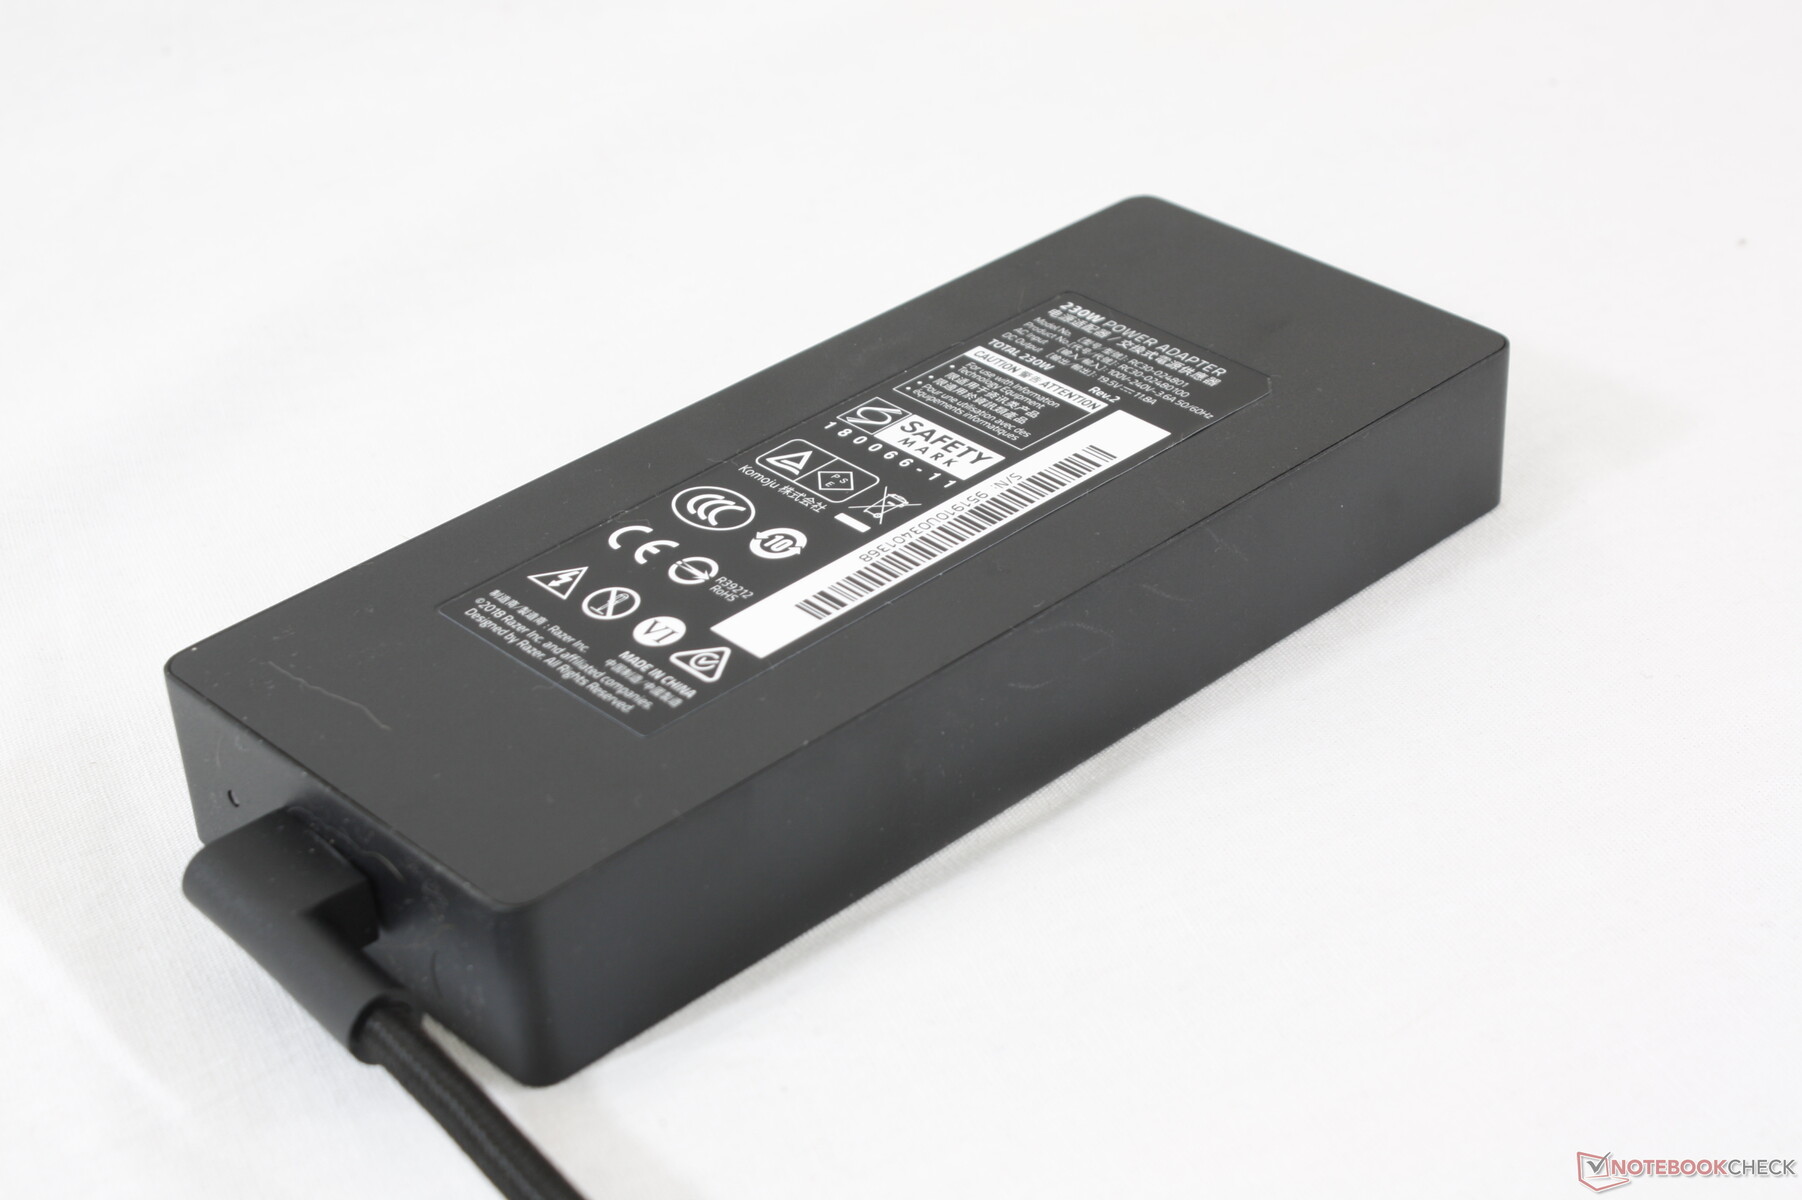
Running both Prime95 and FurMark demands 209 W from the relatively small (~17 x 7 x 2.5 cm) 230 W AC adapter. This only lasts for a few seconds, however, and consumption eventually drops and stabilizes at 186 W in order to keep temperatures in check. Older Blade 15 SKUs with RTX 2060 graphics or last generation GTX graphics may ship with 180 W or 200 W AC adapters that are incompatible with this newer model.
| Off / Standby | |
| Idle | |
| Load |
|
Key:
min: | |
| Razer Blade 15 RTX 2080 Max-Q i7-9750H, GeForce RTX 2080 Max-Q, Samsung SSD PM981 MZVLB512HAJQ, IPS, 1920x1080, 15.6" | Razer Blade 15 RTX 2070 Max-Q i7-8750H, GeForce RTX 2070 Max-Q, Samsung SSD PM981 MZVLB512HAJQ, IPS, 1920x1080, 15.6" | Alienware m15 GTX 1070 Max-Q i7-8750H, GeForce GTX 1070 Max-Q, Toshiba XG5 KXG50ZNV512G, IPS, 1920x1080, 15.6" | Asus Zephyrus S GX502GW i7-9750H, GeForce RTX 2070 Mobile, 2x Intel SSD 660p SSDPEKNW512G8 (RAID 0), IPS, 1920x1080, 15.6" | Apple MacBook Pro 15 2018 (2.6 GHz, 560X) i7-8850H, Radeon Pro 560X, Apple SSD AP0512, IPS, 2880x1800, 15.4" | MSI GS65 Stealth Thin 8RE-051US i7-8750H, GeForce GTX 1060 Mobile, Samsung SSD PM981 MZVLB256HAHQ, IPS, 1920x1080, 15.6" | Dell XPS 15 9570 Core i9 UHD i9-8950HK, GeForce GTX 1050 Ti Max-Q, Samsung SSD PM981 MZVLB1T0HALR, IPS, 3840x2160, 15.6" | |
|---|---|---|---|---|---|---|---|
| Power Consumption | 10% | 16% | -47% | 40% | 18% | 24% | |
| Idle Minimum * (Watt) | 12.5 | 10.4 17% | 7.6 39% | 24 -92% | 3.4 73% | 8.7 30% | 7.1 43% |
| Idle Average * (Watt) | 15.3 | 14.6 5% | 13.8 10% | 27 -76% | 11 28% | 13 15% | 13.6 11% |
| Idle Maximum * (Watt) | 20.7 | 16.3 21% | 14.6 29% | 33 -59% | 14.9 28% | 14.3 31% | 14.1 32% |
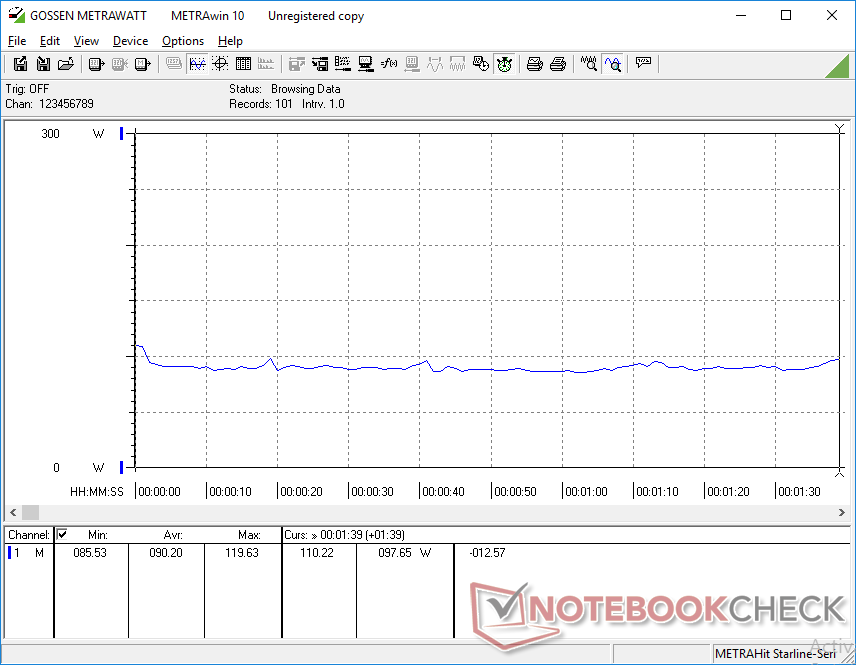
| Load Average * (Watt) | 90.2 | 88.5 2% | 97.6 -8% | 129 -43% | 78.9 13% | 107.4 -19% | 103.9 -15% |
| Witcher 3 ultra * (Watt) | 162 | 155.4 4% | 145.8 10% | 176 -9% | 129 20% | 103 36% | |
| Load Maximum * (Watt) | 209.3 | 182.4 13% | 172.5 18% | 216 -3% | 91.2 56% | 151.5 28% | 130.9 37% |
* ... smaller is better
Battery Life
Runtimes have not changed by significant margins when compared to the Blade 15 RTX 2070 Max-Q despite the slightly higher power consumption recorded above. We're still able to record a WLAN battery life of 6.5 hours to be about an hour shorter than the Alienware m15.
Charging from empty to full capacity takes between 1.5 to 2 hours. The higher overhead from the 230 W AC adapter means users can still charge the laptop at a respectable rate even when gaming unlike what we discovered on the MX150-powered Blade Stealth.
| Razer Blade 15 RTX 2080 Max-Q i7-9750H, GeForce RTX 2080 Max-Q, 80 Wh | Razer Blade 15 RTX 2070 Max-Q i7-8750H, GeForce RTX 2070 Max-Q, 80 Wh | Alienware m15 GTX 1070 Max-Q i7-8750H, GeForce GTX 1070 Max-Q, 90 Wh | Asus Zephyrus S GX502GW i7-9750H, GeForce RTX 2070 Mobile, 76 Wh | Apple MacBook Pro 15 2018 (2.6 GHz, 560X) i7-8850H, Radeon Pro 560X, 83 Wh | MSI GS65 Stealth Thin 8RE-051US i7-8750H, GeForce GTX 1060 Mobile, 82 Wh | Dell XPS 15 9570 Core i9 UHD i9-8950HK, GeForce GTX 1050 Ti Max-Q, 97 Wh | |
|---|---|---|---|---|---|---|---|
| Battery runtime | -14% | -6% | -49% | 55% | -18% | -6% | |
| Reader / Idle (h) | 15.9 | 11.4 -28% | 10.5 -34% | 5.9 -63% | 15 -6% | ||
| WiFi v1.3 (h) | 6.6 | 6.5 -2% | 7.7 17% | 3.7 -44% | 10.2 55% | 6.2 -6% | 8.6 30% |
| Load (h) | 1.7 | 1.5 -12% | 1.7 0% | 1 -41% | 1.2 -29% | 1 -41% | |
| Witcher 3 ultra (h) | 1.5 |
Pros
Cons
Verdict
The biggest reason to own the latest Blade 15 over previous generation SKUs is for its 240 Hz or OLED display. While we can't speak for the OLED option right now, the jump from Wi-Fi 5 to Wi-Fi 6 or Intel 8th gen Core i7 to 9th gen Core i7 pales in comparison to the jump from a 60 Hz display to a 240 Hz display. The smoothness, responsiveness, and luxuriousness of the 4x faster refresh rate are immediately tangible both when gaming and out of gaming.
Meanwhile, users considering the RTX 2080 Max-Q over the RTX 2070 Max-Q will see up to 17 percent faster gaming performance with no real impact to fan noise, temperatures, or battery life. The 2080 Max-Q option is $500 more expensive, however, and so there is a definite price premium for getting the best that the Blade 15 has to offer.
For most users beyond the ultra enthusiast, the original 144 Hz panel is still more than sufficient because it is difficult to tell the difference between 144 Hz and 240 Hz in practice. Either option will make the base 60 Hz panel look dull after just a few days of use. The money saved can instead go towards potentially more important features like additional storage, RAM, accessories, or even a RazerCare extended warranty plan.
Razer's most well-rounded gaming laptop just got even better with these additional high-end SKUs for enthusiasts. The new upgrades cement Razer's position as a company built for gamers. Still, mainstream and mid-range gamers won't see any huge performance gains from the already excellent 144 Hz and Intel 8th gen Blade 15 options.
Razer Blade 15 RTX 2080 Max-Q
- 05/20/2019 v6 (old)
Allen Ngo
Price comparison
