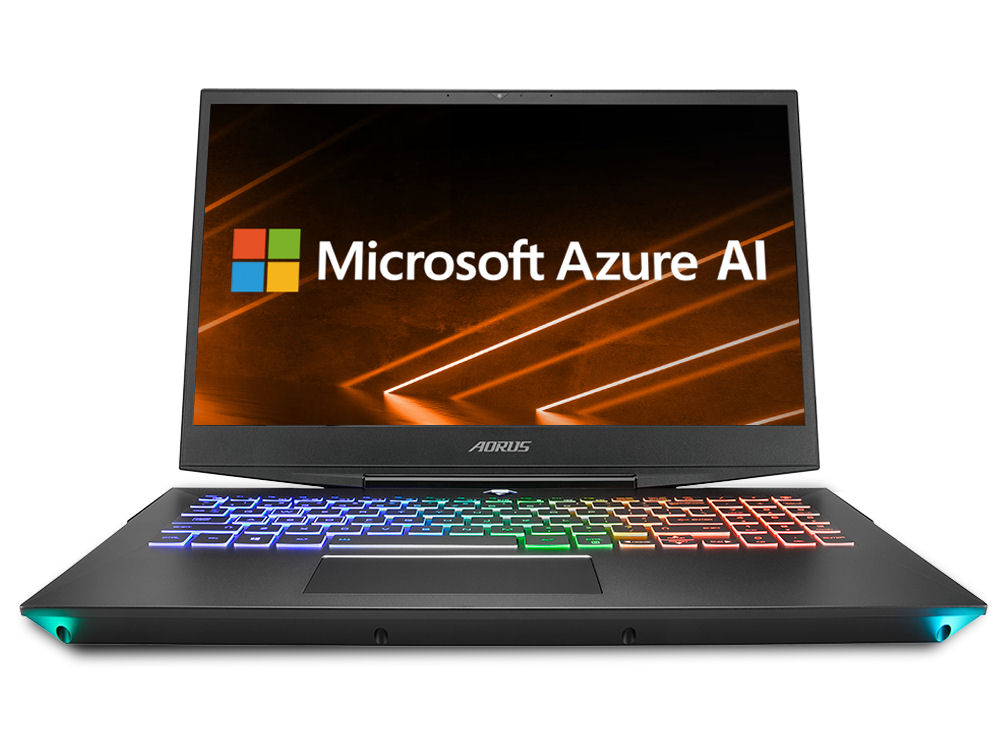
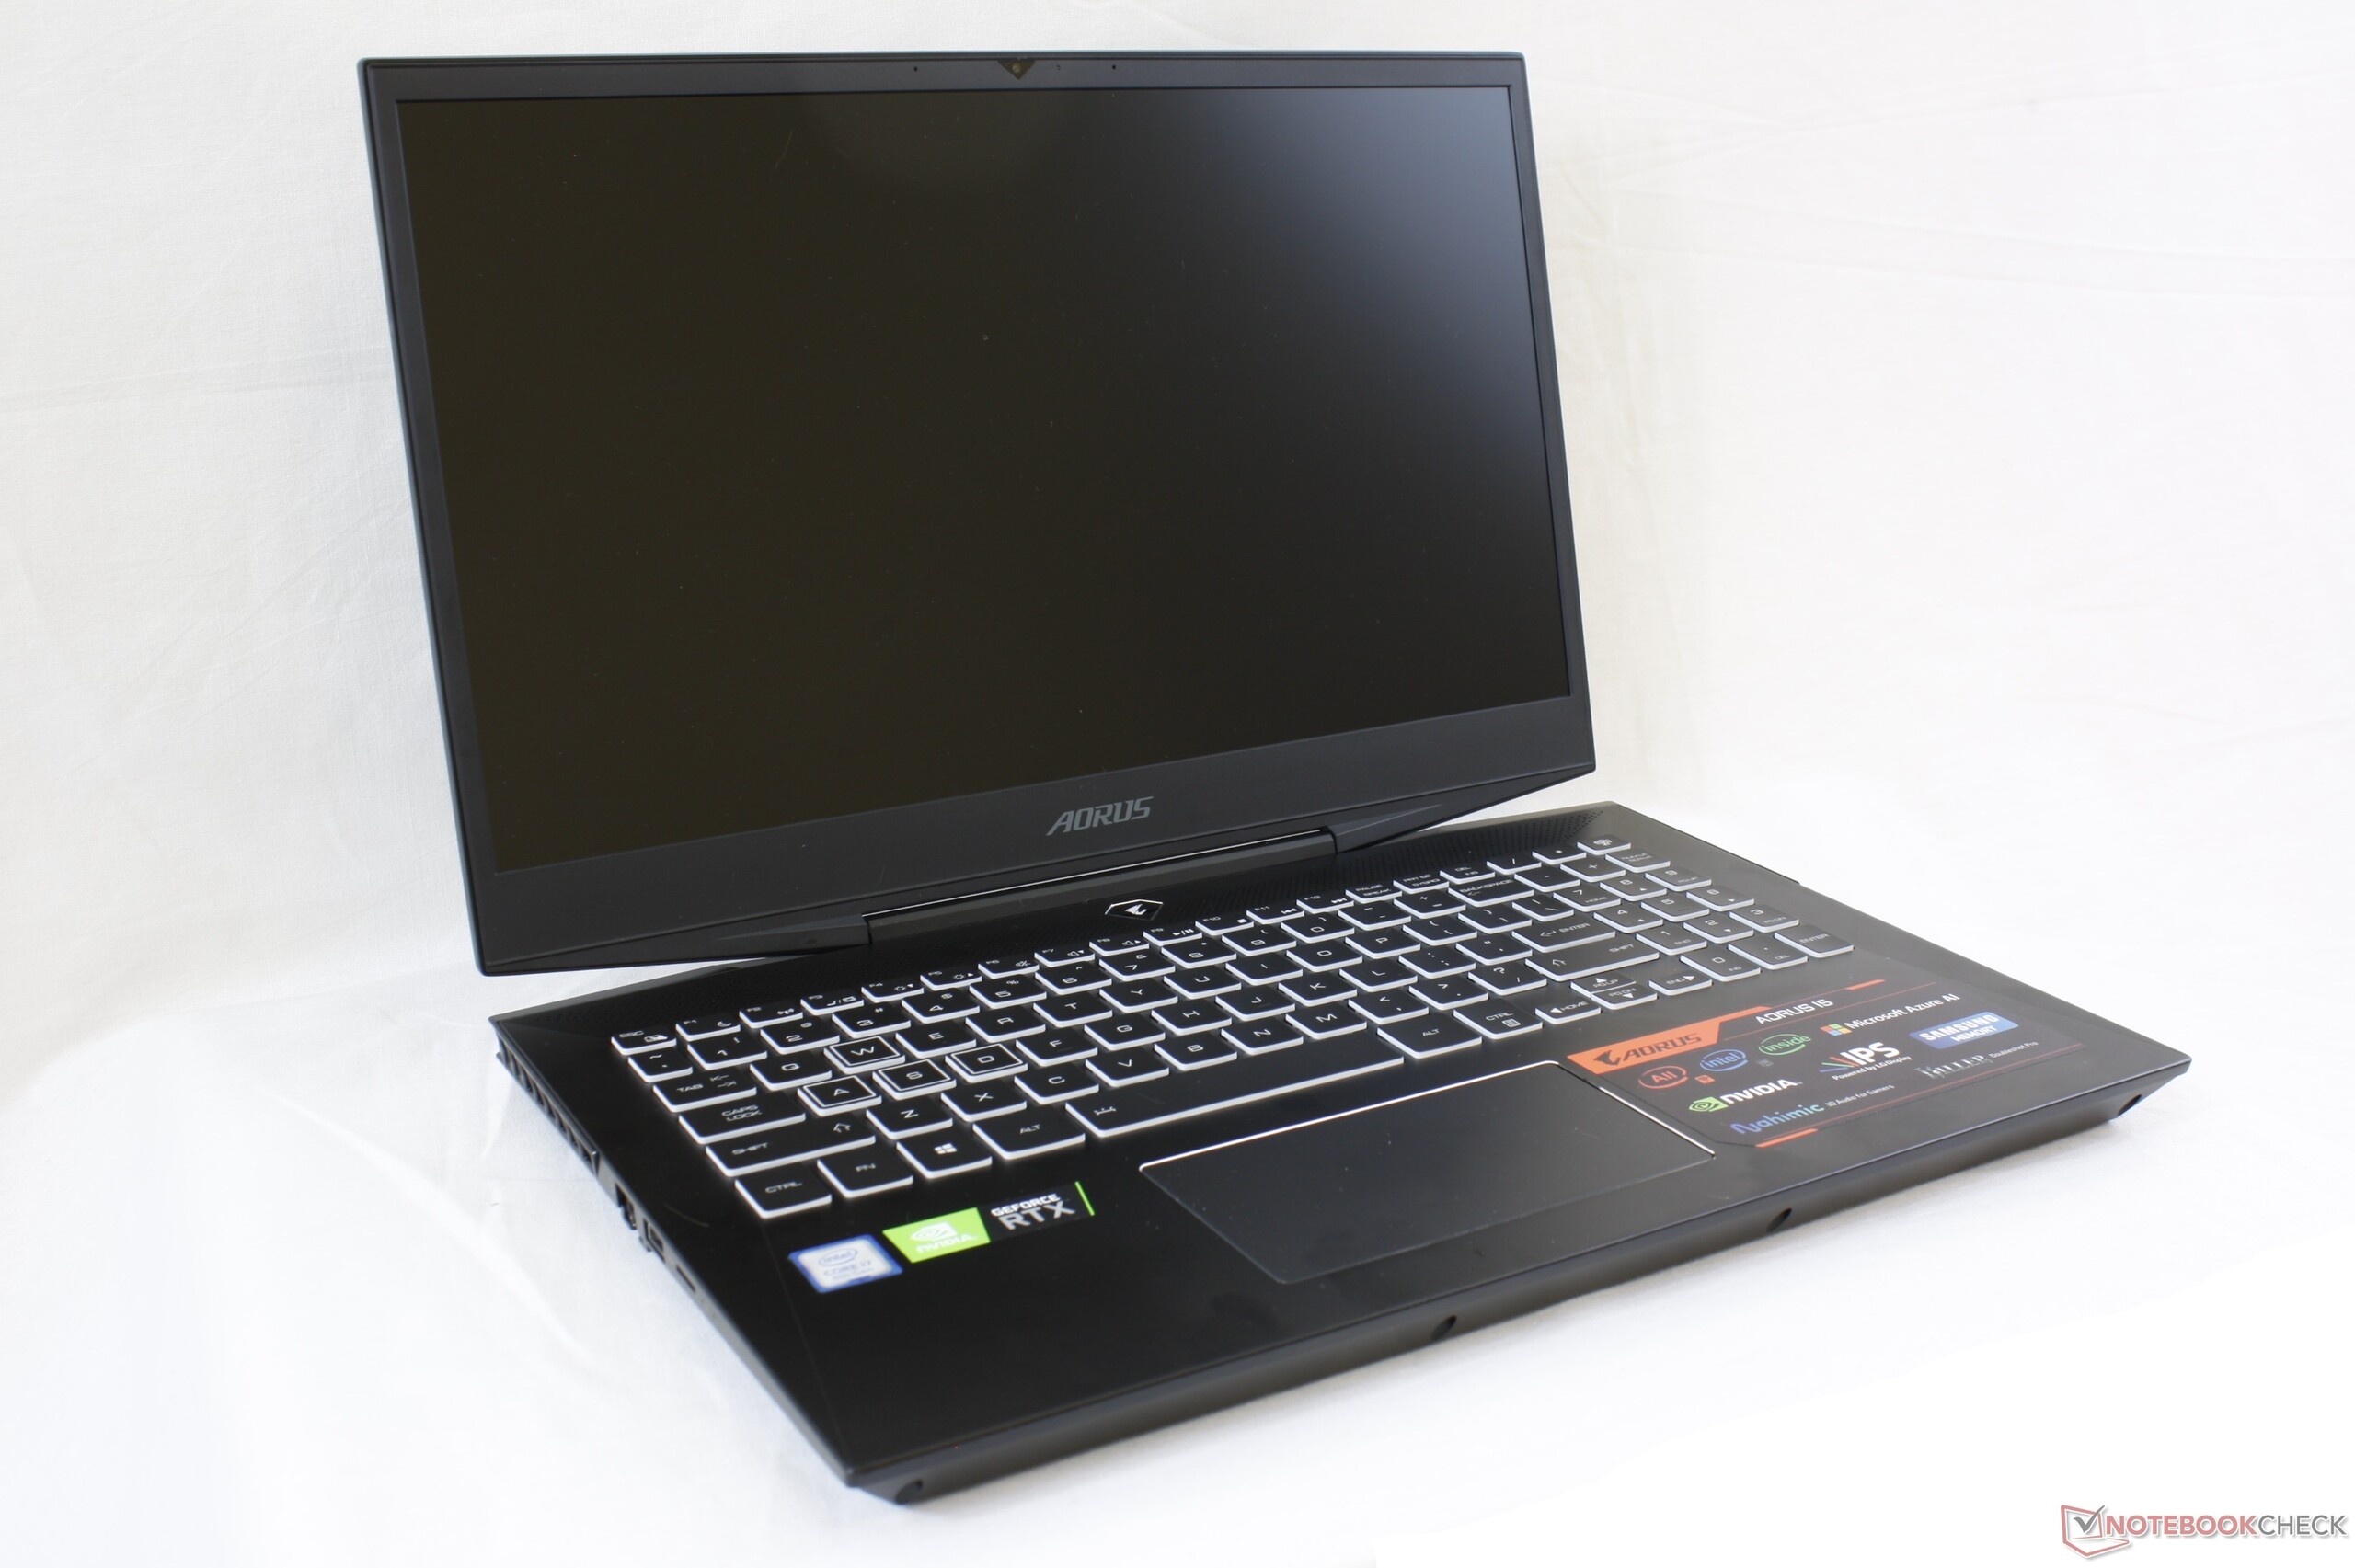
Aorus 15-W9 (i7-8750H, RTX 2060) Laptop Review
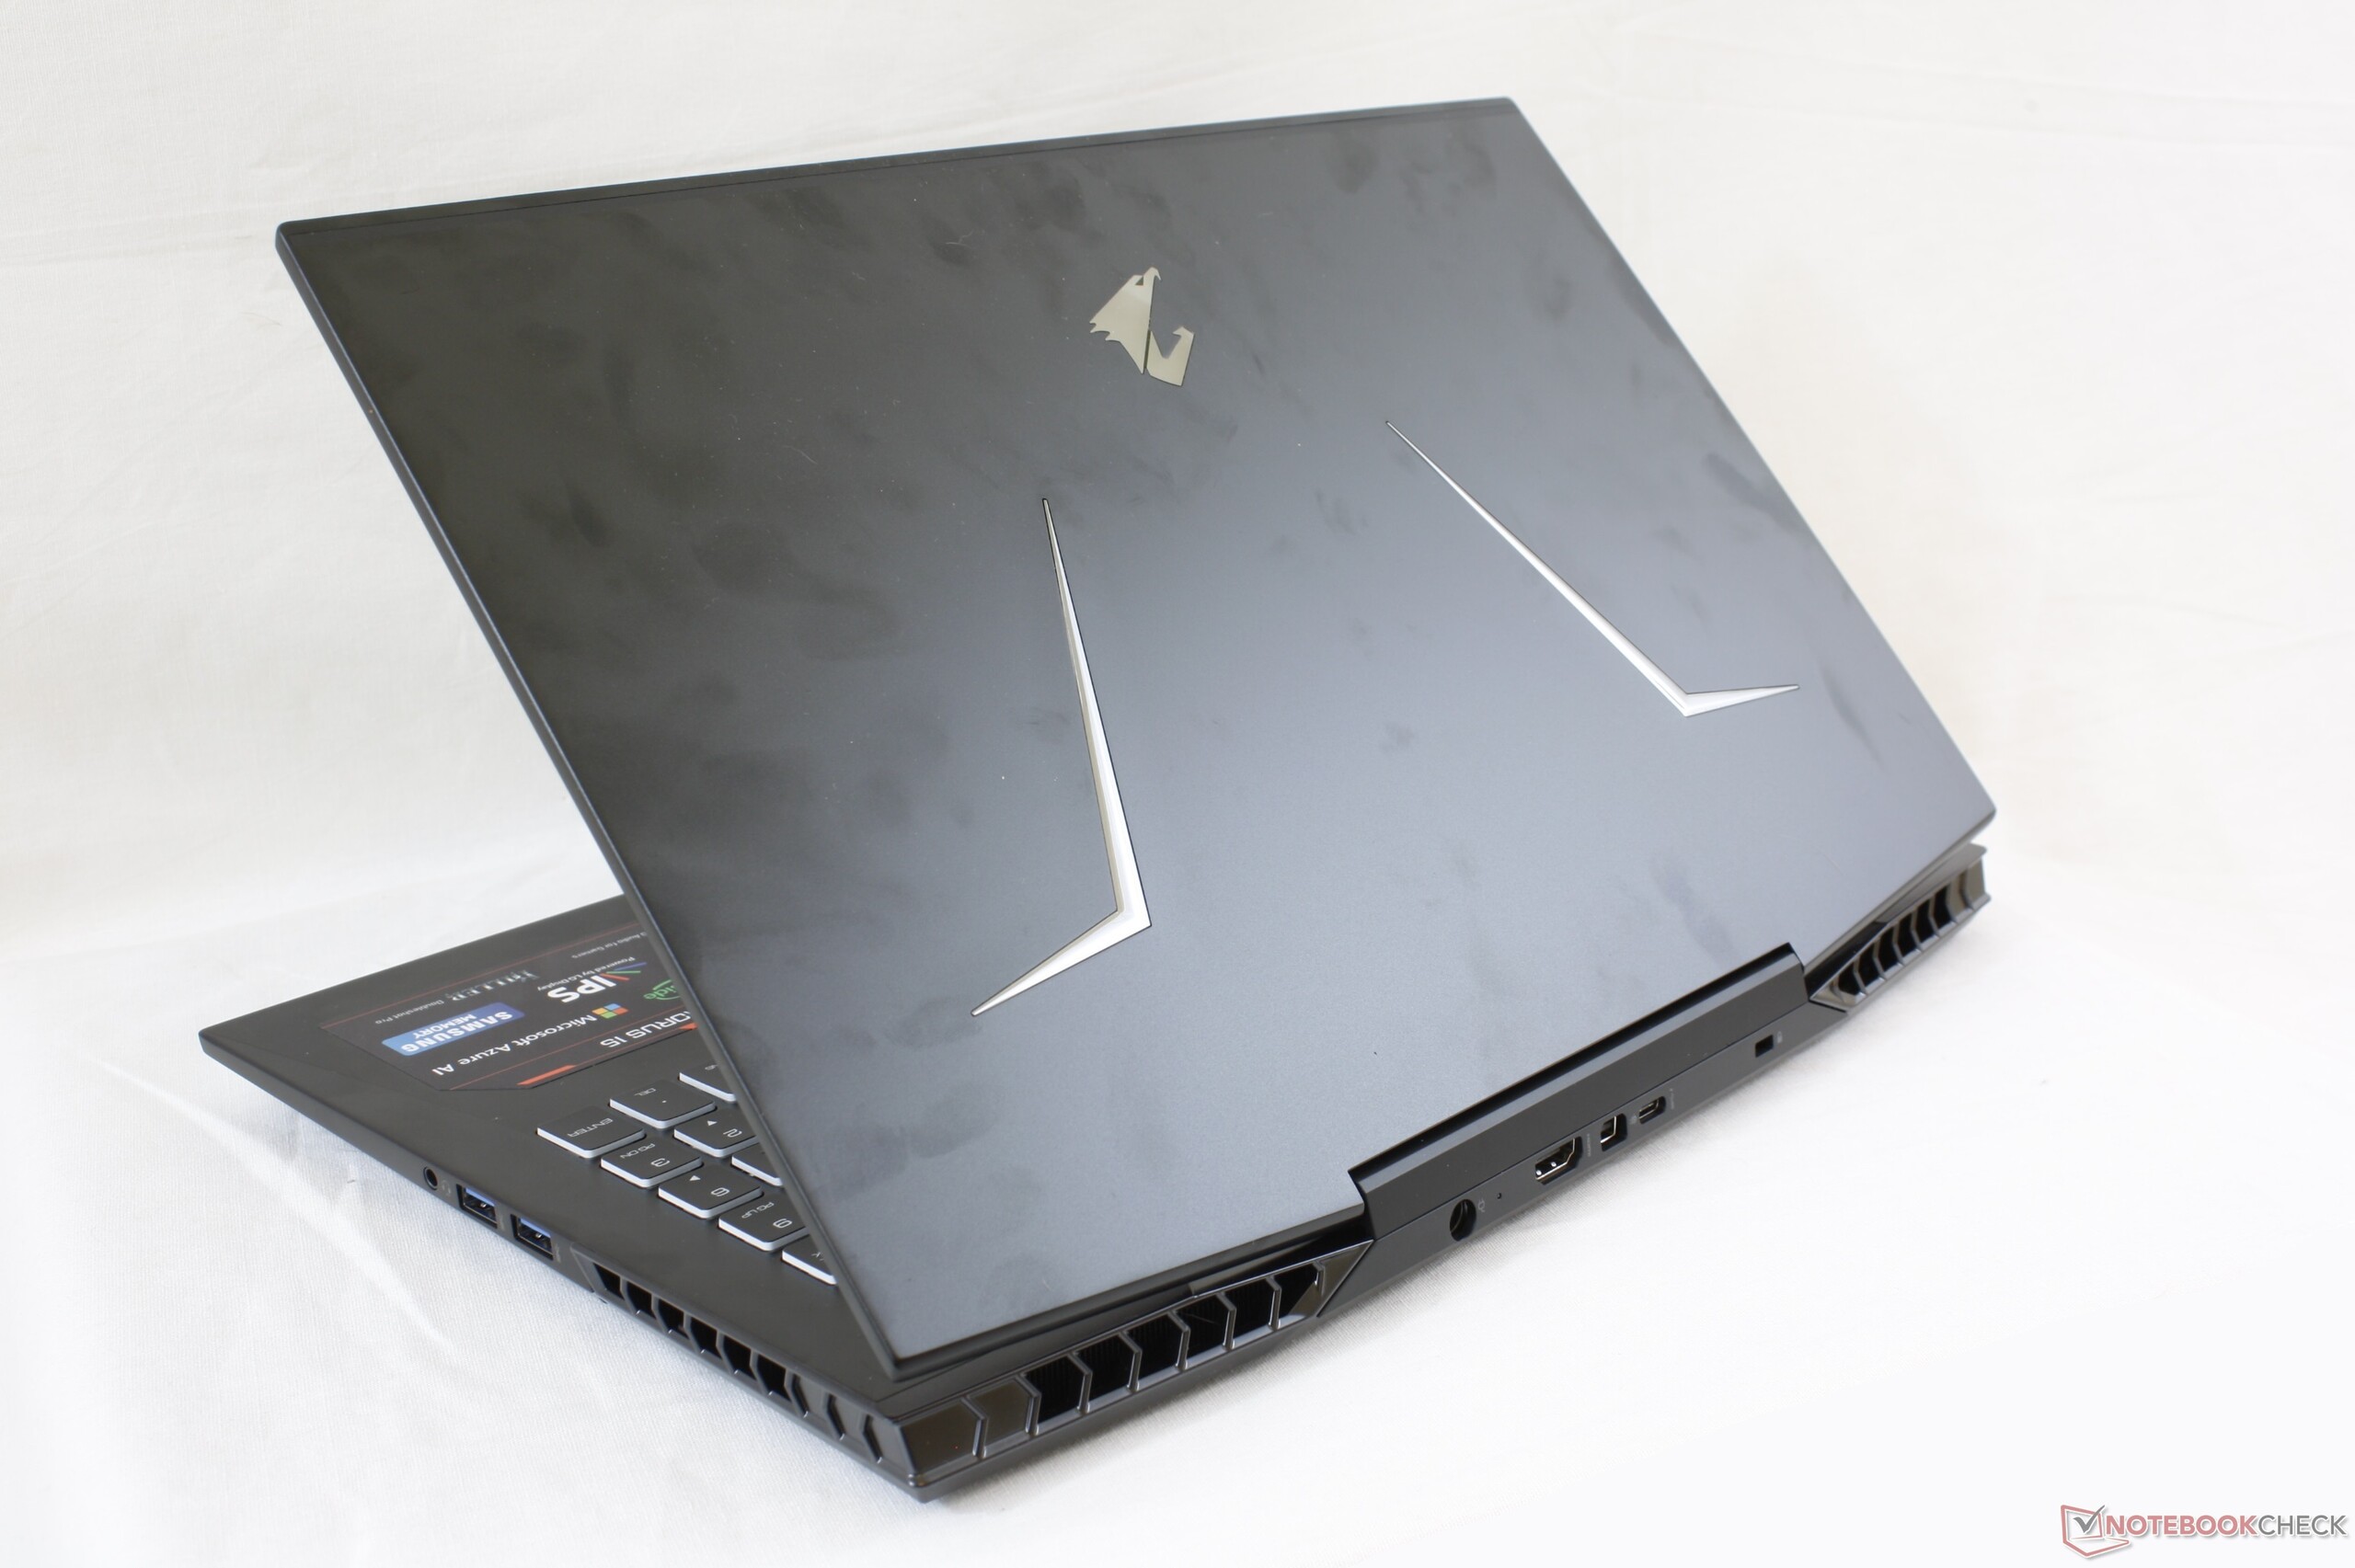
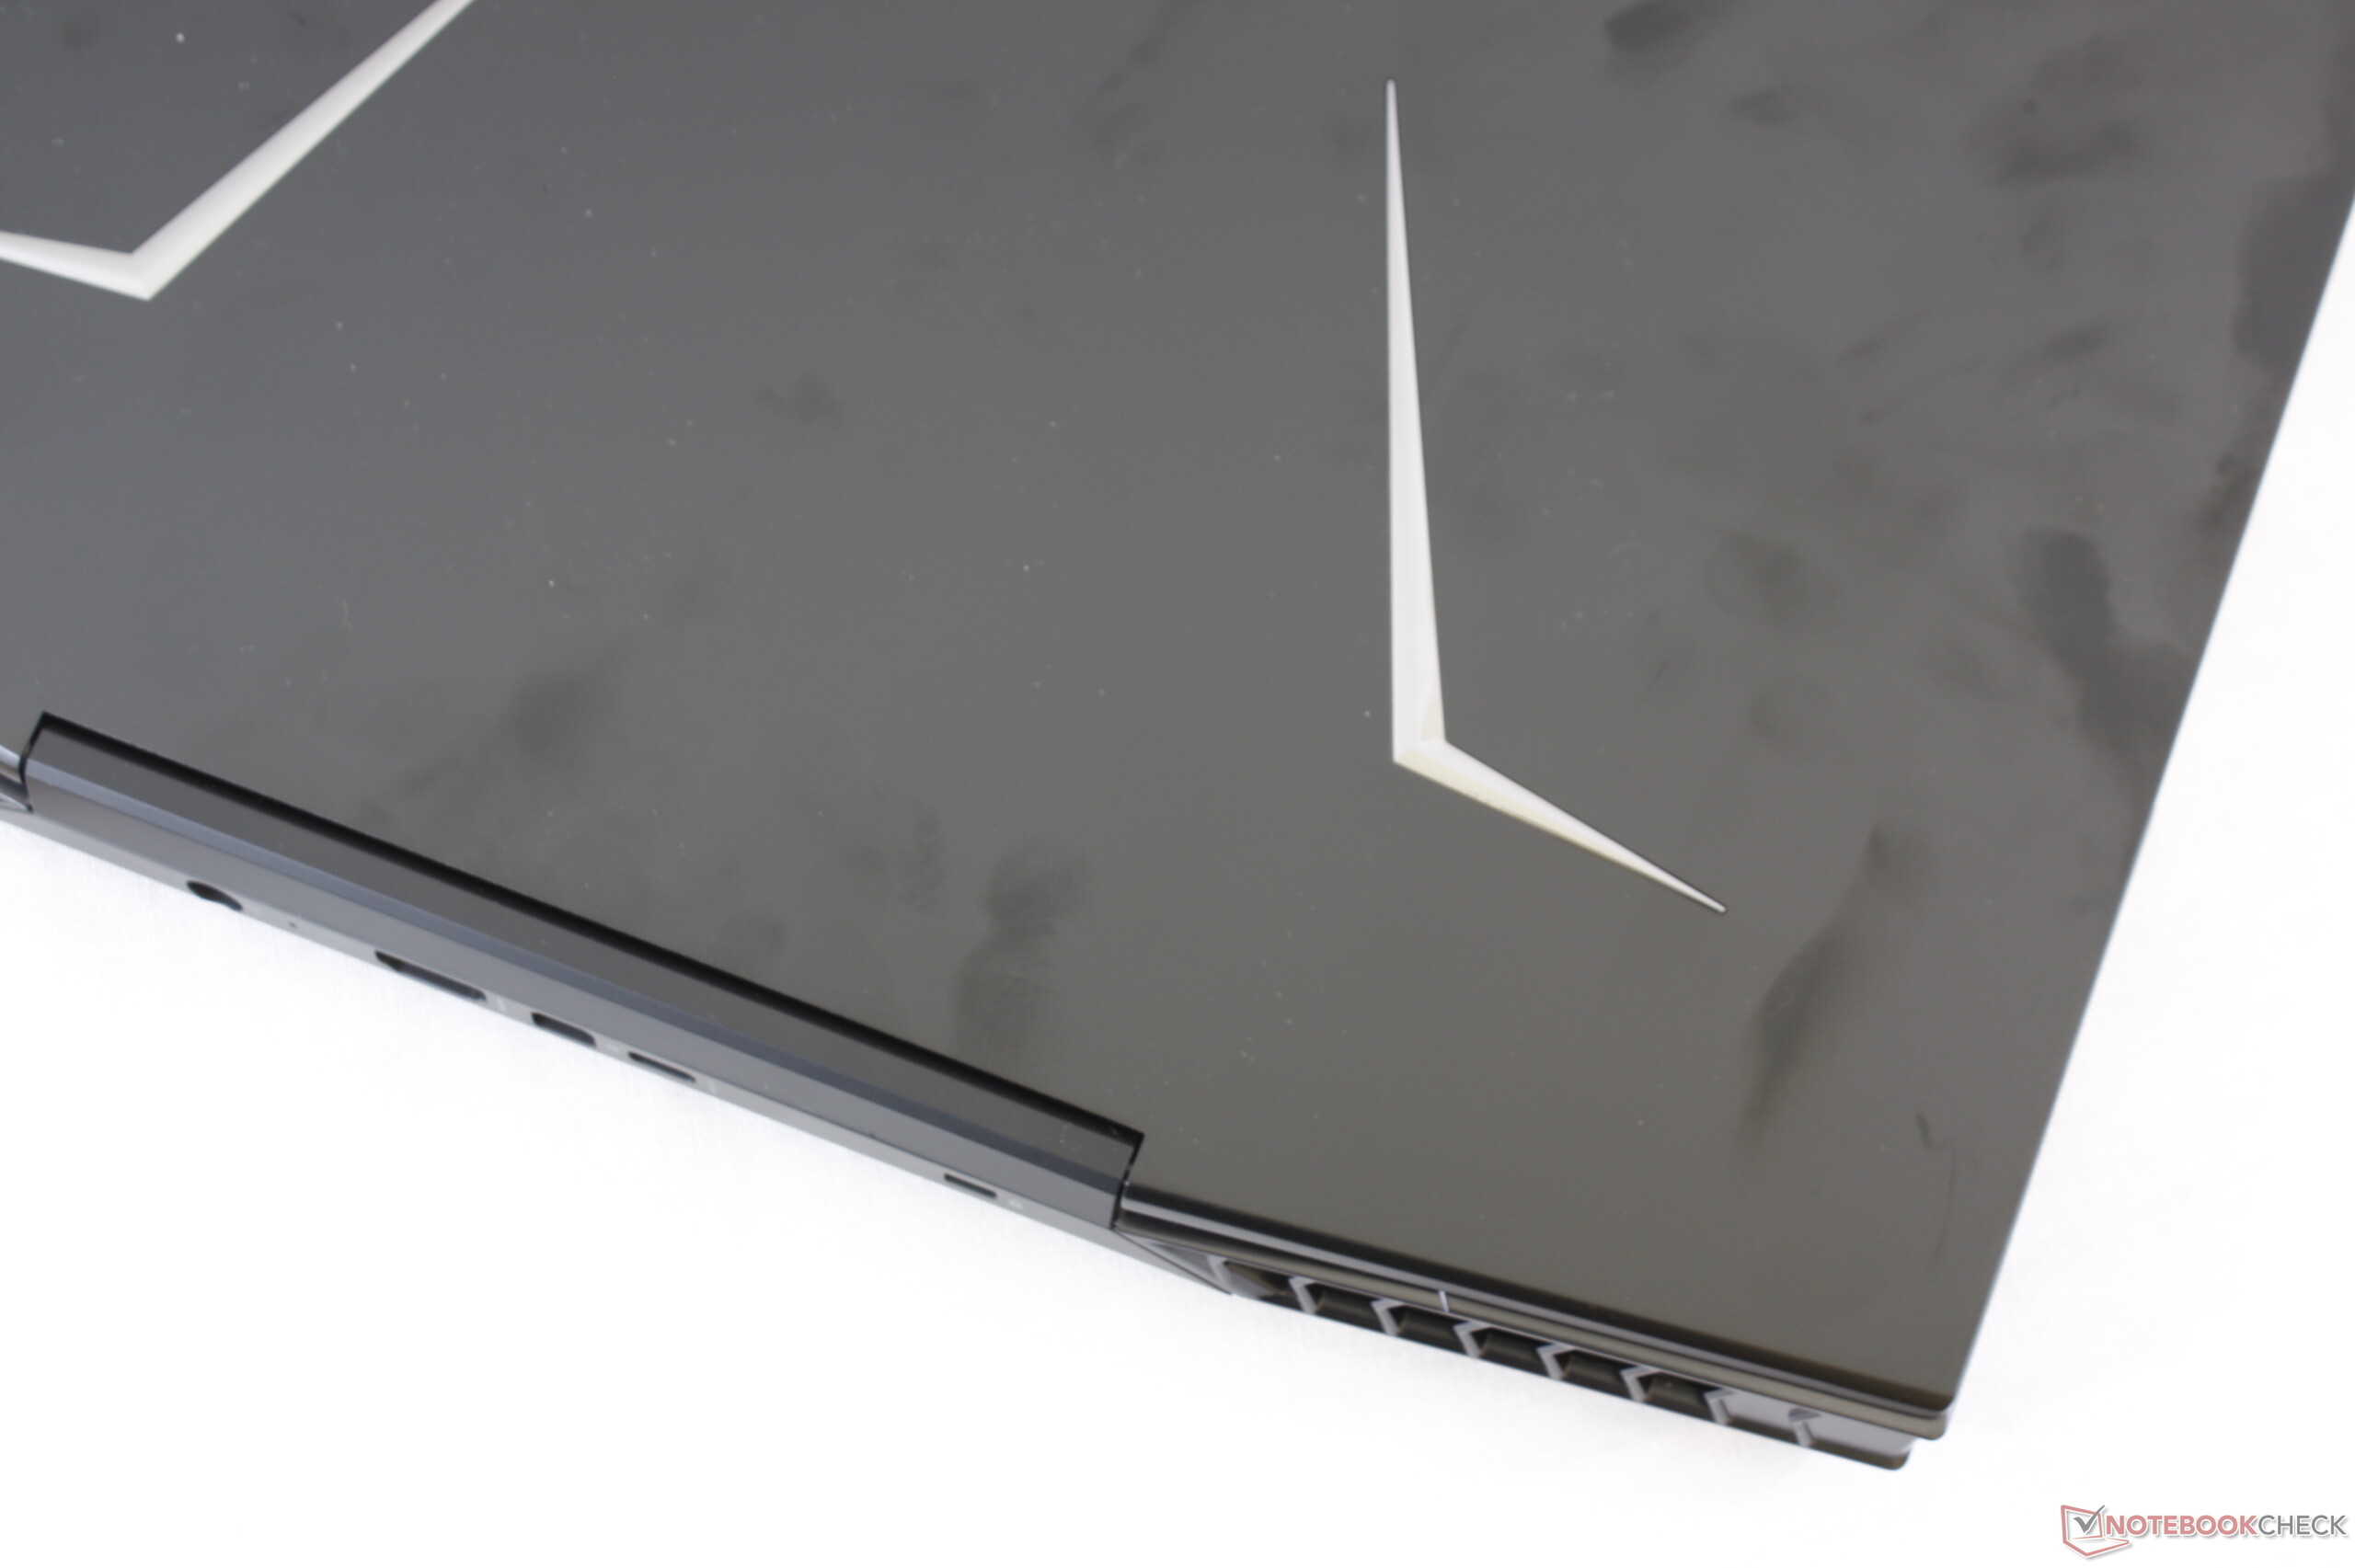
The Aorus 15-W9 is not unknown to us, since it is the identically built sibling of the Aorus 15-X9 that we have already tested. The difference between the two devices lies in the graphics core. While the X9 has a GeForce-RTX-2070 GPU on board, our current test unit brings a GeForce RTX 2060. The competitors include notebooks such as the MSI GS65 Stealth Thin 8RE, the Alienware m15, the Razer Blade 15, the Lenovo Legion Y740-15ICH, the Asus GX531GM (Zephyrus S), and the Gigabyte Aero 15-X9.
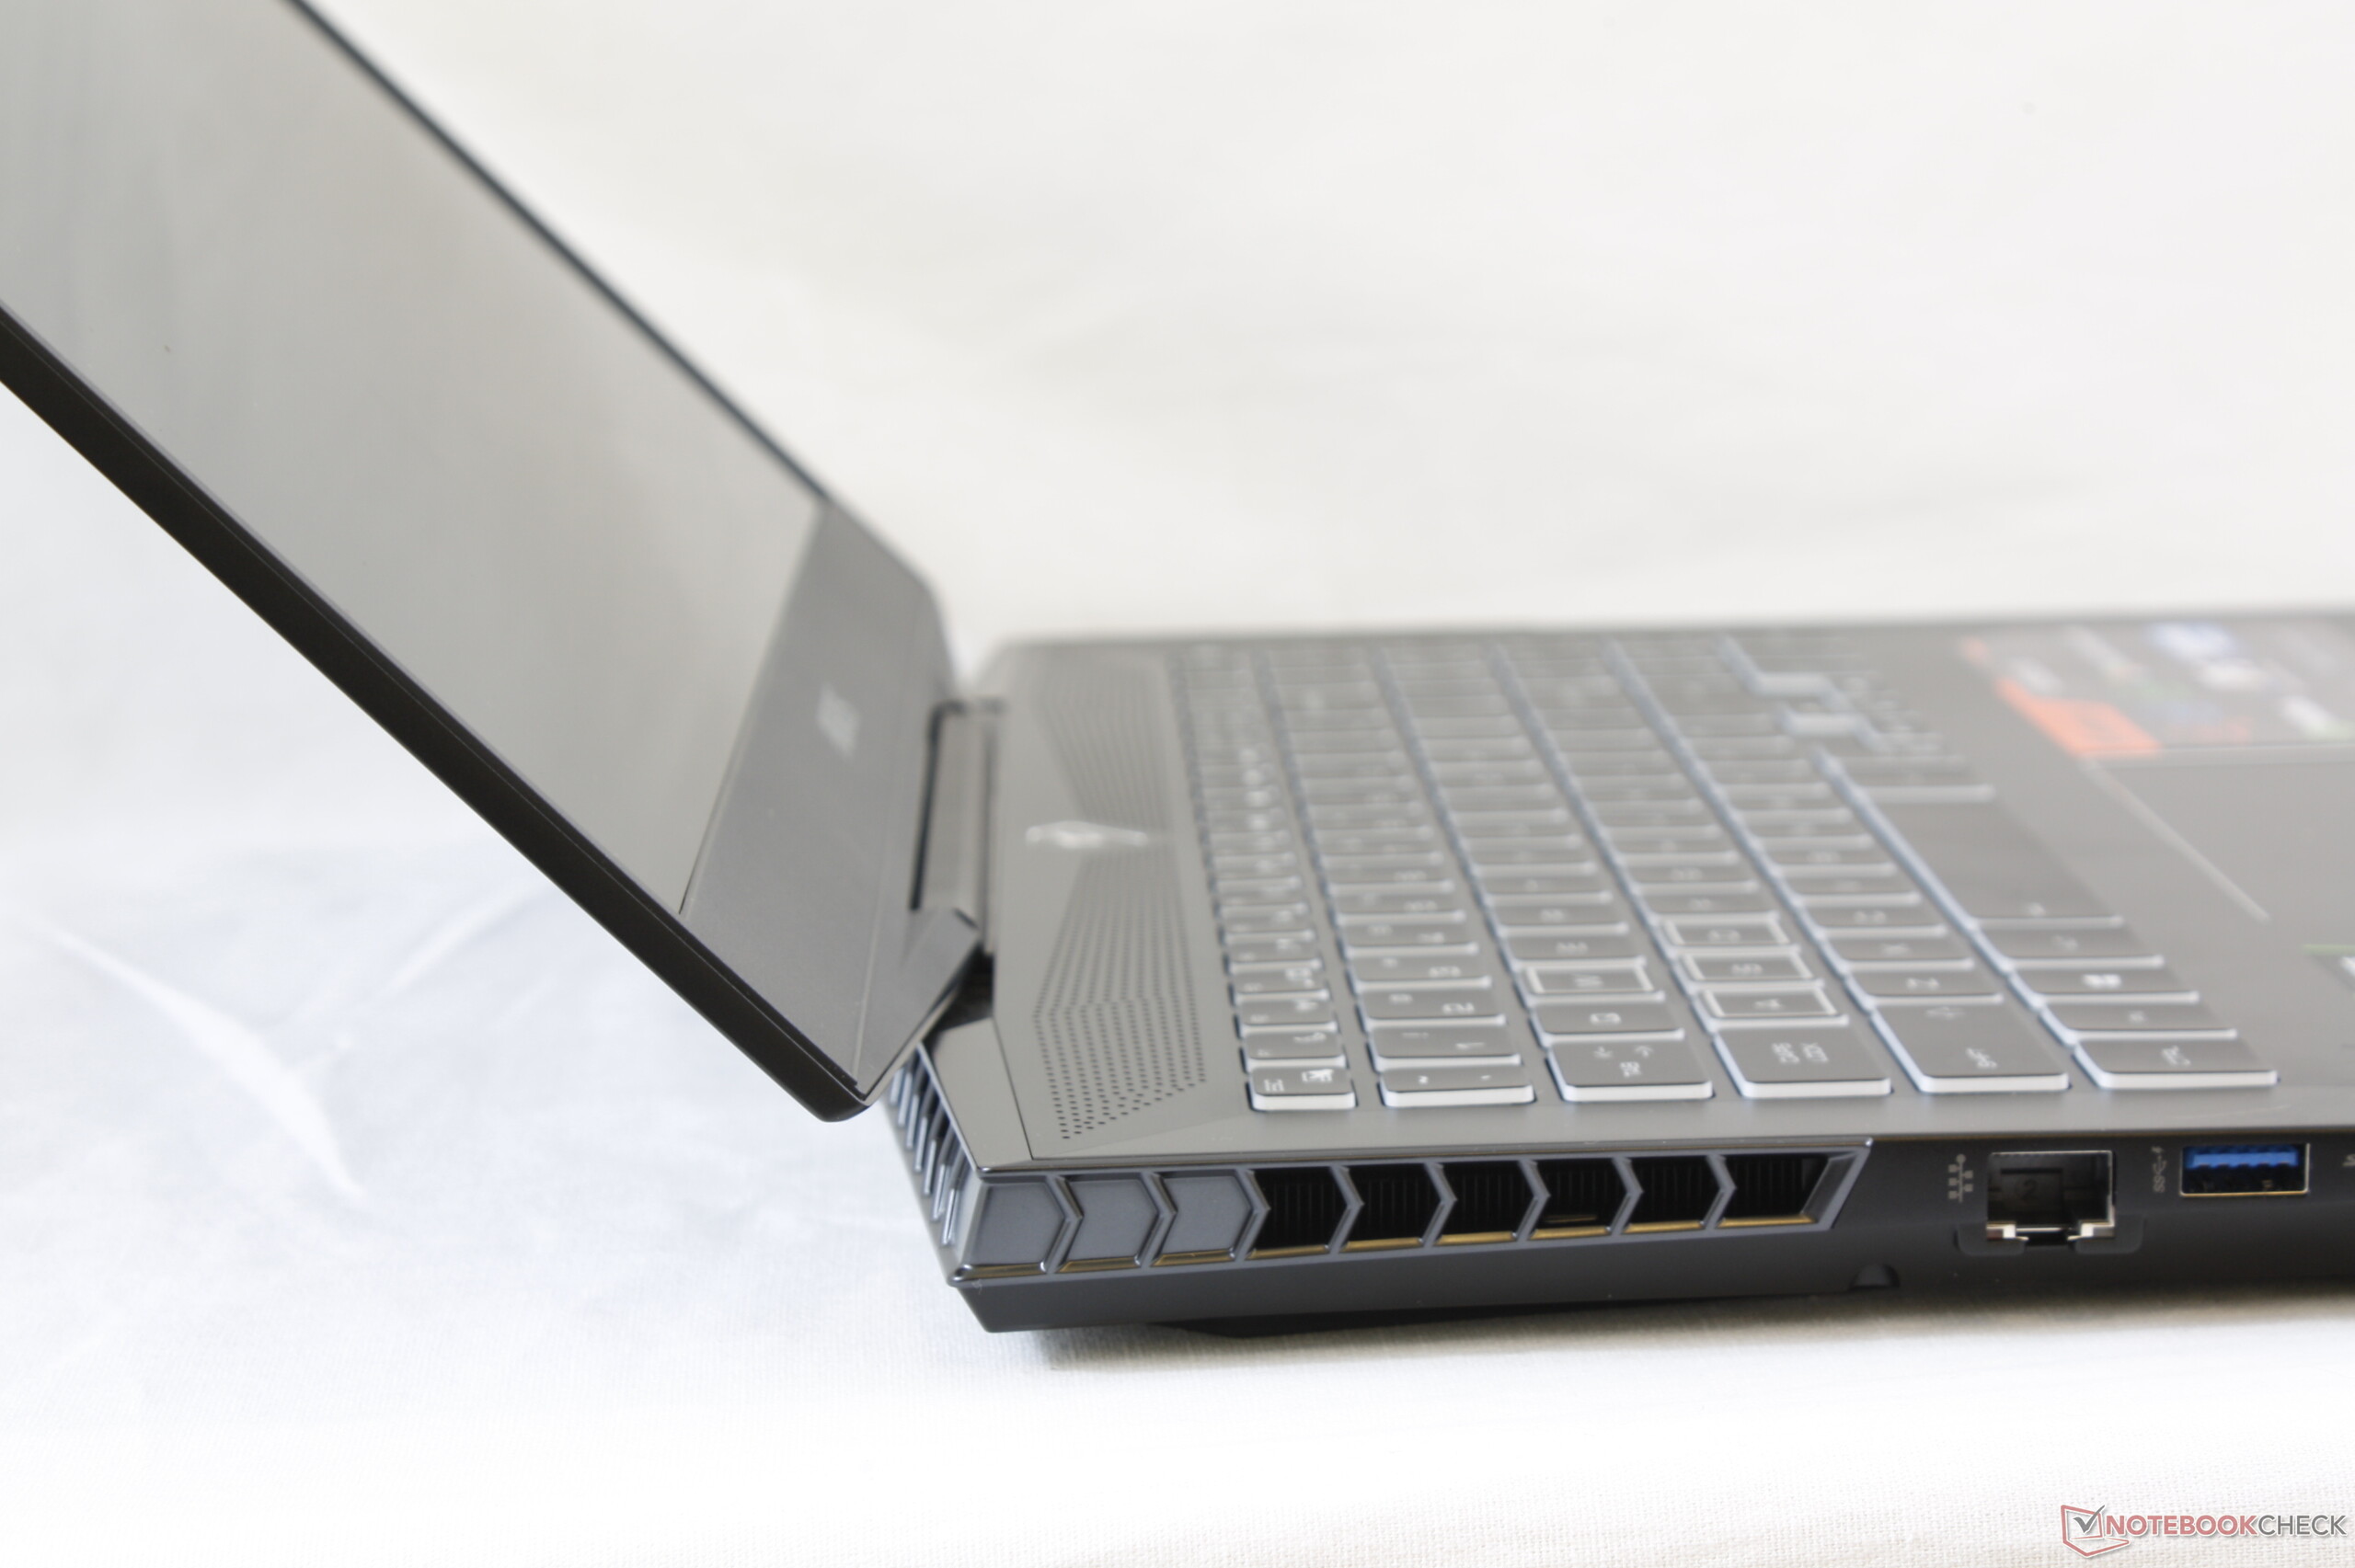
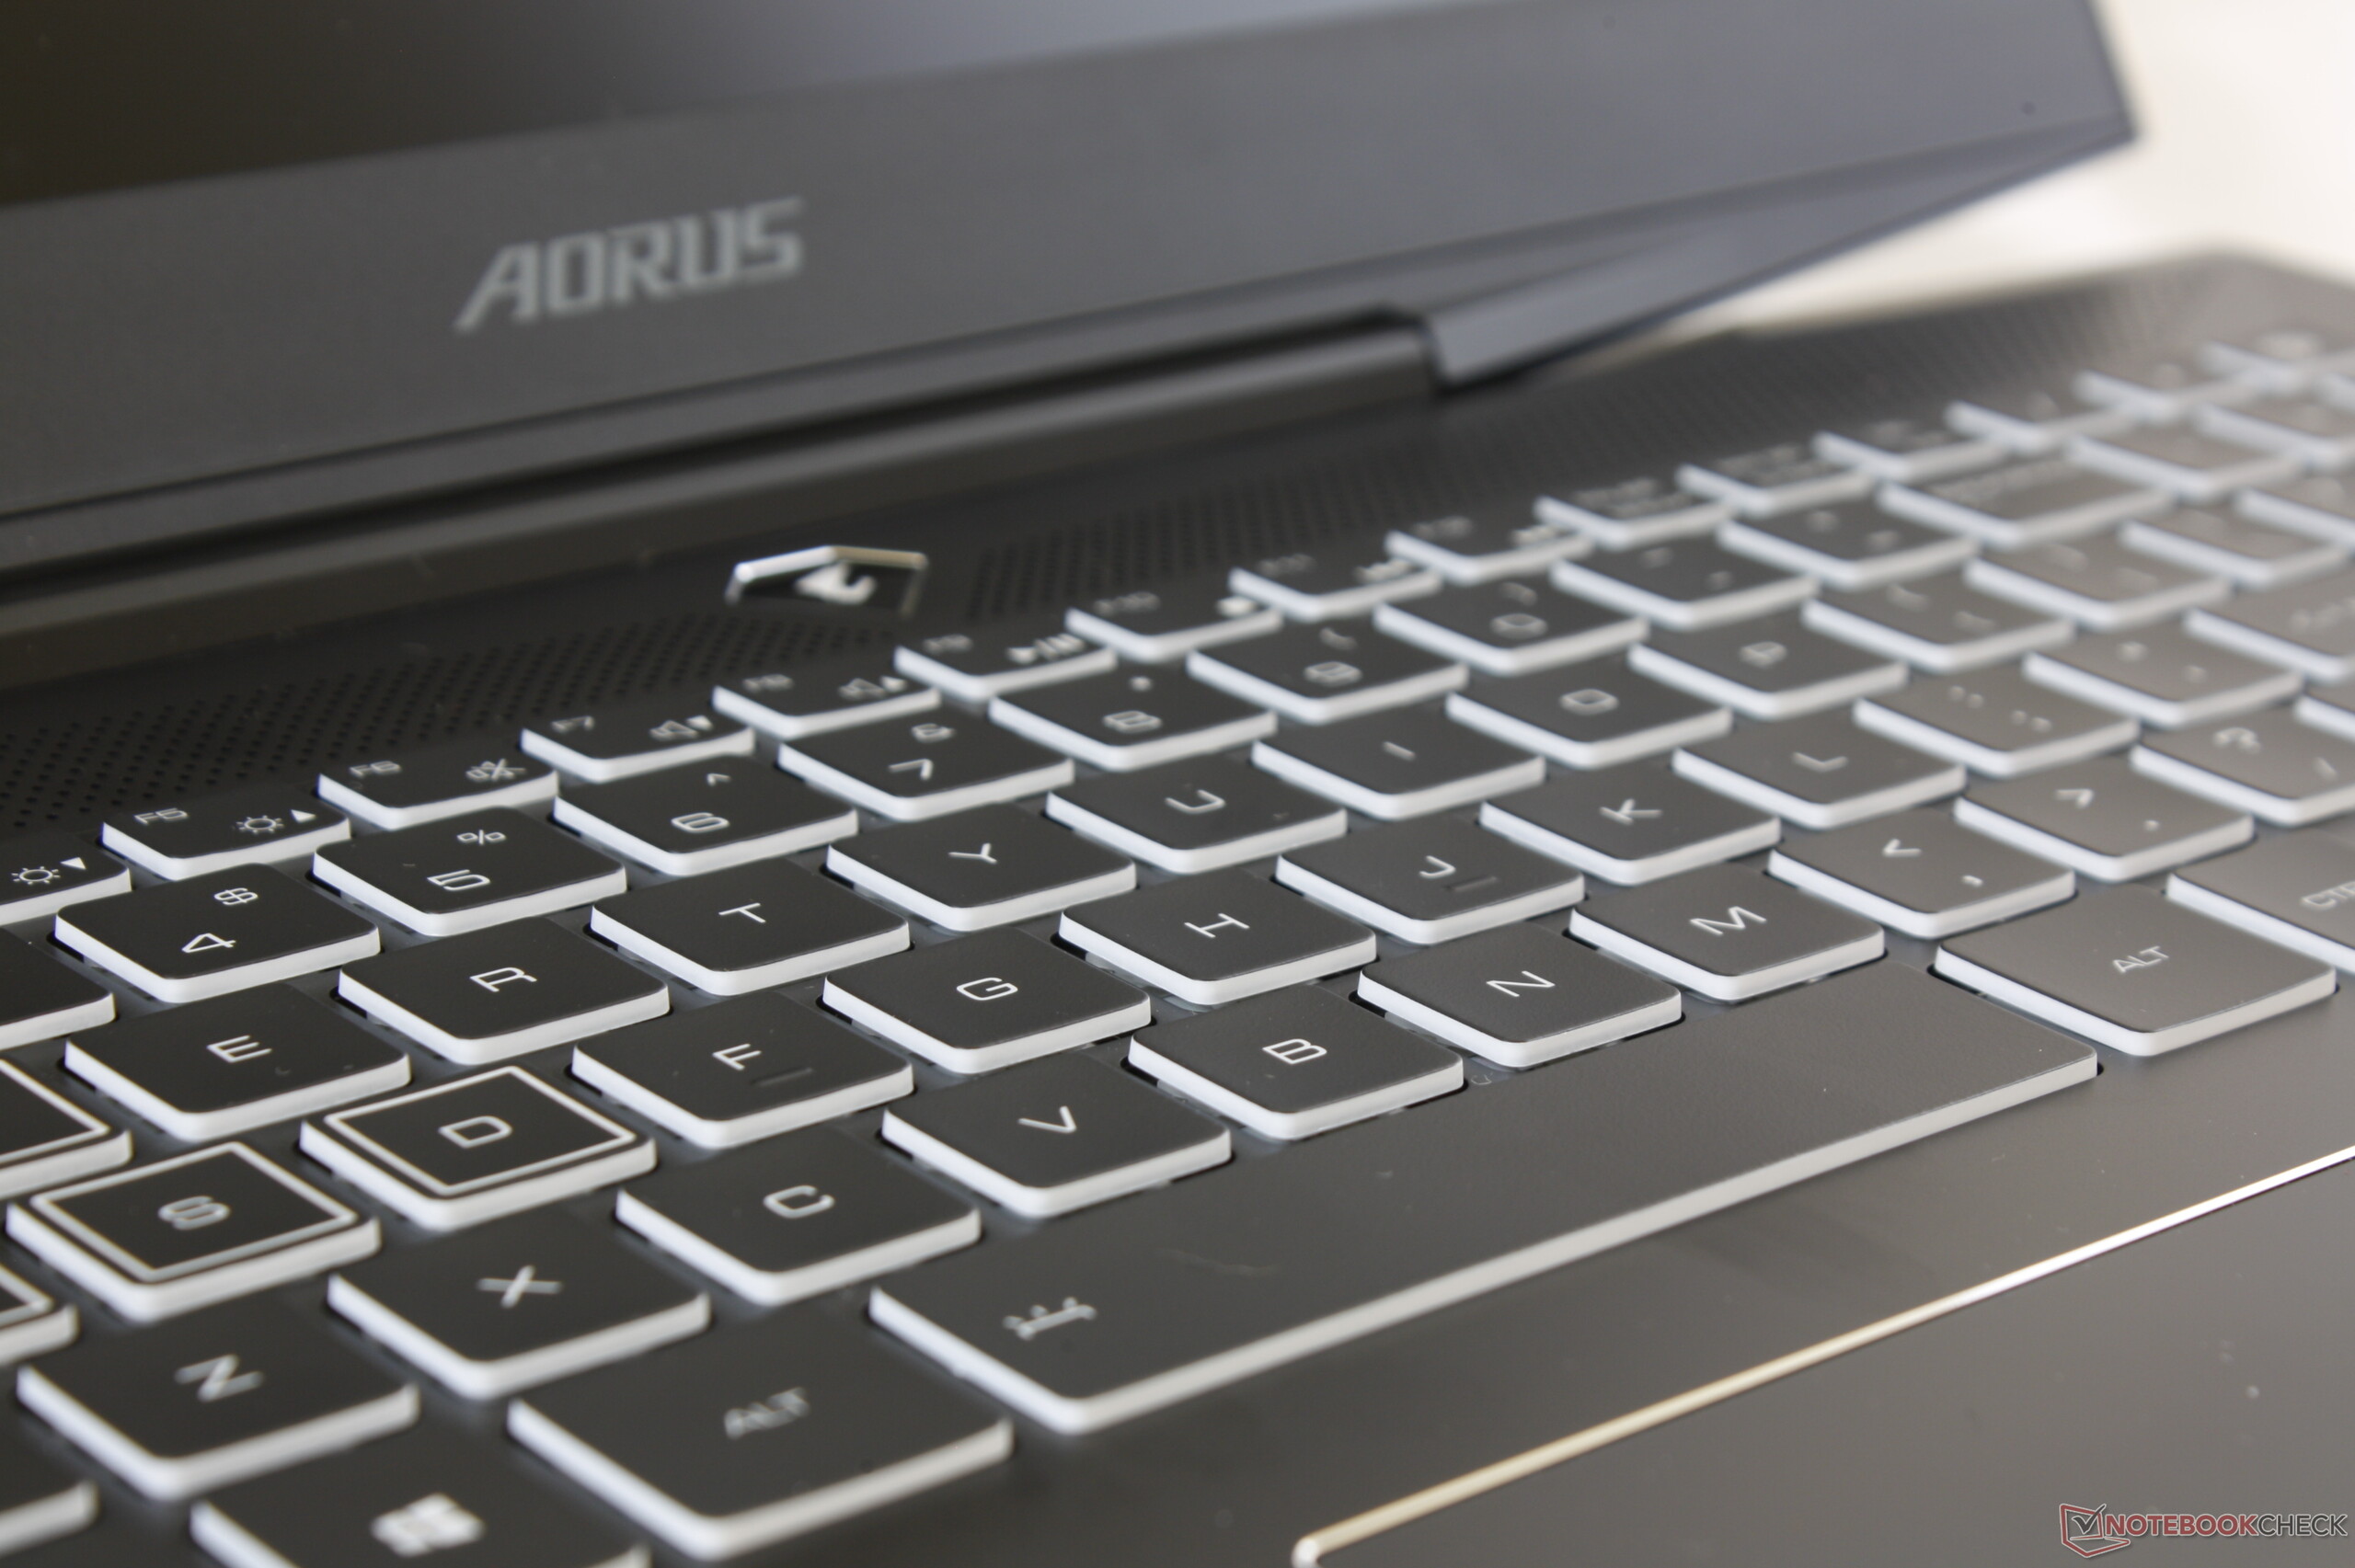
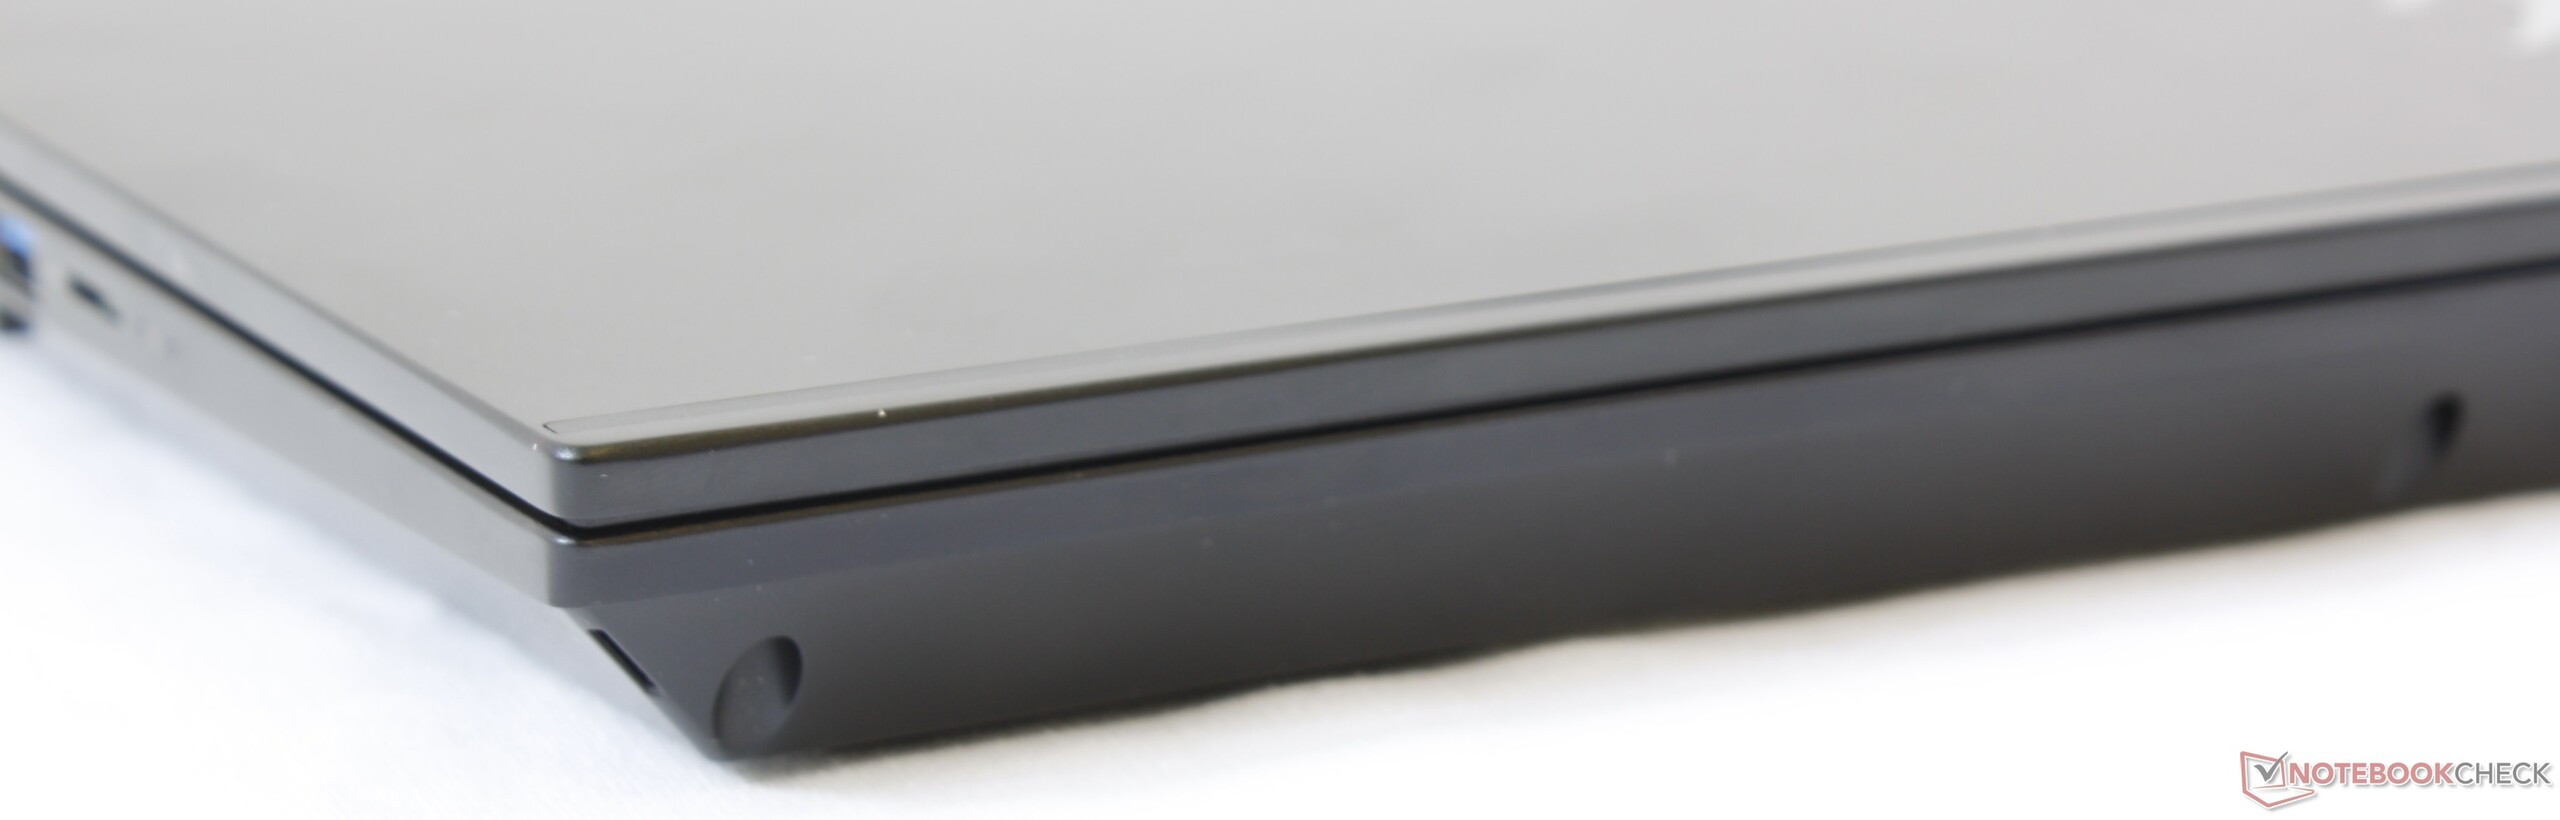
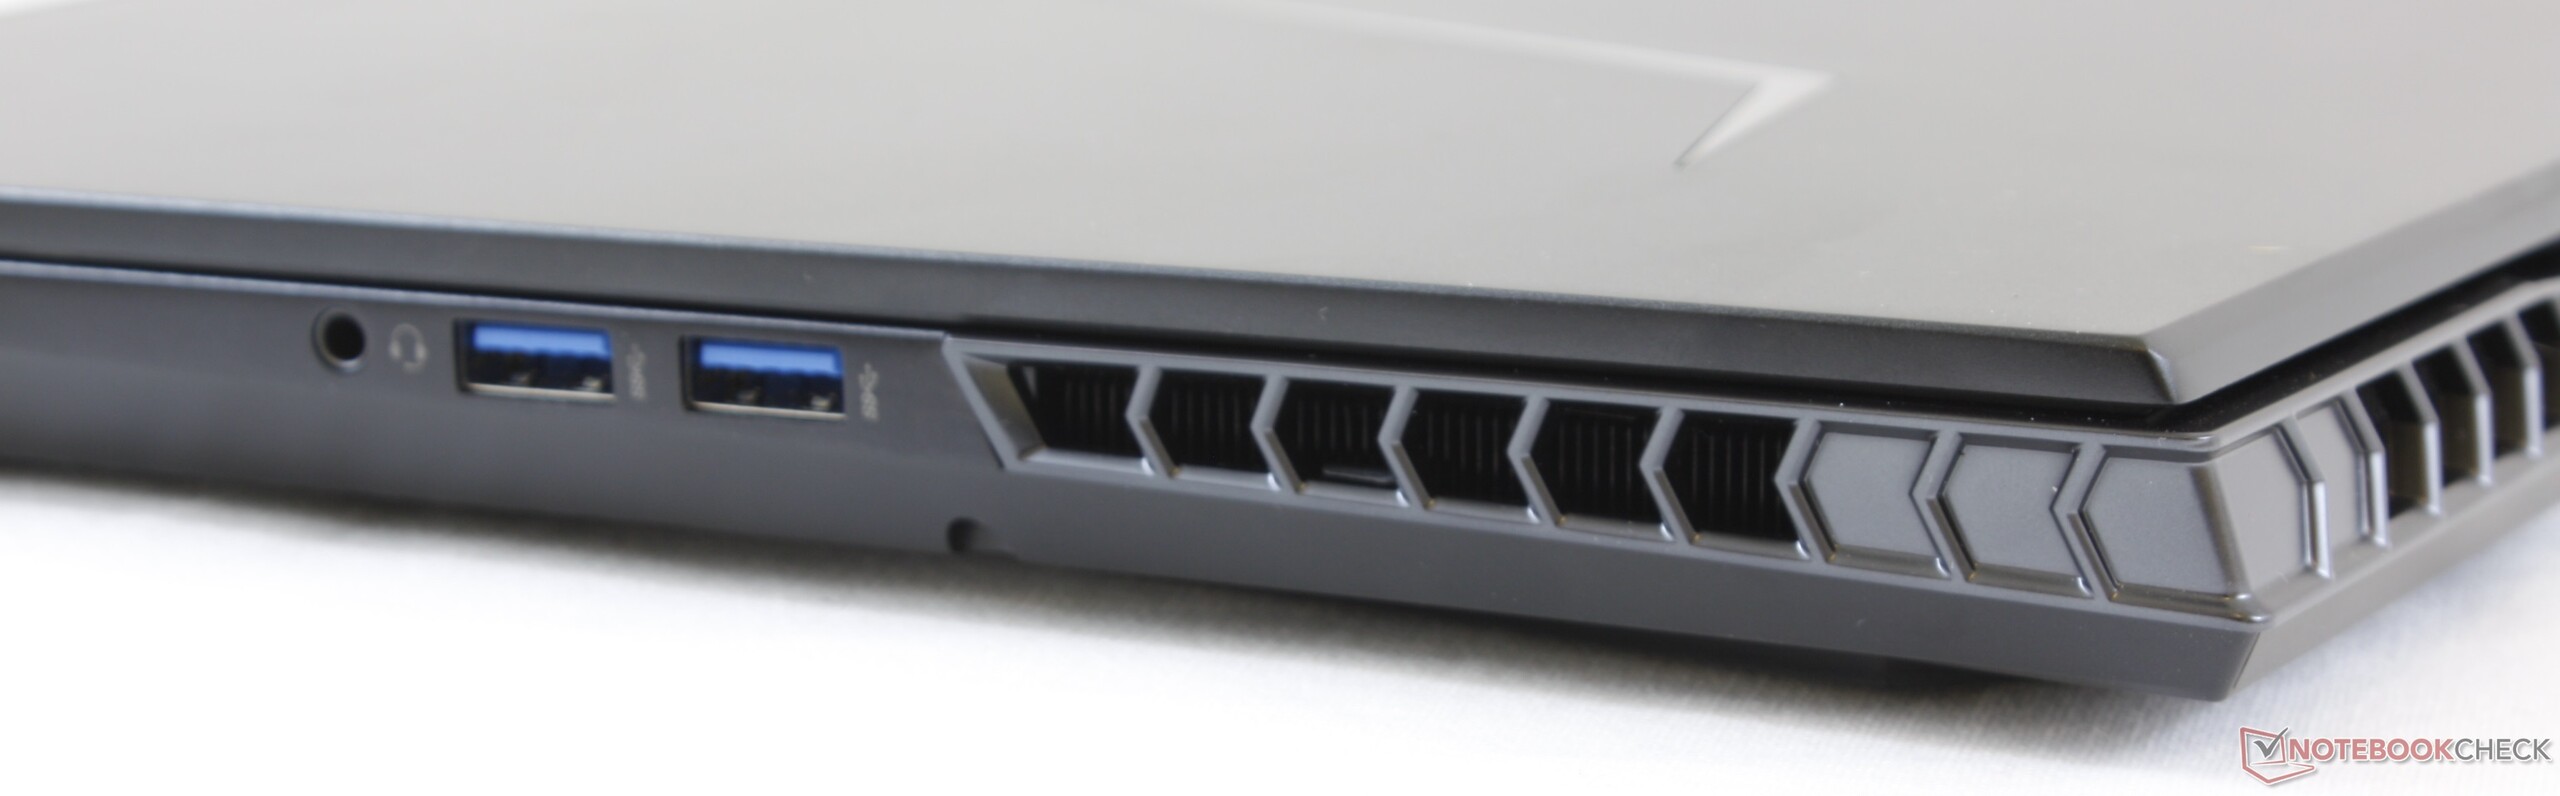
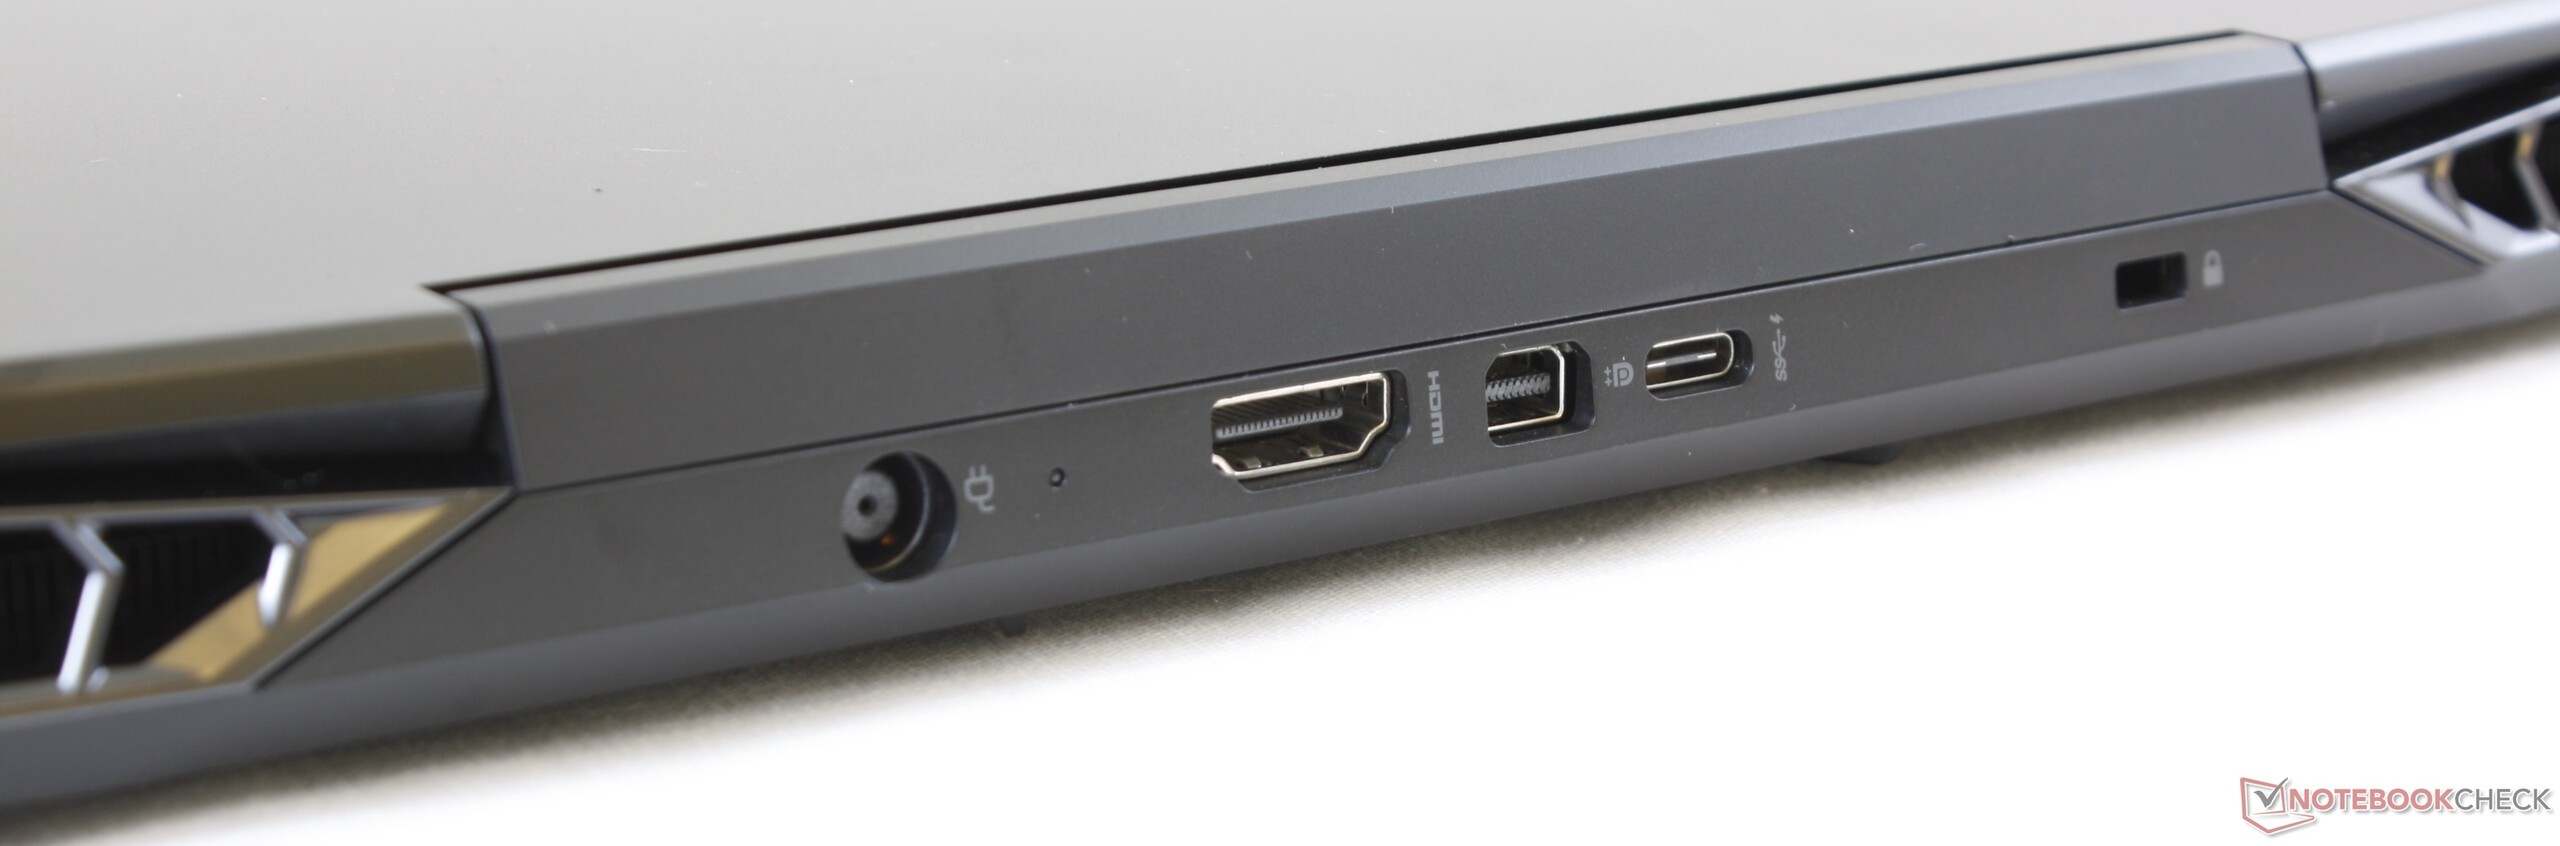
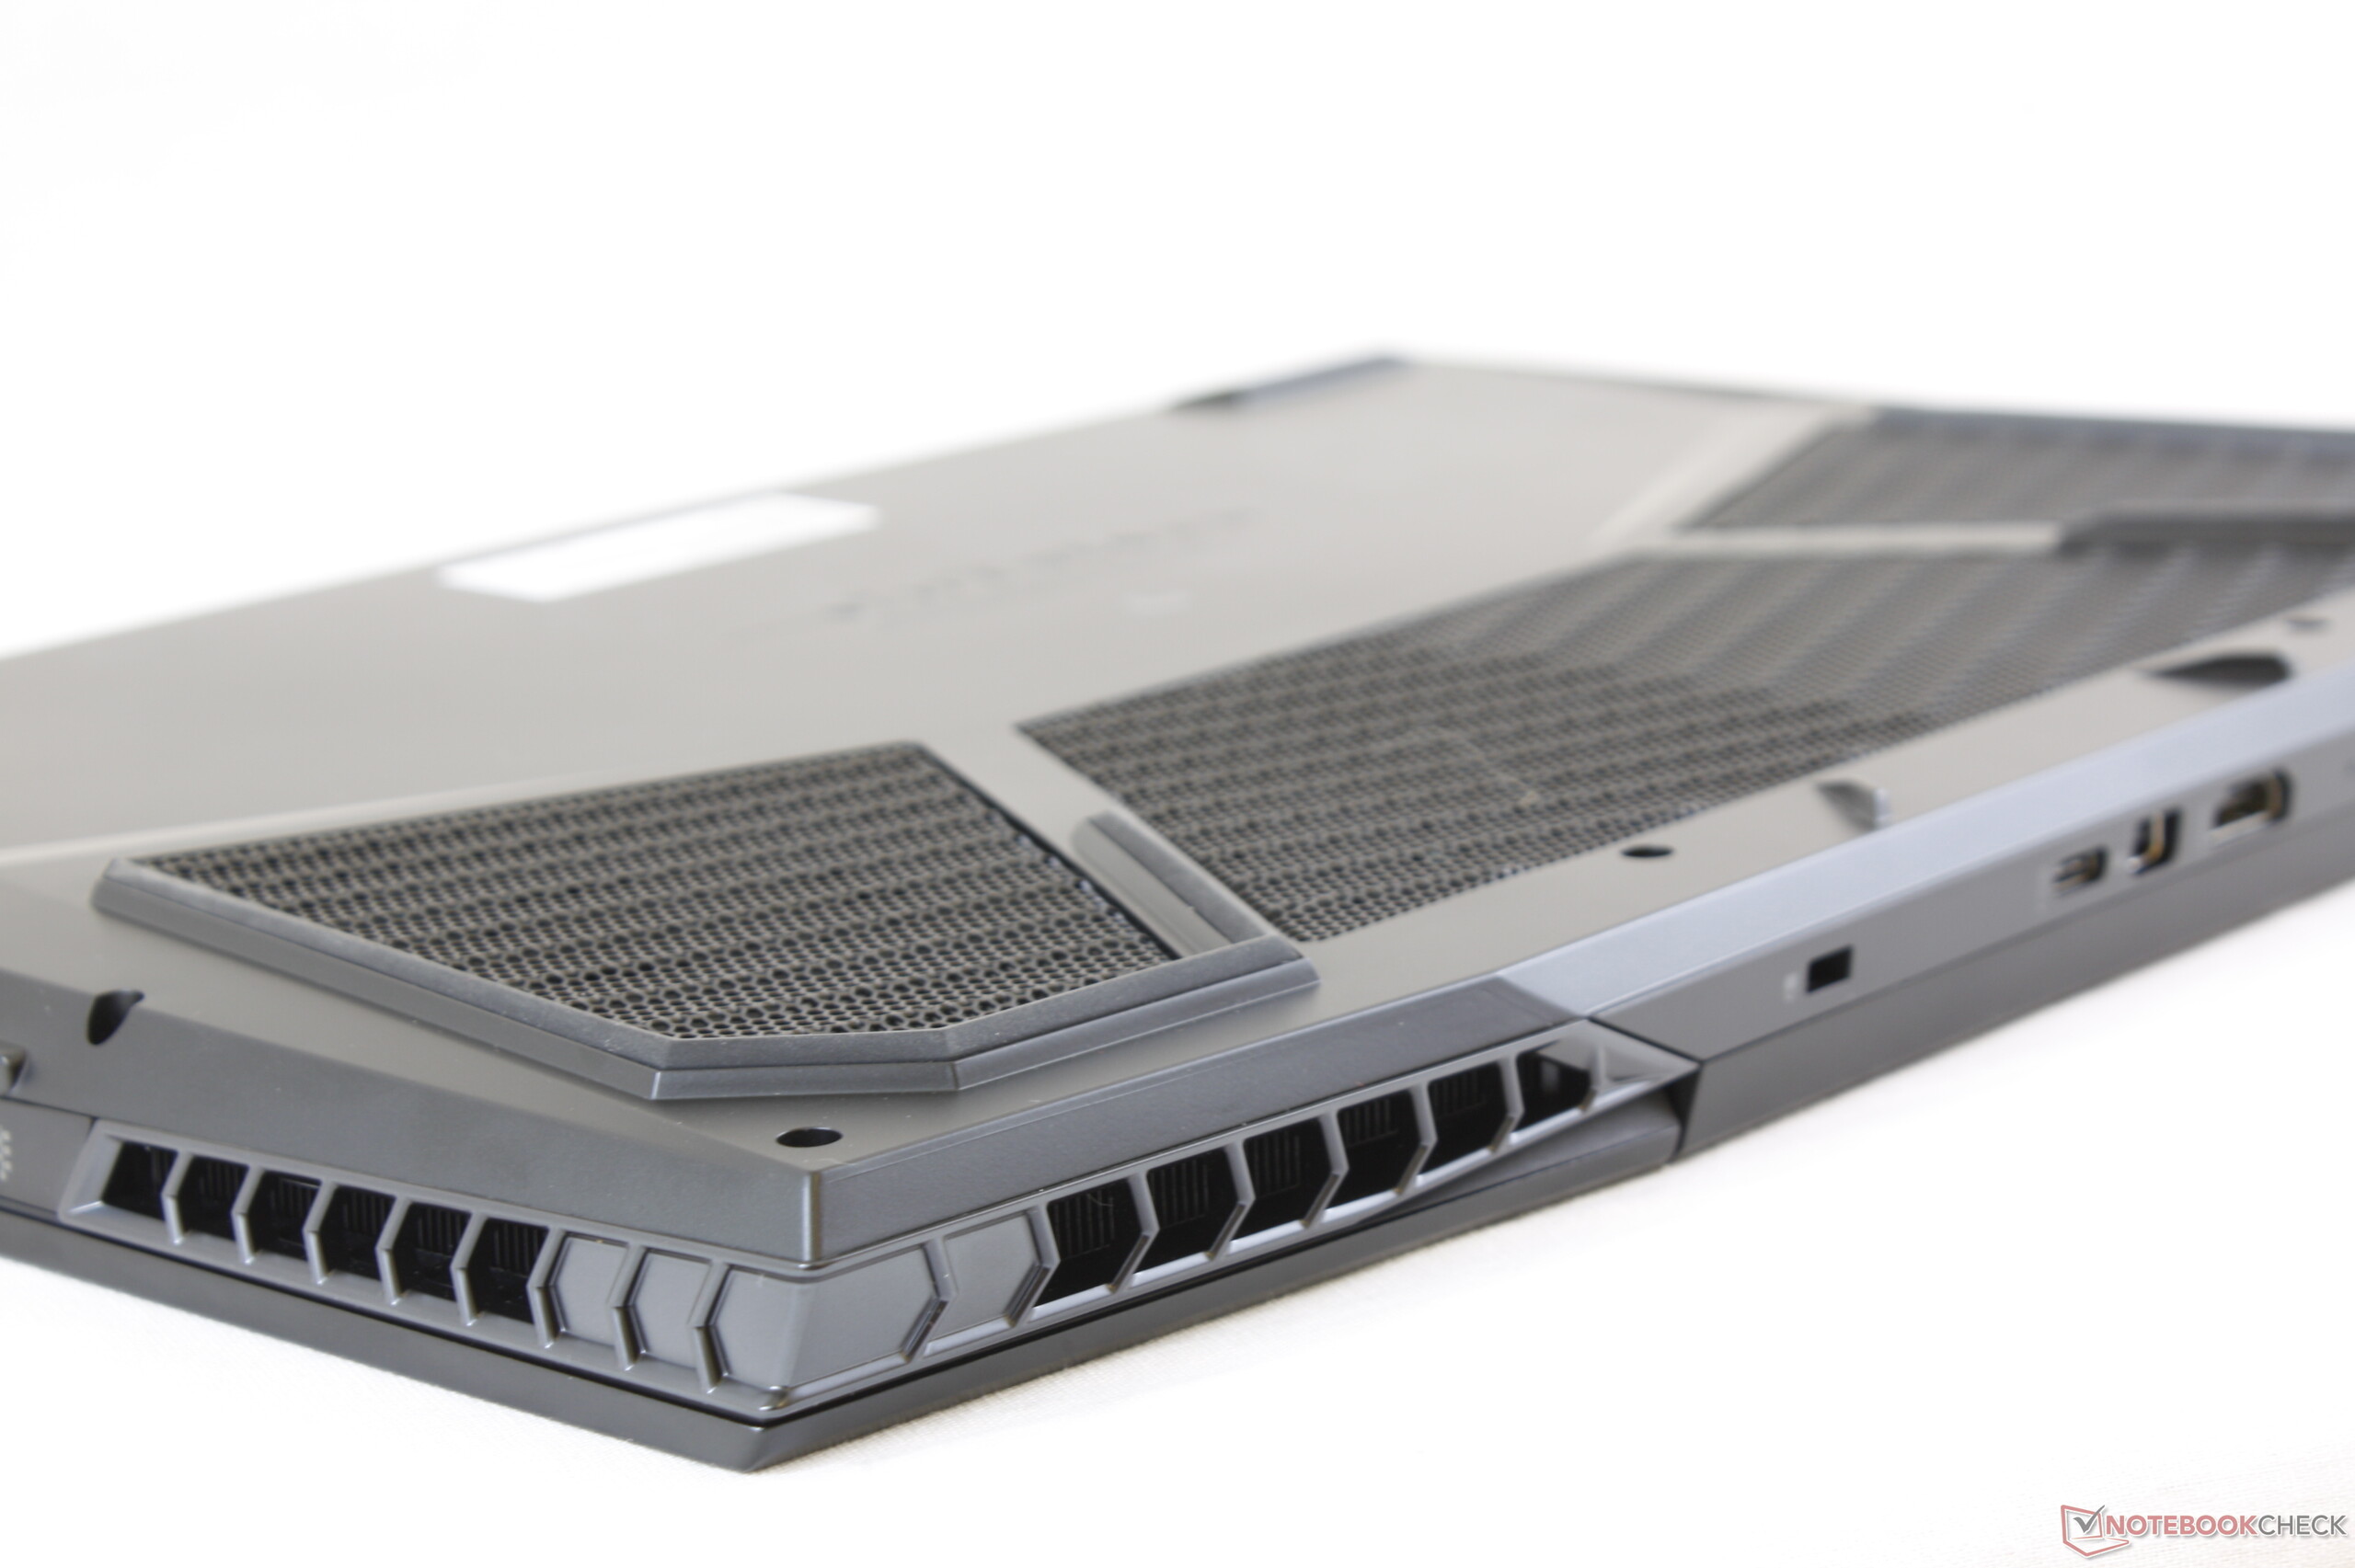
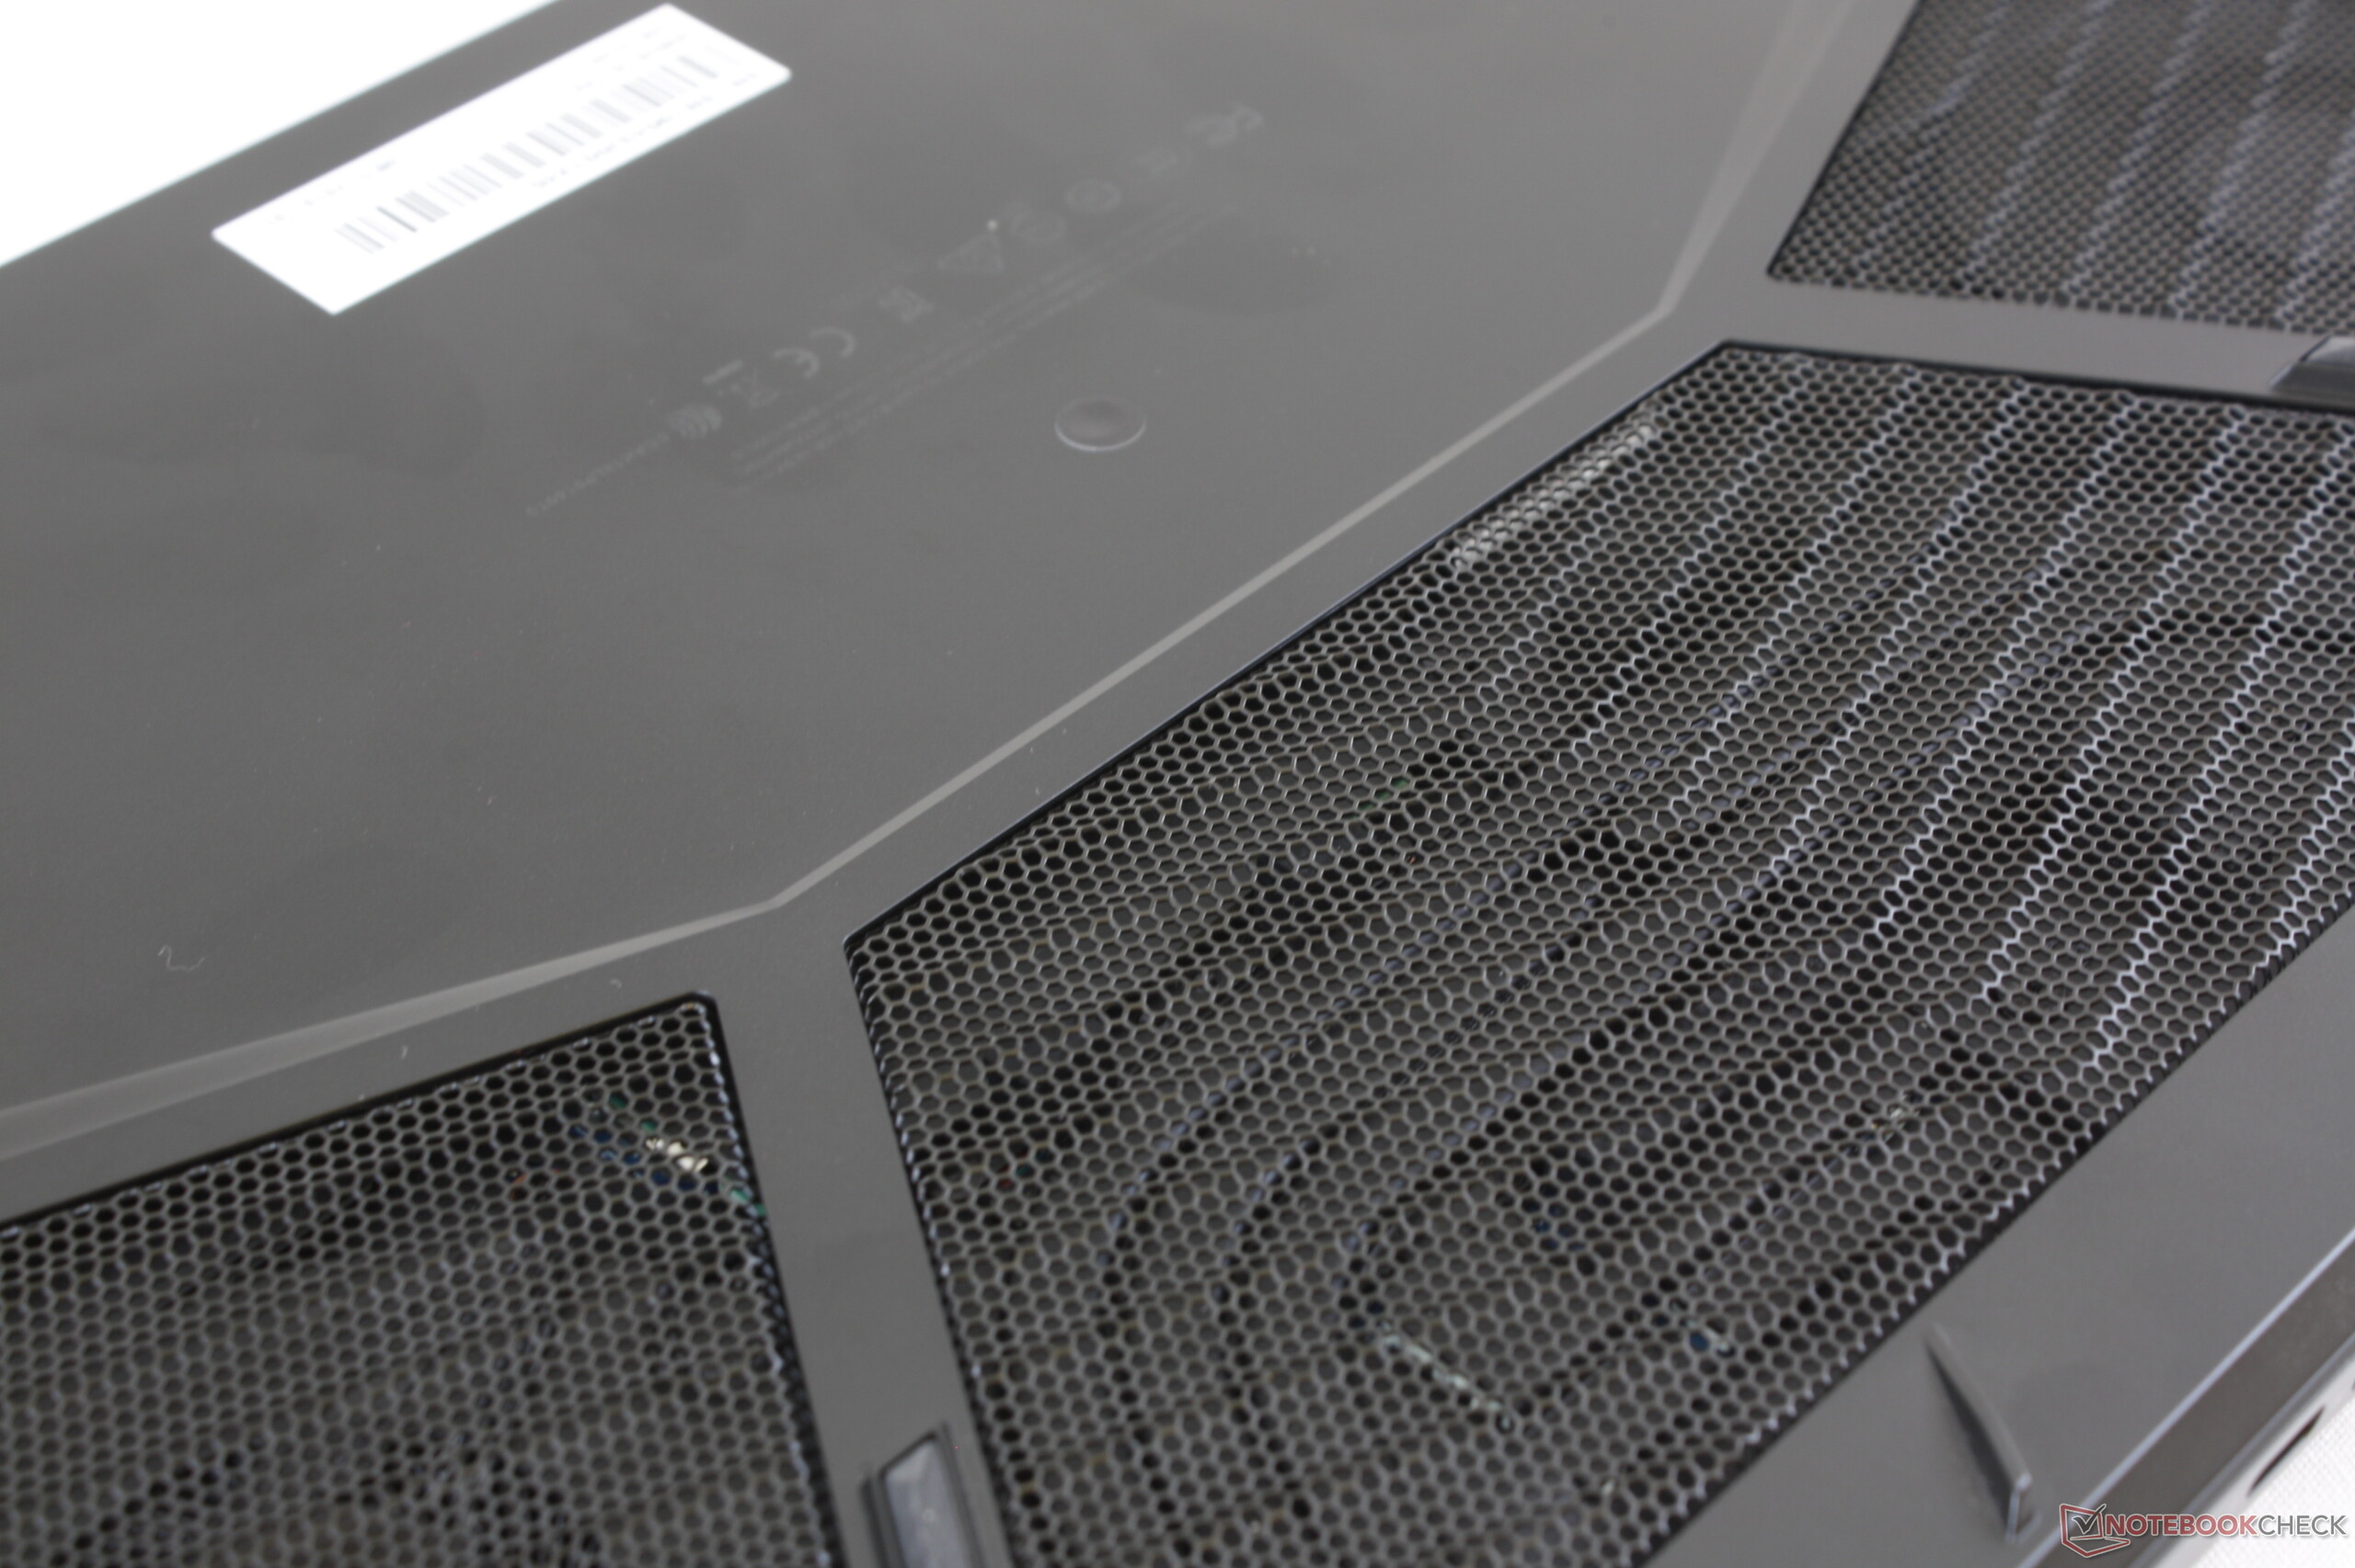
Since the Aorus 15-W9 and the Aorus 15-X9 have an identical build, we will not discuss the case, connections, input devices, display, and speakers here. You can find the corresponding information in our Aorus 15-X9 review.
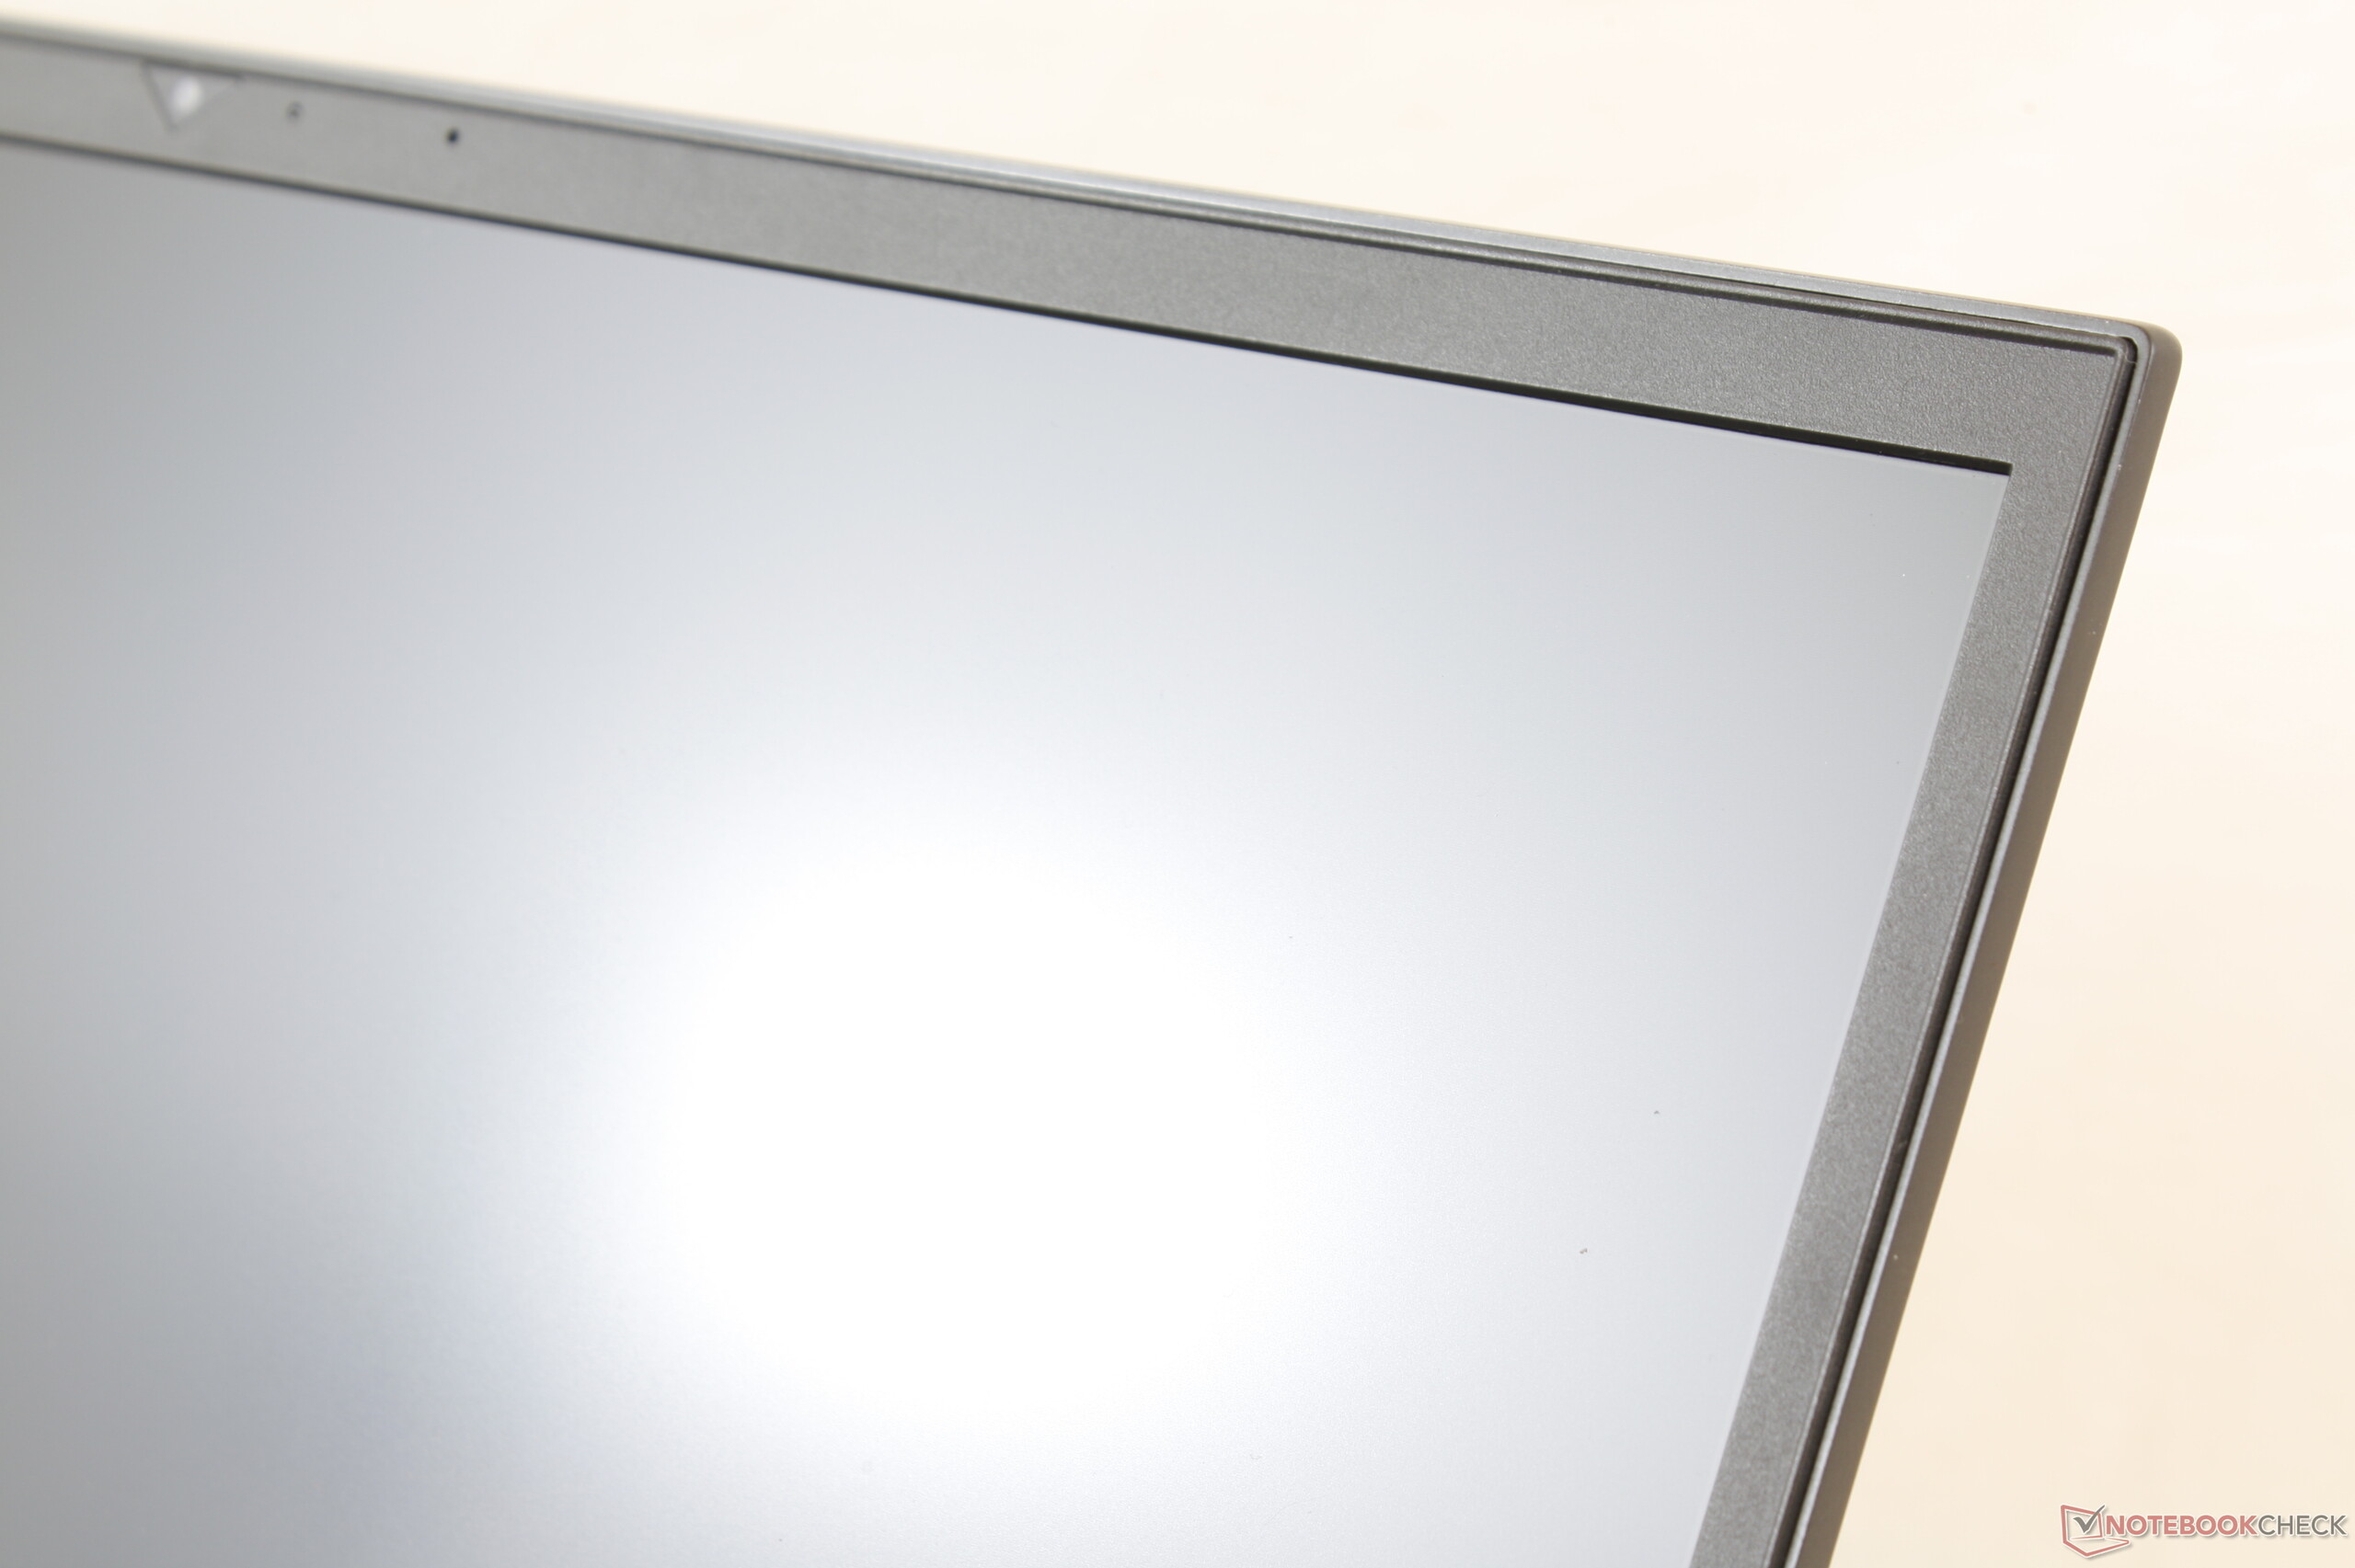
Display - 144 Hz, no G-Sync
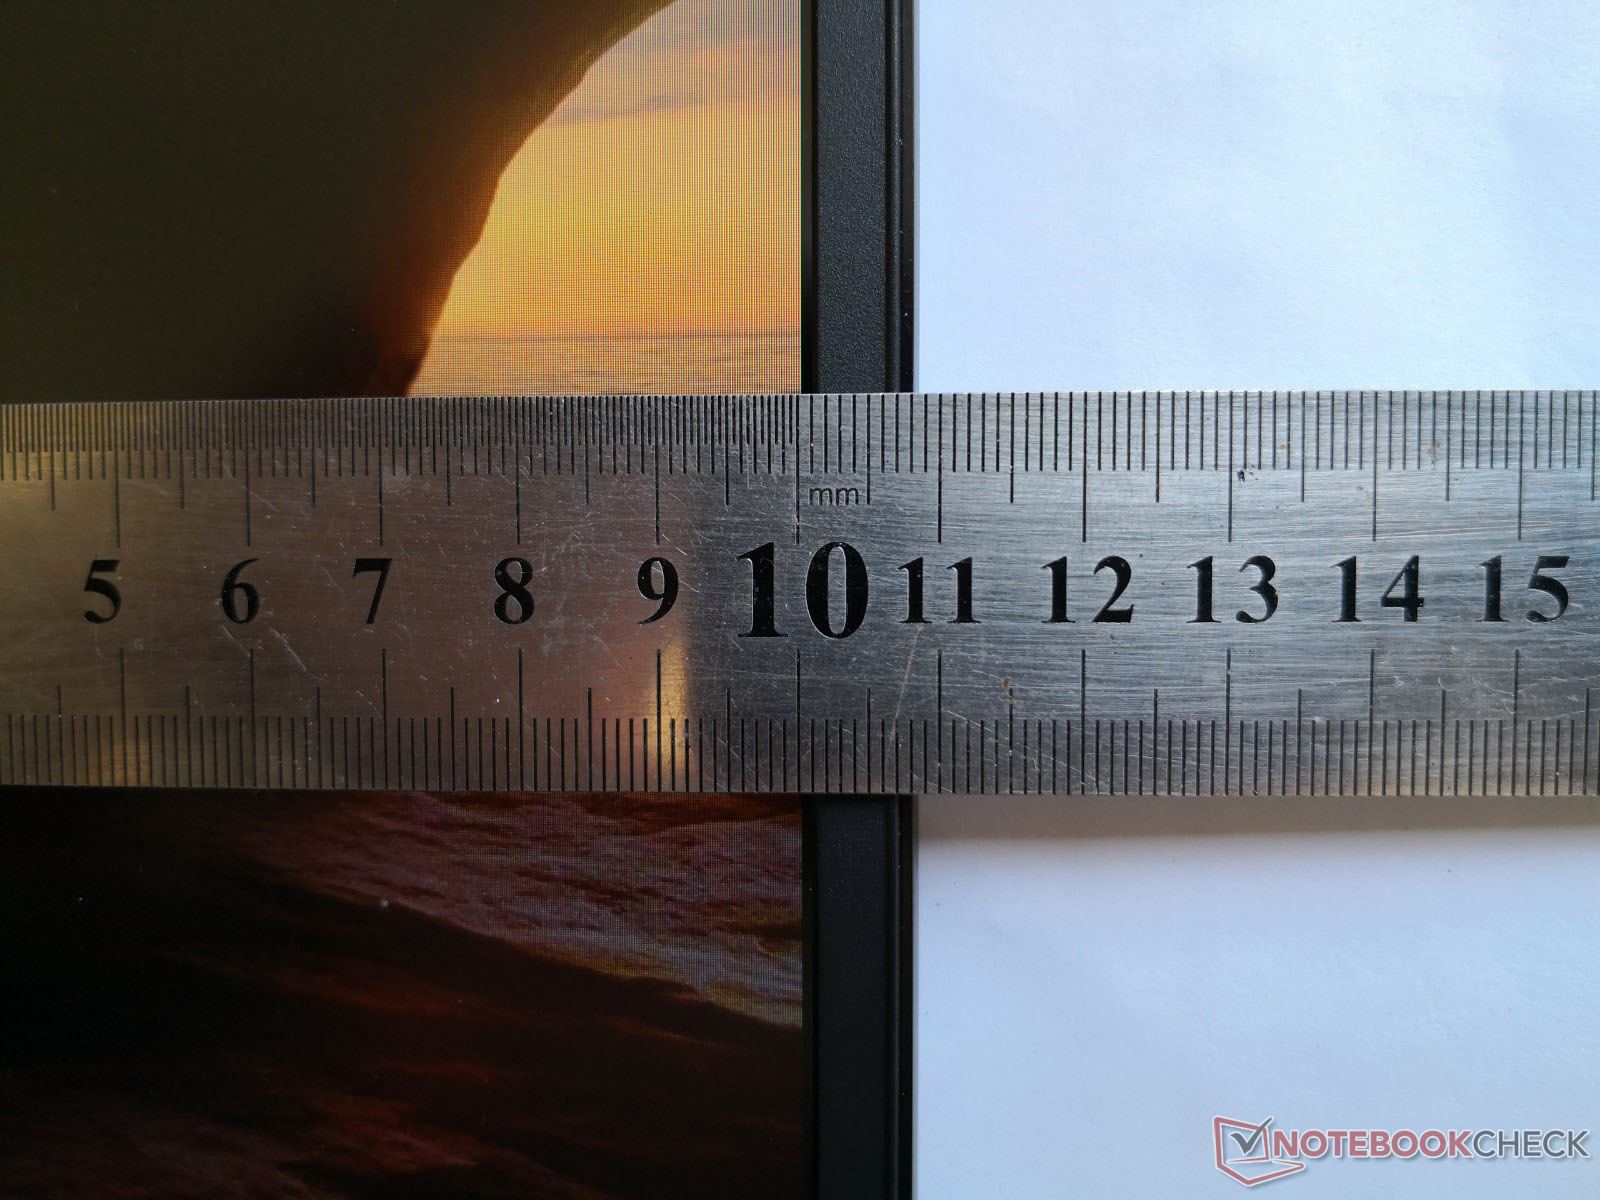
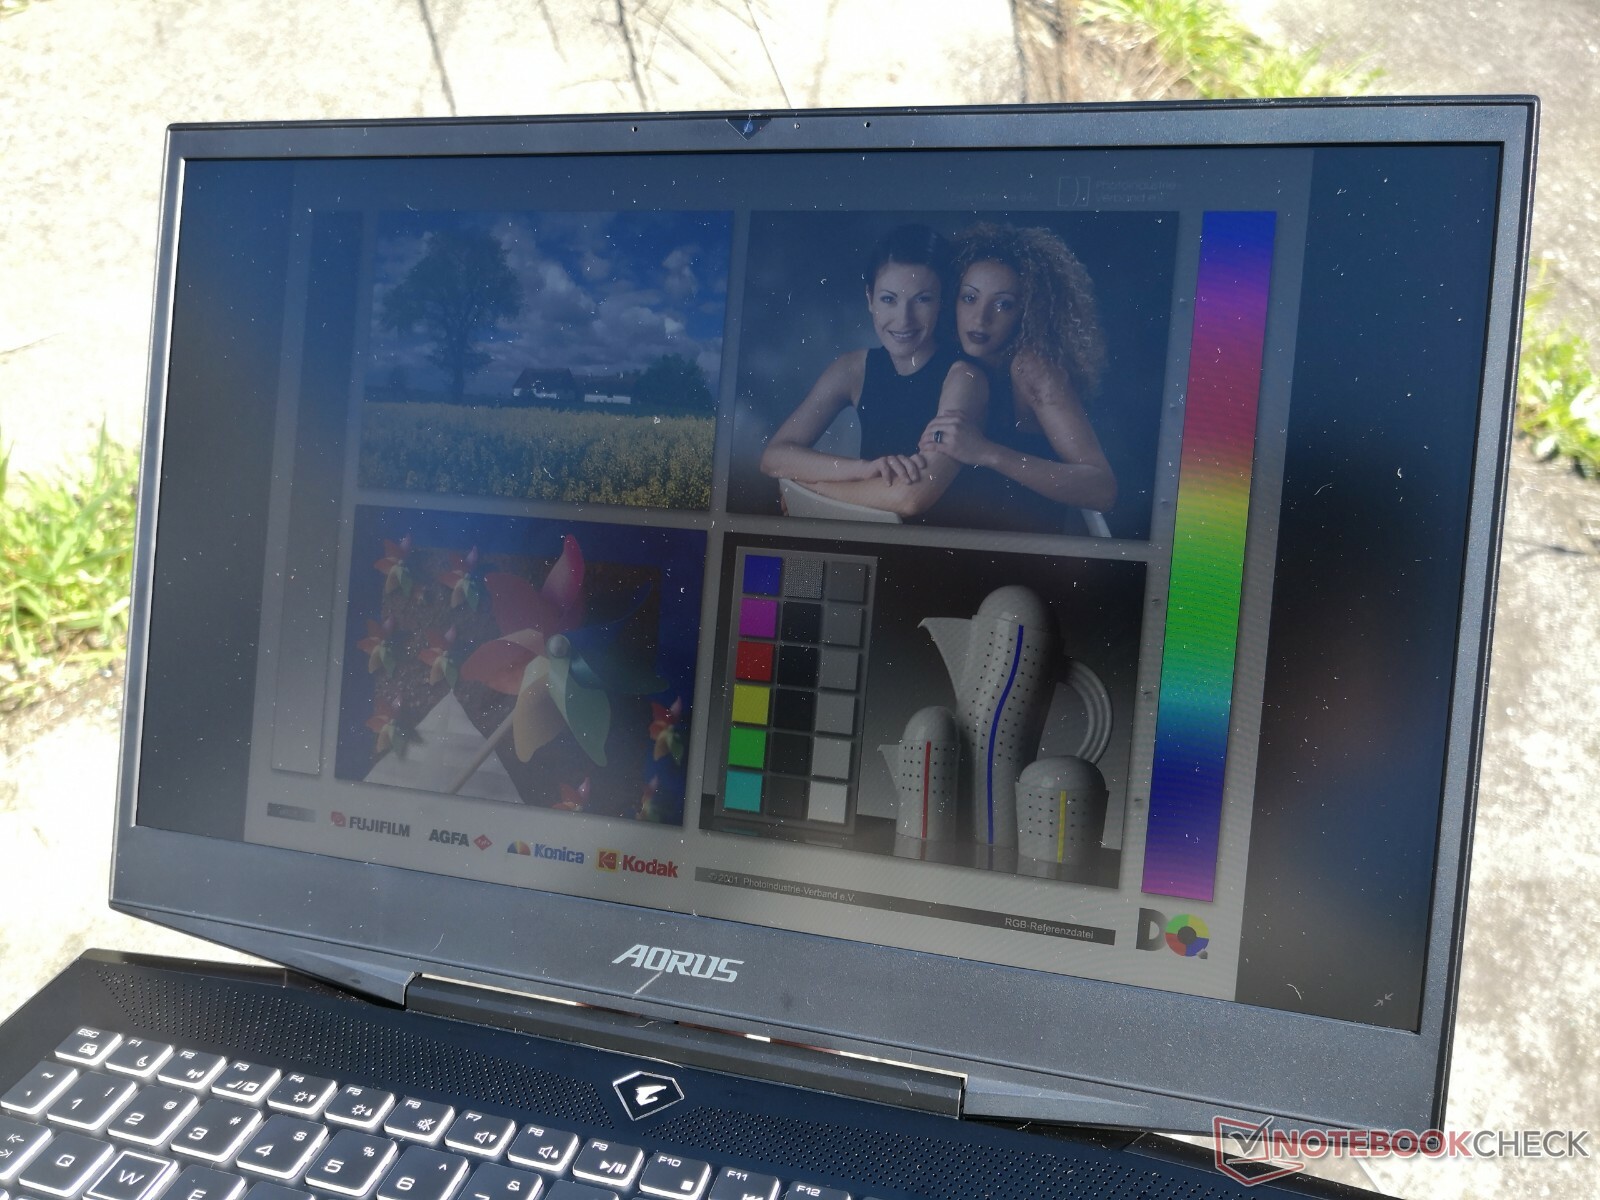
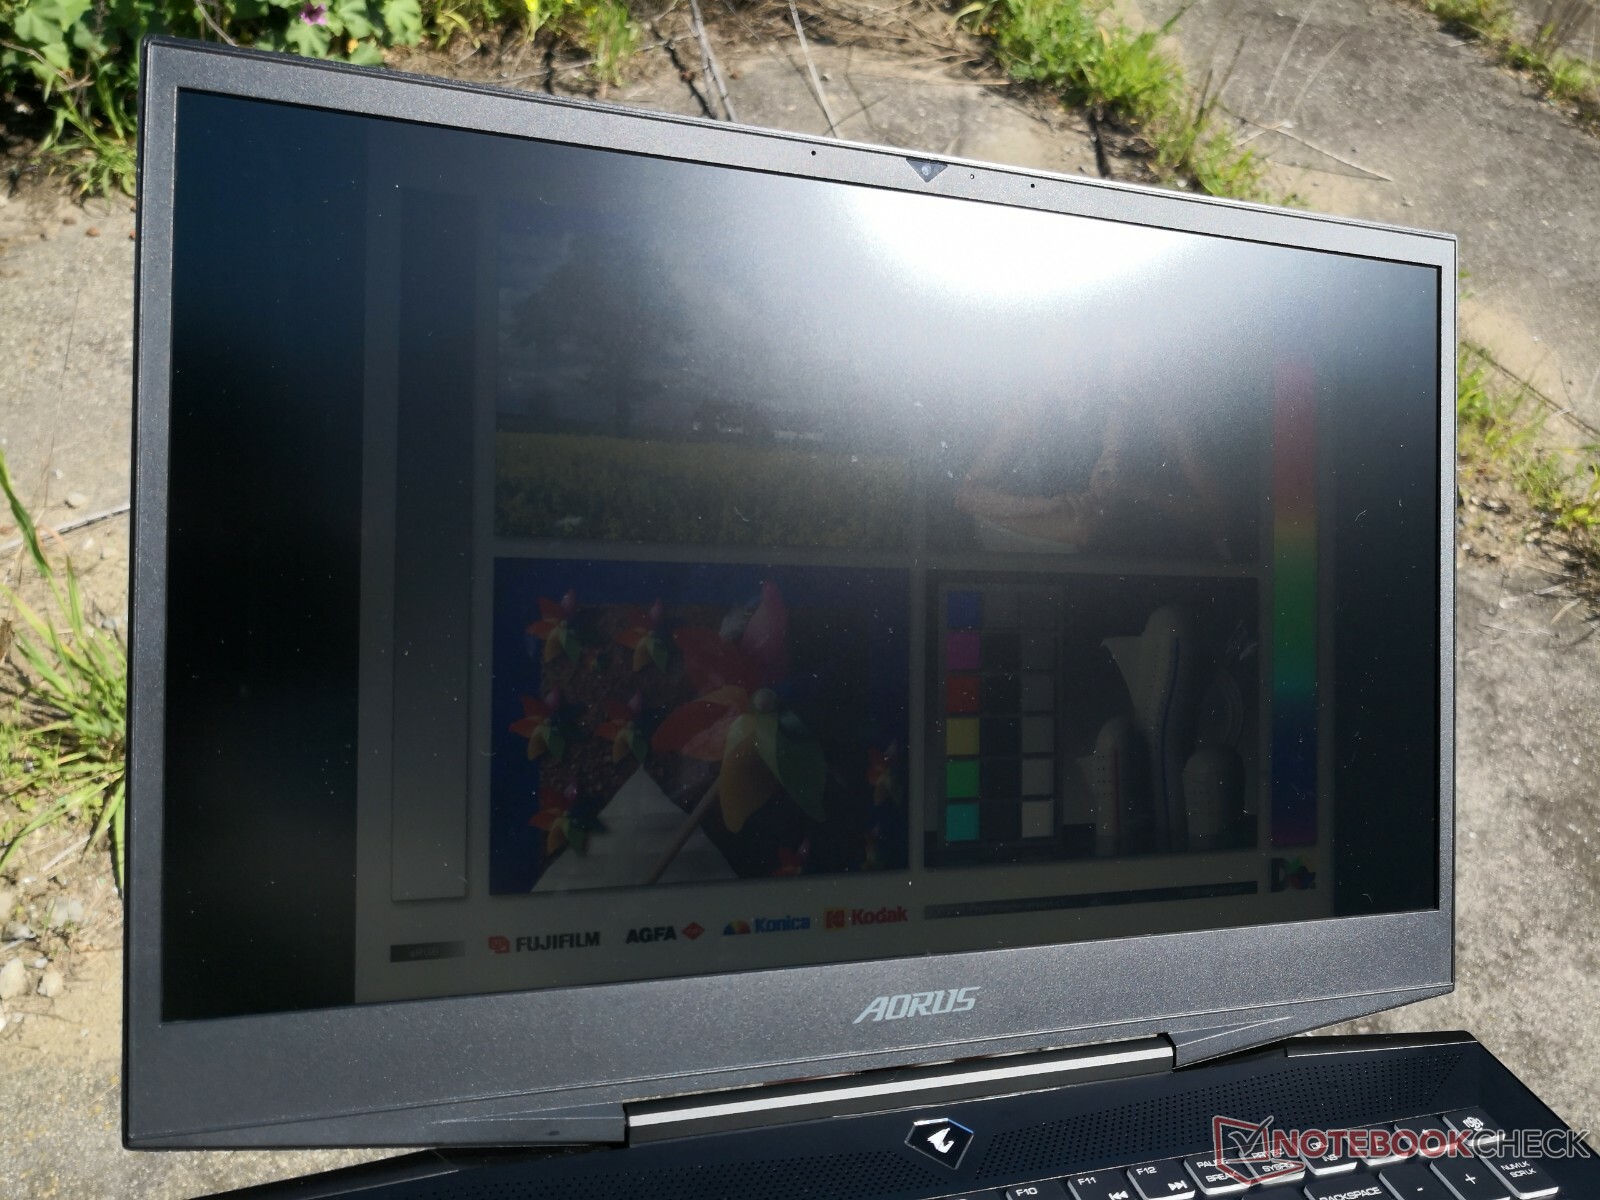
The 15.6-inch display of the Aorus 15 has a native resolution of 1920x1080 pixels. While the contrast (868:1) and brightness (292 cd/m²) can be deemed acceptable, they could have been higher, considering the price level of the notebook. We think that values beyond 300 cd/m² and 1000:1 are good.
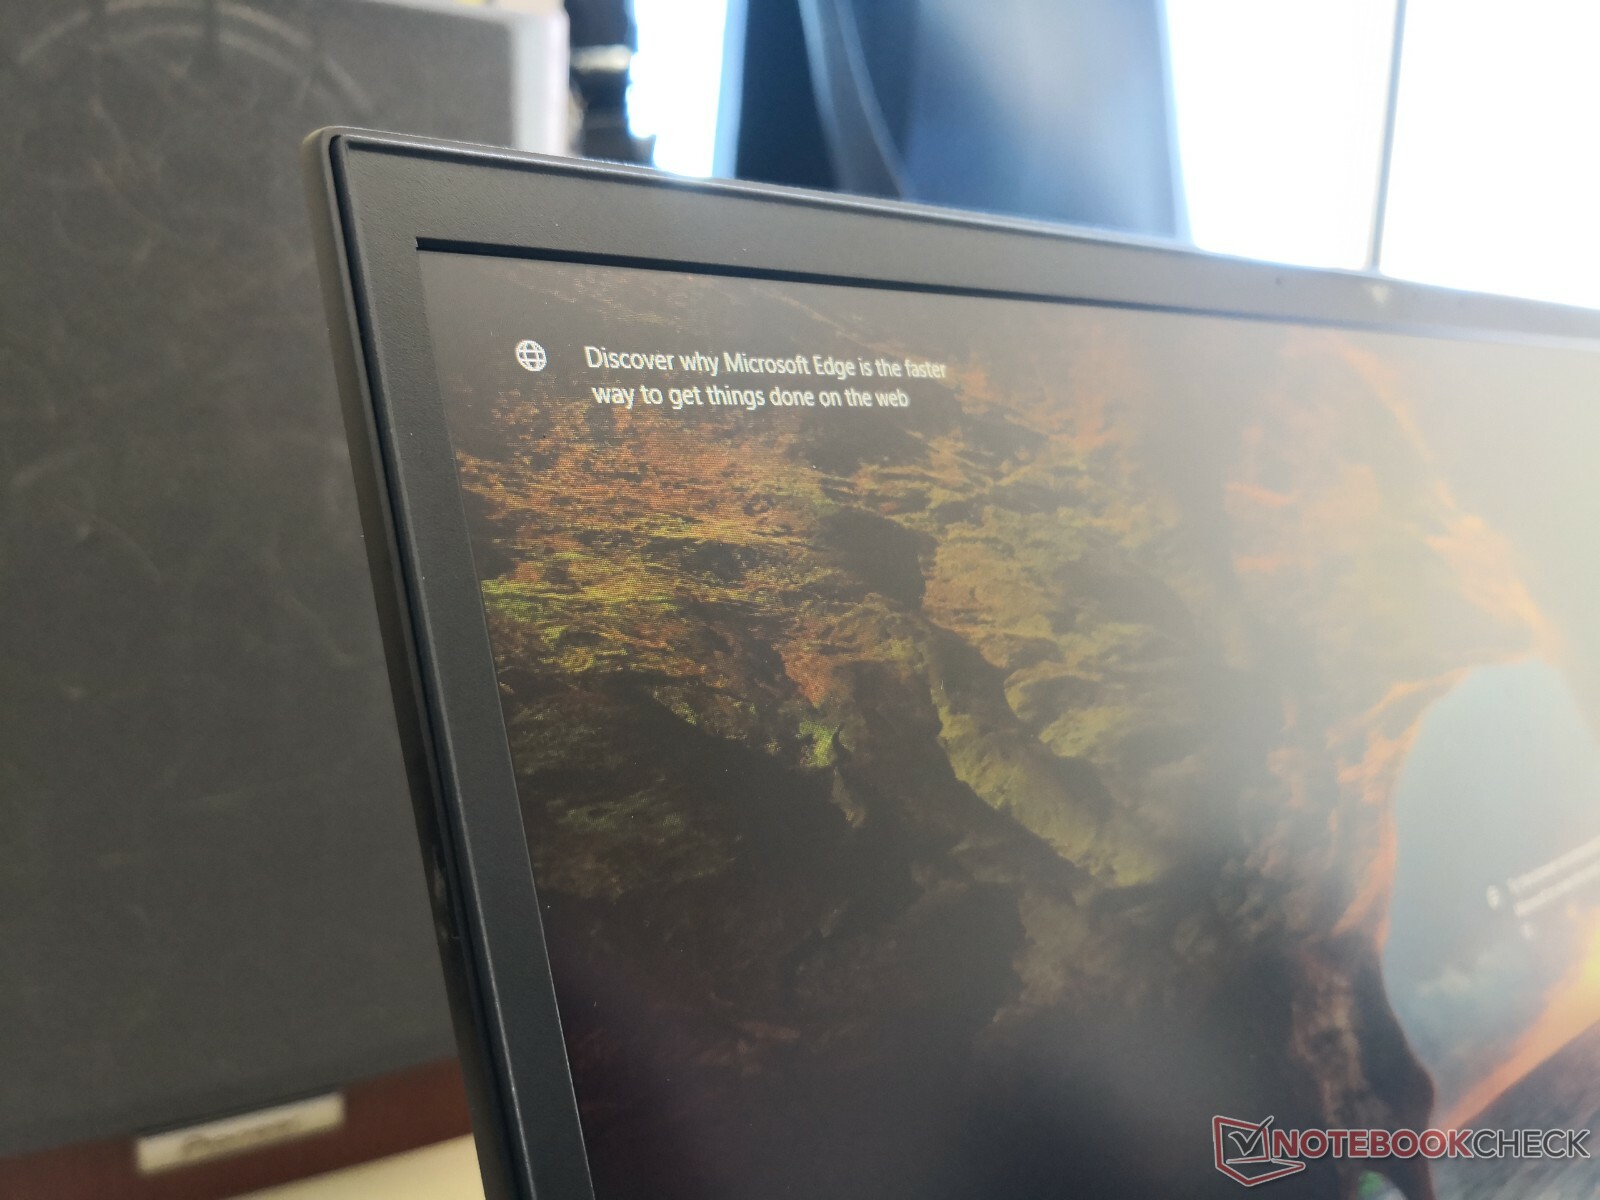
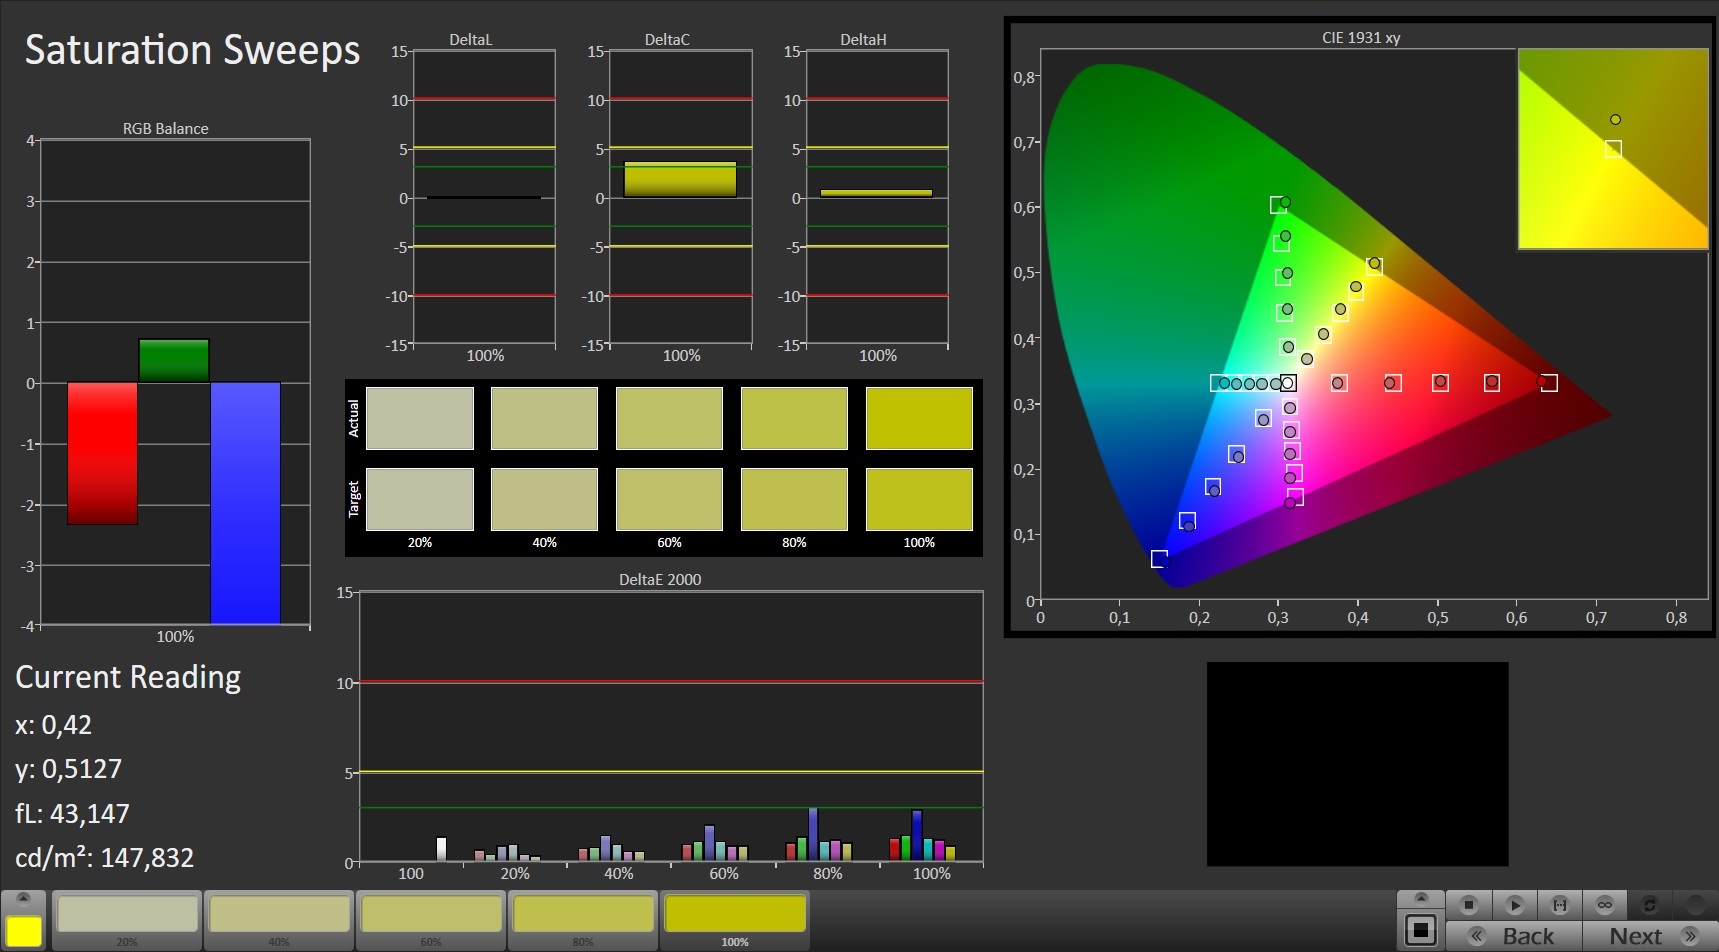
The 15-W9 is equipped with the same 144-Hz IPS display that is also in the Aorus 15-X9 and whose viewing angles are stable. The results we measured here are slightly different, which is normal since two displays from the same series are never 100% identical.
| |||||||||||||||||||||||||
Brightness Distribution: 80 %
Center on Battery: 295 cd/m²
Contrast: 868:1 (Black: 0.34 cd/m²)
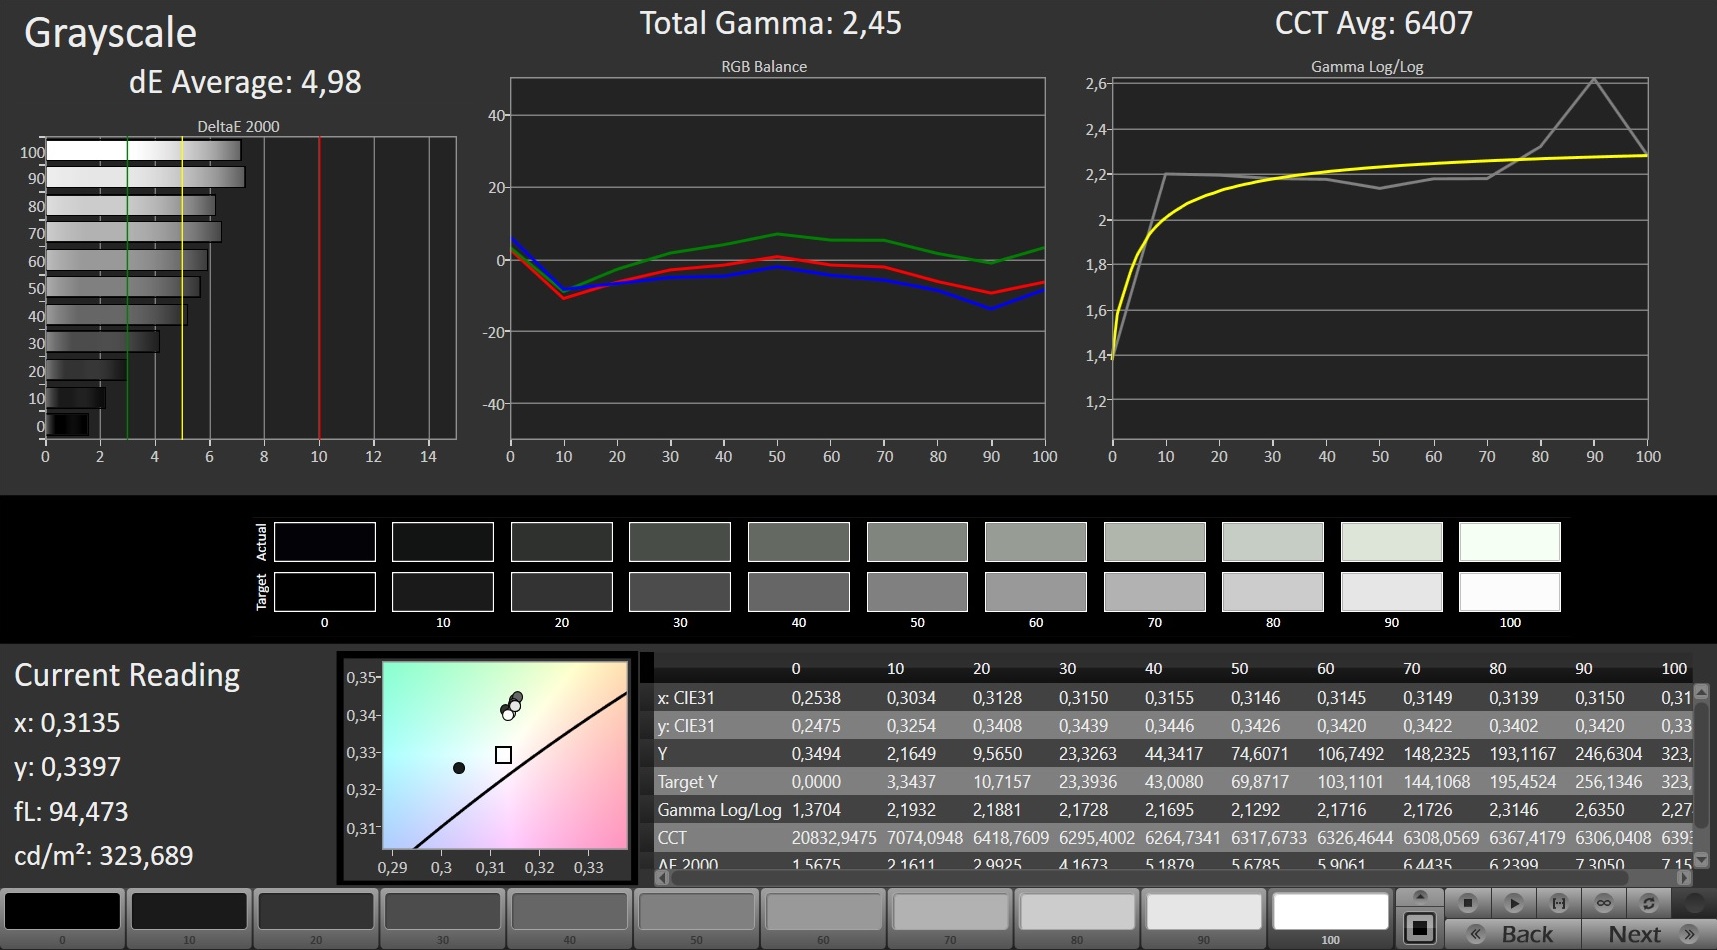
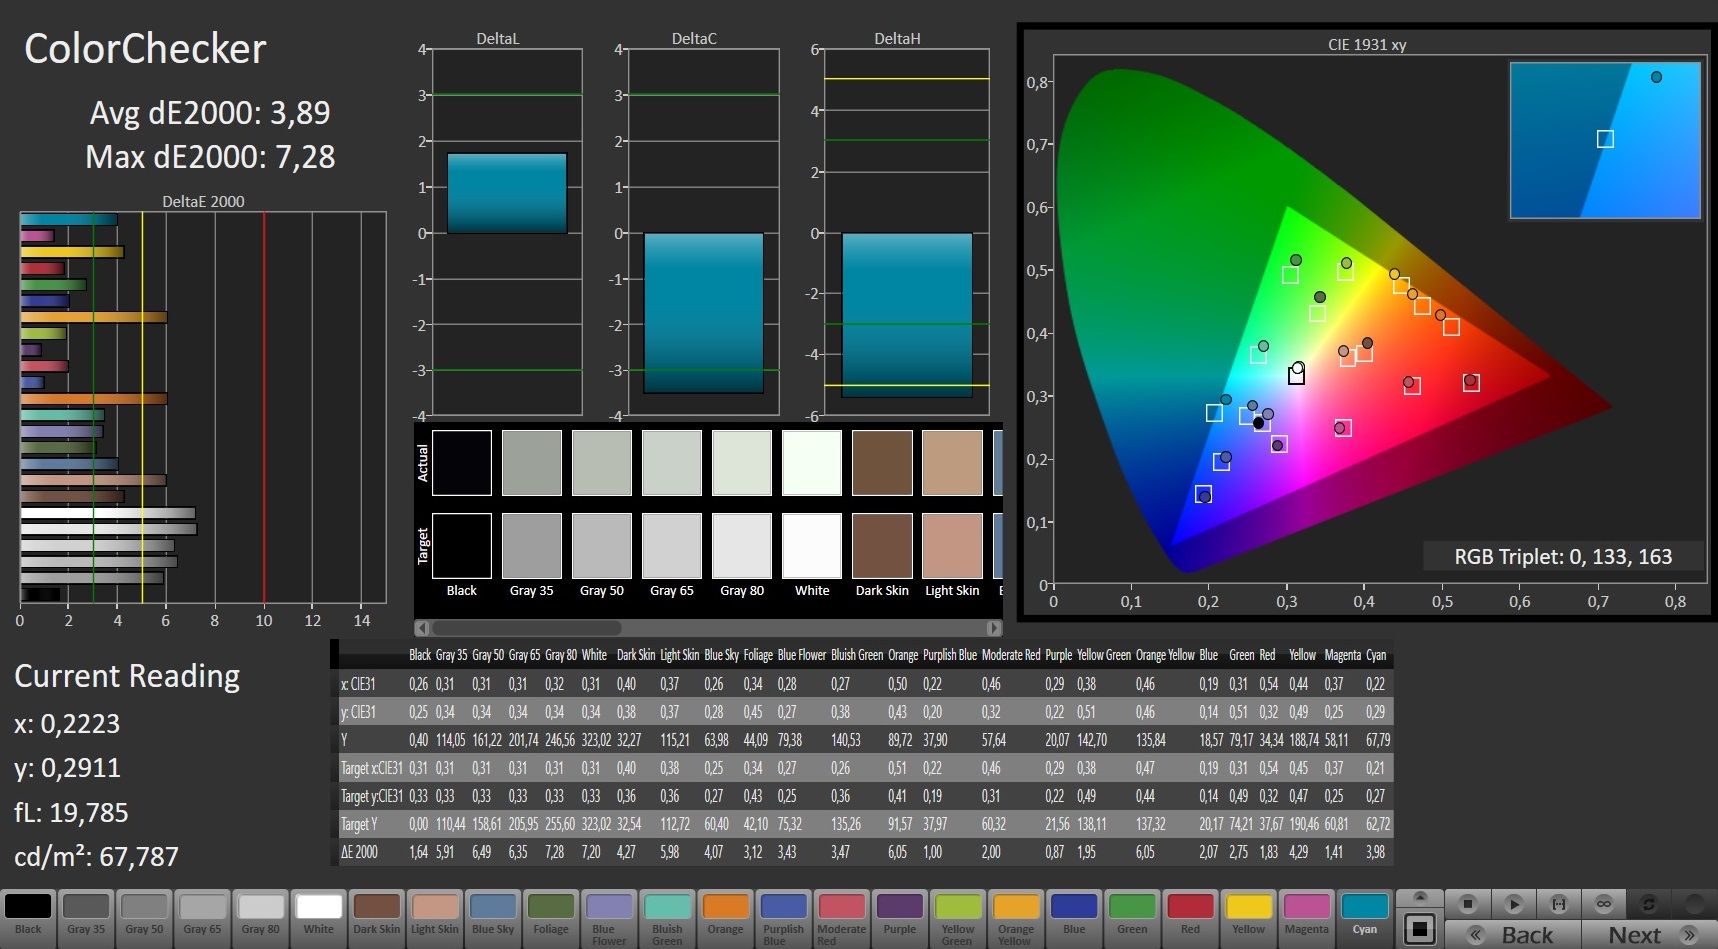
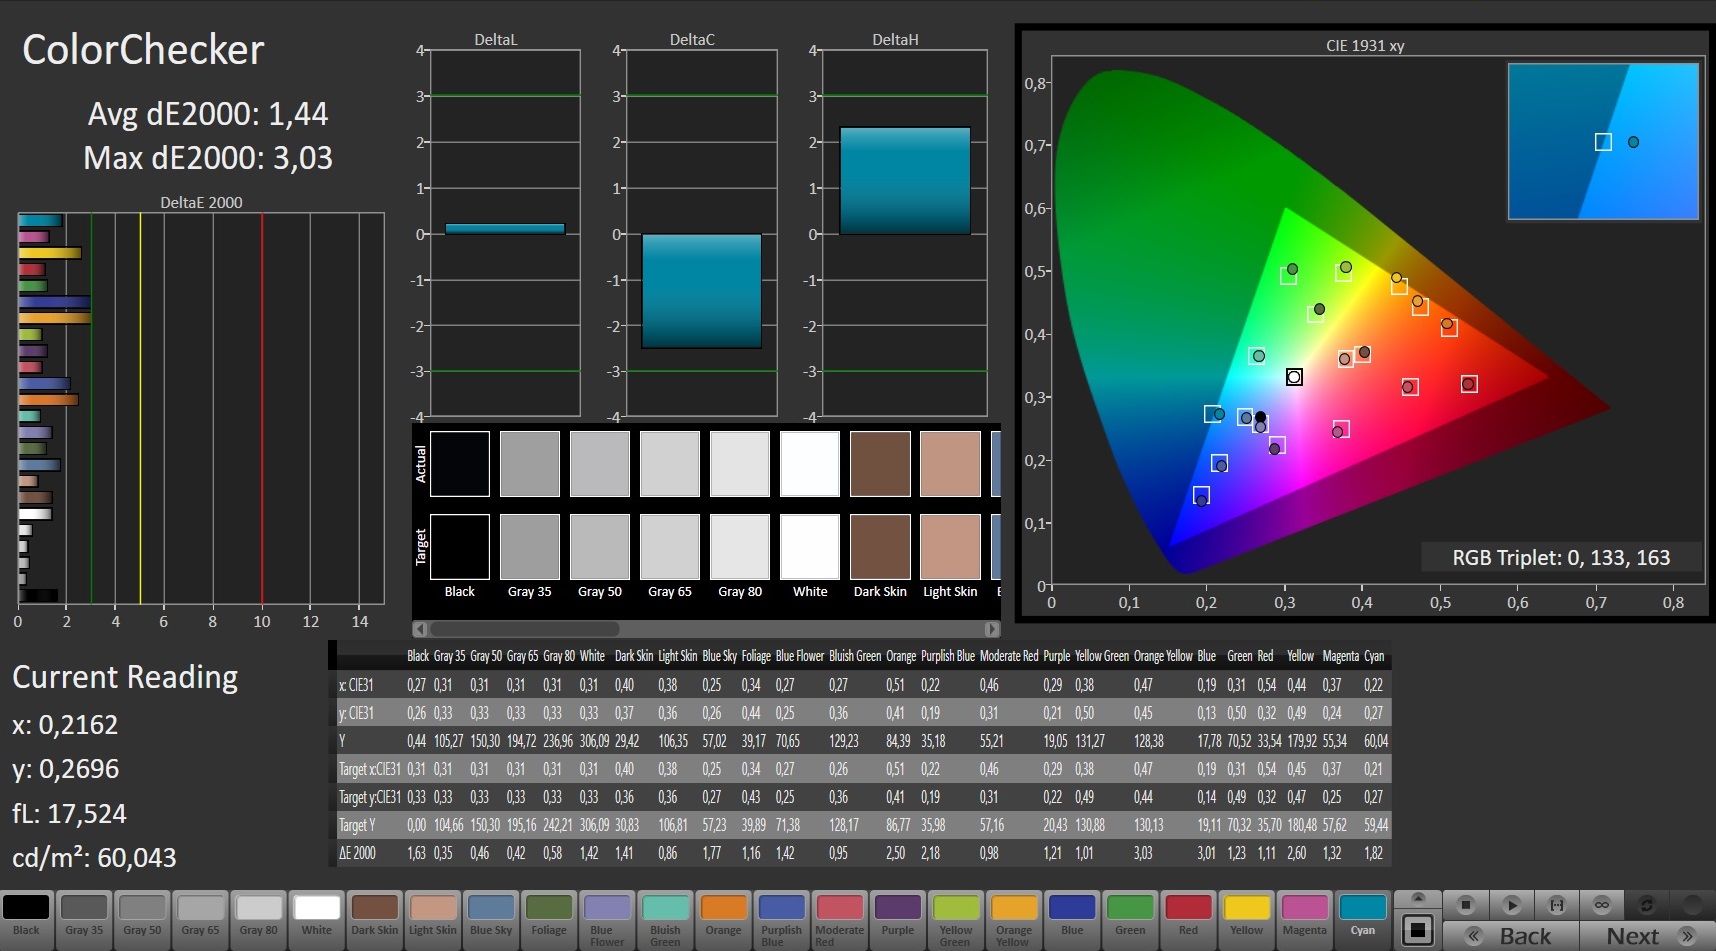
ΔE ColorChecker Calman: 3.89 | ∀{0.5-29.43 Ø4.71}
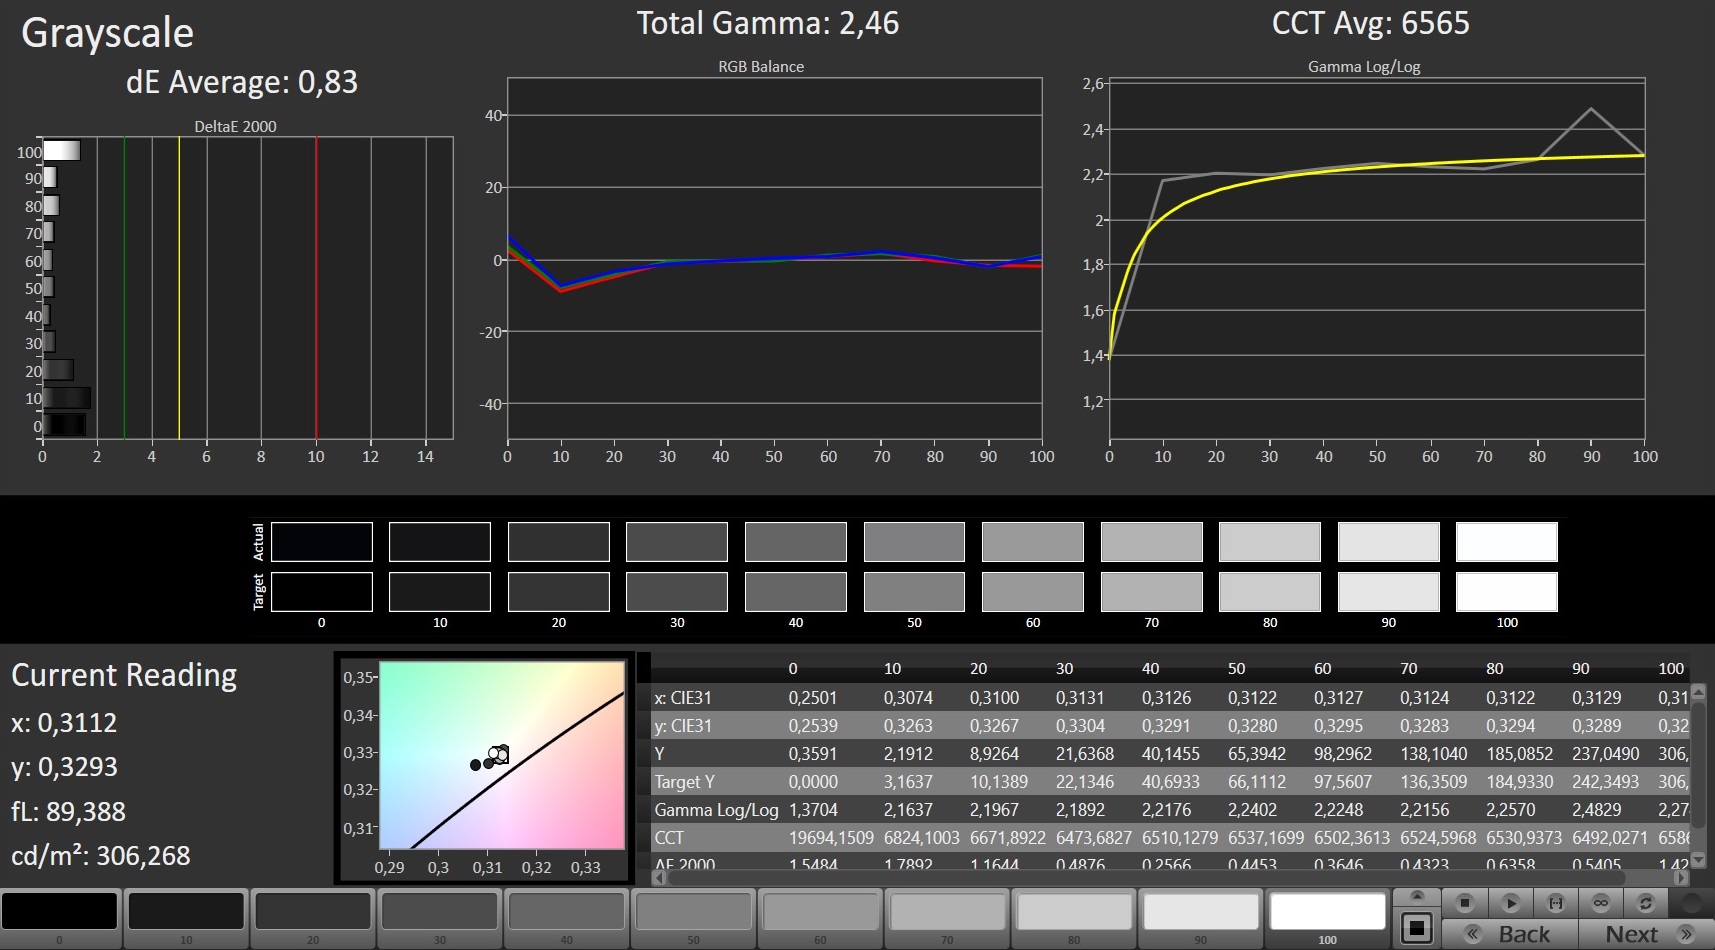
calibrated: 1.44
ΔE Greyscale Calman: 4.98 | ∀{0.09-98 Ø4.96}
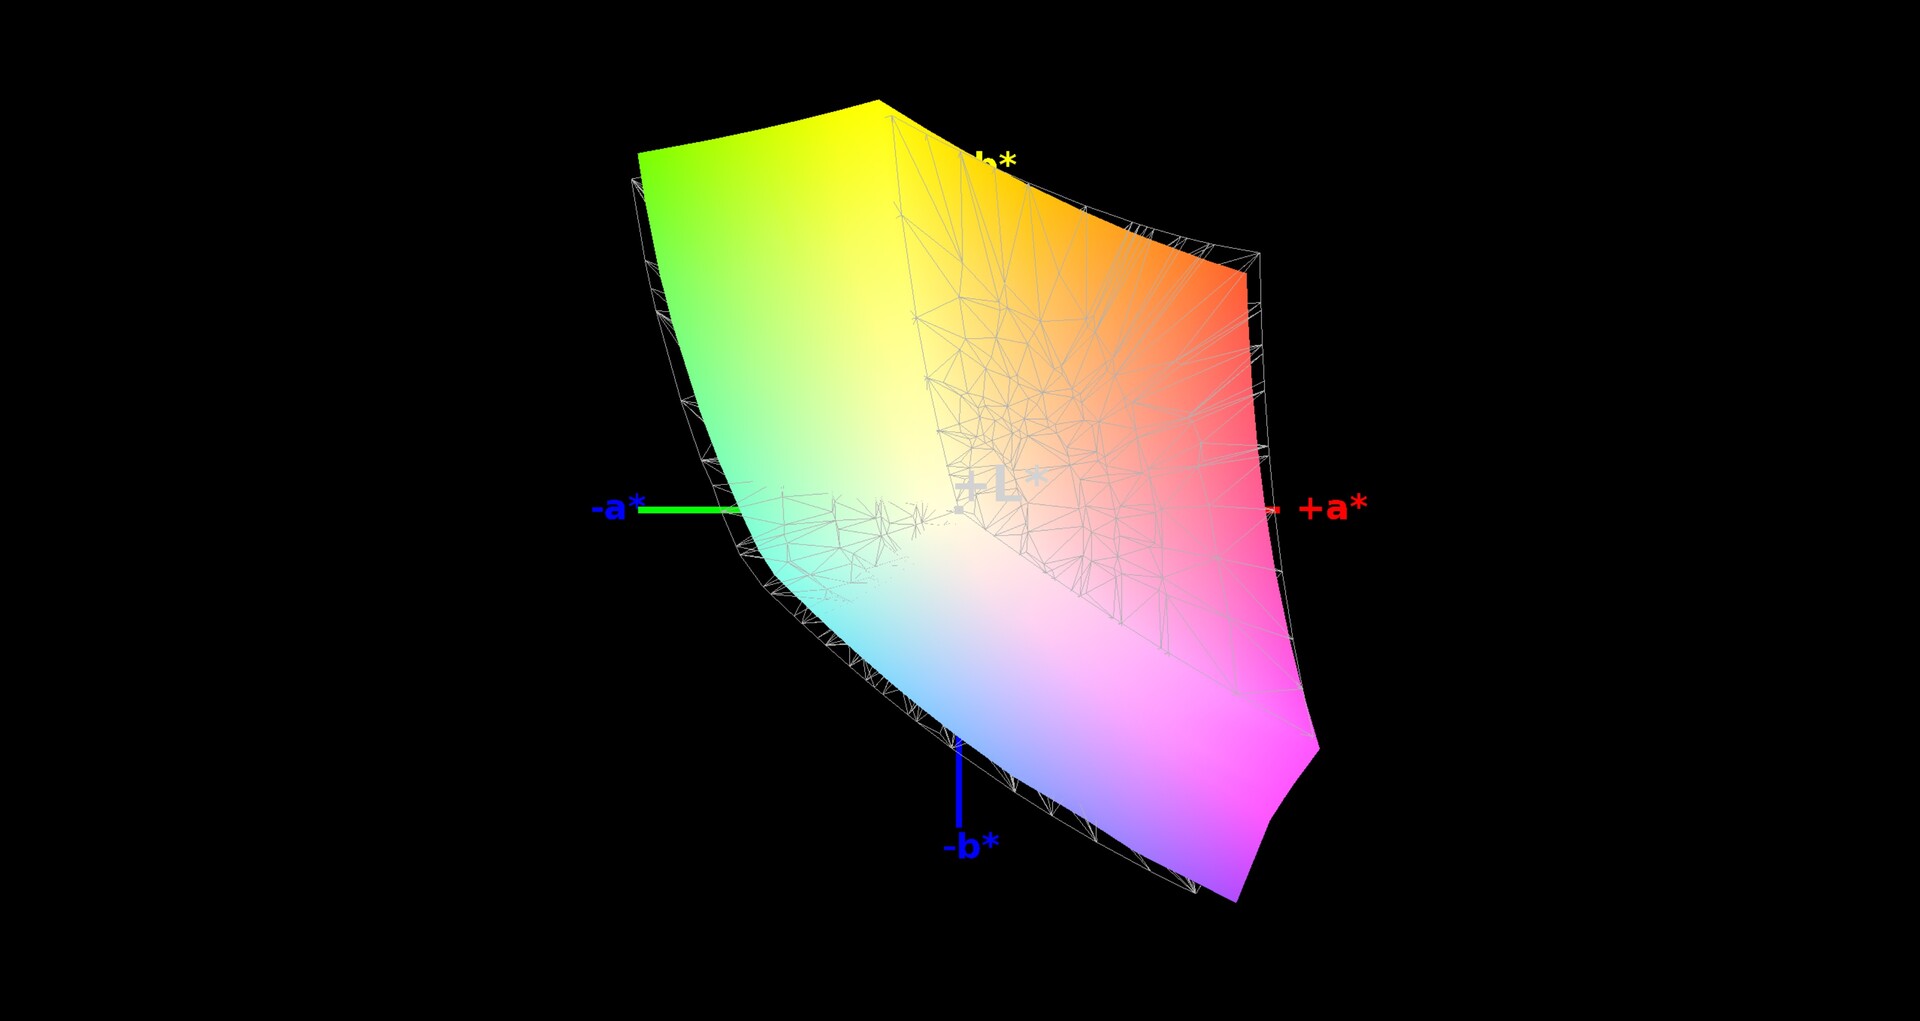
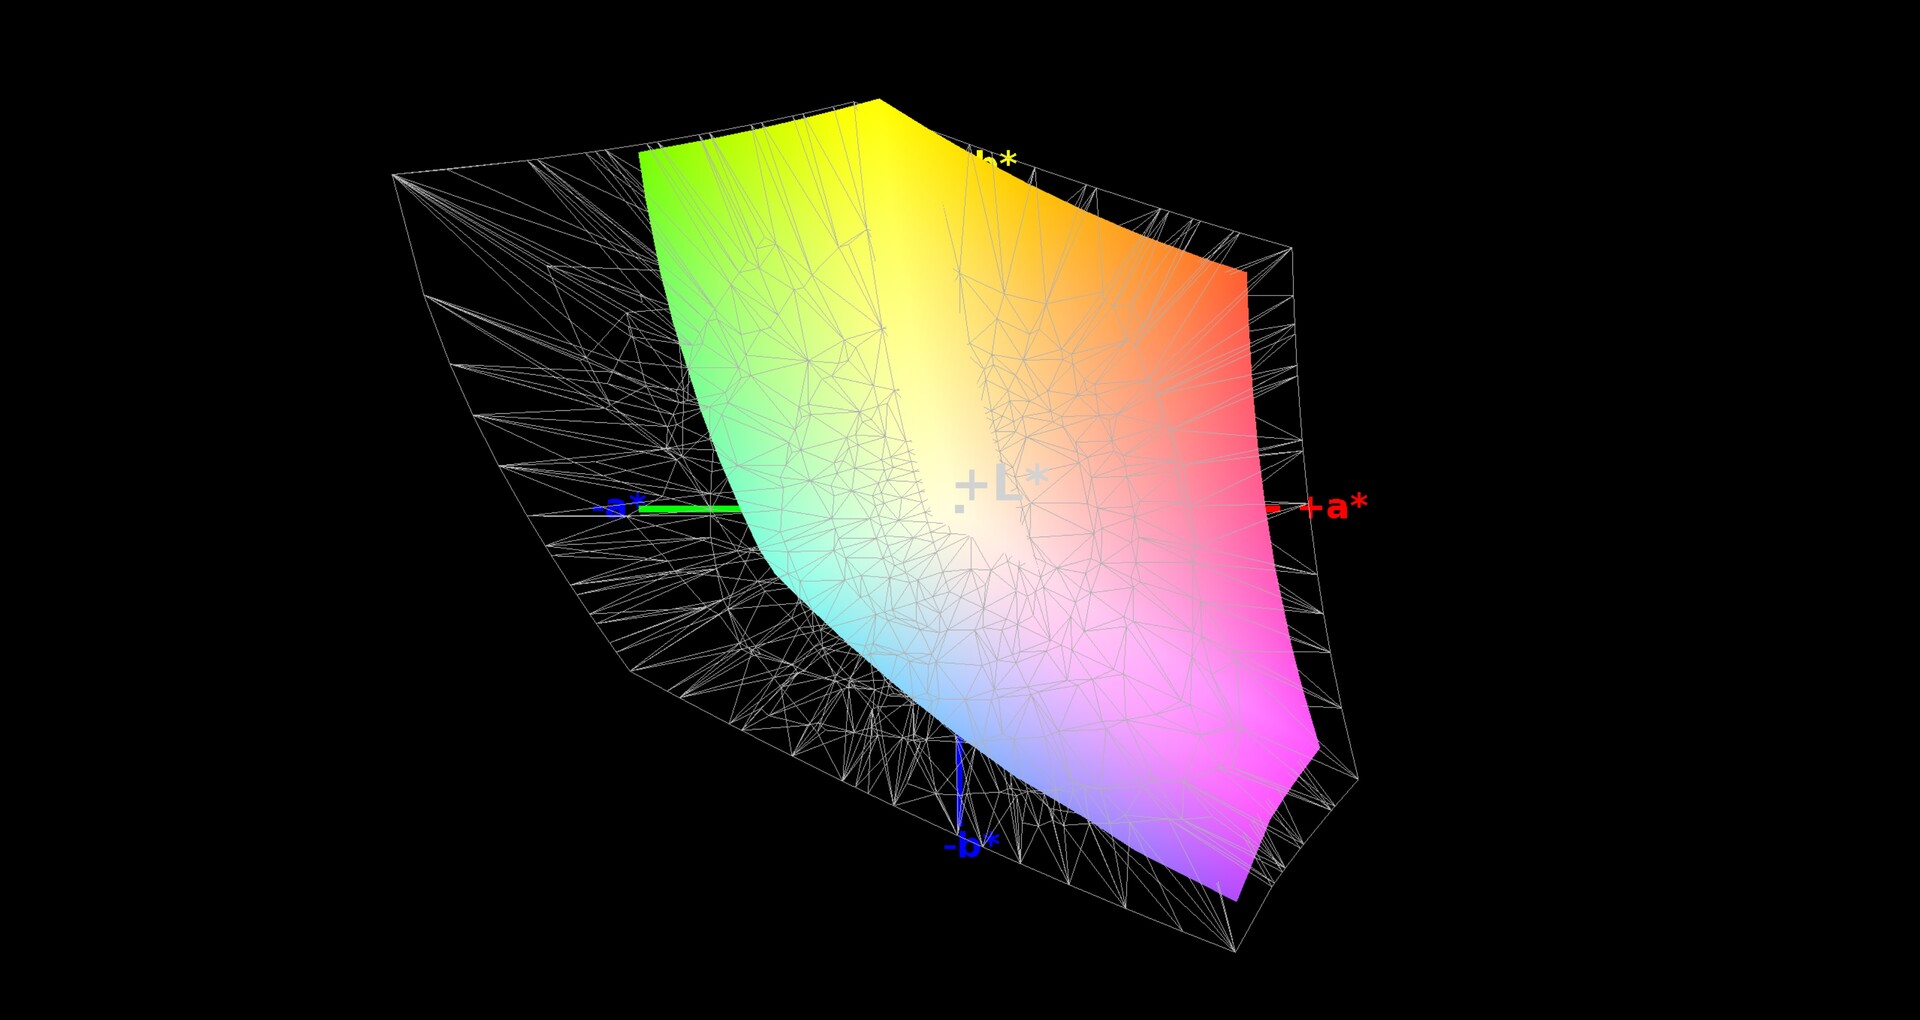
93% sRGB (Argyll 1.6.3 3D)
60% AdobeRGB 1998 (Argyll 1.6.3 3D)
65.6% AdobeRGB 1998 (Argyll 3D)
93.5% sRGB (Argyll 3D)
64.3% Display P3 (Argyll 3D)
Gamma: 2.45
CCT: 6407 K
| Aorus 15 W9 LG Philips LP156WFG-SPB2 (LGD05E8), IPS, 1920x1080 | Aorus 15 X9 LG Philips LP156WFG-SPB2, IPS, 1920x1080 | MSI GS65 Stealth Thin 8RE-051US AUO80ED, IPS, 1920x1080 | Alienware m15 GTX 1070 Max-Q AU Optronics B156HAN, IPS, 1920x1080 | Lenovo Legion Y740-15ICHg LP156WFG-SPB2, IPS, 1920x1080 | Gigabyte Aero 15-X9 LGD05C0, IPS, 1920x1080 | Razer Blade 15 RTX 2070 Max-Q LG Philips LGD05C0, IPS, 1920x1080 | Asus Zephyrus S GX531GM AU Optronics B156HAN08.2, IPS, 1920x1080 | |
|---|---|---|---|---|---|---|---|---|
| Display | 1% | 1% | -2% | -1% | -1% | 1% | -1% | |
| Display P3 Coverage (%) | 64.3 | 64.9 1% | 65.8 2% | 63.5 -1% | 63.5 -1% | 63.5 -1% | 65.3 2% | 64.9 1% |
| sRGB Coverage (%) | 93.5 | 95.6 2% | 92.1 -1% | 89.4 -4% | 92.4 -1% | 93.1 0% | 94.9 1% | 90.1 -4% |
| AdobeRGB 1998 Coverage (%) | 65.6 | 66.3 1% | 67 2% | 64.5 -2% | 64.7 -1% | 64.5 -2% | 66.3 1% | 65.8 0% |
| Response Times | 7% | -7% | -1% | -8% | -2% | 5% | 36% | |
| Response Time Grey 50% / Grey 80% * (ms) | 16.8 ? | 15.2 ? 10% | 20 ? -19% | 18 ? -7% | 18.8 ? -12% | 16.4 ? 2% | 16.8 ? -0% | 7 ? 58% |
| Response Time Black / White * (ms) | 12.8 ? | 12.4 ? 3% | 12 ? 6% | 12 ? 6% | 13.2 ? -3% | 13.6 ? -6% | 11.6 ? 9% | 11 ? 14% |
| PWM Frequency (Hz) | ||||||||
| Screen | 12% | -3% | -5% | -2% | 19% | 8% | 7% | |
| Brightness middle (cd/m²) | 295 | 305.1 3% | 250.9 -15% | 353.6 20% | 320.4 9% | 250 -15% | 314.7 7% | 323 9% |
| Brightness (cd/m²) | 292 | 295 1% | 257 -12% | 346 18% | 298 2% | 235 -20% | 312 7% | 309 6% |
| Brightness Distribution (%) | 80 | 78 -2% | 83 4% | 86 8% | 85 6% | 85 6% | 90 13% | 93 16% |
| Black Level * (cd/m²) | 0.34 | 0.33 3% | 0.32 6% | 0.3 12% | 0.42 -24% | 0.29 15% | 0.38 -12% | 0.29 15% |
| Contrast (:1) | 868 | 925 7% | 784 -10% | 1179 36% | 763 -12% | 862 -1% | 828 -5% | 1114 28% |
| Colorchecker dE 2000 * | 3.89 | 2.58 34% | 2.77 29% | 4.55 -17% | 3.21 17% | 1.46 62% | 2.56 34% | 4.33 -11% |
| Colorchecker dE 2000 max. * | 7.28 | 4.32 41% | 5.89 19% | 7.91 -9% | 5.54 24% | 2.47 66% | 4.89 33% | 7.64 -5% |
| Colorchecker dE 2000 calibrated * | 1.44 | 1.33 8% | 2.5 -74% | 3.37 -134% | 2.36 -64% | 1.71 -19% | ||
| Greyscale dE 2000 * | 4.98 | 3.4 32% | 4 20% | 4.1 18% | 3.6 28% | 1.27 74% | 3.4 32% | 4.12 17% |
| Gamma | 2.45 90% | 2.28 96% | 2.27 97% | 2.27 97% | 2.27 97% | 2.4 92% | 2.3 96% | 2.43 91% |
| CCT | 6407 101% | 6374 102% | 6901 94% | 7434 87% | 6503 100% | 6749 96% | 6435 101% | 7427 88% |
| Color Space (Percent of AdobeRGB 1998) (%) | 60 | 60.7 1% | 60 0% | 57.9 -3% | 59 -2% | 60 0% | 60.7 1% | 59 -2% |
| Color Space (Percent of sRGB) (%) | 93 | 95.2 2% | 92 -1% | 88.9 -4% | 92 -1% | 93 0% | 94.6 2% | 90 -3% |
| Total Average (Program / Settings) | 7% /
9% | -3% /
-3% | -3% /
-4% | -4% /
-2% | 5% /
12% | 5% /
7% | 14% /
9% |
* ... smaller is better
Display Response Times
| ↔ Response Time Black to White | ||
|---|---|---|
| 12.8 ms ... rise ↗ and fall ↘ combined | ↗ 7.6 ms rise | 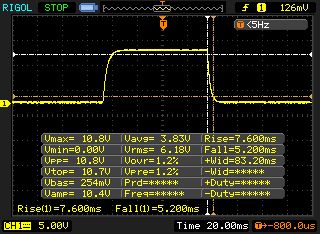 |
| ↘ 5.2 ms fall | ||
| The screen shows good response rates in our tests, but may be too slow for competitive gamers. In comparison, all tested devices range from 0.1 (minimum) to 240 (maximum) ms. » 33 % of all devices are better. This means that the measured response time is better than the average of all tested devices (19.8 ms). | ||
| ↔ Response Time 50% Grey to 80% Grey | ||
| 16.8 ms ... rise ↗ and fall ↘ combined | ↗ 9.2 ms rise | 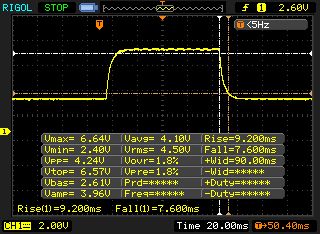 |
| ↘ 7.6 ms fall | ||
| The screen shows good response rates in our tests, but may be too slow for competitive gamers. In comparison, all tested devices range from 0.165 (minimum) to 636 (maximum) ms. » 31 % of all devices are better. This means that the measured response time is better than the average of all tested devices (31 ms). | ||
Screen Flickering / PWM (Pulse-Width Modulation)
| Screen flickering / PWM not detected | 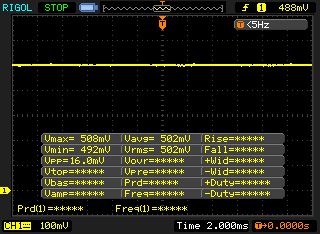 | ||
In comparison: 52 % of all tested devices do not use PWM to dim the display. If PWM was detected, an average of 7747 (minimum: 5 - maximum: 343500) Hz was measured. | |||
Performance - More than enough
With the Aorus 15-W9, Gigabyte delivers a gaming notebook in the 15.6-inch format that brings all the current games smoothly to the screen and also strikes a good figure in all other application areas. You have to pay about 1900 Euros (~$2138; currently starting from $1650 in the US) for your test unit, and other equipment variants are also available.

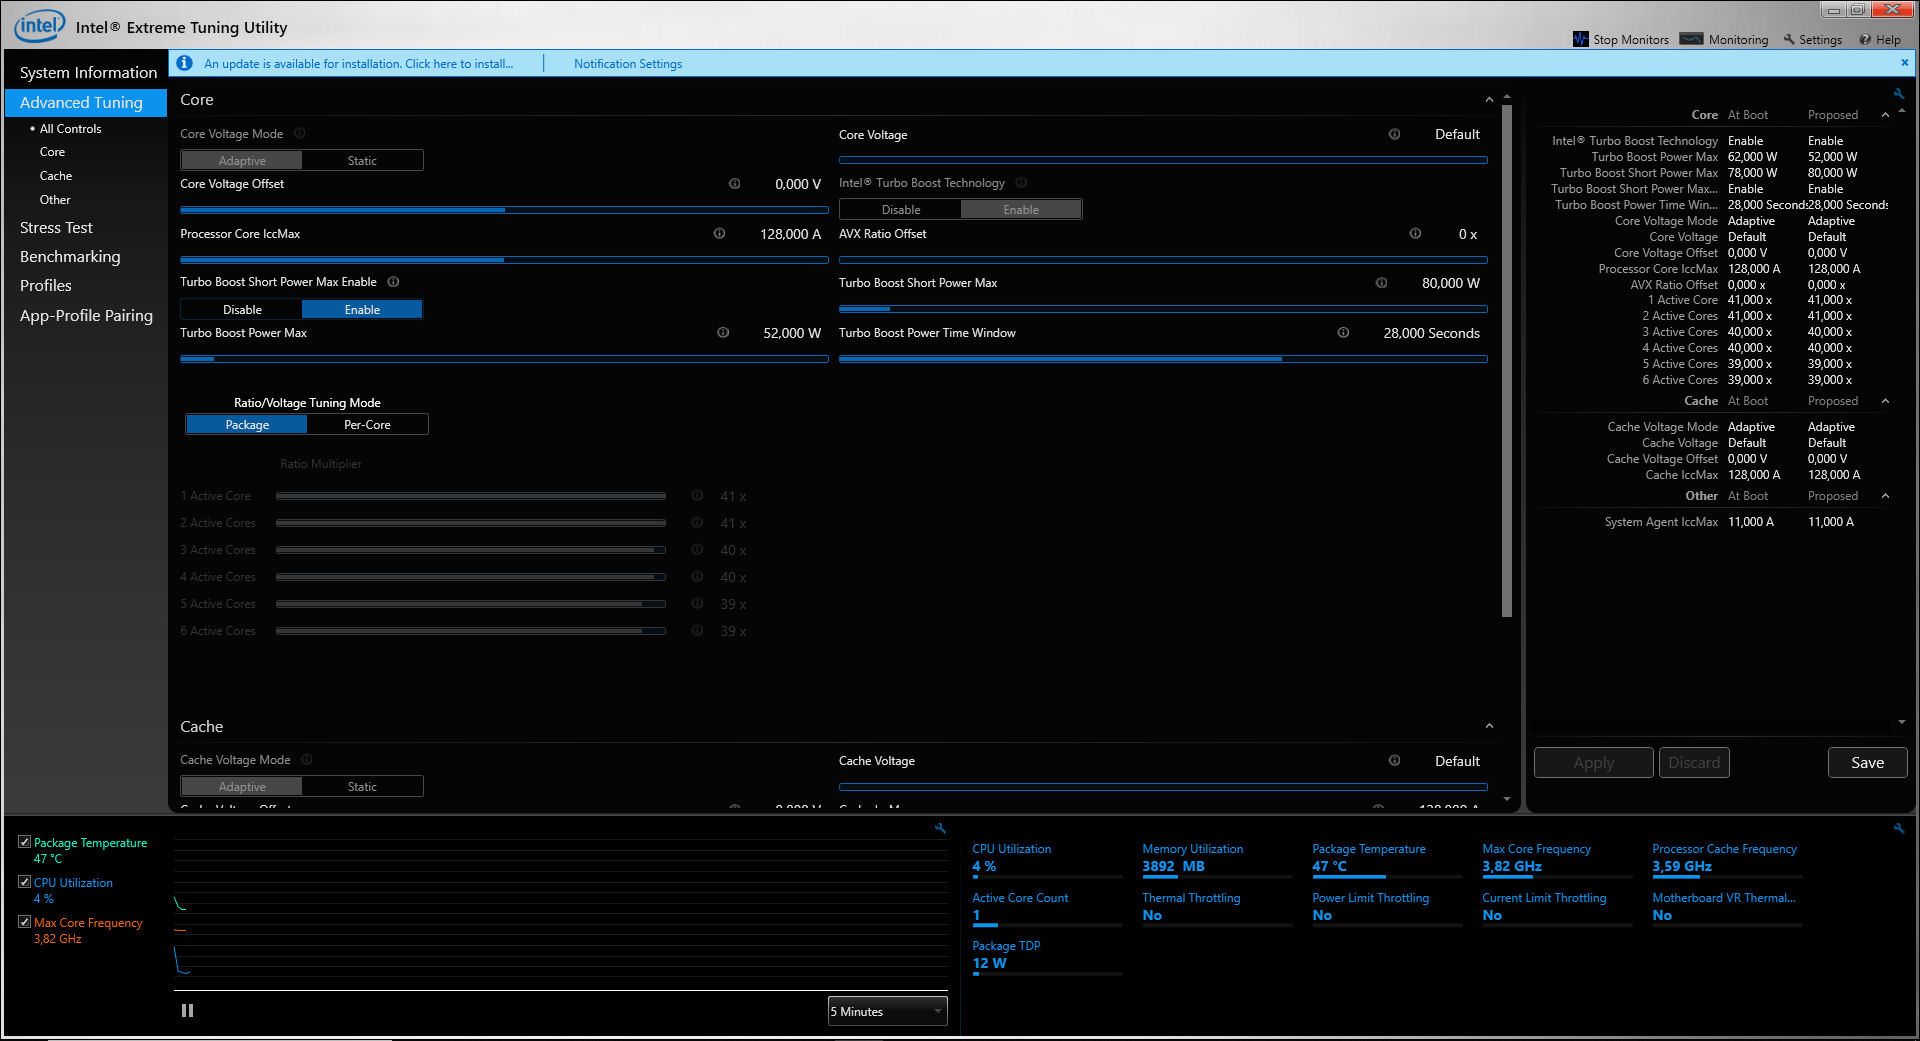
Testing Conditions
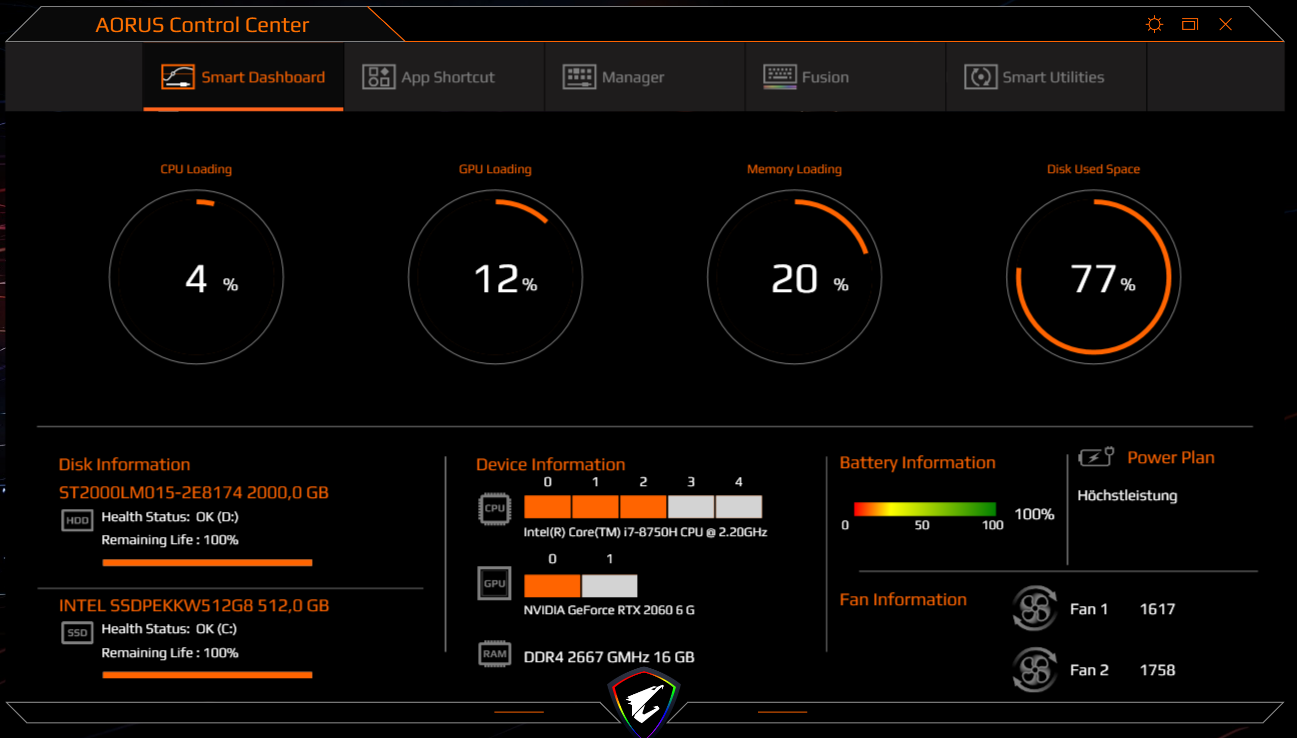
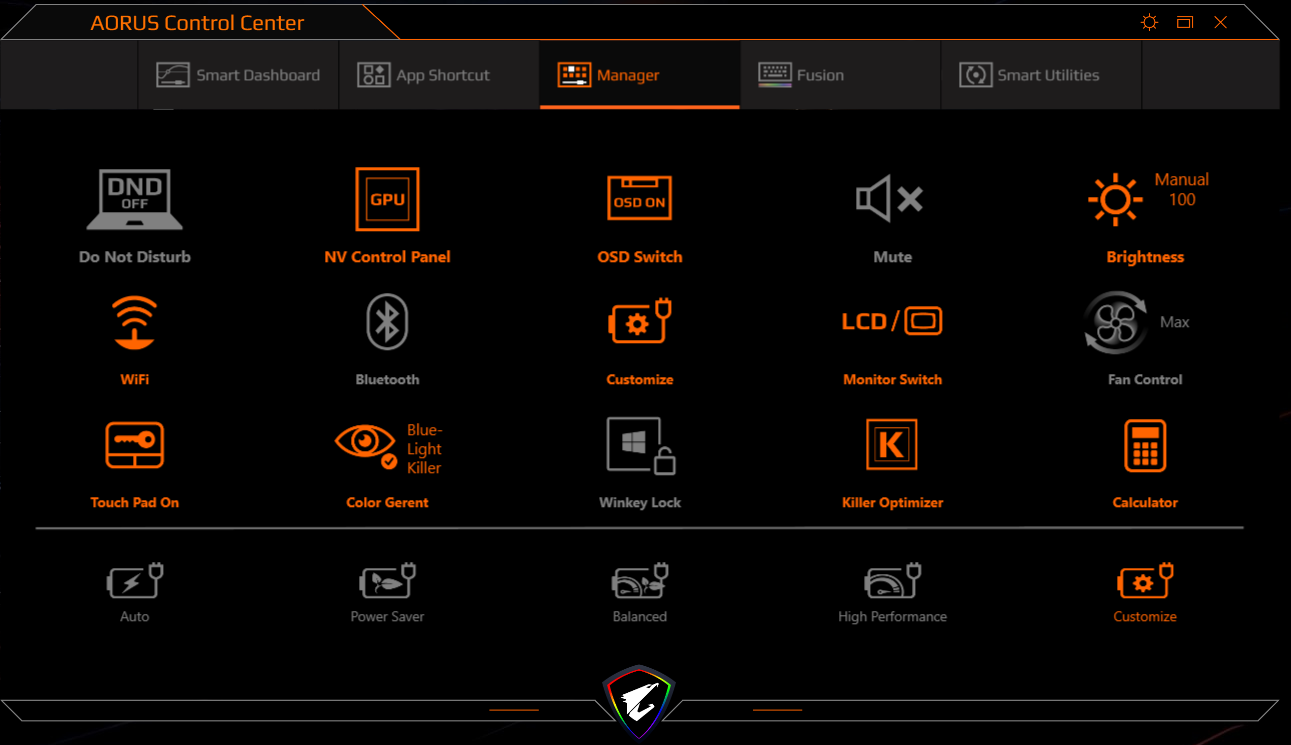
The preinstalled Control Center offers the option to specify a power profile, among other things. However, we are not doing this, but are selecting the "Customize" option instead. We are using Windows' own power profiles in our testing, with the fan control remaining on "Normal."
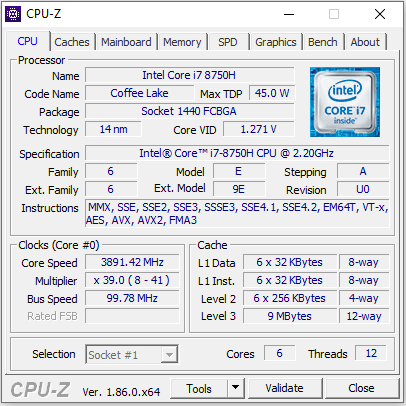
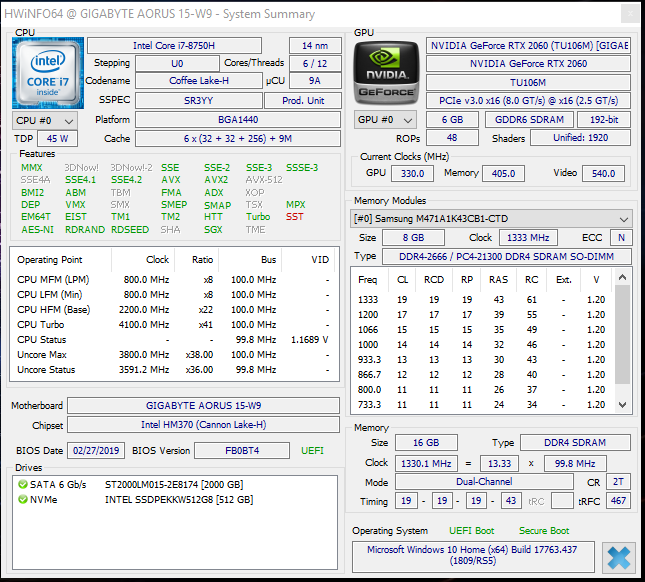
Processor
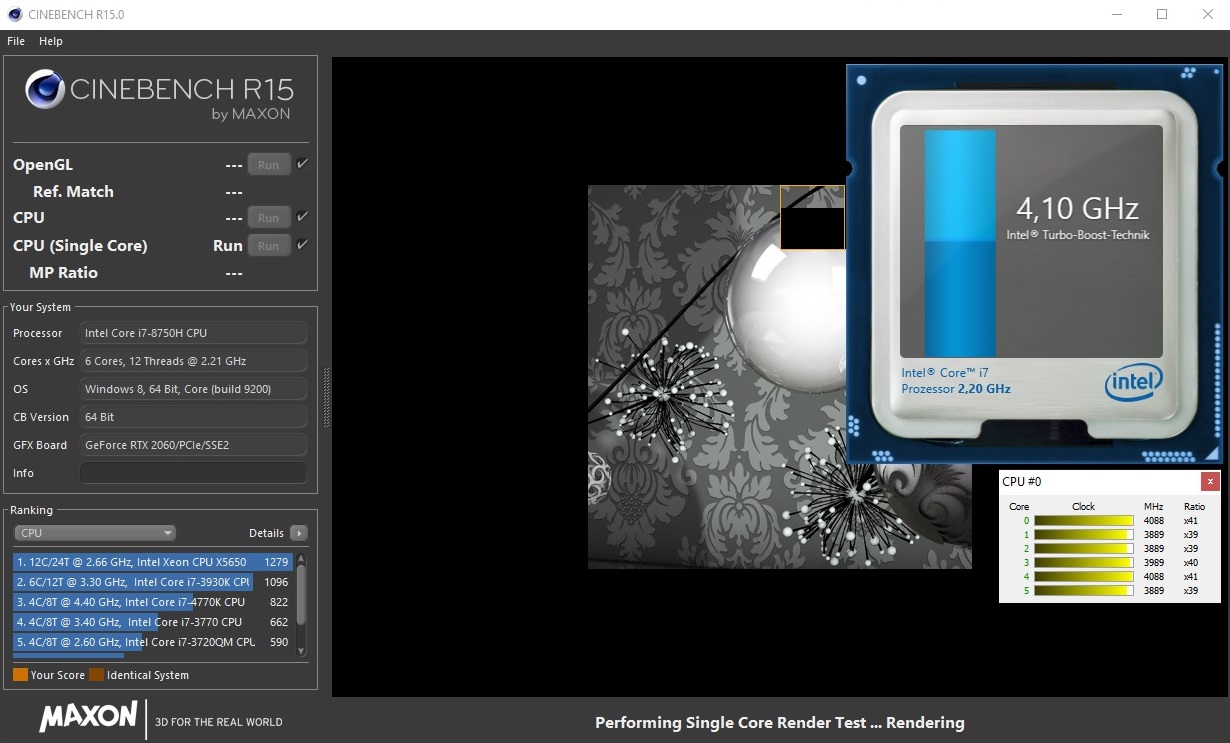
Gigabyte has equipped the Aorus 15 with an Intel Core i7-8750H (Coffee Lake) hexa-core processor. This processor offers a good compromise between computing performance and power consumption and can therefore be found in many gaming notebooks. It is a mobile CPU that has a TDP of 45 watts. The Core i7 runs at a basic clock speed of 2.2 GHz, which can be increased via Turbo up to 3.9 GHz (six cores), 4 GHz (four cores) or 4.1 GHz (one or two cores).
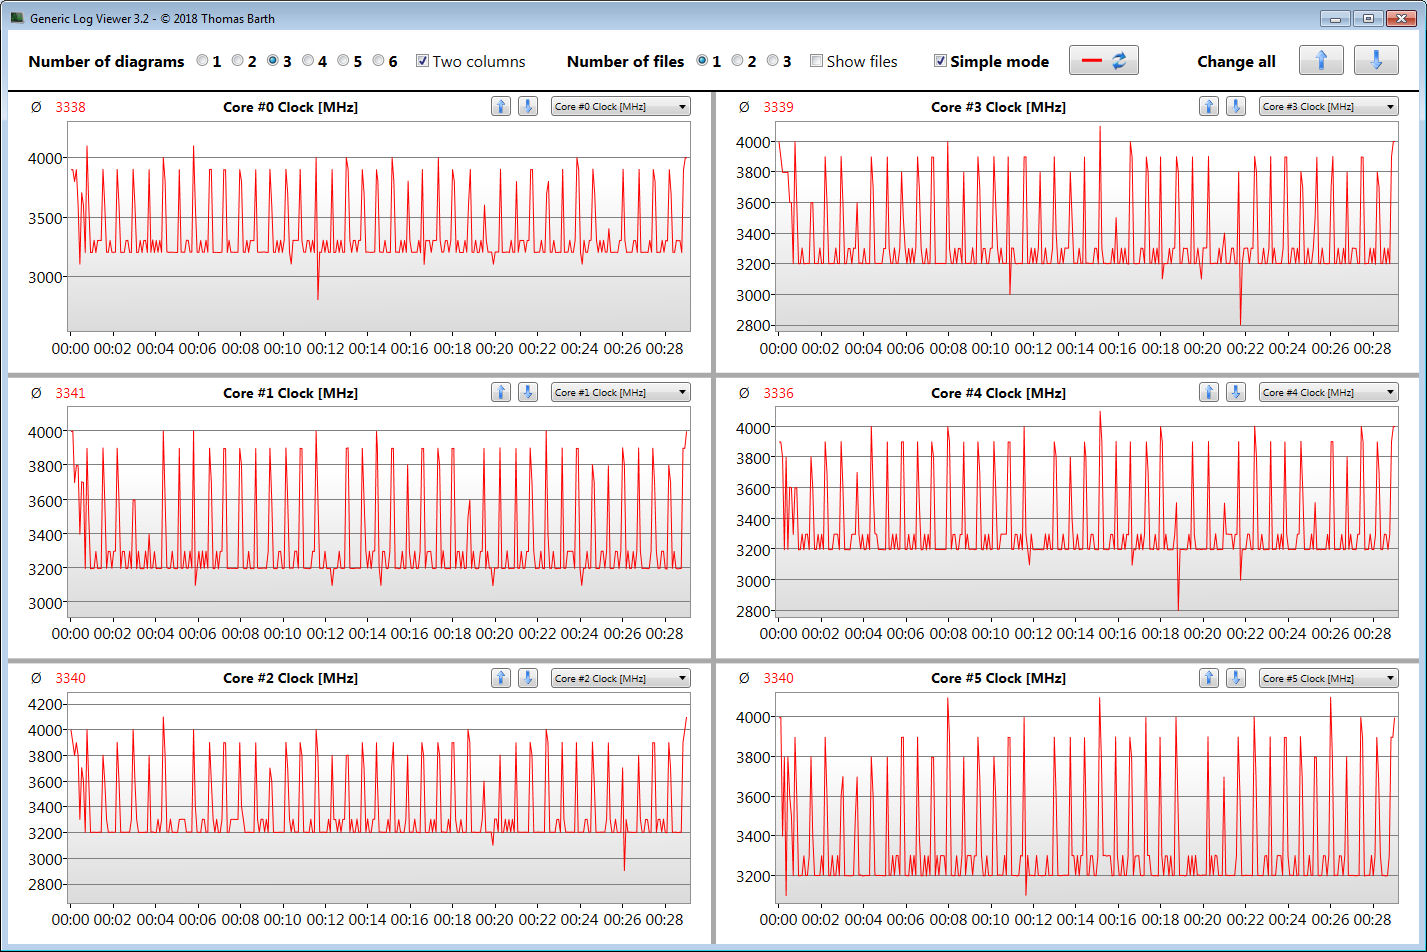
During the multi-thread tests of the Cinebench benchmarks, the processor runs at 3.2 to 3.9 GHz for a short time, before the speed changes to 3.4 - 3.5 GHz. It runs through the single-thread tests at 3.6 to 4.1 GHz so far as the behavior during mains operation is concerned. During battery operation, the CPU runs at a constant 1.7 GHz.
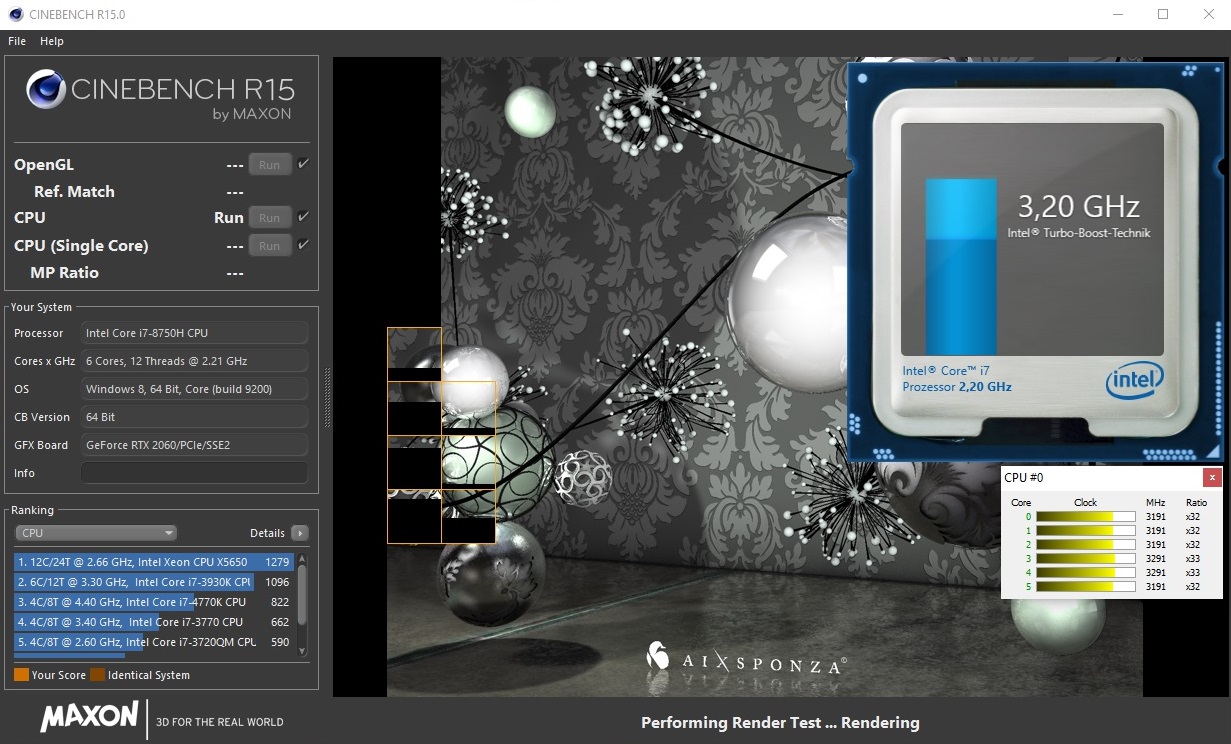
We evaluate whether the CPU Turbo is also used constantly in mains operation by running the multi-thread test of the Cinebench R15 benchmarks for about 30 minutes in a constant loop. From the first to the second run, the results drop by a good 10 percent, but then remain to a large extent at a constant level.
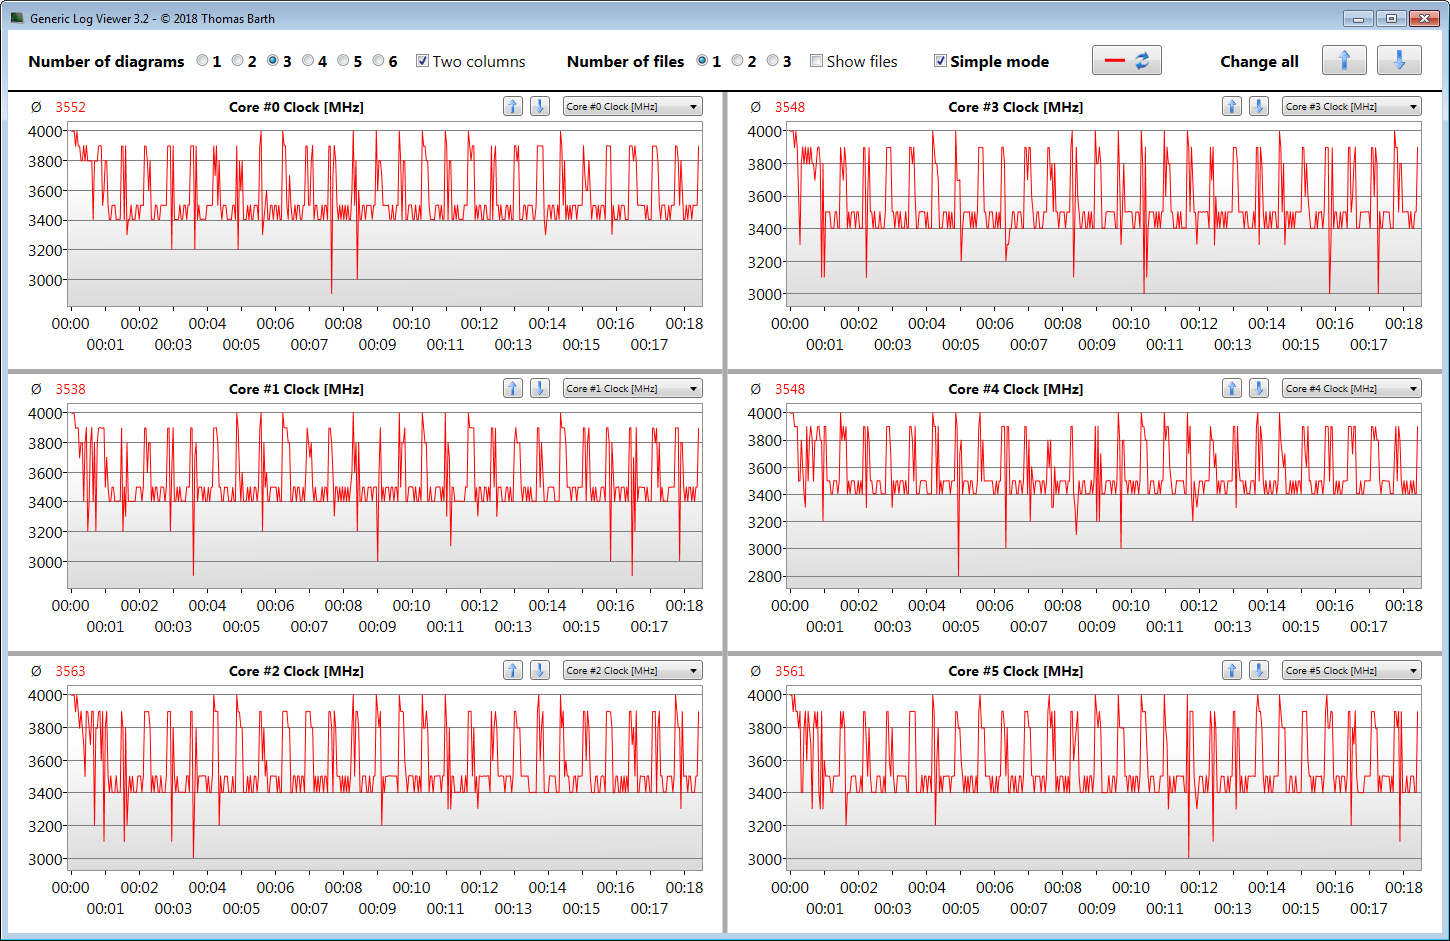
The Control Center offers the option to run the fan constantly at full speed. We therefore also ran the CB15 loop at maximum fan speed. With this, the Aorus offers better results than when using the regular fan adjustment.
| Cinebench R10 | |
| Rendering Single 32Bit | |
| Average of class Gaming (7457 - 12575, n=9, last 2 years) | |
| Asus Zephyrus S GX531GM | |
| Aorus 15 W9 | |
| Gigabyte Aero 15-X9 | |
| Rendering Multiple CPUs 32Bit | |
| Average of class Gaming (42932 - 102066, n=9, last 2 years) | |
| Gigabyte Aero 15-X9 | |
| Aorus 15 W9 | |
| Asus Zephyrus S GX531GM | |
| Cinebench R20 | |
| CPU (Single Core) | |
| Average of class Gaming (442 - 913, n=106, last 2 years) | |
| Aorus 15 W9 | |
| CPU (Multi Core) | |
| Average of class Gaming (4029 - 16433, n=106, last 2 years) | |
| Aorus 15 W9 | |
| Geekbench 3 | |
| 32 Bit Multi-Core Score | |
| Asus Zephyrus S GX531GM | |
| Aorus 15 W9 | |
| Gigabyte Aero 15-X9 | |
| 32 Bit Single-Core Score | |
| Aorus 15 W9 | |
| Asus Zephyrus S GX531GM | |
| Gigabyte Aero 15-X9 | |
| Geekbench 4.4 | |
| 64 Bit Multi-Core Score | |
| Average of class Gaming (89200 - 101054, n=3, last 2 years) | |
| Asus Zephyrus S GX531GM | |
| Aorus 15 W9 | |
| Gigabyte Aero 15-X9 | |
| 64 Bit Single-Core Score | |
| Average of class Gaming (9335 - 9775, n=3, last 2 years) | |
| Aorus 15 W9 | |
| Asus Zephyrus S GX531GM | |
| Gigabyte Aero 15-X9 | |
| Mozilla Kraken 1.1 - Total | |
| Aorus 15 X9 (Edge 42.17134.1.0) | |
| Gigabyte Aero 15-X9 (Edge 44) | |
| Razer Blade 15 RTX 2070 Max-Q (Edge 44.17763.1.0) | |
| Lenovo Legion Y740-15ICHg (Microsoft Edge 44.17763.1.0) | |
| Alienware m15 GTX 1070 Max-Q (Edge 42.17134.1.0) | |
| Aorus 15 W9 (Edge 44) | |
| MSI GS65 Stealth Thin 8RE-051US (Microsoft Edge 42.17134.1.0) | |
| Average of class Gaming (391 - 590, n=100, last 2 years) | |
| Octane V2 - Total Score | |
| Average of class Gaming (93292 - 139447, n=27, last 2 years) | |
| MSI GS65 Stealth Thin 8RE-051US (Microsoft Edge 42.17134.1.0) | |
| Aorus 15 W9 (Edge 44) | |
| Lenovo Legion Y740-15ICHg (Microsoft Edge 44.17763.1.0) | |
| Gigabyte Aero 15-X9 (Edge 44) | |
| Alienware m15 GTX 1070 Max-Q (Edge 42.17134.1.0) | |
| Razer Blade 15 RTX 2070 Max-Q (Edge 44.17763.1.0) | |
| Aorus 15 X9 (Edge 42.17134.1.0) | |
| WebXPRT 3 - Overall | |
| Average of class Gaming (220 - 532, n=98, last 2 years) | |
| Aorus 15 W9 (Edge 44) | |
| Speedometer 2.0 - Result 2.0 | |
| Average of class Gaming (29 - 736, n=27, last 2 years) | |
| Aorus 15 W9 (Edge 44) | |
* ... smaller is better
System Performance
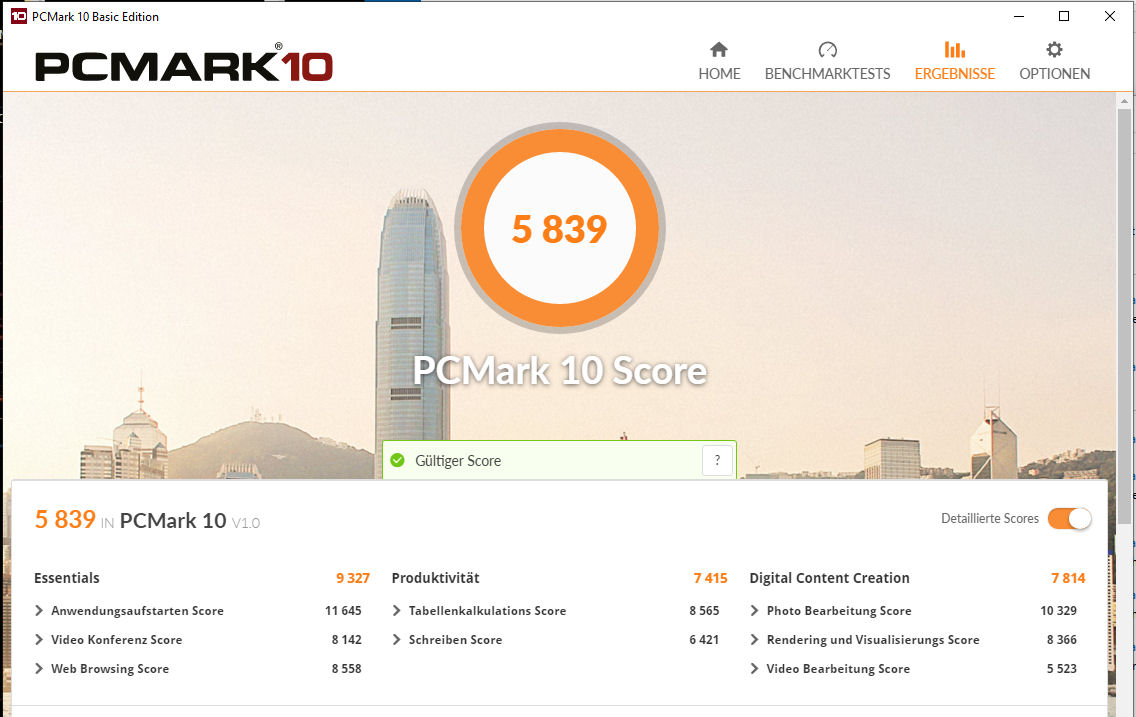
The 15.6-incher does not lack anything in terms of system performance. The built-in hexa-core processor offers more than enough computing performance also for applications beyond gaming - and this also goes for the next few years. In combination with the NVMe SSD and the working memory running in dual-channel mode, it ensures a fast and smooth running system. The dedicated graphics core allows playing computer games. This is accompanied by very good results in the PC-Mark benchmarks.
| PCMark 7 Score | 7400 points | |
| PCMark 8 Home Score Accelerated v2 | 5077 points | |
| PCMark 8 Creative Score Accelerated v2 | 5955 points | |
| PCMark 8 Work Score Accelerated v2 | 5899 points | |
| PCMark 10 Score | 5839 points | |
Help | ||
Storage Solution
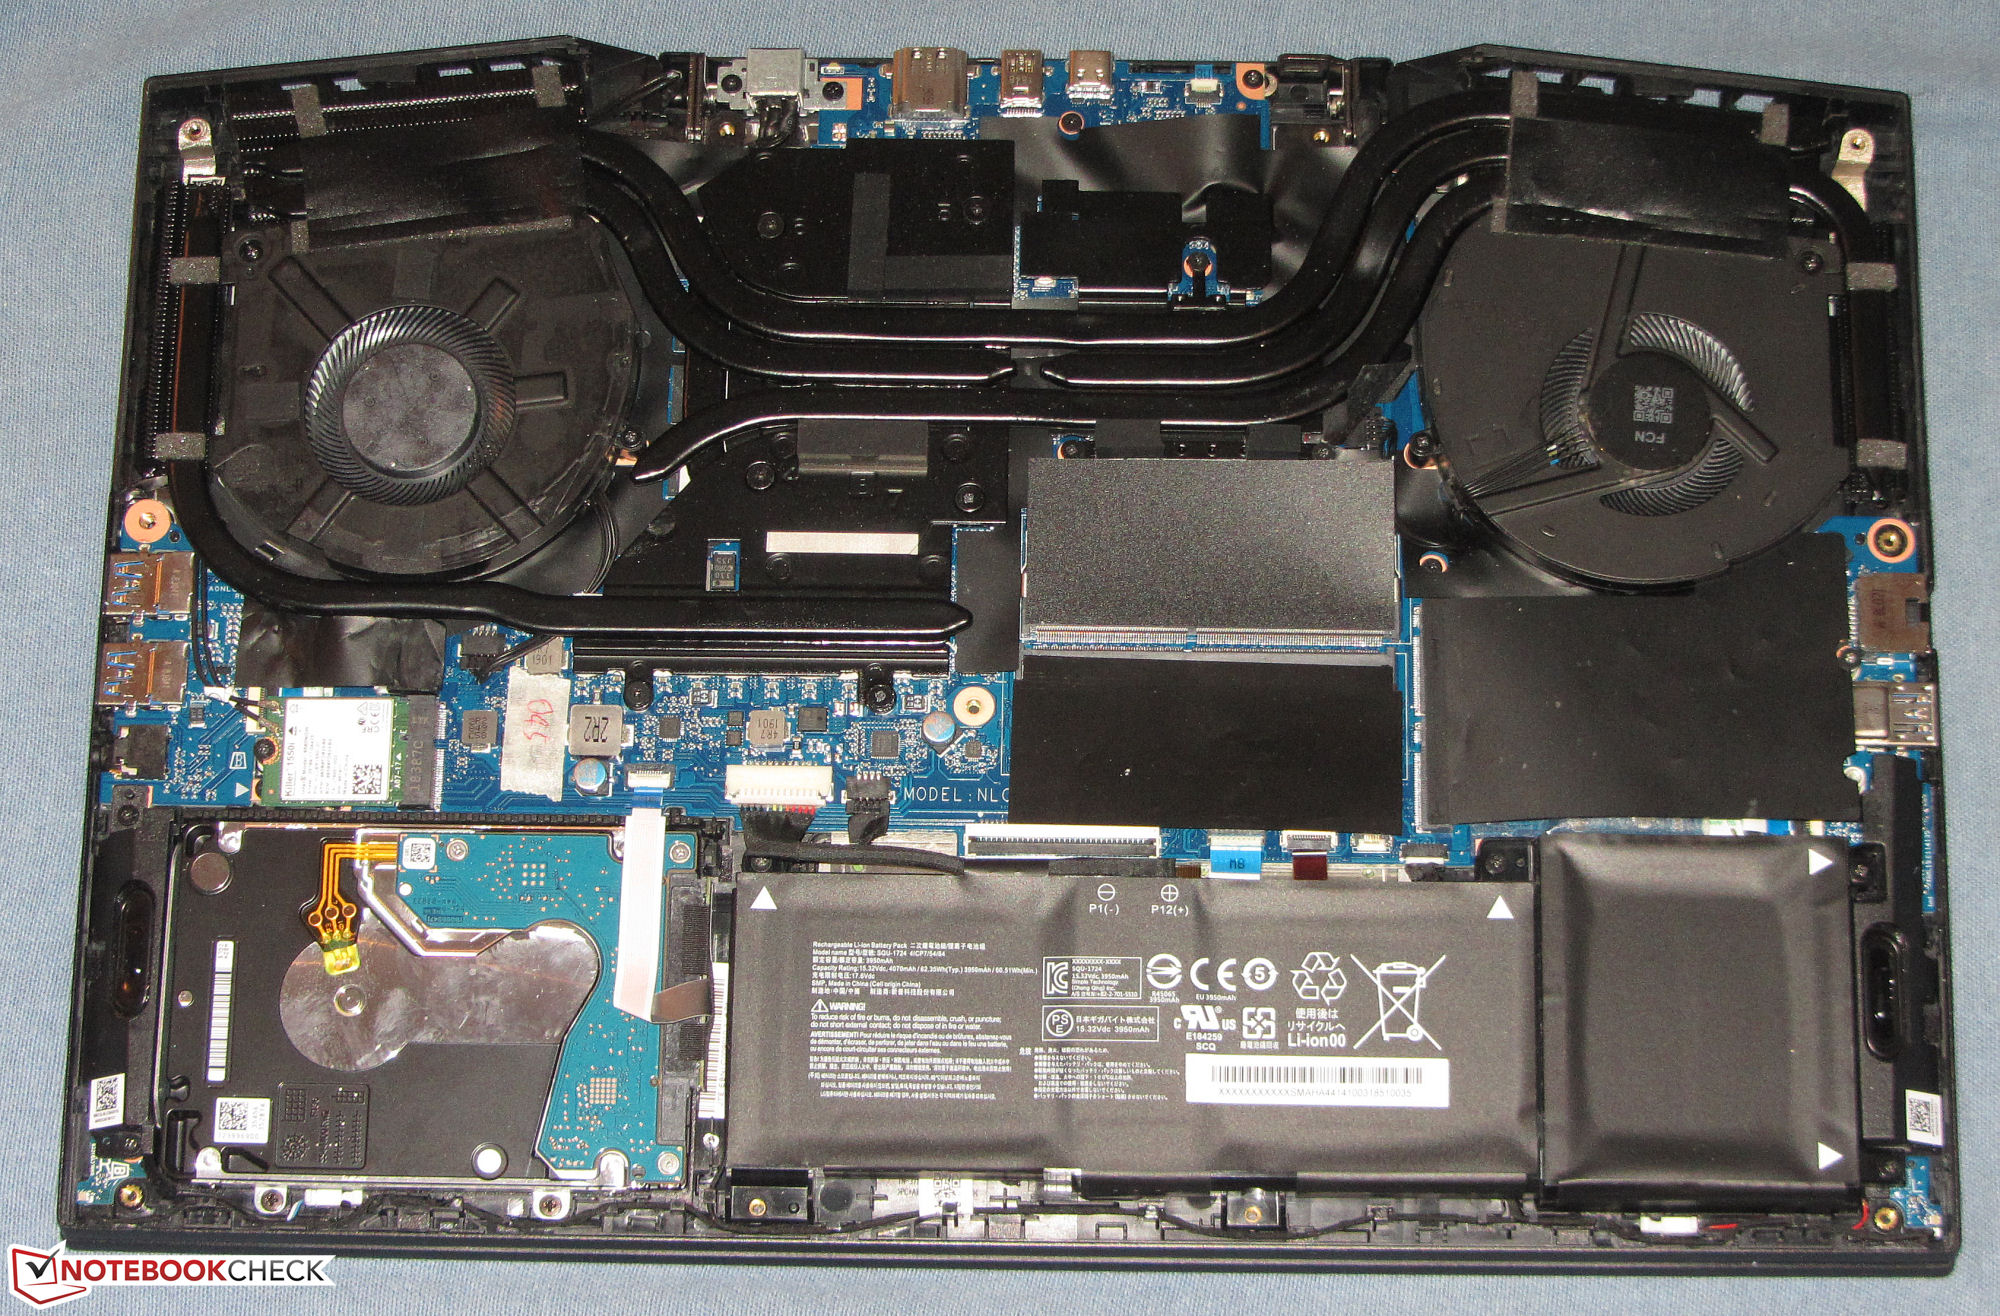
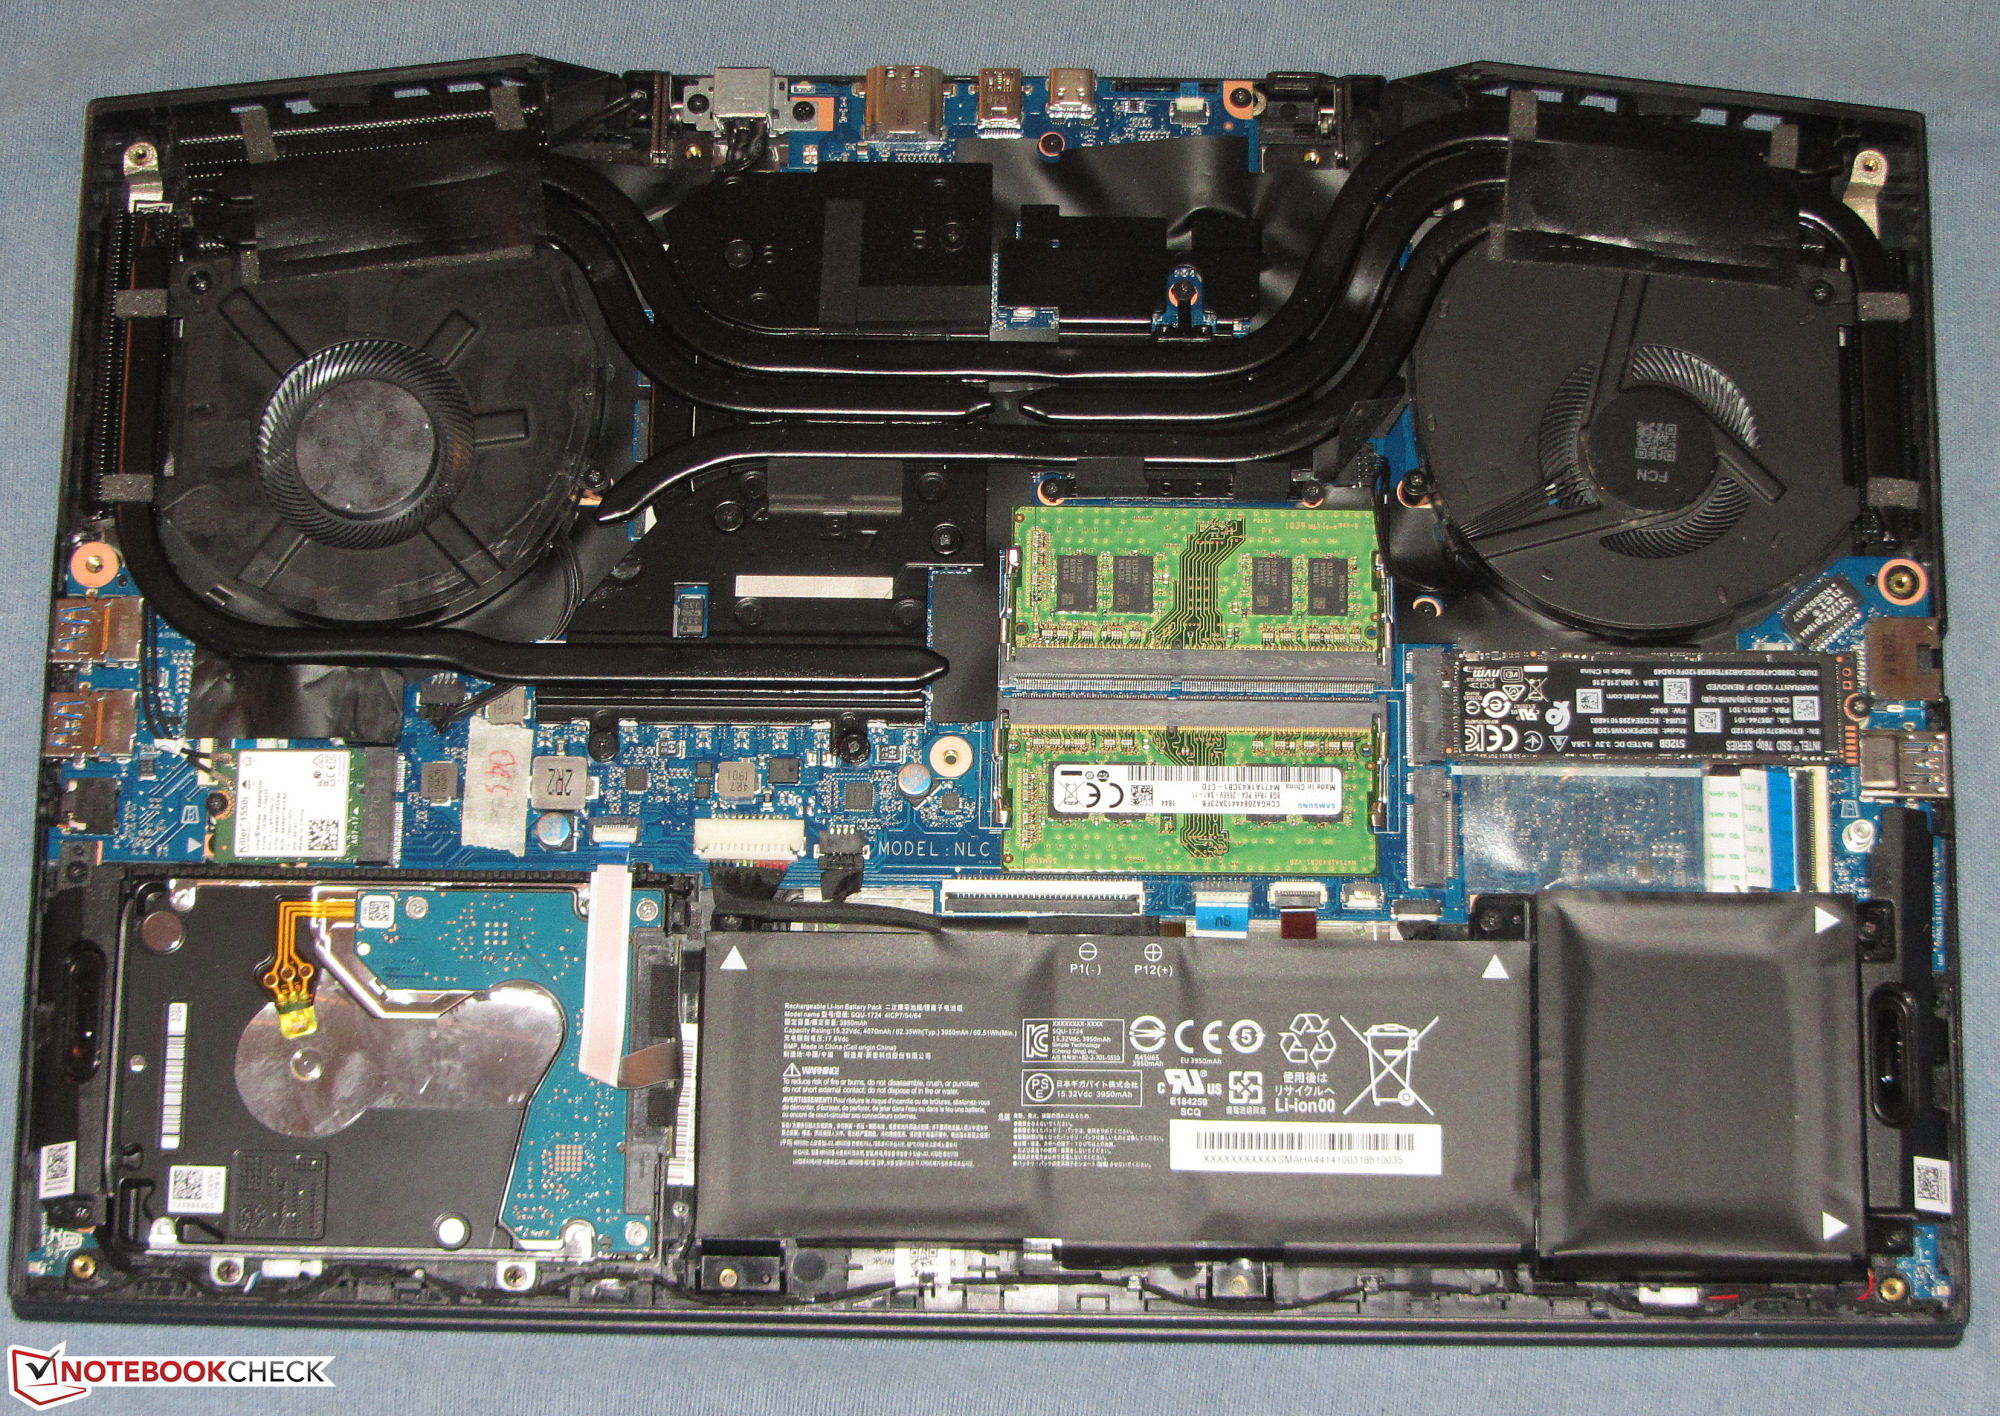
An NVMe SSD from Intel is used as system storage. This is an M.2-2280 model that has a total capacity of 512 GB, 426 GB of which is still available at the time of delivery, and the rest of the storage is occupied by the recovery partition and the Windows installation. The SSD delivers very good transfer rates. Here, the connection via PCI Express becomes noticeable.
Inside the notebook is a second, unoccupied M.2-2280 storage slot. Both slots can accept SATA-III as well as NVMe SSDs. In addition to the SSD, Gigabyte has also equipped the Aorus 15-W9 with a 2.5-inch hard drive (2 TB, 5400 RPM).

| Aorus 15 W9 Intel SSD 760p SSDPEKKW512G8 | Aorus 15 X9 Intel SSD 760p SSDPEKKW512G8 | MSI GS65 Stealth Thin 8RE-051US Samsung SSD PM981 MZVLB256HAHQ | Alienware m15 GTX 1070 Max-Q Toshiba XG5 KXG50ZNV512G | Lenovo Legion Y740-15ICHg Samsung SSD PM981 MZVLB256HAHQ | Gigabyte Aero 15-X9 Intel SSD 760p SSDPEKKW010T8 | Razer Blade 15 RTX 2070 Max-Q Samsung SSD PM981 MZVLB512HAJQ | Asus Zephyrus S GX531GM Intel SSD 660p SSDPEKNW512G8 | |
|---|---|---|---|---|---|---|---|---|
| CrystalDiskMark 5.2 / 6 | 35% | -6% | -15% | -10% | -3% | -1% | -20% | |
| Write 4K (MB/s) | 99.2 | 147.2 48% | 91.5 -8% | 107.4 8% | 81 -18% | 97.1 -2% | 93.9 -5% | 100.8 2% |
| Read 4K (MB/s) | 54.1 | 63.7 18% | 40.41 -25% | 42.91 -21% | 36.03 -33% | 53.7 -1% | 40.56 -25% | 48.75 -10% |
| Write Seq (MB/s) | 1524 | 1573 3% | 1528 0% | 467.5 -69% | 1687 11% | 1526 0% | 1468 -4% | 975 -36% |
| Read Seq (MB/s) | 2325 | 2602 12% | 1235 -47% | 2335 0% | 1835 -21% | 2020 -13% | 1540 -34% | 1344 -42% |
| Write 4K Q32T1 (MB/s) | 259.2 | 531 105% | 259 0% | 289.7 12% | 205.3 -21% | 285.6 10% | 293.5 13% | 283.7 9% |
| Read 4K Q32T1 (MB/s) | 328.9 | 598 82% | 364.9 11% | 354.4 8% | 229 -30% | 321.8 -2% | 346 5% | 330.3 0% |
| Write Seq Q32T1 (MB/s) | 1566 | 1592 2% | 1529 -2% | 460.9 -71% | 1683 7% | 1533 -2% | 1941 24% | 986 -37% |
| Read Seq Q32T1 (MB/s) | 2767 | 2981 8% | 3472 25% | 3111 12% | 3363 22% | 2351 -15% | 3266 18% | 1579 -43% |
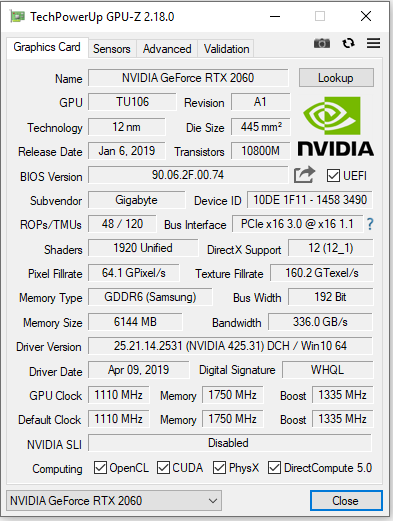
Graphics Card
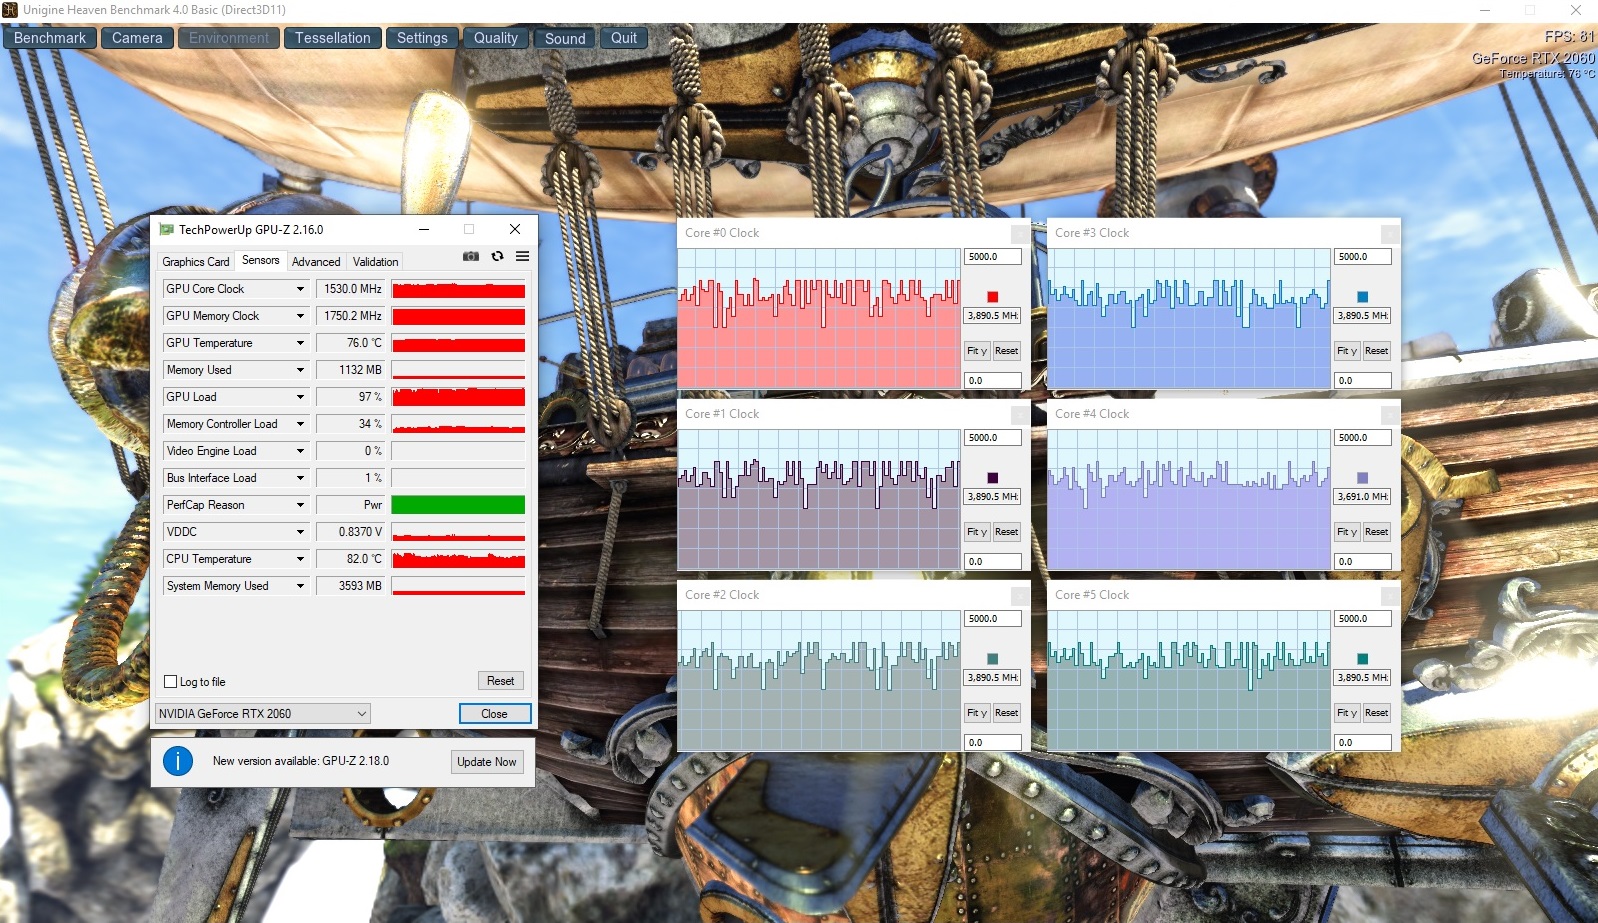
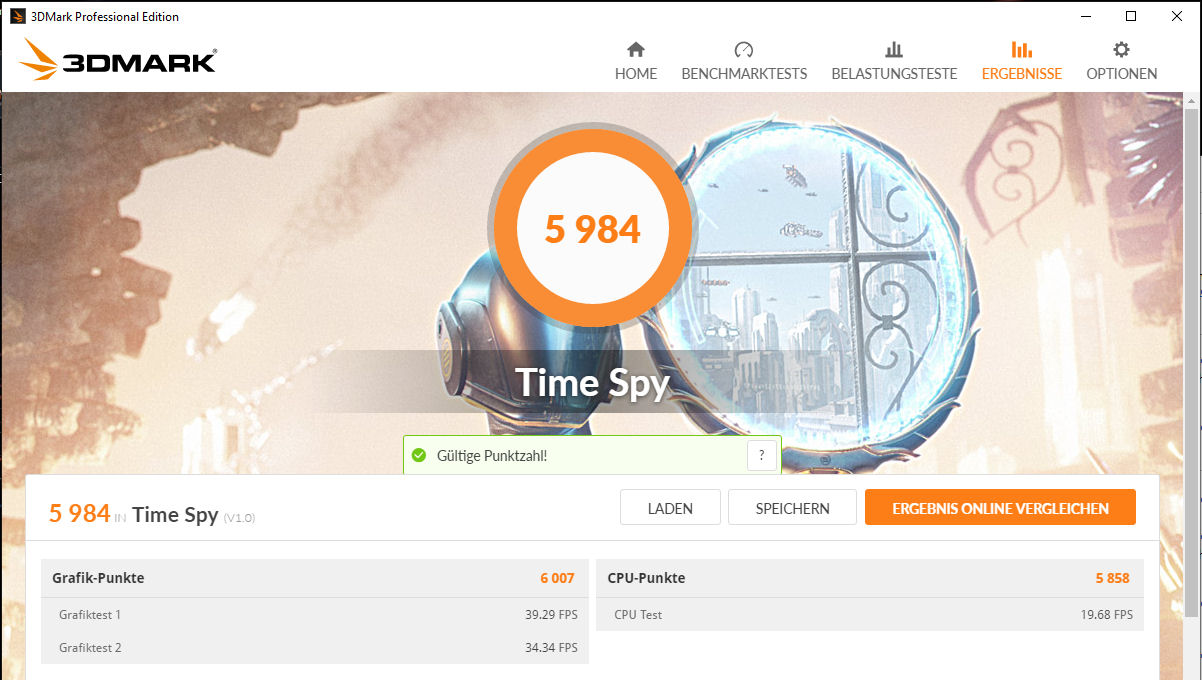
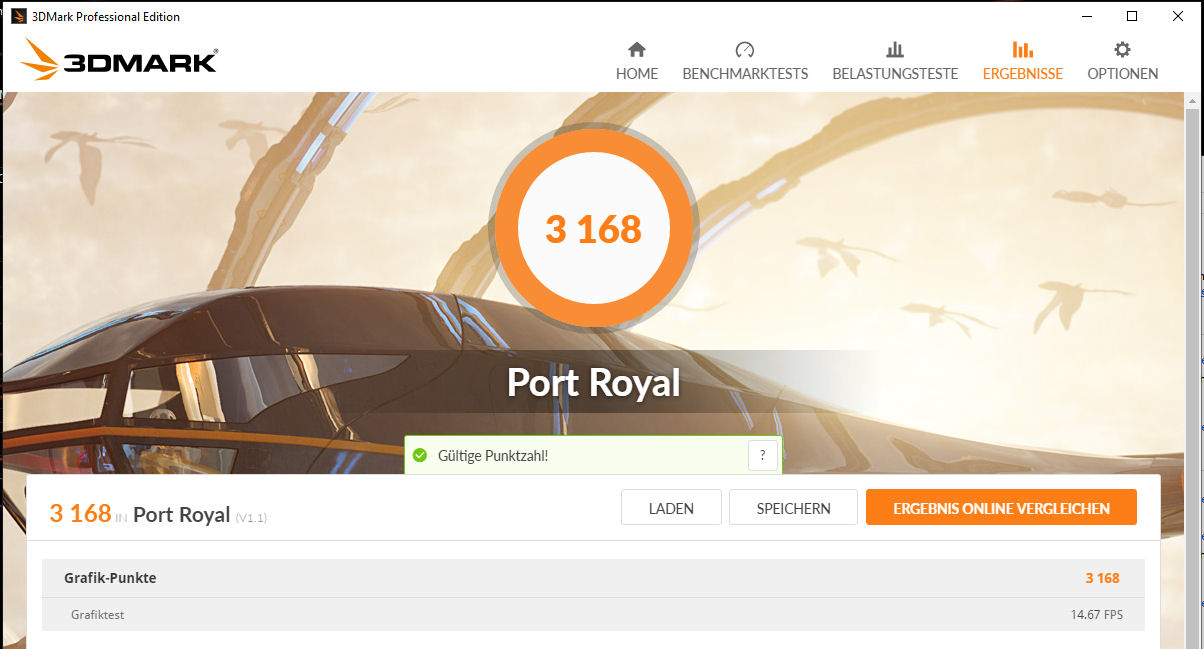
The Aorus 15 includes a GeForce RTX-2060 graphics core. The GPU is based on the Turing architecture, supports DirectX 12, and achieves a maximum speed of 1755 MHz. However, this value cannot be maintained constantly. During our benchmarks, we measured an operating speed of 1530 MHz on average. The GPU is able to make use of fast GDDR6 storage (6144 MB). The results in the 3D-Mark benchmarks range at a normal level for the built-in GPU.
While Intel's integrated UHD Graphics-630 GPU is also included in the notebook together with the Core-i7 processor, this GPU has been deactivated by the manufacturer. Thus, there is no switching graphics solution (Nvidia Optimus), but the GeForce core runs constantly.

| 3DMark 06 Standard Score | 36381 points | |
| 3DMark 11 Performance | 16598 points | |
| 3DMark Ice Storm Standard Score | 164238 points | |
| 3DMark Cloud Gate Standard Score | 31982 points | |
| 3DMark Fire Strike Score | 13646 points | |
| 3DMark Time Spy Score | 5984 points | |
Help | ||
Gaming Performance
The hardware of the Gigabyte notebook is able to bring all the games from our database smoothly to the screen. You can always select the Full HD resolution and high to maximum quality settings. While the GPU is also able to handle resolutions beyond Full HD, you then have to hold back on the quality settings. Games that pose only moderate demands on the hardware allow an increase in the quality settings - we can mention the "FIFA 19" game here as an example.
| The Witcher 3 - 1920x1080 Ultra Graphics & Postprocessing (HBAO+) | |
| Average of class Gaming (104.7 - 240, n=6, last 2 years) | |
| Aorus 15 X9 | |
| Razer Blade 15 RTX 2070 Max-Q | |
| Gigabyte Aero 15-X9 | |
| Aorus 15 W9 | |
| Lenovo Legion Y740-15ICHg | |
| Alienware m15 GTX 1070 Max-Q | |
| Asus Zephyrus S GX531GM | |
| MSI GS65 Stealth Thin 8RE-051US | |
| BioShock Infinite - 1920x1080 Ultra Preset, DX11 (DDOF) | |
| Lenovo Legion Y740-15ICHg | |
| MSI GS65 Stealth Thin 8RE-051US | |
| Aorus 15 X9 | |
| Razer Blade 15 RTX 2070 Max-Q | |
| Alienware m15 GTX 1070 Max-Q | |
| Aorus 15 W9 | |
| Gigabyte Aero 15-X9 | |
| Asus Zephyrus S GX531GM | |
| X-Plane 11.11 - 1920x1080 high (fps_test=3) | |
| Average of class Gaming (55.5 - 143.5, n=109, last 2 years) | |
| Aorus 15 W9 | |
| Asus Zephyrus S GX531GM | |
| Gigabyte Aero 15-X9 | |
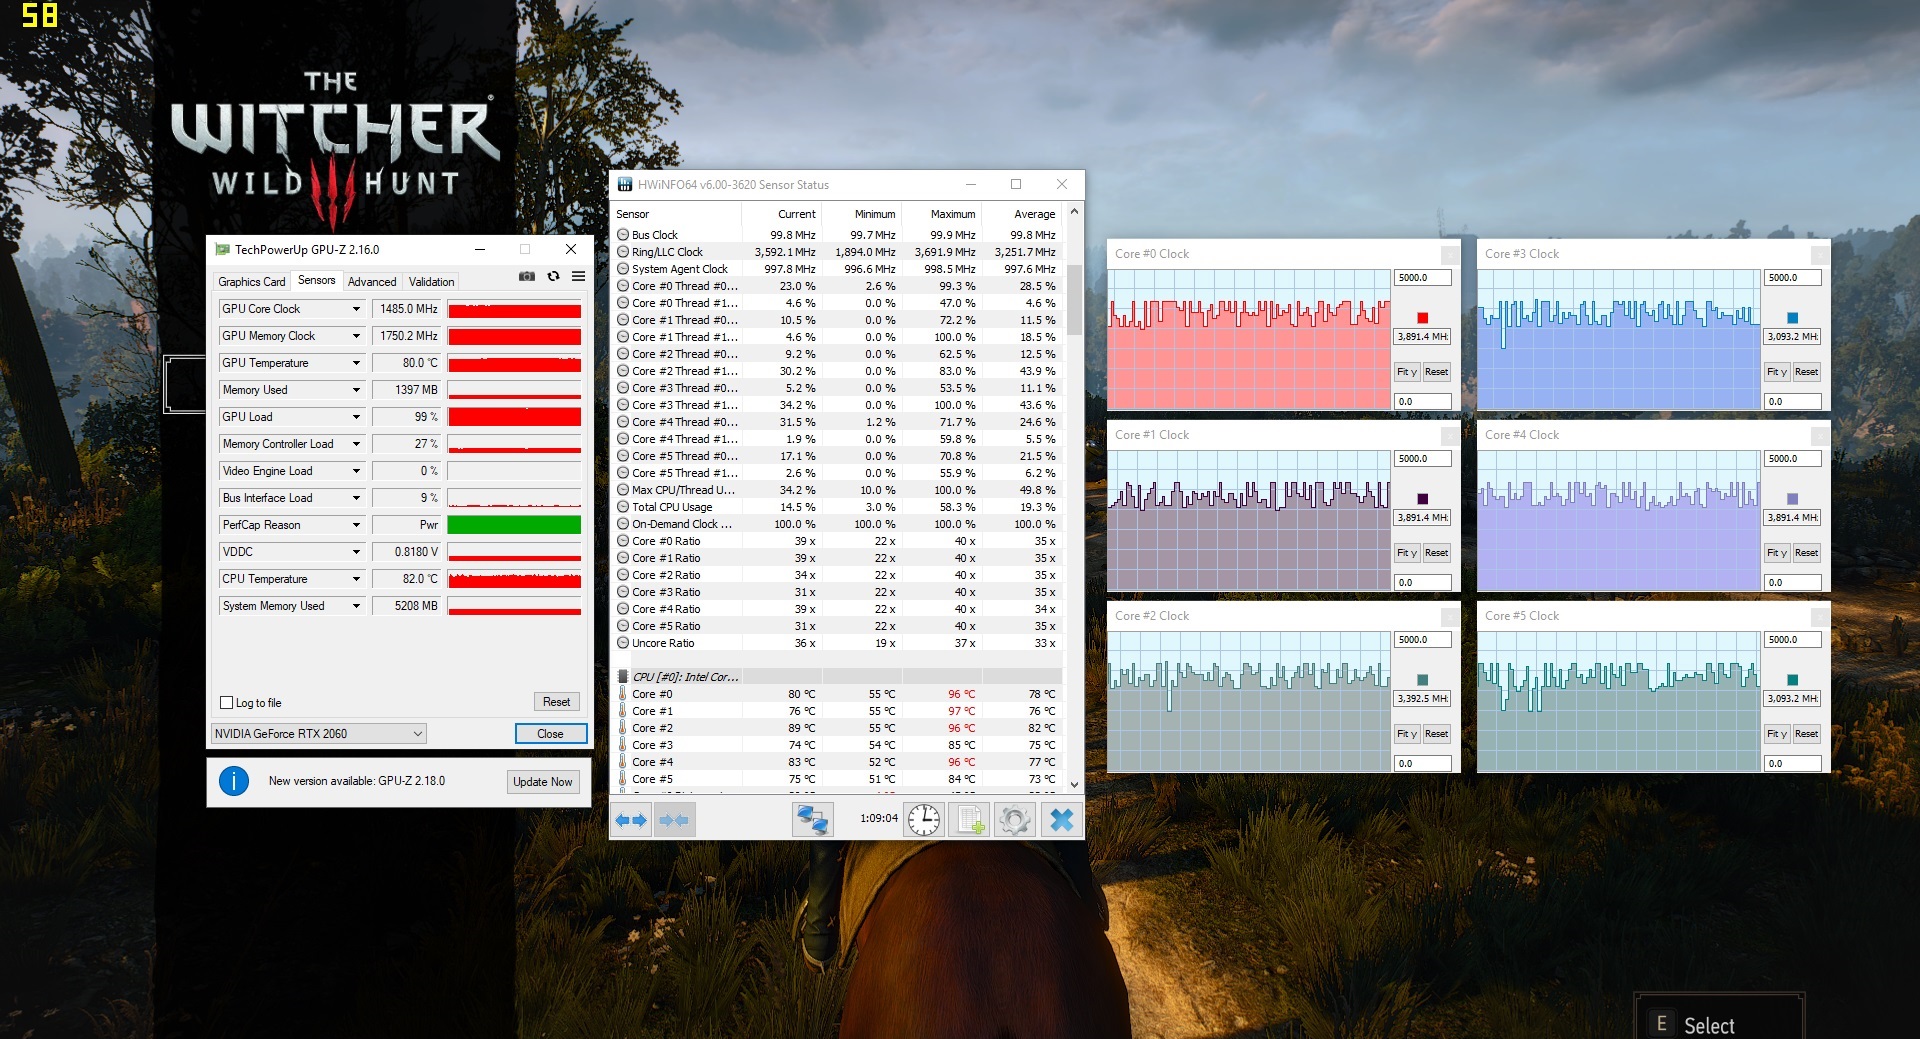
In order to evaluate whether the frame rates can also be maintained to a large extent constantly over a longer time period, we run "The Witcher 3" for about 60 minutes in Full-HD resolution and maximum quality settings. During the whole time, the character embodied by the gamer is not moved. We did not notice any drop in the frame rates.
| low | med. | high | ultra | |
|---|---|---|---|---|
| Tomb Raider (2013) | 439.7 | 393 | 367.3 | 192.9 |
| BioShock Infinite (2013) | 282.4 | 241.1 | 227 | 135.9 |
| The Witcher 3 (2015) | 244.6 | 174.7 | 109.1 | 58 |
| X-Plane 11.11 (2018) | 104.7 | 92.4 | 78.3 | |
| Apex Legends (2019) | 143.7 | 130.4 | 105.2 | 104.4 |
| Far Cry New Dawn (2019) | 86 | 80 | 77 | 69 |
| Metro Exodus (2019) | 109.1 | 67.1 | 50.7 | 41.6 |
| Anthem (2019) | 89.7 | 78.2 | 71 | 68.8 |
| Dirt Rally 2.0 (2019) | 170.7 | 134.6 | 112.5 | 66.3 |
| The Division 2 (2019) | 134 | 108 | 85 | 67 |
Emissions - Noisy and hot
Noise Emissions
The fans are never quiet and can also be heard while idling. Under load, they rev up significantly. During the stress test, the noise level rises up to 53 dB(A). It does not get that much quieter while playing games, and we measure a noise level of 51 to 52 dB(A) while running "The Witcher 3" test. Thus, gaming without a headset is no fun here. Unfortunately, one of the fans also produces an annoying whistle, and in addition, it also wobbles.
Noise level
| Idle |
| 34 / 36 / 38 dB(A) |
| Load |
| 52 / 53 dB(A) |
 | ||
30 dB silent 40 dB(A) audible 50 dB(A) loud |
||
min: | ||
| Aorus 15 W9 i7-8750H, GeForce RTX 2060 Mobile | Aorus 15 X9 i7-8750H, GeForce RTX 2070 Mobile | MSI GS65 Stealth Thin 8RE-051US i7-8750H, GeForce GTX 1060 Mobile | Alienware m15 GTX 1070 Max-Q i7-8750H, GeForce GTX 1070 Max-Q | Lenovo Legion Y740-15ICHg i7-8750H, GeForce RTX 2070 Max-Q | Gigabyte Aero 15-X9 i7-8750H, GeForce RTX 2070 Max-Q | Razer Blade 15 RTX 2070 Max-Q i7-8750H, GeForce RTX 2070 Max-Q | Asus Zephyrus S GX531GM i7-8750H, GeForce GTX 1060 Mobile | |
|---|---|---|---|---|---|---|---|---|
| Noise | 5% | 15% | 14% | 14% | 8% | 18% | 15% | |
| off / environment * (dB) | 29 | 28.2 3% | 28.4 2% | 28.6 1% | 28 3% | 30 -3% | 28.8 1% | 30.3 -4% |
| Idle Minimum * (dB) | 34 | 32.6 4% | 28.4 16% | 28.6 16% | 32.6 4% | 32 6% | 28.8 15% | 30.3 11% |
| Idle Average * (dB) | 36 | 32.7 9% | 28.4 21% | 28.6 21% | 32.7 9% | 34 6% | 28.8 20% | 33.2 8% |
| Idle Maximum * (dB) | 38 | 32.7 14% | 29.6 22% | 28.6 25% | 32.7 14% | 36 5% | 29.4 23% | 33.2 13% |
| Load Average * (dB) | 52 | 38.9 25% | 43.5 16% | 40.8 22% | 33.3 36% | 42 19% | 35.7 31% | 32.3 38% |
| Witcher 3 ultra * (dB) | 52 | 51.8 -0% | 45.7 12% | 49.6 5% | 41.6 20% | 44 15% | 42.5 18% | |
| Load Maximum * (dB) | 53 | 64.1 -21% | 45.7 14% | 49.6 6% | 45.2 15% | 48 9% | 45 15% | 39 26% |
* ... smaller is better
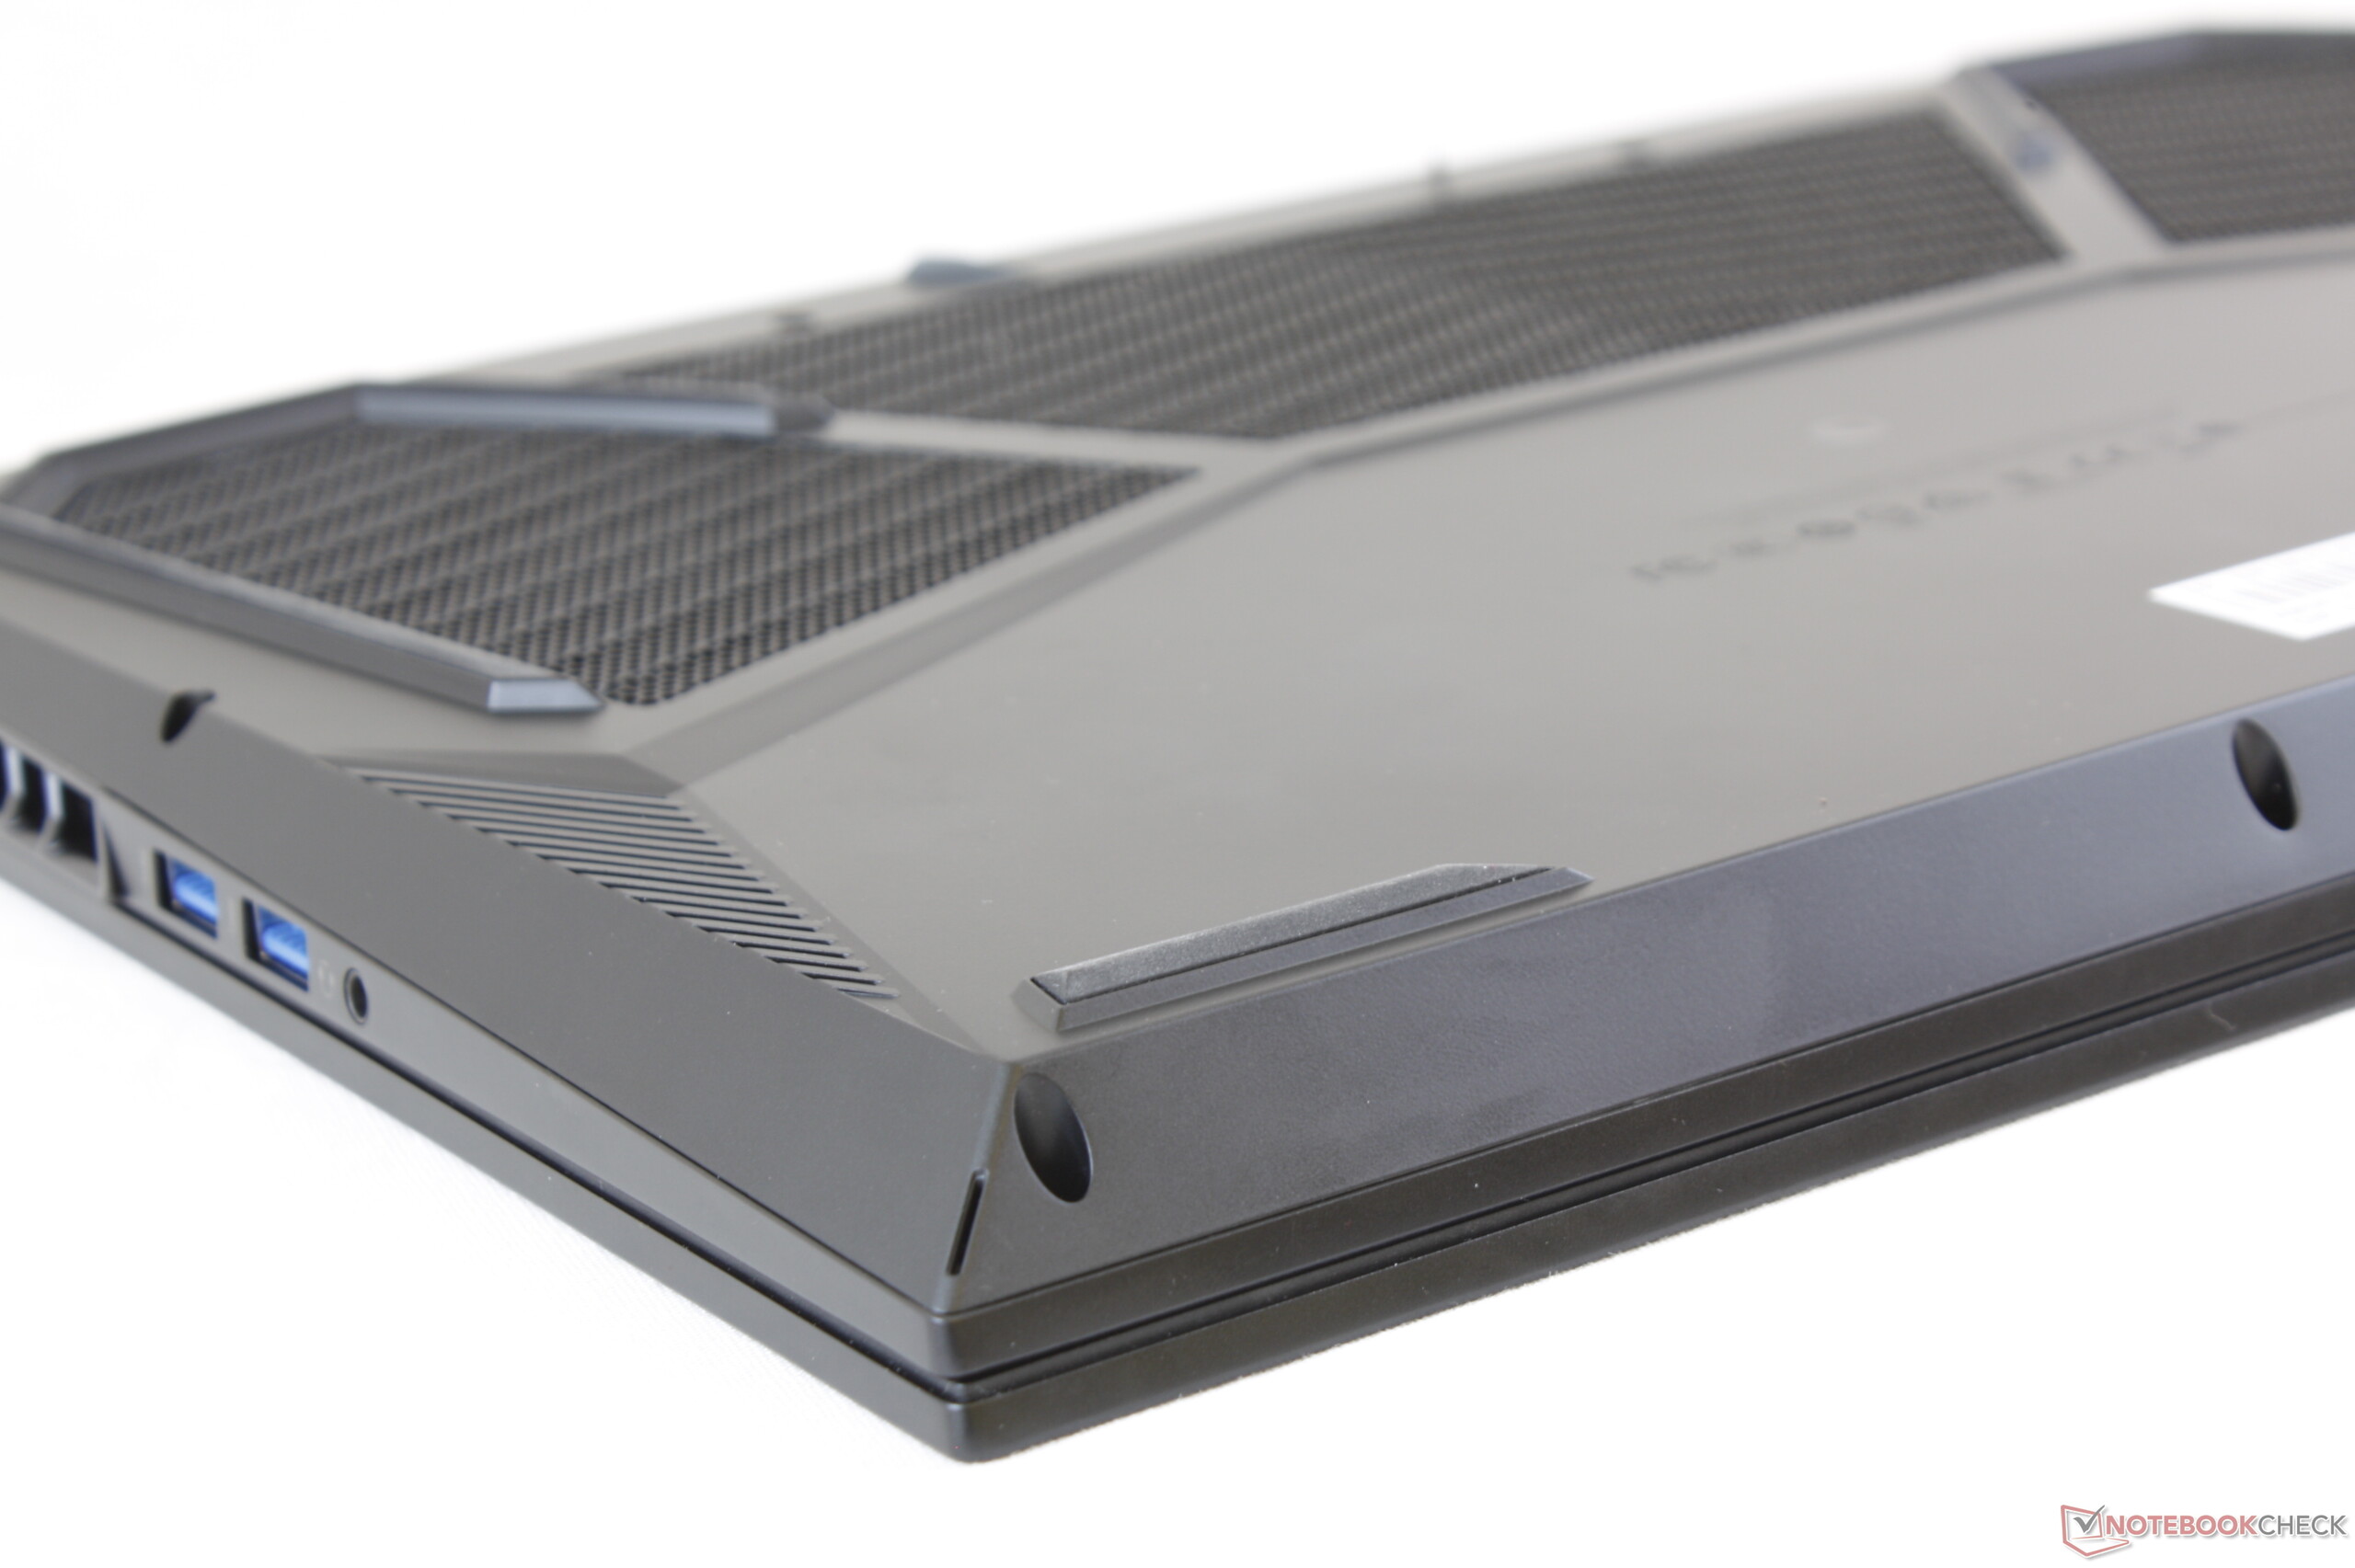
Temperatures
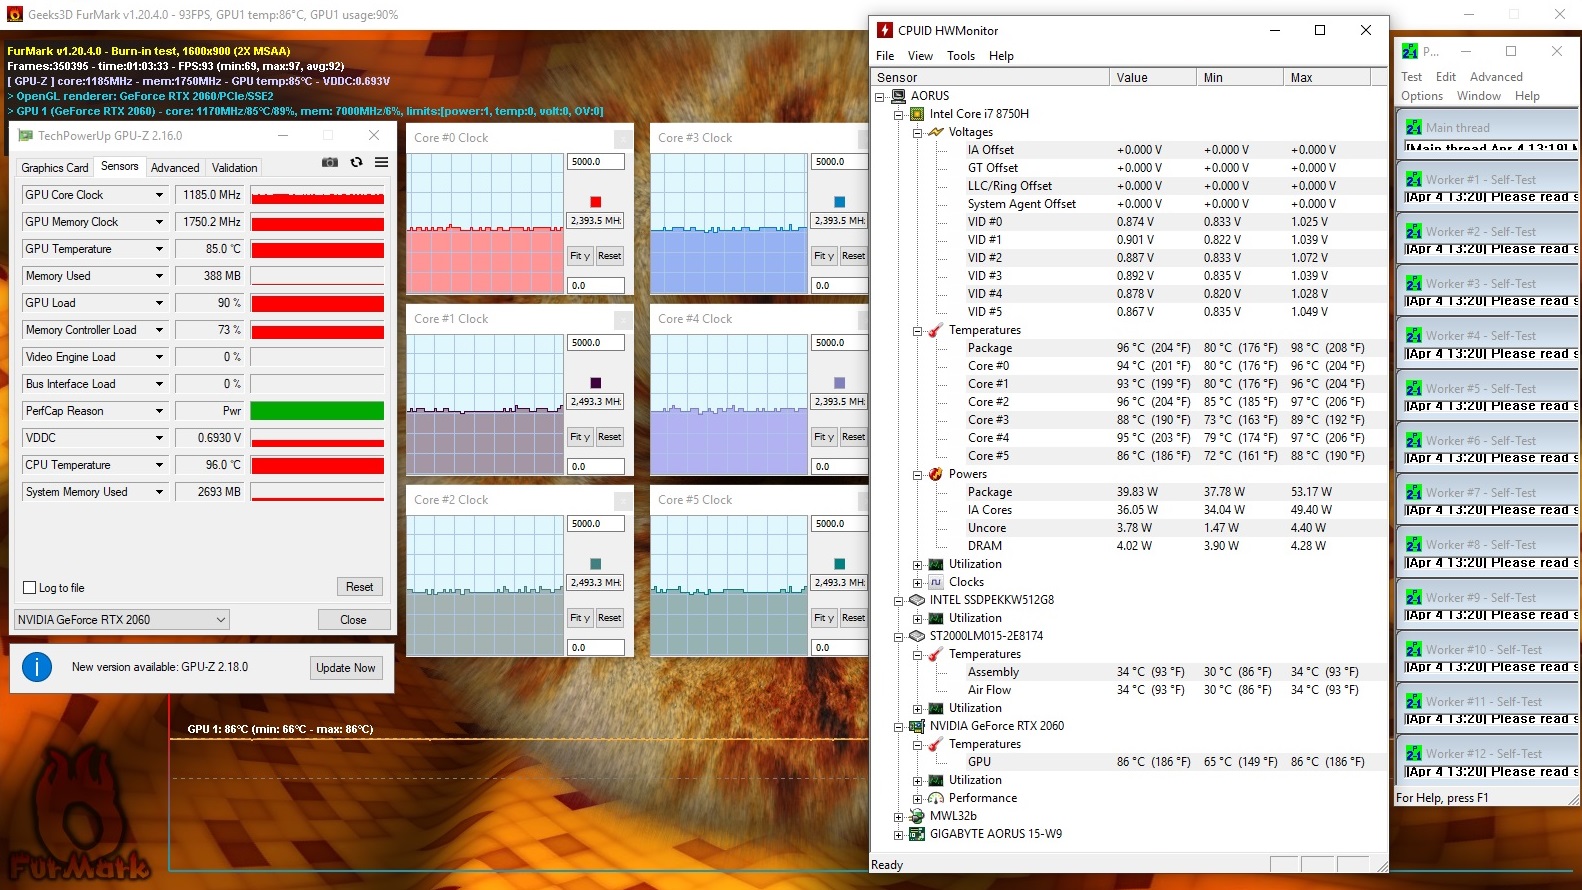
The Aorus 15 handles our stress test (Prime95 and FurMark running for at least one hour) in different ways during mains and battery operation. In mains operation, the processor runs at 2.4 to 2.5 GHz, and the graphics core operates at between 1150 and 1200 MHz. In battery operation, the CPU clock speed is between 1 and 1.4 GHz, and the GPU reaches speeds between 850 and 950 MHz. The stress test is an extreme scenario that does not occur in everyday operation. Using this test, we evaluate whether the system still remains stable under full load.
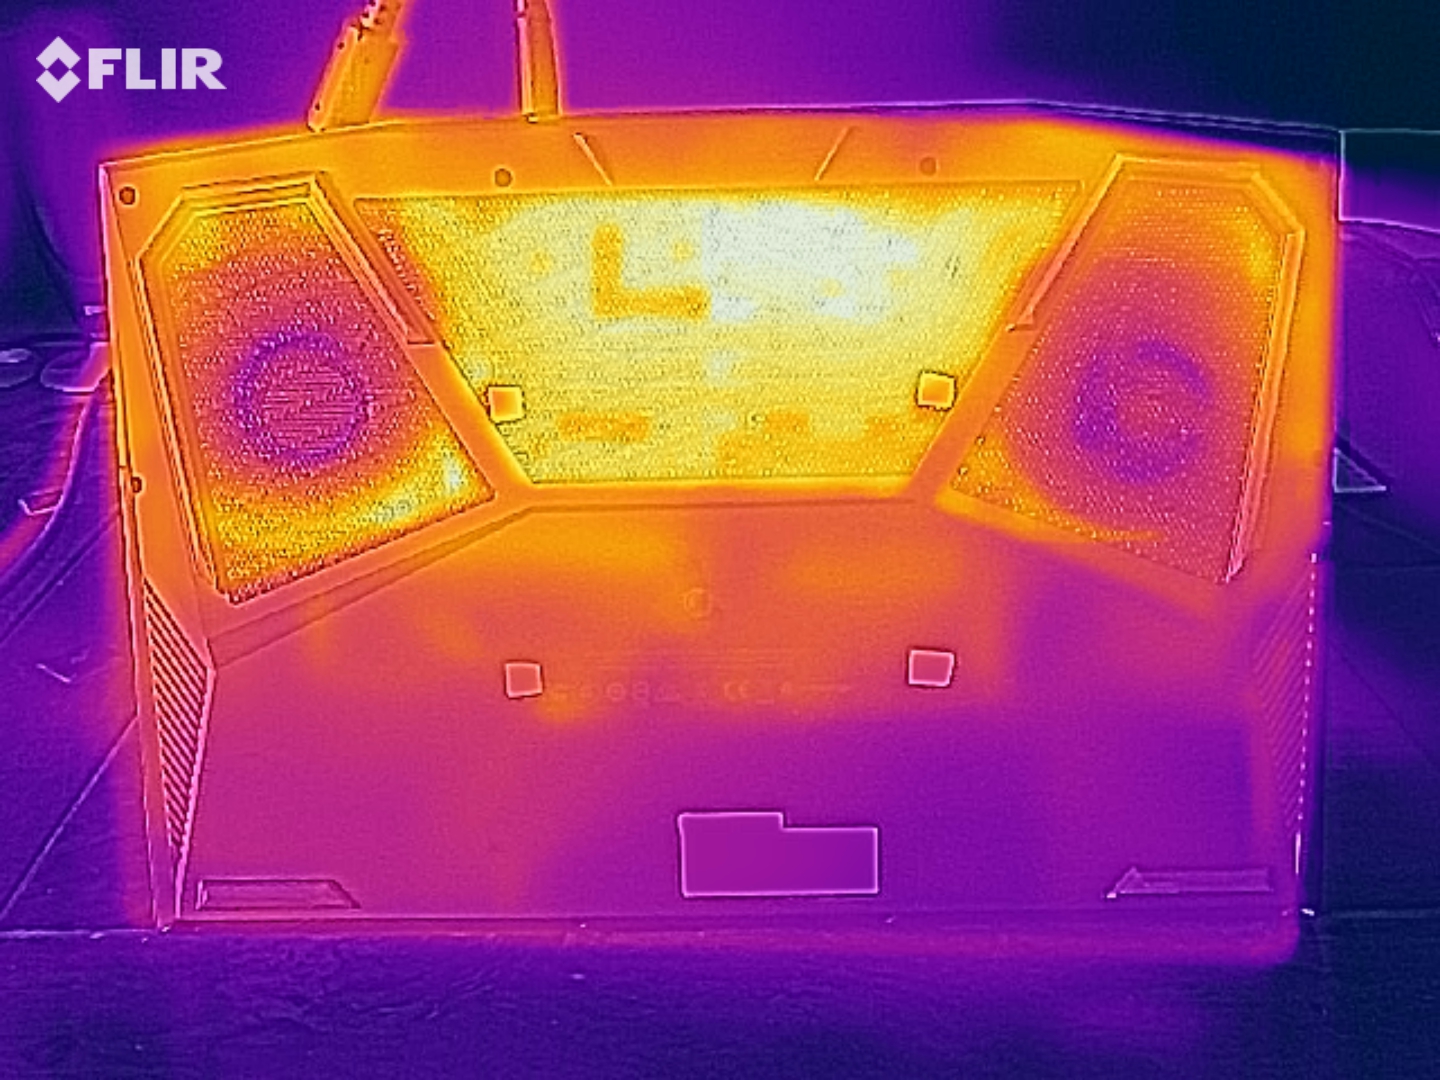
The notebook heats up significantly under load, particularly on the bottom. During the stress test, we measure temperatures around 60 °C (140 °F) at several measurement spots. The heat development is slightly lower while running "The Witcher 3" test (the game runs for one hour in Full HD resolution and maximum quality settings). However, you cannot place the device on your lap in either case. While idling, the values remain within an acceptable range.
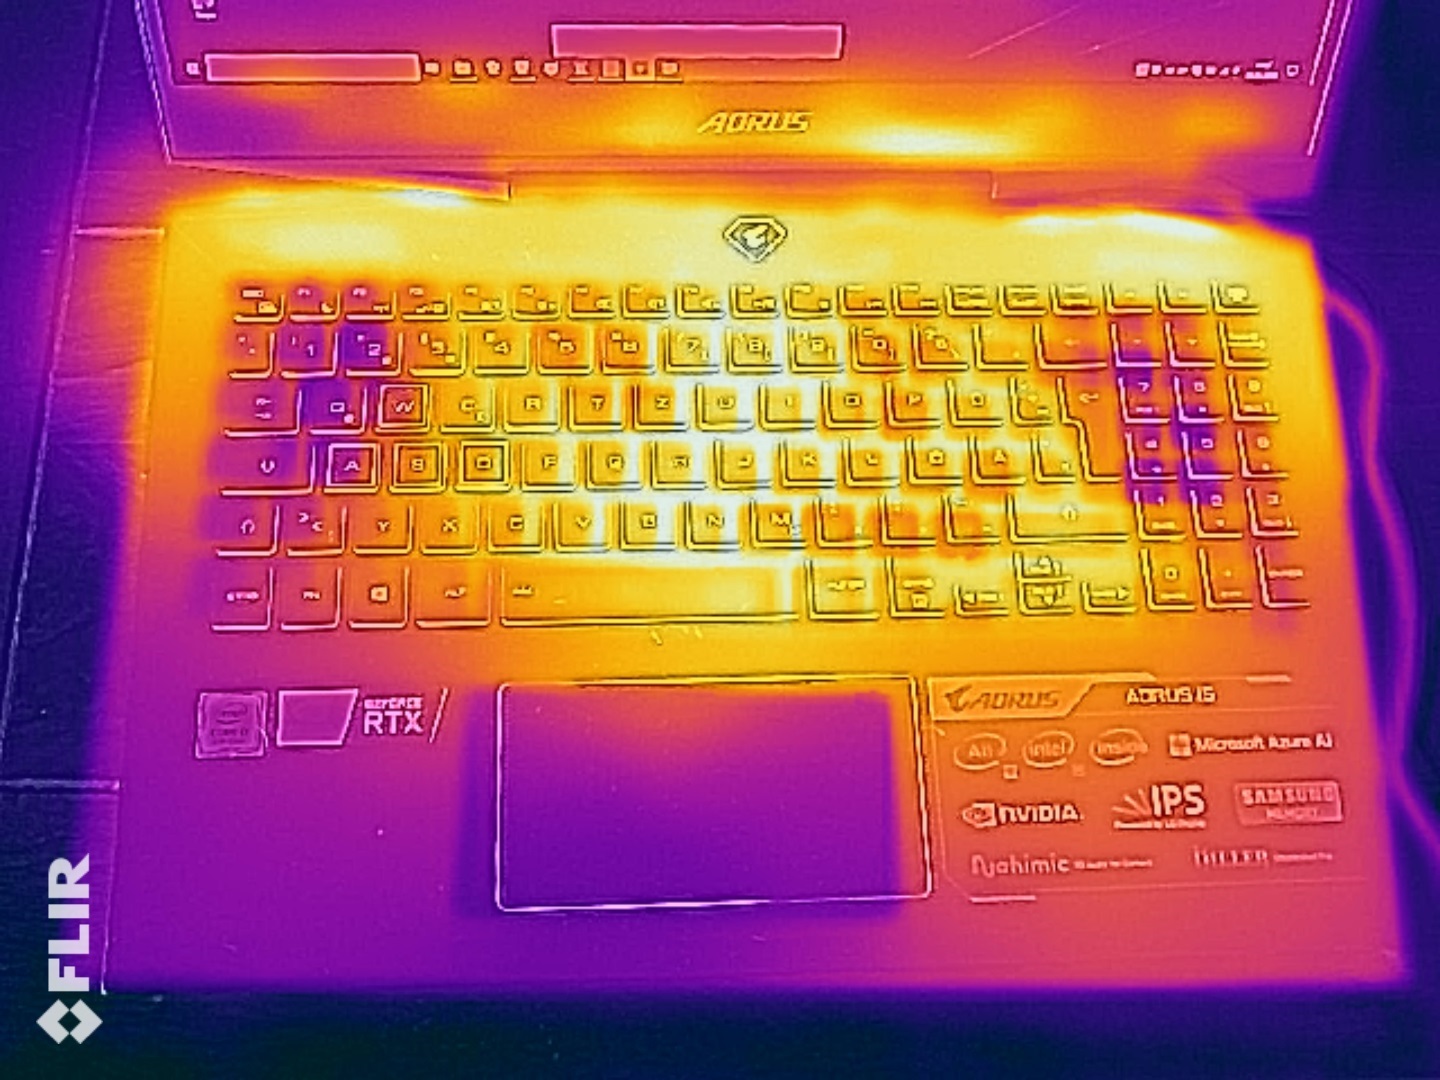
(±) The maximum temperature on the upper side is 44 °C / 111 F, compared to the average of 40.4 °C / 105 F, ranging from 21.2 to 68.8 °C for the class Gaming.
(-) The bottom heats up to a maximum of 63 °C / 145 F, compared to the average of 43.2 °C / 110 F
(+) In idle usage, the average temperature for the upper side is 26.6 °C / 80 F, compared to the device average of 33.9 °C / 93 F.
(-) Playing The Witcher 3, the average temperature for the upper side is 38.3 °C / 101 F, compared to the device average of 33.9 °C / 93 F.
(±) The palmrests and touchpad can get very hot to the touch with a maximum of 38 °C / 100.4 F.
(-) The average temperature of the palmrest area of similar devices was 28.8 °C / 83.8 F (-9.2 °C / -16.6 F).
| Aorus 15 W9 i7-8750H, GeForce RTX 2060 Mobile | Aorus 15 X9 i7-8750H, GeForce RTX 2070 Mobile | MSI GS65 Stealth Thin 8RE-051US i7-8750H, GeForce GTX 1060 Mobile | Alienware m15 GTX 1070 Max-Q i7-8750H, GeForce GTX 1070 Max-Q | Lenovo Legion Y740-15ICHg i7-8750H, GeForce RTX 2070 Max-Q | Gigabyte Aero 15-X9 i7-8750H, GeForce RTX 2070 Max-Q | Razer Blade 15 RTX 2070 Max-Q i7-8750H, GeForce RTX 2070 Max-Q | Asus Zephyrus S GX531GM i7-8750H, GeForce GTX 1060 Mobile | |
|---|---|---|---|---|---|---|---|---|
| Heat | 1% | -7% | -6% | -1% | -6% | 6% | 7% | |
| Maximum Upper Side * (°C) | 44 | 36.6 17% | 46.8 -6% | 52 -18% | 37.6 15% | 56 -27% | 49 -11% | 47.7 -8% |
| Maximum Bottom * (°C) | 63 | 56.8 10% | 59.8 5% | 55.6 12% | 45.2 28% | 66 -5% | 49 22% | 46.1 27% |
| Idle Upper Side * (°C) | 27 | 28.2 -4% | 28.6 -6% | 29.8 -10% | 32.2 -19% | 27 -0% | 25.4 6% | 26.2 3% |
| Idle Bottom * (°C) | 29 | 35 -21% | 34.4 -19% | 31 -7% | 37.2 -28% | 27 7% | 27.2 6% | 27.1 7% |
* ... smaller is better
Speakers
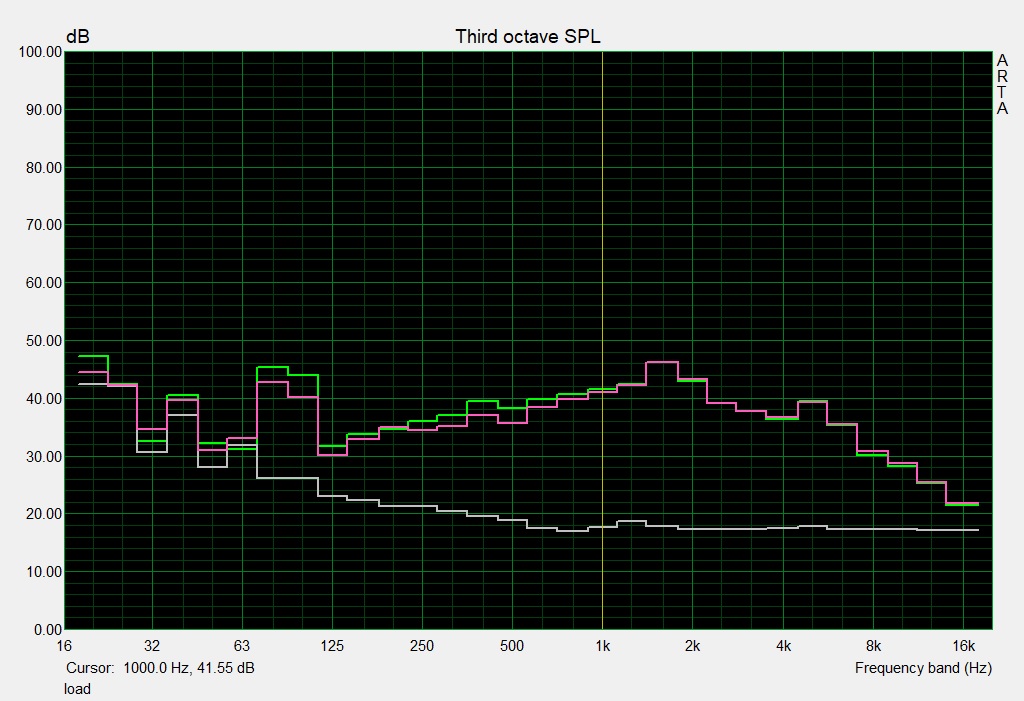
Aorus 15 W9 audio analysis
(±) | speaker loudness is average but good (76 dB)
Bass 100 - 315 Hz
(-) | nearly no bass - on average 18.3% lower than median
(±) | linearity of bass is average (13% delta to prev. frequency)
Mids 400 - 2000 Hz
(+) | balanced mids - only 2.4% away from median
(+) | mids are linear (3.8% delta to prev. frequency)
Highs 2 - 16 kHz
(+) | balanced highs - only 2.1% away from median
(±) | linearity of highs is average (7.6% delta to prev. frequency)
Overall 100 - 16.000 Hz
(±) | linearity of overall sound is average (17.2% difference to median)
Compared to same class
» 47% of all tested devices in this class were better, 11% similar, 42% worse
» The best had a delta of 6%, average was 18%, worst was 132%
Compared to all devices tested
» 32% of all tested devices were better, 8% similar, 60% worse
» The best had a delta of 4%, average was 23%, worst was 134%
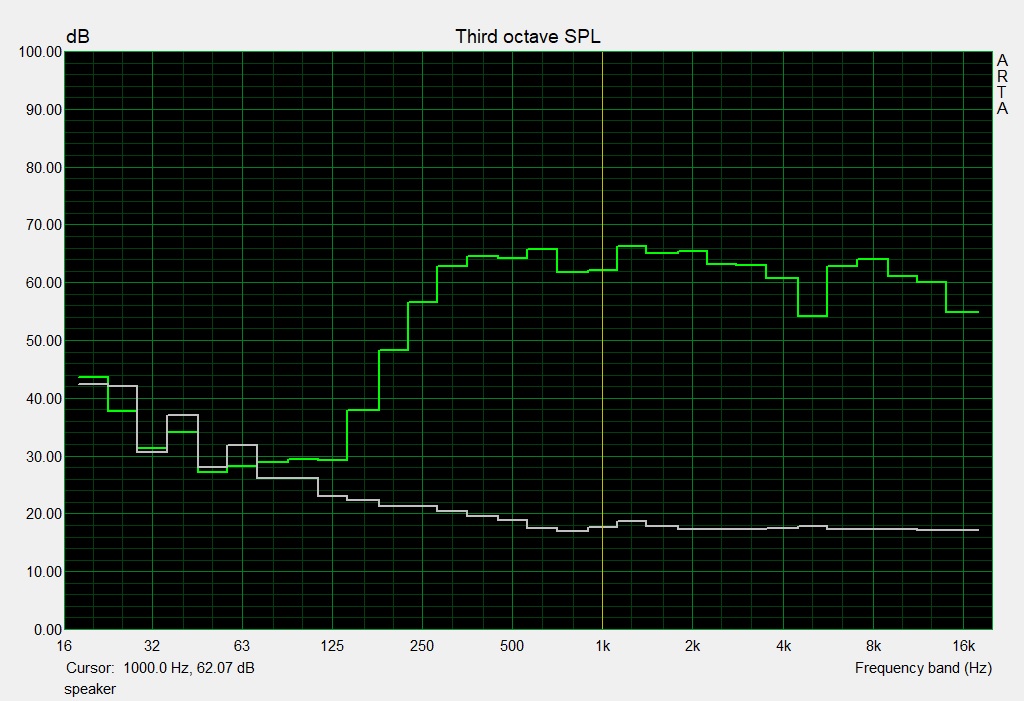
Gigabyte Aero 15-X9 audio analysis
(±) | speaker loudness is average but good (81 dB)
Bass 100 - 315 Hz
(±) | reduced bass - on average 14% lower than median
(±) | linearity of bass is average (13.7% delta to prev. frequency)
Mids 400 - 2000 Hz
(±) | higher mids - on average 6.2% higher than median
(±) | linearity of mids is average (7.9% delta to prev. frequency)
Highs 2 - 16 kHz
(+) | balanced highs - only 4.4% away from median
(±) | linearity of highs is average (9.7% delta to prev. frequency)
Overall 100 - 16.000 Hz
(±) | linearity of overall sound is average (17.5% difference to median)
Compared to same class
» 49% of all tested devices in this class were better, 12% similar, 40% worse
» The best had a delta of 6%, average was 18%, worst was 132%
Compared to all devices tested
» 34% of all tested devices were better, 8% similar, 58% worse
» The best had a delta of 4%, average was 23%, worst was 134%
Power Management - Hardly any stamina
Power Consumption
The Aorus does not offer the Optimus technology. Since the RTX 2060 runs continuously, the power consumption turns out relatively high during idle operation. We measure a maximum of 28 watts. During our stress test, the value increases up to 175 watts. The notebook shows itself more efficient during gaming operation, and we register a power consumption of 135 watts during "The Witcher 3" test. The power supply is rated at 180 watts. The sibling model which is equipped with a more powerful CPU turns out to be even more power hungry over the whole load range.
| Off / Standby | |
| Idle | |
| Load |
|
Key:
min: | |
| Aorus 15 W9 i7-8750H, GeForce RTX 2060 Mobile | Aorus 15 X9 i7-8750H, GeForce RTX 2070 Mobile | MSI GS65 Stealth Thin 8RE-051US i7-8750H, GeForce GTX 1060 Mobile | Alienware m15 GTX 1070 Max-Q i7-8750H, GeForce GTX 1070 Max-Q | Lenovo Legion Y740-15ICHg i7-8750H, GeForce RTX 2070 Max-Q | Gigabyte Aero 15-X9 i7-8750H, GeForce RTX 2070 Max-Q | Razer Blade 15 RTX 2070 Max-Q i7-8750H, GeForce RTX 2070 Max-Q | Asus Zephyrus S GX531GM i7-8750H, GeForce GTX 1060 Mobile | |
|---|---|---|---|---|---|---|---|---|
| Power Consumption | -33% | 22% | 20% | -9% | 9% | 15% | 10% | |
| Idle Minimum * (Watt) | 18 | 26 -44% | 8.7 52% | 7.6 58% | 22.9 -27% | 16 11% | 10.4 42% | 13.8 23% |
| Idle Average * (Watt) | 20 | 30.8 -54% | 13 35% | 13.8 31% | 27.2 -36% | 18 10% | 14.6 27% | 20.9 -5% |
| Idle Maximum * (Watt) | 28 | 34.9 -25% | 14.3 49% | 14.6 48% | 27.5 2% | 23 18% | 16.3 42% | 26 7% |
| Load Average * (Watt) | 87 | 90.7 -4% | 107.4 -23% | 97.6 -12% | 83.4 4% | 88 -1% | 88.5 -2% | 89 -2% |
| Witcher 3 ultra * (Watt) | 135 | 175 -30% | 129 4% | 145.8 -8% | 143.6 -6% | 120 11% | 155.4 -15% | |
| Load Maximum * (Watt) | 175 | 241.2 -38% | 151.5 13% | 172.5 1% | 160.5 8% | 167 5% | 182.4 -4% | 131 25% |
* ... smaller is better
Battery Life
In our realistic WLAN test, the Aorus 15-W9 achieves a runtime of 2:21 hours. Using a script, we simulate the load when calling up websites. The "Balanced" power profile is activated and the display brightness is adjusted to about 150 cd/m². The 15.6-incher lasts for 2:17 hours in our video test, where we run the short film "Big Buck Bunny" (H.264 coding, 1920x1080 pixels) in a constant loop. The "Power Saving" mode is activated, the communication modules are deactivated, and the display brightness is lowered to 150 cd/m².
Overall, the notebook delivers a lousy battery life. The lack of a graphics switching solution is clearly noticeable here. Nonetheless, the 15-W9 lasts longer than its sibling model which is equipped with a more powerful graphics core.
| Aorus 15 W9 i7-8750H, GeForce RTX 2060 Mobile, 62 Wh | Aorus 15 X9 i7-8750H, GeForce RTX 2070 Mobile, 62 Wh | MSI GS65 Stealth Thin 8RE-051US i7-8750H, GeForce GTX 1060 Mobile, 82 Wh | Alienware m15 GTX 1070 Max-Q i7-8750H, GeForce GTX 1070 Max-Q, 90 Wh | Lenovo Legion Y740-15ICHg i7-8750H, GeForce RTX 2070 Max-Q, 57 Wh | Gigabyte Aero 15-X9 i7-8750H, GeForce RTX 2070 Max-Q, 94.24 Wh | Razer Blade 15 RTX 2070 Max-Q i7-8750H, GeForce RTX 2070 Max-Q, 80 Wh | Asus Zephyrus S GX531GM i7-8750H, GeForce GTX 1060 Mobile, 53 Wh | |
|---|---|---|---|---|---|---|---|---|
| Battery runtime | -33% | 72% | 168% | 3% | 164% | 157% | 33% | |
| Reader / Idle (h) | 2.9 | 1.8 -38% | 10.5 262% | 3.9 34% | 9.2 217% | 11.4 293% | ||
| H.264 (h) | 2.3 | 6.1 165% | ||||||
| WiFi v1.3 (h) | 2.4 | 1.6 -33% | 6.2 158% | 7.7 221% | 2.8 17% | 6.4 167% | 6.5 171% | 3.2 33% |
| Load (h) | 1.4 | 1 -29% | 1.2 -14% | 1.7 21% | 0.8 -43% | 2.9 107% | 1.5 7% |
Pros
Cons
Verdict
With the Aorus 15-W9, Gigabyte delivers a gaming notebook in the 15.6-inch format. This is the more compact and light successor of the Aorus X5 v8. The built-in Core-i7-8750H processor offers more than sufficient computing power for all the usual application areas through the next few years. The GeForce RTX-2060 graphics core brings all the current computer games to the Full HD screen smoothly, and you can always chose high to maximum quality settings.
Under load, the device heats up significantly and also produces a lot of noise. In addition to the normal whirring of the two fans, you can also hear some whistling produced by one of the two fans.
While the Aorus 15-W9 does what it is supposed to do, which is to run games smoothly, the notebook does not lack weaknesses either.
A fast NVMe SSD ensures a smoothly running system and there is also an additional 2-TB hard drive, so there will be no lack of storage for a while. There is also an option to expand the storage, since the notebook offers a second, unoccupied M.2-2280 storage slot. In order to access the storage media, you would need to open the case.
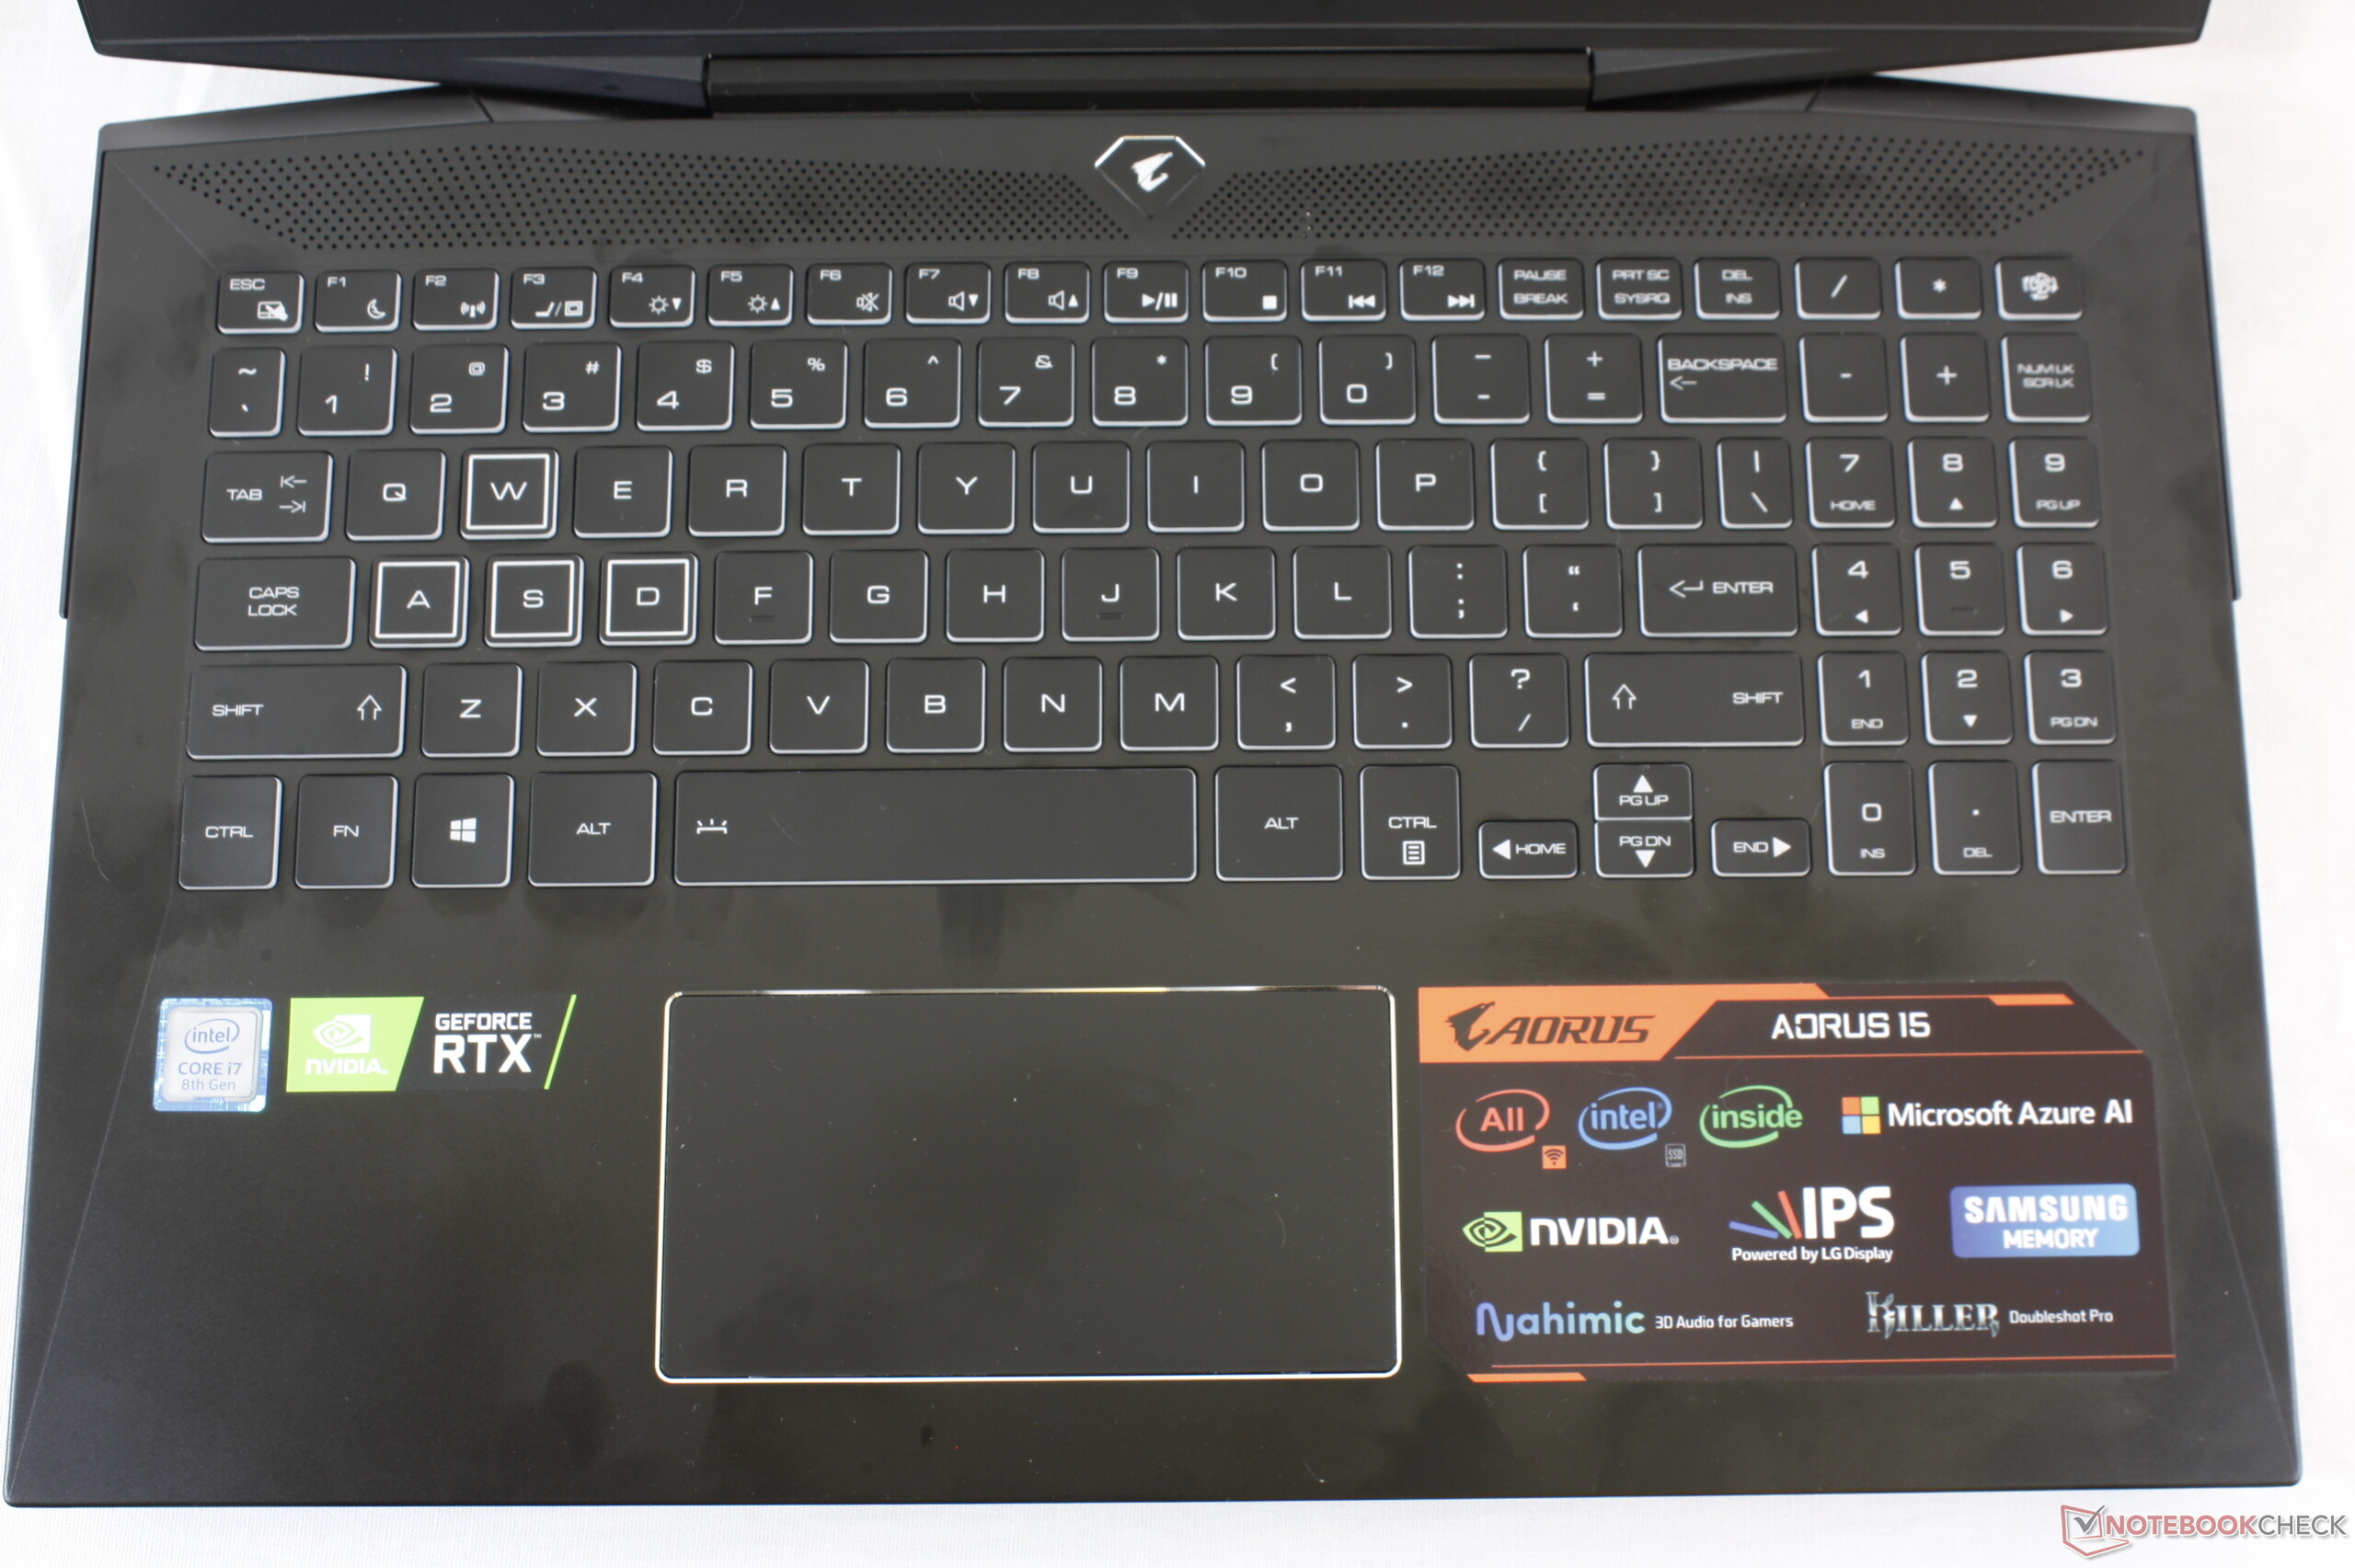
The 144-Hz IPS display pleases with stable viewing angles and short response times. While the brightness and contrast are acceptable, they should have been higher in a notebook of this price range. The built-in keyboard left a good impression. The battery life is not worth mentioning.
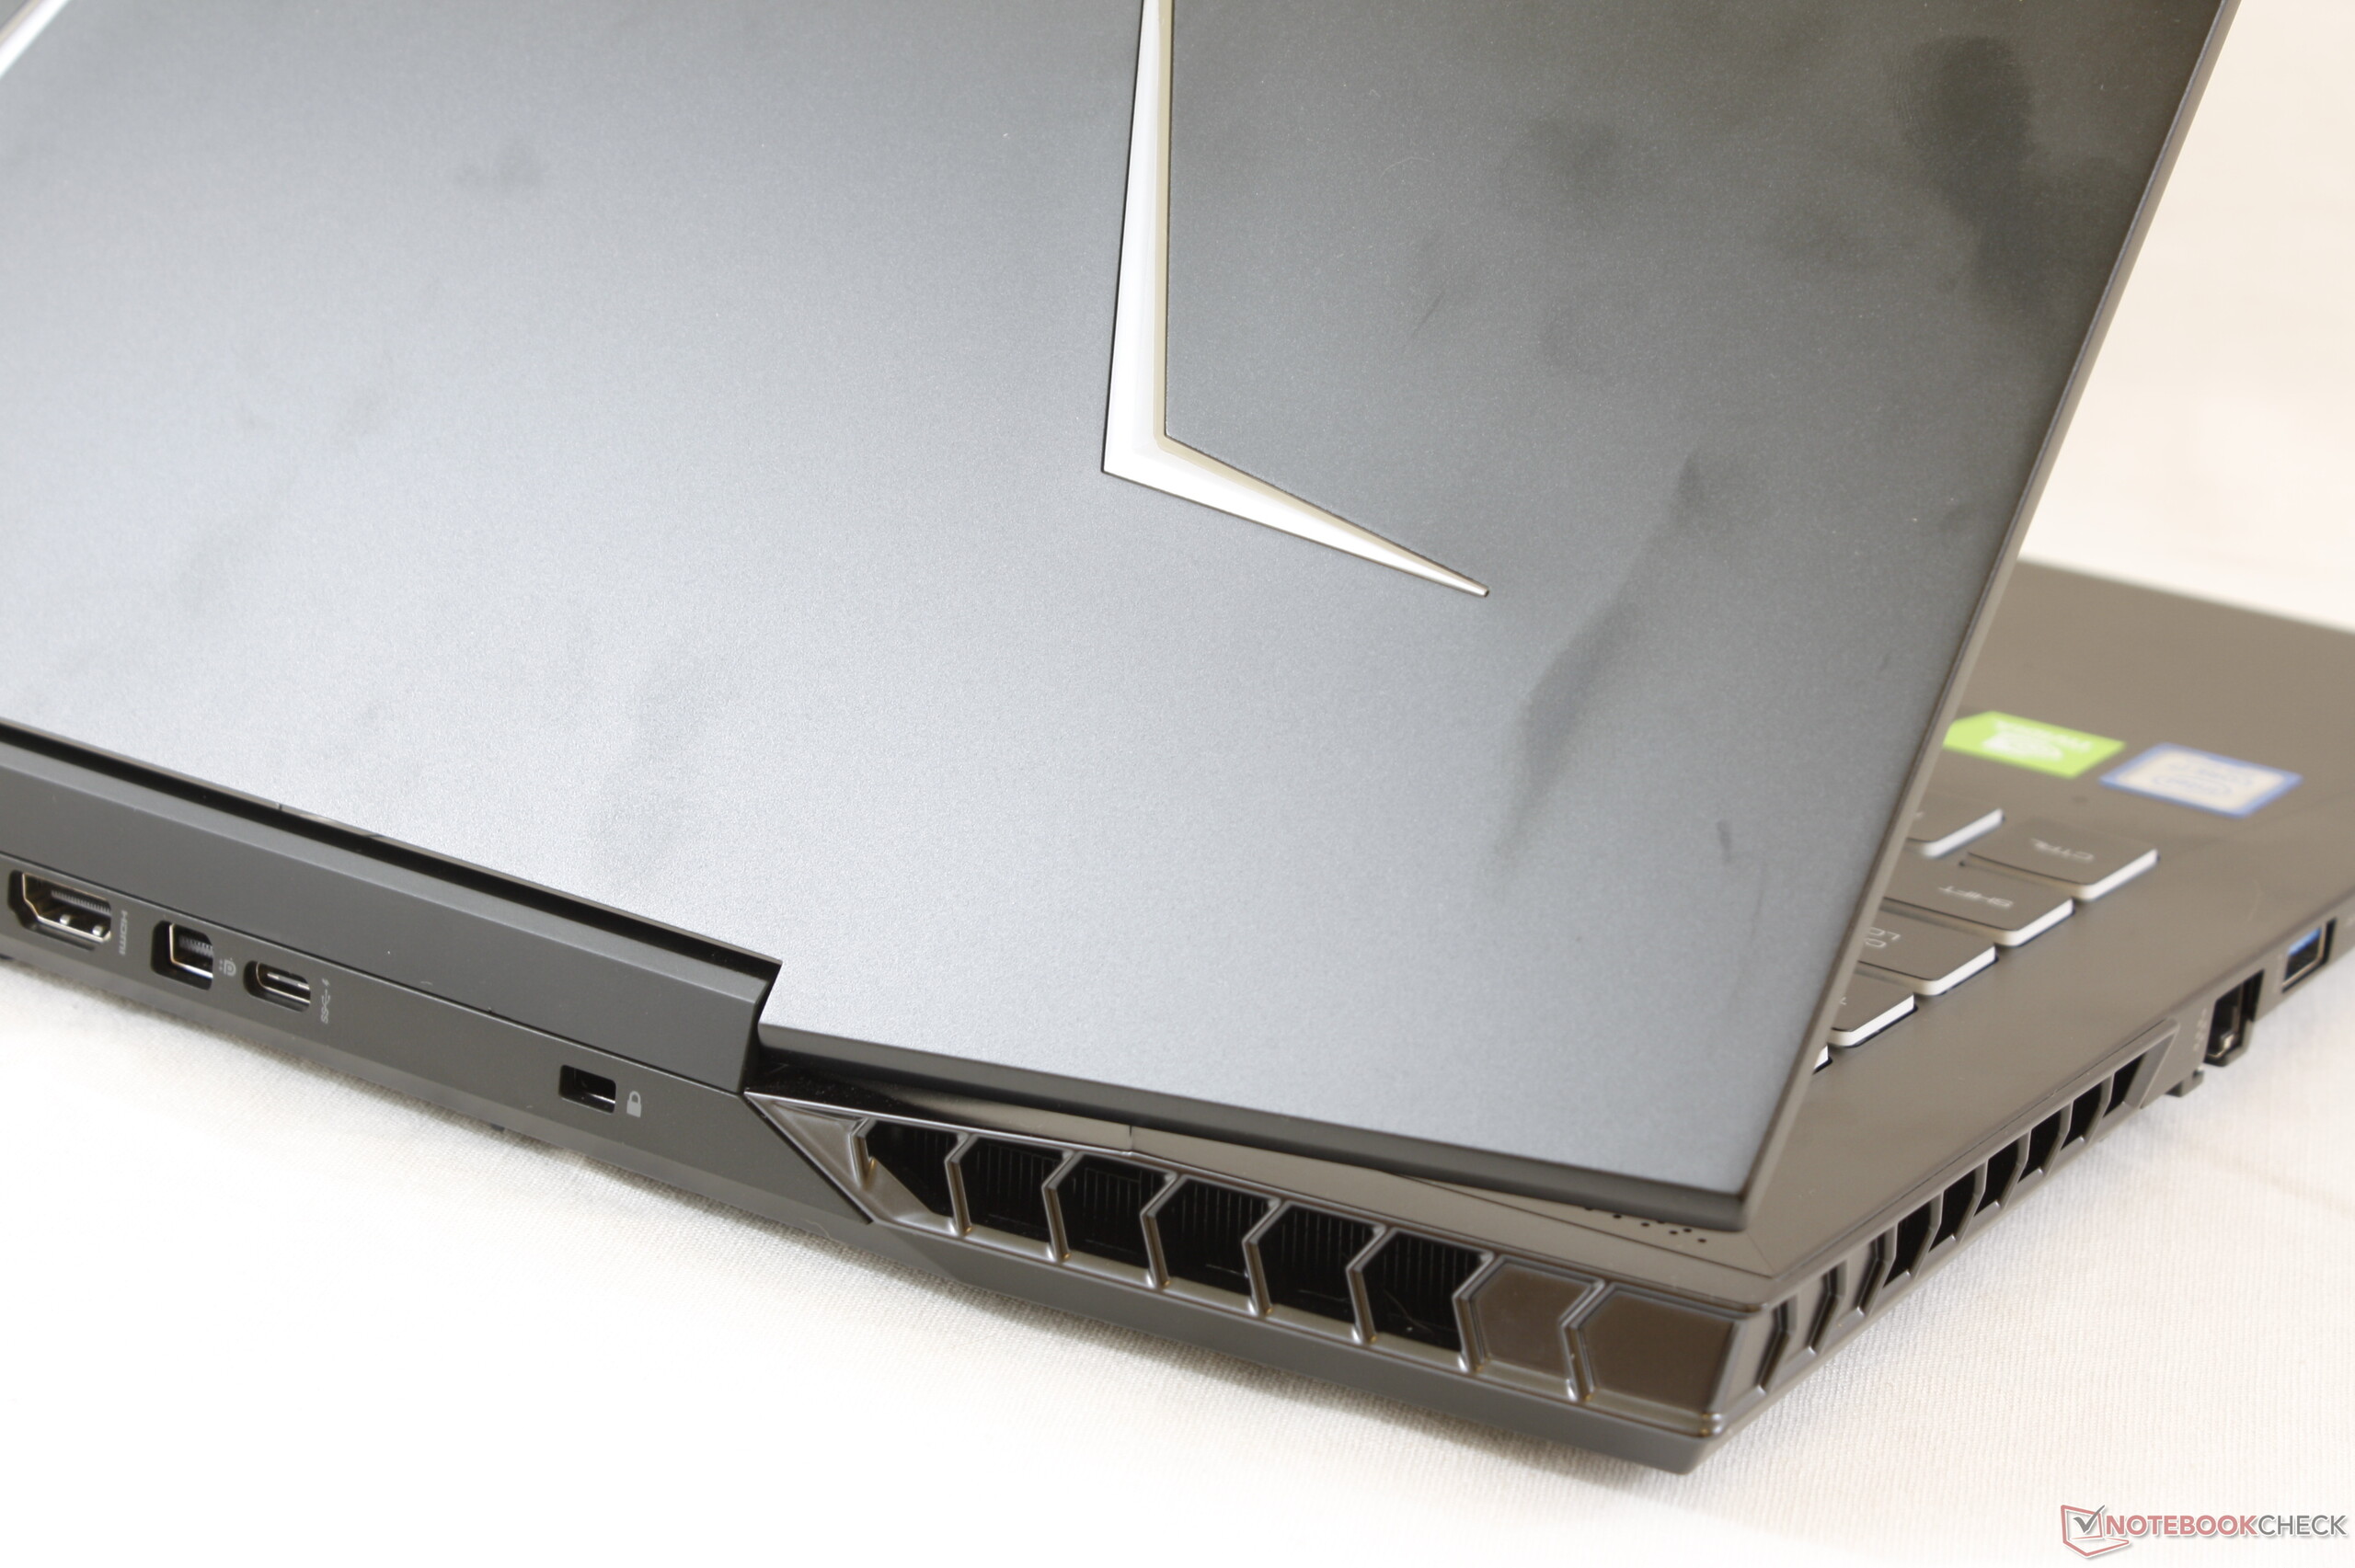
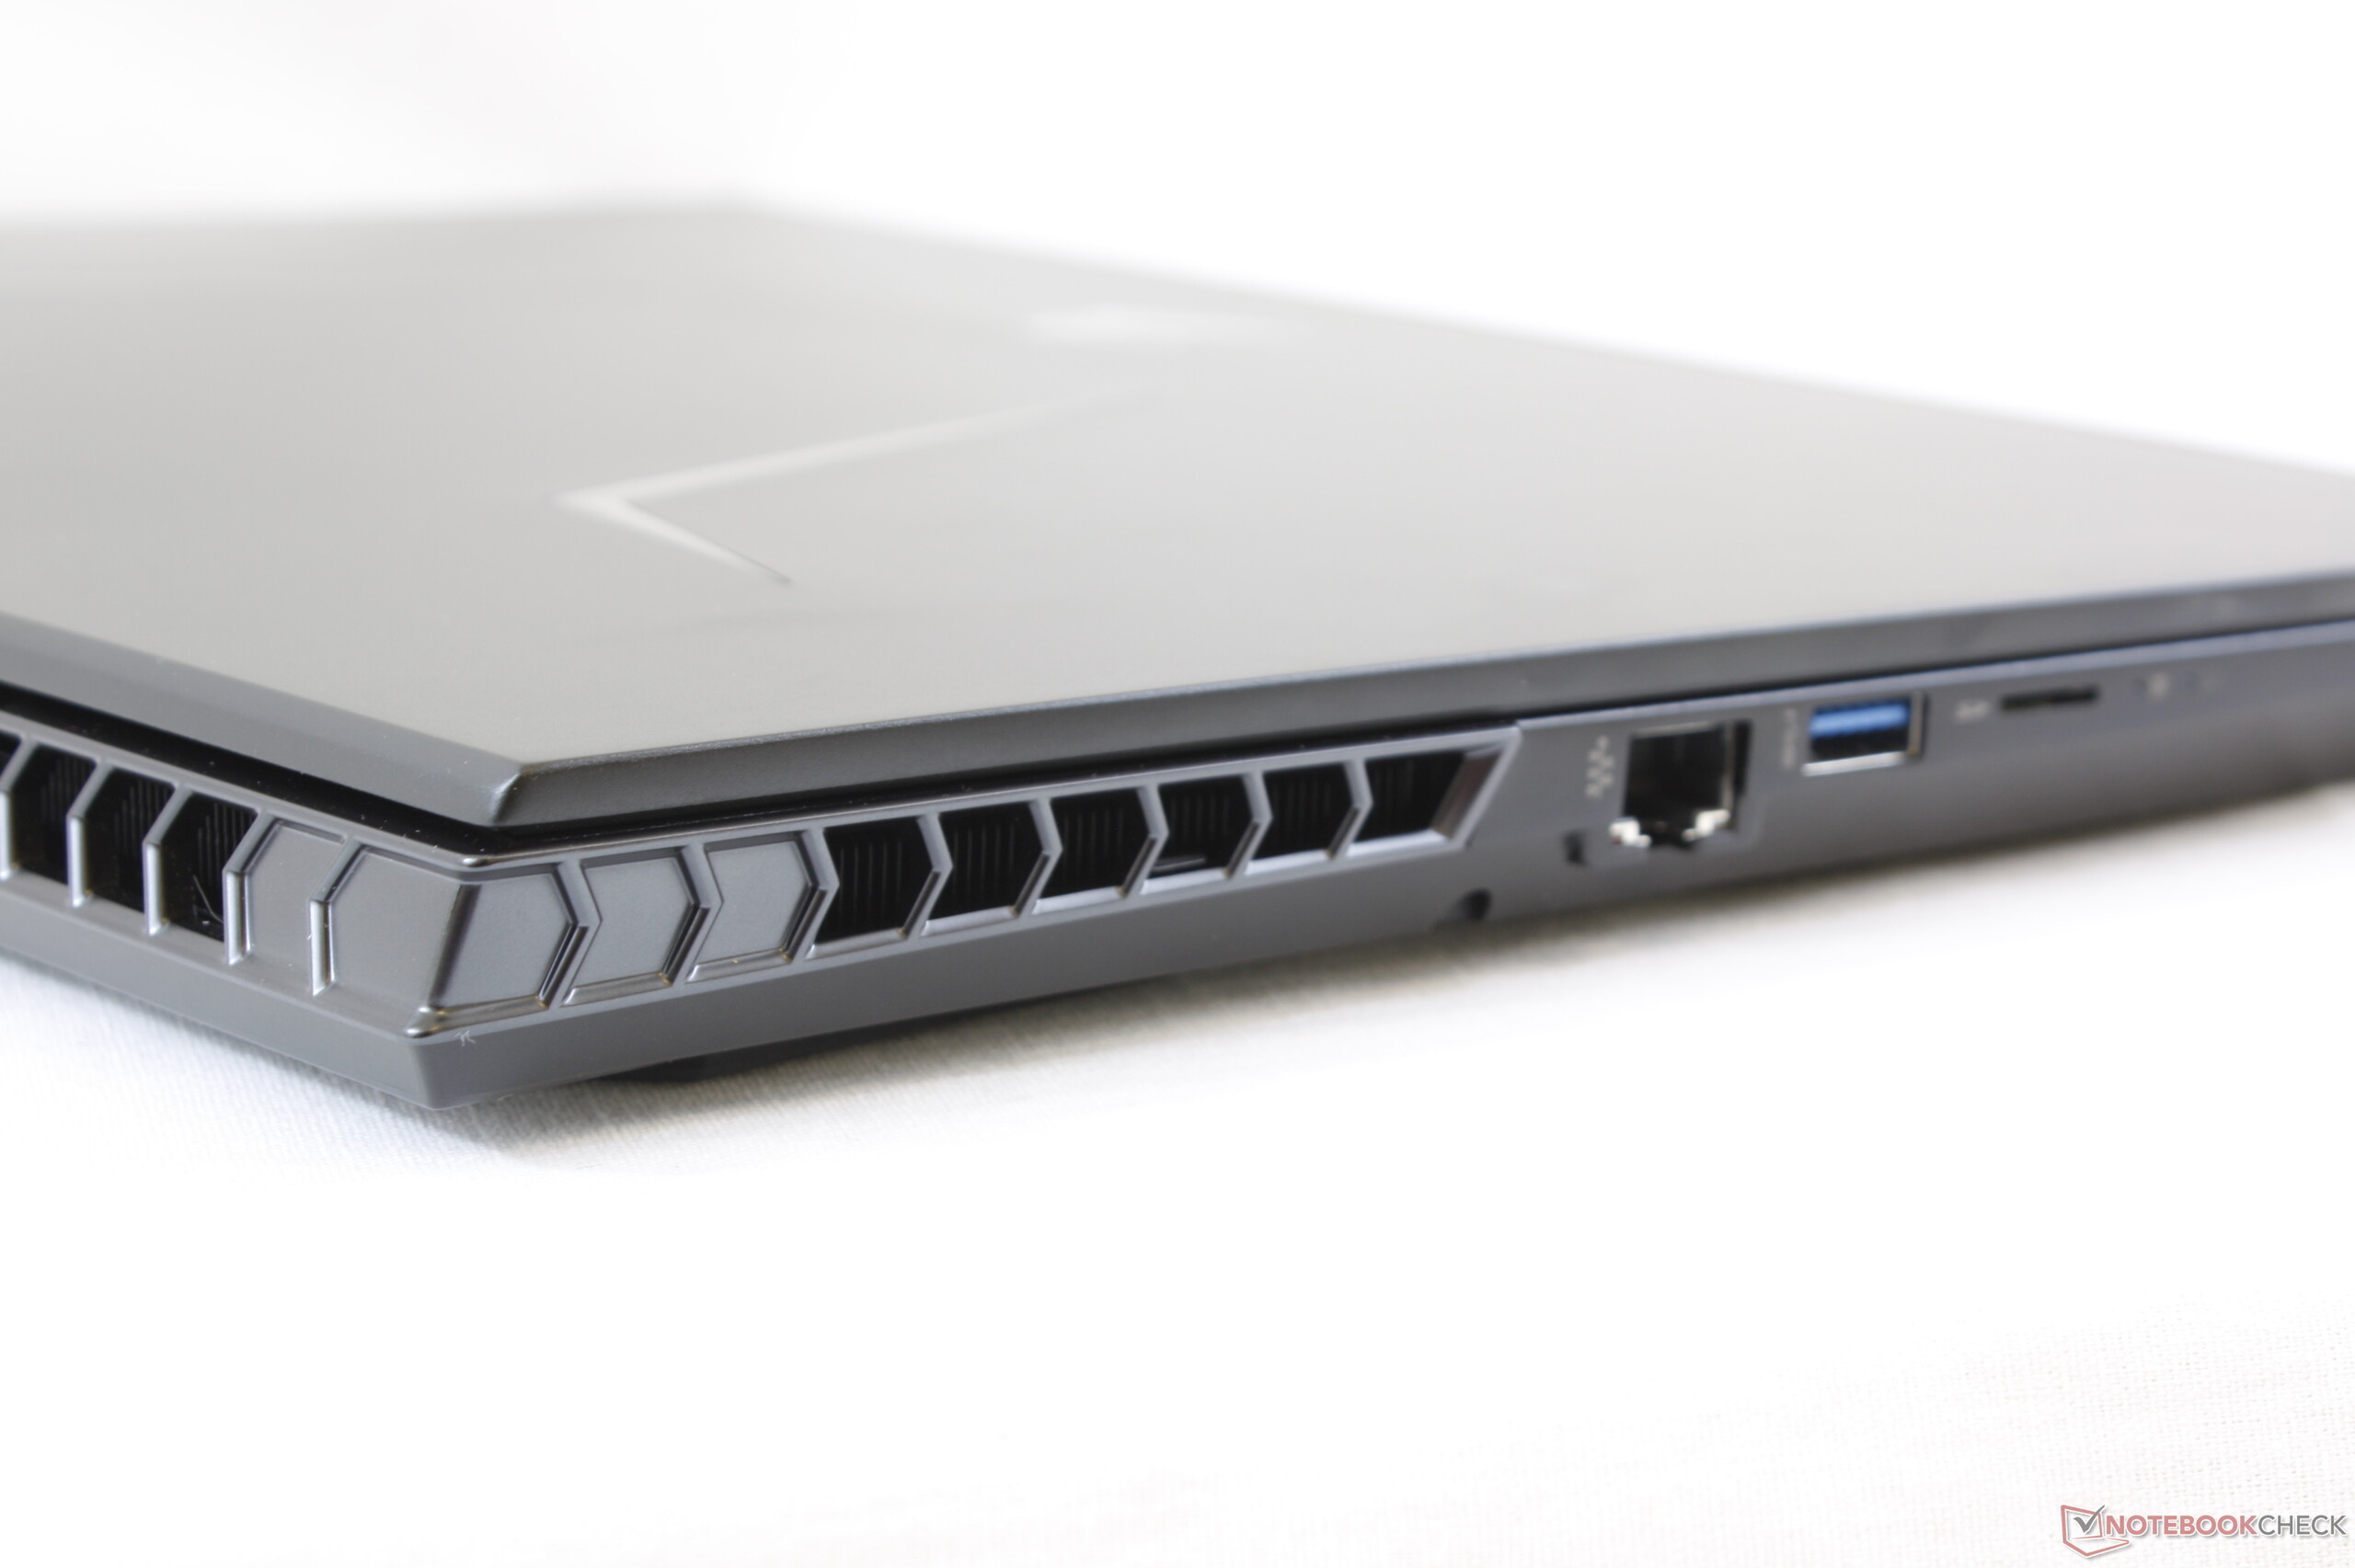
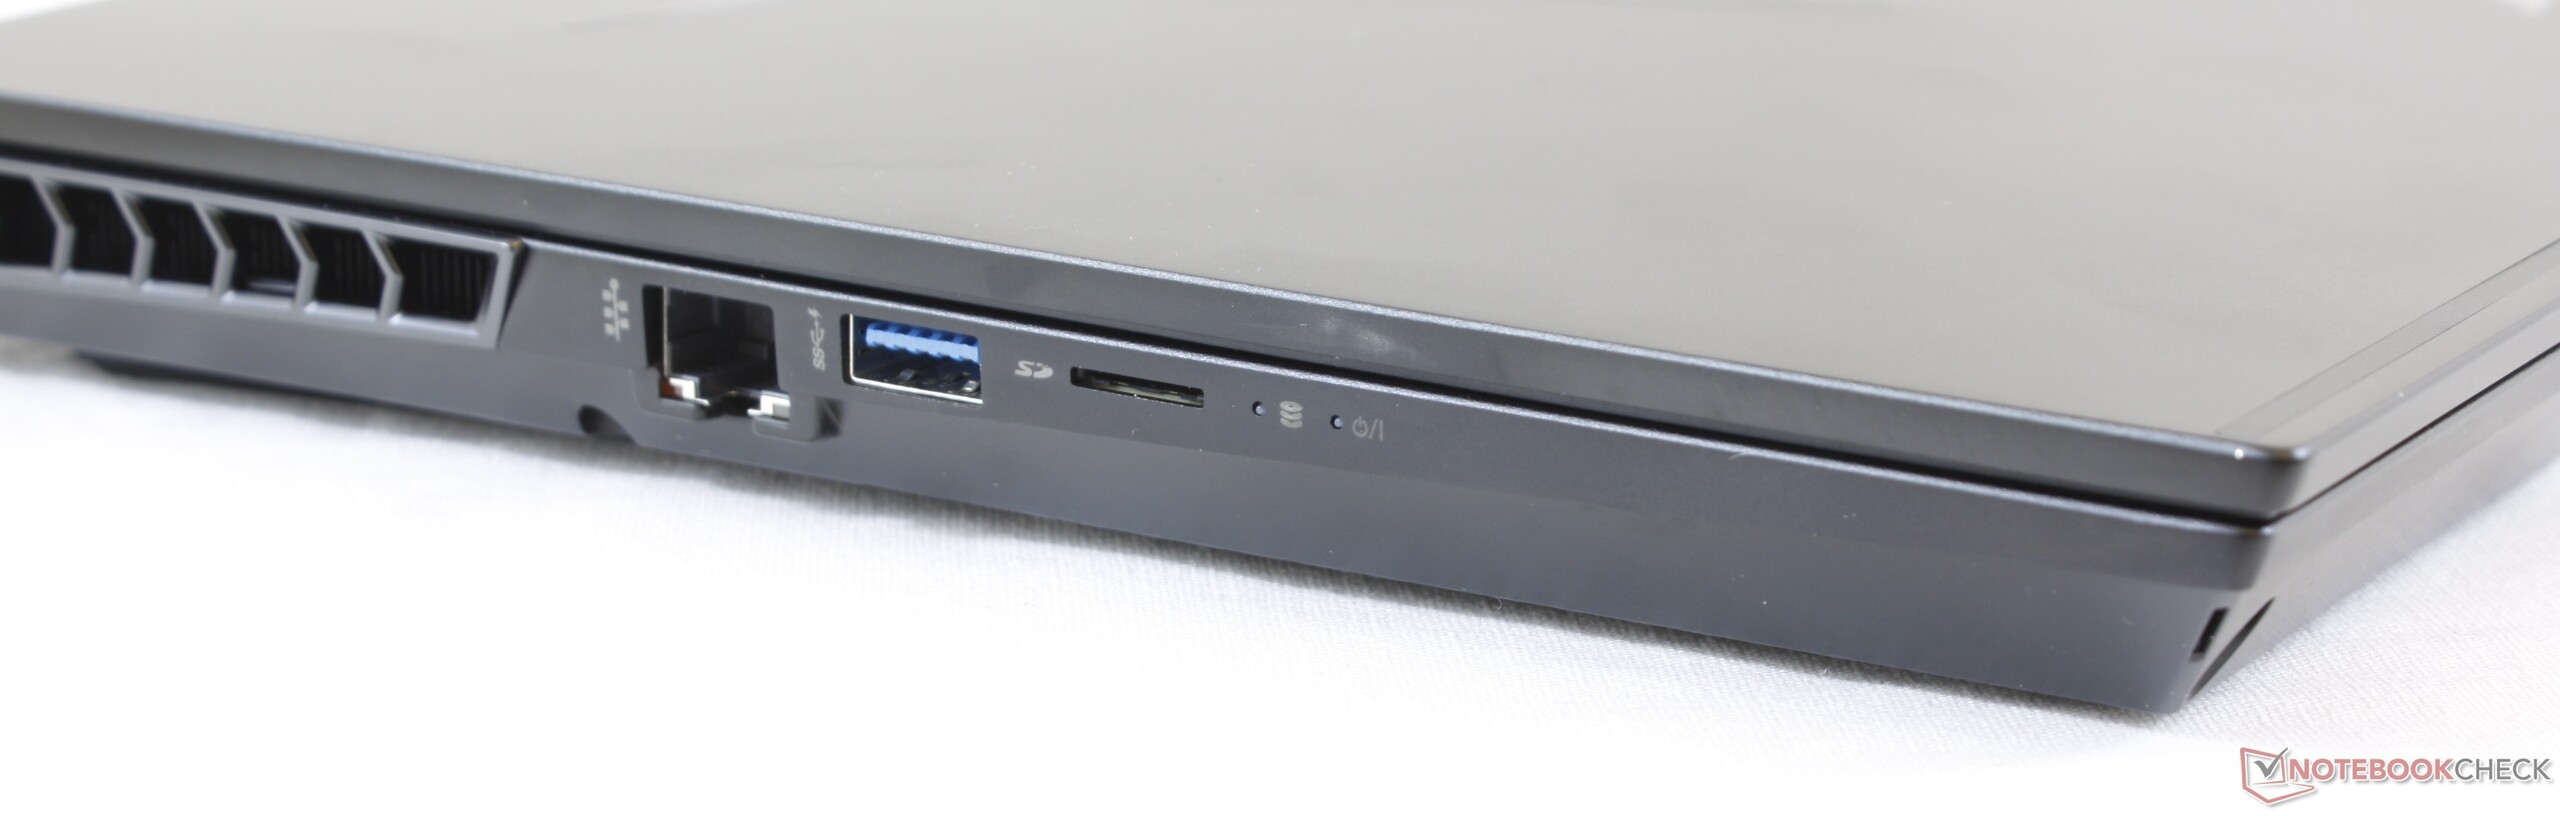
Owners of an Aorus-X5 model who would want to switch to the Aorus 15-W9 (or to the Aorus 15-X9 which is equipped with a stronger GPU) might be disappointed, since they would have to make some compromises. For example, the full-size storage card reader of the X5 was replaced by a microSD model in the 15-W9. There is also no G-Sync, and the battery life turns out lower than in the X5. In addition, the Thunderbolt-3 connection which was still available in the Aorus X5 v8 has been replaced by a USB-3.1 Gen-2 model, which is a step backwards. Thus a model from Gigabyte's Aero-15 series might be a better choice for many interested buyers.
Aorus 15 W9
- 04/21/2019 v6 (old)
Sascha Mölck
Price comparison

