Aorus 15 YE5 review: The high-end gaming laptop for money savers

Thanks to its low price alone, the Aorus 15 YE is already an interesting gaming laptop. From the outside, it looks modern and slim — the affordable package even includes Thunderbolt 4 and DDR5. On the inside, in contrast, (strong) last-gen hardware is installed, namely a not-quite high-end Core i5-12500H and the previous Nvidia flagship model RTX 3080 Ti. This all makes the Aorus 15 YE5 one of the strongest gaming laptops you can get for US$1,500.
Despite its CPU and GPU being from the previous generation, the Aorus has to defend itself against current competitors to show whether it can keep up and whether it actually succeeds in giving you good value for your money. Subsequently, we will be pitting it against current laptops with the RTX 4060 or the RTX 4070, such as the Aorus 15 BSF (RTX 4070), Captiva Advanced Gaming I74-121 (RTX 4060), HP Victus 16 (RTX 4070), HP Omen 16 (RTX 4080) and the much more expensive Dell XPS 15 9530 (RTX 4070).
Possible competitors compared
Rating | Date | Model | Weight | Height | Size | Resolution | Price |
|---|---|---|---|---|---|---|---|
| 86.6 % v7 (old) | 12 / 2023 | Aorus 15 YE5-54DEB34SH i5-12500H, GeForce RTX 3080 Ti Laptop GPU | 2.3 kg | 27 mm | 15.60" | 2560x1440 | |
| 85.7 % v7 (old) | 08 / 2023 | Aorus 15 BSF i7-13700H, GeForce RTX 4070 Laptop GPU | 2.4 kg | 20.9 mm | 15.60" | 2560x1440 | |
| 85.7 % v7 (old) | 09 / 2023 | Captiva Advanced Gaming I74-121 i5-13500H, GeForce RTX 4060 Laptop GPU | 2.3 kg | 29 mm | 15.60" | 1920x1080 | |
| 85.1 % v7 (old) | 09 / 2023 | HP Victus 16-r0077ng i7-13700H, GeForce RTX 4070 Laptop GPU | 2.4 kg | 24 mm | 16.10" | 1920x1080 | |
| 90.3 % v7 (old) | 04 / 2023 | Dell XPS 15 9530 RTX 4070 i7-13700H, GeForce RTX 4070 Laptop GPU | 1.9 kg | 18 mm | 15.60" | 3456x2160 | |
| 87.4 % v7 (old) | 06 / 2023 | HP Omen 16-wf000 i7-13700HX, GeForce RTX 4080 Laptop GPU | 2.4 kg | 23.6 mm | 16.10" | 2560x1440 |
Case & connectivity: Modern, but kept to a minimum

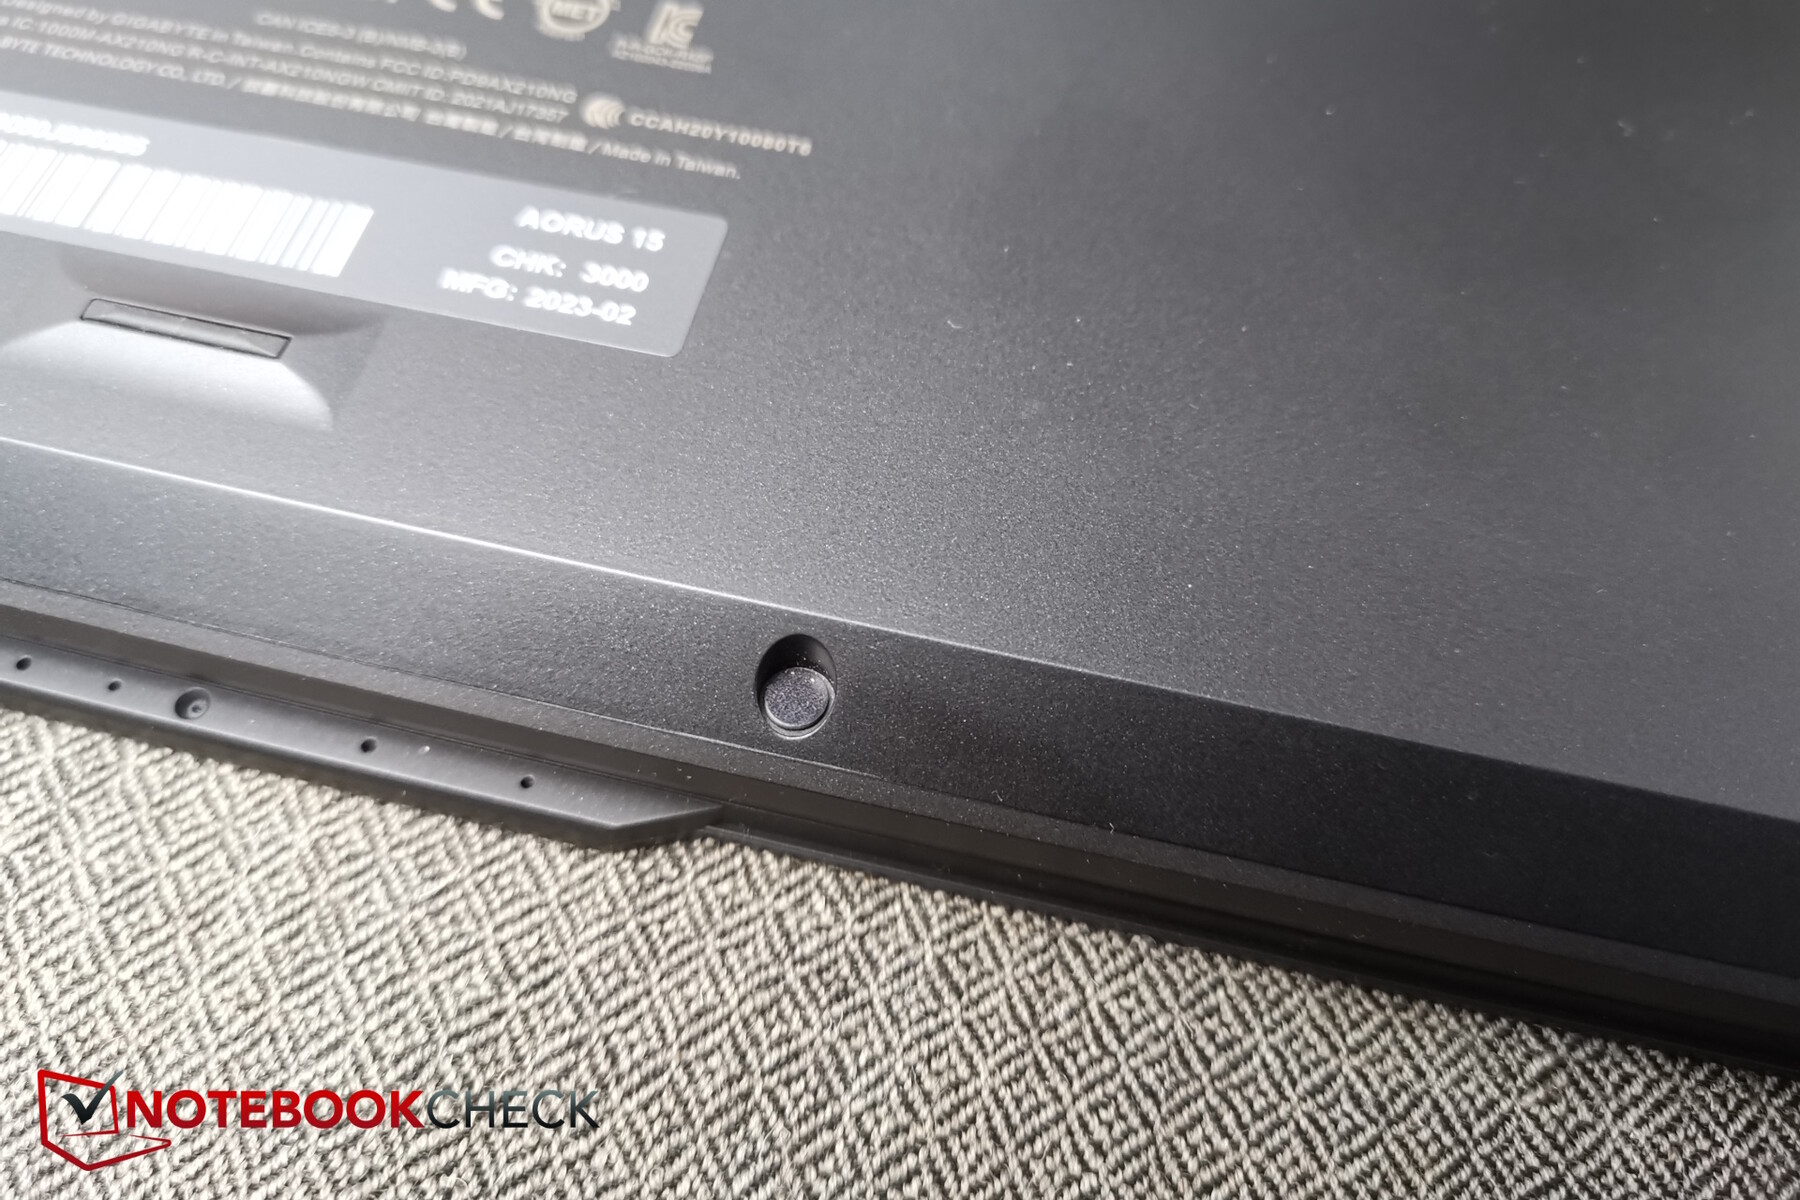
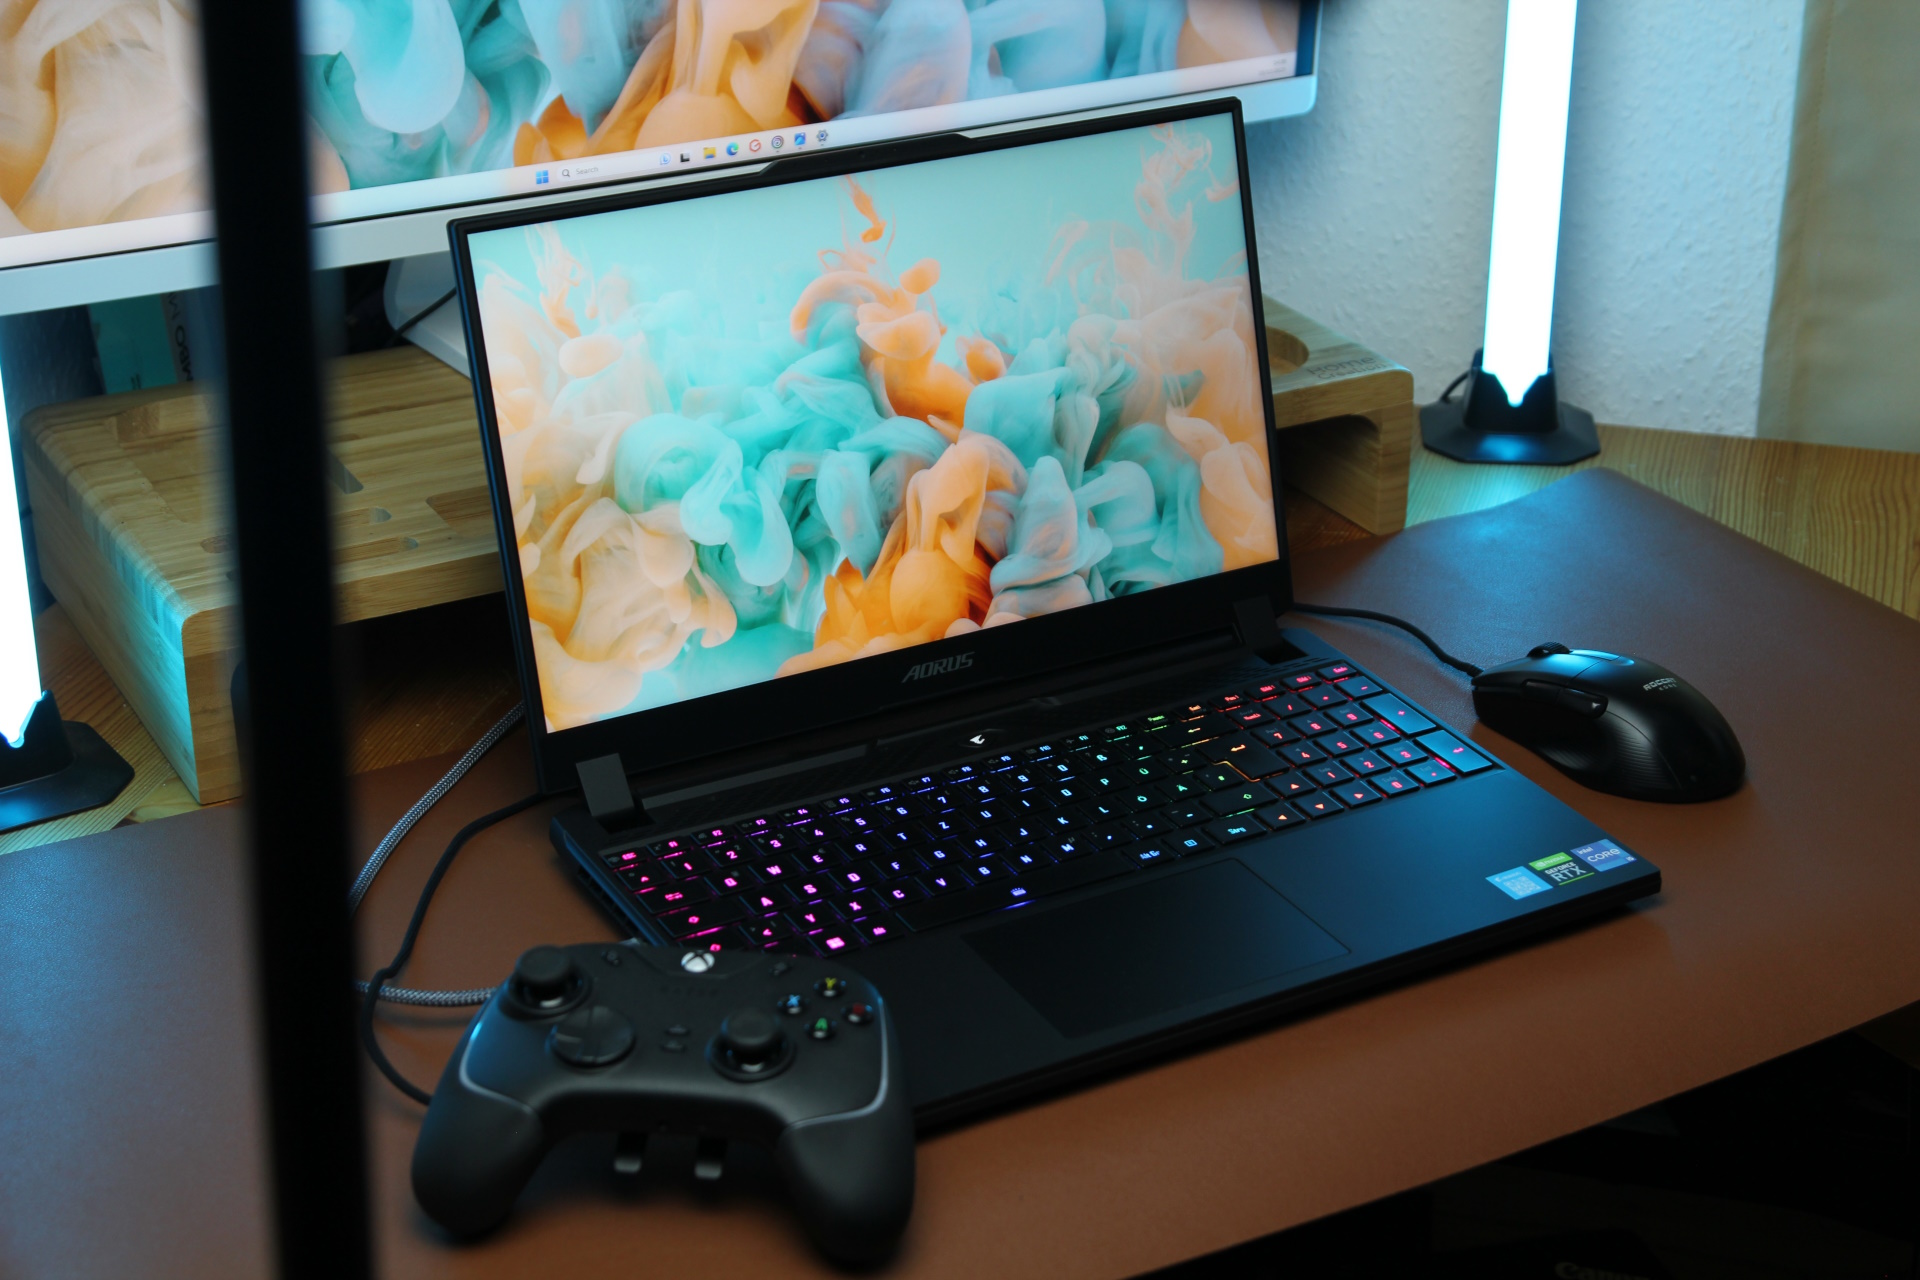
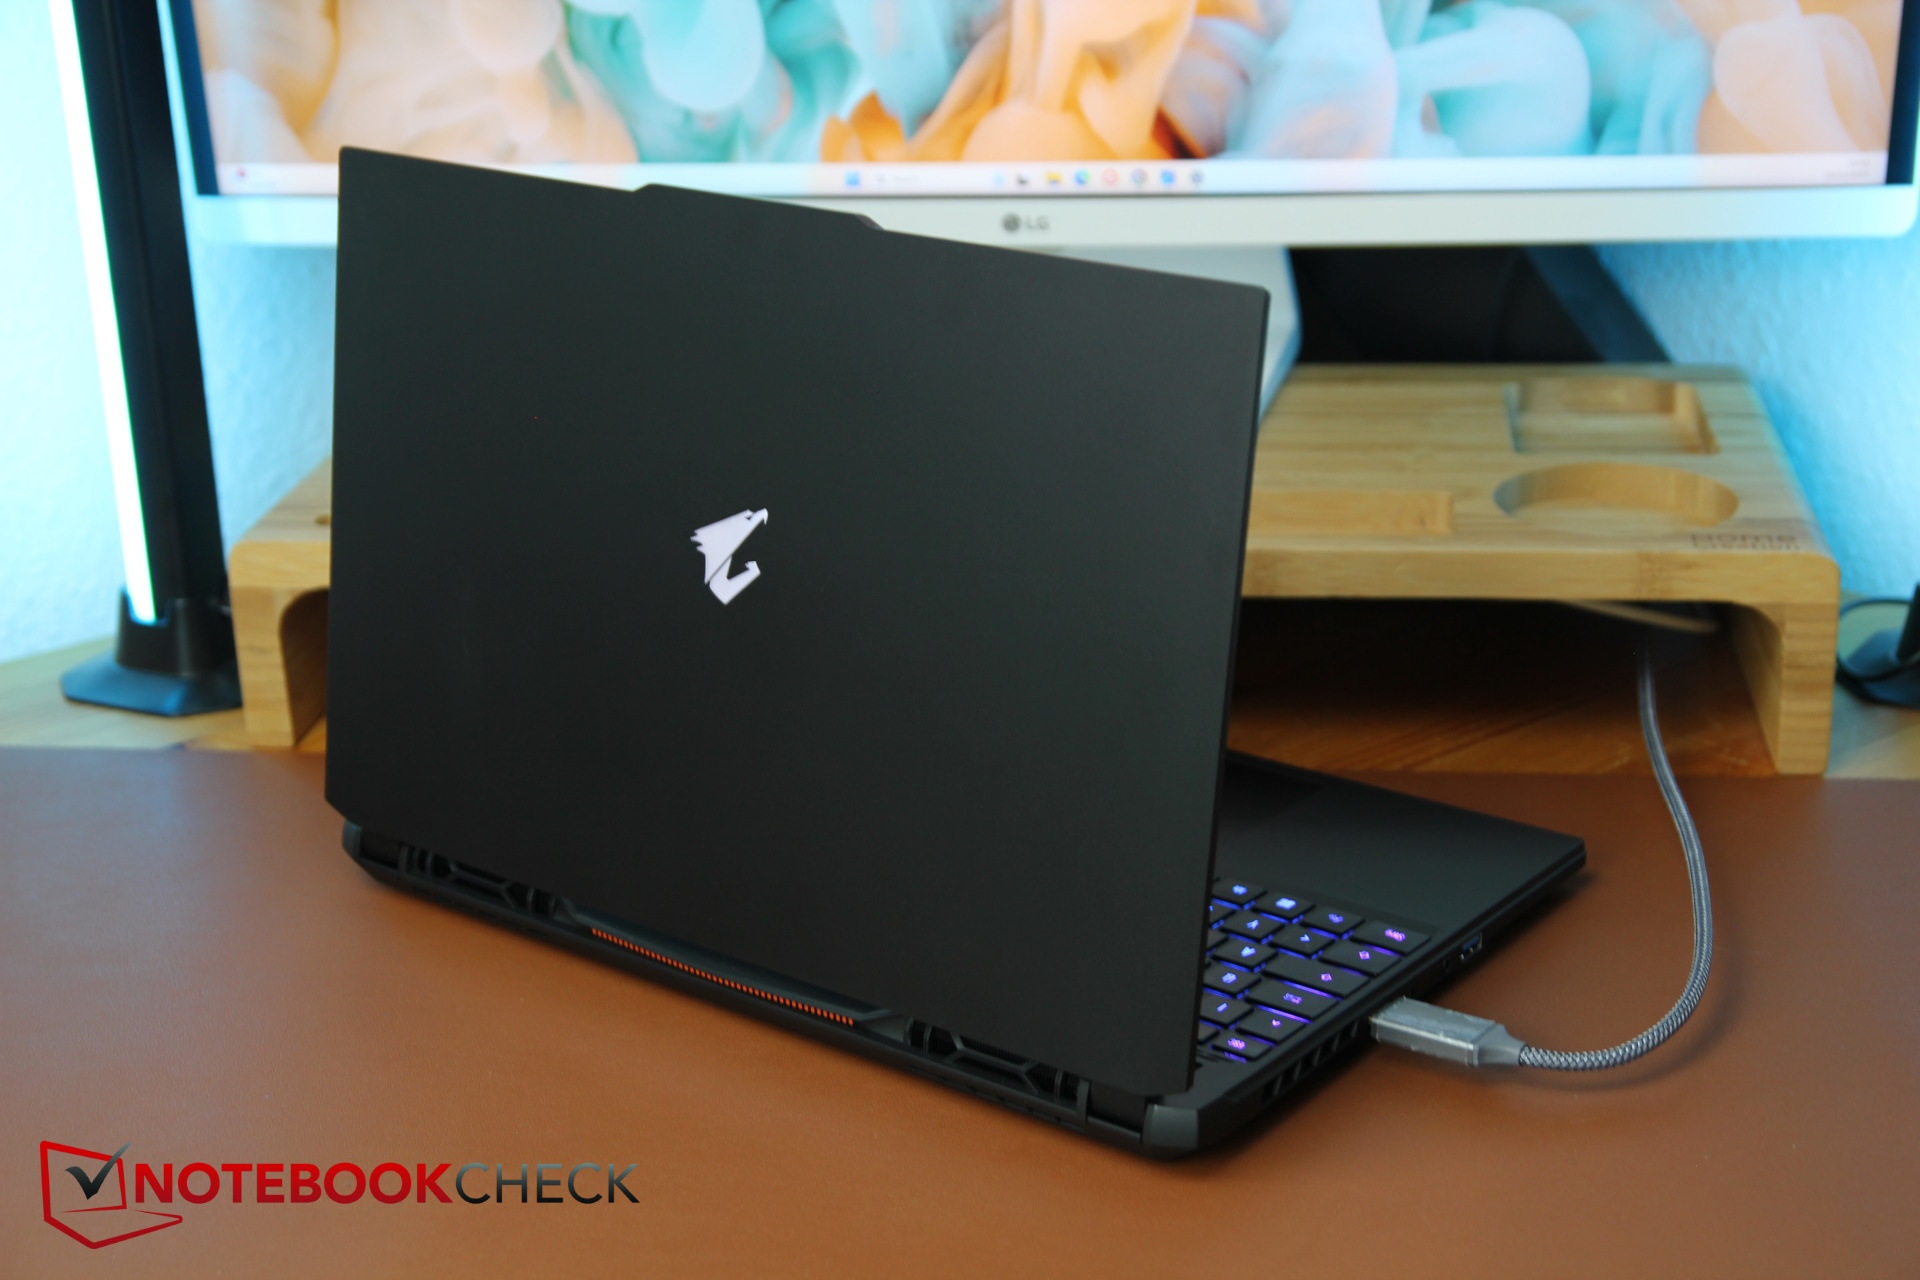
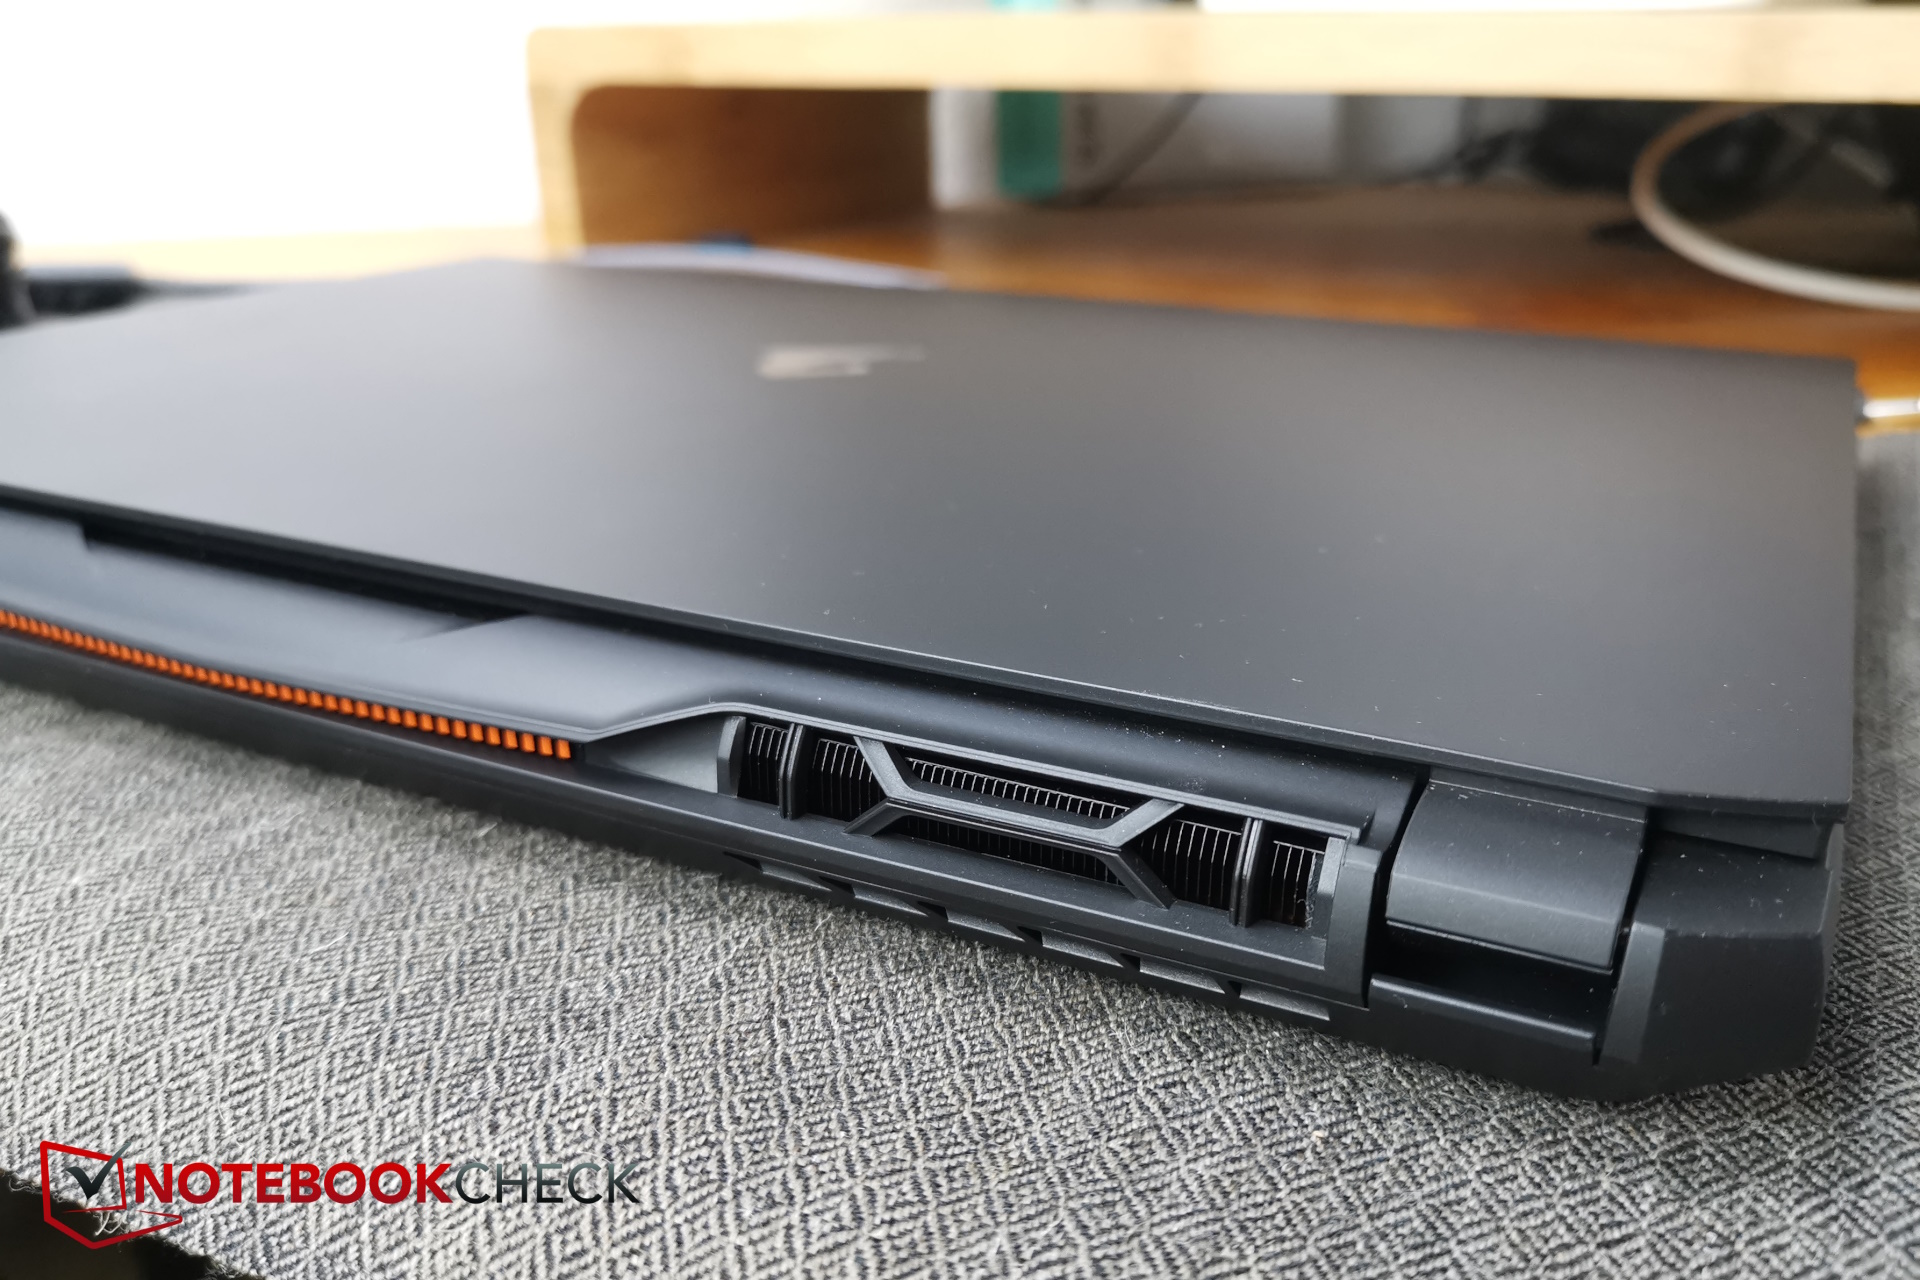
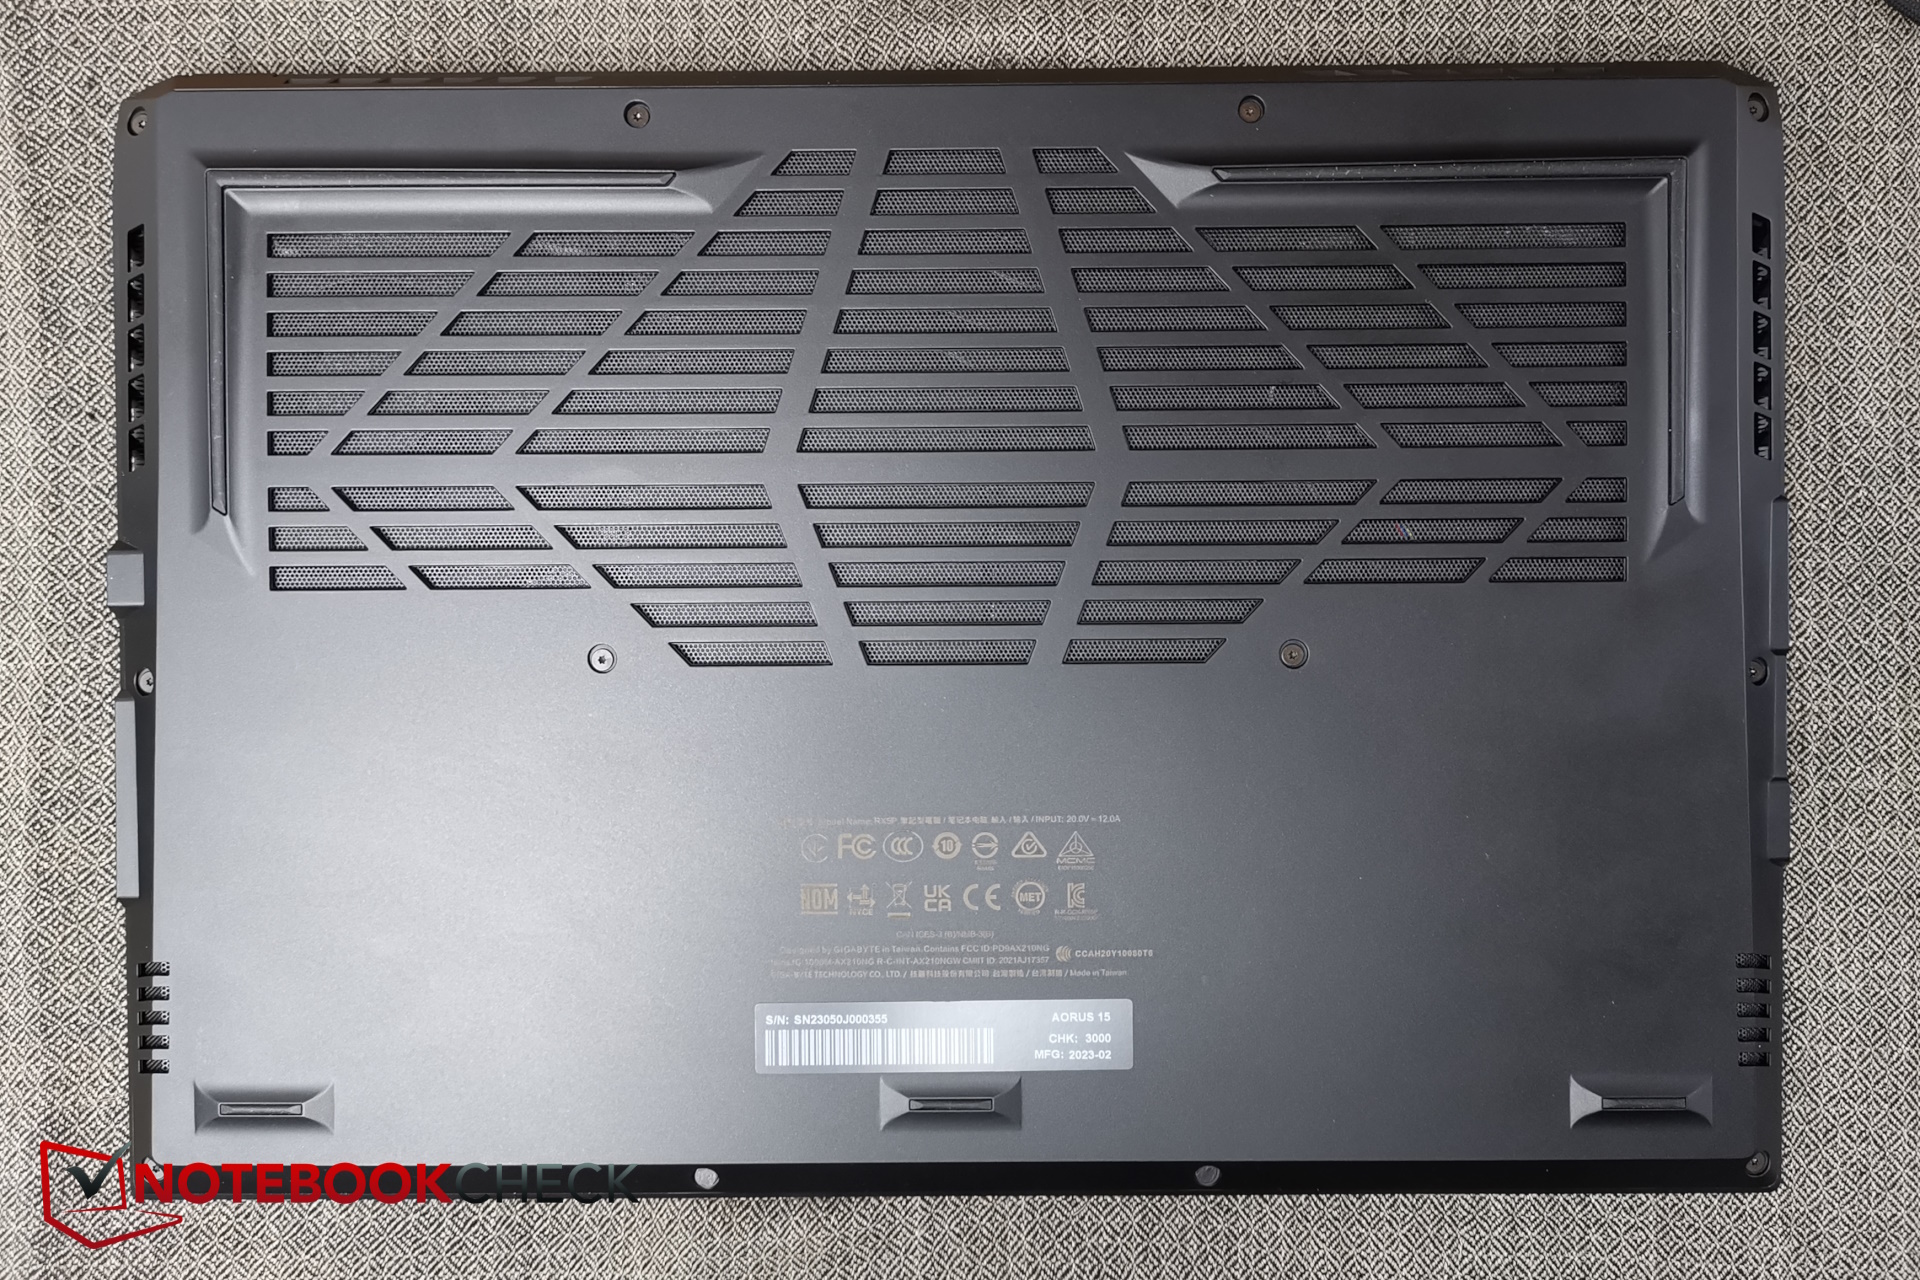
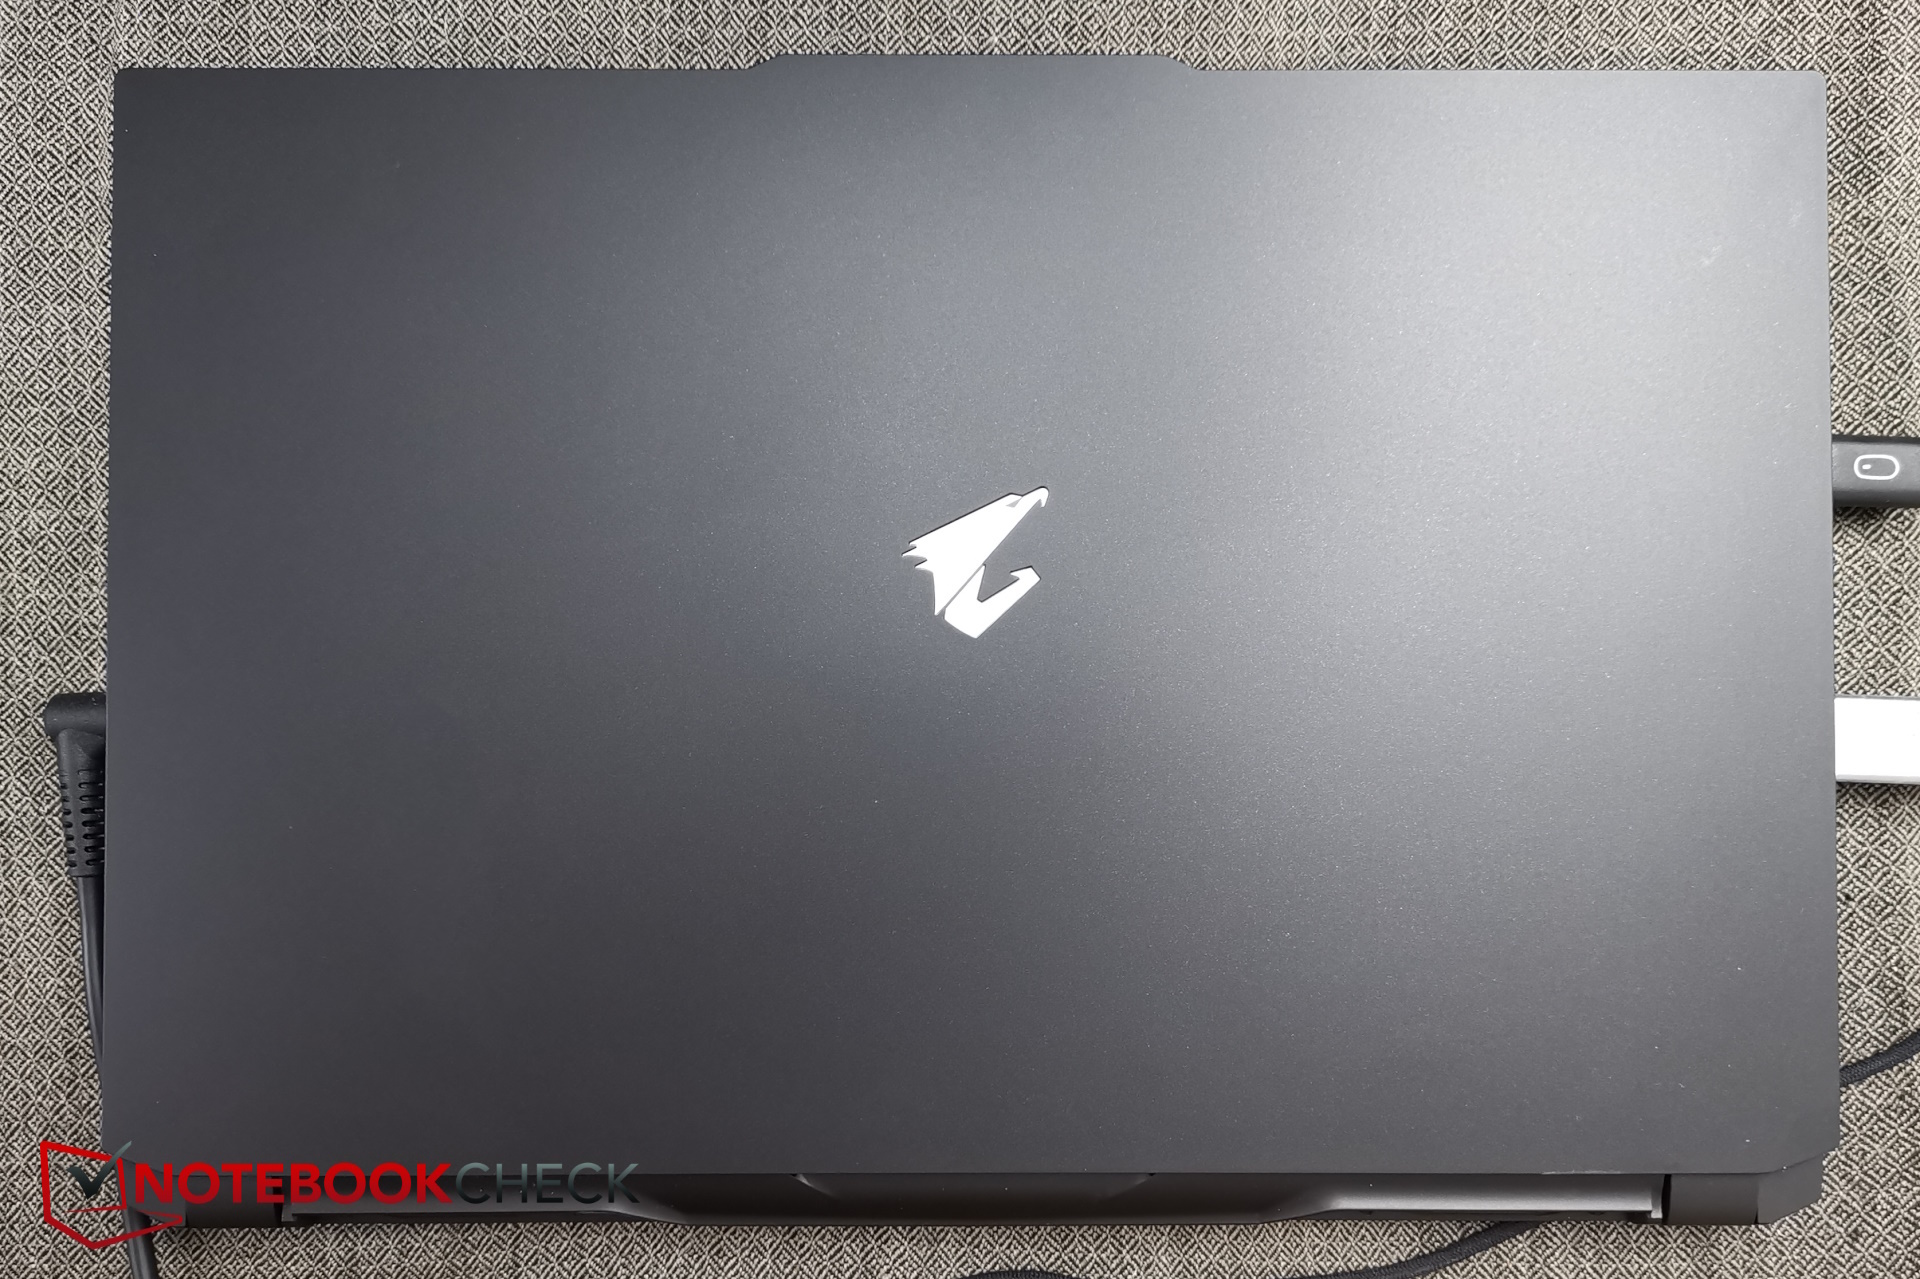
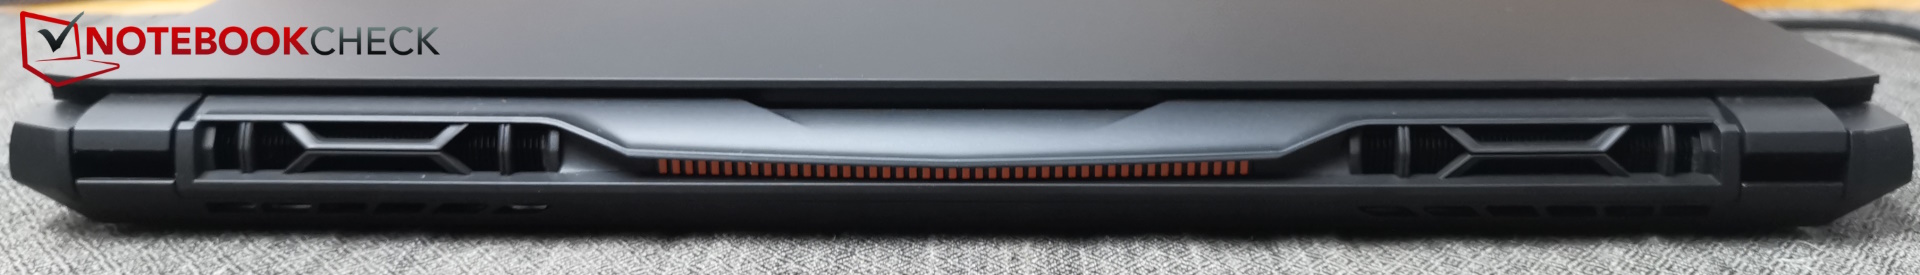
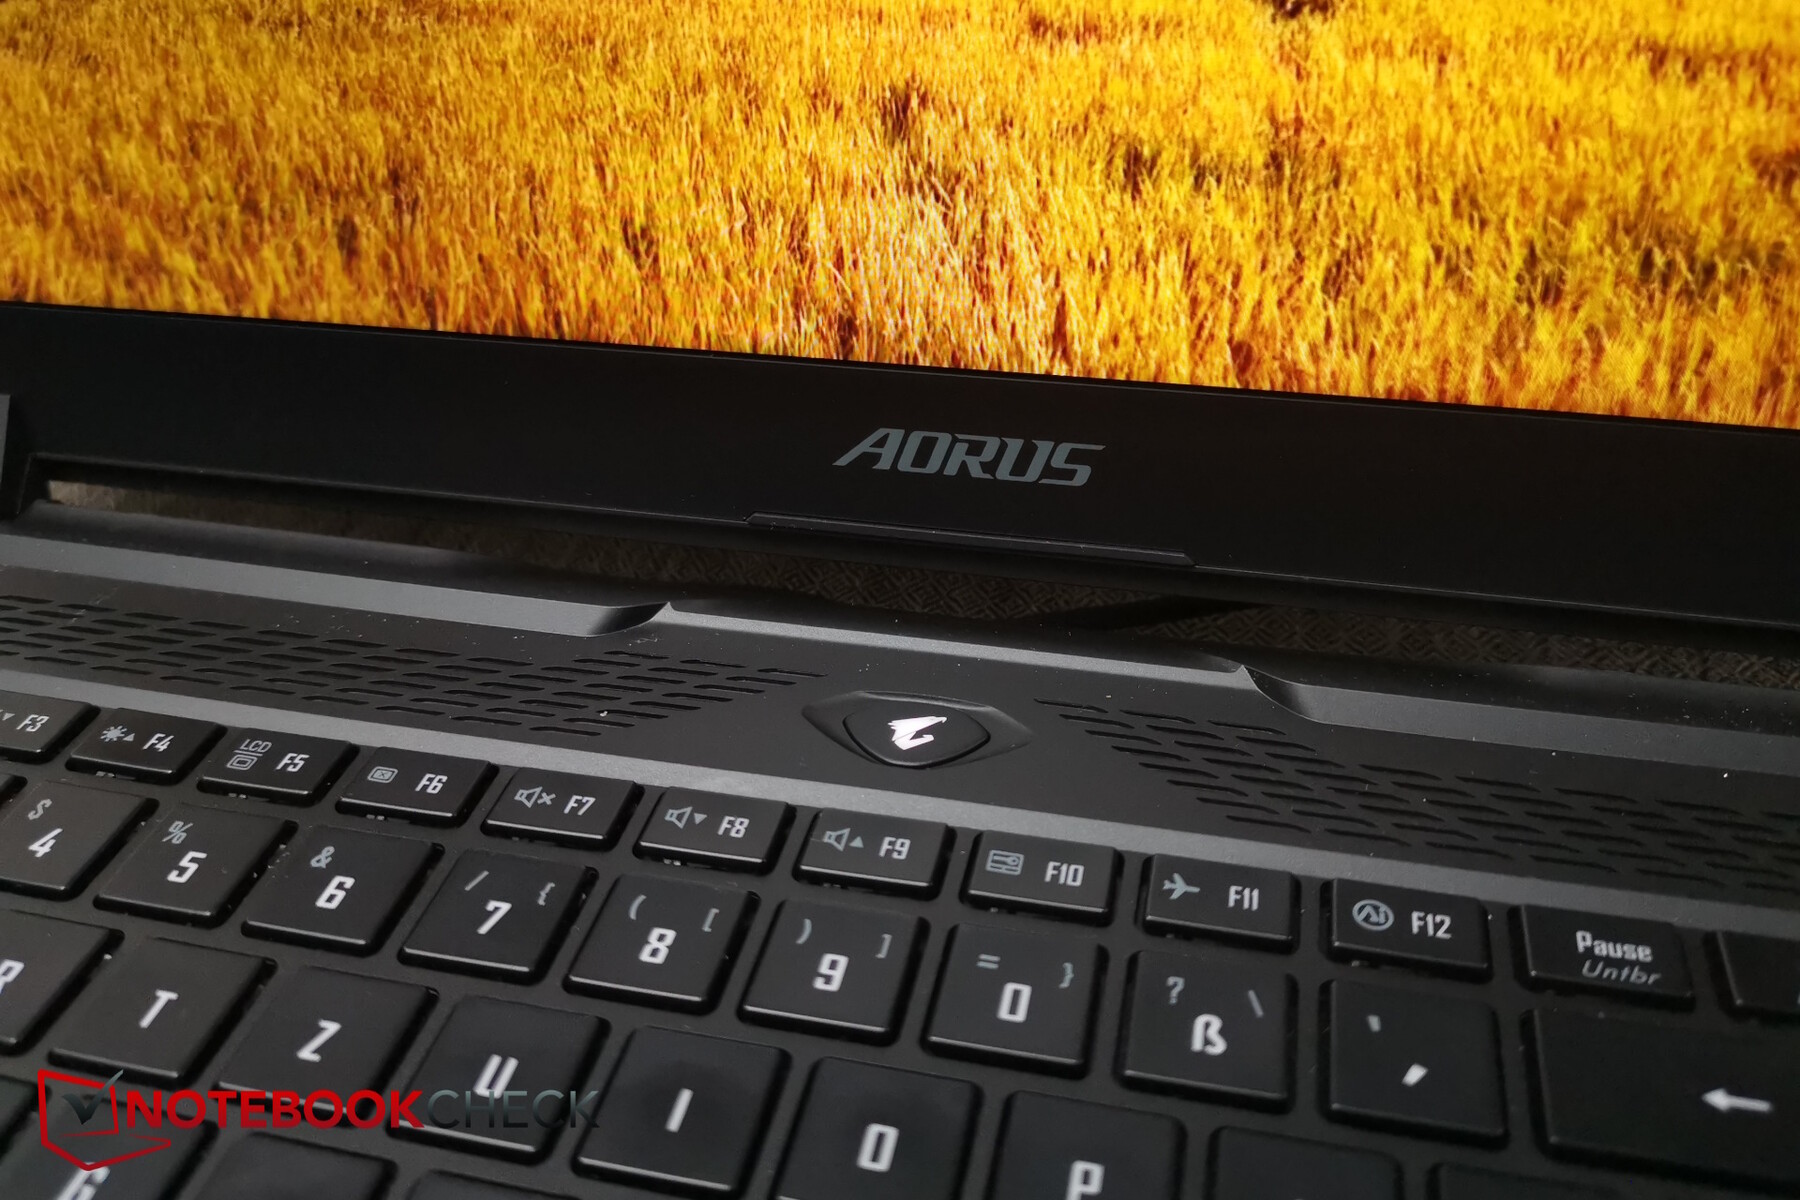
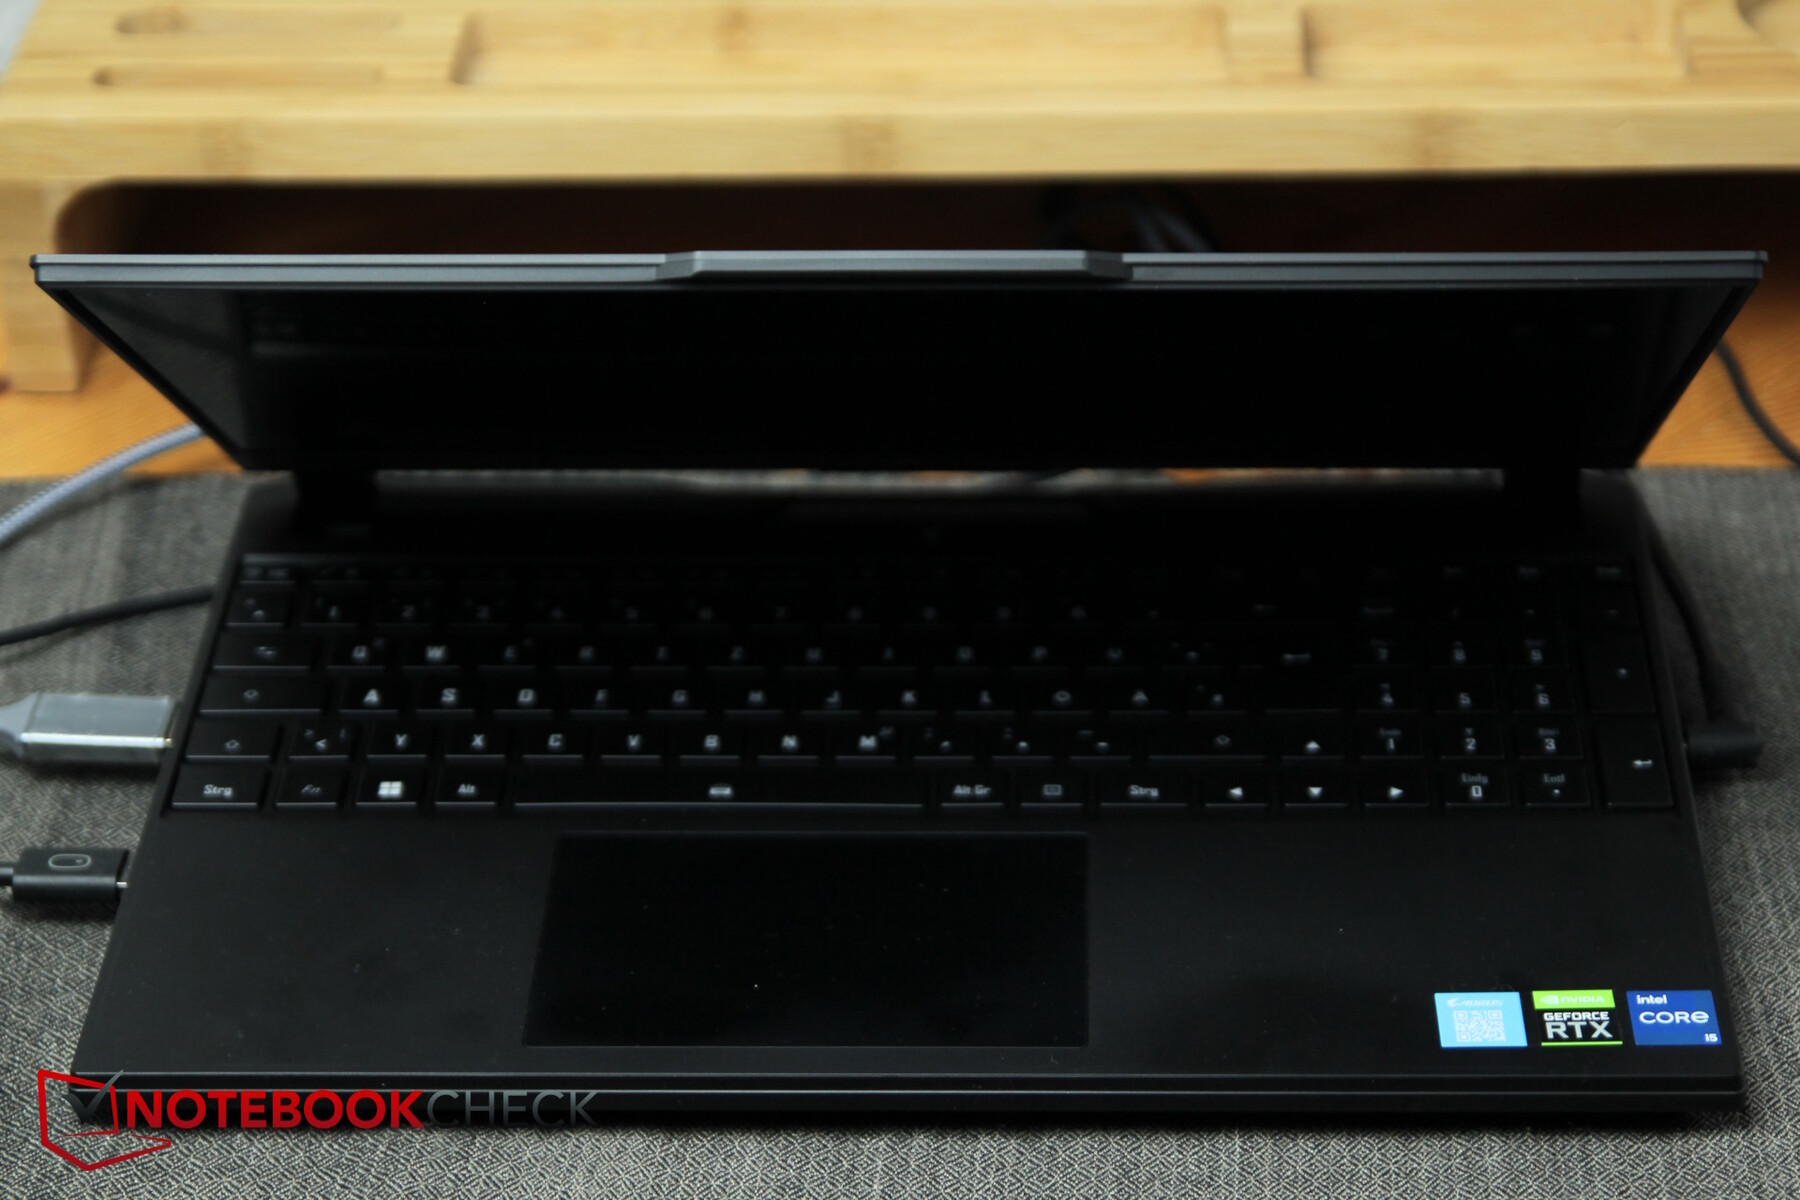
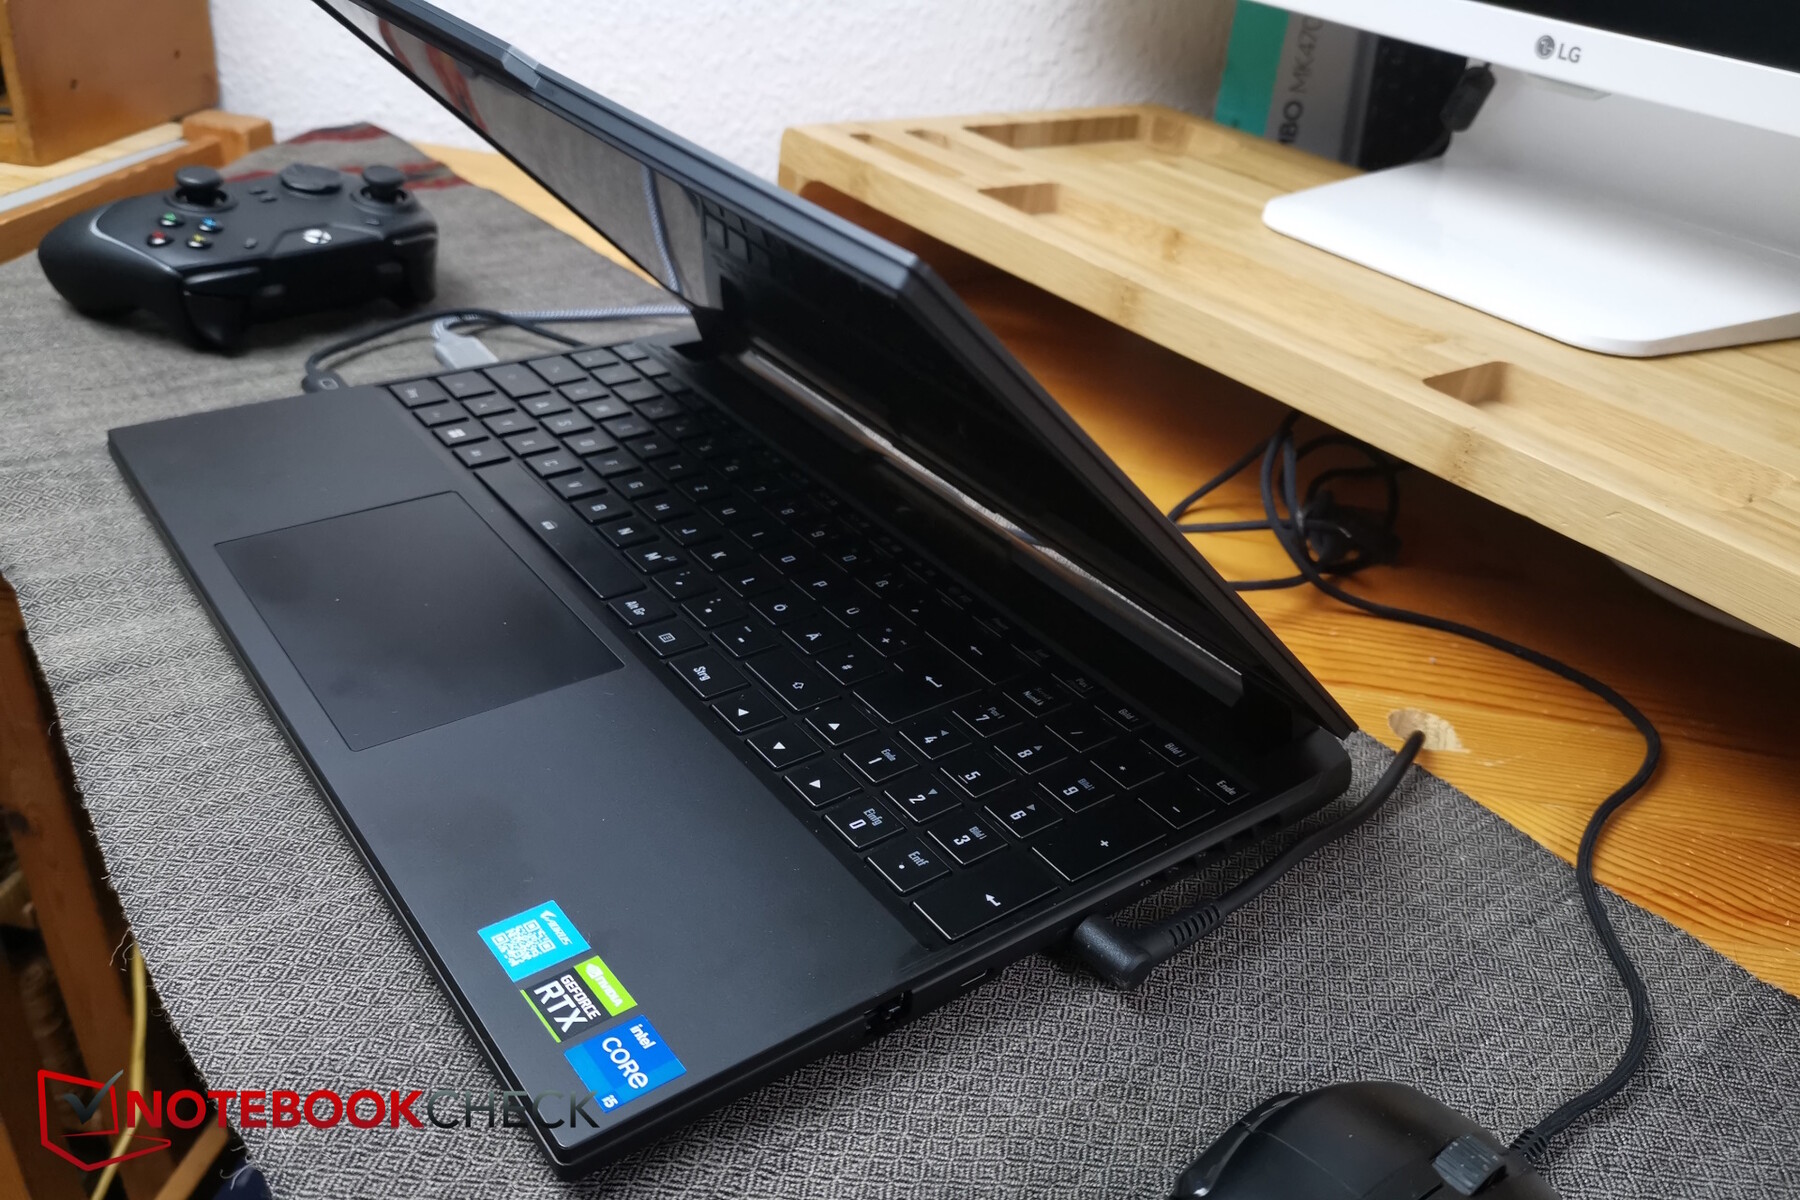
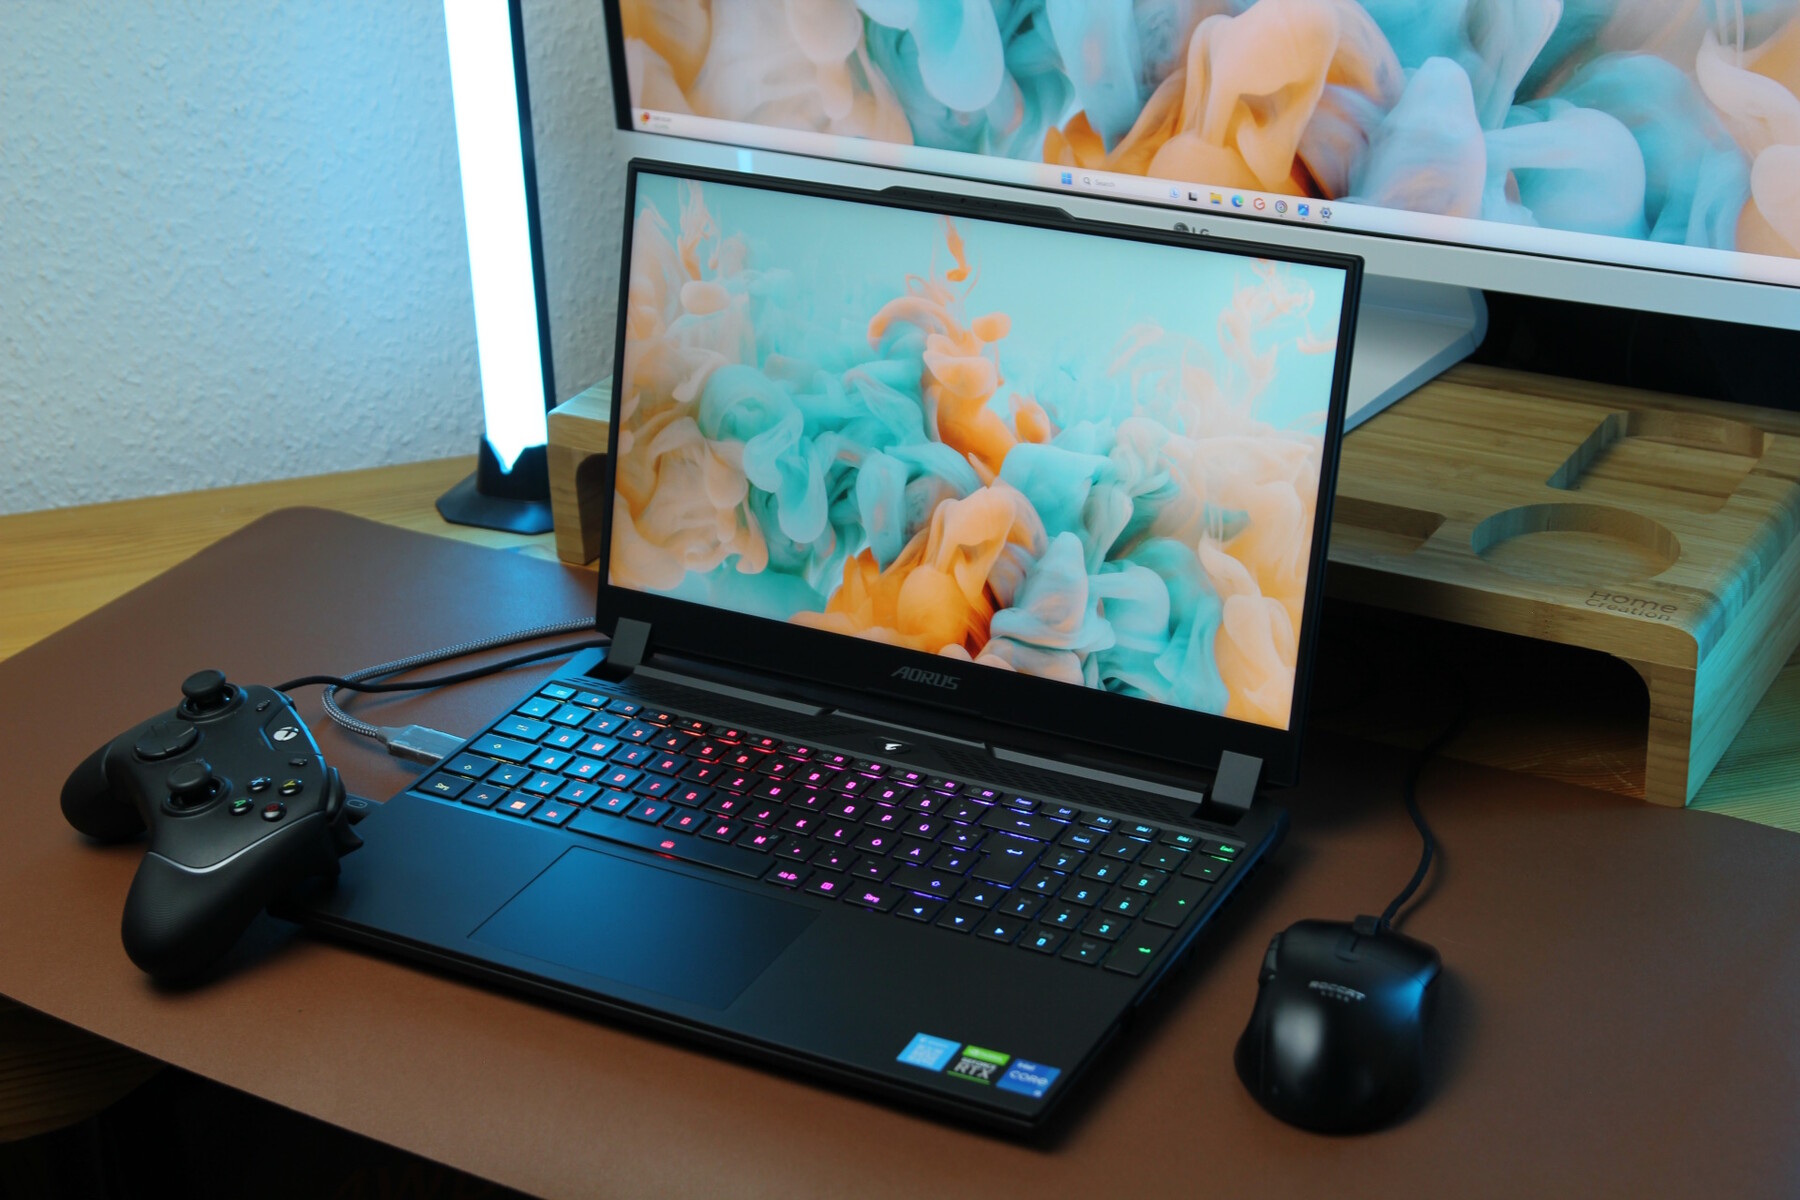
Visually, the Aorus looks quite modern and attractive. This is thanks to its matte black, slim-appearing design — although the laptop isn't actually that slim in reality (up to 27 mm). At the same time, it is sleek while still remaining unique, for example, as a result of its structure along the back fan grate and the small, orange colorings which appear there, or its specially designed beveled edges. The silver Aorus logo draws your attention to the top of the device. The lid has a little notch along the front top edge which houses the webcam and speakers – plus, it gives you a really good grip when opening the laptop with one hand.
All sides of the case are made from smooth plastic. This looks great but isn't as resistant to being twisted compared to certain competitors. The keyboard doesn't have any give when you are typing on it, meaning its stability is fine in total.
We didn't open up the Aorus, as the two Torx screws are covered by a sticker and we didn't want to damage these in the interests of our loaner Cyberport.
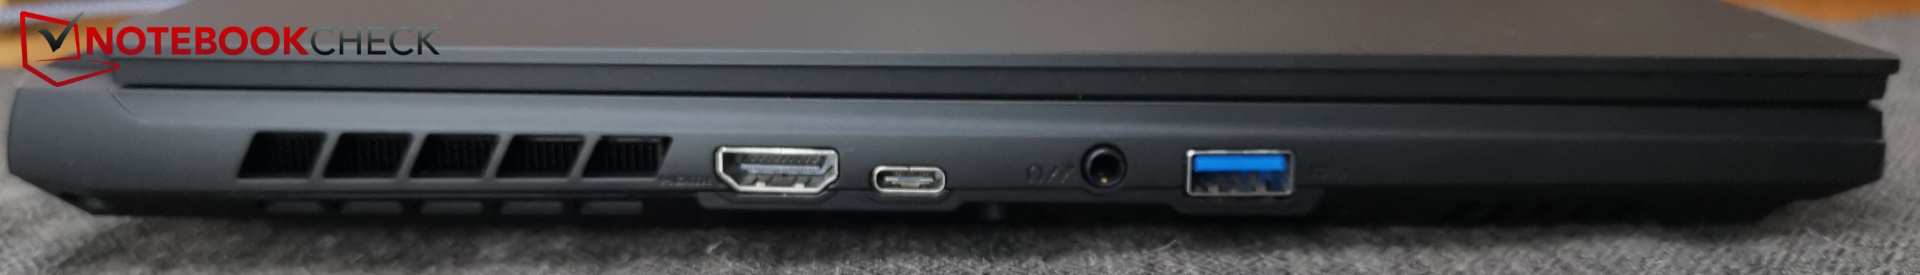
Connectivity
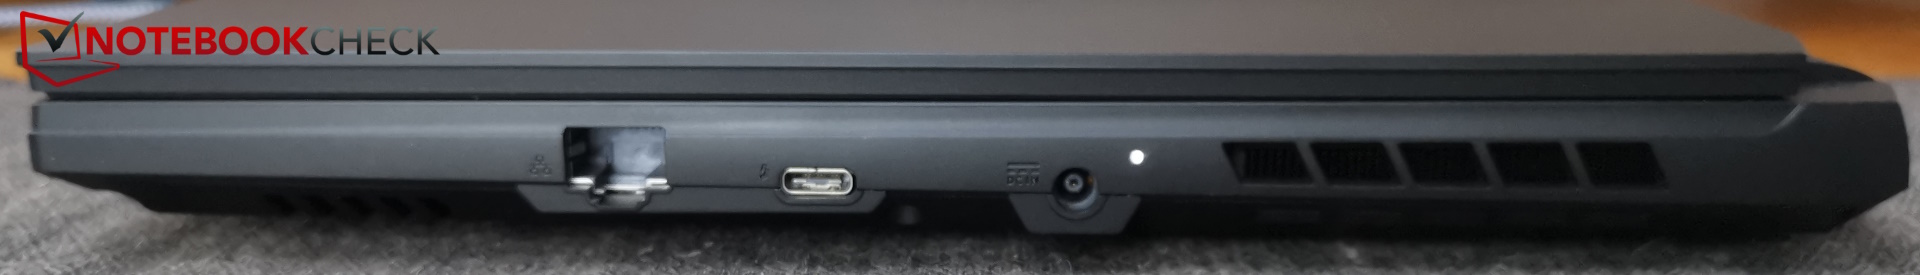
The Aorus laptop's connectivity options are modern, while also being kept to a minimum. Of the three USB ports, only one is Type-A, which is not quite enough. In turn, one of the two Type-C ports has Thunderbolt 4 support. Aside from a fourth USB connection, the device is also missing an SD card reader, a Kensington lock and a dedicated DisplayPort (2x available via USB-C).
Despite its few ports, they aren't laid out terribly well — the RJ45 port for rigid LAN cables is positioned on the right and toward the front. The space on the back of the Aorus is, as usual, not used. It only accommodates the fan outlets.
WiFi and Webcam
Its WLAN transmission rates are among the highest in the comparison field in both the 6 GHz (WiFi 6E) and 5 GHz networks.
Unfortunately, the device's webcam is still last-gen: It only has a resolution of 720p, its color deviations are quite high and there is no shutter in the Control Center.


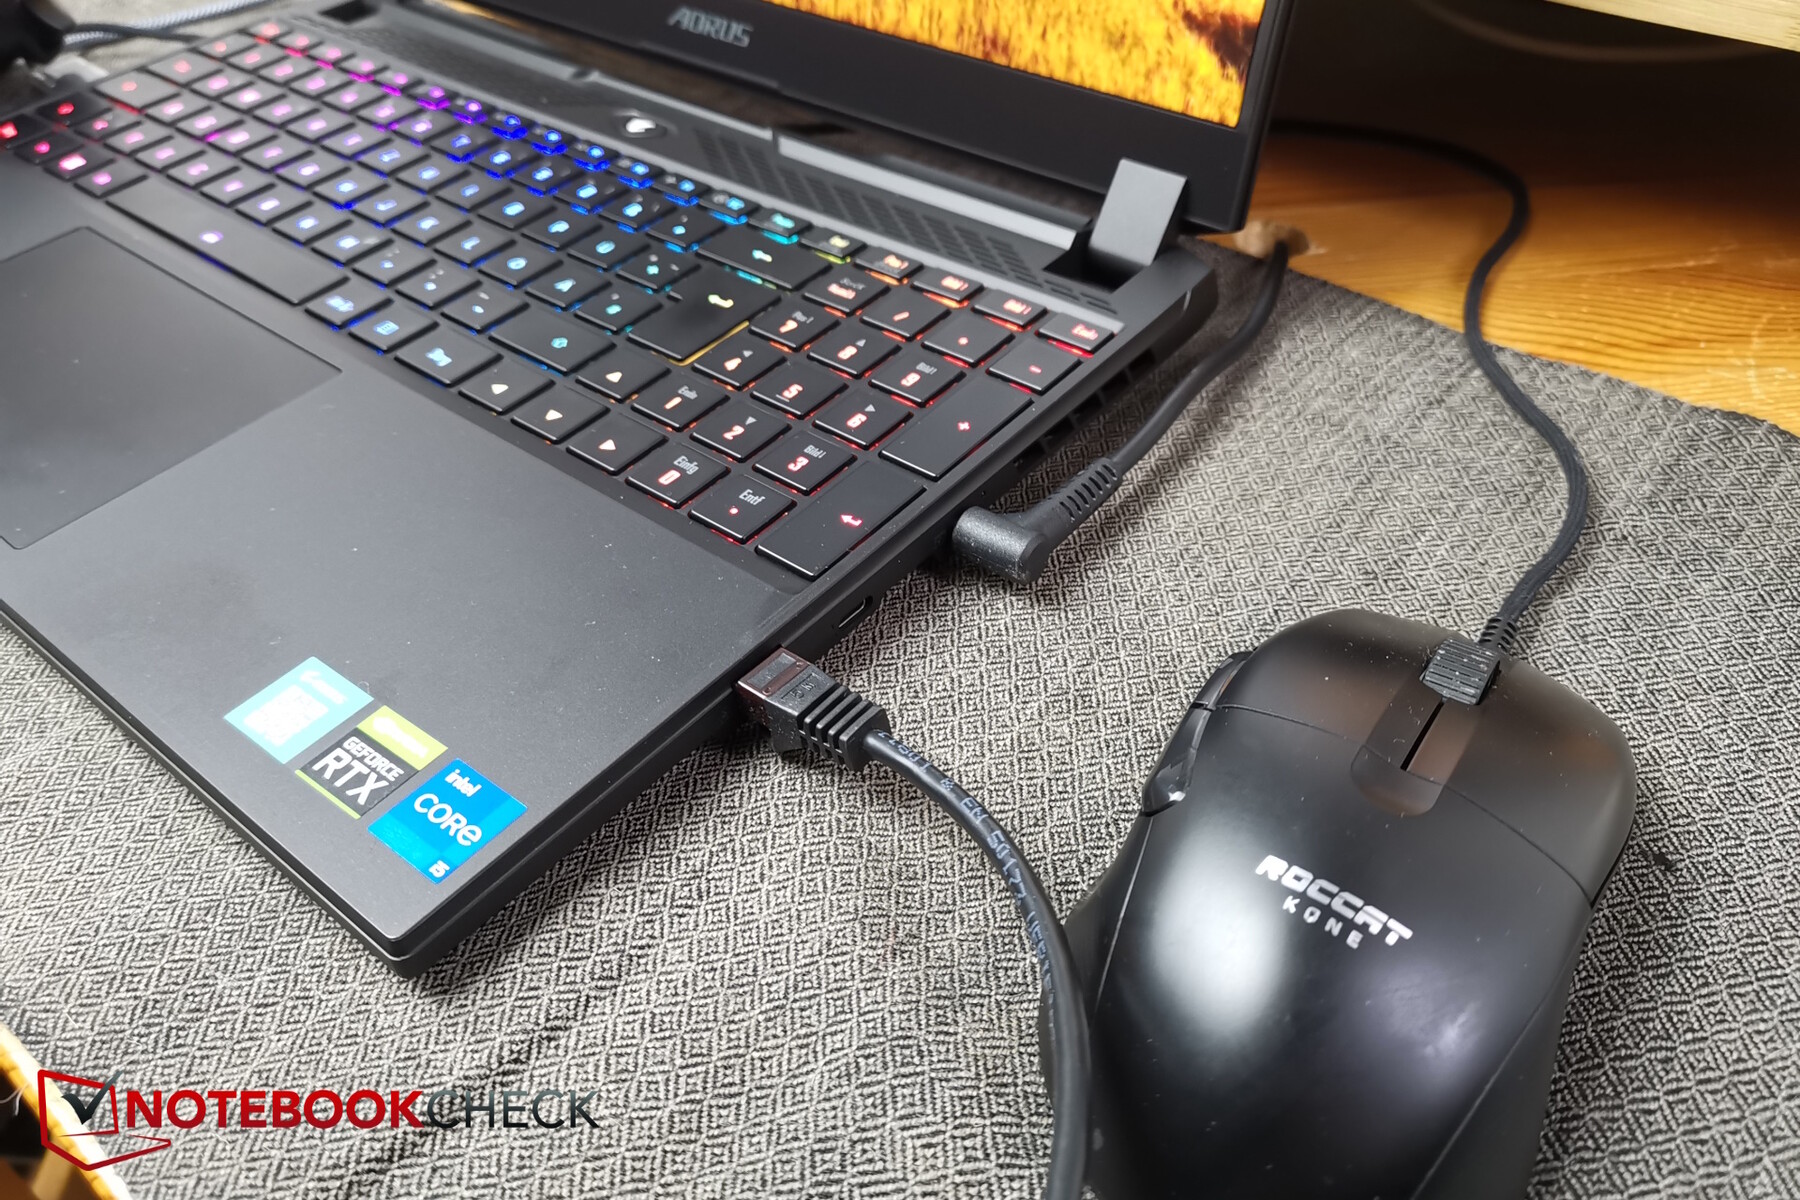
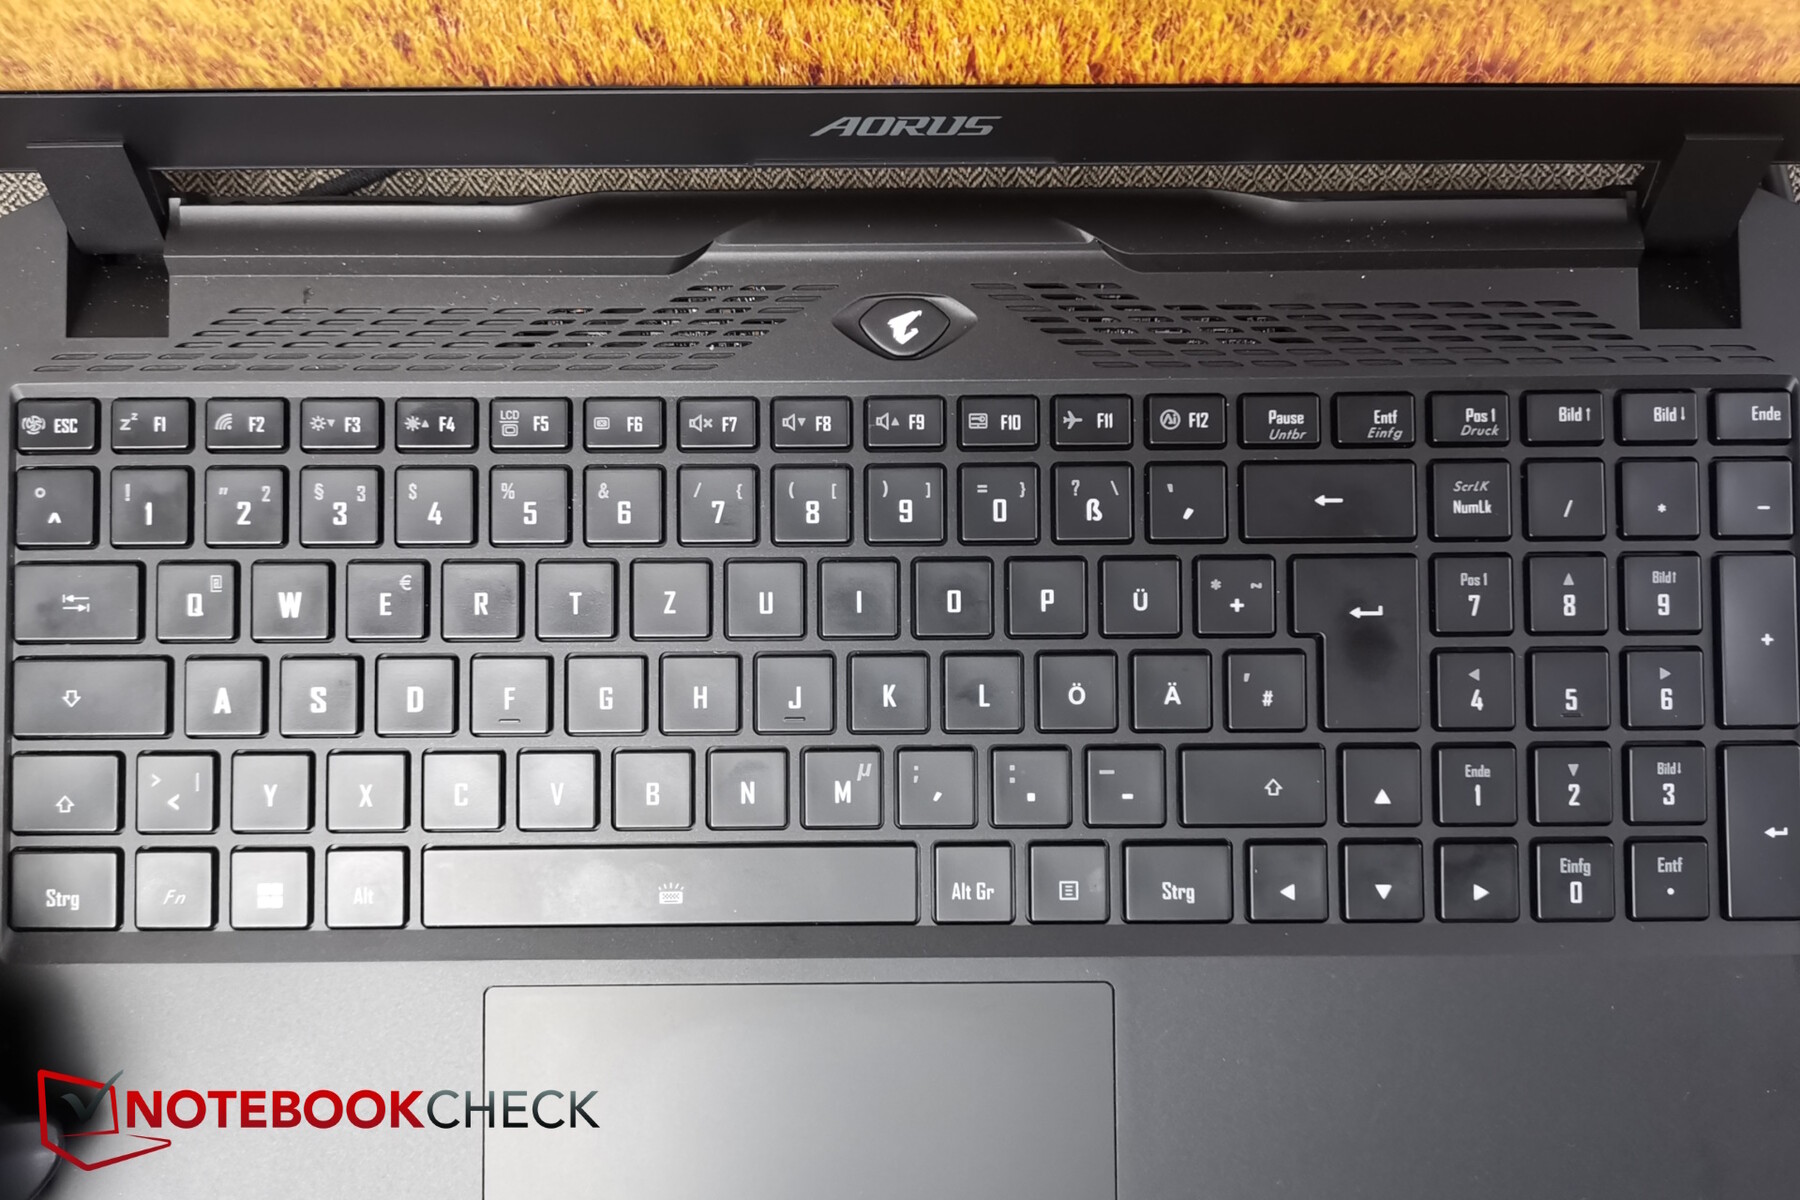
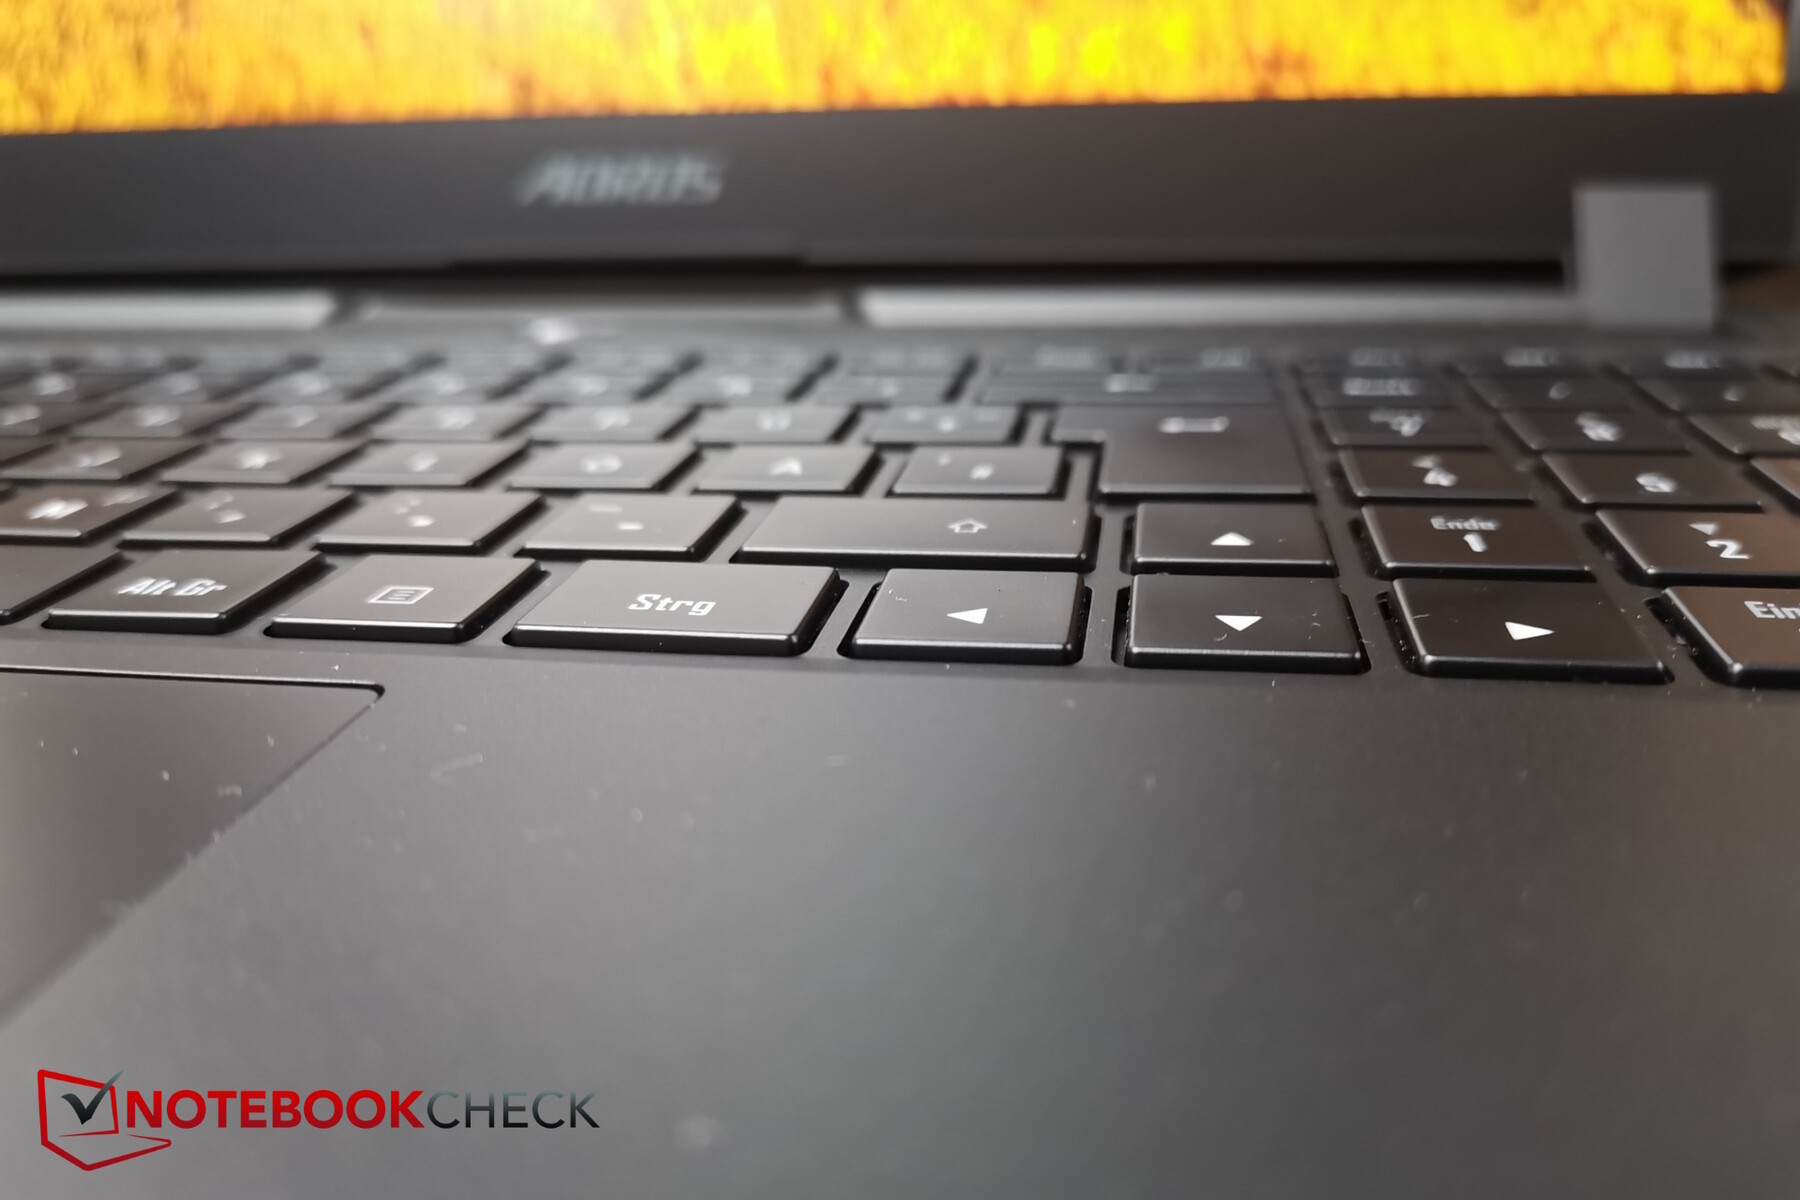
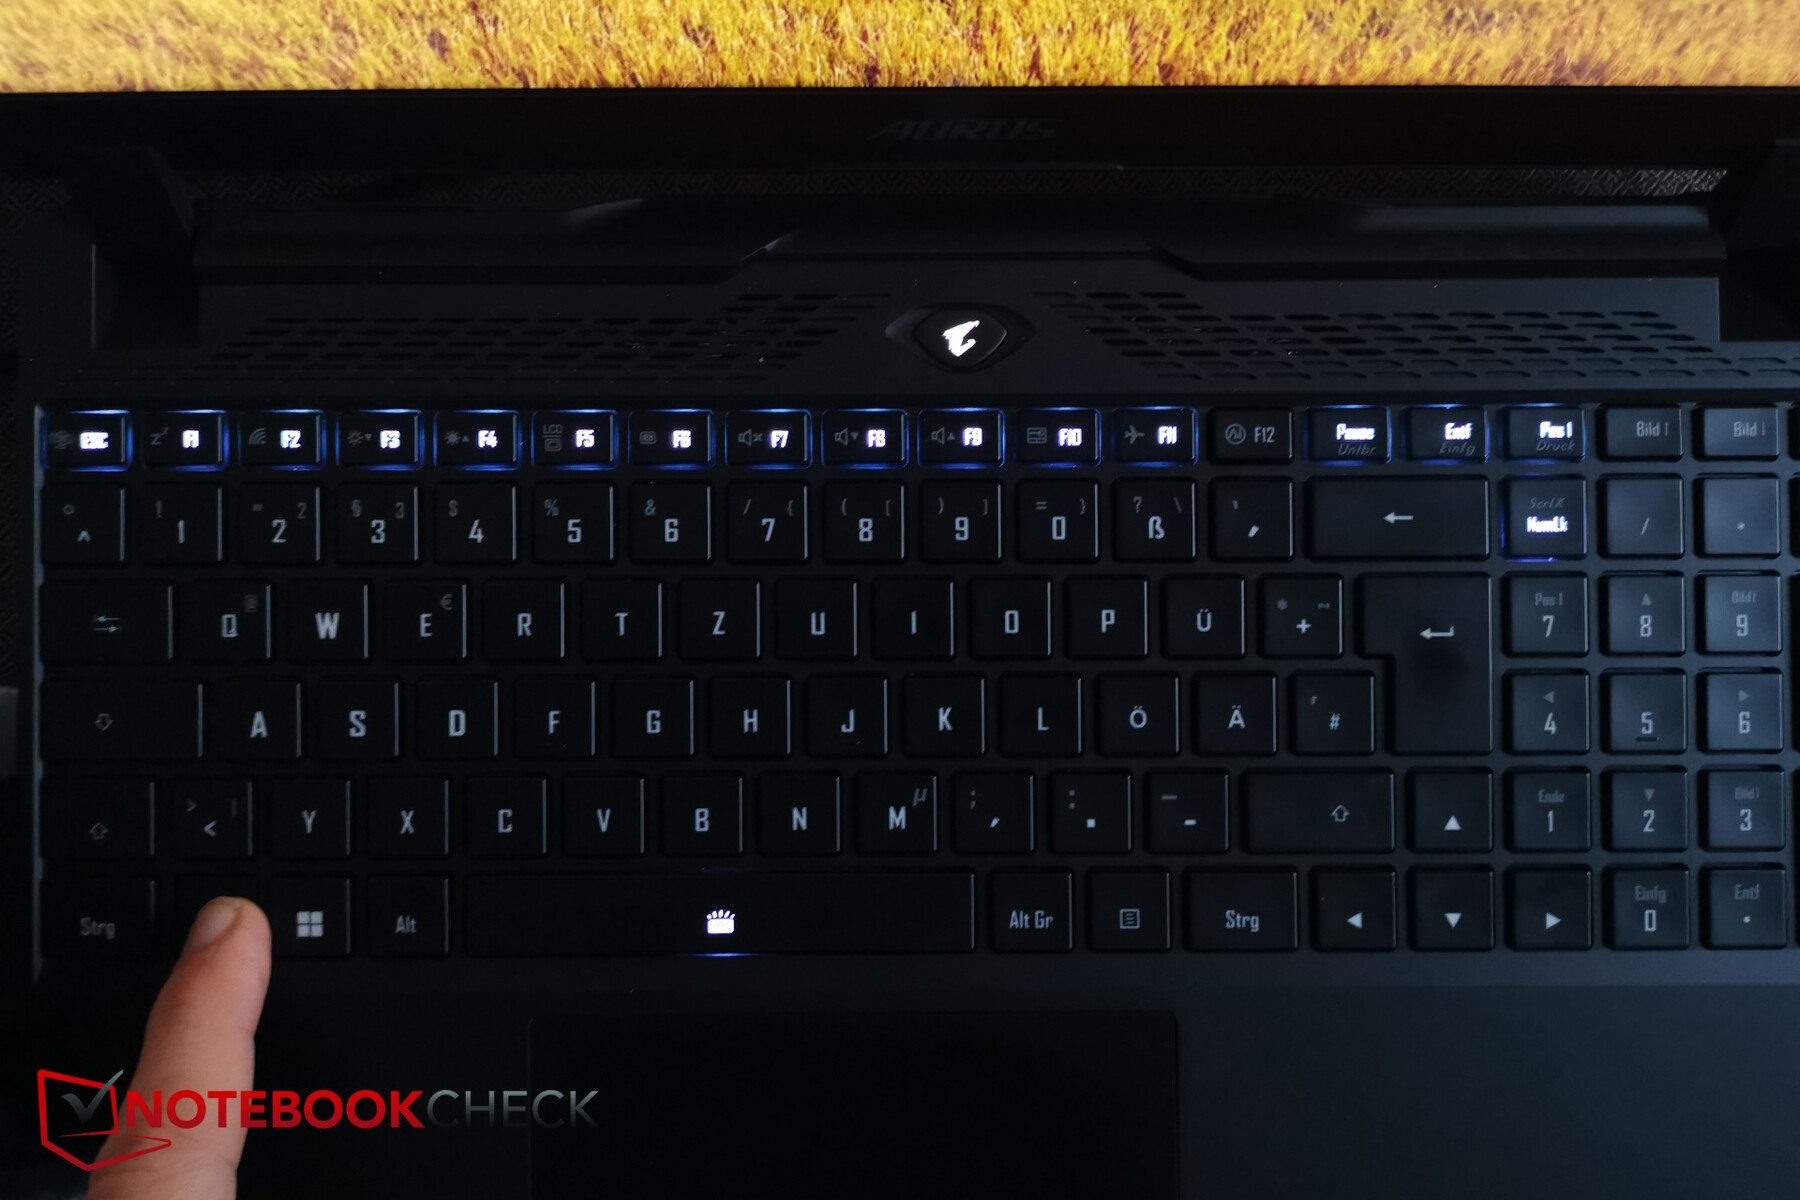
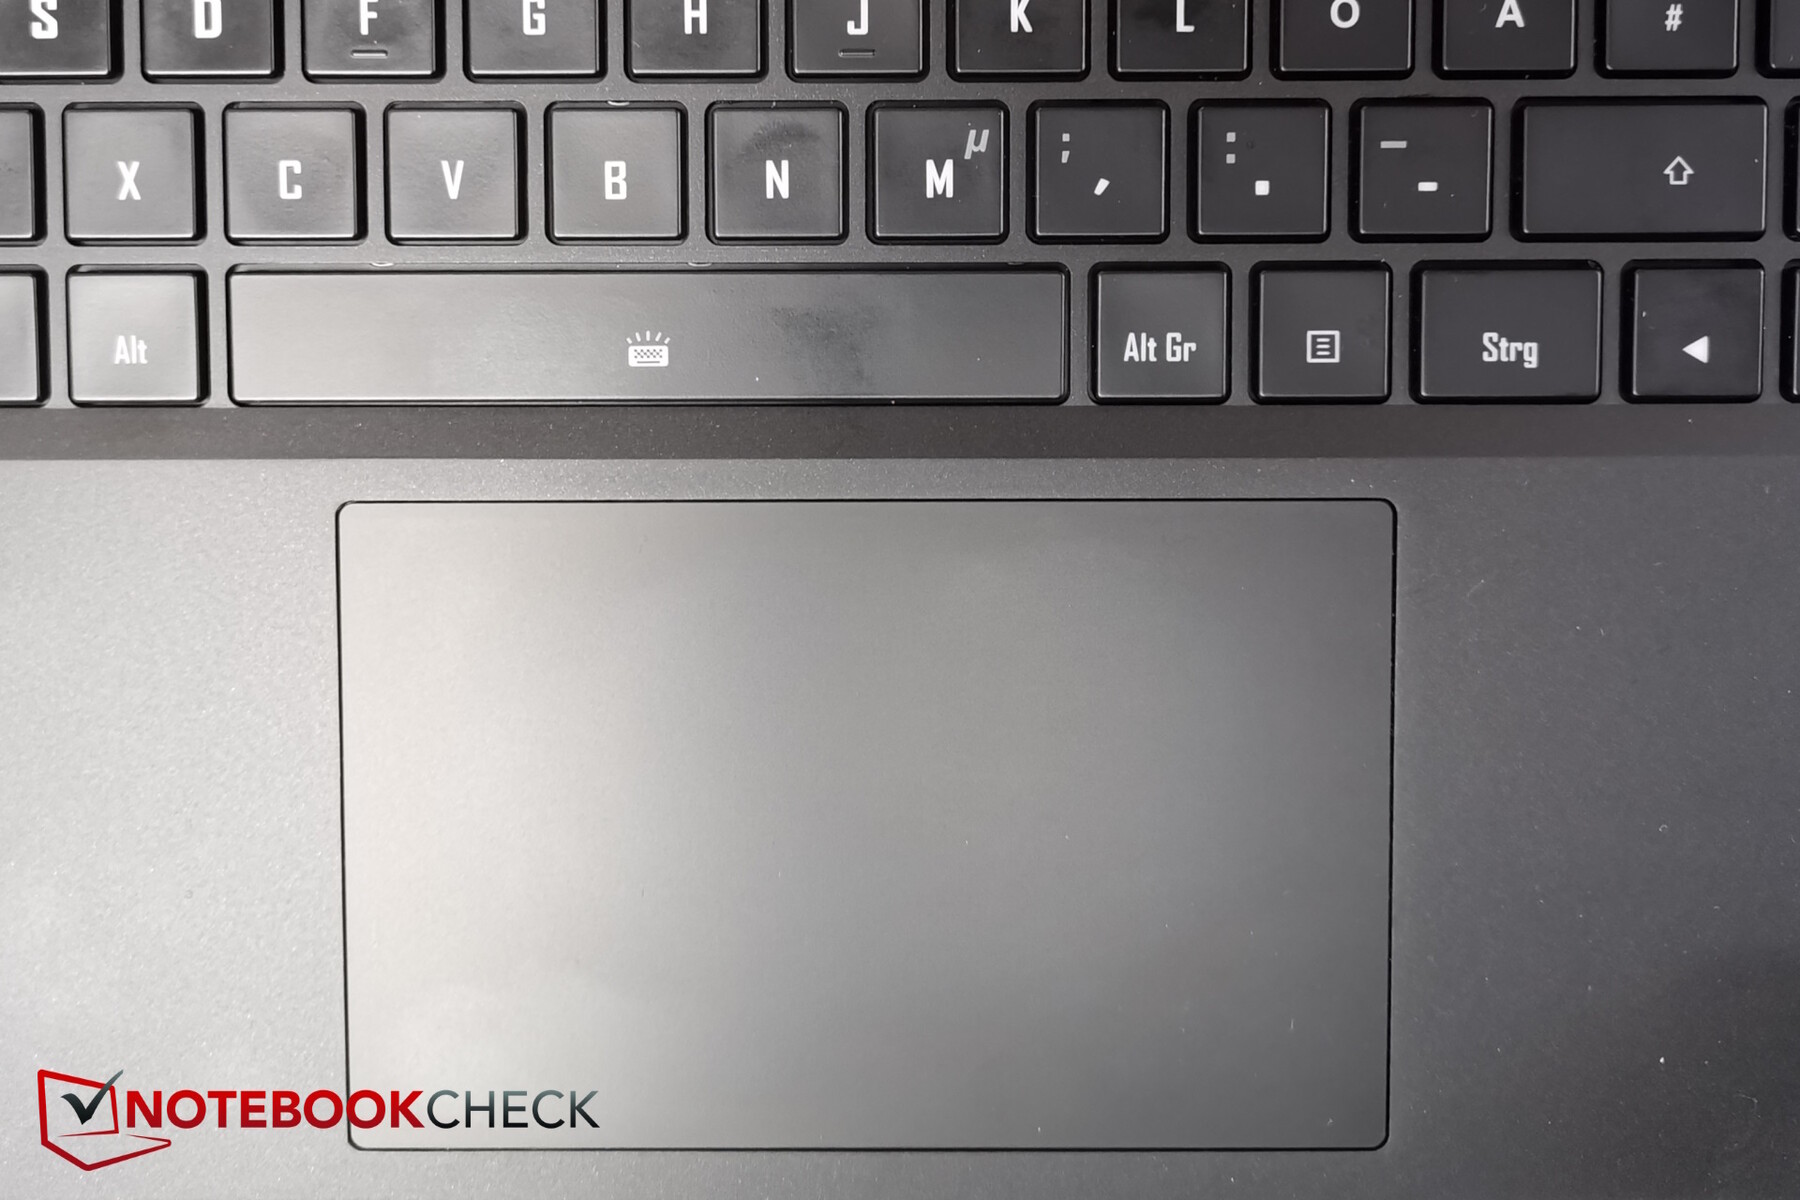
Input devices - More than solid, but dark special key labelling
The key layout is very tidy — the keyboard is slightly lowered into the base of the laptop. The arrow keys are also normally sized and there is a numeric keypad directly to the right.
The keys only have a low to medium lift, but they still feel surprisingly comfortable when typing, which is also due to their decent feedback. Their noises when typing are on the quieter side, so they are also suitable for low-noise environments.
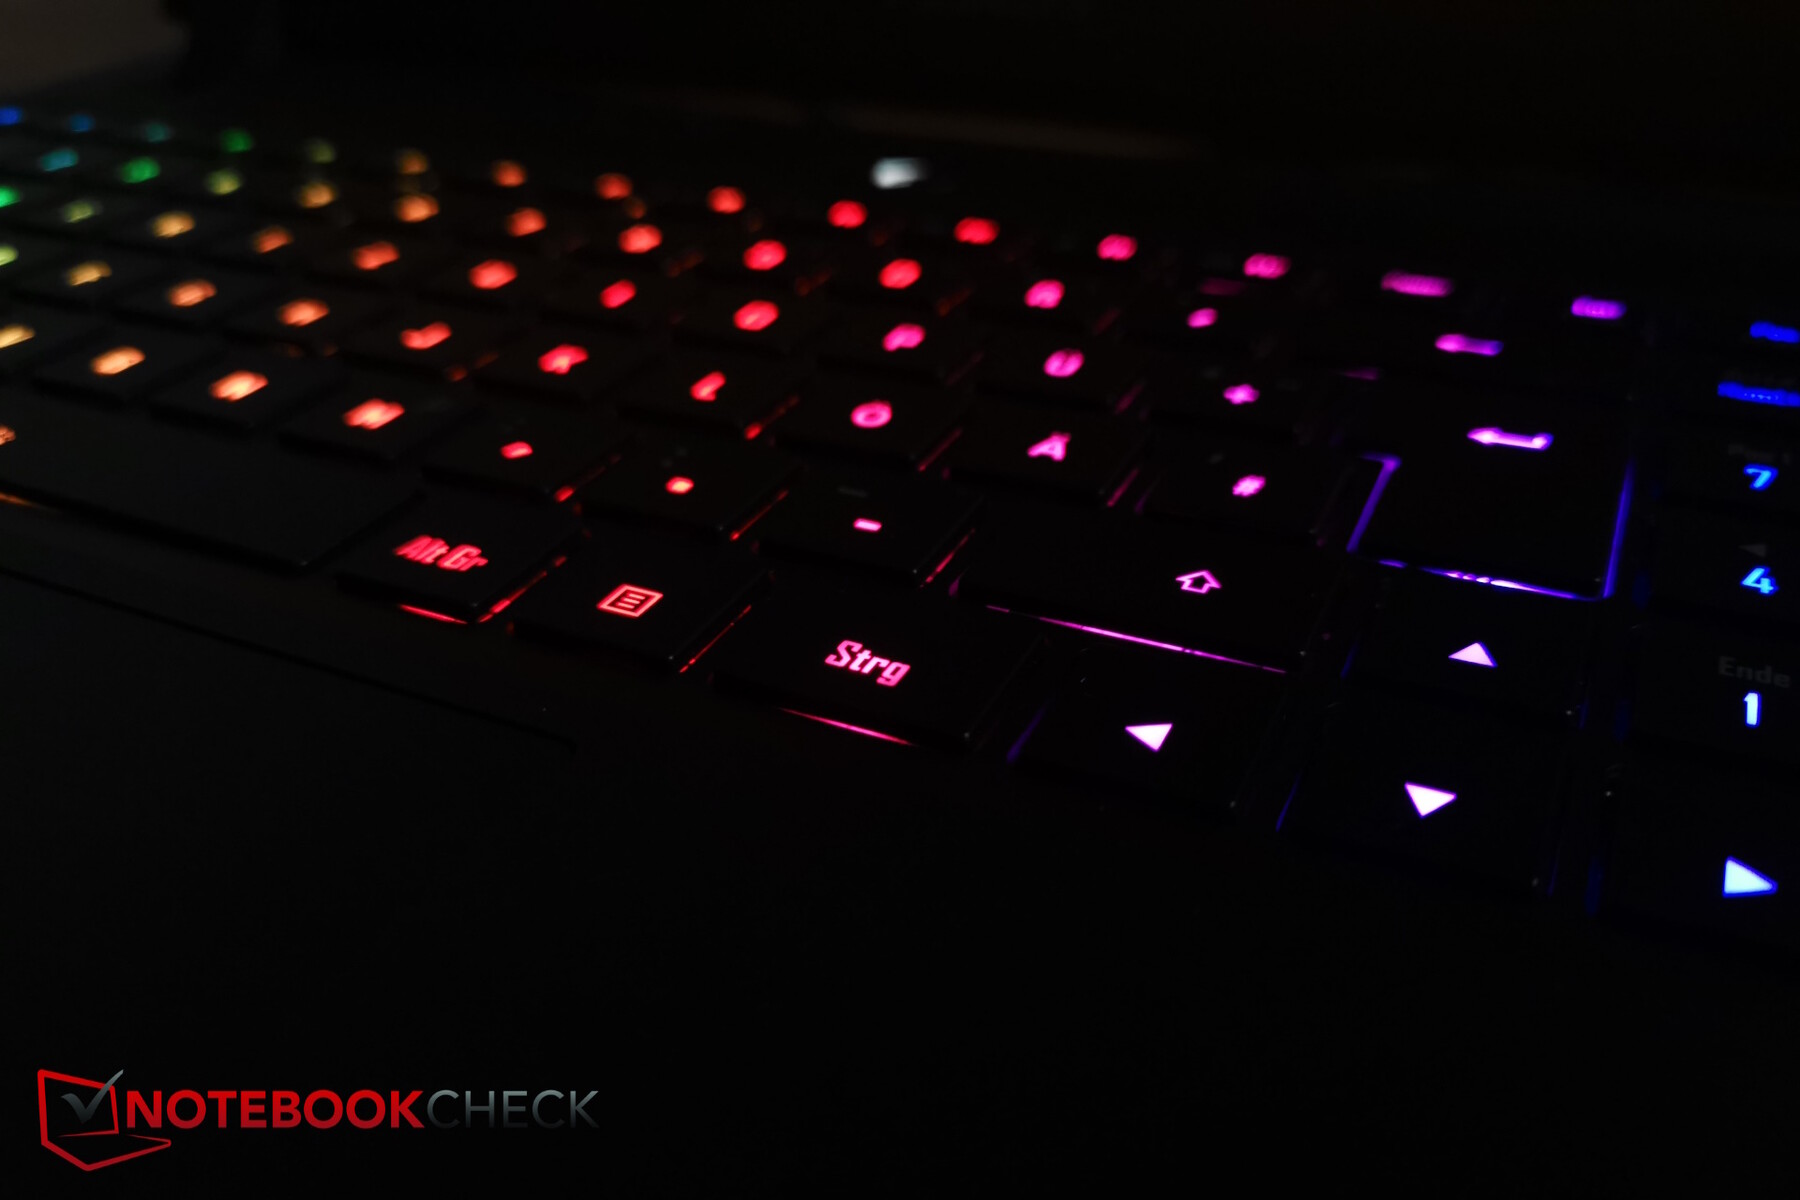
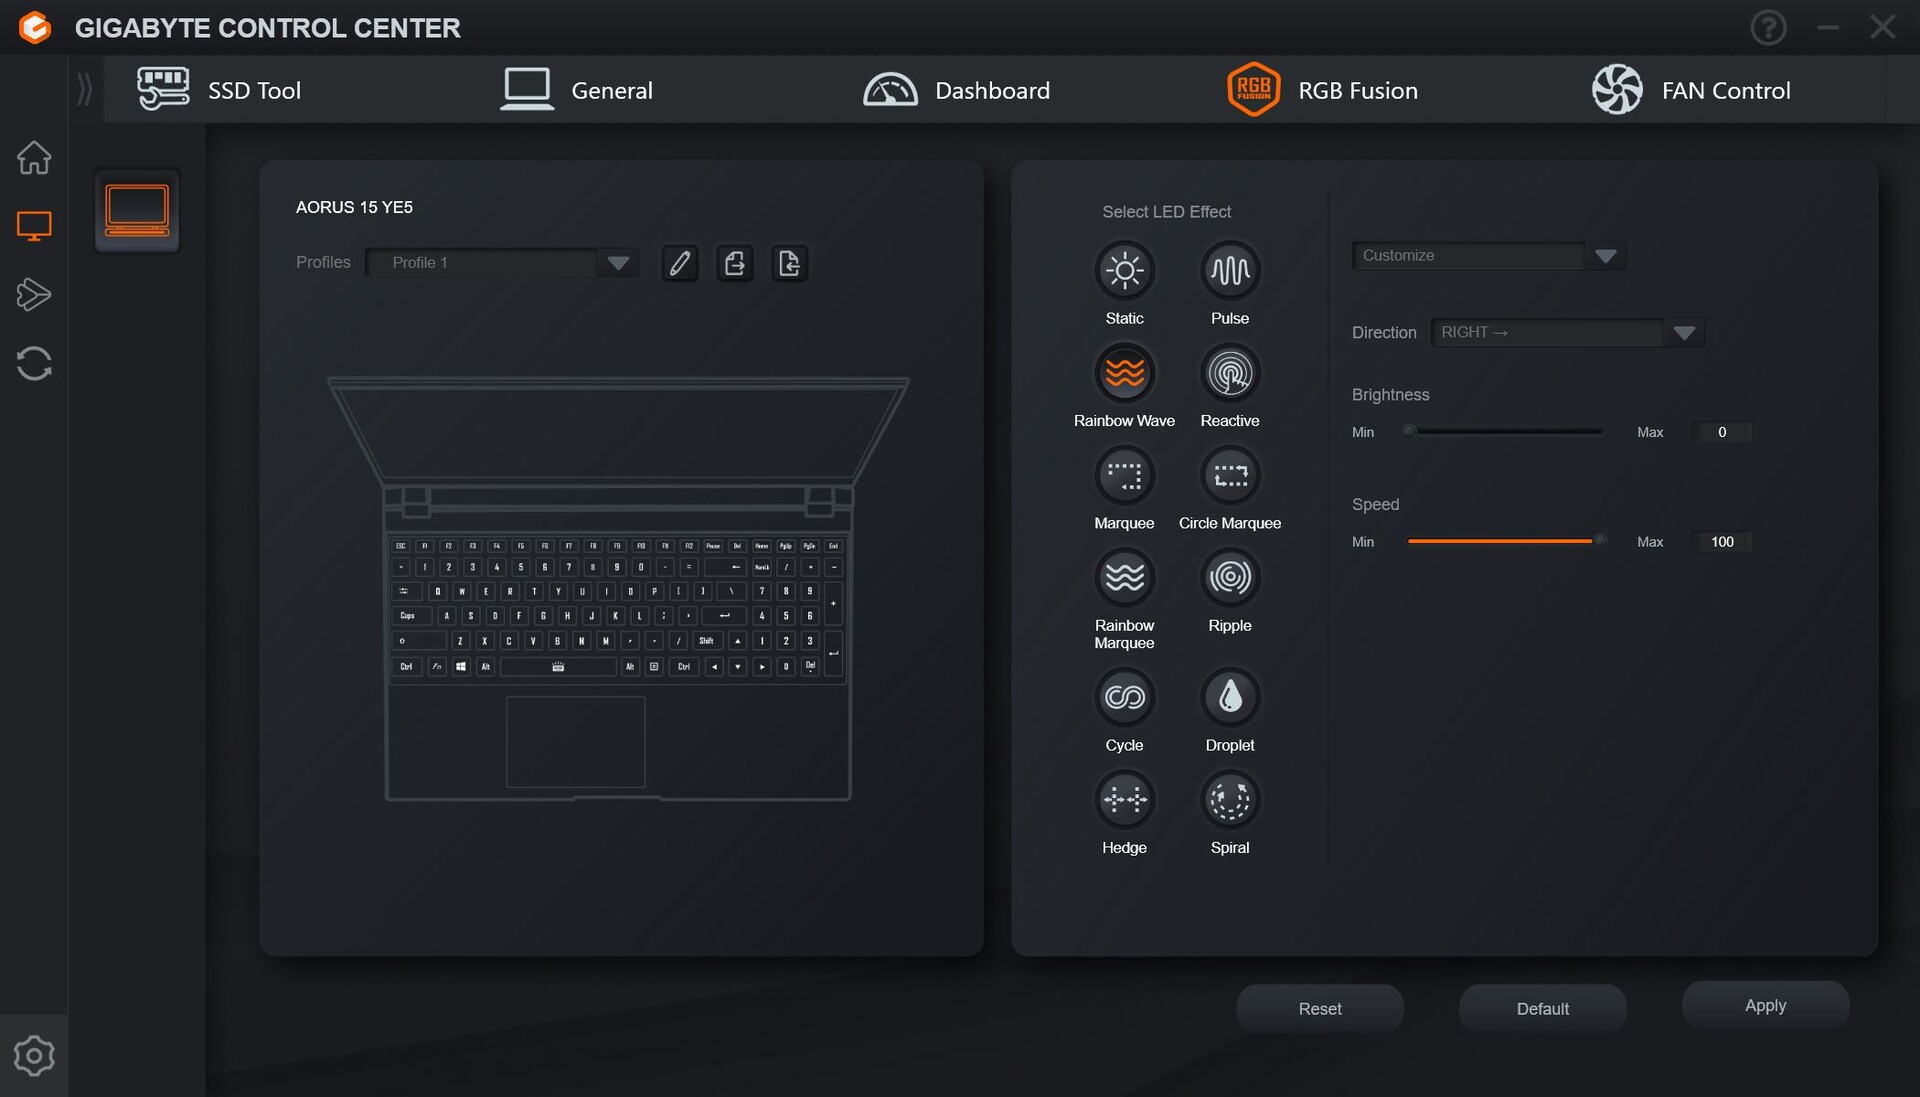
The keys' backlighting is capable of various RGB effects, but it cannot be set individually for each key — although these can light up in different colors for certain effects (Rain Drop). Practical: If you press the fn key, all keys that can be combined with fn to create special functions are illuminated. However, only the normal key labels are illuminated (e.g. "F7"), but not their special function ("mute"), leading to the special function of an F key not being recognizable in dark environments.
The sufficiently large touchpad (21.1 x 7.6 cm) is nice and smooth, even if your hands aren't totally dry. The integrated click buttons require quite a lot of force, which means that its pressure point is clear. The clicking noises are moderate.
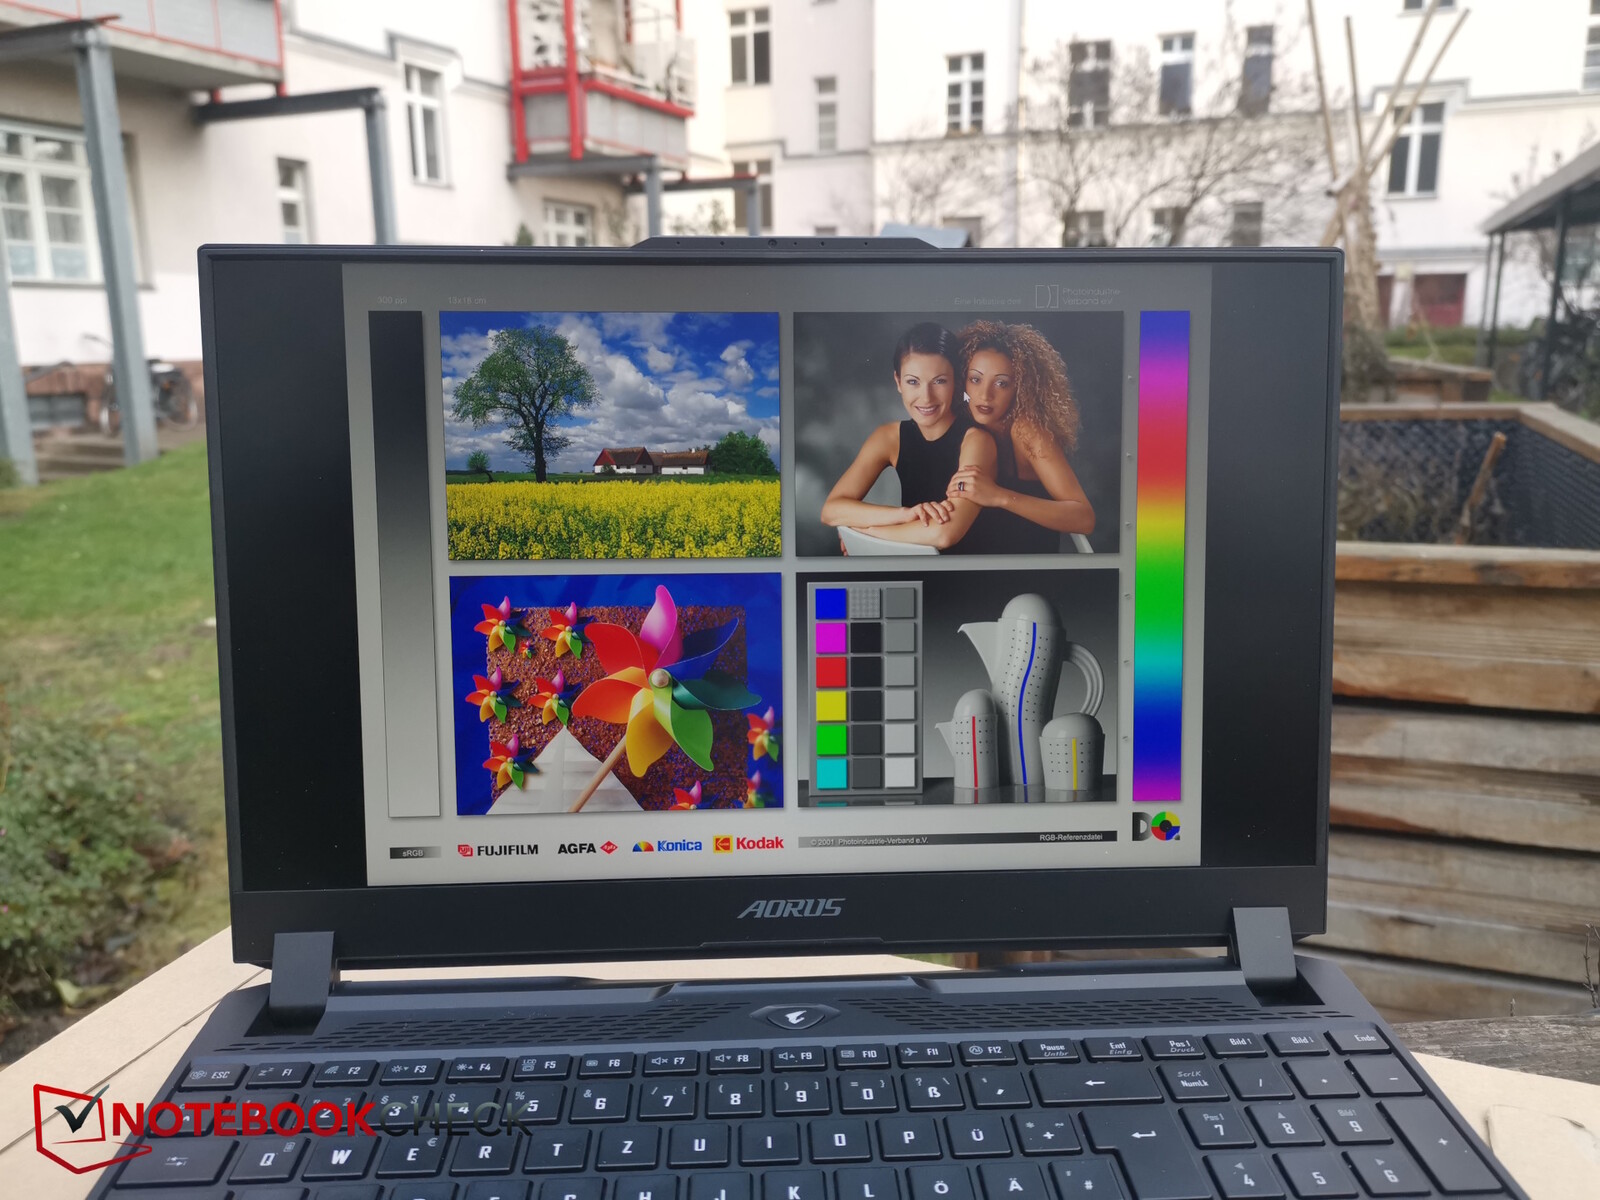
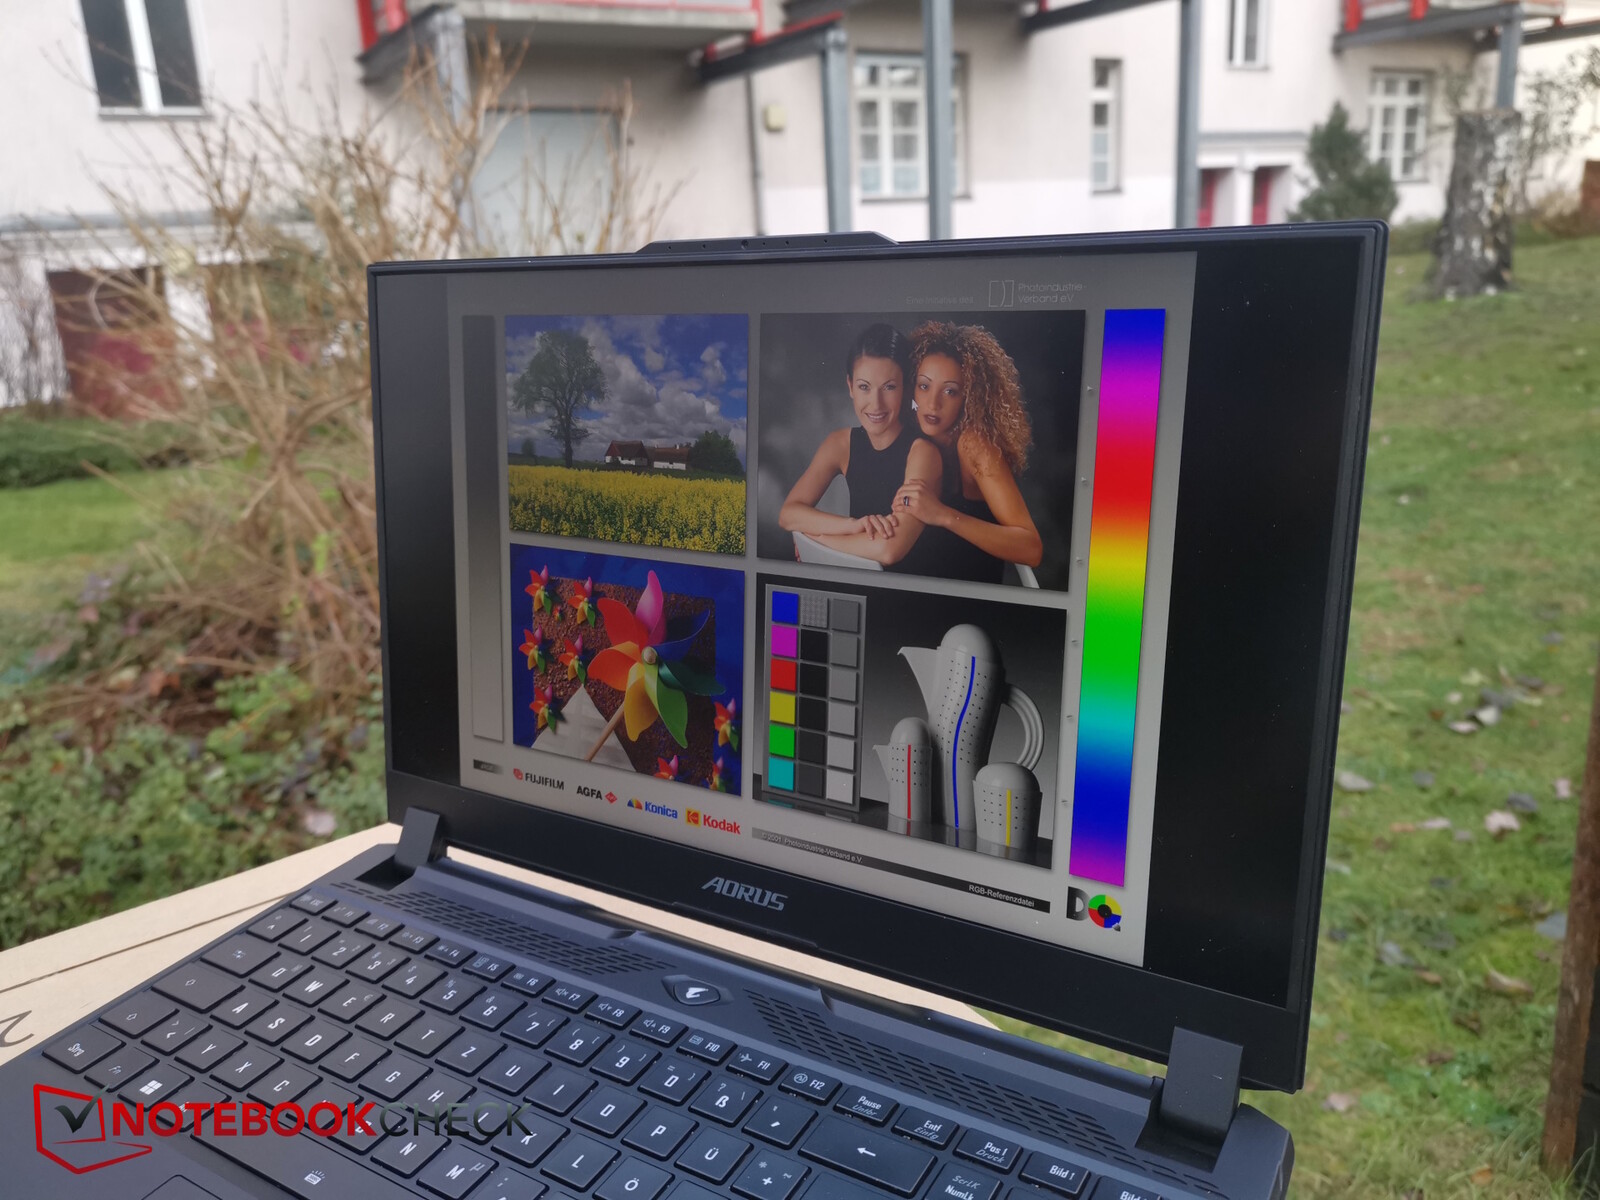
Display - 1,440p with good color accuracy
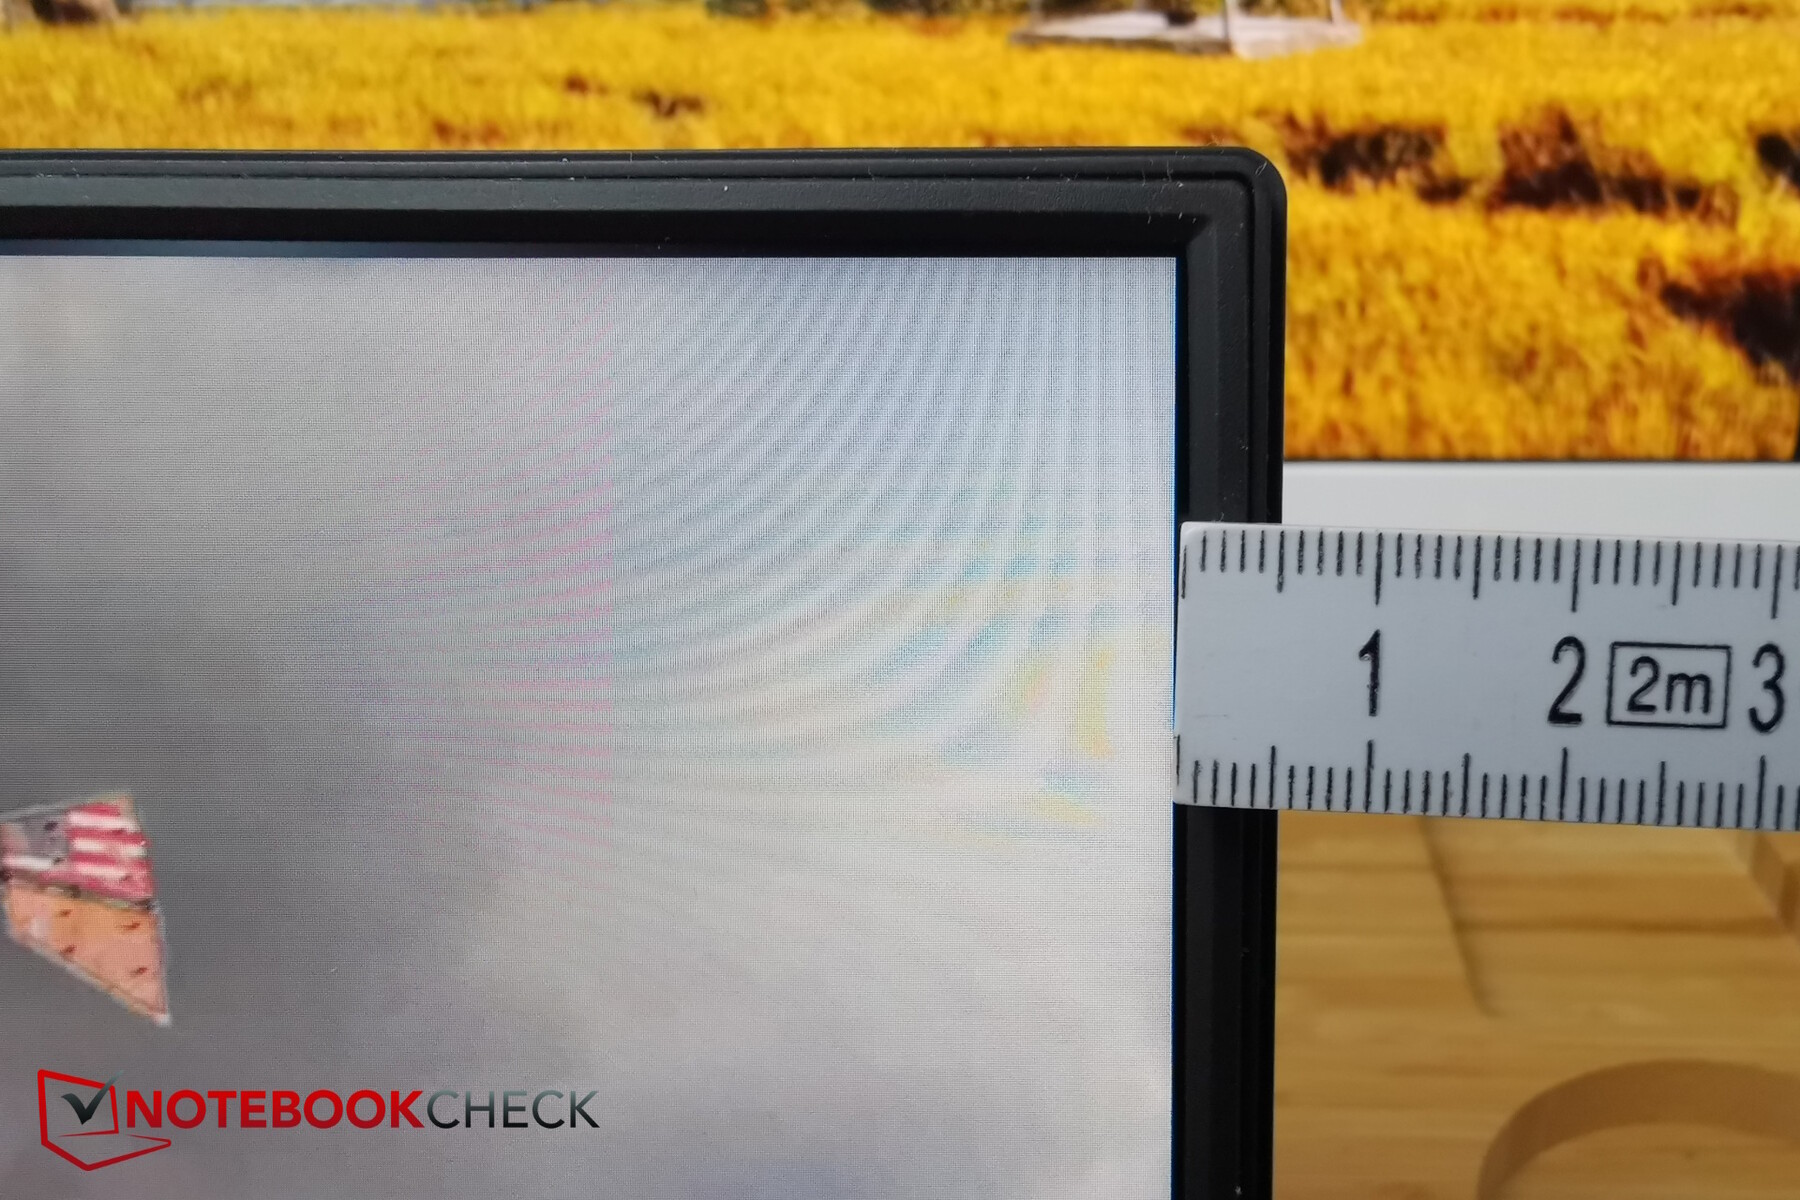
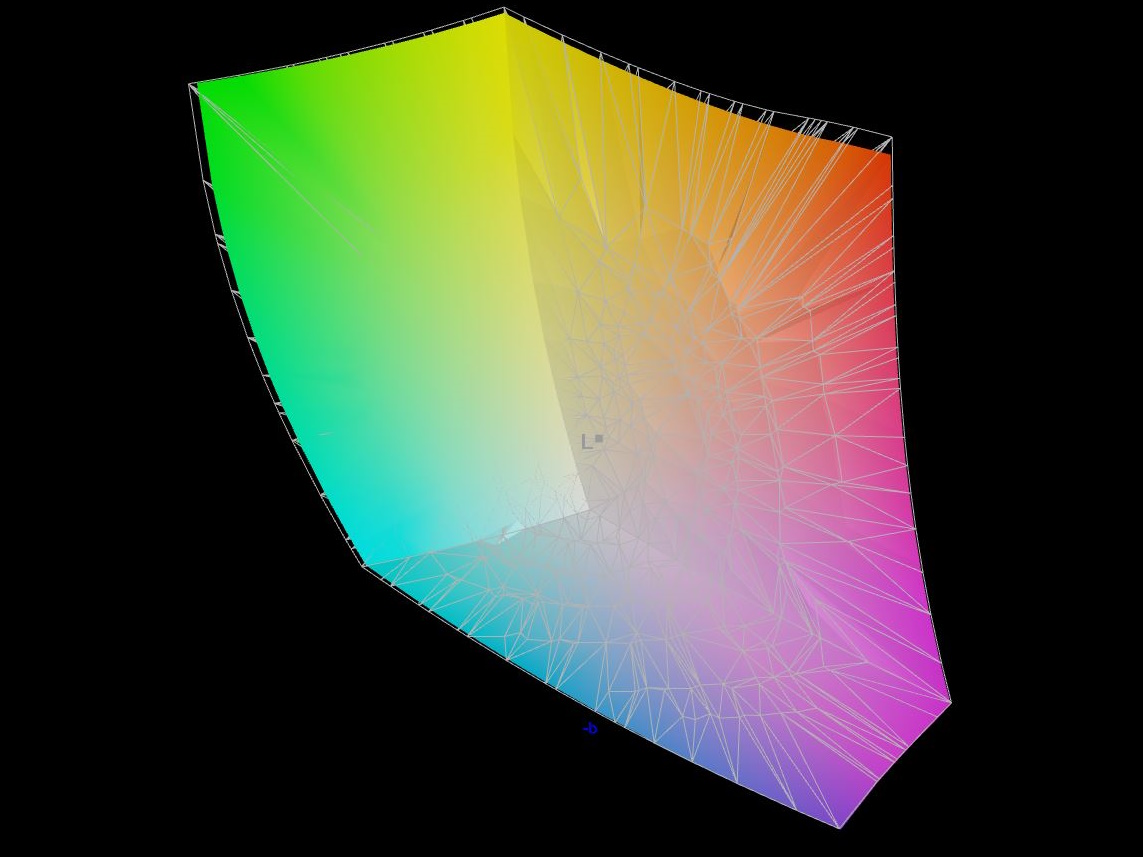
The Aorus laptop's matte WQHD display is made by Chi Mei and it was already used in the Asus ROG Zephyrus G15 in 2021. This was a success, so it doesn't seem outdated in 2023 either. Its resolution of 2,560 x 1,440 pixels is just as impressive as its 165-Hz refresh rate, its relatively fast response times and its color space coverage (100% sRGB, 97% Display P3). The screen's brightness and contrast, on the other hand, are average. Alternatively, there is also a Full HD model with a 360-Hz refresh rate.
Less good is the very visible backlight bleeding on the bottom left corner and along the top right edge. However, PWM is not used for brightness control. Its response times are mediocre at best.


| |||||||||||||||||||||||||
Brightness Distribution: 81 %
Center on Battery: 350 cd/m²
Contrast: 939:1 (Black: 0.38 cd/m²)
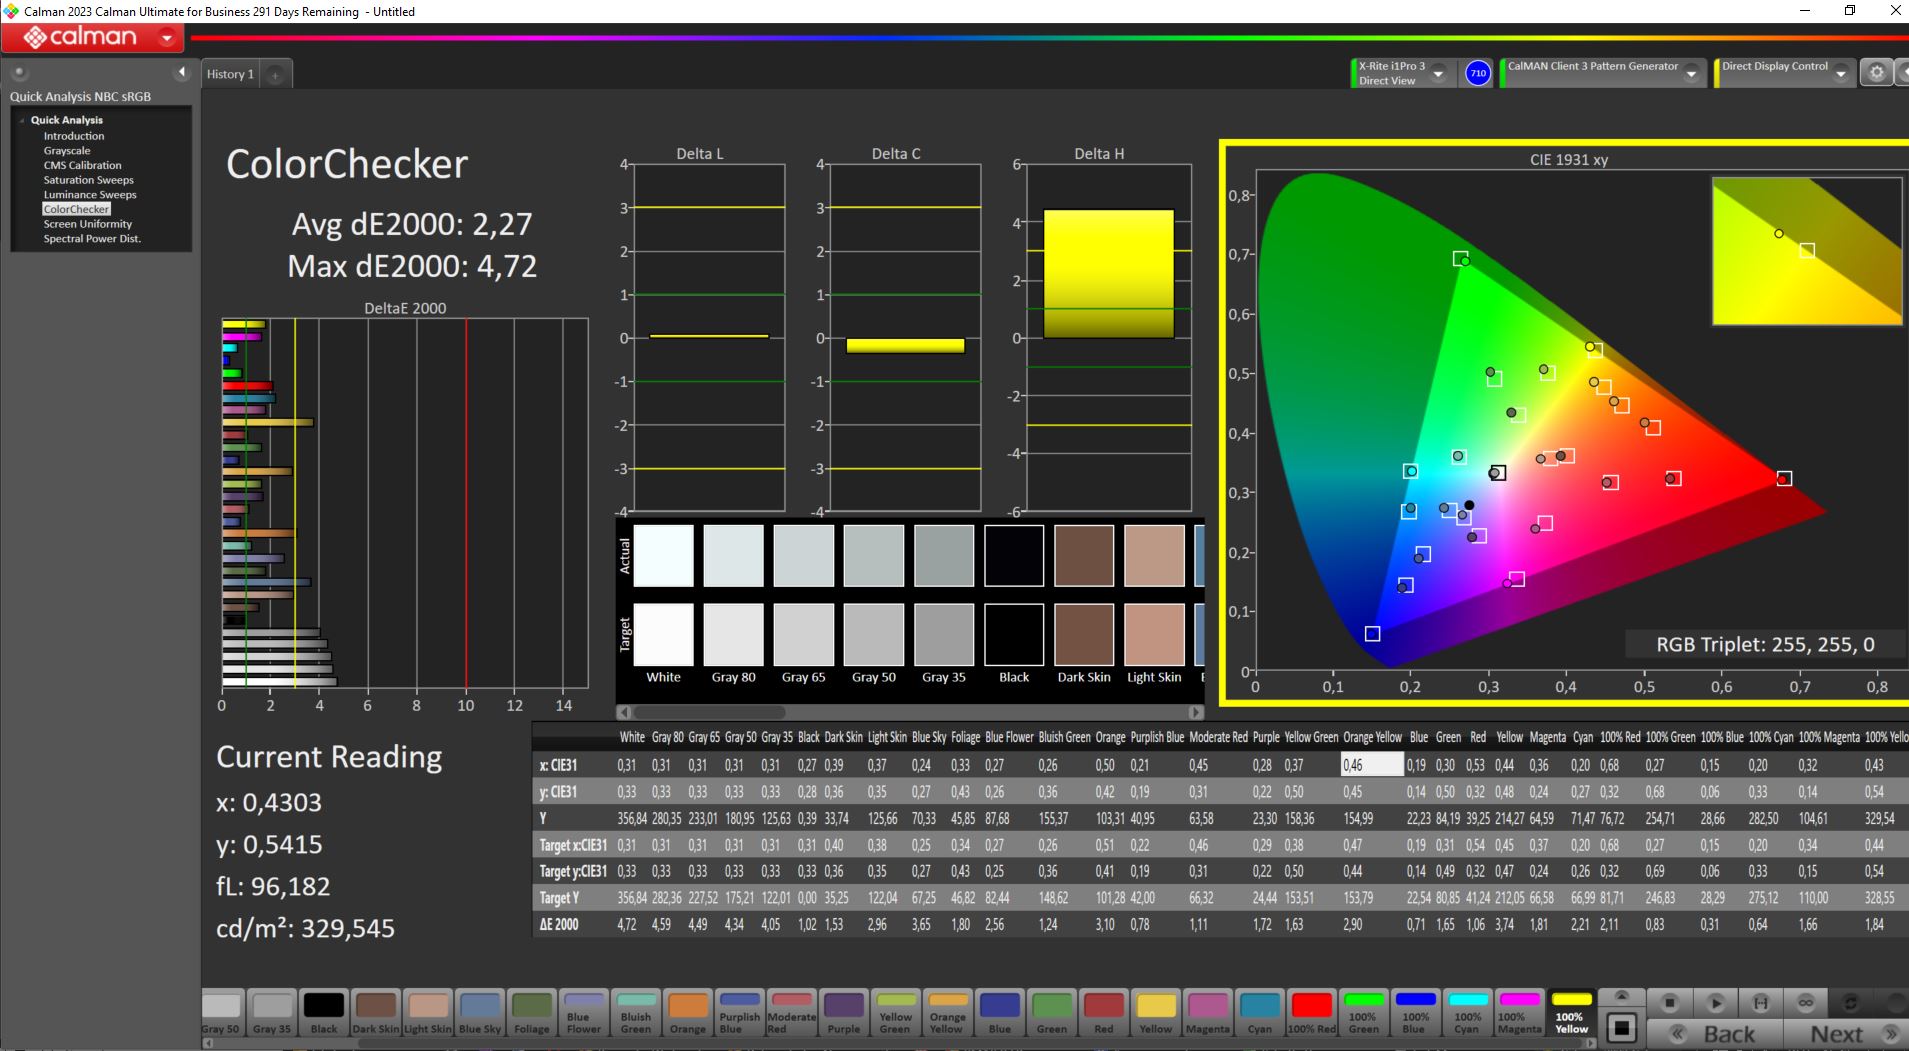
ΔE ColorChecker Calman: 2.27 | ∀{0.5-29.43 Ø4.72}
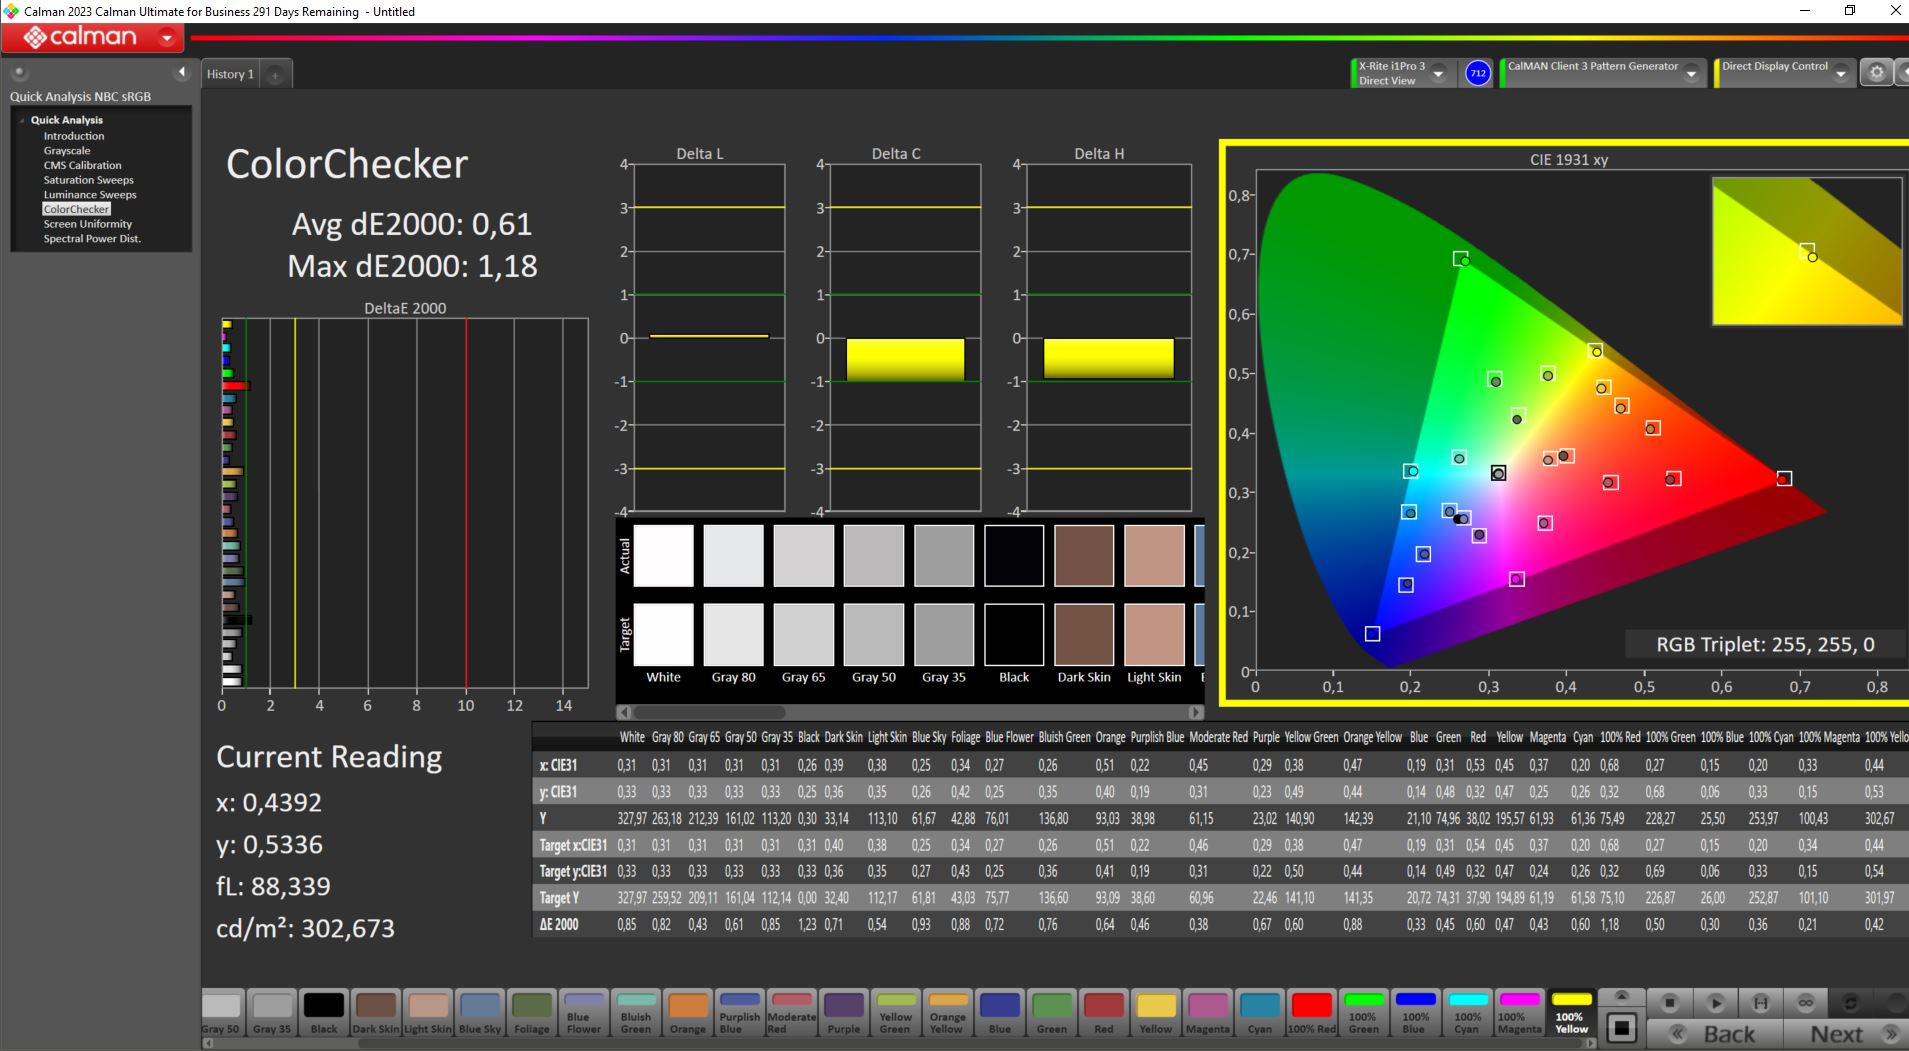
calibrated: 0.61
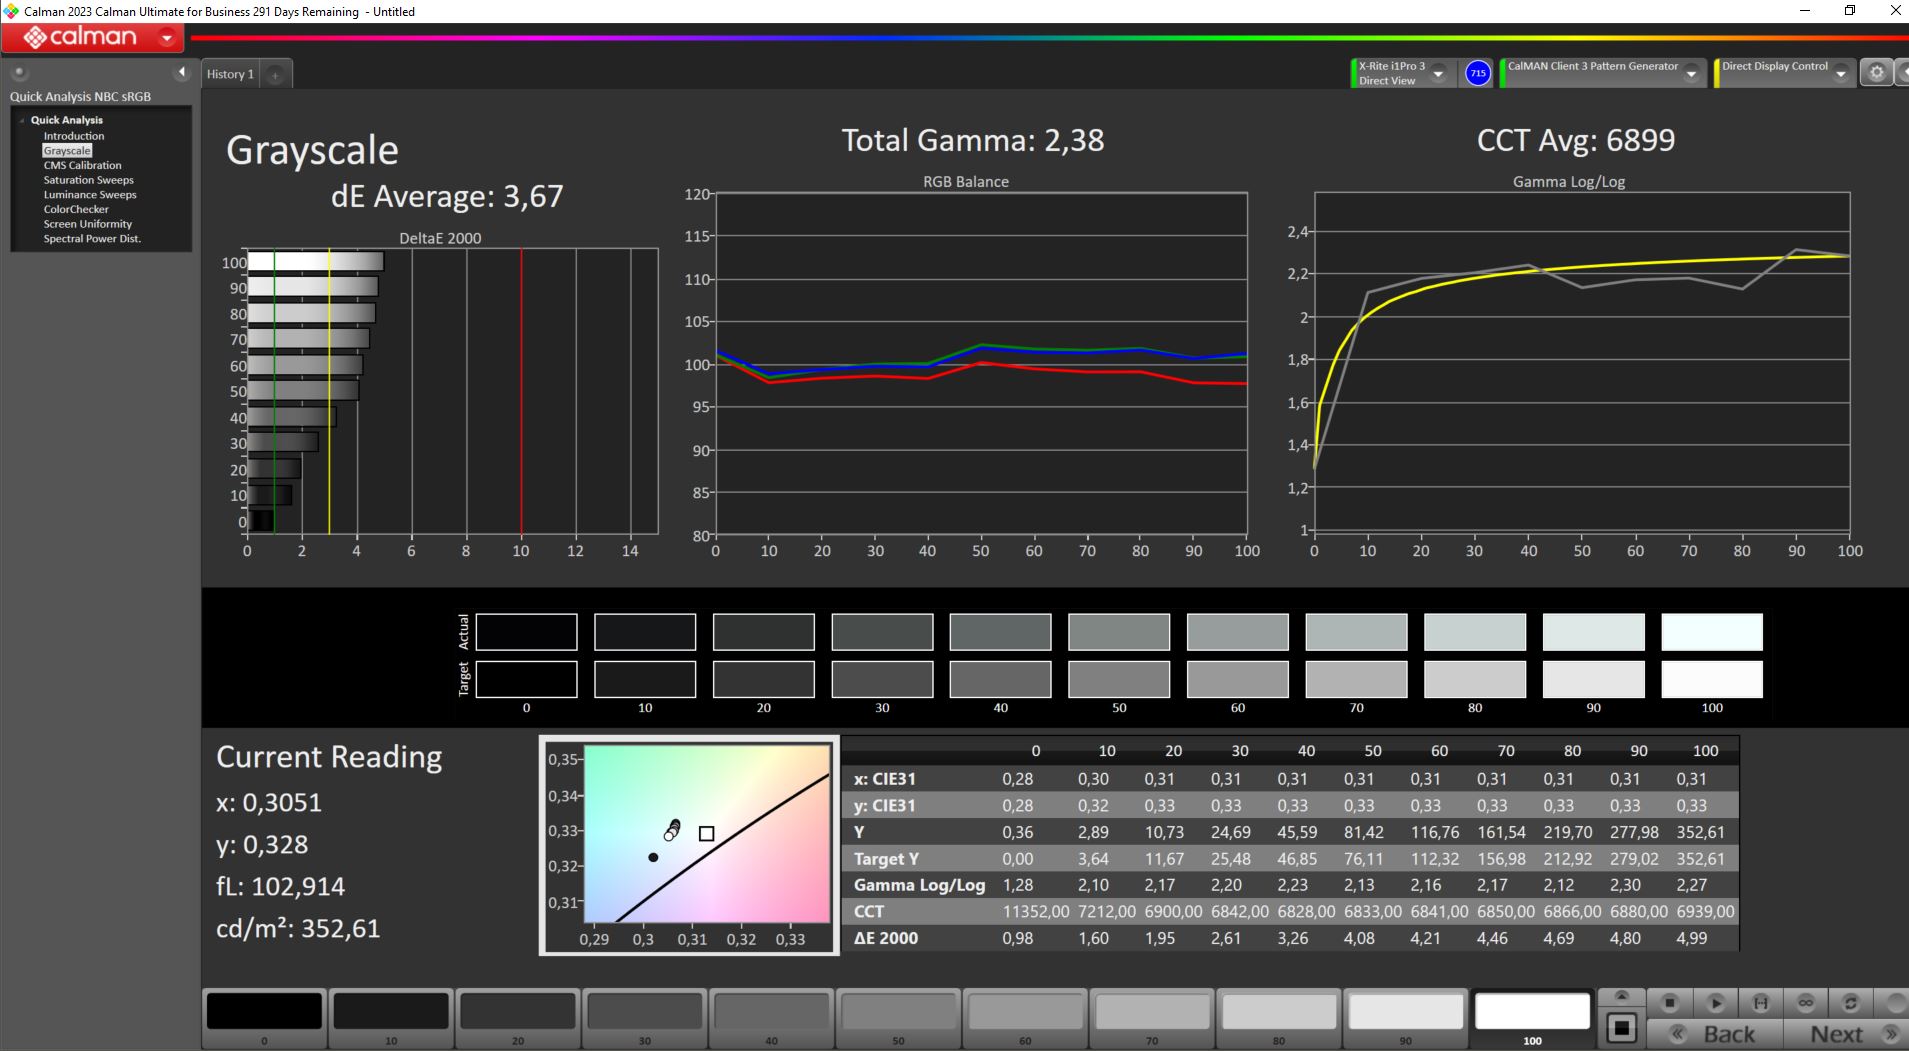
ΔE Greyscale Calman: 3.67 | ∀{0.09-98 Ø4.97}
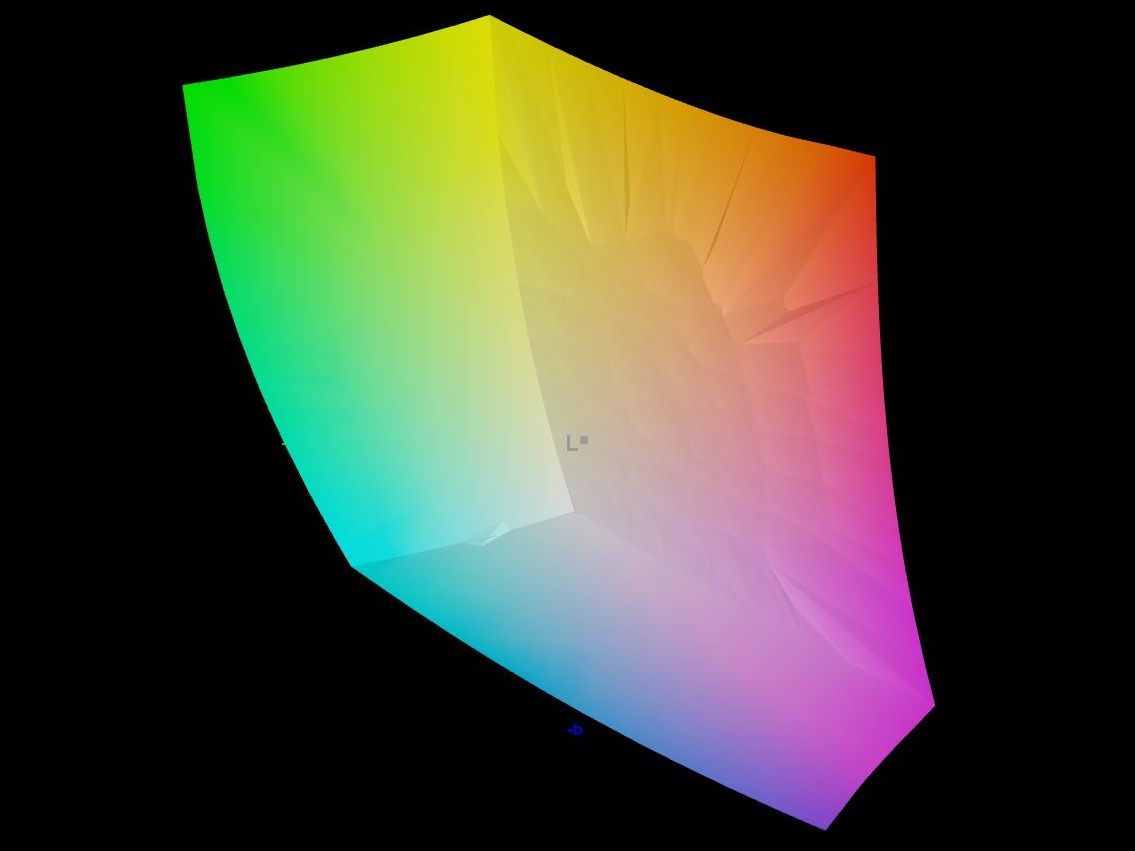
85.9% AdobeRGB 1998 (Argyll 3D)
100% sRGB (Argyll 3D)
97.7% Display P3 (Argyll 3D)
Gamma: 2.38
CCT: 7899 K
| Aorus 15 YE5-54DEB34SH Chi Mei CMN1540 (CMN N156KME-GNA), IPS, 2560x1440, 15.6" | Aorus 15 BSF Sharp LQ156T1JW05, IPS, 2560x1440, 15.6" | Captiva Advanced Gaming I74-121 BOE08B3, IPS, 1920x1080, 15.6" | HP Victus 16-r0077ng CMN162D, IPS, 1920x1080, 16.1" | Dell XPS 15 9530 RTX 4070 Samsung 156XG01, OLED, 3456x2160, 15.6" | HP Omen 16-wf000 BOE0B7D, IPS, 2560x1440, 16.1" | |
|---|---|---|---|---|---|---|
| Display | 0% | -21% | -18% | 6% | -16% | |
| Display P3 Coverage (%) | 97.7 | 98.2 1% | 64 -34% | 66.7 -32% | 99.8 2% | 69 -29% |
| sRGB Coverage (%) | 100 | 99.9 0% | 93.2 -7% | 98 -2% | 100 0% | 99.2 -1% |
| AdobeRGB 1998 Coverage (%) | 85.9 | 85.7 0% | 66 -23% | 69 -20% | 98.4 15% | 71.2 -17% |
| Response Times | 40% | 55% | 30% | 87% | 47% | |
| Response Time Grey 50% / Grey 80% * (ms) | 18.9 ? | 11.3 ? 40% | 5 ? 74% | 13.3 ? 30% | 1.68 ? 91% | 4.6 ? 76% |
| Response Time Black / White * (ms) | 11.7 ? | 7 ? 40% | 7.55 ? 35% | 8.2 ? 30% | 1.94 ? 83% | 9.7 ? 17% |
| PWM Frequency (Hz) | 239 | |||||
| Screen | -34% | -28% | 15% | -36% | 7% | |
| Brightness middle (cd/m²) | 357 | 299 -16% | 346 -3% | 308 -14% | 389.5 9% | 310.9 -13% |
| Brightness (cd/m²) | 322 | 282 -12% | 324 1% | 285 -11% | 392 22% | 296 -8% |
| Brightness Distribution (%) | 81 | 82 1% | 90 11% | 85 5% | 98 21% | 91 12% |
| Black Level * (cd/m²) | 0.38 | 0.31 18% | 0.35 8% | 0.25 34% | 0.35 8% | |
| Contrast (:1) | 939 | 965 3% | 989 5% | 1232 31% | 888 -5% | |
| Colorchecker dE 2000 * | 2.27 | 2.24 1% | 4.12 -81% | 1.3 43% | 4.95 -118% | 2.18 4% |
| Colorchecker dE 2000 max. * | 4.72 | 4.29 9% | 7.78 -65% | 2.76 42% | 8.65 -83% | 3.58 24% |
| Colorchecker dE 2000 calibrated * | 0.61 | 2.62 -330% | 1.22 -100% | 0.92 -51% | 1.53 -151% | 0.52 15% |
| Greyscale dE 2000 * | 3.67 | 3 18% | 4.81 -31% | 1.7 54% | 2 46% | 2.8 24% |
| Gamma | 2.38 92% | 2.086 105% | 2.31 95% | 2.167 102% | 2.27 97% | 2.18 101% |
| CCT | 7899 82% | 6289 103% | 7633 85% | 6767 96% | 6265 104% | 6002 108% |
| Total Average (Program / Settings) | 2% /
-16% | 2% /
-15% | 9% /
10% | 19% /
-5% | 13% /
8% |
* ... smaller is better
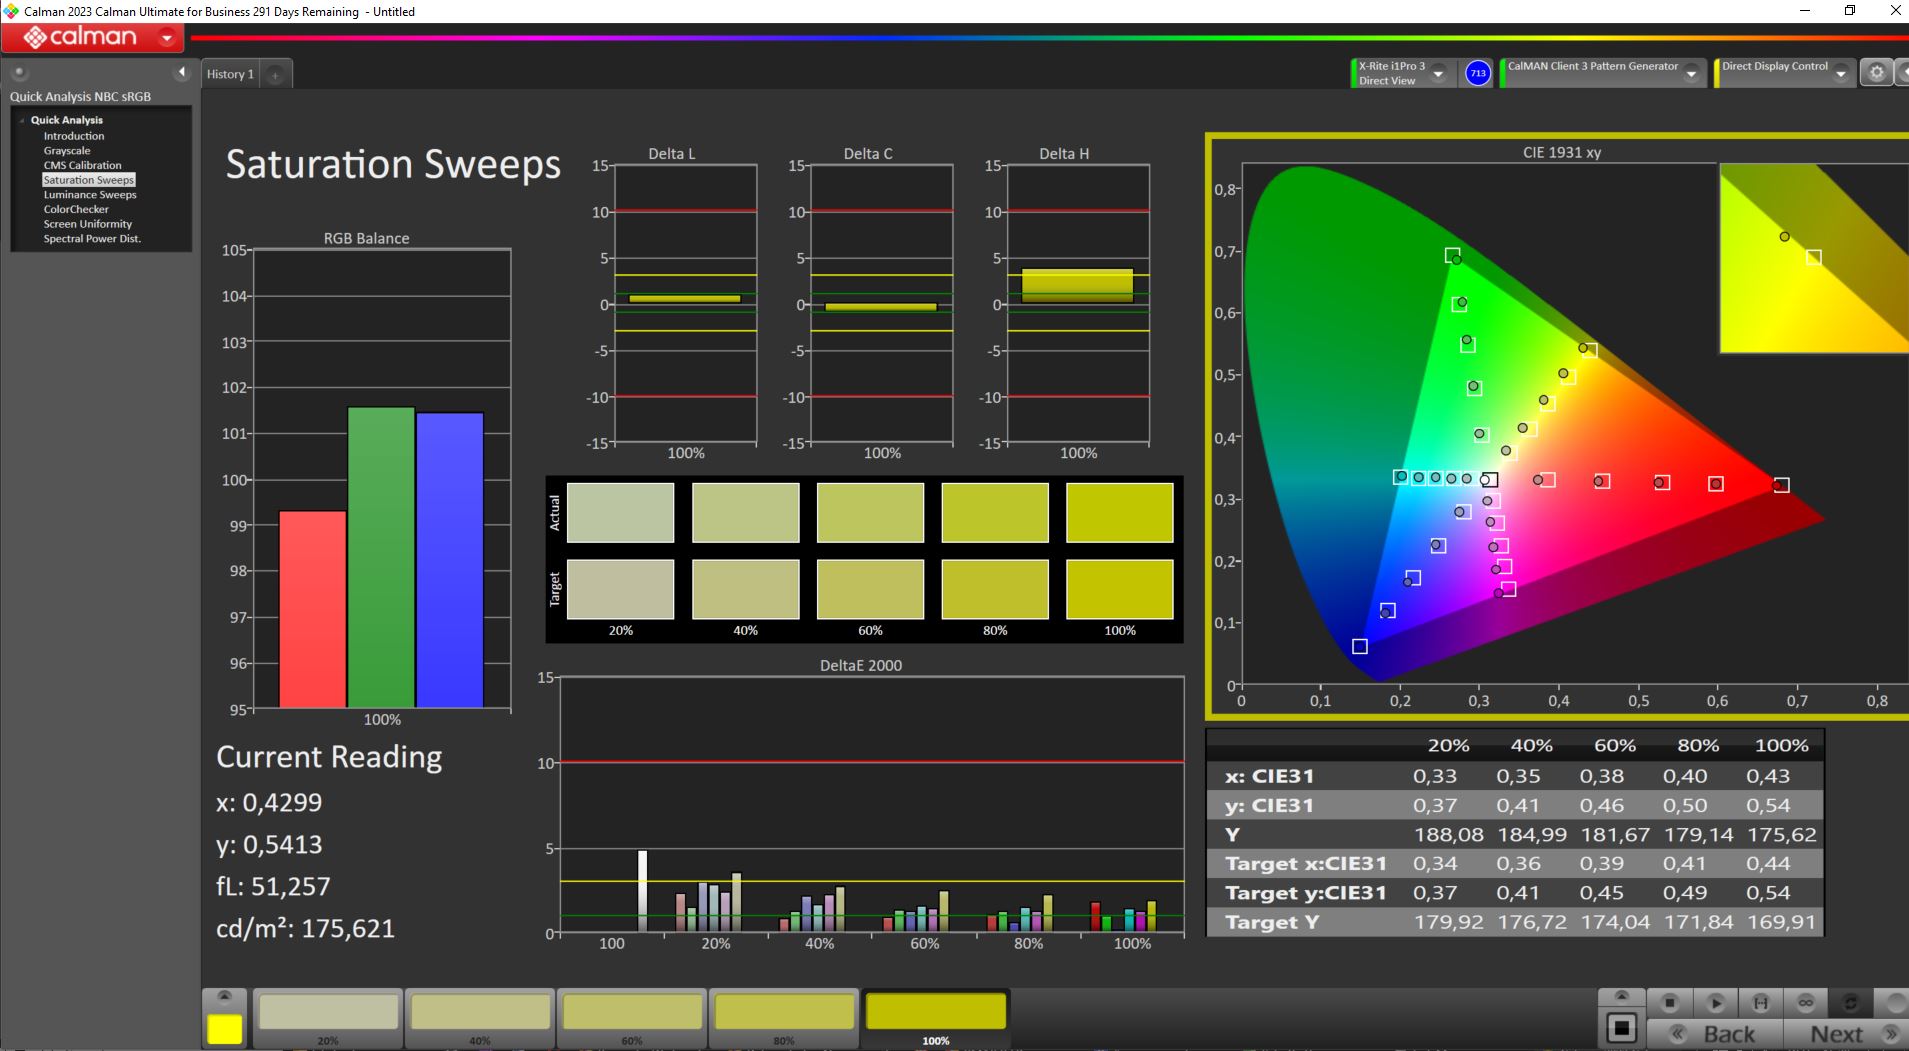
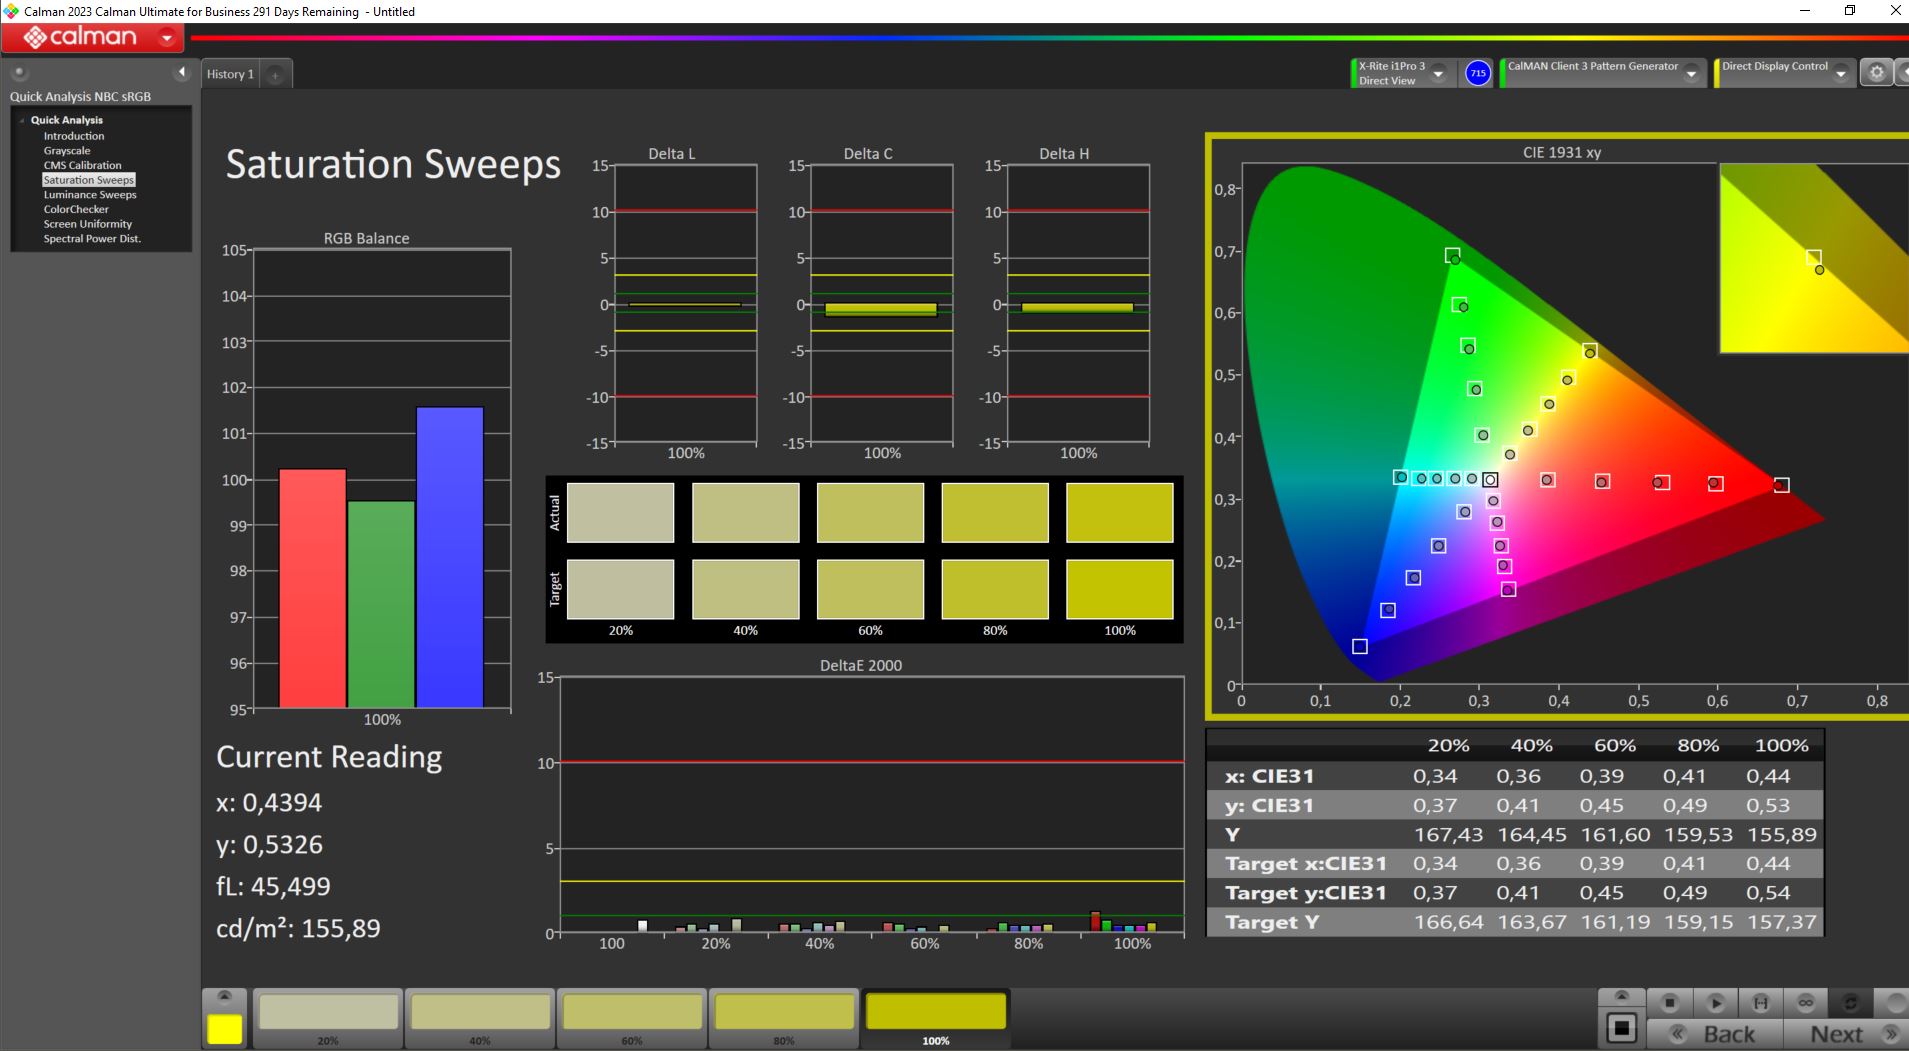
Ex works, the display doesn't come optimally calibrated but our calibration using the X-Rite Fab measuring device and the Calman software reduces the DeltaE value (significant for (color) deviations) to well below 1 — both for grayscale and colors. Together with its good color space coverage (see last row of images below), the display is also suitable for semi-professional image and video editing.


Display Response Times
| ↔ Response Time Black to White | ||
|---|---|---|
| 11.7 ms ... rise ↗ and fall ↘ combined | ↗ 7.2 ms rise | 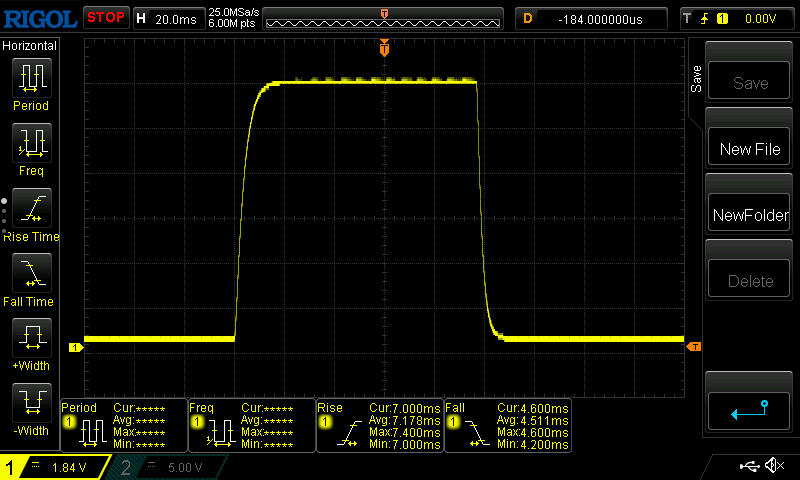 |
| ↘ 4.5 ms fall | ||
| The screen shows good response rates in our tests, but may be too slow for competitive gamers. In comparison, all tested devices range from 0.1 (minimum) to 240 (maximum) ms. » 31 % of all devices are better. This means that the measured response time is better than the average of all tested devices (19.8 ms). | ||
| ↔ Response Time 50% Grey to 80% Grey | ||
| 18.9 ms ... rise ↗ and fall ↘ combined | ↗ 9.4 ms rise | 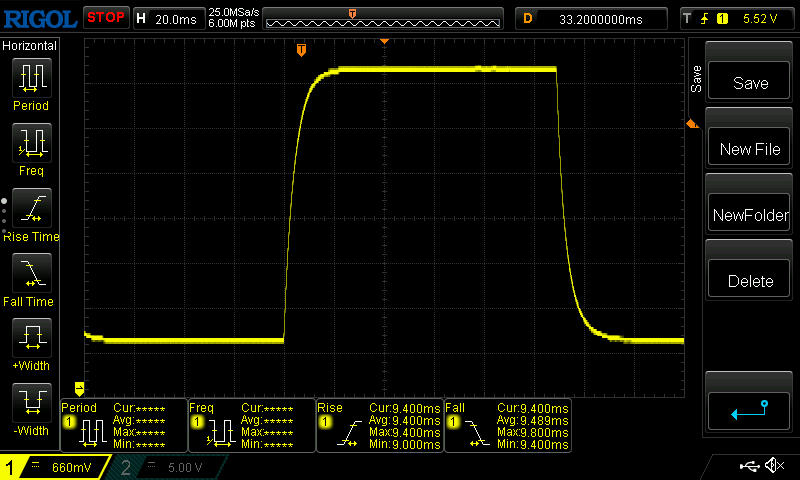 |
| ↘ 9.5 ms fall | ||
| The screen shows good response rates in our tests, but may be too slow for competitive gamers. In comparison, all tested devices range from 0.165 (minimum) to 636 (maximum) ms. » 32 % of all devices are better. This means that the measured response time is better than the average of all tested devices (31 ms). | ||
Screen Flickering / PWM (Pulse-Width Modulation)
| Screen flickering / PWM not detected | 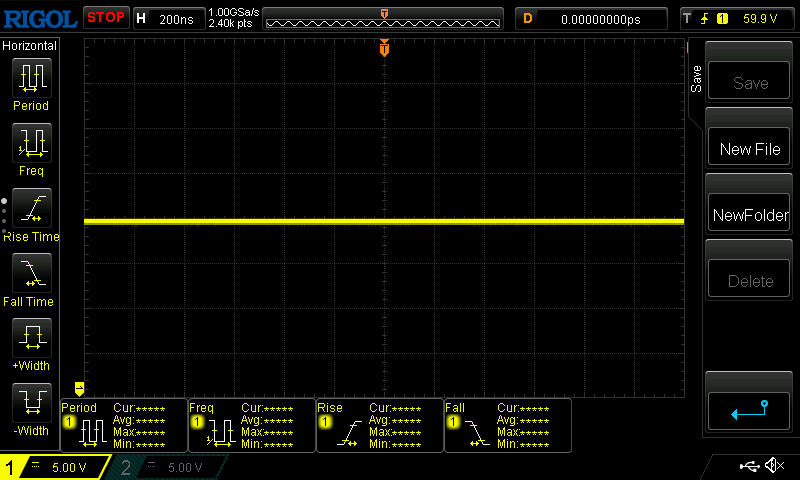 | ||
In comparison: 52 % of all tested devices do not use PWM to dim the display. If PWM was detected, an average of 7778 (minimum: 5 - maximum: 343500) Hz was measured. | |||
Thanks to its acceptable brightness of over 300 nits and its matt surface, the laptop's screen content is still easy to see in shaded surroundings.

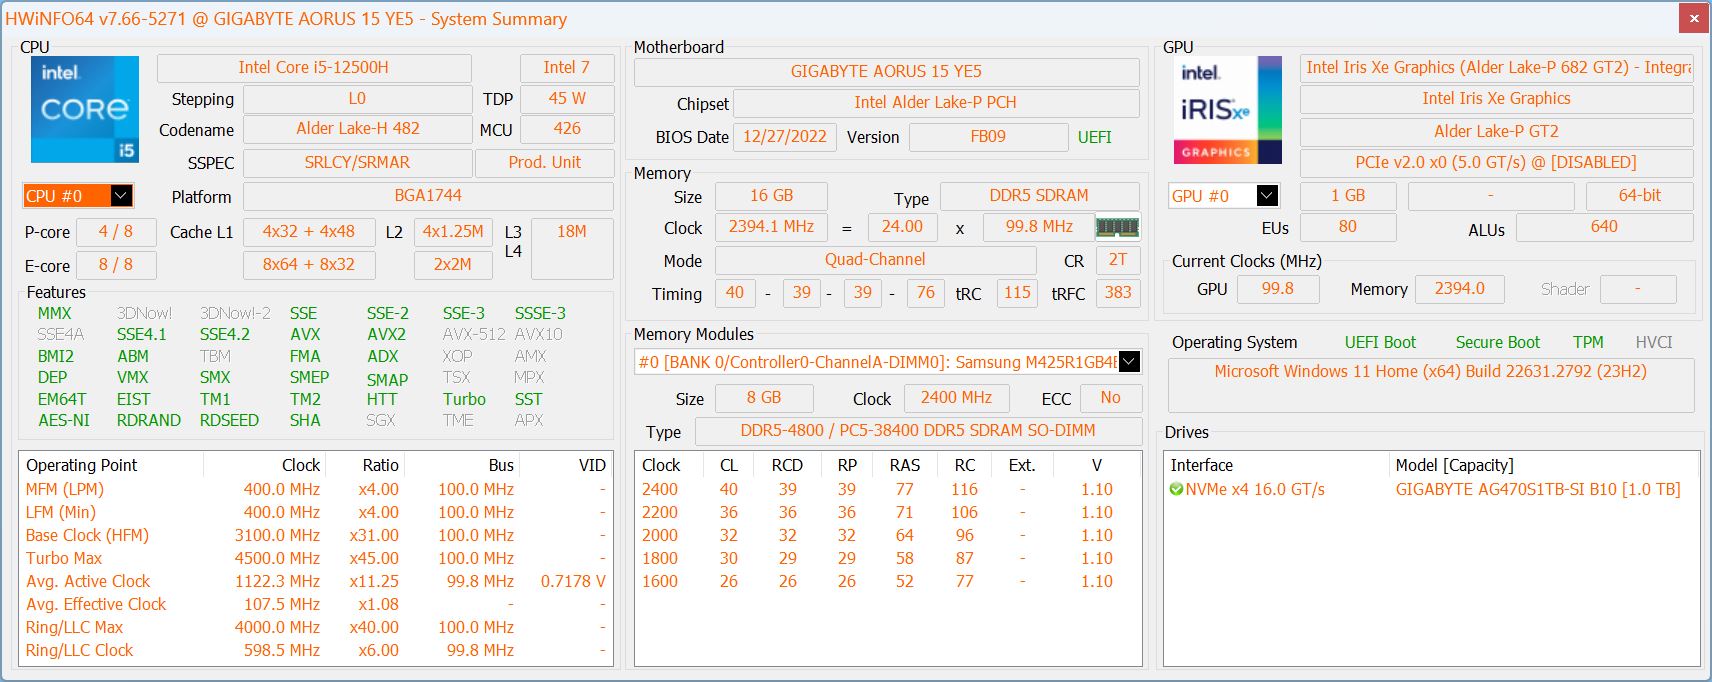
Performance - Last gen still delivers
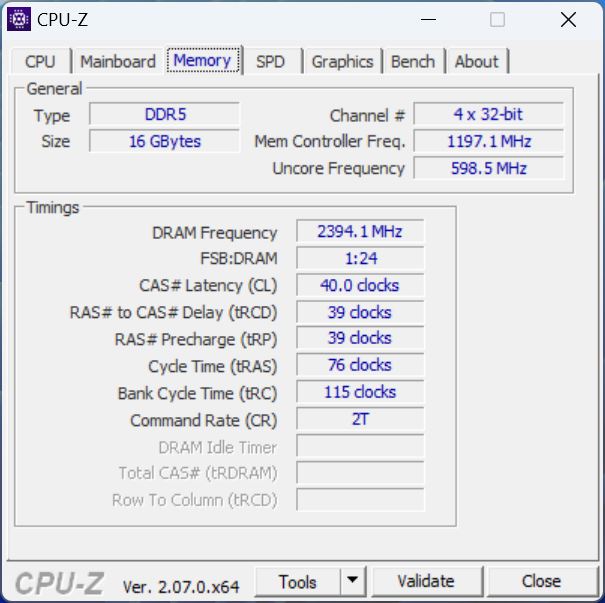
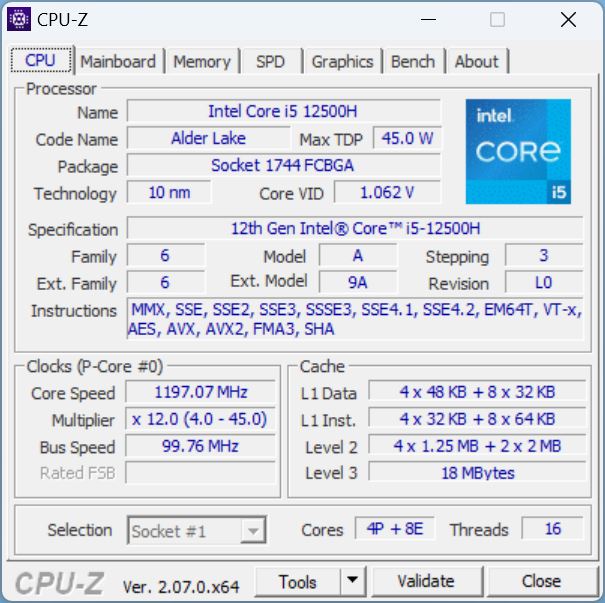
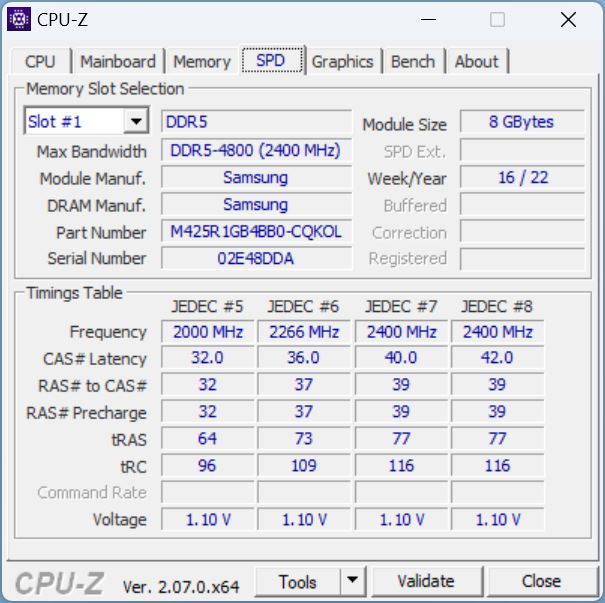
Last-gen CPU and GPU power the system. The older Core i5-12500H has access to 16 GB of modern DDR5 4800 RAM and a 1-TB NVMe SSD from Gigabyte. Together with its RTX 3080 Ti, the Aorus 15 YE5 can definitely be classed as a high-end gamer — despite its last generation and mid-range CPU.
Testing conditions
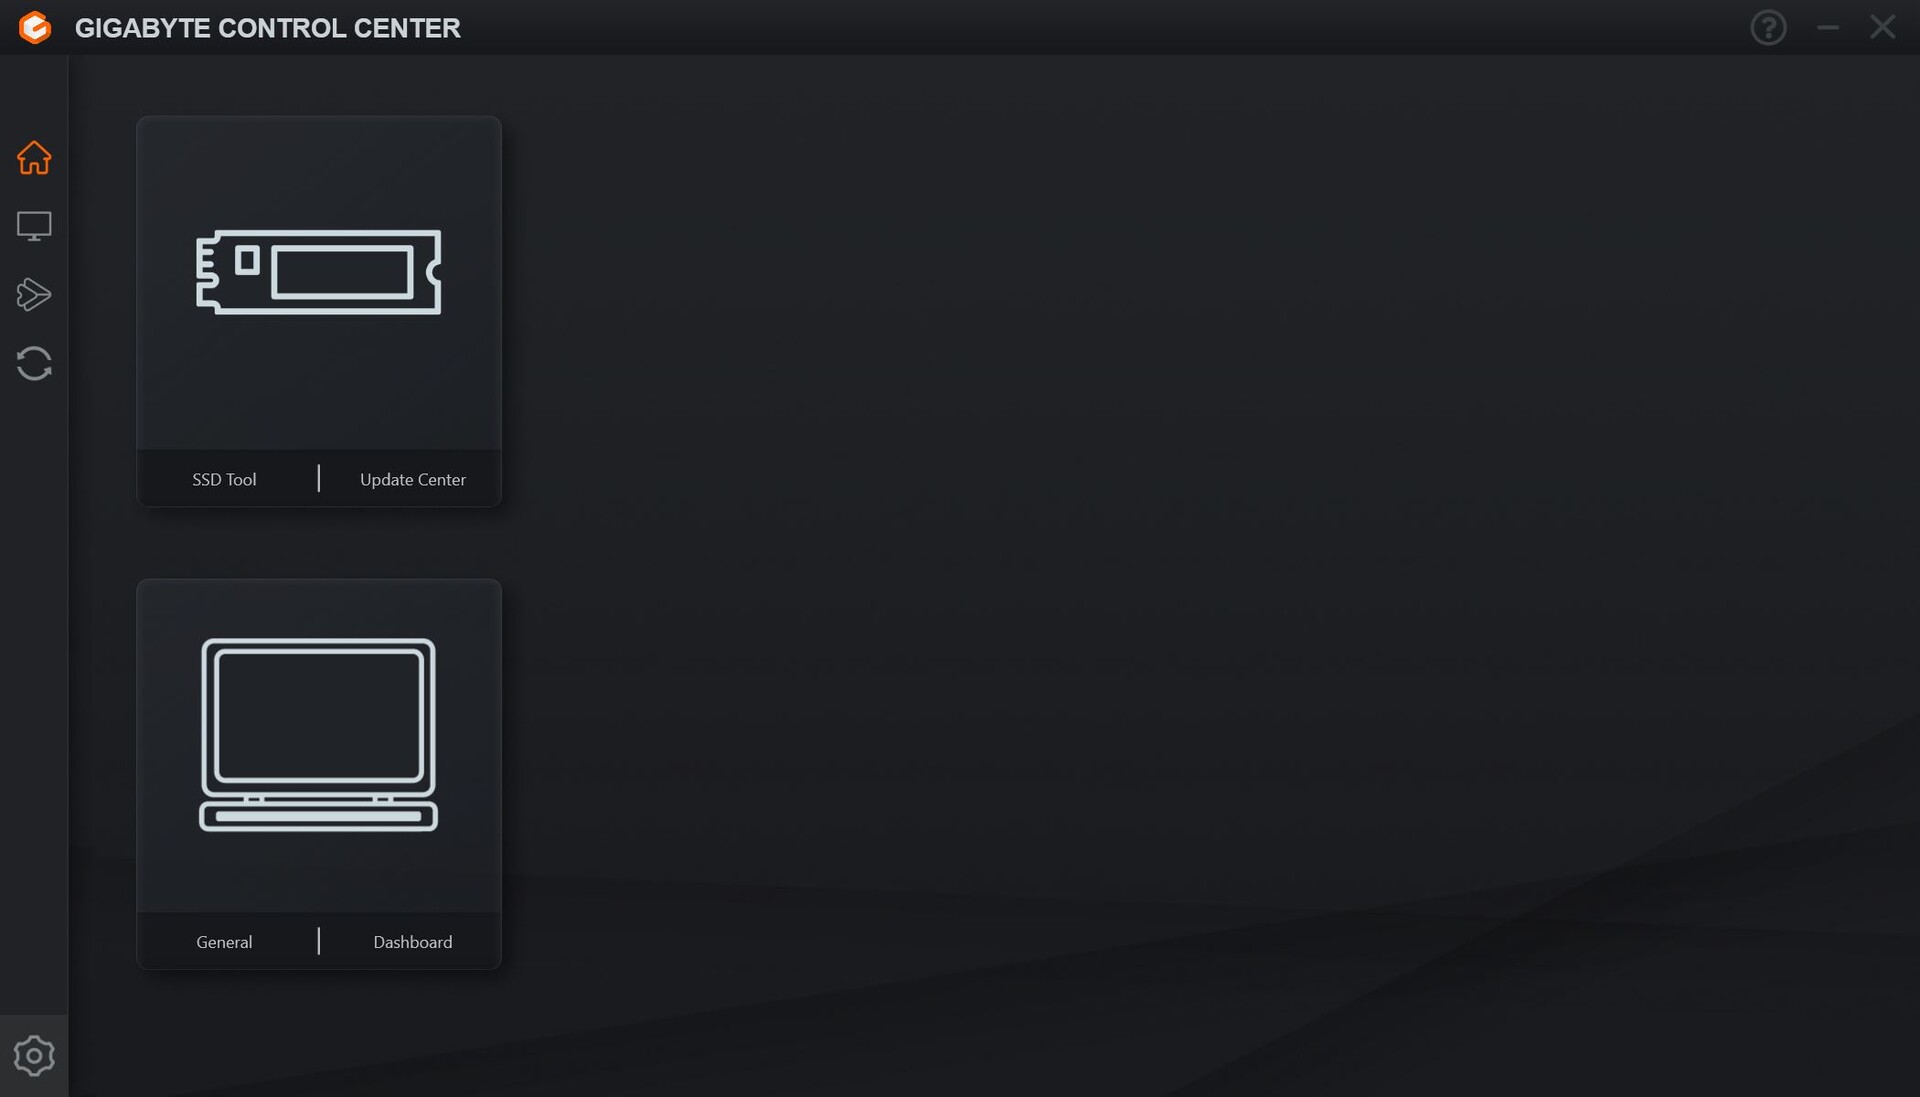
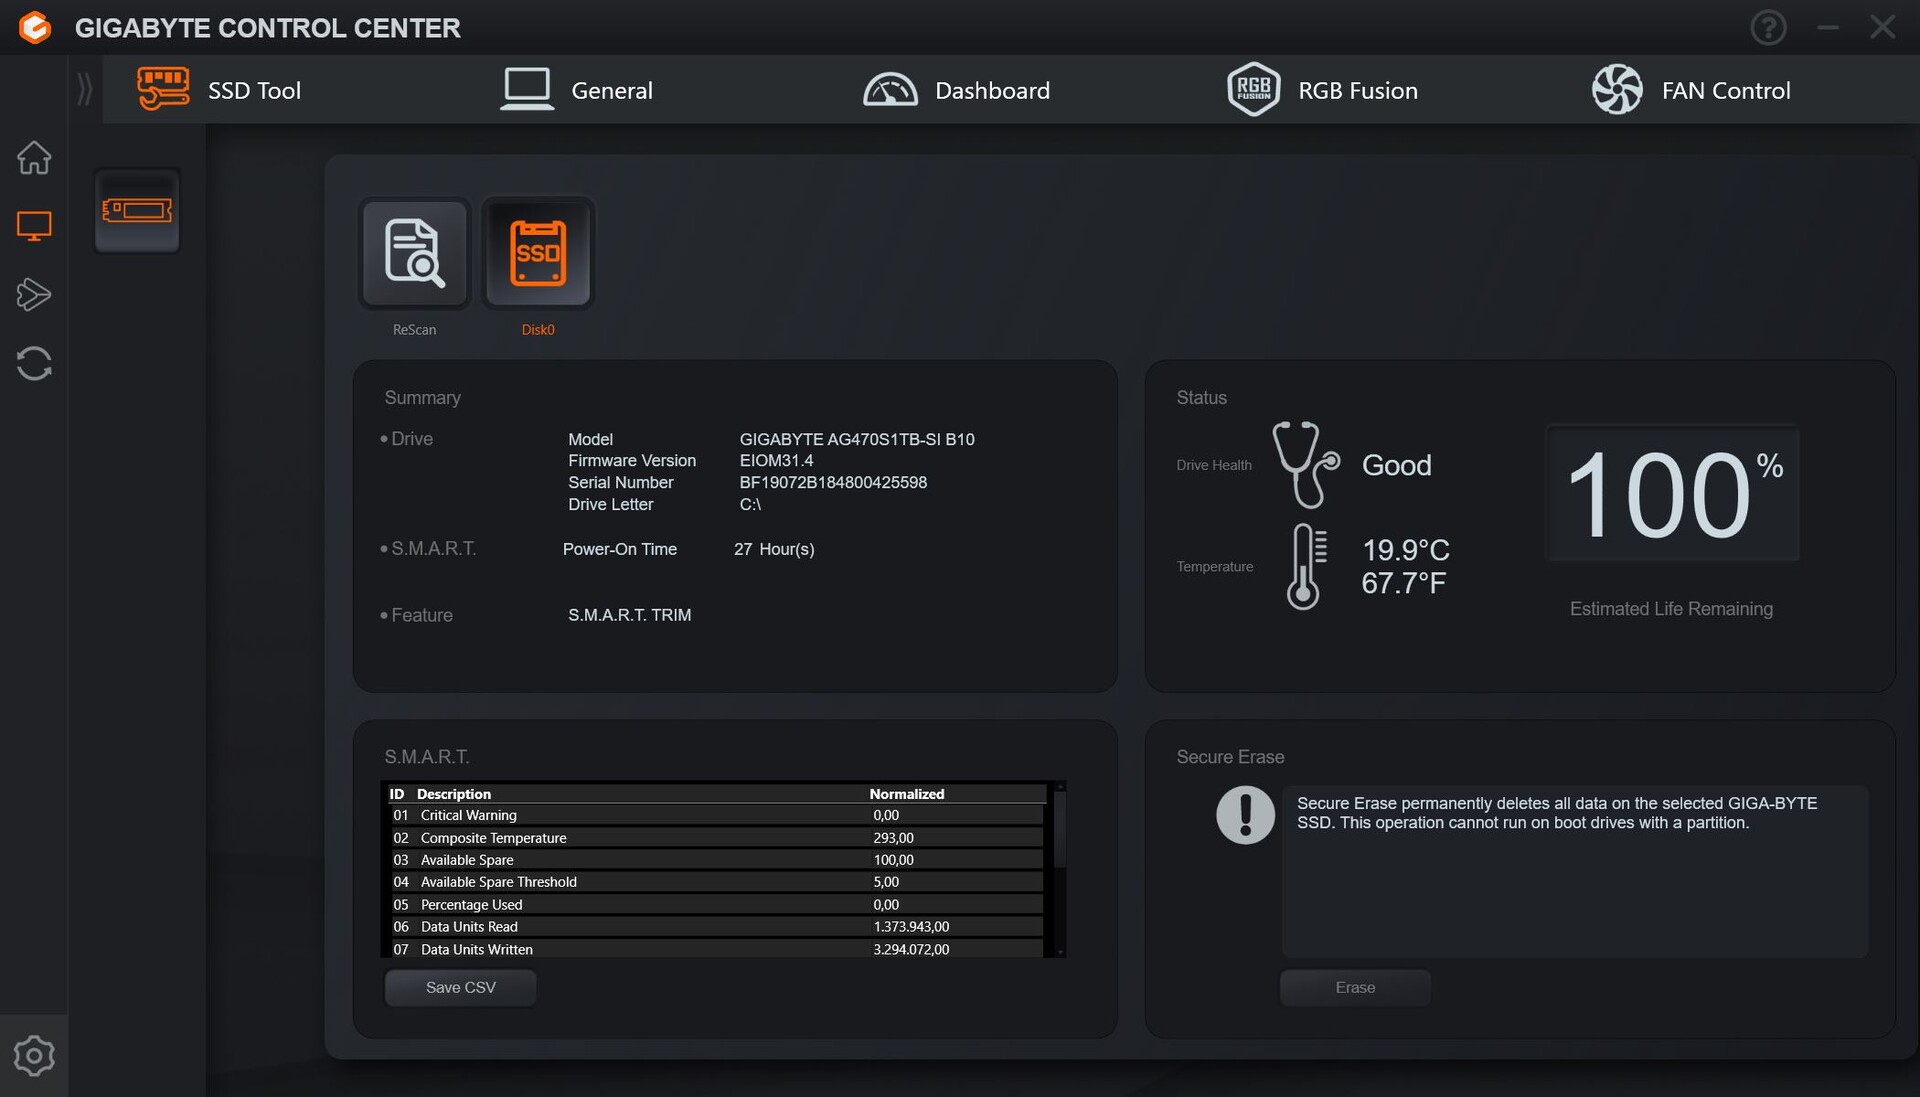
Ex works, the laptop didn't come preinstalled with a Control Center — it should or can be downloaded from the Gigabyte support website if needed.
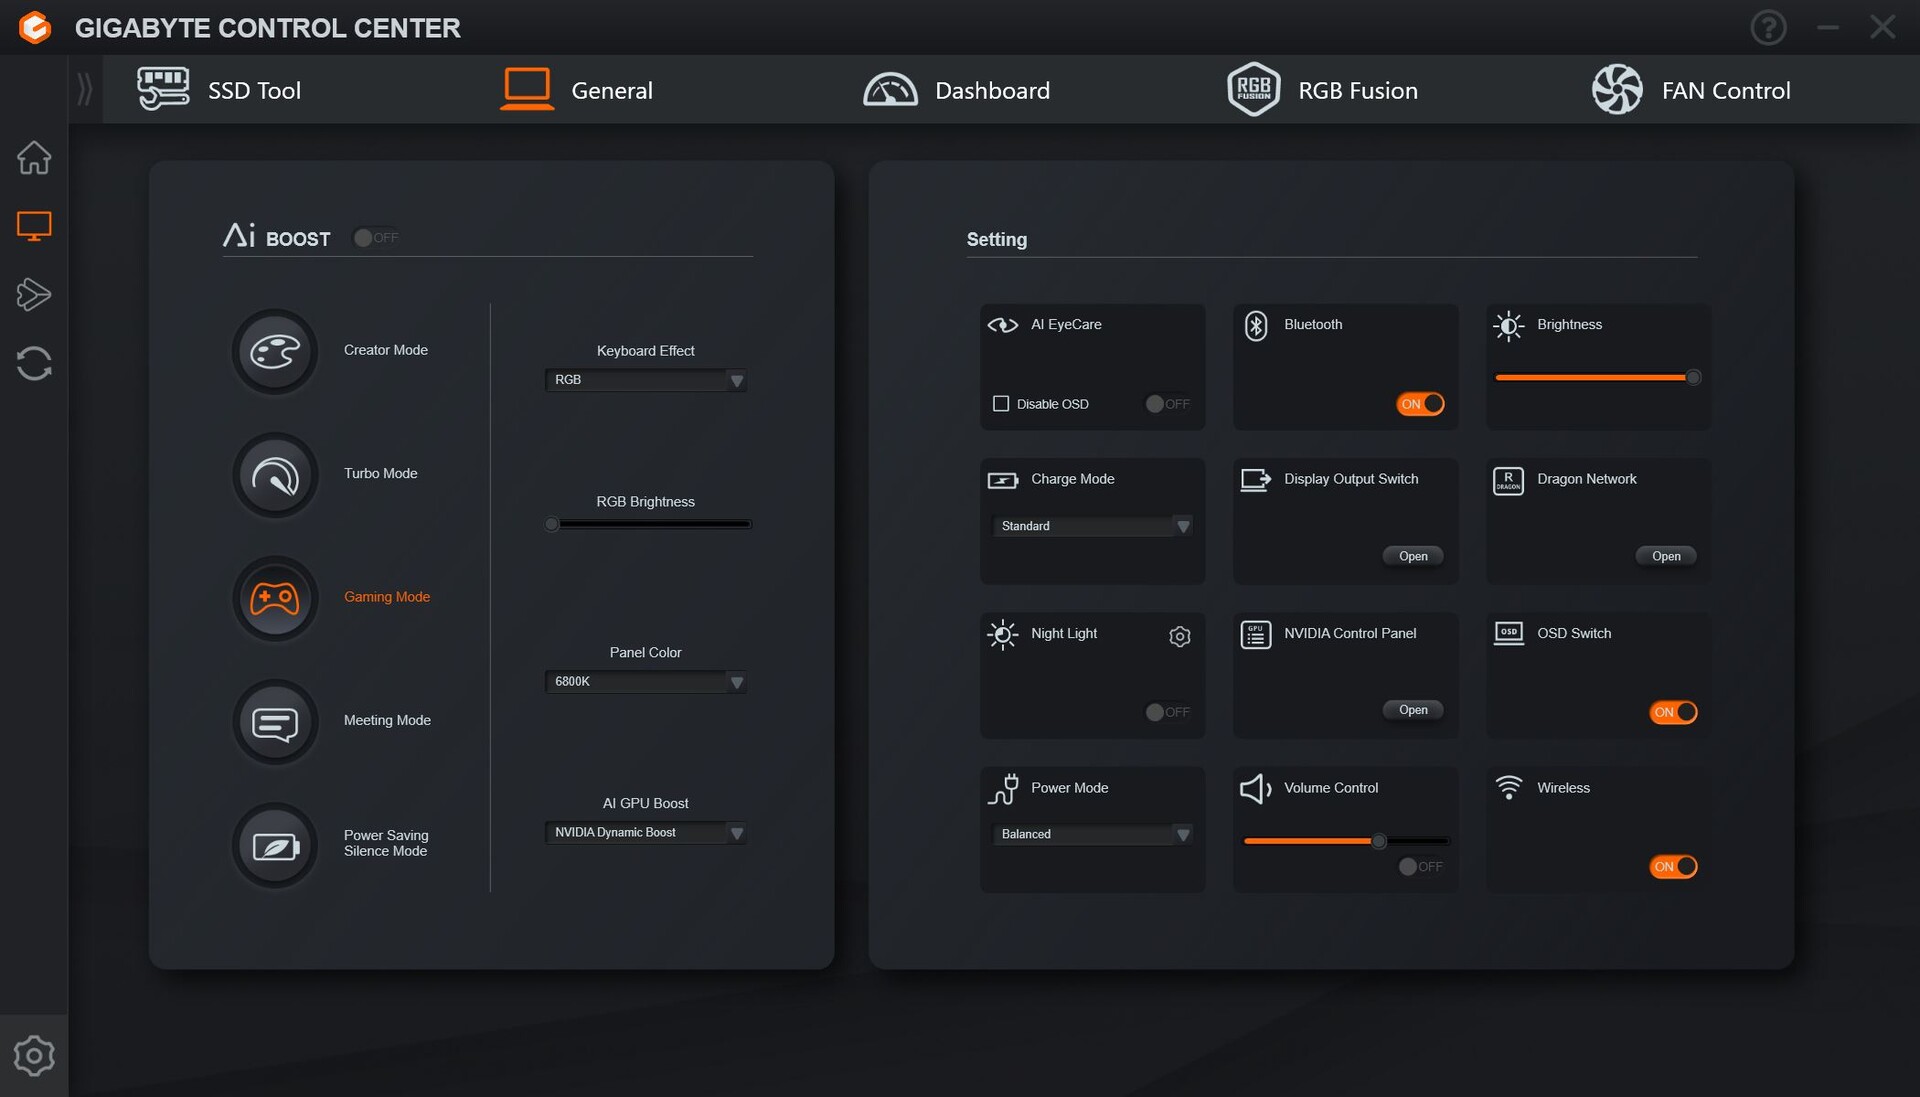
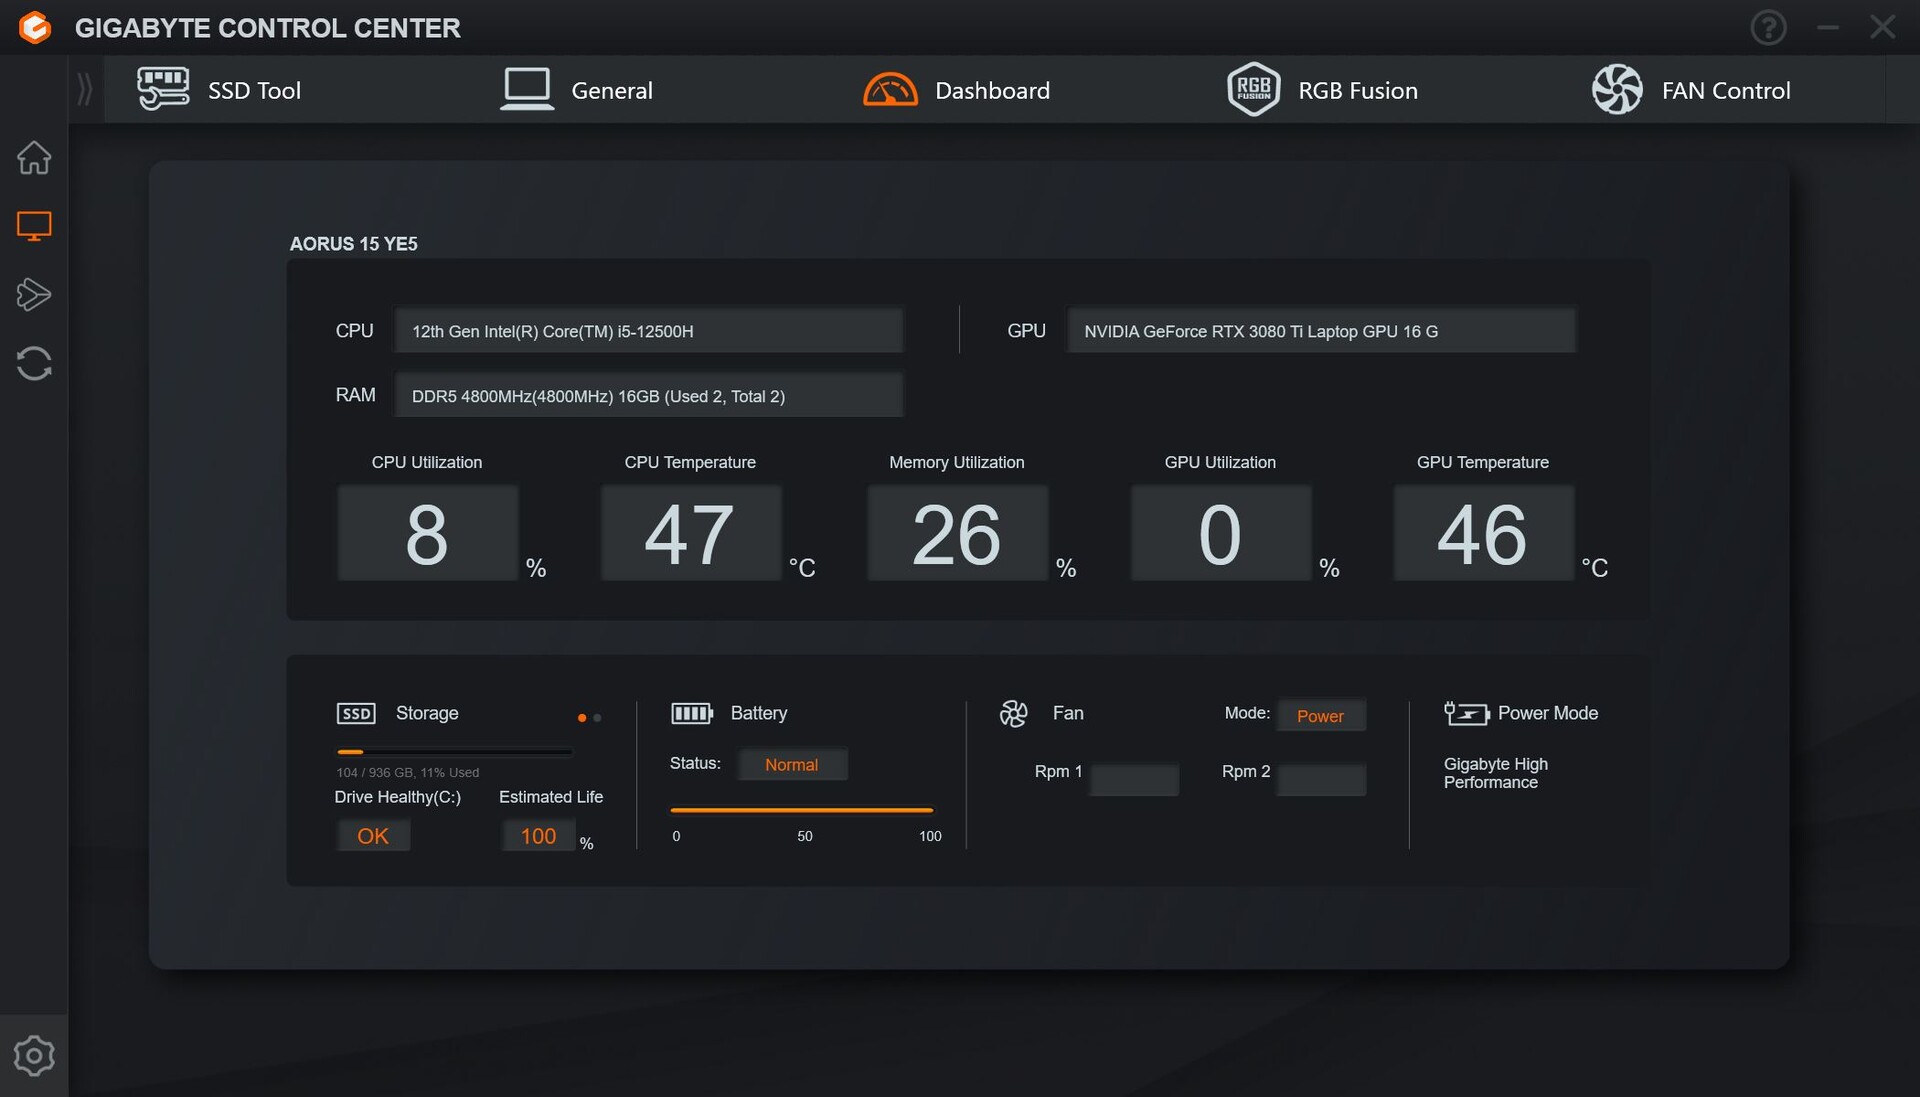
The Gigabyte Control Center contains lots of important settings that control performance, keyboard backlighting and SSD. The menu could do with being a little better structured, as the home screen doesn't seem to display any useful information — you are supposed to first select either the laptop itself or the SSD for more information. However, you can do the same in the relevant menus, which is why the home screen in particular seems nonsensical. We also missed the option to switch GPUs.
Otherwise, there are performance modes as well as fan curves, a separately adjustable performance mode and various other options. We used the gaming mode for our benchmarks. When using the even more powerful turbo mode, the fans always run at full speed.

A word about its standby mode: With Aorus (including the Aorus 15G), it seems to be common for the laptop to switch to standby as soon as the laptop lid is closed slightly. This is extremely annoying, for example, if you are using an external monitor and would like to fold the laptop lid forward slightly. However, the system switches off at around 40 to 45 degrees, which is really far too early and it gets on your nerves. A laptop should only switch off when it is actually closed and not halfway there.
Processor
The laptop features an Alder Lake CPU — the Core i5-12500H — with 4 P and 8 E cores. This adds up to 8 cores and 16 threads in total. The old upper mid-range CPU has saved the manufacturer money.
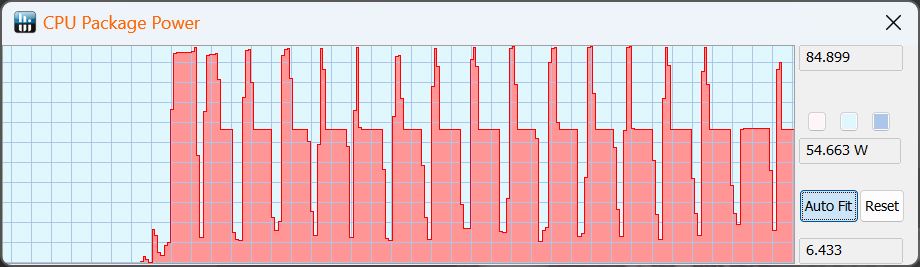
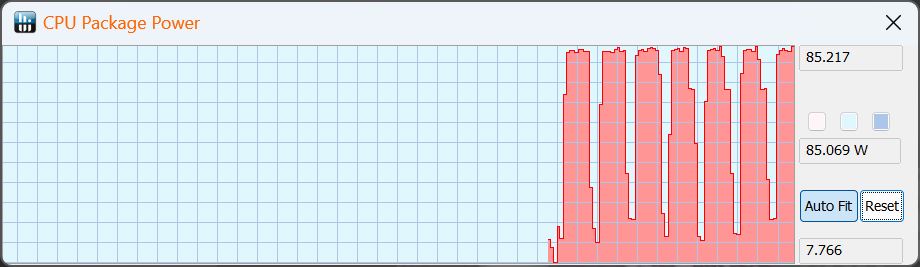
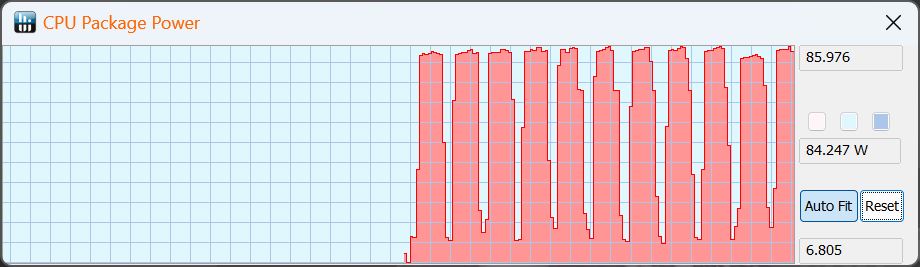
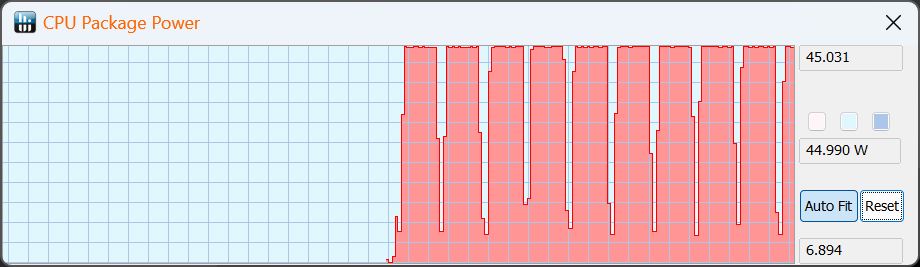
During the Cinebench R15 Loop, its performance sank a little within the first two runs, then remained stable.
Throughout all CPU tests, it became clear that Gen 13 offers a significant (but not enormous) speed advantage over Gen 12.
The Captiva with an i5-13500H came about 13 per cent ahead. The other competitors with the better i7-13700H ranged from being a low 8 per cent better (HP Victus) to a noticeable 22 per cent better (Aorus 15 BSF).
| Cinebench R15 | Multi-thread score (1st run) | CPU power consumption in watts |
|---|---|---|
| AI Boost | 2,277 | 85 |
| Turbo | 2,283 | 85 |
| Gaming | 2,283 | 85, drops to 55 |
| Creator | 2,239 | 85 |
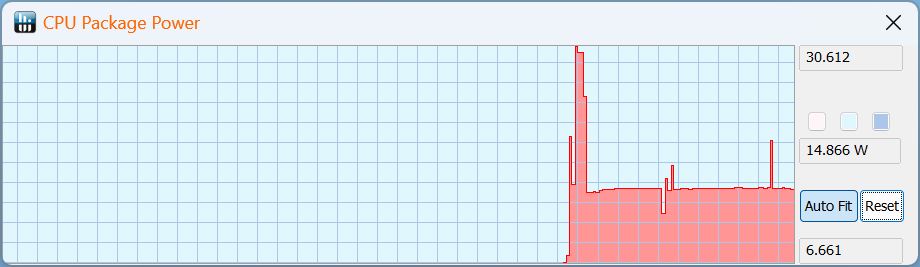
| Meeting | 836 | 30, drops quickly to 15 |
| Power Saver | 724 | 30, drops to 15 |
| Battery | 1,670 | 45 |
Cinebench R15 Multi continuous test
Cinebench R23: Multi Core | Single Core
Cinebench R20: CPU (Multi Core) | CPU (Single Core)
Cinebench R15: CPU Multi 64Bit | CPU Single 64Bit
Blender: v2.79 BMW27 CPU
7-Zip 18.03: 7z b 4 | 7z b 4 -mmt1
Geekbench 5.5: Multi-Core | Single-Core
HWBOT x265 Benchmark v2.2: 4k Preset
LibreOffice : 20 Documents To PDF
R Benchmark 2.5: Overall mean
| CPU Performance rating | |
| Average of class Gaming | |
| HP Omen 16-wf000 -1! | |
| Aorus 15 BSF | |
| Dell XPS 15 9530 RTX 4070 | |
| Captiva Advanced Gaming I74-121 | |
| HP Victus 16-r0077ng | |
| Aorus 15 YE5-54DEB34SH | |
| Average Intel Core i5-12500H | |
| Cinebench R23 / Multi Core | |
| Average of class Gaming (10488 - 40970, n=112, last 2 years) | |
| HP Omen 16-wf000 | |
| Aorus 15 BSF | |
| Captiva Advanced Gaming I74-121 | |
| Dell XPS 15 9530 RTX 4070 | |
| HP Victus 16-r0077ng | |
| Aorus 15 YE5-54DEB34SH | |
| Average Intel Core i5-12500H (11330 - 14686, n=9) | |
| Cinebench R23 / Single Core | |
| Average of class Gaming (1166 - 2356, n=112, last 2 years) | |
| Aorus 15 BSF | |
| HP Omen 16-wf000 | |
| Dell XPS 15 9530 RTX 4070 | |
| Captiva Advanced Gaming I74-121 | |
| Aorus 15 YE5-54DEB34SH | |
| HP Victus 16-r0077ng | |
| Average Intel Core i5-12500H (1558 - 1701, n=9) | |
| Cinebench R20 / CPU (Multi Core) | |
| Average of class Gaming (4029 - 16108, n=111, last 2 years) | |
| HP Omen 16-wf000 | |
| Aorus 15 BSF | |
| Captiva Advanced Gaming I74-121 | |
| Dell XPS 15 9530 RTX 4070 | |
| HP Victus 16-r0077ng | |
| Average Intel Core i5-12500H (4687 - 5640, n=9) | |
| Aorus 15 YE5-54DEB34SH | |
| Cinebench R20 / CPU (Single Core) | |
| Average of class Gaming (442 - 895, n=111, last 2 years) | |
| Aorus 15 BSF | |
| HP Omen 16-wf000 | |
| Dell XPS 15 9530 RTX 4070 | |
| Captiva Advanced Gaming I74-121 | |
| Aorus 15 YE5-54DEB34SH | |
| HP Victus 16-r0077ng | |
| Average Intel Core i5-12500H (602 - 656, n=9) | |
| Cinebench R15 / CPU Multi 64Bit | |
| Average of class Gaming (1578 - 6271, n=111, last 2 years) | |
| HP Omen 16-wf000 | |
| Aorus 15 BSF | |
| Dell XPS 15 9530 RTX 4070 | |
| Captiva Advanced Gaming I74-121 | |
| HP Victus 16-r0077ng | |
| Aorus 15 YE5-54DEB34SH | |
| Average Intel Core i5-12500H (1970 - 2283, n=10) | |
| Cinebench R15 / CPU Single 64Bit | |
| Average of class Gaming (188.8 - 343, n=111, last 2 years) | |
| Aorus 15 BSF | |
| Dell XPS 15 9530 RTX 4070 | |
| HP Omen 16-wf000 | |
| Captiva Advanced Gaming I74-121 | |
| Aorus 15 YE5-54DEB34SH | |
| HP Victus 16-r0077ng | |
| Average Intel Core i5-12500H (220 - 250, n=9) | |
| Blender / v2.79 BMW27 CPU | |
| Aorus 15 YE5-54DEB34SH | |
| Average Intel Core i5-12500H (223 - 288, n=9) | |
| Aorus 15 BSF | |
| Dell XPS 15 9530 RTX 4070 | |
| HP Victus 16-r0077ng | |
| Captiva Advanced Gaming I74-121 | |
| Average of class Gaming (80 - 330, n=109, last 2 years) | |
| 7-Zip 18.03 / 7z b 4 | |
| Average of class Gaming (33491 - 148086, n=110, last 2 years) | |
| HP Omen 16-wf000 | |
| HP Victus 16-r0077ng | |
| Aorus 15 BSF | |
| Dell XPS 15 9530 RTX 4070 | |
| Captiva Advanced Gaming I74-121 | |
| Aorus 15 YE5-54DEB34SH | |
| Average Intel Core i5-12500H (44105 - 54380, n=9) | |
| 7-Zip 18.03 / 7z b 4 -mmt1 | |
| Average of class Gaming (4199 - 7436, n=110, last 2 years) | |
| Aorus 15 BSF | |
| Dell XPS 15 9530 RTX 4070 | |
| HP Omen 16-wf000 | |
| Captiva Advanced Gaming I74-121 | |
| HP Victus 16-r0077ng | |
| Aorus 15 YE5-54DEB34SH | |
| Average Intel Core i5-12500H (5151 - 5563, n=9) | |
| Geekbench 5.5 / Multi-Core | |
| Average of class Gaming (6460 - 27010, n=110, last 2 years) | |
| HP Omen 16-wf000 | |
| Aorus 15 BSF | |
| Dell XPS 15 9530 RTX 4070 | |
| HP Victus 16-r0077ng | |
| Aorus 15 YE5-54DEB34SH | |
| Captiva Advanced Gaming I74-121 | |
| Average Intel Core i5-12500H (7962 - 10828, n=9) | |
| Geekbench 5.5 / Single-Core | |
| Average of class Gaming (986 - 2474, n=110, last 2 years) | |
| Dell XPS 15 9530 RTX 4070 | |
| HP Omen 16-wf000 | |
| Aorus 15 BSF | |
| Captiva Advanced Gaming I74-121 | |
| HP Victus 16-r0077ng | |
| Aorus 15 YE5-54DEB34SH | |
| Average Intel Core i5-12500H (1471 - 1693, n=9) | |
| HWBOT x265 Benchmark v2.2 / 4k Preset | |
| Average of class Gaming (11.5 - 44.3, n=110, last 2 years) | |
| HP Omen 16-wf000 | |
| Captiva Advanced Gaming I74-121 | |
| Dell XPS 15 9530 RTX 4070 | |
| HP Victus 16-r0077ng | |
| Aorus 15 BSF | |
| Aorus 15 YE5-54DEB34SH | |
| Average Intel Core i5-12500H (12 - 16.6, n=9) | |
| LibreOffice / 20 Documents To PDF | |
| HP Victus 16-r0077ng | |
| Aorus 15 YE5-54DEB34SH | |
| Captiva Advanced Gaming I74-121 | |
| Average of class Gaming (19 - 88.8, n=110, last 2 years) | |
| Average Intel Core i5-12500H (40.1 - 58.5, n=9) | |
| Aorus 15 BSF | |
| HP Omen 16-wf000 | |
| Dell XPS 15 9530 RTX 4070 | |
| R Benchmark 2.5 / Overall mean | |
| Aorus 15 YE5-54DEB34SH | |
| Average Intel Core i5-12500H (0.4748 - 0.535, n=9) | |
| HP Victus 16-r0077ng | |
| Captiva Advanced Gaming I74-121 | |
| HP Omen 16-wf000 | |
| Aorus 15 BSF | |
| Dell XPS 15 9530 RTX 4070 | |
| Average of class Gaming (0.3439 - 0.759, n=111, last 2 years) | |
* ... smaller is better
AIDA64: FP32 Ray-Trace | FPU Julia | CPU SHA3 | CPU Queen | FPU SinJulia | FPU Mandel | CPU AES | CPU ZLib | FP64 Ray-Trace | CPU PhotoWorxx
| Performance rating | |
| Average of class Gaming | |
| Aorus 15 BSF | |
| Captiva Advanced Gaming I74-121 | |
| Dell XPS 15 9530 RTX 4070 | |
| HP Victus 16-r0077ng | |
| Aorus 15 YE5-54DEB34SH | |
| Average Intel Core i5-12500H | |
| AIDA64 / FP32 Ray-Trace | |
| Average of class Gaming (10227 - 85542, n=109, last 2 years) | |
| Captiva Advanced Gaming I74-121 | |
| HP Victus 16-r0077ng | |
| Dell XPS 15 9530 RTX 4070 | |
| Aorus 15 BSF | |
| Aorus 15 YE5-54DEB34SH | |
| Average Intel Core i5-12500H (6851 - 13947, n=9) | |
| AIDA64 / FPU Julia | |
| Average of class Gaming (51376 - 238426, n=109, last 2 years) | |
| Captiva Advanced Gaming I74-121 | |
| HP Victus 16-r0077ng | |
| Aorus 15 BSF | |
| Dell XPS 15 9530 RTX 4070 | |
| Aorus 15 YE5-54DEB34SH | |
| Average Intel Core i5-12500H (29874 - 68178, n=9) | |
| AIDA64 / CPU SHA3 | |
| Average of class Gaming (2180 - 9817, n=109, last 2 years) | |
| Captiva Advanced Gaming I74-121 | |
| HP Victus 16-r0077ng | |
| Aorus 15 BSF | |
| Dell XPS 15 9530 RTX 4070 | |
| Aorus 15 YE5-54DEB34SH | |
| Average Intel Core i5-12500H (2287 - 3337, n=9) | |
| AIDA64 / CPU Queen | |
| Average of class Gaming (49785 - 173351, n=98, last 2 years) | |
| Aorus 15 BSF | |
| Dell XPS 15 9530 RTX 4070 | |
| HP Victus 16-r0077ng | |
| Captiva Advanced Gaming I74-121 | |
| Aorus 15 YE5-54DEB34SH | |
| Average Intel Core i5-12500H (77935 - 80703, n=9) | |
| AIDA64 / FPU SinJulia | |
| Average of class Gaming (4424 - 33636, n=109, last 2 years) | |
| Aorus 15 BSF | |
| Dell XPS 15 9530 RTX 4070 | |
| HP Victus 16-r0077ng | |
| Captiva Advanced Gaming I74-121 | |
| Aorus 15 YE5-54DEB34SH | |
| Average Intel Core i5-12500H (6590 - 7431, n=9) | |
| AIDA64 / FPU Mandel | |
| Average of class Gaming (25115 - 128721, n=109, last 2 years) | |
| Captiva Advanced Gaming I74-121 | |
| HP Victus 16-r0077ng | |
| Dell XPS 15 9530 RTX 4070 | |
| Aorus 15 BSF | |
| Aorus 15 YE5-54DEB34SH | |
| Average Intel Core i5-12500H (18252 - 34041, n=9) | |
| AIDA64 / CPU AES | |
| Captiva Advanced Gaming I74-121 | |
| Aorus 15 BSF | |
| Aorus 15 YE5-54DEB34SH | |
| Average of class Gaming (39258 - 247074, n=109, last 2 years) | |
| Average Intel Core i5-12500H (50298 - 111567, n=9) | |
| HP Victus 16-r0077ng | |
| Dell XPS 15 9530 RTX 4070 | |
| AIDA64 / CPU ZLib | |
| Average of class Gaming (574 - 2531, n=109, last 2 years) | |
| Captiva Advanced Gaming I74-121 | |
| HP Victus 16-r0077ng | |
| Aorus 15 YE5-54DEB34SH | |
| Dell XPS 15 9530 RTX 4070 | |
| Aorus 15 BSF | |
| Average Intel Core i5-12500H (746 - 924, n=9) | |
| AIDA64 / FP64 Ray-Trace | |
| Average of class Gaming (5509 - 45446, n=109, last 2 years) | |
| Captiva Advanced Gaming I74-121 | |
| HP Victus 16-r0077ng | |
| Dell XPS 15 9530 RTX 4070 | |
| Aorus 15 BSF | |
| Aorus 15 YE5-54DEB34SH | |
| Average Intel Core i5-12500H (3848 - 7405, n=9) | |
| AIDA64 / CPU PhotoWorxx | |
| Dell XPS 15 9530 RTX 4070 | |
| Average of class Gaming (12271 - 89891, n=109, last 2 years) | |
| HP Victus 16-r0077ng | |
| Aorus 15 BSF | |
| Aorus 15 YE5-54DEB34SH | |
| Average Intel Core i5-12500H (13686 - 43813, n=9) | |
| Captiva Advanced Gaming I74-121 | |
System performance
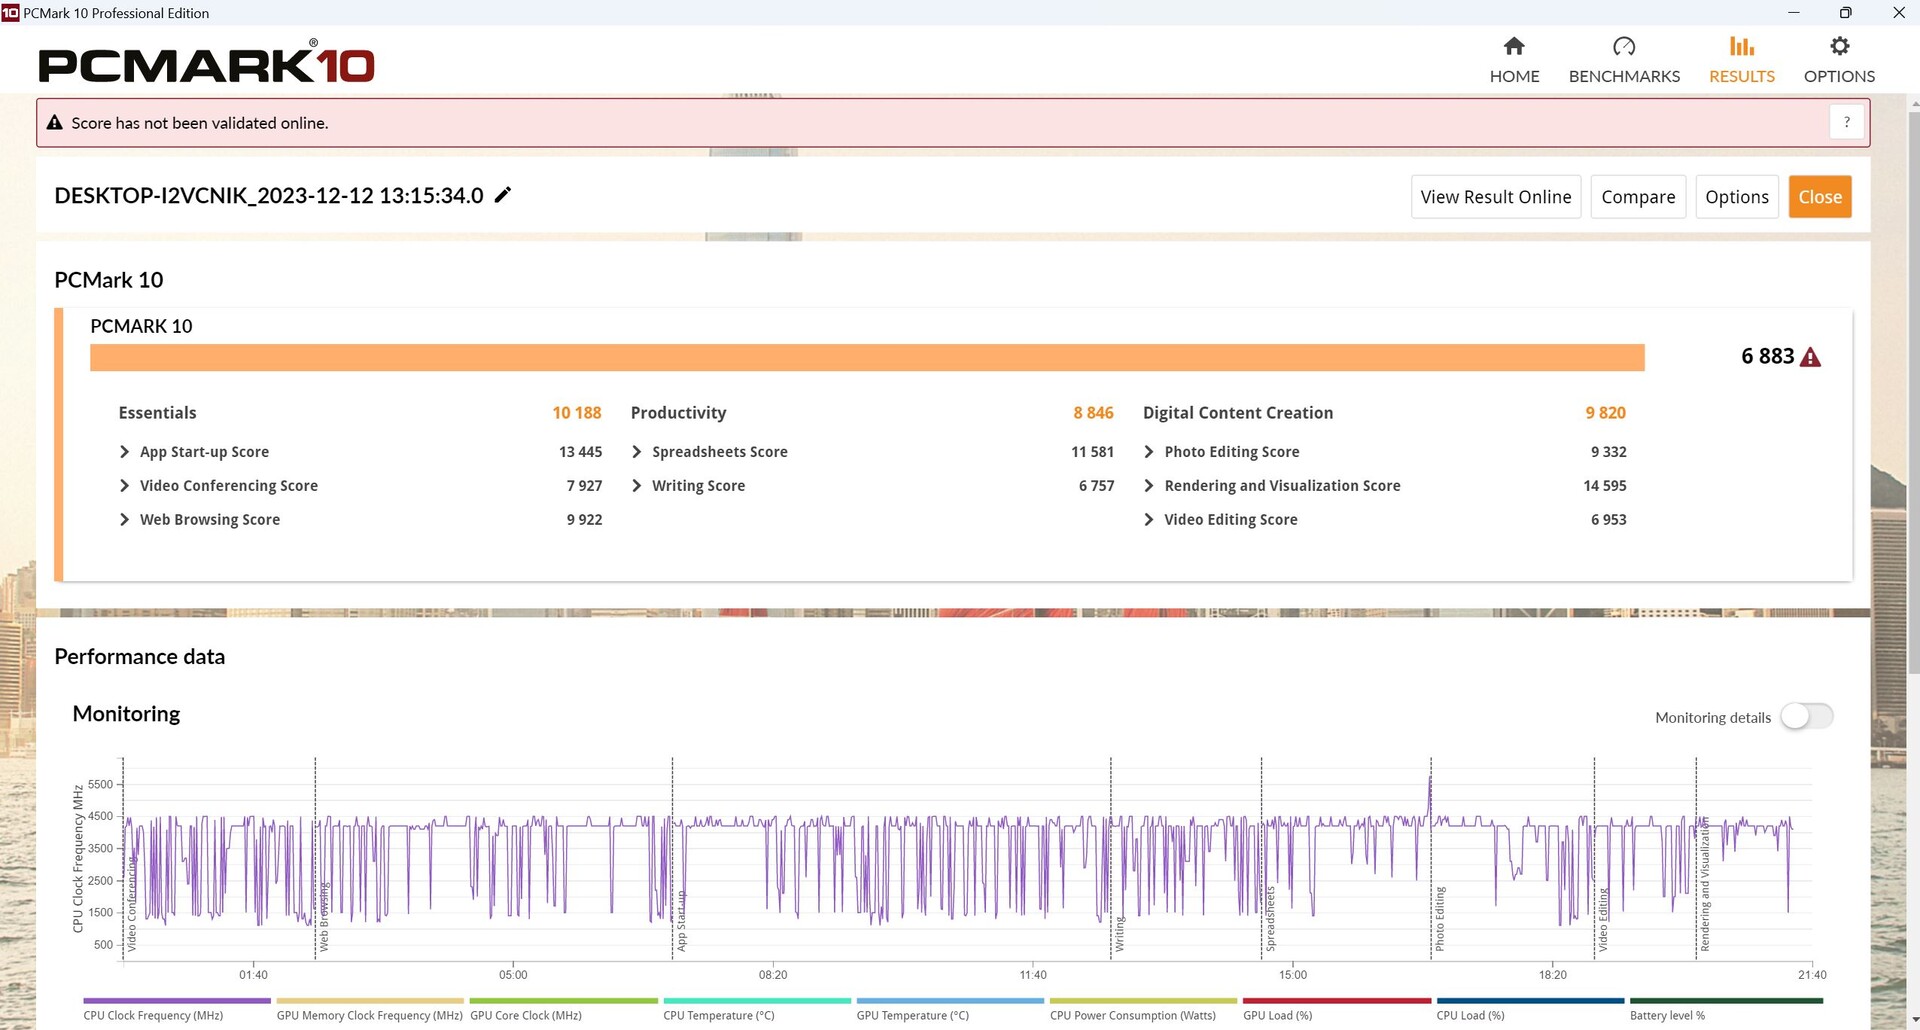
During PCMark 10, the Captiva with the successor CPU came about 7 per cent ahead, whereas both devices did the same during CrossMark.
CrossMark: Overall | Productivity | Creativity | Responsiveness
WebXPRT 3: Overall
WebXPRT 4: Overall
Mozilla Kraken 1.1: Total
| PCMark 10 / Score | |
| Average of class Gaming (5828 - 11574, n=96, last 2 years) | |
| HP Omen 16-wf000 | |
| Captiva Advanced Gaming I74-121 | |
| Aorus 15 BSF | |
| Dell XPS 15 9530 RTX 4070 | |
| HP Victus 16-r0077ng | |
| Aorus 15 YE5-54DEB34SH | |
| Average Intel Core i5-12500H, NVIDIA GeForce RTX 3080 Ti Laptop GPU (n=1) | |
| PCMark 10 / Essentials | |
| Captiva Advanced Gaming I74-121 | |
| Dell XPS 15 9530 RTX 4070 | |
| Aorus 15 BSF | |
| HP Victus 16-r0077ng | |
| Average of class Gaming (8810 - 12600, n=100, last 2 years) | |
| HP Omen 16-wf000 | |
| Aorus 15 YE5-54DEB34SH | |
| Average Intel Core i5-12500H, NVIDIA GeForce RTX 3080 Ti Laptop GPU (n=1) | |
| PCMark 10 / Productivity | |
| Average of class Gaming (6845 - 21327, n=98, last 2 years) | |
| HP Omen 16-wf000 | |
| Captiva Advanced Gaming I74-121 | |
| Aorus 15 BSF | |
| HP Victus 16-r0077ng | |
| Aorus 15 YE5-54DEB34SH | |
| Average Intel Core i5-12500H, NVIDIA GeForce RTX 3080 Ti Laptop GPU (n=1) | |
| Dell XPS 15 9530 RTX 4070 | |
| PCMark 10 / Digital Content Creation | |
| Average of class Gaming (7602 - 19657, n=98, last 2 years) | |
| HP Omen 16-wf000 | |
| Aorus 15 BSF | |
| Dell XPS 15 9530 RTX 4070 | |
| Captiva Advanced Gaming I74-121 | |
| HP Victus 16-r0077ng | |
| Aorus 15 YE5-54DEB34SH | |
| Average Intel Core i5-12500H, NVIDIA GeForce RTX 3080 Ti Laptop GPU (n=1) | |
| CrossMark / Overall | |
| Aorus 15 BSF | |
| Average of class Gaming (1366 - 2409, n=97, last 2 years) | |
| Dell XPS 15 9530 RTX 4070 | |
| HP Omen 16-wf000 | |
| Captiva Advanced Gaming I74-121 | |
| Aorus 15 YE5-54DEB34SH | |
| Average Intel Core i5-12500H, NVIDIA GeForce RTX 3080 Ti Laptop GPU (n=1) | |
| CrossMark / Productivity | |
| Aorus 15 BSF | |
| Average of class Gaming (1386 - 2254, n=97, last 2 years) | |
| Dell XPS 15 9530 RTX 4070 | |
| Captiva Advanced Gaming I74-121 | |
| Aorus 15 YE5-54DEB34SH | |
| Average Intel Core i5-12500H, NVIDIA GeForce RTX 3080 Ti Laptop GPU (n=1) | |
| HP Omen 16-wf000 | |
| CrossMark / Creativity | |
| Average of class Gaming (1343 - 2729, n=97, last 2 years) | |
| Dell XPS 15 9530 RTX 4070 | |
| Aorus 15 BSF | |
| HP Omen 16-wf000 | |
| Aorus 15 YE5-54DEB34SH | |
| Average Intel Core i5-12500H, NVIDIA GeForce RTX 3080 Ti Laptop GPU (n=1) | |
| Captiva Advanced Gaming I74-121 | |
| CrossMark / Responsiveness | |
| Aorus 15 BSF | |
| Average of class Gaming (1226 - 2334, n=97, last 2 years) | |
| Dell XPS 15 9530 RTX 4070 | |
| Captiva Advanced Gaming I74-121 | |
| Aorus 15 YE5-54DEB34SH | |
| Average Intel Core i5-12500H, NVIDIA GeForce RTX 3080 Ti Laptop GPU (n=1) | |
| HP Omen 16-wf000 | |
| WebXPRT 3 / Overall | |
| Dell XPS 15 9530 RTX 4070 | |
| Average of class Gaming (242 - 532, n=101, last 2 years) | |
| Aorus 15 BSF | |
| HP Omen 16-wf000 | |
| HP Victus 16-r0077ng | |
| HP Victus 16-r0077ng | |
| Captiva Advanced Gaming I74-121 | |
| Captiva Advanced Gaming I74-121 | |
| Aorus 15 YE5-54DEB34SH | |
| Average Intel Core i5-12500H, NVIDIA GeForce RTX 3080 Ti Laptop GPU (n=1) | |
| WebXPRT 4 / Overall | |
| Average of class Gaming (176.4 - 354, n=101, last 2 years) | |
| Dell XPS 15 9530 RTX 4070 | |
| Aorus 15 BSF | |
| HP Omen 16-wf000 | |
| HP Victus 16-r0077ng | |
| HP Victus 16-r0077ng | |
| Aorus 15 YE5-54DEB34SH | |
| Average Intel Core i5-12500H, NVIDIA GeForce RTX 3080 Ti Laptop GPU (n=1) | |
| Captiva Advanced Gaming I74-121 | |
| Captiva Advanced Gaming I74-121 | |
| Mozilla Kraken 1.1 / Total | |
| Aorus 15 YE5-54DEB34SH | |
| Average Intel Core i5-12500H, NVIDIA GeForce RTX 3080 Ti Laptop GPU (n=1) | |
| HP Victus 16-r0077ng | |
| HP Victus 16-r0077ng | |
| Captiva Advanced Gaming I74-121 | |
| Captiva Advanced Gaming I74-121 | |
| HP Omen 16-wf000 | |
| Dell XPS 15 9530 RTX 4070 | |
| Aorus 15 BSF | |
| Average of class Gaming (391 - 590, n=106, last 2 years) | |
* ... smaller is better
| PCMark 10 Score | 6883 points | |
Help | ||
| AIDA64 / Memory Copy | |
| Average of class Gaming (21750 - 129946, n=109, last 2 years) | |
| Dell XPS 15 9530 RTX 4070 | |
| HP Victus 16-r0077ng | |
| Aorus 15 BSF | |
| Aorus 15 YE5-54DEB34SH | |
| Average Intel Core i5-12500H (23850 - 66598, n=9) | |
| Captiva Advanced Gaming I74-121 | |
| AIDA64 / Memory Read | |
| Average of class Gaming (22956 - 118858, n=109, last 2 years) | |
| Dell XPS 15 9530 RTX 4070 | |
| HP Victus 16-r0077ng | |
| Aorus 15 BSF | |
| Aorus 15 YE5-54DEB34SH | |
| Average Intel Core i5-12500H (24879 - 68013, n=9) | |
| Captiva Advanced Gaming I74-121 | |
| AIDA64 / Memory Write | |
| Aorus 15 BSF | |
| Average of class Gaming (22297 - 135096, n=109, last 2 years) | |
| Dell XPS 15 9530 RTX 4070 | |
| HP Victus 16-r0077ng | |
| Aorus 15 YE5-54DEB34SH | |
| Average Intel Core i5-12500H (23543 - 58797, n=9) | |
| Captiva Advanced Gaming I74-121 | |
| AIDA64 / Memory Latency | |
| Average of class Gaming (75.3 - 259, n=109, last 2 years) | |
| Aorus 15 YE5-54DEB34SH | |
| Average Intel Core i5-12500H (83.8 - 114.7, n=9) | |
| HP Victus 16-r0077ng | |
| Aorus 15 BSF | |
| Dell XPS 15 9530 RTX 4070 | |
| Captiva Advanced Gaming I74-121 | |
* ... smaller is better
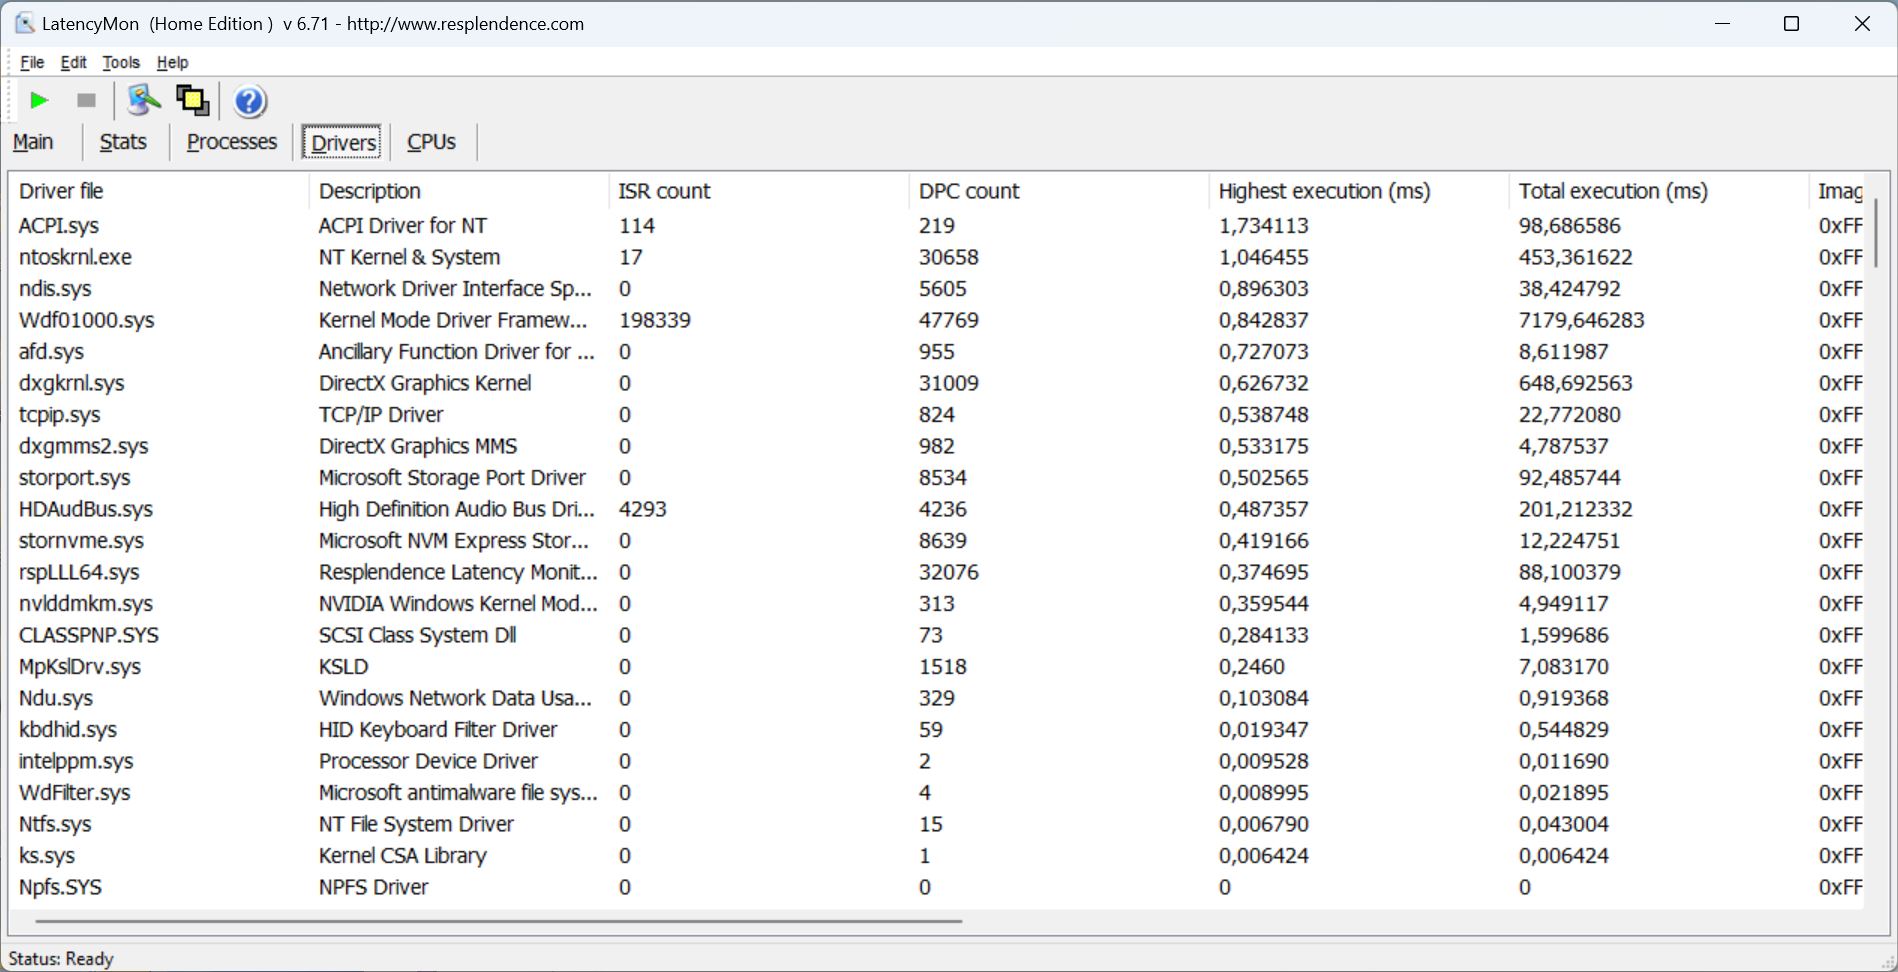
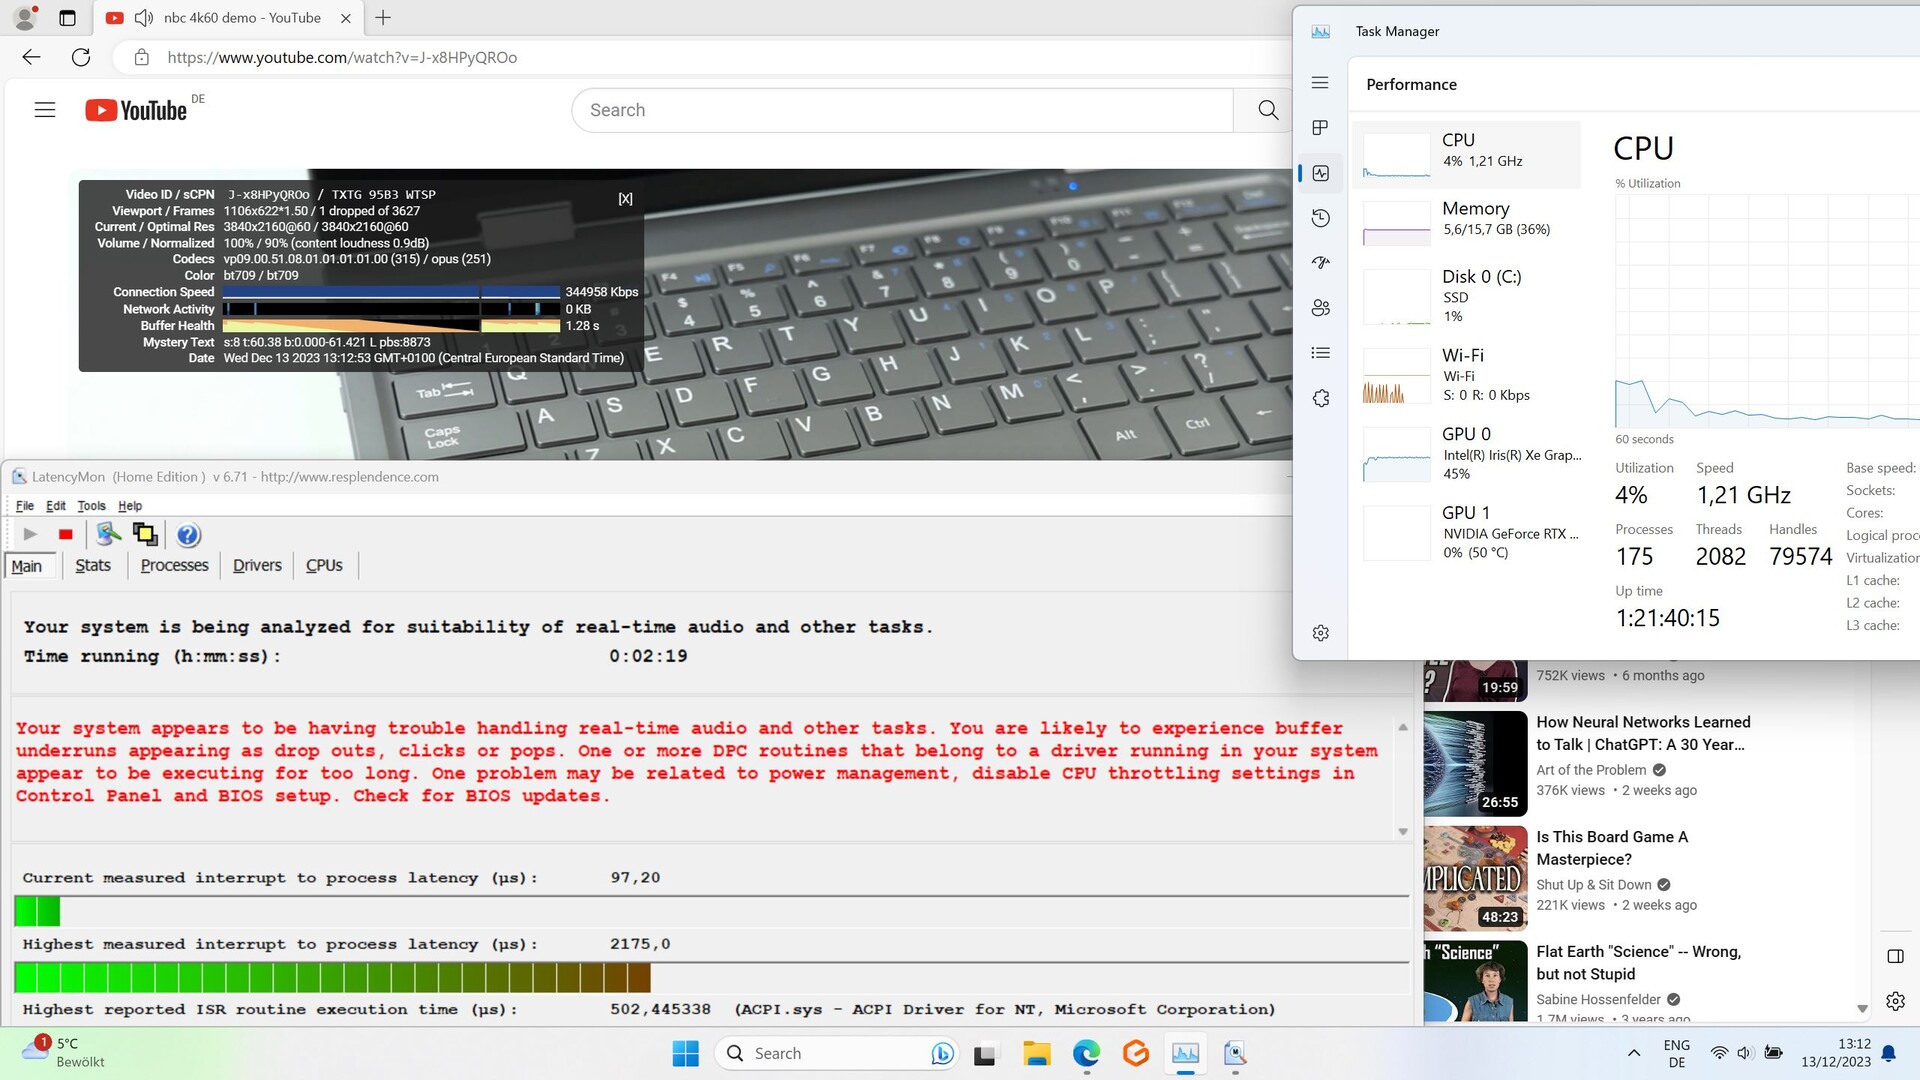
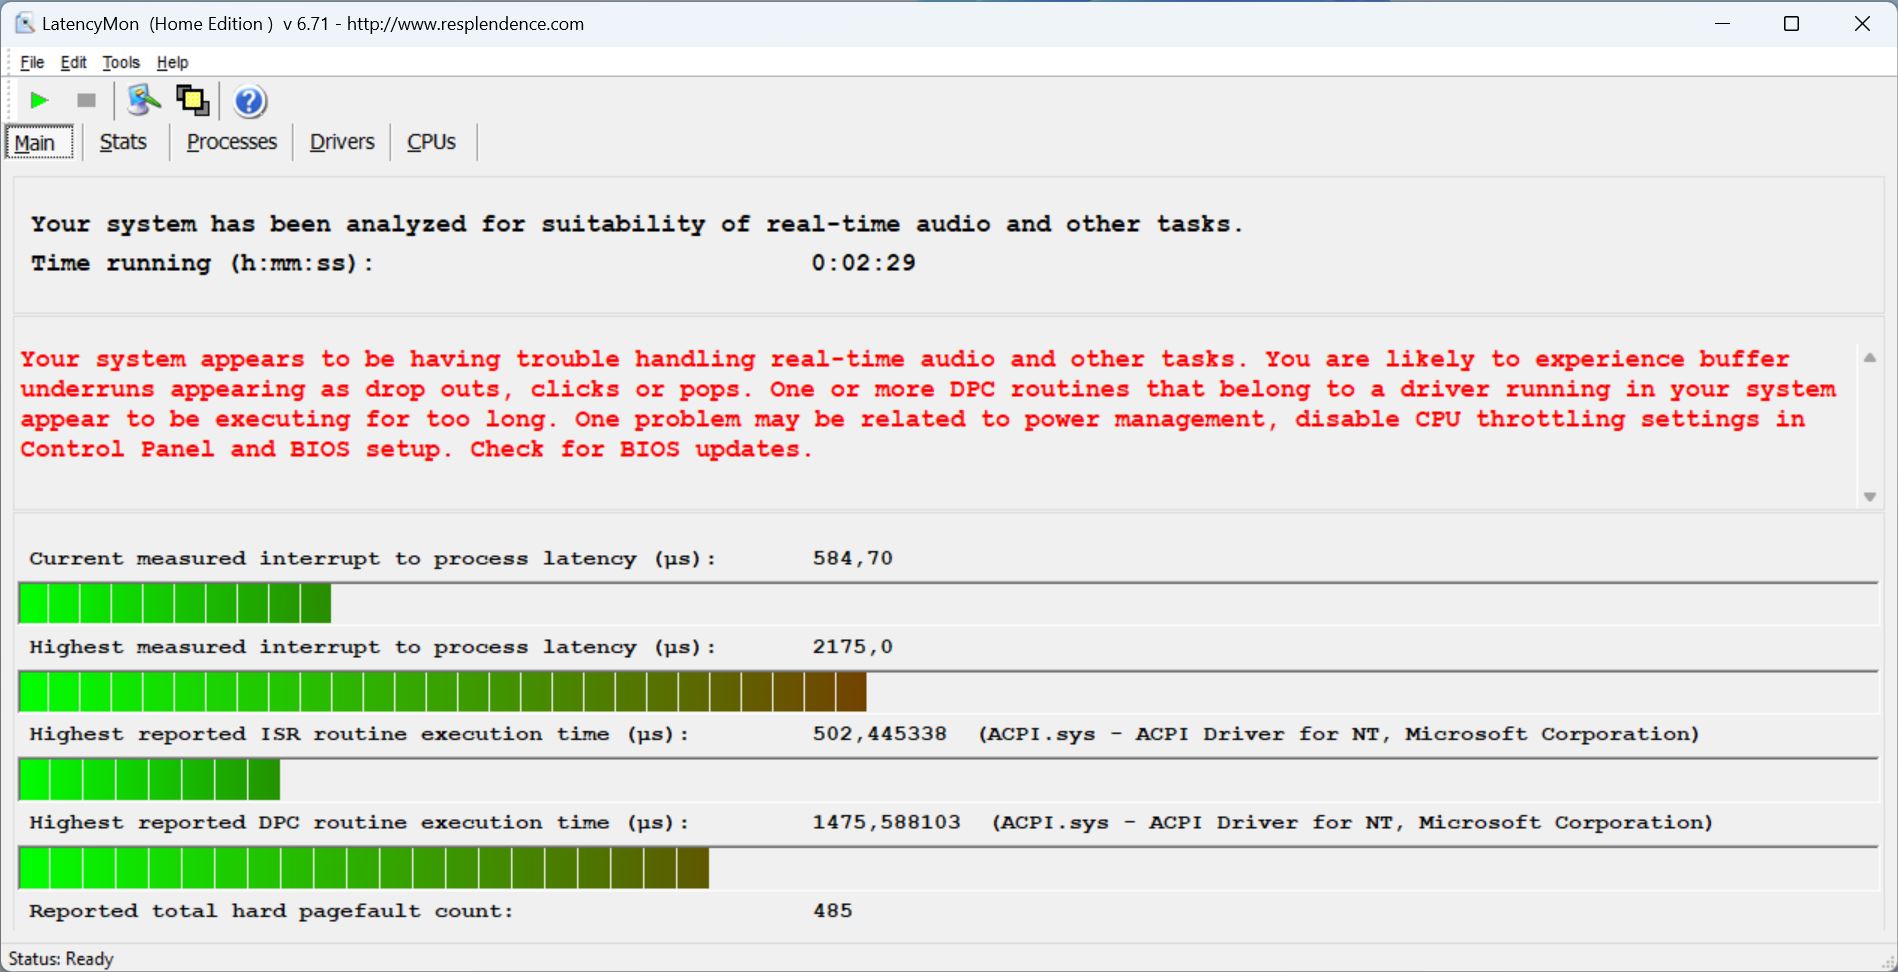
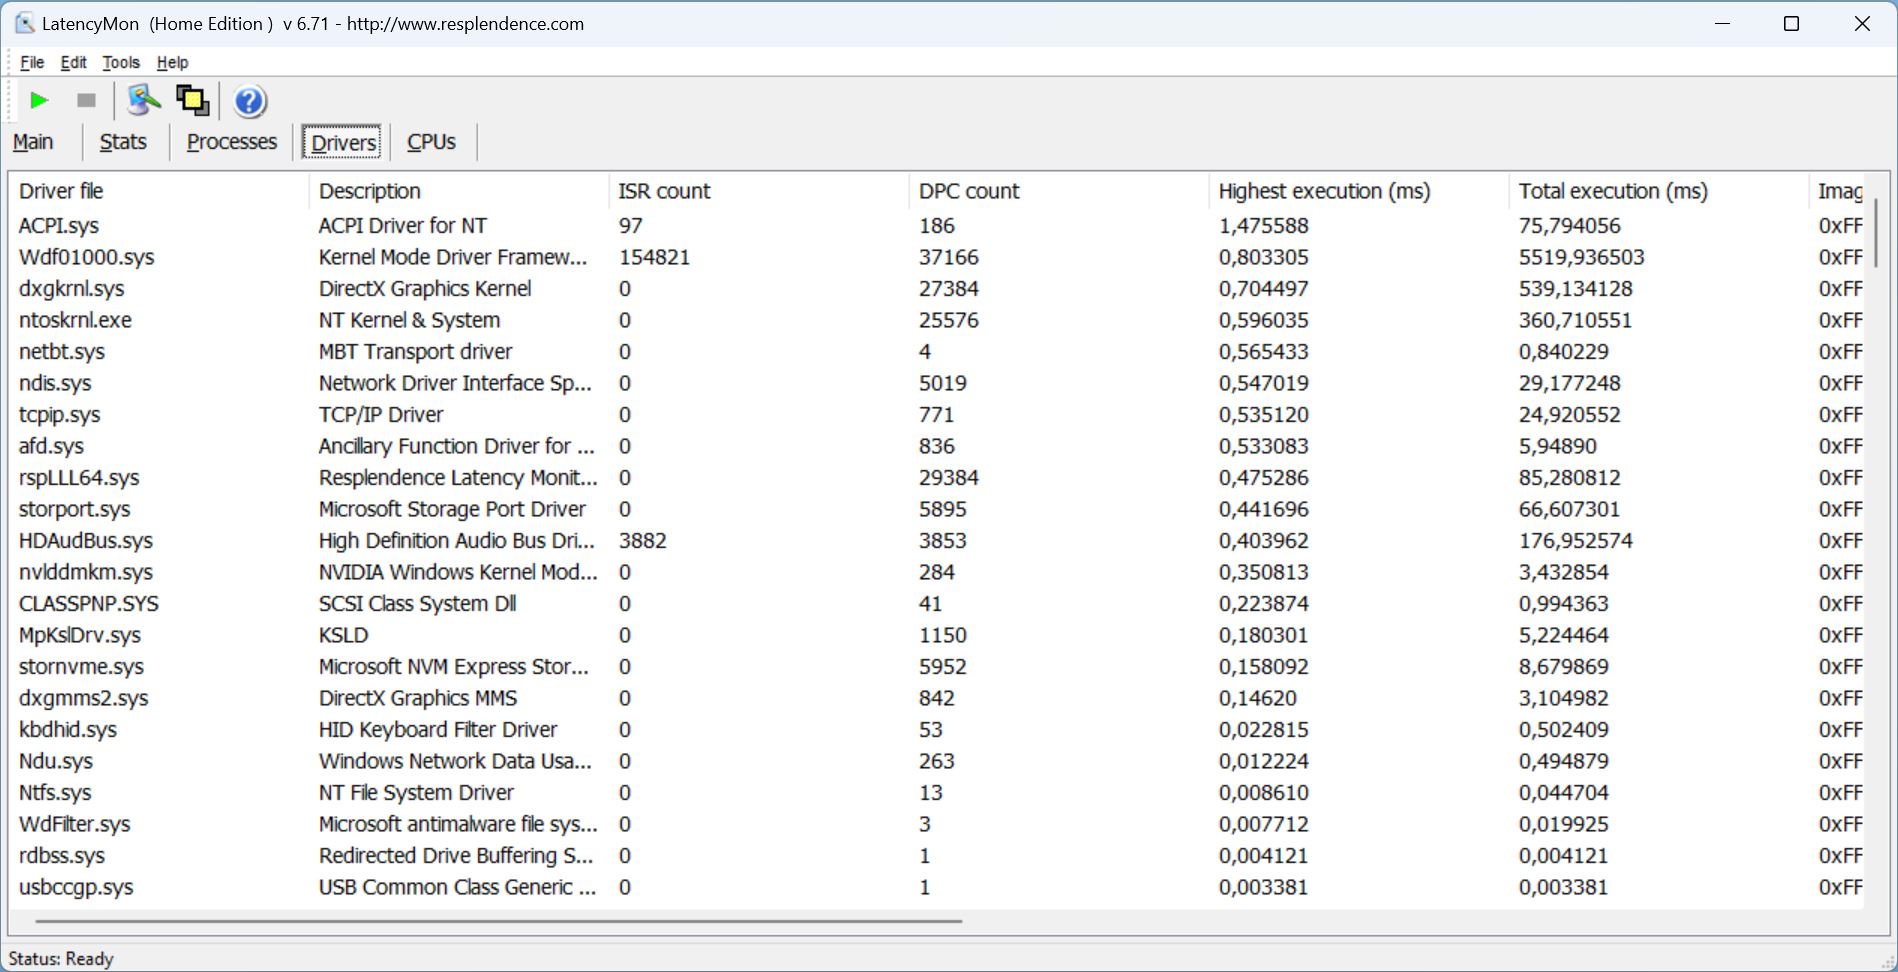
DPC latency
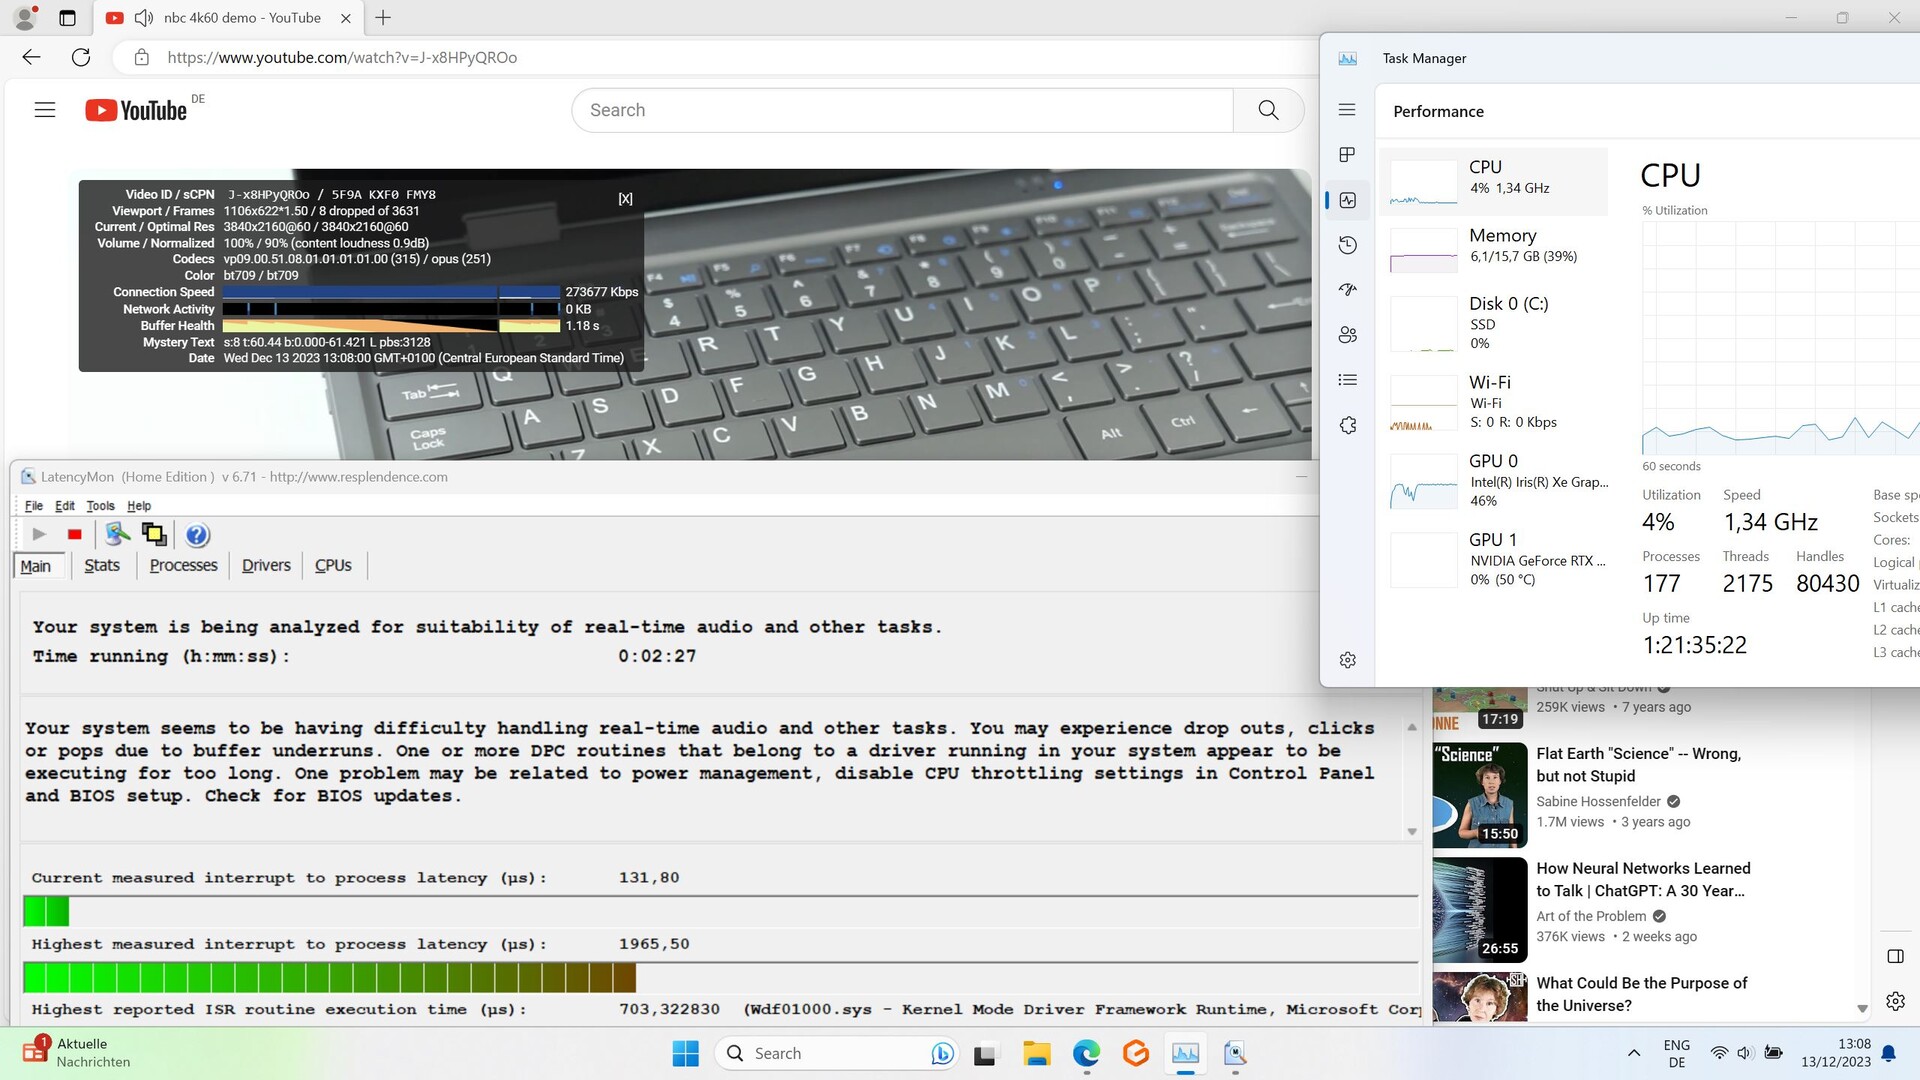
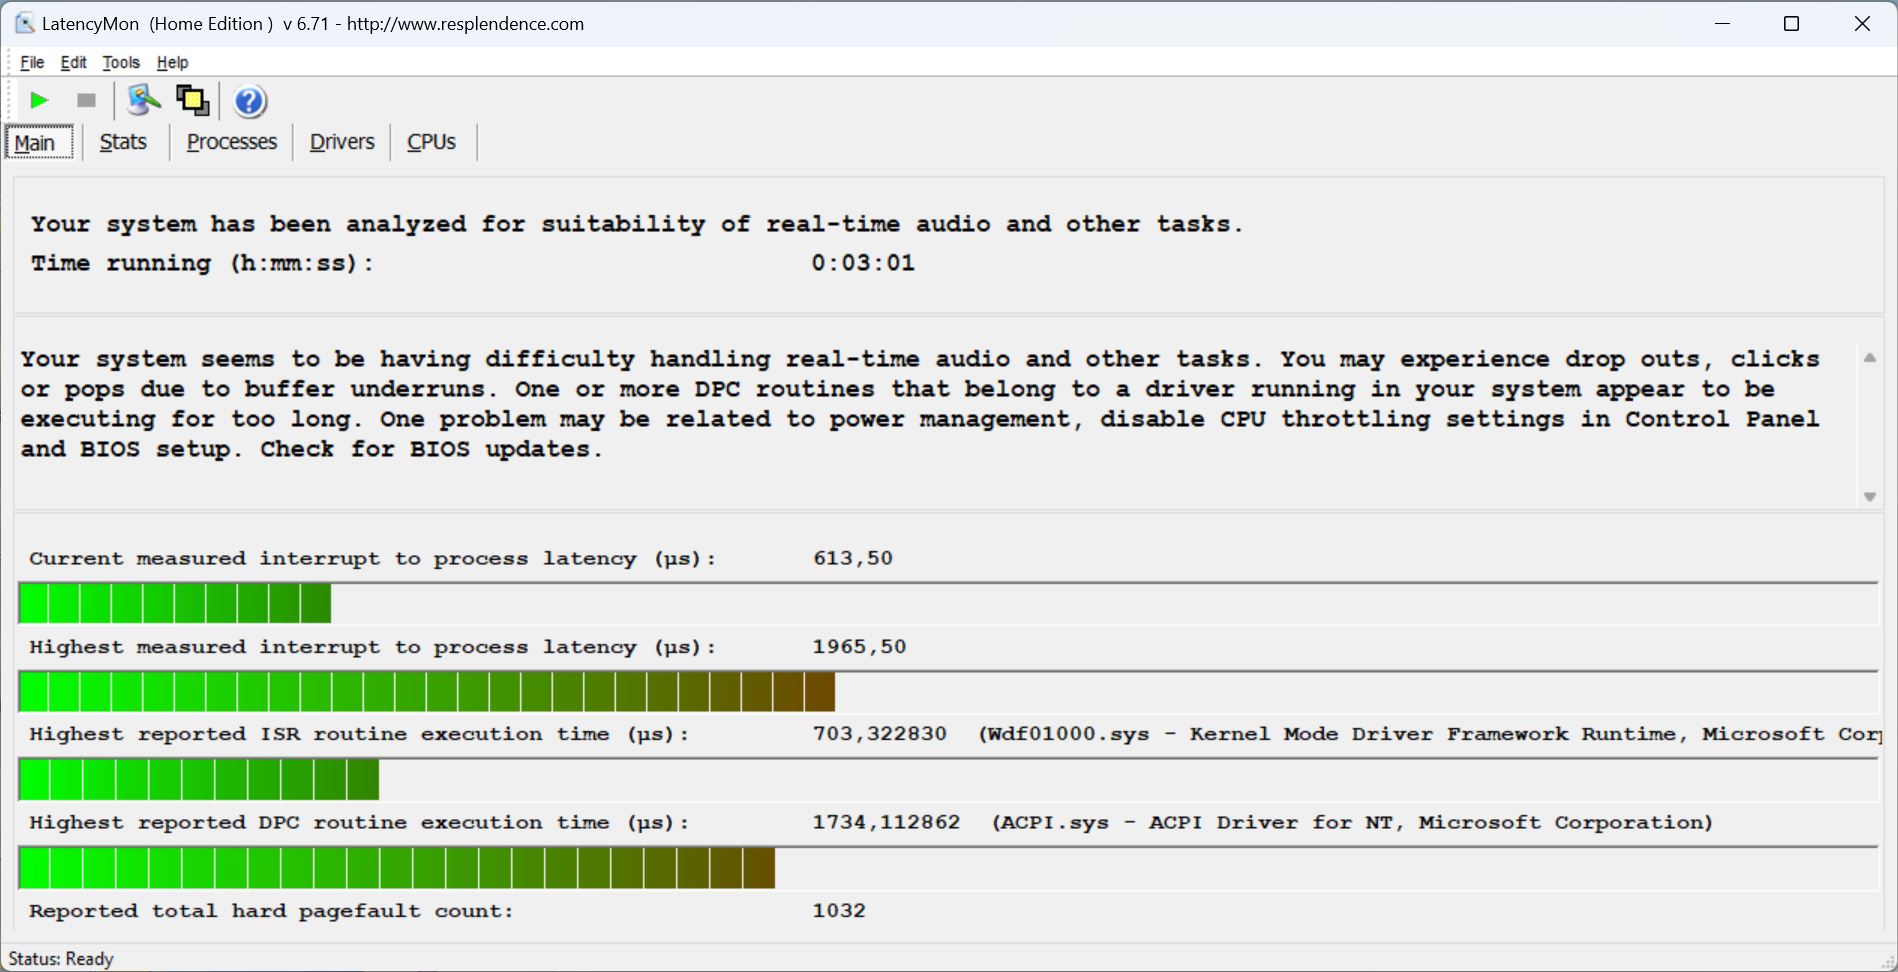
As the Control Center doesn't offer a balanced mode, we tested the laptop using the meeting and creator modes. The former showed some latency issues when opening multiple browser tabs — these became even higher during the 4K/60-fps YouTube video, resulting in eight dropped frames.
If you think that this might change using the more powerful creator mode, then you are unfortunately wrong. We already noted increased latencies when opening the browser. On the other hand, the video ran with only one dropped frame.
| DPC Latencies / LatencyMon - interrupt to process latency (max), Web, Youtube, Prime95 | |
| HP Omen 16-wf000 | |
| Aorus 15 YE5-54DEB34SH | |
| HP Victus 16-r0077ng | |
| Aorus 15 BSF | |
| Dell XPS 15 9530 RTX 4070 | |
| Captiva Advanced Gaming I74-121 | |
* ... smaller is better
Storage devices
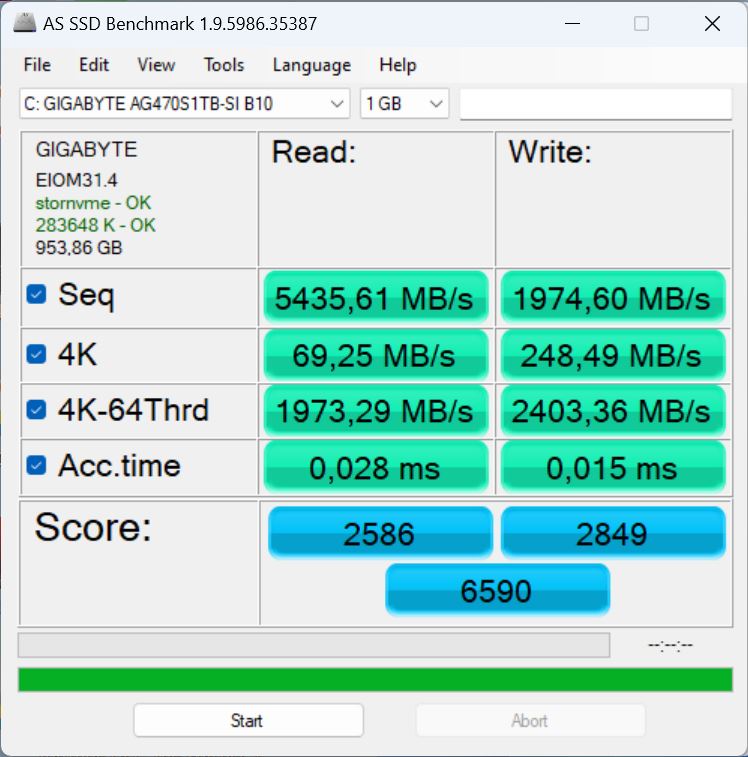
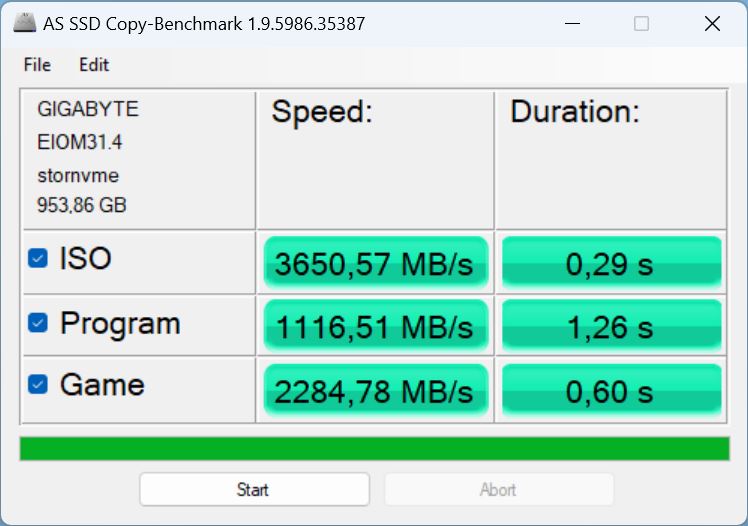
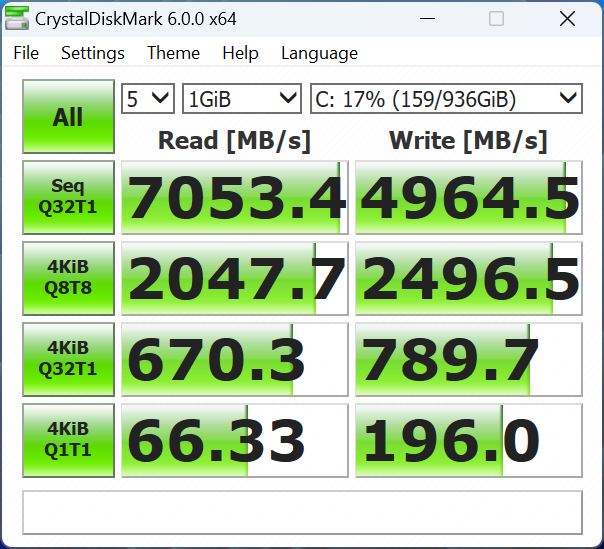
The installed Gigabyte AG470S1TB-SI B10 with 1 TB storage is a fast high-end PCIe Gen 4 NVMe SSD. In our SSD best list, it currently occupies position 3, which is excellent.
Within the Aorus 15 YE5, it may not be able to make use of its full potential (coming in 12 per cent behind the reference model), however, it is still faster than its competitors' SSDs. The only exception to this is the current-gen Aorus 15. It makes use of the same SSD but it is 28 per cent faster. Even so, our test sample's performance is still great and above all else, it remained constant and showed no throttling issues during continuous use.

* ... smaller is better
Reading continuous performance: DiskSpd Read Loop, Queue Depth 8
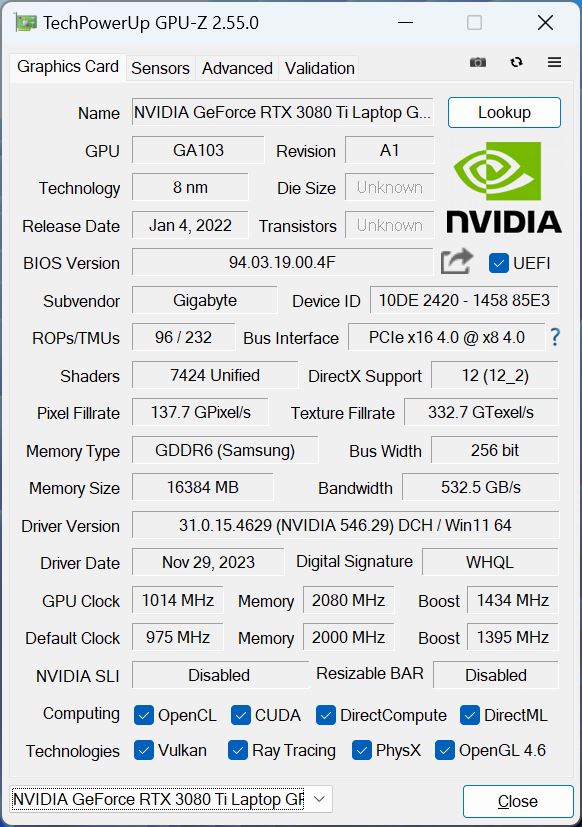
Graphics card
The former flagship model Geforce RTX 3080 Ti with 16 GB of RAM is in charge of 3D calculations as the laptop's graphics card. However, it is only given 130 watts of the maximum possible 165 watts. The powerful Ampere chip is not as efficient as the current Ada Lovelace architecture and is likely to generate more heat.
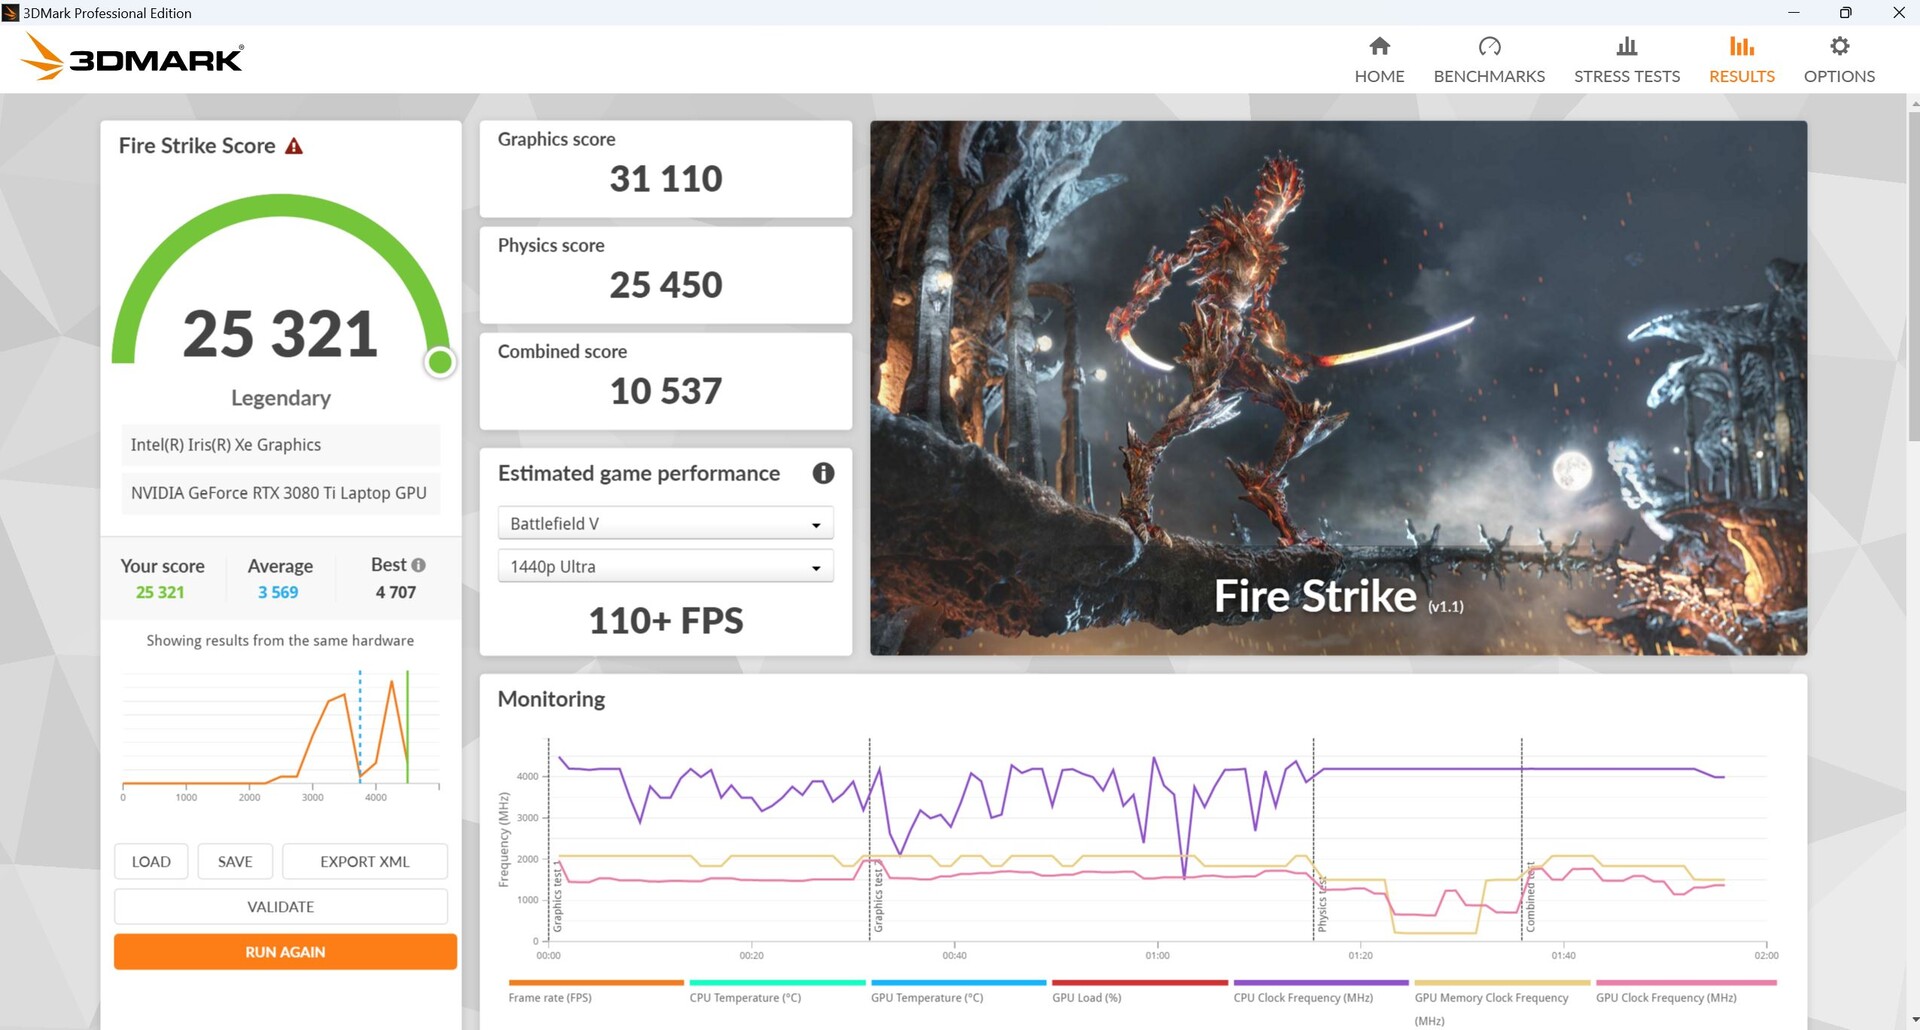
During the synthetic 3DMark benchmarks, our Aorus outperformed the current-gen competition with an RTX 4060 and an RTX 4070. Our RTX 3080 Ti came ahead in almost all tests — even if only by a few percentage points. However, the gaps between them are quite small, but constant across the tests.
In battery mode, its performance in Fire Strike dropped from 31,110 to just 6,921 points, a drop of a whopping 78 per cent!

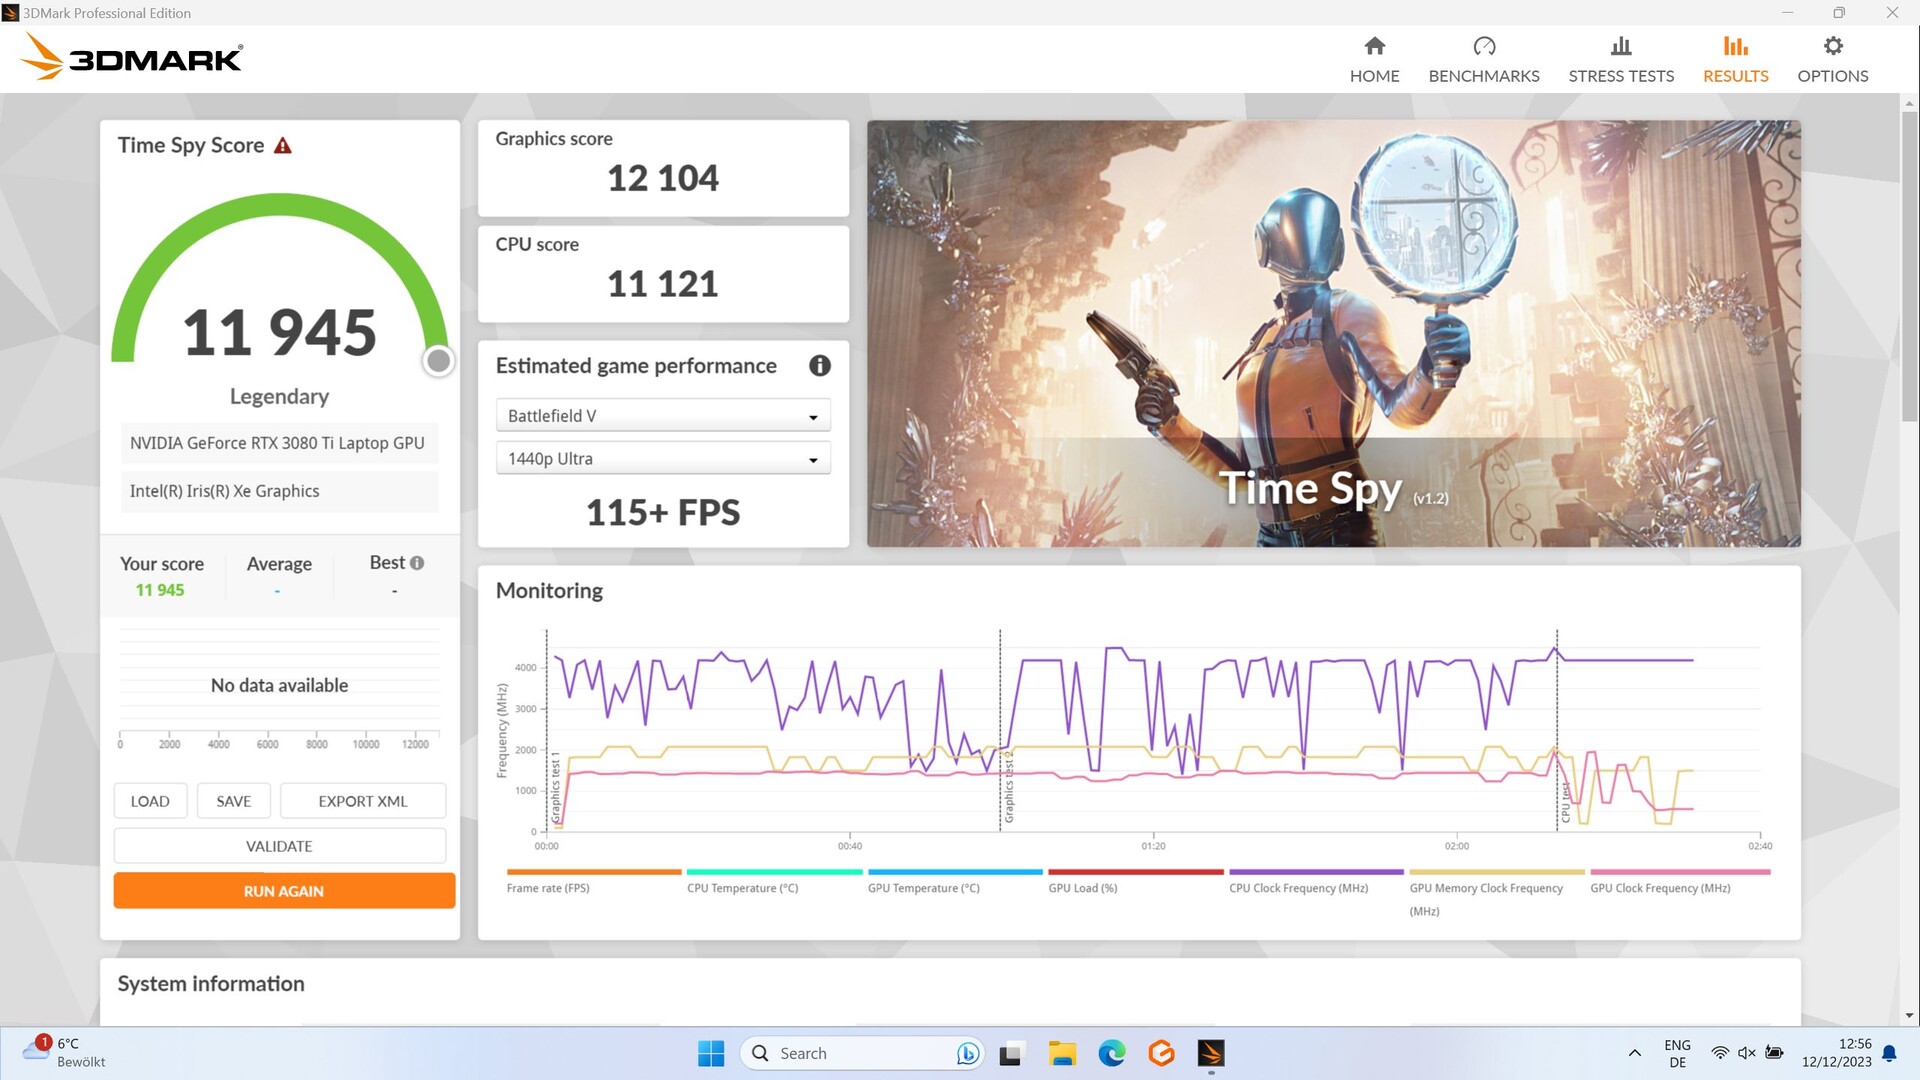
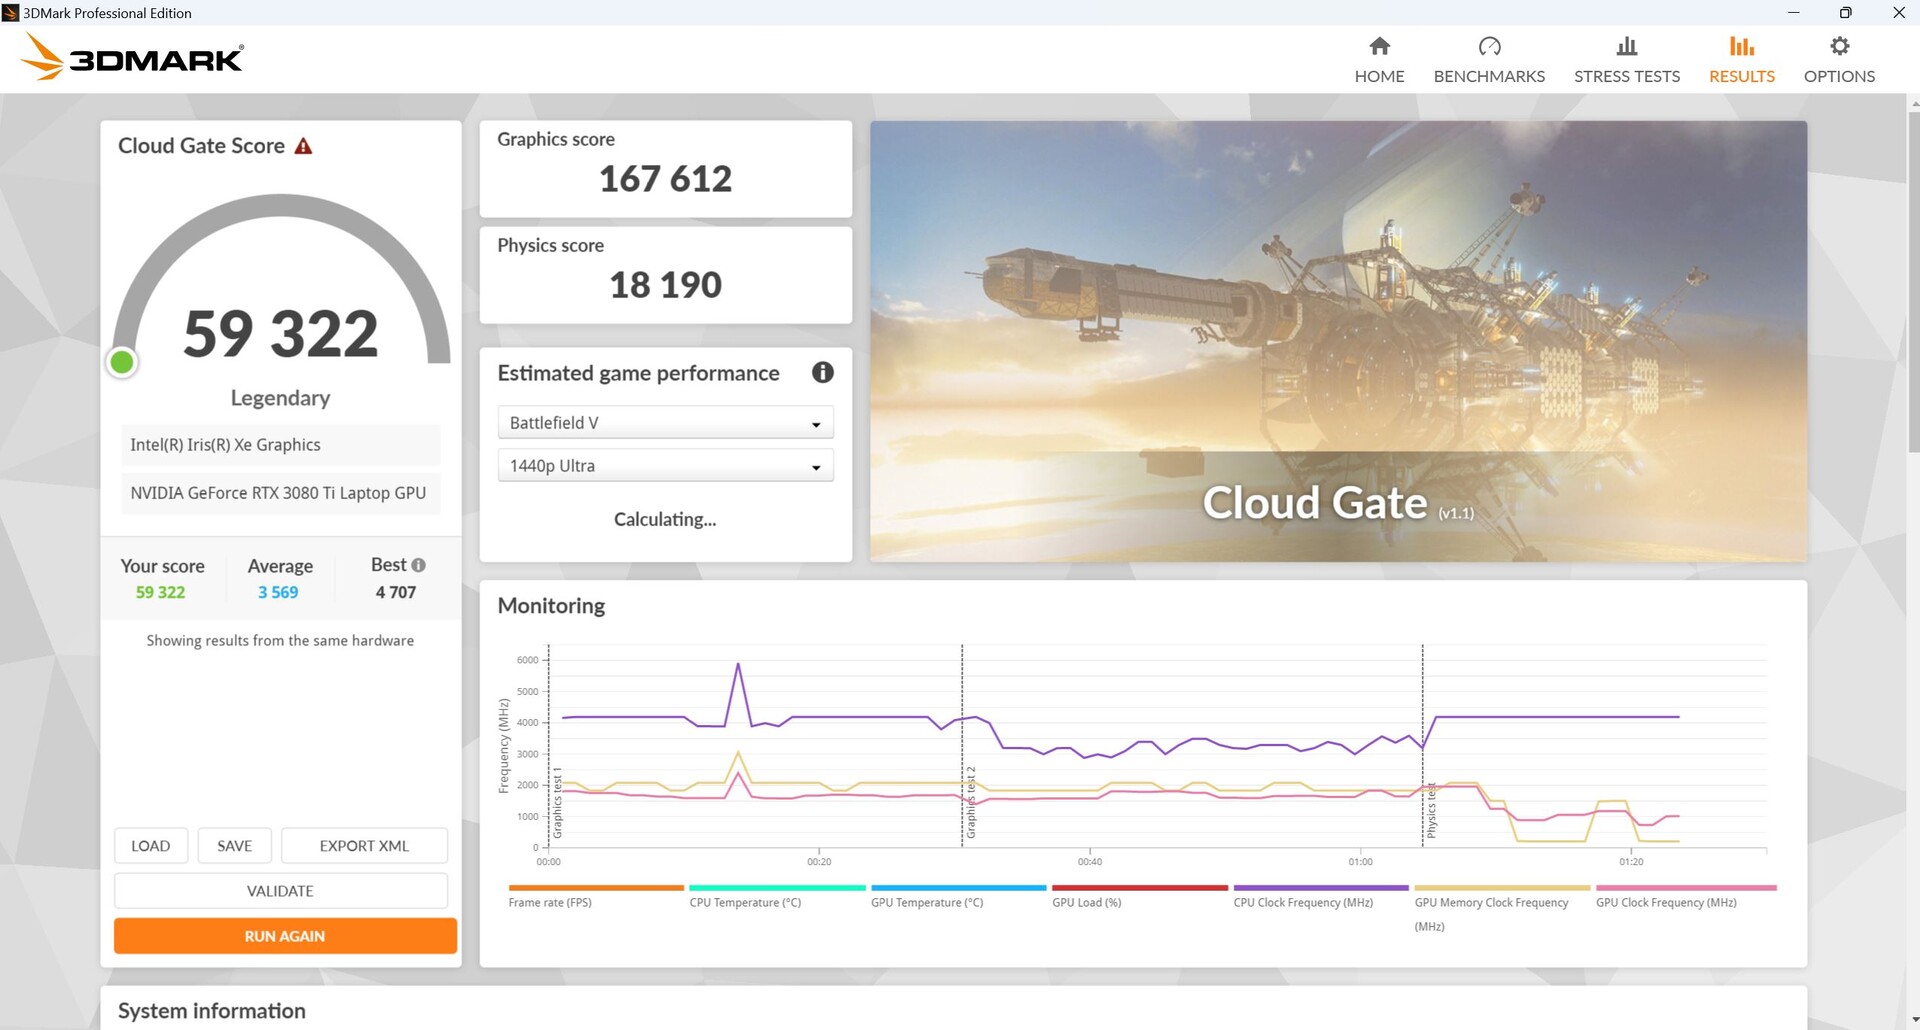
| 3DMark 11 Performance | 30440 points | |
| 3DMark Cloud Gate Standard Score | 59322 points | |
| 3DMark Fire Strike Score | 25321 points | |
| 3DMark Time Spy Score | 11945 points | |
Help | ||
* ... smaller is better
Gaming
While gaming, our Aorus came neck-and-neck with the next gen Aorus featuring an RTX 4070 and it even managed to beat it by a narrow margin. All other competitors with an RTX 4070 were also narrowly beaten. The Omen 16 with an RTX 4080 remained unreachable at the top and was around 18 per cent faster than our second-placed Aorus across all the gaming tests. In games which have a CPU focus, its performance fell behind the competition due to its mediocre i5-12500H.
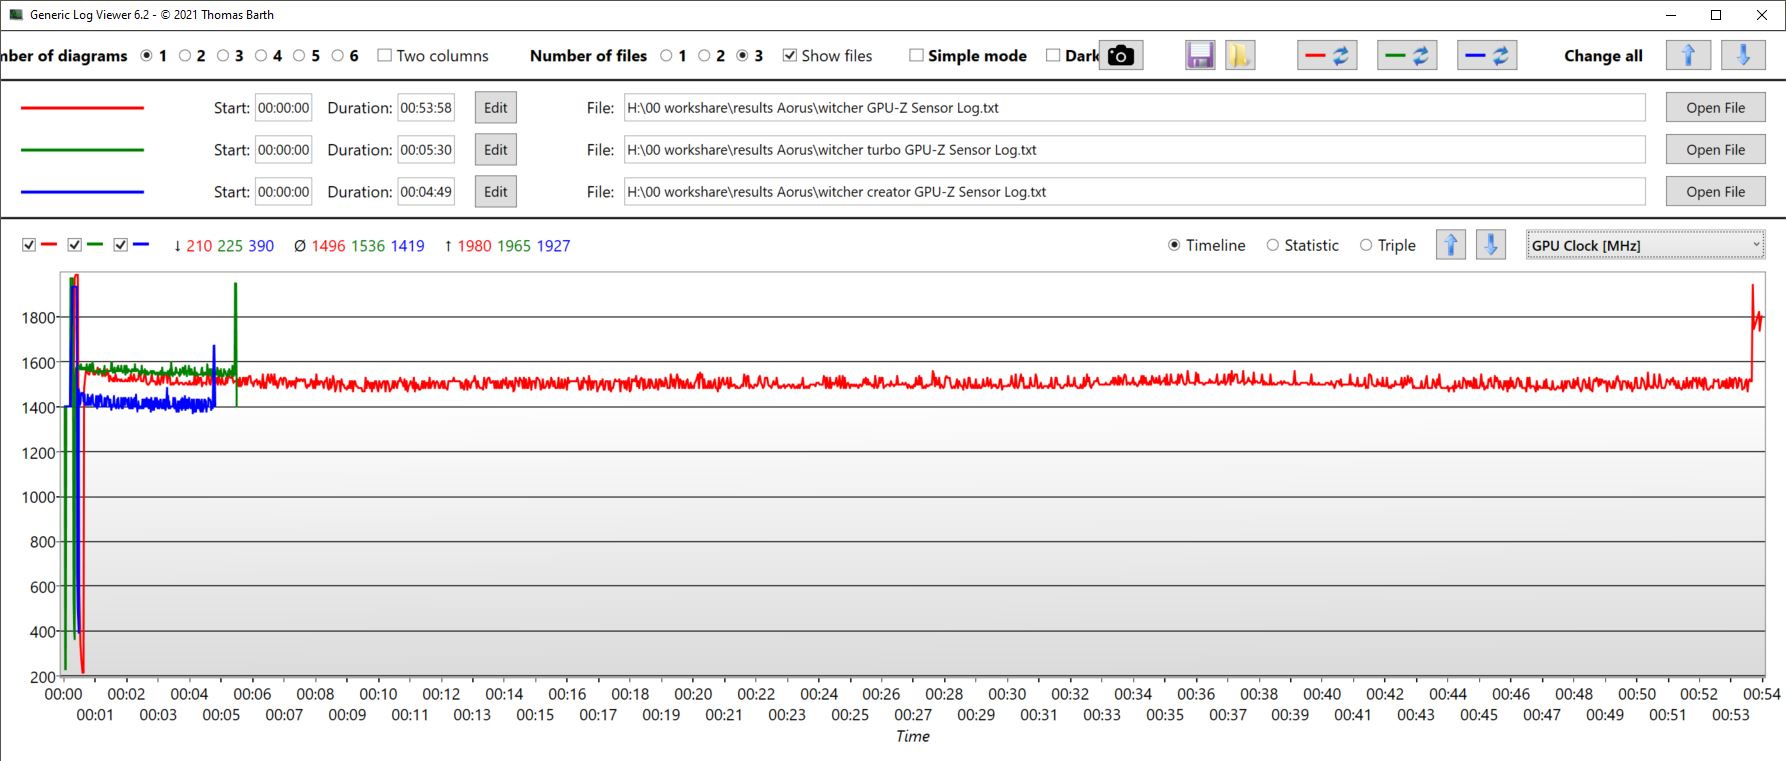
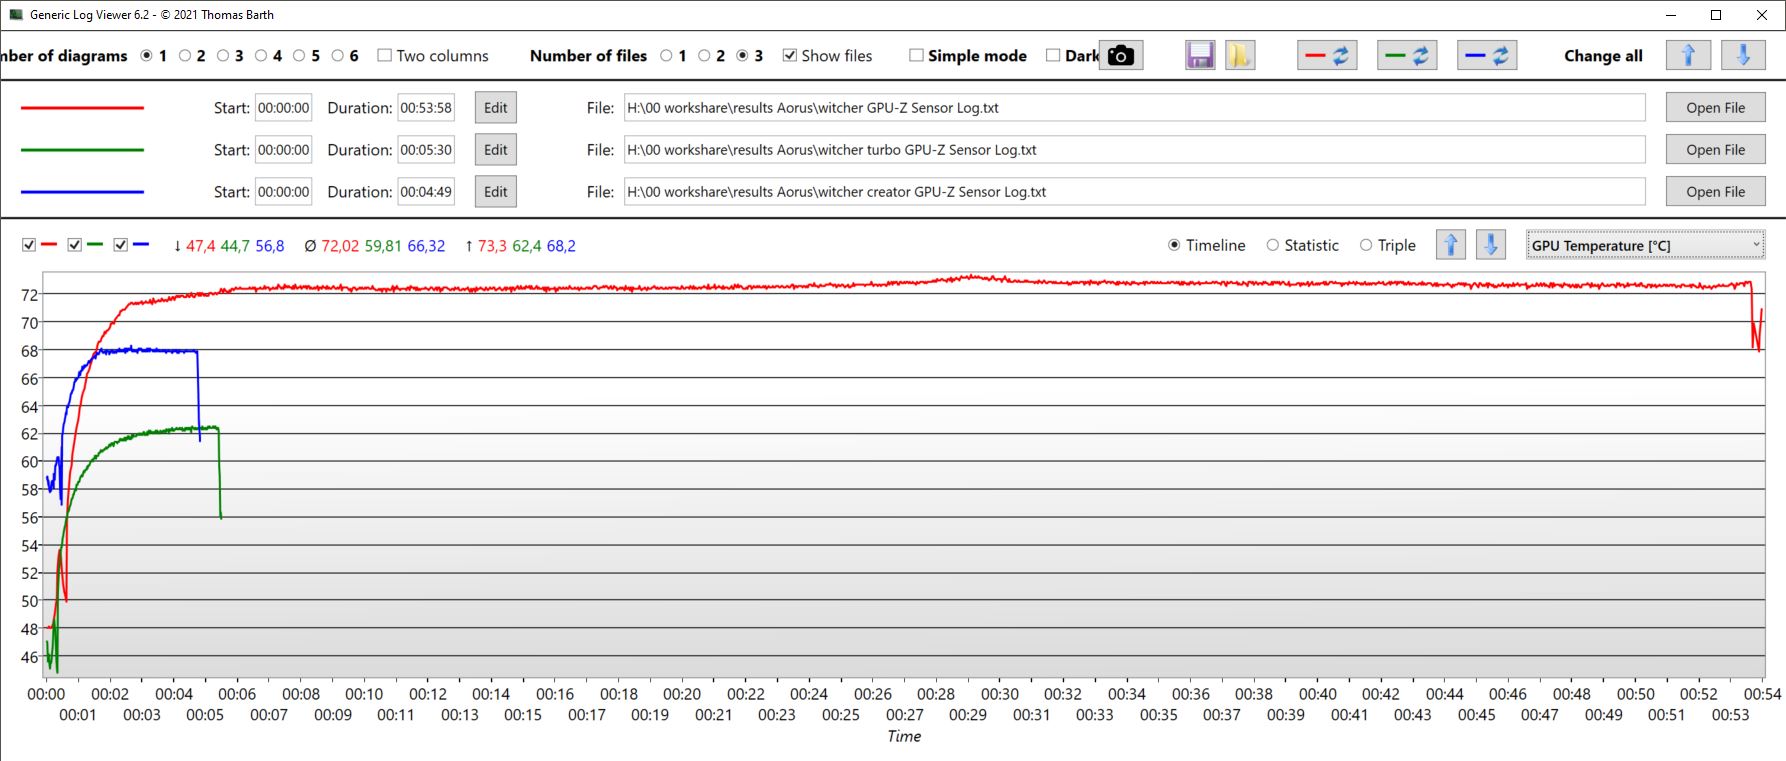
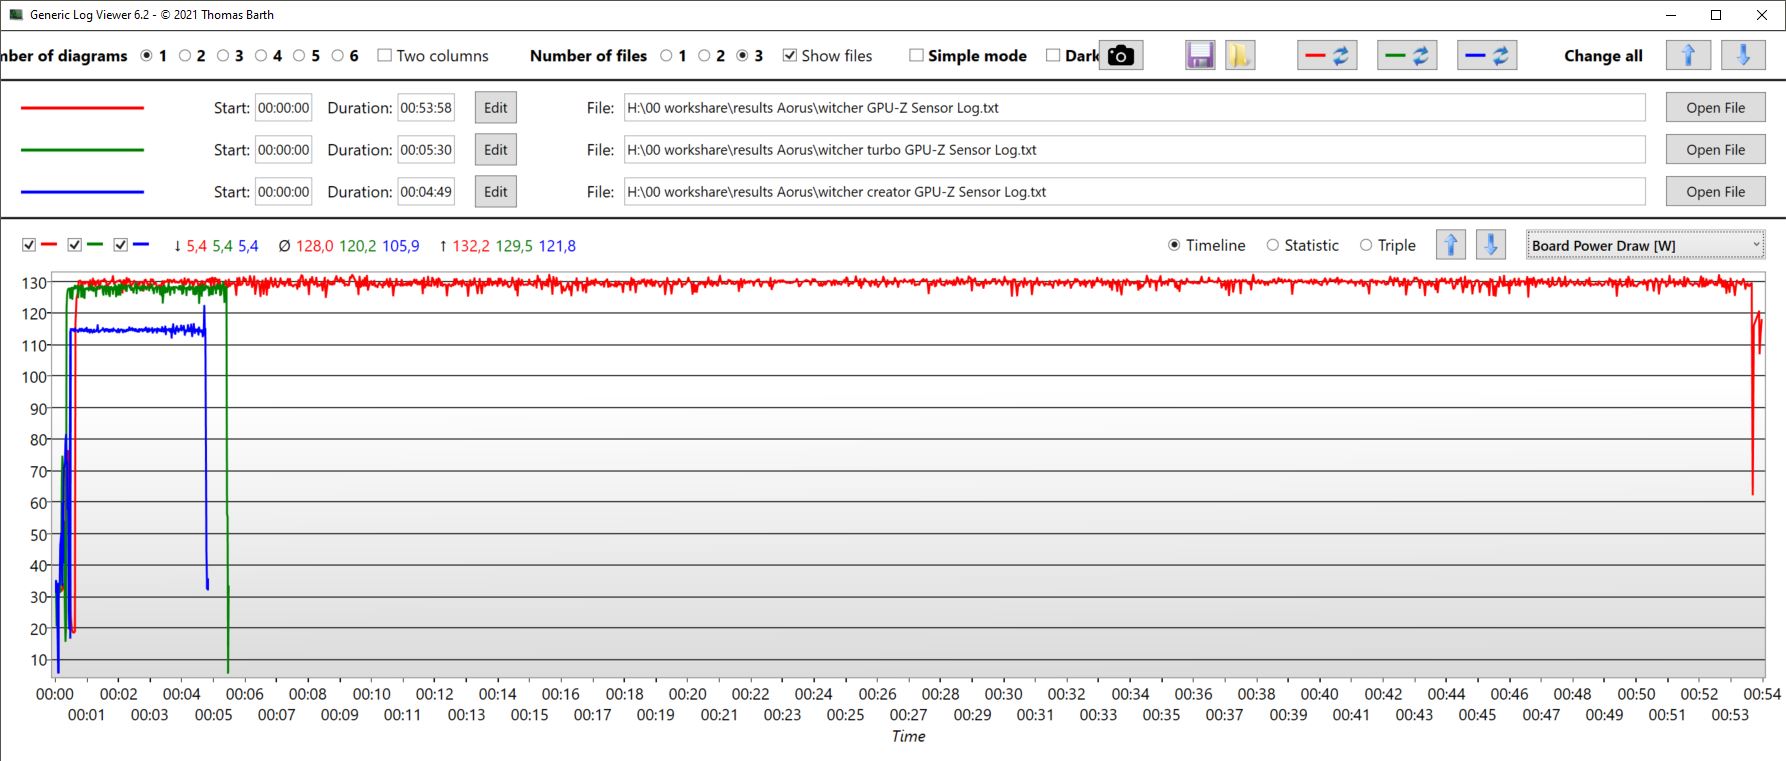
When comparing the modes, it is noticeable that turbo, AI and gaming all delivered virtually the same GPU performance in The Witcher 3. The only difference is that the GPU remained significantly cooler in turbo mode, but this mode was also significantly louder.
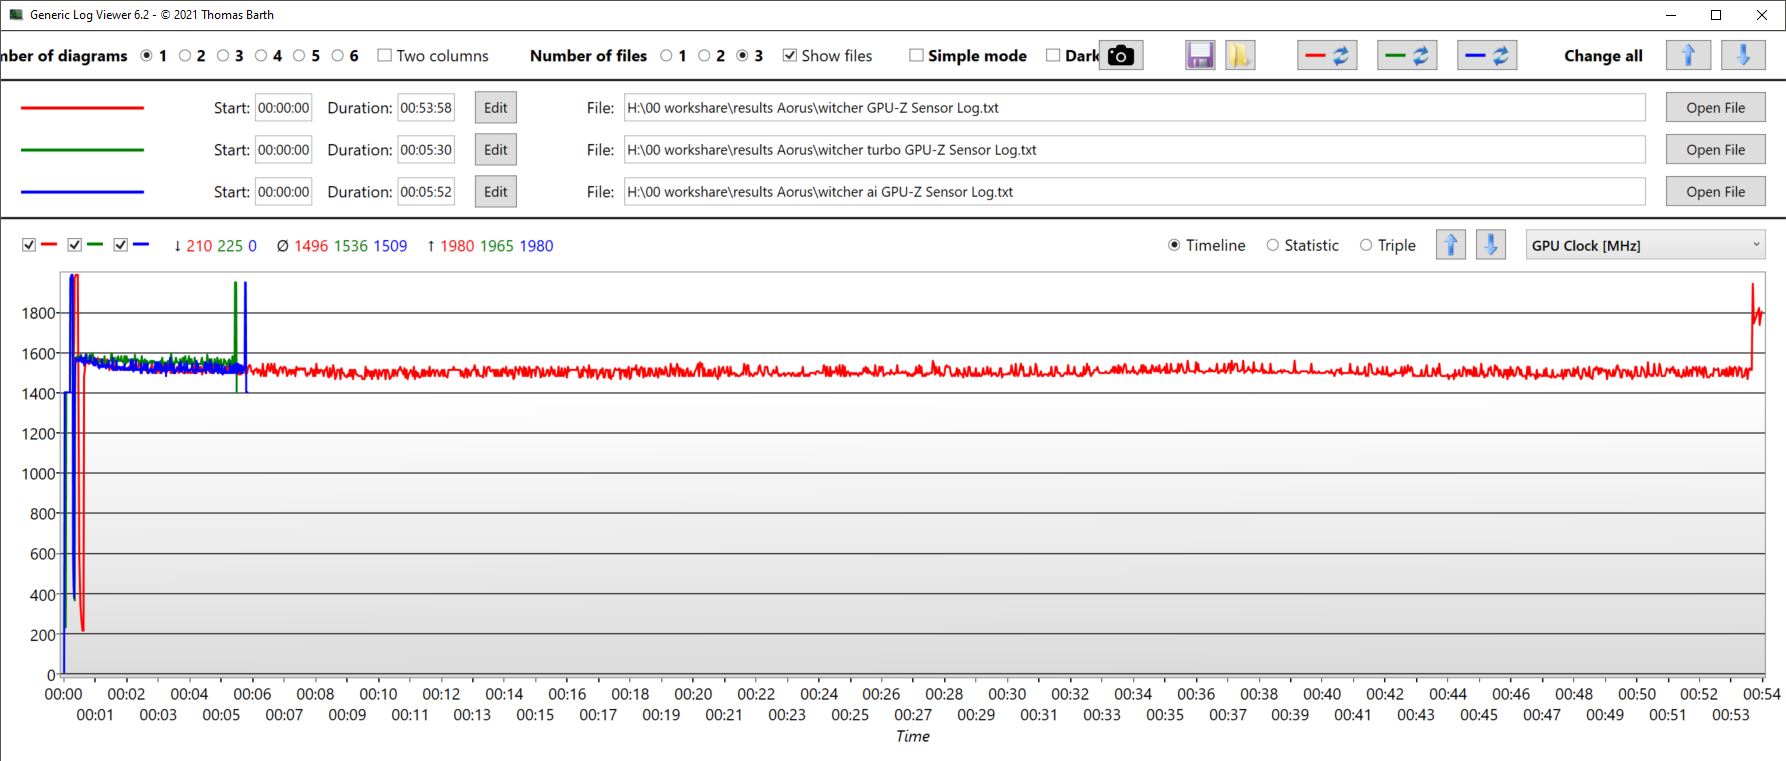
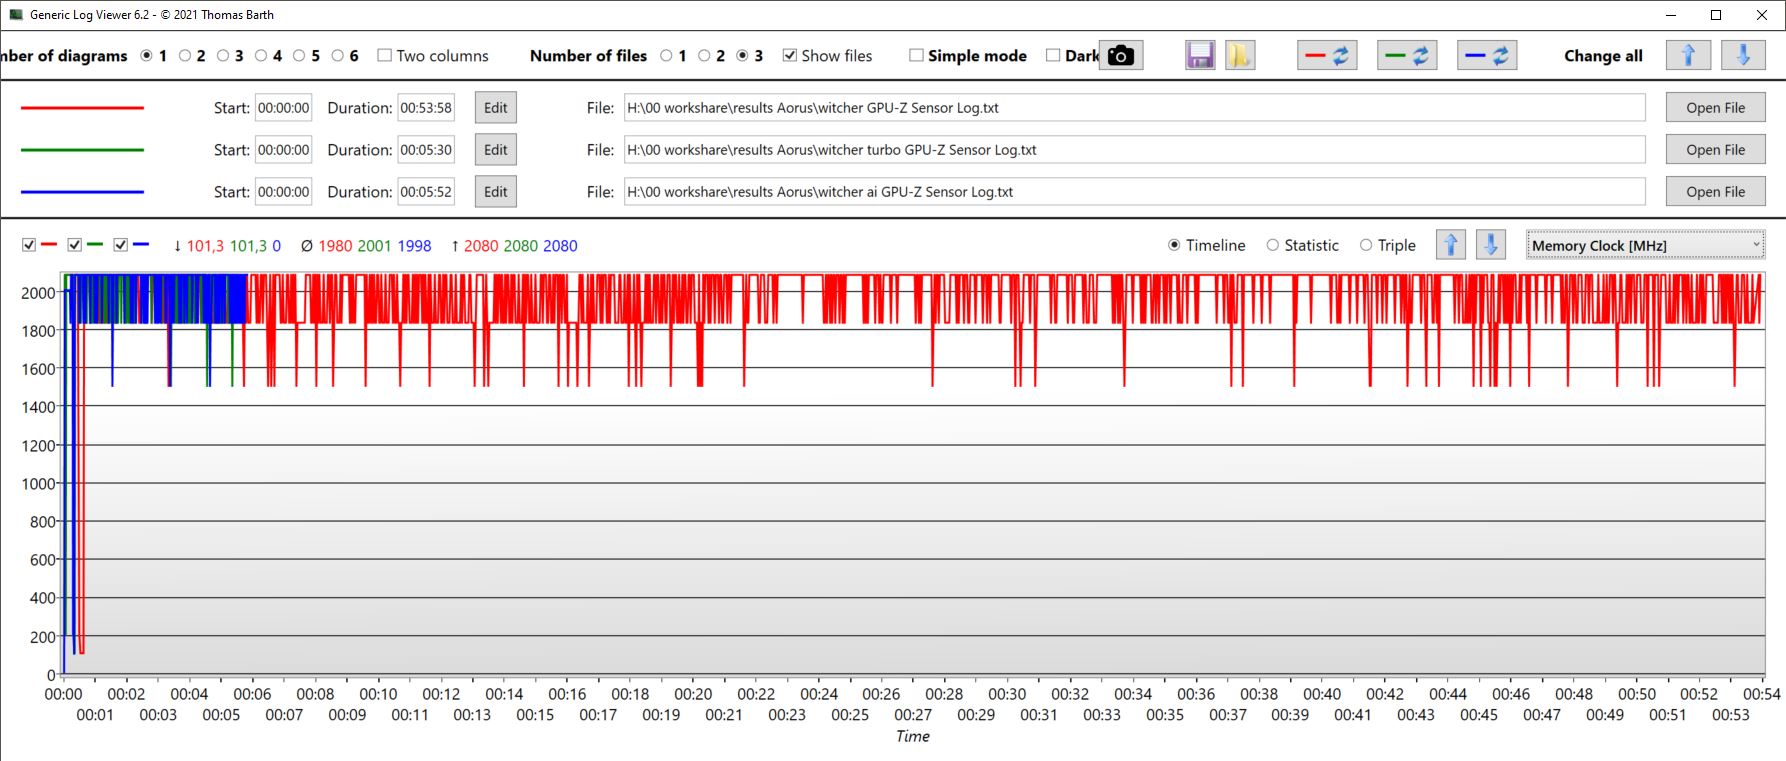
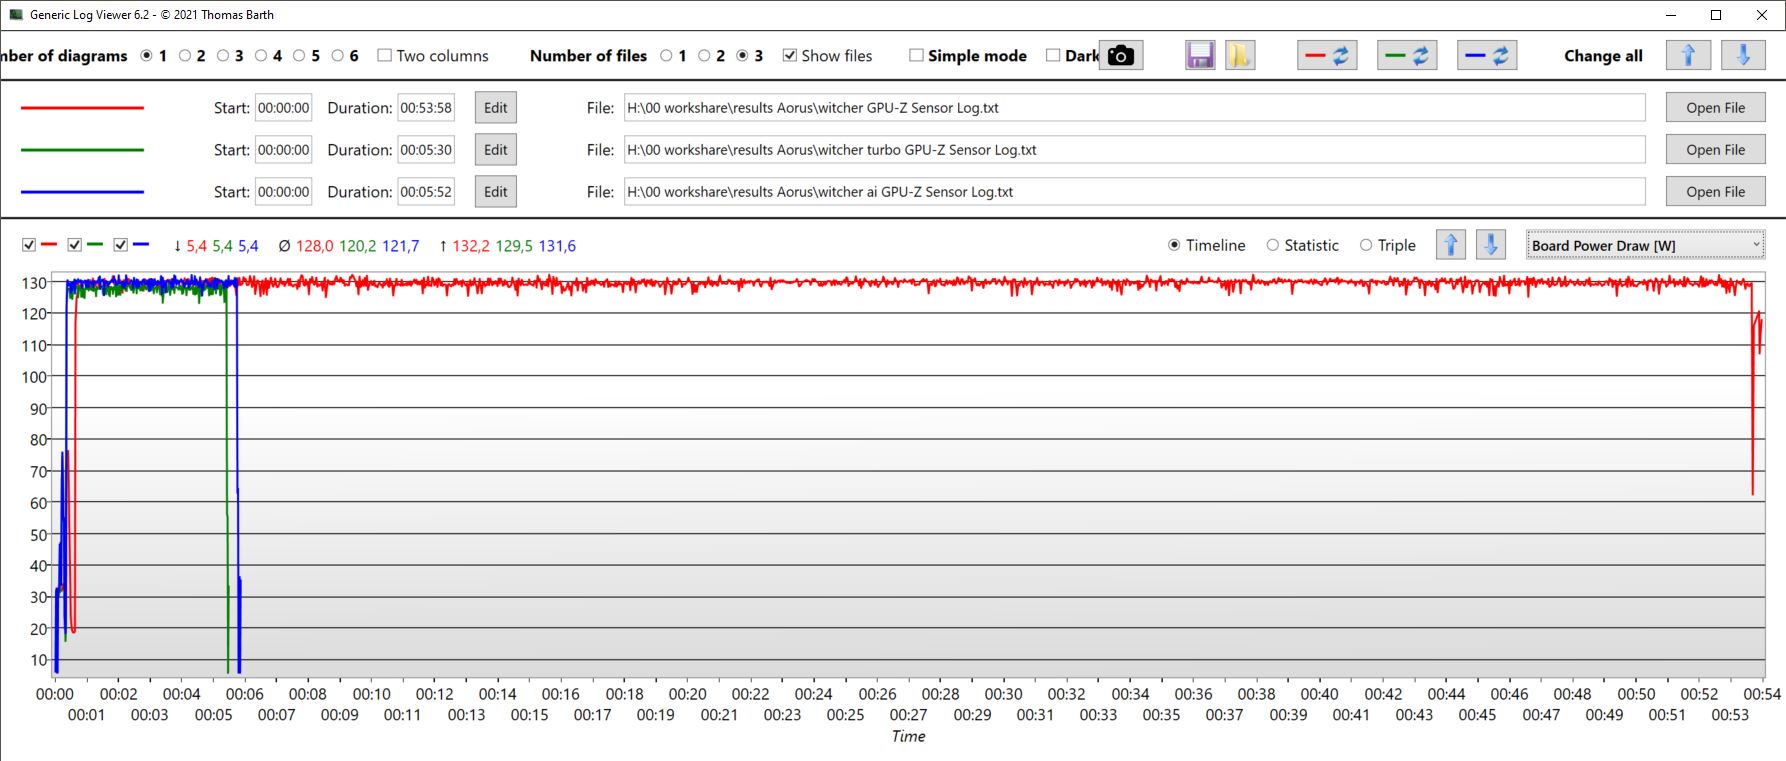
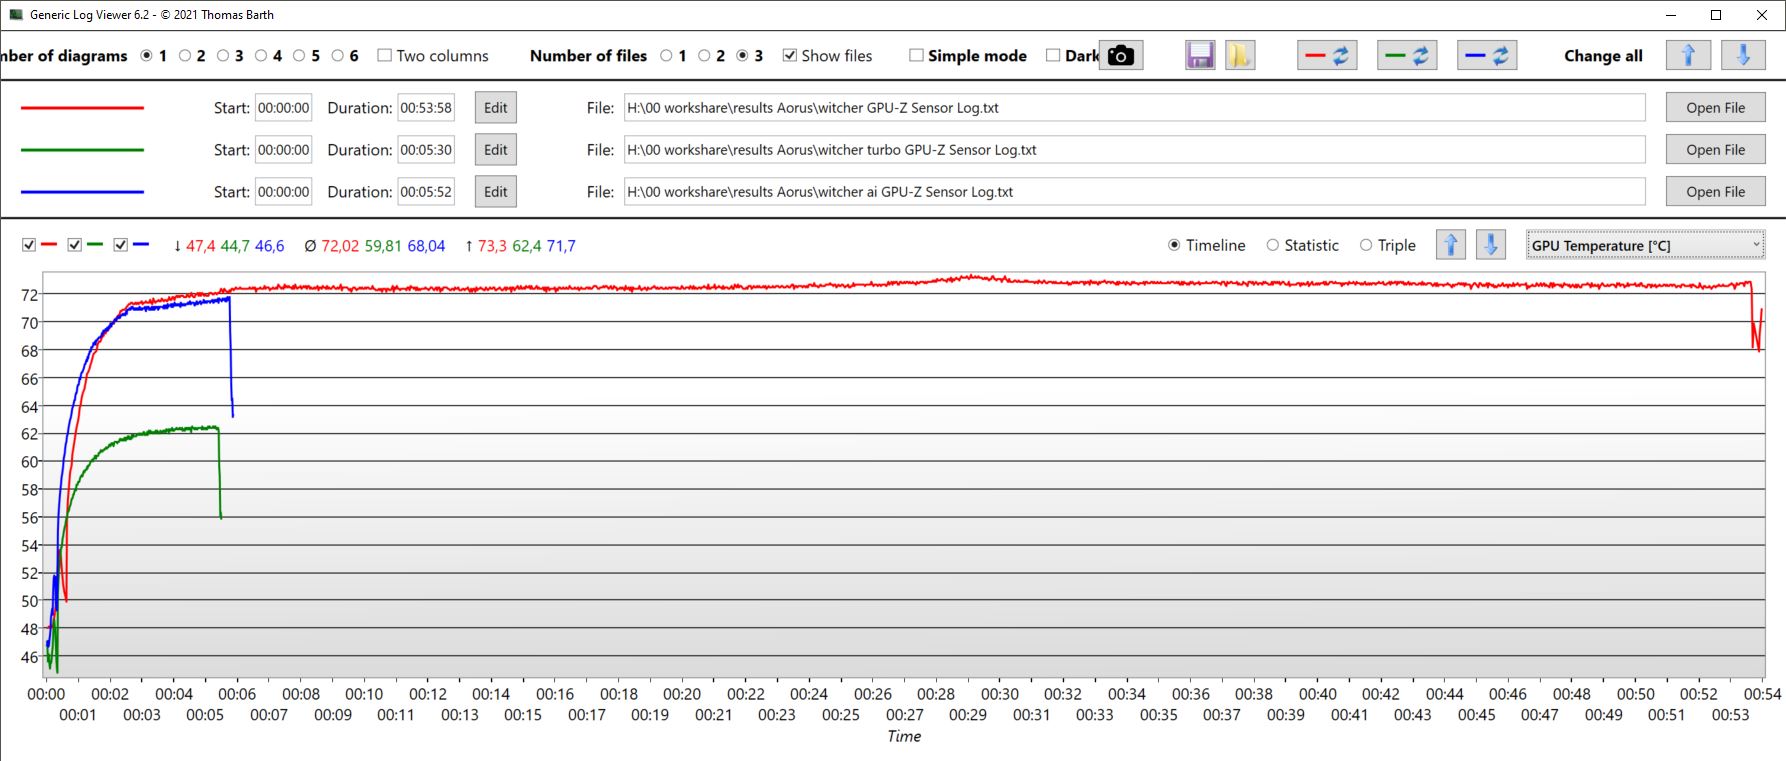
Creator mode (blue curve this time) performed slightly worse, didn't draw as much power and remained slightly cooler. In the noise emissions section, we have listed the modes and their effect on FPS and noise emissions when running The Witcher 3.
| Performance rating - Percent | |
| HP Omen 16-wf000 | |
| Average of class Gaming | |
| Aorus 15 YE5-54DEB34SH -1! | |
| Aorus 15 BSF -1! | |
| HP Victus 16-r0077ng | |
| Captiva Advanced Gaming I74-121 | |
| Dell XPS 15 9530 RTX 4070 | |
| The Witcher 3 - 1920x1080 Ultra Graphics & Postprocessing (HBAO+) | |
| Average of class Gaming (95 - 240, n=8, last 2 years) | |
| HP Omen 16-wf000 | |
| Aorus 15 YE5-54DEB34SH | |
| Aorus 15 BSF | |
| HP Victus 16-r0077ng | |
| Captiva Advanced Gaming I74-121 | |
| Dell XPS 15 9530 RTX 4070 | |
| GTA V - 1920x1080 Highest AA:4xMSAA + FX AF:16x | |
| Average of class Gaming (48.3 - 186.9, n=101, last 2 years) | |
| Aorus 15 YE5-54DEB34SH | |
| Captiva Advanced Gaming I74-121 | |
| HP Omen 16-wf000 | |
| HP Victus 16-r0077ng | |
| Dell XPS 15 9530 RTX 4070 | |
| Final Fantasy XV Benchmark - 1920x1080 High Quality | |
| HP Omen 16-wf000 | |
| Average of class Gaming (41 - 215, n=102, last 2 years) | |
| Aorus 15 YE5-54DEB34SH | |
| Aorus 15 BSF | |
| HP Victus 16-r0077ng | |
| Captiva Advanced Gaming I74-121 | |
| Dell XPS 15 9530 RTX 4070 | |
| Strange Brigade - 1920x1080 ultra AA:ultra AF:16 | |
| HP Omen 16-wf000 | |
| Average of class Gaming (76.3 - 456, n=92, last 2 years) | |
| Aorus 15 BSF | |
| HP Victus 16-r0077ng | |
| Captiva Advanced Gaming I74-121 | |
| Dell XPS 15 9530 RTX 4070 | |
| Dota 2 Reborn - 1920x1080 ultra (3/3) best looking | |
| HP Omen 16-wf000 | |
| Average of class Gaming (84.8 - 248, n=112, last 2 years) | |
| Aorus 15 BSF | |
| Captiva Advanced Gaming I74-121 | |
| Aorus 15 YE5-54DEB34SH | |
| Dell XPS 15 9530 RTX 4070 | |
| HP Victus 16-r0077ng | |
| X-Plane 11.11 - 1920x1080 high (fps_test=3) | |
| HP Omen 16-wf000 | |
| Aorus 15 BSF | |
| Captiva Advanced Gaming I74-121 | |
| Average of class Gaming (52.1 - 143.5, n=115, last 2 years) | |
| HP Victus 16-r0077ng | |
| Aorus 15 YE5-54DEB34SH | |
| Dell XPS 15 9530 RTX 4070 | |
Witcher 3 FPS diagram
| low | med. | high | ultra | QHD | 4K | |
|---|---|---|---|---|---|---|
| GTA V (2015) | 184.4 | 180.8 | 176 | 118 | ||
| The Witcher 3 (2015) | 385 | 306 | 222 | 120 | 86 | |
| Dota 2 Reborn (2015) | 167.6 | 154.1 | 146.4 | 138.9 | 140.1 | |
| Final Fantasy XV Benchmark (2018) | 206 | 151.7 | 119.2 | 92.2 | ||
| X-Plane 11.11 (2018) | 134.1 | 121.3 | 94.9 | 85.4 | ||
| Far Cry 5 (2018) | 165 | 137 | 131 | 124 | 116 |
Emissions & power - Better than the RTX 3080 Ti might suggest
Noise emissions
In turbo mode, the fans are always close to their limit, meaning 52 to 55 dB. In the other modes, the fans work more situationally. The table below lists the noise emission levels of the different modes after about 10 minutes of playing The Witcher 3. In general, its emissions can be described as moderate in relation to its performance and they can be adjusted very variably thanks to the many modes. Both the Captiva and the HP Victus perform worse in 3D applications but are similarly loud — the Captiva being even louder.
In gaming mode, the fans are also active when the laptop is idling, albeit quietly. They are usually quiet in meeting mode or Power Saver. During the simulated average load scenario (3DMark06) with gaming mode selected, its noise emissions gradually increased up to 43 dB. In Power Saver, the same test ran at just 27 dB.
| Performance mode/Witcher 3 | Maximum frame rate | Average frame rate | Noise emissions in dB | Consumption in watts |
|---|---|---|---|---|
| Turbo | 124 | 118 | 52.68 | 199 |
| AI | 122 | 116 | 44.78 | 197 |
| Gaming | 125 | 116 | 46.77 | 196 |
| Creator | 115 | 110 | 44.78 | 185 |
| Meeting | 111 | 105 | 36.53 | 163 |
| Power Saver | 115 | 106 | 36.53 | 162 |
Noise level
| Idle |
| 23 / 23 / 26.42 dB(A) |
| Load |
| 43.5 / 50.21 dB(A) |
 | ||
30 dB silent 40 dB(A) audible 50 dB(A) loud |
||
min: | ||
| Aorus 15 YE5-54DEB34SH GeForce RTX 3080 Ti Laptop GPU, i5-12500H, Gigabyte AG470S1TB-SI B10 | Aorus 15 BSF GeForce RTX 4070 Laptop GPU, i7-13700H, Gigabyte AG470S1TB-SI B10 | Captiva Advanced Gaming I74-121 GeForce RTX 4060 Laptop GPU, i5-13500H, Samsung SSD 980 1TB MZ-V8V1T0BW | HP Victus 16-r0077ng GeForce RTX 4070 Laptop GPU, i7-13700H, Kioxia XG8 KXG80ZNV1T02 | Dell XPS 15 9530 RTX 4070 GeForce RTX 4070 Laptop GPU, i7-13700H, SK hynix PC801 HFS001TEJ9X101N | HP Omen 16-wf000 GeForce RTX 4080 Laptop GPU, i7-13700HX, SK hynix PC801 HFS002TEJ9X101N | |
|---|---|---|---|---|---|---|
| Noise | -20% | -3% | -9% | 10% | -13% | |
| off / environment * (dB) | 23 | 24 -4% | 23 -0% | 25 -9% | 23.1 -0% | 23 -0% |
| Idle Minimum * (dB) | 23 | 25 -9% | 23 -0% | 28 -22% | 23.1 -0% | 29.6 -29% |
| Idle Average * (dB) | 23 | 31 -35% | 25.67 -12% | 29 -26% | 23.1 -0% | 29.8 -30% |
| Idle Maximum * (dB) | 26.42 | 37 -40% | 25.67 3% | 30 -14% | 24.2 8% | 30.4 -15% |
| Load Average * (dB) | 43.5 | 51 -17% | 38.52 11% | 43 1% | 27.1 38% | 33.8 22% |
| Witcher 3 ultra * (dB) | 46.77 | 54.17 -16% | 46 2% | 40.1 14% | 57 -22% | |
| Load Maximum * (dB) | 50.21 | 57 -14% | 54.17 -8% | 48 4% | 44.6 11% | 58.3 -16% |
* ... smaller is better
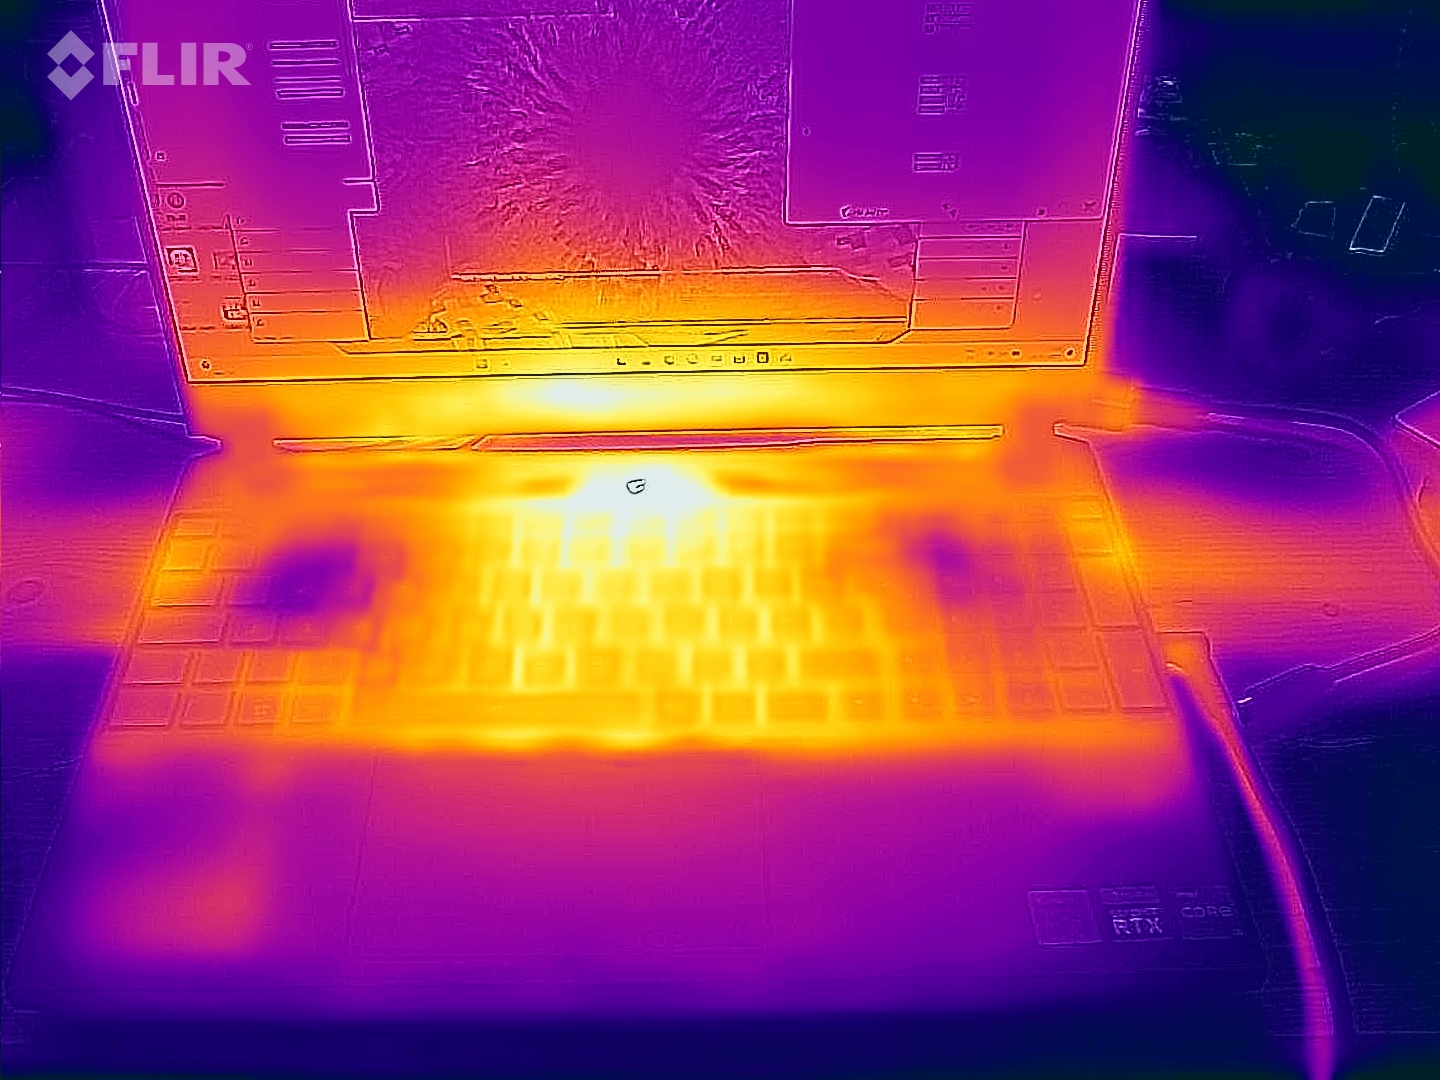
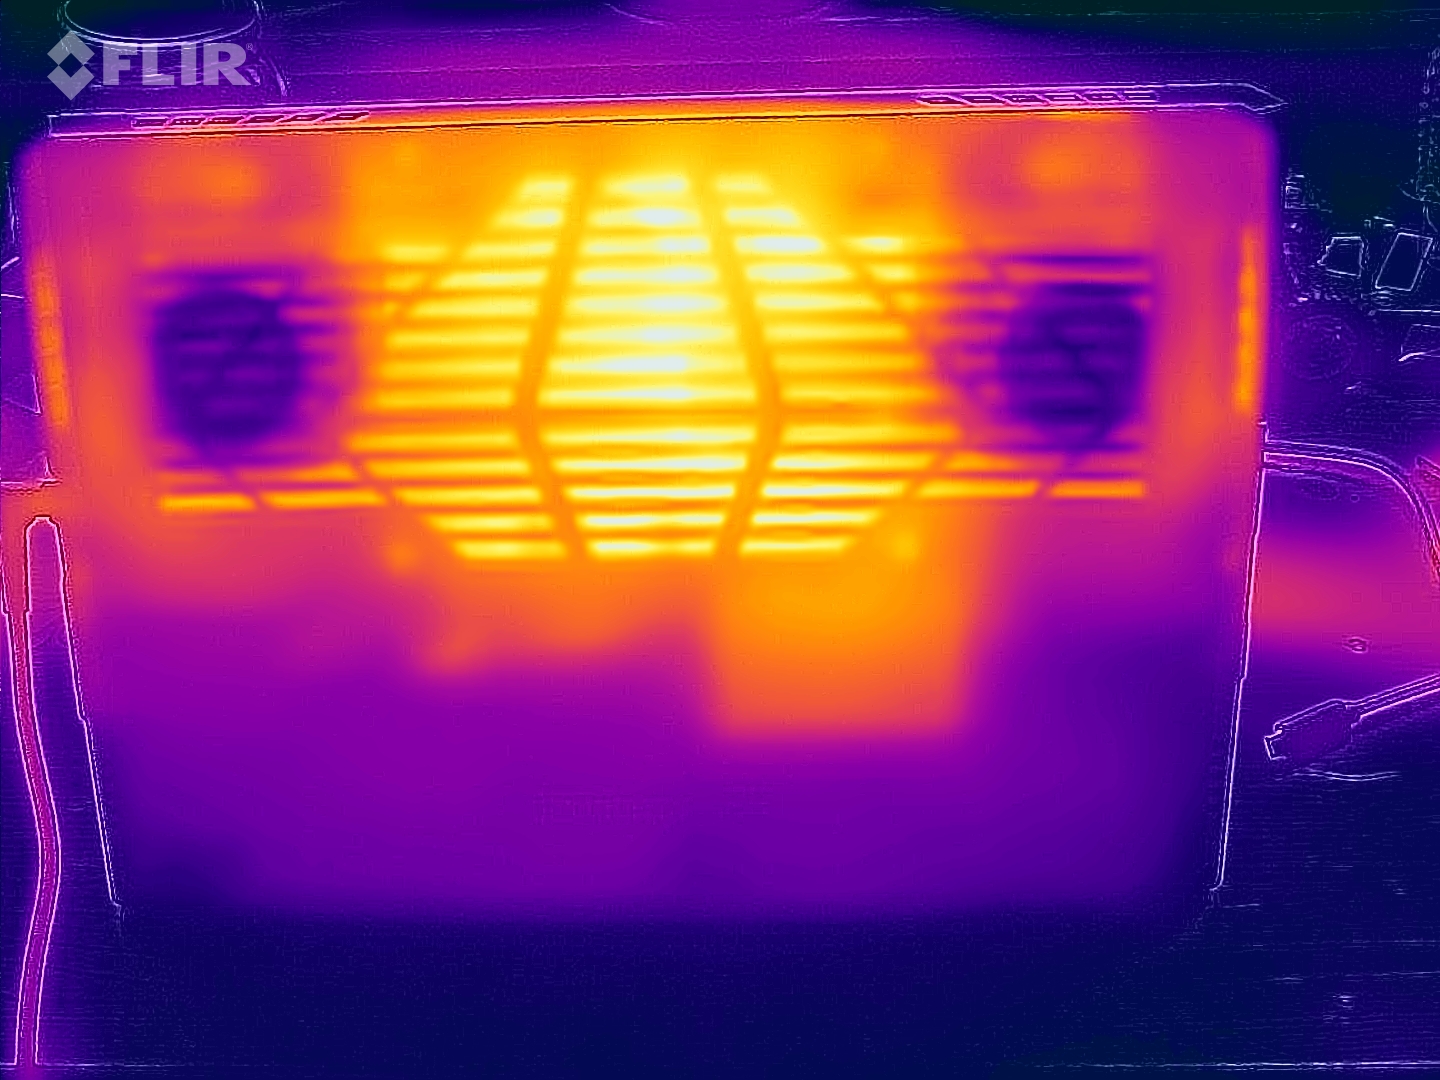
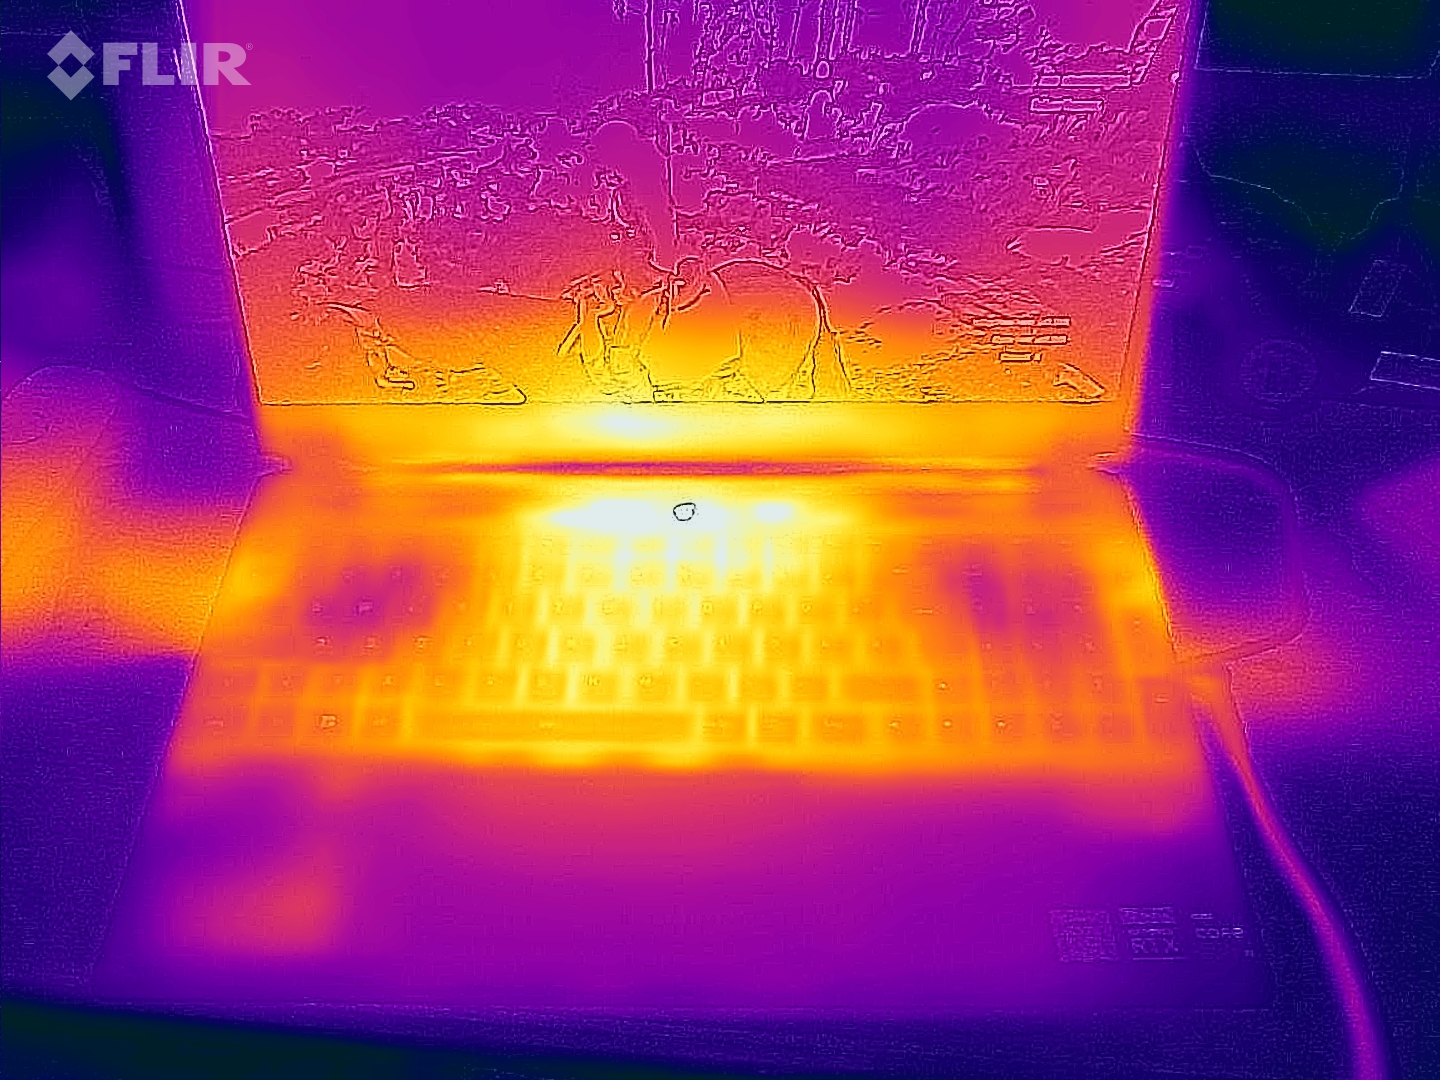
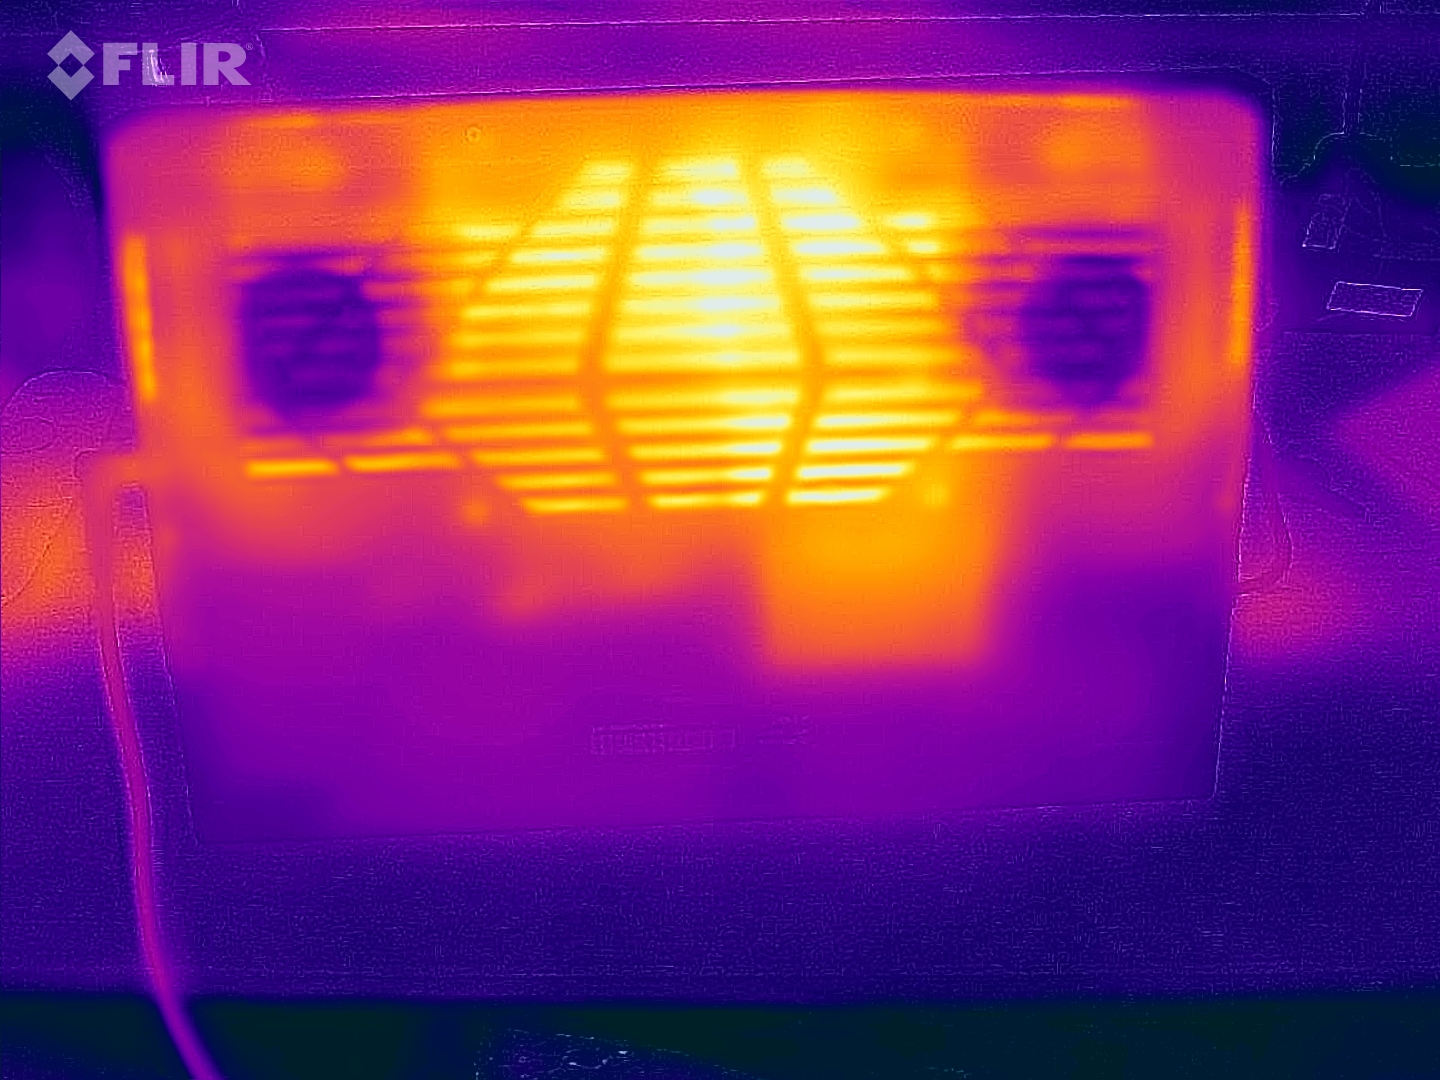
Temperature
It gets hot under high load, especially on the bottom in the center of the device towards the display. However, at up to 50 °C, its temperature is within the range of typical gaming laptops. The top even remains surprisingly cool at a maximum of 43 °C. In turbo mode, the temperatures are even lower.
(±) The maximum temperature on the upper side is 43 °C / 109 F, compared to the average of 40.4 °C / 105 F, ranging from 21.2 to 68.8 °C for the class Gaming.
(-) The bottom heats up to a maximum of 50 °C / 122 F, compared to the average of 43.2 °C / 110 F
(+) In idle usage, the average temperature for the upper side is 27.3 °C / 81 F, compared to the device average of 33.9 °C / 93 F.
(+) Playing The Witcher 3, the average temperature for the upper side is 29.7 °C / 85 F, compared to the device average of 33.9 °C / 93 F.
(+) The palmrests and touchpad are cooler than skin temperature with a maximum of 26 °C / 78.8 F and are therefore cool to the touch.
(+) The average temperature of the palmrest area of similar devices was 28.8 °C / 83.8 F (+2.8 °C / 5 F).
| Aorus 15 YE5-54DEB34SH Intel Core i5-12500H, NVIDIA GeForce RTX 3080 Ti Laptop GPU | Aorus 15 BSF Intel Core i7-13700H, NVIDIA GeForce RTX 4070 Laptop GPU | Captiva Advanced Gaming I74-121 Intel Core i5-13500H, NVIDIA GeForce RTX 4060 Laptop GPU | HP Victus 16-r0077ng Intel Core i7-13700H, NVIDIA GeForce RTX 4070 Laptop GPU | Dell XPS 15 9530 RTX 4070 Intel Core i7-13700H, NVIDIA GeForce RTX 4070 Laptop GPU | HP Omen 16-wf000 Intel Core i7-13700HX, NVIDIA GeForce RTX 4080 Laptop GPU | |
|---|---|---|---|---|---|---|
| Heat | -8% | 4% | -8% | 1% | 5% | |
| Maximum Upper Side * (°C) | 43 | 48 -12% | 41 5% | 51 -19% | 45.6 -6% | 45 -5% |
| Maximum Bottom * (°C) | 50 | 47 6% | 42 16% | 54 -8% | 42 16% | 48.8 2% |
| Idle Upper Side * (°C) | 33 | 39 -18% | 32 3% | 37 -12% | 34.4 -4% | 29.2 12% |
| Idle Bottom * (°C) | 32 | 35 -9% | 35 -9% | 29 9% | 33.2 -4% | 28.8 10% |
* ... smaller is better
Speakers
One positive aspect is the speakers' decent volume. However, there is hardly any bass and even the mids and highs are not particularly balanced.
A combined 3.5 mm jack for microphones and headphones is available for connecting external audio devices.
Aorus 15 YE5-54DEB34SH audio analysis
(+) | speakers can play relatively loud (84.15 dB)
Bass 100 - 315 Hz
(-) | nearly no bass - on average 27.1% lower than median
(±) | linearity of bass is average (12.4% delta to prev. frequency)
Mids 400 - 2000 Hz
(±) | higher mids - on average 6.2% higher than median
(±) | linearity of mids is average (7.7% delta to prev. frequency)
Highs 2 - 16 kHz
(±) | higher highs - on average 7.4% higher than median
(±) | linearity of highs is average (7.5% delta to prev. frequency)
Overall 100 - 16.000 Hz
(±) | linearity of overall sound is average (22.5% difference to median)
Compared to same class
» 81% of all tested devices in this class were better, 5% similar, 14% worse
» The best had a delta of 6%, average was 18%, worst was 132%
Compared to all devices tested
» 66% of all tested devices were better, 6% similar, 28% worse
» The best had a delta of 4%, average was 24%, worst was 134%
Apple MacBook Pro 16 2021 M1 Pro audio analysis
(+) | speakers can play relatively loud (84.7 dB)
Bass 100 - 315 Hz
(+) | good bass - only 3.8% away from median
(+) | bass is linear (5.2% delta to prev. frequency)
Mids 400 - 2000 Hz
(+) | balanced mids - only 1.3% away from median
(+) | mids are linear (2.1% delta to prev. frequency)
Highs 2 - 16 kHz
(+) | balanced highs - only 1.9% away from median
(+) | highs are linear (2.7% delta to prev. frequency)
Overall 100 - 16.000 Hz
(+) | overall sound is linear (4.6% difference to median)
Compared to same class
» 0% of all tested devices in this class were better, 0% similar, 100% worse
» The best had a delta of 5%, average was 17%, worst was 45%
Compared to all devices tested
» 0% of all tested devices were better, 0% similar, 100% worse
» The best had a delta of 4%, average was 24%, worst was 134%
Power consumption
Okay, the RTX 3080 Ti isn't exactly frugal — technically, the current CPU/GPU gen should be more efficient by now.
In order to consume just as "little" as the Captiva when playing The Witcher 3, for example, you would have to set our Aorus to meeting mode or Power Saver. However, the refresh rates in the game are then also at a somewhat surprising level (see table in the noise emissions section).
Above all, the 150 watts that we measured in our 3DMark06 test (average load) stand out negatively; in contrast, the Captiva only consumes 85 watts. Overall, even in idle, a slightly higher consumption must be expected, but this is put into perspective when gaming.
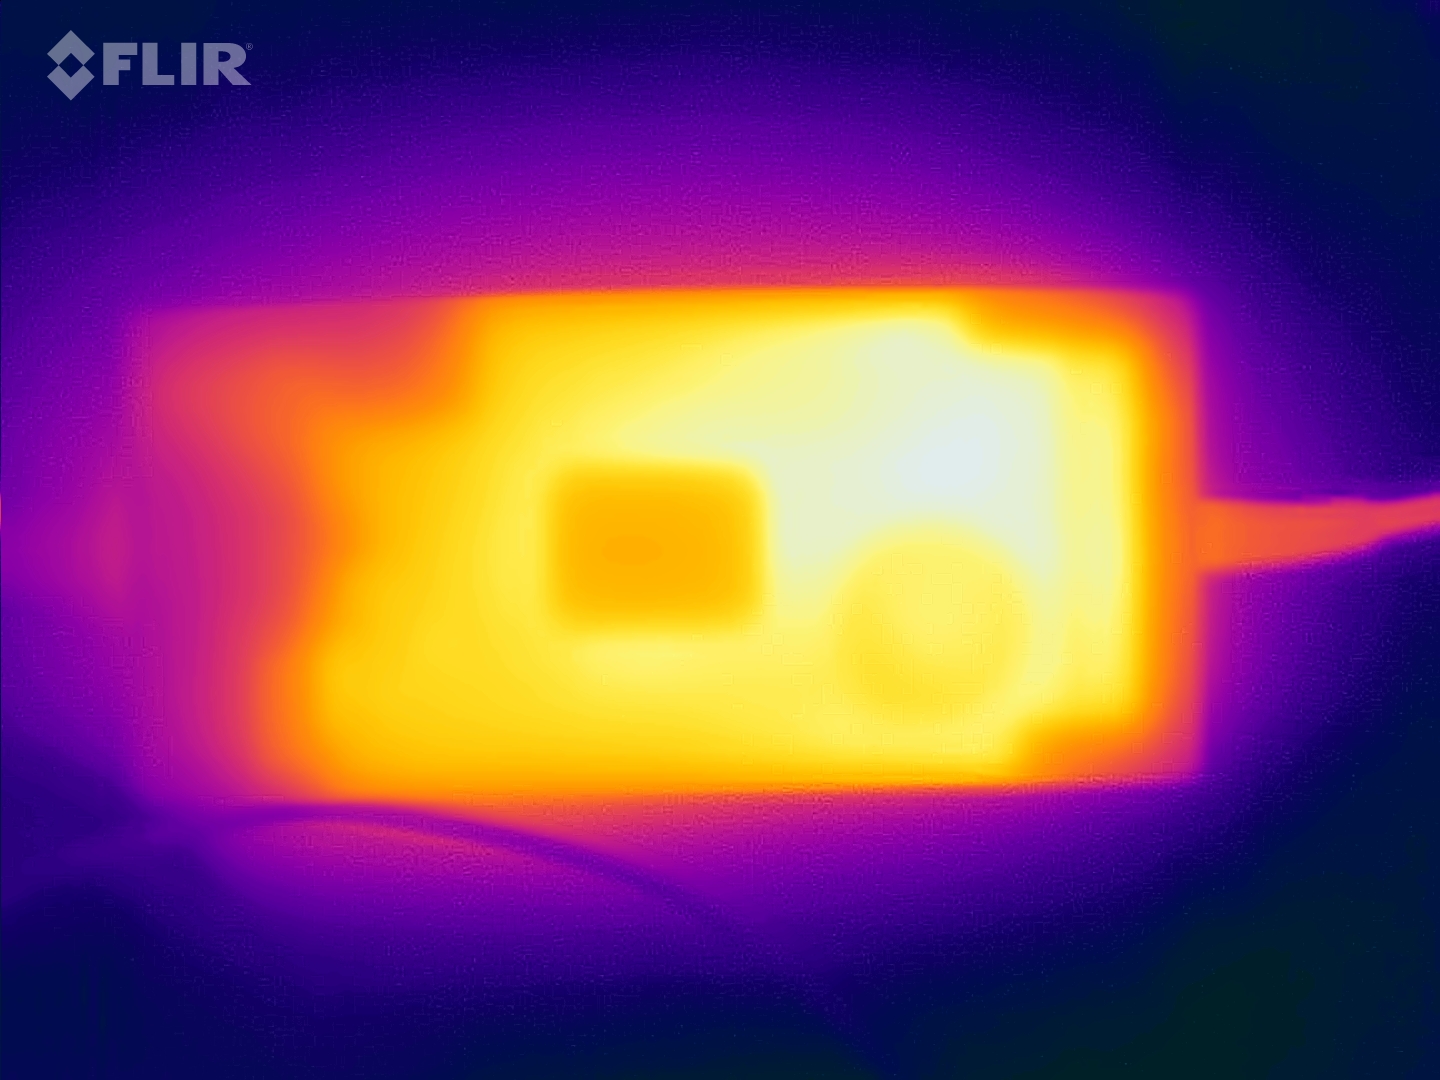
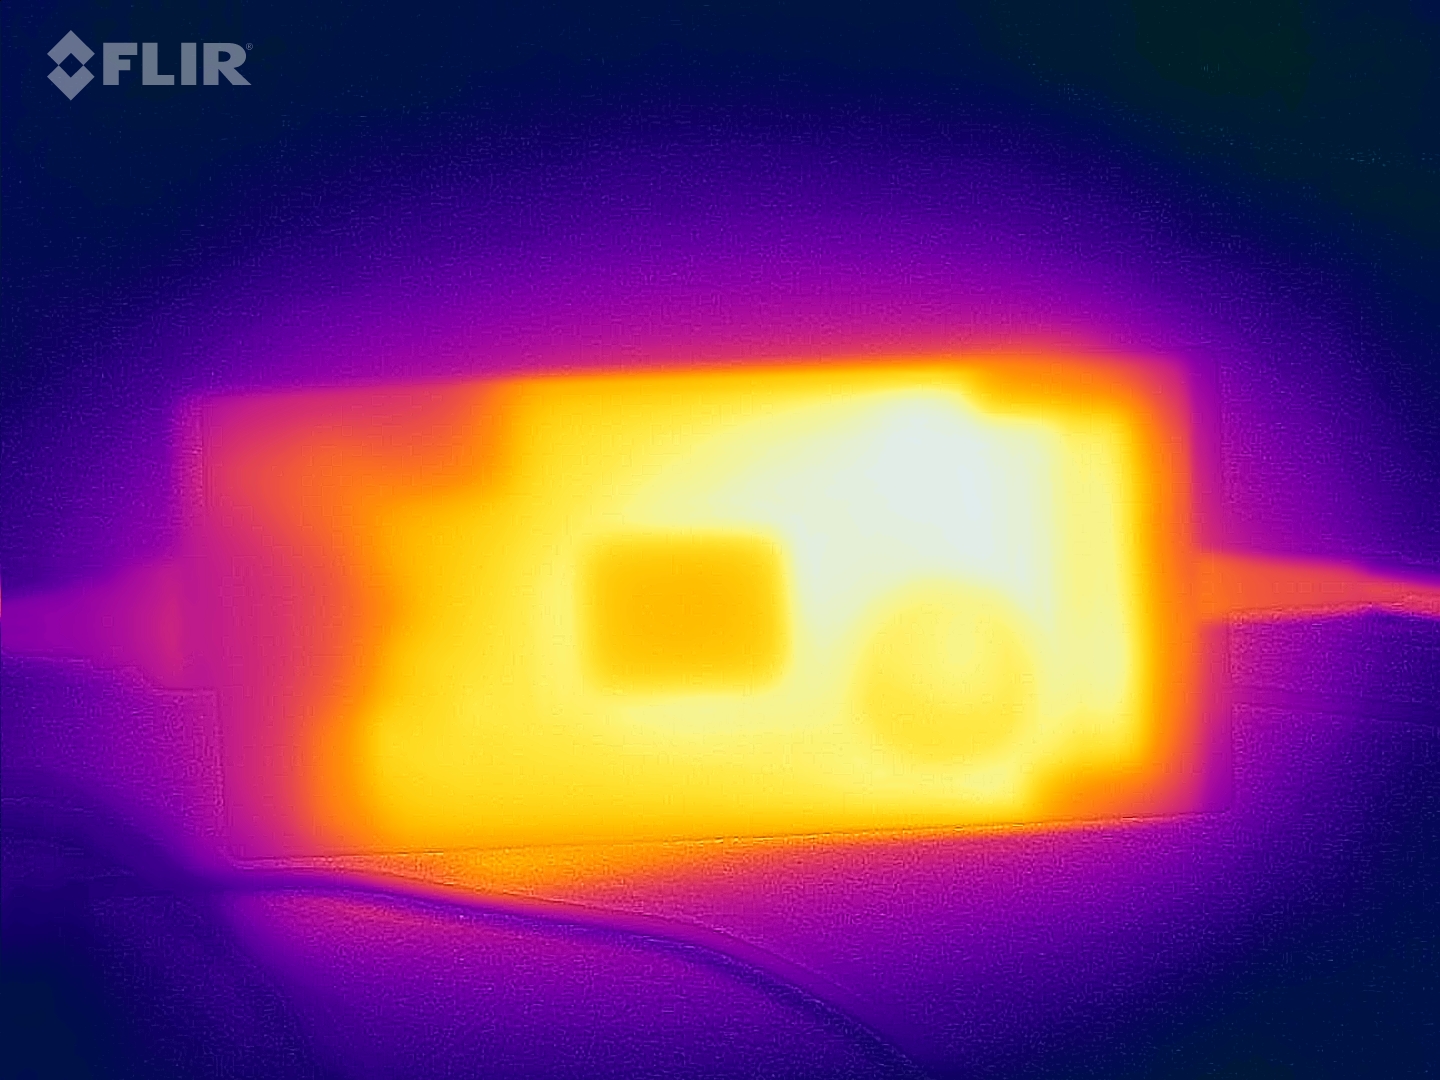
We measured a maximum and temporary value of 204 watts, which the 240-watt power supply from Delta can easily cope with.
| Off / Standby | |
| Idle | |
| Load |
|
Key:
min: | |
| Aorus 15 YE5-54DEB34SH GeForce RTX 3080 Ti Laptop GPU, i5-12500H, Gigabyte AG470S1TB-SI B10 | Aorus 15 BSF GeForce RTX 4070 Laptop GPU, i7-13700H, Gigabyte AG470S1TB-SI B10 | Captiva Advanced Gaming I74-121 GeForce RTX 4060 Laptop GPU, i5-13500H, Samsung SSD 980 1TB MZ-V8V1T0BW | HP Victus 16-r0077ng GeForce RTX 4070 Laptop GPU, i7-13700H, Kioxia XG8 KXG80ZNV1T02 | Dell XPS 15 9530 RTX 4070 GeForce RTX 4070 Laptop GPU, i7-13700H, SK hynix PC801 HFS001TEJ9X101N | HP Omen 16-wf000 GeForce RTX 4080 Laptop GPU, i7-13700HX, SK hynix PC801 HFS002TEJ9X101N | |
|---|---|---|---|---|---|---|
| Power Consumption | 10% | 15% | 23% | 23% | -24% | |
| Idle 150cd/m2 * (Watt) | 16 | 12.4 22% | 18 -13% | 12.8 20% | 20.1 -26% | 23.2 -45% |
| 3DMark06 Return To Proxycon * (Watt) | 150 | 85 43% | ||||
| Witcher 3 ultra * (Watt) | 196 | 175.8 10% | 164 16% | 141.8 28% | 95.4 51% | 214 -9% |
| 1280x720 Prime95 28.10 and Furmark 1.25 * (Watt) | 204 | 210 -3% | 179 12% | 164.1 20% | 117.2 43% | 240 -18% |
* ... smaller is better
Power consumption Witcher 3 / stress test
Power consumption with external monitor
Runtimes
The Aorus disappoints in terms of its runtimes, presumably due to its increased idle consumption. Gigabyte has installed a generous 99-Wh battery but its runtimes were still only on the same level as the Captiva with a 53-Wh battery! The current-gen Aorus BSF with an i7-13700H and an RTX 4070 lasted 65 per cent longer with its 99-Wh battery, and almost twice as long in the WLAN test! It lasted for over 10 hours, while our Aorus lasted less than 5.5 hours.
| Aorus 15 YE5-54DEB34SH i5-12500H, GeForce RTX 3080 Ti Laptop GPU, 99 Wh | Aorus 15 BSF i7-13700H, GeForce RTX 4070 Laptop GPU, 99 Wh | Captiva Advanced Gaming I74-121 i5-13500H, GeForce RTX 4060 Laptop GPU, 53 Wh | HP Victus 16-r0077ng i7-13700H, GeForce RTX 4070 Laptop GPU, 83 Wh | Dell XPS 15 9530 RTX 4070 i7-13700H, GeForce RTX 4070 Laptop GPU, 86 Wh | HP Omen 16-wf000 i7-13700HX, GeForce RTX 4080 Laptop GPU, 83 Wh | Average of class Gaming | |
|---|---|---|---|---|---|---|---|
| Battery runtime | 64% | -5% | 34% | 20% | -20% | 25% | |
| H.264 (h) | 5.3 | 9 70% | 4.9 -8% | 8.26 ? 56% | |||
| WiFi v1.3 (h) | 5.3 | 10.3 94% | 5.3 0% | 7.1 34% | 8 51% | 5.1 -4% | 7.04 ? 33% |
| Load (h) | 1.7 | 2.2 29% | 1.6 -6% | 1.5 -12% | 1.1 -35% | 1.47 ? -14% | |
| Reader / Idle (h) | 10.9 | 11.5 | 5.5 | 8.71 ? |
Pros
Cons
Verdict - Definitely competitive!

The combination of a Gen-12 CPU and an RTX 3080 Ti is by no means a thing of the past, especially when it comes to (3D) performance. The Aorus 15 YE5 can beat most other gaming laptops with an RTX 4070, which makes it worth considering — especially with regards to its low price. In spite of this, the Aorus has not forgone modern features such as Thunderbolt 4, a fast SSD or a well-rounded design like many of its competitors have.
Its poor efficiency isn't entirely up-to-date anymore, which is mostly reflected in the laptop's disappointing runtimes despite its large battery. Its old 720p webcam may not be an absolute no-go, however, for gamers, this is a clear disadvantage. An annoying feature which is typical for Aorus is that the device switches to standby very quickly as soon as you close the display by 45 degrees.
The Aorus 15 YE5 offers very strong gaming performance at a low price — without seeming cheap, as some other more expensive competitors do. Its last-gen GPU is particularly impressive when it comes to 3D performance, while its efficiency and runtimes are lacking.
There are some similarly priced alternatives available, such as the MSI Katana with an RTX 4070. However, the Aorus should be a small amount faster in lots of games. Furthermore, the Katana doesn't feature Thunderbolt 4 or feel as high-quality. In turn, the MSI benefits from longer runtimes. The HP Victus 16 behaves similarly — it even costs a little more but isn't as fast or feels as high-quality as the Aorus. You will currently have to spend about US$300 more to purchase the current-gen Aorus.
Price and availability
The Aorus 15 YE5 currently retails for around US$1,500. At the time of writing, we couldn't find it for sale at any online retailers in the US.
Aorus 15 YE5-54DEB34SH
- 12/15/2023 v7 (old)
Christian Hintze
Transparency
The selection of devices to be reviewed is made by our editorial team. The test sample was provided to the author as a loan by the manufacturer or retailer for the purpose of this review. The lender had no influence on this review, nor did the manufacturer receive a copy of this review before publication. There was no obligation to publish this review. As an independent media company, Notebookcheck is not subjected to the authority of manufacturers, retailers or publishers.
This is how Notebookcheck is testing
Every year, Notebookcheck independently reviews hundreds of laptops and smartphones using standardized procedures to ensure that all results are comparable. We have continuously developed our test methods for around 20 years and set industry standards in the process. In our test labs, high-quality measuring equipment is utilized by experienced technicians and editors. These tests involve a multi-stage validation process. Our complex rating system is based on hundreds of well-founded measurements and benchmarks, which maintains objectivity. Further information on our test methods can be found here.
Price comparison

