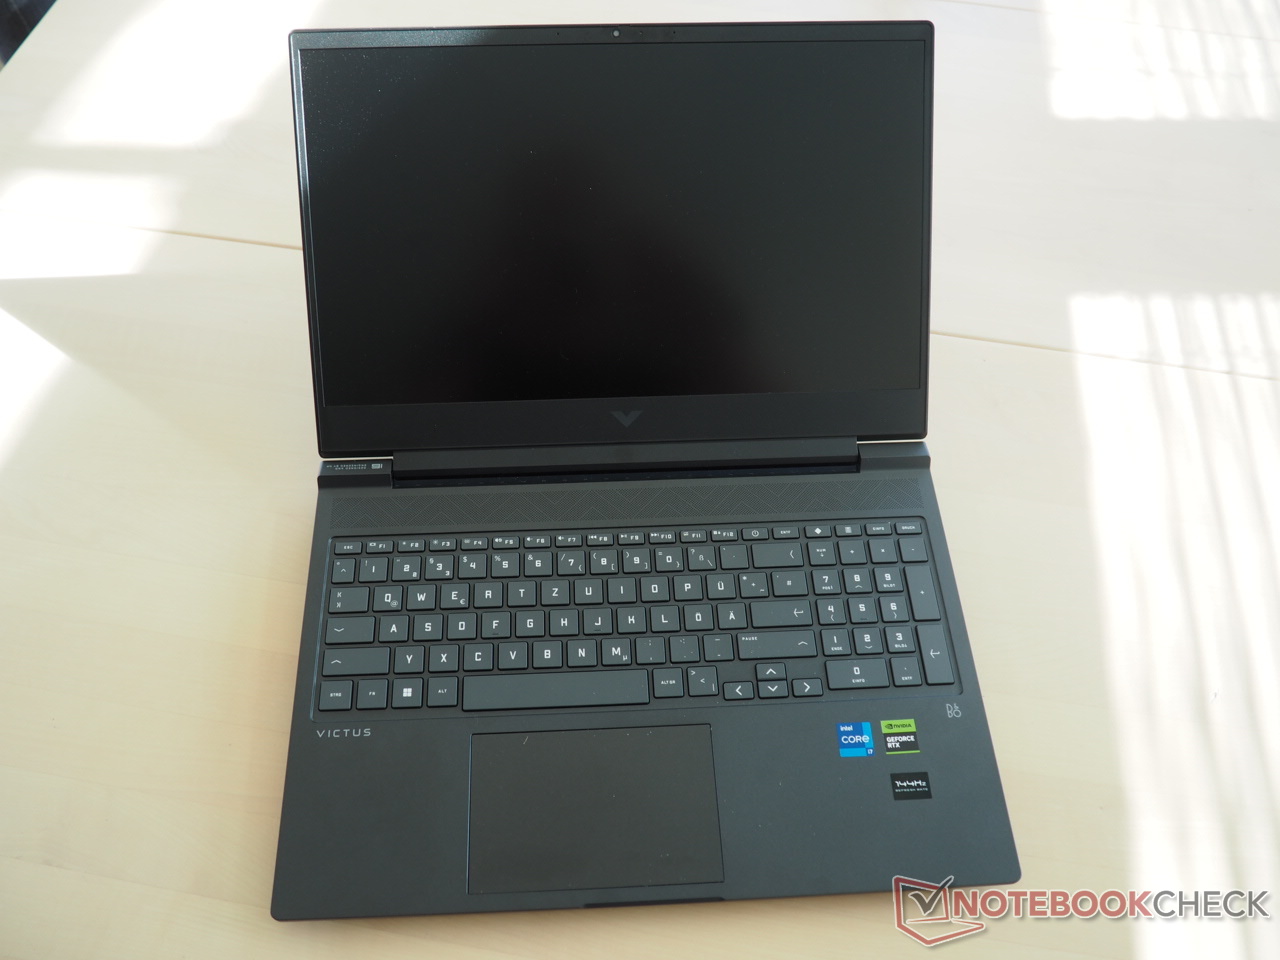
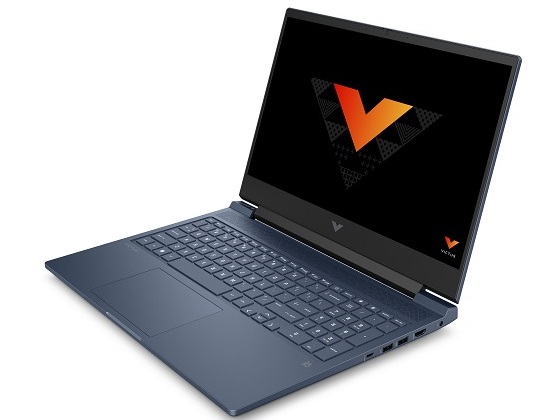
HP Victus 16 laptop review: Full HD gamer with RTX 4070

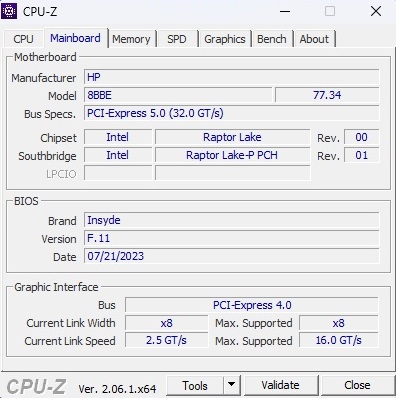
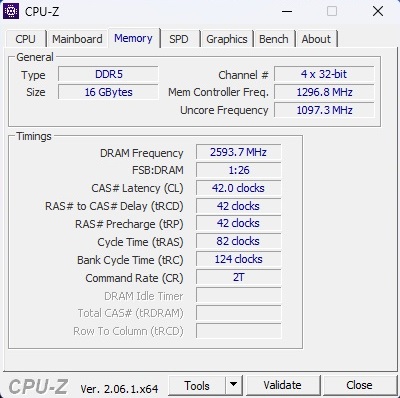
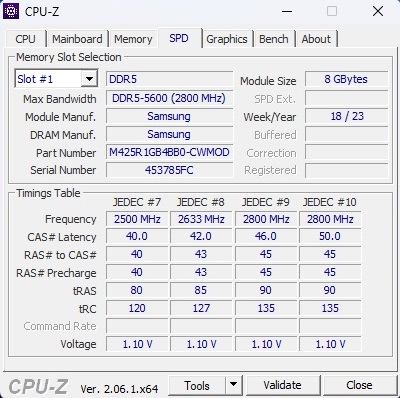
Similarly to the Omen series, the Victus is also available in various hardware configurations. Our test unit, with its Core i7-13700H and GeForce RTX 4070, belongs to the upper end of the performance scale. 16 GB of DDR5-5600 RAM and a 1 TB M.2 NVMe SSD are also solid for 2023. The display is a matte IPS panel in 16:9 format at 1,920 x 1,080 and 144 Hz. Cost for the entire package: at least US $1,439.99 at present.
The Victus 16's competitors include other 16-inch gamers, also with a GeForce RTX 4070, such as the Lenovo Legion Pro 5 16ARX8, the Acer Nitro 16 AN16-41, the Gigabyte Aero 16 OLED BSF and the MSI Stealth 16 Studio A13VG. Some of these utilize an AMD processor and all appear in the following tables as comparison devices.
Possible competitors in comparison
Rating | Date | Model | Weight | Height | Size | Resolution | Price |
|---|---|---|---|---|---|---|---|
| 85.1 % v7 (old) | 09 / 2023 | HP Victus 16-r0077ng i7-13700H, GeForce RTX 4070 Laptop GPU | 2.4 kg | 24 mm | 16.10" | 1920x1080 | |
| 86.6 % v7 (old) | 09 / 2023 | HP Omen 16-xf0376ng R7 7840HS, GeForce RTX 4070 Laptop GPU | 2.4 kg | 23.5 mm | 16.10" | 1920x1080 | |
| 88.4 % v7 (old) | 05 / 2023 | Lenovo Legion Pro 5 16ARX8 R7 7745HX, GeForce RTX 4070 Laptop GPU | 2.5 kg | 26.8 mm | 16.00" | 2560x1600 | |
| 88.1 % v7 (old) | 06 / 2023 | Acer Nitro 16 AN16-41 R7 7735HS, GeForce RTX 4070 Laptop GPU | 2.7 kg | 27.9 mm | 16.00" | 2560x1600 | |
| 86.2 % v7 (old) | 03 / 2023 | Gigabyte AERO 16 OLED BSF i9-13900H, GeForce RTX 4070 Laptop GPU | 2.1 kg | 18 mm | 16.00" | 3840x2400 | |
| 88.8 % v7 (old) | 07 / 2023 | MSI Stealth 16 Studio A13VG i7-13700H, GeForce RTX 4070 Laptop GPU | 2 kg | 19.95 mm | 16.00" | 2560x1600 |
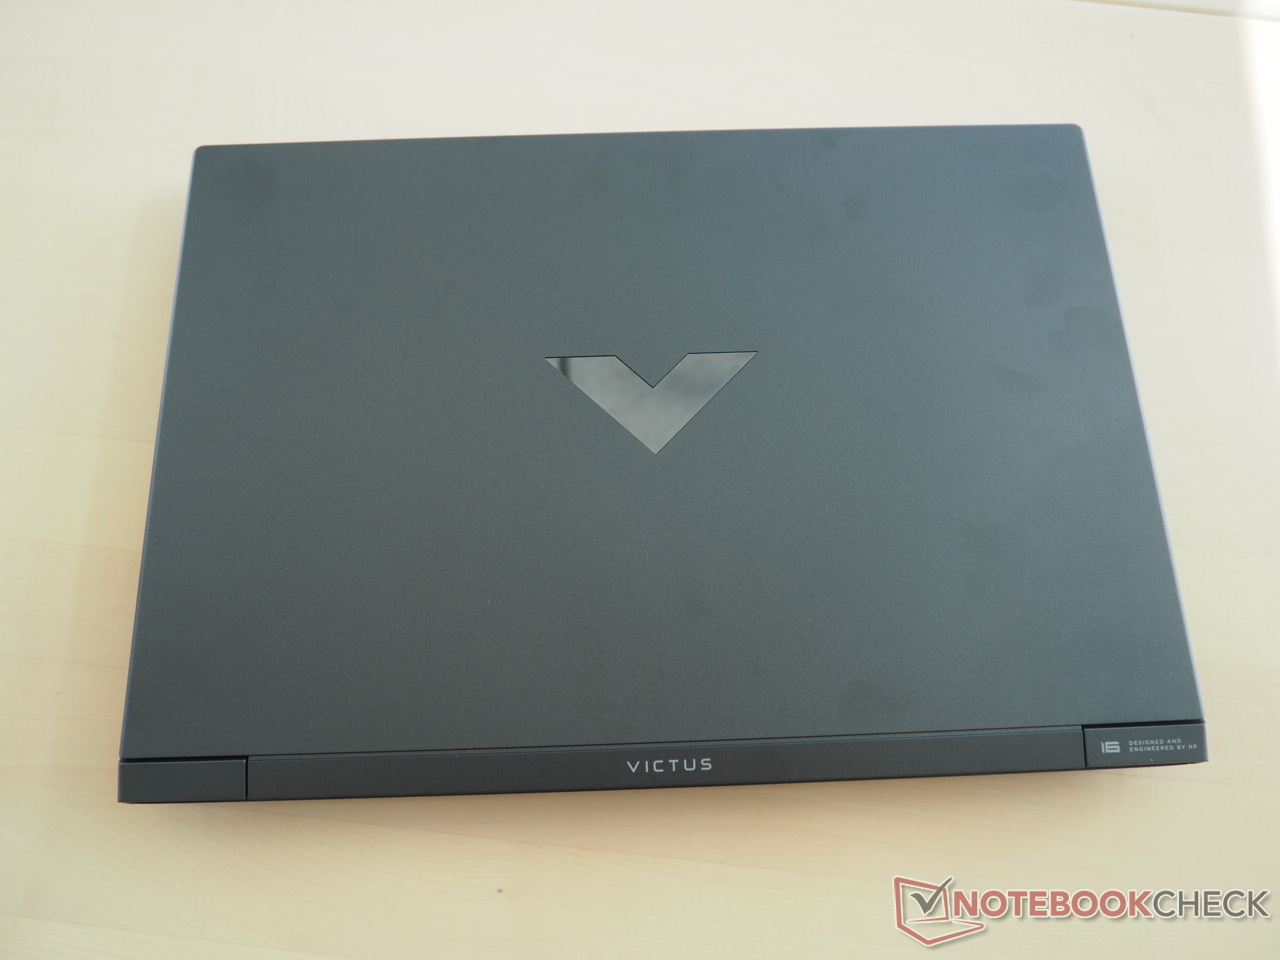
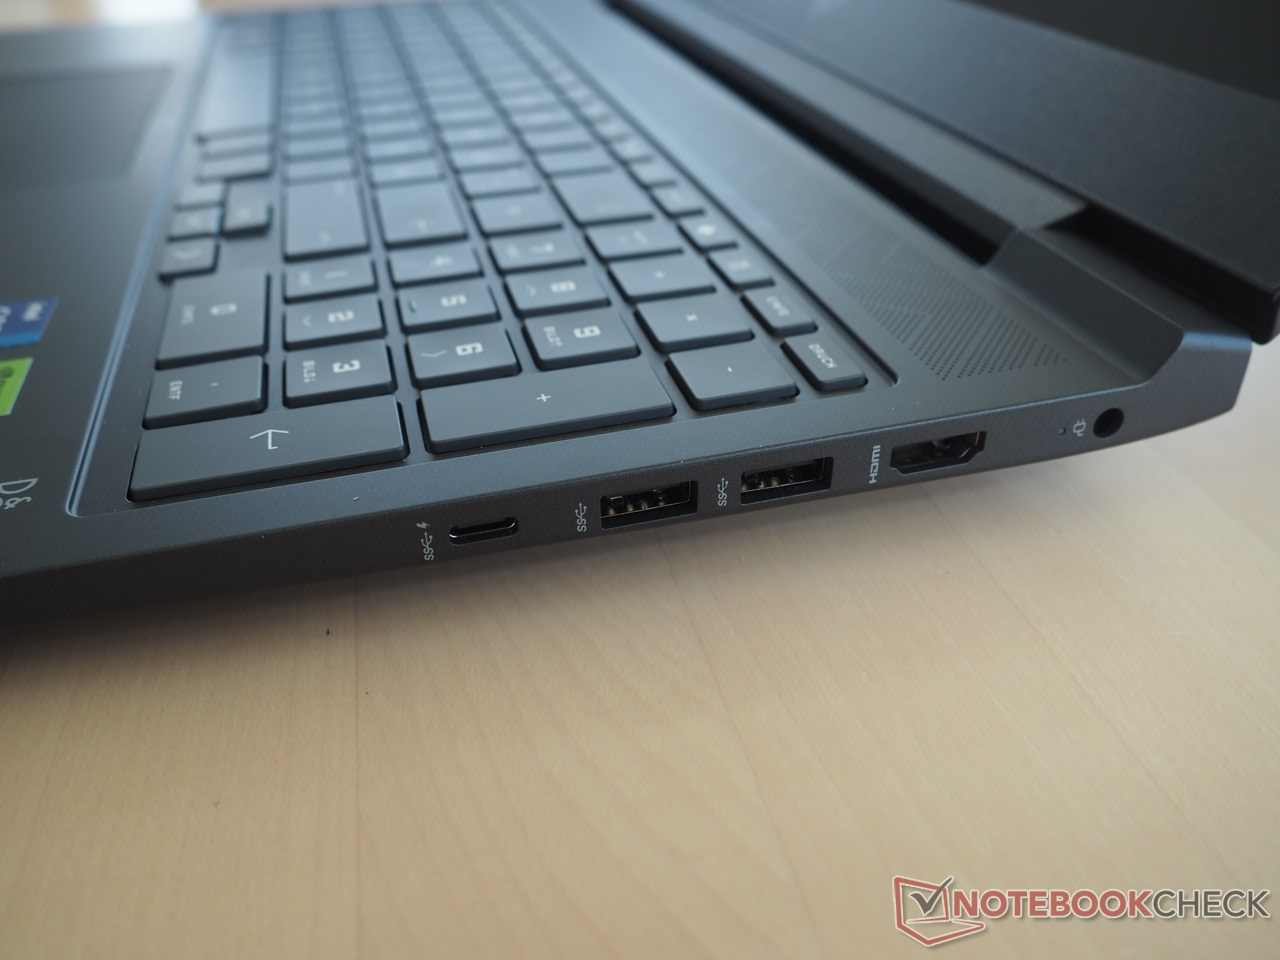
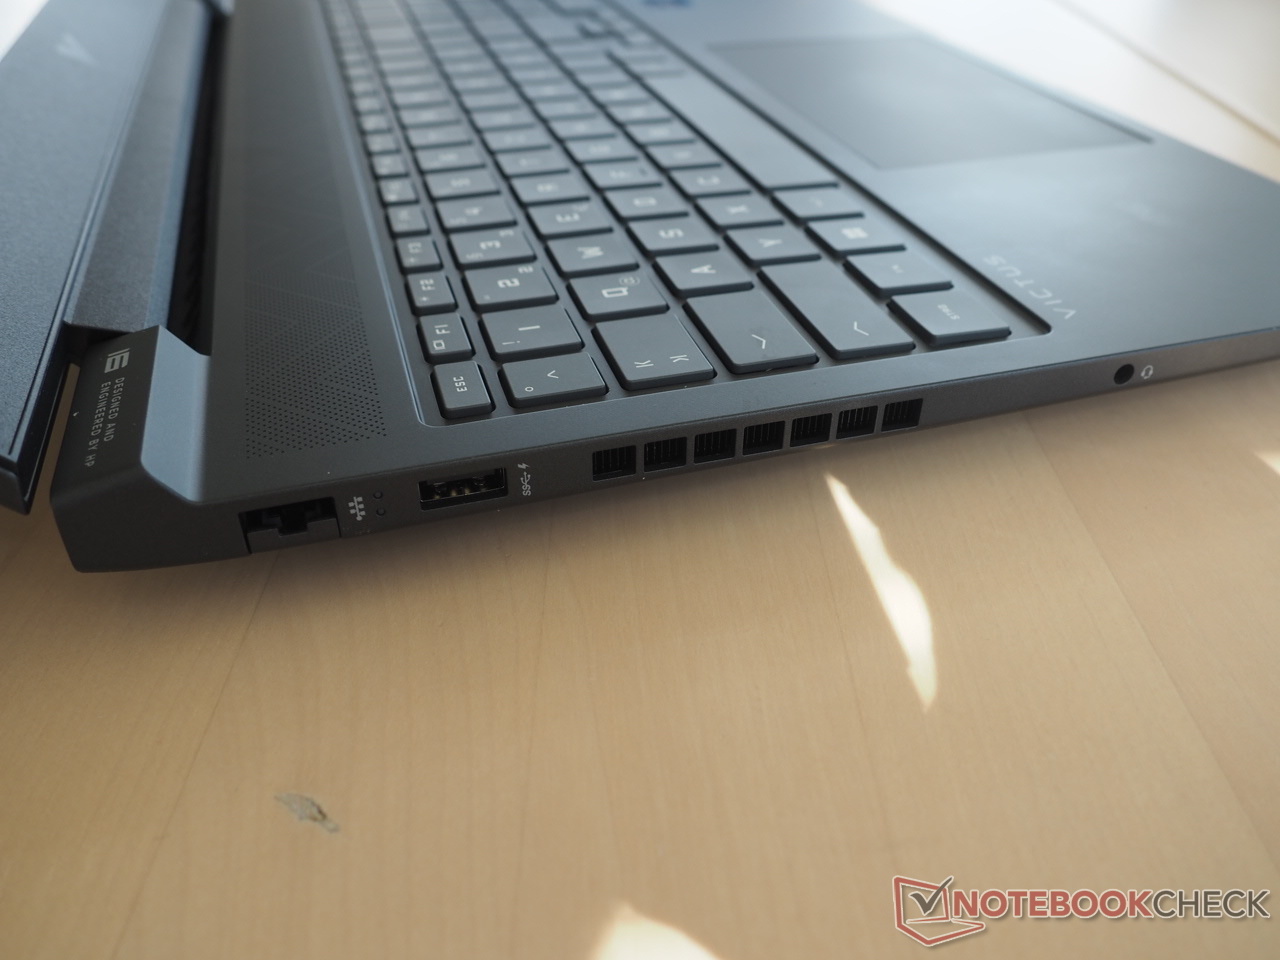
Since the chassis is identical to the recently reviewed US version with a Core i5-13500HX and a GeForce RTX 4050, we don't go into detail about the case, equipment and input devices in this review. You can find all relevant information in the corresponding review here.
Communication
Webcam


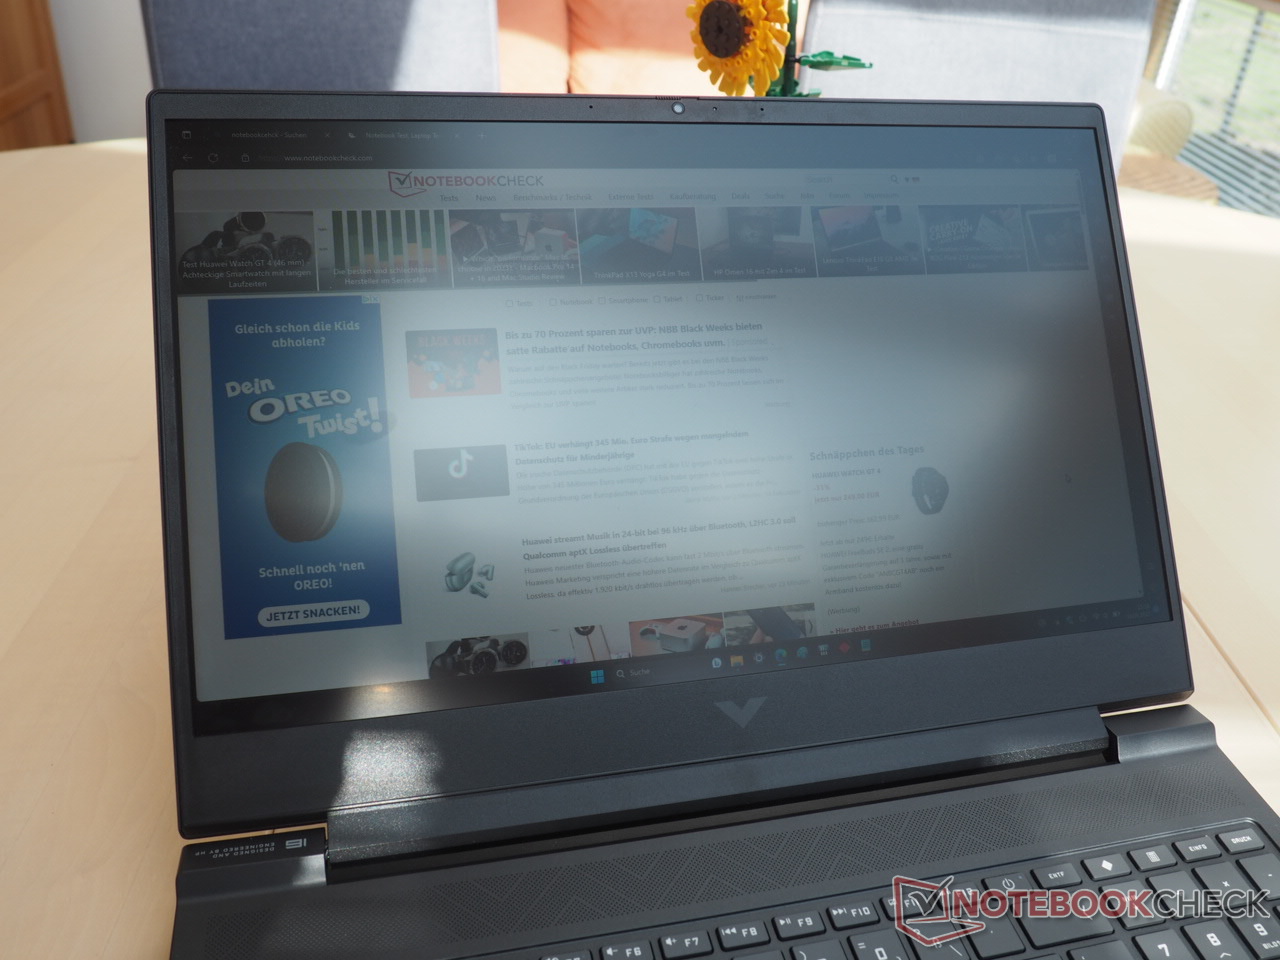
Display
Although the panel designations are very similar, the RTX 4070 version has a slightly different Full HD display than the RTX 4050 variant, although the results hardly differ for the most part.
| |||||||||||||||||||||||||
Brightness Distribution: 85 %
Center on Battery: 308 cd/m²
Contrast: 1232:1 (Black: 0.25 cd/m²)
ΔE ColorChecker Calman: 1.3 | ∀{0.5-29.43 Ø4.72}
calibrated: 0.92
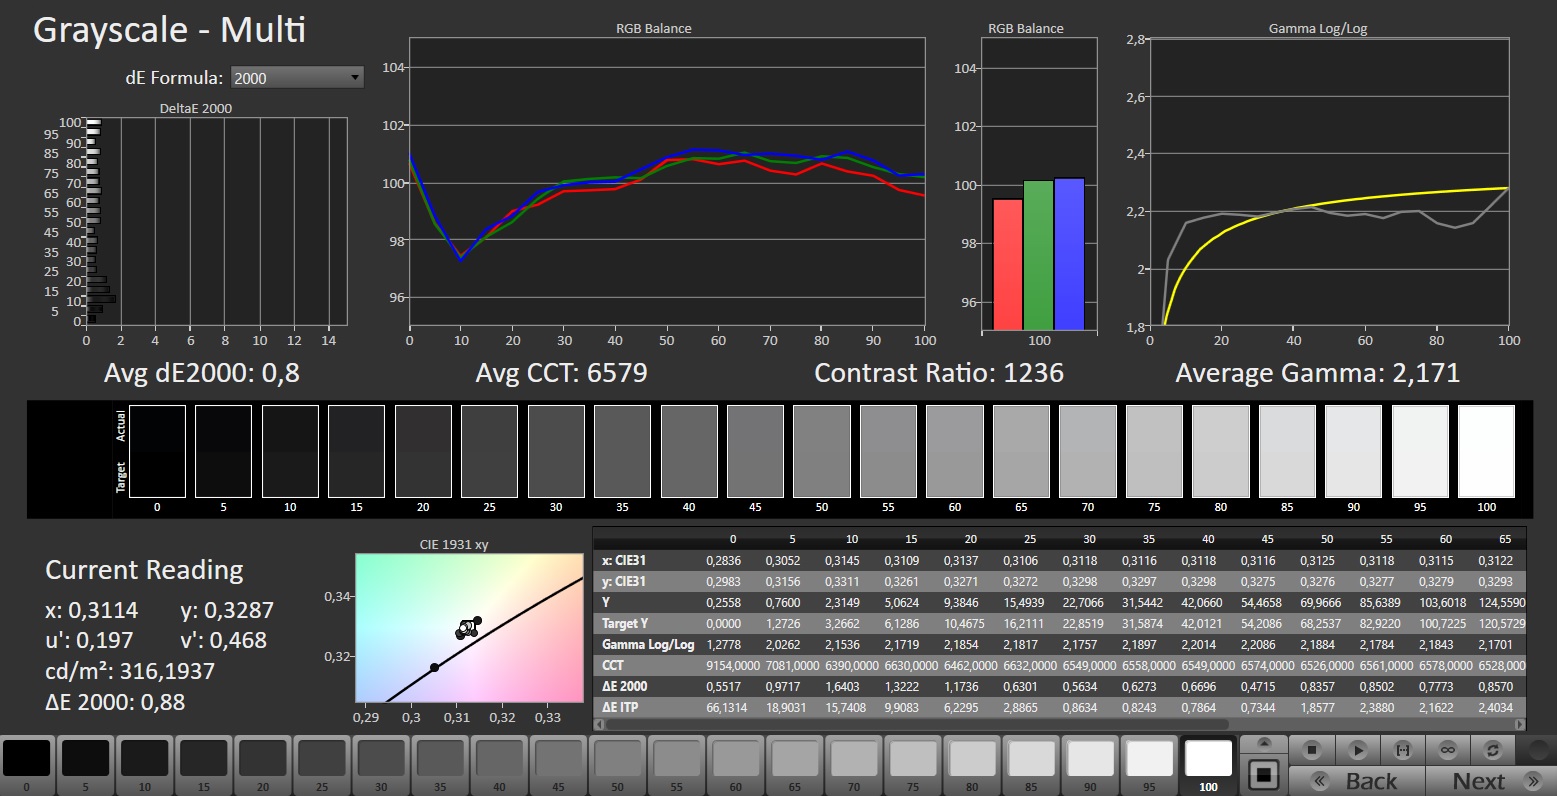
ΔE Greyscale Calman: 1.7 | ∀{0.09-98 Ø4.97}
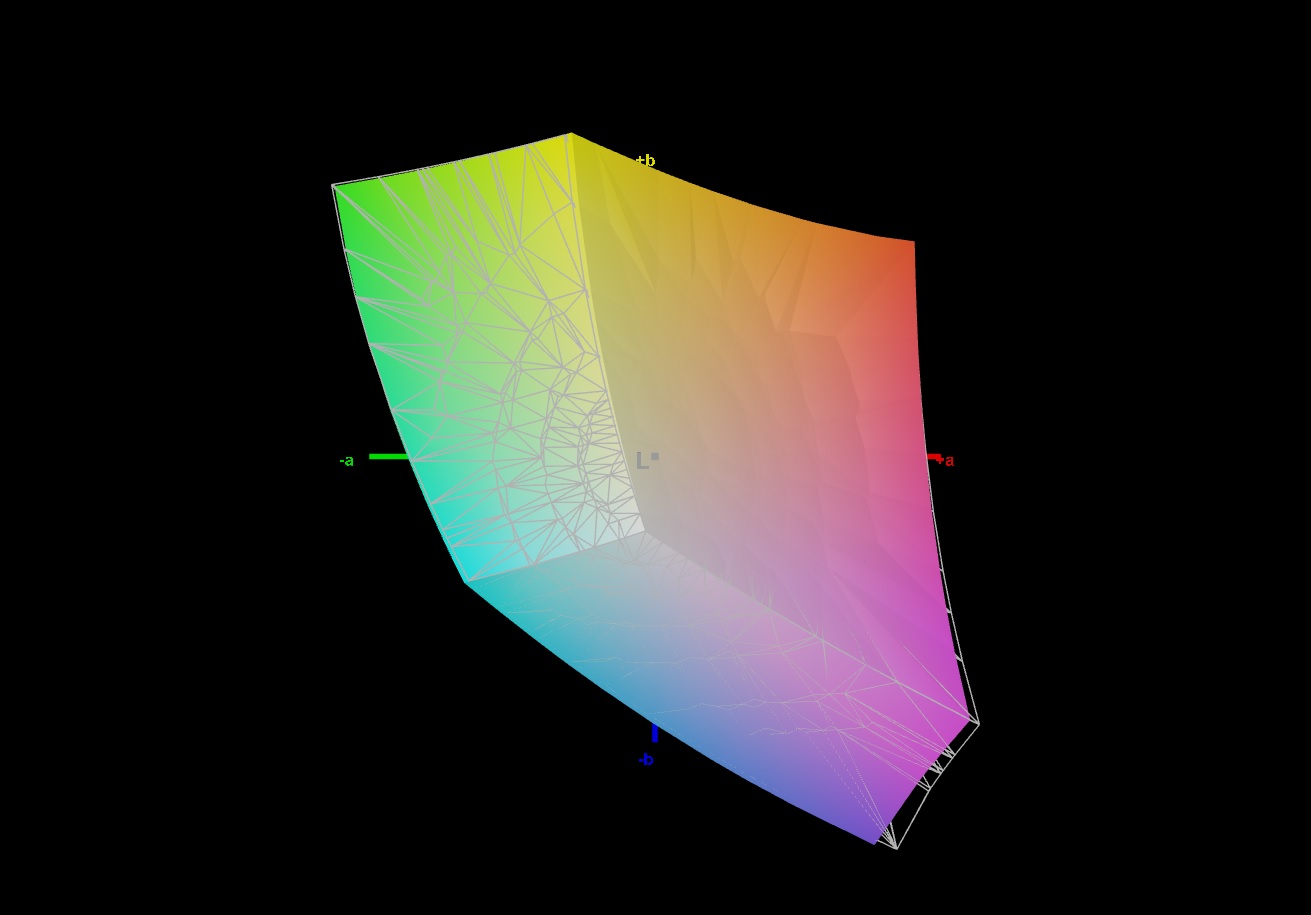
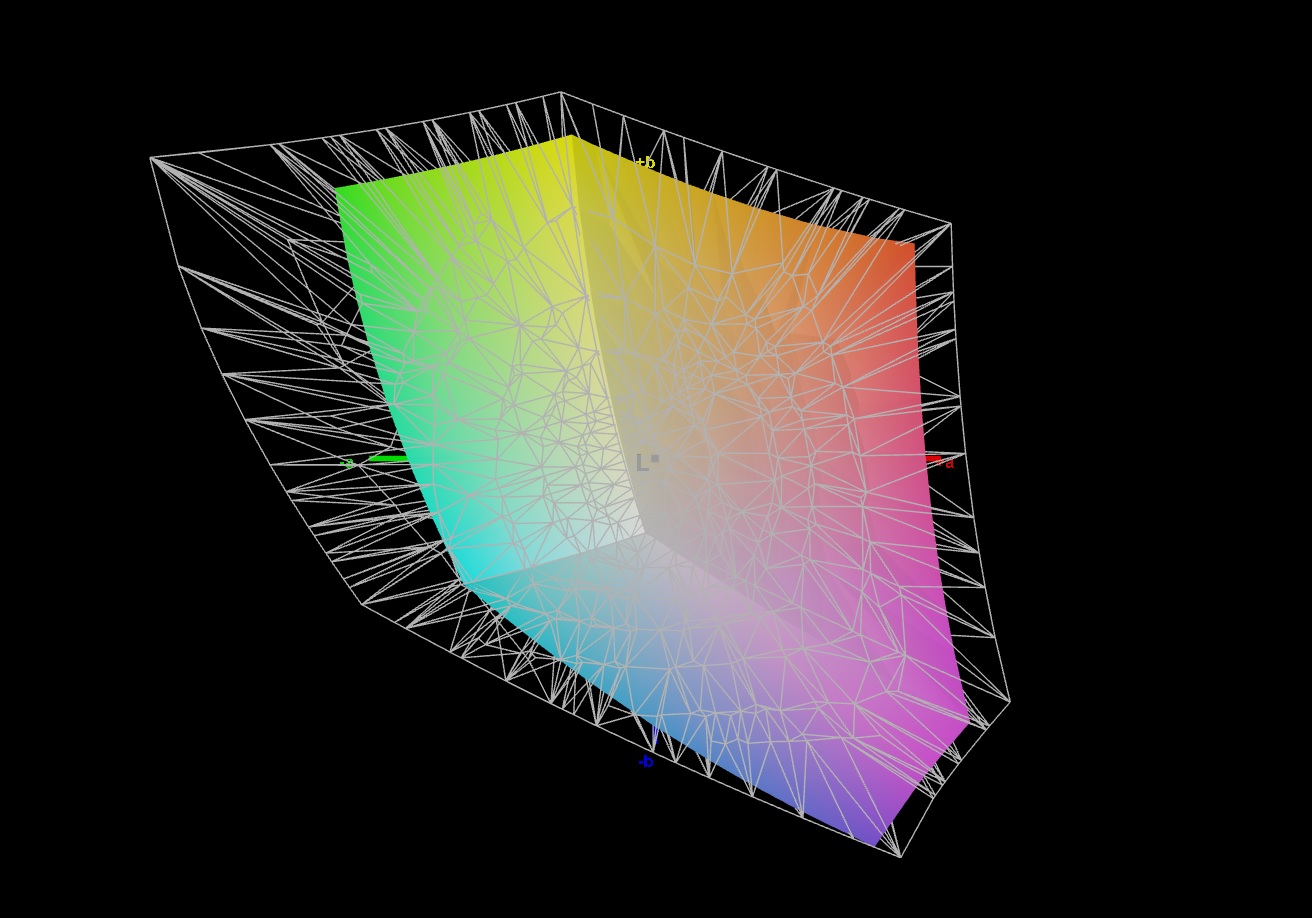
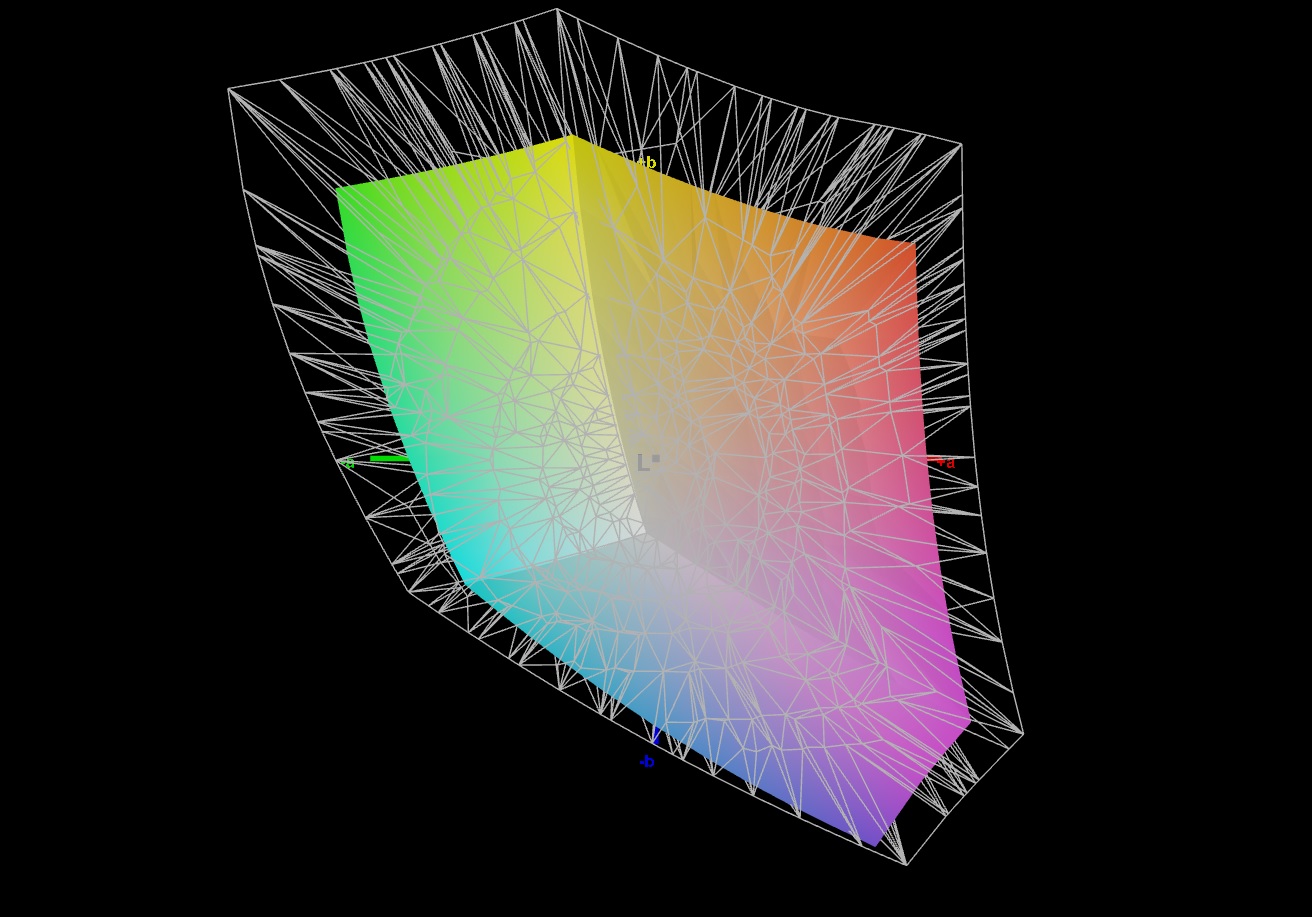
69% AdobeRGB 1998 (Argyll 3D)
98% sRGB (Argyll 3D)
66.7% Display P3 (Argyll 3D)
Gamma: 2.167
CCT: 6767 K
| HP Victus 16-r0077ng CMN162D, IPS, 1920x1080, 16.1" | HP Omen 16-xf0376ng BOE0B81, IPS, 1920x1080, 16.1" | Lenovo Legion Pro 5 16ARX8 CSOT T3 MNG007DA1-Q, IPS, 2560x1600, 16" | Acer Nitro 16 AN16-41 BOE CQ NE16QDM-NY1, IPS, 2560x1600, 16" | Gigabyte AERO 16 OLED BSF Samsung SDC4191 (ATNA60YV09-0, OLED, 3840x2400, 16" | MSI Stealth 16 Studio A13VG AUO26A9, IPS, 2560x1600, 16" | |
|---|---|---|---|---|---|---|
| Display | 5% | 4% | 1% | 31% | 23% | |
| Display P3 Coverage (%) | 66.7 | 72.1 8% | 70.4 6% | 67.9 2% | 99.9 50% | 96.4 45% |
| sRGB Coverage (%) | 98 | 99.6 2% | 99.6 2% | 99.1 1% | 100 2% | 99.7 2% |
| AdobeRGB 1998 Coverage (%) | 69 | 72.3 5% | 72.6 5% | 69.9 1% | 96.4 40% | 84.8 23% |
| Response Times | 10% | 18% | 28% | 81% | 50% | |
| Response Time Grey 50% / Grey 80% * (ms) | 13.3 ? | 12.3 ? 8% | 7 ? 47% | 11 ? 17% | 2 ? 85% | 4.4 ? 67% |
| Response Time Black / White * (ms) | 8.2 ? | 7.2 ? 12% | 9.1 ? -11% | 5 ? 39% | 1.98 ? 76% | 5.6 ? 32% |
| PWM Frequency (Hz) | 60 | |||||
| Screen | -68% | 11% | -12% | 101% | -73% | |
| Brightness middle (cd/m²) | 308 | 350 14% | 355.3 15% | 520 69% | 389.97 27% | 424 38% |
| Brightness (cd/m²) | 285 | 338 19% | 340 19% | 494 73% | 395 39% | 411 44% |
| Brightness Distribution (%) | 85 | 91 7% | 91 7% | 91 7% | 97 14% | 88 4% |
| Black Level * (cd/m²) | 0.25 | 0.35 -40% | 0.32 -28% | 0.39 -56% | 0.03 88% | 0.37 -48% |
| Contrast (:1) | 1232 | 1000 -19% | 1110 -10% | 1333 8% | 12999 955% | 1146 -7% |
| Colorchecker dE 2000 * | 1.3 | 3.29 -153% | 1.13 13% | 1.94 -49% | 2 -54% | 3.04 -134% |
| Colorchecker dE 2000 max. * | 2.76 | 8.47 -207% | 2.78 -1% | 5.62 -104% | 4.1 -49% | 7.5 -172% |
| Colorchecker dE 2000 calibrated * | 0.92 | 2.23 -142% | 0.32 65% | 0.74 20% | 1.68 -83% | 3.04 -230% |
| Greyscale dE 2000 * | 1.7 | 3.2 -88% | 1.4 18% | 2.94 -73% | 2.23 -31% | 4.34 -155% |
| Gamma | 2.167 102% | 2.131 103% | 2.24 98% | 2.37 93% | 2.41 91% | 2.32 95% |
| CCT | 6767 96% | 6317 103% | 6372 102% | 6443 101% | 6323 103% | 6952 93% |
| Total Average (Program / Settings) | -18% /
-41% | 11% /
11% | 6% /
-3% | 71% /
83% | 0% /
-35% |
* ... smaller is better
At an average brightness of 285 cd/m², the Victus 16 is unfortunately not among the brightest models. While this value may still be sufficient for most indoor spaces, you'll quickly reach the limits of readability and recognizability outdoors. Thanks to the relatively good black value of 0.25 cd/m² for IPS standards, the display still achieves a solid contrast of around 1200:1.
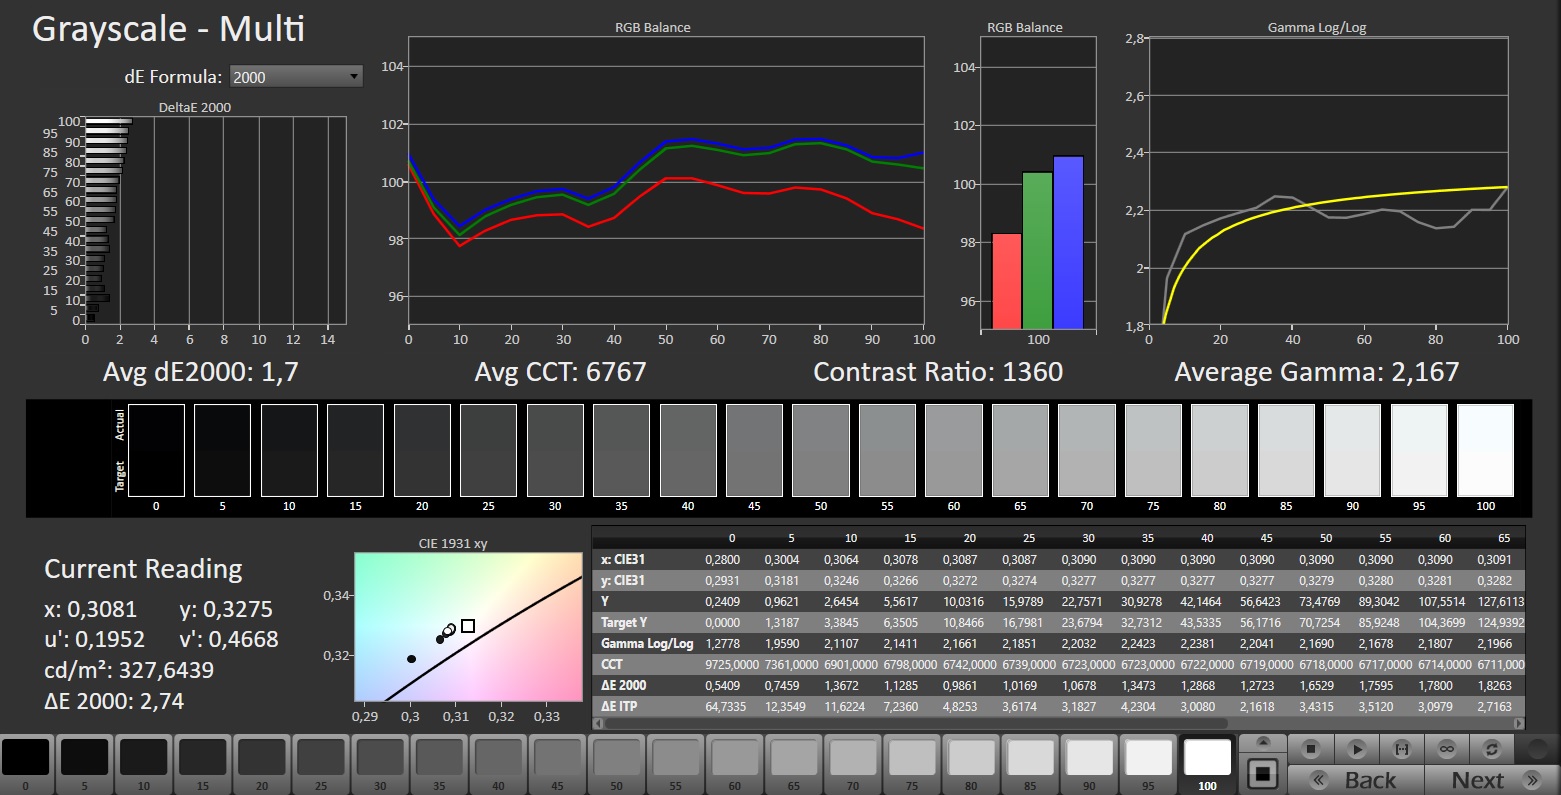
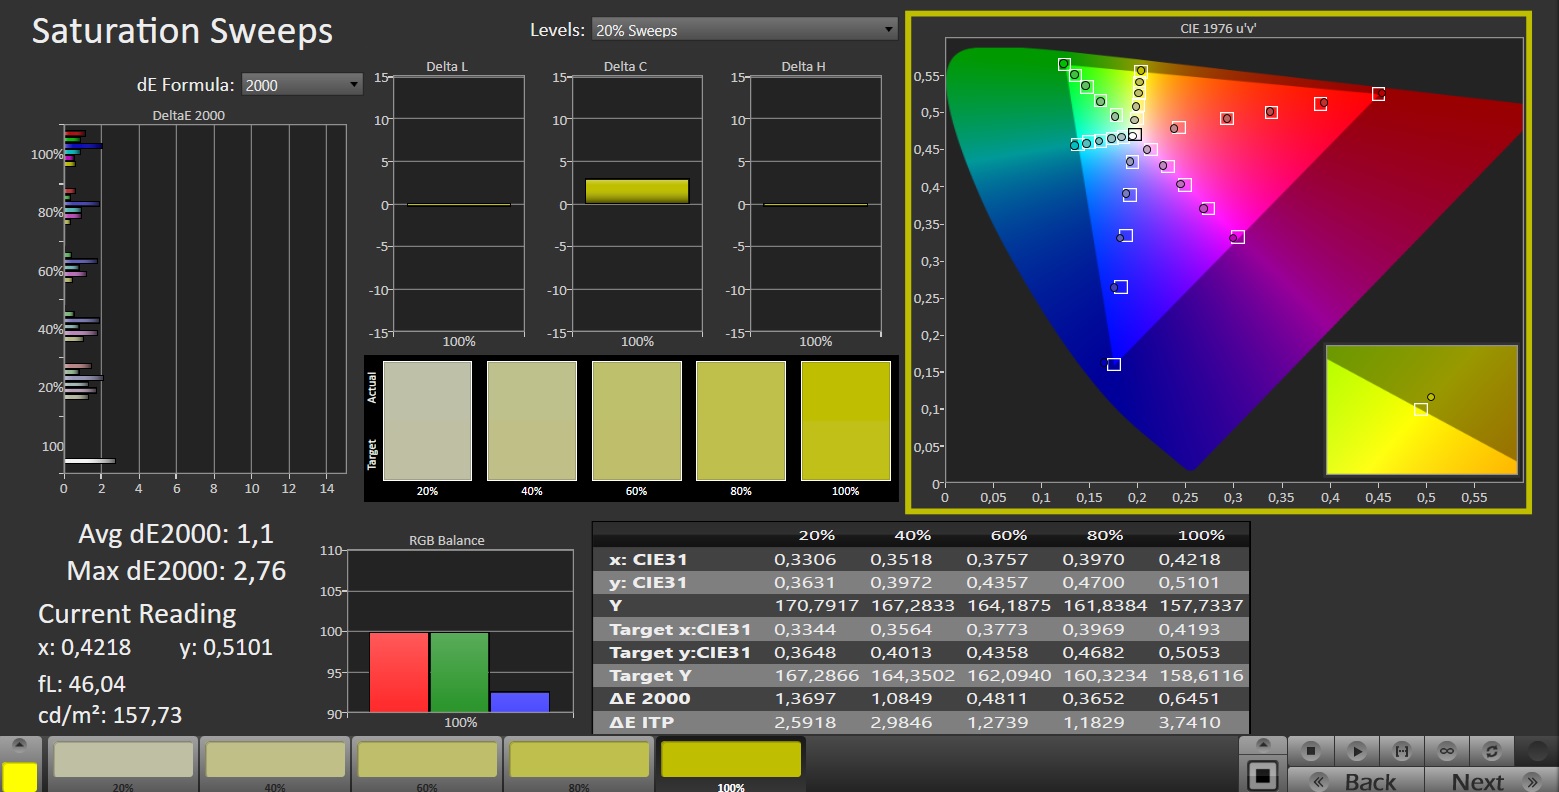
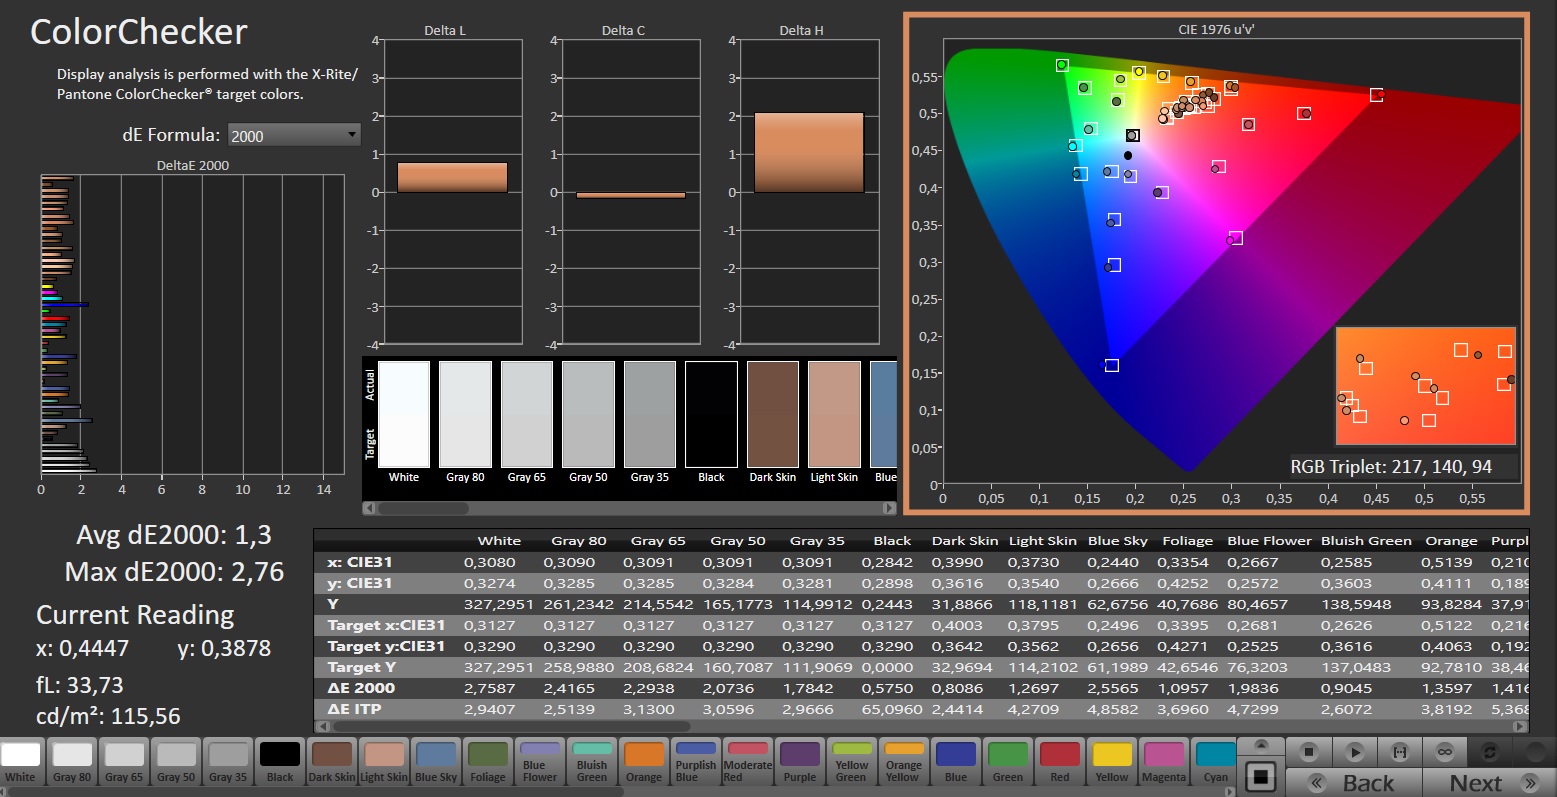
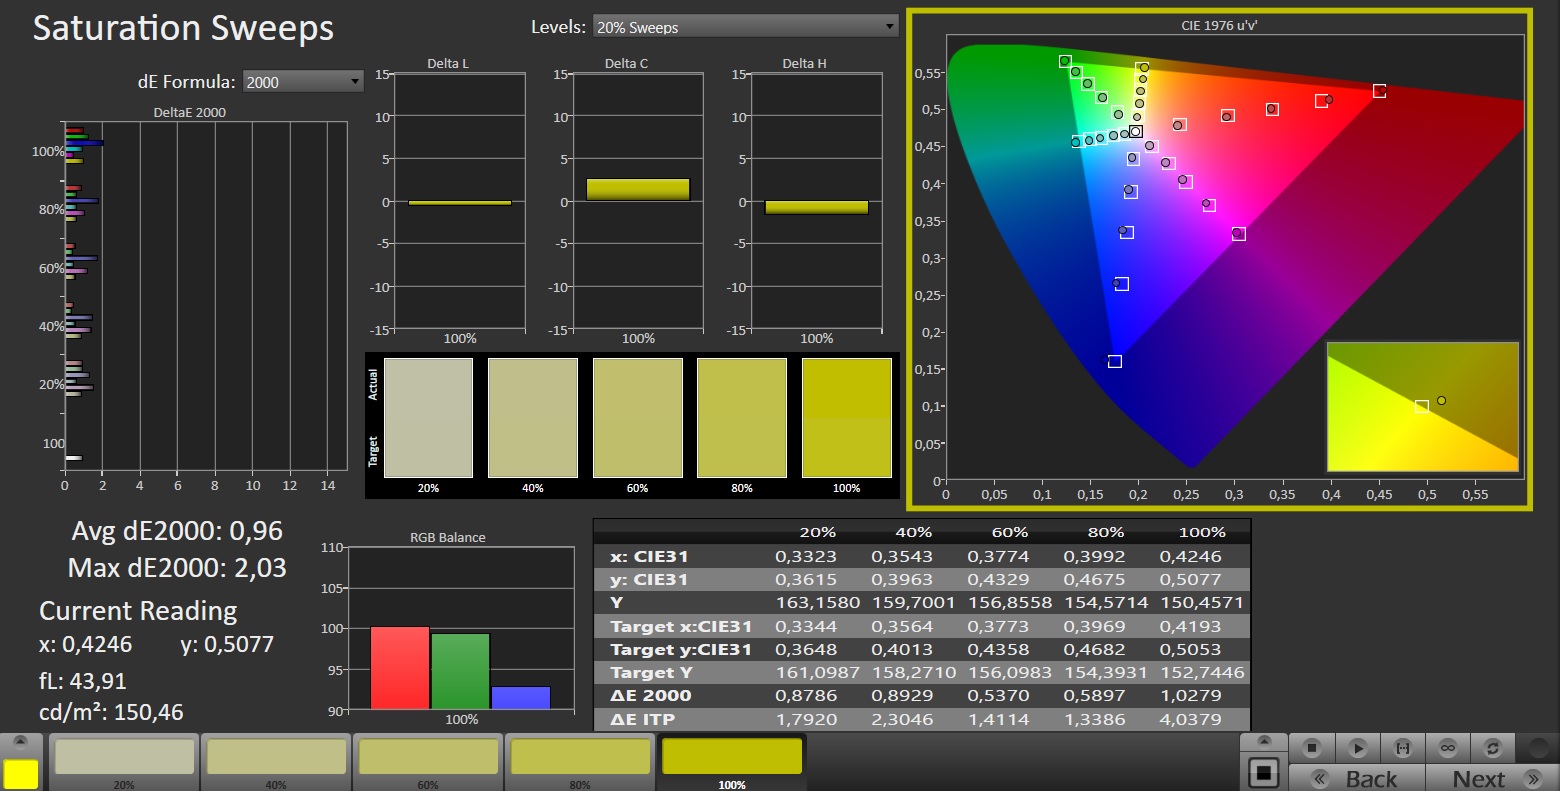
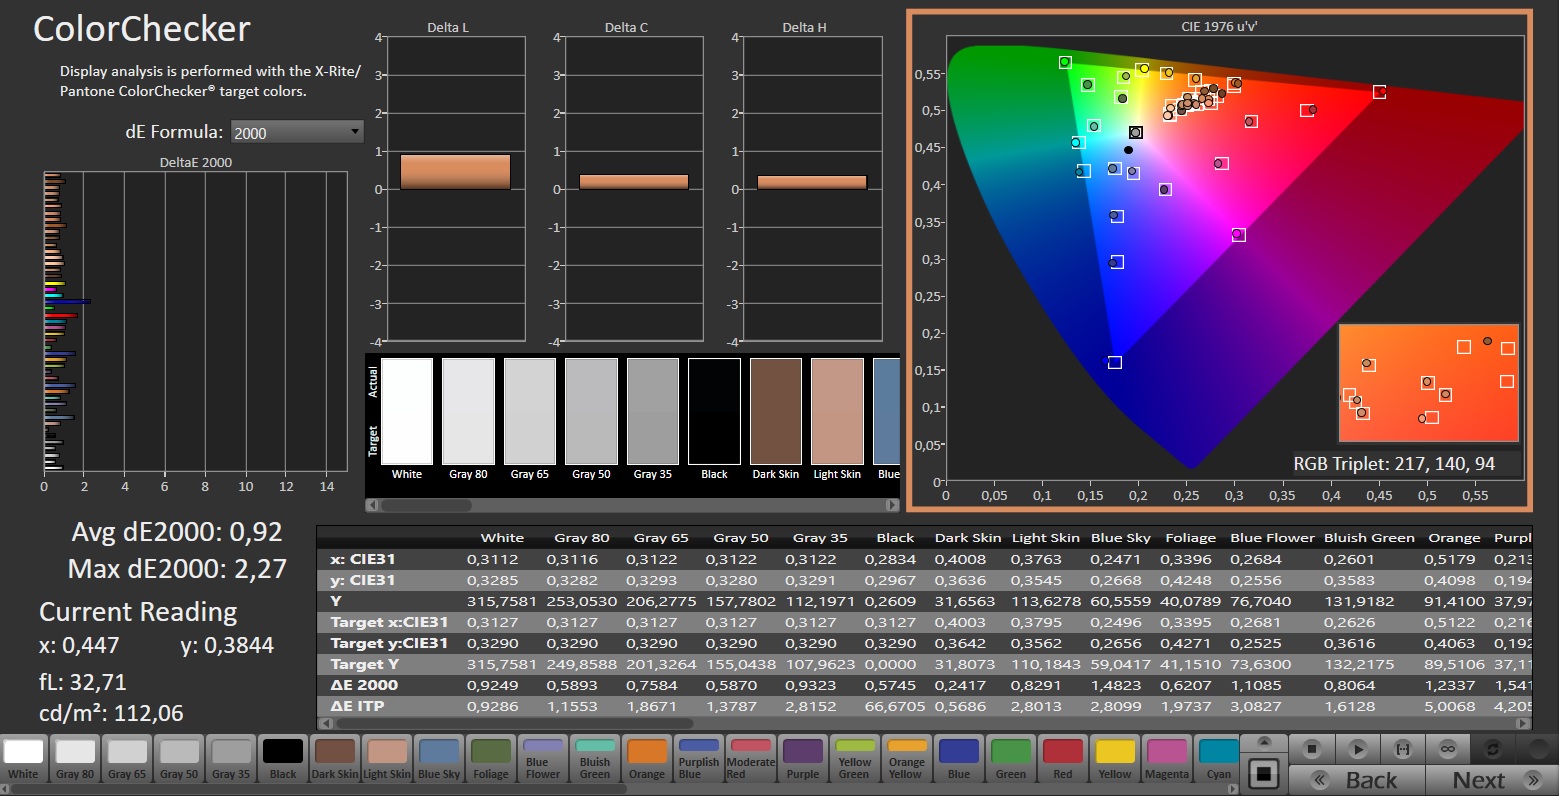
The color space also gives little cause for criticism, as sRGB has nearly 100% coverage. 69% for AdobeRGB and 67% for DCI-P3 are also acceptable for a gaming notebook. The Victus 16 deserves special praise for its color accuracy: even in the state of delivery, the values are in the ideal range (see Calman screenshots).
Viewing angles are at the typical (good) IPS level. Our test device did not show any signs of screen flickering or screen bleeding. Response times were also inconspicuous and should meet the requirements of most users.
Display Response Times
| ↔ Response Time Black to White | ||
|---|---|---|
| 8.2 ms ... rise ↗ and fall ↘ combined | ↗ 4.5 ms rise | 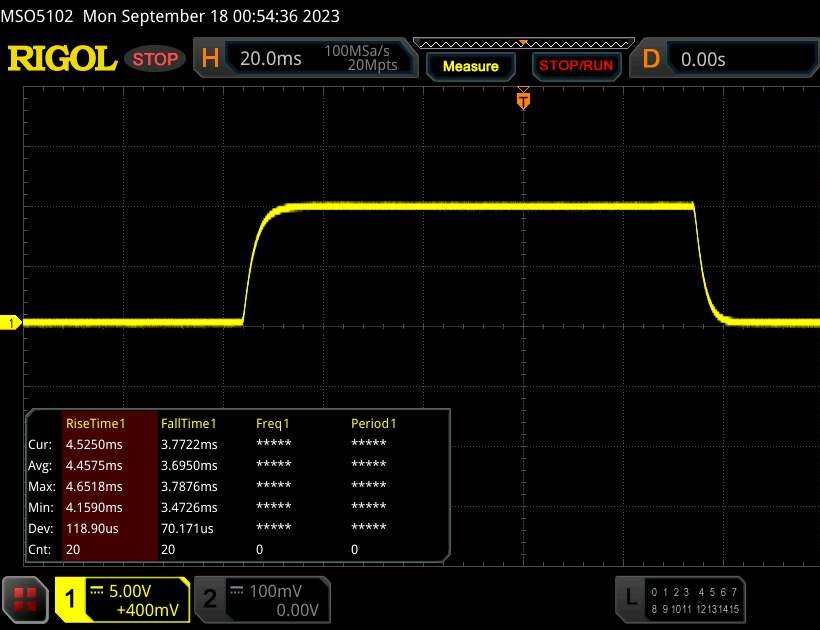 |
| ↘ 3.7 ms fall | ||
| The screen shows fast response rates in our tests and should be suited for gaming. In comparison, all tested devices range from 0.1 (minimum) to 240 (maximum) ms. » 24 % of all devices are better. This means that the measured response time is better than the average of all tested devices (19.8 ms). | ||
| ↔ Response Time 50% Grey to 80% Grey | ||
| 13.3 ms ... rise ↗ and fall ↘ combined | ↗ 6 ms rise | 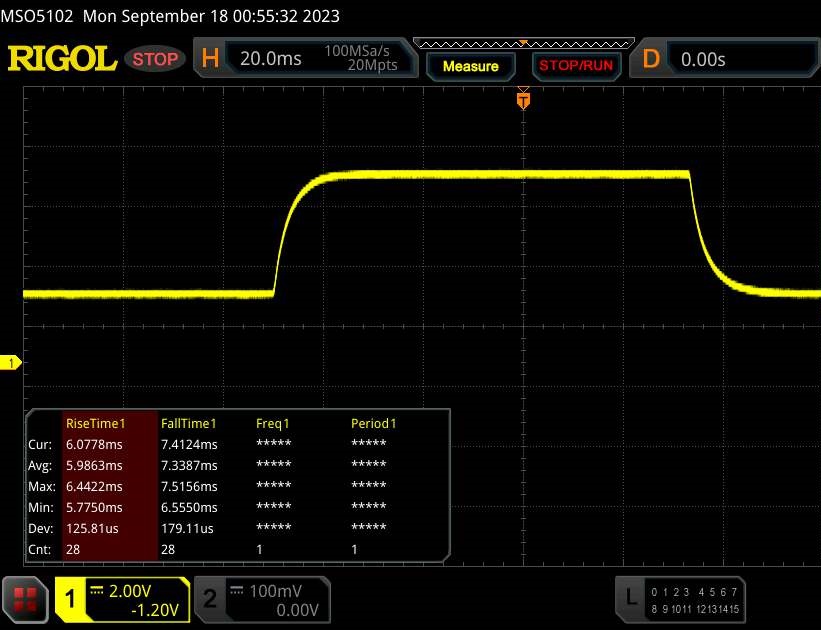 |
| ↘ 7.3 ms fall | ||
| The screen shows good response rates in our tests, but may be too slow for competitive gamers. In comparison, all tested devices range from 0.165 (minimum) to 636 (maximum) ms. » 27 % of all devices are better. This means that the measured response time is better than the average of all tested devices (31 ms). | ||
Screen Flickering / PWM (Pulse-Width Modulation)
| Screen flickering / PWM not detected | 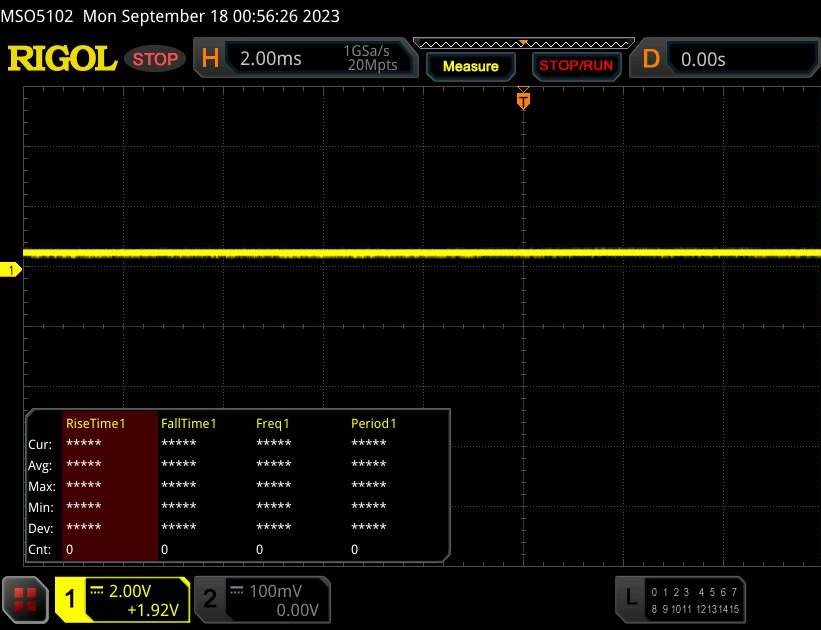 | ||
In comparison: 52 % of all tested devices do not use PWM to dim the display. If PWM was detected, an average of 7747 (minimum: 5 - maximum: 343500) Hz was measured. | |||
Performance
In terms of hardware, the Victus 16 falls between the mid-range and high-end segments. While the Intel processor should have more than enough reserves for the coming years, the GeForce RTX 4070 may struggle due to its somewhat meager VRAM size (8 GB GDDR6 is no longer quite up to date or future proof).
Testing Conditions
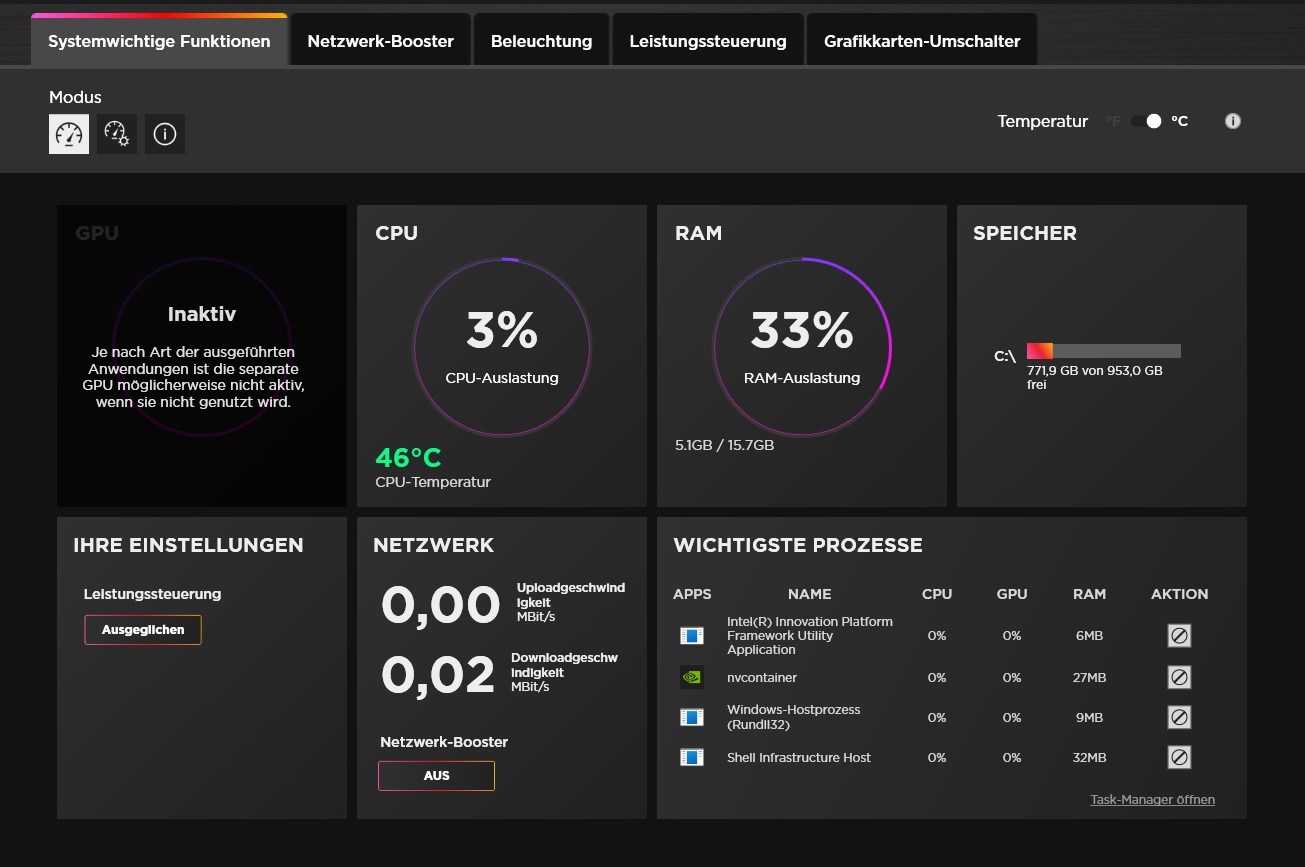
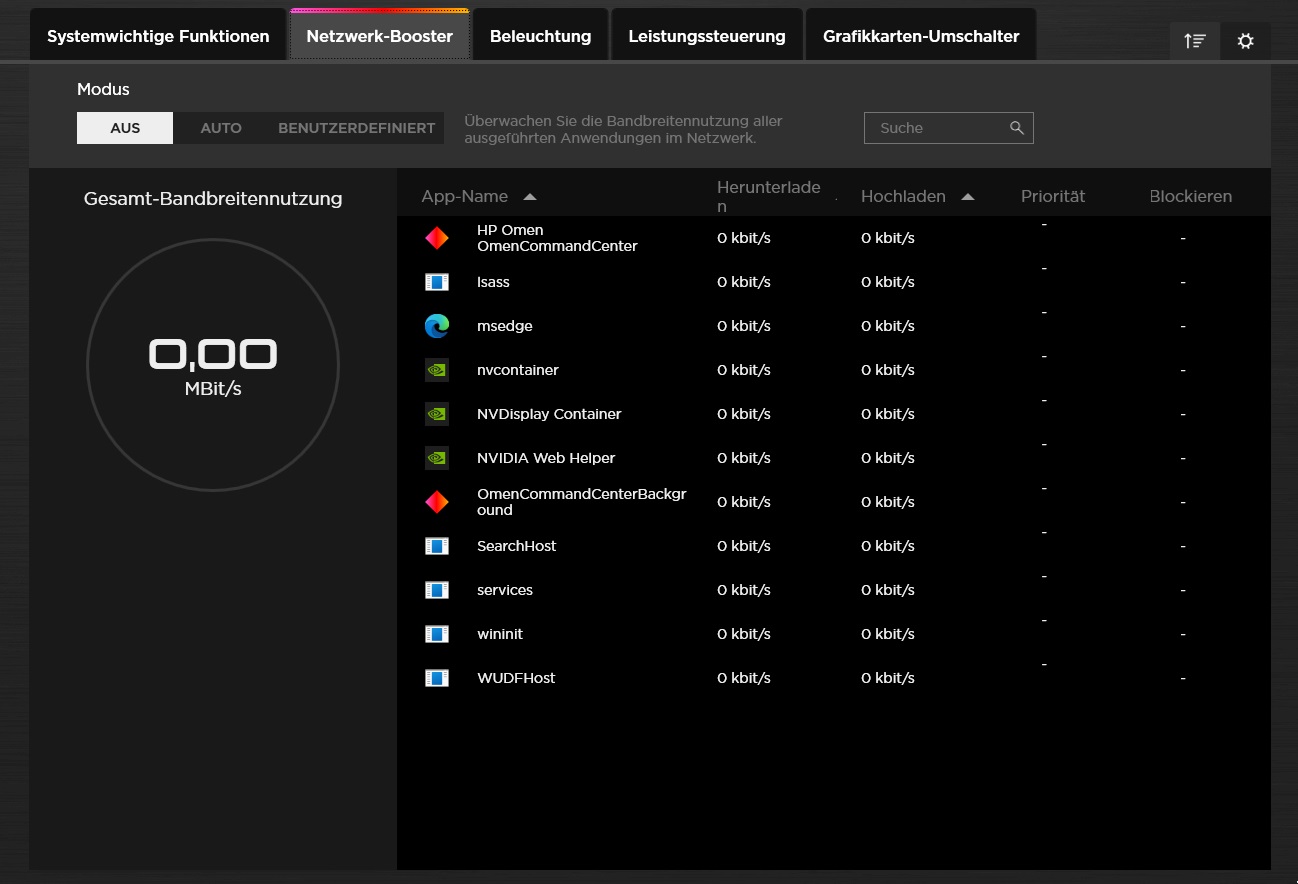
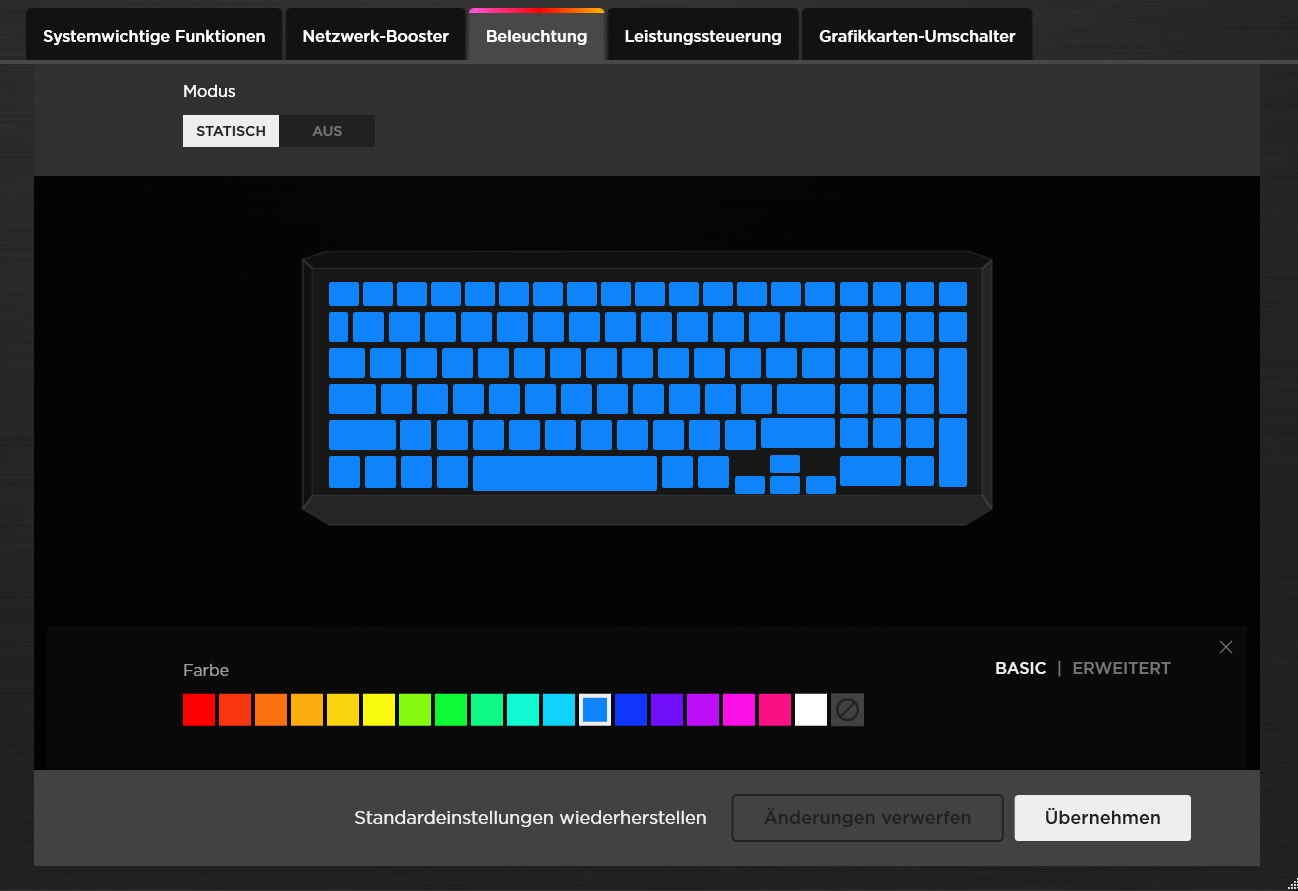
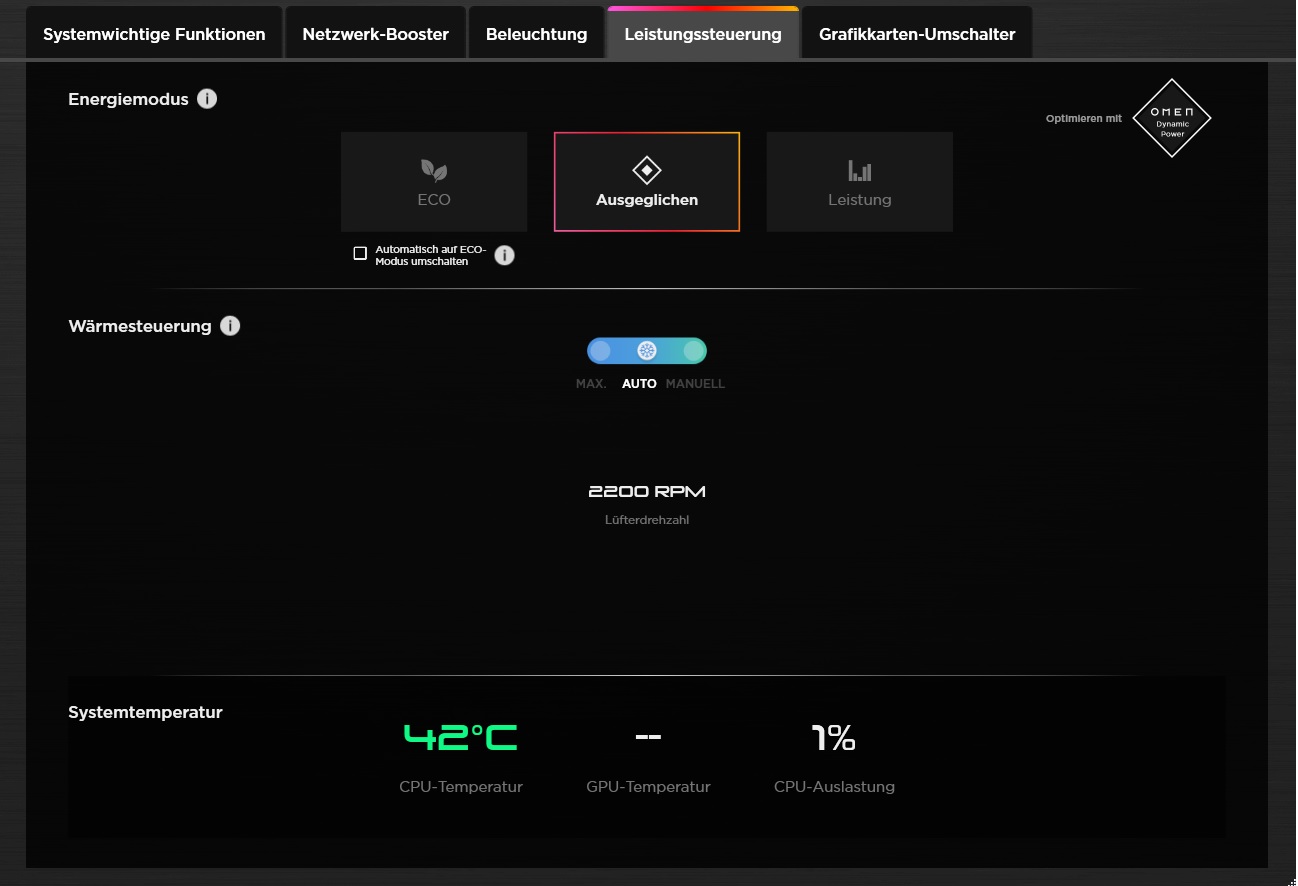
In the preinstalled Omen Gaming Hub, users can, among other things, adjust performance control (screenshot #4). Since 3D performance hardly increases in Performance mode, but the noise increases significantly, we carried out all measurements in Balanced mode. Eco mode only partially lives up to its name: the frame rate and noise level gravitate towards the middle mode.
| Witcher 3 (FHD/Ultra) | Eco | Balanced | Performance |
|---|---|---|---|
| Frame rate | ~110 fps | ~114 fps | ~118 fps |
| Noise | ~46 dB(A) | ~46 dB(A) | ~56 dB(A) |
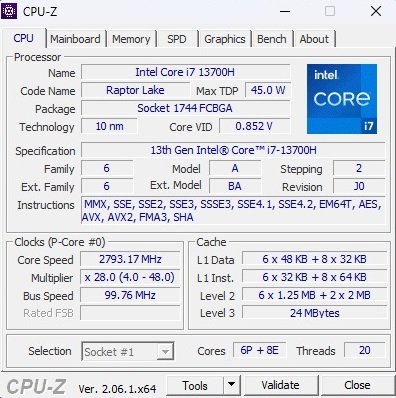
Processor
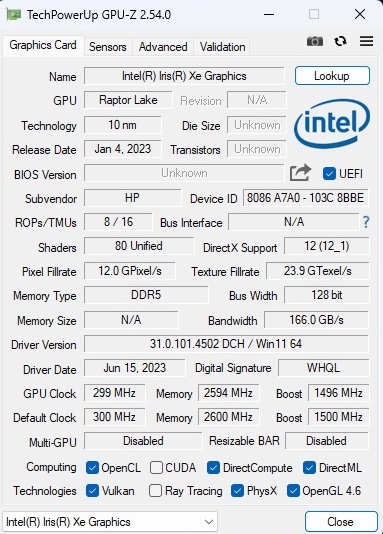
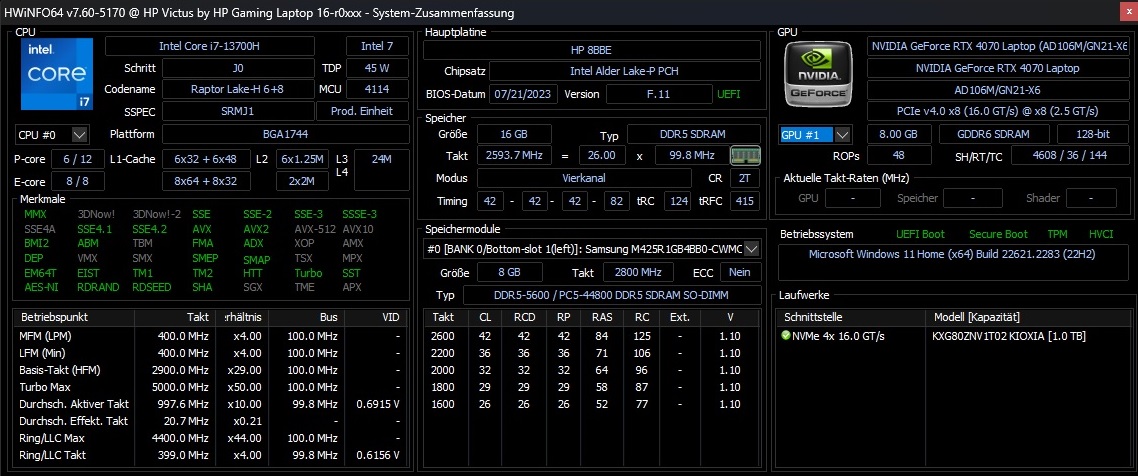
Intel's Core i7-13700H is currently found in a large number gaming notebooks. The 10 nm model from the Raptor Lake generation offers 6 performance cores with hyper-threading and 8 efficiency cores without HT, resulting in up to 20 parallel threads.
In the benchmark course, the Core i7-13700H of the Victus 16 delivers slightly below-average performance if you compare the results with the previous average. At least you have to give HP credit for the fact that performance remains quite stable over long periods of time. There were no major fluctuations or drops in our Cinebench loop.
Cinebench R15 Multi Sustained Load
* ... smaller is better
AIDA64: FP32 Ray-Trace | FPU Julia | CPU SHA3 | CPU Queen | FPU SinJulia | FPU Mandel | CPU AES | CPU ZLib | FP64 Ray-Trace | CPU PhotoWorxx
| Performance rating | |
| Average of class Gaming | |
| Lenovo Legion Pro 5 16ARX8 | |
| HP Omen 16-xf0376ng | |
| Gigabyte AERO 16 OLED BSF | |
| MSI Stealth 16 Studio A13VG | |
| Acer Nitro 16 AN16-41 | |
| HP Victus 16-r0077ng | |
| Average Intel Core i7-13700H | |
| AIDA64 / FP32 Ray-Trace | |
| Average of class Gaming (10227 - 85542, n=103, last 2 years) | |
| Lenovo Legion Pro 5 16ARX8 | |
| HP Omen 16-xf0376ng | |
| Gigabyte AERO 16 OLED BSF | |
| MSI Stealth 16 Studio A13VG | |
| Acer Nitro 16 AN16-41 | |
| HP Victus 16-r0077ng | |
| Average Intel Core i7-13700H (4986 - 18908, n=29) | |
| AIDA64 / FPU Julia | |
| Average of class Gaming (51376 - 238426, n=103, last 2 years) | |
| Lenovo Legion Pro 5 16ARX8 | |
| HP Omen 16-xf0376ng | |
| Acer Nitro 16 AN16-41 | |
| Gigabyte AERO 16 OLED BSF | |
| MSI Stealth 16 Studio A13VG | |
| HP Victus 16-r0077ng | |
| Average Intel Core i7-13700H (25360 - 92359, n=29) | |
| AIDA64 / CPU SHA3 | |
| Average of class Gaming (2180 - 9817, n=103, last 2 years) | |
| Lenovo Legion Pro 5 16ARX8 | |
| HP Omen 16-xf0376ng | |
| Gigabyte AERO 16 OLED BSF | |
| MSI Stealth 16 Studio A13VG | |
| Acer Nitro 16 AN16-41 | |
| HP Victus 16-r0077ng | |
| Average Intel Core i7-13700H (1339 - 4224, n=29) | |
| AIDA64 / CPU Queen | |
| Lenovo Legion Pro 5 16ARX8 | |
| HP Omen 16-xf0376ng | |
| Average of class Gaming (49785 - 173351, n=89, last 2 years) | |
| Acer Nitro 16 AN16-41 | |
| MSI Stealth 16 Studio A13VG | |
| Average Intel Core i7-13700H (59324 - 107159, n=29) | |
| Gigabyte AERO 16 OLED BSF | |
| HP Victus 16-r0077ng | |
| AIDA64 / FPU SinJulia | |
| Lenovo Legion Pro 5 16ARX8 | |
| HP Omen 16-xf0376ng | |
| Average of class Gaming (4424 - 33636, n=103, last 2 years) | |
| Acer Nitro 16 AN16-41 | |
| MSI Stealth 16 Studio A13VG | |
| Gigabyte AERO 16 OLED BSF | |
| Average Intel Core i7-13700H (4800 - 11050, n=29) | |
| HP Victus 16-r0077ng | |
| AIDA64 / FPU Mandel | |
| Average of class Gaming (25115 - 128721, n=103, last 2 years) | |
| Lenovo Legion Pro 5 16ARX8 | |
| HP Omen 16-xf0376ng | |
| Acer Nitro 16 AN16-41 | |
| Gigabyte AERO 16 OLED BSF | |
| MSI Stealth 16 Studio A13VG | |
| HP Victus 16-r0077ng | |
| Average Intel Core i7-13700H (12321 - 45118, n=29) | |
| AIDA64 / CPU AES | |
| Gigabyte AERO 16 OLED BSF | |
| Average of class Gaming (39258 - 247074, n=103, last 2 years) | |
| MSI Stealth 16 Studio A13VG | |
| Average Intel Core i7-13700H (28769 - 151254, n=29) | |
| Lenovo Legion Pro 5 16ARX8 | |
| HP Omen 16-xf0376ng | |
| HP Victus 16-r0077ng | |
| Acer Nitro 16 AN16-41 | |
| AIDA64 / CPU ZLib | |
| Average of class Gaming (574 - 2531, n=103, last 2 years) | |
| Gigabyte AERO 16 OLED BSF | |
| Lenovo Legion Pro 5 16ARX8 | |
| HP Omen 16-xf0376ng | |
| MSI Stealth 16 Studio A13VG | |
| HP Victus 16-r0077ng | |
| Average Intel Core i7-13700H (389 - 1215, n=29) | |
| Acer Nitro 16 AN16-41 | |
| AIDA64 / FP64 Ray-Trace | |
| Average of class Gaming (5509 - 45446, n=103, last 2 years) | |
| Lenovo Legion Pro 5 16ARX8 | |
| HP Omen 16-xf0376ng | |
| Gigabyte AERO 16 OLED BSF | |
| MSI Stealth 16 Studio A13VG | |
| Acer Nitro 16 AN16-41 | |
| HP Victus 16-r0077ng | |
| Average Intel Core i7-13700H (2540 - 10135, n=29) | |
| AIDA64 / CPU PhotoWorxx | |
| MSI Stealth 16 Studio A13VG | |
| Gigabyte AERO 16 OLED BSF | |
| Average of class Gaming (12271 - 89891, n=103, last 2 years) | |
| Average Intel Core i7-13700H (12872 - 52727, n=29) | |
| HP Victus 16-r0077ng | |
| HP Omen 16-xf0376ng | |
| Lenovo Legion Pro 5 16ARX8 | |
| Acer Nitro 16 AN16-41 | |
System Performance
Because the SSD is not quite as fast, the Victus 16 comes in last place in the system benchmarks. However, 7,158 points in PCMark 10 is still a good overall result.
CrossMark: Overall | Productivity | Creativity | Responsiveness
| PCMark 10 / Score | |
| Average of class Gaming (5828 - 11730, n=92, last 2 years) | |
| Lenovo Legion Pro 5 16ARX8 | |
| HP Omen 16-xf0376ng | |
| Gigabyte AERO 16 OLED BSF | |
| Average Intel Core i7-13700H, NVIDIA GeForce RTX 4070 Laptop GPU (7158 - 7956, n=8) | |
| MSI Stealth 16 Studio A13VG | |
| Acer Nitro 16 AN16-41 | |
| HP Victus 16-r0077ng | |
| PCMark 10 / Essentials | |
| Gigabyte AERO 16 OLED BSF | |
| HP Omen 16-xf0376ng | |
| Lenovo Legion Pro 5 16ARX8 | |
| HP Victus 16-r0077ng | |
| Average Intel Core i7-13700H, NVIDIA GeForce RTX 4070 Laptop GPU (10252 - 11449, n=8) | |
| Average of class Gaming (8810 - 11935, n=96, last 2 years) | |
| Acer Nitro 16 AN16-41 | |
| MSI Stealth 16 Studio A13VG | |
| PCMark 10 / Productivity | |
| Average of class Gaming (6845 - 21327, n=94, last 2 years) | |
| Lenovo Legion Pro 5 16ARX8 | |
| HP Omen 16-xf0376ng | |
| Average Intel Core i7-13700H, NVIDIA GeForce RTX 4070 Laptop GPU (8501 - 10769, n=8) | |
| MSI Stealth 16 Studio A13VG | |
| Gigabyte AERO 16 OLED BSF | |
| Acer Nitro 16 AN16-41 | |
| HP Victus 16-r0077ng | |
| PCMark 10 / Digital Content Creation | |
| Average of class Gaming (7602 - 19954, n=94, last 2 years) | |
| Gigabyte AERO 16 OLED BSF | |
| Lenovo Legion Pro 5 16ARX8 | |
| HP Omen 16-xf0376ng | |
| Average Intel Core i7-13700H, NVIDIA GeForce RTX 4070 Laptop GPU (10358 - 12908, n=8) | |
| MSI Stealth 16 Studio A13VG | |
| Acer Nitro 16 AN16-41 | |
| HP Victus 16-r0077ng | |
| CrossMark / Overall | |
| Lenovo Legion Pro 5 16ARX8 | |
| Average of class Gaming (1366 - 2409, n=93, last 2 years) | |
| Average Intel Core i7-13700H, NVIDIA GeForce RTX 4070 Laptop GPU (1768 - 2073, n=6) | |
| Gigabyte AERO 16 OLED BSF | |
| MSI Stealth 16 Studio A13VG | |
| Acer Nitro 16 AN16-41 | |
| CrossMark / Productivity | |
| Lenovo Legion Pro 5 16ARX8 | |
| Average of class Gaming (1386 - 2254, n=93, last 2 years) | |
| Average Intel Core i7-13700H, NVIDIA GeForce RTX 4070 Laptop GPU (1645 - 2006, n=6) | |
| Gigabyte AERO 16 OLED BSF | |
| MSI Stealth 16 Studio A13VG | |
| Acer Nitro 16 AN16-41 | |
| CrossMark / Creativity | |
| Average of class Gaming (1343 - 2729, n=93, last 2 years) | |
| Lenovo Legion Pro 5 16ARX8 | |
| Average Intel Core i7-13700H, NVIDIA GeForce RTX 4070 Laptop GPU (1936 - 2137, n=6) | |
| Gigabyte AERO 16 OLED BSF | |
| MSI Stealth 16 Studio A13VG | |
| Acer Nitro 16 AN16-41 | |
| CrossMark / Responsiveness | |
| Gigabyte AERO 16 OLED BSF | |
| Lenovo Legion Pro 5 16ARX8 | |
| Average Intel Core i7-13700H, NVIDIA GeForce RTX 4070 Laptop GPU (1451 - 2202, n=6) | |
| Average of class Gaming (1226 - 2334, n=93, last 2 years) | |
| MSI Stealth 16 Studio A13VG | |
| Acer Nitro 16 AN16-41 | |
| PCMark 10 Score | 7158 points | |
Help | ||
| AIDA64 / Memory Copy | |
| Average of class Gaming (21750 - 129946, n=103, last 2 years) | |
| MSI Stealth 16 Studio A13VG | |
| Gigabyte AERO 16 OLED BSF | |
| HP Omen 16-xf0376ng | |
| Average Intel Core i7-13700H (24334 - 78081, n=29) | |
| HP Victus 16-r0077ng | |
| Lenovo Legion Pro 5 16ARX8 | |
| Acer Nitro 16 AN16-41 | |
| AIDA64 / Memory Read | |
| MSI Stealth 16 Studio A13VG | |
| Average of class Gaming (22956 - 118858, n=103, last 2 years) | |
| HP Victus 16-r0077ng | |
| Gigabyte AERO 16 OLED BSF | |
| Average Intel Core i7-13700H (23681 - 79656, n=29) | |
| HP Omen 16-xf0376ng | |
| Lenovo Legion Pro 5 16ARX8 | |
| Acer Nitro 16 AN16-41 | |
| AIDA64 / Memory Write | |
| HP Omen 16-xf0376ng | |
| Average of class Gaming (22297 - 135096, n=103, last 2 years) | |
| MSI Stealth 16 Studio A13VG | |
| Gigabyte AERO 16 OLED BSF | |
| Average Intel Core i7-13700H (22986 - 99898, n=29) | |
| HP Victus 16-r0077ng | |
| Acer Nitro 16 AN16-41 | |
| Lenovo Legion Pro 5 16ARX8 | |
| AIDA64 / Memory Latency | |
| Average of class Gaming (75.3 - 259, n=103, last 2 years) | |
| Gigabyte AERO 16 OLED BSF | |
| HP Victus 16-r0077ng | |
| Average Intel Core i7-13700H (82.4 - 136.8, n=29) | |
| Acer Nitro 16 AN16-41 | |
| HP Omen 16-xf0376ng | |
| MSI Stealth 16 Studio A13VG | |
| Lenovo Legion Pro 5 16ARX8 | |
* ... smaller is better
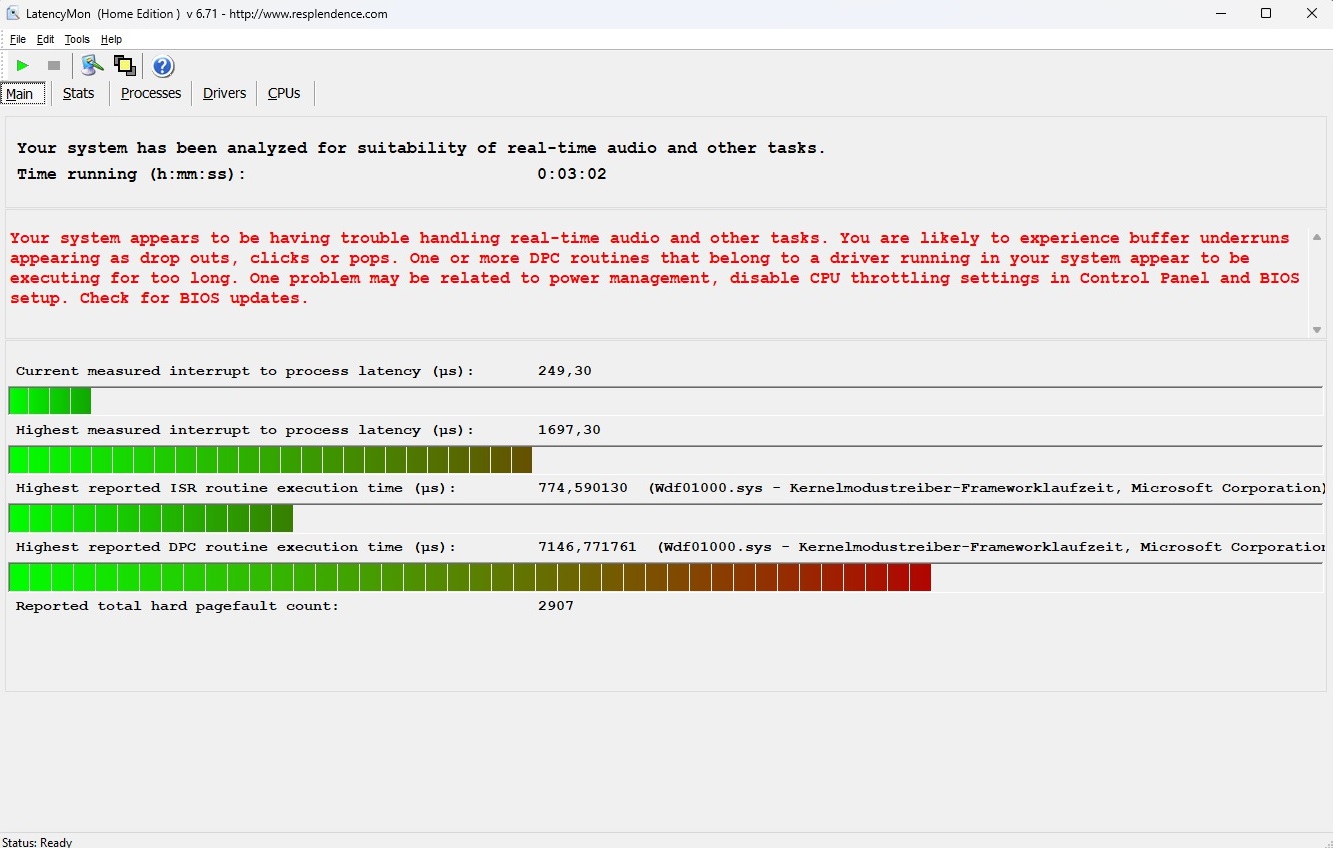
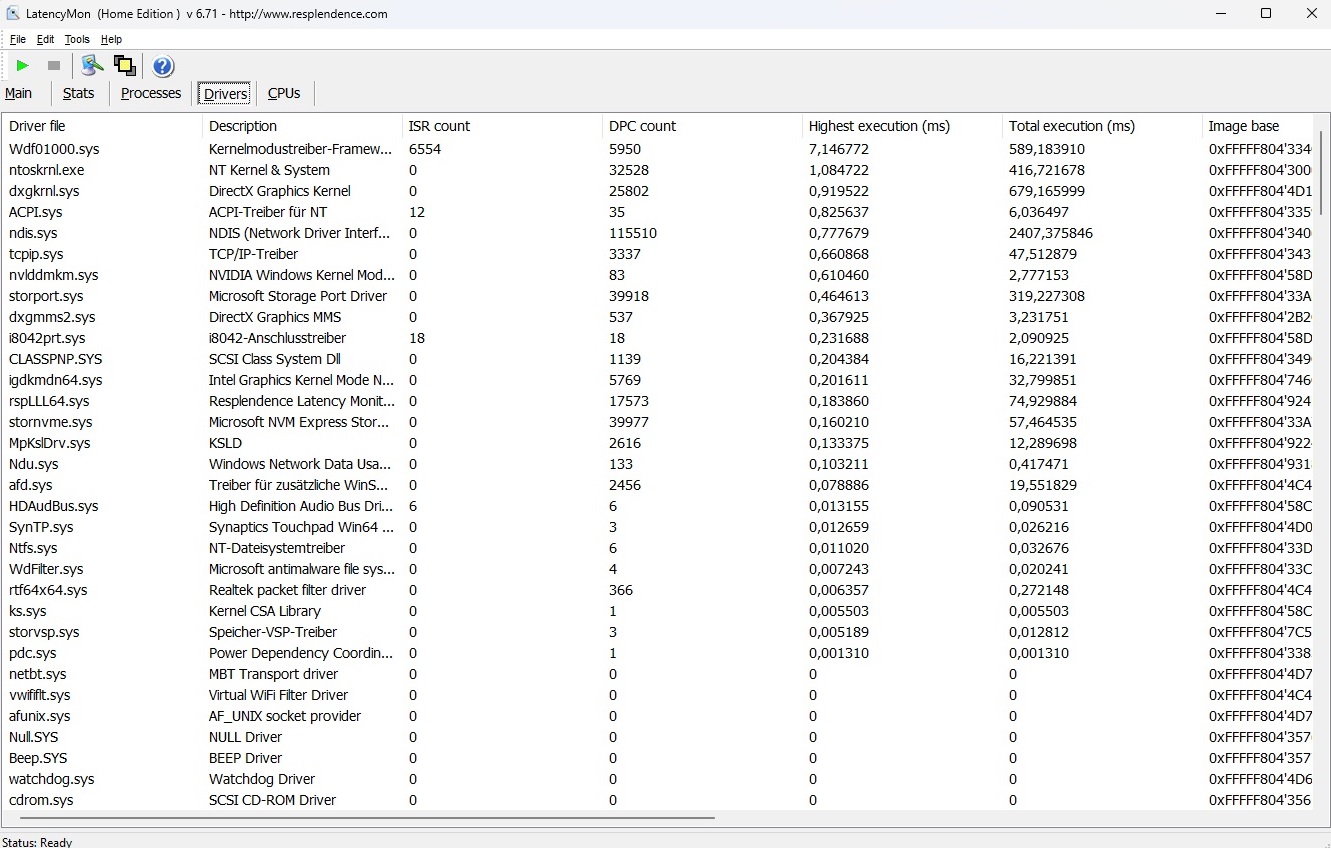
DPC Latency
Like numerous other competitors, the Victus 16 also weakens when it comes to latency. According to the LatencyMon tool, users may encounter problems with latency-sensitive tasks such as real-time audio and video editing.
| DPC Latencies / LatencyMon - interrupt to process latency (max), Web, Youtube, Prime95 | |
| MSI Stealth 16 Studio A13VG | |
| HP Omen 16-xf0376ng | |
| HP Victus 16-r0077ng | |
| Acer Nitro 16 AN16-41 | |
| Gigabyte AERO 16 OLED BSF | |
| Lenovo Legion Pro 5 16ARX8 | |
* ... smaller is better
Storage Devices
Altogether, SSD performance is slightly lower than the Omen 16 despite its higher capacity (1,000 GB vs 512 GB), which itself cannot quite keep up with the competition. Our DiskSpd loop also shows that the Kioxia SSD installed in the Victus 16 loses speed after a while under load, as can be seen in other laptops.

* ... smaller is better
Sustained Read Performance: DiskSpd Read Loop, Queue Depth 8
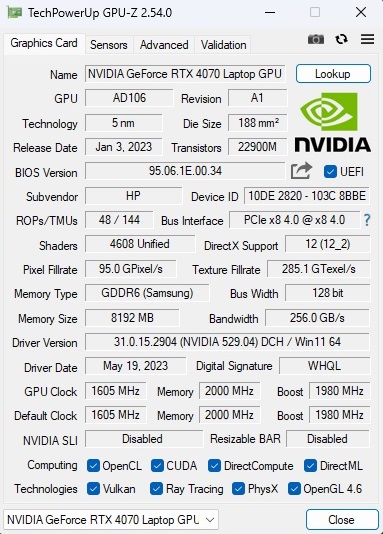
Graphics Card
Since Nvidia was rather frugal in terms of memory expansion (VRAM amount, interface) - as previously mentioned - the GeForce RTX 4070 is well behind the RTX 4080 and RTX 4090. If you compare the performance purely with other RTX 4070 notebooks, the Victus 16 is not bad. In the synthetic graphics benchmarks, the 16-inch model is forced to concede defeat to the competition, but the previous RTX 4070 average is still maintained, especially since HP does not limit itself to the maximum possible TGP of 140 watts, but only sets it at 120 watts.
| 3DMark 11 Performance | 33616 points | |
| 3DMark Ice Storm Standard Score | 159379 points | |
| 3DMark Cloud Gate Standard Score | 65316 points | |
| 3DMark Fire Strike Score | 26013 points | |
| 3DMark Time Spy Score | 11427 points | |
Help | ||
* ... smaller is better
Gaming Performance
In the practical gaming tests, 3D performance also gravitates towards the RTX 4070 average. In native Full HD resolution, the Victus 16 is able to run almost all current games smoothly, even at maximum settings. Only very demanding or poorly optimized titles such as Immortals of Aveum or Starfield cannot achieve more than 60 FPS.
| The Witcher 3 - 1920x1080 Ultra Graphics & Postprocessing (HBAO+) | |
| Average of class Gaming (104.7 - 240, n=6, last 2 years) | |
| Lenovo Legion Pro 5 16ARX8 | |
| MSI Stealth 16 Studio A13VG | |
| Gigabyte AERO 16 OLED BSF | |
| HP Victus 16-r0077ng | |
| Acer Nitro 16 AN16-41 | |
| Average NVIDIA GeForce RTX 4070 Laptop GPU (69.8 - 133.7, n=57) | |
| HP Omen 16-xf0376ng | |
| Immortals of Aveum - 1920x1080 Ultra AF:16x | |
| Average NVIDIA GeForce RTX 4070 Laptop GPU (46.1 - 49.9, n=4) | |
| HP Omen 16-xf0376ng | |
| HP Victus 16-r0077ng | |
| Atlas Fallen - 1920x1080 Very High Preset | |
| HP Omen 16-xf0376ng | |
| Average NVIDIA GeForce RTX 4070 Laptop GPU (105.3 - 111.1, n=4) | |
| HP Victus 16-r0077ng | |
| Armored Core 6 - 1920x1080 Maximum Preset | |
| HP Omen 16-xf0376ng | |
| Average NVIDIA GeForce RTX 4070 Laptop GPU (87.2 - 107, n=4) | |
| HP Victus 16-r0077ng | |
| Average of class Gaming (n=1last 2 years) | |
| Atomic Heart - 1920x1080 Atomic Preset | |
| Acer Nitro 16 AN16-41 | |
| Average NVIDIA GeForce RTX 4070 Laptop GPU (70.4 - 79, n=4) | |
| HP Victus 16-r0077ng | |
| High On Life - 1920x1080 Very High Preset | |
| MSI Stealth 16 Studio A13VG | |
| Average NVIDIA GeForce RTX 4070 Laptop GPU (101.9 - 114, n=4) | |
| HP Victus 16-r0077ng | |
| Company of Heroes 3 - 1920x1080 Maximum Settings | |
| MSI Stealth 16 Studio A13VG | |
| Average NVIDIA GeForce RTX 4070 Laptop GPU (134 - 157.5, n=5) | |
| HP Victus 16-r0077ng | |
| Resident Evil 4 Remake - 1920x1080 Max Preset | |
| MSI Stealth 16 Studio A13VG | |
| Average NVIDIA GeForce RTX 4070 Laptop GPU (74.8 - 86.7, n=4) | |
| Acer Nitro 16 AN16-41 | |
| HP Victus 16-r0077ng | |
| Sons of the Forest - 1920x1080 Ultra Preset AA:T | |
| HP Victus 16-r0077ng | |
| HP Omen 16-xf0376ng | |
| Average NVIDIA GeForce RTX 4070 Laptop GPU (71.1 - 87.5, n=4) | |
| Baldur's Gate 3 - 1920x1080 Ultra Preset AA:T | |
| Average of class Gaming (59.4 - 246, n=103, last 2 years) | |
| Average NVIDIA GeForce RTX 4070 Laptop GPU (66.7 - 128.5, n=30) | |
| HP Victus 16-r0077ng | |
| Ratchet & Clank Rift Apart - 1920x1080 Very High Preset AA:T | |
| Average NVIDIA GeForce RTX 4070 Laptop GPU (52.3 - 58.1, n=4) | |
| HP Victus 16-r0077ng | |
In our 60-minute Witcher 3 test, there were no abnormalities such as frame drops. Performance dropped slightly over time, but remained quite stable.
Witcher 3 FPS chart
| low | med. | high | ultra | |
|---|---|---|---|---|
| GTA V (2015) | 180.9 | 175.7 | 112.8 | |
| The Witcher 3 (2015) | 114 | |||
| Dota 2 Reborn (2015) | 173.9 | 147.9 | 139.3 | 131.6 |
| Final Fantasy XV Benchmark (2018) | 145 | 109.3 | ||
| X-Plane 11.11 (2018) | 136 | 118.3 | 95.4 | |
| Strange Brigade (2018) | 224 | 192.4 | 192 | |
| High On Life (2023) | 166.2 | 126.7 | 101.9 | |
| Atomic Heart (2023) | 131.7 | 86.2 | 70.4 | |
| Company of Heroes 3 (2023) | 174 | 135 | 134 | |
| Sons of the Forest (2023) | 92.1 | 88.5 | 87.5 | |
| Resident Evil 4 Remake (2023) | 108.3 | 105.5 | 74.8 | |
| Ratchet & Clank Rift Apart (2023) | 72.5 | 58 | 52.3 | |
| Atlas Fallen (2023) | 133.8 | 126.7 | 106.6 | |
| Immortals of Aveum (2023) | 56 | 46.1 | ||
| Armored Core 6 (2023) | 102.5 | 101.9 | 97 | |
| Starfield (2023) | 62.3 | 51.2 | 46.6 | |
| The Crew Motorfest (2023) | 60 | 60 | 60 | |
| Baldur's Gate 3 (2023) | 115.2 | 99.1 | 95.4 |
Emissions
Noise
If you use Balanced mode, the Victus 16 is not too loud. Around 46 dB(A) in Witcher 3 is a clearly audible, but not an extreme level (in Performance mode this becomes an annoyingly loud 56 dB). In idle situations and harmless tasks such as office, video and web browsing, the fans usually spin at 28 to 30 dB(A), which is more than the competition. HP has room for improvement here.
Noise level
| Idle |
| 28 / 29 / 30 dB(A) |
| Load |
| 43 / 48 dB(A) |
 | ||
30 dB silent 40 dB(A) audible 50 dB(A) loud |
||
min: | ||
| HP Victus 16-r0077ng i7-13700H, GeForce RTX 4070 Laptop GPU | HP Omen 16-xf0376ng R7 7840HS, GeForce RTX 4070 Laptop GPU | Lenovo Legion Pro 5 16ARX8 R7 7745HX, GeForce RTX 4070 Laptop GPU | Acer Nitro 16 AN16-41 R7 7735HS, GeForce RTX 4070 Laptop GPU | Gigabyte AERO 16 OLED BSF i9-13900H, GeForce RTX 4070 Laptop GPU | MSI Stealth 16 Studio A13VG i7-13700H, GeForce RTX 4070 Laptop GPU | |
|---|---|---|---|---|---|---|
| Noise | 2% | 10% | 3% | -3% | 10% | |
| off / environment * (dB) | 25 | 24 4% | 23.2 7% | 25.7 -3% | 23 8% | 24 4% |
| Idle Minimum * (dB) | 28 | 25 11% | 23.2 17% | 25.7 8% | 23 18% | 24 14% |
| Idle Average * (dB) | 29 | 29 -0% | 23.2 20% | 25.7 11% | 23 21% | 24 17% |
| Idle Maximum * (dB) | 30 | 32 -7% | 26.2 13% | 26.3 12% | 33.64 -12% | 24 20% |
| Load Average * (dB) | 43 | 44 -2% | 31.4 27% | 33.9 21% | 51.49 -20% | 34.81 19% |
| Witcher 3 ultra * (dB) | 46 | 44 4% | 48.4 -5% | 55.27 -20% | 44.05 4% | |
| Load Maximum * (dB) | 48 | 46 4% | 53.8 -12% | 62 -29% | 55.24 -15% | 51.57 -7% |
* ... smaller is better
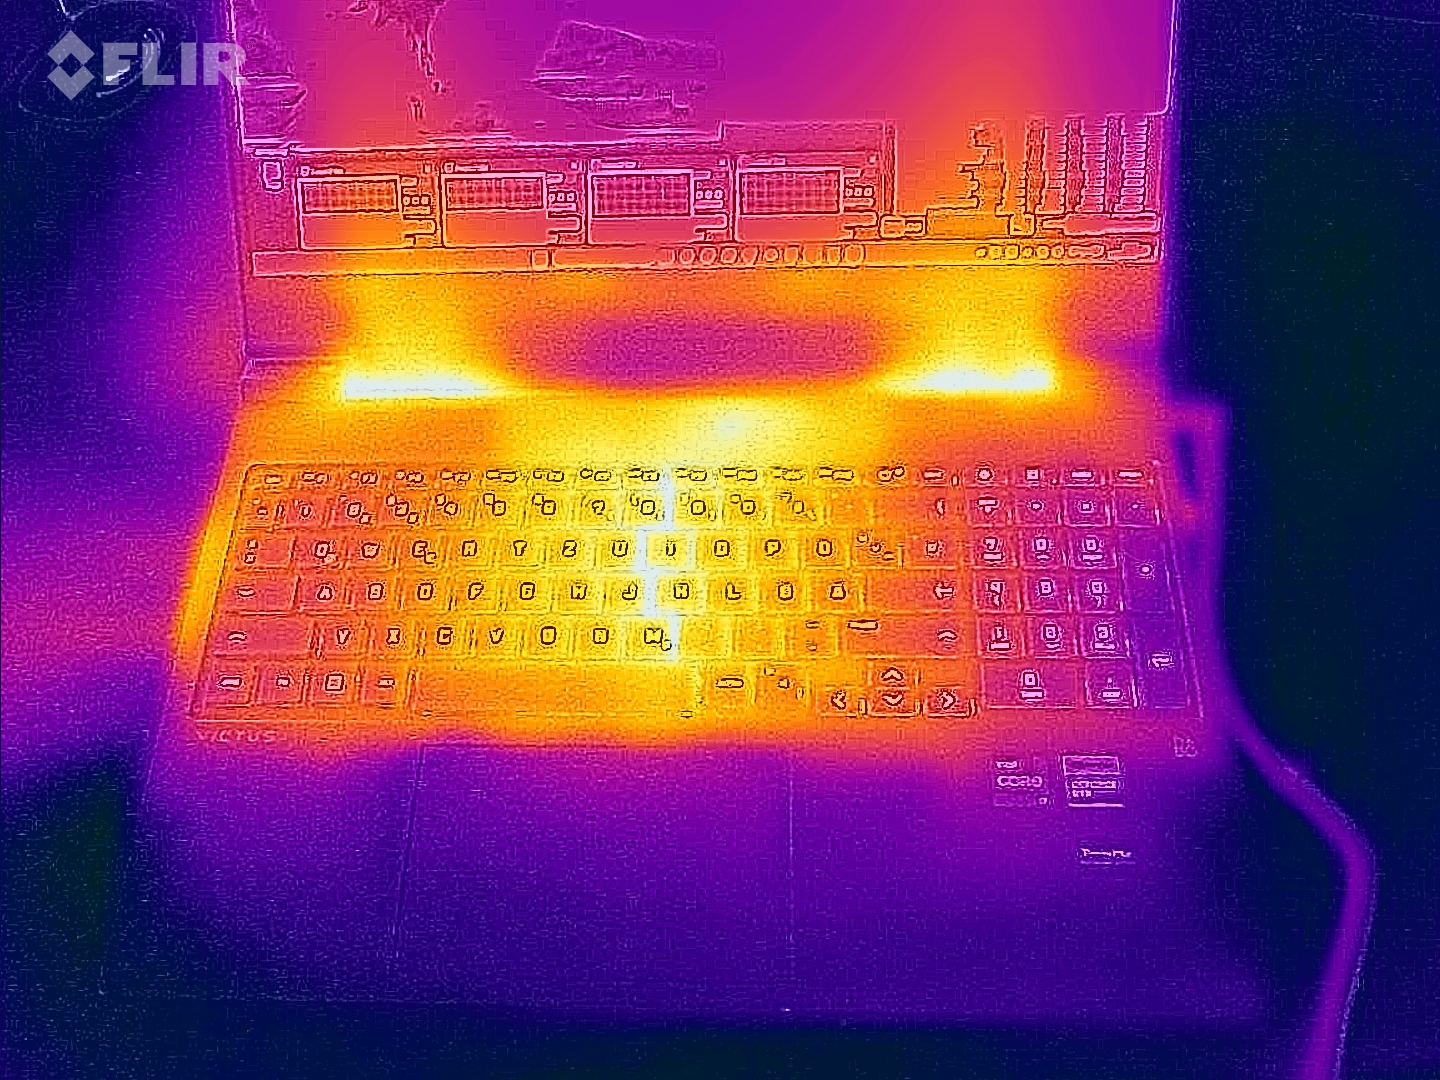
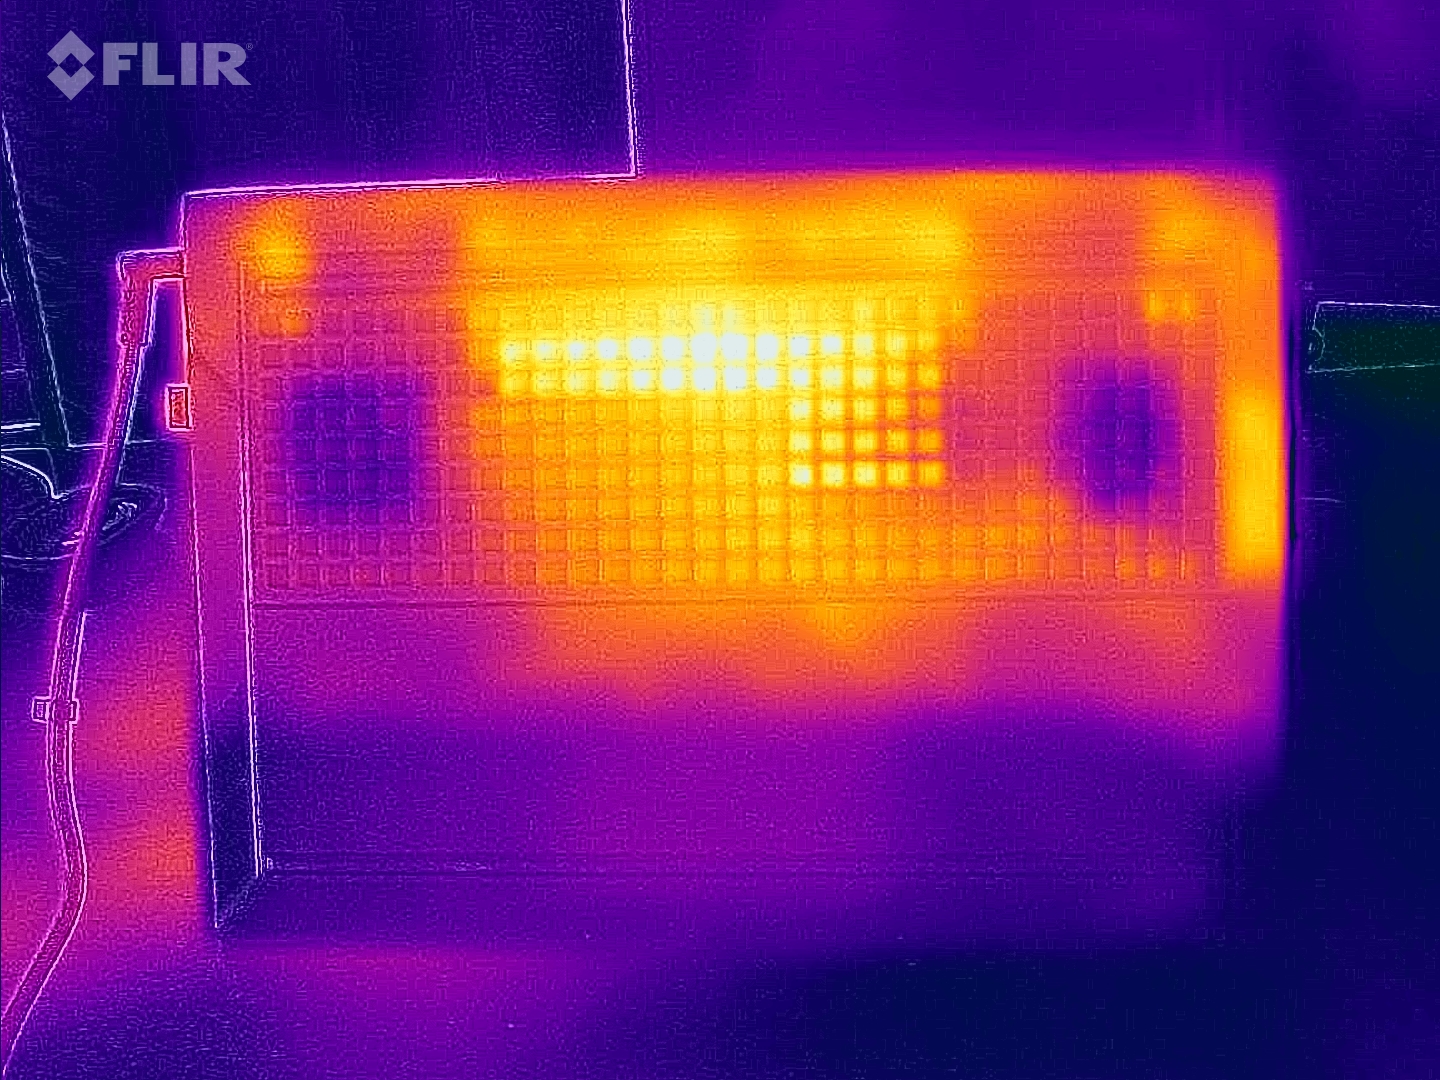
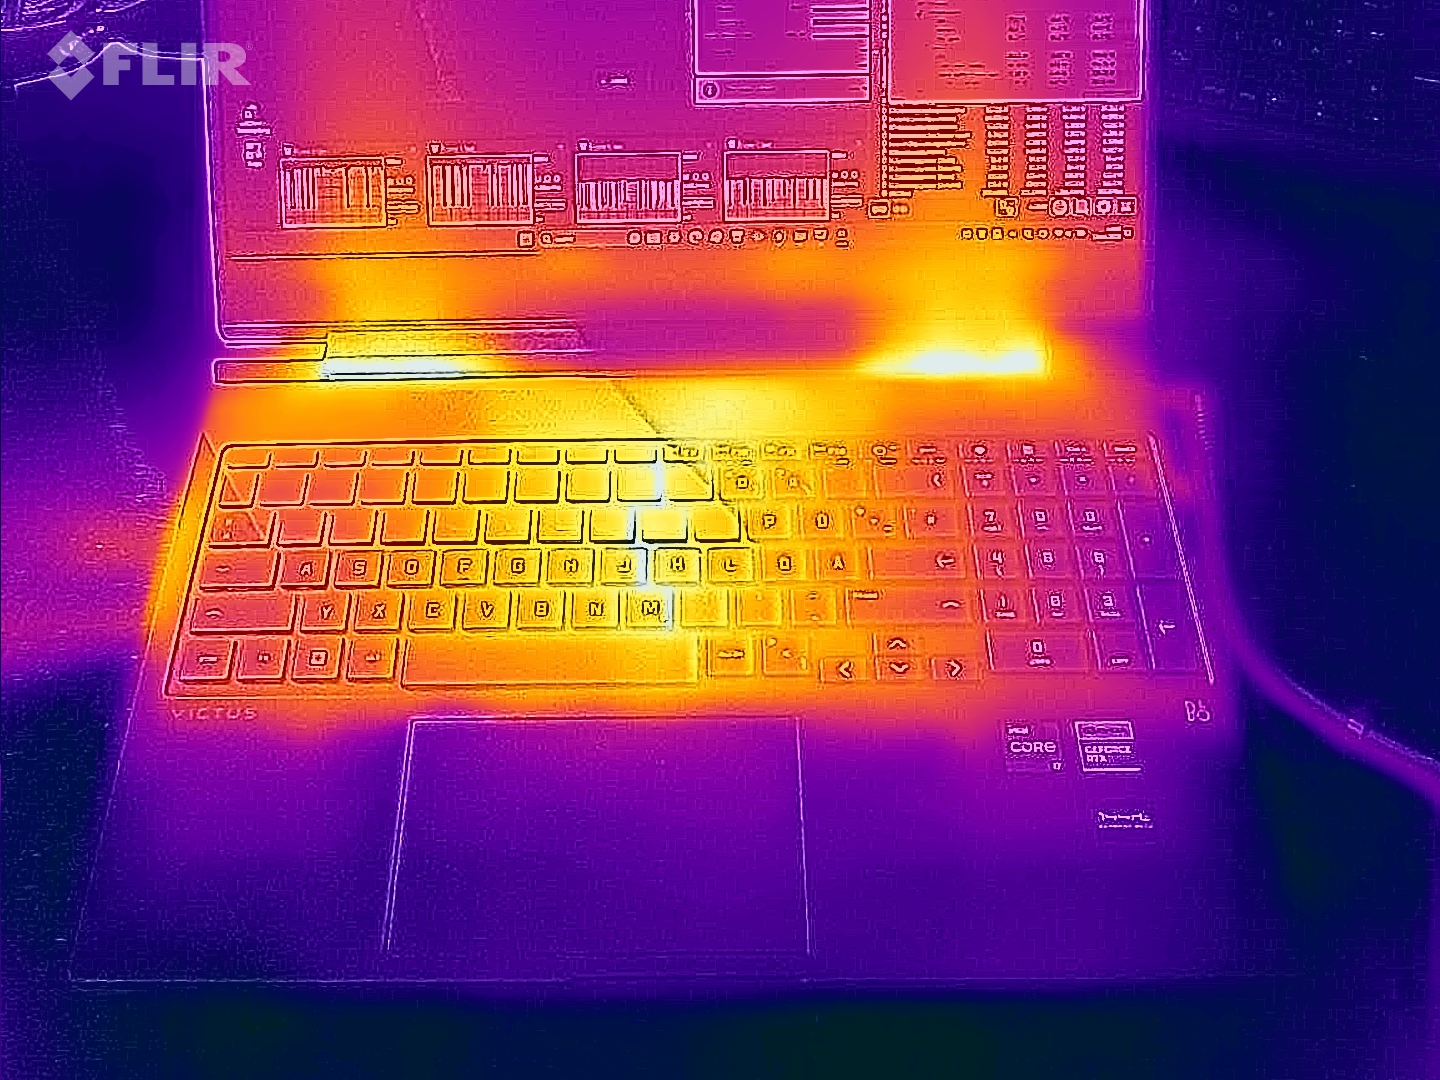
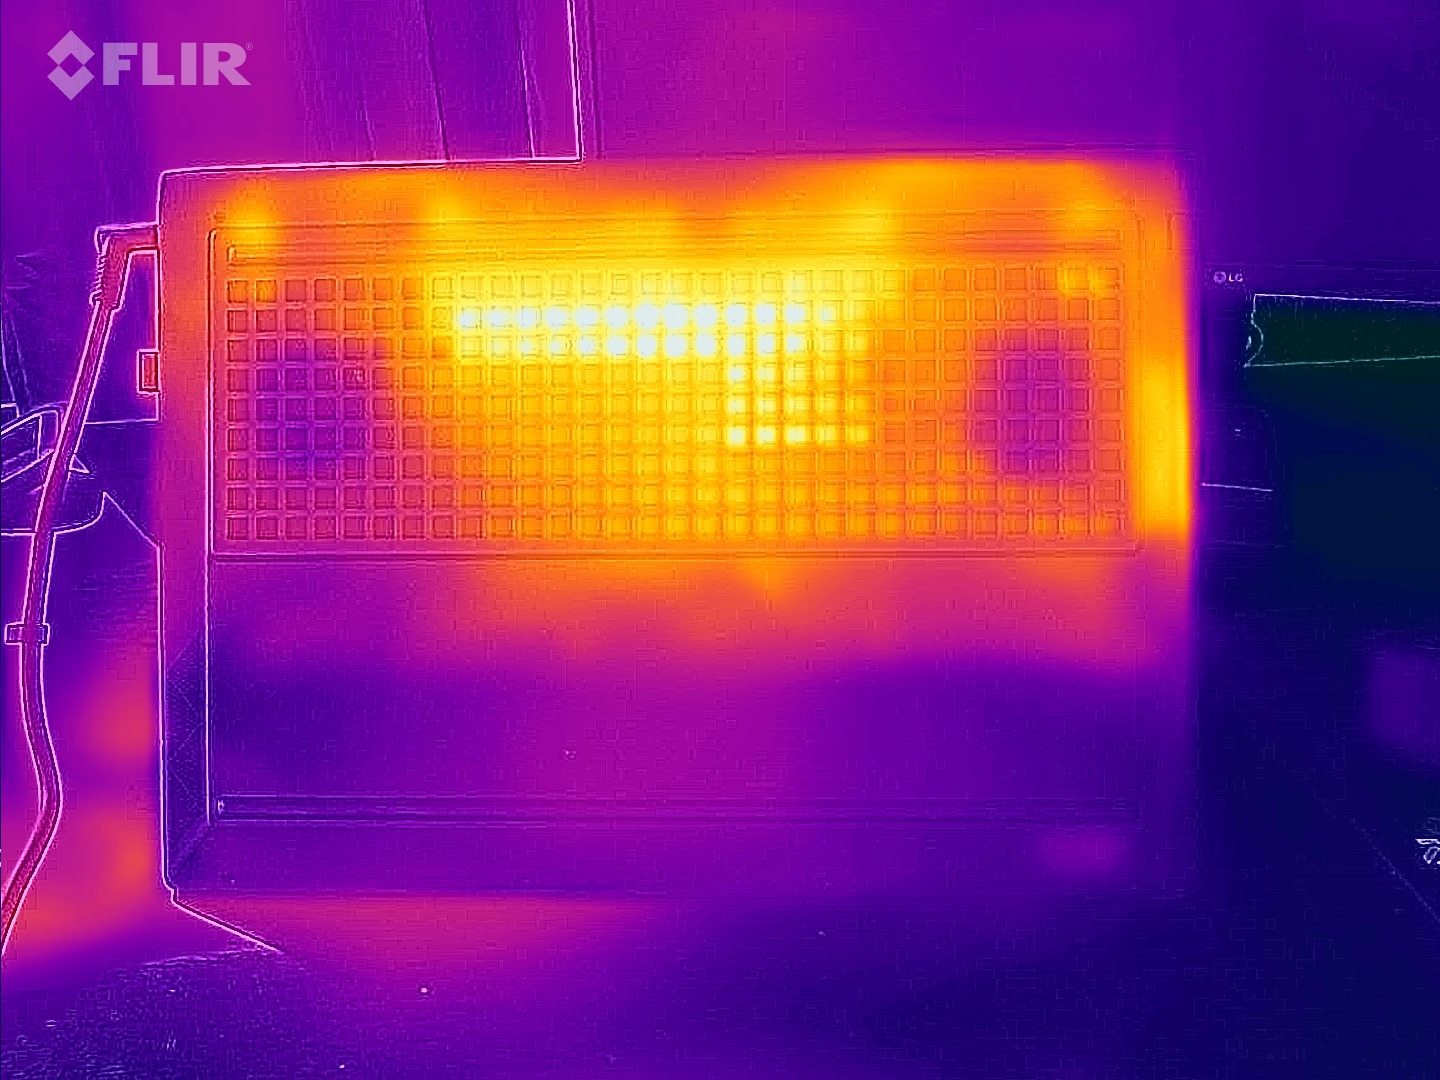
Temperature
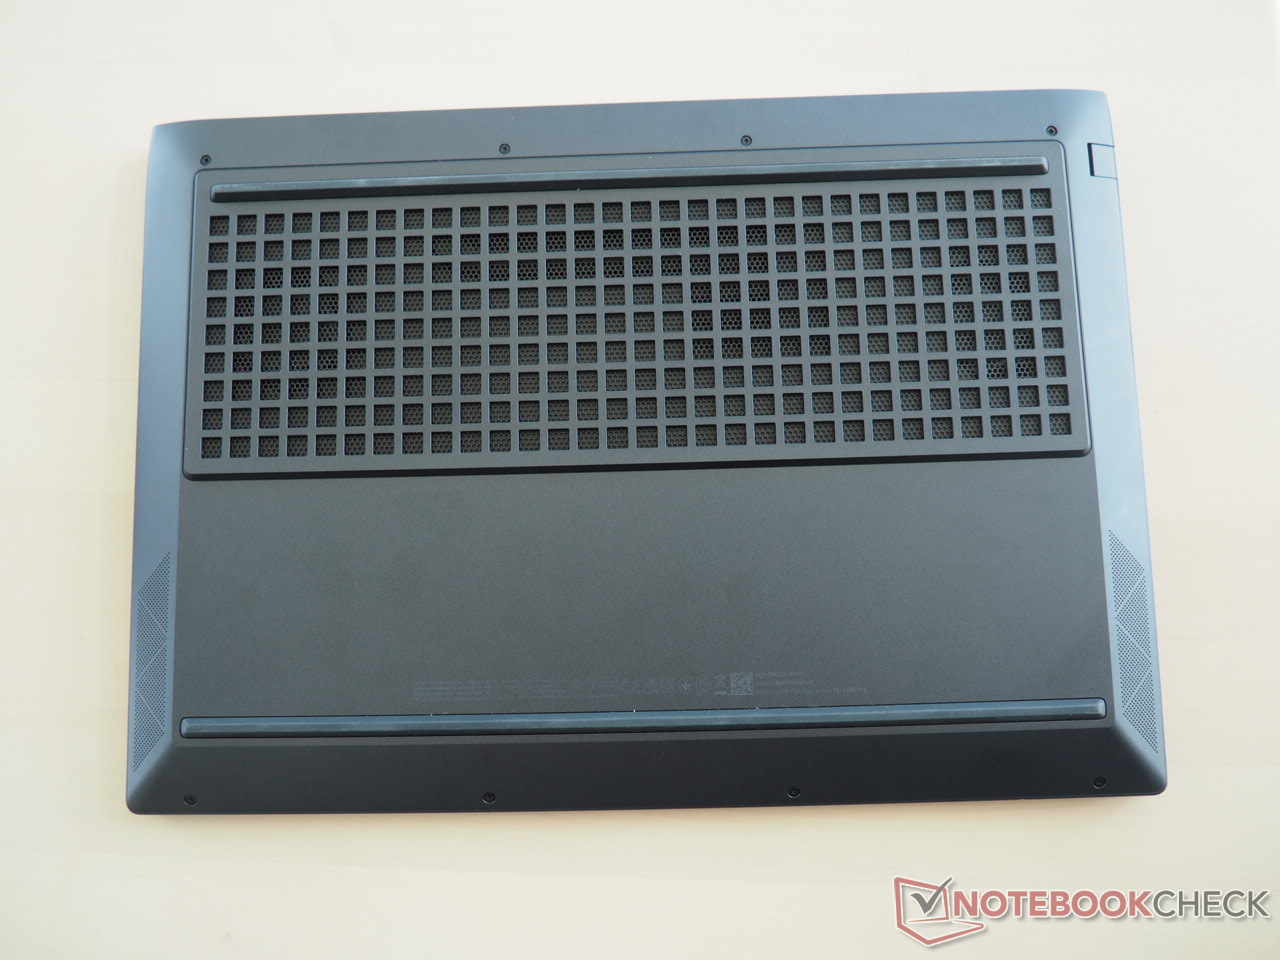
Temperatures are also slightly higher than most comparison devices, both in idle mode and under load. After an hour of Witcher 3, the top of the chassis reached 52 °C and the bottom of the case 54 °C, which speaks against gaming sessions on the lap. At least the palm area always remains in comfortable regions at a maximum of 33 °C.
(-) The maximum temperature on the upper side is 51 °C / 124 F, compared to the average of 40.4 °C / 105 F, ranging from 21.2 to 68.8 °C for the class Gaming.
(-) The bottom heats up to a maximum of 54 °C / 129 F, compared to the average of 43.2 °C / 110 F
(+) In idle usage, the average temperature for the upper side is 29.8 °C / 86 F, compared to the device average of 33.9 °C / 93 F.
(-) Playing The Witcher 3, the average temperature for the upper side is 41.6 °C / 107 F, compared to the device average of 33.9 °C / 93 F.
(+) The palmrests and touchpad are reaching skin temperature as a maximum (33 °C / 91.4 F) and are therefore not hot.
(-) The average temperature of the palmrest area of similar devices was 28.8 °C / 83.8 F (-4.2 °C / -7.6 F).
| HP Victus 16-r0077ng i7-13700H, GeForce RTX 4070 Laptop GPU | HP Omen 16-xf0376ng R7 7840HS, GeForce RTX 4070 Laptop GPU | Lenovo Legion Pro 5 16ARX8 R7 7745HX, GeForce RTX 4070 Laptop GPU | Acer Nitro 16 AN16-41 R7 7735HS, GeForce RTX 4070 Laptop GPU | Gigabyte AERO 16 OLED BSF i9-13900H, GeForce RTX 4070 Laptop GPU | MSI Stealth 16 Studio A13VG i7-13700H, GeForce RTX 4070 Laptop GPU | |
|---|---|---|---|---|---|---|
| Heat | 2% | 15% | 5% | 23% | -16% | |
| Maximum Upper Side * (°C) | 51 | 49 4% | 41.8 18% | 41.5 19% | 41 20% | 60 -18% |
| Maximum Bottom * (°C) | 54 | 57 -6% | 41.4 23% | 51.8 4% | 47 13% | 61 -13% |
| Idle Upper Side * (°C) | 37 | 31 16% | 29 22% | 31.6 15% | 23 38% | 38.2 -3% |
| Idle Bottom * (°C) | 29 | 31 -7% | 30.4 -5% | 34.5 -19% | 23 21% | 37.7 -30% |
* ... smaller is better
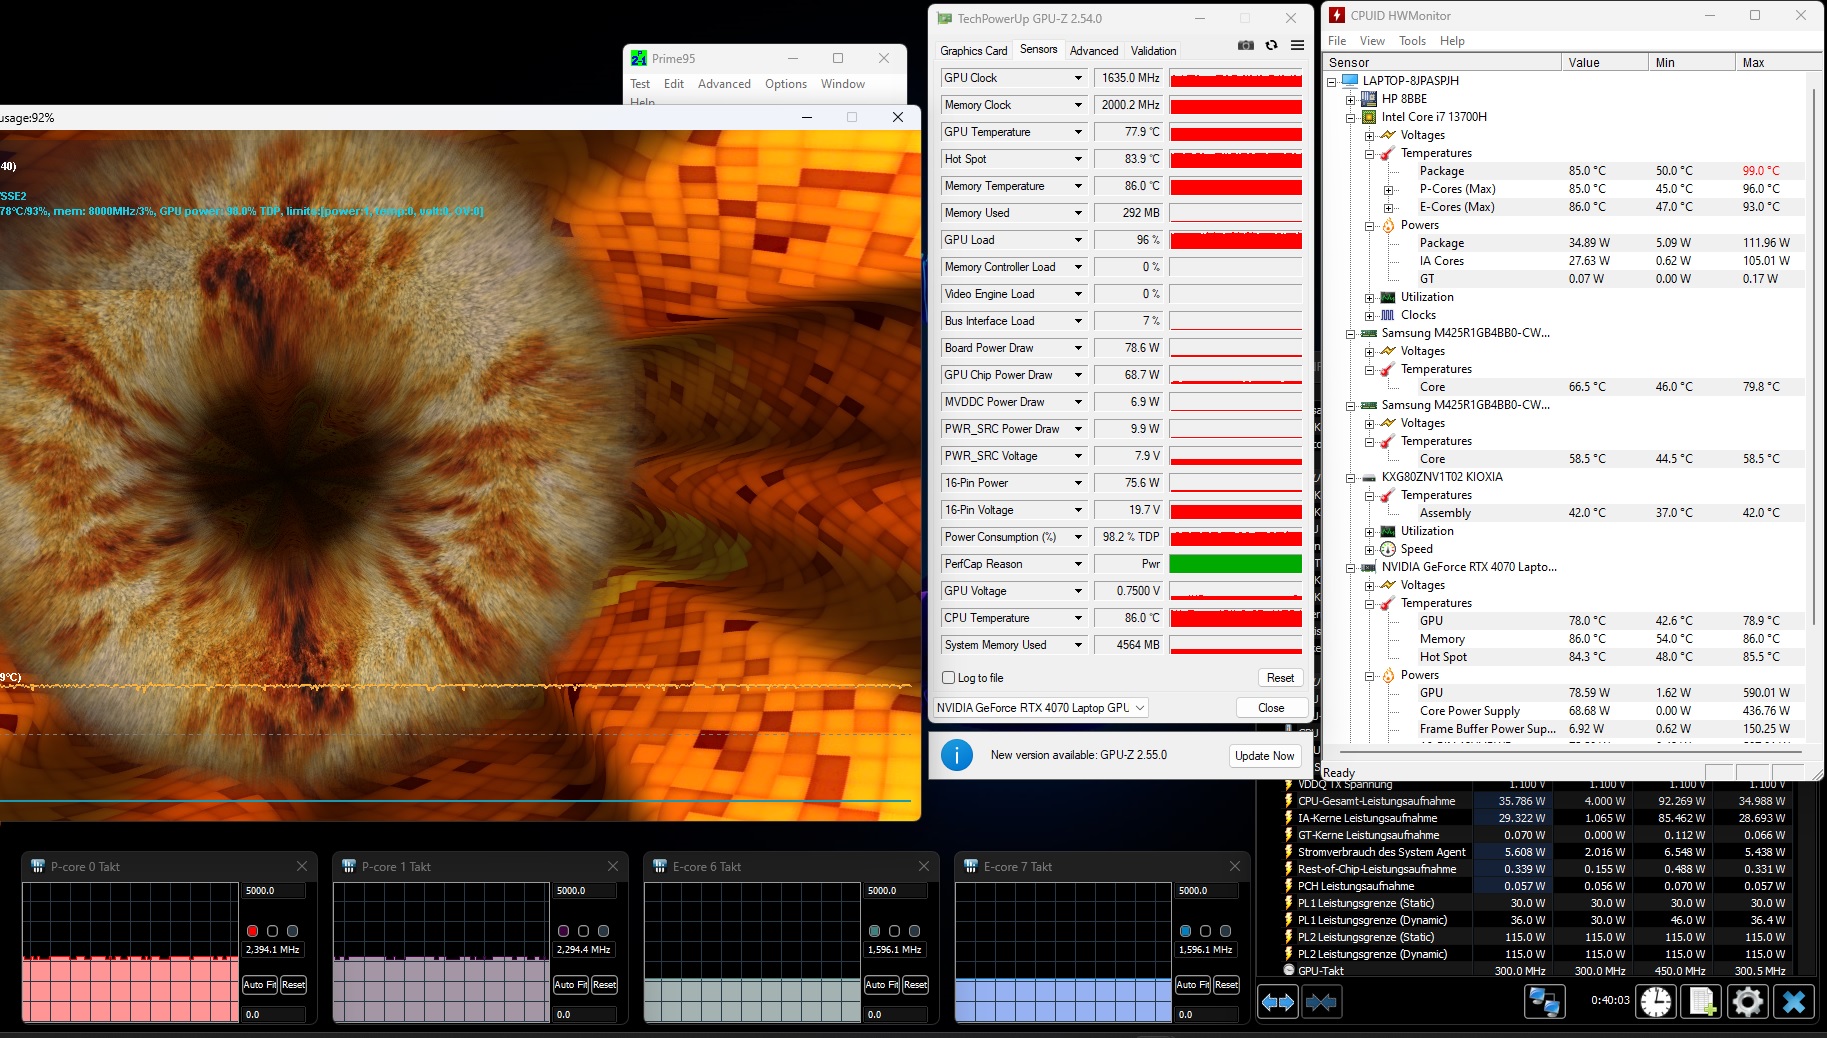
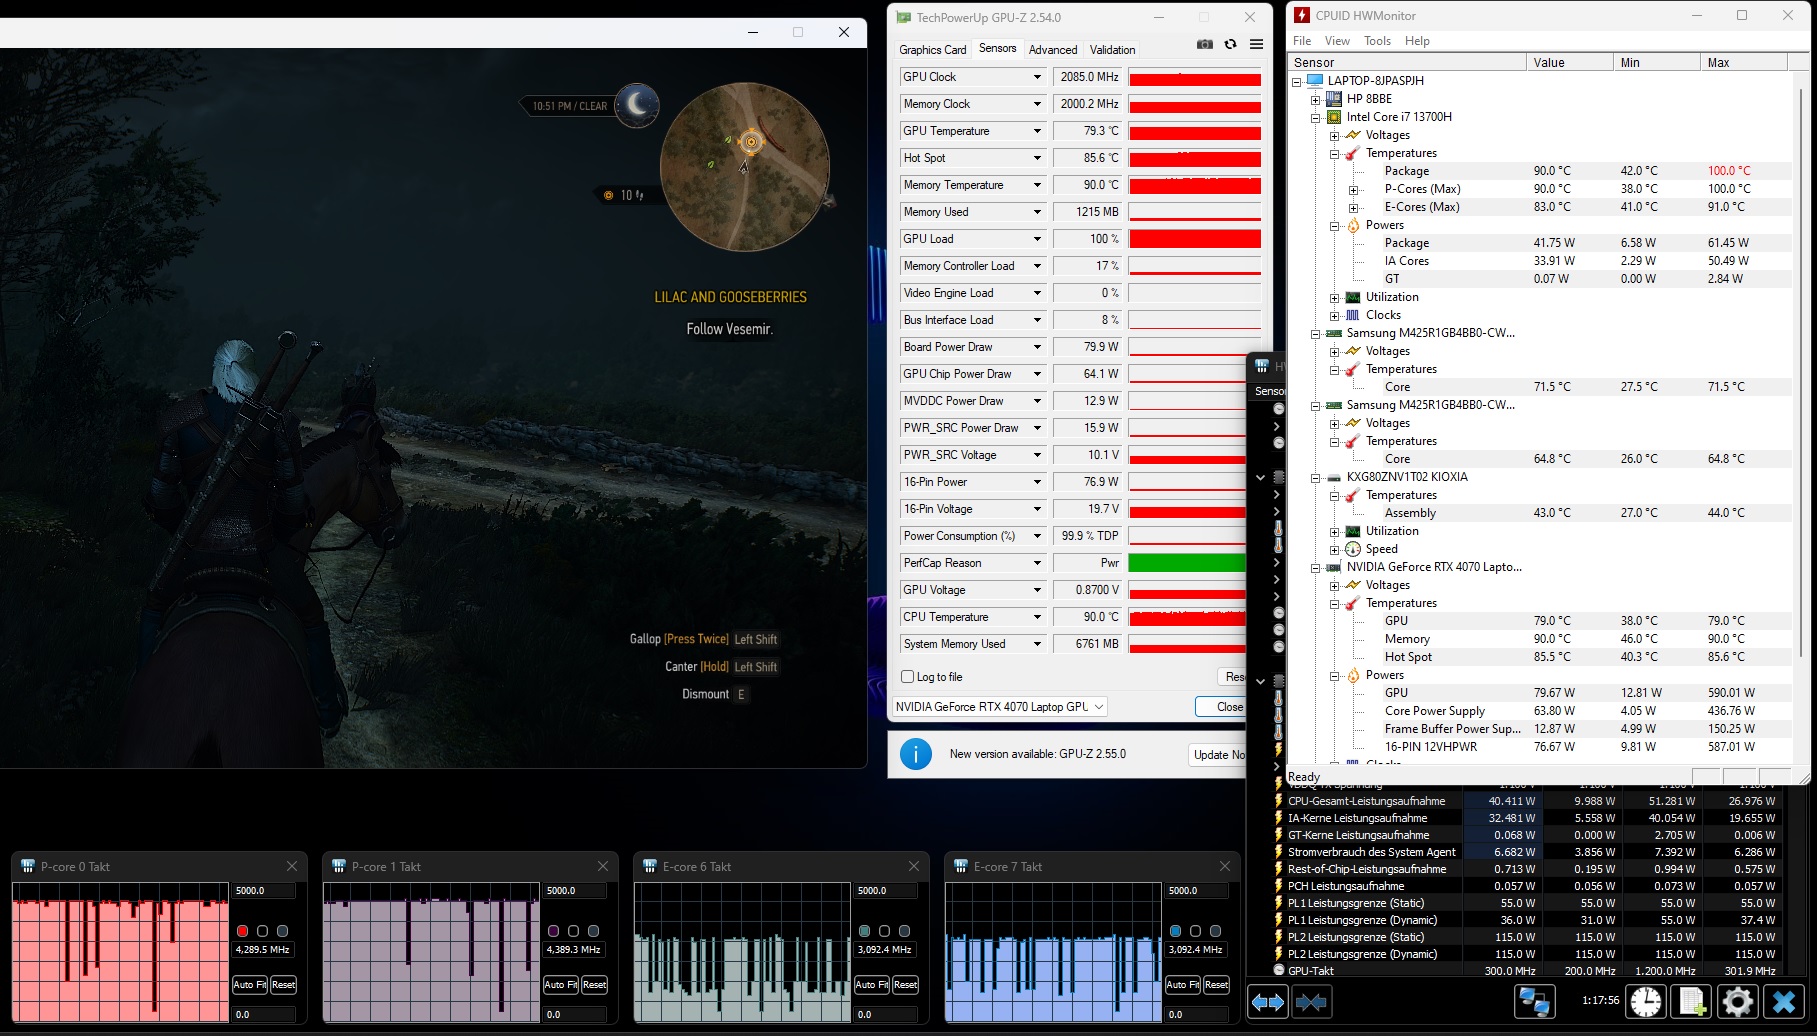
Stress Test
The cooling system leaves us with mixed feelings. Although the Core i7-13700H only operates at its base clock or slightly below it under full load, the CPU gets quite warm at around 85 °C. The situation with the graphics card is somewhat more relaxed. Just under 78 °C and a 1,635 MHz clock rate after 60 minutes of Furmark and Prime95 are a solid result.
Speakers
HP Victus 16-r0077ng audio analysis
(±) | speaker loudness is average but good (77 dB)
Bass 100 - 315 Hz
(-) | nearly no bass - on average 21.1% lower than median
(±) | linearity of bass is average (13.6% delta to prev. frequency)
Mids 400 - 2000 Hz
(+) | balanced mids - only 1.3% away from median
(+) | mids are linear (2.7% delta to prev. frequency)
Highs 2 - 16 kHz
(+) | balanced highs - only 2.8% away from median
(+) | highs are linear (5.3% delta to prev. frequency)
Overall 100 - 16.000 Hz
(±) | linearity of overall sound is average (15.8% difference to median)
Compared to same class
» 37% of all tested devices in this class were better, 7% similar, 56% worse
» The best had a delta of 6%, average was 18%, worst was 132%
Compared to all devices tested
» 24% of all tested devices were better, 5% similar, 70% worse
» The best had a delta of 4%, average was 23%, worst was 134%
HP Omen 16-xf0376ng audio analysis
(±) | speaker loudness is average but good (81 dB)
Bass 100 - 315 Hz
(±) | reduced bass - on average 14.9% lower than median
(±) | linearity of bass is average (13.6% delta to prev. frequency)
Mids 400 - 2000 Hz
(±) | higher mids - on average 5.2% higher than median
(+) | mids are linear (4.7% delta to prev. frequency)
Highs 2 - 16 kHz
(+) | balanced highs - only 3.7% away from median
(+) | highs are linear (6.6% delta to prev. frequency)
Overall 100 - 16.000 Hz
(+) | overall sound is linear (14.6% difference to median)
Compared to same class
» 28% of all tested devices in this class were better, 7% similar, 65% worse
» The best had a delta of 6%, average was 18%, worst was 132%
Compared to all devices tested
» 19% of all tested devices were better, 4% similar, 77% worse
» The best had a delta of 4%, average was 23%, worst was 134%
Energy Management
Power Consumption
The Victus 16 stands out from the competition somewhat positively in terms of power consumption. An average idle consumption rate of 13 watts and gaming consumption of 142 watts are below most comparison devices. The included 230-watt power supply is thus perfectly adequate.
| Off / Standby | |
| Idle | |
| Load |
|
Key:
min: | |
| HP Victus 16-r0077ng i7-13700H, GeForce RTX 4070 Laptop GPU | HP Omen 16-xf0376ng R7 7840HS, GeForce RTX 4070 Laptop GPU | Lenovo Legion Pro 5 16ARX8 R7 7745HX, GeForce RTX 4070 Laptop GPU | Acer Nitro 16 AN16-41 R7 7735HS, GeForce RTX 4070 Laptop GPU | Gigabyte AERO 16 OLED BSF i9-13900H, GeForce RTX 4070 Laptop GPU | MSI Stealth 16 Studio A13VG i7-13700H, GeForce RTX 4070 Laptop GPU | Average of class Gaming | |
|---|---|---|---|---|---|---|---|
| Power Consumption | 3% | -24% | -20% | -10% | -10% | -31% | |
| Idle Minimum * (Watt) | 8 | 9 -13% | 8.1 -1% | 11.6 -45% | 11.8 -48% | 11 -38% | 13 ? -63% |
| Idle Average * (Watt) | 13 | 14 -8% | 15.9 -22% | 15.6 -20% | 16.1 -24% | 18 -38% | 18.7 ? -44% |
| Idle Maximum * (Watt) | 22 | 20 9% | 37.2 -69% | 16.5 25% | 17 23% | 19 14% | 24.3 ? -10% |
| Load Average * (Watt) | 86 | 84 2% | 90.9 -6% | 155 -80% | 100.6 -17% | 91 -6% | 110.2 ? -28% |
| Witcher 3 ultra * (Watt) | 141.8 | 140.9 1% | 189.6 -34% | 154.8 -9% | 158 -11% | 130 8% | |
| Load Maximum * (Watt) | 233 | 176 24% | 263.5 -13% | 205 12% | 192 18% | 228 2% | 258 ? -11% |
* ... smaller is better
Power consumption Witcher 3 / Stress test
Power consumption with an external monitor
Battery Life
With active graphics switching, the Victus 16 lasts a relatively long time without a power outlet for a gaming notebook. In the practical WLAN test (brightness set to 150 cd/m²), the 16-inch device lasted 426 minutes, almost 1.5 hours longer than the comparable Omen 16, although some competitors have even longer runtimes thanks to larger batteries (the Victus 16 offers 83 Wh).
| HP Victus 16-r0077ng i7-13700H, GeForce RTX 4070 Laptop GPU, 83 Wh | HP Omen 16-xf0376ng R7 7840HS, GeForce RTX 4070 Laptop GPU, 83 Wh | Lenovo Legion Pro 5 16ARX8 R7 7745HX, GeForce RTX 4070 Laptop GPU, 80 Wh | Acer Nitro 16 AN16-41 R7 7735HS, GeForce RTX 4070 Laptop GPU, 90 Wh | Gigabyte AERO 16 OLED BSF i9-13900H, GeForce RTX 4070 Laptop GPU, 88 Wh | MSI Stealth 16 Studio A13VG i7-13700H, GeForce RTX 4070 Laptop GPU, 99.9 Wh | Average of class Gaming | |
|---|---|---|---|---|---|---|---|
| Battery runtime | -20% | -44% | 27% | 6% | 10% | 1% | |
| WiFi v1.3 (h) | 7.1 | 5.7 -20% | 4 -44% | 9 27% | 7.5 6% | 7.8 10% | 7.15 ? 1% |
| Reader / Idle (h) | 6.5 | 12.2 | 11 | 8.71 ? | |||
| Load (h) | 1 | 1.8 | 2.1 | 2.4 | 1.502 ? | ||
| H.264 (h) | 10.2 | 7.4 | 7.7 | 8.64 ? |
Pros
Cons
Verdict
If HP hadn't gone the way of reasonable pricing, the Victus 16-r0077ng would've had quite a tough time against the competition. The Gigabyte Aero 16, the Lenovo Legion Pro 5, the Acer Nitro 16 and the MSI Stealth 16 Studio all have better overall ratings, although some of them cost considerably more.
For a starting price of around US$949.99, the Victus 16 cuts a relatively good figure.
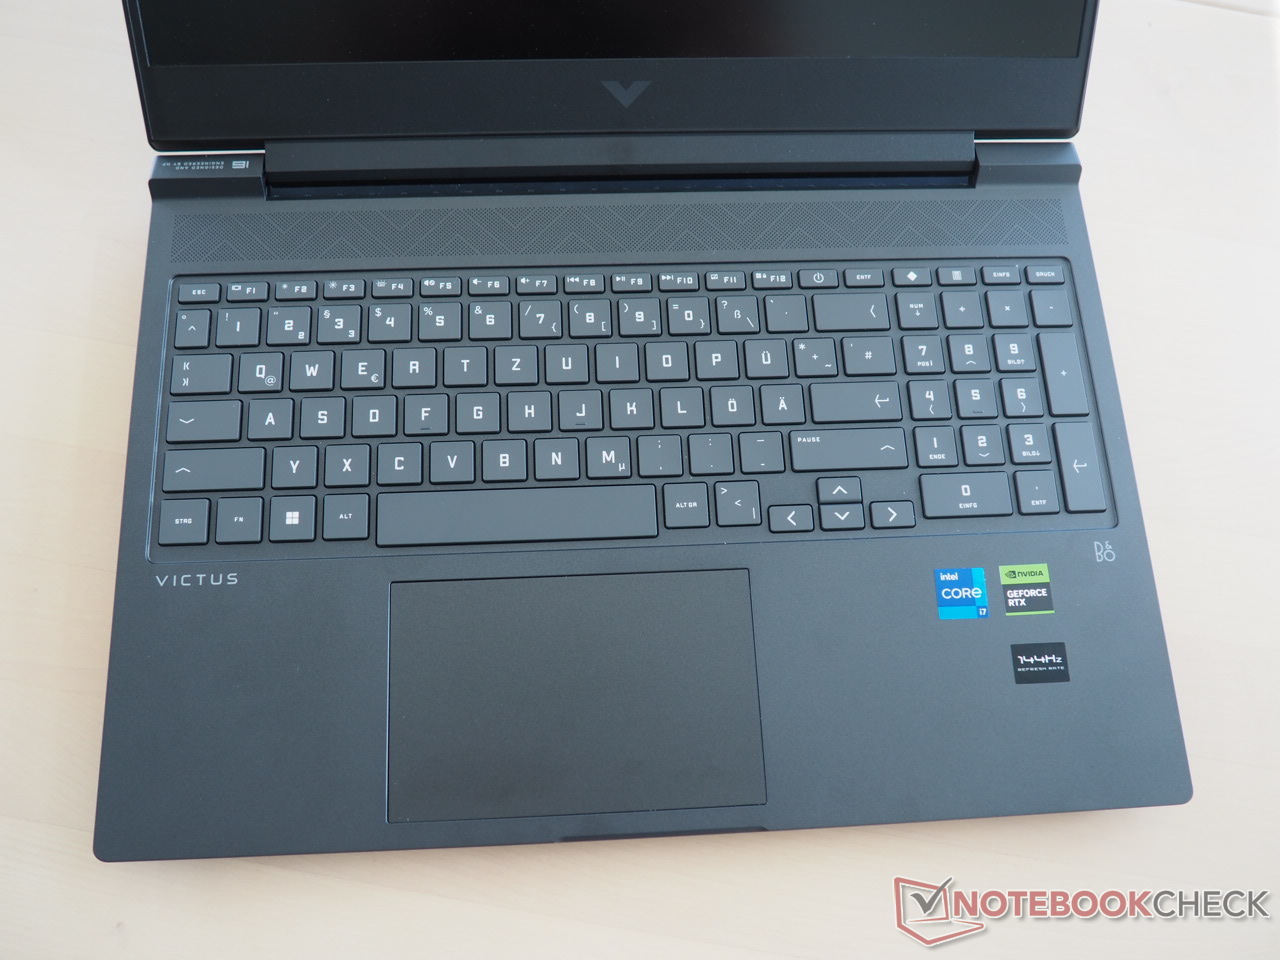
Although the plastic chassis does not look particularly high-quality and has to do without Thunderbolt 4, it scores with a classy design and usable input devices. Most buyers should also be satisfied with the color-accurate Full HD display (144 Hz), although the brightness is rather poor. The performance of the Core i7-13700H and GeForce RTX 4070 generally meets expectations, while the emission values are somewhat mixed. In Balanced mode, which we would recommend for everyday use, the 16-incher is not too loud, but quite warm.
Overall, price-conscious gamers can't really go wrong here. However, those who place more value on quality in individual areas or want better results should preferably buy one of the competing devices.
Price and Availability
The US equivalent of our Victus 16 review configuration (Core i7-13700H, GeForce RTX 4070 and 144 Hz display) is available via HP's webstore for $1,439.99.
Prices are as of 26.09.2023 and are subject to change.
HP Victus 16-r0077ng
- 09/25/2023 v7 (old)
Florian Glaser
Transparency
The selection of devices to be reviewed is made by our editorial team. The test sample was provided to the author as a loan by the manufacturer or retailer for the purpose of this review. The lender had no influence on this review, nor did the manufacturer receive a copy of this review before publication. There was no obligation to publish this review. As an independent media company, Notebookcheck is not subjected to the authority of manufacturers, retailers or publishers.
This is how Notebookcheck is testing
Every year, Notebookcheck independently reviews hundreds of laptops and smartphones using standardized procedures to ensure that all results are comparable. We have continuously developed our test methods for around 20 years and set industry standards in the process. In our test labs, high-quality measuring equipment is utilized by experienced technicians and editors. These tests involve a multi-stage validation process. Our complex rating system is based on hundreds of well-founded measurements and benchmarks, which maintains objectivity. Further information on our test methods can be found here.
Price comparison

