HP Omen 16 laptop review: A good choice for gamers even with Zen 4
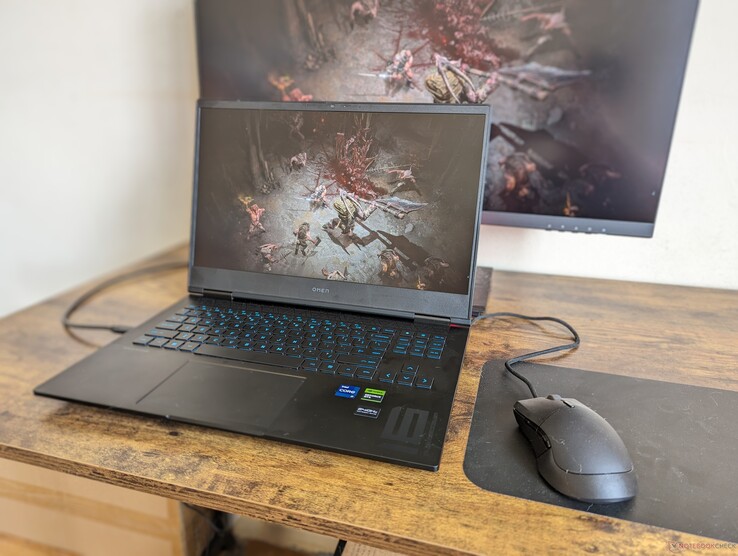
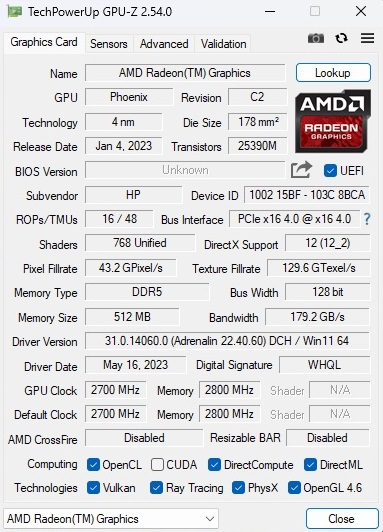
The Omen 16-xf0376ng is currently available for just under 1,900 Euros (~$2026). For this price, buyers get a cutting-edge Zen 4 processor from AMD: The Ryzen 7 7840HS not only offers a lot of CPU performance, but with the Radeon 780M it also has a pretty fast iGPU. However, demanding graphics calculations are taken care of by a GeForce RTX 4070 from Nvidia. The Ada-Lovelace accelerator is more in the upper mid-range than the high-end segment due to the somewhat meager video memory (only 8 GB GDDR6). The M.2 SSD could also be bigger in view of only 512 GB capacity. however, 16 GB of DDR5-5600 RAM is still appropriate for a gaming notebook from 2023. The display is a matte 16.1-inch IPS-based panel with 1,920 x 1,080 pixels and 165 Hz.
Competitors of the Omen 16 include other 16-inch gamers with RTX 4070 like the MSI Stealth 16 Studio A13VG, the Gigabyte Aero 16 OLED BSF, the Acer Nitro 16 AN16-41 and the Lenovo Legion Pro 5 16ARX8, which cost more, though.
Possible competitors in comparison
Rating | Date | Model | Weight | Height | Size | Resolution | Price |
|---|---|---|---|---|---|---|---|
| 86.6 % v7 (old) | 09 / 2023 | HP Omen 16-xf0376ng R7 7840HS, GeForce RTX 4070 Laptop GPU | 2.4 kg | 23.5 mm | 16.10" | 1920x1080 | |
| 87.4 % v7 (old) | 06 / 2023 | HP Omen 16-wf000 i7-13700HX, GeForce RTX 4080 Laptop GPU | 2.4 kg | 23.6 mm | 16.10" | 2560x1440 | |
| 88.8 % v7 (old) | 07 / 2023 | MSI Stealth 16 Studio A13VG i7-13700H, GeForce RTX 4070 Laptop GPU | 2 kg | 19.95 mm | 16.00" | 2560x1600 | |
| 86.2 % v7 (old) | 03 / 2023 | Gigabyte AERO 16 OLED BSF i9-13900H, GeForce RTX 4070 Laptop GPU | 2.1 kg | 18 mm | 16.00" | 3840x2400 | |
| 88.1 % v7 (old) | 06 / 2023 | Acer Nitro 16 AN16-41 R7 7735HS, GeForce RTX 4070 Laptop GPU | 2.7 kg | 27.9 mm | 16.00" | 2560x1600 | |
| 88.4 % v7 (old) | 05 / 2023 | Lenovo Legion Pro 5 16ARX8 R7 7745HX, GeForce RTX 4070 Laptop GPU | 2.5 kg | 26.8 mm | 16.00" | 2560x1600 |
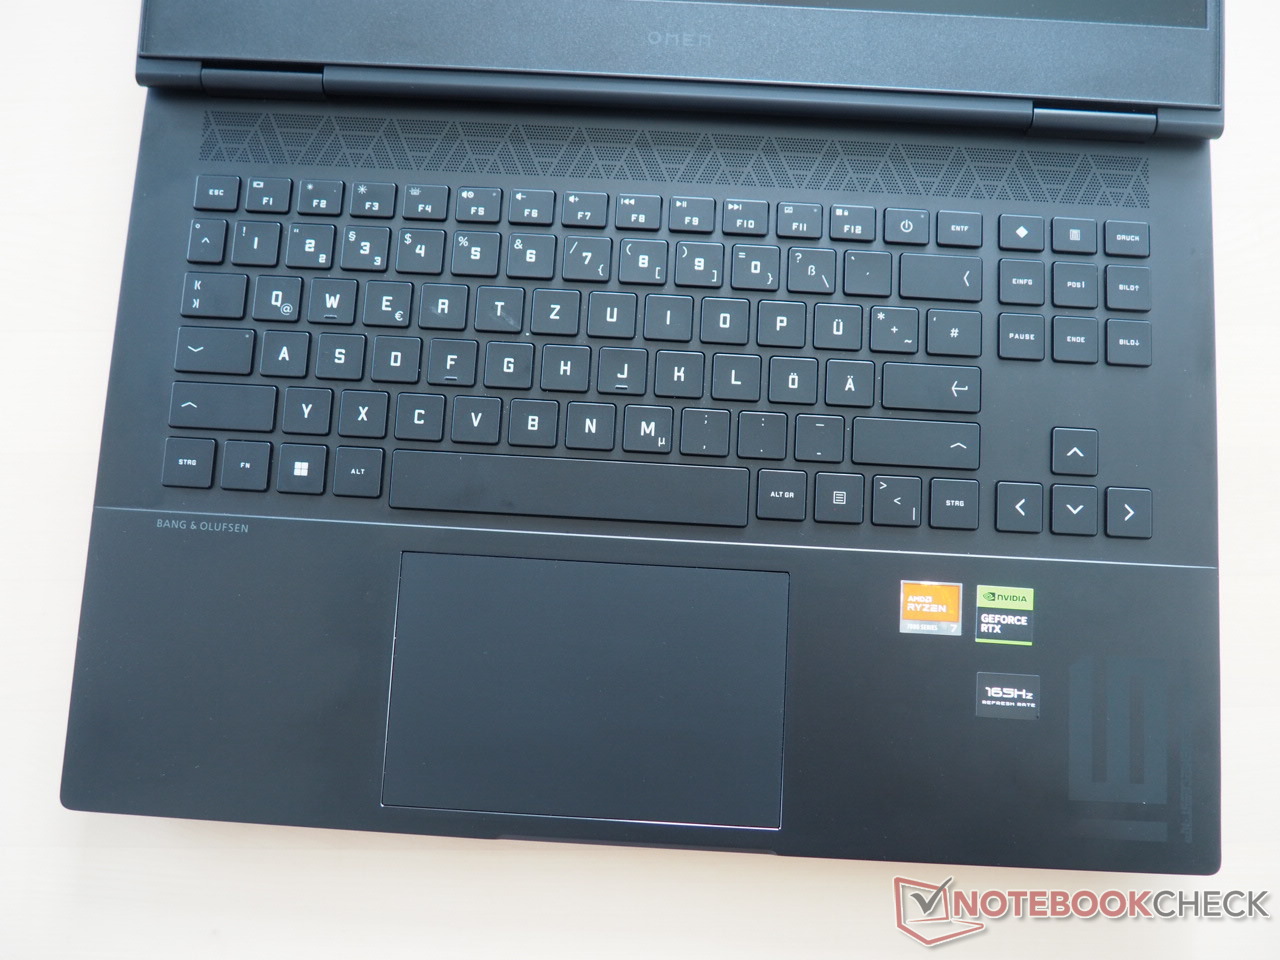
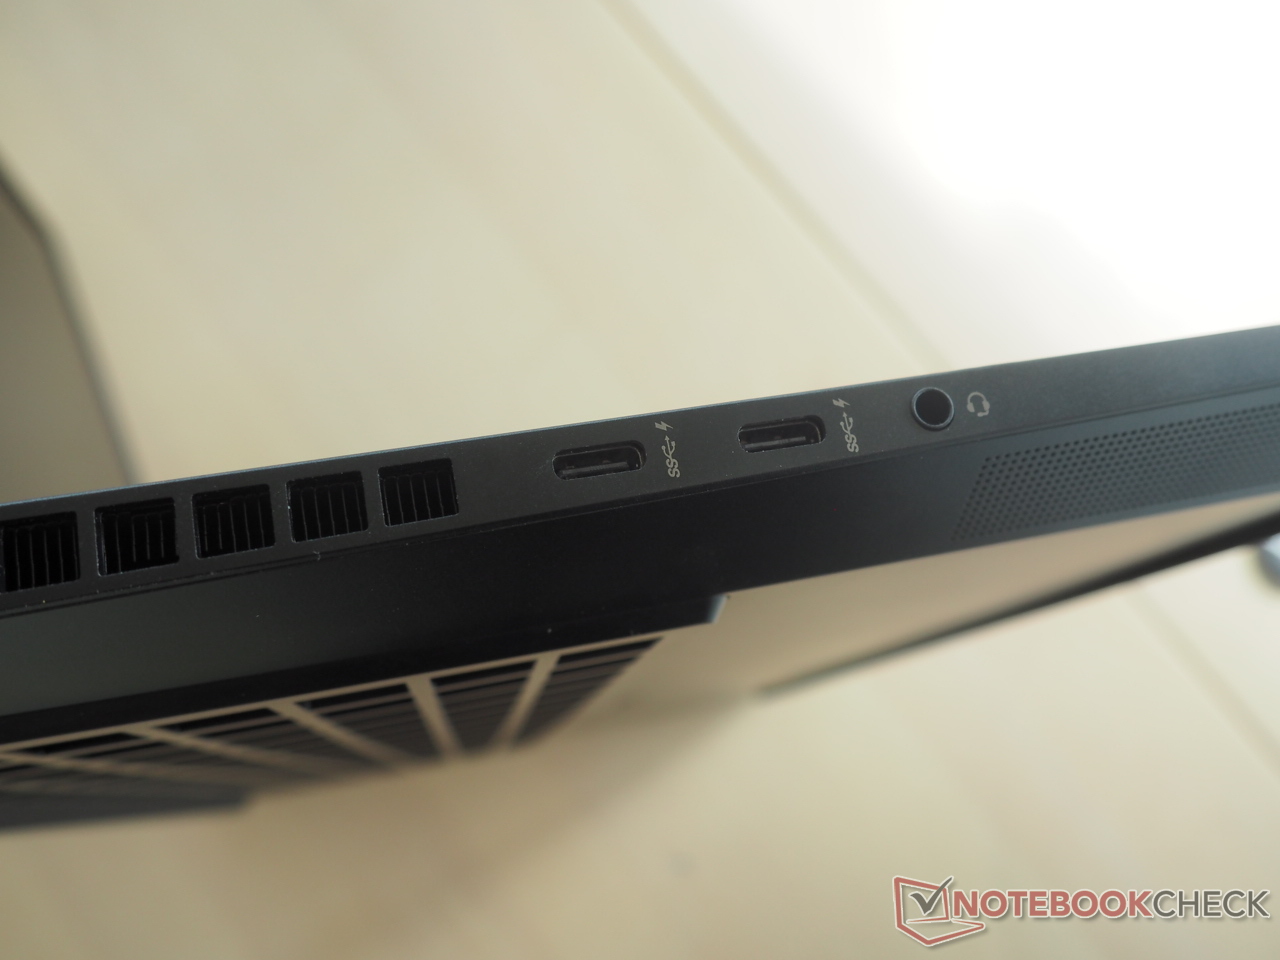
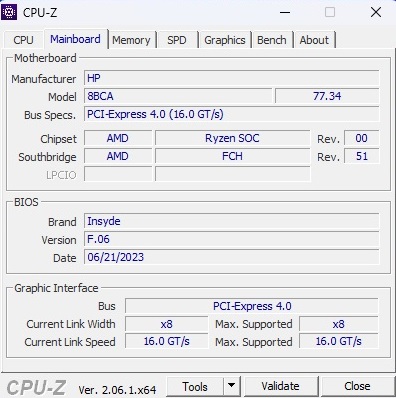
Since the case is largely identical to the already tested 16-wf000 model with a Core i7-13700HX and GeForce RTX 4080 (the AMD version unfortunately has to do without Thunderbolt 4), we will spare ourselves a renewed analysis of the chassis, the equipment and the input devices in this article and refer at this point to the existing Test report.


Communication
Webcam


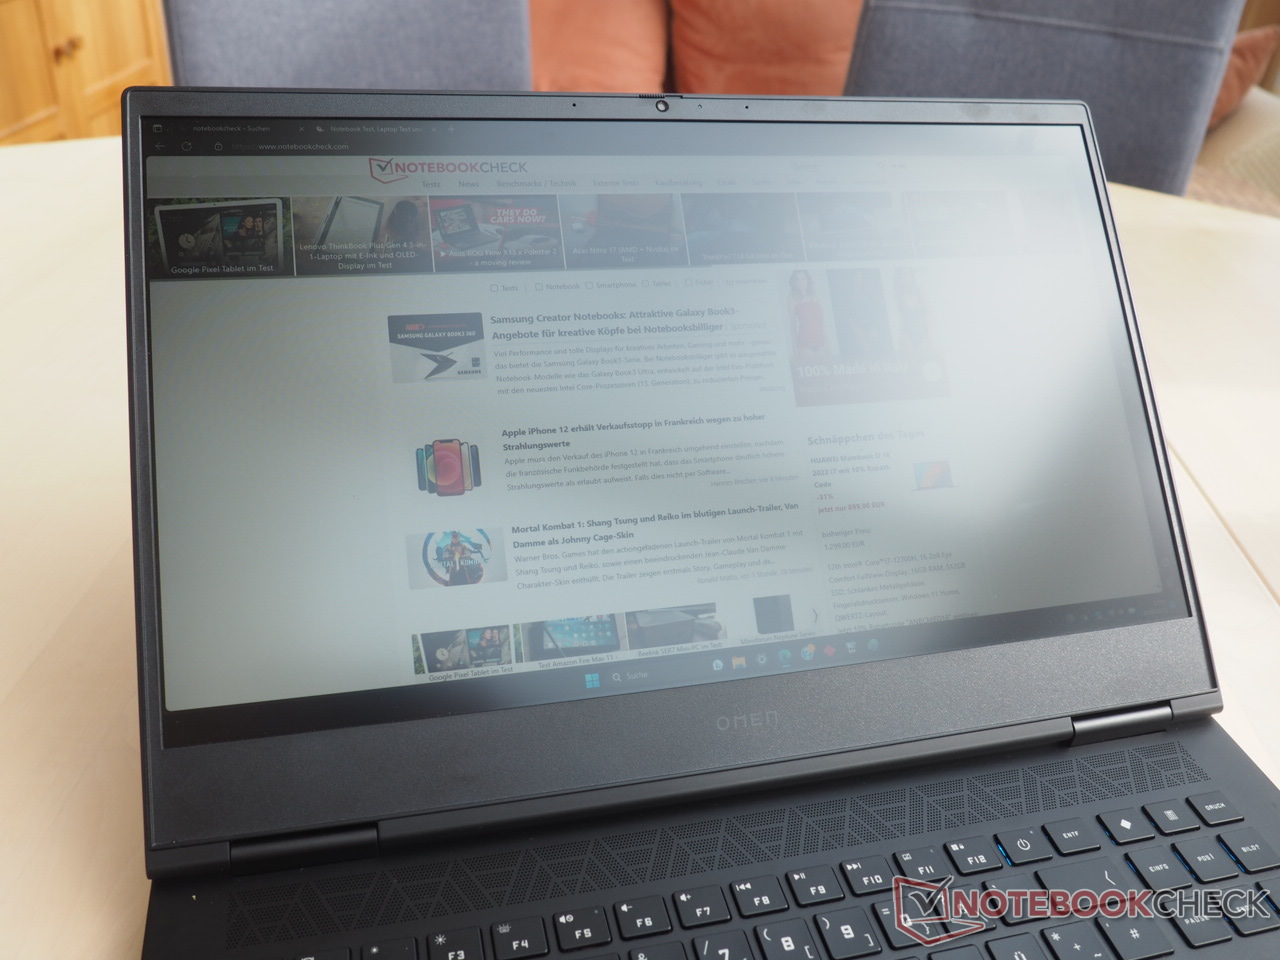
Display
While the Intel version we reviewed relies on a QHD display (2,560 x 1,440 pixels), the AMD variant uses a classic Full HD panel.
| |||||||||||||||||||||||||
Brightness Distribution: 91 %
Center on Battery: 350 cd/m²
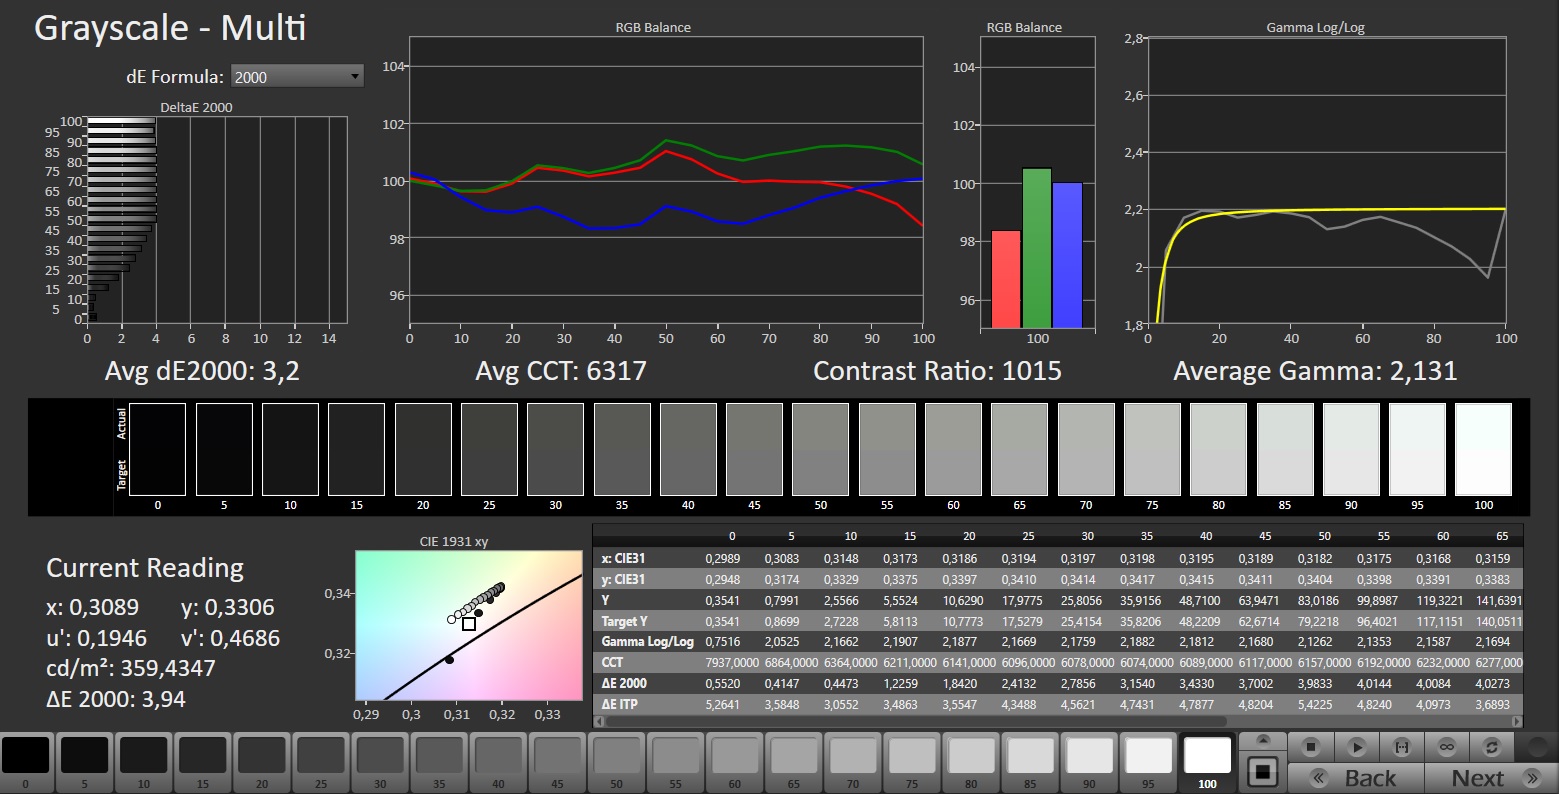
Contrast: 1000:1 (Black: 0.35 cd/m²)
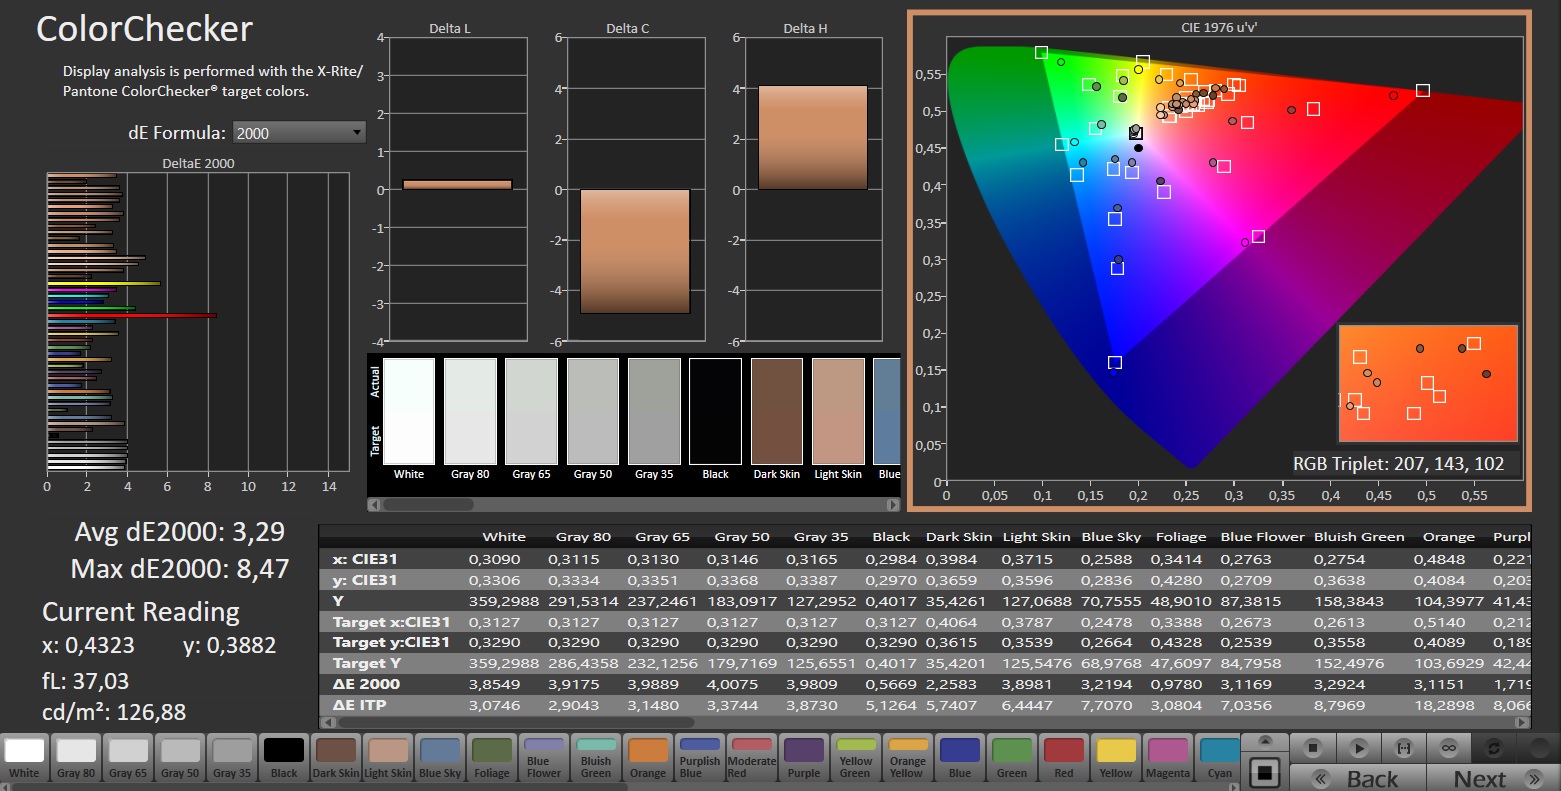
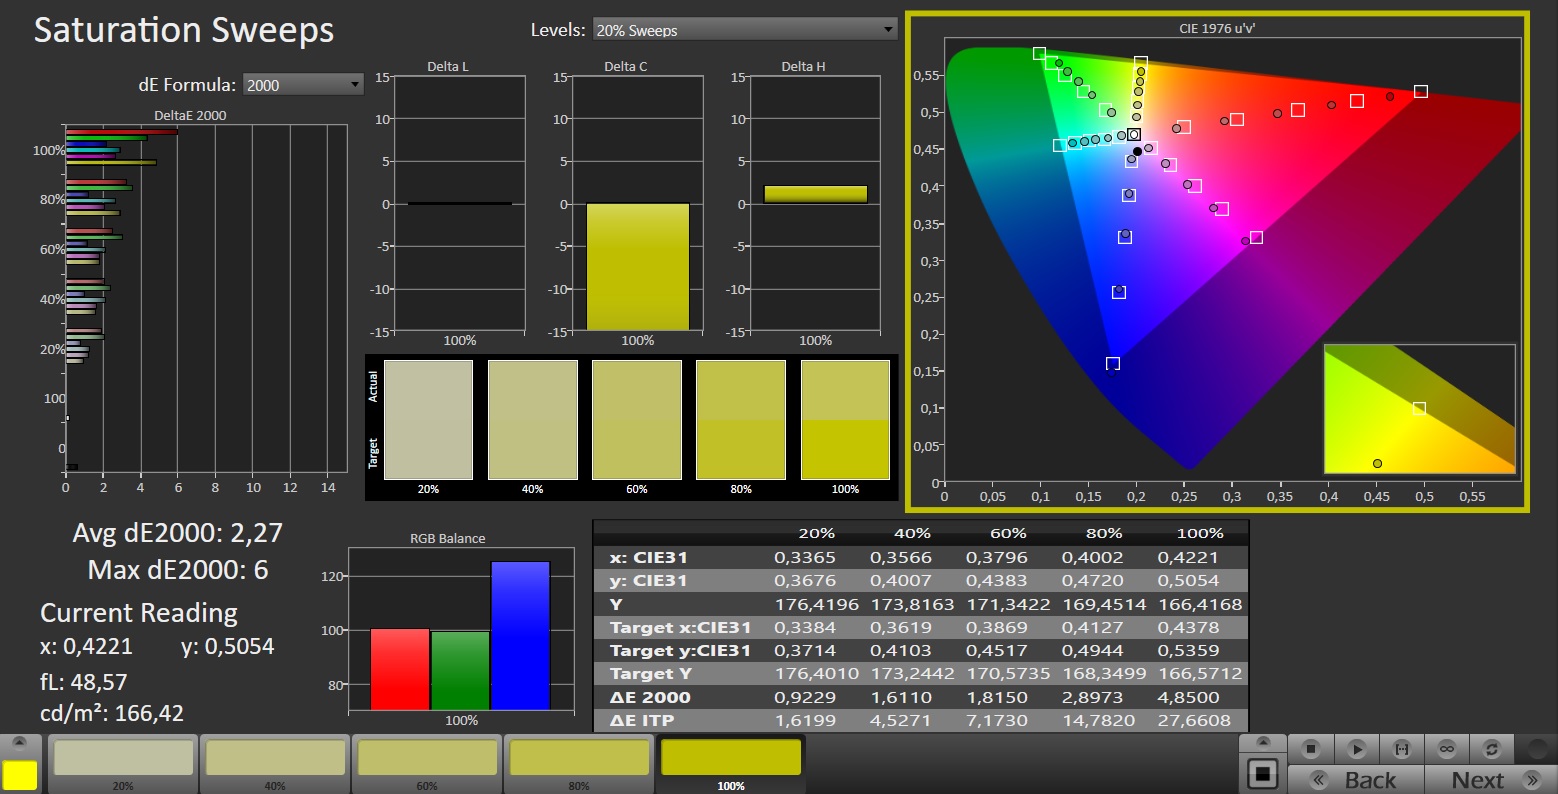
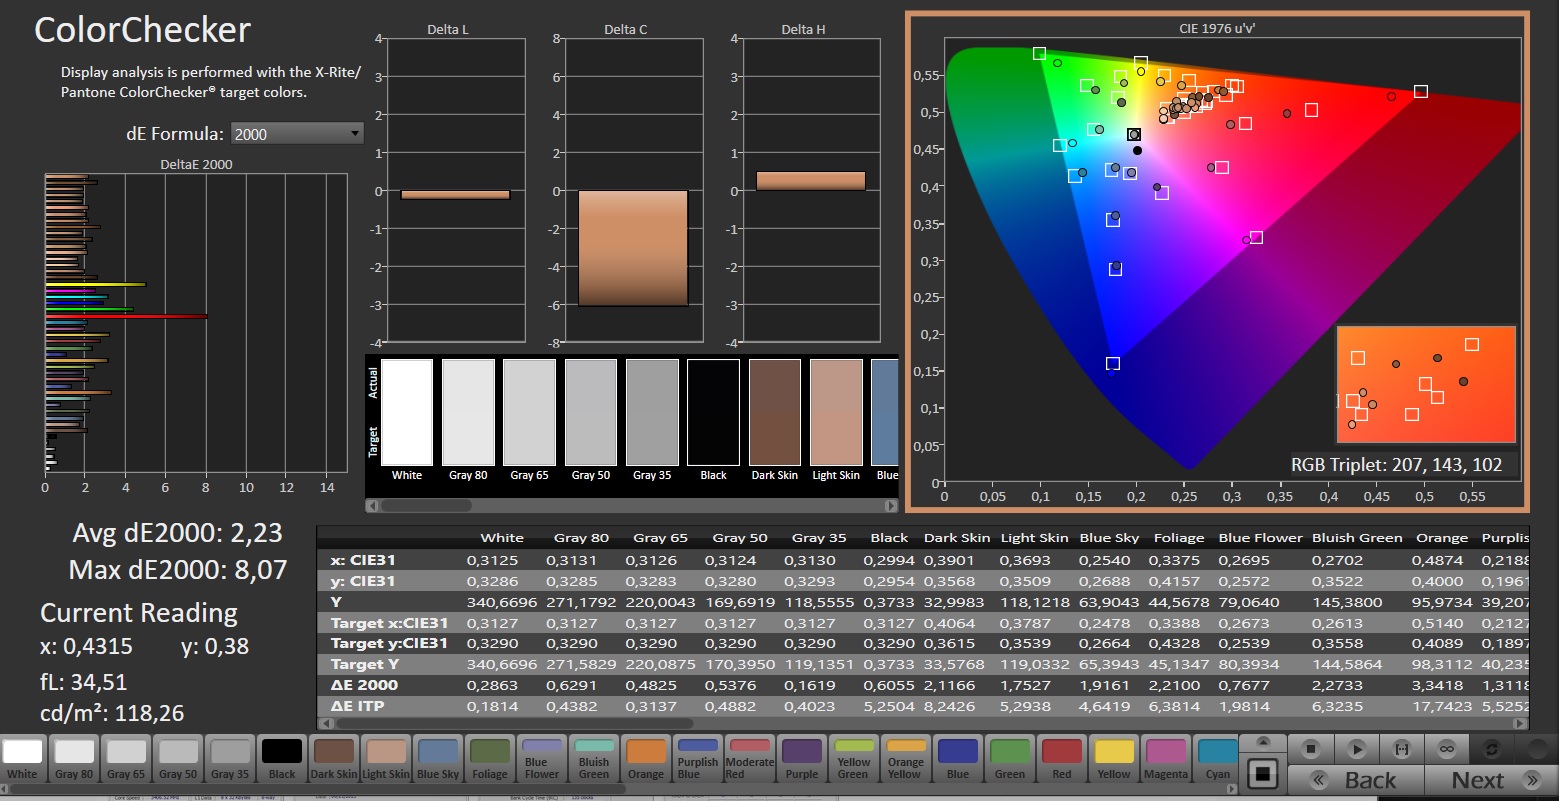
ΔE ColorChecker Calman: 3.29 | ∀{0.5-29.43 Ø4.71}
calibrated: 2.23
ΔE Greyscale Calman: 3.2 | ∀{0.09-98 Ø4.96}
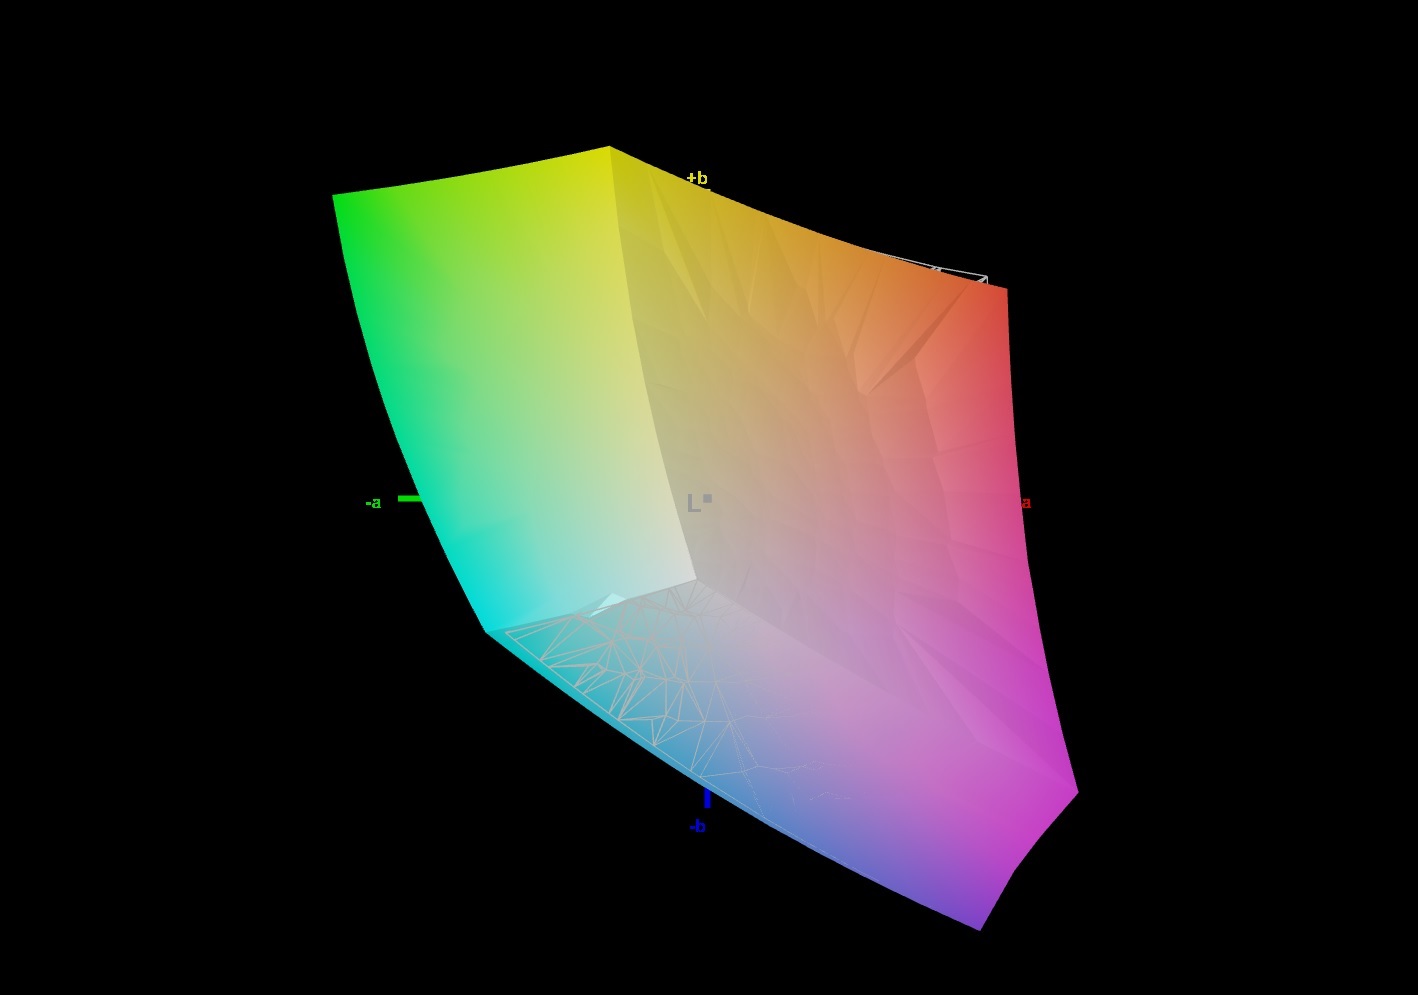
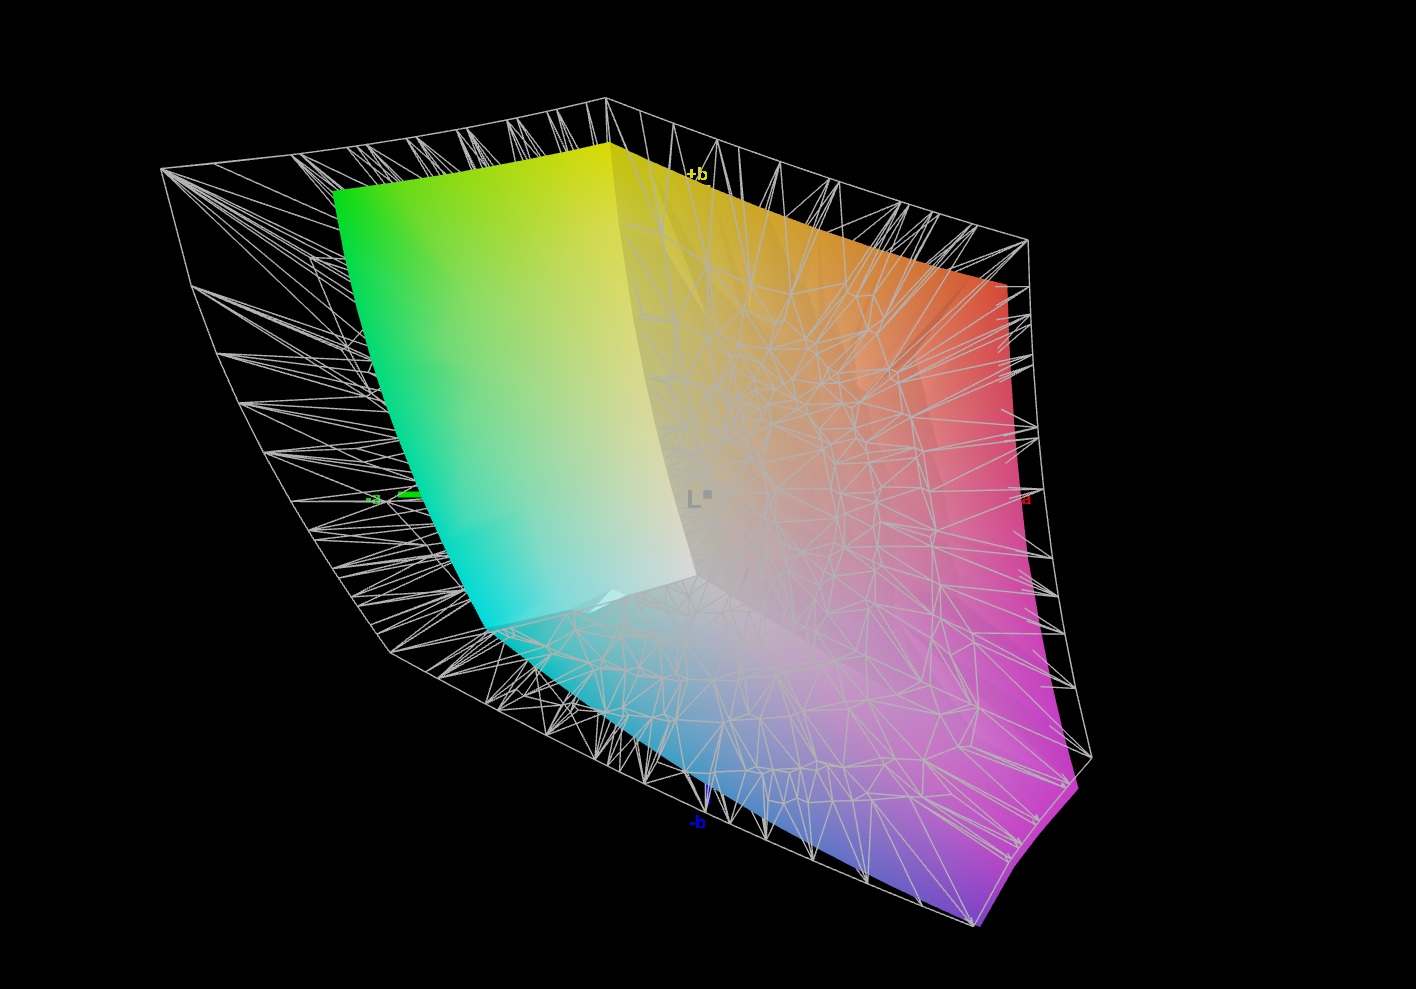
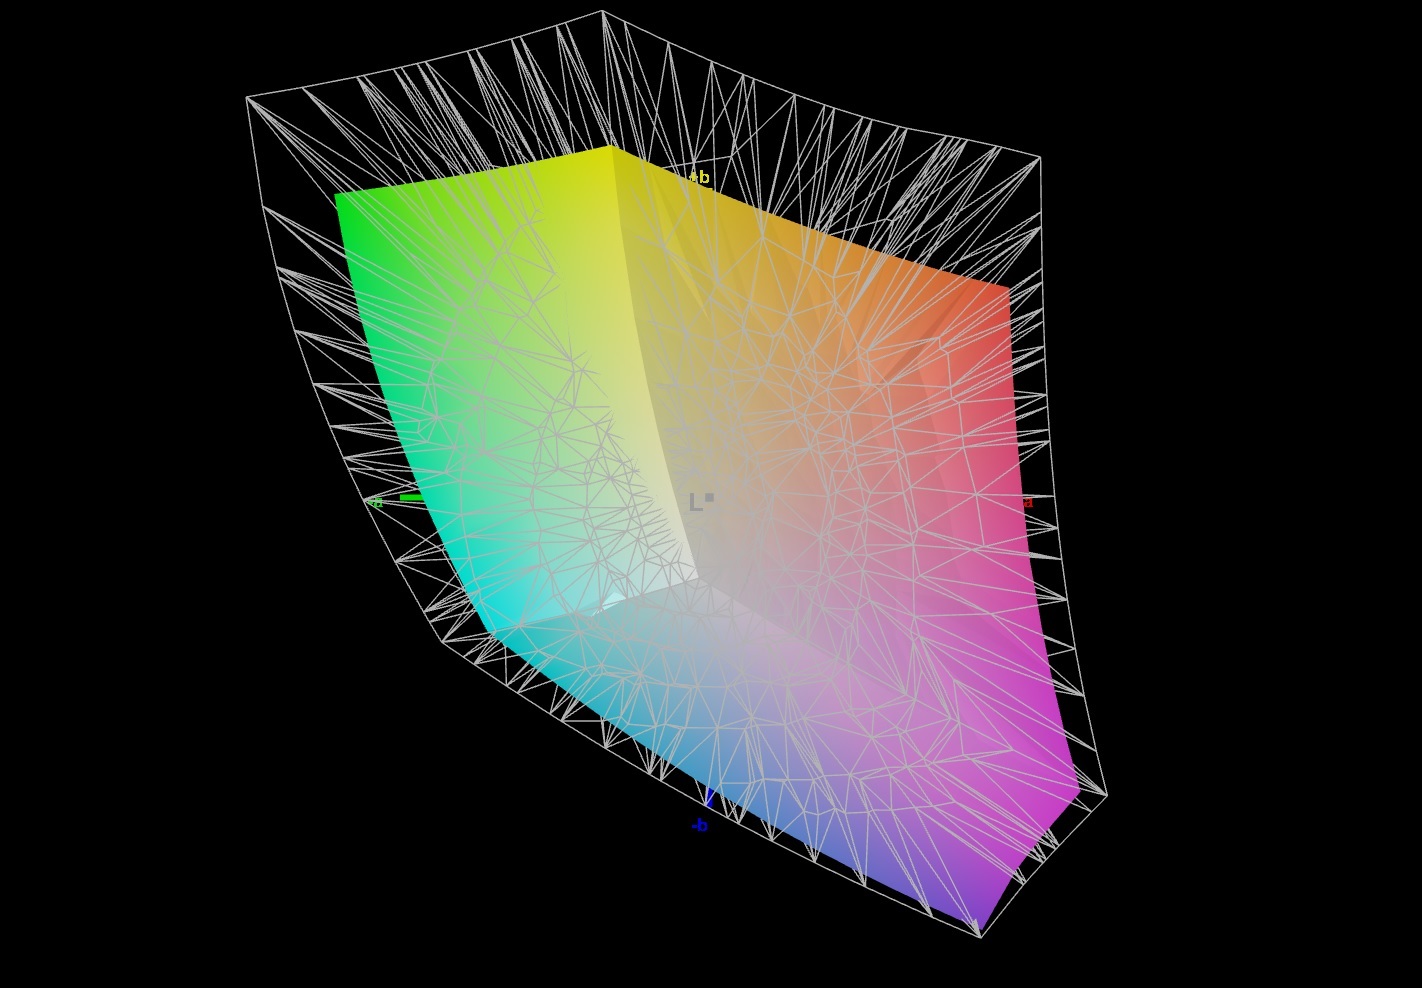
72.3% AdobeRGB 1998 (Argyll 3D)
99.6% sRGB (Argyll 3D)
72.1% Display P3 (Argyll 3D)
Gamma: 2.131
CCT: 6317 K
| HP Omen 16-xf0376ng BOE0B81, IPS, 1920x1080, 16.1" | HP Omen 16-wf000 BOE0B7D, IPS, 2560x1440, 16.1" | MSI Stealth 16 Studio A13VG AUO26A9, IPS, 2560x1600, 16" | Gigabyte AERO 16 OLED BSF Samsung SDC4191 (ATNA60YV09-0, OLED, 3840x2400, 16" | Acer Nitro 16 AN16-41 BOE CQ NE16QDM-NY1, IPS, 2560x1600, 16" | Lenovo Legion Pro 5 16ARX8 CSOT T3 MNG007DA1-Q, IPS, 2560x1600, 16" | |
|---|---|---|---|---|---|---|
| Display | -2% | 17% | 24% | -3% | -1% | |
| Display P3 Coverage (%) | 72.1 | 69 -4% | 96.4 34% | 99.9 39% | 67.9 -6% | 70.4 -2% |
| sRGB Coverage (%) | 99.6 | 99.2 0% | 99.7 0% | 100 0% | 99.1 -1% | 99.6 0% |
| AdobeRGB 1998 Coverage (%) | 72.3 | 71.2 -2% | 84.8 17% | 96.4 33% | 69.9 -3% | 72.6 0% |
| Response Times | 14% | 43% | 79% | 21% | 9% | |
| Response Time Grey 50% / Grey 80% * (ms) | 12.3 ? | 4.6 ? 63% | 4.4 ? 64% | 2 ? 84% | 11 ? 11% | 7 ? 43% |
| Response Time Black / White * (ms) | 7.2 ? | 9.7 ? -35% | 5.6 ? 22% | 1.98 ? 73% | 5 ? 31% | 9.1 ? -26% |
| PWM Frequency (Hz) | 60 | |||||
| Screen | 16% | -0% | 164% | 30% | 33% | |
| Brightness middle (cd/m²) | 350 | 310.9 -11% | 424 21% | 389.97 11% | 520 49% | 355.3 2% |
| Brightness (cd/m²) | 338 | 296 -12% | 411 22% | 395 17% | 494 46% | 340 1% |
| Brightness Distribution (%) | 91 | 91 0% | 88 -3% | 97 7% | 91 0% | 91 0% |
| Black Level * (cd/m²) | 0.35 | 0.35 -0% | 0.37 -6% | 0.03 91% | 0.39 -11% | 0.32 9% |
| Contrast (:1) | 1000 | 888 -11% | 1146 15% | 12999 1200% | 1333 33% | 1110 11% |
| Colorchecker dE 2000 * | 3.29 | 2.18 34% | 3.04 8% | 2 39% | 1.94 41% | 1.13 66% |
| Colorchecker dE 2000 max. * | 8.47 | 3.58 58% | 7.5 11% | 4.1 52% | 5.62 34% | 2.78 67% |
| Colorchecker dE 2000 calibrated * | 2.23 | 0.52 77% | 3.04 -36% | 1.68 25% | 0.74 67% | 0.32 86% |
| Greyscale dE 2000 * | 3.2 | 2.8 13% | 4.34 -36% | 2.23 30% | 2.94 8% | 1.4 56% |
| Gamma | 2.131 103% | 2.18 101% | 2.32 95% | 2.41 91% | 2.37 93% | 2.24 98% |
| CCT | 6317 103% | 6002 108% | 6952 93% | 6323 103% | 6443 101% | 6372 102% |
| Total Average (Program / Settings) | 9% /
12% | 20% /
10% | 89% /
122% | 16% /
21% | 14% /
22% |
* ... smaller is better
However, the determined image values are similar. Both models can cover almost 100% of the sRGB color space and about 70% of the AdobeRGB and DCI-P3 color space, respectively, although some competitors (MSI, Gigabyte) score better here. The response time is not bad either and should satisfy most demands.
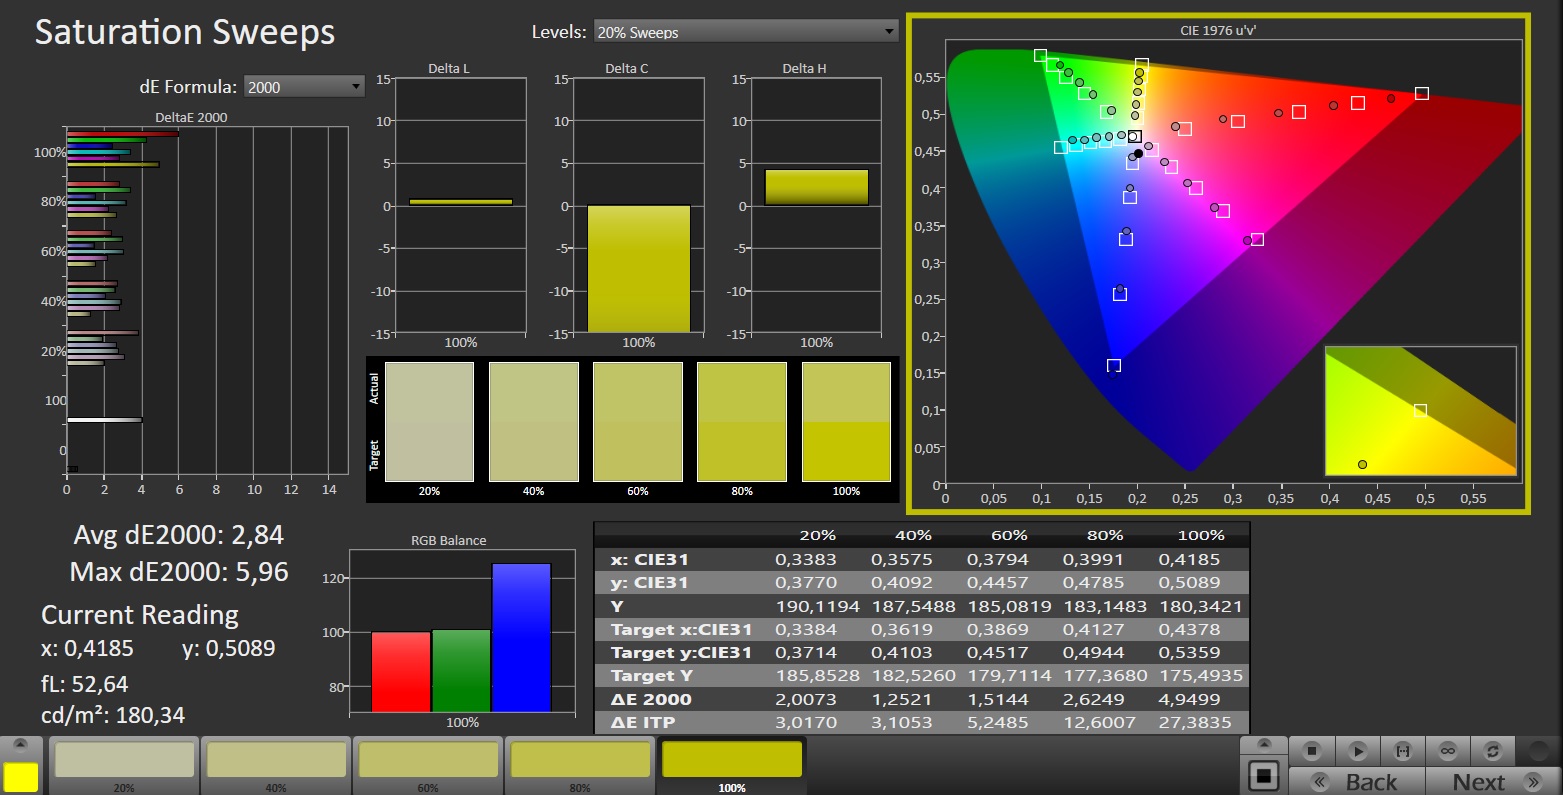
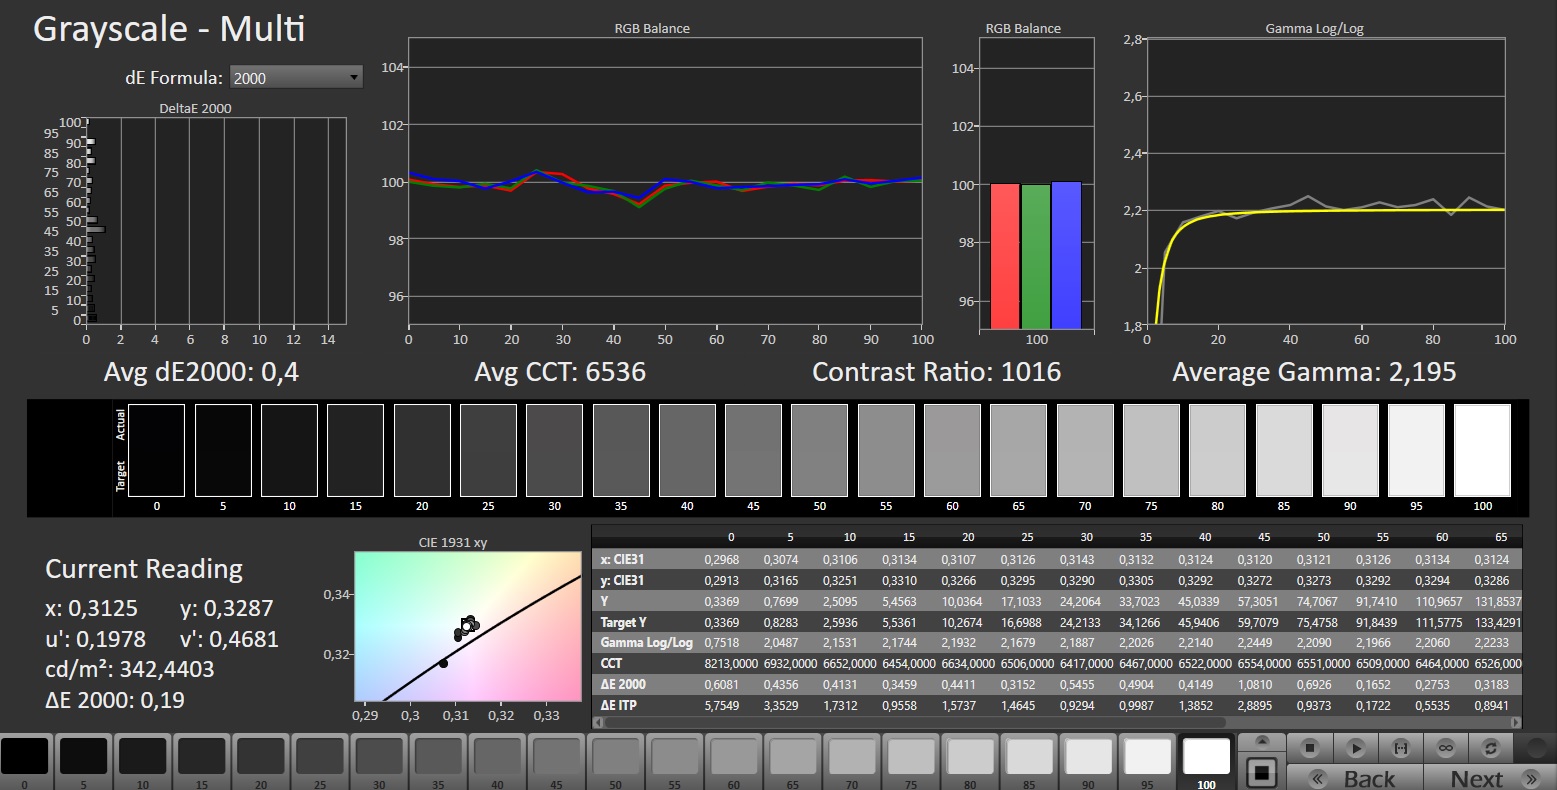
Illumination (91%) and black value (0.35 cd/m²) are completely the same, but the AMD edition has a slightly better contrast (1000:1 vs 888:1) due to the slightly higher brightness (338 instead of 296 cd/m² on average). However, both devices cannot quite reach the competition. Above all, the OLED panel of the Aero 16 pulls away in many disciplines if you can come to terms with a glossy surface and display flickering.
But back to the Omen 16: The viewing angles are good as typical for IPS, so the picture remains quite stable even from a slanted position. By the way, if you need the most accurate colors possible, you should perform a calibration or download and use the ICC file we linked next to the illumination graphic (assuming it is the same Full HD panel).
Display Response Times
| ↔ Response Time Black to White | ||
|---|---|---|
| 7.2 ms ... rise ↗ and fall ↘ combined | ↗ 4 ms rise | 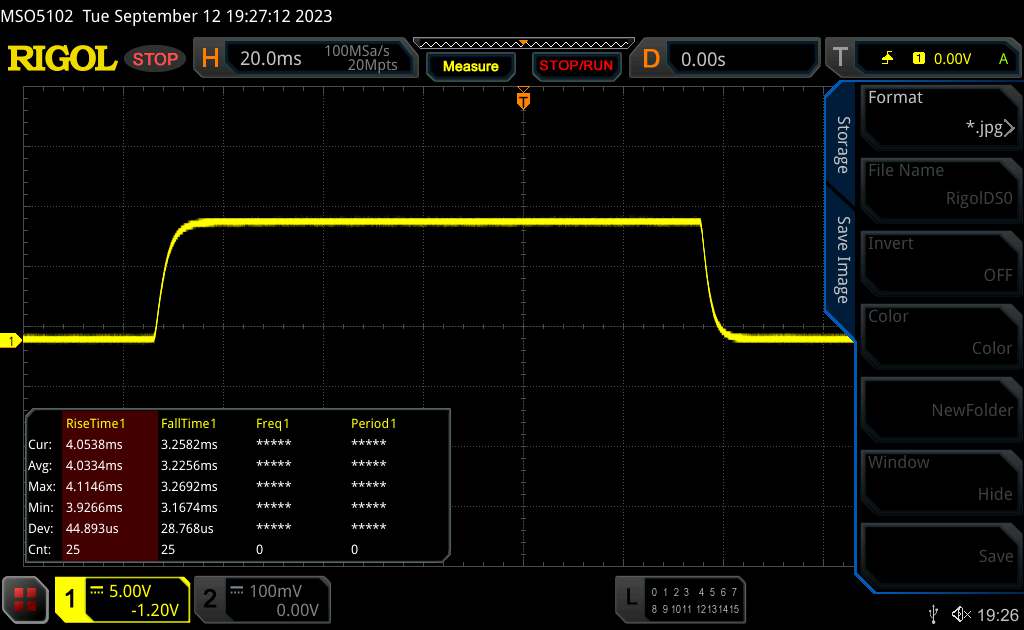 |
| ↘ 3.2 ms fall | ||
| The screen shows very fast response rates in our tests and should be very well suited for fast-paced gaming. In comparison, all tested devices range from 0.1 (minimum) to 240 (maximum) ms. » 21 % of all devices are better. This means that the measured response time is better than the average of all tested devices (19.8 ms). | ||
| ↔ Response Time 50% Grey to 80% Grey | ||
| 12.3 ms ... rise ↗ and fall ↘ combined | ↗ 5.9 ms rise | 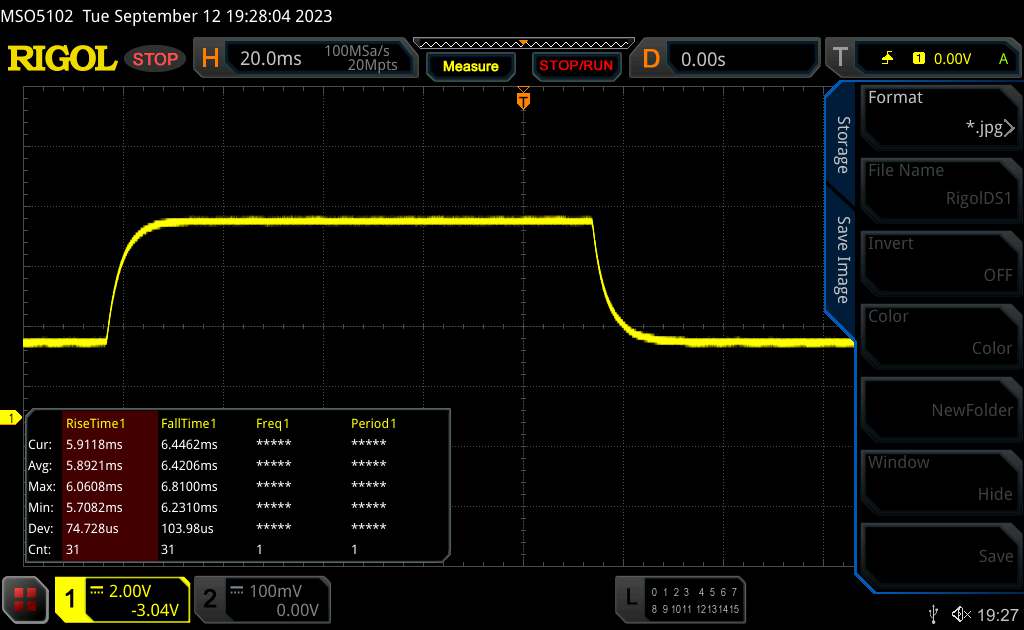 |
| ↘ 6.4 ms fall | ||
| The screen shows good response rates in our tests, but may be too slow for competitive gamers. In comparison, all tested devices range from 0.165 (minimum) to 636 (maximum) ms. » 26 % of all devices are better. This means that the measured response time is better than the average of all tested devices (31 ms). | ||
Screen Flickering / PWM (Pulse-Width Modulation)
| Screen flickering / PWM not detected | 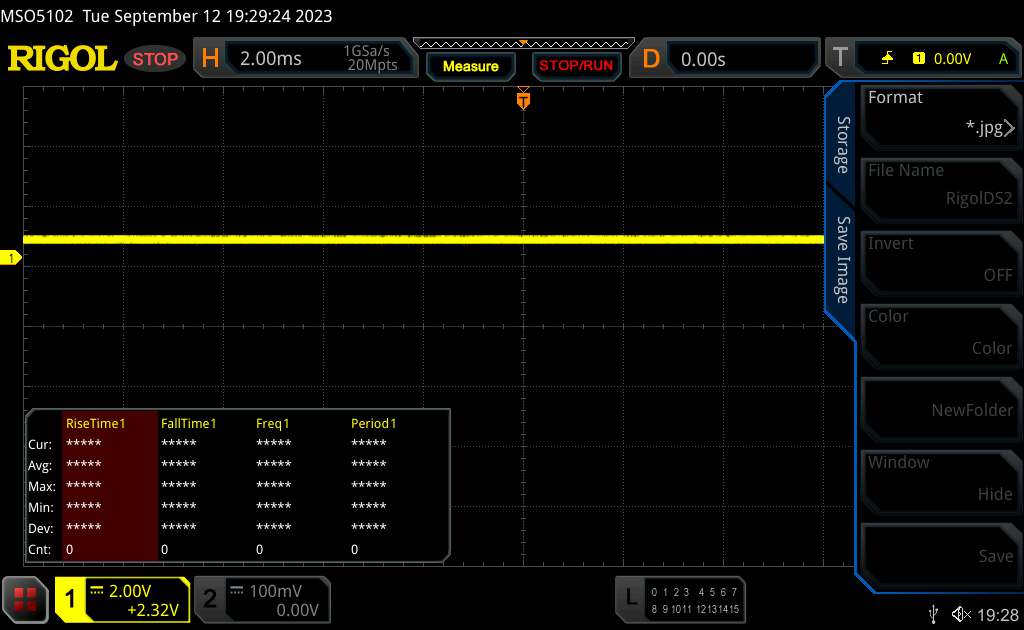 | ||
In comparison: 52 % of all tested devices do not use PWM to dim the display. If PWM was detected, an average of 7757 (minimum: 5 - maximum: 343500) Hz was measured. | |||
Power
The Omen 16 is available in a large number of different configurations. The palette ranges from the GeForce RTX 4050 up to the GeForce RTX 4080. As already mentioned, HP uses current CPU models from AMD and Intel. Our review sample is positioned in the (upper) midfield in terms of price and performance.
Test conditions
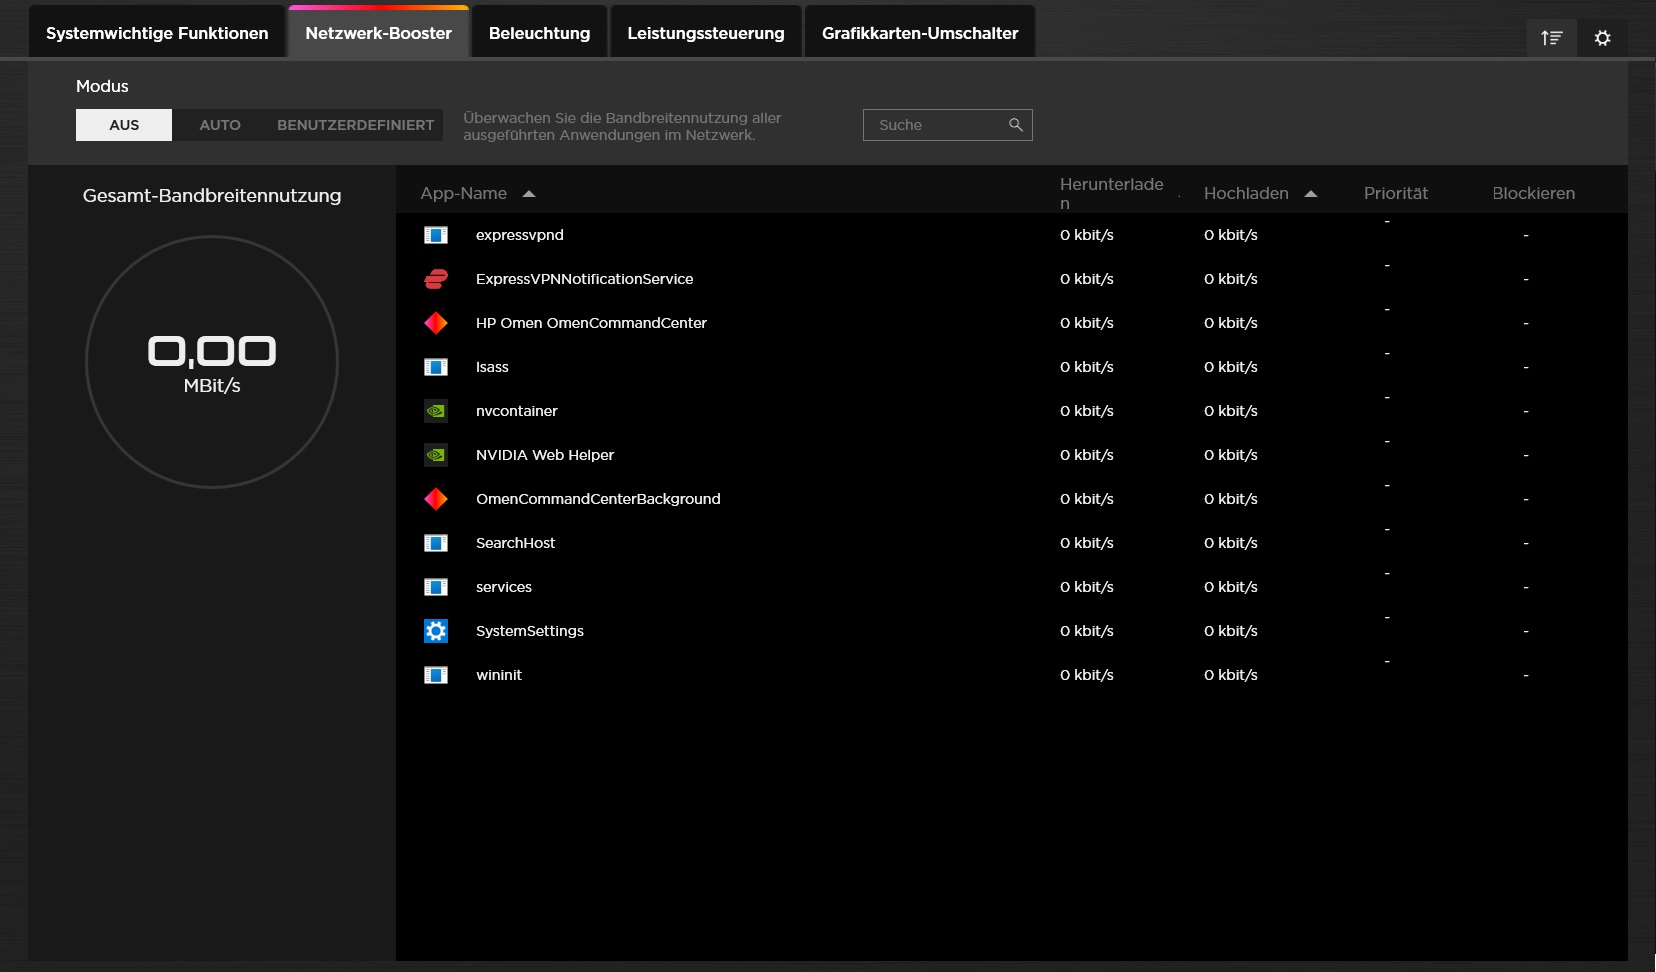
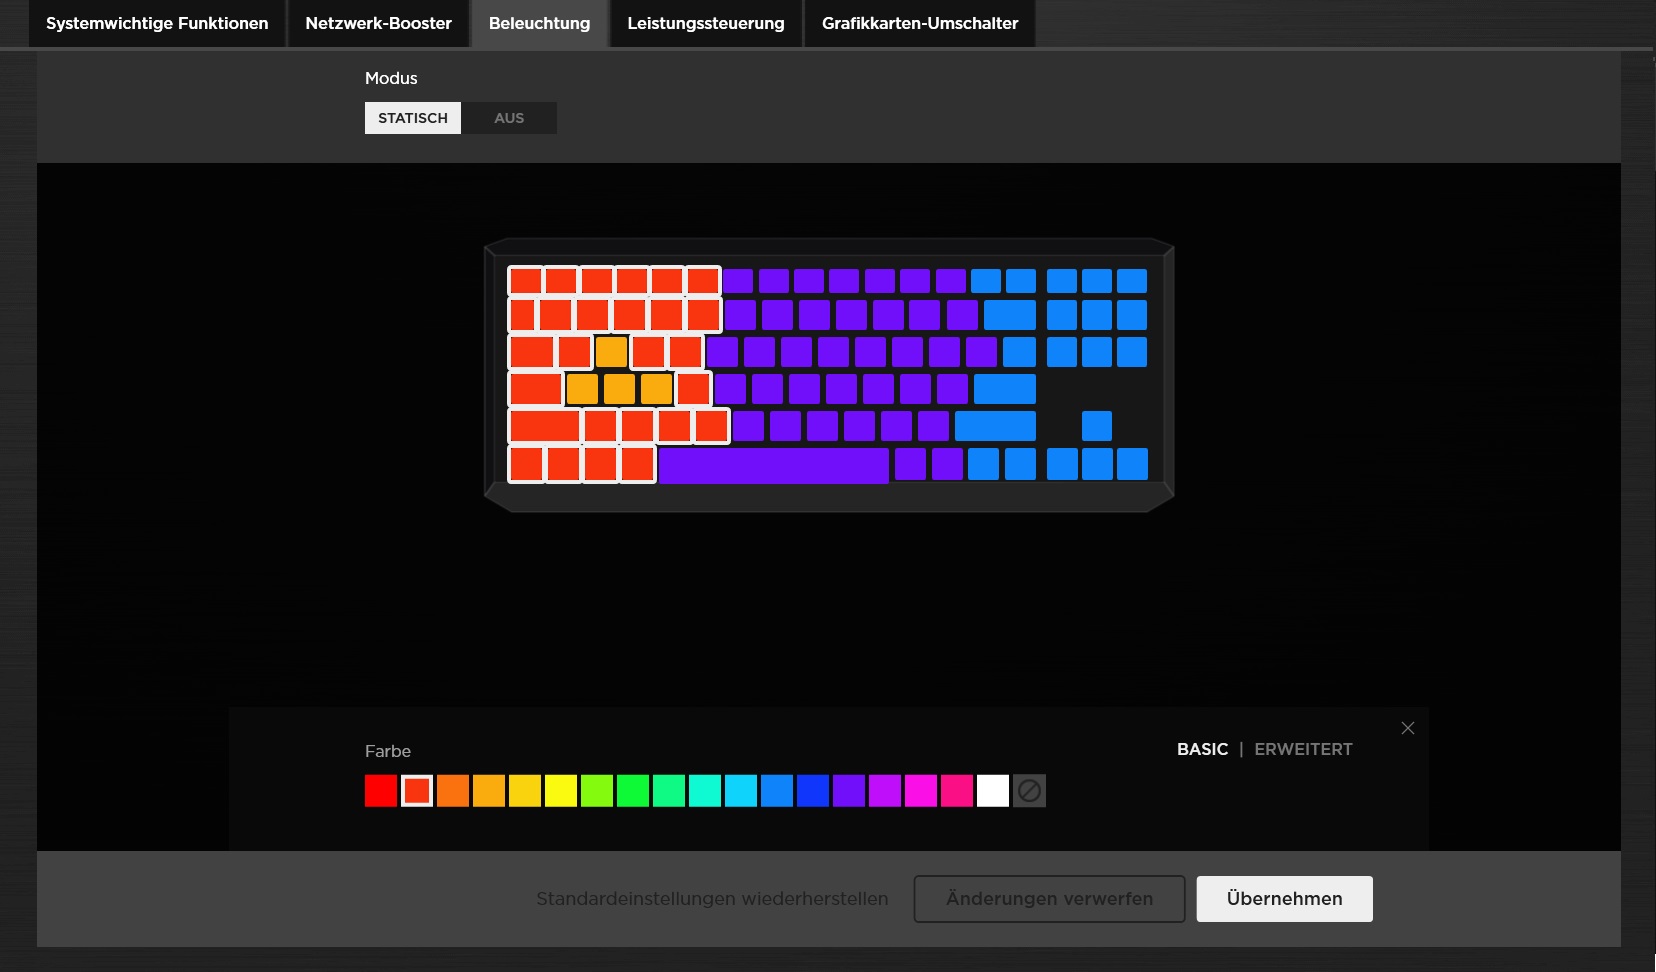
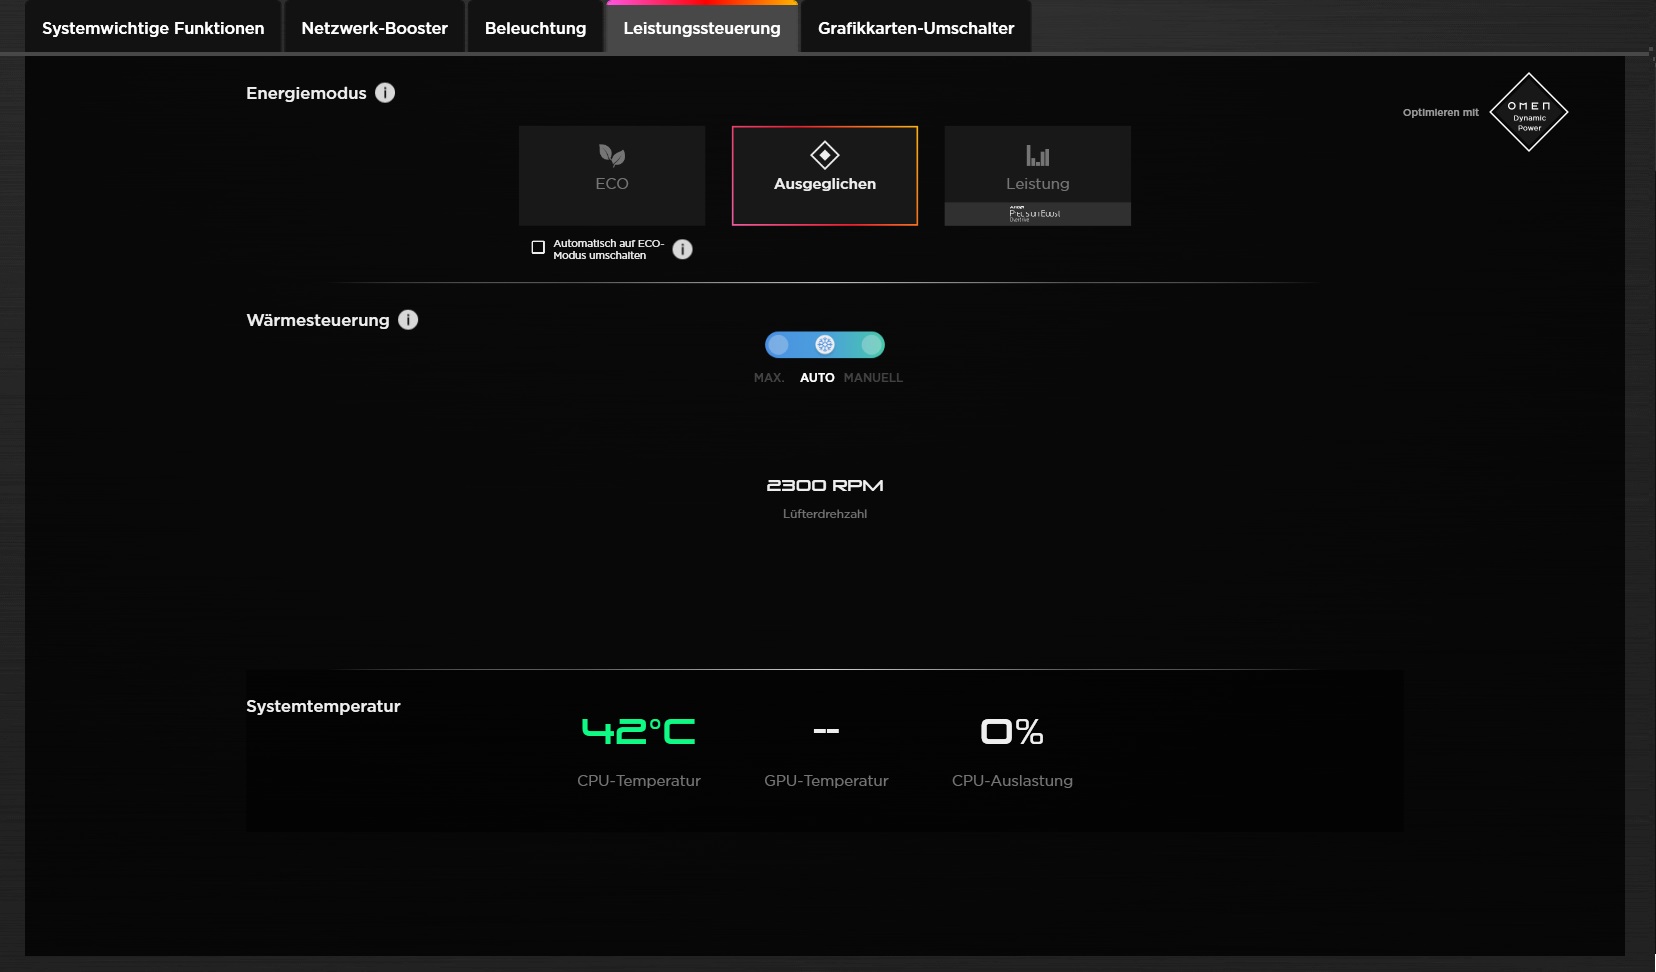
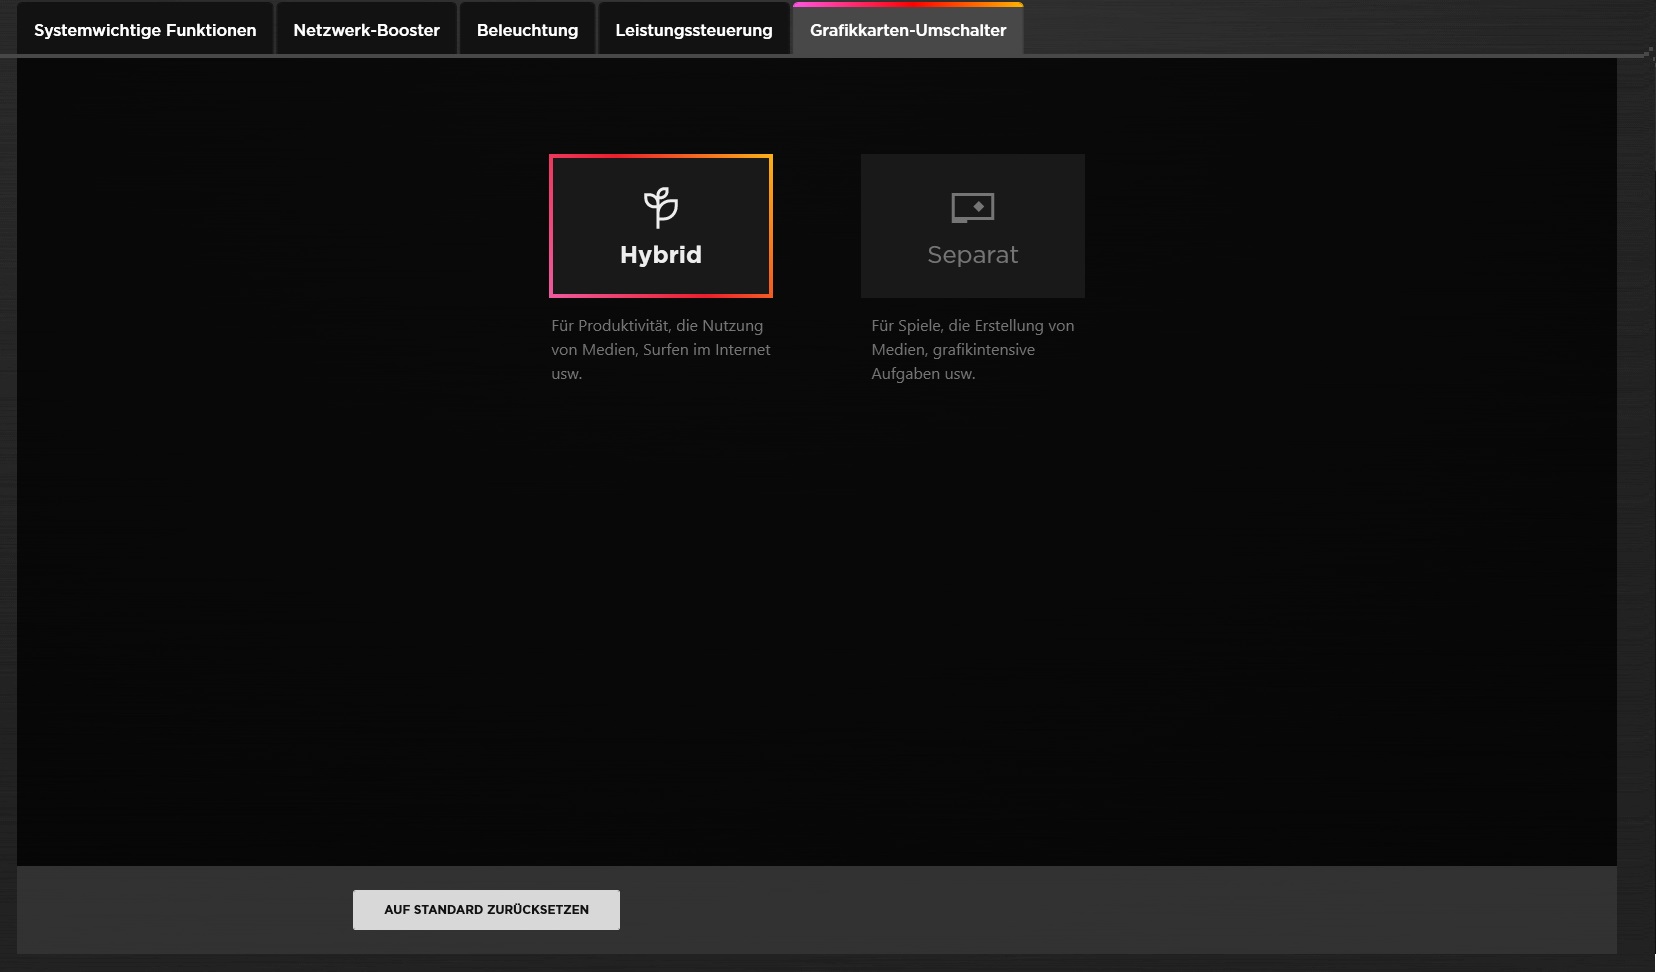
As befits a gaming notebook, the manufacturer includes extensive system and tuning software on the computer. In the Omen Gaming Hub, the keyboard backlight, the graphics switching (hybrid or separate) and the performance profile can be adjusted, among other things (see screenshots). Since the noise level when using the performance mode is out of proportion to the (slightly) better 3D performance and the device is already quite present in idle mode, we performed all measurements in "Balanced" mode. There is also the "Eco" mode, but it is very similar to the tested setting in terms of performance and emissions.
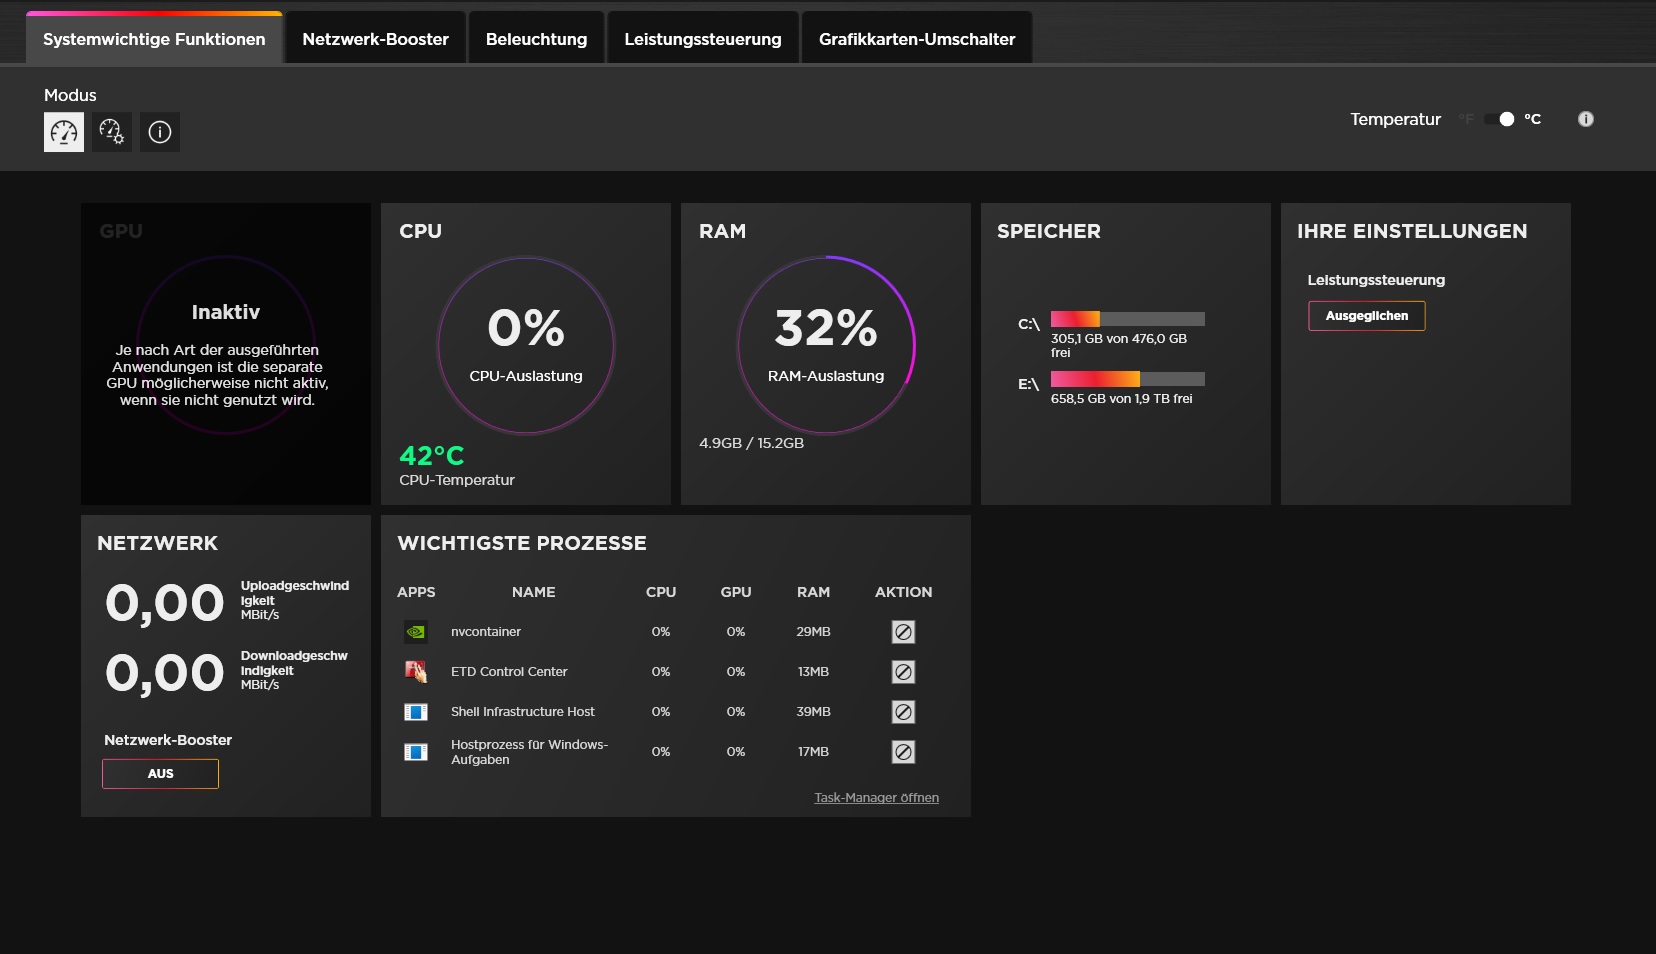
| Witcher 3 (FHD/Ultra) | Eco | Balanced | Performance |
|---|---|---|---|
| Frame rate | ~110 fps | ~112 fps | ~120 fps |
| Noise | ~44 dB(A) | ~44 dB(A) | ~55 dB(A) |
Processor
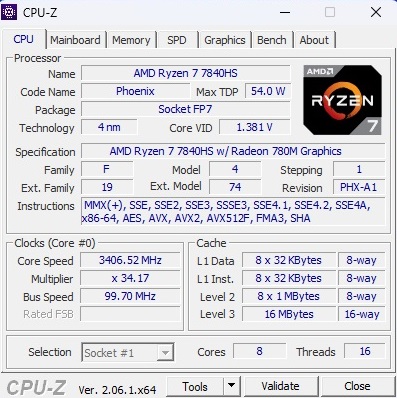
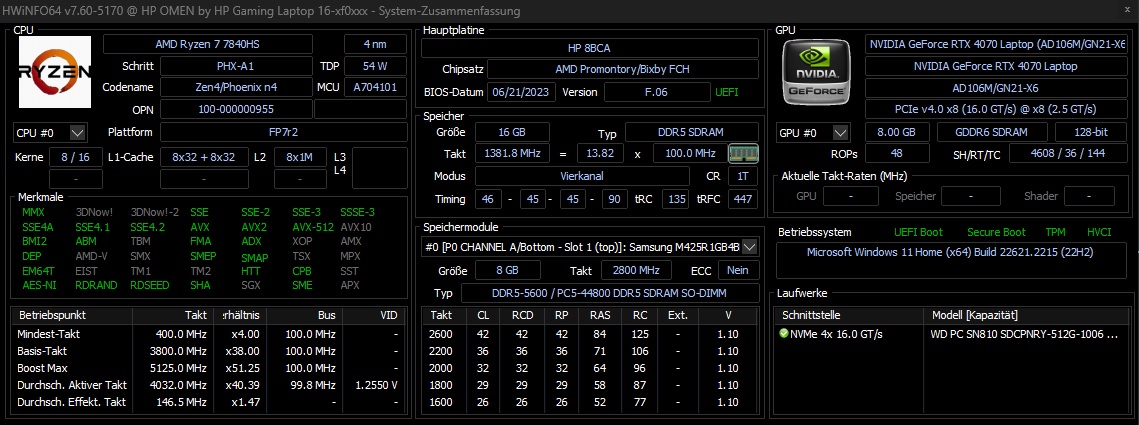
The Ryzen 7 7840HS comes from AMD's Phoenix generation and has 16 MB of L3 cache, a maximum clock of 5.1 GHz and 8 cores, which can handle up to 16 threads in parallel thanks to SMT. The 4 nm model is placed in the middle of the benchmark field between the Ryzen 7 7735HS of the Acer Nitro 16 (still based on Zen 3+) and the Ryzen 7 7745HX of the Lenovo Legion Pro 5. Computer on Core i7-13700H(X)-based computers are usually a bit faster. The same applies to the Core i9-13900H of the Gigabyte Aero 16. Above all, we have to praise the constant performance. In our Cinebench loop, the Ryzen 7 7840HS also delivered very similar rates in the long run.
Cinebench R15 Multi-Endurance test
* ... smaller is better
AIDA64: FP32 Ray-Trace | FPU Julia | CPU SHA3 | CPU Queen | FPU SinJulia | FPU Mandel | CPU AES | CPU ZLib | FP64 Ray-Trace | CPU PhotoWorxx
| Performance rating | |
| Average of class Gaming | |
| Average AMD Ryzen 7 7840HS | |
| Lenovo Legion Pro 5 16ARX8 | |
| HP Omen 16-xf0376ng | |
| Gigabyte AERO 16 OLED BSF | |
| HP Omen 16-wf000 | |
| MSI Stealth 16 Studio A13VG | |
| Acer Nitro 16 AN16-41 | |
| AIDA64 / FP32 Ray-Trace | |
| Average of class Gaming (10227 - 85542, n=105, last 2 years) | |
| Lenovo Legion Pro 5 16ARX8 | |
| Average AMD Ryzen 7 7840HS (22845 - 28921, n=21) | |
| HP Omen 16-xf0376ng | |
| HP Omen 16-wf000 | |
| Gigabyte AERO 16 OLED BSF | |
| MSI Stealth 16 Studio A13VG | |
| Acer Nitro 16 AN16-41 | |
| AIDA64 / FPU Julia | |
| Average of class Gaming (51376 - 238426, n=105, last 2 years) | |
| Lenovo Legion Pro 5 16ARX8 | |
| Average AMD Ryzen 7 7840HS (97164 - 123167, n=21) | |
| HP Omen 16-xf0376ng | |
| Acer Nitro 16 AN16-41 | |
| HP Omen 16-wf000 | |
| Gigabyte AERO 16 OLED BSF | |
| MSI Stealth 16 Studio A13VG | |
| AIDA64 / CPU SHA3 | |
| Average of class Gaming (2180 - 10115, n=105, last 2 years) | |
| Lenovo Legion Pro 5 16ARX8 | |
| Average AMD Ryzen 7 7840HS (4293 - 5155, n=21) | |
| HP Omen 16-xf0376ng | |
| HP Omen 16-wf000 | |
| Gigabyte AERO 16 OLED BSF | |
| MSI Stealth 16 Studio A13VG | |
| Acer Nitro 16 AN16-41 | |
| AIDA64 / CPU Queen | |
| Lenovo Legion Pro 5 16ARX8 | |
| HP Omen 16-xf0376ng | |
| Average of class Gaming (49785 - 173351, n=90, last 2 years) | |
| Average AMD Ryzen 7 7840HS (102271 - 125820, n=21) | |
| Acer Nitro 16 AN16-41 | |
| MSI Stealth 16 Studio A13VG | |
| HP Omen 16-wf000 | |
| Gigabyte AERO 16 OLED BSF | |
| AIDA64 / FPU SinJulia | |
| Lenovo Legion Pro 5 16ARX8 | |
| HP Omen 16-xf0376ng | |
| Average AMD Ryzen 7 7840HS (13767 - 15525, n=21) | |
| Average of class Gaming (4424 - 33636, n=105, last 2 years) | |
| Acer Nitro 16 AN16-41 | |
| HP Omen 16-wf000 | |
| MSI Stealth 16 Studio A13VG | |
| Gigabyte AERO 16 OLED BSF | |
| AIDA64 / FPU Mandel | |
| Average of class Gaming (25115 - 128721, n=105, last 2 years) | |
| Lenovo Legion Pro 5 16ARX8 | |
| Average AMD Ryzen 7 7840HS (52084 - 65812, n=21) | |
| HP Omen 16-xf0376ng | |
| Acer Nitro 16 AN16-41 | |
| HP Omen 16-wf000 | |
| Gigabyte AERO 16 OLED BSF | |
| MSI Stealth 16 Studio A13VG | |
| AIDA64 / CPU AES | |
| Gigabyte AERO 16 OLED BSF | |
| Average AMD Ryzen 7 7840HS (67389 - 177158, n=21) | |
| Average of class Gaming (39258 - 247074, n=105, last 2 years) | |
| HP Omen 16-wf000 | |
| MSI Stealth 16 Studio A13VG | |
| Lenovo Legion Pro 5 16ARX8 | |
| HP Omen 16-xf0376ng | |
| Acer Nitro 16 AN16-41 | |
| AIDA64 / CPU ZLib | |
| Average of class Gaming (574 - 2531, n=105, last 2 years) | |
| HP Omen 16-wf000 | |
| Gigabyte AERO 16 OLED BSF | |
| Lenovo Legion Pro 5 16ARX8 | |
| HP Omen 16-xf0376ng | |
| Average AMD Ryzen 7 7840HS (944 - 1123, n=21) | |
| MSI Stealth 16 Studio A13VG | |
| Acer Nitro 16 AN16-41 | |
| AIDA64 / FP64 Ray-Trace | |
| Average of class Gaming (5509 - 45446, n=105, last 2 years) | |
| Lenovo Legion Pro 5 16ARX8 | |
| Average AMD Ryzen 7 7840HS (12248 - 15599, n=21) | |
| HP Omen 16-xf0376ng | |
| HP Omen 16-wf000 | |
| Gigabyte AERO 16 OLED BSF | |
| MSI Stealth 16 Studio A13VG | |
| Acer Nitro 16 AN16-41 | |
| AIDA64 / CPU PhotoWorxx | |
| MSI Stealth 16 Studio A13VG | |
| Average of class Gaming (12271 - 89891, n=105, last 2 years) | |
| Gigabyte AERO 16 OLED BSF | |
| HP Omen 16-wf000 | |
| Average AMD Ryzen 7 7840HS (17615 - 41516, n=21) | |
| HP Omen 16-xf0376ng | |
| Lenovo Legion Pro 5 16ARX8 | |
| Acer Nitro 16 AN16-41 | |
System performance
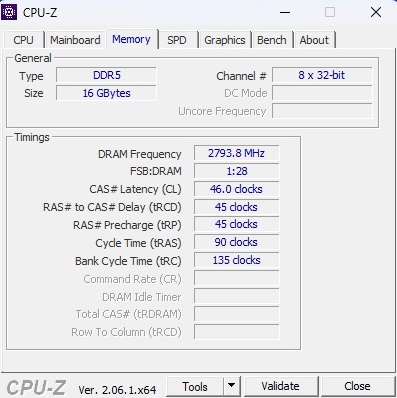
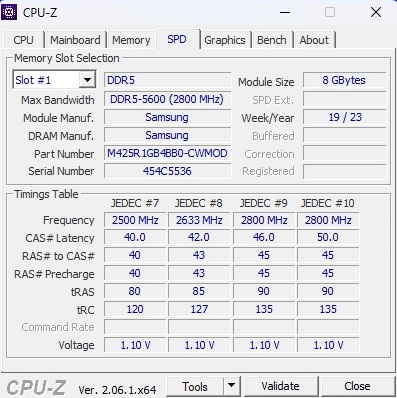
In terms of system performance, the Omen 16 takes second place among the comparison devices, just behind Lenovo's Legion Pro 5. While other manufacturers only give their gaming notebooks DDR5-4,800 RAM, HP gives its 16-incher DDR5-5,600 RAM.
CrossMark: Overall | Productivity | Creativity | Responsiveness
| PCMark 10 / Score | |
| Average of class Gaming (5828 - 12414, n=93, last 2 years) | |
| Lenovo Legion Pro 5 16ARX8 | |
| Average AMD Ryzen 7 7840HS, NVIDIA GeForce RTX 4070 Laptop GPU (8167 - 8183, n=2) | |
| HP Omen 16-xf0376ng | |
| Gigabyte AERO 16 OLED BSF | |
| HP Omen 16-wf000 | |
| MSI Stealth 16 Studio A13VG | |
| Acer Nitro 16 AN16-41 | |
| PCMark 10 / Essentials | |
| Gigabyte AERO 16 OLED BSF | |
| HP Omen 16-xf0376ng | |
| Average AMD Ryzen 7 7840HS, NVIDIA GeForce RTX 4070 Laptop GPU (10934 - 11250, n=2) | |
| Lenovo Legion Pro 5 16ARX8 | |
| Average of class Gaming (8810 - 11935, n=97, last 2 years) | |
| Acer Nitro 16 AN16-41 | |
| HP Omen 16-wf000 | |
| MSI Stealth 16 Studio A13VG | |
| PCMark 10 / Productivity | |
| Average of class Gaming (6845 - 25323, n=95, last 2 years) | |
| Average AMD Ryzen 7 7840HS, NVIDIA GeForce RTX 4070 Laptop GPU (10179 - 10526, n=2) | |
| Lenovo Legion Pro 5 16ARX8 | |
| HP Omen 16-xf0376ng | |
| MSI Stealth 16 Studio A13VG | |
| Gigabyte AERO 16 OLED BSF | |
| Acer Nitro 16 AN16-41 | |
| HP Omen 16-wf000 | |
| PCMark 10 / Digital Content Creation | |
| Average of class Gaming (7602 - 19954, n=95, last 2 years) | |
| Gigabyte AERO 16 OLED BSF | |
| HP Omen 16-wf000 | |
| Lenovo Legion Pro 5 16ARX8 | |
| Average AMD Ryzen 7 7840HS, NVIDIA GeForce RTX 4070 Laptop GPU (12908 - 12920, n=2) | |
| HP Omen 16-xf0376ng | |
| MSI Stealth 16 Studio A13VG | |
| Acer Nitro 16 AN16-41 | |
| CrossMark / Overall | |
| Lenovo Legion Pro 5 16ARX8 | |
| Average of class Gaming (1366 - 2409, n=94, last 2 years) | |
| Gigabyte AERO 16 OLED BSF | |
| MSI Stealth 16 Studio A13VG | |
| HP Omen 16-wf000 | |
| Average AMD Ryzen 7 7840HS, NVIDIA GeForce RTX 4070 Laptop GPU (n=1) | |
| Acer Nitro 16 AN16-41 | |
| CrossMark / Productivity | |
| Lenovo Legion Pro 5 16ARX8 | |
| Average of class Gaming (1386 - 2254, n=94, last 2 years) | |
| Gigabyte AERO 16 OLED BSF | |
| MSI Stealth 16 Studio A13VG | |
| Average AMD Ryzen 7 7840HS, NVIDIA GeForce RTX 4070 Laptop GPU (n=1) | |
| HP Omen 16-wf000 | |
| Acer Nitro 16 AN16-41 | |
| CrossMark / Creativity | |
| Average of class Gaming (1343 - 2786, n=94, last 2 years) | |
| Lenovo Legion Pro 5 16ARX8 | |
| Gigabyte AERO 16 OLED BSF | |
| HP Omen 16-wf000 | |
| MSI Stealth 16 Studio A13VG | |
| Average AMD Ryzen 7 7840HS, NVIDIA GeForce RTX 4070 Laptop GPU (n=1) | |
| Acer Nitro 16 AN16-41 | |
| CrossMark / Responsiveness | |
| Gigabyte AERO 16 OLED BSF | |
| Lenovo Legion Pro 5 16ARX8 | |
| Average of class Gaming (1226 - 2334, n=94, last 2 years) | |
| MSI Stealth 16 Studio A13VG | |
| Average AMD Ryzen 7 7840HS, NVIDIA GeForce RTX 4070 Laptop GPU (n=1) | |
| HP Omen 16-wf000 | |
| Acer Nitro 16 AN16-41 | |
| PCMark 10 Score | 8167 points | |
Help | ||
| AIDA64 / Memory Copy | |
| Average of class Gaming (21750 - 129946, n=105, last 2 years) | |
| MSI Stealth 16 Studio A13VG | |
| Average AMD Ryzen 7 7840HS (30937 - 72158, n=21) | |
| Gigabyte AERO 16 OLED BSF | |
| HP Omen 16-wf000 | |
| HP Omen 16-xf0376ng | |
| Lenovo Legion Pro 5 16ARX8 | |
| Acer Nitro 16 AN16-41 | |
| AIDA64 / Memory Read | |
| Average of class Gaming (22956 - 118858, n=105, last 2 years) | |
| MSI Stealth 16 Studio A13VG | |
| Gigabyte AERO 16 OLED BSF | |
| HP Omen 16-wf000 | |
| HP Omen 16-xf0376ng | |
| Average AMD Ryzen 7 7840HS (30497 - 62147, n=21) | |
| Lenovo Legion Pro 5 16ARX8 | |
| Acer Nitro 16 AN16-41 | |
| AIDA64 / Memory Write | |
| Average AMD Ryzen 7 7840HS (34590 - 93323, n=21) | |
| HP Omen 16-xf0376ng | |
| Average of class Gaming (22297 - 135096, n=105, last 2 years) | |
| MSI Stealth 16 Studio A13VG | |
| Gigabyte AERO 16 OLED BSF | |
| HP Omen 16-wf000 | |
| Acer Nitro 16 AN16-41 | |
| Lenovo Legion Pro 5 16ARX8 | |
| AIDA64 / Memory Latency | |
| Average of class Gaming (75.3 - 259, n=105, last 2 years) | |
| Gigabyte AERO 16 OLED BSF | |
| Acer Nitro 16 AN16-41 | |
| Average AMD Ryzen 7 7840HS (85.1 - 112, n=21) | |
| HP Omen 16-xf0376ng | |
| MSI Stealth 16 Studio A13VG | |
| HP Omen 16-wf000 | |
| Lenovo Legion Pro 5 16ARX8 | |
* ... smaller is better
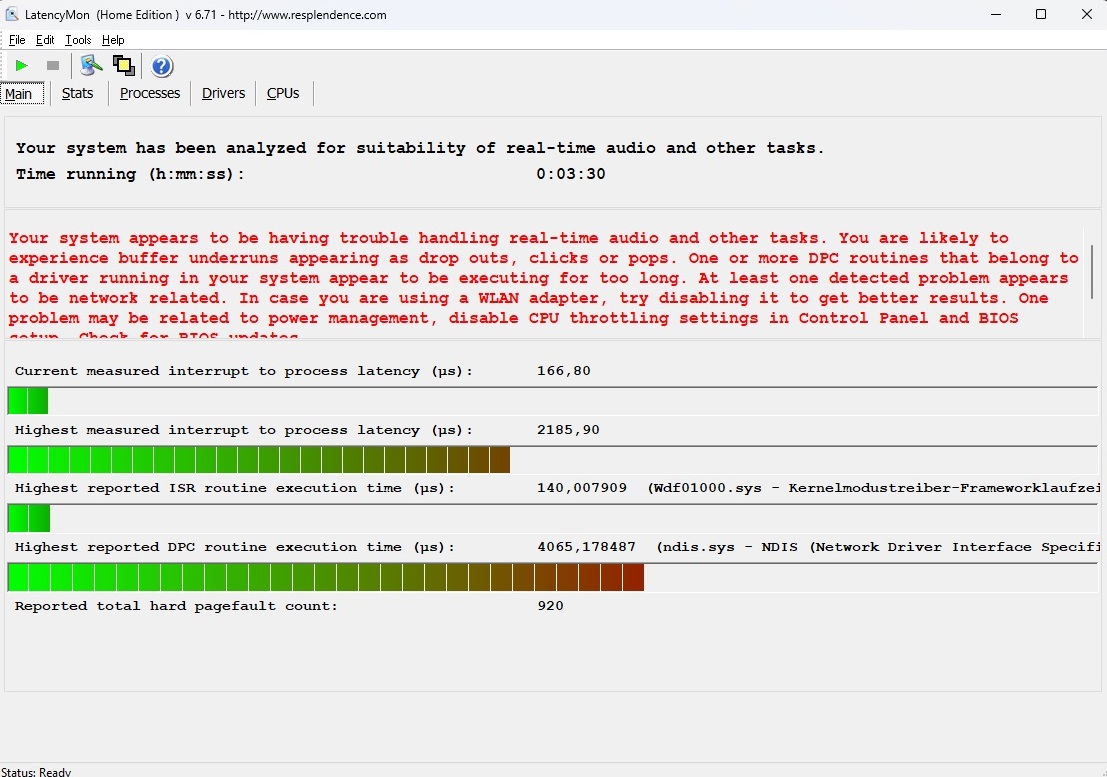
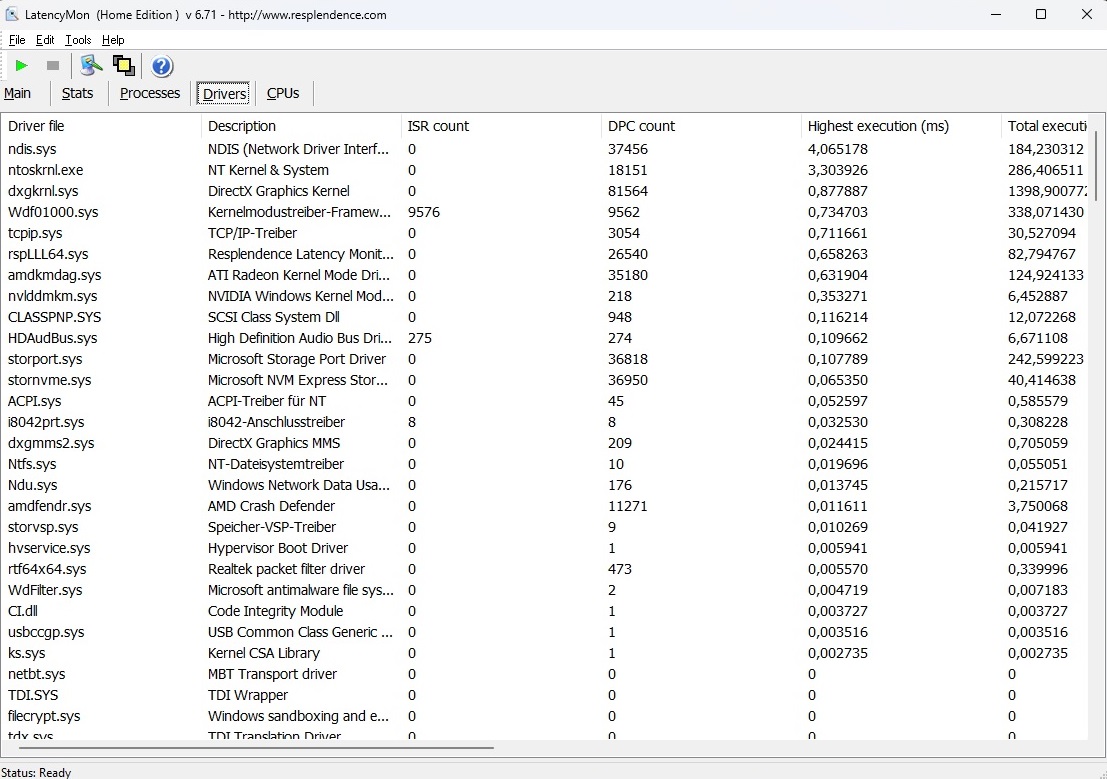
DPC latencies
As is often the case, the latencies give reason for complaint. According to the tool LatencyMon, the laptop is not suitable for latency-sensitive tasks like real-time audio and video editing in its state of delivery.
| DPC Latencies / LatencyMon - interrupt to process latency (max), Web, Youtube, Prime95 | |
| MSI Stealth 16 Studio A13VG | |
| HP Omen 16-wf000 | |
| HP Omen 16-xf0376ng | |
| Acer Nitro 16 AN16-41 | |
| Gigabyte AERO 16 OLED BSF | |
| Lenovo Legion Pro 5 16ARX8 | |
* ... smaller is better
Mass storage
The SSD is quite unspectacular. The installed 512 GB model from WDC achieves more than solid rates and apart from minor fluctuations (compare DiskSpd loop) also a stable long-term performance, but the Omen 16 cannot quite compete with the SSDs of the competition in the AS SSD benchmark, a performance difference rarely noticed in everyday use.

* ... smaller is better
Continuous read: DiskSpd Read Loop, Queue Depth 8
Graphics card
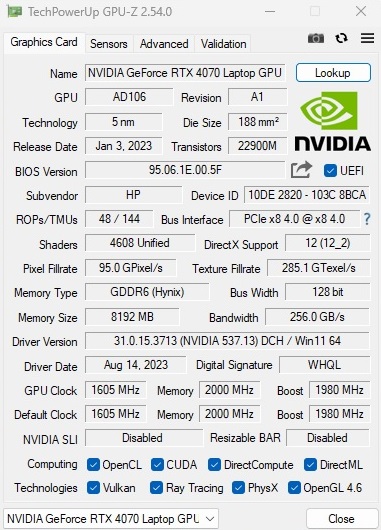
The GeForce RTX 4070 does not show any weaknesses in synthetic benchmarks. According to our performance rating, the speed is slightly higher than the previously determined RTX 4070 average. No wonder, since HP grants the Ada-Lovelace model its maximum 140 W TGP. Whether the surcharge to the RTX 4080 is worth it is up to the user: The Omen 16-wf000 sprints almost 40% past the 16-xf0376ng in the 3DMarks. Thanks to its 12 GB GDDR6 VRAM, which is not particularly large, the RTX 4080 is more future-proof.
| 3DMark 11 Performance | 34584 points | |
| 3DMark Ice Storm Standard Score | 189312 points | |
| 3DMark Cloud Gate Standard Score | 66071 points | |
| 3DMark Fire Strike Score | 27559 points | |
| 3DMark Time Spy Score | 11726 points | |
Help | ||
* ... smaller is better
Gaming performance
As expected, the GeForce RTX 4070 proves to be a good basis for the Full HD panel. 1,920 x 1,080 pixels and maximum details are no problem for most games. Only very CPU-intensive or poorly programmed/optimized titles like Immortals of Aveum or A Plague Tale Requiem are fired with less than 60 FPS.
| Performance rating - Percent | |
| Average of class Gaming | |
| HP Omen 16-wf000 | |
| Lenovo Legion Pro 5 16ARX8 | |
| Gigabyte AERO 16 OLED BSF | |
| MSI Stealth 16 Studio A13VG | |
| HP Omen 16-xf0376ng | |
| Acer Nitro 16 AN16-41 | |
| The Witcher 3 - 1920x1080 Ultra Graphics & Postprocessing (HBAO+) | |
| Average of class Gaming (104.7 - 240, n=7, last 2 years) | |
| HP Omen 16-wf000 | |
| Lenovo Legion Pro 5 16ARX8 | |
| MSI Stealth 16 Studio A13VG | |
| Gigabyte AERO 16 OLED BSF | |
| Acer Nitro 16 AN16-41 | |
| HP Omen 16-xf0376ng | |
| GTA V - 1920x1080 Highest AA:4xMSAA + FX AF:16x | |
| Average of class Gaming (48.3 - 186.9, n=94, last 2 years) | |
| Gigabyte AERO 16 OLED BSF | |
| Lenovo Legion Pro 5 16ARX8 | |
| MSI Stealth 16 Studio A13VG | |
| HP Omen 16-wf000 | |
| HP Omen 16-xf0376ng | |
| Acer Nitro 16 AN16-41 | |
| Final Fantasy XV Benchmark - 1920x1080 High Quality | |
| HP Omen 16-wf000 | |
| Average of class Gaming (41 - 215, n=95, last 2 years) | |
| Lenovo Legion Pro 5 16ARX8 | |
| Gigabyte AERO 16 OLED BSF | |
| MSI Stealth 16 Studio A13VG | |
| Acer Nitro 16 AN16-41 | |
| HP Omen 16-xf0376ng | |
| Strange Brigade - 1920x1080 ultra AA:ultra AF:16 | |
| HP Omen 16-wf000 | |
| Average of class Gaming (76.3 - 458, n=87, last 2 years) | |
| Lenovo Legion Pro 5 16ARX8 | |
| Gigabyte AERO 16 OLED BSF | |
| MSI Stealth 16 Studio A13VG | |
| Acer Nitro 16 AN16-41 | |
| HP Omen 16-xf0376ng | |
| Dota 2 Reborn - 1920x1080 ultra (3/3) best looking | |
| Lenovo Legion Pro 5 16ARX8 | |
| MSI Stealth 16 Studio A13VG | |
| HP Omen 16-wf000 | |
| Average of class Gaming (84.8 - 248, n=107, last 2 years) | |
| Gigabyte AERO 16 OLED BSF | |
| HP Omen 16-xf0376ng | |
| Acer Nitro 16 AN16-41 | |
| Immortals of Aveum - 1920x1080 Ultra AF:16x | |
| XMG Pro 15 E23 | |
| Average NVIDIA GeForce RTX 4070 Laptop GPU (46.1 - 49.9, n=4) | |
| Acer Nitro 17 AN17-41-R9LN | |
| HP Omen 16-xf0376ng | |
| Armored Core 6 - 1920x1080 Maximum Preset | |
| HP Omen 16-xf0376ng | |
| XMG Pro 15 E23 | |
| Average NVIDIA GeForce RTX 4070 Laptop GPU (87.2 - 107, n=4) | |
| Acer Nitro 17 AN17-41-R9LN | |
| Average of class Gaming (n=1last 2 years) | |
| Atlas Fallen - 1920x1080 Very High Preset | |
| HP Omen 16-xf0376ng | |
| Average NVIDIA GeForce RTX 4070 Laptop GPU (105.3 - 111.1, n=4) | |
| XMG Pro 15 E23 | |
| Acer Nitro 17 AN17-41-R9LN | |
| Sons of the Forest - 1920x1080 Ultra Preset AA:T | |
| HP Omen 16-xf0376ng | |
| Average NVIDIA GeForce RTX 4070 Laptop GPU (71.1 - 87.5, n=4) | |
| Acer Nitro 17 AN17-41-R9LN | |
| A Plague Tale Requiem - 1920x1080 Ultra Preset | |
| Average NVIDIA GeForce RTX 4070 Laptop GPU (54.9 - 57.5, n=2) | |
| HP Omen 16-xf0376ng | |
We tested the gaming performance after around 60 minutes with The Witcher 3 (FHD/Ultra). Neither frame rate drops nor other inconsistencies could be observed here.
Witcher 3 FPS-Diagram
| low | med. | high | ultra | |
|---|---|---|---|---|
| GTA V (2015) | 177.7 | 166.8 | 105.9 | |
| The Witcher 3 (2015) | 112 | |||
| Dota 2 Reborn (2015) | 164.1 | 149.2 | 144.1 | 137.8 |
| Final Fantasy XV Benchmark (2018) | 141.1 | 108.7 | ||
| X-Plane 11.11 (2018) | 121 | 103.8 | 84.8 | |
| Strange Brigade (2018) | 277 | 221 | 190.3 | |
| A Plague Tale Requiem (2022) | 67.2 | 58.9 | 54.9 | |
| Sons of the Forest (2023) | 88.1 | 85.8 | 85.4 | |
| Atlas Fallen (2023) | 143.1 | 132.4 | 111.1 | |
| Immortals of Aveum (2023) | 57.3 | 46.9 | ||
| Armored Core 6 (2023) | 110.1 | 109.4 | 107 |
Emissions
Noise emissions
While the Omen 16 gets a very loud ~55 dB(A) when gaming in performance mode, the noise development is kept within limits in balanced mode. 44 dB(A) is by no means quiet, but acceptable in view of the given performance. In idle situations, the fans are sometimes completely off. Most of the time, they run at a fairly decent level, which could be even lower for our taste - the competition often does better here.
Noise level
| Idle |
| 25 / 29 / 32 dB(A) |
| Load |
| 44 / 46 dB(A) |
 | ||
30 dB silent 40 dB(A) audible 50 dB(A) loud |
||
min: | ||
| HP Omen 16-xf0376ng R7 7840HS, GeForce RTX 4070 Laptop GPU | HP Omen 16-wf000 i7-13700HX, GeForce RTX 4080 Laptop GPU | MSI Stealth 16 Studio A13VG i7-13700H, GeForce RTX 4070 Laptop GPU | Gigabyte AERO 16 OLED BSF i9-13900H, GeForce RTX 4070 Laptop GPU | Acer Nitro 16 AN16-41 R7 7735HS, GeForce RTX 4070 Laptop GPU | Lenovo Legion Pro 5 16ARX8 R7 7745HX, GeForce RTX 4070 Laptop GPU | |
|---|---|---|---|---|---|---|
| Noise | -7% | 8% | -5% | 1% | 7% | |
| off / environment * (dB) | 24 | 23 4% | 24 -0% | 23 4% | 25.7 -7% | 23.2 3% |
| Idle Minimum * (dB) | 25 | 29.6 -18% | 24 4% | 23 8% | 25.7 -3% | 23.2 7% |
| Idle Average * (dB) | 29 | 29.8 -3% | 24 17% | 23 21% | 25.7 11% | 23.2 20% |
| Idle Maximum * (dB) | 32 | 30.4 5% | 24 25% | 33.64 -5% | 26.3 18% | 26.2 18% |
| Load Average * (dB) | 44 | 33.8 23% | 34.81 21% | 51.49 -17% | 33.9 23% | 31.4 29% |
| Witcher 3 ultra * (dB) | 44 | 57 -30% | 44.05 -0% | 55.27 -26% | 48.4 -10% | |
| Load Maximum * (dB) | 46 | 58.3 -27% | 51.57 -12% | 55.24 -20% | 62 -35% | 53.8 -17% |
* ... smaller is better
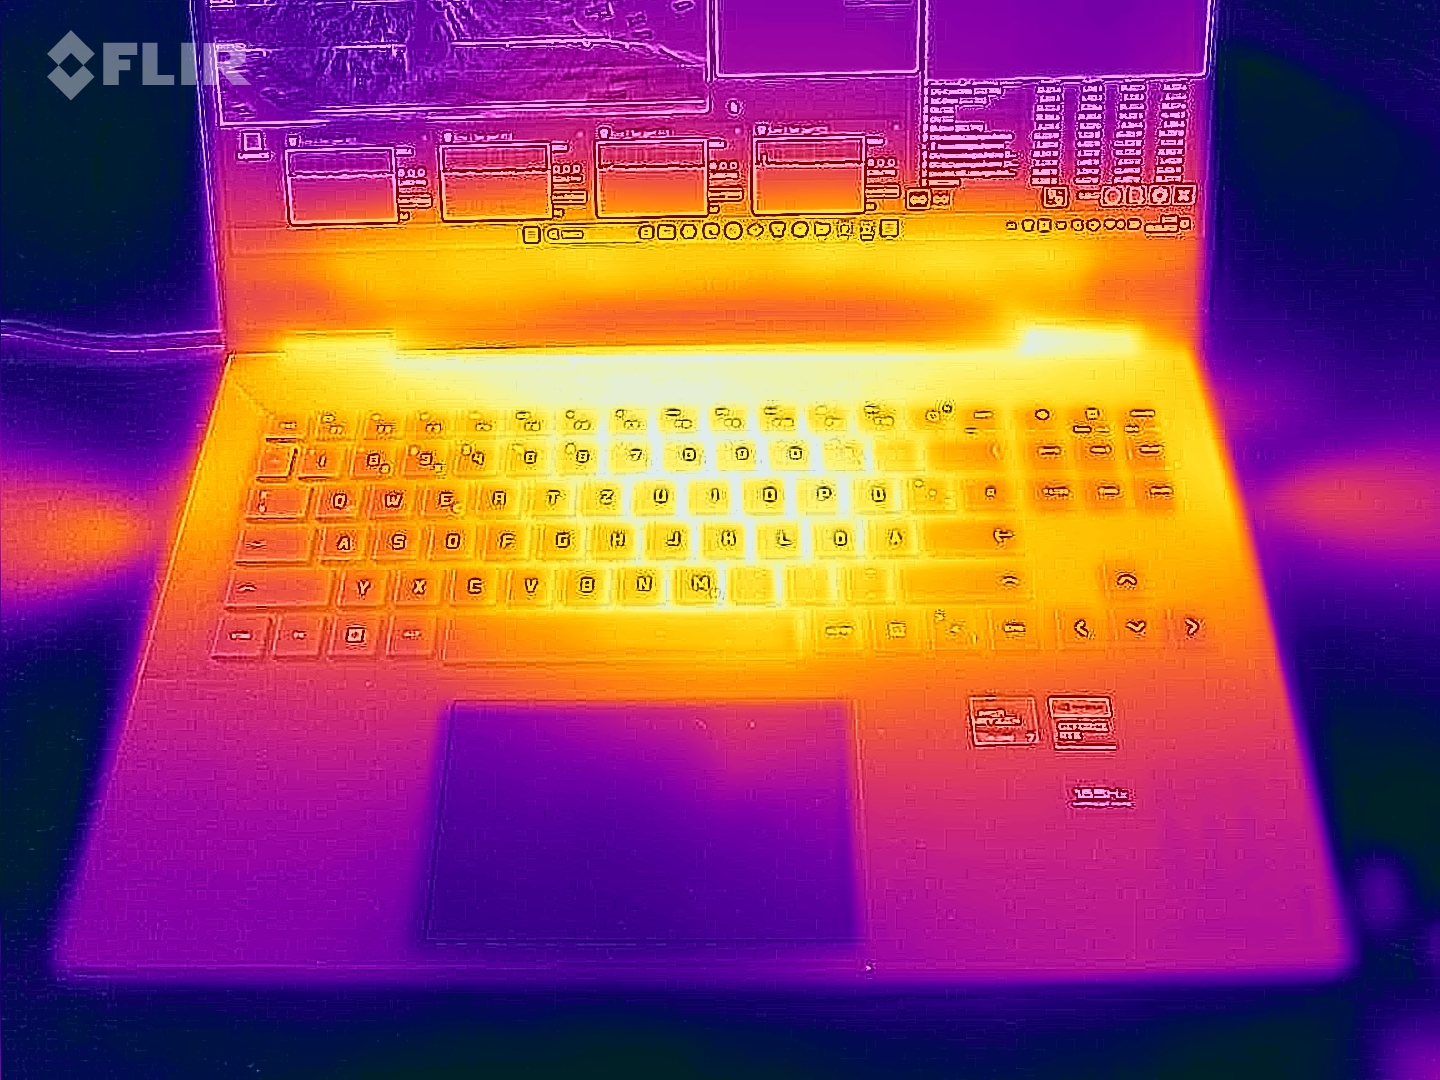
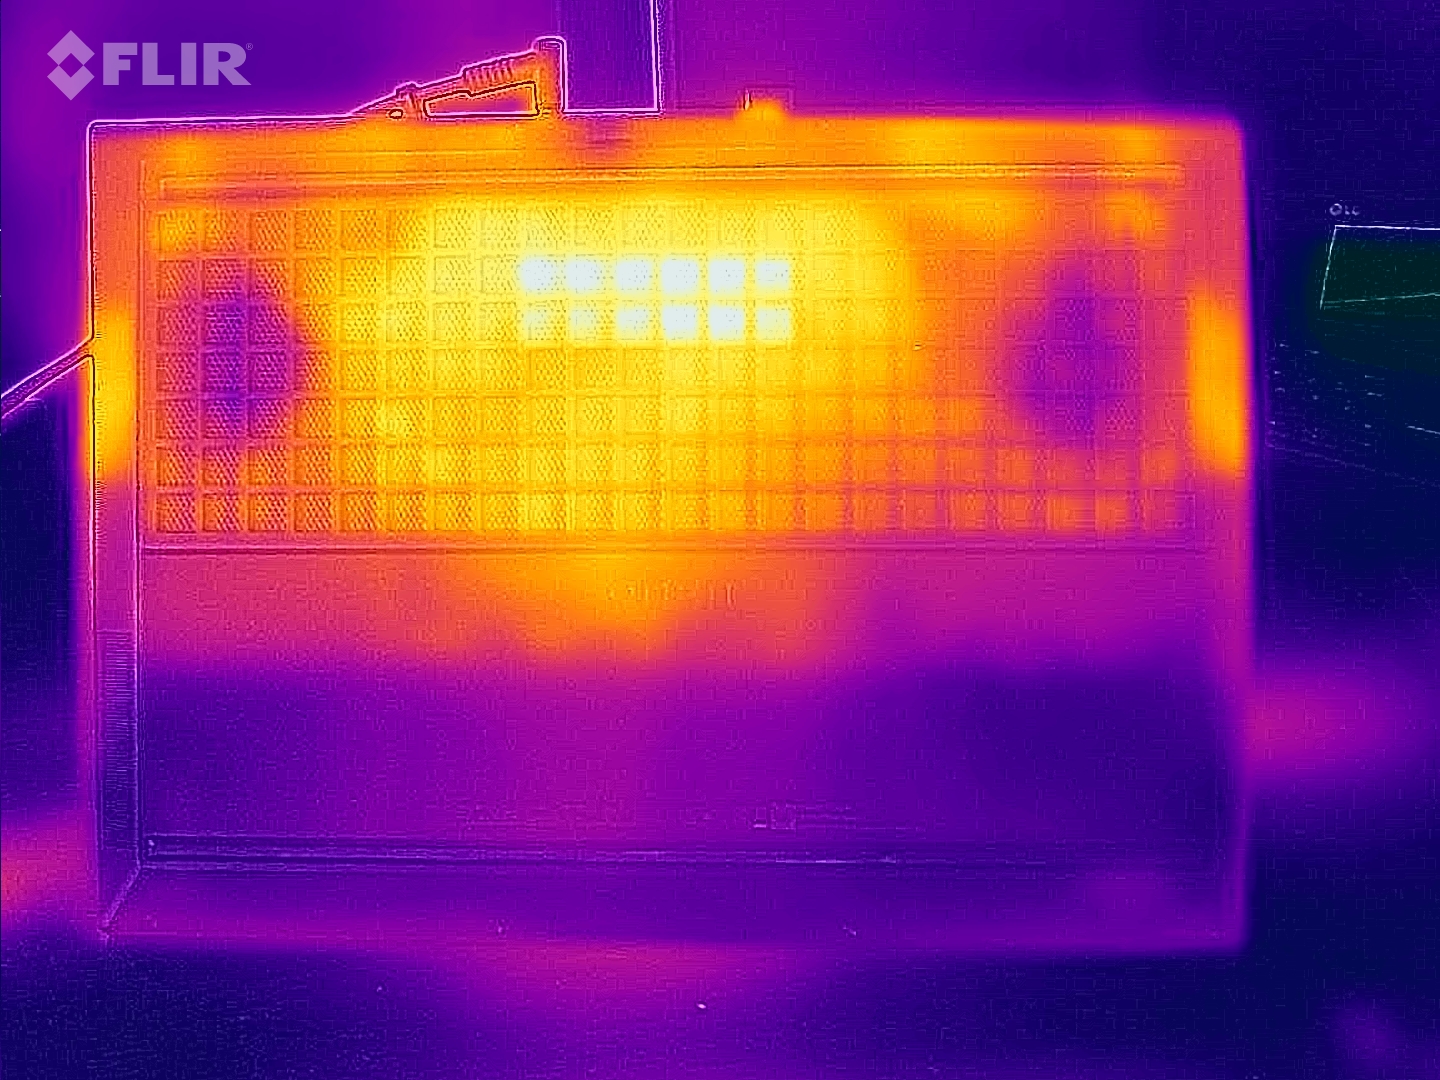
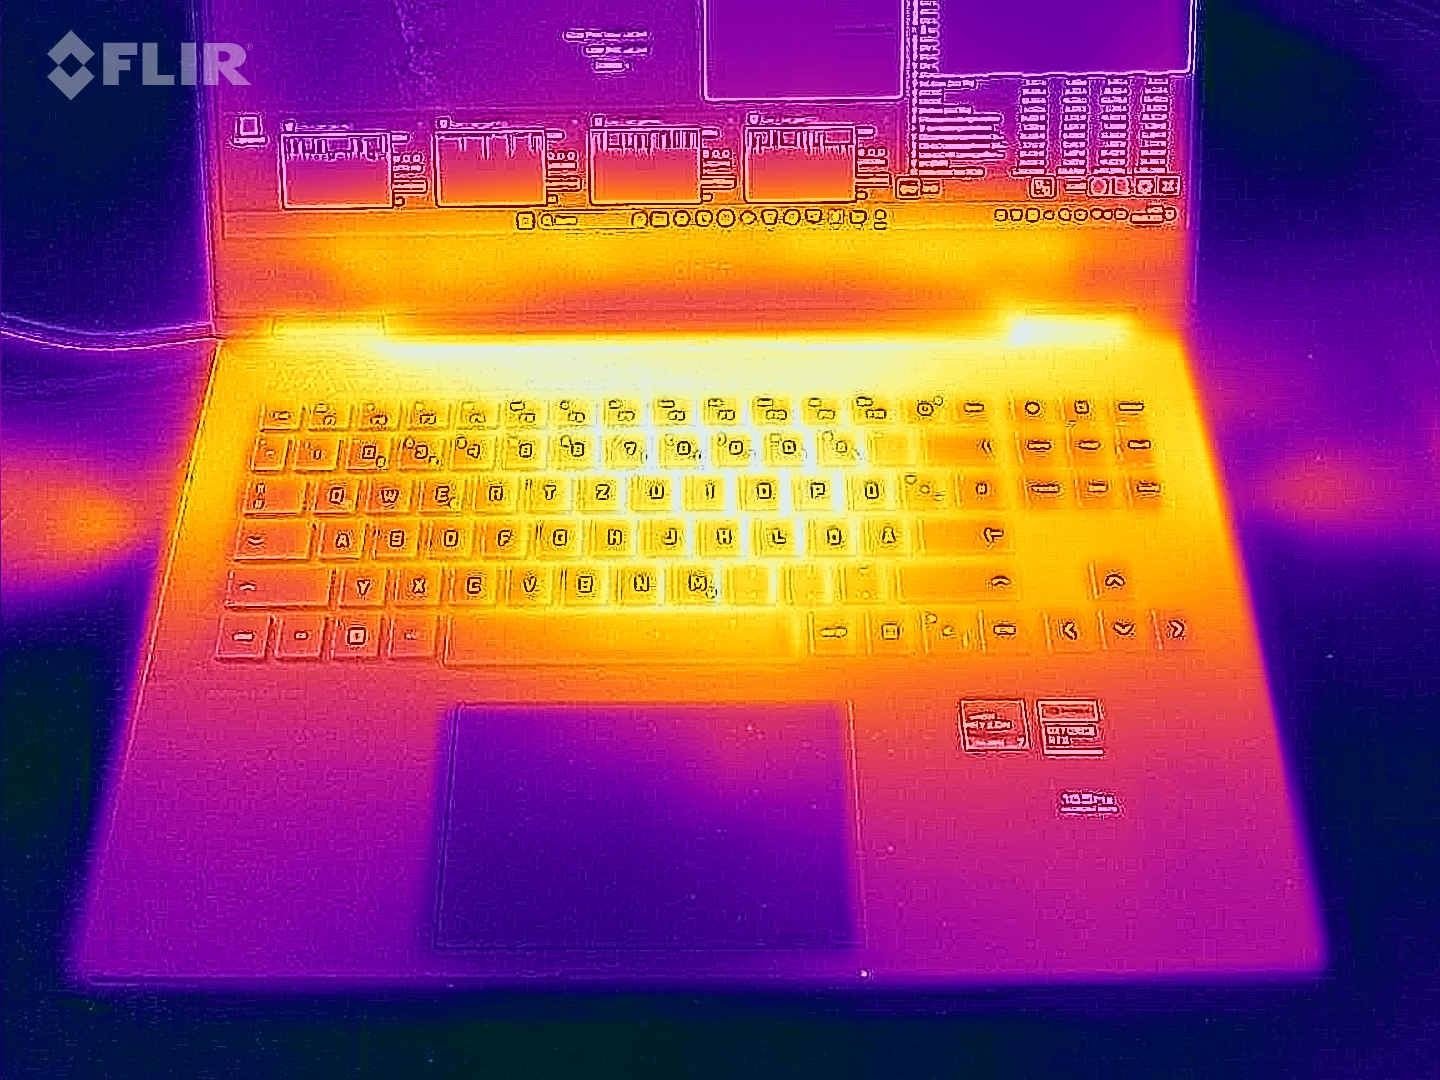
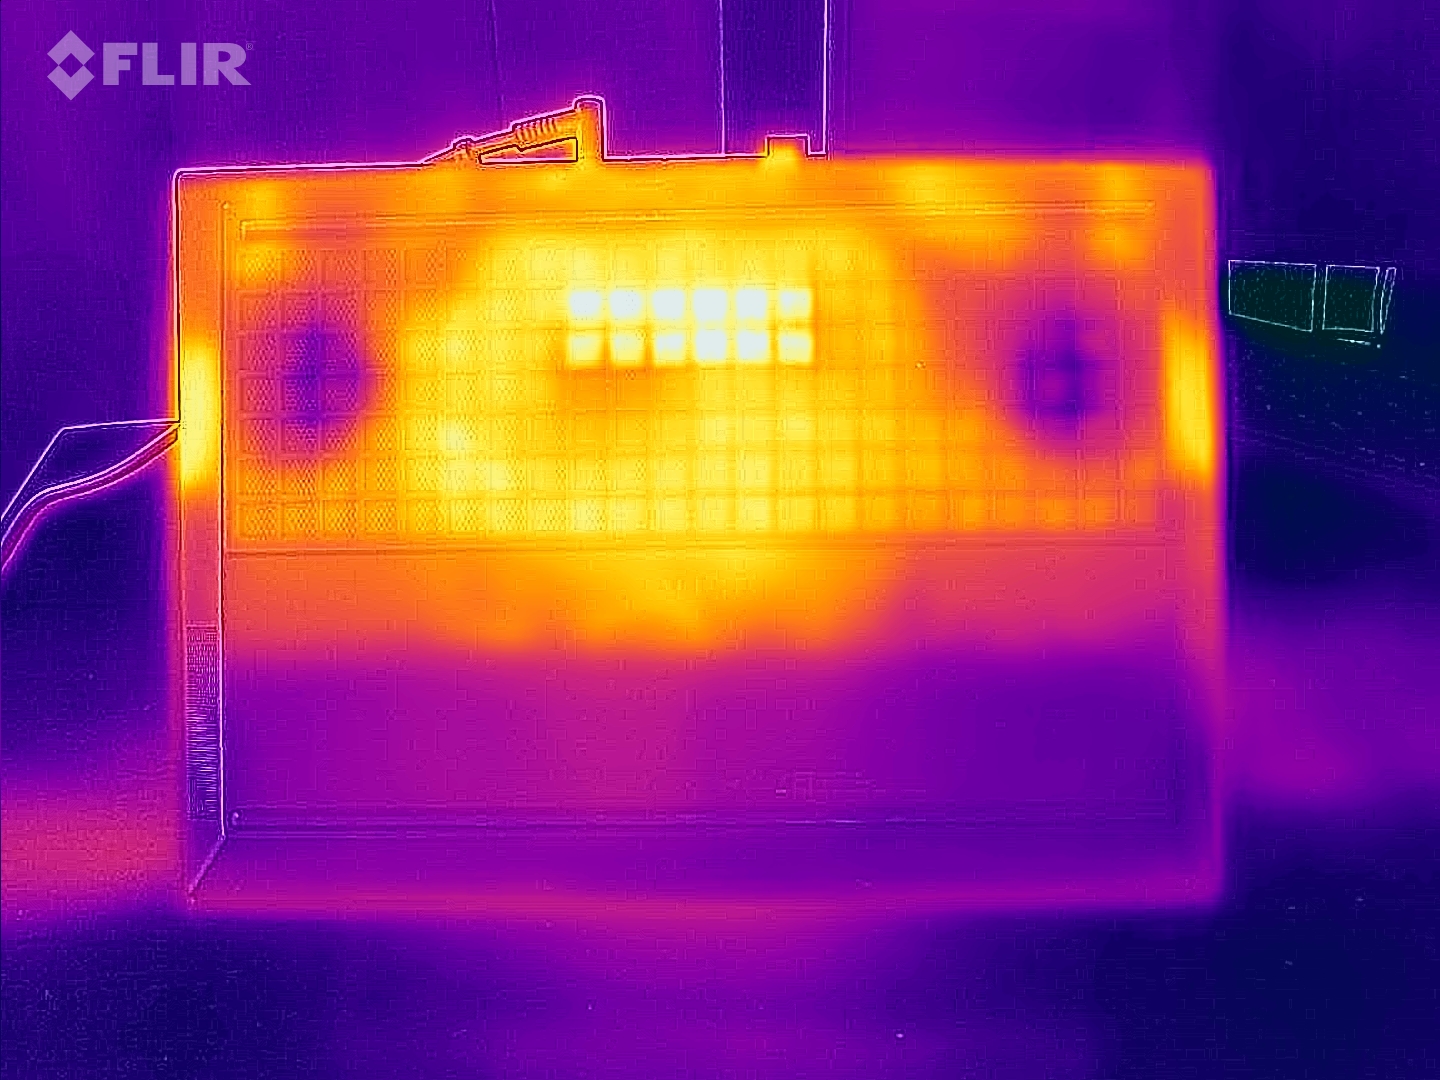
Temperature
The laptop heats up in stress situations, especially the underside of the chassis. A maximum of 57 °C (~135 °F) after one hour of FurMark & Prime95 speaks against gaming sessions on the lap. The upper side also gets quite warm with a maximum of 49 °C (~120 °F), but since the palm rest area always stays below 40 °C (104 °F), this value is still halfway acceptable. Nevertheless, the Omen 16 falls behind the competition in this category - with the exception of the even warmer MSI Stealth 16.
(-) The maximum temperature on the upper side is 49 °C / 120 F, compared to the average of 40.4 °C / 105 F, ranging from 21.2 to 68.8 °C for the class Gaming.
(-) The bottom heats up to a maximum of 57 °C / 135 F, compared to the average of 43.2 °C / 110 F
(+) In idle usage, the average temperature for the upper side is 28.7 °C / 84 F, compared to the device average of 33.9 °C / 93 F.
(-) Playing The Witcher 3, the average temperature for the upper side is 42.1 °C / 108 F, compared to the device average of 33.9 °C / 93 F.
(±) The palmrests and touchpad can get very hot to the touch with a maximum of 37 °C / 98.6 F.
(-) The average temperature of the palmrest area of similar devices was 28.8 °C / 83.8 F (-8.2 °C / -14.8 F).
| HP Omen 16-xf0376ng R7 7840HS, GeForce RTX 4070 Laptop GPU | HP Omen 16-wf000 i7-13700HX, GeForce RTX 4080 Laptop GPU | MSI Stealth 16 Studio A13VG i7-13700H, GeForce RTX 4070 Laptop GPU | Gigabyte AERO 16 OLED BSF i9-13900H, GeForce RTX 4070 Laptop GPU | Acer Nitro 16 AN16-41 R7 7735HS, GeForce RTX 4070 Laptop GPU | Lenovo Legion Pro 5 16ARX8 R7 7745HX, GeForce RTX 4070 Laptop GPU | |
|---|---|---|---|---|---|---|
| Heat | 9% | -19% | 22% | 3% | 13% | |
| Maximum Upper Side * (°C) | 49 | 45 8% | 60 -22% | 41 16% | 41.5 15% | 41.8 15% |
| Maximum Bottom * (°C) | 57 | 48.8 14% | 61 -7% | 47 18% | 51.8 9% | 41.4 27% |
| Idle Upper Side * (°C) | 31 | 29.2 6% | 38.2 -23% | 23 26% | 31.6 -2% | 29 6% |
| Idle Bottom * (°C) | 31 | 28.8 7% | 37.7 -22% | 23 26% | 34.5 -11% | 30.4 2% |
* ... smaller is better
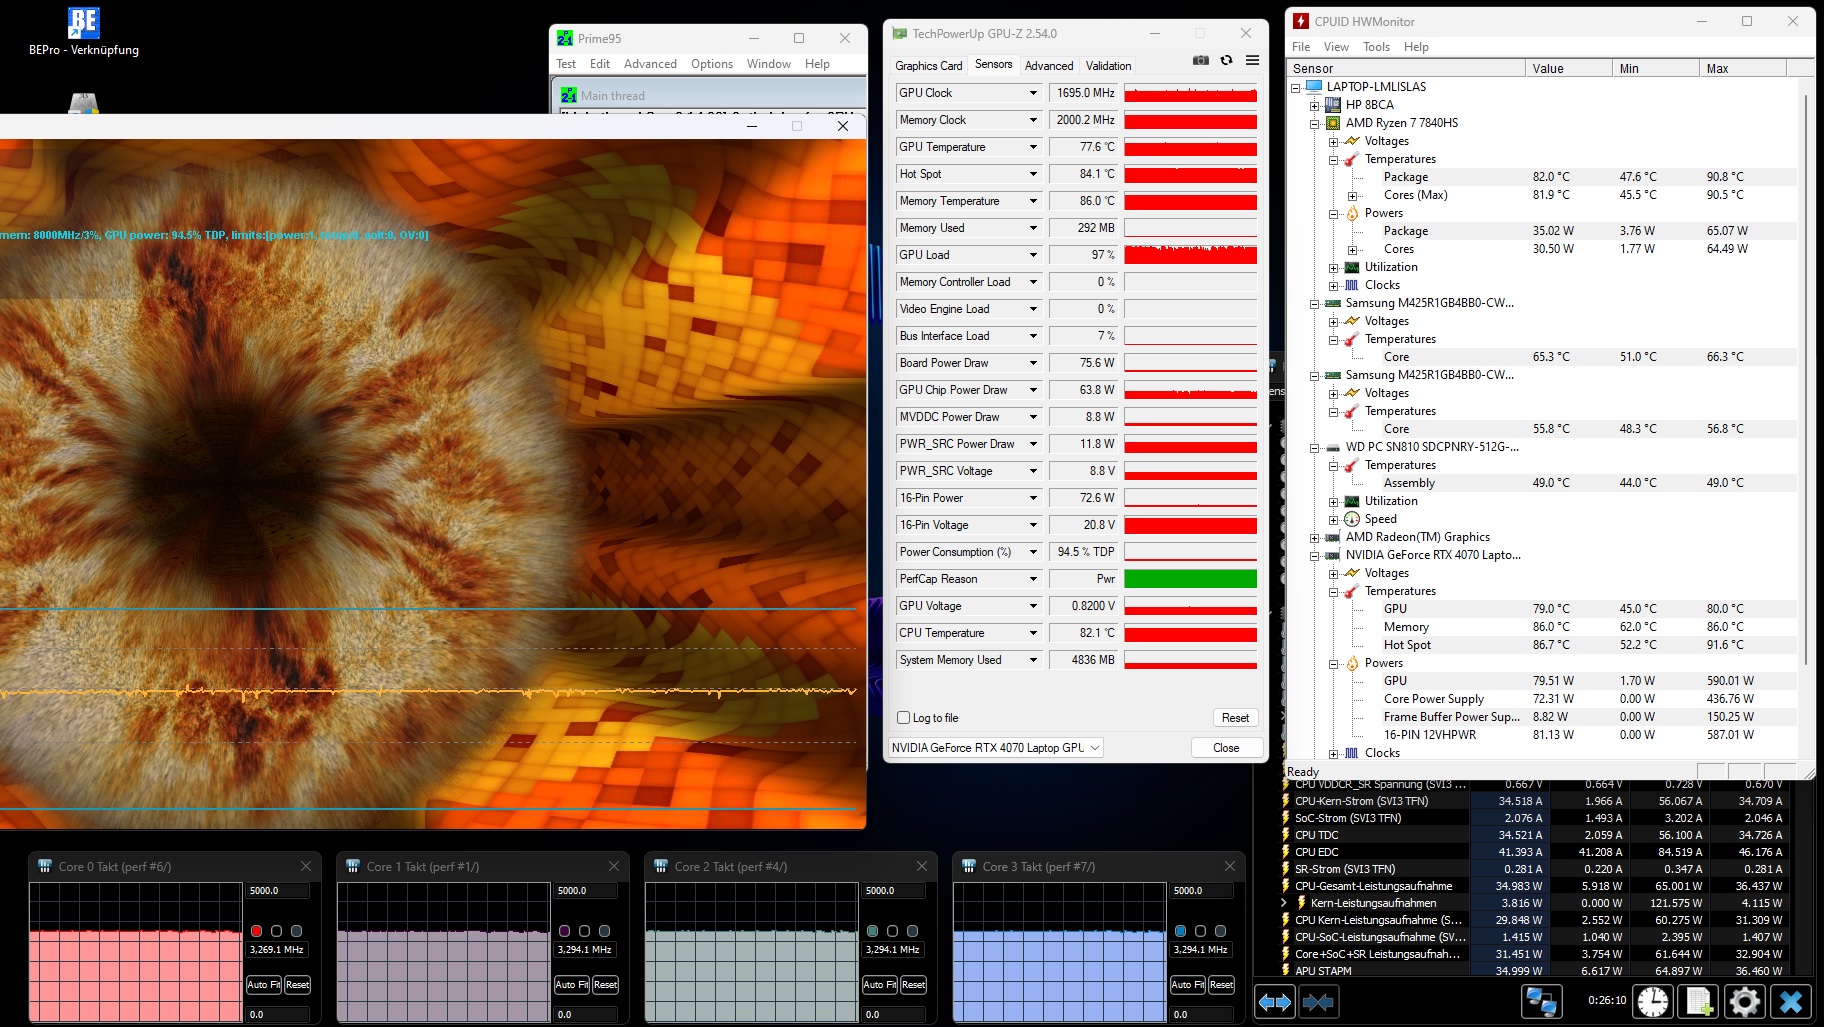
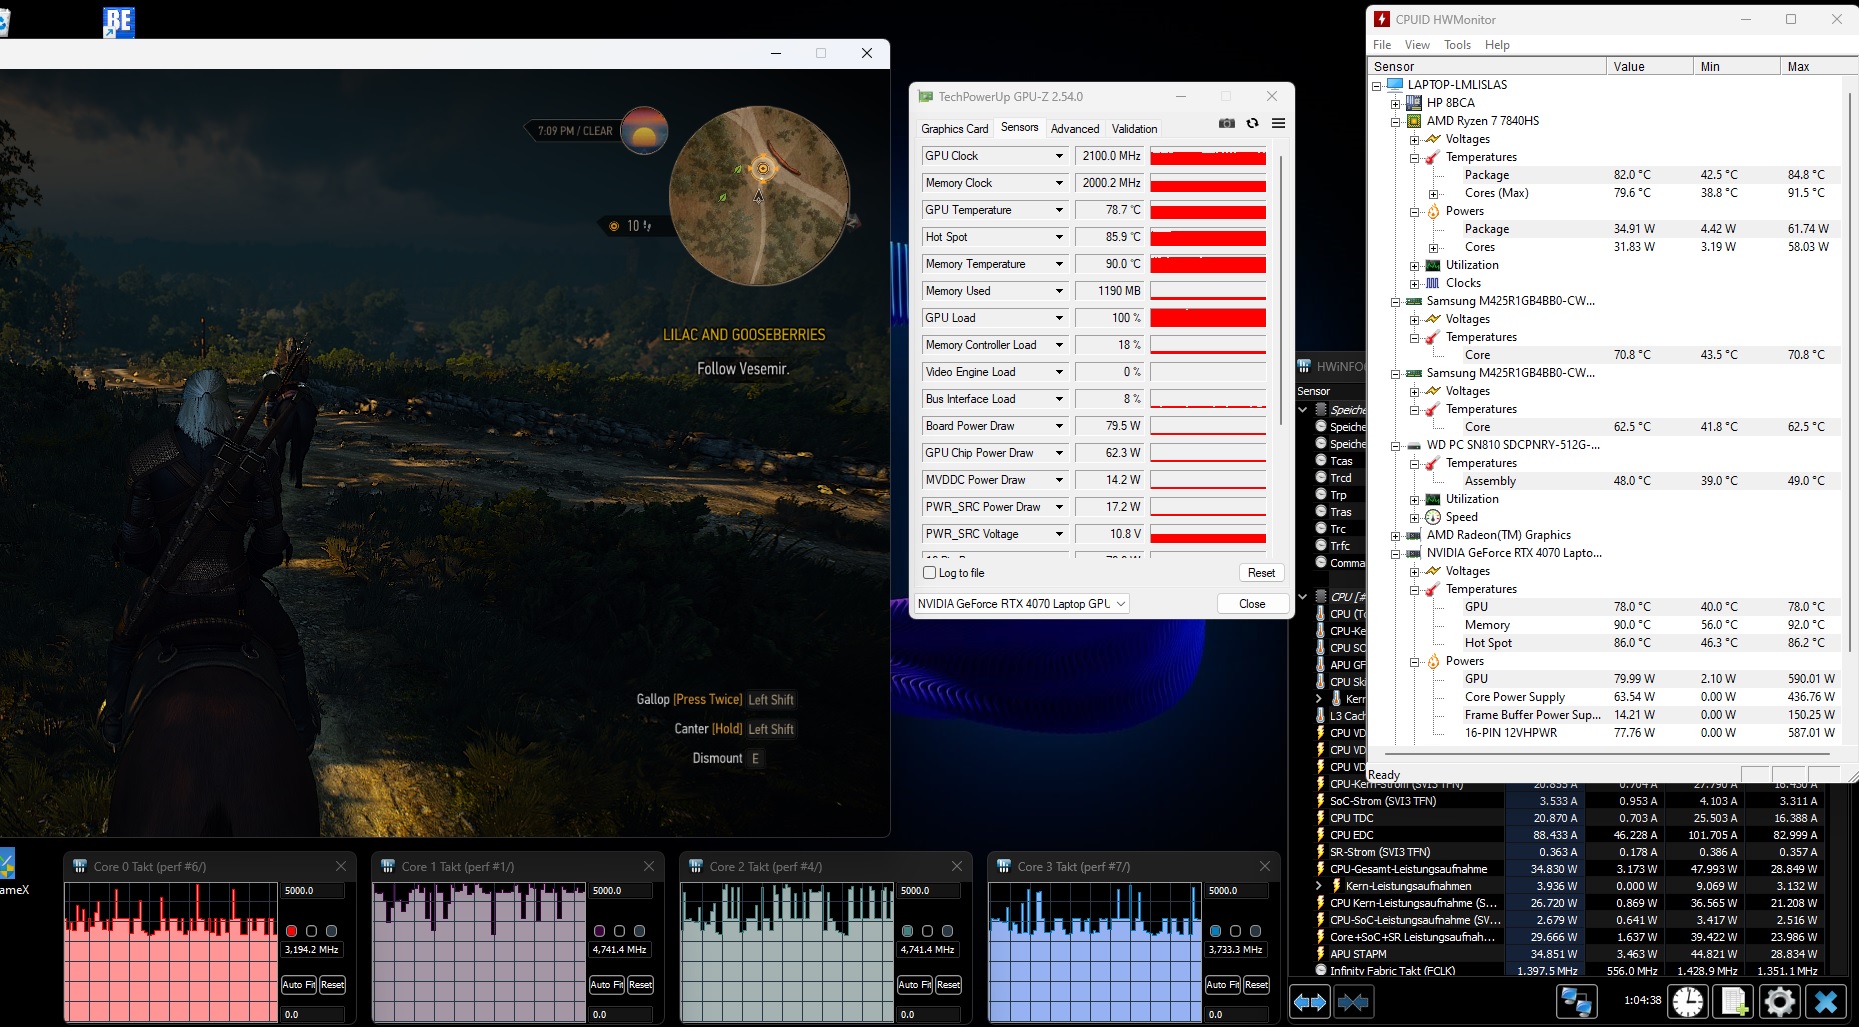
Stress test
You do not have to fear a heat death of the components. The Ryzen 7 7840HS throttles to 3.3 GHz after a longer full load, but around 82 °C (~180 °F) is acceptable. The situation is comparable for the GeForce RTX 4070 with just under 78 °C (~172 °F). A core clock of approximately 1700 MHz does not give reason for criticism.
Speaker
HP Omen 16-xf0376ng audio analysis
(±) | speaker loudness is average but good (81 dB)
Bass 100 - 315 Hz
(±) | reduced bass - on average 14.9% lower than median
(±) | linearity of bass is average (13.6% delta to prev. frequency)
Mids 400 - 2000 Hz
(±) | higher mids - on average 5.2% higher than median
(+) | mids are linear (4.7% delta to prev. frequency)
Highs 2 - 16 kHz
(+) | balanced highs - only 3.7% away from median
(+) | highs are linear (6.6% delta to prev. frequency)
Overall 100 - 16.000 Hz
(+) | overall sound is linear (14.6% difference to median)
Compared to same class
» 28% of all tested devices in this class were better, 7% similar, 65% worse
» The best had a delta of 6%, average was 18%, worst was 132%
Compared to all devices tested
» 19% of all tested devices were better, 4% similar, 77% worse
» The best had a delta of 4%, average was 23%, worst was 134%
Lenovo Legion Pro 5 16ARX8 audio analysis
(±) | speaker loudness is average but good (80.9 dB)
Bass 100 - 315 Hz
(-) | nearly no bass - on average 24% lower than median
(±) | linearity of bass is average (13.4% delta to prev. frequency)
Mids 400 - 2000 Hz
(+) | balanced mids - only 4.7% away from median
(+) | mids are linear (6.2% delta to prev. frequency)
Highs 2 - 16 kHz
(+) | balanced highs - only 2.5% away from median
(+) | highs are linear (6.2% delta to prev. frequency)
Overall 100 - 16.000 Hz
(±) | linearity of overall sound is average (21.9% difference to median)
Compared to same class
» 79% of all tested devices in this class were better, 6% similar, 16% worse
» The best had a delta of 6%, average was 18%, worst was 132%
Compared to all devices tested
» 63% of all tested devices were better, 7% similar, 30% worse
» The best had a delta of 4%, average was 23%, worst was 134%
Power management
Energy consumption
There are also no big surprises in terms of energy consumption. 84 to a maximum of 176 watts under load are even relatively low for such a powerful notebook and speak for the efficiency of the CPU and GPU. The included 280-watt power supply is not even close to being exhausted. In idle mode, the Omen 16 only consumes 9 to 20 watts with active graphics switching - a moderate result.
| Off / Standby | |
| Idle | |
| Load |
|
Key:
min: | |
| HP Omen 16-xf0376ng R7 7840HS, GeForce RTX 4070 Laptop GPU | HP Omen 16-wf000 i7-13700HX, GeForce RTX 4080 Laptop GPU | MSI Stealth 16 Studio A13VG i7-13700H, GeForce RTX 4070 Laptop GPU | Gigabyte AERO 16 OLED BSF i9-13900H, GeForce RTX 4070 Laptop GPU | Acer Nitro 16 AN16-41 R7 7735HS, GeForce RTX 4070 Laptop GPU | Lenovo Legion Pro 5 16ARX8 R7 7745HX, GeForce RTX 4070 Laptop GPU | Average of class Gaming | |
|---|---|---|---|---|---|---|---|
| Power Consumption | -75% | -13% | -12% | -22% | -31% | -36% | |
| Idle Minimum * (Watt) | 9 | 21.8 -142% | 11 -22% | 11.8 -31% | 11.6 -29% | 8.1 10% | 13 ? -44% |
| Idle Average * (Watt) | 14 | 26 -86% | 18 -29% | 16.1 -15% | 15.6 -11% | 15.9 -14% | 19 ? -36% |
| Idle Maximum * (Watt) | 20 | 36 -80% | 19 5% | 17 15% | 16.5 17% | 37.2 -86% | 24.6 ? -23% |
| Load Average * (Watt) | 84 | 115.5 -38% | 91 -8% | 100.6 -20% | 155 -85% | 90.9 -8% | 110.7 ? -32% |
| Witcher 3 ultra * (Watt) | 140.9 | 214 -52% | 130 8% | 158 -12% | 154.8 -10% | 189.6 -35% | |
| Load Maximum * (Watt) | 176 | 269.7 -53% | 228 -30% | 192 -9% | 205 -16% | 263.5 -50% | 259 ? -47% |
* ... smaller is better
Energy consumption Witcher 3 / Stress test
Energy consumption with external Monitor
Battery life
The battery life is based on the Intel version, although the AMD counterpart lasts a bit longer in our real-world WLAN test with reduced brightness to 150 cd/m² in view of 344 to 307 minutes. Just under 6 hours is a useful value for a gaming laptop, although some rivals manage even more here.
| HP Omen 16-xf0376ng R7 7840HS, GeForce RTX 4070 Laptop GPU, 83 Wh | HP Omen 16-wf000 i7-13700HX, GeForce RTX 4080 Laptop GPU, 83 Wh | MSI Stealth 16 Studio A13VG i7-13700H, GeForce RTX 4070 Laptop GPU, 99.9 Wh | Gigabyte AERO 16 OLED BSF i9-13900H, GeForce RTX 4070 Laptop GPU, 88 Wh | Acer Nitro 16 AN16-41 R7 7735HS, GeForce RTX 4070 Laptop GPU, 90 Wh | Lenovo Legion Pro 5 16ARX8 R7 7745HX, GeForce RTX 4070 Laptop GPU, 80 Wh | Average of class Gaming | |
|---|---|---|---|---|---|---|---|
| Battery runtime | -11% | 37% | 32% | 58% | -30% | 25% | |
| WiFi v1.3 (h) | 5.7 | 5.1 -11% | 7.8 37% | 7.5 32% | 9 58% | 4 -30% | 7.11 ? 25% |
| Reader / Idle (h) | 5.5 | 11 | 12.2 | 6.5 | 8.27 ? | ||
| Load (h) | 1.1 | 2.4 | 2.1 | 1.8 | 1 | 1.502 ? | |
| H.264 (h) | 7.7 | 7.4 | 10.2 | 8.32 ? |
Pros
Cons
Conclusion
The Omen 16 delivers good performance with the Ryzen 7 7840HS.
The 16-incher does not make any glaring mistakes and gets at least a "Satisfactory" in almost every category.
It is even good enough for a "Good" or "Very Good" in most categories, so we end up with a respectable overall rating of 87% - just like the Intel version.
On the positive side, we would mention the stable continuous performance, the fast 165 Hz display, the solid speakers and (at least in balanced mode) acceptable noise emissions. We would not recommend the performance mode due to the loud noise (no matter if idle or load).
HP could improve the connectivity (no card reader, no USB 4), the webcam and the temperature development of the chassis, which is above average.
Comparable RTX-4070 laptops with AMD processors can be found, for example, at Acer (Nitro 16) or Lenovo (Legion Pro 5).
Price and availability
The HP Omen 16-xf0376ng with Ryzen 7 7840HS, GeForce RTX 4070 and 165 Hz panel was available for just under 1,900 Euros (~$2026) at Saturn and Mediamarkt at the time of testing.
HP Omen 16-xf0376ng
- 09/13/2023 v7 (old)
Florian Glaser
Transparency
The selection of devices to be reviewed is made by our editorial team. The test sample was provided to the author as a loan by the manufacturer or retailer for the purpose of this review. The lender had no influence on this review, nor did the manufacturer receive a copy of this review before publication. There was no obligation to publish this review. As an independent media company, Notebookcheck is not subjected to the authority of manufacturers, retailers or publishers.
This is how Notebookcheck is testing
Every year, Notebookcheck independently reviews hundreds of laptops and smartphones using standardized procedures to ensure that all results are comparable. We have continuously developed our test methods for around 20 years and set industry standards in the process. In our test labs, high-quality measuring equipment is utilized by experienced technicians and editors. These tests involve a multi-stage validation process. Our complex rating system is based on hundreds of well-founded measurements and benchmarks, which maintains objectivity. Further information on our test methods can be found here.
Price comparison

