Radeon RX 6650M performance debut: HP Omen 16 2022 laptop review
Though the HP Omen 16 series is barely a year old, the latest 2022 model is already a significant refresh from the original both inside and out. The newest version adds Intel 12th gen Alder Lake-H and AMD Zen 3+ CPU options, GeForce RTX 3070 Ti and Radeon RX 6000M GPU options, and several exterior changes.
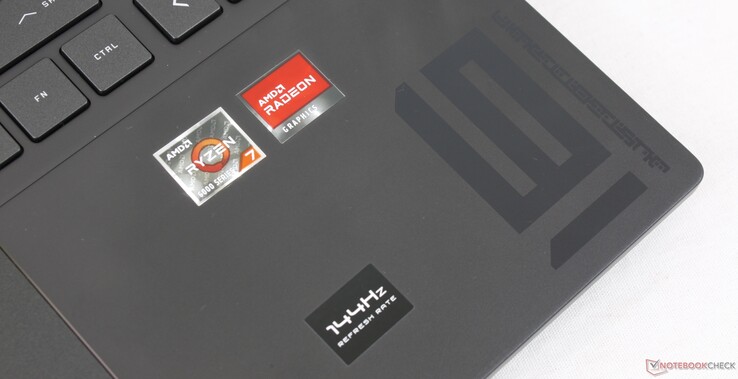
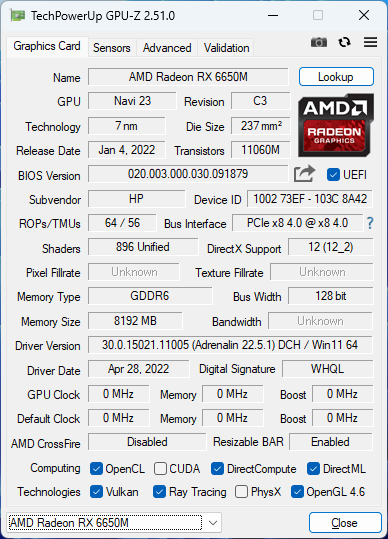
Our configuration in review is the all AMD SKU featuring the Ryzen 7 6800H, 105 W TGP Radeon RX 6650M, and 144 Hz 1080p IPS display for approximately $1600 USD retail. This also happens to be one of the very few laptops to feature Radeon RX 6650M graphics.
The Omen 16 competes directly with other upper midrange 16-inch gaming laptops like the Dell G16 7620, Lenovo Legion S7 16, or the Asus Zephyrus M16. For a more budget-friendly alternative, users can consider the lower-end HP Victus 16.
More HP reviews:
Potential Competitors in Comparison
Rating | Date | Model | Weight | Height | Size | Resolution | Price |
|---|---|---|---|---|---|---|---|
| 86.4 % v7 (old) | 11 / 2022 | HP Omen 16-n0033dx R7 6800H, Radeon RX 6650M | 2.4 kg | 22.6 mm | 16.10" | 1920x1080 | |
| 86.9 % v7 (old) | 09 / 2022 | HP Envy 16 h0112nr i7-12700H, GeForce RTX 3060 Laptop GPU | 2.3 kg | 19.8 mm | 16.00" | 3840x2400 | |
| 85.5 % v7 (old) | 05 / 2022 | HP Omen 16-b1090ng i7-12700H, GeForce RTX 3070 Ti Laptop GPU | 2.3 kg | 23 mm | 16.10" | 2560x1440 | |
| 82.3 % v7 (old) | 05 / 2022 | HP Victus 16-e0145ng R5 5600H, GeForce RTX 3050 Ti Laptop GPU | 2.4 kg | 23.5 mm | 16.10" | 1920x1080 | |
| 89.3 % v7 (old) | 11 / 2022 | Lenovo Legion S7 16ARHA7 R9 6900HX, Radeon RX 6800S | 2.2 kg | 16.9 mm | 16.00" | 2560x1600 | |
| 86.1 % v7 (old) | 10 / 2022 | Dell G16 7620 i7-12700H, GeForce RTX 3060 Laptop GPU | 2.6 kg | 26.9 mm | 16.00" | 2560x1600 |
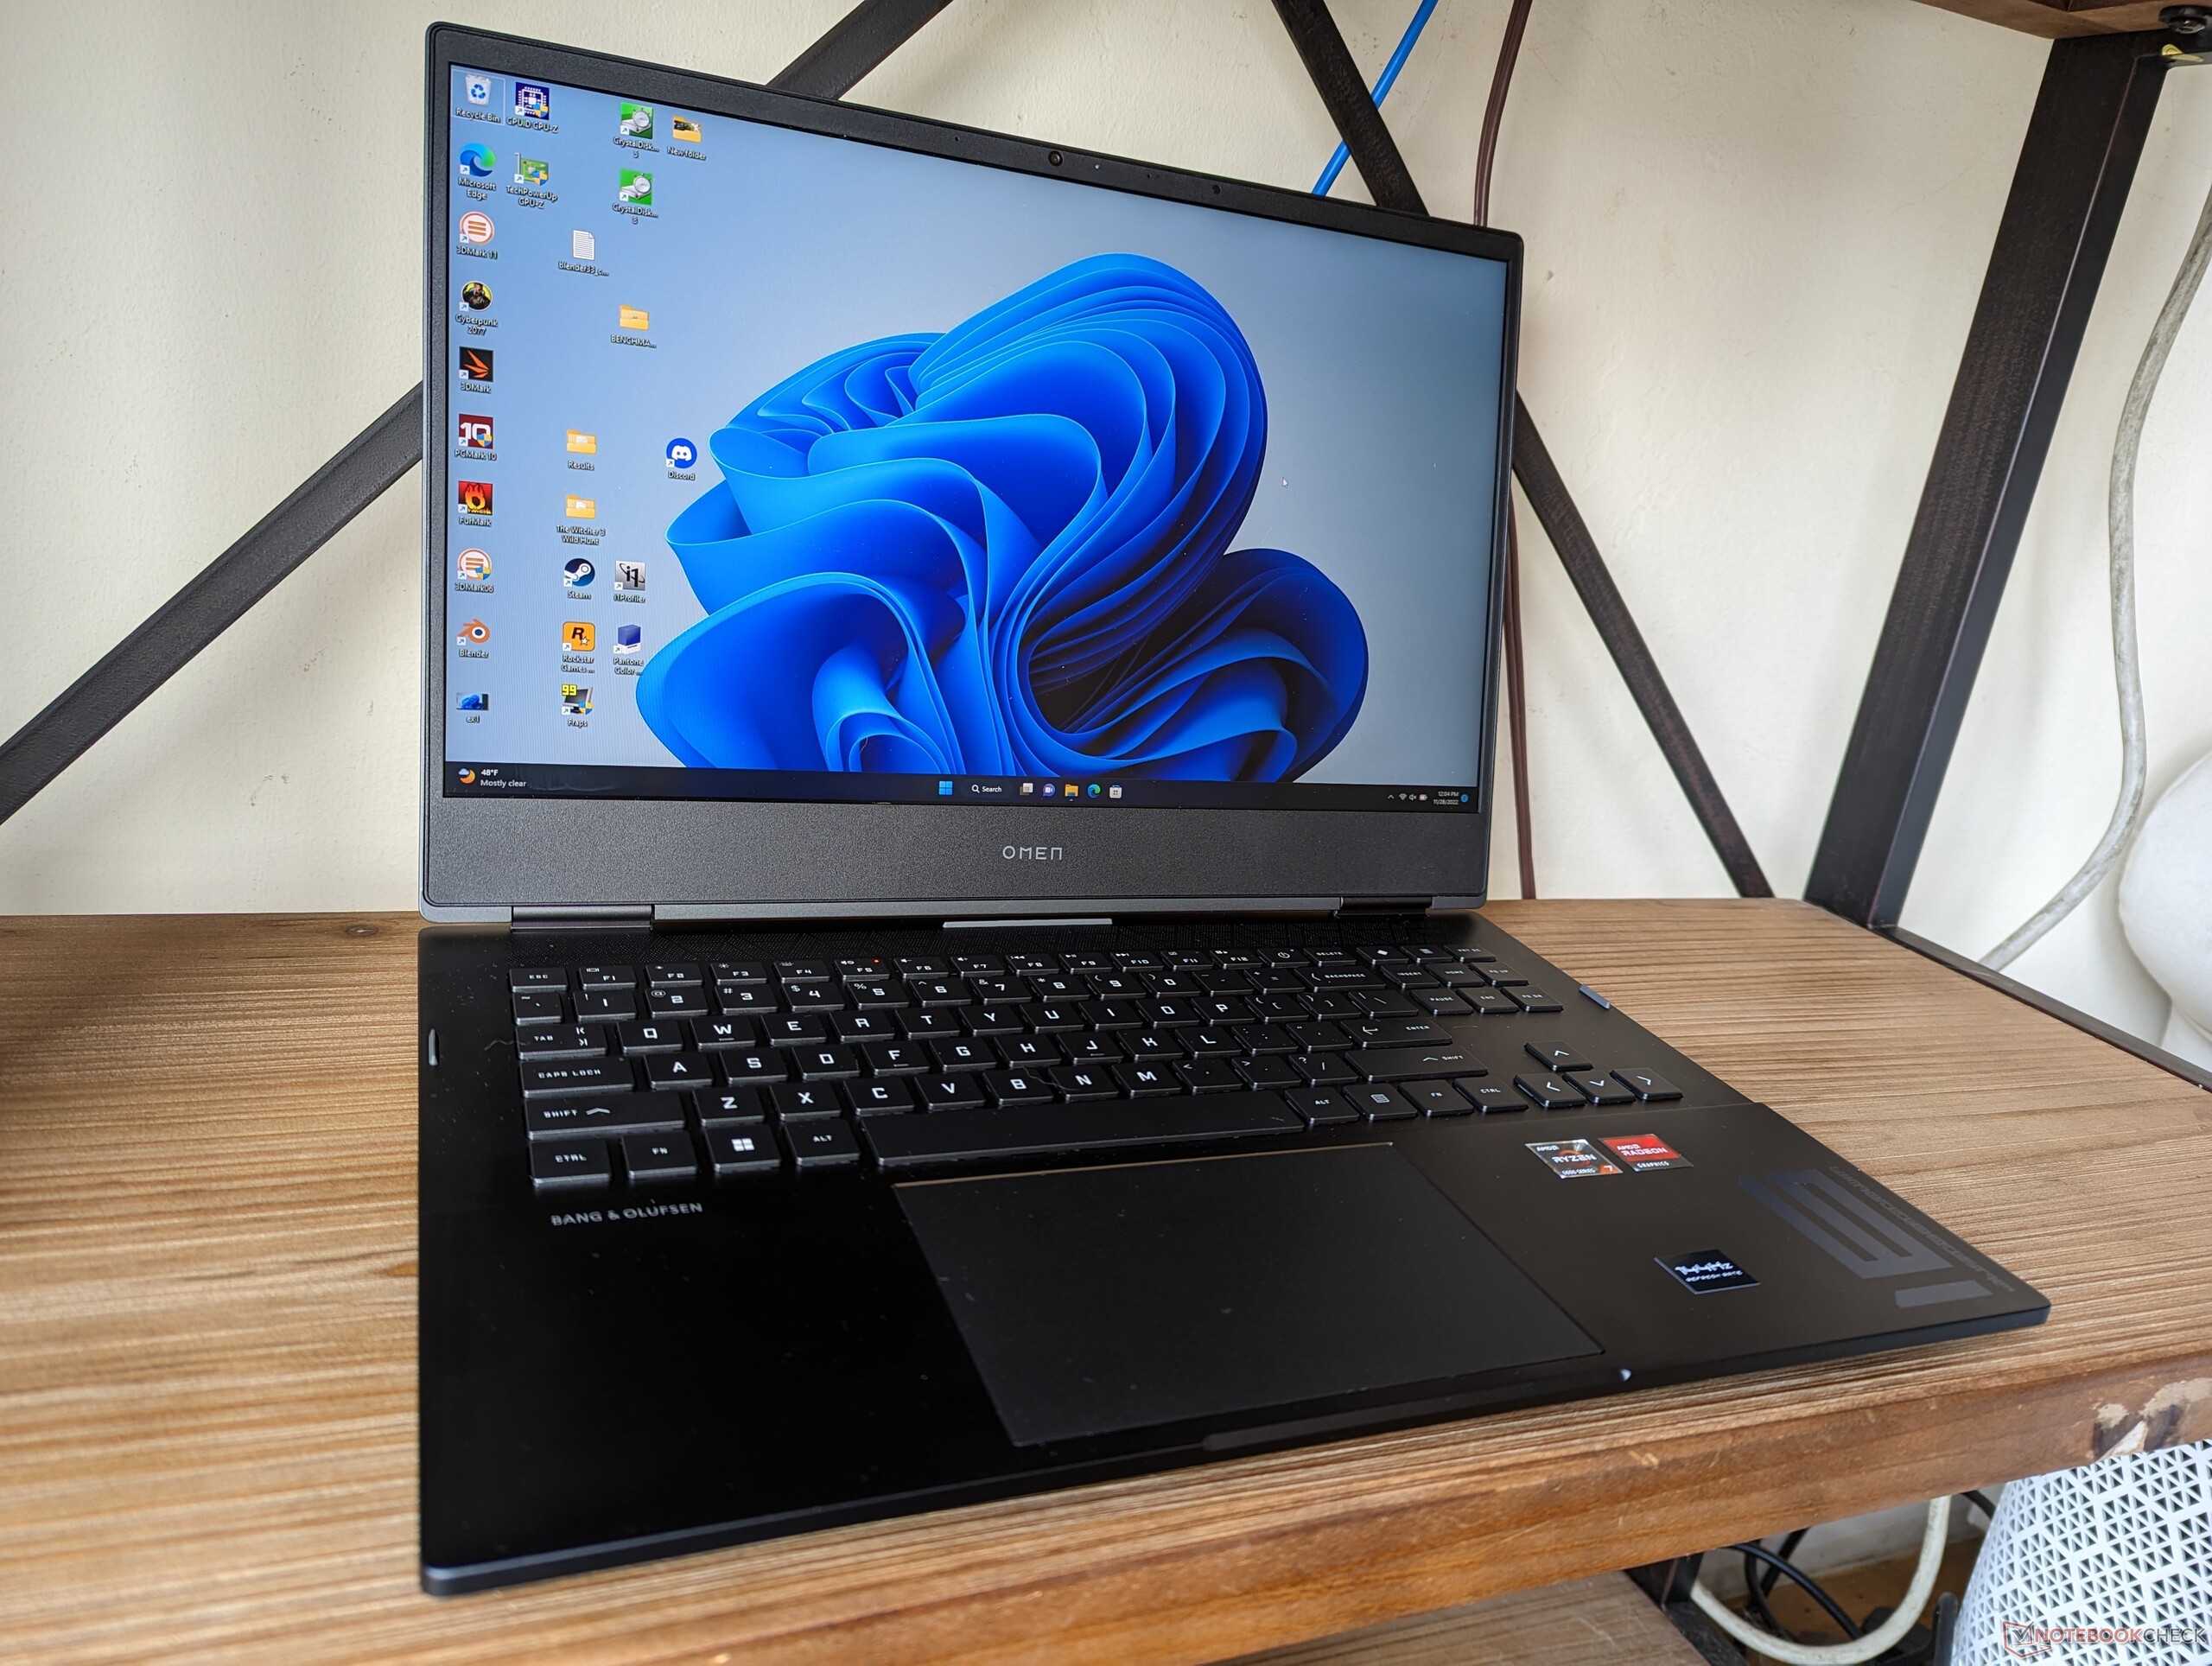
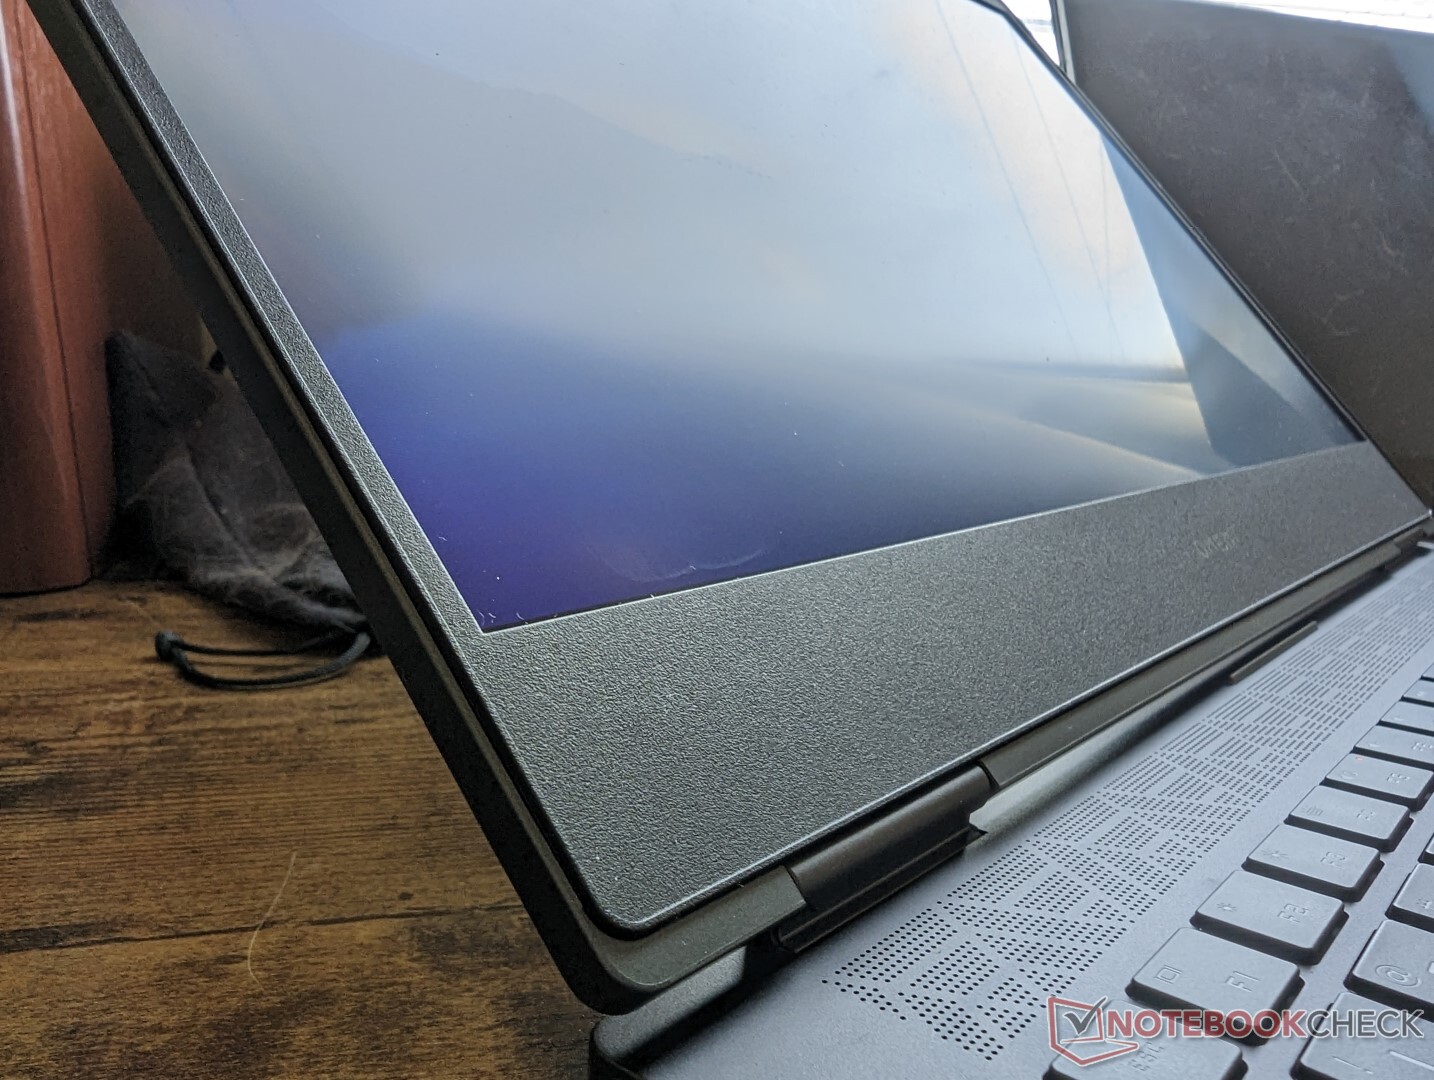
Case — Inspired By The Envy 16
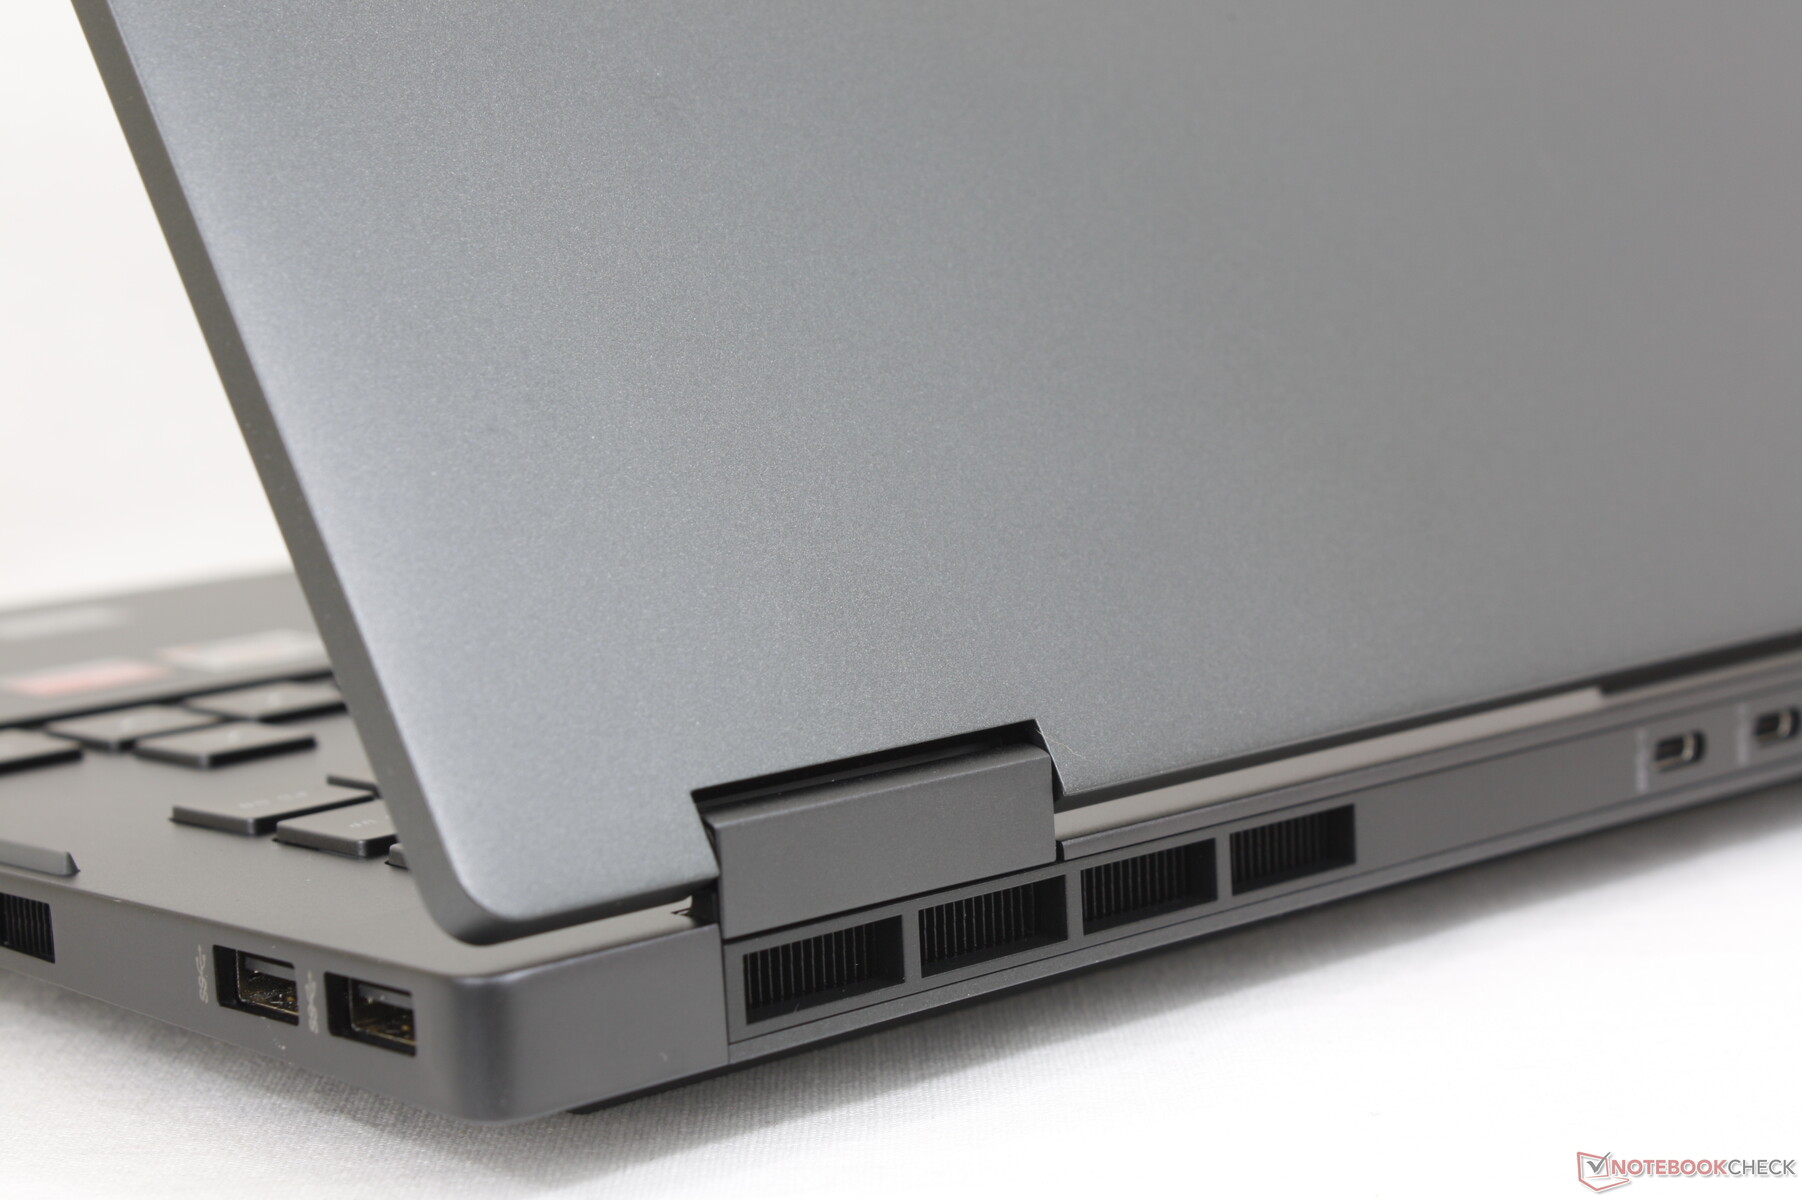
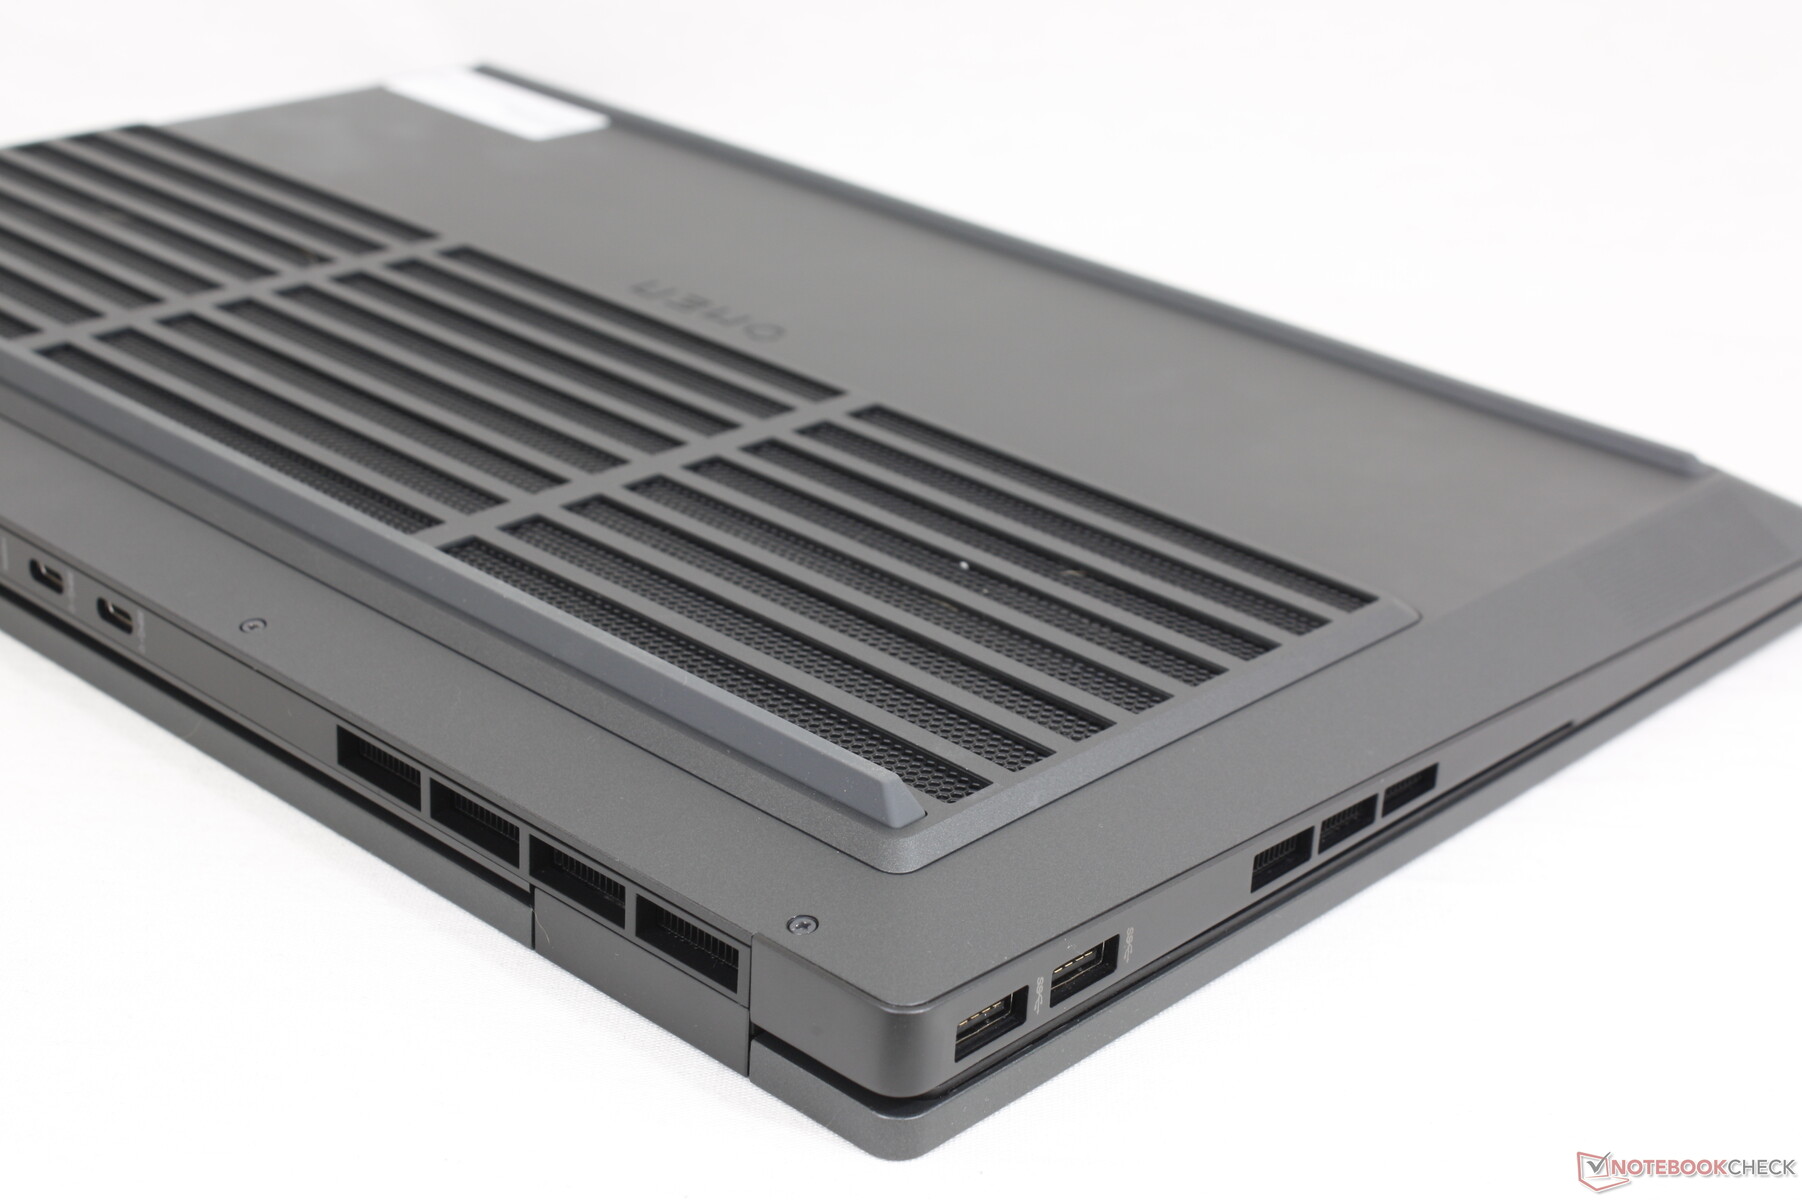
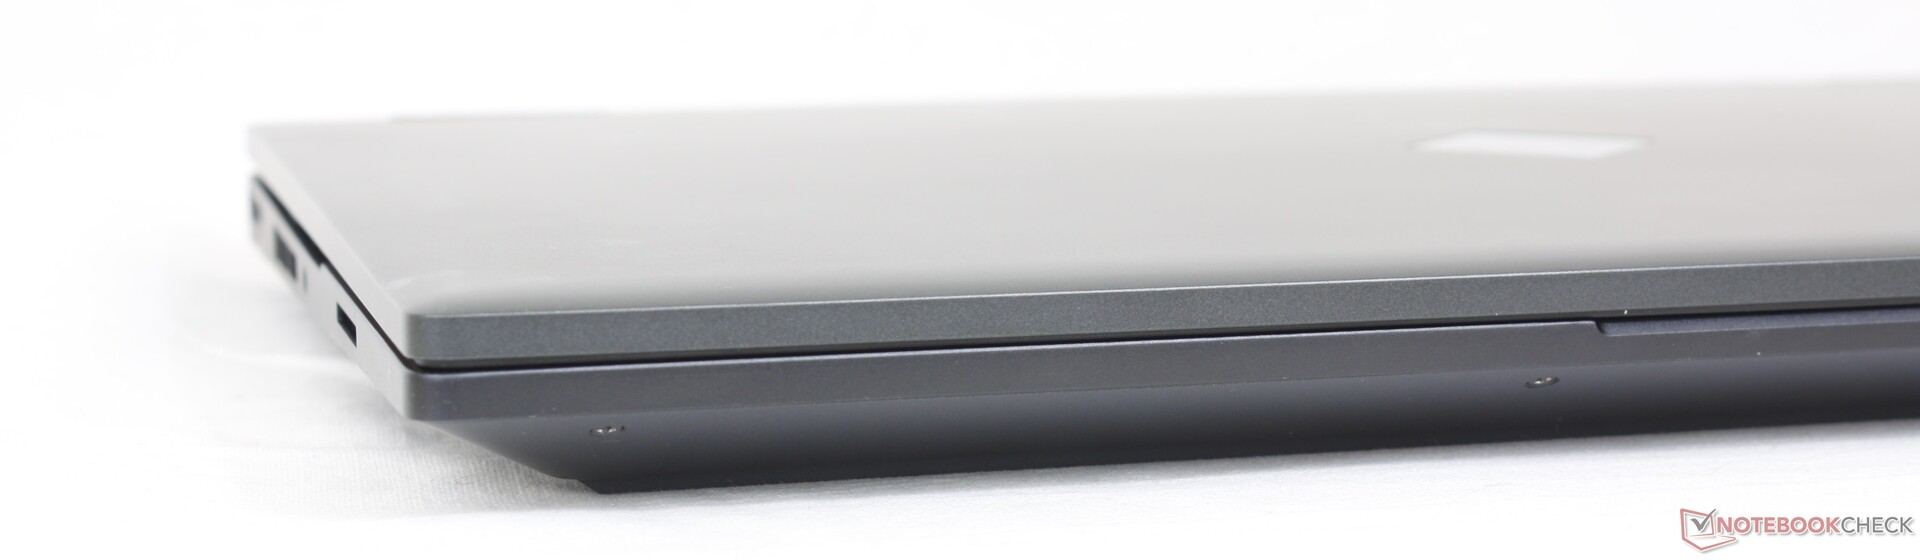
The 2022 Omen 16 looks almost exactly like the 2021 model from the front, but details around the back and bottom have changed. Ports are no longer where they used to be, for example, while the rear corners are now rounder than before. The ventilation and speaker grilles have also been redesigned and the bottom plate in particular has an even larger vent.
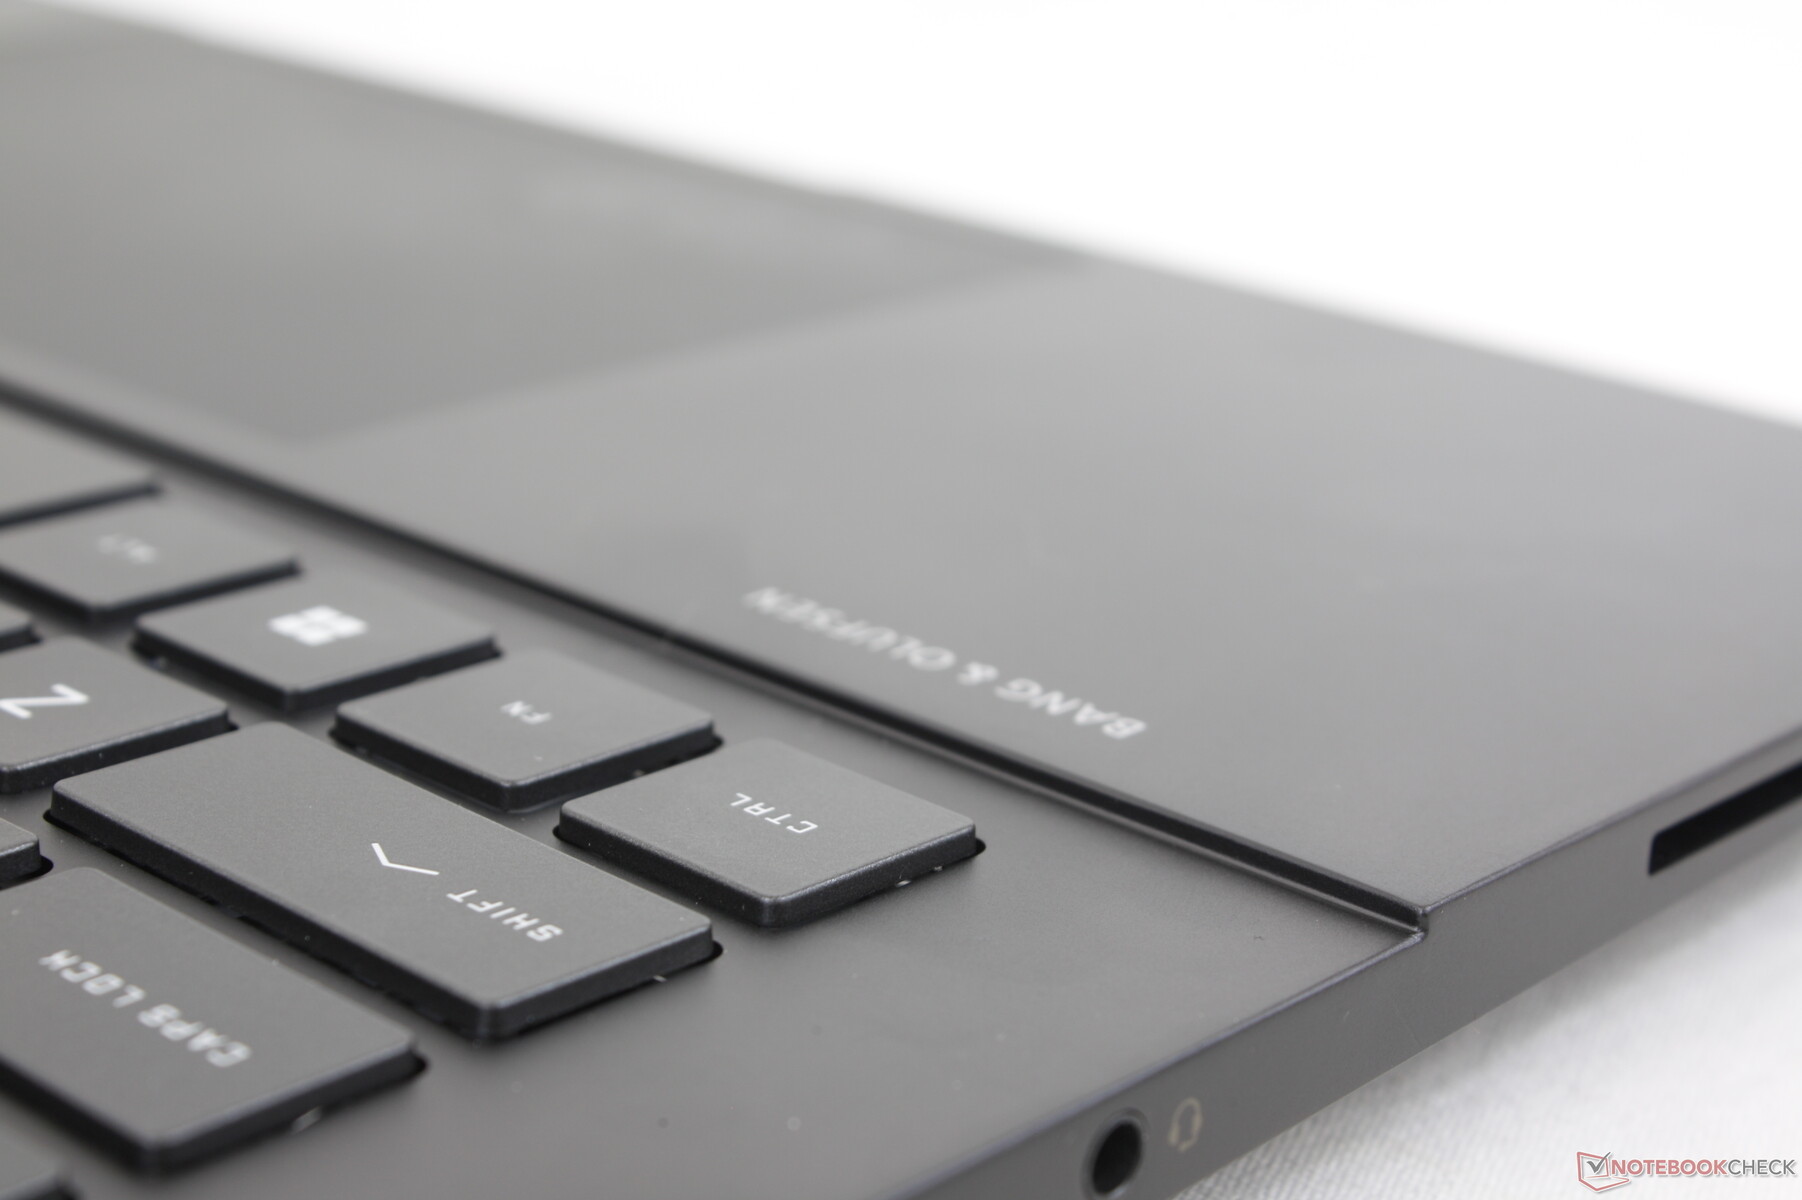
The metal chassis materials are otherwise the same as on last year's model for a similar feel and impression. The base is still stiff and almost Envy 16-like, but the lid tends to teeter when adjusting angles. The small hinges are also susceptible to breaking when opened to their maximum angle. The hinges on the Dell G16 feel stronger in comparison.
Dimensions and weight are almost unchanged from last year's model despite all the external updates. The model lies comfortably in between the thinner and lighter Lenovo Legion S7 16 and the thicker and heavier Dell G16. The Asus Zephyrus M16 is significantly lighter by half a kilogram if users want a more portable 16-inch gaming laptop.
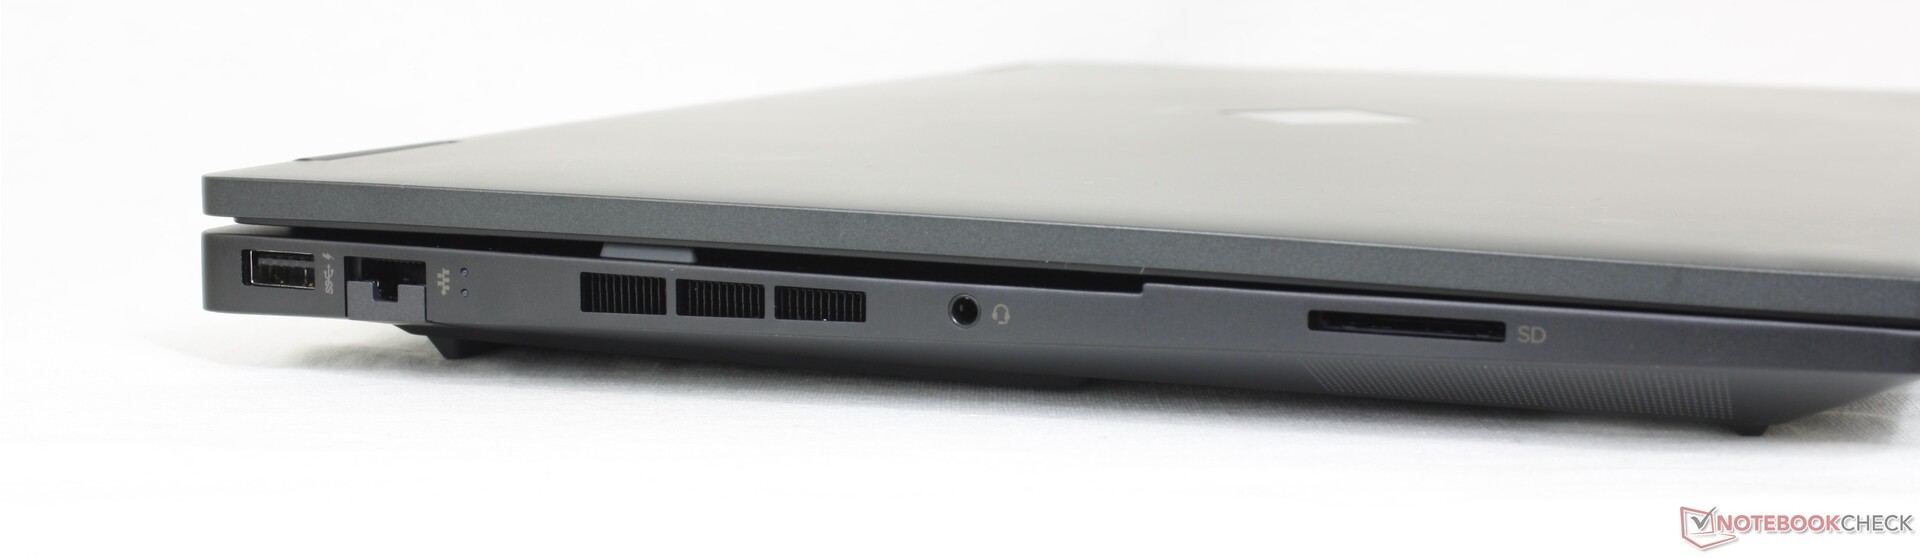
Connectivity — No Thunderbolt Support
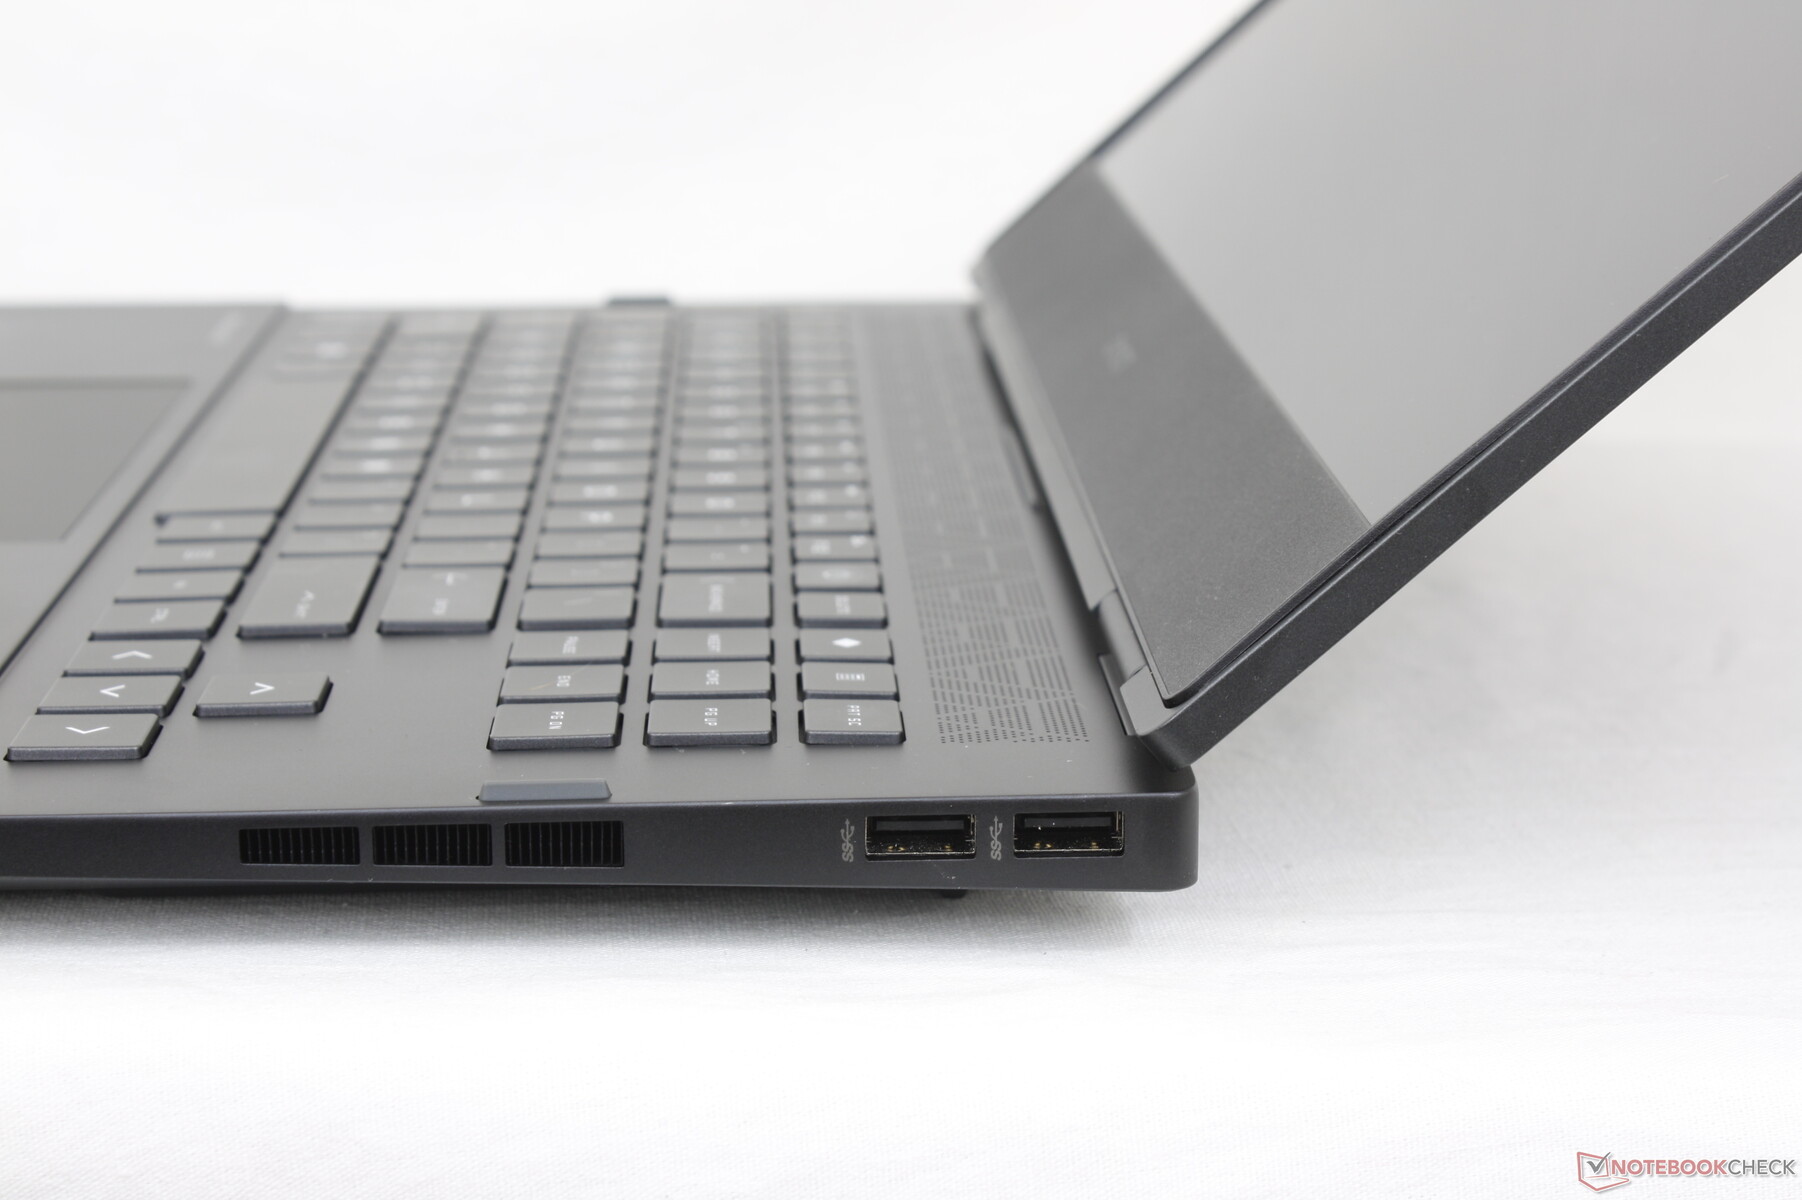
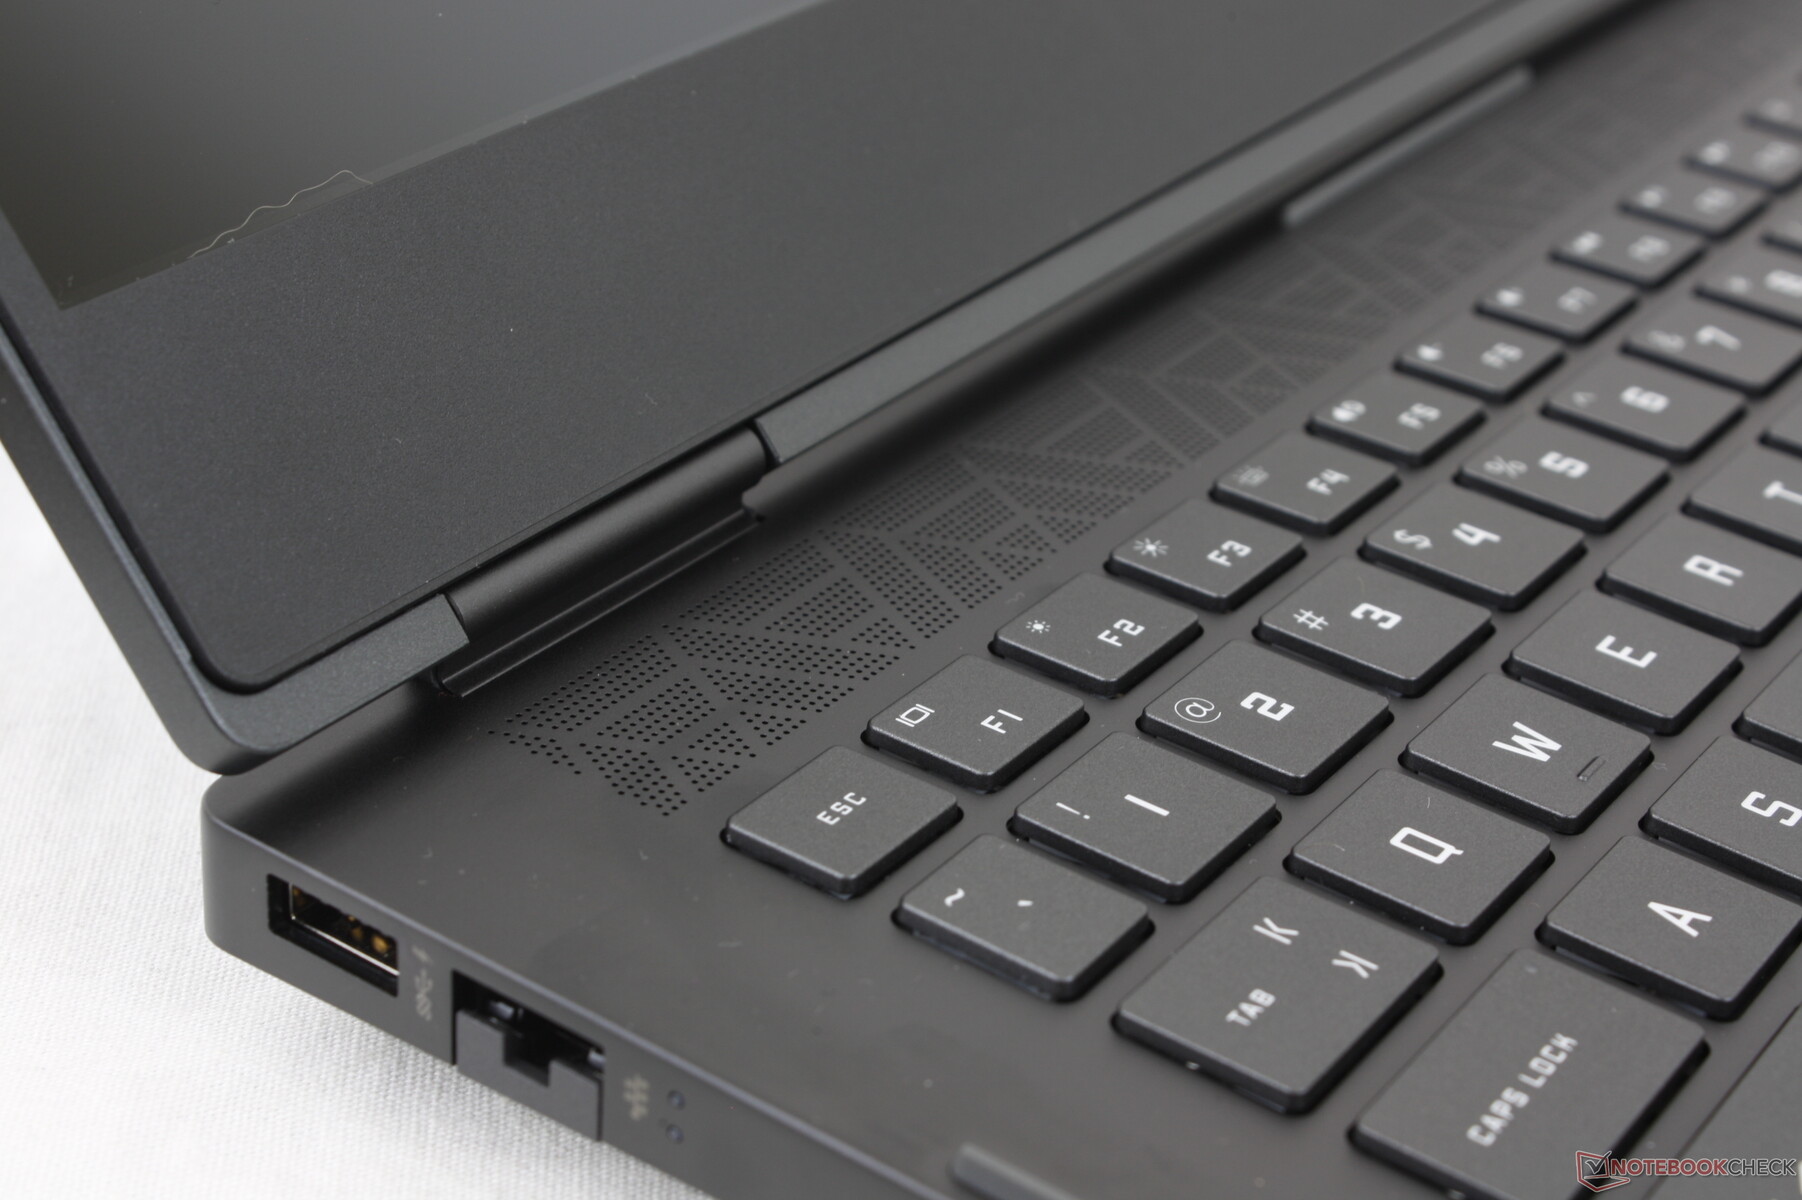
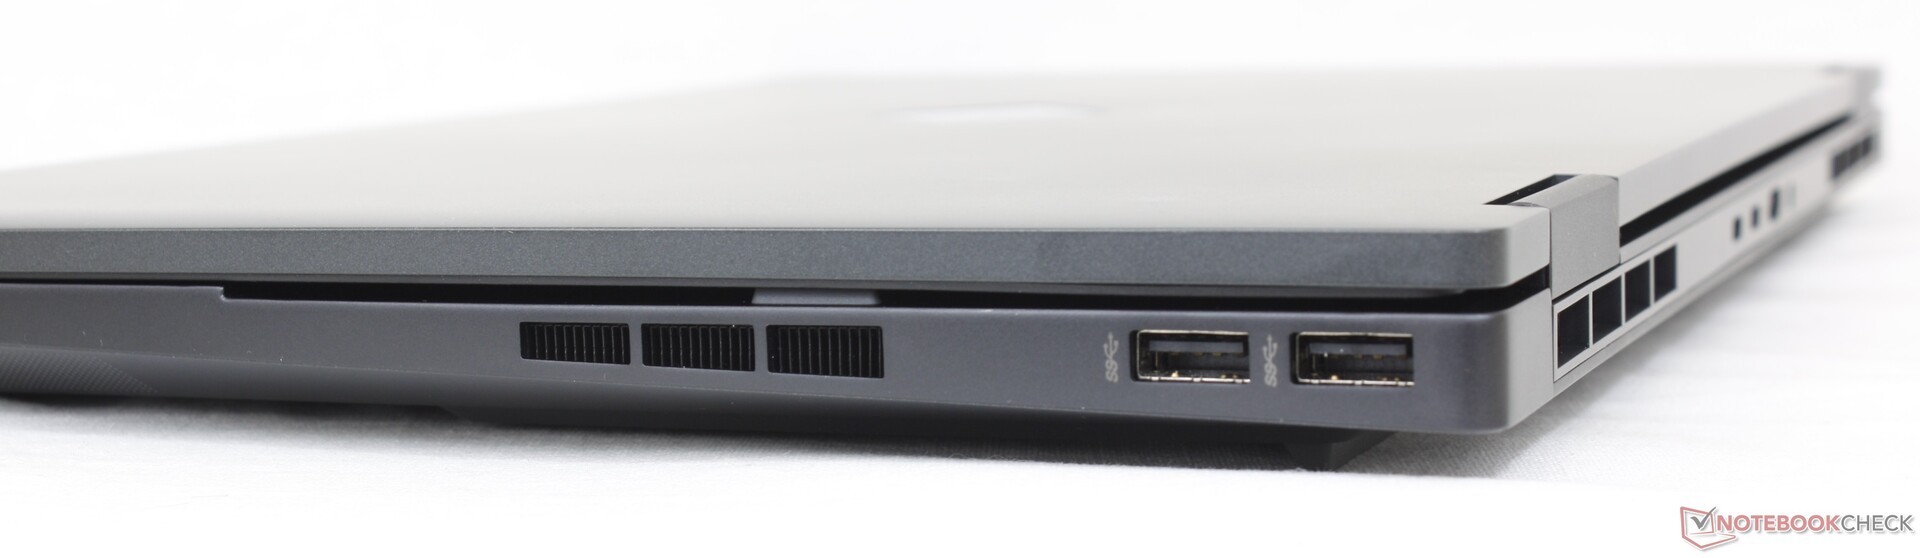
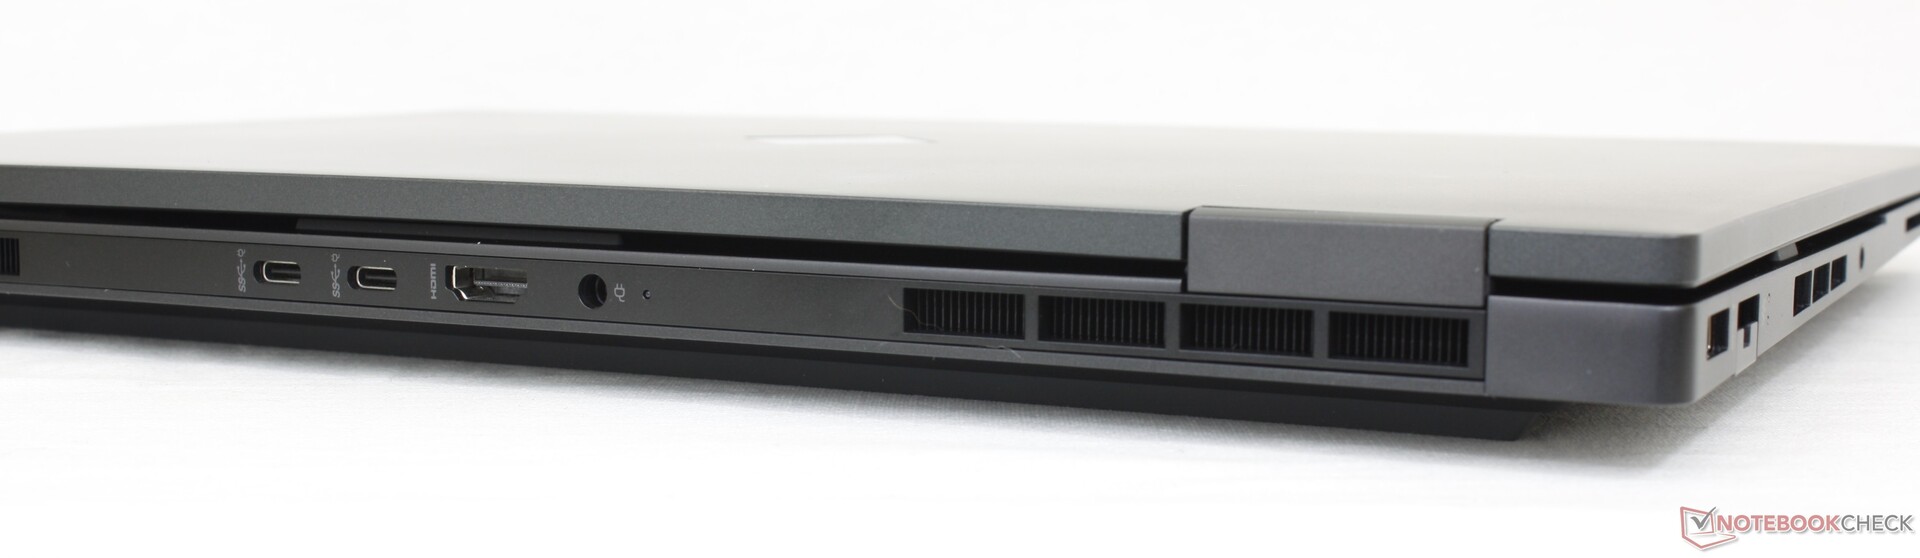
This year's model has swapped out the mini-DisplayPort in favor of a second USB-C port when compared to the 2021 model. Port options are otherwise essentially the same between the two models.
The most noticeable year-over-year change involves the positioning of the ports. The ports on last year's model were too crowded along the left edge and so some have been reassigned to the rear edge instead. Though not particularly ideal, this is still preferable over having fewer ports altogether.
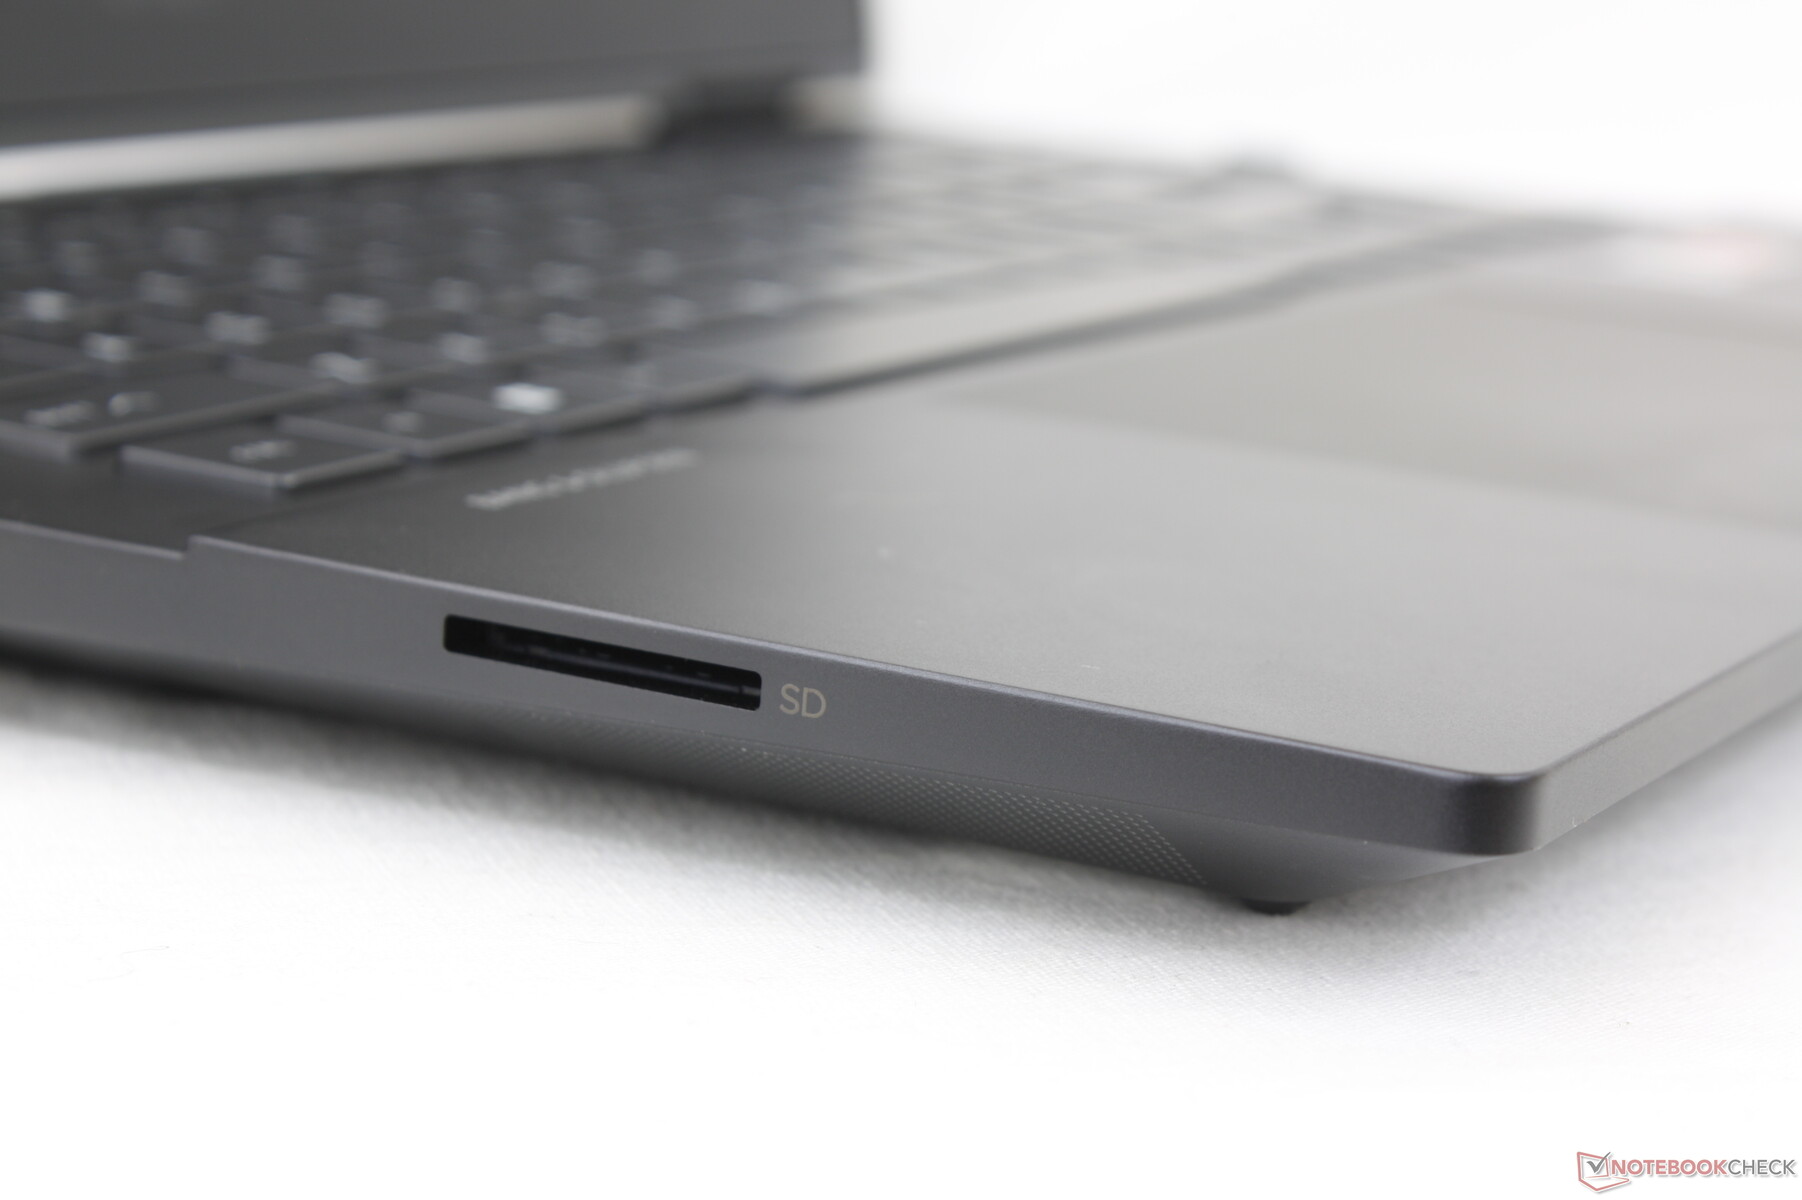
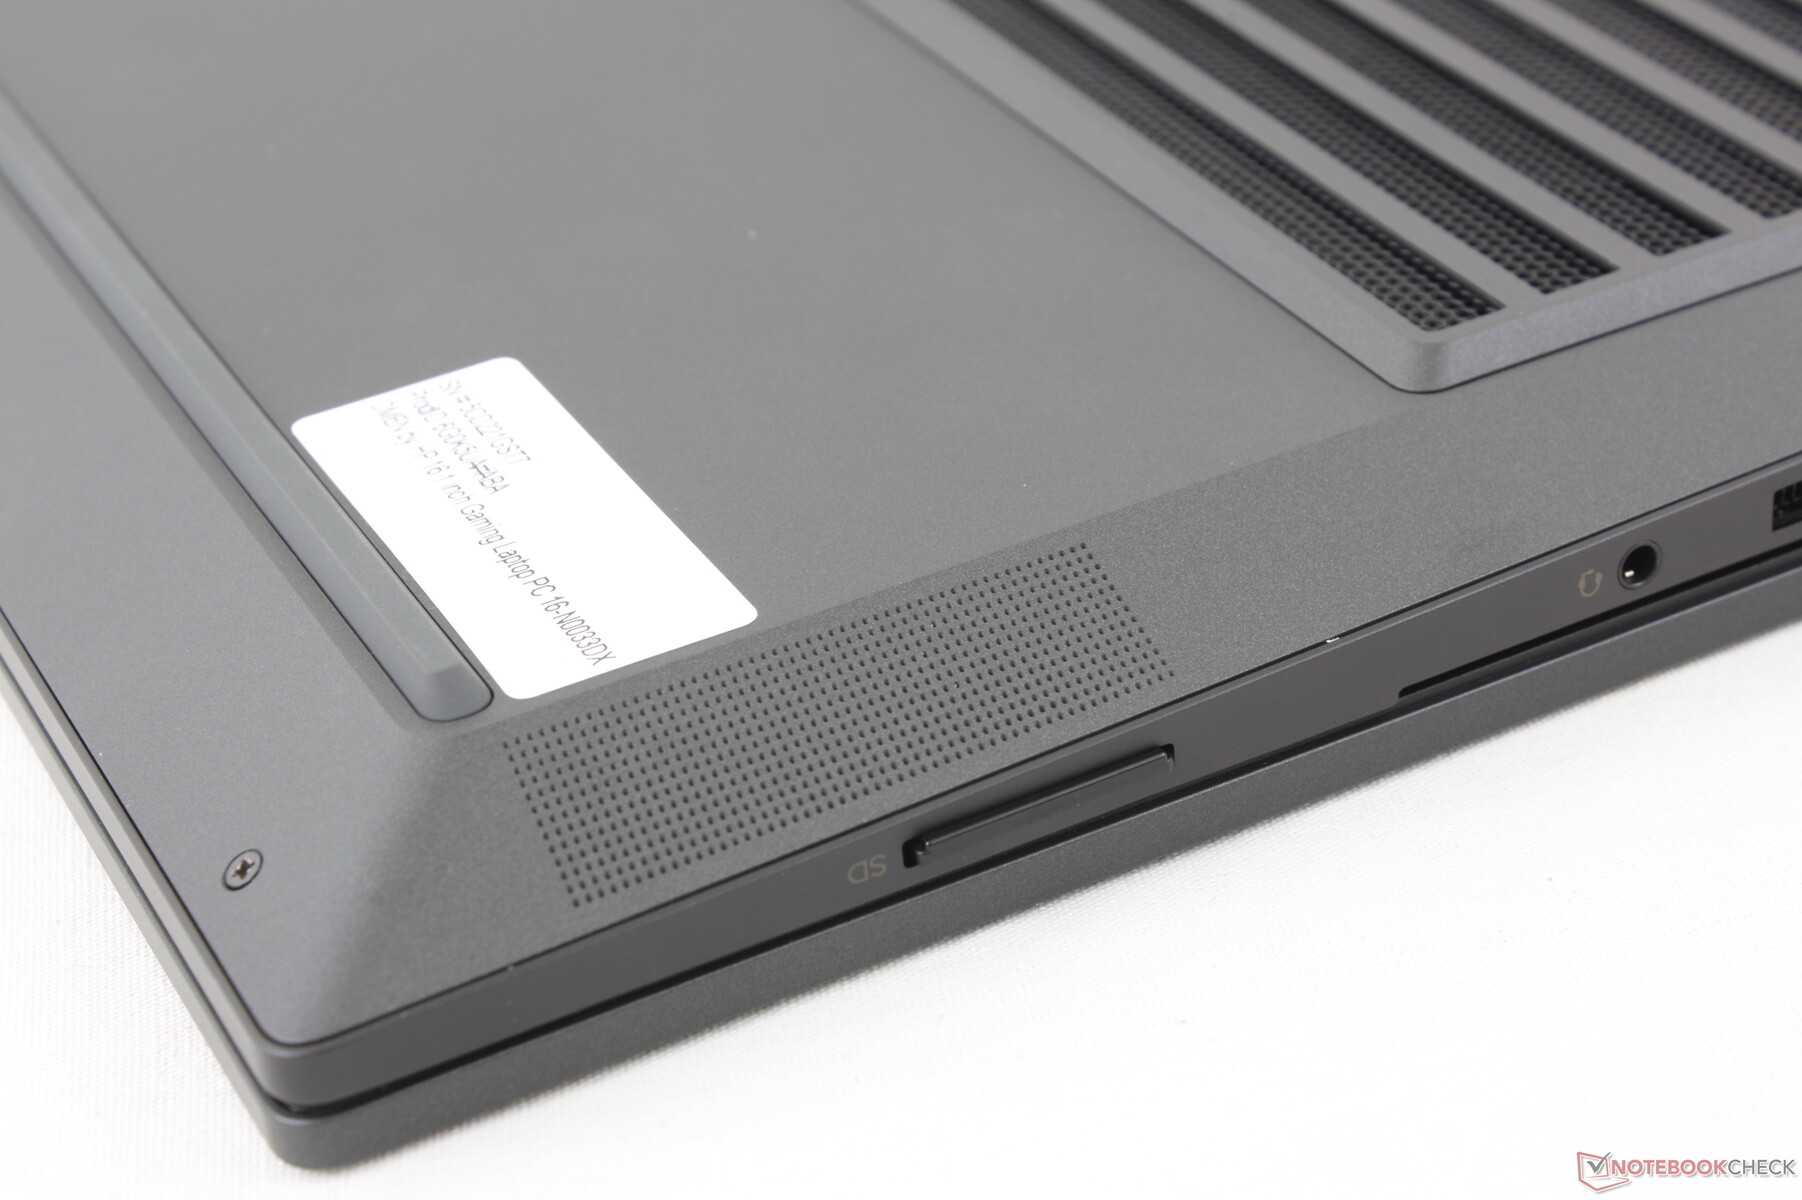
SD Card Reader
Transfer rates with the SD reader remain unchanged from last year's model. Many competing gaming laptops, such as the Dell G16, omit the card reader completely. Meanwhile, the SD reader on the Razer Blade 15 offers 2x the performance.
| SD Card Reader | |
| average JPG Copy Test (av. of 3 runs) | |
| Lenovo Legion S7 16ARHA7 (AV PRO microSD 128 GB V60) | |
| HP Omen 16-n0033dx (AV PRO microSD 128 GB V60) | |
| HP Victus 16-e0145ng (AV PRO microSD 128 GB V60) | |
| HP Envy 16 h0112nr (AV Pro SD microSD 128 GB V60) | |
| HP Omen 16-b1090ng (AV PRO microSD 128 GB V60) | |
| maximum AS SSD Seq Read Test (1GB) | |
| Lenovo Legion S7 16ARHA7 (AV PRO microSD 128 GB V60) | |
| HP Omen 16-n0033dx (AV PRO microSD 128 GB V60) | |
| HP Envy 16 h0112nr (AV Pro SD microSD 128 GB V60) | |
Communication
A MediaTek MT7922 comes standard for Wi-Fi 6E and Bluetooth 5.2 connectivity. Most other gaming laptops ship with the Intel AX201/210 series instead, but the MediaTek solution is likely the more affordable option. Transfer rates are excellent and with no performance issues when connected to our 6 GHz network.
| Networking | |
| iperf3 receive AXE11000 6GHz | |
| Lenovo Legion S7 16ARHA7 | |
| HP Omen 16-n0033dx | |
| HP Envy 16 h0112nr | |
| iperf3 receive AXE11000 | |
| HP Omen 16-n0033dx | |
| Dell G16 7620 | |
| HP Omen 16-b1090ng | |
| HP Victus 16-e0145ng | |
| iperf3 transmit AXE11000 | |
| HP Omen 16-n0033dx | |
| HP Omen 16-b1090ng | |
| Dell G16 7620 | |
| HP Victus 16-e0145ng | |
| iperf3 transmit AXE11000 6GHz | |
| Lenovo Legion S7 16ARHA7 | |
| HP Omen 16-n0033dx | |
| HP Envy 16 h0112nr | |
Webcam
The webcam is disappointing at just 720p or 1 MP whereas other gaming laptops like the Razer Blade 15 have 1080p or 2 MP webcams. Additionally, the model lacks both a webcam shutter and an IR sensor.


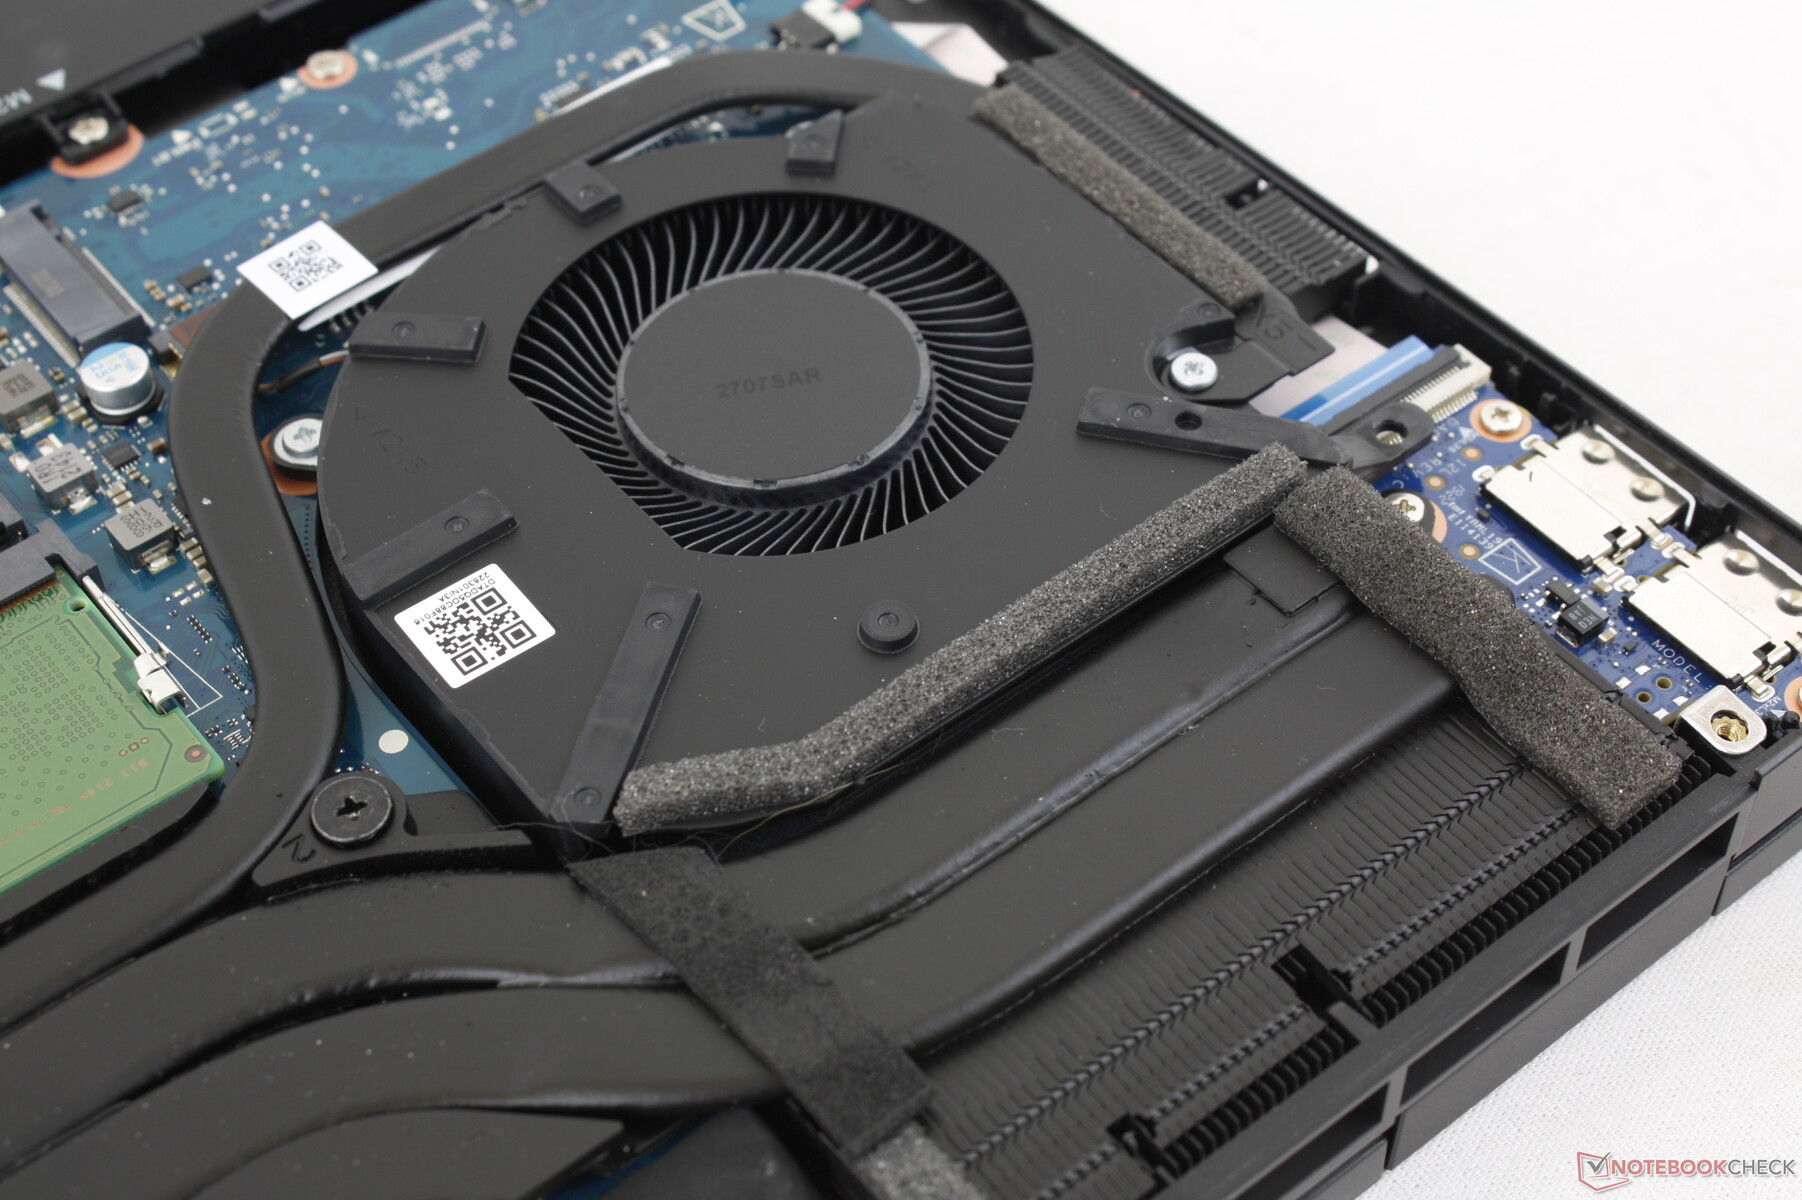
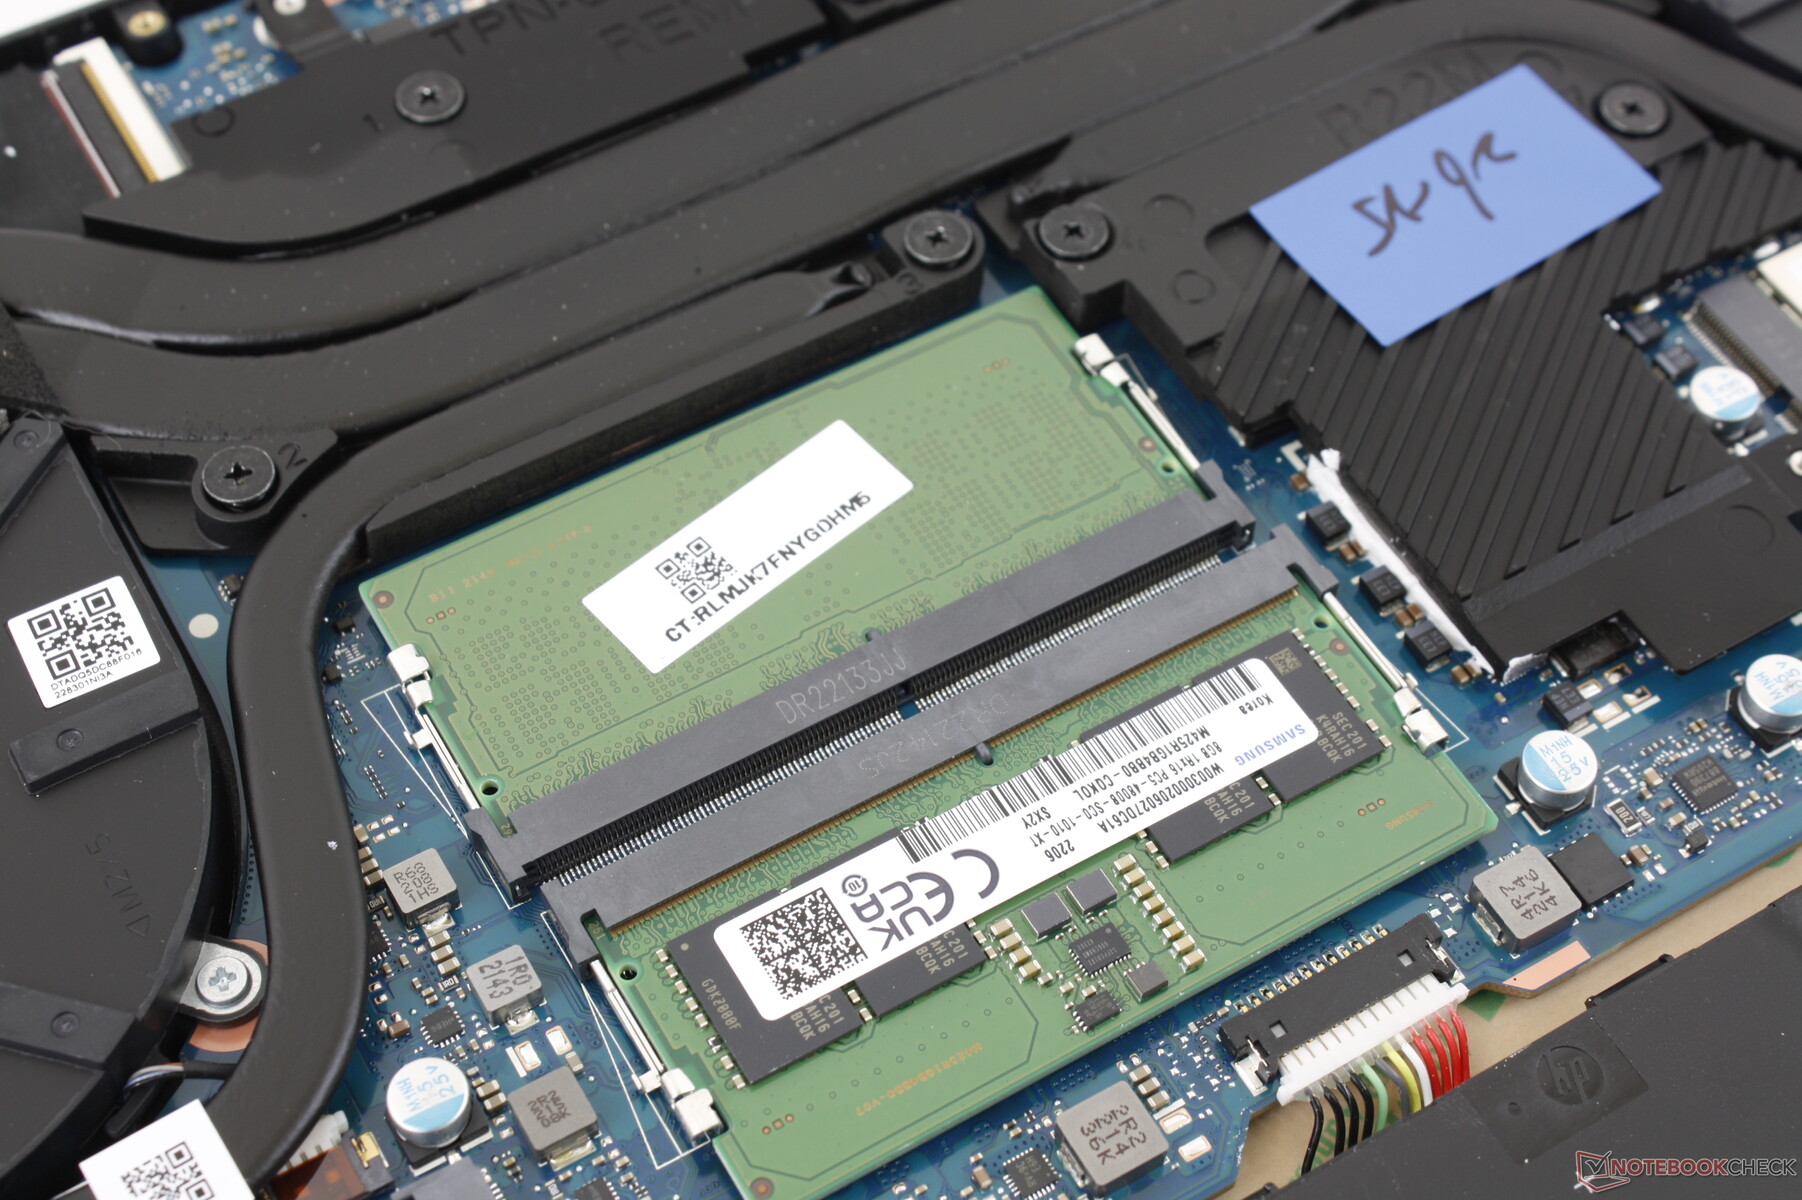
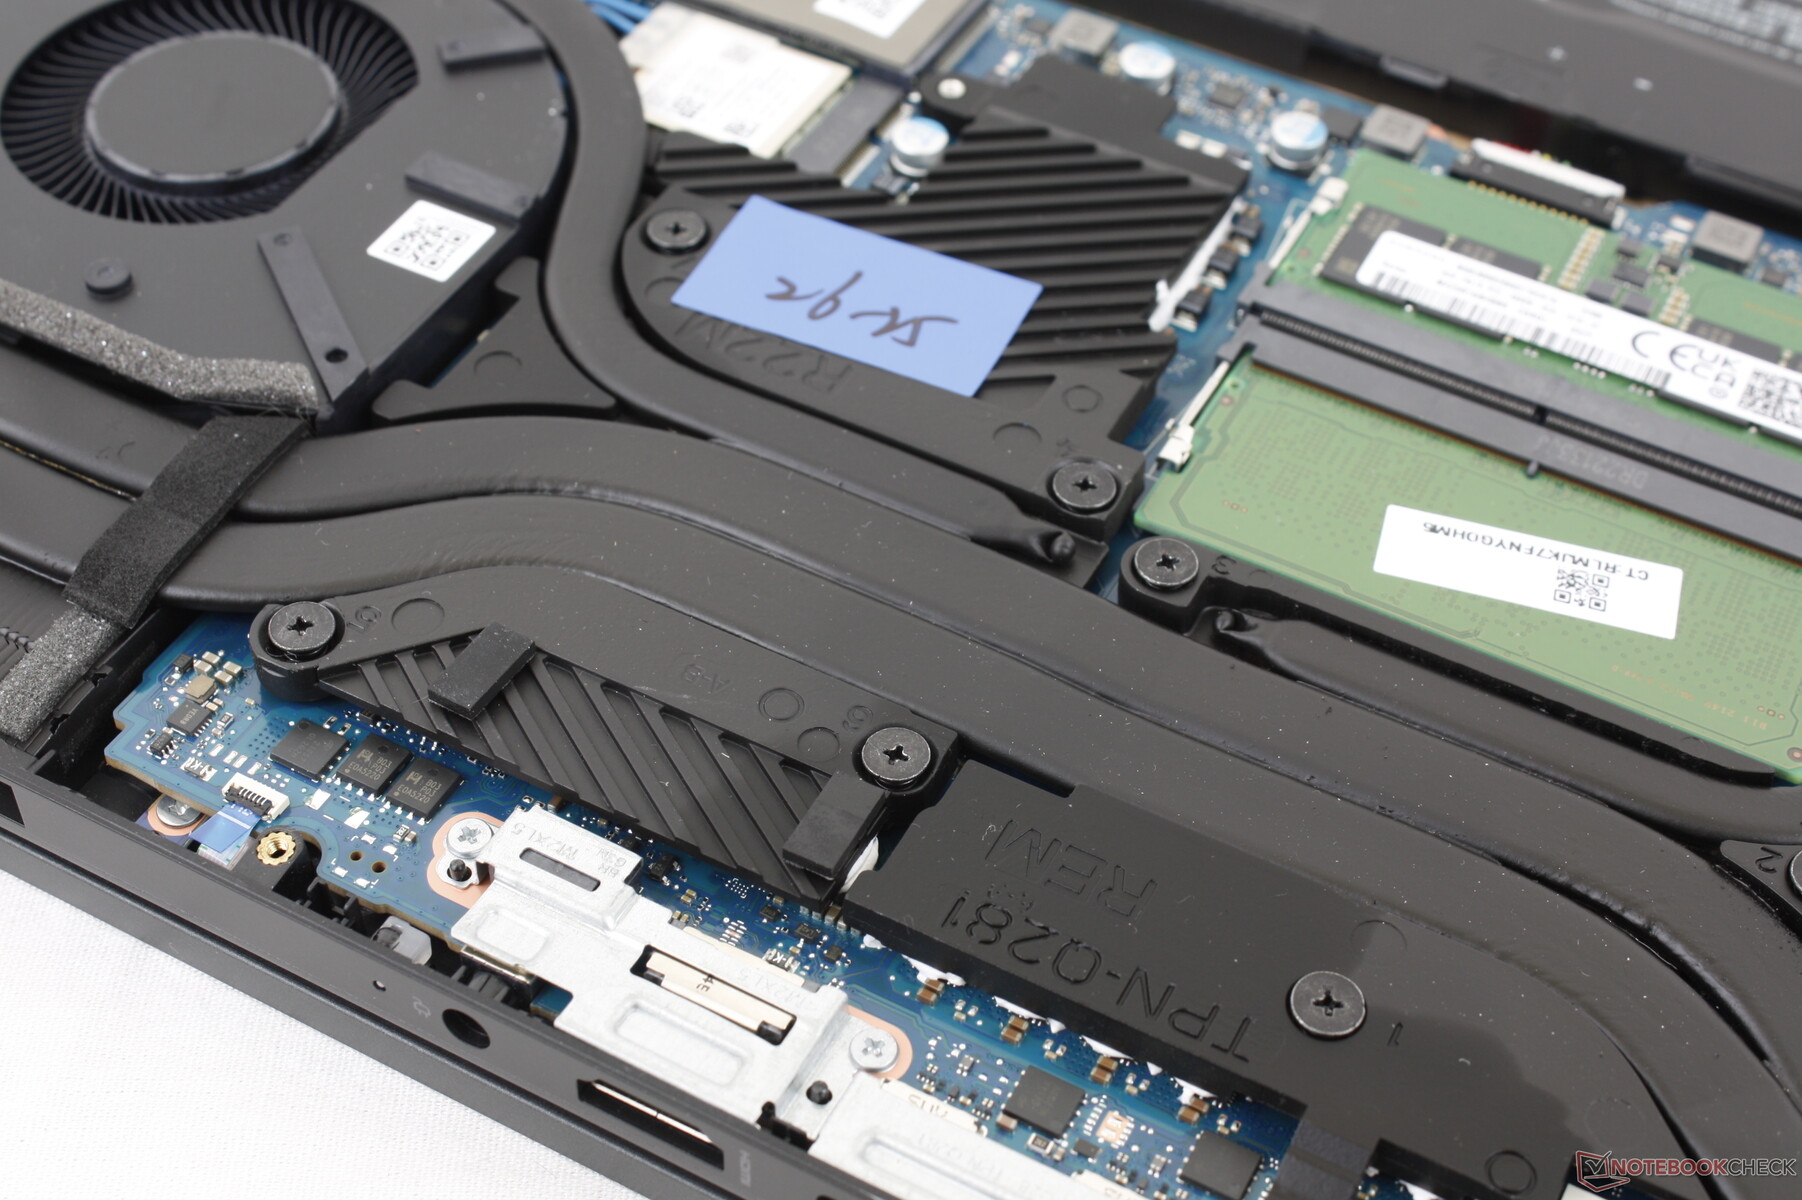
Maintenance
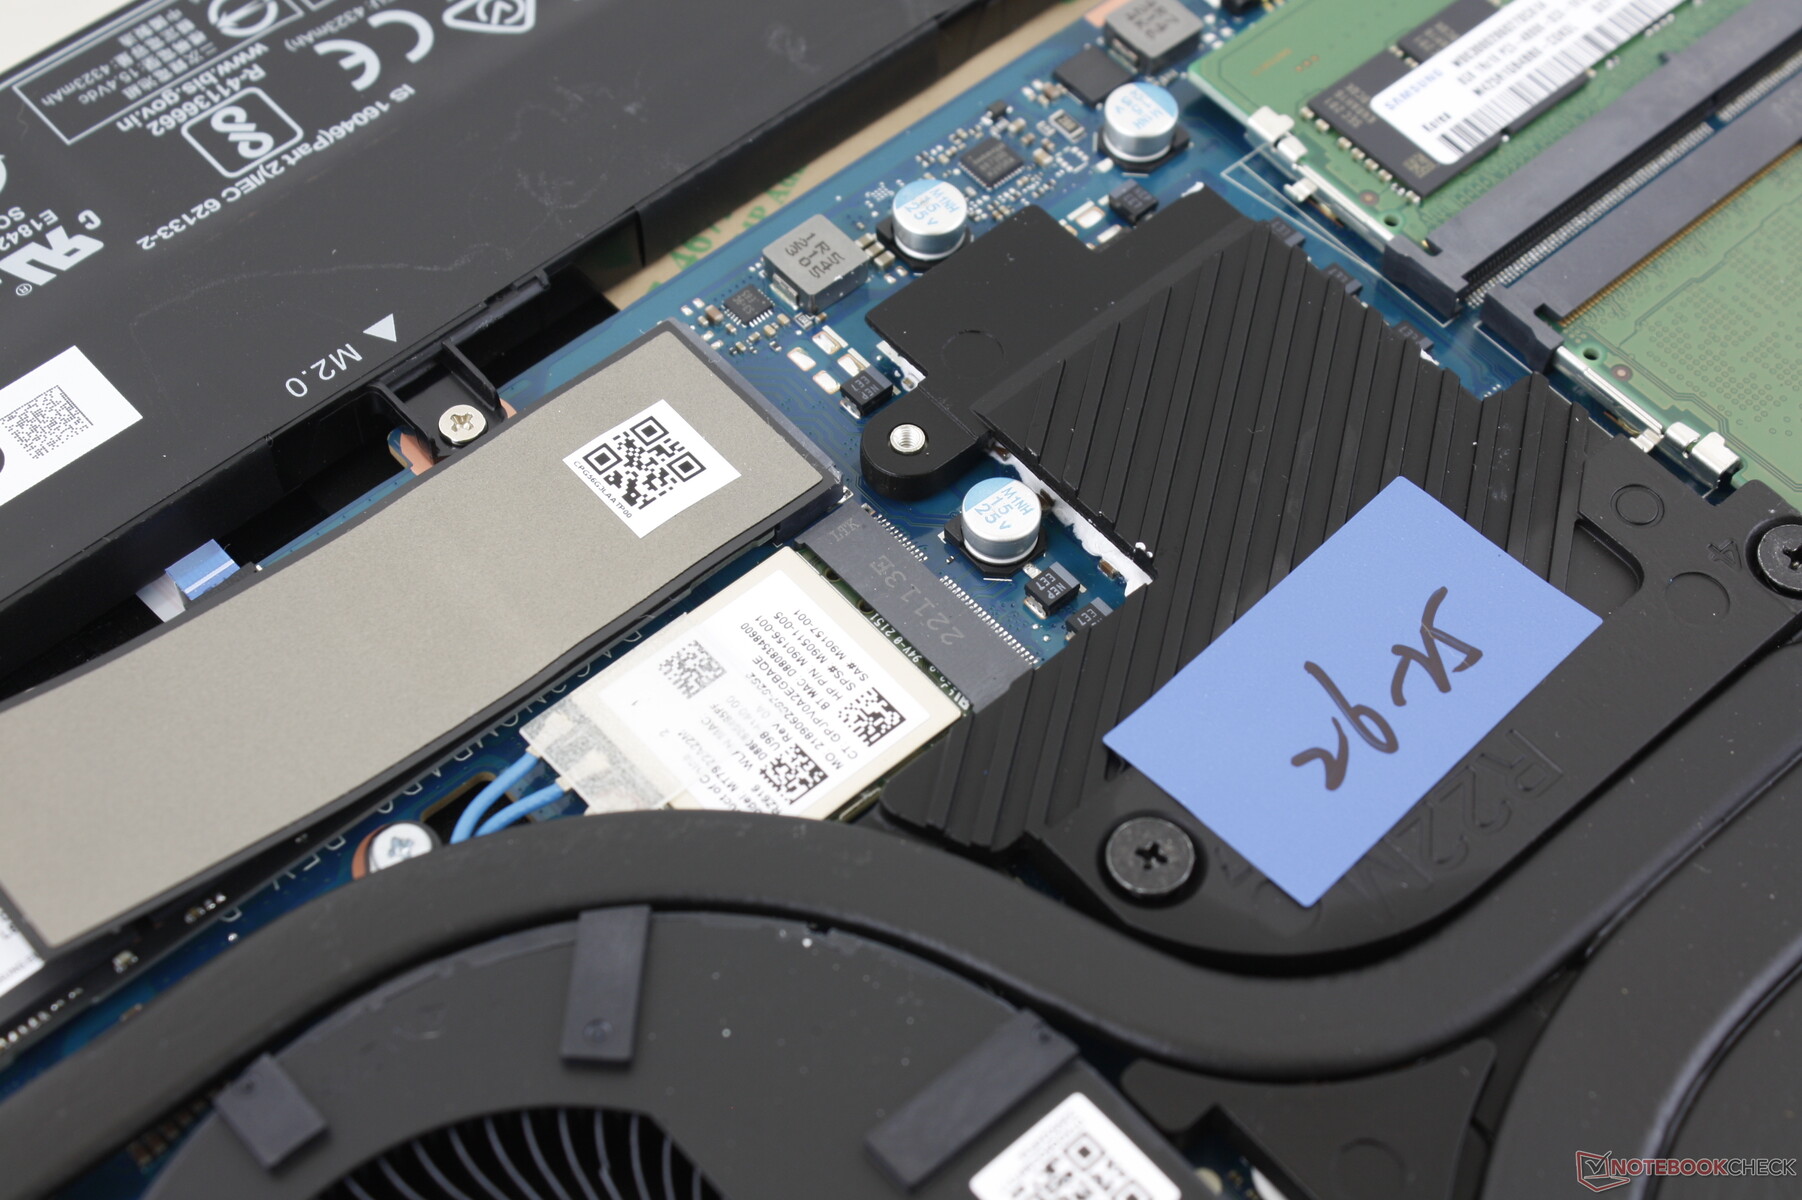
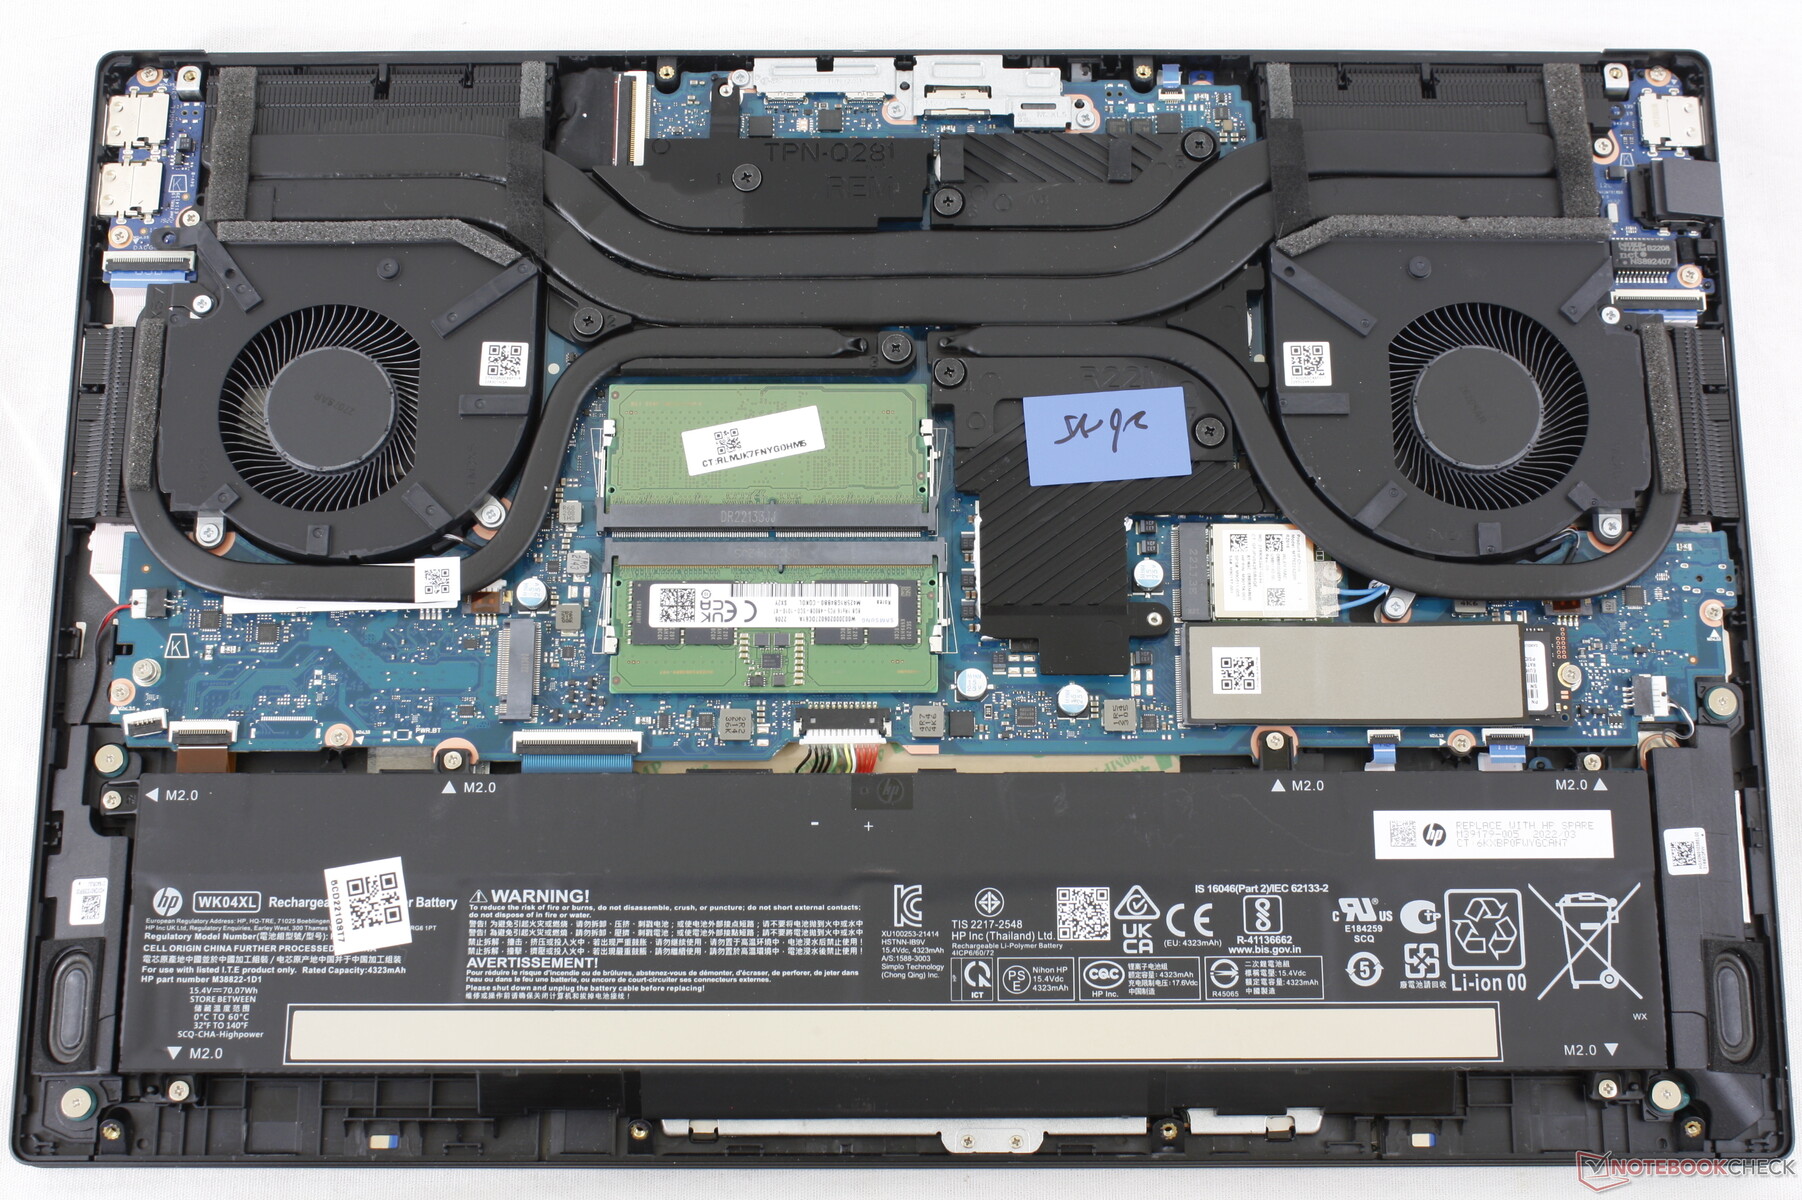
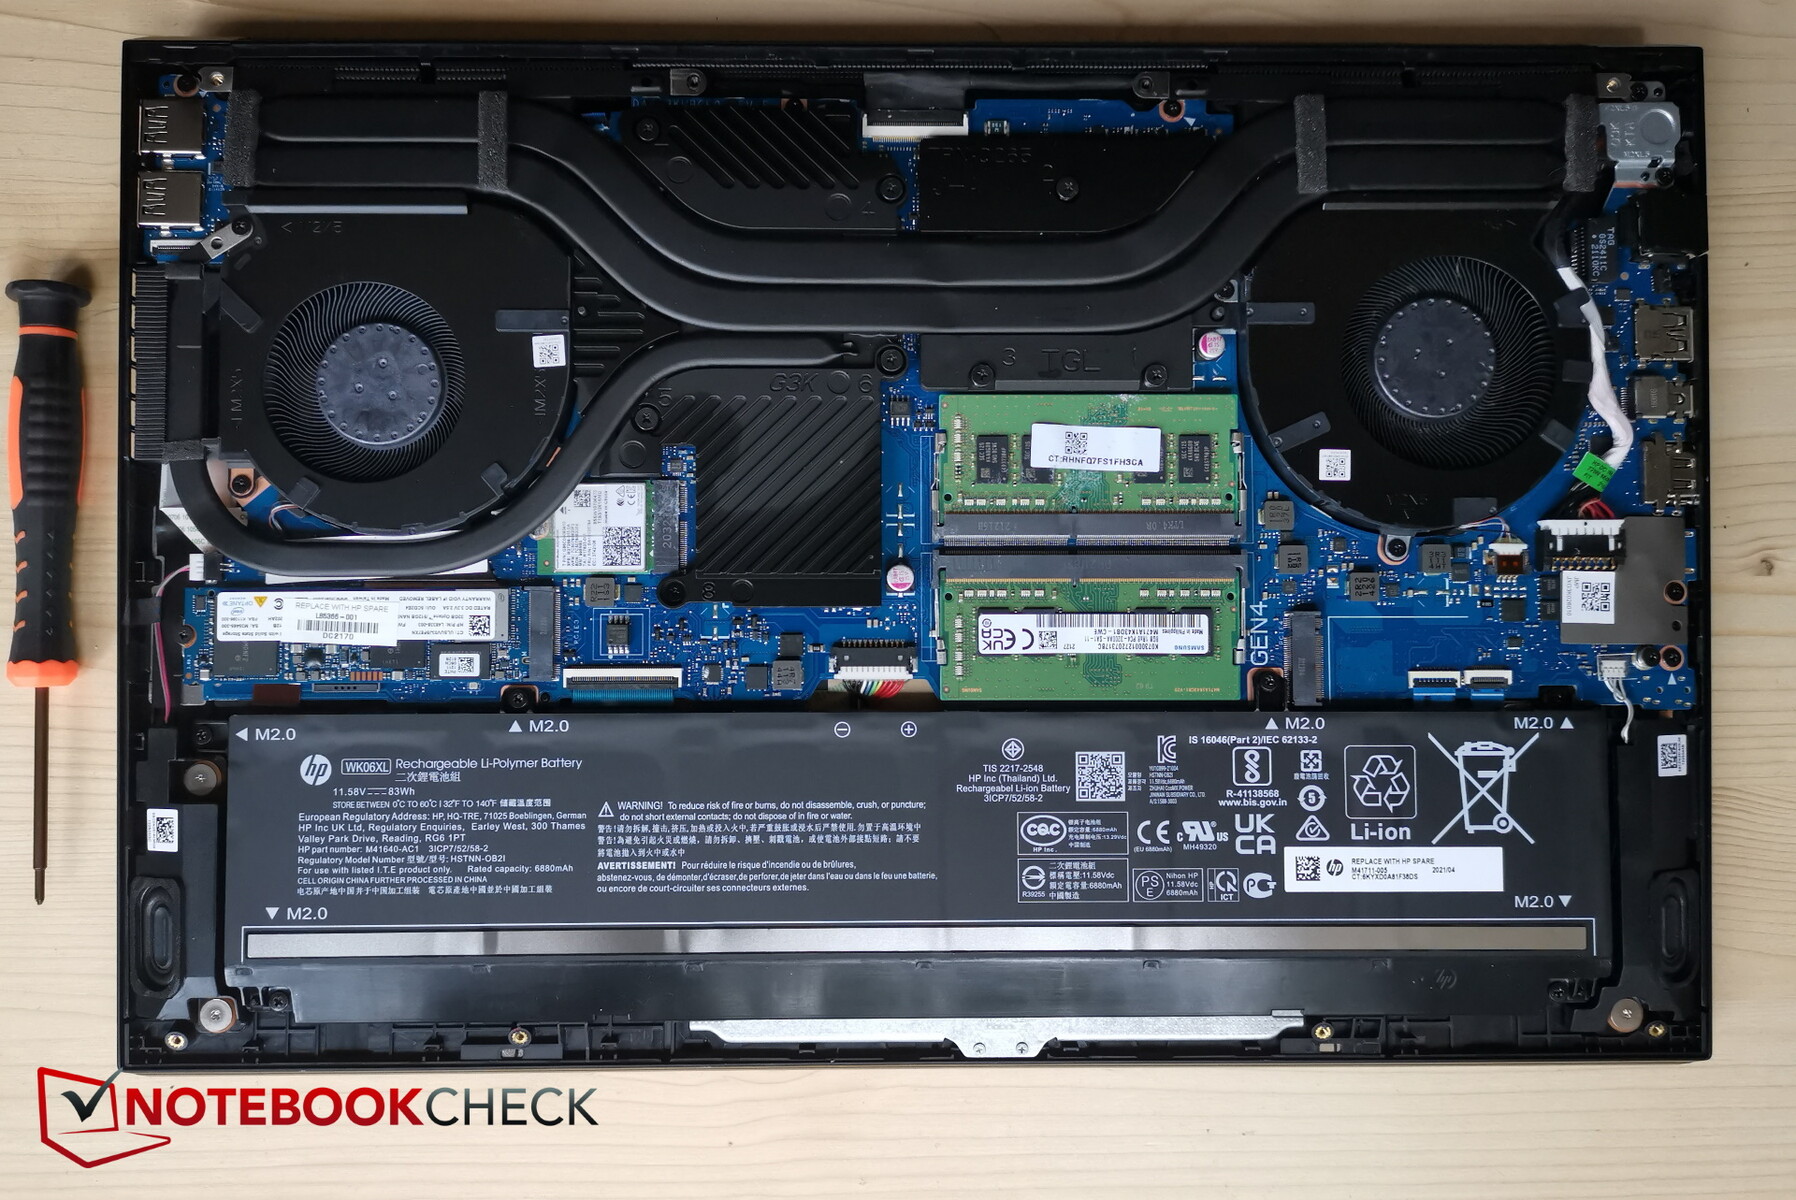
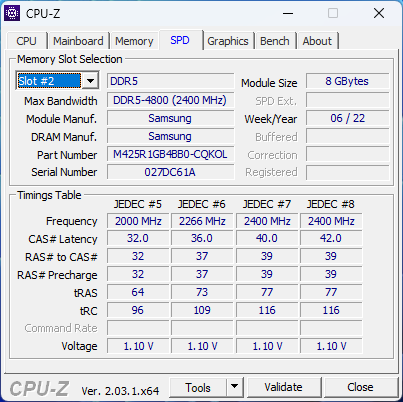
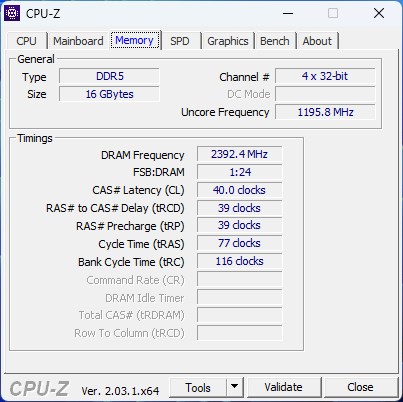
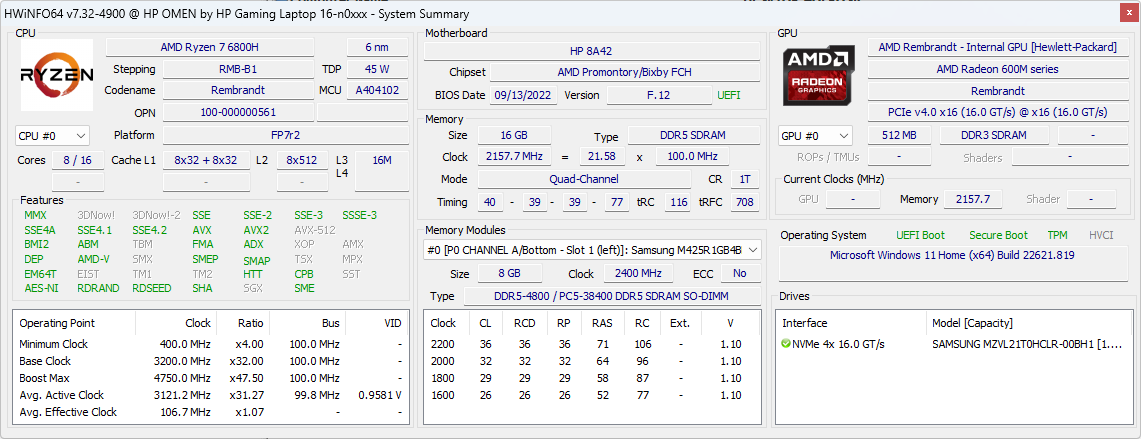
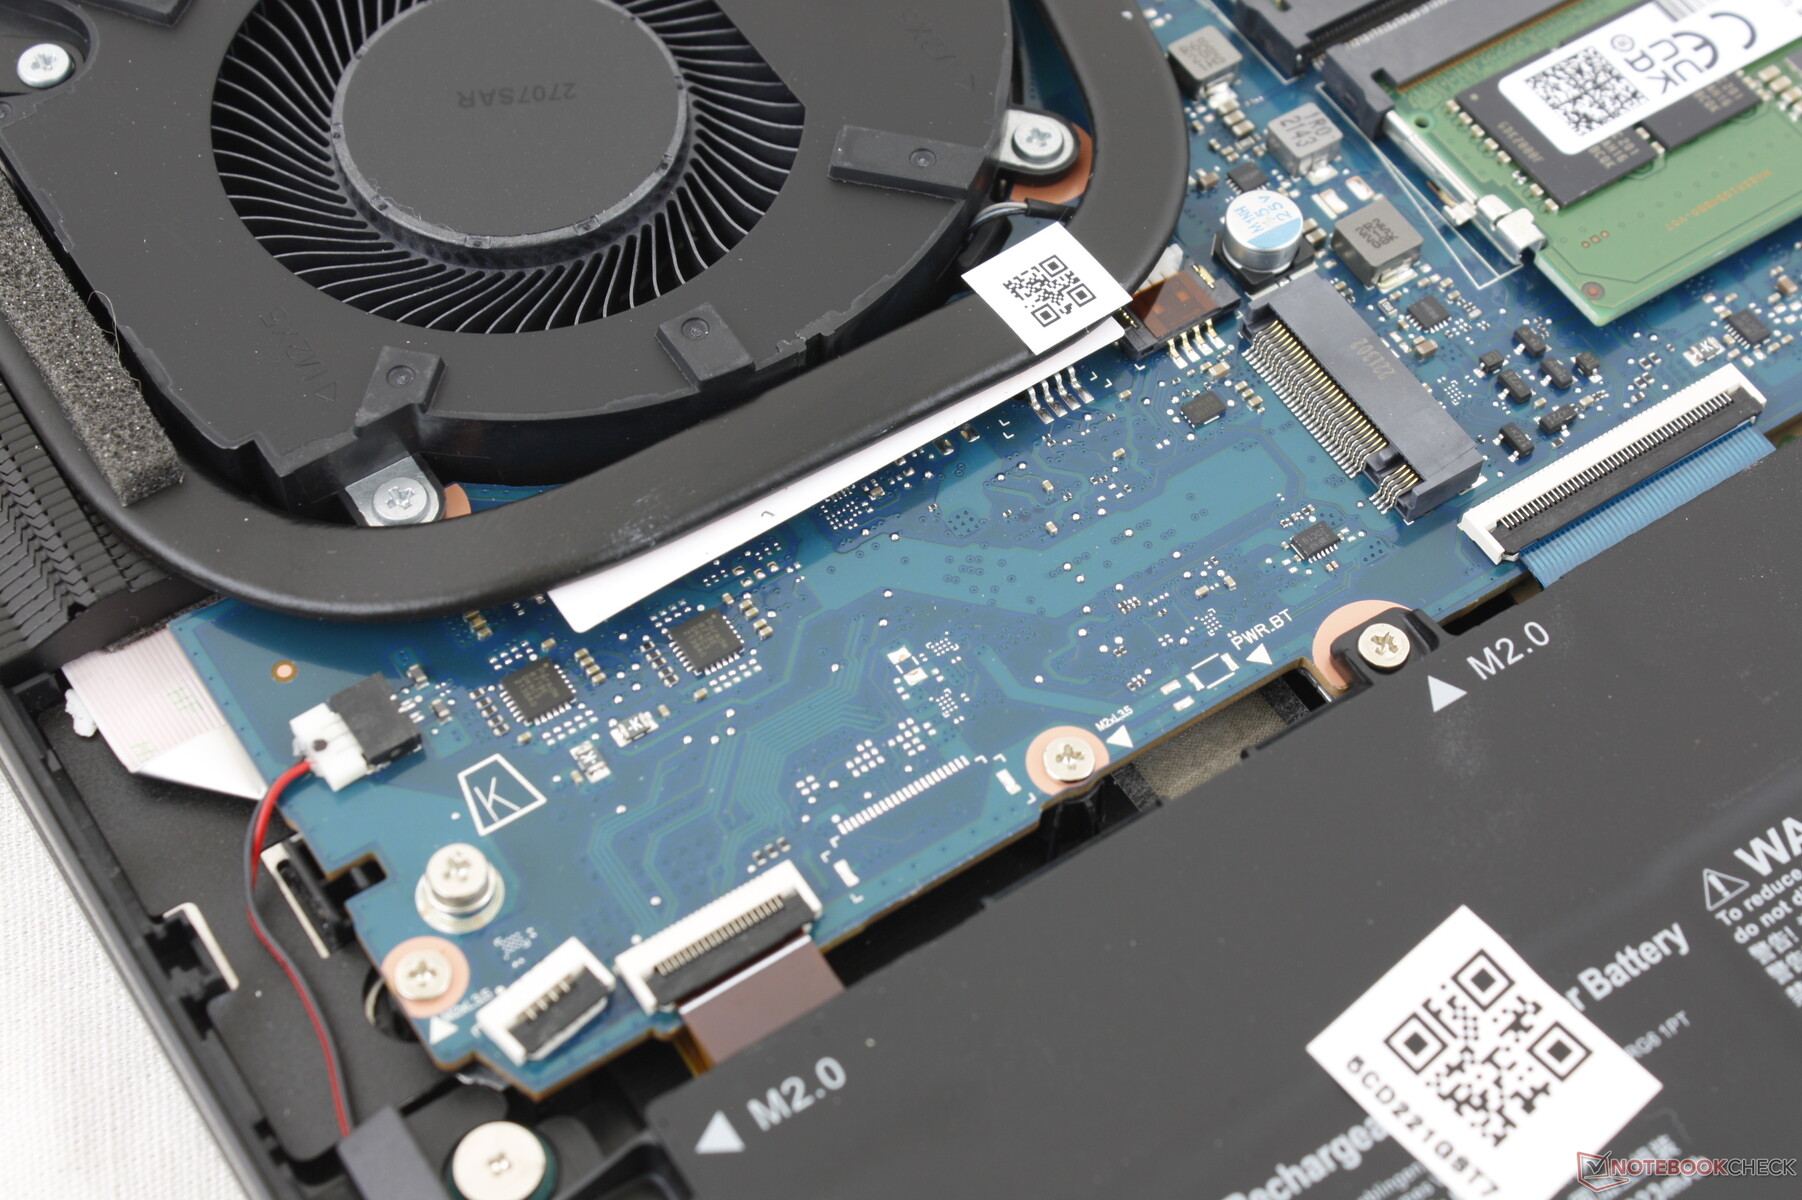
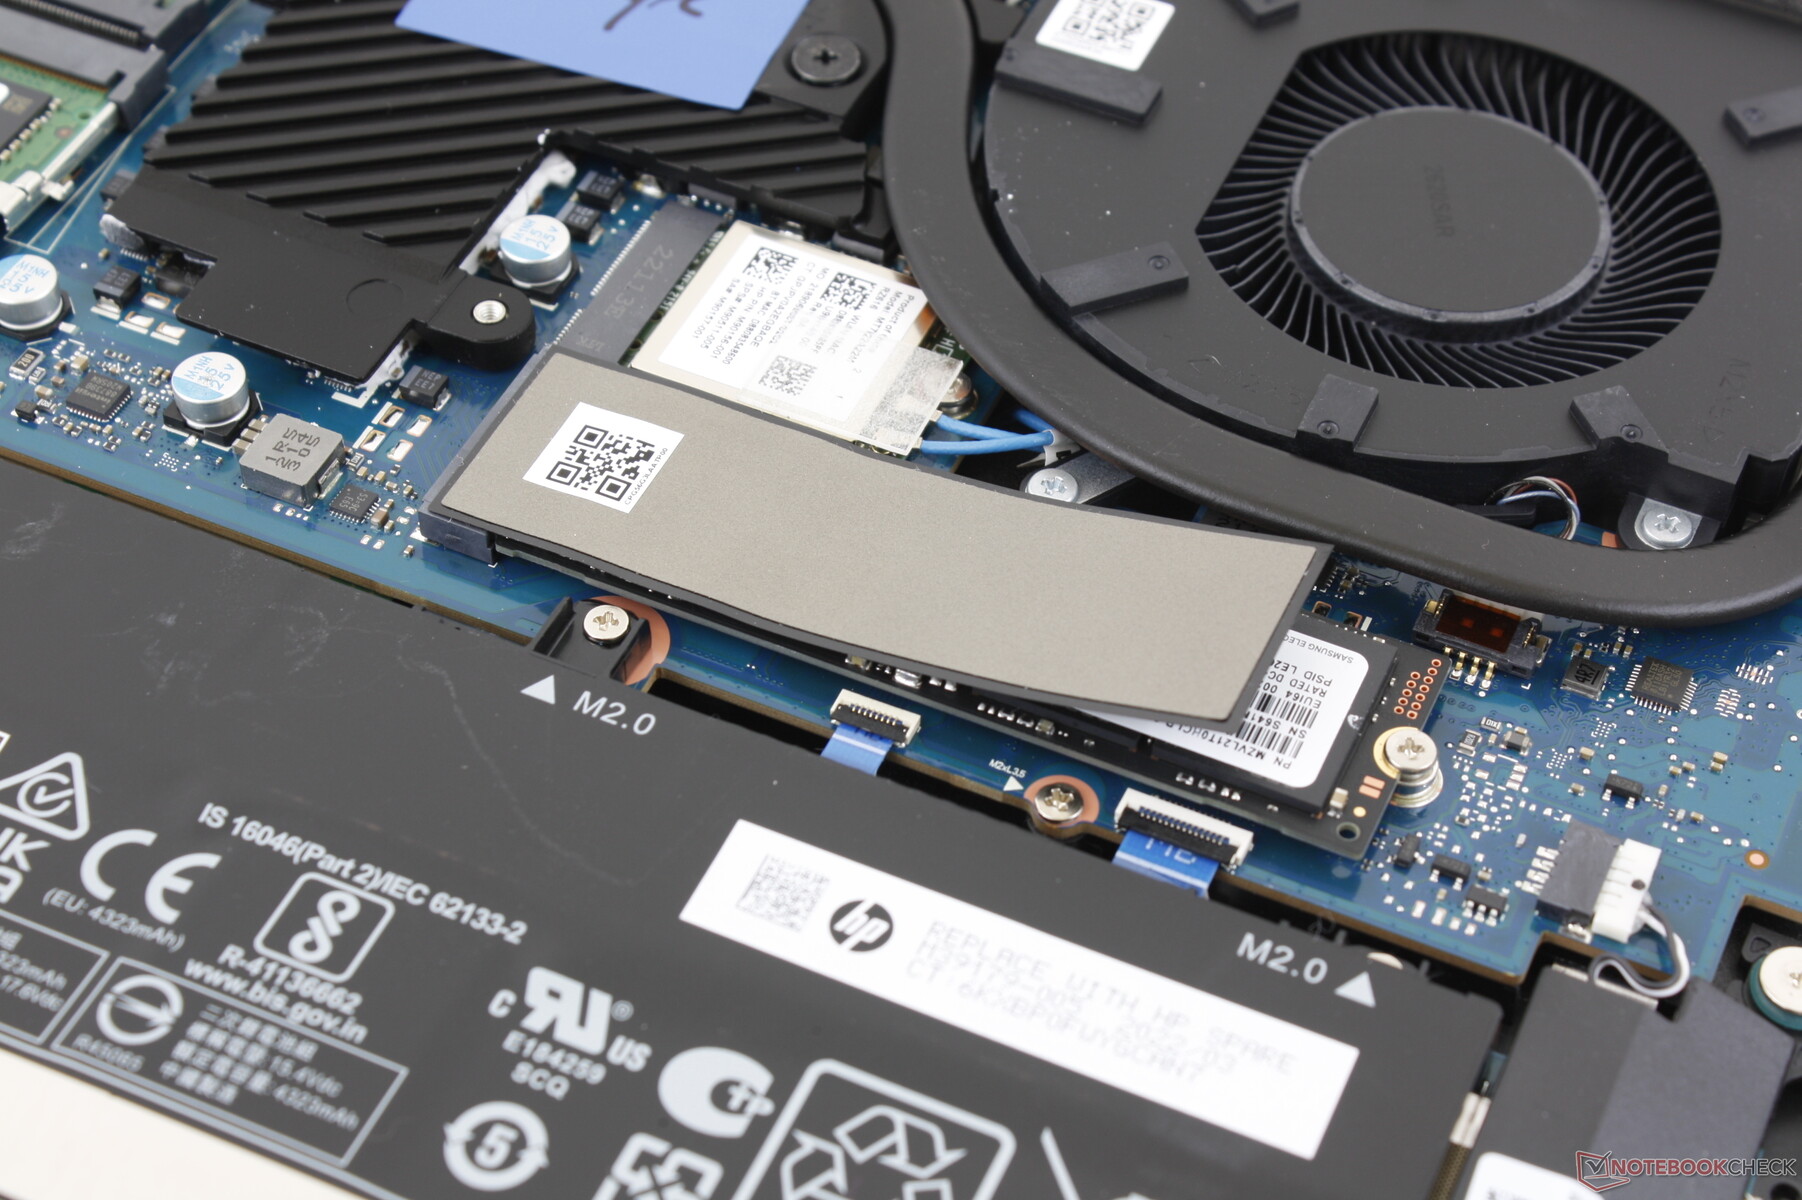
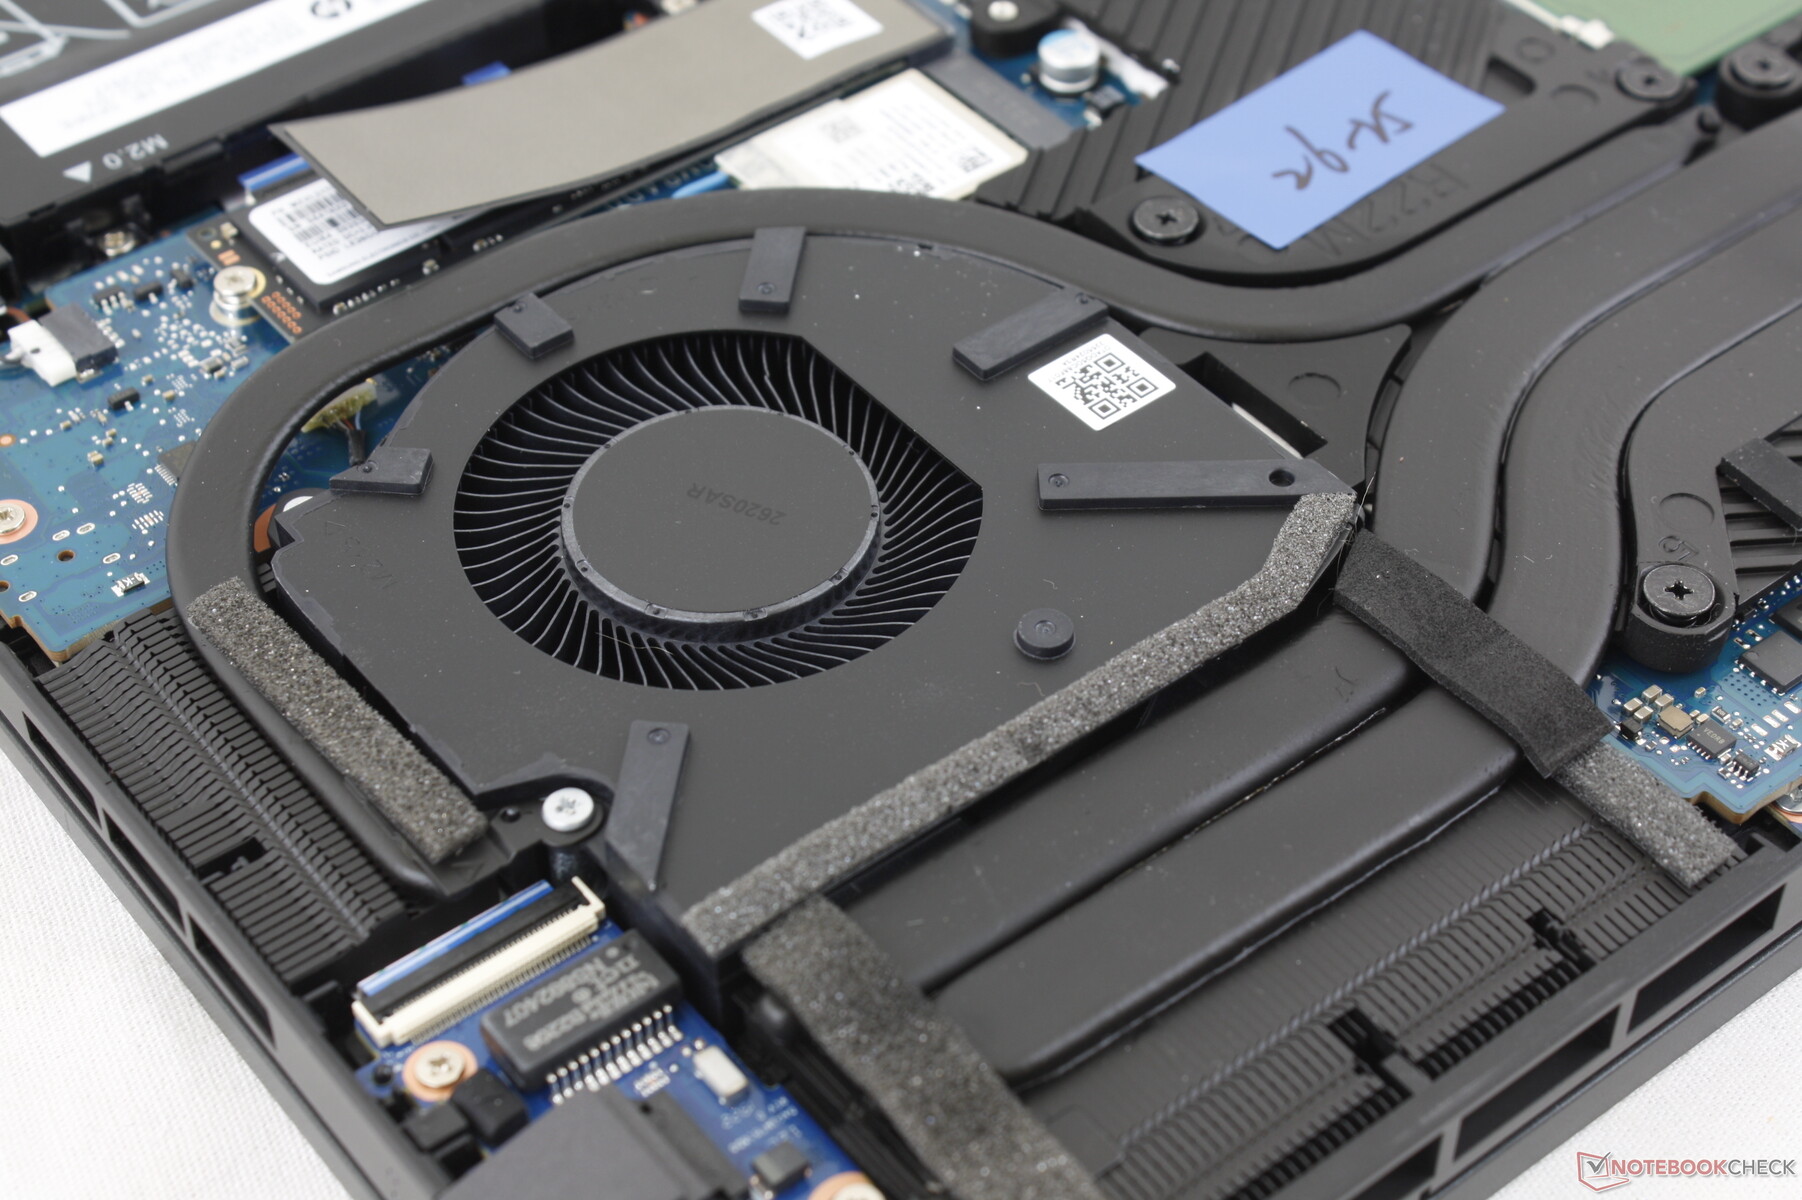
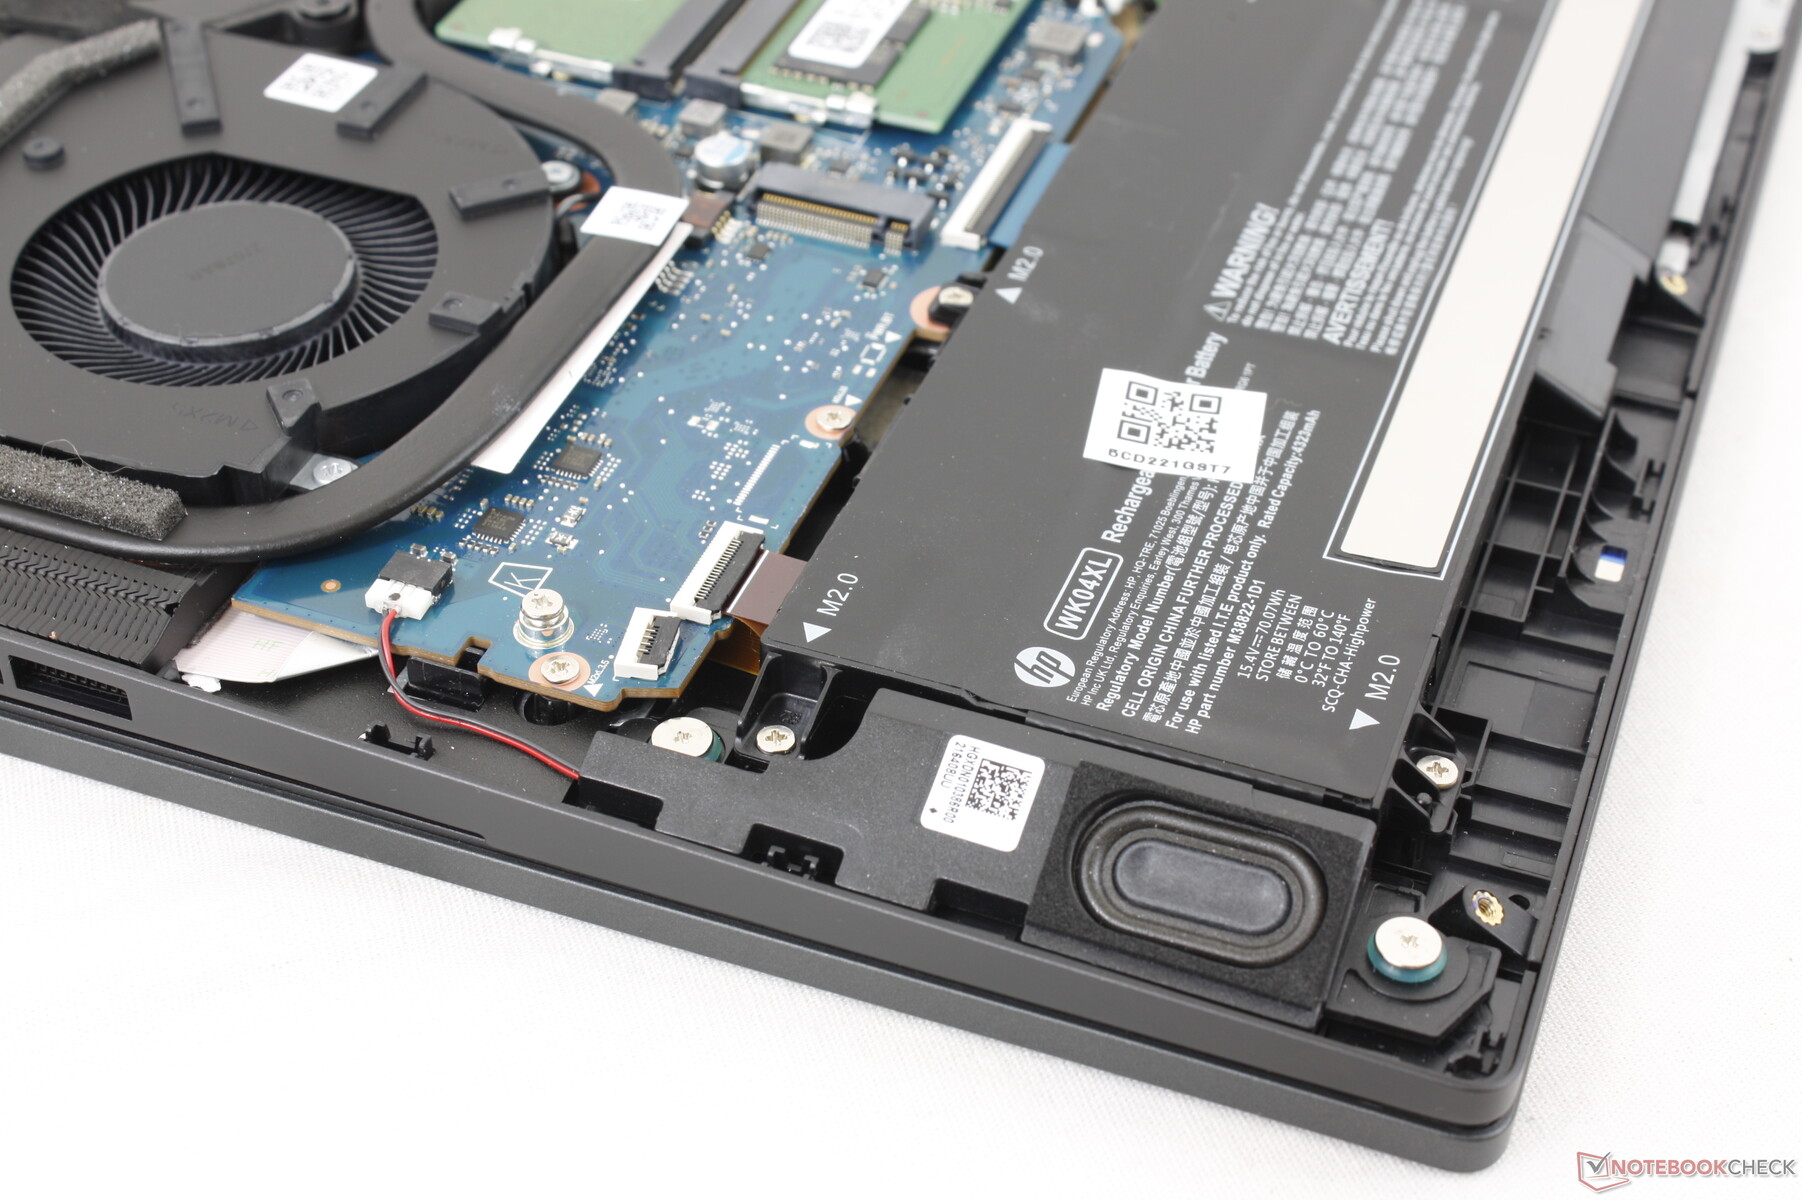
The bottom panel is secured by eight Philips screws for easy servicing. Users have direct access to 2x M.2 storage bays, 2x DDR5 SODIMM slots, the removable WLAN module, and the main battery.
Accessories and Warranty
There are no extras in the box other than the AC adapter and paperwork. The usual one-year limited warranty applies.
Input Devices — Comfortable Keyboard, Uncomfortable Clickpad
Keyboard
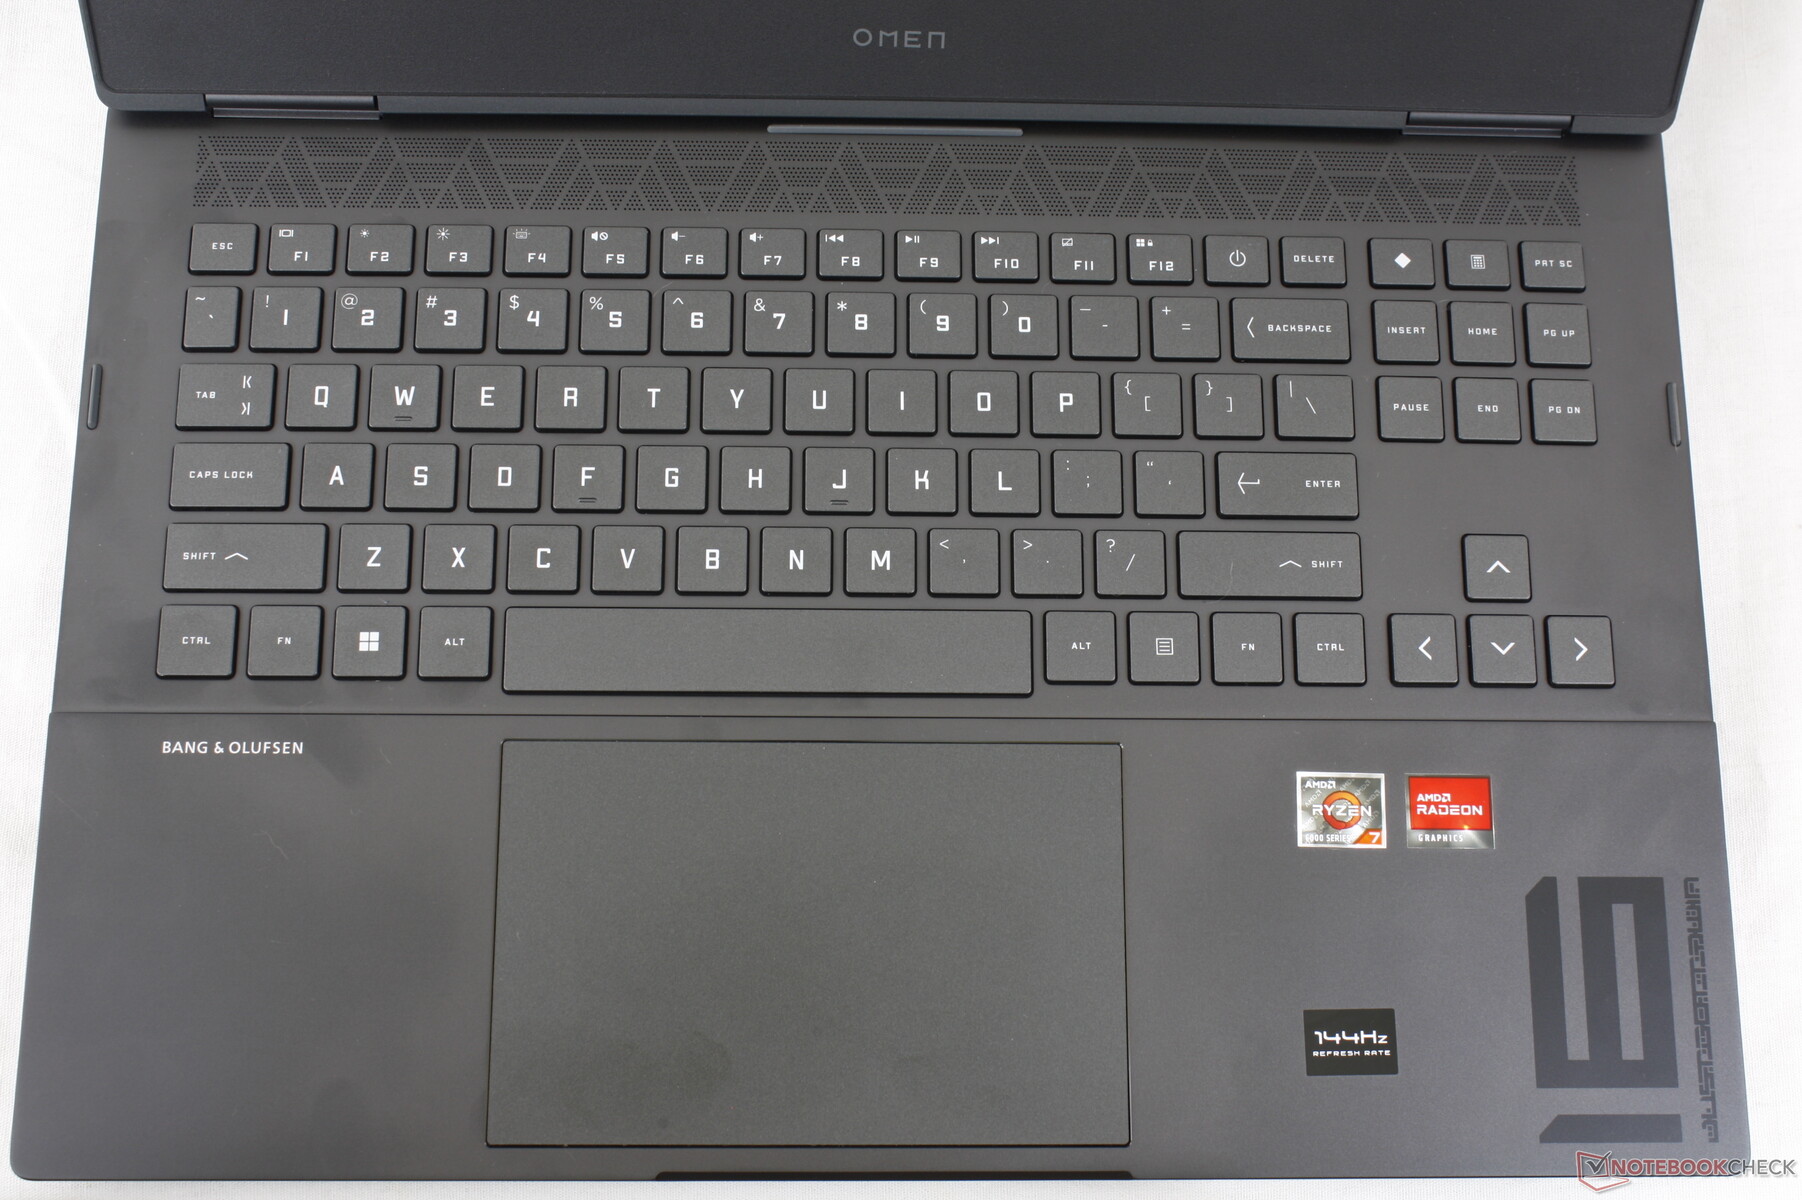
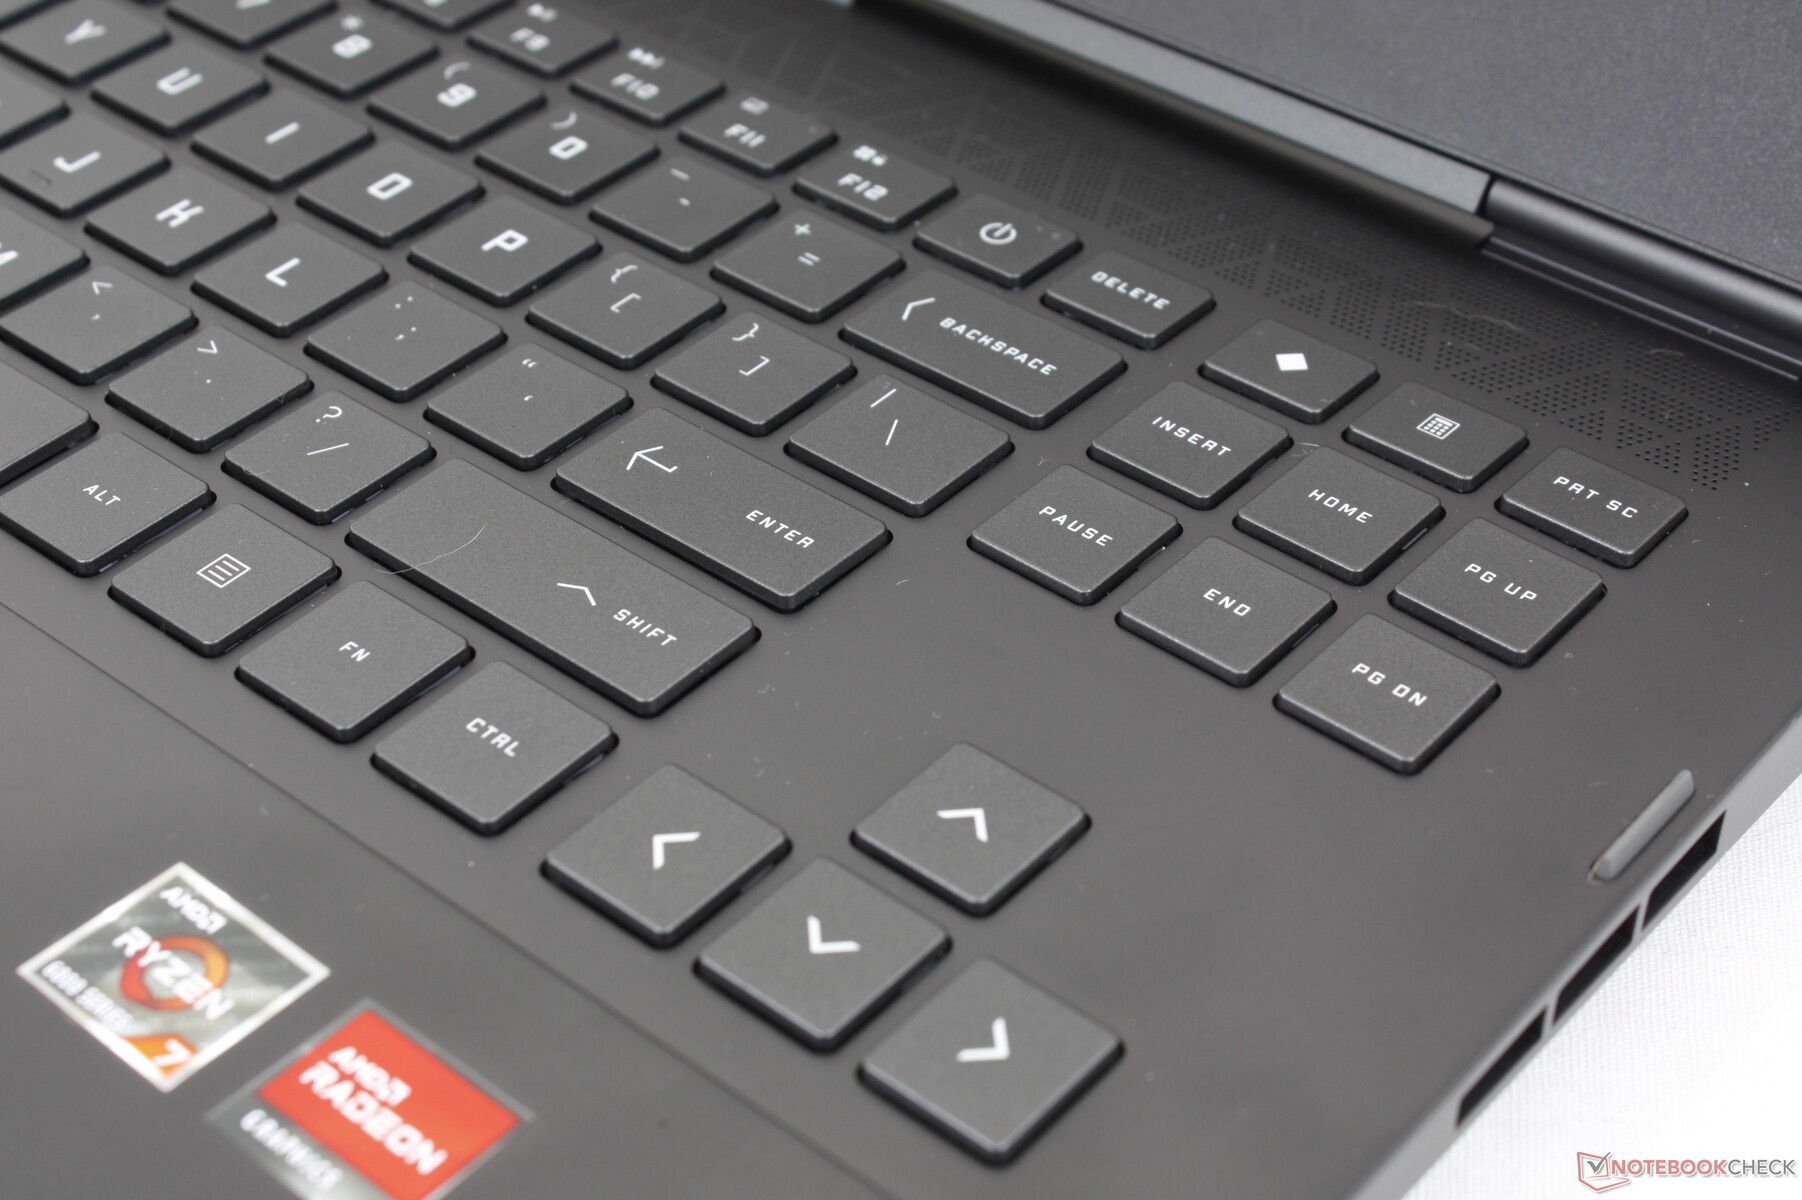
The typing experience remains identical to last year's Omen 16 since there are no changes to the keyboard. Key travel is shallow and Ultrabook-like, but the firm feedback and extra-large Space key make up for it. We would like to see the Power button move somewhere else on future revisions as its current location next to the Backspace and Del keys makes it easy to accidentally press.
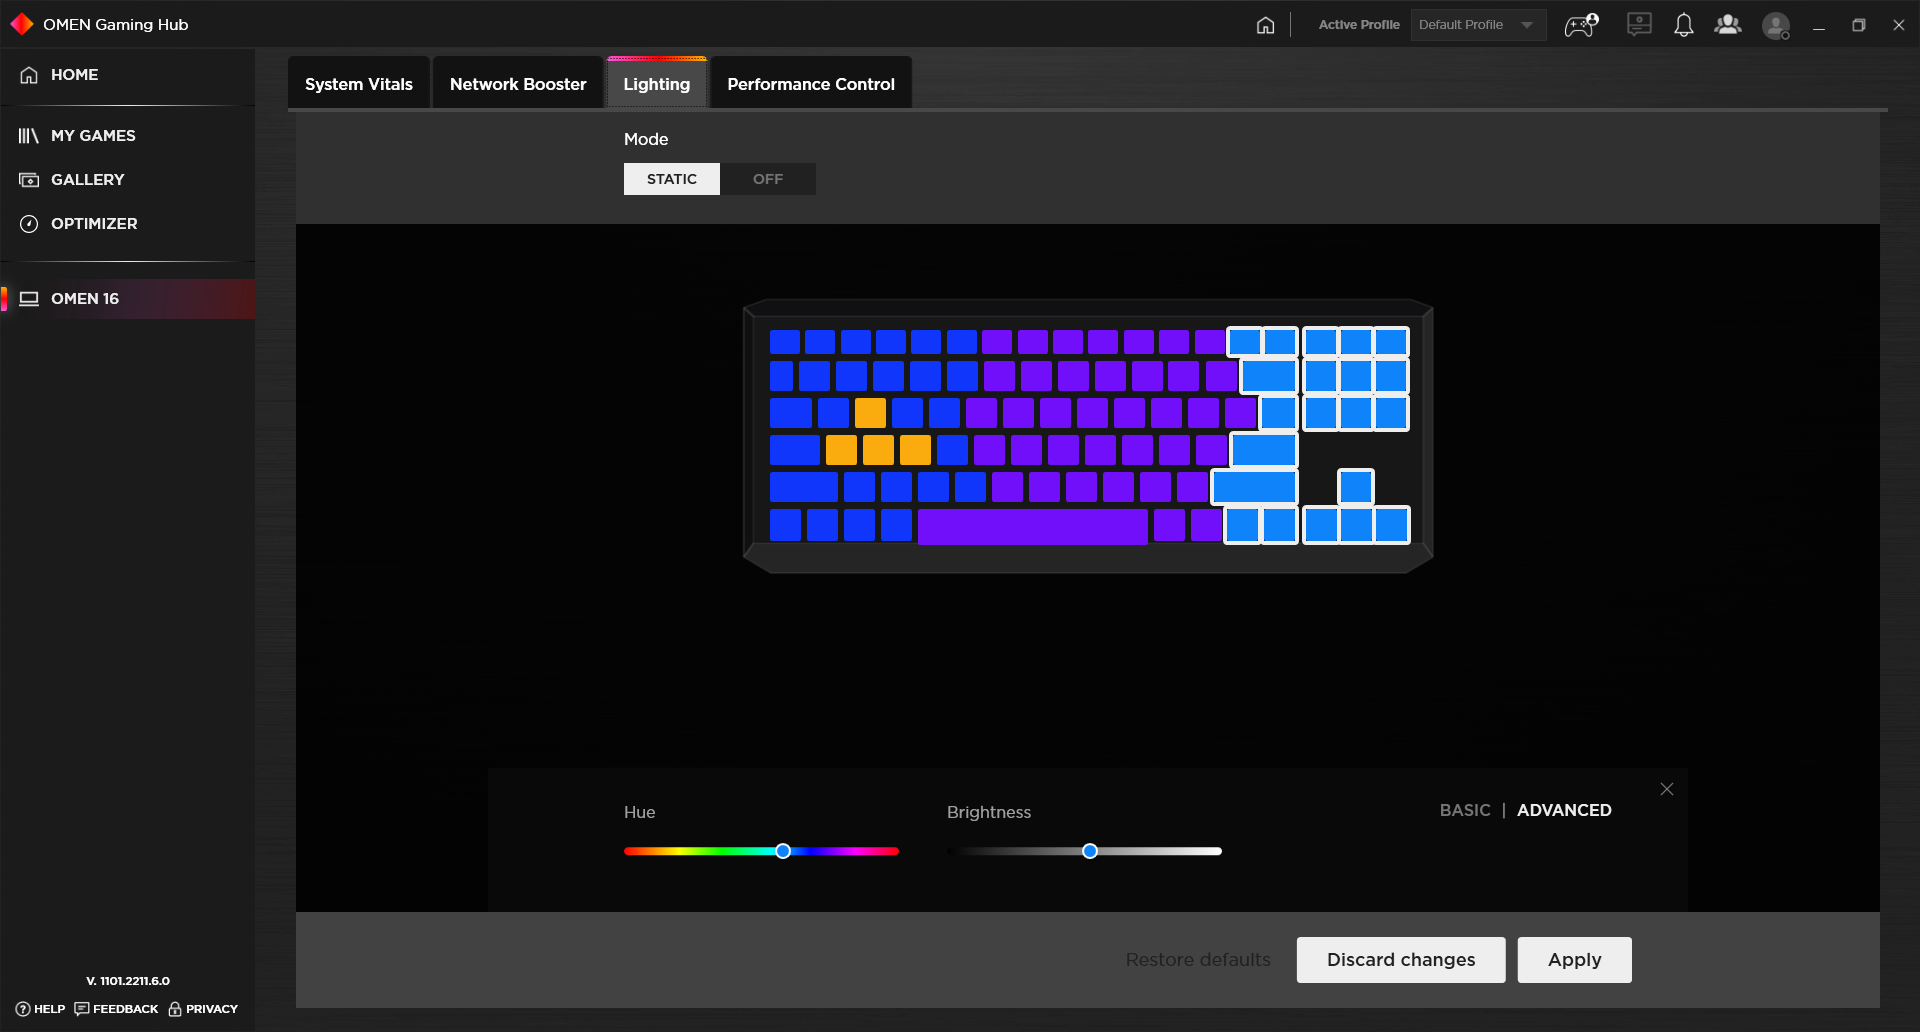
The keyboard backlight is split into four different zones as opposed to per-key RGB which is disappointing considering the high price point and performance levels of the Omen 16.
Touchpad
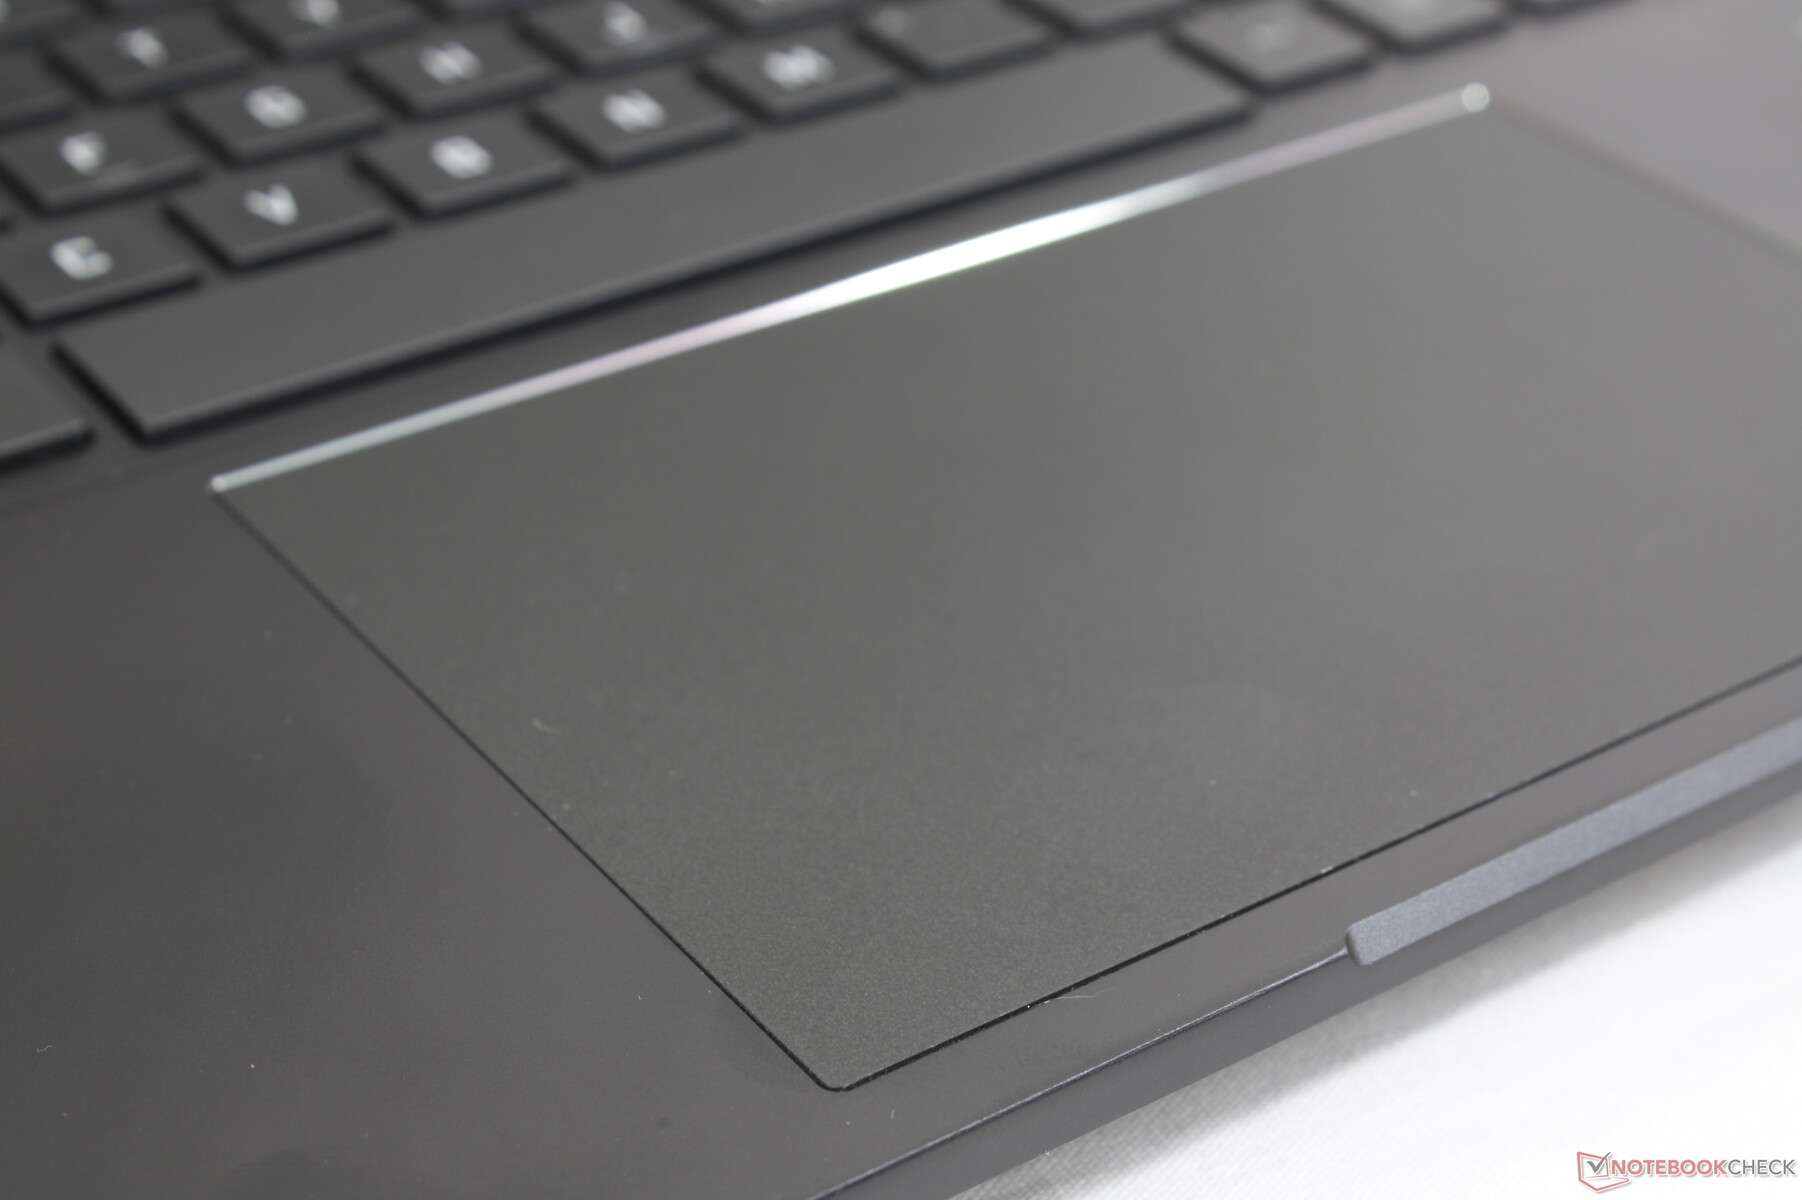
The clickpad is much larger than the one on the Dell G16 (13 x 8.6 cm vs. 10.5 x 6 cm) for easier multi-touch inputs. Traction is smooth and with minimal sticking much like on the outer lid or surrounding palm rests.
Unfortunately, a major drawback to the clickpad here is its oversensitivity to pressure. When scrolling with a finger, for example, it becomes too easy to accidentally input a click which makes the whole laptop very annoying to use without an external mouse. The clickpads on other gaming laptops are much less sensitive in comparison.

Display — FreeSync With 144 Hz And 100% sRGB
There are three display options to choose from as follows:
- 1080p, 144 Hz, 250 nits
- 1080p, 144 Hz, 300 nits
- 1440p, 165 Hz, 300 nits
Our display measurements here reflect only the bolded option above. The highest-end 165 Hz option is available on both Intel and AMD Omen 16 SKUs.
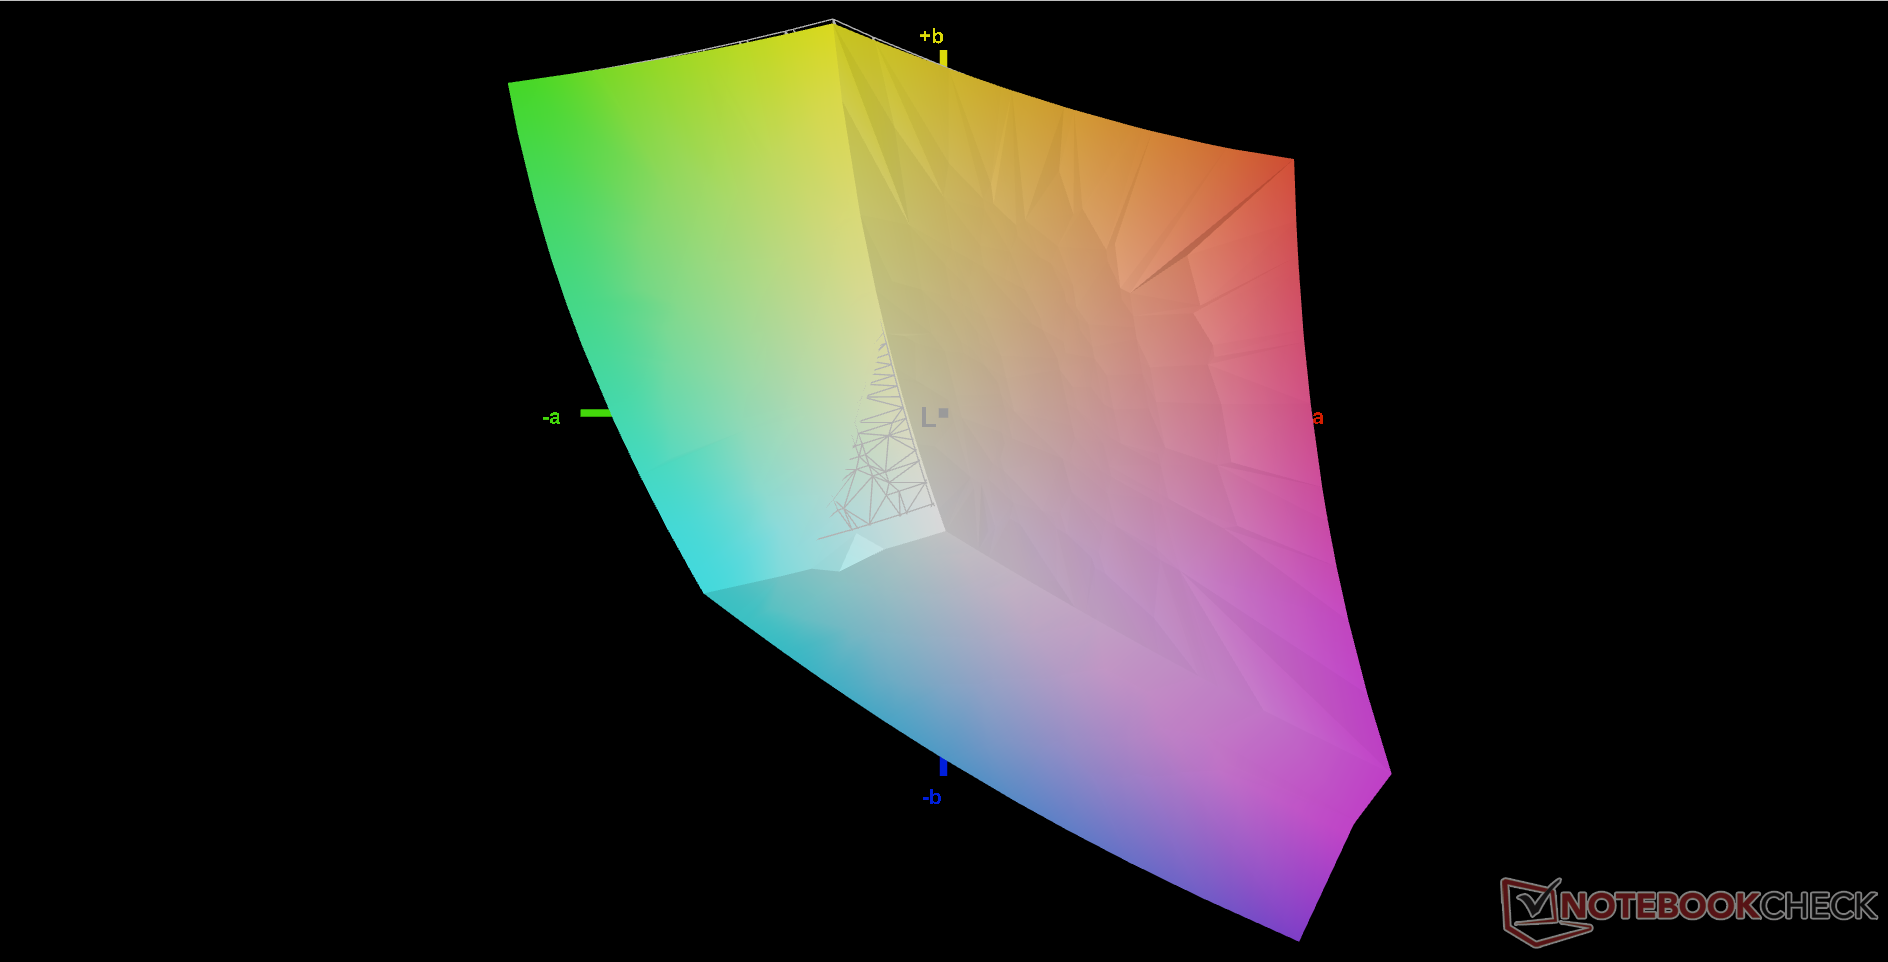
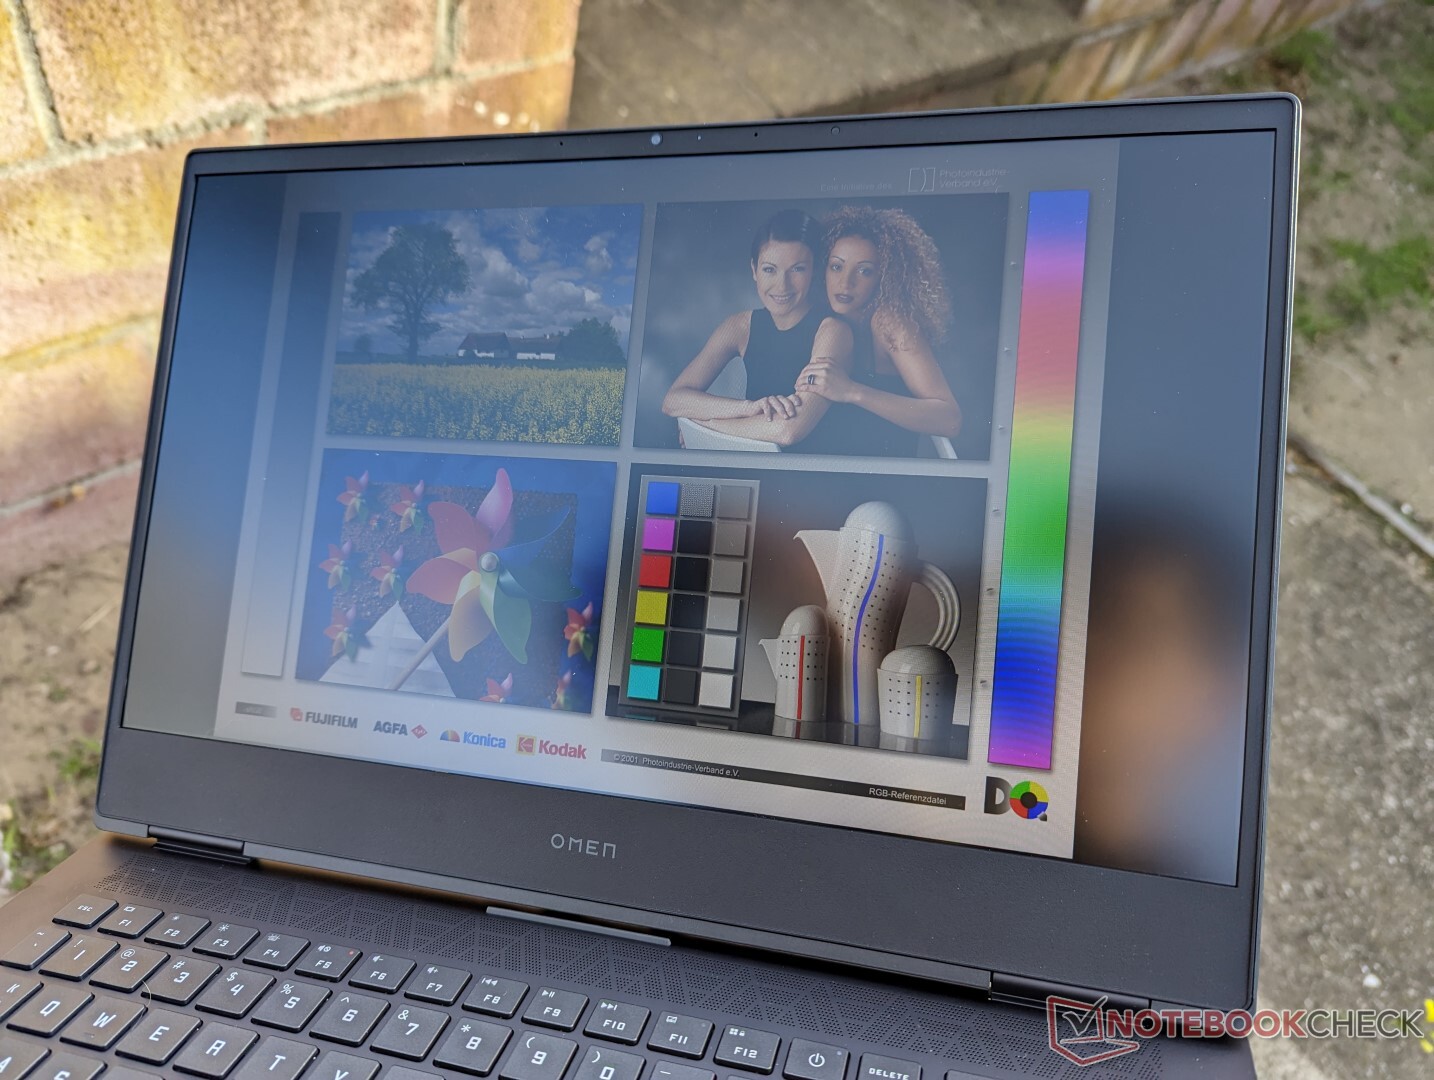
The IPS panel on our AMD unit is still very good nonetheless with its full sRGB coverage, decent contrast ratio, and decent black-white response times. Even the maximum brightness of the display is 20 percent higher than what HP is advertising according to our own X-Rite colorimeter. Overall image quality is significantly better than on the less expensive HP Victus 16 which uses a much cheaper Chi Mei panel with worse colors and more noticeable ghosting.


| |||||||||||||||||||||||||
Brightness Distribution: 79 %
Center on Battery: 373.3 cd/m²
Contrast: 848:1 (Black: 0.44 cd/m²)
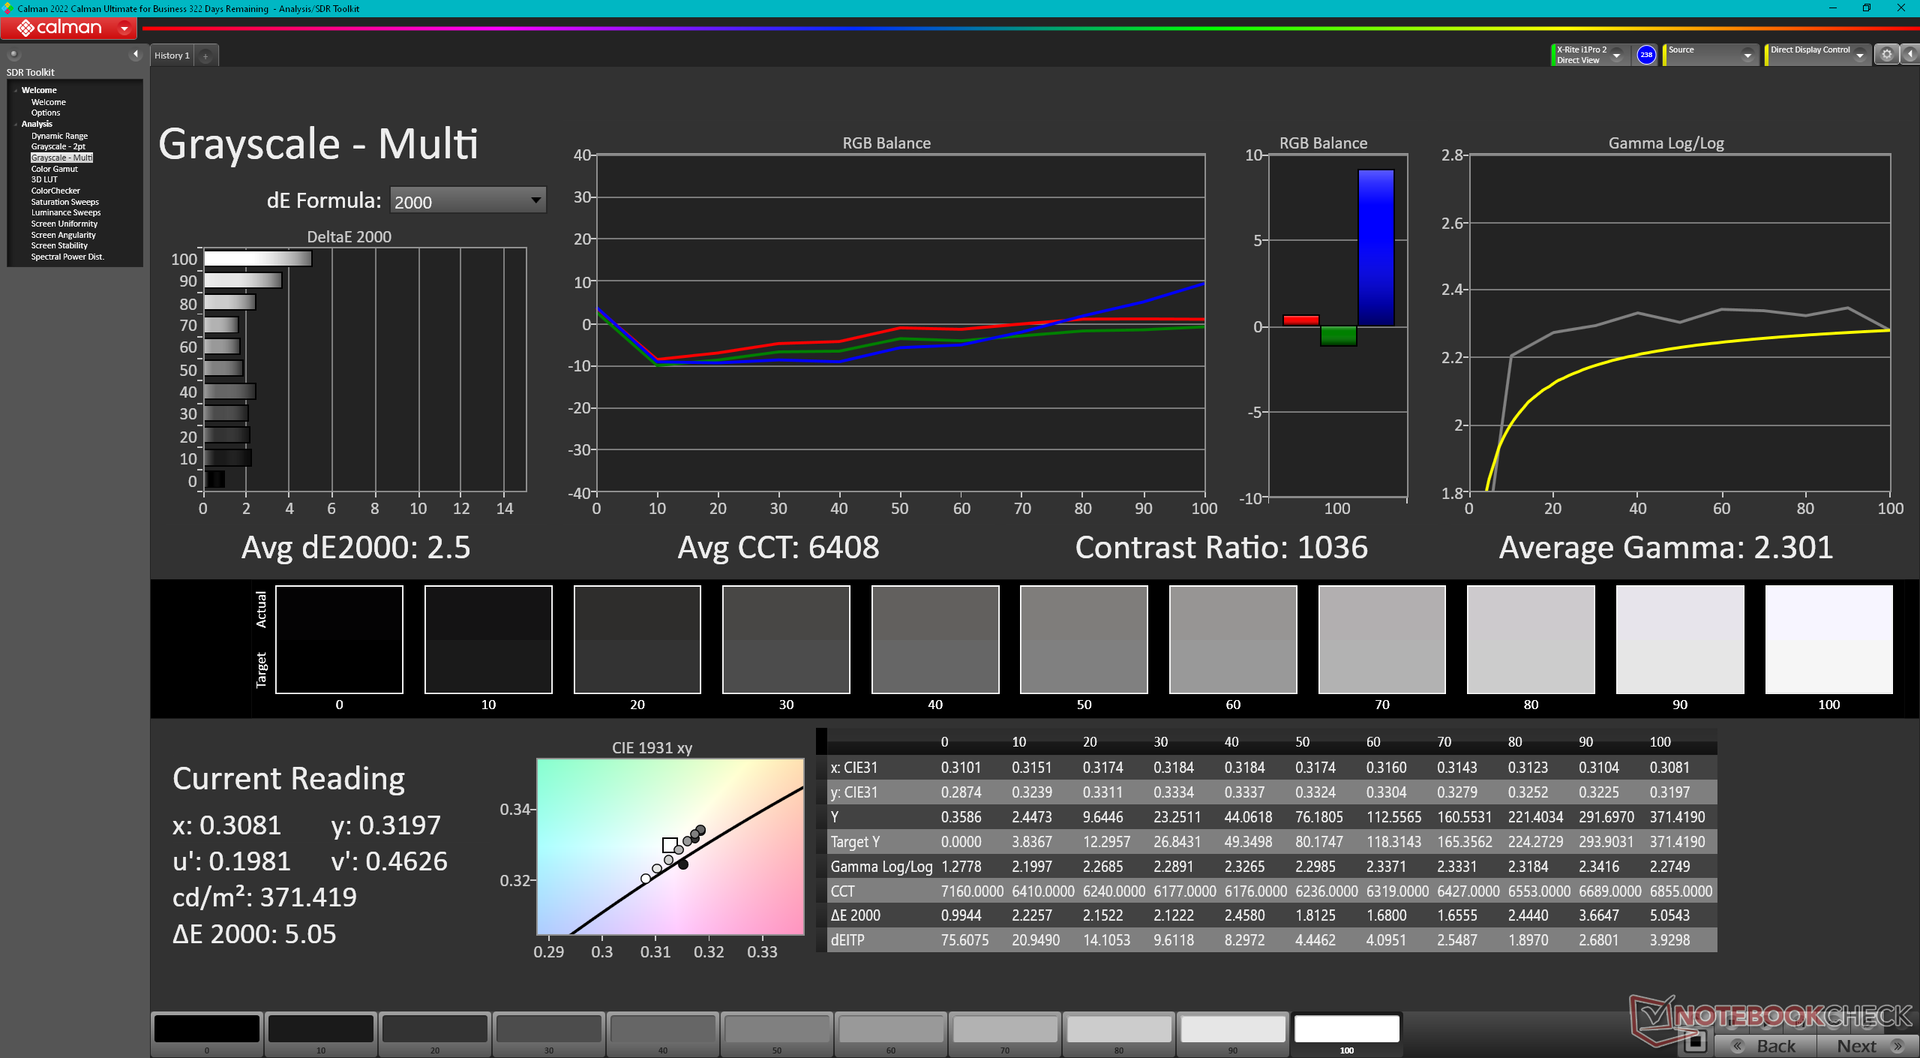
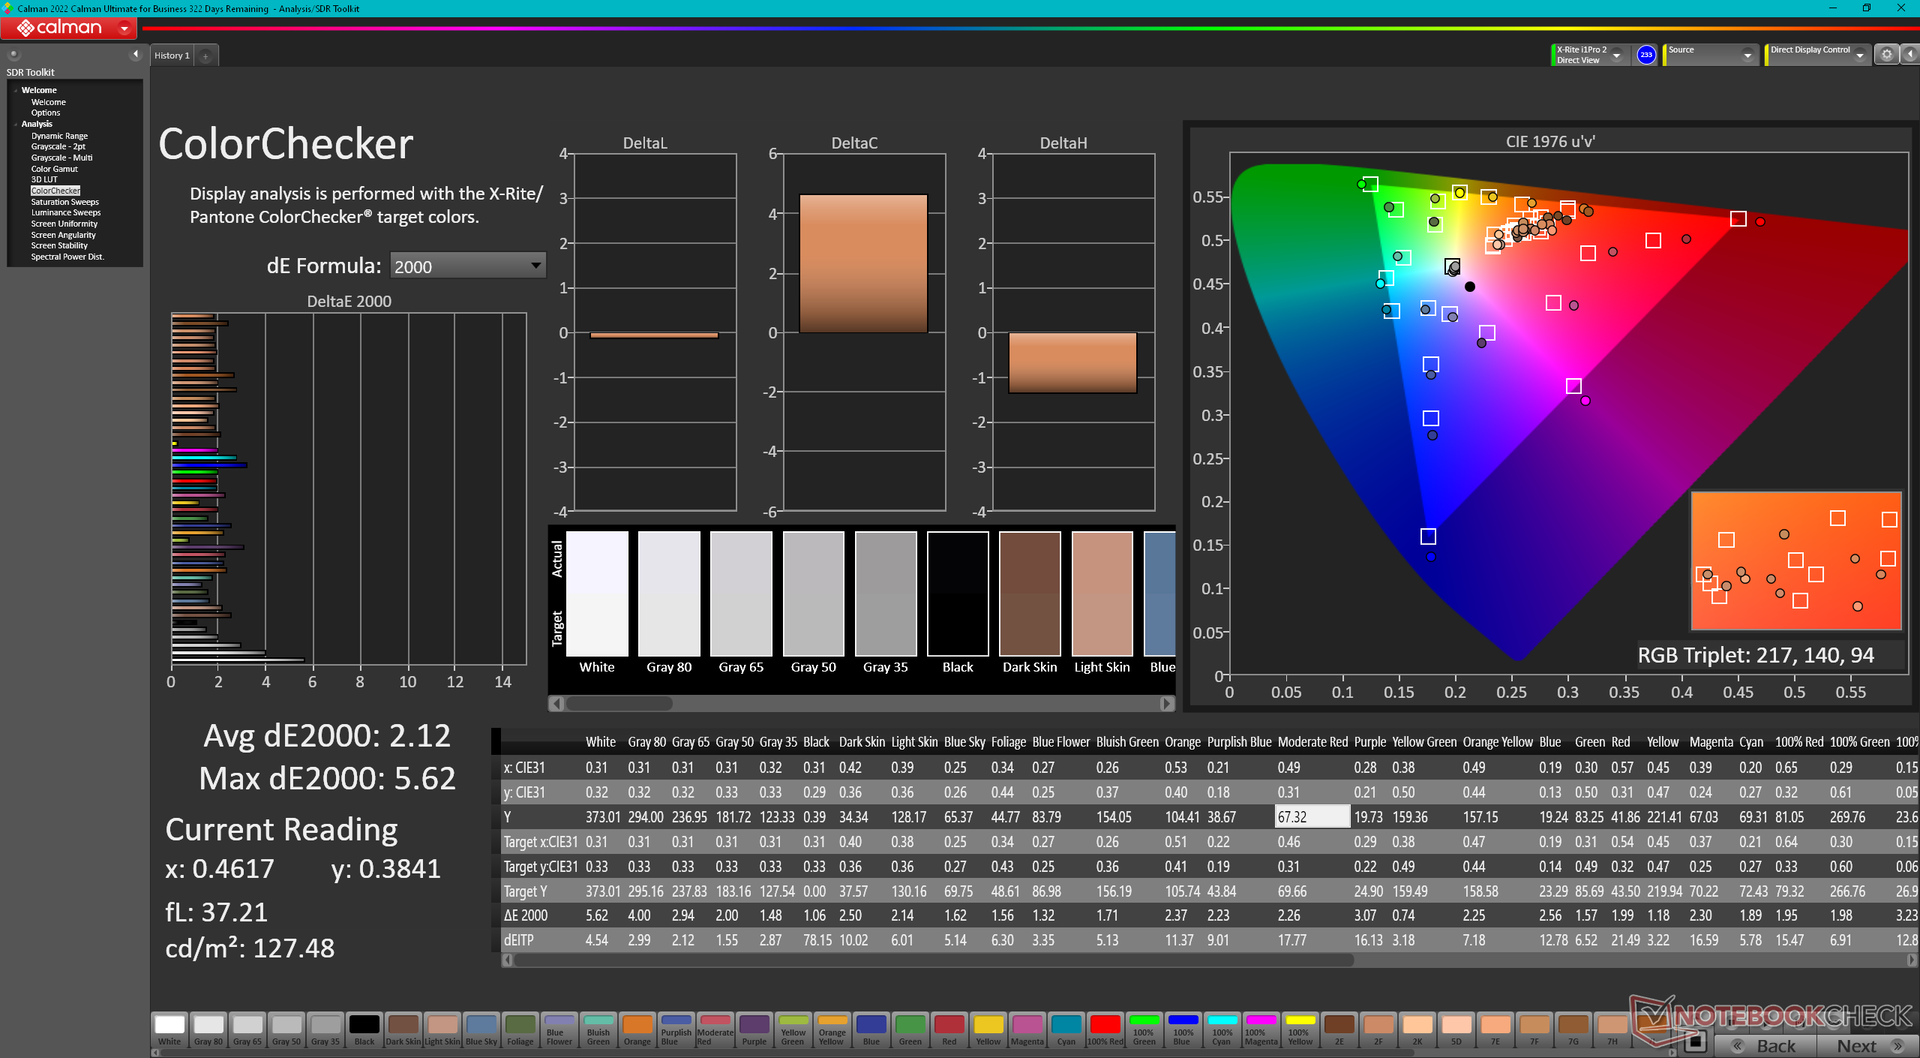
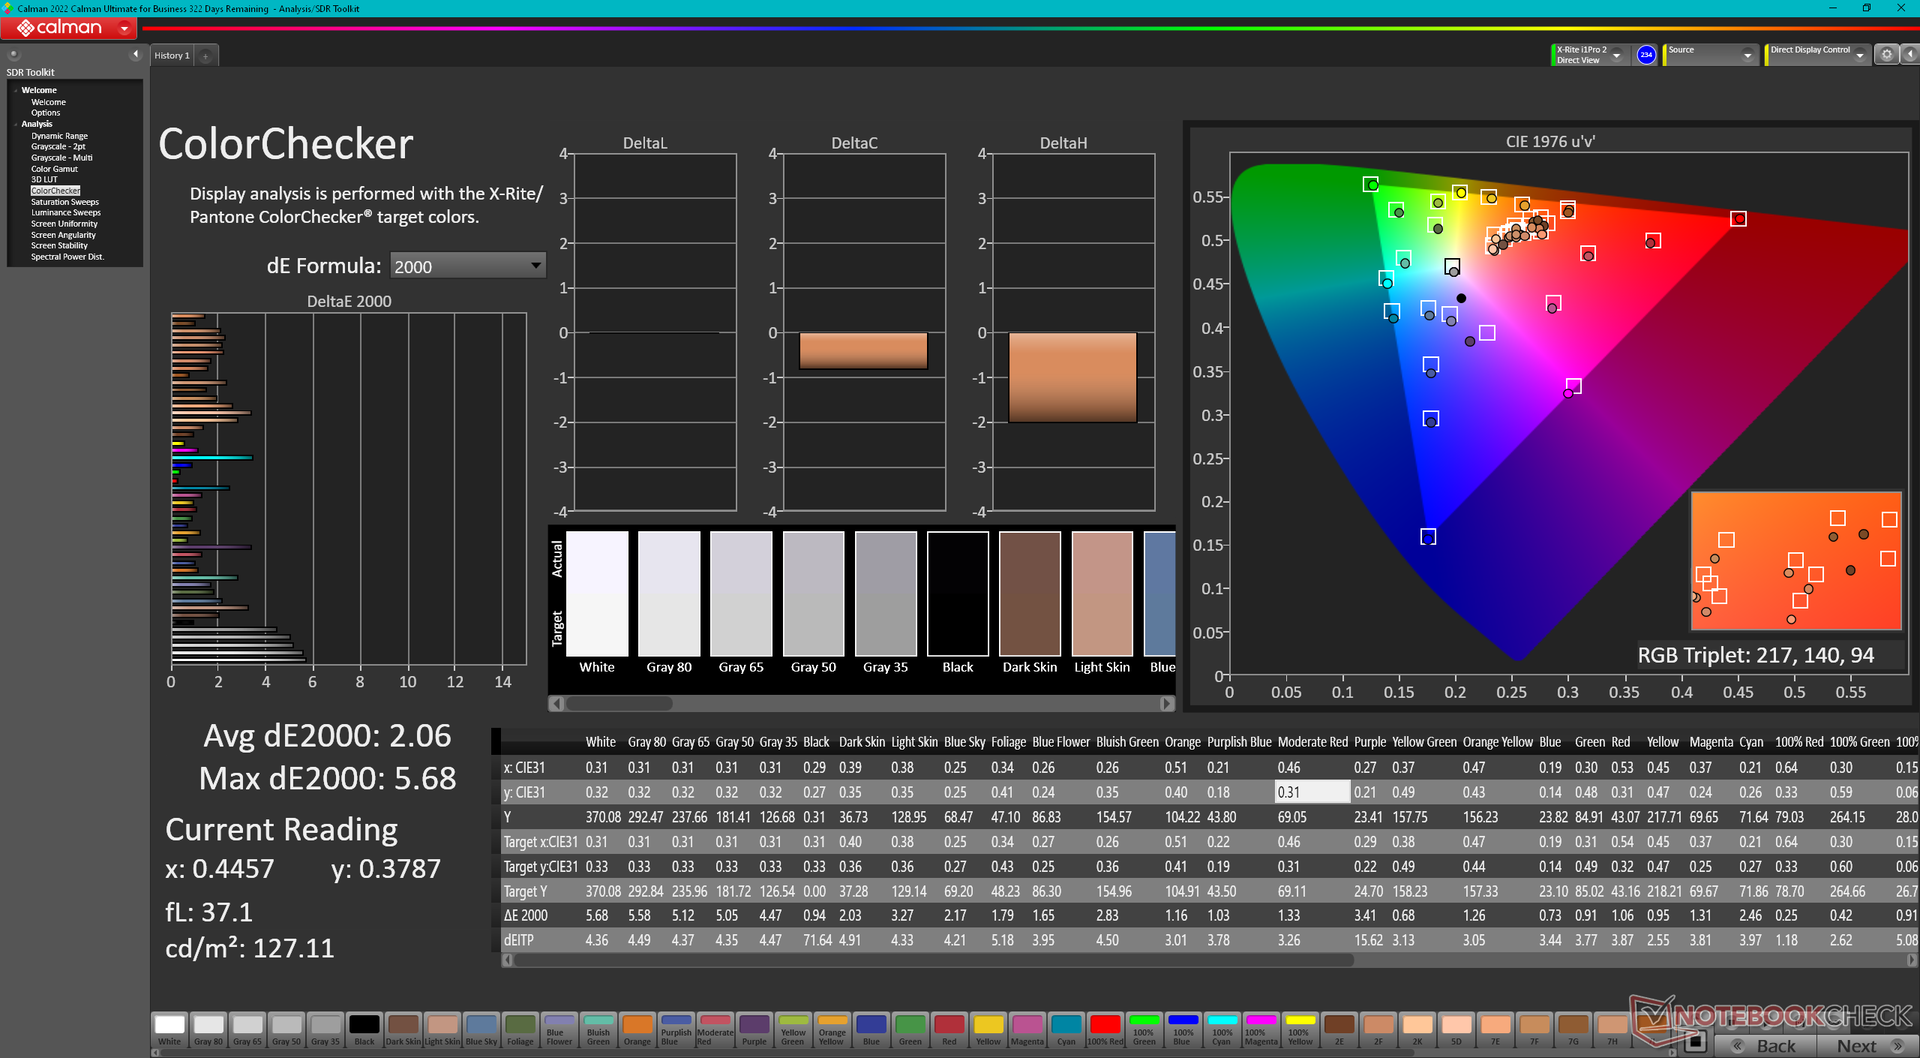
ΔE ColorChecker Calman: 2.12 | ∀{0.5-29.43 Ø4.72}
calibrated: 2.06
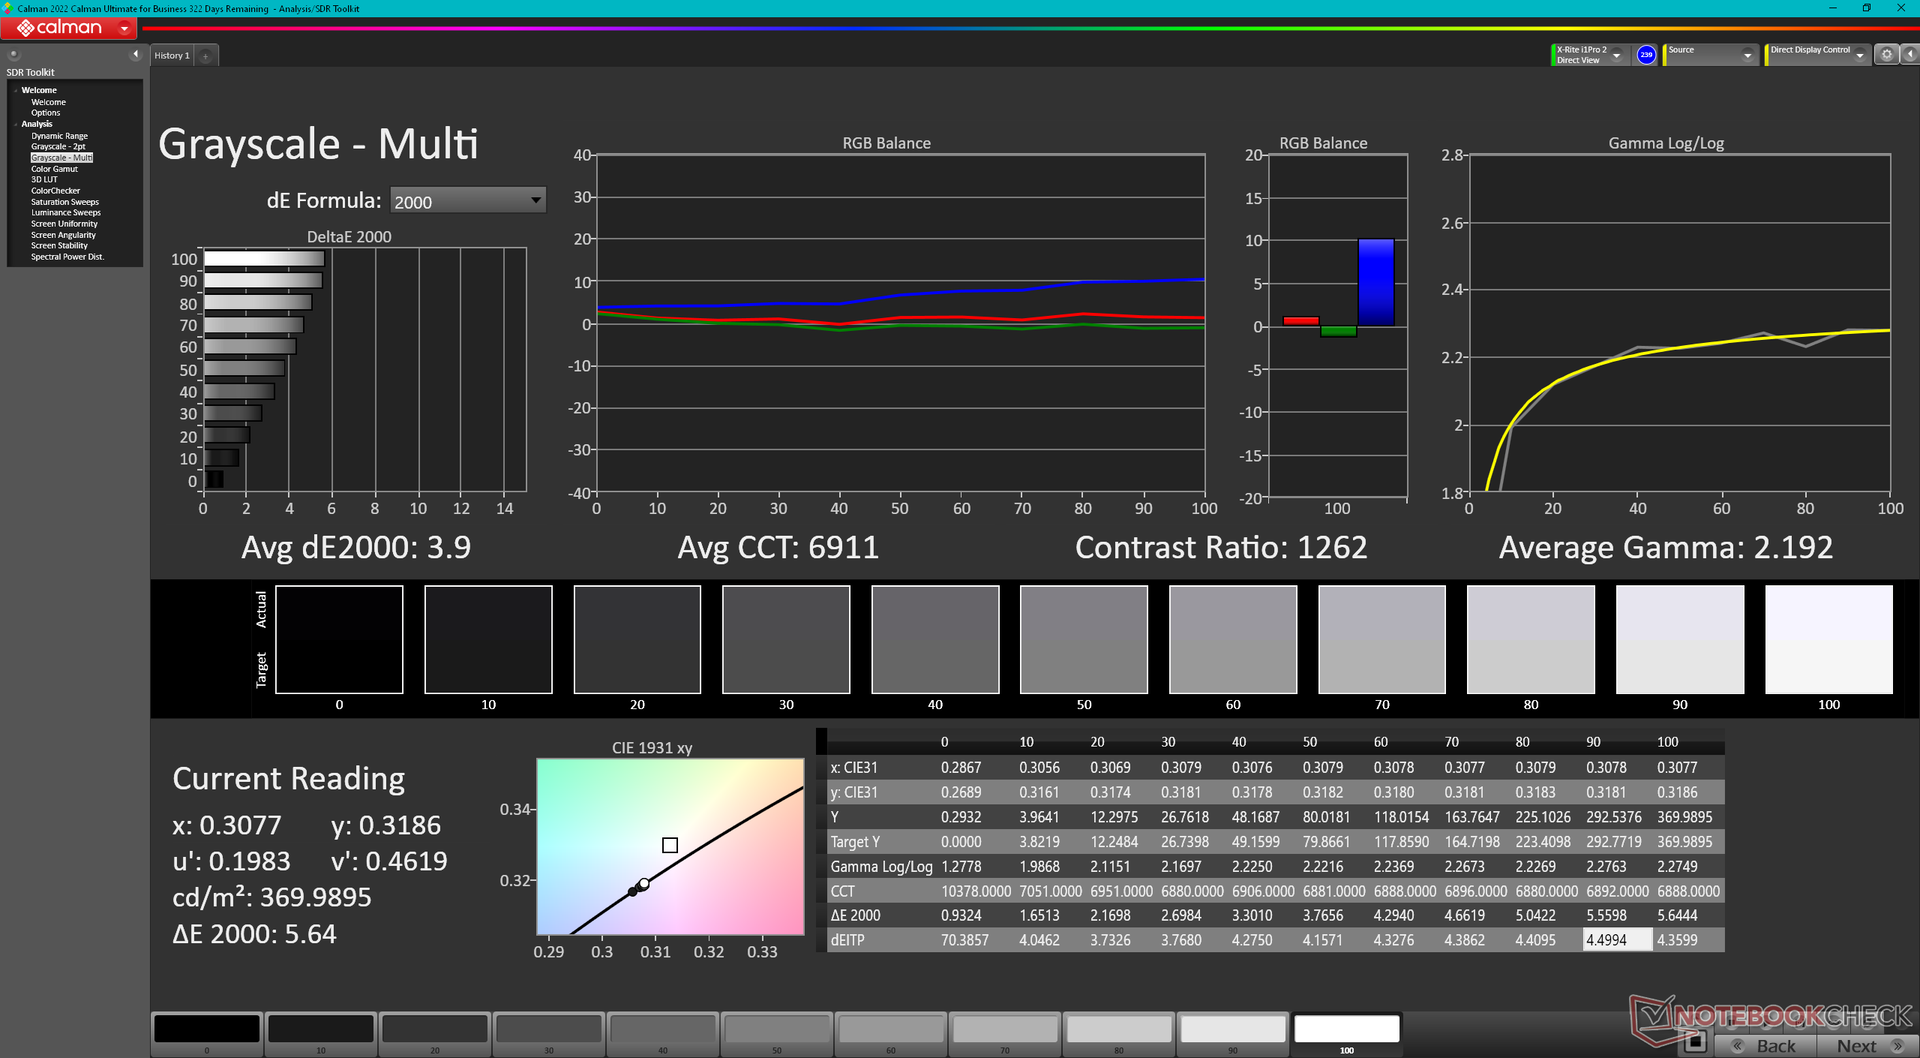
ΔE Greyscale Calman: 2.5 | ∀{0.09-98 Ø4.97}
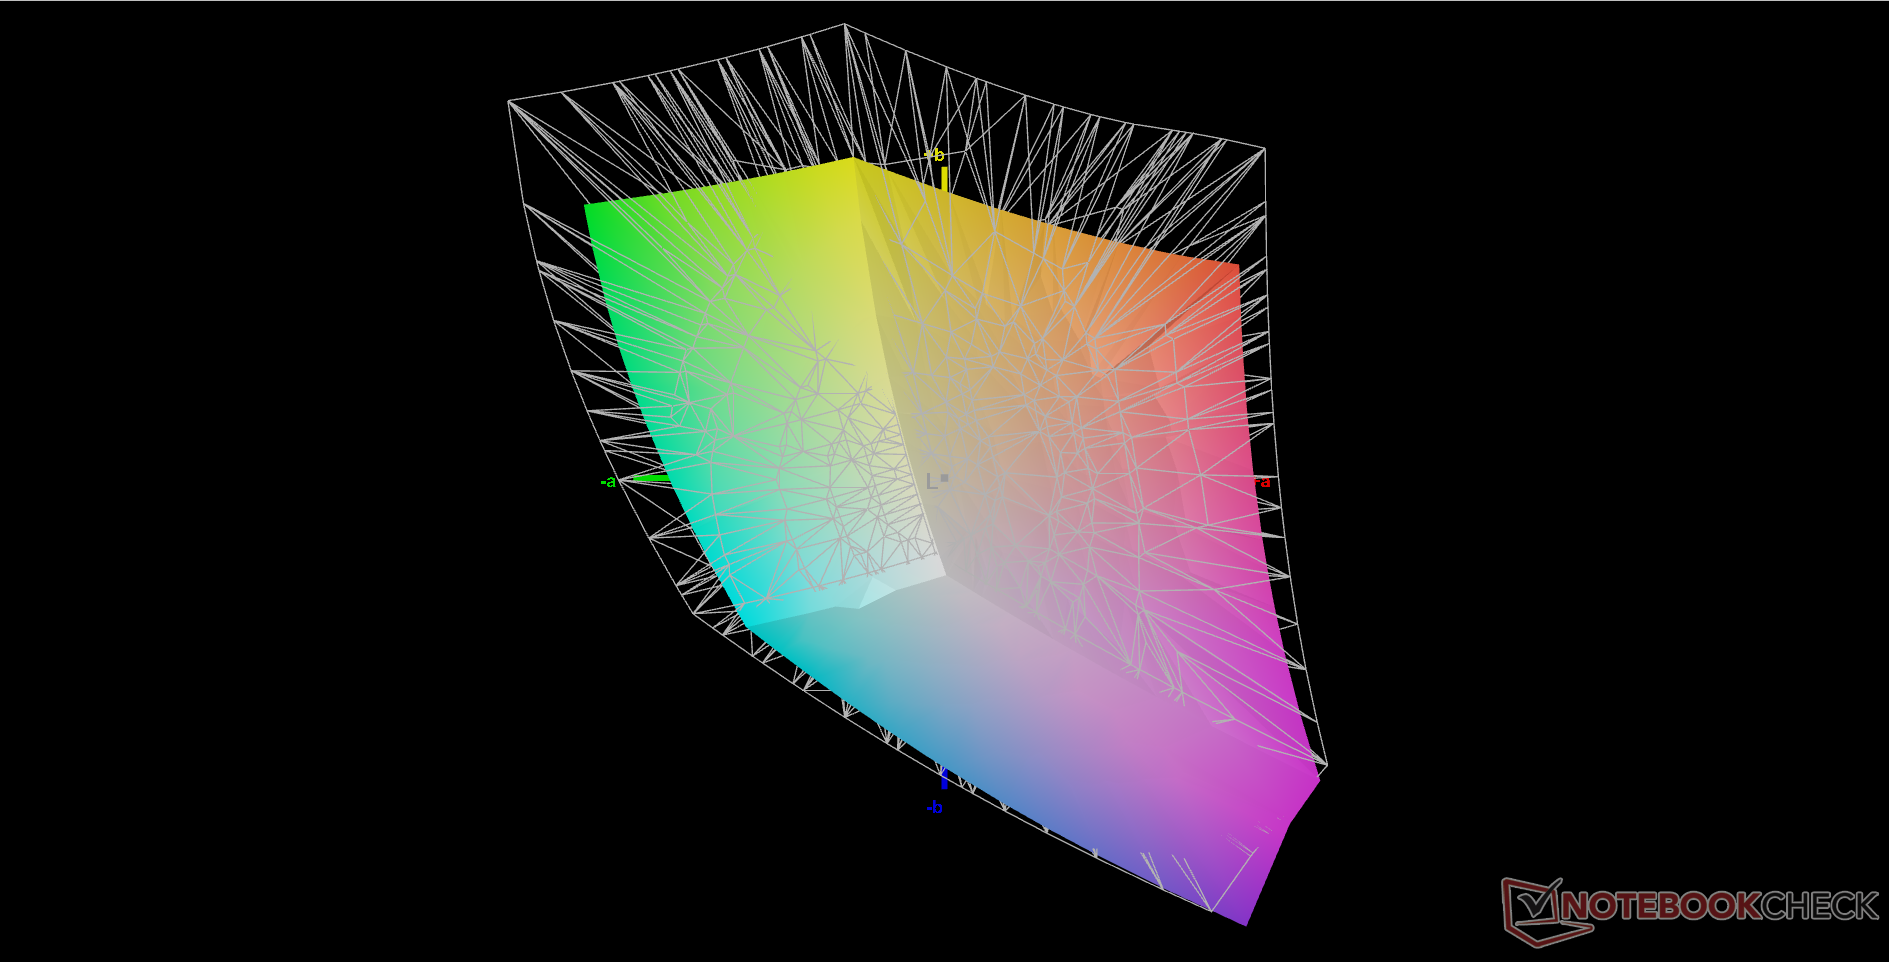
73.4% AdobeRGB 1998 (Argyll 3D)
99.2% sRGB (Argyll 3D)
74.4% Display P3 (Argyll 3D)
Gamma: 2.3
CCT: 6408 K
| HP Omen 16-n0033dx BOE0AAE, IPS, 1920x1080, 16.1" | HP Envy 16 h0112nr Samsung SDC4174, OLED, 3840x2400, 16" | HP Omen 16-b1090ng BOE09E5, IPS, 2560x1440, 16.1" | HP Victus 16-e0145ng CMN1609, IPS, 1920x1080, 16.1" | Lenovo Legion S7 16ARHA7 BOE CQ NE160QDM-NY1, IPS, 2560x1600, 16" | Dell G16 7620 BOE NE16QDM, IPS, 2560x1600, 16" | |
|---|---|---|---|---|---|---|
| Display | 18% | -2% | -41% | -3% | -4% | |
| Display P3 Coverage (%) | 74.4 | 99.3 33% | 71 -5% | 41.6 -44% | 69.8 -6% | 68.3 -8% |
| sRGB Coverage (%) | 99.2 | 100 1% | 97.9 -1% | 61.9 -38% | 98.1 -1% | 98 -1% |
| AdobeRGB 1998 Coverage (%) | 73.4 | 88 20% | 73.3 0% | 43 -41% | 71.9 -2% | 70.5 -4% |
| Response Times | 86% | 17% | -71% | 15% | 29% | |
| Response Time Grey 50% / Grey 80% * (ms) | 17.6 ? | 2 ? 89% | 14.5 ? 18% | 29.6 ? -68% | 10 ? 43% | 8.6 ? 51% |
| Response Time Black / White * (ms) | 11.2 ? | 1.9 ? 83% | 9.4 ? 16% | 19.4 ? -73% | 12.8 ? -14% | 10.4 ? 7% |
| PWM Frequency (Hz) | 240.4 ? | |||||
| Screen | 12% | -28% | -87% | 28% | 13% | |
| Brightness middle (cd/m²) | 373.3 | 328.8 -12% | 335 -10% | 257 -31% | 492.4 32% | 369.4 -1% |
| Brightness (cd/m²) | 361 | 332 -8% | 319 -12% | 239 -34% | 471 30% | 348 -4% |
| Brightness Distribution (%) | 79 | 97 23% | 90 14% | 88 11% | 90 14% | 83 5% |
| Black Level * (cd/m²) | 0.44 | 0.28 36% | 0.25 43% | 0.4 9% | 0.32 27% | |
| Contrast (:1) | 848 | 1196 41% | 1028 21% | 1231 45% | 1154 36% | |
| Colorchecker dE 2000 * | 2.12 | 1.53 28% | 4.38 -107% | 6.91 -226% | 1.9 10% | 1.78 16% |
| Colorchecker dE 2000 max. * | 5.62 | 6.04 -7% | 9.48 -69% | 22.27 -296% | 3.81 32% | 4.41 22% |
| Colorchecker dE 2000 calibrated * | 2.06 | 1.33 35% | 3.61 -75% | 0.99 52% | 1.22 41% | |
| Greyscale dE 2000 * | 2.5 | 1.3 48% | 7 -180% | 7.5 -200% | 1.7 32% | 3.2 -28% |
| Gamma | 2.3 96% | 2.18 101% | 2.103 105% | 2.125 104% | 2.36 93% | 2.2 100% |
| CCT | 6408 101% | 6362 102% | 6244 104% | 6025 108% | 6497 100% | 6750 96% |
| Total Average (Program / Settings) | 39% /
27% | -4% /
-16% | -66% /
-75% | 13% /
20% | 13% /
11% |
* ... smaller is better
The display is already decently calibrated out of the box with average grayscale and color deltaE values of only 2.5 and 2.12, respectively. Attempting to calibrate it further with our X-Rite colorimeter would improves colors just slightly but not enough to make end-user calibration essential.

Display Response Times
| ↔ Response Time Black to White | ||
|---|---|---|
| 11.2 ms ... rise ↗ and fall ↘ combined | ↗ 6.8 ms rise | 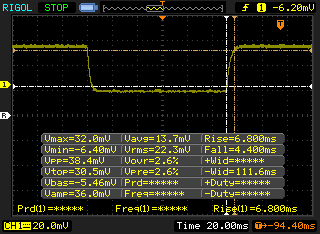 |
| ↘ 4.4 ms fall | ||
| The screen shows good response rates in our tests, but may be too slow for competitive gamers. In comparison, all tested devices range from 0.1 (minimum) to 240 (maximum) ms. » 30 % of all devices are better. This means that the measured response time is better than the average of all tested devices (19.8 ms). | ||
| ↔ Response Time 50% Grey to 80% Grey | ||
| 17.6 ms ... rise ↗ and fall ↘ combined | ↗ 10 ms rise | 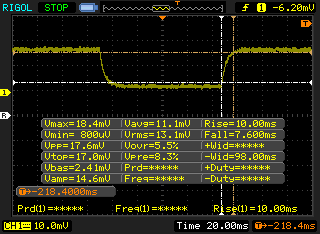 |
| ↘ 7.6 ms fall | ||
| The screen shows good response rates in our tests, but may be too slow for competitive gamers. In comparison, all tested devices range from 0.165 (minimum) to 636 (maximum) ms. » 32 % of all devices are better. This means that the measured response time is better than the average of all tested devices (31 ms). | ||
Screen Flickering / PWM (Pulse-Width Modulation)
| Screen flickering / PWM not detected | 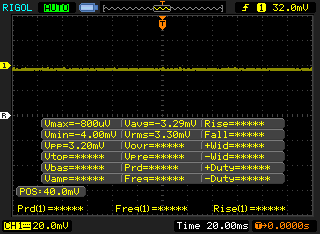 | ||
In comparison: 52 % of all tested devices do not use PWM to dim the display. If PWM was detected, an average of 7750 (minimum: 5 - maximum: 343500) Hz was measured. | |||
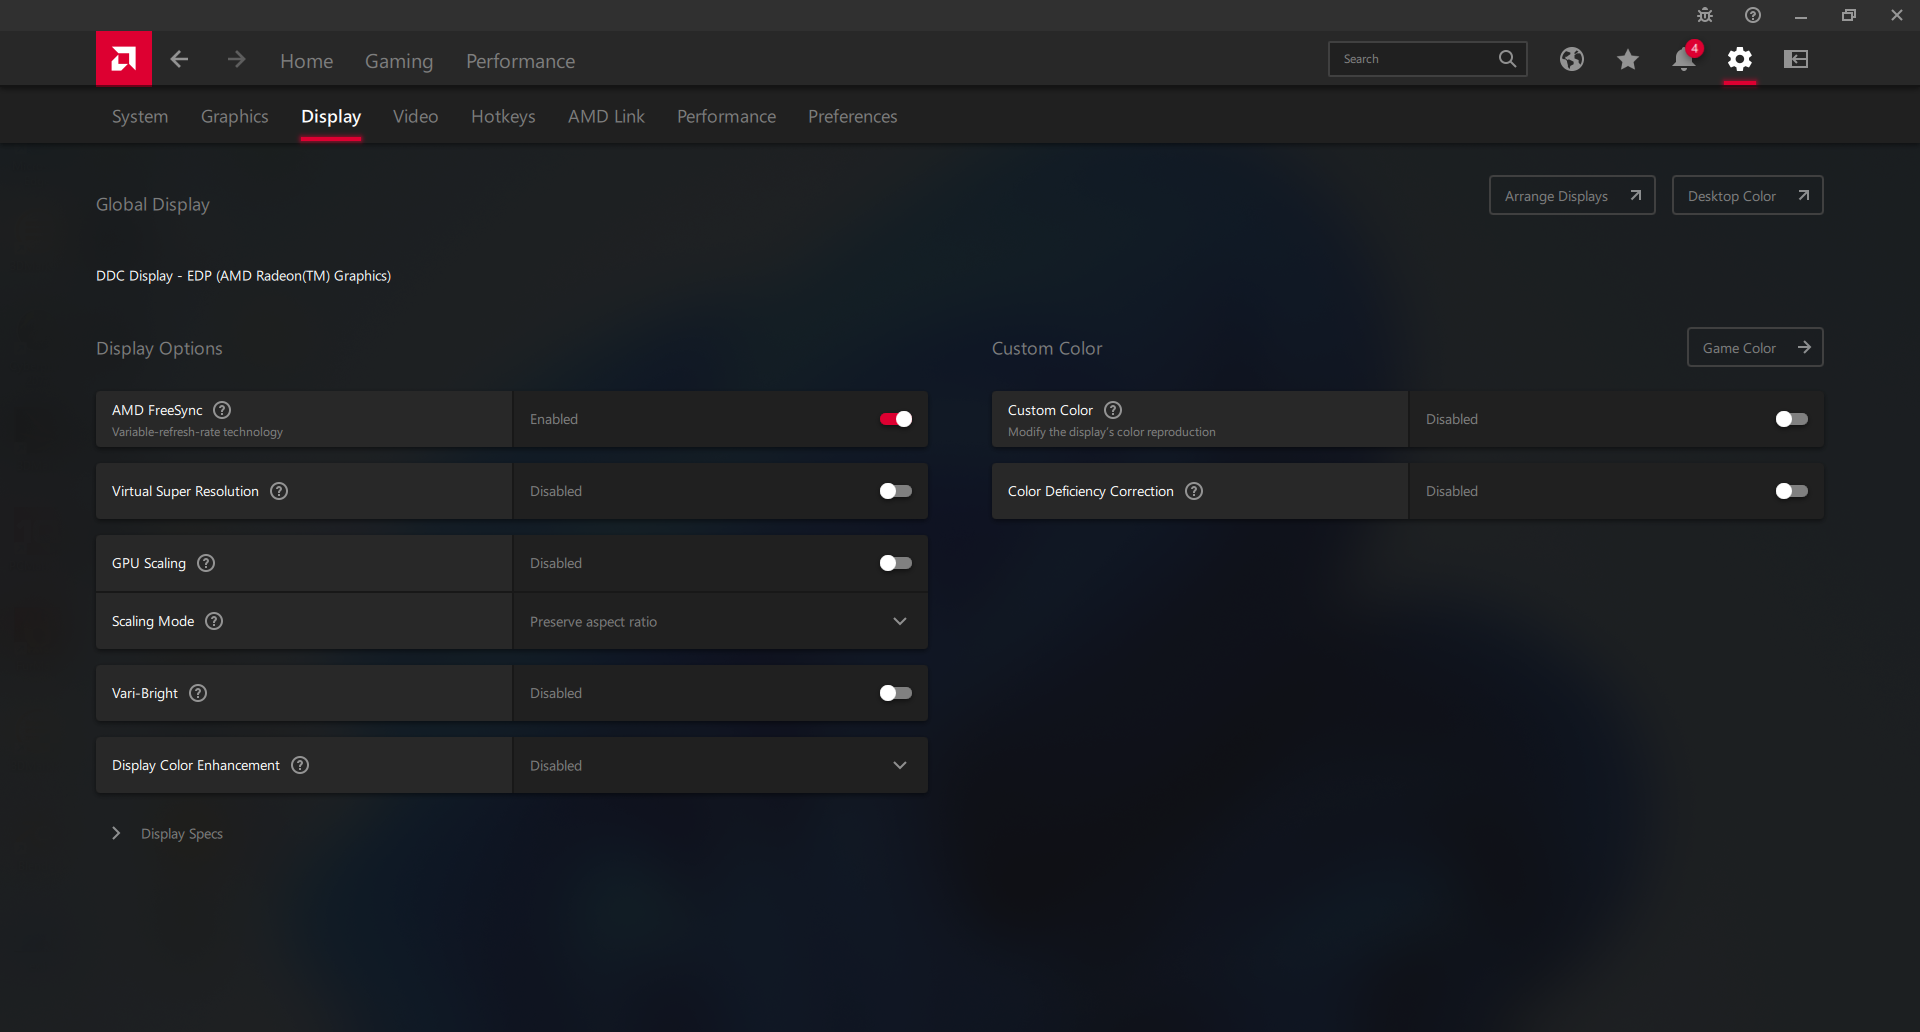
Outdoor visibility is good under shade while anything brighter will wash out the screen. The display on the Lenovo Legion S7 16 can reach almost 500 nits compared to just 370 nits on our HP to be the better option if outdoor visibility is a concern. Be sure to disable AMD Vari-Bright on the HP or else maximum brightness will automatically drop when running on battery power.


Performance
Testing Conditions
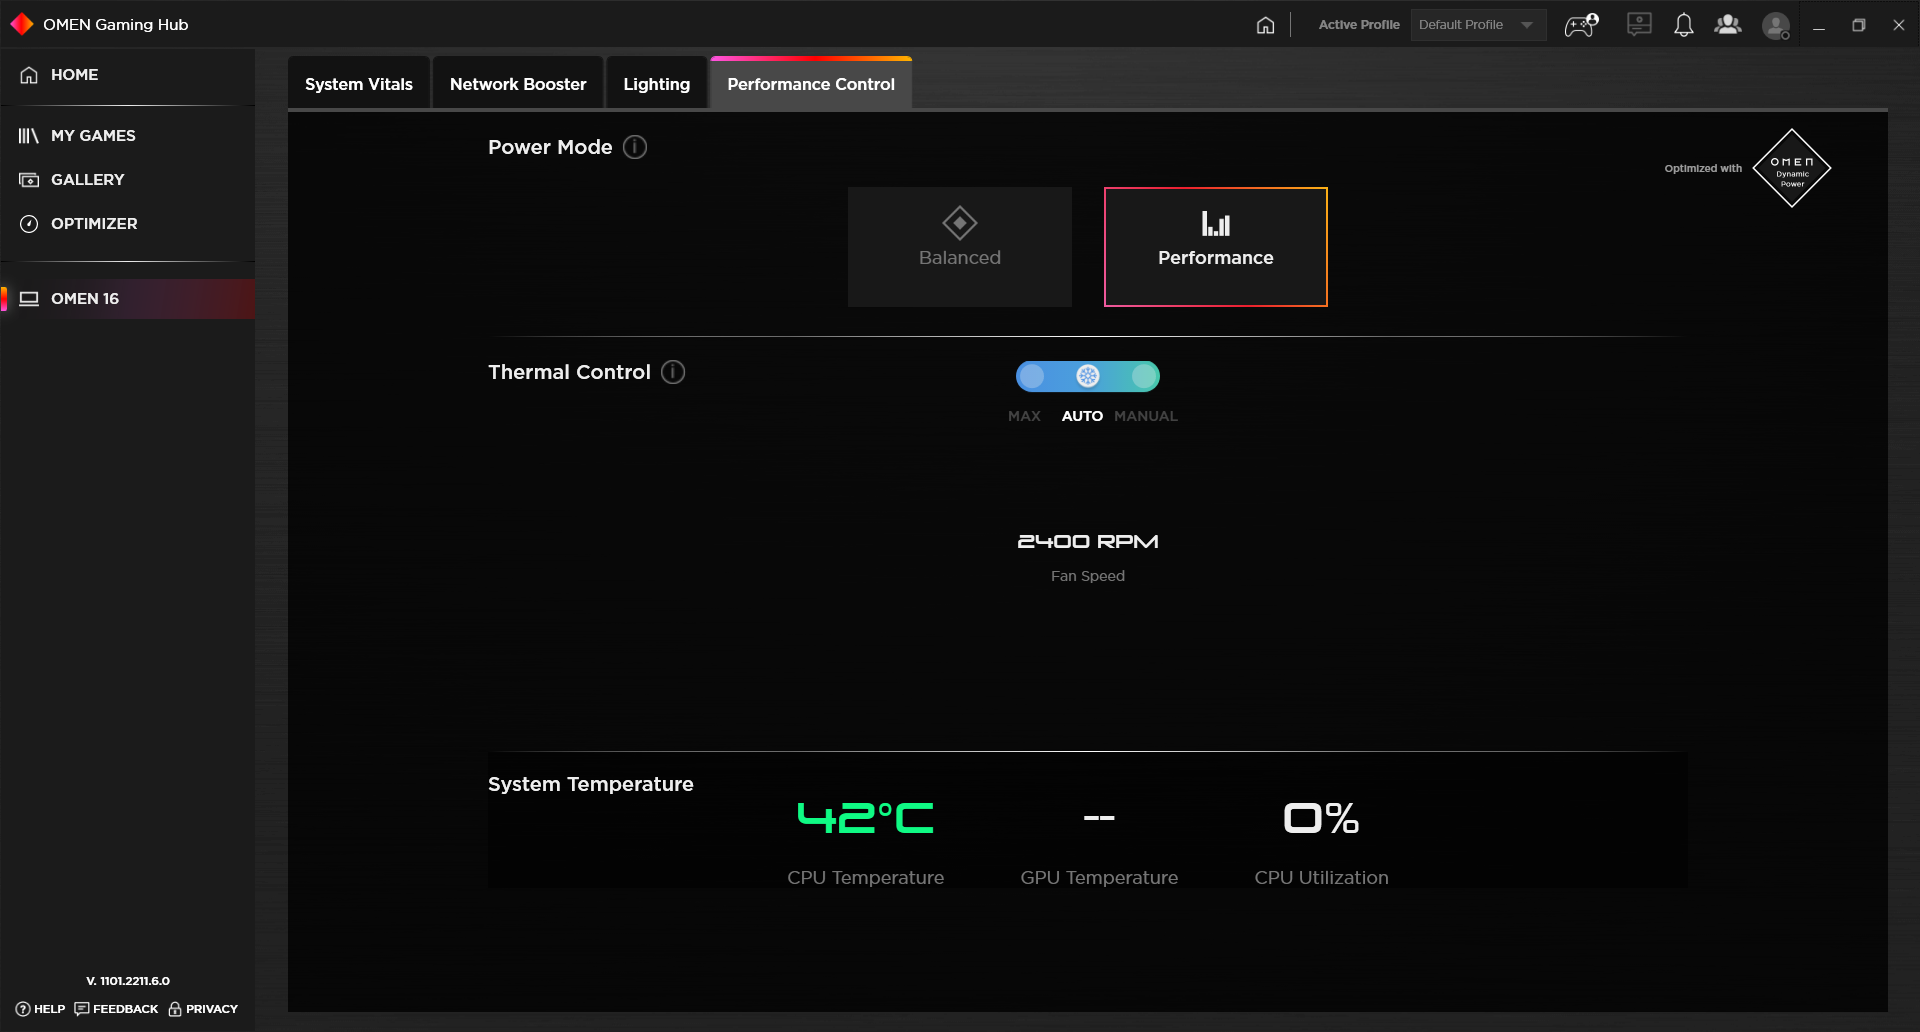
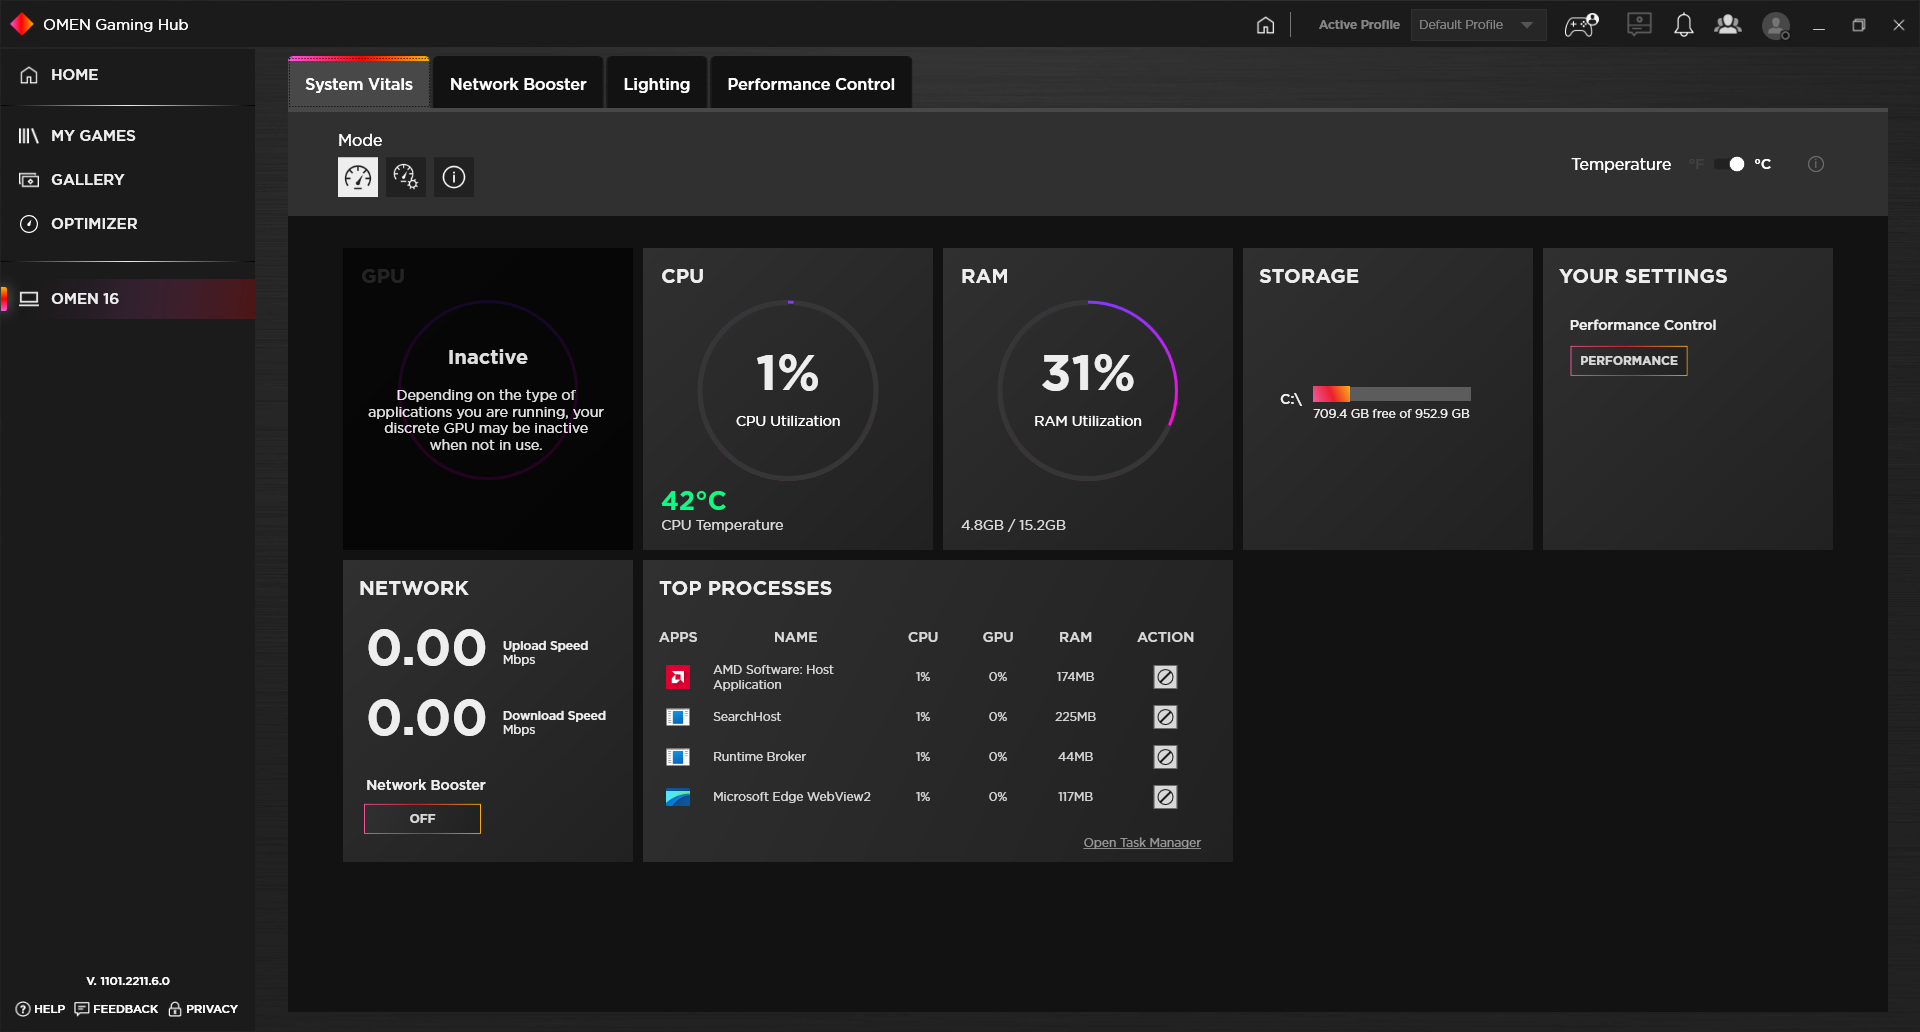
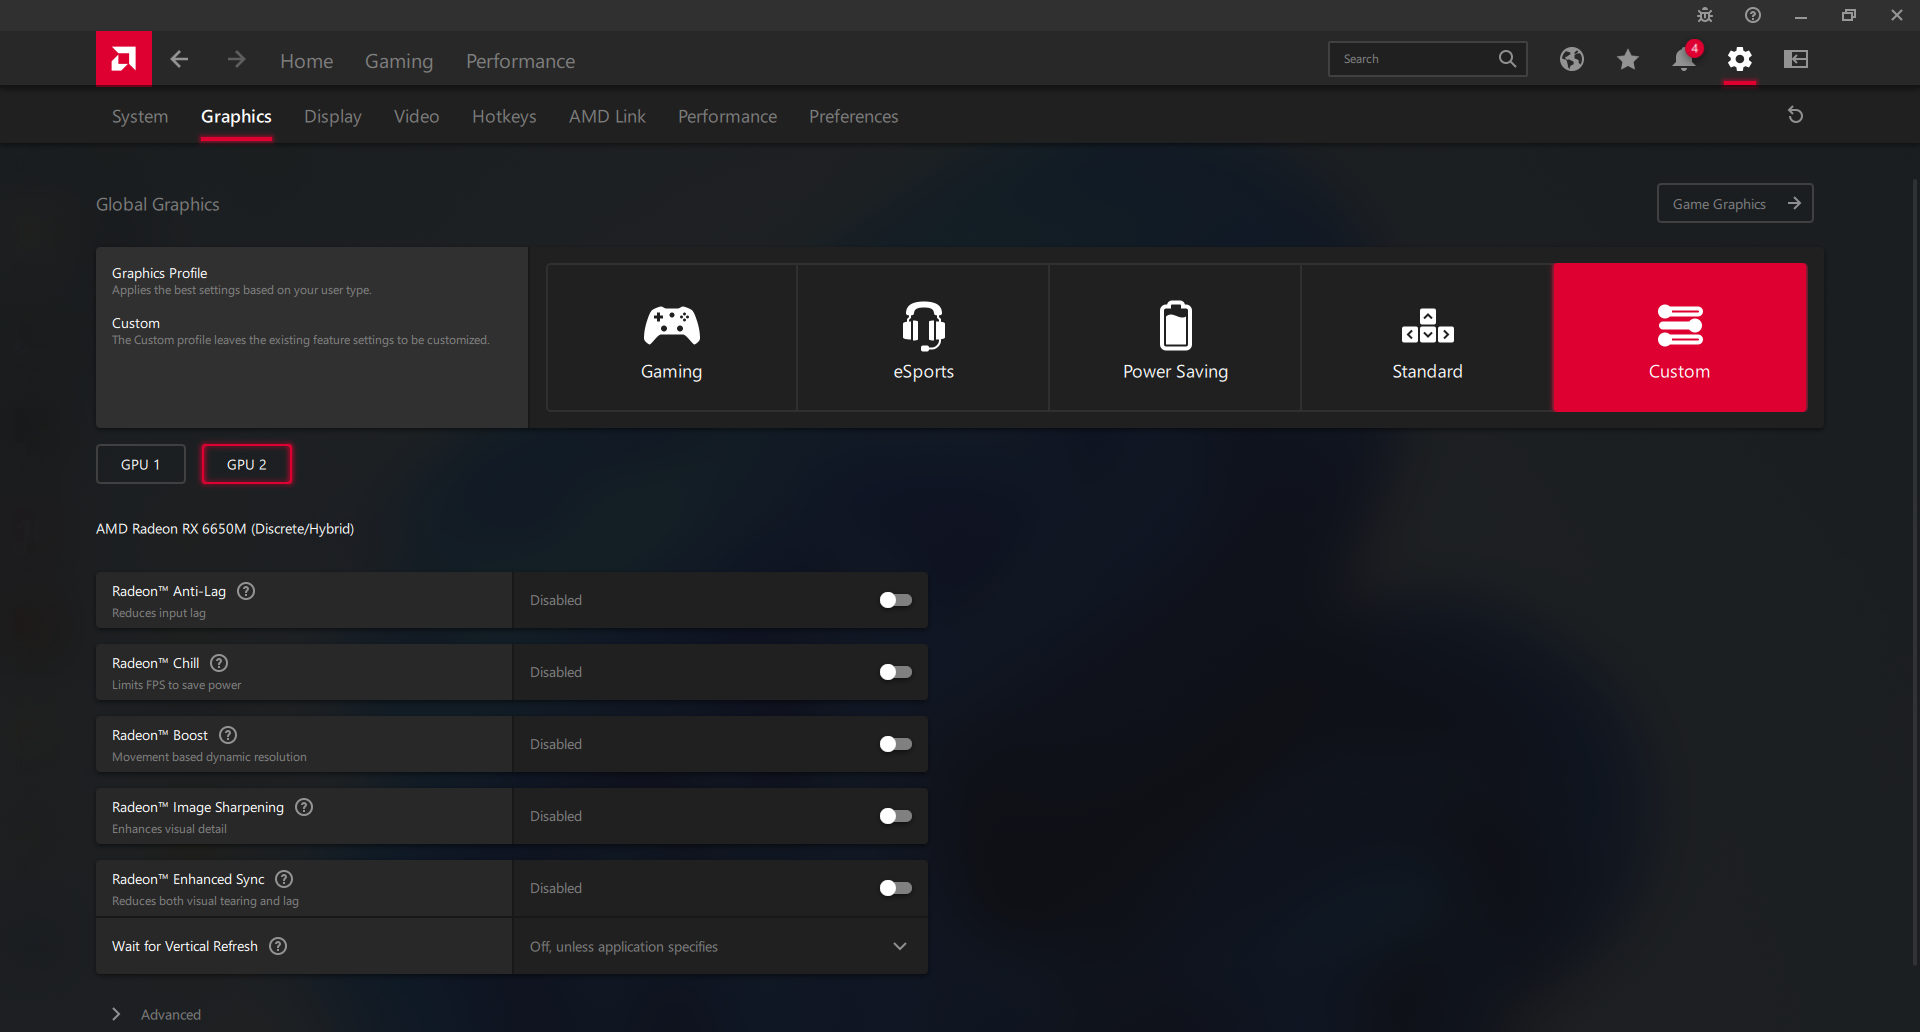
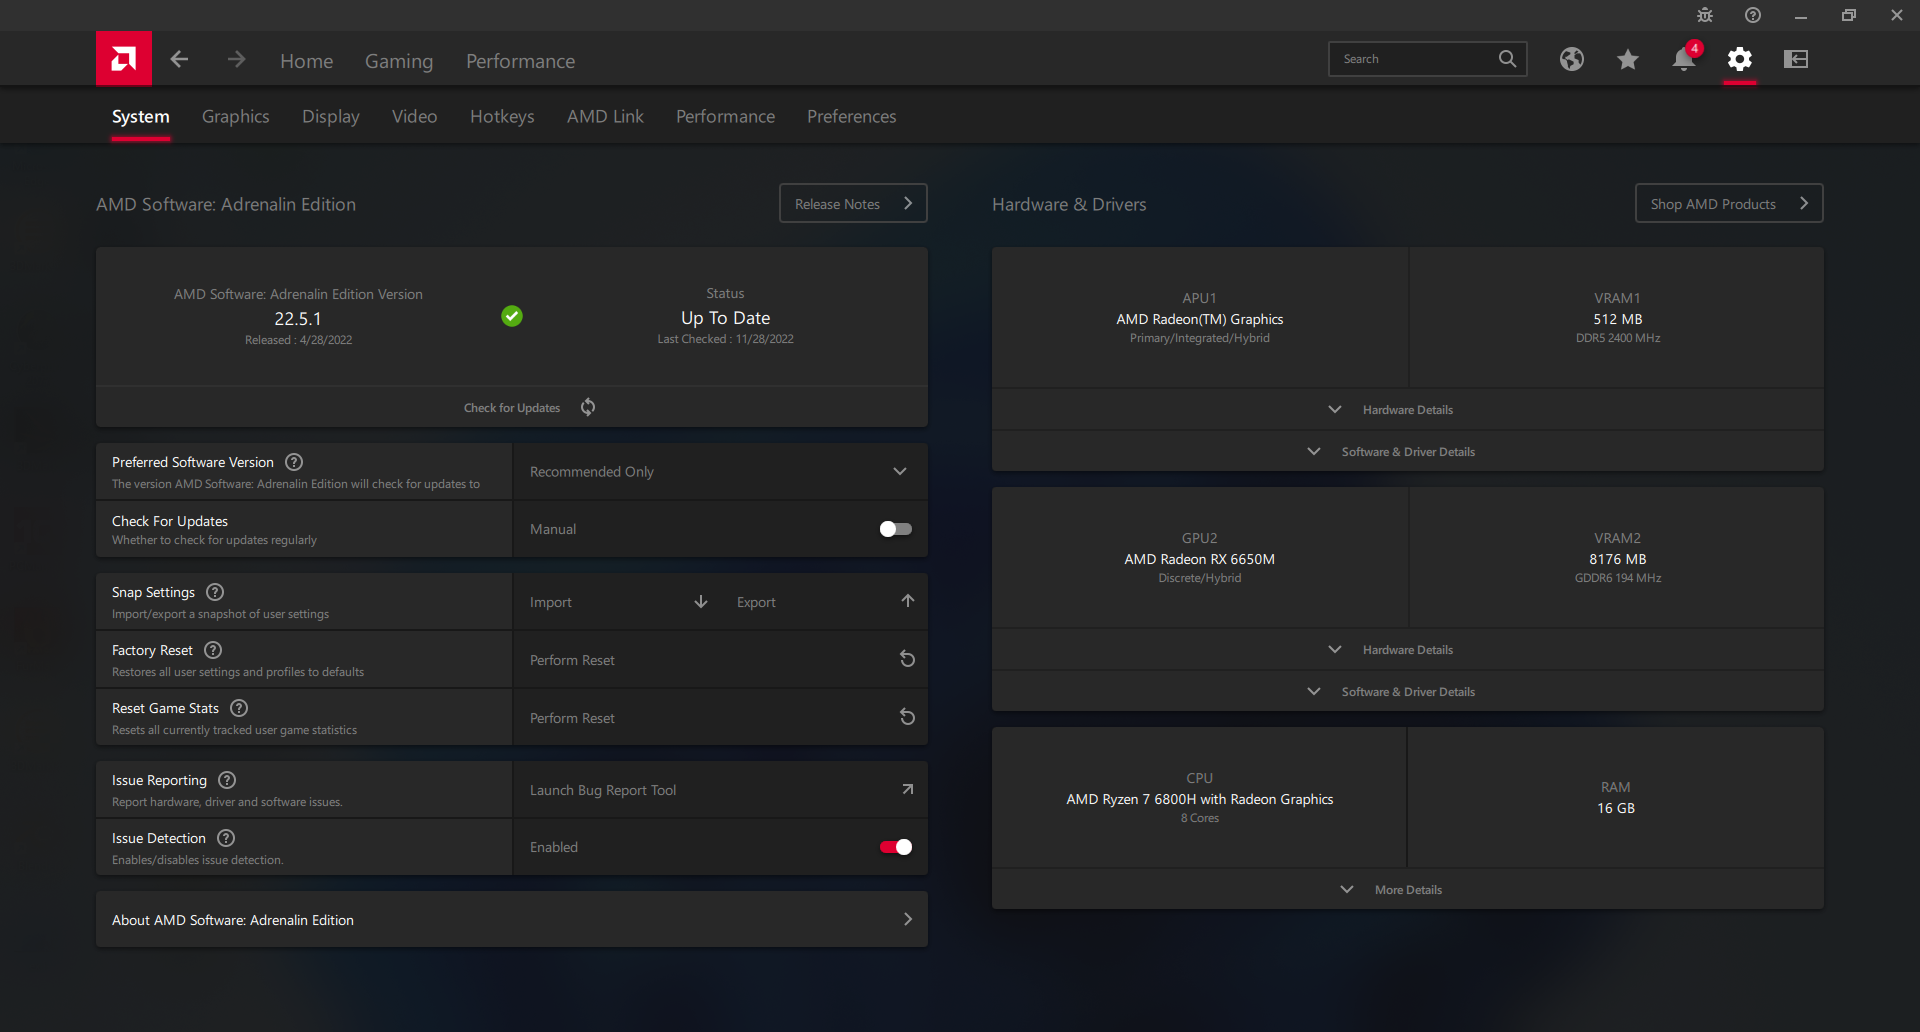
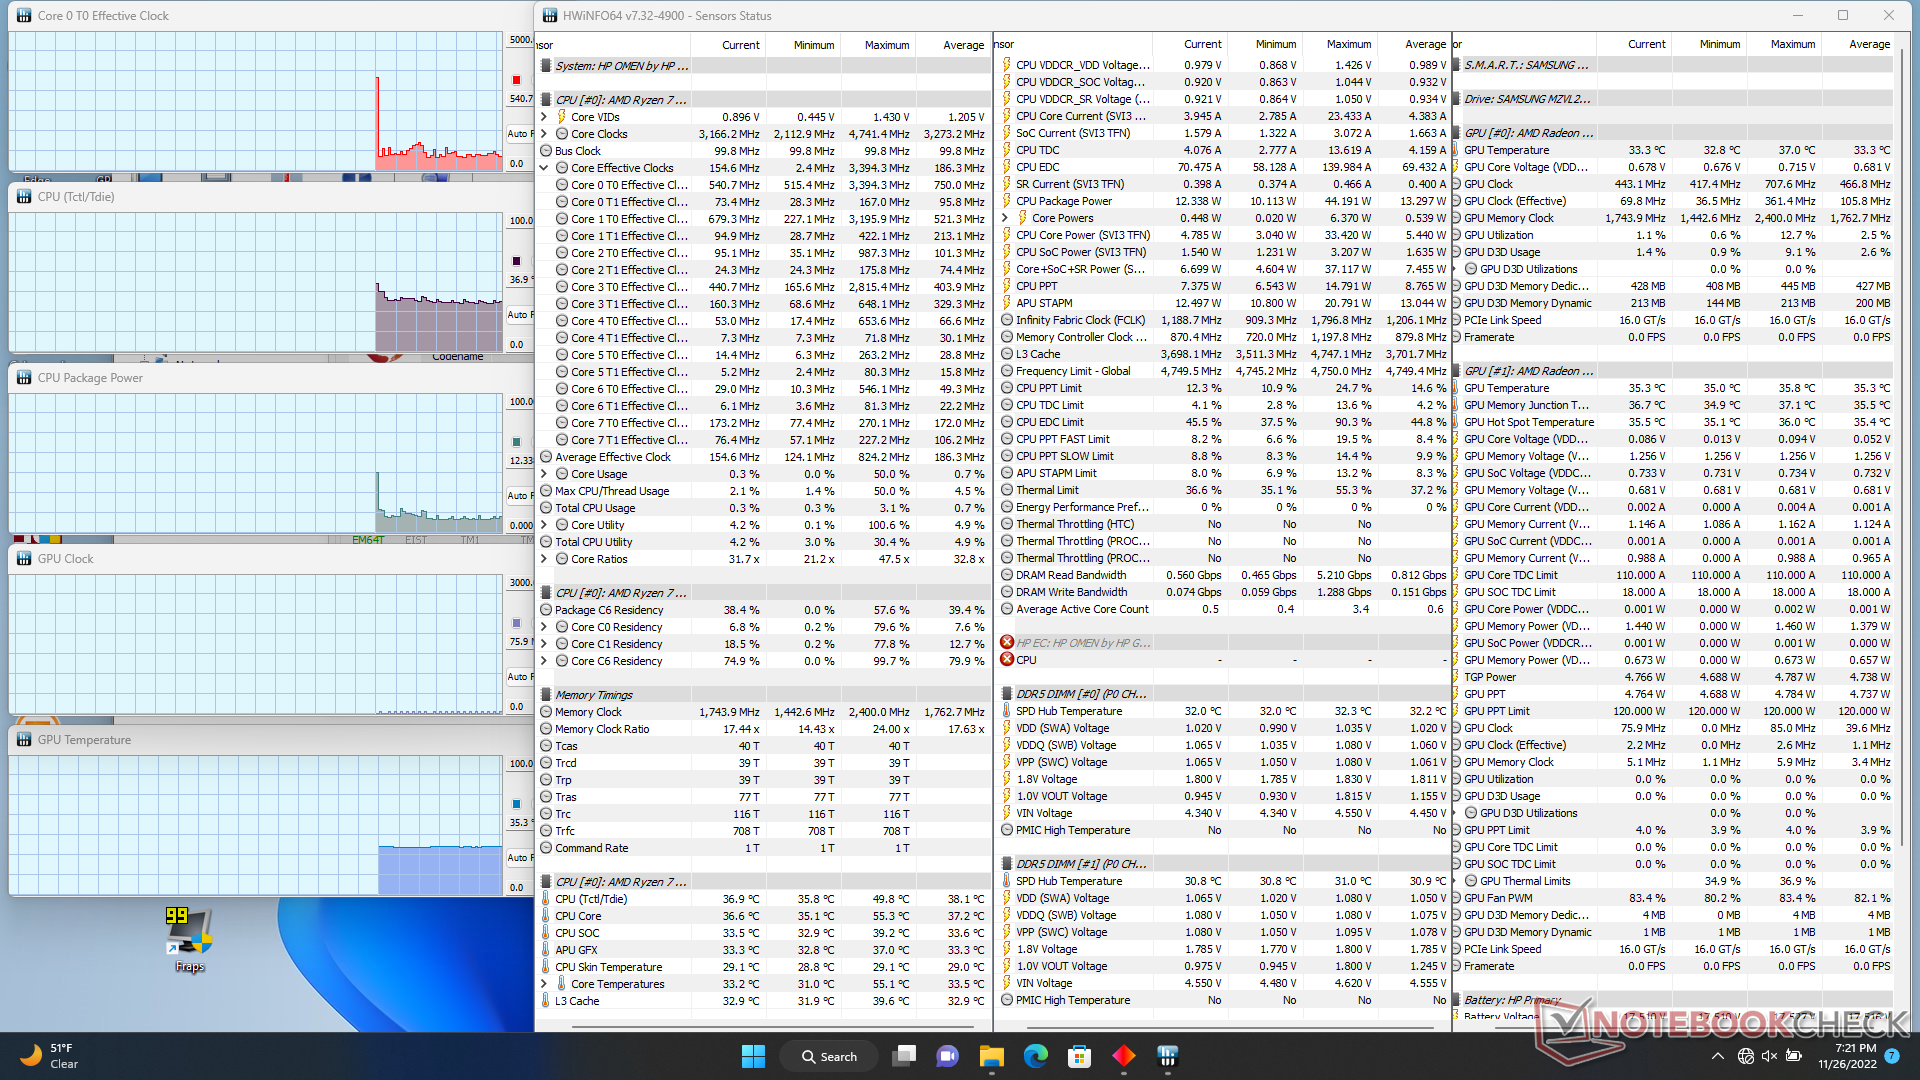
We set our unit to "Best Performance" mode via Windows and "Performance" mode via the Omen Gaming Hub software prior to running any performance benchmarks below. We highly recommend becoming accustomed to Omen Gaming Hub and the Radeon Adrenalin applications as they are both control hubs for adjusting power profiles, keyboard lighting, adaptive sync, Vari-Bright, and more as shown by the screenshots below.
We can find no MUX switch anywhere on the laptop whether it be the BIOS screen or Omen Gaming Hub software.
Processor
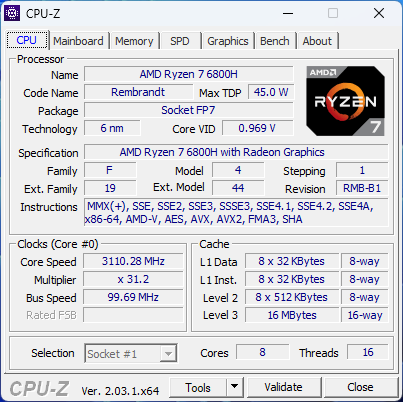
Raw CPU performance is about 5 percent slower than the average laptop in our database equipped with the same Ryzen 7 6800H processor. Our CPU is therefore only about 10 percent faster than last year's Ryzen 7 5800H to be a marginal year-over-year update. The biggest difference between mobile Zen 3 and Zen 3+ lies in their integrated graphics solutions, but this is almost irrelevant on gaming laptops like the Omen 16 since they almost always come with faster dedicated GPUs.
Single-thread and multi-thread performance is roughly 10 percent and 25 percent slower, respectively, than the competing Core i7-12700H in the Dell G16 7620. Opting for the pricier Core i9-12900H Omen 16 configuration would boost performance by 30 to 35 percent over our Ryzen SKU.
Cinebench R15 Multi Loop
Cinebench R23: Multi Core | Single Core
Cinebench R15: CPU Multi 64Bit | CPU Single 64Bit
Blender: v2.79 BMW27 CPU
7-Zip 18.03: 7z b 4 | 7z b 4 -mmt1
Geekbench 5.5: Multi-Core | Single-Core
HWBOT x265 Benchmark v2.2: 4k Preset
LibreOffice : 20 Documents To PDF
R Benchmark 2.5: Overall mean
Cinebench R23: Multi Core | Single Core
Cinebench R15: CPU Multi 64Bit | CPU Single 64Bit
Blender: v2.79 BMW27 CPU
7-Zip 18.03: 7z b 4 | 7z b 4 -mmt1
Geekbench 5.5: Multi-Core | Single-Core
HWBOT x265 Benchmark v2.2: 4k Preset
LibreOffice : 20 Documents To PDF
R Benchmark 2.5: Overall mean
* ... smaller is better
AIDA64: FP32 Ray-Trace | FPU Julia | CPU SHA3 | CPU Queen | FPU SinJulia | FPU Mandel | CPU AES | CPU ZLib | FP64 Ray-Trace | CPU PhotoWorxx
| Performance rating | |
| Lenovo Legion S7 16ARHA7 | |
| HP Omen 16-n0033dx | |
| Average AMD Ryzen 7 6800H | |
| Dell G16 7620 | |
| HP Envy 16 h0112nr | |
| HP Omen 16-b1090ng | |
| HP Victus 16-e0145ng | |
| AIDA64 / FP32 Ray-Trace | |
| Lenovo Legion S7 16ARHA7 | |
| HP Omen 16-n0033dx | |
| Average AMD Ryzen 7 6800H (12876 - 17031, n=8) | |
| Dell G16 7620 | |
| HP Envy 16 h0112nr | |
| HP Victus 16-e0145ng | |
| HP Omen 16-b1090ng | |
| AIDA64 / FPU Julia | |
| Lenovo Legion S7 16ARHA7 | |
| HP Omen 16-n0033dx | |
| Average AMD Ryzen 7 6800H (82673 - 105987, n=8) | |
| Dell G16 7620 | |
| HP Victus 16-e0145ng | |
| HP Envy 16 h0112nr | |
| HP Omen 16-b1090ng | |
| AIDA64 / CPU SHA3 | |
| Dell G16 7620 | |
| Lenovo Legion S7 16ARHA7 | |
| HP Omen 16-n0033dx | |
| Average AMD Ryzen 7 6800H (2886 - 3634, n=8) | |
| HP Envy 16 h0112nr | |
| HP Omen 16-b1090ng | |
| HP Victus 16-e0145ng | |
| AIDA64 / CPU Queen | |
| Lenovo Legion S7 16ARHA7 | |
| HP Omen 16-n0033dx | |
| Dell G16 7620 | |
| HP Envy 16 h0112nr | |
| HP Omen 16-b1090ng | |
| Average AMD Ryzen 7 6800H (75117 - 106322, n=8) | |
| HP Victus 16-e0145ng | |
| AIDA64 / FPU SinJulia | |
| Lenovo Legion S7 16ARHA7 | |
| HP Omen 16-n0033dx | |
| Average AMD Ryzen 7 6800H (11771 - 13120, n=8) | |
| Dell G16 7620 | |
| HP Omen 16-b1090ng | |
| HP Victus 16-e0145ng | |
| HP Envy 16 h0112nr | |
| AIDA64 / FPU Mandel | |
| Lenovo Legion S7 16ARHA7 | |
| HP Omen 16-n0033dx | |
| Average AMD Ryzen 7 6800H (45287 - 58327, n=8) | |
| HP Victus 16-e0145ng | |
| Dell G16 7620 | |
| HP Envy 16 h0112nr | |
| HP Omen 16-b1090ng | |
| AIDA64 / CPU AES | |
| Lenovo Legion S7 16ARHA7 | |
| HP Omen 16-n0033dx | |
| Average AMD Ryzen 7 6800H (67816 - 137383, n=8) | |
| HP Envy 16 h0112nr | |
| HP Omen 16-b1090ng | |
| Dell G16 7620 | |
| HP Victus 16-e0145ng | |
| AIDA64 / CPU ZLib | |
| Dell G16 7620 | |
| HP Omen 16-b1090ng | |
| Lenovo Legion S7 16ARHA7 | |
| HP Omen 16-n0033dx | |
| Average AMD Ryzen 7 6800H (732 - 901, n=8) | |
| HP Envy 16 h0112nr | |
| HP Victus 16-e0145ng | |
| AIDA64 / FP64 Ray-Trace | |
| Lenovo Legion S7 16ARHA7 | |
| HP Omen 16-n0033dx | |
| Average AMD Ryzen 7 6800H (6917 - 8980, n=8) | |
| Dell G16 7620 | |
| HP Envy 16 h0112nr | |
| HP Victus 16-e0145ng | |
| HP Omen 16-b1090ng | |
| AIDA64 / CPU PhotoWorxx | |
| HP Omen 16-b1090ng | |
| HP Envy 16 h0112nr | |
| Dell G16 7620 | |
| Average AMD Ryzen 7 6800H (26496 - 30360, n=8) | |
| Lenovo Legion S7 16ARHA7 | |
| HP Omen 16-n0033dx | |
| HP Victus 16-e0145ng | |
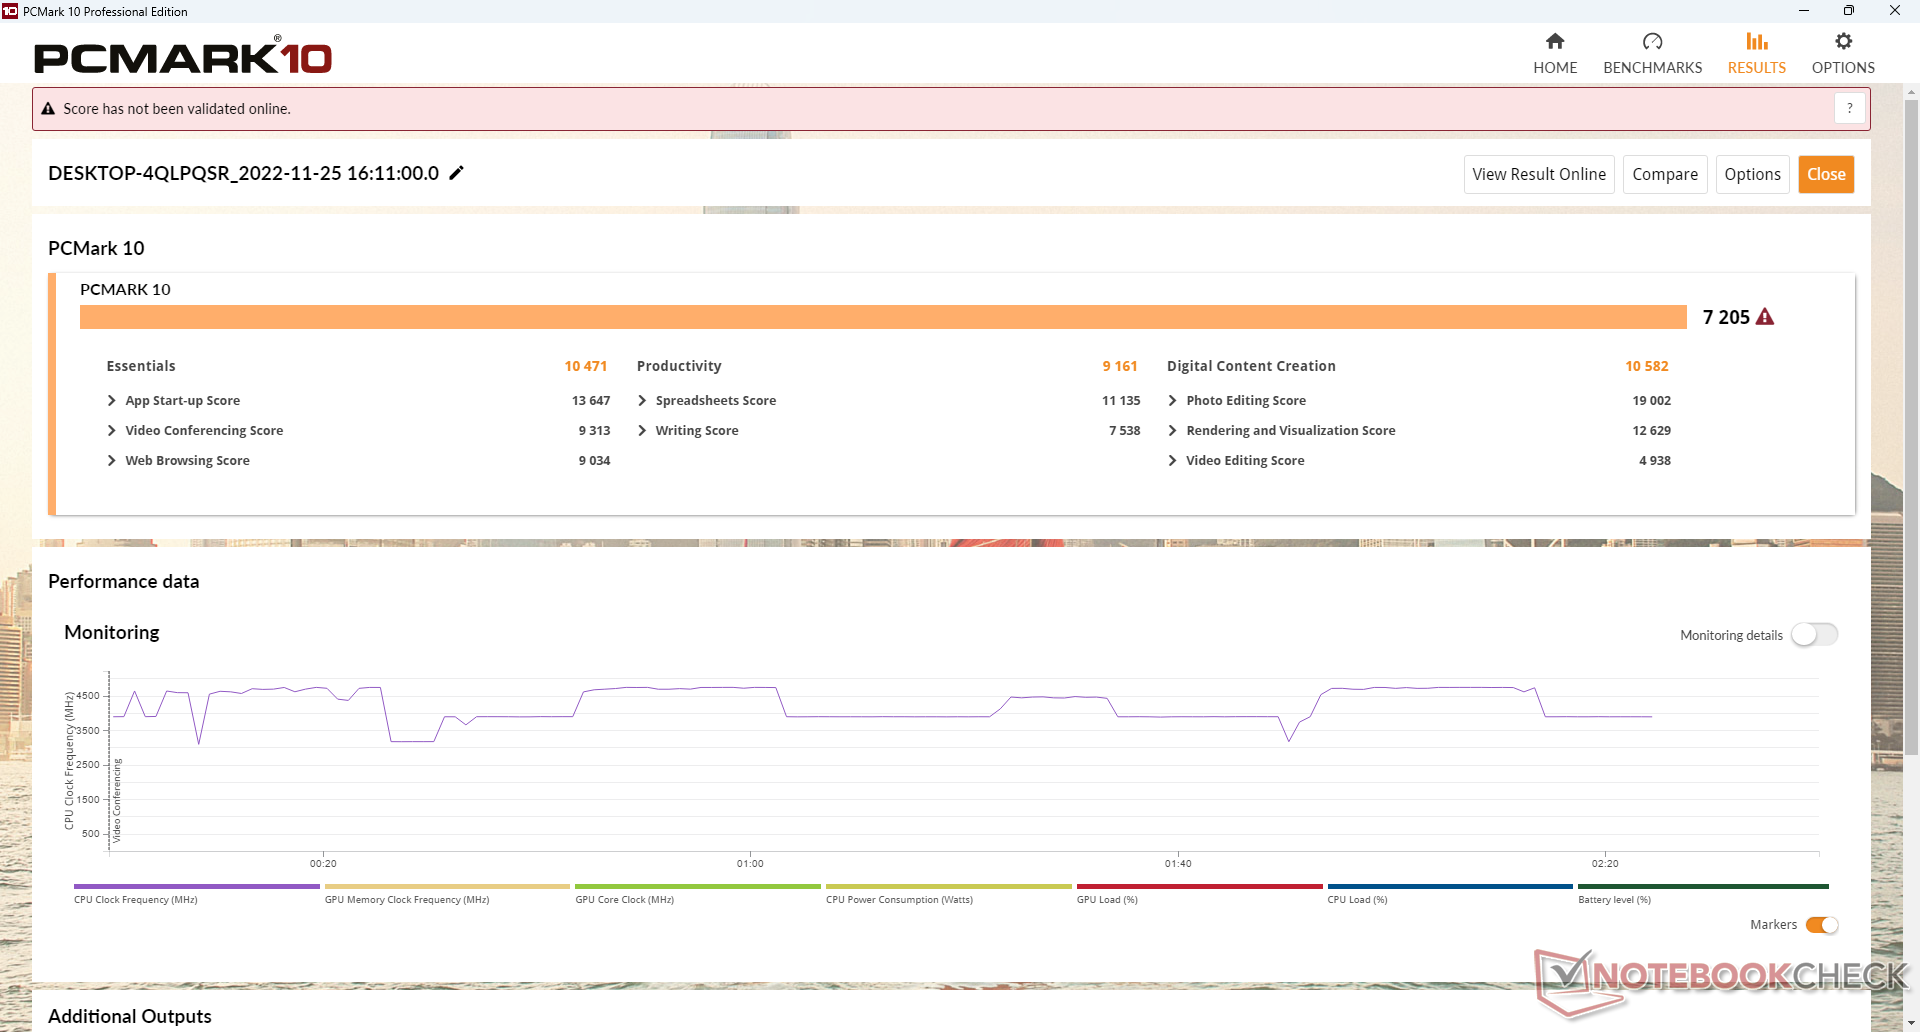
System Performance
PCMark scores are comparable to the latest gaming laptops running on Intel 12th gen CPUs and Nvidia GeForce RTX GPUs. Results are consistently ahead of the Victus 16 which is a more budget-friendly gaming series from HP.
CrossMark: Overall | Productivity | Creativity | Responsiveness
| PCMark 10 / Score | |
| Lenovo Legion S7 16ARHA7 | |
| HP Envy 16 h0112nr | |
| HP Omen 16-b1090ng | |
| Dell G16 7620 | |
| HP Omen 16-n0033dx | |
| HP Victus 16-e0145ng | |
| PCMark 10 / Essentials | |
| HP Envy 16 h0112nr | |
| Lenovo Legion S7 16ARHA7 | |
| HP Omen 16-n0033dx | |
| Dell G16 7620 | |
| HP Omen 16-b1090ng | |
| HP Victus 16-e0145ng | |
| PCMark 10 / Productivity | |
| Lenovo Legion S7 16ARHA7 | |
| HP Omen 16-b1090ng | |
| HP Envy 16 h0112nr | |
| HP Omen 16-n0033dx | |
| Dell G16 7620 | |
| HP Victus 16-e0145ng | |
| PCMark 10 / Digital Content Creation | |
| Lenovo Legion S7 16ARHA7 | |
| Dell G16 7620 | |
| HP Omen 16-b1090ng | |
| HP Envy 16 h0112nr | |
| HP Omen 16-n0033dx | |
| HP Victus 16-e0145ng | |
| CrossMark / Overall | |
| HP Envy 16 h0112nr | |
| Dell G16 7620 | |
| Lenovo Legion S7 16ARHA7 | |
| HP Omen 16-n0033dx | |
| CrossMark / Productivity | |
| HP Envy 16 h0112nr | |
| Dell G16 7620 | |
| Lenovo Legion S7 16ARHA7 | |
| HP Omen 16-n0033dx | |
| CrossMark / Creativity | |
| HP Envy 16 h0112nr | |
| Dell G16 7620 | |
| Lenovo Legion S7 16ARHA7 | |
| HP Omen 16-n0033dx | |
| CrossMark / Responsiveness | |
| Dell G16 7620 | |
| HP Envy 16 h0112nr | |
| Lenovo Legion S7 16ARHA7 | |
| HP Omen 16-n0033dx | |
| PCMark 10 Score | 7205 points | |
Help | ||
| AIDA64 / Memory Copy | |
| HP Omen 16-b1090ng | |
| HP Envy 16 h0112nr | |
| Dell G16 7620 | |
| Average AMD Ryzen 7 6800H (48209 - 51186, n=8) | |
| Lenovo Legion S7 16ARHA7 | |
| HP Omen 16-n0033dx | |
| HP Victus 16-e0145ng | |
| AIDA64 / Memory Read | |
| HP Omen 16-b1090ng | |
| HP Envy 16 h0112nr | |
| Dell G16 7620 | |
| Lenovo Legion S7 16ARHA7 | |
| HP Omen 16-n0033dx | |
| Average AMD Ryzen 7 6800H (43828 - 51778, n=8) | |
| HP Victus 16-e0145ng | |
| AIDA64 / Memory Write | |
| HP Omen 16-b1090ng | |
| HP Envy 16 h0112nr | |
| Dell G16 7620 | |
| Lenovo Legion S7 16ARHA7 | |
| HP Omen 16-n0033dx | |
| Average AMD Ryzen 7 6800H (51116 - 55307, n=8) | |
| HP Victus 16-e0145ng | |
| AIDA64 / Memory Latency | |
| Dell G16 7620 | |
| HP Envy 16 h0112nr | |
| HP Omen 16-b1090ng | |
| Average AMD Ryzen 7 6800H (83.1 - 104.1, n=8) | |
| HP Omen 16-n0033dx | |
| Lenovo Legion S7 16ARHA7 | |
| HP Victus 16-e0145ng | |
* ... smaller is better
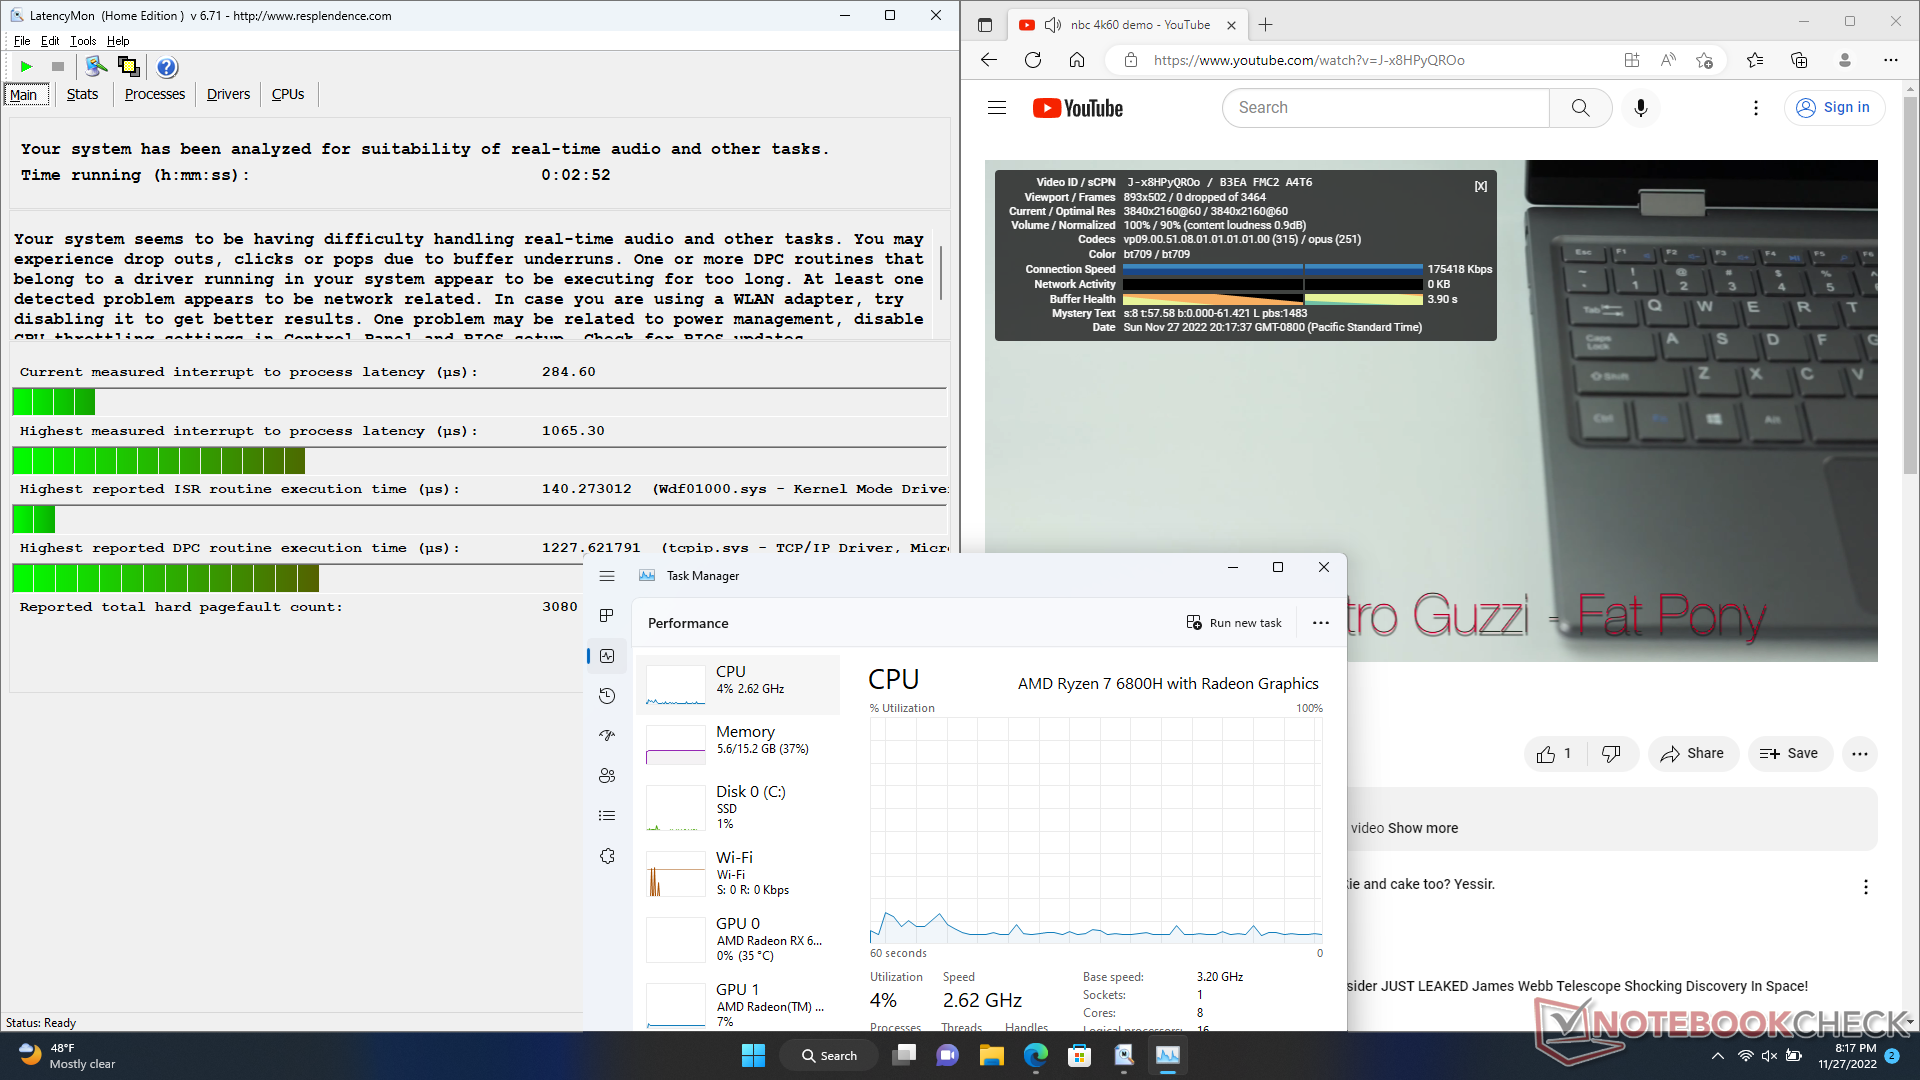
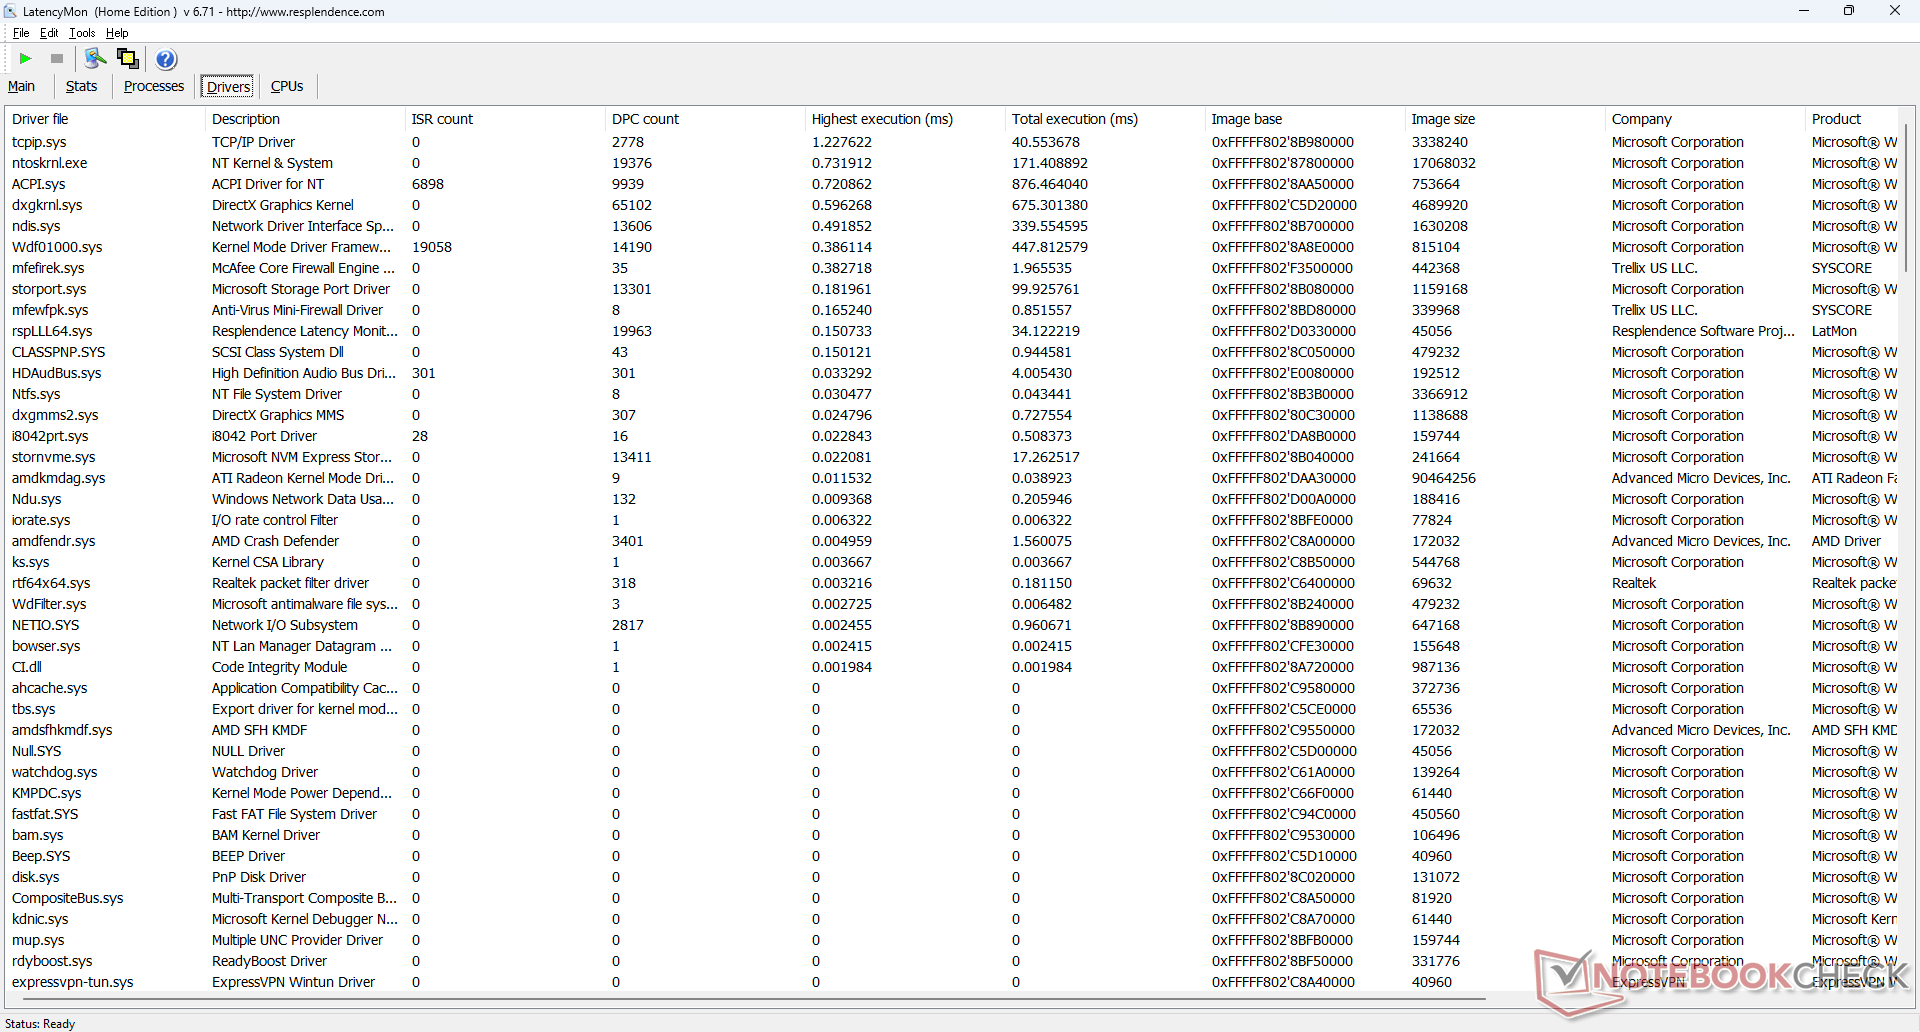
DPC Latency
LatencyMon reveals DPC issues when opening multiple browser tabs on our homepage. 4K video playback at 60 FPS is otherwise perfect with low CPU/GPU utilization and no dropped frames.
| DPC Latencies / LatencyMon - interrupt to process latency (max), Web, Youtube, Prime95 | |
| HP Omen 16-n0033dx | |
| Lenovo Legion S7 16ARHA7 | |
| Dell G16 7620 | |
| HP Victus 16-e0145ng | |
| HP Envy 16 h0112nr | |
| HP Omen 16-b1090ng | |
* ... smaller is better
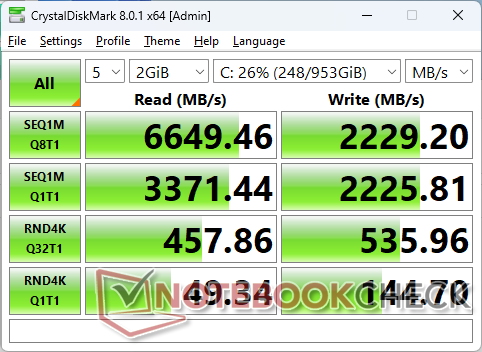
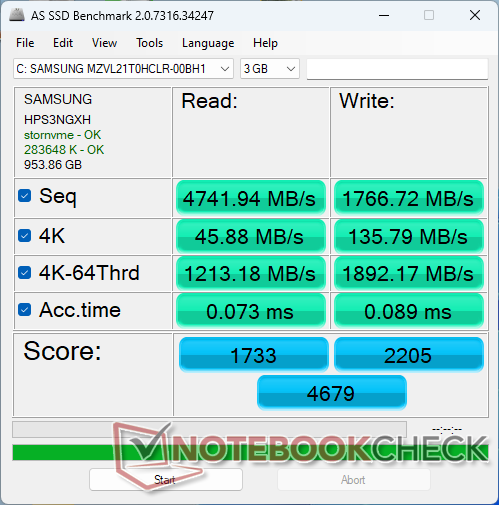
Storage Devices — Up To Two PCIe4 x4 NVMe SSDs
Our test unit ships with a 1 TB Samsung PM9A1 SSD promising 7000 MB/s and 5100 MB/s sequential read and write rates, respectively. The system is able to maintain a real-world read rate of about 6700 MB/s indefinitely, but the drive would occasionally dip to the low 3000 MB/s range before bouncing back up as shown by our loop test results below. This is likely a bug with the system and not a performance throttling measure. Each of the two M.2 2280 slots have their own thermal pad to dissipate heat onto the metal bottom panel and so SSD overheating shouldn't be an issue.

| Drive Performance rating - Percent | |
| Dell G16 7620 | |
| HP Omen 16-b1090ng | |
| Lenovo Legion S7 16ARHA7 | |
| HP Envy 16 h0112nr | |
| HP Victus 16-e0145ng | |
| HP Omen 16-n0033dx | |
* ... smaller is better
Disk Throttling: DiskSpd Read Loop, Queue Depth 8
GPU Performance — Edging Out The GeForce RTX 3060
The Radeon RX 6650M sits in between the mobile GeForce RTX 3060 and mobile GeForce RTX 3070 when it comes to performance. It is unfortunately closer to the RTX 3060 than it is to the RTX 3070, however, and so users should only expect frame rates that are just 5 to 10 percent higher than the average RTX 3060 laptop when playing most games.
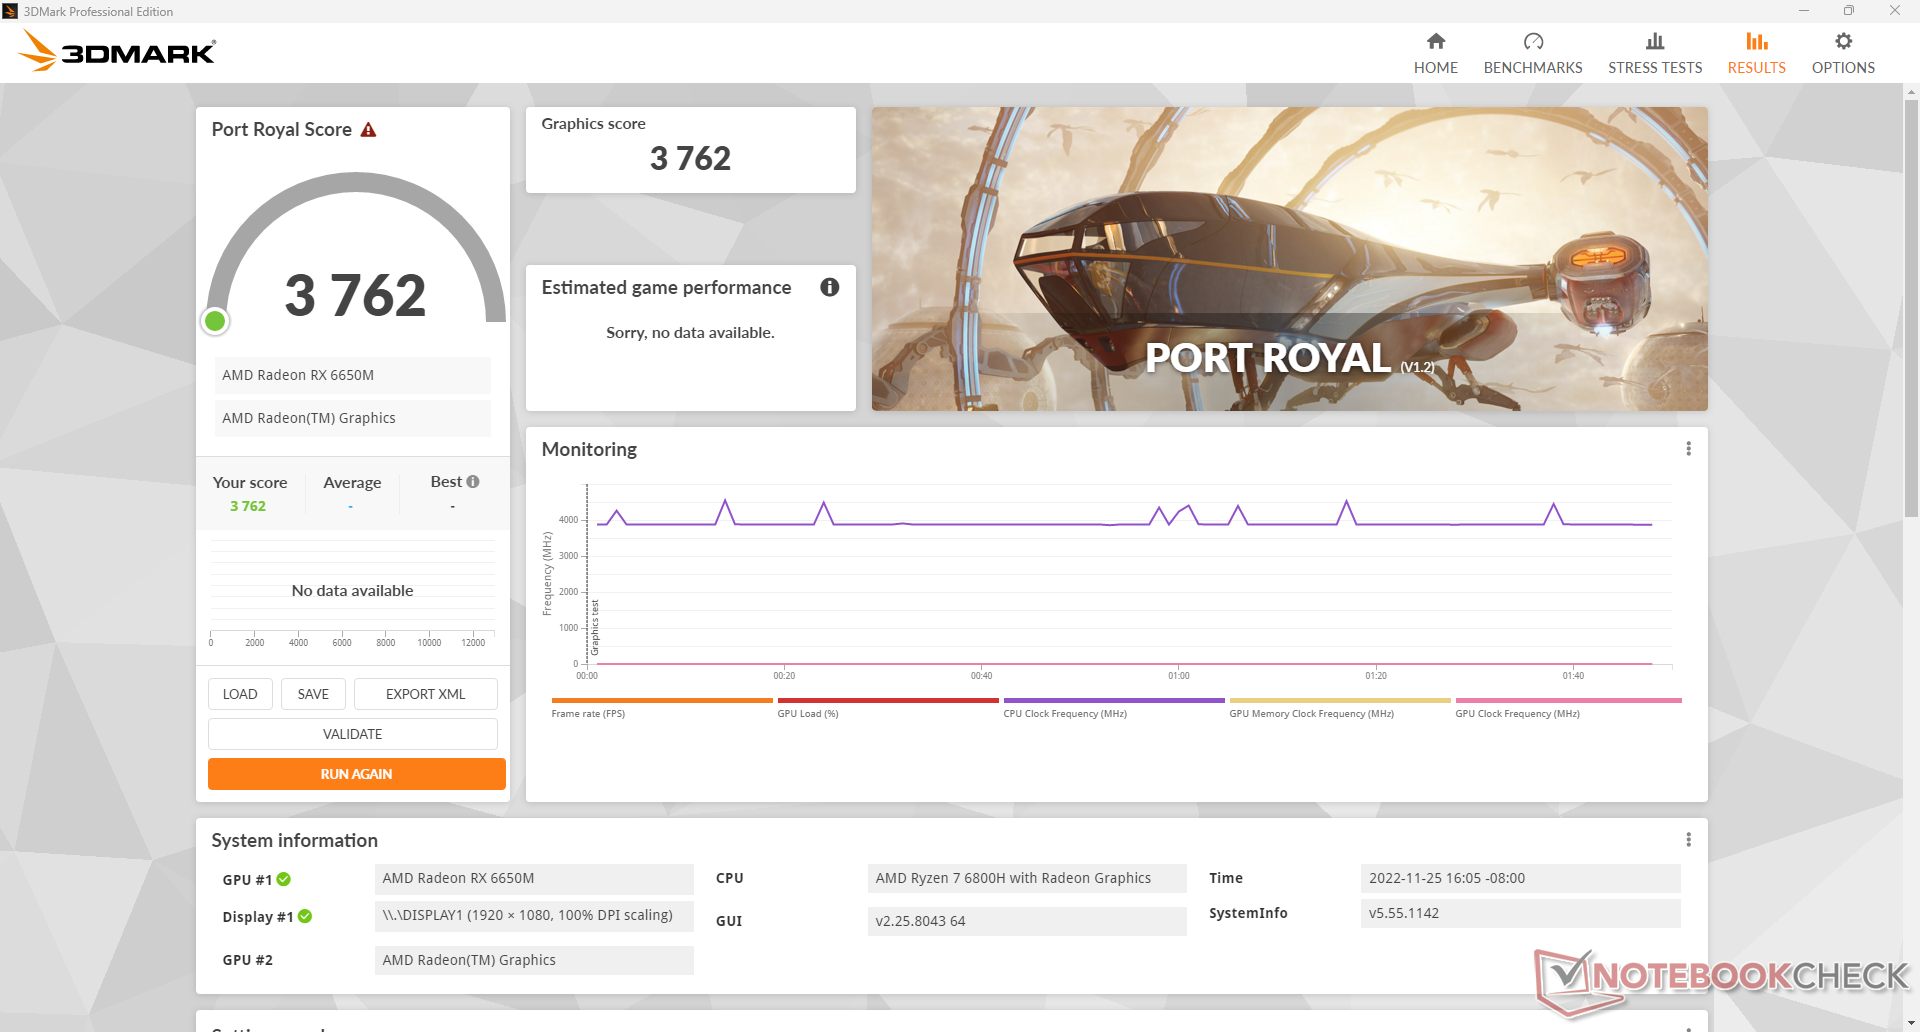
Though the Radeon RX 6650M slightly outperforms the RTX 3060 laptops when it comes to rasterization performance, it is significantly slower when it comes to real-time ray-tracing performance. 3DMark Port Royal results are nearly 30 percent lower than on the Dell G16 powered by the RTX 3060. To test this on an actual game, we would run F1 22 on 1080p settings with and without RT on our AMD-powered HP laptop. When RT is disabled, frame rates would be consistently ahead of any RTX 3060 laptop. When RT is disabled, frame rates would fall to be about 15 percent slower than those same RTX 3060 laptops. If RT performance is important to you, then you'll definitely want to consider an Nvidia SKU instead.
Running on Balanced mode instead of Performance mode will reduce GPU performance by about 11 percent.
The GPU is unfortunately not without a few issues. Blender HIP rendering and Horizon Zero Dawn, for example, would crash the program and have launch issues, respectively, despite being on the latest graphics drivers at the time of review.
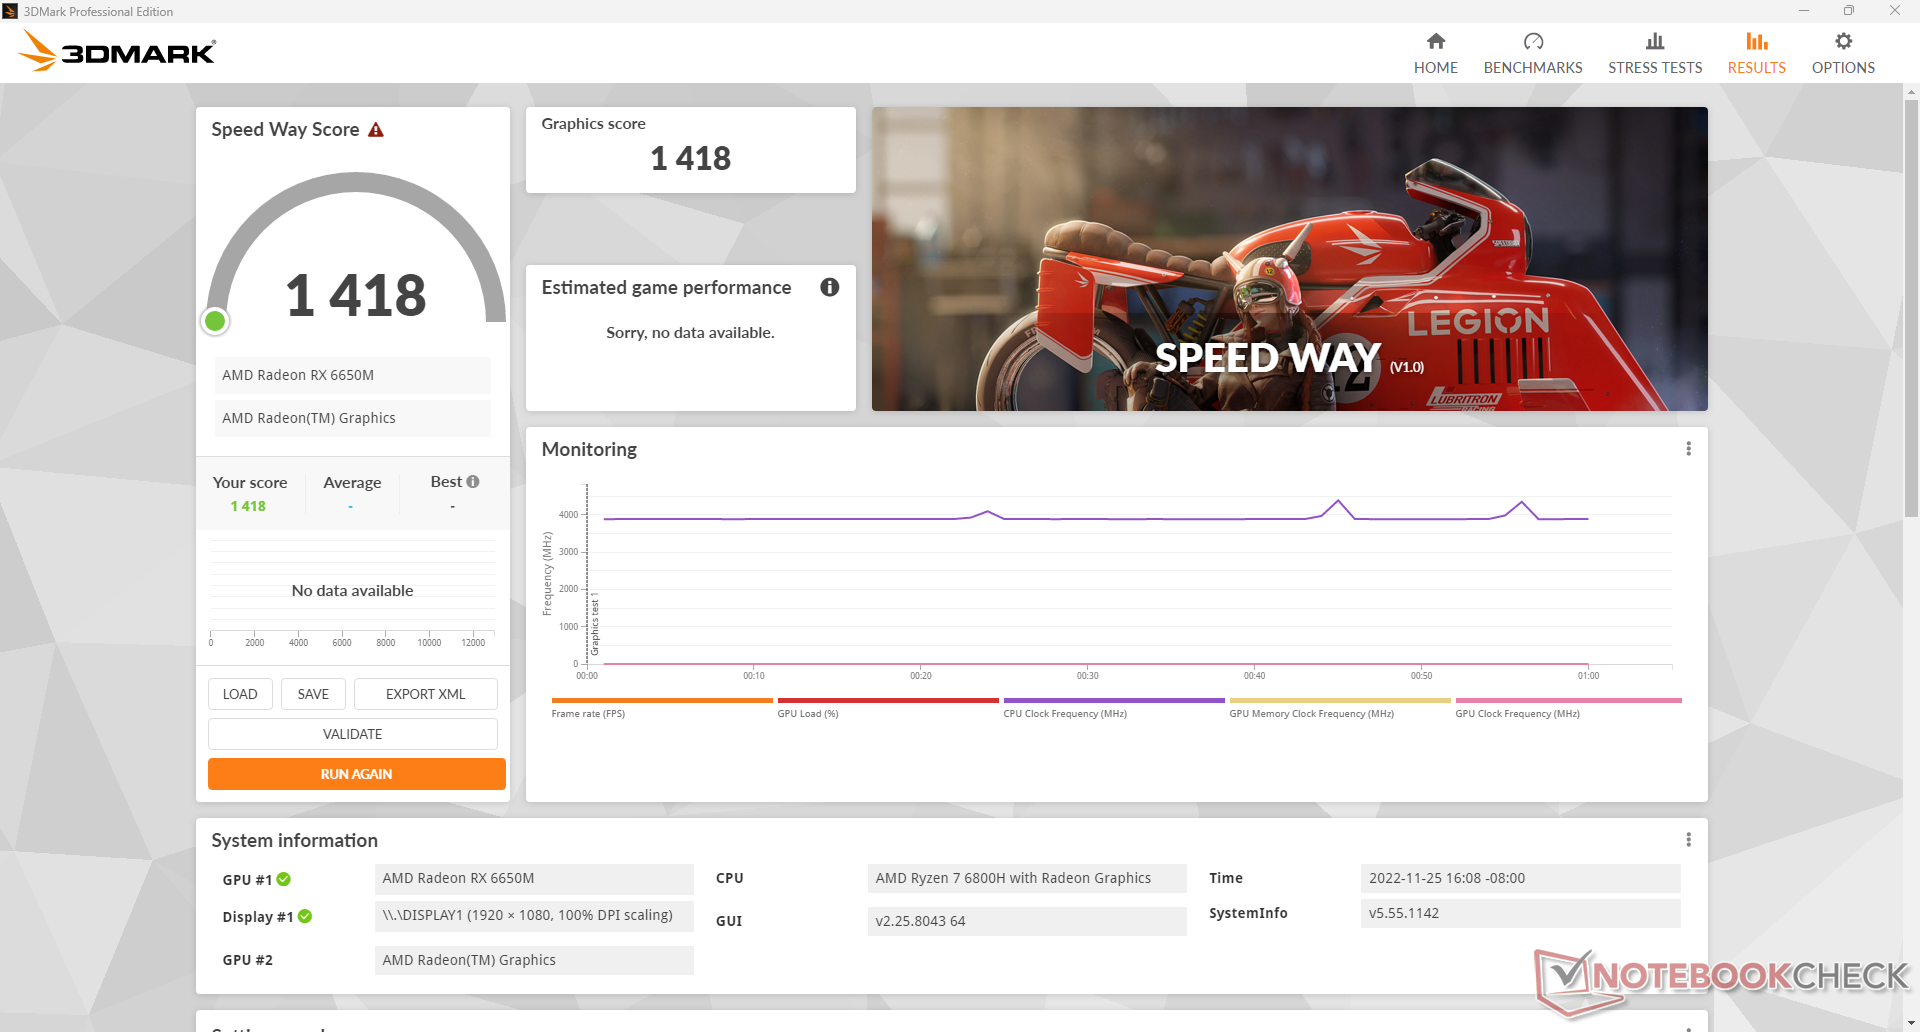
More technical details and benchmarks can be found on our dedicated Radeon RX 6650M page here.
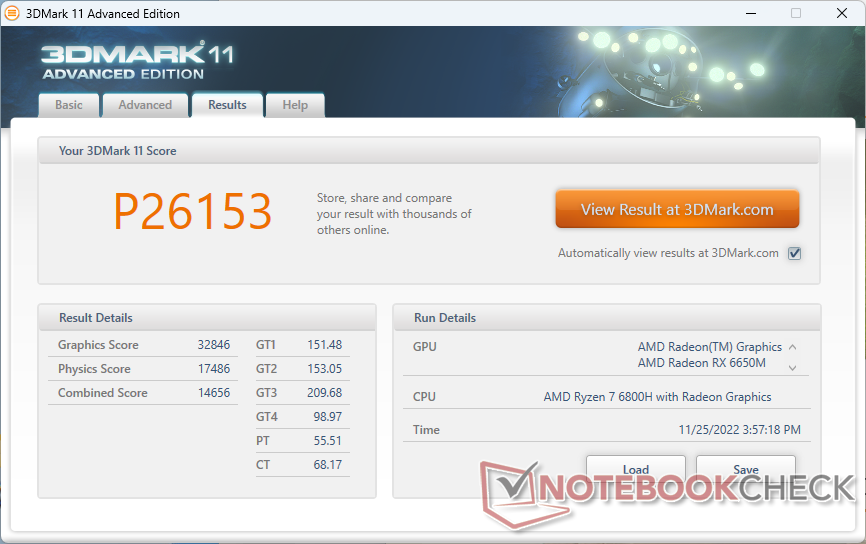
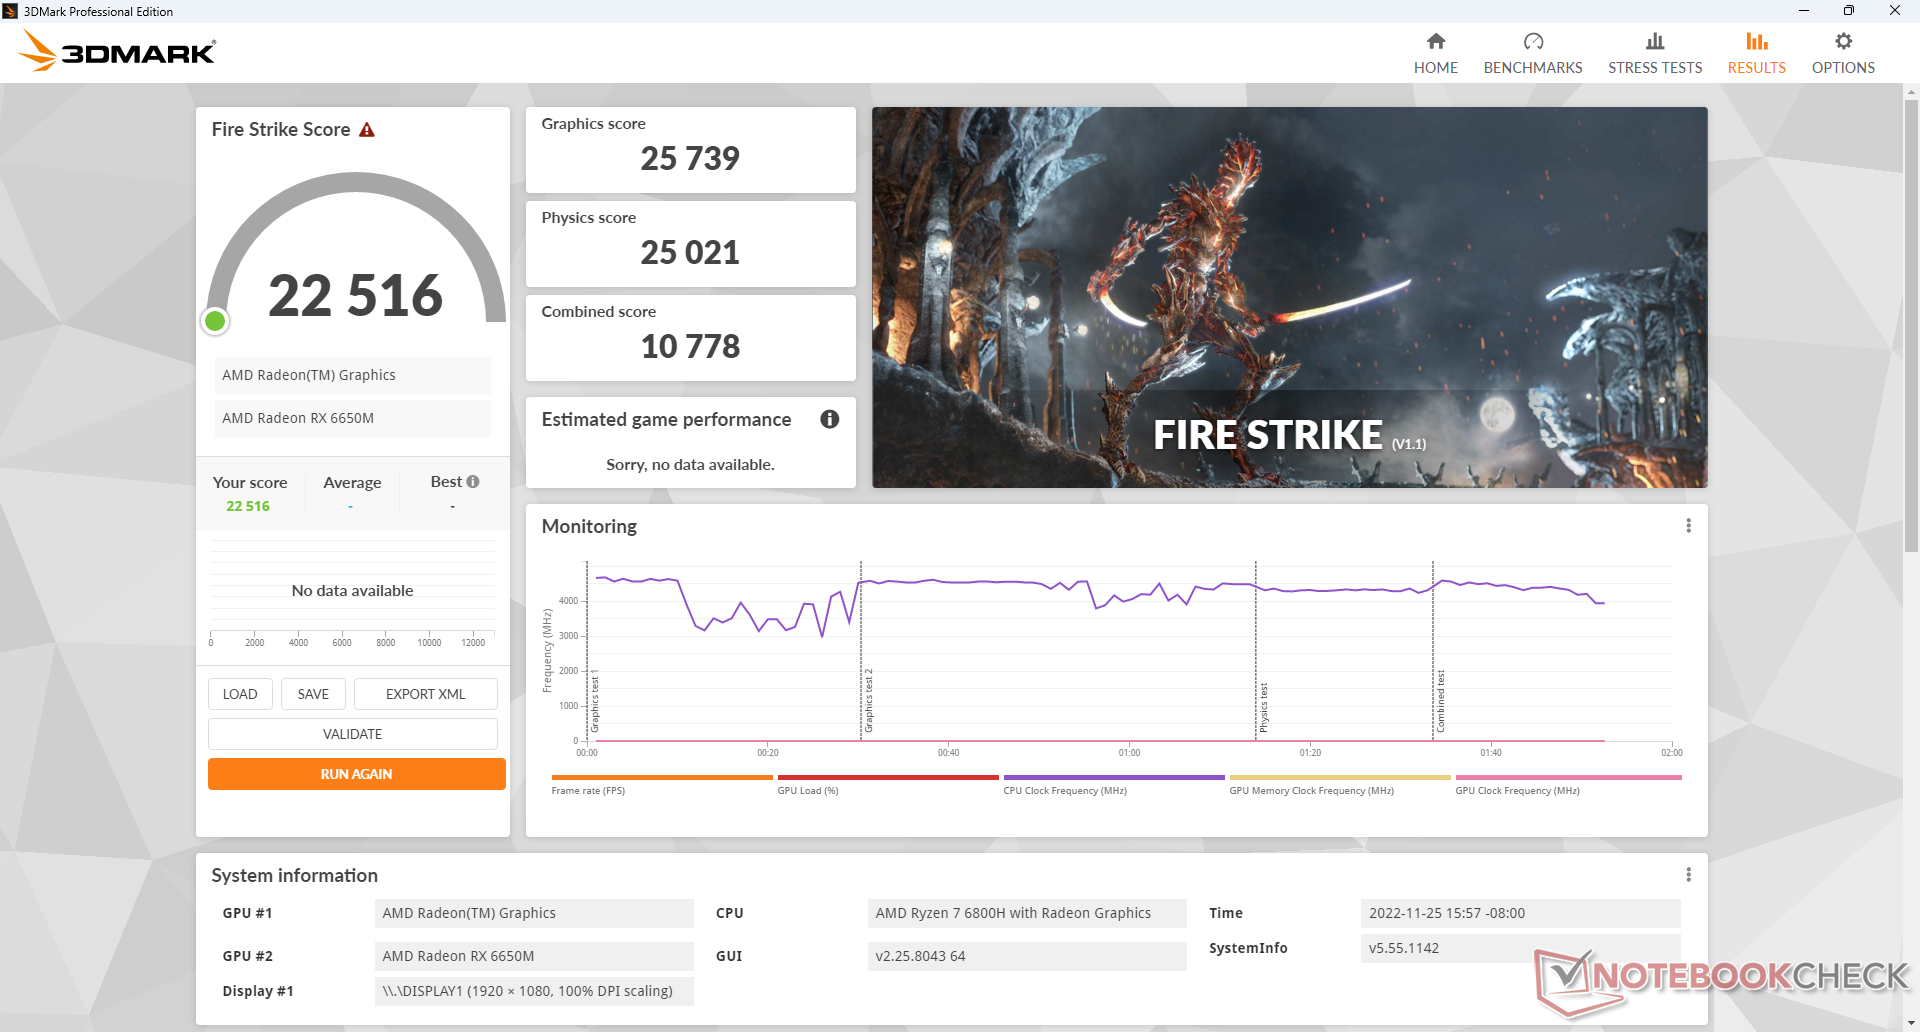
| 3DMark 11 Performance | 26153 points | |
| 3DMark Fire Strike Score | 22516 points | |
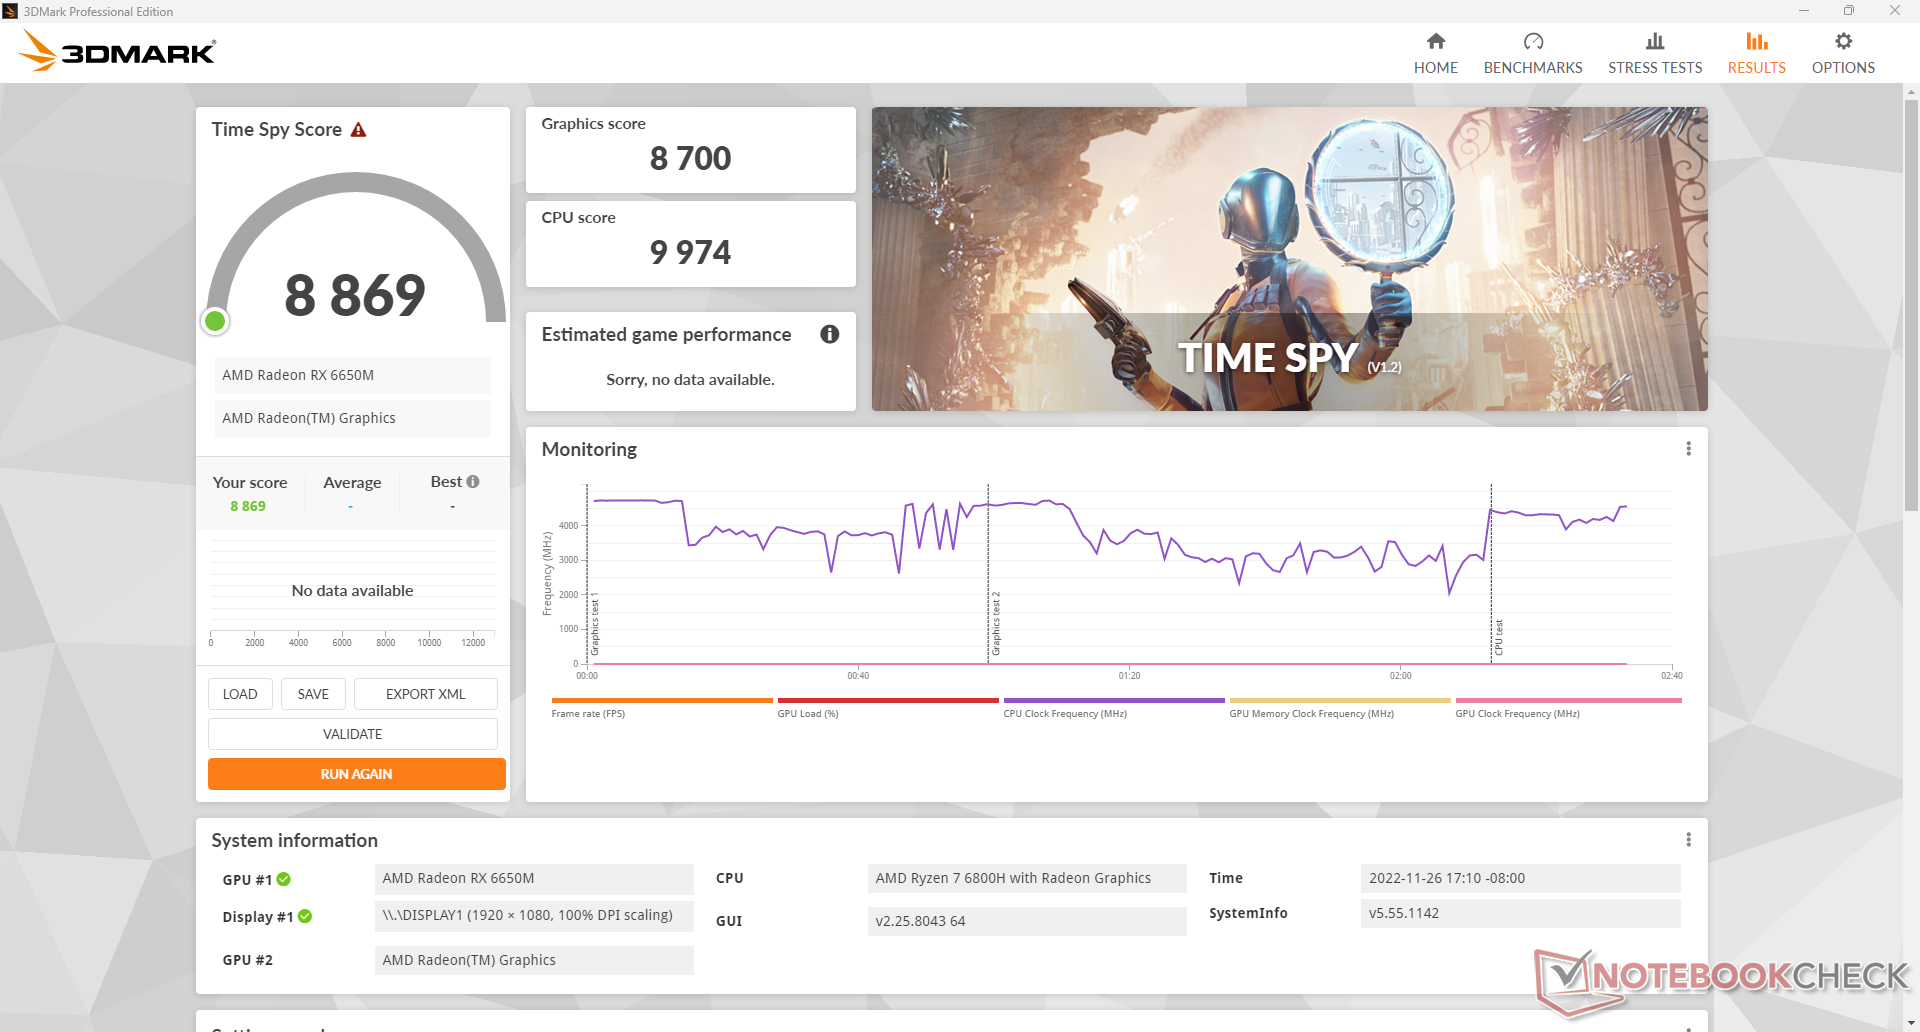
| 3DMark Time Spy Score | 8869 points | |
Help | ||
| Blender - v3.3 Classroom CPU | |
| HP Envy 16 h0112nr | |
| HP Omen 16-n0033dx | |
| Lenovo Legion S7 16ARHA7 | |
| Dell G16 7620 | |
| Lenovo Legion 7 16IAX7-82TD004SGE | |
* ... smaller is better
Frame rates when idling on Witcher 3 is generally steady save for a short-lived drop to 13 FPS. This could be due to a bug or poor prioritization of background activity similar to the performance drops we observed above when stress testing the SSD.
Witcher 3 FPS Chart
| low | med. | high | ultra | |
|---|---|---|---|---|
| The Witcher 3 (2015) | 276.5 | 217.4 | 167 | 90.1 |
| Dota 2 Reborn (2015) | 141 | 130.7 | 118 | 100 |
| Overwatch (2016) | 507.9 | 481.9 | 350.9 | 150 |
| Fortnite (2018) | 95.5 | 54.1 | 46 | 40.4 |
| Final Fantasy XV Benchmark (2018) | 164.7 | 113.3 | 83.2 | |
| X-Plane 11.11 (2018) | 66.4 | 52.7 | 46.4 | |
| Strange Brigade (2018) | 337 | 222 | 190 | 167.2 |
| Metro Exodus (2019) | 138.8 | 111.5 | 81 | 65.8 |
| Borderlands 3 (2019) | 110.4 | 95.9 | 85.2 | 67.4 |
| Gears Tactics (2020) | 162.8 | 205.9 | 124.2 | 100.4 |
| Watch Dogs Legion (2020) | 109 | 104 | 94 | 62 |
| Dirt 5 (2020) | 236.6 | 135.4 | 109.1 | 83.6 |
| Hitman 3 (2021) | 224.8 | 178.8 | 165.5 | 156.3 |
| F1 2021 (2021) | 315 | 247 | 216 | 100 |
| Far Cry 6 (2021) | 111 | 105 | 96 | 88 |
| Guardians of the Galaxy (2021) | 117 | 110 | 111 | 105 |
| God of War (2022) | 69.3 | 68.4 | 64.3 | 51.5 |
| Cyberpunk 2077 1.6 (2022) | 126.8 | 106.3 | 78.9 | 63.8 |
| F1 22 (2022) | 217 | 215 | 178.2 | 40.6 |
Emissions
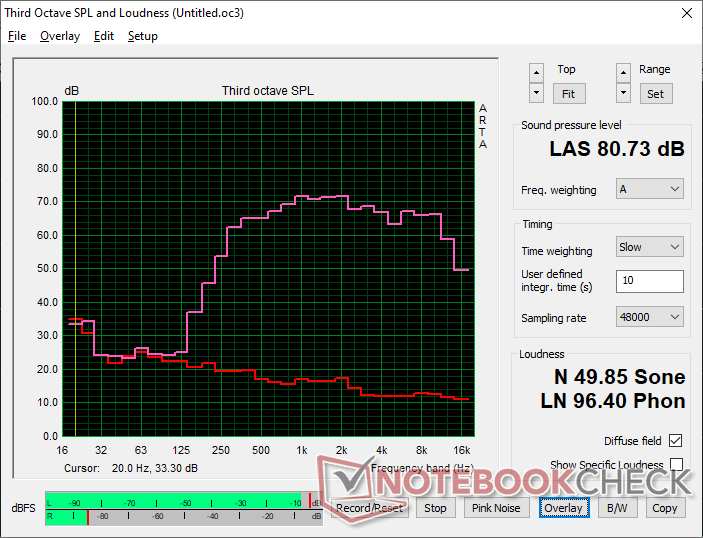
System Noise — Loud On Performance Mode
The internal fans are always active at a low of 27 dB(A) against a silent background of 24 dB(A). They're good at remaining quiet for longer periods of stress, however, and so RPM pulses occur much less frequently when web browsing or video streaming.
Fan noise is tied to the power profile when gaming. Running Witcher 3 on Balanced mode, example, results in a fan noise of just 39.4 dB(A) versus 54.1 dB(A) when on Performance mode. The mid 50 dB(A) range is noticeably louder than on the Dell G16 when under similar conditions. Users must endure the much louder fans if they wish to run the GPU at its highest TGP target.
Noise level
| Idle |
| 27.4 / 27.4 / 28.9 dB(A) |
| Load |
| 32.3 / 57.6 dB(A) |
 | ||
30 dB silent 40 dB(A) audible 50 dB(A) loud |
||
min: | ||
| HP Omen 16-n0033dx Radeon RX 6650M, R7 6800H, Samsung PM9A1 MZVL21T0HCLR | HP Envy 16 h0112nr GeForce RTX 3060 Laptop GPU, i7-12700H, Micron 3400 1TB MTFDKBA1T0TFH | HP Omen 16-b1090ng GeForce RTX 3070 Ti Laptop GPU, i7-12700H, WDC PC SN810 1TB | HP Victus 16-e0145ng GeForce RTX 3050 Ti Laptop GPU, R5 5600H, Samsung SSD PM981a MZVLB512HBJQ | Lenovo Legion S7 16ARHA7 Radeon RX 6800S, R9 6900HX, SK Hynix HFS001TEJ9X115N | Dell G16 7620 GeForce RTX 3060 Laptop GPU, i7-12700H, WDC PC SN810 512GB | |
|---|---|---|---|---|---|---|
| Noise | 3% | -13% | -6% | 11% | 3% | |
| off / environment * (dB) | 24.2 | 22.8 6% | 26 -7% | 26 -7% | 23.1 5% | 23.2 4% |
| Idle Minimum * (dB) | 27.4 | 22.9 16% | 30 -9% | 26 5% | 23.1 16% | 28.3 -3% |
| Idle Average * (dB) | 27.4 | 22.9 16% | 31 -13% | 28 -2% | 23.1 16% | 28.8 -5% |
| Idle Maximum * (dB) | 28.9 | 30.5 -6% | 33 -14% | 34 -18% | 23.1 20% | 28.9 -0% |
| Load Average * (dB) | 32.3 | 41.4 -28% | 49 -52% | 44 -36% | 31.4 3% | 32.4 -0% |
| Witcher 3 ultra * (dB) | 54.1 | 51.1 6% | 53 2% | 48 11% | 51.4 5% | 48.3 11% |
| Load Maximum * (dB) | 57.6 | 51.4 11% | 57 1% | 53 8% | 51.2 11% | 48.1 16% |
* ... smaller is better
Temperature
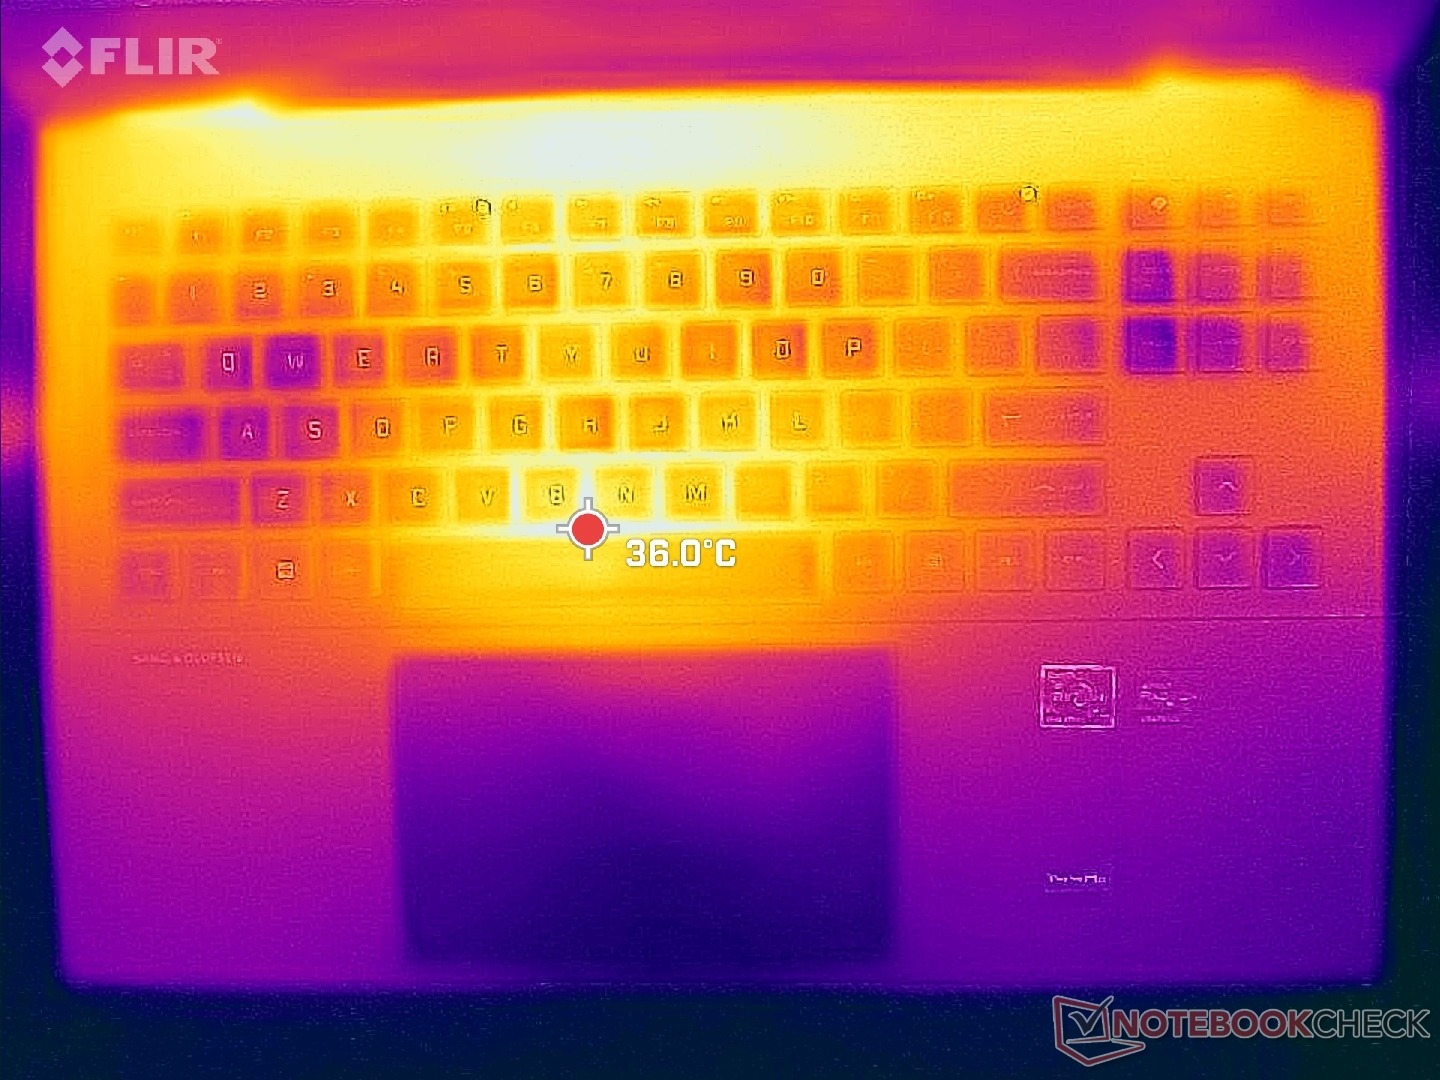
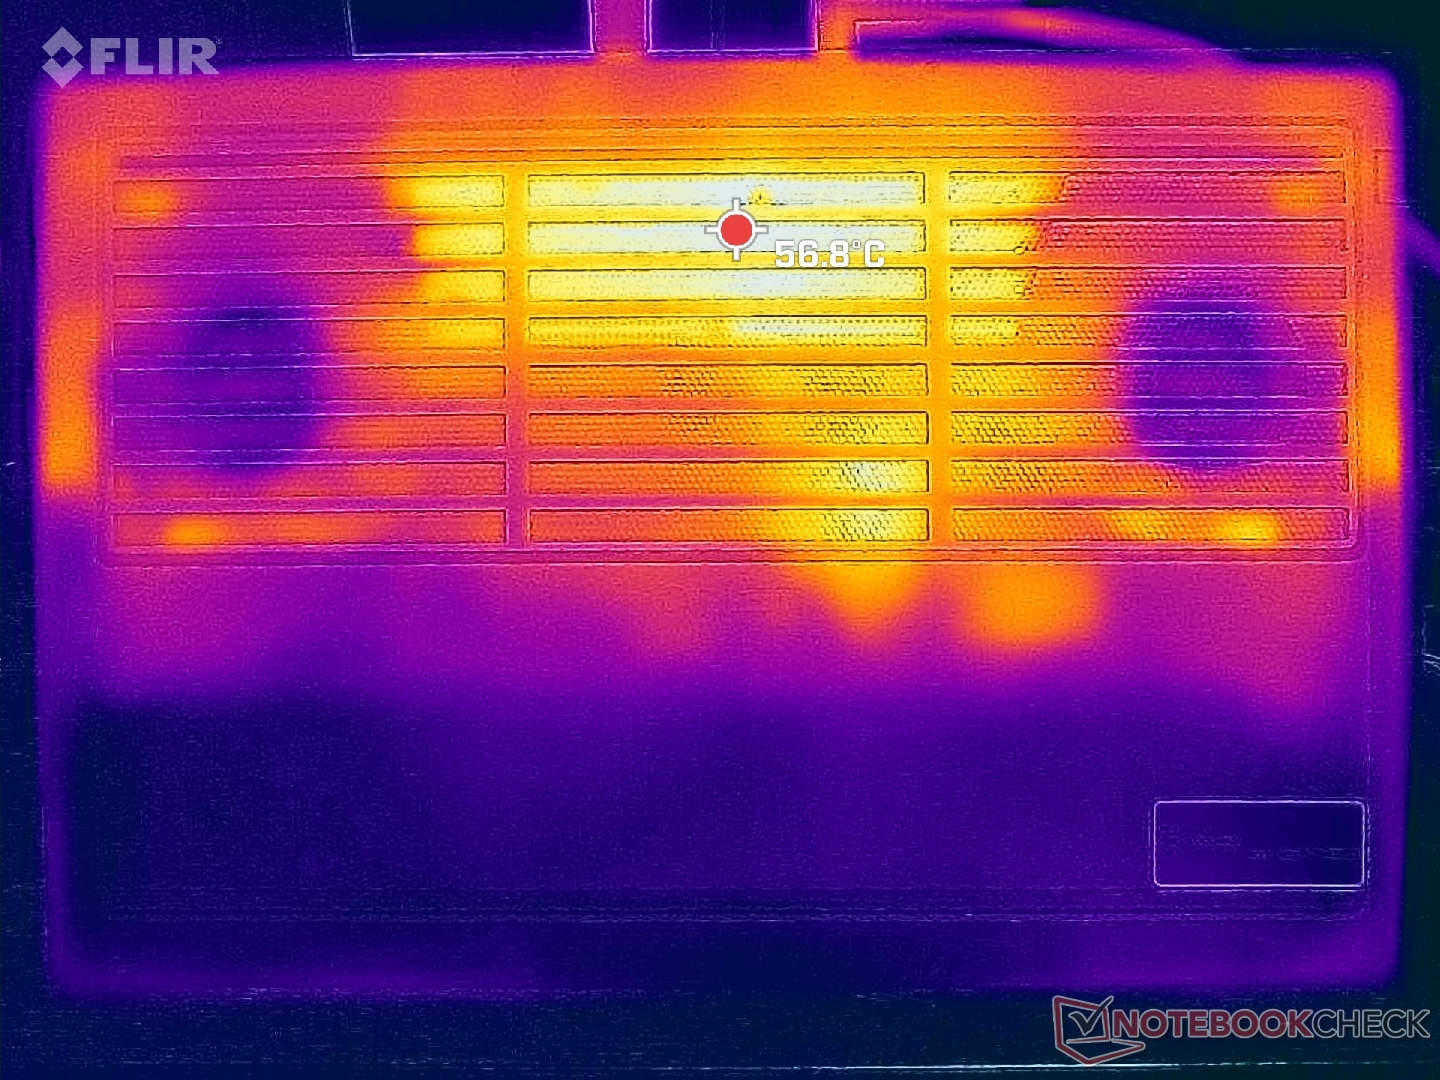
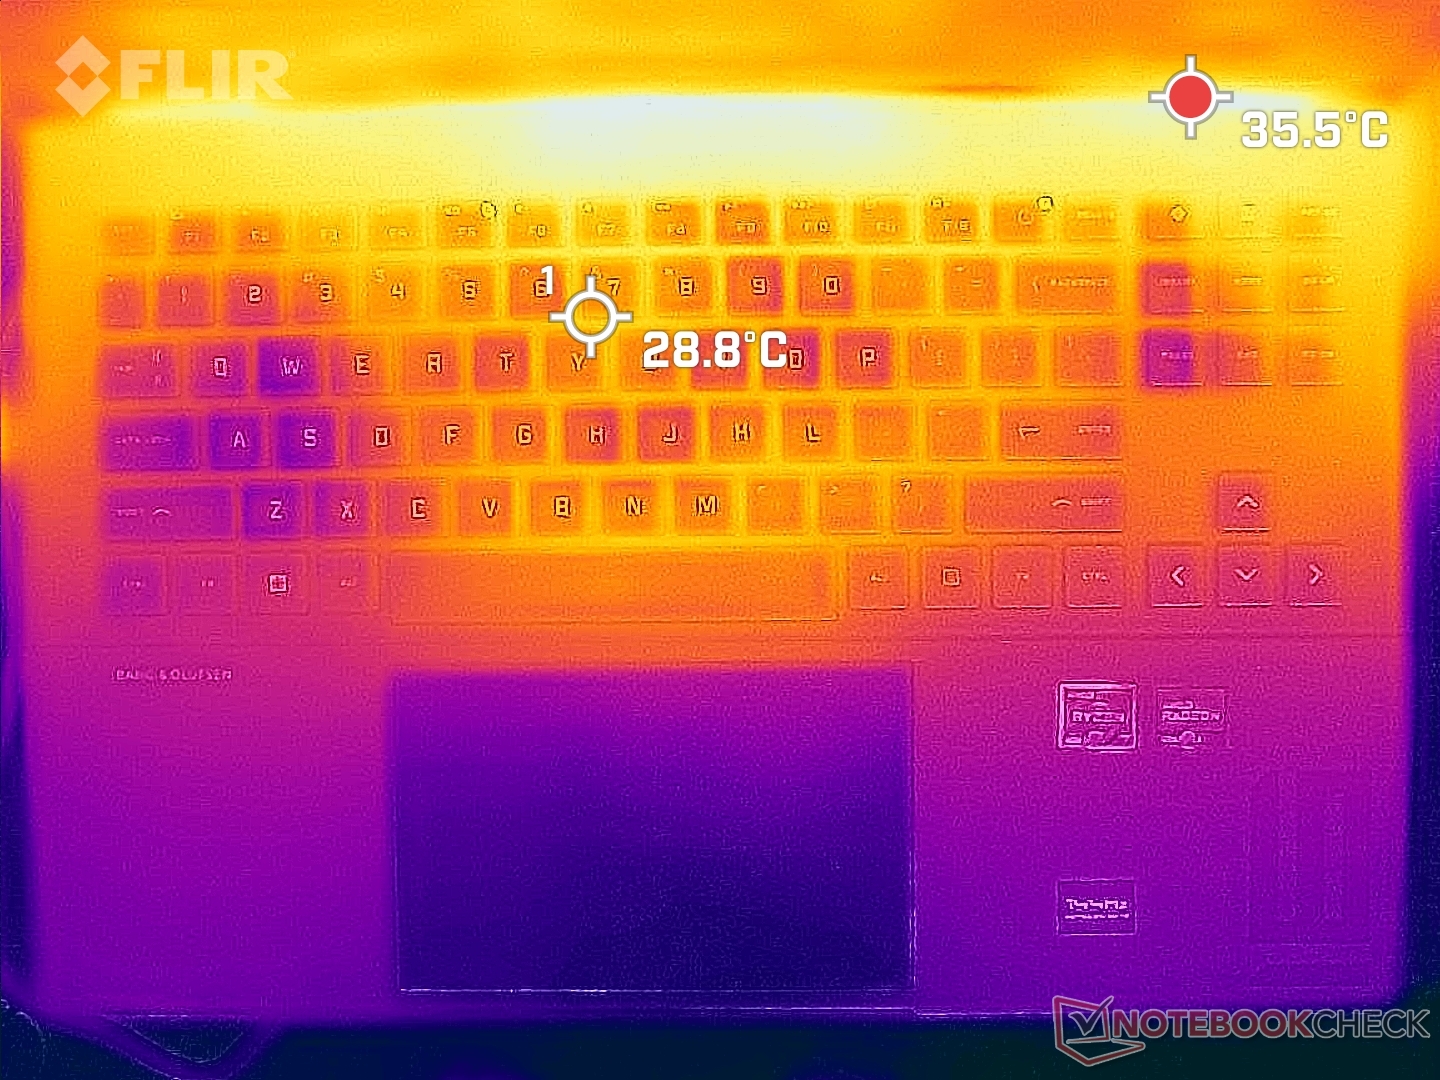
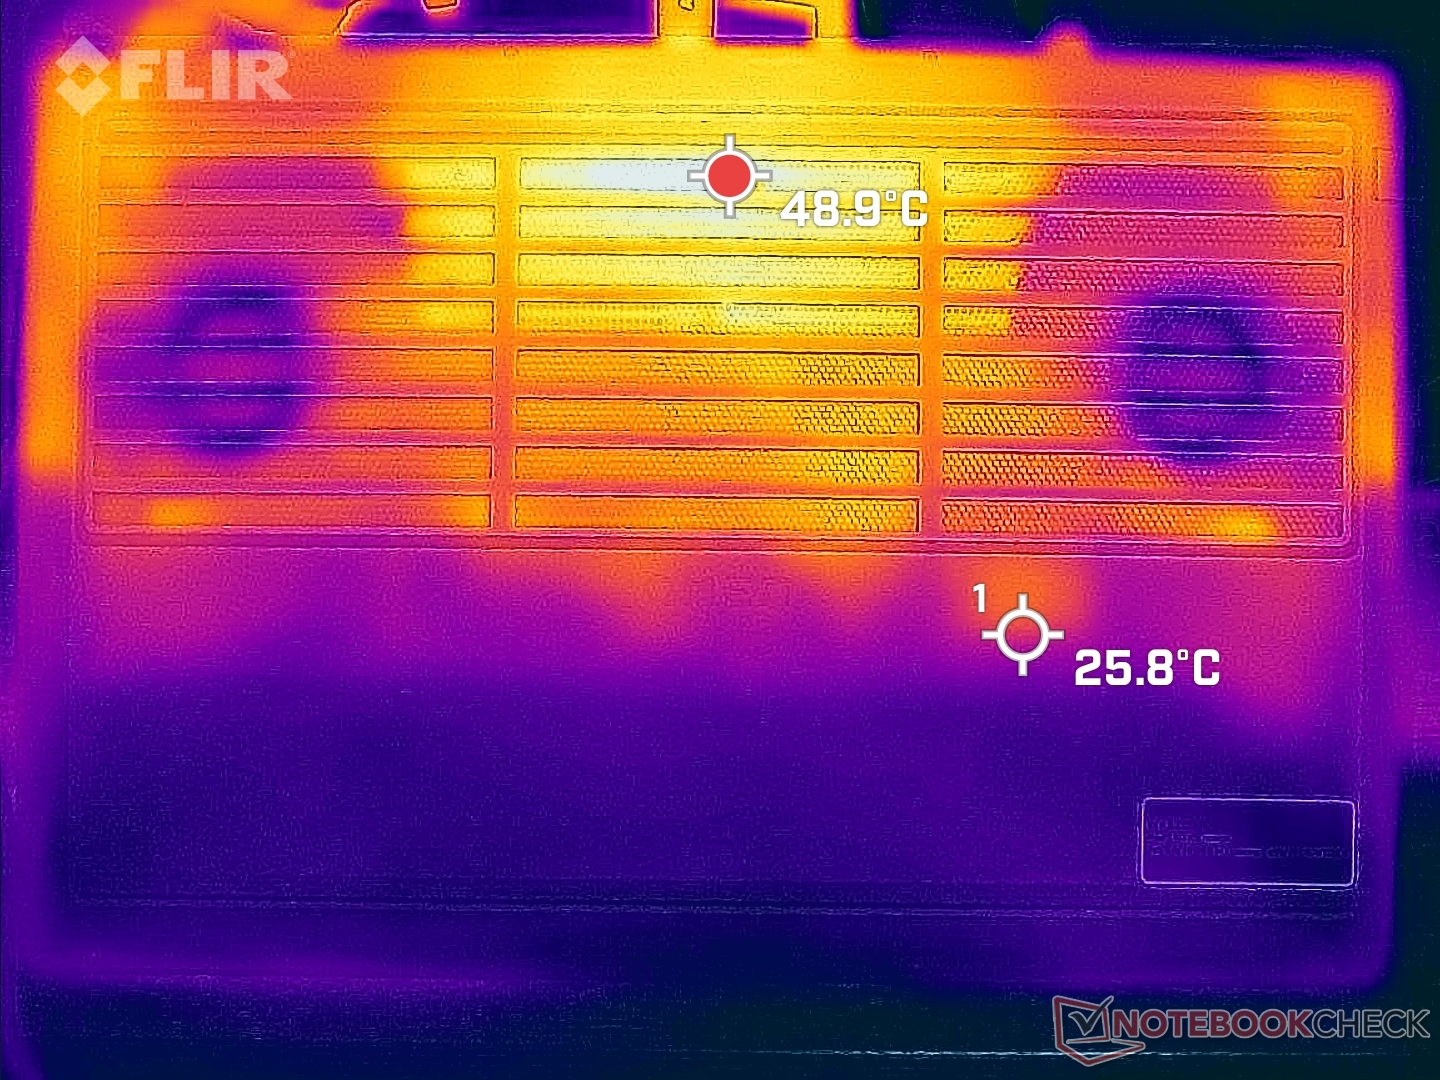
Surface temperatures are much cooler on the keyboard deck when compared to the deck underneath. Hot spots on the top reach about 40 C when gaming compared to over 50 C on the bottom. The Intel-powered Omen 16 can be even warmer at up to 60 C when under similar conditions. These warm spots are toward the rear of the chassis where fingers and palms are unlikely to touch.
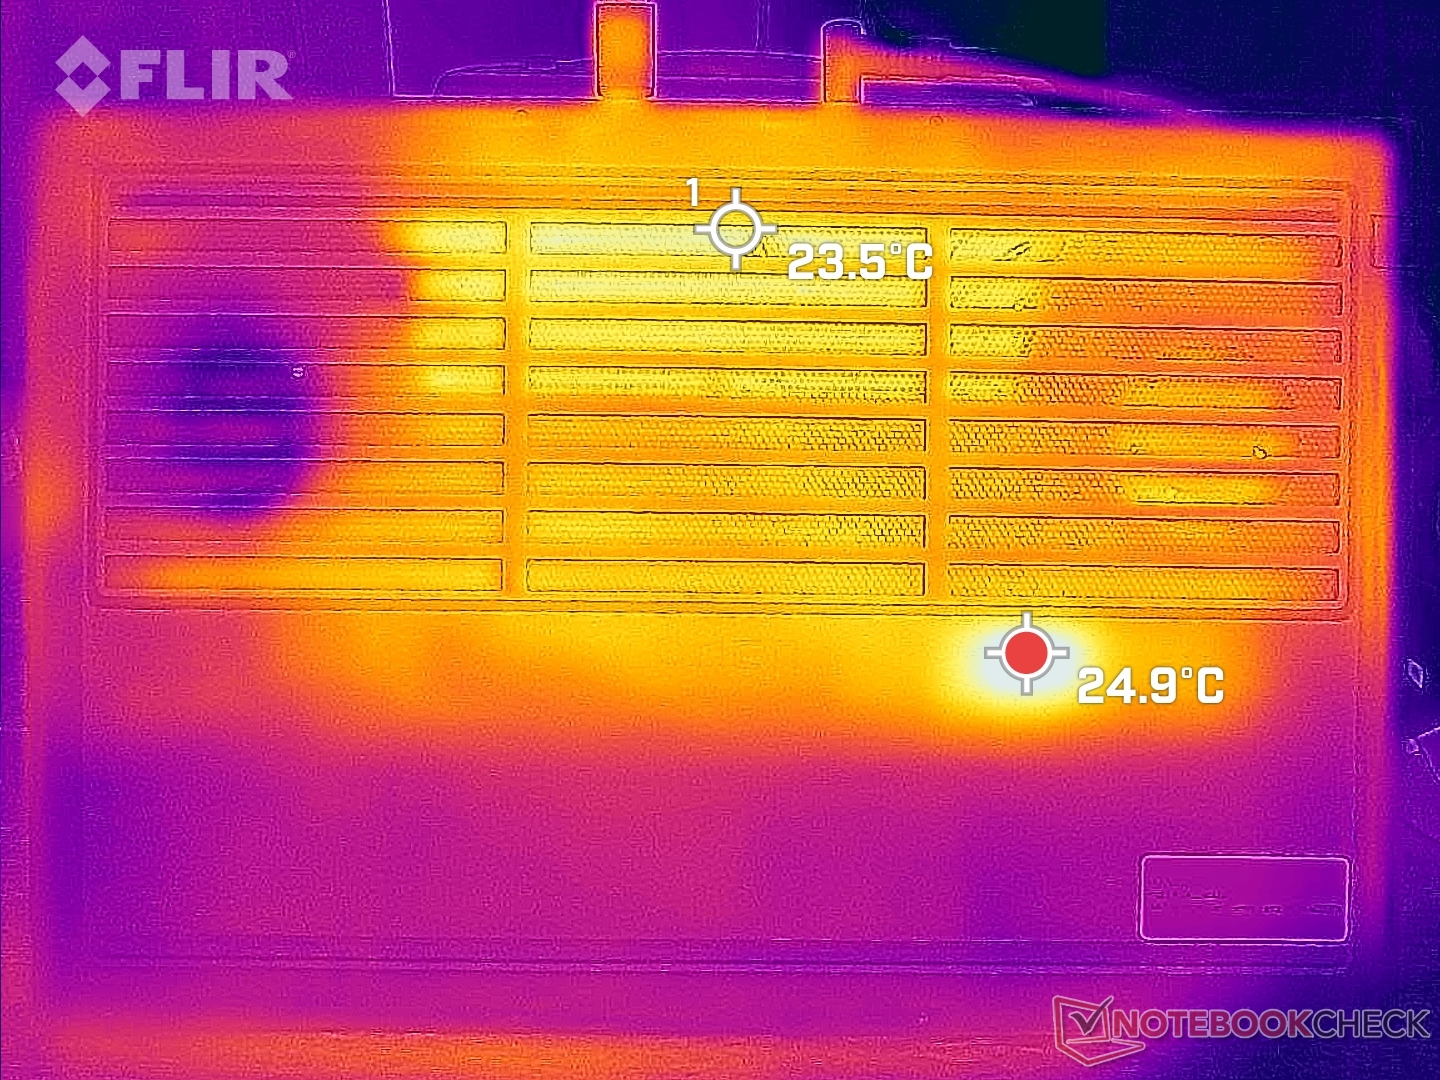
Keep in mind that most of the bottom and rear of the model is dedicated to cooling. it can be easy to accidentally block the ventilation grilles if you're not careful.
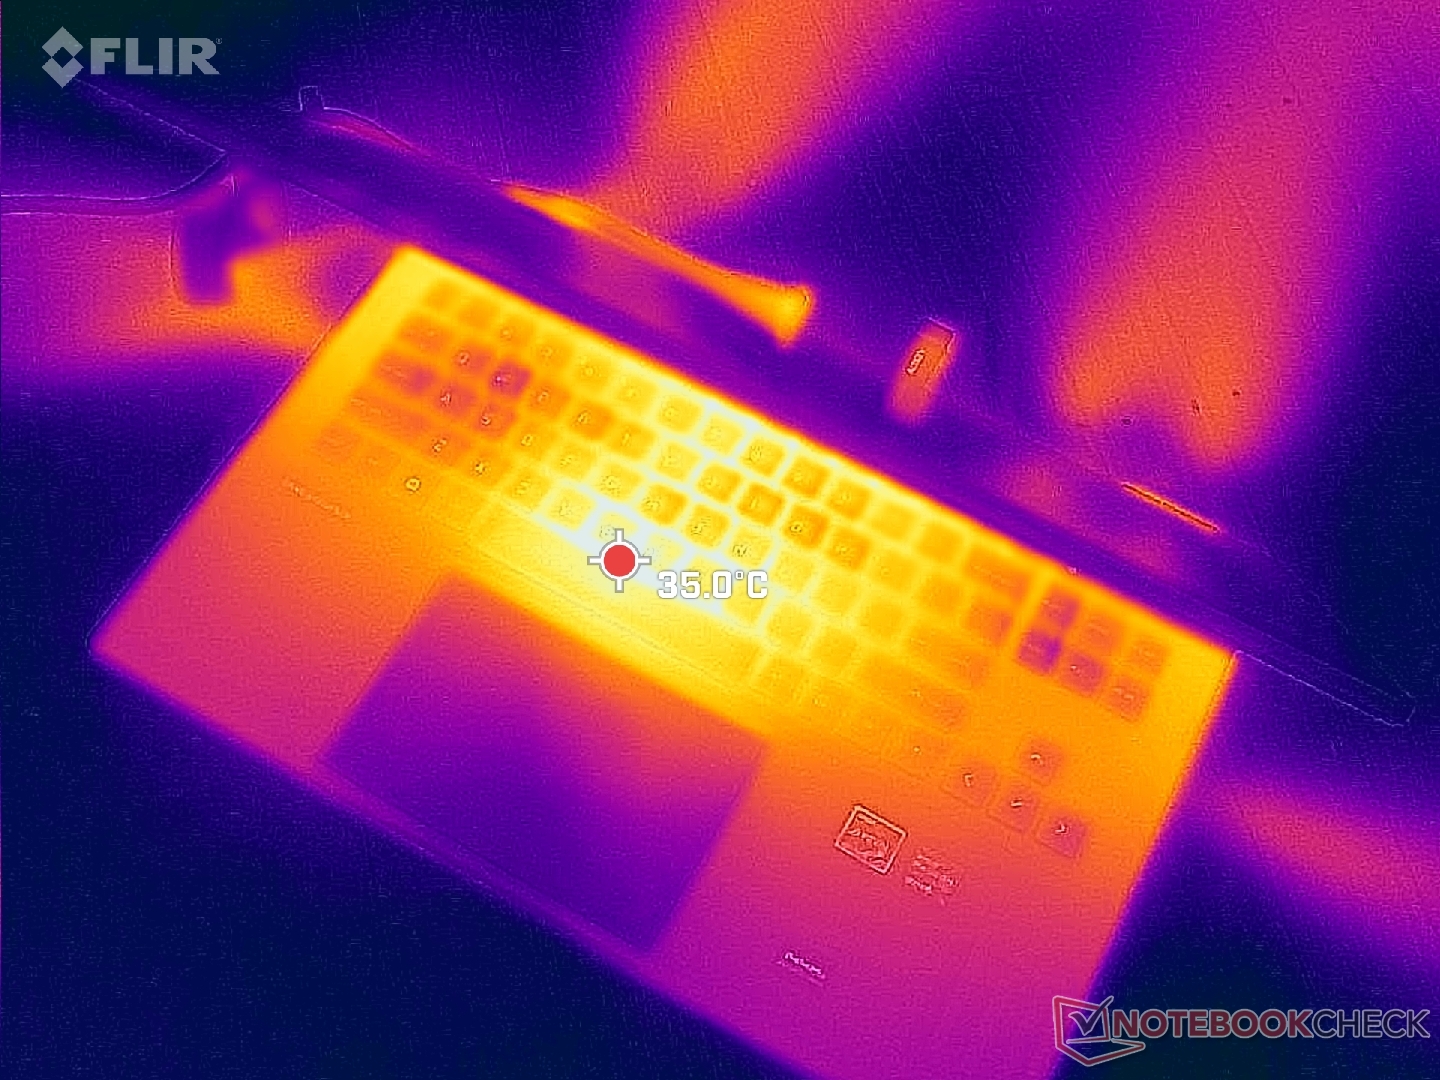
(±) The maximum temperature on the upper side is 41.2 °C / 106 F, compared to the average of 40.4 °C / 105 F, ranging from 21.2 to 68.8 °C for the class Gaming.
(-) The bottom heats up to a maximum of 53.2 °C / 128 F, compared to the average of 43.2 °C / 110 F
(+) In idle usage, the average temperature for the upper side is 24.4 °C / 76 F, compared to the device average of 33.9 °C / 93 F.
(±) Playing The Witcher 3, the average temperature for the upper side is 32.3 °C / 90 F, compared to the device average of 33.9 °C / 93 F.
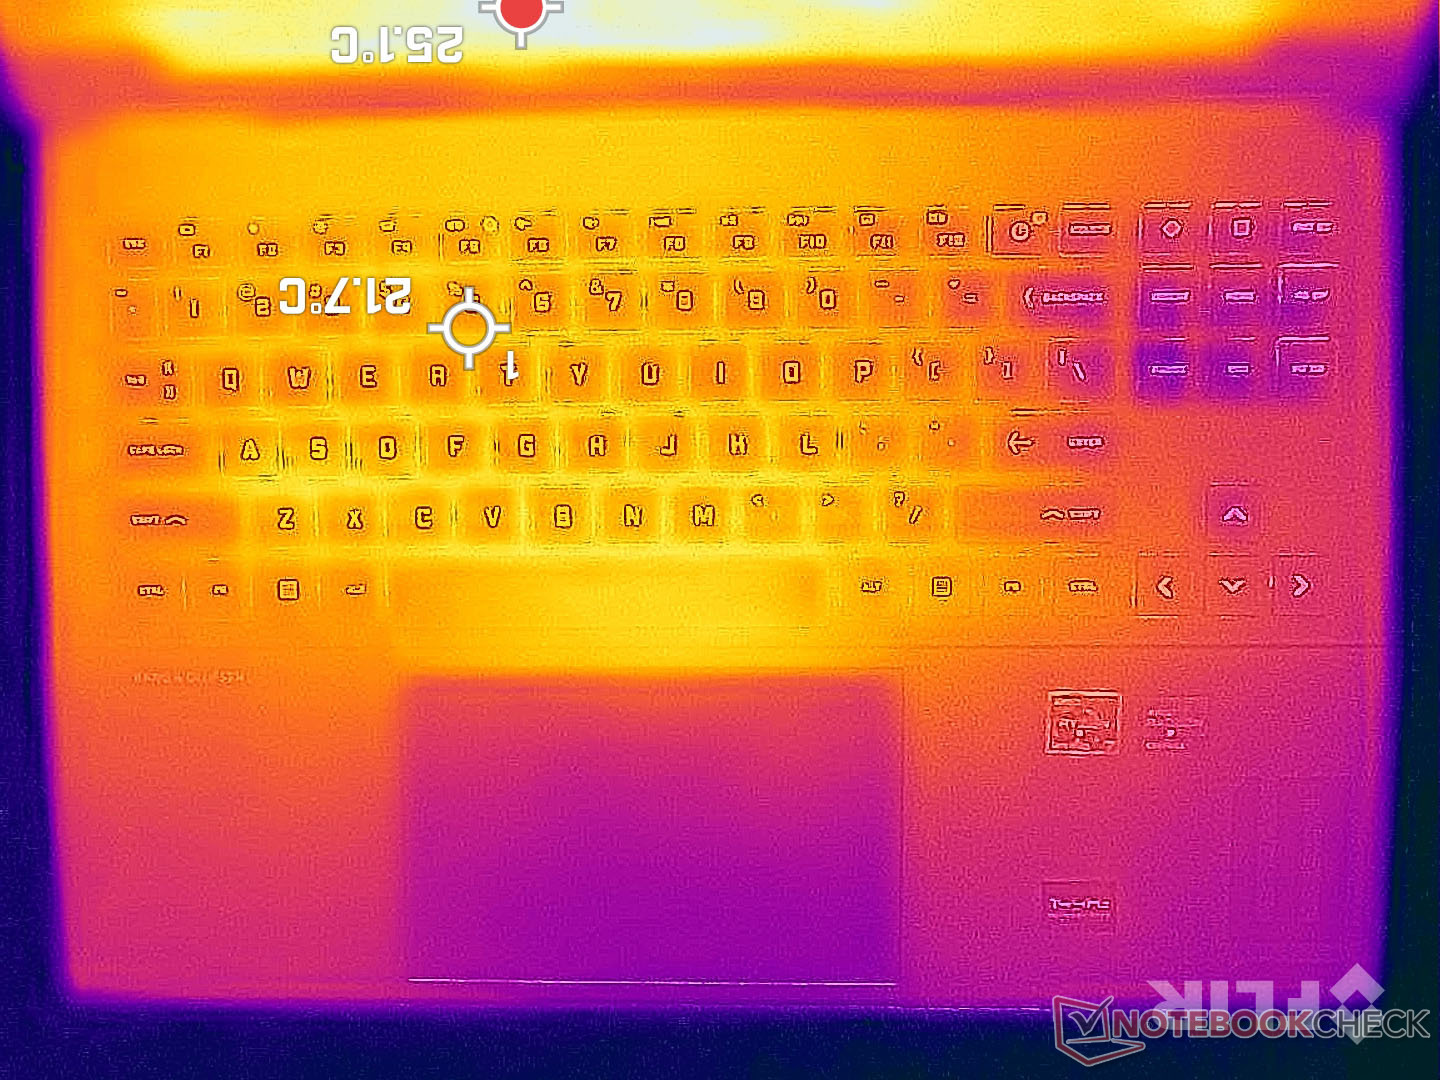
(+) The palmrests and touchpad are cooler than skin temperature with a maximum of 26.2 °C / 79.2 F and are therefore cool to the touch.
(+) The average temperature of the palmrest area of similar devices was 28.8 °C / 83.8 F (+2.6 °C / 4.6 F).
| HP Omen 16-n0033dx AMD Ryzen 7 6800H, AMD Radeon RX 6650M | HP Envy 16 h0112nr Intel Core i7-12700H, NVIDIA GeForce RTX 3060 Laptop GPU | HP Omen 16-b1090ng Intel Core i7-12700H, NVIDIA GeForce RTX 3070 Ti Laptop GPU | HP Victus 16-e0145ng AMD Ryzen 5 5600H, NVIDIA GeForce RTX 3050 Ti Laptop GPU | Lenovo Legion S7 16ARHA7 AMD Ryzen 9 6900HX, AMD Radeon RX 6800S | Dell G16 7620 Intel Core i7-12700H, NVIDIA GeForce RTX 3060 Laptop GPU | |
|---|---|---|---|---|---|---|
| Heat | -9% | -2% | -22% | -2% | 2% | |
| Maximum Upper Side * (°C) | 41.2 | 45.2 -10% | 41 -0% | 54 -31% | 46.6 -13% | 47.6 -16% |
| Maximum Bottom * (°C) | 53.2 | 44 17% | 62 -17% | 47 12% | 50.8 5% | 54 -2% |
| Idle Upper Side * (°C) | 26.4 | 33.6 -27% | 25 5% | 41 -55% | 26.4 -0% | 23 13% |
| Idle Bottom * (°C) | 27.8 | 32.6 -17% | 26 6% | 31 -12% | 27.2 2% | 24.6 12% |
* ... smaller is better
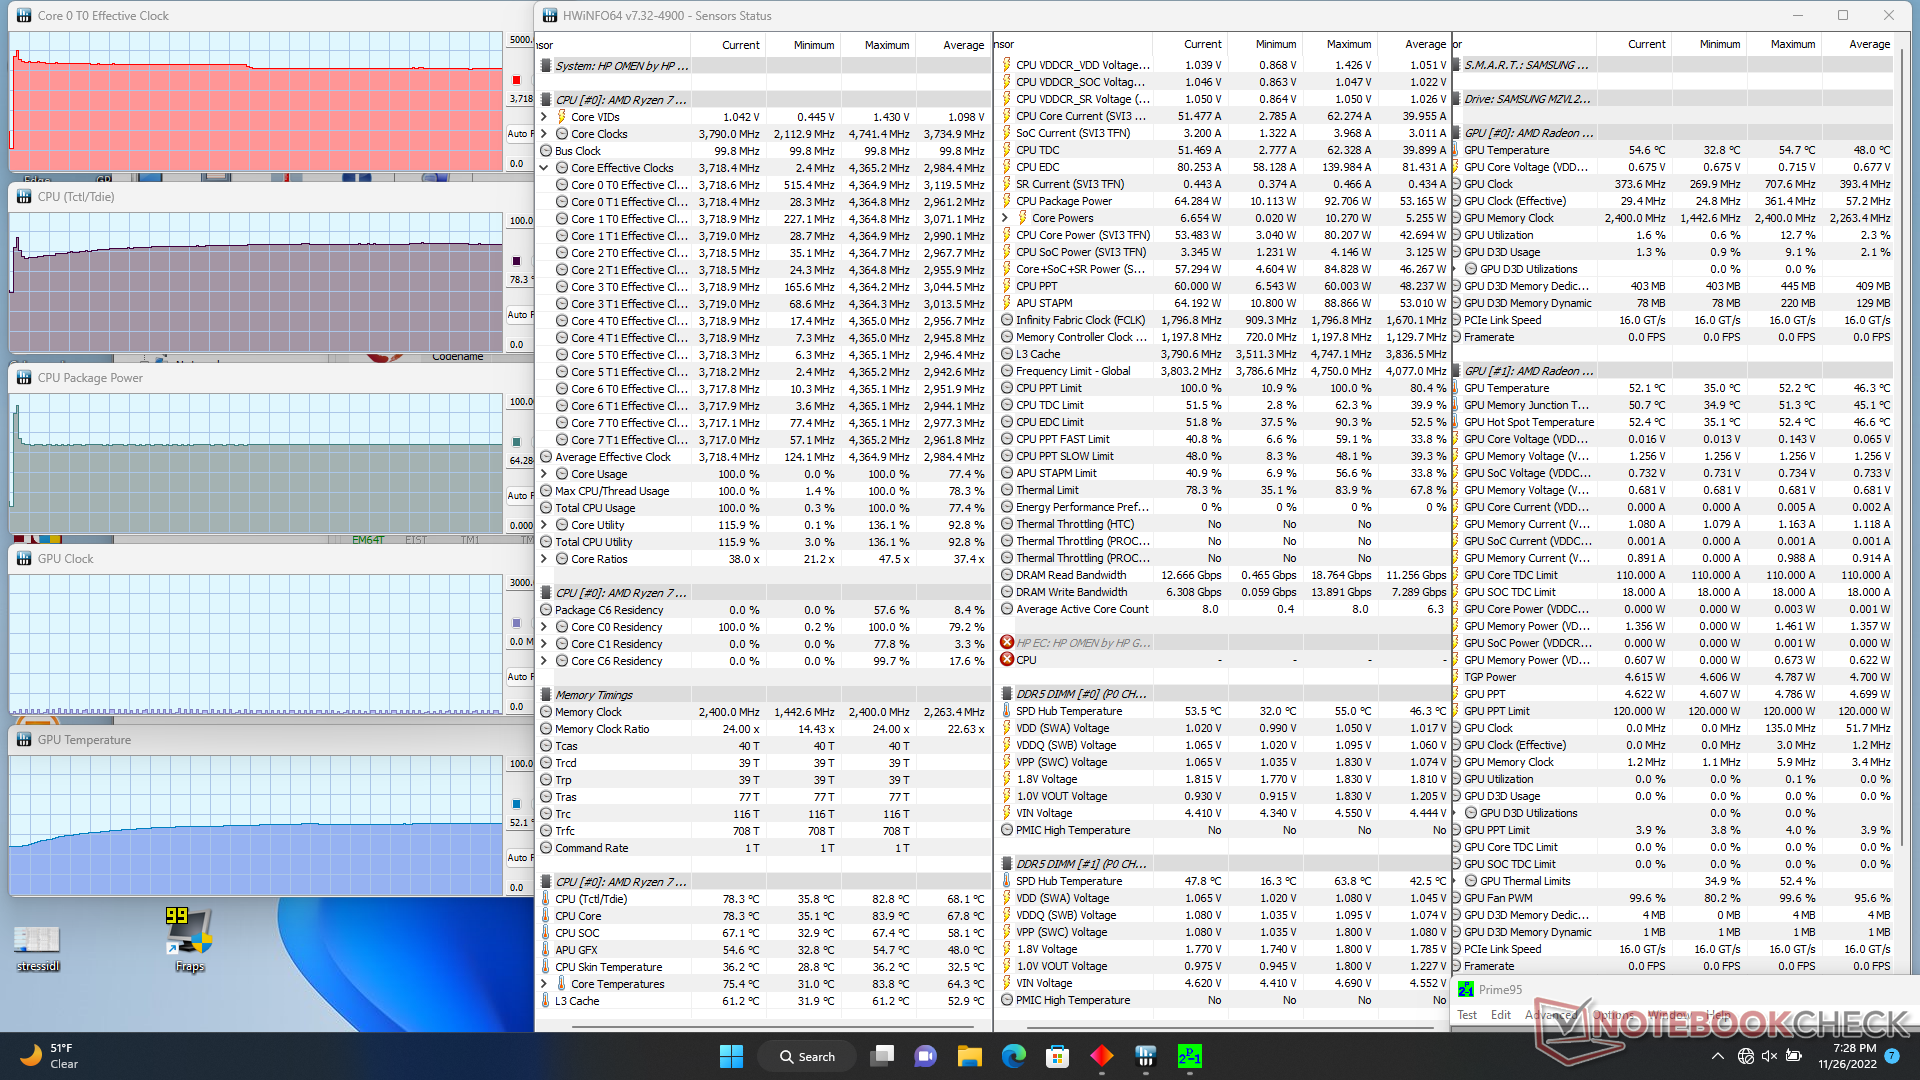
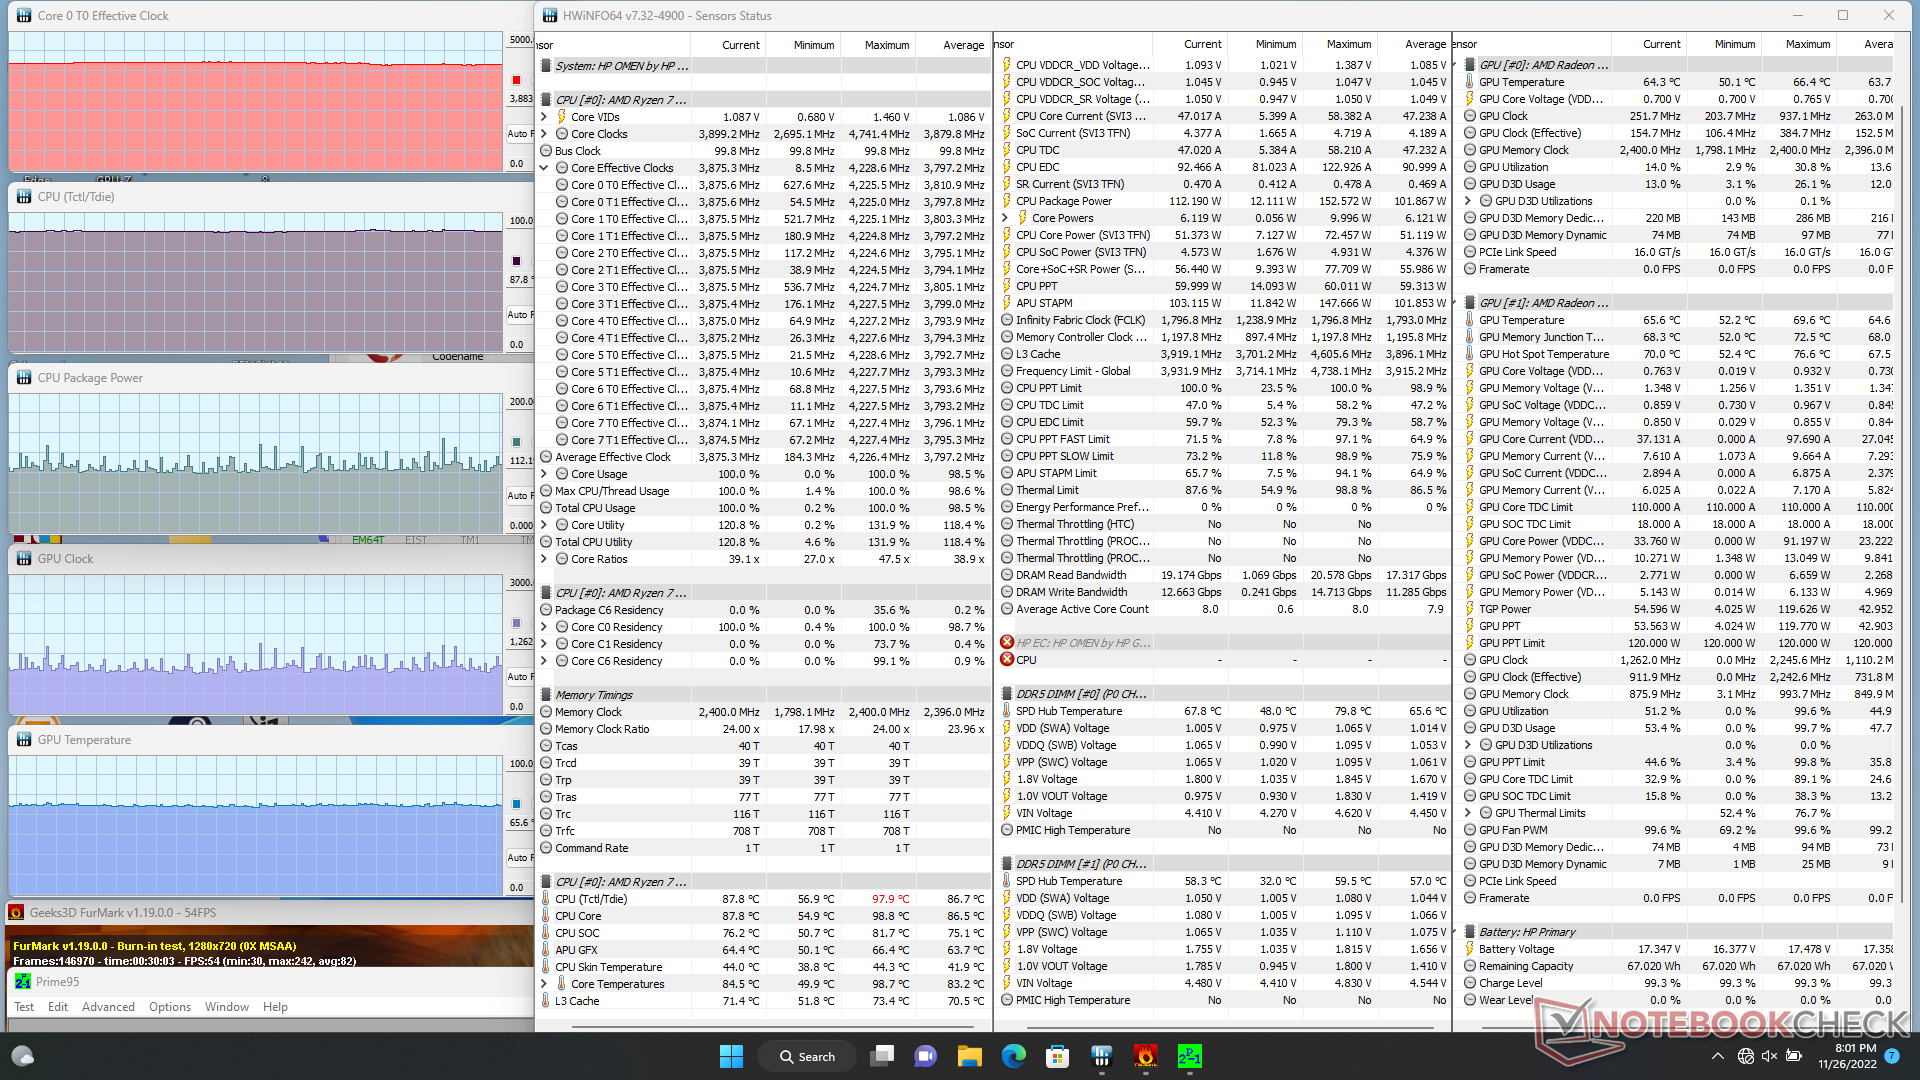
Stress Test
When stressed under Prime95, the CPU would boost to 4.4 GHz and 93 W for just a couple of seconds before falling and stabilizing at 3.7 GHz and 64 W. Maximum boost clock rates are therefore only short-lived on the Omen 16. Repeating this same test on the Lenovo Legion 5 Pro Gen 7 with the same Ryzen 7 6800H CPU would result in a higher stable clock rate and temperature of 4.1 GHz and 93 C, respectively, compared to just 3.7 GHz and 78 C on our HP.
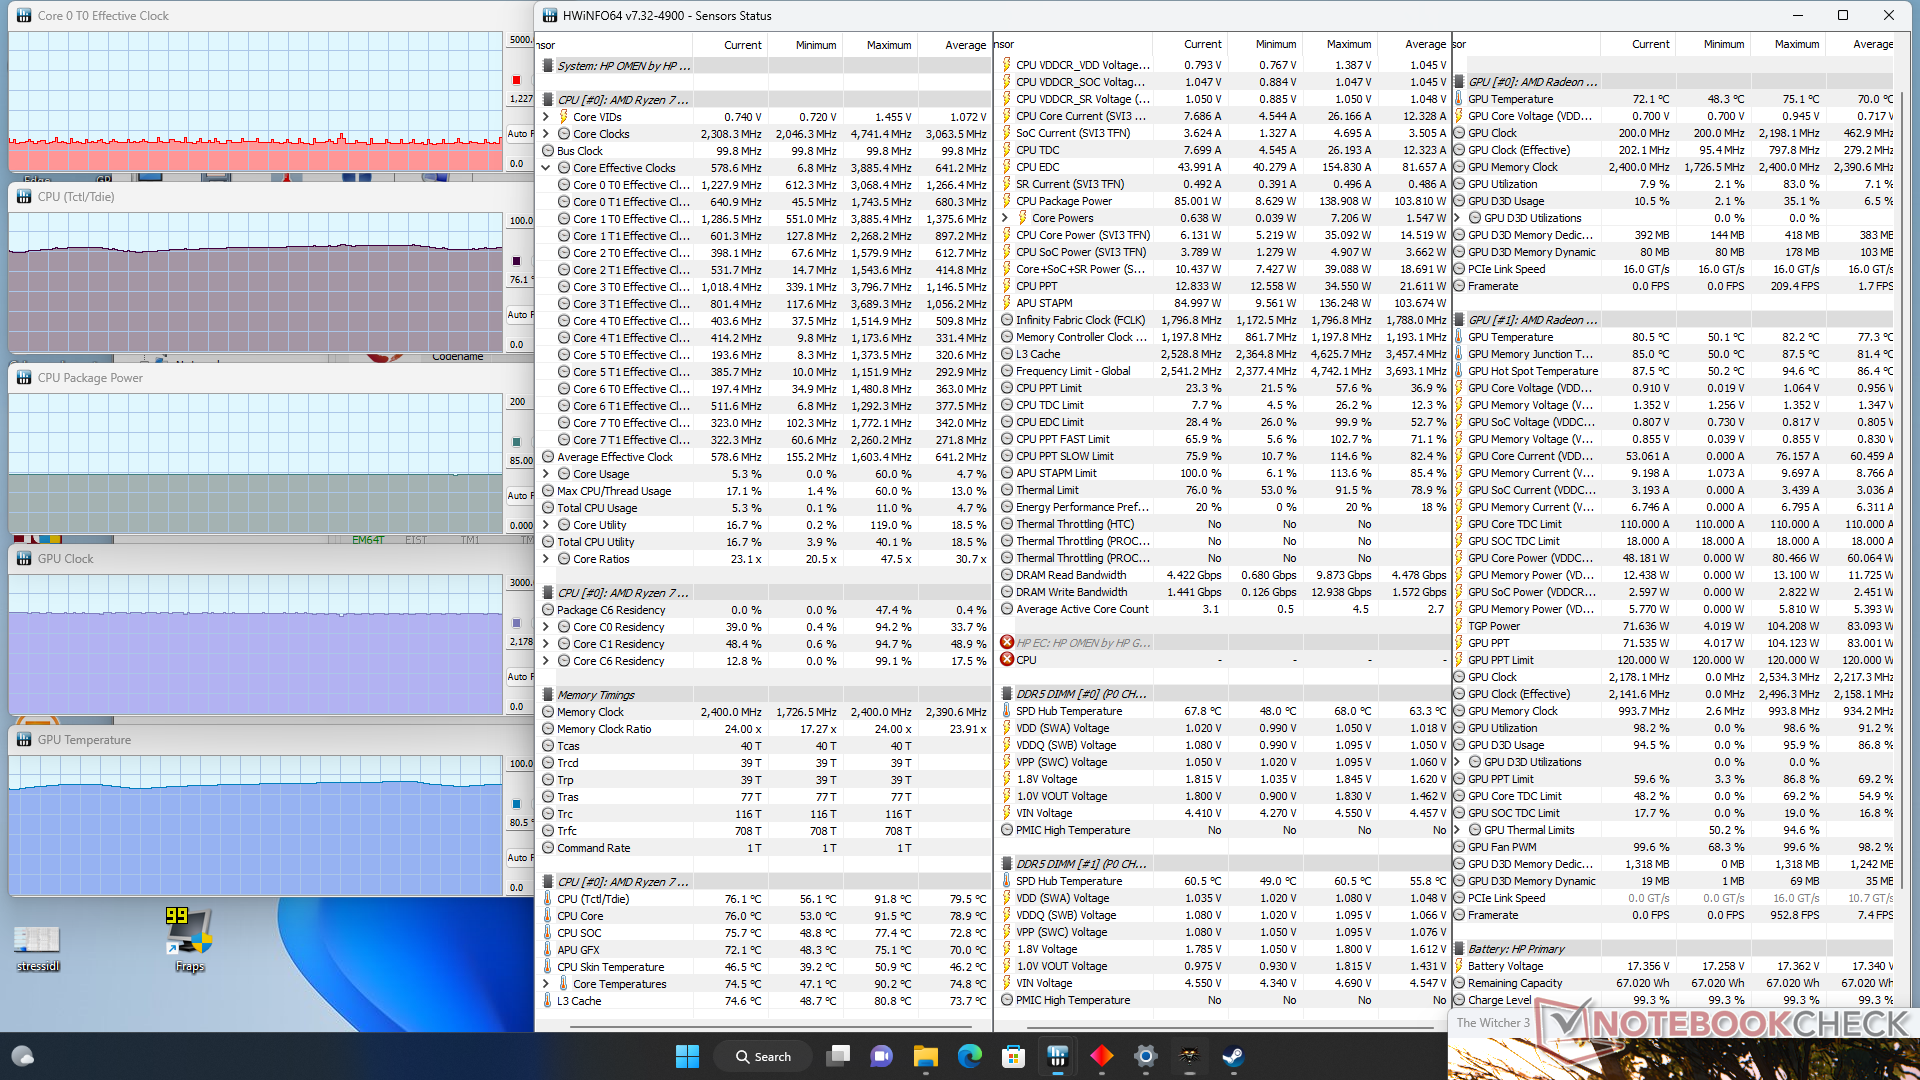
When running Witcher 3 on Performance mode to represent typical gaming loads, the GPU would stabilize at 2516 MHz, 80 C, and 103 W. Dropping down to Balanced mode would result in a lower GPU clock of 2178 MHz and a lower TGP of 72 W but no significant changes in core temperature. Thus, users must remember enable Performance mode via the Omen Gaming Hub software in order to fully exploit the GPU.
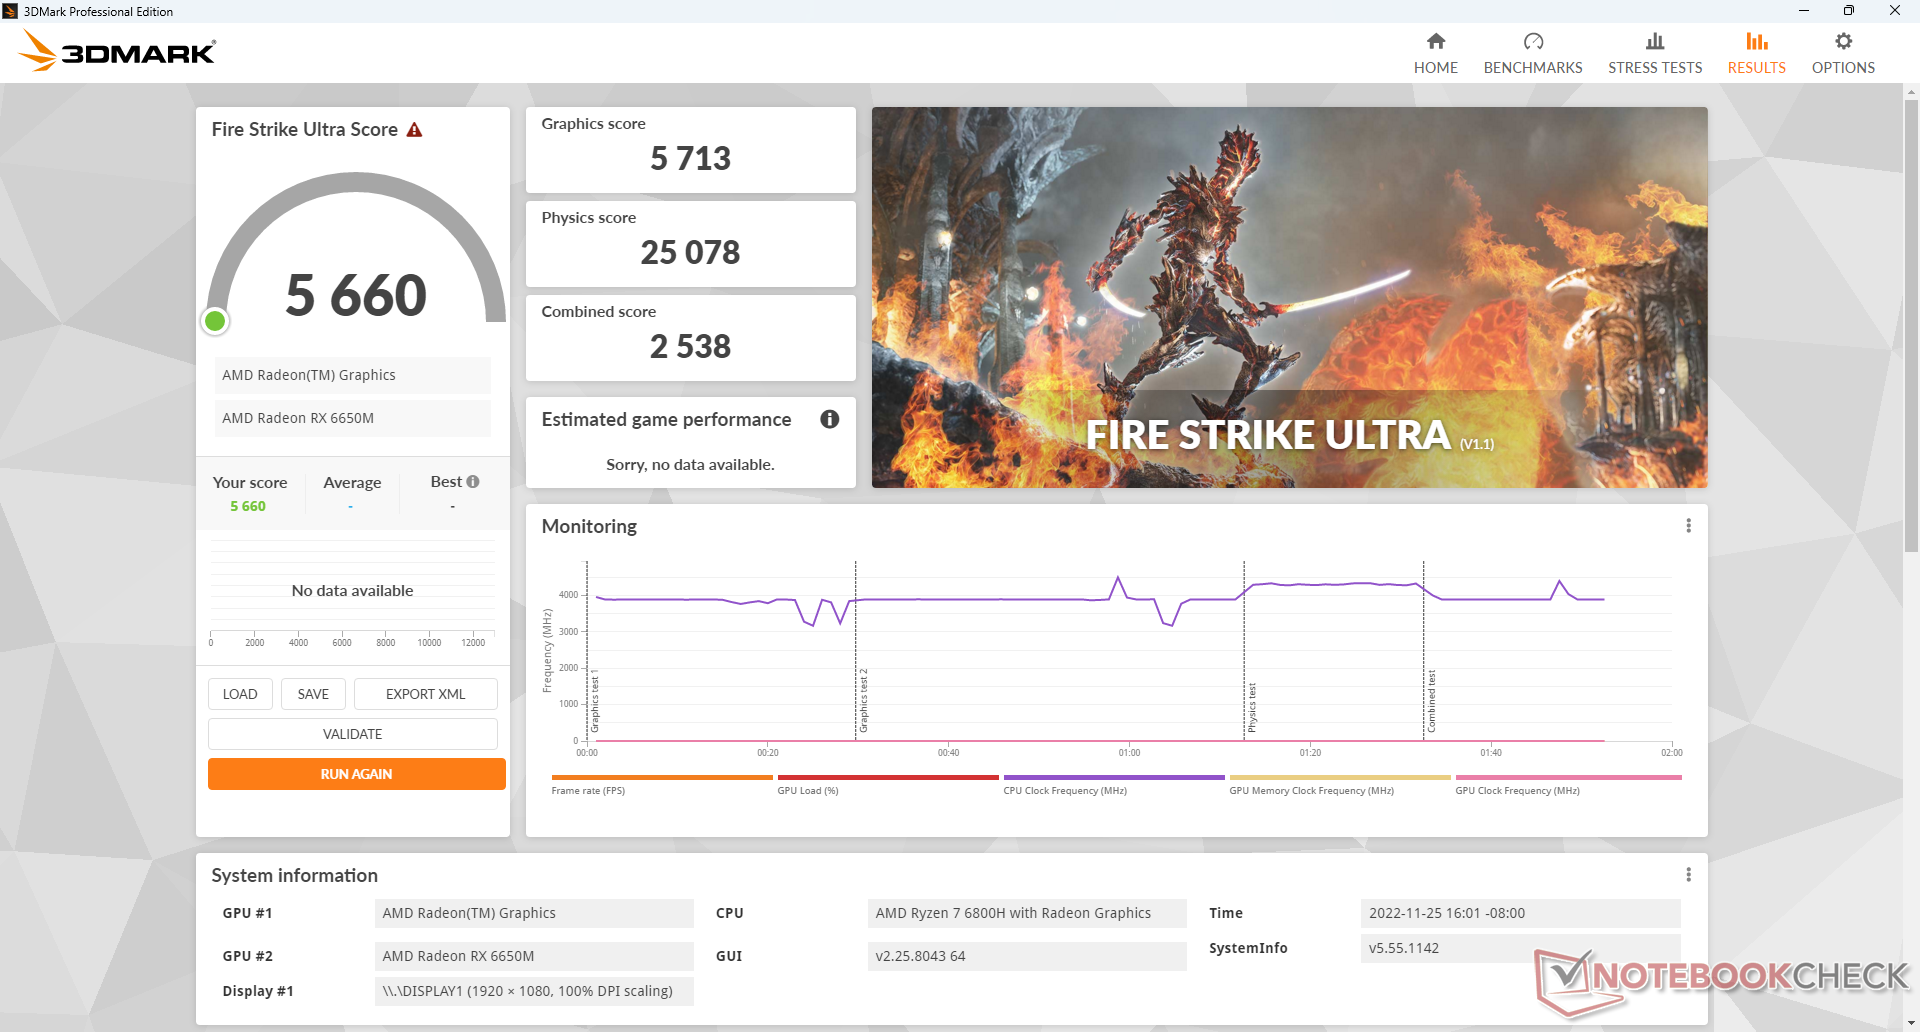
Running on battery power limits performance. A Fire Strike test on batteries would return Physics and Graphics scores of just 21063 and 5722 points, respectively, compared to 25021 and 25739 points when on mains.
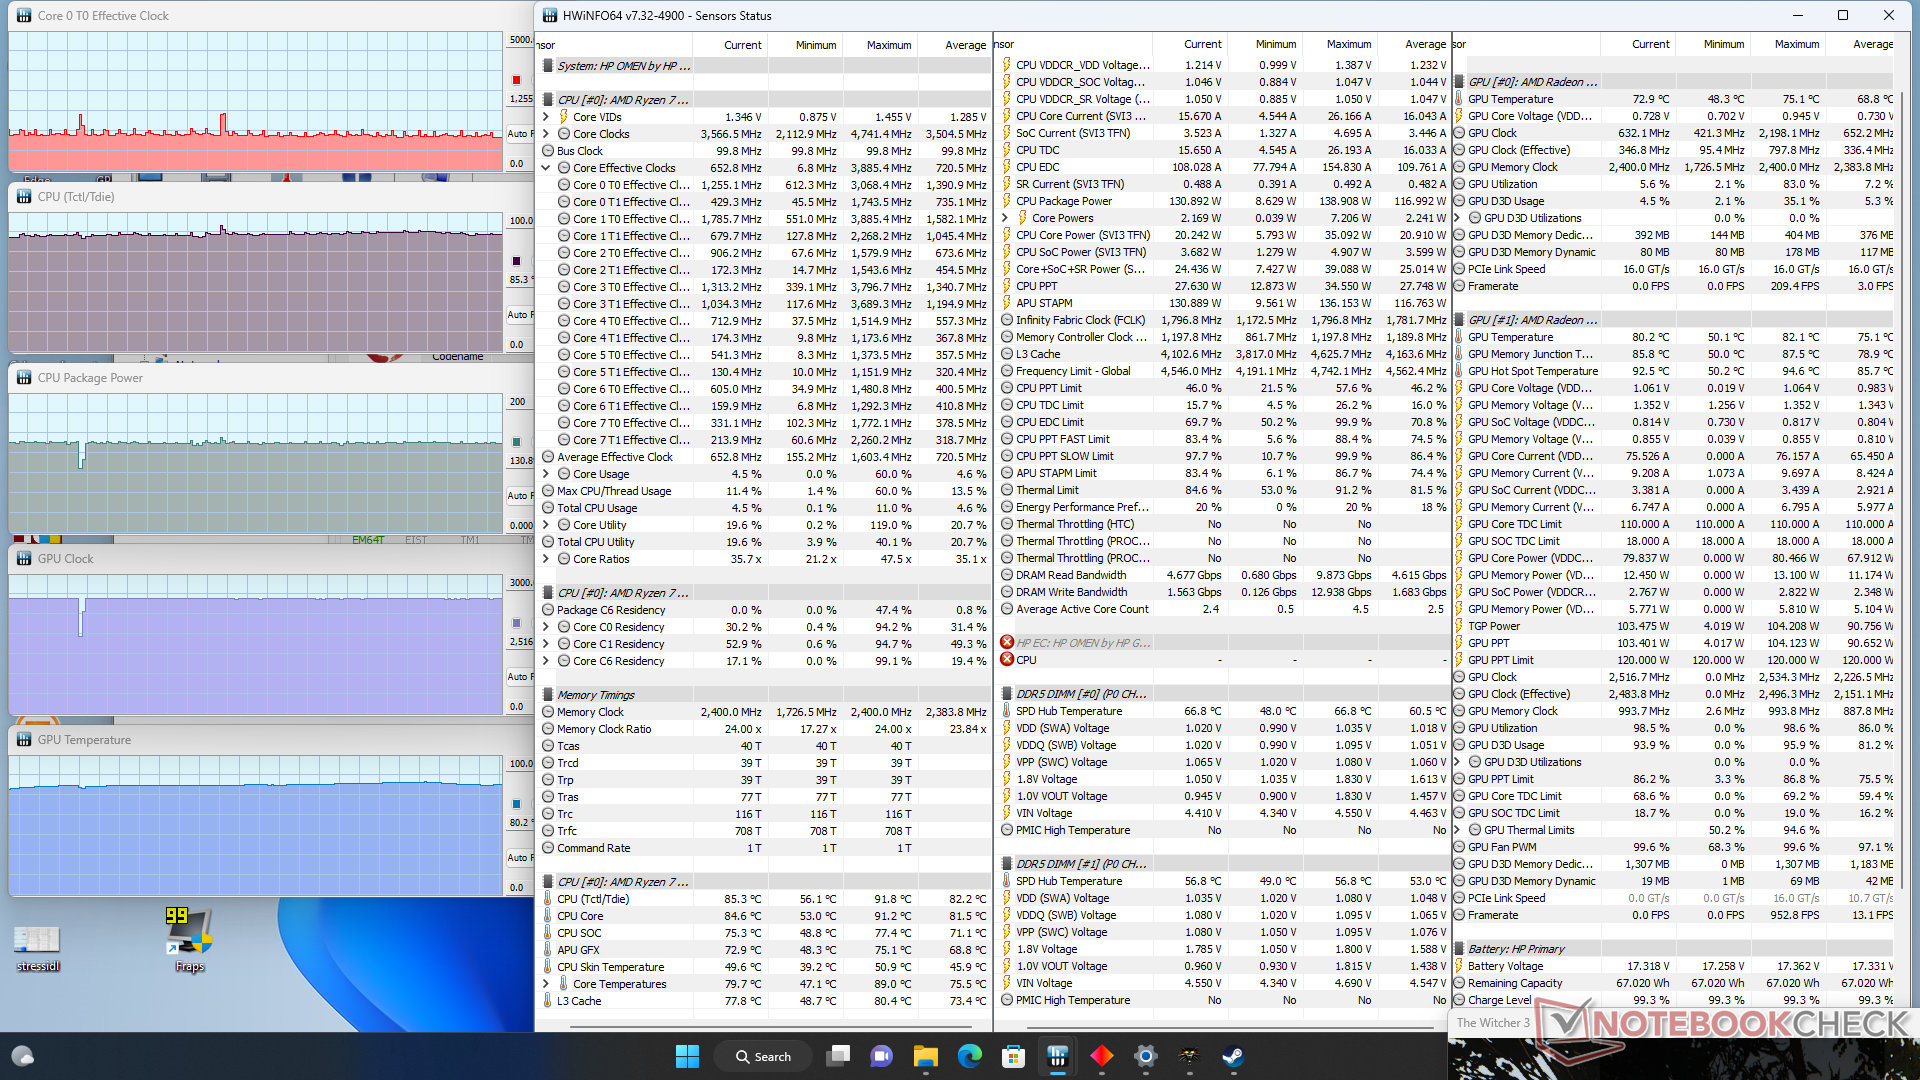
| CPU Clock (GHz) | GPU Clock (MHz) | Average CPU Temperature (°C) | Average GPU Temperature (°C) | |
| System Idle | -- | -- | 37 | 35 |
| Prime95 Stress | 3.7 | -- | 79 | 52 |
| Prime95 + FurMark Stress | 3.9 | ~1262 | 88 | 66 |
| Witcher 3 Stress (Balanced mode) | ~1.1 | 2178 | 76 | 81 |
| Witcher 3 Stress (Performance mode) | ~1.1 | 2516 | 85 | 80 |
Speakers
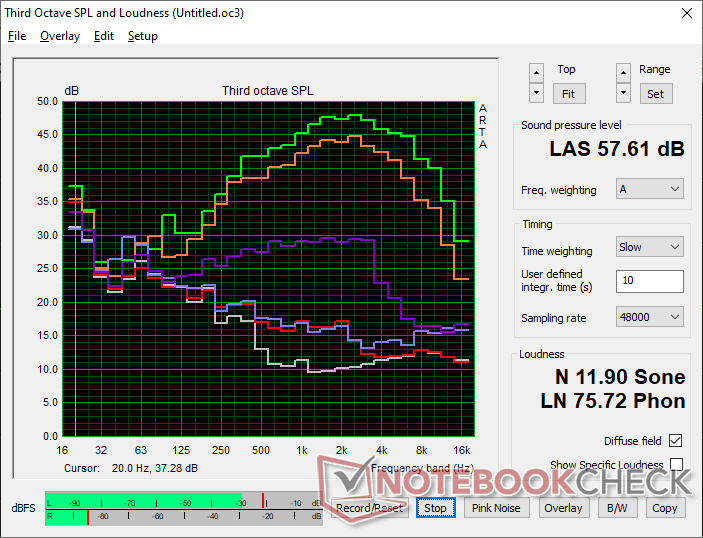
HP Omen 16-n0033dx audio analysis
(±) | speaker loudness is average but good (80.7 dB)
Bass 100 - 315 Hz
(-) | nearly no bass - on average 24.7% lower than median
(±) | linearity of bass is average (13% delta to prev. frequency)
Mids 400 - 2000 Hz
(+) | balanced mids - only 3.4% away from median
(+) | mids are linear (2.8% delta to prev. frequency)
Highs 2 - 16 kHz
(+) | balanced highs - only 1.3% away from median
(+) | highs are linear (4.4% delta to prev. frequency)
Overall 100 - 16.000 Hz
(±) | linearity of overall sound is average (19.3% difference to median)
Compared to same class
» 65% of all tested devices in this class were better, 8% similar, 27% worse
» The best had a delta of 6%, average was 18%, worst was 132%
Compared to all devices tested
» 47% of all tested devices were better, 8% similar, 46% worse
» The best had a delta of 4%, average was 23%, worst was 134%
Apple MacBook Pro 16 2021 M1 Pro audio analysis
(+) | speakers can play relatively loud (84.7 dB)
Bass 100 - 315 Hz
(+) | good bass - only 3.8% away from median
(+) | bass is linear (5.2% delta to prev. frequency)
Mids 400 - 2000 Hz
(+) | balanced mids - only 1.3% away from median
(+) | mids are linear (2.1% delta to prev. frequency)
Highs 2 - 16 kHz
(+) | balanced highs - only 1.9% away from median
(+) | highs are linear (2.7% delta to prev. frequency)
Overall 100 - 16.000 Hz
(+) | overall sound is linear (4.6% difference to median)
Compared to same class
» 0% of all tested devices in this class were better, 0% similar, 100% worse
» The best had a delta of 5%, average was 17%, worst was 45%
Compared to all devices tested
» 0% of all tested devices were better, 0% similar, 100% worse
» The best had a delta of 4%, average was 23%, worst was 134%
Energy Management — Demanding Gamer
Power Consumption
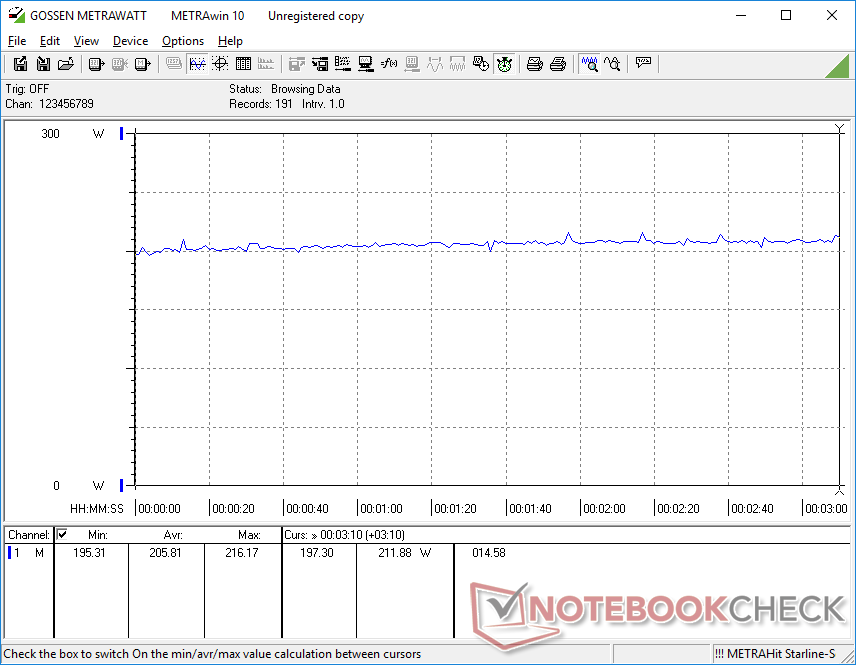
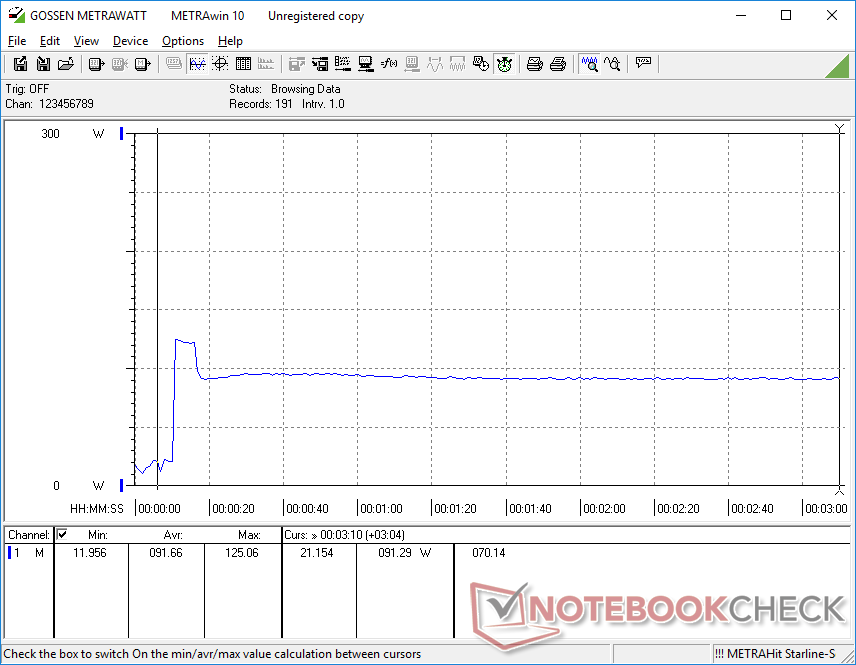
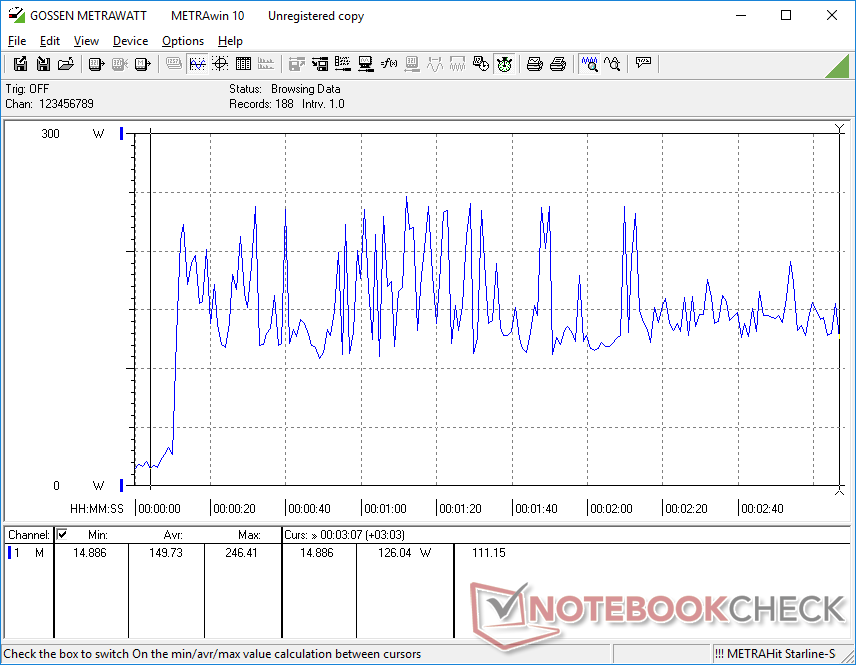
Since the Radeon RX 6650M is slightly faster than the RTX 3060, we should expect the average power consumption to be slightly higher as well. Unfortunately for AMD, the reality is that our Omen 16 can be much more power-hungry than most other RTX 2060 laptops when gaming. Running Witcher 3, for example, demands 206 W compared to 177 W, 187 W, and 155 W on the RTX 3060-powered Dell G16, Lenovo Legion 5 15, and Lenovo Legion Slim 7 16, respectively. These same alternatives can even offer faster CPU performance with their 12th gen Intel processors.
Thankfully, power consumption is comparable to many Intel-Nvidia laptops when not running any demanding applications. This means that battery life will not be dramatically shorter than most Intel-Nvidia alternatives when web browsing or streaming despite how power-hungry the laptop can be when gaming.
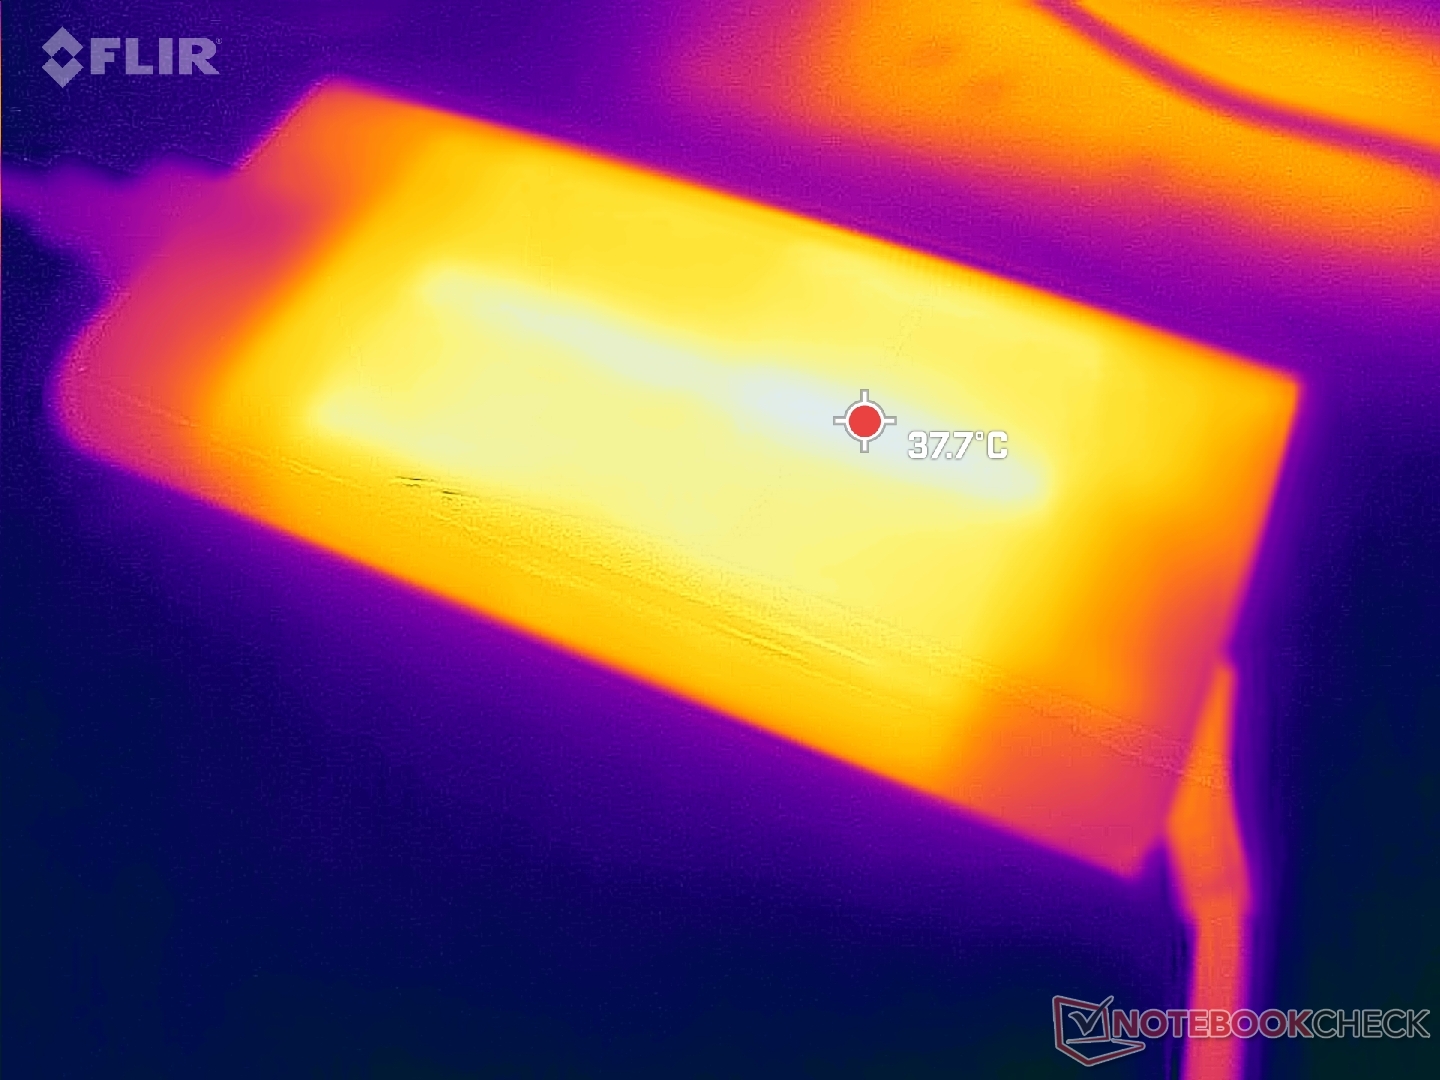
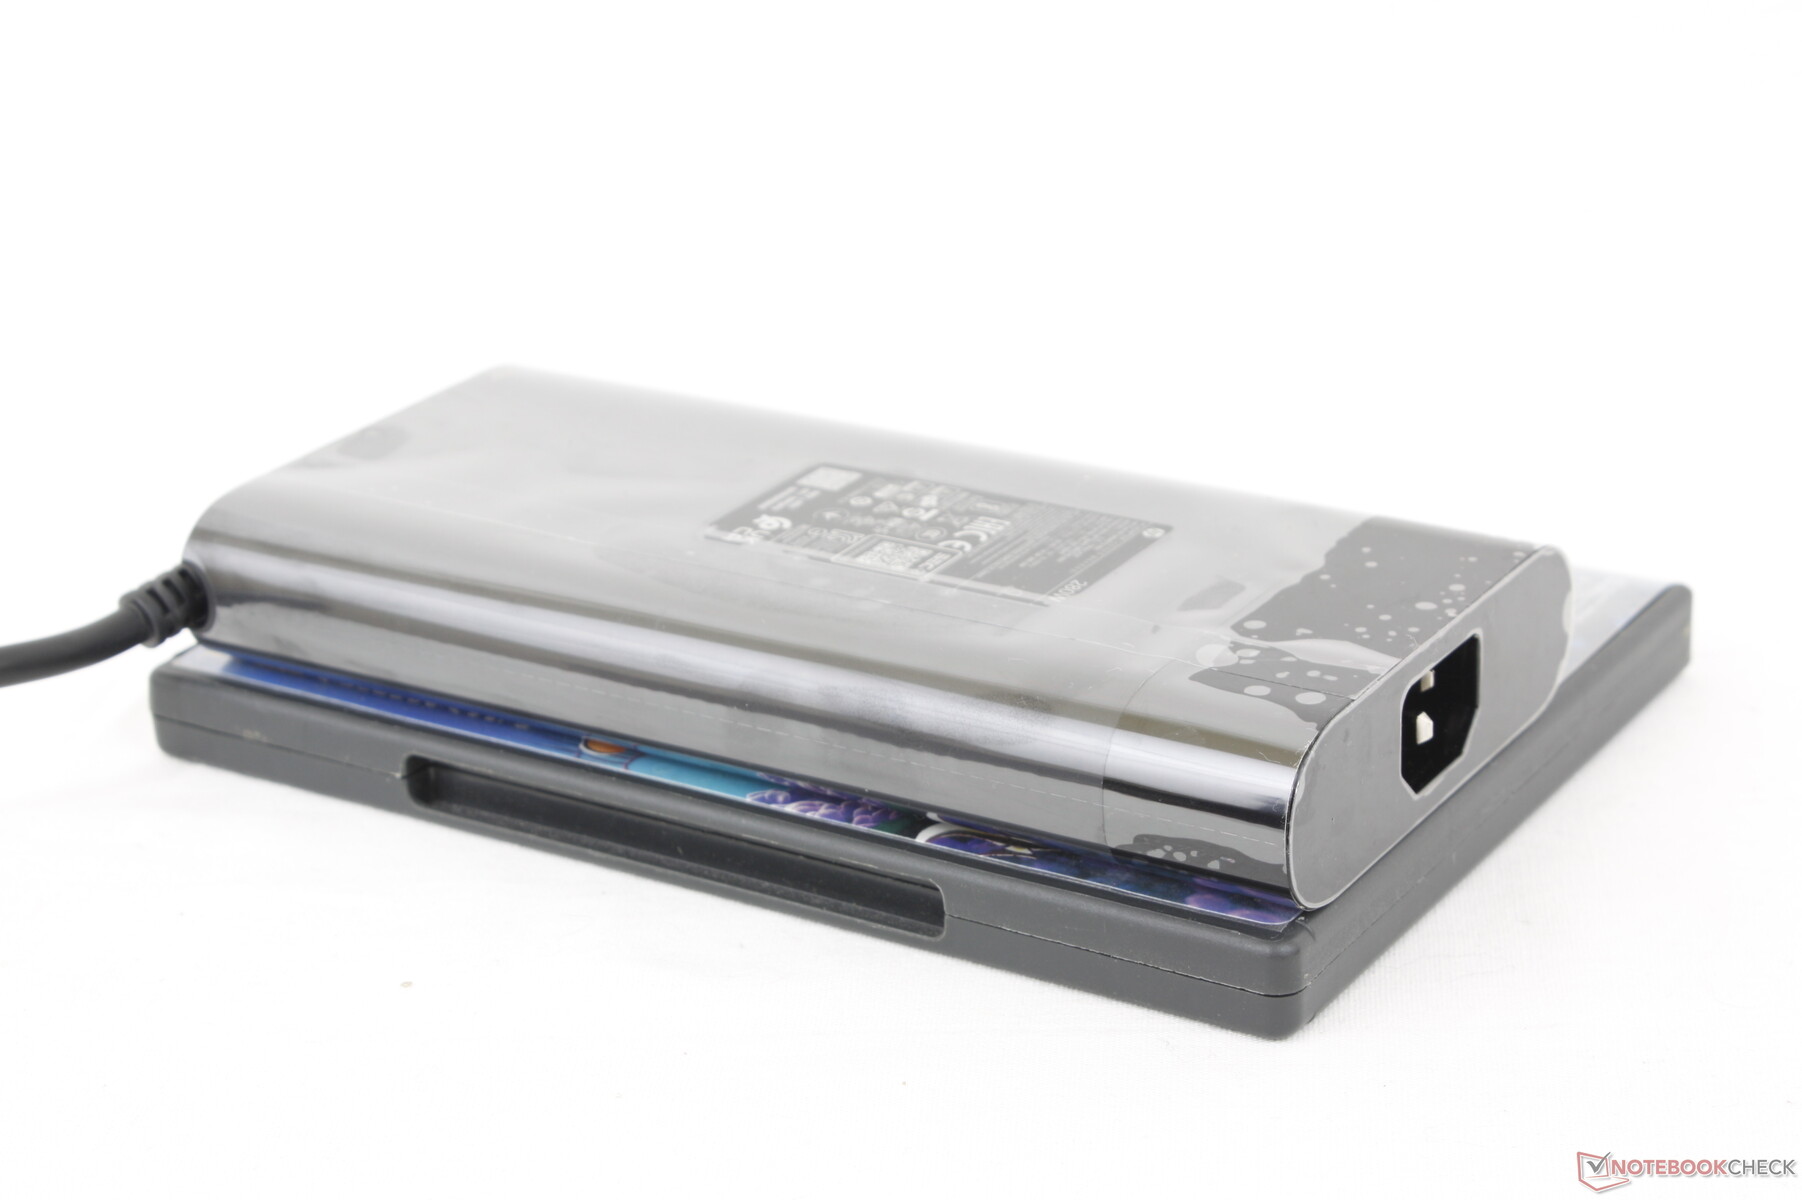
We're able to record a temporary maximum draw of 246 W from the large (~17.9 x 8.5 x 2.5 cm) 280 W AC adapter when both the CPU and GPU are at 100 percent utilization.
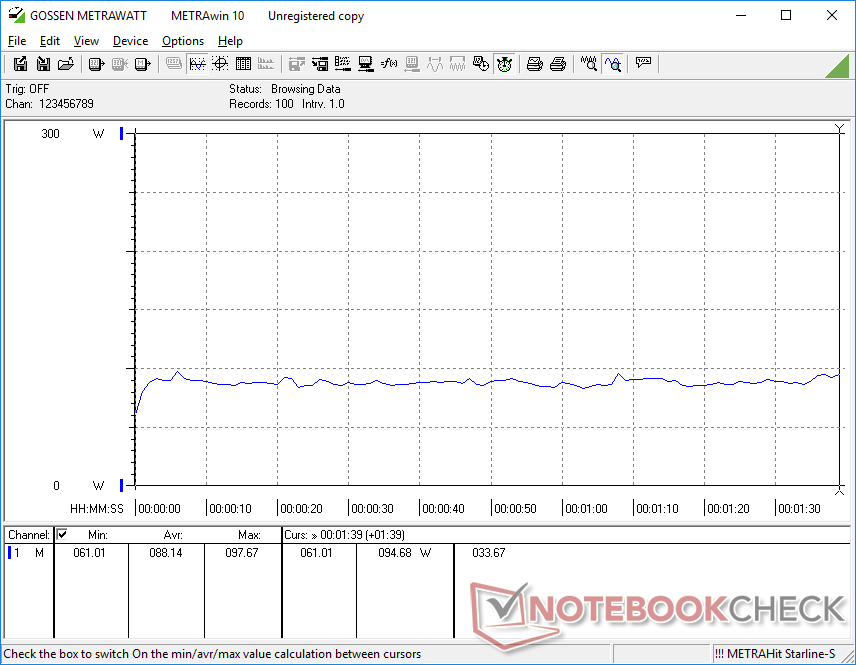
| Off / Standby | |
| Idle | |
| Load |
|
Key:
min: | |
| HP Omen 16-n0033dx R7 6800H, Radeon RX 6650M, Samsung PM9A1 MZVL21T0HCLR, IPS, 1920x1080, 16.1" | HP Envy 16 h0112nr i7-12700H, GeForce RTX 3060 Laptop GPU, Micron 3400 1TB MTFDKBA1T0TFH, OLED, 3840x2400, 16" | HP Omen 16-b1090ng i7-12700H, GeForce RTX 3070 Ti Laptop GPU, WDC PC SN810 1TB, IPS, 2560x1440, 16.1" | HP Victus 16-e0145ng R5 5600H, GeForce RTX 3050 Ti Laptop GPU, Samsung SSD PM981a MZVLB512HBJQ, IPS, 1920x1080, 16.1" | Lenovo Legion S7 16ARHA7 R9 6900HX, Radeon RX 6800S, SK Hynix HFS001TEJ9X115N, IPS, 2560x1600, 16" | Dell G16 7620 i7-12700H, GeForce RTX 3060 Laptop GPU, WDC PC SN810 512GB, IPS, 2560x1600, 16" | |
|---|---|---|---|---|---|---|
| Power Consumption | -9% | 8% | 18% | -3% | -35% | |
| Idle Minimum * (Watt) | 7.9 | 10 -27% | 4 49% | 7 11% | 8.8 -11% | 14.4 -82% |
| Idle Average * (Watt) | 11.5 | 10.9 5% | 10 13% | 9 22% | 14.7 -28% | 17.8 -55% |
| Idle Maximum * (Watt) | 18.3 | 27.8 -52% | 19 -4% | 15 18% | 19.8 -8% | 31.5 -72% |
| Load Average * (Watt) | 88.1 | 116.4 -32% | 114 -29% | 93 -6% | 85.3 3% | 101.2 -15% |
| Witcher 3 ultra * (Watt) | 206 | 133.7 35% | 183.2 11% | 134.5 35% | 167.5 19% | 176.9 14% |
| Load Maximum * (Watt) | 246.4 | 209.8 15% | 221 10% | 185 25% | 230.7 6% | 242.9 1% |
* ... smaller is better
Power Consumption Witcher 3 / Stresstest
Power Consumption external Monitor
Battery Life
Battery capacity is noticeably smaller than on the Intel versions of the older Omen 16 (68 Wh vs. 83 Wh). Nonetheless, overall runtimes aren't significantly shorter on our AMD model. We're able to record a real-world WLAN runtime of almost 7 hours on the Balanced power profile which is above average for a gaming laptop.
Charging from empty to full capacity with the included AC adapter is relatively slow at 2 to 2.5 hours compared to 1.5 hours on most laptops. Additionally, the laptop is not compatible with most third-party USB-C AC chargers. HP advertises that the model supports USB-C Power Delivery, but connecting our own 100 W USB-C AC adapter would result in the warning message "The AC adapter is not compatible with the system". In comparison, PD-enabled gaming laptops from Razer, MSI, or Asus would work with all our tested USB-C AC adapters.
| HP Omen 16-n0033dx R7 6800H, Radeon RX 6650M, 68 Wh | HP Envy 16 h0112nr i7-12700H, GeForce RTX 3060 Laptop GPU, 83 Wh | HP Omen 16-b1090ng i7-12700H, GeForce RTX 3070 Ti Laptop GPU, 83 Wh | HP Victus 16-e0145ng R5 5600H, GeForce RTX 3050 Ti Laptop GPU, 70 Wh | Lenovo Legion S7 16ARHA7 R9 6900HX, Radeon RX 6800S, 71 Wh | Dell G16 7620 i7-12700H, GeForce RTX 3060 Laptop GPU, 84 Wh | |
|---|---|---|---|---|---|---|
| Battery runtime | 45% | 18% | 1% | -11% | -31% | |
| Reader / Idle (h) | 10 | 17.8 78% | 10.1 1% | 7.1 -29% | ||
| WiFi v1.3 (h) | 7 | 7.9 13% | 5.6 -20% | 7.1 1% | 6.2 -11% | 5 -29% |
| Load (h) | 1.1 | 1.6 45% | 1.9 73% | 0.7 -36% |
Pros
Cons
Verdict — Competent Alternative To The GeForce RTX 3060
Like most AMD-based laptops, the AMD Omen 16 retails for several hundred dollars less than an equivalent Intel Core i7 and GeForce RTX laptop. The Ryzen 7 6800H can't compete against the latest 12th gen Core CPUs in raw performance, but the Radeon RX 6650M keeps up better than expected against the RTX 3060. Since most games are GPU bound, the CPU deficit between Intel and AMD in this case matters much less when running actual games. Owners would be getting slightly better gaming performance than an RTX 3060 for noticeably less money which is the main appeal of the AMD Omen 16.
Other positives include the comfortable keyboard, wide selection of ports, good quality 144 Hz display, and a smooth Envy 16-like chassis. Some users may appreciate the lack of LEDs or superficial gamer designs as well unlike on most MSI or Asus alternatives.
The AMD Omen 16 offers better performance-per-dollar than most laptops powered by the GeForce RTX 3060. If you value higher CPU performance and ray-tracing potential, however, then you'll still want to invest in an Intel-Nvidia solution.
There is still a lot to improve upon nonetheless. The display chin bezel, for example, is way too thick leading to both a larger footprint and heavier weight than competitors like the Asus Zephyrus M16 or Lenovo Legion S7. The clickpad is too sensitive and the fans are still louder than average if on Performance mode. Users may want to consider gaming on Balanced mode for the significantly quieter fans even though it entails a slight hit to performance.
Price and Availability
Our review unit as configured is now shipping at Best Buy for $1580 USD. However, HP is running a sale on the same configuration for as low as $900 USD at the time of publishing. Intel-Nvidia variants of the Omen 16 are also widely available.
HP Omen 16-n0033dx
- 11/29/2022 v7 (old)
Allen Ngo
Price comparison
