Lenovo Legion Slim 7-16IAH7 laptop review: slim Legion notebook is just as excellent with Nvidia & Intel
In the past few years, Lenovo has managed to turn its "Legion" gaming brand into quite a popular name on the laptop market. The Legion 7 series comprises high-end models available in both regular and "Slim" versions. Today, we will be reviewing one such slim model: the Lenovo Legion Slim 7 16IAH7 (also known as the Legion S7i).
The abbreviation "IAH" already tells you something about the laptop's specs: "I" stands for Intel and "AH" for Alder Lake-H. This is important because there is also an AMD-based variant of the Legion Slim 7, which we already reviewed. So which of the two models performs better? This is certainly one of the most exciting questions to be answered in this review.
Comparison with possible competitors
Rating | Date | Model | Weight | Height | Size | Resolution | Price |
|---|---|---|---|---|---|---|---|
| 87.9 % v7 (old) | 11 / 2022 | Lenovo Legion Slim 7-16IAH 82TF004YGE i7-12700H, GeForce RTX 3060 Laptop GPU | 2.2 kg | 16.9 mm | 16.00" | 2560x1600 | |
| 89.3 % v7 (old) | 11 / 2022 | Lenovo Legion S7 16ARHA7 R9 6900HX, Radeon RX 6800S | 2.2 kg | 16.9 mm | 16.00" | 2560x1600 | |
| 87.2 % v7 (old) | 06 / 2022 | Acer Predator Triton 500 SE PT516-52s-70KX i7-12700H, GeForce RTX 3080 Ti Laptop GPU | 2.3 kg | 19.9 mm | 16.00" | 2560x1600 | |
| 85.5 % v7 (old) | 05 / 2022 | HP Omen 16-b1090ng i7-12700H, GeForce RTX 3070 Ti Laptop GPU | 2.3 kg | 23 mm | 16.10" | 2560x1440 | |
| 85.6 % v7 (old) | 07 / 2021 | Asus ROG Zephyrus M16 GU603H i9-11900H, GeForce RTX 3070 Laptop GPU | 2 kg | 20 mm | 16.00" | 2560x1600 |
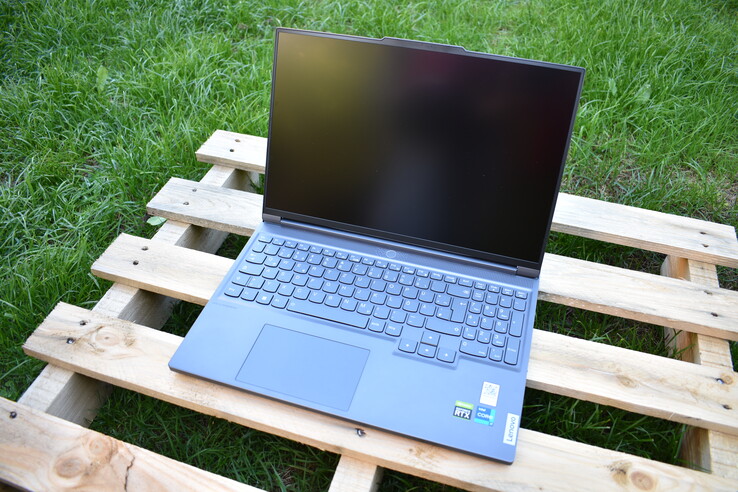
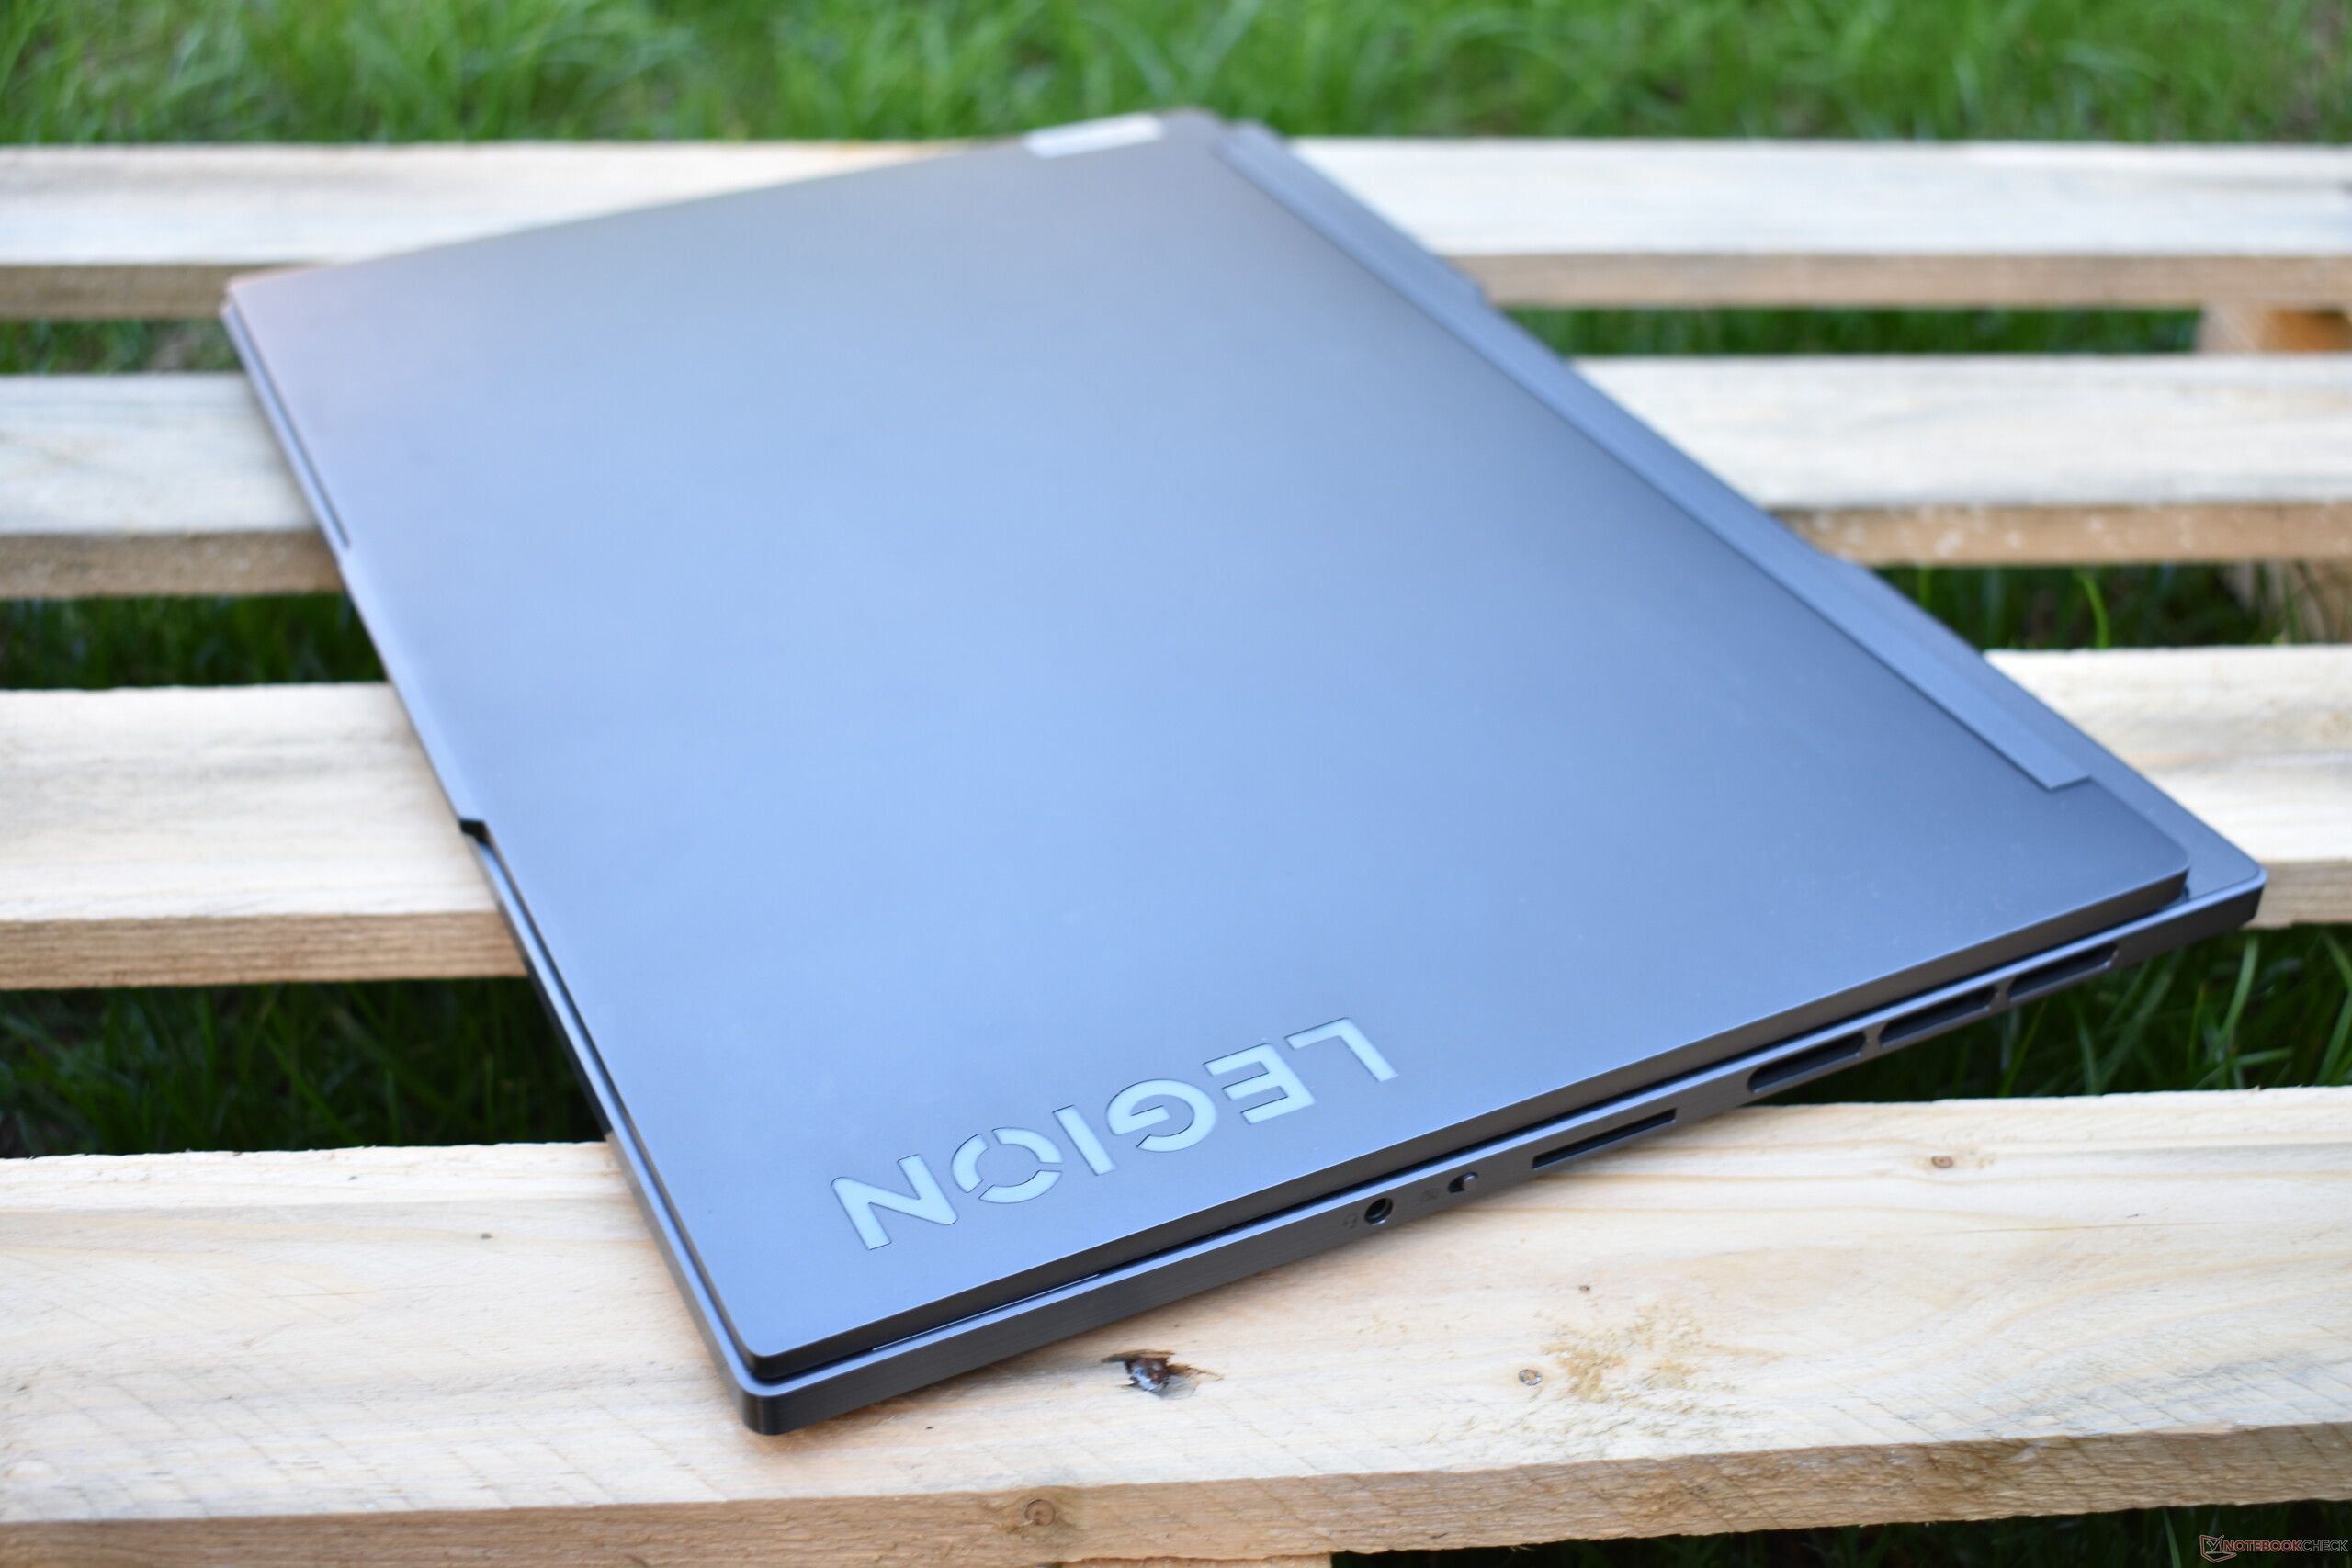
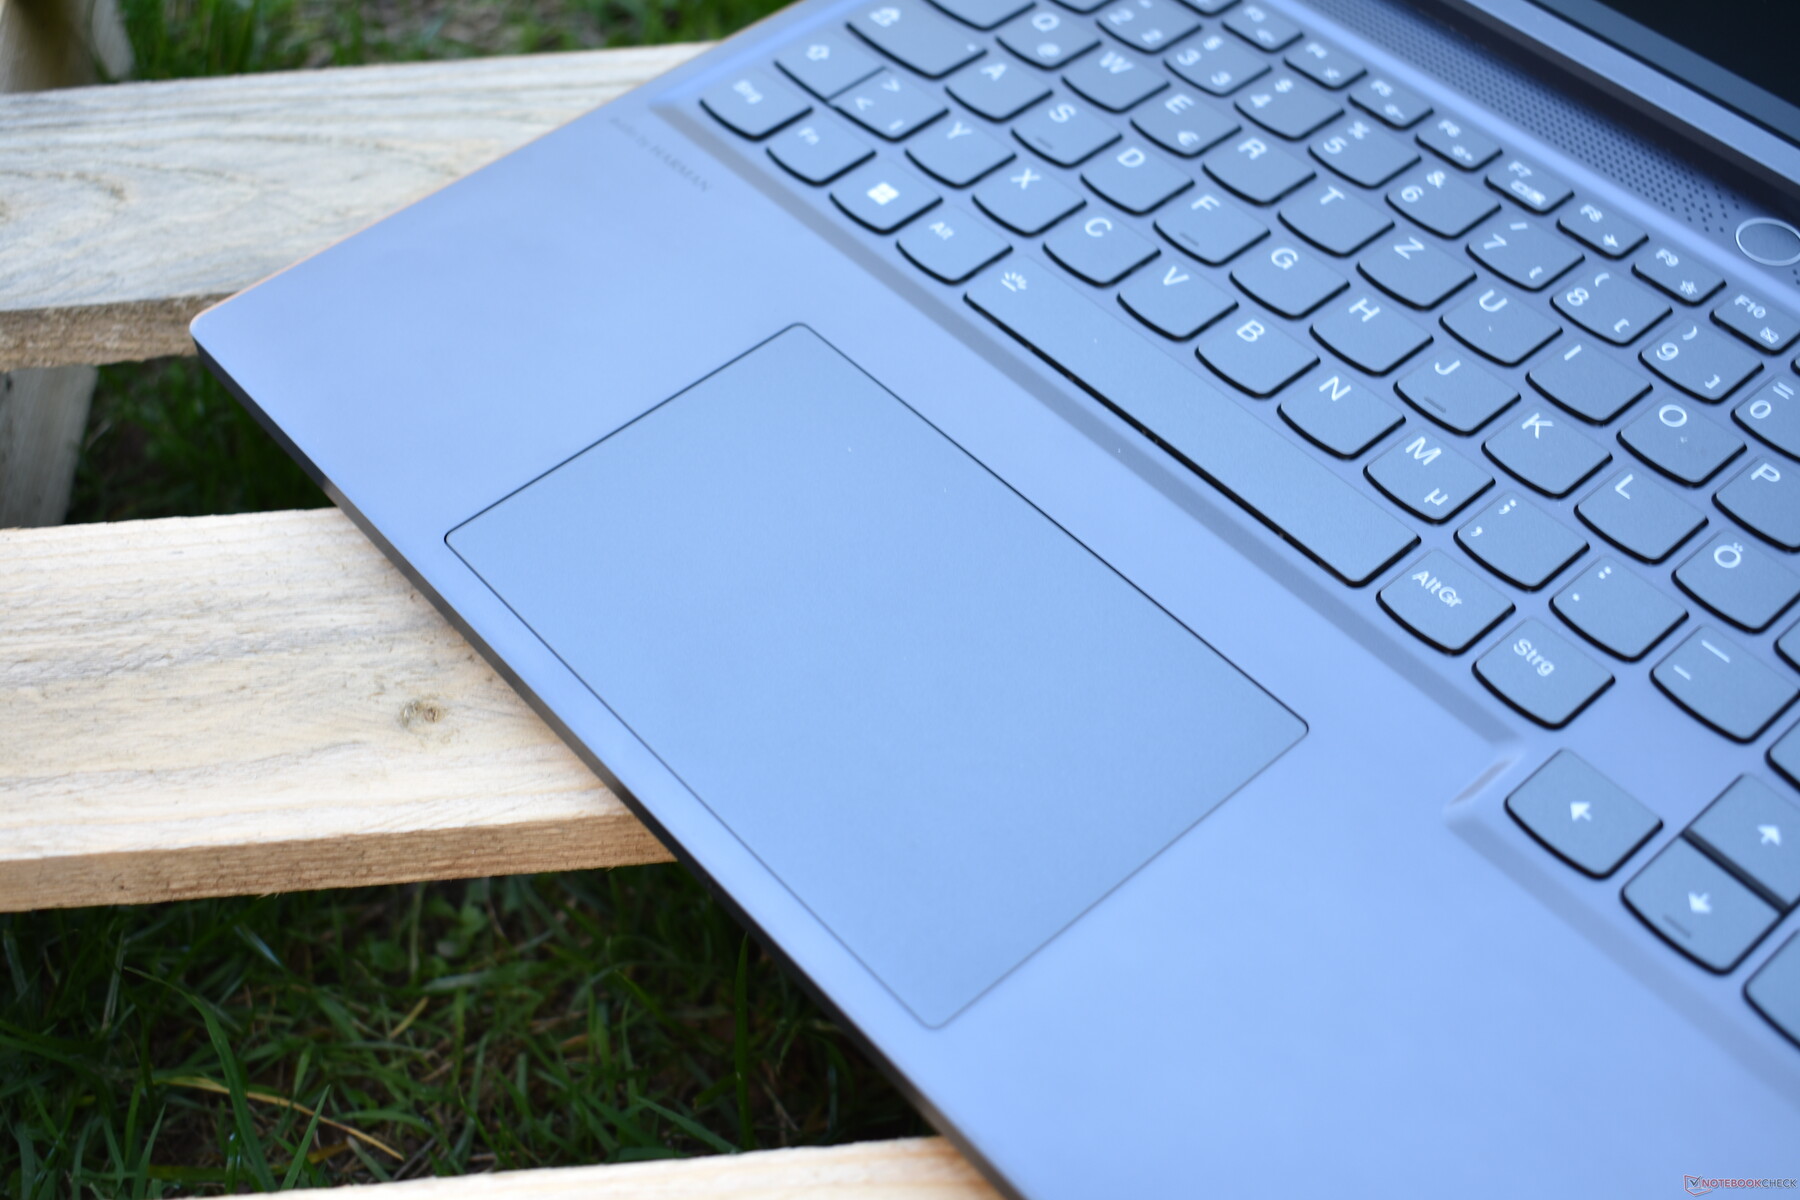
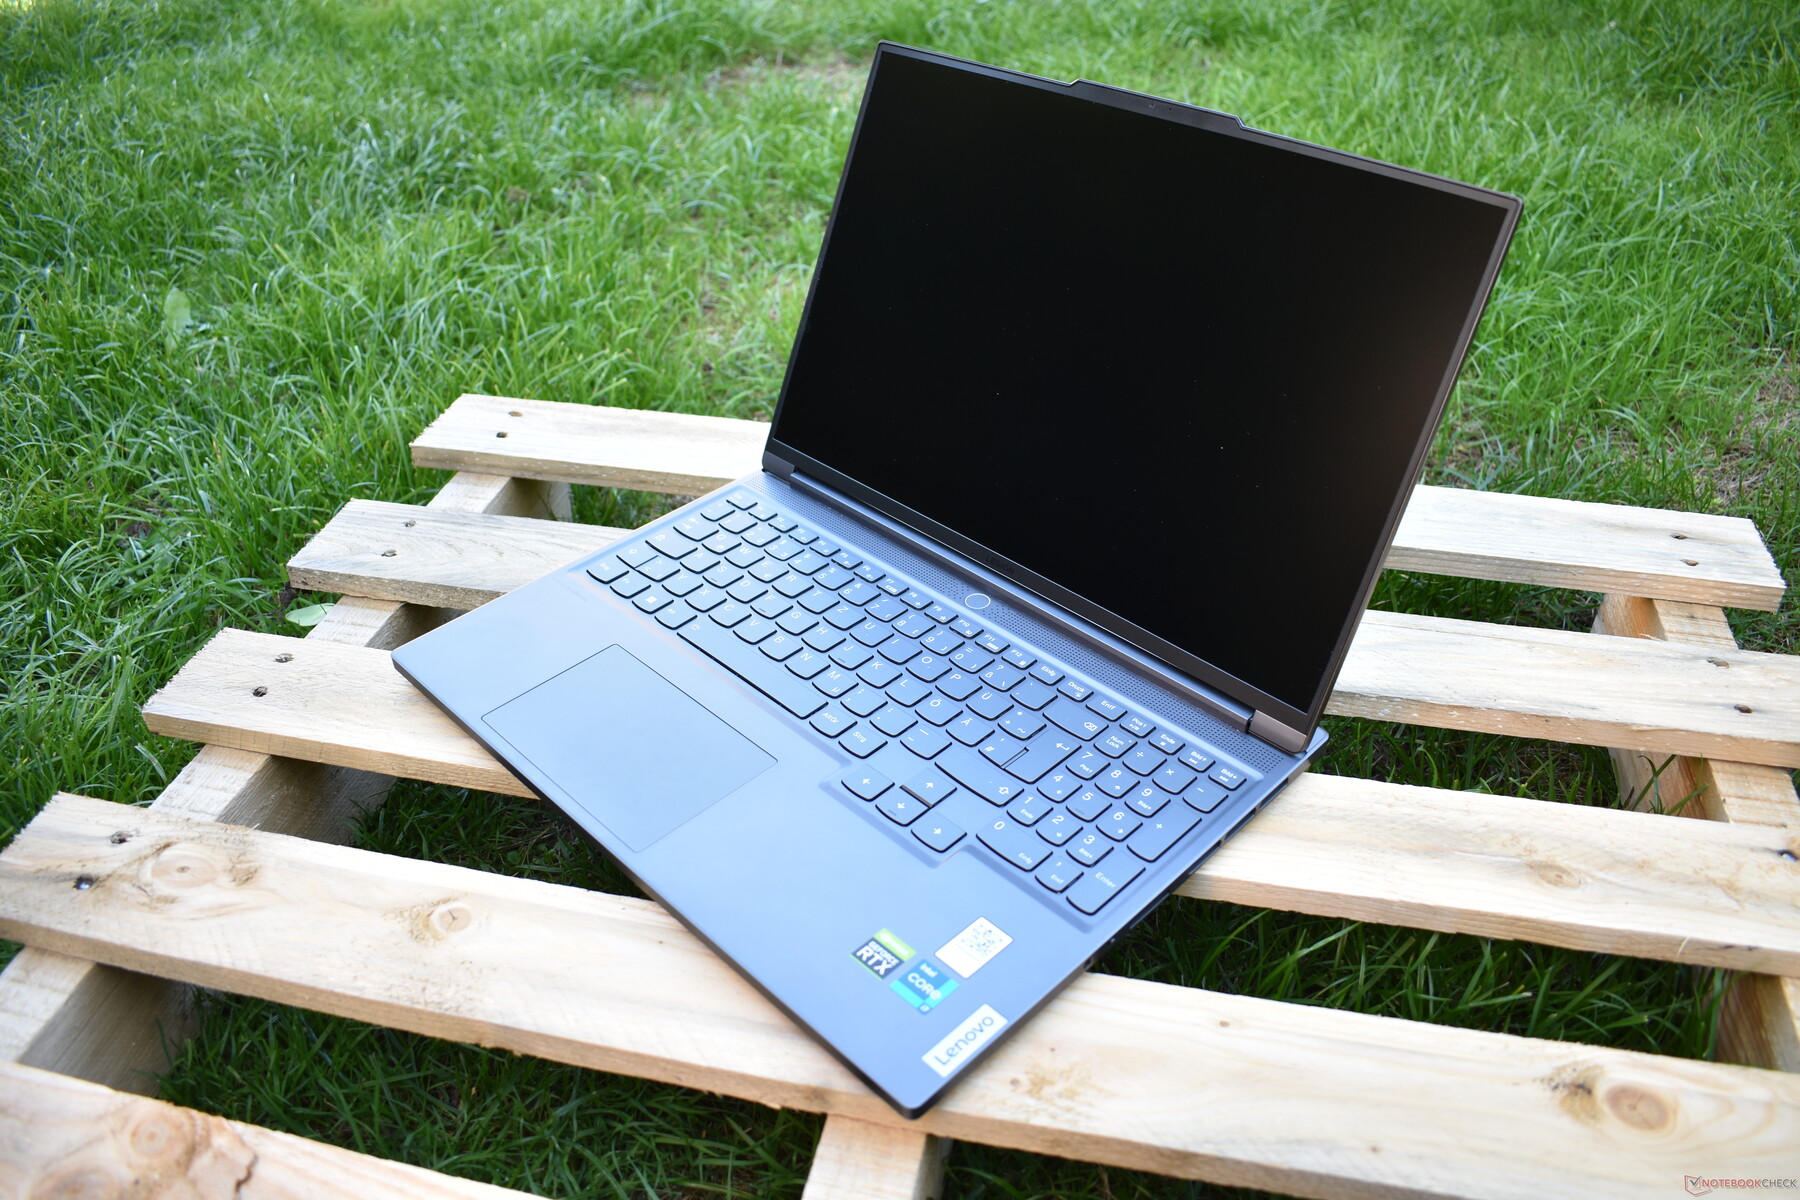
Case: Lenovo Legion with grey aluminium design
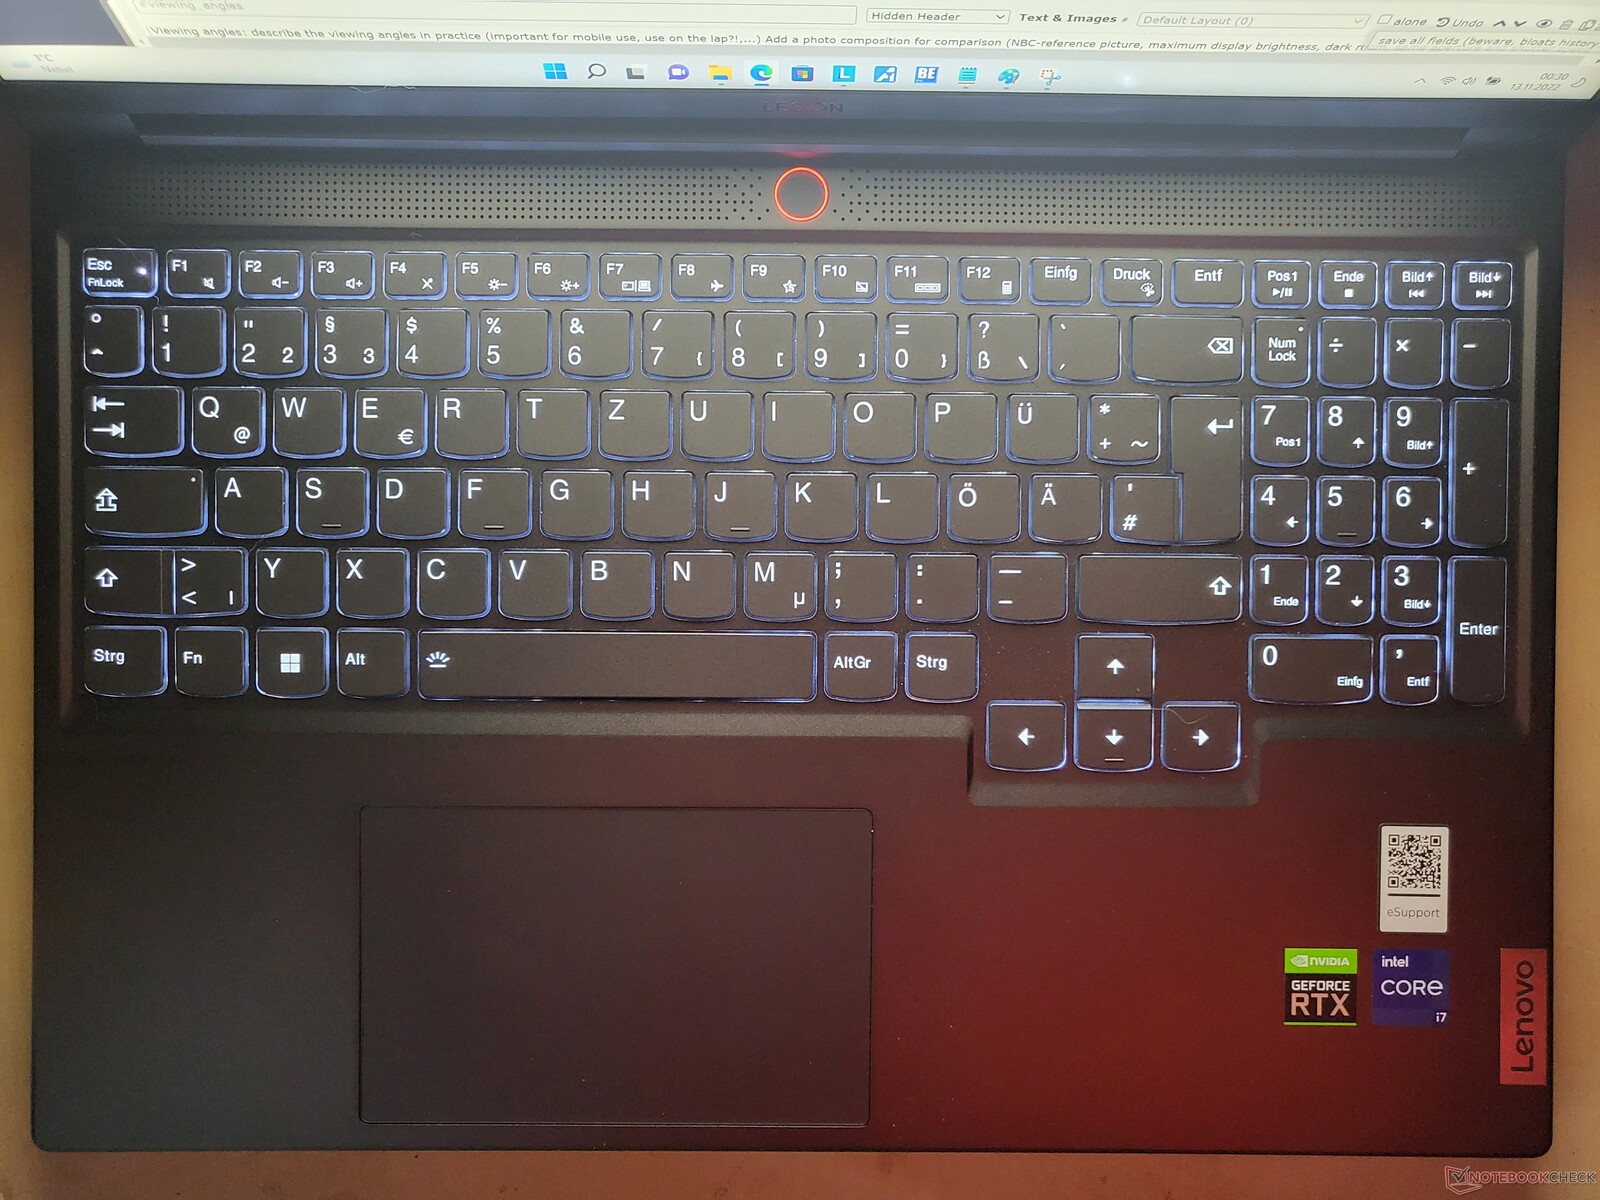
Whilst the cheaper Lenovo Legion 5 laptops are partly made of plastic, the Legion Slim 7 has a mostly aluminium construction. The display bezel is the only plastic component on the chassis. In terms of design, the Legion Slim 7 is considerably more restrained than the thicker Lenovo Legion 7. Lenovo opted not to give the Slim 7 flashy RGB lighting and instead went with a dark-grey colour scheme that wouldn't look too out of place on a business laptop. The white keyboard lighting also calls to mind Lenovo's ThinkPad business series. The LED on the power button is one of the very few splashes of colour on the device. Depending on the performance profile selected, it can light up in either blue (battery saving mode), white (balanced mode) or red (performance mode).
Despite having a simpler design, the S7 is still easily recognisable as a Legion laptop. Lenovo has done a good job when it comes to quality: The fit and finish is perfect, and the aluminium chassis is also very regid. Even the display lid is relatively sturdy despite its thinness and the slim bezel.
The hinges are attached to the base section and allow the laptop to be opened to 180 degrees. However, we wouldn't recommend folding the screen on our review unit back by more than about 135 degrees – otherwise images on the display will become distorted. At least the hinges hold the screen firmly in place and are also so well tuned that the laptop can be opened with one hand.

The Lenovo Legion S7i Gen 7 has the slimmest chassis amongst all the gaming laptops in the comparison. At just 16.9 mm thin, the device is almost in the ultrabook territory. But the story is different with its weight. Although not terribly heavy, the Lenovo Legion Slim 7 is also not a featherweight at 2.2 kg (4.85 lb). The Asus ROG Zephyrus M16 is marginally lighter than the Slim 7.
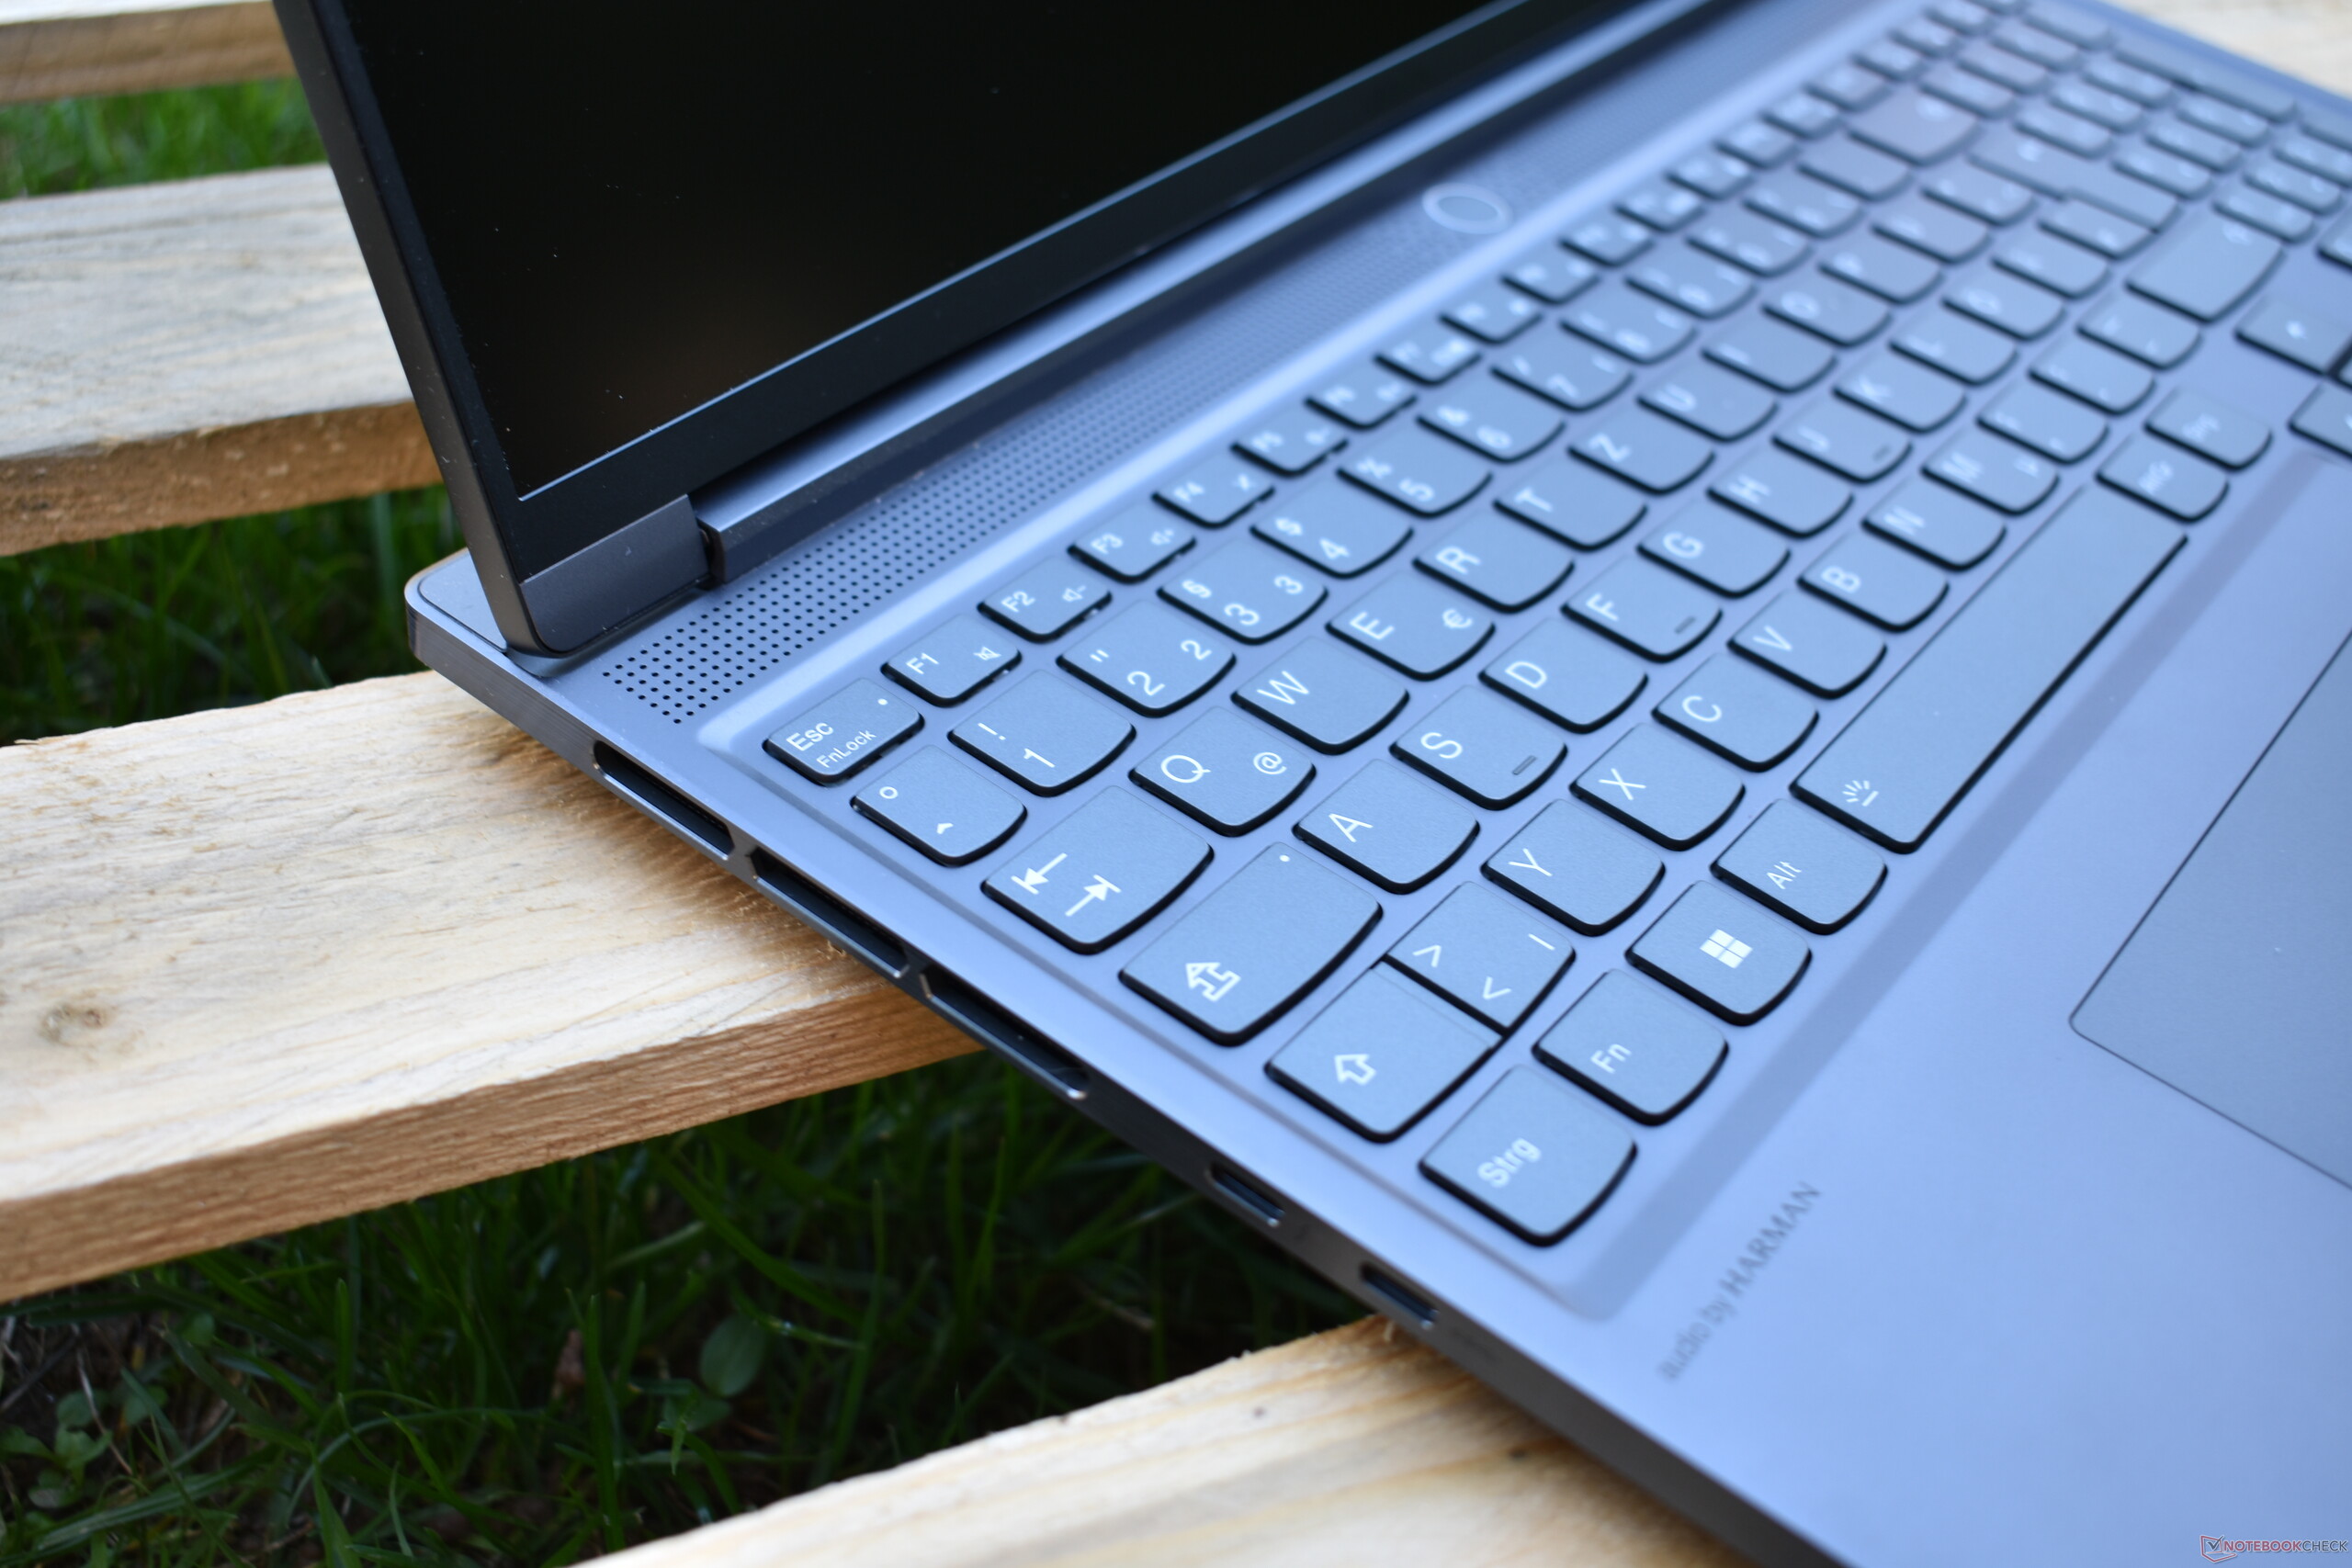
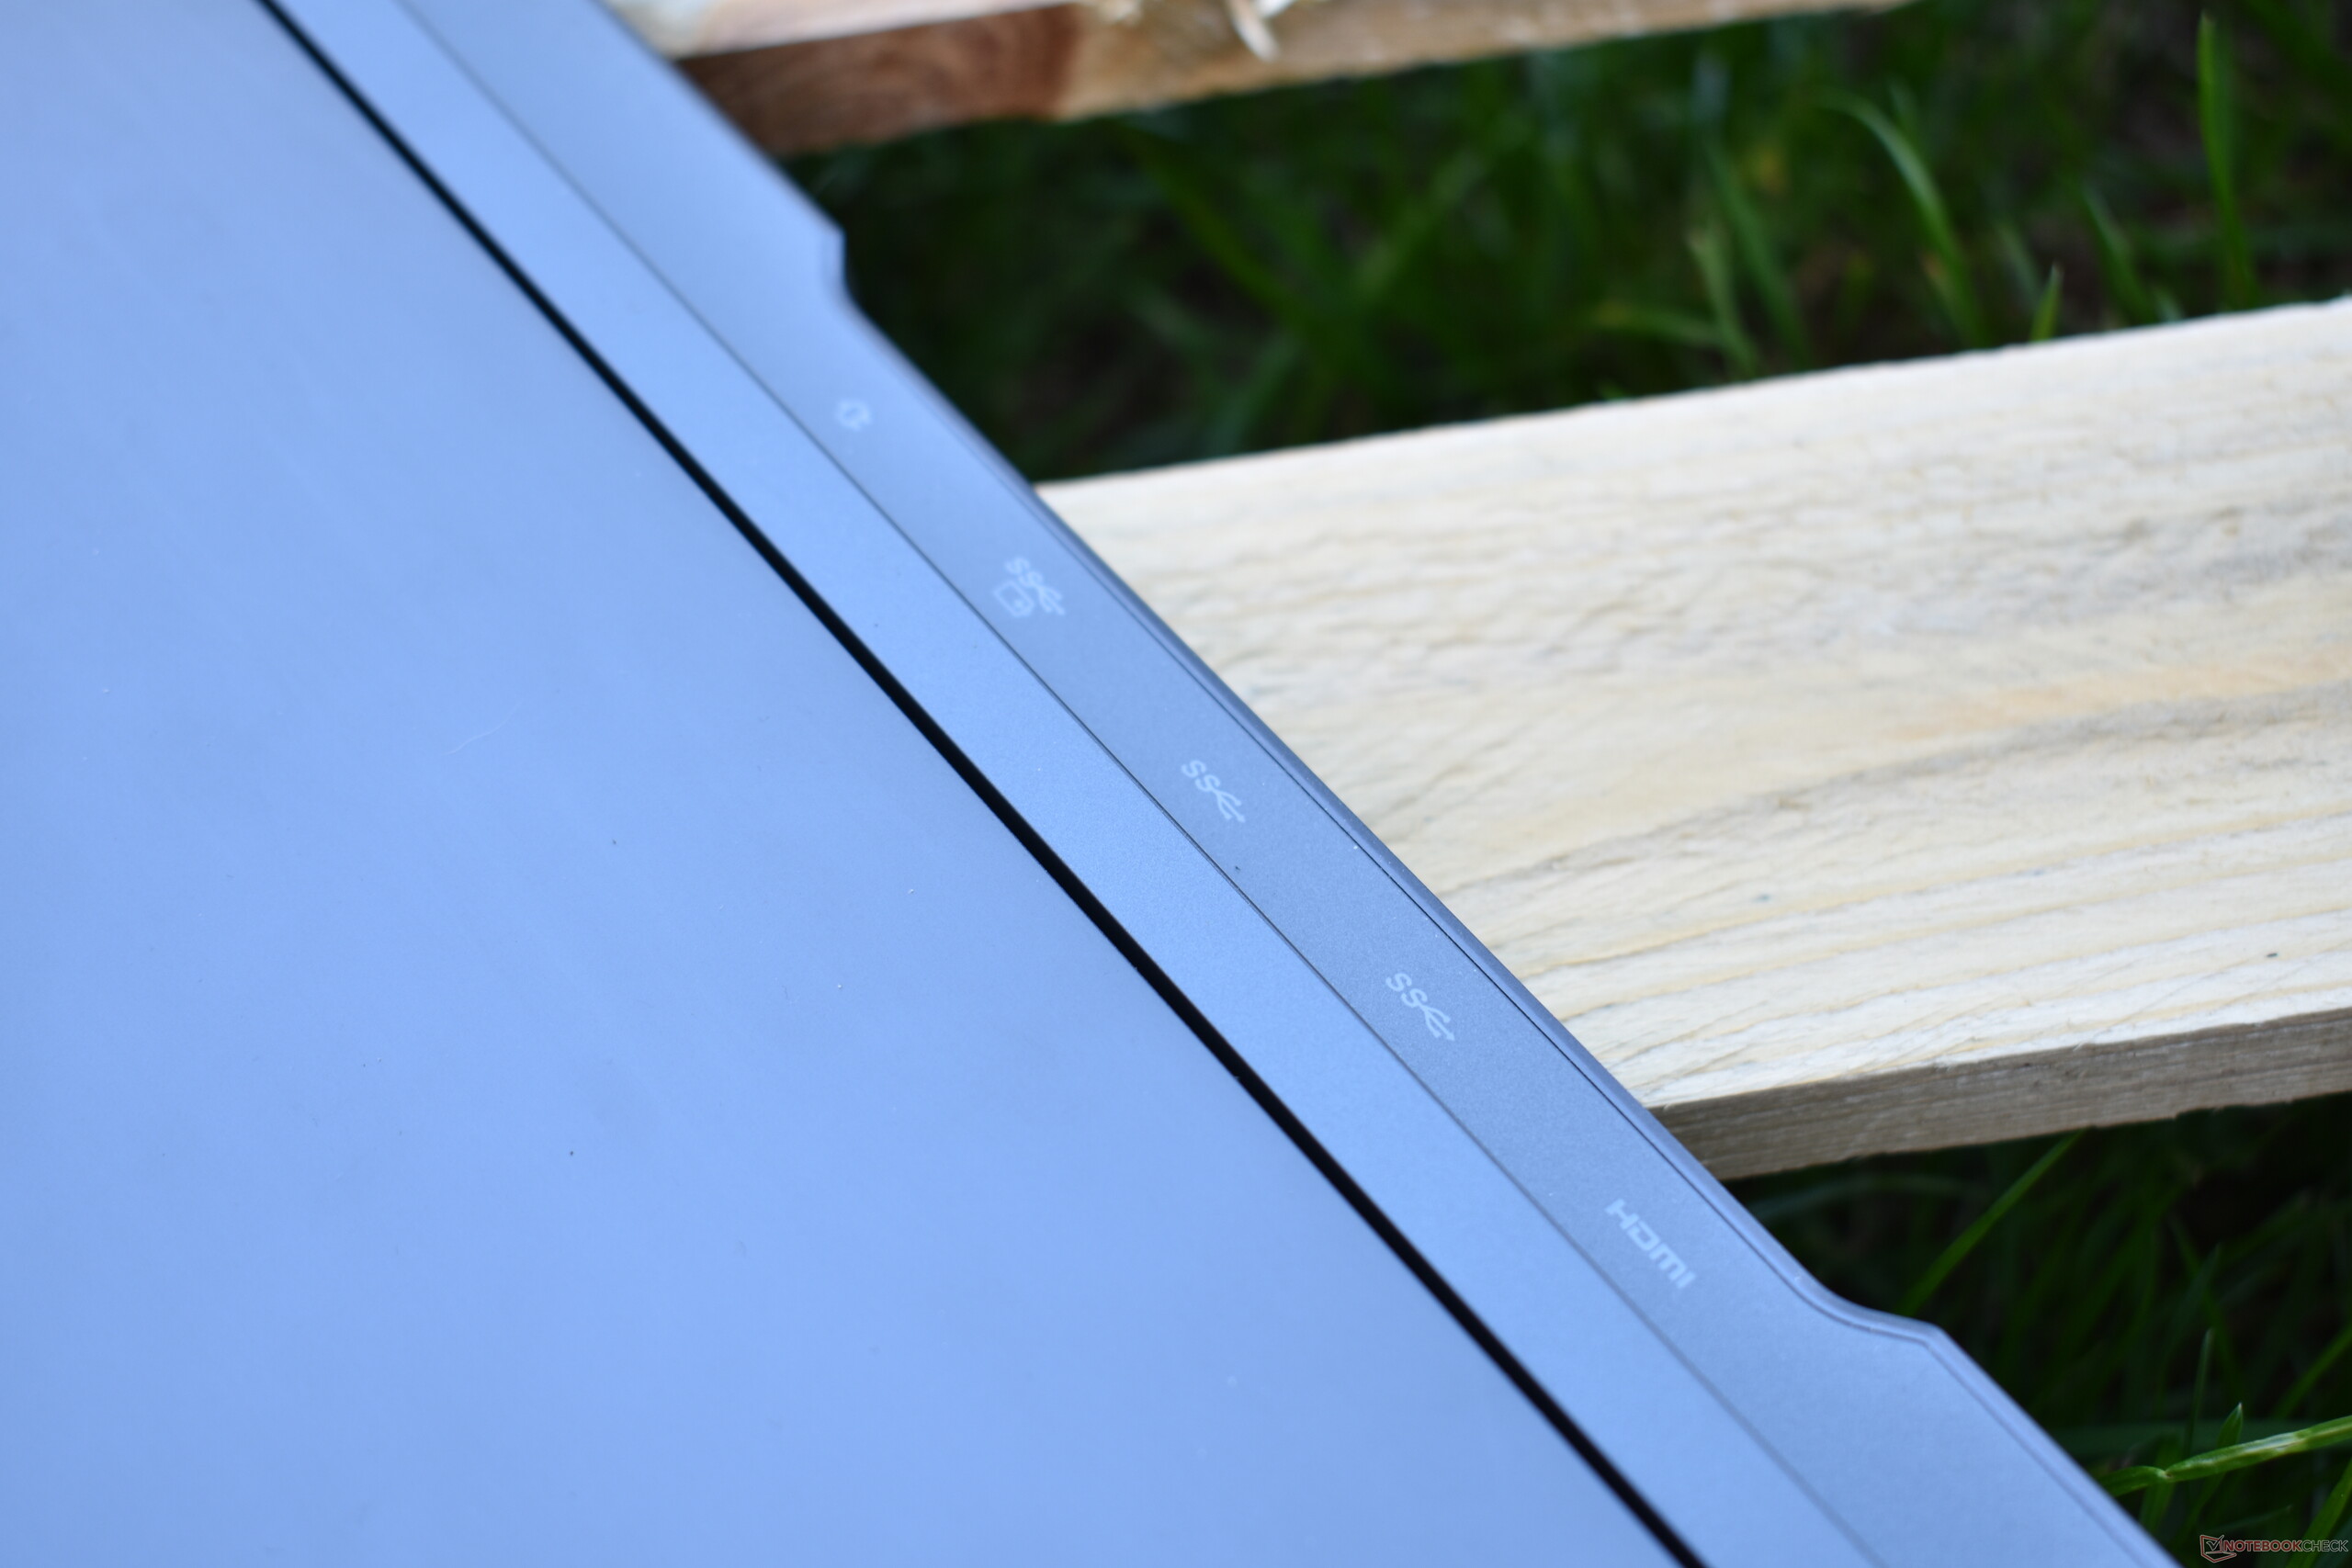
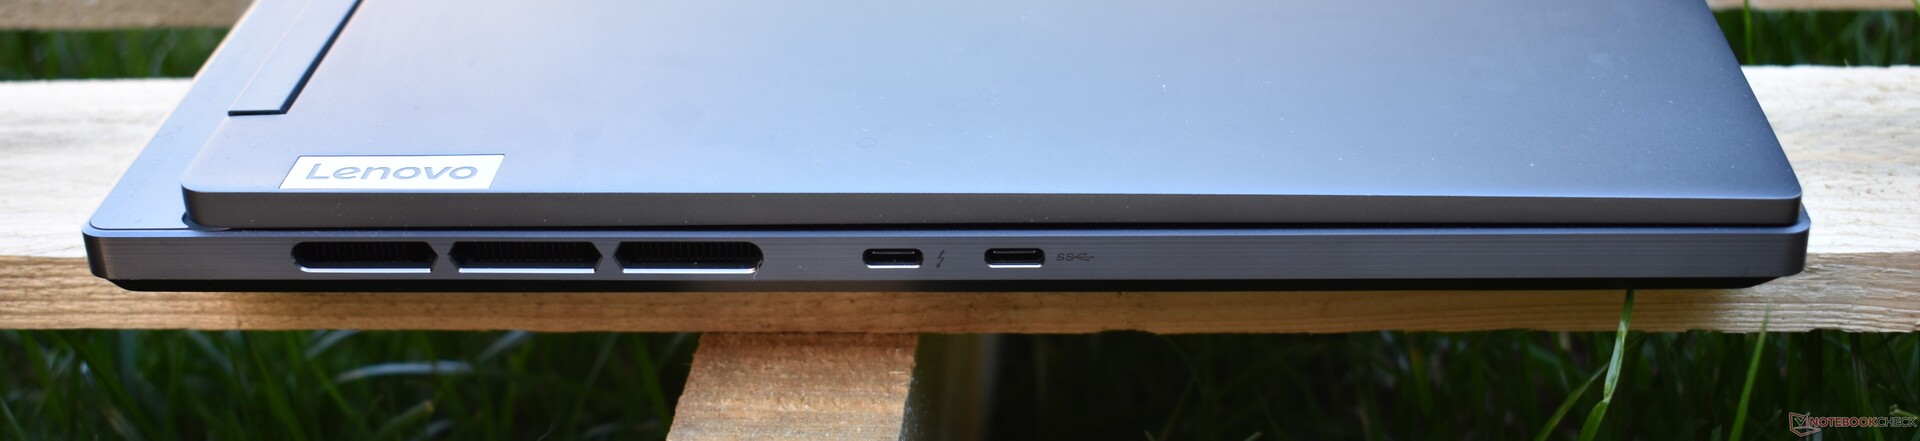
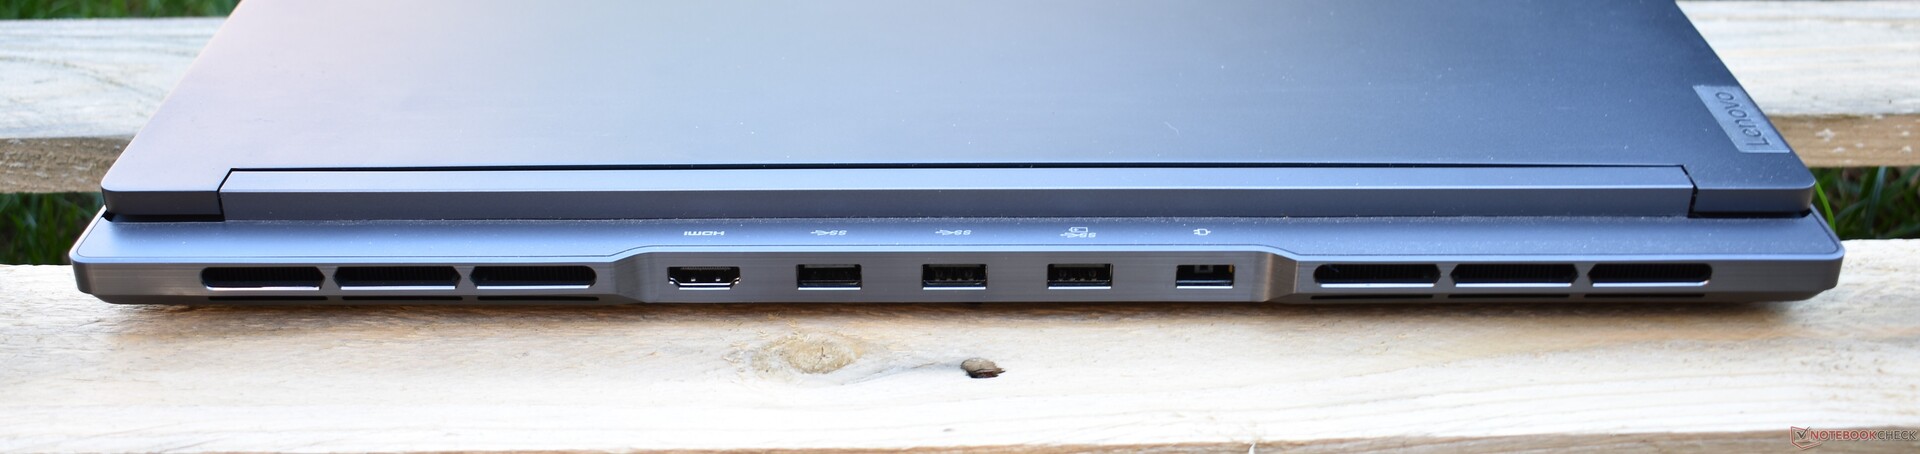
Specifications: Legion S7i with Thunderbolt 4
Unlike the AMD variant, the Lenovo Legion S7-16IAH features a Thunderbolt 4 port. It also comes with a great selection of ports (distributed across its sides and back) but lacks an RJ45 socket. Those who want an Ethernet port can take a look at the regular, "non-Slim" Lenovo Legion 7.
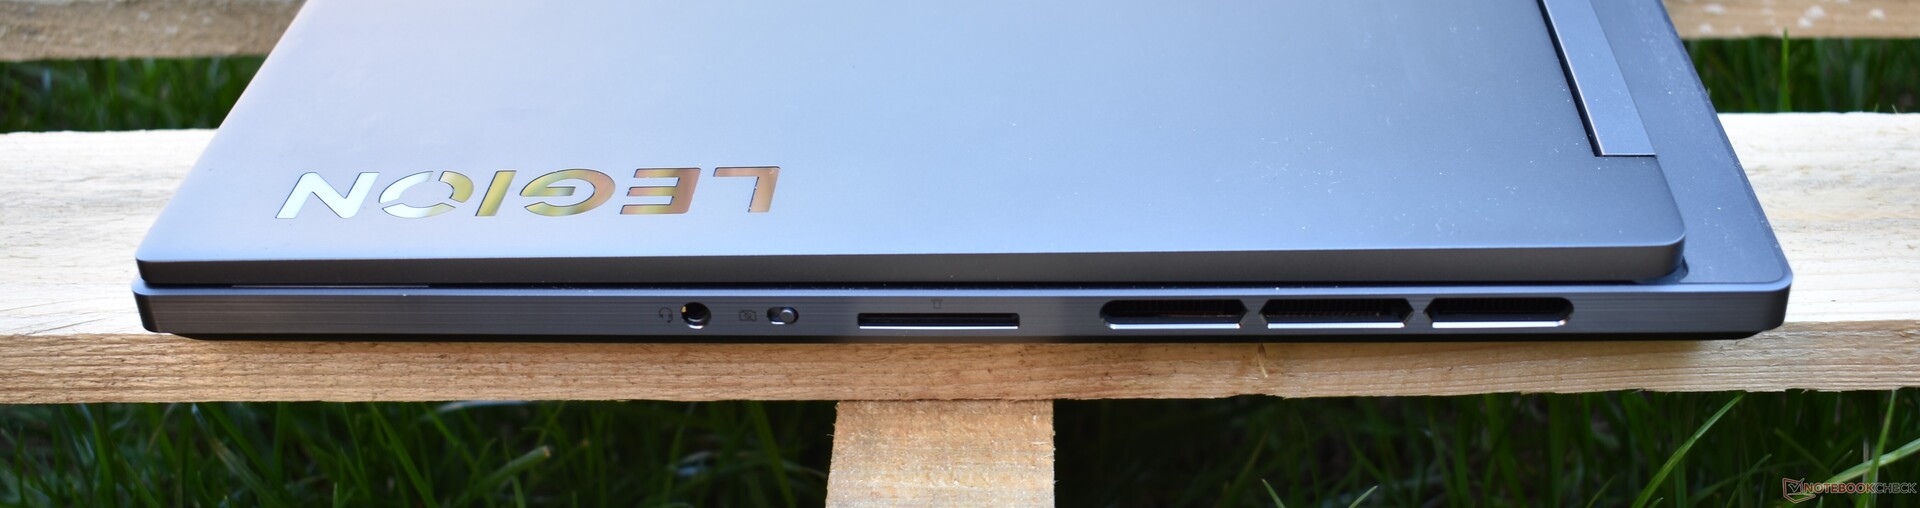
SD card reader
The SD card reader doesn't allow a card to be inserted all the way in, meaning it is not suitable for long-term storage expansion. The laptop delivered an average result in our benchmarks, performed using our AV Pro MicroSD V60 reference card.
| SD Card Reader | |
| average JPG Copy Test (av. of 3 runs) | |
| Average of class Gaming (20.9 - 210, n=54, last 2 years) | |
| Asus ROG Zephyrus M16 GU603H (AV PRO microSD 128 GB V60) | |
| Lenovo Legion S7 16ARHA7 (AV PRO microSD 128 GB V60) | |
| Lenovo Legion Slim 7-16IAH 82TF004YGE | |
| Acer Predator Triton 500 SE PT516-52s-70KX (AV PRO microSD 128 GB V60) | |
| HP Omen 16-b1090ng (AV PRO microSD 128 GB V60) | |
| maximum AS SSD Seq Read Test (1GB) | |
| Asus ROG Zephyrus M16 GU603H (AV PRO microSD 128 GB V60) | |
| Average of class Gaming (25.5 - 261, n=51, last 2 years) | |
| Lenovo Legion S7 16ARHA7 (AV PRO microSD 128 GB V60) | |
| Lenovo Legion Slim 7-16IAH 82TF004YGE | |
| Acer Predator Triton 500 SE PT516-52s-70KX (AV PRO microSD 128 GB V60) | |
Connectivity
The Lenovo Legion Slim 7-16IAH features a Killer Wi-Fi 6E AX1675i, which supports the new Wi-Fi 6E standard. In our testing, this 2x2 module delivered high transfer rates with a few minor fluctuations during the transmit test. Technically, this should also apply to the Wi-Fi 6E mode, but the laptop was unable to find the 6 GHz network – probably due to a driver issue.
Webcam
The Legion Slim 7 can be configured with either a 1080p or a 720p webcam. Our review unit comes with the higher-resolution option. In spite of this, the webcam performs poorly and produces relatively pixelated and noisy images.


Accessories
Lenovo didn't include any accessories with the Legion Slim 7 apart from a 230-watt charger with a Slim-tip plug.
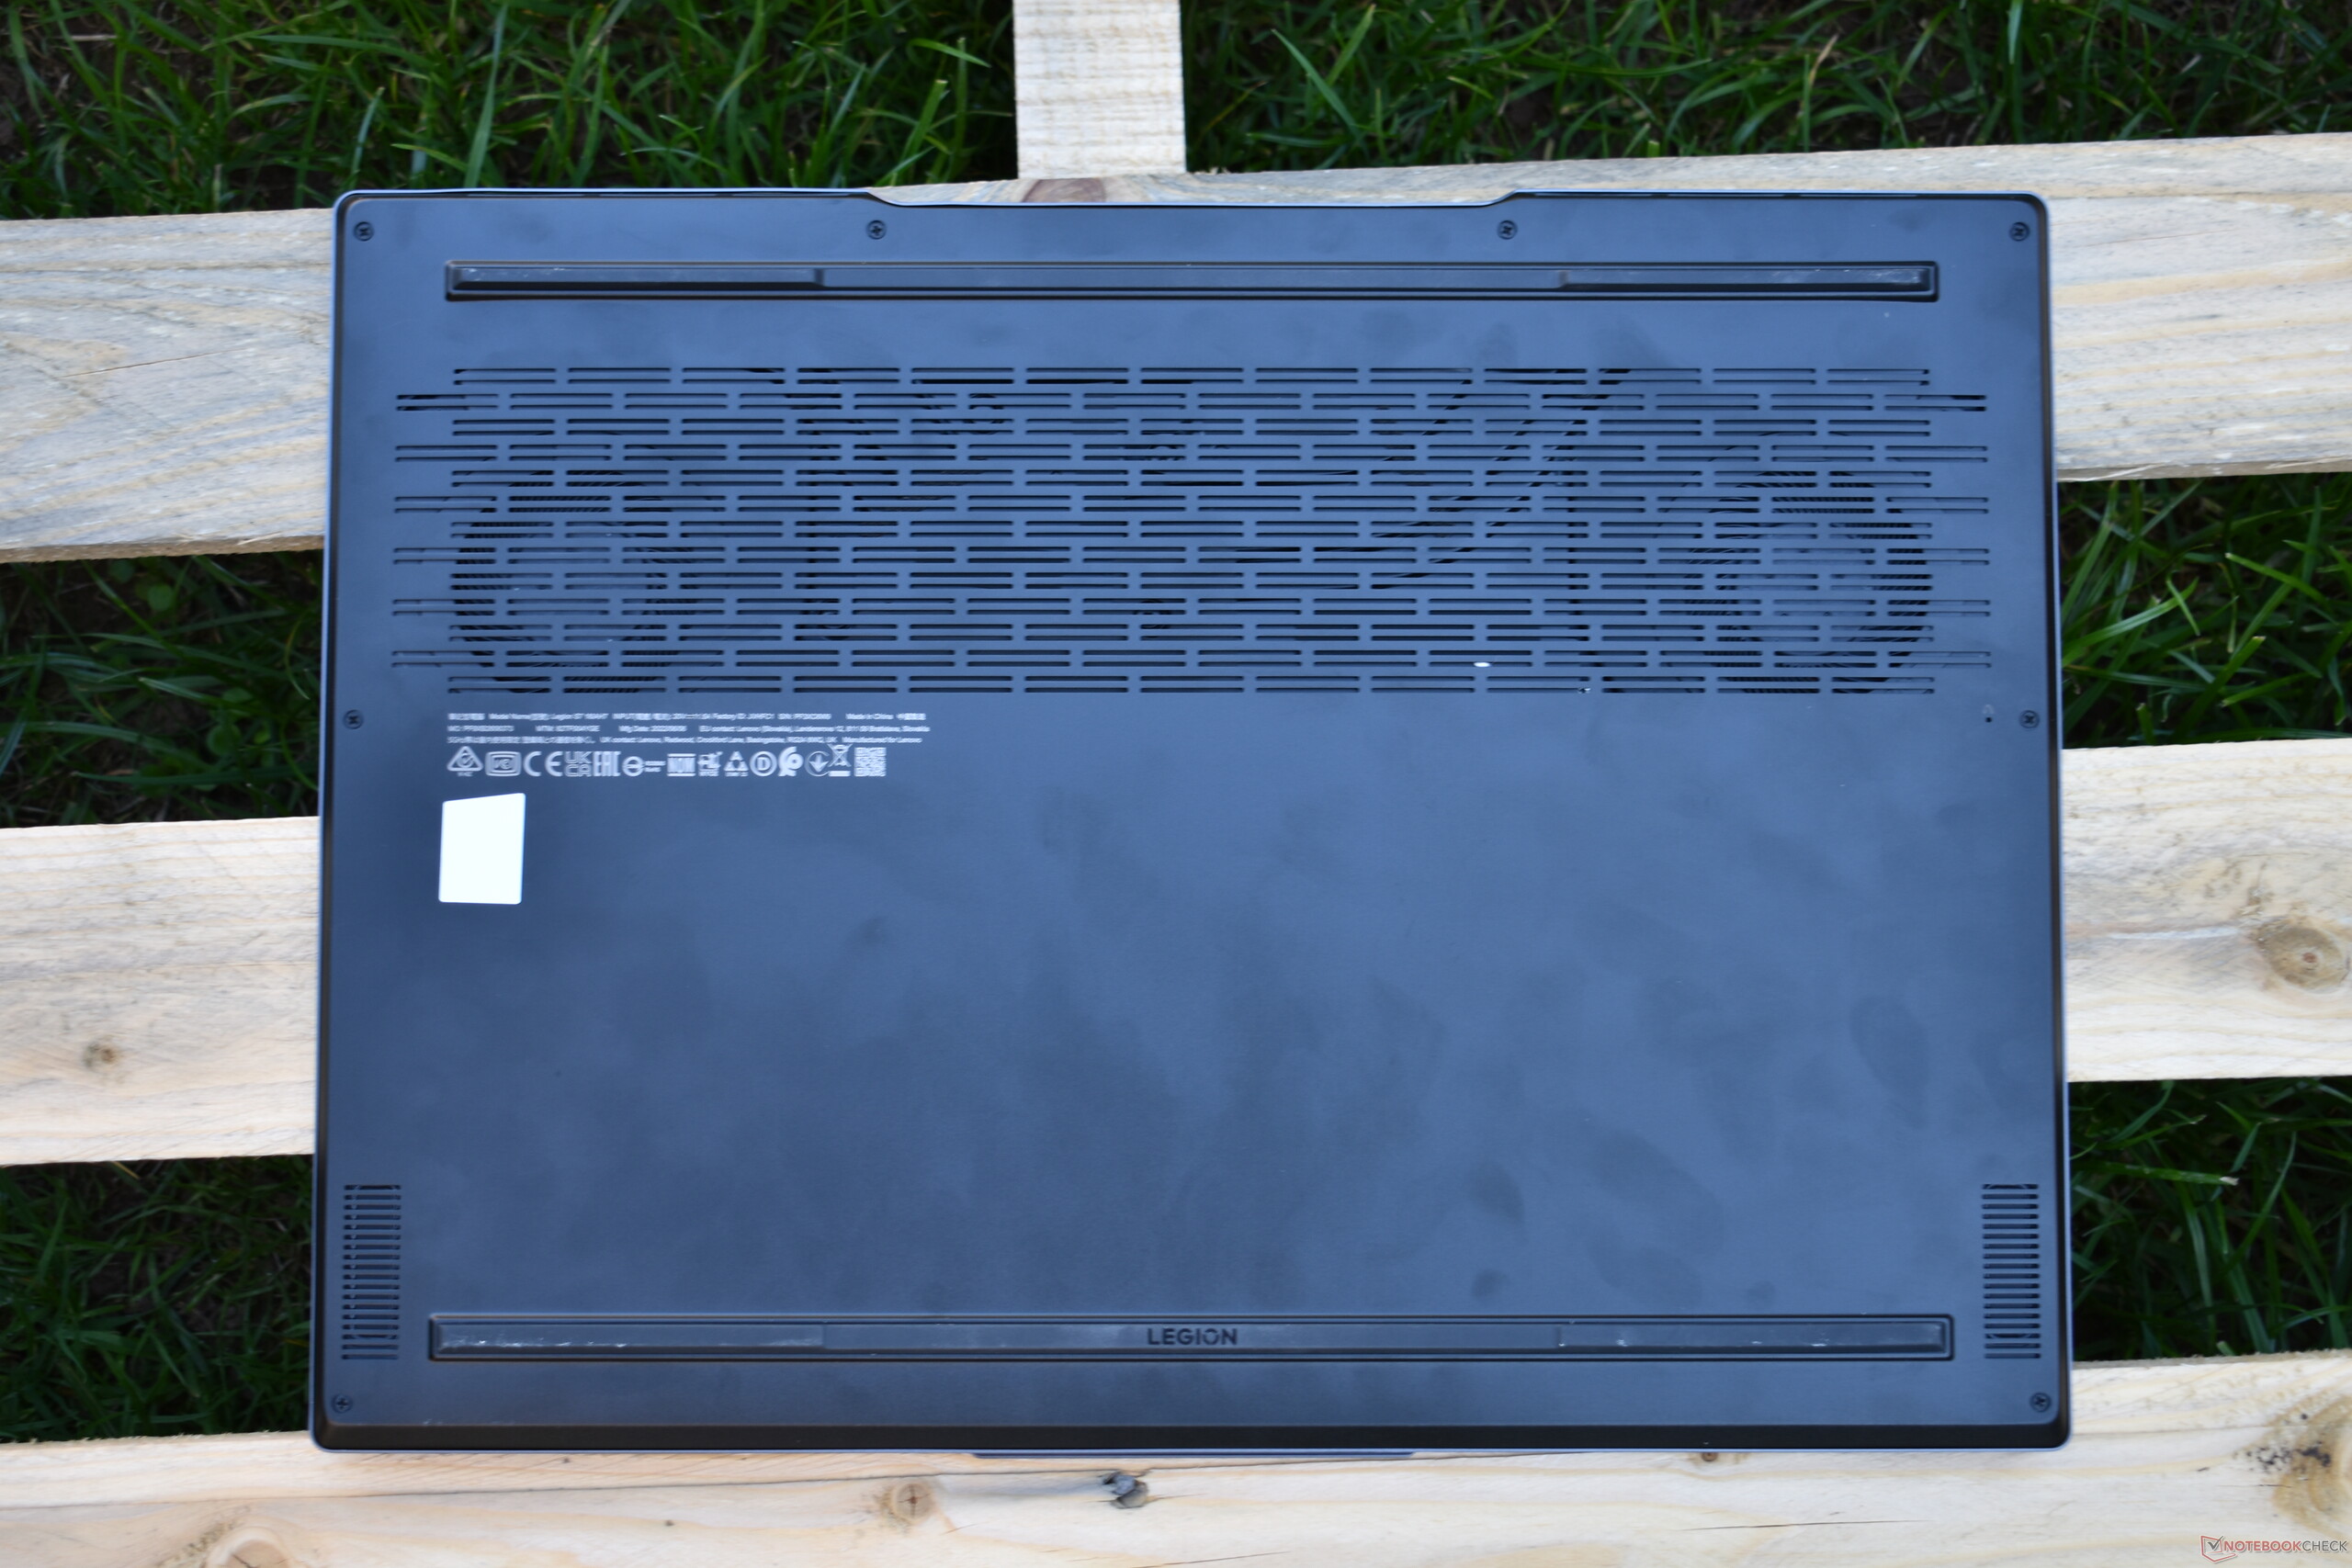
Maintenance
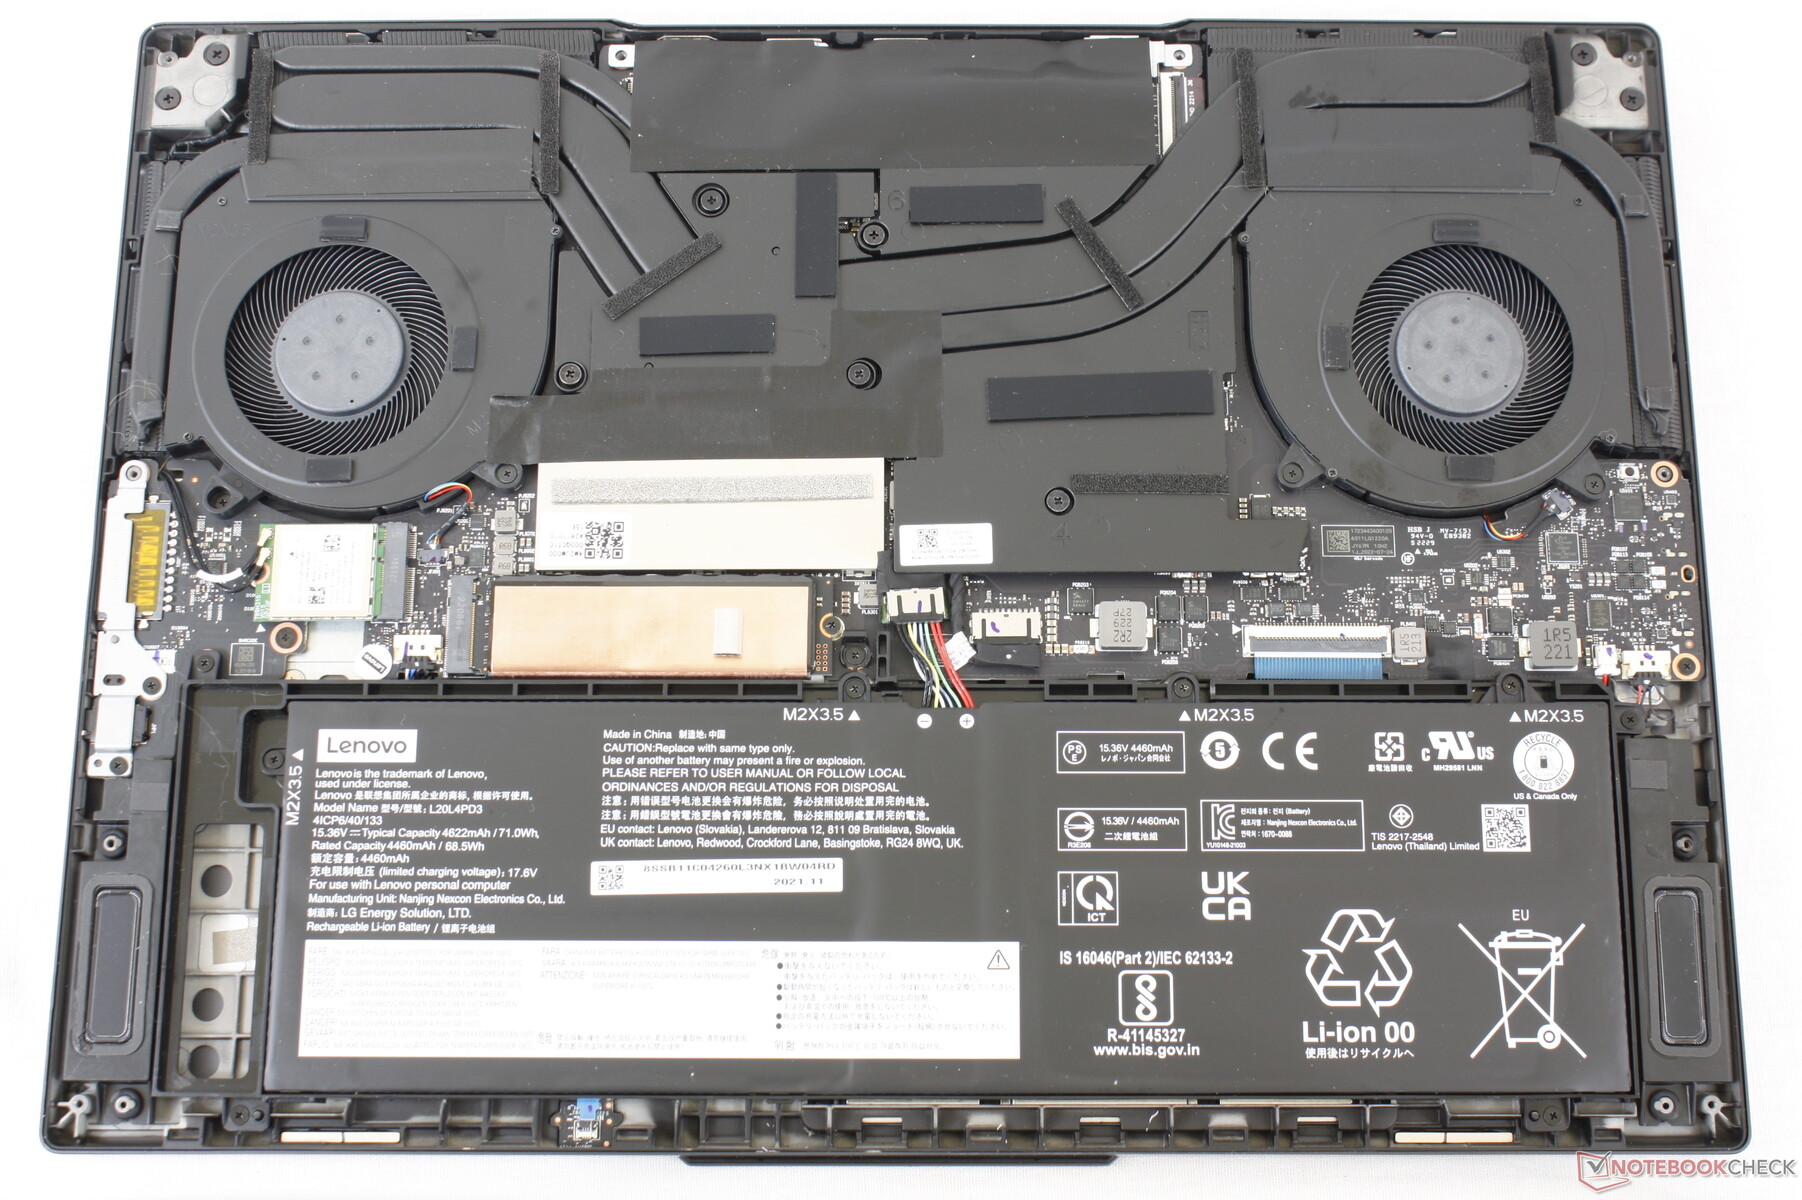
Theoretically, the Lenovo Legion Slim 7i can be opened and upgraded. To do so, you have to remove the base panel, which is secured by eight screws and numerous clips. We said "theoretically" because we couldn't open the device even after several attempts. It wasn't possible to undo the clips without risking damage to the chassis. Nonetheless, the layout of the internals should be similar to the one in the AMD version, so we have borrowed a corresponding image from that review.
Besides the M.2 2280 SSD, both the SODIMM RAM and the Wi-Fi module are upgradable. The battery can likewise be replaced.
Warranty
Lenovo offers a 24-month warranty with bring-in service on a Lenovo Legion S7 purchased in Germany. Warranty periods may vary by country. For instance, customers in the US will only receive a one-year warranty by default.
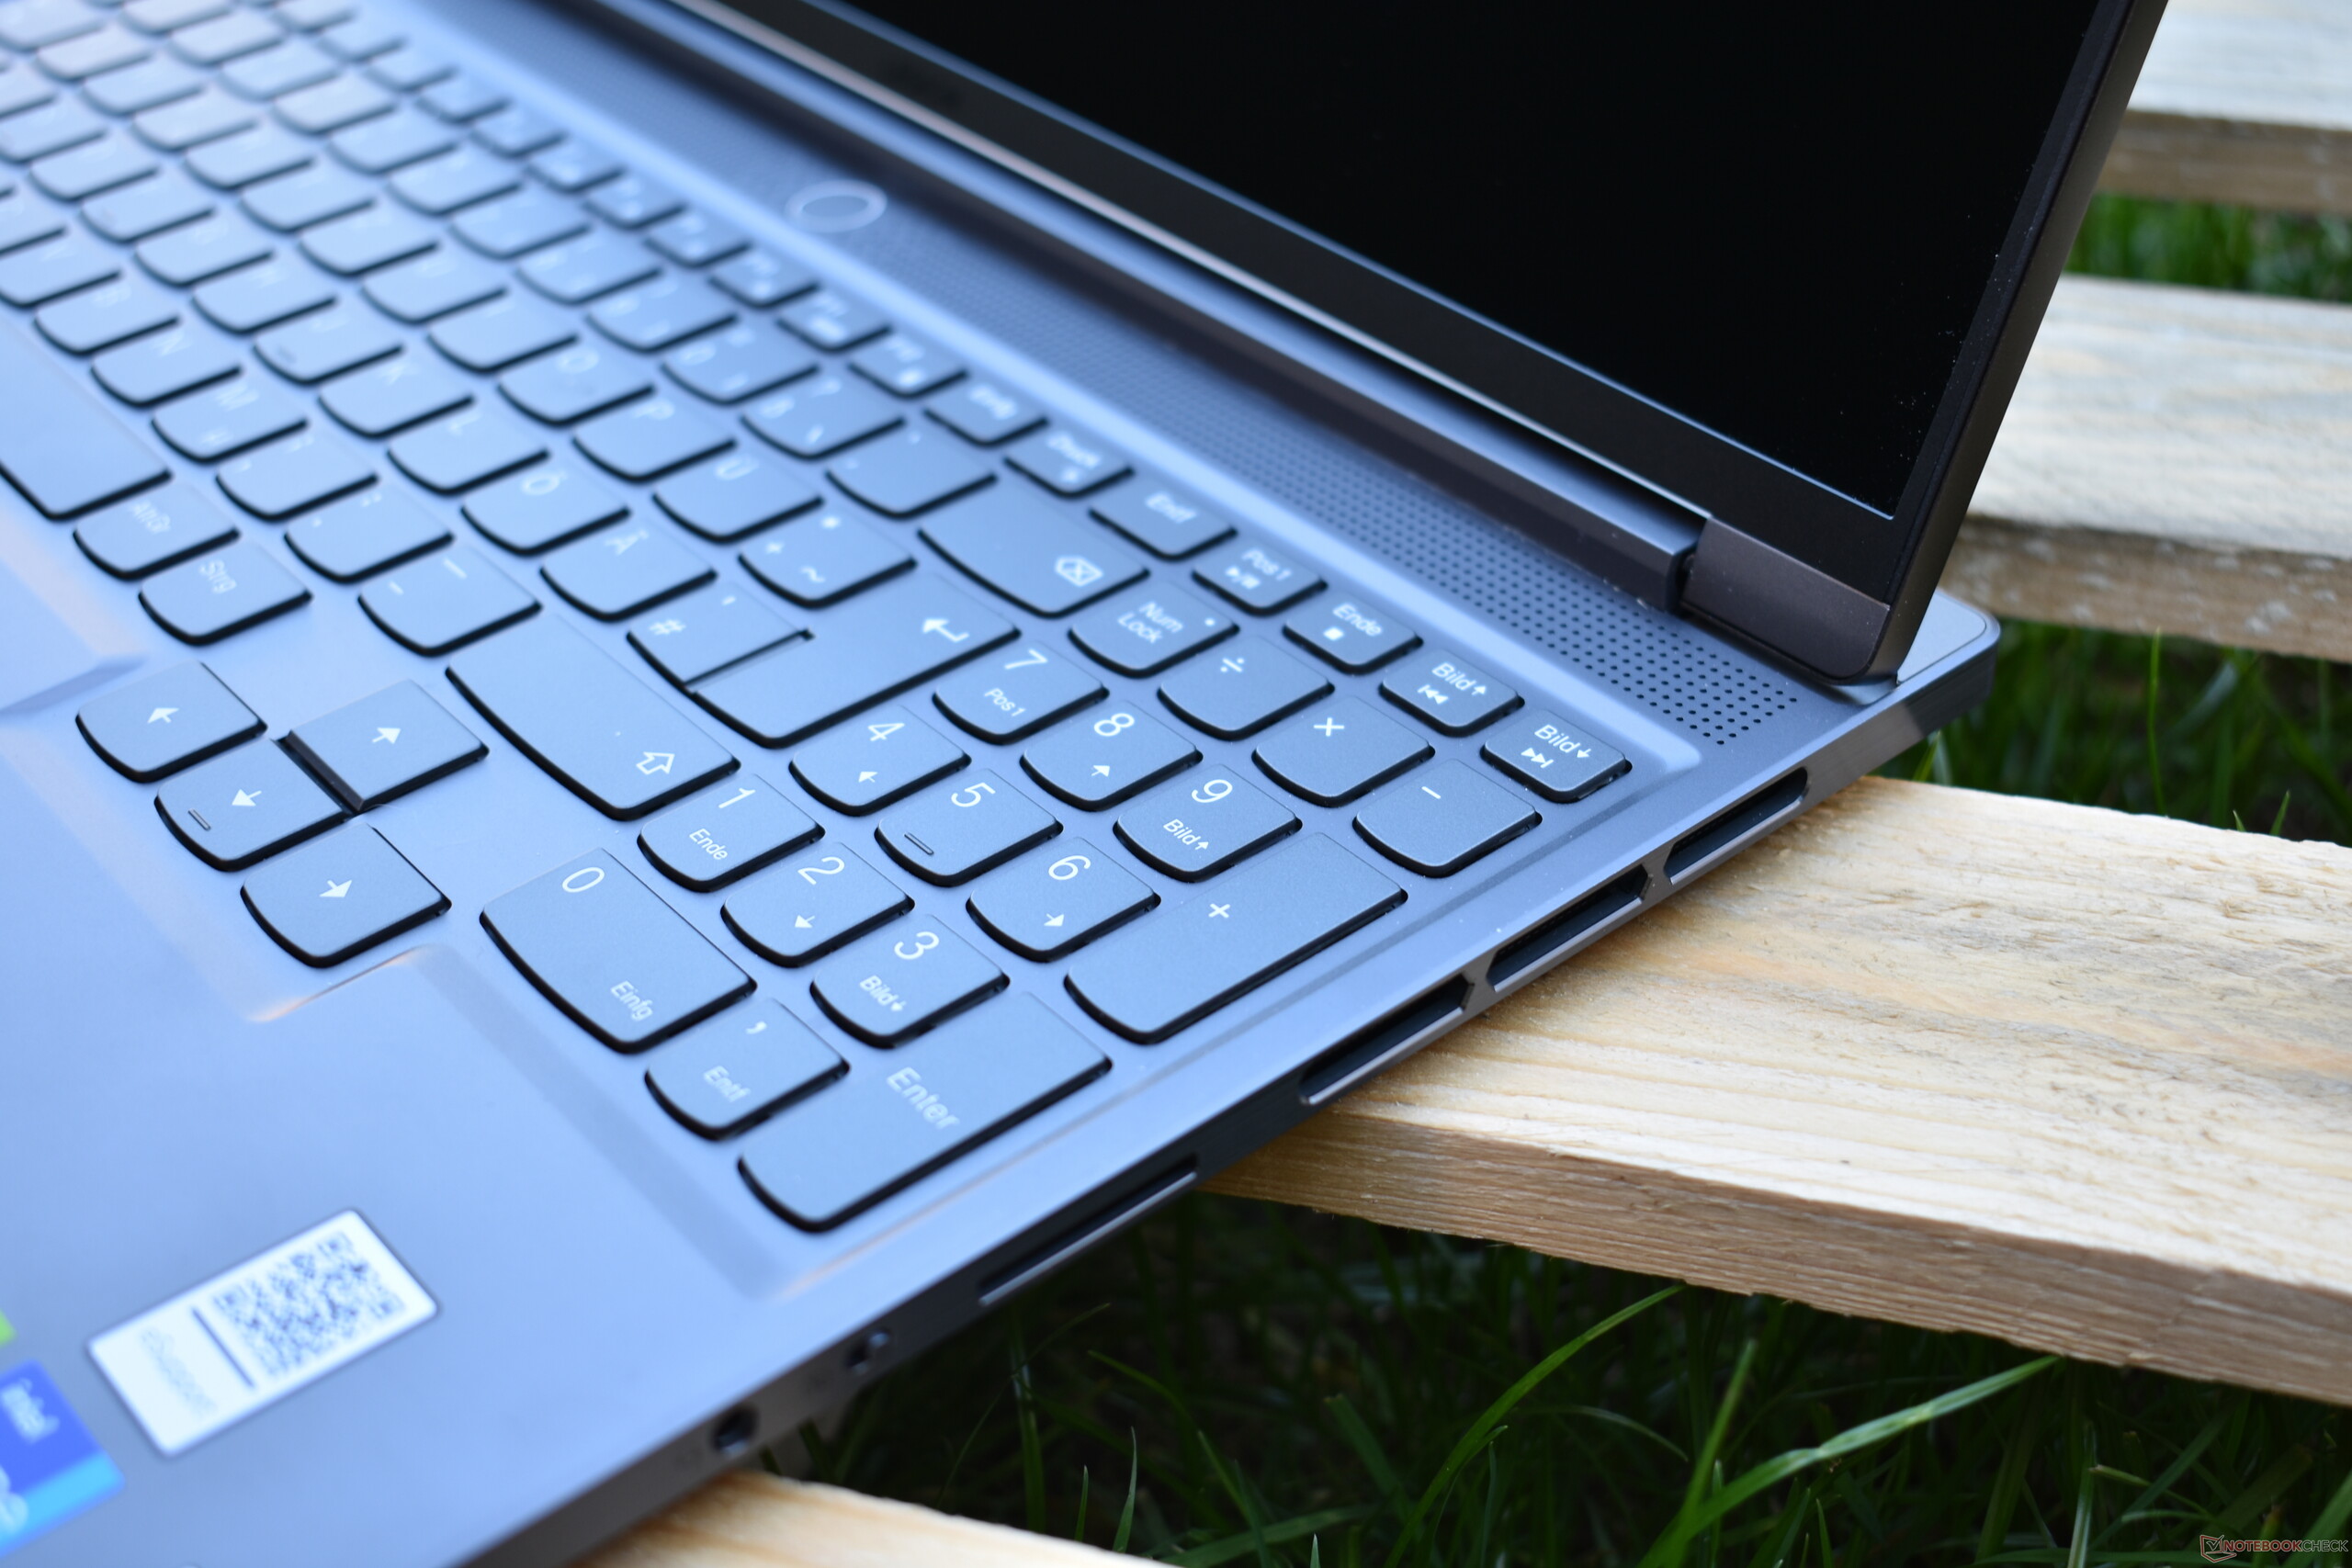
Input devices: Gaming laptop without RGB keyboard
Keyboard
The chiclet keys on the keyboard are dark grey to match the colour of the chassis. As previously mentioned in the case section of this review, Lenovo decided not to use any of the usual RGB gimmicks found on gaming laptops, instead giving the keyboard a bluish-white backlight. That said, an optional RGB backlit keyboard is available at an extra cost.
The keyboard occupies almost the entire width of the chassis and has a numeric pad. One noteworthy feature is the extra-large arrow keys, which you don't see quite often on laptops. Whilst this is nice, we didn't like the narrow enter key as much. Overall, the Lenovo Slim 7i is pretty pleasant to type on. The keys have about 1.5 mm (0.06") of travel and a crisp actuation point and thus don't feel mushy. Furthermore, the metal chassis is sturdy and prevents the keyboard from flexing during typing.
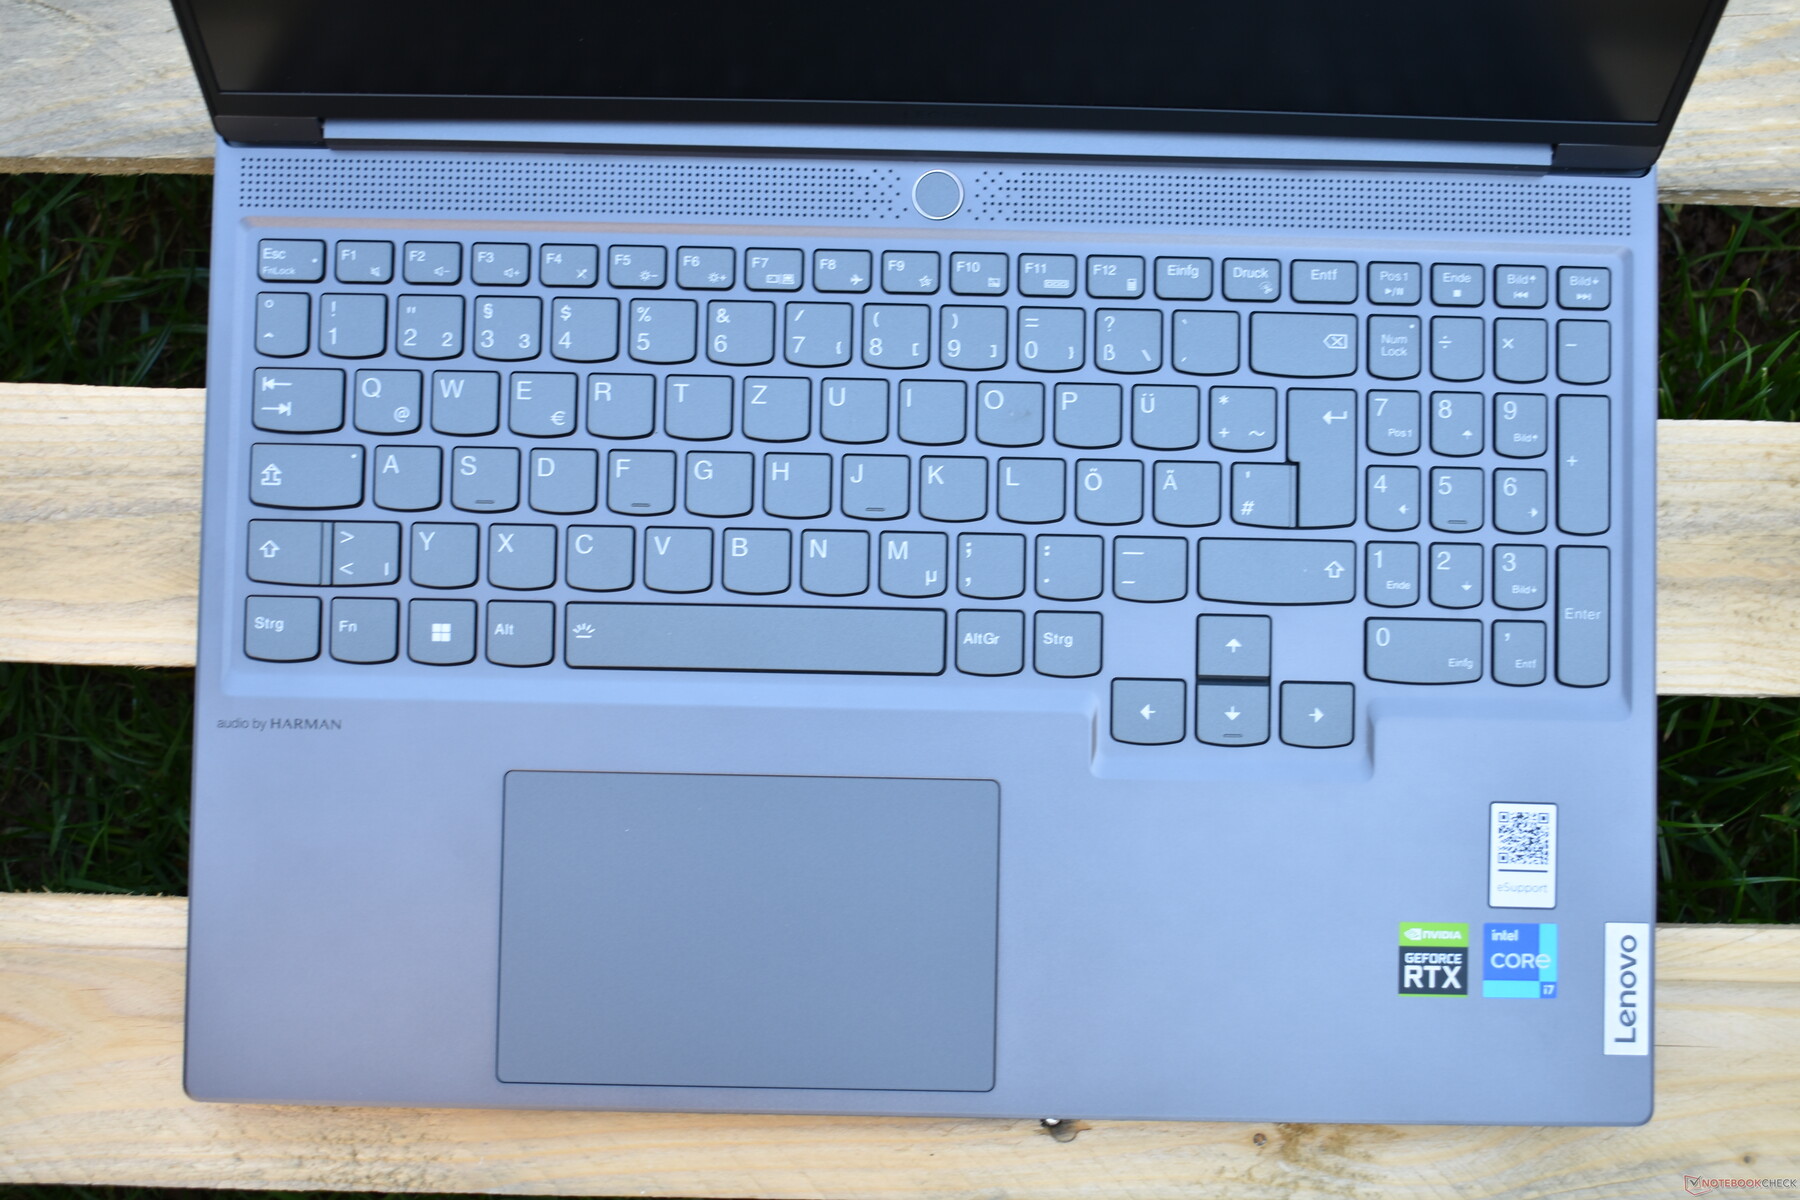
Touchpad
Measuring 12 x 7.5 cm (4.72 x 2.95"), the touchpad is adequate, but we feel it could be slightly larger. The glass trackpad has a smooth, matt surface that feels premium and allows fingers to slide across very effortlessly. We are less impressed by the traditional click mechanism of this clickpad (actuated by pressing down the lower zone). The reason is that the touchpad makes pretty loud clicking sounds, which can be annoying. However, this is our only gripe with the touchpad; the software implementation of features such as multitouch gestures is impeccable, and the mouse pointer can be controlled with very high precision.
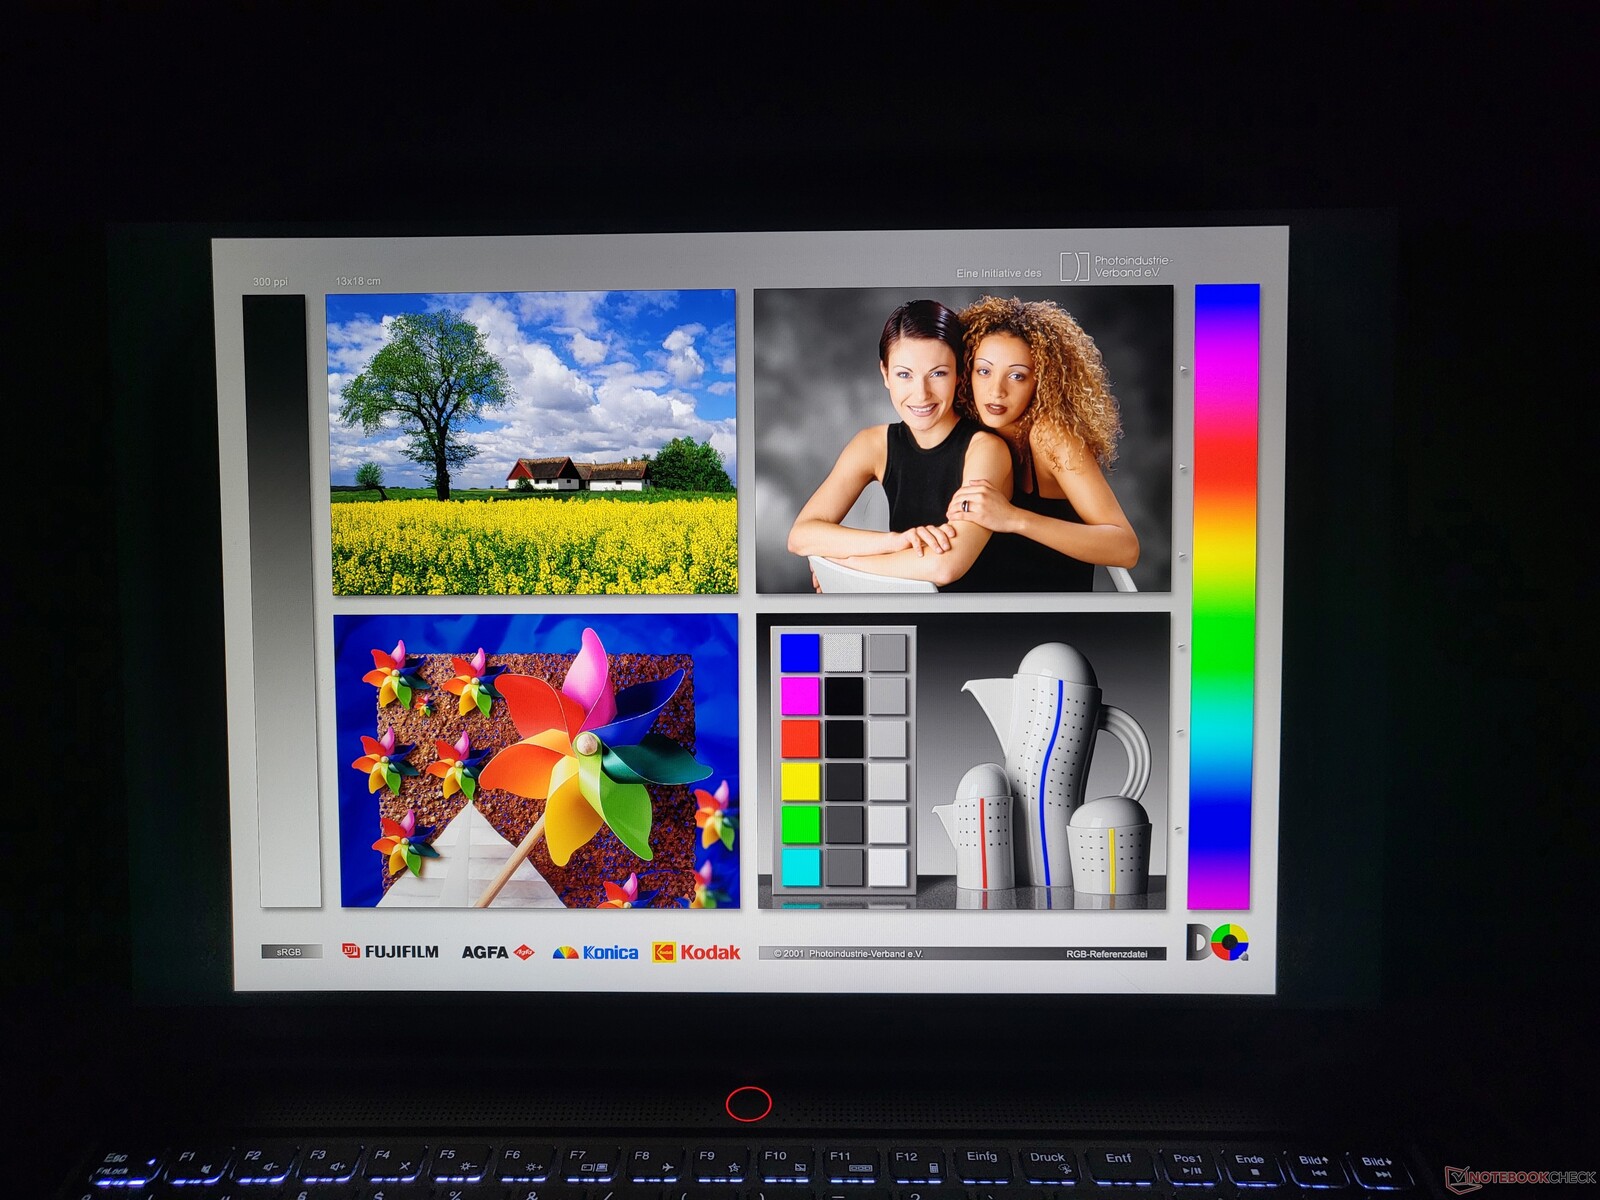
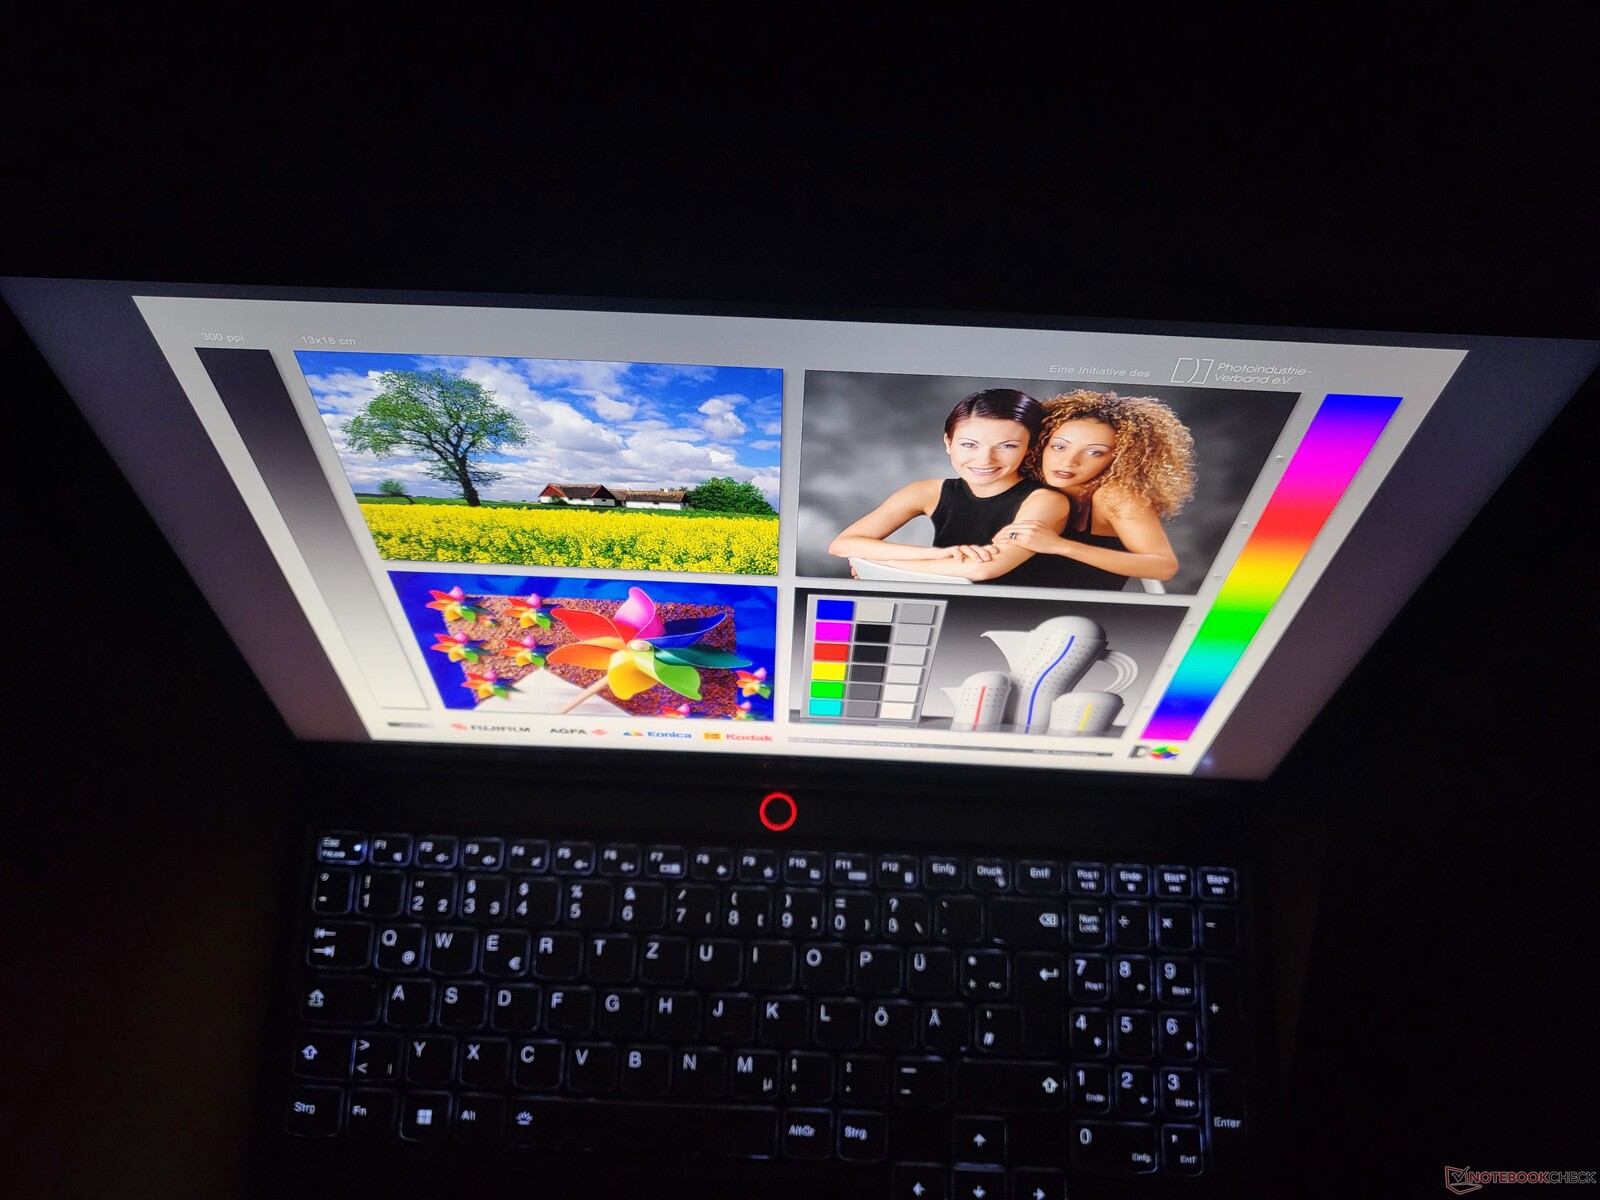
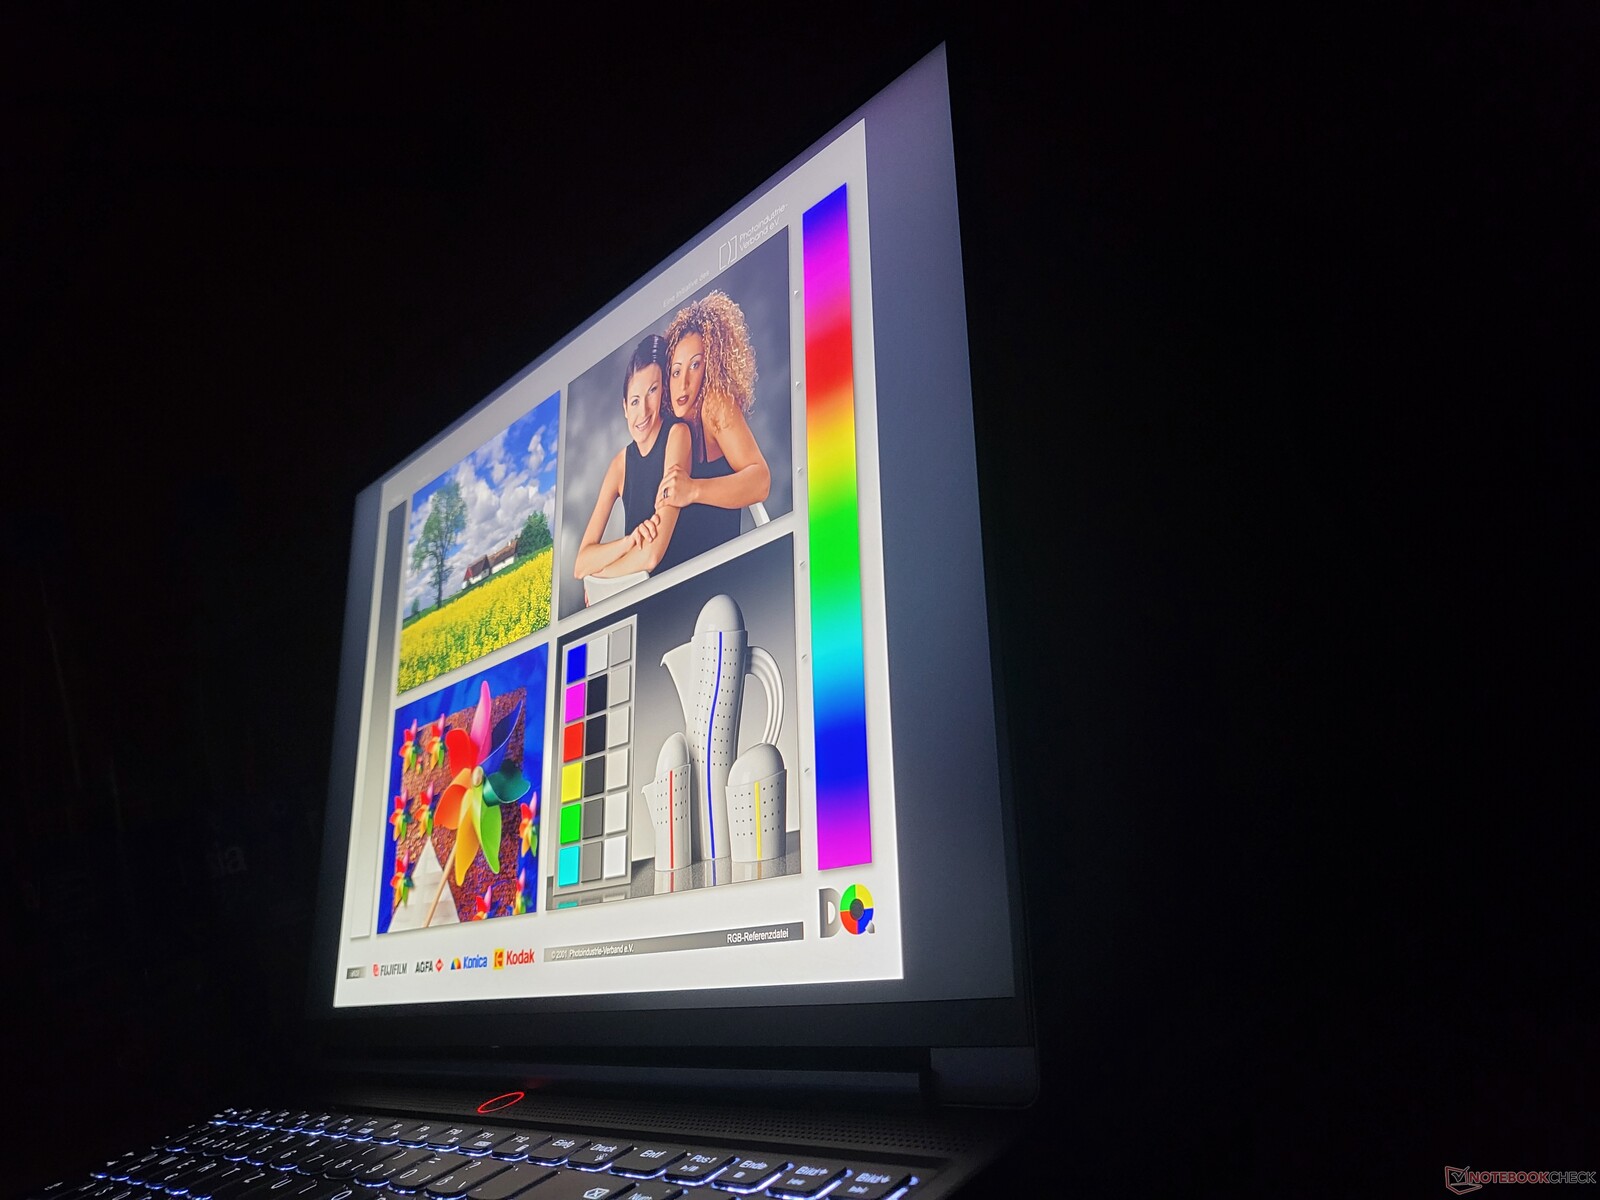
Excellent WQXGA display capable of 165 Hz refresh rate
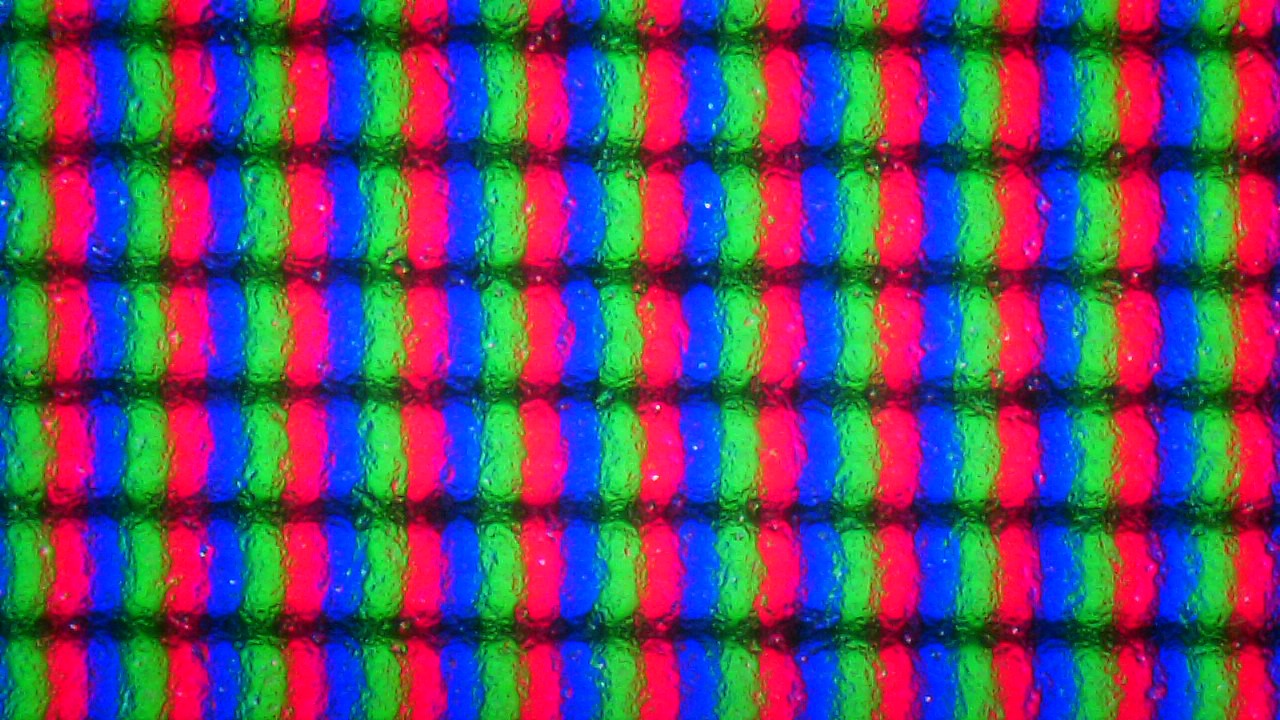
All the display options available for the Legion S7i are matt IPS panels with a 16:10 aspect ratio and a diagonal of 16 inches. They differ in terms of their resolution and feature set:
- WUXGA (1,920 x 1,200), 300 cd/m², 100% sRGB, 165 Hz
- WQXGA (2,560 x 1,600), 500 cd/m², 100% sRGB, 165 Hz
- WQXGA (2,560 x 1,600), 500 cd/m², 100% sRGB, 240 Hz
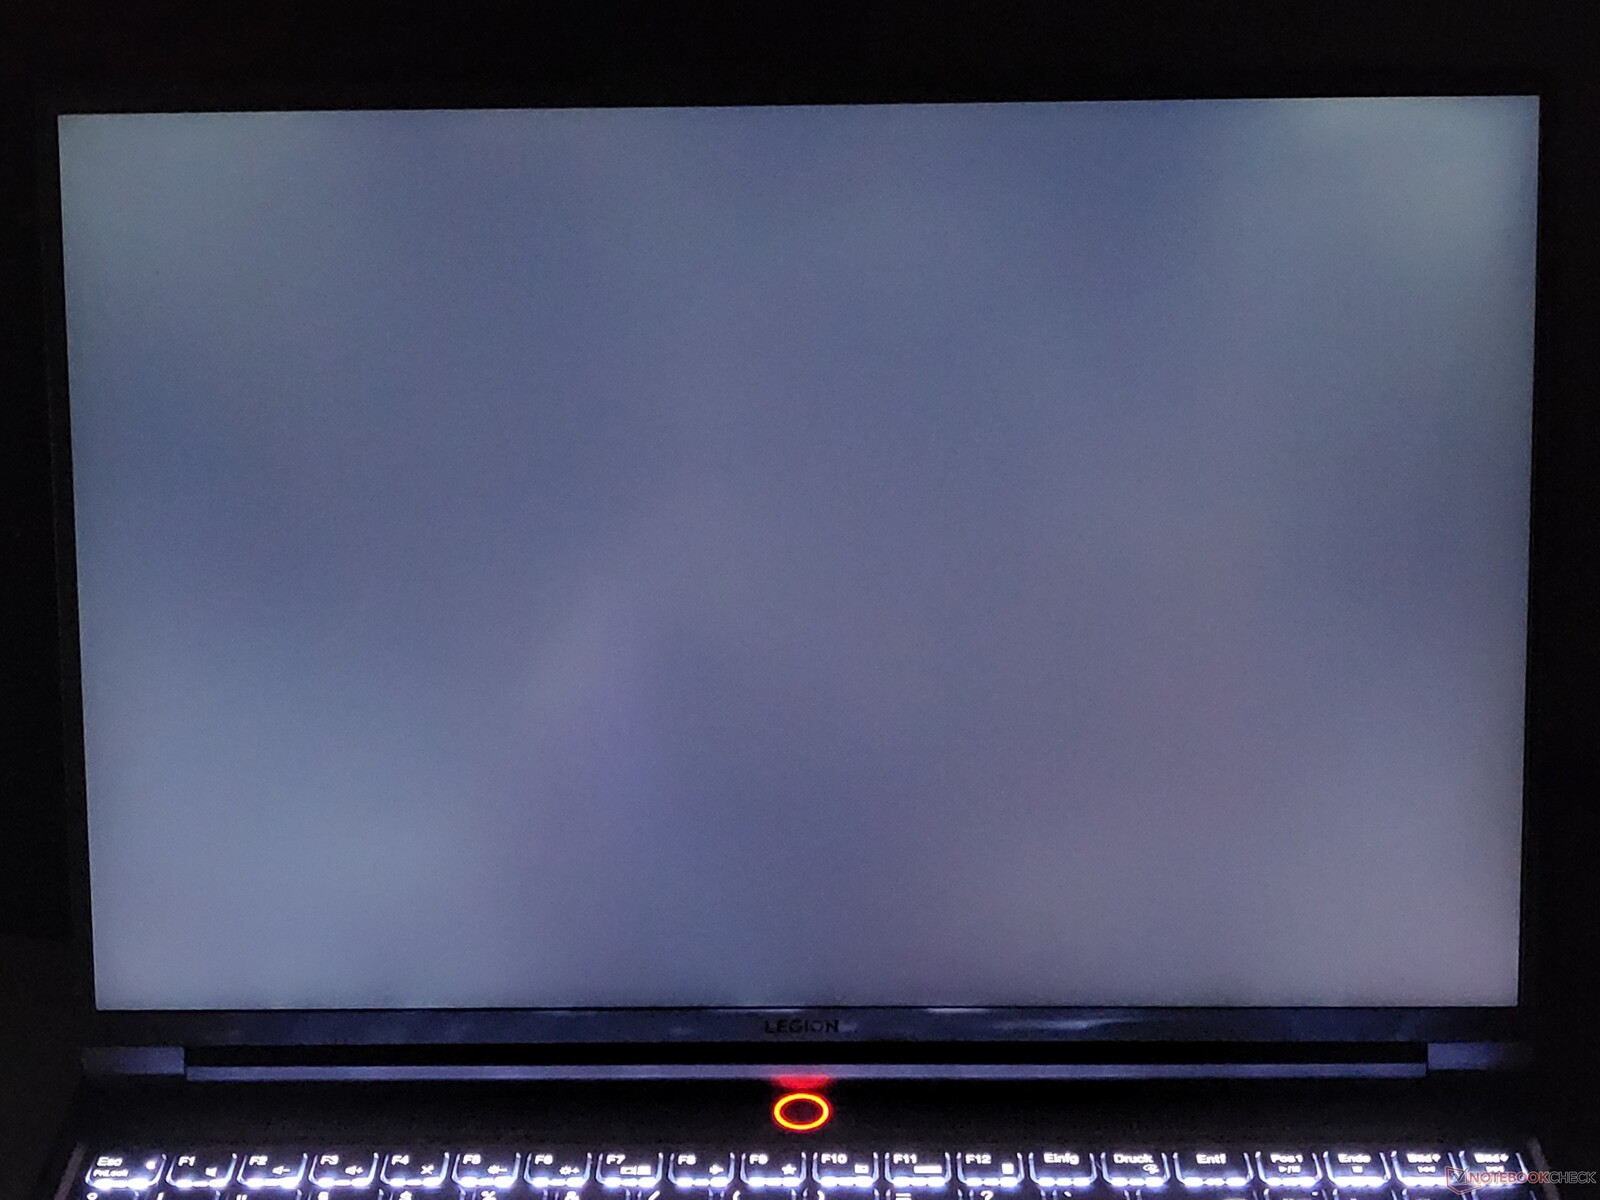
Our review unit exceeded the claimed peak brightness of 500 cd/m², with the screen getting as bright as 523 cd/m². The display has an average peak brightness of 494 cd/m², meaning the Lenovo Legion S7-16IAH7 has the brightest screen in the comparison.
Thanks to the 165 Hz refresh rate, content on the screen looks very smooth in motion, which is ideal for gaming. Moreover, the display also has low response time for an IPS panel.
| |||||||||||||||||||||||||
Brightness Distribution: 90 %
Center on Battery: 523 cd/m²
Contrast: 1308:1 (Black: 0.4 cd/m²)
ΔE ColorChecker Calman: 2.6 | ∀{0.5-29.43 Ø4.73}
calibrated: 1
ΔE Greyscale Calman: 3.3 | ∀{0.09-98 Ø4.97}
72.8% AdobeRGB 1998 (Argyll 3D)
99.1% sRGB (Argyll 3D)
70.5% Display P3 (Argyll 3D)
Gamma: 2.17
CCT: 6013 K
| Lenovo Legion Slim 7-16IAH 82TF004YGE MNG007DA1-G , IPS LED, 2560x1600, 16" | Lenovo Legion S7 16ARHA7 BOE CQ NE160QDM-NY1, IPS, 2560x1600, 16" | Acer Predator Triton 500 SE PT516-52s-70KX NE160QDM-NZ2, IPS LED, 2560x1600, 16" | HP Omen 16-b1090ng BOE09E5, IPS, 2560x1440, 16.1" | Asus ROG Zephyrus M16 GU603H AU Optronics AUOC199, IPS, 2560x1600, 16" | |
|---|---|---|---|---|---|
| Display | -1% | 19% | 0% | ||
| Display P3 Coverage (%) | 70.5 | 69.8 -1% | 97.3 38% | 71 1% | |
| sRGB Coverage (%) | 99.1 | 98.1 -1% | 100 1% | 97.9 -1% | |
| AdobeRGB 1998 Coverage (%) | 72.8 | 71.9 -1% | 84.9 17% | 73.3 1% | |
| Response Times | -33% | -3% | -28% | 37% | |
| Response Time Grey 50% / Grey 80% * (ms) | 12 ? | 10 ? 17% | 13.8 ? -15% | 14.5 ? -21% | 4.8 ? 60% |
| Response Time Black / White * (ms) | 7 ? | 12.8 ? -83% | 6.4 ? 9% | 9.4 ? -34% | 6 ? 14% |
| PWM Frequency (Hz) | |||||
| Screen | 9% | 10% | -39% | -34% | |
| Brightness middle (cd/m²) | 523 | 492.4 -6% | 498 -5% | 335 -36% | 448 -14% |
| Brightness (cd/m²) | 494 | 471 -5% | 468 -5% | 319 -35% | 446 -10% |
| Brightness Distribution (%) | 90 | 90 0% | 80 -11% | 90 0% | 86 -4% |
| Black Level * (cd/m²) | 0.4 | 0.4 -0% | 0.36 10% | 0.28 30% | 0.48 -20% |
| Contrast (:1) | 1308 | 1231 -6% | 1383 6% | 1196 -9% | 933 -29% |
| Colorchecker dE 2000 * | 2.6 | 1.9 27% | 1.77 32% | 4.38 -68% | 2.76 -6% |
| Colorchecker dE 2000 max. * | 5 | 3.81 24% | 5.24 -5% | 9.48 -90% | 7.09 -42% |
| Colorchecker dE 2000 calibrated * | 1 | 0.99 1% | 0.63 37% | 1.33 -33% | 2.86 -186% |
| Greyscale dE 2000 * | 3.3 | 1.7 48% | 2.4 27% | 7 -112% | 3.1 6% |
| Gamma | 2.17 101% | 2.36 93% | 2.14 103% | 2.103 105% | 2.153 102% |
| CCT | 6013 108% | 6497 100% | 7046 92% | 6244 104% | 6826 95% |
| Color Space (Percent of AdobeRGB 1998) (%) | 87 | ||||
| Color Space (Percent of sRGB) (%) | 100 | ||||
| Total Average (Program / Settings) | -8% /
1% | 9% /
10% | -22% /
-29% | 2% /
-21% |
* ... smaller is better
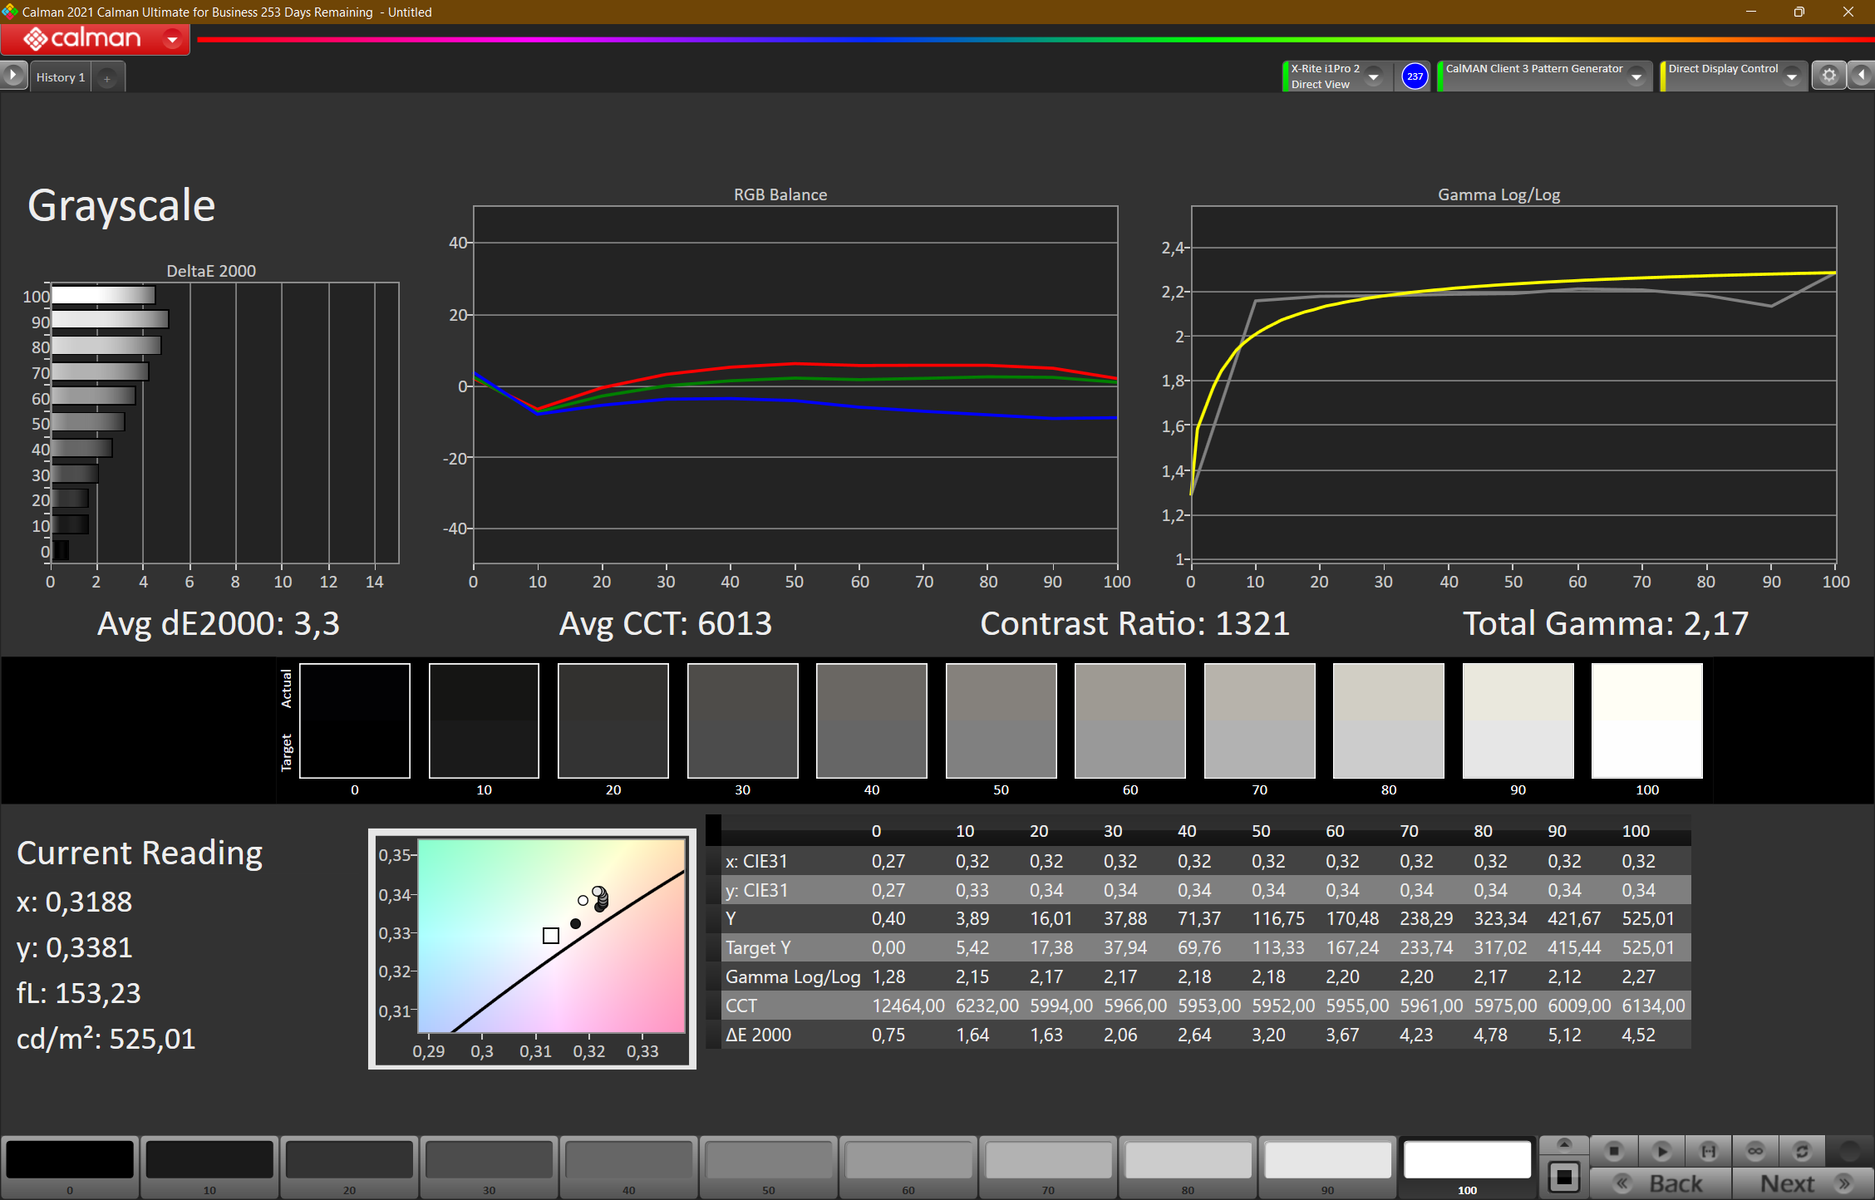
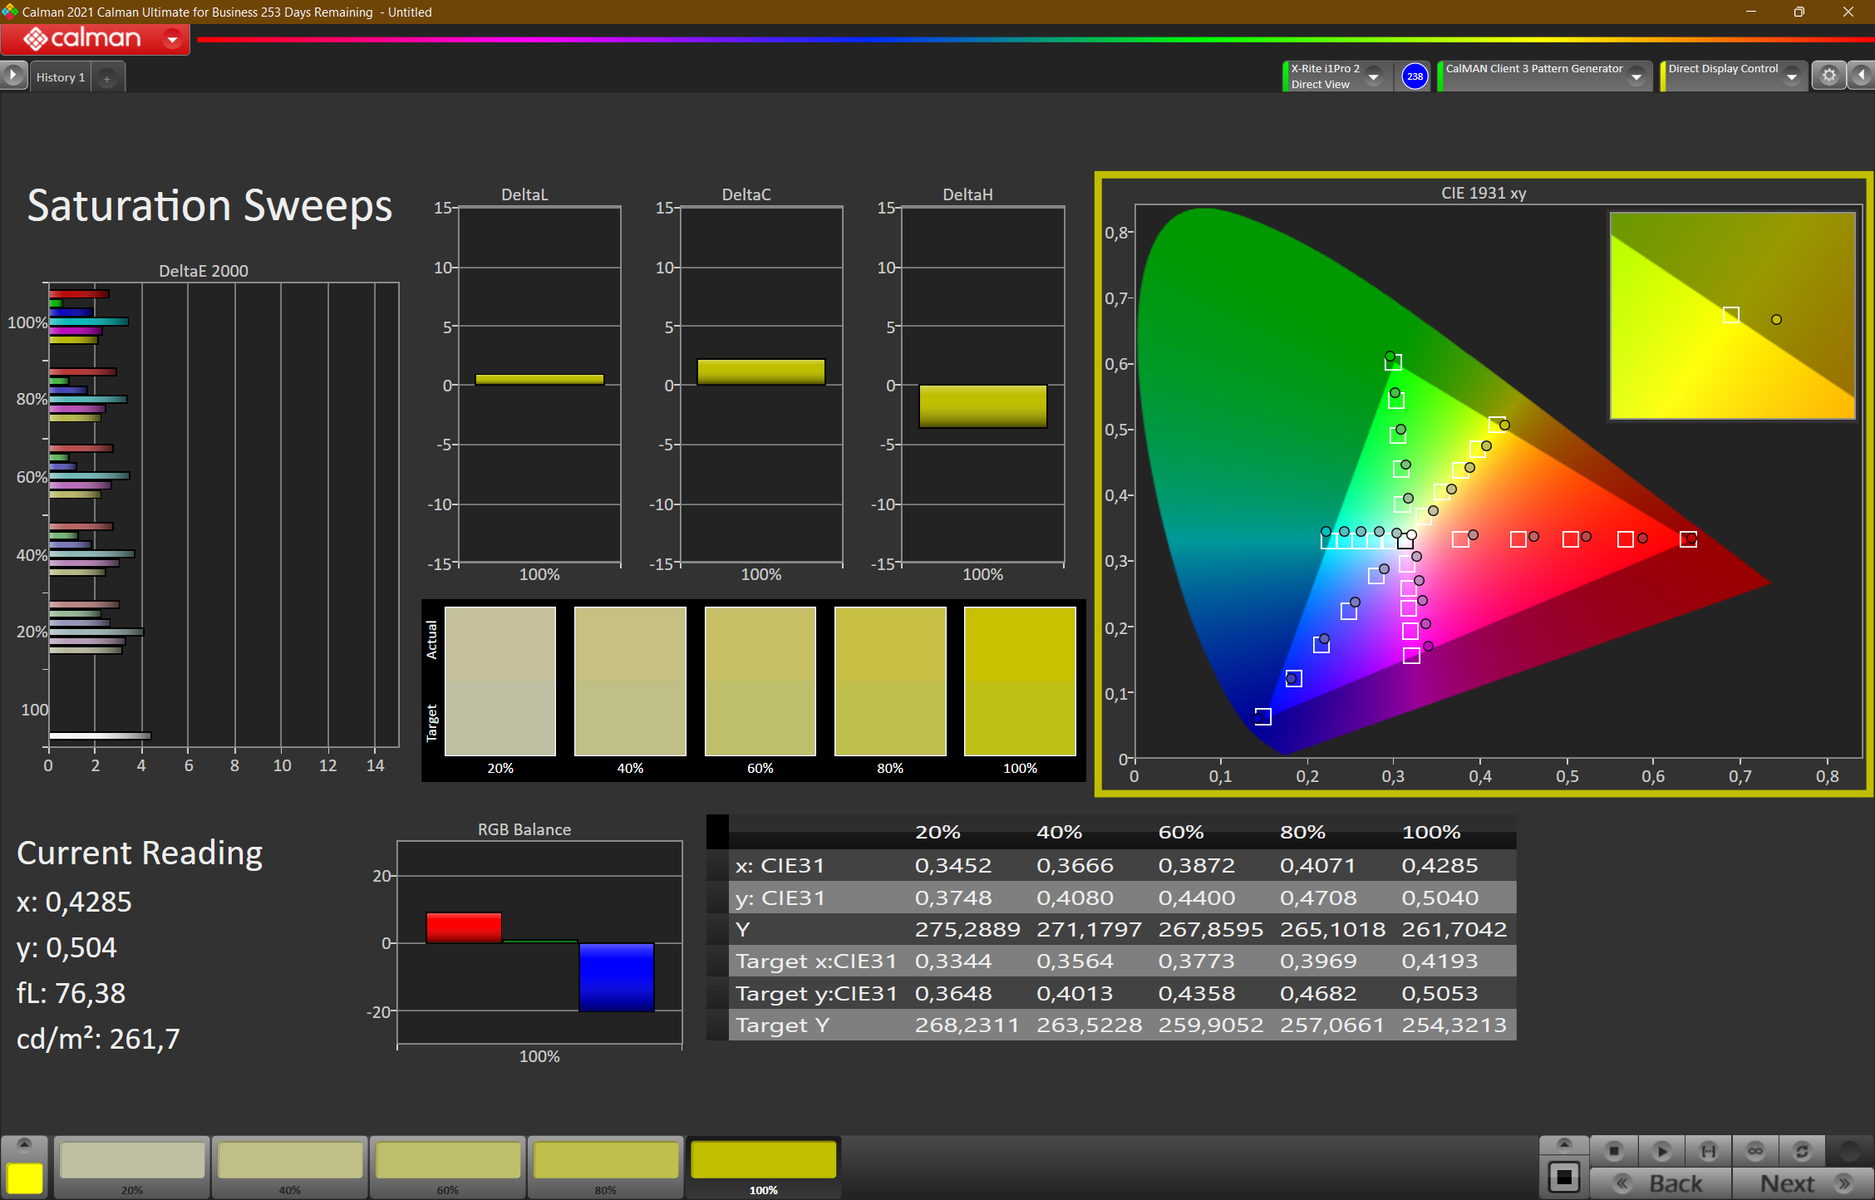
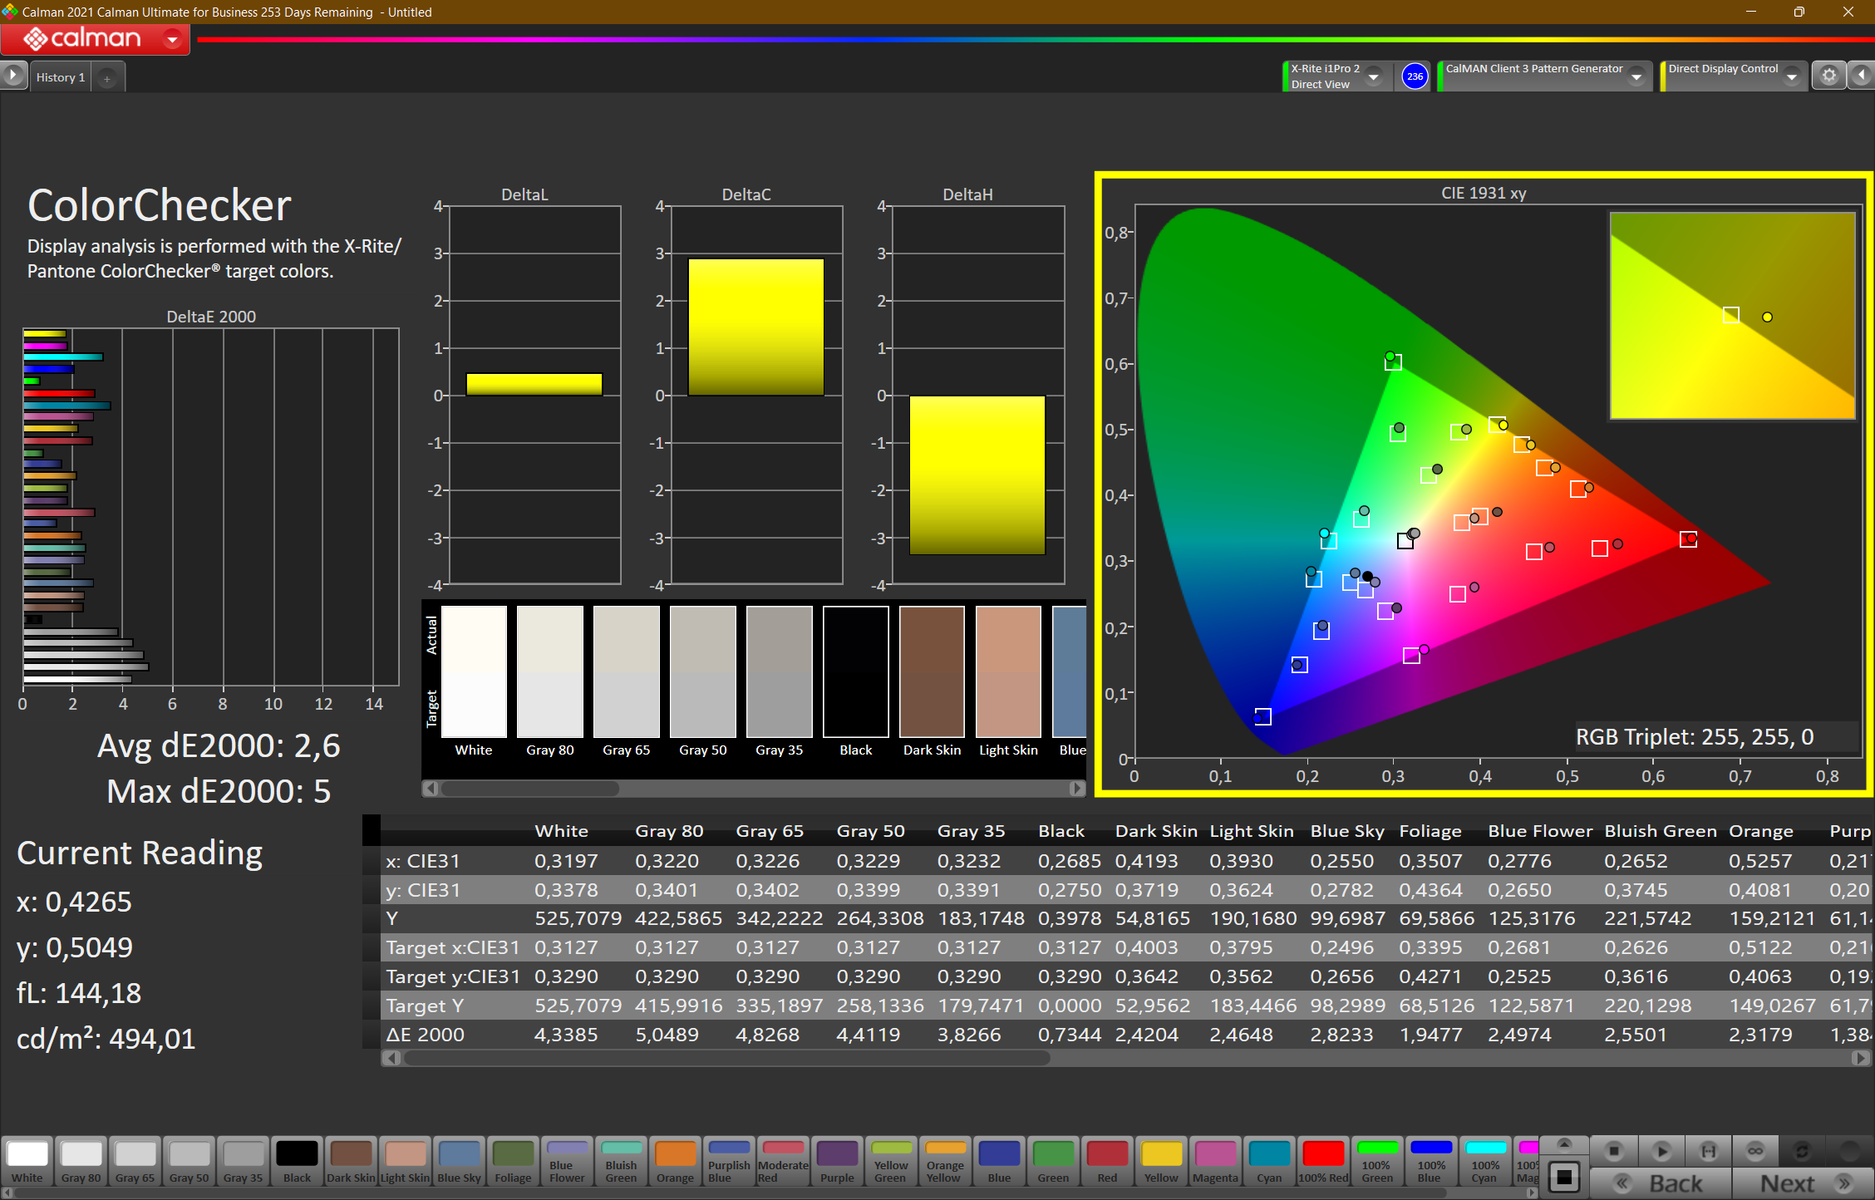
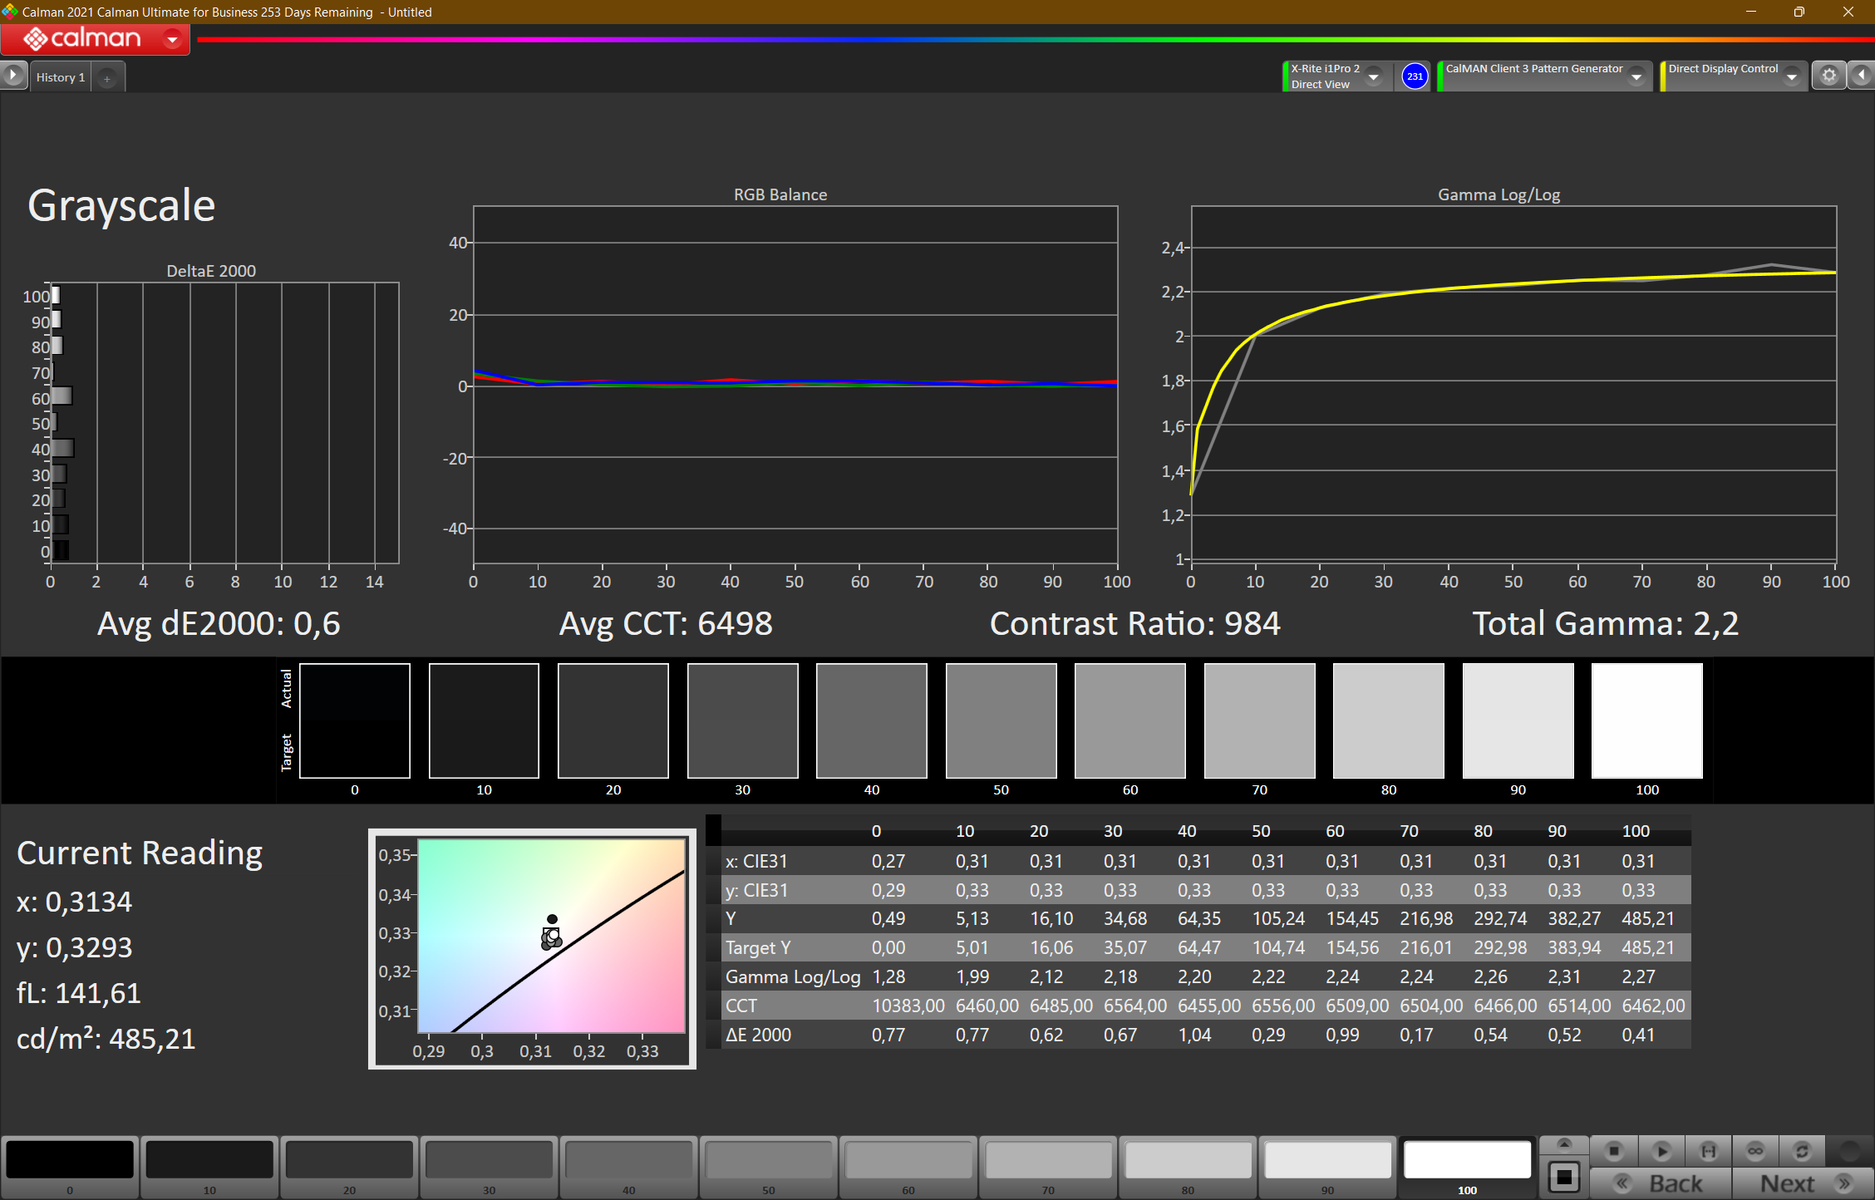
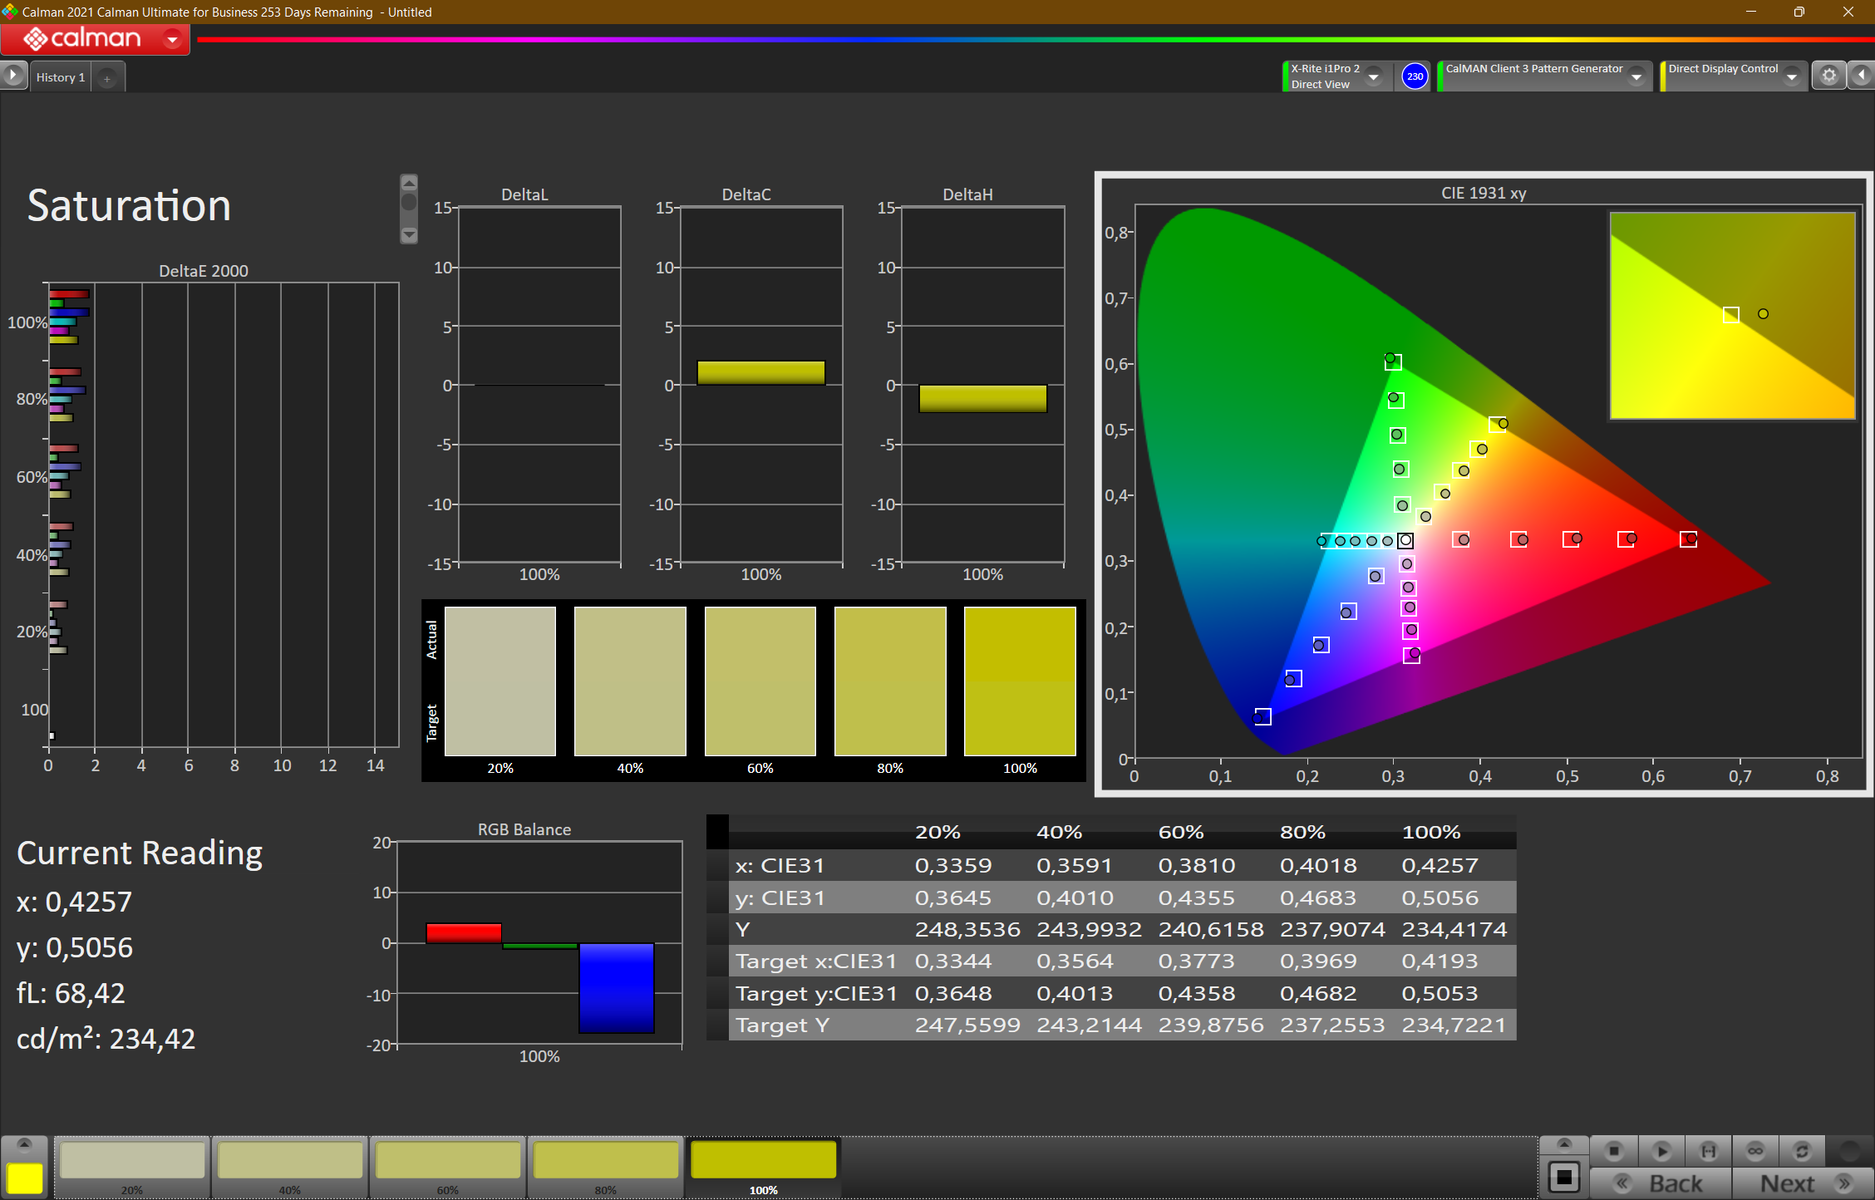
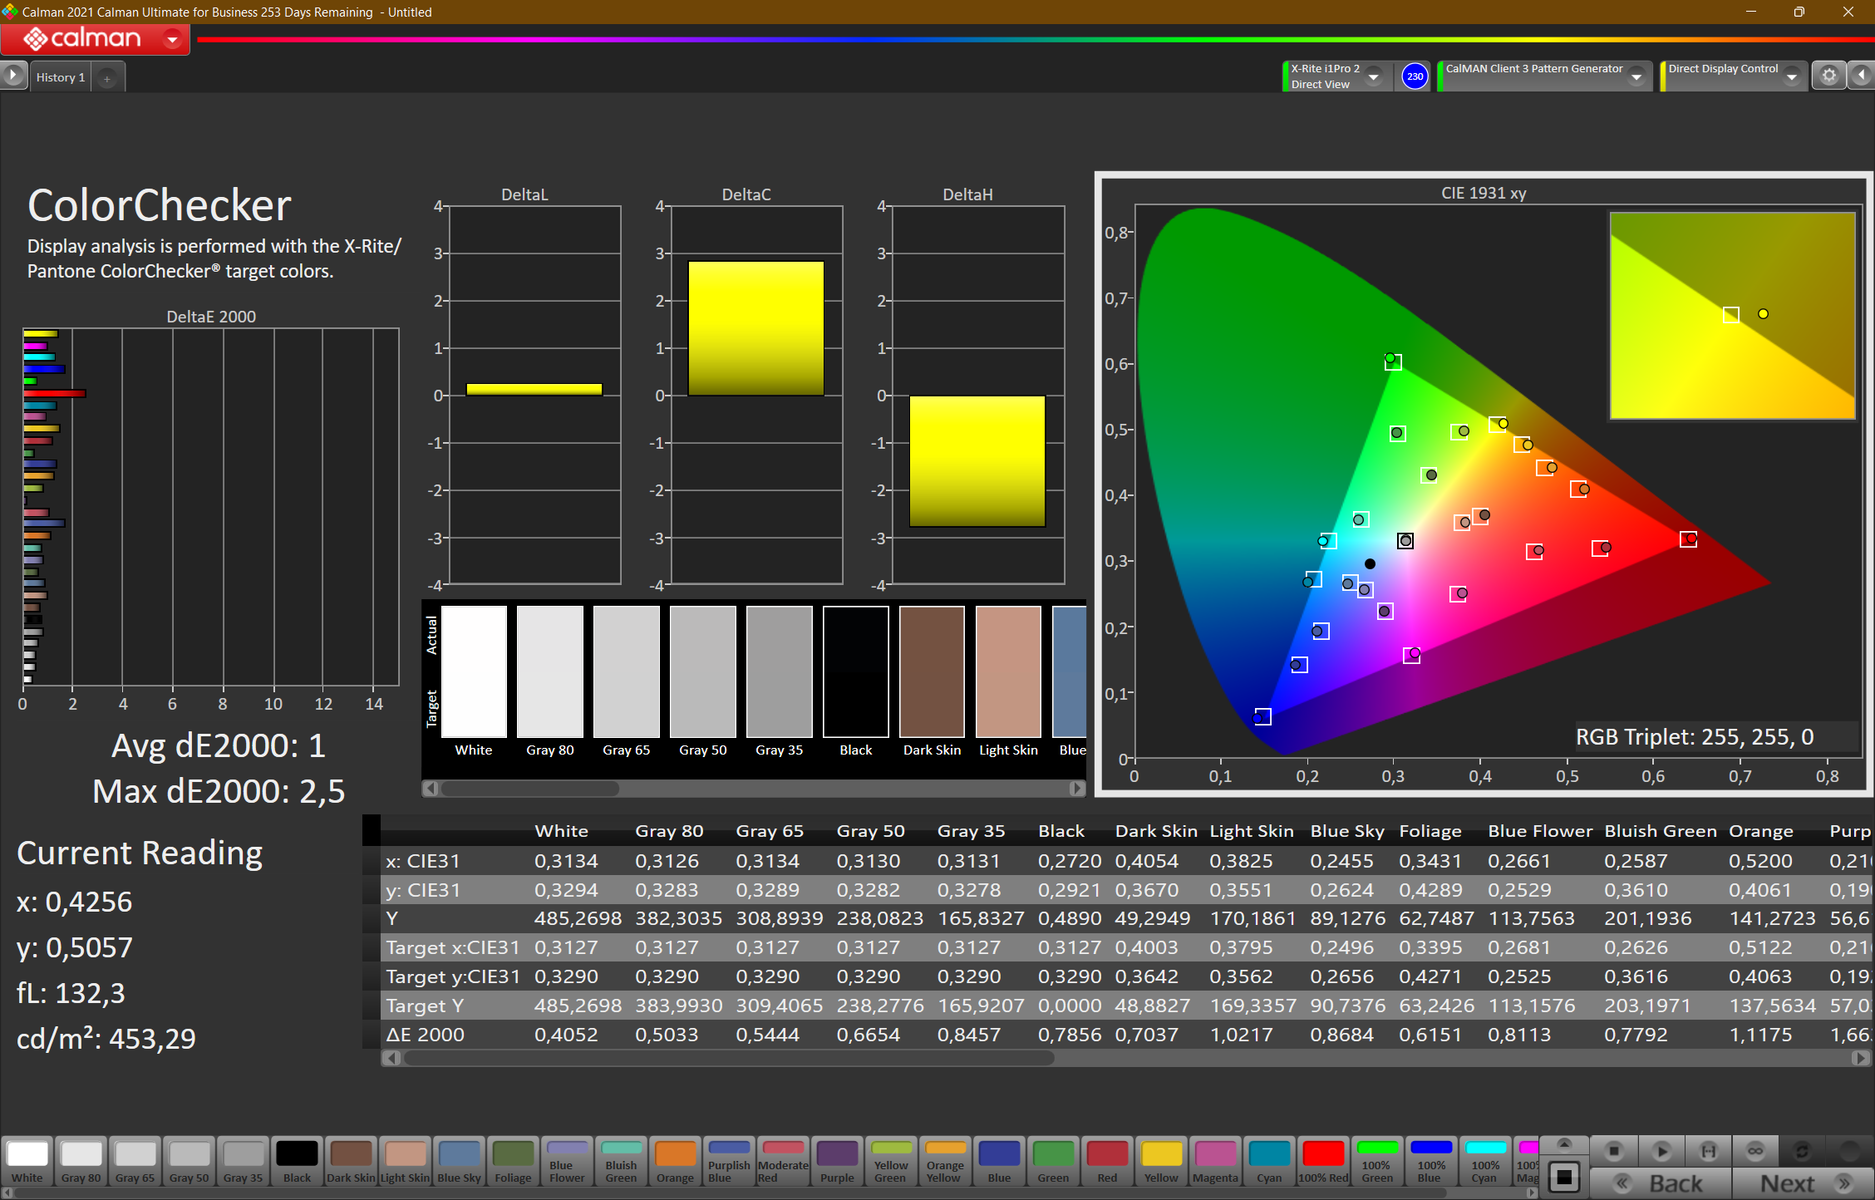
We used CalMan and the X-Rite i1Pro 2 colorimeter to analyse the display. The X-Rite i1 Profiler was also used in conjunction with the i1Pro 2 to calibrate the screen. The screen benefited from calibration and achieved significantly lower Delta E values. This means that the colour reproduction became more accurate. As always, there is a link in the grey box above for you to download the colour profile created by us.
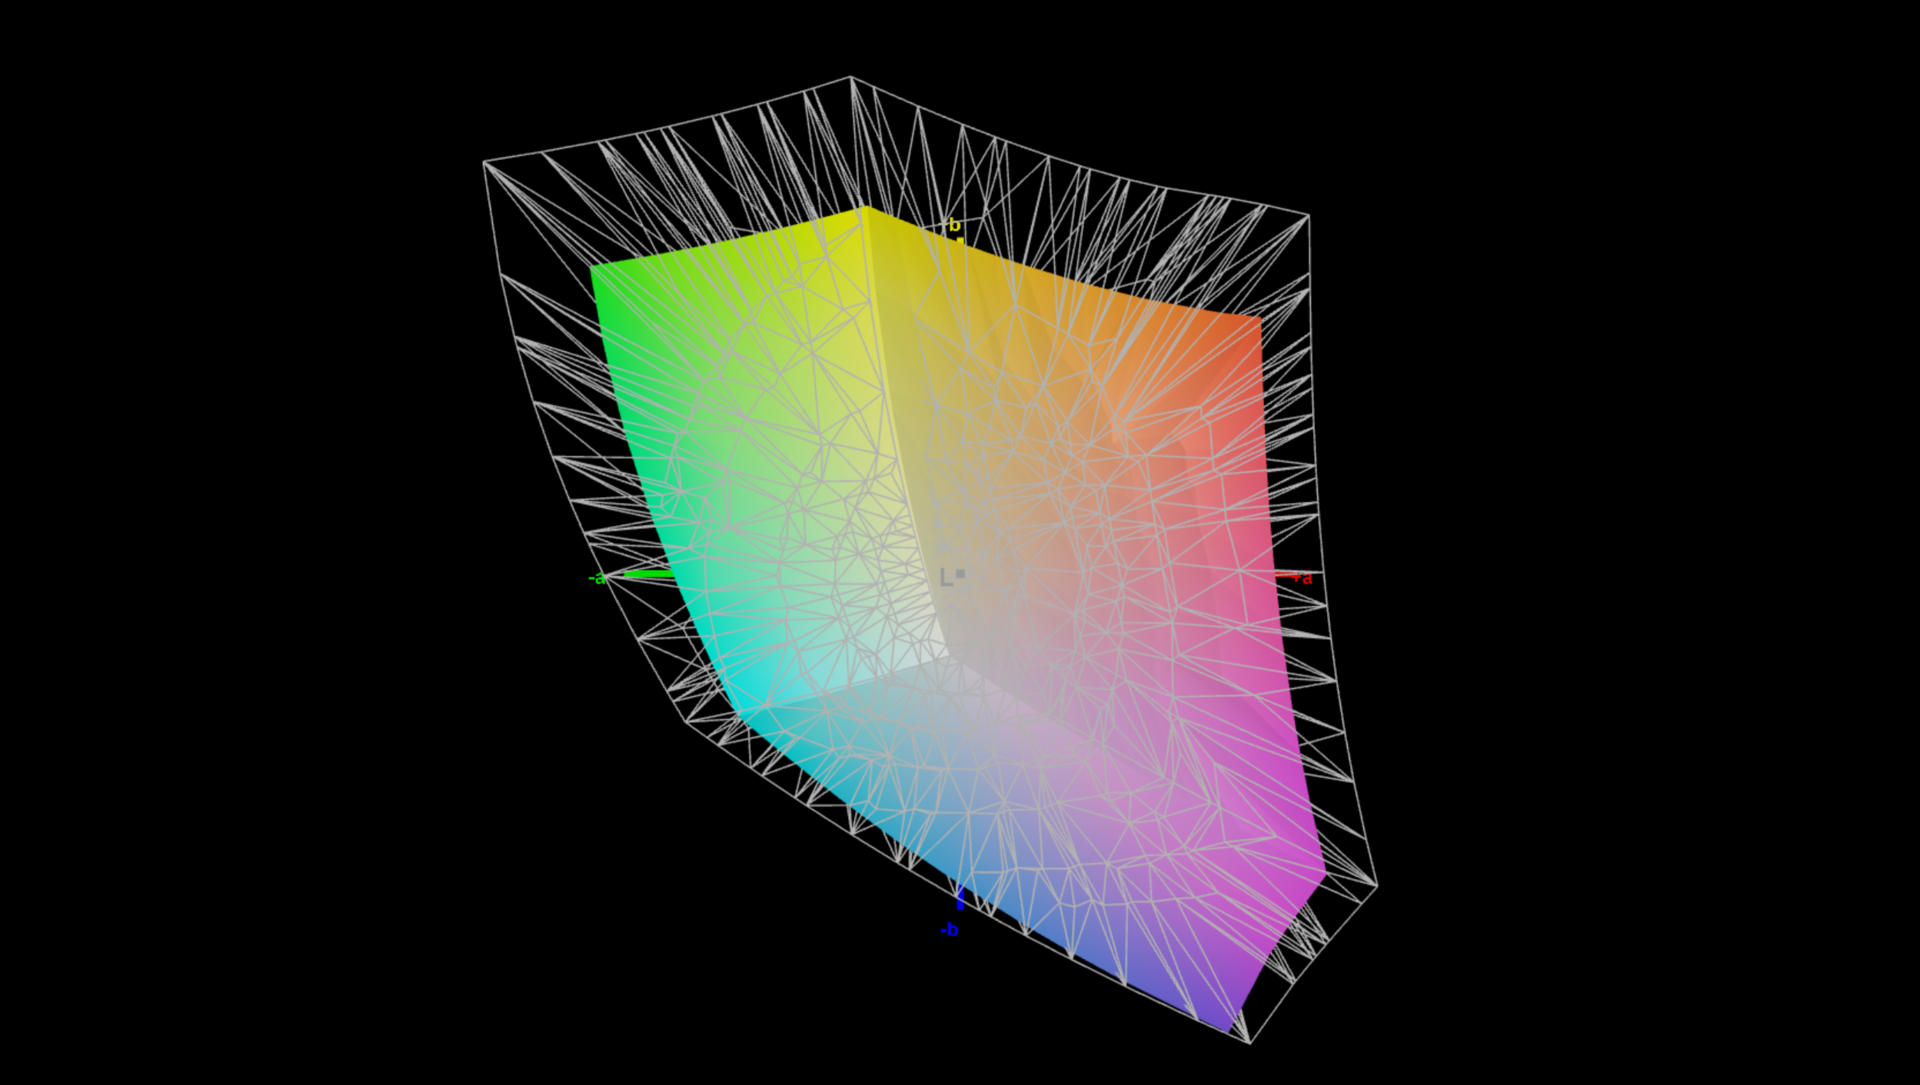
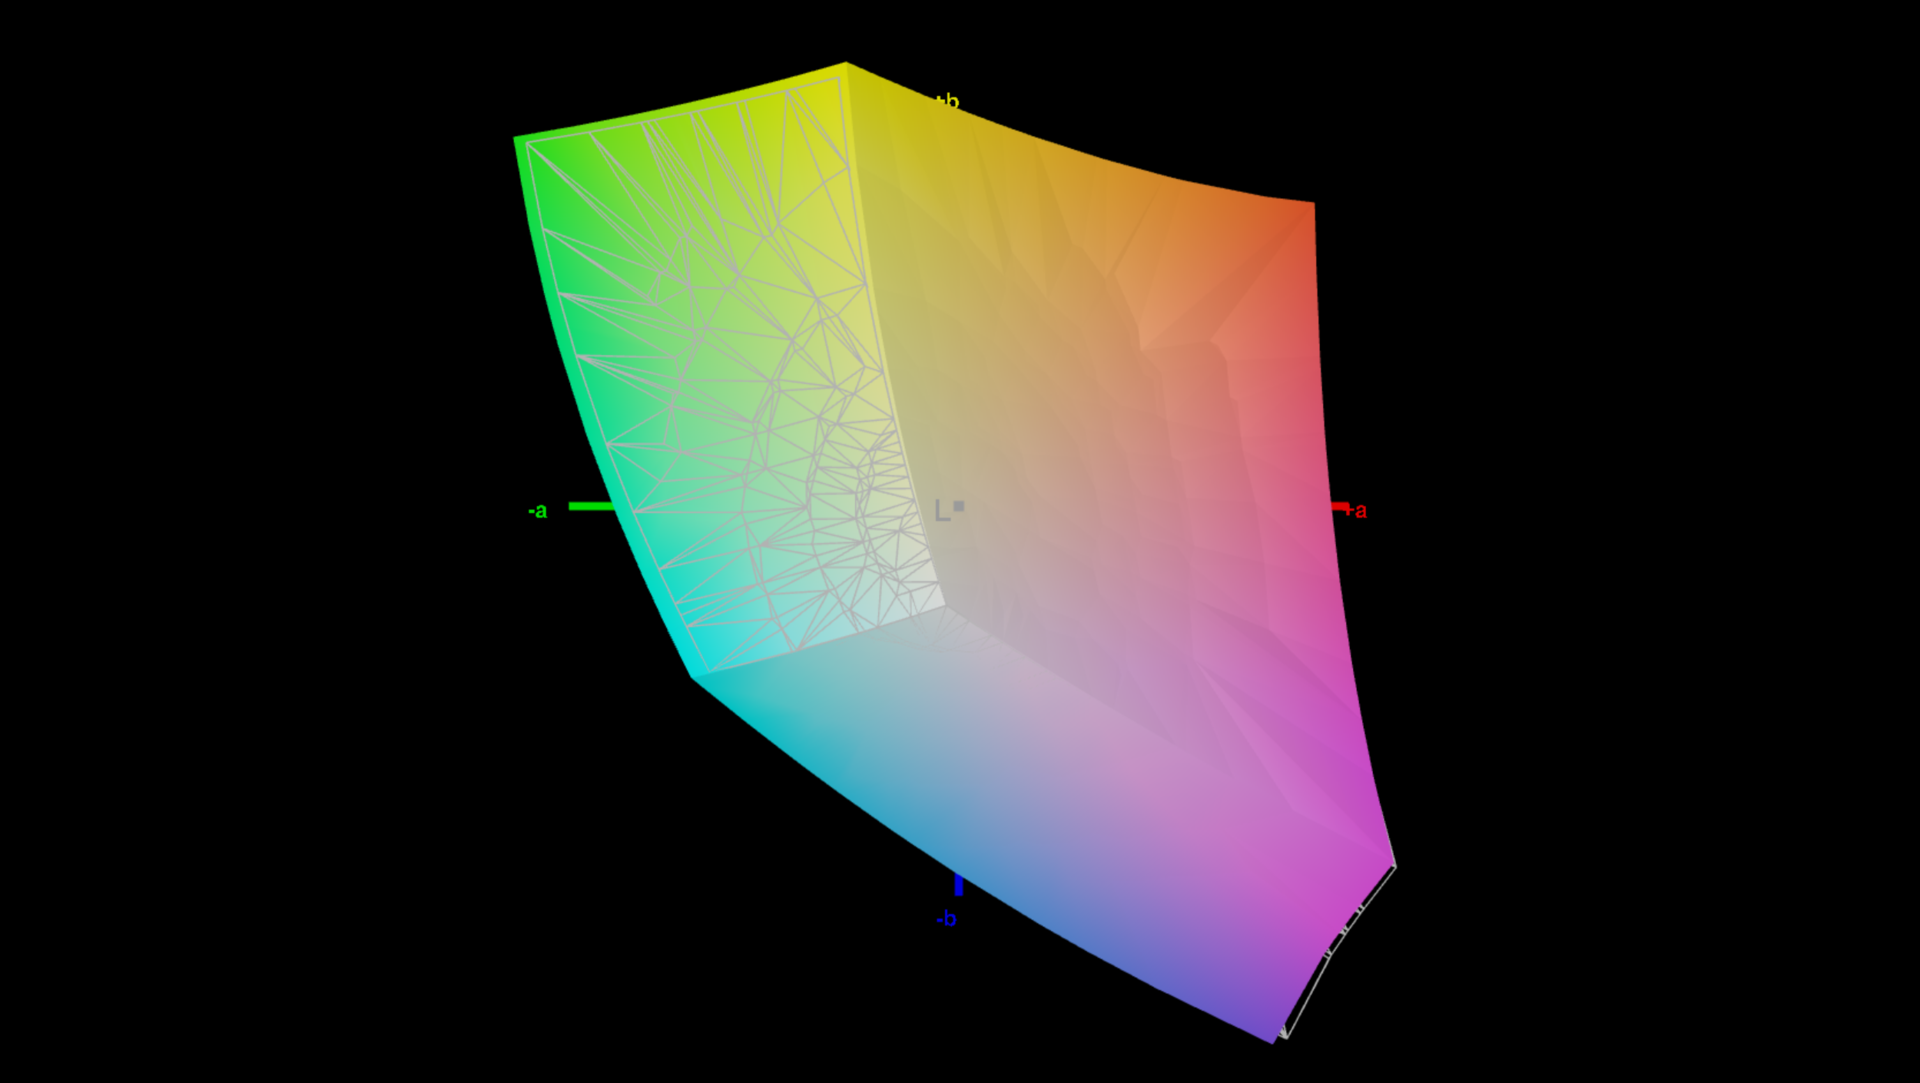
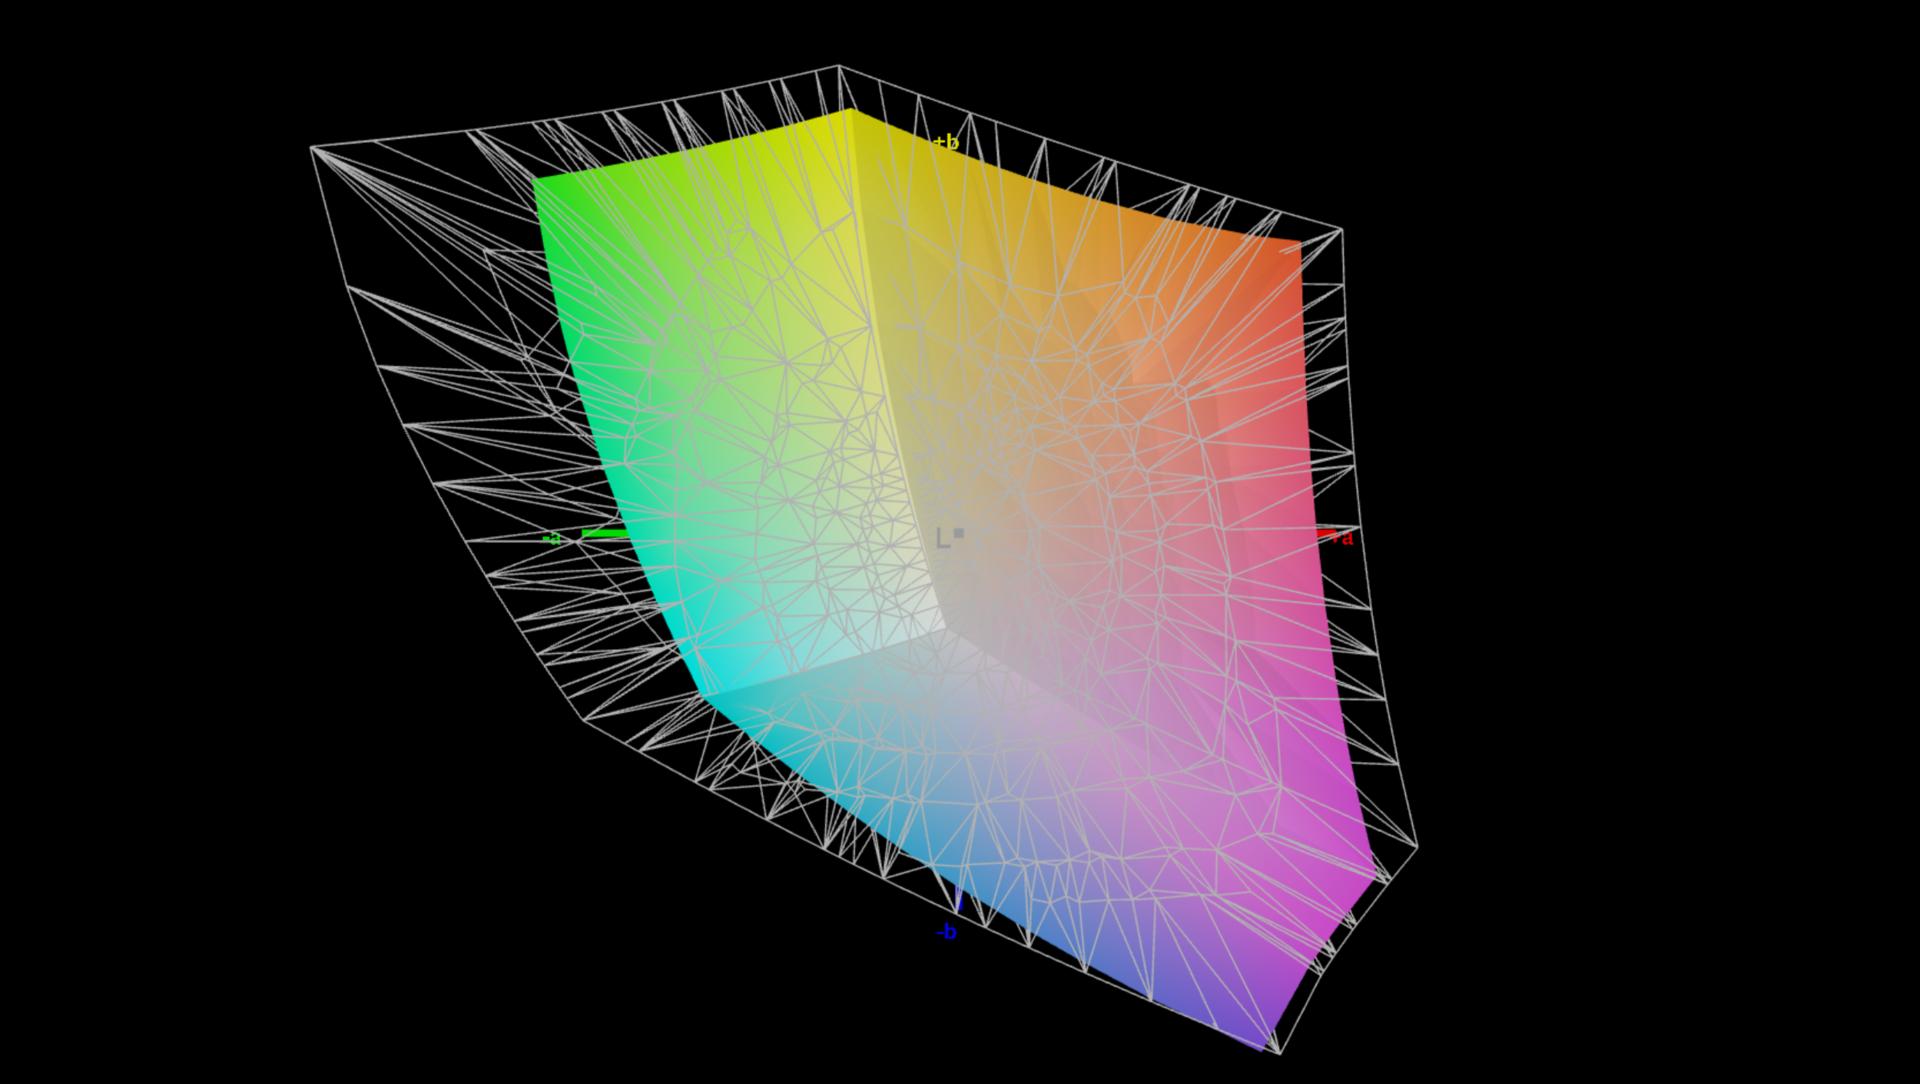
The display's colour coverage isn't exactly amongst the best. Even though the smaller sRGB gamut is almost fully covered, things are different with the wider P3 and AdobeRGB colour spaces. The more expensive Acer Predator Triton 500 SE has superior colour coverage, which is particularly useful for photo editing.
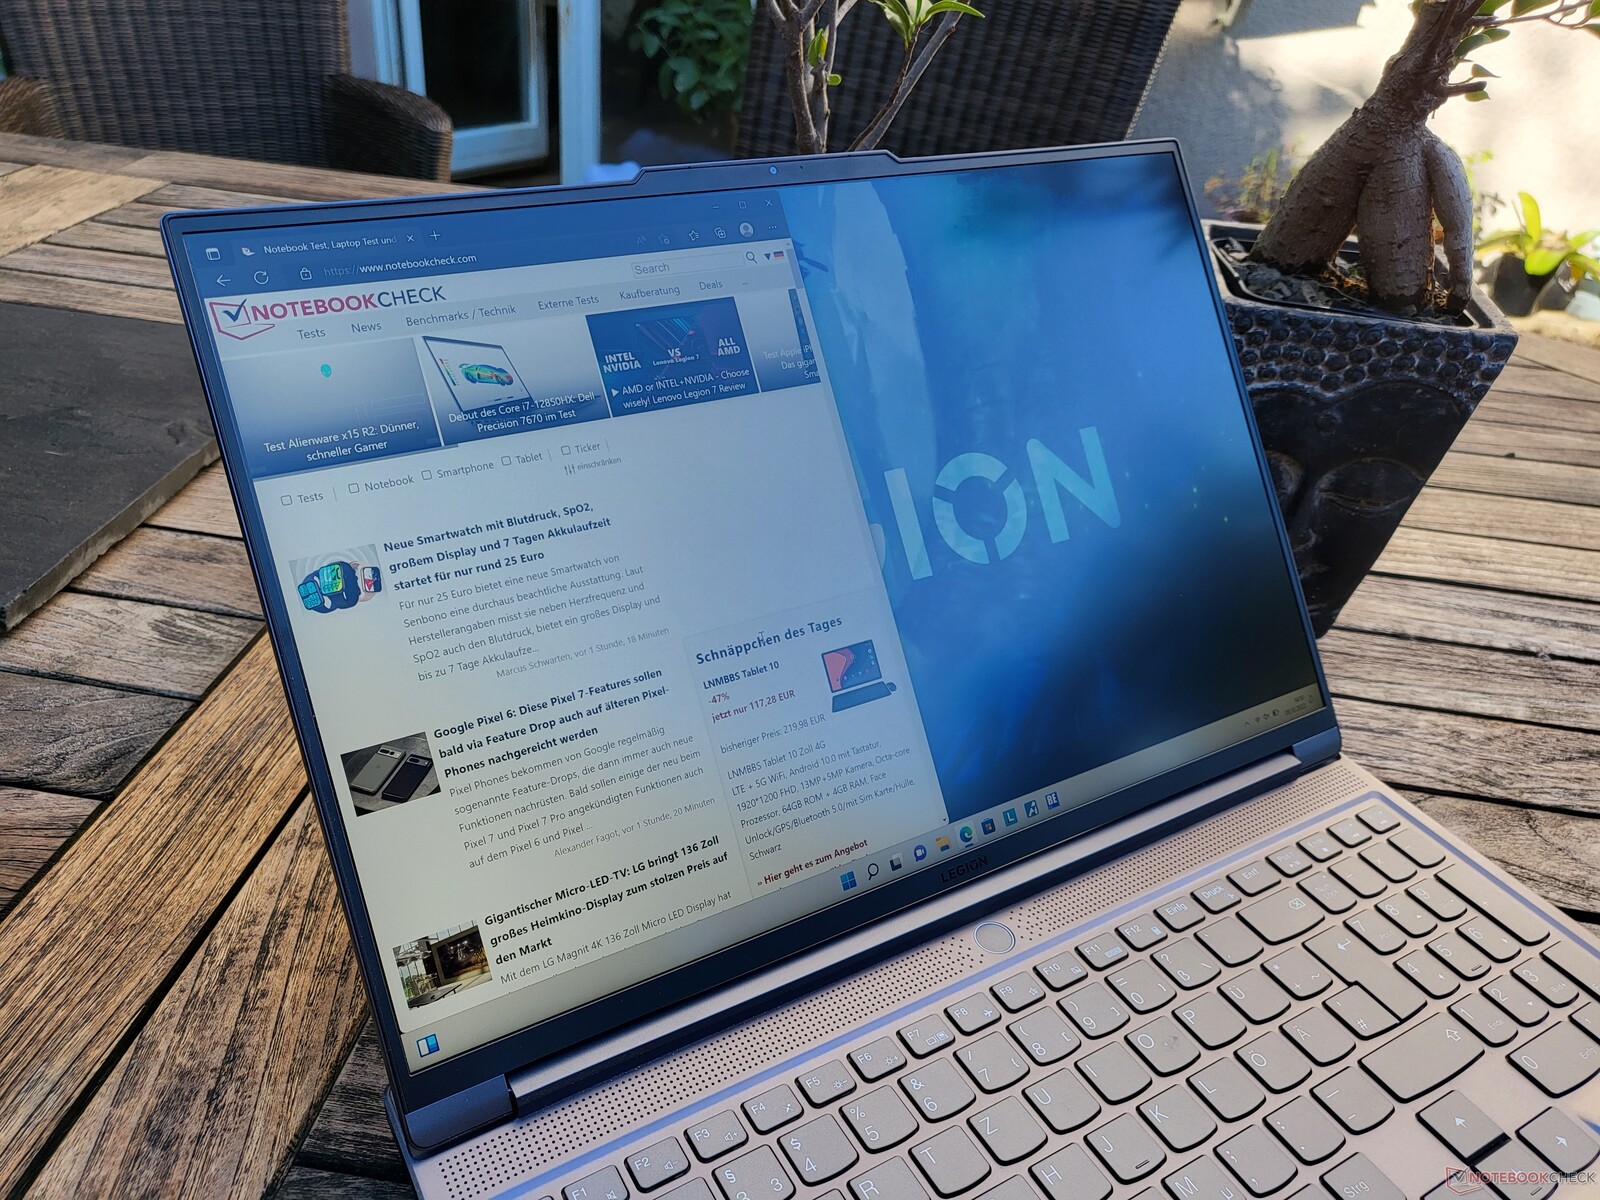
The Lenovo Legion S7i is very usable outdoors thanks to its matt display and high screen brightness. It makes for a great laptop to take with you to an outdoor LAN party.
Display Response Times
| ↔ Response Time Black to White | ||
|---|---|---|
| 7 ms ... rise ↗ and fall ↘ combined | ↗ 4 ms rise | 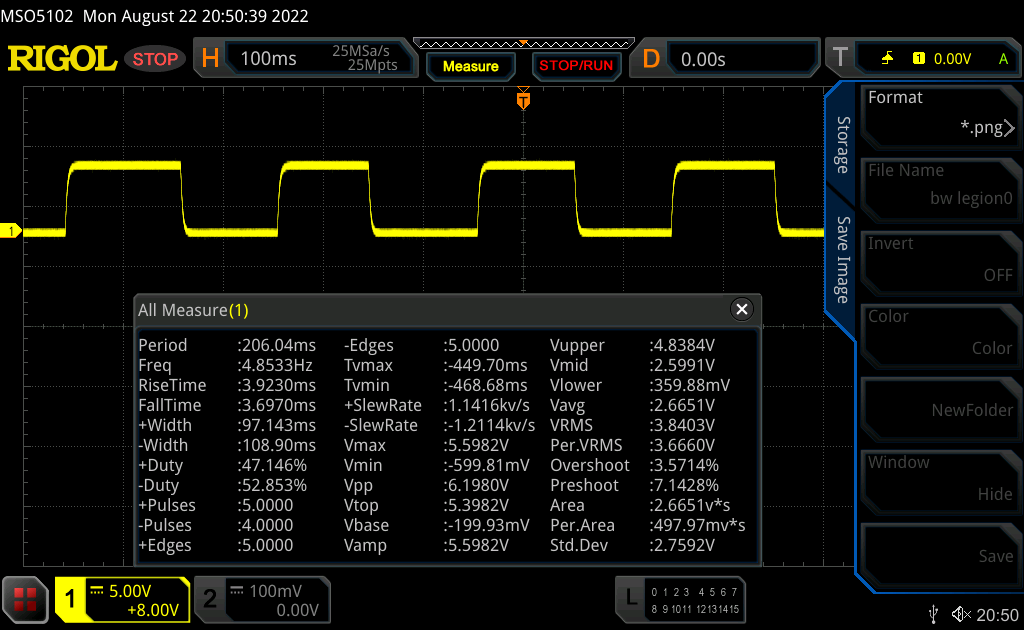 |
| ↘ 3 ms fall | ||
| The screen shows very fast response rates in our tests and should be very well suited for fast-paced gaming. In comparison, all tested devices range from 0.1 (minimum) to 240 (maximum) ms. » 21 % of all devices are better. This means that the measured response time is better than the average of all tested devices (19.9 ms). | ||
| ↔ Response Time 50% Grey to 80% Grey | ||
| 12 ms ... rise ↗ and fall ↘ combined | ↗ 6 ms rise | 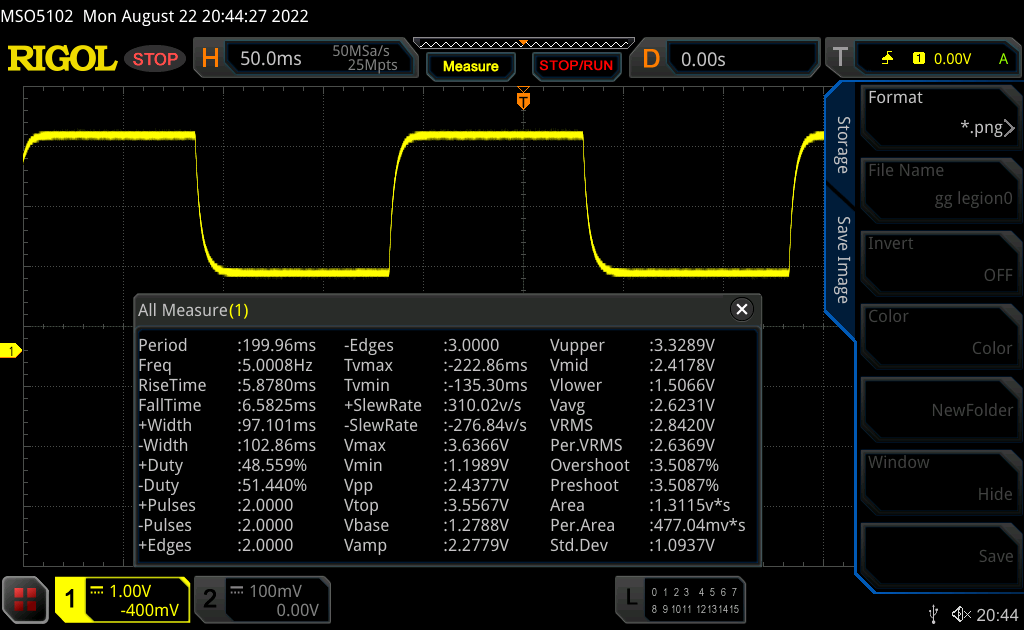 |
| ↘ 6 ms fall | ||
| The screen shows good response rates in our tests, but may be too slow for competitive gamers. In comparison, all tested devices range from 0.165 (minimum) to 636 (maximum) ms. » 25 % of all devices are better. This means that the measured response time is better than the average of all tested devices (31.1 ms). | ||
Screen Flickering / PWM (Pulse-Width Modulation)
| Screen flickering / PWM not detected | 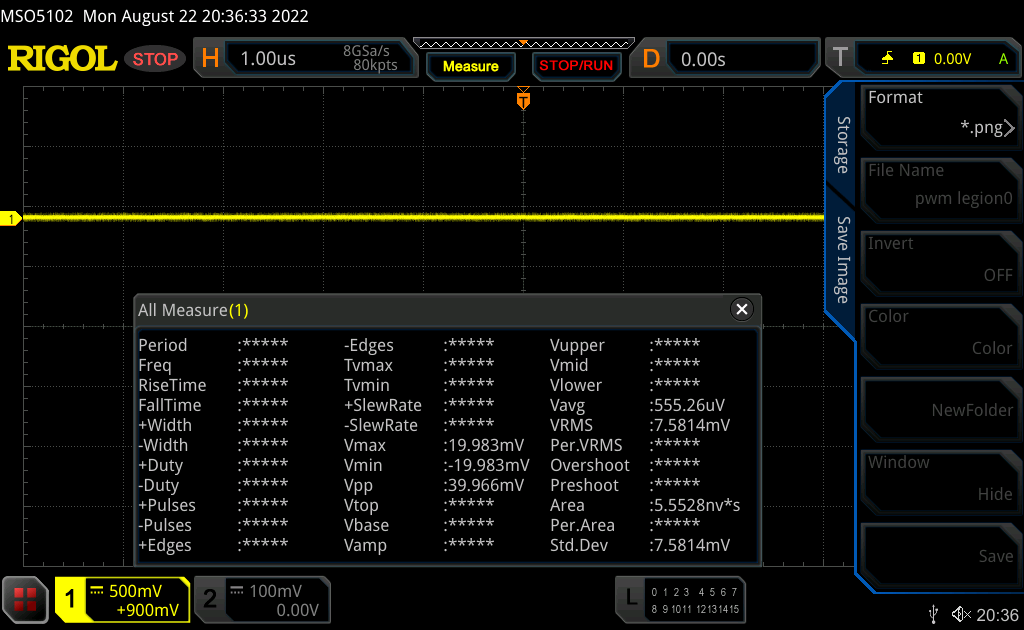 | ||
In comparison: 52 % of all tested devices do not use PWM to dim the display. If PWM was detected, an average of 7798 (minimum: 5 - maximum: 343500) Hz was measured. | |||
Great performance with Nvidia RTX and Intel Alder Lake
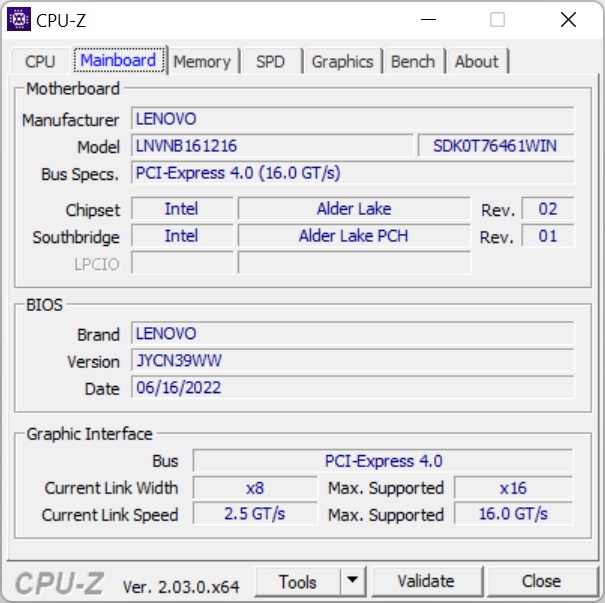
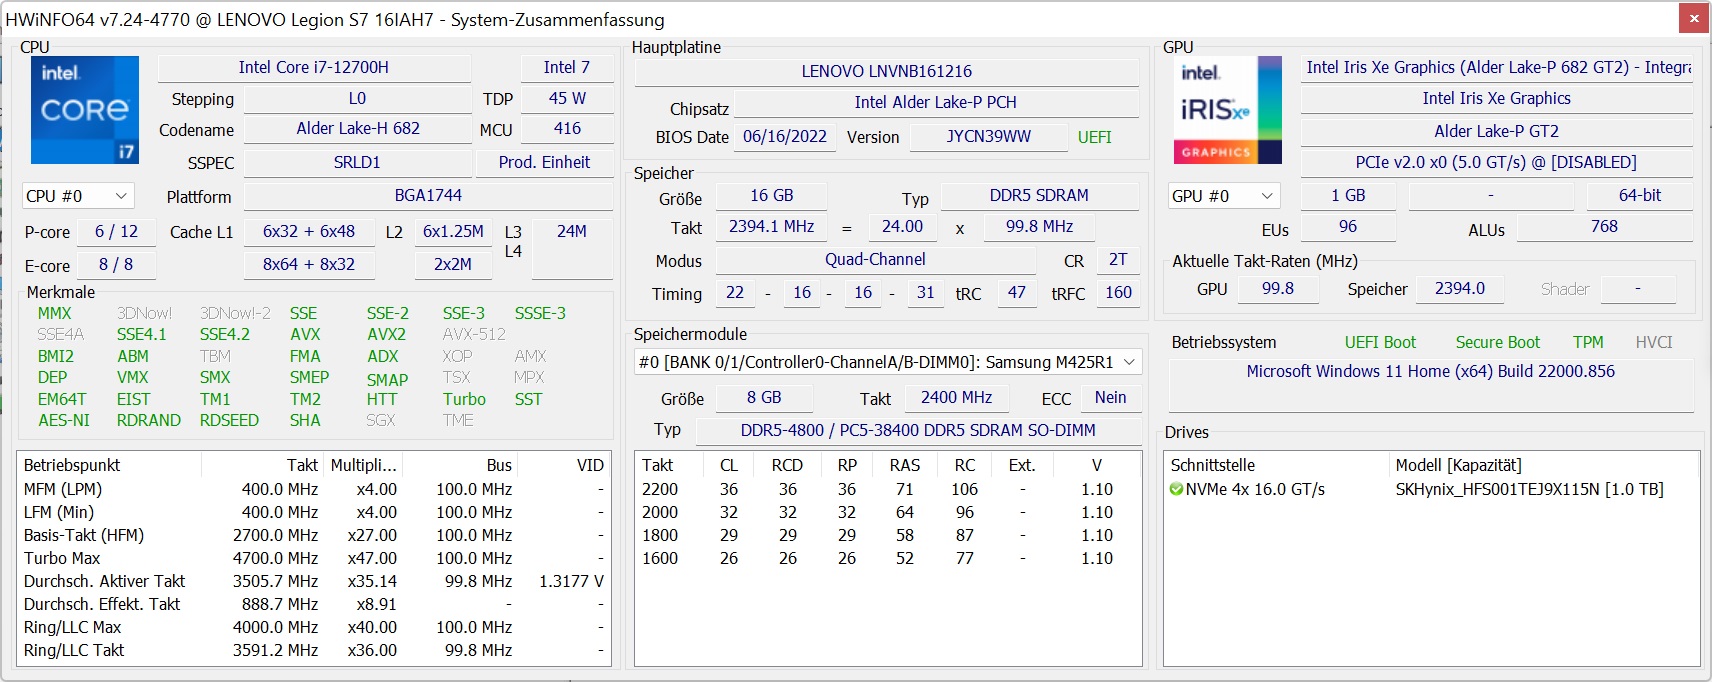
Lenovo offers three processor options for the Legion S7-16IAH: the Intel Core i5-12500H, Core i7-12700H and Core i9-12900H. The laptop also has the same number of GPU options (this time around from Nvidia): GeForce RTX 3050 Ti, GeForce RTX 3060 and GeForce RTX 3070.
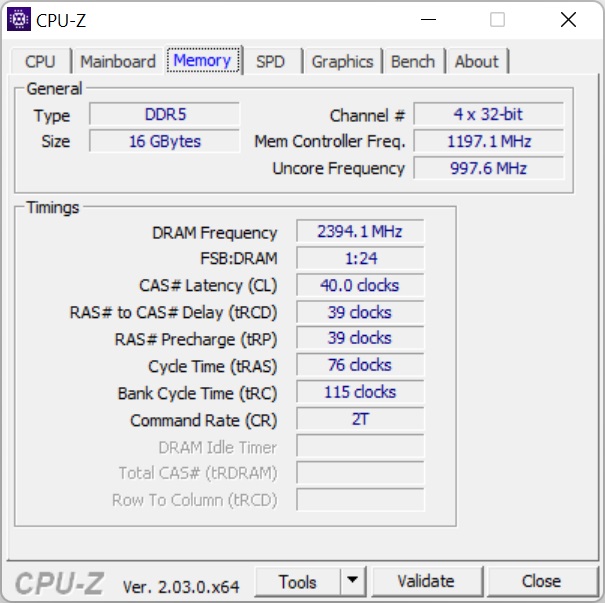
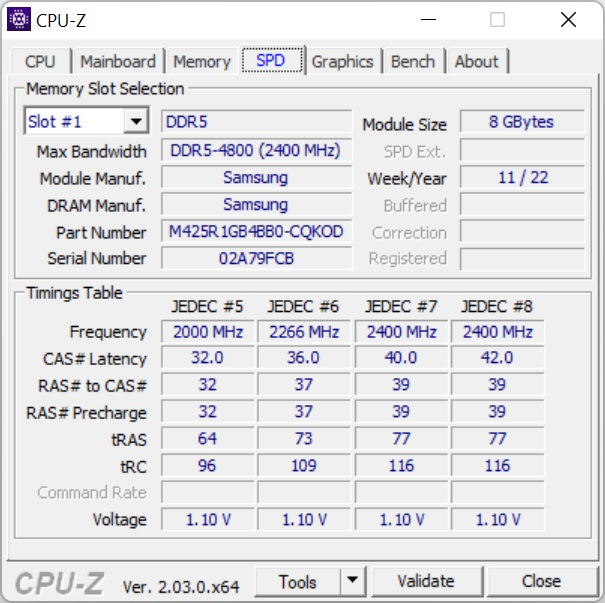
The Lenovo Legion S7 comes with 8 GB of soldered DDR5-4800 RAM as well as a SODIMM slot (our review unit has an 8 GB module). Lenovo sells the laptop with up to 24 GB of RAM, but it should be possible to increase the amount of RAM to 40 GB. There is a M.2 2280 slot for storage.
Test conditions
The processor in the Lenovo Legion S7-16IAH can draw as much as 100 watts of power in short bursts. It could go even slightly higher at absolute peak loads. Under sustained load, power usage is capped at 70 watts in silent mode, 80 watts in auto mode and 90 watts in performance modes. You can toggle between the power profiles by pressing Fn + Q.
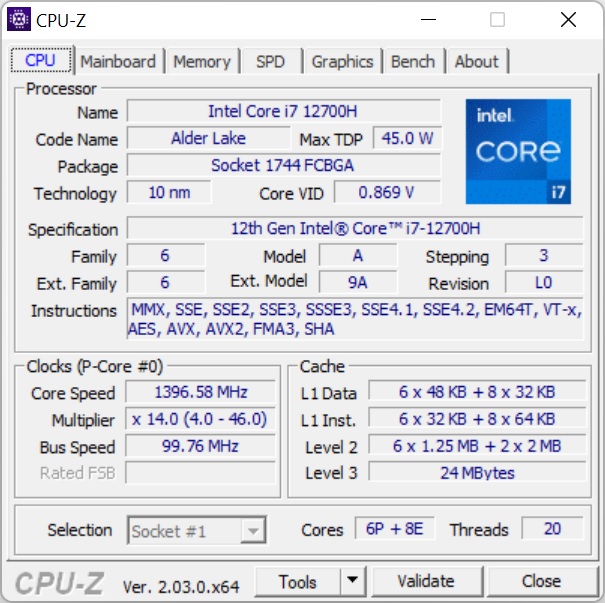
Processor
The Intel Core i7-12700H is part of the Alder Lake line-up. It uses the new hybrid architecture with two types of cores: six large performance cores and eight small efficiency cores. The CPU has a total of 14 cores and 20 threads because the six large cores support hyperthreading. Its TDP is typically around 45 watts, and clock speeds range from 2.4 to 4.7 GHz for the P-cores and 1.8 to 3.5 GHz for the E-cores. For detailed benchmark comparisons, you can refer to our CPU comparison list.
The Alder Lake processor delivers excellent performance in the Lenovo Legion S7i. This Lenovo laptop is the fastest of all the devices with a "H" processor in our comparison and even beats the AMD variant of the Legion Slim 7. The HP Omen 16 took a tiny lead initially but fell behind under sustained load. The Asus ROG Zephyrus M16, which has an older Tiger Lake chip, is considerably slower. However, if you want maximum CPU performance, there is an even faster option with Intel's "HX" processor. The heftier Lenovo Legion 7 brings roughly 22% more power to the table on average with its more powerful cooling system.
Performance mode is not available when the laptop is running on battery. In this case, CPU power usage is limited to around 80 watts in auto mode. In Cinebench R20, the Legion S7i received a score of 4886 when unplugged – equivalent to a 28% decrease in performance.
Cinebench R15 Multi Sustained Load
Cinebench R23: Multi Core | Single Core
Cinebench R20: CPU (Multi Core) | CPU (Single Core)
Cinebench R15: CPU Multi 64Bit | CPU Single 64Bit
Blender: v2.79 BMW27 CPU
7-Zip 18.03: 7z b 4 | 7z b 4 -mmt1
Geekbench 5.5: Multi-Core | Single-Core
HWBOT x265 Benchmark v2.2: 4k Preset
LibreOffice : 20 Documents To PDF
R Benchmark 2.5: Overall mean
| CPU Performance rating | |
| Average of class Gaming | |
| Lenovo Legion 7 16IAX7-82TD004SGE | |
| HP Omen 16-b1090ng | |
| Lenovo Legion Slim 7-16IAH 82TF004YGE | |
| Acer Predator Triton 500 SE PT516-52s-70KX | |
| Average Intel Core i7-12700H | |
| Lenovo Legion S7 16ARHA7 | |
| Asus ROG Zephyrus M16 GU603H -2! | |
| Cinebench R23 / Multi Core | |
| Average of class Gaming (10488 - 40970, n=112, last 2 years) | |
| Lenovo Legion 7 16IAX7-82TD004SGE | |
| Lenovo Legion Slim 7-16IAH 82TF004YGE | |
| Acer Predator Triton 500 SE PT516-52s-70KX | |
| HP Omen 16-b1090ng | |
| Average Intel Core i7-12700H (4032 - 19330, n=64) | |
| Lenovo Legion S7 16ARHA7 | |
| Cinebench R23 / Single Core | |
| Average of class Gaming (1166 - 2356, n=112, last 2 years) | |
| Lenovo Legion 7 16IAX7-82TD004SGE | |
| HP Omen 16-b1090ng | |
| Average Intel Core i7-12700H (778 - 1826, n=63) | |
| Lenovo Legion Slim 7-16IAH 82TF004YGE | |
| Acer Predator Triton 500 SE PT516-52s-70KX | |
| Lenovo Legion S7 16ARHA7 | |
| Cinebench R20 / CPU (Multi Core) | |
| Average of class Gaming (4029 - 16108, n=111, last 2 years) | |
| Lenovo Legion 7 16IAX7-82TD004SGE | |
| Lenovo Legion Slim 7-16IAH 82TF004YGE | |
| Acer Predator Triton 500 SE PT516-52s-70KX | |
| Average Intel Core i7-12700H (1576 - 7407, n=64) | |
| HP Omen 16-b1090ng | |
| Lenovo Legion S7 16ARHA7 | |
| Asus ROG Zephyrus M16 GU603H | |
| Cinebench R20 / CPU (Single Core) | |
| Average of class Gaming (442 - 895, n=111, last 2 years) | |
| Lenovo Legion 7 16IAX7-82TD004SGE | |
| HP Omen 16-b1090ng | |
| Average Intel Core i7-12700H (300 - 704, n=64) | |
| Lenovo Legion Slim 7-16IAH 82TF004YGE | |
| Acer Predator Triton 500 SE PT516-52s-70KX | |
| Lenovo Legion S7 16ARHA7 | |
| Asus ROG Zephyrus M16 GU603H | |
| Cinebench R15 / CPU Multi 64Bit | |
| Average of class Gaming (1578 - 6271, n=111, last 2 years) | |
| Lenovo Legion 7 16IAX7-82TD004SGE | |
| HP Omen 16-b1090ng | |
| Lenovo Legion Slim 7-16IAH 82TF004YGE | |
| Acer Predator Triton 500 SE PT516-52s-70KX | |
| Average Intel Core i7-12700H (1379 - 2916, n=70) | |
| Lenovo Legion S7 16ARHA7 | |
| Asus ROG Zephyrus M16 GU603H | |
| Cinebench R15 / CPU Single 64Bit | |
| Average of class Gaming (188.8 - 343, n=111, last 2 years) | |
| Lenovo Legion 7 16IAX7-82TD004SGE | |
| HP Omen 16-b1090ng | |
| Lenovo Legion S7 16ARHA7 | |
| Lenovo Legion Slim 7-16IAH 82TF004YGE | |
| Average Intel Core i7-12700H (113 - 263, n=65) | |
| Asus ROG Zephyrus M16 GU603H | |
| Acer Predator Triton 500 SE PT516-52s-70KX | |
| Blender / v2.79 BMW27 CPU | |
| Asus ROG Zephyrus M16 GU603H | |
| Average Intel Core i7-12700H (168 - 732, n=63) | |
| Lenovo Legion S7 16ARHA7 | |
| Acer Predator Triton 500 SE PT516-52s-70KX | |
| HP Omen 16-b1090ng | |
| Lenovo Legion Slim 7-16IAH 82TF004YGE | |
| Average of class Gaming (80 - 330, n=109, last 2 years) | |
| Lenovo Legion 7 16IAX7-82TD004SGE | |
| 7-Zip 18.03 / 7z b 4 | |
| Average of class Gaming (33491 - 148086, n=110, last 2 years) | |
| Lenovo Legion 7 16IAX7-82TD004SGE | |
| HP Omen 16-b1090ng | |
| Lenovo Legion Slim 7-16IAH 82TF004YGE | |
| Acer Predator Triton 500 SE PT516-52s-70KX | |
| Lenovo Legion S7 16ARHA7 | |
| Average Intel Core i7-12700H (22844 - 73067, n=63) | |
| Asus ROG Zephyrus M16 GU603H | |
| 7-Zip 18.03 / 7z b 4 -mmt1 | |
| Average of class Gaming (4199 - 7436, n=110, last 2 years) | |
| Lenovo Legion 7 16IAX7-82TD004SGE | |
| Lenovo Legion S7 16ARHA7 | |
| HP Omen 16-b1090ng | |
| Average Intel Core i7-12700H (2743 - 5972, n=63) | |
| Asus ROG Zephyrus M16 GU603H | |
| Lenovo Legion Slim 7-16IAH 82TF004YGE | |
| Acer Predator Triton 500 SE PT516-52s-70KX | |
| Geekbench 5.5 / Multi-Core | |
| Average of class Gaming (6460 - 27010, n=110, last 2 years) | |
| Lenovo Legion 7 16IAX7-82TD004SGE | |
| HP Omen 16-b1090ng | |
| Lenovo Legion Slim 7-16IAH 82TF004YGE | |
| Acer Predator Triton 500 SE PT516-52s-70KX | |
| Average Intel Core i7-12700H (5144 - 13745, n=64) | |
| Lenovo Legion S7 16ARHA7 | |
| Asus ROG Zephyrus M16 GU603H | |
| Geekbench 5.5 / Single-Core | |
| Average of class Gaming (986 - 2474, n=110, last 2 years) | |
| Lenovo Legion 7 16IAX7-82TD004SGE | |
| HP Omen 16-b1090ng | |
| Acer Predator Triton 500 SE PT516-52s-70KX | |
| Average Intel Core i7-12700H (803 - 1851, n=64) | |
| Lenovo Legion Slim 7-16IAH 82TF004YGE | |
| Lenovo Legion S7 16ARHA7 | |
| Asus ROG Zephyrus M16 GU603H | |
| HWBOT x265 Benchmark v2.2 / 4k Preset | |
| Average of class Gaming (11.5 - 44.3, n=110, last 2 years) | |
| Lenovo Legion 7 16IAX7-82TD004SGE | |
| HP Omen 16-b1090ng | |
| Lenovo Legion Slim 7-16IAH 82TF004YGE | |
| Acer Predator Triton 500 SE PT516-52s-70KX | |
| Lenovo Legion S7 16ARHA7 | |
| Average Intel Core i7-12700H (4.67 - 21.8, n=64) | |
| Asus ROG Zephyrus M16 GU603H | |
| LibreOffice / 20 Documents To PDF | |
| Average of class Gaming (19 - 88.8, n=110, last 2 years) | |
| Lenovo Legion S7 16ARHA7 | |
| Average Intel Core i7-12700H (34.2 - 95.3, n=63) | |
| Acer Predator Triton 500 SE PT516-52s-70KX | |
| HP Omen 16-b1090ng | |
| Asus ROG Zephyrus M16 GU603H | |
| Lenovo Legion Slim 7-16IAH 82TF004YGE | |
| Lenovo Legion 7 16IAX7-82TD004SGE | |
| R Benchmark 2.5 / Overall mean | |
| Asus ROG Zephyrus M16 GU603H | |
| Average Intel Core i7-12700H (0.4441 - 1.052, n=63) | |
| Lenovo Legion Slim 7-16IAH 82TF004YGE | |
| Acer Predator Triton 500 SE PT516-52s-70KX | |
| Lenovo Legion S7 16ARHA7 | |
| HP Omen 16-b1090ng | |
| Average of class Gaming (0.3439 - 0.759, n=111, last 2 years) | |
| Lenovo Legion 7 16IAX7-82TD004SGE | |
* ... smaller is better
AIDA64: FP32 Ray-Trace | FPU Julia | CPU SHA3 | CPU Queen | FPU SinJulia | FPU Mandel | CPU AES | CPU ZLib | FP64 Ray-Trace | CPU PhotoWorxx
| Performance rating | |
| Average of class Gaming | |
| Lenovo Legion S7 16ARHA7 | |
| Lenovo Legion Slim 7-16IAH 82TF004YGE | |
| Lenovo Legion 7 16IAX7-82TD004SGE | |
| Acer Predator Triton 500 SE PT516-52s-70KX | |
| Average Intel Core i7-12700H | |
| HP Omen 16-b1090ng | |
| Asus ROG Zephyrus M16 GU603H -9! | |
| AIDA64 / FP32 Ray-Trace | |
| Average of class Gaming (10227 - 85542, n=109, last 2 years) | |
| Lenovo Legion Slim 7-16IAH 82TF004YGE | |
| Lenovo Legion S7 16ARHA7 | |
| Lenovo Legion 7 16IAX7-82TD004SGE | |
| Average Intel Core i7-12700H (2585 - 17957, n=64) | |
| Acer Predator Triton 500 SE PT516-52s-70KX | |
| HP Omen 16-b1090ng | |
| AIDA64 / FPU Julia | |
| Average of class Gaming (51376 - 238426, n=109, last 2 years) | |
| Lenovo Legion S7 16ARHA7 | |
| Lenovo Legion Slim 7-16IAH 82TF004YGE | |
| Average Intel Core i7-12700H (12439 - 90760, n=64) | |
| Lenovo Legion 7 16IAX7-82TD004SGE | |
| Acer Predator Triton 500 SE PT516-52s-70KX | |
| HP Omen 16-b1090ng | |
| AIDA64 / CPU SHA3 | |
| Average of class Gaming (2180 - 9817, n=109, last 2 years) | |
| Lenovo Legion 7 16IAX7-82TD004SGE | |
| Lenovo Legion Slim 7-16IAH 82TF004YGE | |
| Lenovo Legion S7 16ARHA7 | |
| Acer Predator Triton 500 SE PT516-52s-70KX | |
| Average Intel Core i7-12700H (833 - 4242, n=64) | |
| HP Omen 16-b1090ng | |
| AIDA64 / CPU Queen | |
| Average of class Gaming (49785 - 173351, n=100, last 2 years) | |
| Lenovo Legion S7 16ARHA7 | |
| Lenovo Legion Slim 7-16IAH 82TF004YGE | |
| Lenovo Legion 7 16IAX7-82TD004SGE | |
| HP Omen 16-b1090ng | |
| Acer Predator Triton 500 SE PT516-52s-70KX | |
| Average Intel Core i7-12700H (57923 - 103202, n=63) | |
| AIDA64 / FPU SinJulia | |
| Average of class Gaming (4424 - 33636, n=109, last 2 years) | |
| Lenovo Legion 7 16IAX7-82TD004SGE | |
| Lenovo Legion S7 16ARHA7 | |
| Acer Predator Triton 500 SE PT516-52s-70KX | |
| Lenovo Legion Slim 7-16IAH 82TF004YGE | |
| HP Omen 16-b1090ng | |
| Average Intel Core i7-12700H (3249 - 9939, n=64) | |
| AIDA64 / FPU Mandel | |
| Average of class Gaming (25115 - 128721, n=109, last 2 years) | |
| Lenovo Legion S7 16ARHA7 | |
| Lenovo Legion Slim 7-16IAH 82TF004YGE | |
| Lenovo Legion 7 16IAX7-82TD004SGE | |
| Average Intel Core i7-12700H (7135 - 44760, n=64) | |
| Acer Predator Triton 500 SE PT516-52s-70KX | |
| HP Omen 16-b1090ng | |
| AIDA64 / CPU AES | |
| Lenovo Legion Slim 7-16IAH 82TF004YGE | |
| Lenovo Legion S7 16ARHA7 | |
| Lenovo Legion 7 16IAX7-82TD004SGE | |
| Average of class Gaming (39258 - 247074, n=109, last 2 years) | |
| Acer Predator Triton 500 SE PT516-52s-70KX | |
| Average Intel Core i7-12700H (31839 - 144360, n=64) | |
| HP Omen 16-b1090ng | |
| AIDA64 / CPU ZLib | |
| Average of class Gaming (574 - 2531, n=109, last 2 years) | |
| Lenovo Legion 7 16IAX7-82TD004SGE | |
| Acer Predator Triton 500 SE PT516-52s-70KX | |
| Lenovo Legion Slim 7-16IAH 82TF004YGE | |
| Average Intel Core i7-12700H (305 - 1171, n=64) | |
| HP Omen 16-b1090ng | |
| Lenovo Legion S7 16ARHA7 | |
| Asus ROG Zephyrus M16 GU603H | |
| AIDA64 / FP64 Ray-Trace | |
| Average of class Gaming (5509 - 45446, n=109, last 2 years) | |
| Lenovo Legion S7 16ARHA7 | |
| Lenovo Legion Slim 7-16IAH 82TF004YGE | |
| Lenovo Legion 7 16IAX7-82TD004SGE | |
| Average Intel Core i7-12700H (1437 - 9692, n=64) | |
| Acer Predator Triton 500 SE PT516-52s-70KX | |
| HP Omen 16-b1090ng | |
| AIDA64 / CPU PhotoWorxx | |
| Average of class Gaming (12271 - 89891, n=109, last 2 years) | |
| HP Omen 16-b1090ng | |
| Lenovo Legion 7 16IAX7-82TD004SGE | |
| Acer Predator Triton 500 SE PT516-52s-70KX | |
| Lenovo Legion Slim 7-16IAH 82TF004YGE | |
| Average Intel Core i7-12700H (12863 - 52207, n=64) | |
| Lenovo Legion S7 16ARHA7 | |
System performance
Given all the powerful components in the Lenovo Legion Slim 7i, it comes as no surprise that the device not only offers excellent performance in everyday use but also does well in system performance benchmarks.
CrossMark: Overall | Productivity | Creativity | Responsiveness
| PCMark 10 / Score | |
| Lenovo Legion 7 16IAX7-82TD004SGE | |
| Average of class Gaming (5828 - 11574, n=95, last 2 years) | |
| Lenovo Legion S7 16ARHA7 | |
| Acer Predator Triton 500 SE PT516-52s-70KX | |
| Lenovo Legion Slim 7-16IAH 82TF004YGE | |
| HP Omen 16-b1090ng | |
| Average Intel Core i7-12700H, NVIDIA GeForce RTX 3060 Laptop GPU (5986 - 8156, n=12) | |
| Asus ROG Zephyrus M16 GU603H | |
| PCMark 10 / Essentials | |
| Lenovo Legion 7 16IAX7-82TD004SGE | |
| Lenovo Legion Slim 7-16IAH 82TF004YGE | |
| Acer Predator Triton 500 SE PT516-52s-70KX | |
| Lenovo Legion S7 16ARHA7 | |
| Average of class Gaming (8810 - 12600, n=99, last 2 years) | |
| Average Intel Core i7-12700H, NVIDIA GeForce RTX 3060 Laptop GPU (9289 - 12144, n=12) | |
| Asus ROG Zephyrus M16 GU603H | |
| HP Omen 16-b1090ng | |
| PCMark 10 / Productivity | |
| Lenovo Legion 7 16IAX7-82TD004SGE | |
| Average of class Gaming (6845 - 18766, n=97, last 2 years) | |
| Lenovo Legion S7 16ARHA7 | |
| Acer Predator Triton 500 SE PT516-52s-70KX | |
| HP Omen 16-b1090ng | |
| Lenovo Legion Slim 7-16IAH 82TF004YGE | |
| Average Intel Core i7-12700H, NVIDIA GeForce RTX 3060 Laptop GPU (6161 - 10362, n=12) | |
| Asus ROG Zephyrus M16 GU603H | |
| PCMark 10 / Digital Content Creation | |
| Lenovo Legion 7 16IAX7-82TD004SGE | |
| Average of class Gaming (7602 - 19657, n=97, last 2 years) | |
| Lenovo Legion S7 16ARHA7 | |
| Acer Predator Triton 500 SE PT516-52s-70KX | |
| HP Omen 16-b1090ng | |
| Lenovo Legion Slim 7-16IAH 82TF004YGE | |
| Average Intel Core i7-12700H, NVIDIA GeForce RTX 3060 Laptop GPU (8950 - 12554, n=12) | |
| Asus ROG Zephyrus M16 GU603H | |
| CrossMark / Overall | |
| Lenovo Legion 7 16IAX7-82TD004SGE | |
| Average of class Gaming (1366 - 2409, n=97, last 2 years) | |
| Lenovo Legion Slim 7-16IAH 82TF004YGE | |
| Acer Predator Triton 500 SE PT516-52s-70KX | |
| Average Intel Core i7-12700H, NVIDIA GeForce RTX 3060 Laptop GPU (1649 - 2017, n=11) | |
| Lenovo Legion S7 16ARHA7 | |
| CrossMark / Productivity | |
| Lenovo Legion 7 16IAX7-82TD004SGE | |
| Average of class Gaming (1386 - 2254, n=97, last 2 years) | |
| Lenovo Legion Slim 7-16IAH 82TF004YGE | |
| Acer Predator Triton 500 SE PT516-52s-70KX | |
| Average Intel Core i7-12700H, NVIDIA GeForce RTX 3060 Laptop GPU (1536 - 1958, n=11) | |
| Lenovo Legion S7 16ARHA7 | |
| CrossMark / Creativity | |
| Lenovo Legion 7 16IAX7-82TD004SGE | |
| Average of class Gaming (1343 - 2729, n=97, last 2 years) | |
| Lenovo Legion Slim 7-16IAH 82TF004YGE | |
| Average Intel Core i7-12700H, NVIDIA GeForce RTX 3060 Laptop GPU (1816 - 2084, n=11) | |
| Acer Predator Triton 500 SE PT516-52s-70KX | |
| Lenovo Legion S7 16ARHA7 | |
| CrossMark / Responsiveness | |
| Lenovo Legion 7 16IAX7-82TD004SGE | |
| Acer Predator Triton 500 SE PT516-52s-70KX | |
| Lenovo Legion Slim 7-16IAH 82TF004YGE | |
| Average of class Gaming (1226 - 2334, n=97, last 2 years) | |
| Average Intel Core i7-12700H, NVIDIA GeForce RTX 3060 Laptop GPU (1210 - 2207, n=11) | |
| Lenovo Legion S7 16ARHA7 | |
| PCMark 10 Score | 7380 points | |
Help | ||
| AIDA64 / Memory Copy | |
| Average of class Gaming (21750 - 129946, n=109, last 2 years) | |
| HP Omen 16-b1090ng | |
| Acer Predator Triton 500 SE PT516-52s-70KX | |
| Average Intel Core i7-12700H (25615 - 80511, n=64) | |
| Lenovo Legion Slim 7-16IAH 82TF004YGE | |
| Lenovo Legion S7 16ARHA7 | |
| AIDA64 / Memory Read | |
| Average of class Gaming (22956 - 118858, n=109, last 2 years) | |
| Acer Predator Triton 500 SE PT516-52s-70KX | |
| HP Omen 16-b1090ng | |
| Lenovo Legion Slim 7-16IAH 82TF004YGE | |
| Average Intel Core i7-12700H (25586 - 79442, n=64) | |
| Lenovo Legion S7 16ARHA7 | |
| AIDA64 / Memory Write | |
| Average of class Gaming (22297 - 135096, n=109, last 2 years) | |
| HP Omen 16-b1090ng | |
| Lenovo Legion Slim 7-16IAH 82TF004YGE | |
| Lenovo Legion S7 16ARHA7 | |
| Average Intel Core i7-12700H (23679 - 88660, n=64) | |
| Acer Predator Triton 500 SE PT516-52s-70KX | |
| AIDA64 / Memory Latency | |
| Acer Predator Triton 500 SE PT516-52s-70KX | |
| Average of class Gaming (75.3 - 259, n=109, last 2 years) | |
| Lenovo Legion Slim 7-16IAH 82TF004YGE | |
| HP Omen 16-b1090ng | |
| Lenovo Legion S7 16ARHA7 | |
| Average Intel Core i7-12700H (76.2 - 133.9, n=62) | |
| Asus ROG Zephyrus M16 GU603H | |
* ... smaller is better
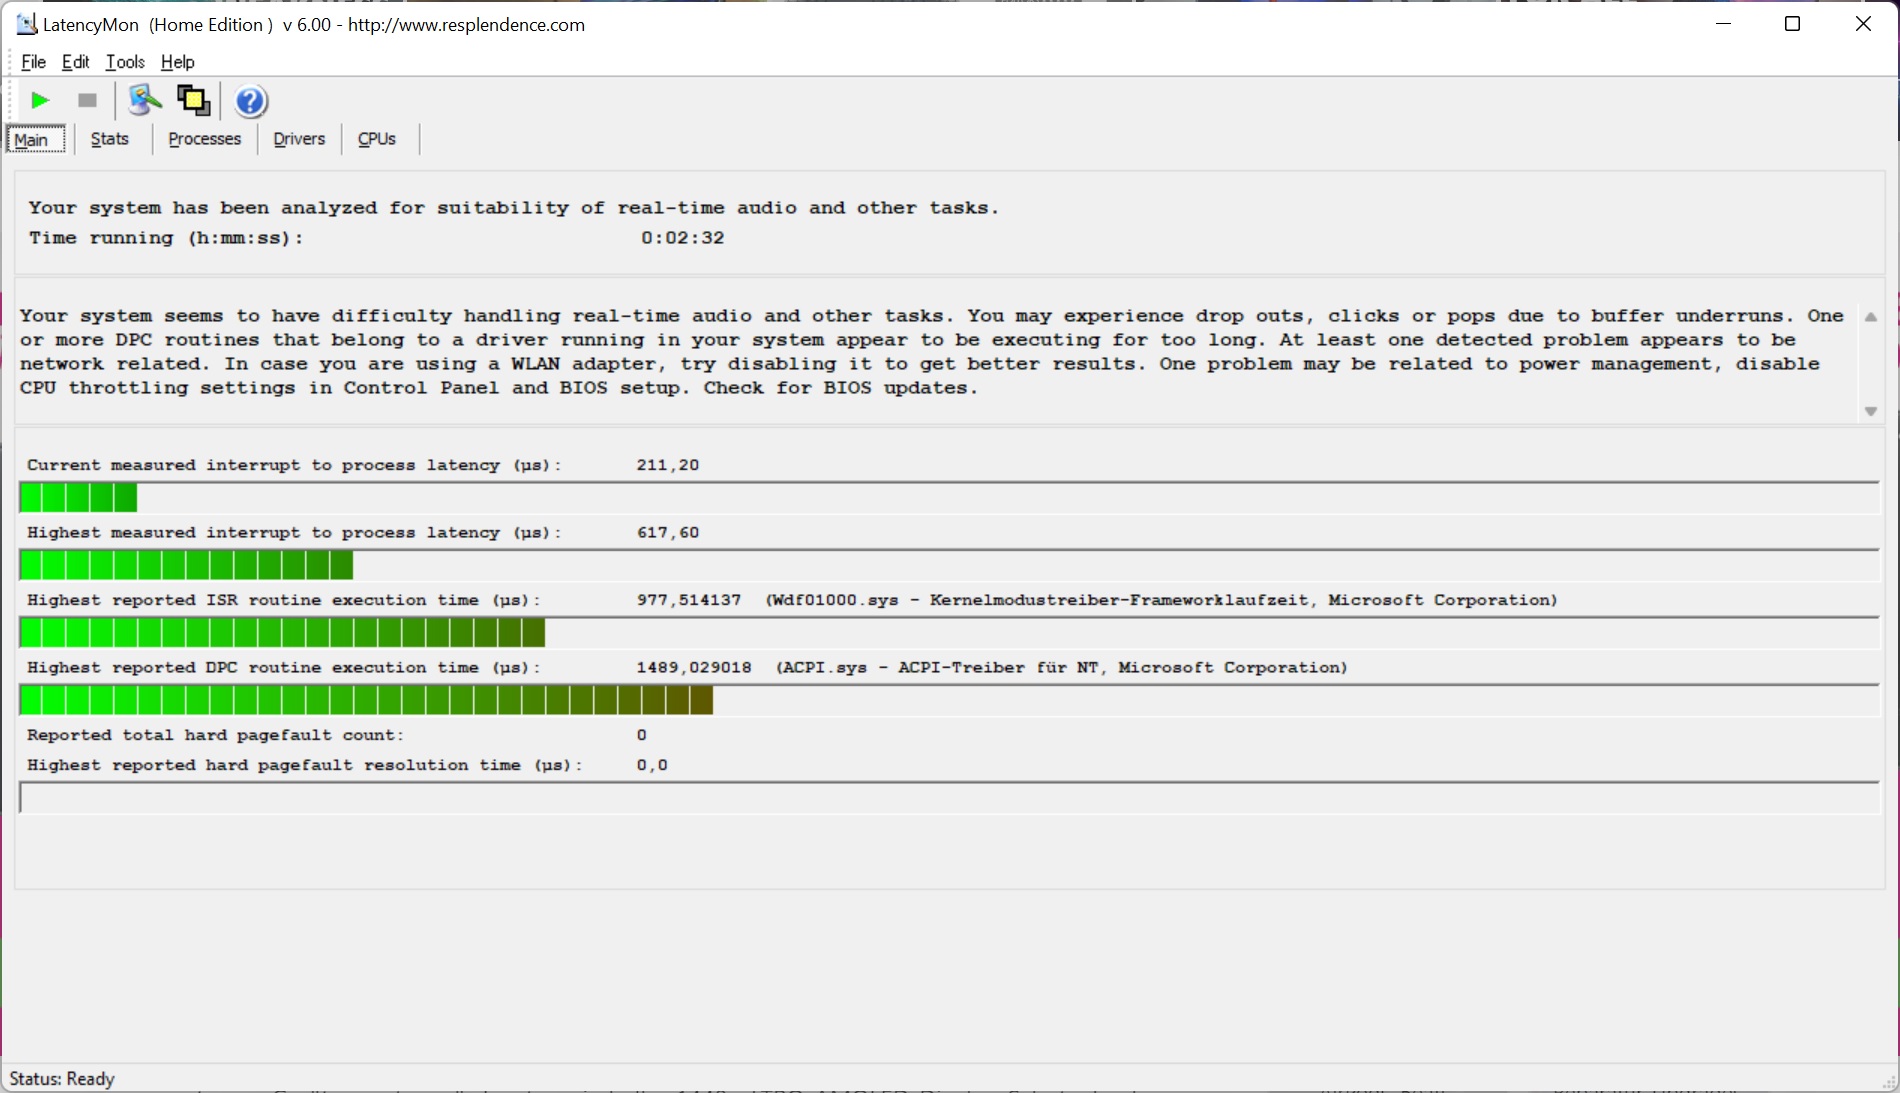
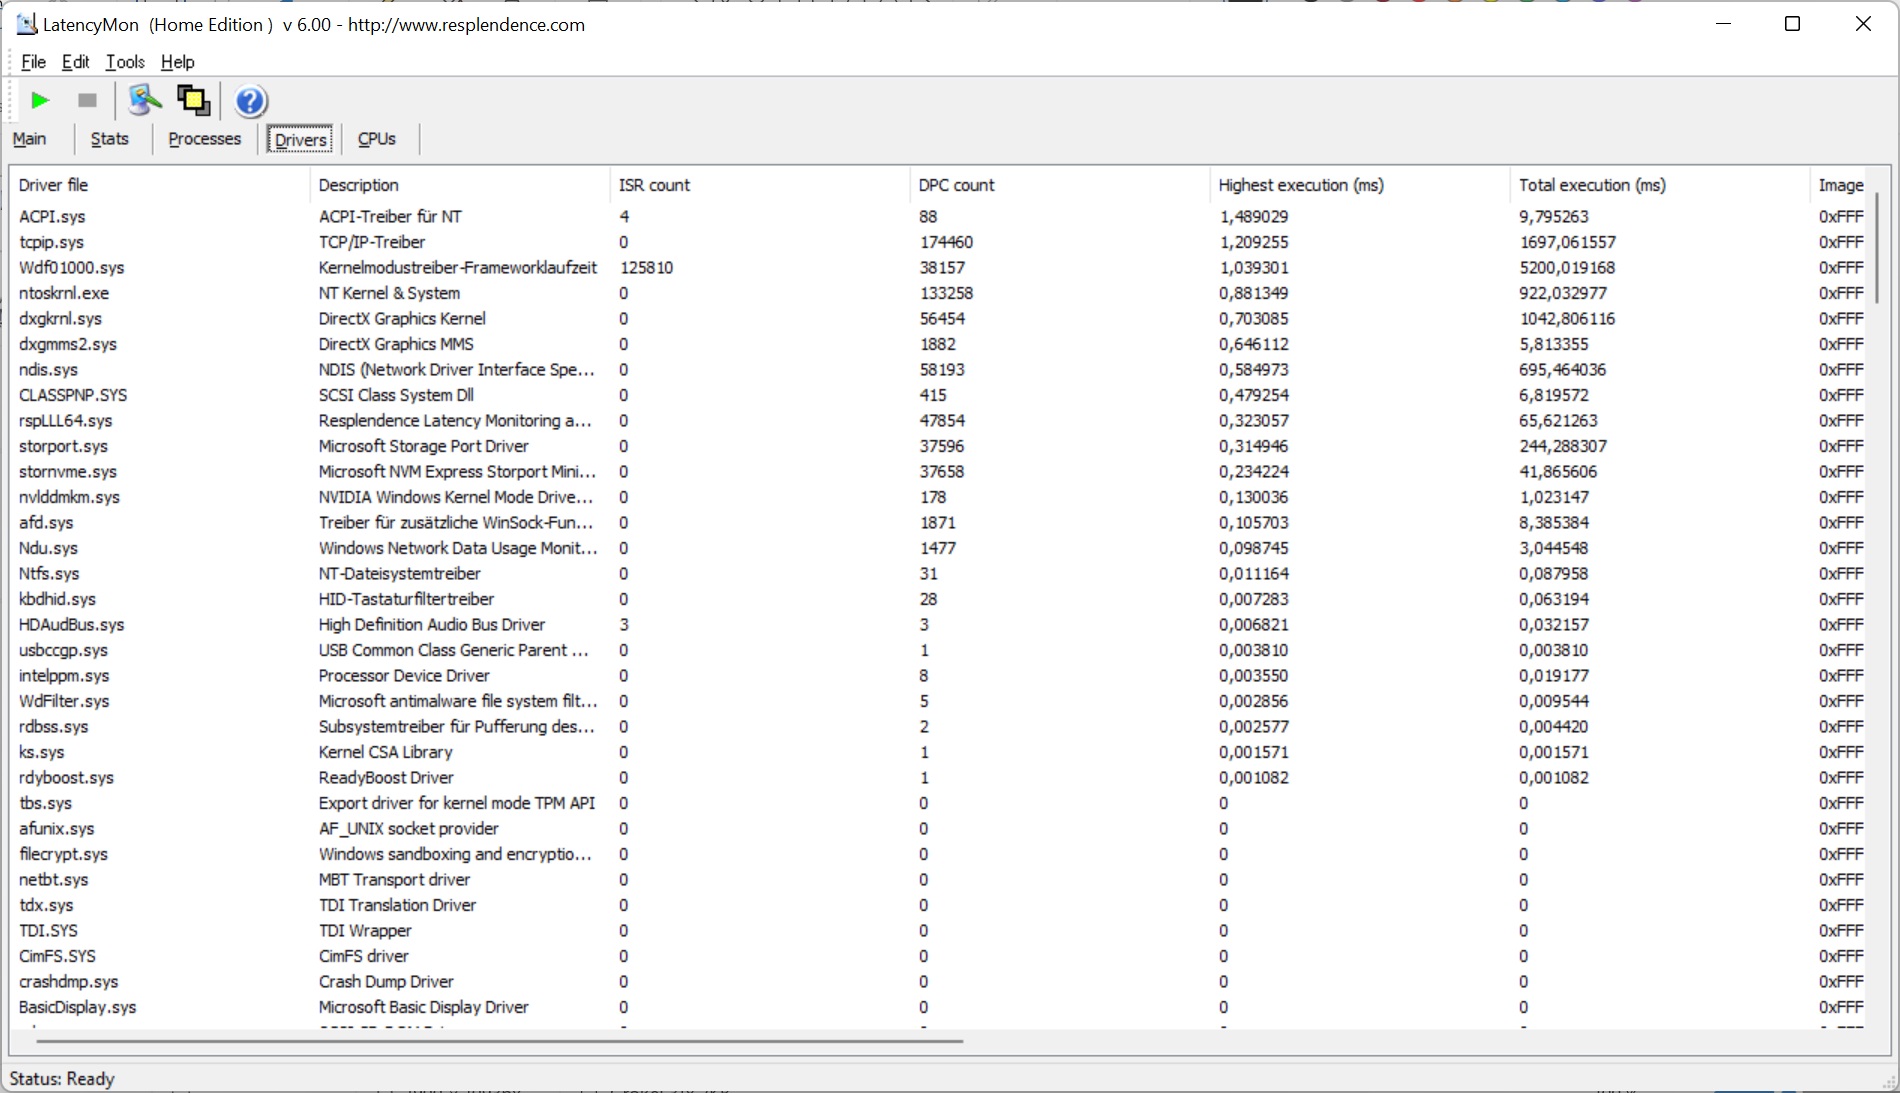
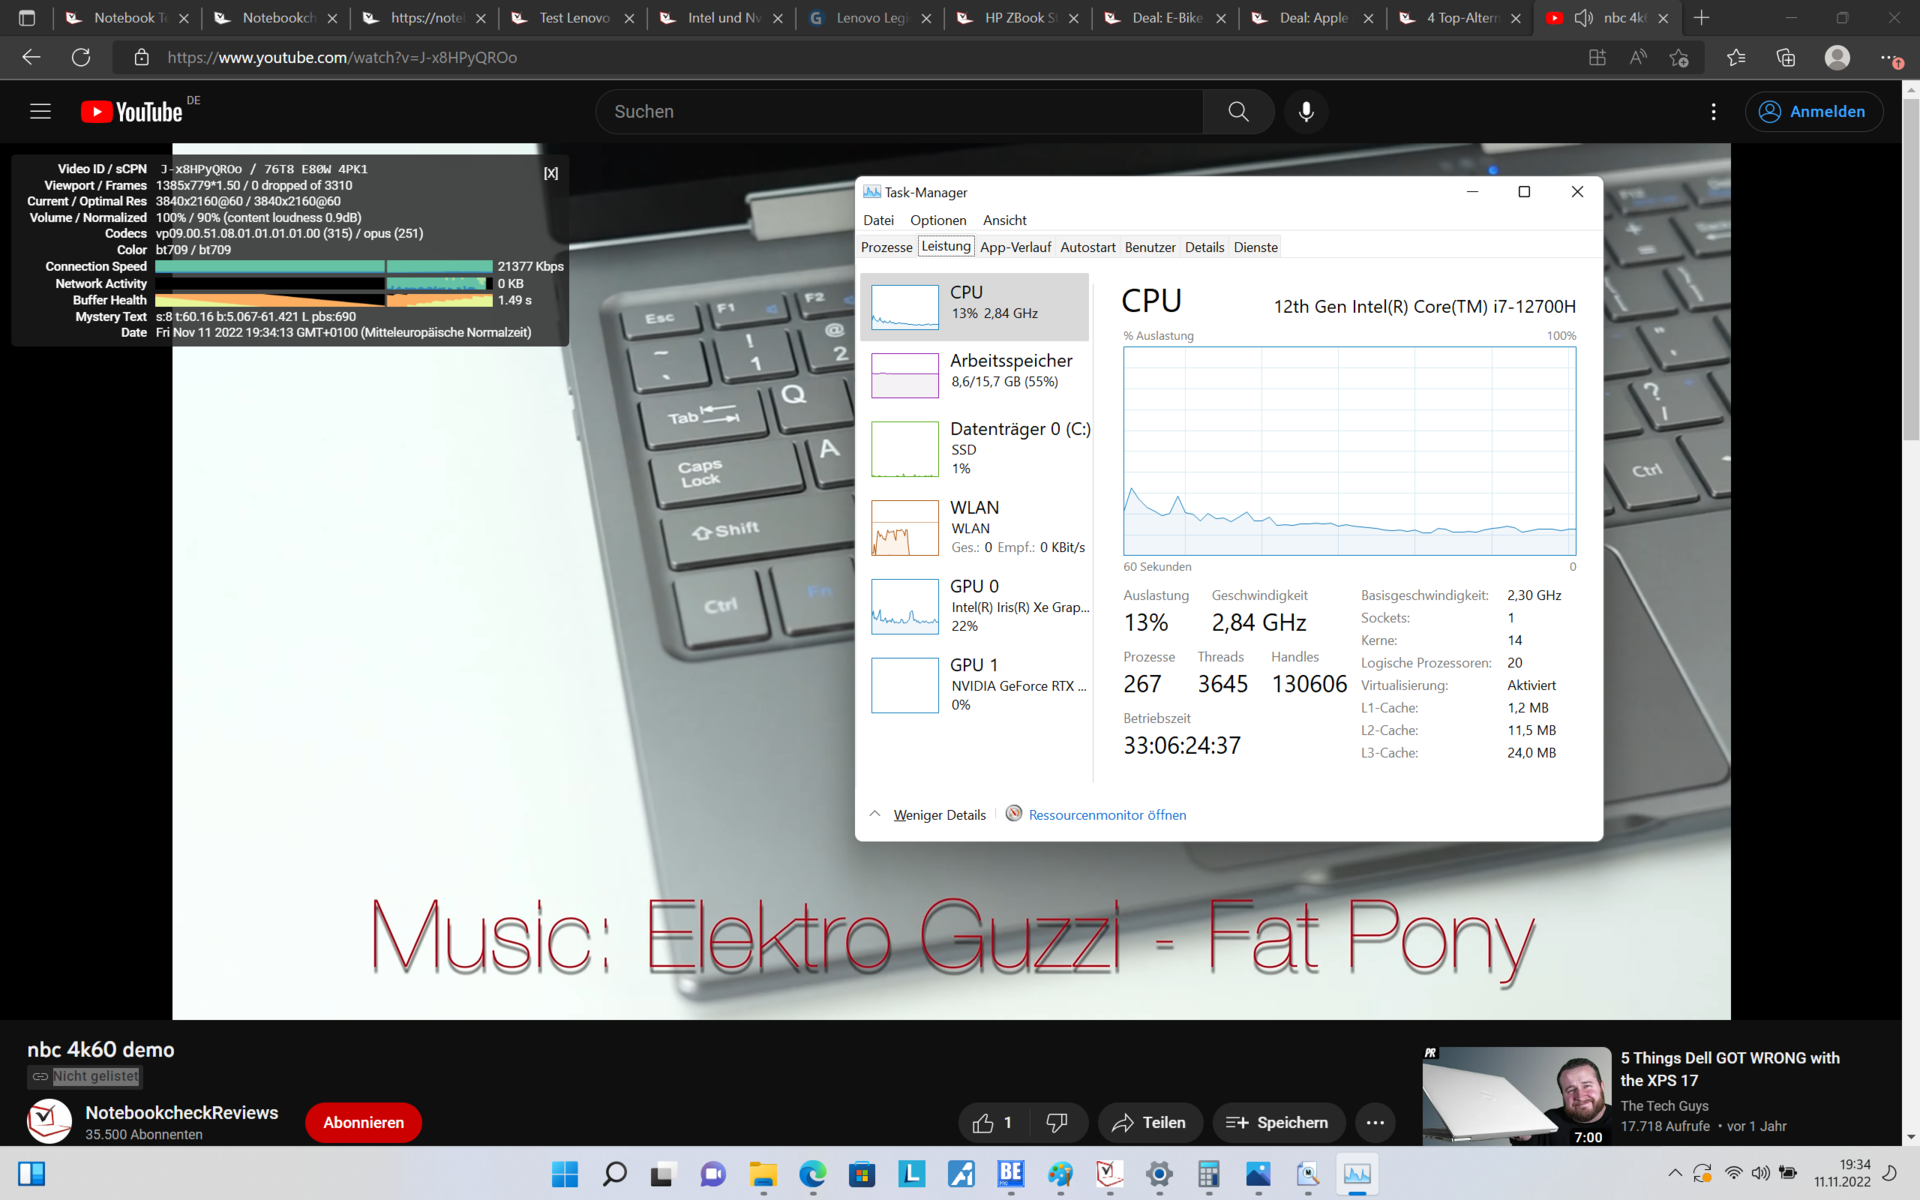
DPC latency
Although the latency is relatively low, our review unit had a few issues handling real-time audio. On the other hand, there weren't any dropped frames during our YouTube test.
| DPC Latencies / LatencyMon - interrupt to process latency (max), Web, Youtube, Prime95 | |
| Acer Predator Triton 500 SE PT516-52s-70KX | |
| Asus ROG Zephyrus M16 GU603H | |
| Lenovo Legion S7 16ARHA7 | |
| HP Omen 16-b1090ng | |
| Lenovo Legion Slim 7-16IAH 82TF004YGE | |
* ... smaller is better
Mass storage
The Legion Slim 7-16IAH comes with an M.2 2280 SSD made by SK Hynix. The NVMe PCIe 4.0 drive with a capacity of 1 TB ran fast in our benchmarks and didn't experience any notable performance dips under sustained load.

* ... smaller is better
Sustained Read: DiskSpd Read Loop, Queue Depth 8
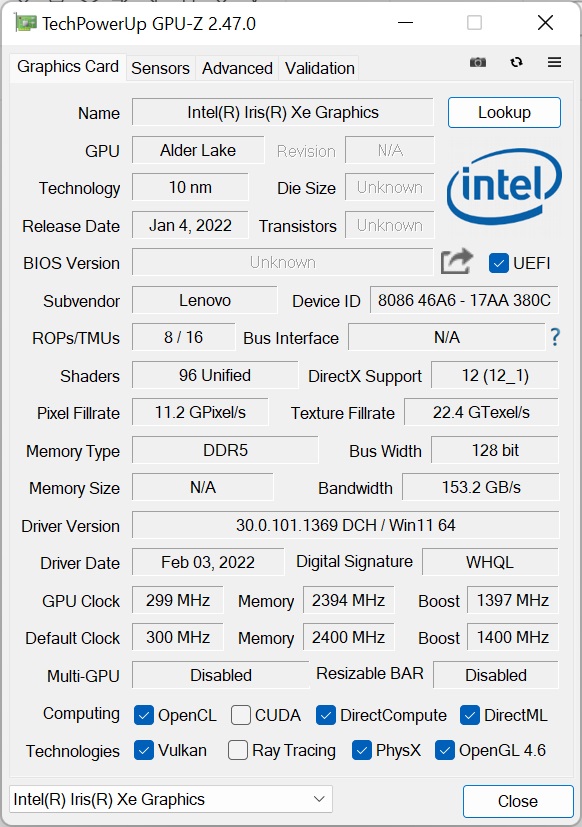
Graphics card
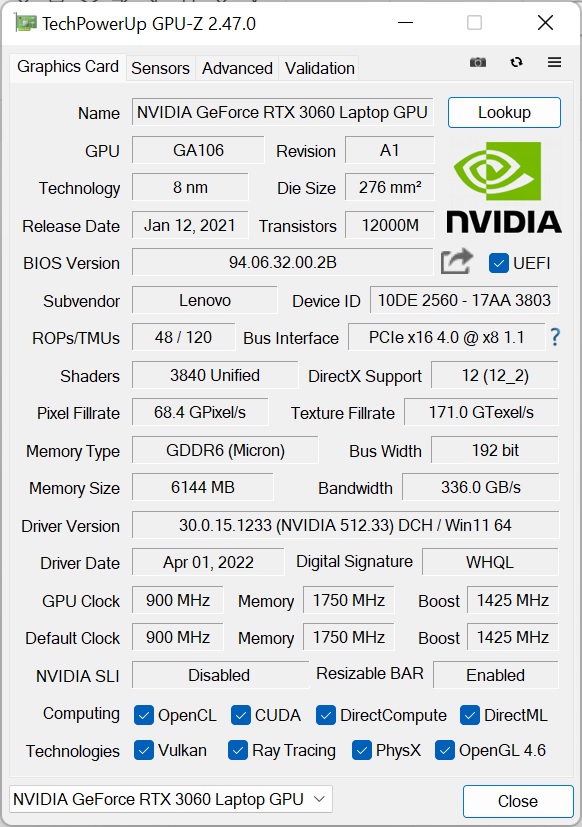
The GeForce RTX 3060 is a mid-tier card in Nvidia's mobile GPU line-up. The GA106 chip has 3840 shader units and 6 GB of dedicated GDDR6 RAM. You can find more data on this and many other graphics cards in our GPU list.
The other laptops in this comparison are equipped with significantly more powerful GPUs. That is why the Lenovo Legion S7i performed worse than most of them in the 3DMark tests. The only exception is the Asus ROG Zephyrus M16, which ran slower despite having a GeForce RTX 3070.
The GPU performance is noticeably limited when the laptop is unplugged. On battery power, the Lenovo Legion S7i only managed to achieve a score of 9412 in the 3DMark 11 graphics test – 65% lower than when plugged in.
| 3DMark 11 Performance | 25620 points | |
| 3DMark Fire Strike Score | 18596 points | |
| 3DMark Time Spy Score | 8319 points | |
Help | ||
Interestingly, the Intel-based Legion S7 outperformed its AMD counterpart in Blender benchmarks. The performance gap was small when the scene was rendered using the CPU. But the Intel model (using either CUDA or OptiX) was substantially faster than the Legion Slim 7 AMD (using HIP) in the GPU render benchmark.
| Blender | |
| v3.3 Classroom CPU | |
| Lenovo Legion S7 16ARHA7 | |
| Lenovo Legion Slim 7-16IAH 82TF004YGE | |
| Lenovo Legion 7 16IAX7-82TD004SGE | |
| v3.3 Classroom CUDA | |
| Lenovo Legion Slim 7-16IAH 82TF004YGE | |
| Lenovo Legion 7 16IAX7-82TD004SGE | |
| v3.3 Classroom OPTIX/RTX | |
| Lenovo Legion Slim 7-16IAH 82TF004YGE | |
| Lenovo Legion 7 16IAX7-82TD004SGE | |
| v3.3 Classroom HIP/AMD | |
| Lenovo Legion S7 16ARHA7 | |
* ... smaller is better
Gaming performance
It is not a huge surprise that the Lenovo Legion Slim 7i was slower than the other devices in the comparison group during the gaming benchmarks, considering all of them have faster GPUs. Nevertheless, the Legion S7i was only marginally slower compared with an average RTX 3060. It also has enough GPU performance to effortlessly run modern games at 2K (2,560 x 1,440) and high settings.
| The Witcher 3 - 1920x1080 Ultra Graphics & Postprocessing (HBAO+) | |
| Average of class Gaming (95 - 240, n=8, last 2 years) | |
| Acer Predator Triton 500 SE PT516-52s-70KX | |
| HP Omen 16-b1090ng | |
| Lenovo Legion S7 16ARHA7 | |
| Asus ROG Zephyrus M16 GU603H | |
| Average NVIDIA GeForce RTX 3060 Laptop GPU (58.2 - 91.5, n=48) | |
| Lenovo Legion Slim 7-16IAH 82TF004YGE | |
Witcher 3 FPS chart
| low | med. | high | ultra | QHD | |
|---|---|---|---|---|---|
| GTA V (2015) | 183.5 | 179.8 | 169.3 | 98 | 70.9 |
| The Witcher 3 (2015) | 362 | 246 | 139.3 | 73.7 | |
| Dota 2 Reborn (2015) | 177.3 | 163.2 | 153.4 | 146.2 | |
| Final Fantasy XV Benchmark (2018) | 175.5 | 100 | 75 | 55.2 | |
| X-Plane 11.11 (2018) | 146.6 | 132.8 | 105 | ||
| Strange Brigade (2018) | 390 | 186.4 | 151.9 | 131.8 | 100.2 |
Emissions: Legion Slim 7i pays the price for its high performance
Noise emissions
Despite having great performance, the Lenovo Legion Slim 7i has a well-tuned fan control that lets it run silently at idle. Under load, the laptop produced up to 52 dB(a) of noise but remained quieter than the competitors. As the only exception, the AMD-based Legion Slim 7 ran even quieter under load.
We could hear a soft hissing sound coming from the laptop when holding our ear close to the keyboard. However, this noise wasn't audible when we were at a normal distance to the device.
Noise level
| Idle |
| 23 / 23 / 23 dB(A) |
| Load |
| 43.7 / 52 dB(A) |
 | ||
30 dB silent 40 dB(A) audible 50 dB(A) loud |
||
min: | ||
| Lenovo Legion Slim 7-16IAH 82TF004YGE GeForce RTX 3060 Laptop GPU, i7-12700H, SK Hynix HFS001TEJ9X115N | Lenovo Legion S7 16ARHA7 Radeon RX 6800S, R9 6900HX, SK Hynix HFS001TEJ9X115N | Acer Predator Triton 500 SE PT516-52s-70KX GeForce RTX 3080 Ti Laptop GPU, i7-12700H, Micron 3400 1TB MTFDKBA1T0TFH | HP Omen 16-b1090ng GeForce RTX 3070 Ti Laptop GPU, i7-12700H, WDC PC SN810 1TB | Asus ROG Zephyrus M16 GU603H GeForce RTX 3070 Laptop GPU, i9-11900H, Samsung PM9A1 MZVL22T0HBLB | |
|---|---|---|---|---|---|
| Noise | 4% | -18% | -21% | -22% | |
| off / environment * (dB) | 23 | 23.1 -0% | 26 -13% | 26 -13% | 25 -9% |
| Idle Minimum * (dB) | 23 | 23.1 -0% | 26 -13% | 30 -30% | 25 -9% |
| Idle Average * (dB) | 23 | 23.1 -0% | 29 -26% | 31 -35% | 31 -35% |
| Idle Maximum * (dB) | 23 | 23.1 -0% | 34 -48% | 33 -43% | 42 -83% |
| Load Average * (dB) | 43.7 | 31.4 28% | 50 -14% | 49 -12% | 48 -10% |
| Witcher 3 ultra * (dB) | 51.7 | 51.4 1% | 53 -3% | 53 -3% | 52 -1% |
| Load Maximum * (dB) | 52 | 51.2 2% | 56 -8% | 57 -10% | 56 -8% |
* ... smaller is better
Temperature
A thin chassis paired with powerful components is a recipe for high temperatures. At idle, the Lenovo laptop was able to stay relatively cool. That said, it still generated a noticeable amount of heat, with chassis temperatures hitting 37.6°C (99.7°F). During the stress test, we measured a peak temperature of 55°C (131°F) at a hotspot on the bottom of the device, which is already outside the acceptable range. In the Witcher 3 test (important for a gaming laptop), chassis temperatures on the bottom didn't exceed 50°C (122°F), but the keyboard deck became slightly warmer than during the stress test. This means your hands might get sweaty when you're gaming on the device.
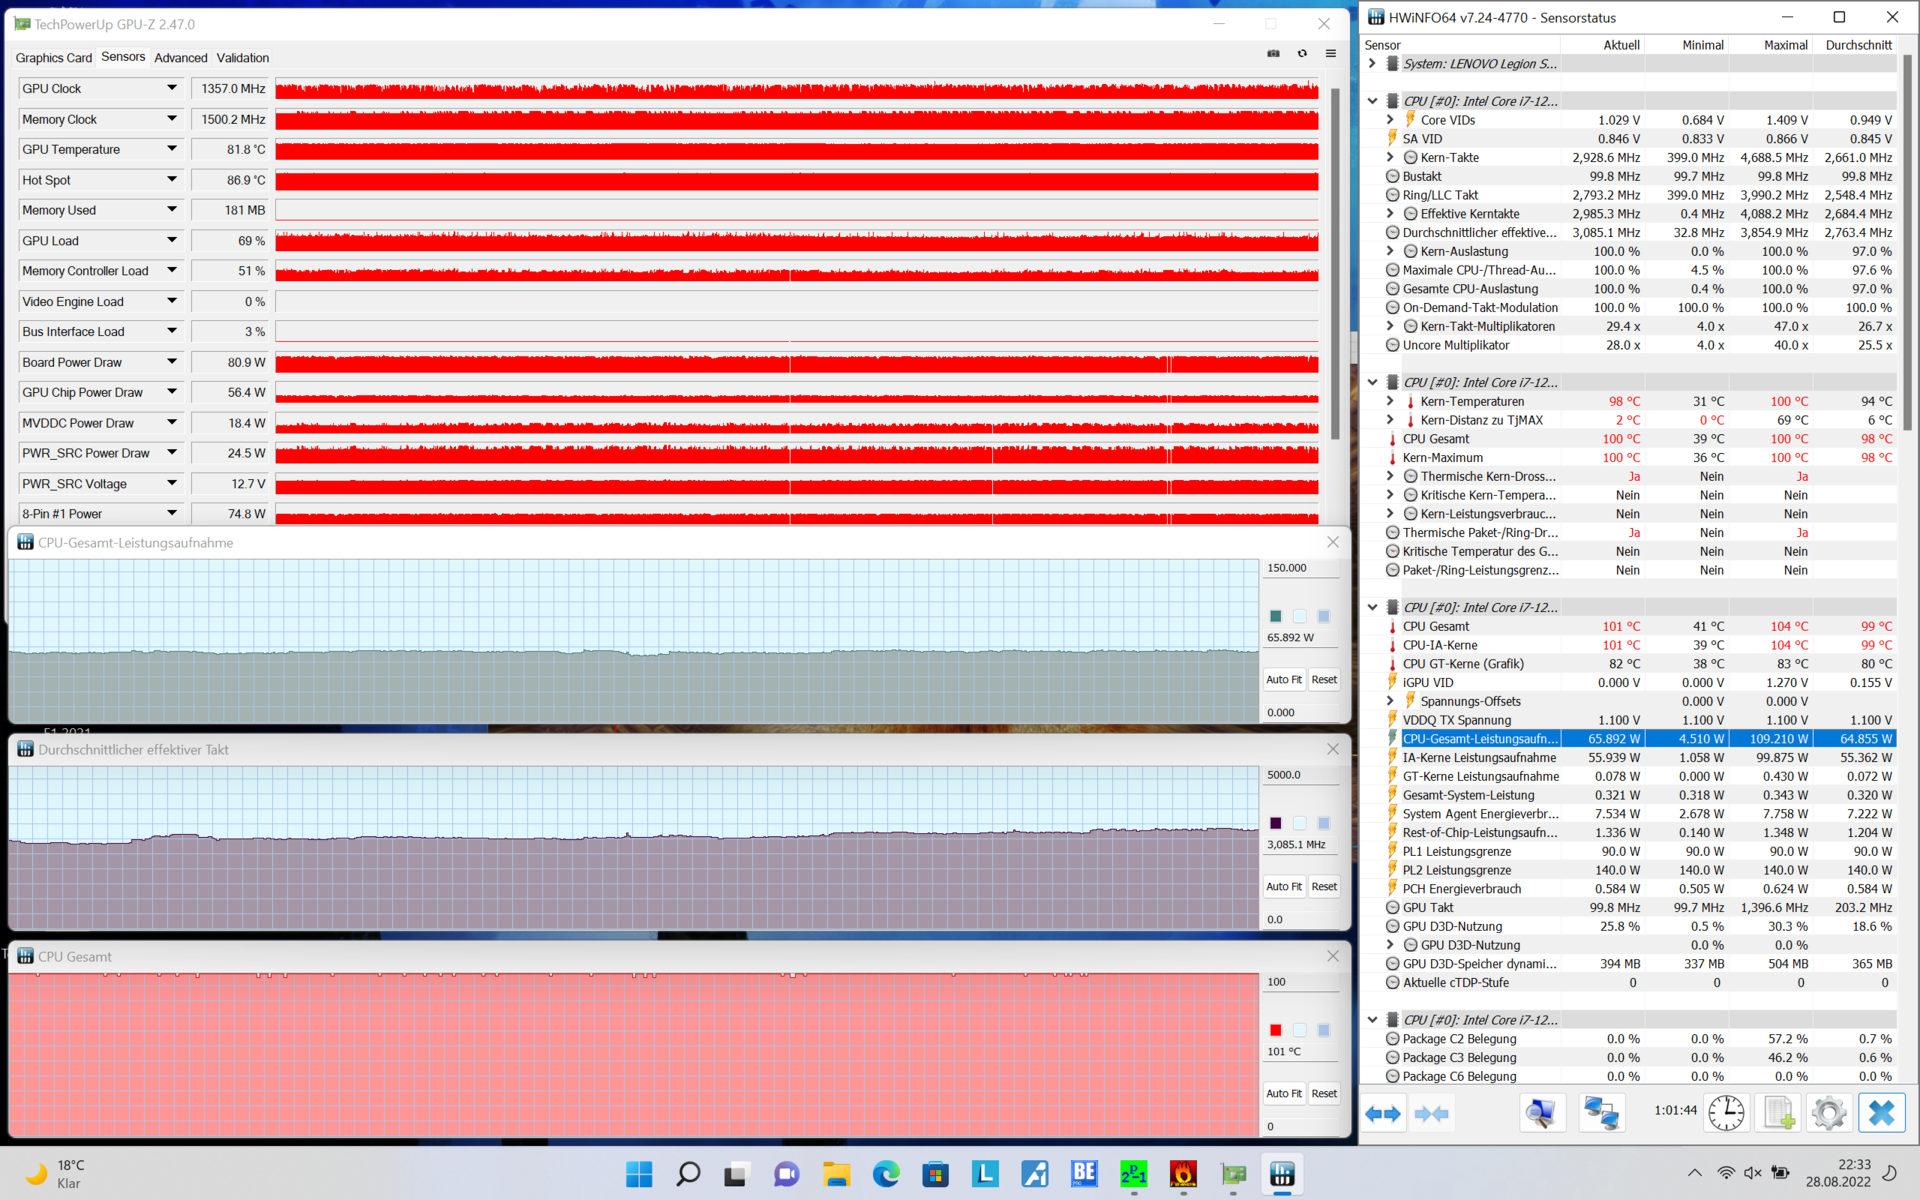
During the combined CPU/GPU stress test, the processor's power draw was capped at 65 watts, whilst the GPU's power usage was slightly higher at 80 watts. The Lenovo Legion Slim 7-16IAH doesn't have any problem with the CPU or GPU going below their base clocks due to throttling.
(-) The maximum temperature on the upper side is 48.3 °C / 119 F, compared to the average of 40.4 °C / 105 F, ranging from 21.2 to 68.8 °C for the class Gaming.
(-) The bottom heats up to a maximum of 55.3 °C / 132 F, compared to the average of 43.2 °C / 110 F
(+) In idle usage, the average temperature for the upper side is 31.3 °C / 88 F, compared to the device average of 33.9 °C / 93 F.
(-) Playing The Witcher 3, the average temperature for the upper side is 39.2 °C / 103 F, compared to the device average of 33.9 °C / 93 F.
(±) The palmrests and touchpad can get very hot to the touch with a maximum of 39.5 °C / 103.1 F.
(-) The average temperature of the palmrest area of similar devices was 28.8 °C / 83.8 F (-10.7 °C / -19.3 F).
| Lenovo Legion Slim 7-16IAH 82TF004YGE Intel Core i7-12700H, NVIDIA GeForce RTX 3060 Laptop GPU | Lenovo Legion S7 16ARHA7 AMD Ryzen 9 6900HX, AMD Radeon RX 6800S | Acer Predator Triton 500 SE PT516-52s-70KX Intel Core i7-12700H, NVIDIA GeForce RTX 3080 Ti Laptop GPU | HP Omen 16-b1090ng Intel Core i7-12700H, NVIDIA GeForce RTX 3070 Ti Laptop GPU | Asus ROG Zephyrus M16 GU603H Intel Core i9-11900H, NVIDIA GeForce RTX 3070 Laptop GPU | |
|---|---|---|---|---|---|
| Heat | 17% | 11% | 16% | -5% | |
| Maximum Upper Side * (°C) | 48.3 | 46.6 4% | 47 3% | 41 15% | 52 -8% |
| Maximum Bottom * (°C) | 55.3 | 50.8 8% | 49 11% | 62 -12% | 53 4% |
| Idle Upper Side * (°C) | 35.7 | 26.4 26% | 31 13% | 25 30% | 38 -6% |
| Idle Bottom * (°C) | 37.6 | 27.2 28% | 32 15% | 26 31% | 41 -9% |
* ... smaller is better
Speakers
The speakers are located above the keyboard on the Legion S7i. They sound pretty good for a pair of laptop speakers, as they do have some bass and can get quite loud.
Lenovo Legion Slim 7-16IAH 82TF004YGE audio analysis
(±) | speaker loudness is average but good (73.4 dB)
Bass 100 - 315 Hz
(±) | reduced bass - on average 10% lower than median
(±) | linearity of bass is average (13.4% delta to prev. frequency)
Mids 400 - 2000 Hz
(+) | balanced mids - only 1.2% away from median
(+) | mids are linear (3.3% delta to prev. frequency)
Highs 2 - 16 kHz
(±) | higher highs - on average 5.5% higher than median
(±) | linearity of highs is average (10.6% delta to prev. frequency)
Overall 100 - 16.000 Hz
(+) | overall sound is linear (13% difference to median)
Compared to same class
» 18% of all tested devices in this class were better, 3% similar, 79% worse
» The best had a delta of 6%, average was 18%, worst was 132%
Compared to all devices tested
» 13% of all tested devices were better, 2% similar, 85% worse
» The best had a delta of 4%, average was 24%, worst was 134%
Asus ROG Zephyrus M16 GU603H audio analysis
(±) | speaker loudness is average but good (80 dB)
Bass 100 - 315 Hz
(±) | reduced bass - on average 7.4% lower than median
(±) | linearity of bass is average (9.2% delta to prev. frequency)
Mids 400 - 2000 Hz
(±) | higher mids - on average 5.6% higher than median
(+) | mids are linear (4% delta to prev. frequency)
Highs 2 - 16 kHz
(+) | balanced highs - only 2.6% away from median
(+) | highs are linear (6.7% delta to prev. frequency)
Overall 100 - 16.000 Hz
(+) | overall sound is linear (12.1% difference to median)
Compared to same class
» 12% of all tested devices in this class were better, 4% similar, 84% worse
» The best had a delta of 6%, average was 18%, worst was 132%
Compared to all devices tested
» 9% of all tested devices were better, 2% similar, 88% worse
» The best had a delta of 4%, average was 24%, worst was 134%
Power management: Lenovo Legion S7i isn't very efficient
Power consumption
One major weakness of the Lenovo Slim 7i is its high power consumption. At idle, its power usage is already very high at 13.3 watts. The AMD-based model is better in this regard.
During our testing, we measured a peak power usage of 232 watts – a touch above 230 watts that the charger can output. Nevertheless, you don't have to worry about the battery discharging when the laptop is plugged in, as this represents the absolute peak value and the laptop's power consumption quickly dropped below the critical mark.
| Off / Standby | |
| Idle | |
| Load |
|
Key:
min: | |
| Lenovo Legion Slim 7-16IAH 82TF004YGE i7-12700H, GeForce RTX 3060 Laptop GPU, SK Hynix HFS001TEJ9X115N, IPS LED, 2560x1600, 16" | Lenovo Legion S7 16ARHA7 R9 6900HX, Radeon RX 6800S, SK Hynix HFS001TEJ9X115N, IPS, 2560x1600, 16" | Acer Predator Triton 500 SE PT516-52s-70KX i7-12700H, GeForce RTX 3080 Ti Laptop GPU, Micron 3400 1TB MTFDKBA1T0TFH, IPS LED, 2560x1600, 16" | HP Omen 16-b1090ng i7-12700H, GeForce RTX 3070 Ti Laptop GPU, WDC PC SN810 1TB, IPS, 2560x1440, 16.1" | Asus ROG Zephyrus M16 GU603H i9-11900H, GeForce RTX 3070 Laptop GPU, Samsung PM9A1 MZVL22T0HBLB, IPS, 2560x1600, 16" | Average NVIDIA GeForce RTX 3060 Laptop GPU | Average of class Gaming | |
|---|---|---|---|---|---|---|---|
| Power Consumption | 11% | -1% | 17% | -6% | 9% | -7% | |
| Idle Minimum * (Watt) | 13.3 | 8.8 34% | 7 47% | 4 70% | 11 17% | 10.4 ? 22% | 13.2 ? 1% |
| Idle Average * (Watt) | 17.5 | 14.7 16% | 19 -9% | 10 43% | 20 -14% | 14.5 ? 17% | 18.9 ? -8% |
| Idle Maximum * (Watt) | 18.4 | 19.8 -8% | 28 -52% | 19 -3% | 30 -63% | 21.4 ? -16% | 24.3 ? -32% |
| Load Average * (Watt) | 122.8 | 85.3 31% | 114 7% | 114 7% | 111 10% | 109.3 ? 11% | 108 ? 12% |
| Witcher 3 ultra * (Watt) | 154.7 | 167.5 -8% | 159 -3% | 183.2 -18% | 156 -1% | ||
| Load Maximum * (Watt) | 232.6 | 230.7 1% | 227 2% | 221 5% | 197 15% | 206 ? 11% | 254 ? -9% |
* ... smaller is better
Power consumption Witcher 3 / Stress test
Power consumption with external monitor
Battery life
Lenovo spared no effort when it comes to battery capacity, putting in the largest battery (99.99 Wh) allowed in a laptop according to travel regulations. However, the battery life is rather mediocre due to the device's high power consumption. During the Wi-Fi test (screen brightness at 150 cd/m²), the laptop only managed to run for five hours. In comparison, the more efficient AMD model lasted roughly one hour longer.
| Lenovo Legion Slim 7-16IAH 82TF004YGE i7-12700H, GeForce RTX 3060 Laptop GPU, 99.99 Wh | Lenovo Legion S7 16ARHA7 R9 6900HX, Radeon RX 6800S, 71 Wh | Acer Predator Triton 500 SE PT516-52s-70KX i7-12700H, GeForce RTX 3080 Ti Laptop GPU, 99.98 Wh | HP Omen 16-b1090ng i7-12700H, GeForce RTX 3070 Ti Laptop GPU, 83 Wh | Asus ROG Zephyrus M16 GU603H i9-11900H, GeForce RTX 3070 Laptop GPU, 90 Wh | Average of class Gaming | |
|---|---|---|---|---|---|---|
| Battery runtime | 19% | 22% | 27% | 36% | 12% | |
| H.264 (h) | 9.5 | 8.2 -14% | 8.26 ? -13% | |||
| WiFi v1.3 (h) | 5.2 | 6.2 19% | 5.7 10% | 5.6 8% | 7.7 48% | 7.02 ? 35% |
| Witcher 3 ultra (h) | 1.5 | |||||
| Load (h) | 1.3 | 2.2 69% | 1.9 46% | 1.6 23% | 1.47 ? 13% |
Pros
Cons
Verdict: Legion Slim 7i slightly sullied by lacklustre battery life
Full AMD or Intel pair with Nvidia – Lenovo allows consumers to make their own choice when purchasing a Legion Slim 7. Both variants offer their own advantages whilst having many strengths in common.
Despite having vastly different CPUs and GPUs, the two variants share the same slim aluminium chassis, great input devices, decent port selection, fast high-quality WQXGA display and great performance. Supporting Thunderbolt 4 is one advantage of the Intel/Nvidia model tested in this review. Moreover, this variant has slightly higher CPU performance as well as better GPU performance in certain applications (e.g. CUDA-based apps).
The Lenovo Legion S7i is thin, premium and performant – but less efficient than its AMD counterpart.
Having said that, the AMD-based variant ends up being the superior option. The Lenovo Legion S7i 16IAH7 not only runs hotter and louder but also has a shorter battery life than the Lenovo Legion S7 16ARHA7. We think the battery life, in particular, is a crucial factor that undermines Lenovo's attempt to position the Slim 7i 16IAH7 as a thin and portable gaming laptop. The Legion S7i falls a little between two stools: the AMD model is better for portable use, whereas the thicker Lenovo Legion 7 16IAX7 features a HX processor and is probably the better choice for those who really want that last bit of performance.
Amongst the competitors, the Acer Predator Triton 500 SE is an especially exciting alternative due to its faster GPU and better display. However, it is more expensive and only has soldered RAM. Also worth mentioning is the Asus ROG Zephyrus M16, but it is still equipped with an older processor.
Price and availability
The Lenovo Legion Slim 7 16IAH7 is currently available from Lenovo US at a discount price of US$1,360 (original price US$1,700). The review configuration will set you back US$1,700 after discounts have been applied.
Note: Prices are accurate as at 17.11.22 and subject to change.
Lenovo Legion Slim 7-16IAH 82TF004YGE
- 11/13/2022 v7 (old)
Benjamin Herzig
Price comparison

