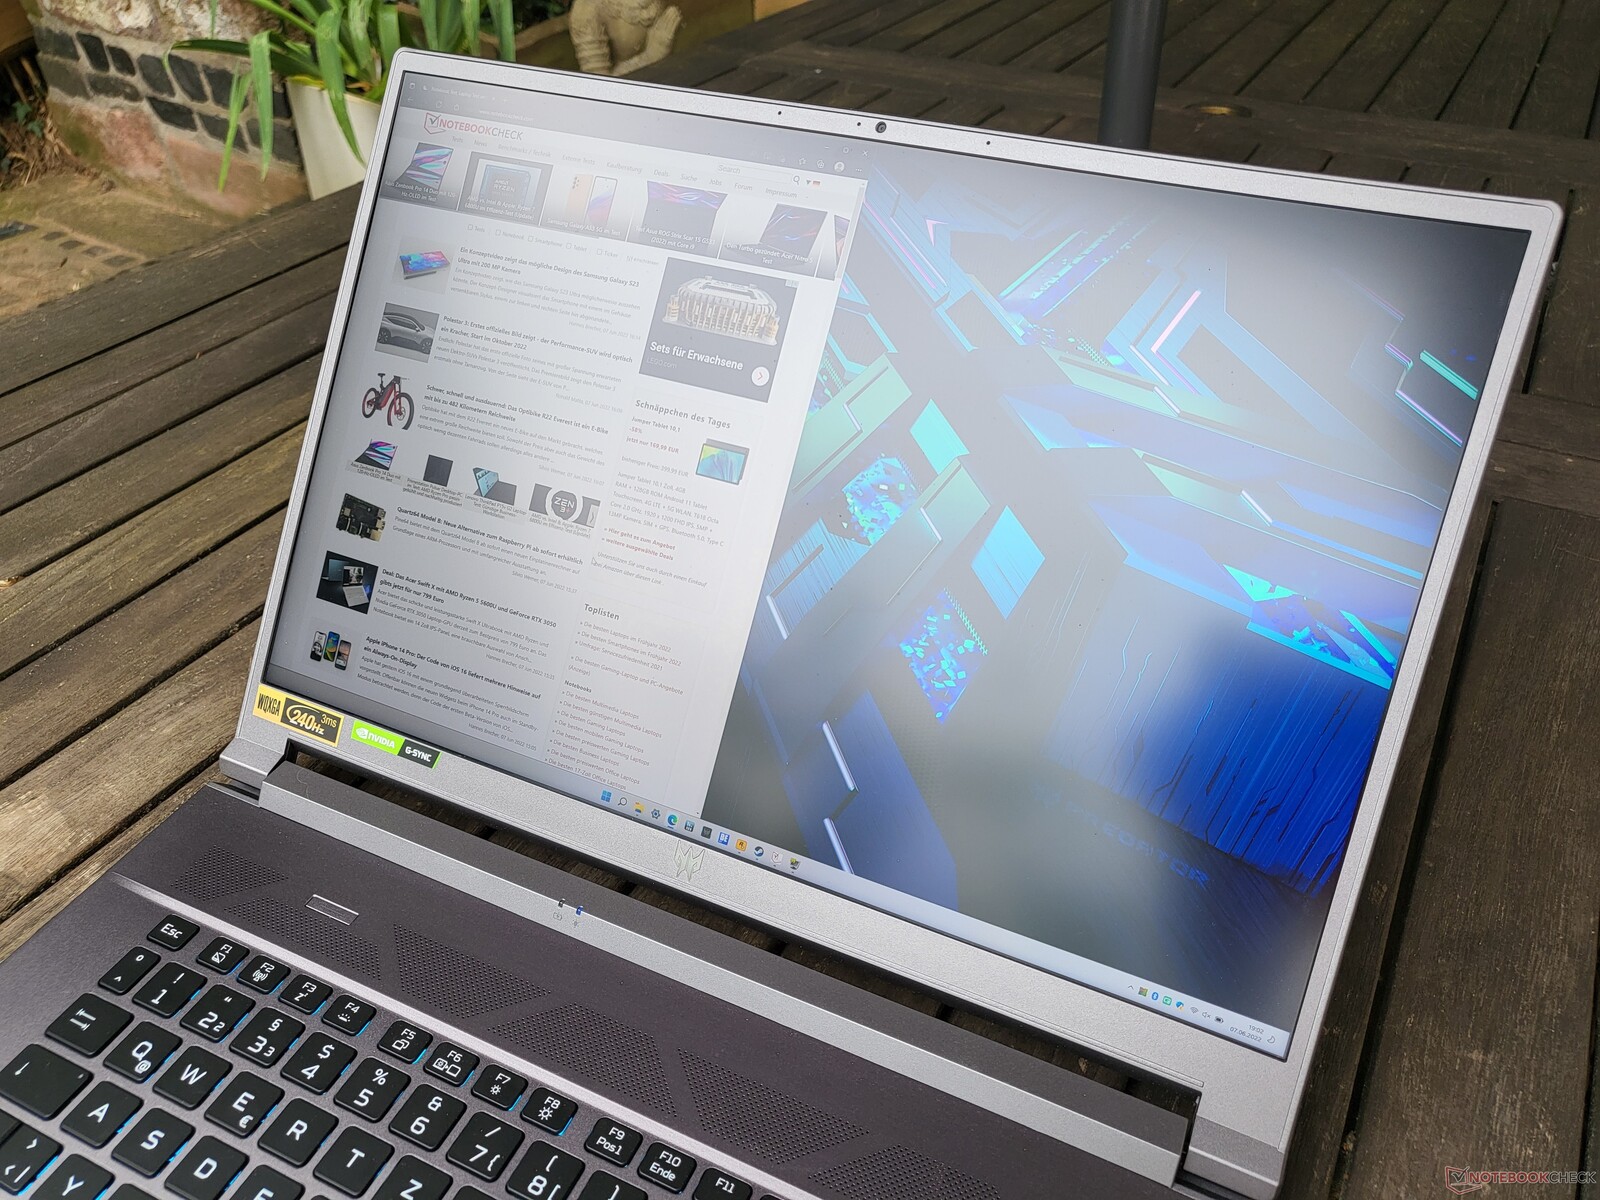
Acer Predator Triton 500 SE review: Slim gaming laptop with RTX 3080 Ti and Alder Lake

Acer advertises the Predator Triton 500 SE as a "slim gaming laptop." If looking at the relative size, there are of course laptops that are significantly thicker. However, at about 20 mm (~0.8 in), the Acer Predator Triton 500 SE is not extremely thin in absolute terms. But whether you would like to see an even slimmer size is another question, since Acer still has to somehow cool all the power components in the 16-inch 16:10 format, which is becoming increasingly popular. In addition to the 45-Watt Intel Core i7-12700H processor from the newest Alder Lake series, our test unit also houses an Nvidia GeForce 3080 Ti.
This combination promises gaming in the highest quality. But our detailed review will find out whether it also leads to a good laptop.
Possible Competitors in Comparison
Rating | Date | Model | Weight | Height | Size | Resolution | Price |
|---|---|---|---|---|---|---|---|
| 87.2 % v7 (old) | 06 / 2022 | Acer Predator Triton 500 SE PT516-52s-70KX i7-12700H, GeForce RTX 3080 Ti Laptop GPU | 2.3 kg | 19.9 mm | 16.00" | 2560x1600 | |
| 91.2 % v7 (old) | 03 / 2022 | Razer Blade 17 RTX 3080 Ti i7-12800H, GeForce RTX 3080 Ti Laptop GPU | 2.7 kg | 19.9 mm | 17.30" | 2560x1440 | |
| 88 % v7 (old) | 03 / 2022 | Lenovo Legion 5 Pro 16 G7 i7 RTX 3070Ti i7-12700H, GeForce RTX 3070 Ti Laptop GPU | 2.6 kg | 26.6 mm | 16.00" | 2560x1600 | |
| 87.5 % v7 (old) | 01 / 2022 | MSI GE76 Raider i9-12900HK, GeForce RTX 3080 Ti Laptop GPU | 3 kg | 26 mm | 17.30" | 1920x1080 |
Case: Acer laptop in aluminum case design with lots of gray
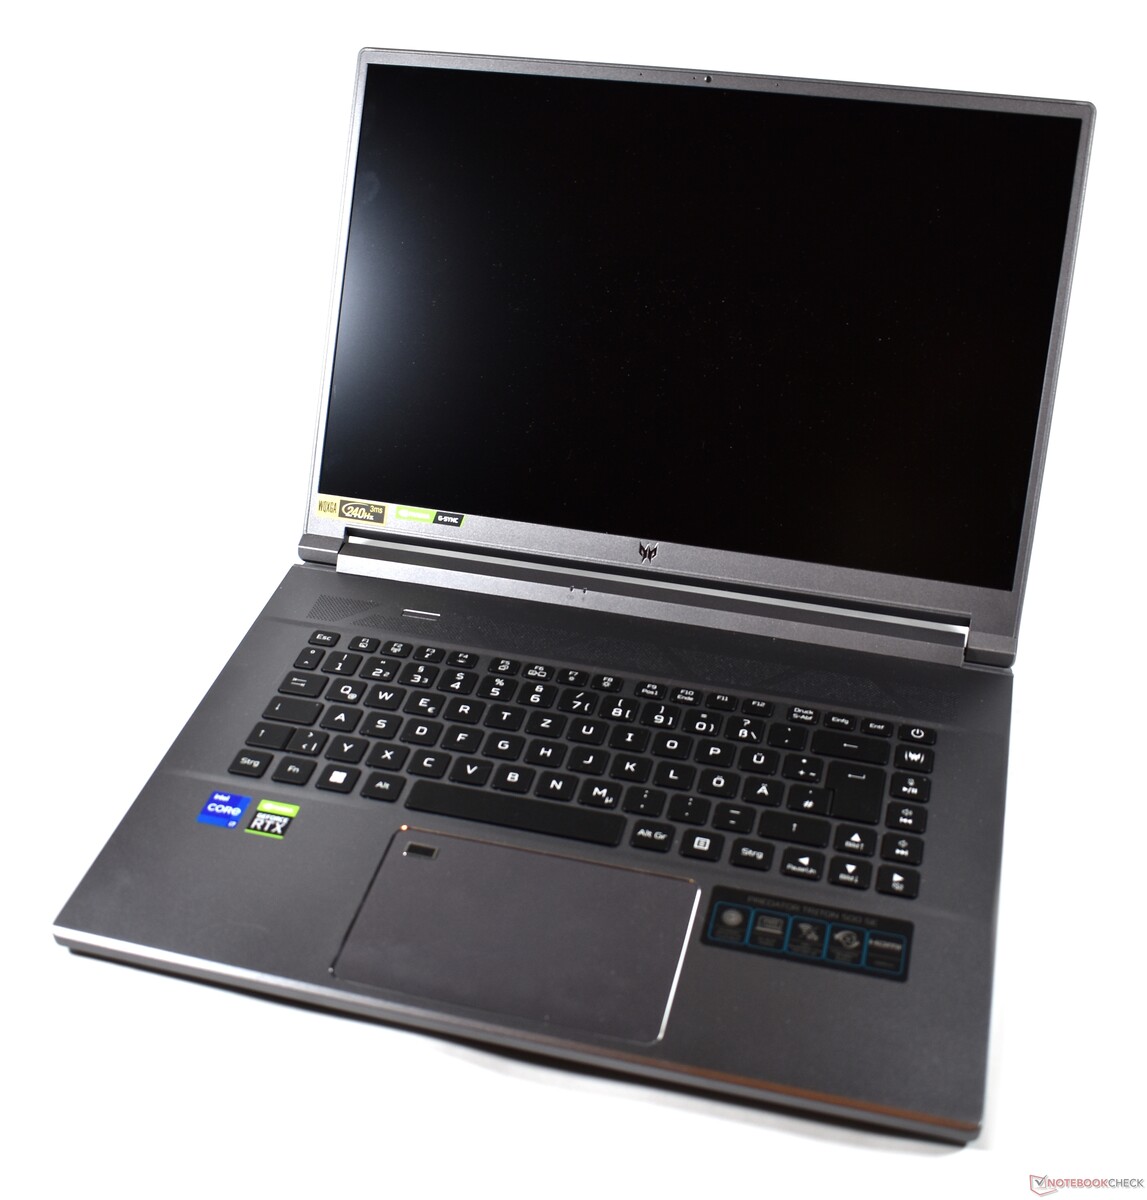
The Acer Predator Triton 500 SE has a rather subdued design for a gaming laptop, and the exterior of the dark gray case doesn't reveal much about its purpose. The only things that point towards gaming are the Predator logos on the display lid and frame, and the keyboard illumination that is blue by default might also attract some attention. In terms of gaming-specific design details, there are also the Turbo key above the keyboard on the left and the distinctive fan vents on the back that are clear signs of a powerful performance. A design feature that provides some ergonomic comfort is the rounded front edge of the palm rest.
The case is made almost completely from aluminum. Only the display frame is made of plastic. This choice of materials contributes to the robustness of the case. The base can hardly be warped and also not pressed in. The only area where you can do that is the spot between the keyboard and touchpad, and then only if you use a lot of force. So you don't have to worry about the stability of the keyboard. What is less robust is the display lid, since the display can already be warped using only little force. But at least the back of the display lid also has good haptic qualities, just like the bottom of the case.
It is very nice that the display can be opened to an almost 180-degree opening angle. The fact that the Acer laptop can be opened with one hand is another positive point. The two hinges that are fixed on the base are well-adjusted, only allowing for some slight wobbling of the display after it is moved.
For a gaming laptop, the Acer Predator Triton 500SE is in fact slim, and only the Razer Blade 17 can compete in this regard, being just as slim. However, that is also significantly wider with its 17.3-inch display in the 16:9 format. While the MSI GE76 Raider is also significantly larger, the Lenovo Legion 5 Pro 16 has a similar footprint, but that is also thicker.
In terms of weight, the Acer Predator Triton 500 SE is the clear winner. At only 2.3 kg (~5 lb), it is clearly the lightweight among the gaming laptops in our comparison.
Equipment: The Predator Triton 500 SE impresses with 2.5 Gbit Ethernet
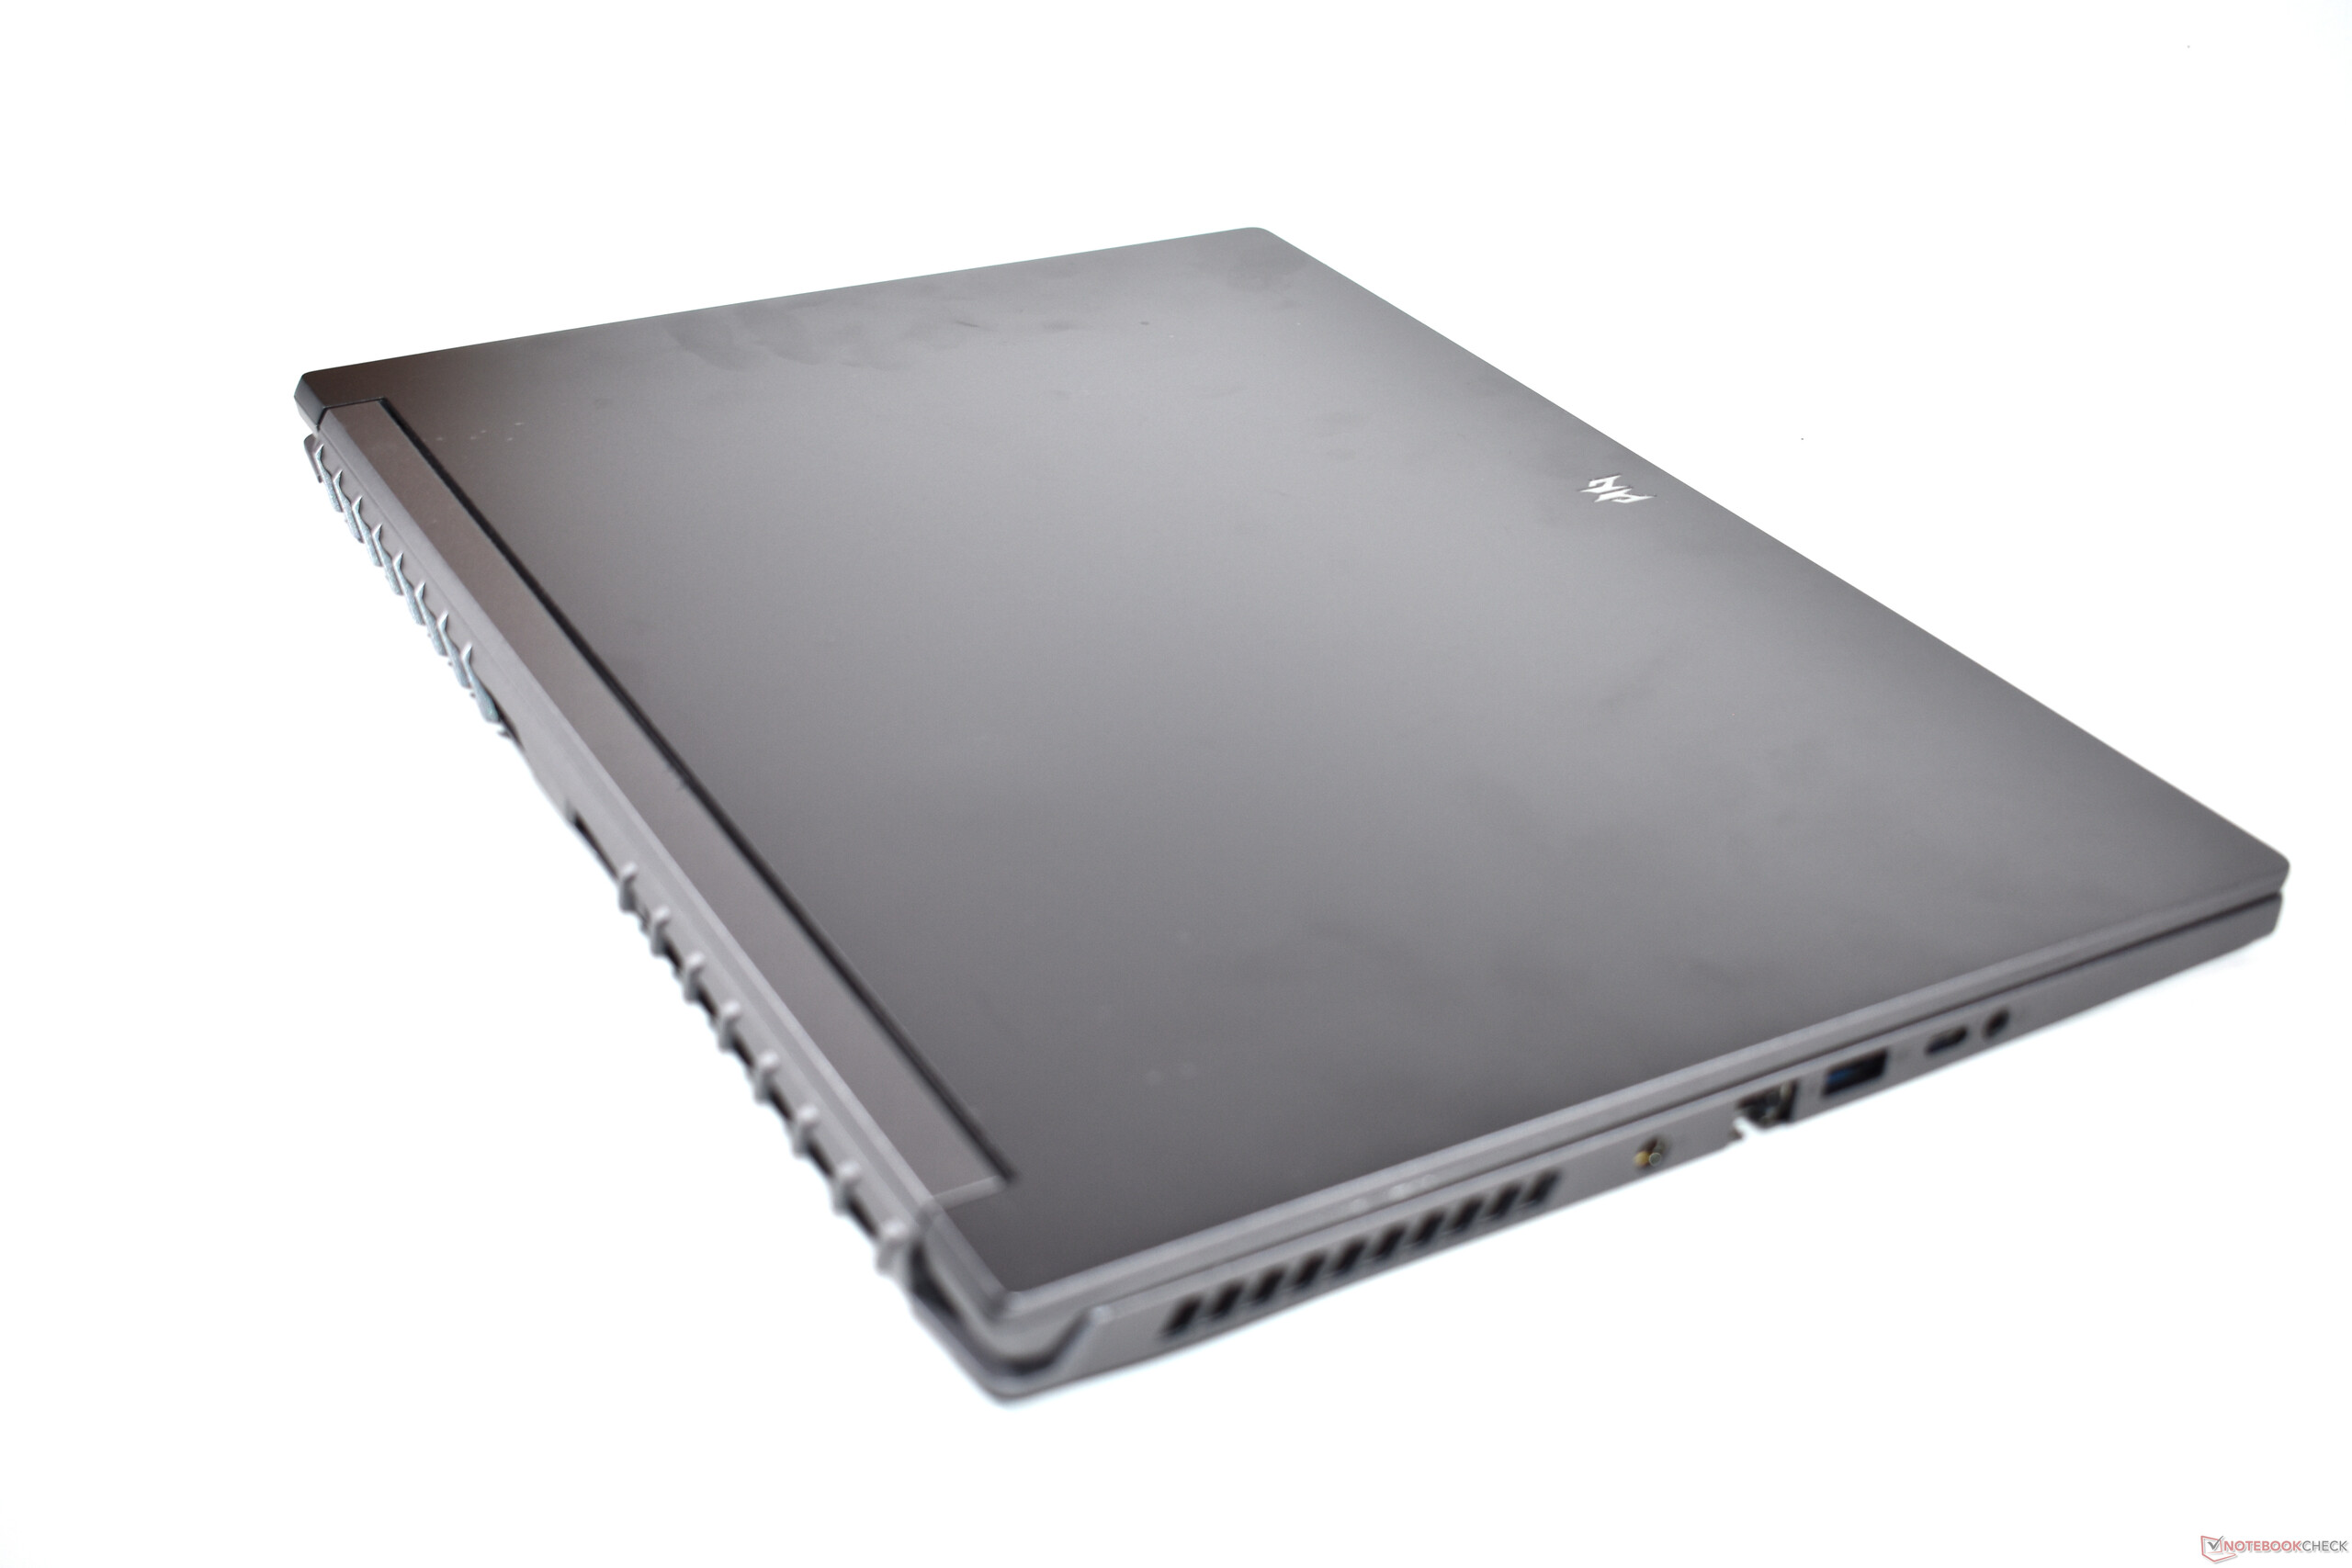
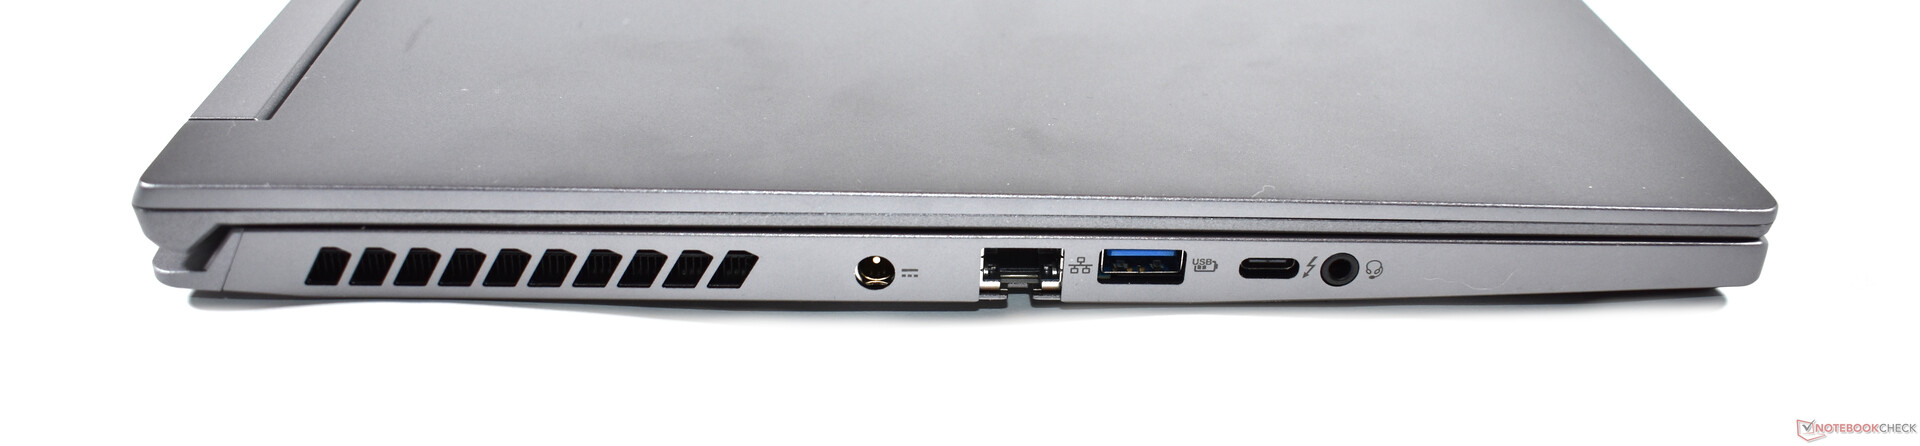
The connection equipment is impressive. There is practically everything you might need these days. In addition to HDMI and two USB-A ports, the Acer Predator Triton 500 SE also offers RJ45 Ethernet and a full-size SD card reader. Another positive point is the fact that the connections are distributed over the two sides. On the other hand, the position of the proprietary charging port in the center is less than ideal, and we would have preferred if this connection was positioned further in the back.
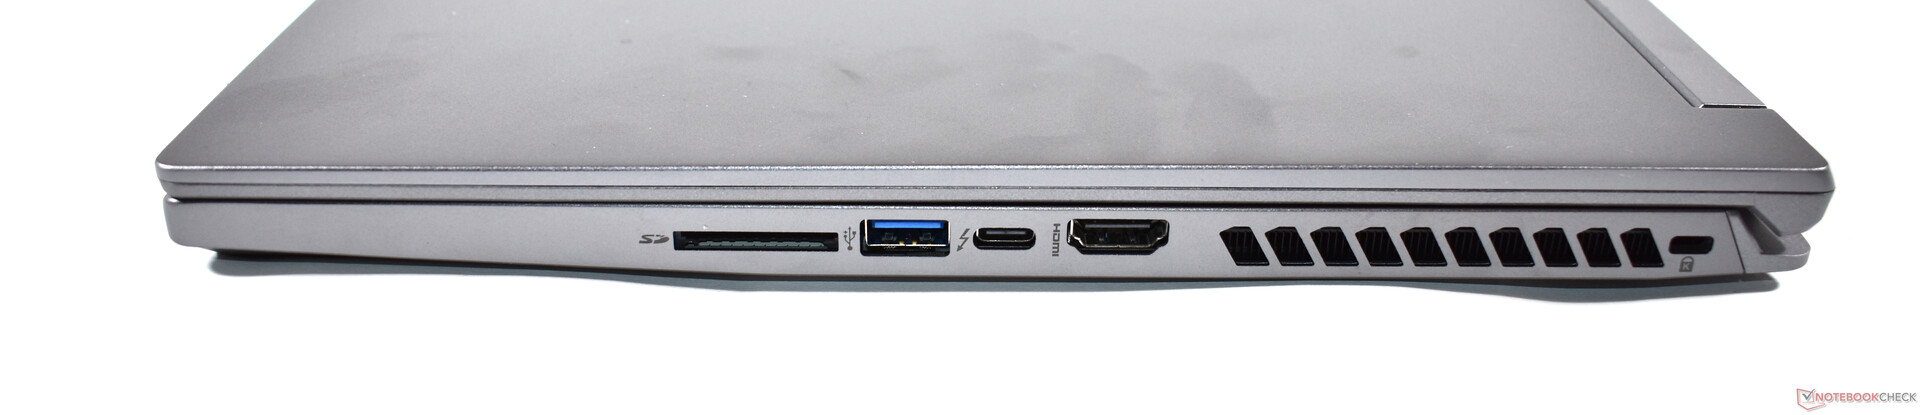
SD Card Reader
Since SD cards cannot be inserted fully into the card reader on the right side, it is not suited for usage as permanent storage expansion. As measured with the AV Pro V60 storage card, the SD card reader performance in the benchmarks is average.
| SD Card Reader | |
| average JPG Copy Test (av. of 3 runs) | |
| Razer Blade 17 RTX 3080 Ti (AV Pro V60) | |
| Average of class Gaming (20.9 - 210, n=53, last 2 years) | |
| MSI GE76 Raider (AV PRO microSD 128 GB V60) | |
| Acer Predator Triton 500 SE PT516-52s-70KX (AV PRO microSD 128 GB V60) | |
| maximum AS SSD Seq Read Test (1GB) | |
| Razer Blade 17 RTX 3080 Ti (AV Pro V60) | |
| Average of class Gaming (25.5 - 261, n=50, last 2 years) | |
| Acer Predator Triton 500 SE PT516-52s-70KX (AV PRO microSD 128 GB V60) | |
Communication
In addition to the RJ45 connection, which is a 2.5 Gigabit Ethernet port, the Acer Predator Triton 500 SE offers a Wi-Fi module of the most current generation. The Killer AX1675 is a 2x2 card with Wi-Fi 6E.
In our benchmarks that are limited to Wi-Fi 6, the card delivers up to 1664 Mbit/s. The absolutely stable performance while receiving stands out. On the other hand, the performance varies while sending data.
| Networking | |
| iperf3 transmit AXE11000 | |
| Acer Predator Triton 500 SE PT516-52s-70KX | |
| Average of class Gaming (560 - 1862, n=89, last 2 years) | |
| iperf3 receive AXE11000 | |
| Acer Predator Triton 500 SE PT516-52s-70KX | |
| Average of class Gaming (680 - 1745, n=89, last 2 years) | |
| iperf3 receive AX12 | |
| Lenovo Legion 5 Pro 16 G7 i7 RTX 3070Ti | |
| Razer Blade 17 RTX 3080 Ti | |
| MSI GE76 Raider | |
| iperf3 transmit AX12 | |
| Lenovo Legion 5 Pro 16 G7 i7 RTX 3070Ti | |
| MSI GE76 Raider | |
| Razer Blade 17 RTX 3080 Ti | |
Webcam
The display frame above the screen contains a webcam with a resolution of 2 Megapixels. While its image is better than those of typical 720p webcams, it is still far from the quality of a selfie camera in a smartphone.


Accessories
Besides the 230-Watt power supply with a proprietary connector, there are no additional included accessories.
Maintenance
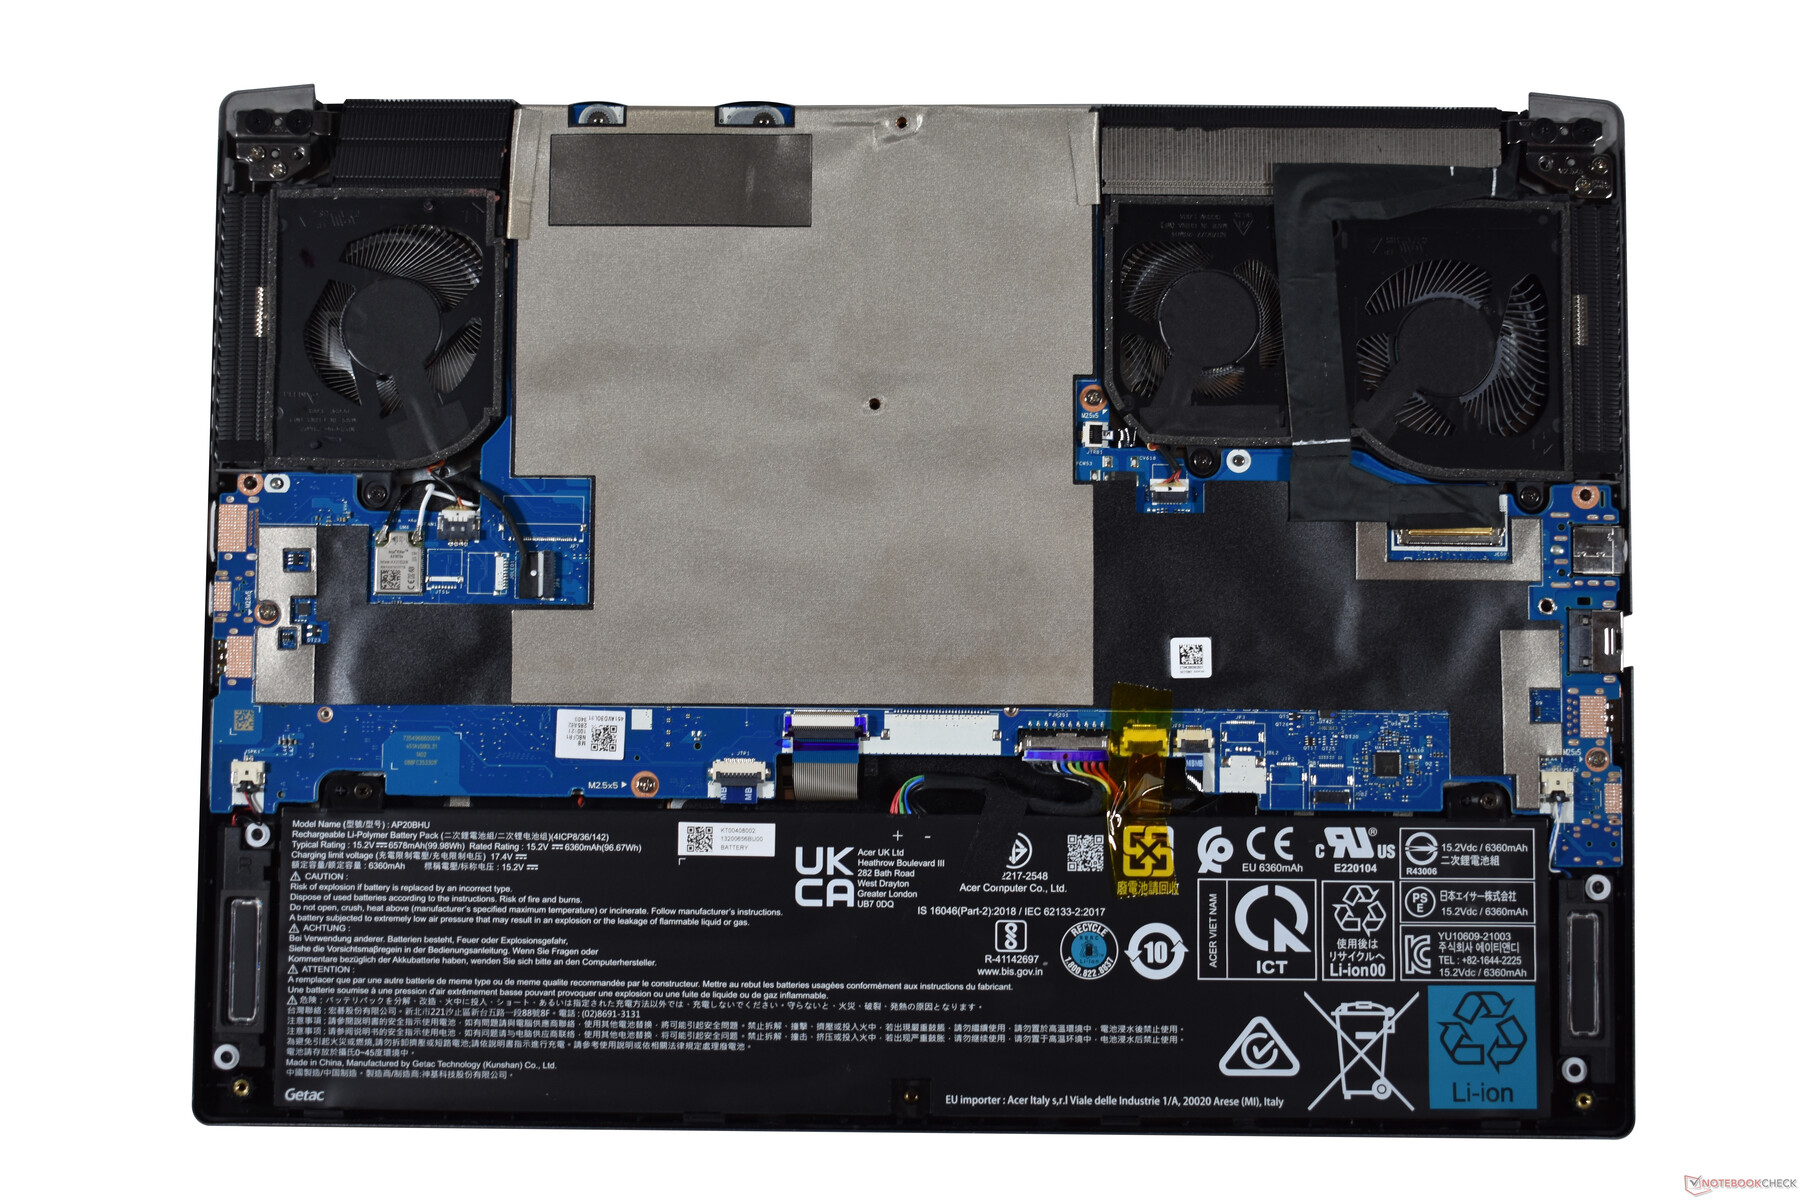
In order to access the components inside the Acer laptop, you first have to remove 8 Torx screws at the bottom of the case. The bottom plate is also secured by additional clips that are best loosened carefully with a plastic prying tool. To do that, the Ethernet port offers itself as a place to start. You only need to open the plastic clips on the sides and in front, and the clips on the back will then automatically loosen when you remove the bottom plate.
However, you might as well save the effort, since you don't really have a lot of options in changing the inside components of the Acer Predator Triton 500 SE. The working memory is soldered in, and the SSD cannot be accessed without first removing the mainboard. But at least you can replace the battery, and the fans are also accessible for cleaning.
Warranty
The Acer Predator Triton 500 SE is offered with two years of pickup & return warranty. So in the case of a defect, the Acer laptop is being picked up and repaired in a repair shop.
Input Devices: Acer Predator offers a good touchpad
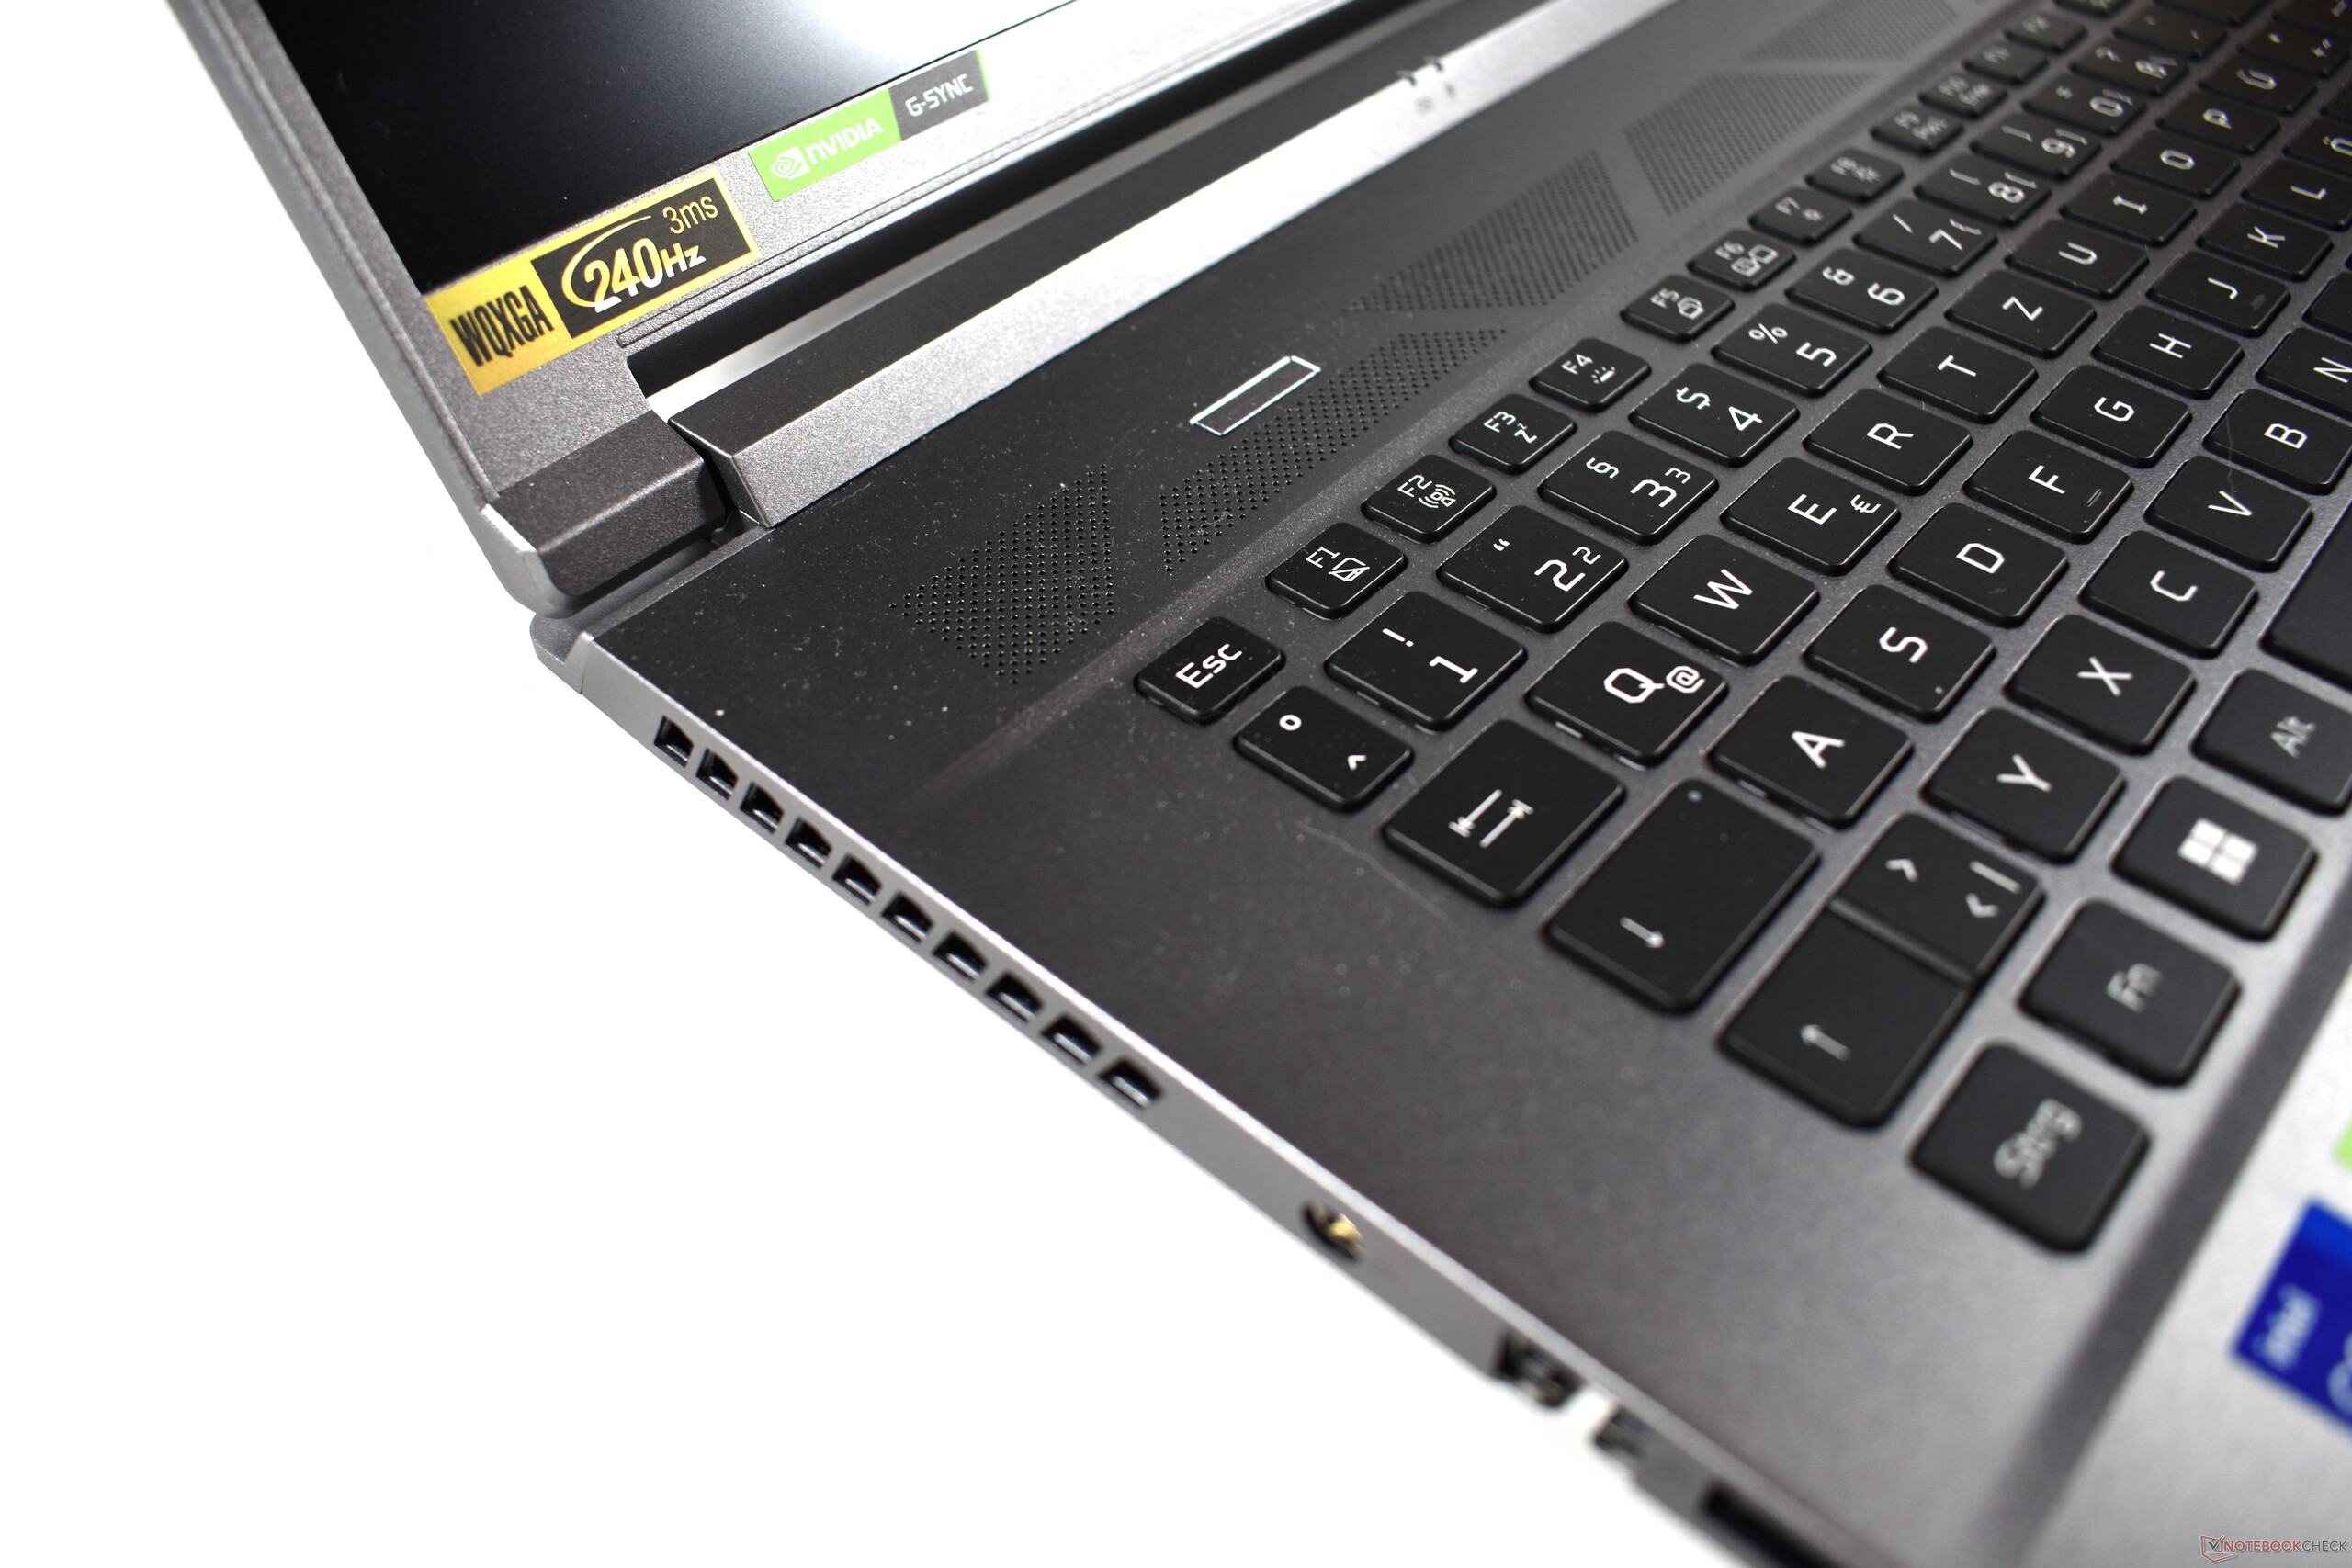
Keyboard
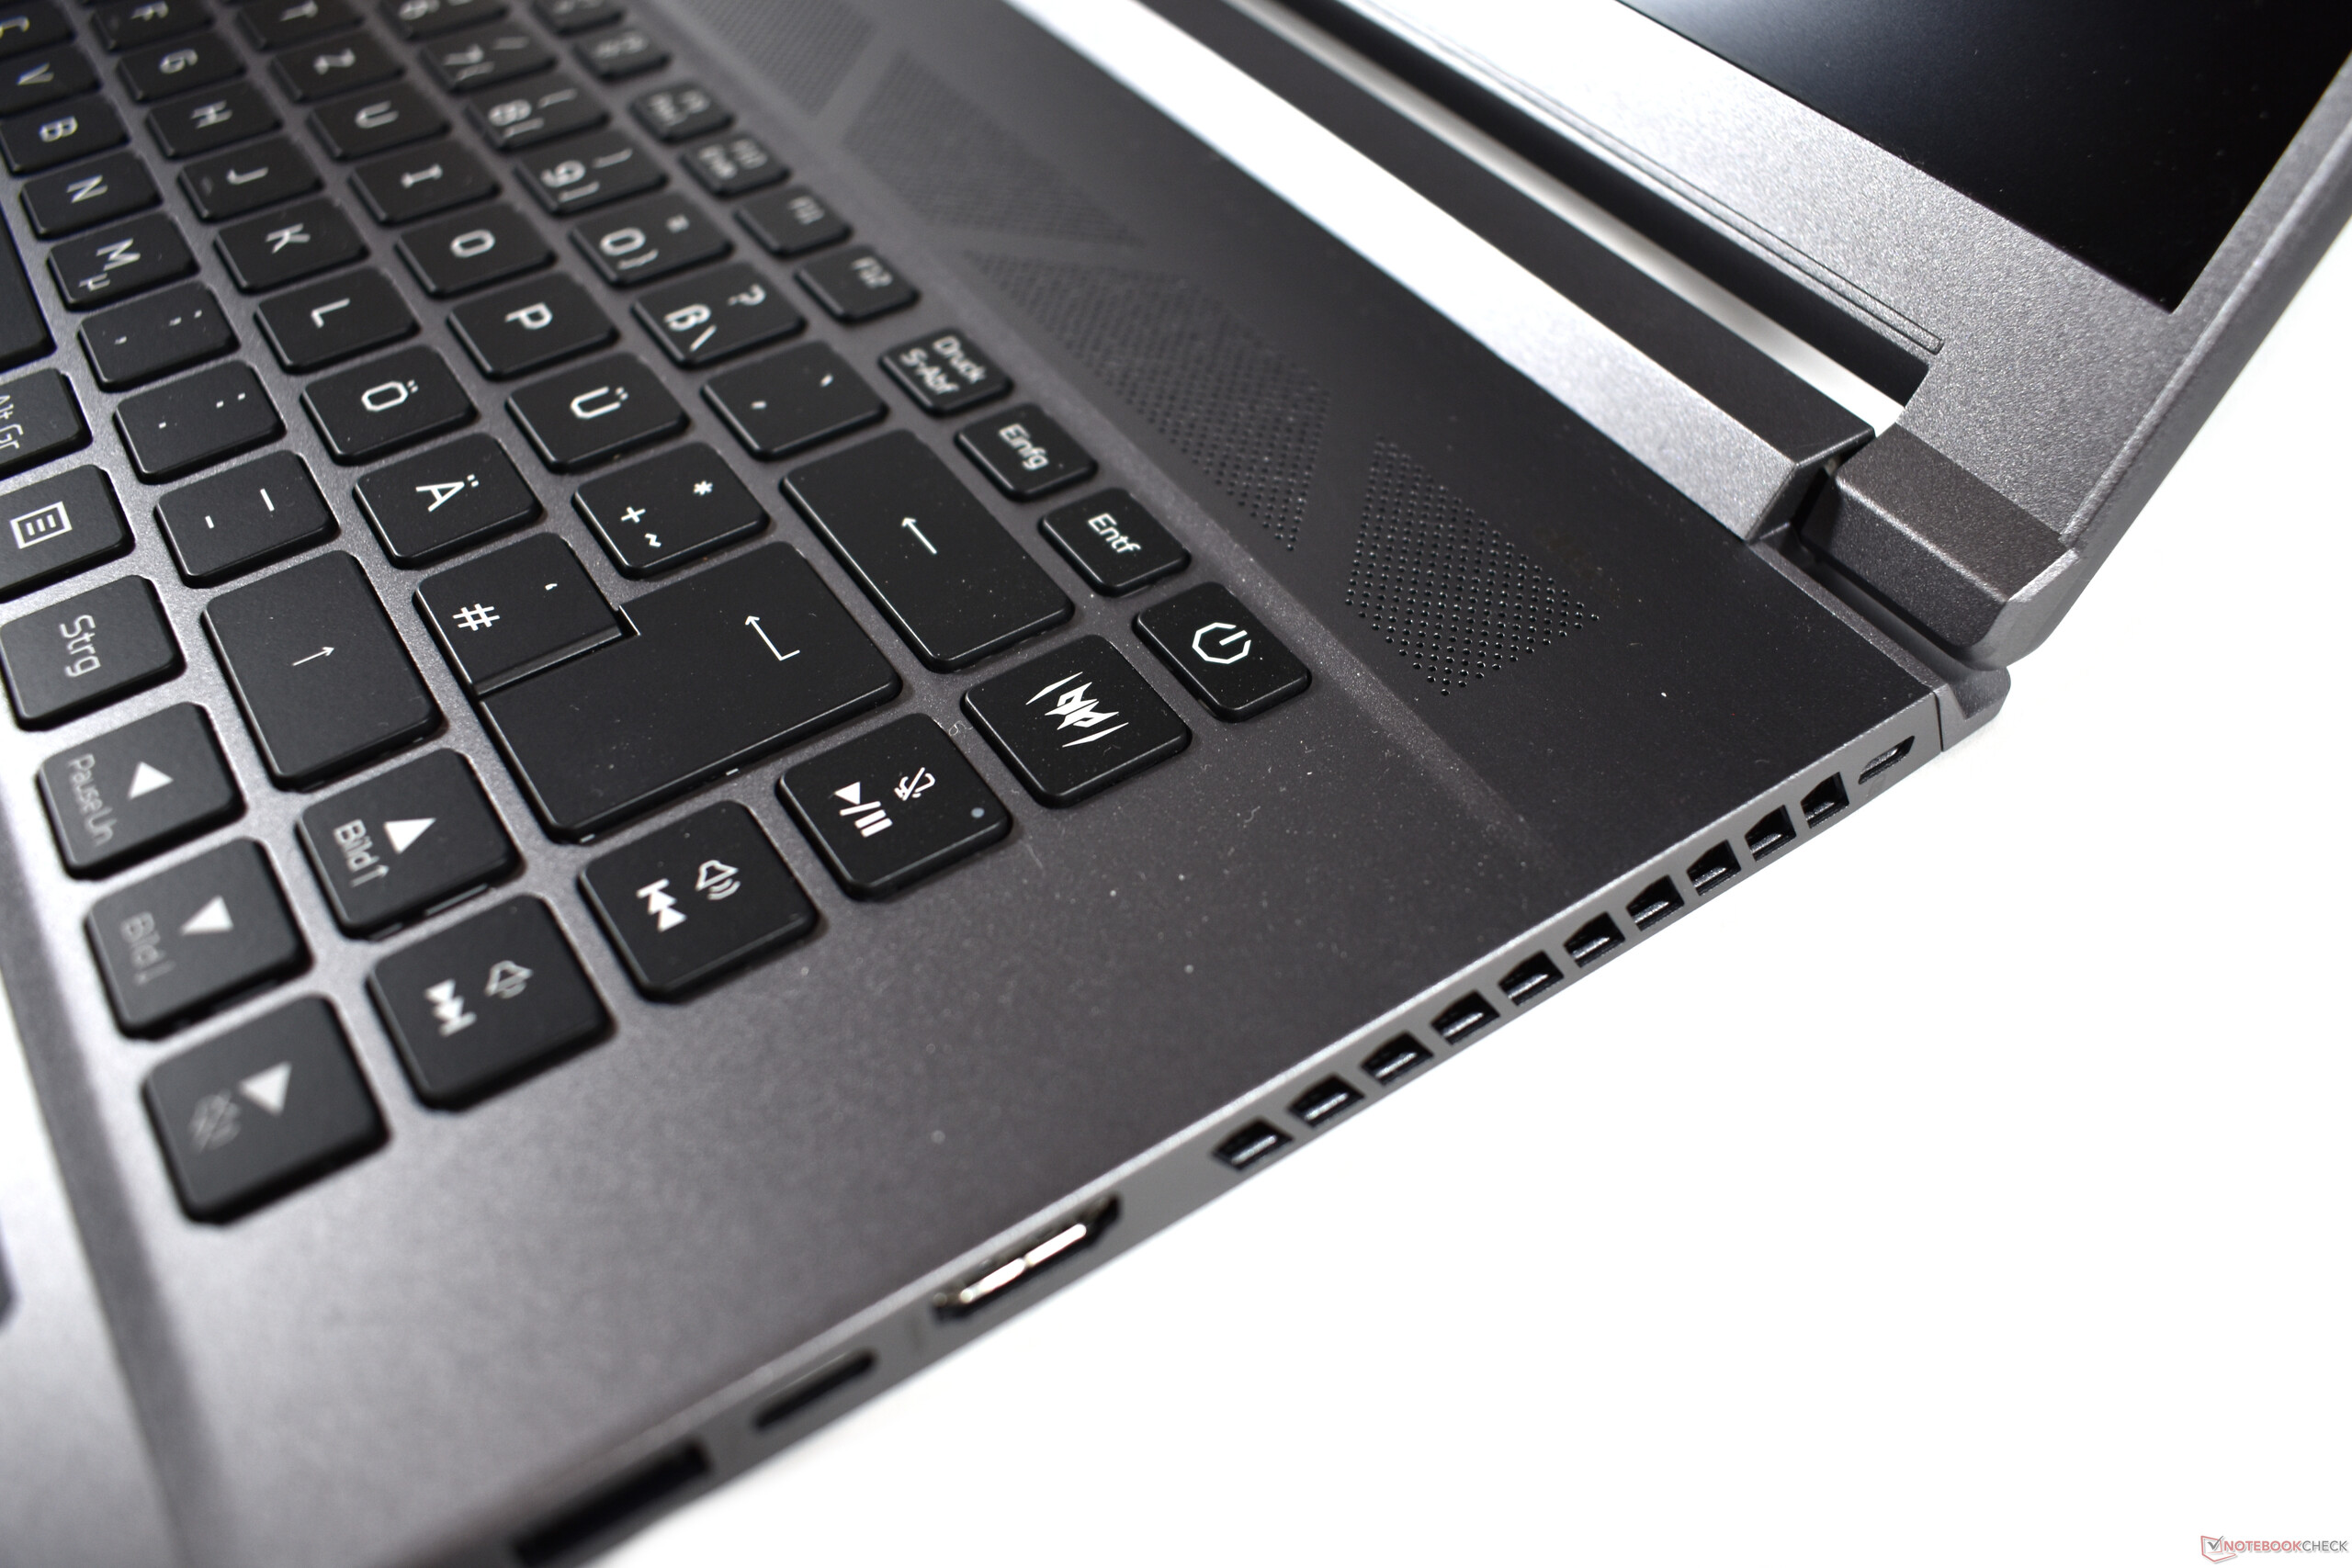
Acer uses a keyboard in the chiclet style and a layout with six key rows. Interestingly, Acer forgoes adding a number block in the Predator Triton 500 SE as we usually see in larger laptops. This also means that the keyboard is placed in the center of the case, which is ergonomically comfortable. Another positive point are the regular-size arrow keys. On the other hand, the right Shift key has to be smaller to allow for this, which is annoying when you are trying to use it. The special keys to the right of the Enter key are also unusual. Since the rest of the keyboard turns out slightly smaller because of them, this can also become a cause of more frequent typing errors.
We estimate that the black keys offer a stroke of about 1.5 mm (~0.06 in). The typing experience is good, and the keys offer a comfortable pressure point and resistance, without feeling spongy. While the typing experience is not the absolute top of the line, it is still sufficient for everyday typing tasks.
We should mention the background illumination as a relevant special function. By default, it is blue throughout, and it can be adjusted in four steps. Using the preinstalled PredatorSense software, the colors can be adjusted very freely, and you can also activate various effects such as a slow blinking or a wave effect in rainbow colors.
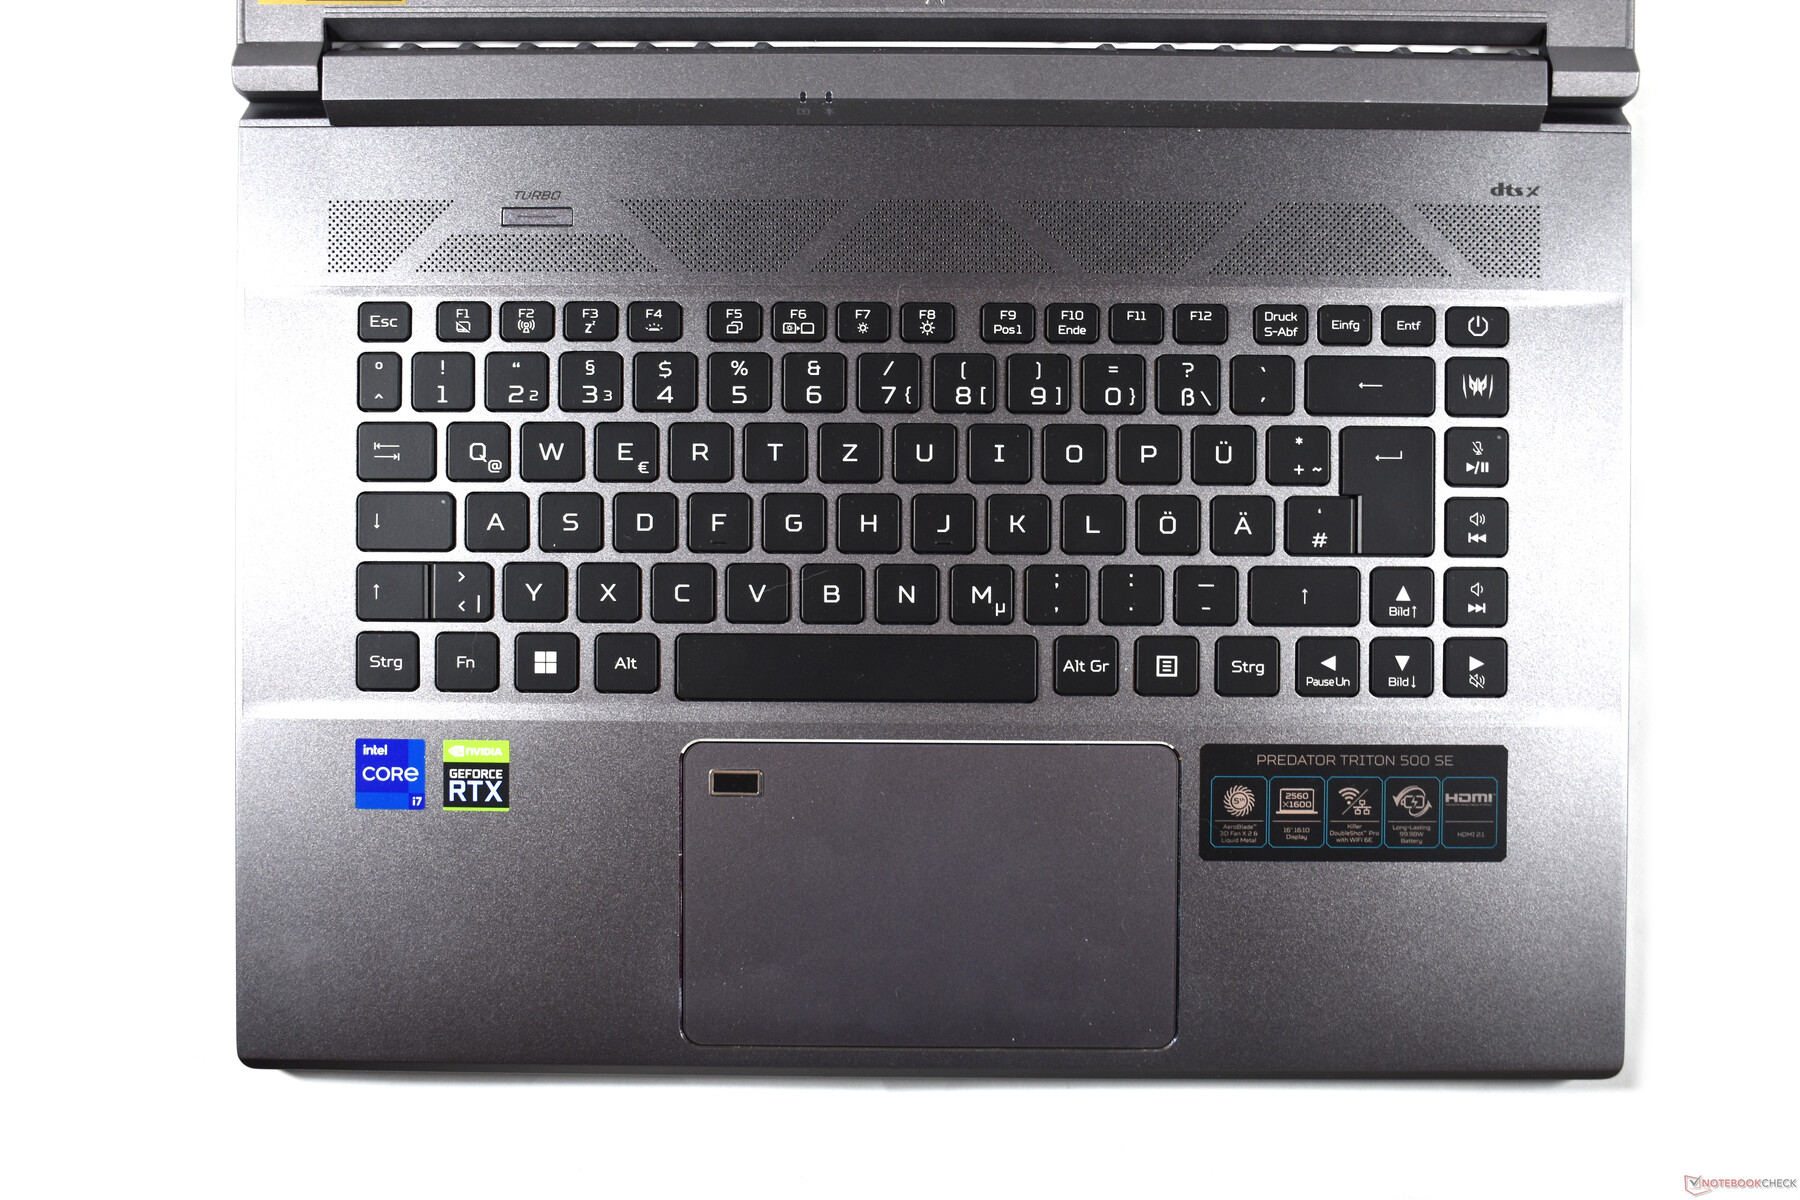
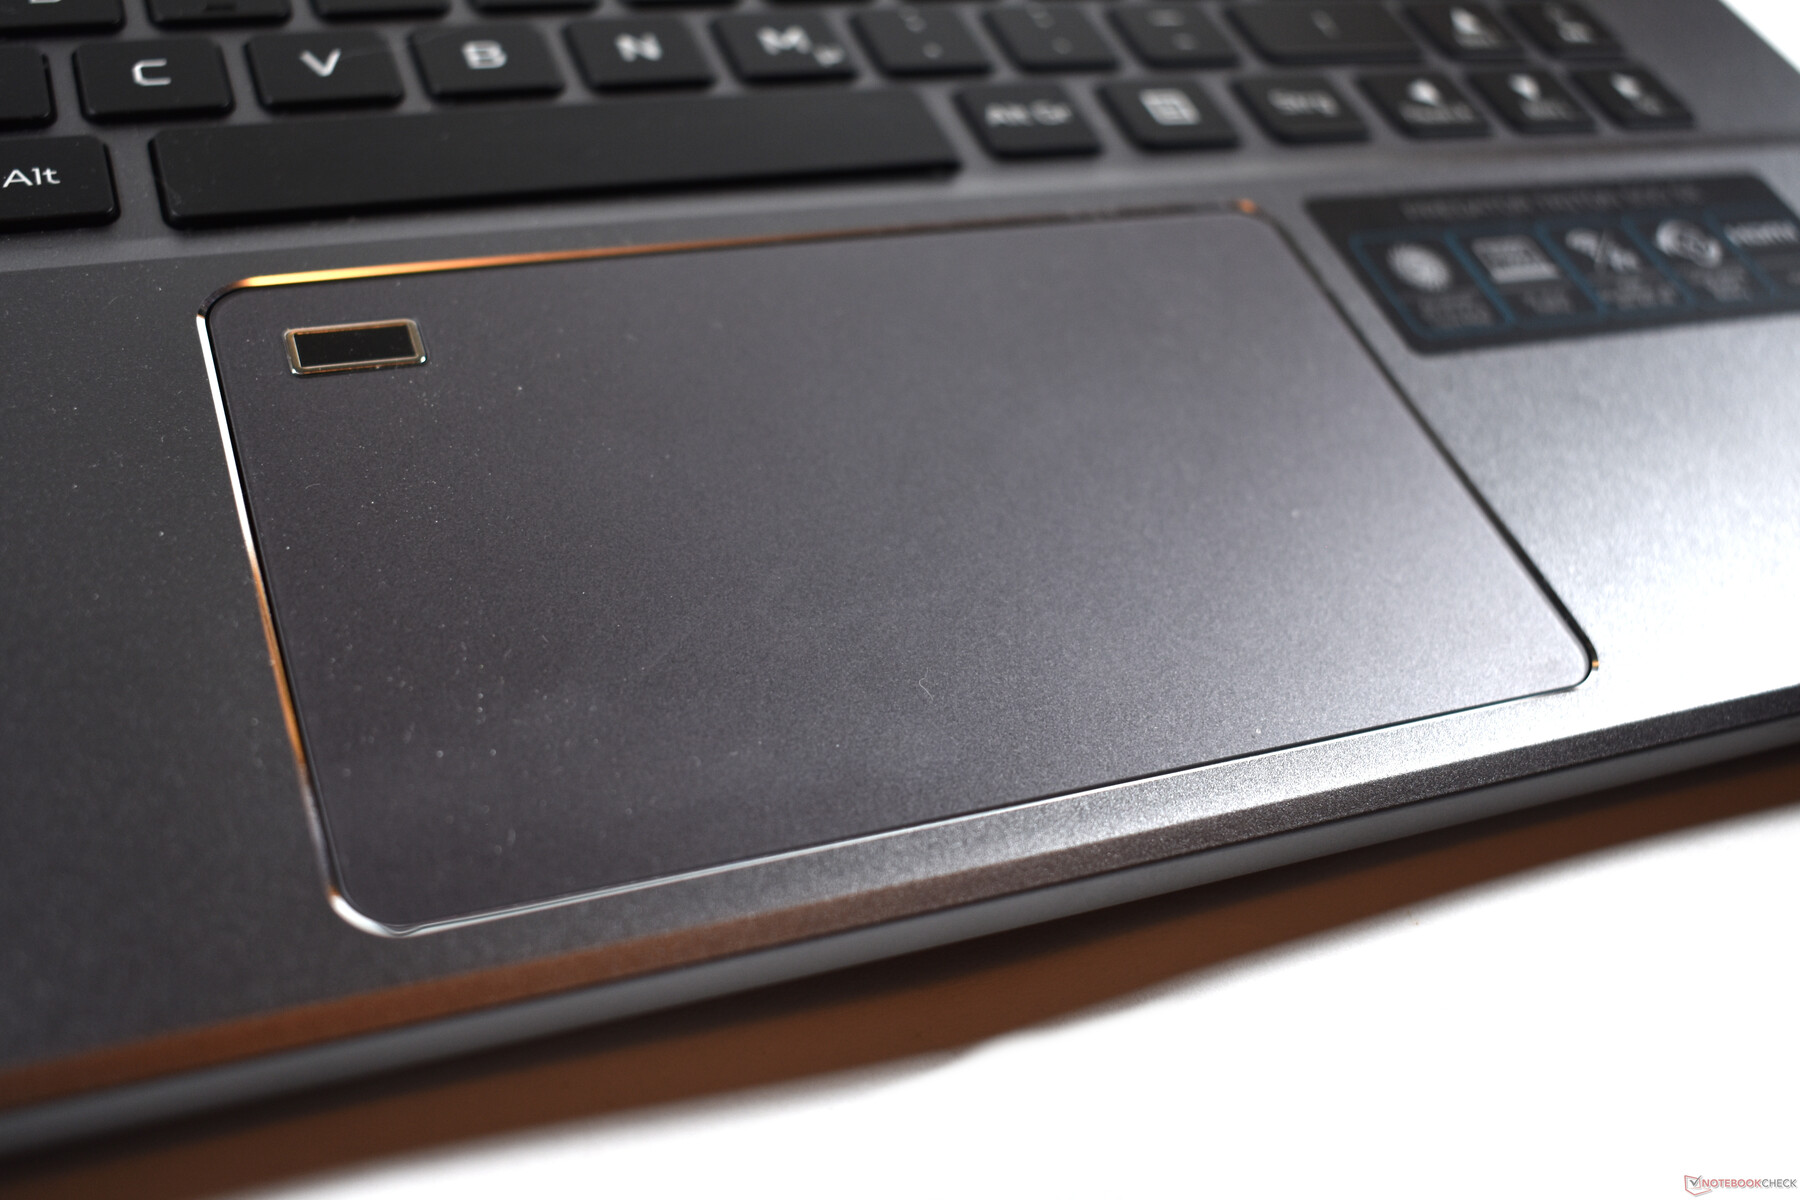
Touchpad
The touchpad of the Acer Predator measures 12.5 x 8 cm (~4.9 x 3.15 in), which is quite a massive size. The surface is smooth but not slippery. Thanks to its good sliding characteristics, the mouse pointer can be controlled without any effort, and the software implementation is also accurate.
The touchpad is a ClickPad, and correspondingly, you can press down on the surface at the bottom area. The mechanics are quiet, and clicks have a clearly defined pressure point. This is a high-quality implementation.
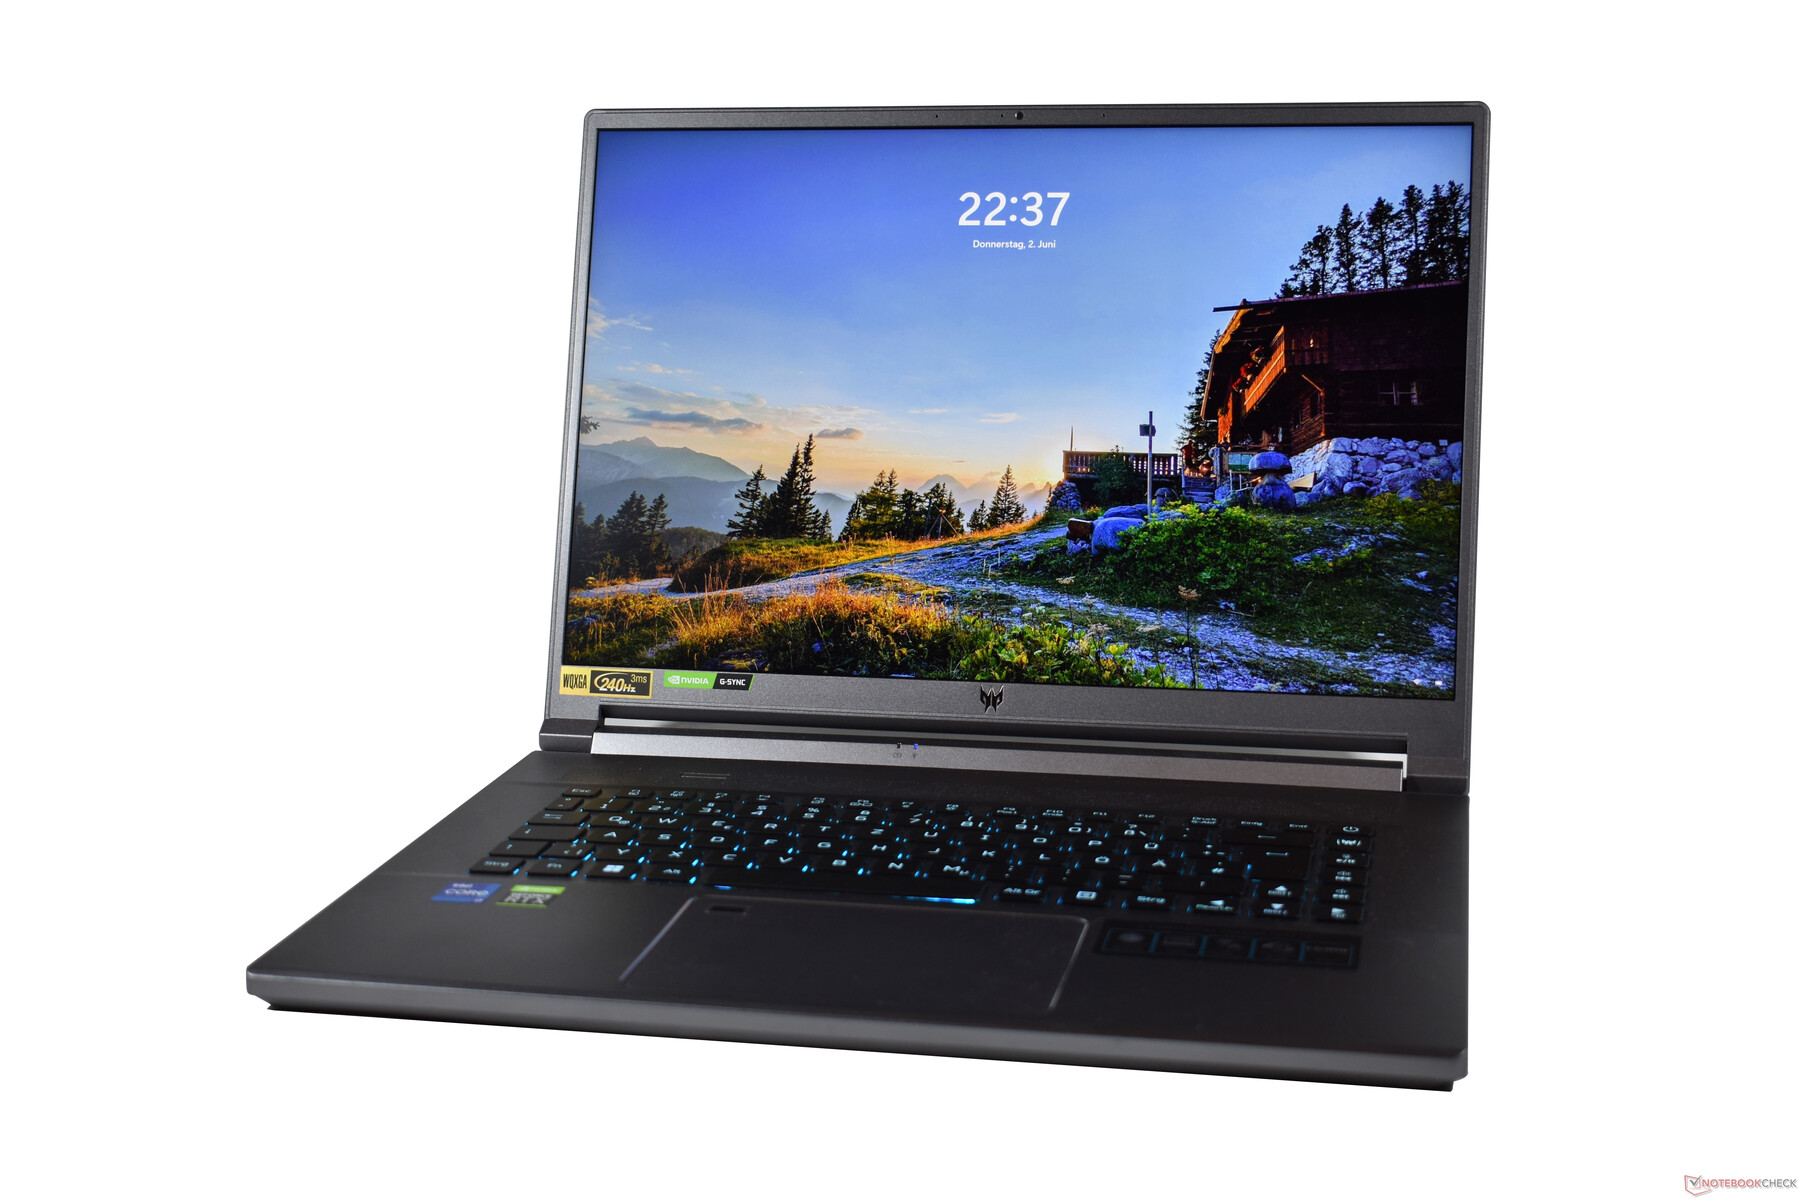
Display: Acer pleases gamer hearts with a 240-Hz LCD
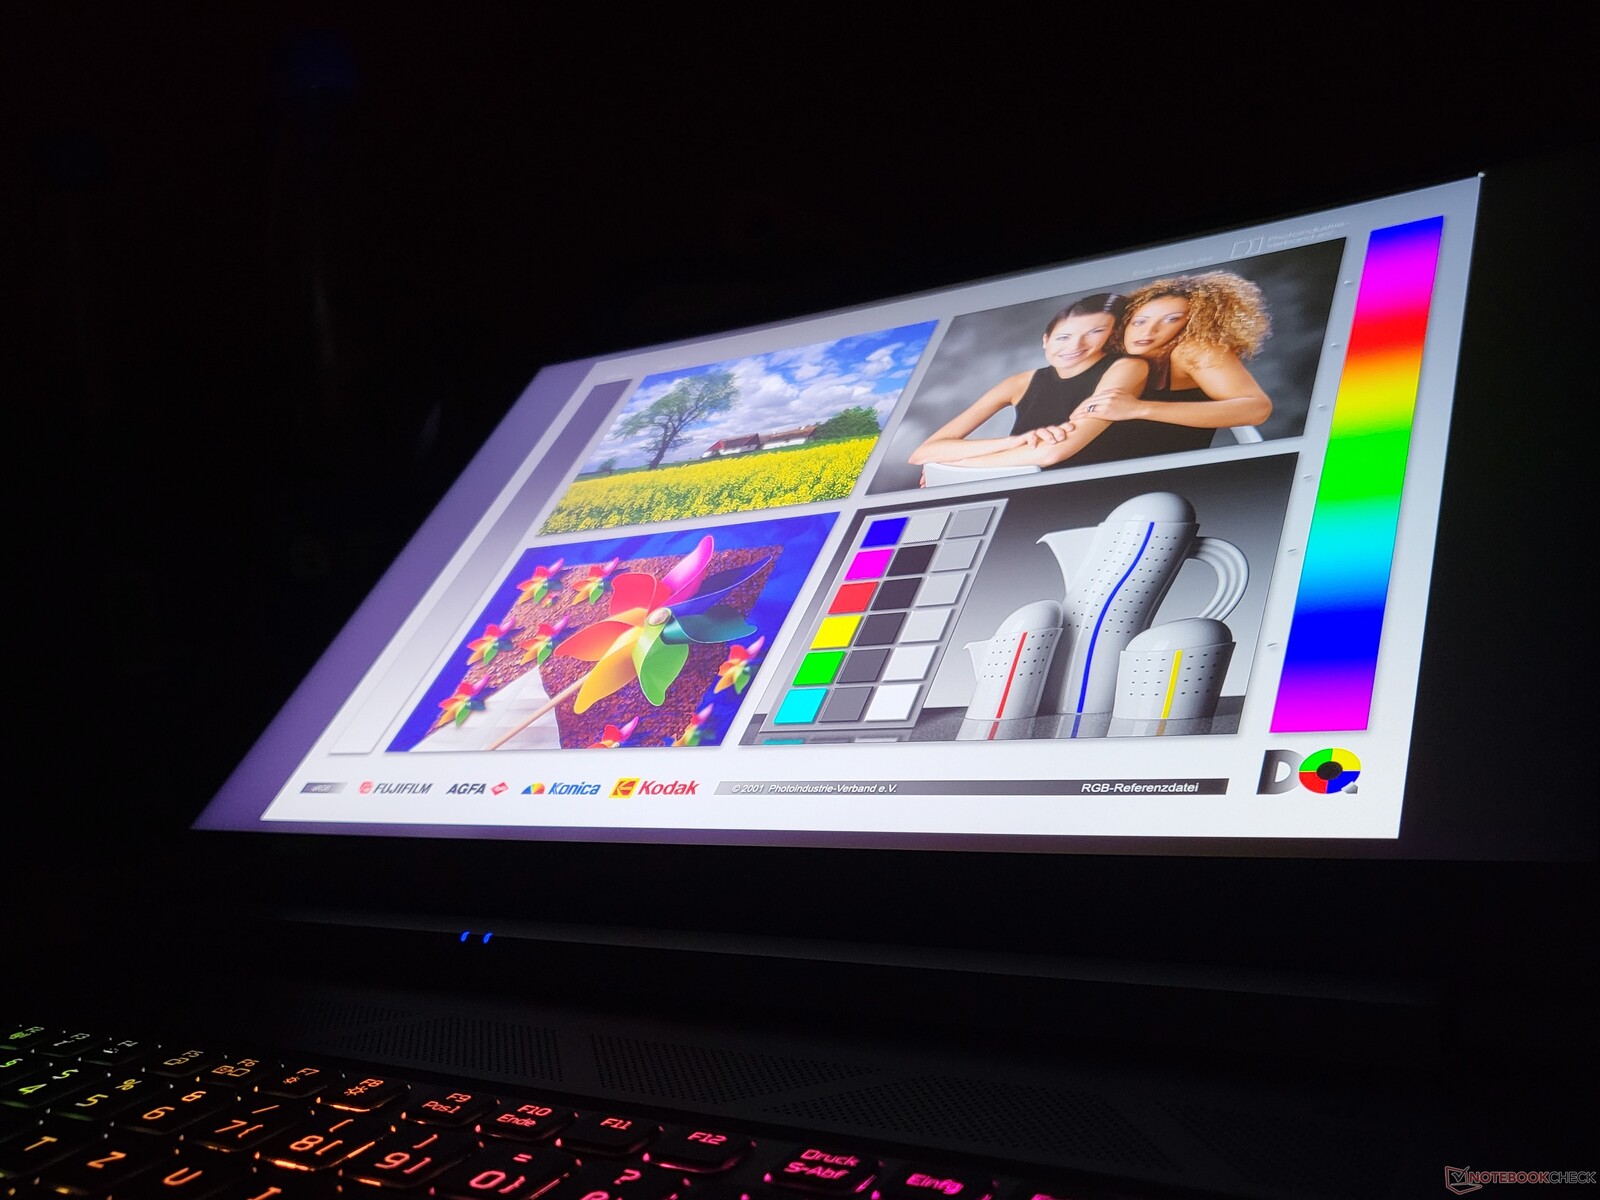
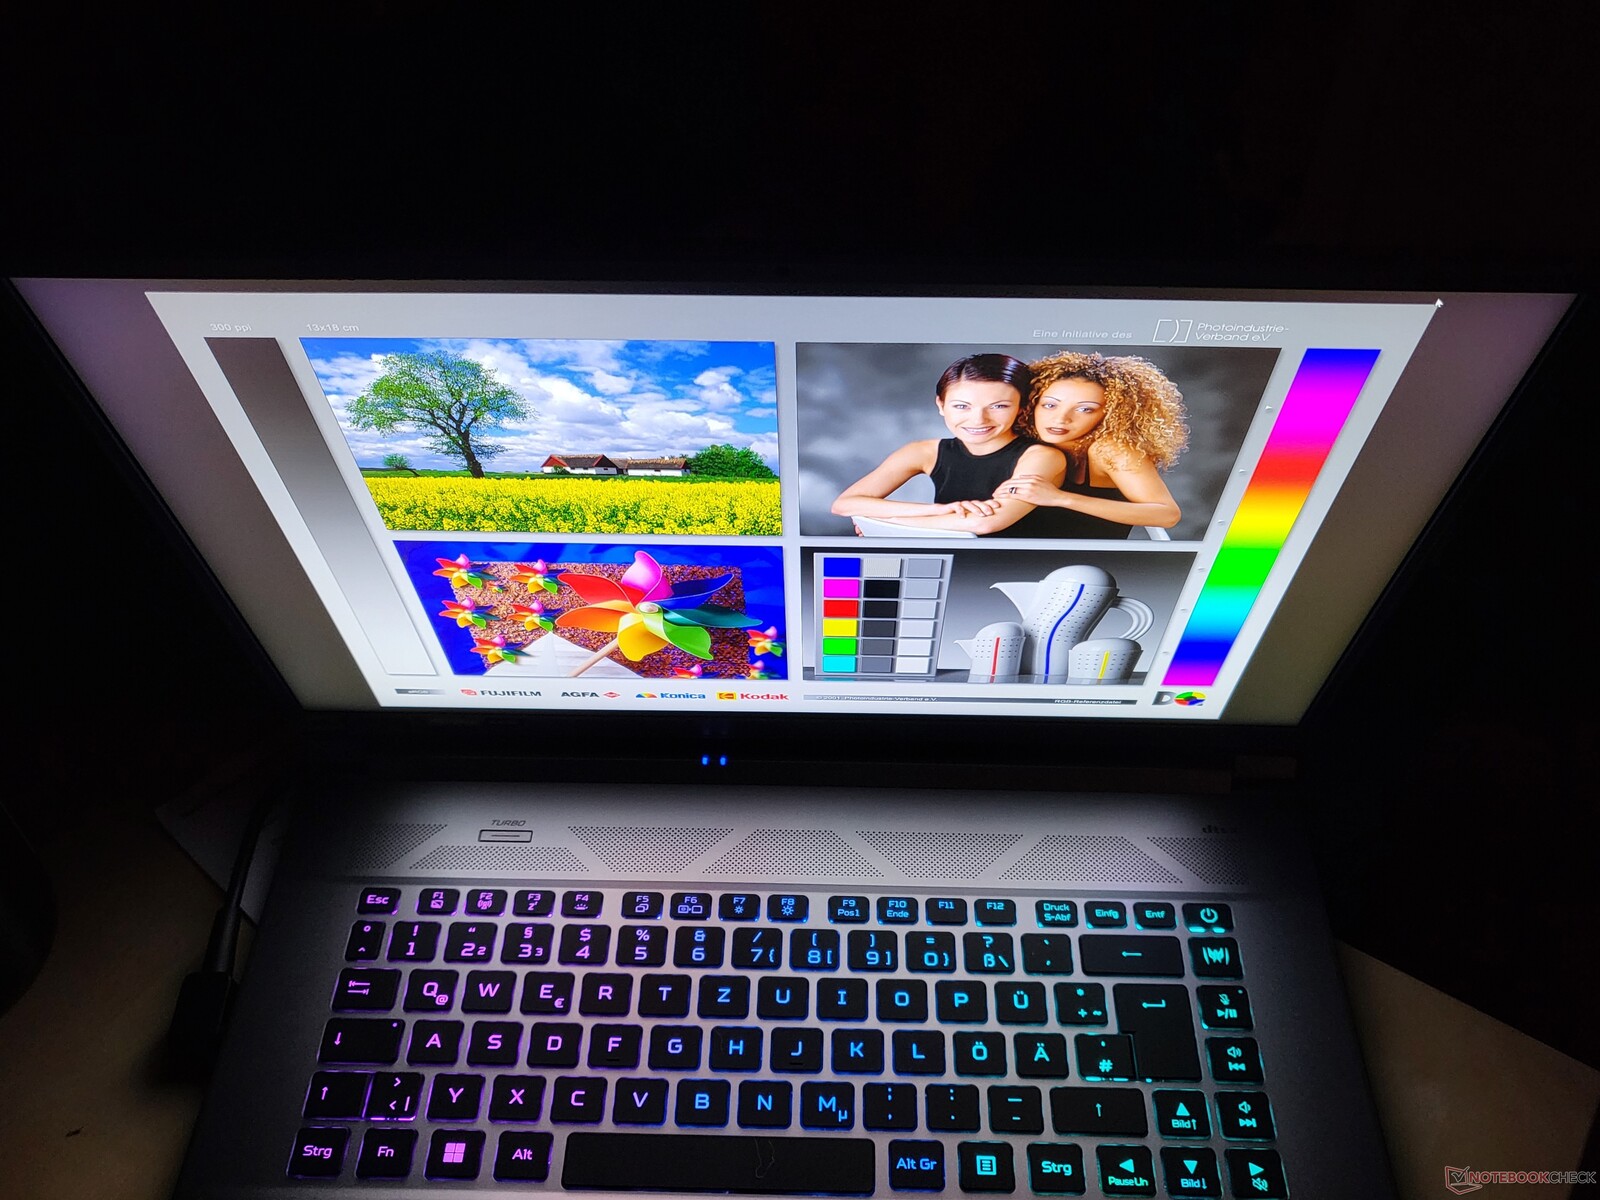
The Acer Predator Triton 500 SE is always equipped with the same display: a 16-inch IPS LCD in the 16:10 format that offers a resolution of 2560 x 1600 pixels (QHD and 2.5k). Acer does not offer a 4K UHD display in this laptop.
On the other hand, the panel used here also offers some other advantages such as the high brightness, for example. Acer specifies 500 cd/m², and this is also the top value we measure. The panel has a 468 cd/m² average brightness, which is particularly due to the brightness decreasing significantly at the bottom edge of the display. However, there is no visible shading that can be noticed with the bare eye. In this regard, only the Lenovo Legion 5 Pro is able to keep up with the Acer Predator in our direct comparison.
The response times of the display also turn out very good. In addition, the display offers a refresh rate of 240 Hz, which makes movements look absolutely smooth.
| |||||||||||||||||||||||||
Brightness Distribution: 80 %
Center on Battery: 498 cd/m²
Contrast: 1383:1 (Black: 0.36 cd/m²)
ΔE ColorChecker Calman: 1.77 | ∀{0.5-29.43 Ø4.72}
calibrated: 0.63
ΔE Greyscale Calman: 2.4 | ∀{0.09-98 Ø4.97}
84.9% AdobeRGB 1998 (Argyll 3D)
100% sRGB (Argyll 3D)
97.3% Display P3 (Argyll 3D)
Gamma: 2.14
CCT: 7046 K
| Acer Predator Triton 500 SE PT516-52s-70KX NE160QDM-NZ2, IPS LED, 2560x1600, 16" | Razer Blade 17 RTX 3080 Ti BOE NE173QHM-NZ1, IPS, 2560x1440, 17.3" | Lenovo Legion 5 Pro 16 G7 i7 RTX 3070Ti NE160QDM-NY1, IPS, 2560x1600, 16" | MSI GE76 Raider AU Optronics B173HAN05.4 (AUOE295), IPS-Level, 1920x1080, 17.3" | |
|---|---|---|---|---|
| Display | 1% | -16% | -21% | |
| Display P3 Coverage (%) | 97.3 | 98.7 1% | 68.7 -29% | 63.1 -35% |
| sRGB Coverage (%) | 100 | 99.9 0% | 97.6 -2% | 94 -6% |
| AdobeRGB 1998 Coverage (%) | 84.9 | 86.2 2% | 70.9 -16% | 65.2 -23% |
| Response Times | -53% | -24% | 5% | |
| Response Time Grey 50% / Grey 80% * (ms) | 13.8 ? | 17.6 ? -28% | 17.6 ? -28% | 5.6 ? 59% |
| Response Time Black / White * (ms) | 6.4 ? | 11.4 ? -78% | 7.6 ? -19% | 9.6 ? -50% |
| PWM Frequency (Hz) | ||||
| Screen | -18% | -18% | -3% | |
| Brightness middle (cd/m²) | 498 | 335.9 -33% | 502 1% | 290 -42% |
| Brightness (cd/m²) | 468 | 294 -37% | 491 5% | 290 -38% |
| Brightness Distribution (%) | 80 | 75 -6% | 91 14% | 96 20% |
| Black Level * (cd/m²) | 0.36 | 0.38 -6% | 0.37 -3% | 0.23 36% |
| Contrast (:1) | 1383 | 884 -36% | 1357 -2% | 1261 -9% |
| Colorchecker dE 2000 * | 1.77 | 2.82 -59% | 2.7 -53% | 1.59 10% |
| Colorchecker dE 2000 max. * | 5.24 | 5.04 4% | 4.5 14% | 3.17 40% |
| Colorchecker dE 2000 calibrated * | 0.63 | 1.4 -122% | 0.87 -38% | |
| Greyscale dE 2000 * | 2.4 | 1.7 29% | 2.7 -13% | 2.5 -4% |
| Gamma | 2.14 103% | 2.14 103% | 2.44 90% | 2.253 98% |
| CCT | 7046 92% | 6382 102% | 6326 103% | 6640 98% |
| Total Average (Program / Settings) | -23% /
-19% | -19% /
-18% | -6% /
-6% |
* ... smaller is better

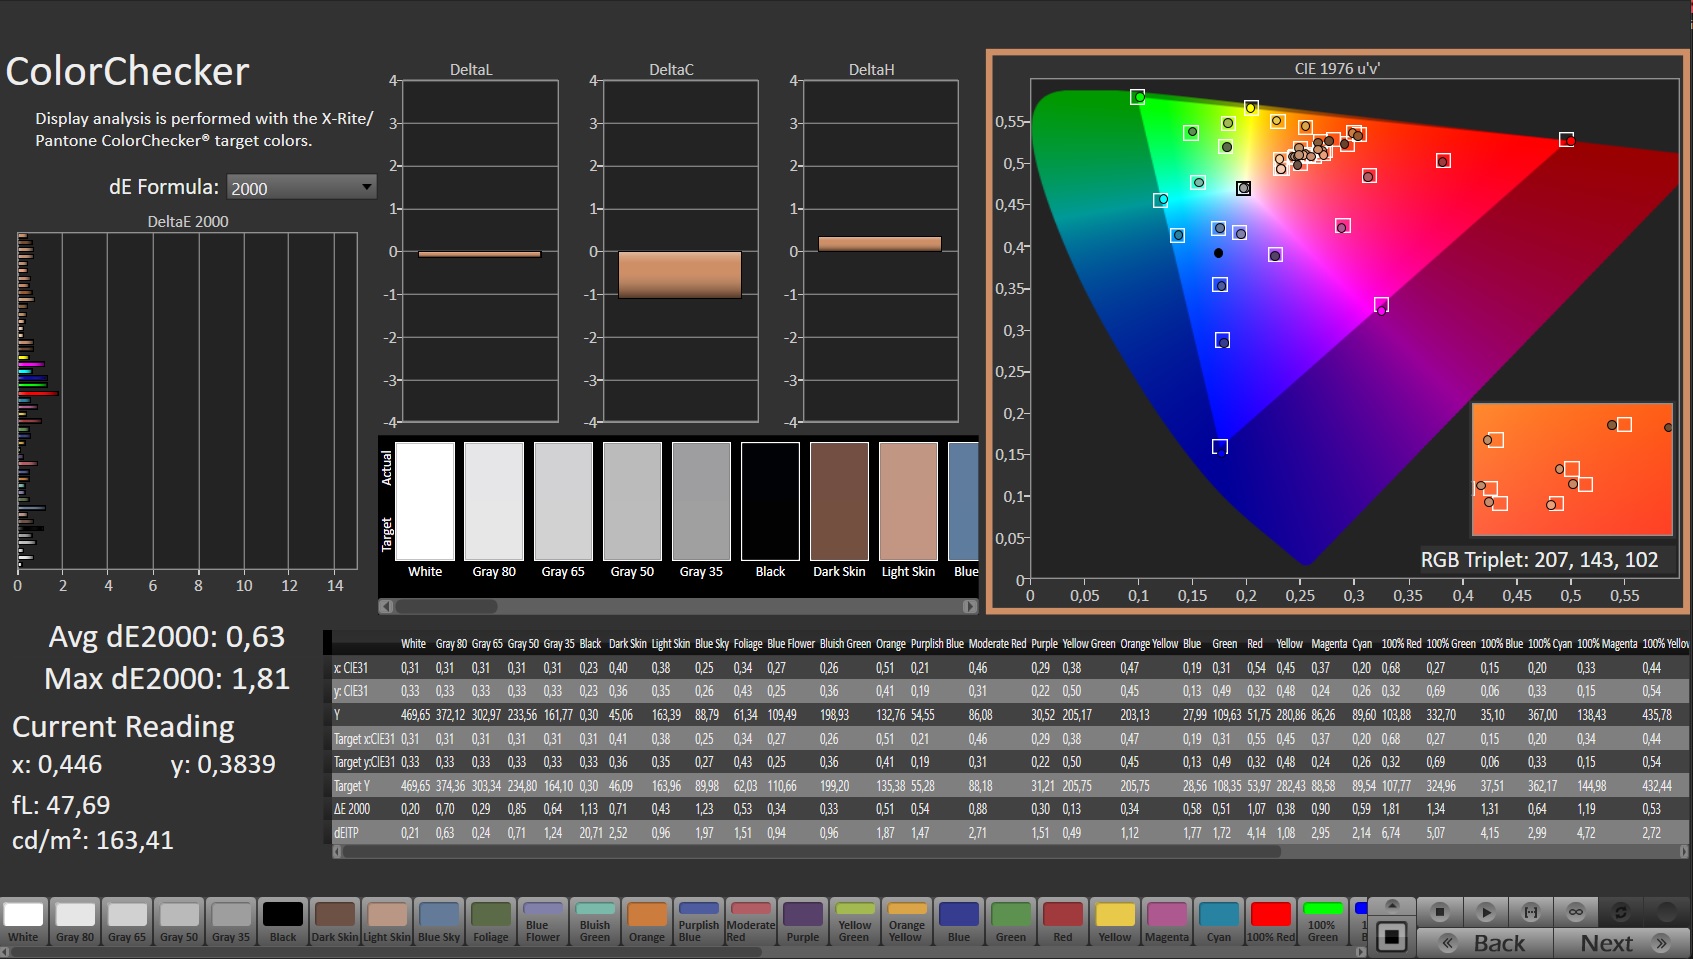
In the state of delivery, the color temperature of the display is slightly too cold, as we measured with the CalMan and the X-Rite i1 Pro 2 Colorimeter. However, this can be remedied by a calibration with the X-Rite i1 Profiler. After the calibration, the color reproduction is fairly accurate. As usual, the color profile we created is available for your free download.
According to Acer, the display is able to cover 100% of the small sRGB color space. Our measurements also confirm this and even more: the display is also able to cover the DCI-P3 color space almost completely. This also makes the Acer Predator Triton 500 SE suited for simple image and video processing.
Because the display offers a matte surface in combination with a high brightness, it is also excellently suited for outdoor usage.
Display Response Times
| ↔ Response Time Black to White | ||
|---|---|---|
| 6.4 ms ... rise ↗ and fall ↘ combined | ↗ 1.8 ms rise | 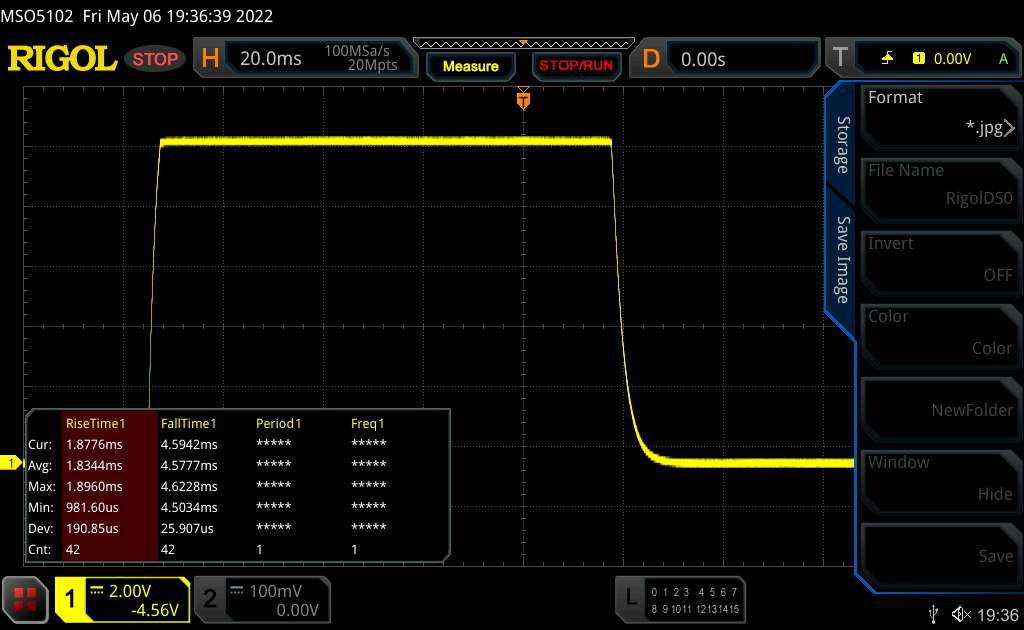 |
| ↘ 4.6 ms fall | ||
| The screen shows very fast response rates in our tests and should be very well suited for fast-paced gaming. In comparison, all tested devices range from 0.1 (minimum) to 240 (maximum) ms. » 20 % of all devices are better. This means that the measured response time is better than the average of all tested devices (19.8 ms). | ||
| ↔ Response Time 50% Grey to 80% Grey | ||
| 13.8 ms ... rise ↗ and fall ↘ combined | ↗ 6.3 ms rise | 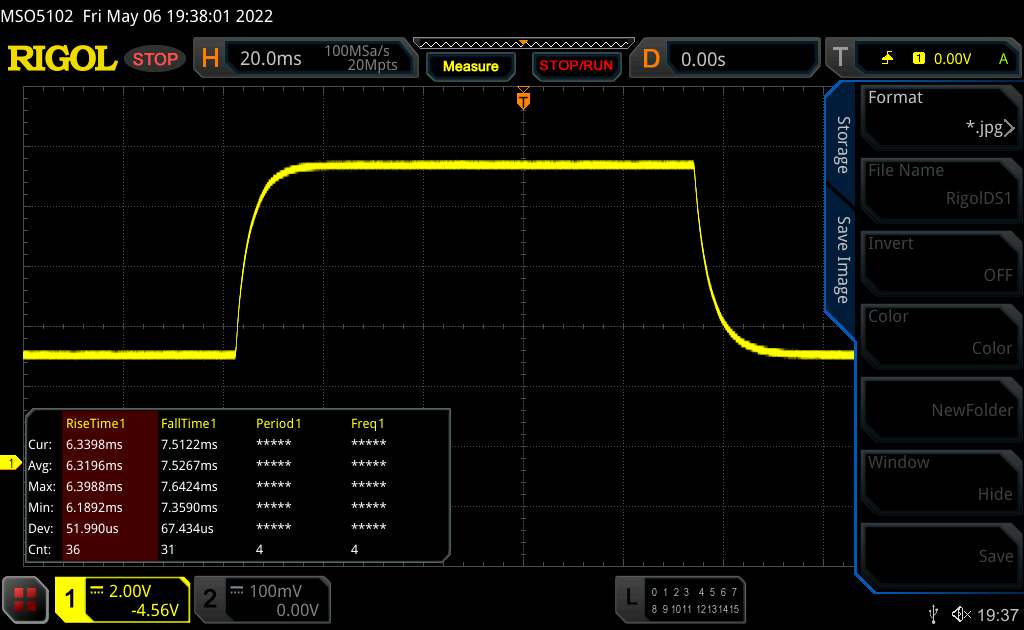 |
| ↘ 7.5 ms fall | ||
| The screen shows good response rates in our tests, but may be too slow for competitive gamers. In comparison, all tested devices range from 0.165 (minimum) to 636 (maximum) ms. » 28 % of all devices are better. This means that the measured response time is better than the average of all tested devices (31 ms). | ||
Screen Flickering / PWM (Pulse-Width Modulation)
| Screen flickering / PWM not detected | 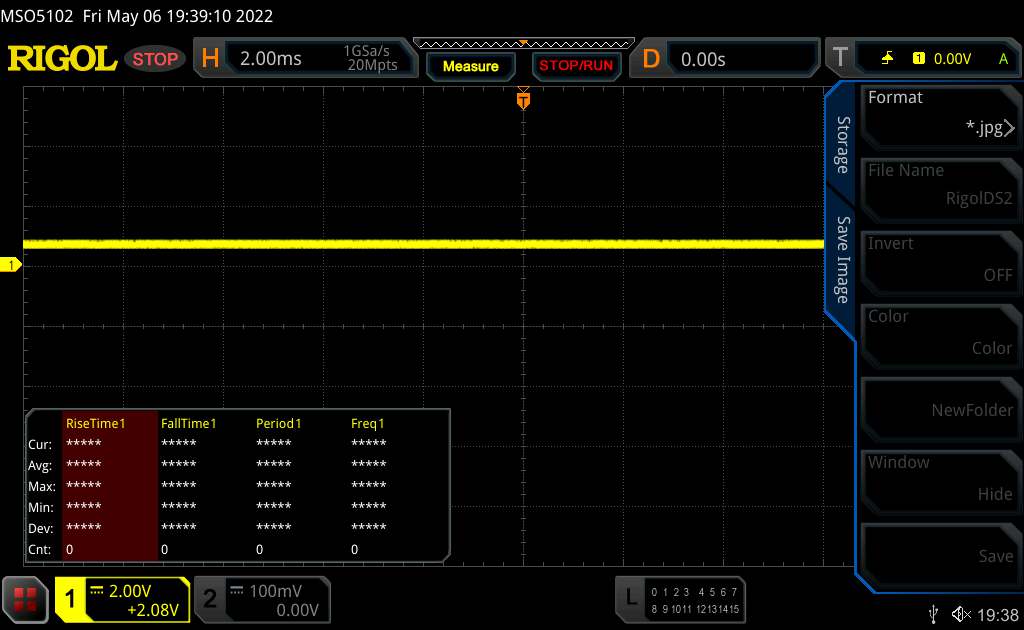 | ||
In comparison: 52 % of all tested devices do not use PWM to dim the display. If PWM was detected, an average of 7753 (minimum: 5 - maximum: 343500) Hz was measured. | |||
Performance: Alder Lake CPU & GeForce RTX 3080 Ti bring a powerful performance
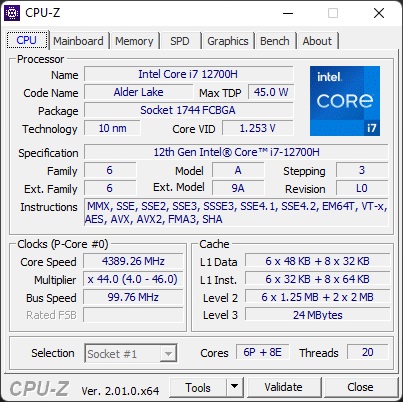
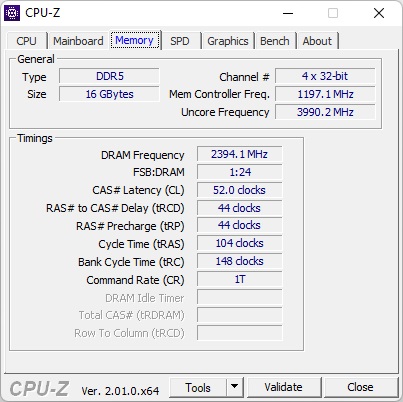
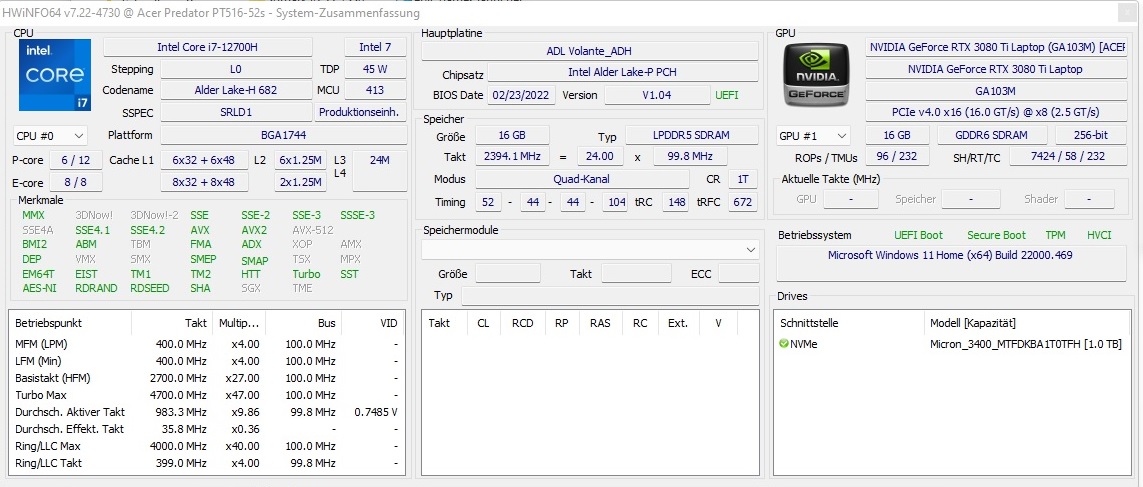
At the time of our test, two versions of the Acer Predator Triton 500 SE are available: one model with an Intel Core i7-12700H and the other with a Core i9-12900H. Being also equipped with the Nvidia GeForce RTX 3080 Ti is common to both models. The i7 model offers 16 GB of RAM, and in the i9, 32 GB LPDDR5-5200 are soldered in. At the same time, the more expensive model with the i9 offers 2 TB of SSD storage, while the Acer laptop with the i7 has a 1-TB SSD.
Test Conditions
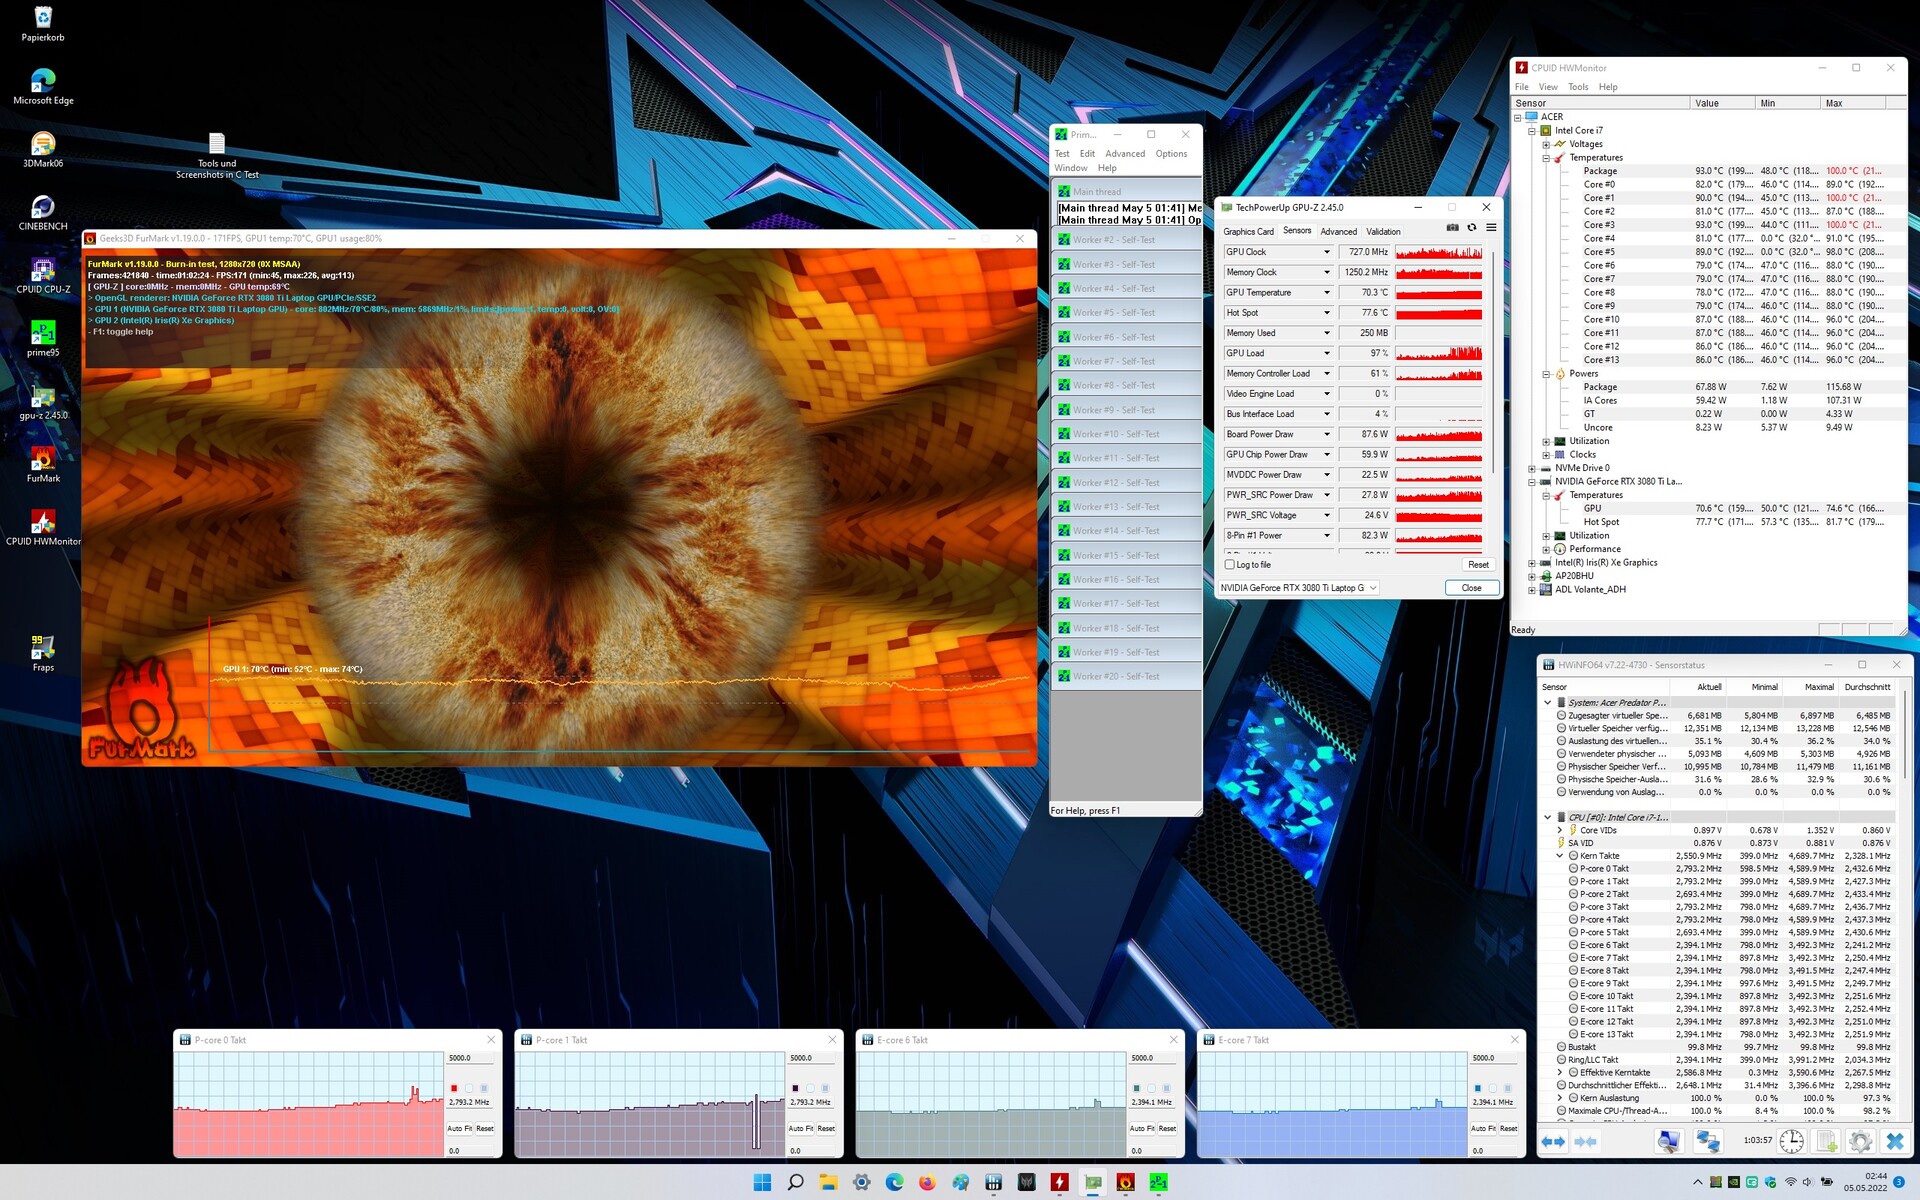
There are various performance modes that you can adjust via the "PredatorSense" software: Silent, Standard, Extreme, and Turbo, with the latter forcing the fan to run constantly at maximum noise level. Our performance tests were run with the Extreme mode, which results in a power limit of 115 watts as the top performance and a constant consumption of 95 watts for the CPU.
Processor
The Intel Core i7-12700H is a processor with a total of 14 cores. Six of them are "large" Performance cores and eight are "small" Efficiency cores according to the hybrid structure of the Alder Lake architecture. The P cores have a maximum clock speed of 4.7 GHz (basic clock speed: 2.4 GHz), and the maximum of the E cores is 3.5 GHz (1.8 GHz). As part of the Alder Lake H series, the i7-12700H has a TDP of 45 watts, with Intel specifying a maximum consumption of 115 watts. You can find additional information and extensive benchmarks in our CPU comparison list.
Acer is able to get a lot of performance from the relatively slim case, and the Razer Blade 17 can clearly be surpassed in the multicore constant performance, while its i7-12800H is only better in the single-core performance. On the other hand, compared to the significantly thicker gaming laptops from Lenovo and MSI, the Acer Predator Triton 500 SE has a disadvantage.
In battery operation, the laptop automatically switches to the Standard performance mode and the faster modes are unavailable. But the performance is also limited additionally, and while the Standard mode allows for a constant consumption of 80 watts during mains operation, it is only 35 watts in battery operation. In the CPU-heavy 3DMark 11 Physics Score, it only achieves 9,142 points in battery operation, instead of 24,020 points (minus 62%).
Cinebench R15 Multi Constant Load Test
* ... smaller is better
AIDA64: FP32 Ray-Trace | FPU Julia | CPU SHA3 | CPU Queen | FPU SinJulia | FPU Mandel | CPU AES | CPU ZLib | FP64 Ray-Trace | CPU PhotoWorxx
| Performance rating | |
| Average of class Gaming | |
| MSI GE76 Raider | |
| Lenovo Legion 5 Pro 16 G7 i7 RTX 3070Ti | |
| Acer Predator Triton 500 SE PT516-52s-70KX | |
| Average Intel Core i7-12700H | |
| Razer Blade 17 RTX 3080 Ti | |
| AIDA64 / FP32 Ray-Trace | |
| Average of class Gaming (10227 - 85542, n=103, last 2 years) | |
| Average Intel Core i7-12700H (2585 - 17957, n=64) | |
| Lenovo Legion 5 Pro 16 G7 i7 RTX 3070Ti | |
| Acer Predator Triton 500 SE PT516-52s-70KX | |
| MSI GE76 Raider | |
| Razer Blade 17 RTX 3080 Ti | |
| AIDA64 / FPU Julia | |
| Average of class Gaming (51376 - 238426, n=103, last 2 years) | |
| Average Intel Core i7-12700H (12439 - 90760, n=64) | |
| Lenovo Legion 5 Pro 16 G7 i7 RTX 3070Ti | |
| Acer Predator Triton 500 SE PT516-52s-70KX | |
| MSI GE76 Raider | |
| Razer Blade 17 RTX 3080 Ti | |
| AIDA64 / CPU SHA3 | |
| Average of class Gaming (2180 - 9817, n=103, last 2 years) | |
| Lenovo Legion 5 Pro 16 G7 i7 RTX 3070Ti | |
| Acer Predator Triton 500 SE PT516-52s-70KX | |
| MSI GE76 Raider | |
| Average Intel Core i7-12700H (833 - 4242, n=64) | |
| Razer Blade 17 RTX 3080 Ti | |
| AIDA64 / CPU Queen | |
| Average of class Gaming (49785 - 173351, n=90, last 2 years) | |
| MSI GE76 Raider | |
| Razer Blade 17 RTX 3080 Ti | |
| Lenovo Legion 5 Pro 16 G7 i7 RTX 3070Ti | |
| Acer Predator Triton 500 SE PT516-52s-70KX | |
| Average Intel Core i7-12700H (57923 - 103202, n=63) | |
| AIDA64 / FPU SinJulia | |
| Average of class Gaming (4424 - 33636, n=103, last 2 years) | |
| MSI GE76 Raider | |
| Lenovo Legion 5 Pro 16 G7 i7 RTX 3070Ti | |
| Acer Predator Triton 500 SE PT516-52s-70KX | |
| Razer Blade 17 RTX 3080 Ti | |
| Average Intel Core i7-12700H (3249 - 9939, n=64) | |
| AIDA64 / FPU Mandel | |
| Average of class Gaming (25115 - 128721, n=103, last 2 years) | |
| Average Intel Core i7-12700H (7135 - 44760, n=64) | |
| Lenovo Legion 5 Pro 16 G7 i7 RTX 3070Ti | |
| Acer Predator Triton 500 SE PT516-52s-70KX | |
| MSI GE76 Raider | |
| Razer Blade 17 RTX 3080 Ti | |
| AIDA64 / CPU AES | |
| Average of class Gaming (39258 - 247074, n=103, last 2 years) | |
| Lenovo Legion 5 Pro 16 G7 i7 RTX 3070Ti | |
| Acer Predator Triton 500 SE PT516-52s-70KX | |
| MSI GE76 Raider | |
| Average Intel Core i7-12700H (31839 - 144360, n=64) | |
| Razer Blade 17 RTX 3080 Ti | |
| AIDA64 / CPU ZLib | |
| Average of class Gaming (574 - 2531, n=103, last 2 years) | |
| Lenovo Legion 5 Pro 16 G7 i7 RTX 3070Ti | |
| Acer Predator Triton 500 SE PT516-52s-70KX | |
| MSI GE76 Raider | |
| Average Intel Core i7-12700H (305 - 1171, n=64) | |
| Razer Blade 17 RTX 3080 Ti | |
| AIDA64 / FP64 Ray-Trace | |
| Average of class Gaming (5509 - 45446, n=103, last 2 years) | |
| Average Intel Core i7-12700H (1437 - 9692, n=64) | |
| Lenovo Legion 5 Pro 16 G7 i7 RTX 3070Ti | |
| Acer Predator Triton 500 SE PT516-52s-70KX | |
| MSI GE76 Raider | |
| Razer Blade 17 RTX 3080 Ti | |
| AIDA64 / CPU PhotoWorxx | |
| Average of class Gaming (12271 - 89891, n=103, last 2 years) | |
| Razer Blade 17 RTX 3080 Ti | |
| MSI GE76 Raider | |
| Acer Predator Triton 500 SE PT516-52s-70KX | |
| Lenovo Legion 5 Pro 16 G7 i7 RTX 3070Ti | |
| Average Intel Core i7-12700H (12863 - 52207, n=64) | |
System Performance
Even though the Acer Predator Triton 500 SE remains behind the competitors in PCMark 10, the distance is small. The system runs absolutely smoothly in everyday operation.
CrossMark: Overall | Productivity | Creativity | Responsiveness
| PCMark 10 / Score | |
| Average of class Gaming (5828 - 11574, n=92, last 2 years) | |
| MSI GE76 Raider | |
| Razer Blade 17 RTX 3080 Ti | |
| Lenovo Legion 5 Pro 16 G7 i7 RTX 3070Ti | |
| Acer Predator Triton 500 SE PT516-52s-70KX | |
| Average Intel Core i7-12700H, NVIDIA GeForce RTX 3080 Ti Laptop GPU (6868 - 7638, n=7) | |
| PCMark 10 / Essentials | |
| Razer Blade 17 RTX 3080 Ti | |
| Acer Predator Triton 500 SE PT516-52s-70KX | |
| MSI GE76 Raider | |
| Average of class Gaming (8810 - 11935, n=96, last 2 years) | |
| Average Intel Core i7-12700H, NVIDIA GeForce RTX 3080 Ti Laptop GPU (9987 - 11318, n=7) | |
| Lenovo Legion 5 Pro 16 G7 i7 RTX 3070Ti | |
| PCMark 10 / Productivity | |
| Average of class Gaming (6845 - 21327, n=94, last 2 years) | |
| MSI GE76 Raider | |
| Lenovo Legion 5 Pro 16 G7 i7 RTX 3070Ti | |
| Acer Predator Triton 500 SE PT516-52s-70KX | |
| Average Intel Core i7-12700H, NVIDIA GeForce RTX 3080 Ti Laptop GPU (8944 - 10726, n=7) | |
| Razer Blade 17 RTX 3080 Ti | |
| PCMark 10 / Digital Content Creation | |
| Average of class Gaming (7602 - 19657, n=94, last 2 years) | |
| MSI GE76 Raider | |
| Razer Blade 17 RTX 3080 Ti | |
| Lenovo Legion 5 Pro 16 G7 i7 RTX 3070Ti | |
| Acer Predator Triton 500 SE PT516-52s-70KX | |
| Average Intel Core i7-12700H, NVIDIA GeForce RTX 3080 Ti Laptop GPU (8956 - 12249, n=7) | |
| CrossMark / Overall | |
| Average of class Gaming (1366 - 2409, n=93, last 2 years) | |
| Lenovo Legion 5 Pro 16 G7 i7 RTX 3070Ti | |
| Acer Predator Triton 500 SE PT516-52s-70KX | |
| Average Intel Core i7-12700H, NVIDIA GeForce RTX 3080 Ti Laptop GPU (1761 - 1861, n=4) | |
| CrossMark / Productivity | |
| Lenovo Legion 5 Pro 16 G7 i7 RTX 3070Ti | |
| Average of class Gaming (1386 - 2254, n=93, last 2 years) | |
| Acer Predator Triton 500 SE PT516-52s-70KX | |
| Average Intel Core i7-12700H, NVIDIA GeForce RTX 3080 Ti Laptop GPU (1645 - 1800, n=4) | |
| CrossMark / Creativity | |
| Average of class Gaming (1343 - 2729, n=93, last 2 years) | |
| Lenovo Legion 5 Pro 16 G7 i7 RTX 3070Ti | |
| Average Intel Core i7-12700H, NVIDIA GeForce RTX 3080 Ti Laptop GPU (1936 - 2041, n=4) | |
| Acer Predator Triton 500 SE PT516-52s-70KX | |
| CrossMark / Responsiveness | |
| Lenovo Legion 5 Pro 16 G7 i7 RTX 3070Ti | |
| Acer Predator Triton 500 SE PT516-52s-70KX | |
| Average of class Gaming (1226 - 2334, n=93, last 2 years) | |
| Average Intel Core i7-12700H, NVIDIA GeForce RTX 3080 Ti Laptop GPU (1461 - 1868, n=4) | |
| PCMark 10 Score | 7539 points | |
Help | ||
| AIDA64 / Memory Copy | |
| Average of class Gaming (21750 - 129946, n=103, last 2 years) | |
| MSI GE76 Raider | |
| Razer Blade 17 RTX 3080 Ti | |
| Acer Predator Triton 500 SE PT516-52s-70KX | |
| Average Intel Core i7-12700H (25615 - 80511, n=64) | |
| Lenovo Legion 5 Pro 16 G7 i7 RTX 3070Ti | |
| AIDA64 / Memory Read | |
| Average of class Gaming (22956 - 118858, n=103, last 2 years) | |
| Acer Predator Triton 500 SE PT516-52s-70KX | |
| Razer Blade 17 RTX 3080 Ti | |
| MSI GE76 Raider | |
| Lenovo Legion 5 Pro 16 G7 i7 RTX 3070Ti | |
| Average Intel Core i7-12700H (25586 - 79442, n=64) | |
| AIDA64 / Memory Write | |
| Average of class Gaming (22297 - 135096, n=103, last 2 years) | |
| Razer Blade 17 RTX 3080 Ti | |
| MSI GE76 Raider | |
| Lenovo Legion 5 Pro 16 G7 i7 RTX 3070Ti | |
| Average Intel Core i7-12700H (23679 - 88660, n=64) | |
| Acer Predator Triton 500 SE PT516-52s-70KX | |
| AIDA64 / Memory Latency | |
| Acer Predator Triton 500 SE PT516-52s-70KX | |
| Average of class Gaming (75.3 - 259, n=103, last 2 years) | |
| Lenovo Legion 5 Pro 16 G7 i7 RTX 3070Ti | |
| MSI GE76 Raider | |
| Average Intel Core i7-12700H (76.2 - 133.9, n=62) | |
| Razer Blade 17 RTX 3080 Ti | |
* ... smaller is better
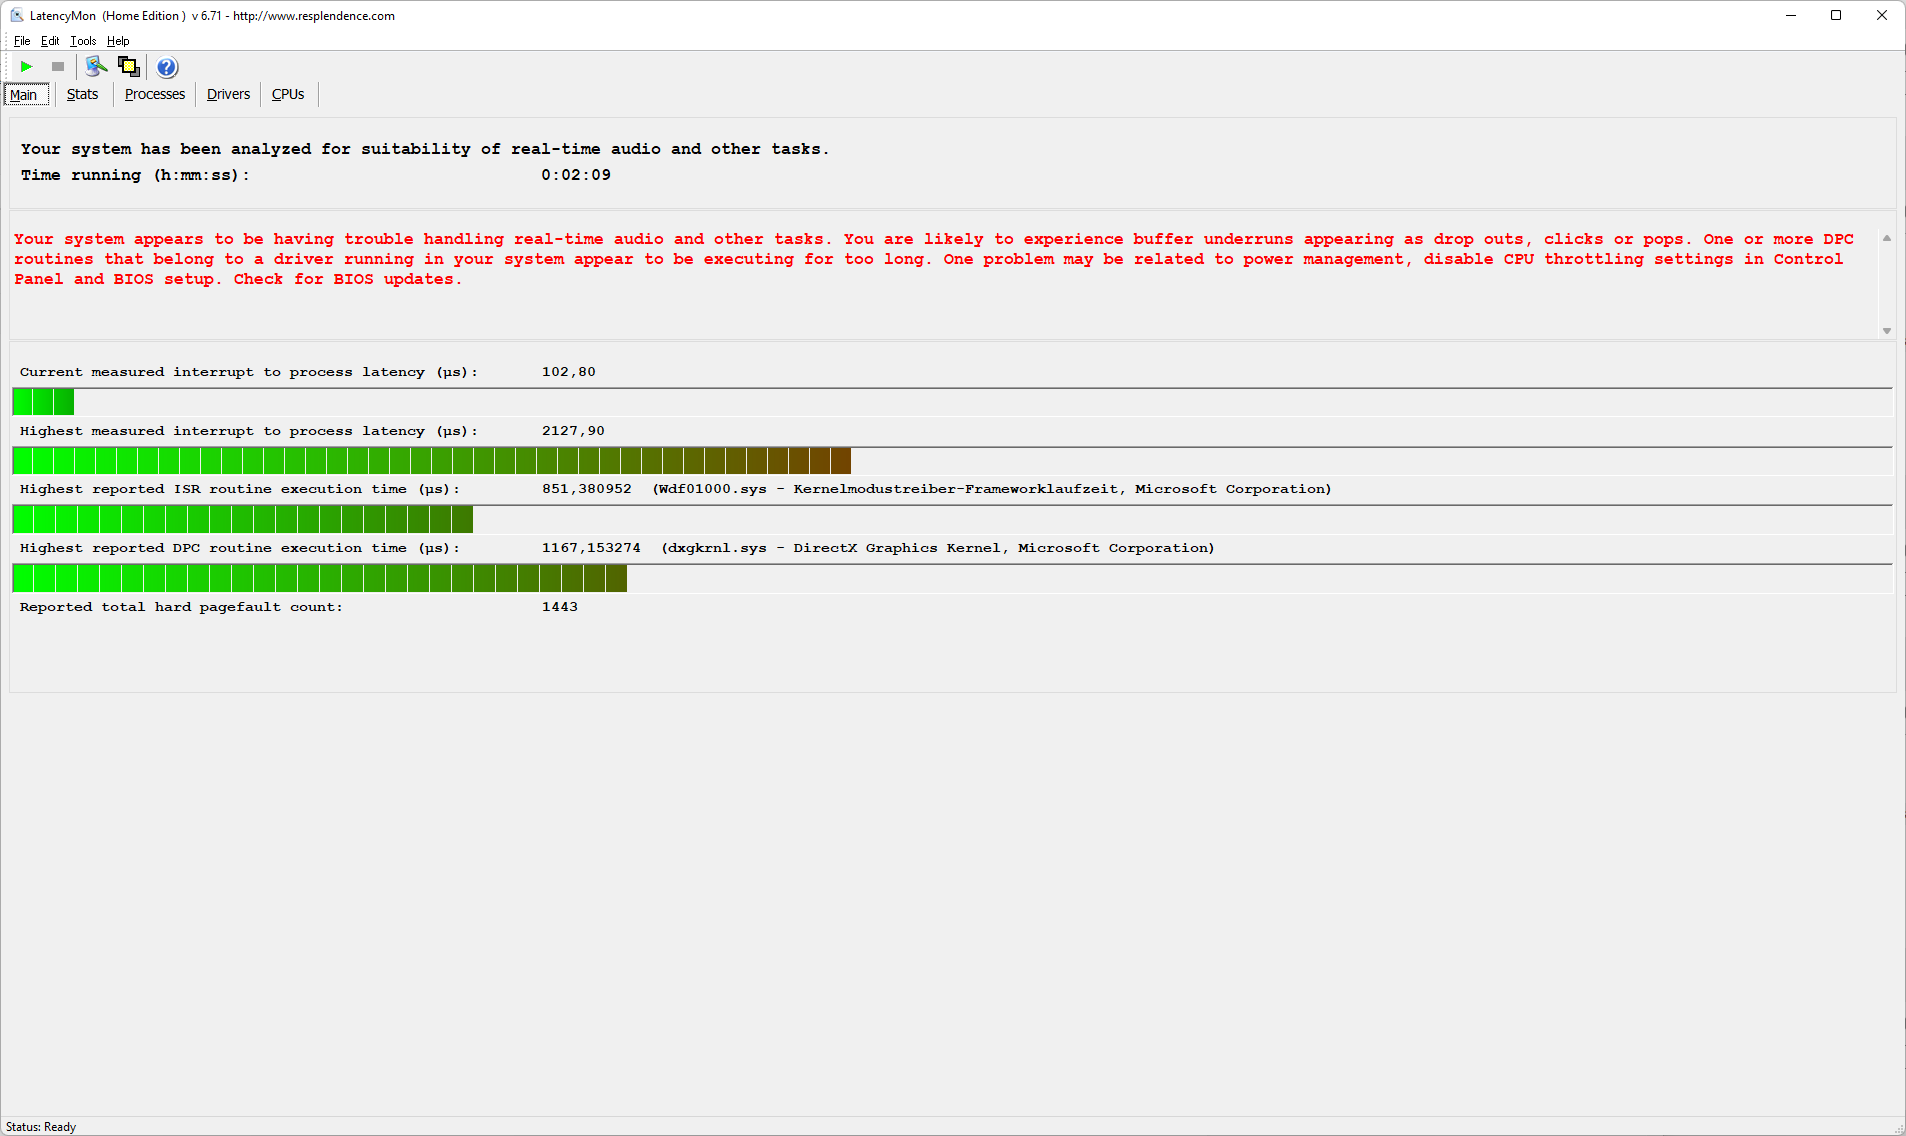
DPC Latencies
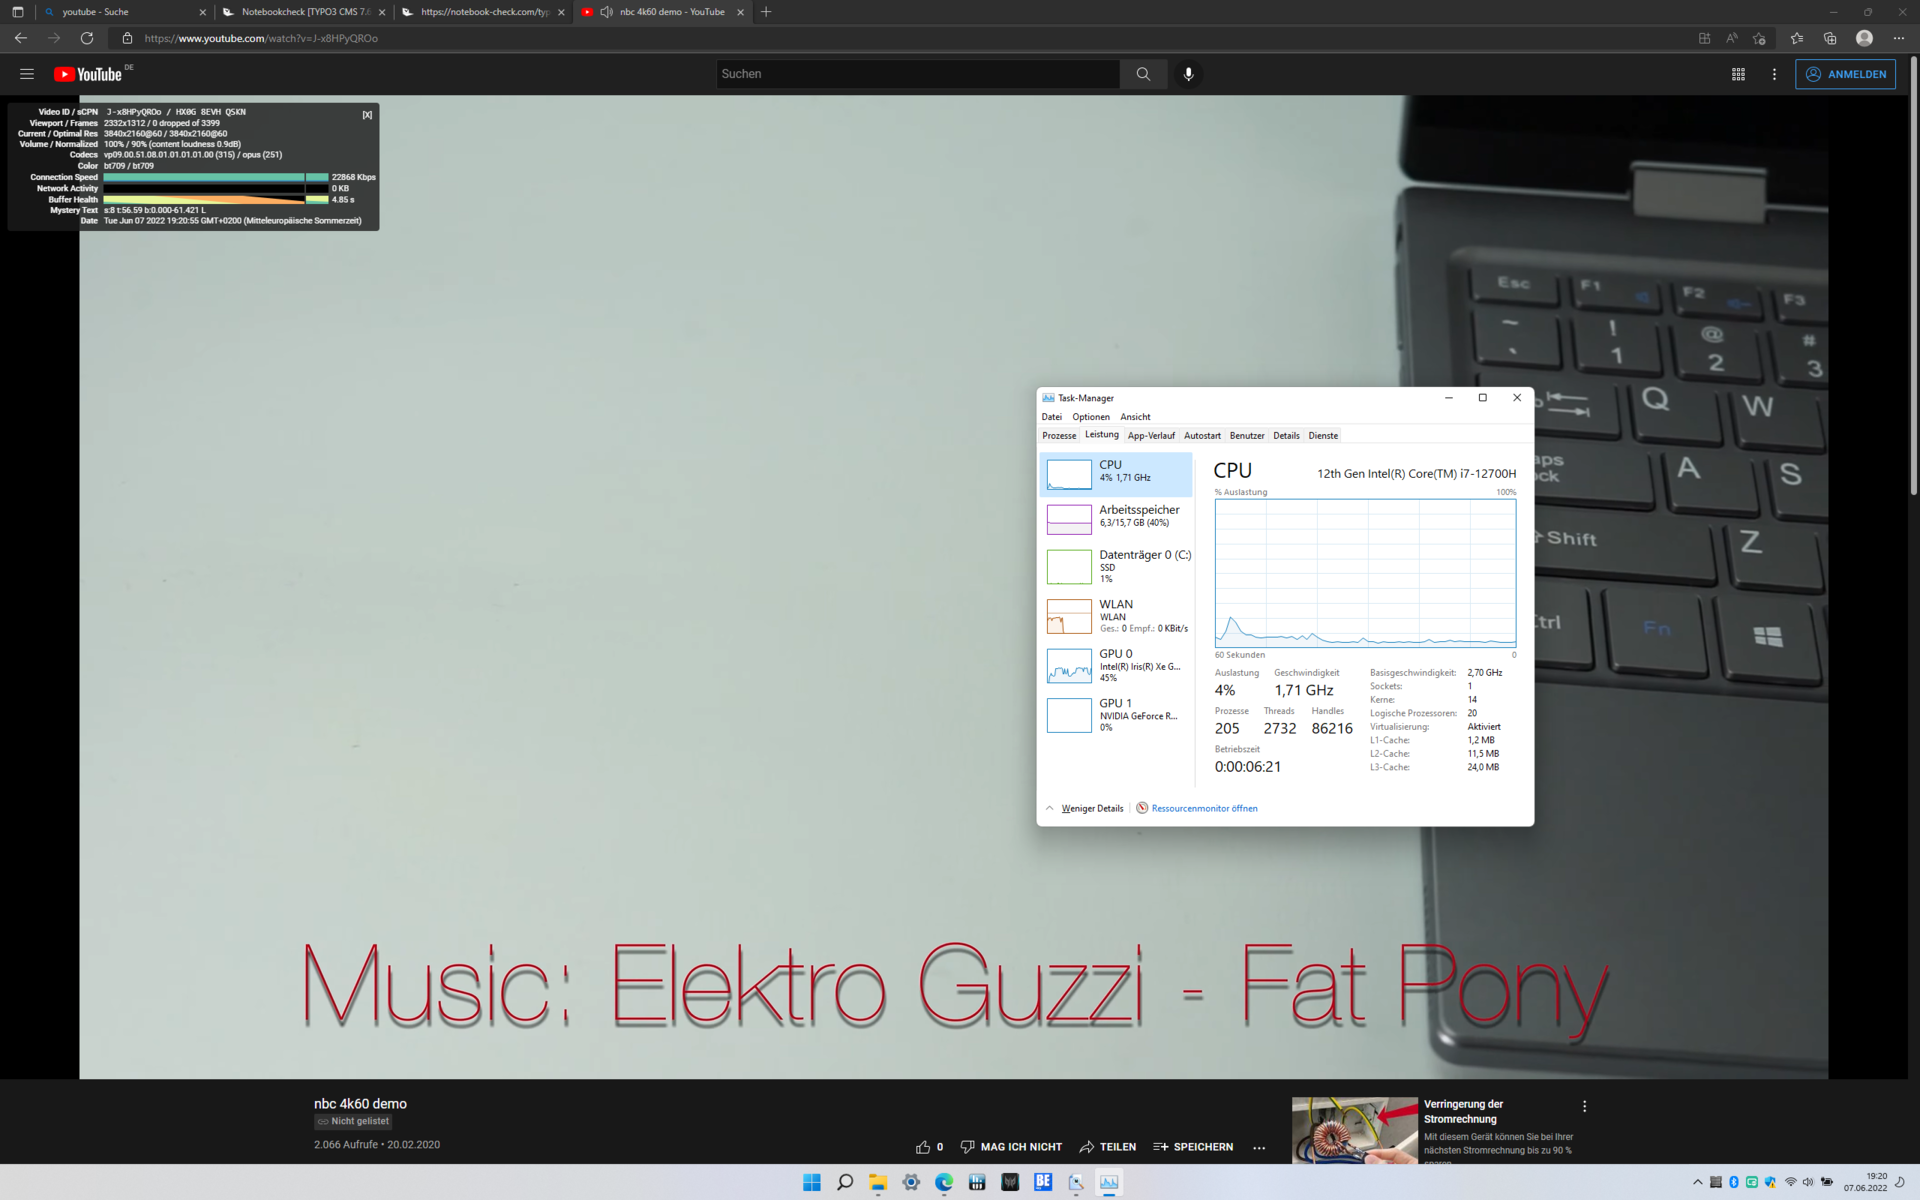
The Acer Predator Triton 500 SE has problems with DPC latencies, which can lead to some drops during live video or audio processing.
But at least there were no dropped frames in the YouTube test.
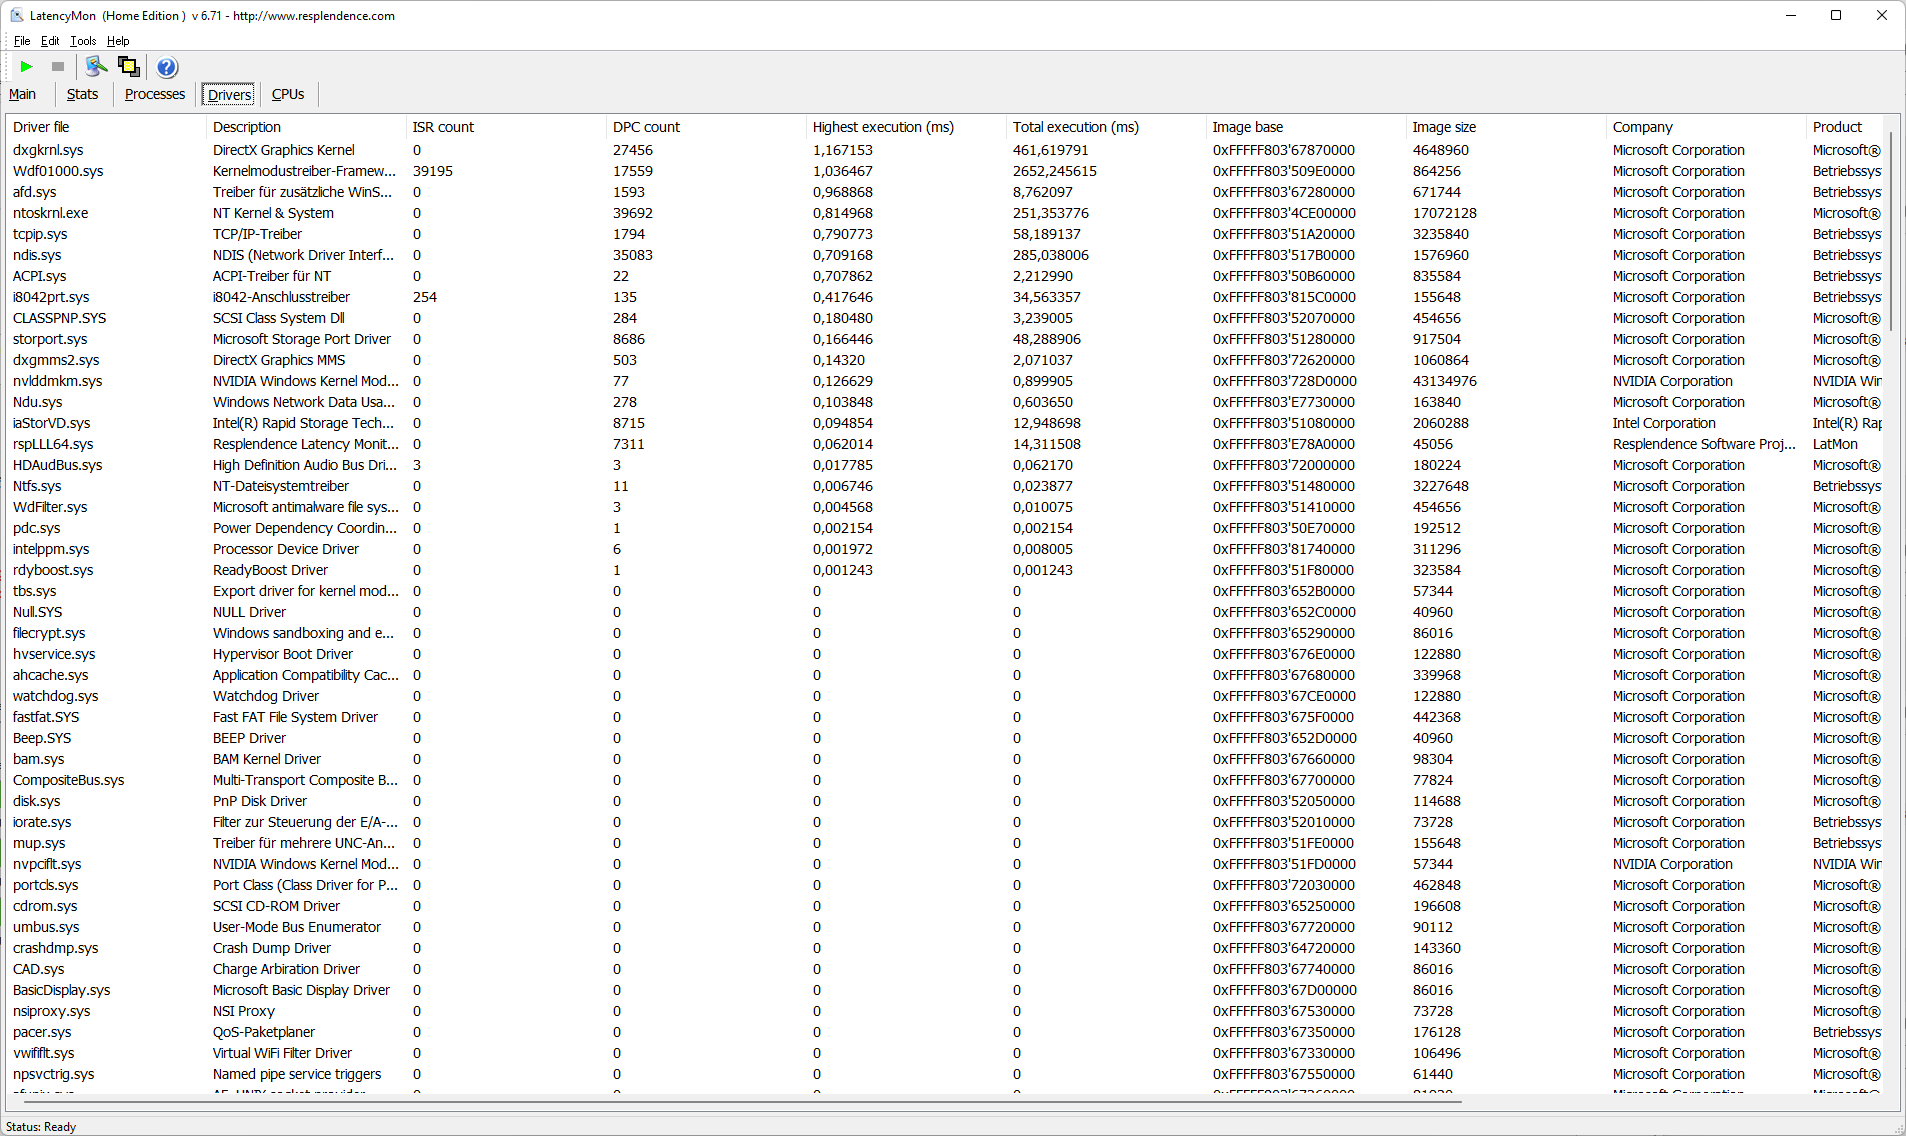
| DPC Latencies / LatencyMon - interrupt to process latency (max), Web, Youtube, Prime95 | |
| Acer Predator Triton 500 SE PT516-52s-70KX | |
| MSI GE76 Raider | |
| Razer Blade 17 RTX 3080 Ti | |
| Lenovo Legion 5 Pro 16 G7 i7 RTX 3070Ti | |
* ... smaller is better
Storage Solution
The NVMe SSD from Micron is connected using the most current PCIe 4.0 standard. It offers a capacity of 1 TB and is slightly slower than the Samsung SSDs of the competitors. However, the difference isn't large and even under constant load, the SSD always delivers its maximum performance.

* ... smaller is better
Constant Performance Reading: DiskSpd Read Loop, Queue Depth 8
Graphics Card
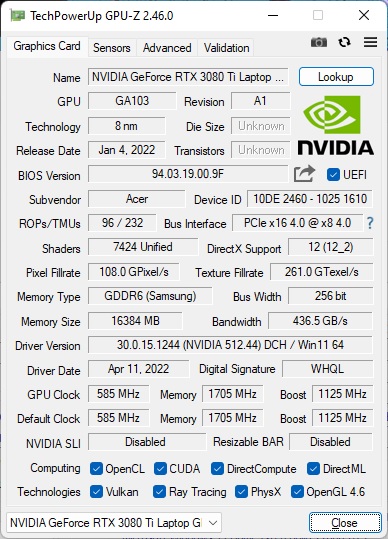
The Nvidia GeForce RTX 3080 Ti is one of the most powerful mobile GPUs from Nvidia. The 7,424 shader units should be provided with a consumption of up to 165 watts, allowing the GPU to achieve clock speeds of up to 1.59 GHz. You can find out about additional comparisons with other graphics chips in our GPU list.
Unfortunately, the graphics chip isn't able to make use of its full potential in the Acer Predator Triton 500SE. Instead of the full 165 watts, we only see a consumption of 115 watts. With this, the Acer laptop performs worse than the competitors with the same GPU, and the Razer Blade 17 and MSI GE76 Raider are 14 and 24% faster respectively. The Lenovo Legion 5 Pro with its nominally worse GeForce RTX 3070 Ti is also about 8% faster on average.
Like the CPU, the GPU is also clearly throttled without a connected power supply. In the 3DMark 11 GPU Score, the result turns out about 81% worse at only 6,900 instead of 37,288 points - a massive performance drop in battery operation.
| 3DMark 11 Performance | 32346 points | |
| 3DMark Cloud Gate Standard Score | 61970 points | |
| 3DMark Fire Strike Score | 25051 points | |
| 3DMark Time Spy Score | 11428 points | |
Help | ||
Gaming Performance
What was already hinted at in the 3DMark tests is confirmed in the gaming benchmarks: The Acer Predator Triton 500 SE is unable to fully keep up with the competitors. Particularly the MSI GE76 Raider is ahead in all the areas.
However, this of course doesn't mean that the Acer laptop would be a bad gaming laptop. It is still sufficiently powerful, allowing for even very demanding games in QHD resolution at the highest detail levels without any problems. 4K gaming with an external monitor should also not pose any major problems.
| The Witcher 3 - 1920x1080 Ultra Graphics & Postprocessing (HBAO+) | |
| Average of class Gaming (104.7 - 240, n=6, last 2 years) | |
| MSI GE76 Raider | |
| Razer Blade 17 RTX 3080 Ti | |
| Average NVIDIA GeForce RTX 3080 Ti Laptop GPU (30 - 130.6, n=43) | |
| Lenovo Legion 5 Pro 16 G7 i7 RTX 3070Ti | |
| Acer Predator Triton 500 SE PT516-52s-70KX | |
| F1 2021 - 2560x1440 Ultra High Preset + Raytracing AA:T AF:16x | |
| MSI GE76 Raider | |
| Lenovo Legion 5 Pro 16 G7 i7 RTX 3070Ti | |
| Average NVIDIA GeForce RTX 3080 Ti Laptop GPU (30 - 120.1, n=19) | |
| Acer Predator Triton 500 SE PT516-52s-70KX | |
We did not see any performance drops in our The Witcher 3 constant load test, so throttling should not occur during everyday gaming operation.
The Witcher 3 FPS Chart
| low | med. | high | ultra | QHD | |
|---|---|---|---|---|---|
| GTA V (2015) | 185.7 | 182.8 | 176.1 | 113 | 91 |
| The Witcher 3 (2015) | 398 | 291 | 186.6 | 102.1 | |
| Dota 2 Reborn (2015) | 171.7 | 157.8 | 151.4 | 144 | |
| Final Fantasy XV Benchmark (2018) | 193.3 | 134.7 | 103.9 | 80.9 | |
| X-Plane 11.11 (2018) | 142.5 | 130.8 | 103.1 | ||
| Strange Brigade (2018) | 442 | 234 | 189.4 | 171.2 | 127.8 |
| F1 2021 (2021) | 384 | 287 | 246 | 121.9 | 91.7 |
Emissions: The fans in the Acer laptop get very loud
Noise Emissions
The Acer Predator Triton 500 SE is clearly not a good choice for those with sensitive ears. Although it remains mostly quiet during idle operation, this is not always the case, and particularly in the more aggressive performance modes, the fan will quickly turn on, even during low activity.
And when the fan runs, it quickly becomes loud. At a maximum of 56 dB(a), the Acer laptop produces the highest noise level in our test field, although the competitors aren't much quieter either. The only exception is the Razer Blade 17, which at least is only moderately loud under average load.
Noise level
| Idle |
| 26 / 29 / 34 dB(A) |
| Load |
| 50 / 56 dB(A) |
 | ||
30 dB silent 40 dB(A) audible 50 dB(A) loud |
||
min: | ||
| Acer Predator Triton 500 SE PT516-52s-70KX GeForce RTX 3080 Ti Laptop GPU, i7-12700H, Micron 3400 1TB MTFDKBA1T0TFH | Razer Blade 17 RTX 3080 Ti GeForce RTX 3080 Ti Laptop GPU, i7-12800H, Samsung PM9A1 MZVL21T0HCLR | Lenovo Legion 5 Pro 16 G7 i7 RTX 3070Ti GeForce RTX 3070 Ti Laptop GPU, i7-12700H, Samsung PM9A1 MZVL21T0HCLR | MSI GE76 Raider GeForce RTX 3080 Ti Laptop GPU, i9-12900HK, Samsung PM9A1 MZVL22T0HBLB | |
|---|---|---|---|---|
| Noise | 15% | 3% | -1% | |
| off / environment * (dB) | 26 | 23.3 10% | 24.6 5% | 26 -0% |
| Idle Minimum * (dB) | 26 | 23.3 10% | 28.4 -9% | 26 -0% |
| Idle Average * (dB) | 29 | 23.3 20% | 28.4 2% | 27 7% |
| Idle Maximum * (dB) | 34 | 26.3 23% | 28.4 16% | 40 -18% |
| Load Average * (dB) | 50 | 38.2 24% | 49.4 1% | 50 -0% |
| Witcher 3 ultra * (dB) | 53 | 50.9 4% | 49.4 7% | 53 -0% |
| Load Maximum * (dB) | 56 | 49.1 12% | 54.7 2% | 53 5% |
* ... smaller is better
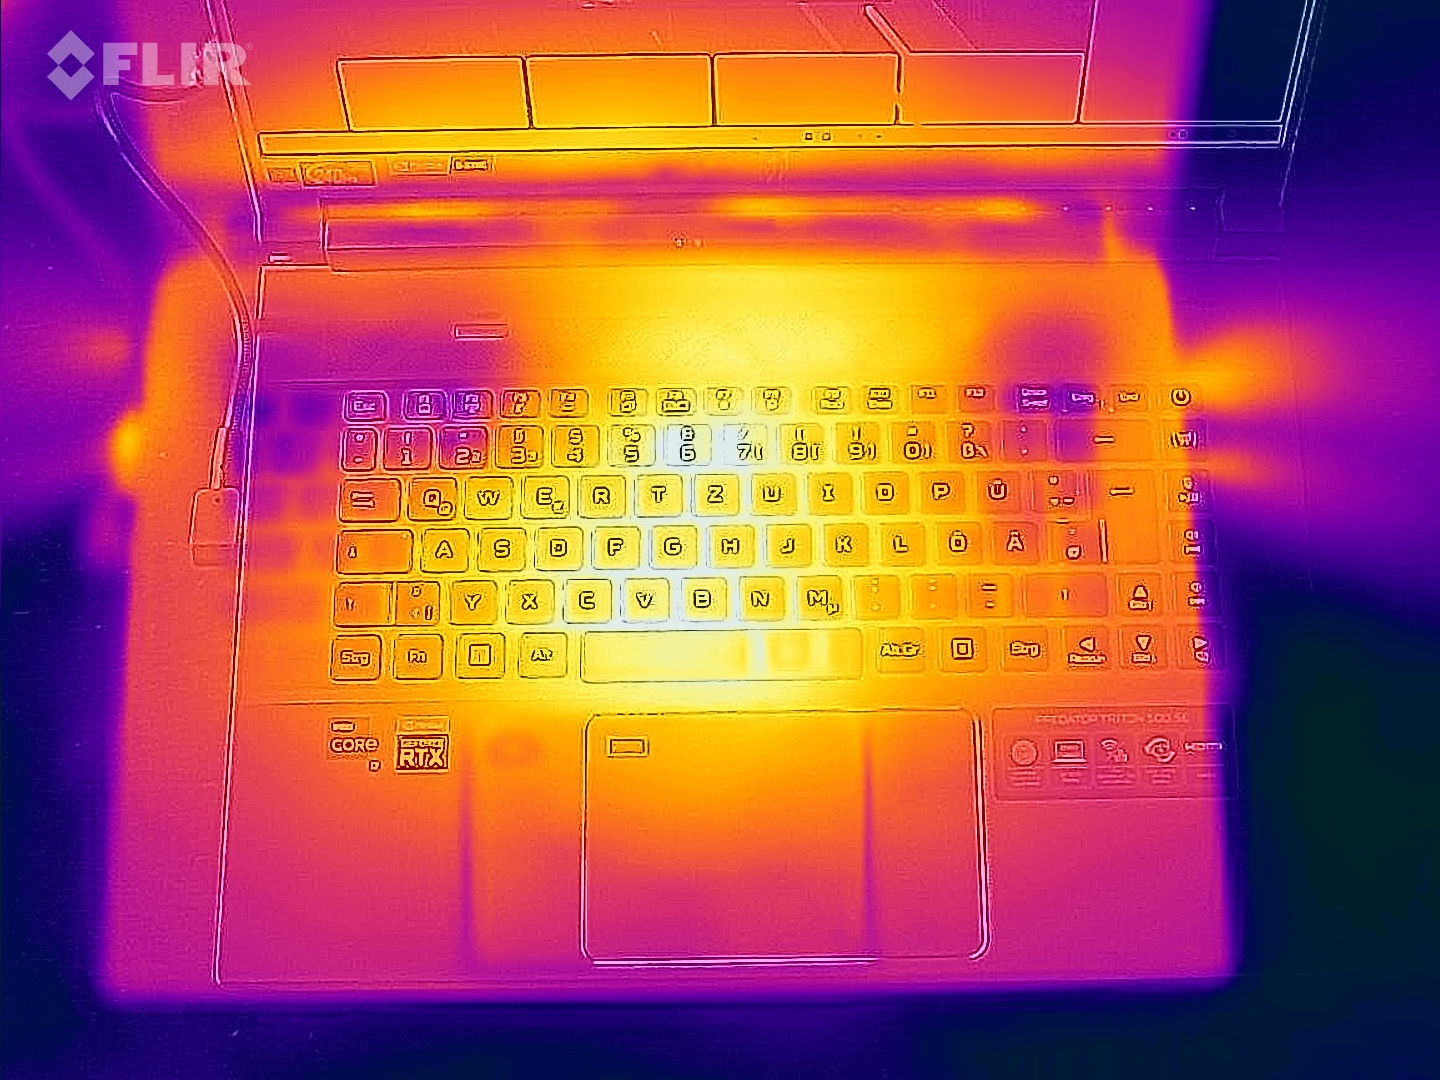
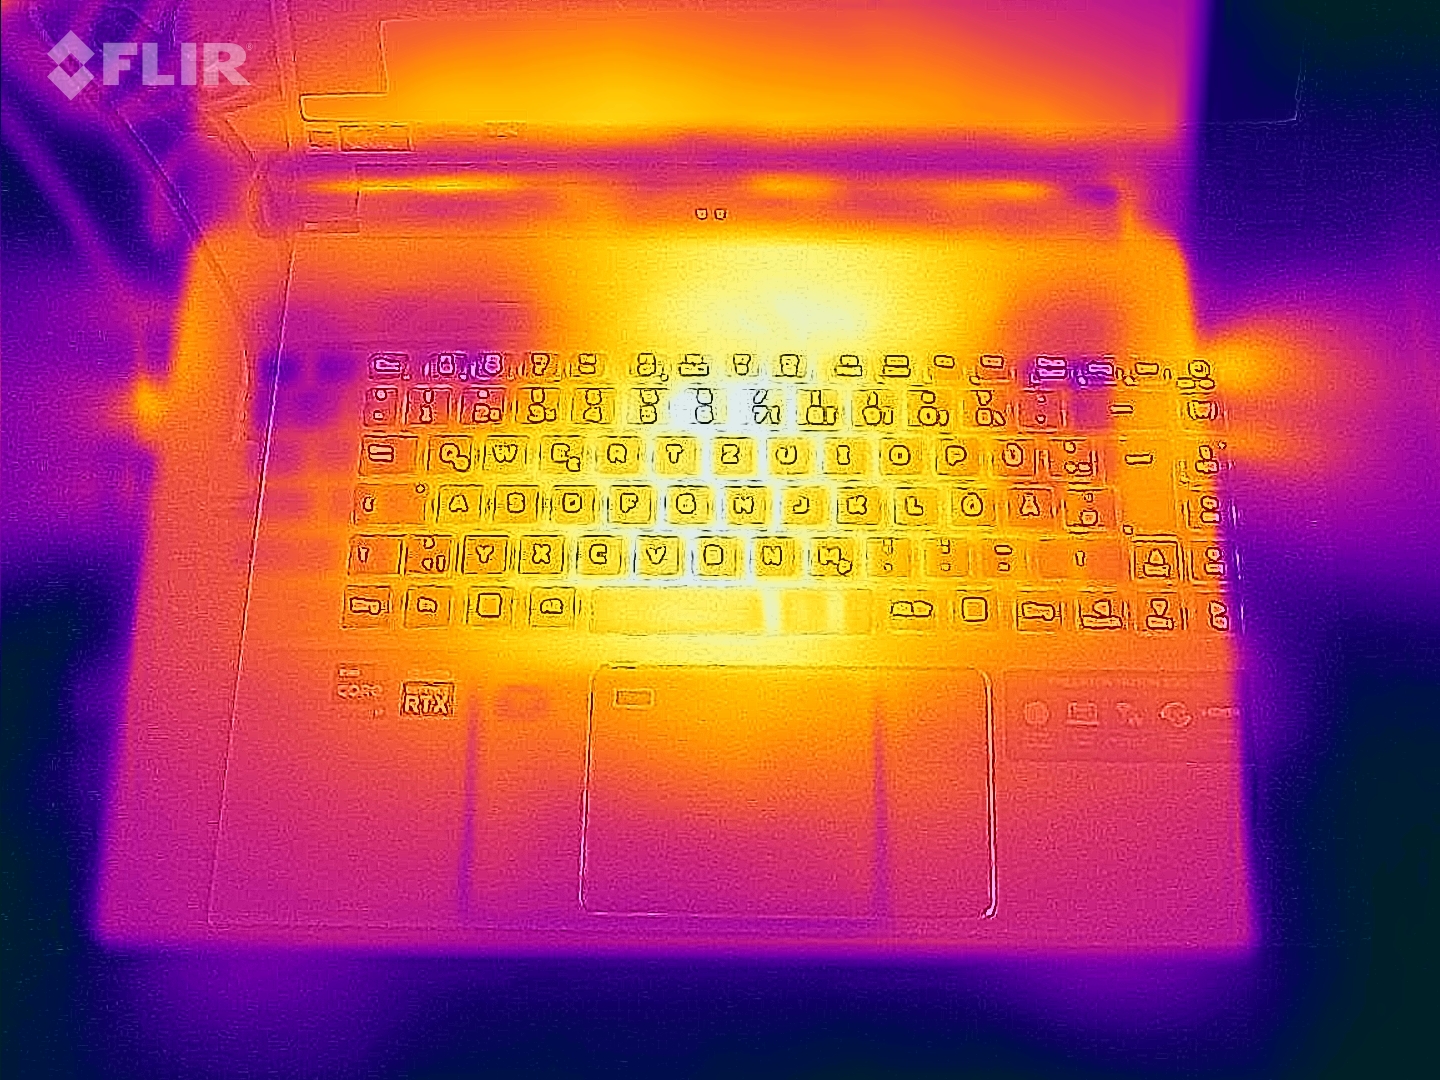
Temperatures
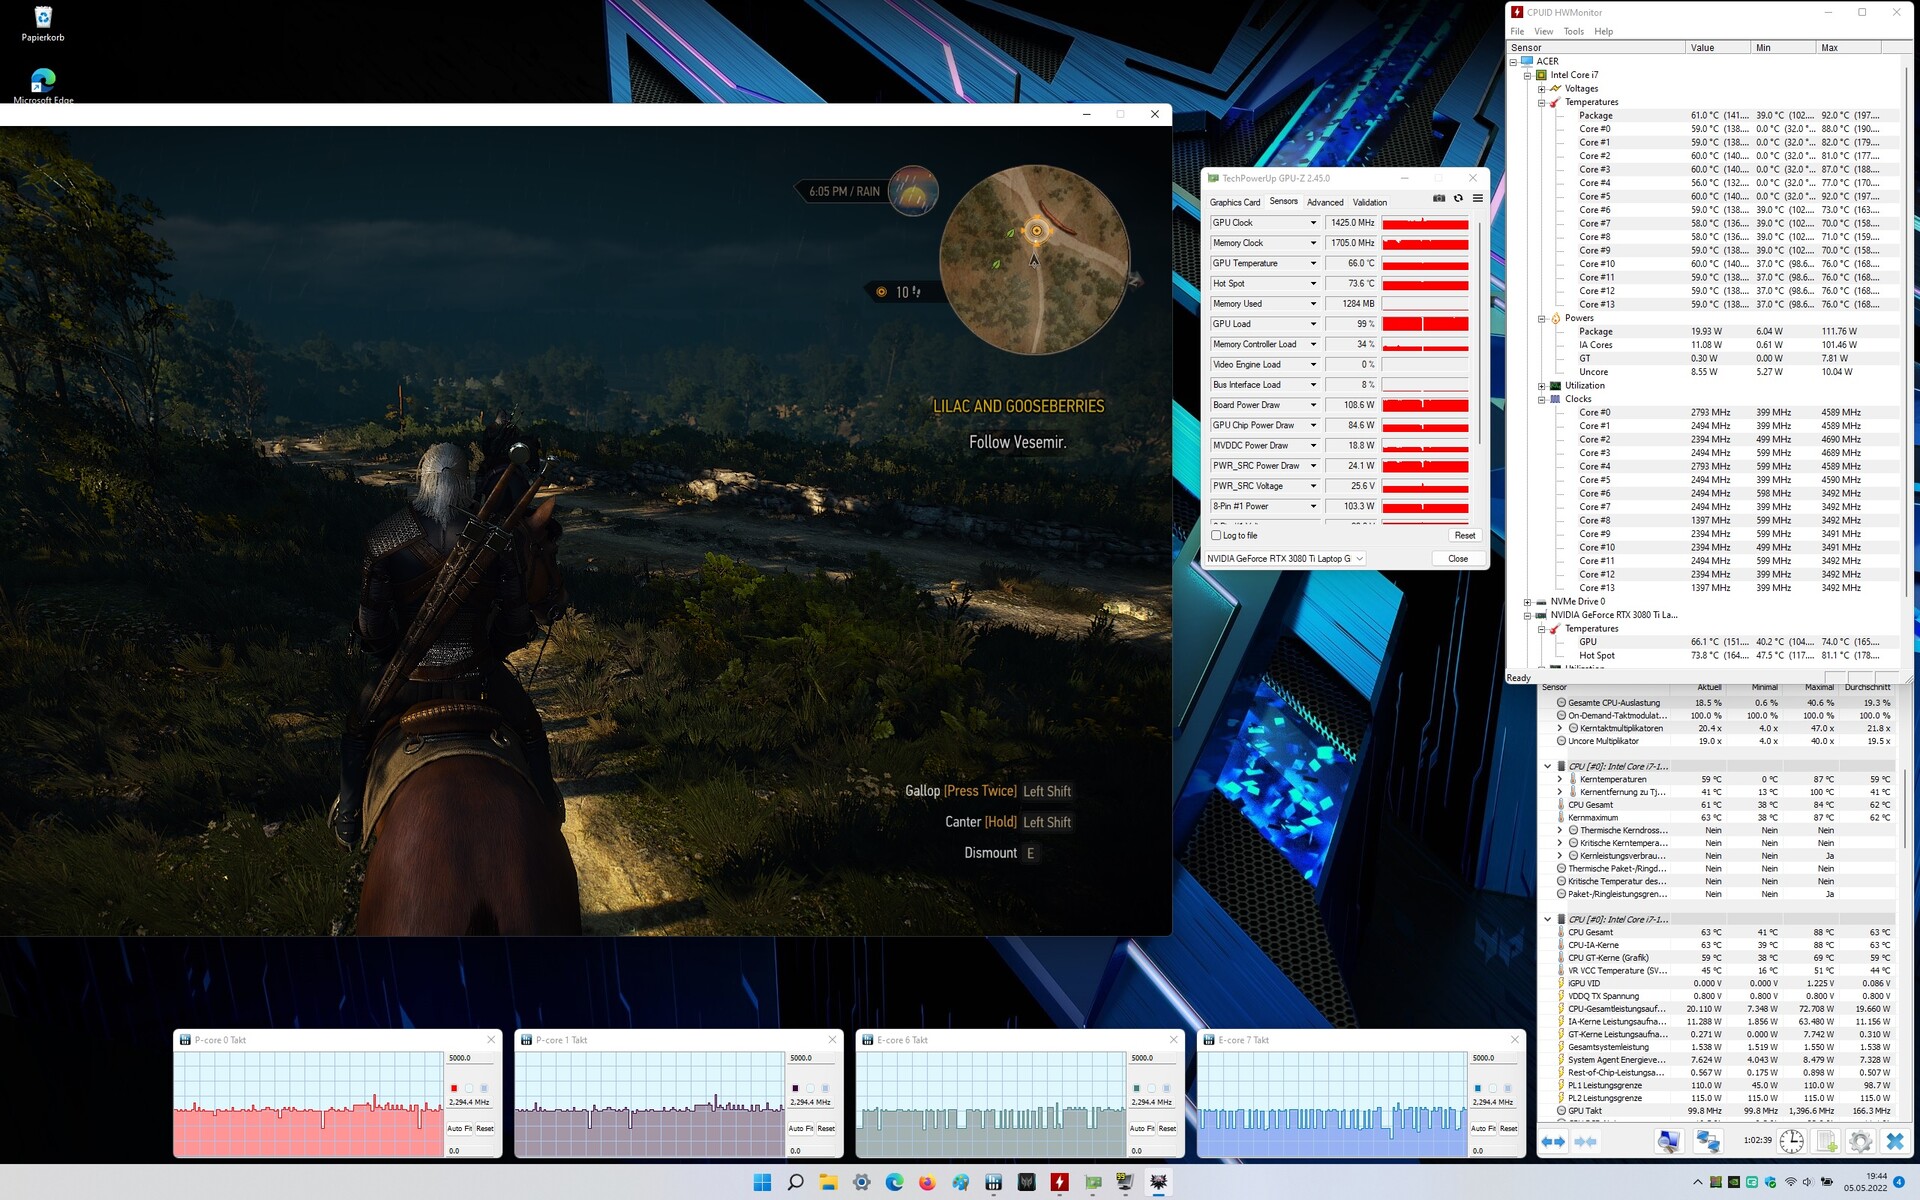
Already during idle operation, the case temperatures are slightly higher than in other laptops. Under load, the Acer Predator Triton 500 SE also heats up significantly. Even though the maximum temperature of 49 ºC (120 ºF) on the bottom remains below the critical mark of 50 ºC (122 ºF), the palm rests heat up significantly. This also goes for our The Witcher 3 test, so when gaming with the Acer laptop you also have to expect some sweaty hands.
In the load scenario with The Witcher 3, we measure no throttling at all, which is mainly due to the fact that load is primarily put on the GPU, and not the CPU. Things look different in the stress test, where both the graphics chip as well as the processor have to give up some performance. After one hour, the processor still gets 88 watts and the GPU around 60 watts.
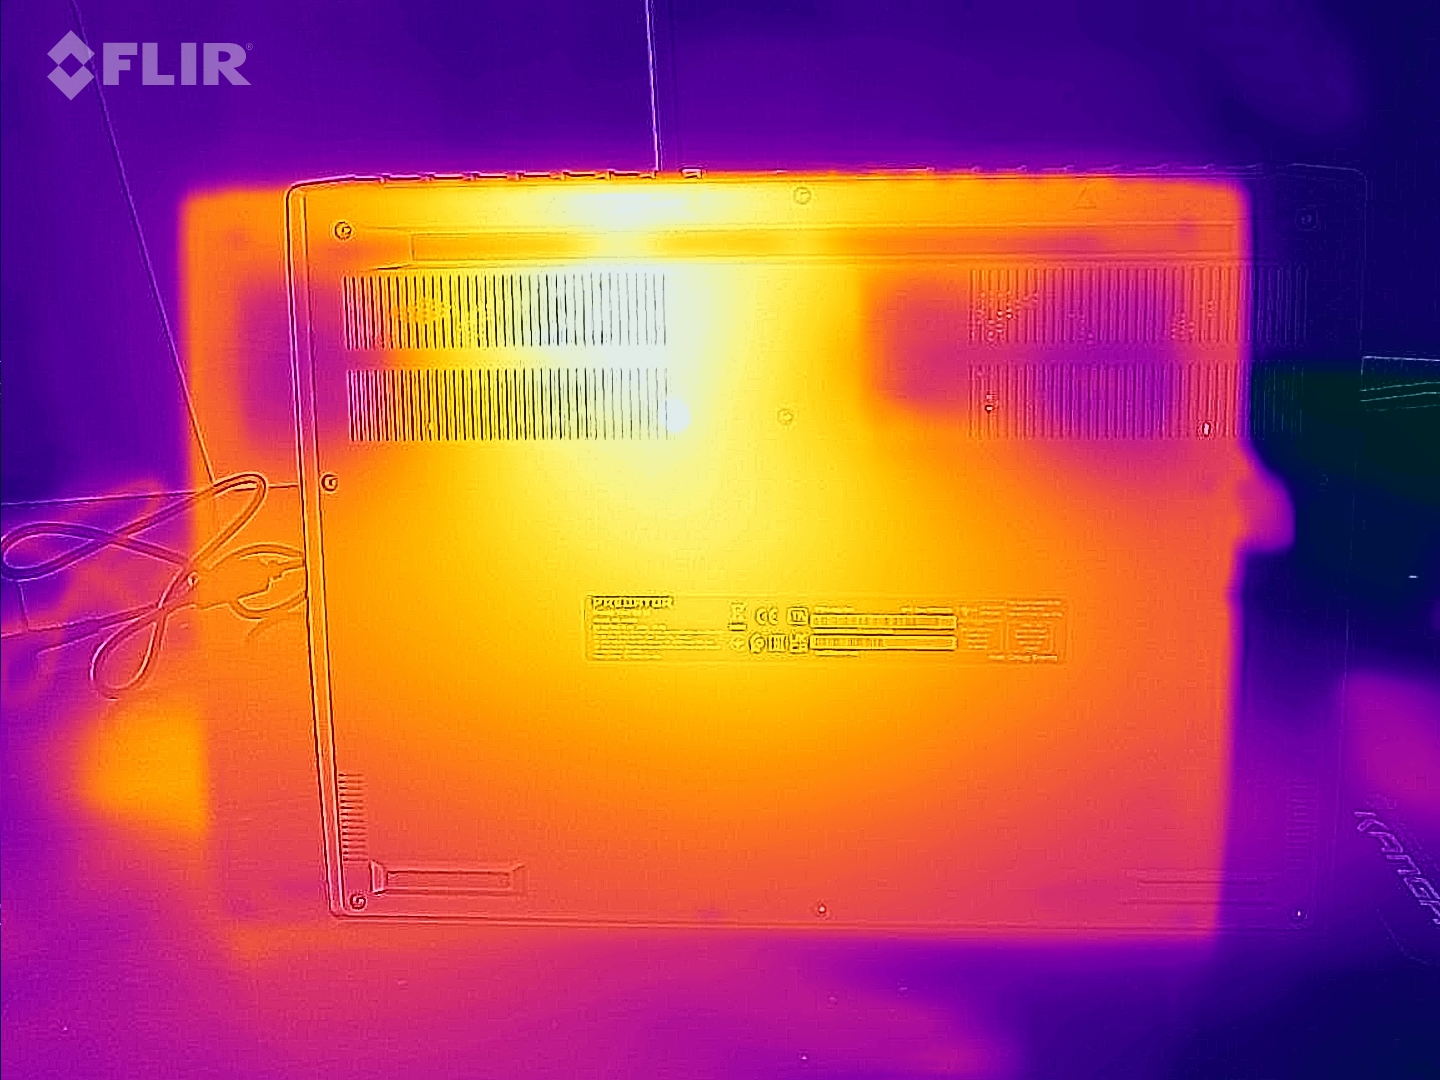
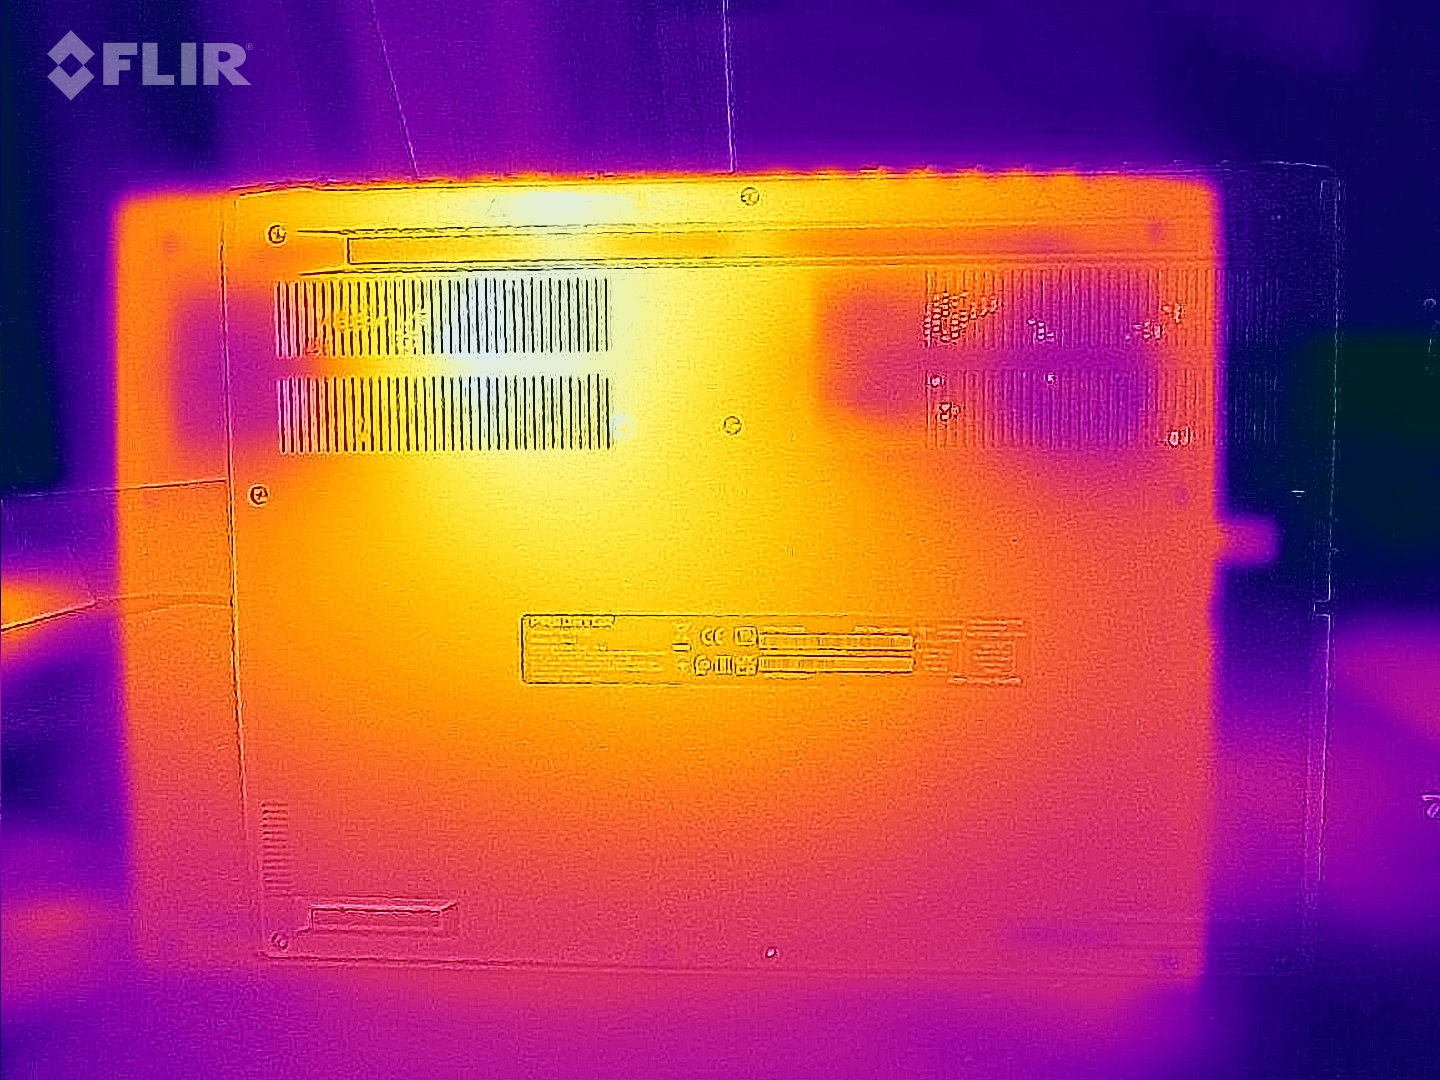
(-) The maximum temperature on the upper side is 47 °C / 117 F, compared to the average of 40.4 °C / 105 F, ranging from 21.2 to 68.8 °C for the class Gaming.
(-) The bottom heats up to a maximum of 49 °C / 120 F, compared to the average of 43.2 °C / 110 F
(+) In idle usage, the average temperature for the upper side is 29.8 °C / 86 F, compared to the device average of 33.9 °C / 93 F.
(-) Playing The Witcher 3, the average temperature for the upper side is 42.3 °C / 108 F, compared to the device average of 33.9 °C / 93 F.
(-) The palmrests and touchpad can get very hot to the touch with a maximum of 41 °C / 105.8 F.
(-) The average temperature of the palmrest area of similar devices was 28.8 °C / 83.8 F (-12.2 °C / -22 F).
| Acer Predator Triton 500 SE PT516-52s-70KX Intel Core i7-12700H, NVIDIA GeForce RTX 3080 Ti Laptop GPU | Razer Blade 17 RTX 3080 Ti Intel Core i7-12800H, NVIDIA GeForce RTX 3080 Ti Laptop GPU | Lenovo Legion 5 Pro 16 G7 i7 RTX 3070Ti Intel Core i7-12700H, NVIDIA GeForce RTX 3070 Ti Laptop GPU | MSI GE76 Raider Intel Core i9-12900HK, NVIDIA GeForce RTX 3080 Ti Laptop GPU | |
|---|---|---|---|---|
| Heat | -8% | -3% | -2% | |
| Maximum Upper Side * (°C) | 47 | 46 2% | 45.3 4% | 43 9% |
| Maximum Bottom * (°C) | 49 | 46.8 4% | 61.2 -25% | 47 4% |
| Idle Upper Side * (°C) | 31 | 36.2 -17% | 28.6 8% | 33 -6% |
| Idle Bottom * (°C) | 32 | 38.6 -21% | 31.4 2% | 37 -16% |
* ... smaller is better
Speakers
The speaker above the keyboard are decent but not very good. They point toward the user and deliver balanced sound that slightly lacks volume but particularly lacks bass. The Razer Blade 17 shows how this can be done better.
Acer Predator Triton 500 SE PT516-52s-70KX audio analysis
(±) | speaker loudness is average but good (79 dB)
Bass 100 - 315 Hz
(-) | nearly no bass - on average 22.7% lower than median
(±) | linearity of bass is average (12.5% delta to prev. frequency)
Mids 400 - 2000 Hz
(+) | balanced mids - only 4.4% away from median
(+) | mids are linear (4.2% delta to prev. frequency)
Highs 2 - 16 kHz
(+) | balanced highs - only 3.6% away from median
(+) | highs are linear (5.3% delta to prev. frequency)
Overall 100 - 16.000 Hz
(±) | linearity of overall sound is average (19.5% difference to median)
Compared to same class
» 67% of all tested devices in this class were better, 7% similar, 26% worse
» The best had a delta of 6%, average was 18%, worst was 132%
Compared to all devices tested
» 49% of all tested devices were better, 7% similar, 44% worse
» The best had a delta of 4%, average was 23%, worst was 134%
Razer Blade 17 RTX 3080 Ti audio analysis
(±) | speaker loudness is average but good (81.5 dB)
Bass 100 - 315 Hz
(±) | reduced bass - on average 6.7% lower than median
(±) | linearity of bass is average (8.3% delta to prev. frequency)
Mids 400 - 2000 Hz
(+) | balanced mids - only 2.1% away from median
(+) | mids are linear (4.3% delta to prev. frequency)
Highs 2 - 16 kHz
(+) | balanced highs - only 0.7% away from median
(+) | highs are linear (1.7% delta to prev. frequency)
Overall 100 - 16.000 Hz
(+) | overall sound is linear (6.8% difference to median)
Compared to same class
» 0% of all tested devices in this class were better, 0% similar, 99% worse
» The best had a delta of 6%, average was 18%, worst was 132%
Compared to all devices tested
» 1% of all tested devices were better, 0% similar, 99% worse
» The best had a delta of 4%, average was 23%, worst was 134%
Power Management: The Acer Predator battery life is mediocre
Power Consumption
The minimal power consumption during idle operation is better than that of the competitors. However, the advantage to the competitors disappears during medium idle consumption. But at least, it can beat the Razer Blade 17 in all scenarios.
The absolute peak consumption is 227 watts, which is almost exactly the limit of the power supply, which can deliver a maximum of 230 watts.
| Off / Standby | |
| Idle | |
| Load |
|
Key:
min: | |
| Acer Predator Triton 500 SE PT516-52s-70KX i7-12700H, GeForce RTX 3080 Ti Laptop GPU, Micron 3400 1TB MTFDKBA1T0TFH, IPS LED, 2560x1600, 16" | Razer Blade 17 RTX 3080 Ti i7-12800H, GeForce RTX 3080 Ti Laptop GPU, Samsung PM9A1 MZVL21T0HCLR, IPS, 2560x1440, 17.3" | Lenovo Legion 5 Pro 16 G7 i7 RTX 3070Ti i7-12700H, GeForce RTX 3070 Ti Laptop GPU, Samsung PM9A1 MZVL21T0HCLR, IPS, 2560x1600, 16" | MSI GE76 Raider i9-12900HK, GeForce RTX 3080 Ti Laptop GPU, Samsung PM9A1 MZVL22T0HBLB, IPS-Level, 1920x1080, 17.3" | Average of class Gaming | |
|---|---|---|---|---|---|
| Power Consumption | -105% | -9% | -24% | -16% | |
| Idle Minimum * (Watt) | 7 | 29.8 -326% | 8.6 -23% | 12 -71% | 13 ? -86% |
| Idle Average * (Watt) | 19 | 37.1 -95% | 17.6 7% | 17 11% | 18.6 ? 2% |
| Idle Maximum * (Watt) | 28 | 60.8 -117% | 18.5 34% | 28 -0% | 24.2 ? 14% |
| Load Average * (Watt) | 114 | 135.3 -19% | 110 4% | 118 -4% | 109.2 ? 4% |
| Witcher 3 ultra * (Watt) | 159 | 243 -53% | 227 -43% | 252 -58% | |
| Load Maximum * (Watt) | 227 | 273.1 -20% | 294.6 -30% | 272 -20% | 256 ? -13% |
* ... smaller is better
Power Consumption The Witcher 3 / Stress Test
Power Consumption With External Monitor
Battery Life
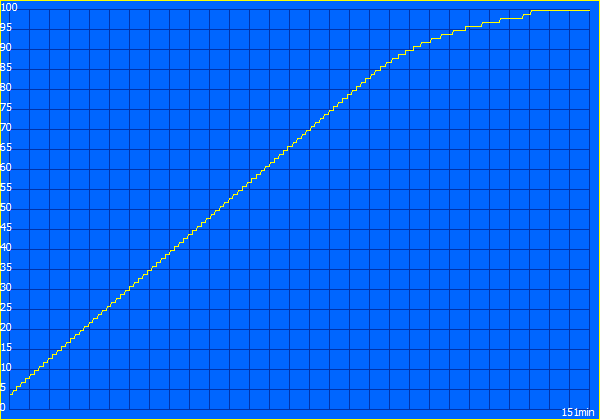
Despite the battery capacity of 99.98 Wh, which is the maximum allowed for a laptop according to some regulations for flight travel, the Acer Predator Triton 500 SE only achieves a battery life of about 5 hours and 45 minutes in our Wi-Fi test at 150 cd/m² brightness. With maximum display brightness, the runtime is reduced by about 1 hour.
This means that the Acer laptop is the wrong device for longer mobile usage, but this is also the case for gaming laptops in general, and the direct competitors don't do any better in this regard.
| Acer Predator Triton 500 SE PT516-52s-70KX i7-12700H, GeForce RTX 3080 Ti Laptop GPU, 99.98 Wh | Razer Blade 17 RTX 3080 Ti i7-12800H, GeForce RTX 3080 Ti Laptop GPU, 82 Wh | Lenovo Legion 5 Pro 16 G7 i7 RTX 3070Ti i7-12700H, GeForce RTX 3070 Ti Laptop GPU, 80 Wh | MSI GE76 Raider i9-12900HK, GeForce RTX 3080 Ti Laptop GPU, 99.99 Wh | Average of class Gaming | |
|---|---|---|---|---|---|
| Battery runtime | -27% | -34% | -11% | -1% | |
| H.264 (h) | 8.2 | 6.3 -23% | 8.64 ? 5% | ||
| WiFi v1.3 (h) | 5.7 | 5.5 -4% | 5.4 -5% | 5.1 -11% | 7.11 ? 25% |
| Load (h) | 2.2 | 1.1 -50% | 0.6 -73% | 1.502 ? -32% |
Pros
Cons
Verdict: Acer Predator Triton 500 SE offers premium performance at a premium price
An attractive design and powerful performance - these are the aspects that Acer aims to combine in the Predator Triton 500 SE. After our test, we can say that this task has succeeded to a large extent.
The simple and relatively slim design makes the Predator Triton more suitable for everyday tasks than many other gaming representatives. The connection equipment is very good, just as the display, which impresses particularly with the high color space coverage and high refresh rate. In addition, 2560 x 1600 is also the ideal resolution for a 16-inch laptop. In terms of performance, the Acer laptop is able display games smoothly also in the highest detail settings and high resolutions.
However, compared to the competitors there are also some disadvantages in the gaming performance. Subjectively, Acer misplaces the emphasis on the CPU performance while limiting the GPU more significantly. At the same time, the Predator Triton 500 SE also becomes quite warm and very loud. In addition to this weakness, we also see the internal construction very critical. The RAM is soldered in, and the SSD is also inaccessible. This results in some clear deficiencies in the maintainability, and the layout of the keyboard also receives a lower valuation. The battery life is also not that great, but this is relatively normal in the gaming area. But the fact that the performance during battery operation is also so much lower definitely deserves some critique.
Not maintainable but still worth a recommendation thanks to the very good performance: The Acer Predator Triton 500 SE
Overall, the lack of maintainability is our largest point of complaint. But if you don't need to change anything about it, the Acer Predator Triton 500 SE is worth a recommendation from us as a relatively slim gaming laptop. However, we definitely should not disregard the high price, and when a slightly thicker case is also acceptable, you can get a comparable performance for less money - for example with the Lenovo Legion 5 Pro. On the other hand, you need to pay even more for the Razer Blade 17, so the Predator Triton 500 SE as an alternative to that is worth a consideration.
Price and Availability
The Acer Predator Triton 500 SE is available from Amazon starting from $1425, and the high-end model costs $3000 (affiliate link).
Acer Predator Triton 500 SE PT516-52s-70KX
- 06/10/2022 v7 (old)
Benjamin Herzig
Price comparison

