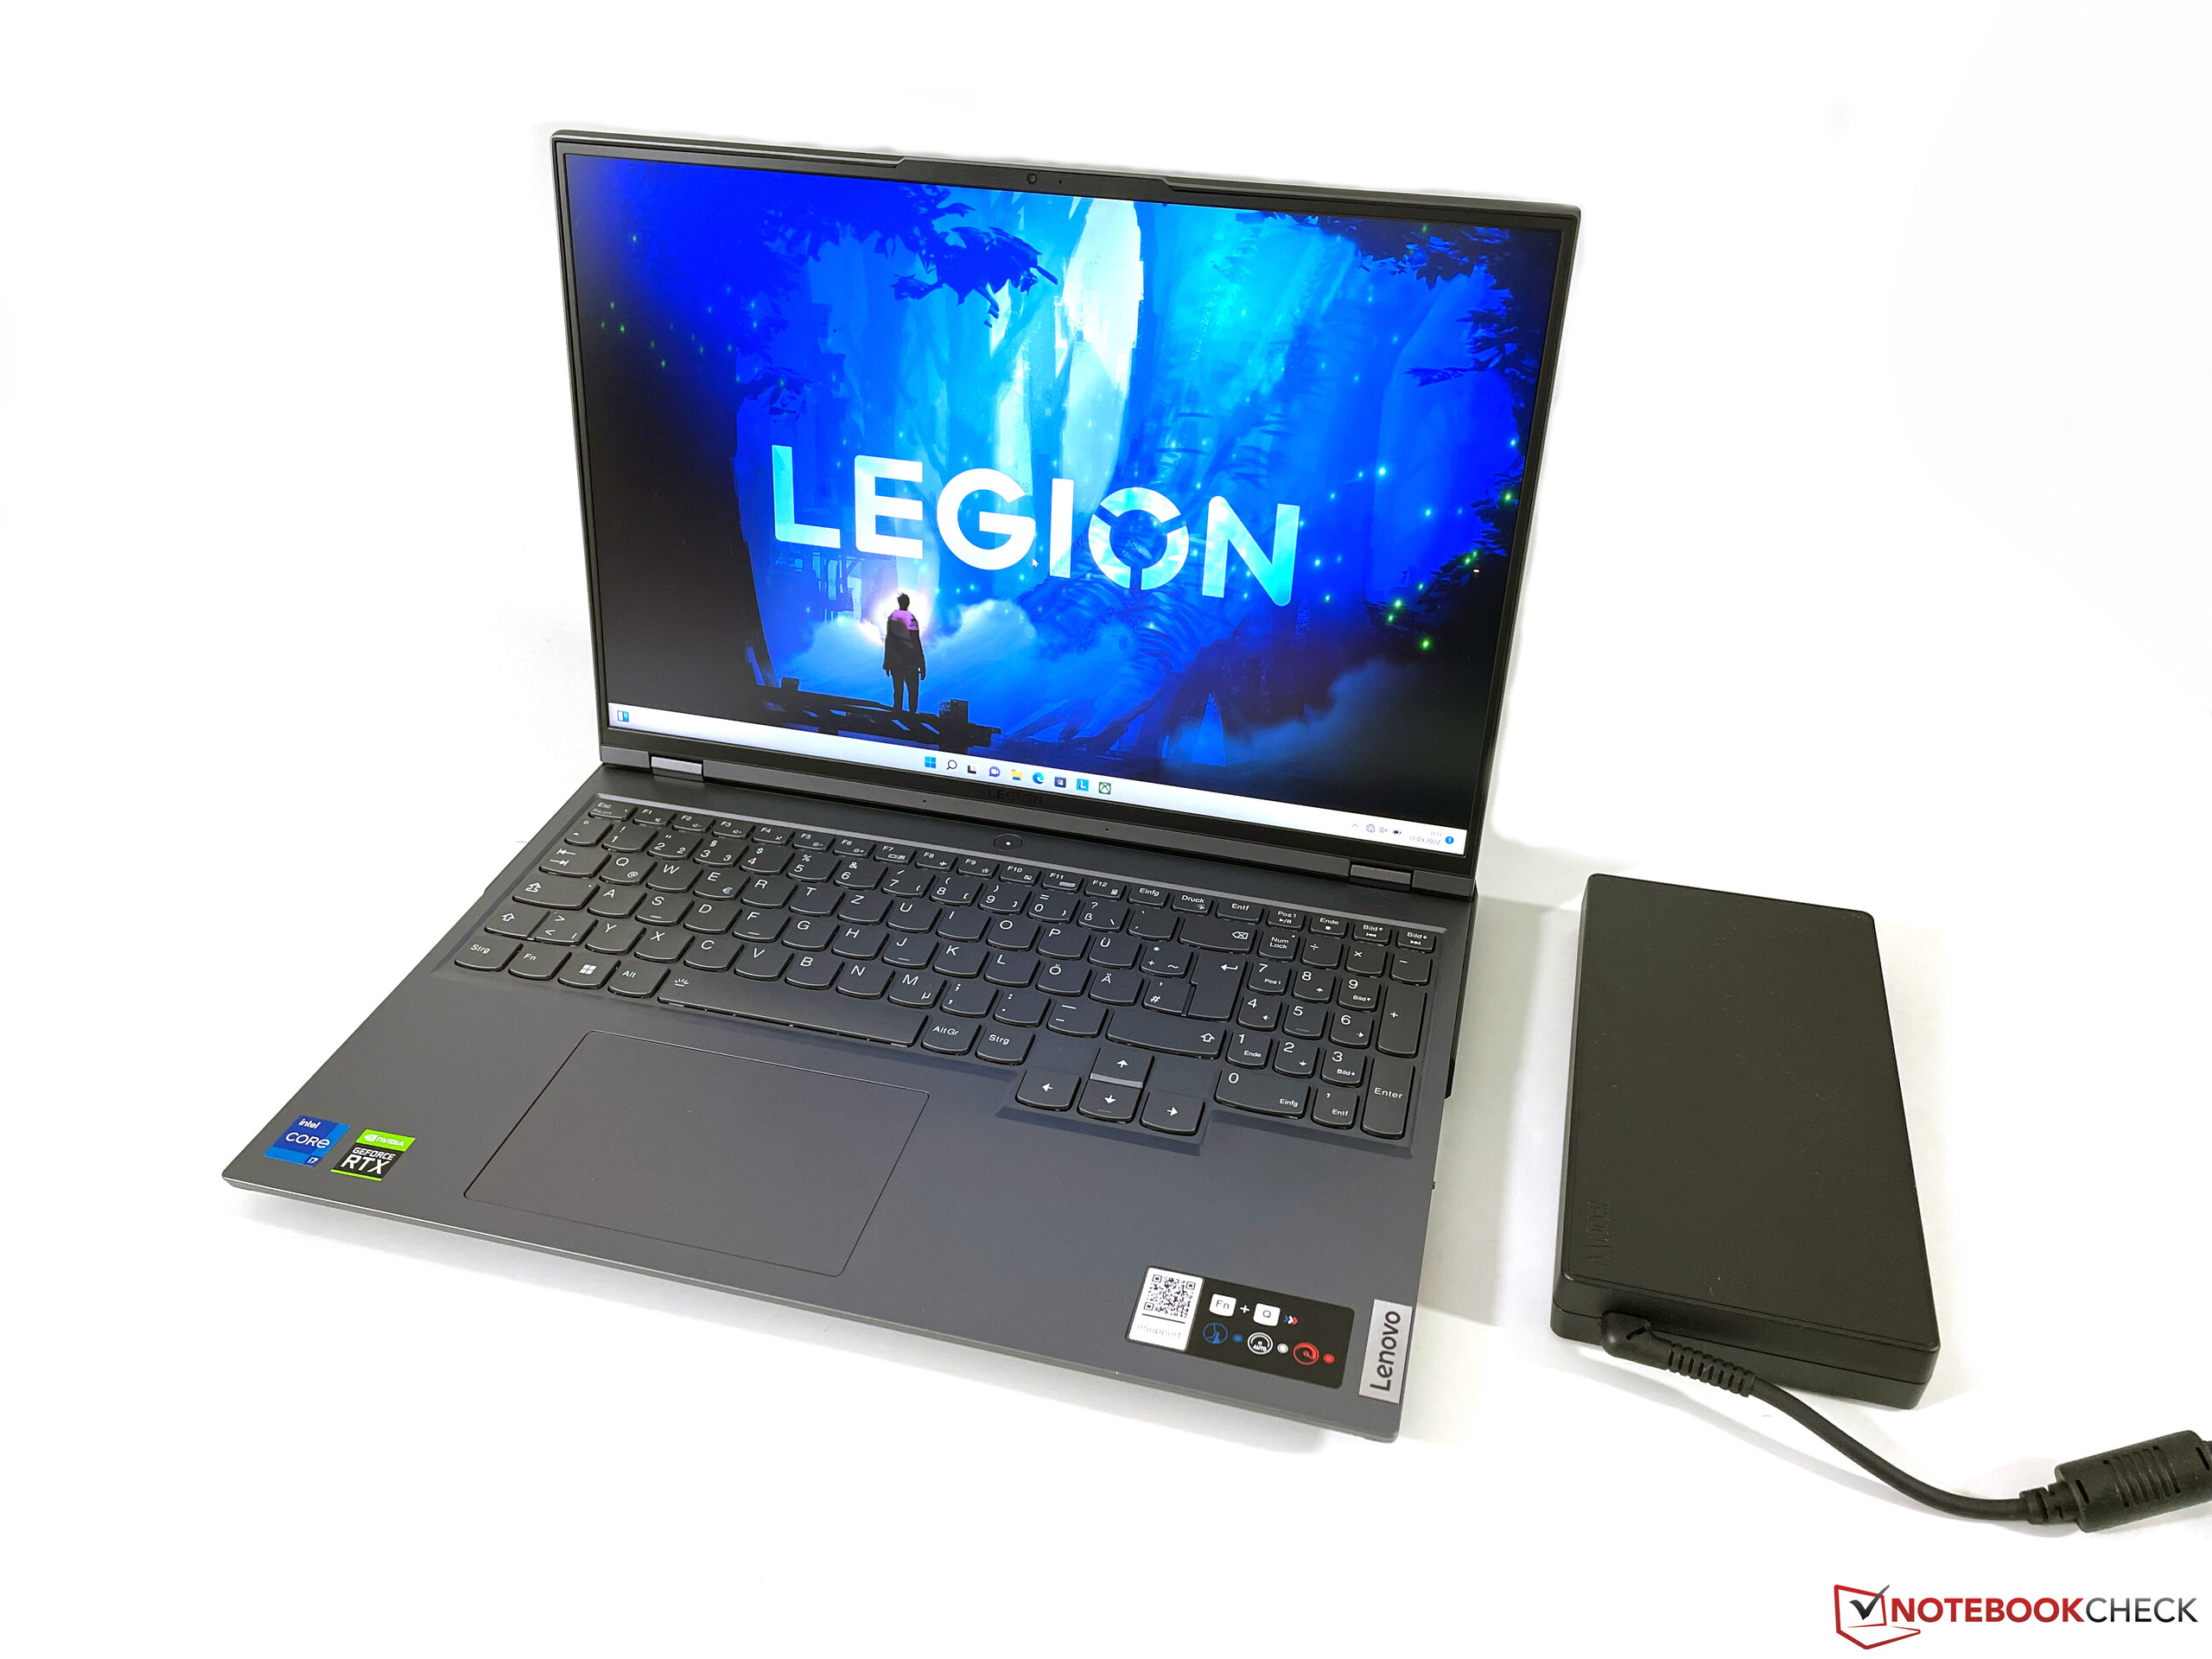
Lenovo Legion 5i Pro 16 G7 Review: Gaming Laptop now with Alder Lake and RTX 3070 Ti

We have already reviewed the Legion 5 Pro 16 last year and Lenovo now offers an updated version of its 16-inch gaming laptop. The updates are focused on the performance, because in addition to new Alder Lake processors from Intel, you also get the GeForce RTX 3070 Ti from Nvidia including Advanced Optimus (dynamic MUX). You also get Thunderbolt 4 supports as well as fast PCIe 4.0 SSDs. Today we have a look at the model 82RF000VGE for 2100 Euros, which is equipped with 16 GB DDR5-RAM, 1 TB PCIe 4.0 storage, and the fast 165 Hz display with the WQHD resolution. This laptop is also available in Lenovo’s campus program for 1900 Euros.
Potential Rivals
Rating | Date | Model | Weight | Height | Size | Resolution | Price |
|---|---|---|---|---|---|---|---|
| 88 % v7 (old) | 03 / 2022 | Lenovo Legion 5 Pro 16 G7 i7 RTX 3070Ti i7-12700H, GeForce RTX 3070 Ti Laptop GPU | 2.6 kg | 26.6 mm | 16.00" | 2560x1600 | |
| 86.9 % v7 (old) | 03 / 2022 | MSI Vector GP66 12UGS i9-12900H, GeForce RTX 3070 Ti Laptop GPU | 2.3 kg | 23.4 mm | 15.60" | 1920x1080 | |
| 86.6 % v7 (old) | 10 / 2021 | HP Omen 16-b0085ng i7-11800H, GeForce RTX 3070 Laptop GPU | 2.4 kg | 23 mm | 16.10" | 1920x1080 | |
| 82.2 % v7 (old) | 08 / 2021 | Acer Nitro 5 AN515-45-R1JH R7 5800H, GeForce RTX 3070 Laptop GPU | 2.3 kg | 23.9 mm | 15.60" | 2560x1440 | |
| 85 % v7 (old) | 07 / 2021 | Asus TUF Gaming A15 FA506QR-AZ061T R7 5800H, GeForce RTX 3070 Laptop GPU | 2.3 kg | 24 mm | 15.60" | 1920x1080 |
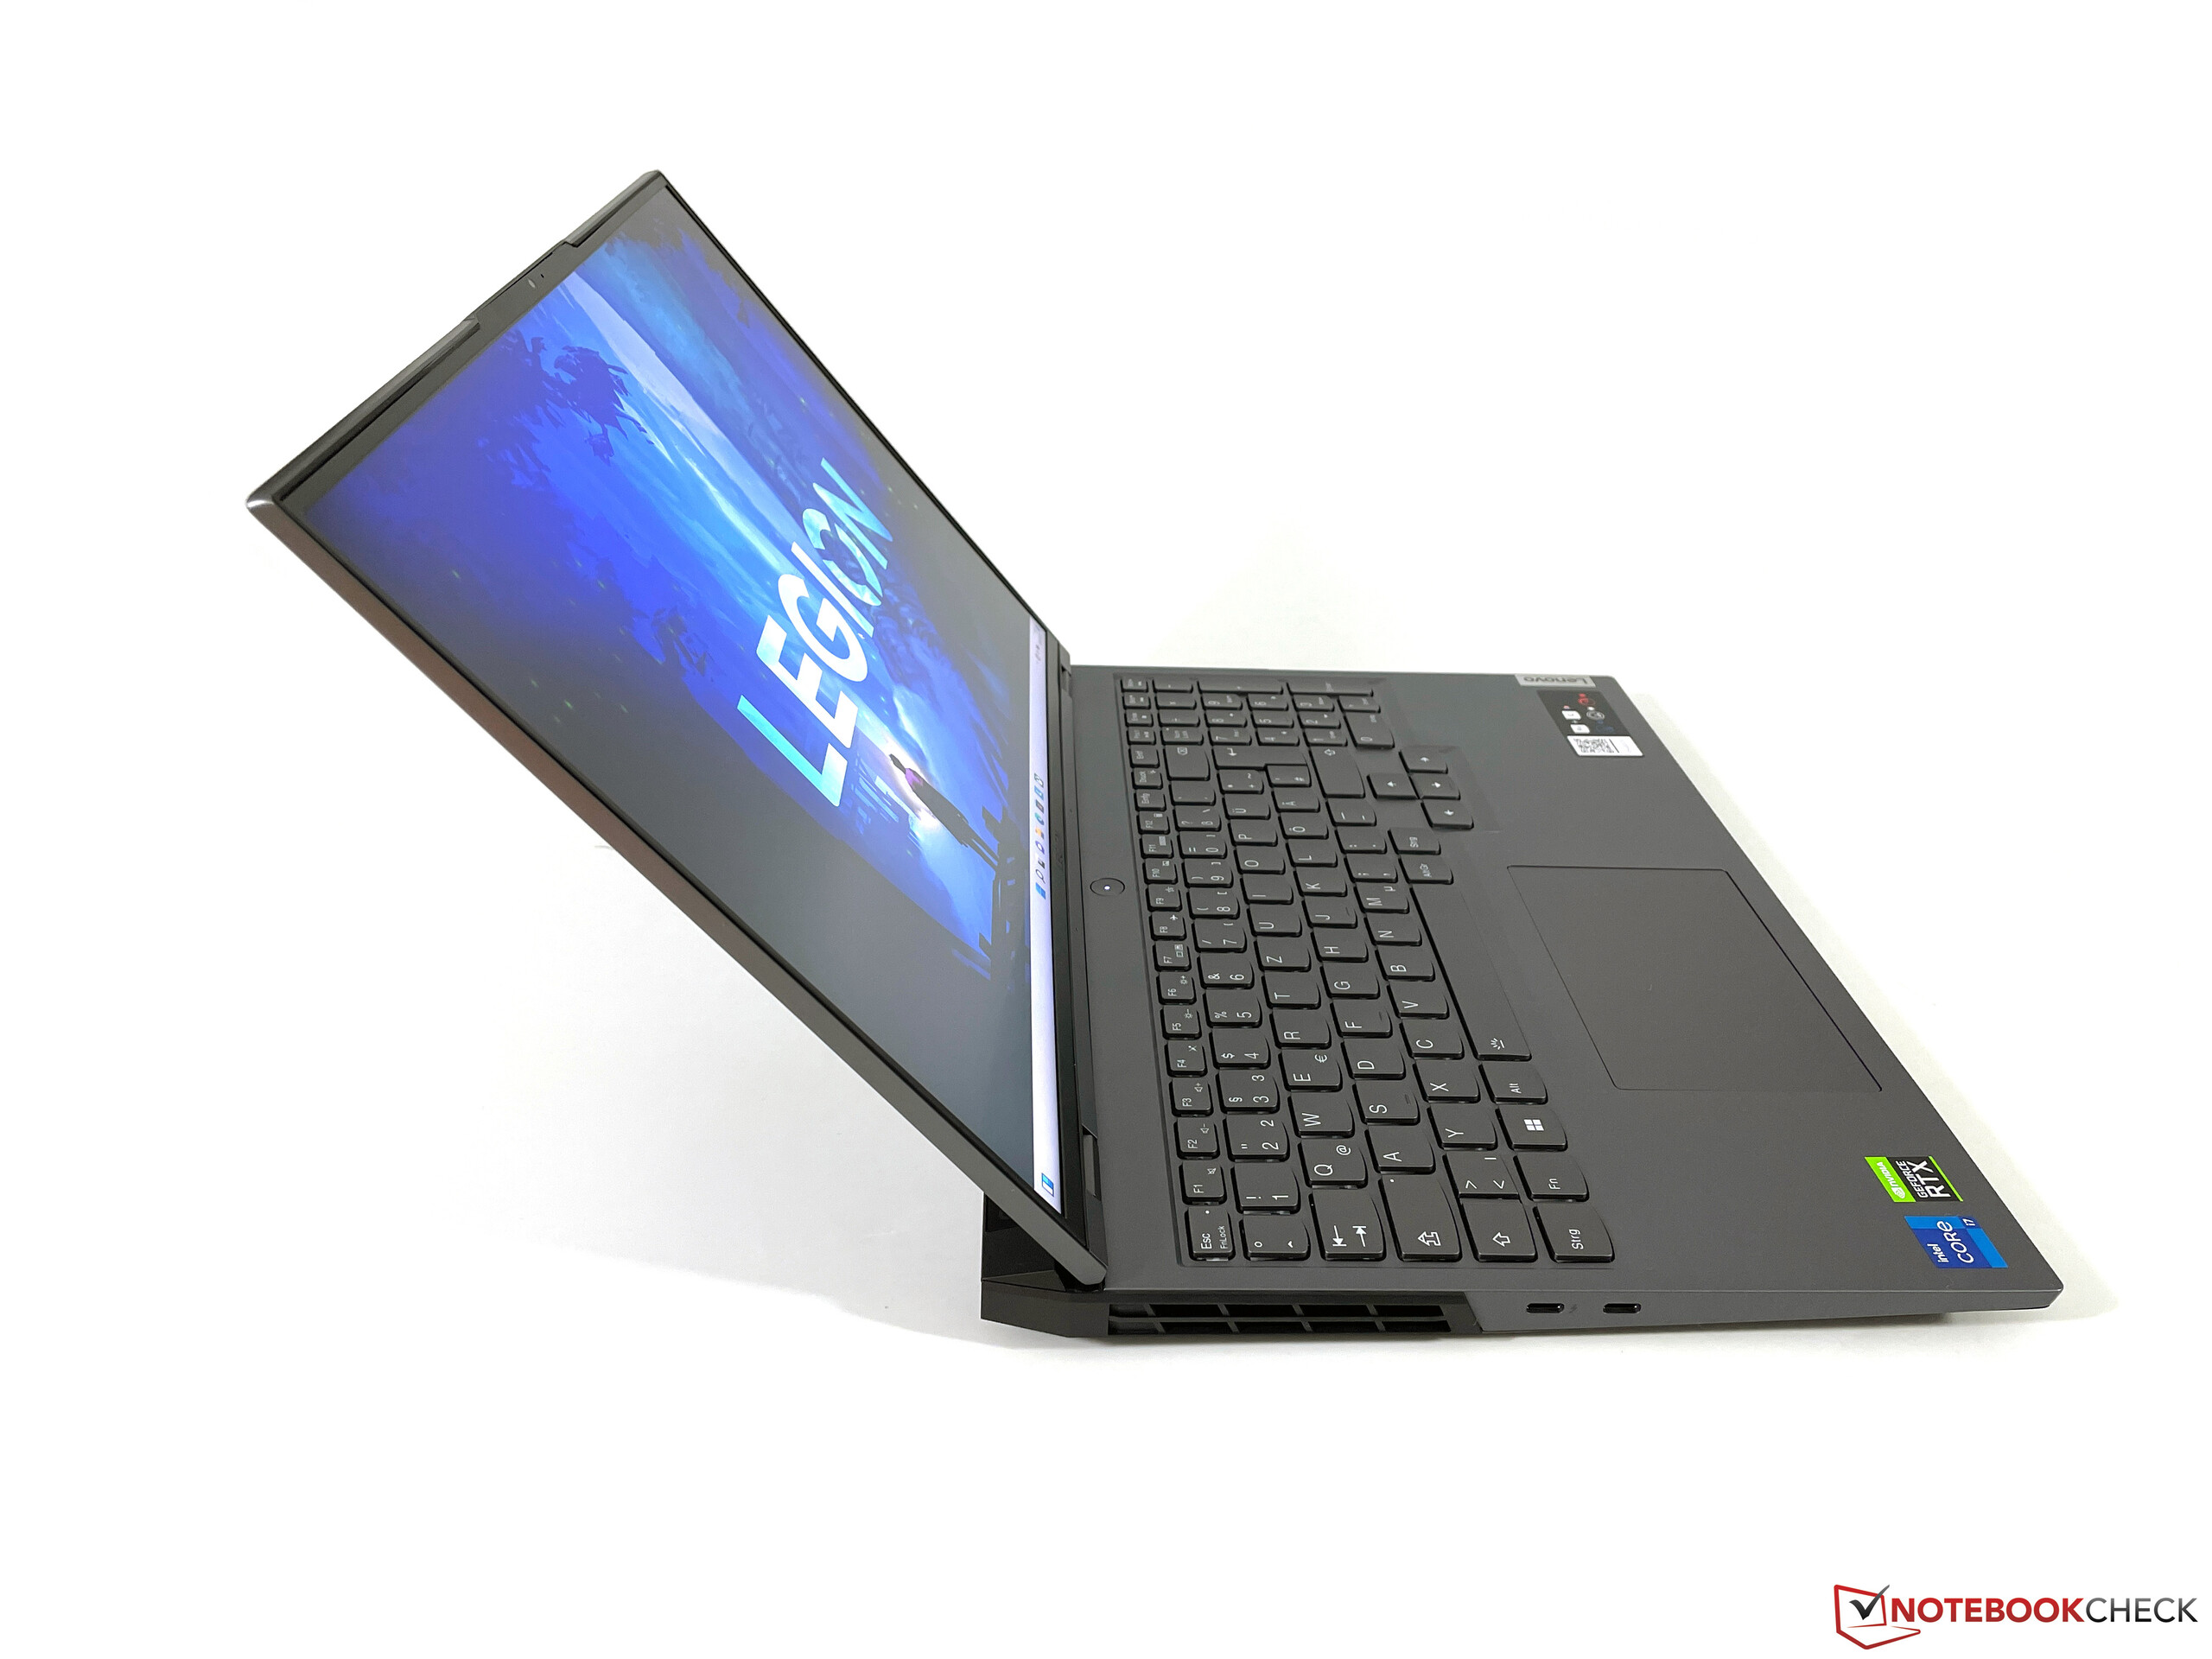
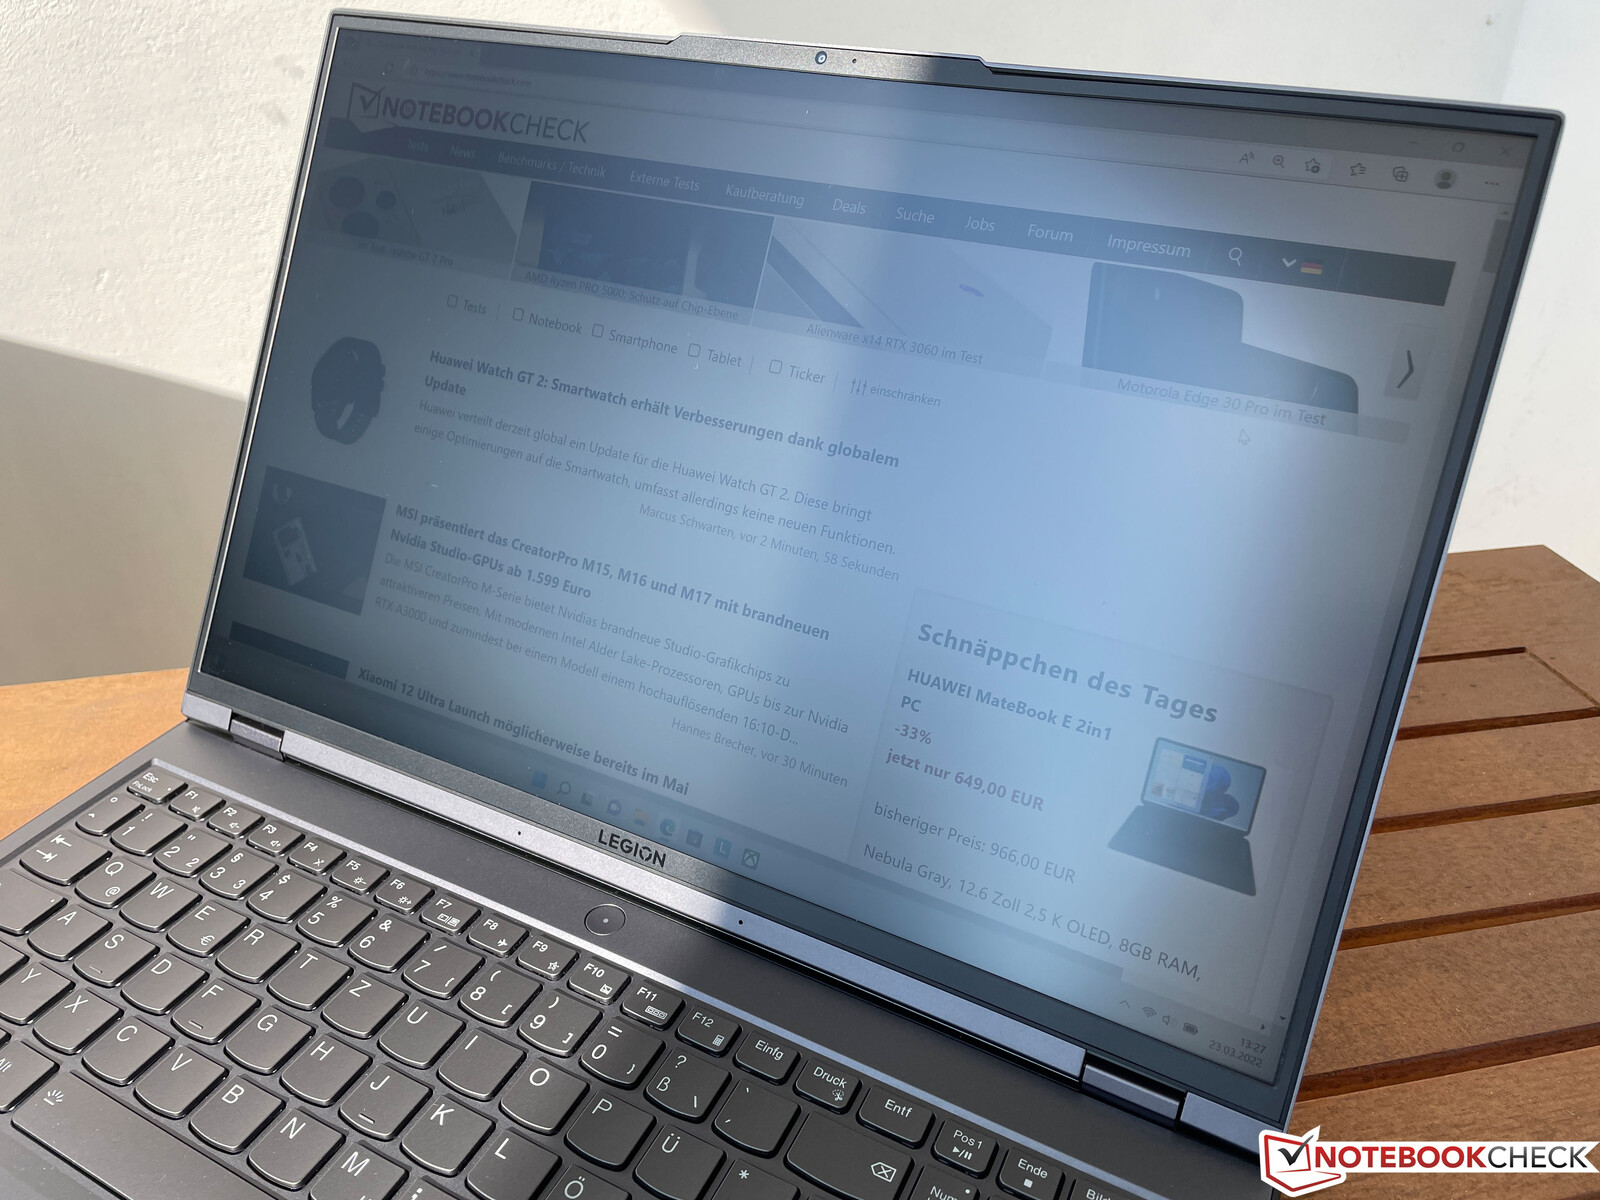
Case - Legion with minor visual changes
Compared to the Legion 5 Pro 16 with the AMD Ryzen 7 CPU we reviewed last year, the chassis is basically still the same, but the lid design changed a bit. Instead of the large and illuminated Legion logo, which was also imprinted on the side of the lid, there is now only a subtle Legion lettering in the upper part of the lid. This means the two-tone chassis (dark gray and light gray), which does not offer any extensive chassis lighting elements, looks even more restrained than before. The bezels are very slim thanks to the 16:10 aspect ratio screen and the design appears very modern. There is still no criticism for the stability, either.
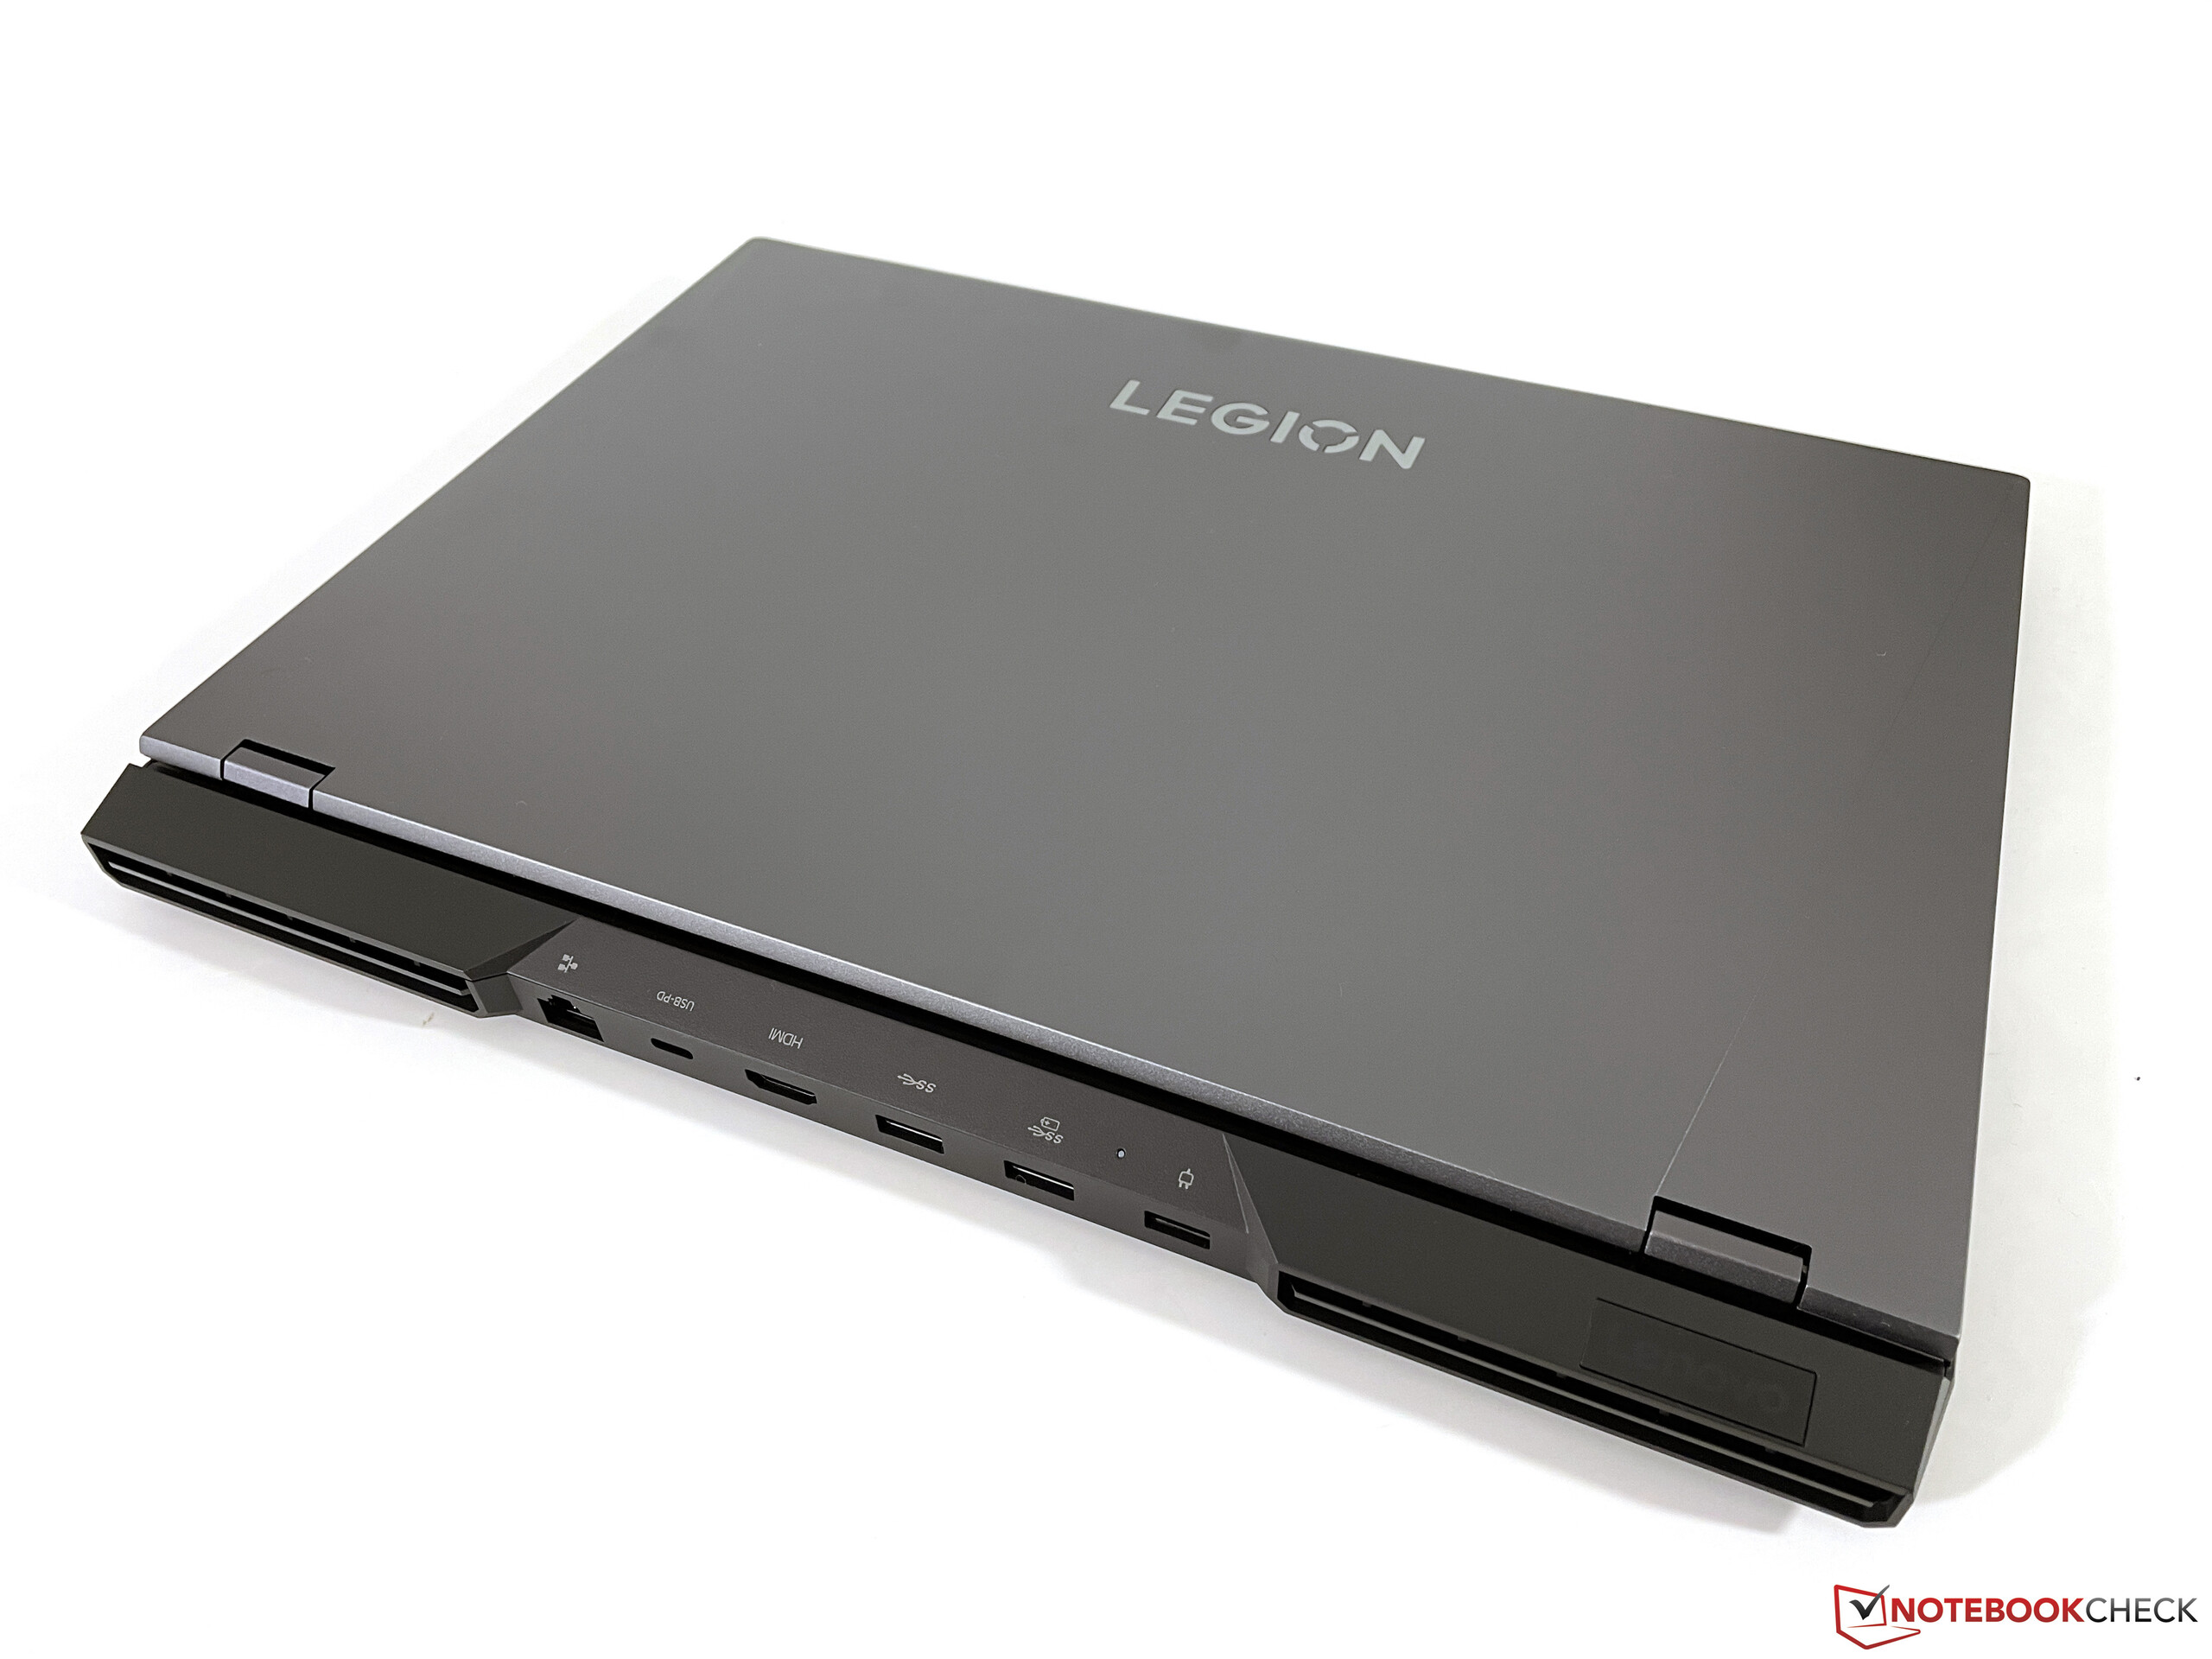

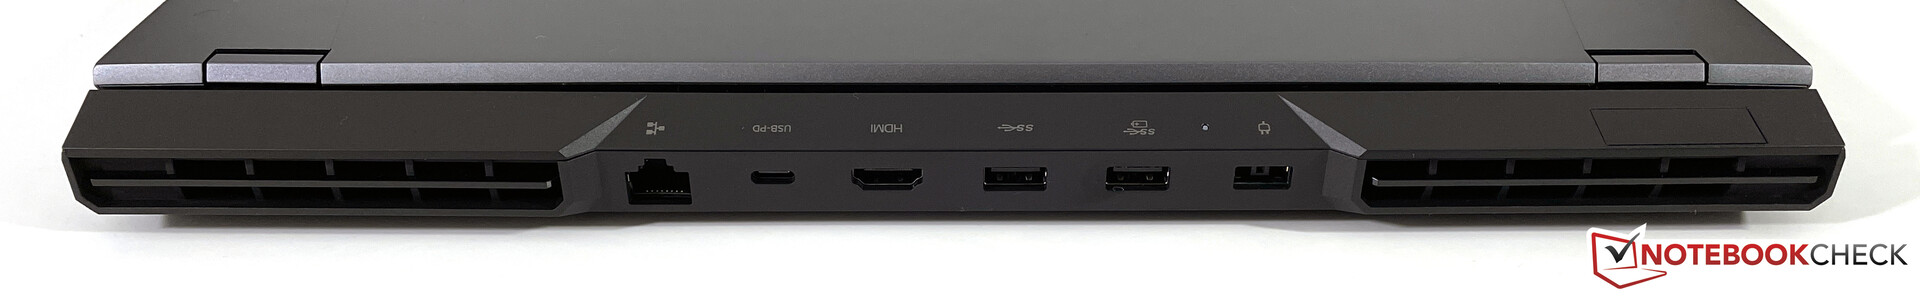
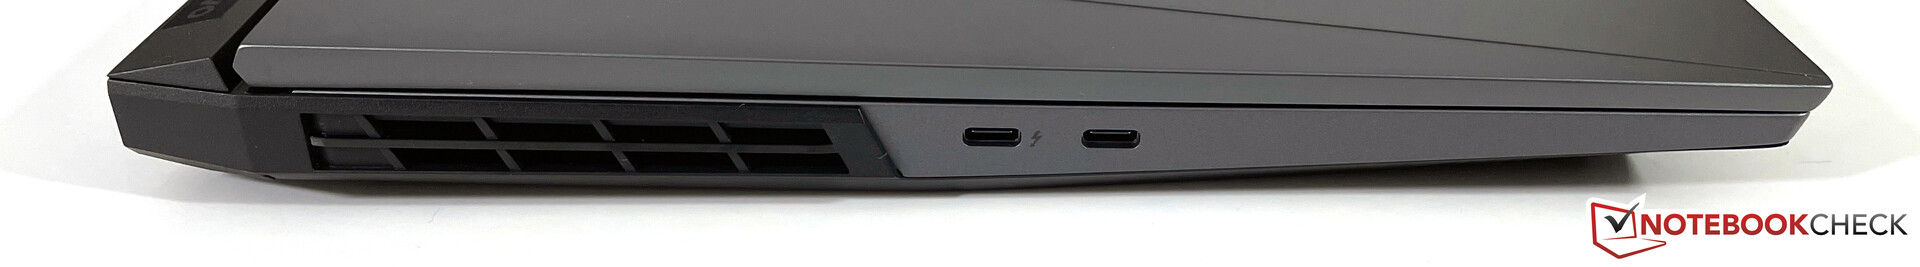
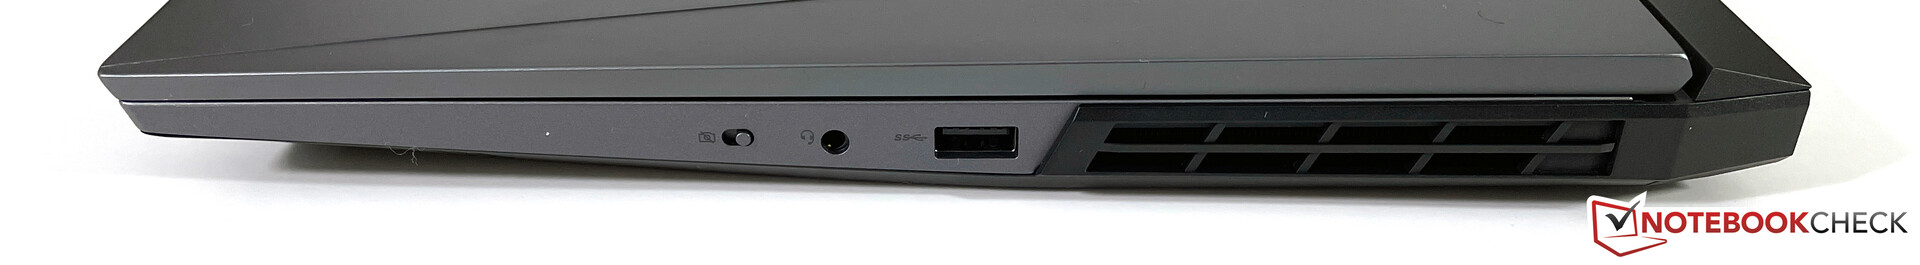
Connectivity - Legion now with Thunderbolt 4
The ports, which are distributed across the two sides as well as the rear, are very similar to the previous model. Our Intel review unit also offers Thunderbolt 4 support (40 Gbps) for the USB-C port on the left side. Thanks to the little icons on the top of the rear edge, it is very easy to attach cables without turning the whole device. One of the USB-C ports supports Power Delivery (up to 135W), so you can also charge the Legion via USB-C if necessary. We tested it with a 65W PSU from Lenovo and it worked, but the performance will obviously be limited in this case.
Communication
In addition to the Gigabit-Ethernet port for wired networks, Lenovo implements an AX201 Wi-Fi module from Intel. It supports the Wi-Fi 6 standard (802.11ax) as well as Bluetooth 5.1, but not the latest Wi-Fi 6E standard (6 GHz). Our test with the reference router Netgear Nighthawk AX12 determines excellent transfer rates and we did not experience any other issues with the signal quality, either.
Webcam
The webcam still uses a 720p sensor and the picture quality is not very good, even in good lighting conditions. There is no mechanical shutter, but an E-Shutter with a button on the right side.


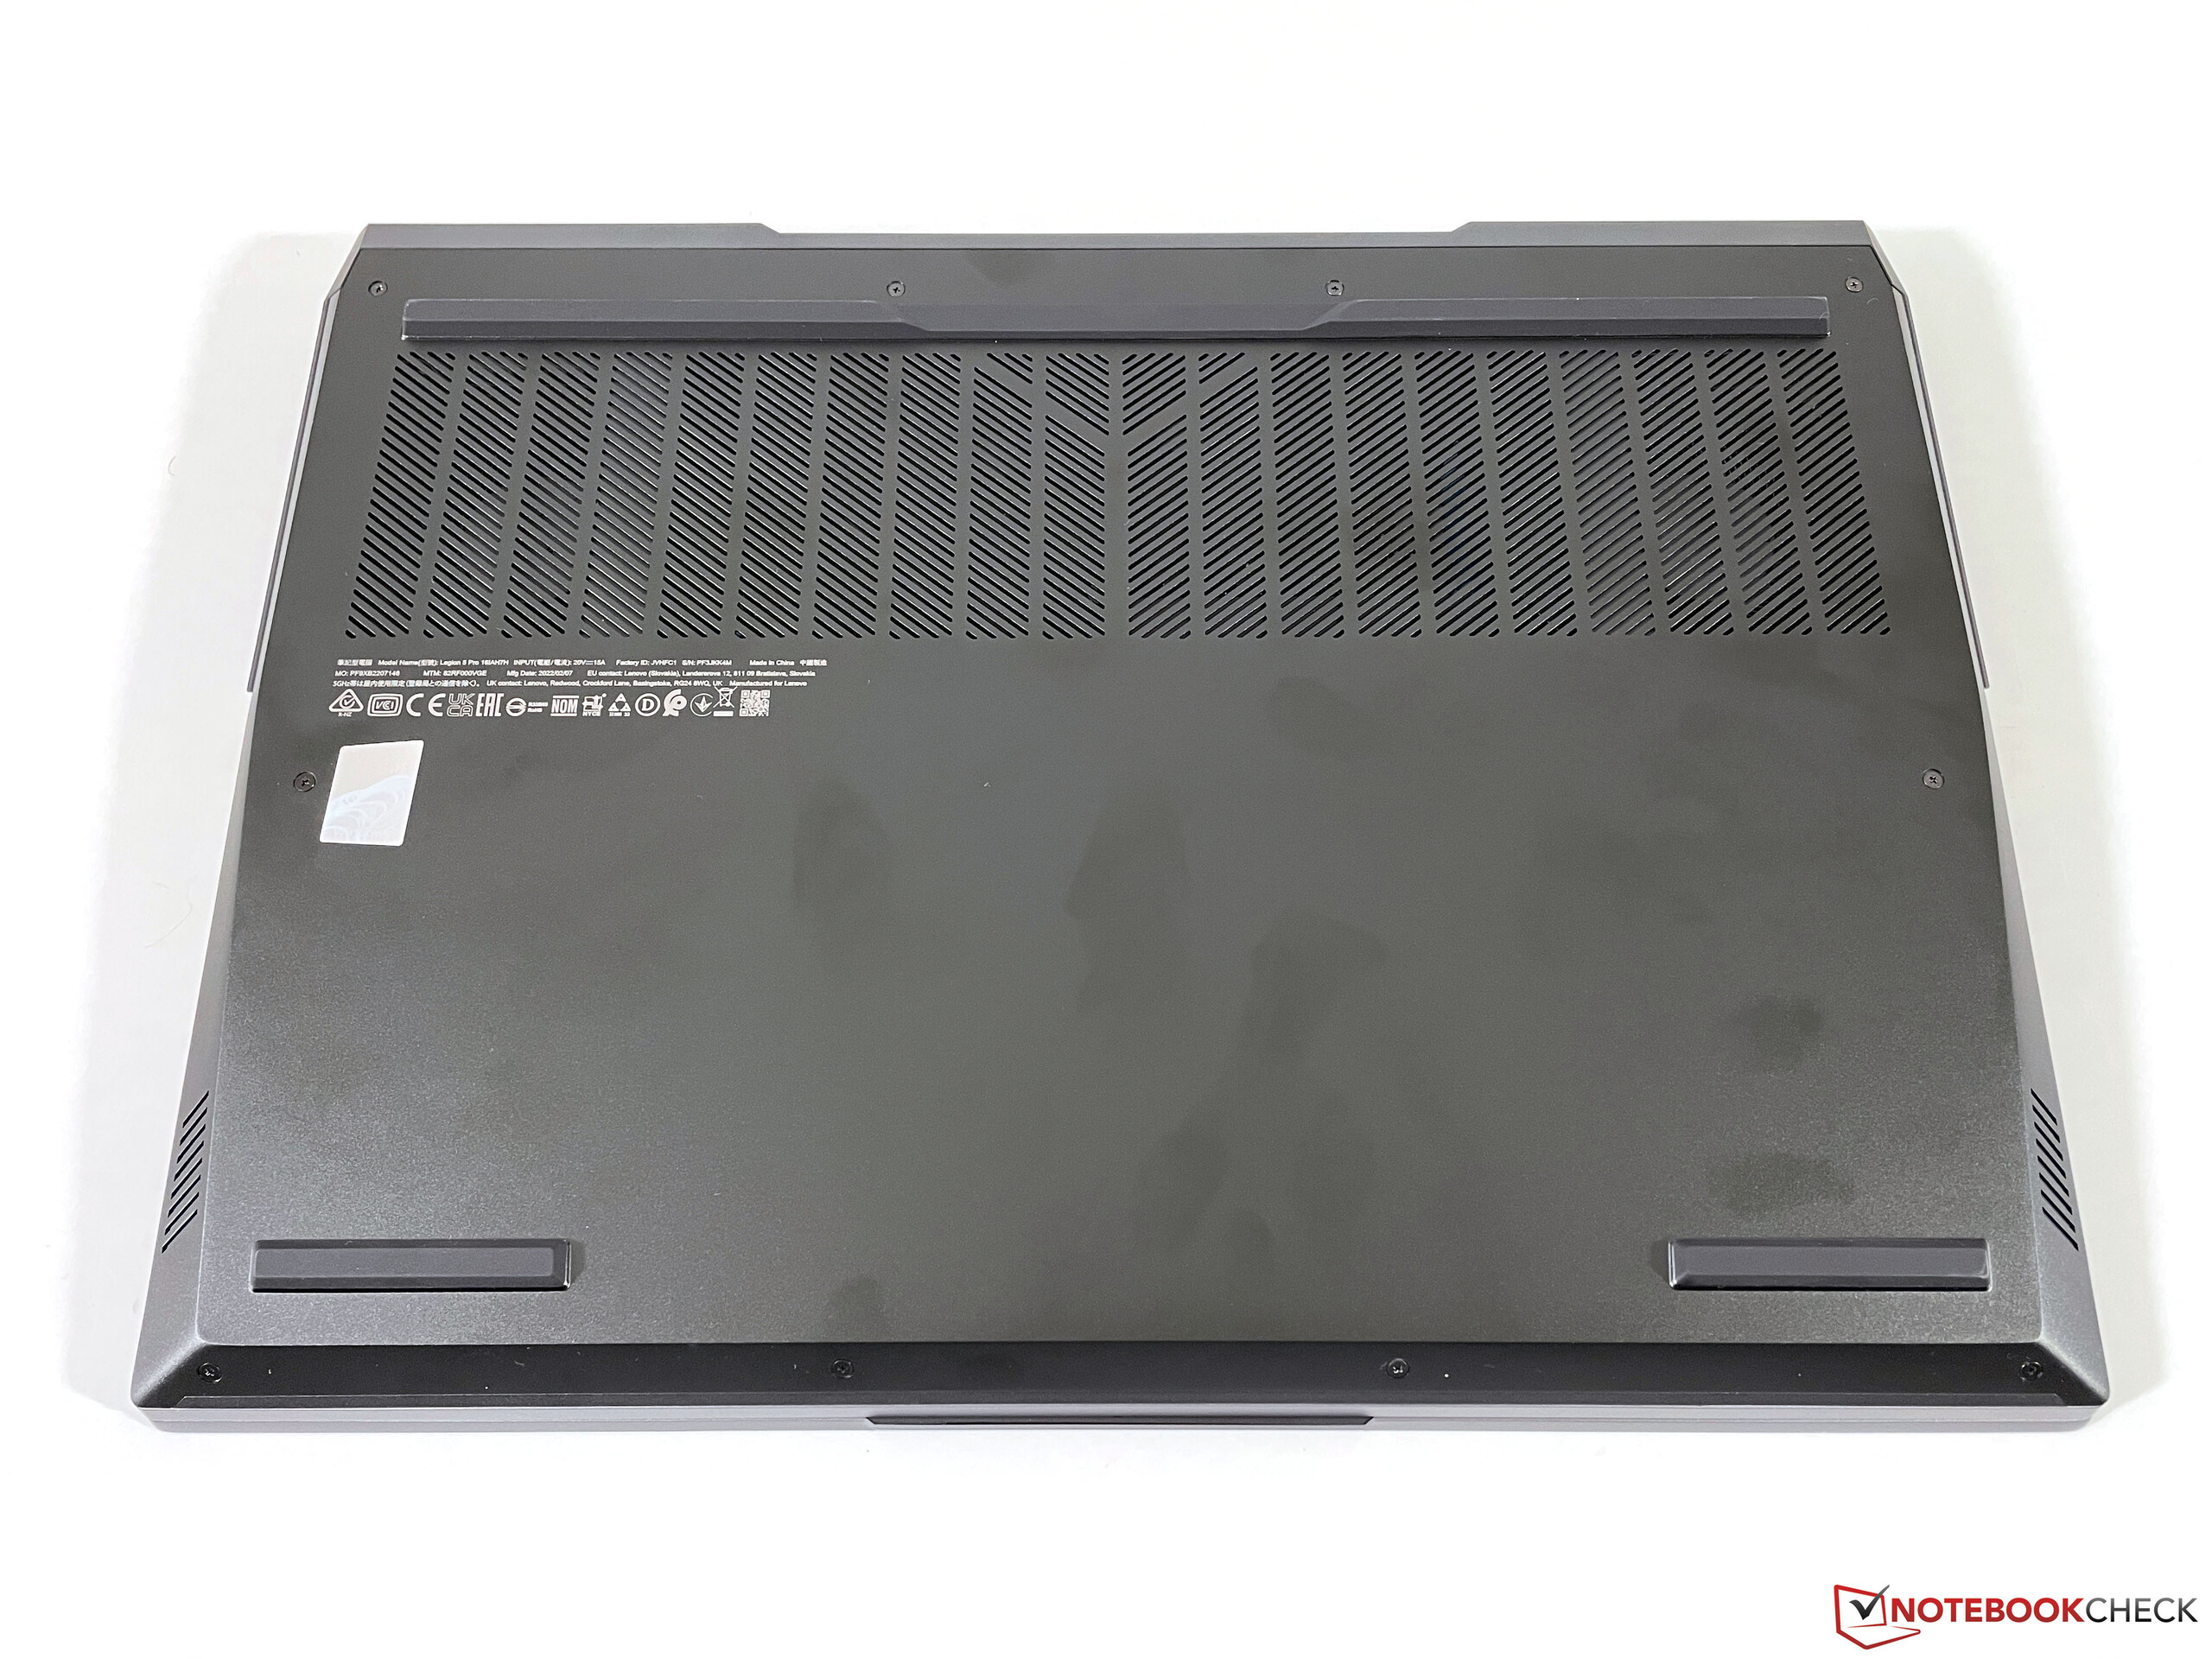
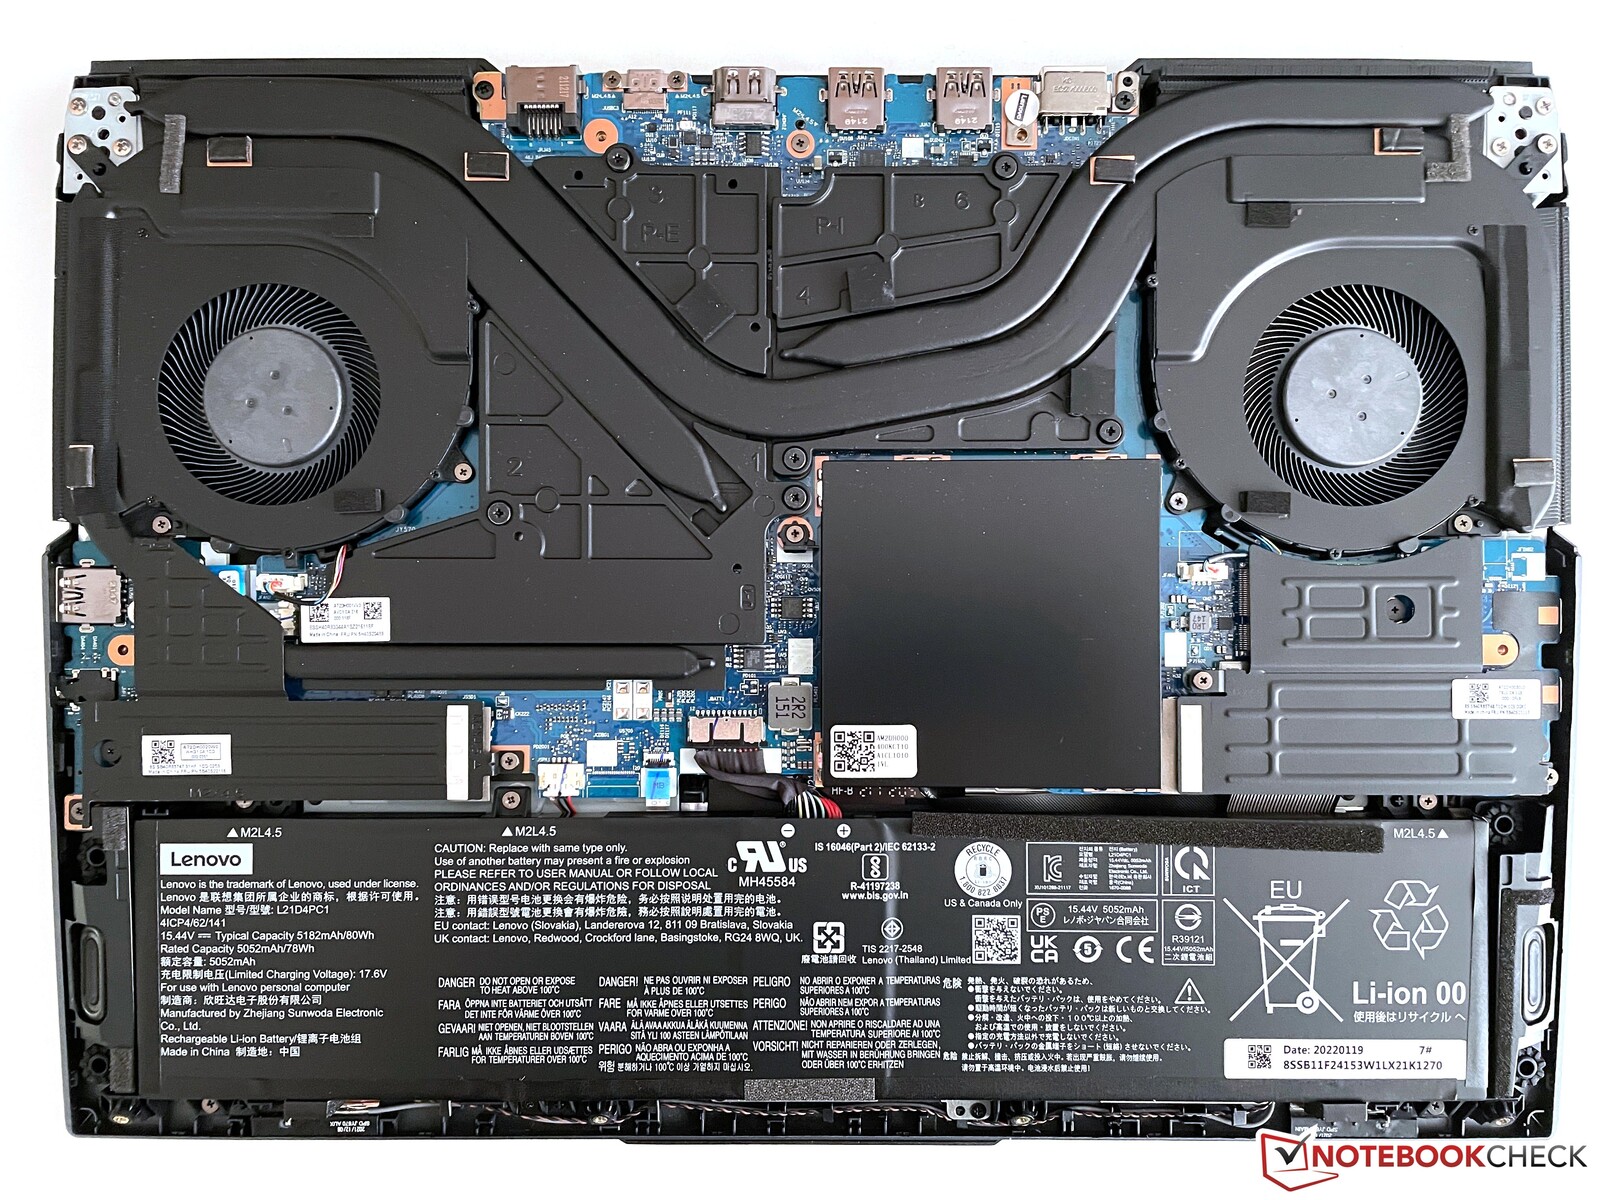
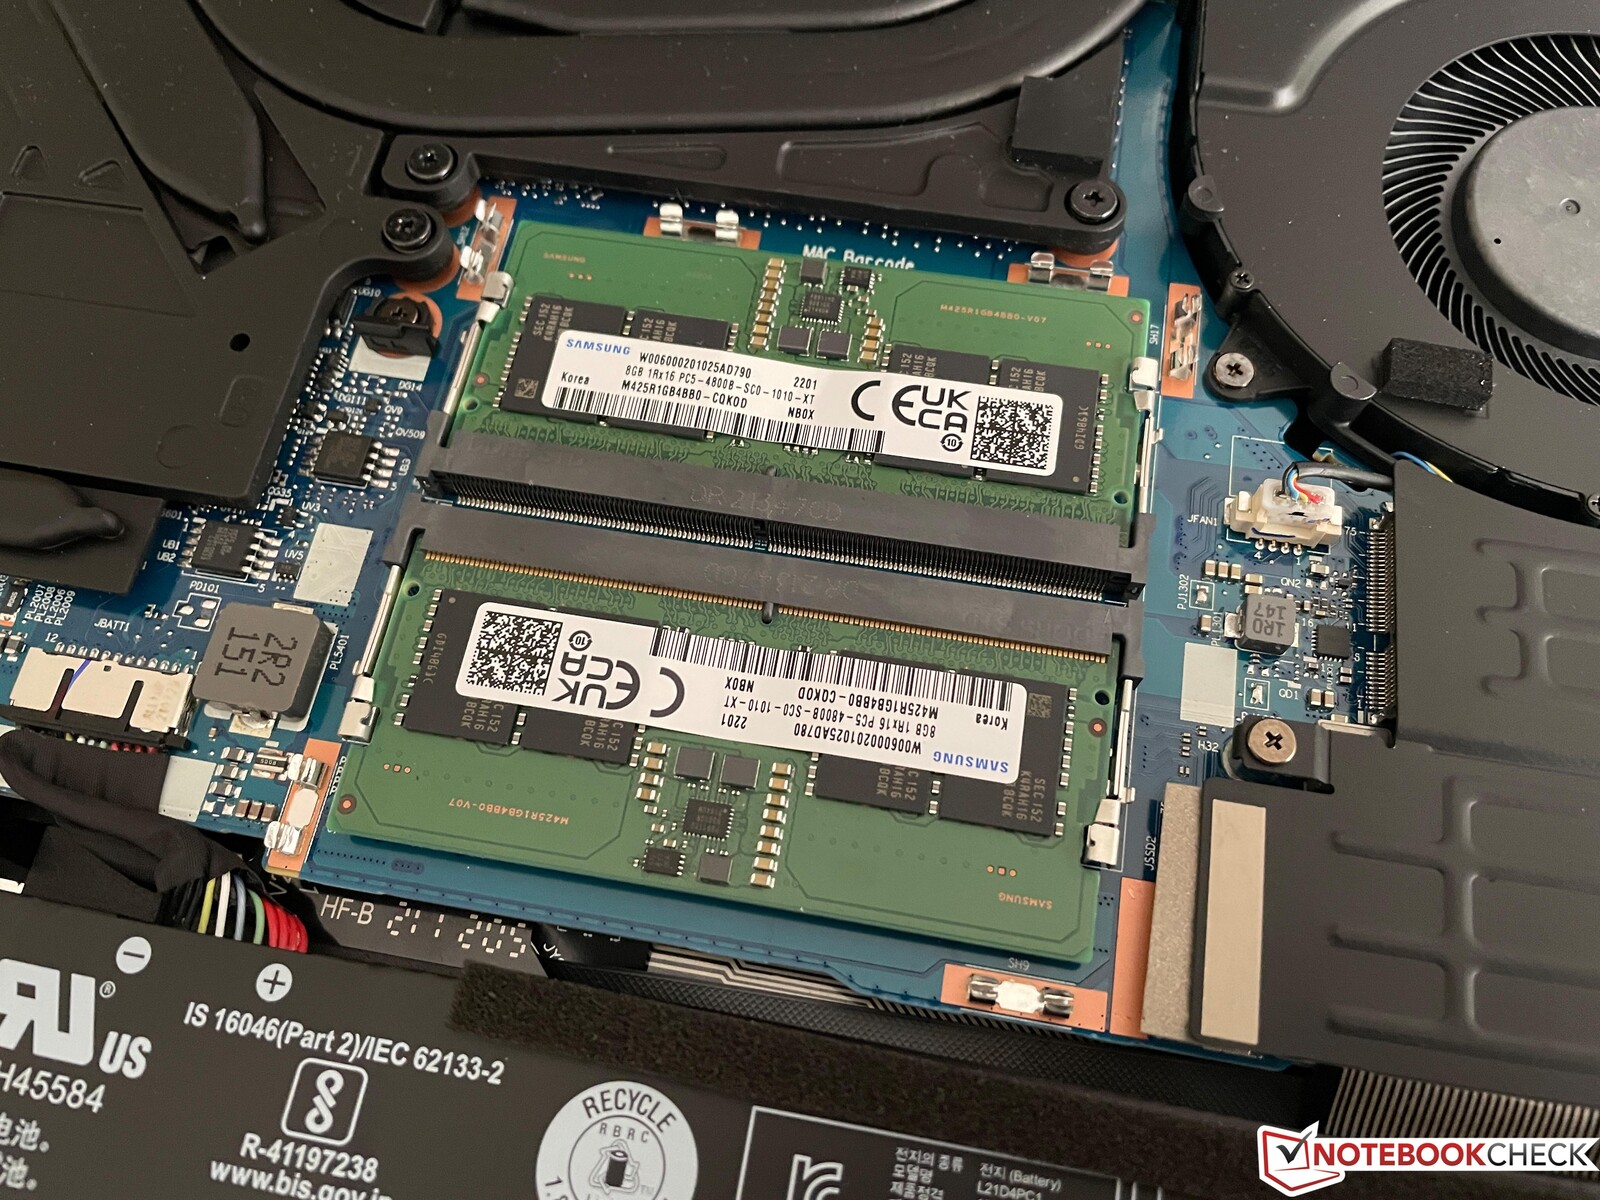
Maintenance
You can remove the whole bottom part of the base unit, which secured by 10 Philips screws. There are additional covers (some of them with additional screws) for the two RAM slots, the two M.2 slots as well as the Wi-Fi module. You can also clean the fans.
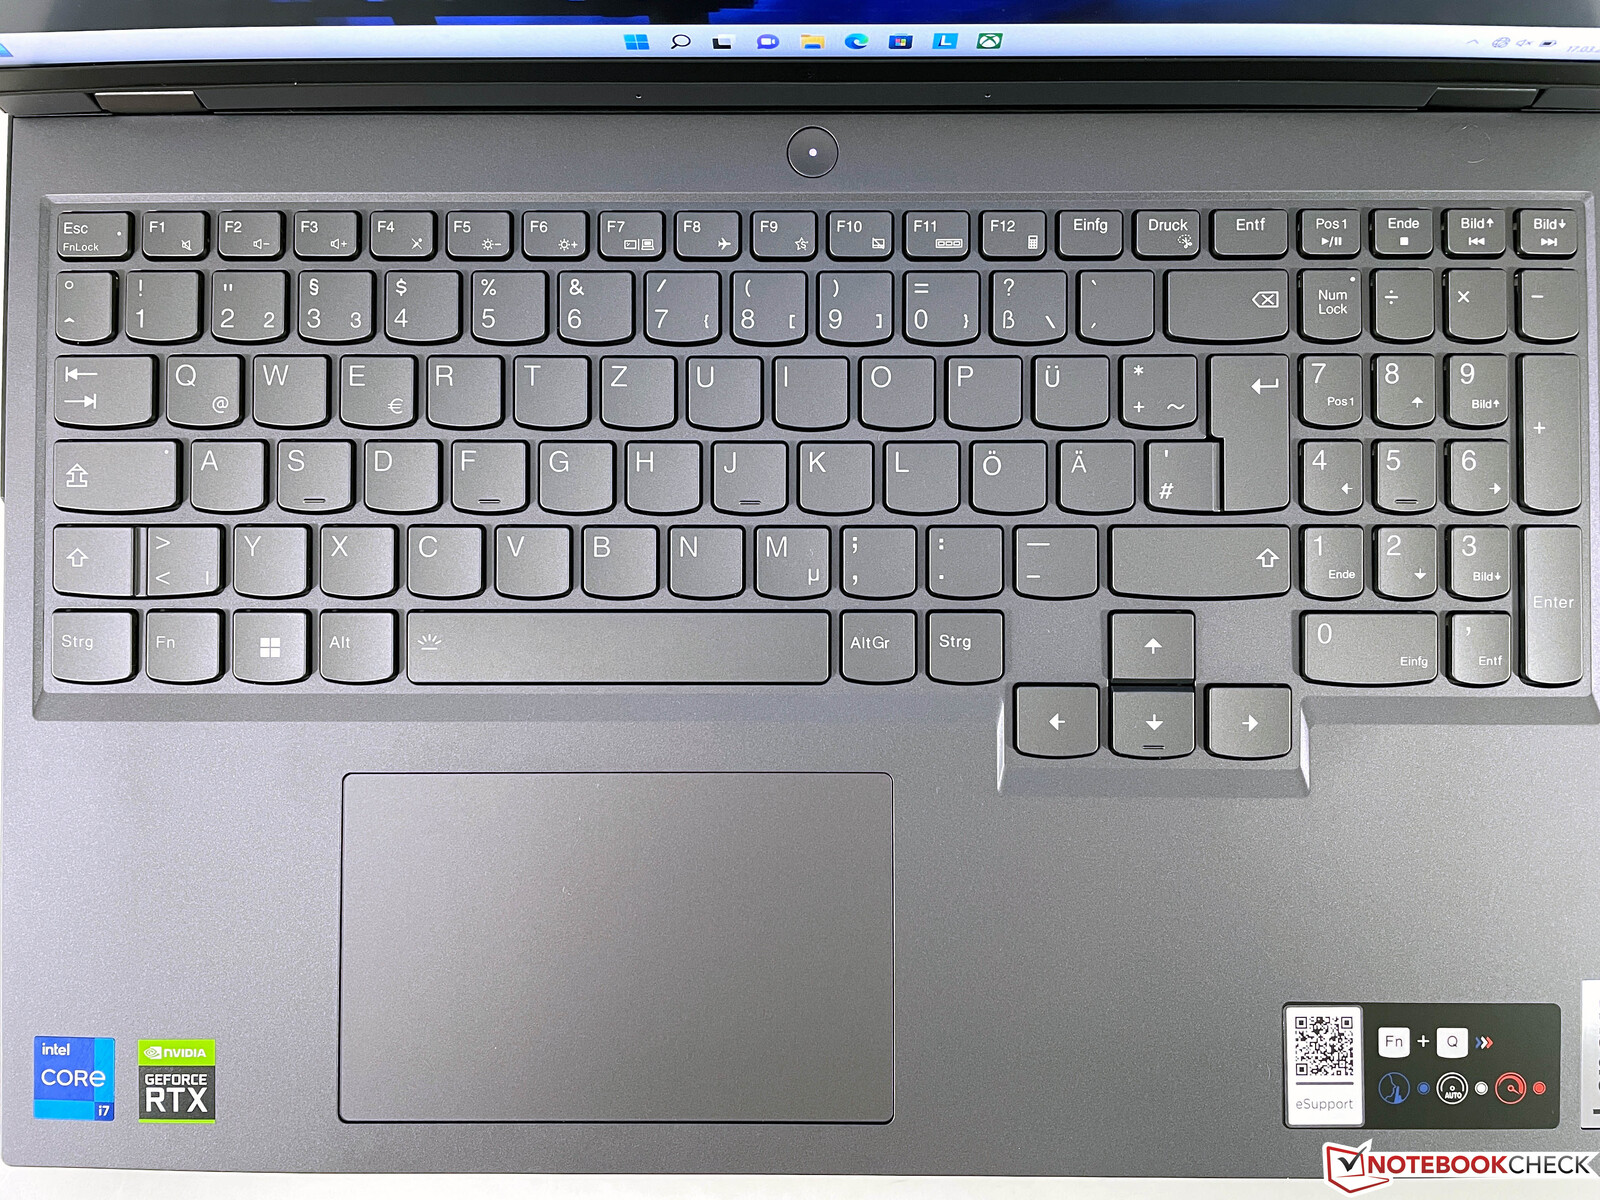
Input Devices - Lenovo uses with a good keyboard
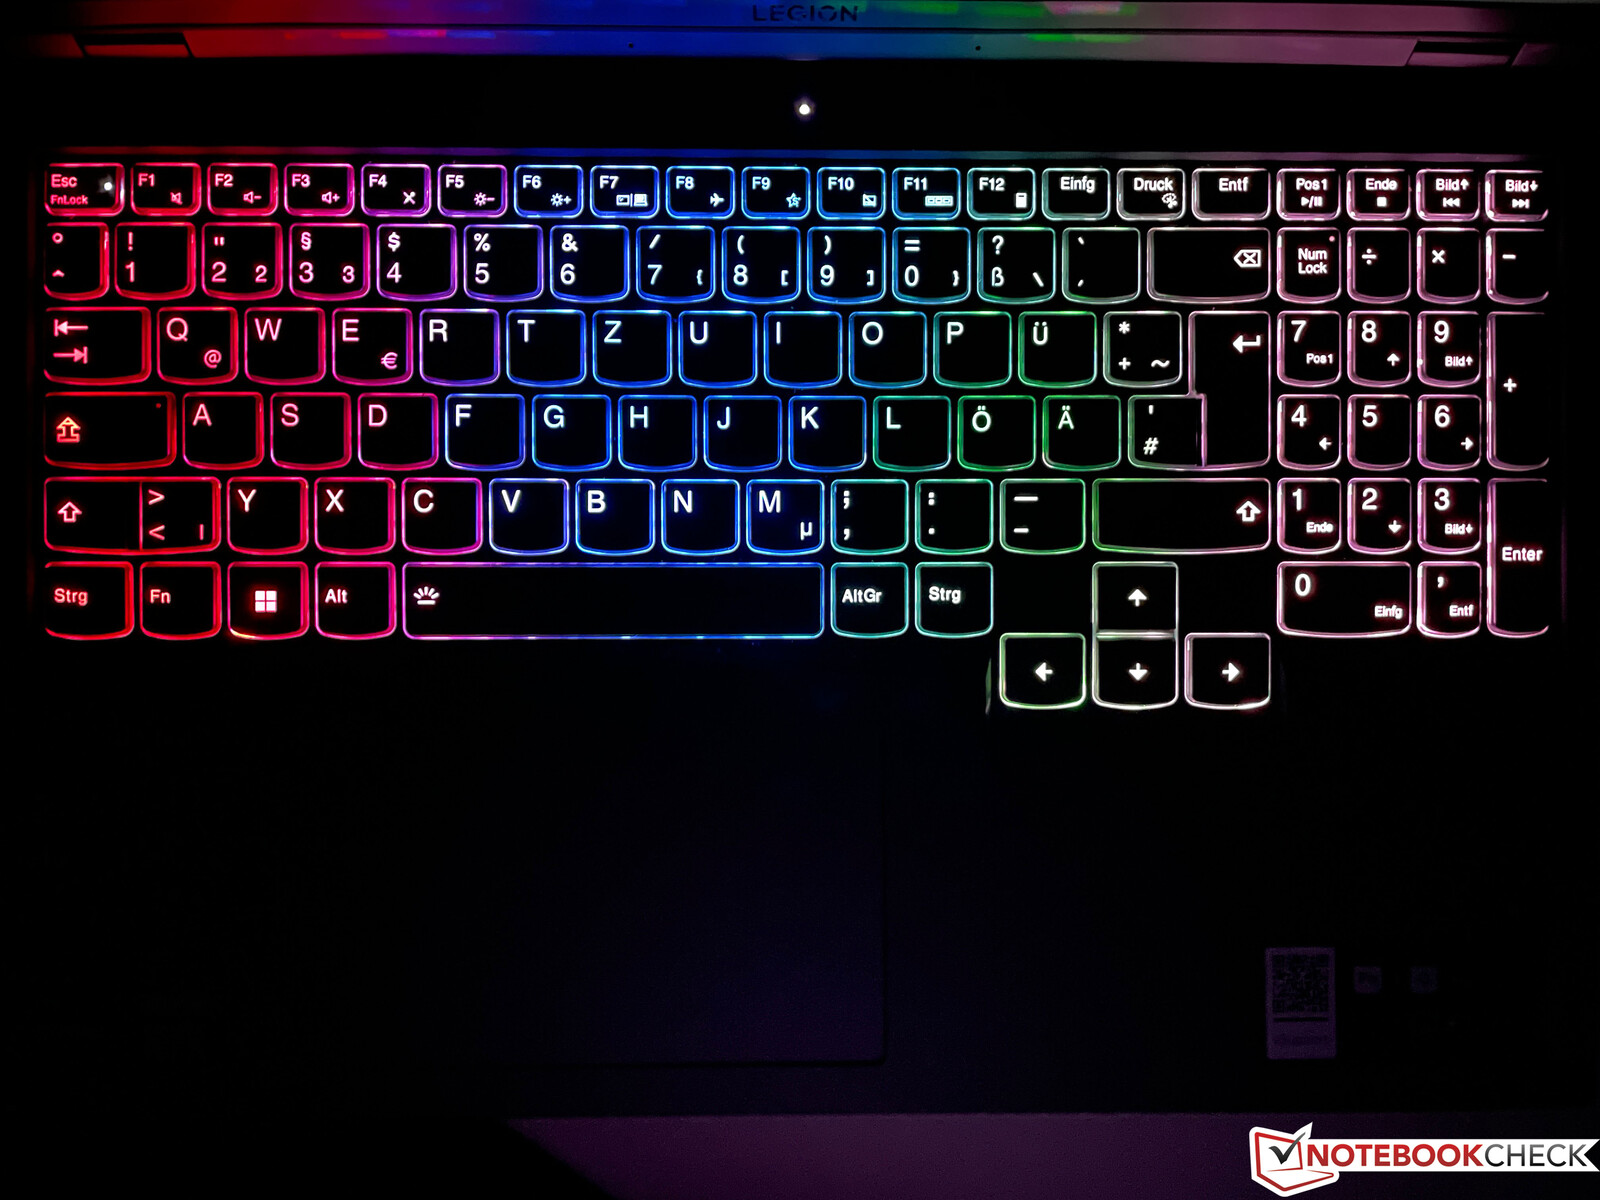
The keyboard still offers a generous travel of 1.5 mm and a very comfortable typing experience, so you can easily use the Legion for longer texts. The arrow keys are large and slightly isolated and there is also a dedicated numeric keypad, even though the keys are a bit narrower. Our review unit features a 4-zone illumination and you can set up three different profiles (a uniform illumination is also possible).
The large clickpad works well in everyday situations and gestures with up to four fingers are executed very well, but the clicking sounds are pretty loud. Most gamers will probably use an external mouse anyway, so this should not be a big deal.
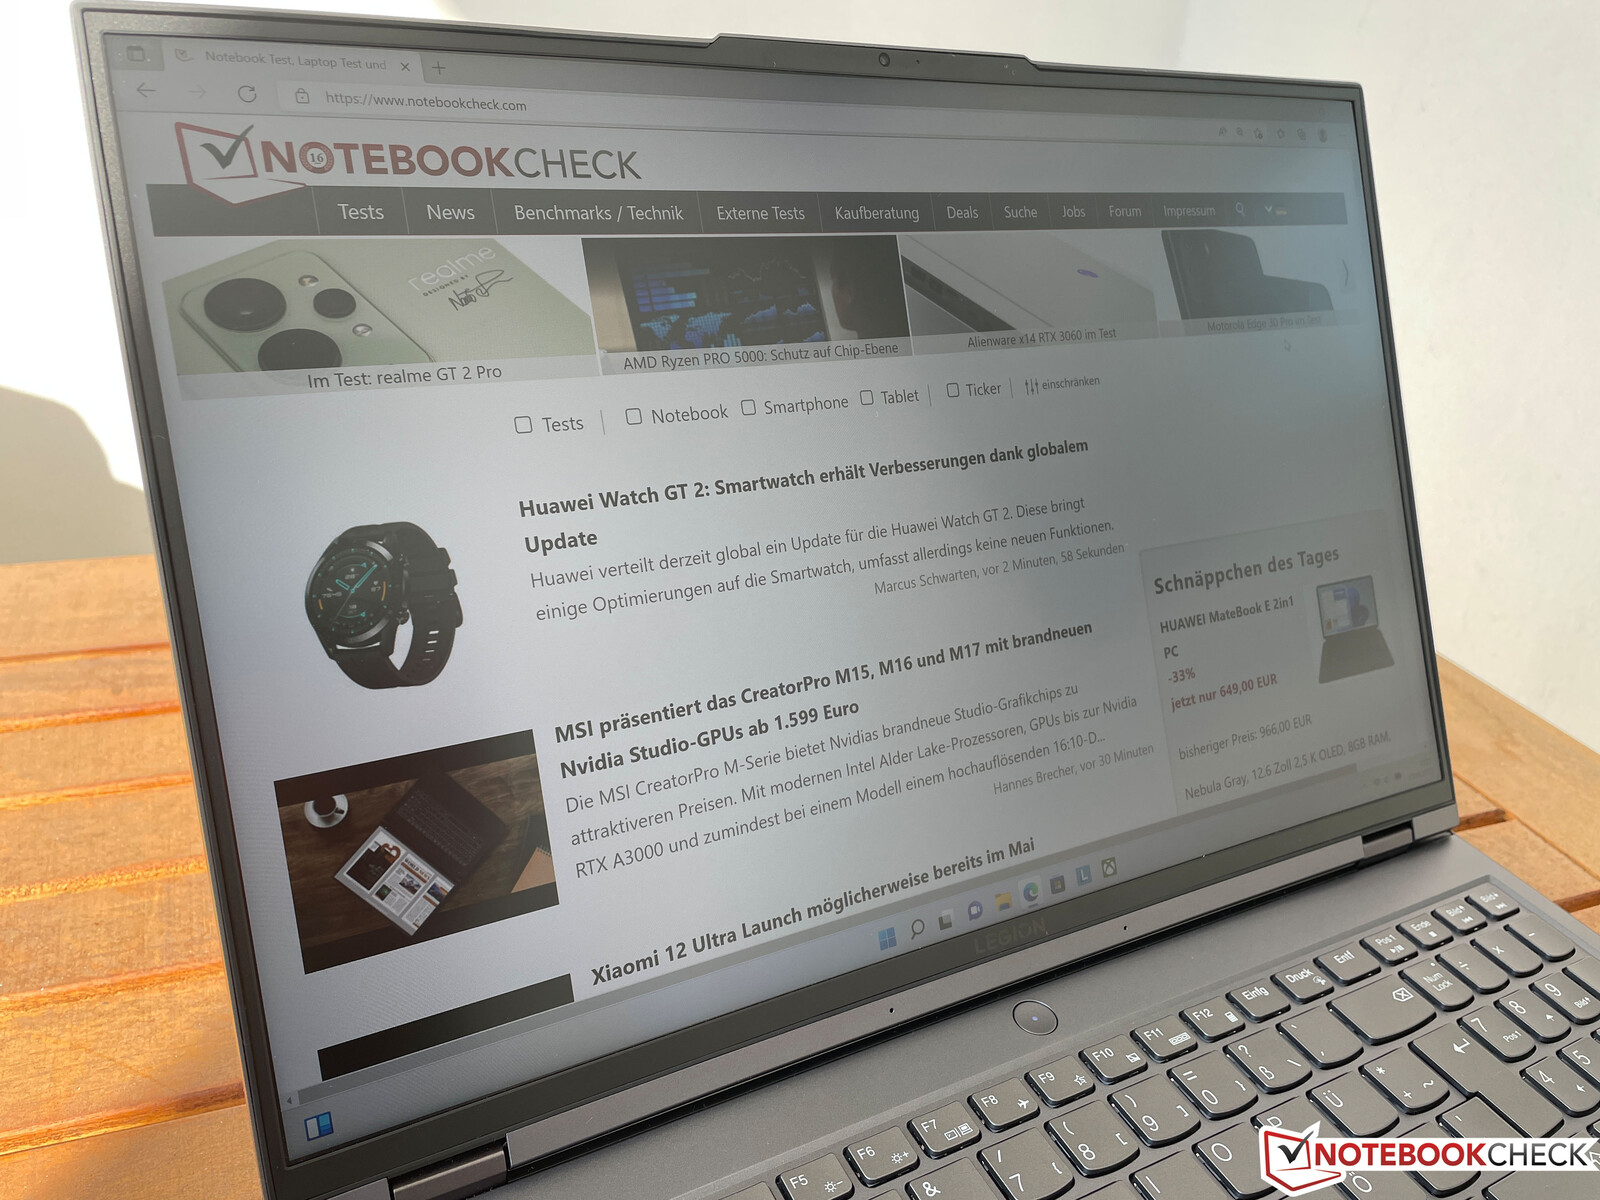
Display - 165 Hz Panel with WQHD resolution and G-Sync

The basic specs of the 16-inch display are similar to our previous test unit: 2560 x 1600 pixels, 16:10, IPS, HDR 400, and a high refresh rate of 165 Hz. Thanks to Advanced Optimus, the system now supports switchable graphics and G-Sync at the same time. Our unit does, however, use a panel from another supplier (BOE). The subjective picture impression is still excellent with crisp colors, good contrast, and the picture does not look grainy despite the matte surface. The high refresh rate results in smoother pictures and you can clearly see the effect when you scroll through websites or documents.
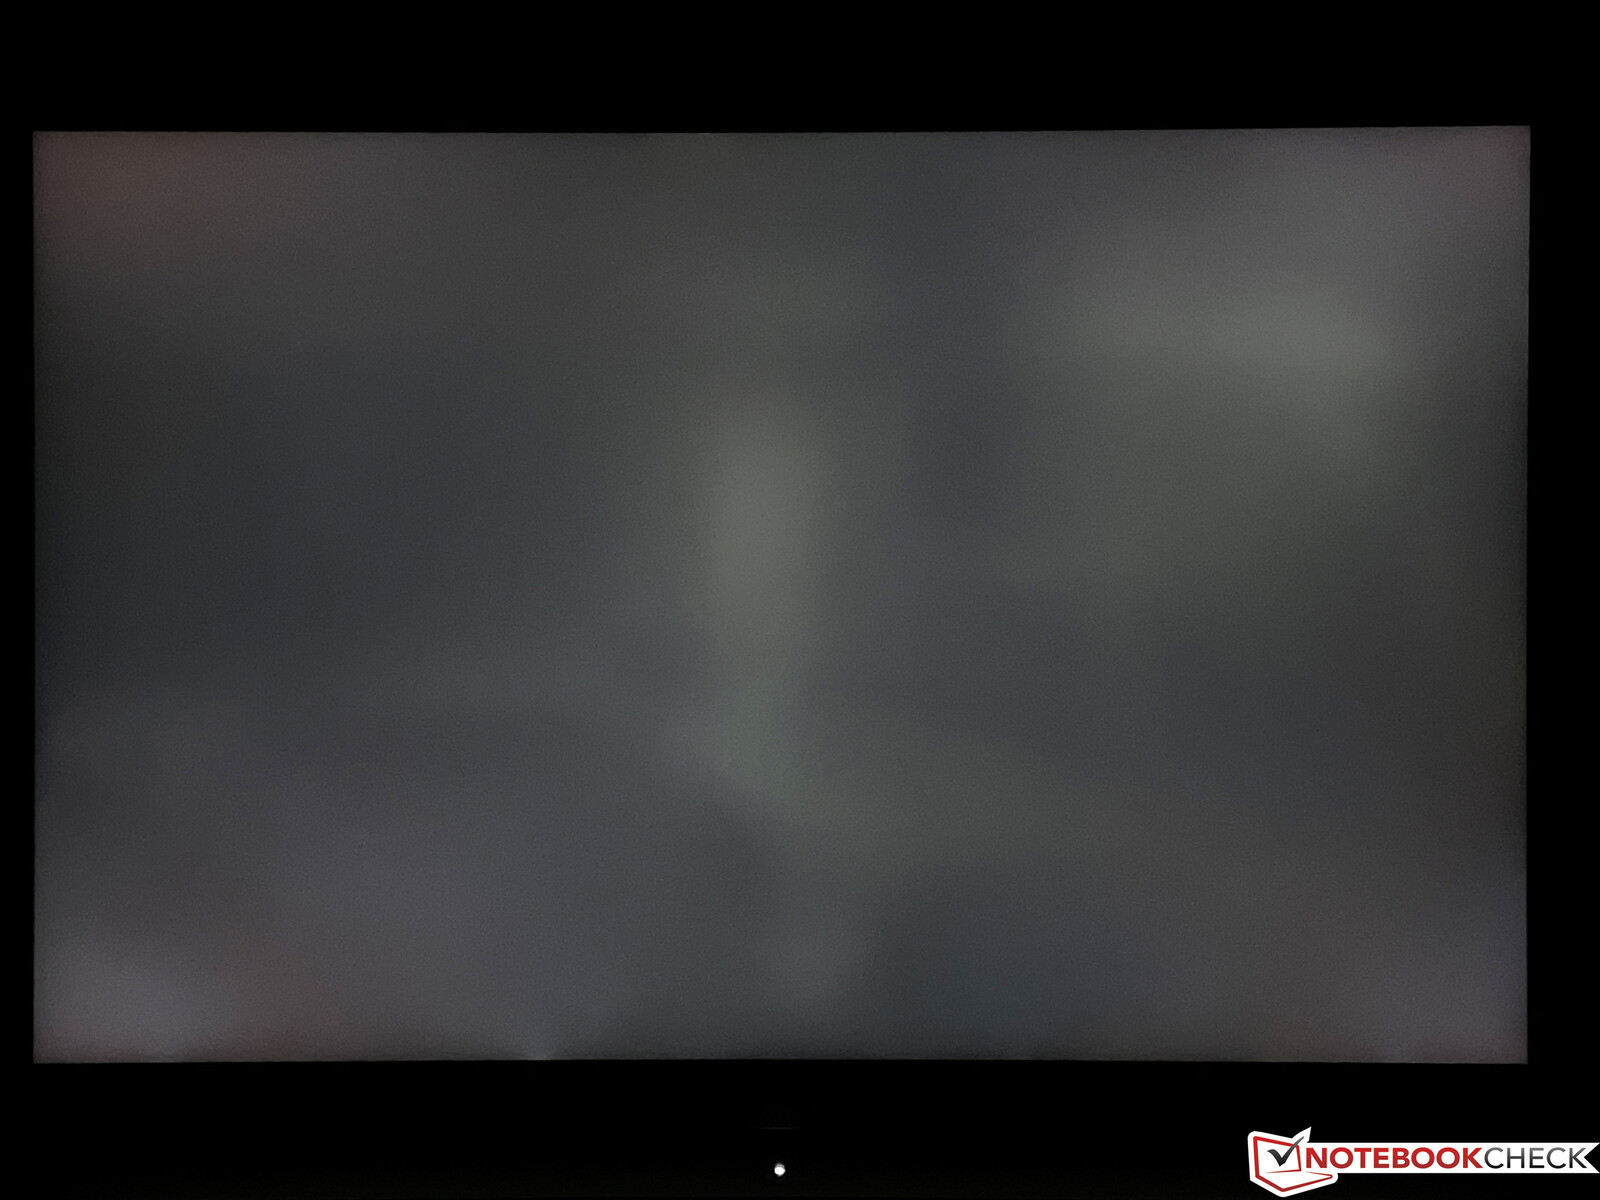
The average brightness is slightly below 500 nits, but the black value is better compared to our first test unit, which results in a good contrast ratio of more than 1300:1. The response times are fast and we did not detect any PWM flickering, either. There is visible backlight bleeding on dark backgrounds and high brightness levels, but they are luckily not visible in practice.
| |||||||||||||||||||||||||
Brightness Distribution: 91 %
Center on Battery: 503 cd/m²
Contrast: 1357:1 (Black: 0.37 cd/m²)
ΔE ColorChecker Calman: 2.7 | ∀{0.5-29.43 Ø4.73}
calibrated: 1.4
ΔE Greyscale Calman: 2.7 | ∀{0.09-98 Ø4.97}
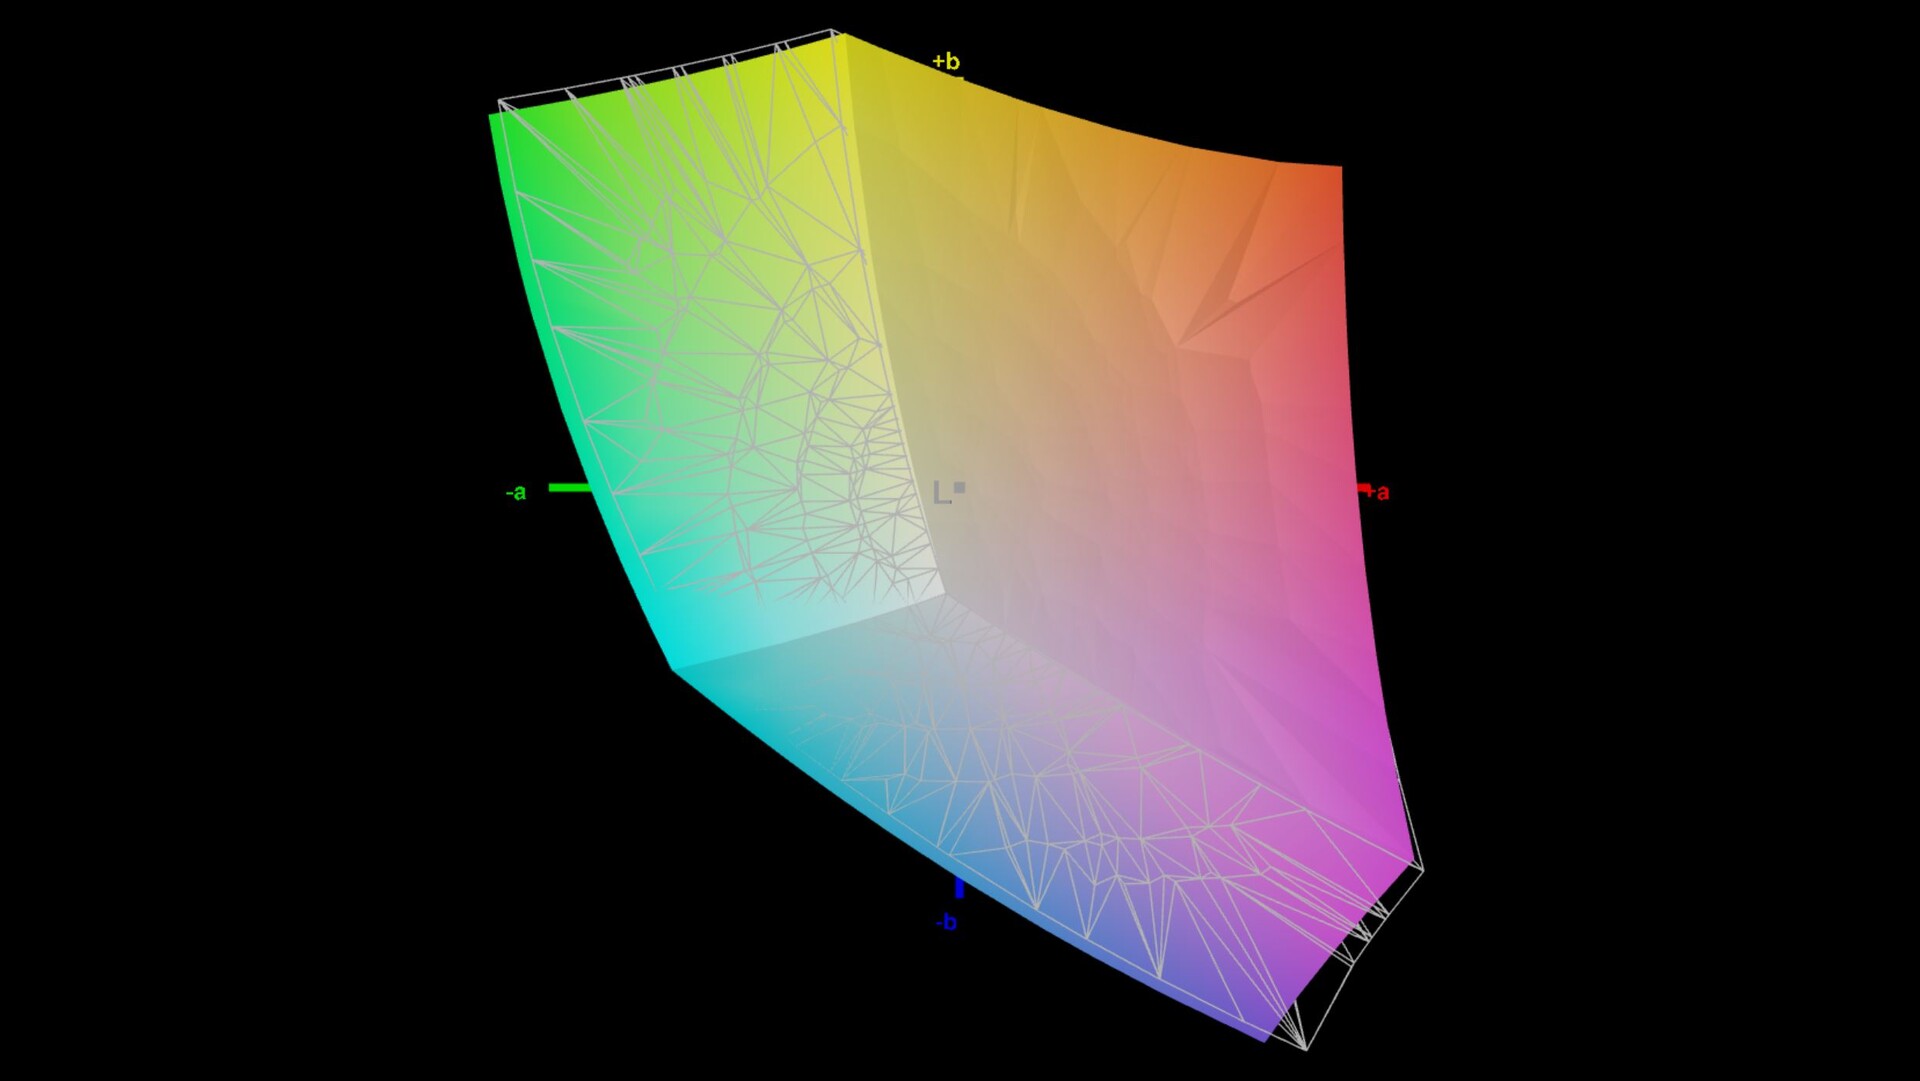
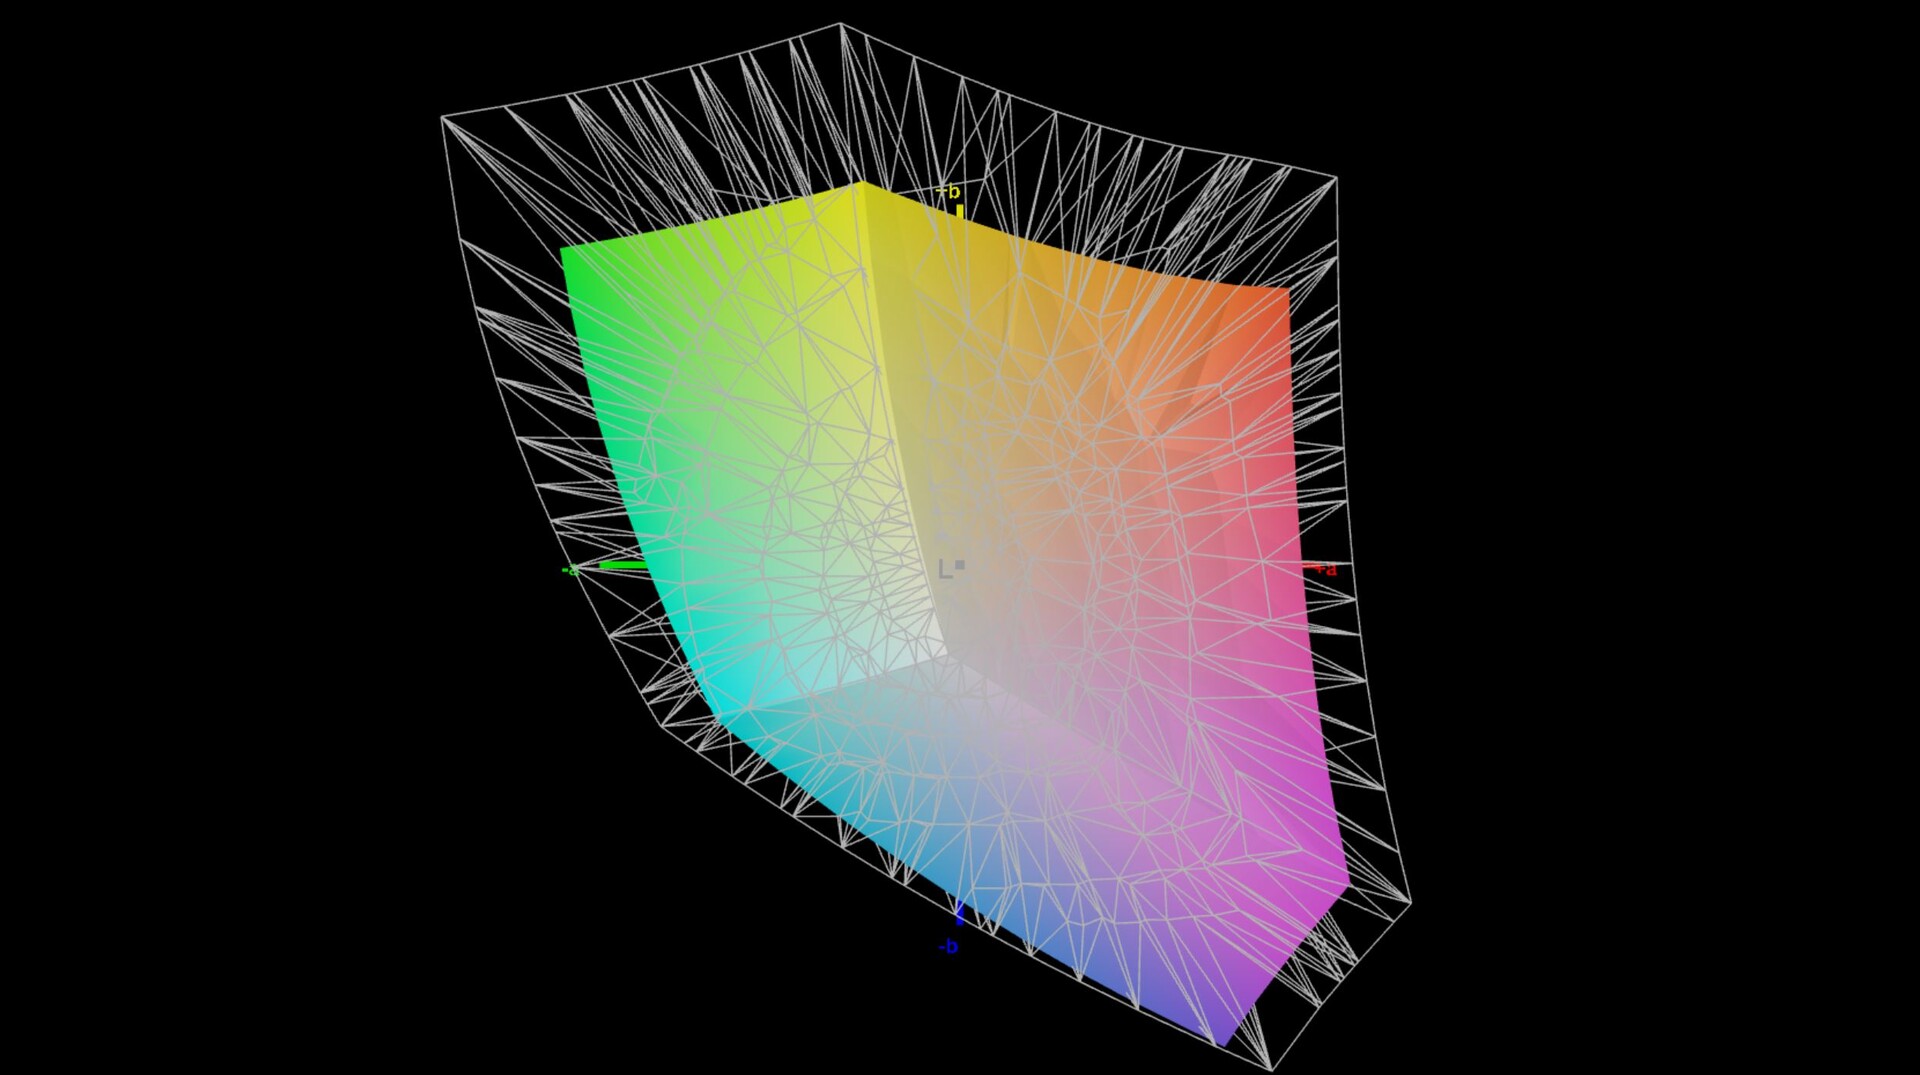
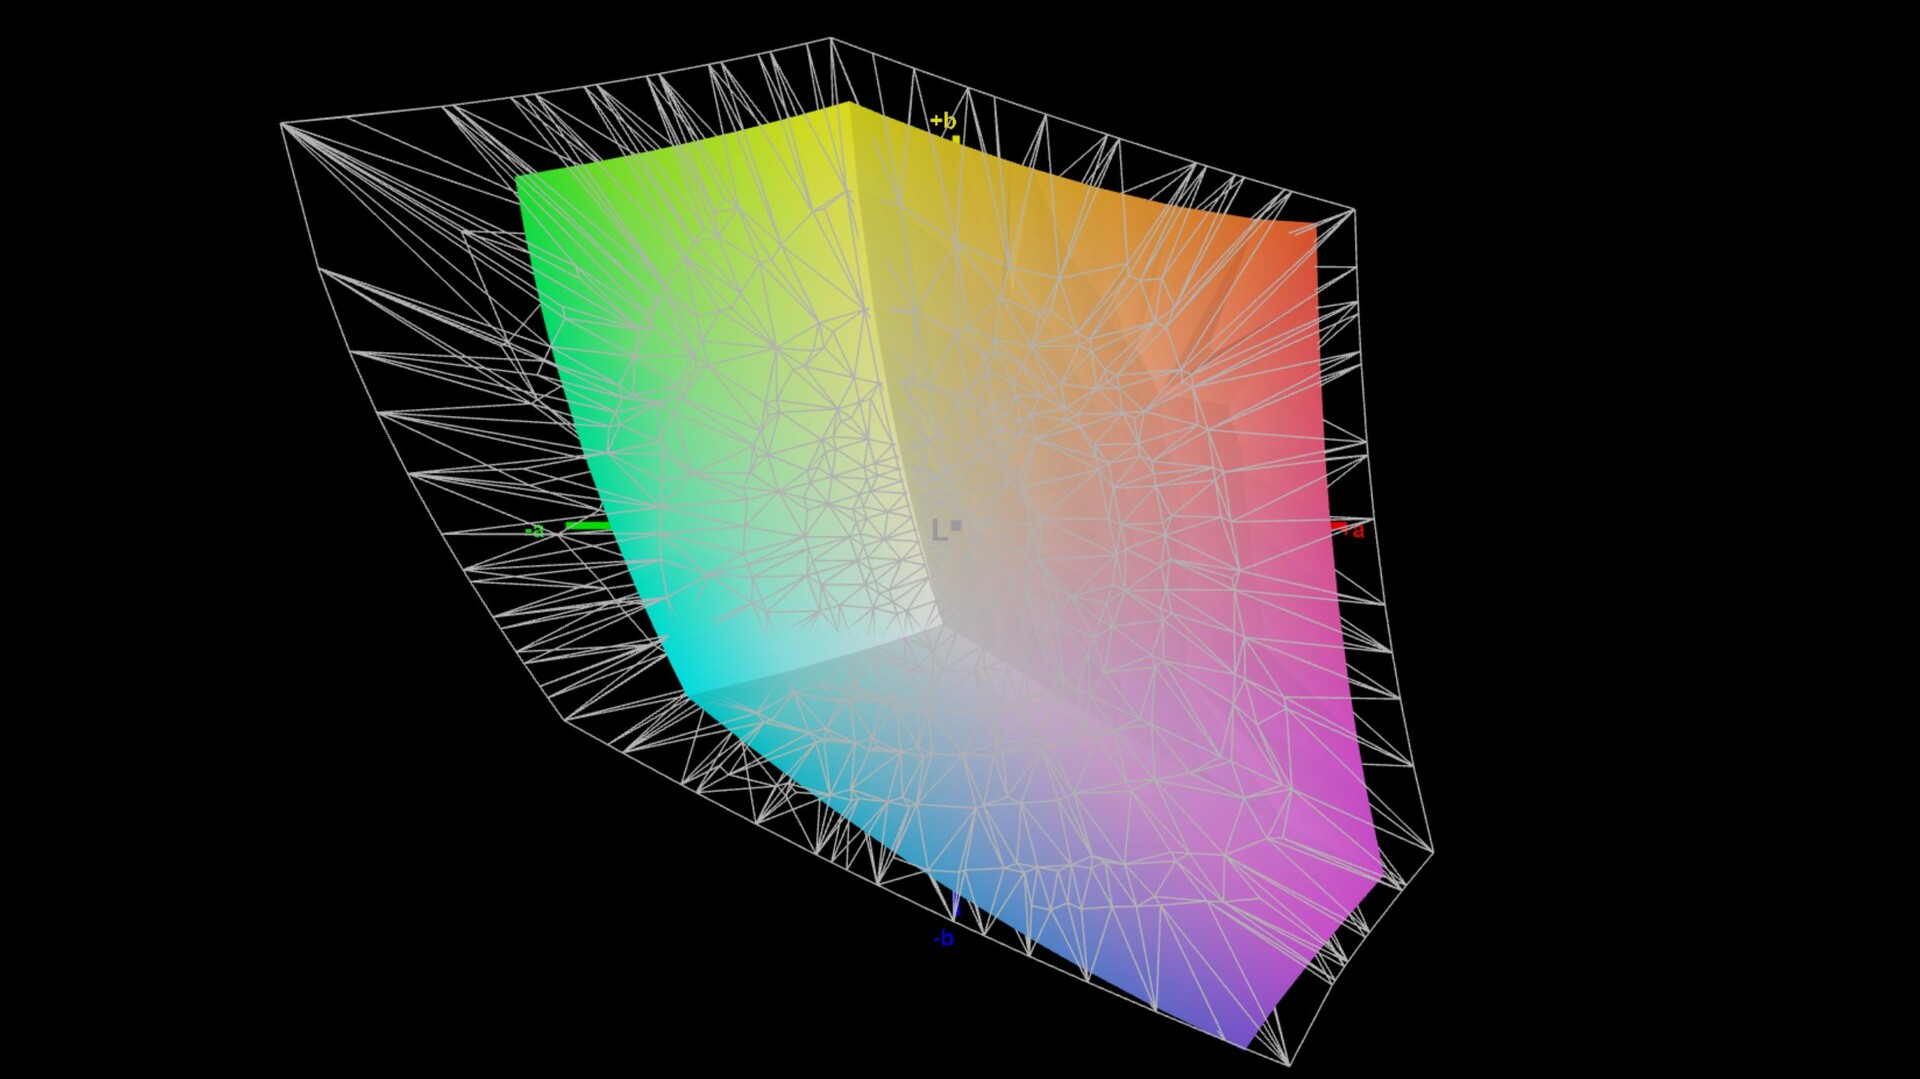
70.9% AdobeRGB 1998 (Argyll 3D)
97.6% sRGB (Argyll 3D)
68.7% Display P3 (Argyll 3D)
Gamma: 2.44
CCT: 6326 K
| Lenovo Legion 5 Pro 16 G7 i7 RTX 3070Ti NE160QDM-NY1, IPS, 2560x1600, 16" | MSI Vector GP66 12UGS BOE NE156FHM-NZ3, IPS, 1920x1080, 15.6" | HP Omen 16-b0085ng BOE09BE, IPS, 1920x1080, 16.1" | Acer Nitro 5 AN515-45-R1JH BOE BOE09B8, IPS, 2560x1440, 15.6" | Asus TUF Gaming A15 FA506QR-AZ061T Sharp SHP1532, IPS, 1920x1080, 15.6" | Lenovo Legion 5 Pro 16ACH6H (82JQ001PGE) CSOT T3 MNG007DA1-1, IPS, 2560x1600, 16" | |
|---|---|---|---|---|---|---|
| Display | 2% | 4% | -3% | 2% | ||
| Display P3 Coverage (%) | 68.7 | 70.1 2% | 72.3 5% | 66.2 -4% | ||
| sRGB Coverage (%) | 97.6 | 99.5 2% | 99.5 2% | 96.3 -1% | 99 1% | |
| AdobeRGB 1998 Coverage (%) | 70.9 | 72.1 2% | 73.8 4% | 67.1 -5% | 73 3% | |
| Response Times | 21% | -4% | 8% | 14% | 43% | |
| Response Time Grey 50% / Grey 80% * (ms) | 17.6 ? | 5.8 ? 67% | 8 ? 55% | 14 ? 20% | 12 ? 32% | 9.2 ? 48% |
| Response Time Black / White * (ms) | 7.6 ? | 9.6 ? -26% | 12.4 ? -63% | 8 ? -5% | 8 ? -5% | 4.8 37% |
| PWM Frequency (Hz) | 1250 ? | |||||
| Screen | -13% | -47% | -49% | 5% | 4% | |
| Brightness middle (cd/m²) | 502 | 353.1 -30% | 405 -19% | 349 -30% | 297 -41% | 551 10% |
| Brightness (cd/m²) | 491 | 325 -34% | 378 -23% | 304 -38% | 268 -45% | 523 7% |
| Brightness Distribution (%) | 91 | 85 -7% | 87 -4% | 79 -13% | 84 -8% | 88 -3% |
| Black Level * (cd/m²) | 0.37 | 0.38 -3% | 0.34 8% | 0.535 -45% | 0.22 41% | 0.54 -46% |
| Contrast (:1) | 1357 | 929 -32% | 1191 -12% | 652 -52% | 1350 -1% | 1020 -25% |
| Colorchecker dE 2000 * | 2.7 | 2.24 17% | 3.7 -37% | 3.11 -15% | 1.36 50% | 1.8 33% |
| Colorchecker dE 2000 max. * | 4.5 | 5 -11% | 7.77 -73% | 9.57 -113% | 3.82 15% | 2.53 44% |
| Colorchecker dE 2000 calibrated * | 1.4 | 1.02 27% | 3.49 -149% | 1.66 -19% | ||
| Greyscale dE 2000 * | 2.7 | 4 -48% | 5.88 -118% | 5 -85% | 1.88 30% | 1.85 31% |
| Gamma | 2.44 90% | 2.24 98% | 2.57 86% | 2.36 93% | 2.48 89% | 2.3 96% |
| CCT | 6326 103% | 6864 95% | 6342 102% | 6976 93% | 6768 96% | 6338 103% |
| Color Space (Percent of AdobeRGB 1998) (%) | 73.76 | 63 | 72.81 | |||
| Color Space (Percent of sRGB) (%) | 99.47 | 99 | 99.41 | |||
| Total Average (Program / Settings) | 3% /
-5% | -16% /
-30% | -15% /
-30% | 10% /
7% | 16% /
9% |
* ... smaller is better

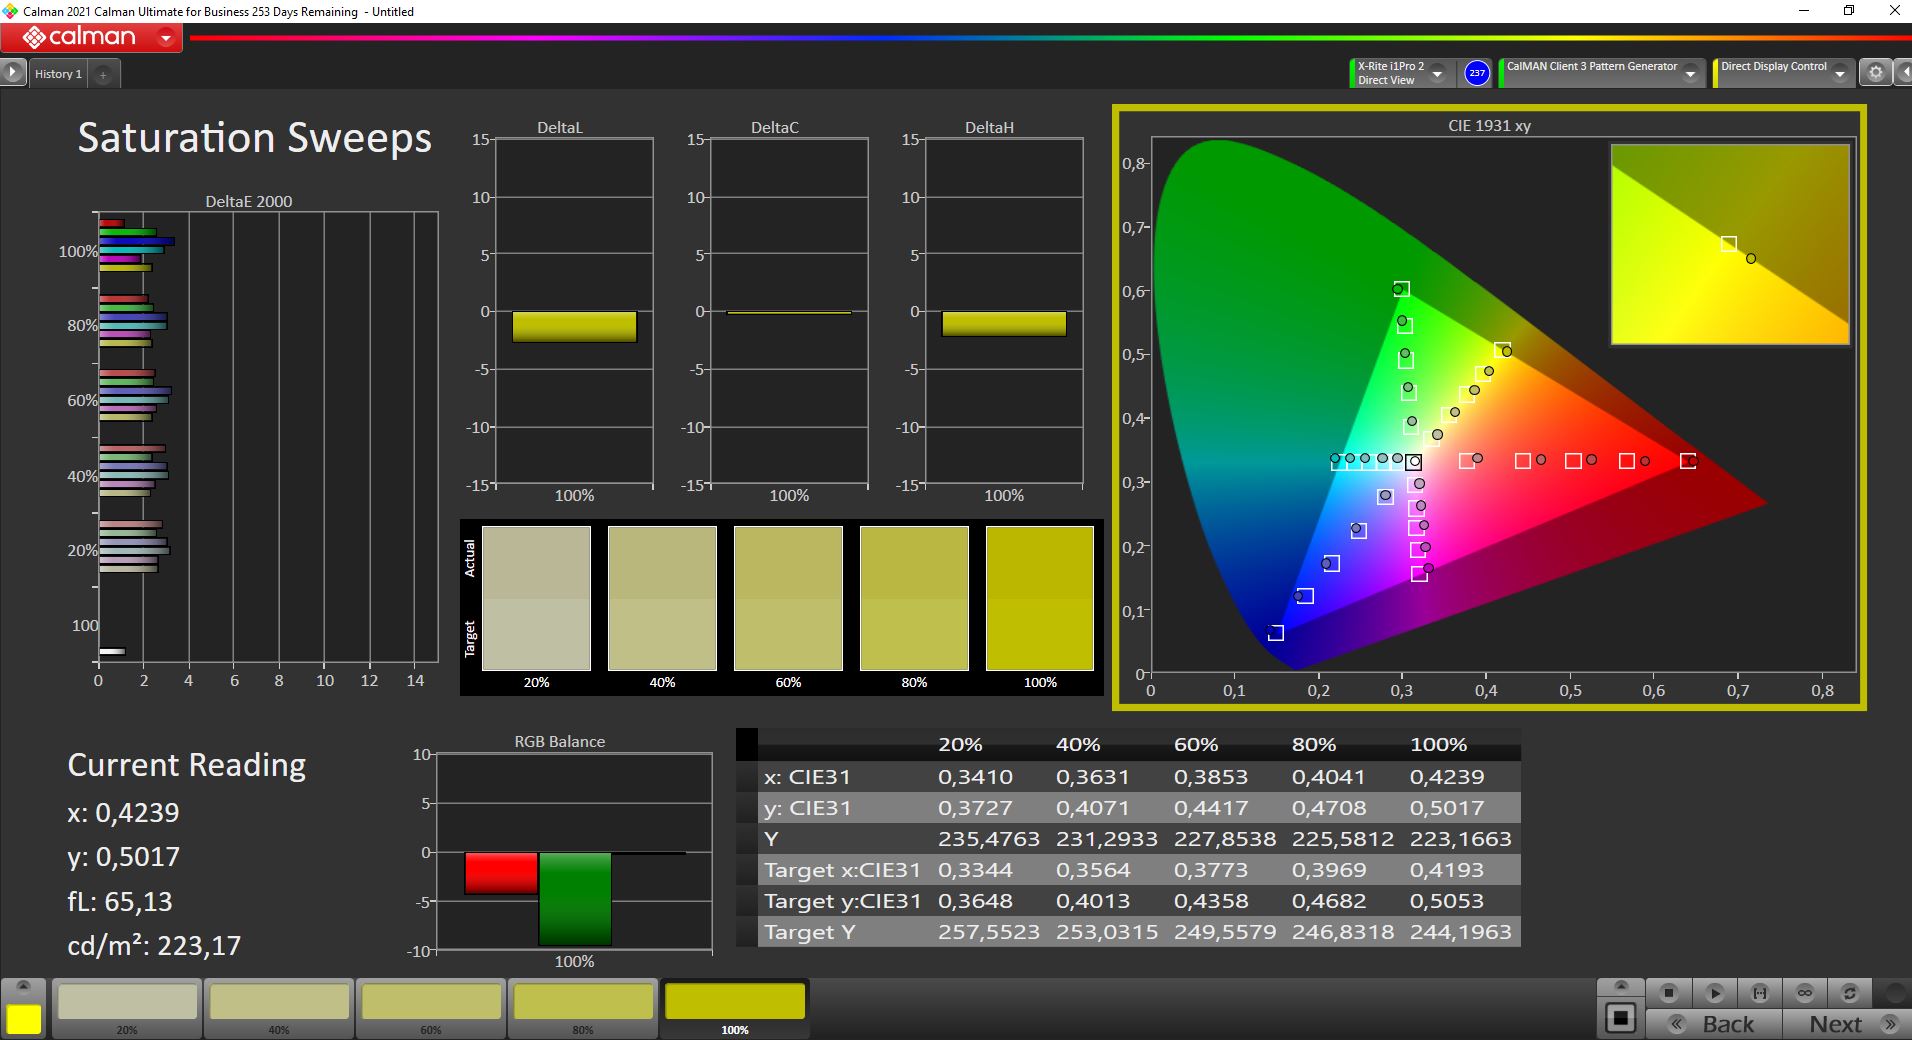
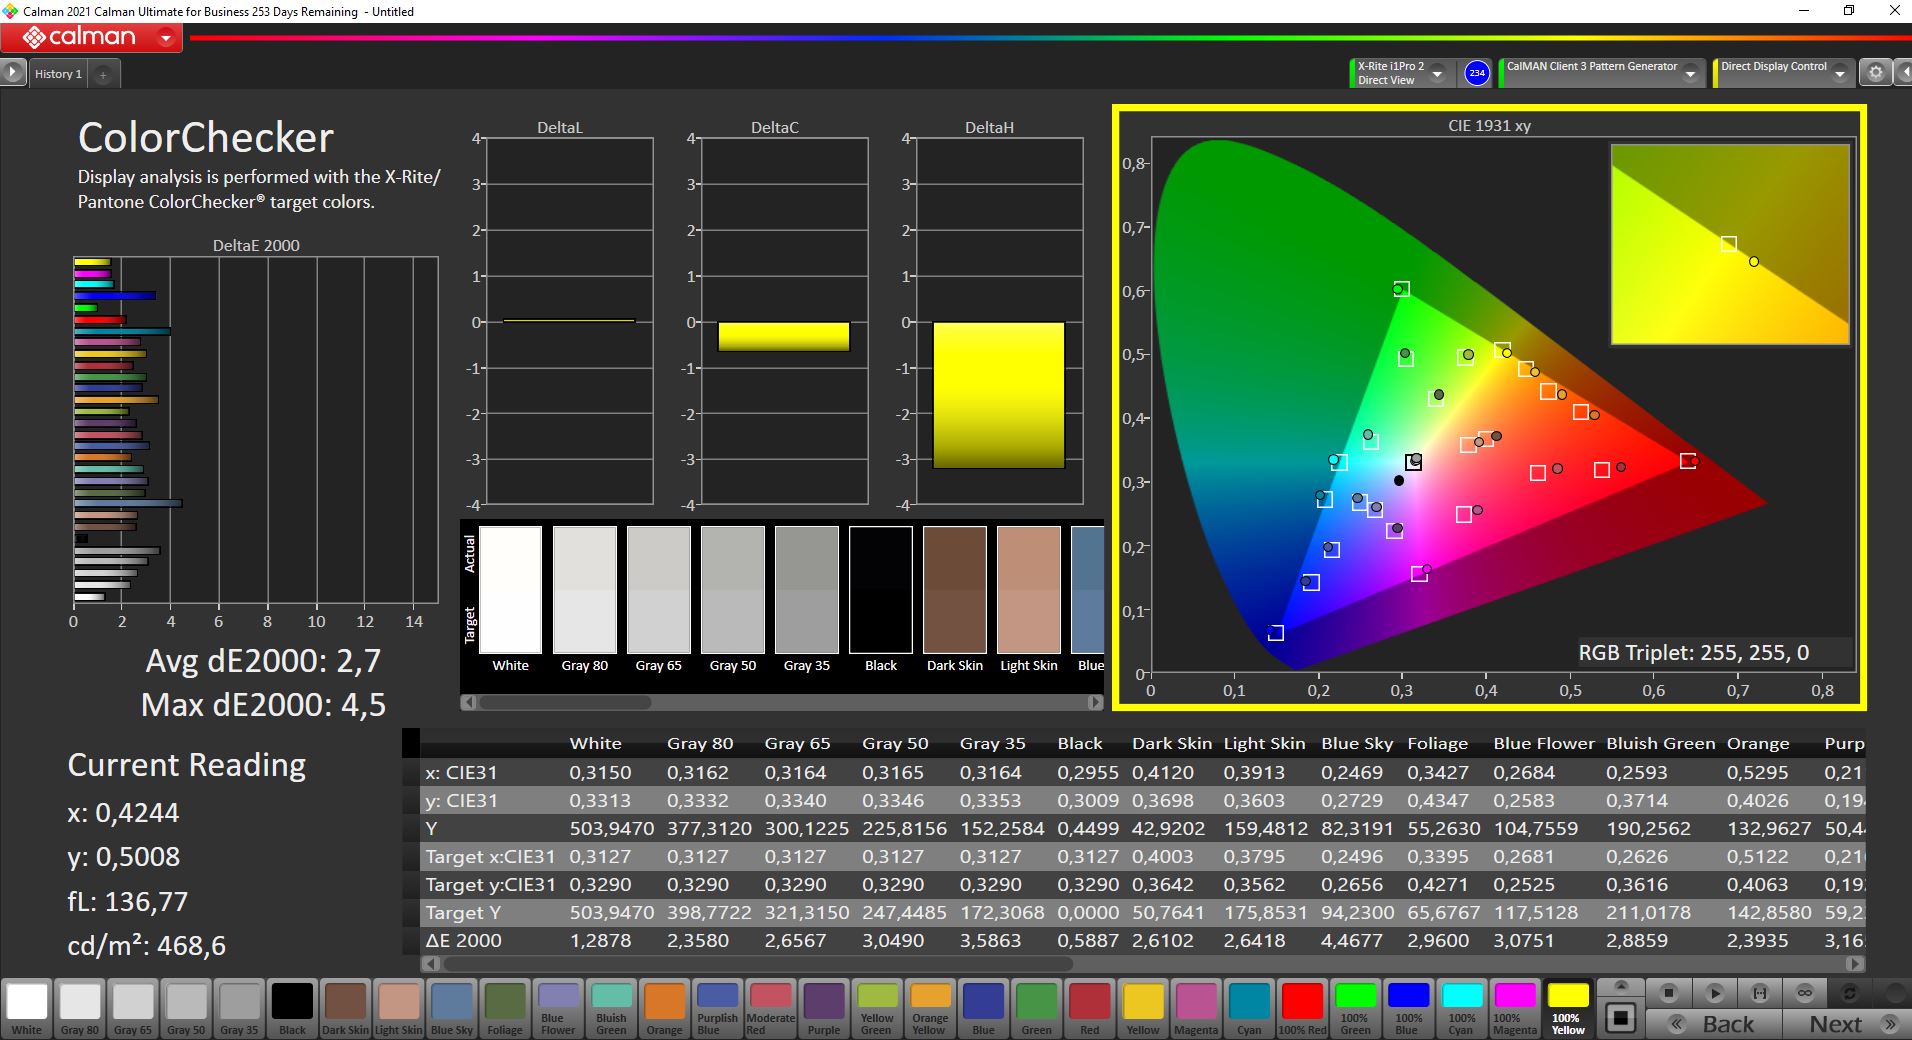
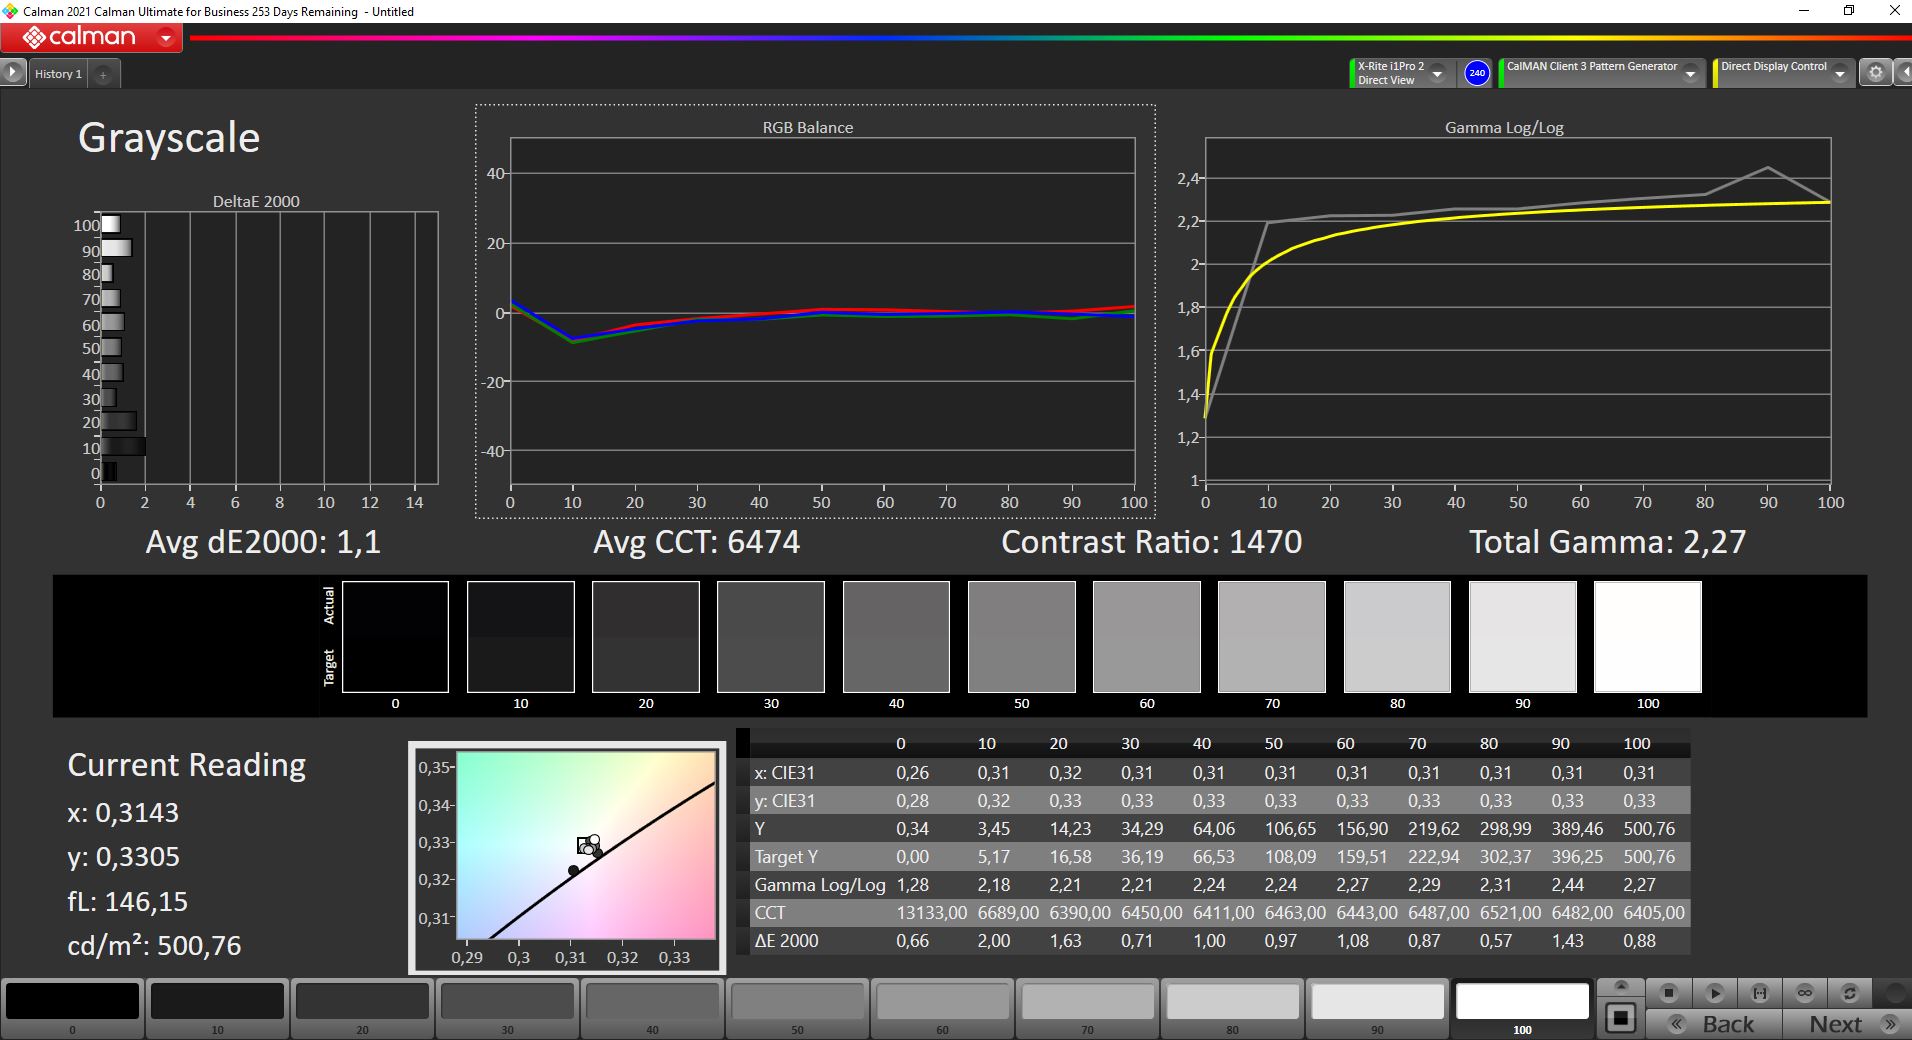
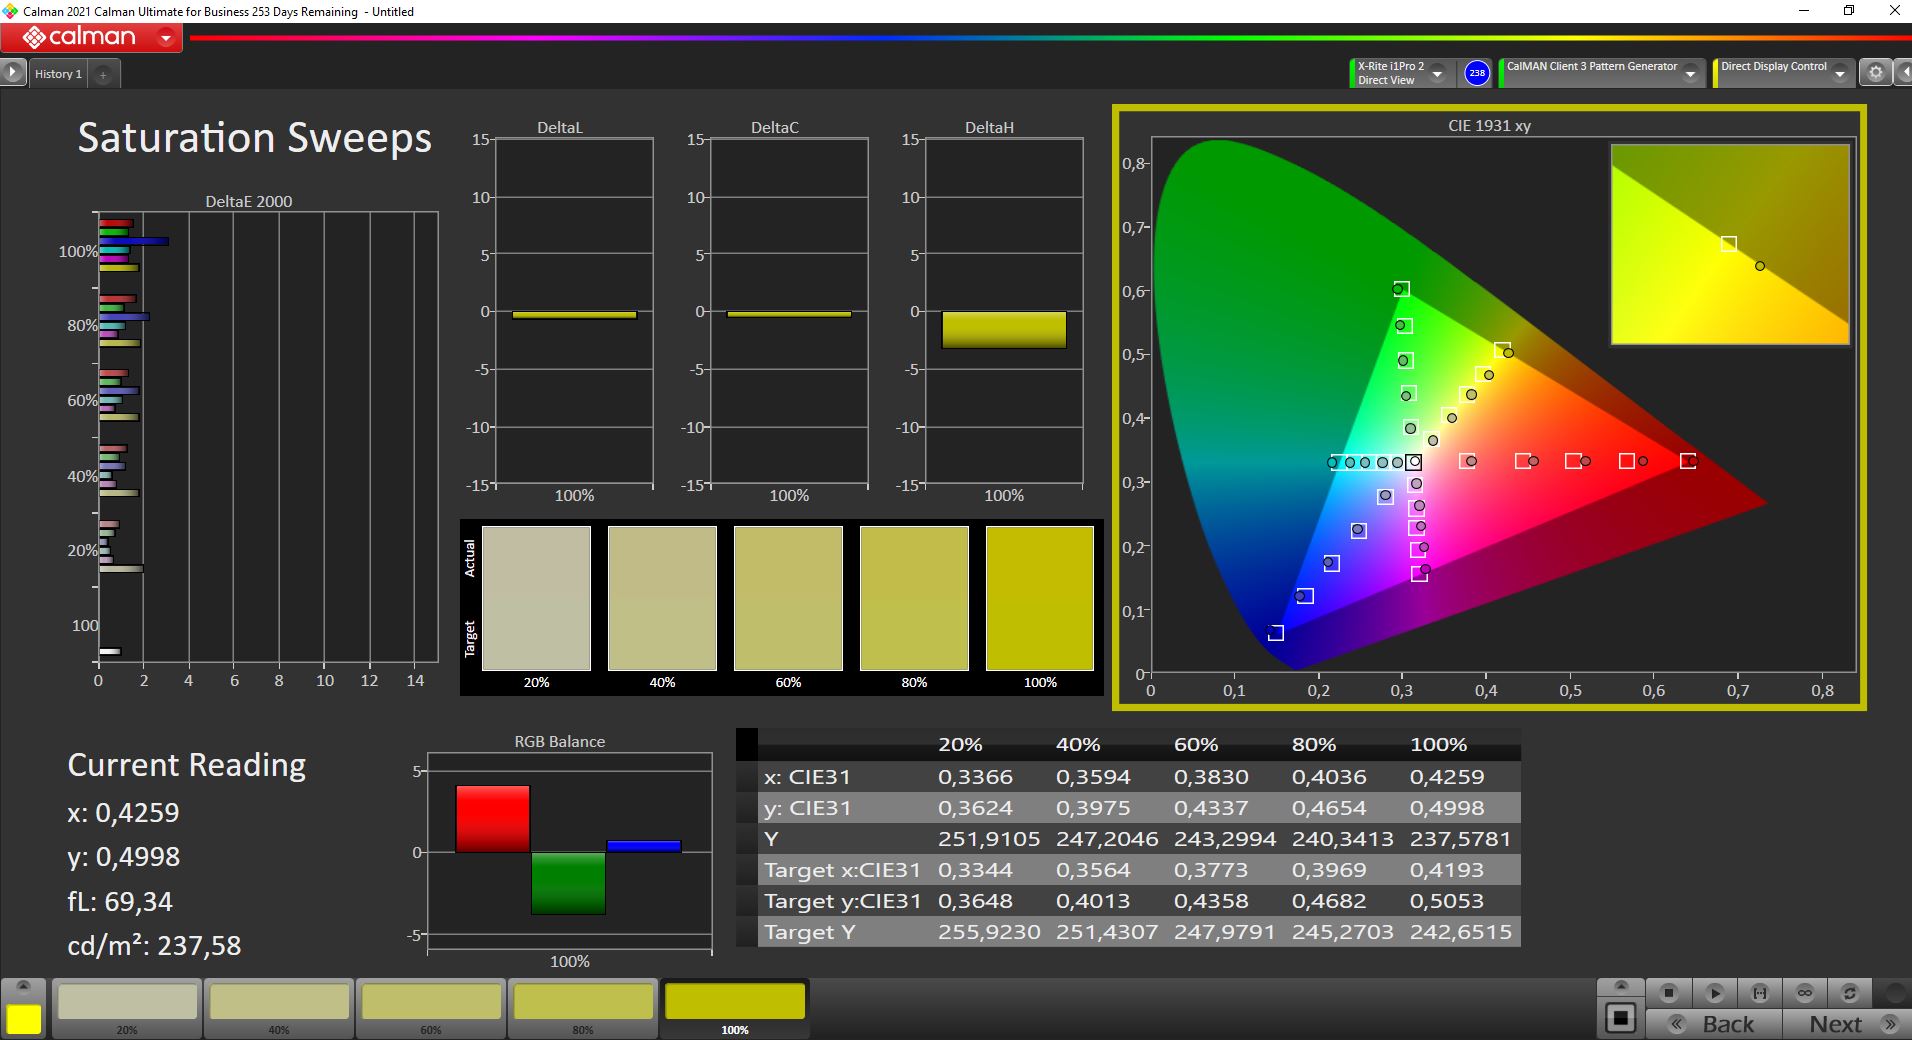
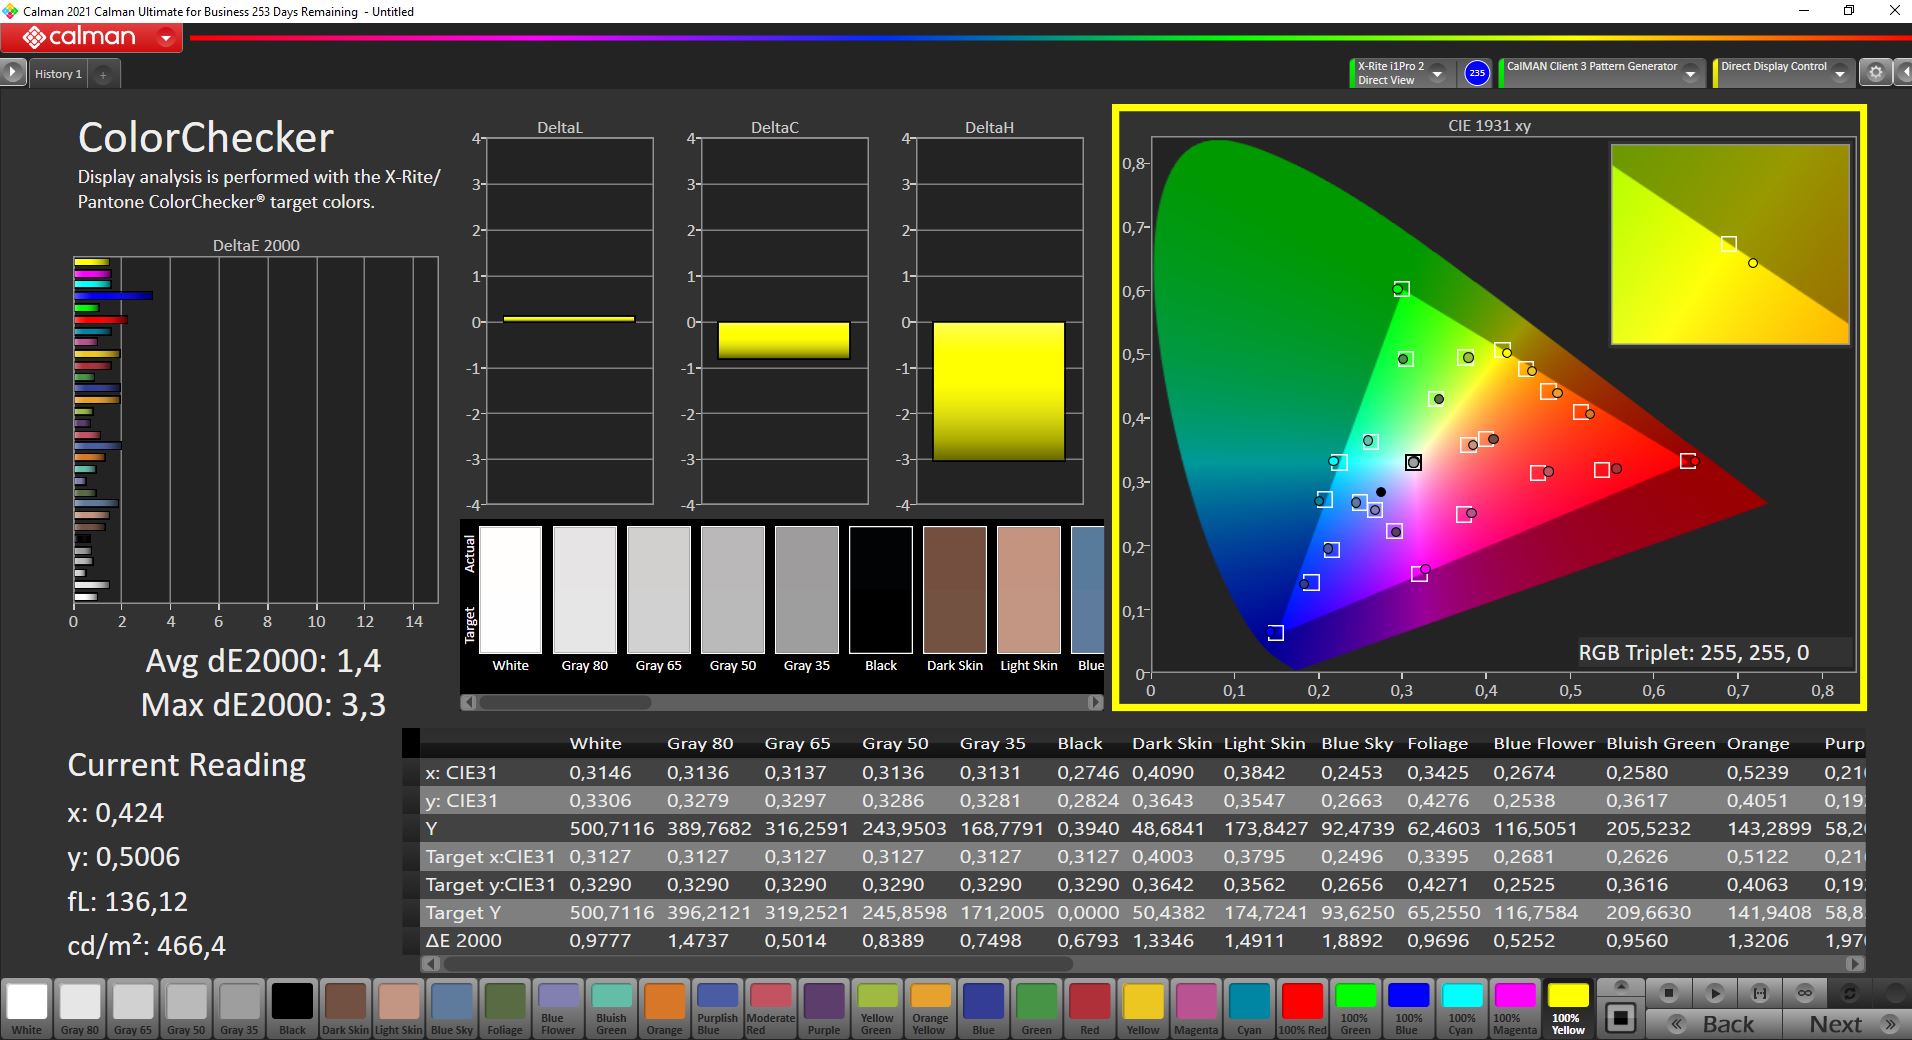
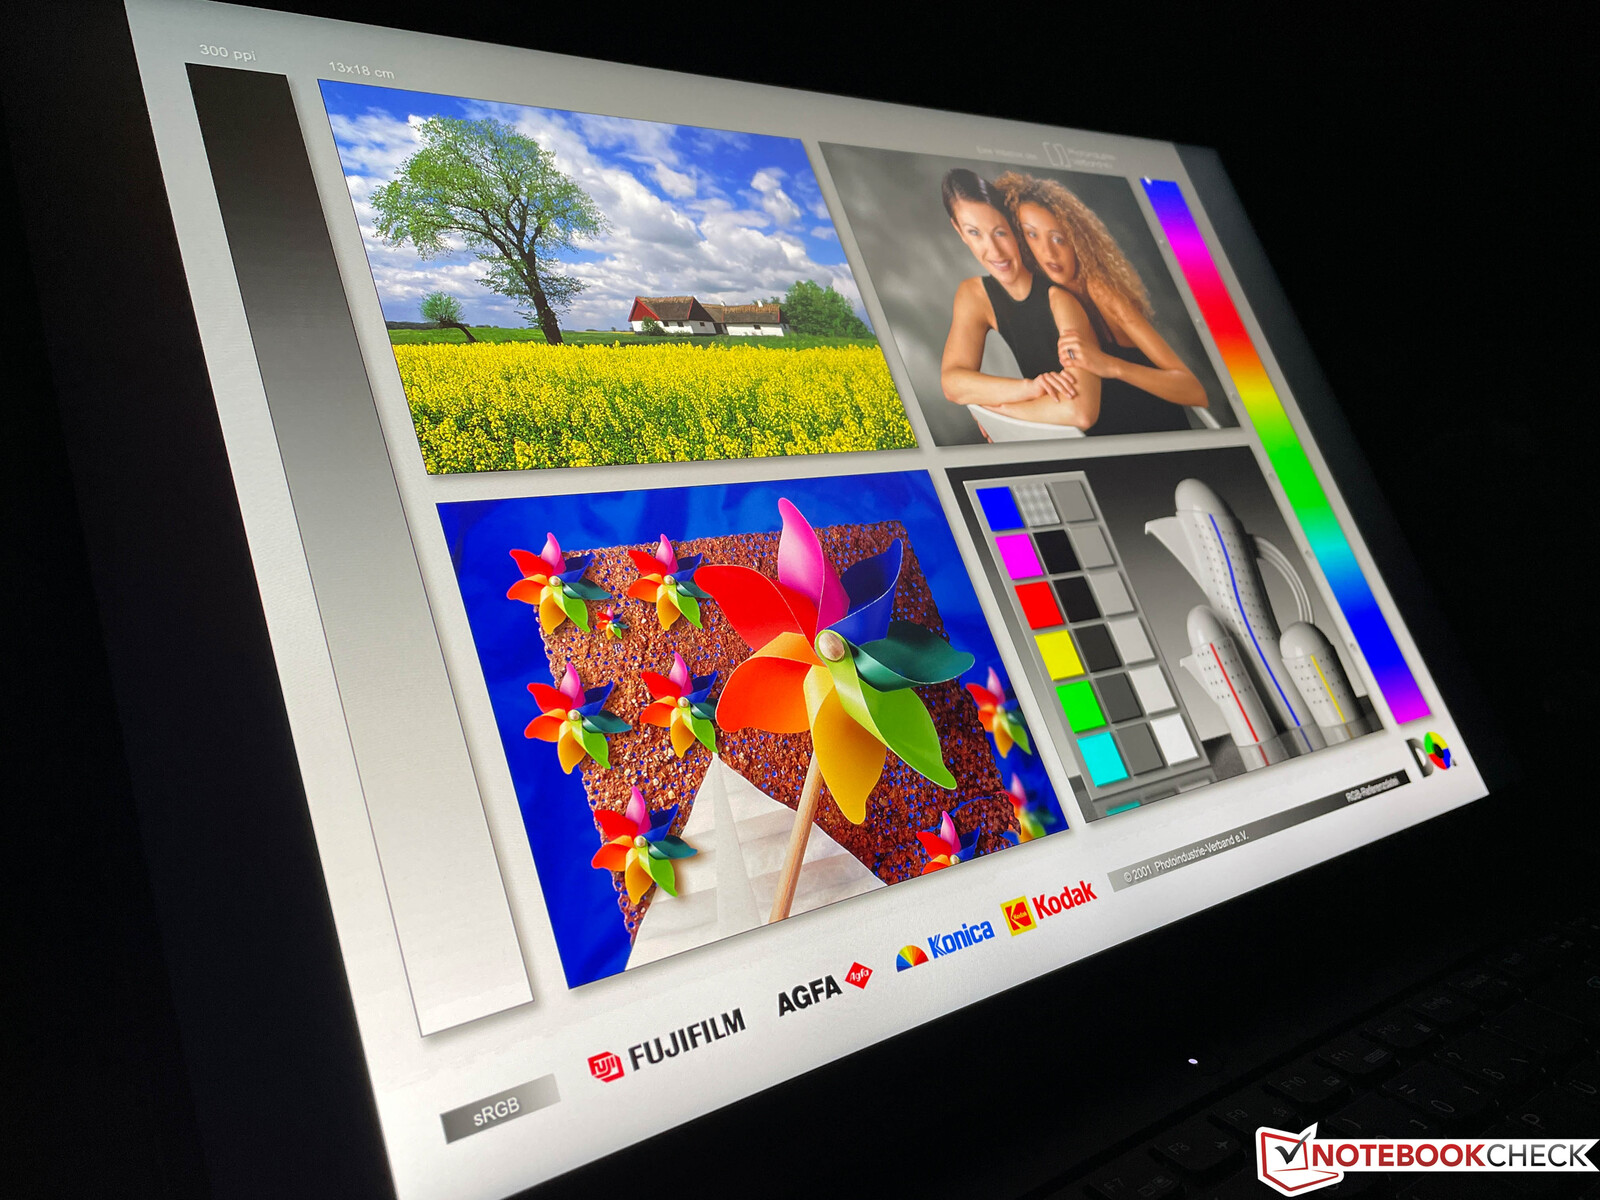
We analyzed the panel with the professional CalMAN software and the picture is already decent out of the box. There is no visible color cast and almost all the colors are already within the target deviation. Our own calibration (profile can be downloaded for free in the box above) improves the performance a bit. The panel almost covers the small sRGB color gamut completely, which is completely fine for gaming. Thanks to the low color deviations, you can also edit pictures/videos.
Display Response Times
| ↔ Response Time Black to White | ||
|---|---|---|
| 7.6 ms ... rise ↗ and fall ↘ combined | ↗ 2.4 ms rise | 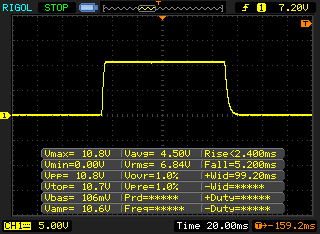 |
| ↘ 5.2 ms fall | ||
| The screen shows very fast response rates in our tests and should be very well suited for fast-paced gaming. In comparison, all tested devices range from 0.1 (minimum) to 240 (maximum) ms. » 22 % of all devices are better. This means that the measured response time is better than the average of all tested devices (19.9 ms). | ||
| ↔ Response Time 50% Grey to 80% Grey | ||
| 17.6 ms ... rise ↗ and fall ↘ combined | ↗ 9.2 ms rise | 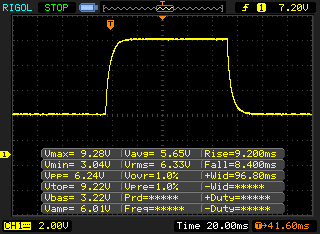 |
| ↘ 8.4 ms fall | ||
| The screen shows good response rates in our tests, but may be too slow for competitive gamers. In comparison, all tested devices range from 0.165 (minimum) to 636 (maximum) ms. » 31 % of all devices are better. This means that the measured response time is better than the average of all tested devices (31.1 ms). | ||
Screen Flickering / PWM (Pulse-Width Modulation)
| Screen flickering / PWM not detected | 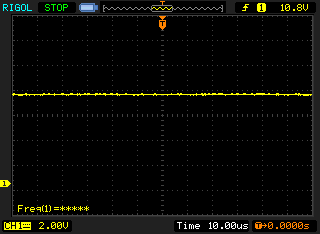 | ||
In comparison: 52 % of all tested devices do not use PWM to dim the display. If PWM was detected, an average of 7798 (minimum: 5 - maximum: 343500) Hz was measured. | |||
The viewing angle stability of the IPS panel is very good. Thanks to the matte surface and the good brightness, it is also possible to use the Legion 5 Pro 16 outdoors in brighter environments.
Performance - Alder Lake without limitations
Review Settings
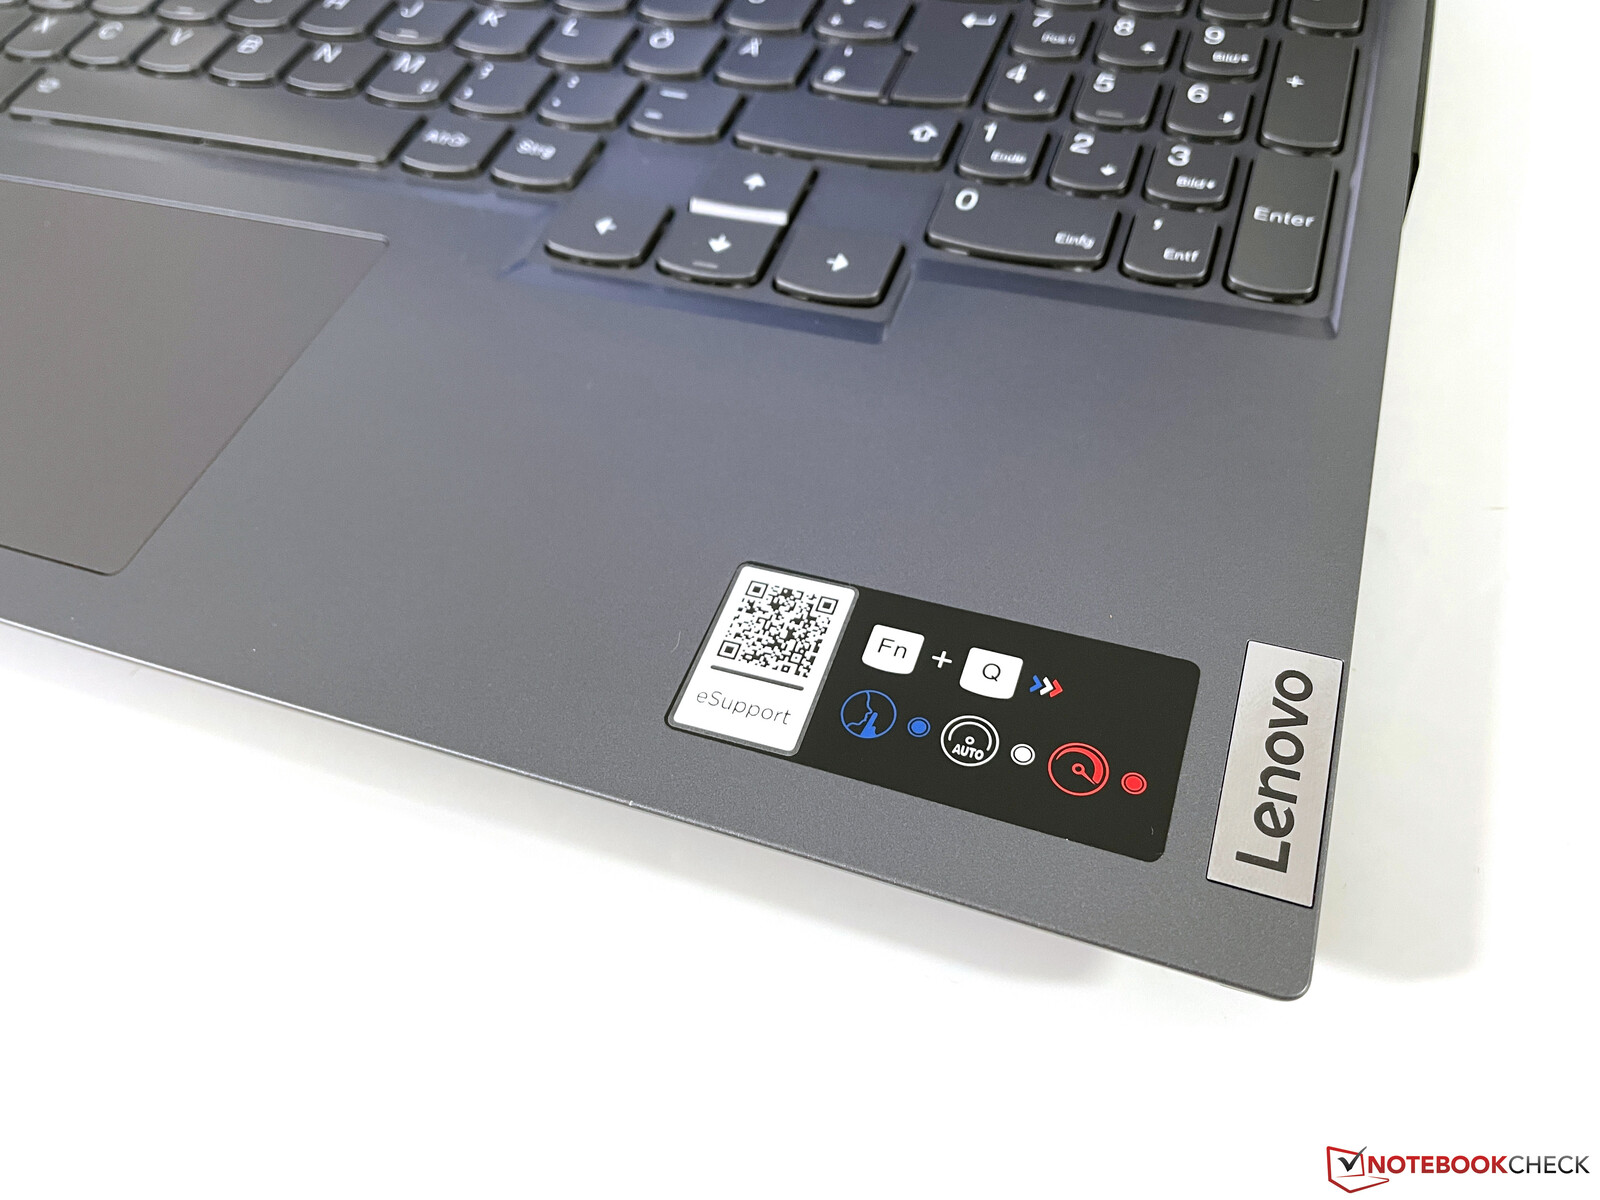
As per usual, Lenovo offers three different energy profile in the preloaded Vantage app, which can be selected via software or toggled via key combination Fn+Q. The color of the LED in the power button indicated the current profile: Blue = Silent Mode, White = Auto, Red = Performance. The performance profile is only available on mains. We have listed the different profiles and the effects on the CPU & GPU performance in the following table.
| Scenario | Silent | Auto | Performance |
|---|---|---|---|
| CPU load | 124/80W | 124/100W | 124/108W |
| GPU load | 115W | 120W | 150W |
| Stress test | CPU: 62W GPU: 40W |
CPU: 62W GPU: 100W |
CPU: 62W GPU:125W |
Like on the previous test unit of the Legion 5 Pro 16, it is once again possible to deactivate the integrated GPU via Vantage app. The new model supports Advanced Optimus though, so this is not really necessary. We performed the following benchmarks and measurements with the following settings: Hybrid Graphics and Performance mode. If you are not playing, you can definitely select the Silent mode where the CPU performance is still very good.
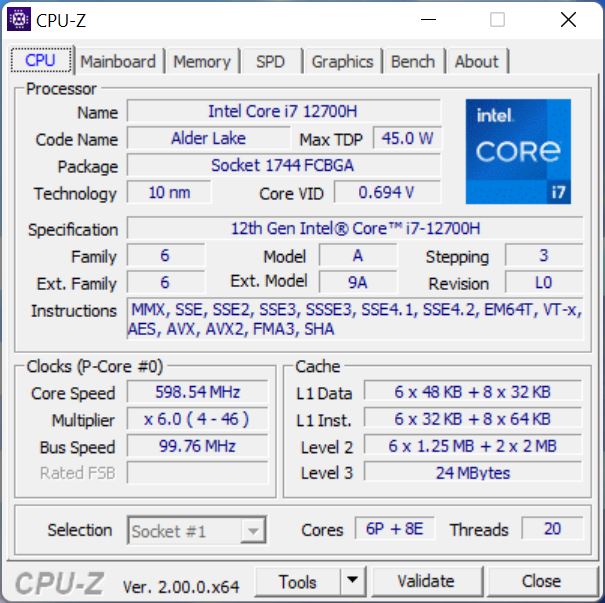
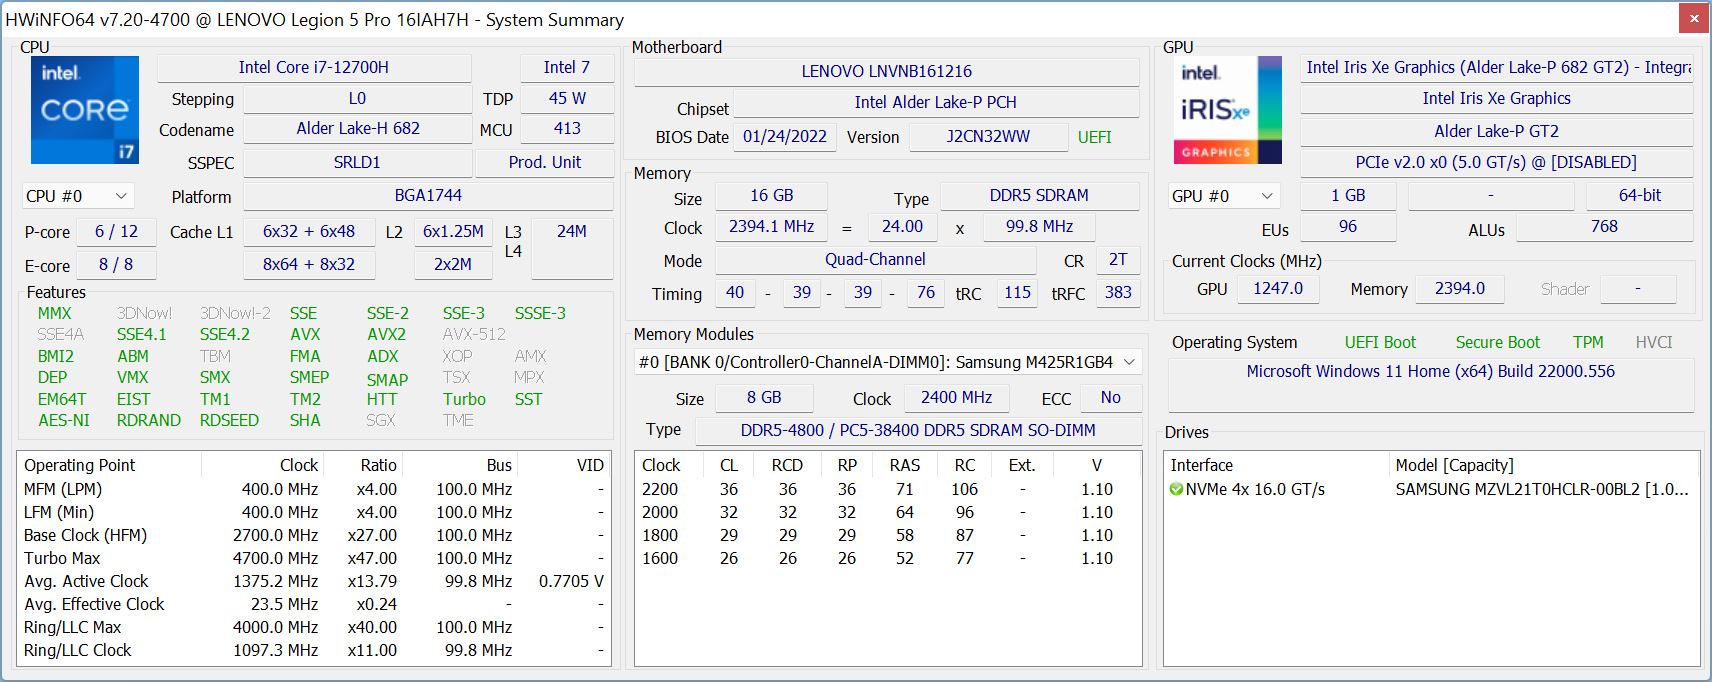
Processor - Core i7-12700H
Lenovo uses the brand-new Intel Core i7-12700H from the Alder Lake generation, which uses a hybrid structure with 6 performance cores (up to 4.8 GHz including hyper threading) as well as 8 efficiency cores (up to 3.7 GHz). The CPU can therefore execute up to 20 threads simultaneously. It is a 45W CPU, at least in theory, but Lenovo does not limit the consumption. Full load for all cores results in a consumption of 124W and we can still see about 25W (IA core) in single-core tests. The efficiency is not really important here, but the performance of the Legion 5 Pro is excellent and it can easily take the top spot within our comparison group and even beats the Core i9-12900H in the MSI Vector. This is the case for multi-core tests, but the i9 benefits from its higher Turbo clock during single-core workloads.
Cinebench R15 Multi Loop
The system cannot maintain the full 124W for sustained periods and the processor eventually levels off at 108W. The CB R15 Multi score drops to around 2700 points in the Auto mode and still around 2450 Euros at 80W (Silent mode). Overall, the CPU performance is excellent, but it also results in a high power consumption.
The single-core performance on battery power is identical and the processor can still consume little more than 110W in multi-core tests, which drops to “just” around 90W under sustained workloads. Mire CPU benchmarks are available here.
Cinebench R23: Multi Core | Single Core
Cinebench R20: CPU (Multi Core) | CPU (Single Core)
Cinebench R15: CPU Multi 64Bit | CPU Single 64Bit
Blender: v2.79 BMW27 CPU
7-Zip 18.03: 7z b 4 | 7z b 4 -mmt1
Geekbench 5.5: Multi-Core | Single-Core
HWBOT x265 Benchmark v2.2: 4k Preset
LibreOffice : 20 Documents To PDF
R Benchmark 2.5: Overall mean
| CPU Performance rating | |
| Average of class Gaming | |
| Lenovo Legion 5 Pro 16 G7 i7 RTX 3070Ti | |
| MSI Vector GP66 12UGS | |
| Average Intel Core i7-12700H | |
| HP Omen 16-b0085ng | |
| Asus TUF Gaming A15 FA506QR-AZ061T -2! | |
| Acer Nitro 5 AN515-45-R1JH | |
| Lenovo Legion 5 Pro 16ACH6H (82JQ001PGE) | |
| Cinebench R23 / Multi Core | |
| Average of class Gaming (10488 - 40970, n=112, last 2 years) | |
| Lenovo Legion 5 Pro 16 G7 i7 RTX 3070Ti | |
| MSI Vector GP66 12UGS | |
| Average Intel Core i7-12700H (4032 - 19330, n=64) | |
| Lenovo Legion 5 Pro 16ACH6H (82JQ001PGE) | |
| Lenovo Legion 5 Pro 16ACH6H (82JQ001PGE) | |
| HP Omen 16-b0085ng | |
| Acer Nitro 5 AN515-45-R1JH | |
| Cinebench R23 / Single Core | |
| Average of class Gaming (1166 - 2356, n=112, last 2 years) | |
| MSI Vector GP66 12UGS | |
| Lenovo Legion 5 Pro 16 G7 i7 RTX 3070Ti | |
| Average Intel Core i7-12700H (778 - 1826, n=63) | |
| HP Omen 16-b0085ng | |
| Acer Nitro 5 AN515-45-R1JH | |
| Lenovo Legion 5 Pro 16ACH6H (82JQ001PGE) | |
| Lenovo Legion 5 Pro 16ACH6H (82JQ001PGE) | |
| Cinebench R20 / CPU (Multi Core) | |
| Average of class Gaming (4029 - 16108, n=111, last 2 years) | |
| Lenovo Legion 5 Pro 16 G7 i7 RTX 3070Ti | |
| MSI Vector GP66 12UGS | |
| Average Intel Core i7-12700H (1576 - 7407, n=64) | |
| Lenovo Legion 5 Pro 16ACH6H (82JQ001PGE) | |
| Lenovo Legion 5 Pro 16ACH6H (82JQ001PGE) | |
| HP Omen 16-b0085ng | |
| Acer Nitro 5 AN515-45-R1JH | |
| Asus TUF Gaming A15 FA506QR-AZ061T | |
| Cinebench R20 / CPU (Single Core) | |
| Average of class Gaming (442 - 895, n=111, last 2 years) | |
| MSI Vector GP66 12UGS | |
| Lenovo Legion 5 Pro 16 G7 i7 RTX 3070Ti | |
| Average Intel Core i7-12700H (300 - 704, n=64) | |
| HP Omen 16-b0085ng | |
| Asus TUF Gaming A15 FA506QR-AZ061T | |
| Acer Nitro 5 AN515-45-R1JH | |
| Lenovo Legion 5 Pro 16ACH6H (82JQ001PGE) | |
| Lenovo Legion 5 Pro 16ACH6H (82JQ001PGE) | |
| Cinebench R15 / CPU Multi 64Bit | |
| Average of class Gaming (1578 - 6271, n=111, last 2 years) | |
| Lenovo Legion 5 Pro 16 G7 i7 RTX 3070Ti | |
| Average Intel Core i7-12700H (1379 - 2916, n=70) | |
| MSI Vector GP66 12UGS | |
| HP Omen 16-b0085ng | |
| Lenovo Legion 5 Pro 16ACH6H (82JQ001PGE) | |
| Asus TUF Gaming A15 FA506QR-AZ061T | |
| Acer Nitro 5 AN515-45-R1JH | |
| Cinebench R15 / CPU Single 64Bit | |
| Average of class Gaming (188.8 - 343, n=111, last 2 years) | |
| MSI Vector GP66 12UGS | |
| Lenovo Legion 5 Pro 16 G7 i7 RTX 3070Ti | |
| Average Intel Core i7-12700H (113 - 263, n=65) | |
| Asus TUF Gaming A15 FA506QR-AZ061T | |
| Acer Nitro 5 AN515-45-R1JH | |
| Lenovo Legion 5 Pro 16ACH6H (82JQ001PGE) | |
| Lenovo Legion 5 Pro 16ACH6H (82JQ001PGE) | |
| HP Omen 16-b0085ng | |
| Blender / v2.79 BMW27 CPU | |
| Asus TUF Gaming A15 FA506QR-AZ061T | |
| Acer Nitro 5 AN515-45-R1JH | |
| Lenovo Legion 5 Pro 16ACH6H (82JQ001PGE) | |
| Lenovo Legion 5 Pro 16ACH6H (82JQ001PGE) | |
| HP Omen 16-b0085ng | |
| Average Intel Core i7-12700H (168 - 732, n=63) | |
| MSI Vector GP66 12UGS | |
| Lenovo Legion 5 Pro 16 G7 i7 RTX 3070Ti | |
| Average of class Gaming (80 - 330, n=109, last 2 years) | |
| 7-Zip 18.03 / 7z b 4 | |
| Average of class Gaming (33491 - 148086, n=110, last 2 years) | |
| Lenovo Legion 5 Pro 16 G7 i7 RTX 3070Ti | |
| MSI Vector GP66 12UGS | |
| Average Intel Core i7-12700H (22844 - 73067, n=63) | |
| Lenovo Legion 5 Pro 16ACH6H (82JQ001PGE) | |
| Lenovo Legion 5 Pro 16ACH6H (82JQ001PGE) | |
| HP Omen 16-b0085ng | |
| Acer Nitro 5 AN515-45-R1JH | |
| Asus TUF Gaming A15 FA506QR-AZ061T | |
| 7-Zip 18.03 / 7z b 4 -mmt1 | |
| Average of class Gaming (4199 - 7436, n=110, last 2 years) | |
| MSI Vector GP66 12UGS | |
| Lenovo Legion 5 Pro 16 G7 i7 RTX 3070Ti | |
| HP Omen 16-b0085ng | |
| Average Intel Core i7-12700H (2743 - 5972, n=63) | |
| Asus TUF Gaming A15 FA506QR-AZ061T | |
| Acer Nitro 5 AN515-45-R1JH | |
| Lenovo Legion 5 Pro 16ACH6H (82JQ001PGE) | |
| Lenovo Legion 5 Pro 16ACH6H (82JQ001PGE) | |
| Geekbench 5.5 / Multi-Core | |
| Average of class Gaming (6460 - 27010, n=110, last 2 years) | |
| Lenovo Legion 5 Pro 16 G7 i7 RTX 3070Ti | |
| MSI Vector GP66 12UGS | |
| Average Intel Core i7-12700H (5144 - 13745, n=64) | |
| HP Omen 16-b0085ng | |
| Lenovo Legion 5 Pro 16ACH6H (82JQ001PGE) | |
| Lenovo Legion 5 Pro 16ACH6H (82JQ001PGE) | |
| Asus TUF Gaming A15 FA506QR-AZ061T | |
| Acer Nitro 5 AN515-45-R1JH | |
| Geekbench 5.5 / Single-Core | |
| Average of class Gaming (986 - 2474, n=110, last 2 years) | |
| MSI Vector GP66 12UGS | |
| Lenovo Legion 5 Pro 16 G7 i7 RTX 3070Ti | |
| Average Intel Core i7-12700H (803 - 1851, n=64) | |
| HP Omen 16-b0085ng | |
| Acer Nitro 5 AN515-45-R1JH | |
| Asus TUF Gaming A15 FA506QR-AZ061T | |
| Lenovo Legion 5 Pro 16ACH6H (82JQ001PGE) | |
| Lenovo Legion 5 Pro 16ACH6H (82JQ001PGE) | |
| HWBOT x265 Benchmark v2.2 / 4k Preset | |
| Average of class Gaming (11.5 - 44.3, n=110, last 2 years) | |
| Lenovo Legion 5 Pro 16 G7 i7 RTX 3070Ti | |
| MSI Vector GP66 12UGS | |
| HP Omen 16-b0085ng | |
| Average Intel Core i7-12700H (4.67 - 21.8, n=64) | |
| Lenovo Legion 5 Pro 16ACH6H (82JQ001PGE) | |
| Lenovo Legion 5 Pro 16ACH6H (82JQ001PGE) | |
| Acer Nitro 5 AN515-45-R1JH | |
| Asus TUF Gaming A15 FA506QR-AZ061T | |
| LibreOffice / 20 Documents To PDF | |
| Lenovo Legion 5 Pro 16ACH6H (82JQ001PGE) | |
| Lenovo Legion 5 Pro 16ACH6H (82JQ001PGE) | |
| Acer Nitro 5 AN515-45-R1JH | |
| Average of class Gaming (19 - 88.8, n=110, last 2 years) | |
| Asus TUF Gaming A15 FA506QR-AZ061T | |
| HP Omen 16-b0085ng | |
| Average Intel Core i7-12700H (34.2 - 95.3, n=63) | |
| Lenovo Legion 5 Pro 16 G7 i7 RTX 3070Ti | |
| MSI Vector GP66 12UGS | |
| R Benchmark 2.5 / Overall mean | |
| Lenovo Legion 5 Pro 16ACH6H (82JQ001PGE) | |
| Lenovo Legion 5 Pro 16ACH6H (82JQ001PGE) | |
| HP Omen 16-b0085ng | |
| Acer Nitro 5 AN515-45-R1JH | |
| Asus TUF Gaming A15 FA506QR-AZ061T | |
| Average Intel Core i7-12700H (0.4441 - 1.052, n=63) | |
| Lenovo Legion 5 Pro 16 G7 i7 RTX 3070Ti | |
| Average of class Gaming (0.3439 - 0.759, n=111, last 2 years) | |
| MSI Vector GP66 12UGS | |
* ... smaller is better
AIDA64: FP32 Ray-Trace | FPU Julia | CPU SHA3 | CPU Queen | FPU SinJulia | FPU Mandel | CPU AES | CPU ZLib | FP64 Ray-Trace | CPU PhotoWorxx
| Performance rating | |
| Average of class Gaming | |
| Lenovo Legion 5 Pro 16ACH6H (82JQ001PGE) | |
| Acer Nitro 5 AN515-45-R1JH | |
| Lenovo Legion 5 Pro 16 G7 i7 RTX 3070Ti | |
| Average Intel Core i7-12700H | |
| MSI Vector GP66 12UGS | |
| Asus TUF Gaming A15 FA506QR-AZ061T | |
| HP Omen 16-b0085ng -9! | |
| AIDA64 / FP32 Ray-Trace | |
| Average of class Gaming (10227 - 85542, n=109, last 2 years) | |
| Lenovo Legion 5 Pro 16ACH6H (82JQ001PGE) | |
| Lenovo Legion 5 Pro 16ACH6H (82JQ001PGE) | |
| Asus TUF Gaming A15 FA506QR-AZ061T | |
| Acer Nitro 5 AN515-45-R1JH | |
| Average Intel Core i7-12700H (2585 - 17957, n=64) | |
| Lenovo Legion 5 Pro 16 G7 i7 RTX 3070Ti | |
| MSI Vector GP66 12UGS | |
| AIDA64 / FPU Julia | |
| Average of class Gaming (51376 - 238426, n=109, last 2 years) | |
| Lenovo Legion 5 Pro 16ACH6H (82JQ001PGE) | |
| Lenovo Legion 5 Pro 16ACH6H (82JQ001PGE) | |
| Acer Nitro 5 AN515-45-R1JH | |
| Asus TUF Gaming A15 FA506QR-AZ061T | |
| Average Intel Core i7-12700H (12439 - 90760, n=64) | |
| Lenovo Legion 5 Pro 16 G7 i7 RTX 3070Ti | |
| MSI Vector GP66 12UGS | |
| AIDA64 / CPU SHA3 | |
| Average of class Gaming (2180 - 9817, n=109, last 2 years) | |
| Lenovo Legion 5 Pro 16 G7 i7 RTX 3070Ti | |
| Lenovo Legion 5 Pro 16ACH6H (82JQ001PGE) | |
| Lenovo Legion 5 Pro 16ACH6H (82JQ001PGE) | |
| Average Intel Core i7-12700H (833 - 4242, n=64) | |
| MSI Vector GP66 12UGS | |
| Acer Nitro 5 AN515-45-R1JH | |
| Asus TUF Gaming A15 FA506QR-AZ061T | |
| AIDA64 / CPU Queen | |
| Average of class Gaming (49785 - 173351, n=100, last 2 years) | |
| MSI Vector GP66 12UGS | |
| Lenovo Legion 5 Pro 16 G7 i7 RTX 3070Ti | |
| Average Intel Core i7-12700H (57923 - 103202, n=63) | |
| Acer Nitro 5 AN515-45-R1JH | |
| Asus TUF Gaming A15 FA506QR-AZ061T | |
| Lenovo Legion 5 Pro 16ACH6H (82JQ001PGE) | |
| Lenovo Legion 5 Pro 16ACH6H (82JQ001PGE) | |
| AIDA64 / FPU SinJulia | |
| Average of class Gaming (4424 - 33636, n=109, last 2 years) | |
| Acer Nitro 5 AN515-45-R1JH | |
| Asus TUF Gaming A15 FA506QR-AZ061T | |
| Lenovo Legion 5 Pro 16ACH6H (82JQ001PGE) | |
| Lenovo Legion 5 Pro 16ACH6H (82JQ001PGE) | |
| Lenovo Legion 5 Pro 16 G7 i7 RTX 3070Ti | |
| MSI Vector GP66 12UGS | |
| Average Intel Core i7-12700H (3249 - 9939, n=64) | |
| AIDA64 / FPU Mandel | |
| Average of class Gaming (25115 - 128721, n=109, last 2 years) | |
| Lenovo Legion 5 Pro 16ACH6H (82JQ001PGE) | |
| Lenovo Legion 5 Pro 16ACH6H (82JQ001PGE) | |
| Acer Nitro 5 AN515-45-R1JH | |
| Asus TUF Gaming A15 FA506QR-AZ061T | |
| Average Intel Core i7-12700H (7135 - 44760, n=64) | |
| Lenovo Legion 5 Pro 16 G7 i7 RTX 3070Ti | |
| MSI Vector GP66 12UGS | |
| AIDA64 / CPU AES | |
| Lenovo Legion 5 Pro 16ACH6H (82JQ001PGE) | |
| Lenovo Legion 5 Pro 16ACH6H (82JQ001PGE) | |
| Acer Nitro 5 AN515-45-R1JH | |
| Average of class Gaming (39258 - 247074, n=109, last 2 years) | |
| Lenovo Legion 5 Pro 16 G7 i7 RTX 3070Ti | |
| MSI Vector GP66 12UGS | |
| Average Intel Core i7-12700H (31839 - 144360, n=64) | |
| Asus TUF Gaming A15 FA506QR-AZ061T | |
| AIDA64 / CPU ZLib | |
| Average of class Gaming (574 - 2531, n=109, last 2 years) | |
| Lenovo Legion 5 Pro 16 G7 i7 RTX 3070Ti | |
| MSI Vector GP66 12UGS | |
| Average Intel Core i7-12700H (305 - 1171, n=64) | |
| Lenovo Legion 5 Pro 16ACH6H (82JQ001PGE) | |
| Lenovo Legion 5 Pro 16ACH6H (82JQ001PGE) | |
| Asus TUF Gaming A15 FA506QR-AZ061T | |
| Acer Nitro 5 AN515-45-R1JH | |
| HP Omen 16-b0085ng | |
| AIDA64 / FP64 Ray-Trace | |
| Average of class Gaming (5509 - 45446, n=109, last 2 years) | |
| Asus TUF Gaming A15 FA506QR-AZ061T | |
| Lenovo Legion 5 Pro 16ACH6H (82JQ001PGE) | |
| Lenovo Legion 5 Pro 16ACH6H (82JQ001PGE) | |
| Acer Nitro 5 AN515-45-R1JH | |
| Average Intel Core i7-12700H (1437 - 9692, n=64) | |
| Lenovo Legion 5 Pro 16 G7 i7 RTX 3070Ti | |
| MSI Vector GP66 12UGS | |
| AIDA64 / CPU PhotoWorxx | |
| Average of class Gaming (12271 - 89891, n=109, last 2 years) | |
| Lenovo Legion 5 Pro 16 G7 i7 RTX 3070Ti | |
| Average Intel Core i7-12700H (12863 - 52207, n=64) | |
| MSI Vector GP66 12UGS | |
| Lenovo Legion 5 Pro 16ACH6H (82JQ001PGE) | |
| Lenovo Legion 5 Pro 16ACH6H (82JQ001PGE) | |
| Asus TUF Gaming A15 FA506QR-AZ061T | |
| Acer Nitro 5 AN515-45-R1JH | |
System Performance
The subjective performance impression is very good and the benchmark results are great. Considering the hardware, however, this is not really surprising. The laptop is shipped with Windows 11 and we did not experience and freezes or lags.
CrossMark: Overall | Productivity | Creativity | Responsiveness
| PCMark 10 / Score | |
| Average of class Gaming (5828 - 11574, n=95, last 2 years) | |
| MSI Vector GP66 12UGS | |
| Lenovo Legion 5 Pro 16 G7 i7 RTX 3070Ti | |
| Average Intel Core i7-12700H, NVIDIA GeForce RTX 3070 Ti Laptop GPU (6941 - 7947, n=11) | |
| HP Omen 16-b0085ng | |
| Asus TUF Gaming A15 FA506QR-AZ061T | |
| Acer Nitro 5 AN515-45-R1JH | |
| Lenovo Legion 5 Pro 16ACH6H (82JQ001PGE) | |
| PCMark 10 / Essentials | |
| MSI Vector GP66 12UGS | |
| HP Omen 16-b0085ng | |
| Average of class Gaming (8810 - 12600, n=99, last 2 years) | |
| Average Intel Core i7-12700H, NVIDIA GeForce RTX 3070 Ti Laptop GPU (9892 - 10935, n=11) | |
| Asus TUF Gaming A15 FA506QR-AZ061T | |
| Acer Nitro 5 AN515-45-R1JH | |
| Lenovo Legion 5 Pro 16 G7 i7 RTX 3070Ti | |
| Lenovo Legion 5 Pro 16ACH6H (82JQ001PGE) | |
| PCMark 10 / Productivity | |
| Average of class Gaming (6845 - 18766, n=97, last 2 years) | |
| MSI Vector GP66 12UGS | |
| Lenovo Legion 5 Pro 16 G7 i7 RTX 3070Ti | |
| Average Intel Core i7-12700H, NVIDIA GeForce RTX 3070 Ti Laptop GPU (9024 - 10638, n=11) | |
| Asus TUF Gaming A15 FA506QR-AZ061T | |
| Acer Nitro 5 AN515-45-R1JH | |
| HP Omen 16-b0085ng | |
| Lenovo Legion 5 Pro 16ACH6H (82JQ001PGE) | |
| PCMark 10 / Digital Content Creation | |
| Average of class Gaming (7602 - 19657, n=97, last 2 years) | |
| MSI Vector GP66 12UGS | |
| Lenovo Legion 5 Pro 16 G7 i7 RTX 3070Ti | |
| Average Intel Core i7-12700H, NVIDIA GeForce RTX 3070 Ti Laptop GPU (10165 - 12546, n=11) | |
| HP Omen 16-b0085ng | |
| Lenovo Legion 5 Pro 16ACH6H (82JQ001PGE) | |
| Asus TUF Gaming A15 FA506QR-AZ061T | |
| Acer Nitro 5 AN515-45-R1JH | |
| CrossMark / Overall | |
| Average of class Gaming (1366 - 2409, n=97, last 2 years) | |
| Lenovo Legion 5 Pro 16 G7 i7 RTX 3070Ti | |
| Average Intel Core i7-12700H, NVIDIA GeForce RTX 3070 Ti Laptop GPU (974 - 2000, n=12) | |
| CrossMark / Productivity | |
| Lenovo Legion 5 Pro 16 G7 i7 RTX 3070Ti | |
| Average of class Gaming (1386 - 2254, n=97, last 2 years) | |
| Average Intel Core i7-12700H, NVIDIA GeForce RTX 3070 Ti Laptop GPU (907 - 1962, n=12) | |
| CrossMark / Creativity | |
| Average of class Gaming (1343 - 2729, n=97, last 2 years) | |
| Lenovo Legion 5 Pro 16 G7 i7 RTX 3070Ti | |
| Average Intel Core i7-12700H, NVIDIA GeForce RTX 3070 Ti Laptop GPU (1027 - 2057, n=12) | |
| CrossMark / Responsiveness | |
| Lenovo Legion 5 Pro 16 G7 i7 RTX 3070Ti | |
| Average Intel Core i7-12700H, NVIDIA GeForce RTX 3070 Ti Laptop GPU (1029 - 2142, n=12) | |
| Average of class Gaming (1226 - 2334, n=97, last 2 years) | |
| PCMark 10 Score | 7555 points | |
Help | ||
| AIDA64 / Memory Copy | |
| Average of class Gaming (21750 - 129946, n=109, last 2 years) | |
| Average Intel Core i7-12700H (25615 - 80511, n=64) | |
| Lenovo Legion 5 Pro 16 G7 i7 RTX 3070Ti | |
| MSI Vector GP66 12UGS | |
| Lenovo Legion 5 Pro 16ACH6H (82JQ001PGE) | |
| Lenovo Legion 5 Pro 16ACH6H (82JQ001PGE) | |
| Asus TUF Gaming A15 FA506QR-AZ061T | |
| Acer Nitro 5 AN515-45-R1JH | |
| AIDA64 / Memory Read | |
| Average of class Gaming (22956 - 118858, n=109, last 2 years) | |
| Lenovo Legion 5 Pro 16 G7 i7 RTX 3070Ti | |
| Average Intel Core i7-12700H (25586 - 79442, n=64) | |
| MSI Vector GP66 12UGS | |
| Lenovo Legion 5 Pro 16ACH6H (82JQ001PGE) | |
| Lenovo Legion 5 Pro 16ACH6H (82JQ001PGE) | |
| Asus TUF Gaming A15 FA506QR-AZ061T | |
| Acer Nitro 5 AN515-45-R1JH | |
| AIDA64 / Memory Write | |
| Average of class Gaming (22297 - 135096, n=109, last 2 years) | |
| Lenovo Legion 5 Pro 16 G7 i7 RTX 3070Ti | |
| Average Intel Core i7-12700H (23679 - 88660, n=64) | |
| MSI Vector GP66 12UGS | |
| Lenovo Legion 5 Pro 16ACH6H (82JQ001PGE) | |
| Lenovo Legion 5 Pro 16ACH6H (82JQ001PGE) | |
| Acer Nitro 5 AN515-45-R1JH | |
| Asus TUF Gaming A15 FA506QR-AZ061T | |
| AIDA64 / Memory Latency | |
| Average of class Gaming (75.3 - 259, n=109, last 2 years) | |
| Lenovo Legion 5 Pro 16 G7 i7 RTX 3070Ti | |
| MSI Vector GP66 12UGS | |
| Lenovo Legion 5 Pro 16ACH6H (82JQ001PGE) | |
| Lenovo Legion 5 Pro 16ACH6H (82JQ001PGE) | |
| Asus TUF Gaming A15 FA506QR-AZ061T | |
| Average Intel Core i7-12700H (76.2 - 133.9, n=62) | |
| Acer Nitro 5 AN515-45-R1JH | |
| HP Omen 16-b0085ng | |
* ... smaller is better
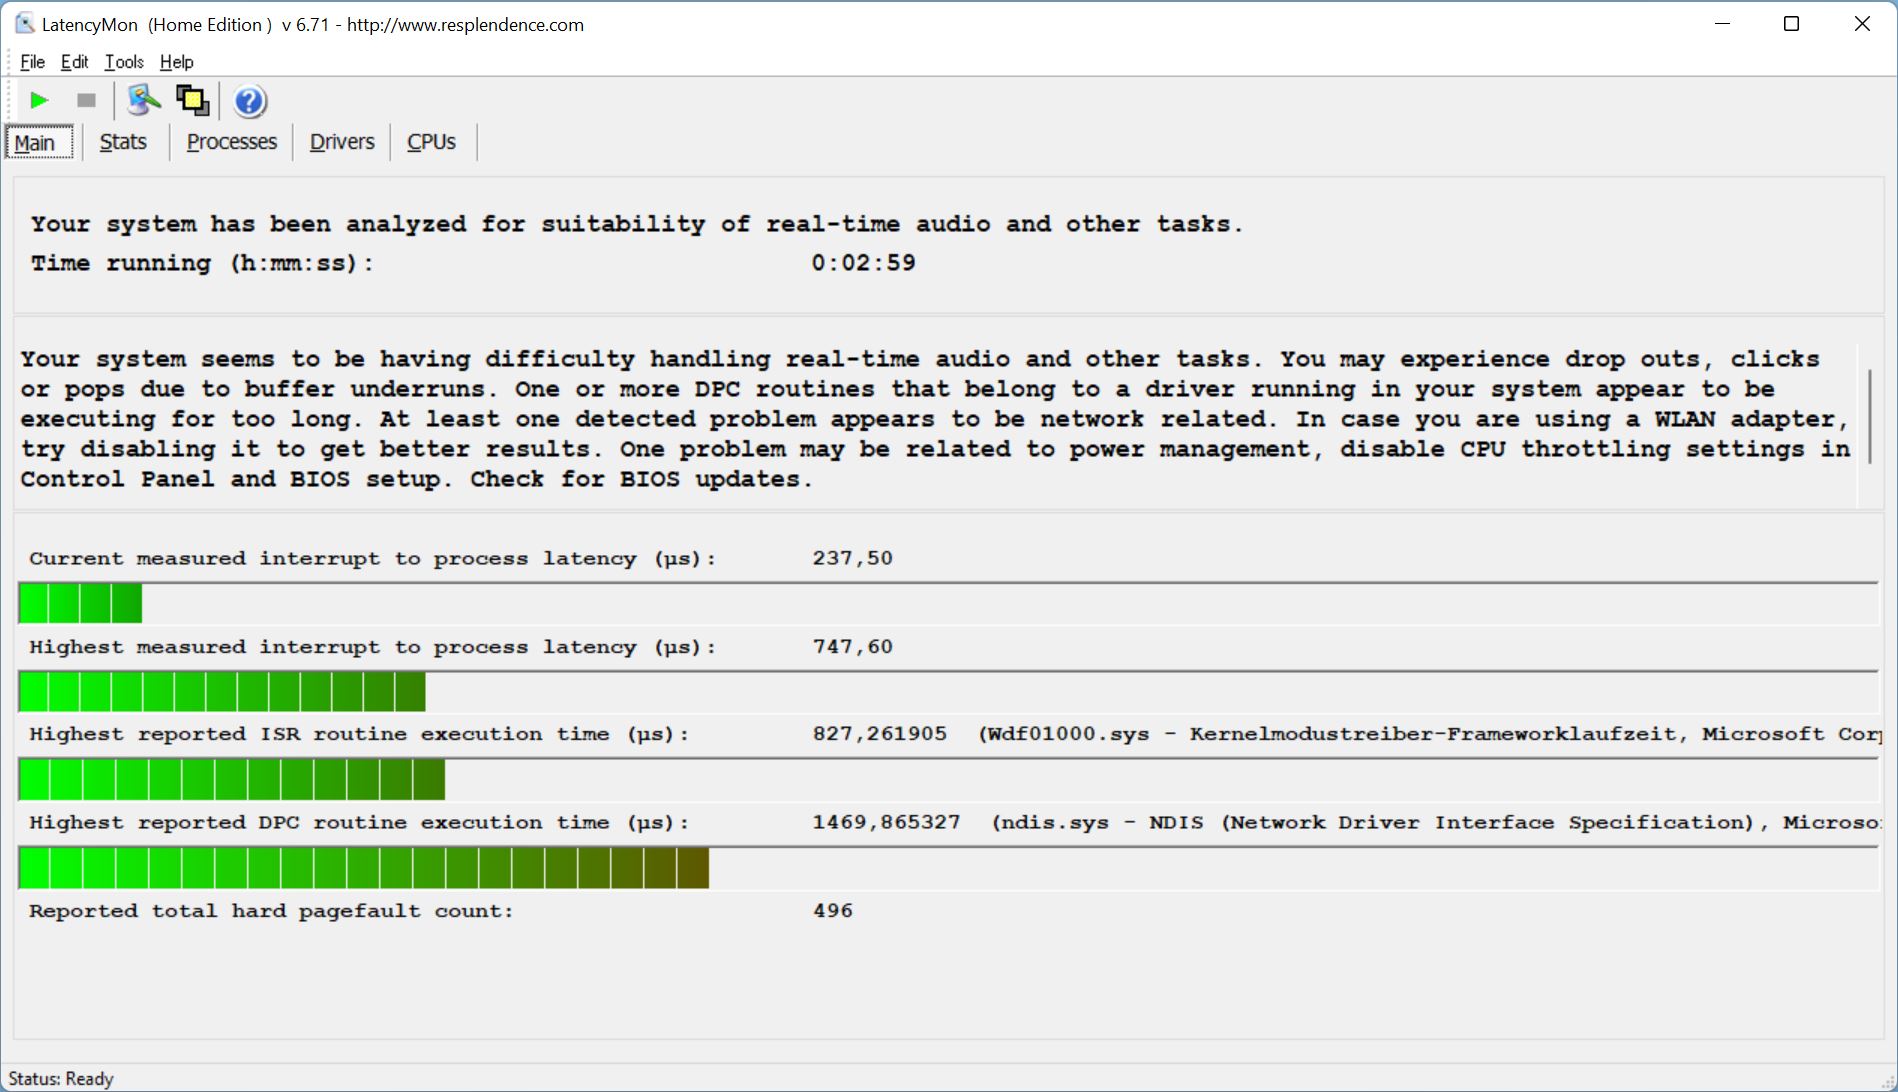
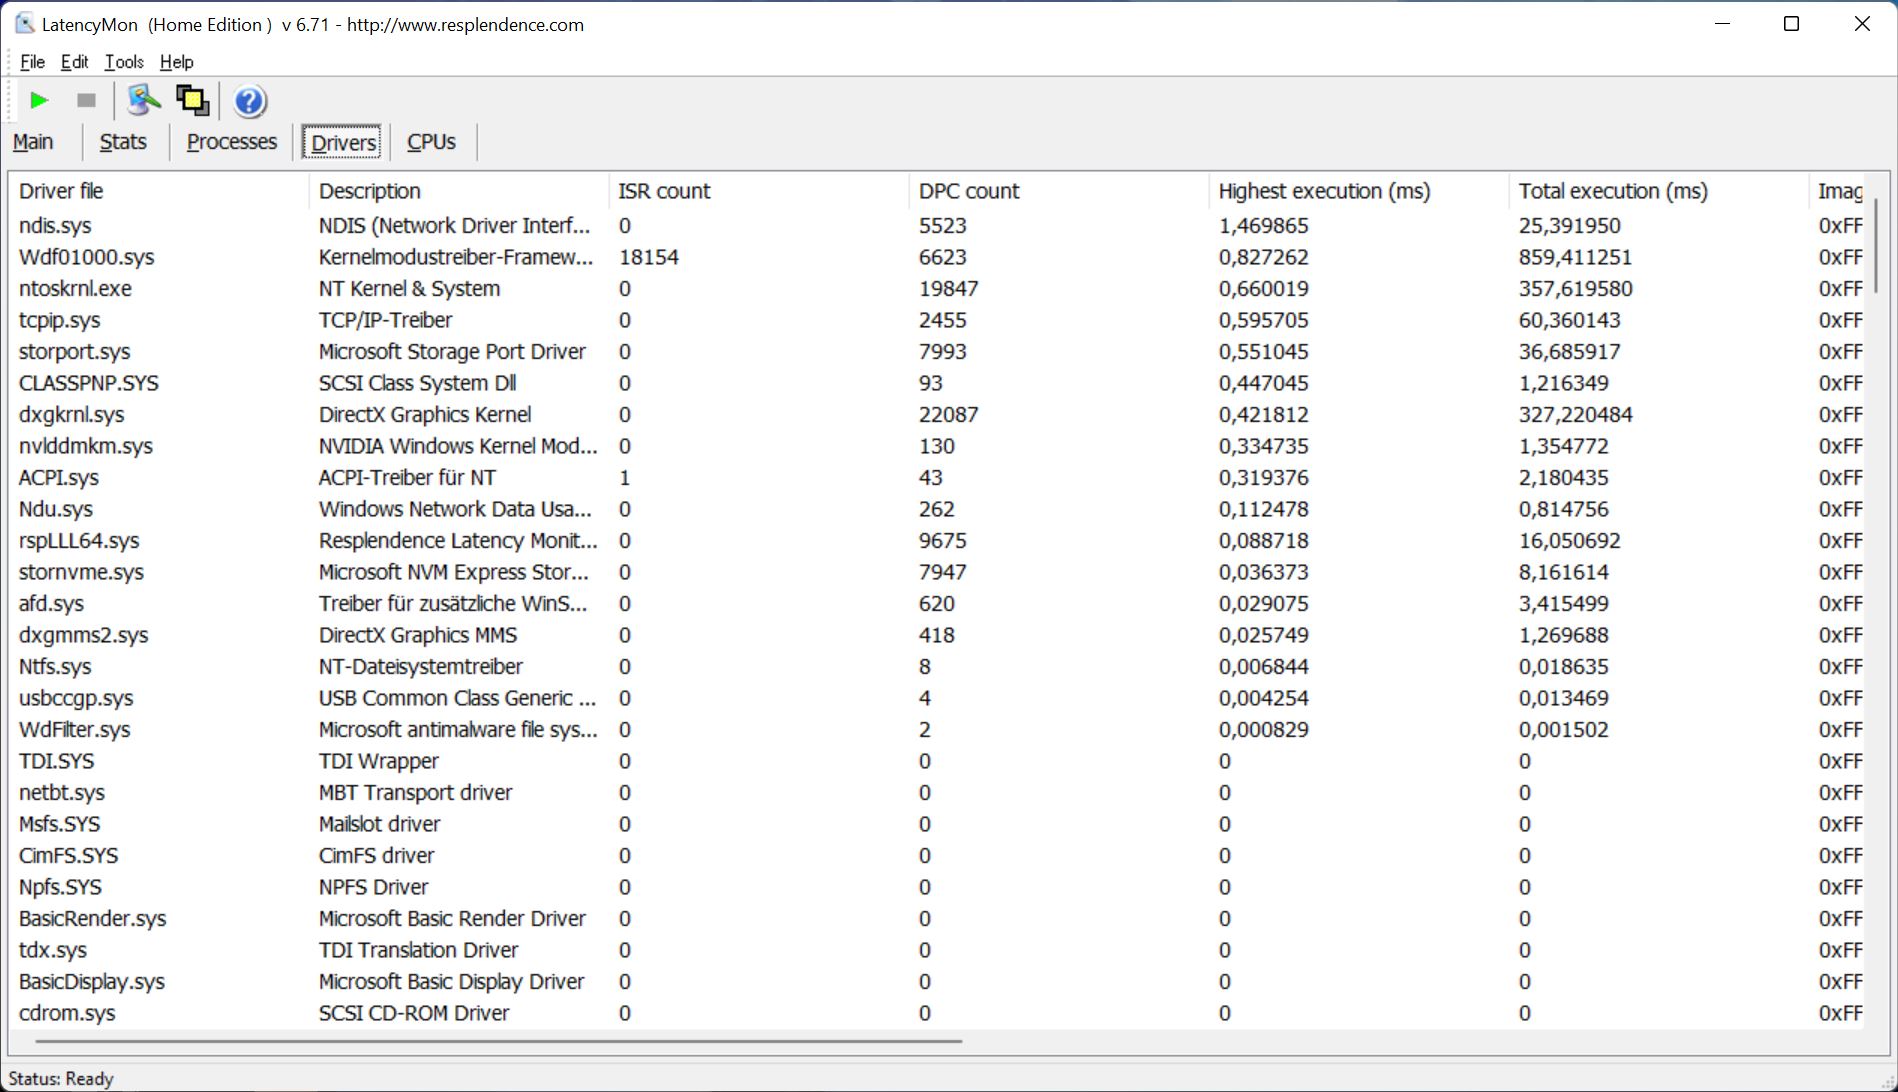
DPC Latency
Our standardized latency test reveals some driver issues with the current BIOS version, but the latency itself is good. There were no dropped frames during the playback of a 4K YouTube video.
| DPC Latencies / LatencyMon - interrupt to process latency (max), Web, Youtube, Prime95 | |
| MSI Vector GP66 12UGS | |
| Lenovo Legion 5 Pro 16ACH6H (82JQ001PGE) | |
| Asus TUF Gaming A15 FA506QR-AZ061T | |
| Lenovo Legion 5 Pro 16 G7 i7 RTX 3070Ti | |
| HP Omen 16-b0085ng | |
| Acer Nitro 5 AN515-45-R1JH | |
* ... smaller is better
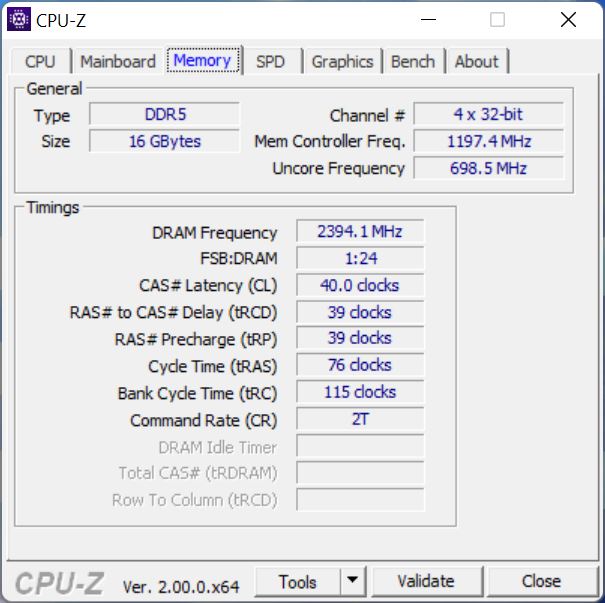
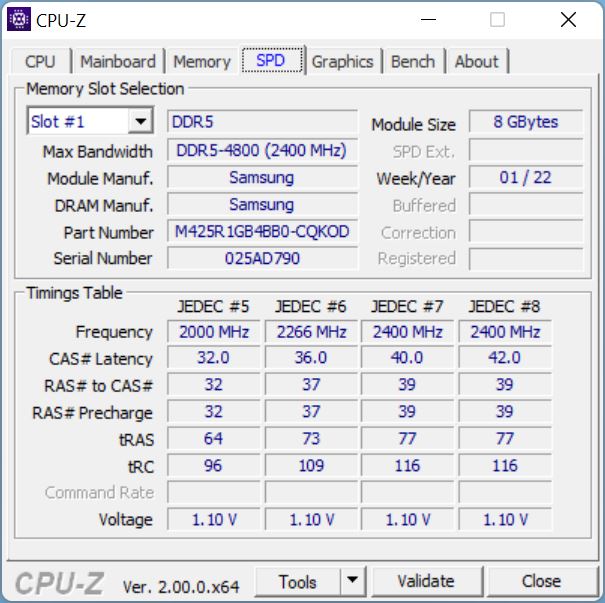
Storage Devices
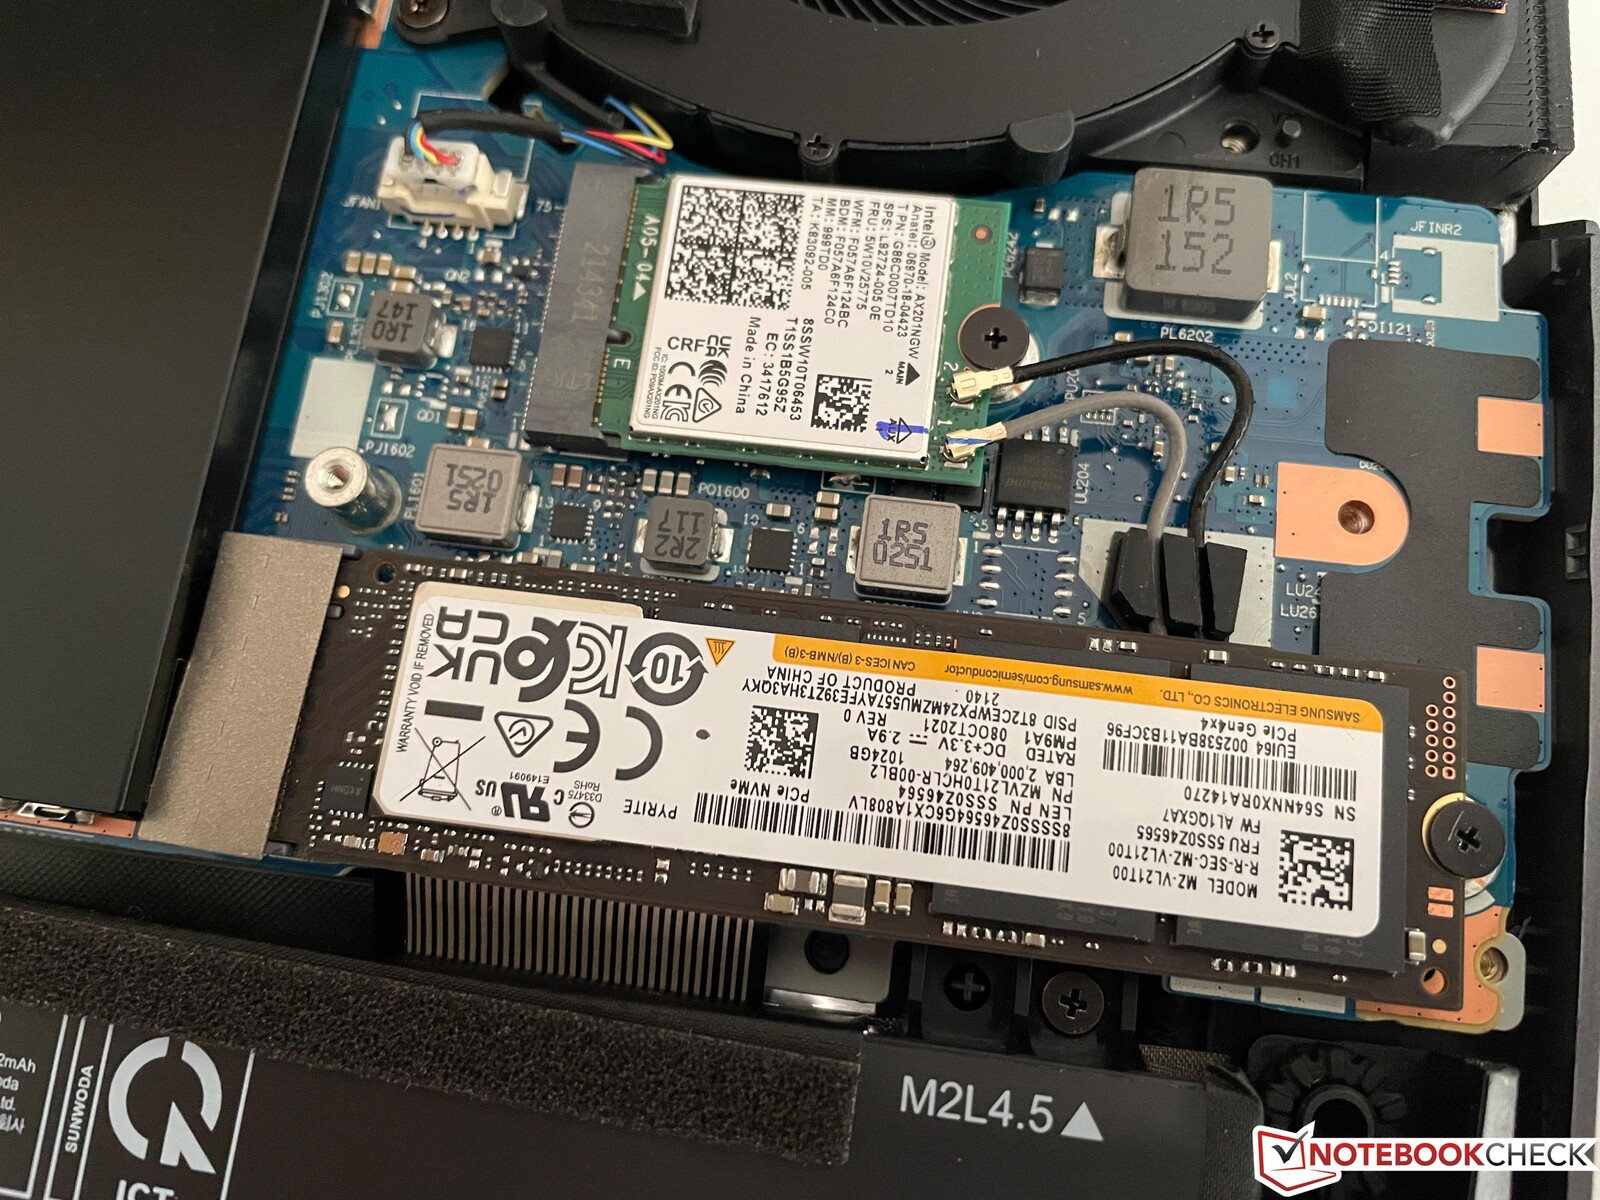
The Legion offers two M.2-2280 slots, which are hidden underneath additional covers. It is therefore no problem to expand the storage capacity. Our review unit is equipped with a single PCIe 4.0 SSD from Samsung (PM91A) with a storage capacity of 1 TB. You can use 895 GB for your own files/apps after the initial set up. The OM91A manages very high transfer rates of more than 6 GB/s and it is one of the fastest drives on the market. The Legion also secure the top spot within our comparison group. More SSD benchmarks are available here.

* ... smaller is better
Disk Throttling: DiskSpd Read Loop, Queue Depth 8
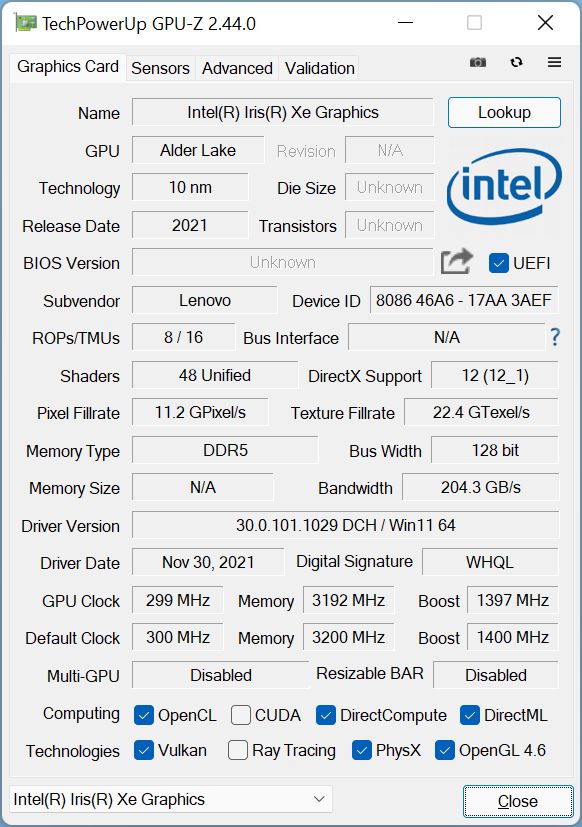
GPU Performance - GeForce RTX 3070 Ti
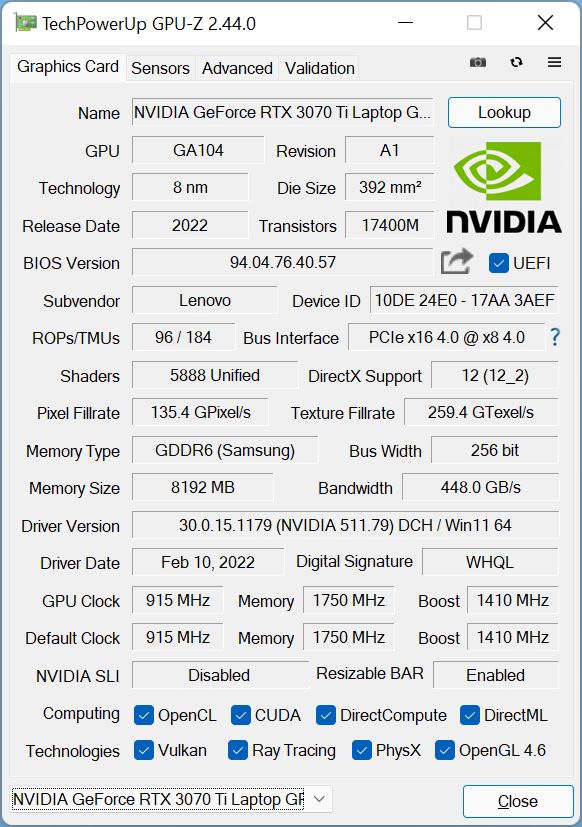
We already mentioned that the Legion now supports the Advanced Optimus technology from Nvidia, which uses a dynamic MUX. This means the iGPU can be deactivated when you drive the internal display, which was not possible before without a restart. The new GeForce RTX 3070 Ti automatically steps in when you need more performance. Lenovo uses the 125W version of the 3070 Ti with 8 GB GDDR6-VRAM and a maximum clock of 1702 MHz, but the GPU can also use 25W dynamic boost from the processor.
The benchmark results are very good and on the expected level, but the MSI Vector GP66 is usually slightly faster in the benchmarks. Compared to the old Legion 5 Pro 16 with the RTX 3070, the advantage is about 20 percent. We listed the results of the three energy modes in the following table.
| Scenario | Silent | Auto | Performance |
|---|---|---|---|
| Time Spy Graphics | 9280 Point | 10424 Points | 11577 Points |
| Time Spy Stress test | 71.4 % (not passed) | 96.8 % (not passed) | 98 % (passed) |
The RTX 3070 Ti is limited to just 40W on battery power, so the performance drop is much bigger compared to the processor. The Time Spy Graphics score drops to just 2670 points (-78 %). Please see our tech section for more GPU benchmarks.
| 3DMark Fire Strike Score | 26098 points | |
| 3DMark Time Spy Score | 11752 points | |
Help | ||
Gaming Performance
The gaming performance of the Legion 5i Pro 16 is – as expected – very good and the gaming laptop can easily handle all modern games in the native QHD resolution. Cyberpunk 2077 also runs at slightly more than 60 fps, even with Ray Tracing. The new RTX 3070 Ti is about 15-20 % faster on average compared to the regular RTX 3070. Some titles will still run smoothly in the Silent mode (there is a performance deficit of 30-40 %) and you benefit from the quieter fan noise.
| The Witcher 3 | |
| 1920x1080 High Graphics & Postprocessing (Nvidia HairWorks Off) | |
| Average of class Gaming (181 - 341, n=3, last 2 years) | |
| MSI Vector GP66 12UGS | |
| Lenovo Legion 5 Pro 16 G7 i7 RTX 3070Ti | |
| Average NVIDIA GeForce RTX 3070 Ti Laptop GPU (139.7 - 226, n=27) | |
| HP Omen 16-b0085ng | |
| Acer Nitro 5 AN515-45-R1JH | |
| Lenovo Legion 5 Pro 16ACH6H (82JQ001PGE) | |
| 1920x1080 Ultra Graphics & Postprocessing (HBAO+) | |
| Average of class Gaming (95 - 240, n=8, last 2 years) | |
| MSI Vector GP66 12UGS | |
| Lenovo Legion 5 Pro 16 G7 i7 RTX 3070Ti | |
| Average NVIDIA GeForce RTX 3070 Ti Laptop GPU (76.8 - 124.1, n=39) | |
| HP Omen 16-b0085ng | |
| Lenovo Legion 5 Pro 16ACH6H (82JQ001PGE) | |
| Acer Nitro 5 AN515-45-R1JH | |
| Asus TUF Gaming A15 FA506QR-AZ061T | |
| F1 2021 | |
| 1920x1080 High Preset AA:T AF:16x | |
| Lenovo Legion 5 Pro 16ACH6H (82JQ001PGE) | |
| Lenovo Legion 5 Pro 16 G7 i7 RTX 3070Ti | |
| Average NVIDIA GeForce RTX 3070 Ti Laptop GPU (139.2 - 238, n=8) | |
| 1920x1080 Ultra High Preset + Raytracing AA:T AF:16x | |
| Lenovo Legion 5 Pro 16 G7 i7 RTX 3070Ti | |
| Lenovo Legion 5 Pro 16ACH6H (82JQ001PGE) | |
| Average NVIDIA GeForce RTX 3070 Ti Laptop GPU (67.3 - 134.2, n=13) | |
| 2560x1440 Ultra High Preset + Raytracing AA:T AF:16x | |
| Lenovo Legion 5 Pro 16 G7 i7 RTX 3070Ti | |
| Lenovo Legion 5 Pro 16ACH6H (82JQ001PGE) | |
| Average NVIDIA GeForce RTX 3070 Ti Laptop GPU (47.5 - 99.2, n=11) | |
| GRID Legends | |
| 1920x1080 High Preset | |
| Average NVIDIA GeForce RTX 3070 Ti Laptop GPU (148 - 149.1, n=2) | |
| Lenovo Legion 5 Pro 16 G7 i7 RTX 3070Ti | |
| 1920x1080 Ultra Preset | |
| Lenovo Legion 5 Pro 16 G7 i7 RTX 3070Ti | |
| Average NVIDIA GeForce RTX 3070 Ti Laptop GPU (111.2 - 114, n=2) | |
| 2560x1440 Ultra Preset | |
| Lenovo Legion 5 Pro 16 G7 i7 RTX 3070Ti | |
| Average NVIDIA GeForce RTX 3070 Ti Laptop GPU (n=1) | |
| Cyberpunk 2077 1.6 | |
| 1920x1080 Ultra Preset | |
| Lenovo Legion 5 Pro 16 G7 i7 RTX 3070Ti | |
| Average NVIDIA GeForce RTX 3070 Ti Laptop GPU (48.5 - 104, n=13) | |
| 2560x1440 Ultra Preset | |
| Lenovo Legion 5 Pro 16 G7 i7 RTX 3070Ti | |
| Average NVIDIA GeForce RTX 3070 Ti Laptop GPU (40 - 62, n=10) | |
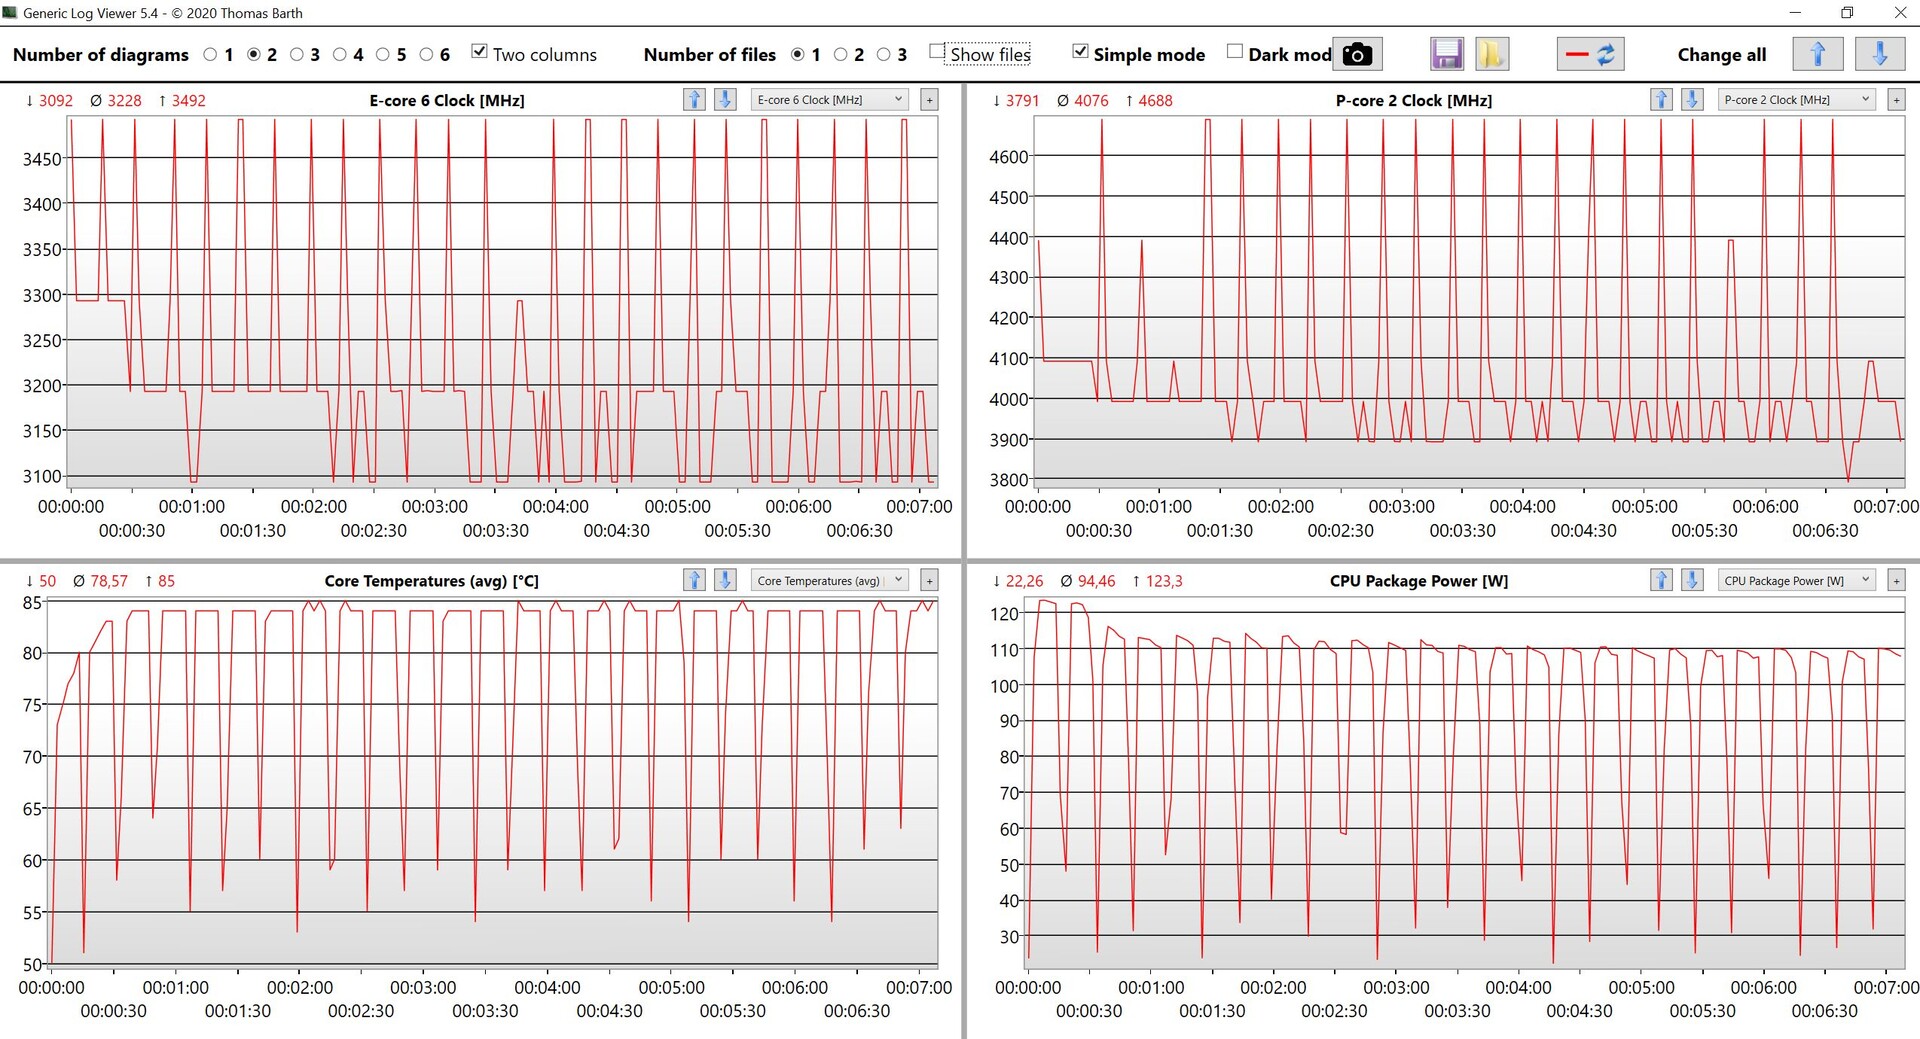
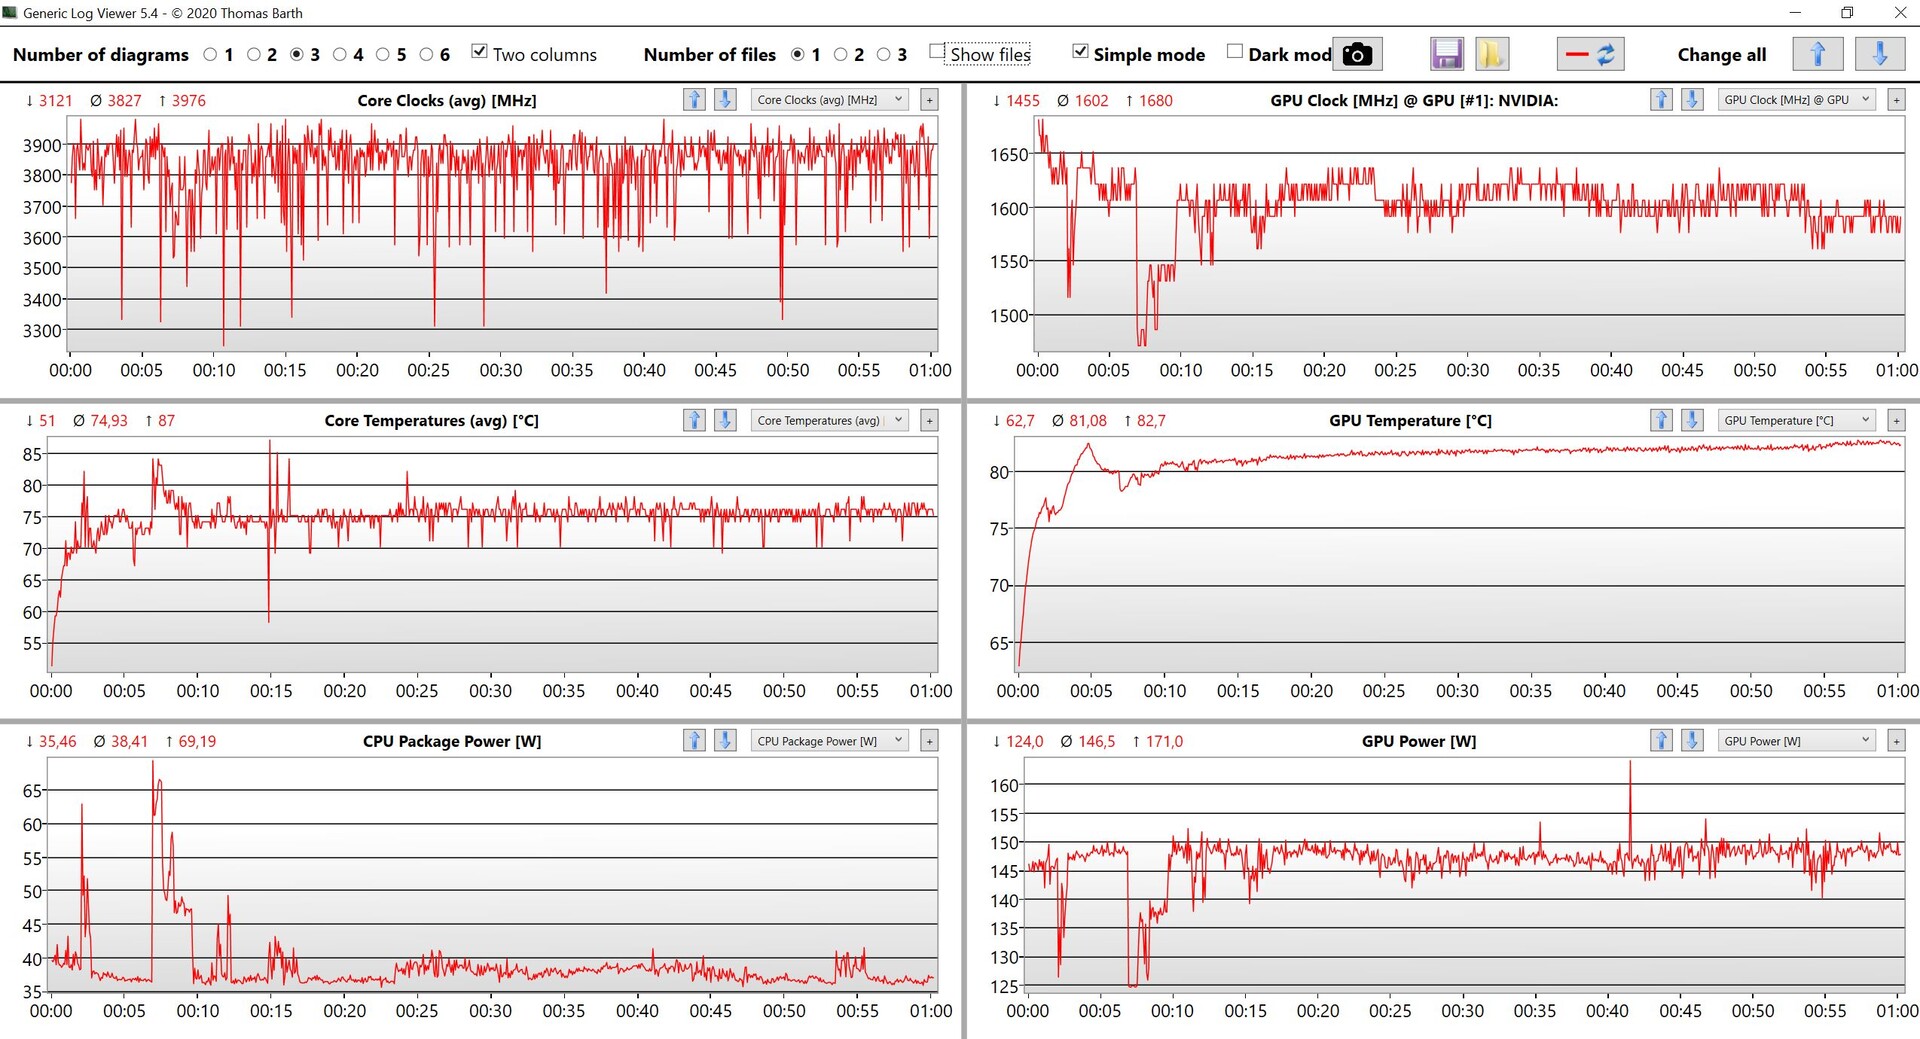
The GPU can also consume 150W during gaming, at least depending on the CPU load (see chart below). Gaming in battery power is a bit of a problem because the performance takes a massive hit. Witcher 3 (Ultra preset), for example, drops below 30 fps without the power adapter. More gaming benchmarks are listed here.
Witcher 3 FPS-Diagramm
| low | med. | high | ultra | QHD | |
|---|---|---|---|---|---|
| GTA V (2015) | 185 | 182 | 171 | 117 | 100 |
| The Witcher 3 (2015) | 417 | 324 | 219 | 103 | |
| Dota 2 Reborn (2015) | 178 | 161 | 152 | 145 | |
| Final Fantasy XV Benchmark (2018) | 205 | 142 | 107 | 82.3 | |
| X-Plane 11.11 (2018) | 144 | 123 | 100 | ||
| Far Cry 5 (2018) | 172 | 137 | 129 | 122 | 108 |
| Strange Brigade (2018) | 453 | 270 | 224 | 199 | 150 |
| F1 2021 (2021) | 365 | 255 | 210 | 130 | 99.2 |
| GRID Legends (2022) | 209 | 169 | 148 | 114 | 99 |
| Cyberpunk 2077 1.6 (2022) | 145 | 123 | 96 | 94 | 62 |
Emissions - Legion 5i gets loud and warm
System Noise
We recommend the Silent mode during everyday tasks, because the fans will be deactivated most of the time and there are no other electronic sounds like coil whine. The fans are pretty much always running in the other two modes, even while idling. We measure about 40 dB(A) when you play with the Silent mode, and it depends on the CPU load for the other two modes. Witcher 3 with low CPU usage results in up to 49 dB(A), while Cyberpunk 2077 results in up to 54 dB(A), which is obviously clearly audible.
| Scenario | Silent | Auto | Performance |
|---|---|---|---|
| Witcher 3 Ultra | 39.1 dB(A) (64 fps) | 49.4 dB(A) (100 fps) | 49.4 dB(A) (103 fps) |
| Cyberpunk 2077 1.5 Ultra QHD | 39.1 dB(A) (35 fps) | 49.4 dB(A) (57 fps) | 54.7 dB(A) (62 fps) |
| Stress test | 39.1 dB(A) | 49.4 dB(A) | 54.7 dB(A) |
Noise level
| Idle |
| 28.4 / 28.4 / 28.4 dB(A) |
| Load |
| 49.4 / 54.7 dB(A) |
 | ||
30 dB silent 40 dB(A) audible 50 dB(A) loud |
||
min: | ||
| Lenovo Legion 5 Pro 16 G7 i7 RTX 3070Ti GeForce RTX 3070 Ti Laptop GPU, i7-12700H, Samsung PM9A1 MZVL21T0HCLR | MSI Vector GP66 12UGS GeForce RTX 3070 Ti Laptop GPU, i9-12900H | HP Omen 16-b0085ng GeForce RTX 3070 Laptop GPU, i7-11800H, Intel Optane Memory H10 with Solid State Storage 32GB + 512GB HBRPEKNX0202A(L/H) | Acer Nitro 5 AN515-45-R1JH GeForce RTX 3070 Laptop GPU, R7 5800H, WDC PC SN530 SDBPNPZ-1T00 | Asus TUF Gaming A15 FA506QR-AZ061T GeForce RTX 3070 Laptop GPU, R7 5800H, SK Hynix HFM001TD3JX013N | Lenovo Legion 5 Pro 16ACH6H (82JQ001PGE) GeForce RTX 3070 Laptop GPU, R7 5800H, WDC PC SN730 SDBPNTY-1T00 | |
|---|---|---|---|---|---|---|
| Noise | 7% | 6% | 4% | 5% | 12% | |
| off / environment * (dB) | 24.6 | 22.9 7% | 23 7% | 25 -2% | 26 -6% | 23 7% |
| Idle Minimum * (dB) | 28.4 | 23.4 18% | 23 19% | 25 12% | 26 8% | 25 12% |
| Idle Average * (dB) | 28.4 | 23.4 18% | 23 19% | 25 12% | 26 8% | 25 12% |
| Idle Maximum * (dB) | 28.4 | 27.4 4% | 34.81 -23% | 32.2 -13% | 27.4 4% | 25 12% |
| Load Average * (dB) | 49.4 | 36 27% | 35.02 29% | 45.8 7% | 46.6 6% | 35.5 28% |
| Witcher 3 ultra * (dB) | 49.4 | 58.2 -18% | 52 -5% | 46.67 6% | ||
| Load Maximum * (dB) | 54.7 | 58 -6% | 56 -2% | 49.1 10% | 49.3 10% | 50.35 8% |
* ... smaller is better
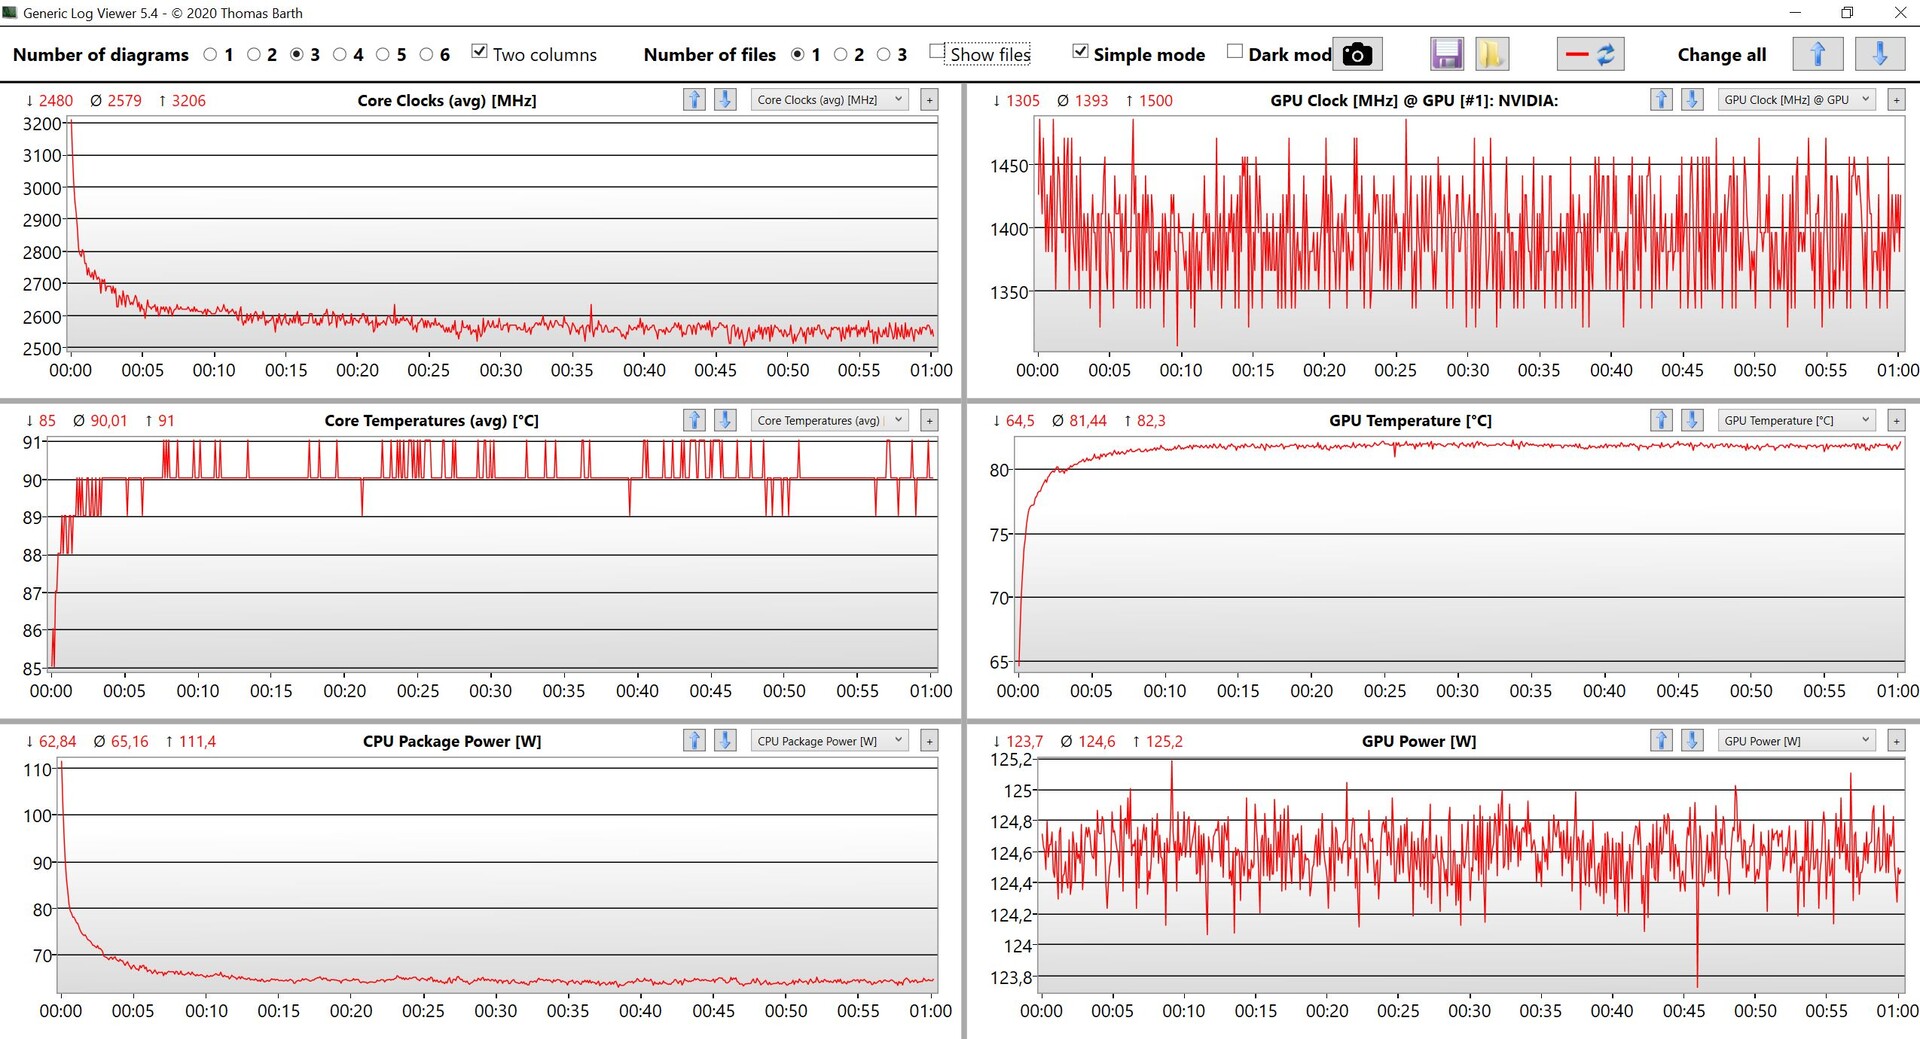
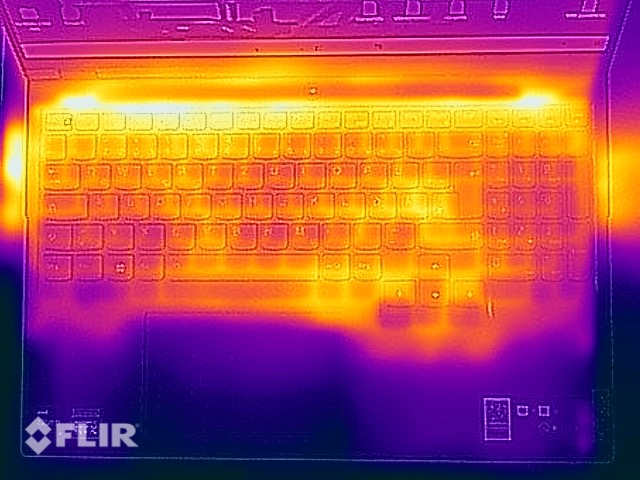
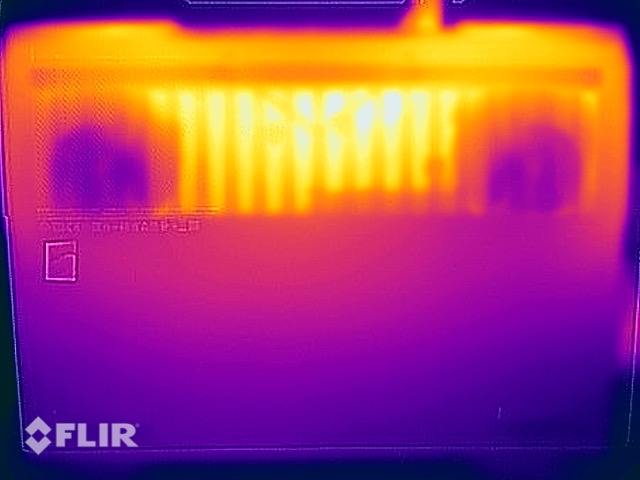
Temperature
Some spots already reach more than 30 °C while idling, but this does not mean there are any limitations in light workloads. We can, however, measure almost 60 °C on the bottom of the base unit while gaming, so you should not use it on your lap in this case. The keyboard warms up significantly as well and you will get warm fingers during gaming. The GPU runs at 125W during the stress test and the processor quickly levels off at 62W.
(-) The maximum temperature on the upper side is 45.3 °C / 114 F, compared to the average of 40.4 °C / 105 F, ranging from 21.2 to 68.8 °C for the class Gaming.
(-) The bottom heats up to a maximum of 61.2 °C / 142 F, compared to the average of 43.2 °C / 110 F
(+) In idle usage, the average temperature for the upper side is 26.8 °C / 80 F, compared to the device average of 33.9 °C / 93 F.
(±) Playing The Witcher 3, the average temperature for the upper side is 37.7 °C / 100 F, compared to the device average of 33.9 °C / 93 F.
(±) The palmrests and touchpad can get very hot to the touch with a maximum of 37.5 °C / 99.5 F.
(-) The average temperature of the palmrest area of similar devices was 28.8 °C / 83.8 F (-8.7 °C / -15.7 F).
| Lenovo Legion 5 Pro 16 G7 i7 RTX 3070Ti Intel Core i7-12700H, NVIDIA GeForce RTX 3070 Ti Laptop GPU | MSI Vector GP66 12UGS Intel Core i9-12900H, NVIDIA GeForce RTX 3070 Ti Laptop GPU | HP Omen 16-b0085ng Intel Core i7-11800H, NVIDIA GeForce RTX 3070 Laptop GPU | Acer Nitro 5 AN515-45-R1JH AMD Ryzen 7 5800H, NVIDIA GeForce RTX 3070 Laptop GPU | Asus TUF Gaming A15 FA506QR-AZ061T AMD Ryzen 7 5800H, NVIDIA GeForce RTX 3070 Laptop GPU | Lenovo Legion 5 Pro 16ACH6H (82JQ001PGE) AMD Ryzen 7 5800H, NVIDIA GeForce RTX 3070 Laptop GPU | |
|---|---|---|---|---|---|---|
| Heat | -0% | -9% | -4% | -11% | -9% | |
| Maximum Upper Side * (°C) | 45.3 | 40.2 11% | 48 -6% | 53.2 -17% | 46.7 -3% | 50 -10% |
| Maximum Bottom * (°C) | 61.2 | 43.8 28% | 55 10% | 58.2 5% | 55.9 9% | 55 10% |
| Idle Upper Side * (°C) | 28.6 | 34.8 -22% | 33 -15% | 29.5 -3% | 37.1 -30% | 34 -19% |
| Idle Bottom * (°C) | 31.4 | 37 -18% | 39 -24% | 31.2 1% | 38.1 -21% | 37 -18% |
* ... smaller is better
Speakers
The two stereo speakers (2W each) are located in the front area of the base unit and direct the sound towards the bottom. Lenovo installs the Nahimic app, which offers multiple profiles and it definitely improves the sound, which is pretty tinny without the software support. However, the bass performance could be better. The speaker system is fine for some background music or video playback, but you should use a headset during gaming anyway since the fans are just too loud.
Lenovo Legion 5 Pro 16 G7 i7 RTX 3070Ti audio analysis
(±) | speaker loudness is average but good (79.1 dB)
Bass 100 - 315 Hz
(-) | nearly no bass - on average 17.8% lower than median
(±) | linearity of bass is average (9.9% delta to prev. frequency)
Mids 400 - 2000 Hz
(+) | balanced mids - only 3.7% away from median
(+) | mids are linear (3.3% delta to prev. frequency)
Highs 2 - 16 kHz
(+) | balanced highs - only 2.1% away from median
(+) | highs are linear (5.8% delta to prev. frequency)
Overall 100 - 16.000 Hz
(+) | overall sound is linear (14.7% difference to median)
Compared to same class
» 28% of all tested devices in this class were better, 7% similar, 64% worse
» The best had a delta of 6%, average was 18%, worst was 132%
Compared to all devices tested
» 19% of all tested devices were better, 4% similar, 77% worse
» The best had a delta of 4%, average was 24%, worst was 134%
HP Omen 16-b0085ng audio analysis
(+) | speakers can play relatively loud (84.4 dB)
Bass 100 - 315 Hz
(-) | nearly no bass - on average 17.4% lower than median
(±) | linearity of bass is average (13.9% delta to prev. frequency)
Mids 400 - 2000 Hz
(+) | balanced mids - only 3.2% away from median
(+) | mids are linear (2.9% delta to prev. frequency)
Highs 2 - 16 kHz
(+) | balanced highs - only 1.5% away from median
(+) | highs are linear (3.9% delta to prev. frequency)
Overall 100 - 16.000 Hz
(+) | overall sound is linear (12.1% difference to median)
Compared to same class
» 12% of all tested devices in this class were better, 4% similar, 84% worse
» The best had a delta of 6%, average was 18%, worst was 132%
Compared to all devices tested
» 9% of all tested devices were better, 2% similar, 88% worse
» The best had a delta of 4%, average was 24%, worst was 134%
Energy Management - Legion 5i Pro with Rapid Charge Pro
Power Consumption
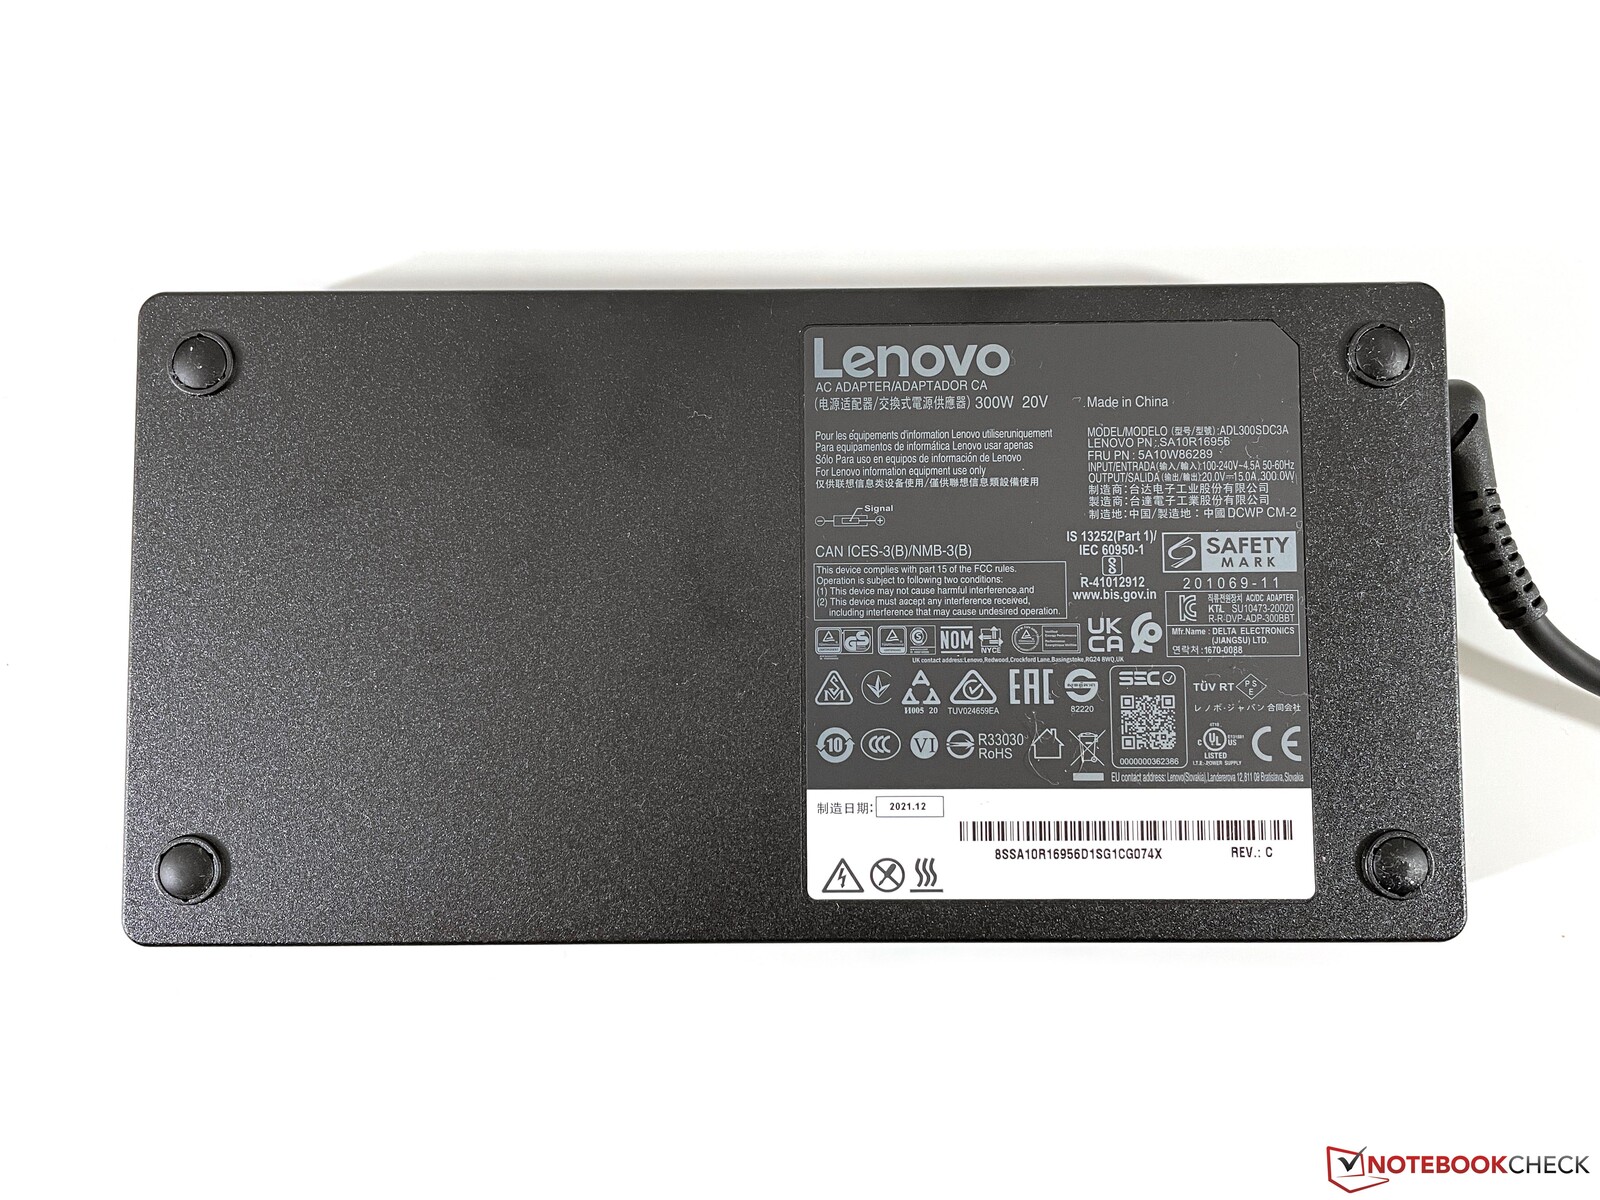
We measure a maximum idle consumption of up to 18W, which is still okay considering the bigh brightness. The maximum consumption during the stress test is 294W, but the value levels off at around 240W after a few minutes and you can also expect 230-240W during gaming. The included 300W power adapter (1.056 kg) is therefore sufficient.
| Off / Standby | |
| Idle | |
| Load |
|
Key:
min: | |
| Lenovo Legion 5 Pro 16 G7 i7 RTX 3070Ti i7-12700H, GeForce RTX 3070 Ti Laptop GPU, Samsung PM9A1 MZVL21T0HCLR, IPS, 2560x1600, 16" | MSI Vector GP66 12UGS i9-12900H, GeForce RTX 3070 Ti Laptop GPU, , IPS, 1920x1080, 15.6" | HP Omen 16-b0085ng i7-11800H, GeForce RTX 3070 Laptop GPU, Intel Optane Memory H10 with Solid State Storage 32GB + 512GB HBRPEKNX0202A(L/H), IPS, 1920x1080, 16.1" | Acer Nitro 5 AN515-45-R1JH R7 5800H, GeForce RTX 3070 Laptop GPU, WDC PC SN530 SDBPNPZ-1T00, IPS, 2560x1440, 15.6" | Asus TUF Gaming A15 FA506QR-AZ061T R7 5800H, GeForce RTX 3070 Laptop GPU, SK Hynix HFM001TD3JX013N, IPS, 1920x1080, 15.6" | Lenovo Legion 5 Pro 16ACH6H (82JQ001PGE) R7 5800H, GeForce RTX 3070 Laptop GPU, WDC PC SN730 SDBPNTY-1T00, IPS, 2560x1600, 16" | Average NVIDIA GeForce RTX 3070 Ti Laptop GPU | Average of class Gaming | |
|---|---|---|---|---|---|---|---|---|
| Power Consumption | -44% | 4% | 18% | 15% | 9% | -24% | -15% | |
| Idle Minimum * (Watt) | 8.6 | 17.5 -103% | 12 -40% | 8.8 -2% | 10.2 -19% | 10.45 -22% | 14.2 ? -65% | 13.2 ? -53% |
| Idle Average * (Watt) | 17.6 | 20.1 -14% | 18 -2% | 13 26% | 12.8 27% | 14.92 15% | 19.9 ? -13% | 18.9 ? -7% |
| Idle Maximum * (Watt) | 18.5 | 47.3 -156% | 21 -14% | 14.6 21% | 15 19% | 16.02 13% | 26.2 ? -42% | 24.3 ? -31% |
| Load Average * (Watt) | 110 | 107.3 2% | 94 15% | 133 -21% | 130 -18% | 119.65 -9% | 125.8 ? -14% | 108 ? 2% |
| Witcher 3 ultra * (Watt) | 227 | 225 1% | 147 35% | 134 41% | 137 40% | 174.9 23% | ||
| Load Maximum * (Watt) | 294.6 | 277.7 6% | 199 32% | 164 44% | 184 38% | 187.26 36% | 248 ? 16% | 254 ? 14% |
* ... smaller is better
Power Consumption Witcher 3 / Stress test
Power Consumption external screen
Battery Runtimes
The 80Wh battery does not lead to very long battery runtimes. At 150 nits (which is 67 % of the maximum brightness on our unit), our video test runs for little more than 6 hours and the Wi-Fi test runs for 4.5-5.5 hours depending on the brightness. If you really stress the laptop, the battery will be drained after 37 minutes.

The device supports Rapid Charge Pro for faster charging times. You can activate this feature via Vantage software and it really shortens the charging time noticeably. The normal mode has a very linear charging curve and a full charge takes 102 minutes. The quick-charge shortens this time by around 40 minutes and 80 % of the capacity are already available after just 22 minutes.
| Lenovo Legion 5 Pro 16 G7 i7 RTX 3070Ti i7-12700H, GeForce RTX 3070 Ti Laptop GPU, 80 Wh | MSI Vector GP66 12UGS i9-12900H, GeForce RTX 3070 Ti Laptop GPU, 65 Wh | HP Omen 16-b0085ng i7-11800H, GeForce RTX 3070 Laptop GPU, 83 Wh | Acer Nitro 5 AN515-45-R1JH R7 5800H, GeForce RTX 3070 Laptop GPU, 57.5 Wh | Asus TUF Gaming A15 FA506QR-AZ061T R7 5800H, GeForce RTX 3070 Laptop GPU, 90 Wh | Lenovo Legion 5 Pro 16ACH6H (82JQ001PGE) R7 5800H, GeForce RTX 3070 Laptop GPU, 80 Wh | Average of class Gaming | |
|---|---|---|---|---|---|---|---|
| Battery runtime | 37% | 53% | 28% | 206% | 24% | 69% | |
| H.264 (h) | 6.3 | 5.4 -14% | 6.9 10% | 8.26 ? 31% | |||
| WiFi v1.3 (h) | 5.4 | 5.7 6% | 7.6 41% | 5.7 6% | 11.4 111% | 7 30% | 7.02 ? 30% |
| Load (h) | 0.6 | 1 67% | 1.4 133% | 1 67% | 2.4 300% | 0.7 17% | 1.47 ? 145% |
| Reader / Idle (h) | 7.9 | 9.2 | 17.4 | 9.1 | 8.71 ? |
Pros
Cons
Verdict - Lenovo's Gaming Laptop offers high performance for a fair price
The seventh generation of the Legion 5i Pro 16 gets a noticeable performance boost. Lenovo still uses the same chassis, which does not use any illumination elements or any other special features. It offers good cooling capabilities, plenty of ports and decent maintenance options with two RAM slots and two M.2-SSD slots instead. The 165 Hz panel also leaves a good impression and is definitely a good choice for a gaming laptop.
The performance with the new Alder Lake Core i7-12700H and the GeForce RTX 3070 Ti with high TDP/TGP values is also impressive. Even very demanding titles like Cyberpunk 2077 run completely smoothly in QHD with Ray Tracing. You also get a fast PCIe 4.0 SSD as well as Thunderbolt 4, but not the latest Wi-Fi 6E standard (6 GHz) or a 2.5 Gbps Ethernet port. This should not be a big issue though.
The Lenovo Legion 5i Pro 16 focuses on the gaming performance and combines powerful components with a good display. It is hard to get more performance for about 2000 Euros and the Legion 5i Pro 16 is just a very good gaming laptop.
The system is not without its flaws, because all the performance results in loud fans as well as high surface temperatures. We recommend the Silent mode if you are not playing games, and it can be easily activated via key combination. It can also make sense while gaming thanks to the noticeably quieter fan noise, but the performance drops by 30-40 %.
MSI’s Vector GP66 also uses the new RTX 3070 Ti and is usually a bit faster while gaming, but it also uses an inferior 1080p screen with lower brightness figures. All the other competitors like the Acer Nitro 5, Asus TUF Gaming A15 or HP Omen 16 still use the old RTX 3070 and are 15-20 % slower when you play games.
Price and Availability
Lenovo's online store in the U.S. currently only lists a less powerful version of the Legion 5i Pro 16 Gen7 with the same Core i7-12700H, but a slower GeForce RTX 3050 Ti for $1779.
Lenovo Legion 5 Pro 16 G7 i7 RTX 3070Ti
- 03/28/2022 v7 (old)
Andreas Osthoff
Price comparison
