Lenovo Legion 5 Pro 16 review: A gaming laptop with a bright 165-Hz display
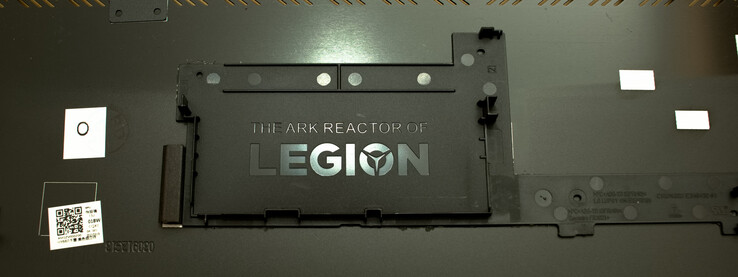
For about four years, Lenovo has been present in the high-end gaming market with its Legion gaming laptops. But the introduction of the predecessor models with Nividia graphics cards of the 2000 series happened at the worst possible time, right before Nvidia introduced its new graphics cards of the 3000 series. With a Ryzen 7-5800H processor, 32 GB of DDR 4 working memory, a 1-GB NVMe SSD, and an Nvidia GeForce RTX 3070, our test unit offers a good equipment base to achieve a top performance. However, Lenovo doesn't quite succeed in creating a technological marvel such as that created by Tony Stark in the Marvel Comics with his Ark Reactor. At the same time, the single tests show that the hardware of the competitors, despite looking better on paper, doesn't always bring the better performance.
The direct competitors of the Lenovo Legion Pro 5 include the Asus ROG Strix G15 gaming laptop, the Medion Erazer Beast X25, and the Alienware m15 R5 Ryzen Edition, among others. All these laptops use the current top hardware and range at similar levels in terms of their size and weight.
Possible Competitors in Comparison
Rating | Date | Model | Weight | Height | Size | Resolution | Price |
|---|---|---|---|---|---|---|---|
| 87.4 % v7 (old) | 08 / 2021 | Lenovo Legion 5 Pro 16ACH6H (82JQ001PGE) R7 5800H, GeForce RTX 3070 Laptop GPU | 2.6 kg | 26.85 mm | 16.00" | 2560x1600 | |
| 85 % v7 (old) | 07 / 2021 | Medion Erazer Beast X25 R9 5900HX, GeForce RTX 3080 Laptop GPU | 2.3 kg | 23 mm | 17.30" | 1920x1080 | |
| 84.7 % v7 (old) | 07 / 2021 | Asus ROG Strix G15 G513QY R9 5900HX, Radeon RX 6800M | 2.4 kg | 27.9 mm | 15.60" | 1920x1080 | |
| 85.4 % v7 (old) | 04 / 2021 | Alienware m15 R4 i9-10980HK, GeForce RTX 3070 Laptop GPU | 2.3 kg | 20 mm | 15.60" | 1920x1080 | |
| 85.1 % v7 (old) | 01 / 2021 | Schenker XMG Neo 17 (Early 2021, RTX 3070, 5800H) R7 5800H, GeForce RTX 3070 Laptop GPU | 2.5 kg | 27 mm | 17.30" | 2560x1440 | |
| 85 % v7 (old) | 07 / 2021 | Asus TUF Gaming A15 FA506QR-AZ061T R7 5800H, GeForce RTX 3070 Laptop GPU | 2.3 kg | 24 mm | 15.60" | 1920x1080 |
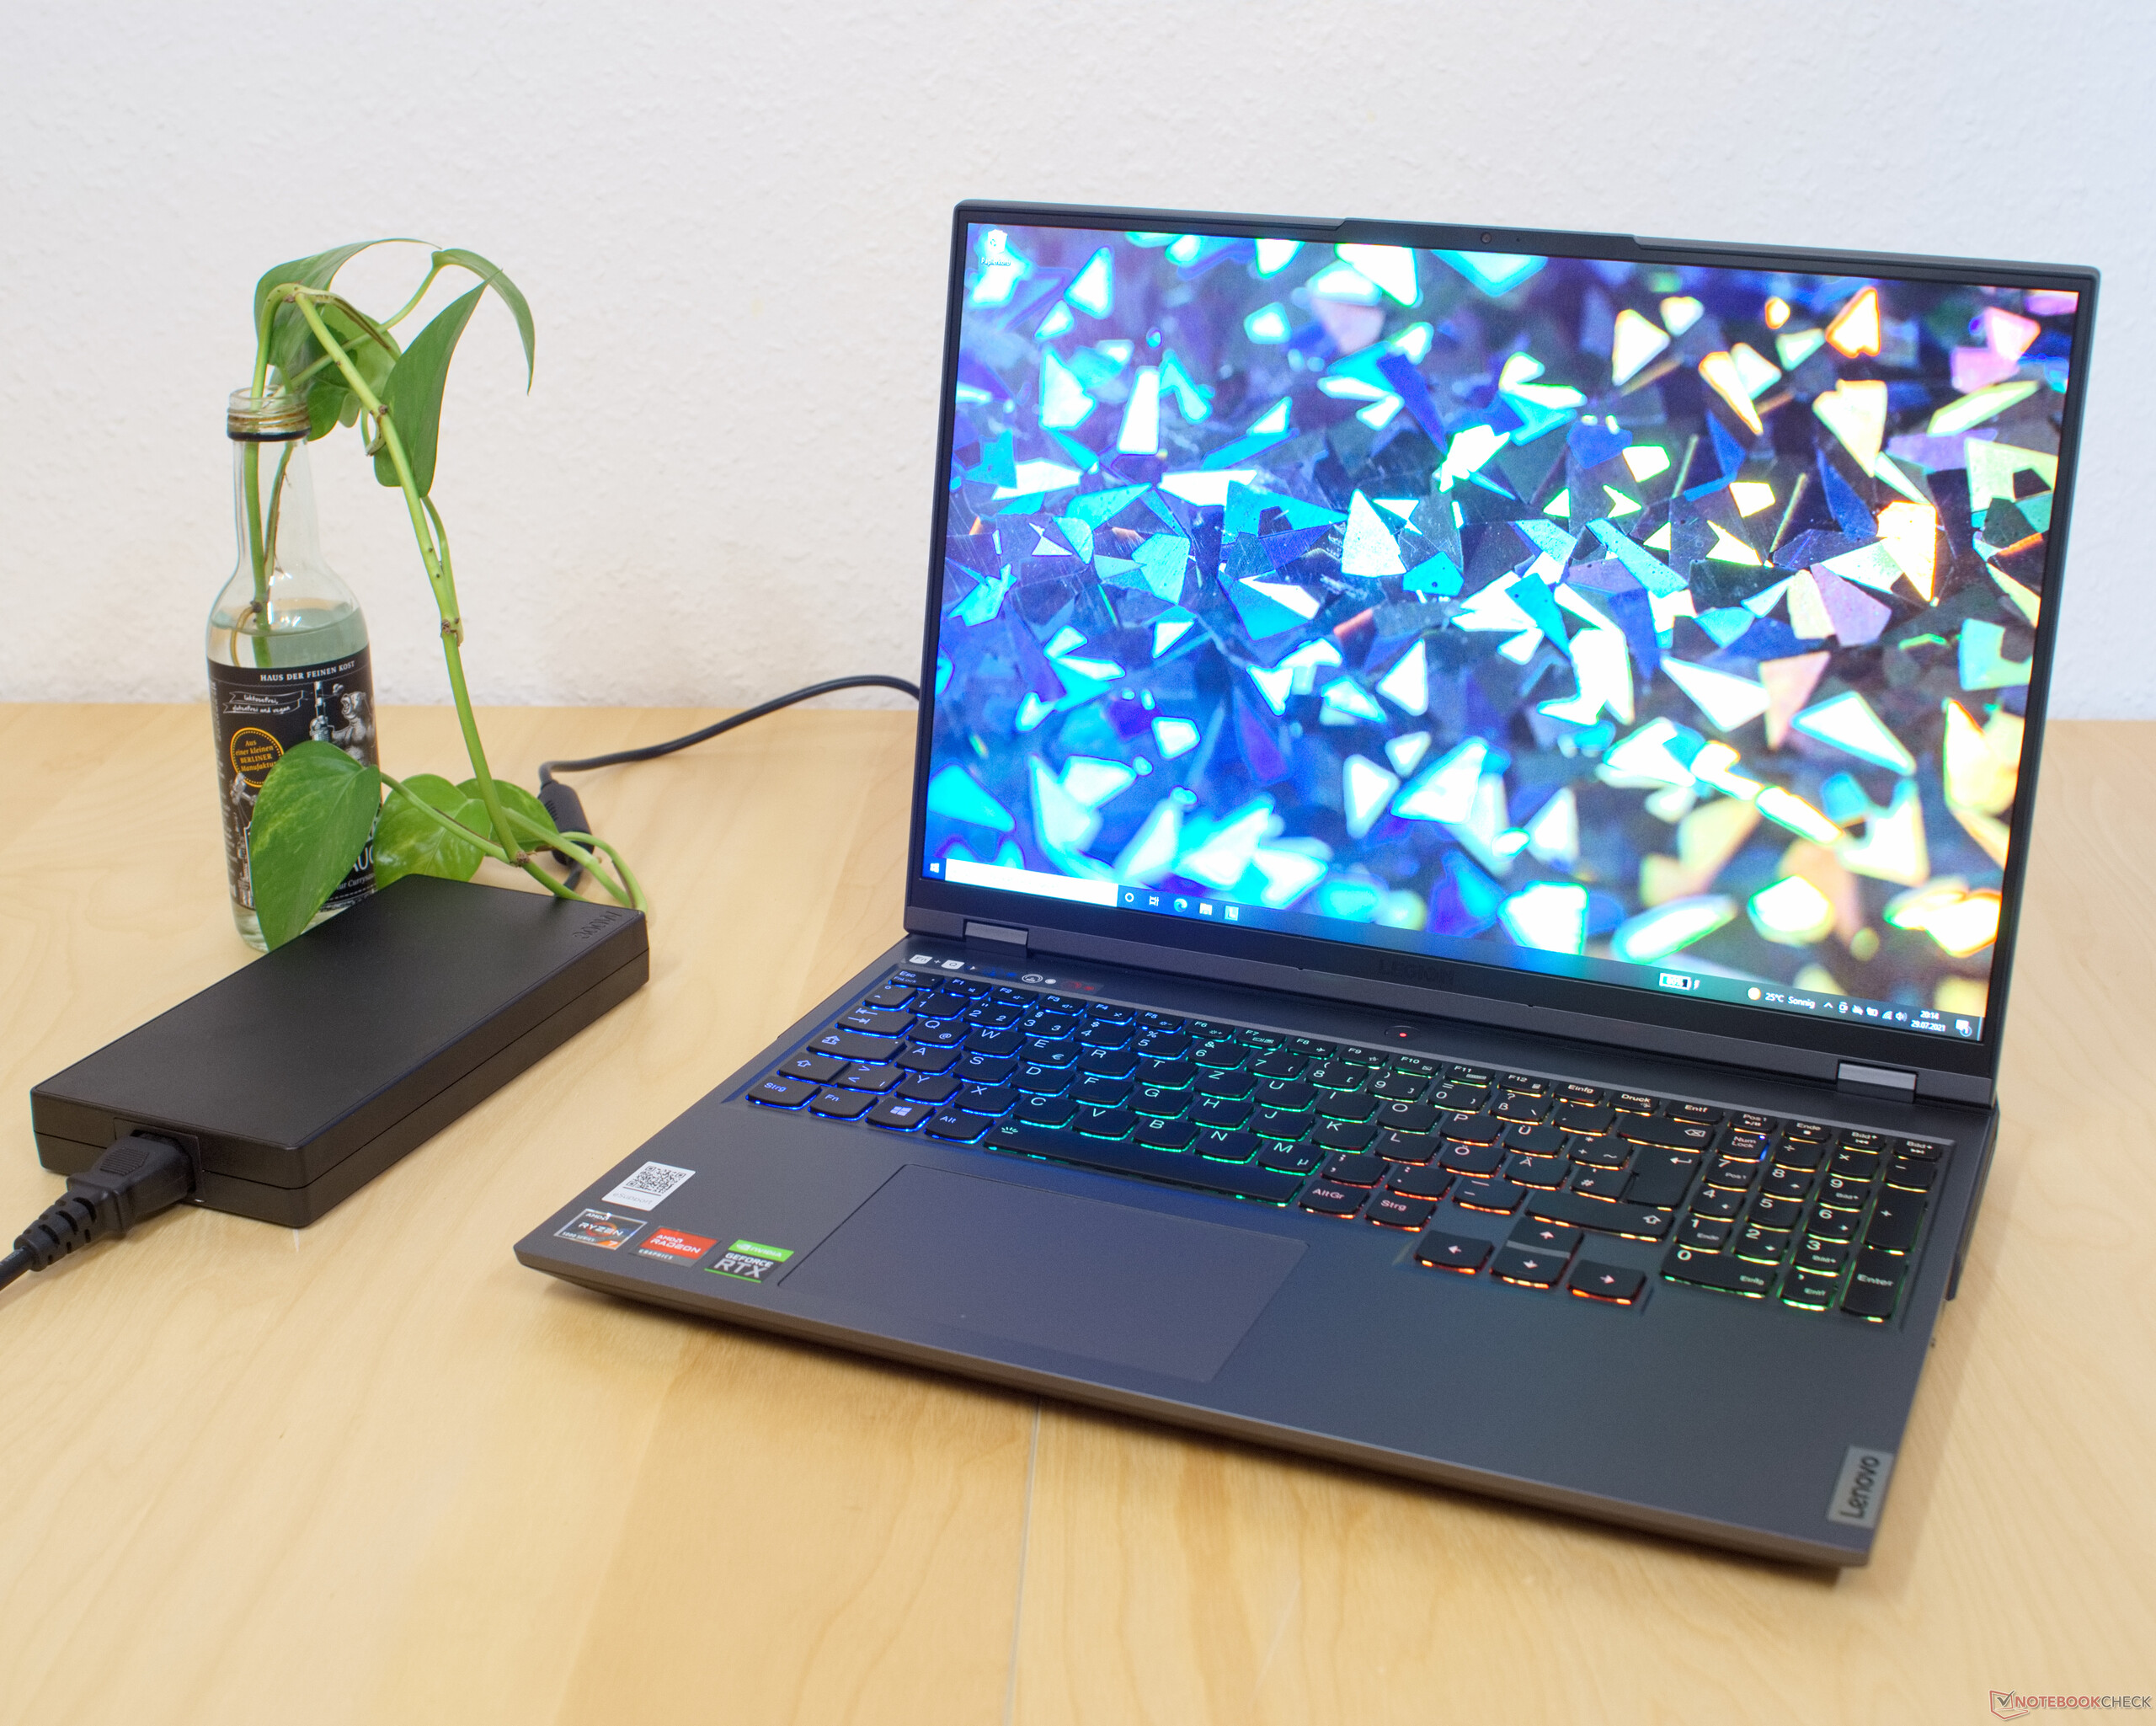
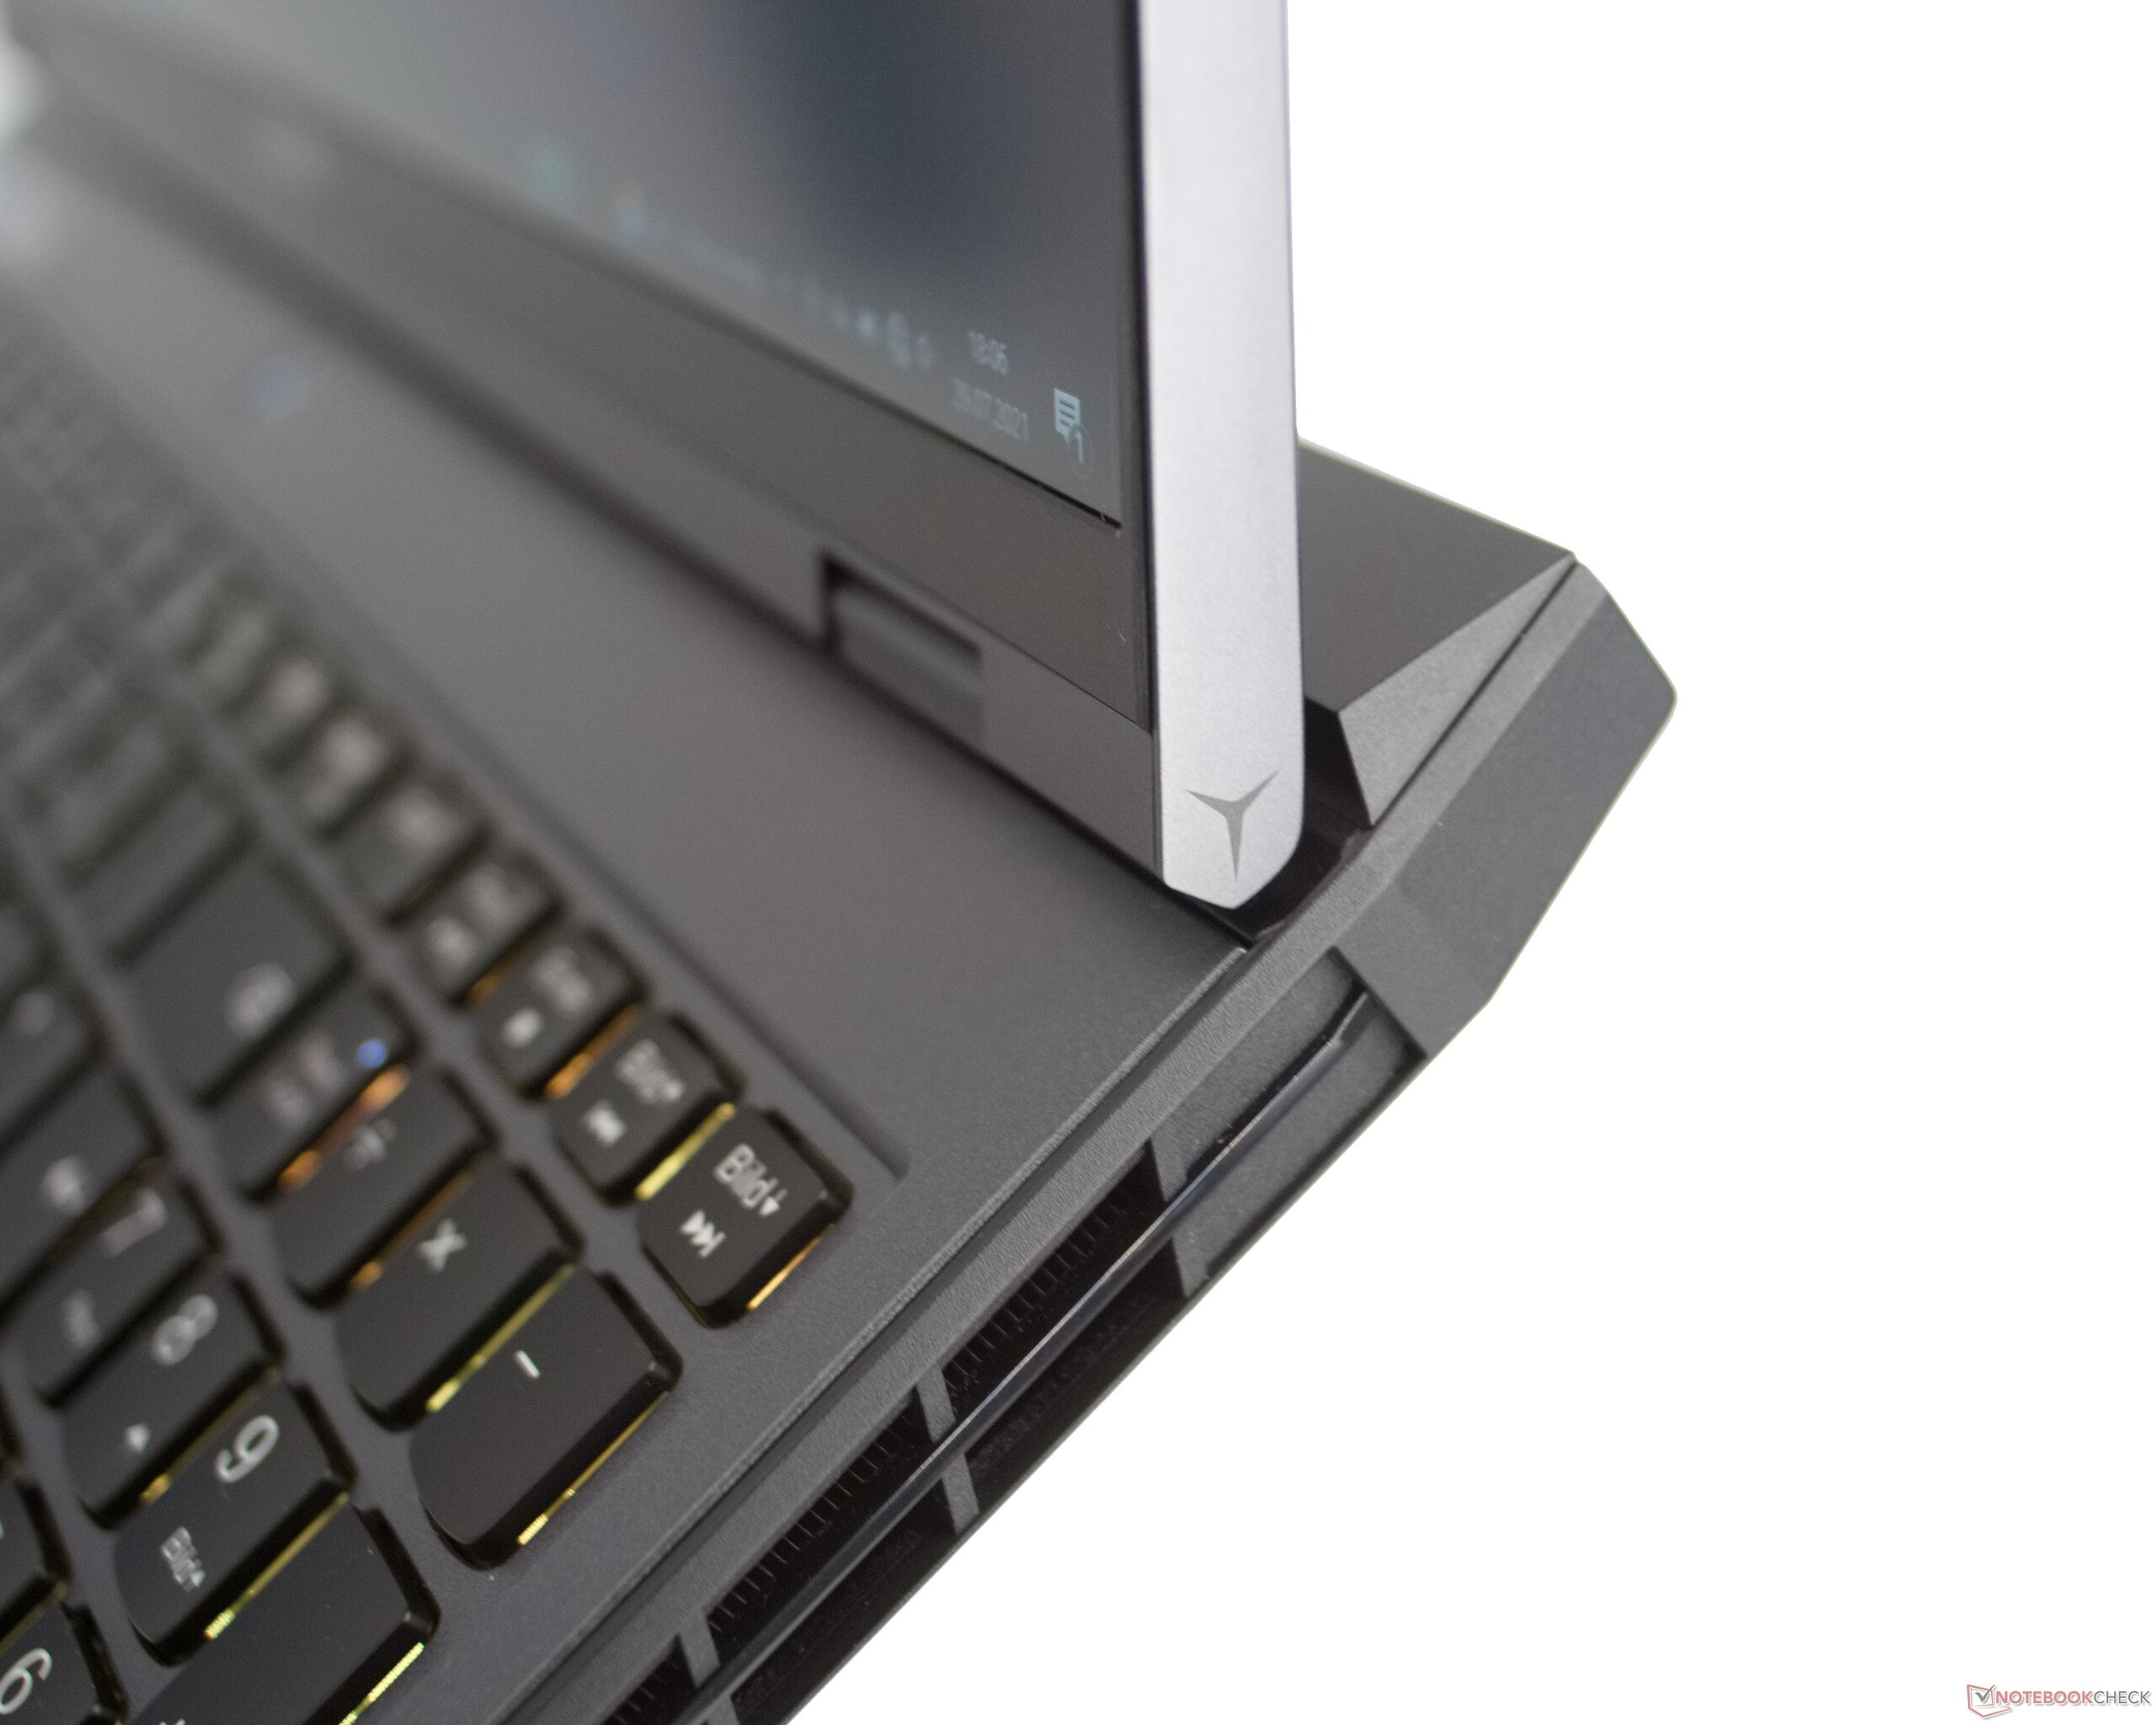
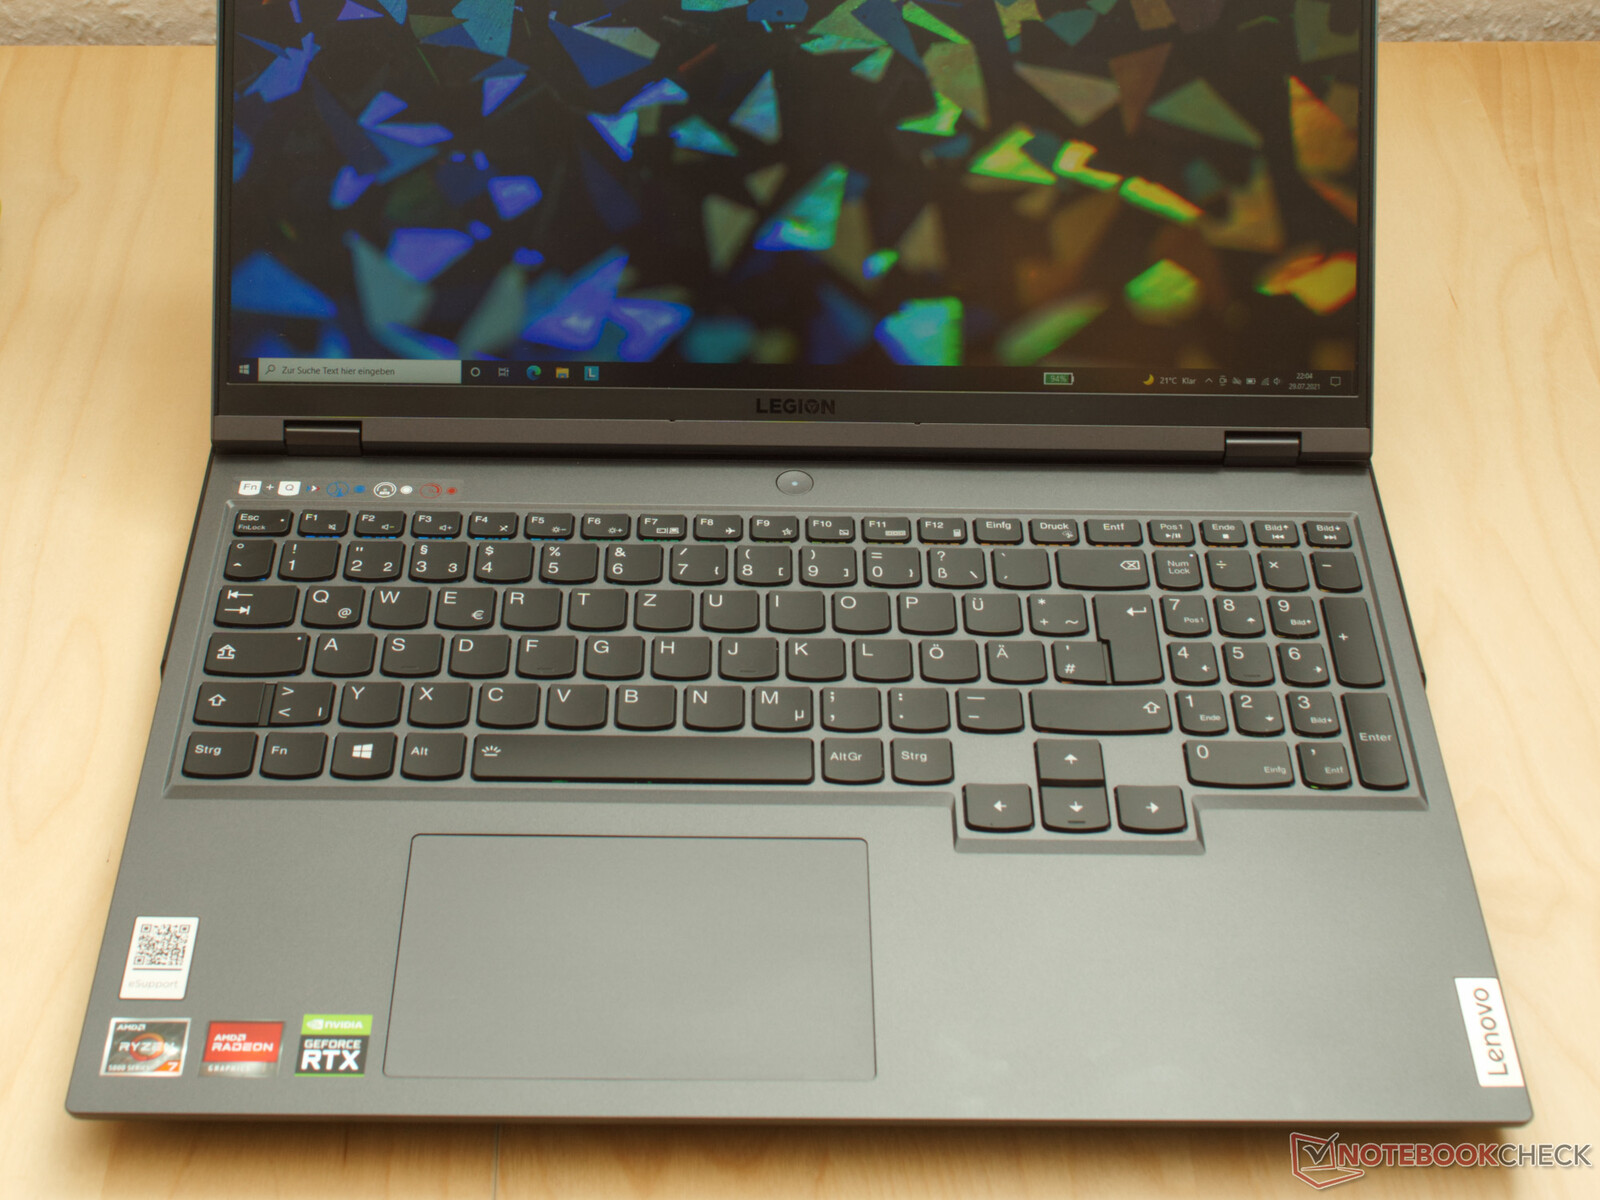
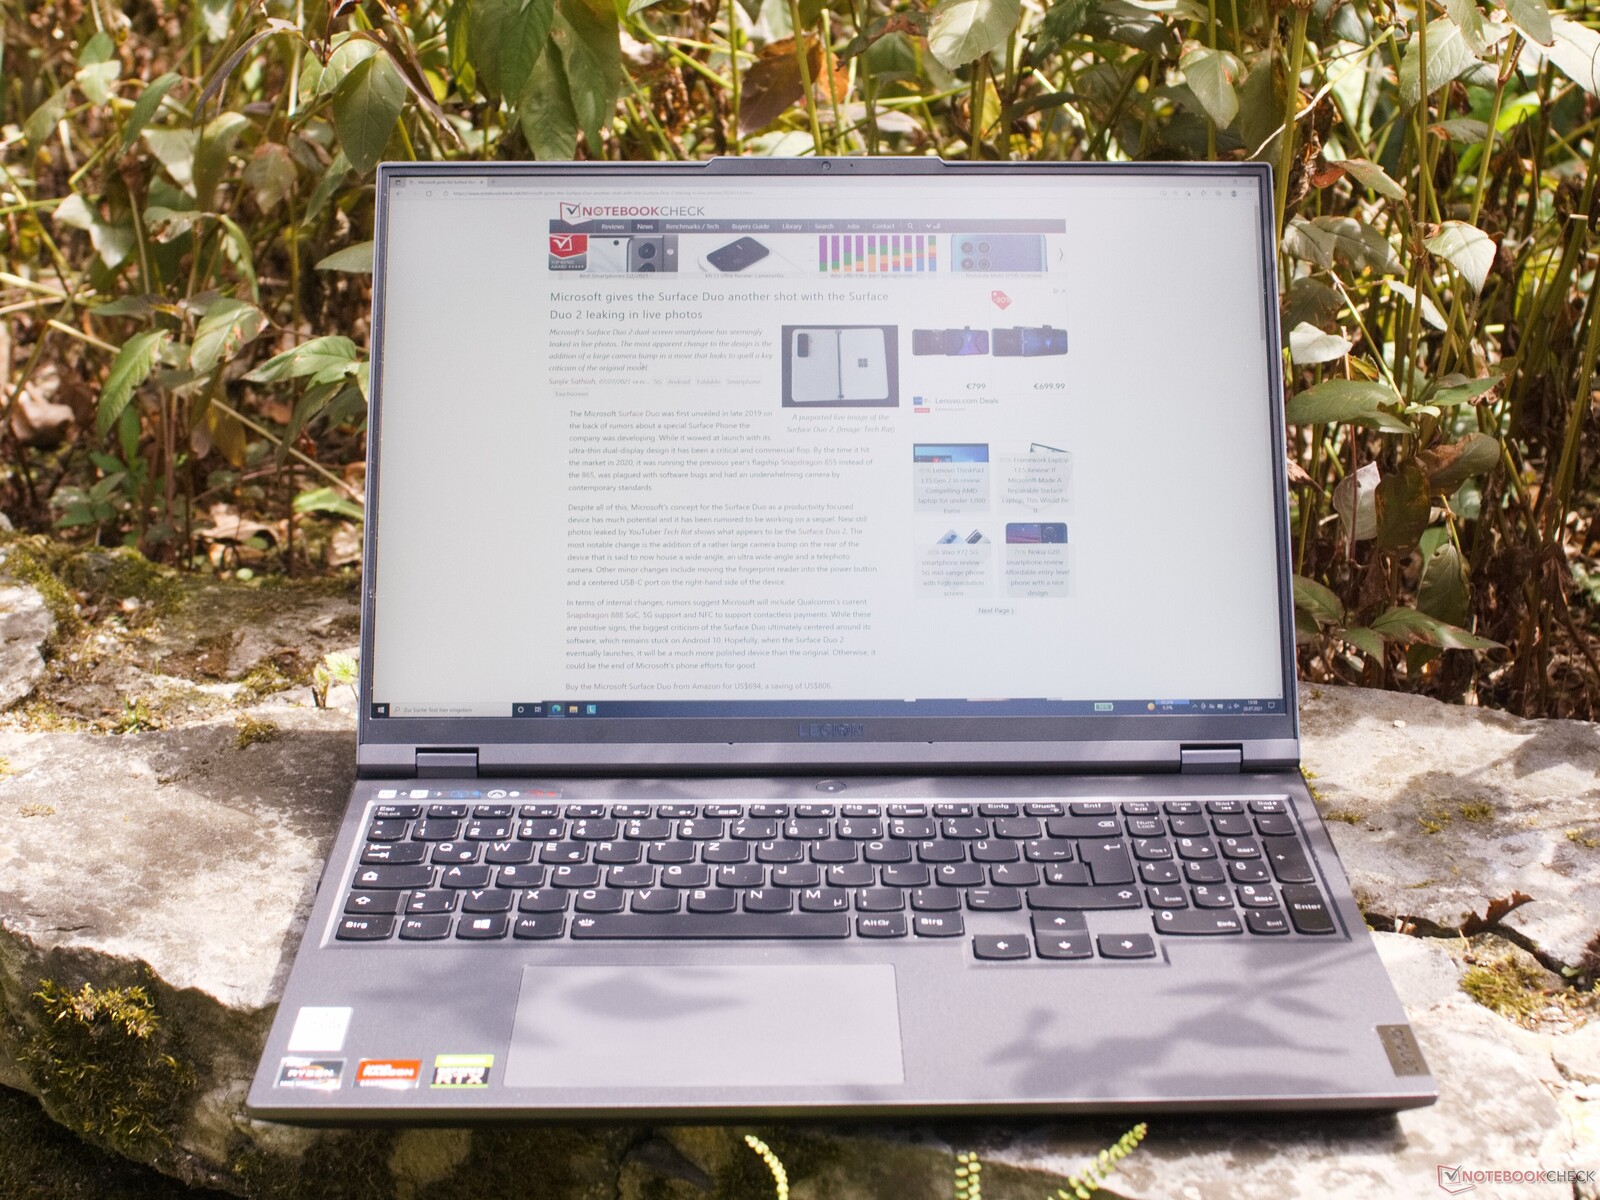
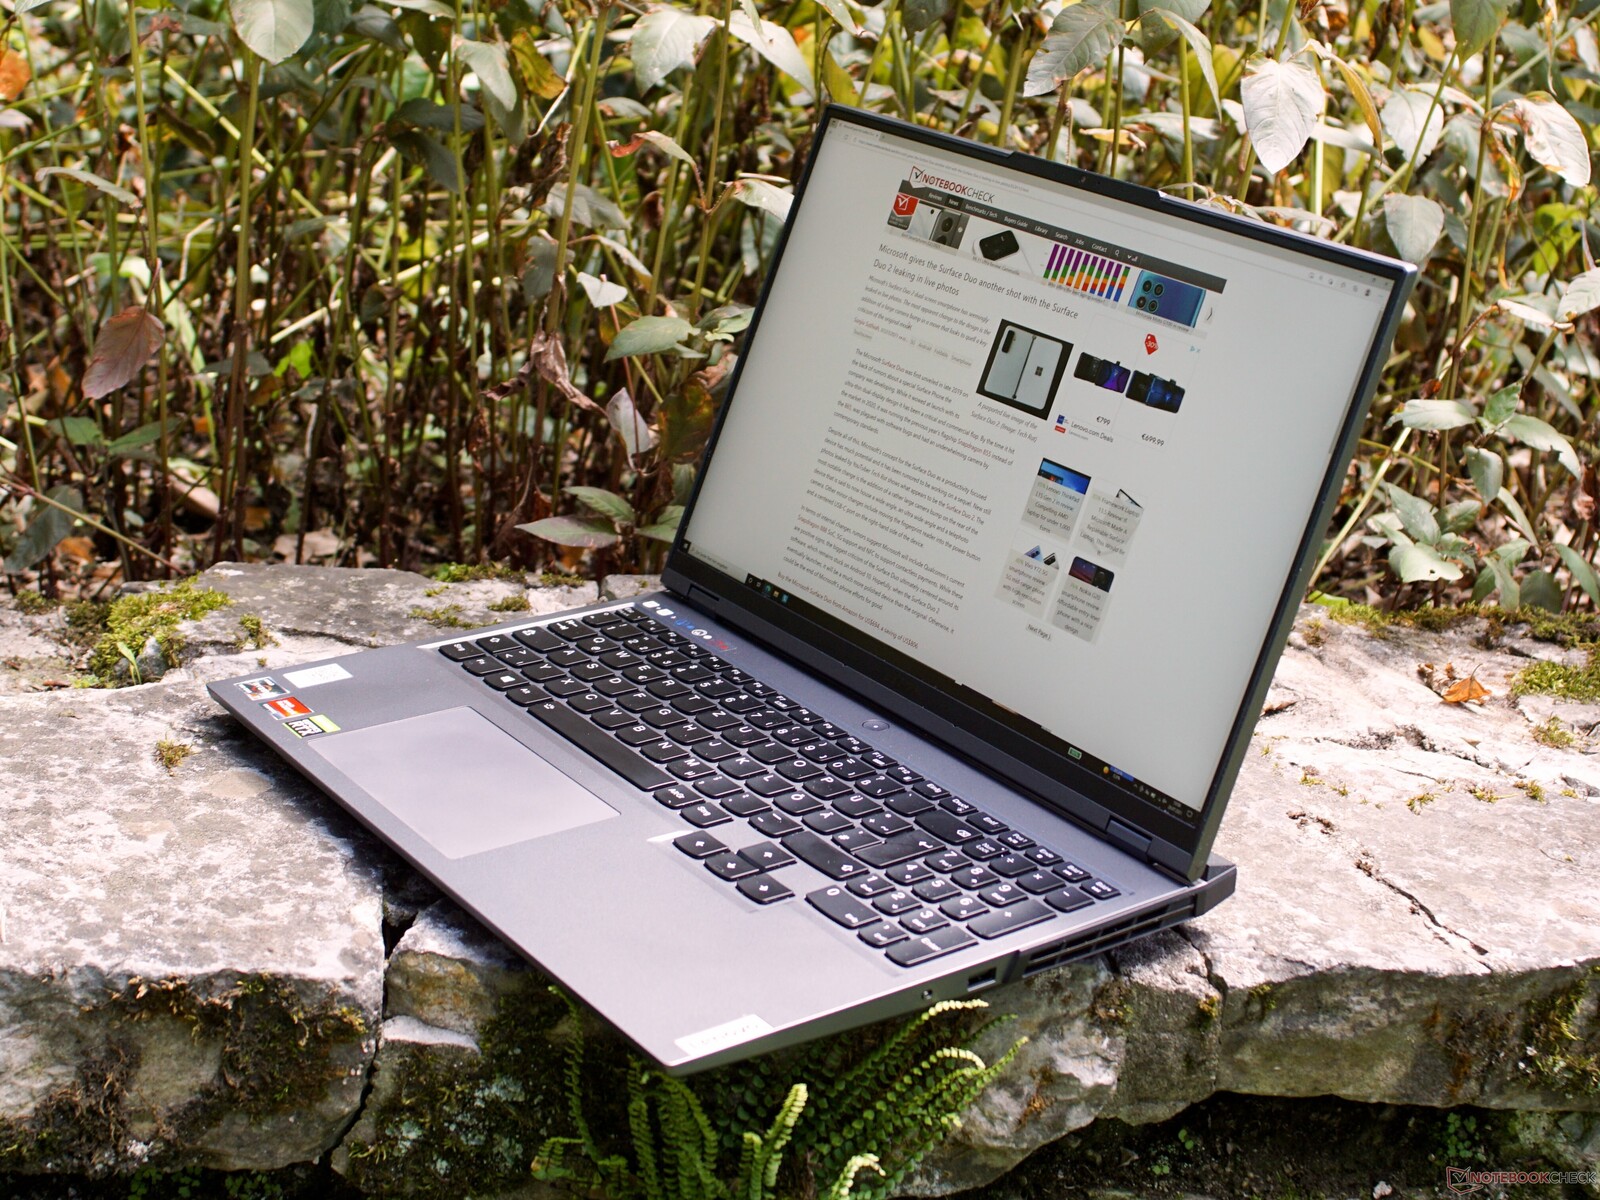
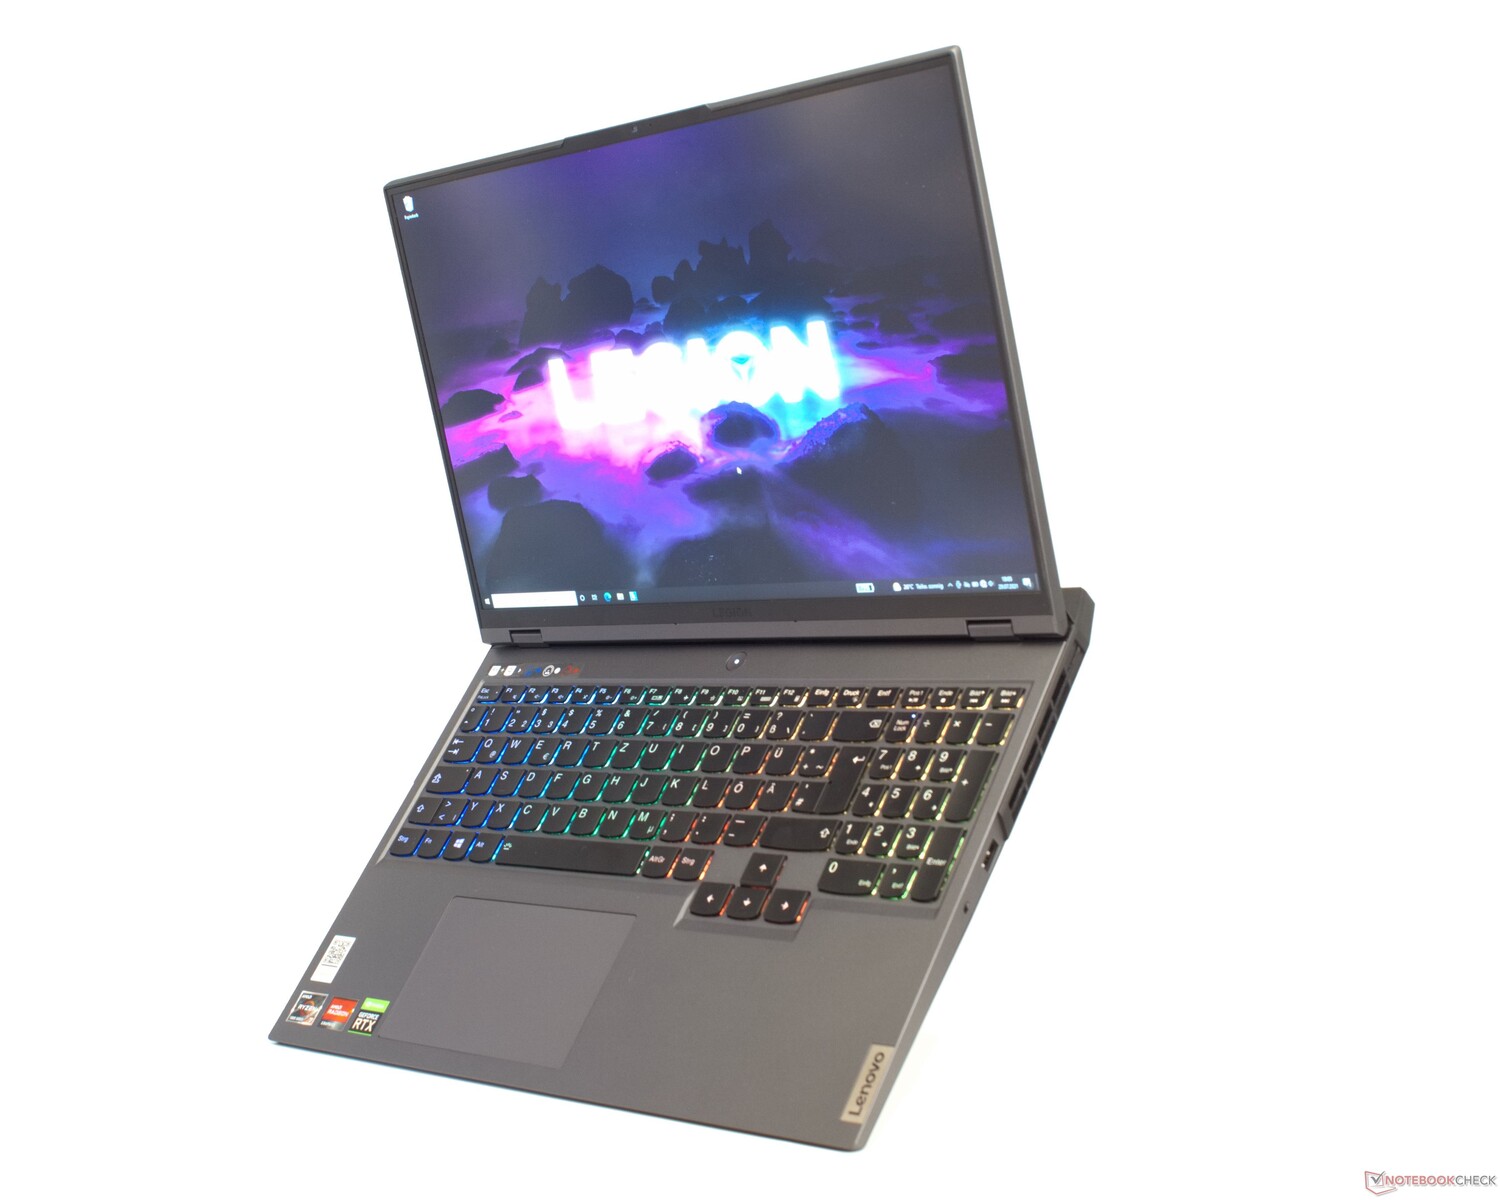
Case - Lenovo's design language is clearly recognizable
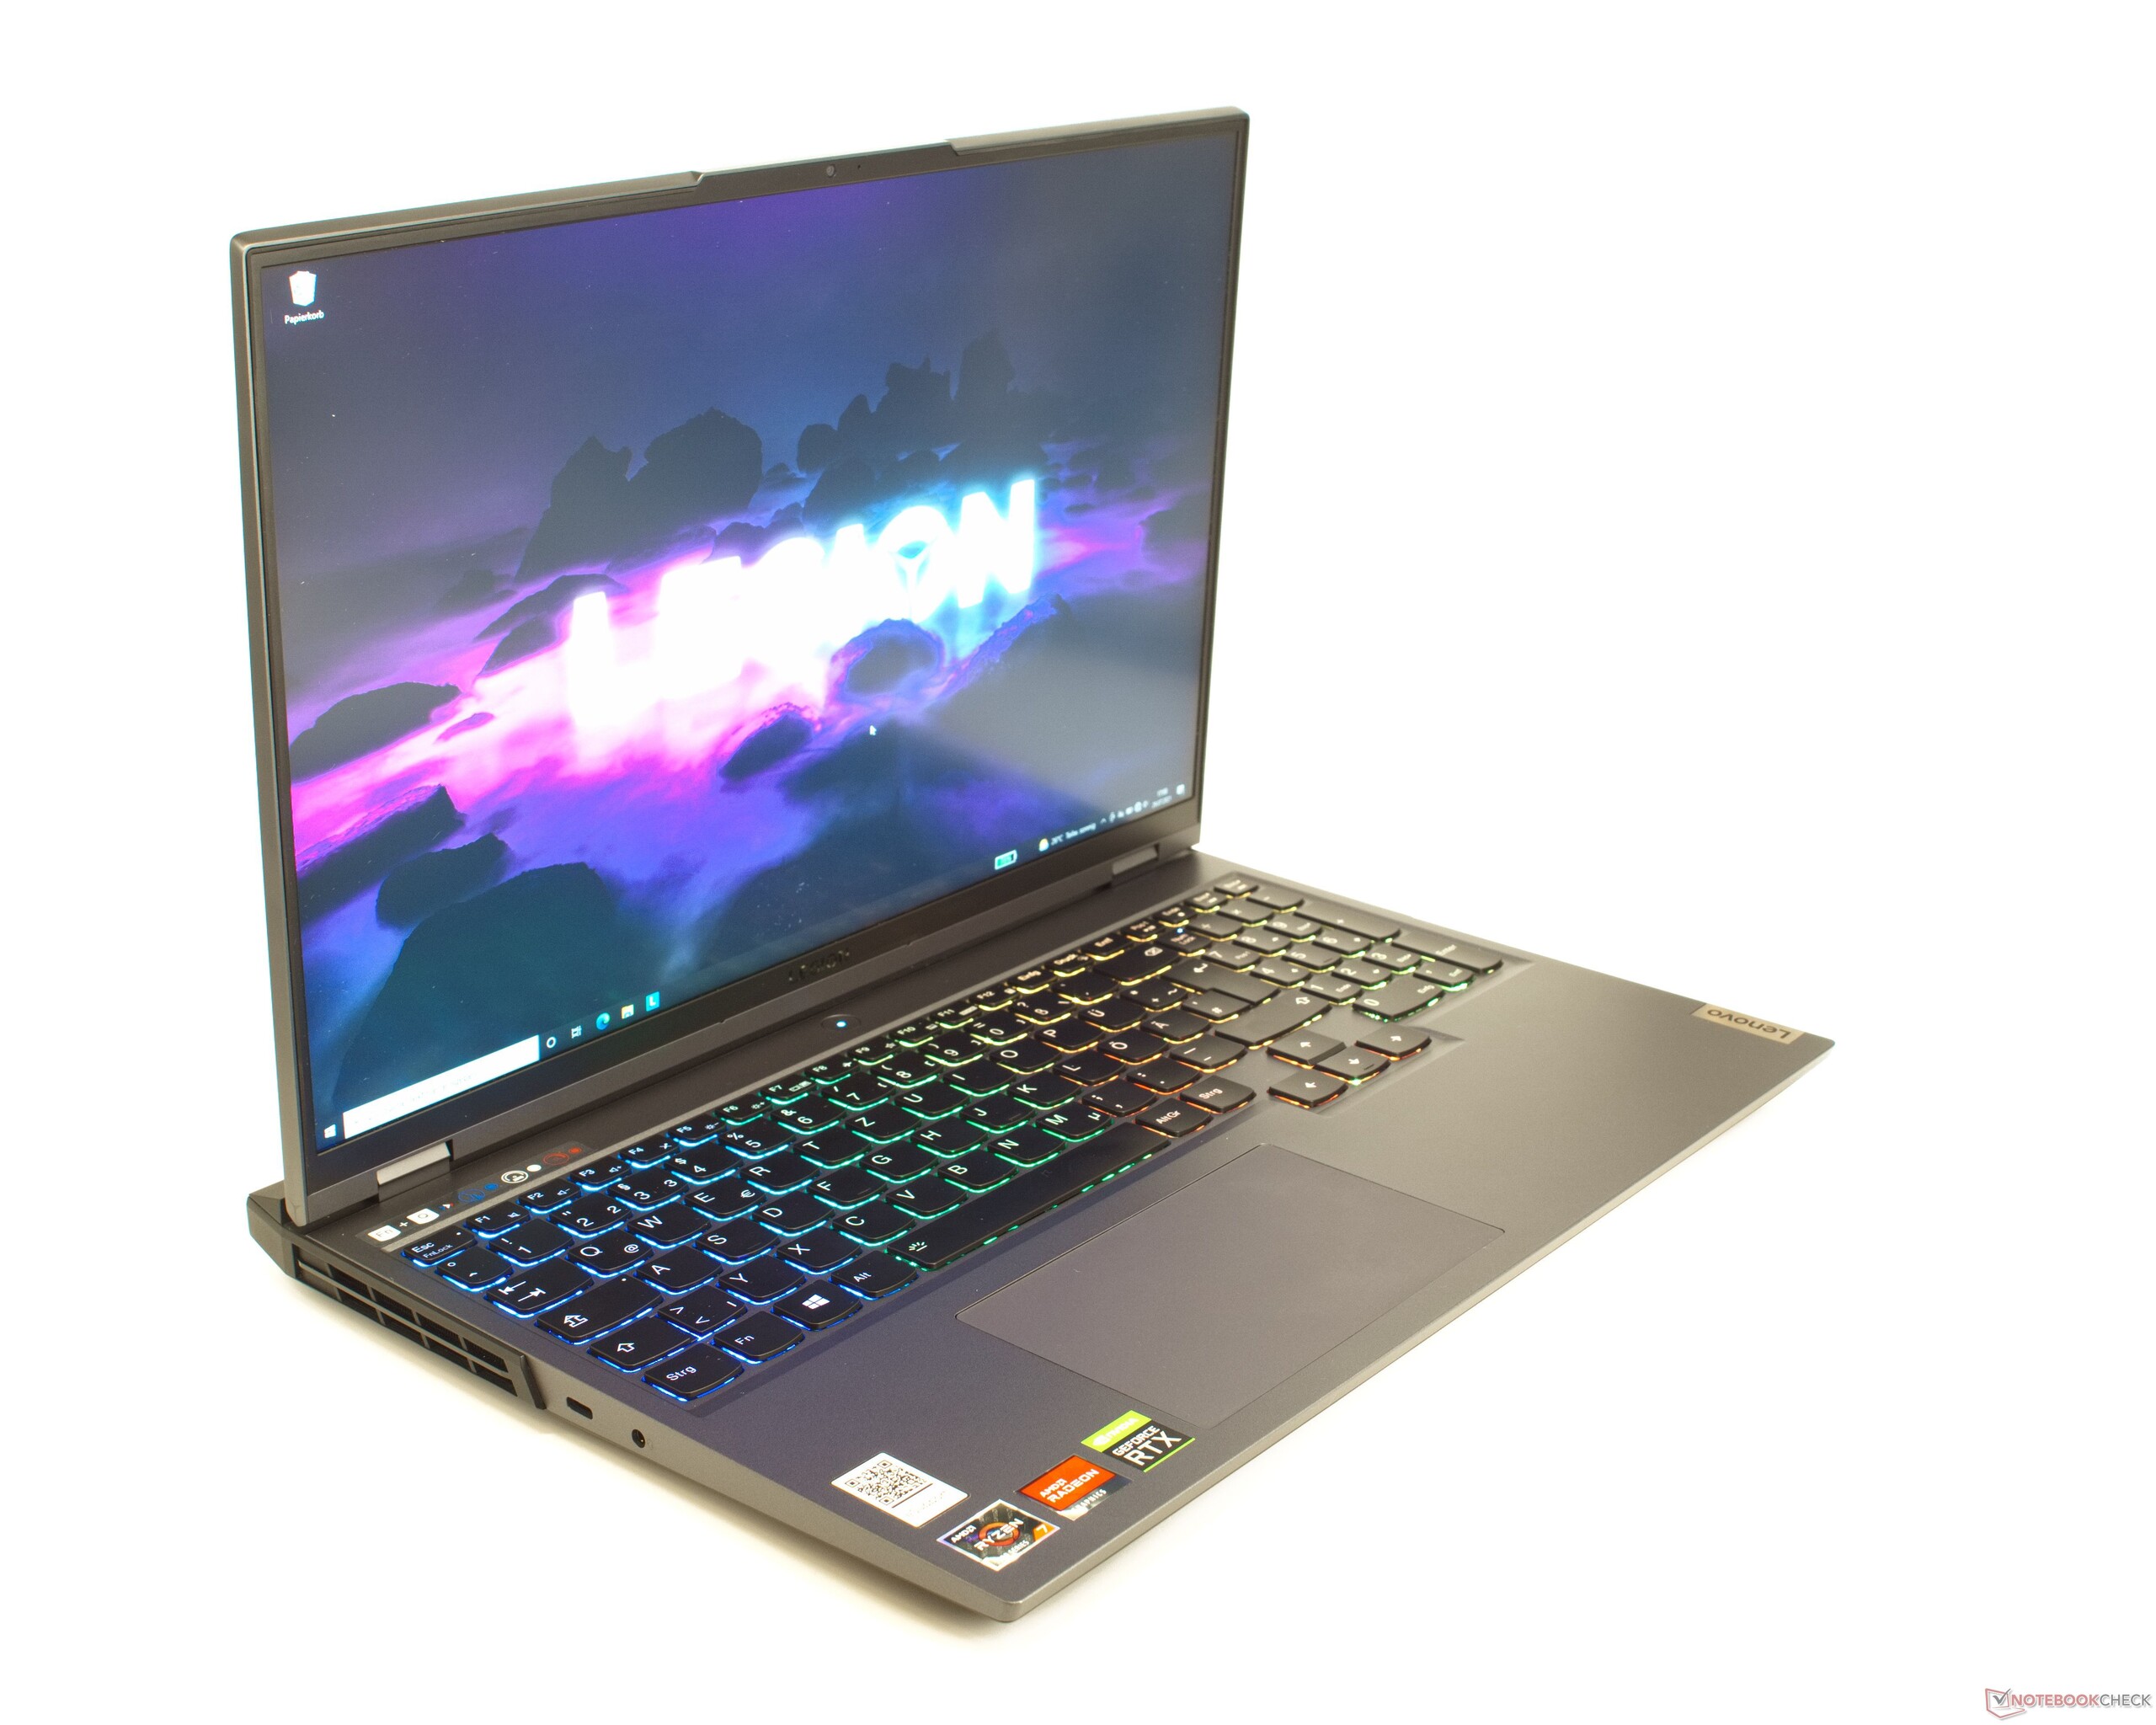
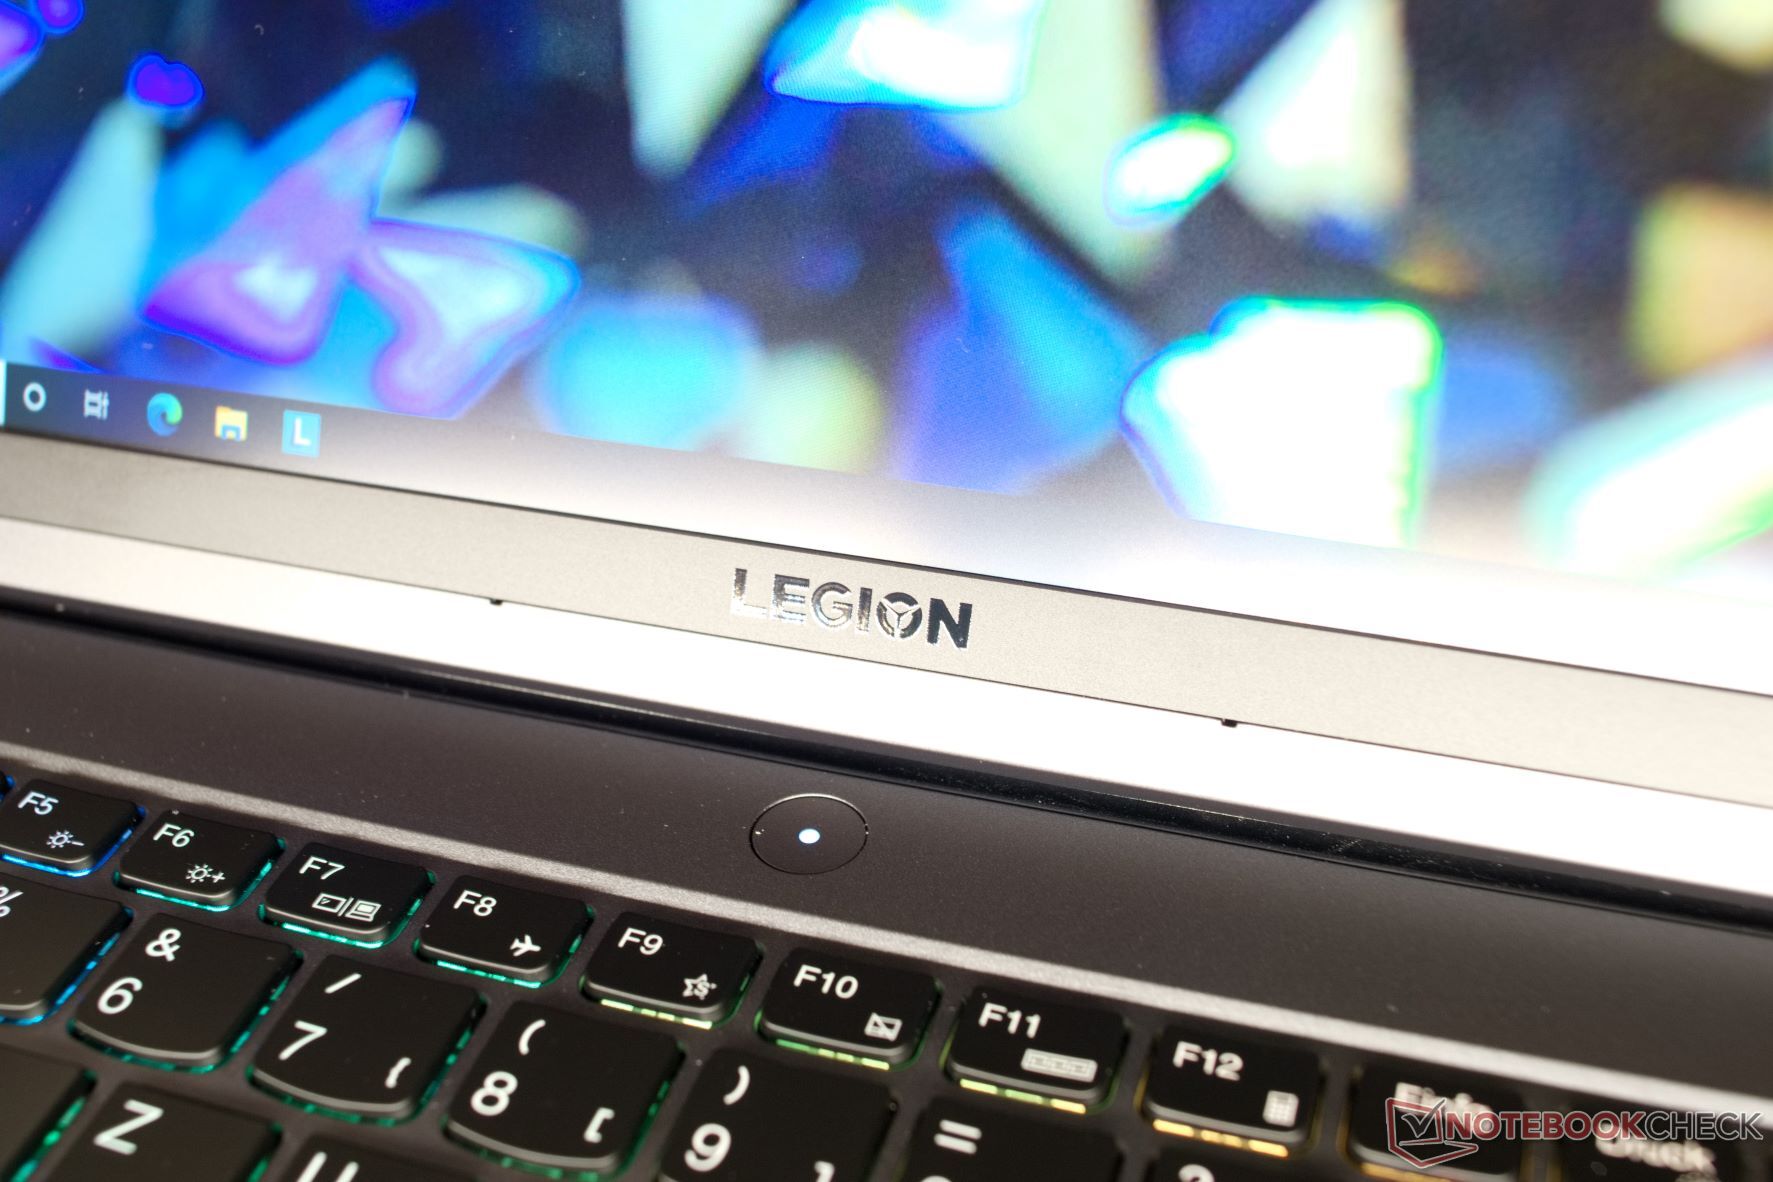
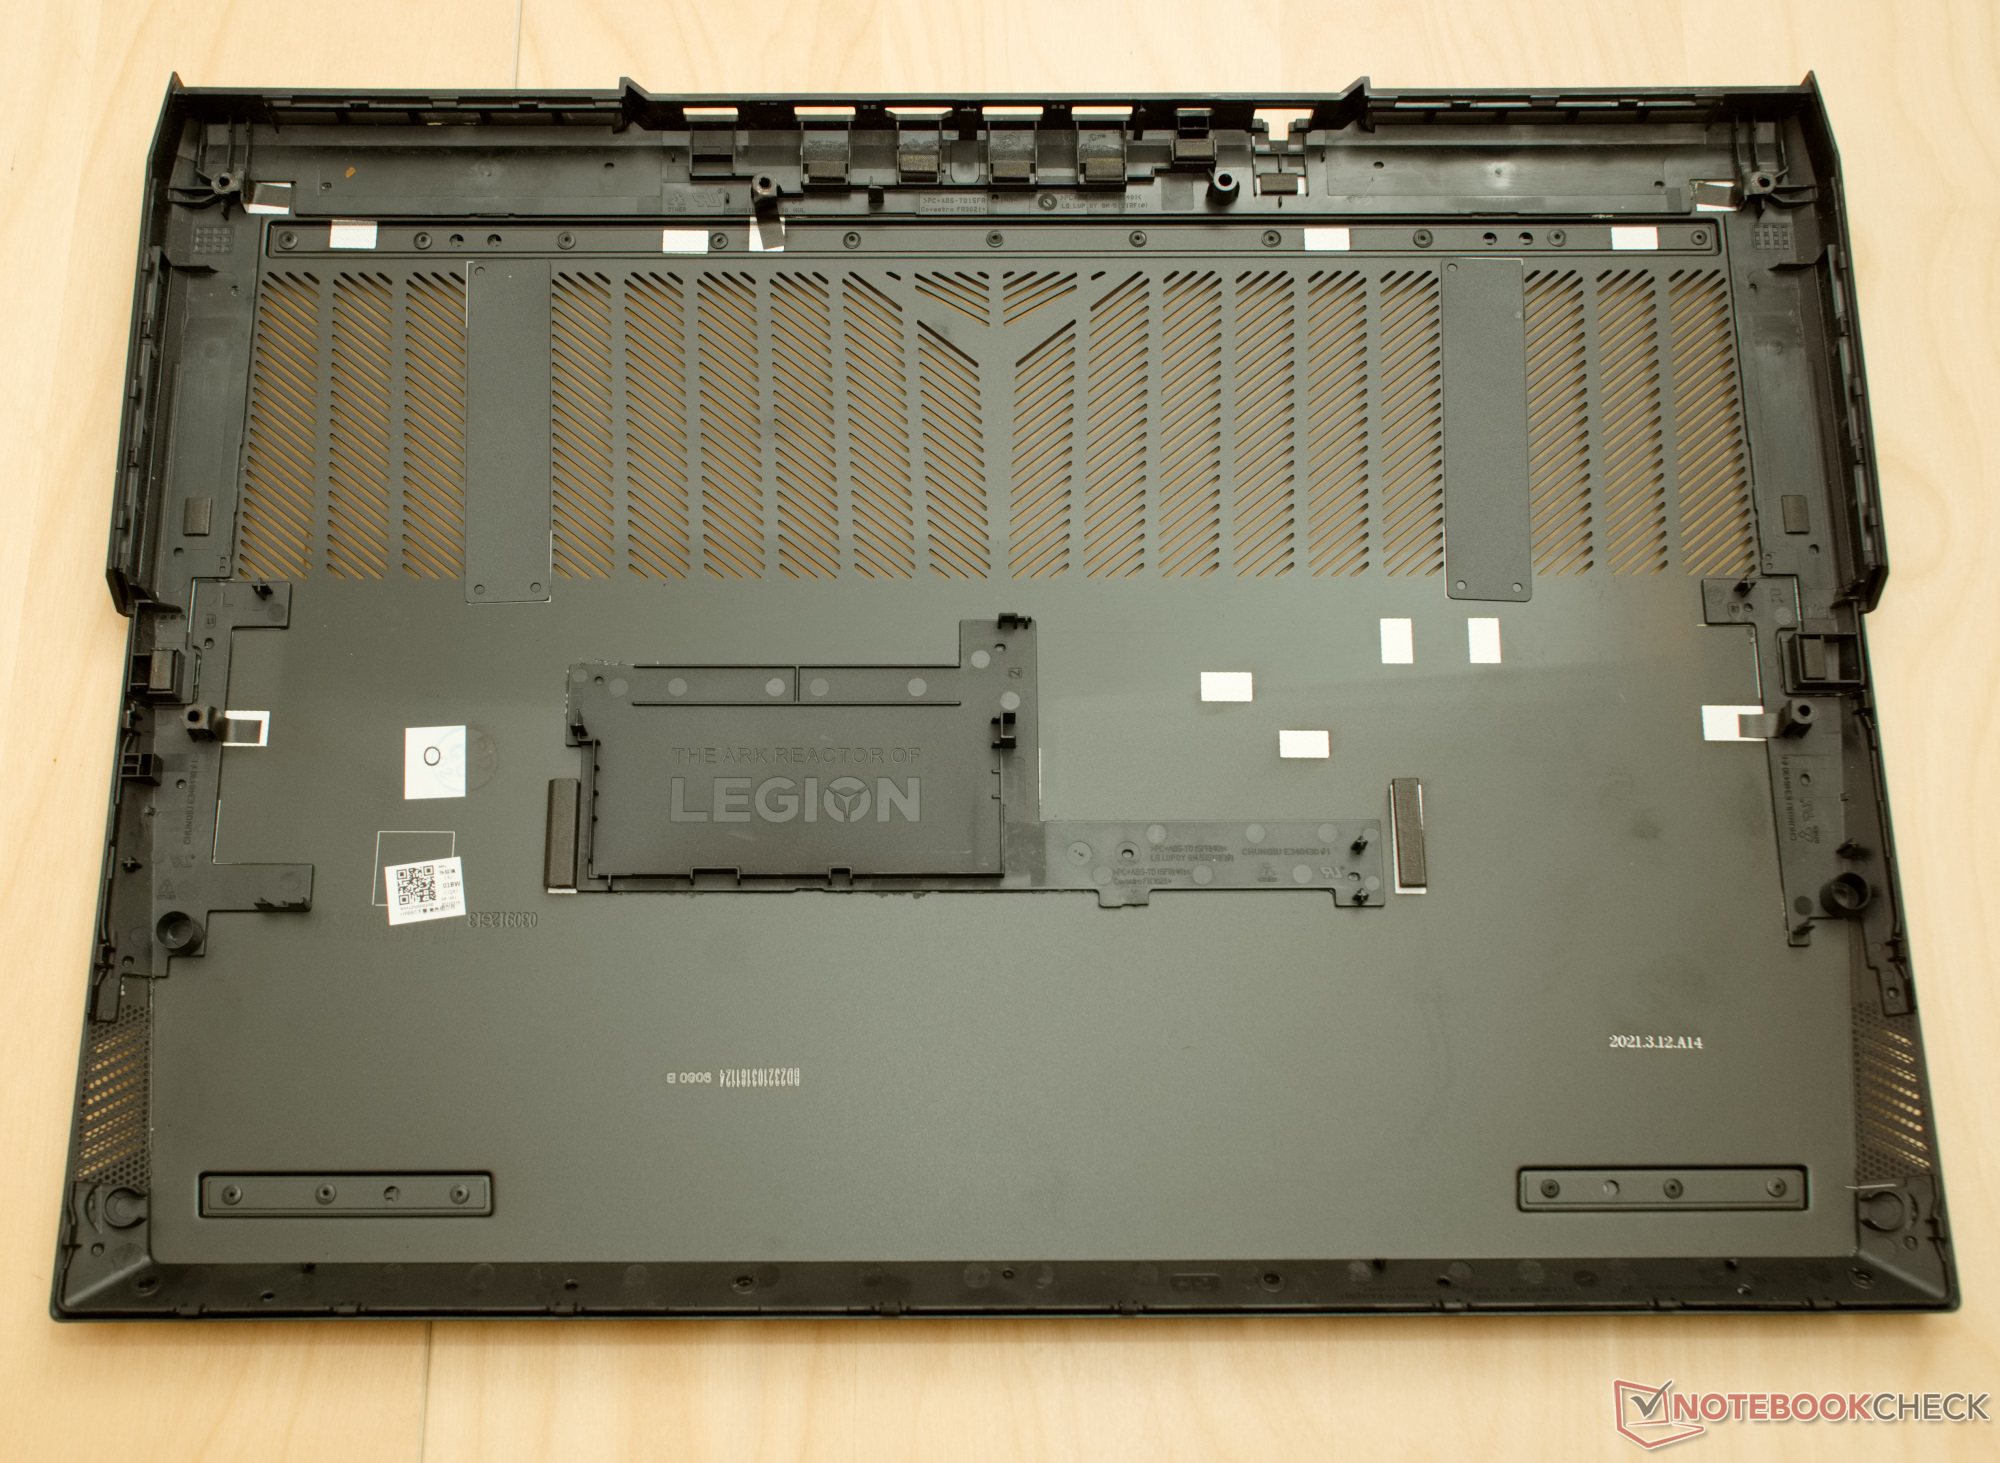
Lenovo's design language can be seen in many elements of the Lenovo Legion 5 Pro: Straight and flat lines, a discreet branding, slightly rounded keys, and the slanted front edge show the origin of this gaming laptop. Lenovo also elevates the simple design with many details such as the logos on the sides or the slanted edges of the lid. And finally, the large, illuminated Legion logo and the large fan vents make it obvious what kind of device we have here.
While Lenovo uses aluminum for the lid and bottom of the case, the top of the case with the keyboard, trackpad, and palm rests is made from plastic, which helps keeping the surface temperatures within bearable limits. The case is extremely stable. The display lid can hardly be bent, and the keyboard does not show any give even when we apply a higher amount of pressure. The display cannot be opened very far – the maximum opening angle is about 130 degrees.
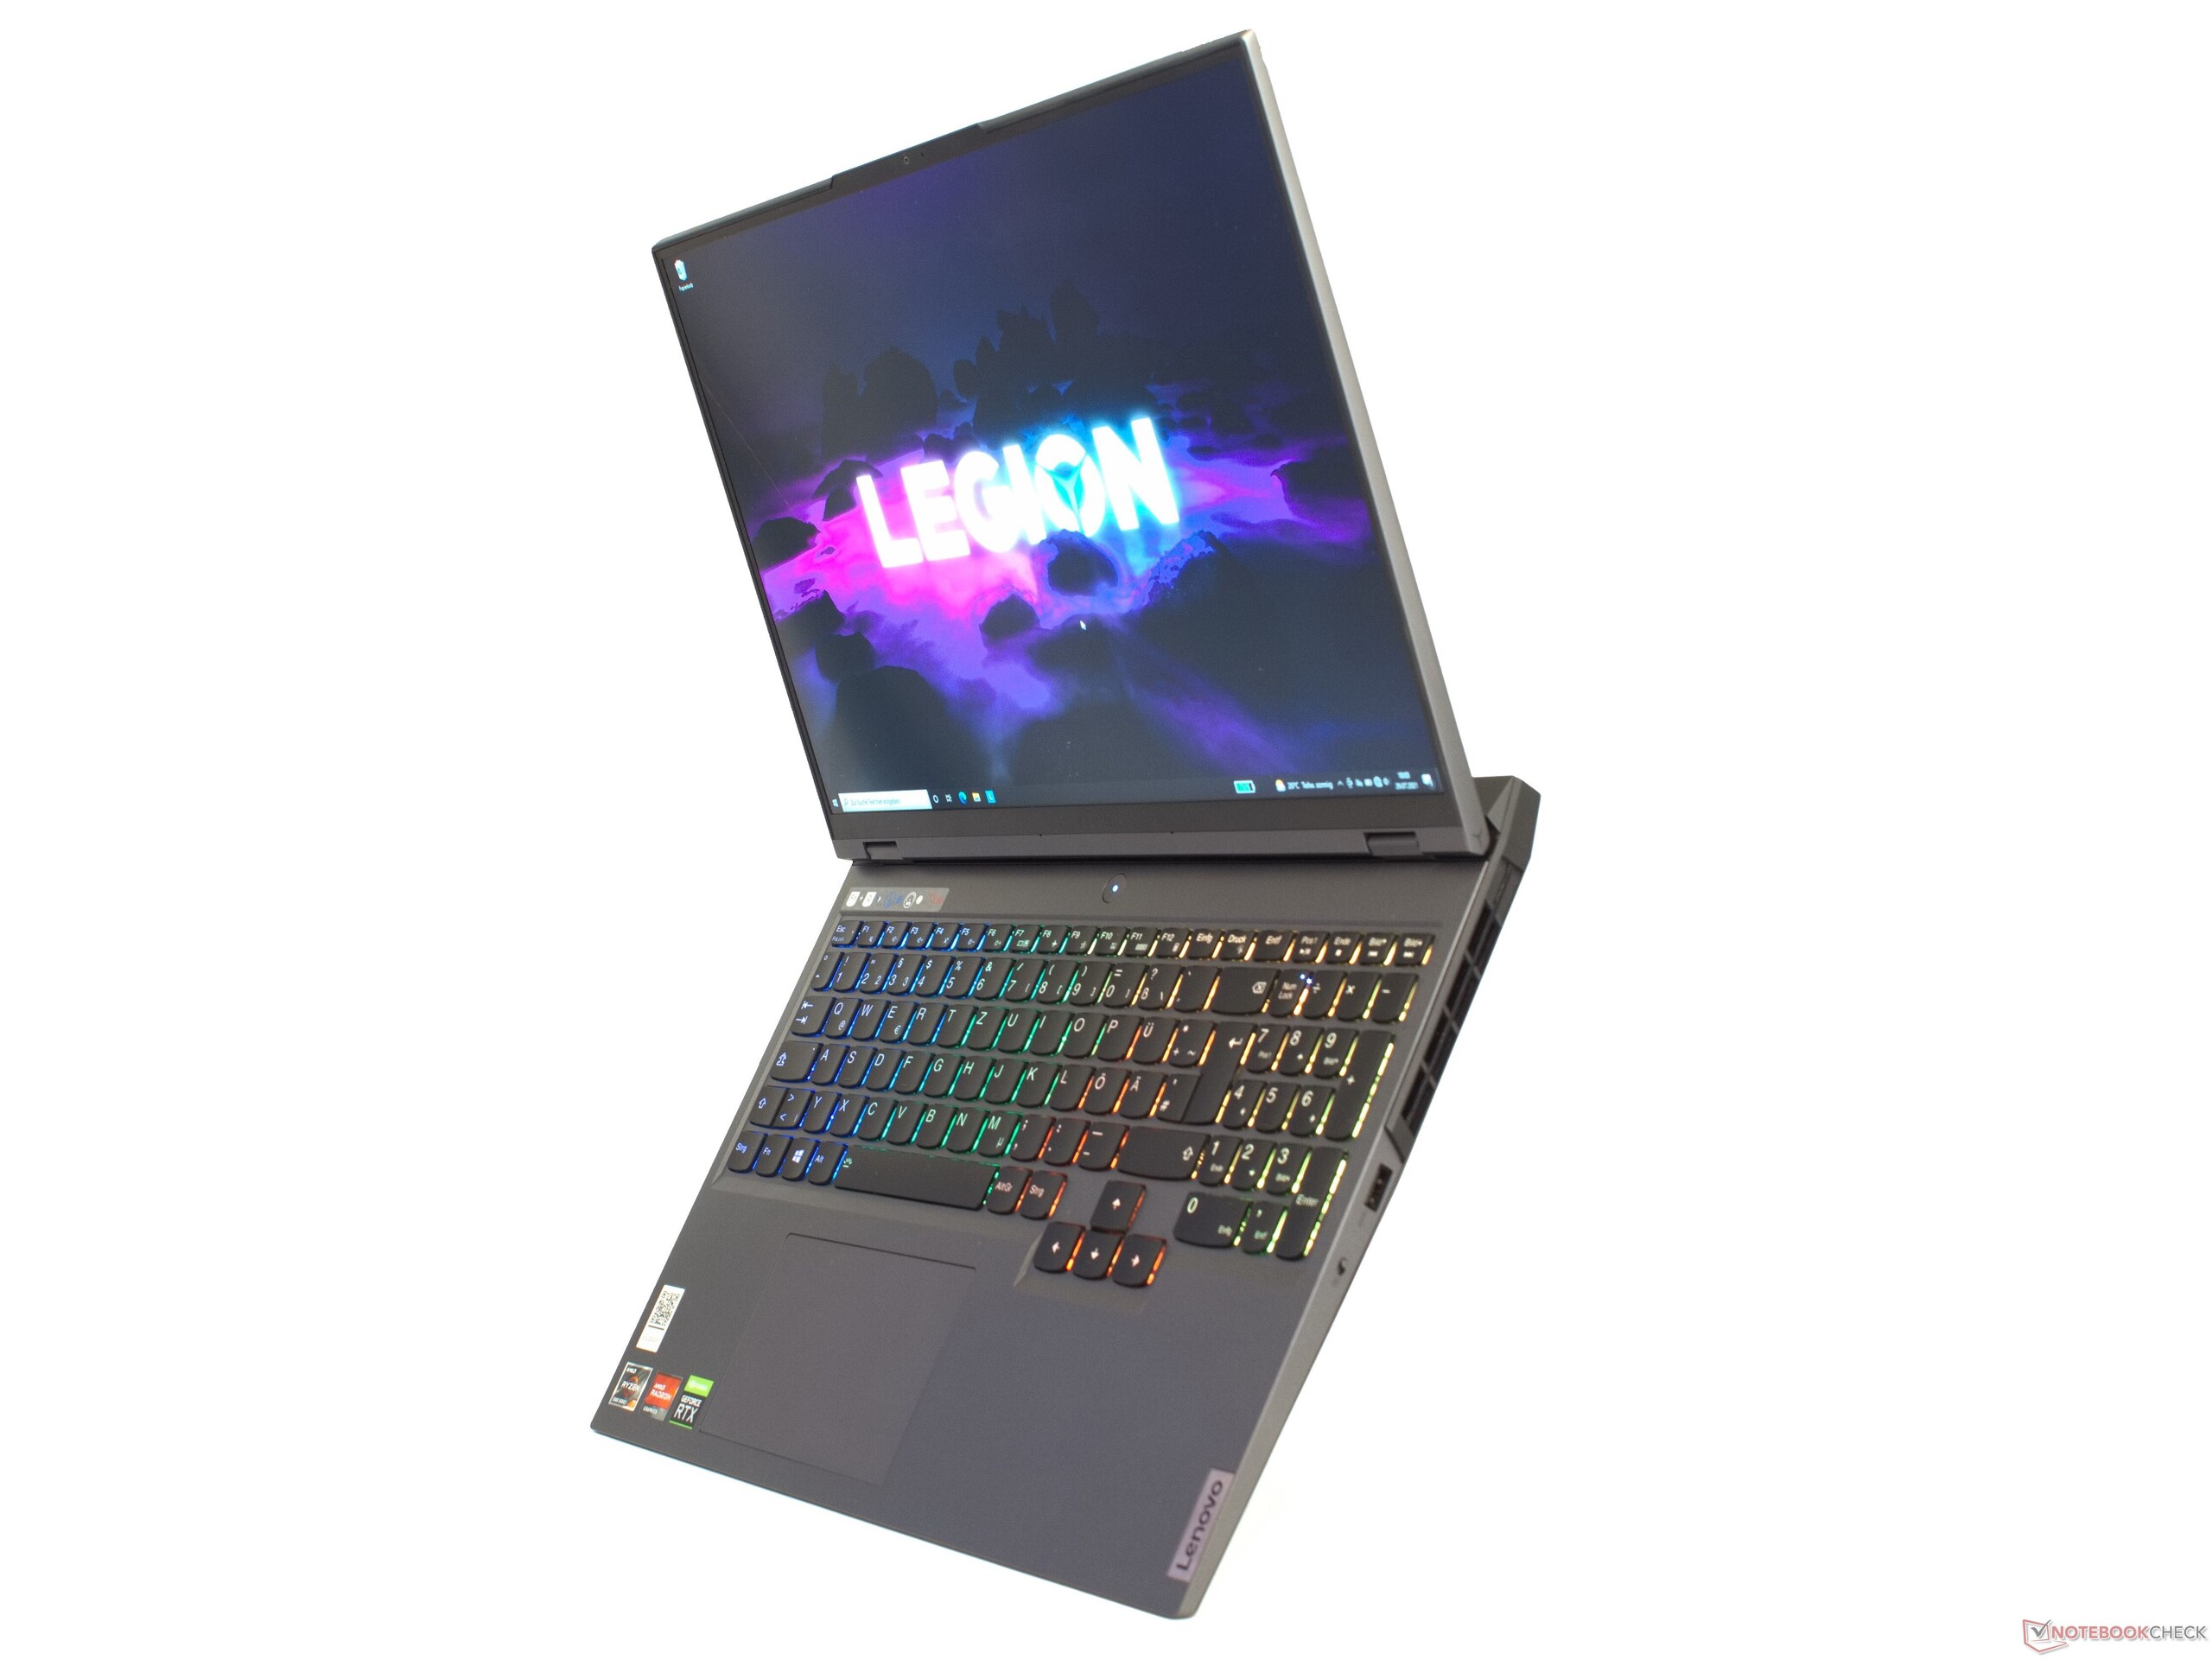
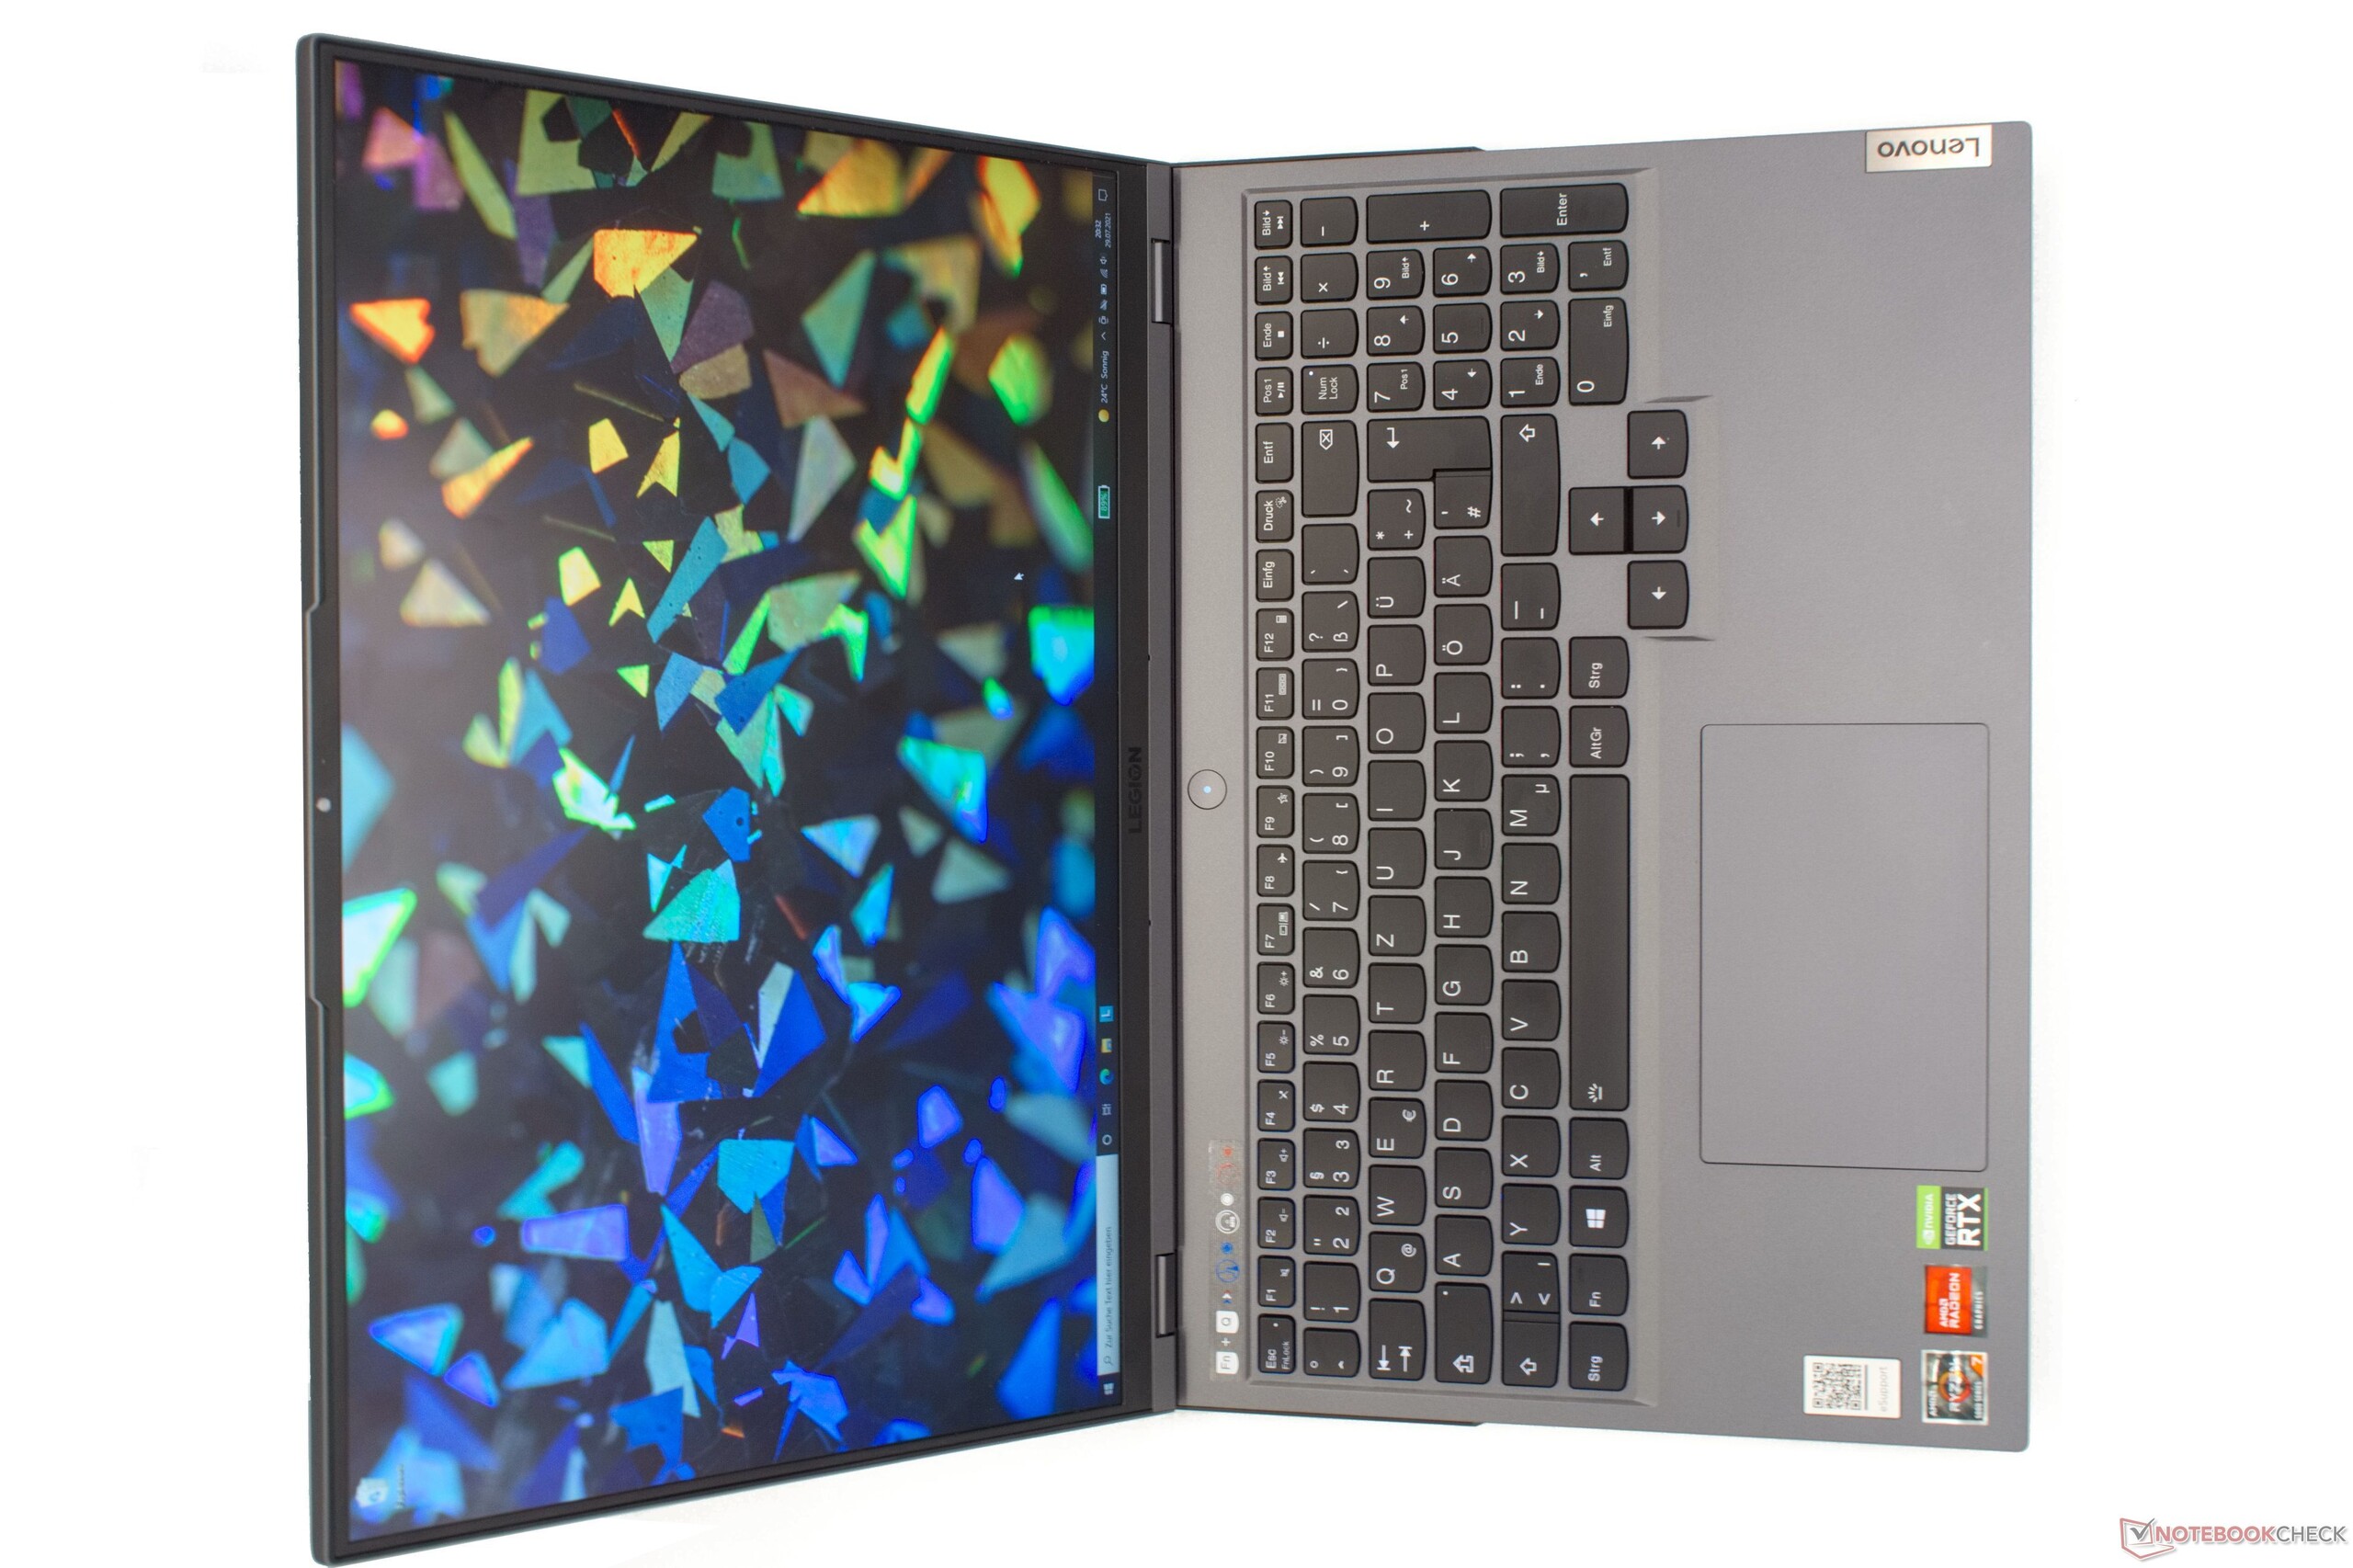
The size of the Legion 5 Pro is the same as that of 15.6-inch laptops in the 16:9 format, so the Lenovo laptop offers a slightly larger screen in a case of the same size.
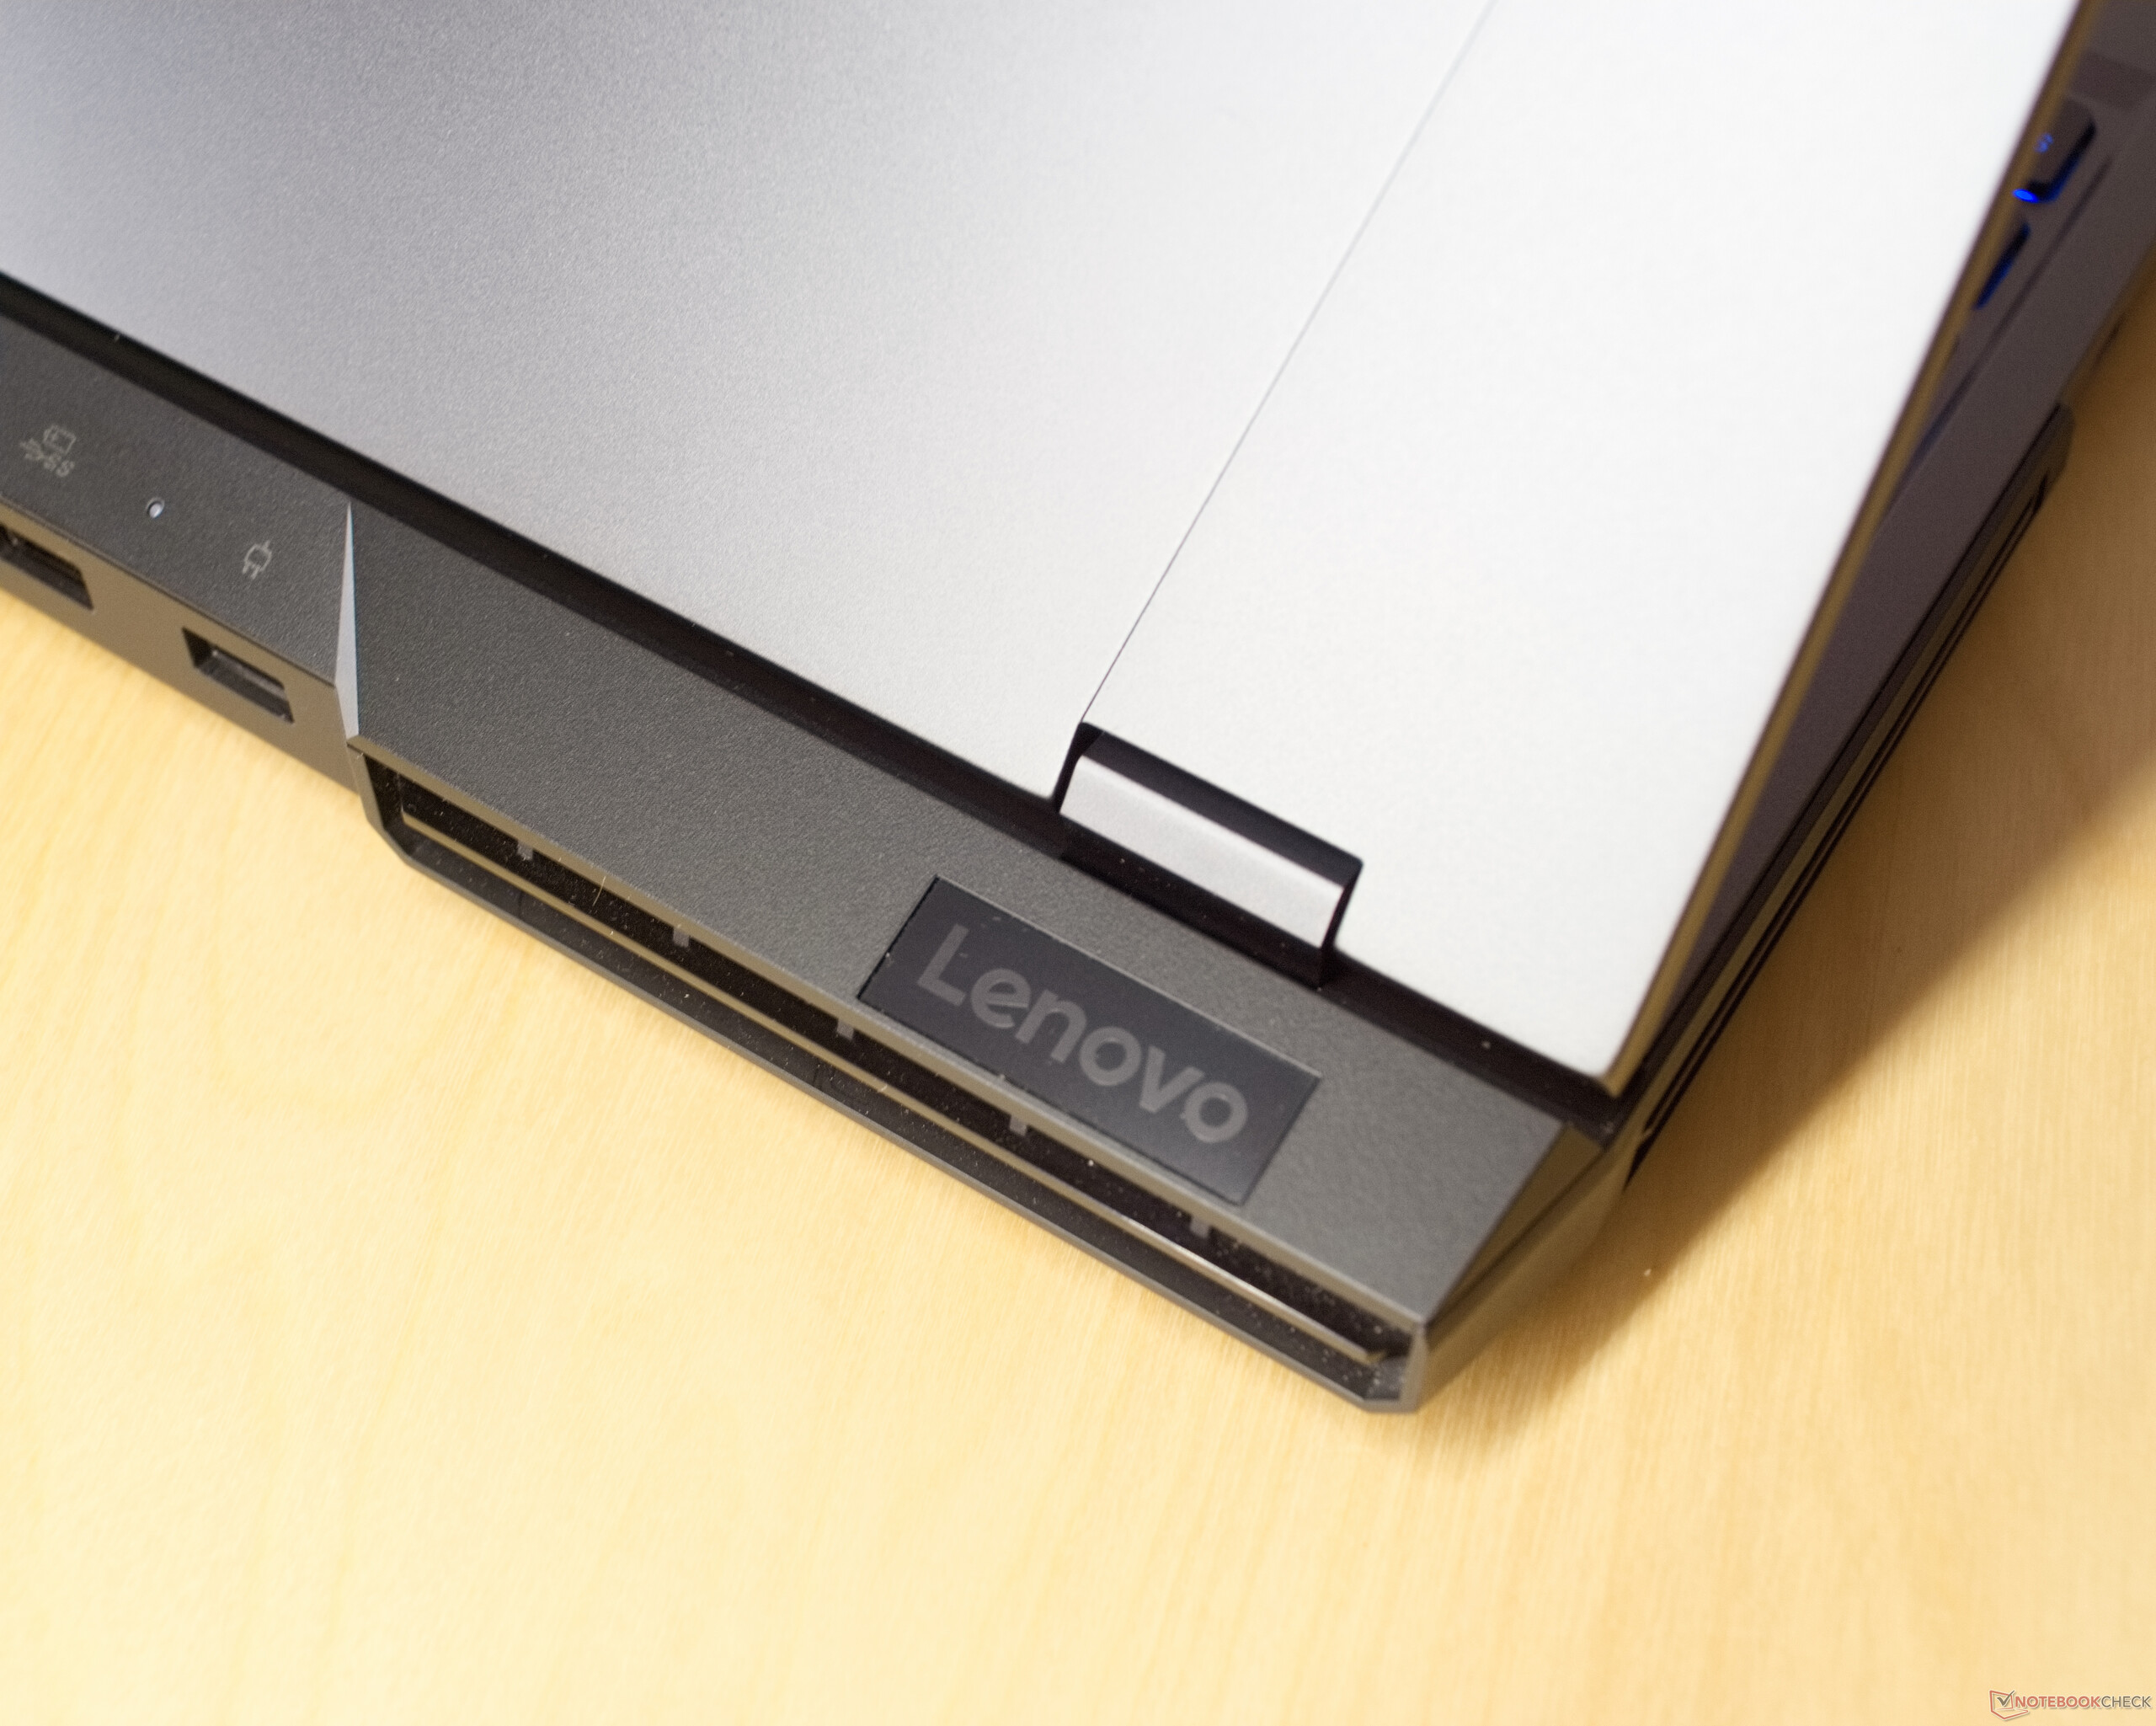
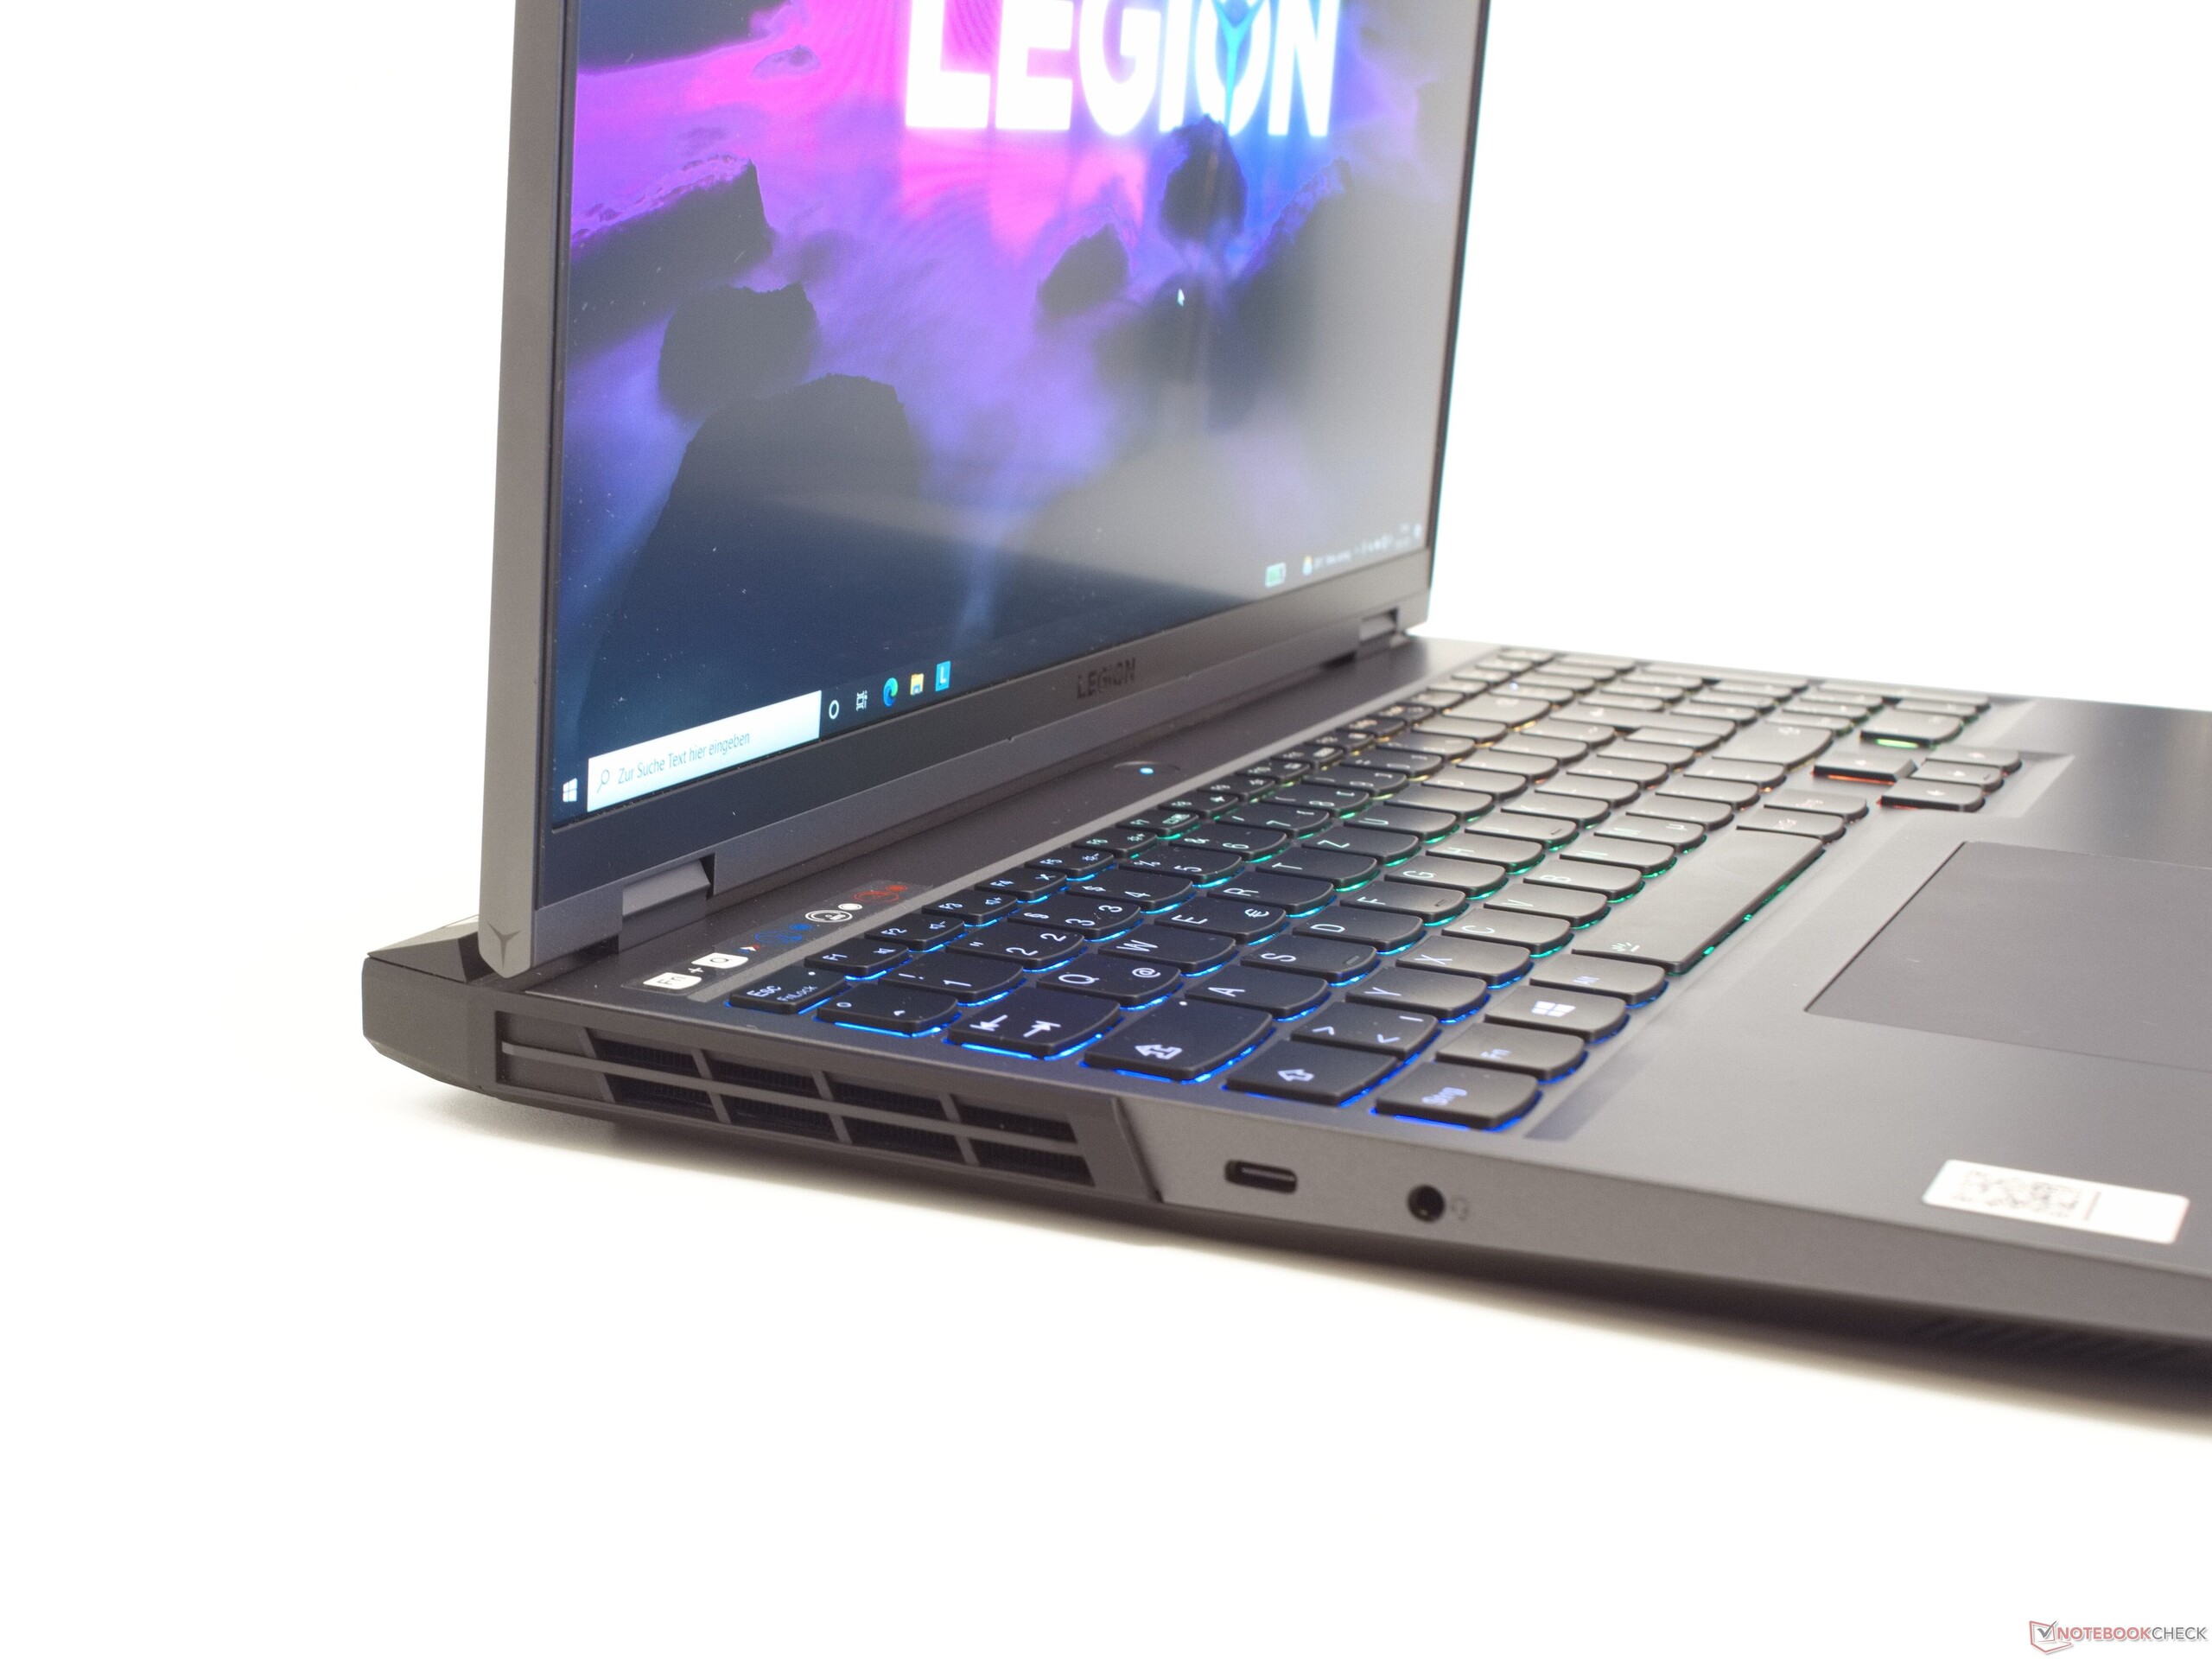
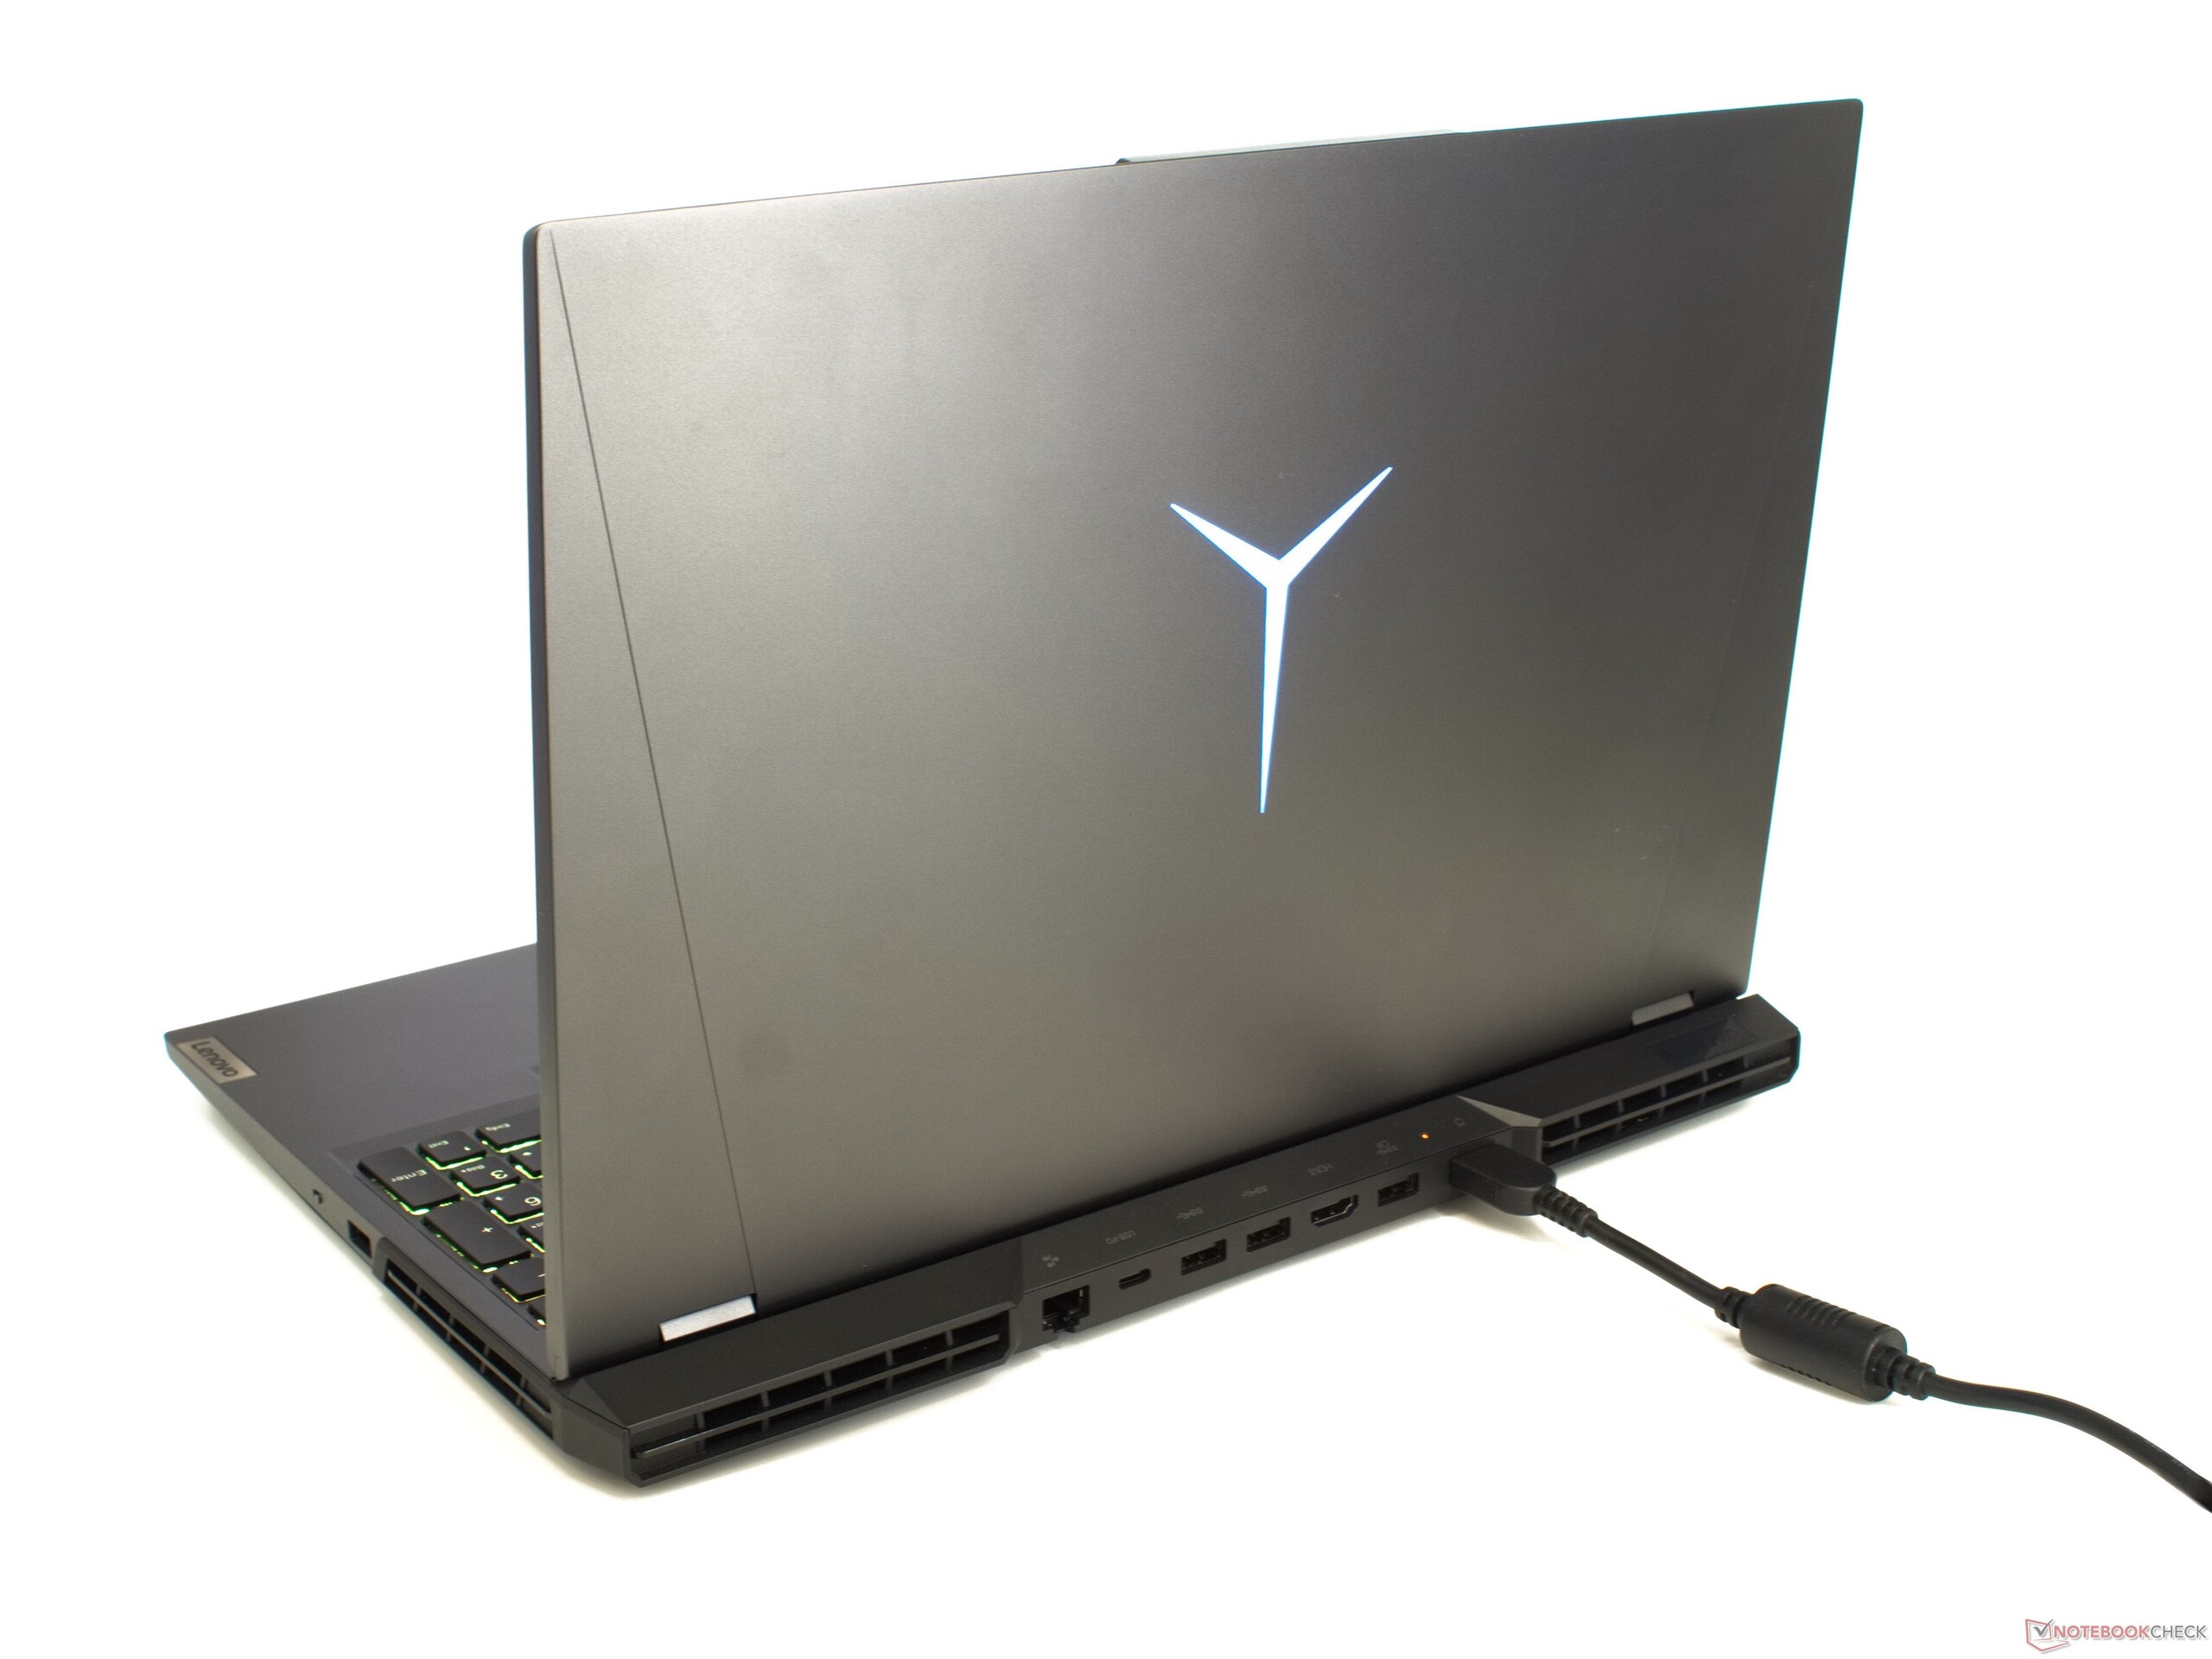
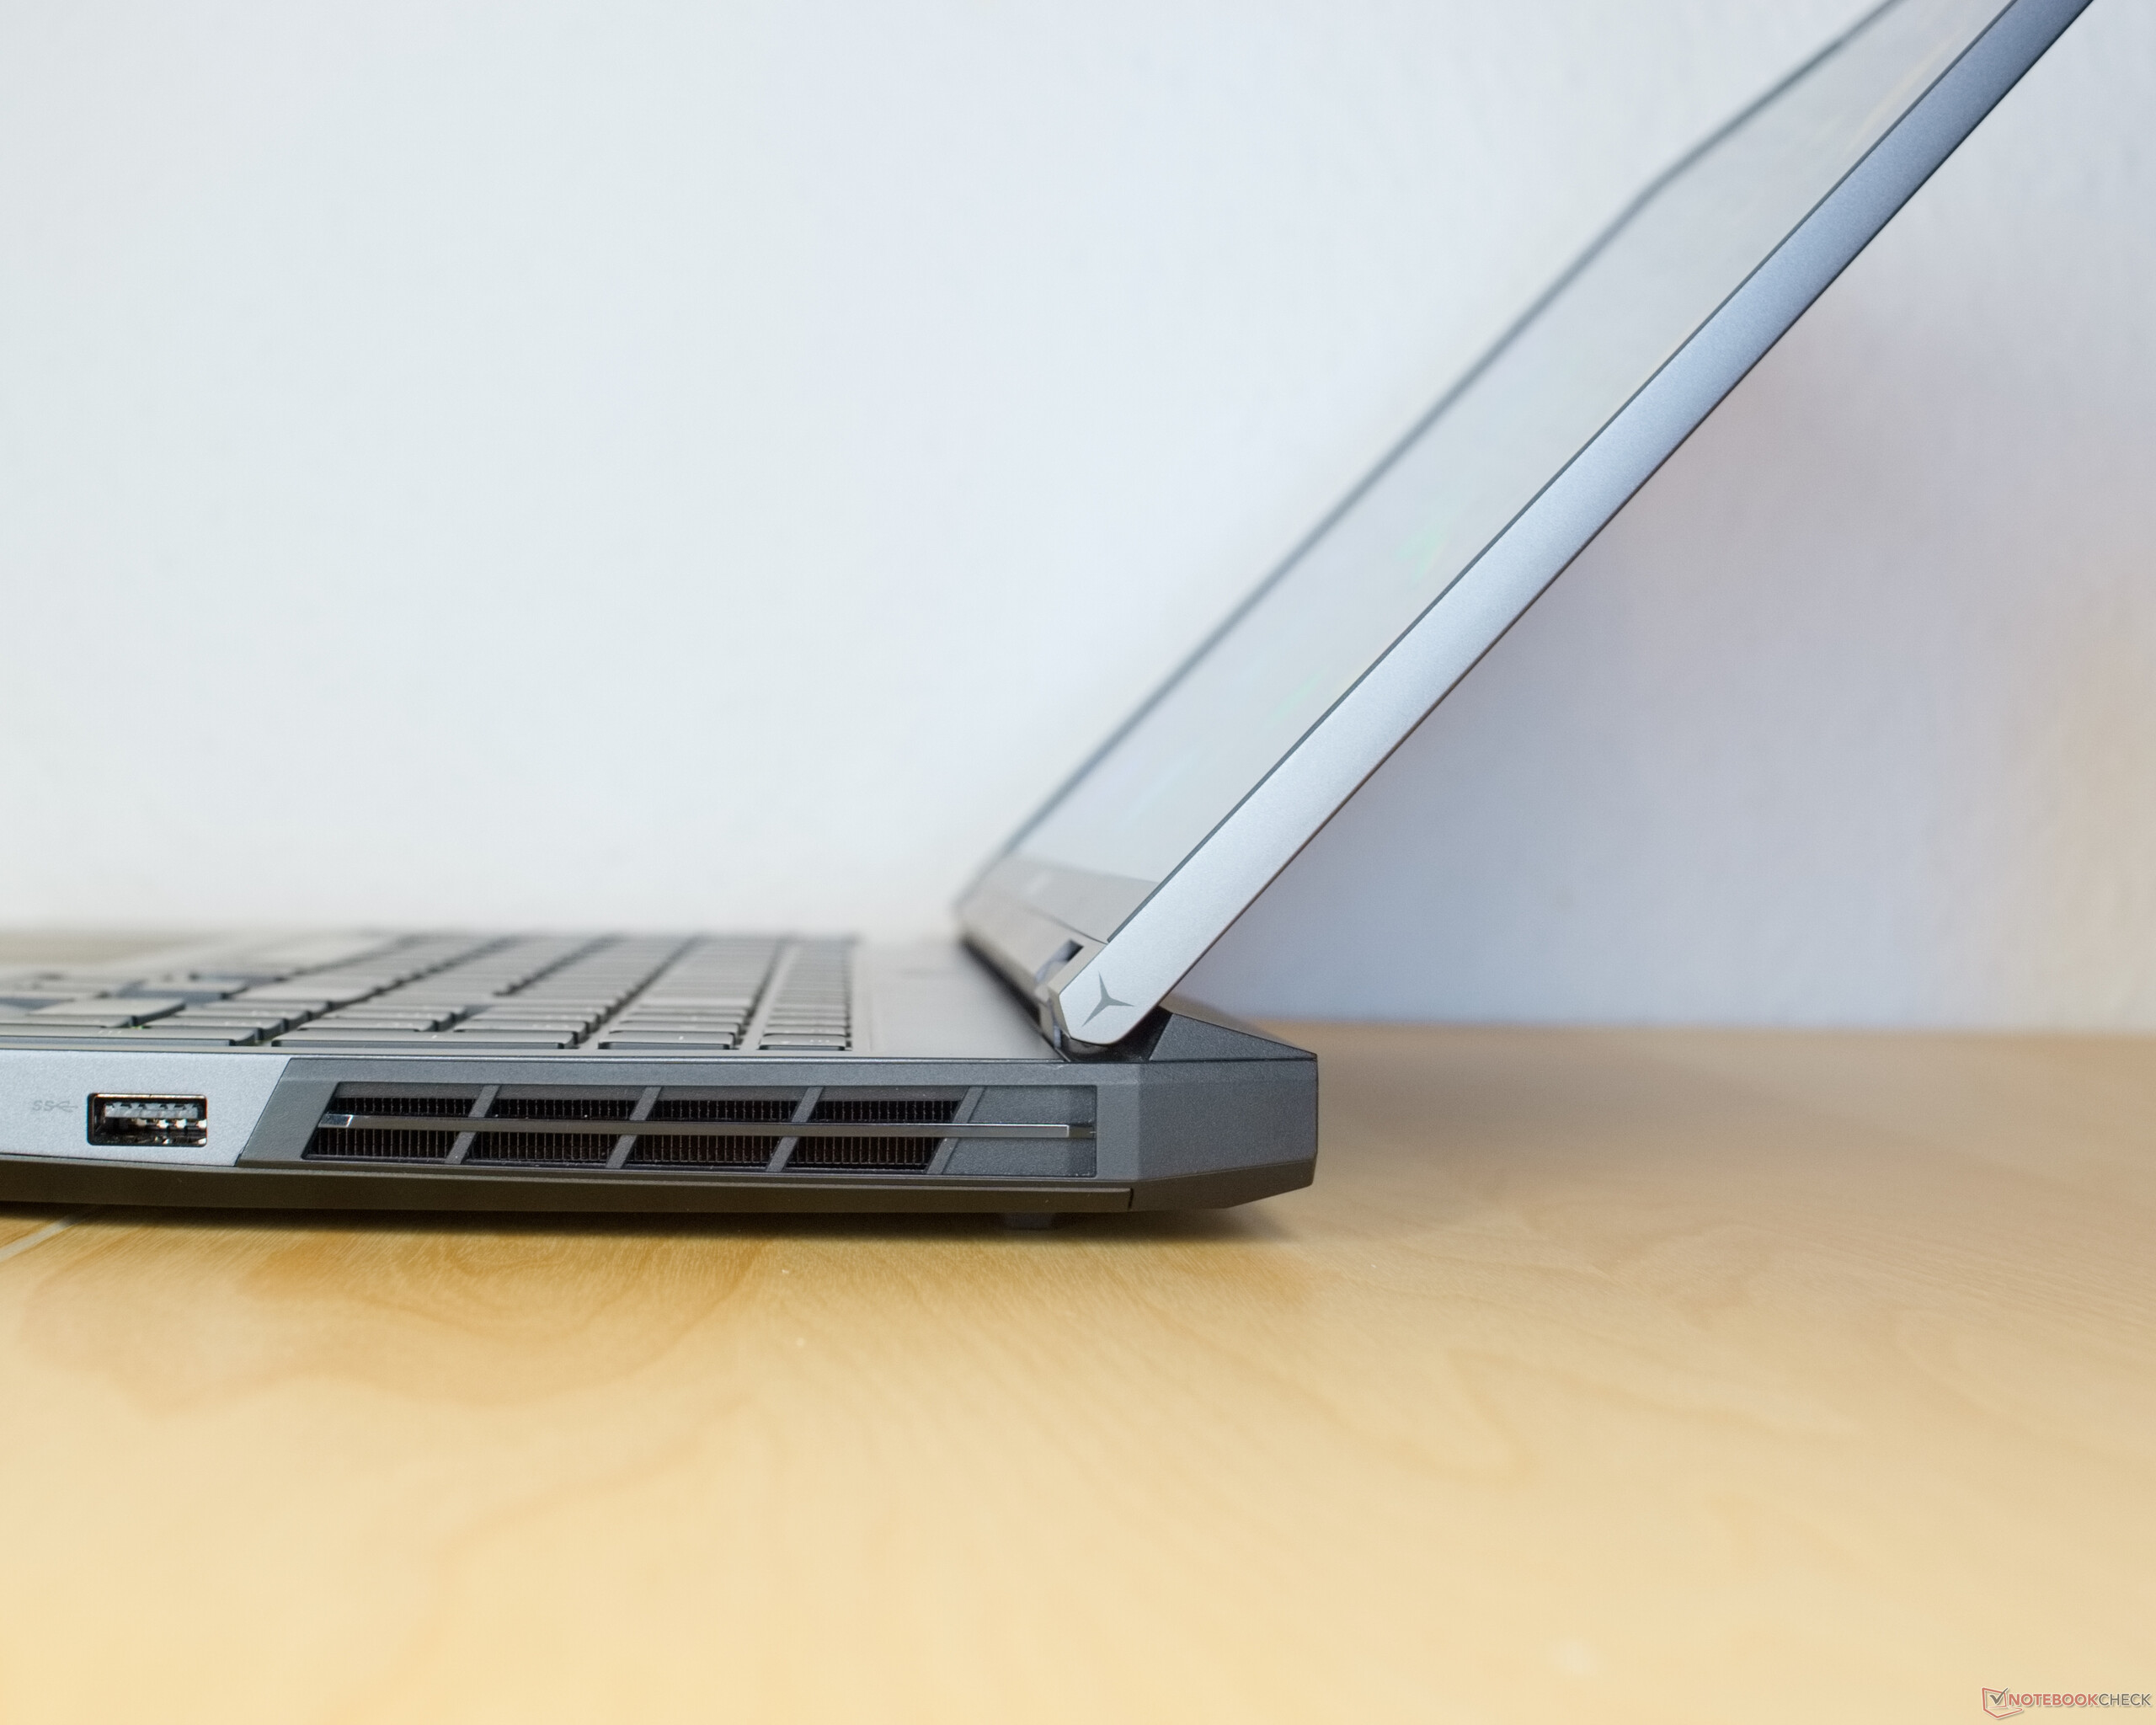
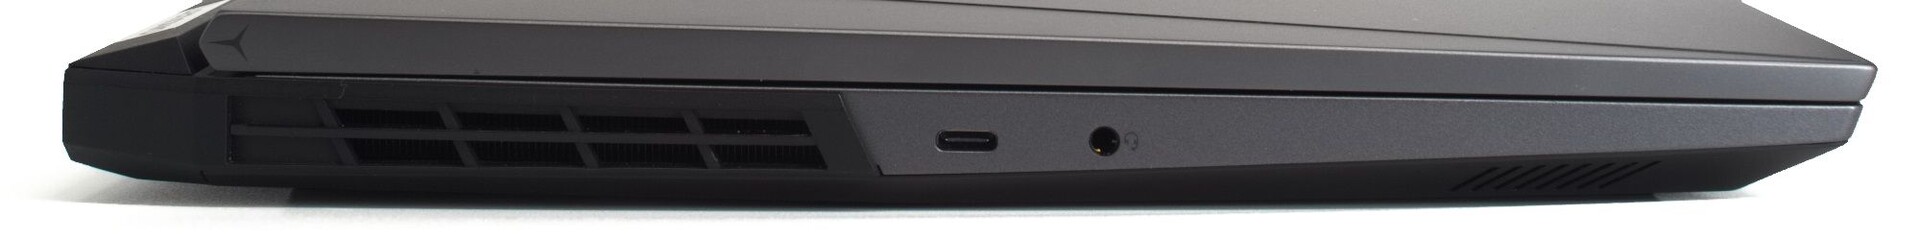
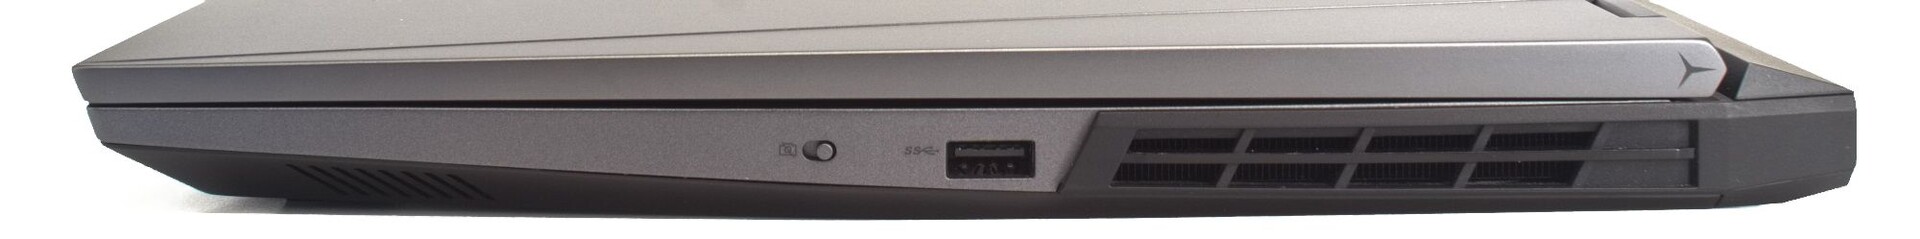
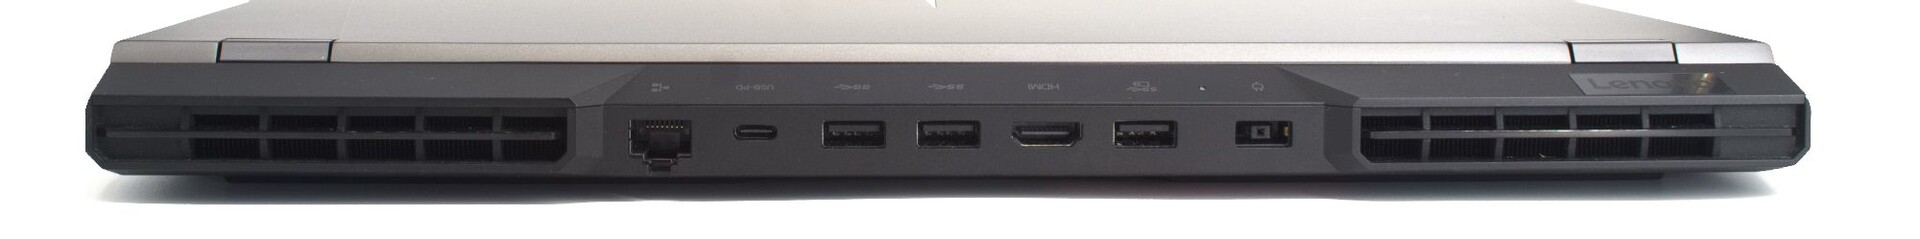
Equipment - The Legion 5 Pro offers many connections and can be opened easily
A large part of the connections is on the back of the case. Depending on whether you use a mouse with your left or right hand, the positioning of the connections on the side can become a small hindrance.
The available connections leave little to be desired. However, the laptop does not offer an SD card reader, and because of the AMD platform used, Thunderbolt is also not available.
Communication
An Intel AX200 WLAN module allows communicating via WiFi 6 (802.11ax) and Bluetooth 5. While the WLAN transfer rates of the laptop are slightly below average, the gaming laptop also offers a LAN port for a wired connection to the Internet.
Webcam

The 0.9-MP webcam doesn't stand above the masses in terms of its quality. However, at least the webcam can be deactivated by using the e-shutter.


 GeForce RTX 3070 Laptop GPU, R7 5800H, WDC PC SN730 SDBPNTY-1T00")
 GeForce RTX 3070 Laptop GPU, R7 5800H, WDC PC SN730 SDBPNTY-1T00")
Accessories
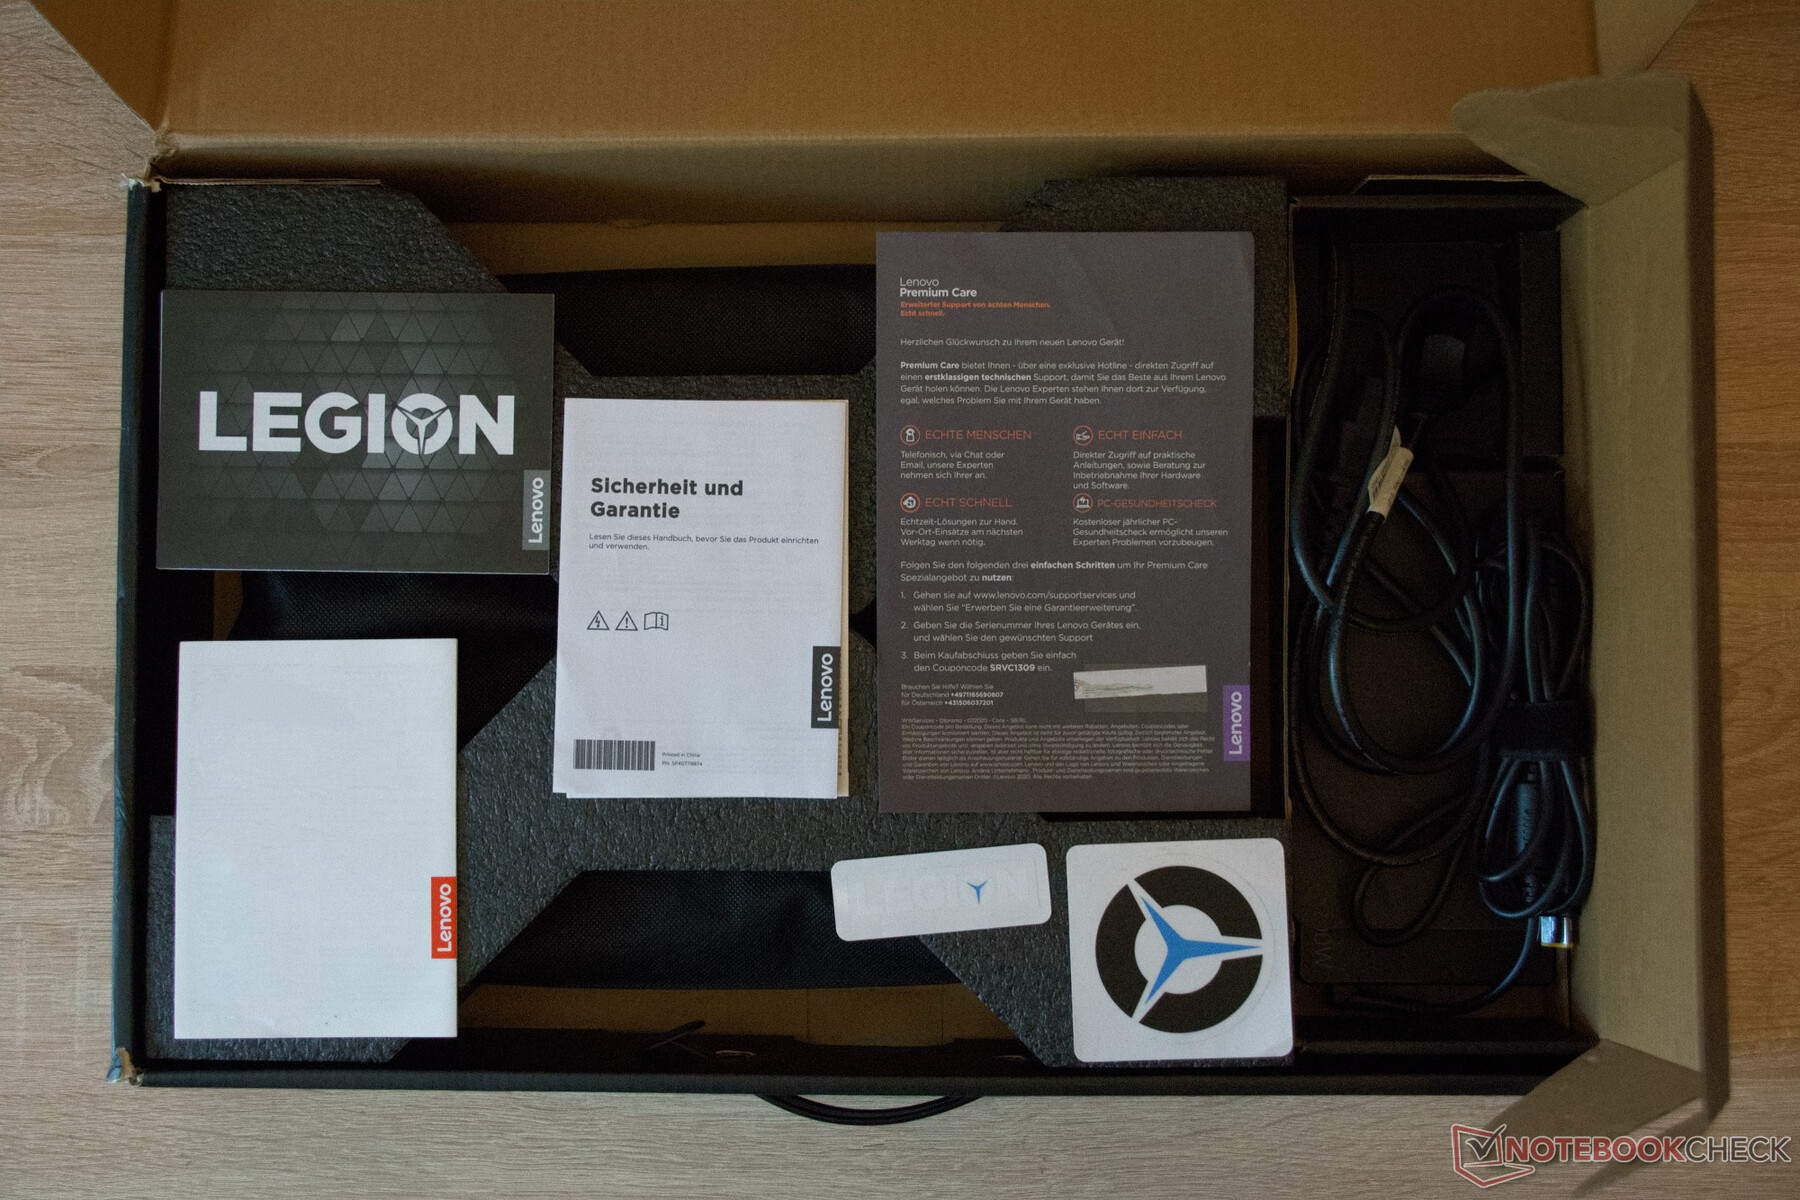
In addition to the paperwork and power supply, the box of the Lenovo Legion 5 Pro only includes two stickers with the logos of the Legion series.
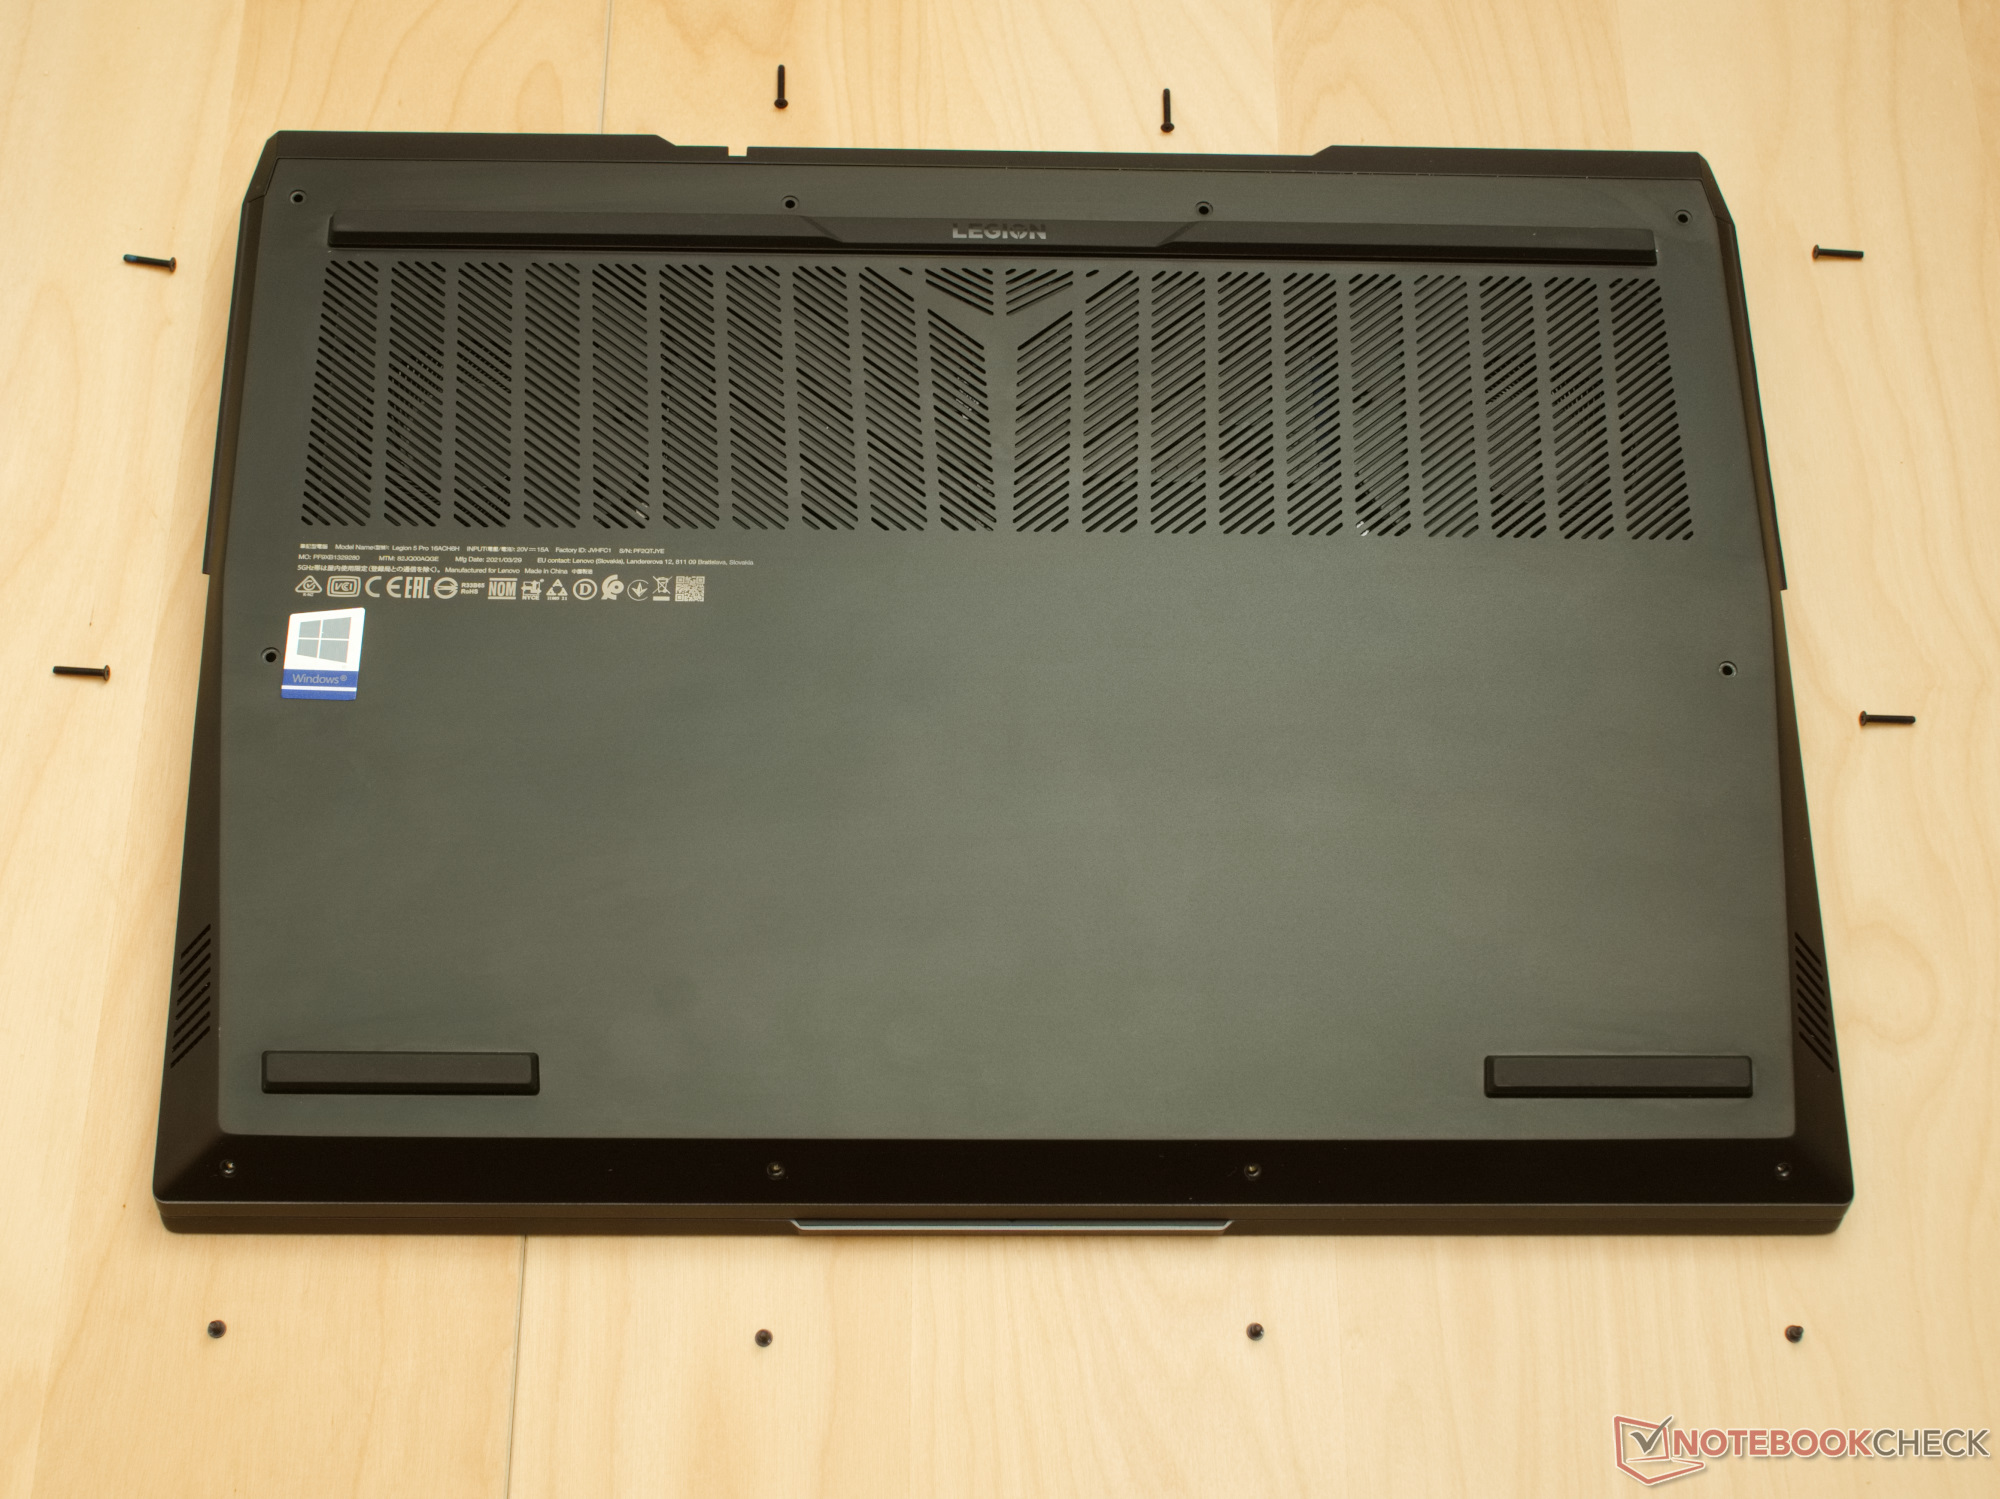
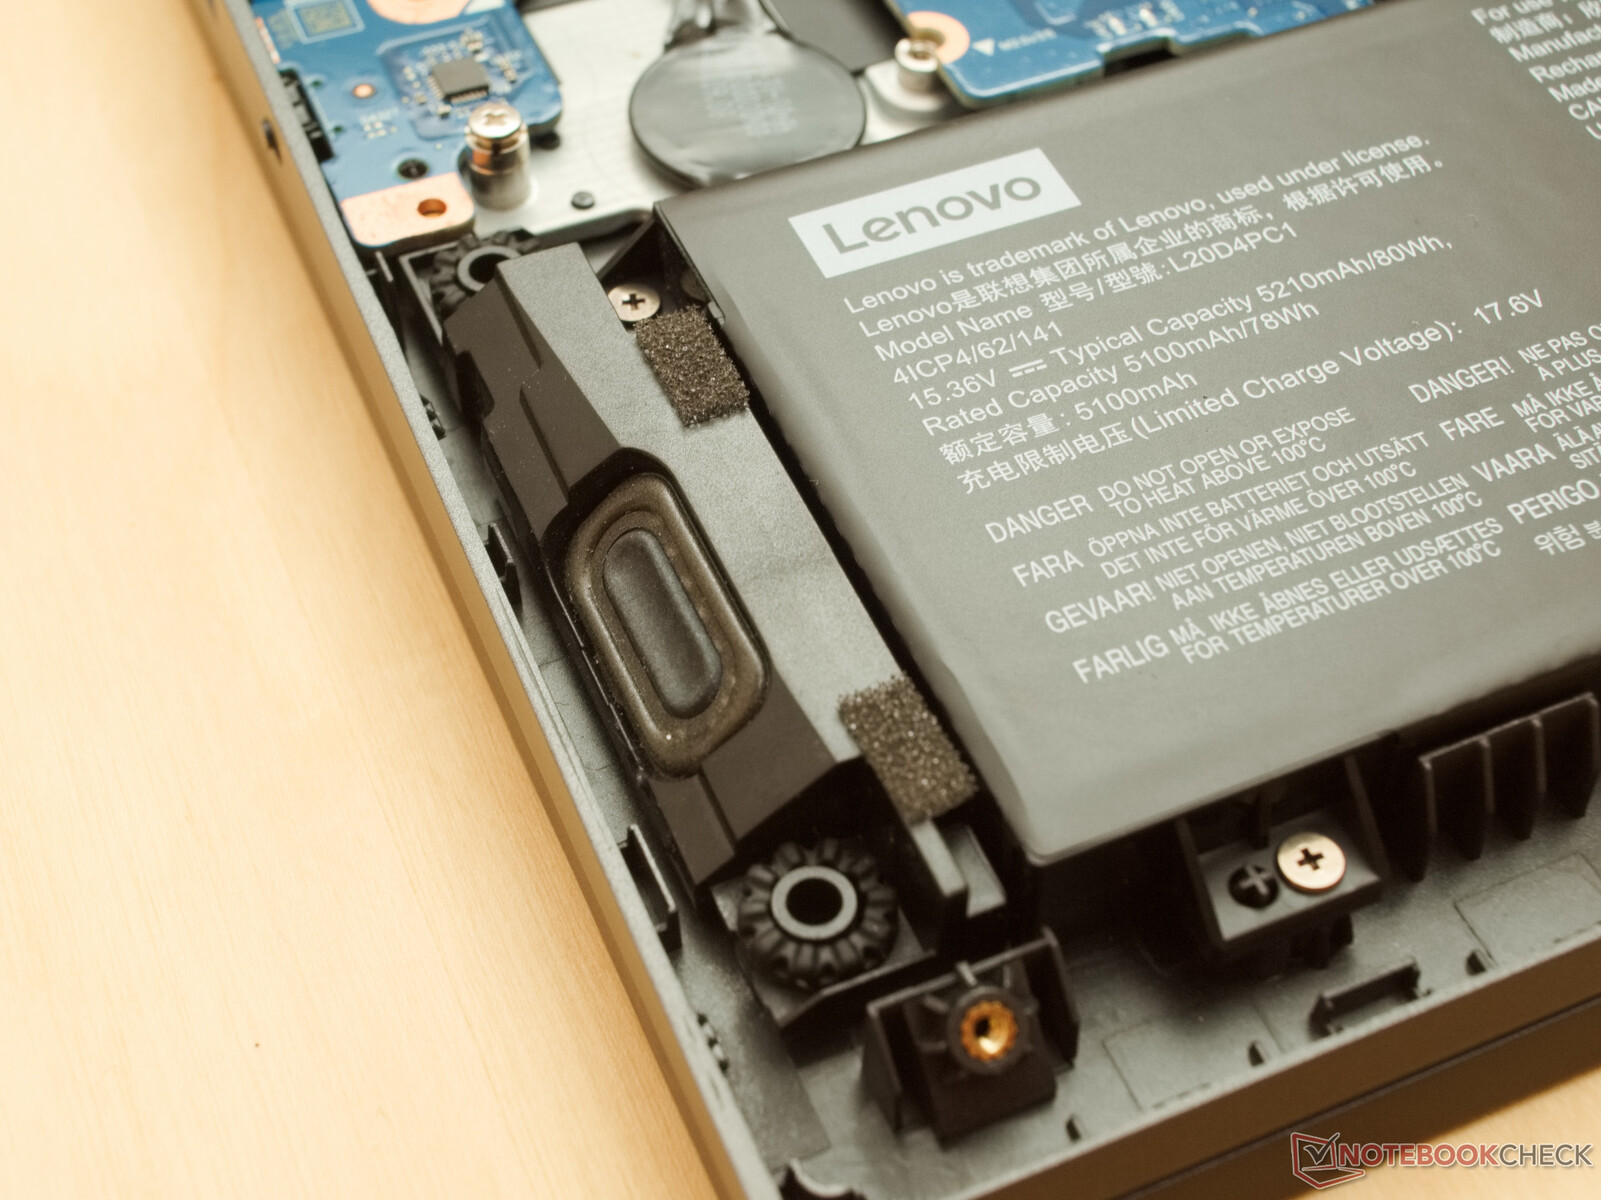
Maintenance
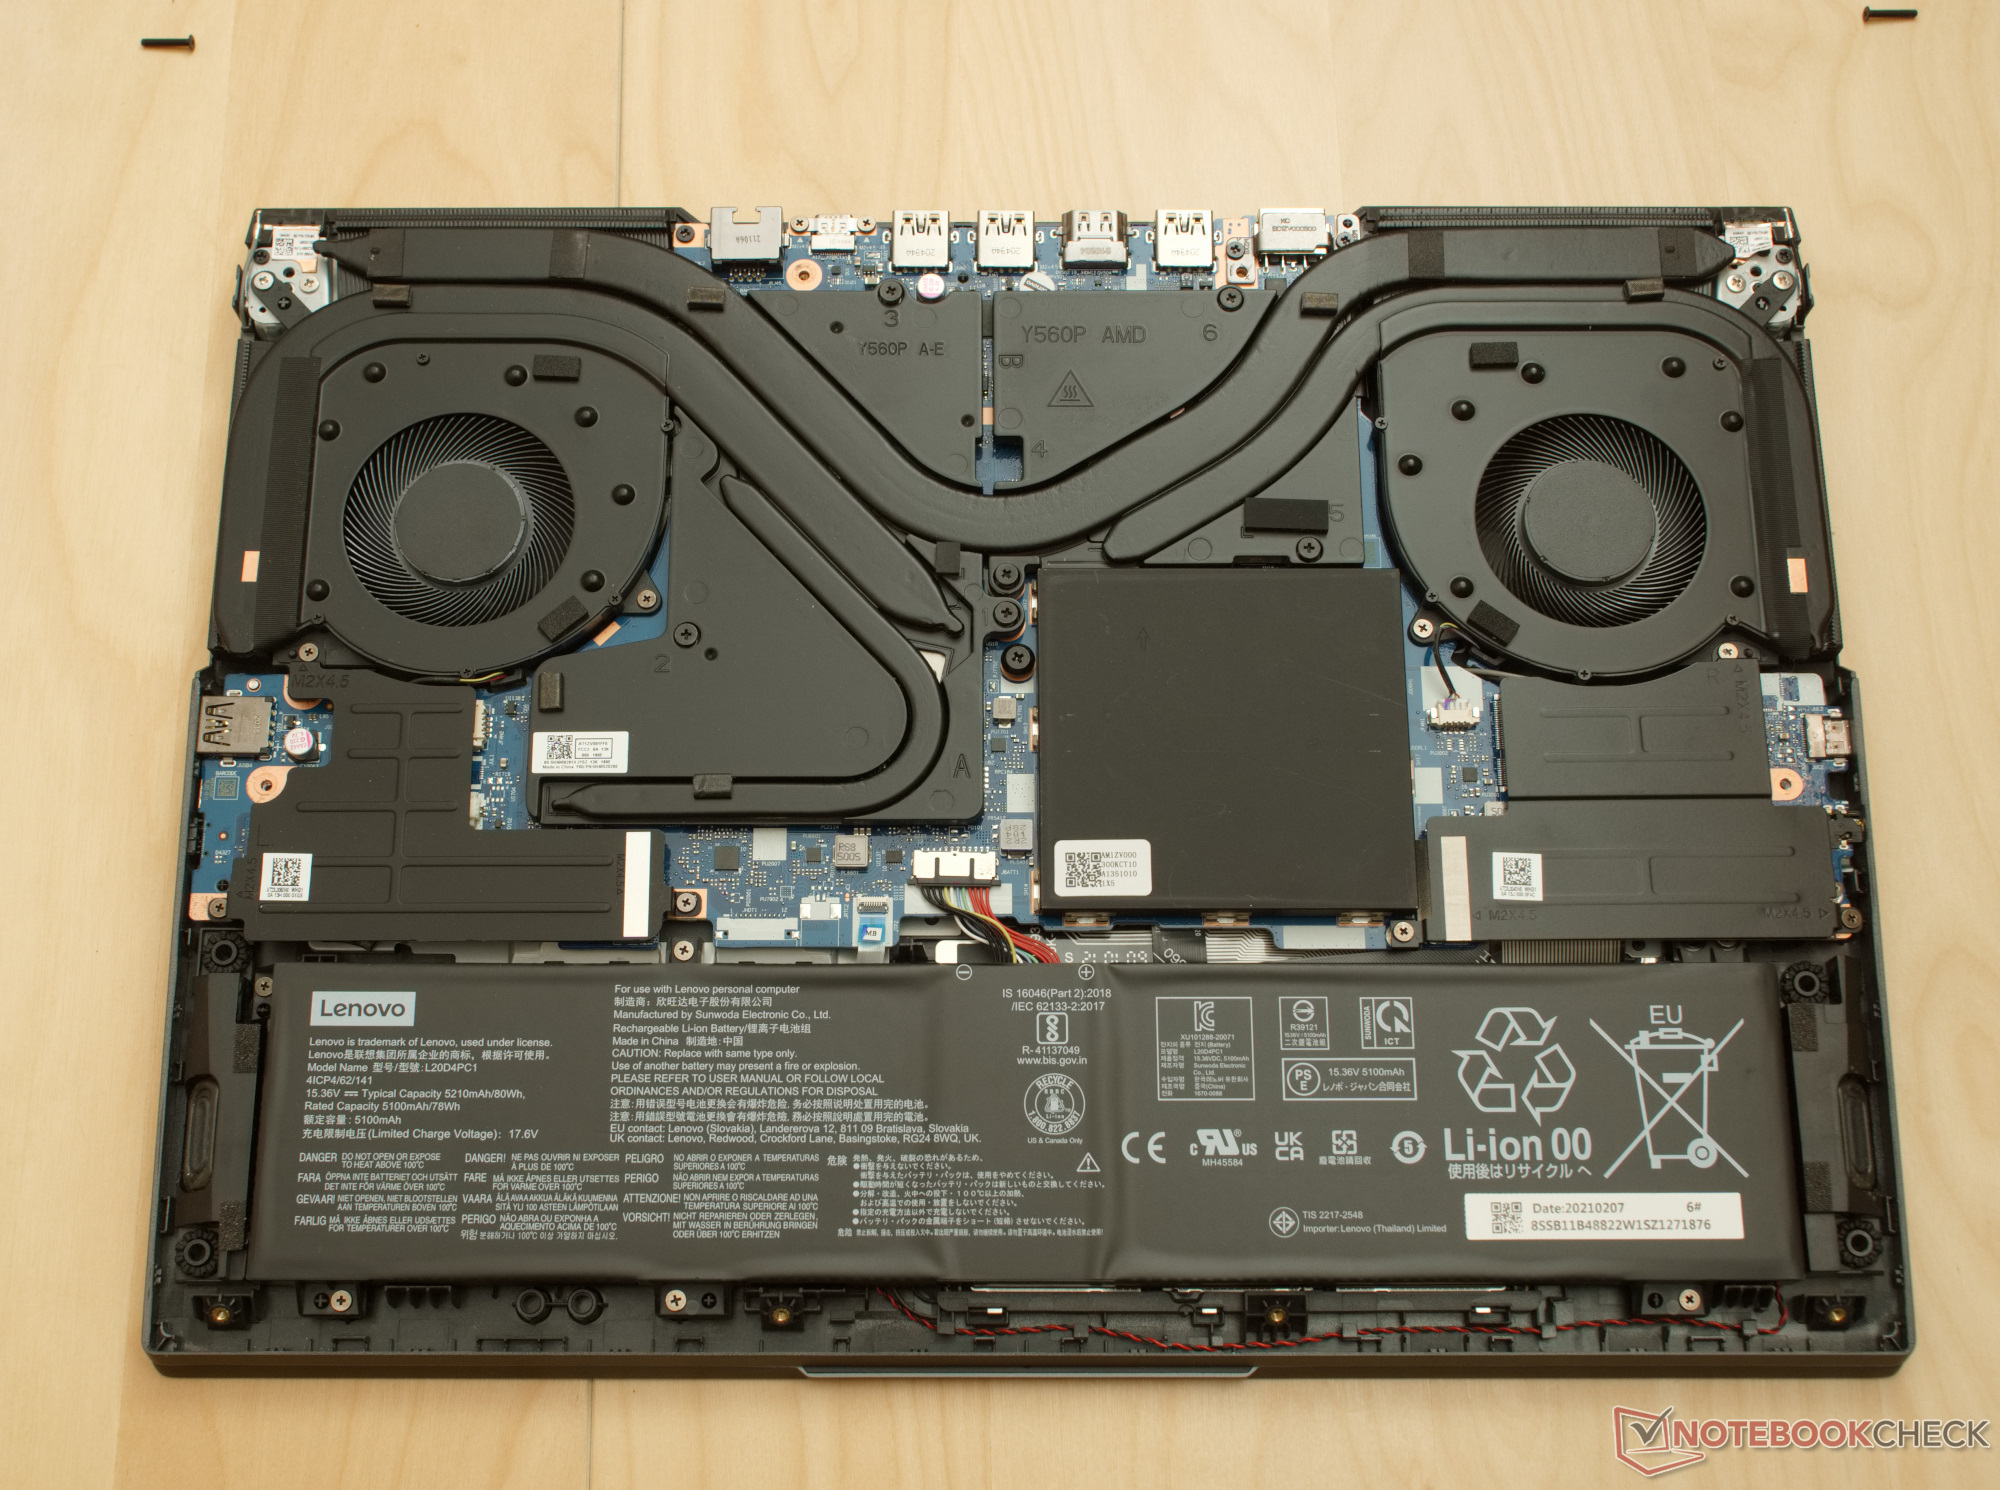
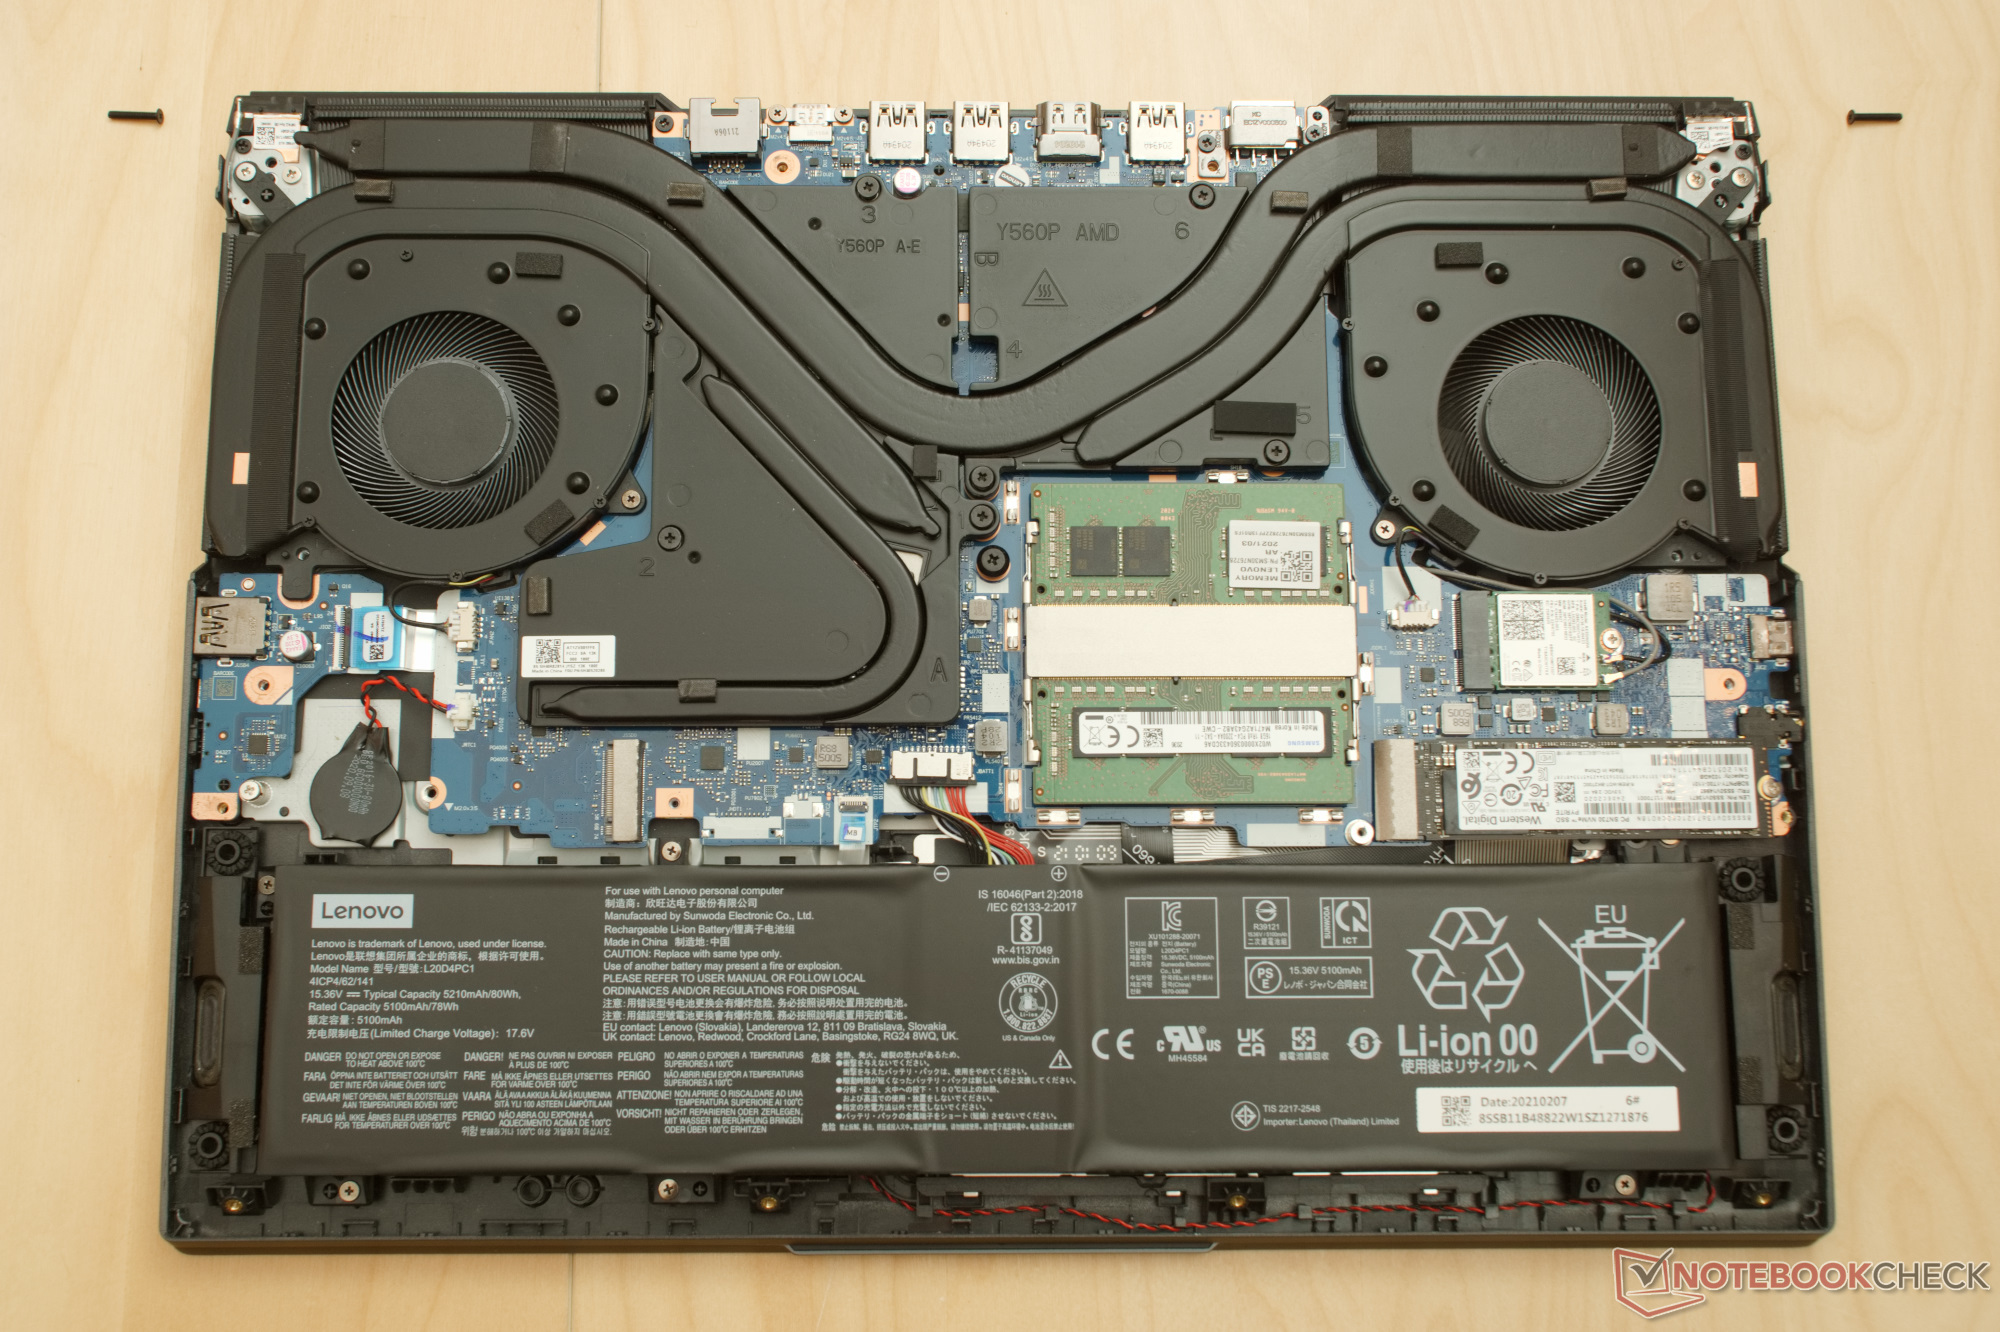
In order to open the case, you only need a Phillips screwdriver and a suction cup or plastic prying tool. After you have removed the ten screws, the bottom of the case can be opened easily using a suction cup, or if necessary, you can also pry it open with a plastic tool.
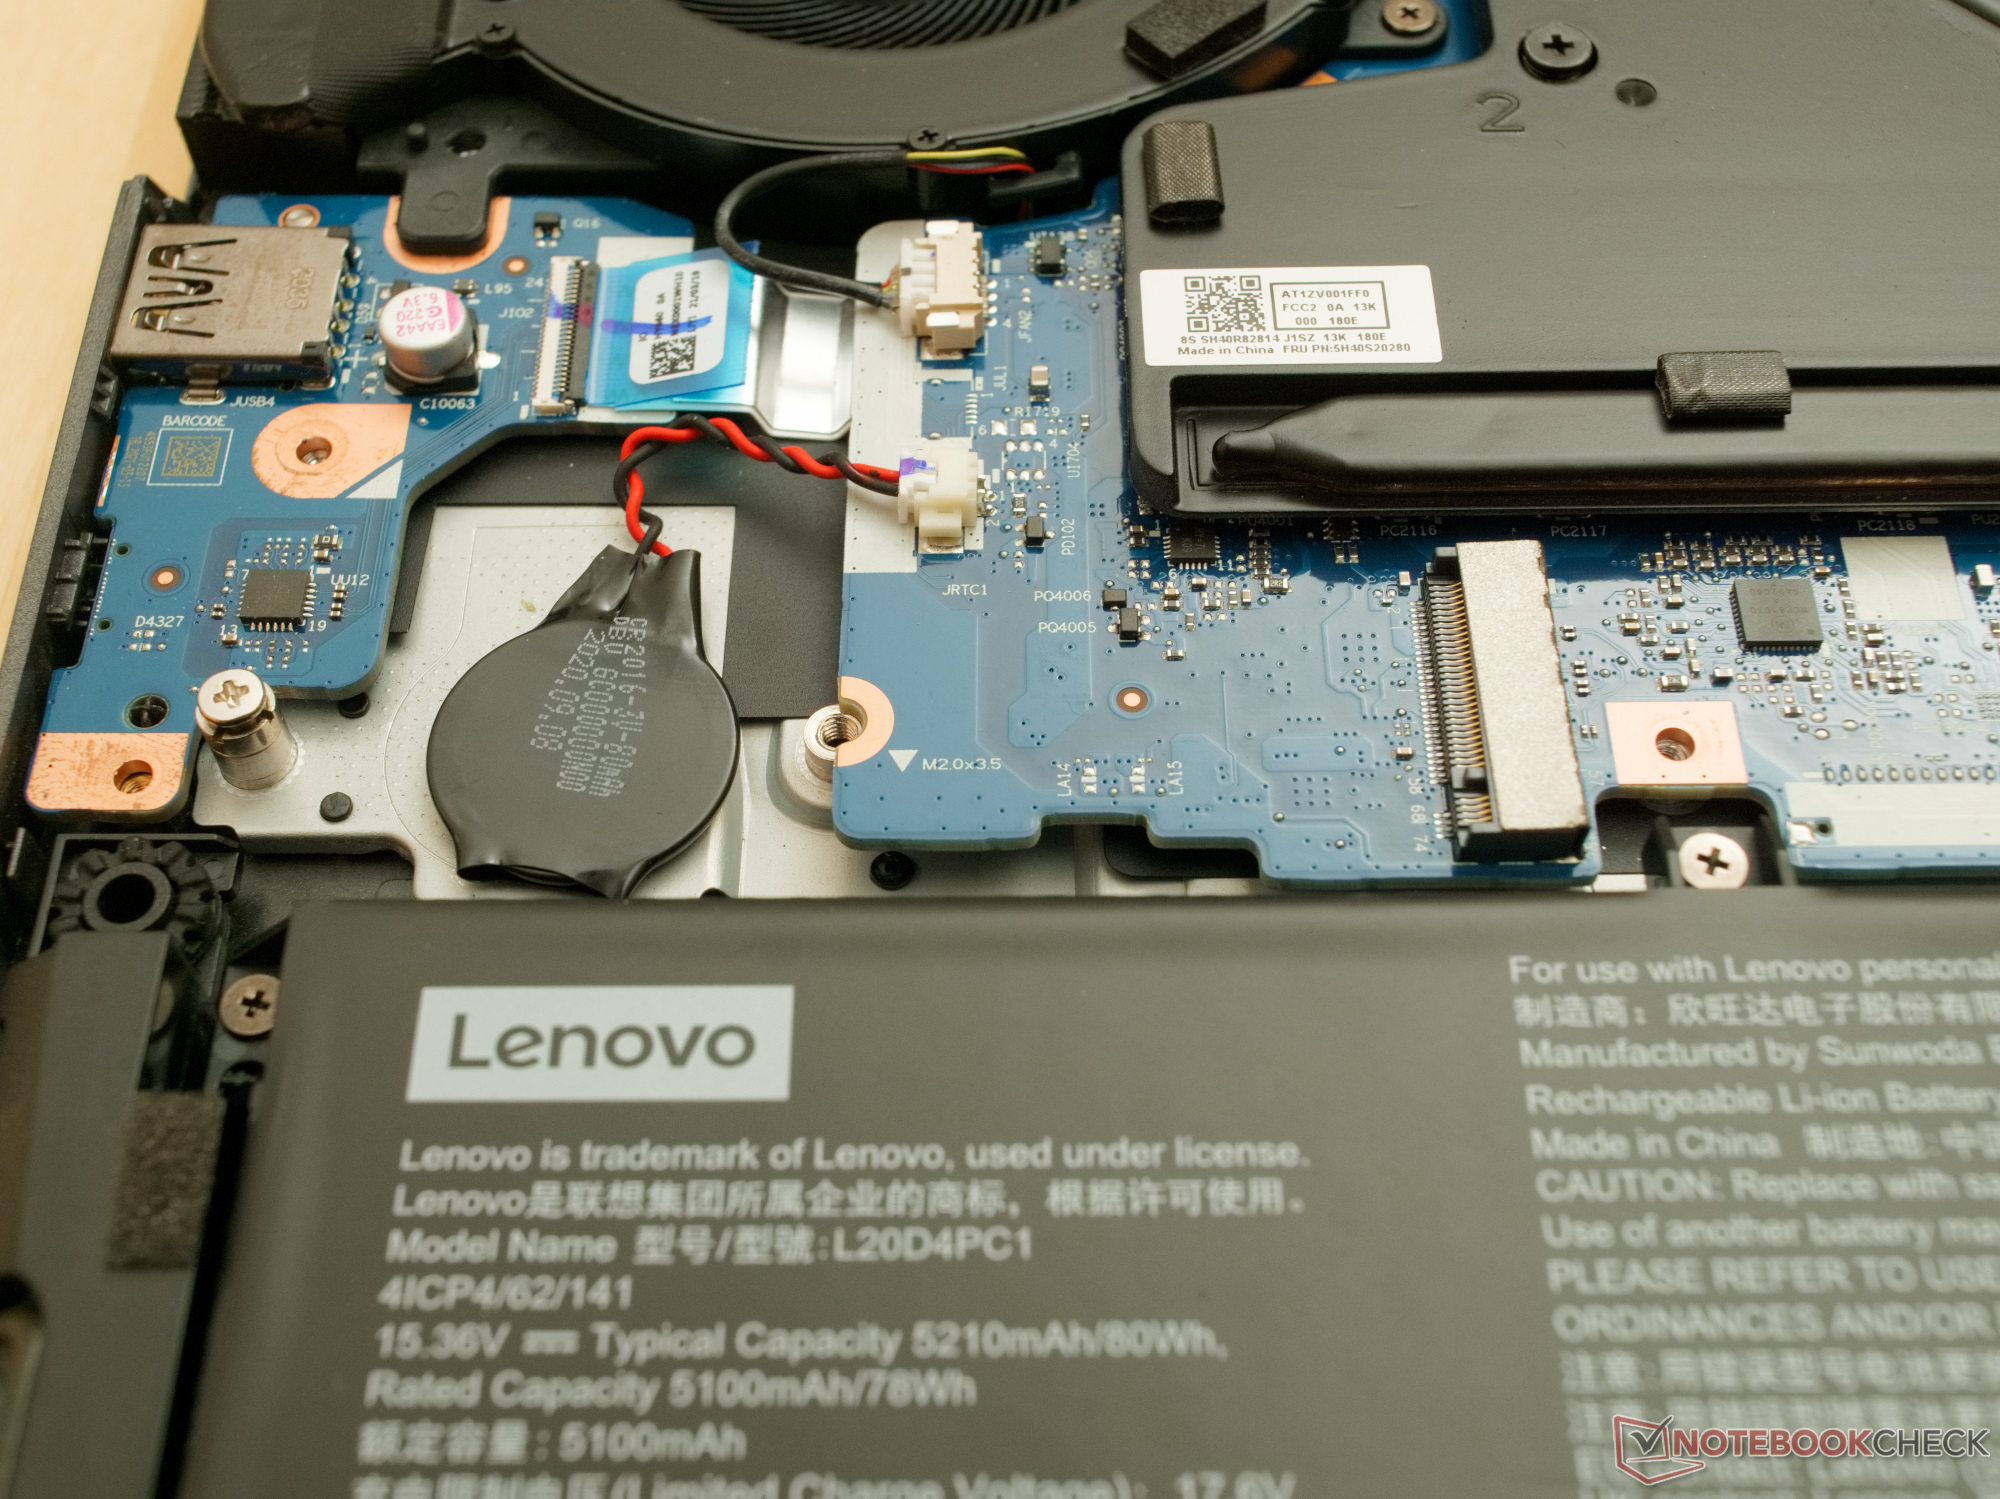
Inside, all the replaceable components are also protected by additional covers. After removing the covers, you can see that the working memory, SSD, and WLAN module can be replaced, and a free M.2 connection also gives you the option to expand the storage.
Warranty
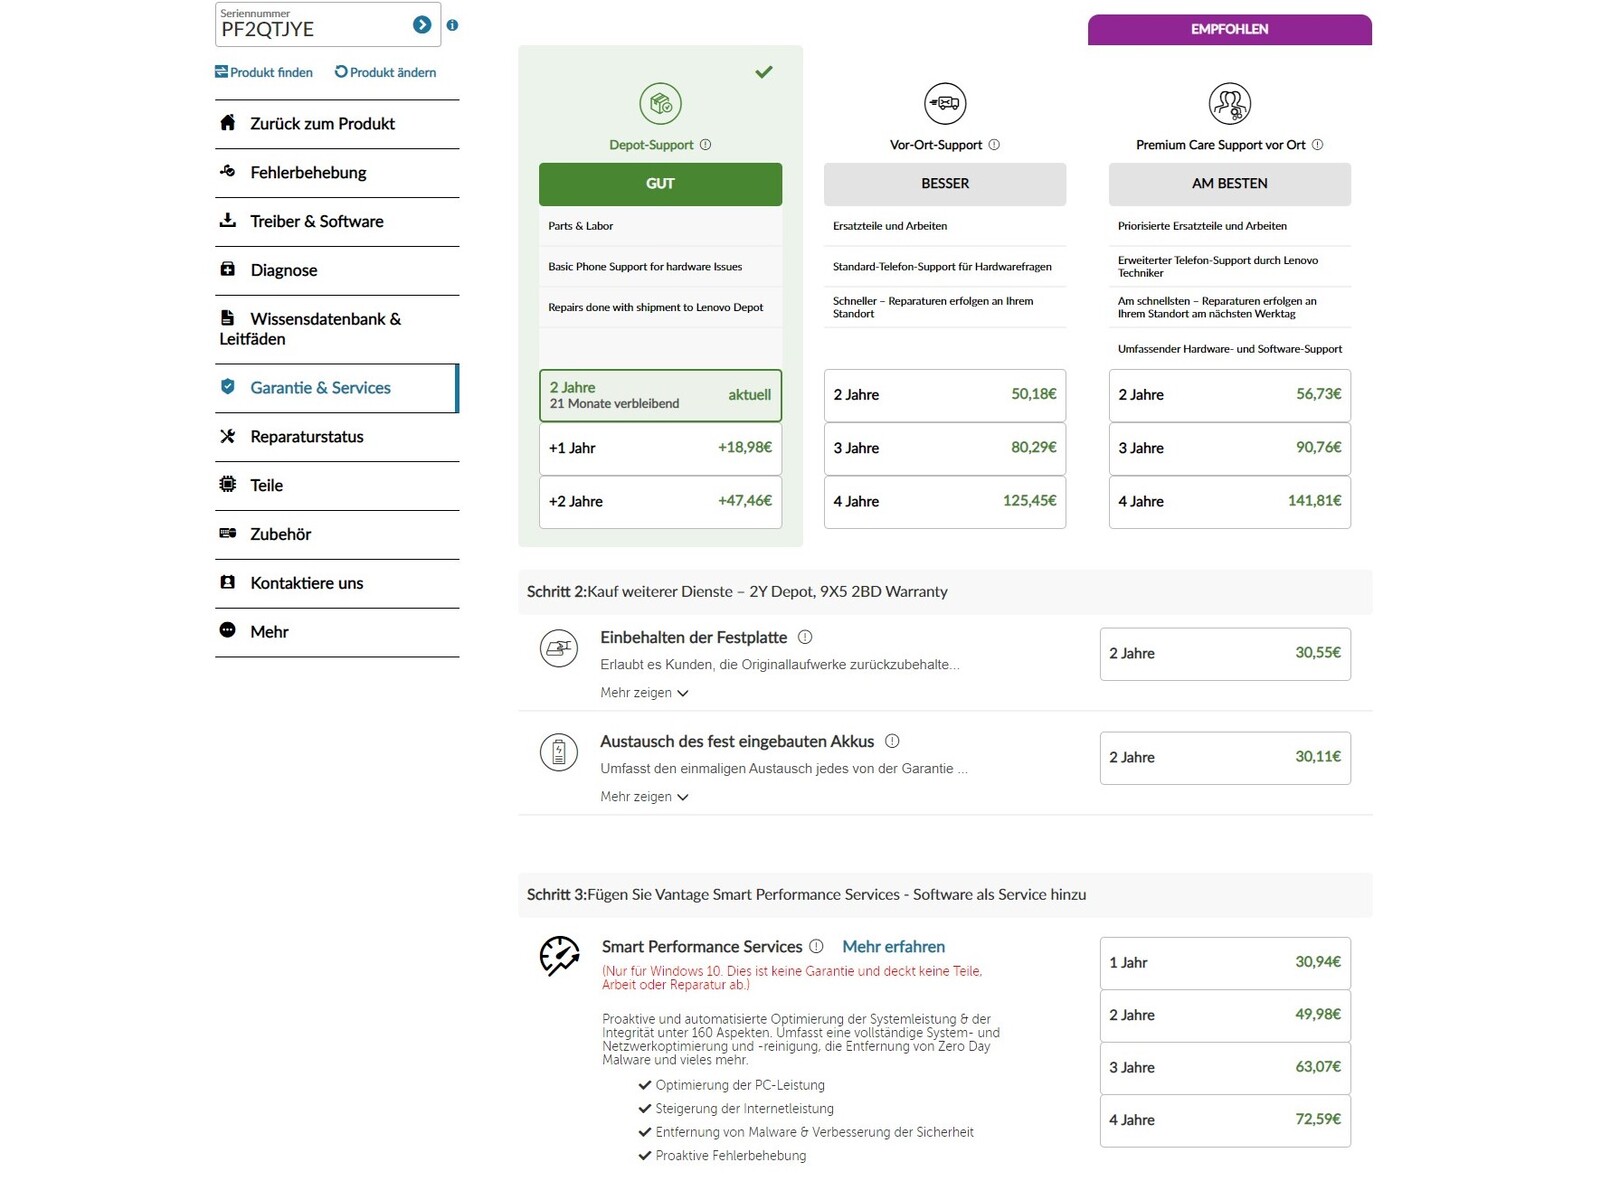
The Lenovo Legion 5 Pro comes with a two-year warranty on all of the hardware except for the battery. This warranty can be expanded by up to two years via the Lenovo Vantage application or Lenovo's support webpage. In addition, Lenovo also allows purchasing more service options, such as on-site support or an expanded support for two to four years.
Input Devices - A little bit of RGB illumination
Keyboard
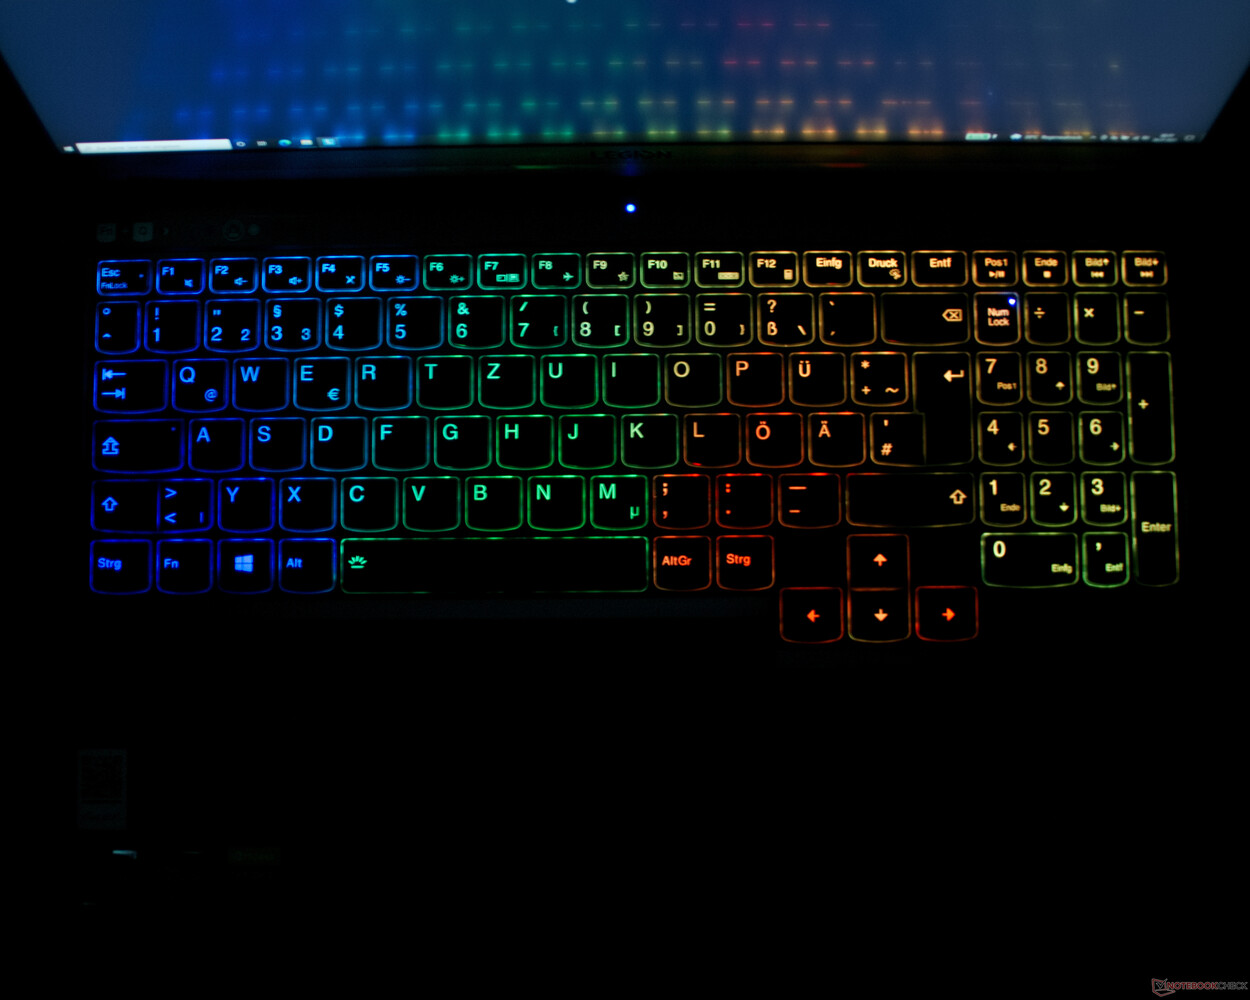
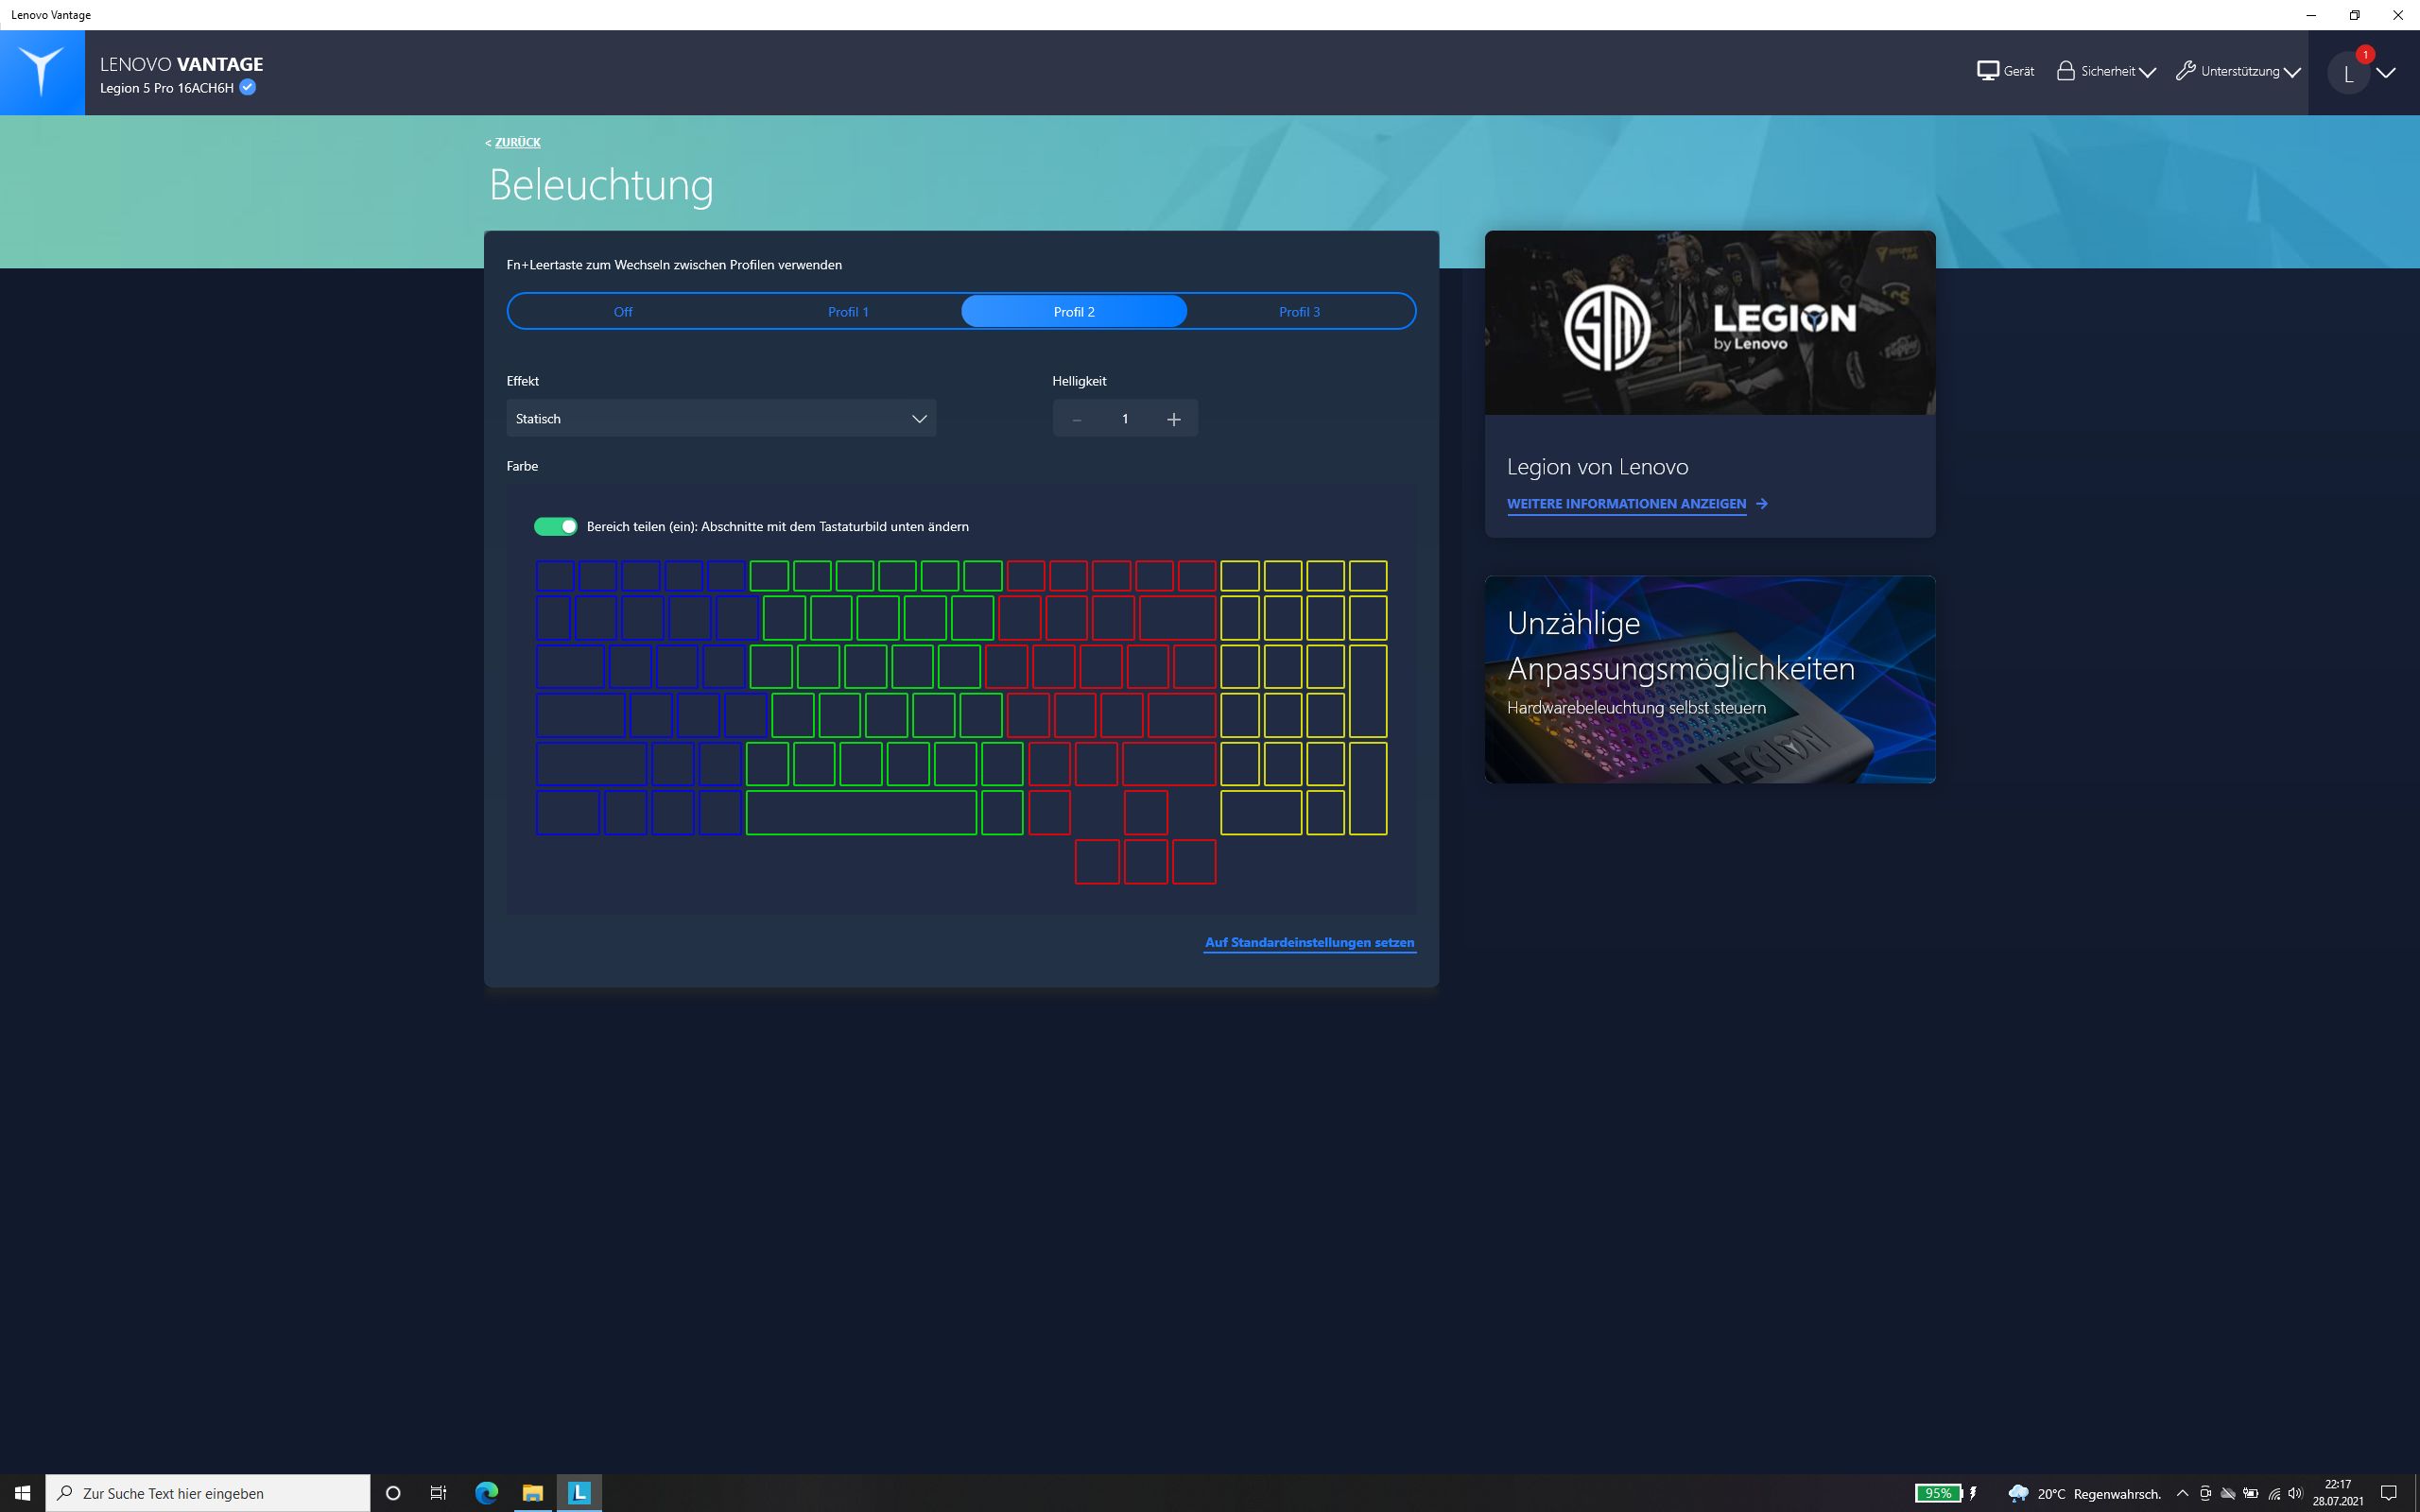
The Legion Pro 5 gaming laptop is equipped with an RGB-illuminated island keyboard. The key stroke of slightly more than 1 mm (~0.04 in) is quite comfortable. The key size of approx. 16 × 15 mm (~0.63 x 0.59 in) corresponds approximately to that of a standard keyboard. While gaming, the keys show a good response behavior. The keyboard illumination offers two brightness levels and four areas where you can adjust the color. Since the transitions between the areas are not abrupt, they show mixed colors. The Lenovo Vantage application allows you to select among various illumination modes and effects.
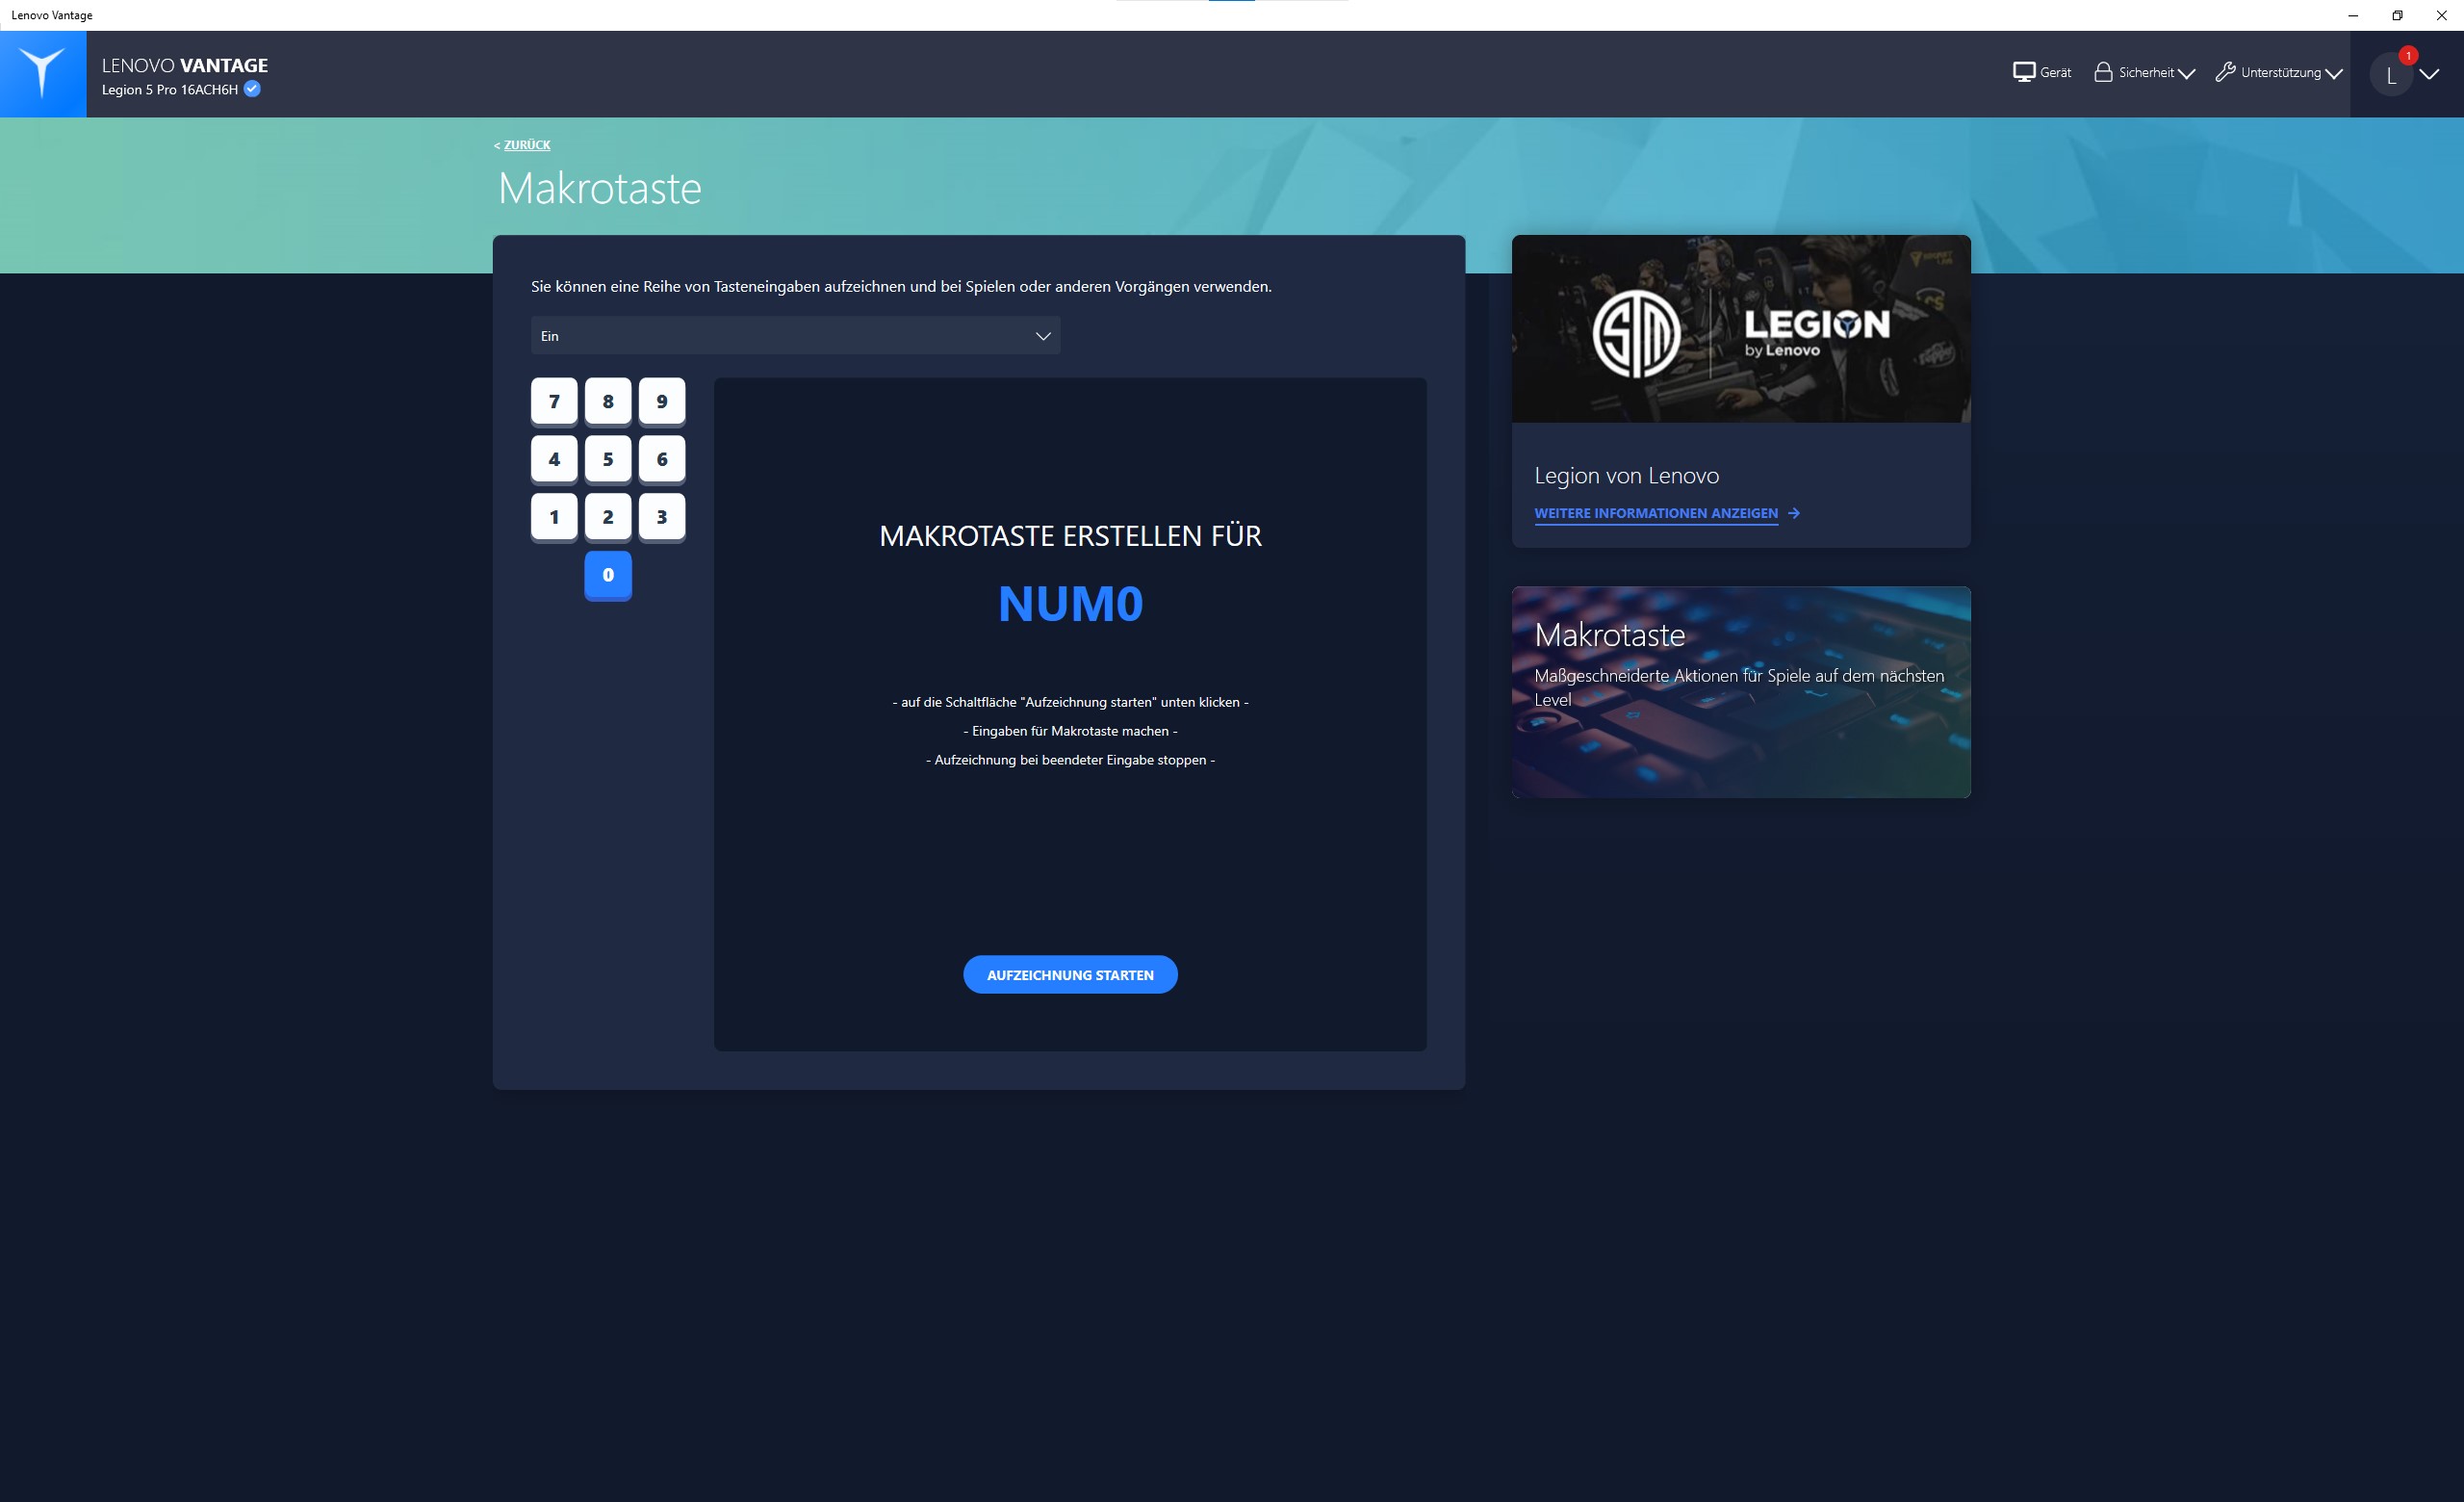
The macros for games and other applications, which can be set in the Vantage application, represent an additional value. The macros can also be programmed fairly easily using the Lenovo Vantage application.
Touchpad
The multitouch-capable ClickPad has a comfortable size and a very smooth surface. However, its positioning towards the left and the integrated keys make using the ClickPad harder while gaming, since the hands are constantly in each other's way.
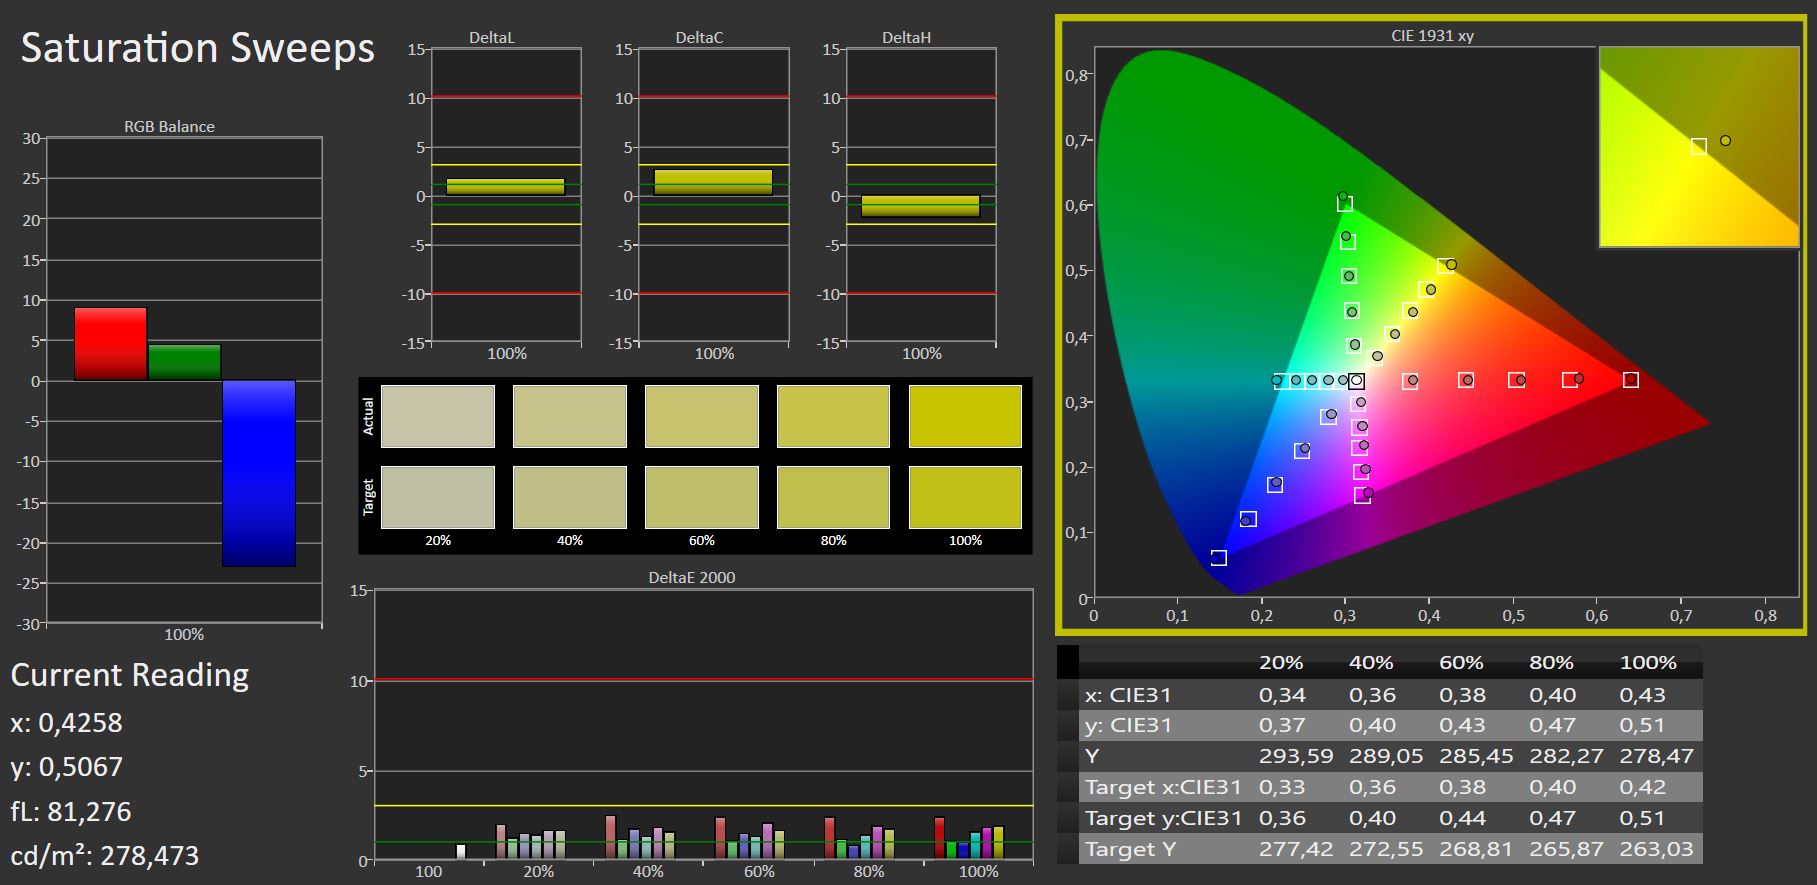
Display - A super bright QHD panel with 165 Hz
With its high QHD resolution and 165-Hz refresh rate, the matte display in the 16:10 format is very well-suited for gaming. In addition, the display panel supports Adaptive Sync.
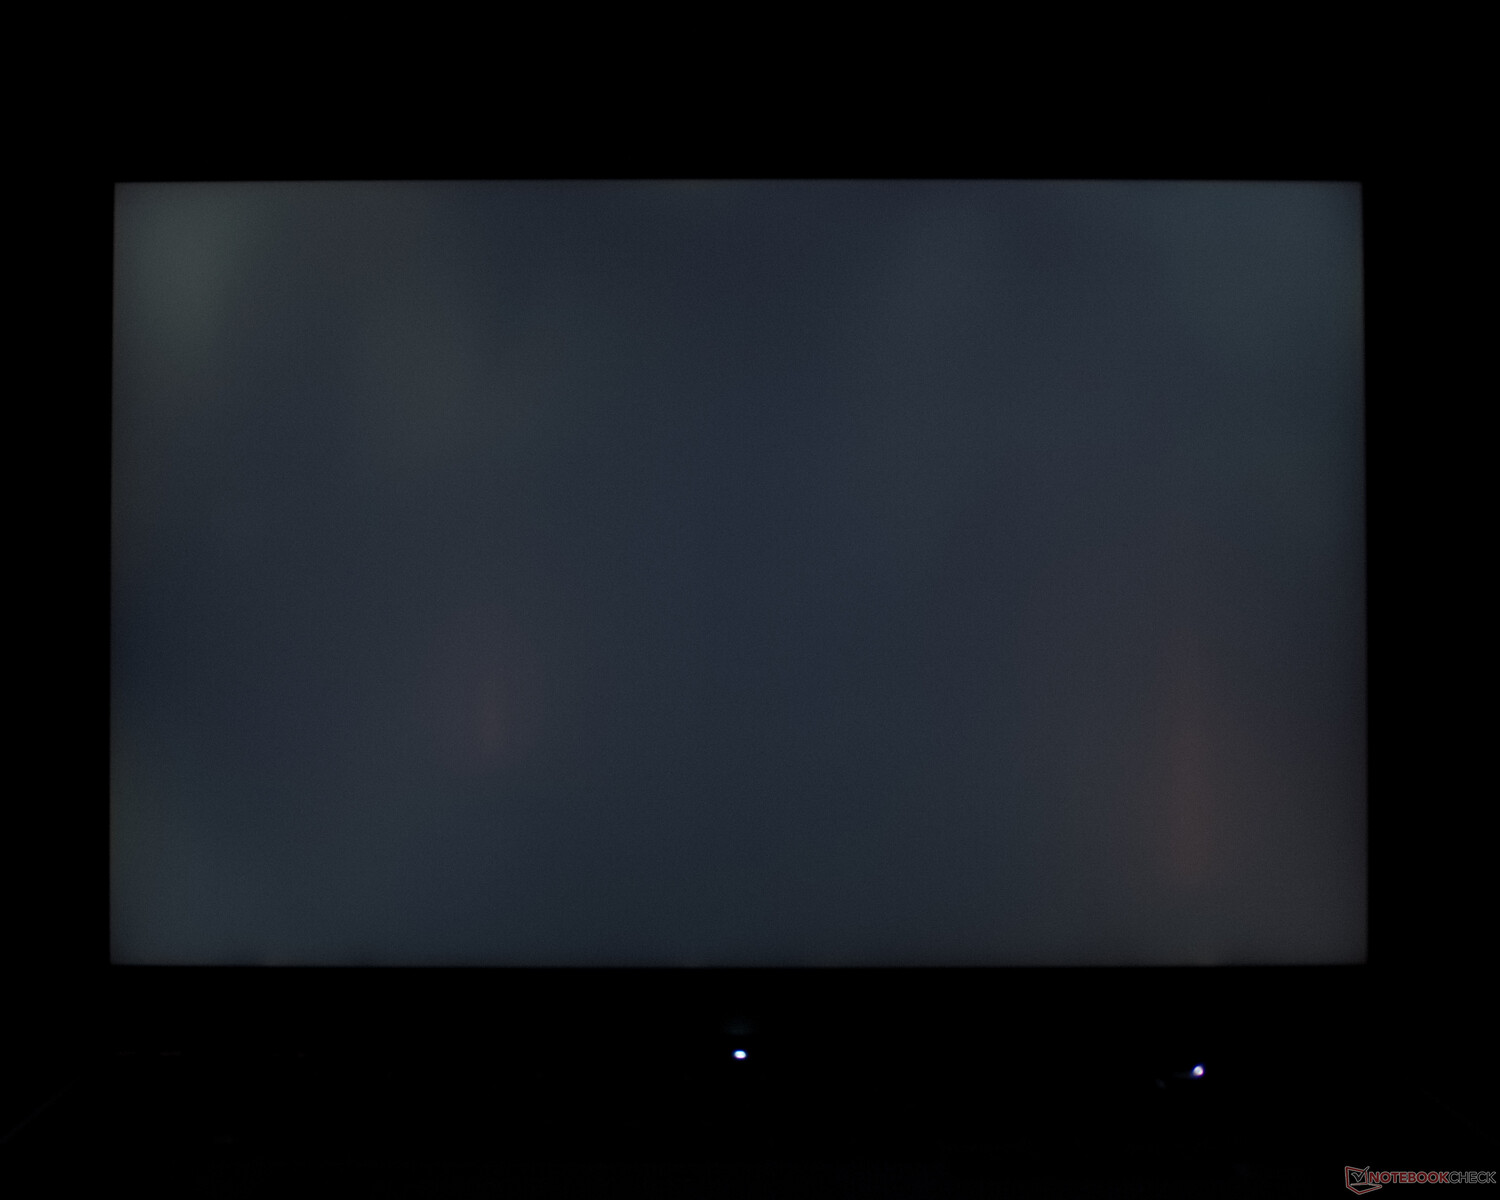
At an average brightness of 522.6 cd/m², the display in the Lenovo Legion is very bright. If you start the laptop at its highest brightness settings, this can already feel uncomfortable for the eyes. The screen bleeding shown in the image to the right only occurs if Dolby Vision is deactivated and the brightness set to the maximum level.
| |||||||||||||||||||||||||
Brightness Distribution: 88 %
Center on Battery: 547 cd/m²
Contrast: 1020:1 (Black: 0.54 cd/m²)
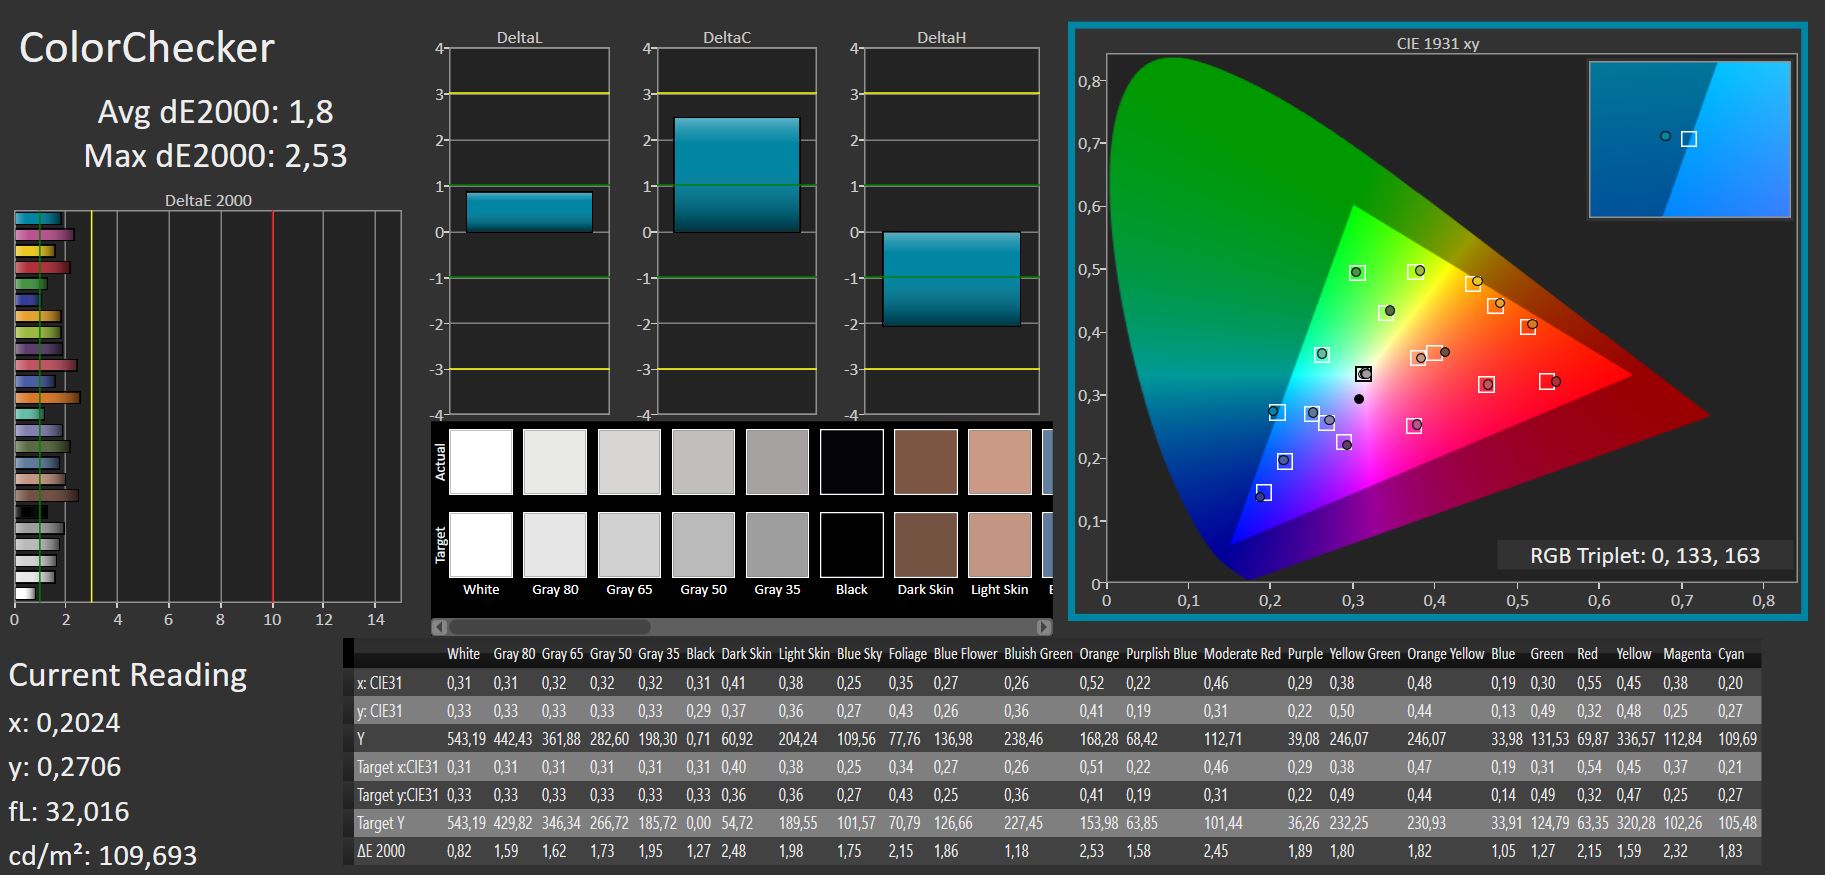
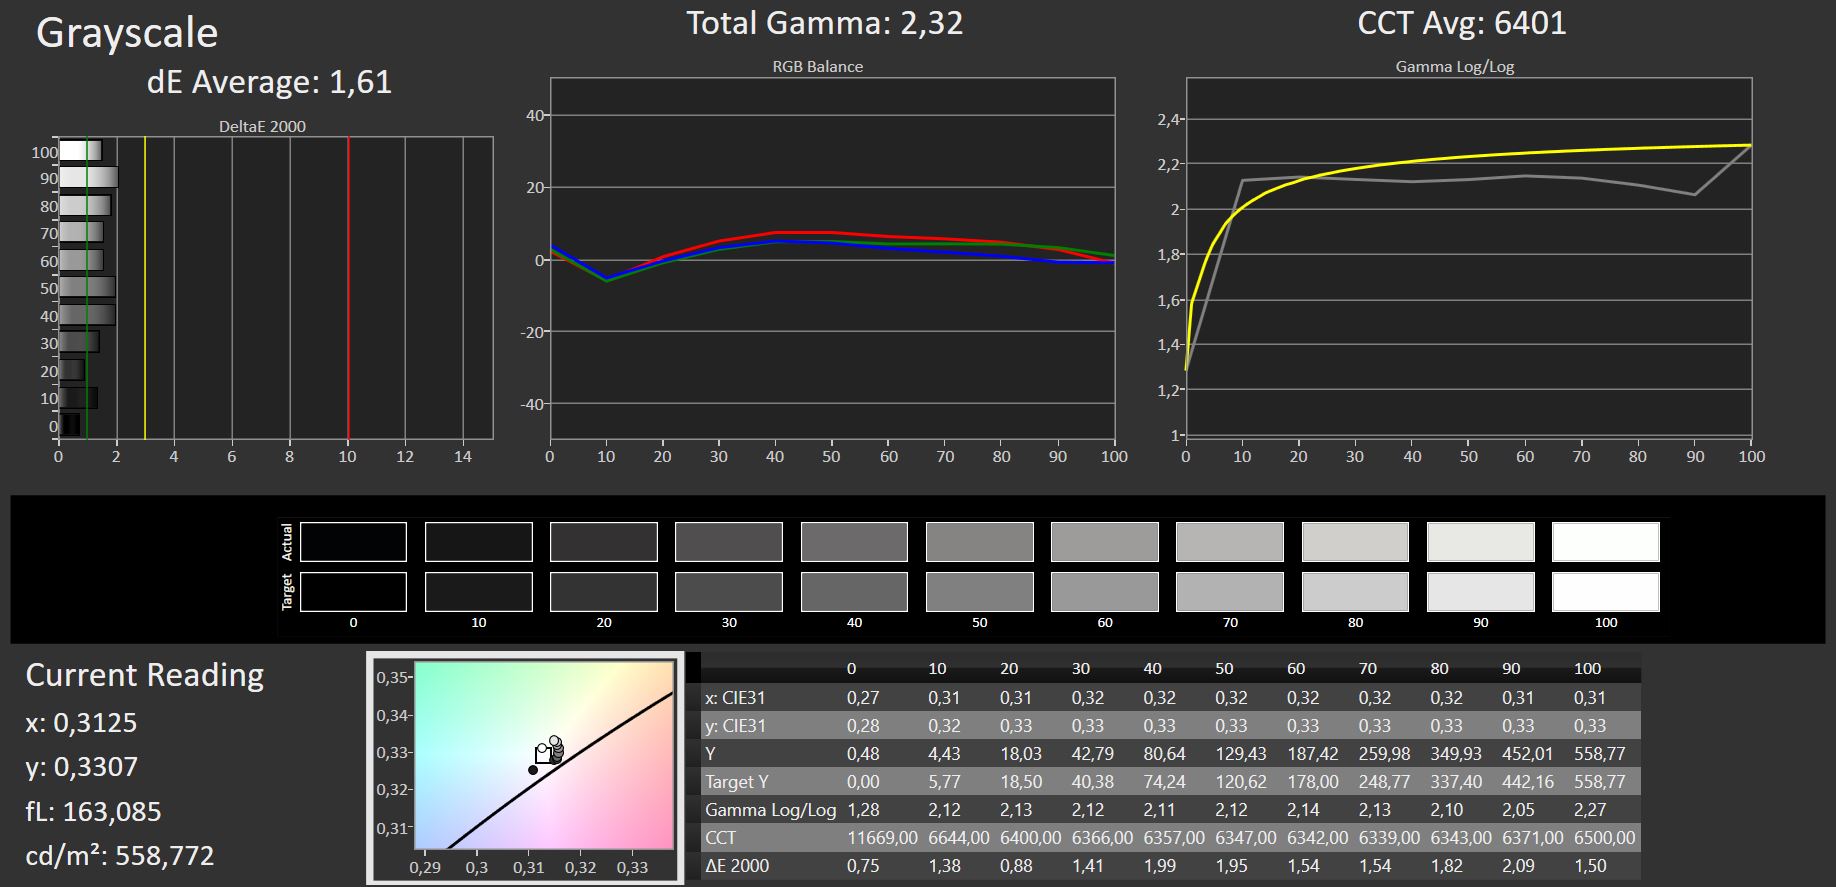
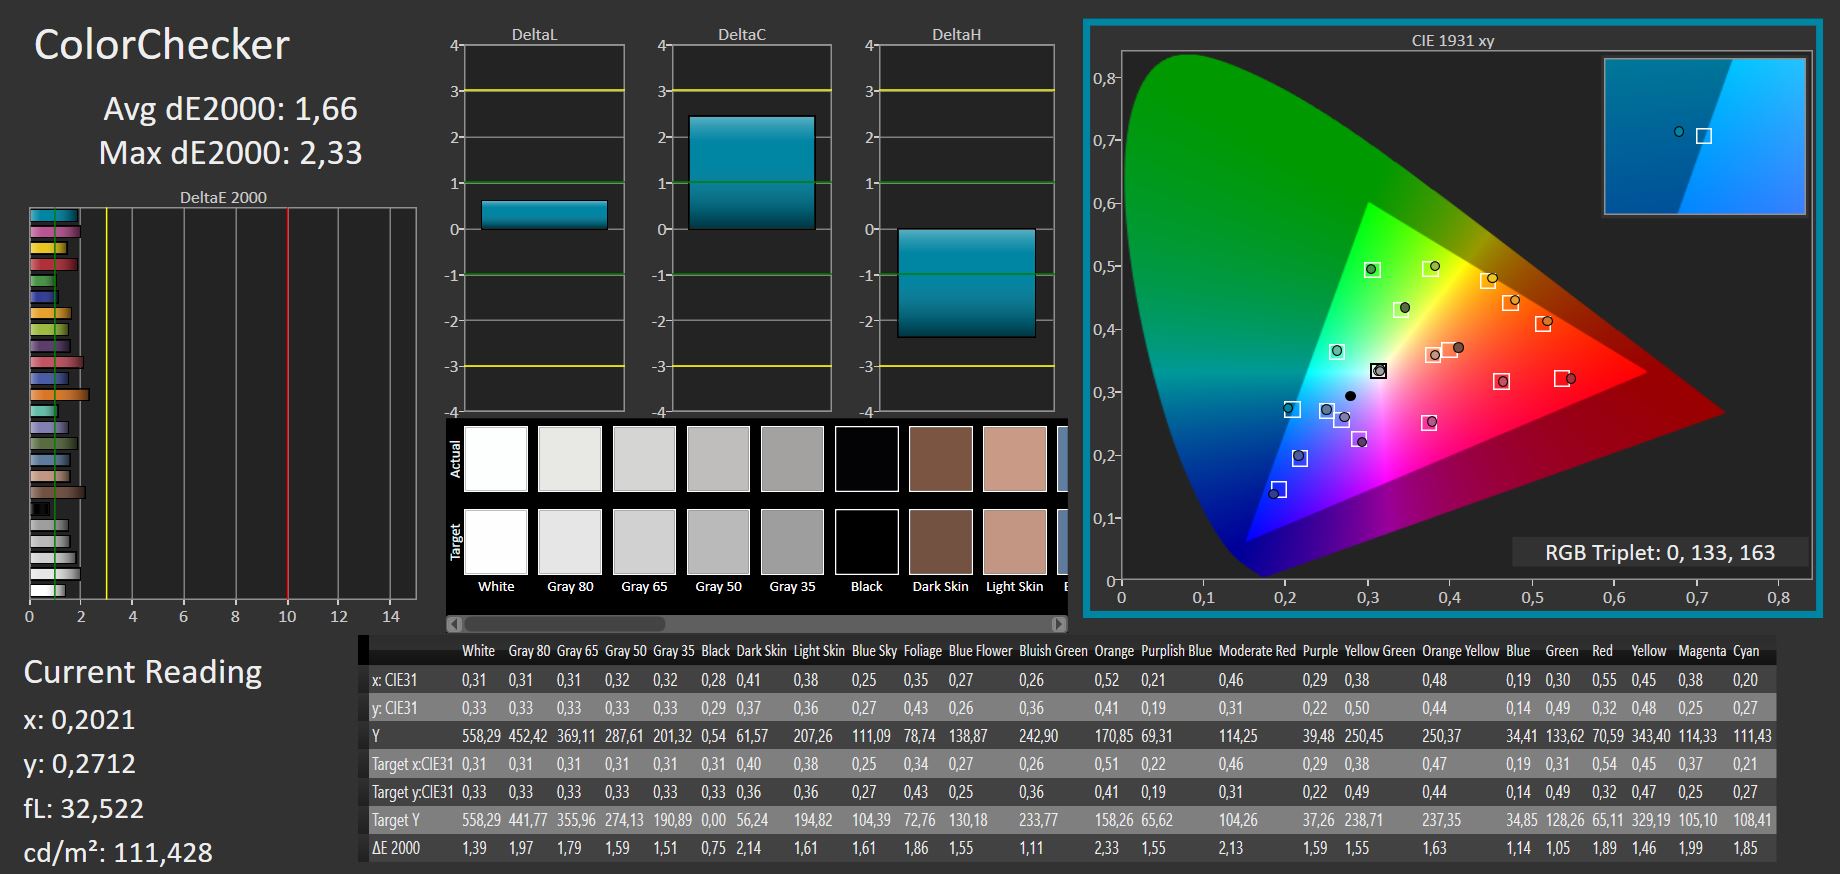
ΔE ColorChecker Calman: 1.8 | ∀{0.5-29.43 Ø4.71}
calibrated: 1.66
ΔE Greyscale Calman: 1.85 | ∀{0.09-98 Ø4.96}
99.41% sRGB (Argyll 1.6.3 3D)
72.81% AdobeRGB 1998 (Argyll 1.6.3 3D)
73% AdobeRGB 1998 (Argyll 3D)
99% sRGB (Argyll 3D)
Gamma: 2.3
CCT: 6338 K
| Lenovo Legion 5 Pro 16ACH6H (82JQ001PGE) CSOT T3 MNG007DA1-1, IPS, 2560x1600, 16" | Asus ROG Strix G15 G513QY Sharp SHP152C, IPS, 1920x1080, 15.6" | Medion Erazer Beast X25 BOE NE173FHM-NZ1 (BOE0884), IPS, 1920x1080, 17.3" | Alienware m15 R4 LG Philips LGD066E, IPS, 1920x1080, 15.6" | Schenker XMG Neo 17 (Early 2021, RTX 3070, 5800H) BOE NE173QHM-NY2 (BOE0977), IPS, 2560x1440, 17.3" | Asus TUF Gaming A15 FA506QR-AZ061T Sharp SHP1532, IPS, 1920x1080, 15.6" | |
|---|---|---|---|---|---|---|
| Display | -4% | -1% | -2% | -1% | ||
| Display P3 Coverage (%) | 66.5 | 70.4 | 69.4 | 70.5 | ||
| sRGB Coverage (%) | 99 | 97.7 -1% | 99.8 1% | 99 0% | 99.5 1% | |
| AdobeRGB 1998 Coverage (%) | 73 | 67.6 -7% | 71.6 -2% | 70.5 -3% | 71.8 -2% | |
| Response Times | -48% | -9% | -44% | -96% | -49% | |
| Response Time Grey 50% / Grey 80% * (ms) | 9.2 ? | 8 ? 13% | 9.2 ? -0% | 7.4 ? 20% | 16.8 ? -83% | 12 ? -30% |
| Response Time Black / White * (ms) | 4.8 | 10 ? -108% | 5.6 ? -17% | 10 ? -108% | 10 ? -108% | 8 ? -67% |
| PWM Frequency (Hz) | 1250 ? | |||||
| Screen | -67% | -23% | -7% | -17% | -5% | |
| Brightness middle (cd/m²) | 551 | 306 -44% | 329 -40% | 333 -40% | 410 -26% | 297 -46% |
| Brightness (cd/m²) | 523 | 283 -46% | 315 -40% | 303 -42% | 381 -27% | 268 -49% |
| Brightness Distribution (%) | 88 | 86 -2% | 88 0% | 86 -2% | 88 0% | 84 -5% |
| Black Level * (cd/m²) | 0.54 | 0.25 54% | 0.33 39% | 0.29 46% | 0.37 31% | 0.22 59% |
| Contrast (:1) | 1020 | 1224 20% | 997 -2% | 1148 13% | 1108 9% | 1350 32% |
| Colorchecker dE 2000 * | 1.8 | 4.97 -176% | 2.03 -13% | 1.8 -0% | 2.55 -42% | 1.36 24% |
| Colorchecker dE 2000 max. * | 2.53 | 10.12 -300% | 5.5 -117% | 4.49 -77% | 4.33 -71% | 3.82 -51% |
| Colorchecker dE 2000 calibrated * | 1.66 | 0.7 58% | 0.82 51% | 1.13 32% | 1.28 23% | |
| Greyscale dE 2000 * | 1.85 | 7.2 -289% | 3.5 -89% | 1.9 -3% | 3.4 -84% | 1.88 -2% |
| Gamma | 2.3 96% | 2.23 99% | 2.223 99% | 2.265 97% | 2.275 97% | 2.48 89% |
| CCT | 6338 103% | 7784 84% | 6526 100% | 6840 95% | 6637 98% | 6768 96% |
| Color Space (Percent of AdobeRGB 1998) (%) | 72.81 | 67.6 -7% | 71 -2% | 72 -1% | 63 -13% | |
| Color Space (Percent of sRGB) (%) | 99.41 | 97.7 -2% | 93 -6% | 95 -4% | 99 0% | |
| Total Average (Program / Settings) | -40% /
-56% | -11% /
-18% | -18% /
-11% | -38% /
-26% | -27% /
-12% |
* ... smaller is better
The display of the Legion Pro 5 covers almost 100% of the sRGB color space. Colors are reproduced accurately in the state of delivery as well as after the calibration with CalMan. You can download our color profile from the link in the info box above.
At 1020:1, the contrast ratio is rather average. It is worthwhile to slightly reduce the display brightness and activate Dolby Vision. At less than 70% brightness, dark image areas will gain in intensity. Thanks to its fast response times, the display is well-suited for gamers.


Outdoors, the display of the Lenovo Legion Pro 5 strikes a good figure. The matte surface hardly produces any reflections, and the display brightness ensures easy readability even in bright sunlight.
Display Response Times
| ↔ Response Time Black to White | ||
|---|---|---|
| 4.8 ms ... rise ↗ and fall ↘ combined | ↗ ms rise | 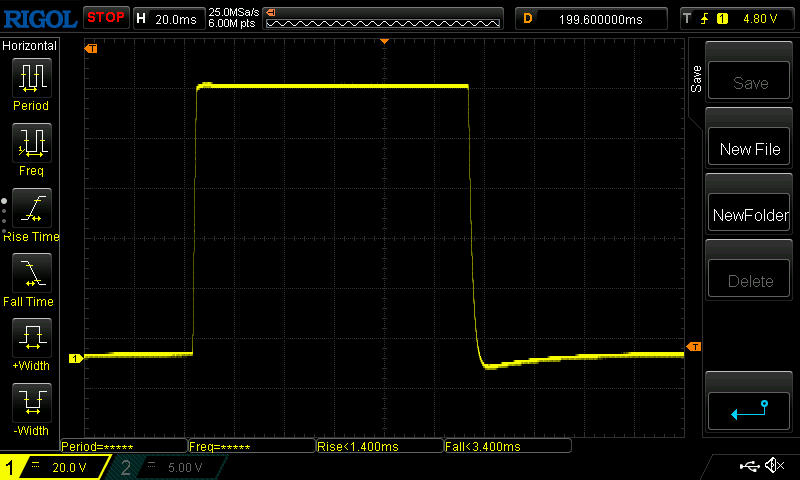 |
| ↘ ms fall | ||
| The screen shows very fast response rates in our tests and should be very well suited for fast-paced gaming. In comparison, all tested devices range from 0.1 (minimum) to 240 (maximum) ms. » 17 % of all devices are better. This means that the measured response time is better than the average of all tested devices (19.8 ms). | ||
| ↔ Response Time 50% Grey to 80% Grey | ||
| 9.2 ms ... rise ↗ and fall ↘ combined | ↗ 3 ms rise | 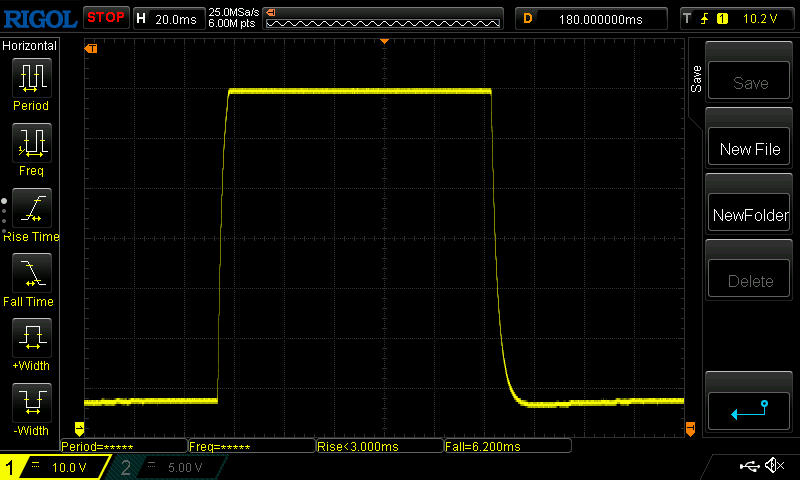 |
| ↘ 6.2 ms fall | ||
| The screen shows fast response rates in our tests and should be suited for gaming. In comparison, all tested devices range from 0.165 (minimum) to 636 (maximum) ms. » 23 % of all devices are better. This means that the measured response time is better than the average of all tested devices (31 ms). | ||
Screen Flickering / PWM (Pulse-Width Modulation)
| Screen flickering / PWM not detected | ||
In comparison: 52 % of all tested devices do not use PWM to dim the display. If PWM was detected, an average of 7747 (minimum: 5 - maximum: 343500) Hz was measured. | ||
The viewing angle stability also shows that Lenovo uses a good display. There are no noticeable distortions in the color reproduction, and only the brightness changes slightly depending on the viewing angle.

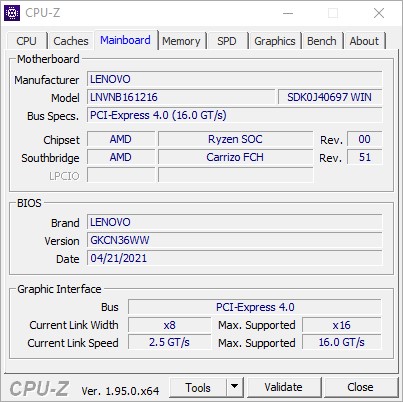
Performance - AMD and Nvidia complement each other very well
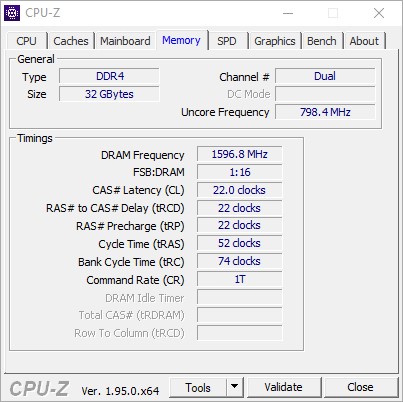
Our test unit is equipped with an AMD Ryzen 7-5800H processor, an Nividia GeForce RTX 3070, 32 GB of DDR-4 RAM, and a 1-TB NVMe SSD from Western Digital. With this, the laptop offers sufficient computing performance for current games, and there should also be sufficient performance reserves in the Legion 5 Pro for image and video processing. All the tests were run in the high performance mode with the AMD Radeon graphics chip deactivated.
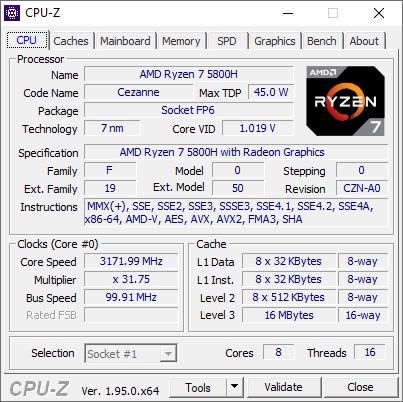

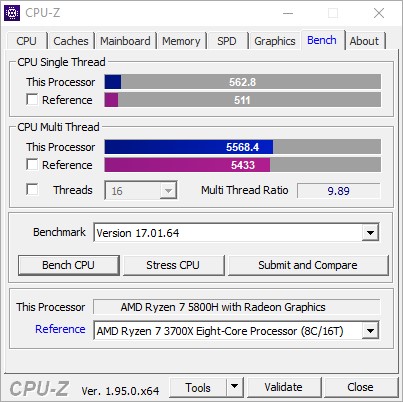
Processor
The AMD Ryzen 7 5800H is a mobile processor for larger laptops that are supposed to offer a higher class of performance. The processor can be configured by the manufacturer with a TDP between 35 and 54 watts, with Lenovo deciding for the golden middle of 45 watts. It is surprising that most benchmarks don't show a significant performance advantage of the better Ryzen 9 5900HX. The Intel processors in the competitors from Alienware and MSI all performed at a fairly similar level as the Ryzen 7. The AMD processor in the Lenovo Legion 5 Pro benefits considerably from applications with a large number of threads, so that it often ends up at the top of the comparison field in multi-threading applications.
Cinebench R15 Multi Constant Test
Cinebench R20: CPU (Single Core) | CPU (Multi Core)
Cinebench R15: CPU Single 64Bit | CPU Multi 64Bit
Blender: v2.79 BMW27 CPU
7-Zip 18.03: 7z b 4 -mmt1 | 7z b 4
Geekbench 5.5: Single-Core | Multi-Core
HWBOT x265 Benchmark v2.2: 4k Preset
LibreOffice : 20 Documents To PDF
R Benchmark 2.5: Overall mean
| Cinebench R23 / Single Core | |
| Average of class Gaming (1166 - 2415, n=107, last 2 years) | |
| Medion Erazer Beast X25 | |
| Asus ROG Strix G15 G513QR | |
| Alienware m15 R5 Ryzen Edition | |
| Average AMD Ryzen 7 5800H (1294 - 1441, n=29) | |
| Lenovo Legion 5 Pro 16ACH6H (82JQ001PGE) | |
| Lenovo Legion 5 Pro 16ACH6H (82JQ001PGE) | |
| Cinebench R23 / Multi Core | |
| Average of class Gaming (10488 - 42661, n=107, last 2 years) | |
| Asus ROG Strix G15 G513QR | |
| Lenovo Legion 5 Pro 16ACH6H (82JQ001PGE) | |
| Lenovo Legion 5 Pro 16ACH6H (82JQ001PGE) | |
| Medion Erazer Beast X25 | |
| Alienware m15 R5 Ryzen Edition | |
| Average AMD Ryzen 7 5800H (8812 - 13214, n=29) | |
| Cinebench R20 / CPU (Single Core) | |
| Average of class Gaming (442 - 913, n=106, last 2 years) | |
| MSI GE76 Raider 11UH-472US | |
| MSI GE76 Raider 11UH-472US | |
| Medion Erazer Beast X25 | |
| Asus ROG Strix G15 G513QR | |
| Alienware m15 R5 Ryzen Edition | |
| Asus TUF Gaming A15 FA506QR-AZ061T | |
| Average AMD Ryzen 7 5800H (502 - 560, n=30) | |
| Lenovo Legion 5 Pro 16ACH6H (82JQ001PGE) | |
| Lenovo Legion 5 Pro 16ACH6H (82JQ001PGE) | |
| Cinebench R20 / CPU (Multi Core) | |
| Average of class Gaming (4029 - 16433, n=106, last 2 years) | |
| MSI GE76 Raider 11UH-472US | |
| MSI GE76 Raider 11UH-472US | |
| Asus ROG Strix G15 G513QR | |
| Lenovo Legion 5 Pro 16ACH6H (82JQ001PGE) | |
| Lenovo Legion 5 Pro 16ACH6H (82JQ001PGE) | |
| Medion Erazer Beast X25 | |
| Alienware m15 R5 Ryzen Edition | |
| Average AMD Ryzen 7 5800H (3430 - 5020, n=31) | |
| Asus TUF Gaming A15 FA506QR-AZ061T | |
| Cinebench R15 / CPU Single 64Bit | |
| Average of class Gaming (188.8 - 350, n=106, last 2 years) | |
| Medion Erazer Beast X25 | |
| Asus ROG Strix G15 G513QR | |
| Asus TUF Gaming A15 FA506QR-AZ061T | |
| Alienware m15 R5 Ryzen Edition | |
| MSI GE76 Raider 11UH-472US | |
| MSI GE76 Raider 11UH-472US | |
| Lenovo Legion 5 Pro 16ACH6H (82JQ001PGE) | |
| Lenovo Legion 5 Pro 16ACH6H (82JQ001PGE) | |
| Average AMD Ryzen 7 5800H (209 - 234, n=29) | |
| Cinebench R15 / CPU Multi 64Bit | |
| Average of class Gaming (1578 - 6330, n=105, last 2 years) | |
| MSI GE76 Raider 11UH-472US | |
| MSI GE76 Raider 11UH-472US | |
| Asus ROG Strix G15 G513QR | |
| Lenovo Legion 5 Pro 16ACH6H (82JQ001PGE) | |
| Medion Erazer Beast X25 | |
| Asus TUF Gaming A15 FA506QR-AZ061T | |
| Alienware m15 R5 Ryzen Edition | |
| Average AMD Ryzen 7 5800H (1487 - 2119, n=28) | |
| Blender / v2.79 BMW27 CPU | |
| MSI GE76 Raider 11UH-472US | |
| MSI GE76 Raider 11UH-472US | |
| Asus TUF Gaming A15 FA506QR-AZ061T | |
| Average AMD Ryzen 7 5800H (237 - 340, n=29) | |
| Lenovo Legion 5 Pro 16ACH6H (82JQ001PGE) | |
| Lenovo Legion 5 Pro 16ACH6H (82JQ001PGE) | |
| Alienware m15 R5 Ryzen Edition | |
| Medion Erazer Beast X25 | |
| Asus ROG Strix G15 G513QR | |
| Average of class Gaming (79 - 330, n=104, last 2 years) | |
| 7-Zip 18.03 / 7z b 4 -mmt1 | |
| Average of class Gaming (4199 - 7436, n=105, last 2 years) | |
| Medion Erazer Beast X25 | |
| MSI GE76 Raider 11UH-472US | |
| MSI GE76 Raider 11UH-472US | |
| Alienware m15 R5 Ryzen Edition | |
| Asus ROG Strix G15 G513QR | |
| Asus TUF Gaming A15 FA506QR-AZ061T | |
| Lenovo Legion 5 Pro 16ACH6H (82JQ001PGE) | |
| Lenovo Legion 5 Pro 16ACH6H (82JQ001PGE) | |
| Average AMD Ryzen 7 5800H (5038 - 5632, n=29) | |
| 7-Zip 18.03 / 7z b 4 | |
| Average of class Gaming (33491 - 148086, n=105, last 2 years) | |
| Medion Erazer Beast X25 | |
| Lenovo Legion 5 Pro 16ACH6H (82JQ001PGE) | |
| Lenovo Legion 5 Pro 16ACH6H (82JQ001PGE) | |
| MSI GE76 Raider 11UH-472US | |
| MSI GE76 Raider 11UH-472US | |
| Asus ROG Strix G15 G513QR | |
| Average AMD Ryzen 7 5800H (45773 - 59986, n=28) | |
| Alienware m15 R5 Ryzen Edition | |
| Asus TUF Gaming A15 FA506QR-AZ061T | |
| Geekbench 5.5 / Single-Core | |
| Average of class Gaming (986 - 2474, n=105, last 2 years) | |
| MSI GE76 Raider 11UH-472US | |
| MSI GE76 Raider 11UH-472US | |
| Medion Erazer Beast X25 | |
| Asus ROG Strix G15 G513QR | |
| Alienware m15 R5 Ryzen Edition | |
| Average AMD Ryzen 7 5800H (1336 - 1505, n=28) | |
| Asus TUF Gaming A15 FA506QR-AZ061T | |
| Lenovo Legion 5 Pro 16ACH6H (82JQ001PGE) | |
| Lenovo Legion 5 Pro 16ACH6H (82JQ001PGE) | |
| Geekbench 5.5 / Multi-Core | |
| Average of class Gaming (6460 - 28263, n=105, last 2 years) | |
| MSI GE76 Raider 11UH-472US | |
| MSI GE76 Raider 11UH-472US | |
| Medion Erazer Beast X25 | |
| Lenovo Legion 5 Pro 16ACH6H (82JQ001PGE) | |
| Lenovo Legion 5 Pro 16ACH6H (82JQ001PGE) | |
| Average AMD Ryzen 7 5800H (6551 - 9062, n=28) | |
| Asus TUF Gaming A15 FA506QR-AZ061T | |
| Alienware m15 R5 Ryzen Edition | |
| Asus ROG Strix G15 G513QR | |
| HWBOT x265 Benchmark v2.2 / 4k Preset | |
| Average of class Gaming (11.5 - 44.4, n=105, last 2 years) | |
| MSI GE76 Raider 11UH-472US | |
| MSI GE76 Raider 11UH-472US | |
| Lenovo Legion 5 Pro 16ACH6H (82JQ001PGE) | |
| Lenovo Legion 5 Pro 16ACH6H (82JQ001PGE) | |
| Medion Erazer Beast X25 | |
| Alienware m15 R5 Ryzen Edition | |
| Average AMD Ryzen 7 5800H (11.6 - 16.1, n=29) | |
| Asus ROG Strix G15 G513QR | |
| Asus TUF Gaming A15 FA506QR-AZ061T | |
| LibreOffice / 20 Documents To PDF | |
| Lenovo Legion 5 Pro 16ACH6H (82JQ001PGE) | |
| Lenovo Legion 5 Pro 16ACH6H (82JQ001PGE) | |
| Average AMD Ryzen 7 5800H (47.4 - 113, n=29) | |
| Alienware m15 R5 Ryzen Edition | |
| Asus ROG Strix G15 G513QR | |
| Average of class Gaming (33.2 - 88.8, n=105, last 2 years) | |
| Medion Erazer Beast X25 | |
| Asus TUF Gaming A15 FA506QR-AZ061T | |
| MSI GE76 Raider 11UH-472US | |
| MSI GE76 Raider 11UH-472US | |
| R Benchmark 2.5 / Overall mean | |
| MSI GE76 Raider 11UH-472US | |
| MSI GE76 Raider 11UH-472US | |
| Lenovo Legion 5 Pro 16ACH6H (82JQ001PGE) | |
| Lenovo Legion 5 Pro 16ACH6H (82JQ001PGE) | |
| Average AMD Ryzen 7 5800H (0.511 - 0.559, n=28) | |
| Alienware m15 R5 Ryzen Edition | |
| Asus ROG Strix G15 G513QR | |
| Asus TUF Gaming A15 FA506QR-AZ061T | |
| Medion Erazer Beast X25 | |
| Average of class Gaming (0.3439 - 0.759, n=106, last 2 years) | |
* ... smaller is better
System Performance
The benchmarks with PCMark 10 show some smaller weaknesses in performance compared to the competitors. In terms of the points in the separate Essentials and Productivity test sections, the Lenovo laptop ends up significantly behind in the comparison field. Only in the Digital Content Creation section, the gaming laptop places a safe second. Our search for the bottleneck reveals some apparent weaknesses of the built-in SSD. The Essentials and Productivity sections test for fast storage access.
However, these small weaknesses aren't really noticeable. While the number of points achieved are very good values, they are unfortunately slightly below those of the comparison devices. In everyday operation, this will at most result in some disadvantages in the load times, but those can be expressed in fractions of seconds.
| PCMark 10 / Score | |
| Average of class Gaming (5828 - 12414, n=93, last 2 years) | |
| MSI GE76 Raider 11UH-472US | |
| MSI GE76 Raider 11UH-472US | |
| Asus ROG Strix G15 G513QR | |
| Asus TUF Gaming A15 FA506QR-AZ061T | |
| Average AMD Ryzen 7 5800H, NVIDIA GeForce RTX 3070 Laptop GPU (6717 - 6983, n=6) | |
| Medion Erazer Beast X25 | |
| Lenovo Legion 5 Pro 16ACH6H (82JQ001PGE) | |
| Alienware m15 R4 | |
| Alienware m15 R5 Ryzen Edition | |
| PCMark 10 / Essentials | |
| Average of class Gaming (8810 - 11935, n=97, last 2 years) | |
| MSI GE76 Raider 11UH-472US | |
| MSI GE76 Raider 11UH-472US | |
| Asus TUF Gaming A15 FA506QR-AZ061T | |
| Average AMD Ryzen 7 5800H, NVIDIA GeForce RTX 3070 Laptop GPU (9548 - 10226, n=6) | |
| Medion Erazer Beast X25 | |
| Alienware m15 R5 Ryzen Edition | |
| Alienware m15 R4 | |
| Lenovo Legion 5 Pro 16ACH6H (82JQ001PGE) | |
| PCMark 10 / Productivity | |
| Average of class Gaming (6845 - 25323, n=95, last 2 years) | |
| Asus TUF Gaming A15 FA506QR-AZ061T | |
| Medion Erazer Beast X25 | |
| Average AMD Ryzen 7 5800H, NVIDIA GeForce RTX 3070 Laptop GPU (8849 - 9514, n=6) | |
| MSI GE76 Raider 11UH-472US | |
| MSI GE76 Raider 11UH-472US | |
| Alienware m15 R5 Ryzen Edition | |
| Lenovo Legion 5 Pro 16ACH6H (82JQ001PGE) | |
| Alienware m15 R4 | |
| PCMark 10 / Digital Content Creation | |
| Average of class Gaming (7602 - 19954, n=95, last 2 years) | |
| MSI GE76 Raider 11UH-472US | |
| MSI GE76 Raider 11UH-472US | |
| Lenovo Legion 5 Pro 16ACH6H (82JQ001PGE) | |
| Alienware m15 R4 | |
| Average AMD Ryzen 7 5800H, NVIDIA GeForce RTX 3070 Laptop GPU (8948 - 10389, n=6) | |
| Medion Erazer Beast X25 | |
| Asus TUF Gaming A15 FA506QR-AZ061T | |
| Alienware m15 R5 Ryzen Edition | |
| PCMark 10 Score | 6717 points | |
Help | ||
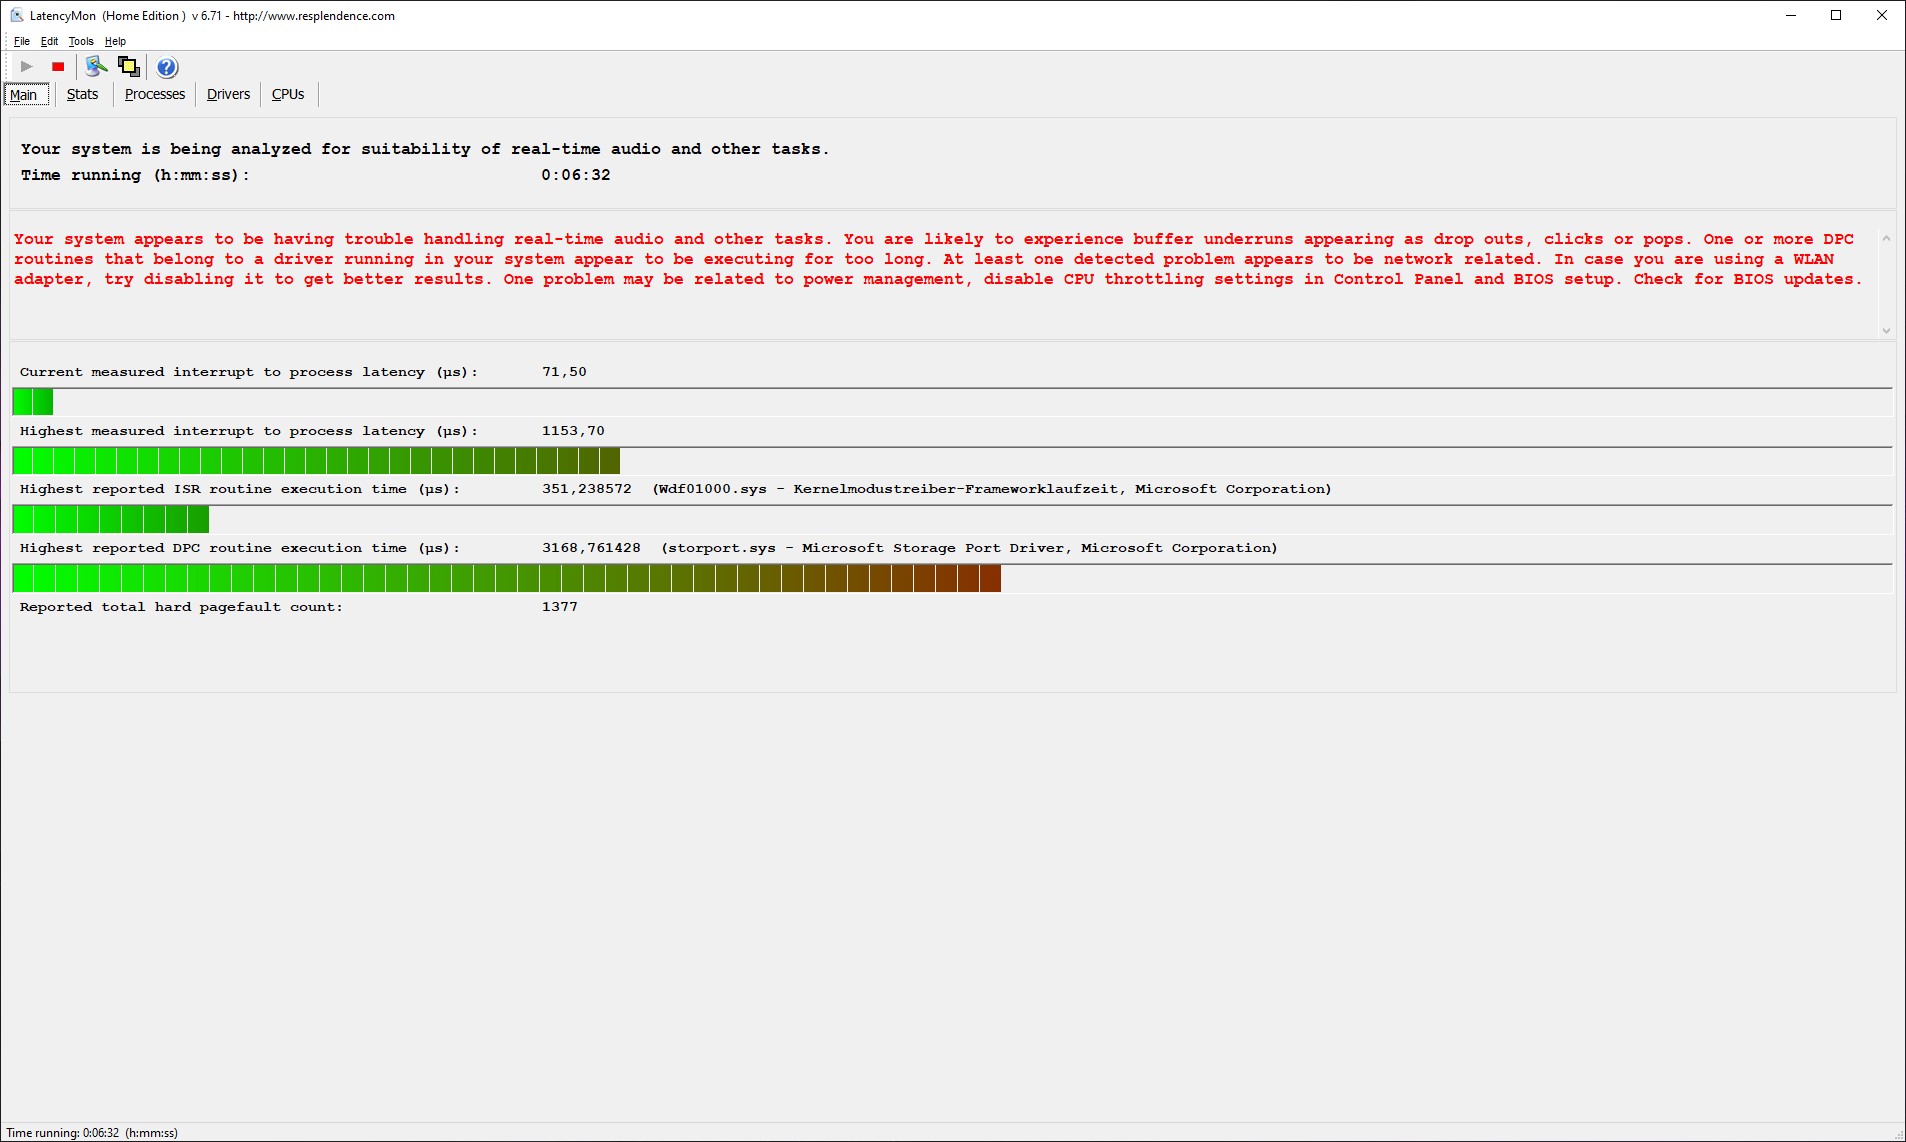
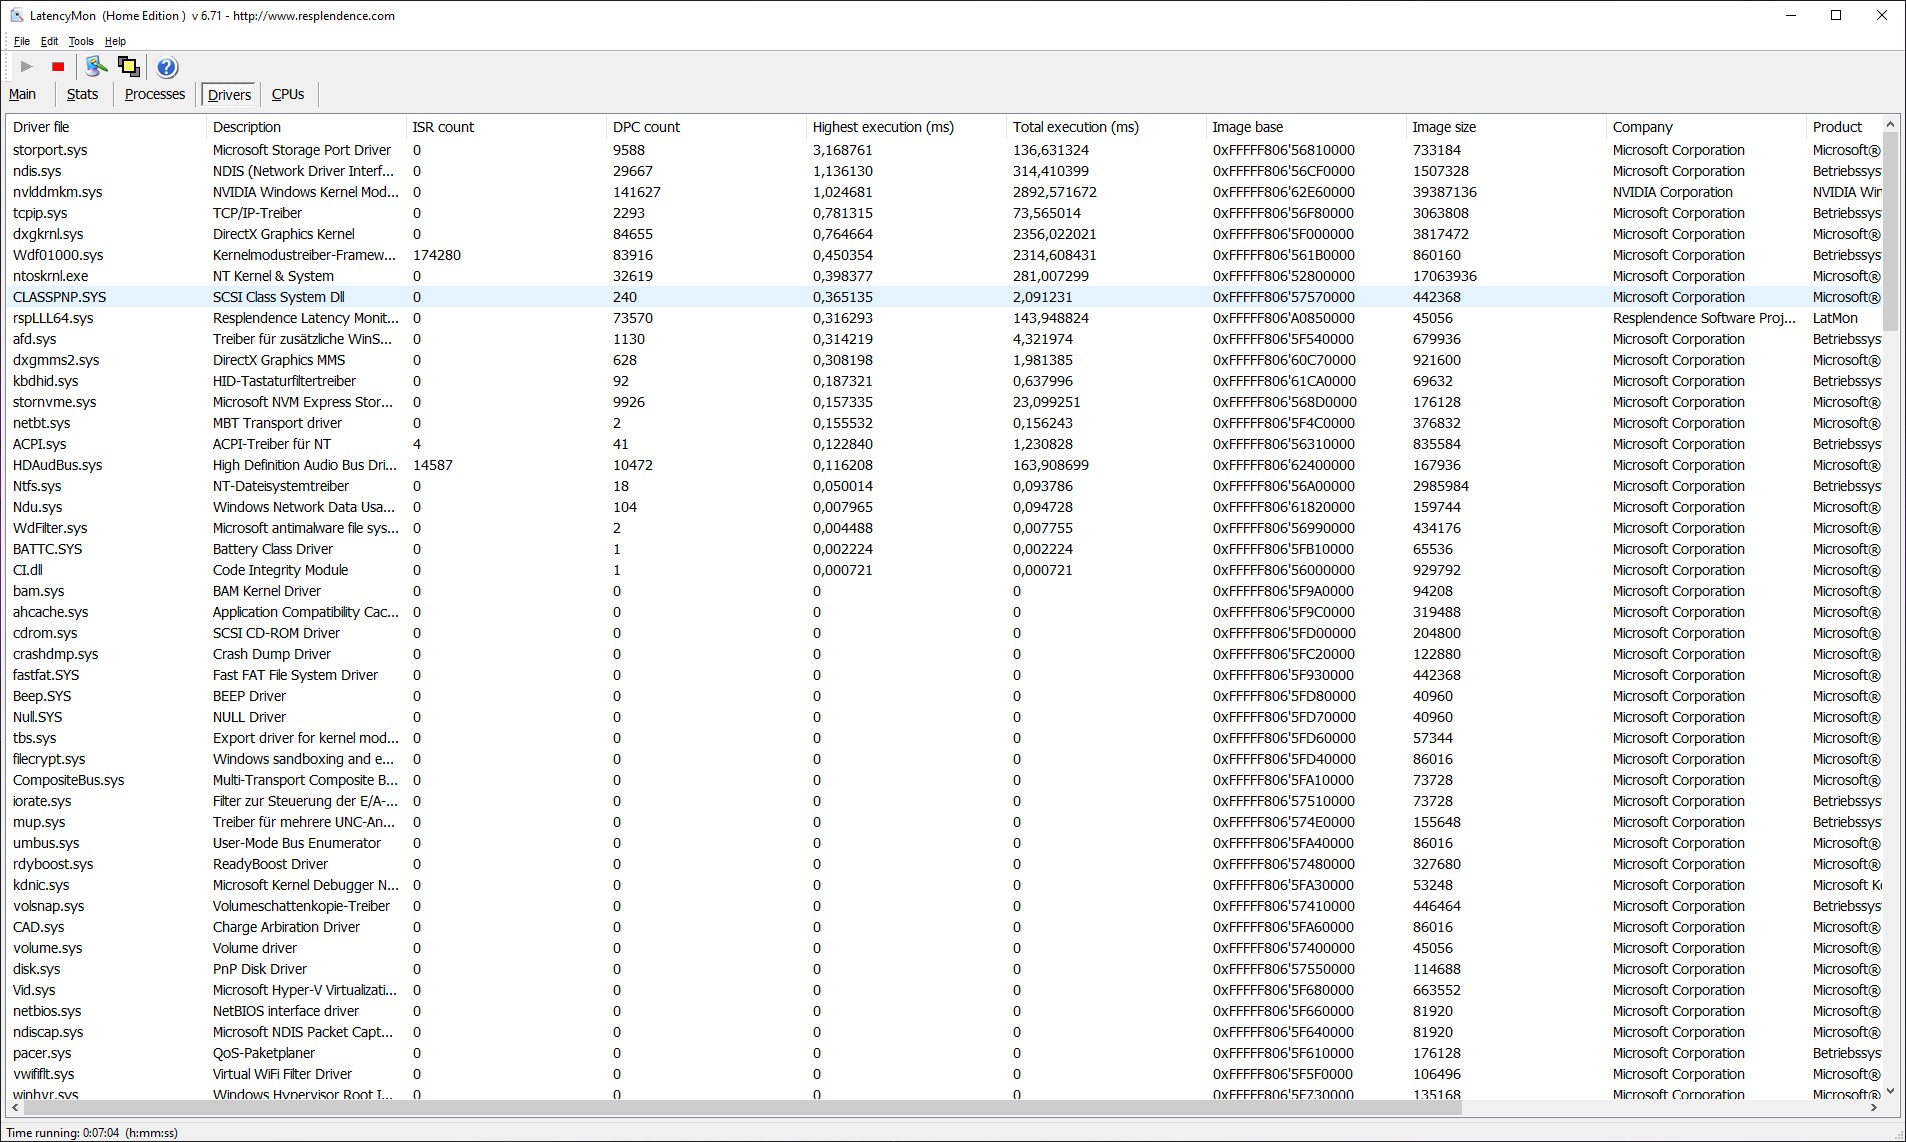
DPC Latencies
Even though gaming laptops should show latencies that are particularly low, the latency test also reveals some deficits in the Lenovo Legion 5 Pro. The measured maximum latencies are too high, even if they are fairly similar to the results of the comparison field.

| DPC Latencies / LatencyMon - interrupt to process latency (max), Web, Youtube, Prime95 | |
| Alienware m15 R4 | |
| Schenker XMG Neo 17 (Early 2021, RTX 3070, 5800H) | |
| Lenovo Legion 5 Pro 16ACH6H (82JQ001PGE) | |
| Medion Erazer Beast X25 | |
| Asus ROG Strix G15 G513QR | |
| Alienware m15 R5 Ryzen Edition | |
* ... smaller is better
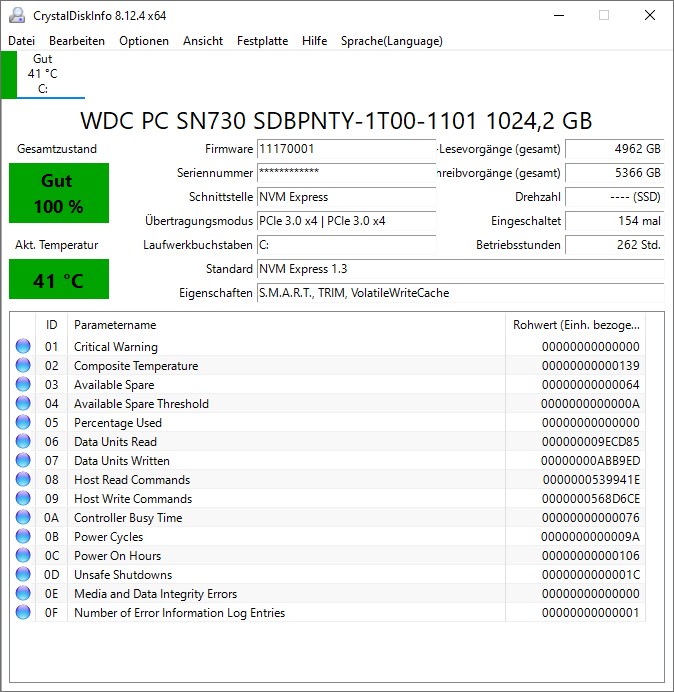
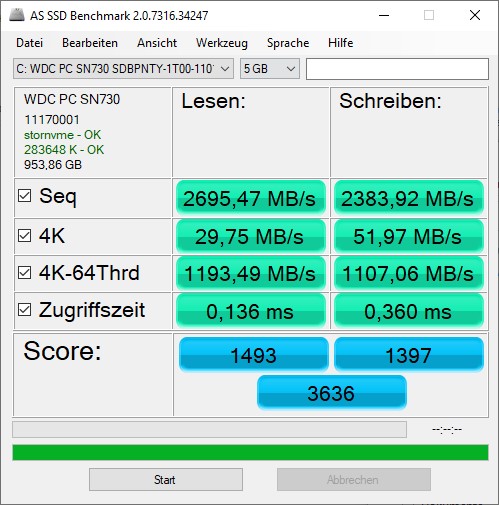
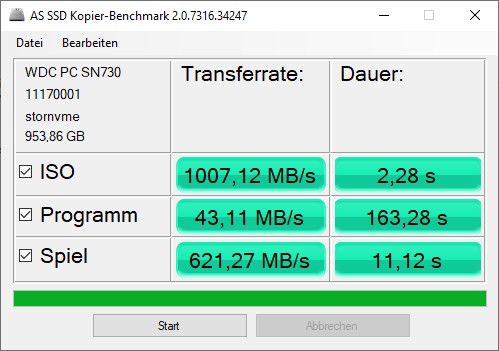
Storage Solution
The SSD from Western Digital that Lenovo used in the test unit is a bit slow for a gaming laptop. The benchmarks with AS SSD and CrystalDiskMark show some slight shortcomings in the access times and the data transfer of many small files. Even though the storage solution is not a bad SSD in general, there is some room for improvement here.
You can find additional information and benchmarks in our hard drive and SSD table.
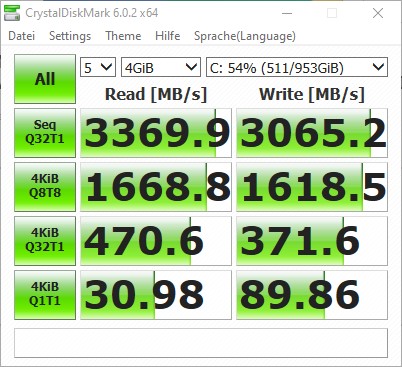
| Lenovo Legion 5 Pro 16ACH6H (82JQ001PGE) WDC PC SN730 SDBPNTY-1T00 | Medion Erazer Beast X25 Samsung PM9A1 MZVL22T0HBLB | Asus ROG Strix G15 G513QY Samsung PM991 MZVLQ512HALU | MSI GE76 Raider 11UH-472US Samsung PM9A1 MZVL21T0HCLR | Alienware m15 R5 Ryzen Edition Toshiba KBG40ZNS512G NVMe | Schenker XMG Neo 17 (Early 2021, RTX 3070, 5800H) Samsung SSD 970 EVO Plus 500GB | Average WDC PC SN730 SDBPNTY-1T00 | |
|---|---|---|---|---|---|---|---|
| CrystalDiskMark 5.2 / 6 | 33% | 9% | 113% | 3% | 48% | 7% | |
| Write 4K (MB/s) | 89.9 | 129.7 44% | 140.4 56% | 238.8 166% | 116.9 30% | 206.1 129% | 139.9 ? 56% |
| Read 4K (MB/s) | 30.98 | 62.4 101% | 48.91 58% | 88 184% | 44.56 44% | 53 71% | 44.5 ? 44% |
| Write 4K Q32T1 (MB/s) | 371.6 | 512 38% | 482.5 30% | 699 88% | 497.8 34% | 535 44% | 442 ? 19% |
| Read 4K Q32T1 (MB/s) | 470.6 | 436.2 -7% | 553 18% | 752 60% | 436.8 -7% | 608 29% | 460 ? -2% |
| Write Seq Q32T1 (MB/s) | 3065 | 3541 16% | 1612 -47% | 5119 67% | 1461 -52% | 3242 6% | 3049 ? -1% |
| Read Seq Q32T1 (MB/s) | 3370 | 3568 6% | 3105 -8% | 7086 110% | 2364 -30% | 3617 7% | 3285 ? -3% |
| Write 4K Q8T8 (MB/s) | 1619 | 1202 -26% | 1012 ? -37% | ||||
| Read 4K Q8T8 (MB/s) | 1670 | 1451 -13% | 1300 ? -22% | ||||
| AS SSD | 65% | 171% | 120% | 111% | 73% | 133% | |
| Seq Read (MB/s) | 2695 | 2591 -4% | 2706 0% | 5435 102% | 2082 -23% | 3020 12% | 2606 ? -3% |
| Seq Write (MB/s) | 2384 | 1900 -20% | 1652 -31% | 3954 66% | 825 -65% | 2631 10% | 1935 ? -19% |
| 4K Read (MB/s) | 29.75 | 53.9 81% | 45.46 53% | 52.9 78% | 42.41 43% | 60.3 103% | 42.9 ? 44% |
| 4K Write (MB/s) | 52 | 112.6 117% | 128.5 147% | 158.8 205% | 98.3 89% | 171.6 230% | 129.1 ? 148% |
| 4K-64 Read (MB/s) | 1193 | 1335 12% | 1342 12% | 2551 114% | 1255 5% | 1410 18% | 1361 ? 14% |
| 4K-64 Write (MB/s) | 1107 | 2966 168% | 1066 -4% | 3155 185% | 738 -33% | 2324 110% | 1920 ? 73% |
| Access Time Read * (ms) | 0.136 | 0.038 72% | 0.095 30% | 0.044 68% | 0.109 20% | 0.045 67% | 0.0689 ? 49% |
| Access Time Write * (ms) | 0.36 | 0.036 90% | 0.03 92% | 0.026 93% | 0.17 53% | 0.024 93% | 0.06215 ? 83% |
| Score Read (Points) | 1493 | 1648 10% | 1658 11% | 3148 111% | 1506 1% | 1773 19% | 1664 ? 11% |
| Score Write (Points) | 1397 | 3269 134% | 1360 -3% | 3709 165% | 918 -34% | 2759 97% | 2242 ? 60% |
| Score Total (Points) | 3636 | 5733 58% | 3818 5% | 8383 131% | 3136 -14% | 5429 49% | 4726 ? 30% |
| Copy ISO MB/s (MB/s) | 1007 | 1838 83% | 1391 38% | 2041 ? 103% | |||
| Copy Program MB/s (MB/s) | 43.11 | 848 1867% | 645 1396% | 552 ? 1180% | |||
| Copy Game MB/s (MB/s) | 621 | 1409 127% | 1101 77% | 1183 ? 90% | |||
| Total Average (Program / Settings) | 49% /
54% | 90% /
112% | 117% /
117% | 57% /
79% | 61% /
64% | 70% /
87% |
* ... smaller is better

Constant Performance Reading: DiskSpd Read Loop, Queue Depth 8
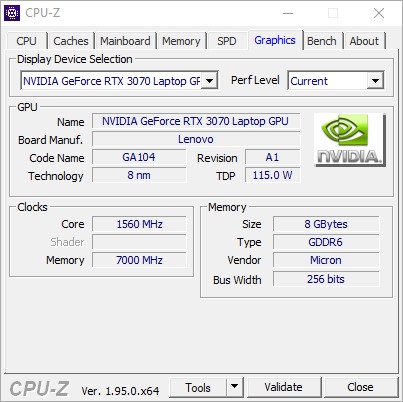
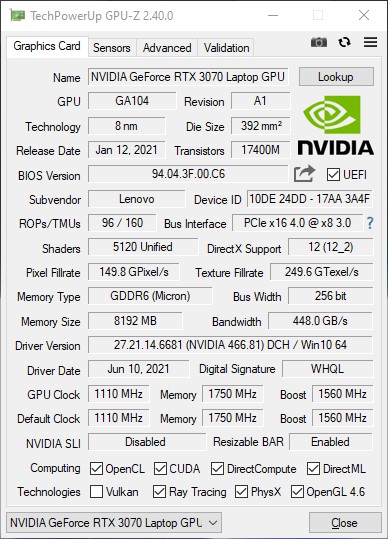
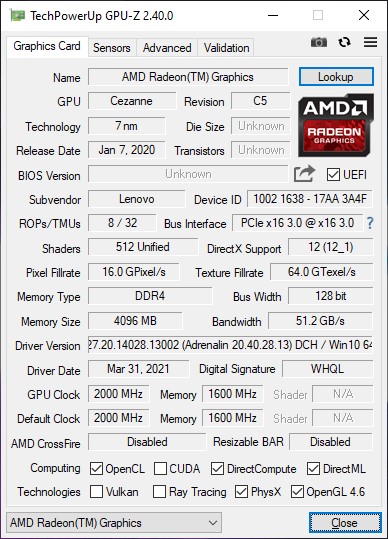
Graphics Card
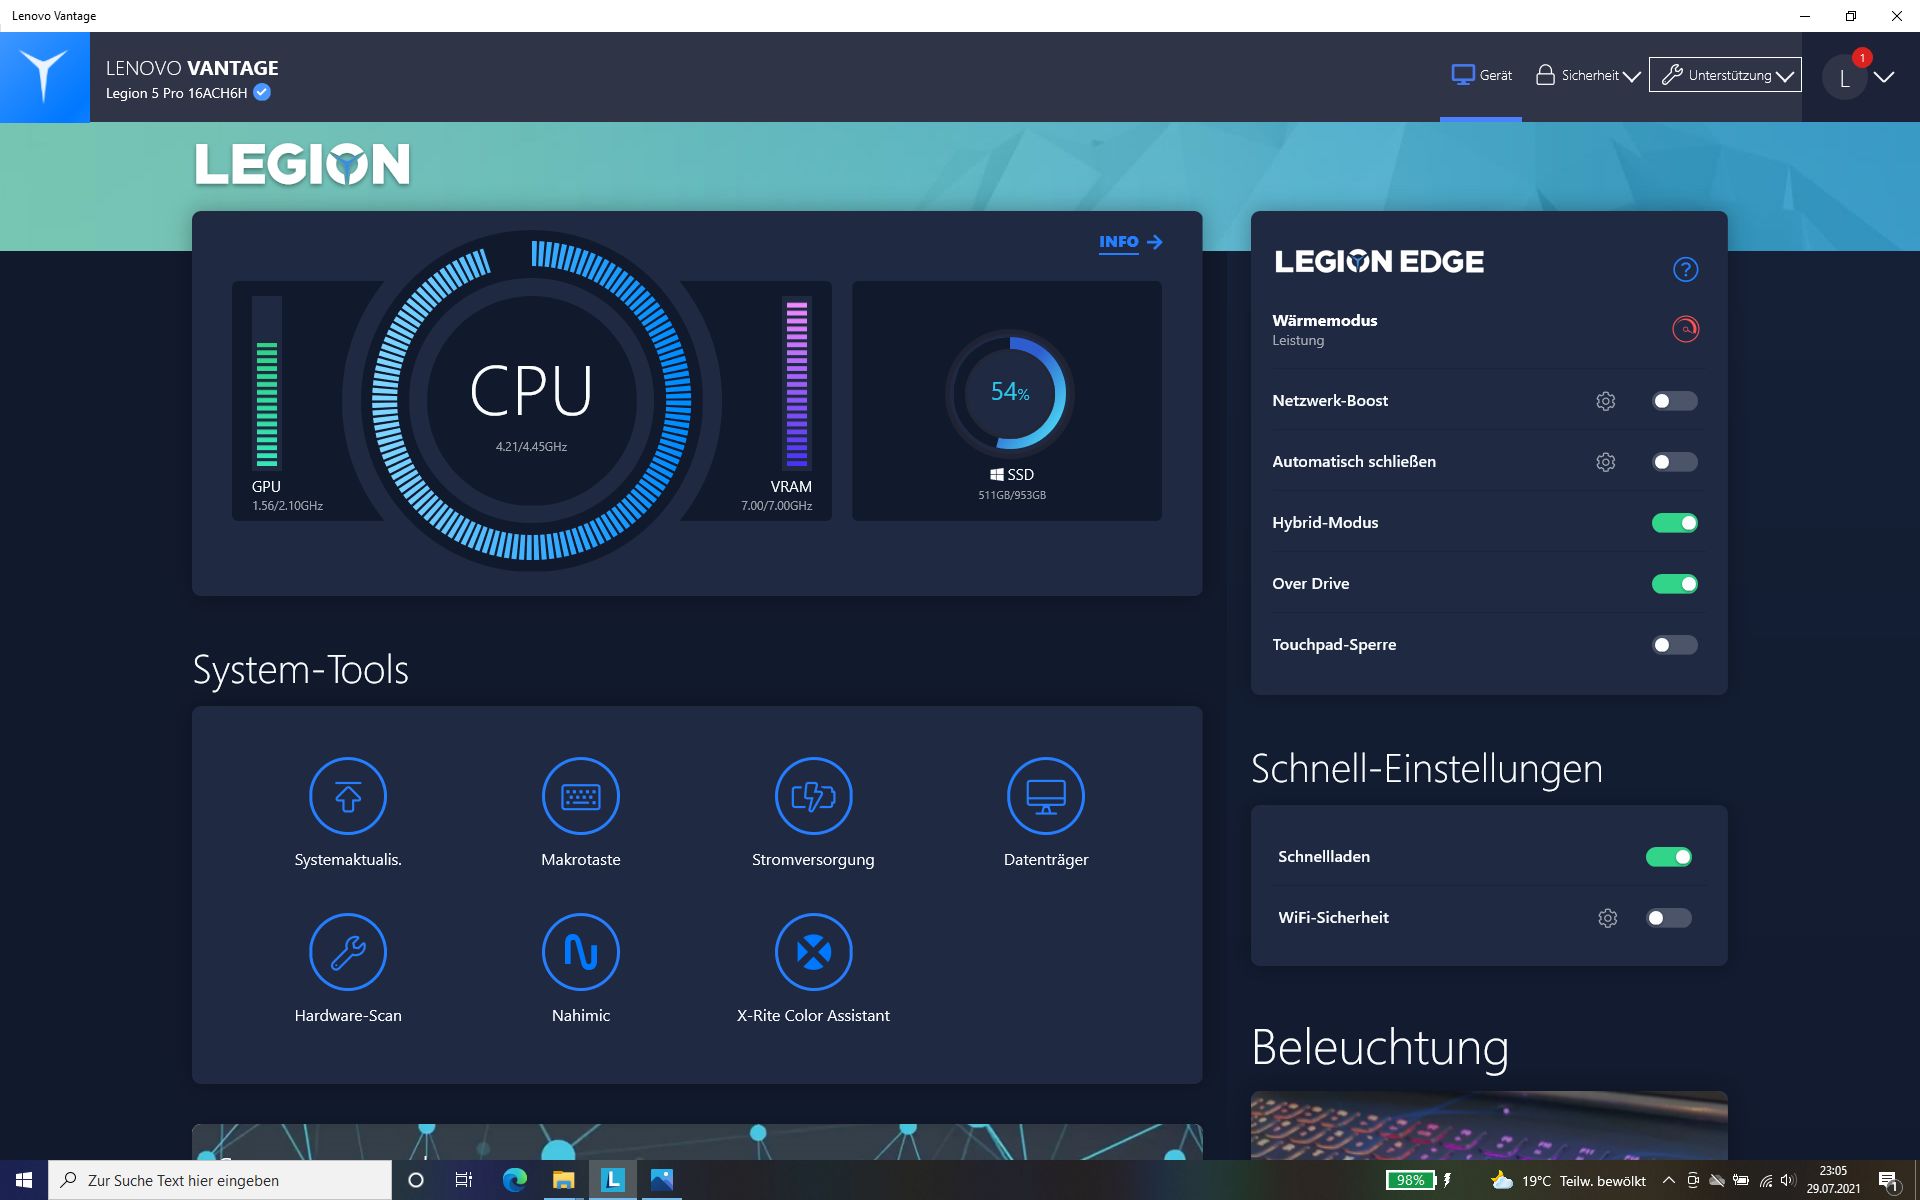
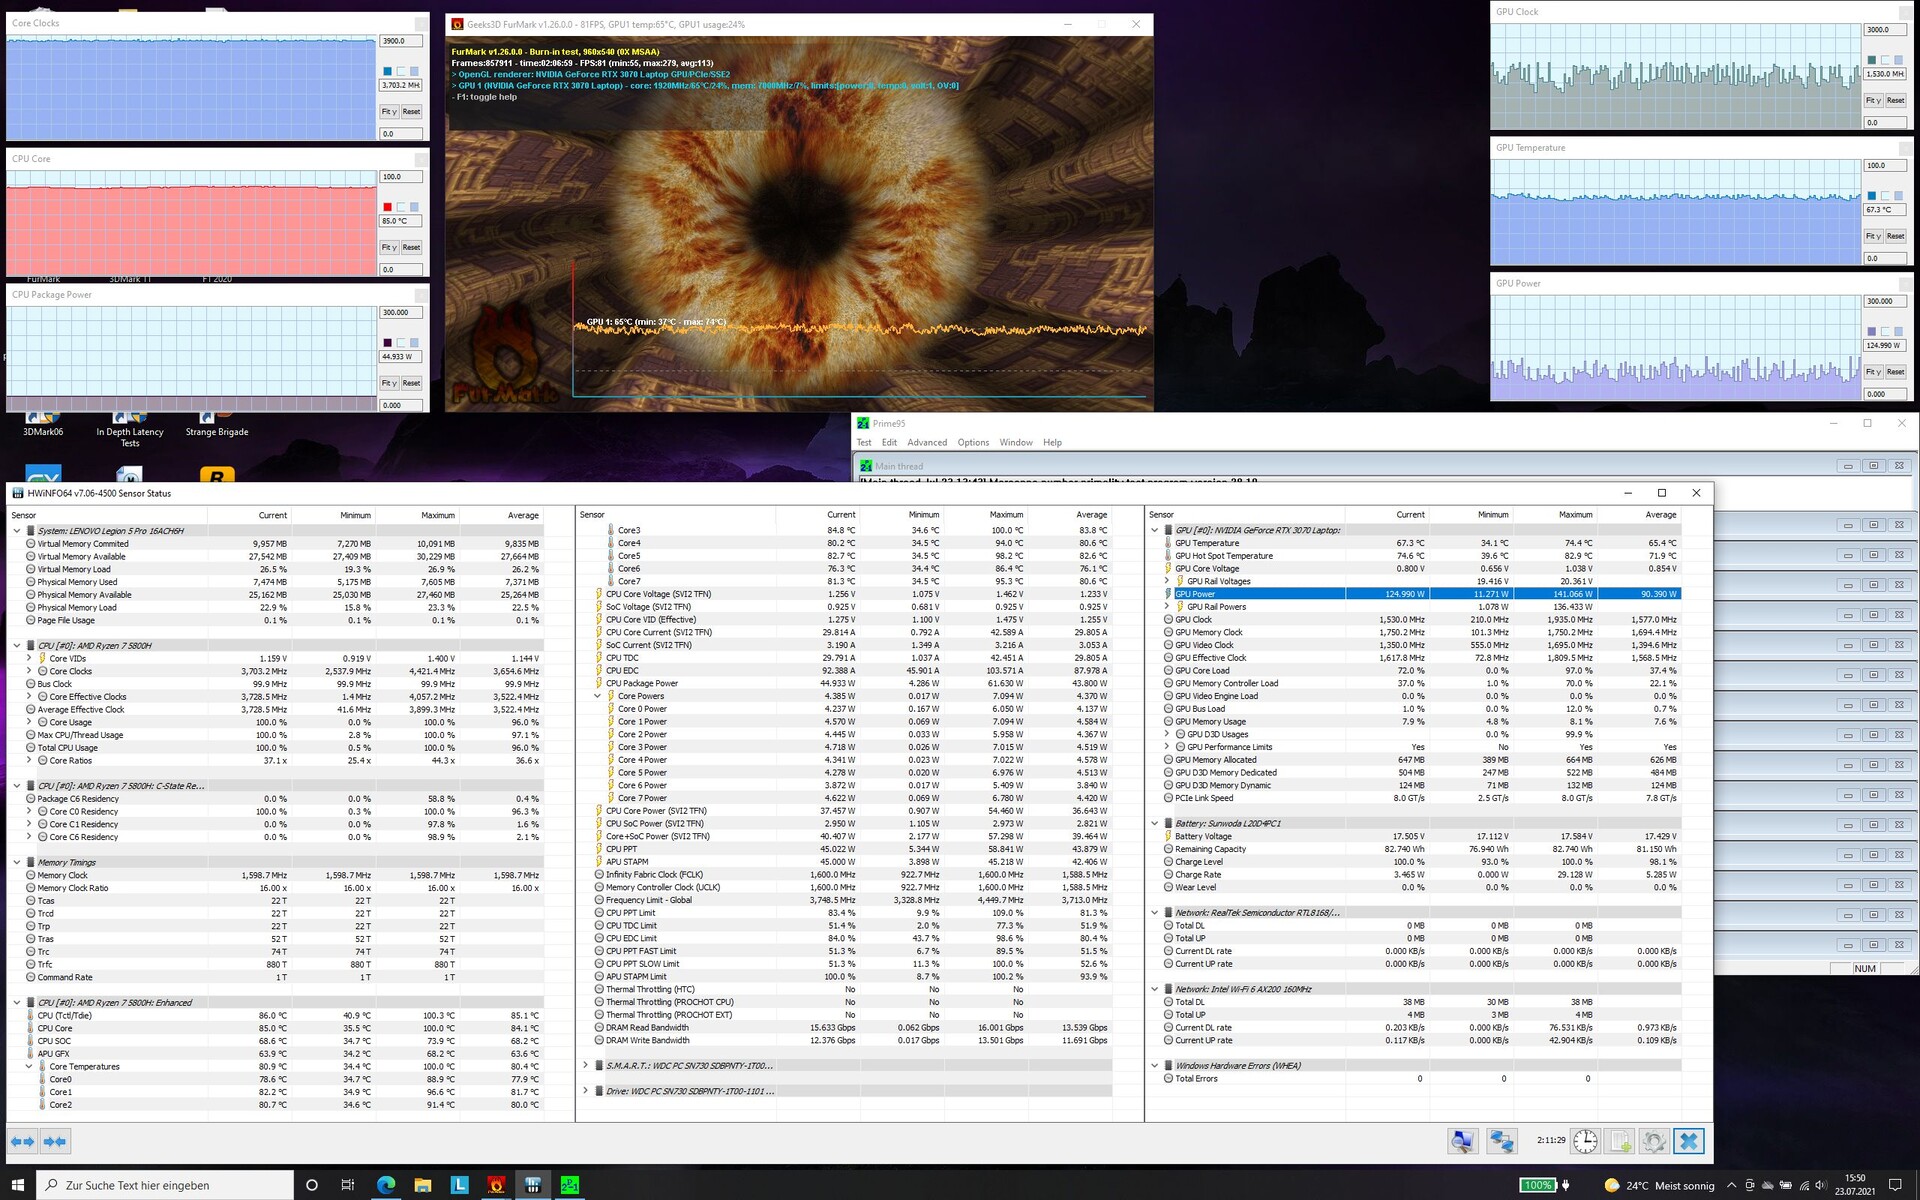
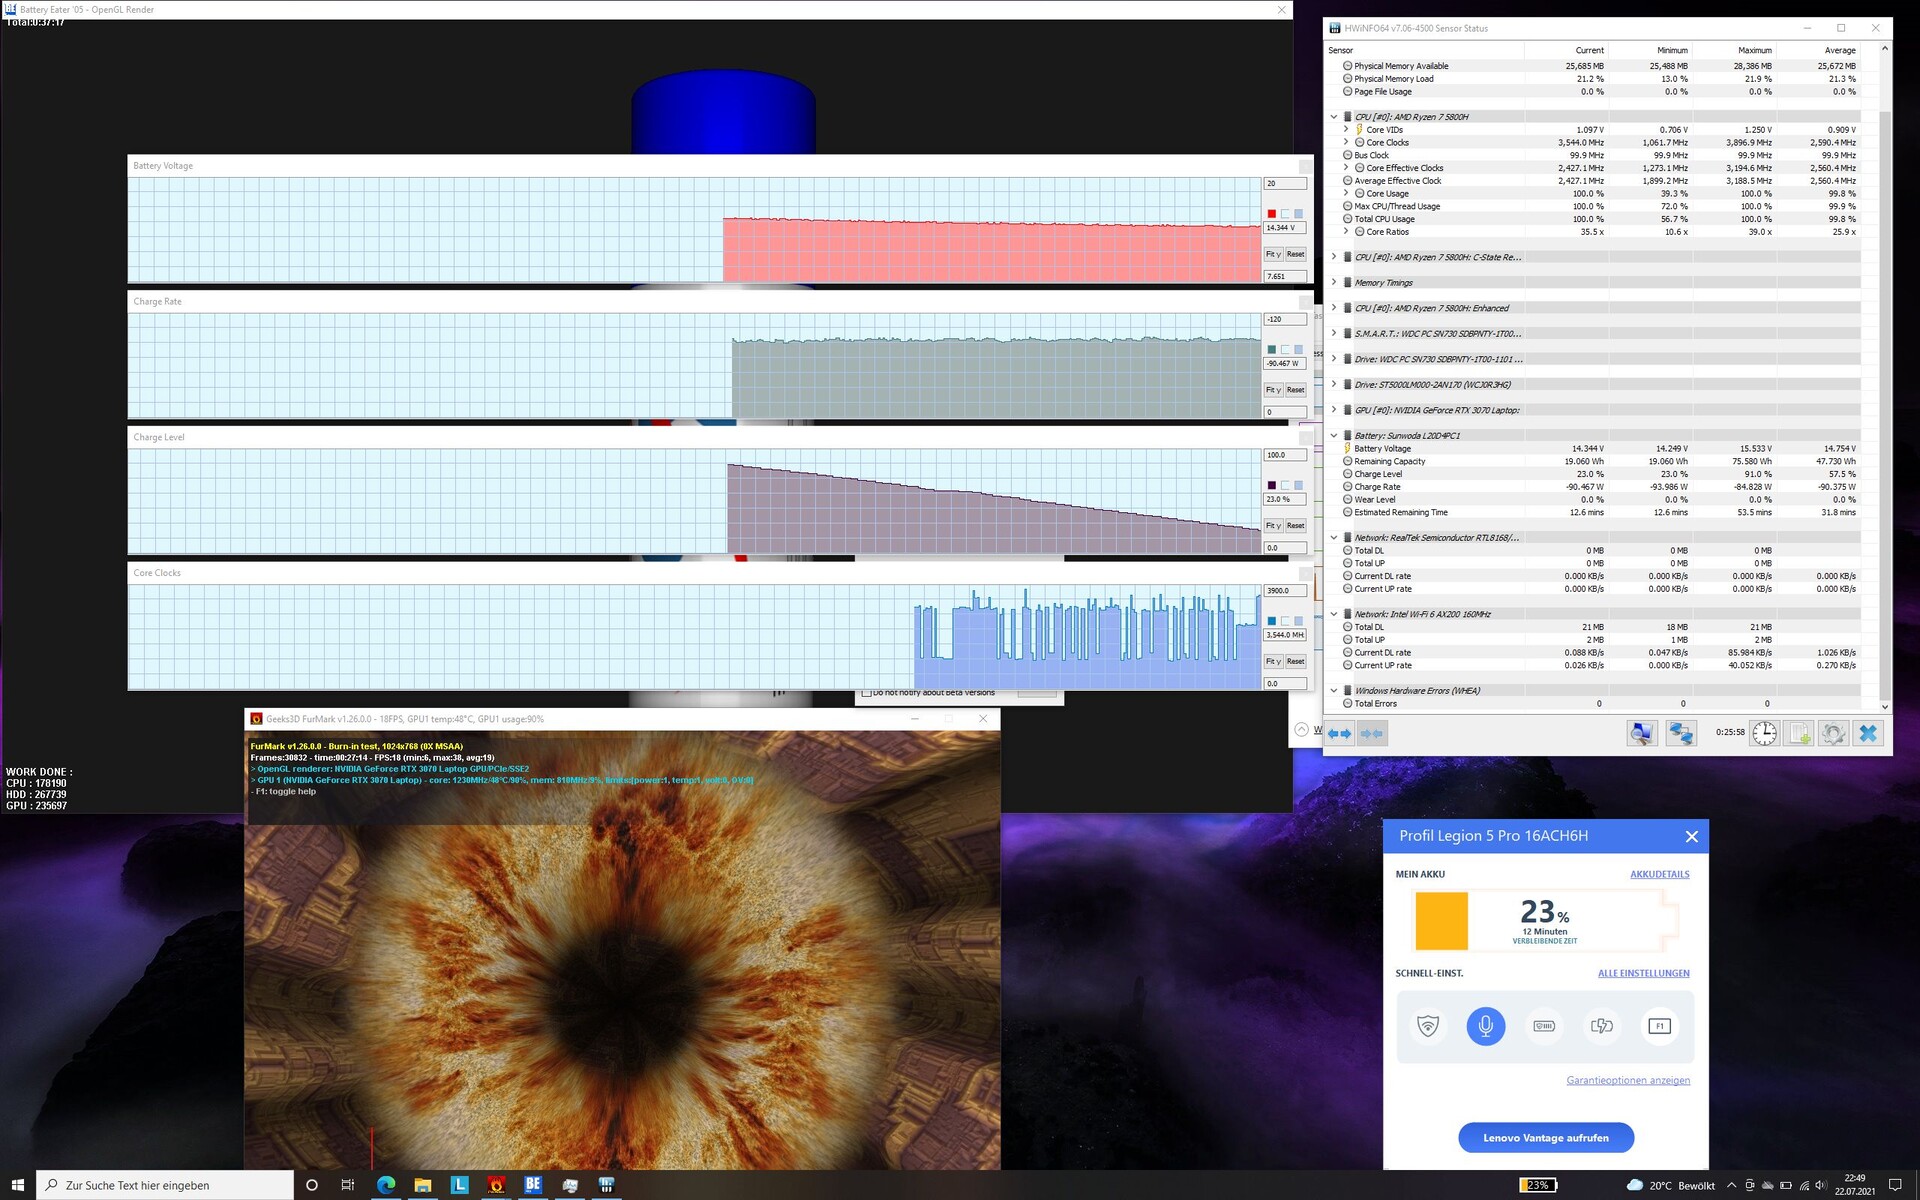
This laptop version of the Nvidia GeForce RTX 3070 offers 5,120 shader units. With 8 GB of DDR6 working memory, the dedicated graphics card of the Lenovo laptop is basically well equipped. However, current games can even use this generous amount of storage to capacity. The Legion 5 Pro provides the graphics card with up to 140 watts. At around 75 °C (167 °F), the Nvidia chip remains relatively cool. The AMD Radeon chip of the Ryzen 7 is deactivated in the state of delivery. Via the Lenovo Vantage application, you can activate the hybrid mode where both graphics chips are running. This will bring some advantages and disadvantages. In hybrid mode, the AMD Radeon graphics is supplied with up to 4 GB of the 32 GB working memory. This causes the system performance to drop slightly. On the other hand, the power consumption of the Lenovo gaming laptop will also drop, since the Nvidia chip can be deactivated during times of low demands on the graphics. This will cause the battery to last longer.
In battery mode, the laptop consumes up to 90 watts. With this, neither the graphics card nor the CPU are able to develop their full performance. In our test with "The Witcher 3" at highest graphics settings and in 1920p resolution, the performance dropped from 90 to about 50 fps in battery operation. In other games whose demands on the graphics card are more intense, you'd probably have to adjust the quality settings to get a smooth gaming experience.
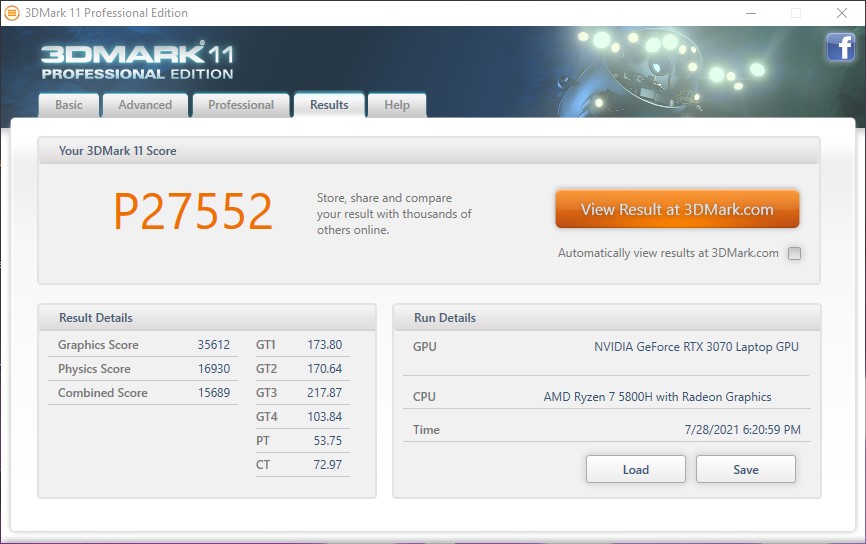
| 3DMark 11 - 1280x720 Performance GPU | |
| Average of class Gaming (21841 - 80022, n=104, last 2 years) | |
| Lenovo Legion 5 Pro 16ACH6H (82JQ001PGE) | |
| Average NVIDIA GeForce RTX 3070 Laptop GPU (12535 - 38275, n=54) | |
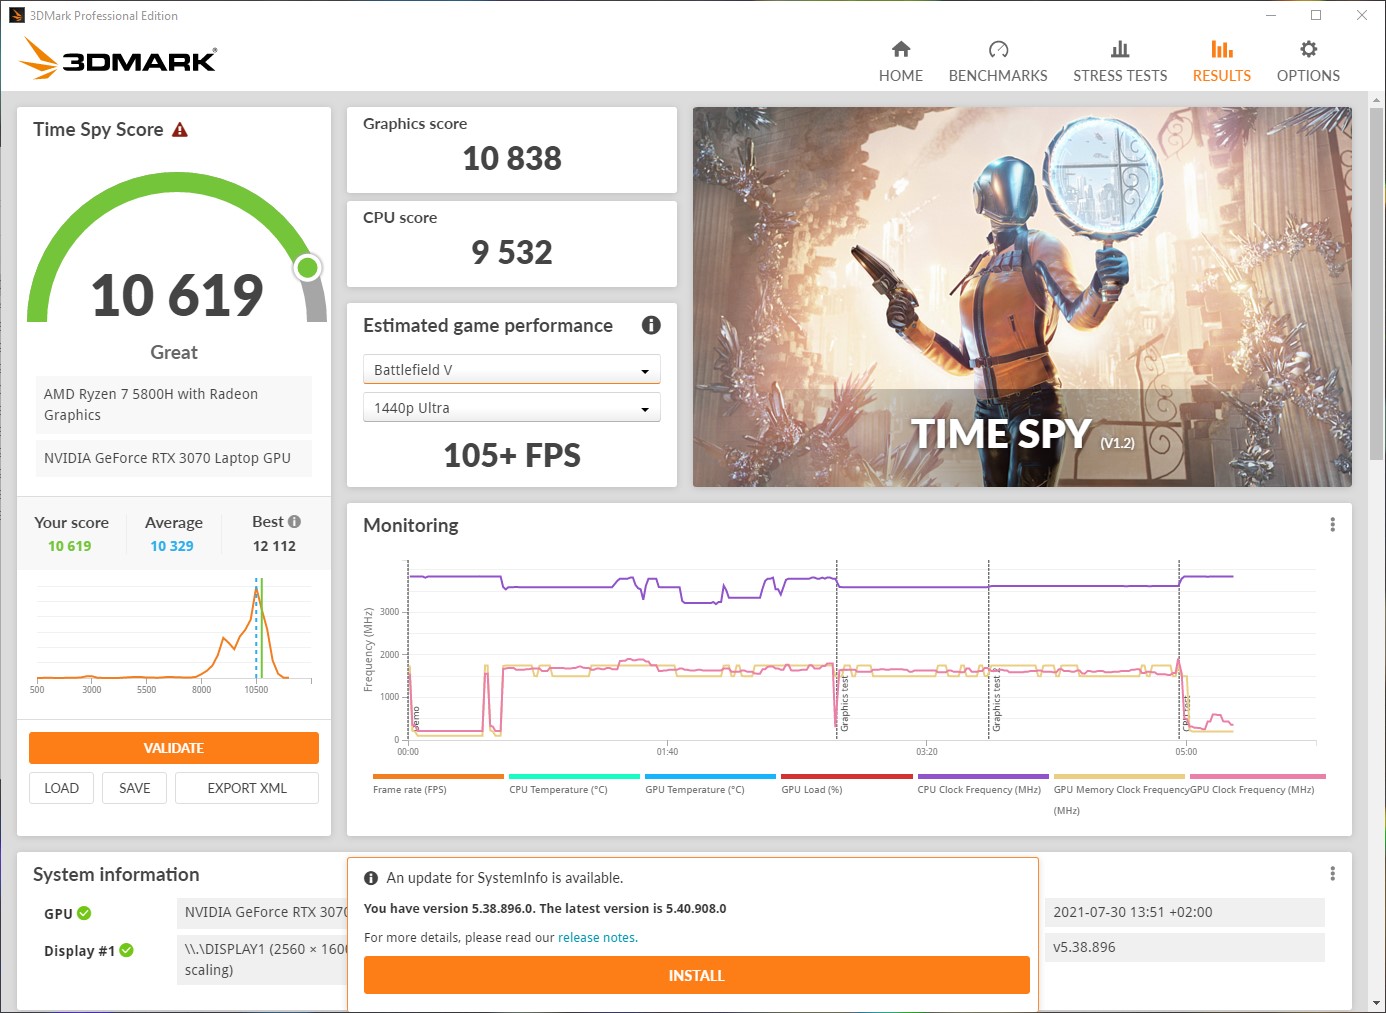
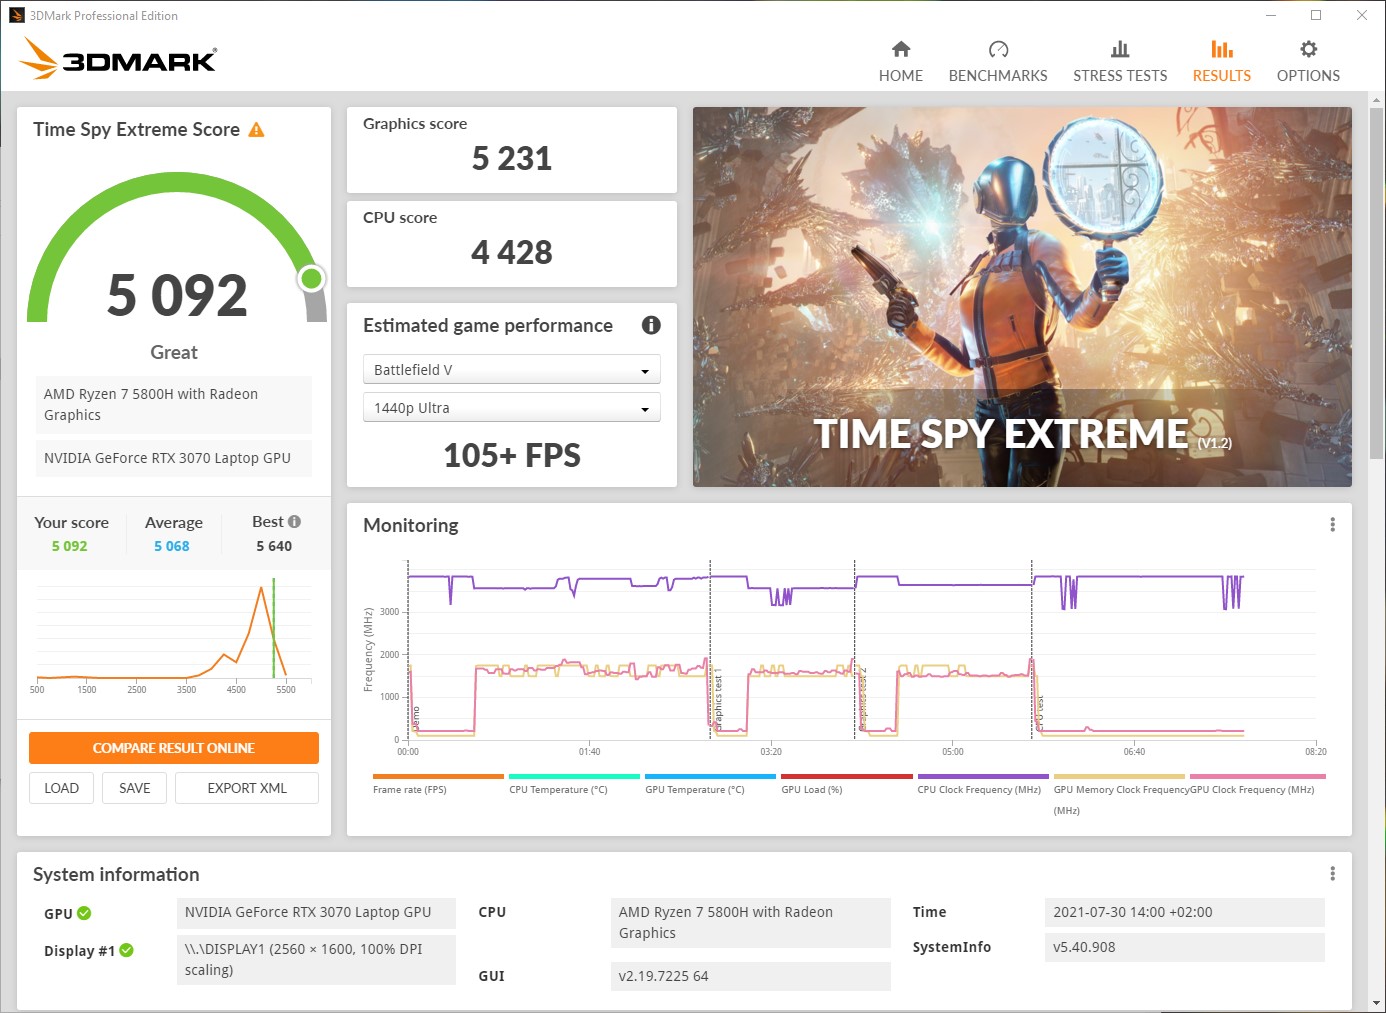
| 3DMark Fire Strike Score | 23775 points | |
| 3DMark Time Spy Score | 10574 points | |
Help | ||
Gaming Performance
The Lenovo Legion 5 Pro was able to convince in all the benchmarks. In the demanding Cyberpunk 2077, the frame rate was at a playable 45 fps even in the highest quality settings. The device was fun to play in practice. The bright and responsive display is complemented well by the powerful hardware. The 2560p resolution seems to be the optimum selection for the performance capabilities of the Nvidia graphics card.
The comparison with the competitors shows that the performance range of the current gaming laptops is very narrow. None of the devices was able to show a really large performance advantage. The top positions changed depending on the game.
| F1 2021 | |
| 2560x1440 Ultra High Preset + Raytracing AA:T AF:16x | |
| Lenovo Legion 5 Pro 16ACH6H (82JQ001PGE) | |
| Average NVIDIA GeForce RTX 3070 Laptop GPU (67.1 - 90.2, n=11) | |
| 1920x1080 Ultra High Preset + Raytracing AA:T AF:16x | |
| Lenovo Legion 5 Pro 16ACH6H (82JQ001PGE) | |
| Asus ROG Strix G15 G513QY | |
| Medion Erazer Beast X25 | |
| Average NVIDIA GeForce RTX 3070 Laptop GPU (33.1 - 123.1, n=23) | |
| 1920x1080 High Preset AA:T AF:16x | |
| Lenovo Legion 5 Pro 16ACH6H (82JQ001PGE) | |
| Asus ROG Strix G15 G513QY | |
| Average NVIDIA GeForce RTX 3070 Laptop GPU (66.1 - 256, n=16) | |
| Medion Erazer Beast X25 | |
| 1920x1080 Medium Preset AA:T AF:16x | |
| Lenovo Legion 5 Pro 16ACH6H (82JQ001PGE) | |
| Asus ROG Strix G15 G513QY | |
| Average NVIDIA GeForce RTX 3070 Laptop GPU (83.5 - 324, n=16) | |
| 1280x720 Ultra Low Preset | |
| Average NVIDIA GeForce RTX 3070 Laptop GPU (118.3 - 460, n=16) | |
| Asus ROG Strix G15 G513QY | |
| Lenovo Legion 5 Pro 16ACH6H (82JQ001PGE) | |
| F1 2020 | |
| 1920x1080 Ultra High Preset AA:T AF:16x | |
| Lenovo Legion 5 Pro 16ACH6H (82JQ001PGE) | |
| Average NVIDIA GeForce RTX 3070 Laptop GPU (97 - 173, n=7) | |
| Alienware m15 R5 Ryzen Edition | |
| 1920x1080 High Preset AA:T AF:16x | |
| Lenovo Legion 5 Pro 16ACH6H (82JQ001PGE) | |
| Average NVIDIA GeForce RTX 3070 Laptop GPU (118 - 238, n=7) | |
| Alienware m15 R5 Ryzen Edition | |
| 1920x1080 Medium Preset AF:16x | |
| Lenovo Legion 5 Pro 16ACH6H (82JQ001PGE) | |
| Average NVIDIA GeForce RTX 3070 Laptop GPU (157 - 273, n=6) | |
| Alienware m15 R5 Ryzen Edition | |
| 1280x720 Ultra Low Preset | |
| Average NVIDIA GeForce RTX 3070 Laptop GPU (119 - 333, n=6) | |
| Lenovo Legion 5 Pro 16ACH6H (82JQ001PGE) | |
| Alienware m15 R5 Ryzen Edition | |
After a smaller drop in the frame rate in the beginning of our 60-minute constant load test with "The Witcher 3," the performance of the graphics card and processor remained constant at a high level for the complete rest of the test. However, we need to mention that we mostly test very new devices, and that the fan curves often still adjust to the test conditions.
Witcher 3 FPS Chart
| low | med. | high | ultra | QHD | 4K | |
|---|---|---|---|---|---|---|
| GTA V (2015) | 178 | 169 | 155 | 95.4 | ||
| The Witcher 3 (2015) | 209 | 198 | 132 | 86.5 | ||
| Dota 2 Reborn (2015) | 142 | 134 | 121 | 117 | 114 | |
| Final Fantasy XV Benchmark (2018) | 173 | 138 | 102 | 78.2 | 46.8 | |
| X-Plane 11.11 (2018) | 93.4 | 84.9 | 69.1 | 66 | ||
| Far Cry 5 (2018) | 131 | 117 | 112 | 107 | 99 | |
| Strange Brigade (2018) | 337 | 257 | 219 | 192 | ||
| Far Cry New Dawn (2019) | 112 | 99 | 96 | 86 | 84 | |
| F1 2020 (2020) | 240 | 212 | 207 | 173 | ||
| Cyberpunk 2077 1.0 (2020) | 111.1 | 94.8 | 81.2 | 67.7 | 45.3 | |
| F1 2021 (2021) | 270 | 255 | 218 | 119 | 89.8 |
Emissions - The speakers are louder than the fans
Noise Emissions
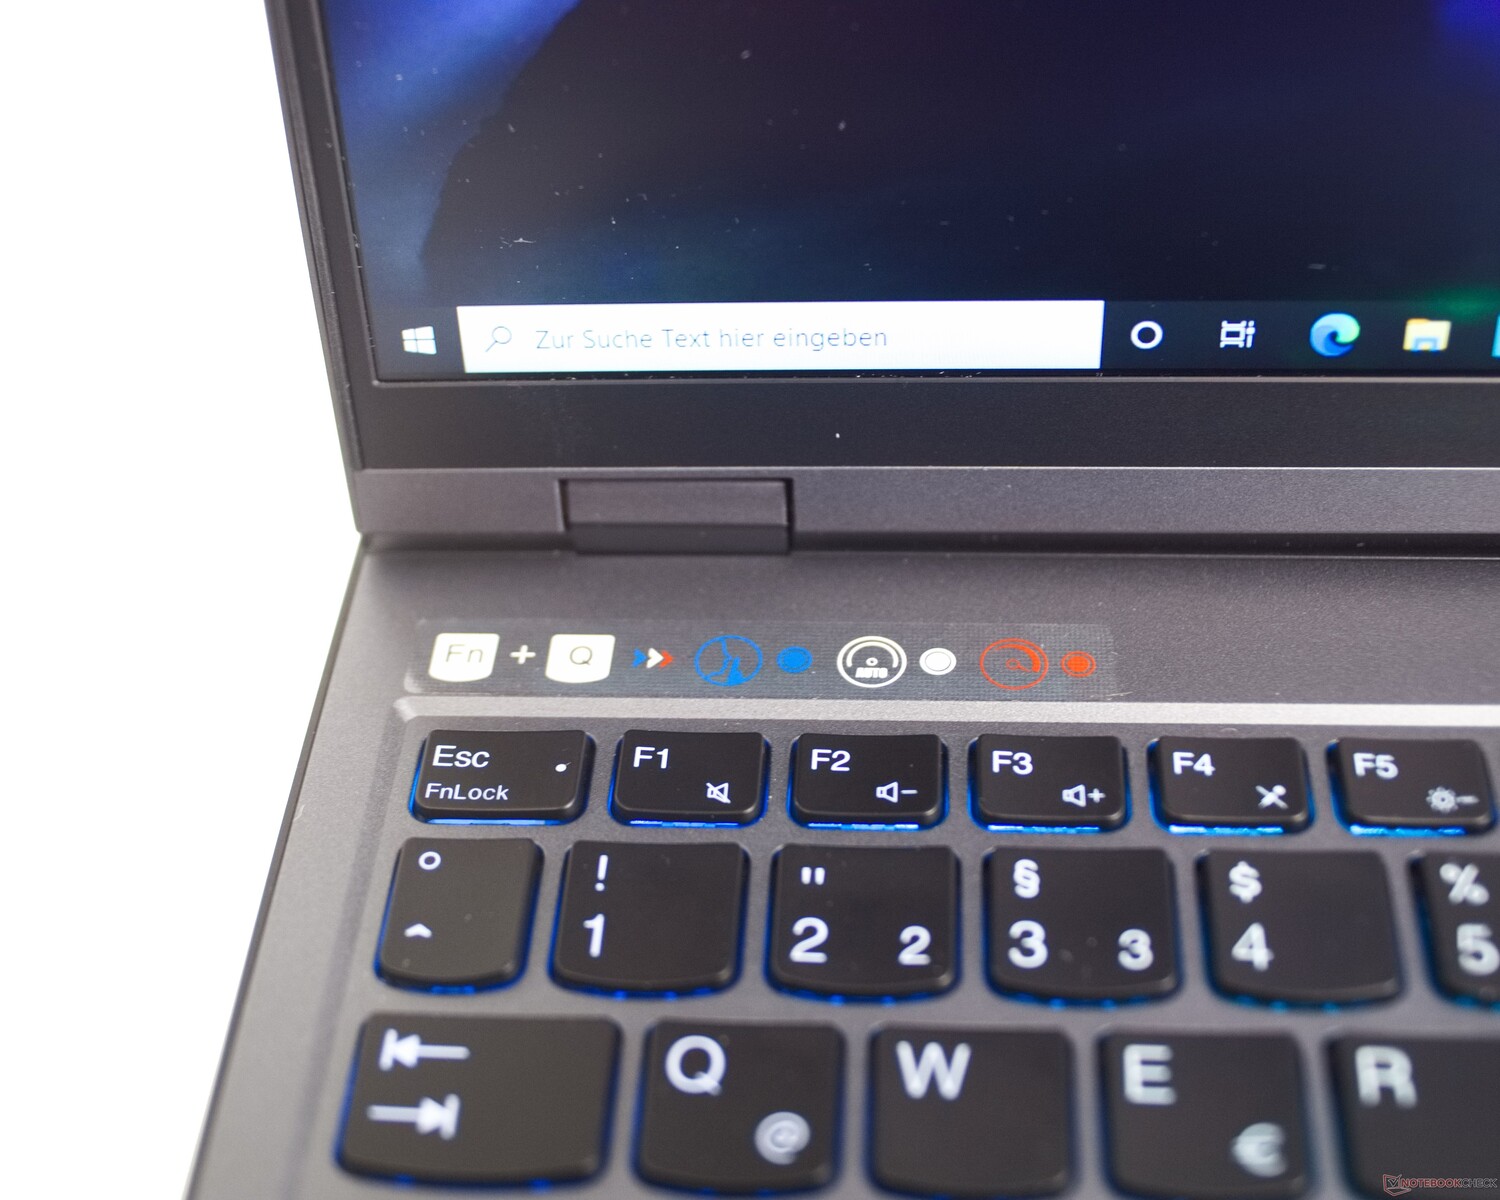
The performance of the Lenovo Legion 5 Pro can be adjusted in three different levels, which also have a direct impact on the noise level of the laptop fans. The performance level can be adjusted using the [Fn]+[Q] key combination. The color of the power LED in the on/off switch indicates the selected performance setting. In quiet mode, the two fans of the laptop are only rarely turned on and if they are, they run quietly, so that the noise doesn't appear annoying.
During higher system load in the two other modes, the fans become noticeably louder. At a full 50 dB(A), their noise level can already become annoying, so during long gaming sessions, good head phones with at least some passive noise cancelling would be appropriate.
After we unpacked the laptop, we also noticed some high-frequency noise coming from the power supply. However, this disappeared after several hours of operation.
Noise level
| Idle |
| 25 / 25 / 25 dB(A) |
| Load |
| 35.5 / 50.35 dB(A) |
 | ||
30 dB silent 40 dB(A) audible 50 dB(A) loud |
||
min: | ||
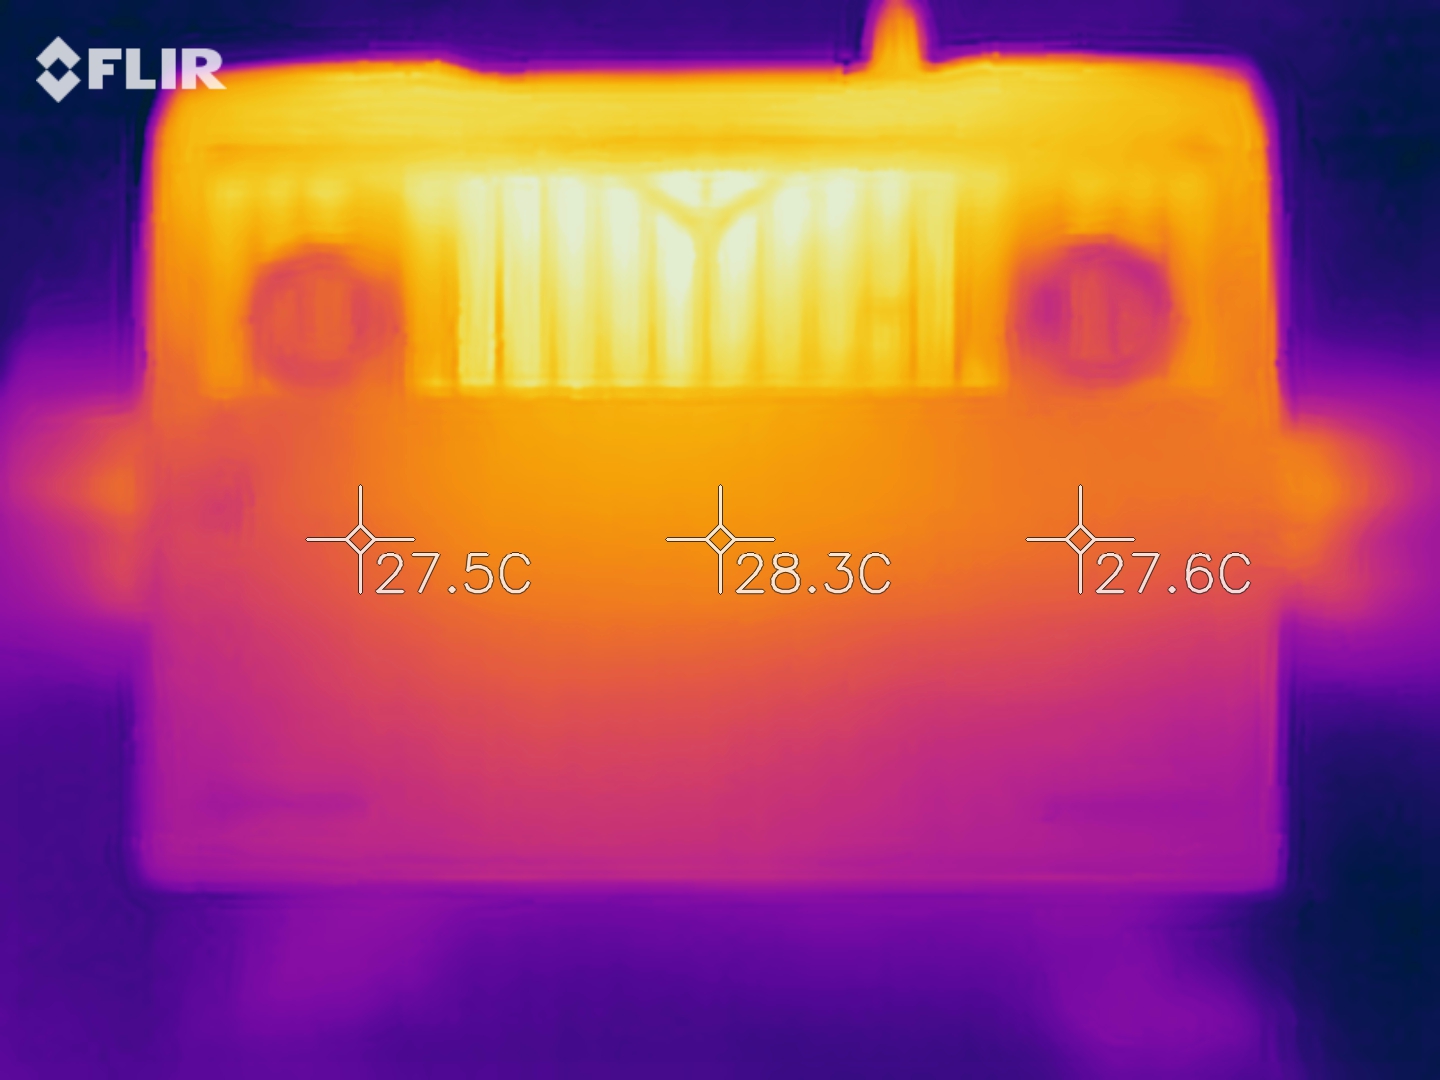
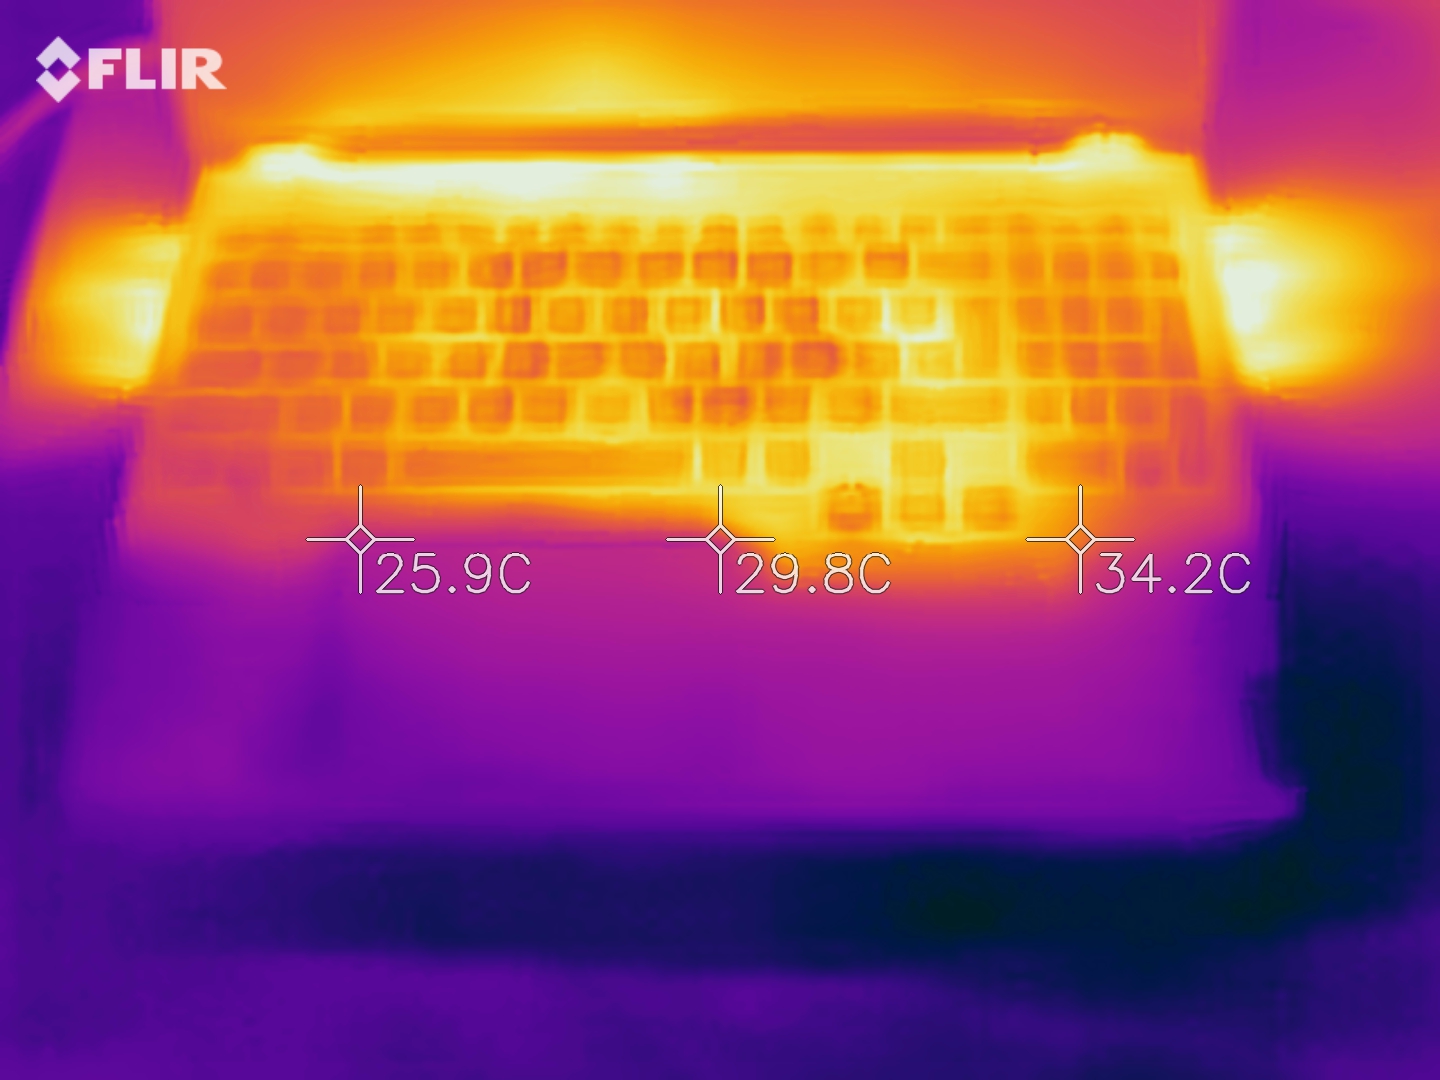
Temperatures
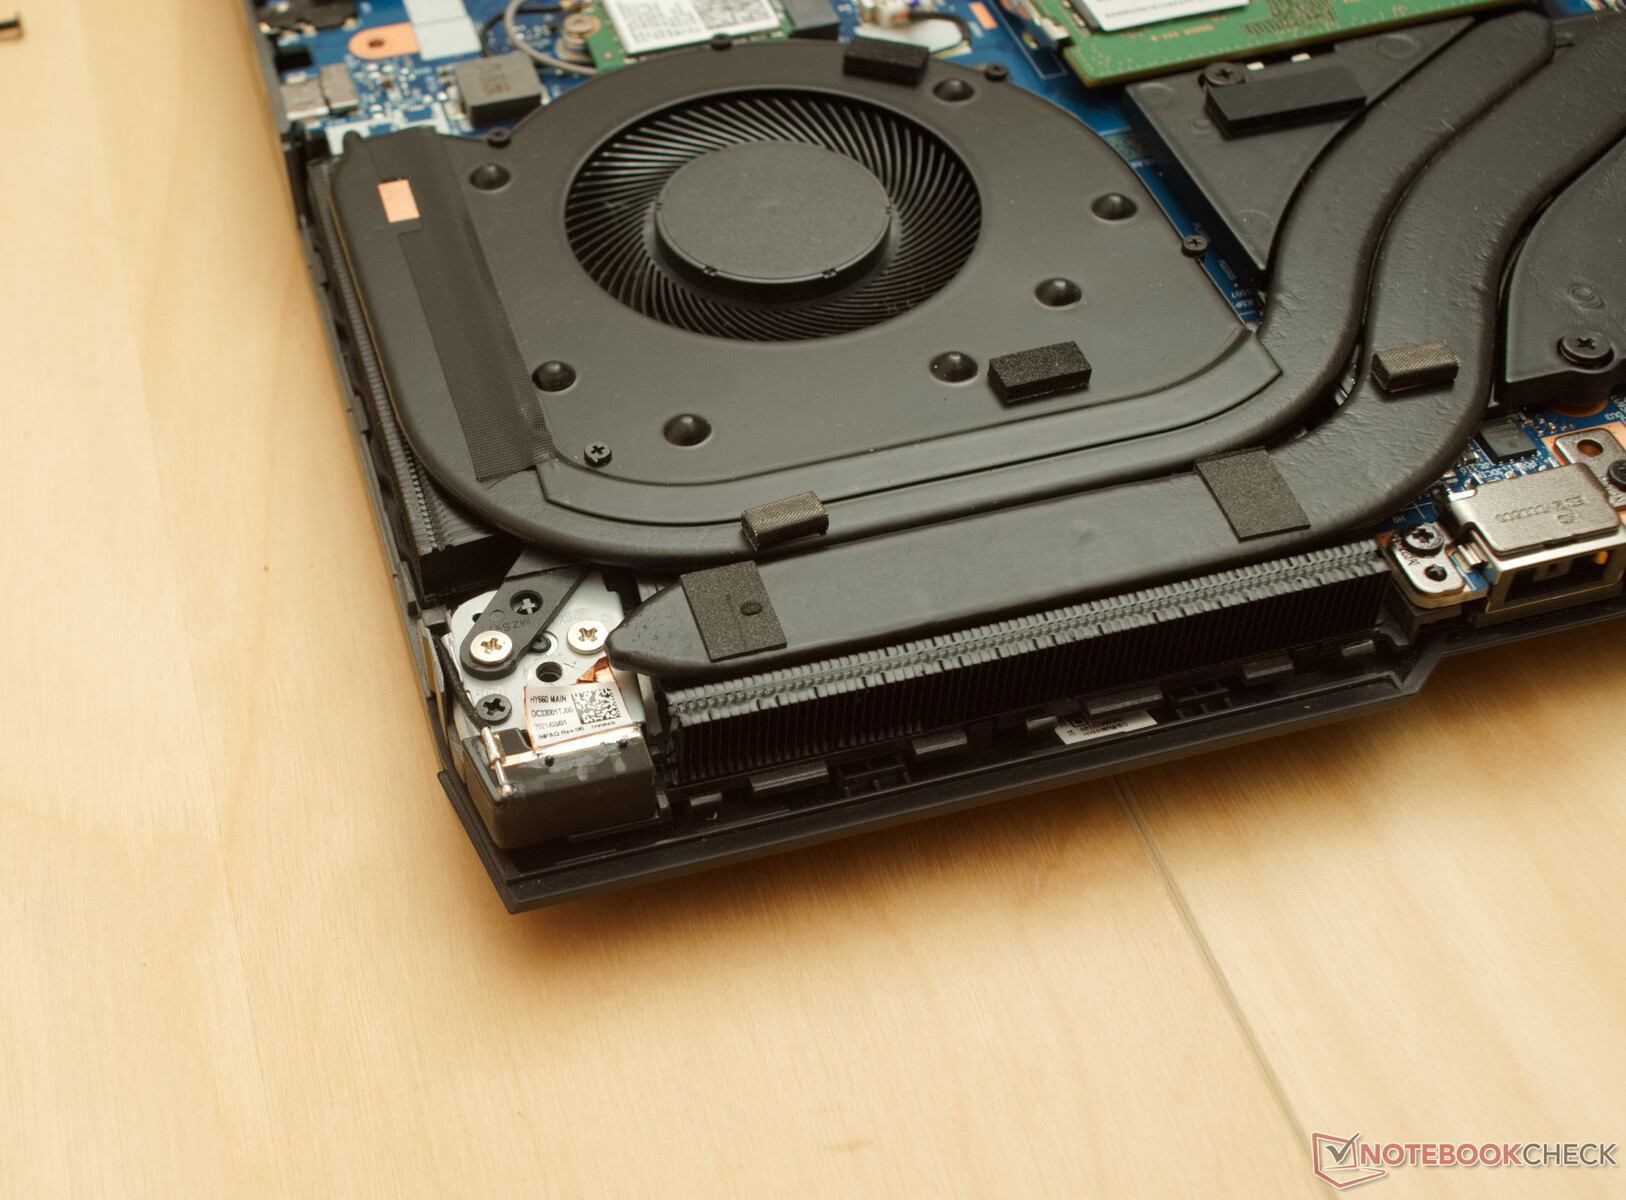
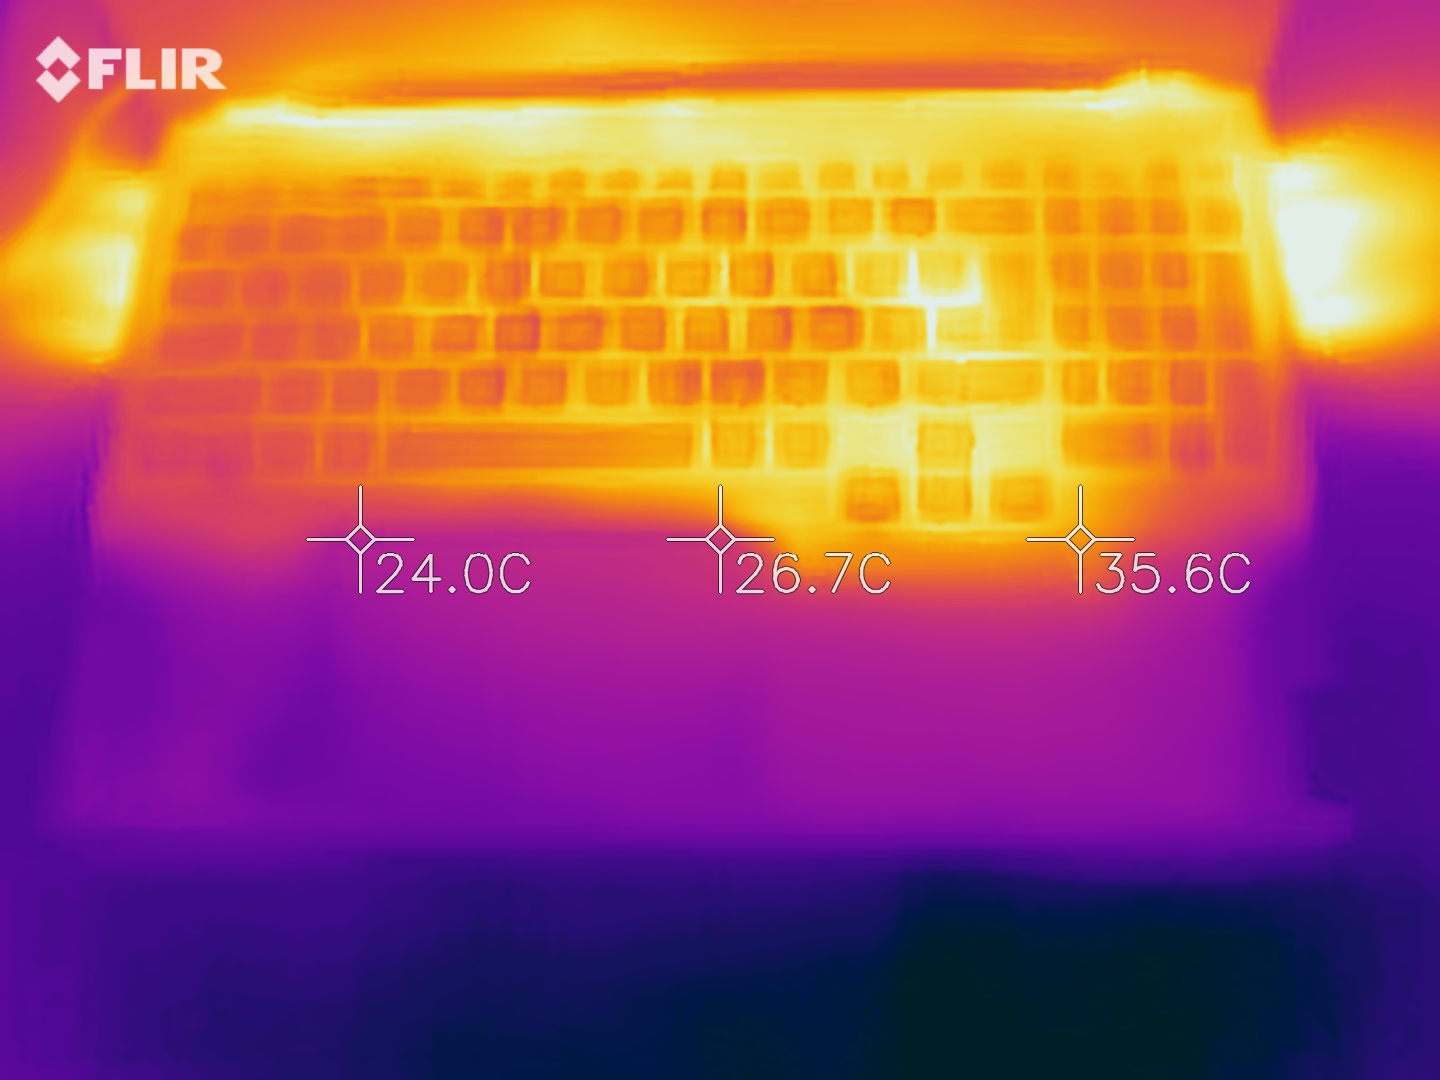
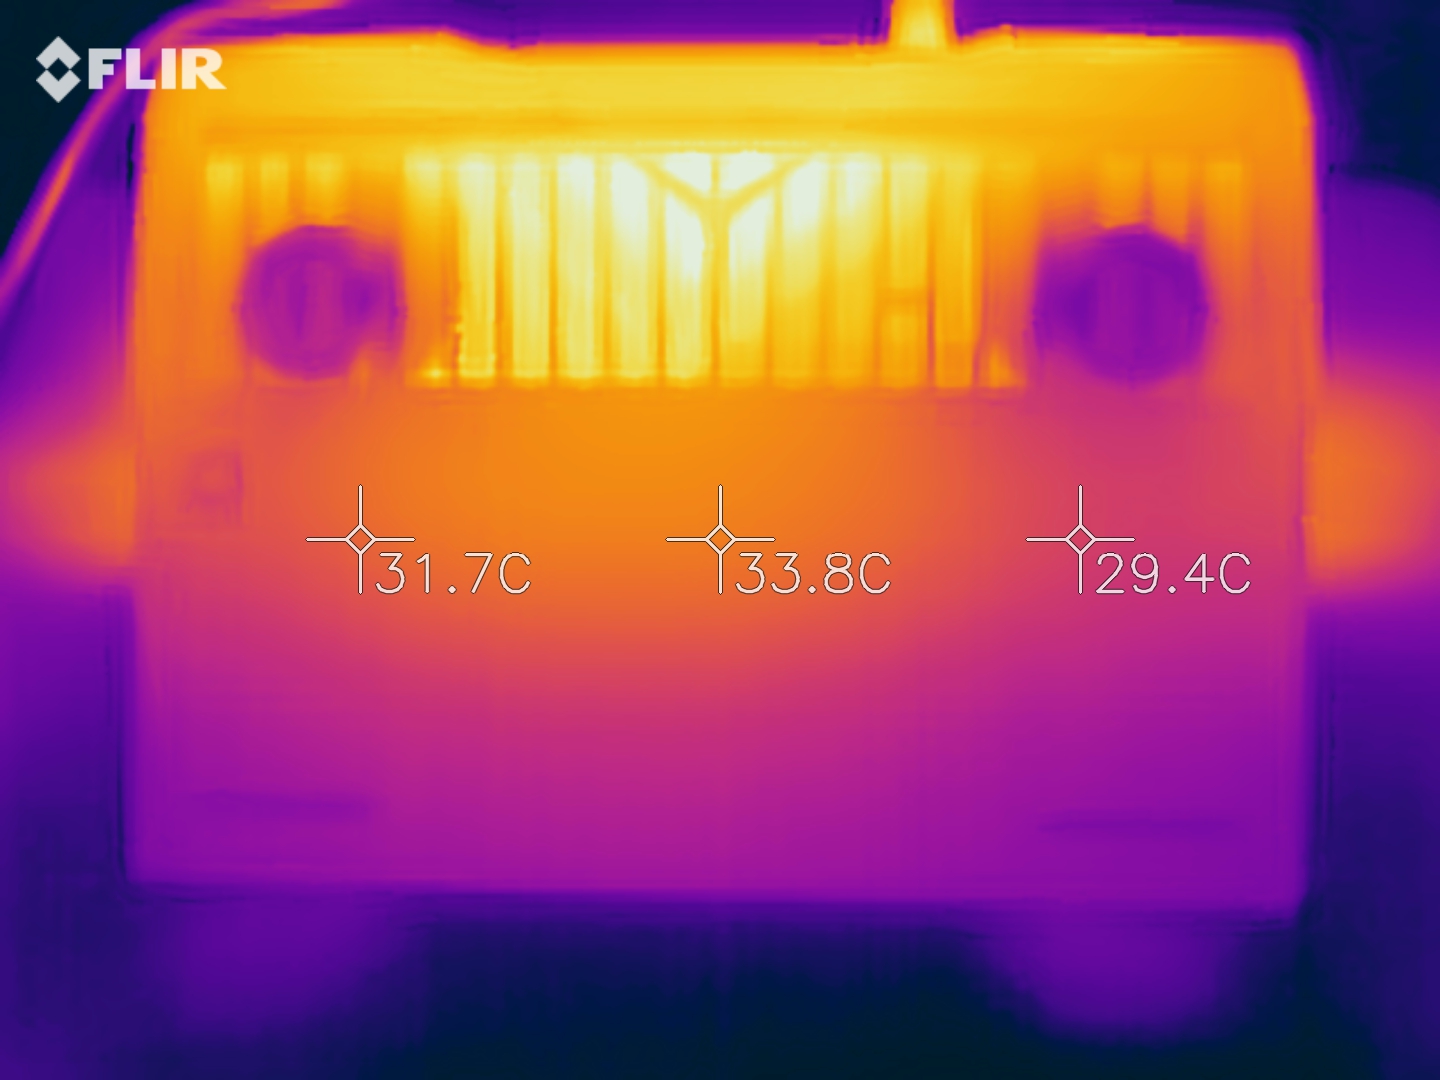
The large cooling elements dissipate most of the heat from the case of the Lenovo gaming laptop. While the surfaces of the palm rests and keyboard become warm during longer periods of load, they never get uncomfortably hot. The insulating properties of the plastic used here provide some additional comfort. During our test, we only saw a smaller hotspot in the area around the Enter key, but the W, A, S, and D keys always remained within a comfortable temperature range across all of our tests.
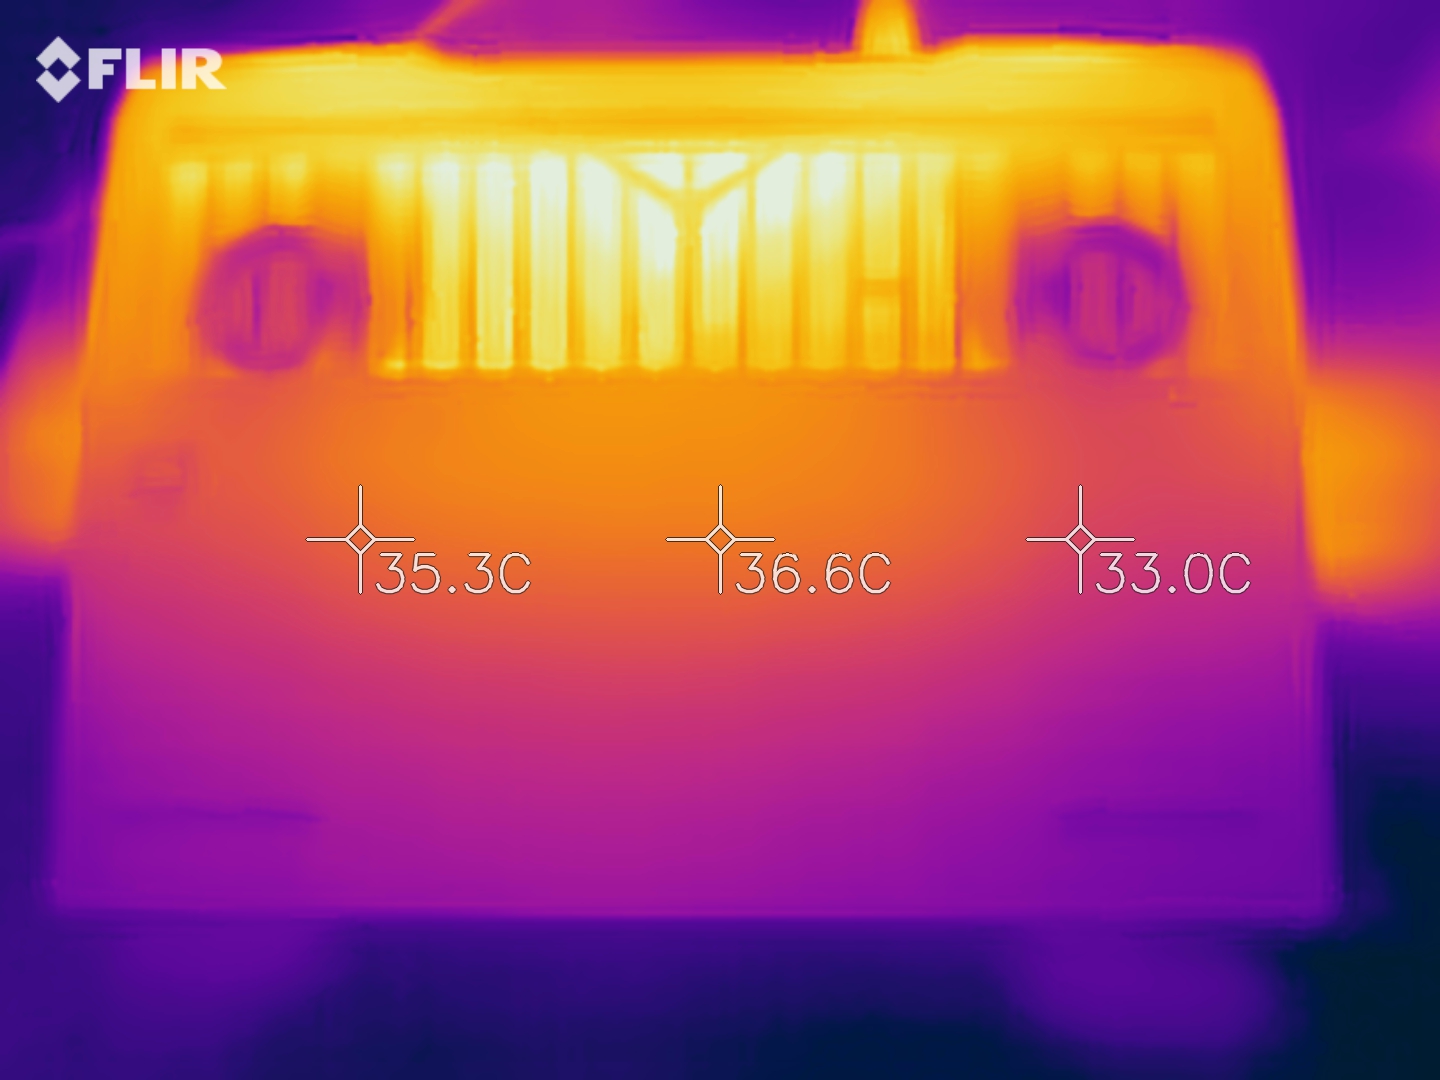
The system performance remained stable even after longer load on the system by Prime95 and Furmark. The processor temperatures exceeded the 99-°C (210 °F) limit to thermal throttling only once toward the beginning of the test, since the fans responded slightly too late by revving up to full performance. Afterwards, the processor temperatures remained constant at around 90 °C (194 °F) for almost two hours, and the temperatures of the Nvidia graphics chip remained at around 65 °C (149 °F). The four cooling elements and fans are more than sufficient to keep the operating temperatures at a low level.
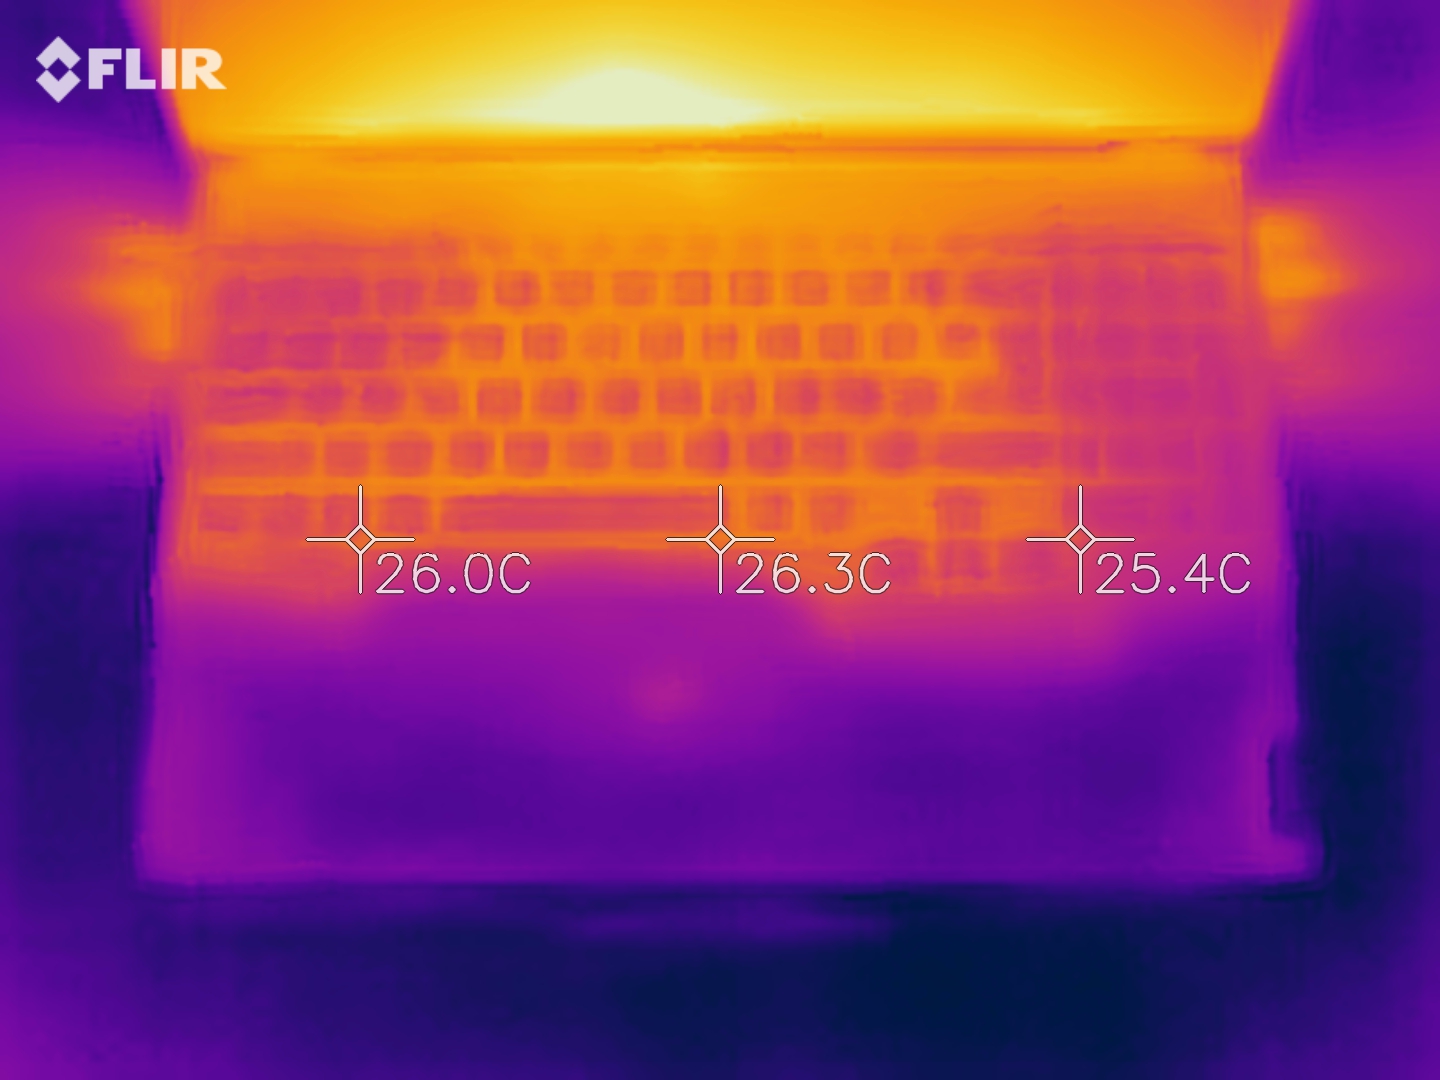
(-) The maximum temperature on the upper side is 50 °C / 122 F, compared to the average of 40.4 °C / 105 F, ranging from 21.2 to 68.8 °C for the class Gaming.
(-) The bottom heats up to a maximum of 55 °C / 131 F, compared to the average of 43.2 °C / 110 F
(+) In idle usage, the average temperature for the upper side is 31.7 °C / 89 F, compared to the device average of 33.9 °C / 93 F.
(-) Playing The Witcher 3, the average temperature for the upper side is 41.7 °C / 107 F, compared to the device average of 33.9 °C / 93 F.
(+) The palmrests and touchpad are reaching skin temperature as a maximum (35 °C / 95 F) and are therefore not hot.
(-) The average temperature of the palmrest area of similar devices was 28.8 °C / 83.8 F (-6.2 °C / -11.2 F).
Speakers
The small speakers of the gaming laptop produced a better than expected sound. The whole audible spectrum is reproduced well by the laptop. The sound quality is sufficient at least for YouTube videos and video calls. For a more intense experience, you can also connect external speakers or headphones via the 3.5-mm audio port or Bluetooth.
Lenovo Legion 5 Pro 16ACH6H (82JQ001PGE) audio analysis
(±) | speaker loudness is average but good (76.1 dB)
Bass 100 - 315 Hz
(±) | reduced bass - on average 10.8% lower than median
(±) | linearity of bass is average (14.7% delta to prev. frequency)
Mids 400 - 2000 Hz
(±) | higher mids - on average 6.7% higher than median
(±) | linearity of mids is average (7.8% delta to prev. frequency)
Highs 2 - 16 kHz
(±) | reduced highs - on average 5.2% lower than median
(±) | linearity of highs is average (8.6% delta to prev. frequency)
Overall 100 - 16.000 Hz
(±) | linearity of overall sound is average (17.4% difference to median)
Compared to same class
» 48% of all tested devices in this class were better, 12% similar, 40% worse
» The best had a delta of 6%, average was 18%, worst was 132%
Compared to all devices tested
» 33% of all tested devices were better, 8% similar, 58% worse
» The best had a delta of 4%, average was 23%, worst was 134%
Medion Erazer Beast X25 audio analysis
(+) | speakers can play relatively loud (85 dB)
Bass 100 - 315 Hz
(-) | nearly no bass - on average 25% lower than median
(±) | linearity of bass is average (14.4% delta to prev. frequency)
Mids 400 - 2000 Hz
(+) | balanced mids - only 1.8% away from median
(+) | mids are linear (3.5% delta to prev. frequency)
Highs 2 - 16 kHz
(±) | higher highs - on average 5% higher than median
(±) | linearity of highs is average (8.3% delta to prev. frequency)
Overall 100 - 16.000 Hz
(±) | linearity of overall sound is average (15.5% difference to median)
Compared to same class
» 35% of all tested devices in this class were better, 7% similar, 58% worse
» The best had a delta of 6%, average was 18%, worst was 132%
Compared to all devices tested
» 23% of all tested devices were better, 4% similar, 73% worse
» The best had a delta of 4%, average was 23%, worst was 134%
Power Management - The battery does not last long without Lenovo's hybrid mode
Power Consumption
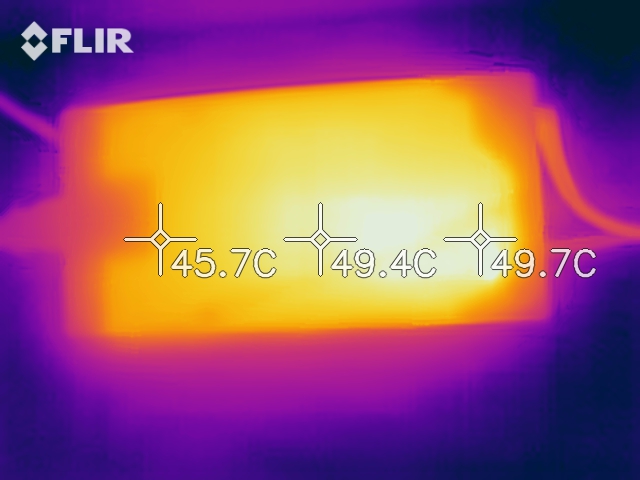
In the class comparison of gaming laptops, the Lenovo Legion 5 Pro fares well in terms of the power consumption. Such powerful laptops are usually not very efficient, but the average consumption of the Lenovo laptop is not particularly high. The 300-Watt power supply that Lenovo includes with the laptop offers more than sufficient power for the laptop, which has a maximum power consumption of around 190 watts.
| Off / Standby | |
| Idle | |
| Load |
|
Key:
min: | |
| Lenovo Legion 5 Pro 16ACH6H (82JQ001PGE) R7 5800H, GeForce RTX 3070 Laptop GPU, WDC PC SN730 SDBPNTY-1T00, IPS, 2560x1600, 16" | Medion Erazer Beast X25 R9 5900HX, GeForce RTX 3080 Laptop GPU, Samsung PM9A1 MZVL22T0HBLB, IPS, 1920x1080, 17.3" | Asus ROG Strix G15 G513QY R9 5900HX, Radeon RX 6800M, Samsung PM991 MZVLQ512HALU, IPS, 1920x1080, 15.6" | MSI GE76 Raider 11UH-472US i9-11980HK, GeForce RTX 3080 Laptop GPU, Samsung PM9A1 MZVL21T0HCLR, IPS, 1920x1080, 17.3" | Alienware m15 R4 i9-10980HK, GeForce RTX 3070 Laptop GPU, Micron 2300 1TB MTFDHBA1T0TDV, IPS, 1920x1080, 15.6" | Schenker XMG Neo 17 (Early 2021, RTX 3070, 5800H) R7 5800H, GeForce RTX 3070 Laptop GPU, Samsung SSD 970 EVO Plus 500GB, IPS, 2560x1440, 17.3" | Average NVIDIA GeForce RTX 3070 Laptop GPU | Average of class Gaming | |
|---|---|---|---|---|---|---|---|---|
| Power Consumption | -55% | -4% | -18% | -109% | -24% | -35% | -26% | |
| Idle Minimum * (Watt) | 10.45 | 22 -111% | 12.1 -16% | 10 4% | 35 -235% | 13 -24% | 15.6 ? -49% | 13 ? -24% |
| Idle Average * (Watt) | 14.92 | 26 -74% | 13 13% | 16 -7% | 39 -161% | 16 -7% | 20.1 ? -35% | 18.7 ? -25% |
| Idle Maximum * (Watt) | 16.02 | 34 -112% | 14.7 8% | 26 -62% | 48 -200% | 26 -62% | 29.4 ? -84% | 24.3 ? -52% |
| Load Average * (Watt) | 119.65 | 120 -0% | 90.3 25% | 103 14% | 135 -13% | 125 -4% | 110.8 ? 7% | 110.2 ? 8% |
| Witcher 3 ultra * (Watt) | 174.9 | 189 -8% | 200 -14% | 204 -17% | 194 -11% | 187 -7% | ||
| Load Maximum * (Watt) | 187.26 | 231 -23% | 263.4 -41% | 266 -42% | 252 -35% | 259 -38% | 214 ? -14% | 258 ? -38% |
* ... smaller is better
Power Consumption The Witcher 3 / Stress Test
Battery Life
The battery test showed that it is worthwhile to activate the hybrid mode in the Lenovo Vantage application. In this way, we noticed quite a significant increase in the battery life in idle operation and our WiFi websurfing test. As already mentioned, even though this mode can have a detrimental effect on the system performance, if you depend on a longer battery life, this mode makes a lot of sense. While there was no significant change in the battery life under full load, the battery life more than doubled in idle operation and in the WiFi websurfing test after we turned on the hybrid mode.
| Lenovo Legion 5 Pro 16ACH6H (82JQ001PGE) R7 5800H, GeForce RTX 3070 Laptop GPU, 80 Wh | Medion Erazer Beast X25 R9 5900HX, GeForce RTX 3080 Laptop GPU, 91 Wh | Asus ROG Strix G15 G513QY R9 5900HX, Radeon RX 6800M, 90 Wh | MSI GE76 Raider 11UH-472US i9-11980HK, GeForce RTX 3080 Laptop GPU, 99.9 Wh | Alienware m15 R4 i9-10980HK, GeForce RTX 3070 Laptop GPU, 86 Wh | Schenker XMG Neo 17 (Early 2021, RTX 3070, 5800H) R7 5800H, GeForce RTX 3070 Laptop GPU, 62 Wh | Average of class Gaming | |
|---|---|---|---|---|---|---|---|
| Battery runtime | 35% | 112% | 26% | -30% | -33% | 38% | |
| Reader / Idle (h) | 9.1 | 9.9 9% | 16.1 77% | 7.8 -14% | 3.7 -59% | 4.7 -48% | 8.71 ? -4% |
| WiFi v1.3 (h) | 7 | 6.8 -3% | 9.2 31% | 5.5 -21% | 2.7 -61% | 3.5 -50% | 7.11 ? 2% |
| Load (h) | 0.7 | 1.4 100% | 2.3 229% | 1.5 114% | 0.9 29% | 0.7 0% | 1.502 ? 115% |
Pros
Cons
Verdict - A gaming laptop that is more than serviceable
Overall, the Lenovo Legion 5 Pro is a solid gaming laptop that will probably allow you to play all the current games at high graphics settings. There are no larger reasons for complaint to report for the gaming laptop. However, the laptop also wasn't able to move significantly ahead of the competitors in any of the many tests. Regardless of this, Lenovo has delivered a more than satisfactory device that should also be futureproof for several years. Thanks to the easy access to the modules that are not soldered in, such as the storage solution, working memory, and WLAN module, the system can also be upgraded at a later time.
While the Lenovo Legion 5 Pro is no Ark Reactor, it still is a solid piece of technology.
Lenovo's typical design is a matter of taste, but the amount of connections offered by the laptop is more than sufficient. The many USB connections also allow the laptop to the expanded easily. The robust case should contribute to the longevity of the computer. In connection with the Ryzen 7, the Nvidia GeForce 3070 delivers a very good performance in all the games we tested, also handling raytracing easily. All the components used are matched well with each other in terms of their performance capabilities.
Price and Availability
The Lenovo Legion 5 Pro is available in the US from Lenovo starting from $1300. The prebuilt configuration with a Ryzen 5800H, 32 GB DDR-4 RAM, Nvidia GeForce RTX 3070, 1 TB SSD, and Windows 10 Home costs $1900. Walmart also offers a configuration for $1530.
Lenovo Legion 5 Pro 16ACH6H (82JQ001PGE)
- 08/10/2021 v7 (old)
Marc Herter
Price comparison

