Verdict - A successful gaming-creator hybrid
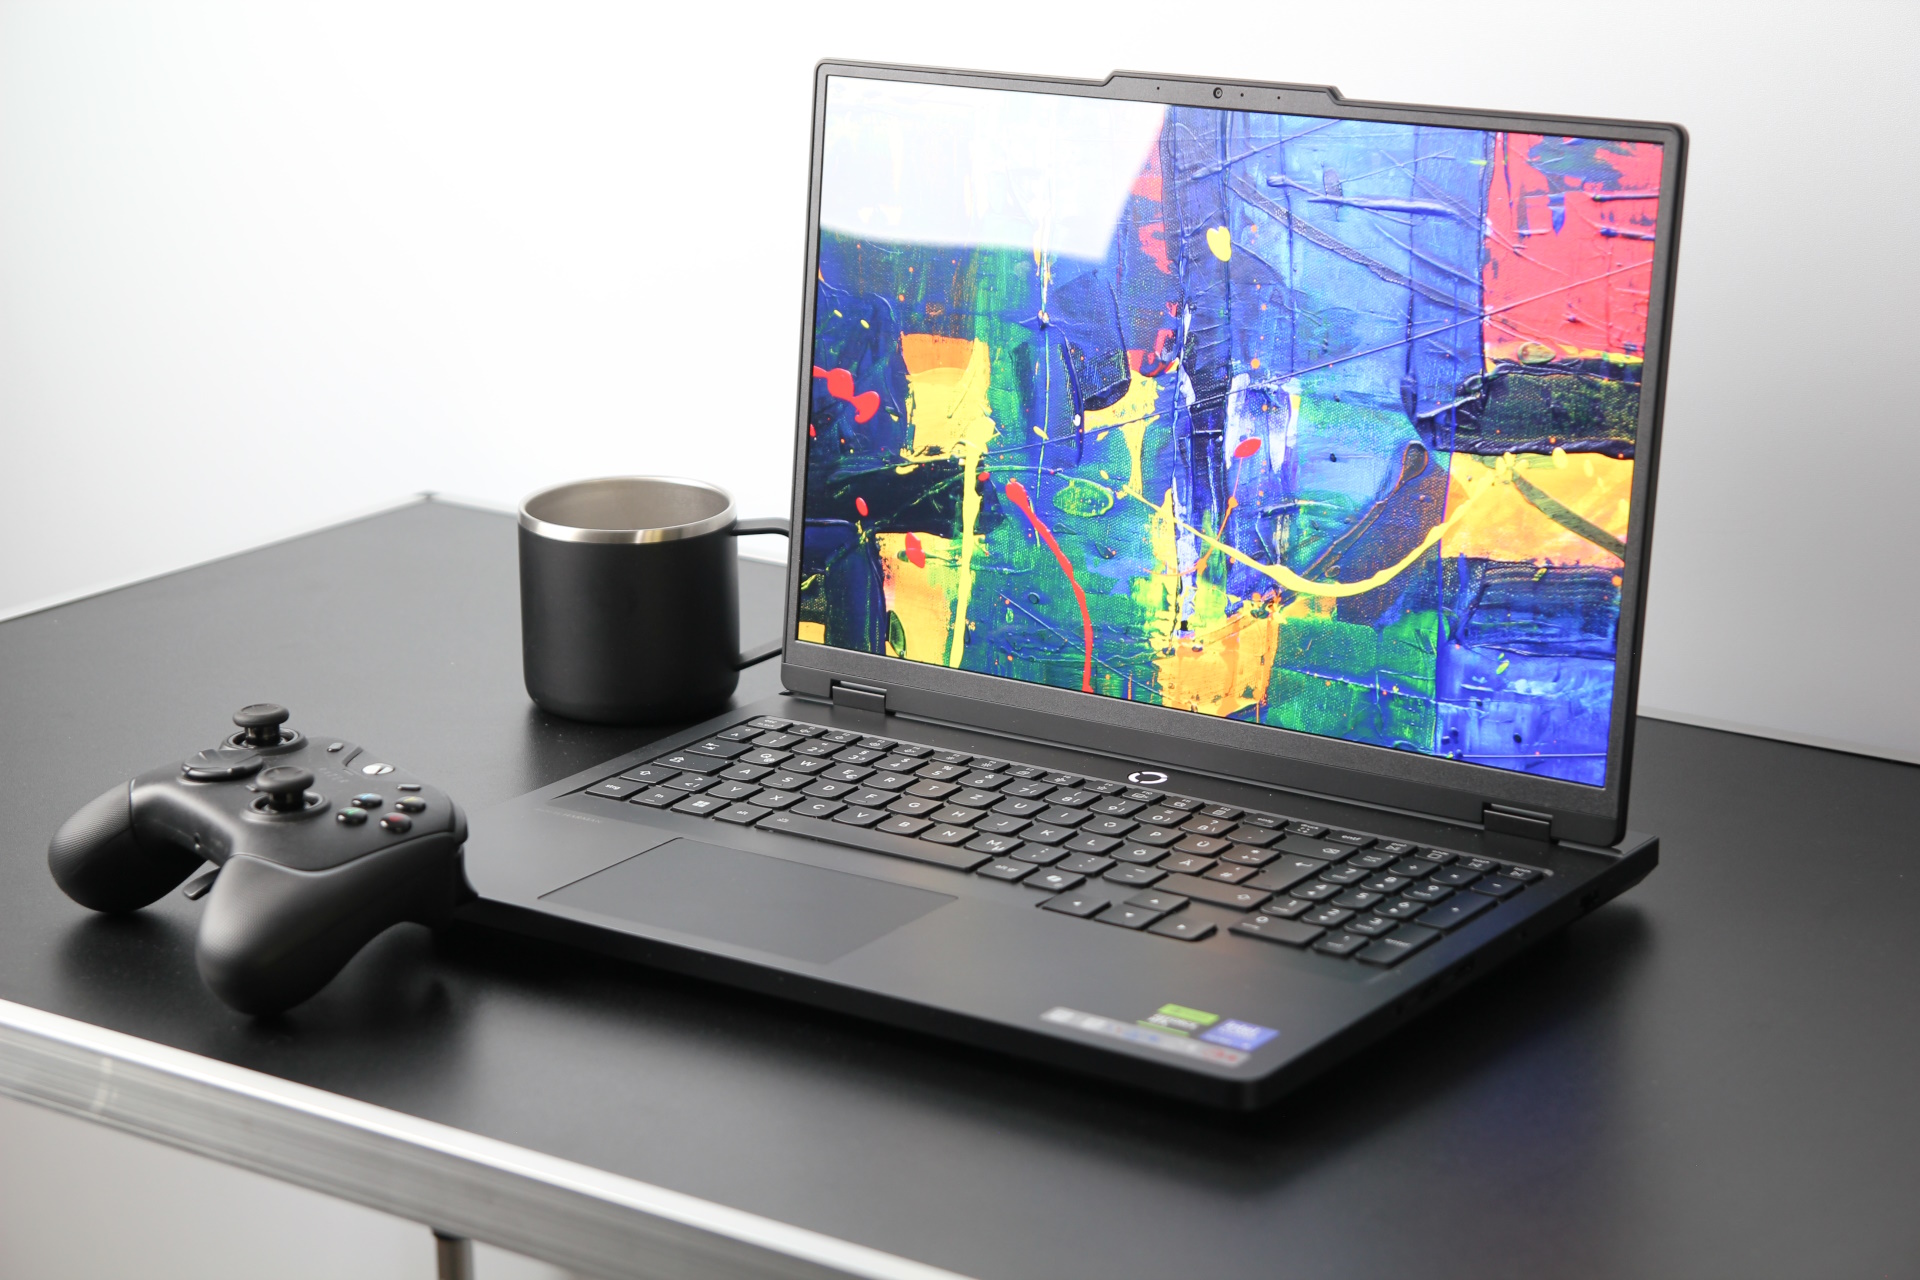
As befits a "pro" laptop, the somewhat simpler gaming design can also appeal to content creators. Furthermore, we were particularly impressed by the Legion Pro 5 16's excellent OLED display and powerful 3D performance. In the 16-inch laptop, RTX 5070 Ti category, the Legion Pro is certainly one of the strongest representatives in terms of performance and build quality. On top of this, its predecessor's criticisms have been eliminated, which means that the initial question of whether Lenovo has worked on the weaknesses while retaining its strengths can be answered in the affirmative.
However, you get the feeling that Lenovo, perhaps because of the OLED, had to cut corners elsewhere. This is especially true of the hardware, some of which is no longer quite up to date. Two of the three USB-A ports only transmit at 5 Gbps instead of 10 Gbps, there's no Thunderbolt 5 (only 4 Gbps), no Wi-Fi 6E, and no Wi-Fi 7. There's also no SD card reader, which is likely to annoy creators. Similarly problematic are the dropped frames when playing a high-resolution YouTube video or the relatively loud volume at high performance. An additional gripe is the increasing amount of advertising Lenovo includes in its various more or less mandatory software solutions. This is an area where Lenovo should take a step back for the sake of its customers!
Pros
Cons
Price and availability
This model is still hard to come by and isn't listed on various comparison portals. In Germany, only the model with the RTX 5070 (without the "Ti") is available starting at €2,400 (around $2,880).
Table of Contents
- Verdict - A successful gaming-creator hybrid
- Specifications
- Case - An elegant fingerprint magnet
- Features - A somewhat long in the tooth Legion Pro
- Input devices - Good for a gamer
- Display - A dazzling OLED
- Performance - Powerful 3D performance
- Emissions - A very loud pro laptop
- Energy management - The battery could be bigger
- Notebookcheck overall rating
- Possible alternatives compared
Last year, the Legion Pro 5 16 or the Legion Pro 5i were some of the best and most popular gaming laptops. The main criticisms were the thermally throttling SSD, the heaviness, and the somewhat uneven cooling system. However, the CPU and GPU performance were above average. Which changes have Lenovo made to the successor?
Specifications
Case - An elegant fingerprint magnet
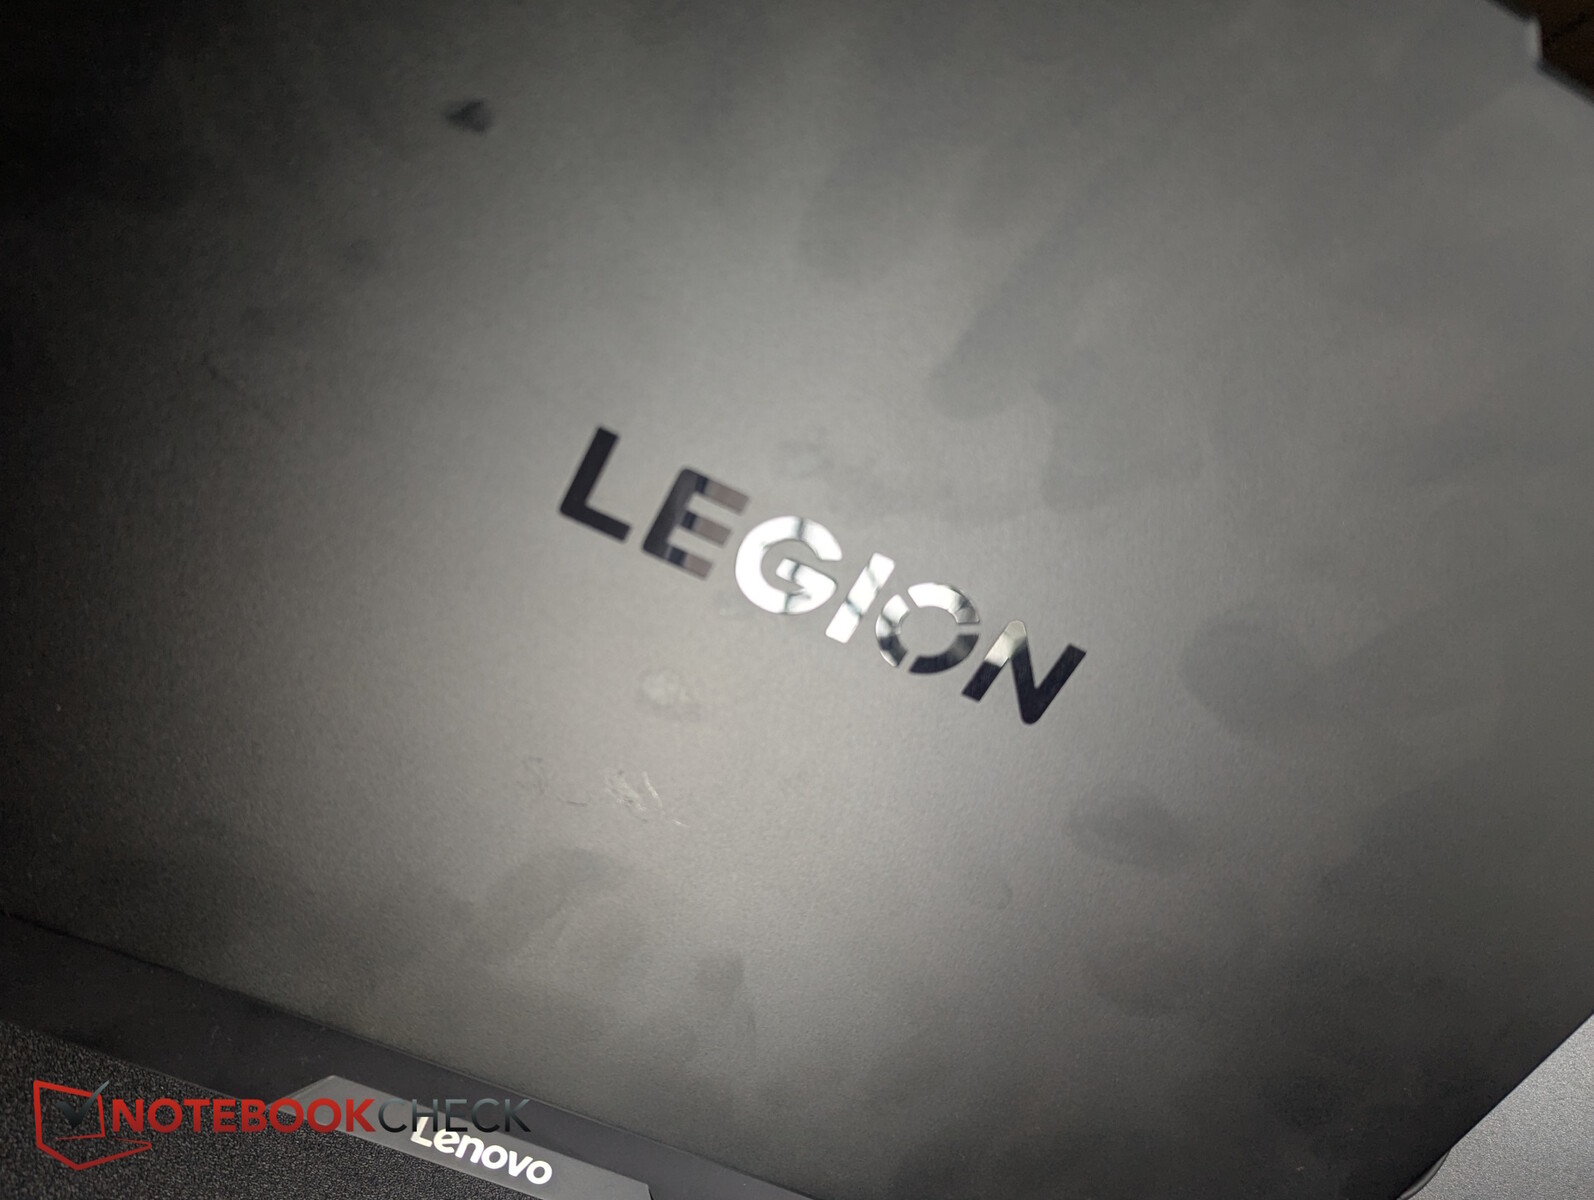
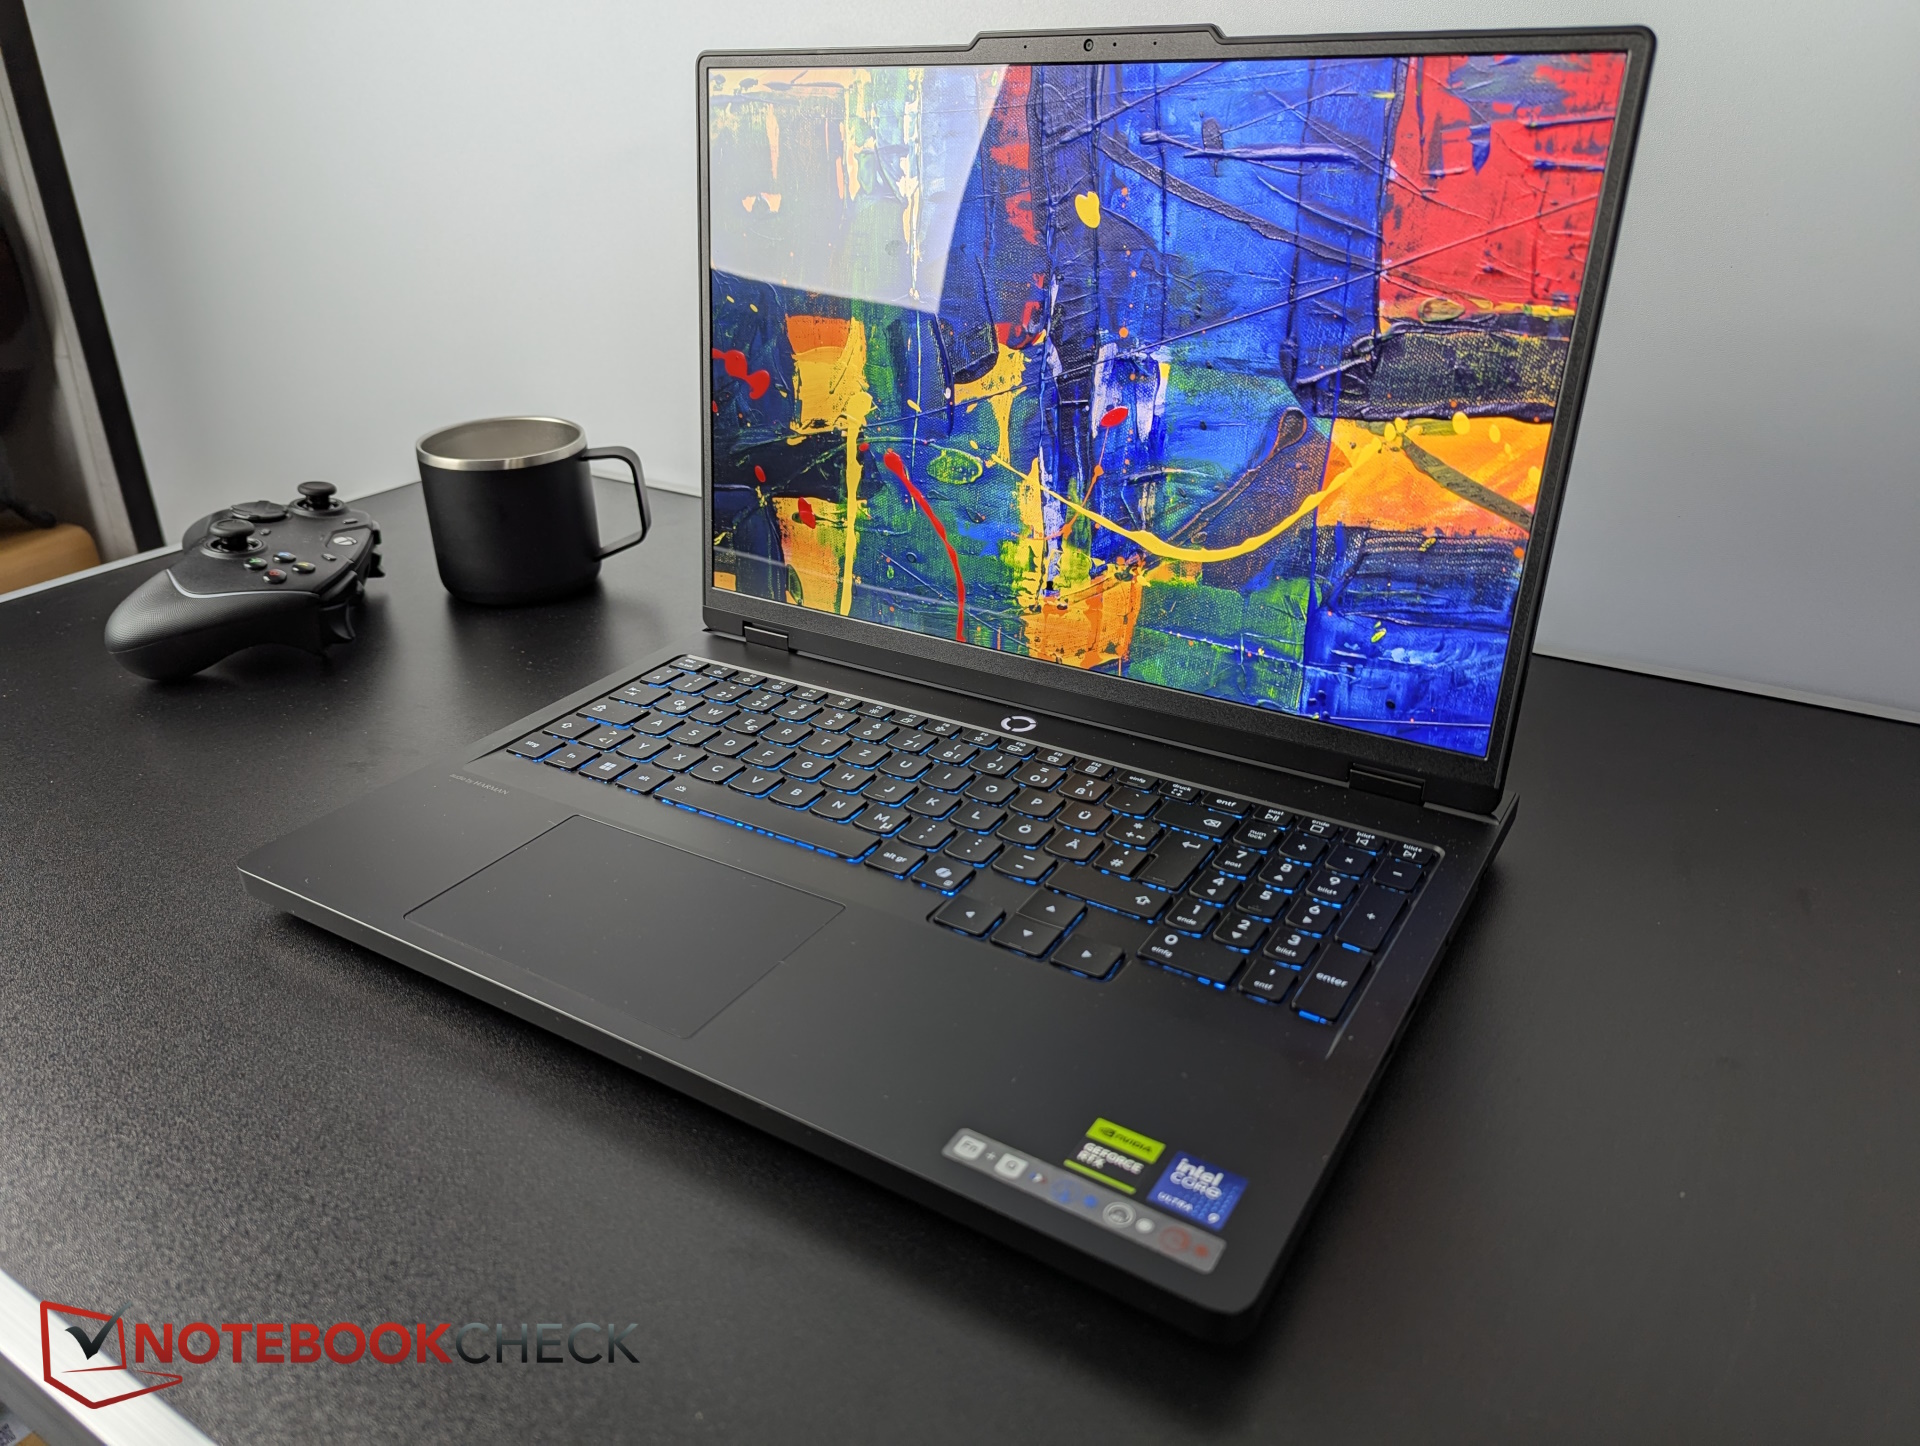
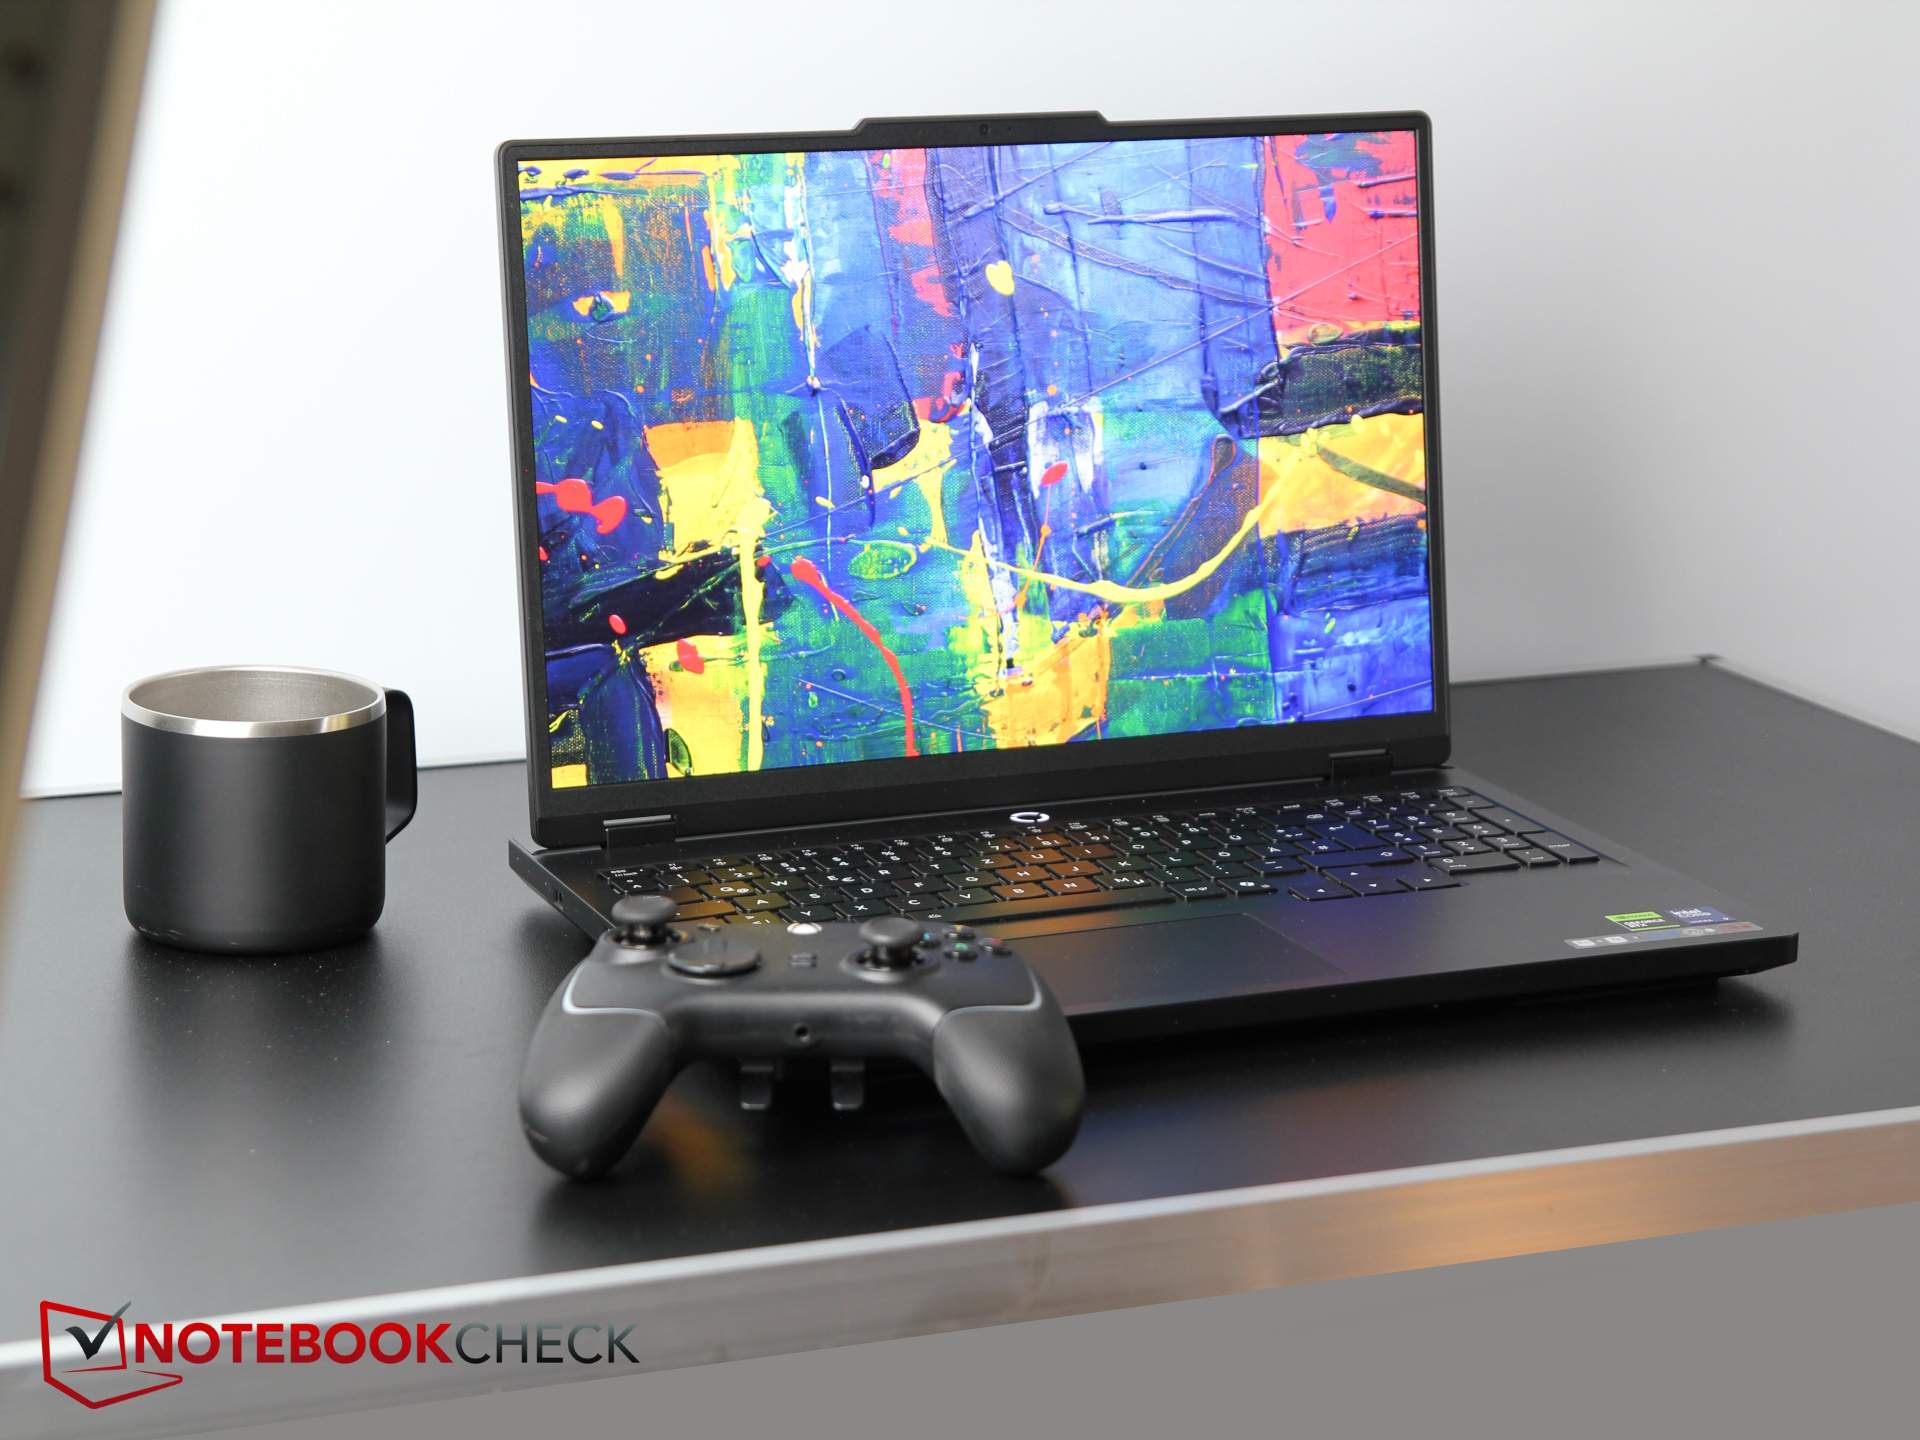
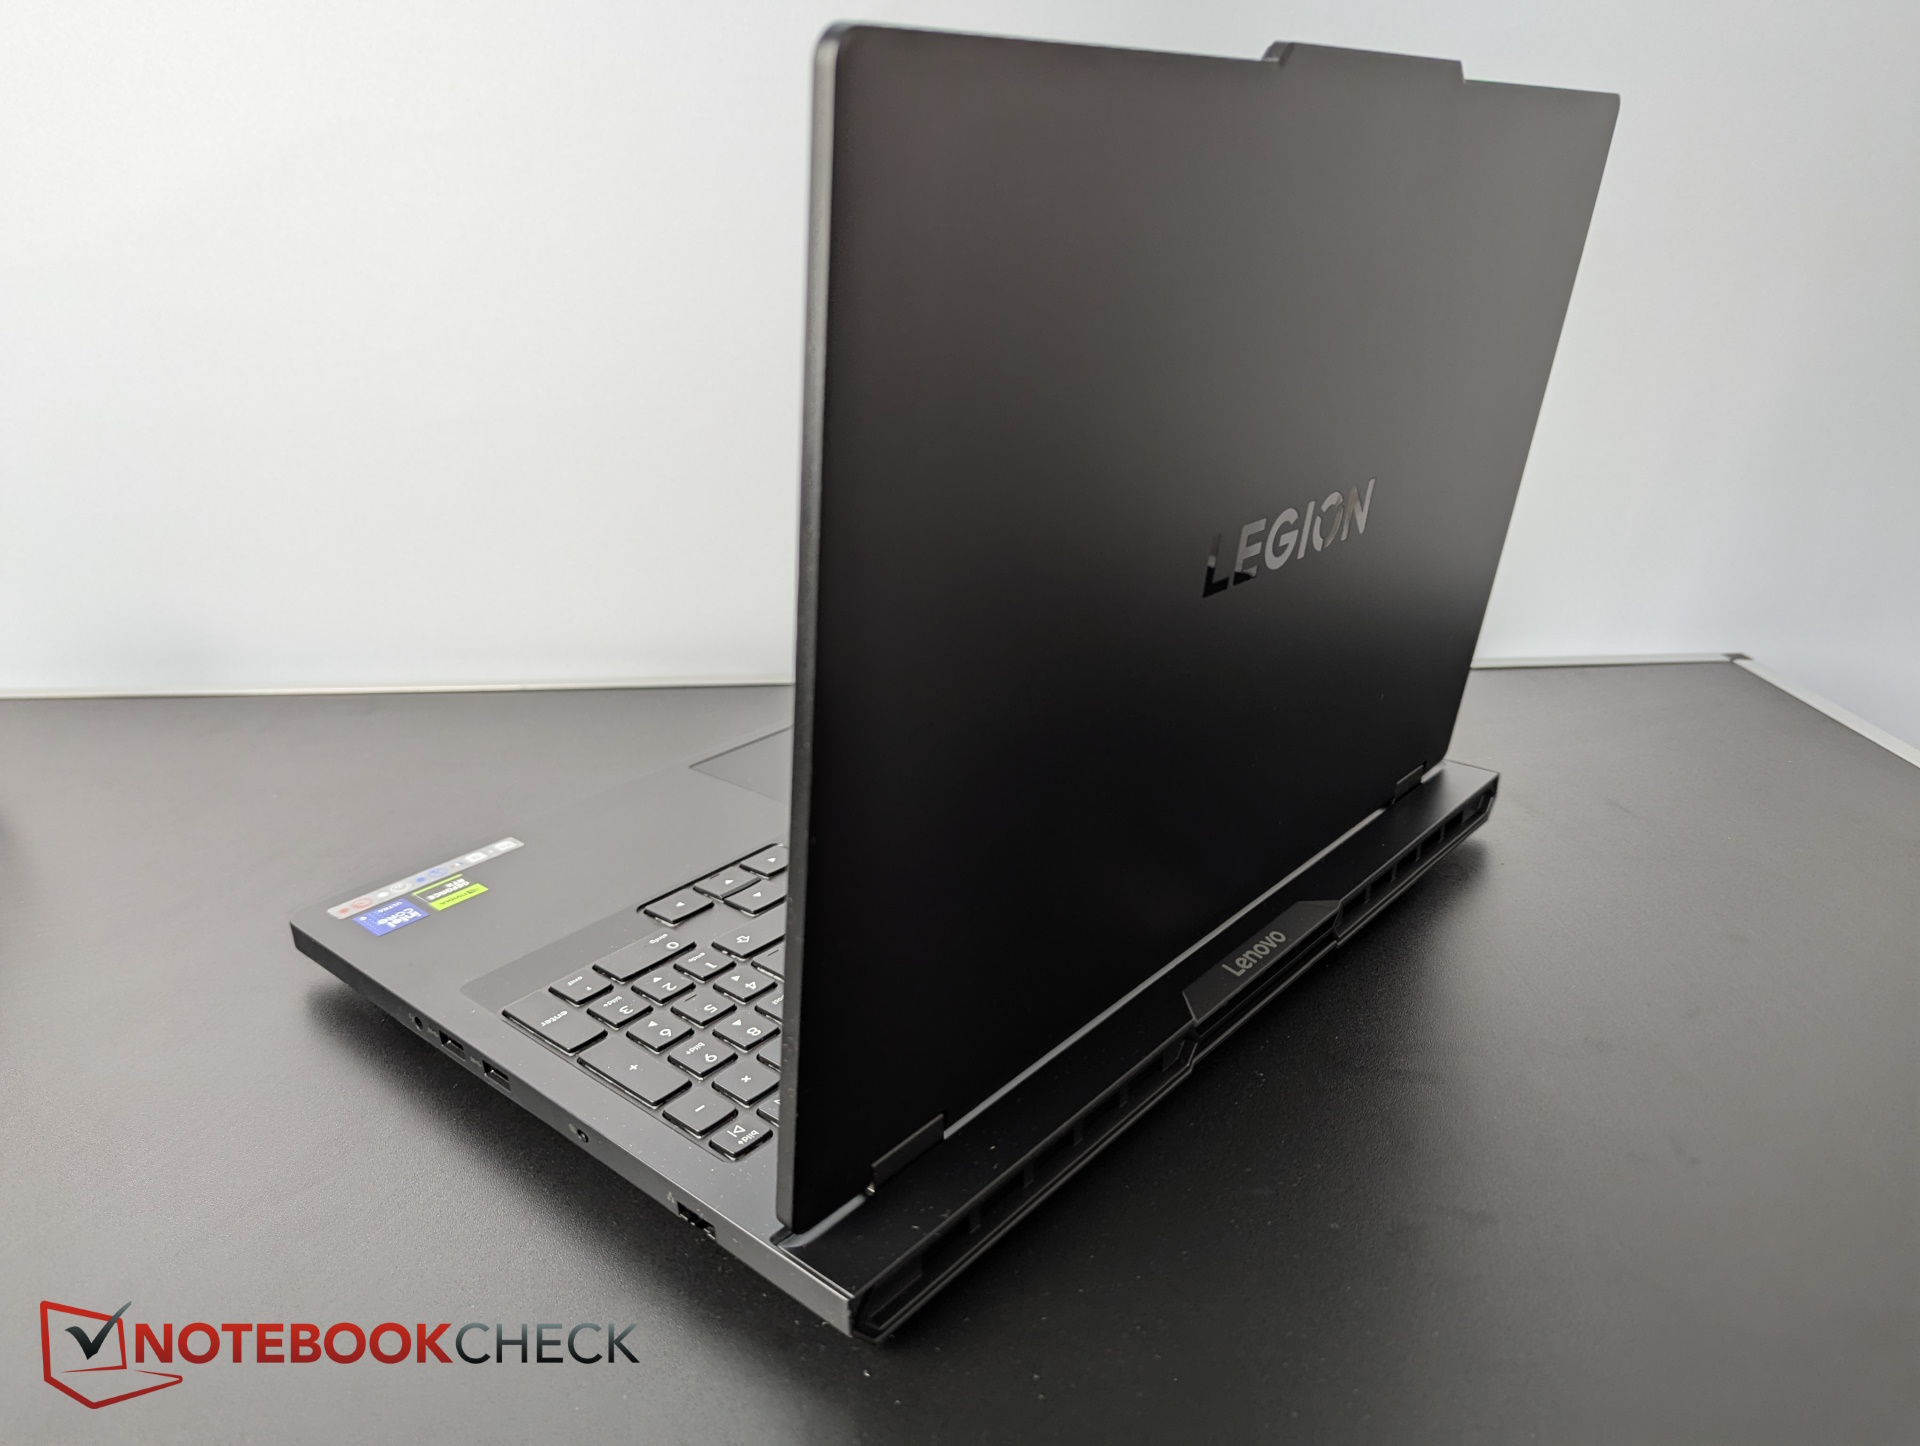
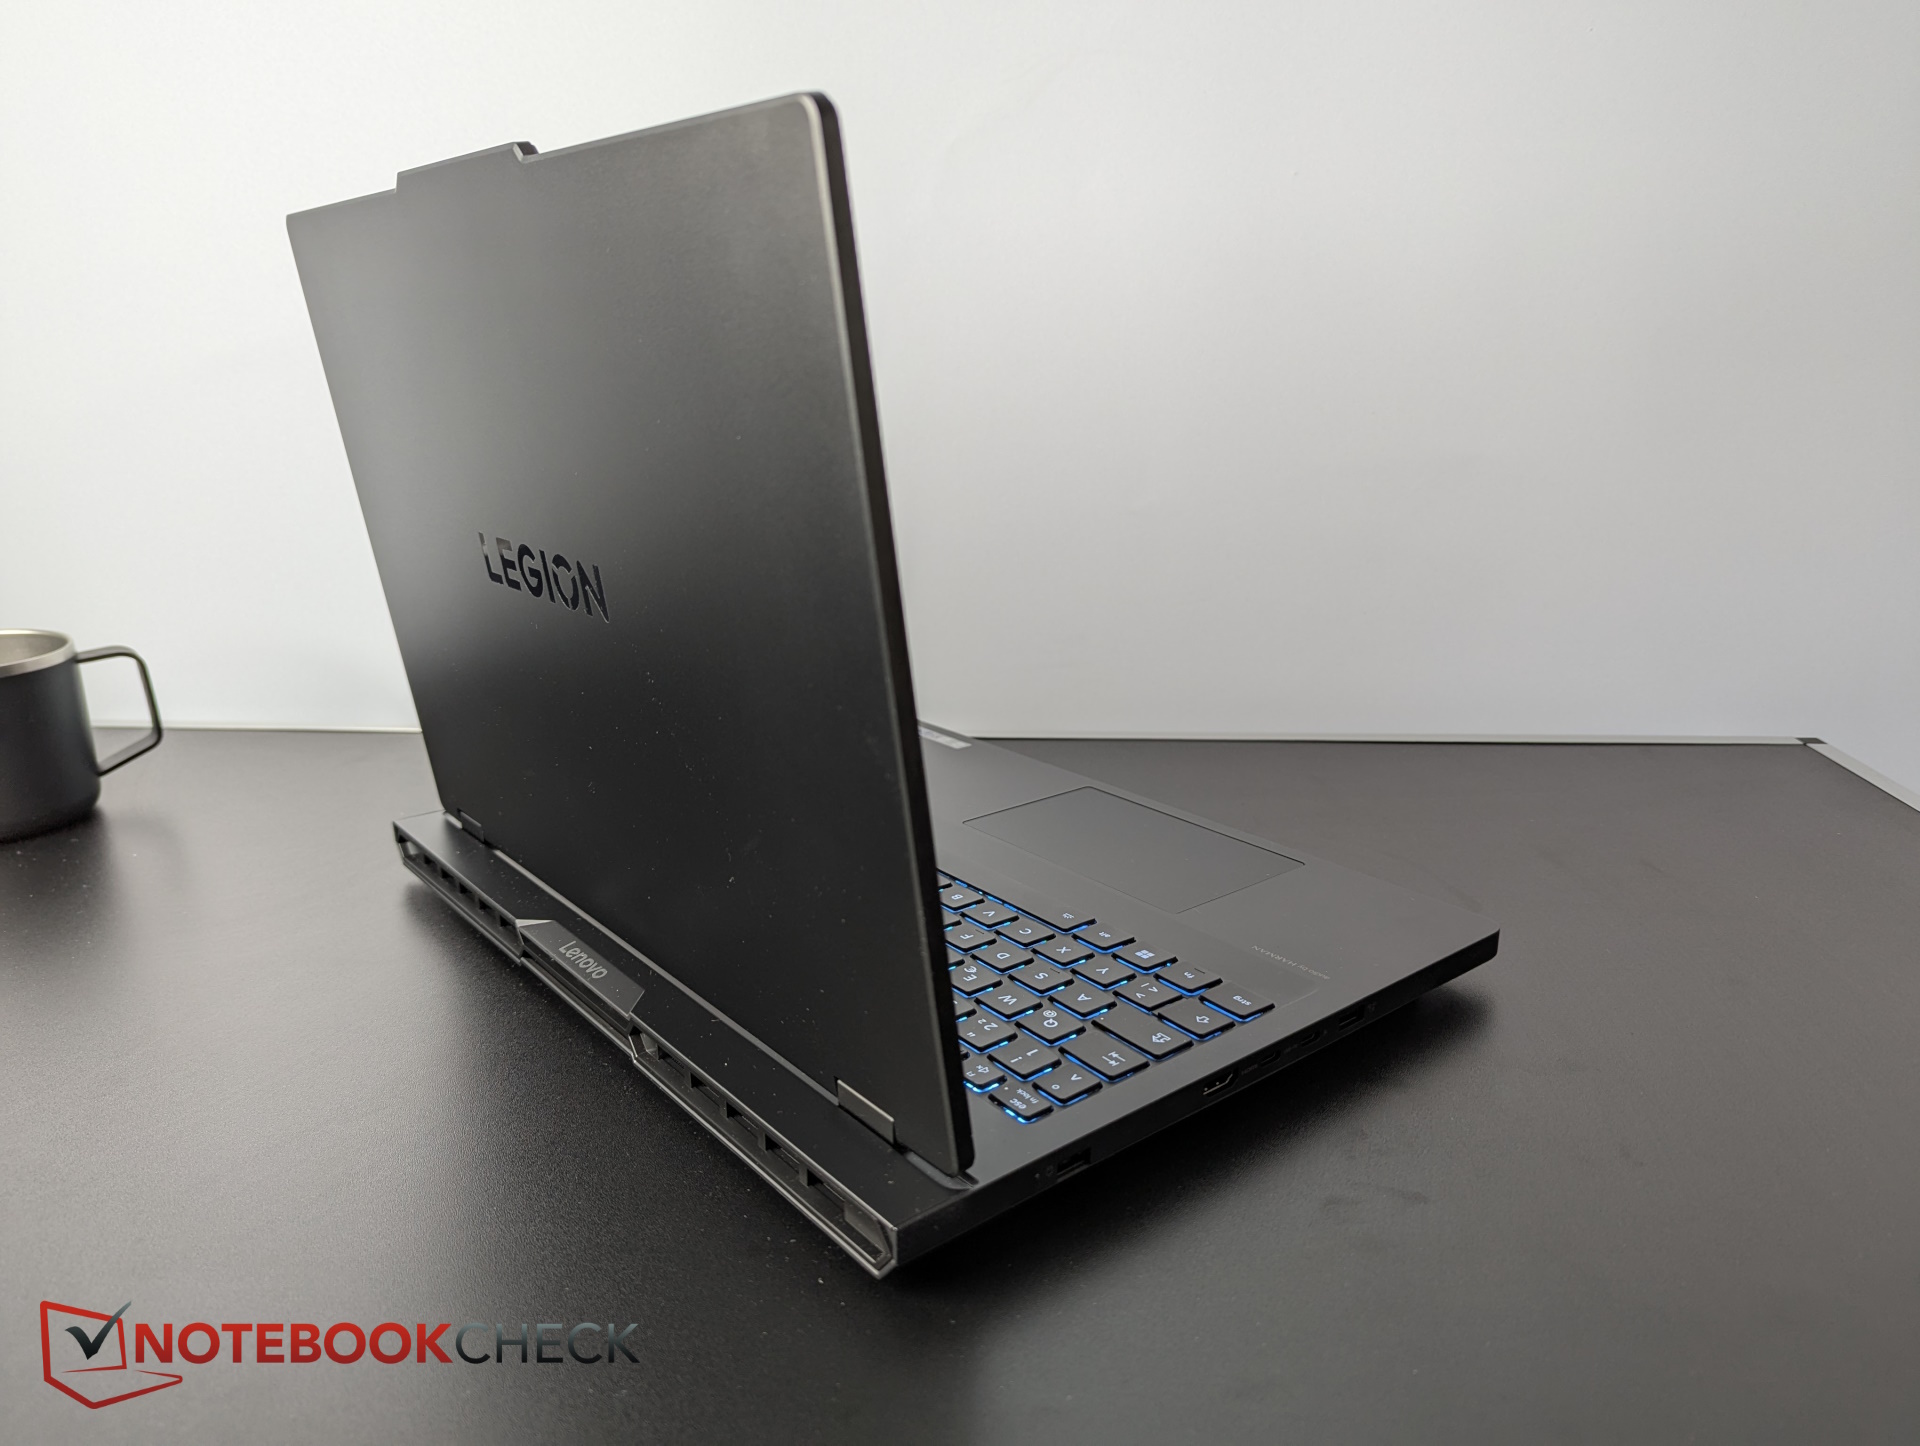
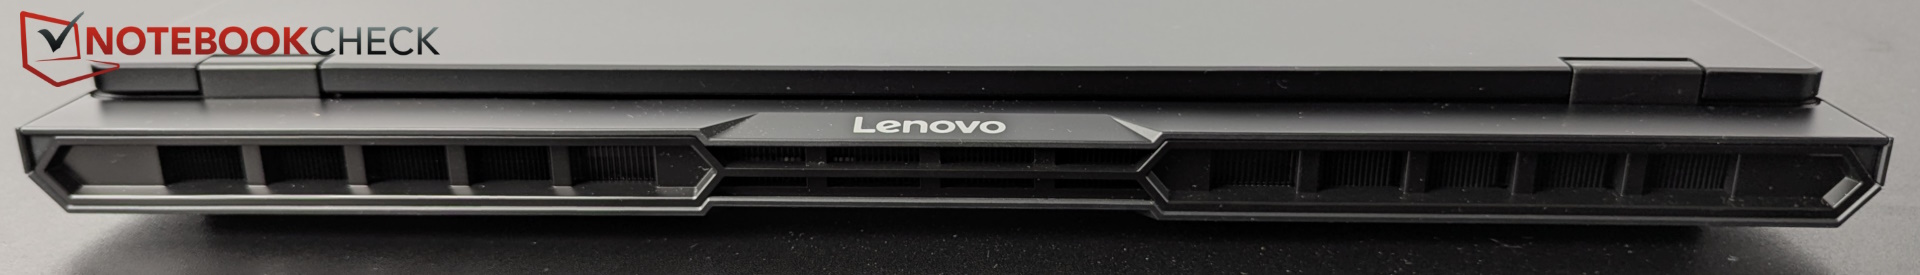
The elegant black plastic case and its sturdy metal lid have been redesigned for this year. The top "camera flap" remains, but much else has changed. There are no longer any ports on the back, since they've now all been relocated to the sides, and the rear is reserved for the airflow. Overall, we like the design, as it strikes a good balance between gaming and creator looks.
The base can be twisted slightly, the result of which causes a slight creaking noise on the right-hand side, and the 180-degree hinges could be a bit tighter. Fingerprints quickly accumulate on the surfaces.
Compared to its predecessor, the new chassis is about 1 mm thinner, but 1 mm deeper and 6 mm wider. All other laptops in this class are narrower, but our Legion Pro 5 is the thinnest, excluding the Blade 16 and G16. It also weighs 100 g less.


Features - A somewhat long in the tooth Legion Pro
The power connector and HDMI port are now on the left, the LAN port and one USB-A port are on the right, and other ports have also been moved from the back to the sides.
However, the USB ports in particular are no longer quite as modern. There's no Thunderbolt 5, only version 4, and the second USB-C slot isn't Thunderbolt-capable. Two of the three USB-A slots (the two on the right) only operate at 5 Gbps, and an SD reader is completely absent.
The port layout is fine, although the sides are now obviously more crowded than before.


Communication
Wi-Fi 6 and Bluetooth 5.2 are no longer impressive in the age of Wi-Fi 7 or even Wi-Fi 6E, especially with Bluetooth 6 having been available since September 2024, and Bluetooth 5.4 no longer setting the standard. The predecessor already featured Wi-Fi 6E, and the direct competition is all faster, but at least the module is replaceable.
Webcam
Lenovo has packed a 5-megapixel camera into the wide notch on the top of the case. Images are sharp, and color accuracy is acceptable. On the right-hand side, there's a slider switch for the electronic shutter.


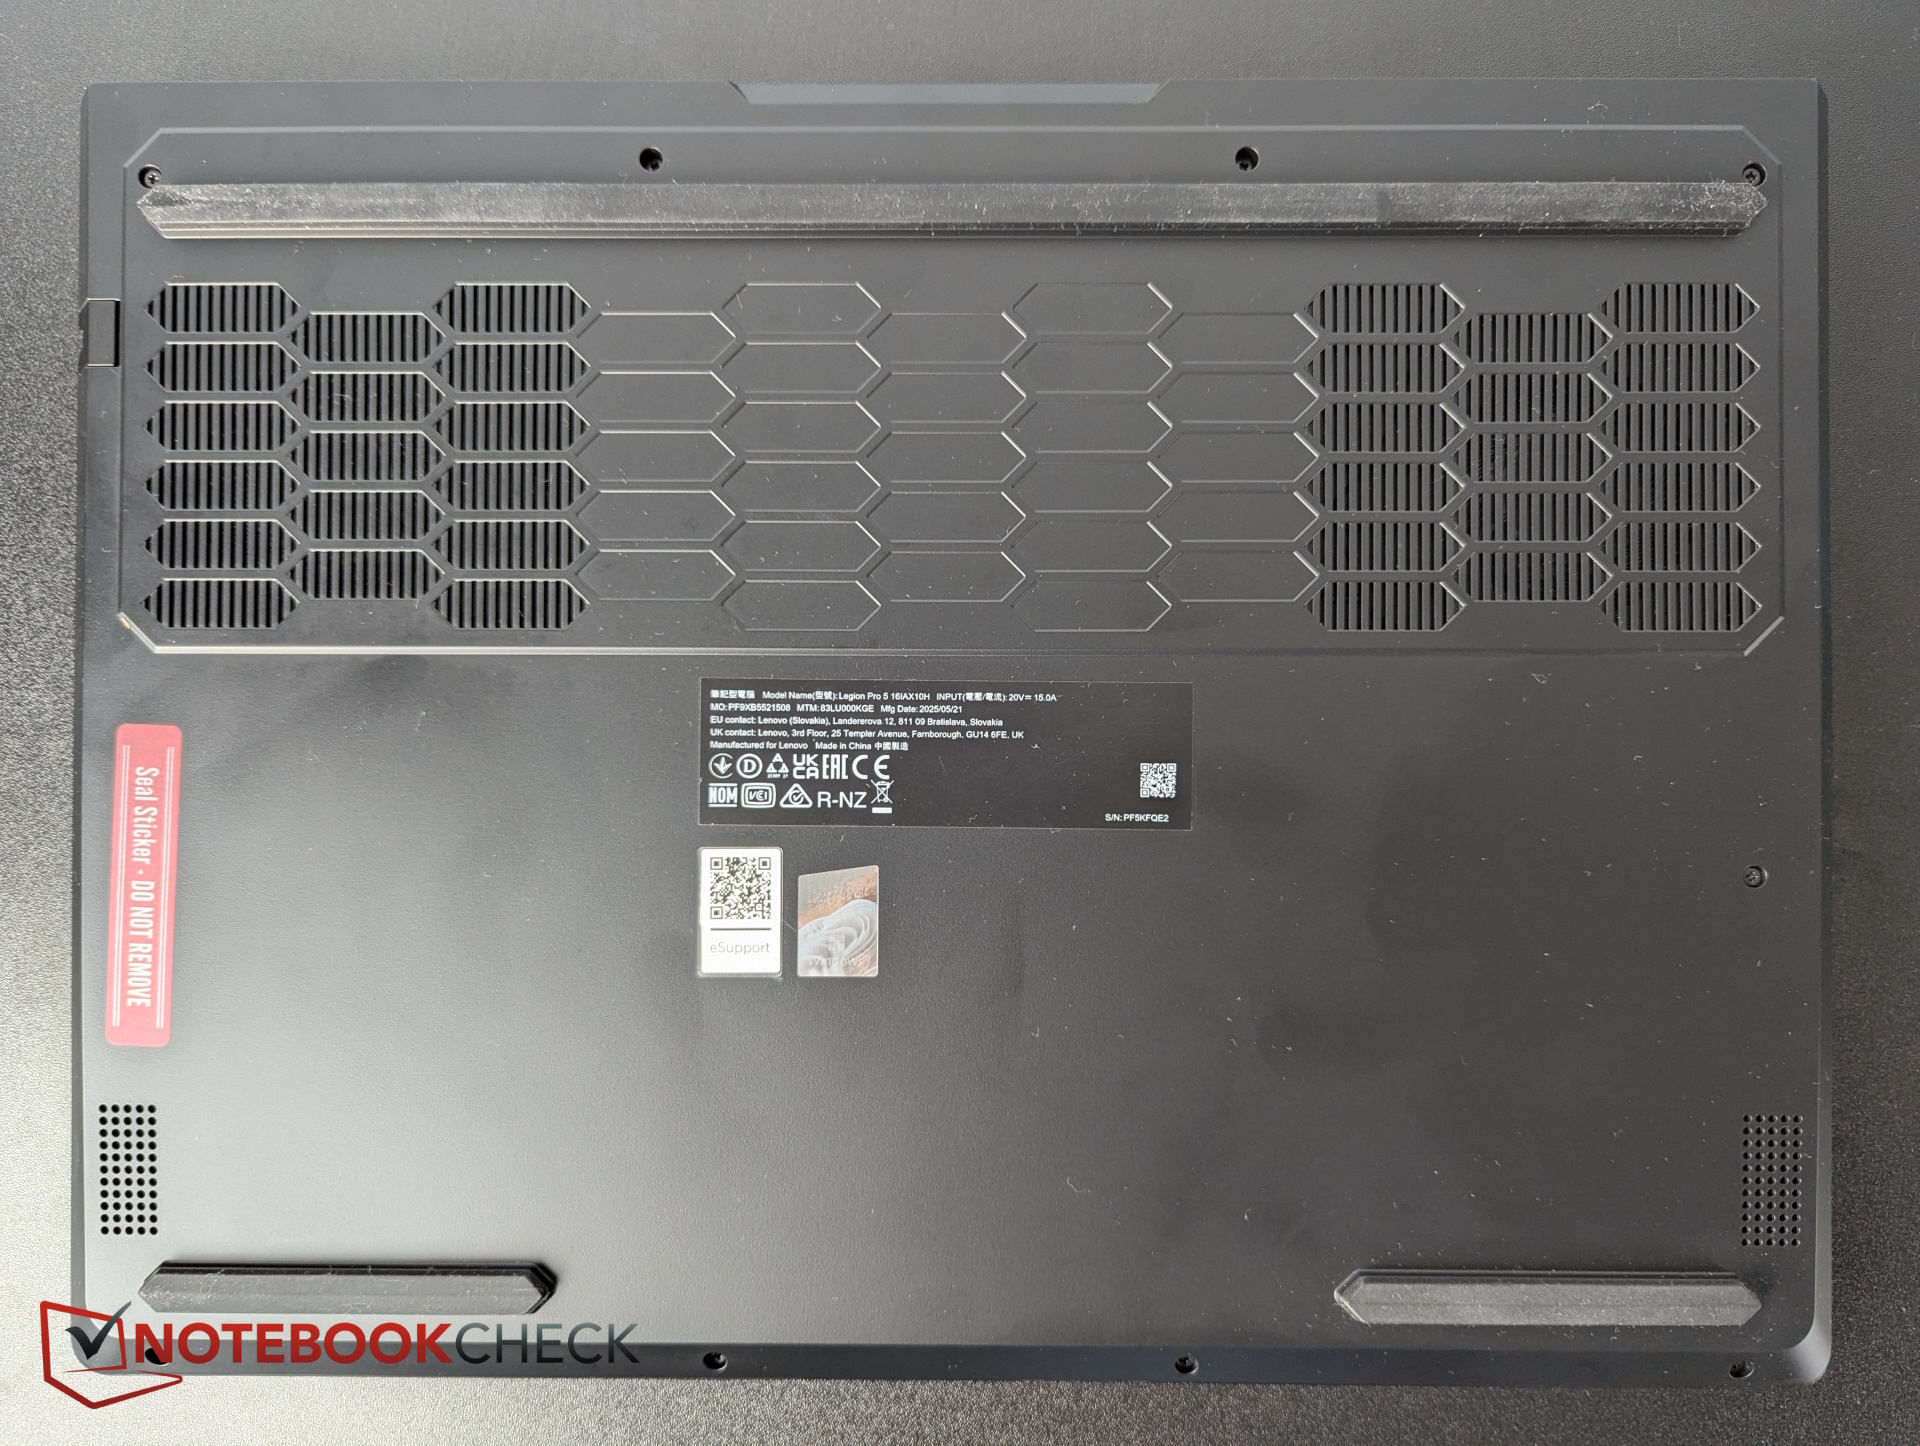
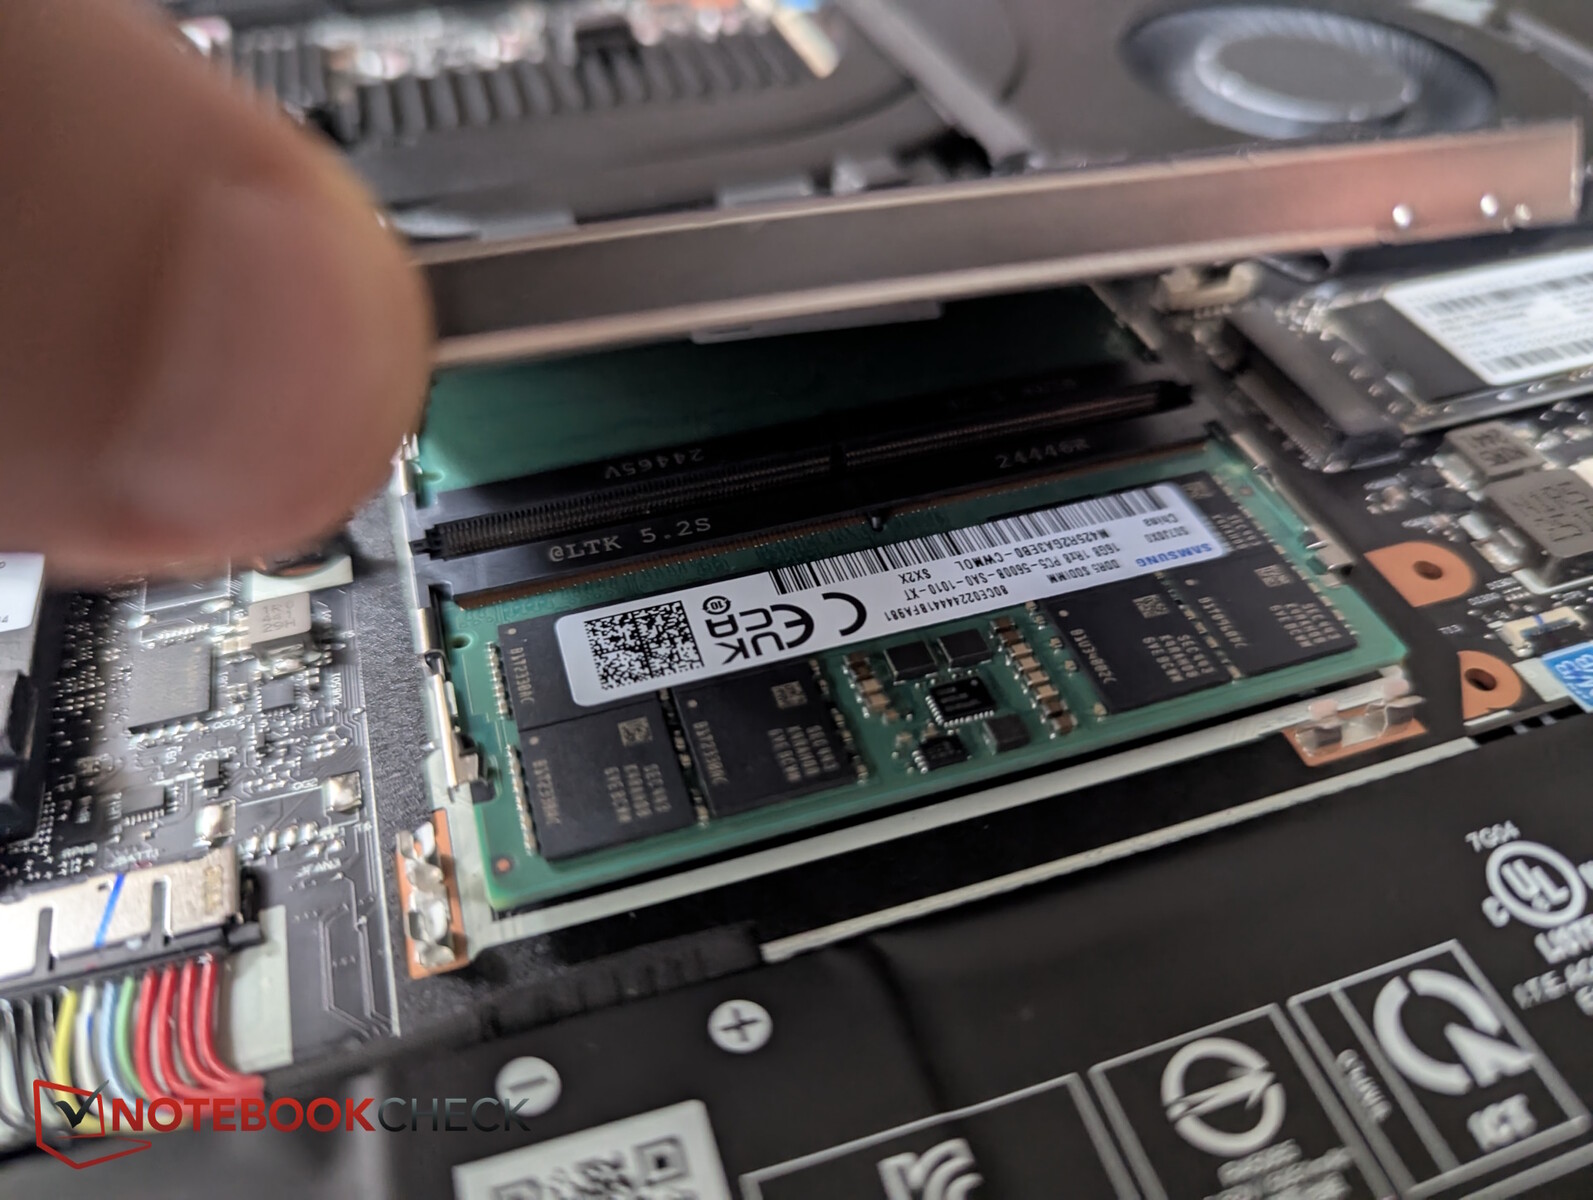
Maintenance
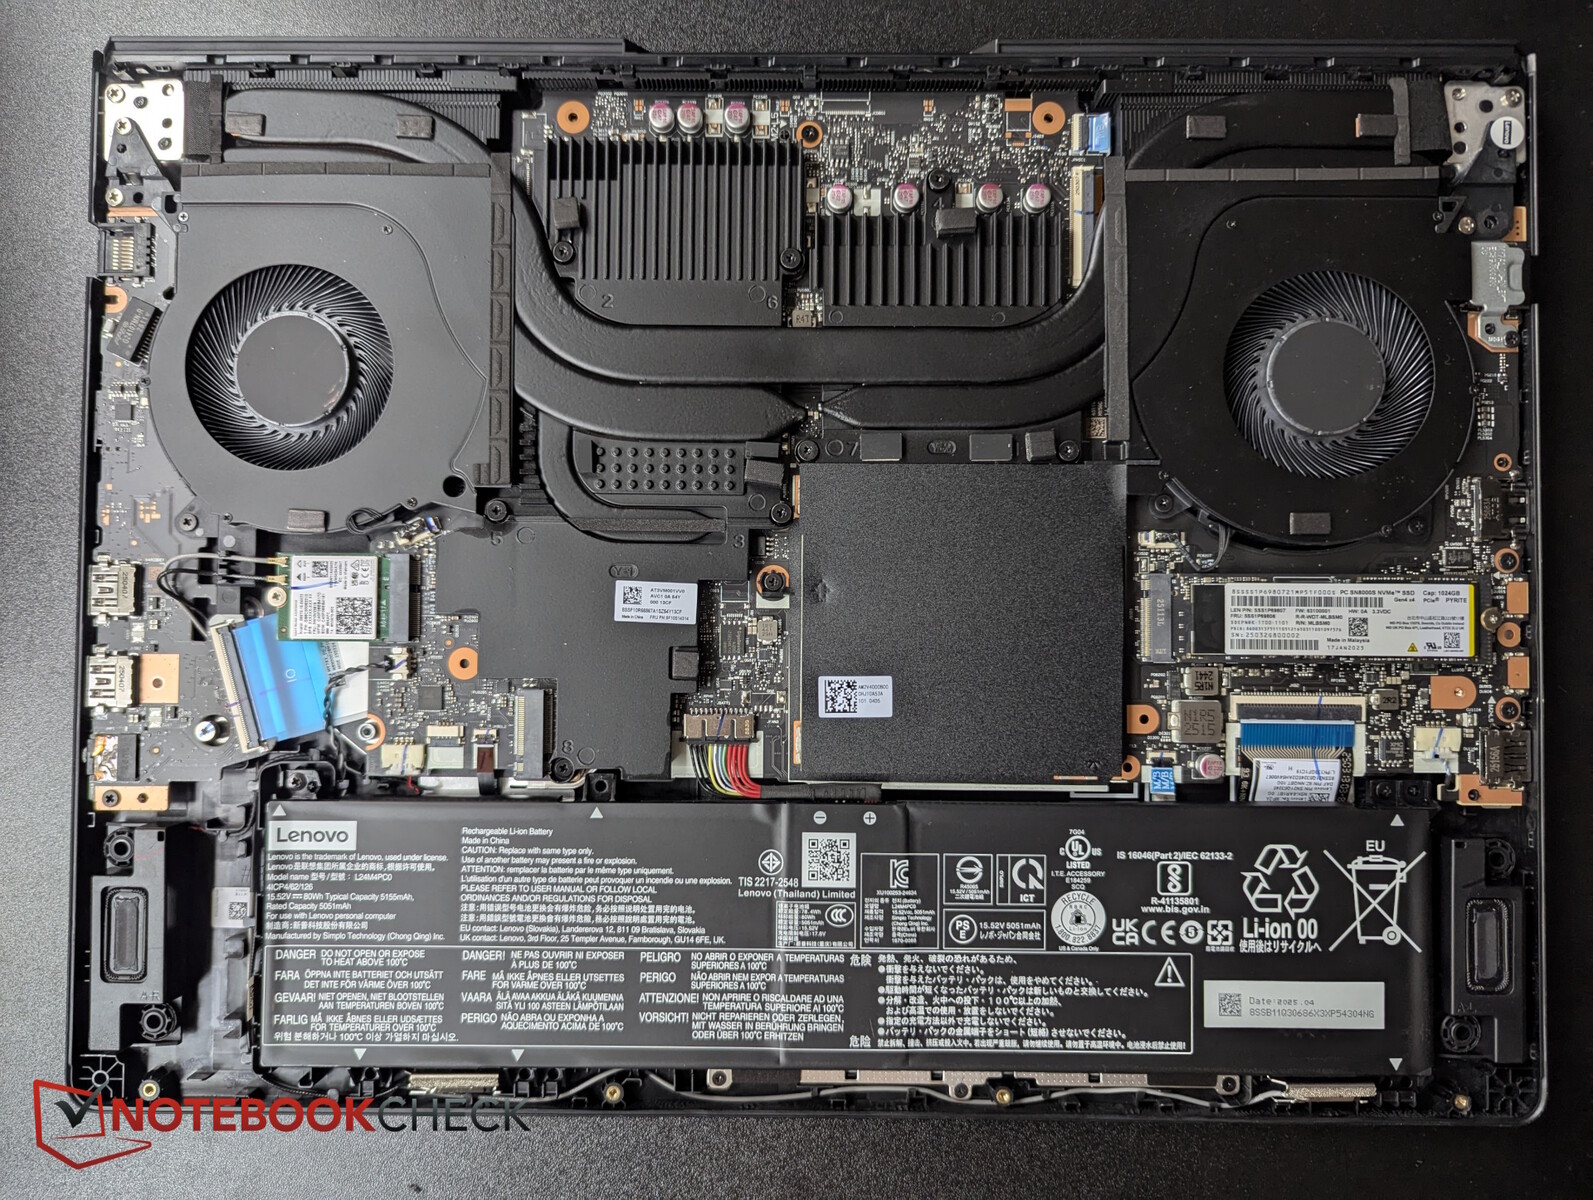
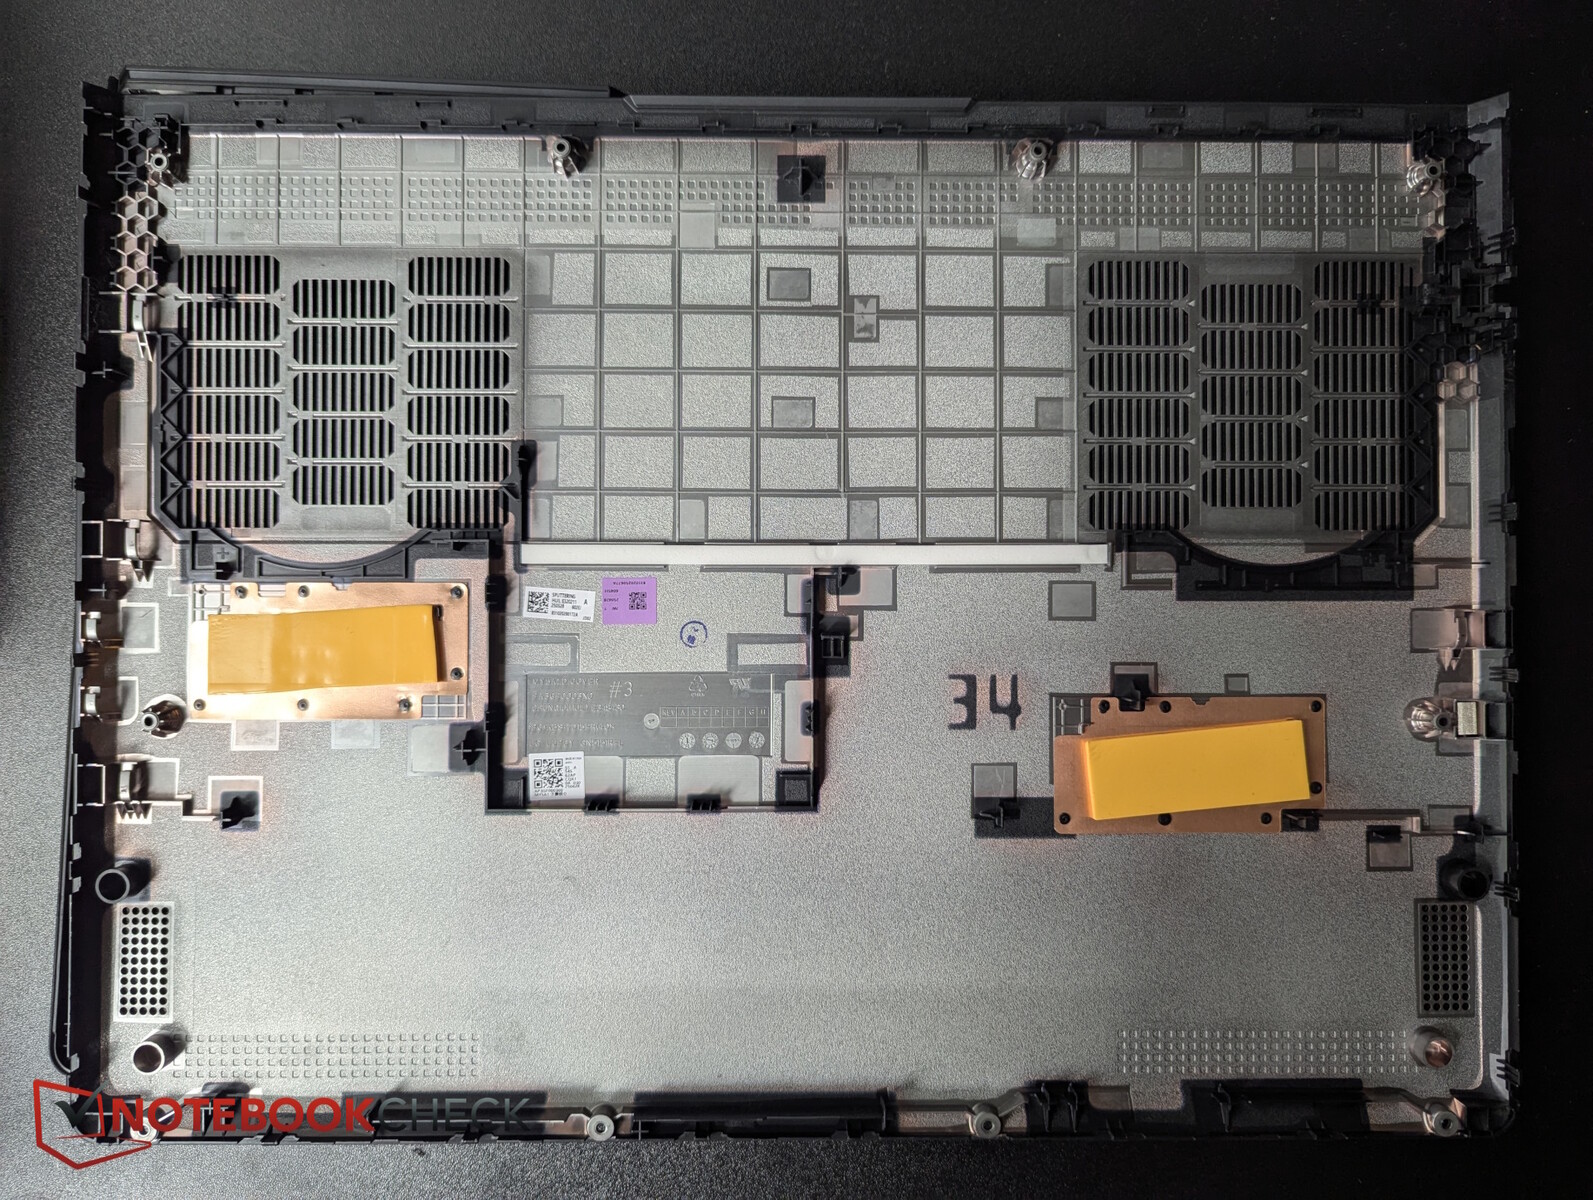
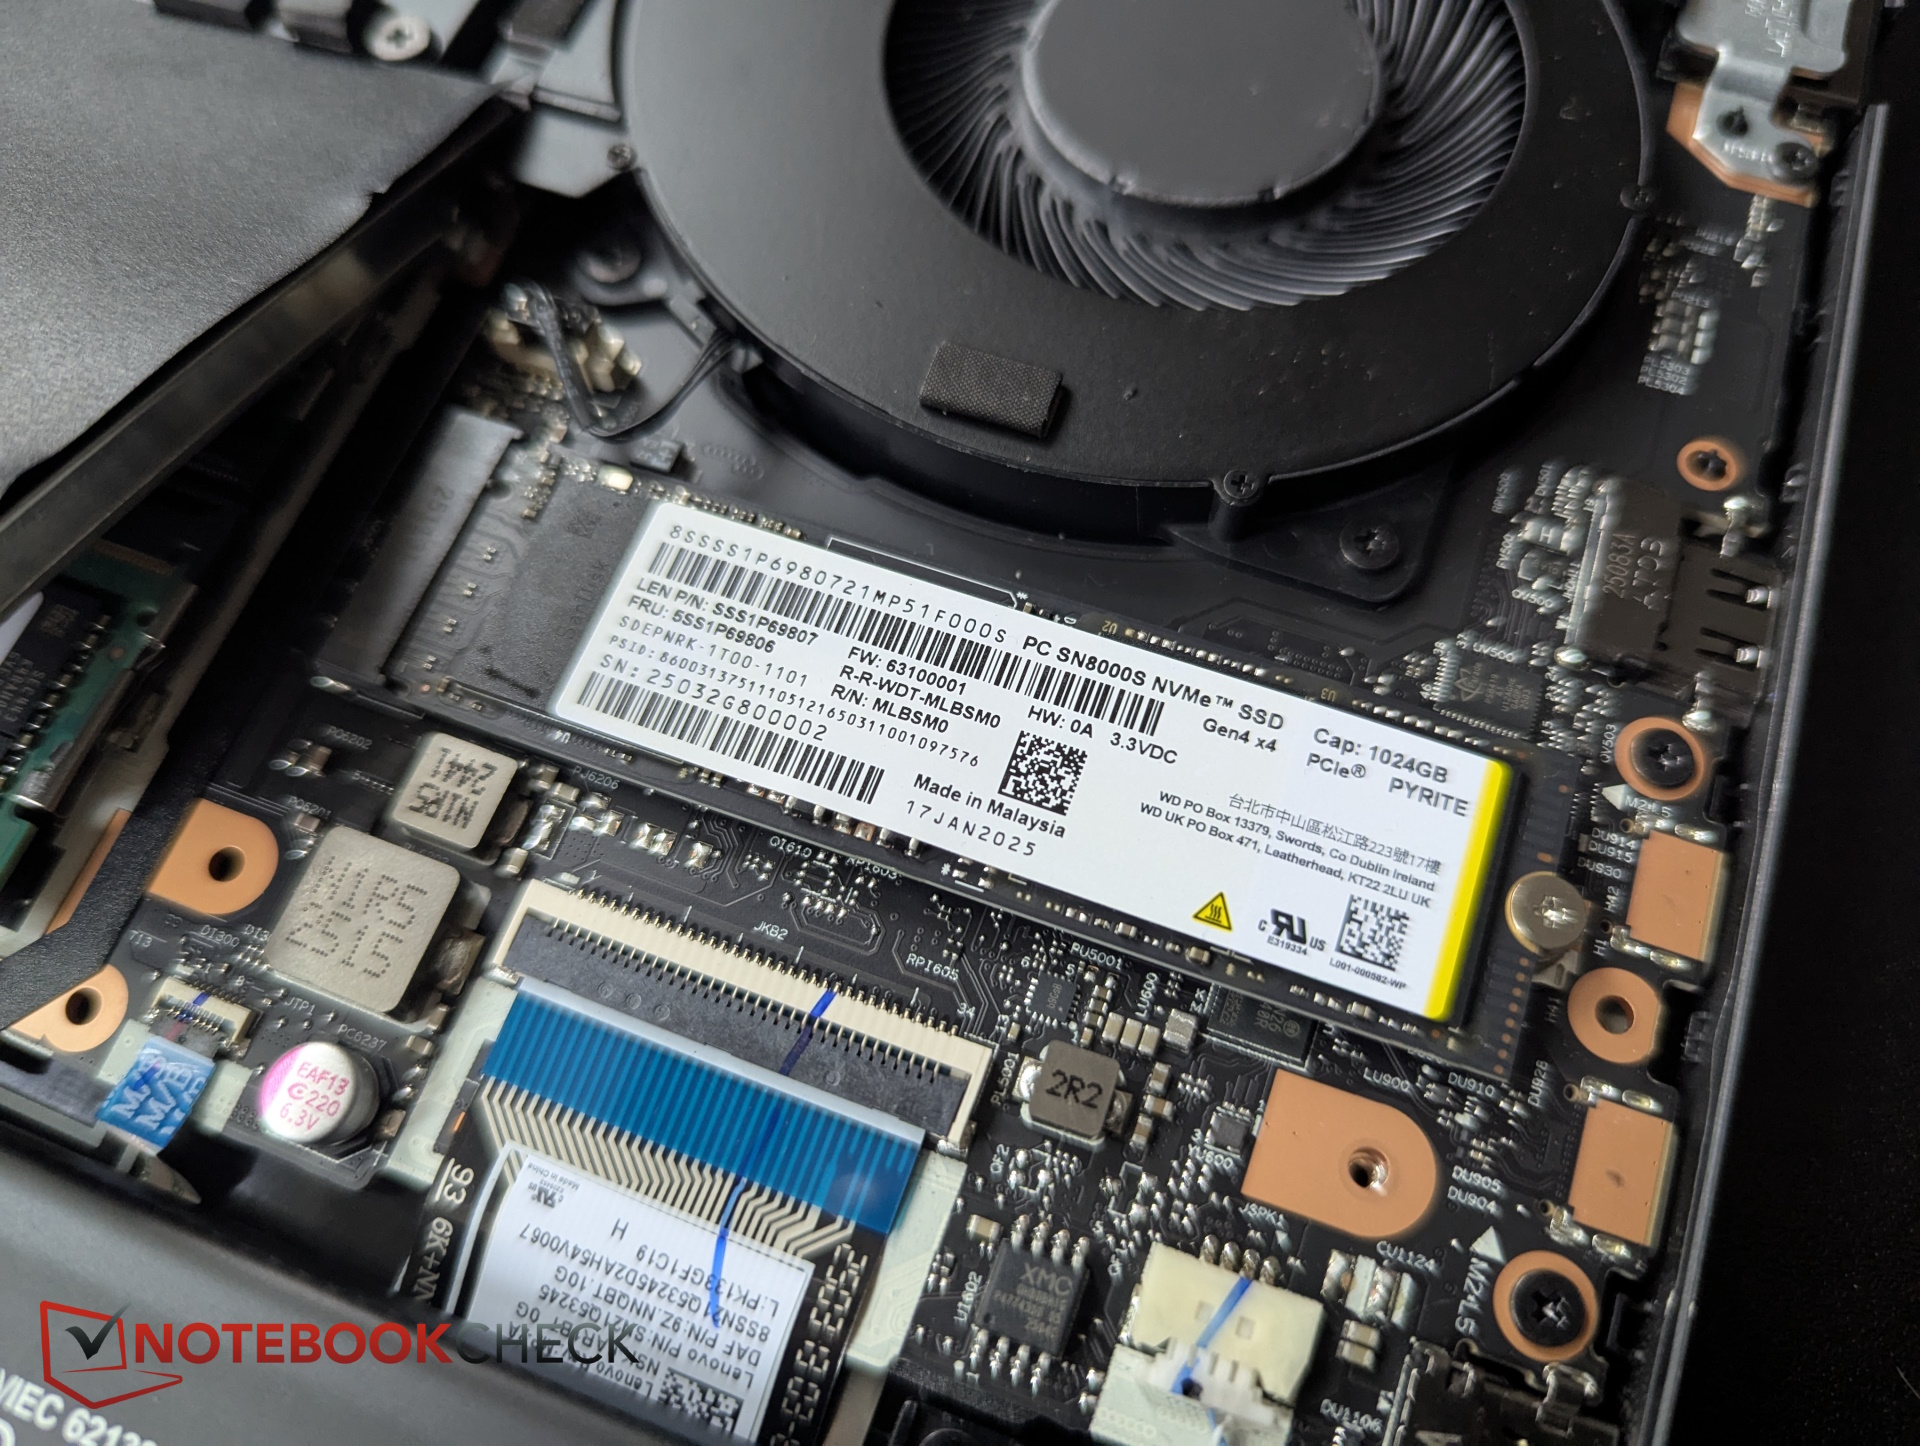
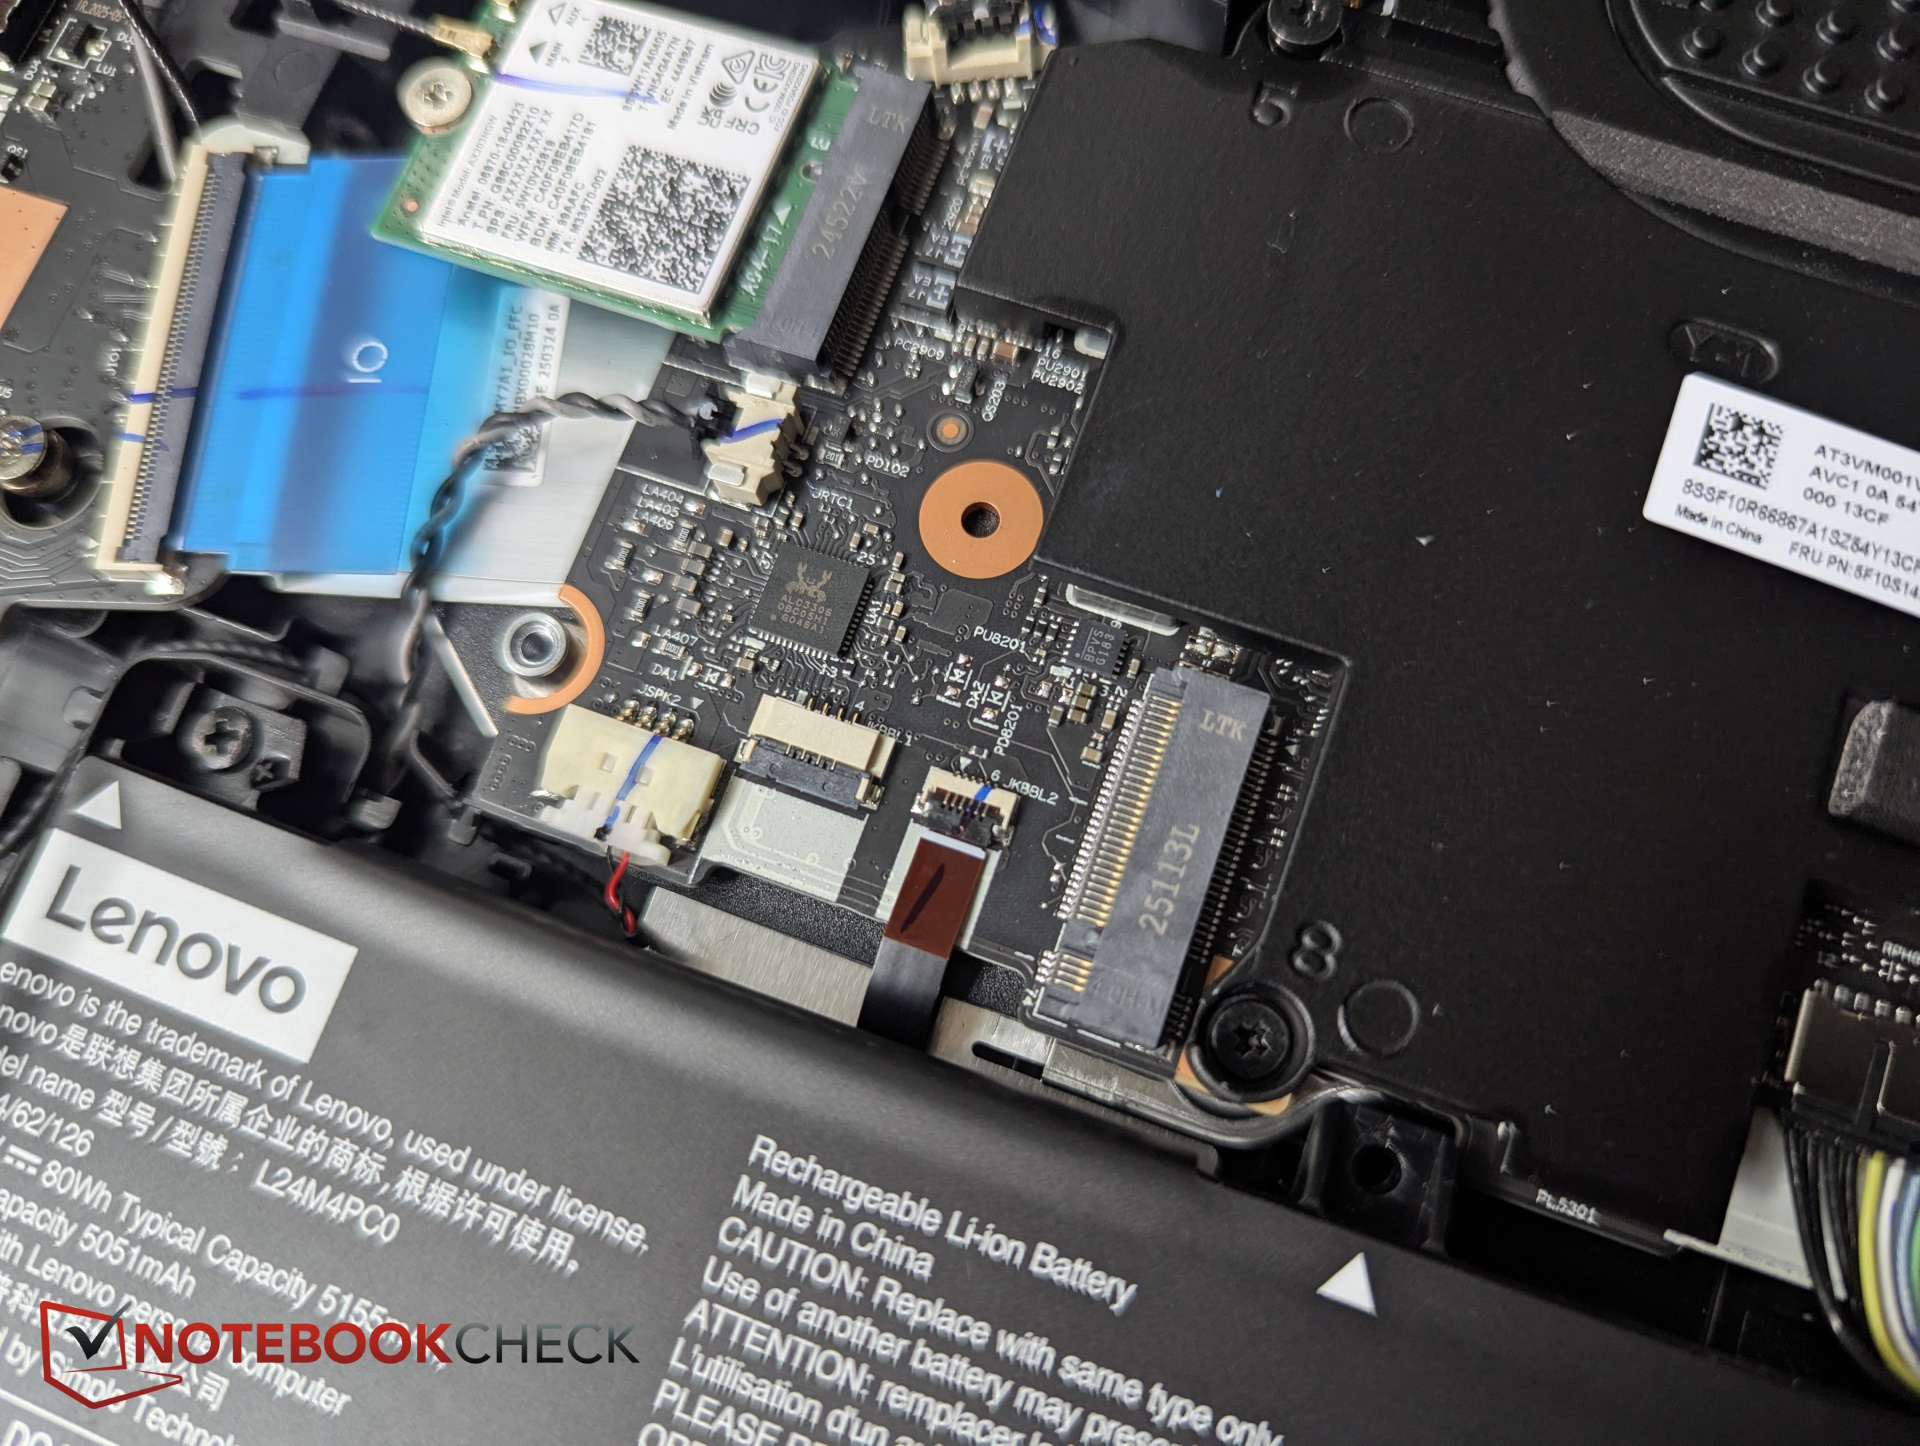
The bottom panel is secured by 10 screws (2 lengths). Prying it open is quite easy, even without tools. Inside, there's access to the two M.2 SSD slots, the removable Wi-Fi module, the two RAM slots, the battery, and the cooling system.
Sustainability
The packaging is a mix of cardboard and plastic, with the latter used as a plastic bag that not only wraps the Legion and the power supply, but also serves as adhesive strips around the edges of the Legion, and as foam for insulation.
Accessories und warranty
Lenovo offers a two-year warranty, including courier or carry-in service. Accessories are not included in the package.
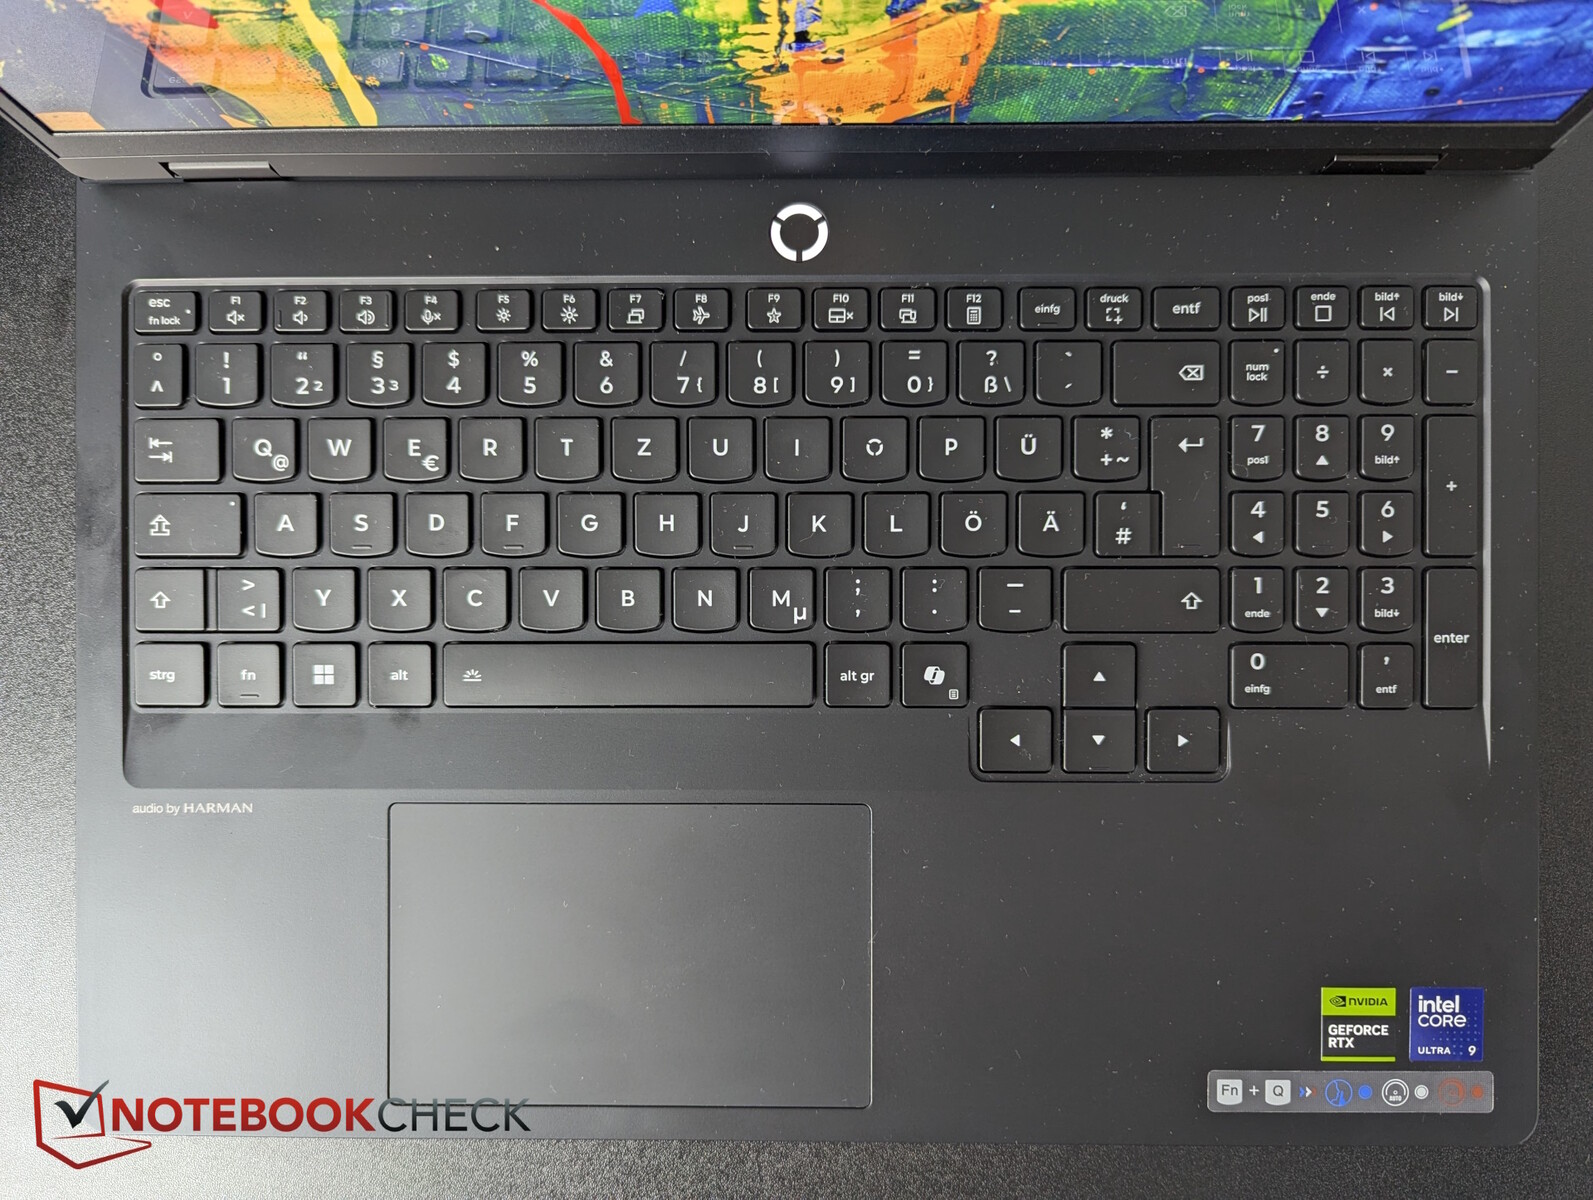
Input devices - Good for a gamer
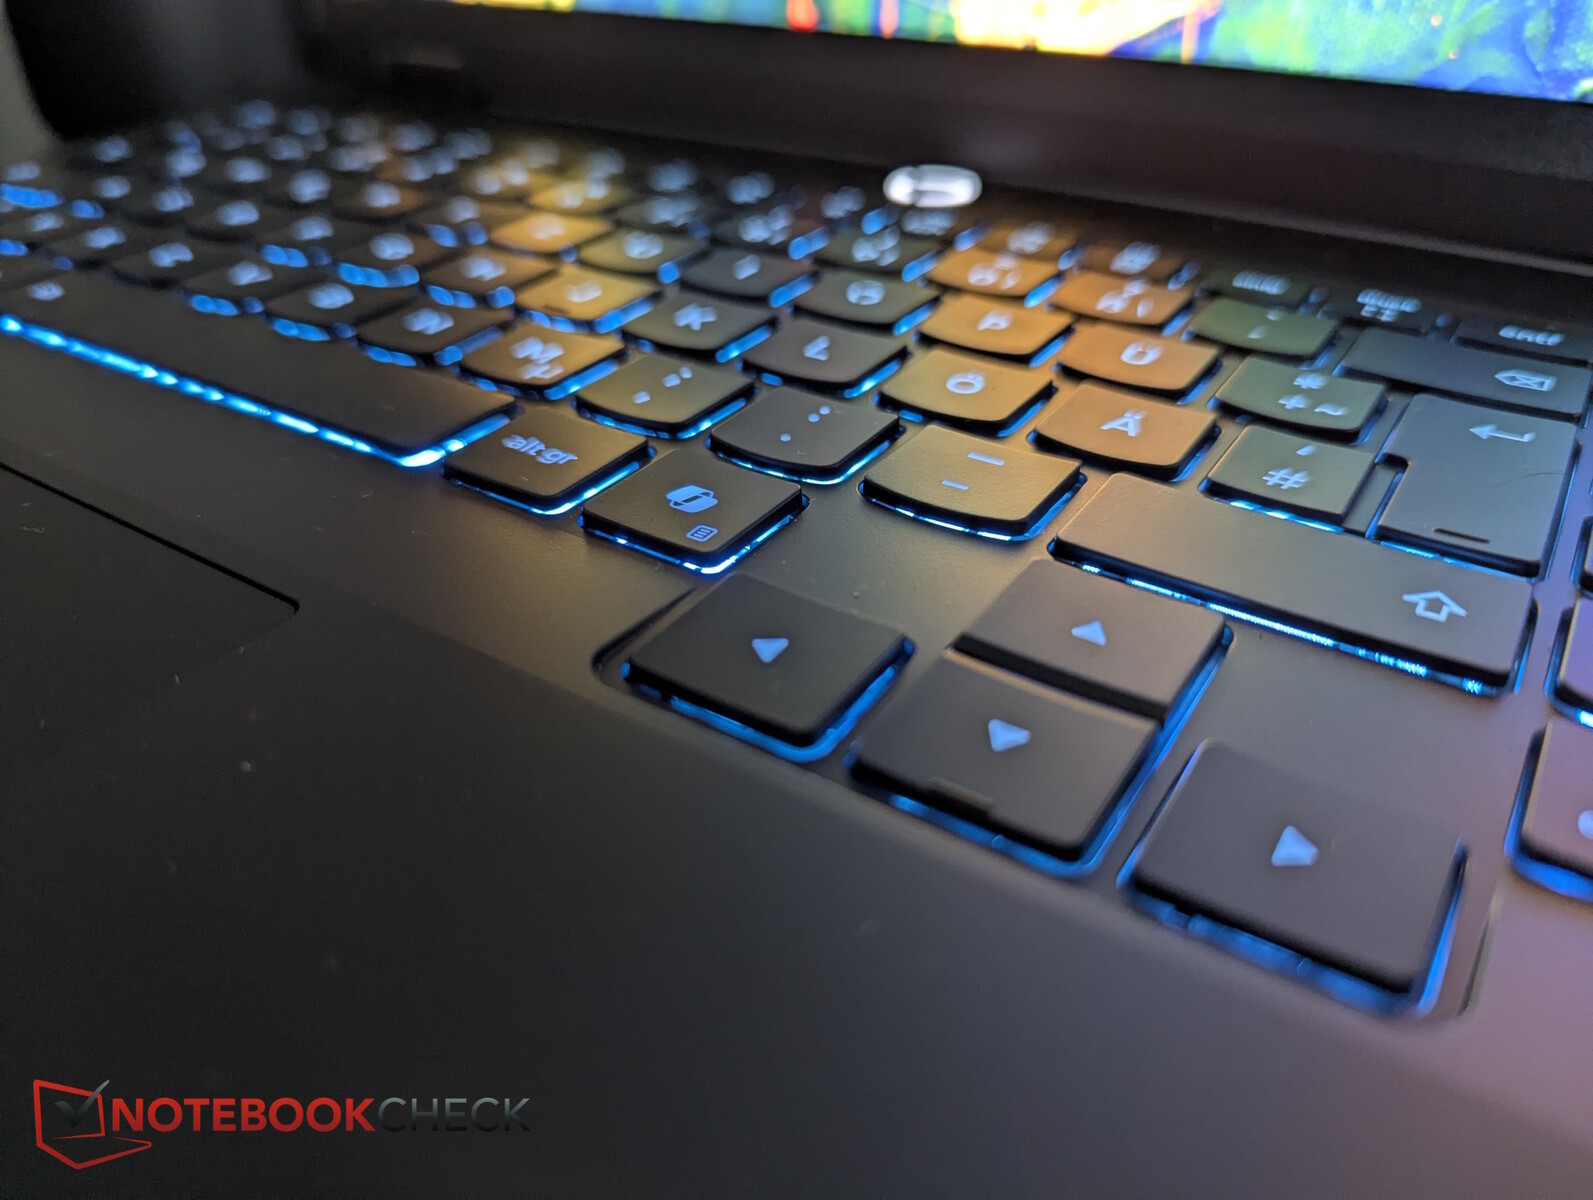
Keyboard
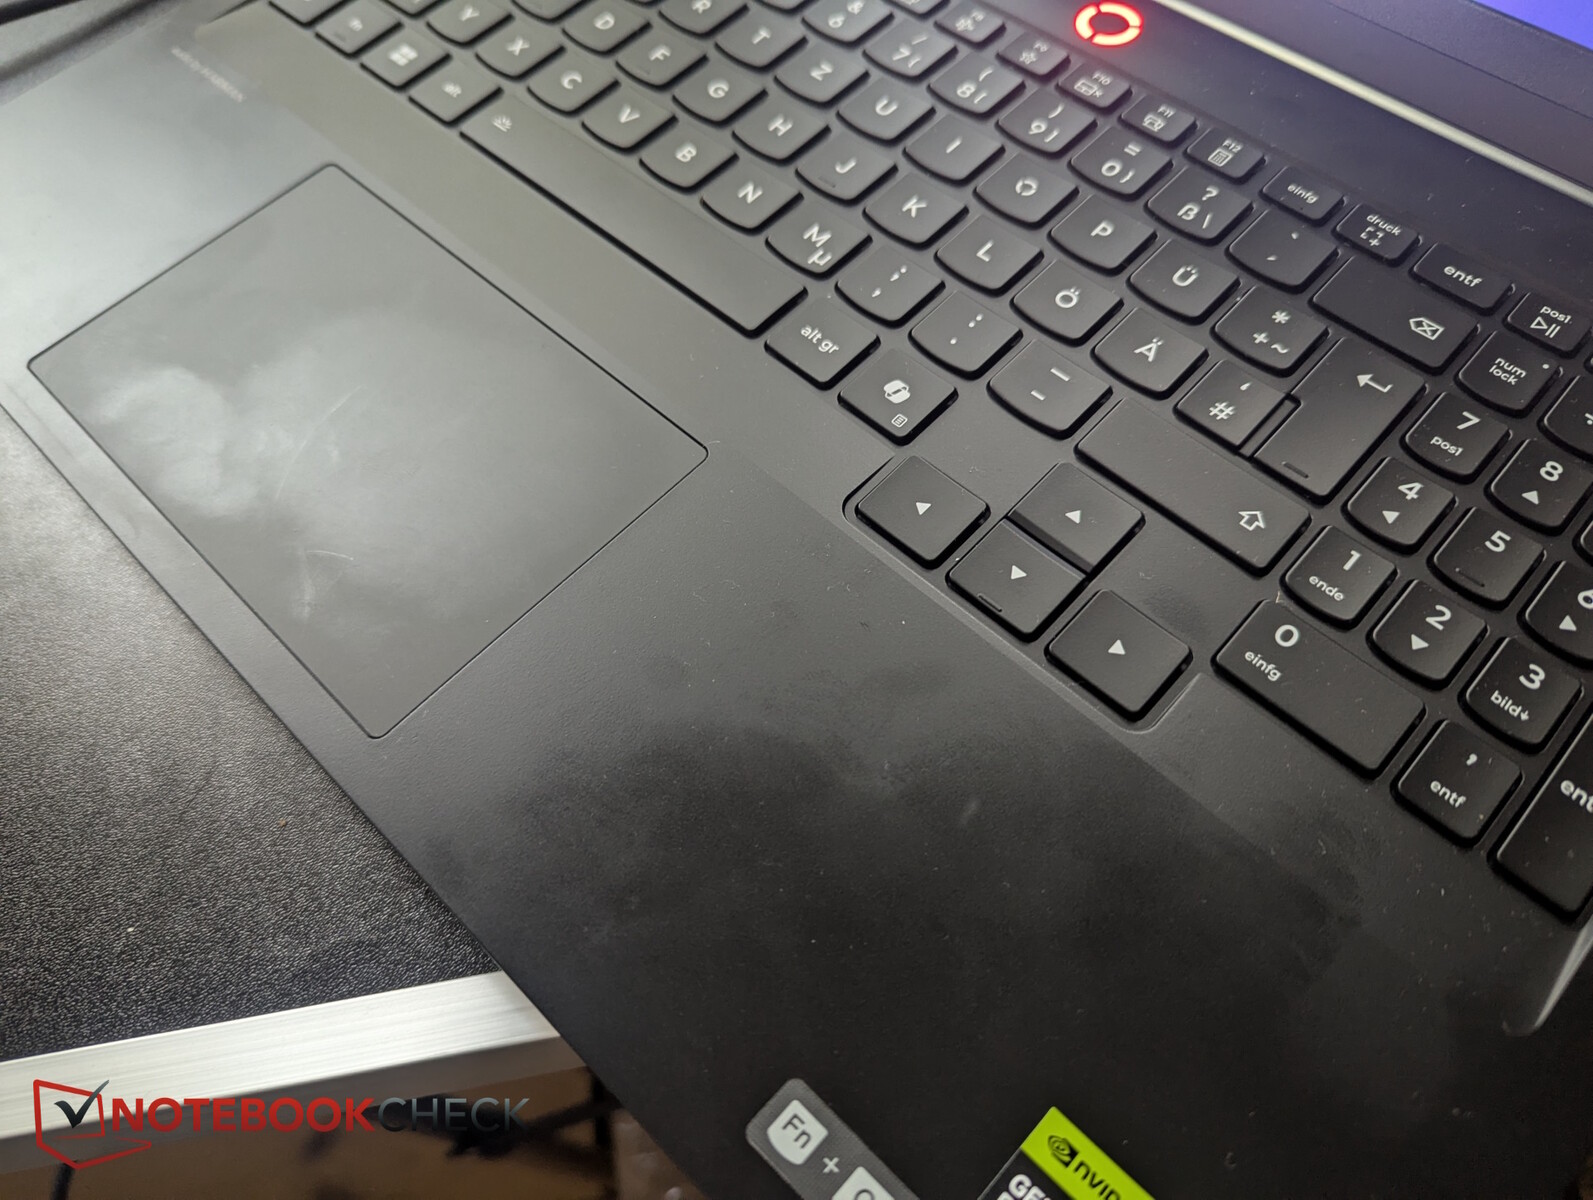
All keys are spaced apart, with a narrow numerical pad on the right. The full-size arrow keys are slightly offset, and the power button is designed as a separate button above the keyboard - all very good. RGB backlighting can be configured in 24 different zones.
The keys impress with a clear pressure point and therefore good feedback, even though the travel is medium to short. Overall, the keyboard is very comfortable to use and fast to type on, and the keystroke noise can be described as quiet to moderate.
Touchpad
The touchpad measures 12 x 7.5 cm and is covered with a smooth Mylar surface. Multi-touch inputs are implemented smoothly, and the integrated buttons respond reliably and with a moderate click. However, tapped clicks were sometimes not recognized correctly in our testing.
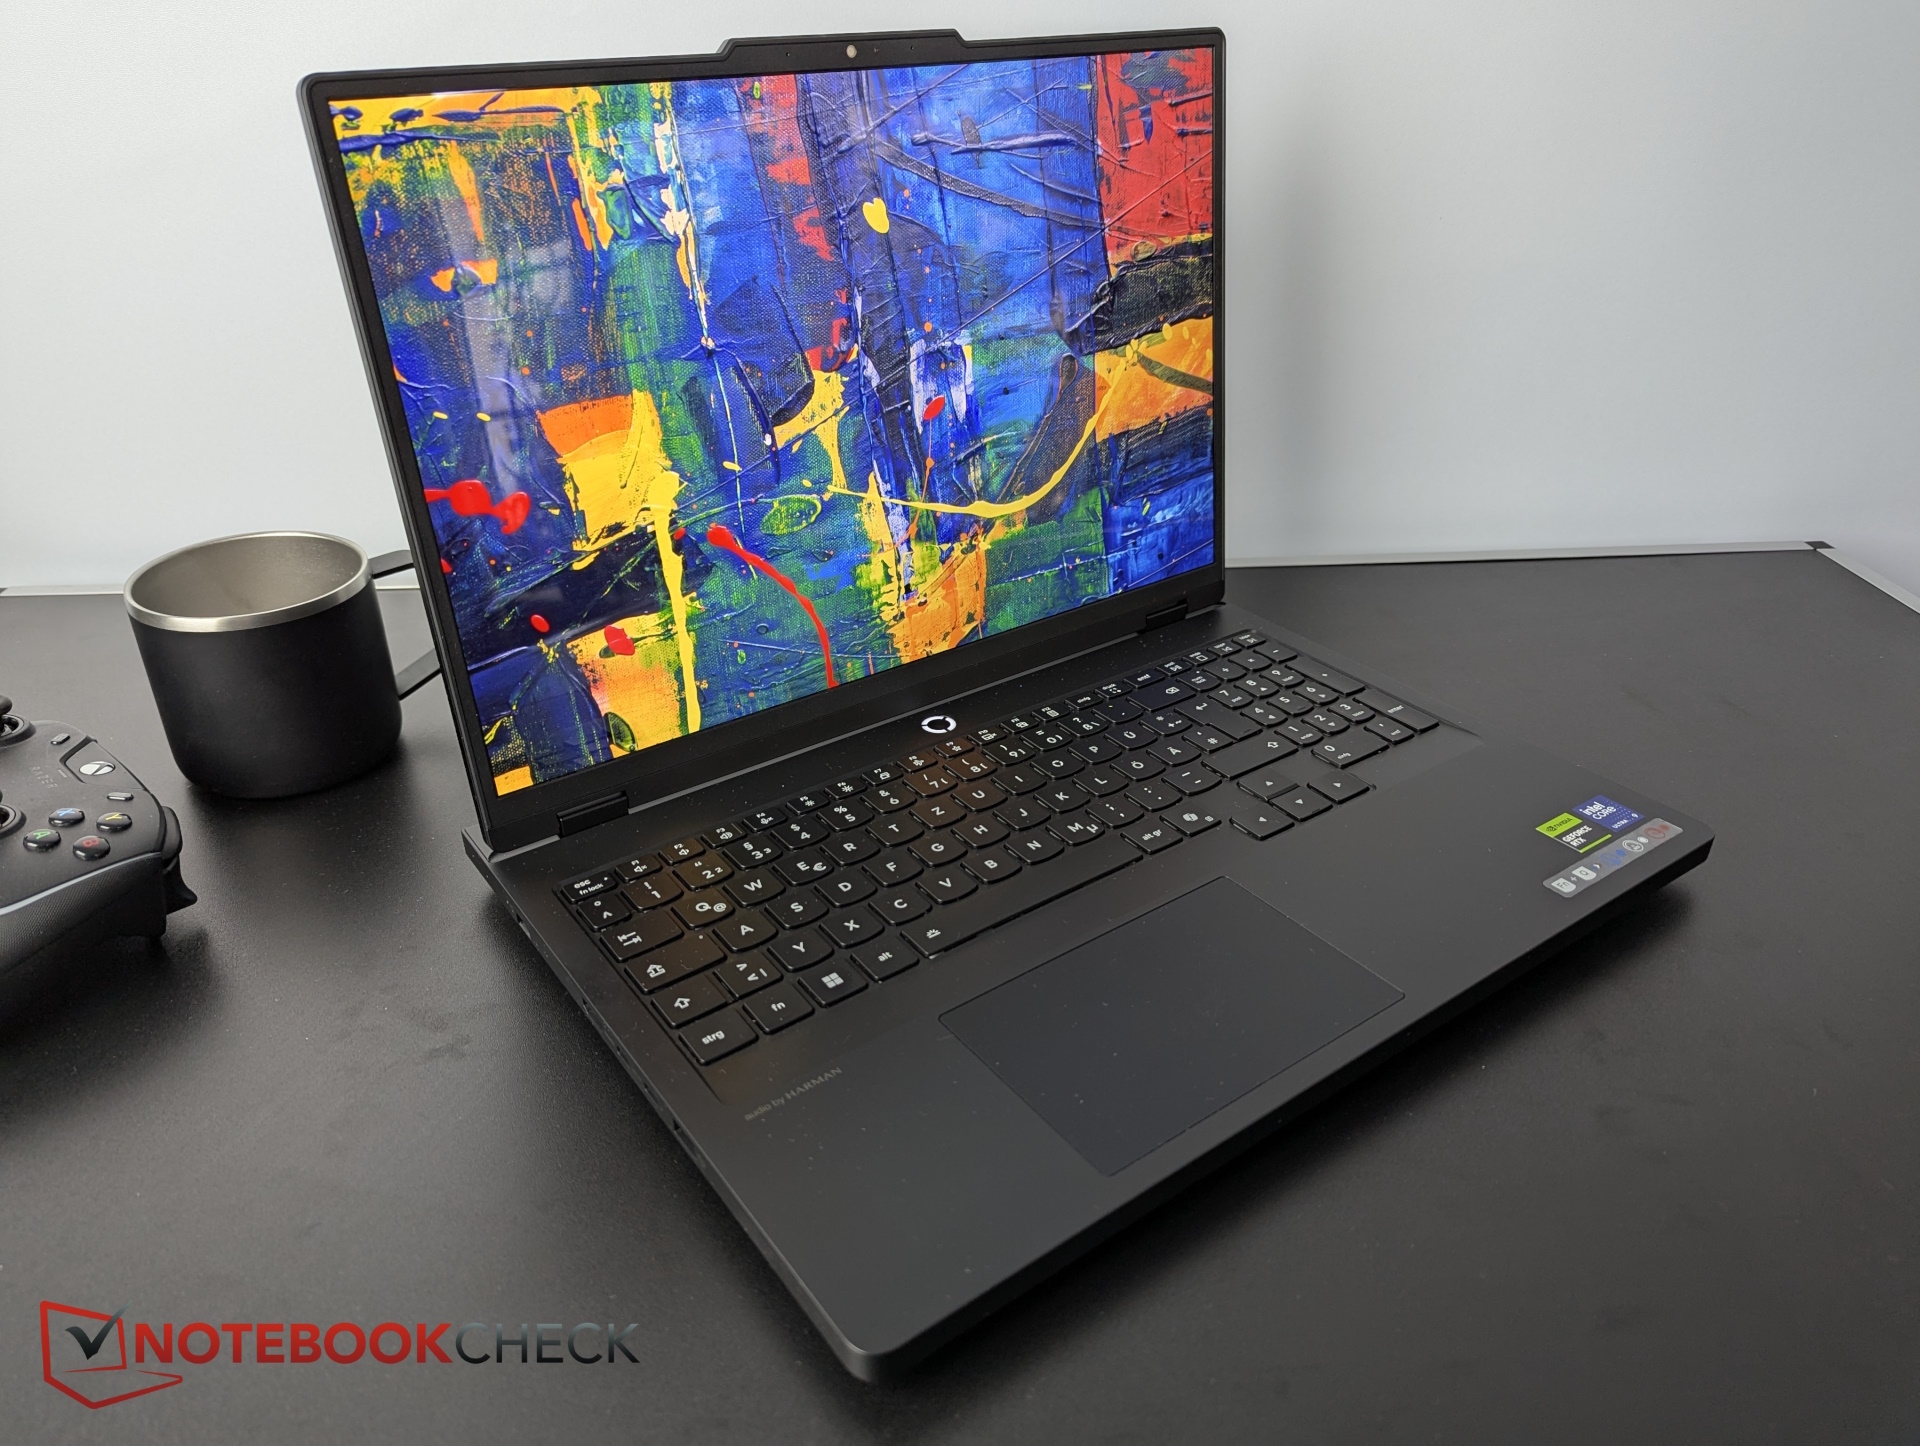
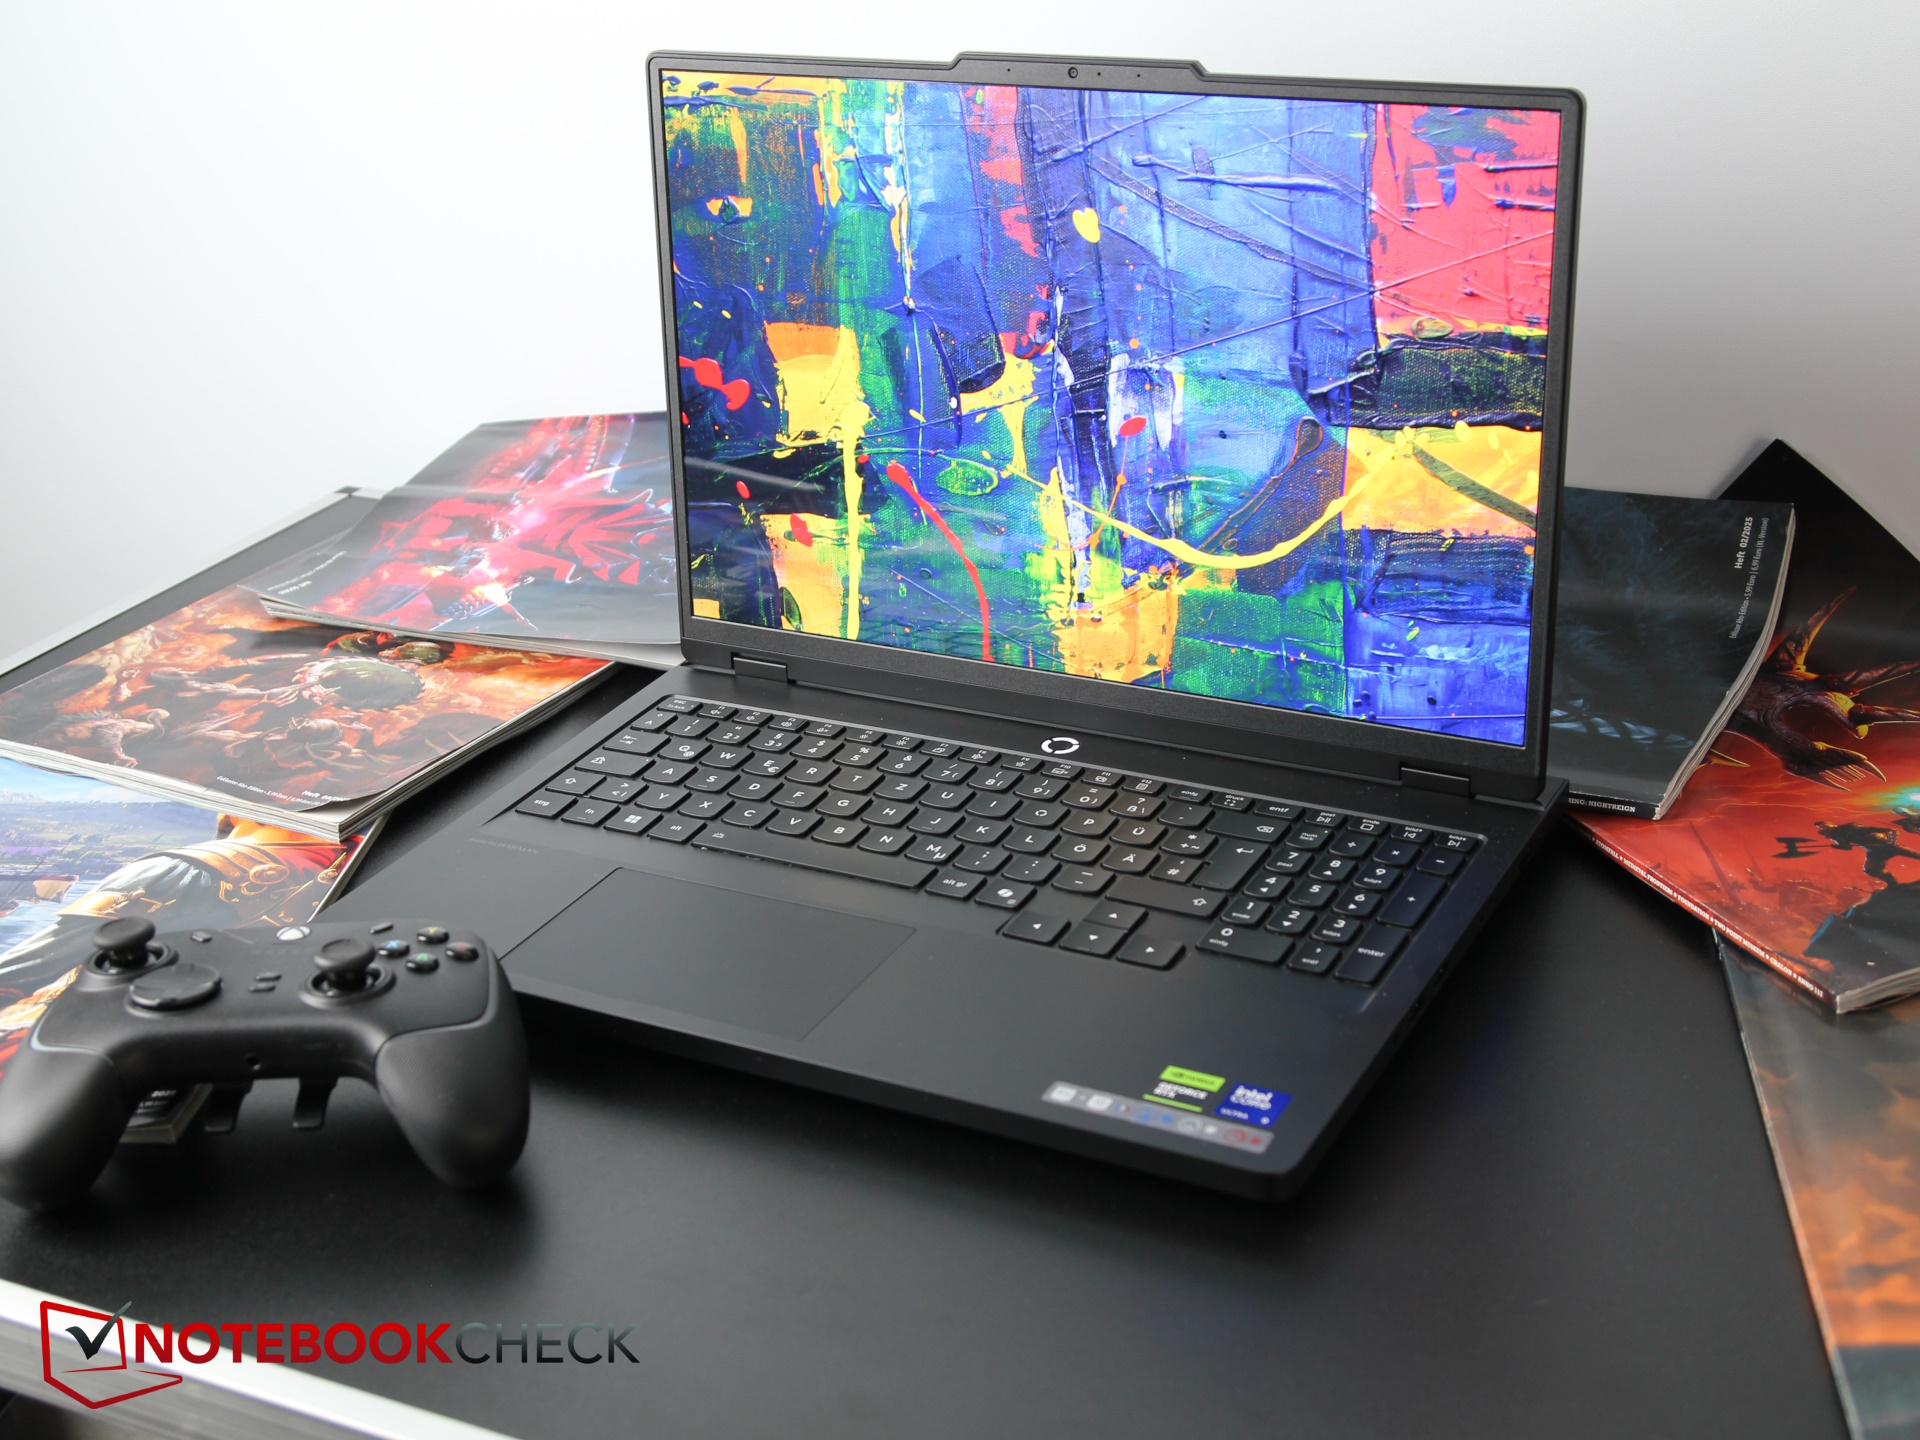
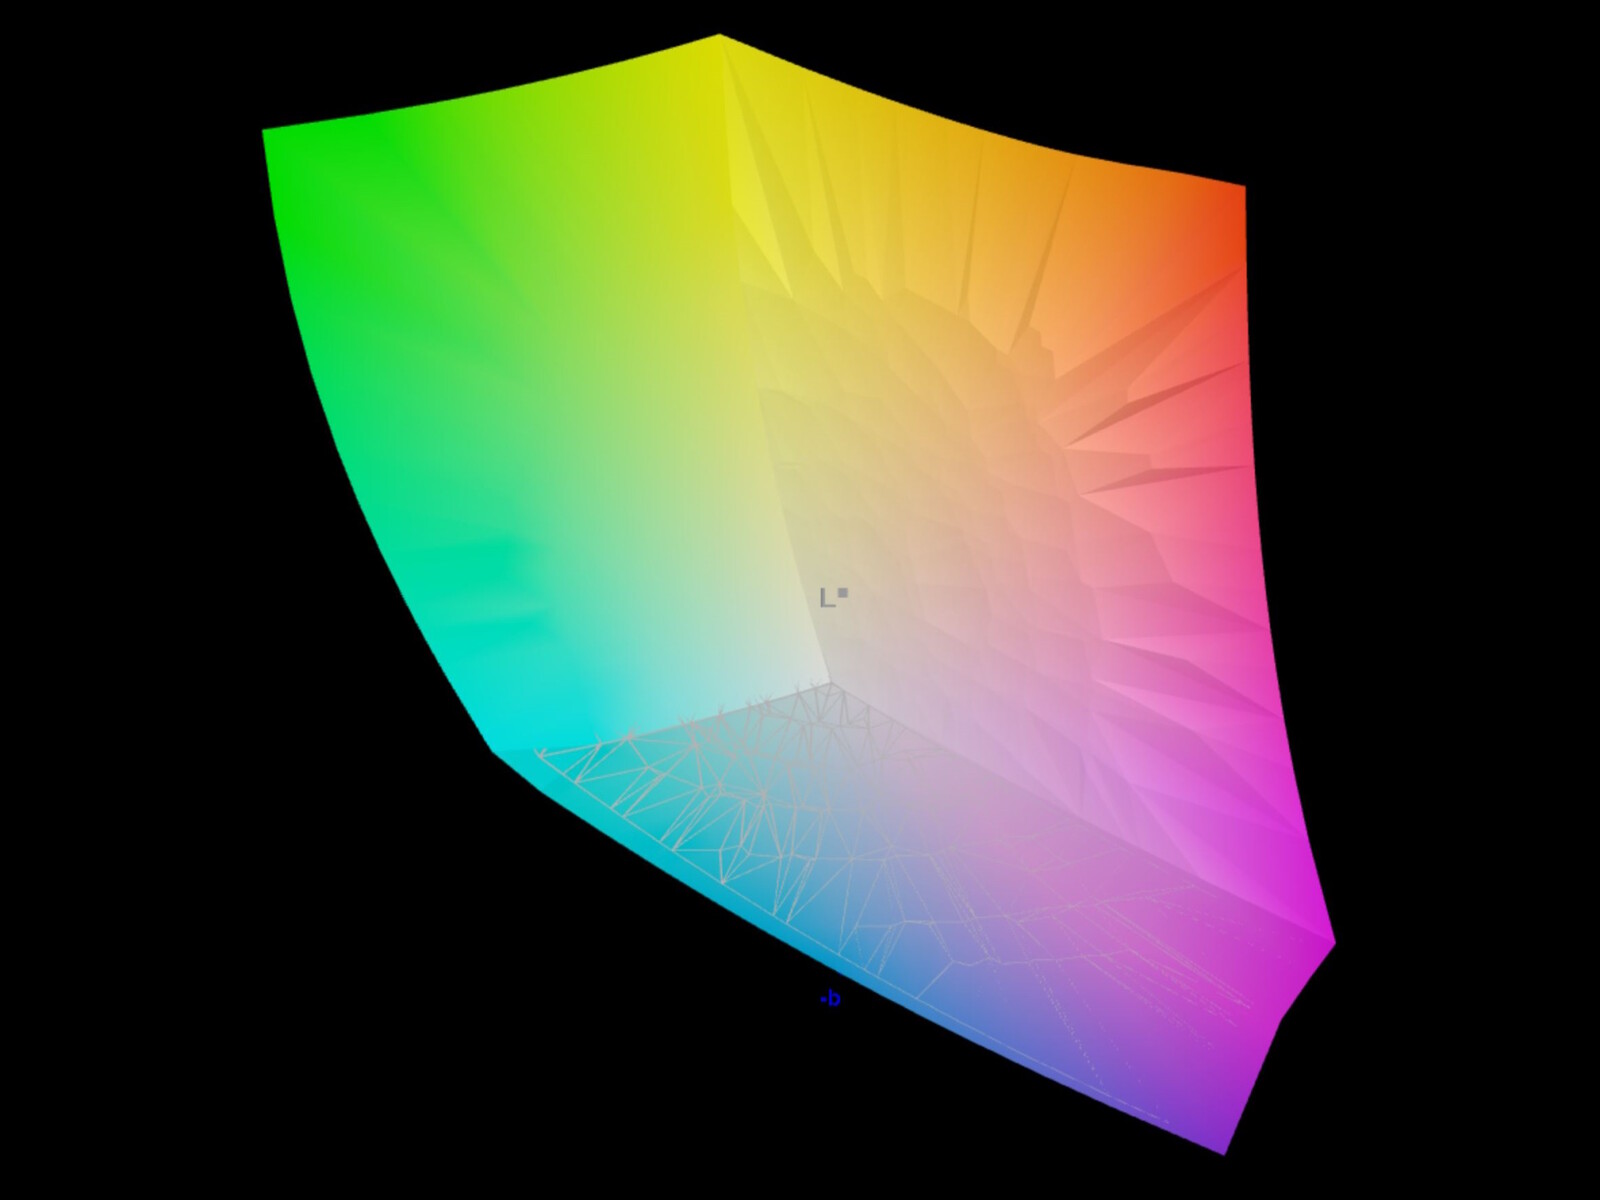
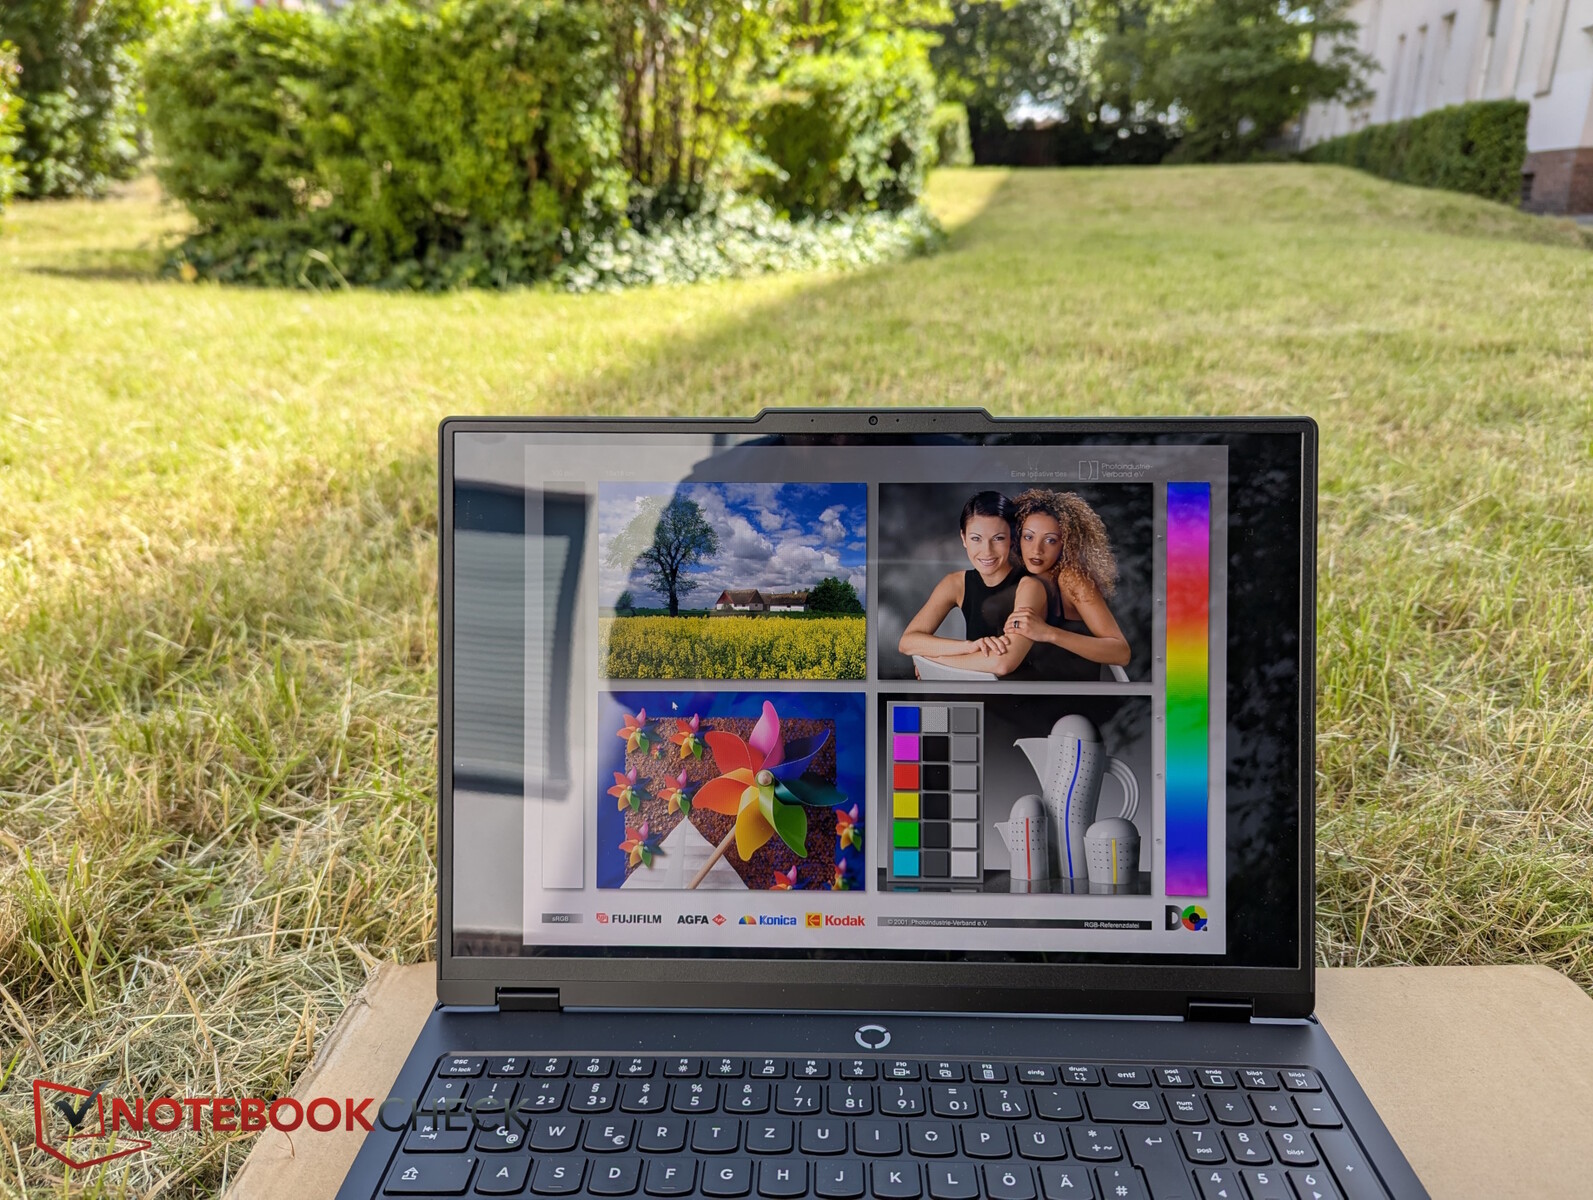
Display - A dazzling OLED

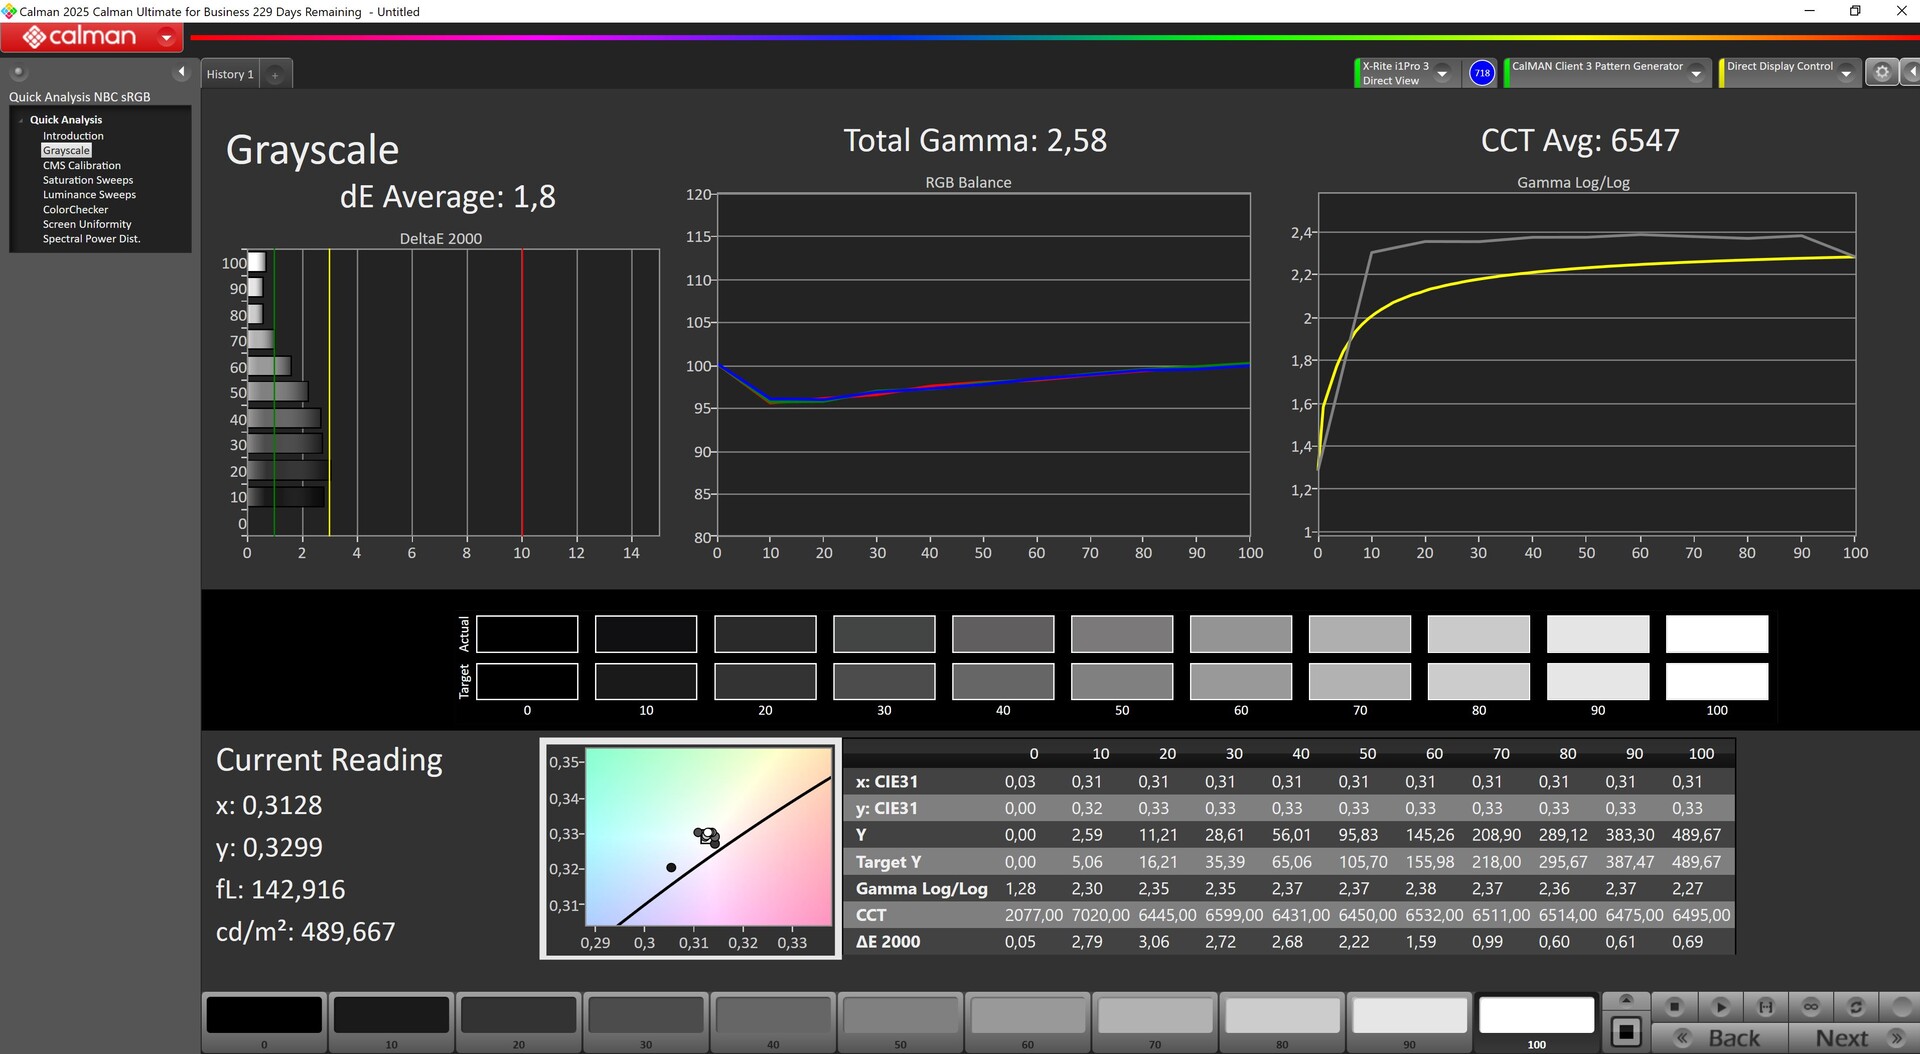
Lenovo has equipped the Pro 5 with a 16-inch, glossy OLED display, which possesses a resolution of 2,560 x 1,600 pixels. The display supports DisplayHDR True Black 1000, Dolby Vision, and G-Sync.
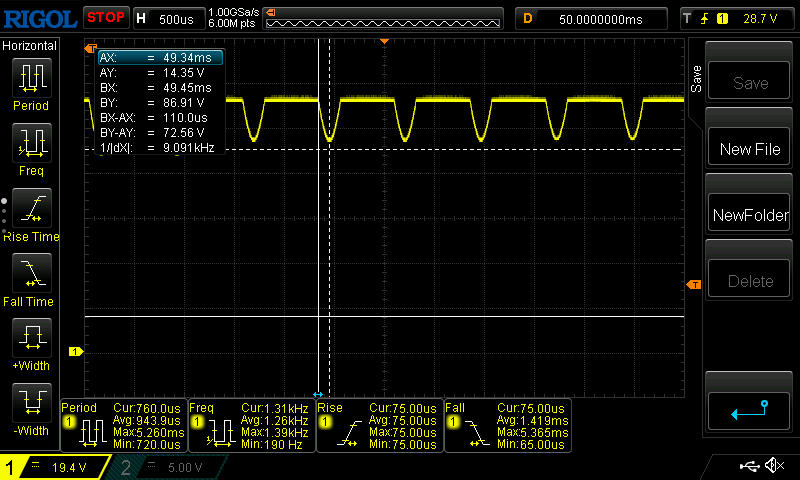
We measured an average brightness of 522 nits and an excellent illumination of 97 percent. Typical for OLEDs, the black level is virtually zero, resulting in excellent contrast. This also eliminates backlight bleed, and the display is extremely fast (around 2 ms). The display does flicker, but at a high frequency of 1.3 kHz, which even sensitive users shouldn't notice.
| |||||||||||||||||||||||||
Brightness Distribution: 97 %
Center on Battery: 518 cd/m²
Contrast: ∞:1 (Black: 0 cd/m²)
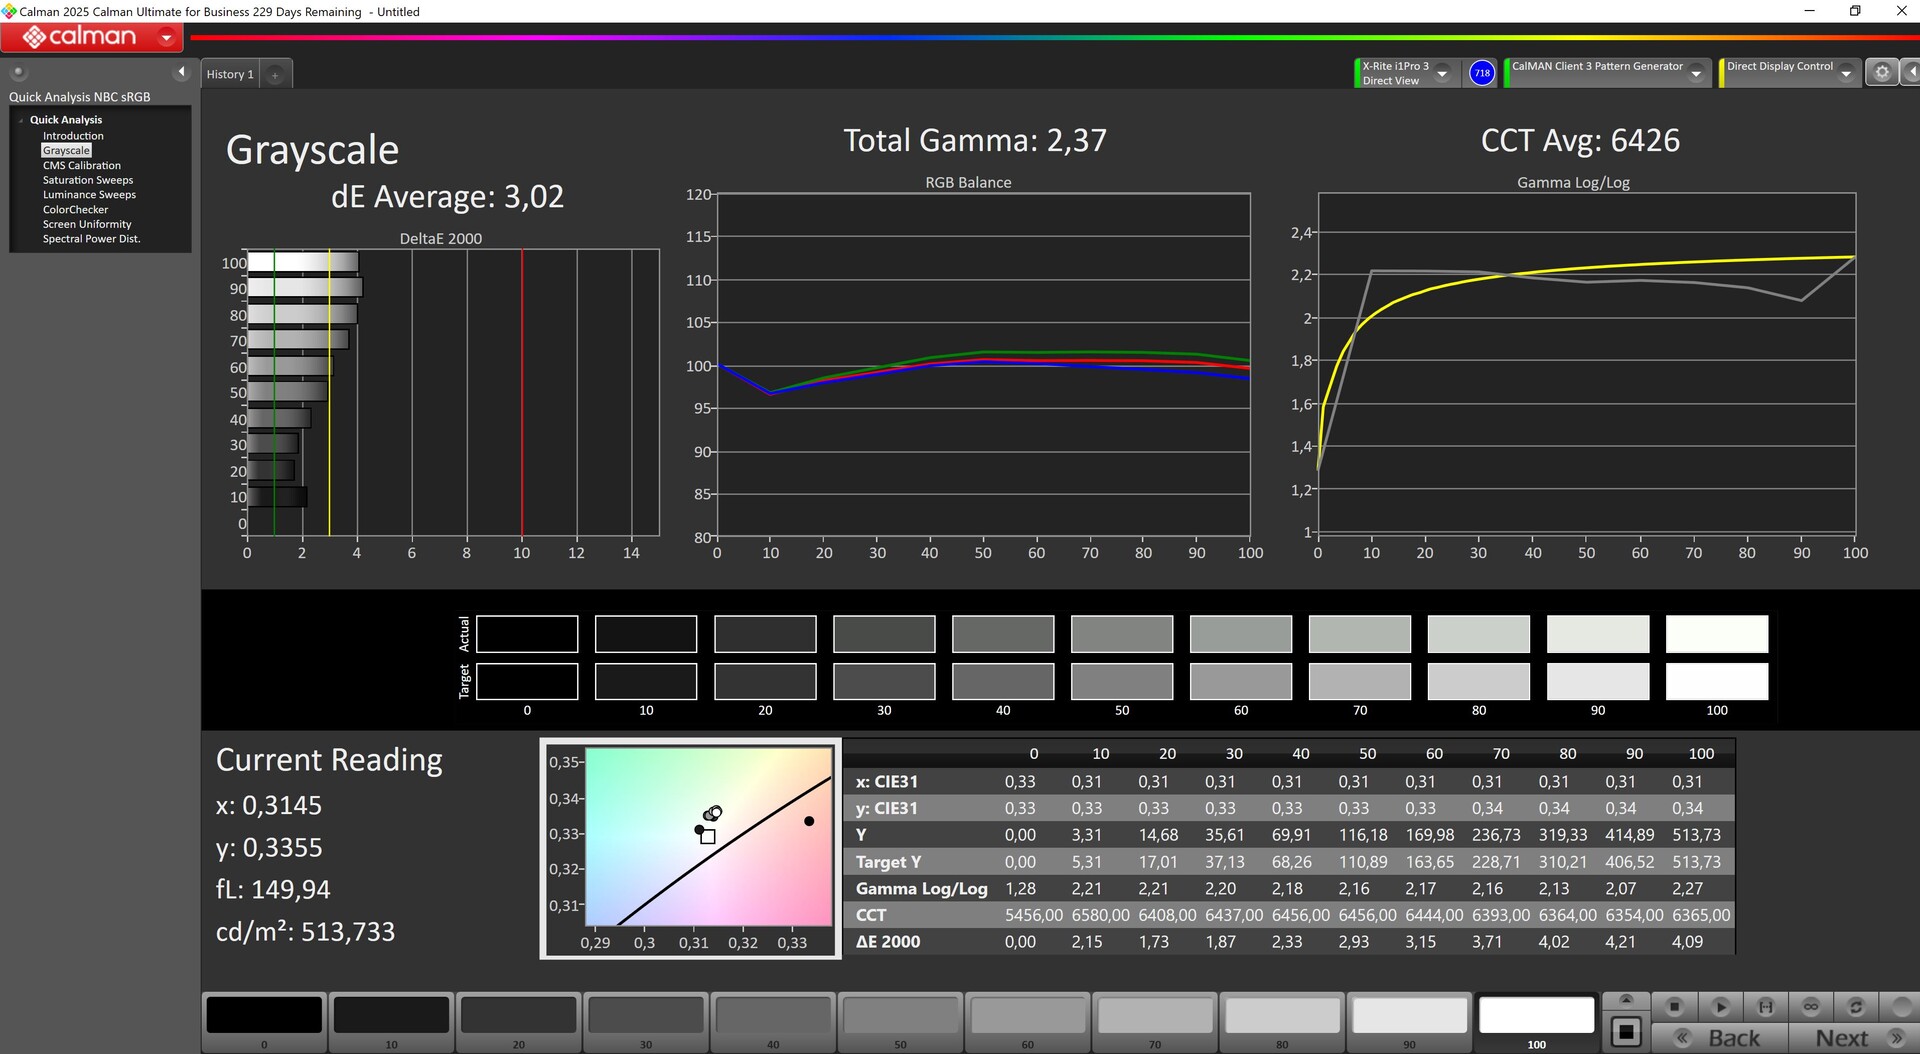
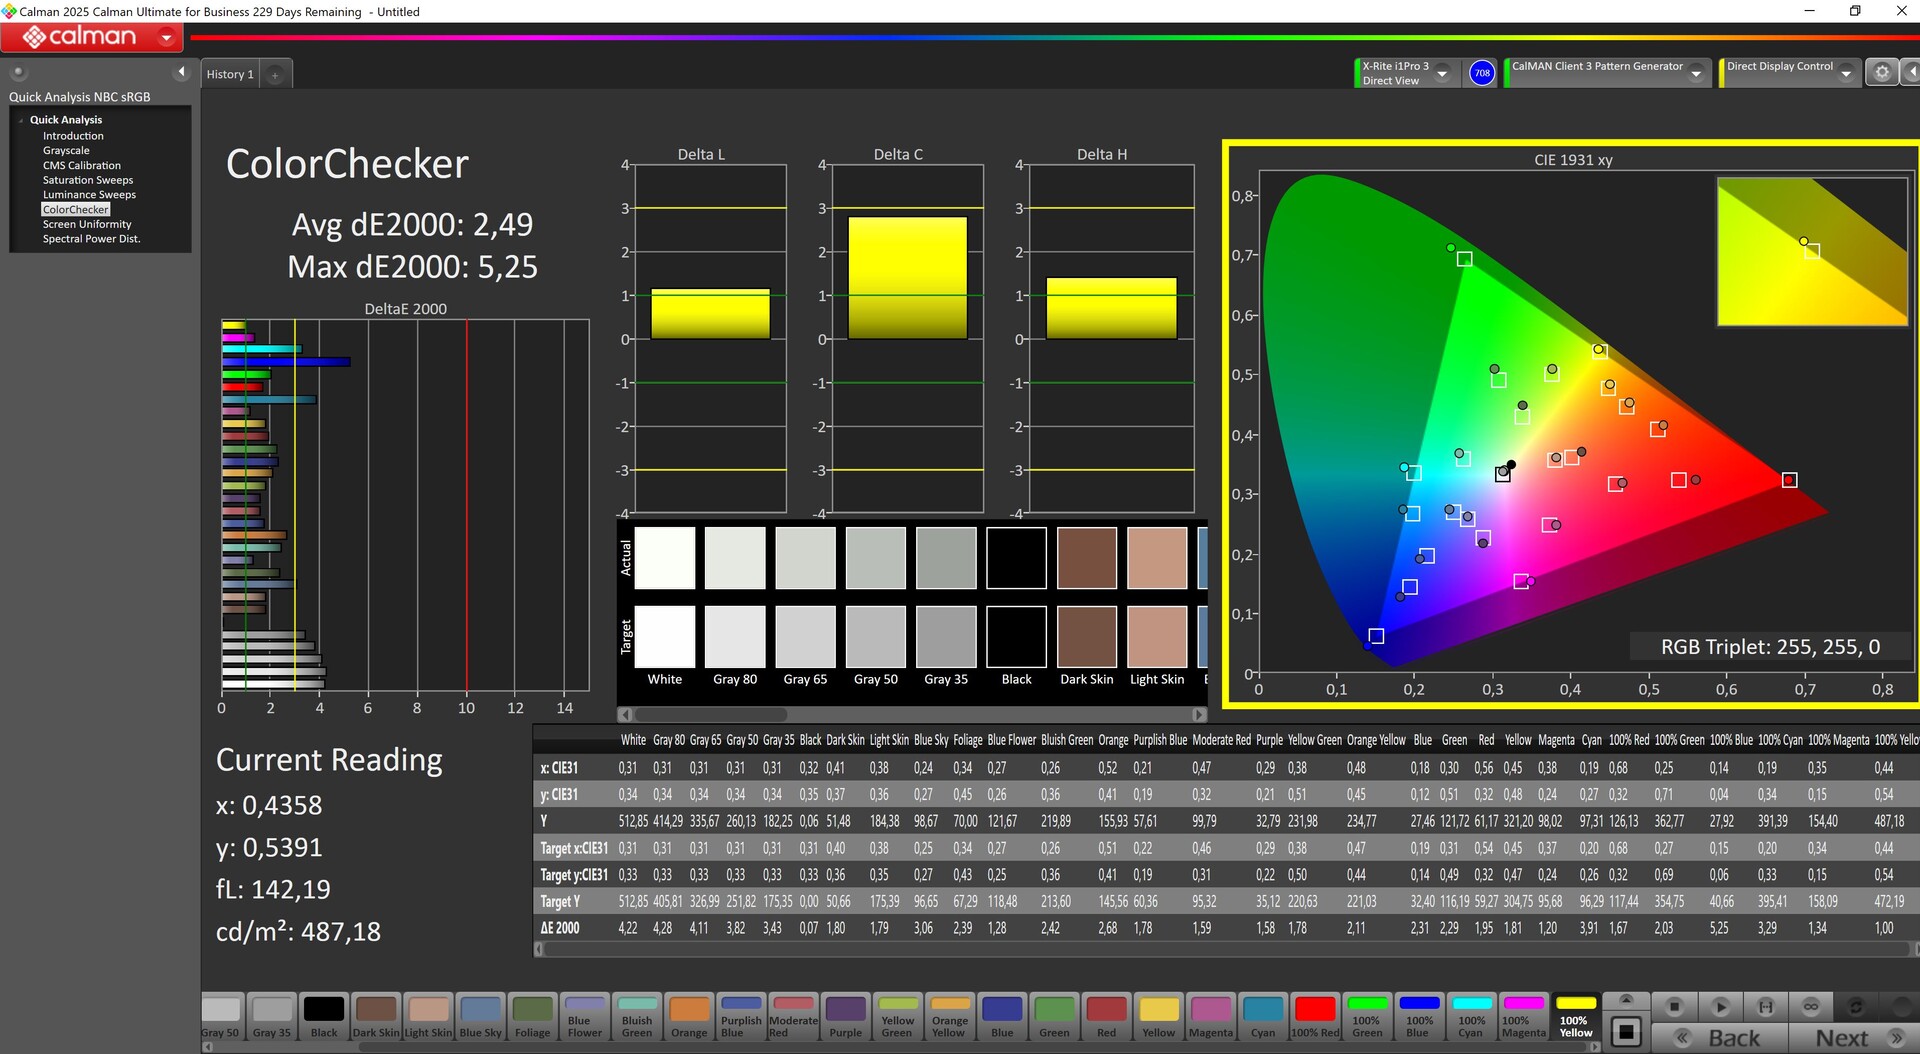
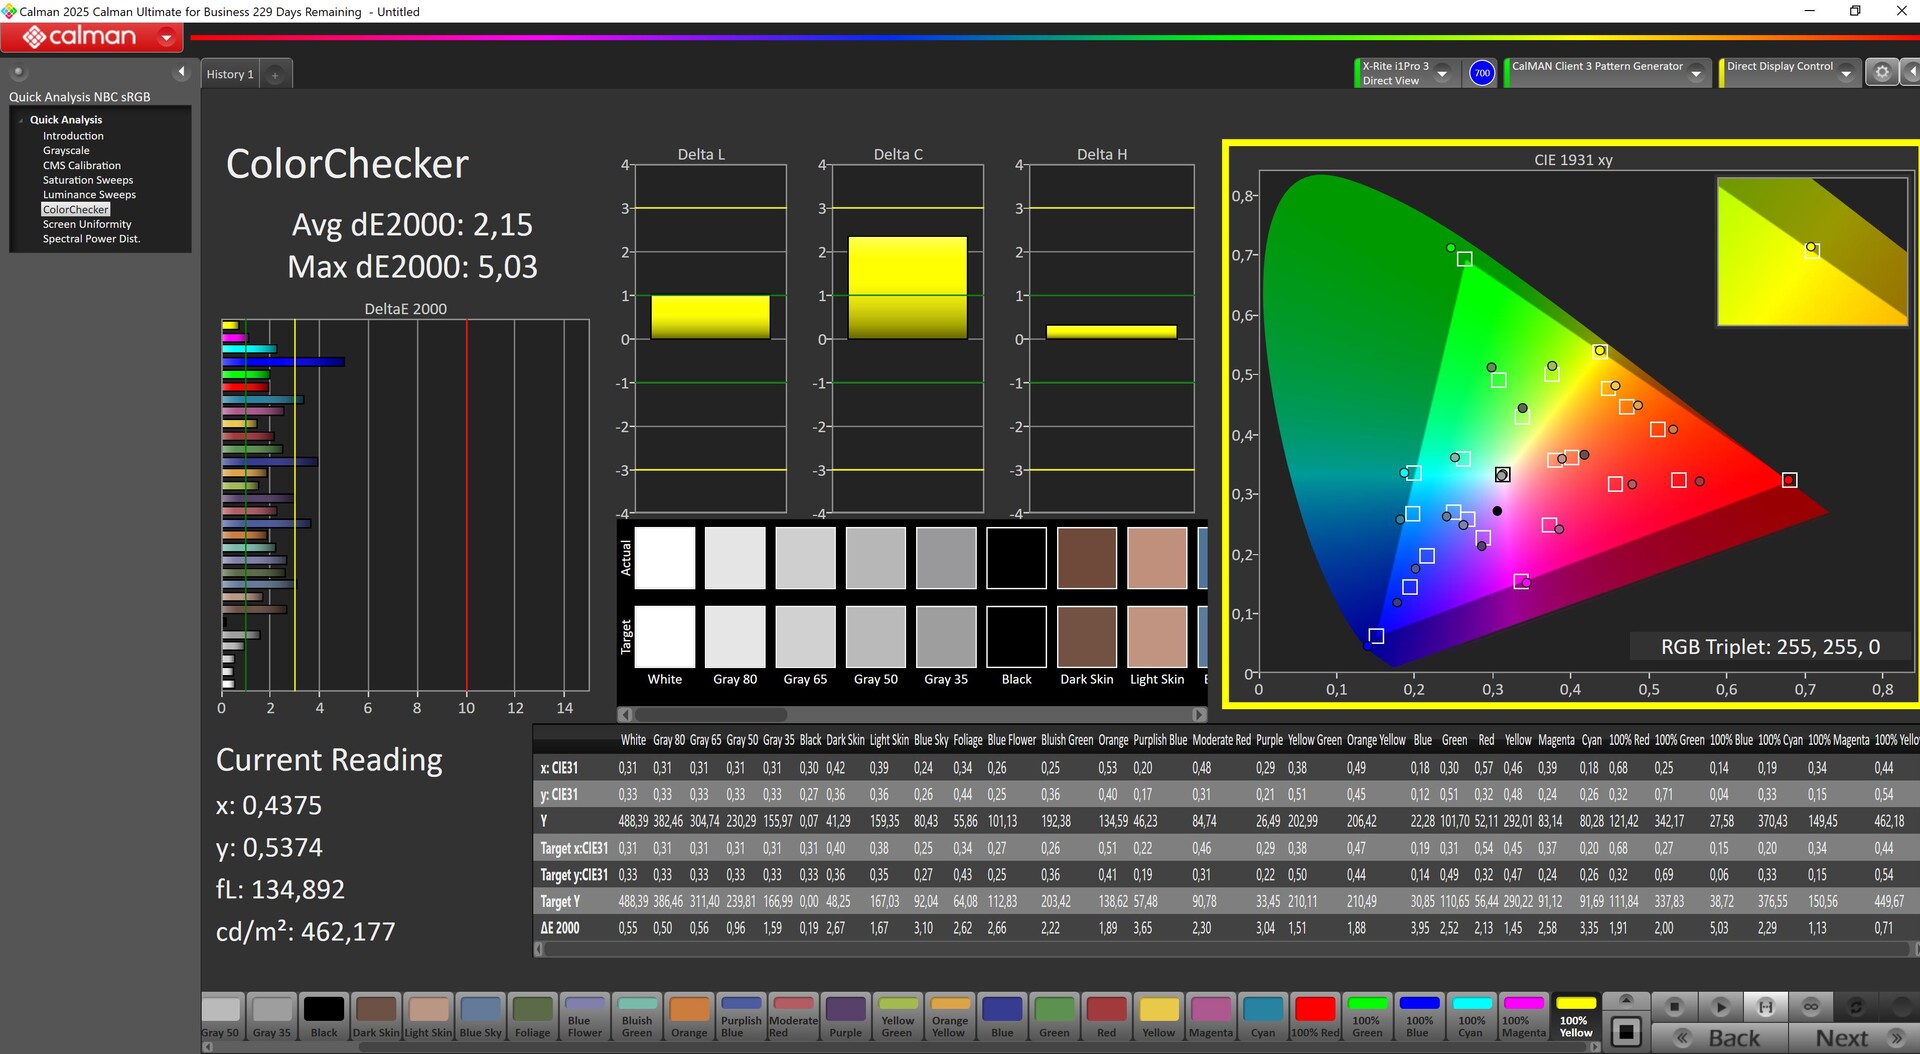
ΔE ColorChecker Calman: 2.49 | ∀{0.5-29.43 Ø4.72}
calibrated: 2.15
ΔE Greyscale Calman: 3.02 | ∀{0.09-98 Ø4.97}
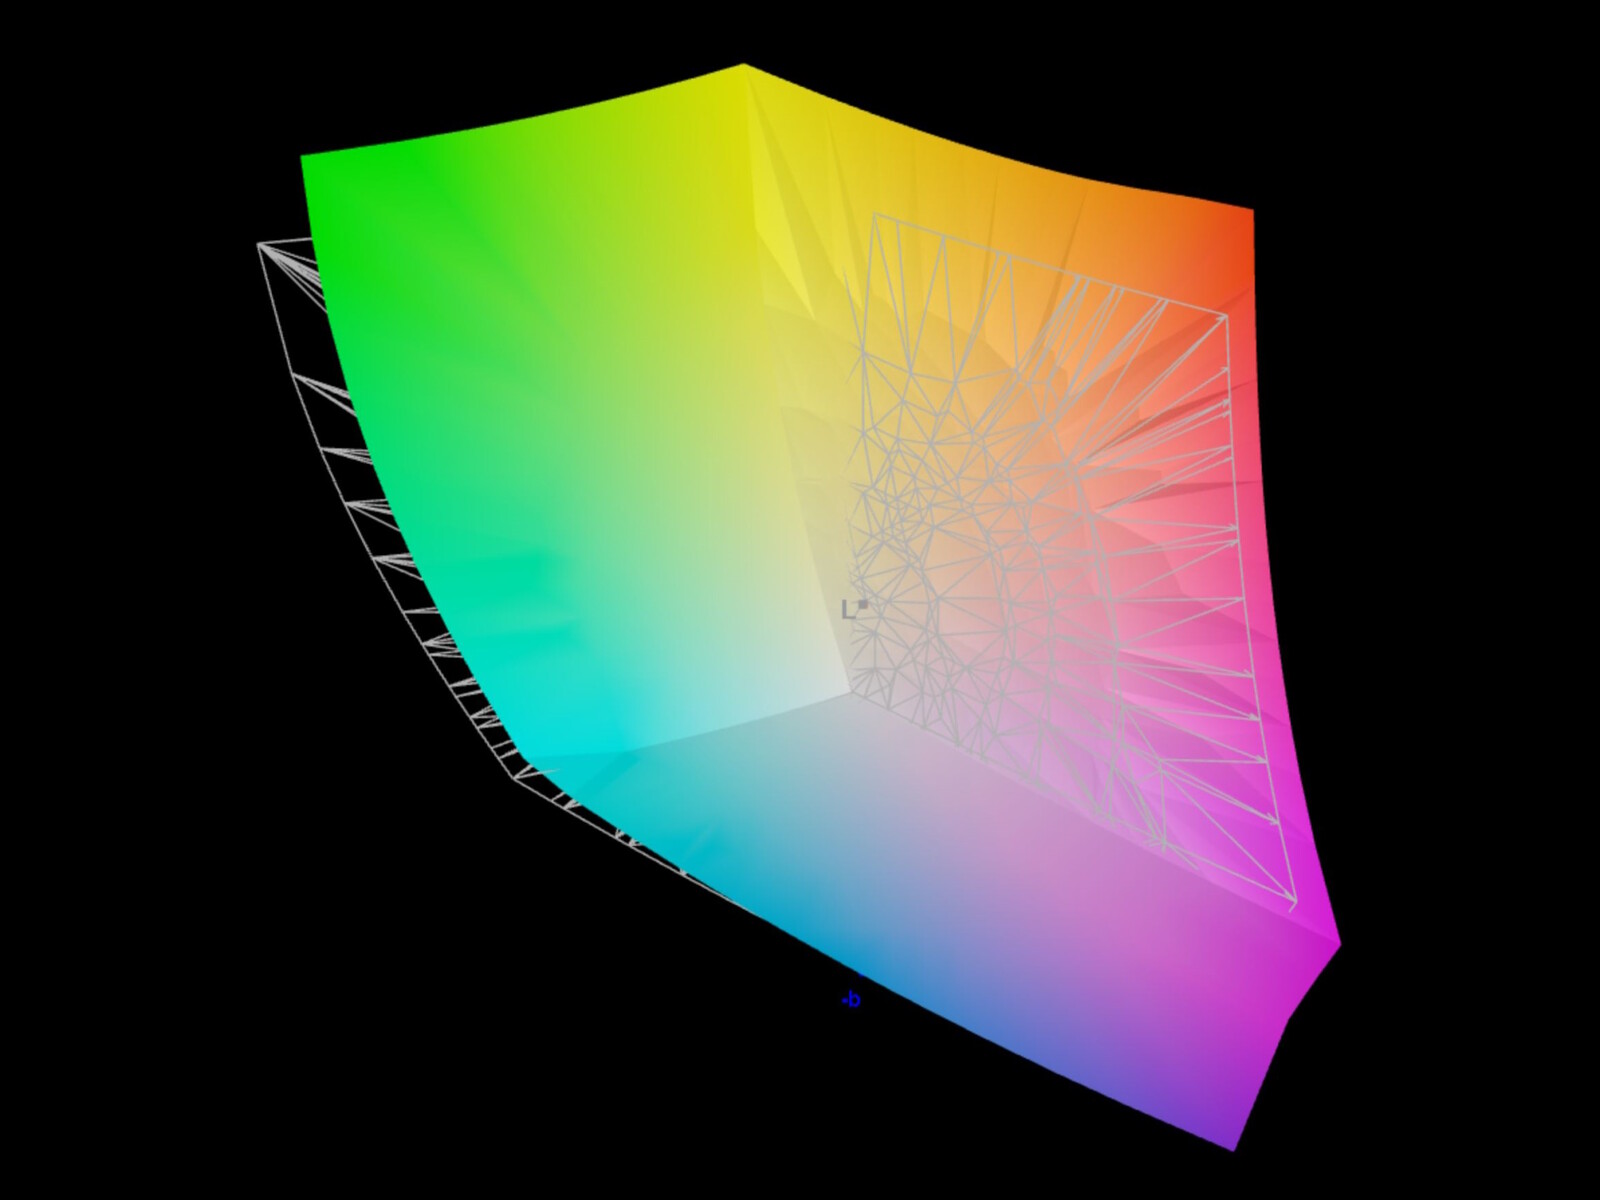
94.1% AdobeRGB 1998 (Argyll 3D)
100% sRGB (Argyll 3D)
99.9% Display P3 (Argyll 3D)
Gamma: 2.37
CCT: 6426 K
| Lenovo Legion 5 Pro 16IAX10H ATNA60HS01-0 (Samsung SDC420A), OLED, 2560x1600, 16", 165 Hz | Lenovo Legion Pro 5 16IRX9 BOE NE160QDM-NYC, IPS, 2560x1600, 16", 165 Hz | Schenker XMG Neo 16 E25 RTX 5090 Laptop NE160QDM-NM9, Mini-LED, 2560x1600, 16", 300 Hz | Aorus MASTER 16 AM6H ATNA60DL03-0 (SDC41AB), OLED, 2560x1600, 16", 240 Hz | Schenker XMG Pro 16 (E25) NE160QDM-NZL, IPS, 2560x1600, 16", 300 Hz | Asus ROG Strix Scar 16 2025 NE160QDM-NM8, Mini-LED, 2560x1600, 16", 240 Hz | Lenovo Legion Pro 7i 16 Gen 10 Samsung ATNA60HU01-0, OLED, 2560x1600, 16", 240 Hz | |
|---|---|---|---|---|---|---|---|
| Display | -19% | -2% | -2% | -15% | -2% | 0% | |
| Display P3 Coverage (%) | 99.9 | 69.3 -31% | 99.9 0% | 95.3 -5% | 74.7 -25% | 99.9 0% | 99.5 0% |
| sRGB Coverage (%) | 100 | 99.4 -1% | 100 0% | 98.8 -1% | 99.8 0% | 100 0% | 100 0% |
| AdobeRGB 1998 Coverage (%) | 94.1 | 70.1 -26% | 88.5 -6% | 94.1 0% | 75.4 -20% | 88.4 -6% | 94.4 0% |
| Response Times | -516% | -649% | -8% | -356% | -375% | 27% | |
| Response Time Grey 50% / Grey 80% * (ms) | 2 ? | 11.9 ? -495% | 17.4 ? -770% | 0.24 ? 88% | 10.5 ? -425% | 7 ? -250% | 0.28 ? 86% |
| Response Time Black / White * (ms) | 1.4 ? | 8.9 ? -536% | 13 ? -829% | 0.43 ? 69% | 5.4 ? -286% | 8.4 ? -500% | 0.43 ? 69% |
| PWM Frequency (Hz) | 1300 | 20253 | 960 | 20555 ? | 1438 ? | ||
| PWM Amplitude * (%) | 16.7 | 75 -349% | 47 -181% | 29 -74% | |||
| Screen | 21% | 14% | -3% | 9% | 46% | 11% | |
| Brightness middle (cd/m²) | 518 | 384 -26% | 888 71% | 435 -16% | 538 4% | 754 46% | 490.4 -5% |
| Brightness (cd/m²) | 522 | 366 -30% | 859 65% | 437 -16% | 508 -3% | 773 48% | 498 -5% |
| Brightness Distribution (%) | 97 | 91 -6% | 94 -3% | 96 -1% | 88 -9% | 91 -6% | 97 0% |
| Black Level * (cd/m²) | 0.35 | 0.08 | 0.47 | 0.07 | |||
| Colorchecker dE 2000 * | 2.49 | 0.97 61% | 3.3 -33% | 2.42 3% | 1.9 24% | 1 60% | 3.2 -29% |
| Colorchecker dE 2000 max. * | 5.25 | 3.57 32% | 5.5 -5% | 4.81 8% | 4 24% | 2 62% | 6.04 -15% |
| Colorchecker dE 2000 calibrated * | 2.15 | 0.77 64% | 1.5 30% | 2.03 6% | 0.84 61% | ||
| Greyscale dE 2000 * | 3.02 | 1.5 50% | 3.8 -26% | 3.11 -3% | 2.7 11% | 1 67% | 1 67% |
| Gamma | 2.37 93% | 2.24 98% | 2.46 89% | 2.48 89% | 2.24 98% | 2.14 103% | 2.24 98% |
| CCT | 6426 101% | 6709 97% | 6267 104% | 6270 104% | 7027 93% | 6493 100% | 6373 102% |
| Contrast (:1) | 1097 | 5438 | 1145 | 10771 | |||
| Total Average (Program / Settings) | -171% /
-79% | -212% /
-143% | -4% /
-4% | -121% /
-64% | -110% /
-44% | 13% /
12% |
* ... smaller is better
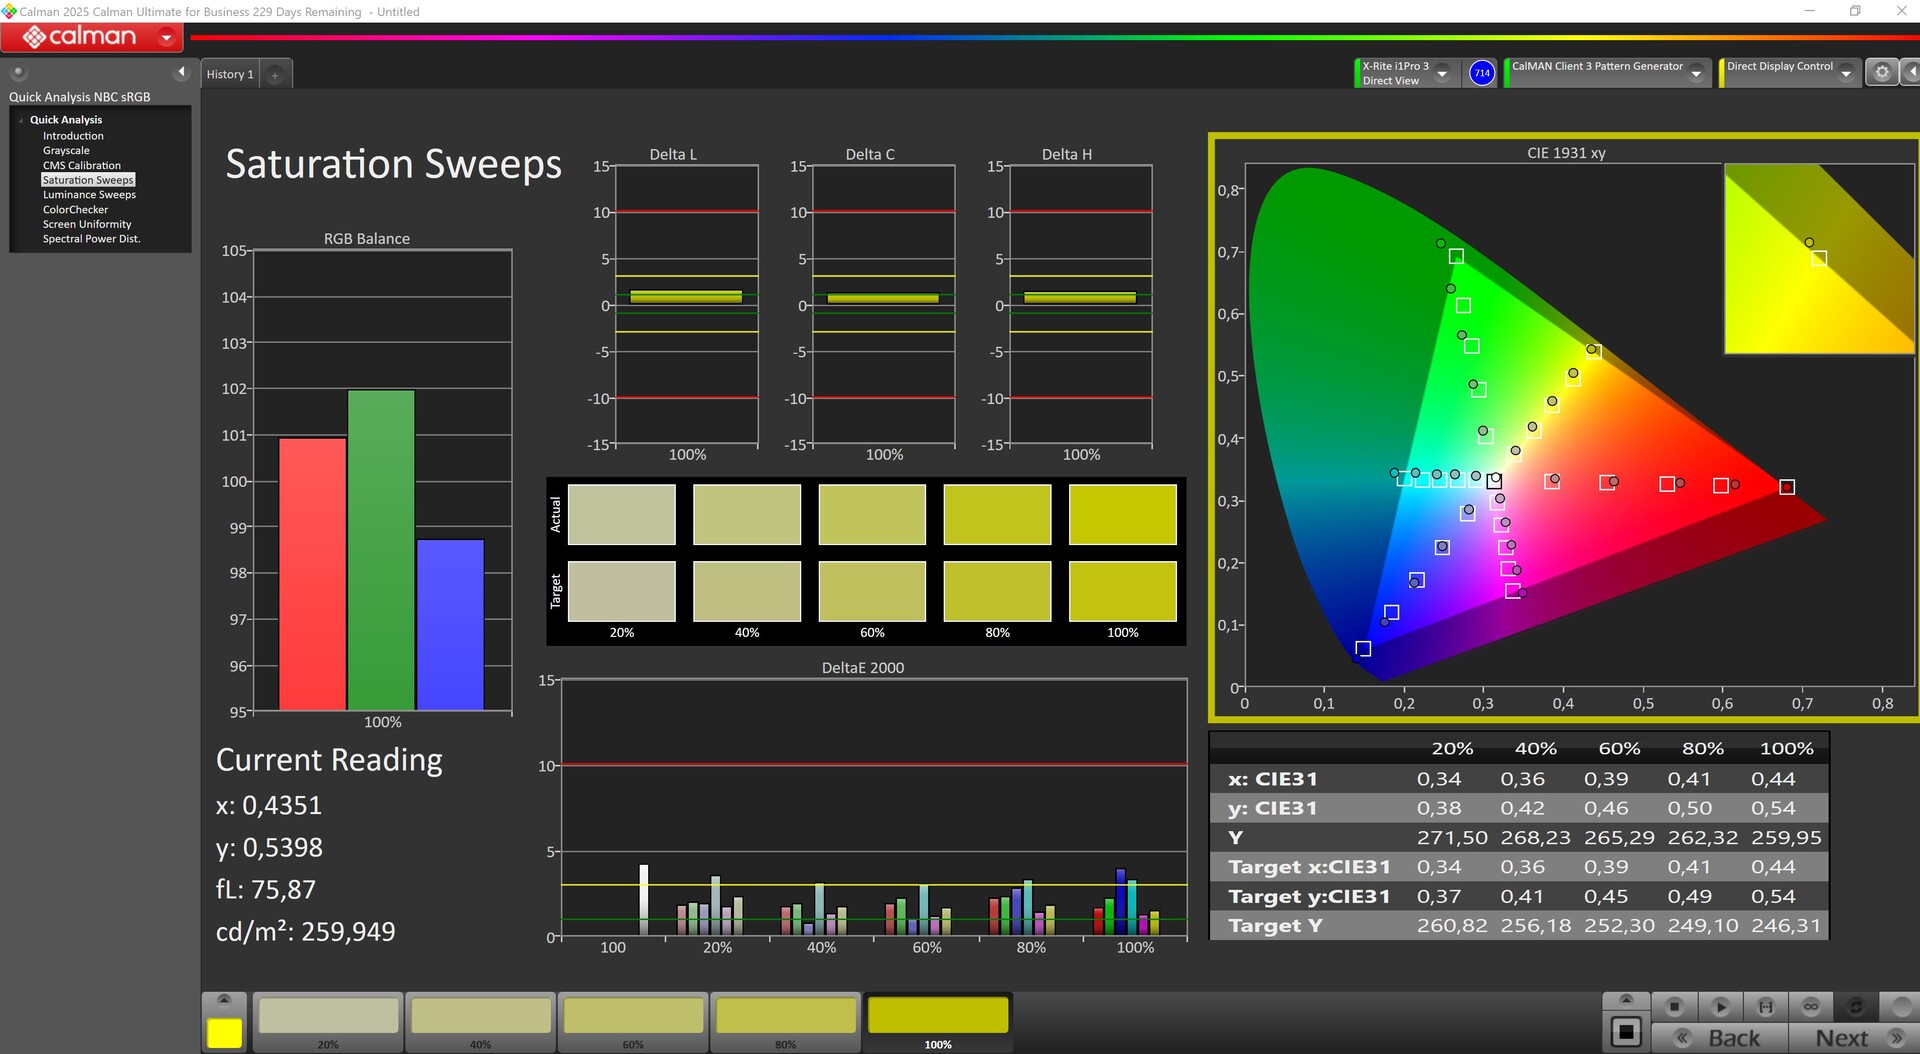
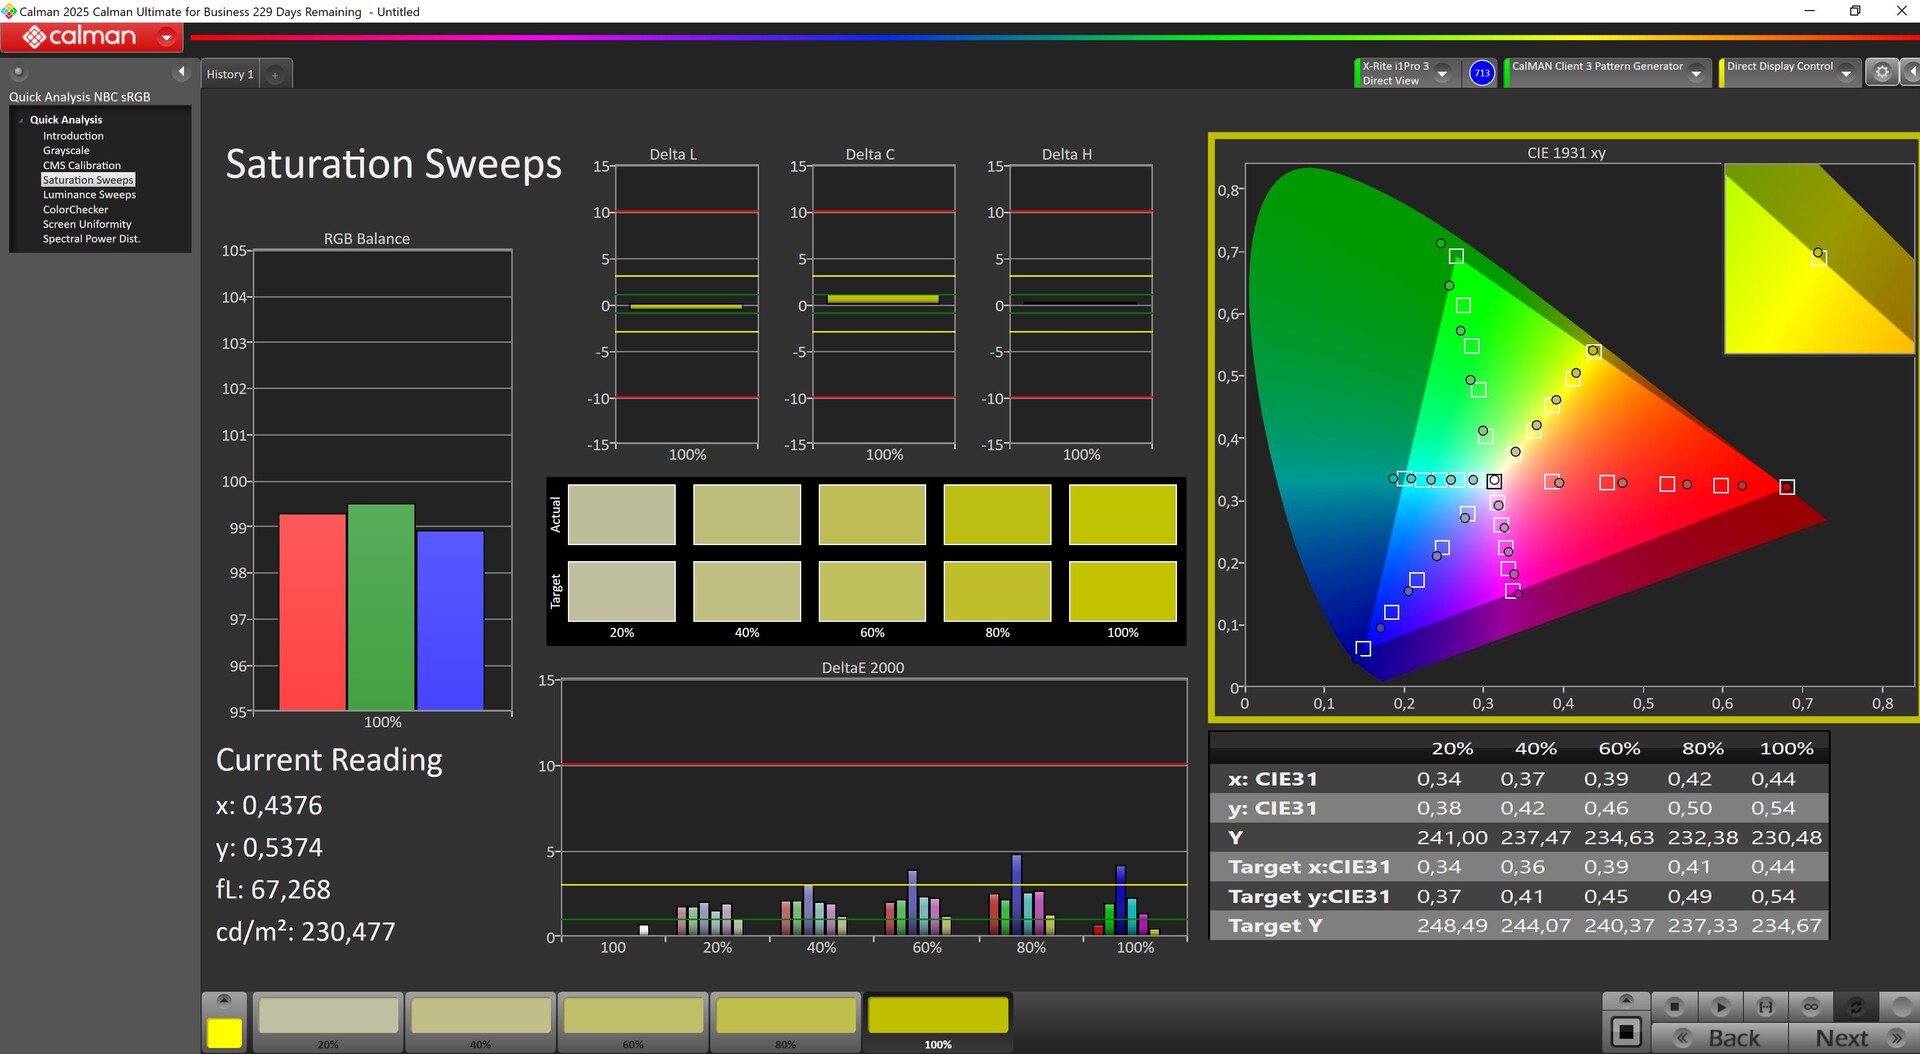
The OLED fully displays sRGB and Display P3, and even AdobeRGB is still displayed at 94 percent.

The Legion Pro 5 comes with a factory-calibrated display. At full brightness, the deviations are still 2.49 (colors) and just over 3 (grayscale). Our manual calibration reduced the DeltaE values slightly.
Display Response Times
| ↔ Response Time Black to White | ||
|---|---|---|
| 1.4 ms ... rise ↗ and fall ↘ combined | ↗ 0.8 ms rise | 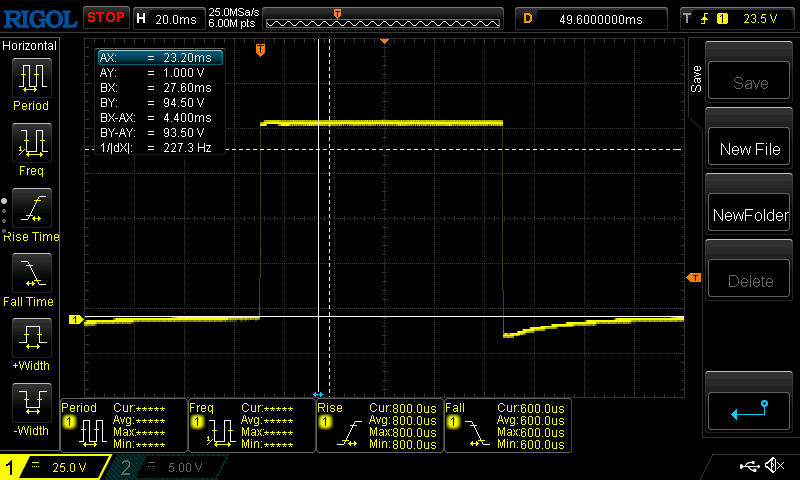 |
| ↘ 0.6 ms fall | ||
| The screen shows very fast response rates in our tests and should be very well suited for fast-paced gaming. In comparison, all tested devices range from 0.1 (minimum) to 240 (maximum) ms. » 8 % of all devices are better. This means that the measured response time is better than the average of all tested devices (19.8 ms). | ||
| ↔ Response Time 50% Grey to 80% Grey | ||
| 2 ms ... rise ↗ and fall ↘ combined | ↗ 1 ms rise | 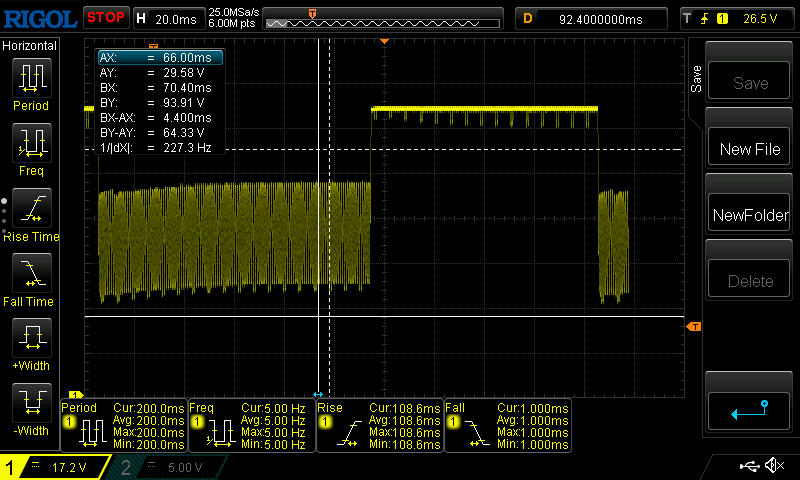 |
| ↘ 1 ms fall | ||
| The screen shows very fast response rates in our tests and should be very well suited for fast-paced gaming. In comparison, all tested devices range from 0.165 (minimum) to 636 (maximum) ms. » 10 % of all devices are better. This means that the measured response time is better than the average of all tested devices (31 ms). | ||
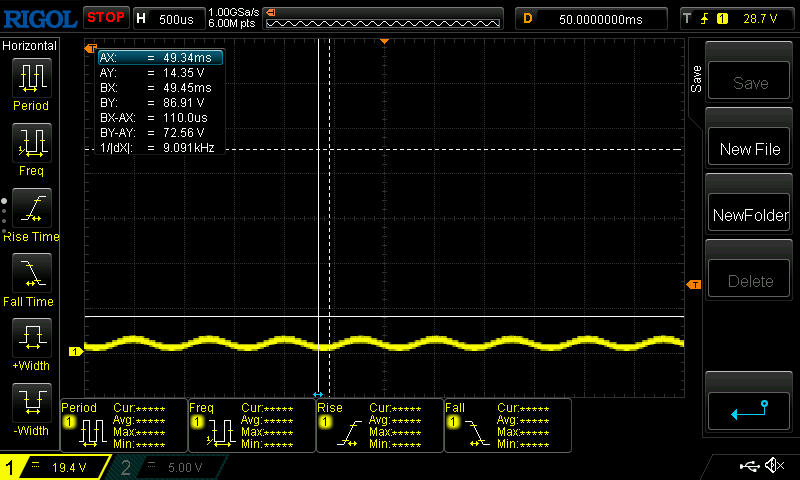
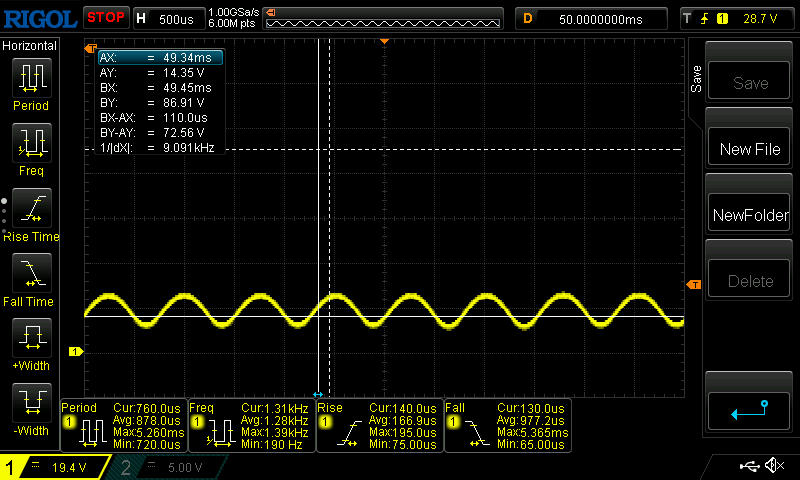
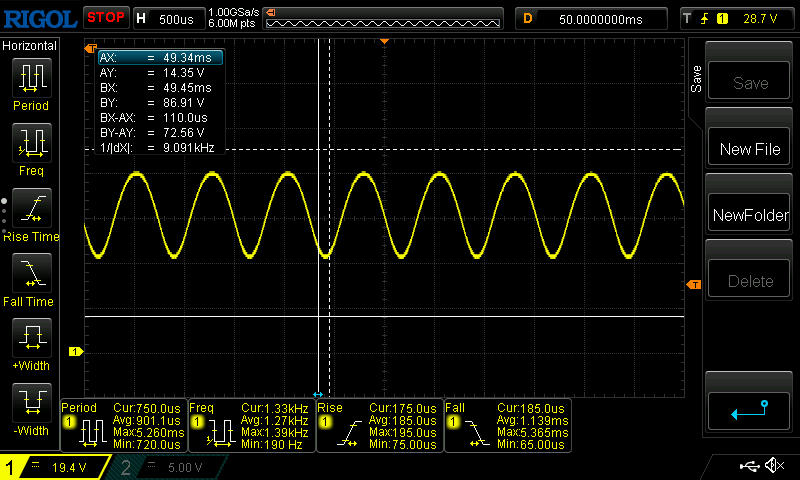
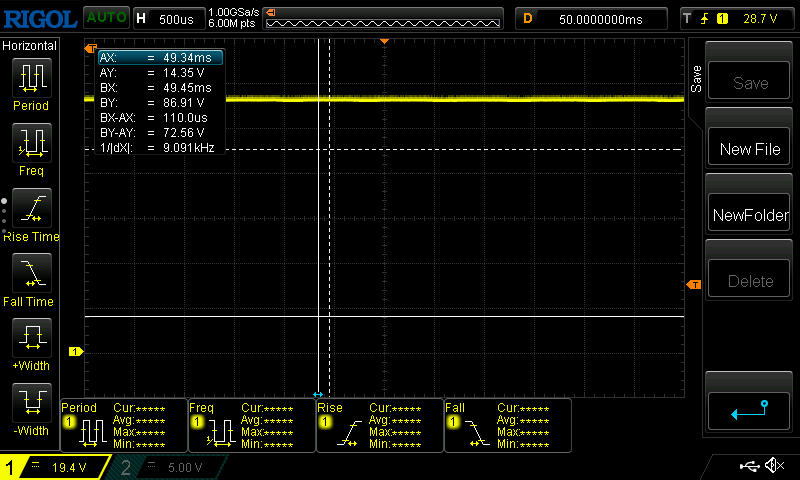
Screen Flickering / PWM (Pulse-Width Modulation)
| Screen flickering / PWM detected | 1300 Hz Amplitude: 16.7 % |  | |
The display backlight flickers at 1300 Hz (worst case, e.g., utilizing PWM) . The frequency of 1300 Hz is quite high, so most users sensitive to PWM should not notice any flickering. In comparison: 52 % of all tested devices do not use PWM to dim the display. If PWM was detected, an average of 7763 (minimum: 5 - maximum: 343500) Hz was measured. | |||
Theoretically, the reflective panel could be a nuisance outdoors, but since it is bright and high contrast, it's still very usable as long as you make sure you have a straight on view and a shady spot.


Performance - Powerful 3D performance
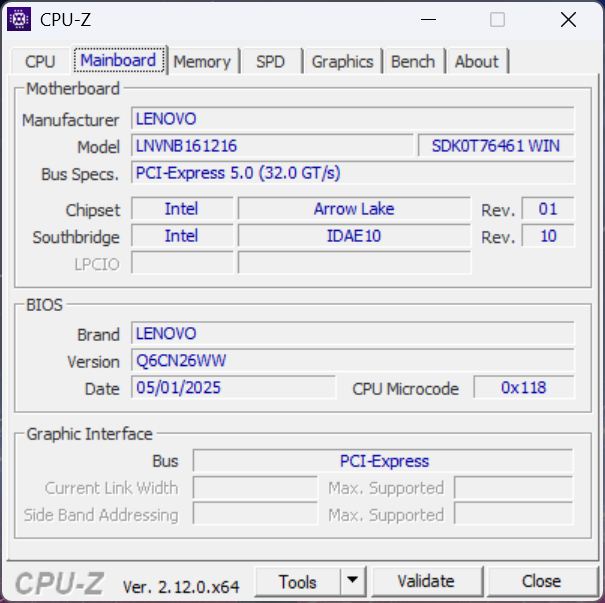
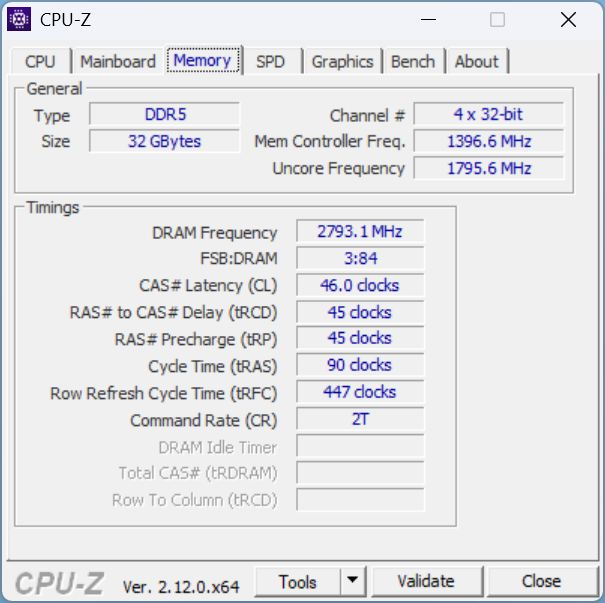
With the Intel Core Ultra 9 275HX, an RTX 5070 Ti Laptop, 32 GB of RAM and a 1 TB SSD, the Legion positions itself as a gamer. On the other hand, the "pro" (fessional) device is also aimed at content creators with its design and brilliant OLED display.
Test conditions
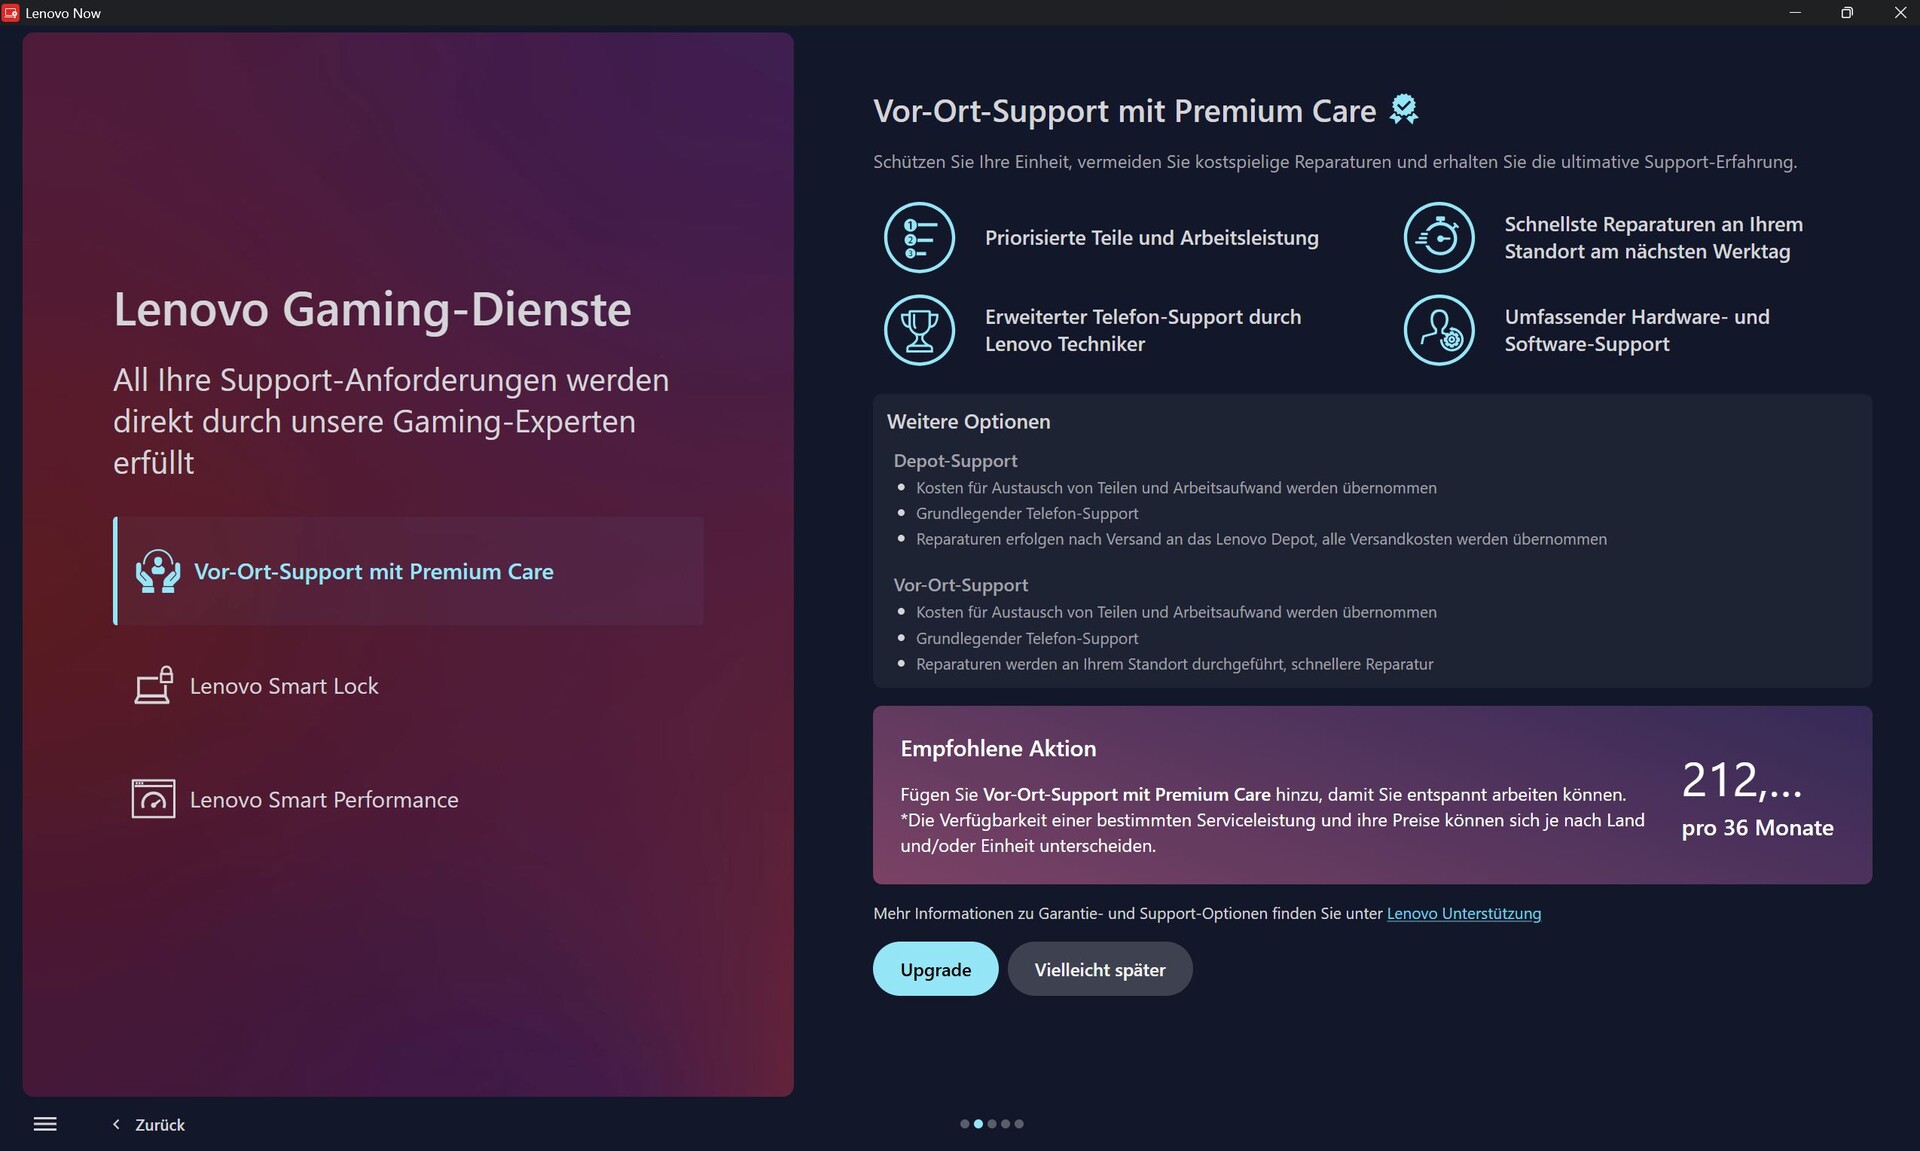
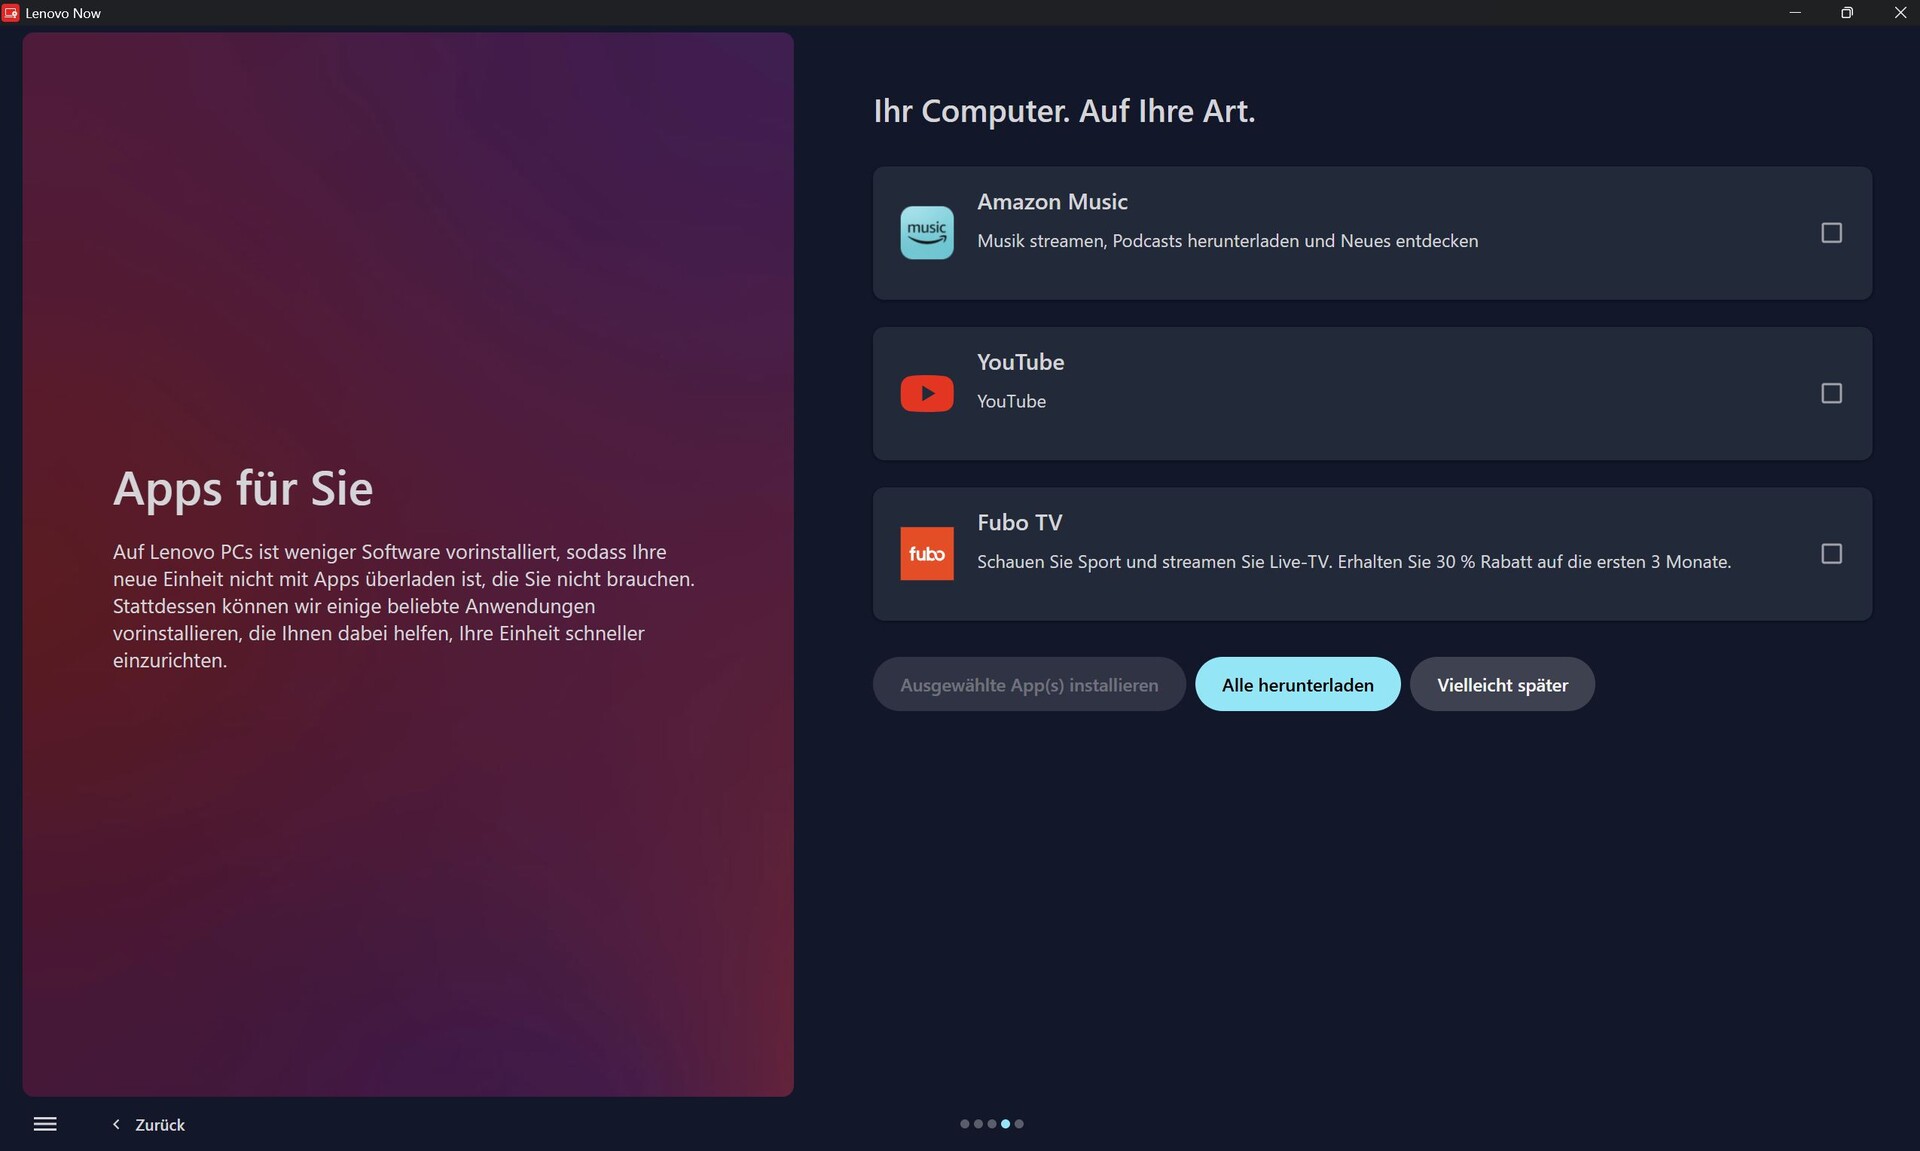
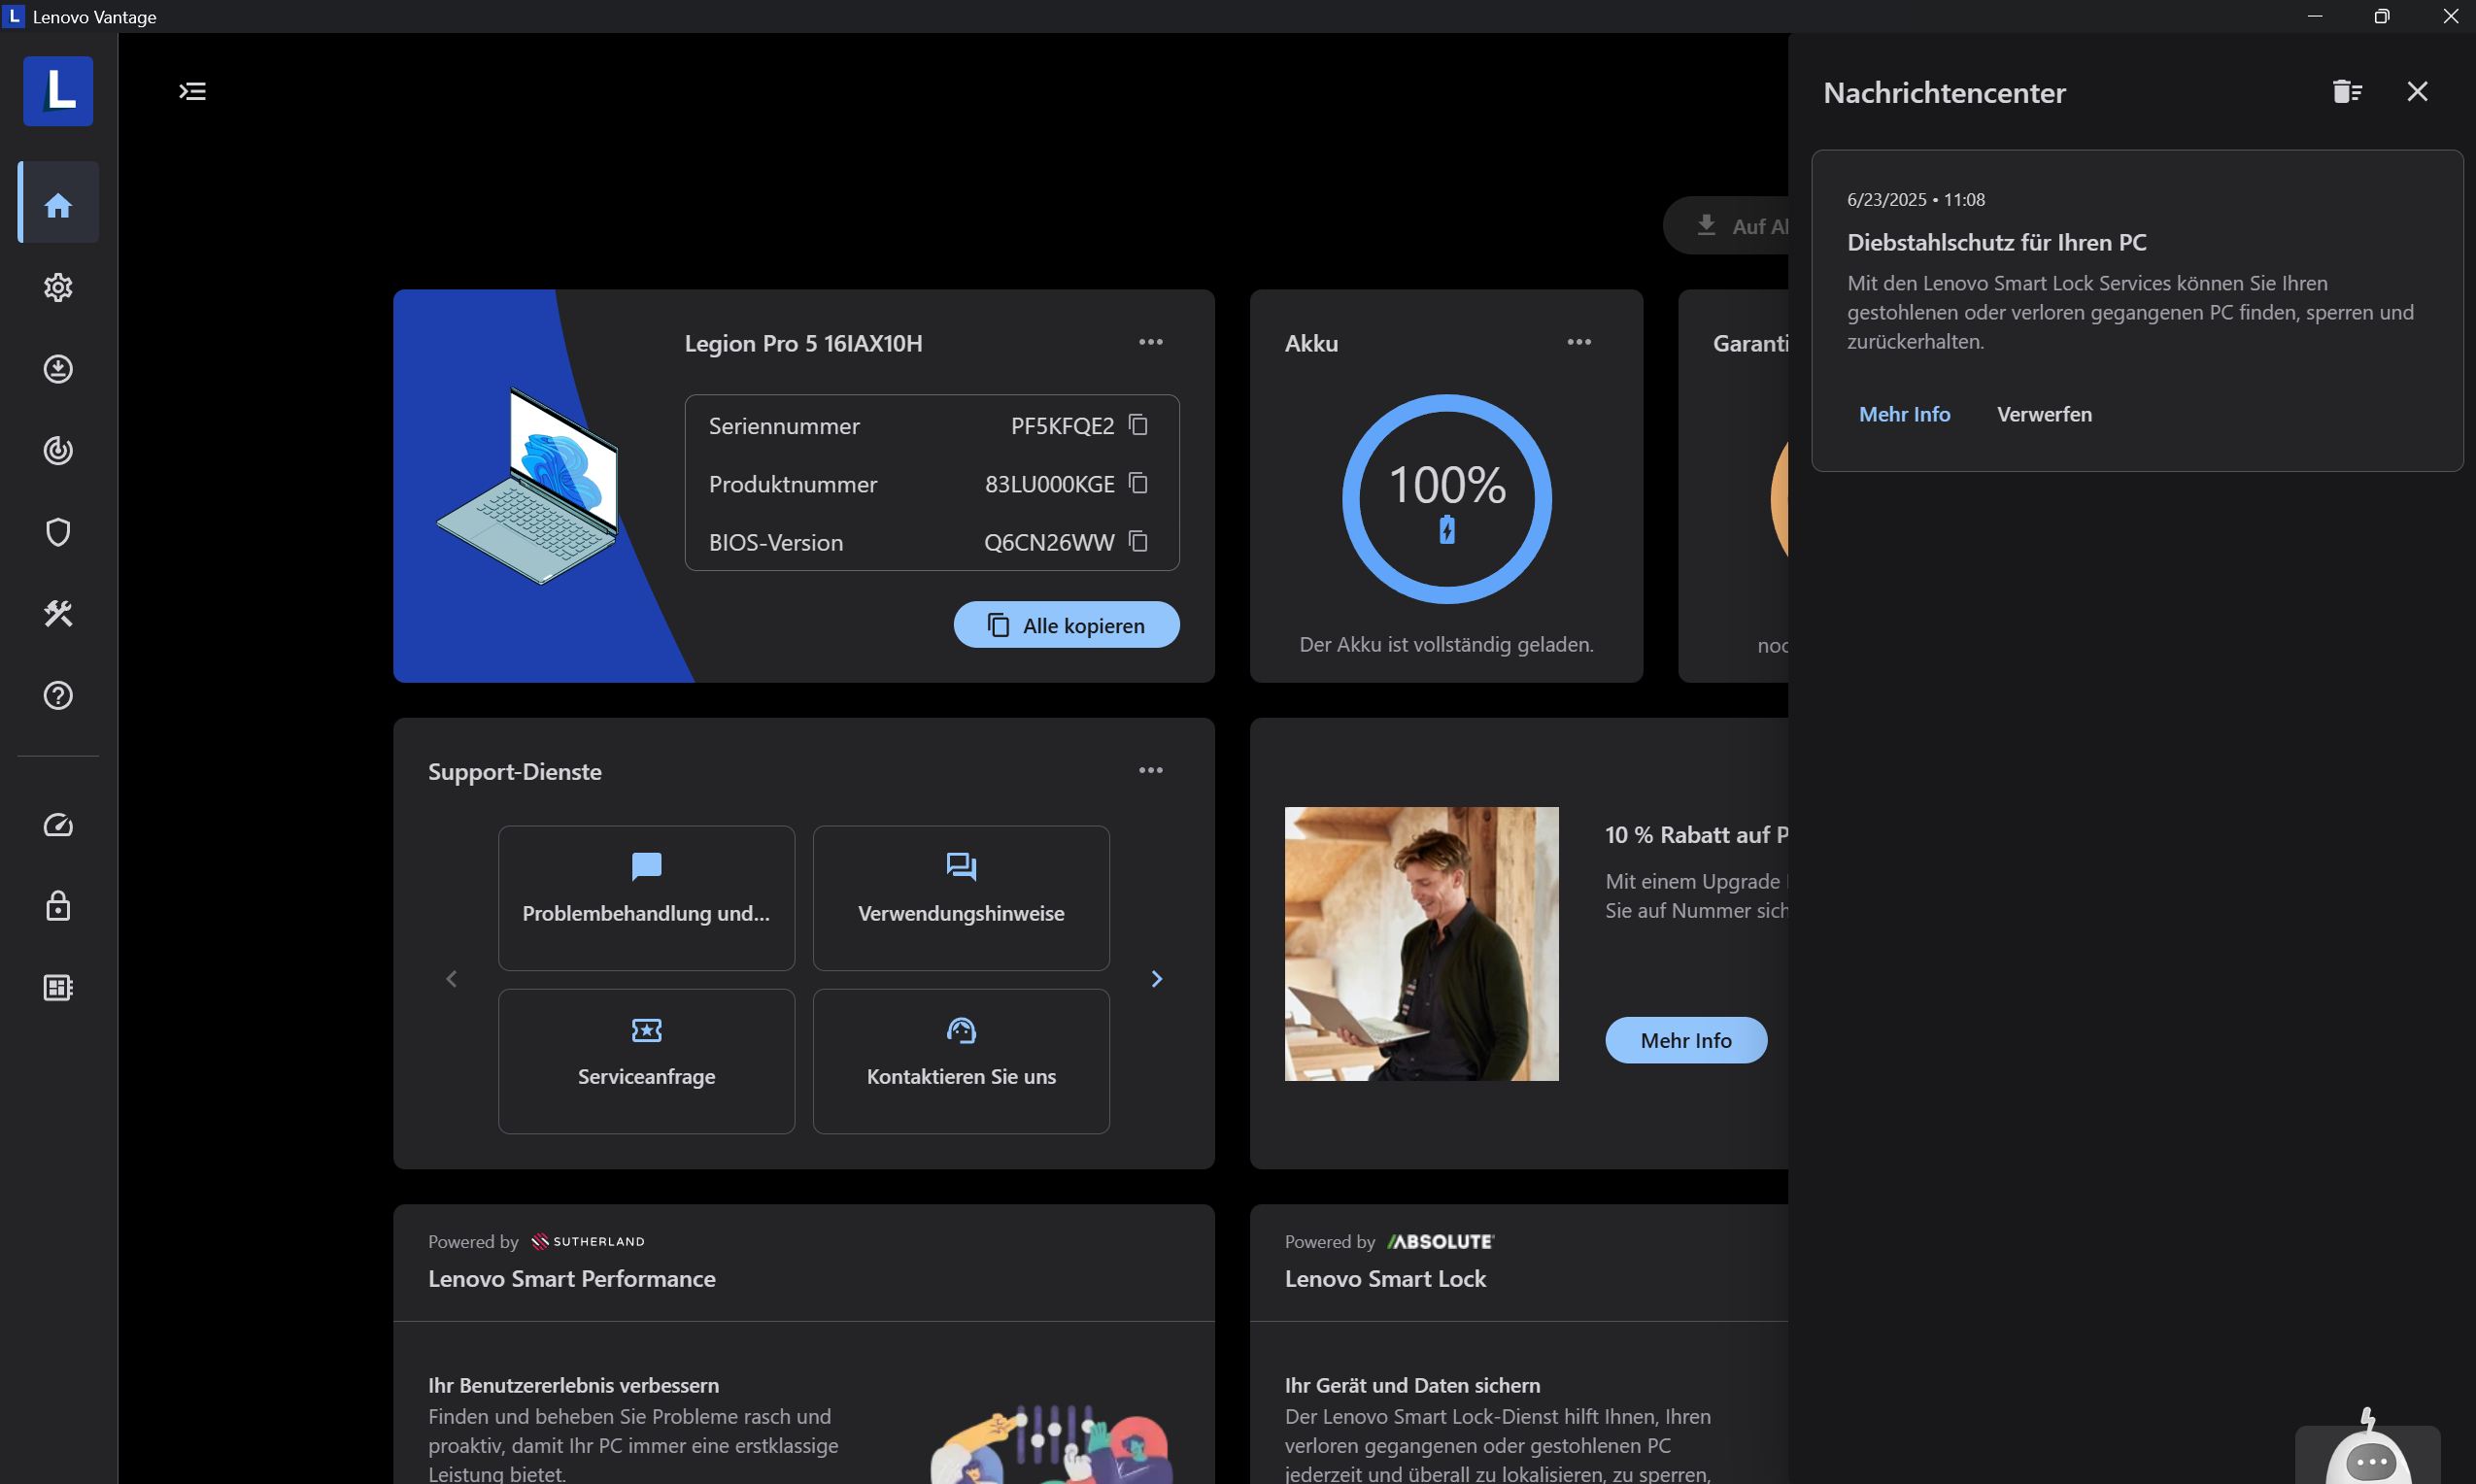
Unfortunately, Lenovo also uses its software to advertize to gaming users. For example, Lenovo LegionSpace, which is needed to set performance modes, always launches on the "Game Store" home screen with the latest game offerings. The second software, Lenovo Vantage, is responsible for updates and support, but also repeatedly pesters users with survey requests or self-promoted advertising. A trial version of McAfee is also preinstalled.
Interested users are fobbed off with a browser link to Lenovo's general privacy policy. The exact data LegionSpace and Vantage collect is not clear to the average user.
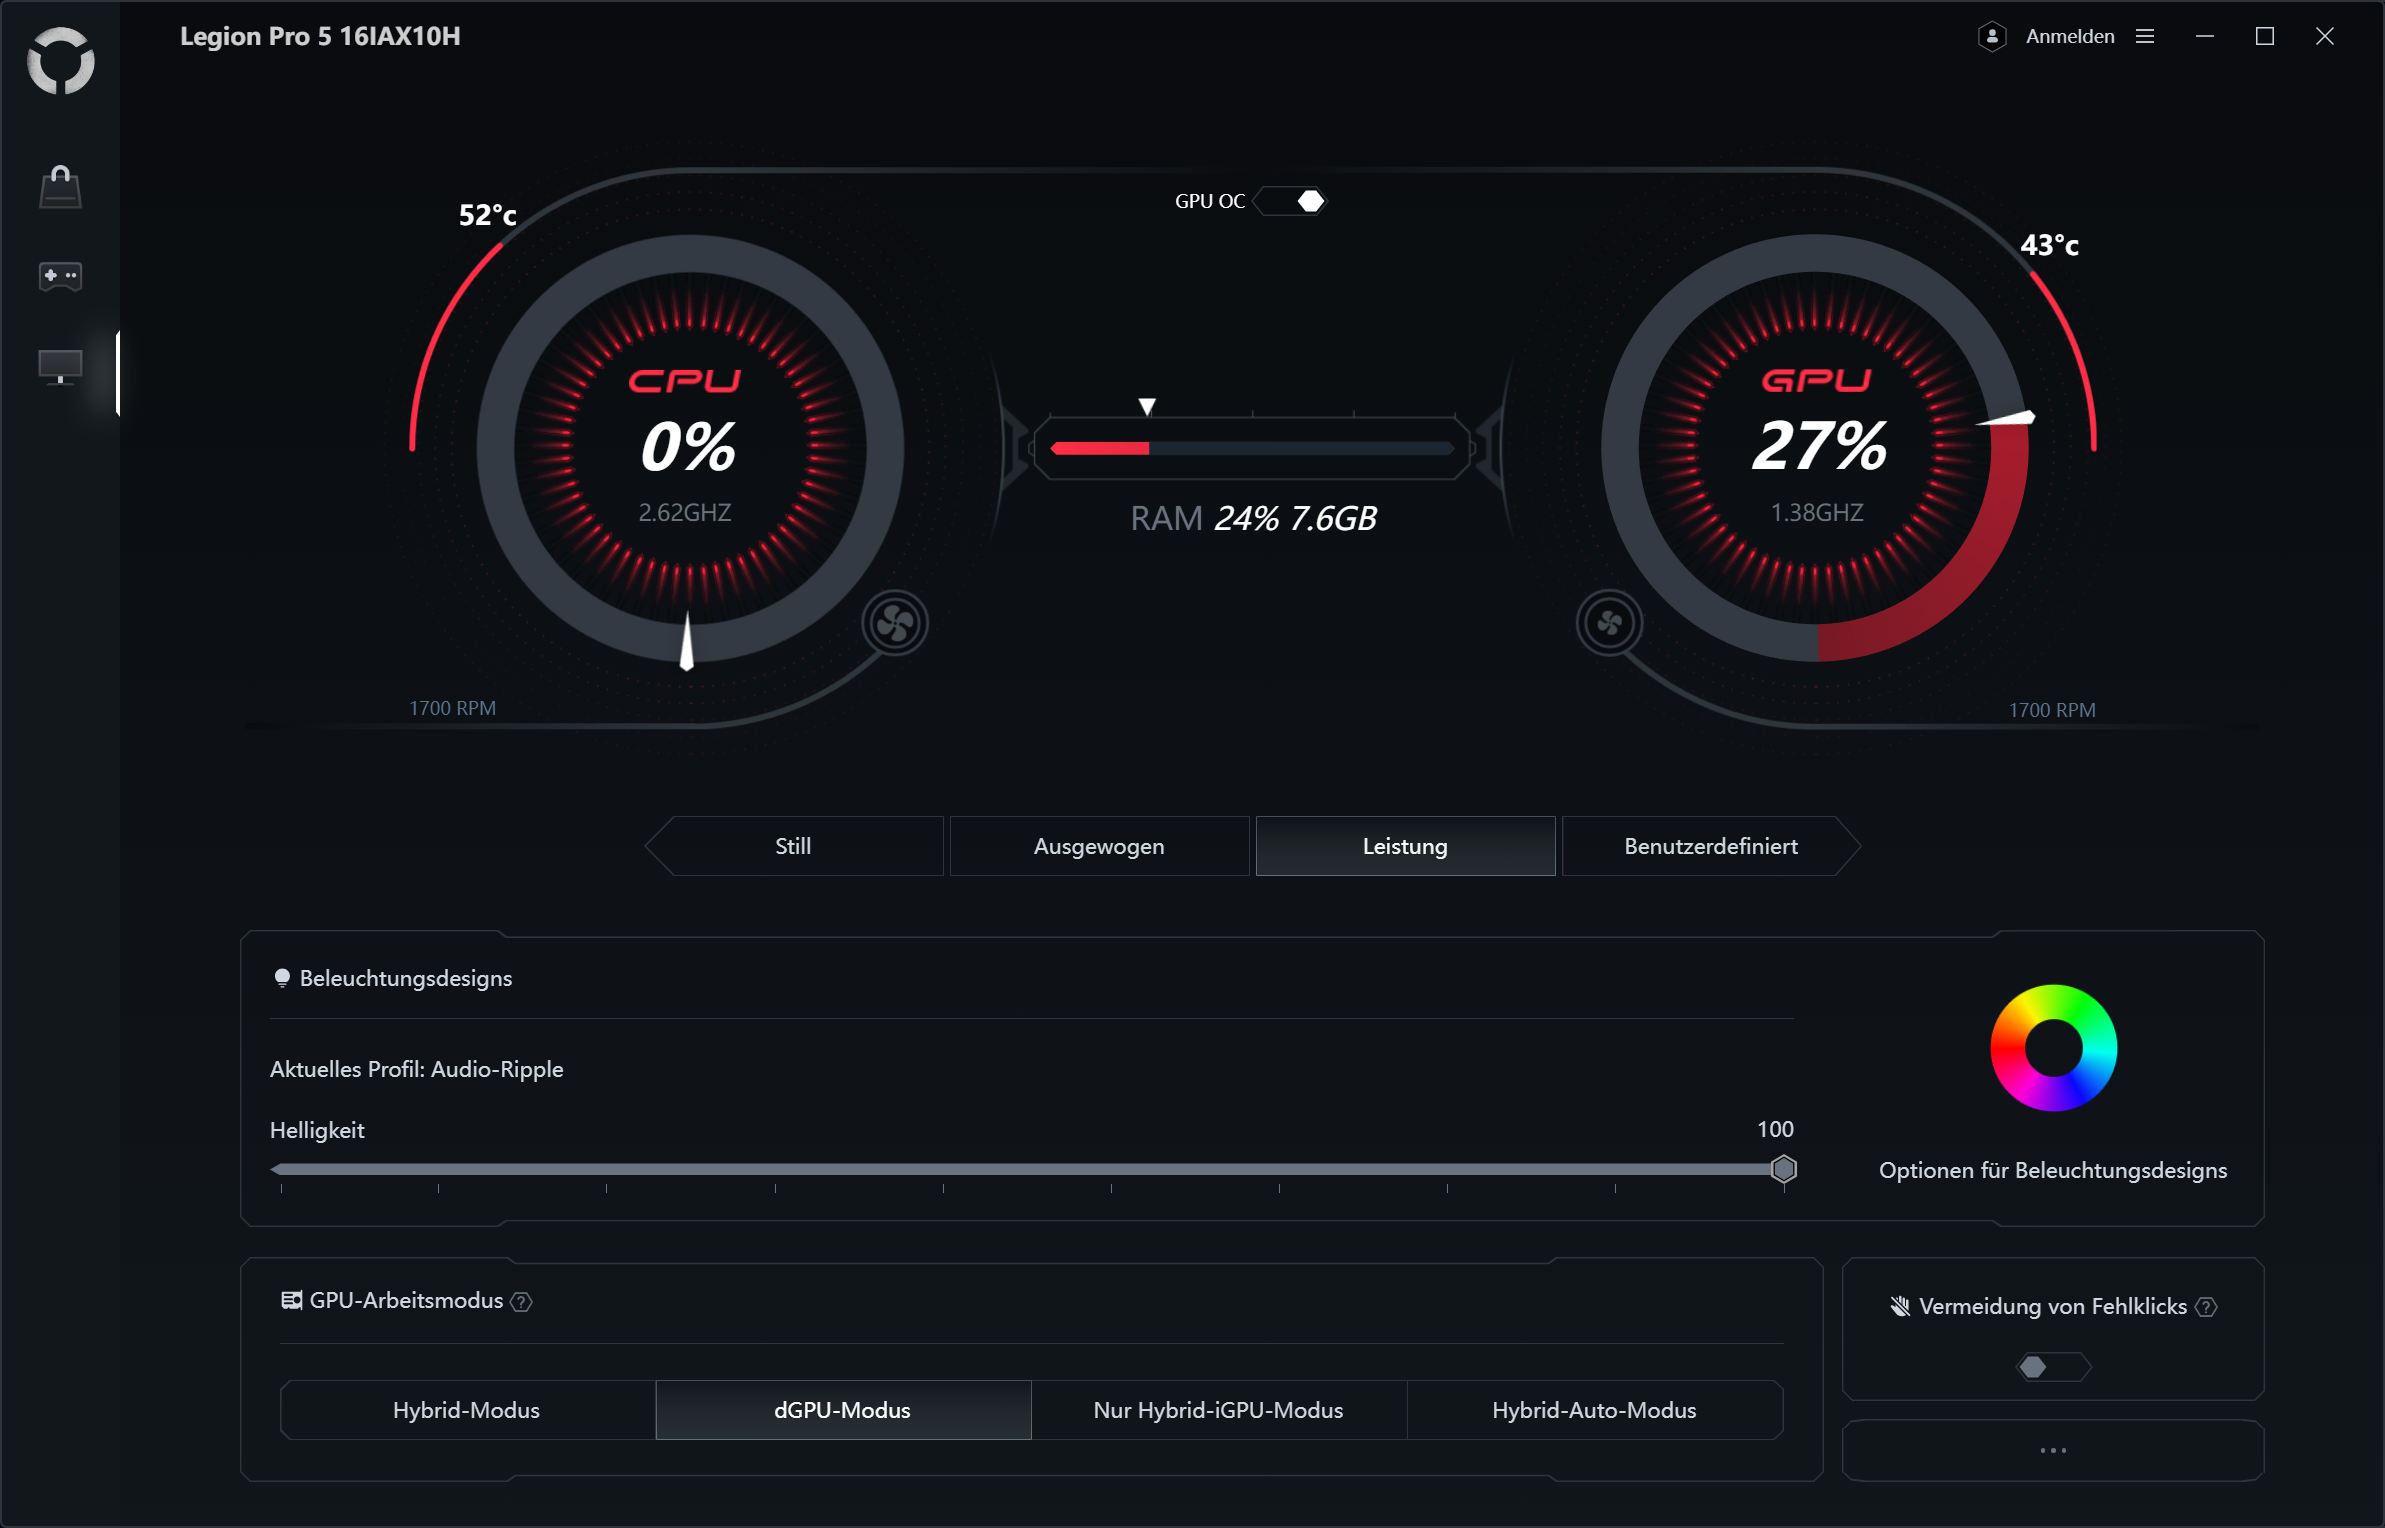
LegionSpace offers three automatic performance modes (Quiet, Balanced, Performance) plus a custom mode, which can be extensively configured. One convenience is that you can switch between the modes using fn + "Q." We used Performance mode for our benchmarks. The system has an MUX graphics switch, which requires a reboot.


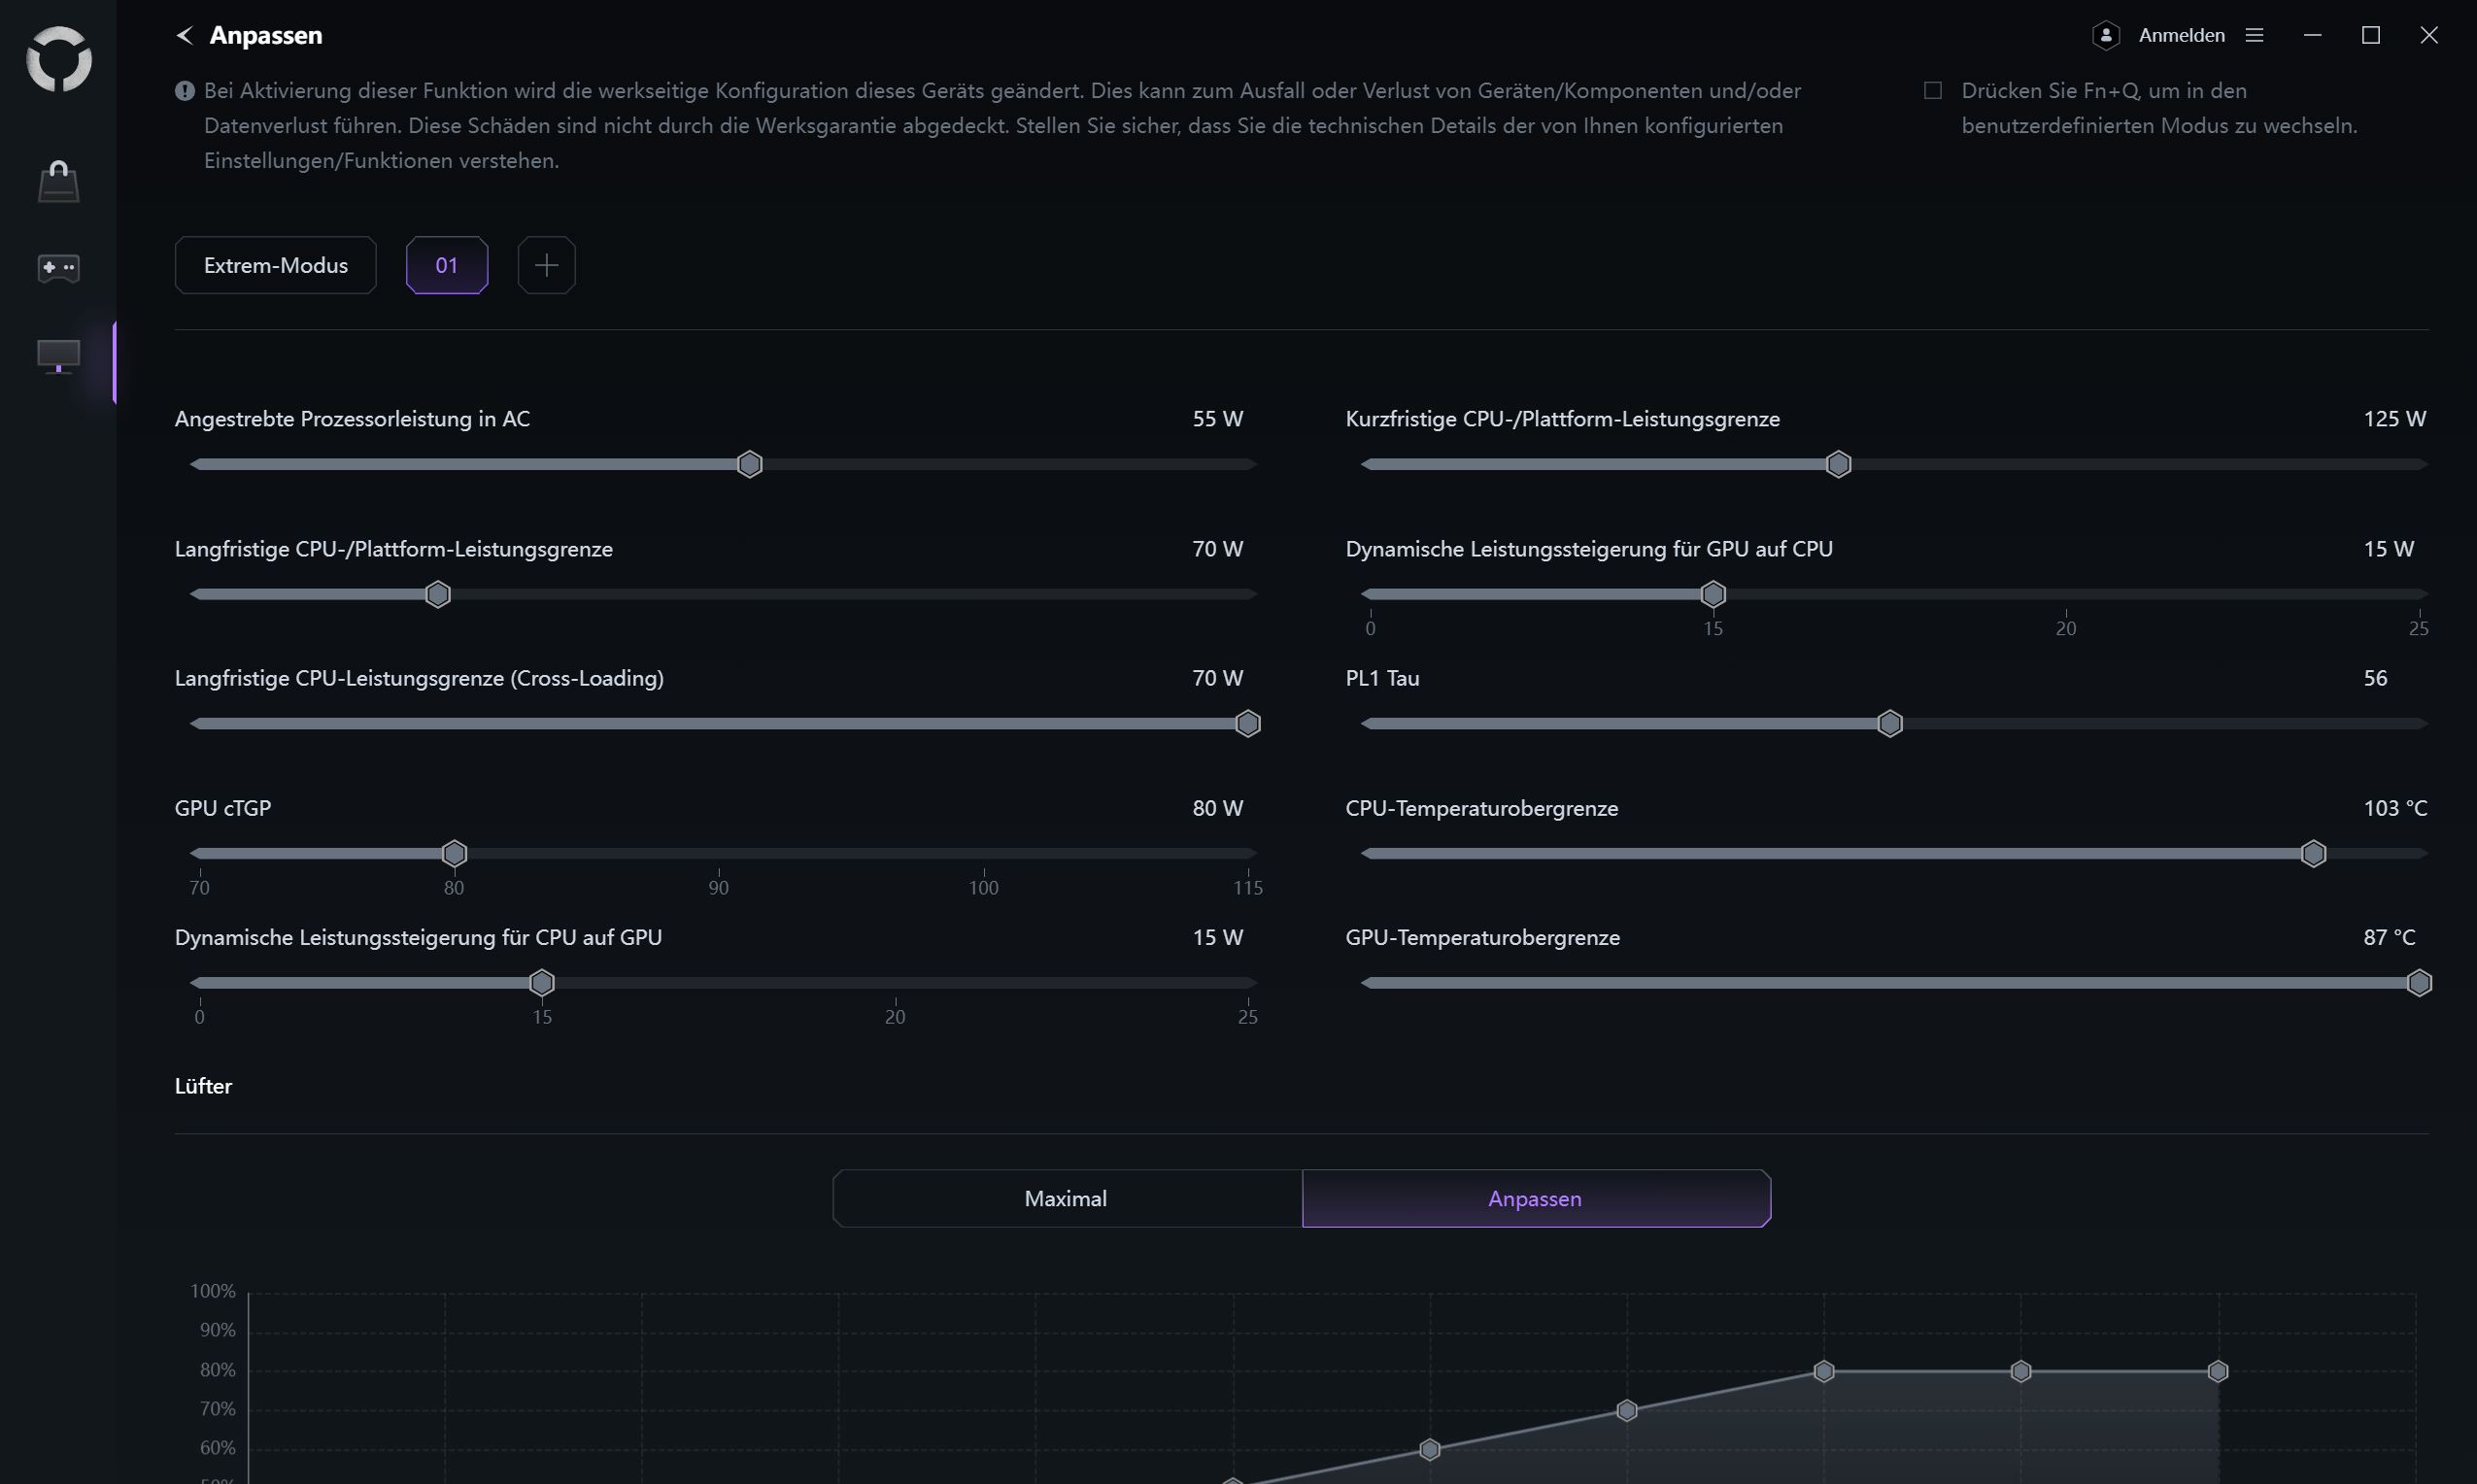
| Energy profile | CPU TDP | CB 15 Multi | CP 2077 FHD Ultra | Assassin's Creed: Shadows FHD Ultra | max. fan volume |
|---|---|---|---|---|---|
| Quiet | 65/35 watts | 4,076 points | 90,6 fps | 43fps | 40.68 dB(A) |
| Balanced | 130/70 watts | 5,141 points | 103fps | 47fps | 46.37 dB(A) |
| Performance | 185/125 watts | 5,885 points | 132fps | 53fps | 56.72 dB(A) |
| Extreme (user-defined) | 202/135 watts | 5,867 points | 142fps | 50fps | 58.48 dB(A) |
| Battery (balanced) | 55/45 watts | 3,563 points | 30fps | 30fps | 29 dB(A) |
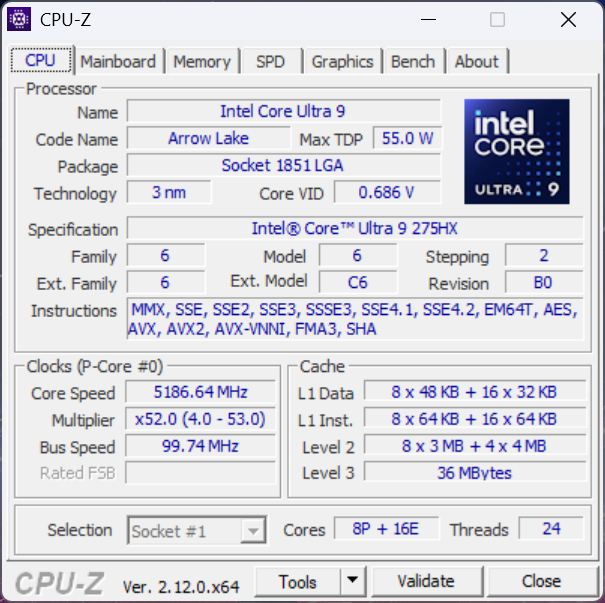
Processor
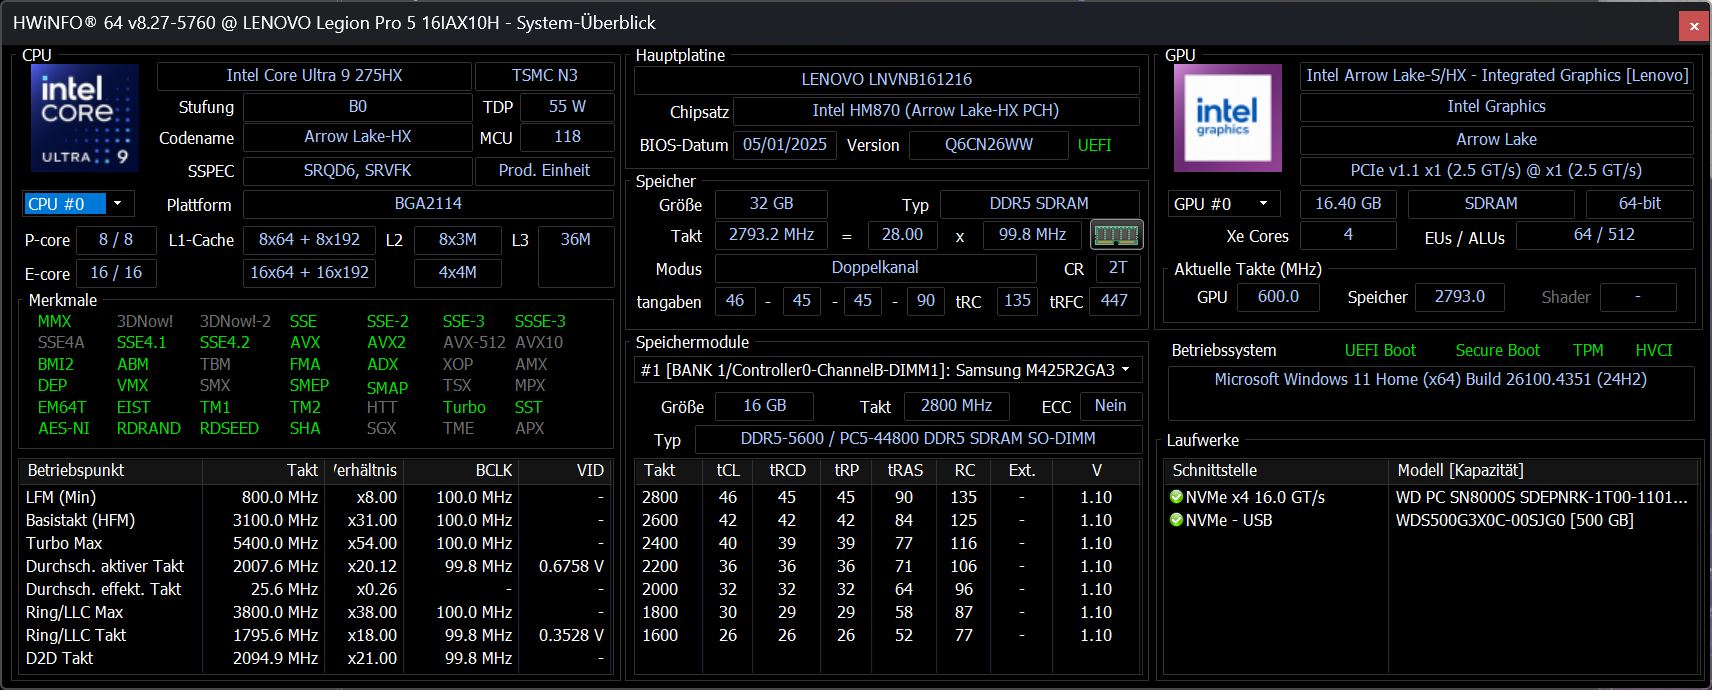
The Intel Core Ultra 9 275HX is a high-end mobile CPU. Its 24 cores (8 P and 16 E cores) clock at up to 5.4 GHz. It integrates a small NPU with 13 TOPs and an iGPU with four Xe cores.
In Cinebench R15 loop, our Legion Pro 5 demonstrated high performance on par with a Asus Scar Strix 16 or even a Neo 16 A25. Unlike the RTX 5090 competition, however, the performance does not remain quite as constant and drops by a total of around 8 percent within 5 to 6 runs, settling to the level of the XMG Pro 16.
Across all CPU tests, the Legion sat just between the Asus Strix Scar 16 (+1%) and the XMG Pro 16 (-1%). The gap between the competitors is small, with the fastest device (Neo 16 E25) enjoying a 5 percent advantage.
When away from a power outlet, Performance mode is not selectable and Balanced mode is active. In Cinebench R15 Multi, the score dropped by approximately 37 percent.
Cinebench R15 Multi Continuous Test
Cinebench R23: Multi Core | Single Core
Cinebench R20: CPU (Multi Core) | CPU (Single Core)
Cinebench R15: CPU Multi 64Bit | CPU Single 64Bit
Blender: v2.79 BMW27 CPU
7-Zip 18.03: 7z b 4 | 7z b 4 -mmt1
Geekbench 6.7: Multi-Core | Single-Core
Geekbench 5.5: Multi-Core | Single-Core
HWBOT x265 Benchmark v2.2: 4k Preset
LibreOffice : 20 Documents To PDF
R Benchmark 2.5: Overall mean
| CPU Performance rating | |
| Schenker XMG Neo 16 E25 RTX 5090 Laptop | |
| Asus ROG Strix Scar 16 2025 | |
| Lenovo Legion 5 Pro 16IAX10H | |
| Schenker XMG Pro 16 (E25) | |
| Lenovo Legion Pro 7i 16 Gen 10 | |
| Aorus MASTER 16 AM6H | |
| Average Intel Core Ultra 9 275HX | |
| Lenovo Legion Pro 5 16IRX9 | |
| MSI Vector 16 HX AI A2XWHG | |
| Average of class Gaming | |
| Cinebench R23 / Multi Core | |
| Schenker XMG Neo 16 E25 RTX 5090 Laptop | |
| Asus ROG Strix Scar 16 2025 | |
| Lenovo Legion 5 Pro 16IAX10H | |
| Lenovo Legion Pro 7i 16 Gen 10 | |
| Schenker XMG Pro 16 (E25) | |
| Aorus MASTER 16 AM6H | |
| Average Intel Core Ultra 9 275HX (30712 - 40970, n=31) | |
| Lenovo Legion Pro 5 16IRX9 | |
| MSI Vector 16 HX AI A2XWHG | |
| Average of class Gaming (10488 - 40970, n=109, last 2 years) | |
| Cinebench R23 / Single Core | |
| Schenker XMG Neo 16 E25 RTX 5090 Laptop | |
| Lenovo Legion 5 Pro 16IAX10H | |
| Schenker XMG Pro 16 (E25) | |
| Aorus MASTER 16 AM6H | |
| Lenovo Legion Pro 7i 16 Gen 10 | |
| Average Intel Core Ultra 9 275HX (2009 - 2267, n=31) | |
| MSI Vector 16 HX AI A2XWHG | |
| Asus ROG Strix Scar 16 2025 | |
| Lenovo Legion Pro 5 16IRX9 | |
| Average of class Gaming (1166 - 2356, n=109, last 2 years) | |
| Cinebench R20 / CPU (Multi Core) | |
| Schenker XMG Neo 16 E25 RTX 5090 Laptop | |
| Asus ROG Strix Scar 16 2025 | |
| Lenovo Legion 5 Pro 16IAX10H | |
| Schenker XMG Pro 16 (E25) | |
| Aorus MASTER 16 AM6H | |
| Lenovo Legion Pro 7i 16 Gen 10 | |
| Average Intel Core Ultra 9 275HX (12026 - 16108, n=30) | |
| Lenovo Legion Pro 5 16IRX9 | |
| MSI Vector 16 HX AI A2XWHG | |
| Average of class Gaming (4029 - 16108, n=108, last 2 years) | |
| Cinebench R20 / CPU (Single Core) | |
| Schenker XMG Neo 16 E25 RTX 5090 Laptop | |
| Lenovo Legion 5 Pro 16IAX10H | |
| Schenker XMG Pro 16 (E25) | |
| Aorus MASTER 16 AM6H | |
| Average Intel Core Ultra 9 275HX (774 - 870, n=30) | |
| Asus ROG Strix Scar 16 2025 | |
| MSI Vector 16 HX AI A2XWHG | |
| Lenovo Legion Pro 7i 16 Gen 10 | |
| Lenovo Legion Pro 5 16IRX9 | |
| Average of class Gaming (442 - 895, n=108, last 2 years) | |
| Cinebench R15 / CPU Multi 64Bit | |
| Schenker XMG Neo 16 E25 RTX 5090 Laptop | |
| Asus ROG Strix Scar 16 2025 | |
| Lenovo Legion 5 Pro 16IAX10H | |
| Lenovo Legion Pro 7i 16 Gen 10 | |
| Aorus MASTER 16 AM6H | |
| Schenker XMG Pro 16 (E25) | |
| Average Intel Core Ultra 9 275HX (4737 - 6271, n=30) | |
| Lenovo Legion Pro 5 16IRX9 | |
| MSI Vector 16 HX AI A2XWHG | |
| Average of class Gaming (1578 - 6271, n=107, last 2 years) | |
| Cinebench R15 / CPU Single 64Bit | |
| Asus ROG Strix Scar 16 2025 | |
| Schenker XMG Neo 16 E25 RTX 5090 Laptop | |
| Lenovo Legion Pro 7i 16 Gen 10 | |
| Schenker XMG Pro 16 (E25) | |
| Lenovo Legion 5 Pro 16IAX10H | |
| Aorus MASTER 16 AM6H | |
| Average Intel Core Ultra 9 275HX (306 - 343, n=31) | |
| MSI Vector 16 HX AI A2XWHG | |
| Lenovo Legion Pro 5 16IRX9 | |
| Average of class Gaming (188.8 - 343, n=108, last 2 years) | |
| Blender / v2.79 BMW27 CPU | |
| Average of class Gaming (80 - 330, n=106, last 2 years) | |
| MSI Vector 16 HX AI A2XWHG | |
| Lenovo Legion Pro 5 16IRX9 | |
| Lenovo Legion 5 Pro 16IAX10H | |
| Average Intel Core Ultra 9 275HX (82 - 116, n=29) | |
| Aorus MASTER 16 AM6H | |
| Schenker XMG Pro 16 (E25) | |
| Lenovo Legion Pro 7i 16 Gen 10 | |
| Asus ROG Strix Scar 16 2025 | |
| Schenker XMG Neo 16 E25 RTX 5090 Laptop | |
| 7-Zip 18.03 / 7z b 4 | |
| Schenker XMG Neo 16 E25 RTX 5090 Laptop | |
| Asus ROG Strix Scar 16 2025 | |
| Lenovo Legion Pro 7i 16 Gen 10 | |
| Schenker XMG Pro 16 (E25) | |
| Lenovo Legion Pro 5 16IRX9 | |
| Average Intel Core Ultra 9 275HX (98236 - 124155, n=30) | |
| Lenovo Legion 5 Pro 16IAX10H | |
| Aorus MASTER 16 AM6H | |
| Average of class Gaming (33491 - 148086, n=107, last 2 years) | |
| MSI Vector 16 HX AI A2XWHG | |
| 7-Zip 18.03 / 7z b 4 -mmt1 | |
| Schenker XMG Neo 16 E25 RTX 5090 Laptop | |
| Schenker XMG Pro 16 (E25) | |
| Lenovo Legion Pro 5 16IRX9 | |
| Average Intel Core Ultra 9 275HX (6026 - 7149, n=30) | |
| Lenovo Legion 5 Pro 16IAX10H | |
| Aorus MASTER 16 AM6H | |
| Asus ROG Strix Scar 16 2025 | |
| Lenovo Legion Pro 7i 16 Gen 10 | |
| MSI Vector 16 HX AI A2XWHG | |
| Average of class Gaming (4199 - 7436, n=107, last 2 years) | |
| Geekbench 6.7 / Multi-Core | |
| Asus ROG Strix Scar 16 2025 | |
| Schenker XMG Neo 16 E25 RTX 5090 Laptop | |
| Schenker XMG Pro 16 (E25) | |
| Lenovo Legion 5 Pro 16IAX10H | |
| Average Intel Core Ultra 9 275HX (16033 - 21668, n=33) | |
| Aorus MASTER 16 AM6H | |
| Lenovo Legion Pro 7i 16 Gen 10 | |
| Lenovo Legion Pro 5 16IRX9 | |
| MSI Vector 16 HX AI A2XWHG | |
| Average of class Gaming (6625 - 22104, n=108, last 2 years) | |
| Geekbench 6.7 / Single-Core | |
| Schenker XMG Pro 16 (E25) | |
| Schenker XMG Neo 16 E25 RTX 5090 Laptop | |
| Lenovo Legion 5 Pro 16IAX10H | |
| Asus ROG Strix Scar 16 2025 | |
| Lenovo Legion Pro 7i 16 Gen 10 | |
| Aorus MASTER 16 AM6H | |
| Average Intel Core Ultra 9 275HX (2843 - 3160, n=33) | |
| MSI Vector 16 HX AI A2XWHG | |
| Lenovo Legion Pro 5 16IRX9 | |
| Average of class Gaming (1490 - 3259, n=108, last 2 years) | |
| Geekbench 5.5 / Multi-Core | |
| Schenker XMG Neo 16 E25 RTX 5090 Laptop | |
| Asus ROG Strix Scar 16 2025 | |
| Schenker XMG Pro 16 (E25) | |
| Average Intel Core Ultra 9 275HX (19105 - 25855, n=31) | |
| Lenovo Legion Pro 7i 16 Gen 10 | |
| Lenovo Legion 5 Pro 16IAX10H | |
| Aorus MASTER 16 AM6H | |
| Lenovo Legion Pro 5 16IRX9 | |
| MSI Vector 16 HX AI A2XWHG | |
| Average of class Gaming (6460 - 27010, n=107, last 2 years) | |
| Geekbench 5.5 / Single-Core | |
| Schenker XMG Neo 16 E25 RTX 5090 Laptop | |
| Schenker XMG Pro 16 (E25) | |
| Lenovo Legion 5 Pro 16IAX10H | |
| Asus ROG Strix Scar 16 2025 | |
| Aorus MASTER 16 AM6H | |
| Average Intel Core Ultra 9 275HX (2033 - 2292, n=31) | |
| Lenovo Legion Pro 7i 16 Gen 10 | |
| MSI Vector 16 HX AI A2XWHG | |
| Average of class Gaming (986 - 2474, n=107, last 2 years) | |
| Lenovo Legion Pro 5 16IRX9 | |
| HWBOT x265 Benchmark v2.2 / 4k Preset | |
| Schenker XMG Neo 16 E25 RTX 5090 Laptop | |
| Asus ROG Strix Scar 16 2025 | |
| Schenker XMG Pro 16 (E25) | |
| Lenovo Legion 5 Pro 16IAX10H | |
| Lenovo Legion Pro 7i 16 Gen 10 | |
| Average Intel Core Ultra 9 275HX (30.7 - 43.8, n=30) | |
| Aorus MASTER 16 AM6H | |
| MSI Vector 16 HX AI A2XWHG | |
| Lenovo Legion Pro 5 16IRX9 | |
| Average of class Gaming (11.5 - 44.3, n=107, last 2 years) | |
| LibreOffice / 20 Documents To PDF | |
| Average of class Gaming (19 - 88.8, n=107, last 2 years) | |
| Schenker XMG Pro 16 (E25) | |
| Average Intel Core Ultra 9 275HX (33.2 - 62.1, n=30) | |
| Lenovo Legion Pro 5 16IRX9 | |
| Schenker XMG Neo 16 E25 RTX 5090 Laptop | |
| Asus ROG Strix Scar 16 2025 | |
| Aorus MASTER 16 AM6H | |
| MSI Vector 16 HX AI A2XWHG | |
| Lenovo Legion Pro 7i 16 Gen 10 | |
| Lenovo Legion 5 Pro 16IAX10H | |
| R Benchmark 2.5 / Overall mean | |
| Aorus MASTER 16 AM6H | |
| Average of class Gaming (0.3439 - 0.759, n=108, last 2 years) | |
| MSI Vector 16 HX AI A2XWHG | |
| Average Intel Core Ultra 9 275HX (0.3943 - 0.4568, n=30) | |
| Asus ROG Strix Scar 16 2025 | |
| Lenovo Legion Pro 7i 16 Gen 10 | |
| Lenovo Legion 5 Pro 16IAX10H | |
| Schenker XMG Neo 16 E25 RTX 5090 Laptop | |
| Schenker XMG Pro 16 (E25) | |
| Lenovo Legion Pro 5 16IRX9 | |
* ... smaller is better
AIDA64: FP32 Ray-Trace | FPU Julia | CPU SHA3 | CPU Queen | FPU SinJulia | FPU Mandel | CPU AES | CPU ZLib | FP64 Ray-Trace | CPU PhotoWorxx
| Performance rating | |
| Schenker XMG Neo 16 A25 5090 | |
| Schenker XMG Neo 16 E25 RTX 5090 Laptop | |
| Asus ROG Strix Scar 16 2025 | |
| Aorus MASTER 16 AM6H | |
| Lenovo Legion 5 Pro 16IAX10H | |
| Average Intel Core Ultra 9 275HX | |
| Schenker XMG Pro 16 (E25) | |
| Lenovo Legion Pro 5 16IRX9 | |
| Average of class Gaming | |
| AIDA64 / FP32 Ray-Trace | |
| Schenker XMG Neo 16 A25 5090 | |
| Schenker XMG Neo 16 E25 RTX 5090 Laptop | |
| Asus ROG Strix Scar 16 2025 | |
| Aorus MASTER 16 AM6H | |
| Average Intel Core Ultra 9 275HX (28039 - 39895, n=30) | |
| Lenovo Legion 5 Pro 16IAX10H | |
| Schenker XMG Pro 16 (E25) | |
| Average of class Gaming (10227 - 85542, n=106, last 2 years) | |
| Lenovo Legion Pro 5 16IRX9 | |
| AIDA64 / FPU Julia | |
| Schenker XMG Neo 16 A25 5090 | |
| Schenker XMG Neo 16 E25 RTX 5090 Laptop | |
| Asus ROG Strix Scar 16 2025 | |
| Aorus MASTER 16 AM6H | |
| Lenovo Legion 5 Pro 16IAX10H | |
| Average Intel Core Ultra 9 275HX (140254 - 200744, n=30) | |
| Schenker XMG Pro 16 (E25) | |
| Average of class Gaming (51376 - 238426, n=106, last 2 years) | |
| Lenovo Legion Pro 5 16IRX9 | |
| AIDA64 / CPU SHA3 | |
| Schenker XMG Neo 16 E25 RTX 5090 Laptop | |
| Schenker XMG Neo 16 A25 5090 | |
| Asus ROG Strix Scar 16 2025 | |
| Aorus MASTER 16 AM6H | |
| Average Intel Core Ultra 9 275HX (6710 - 9817, n=30) | |
| Schenker XMG Pro 16 (E25) | |
| Lenovo Legion 5 Pro 16IAX10H | |
| Lenovo Legion Pro 5 16IRX9 | |
| Average of class Gaming (2180 - 9817, n=106, last 2 years) | |
| AIDA64 / CPU Queen | |
| Schenker XMG Neo 16 A25 5090 | |
| Lenovo Legion Pro 5 16IRX9 | |
| Schenker XMG Neo 16 E25 RTX 5090 Laptop | |
| Lenovo Legion 5 Pro 16IAX10H | |
| Asus ROG Strix Scar 16 2025 | |
| Aorus MASTER 16 AM6H | |
| Average Intel Core Ultra 9 275HX (113887 - 140937, n=30) | |
| Schenker XMG Pro 16 (E25) | |
| Average of class Gaming (49785 - 173351, n=94, last 2 years) | |
| AIDA64 / FPU SinJulia | |
| Schenker XMG Neo 16 A25 5090 | |
| Lenovo Legion Pro 5 16IRX9 | |
| Average of class Gaming (4424 - 33636, n=106, last 2 years) | |
| Schenker XMG Neo 16 E25 RTX 5090 Laptop | |
| Schenker XMG Pro 16 (E25) | |
| Asus ROG Strix Scar 16 2025 | |
| Lenovo Legion 5 Pro 16IAX10H | |
| Aorus MASTER 16 AM6H | |
| Average Intel Core Ultra 9 275HX (11172 - 14425, n=30) | |
| AIDA64 / FPU Mandel | |
| Schenker XMG Neo 16 A25 5090 | |
| Asus ROG Strix Scar 16 2025 | |
| Schenker XMG Neo 16 E25 RTX 5090 Laptop | |
| Aorus MASTER 16 AM6H | |
| Average Intel Core Ultra 9 275HX (72596 - 104508, n=30) | |
| Schenker XMG Pro 16 (E25) | |
| Lenovo Legion 5 Pro 16IAX10H | |
| Average of class Gaming (25115 - 128721, n=106, last 2 years) | |
| Lenovo Legion Pro 5 16IRX9 | |
| AIDA64 / CPU AES | |
| Schenker XMG Neo 16 A25 5090 | |
| Schenker XMG Neo 16 E25 RTX 5090 Laptop | |
| Asus ROG Strix Scar 16 2025 | |
| Lenovo Legion 5 Pro 16IAX10H | |
| Average Intel Core Ultra 9 275HX (105608 - 247074, n=30) | |
| Aorus MASTER 16 AM6H | |
| Schenker XMG Pro 16 (E25) | |
| Lenovo Legion Pro 5 16IRX9 | |
| Average of class Gaming (39258 - 247074, n=106, last 2 years) | |
| AIDA64 / CPU ZLib | |
| Schenker XMG Neo 16 A25 5090 | |
| Schenker XMG Neo 16 E25 RTX 5090 Laptop | |
| Asus ROG Strix Scar 16 2025 | |
| Lenovo Legion 5 Pro 16IAX10H | |
| Aorus MASTER 16 AM6H | |
| Average Intel Core Ultra 9 275HX (1582 - 2263, n=30) | |
| Schenker XMG Pro 16 (E25) | |
| Lenovo Legion Pro 5 16IRX9 | |
| Average of class Gaming (574 - 2531, n=106, last 2 years) | |
| AIDA64 / FP64 Ray-Trace | |
| Schenker XMG Neo 16 A25 5090 | |
| Asus ROG Strix Scar 16 2025 | |
| Schenker XMG Neo 16 E25 RTX 5090 Laptop | |
| Aorus MASTER 16 AM6H | |
| Average Intel Core Ultra 9 275HX (14847 - 21854, n=30) | |
| Lenovo Legion 5 Pro 16IAX10H | |
| Schenker XMG Pro 16 (E25) | |
| Average of class Gaming (5509 - 45446, n=106, last 2 years) | |
| Lenovo Legion Pro 5 16IRX9 | |
| AIDA64 / CPU PhotoWorxx | |
| Asus ROG Strix Scar 16 2025 | |
| Schenker XMG Neo 16 E25 RTX 5090 Laptop | |
| Schenker XMG Pro 16 (E25) | |
| Average Intel Core Ultra 9 275HX (37482 - 62916, n=30) | |
| Lenovo Legion Pro 5 16IRX9 | |
| Lenovo Legion 5 Pro 16IAX10H | |
| Aorus MASTER 16 AM6H | |
| Average of class Gaming (12271 - 89891, n=106, last 2 years) | |
| Schenker XMG Neo 16 A25 5090 | |
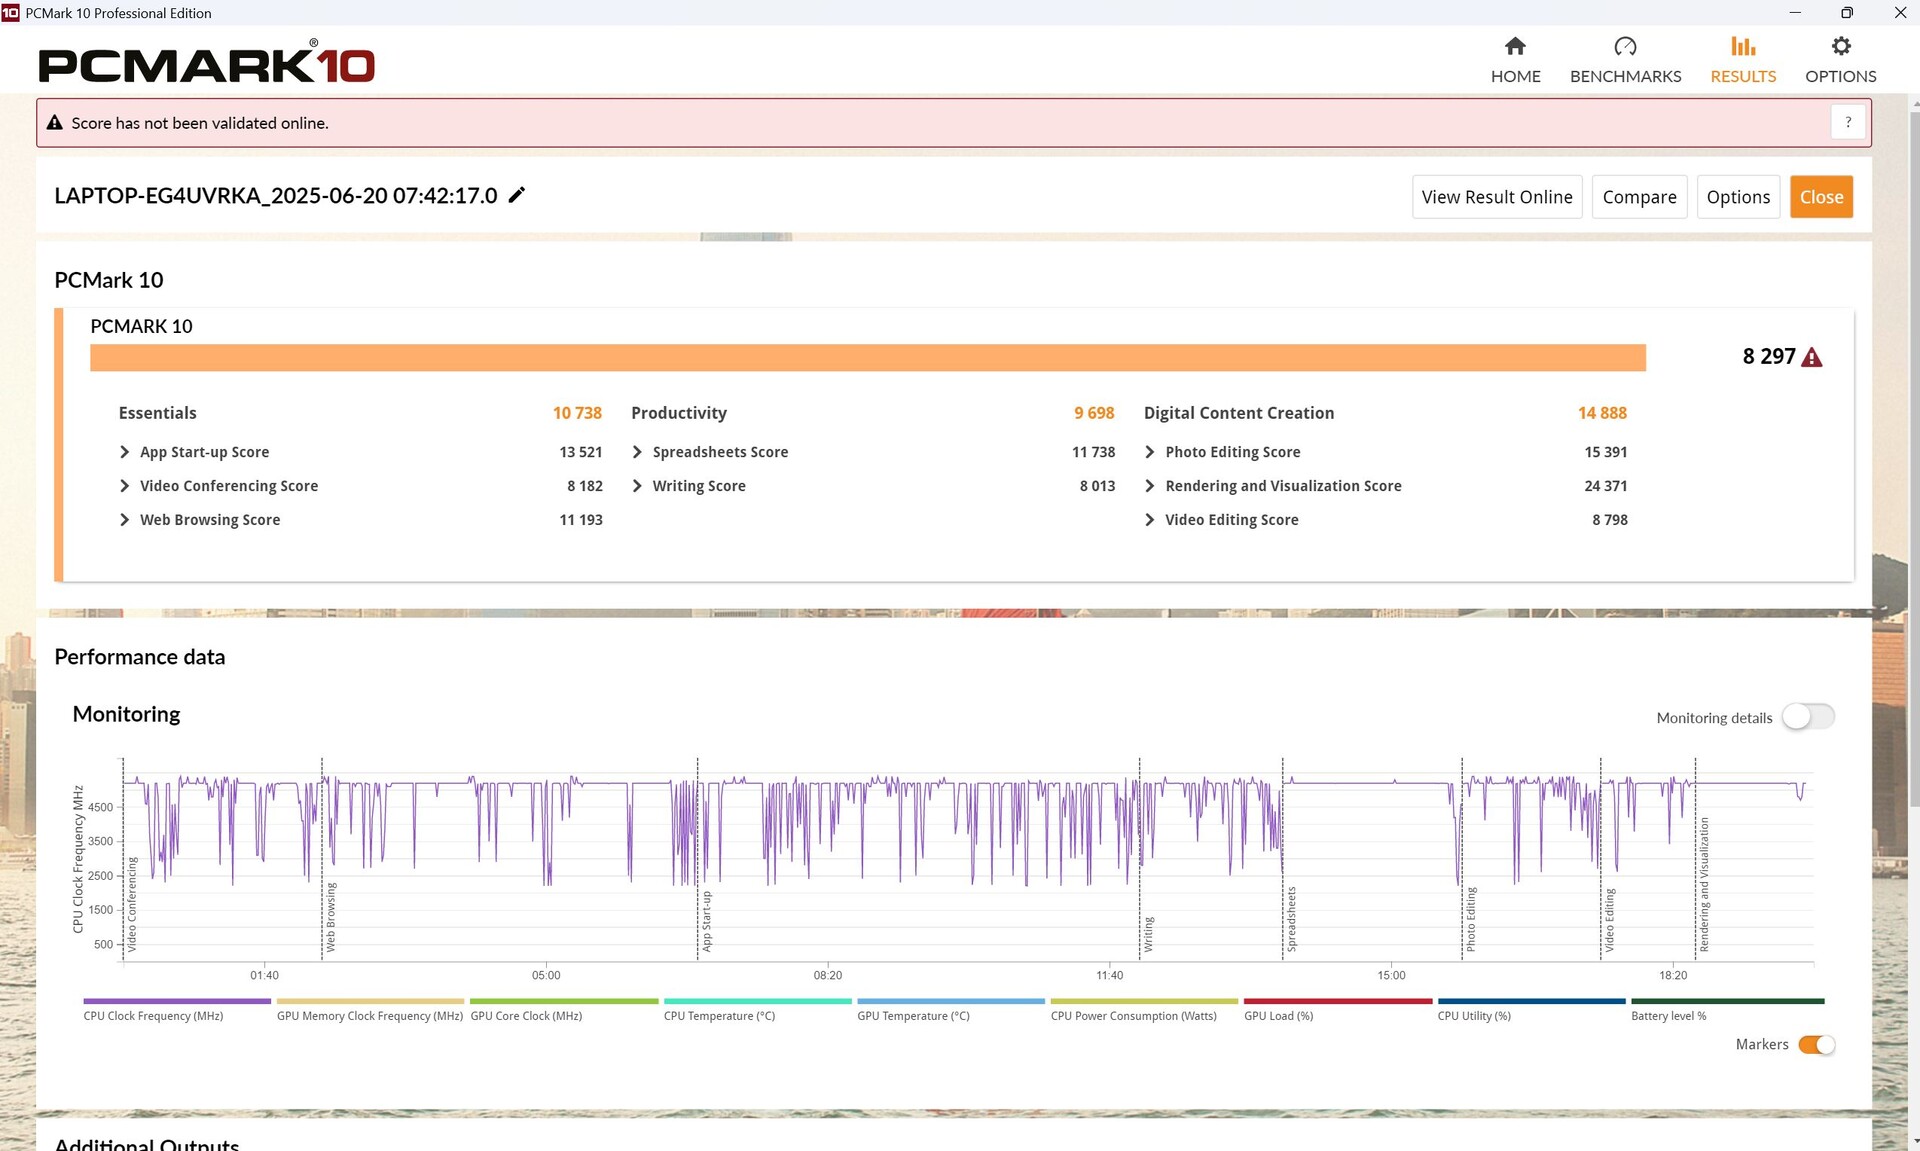
System performance
In PCMark 10 and CrossMark, the difference from the competitors is negligible. The good CrossMark results made up for the slight disadvantage in PCMark 10, allowing our Legion Pro to even have its nose in front overall.
PCMark 10: Score | Essentials | Productivity | Digital Content Creation
CrossMark: Overall | Productivity | Creativity | Responsiveness
WebXPRT 3: Overall
WebXPRT 4: Overall
Mozilla Kraken 1.1: Total
| Performance rating | |
| Lenovo Legion 5 Pro 16IAX10H | |
| Schenker XMG Pro 16 (E25) | |
| Average Intel Core Ultra 9 275HX, NVIDIA GeForce RTX 5070 Ti Laptop | |
| Lenovo Legion Pro 5 16IRX9 | |
| Medion Erazer Major 16 X1 MD62736 | |
| Average of class Gaming | |
| MSI Vector 16 HX AI A2XWHG | |
| PCMark 10 / Score | |
| Lenovo Legion Pro 5 16IRX9 | |
| Schenker XMG Pro 16 (E25) | |
| Average Intel Core Ultra 9 275HX, NVIDIA GeForce RTX 5070 Ti Laptop (8297 - 8550, n=3) | |
| Average of class Gaming (5828 - 11574, n=94, last 2 years) | |
| Lenovo Legion 5 Pro 16IAX10H | |
| Medion Erazer Major 16 X1 MD62736 | |
| MSI Vector 16 HX AI A2XWHG | |
| PCMark 10 / Essentials | |
| Schenker XMG Pro 16 (E25) | |
| Lenovo Legion Pro 5 16IRX9 | |
| Average Intel Core Ultra 9 275HX, NVIDIA GeForce RTX 5070 Ti Laptop (10738 - 11290, n=3) | |
| Medion Erazer Major 16 X1 MD62736 | |
| Lenovo Legion 5 Pro 16IAX10H | |
| MSI Vector 16 HX AI A2XWHG | |
| Average of class Gaming (8810 - 12600, n=98, last 2 years) | |
| PCMark 10 / Productivity | |
| Average of class Gaming (6845 - 21327, n=96, last 2 years) | |
| Lenovo Legion Pro 5 16IRX9 | |
| Lenovo Legion 5 Pro 16IAX10H | |
| Average Intel Core Ultra 9 275HX, NVIDIA GeForce RTX 5070 Ti Laptop (9591 - 9771, n=3) | |
| Schenker XMG Pro 16 (E25) | |
| MSI Vector 16 HX AI A2XWHG | |
| Medion Erazer Major 16 X1 MD62736 | |
| PCMark 10 / Digital Content Creation | |
| Schenker XMG Pro 16 (E25) | |
| Average Intel Core Ultra 9 275HX, NVIDIA GeForce RTX 5070 Ti Laptop (14812 - 15662, n=3) | |
| Lenovo Legion 5 Pro 16IAX10H | |
| Lenovo Legion Pro 5 16IRX9 | |
| Average of class Gaming (7602 - 19657, n=96, last 2 years) | |
| Medion Erazer Major 16 X1 MD62736 | |
| MSI Vector 16 HX AI A2XWHG | |
| CrossMark / Overall | |
| Schenker XMG Pro 16 (E25) | |
| Lenovo Legion 5 Pro 16IAX10H | |
| Average Intel Core Ultra 9 275HX, NVIDIA GeForce RTX 5070 Ti Laptop (2116 - 2193, n=3) | |
| Medion Erazer Major 16 X1 MD62736 | |
| Lenovo Legion Pro 5 16IRX9 | |
| Average of class Gaming (1366 - 2409, n=95, last 2 years) | |
| MSI Vector 16 HX AI A2XWHG | |
| CrossMark / Productivity | |
| Lenovo Legion 5 Pro 16IAX10H | |
| Schenker XMG Pro 16 (E25) | |
| Average Intel Core Ultra 9 275HX, NVIDIA GeForce RTX 5070 Ti Laptop (1967 - 2038, n=3) | |
| Medion Erazer Major 16 X1 MD62736 | |
| Average of class Gaming (1386 - 2254, n=95, last 2 years) | |
| MSI Vector 16 HX AI A2XWHG | |
| Lenovo Legion Pro 5 16IRX9 | |
| CrossMark / Creativity | |
| Schenker XMG Pro 16 (E25) | |
| Average Intel Core Ultra 9 275HX, NVIDIA GeForce RTX 5070 Ti Laptop (2430 - 2531, n=3) | |
| Lenovo Legion 5 Pro 16IAX10H | |
| Medion Erazer Major 16 X1 MD62736 | |
| Lenovo Legion Pro 5 16IRX9 | |
| MSI Vector 16 HX AI A2XWHG | |
| Average of class Gaming (1343 - 2729, n=95, last 2 years) | |
| CrossMark / Responsiveness | |
| Lenovo Legion 5 Pro 16IAX10H | |
| Schenker XMG Pro 16 (E25) | |
| Average Intel Core Ultra 9 275HX, NVIDIA GeForce RTX 5070 Ti Laptop (1740 - 1844, n=3) | |
| Lenovo Legion Pro 5 16IRX9 | |
| Medion Erazer Major 16 X1 MD62736 | |
| Average of class Gaming (1226 - 2334, n=95, last 2 years) | |
| MSI Vector 16 HX AI A2XWHG | |
| WebXPRT 3 / Overall | |
| Lenovo Legion 5 Pro 16IAX10H | |
| Average Intel Core Ultra 9 275HX, NVIDIA GeForce RTX 5070 Ti Laptop (328 - 532, n=3) | |
| Schenker XMG Pro 16 (E25) | |
| Medion Erazer Major 16 X1 MD62736 | |
| Lenovo Legion Pro 5 16IRX9 | |
| MSI Vector 16 HX AI A2XWHG | |
| Average of class Gaming (220 - 532, n=99, last 2 years) | |
| WebXPRT 4 / Overall | |
| Schenker XMG Pro 16 (E25) | |
| Lenovo Legion 5 Pro 16IAX10H | |
| Average Intel Core Ultra 9 275HX, NVIDIA GeForce RTX 5070 Ti Laptop (306 - 341, n=3) | |
| Medion Erazer Major 16 X1 MD62736 | |
| MSI Vector 16 HX AI A2XWHG | |
| Lenovo Legion Pro 5 16IRX9 | |
| Average of class Gaming (165 - 354, n=100, last 2 years) | |
| Mozilla Kraken 1.1 / Total | |
| Average of class Gaming (391 - 590, n=103, last 2 years) | |
| Lenovo Legion Pro 5 16IRX9 | |
| MSI Vector 16 HX AI A2XWHG | |
| Medion Erazer Major 16 X1 MD62736 | |
| Lenovo Legion 5 Pro 16IAX10H | |
| Average Intel Core Ultra 9 275HX, NVIDIA GeForce RTX 5070 Ti Laptop (405 - 414, n=3) | |
| Schenker XMG Pro 16 (E25) | |
* ... smaller is better
| PCMark 10 Score | 8297 points | |
Help | ||
| AIDA64 / Memory Copy | |
| Schenker XMG Pro 16 (E25) | |
| Average Intel Core Ultra 9 275HX (56003 - 94460, n=30) | |
| Lenovo Legion Pro 5 16IRX9 | |
| Lenovo Legion 5 Pro 16IAX10H | |
| Medion Erazer Major 16 X1 MD62736 | |
| Average of class Gaming (21750 - 129946, n=106, last 2 years) | |
| MSI Vector 16 HX AI A2XWHG | |
| AIDA64 / Memory Read | |
| Schenker XMG Pro 16 (E25) | |
| Lenovo Legion 5 Pro 16IAX10H | |
| Lenovo Legion Pro 5 16IRX9 | |
| Medion Erazer Major 16 X1 MD62736 | |
| Average Intel Core Ultra 9 275HX (55795 - 97151, n=30) | |
| MSI Vector 16 HX AI A2XWHG | |
| Average of class Gaming (22956 - 118858, n=106, last 2 years) | |
| AIDA64 / Memory Write | |
| Medion Erazer Major 16 X1 MD62736 | |
| Schenker XMG Pro 16 (E25) | |
| Average Intel Core Ultra 9 275HX (55663 - 116129, n=30) | |
| Lenovo Legion 5 Pro 16IAX10H | |
| Lenovo Legion Pro 5 16IRX9 | |
| Average of class Gaming (22297 - 135096, n=106, last 2 years) | |
| MSI Vector 16 HX AI A2XWHG | |
| AIDA64 / Memory Latency | |
| Average Intel Core Ultra 9 275HX (105.8 - 161.6, n=30) | |
| Lenovo Legion 5 Pro 16IAX10H | |
| Medion Erazer Major 16 X1 MD62736 | |
| Average of class Gaming (75.3 - 259, n=106, last 2 years) | |
| MSI Vector 16 HX AI A2XWHG | |
| Schenker XMG Pro 16 (E25) | |
| Lenovo Legion Pro 5 16IRX9 | |
* ... smaller is better
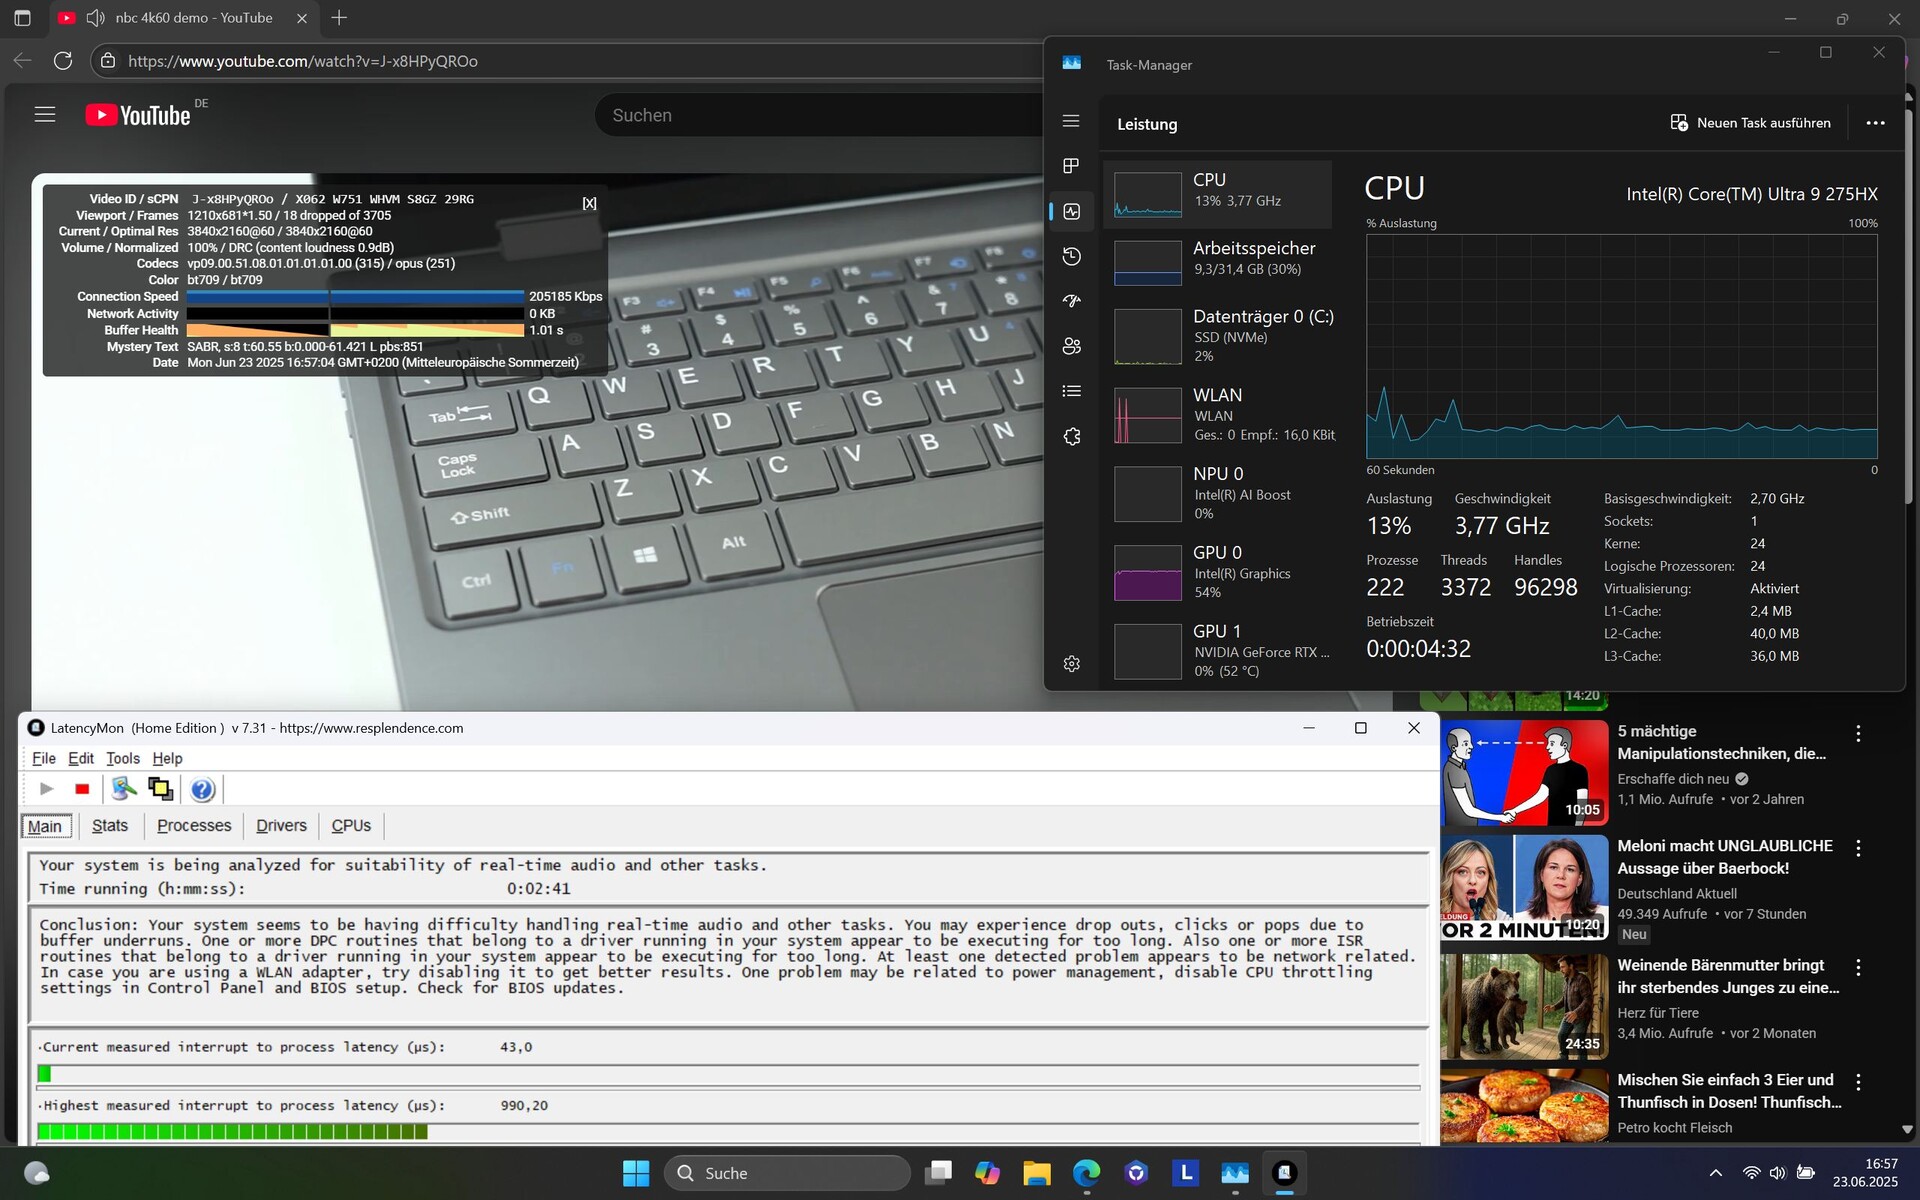
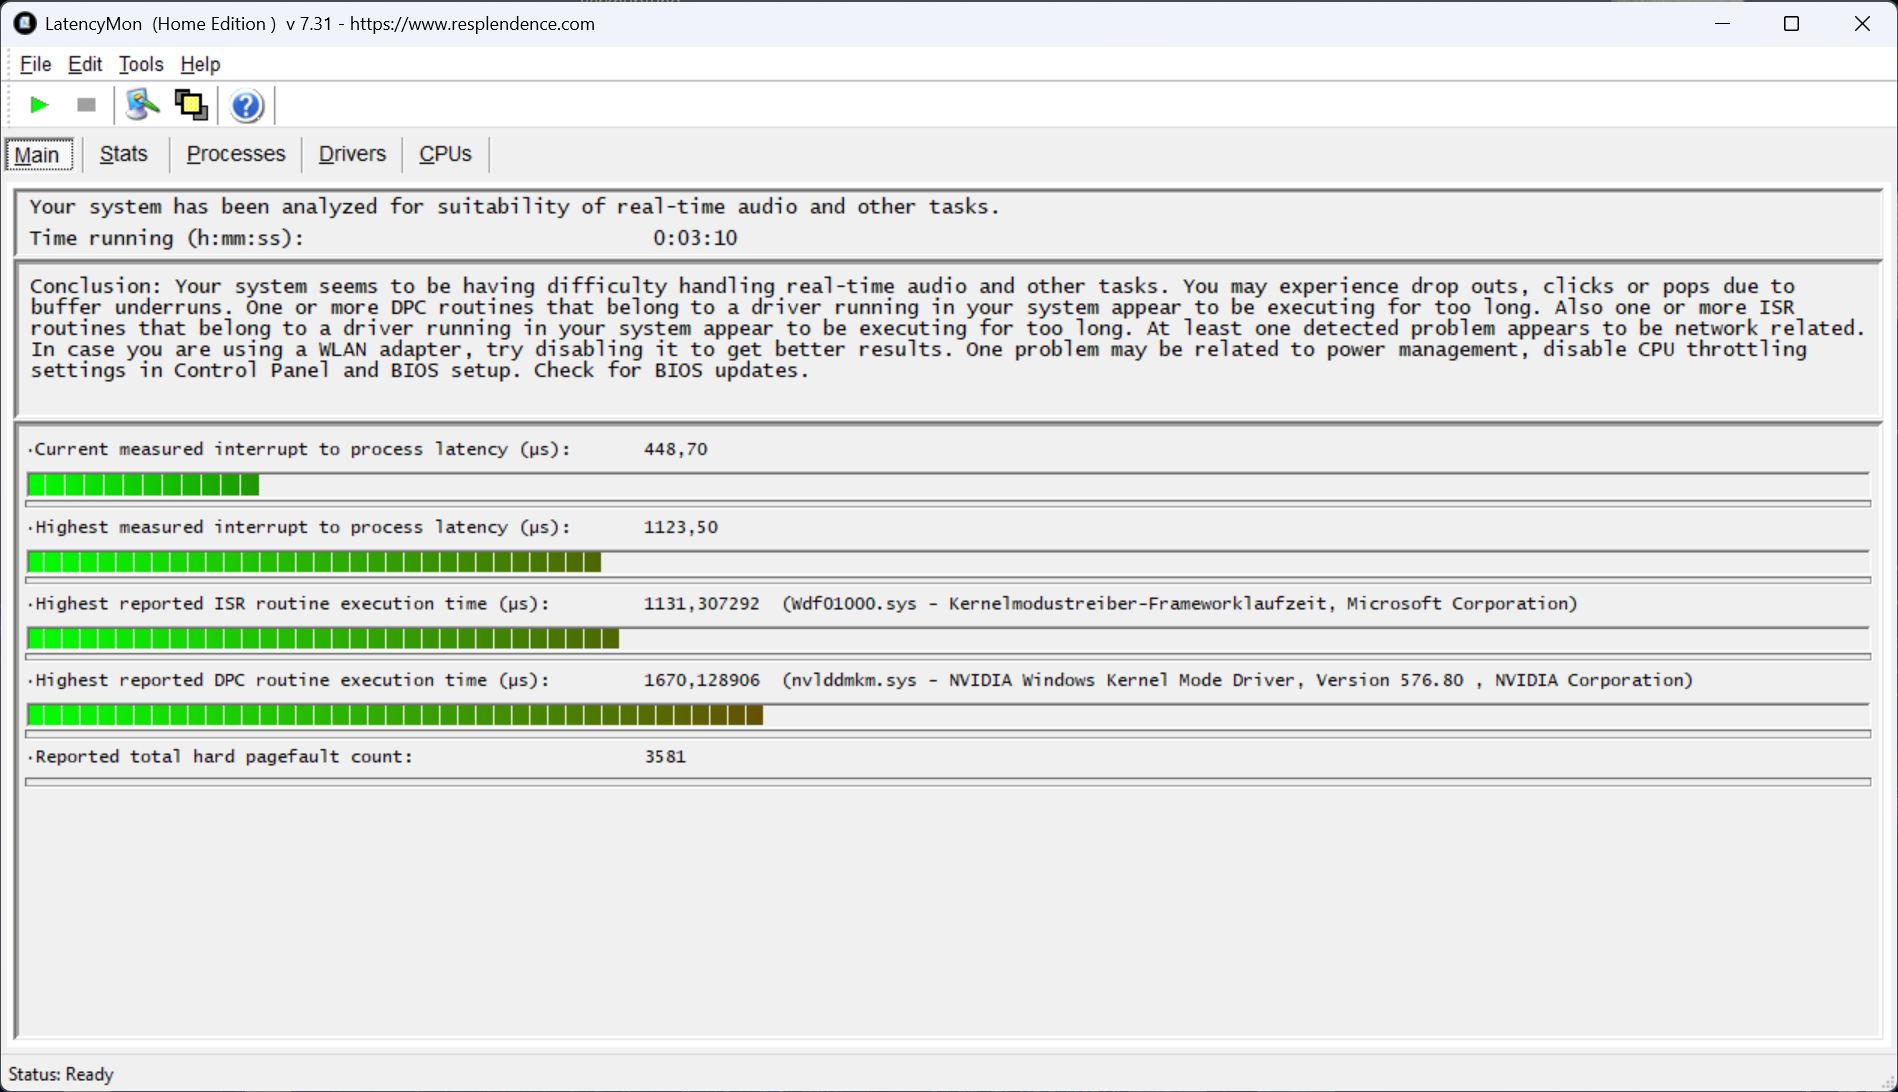
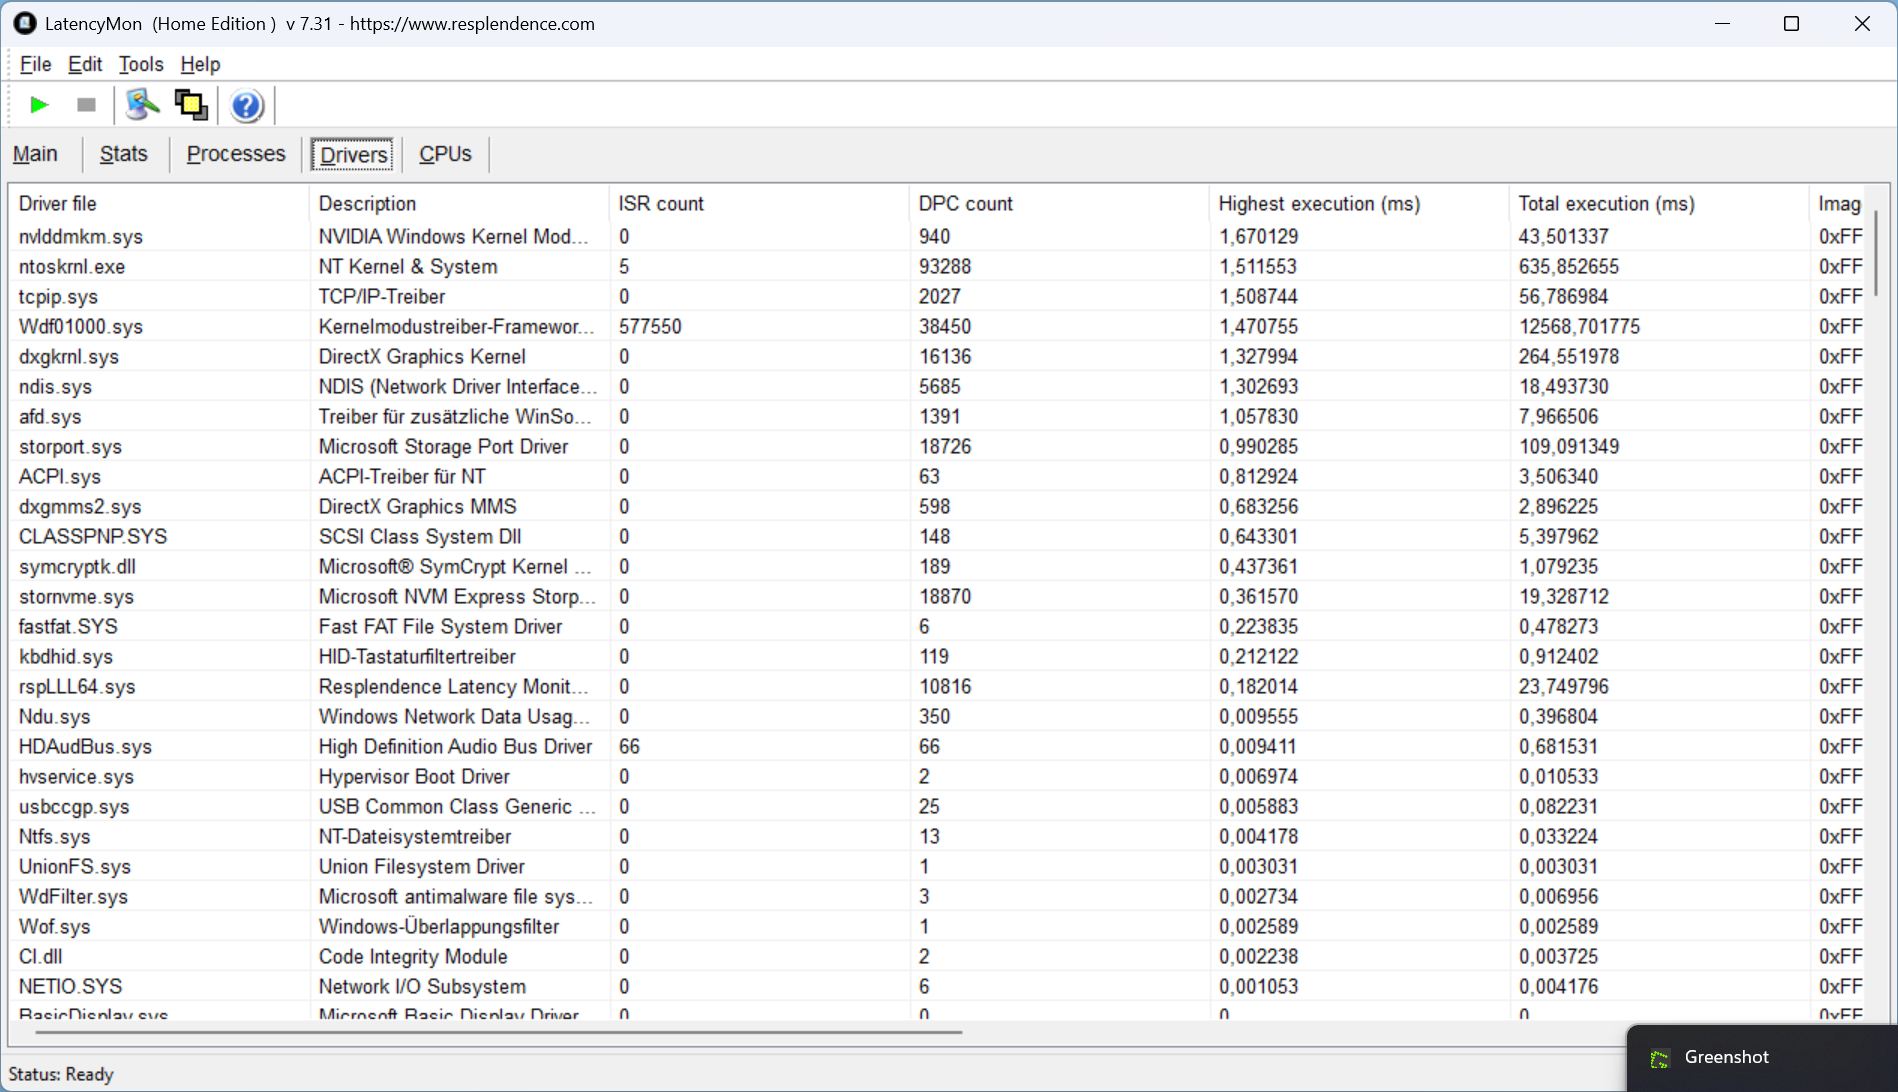
DPC latencies
LatencyMon detected initial latency upon startup and increased when launching the browser, opening multiple tabs, and running Prime95. Unfortunately, our 4K/60fps test video also failed to play without dropping frames (18 dropped frames).
Overall, however, the latency value is relatively low in comparison, and the competition achieves even higher values. However, the dropped frames could be a negative factor for content creators.
| DPC Latencies / LatencyMon - interrupt to process latency (max), Web, Youtube, Prime95 | |
| MSI Vector 16 HX AI A2XWHG | |
| Medion Erazer Major 16 X1 MD62736 | |
| Schenker XMG Pro 16 (E25) | |
| Lenovo Legion 5 Pro 16IAX10H | |
| Lenovo Legion Pro 5 16IRX9 | |
* ... smaller is better
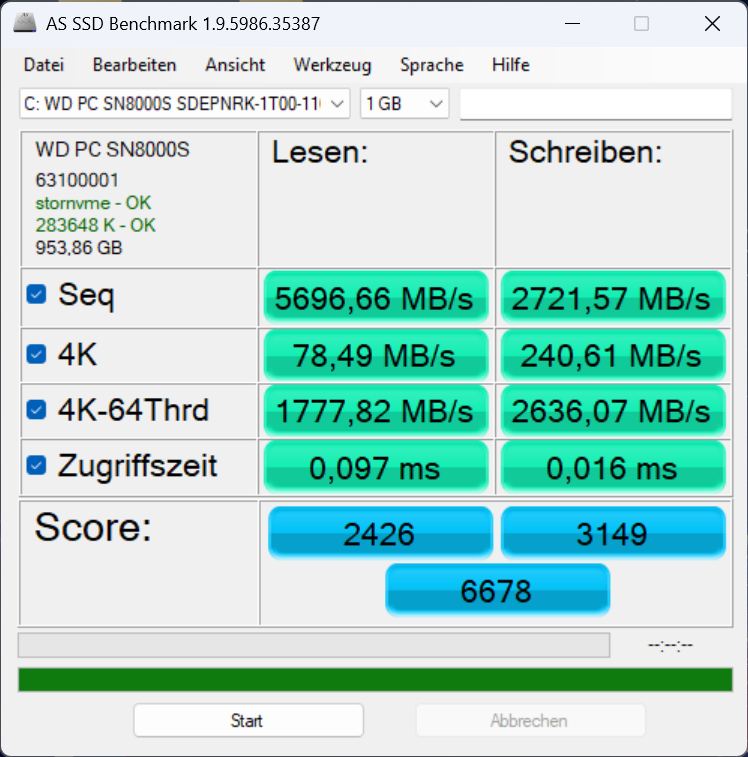
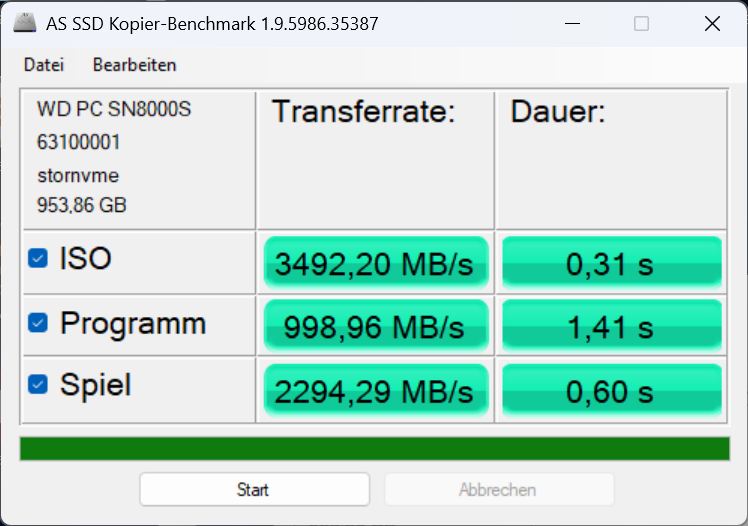
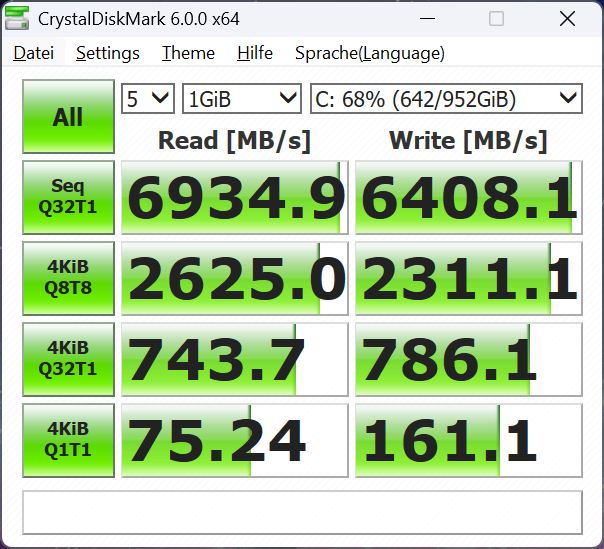
Storage devices
There are two M.2 SSD slots, but only the main slot is connected via PCIe 5.0 x4, while the unoccupied second slot is connected via PCIe 4.0 x4. The 1 TB Western Digital storage device achieved decent transfer speeds, although it's not among the fastest models. Unlike its predecessor, the SSD wasn't throttled in our endurance test.

* ... smaller is better
Continuous Performance Read: DiskSpd Read Loop, Queue Depth 8
GPU performance
The RTX 5070 Ti originates from the Blackwell family, supports multi-frame generation, and is equipped with 12 GB of GDDR7 (192-bit memory bus).
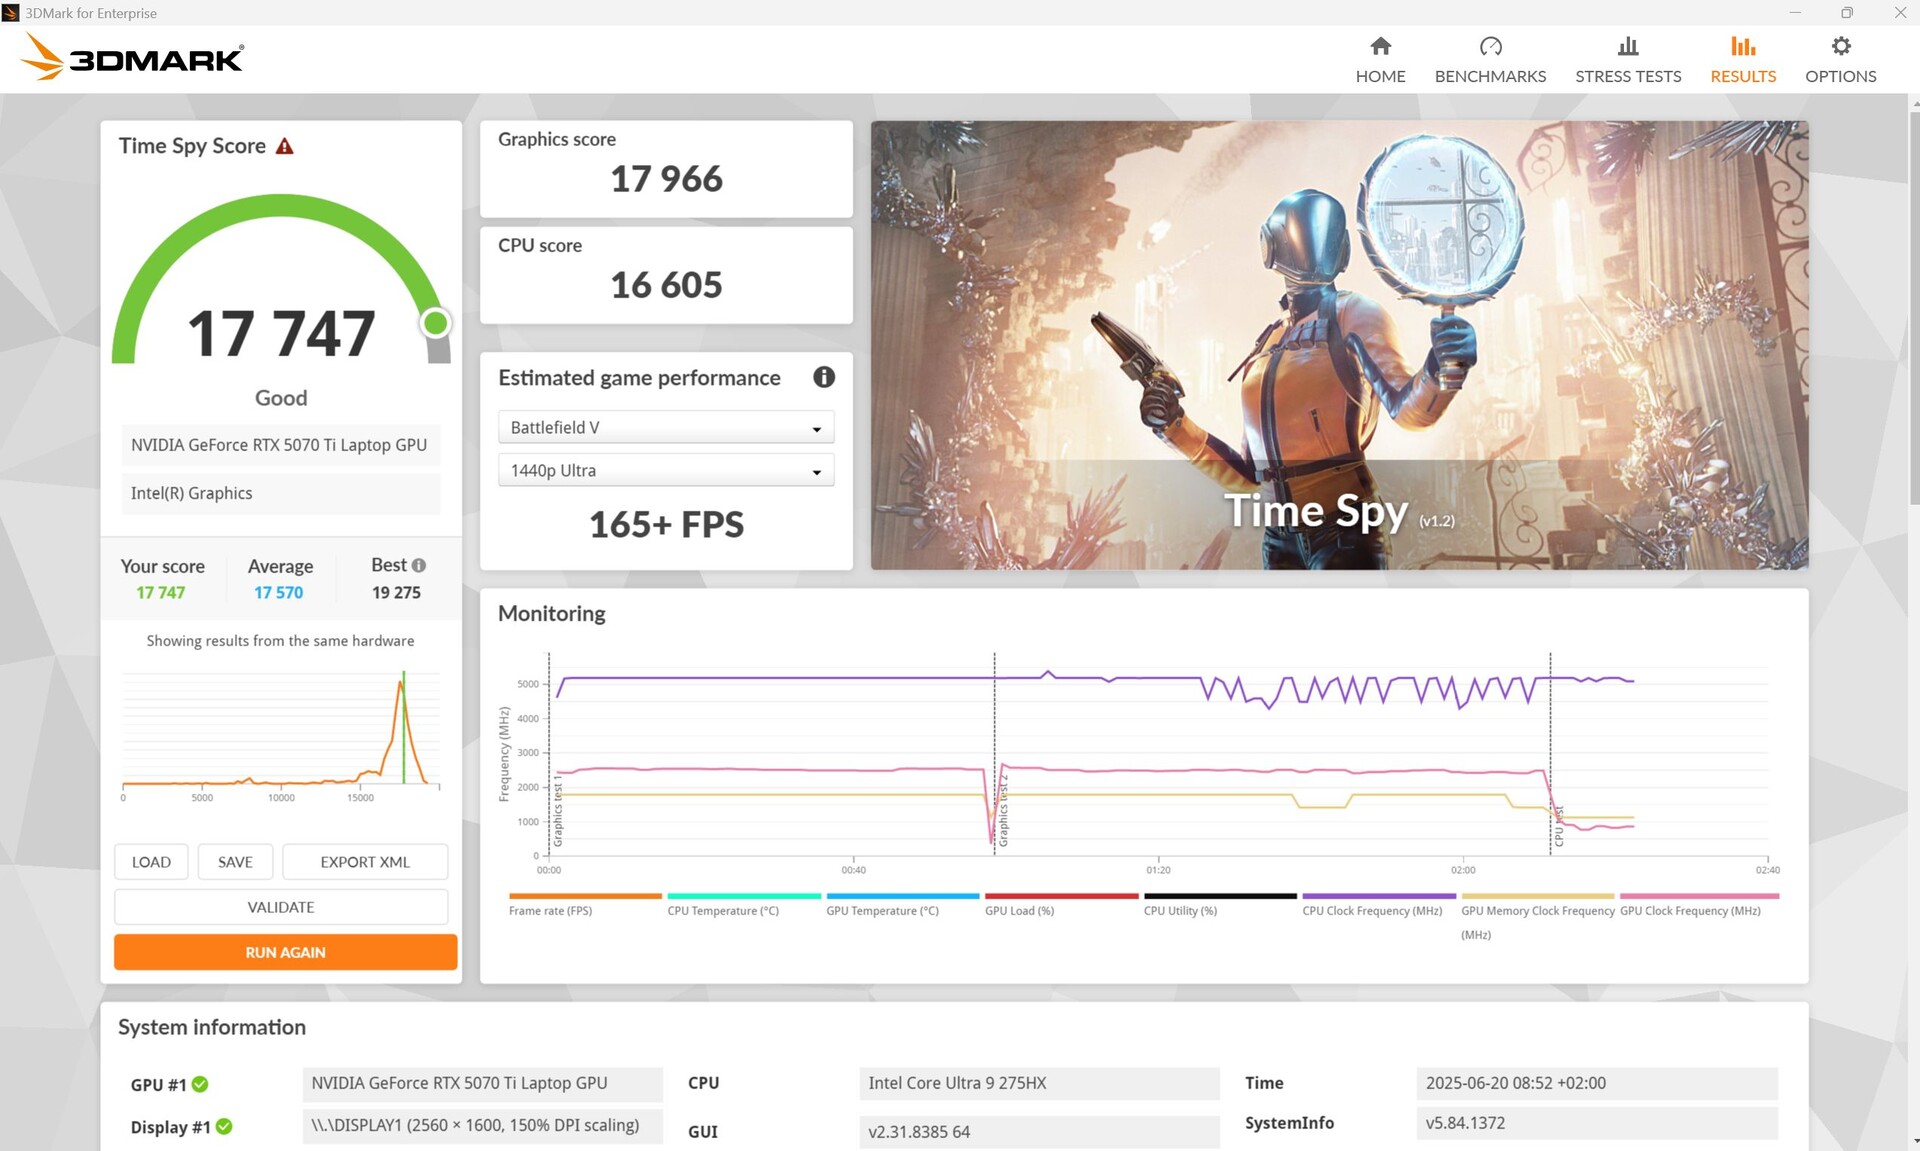
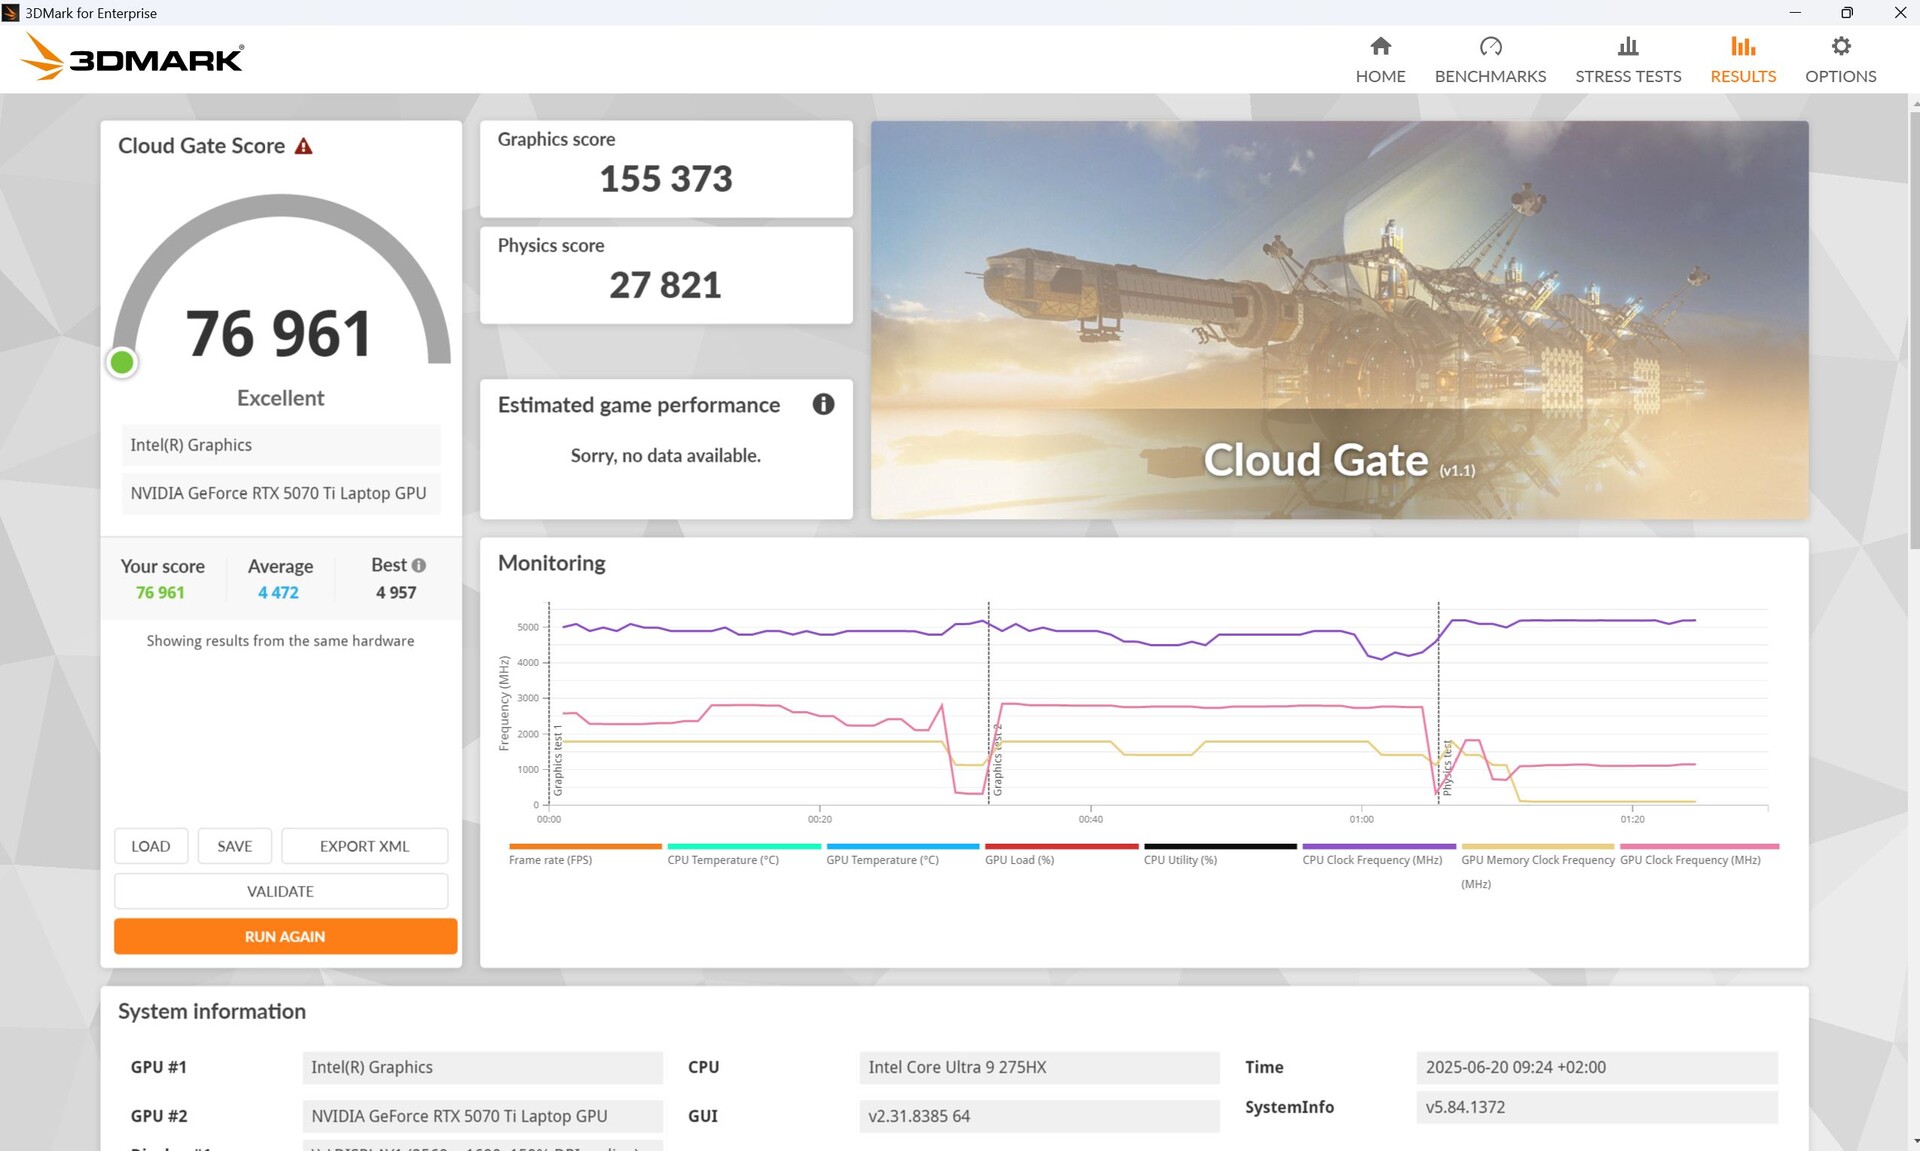
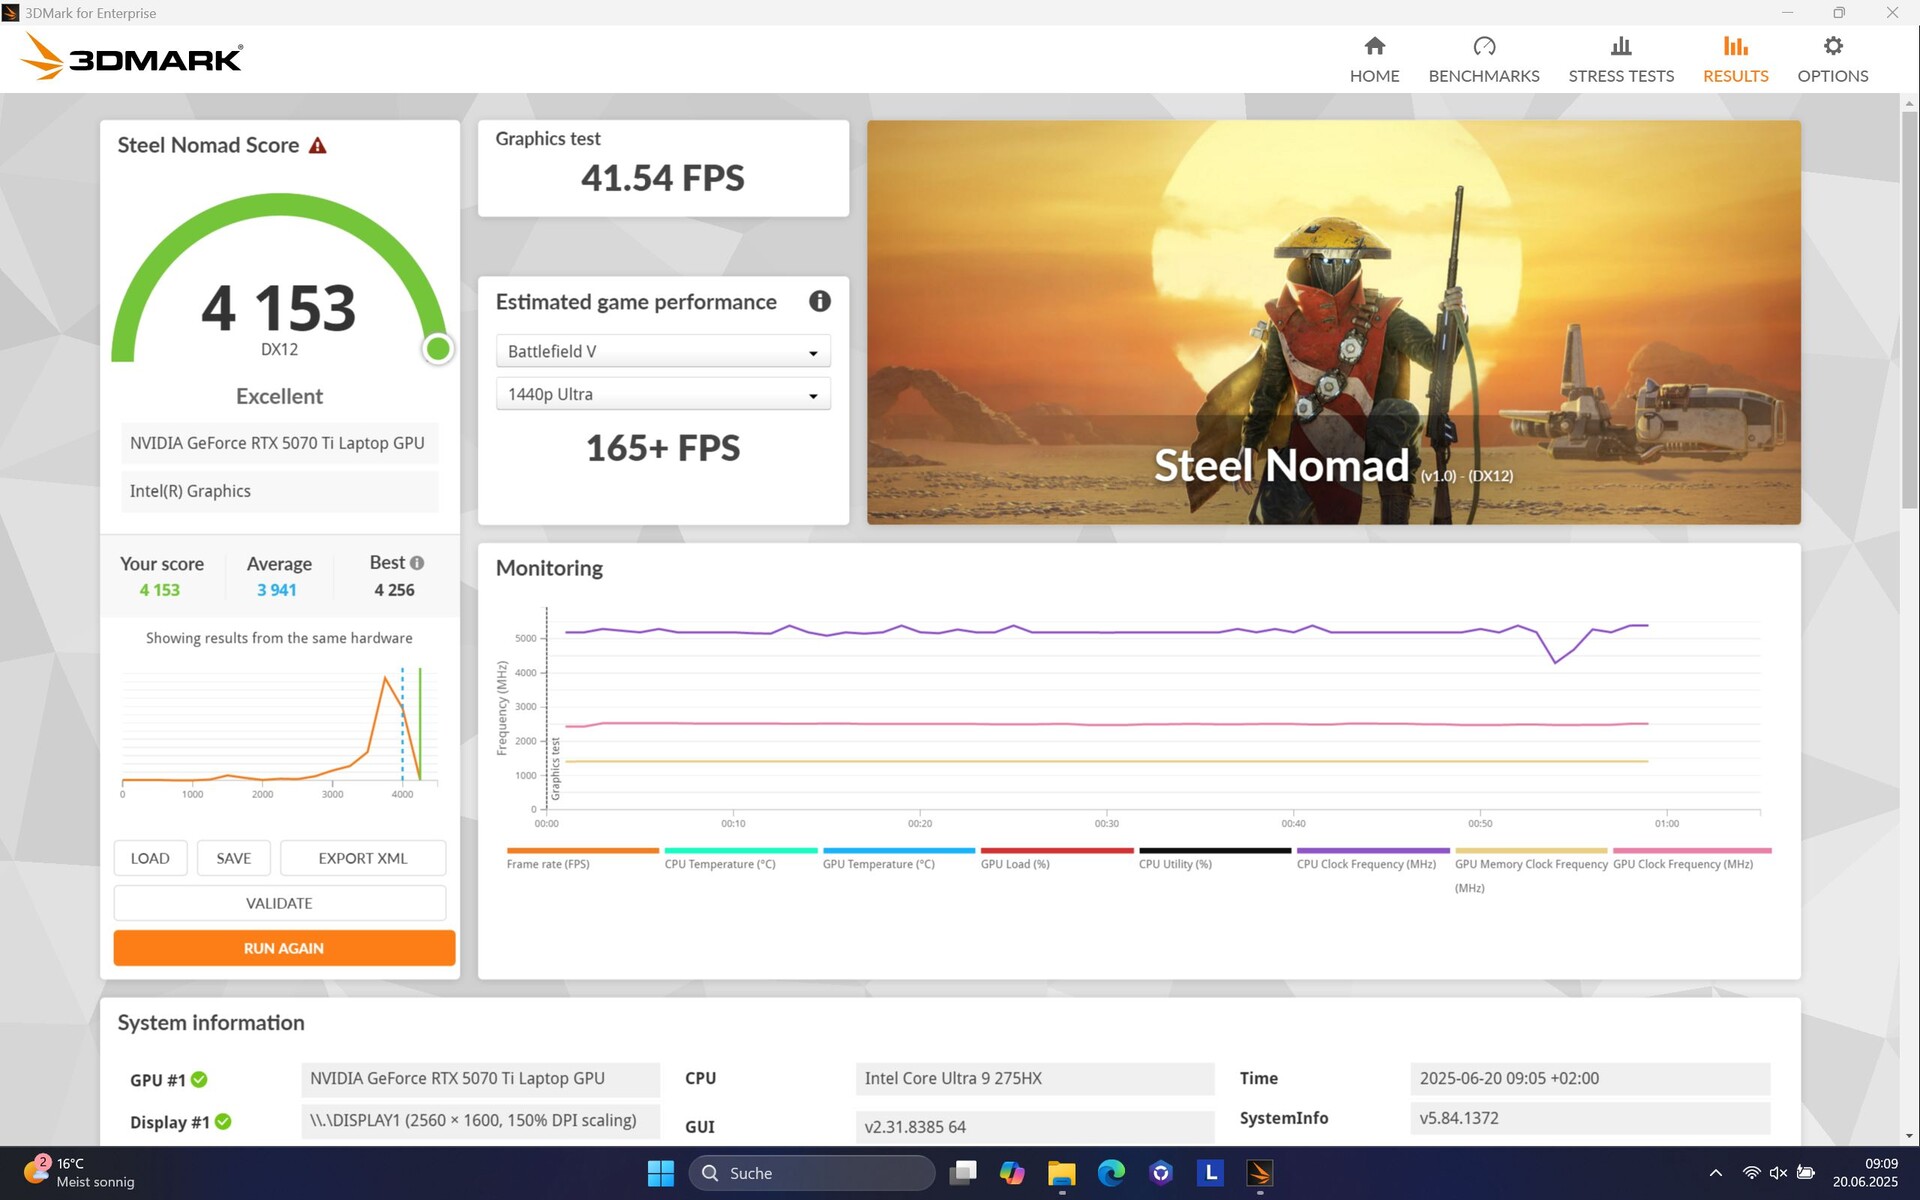
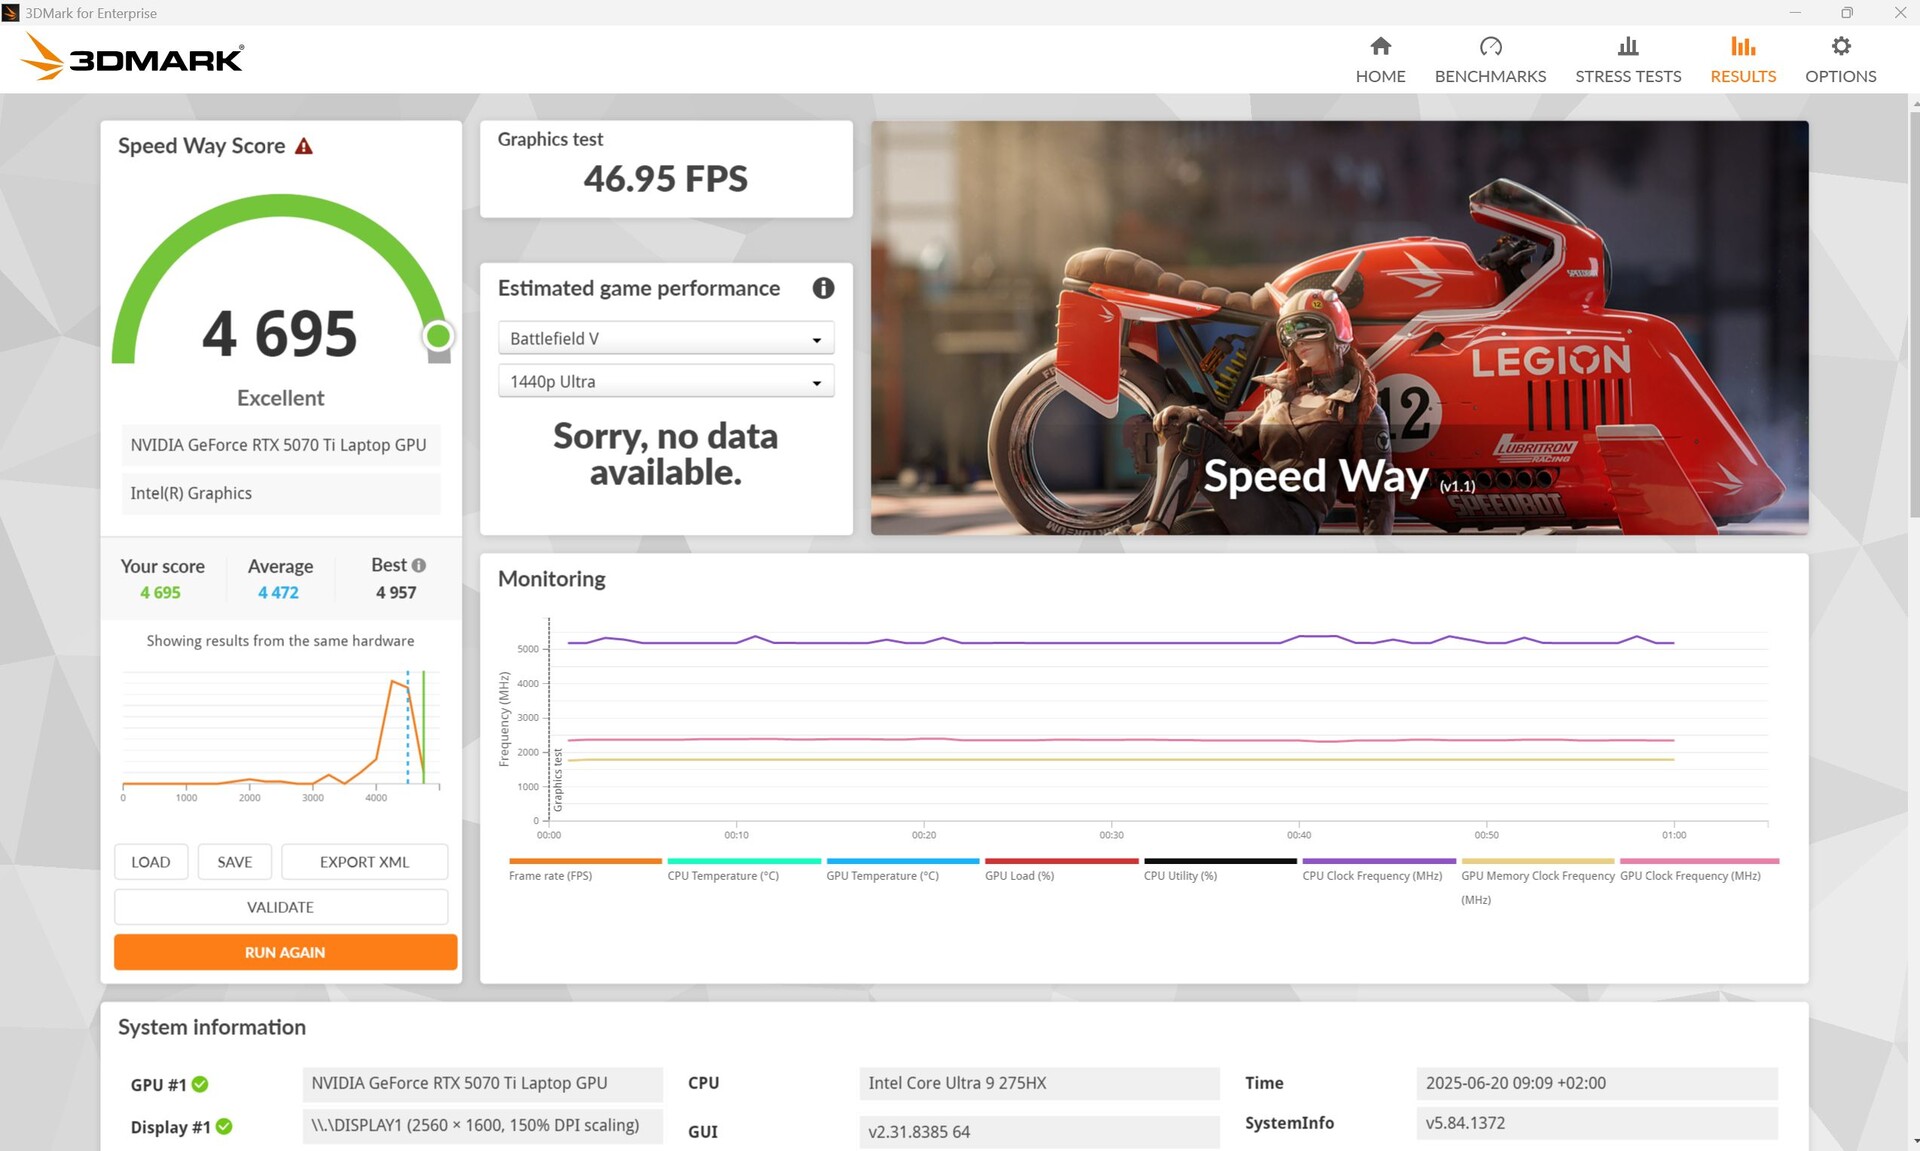
In the 3DMark tests, it performs about 5 percent better than the average laptop with the same GPU, narrowly snatching the performance crown from its direct competitors. The Alienware 16 Area 51 with an RTX 5080 performs around 9 percent better.
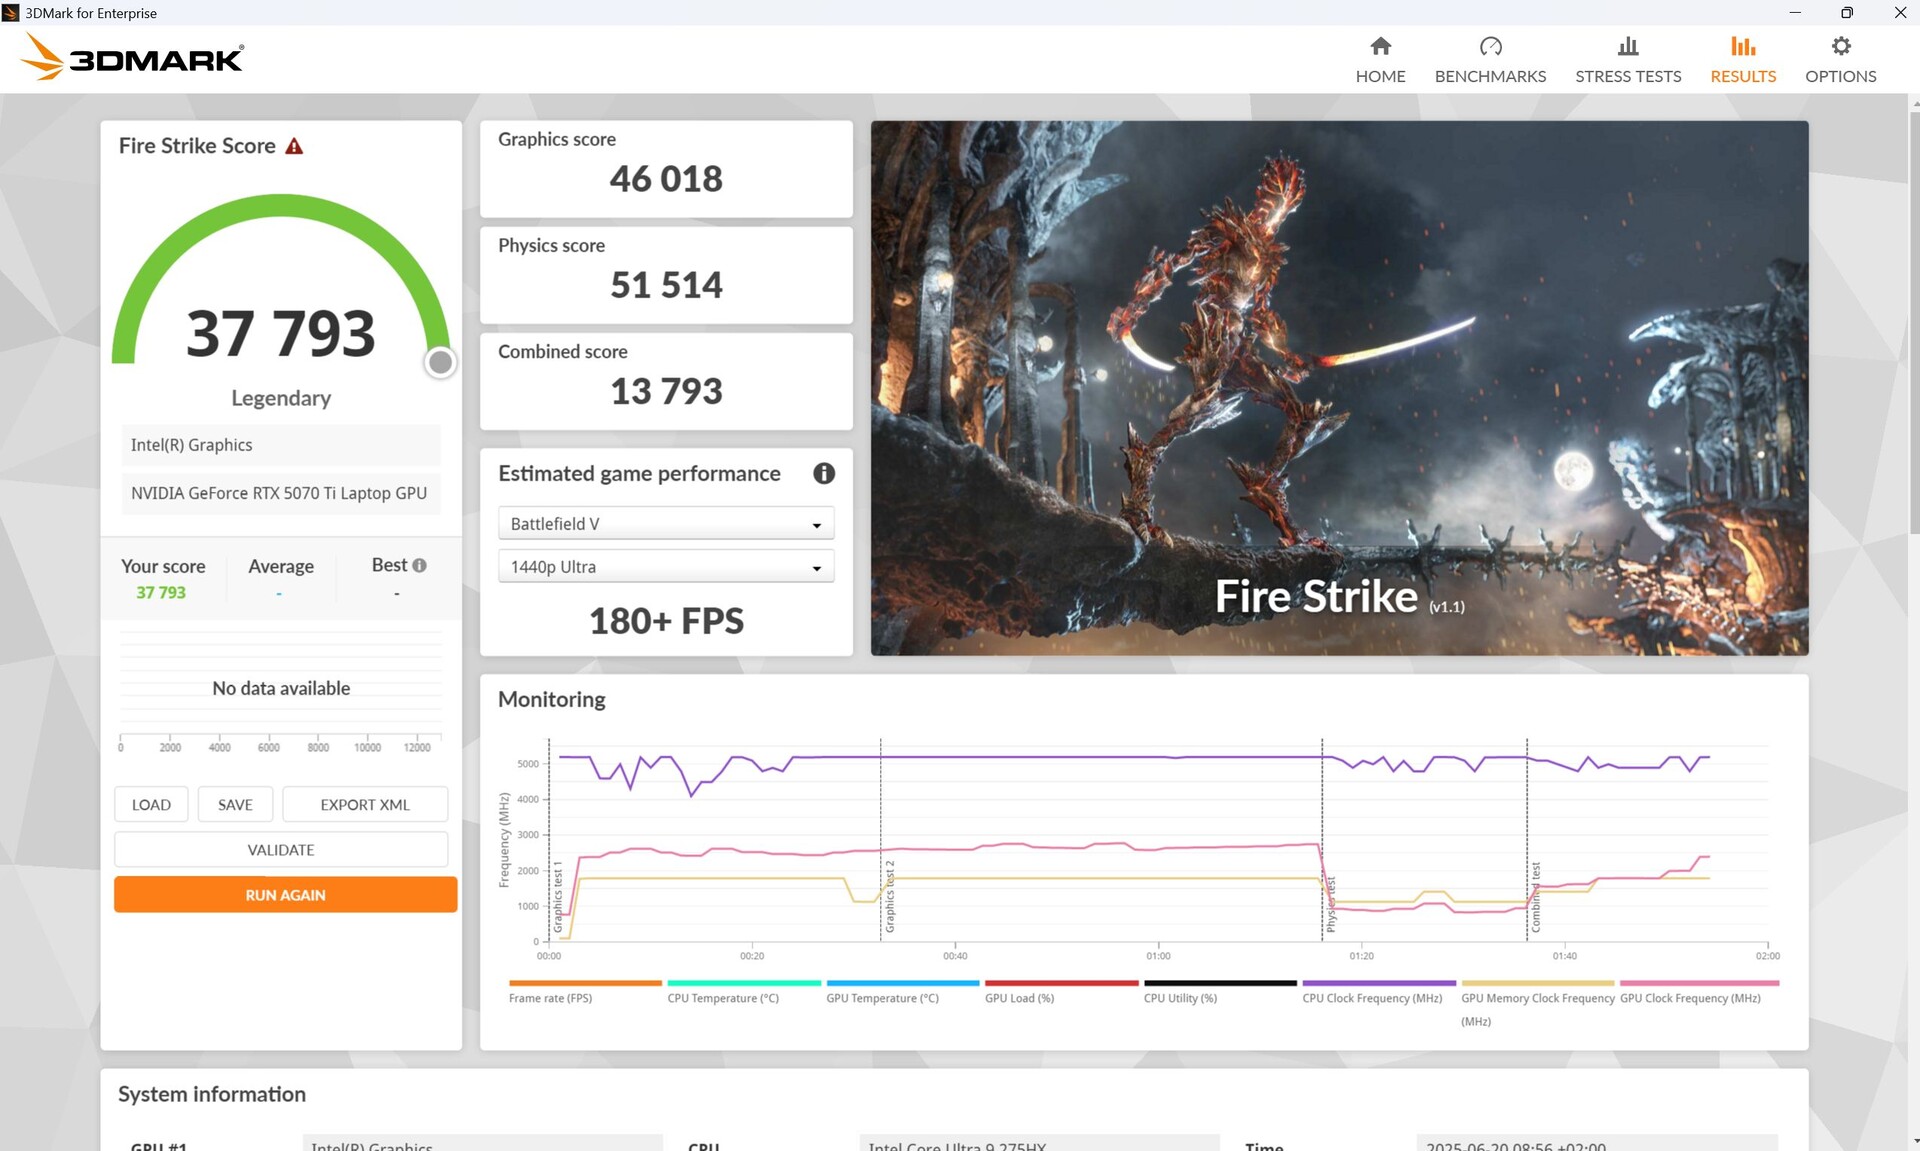
If the Legion Pro is not connected to the power supply, a whopping 85 percent of 3D performance is lost in Fire Strike!
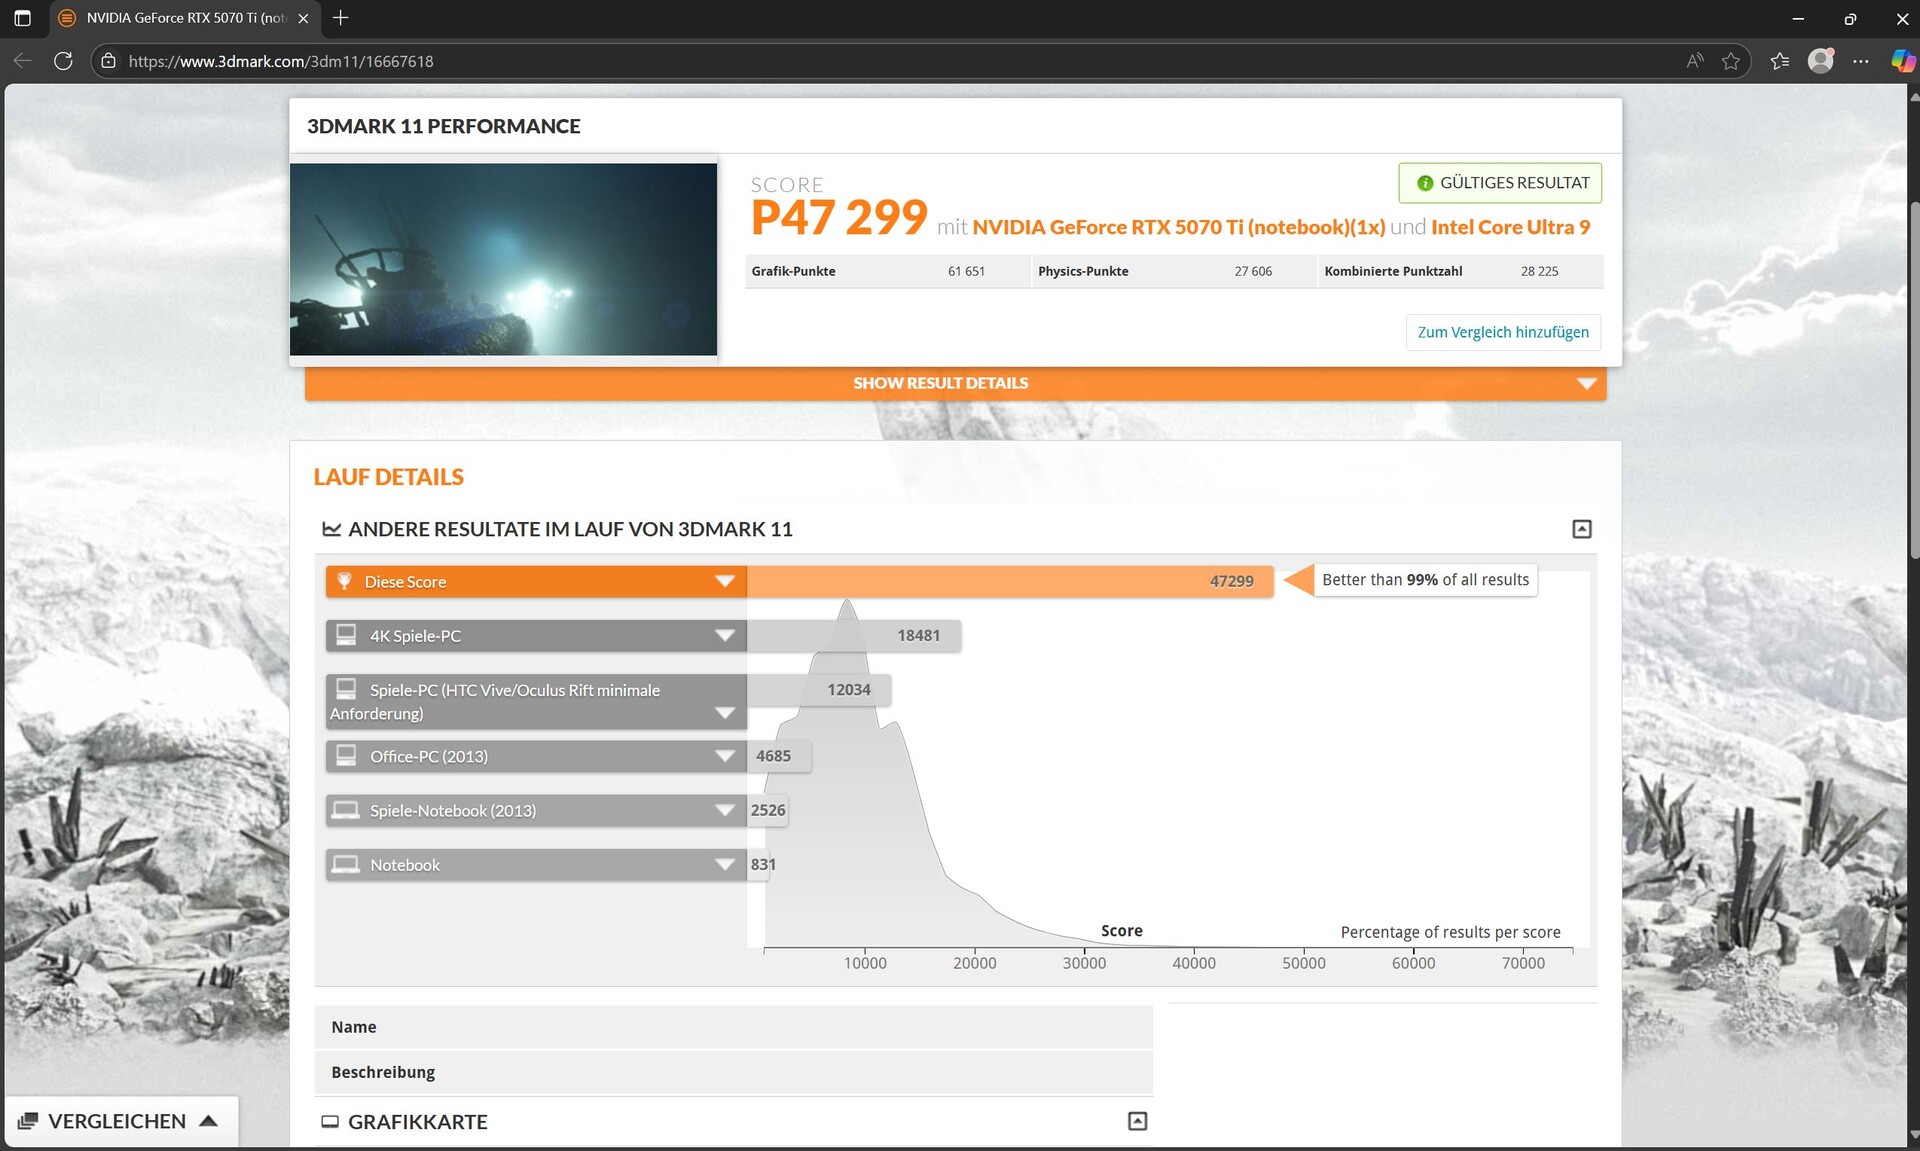
| 3DMark 11 Performance | 47299 points | |
| 3DMark Cloud Gate Standard Score | 76961 points | |
| 3DMark Fire Strike Score | 37793 points | |
| 3DMark Time Spy Score | 17747 points | |
| 3DMark Steel Nomad Score | 4153 points | |
Help | ||
* ... smaller is better
Gaming performance
The Legion Pro 5 with an RTX 5070 Ti feels most comfortable in FHD and QHD. Gaming in 4K is also possible in many titles, but in more demanding games such as Cyberpunk 2077, it can be difficult, even with DLSS. However, if you aim to maximize your monitor's frame rate, you'll have to resort to Full HD in many titles.
Only for particularly demanding titles, such as F1 25, even in Full HD Ultra, DLSS is required. This increases the fps values in this game from 35 to 52. We did not detect any display errors during hectic driving scenes. During the subsequent interview, we noticed edge flickering around the character. Thanks to DLSS and Frame Generation x4 (FG), in Doom: The Dark Ages, the fps increases from 46 to 148, and without FG, it still reaches 61, and we didn't notice any annoying latency.
In a direct comparison, the Legion delivers a strong performance and takes the lead among the 16-inch gaming-screened RTX 5070 Ti devices, with the SCHENKER XMG Pro 16 (E25) lagging 10 percent behind.
| GTA V - 1920x1080 Highest AA:4xMSAA + FX AF:16x | |
| Schenker XMG Pro 16 (E25) | |
| Medion Erazer Major 16 X1 MD62736 | |
| Lenovo Legion 5 Pro 16IAX10H | |
| MSI Vector 16 HX AI A2XWHG | |
| Average of class Gaming (48.3 - 186.9, n=97, last 2 years) | |
| Lenovo Legion Pro 5 16IRX9 | |
| Strange Brigade - 1920x1080 ultra AA:ultra AF:16 | |
| Alienware 16 Area-51 | |
| Lenovo Legion 5 Pro 16IAX10H | |
| Average of class Gaming (76.3 - 456, n=88, last 2 years) | |
| Asus ROG Zephyrus G16 2025 5070 Ti | |
| Lenovo Legion Pro 5 16IRX9 | |
| Schenker XMG Pro 16 (E25) | |
Our Cyberpunk 2077 graph looks very consistent, with no performance drops. In terms of performance, the Legion Pro 5 outperforms the slightly slower XMG Pro 16 and the rest of the RTX 5070 Ti competition.
Cyberpunk 2077 ultra FPS diagram
| low | med. | high | ultra | QHD DLSS | QHD | 4K DLSS | 4K | |
|---|---|---|---|---|---|---|---|---|
| GTA V (2015) | 185.8 | 185.4 | 180.2 | 147.6 | 123.8 | 124.2 | ||
| Dota 2 Reborn (2015) | 228 | 198.2 | 189.7 | 174 | 173.1 | |||
| Final Fantasy XV Benchmark (2018) | 234 | 230 | 181.4 | 139.2 | 78.8 | |||
| X-Plane 11.11 (2018) | 155.8 | 140.1 | 116 | 108.2 | ||||
| Strange Brigade (2018) | 643 | 479 | 403 | 353 | 250 | 138.1 | ||
| Baldur's Gate 3 (2023) | 167.7 | 131.1 | 108.1 | 138.9 | 130 | 91 | 72.4 | 46.6 |
| Cyberpunk 2077 (2023) | 175.1 | 133.9 | 132.4 | 91.2 | 84.3 | 35.9 | ||
| Assassin's Creed Shadows (2025) | 81 | 77 | 63 | 53 | 49 | 44 | ||
| Doom: The Dark Ages (2025) | 93 | 77.5 | 67.3 | 65 | 61 | 45.7 | ||
| F1 25 (2025) | 242 | 217 | 171.9 | 35 | 32 | 18 |
Emissions - A very loud pro laptop
Noise emissions
The fans are mostly off when idling, but in Performance mode, they can occasionally start spinning loudly for a short time.
Under load, the fans are flexible and responsive, meaning they calm down quickly after a load, but they also quickly rev up even under medium loads such as 3DMark06. Under maximum load and while gaming, we measured over 56 dB in Performance mode, which is quite loud by comparison. In Extreme mode, it even exceeded 58 dB. The SCHENKER XMG Pro 16 (E25) or also the MSI Vector 16 run noticeably quieter. Content creators are more likely to switch to Balanced Mode, which, however, results in 13 (CPU) to 22 percent (GPU) weaker performance.
Noise level
| Idle |
| 24 / 24 / 30.9 dB(A) |
| Load |
| 55.9 / 56.72 dB(A) |
 | ||
30 dB silent 40 dB(A) audible 50 dB(A) loud |
||
min: | ||
| Lenovo Legion 5 Pro 16IAX10H GeForce RTX 5070 Ti Laptop, Ultra 9 275HX, Western Digital PC SN8000S SDEPNRK-1T00 | Lenovo Legion Pro 5 16IRX9 GeForce RTX 4070 Laptop GPU, i9-14900HX, Samsung PM9A1 MZVL21T0HCLR | Schenker XMG Pro 16 (E25) GeForce RTX 5070 Ti Laptop, Ultra 9 275HX, Samsung 9100 Pro 1 TB | MSI Vector 16 HX AI A2XWHG GeForce RTX 5070 Ti Laptop, Ultra 7 255HX, Micron 2400 MTFDKBA512QFM | MSI Vector A18 HX A9W GeForce RTX 5070 Ti Laptop, R9 9955HX | Lenovo Legion Pro 7i 16 Gen 10 GeForce RTX 5080 Laptop, Ultra 9 275HX, SK Hynix HFS001TEJ9X115N | |
|---|---|---|---|---|---|---|
| Noise | 4% | 6% | -8% | 1% | 13% | |
| off / environment * (dB) | 24 | 23.9 -0% | 23.3 3% | 25 -4% | 22.5 6% | 22.9 5% |
| Idle Minimum * (dB) | 24 | 24.3 -1% | 25 -4% | 33 -38% | 26 -8% | 22.9 5% |
| Idle Average * (dB) | 24 | 24.3 -1% | 25 -4% | 34 -42% | 26 -8% | 22.9 5% |
| Idle Maximum * (dB) | 30.9 | 28.9 6% | 25 19% | 38 -23% | 32 -4% | 26.3 15% |
| Load Average * (dB) | 55.9 | 45.8 18% | 45.5 19% | 46 18% | 44.4 21% | 27.8 50% |
| Cyberpunk 2077 ultra * (dB) | 56.72 | 53.3 6% | 47 17% | 49.8 12% | 54.2 4% | |
| Load Maximum * (dB) | 56.72 | 56.6 -0% | 53.3 6% | 49 14% | 61.6 -9% | 53.9 5% |
| Witcher 3 ultra * (dB) | 51 |
* ... smaller is better
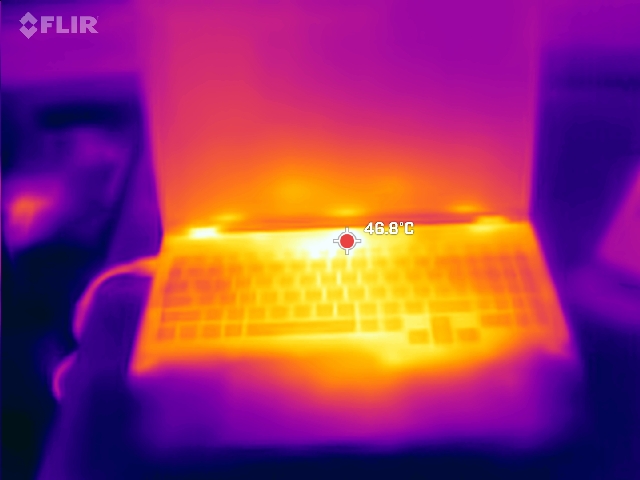
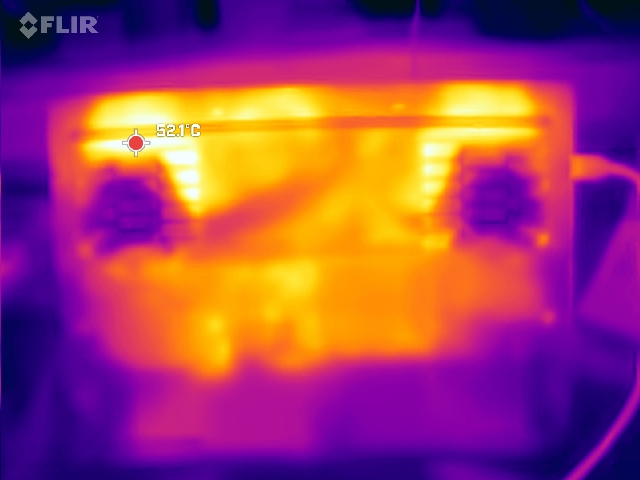
Temperature
Under heavy load, the surface temperatures can rise to around 50°C, especially on the underside of the device, while the WASD keys remain comparatively cool (up to 39°C). The fans now seem to cool much more evenly than their predecessor.
(-) The maximum temperature on the upper side is 48 °C / 118 F, compared to the average of 40.4 °C / 105 F, ranging from 21.2 to 68.8 °C for the class Gaming.
(-) The bottom heats up to a maximum of 50 °C / 122 F, compared to the average of 43.2 °C / 110 F
(±) In idle usage, the average temperature for the upper side is 33.6 °C / 92 F, compared to the device average of 33.9 °C / 93 F.
(-) 3: The average temperature for the upper side is 38.2 °C / 101 F, compared to the average of 33.9 °C / 93 F for the class Gaming.
(±) The palmrests and touchpad can get very hot to the touch with a maximum of 37 °C / 98.6 F.
(-) The average temperature of the palmrest area of similar devices was 28.8 °C / 83.8 F (-8.2 °C / -14.8 F).
| Lenovo Legion 5 Pro 16IAX10H Intel Core Ultra 9 275HX, NVIDIA GeForce RTX 5070 Ti Laptop | Lenovo Legion Pro 5 16IRX9 Intel Core i9-14900HX, NVIDIA GeForce RTX 4070 Laptop GPU | Schenker XMG Pro 16 (E25) Intel Core Ultra 9 275HX, NVIDIA GeForce RTX 5070 Ti Laptop | Medion Erazer Major 16 X1 MD62736 Intel Core Ultra 7 255HX, NVIDIA GeForce RTX 5070 Ti Laptop | MSI Vector 16 HX AI A2XWHG Intel Core Ultra 7 255HX, NVIDIA GeForce RTX 5070 Ti Laptop | MSI Vector A18 HX A9W AMD Ryzen 9 9955HX, NVIDIA GeForce RTX 5070 Ti Laptop | Lenovo Legion Pro 7i 16 Gen 10 Intel Core Ultra 9 275HX, NVIDIA GeForce RTX 5080 Laptop | |
|---|---|---|---|---|---|---|---|
| Heat | 7% | -121% | 4% | 8% | 16% | 17% | |
| Maximum Upper Side * (°C) | 48 | 43.8 9% | 43.2 10% | 49 -2% | 53 -10% | 46.6 3% | 42.6 11% |
| Maximum Bottom * (°C) | 50 | 55.4 -11% | 46 8% | 50 -0% | 52 -4% | 45.6 9% | 41.2 18% |
| Idle Upper Side * (°C) | 38 | 32.8 14% | 27.7 27% | 36 5% | 33 13% | 31.2 18% | 32.6 14% |
| Idle Bottom * (°C) | 42 | 36 14% | 264 -529% | 37 12% | 29 31% | 28.6 32% | 32.4 23% |
* ... smaller is better
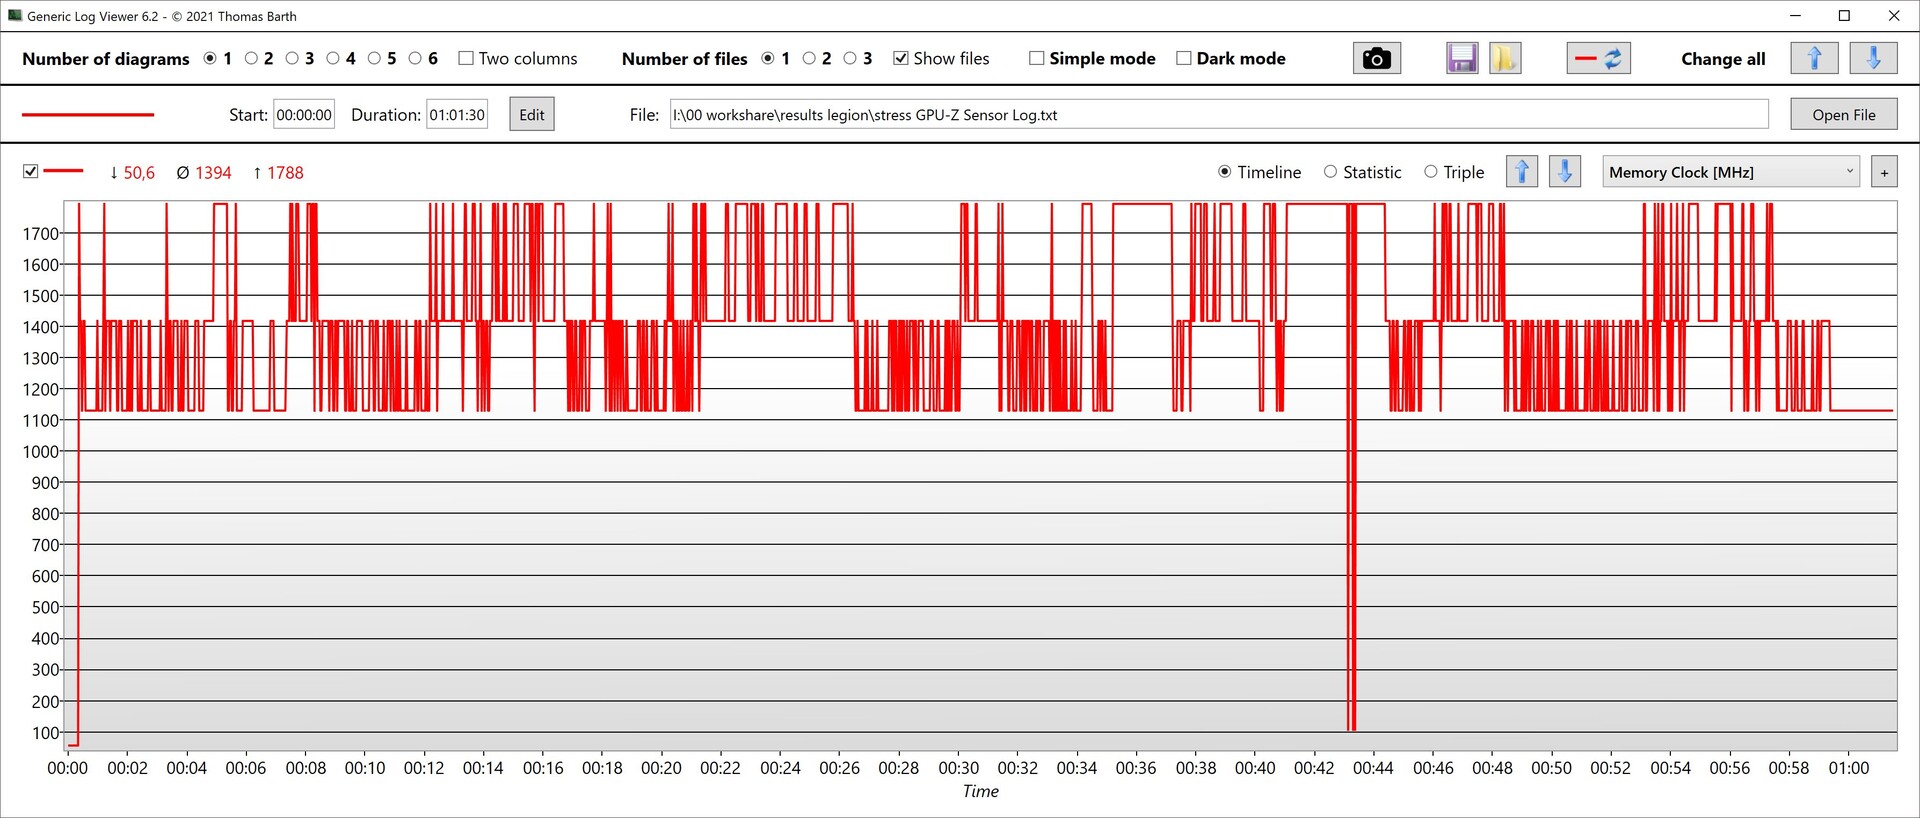
Stress test
The CPU cores briefly started the one-hour stress test at 4.1 GHz (195 W). The CPU exceeded the temperature threshold of 100°C, whereupon the clock speed and power consumption dropped to approximately 2.3 GHz and 60 W, respectively, and then remained relatively constant. The temperature then sat at around 82°C.
During this time, the GPU clock speed fluctuated roughly between 2.2 and 2.5 GHz, while the memory clock speed made larger jumps between 1.1 and 1.8 GHz. The temperature was around 85°C, and the GPU drew approximately 125 W from the power supply.
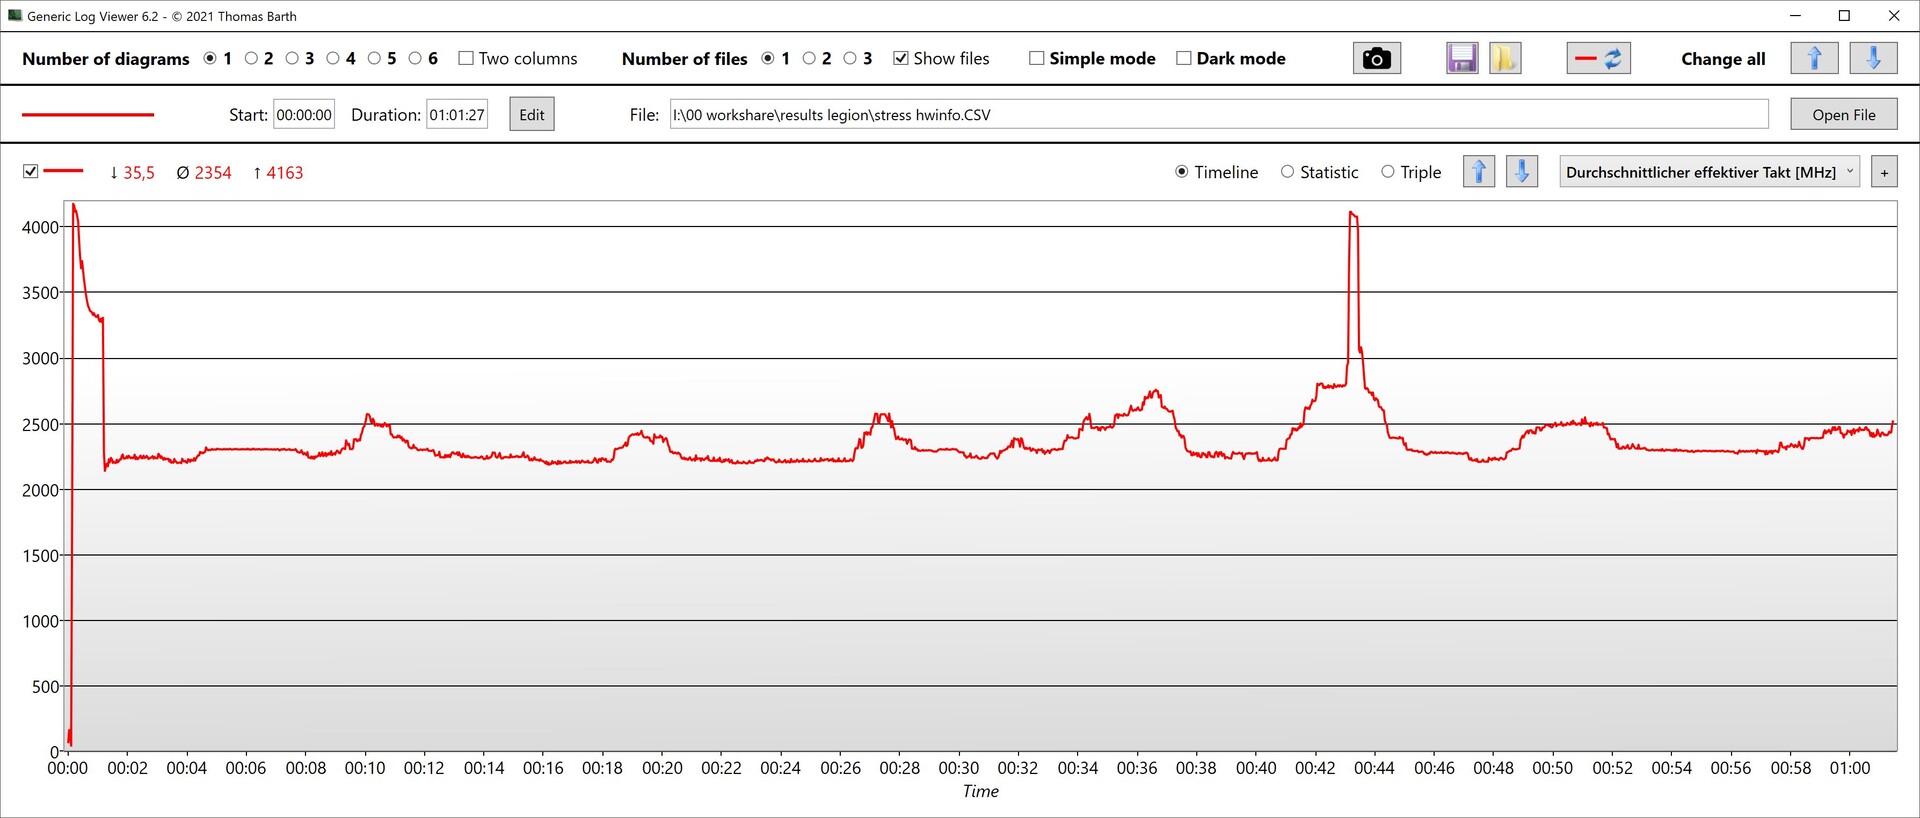
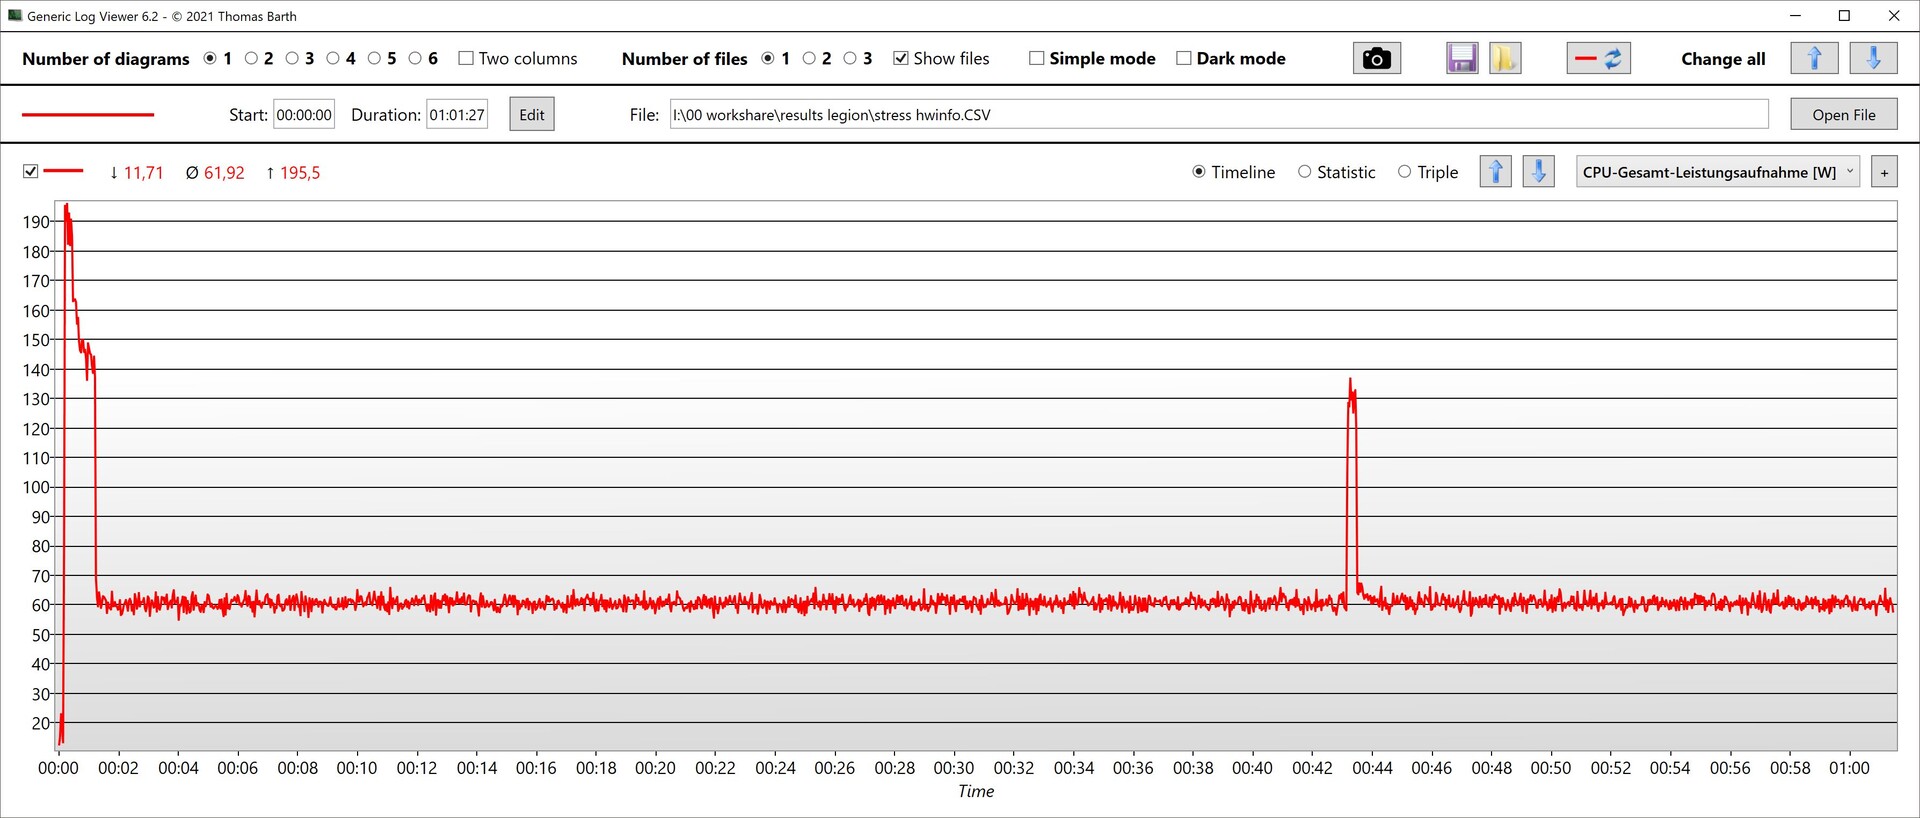

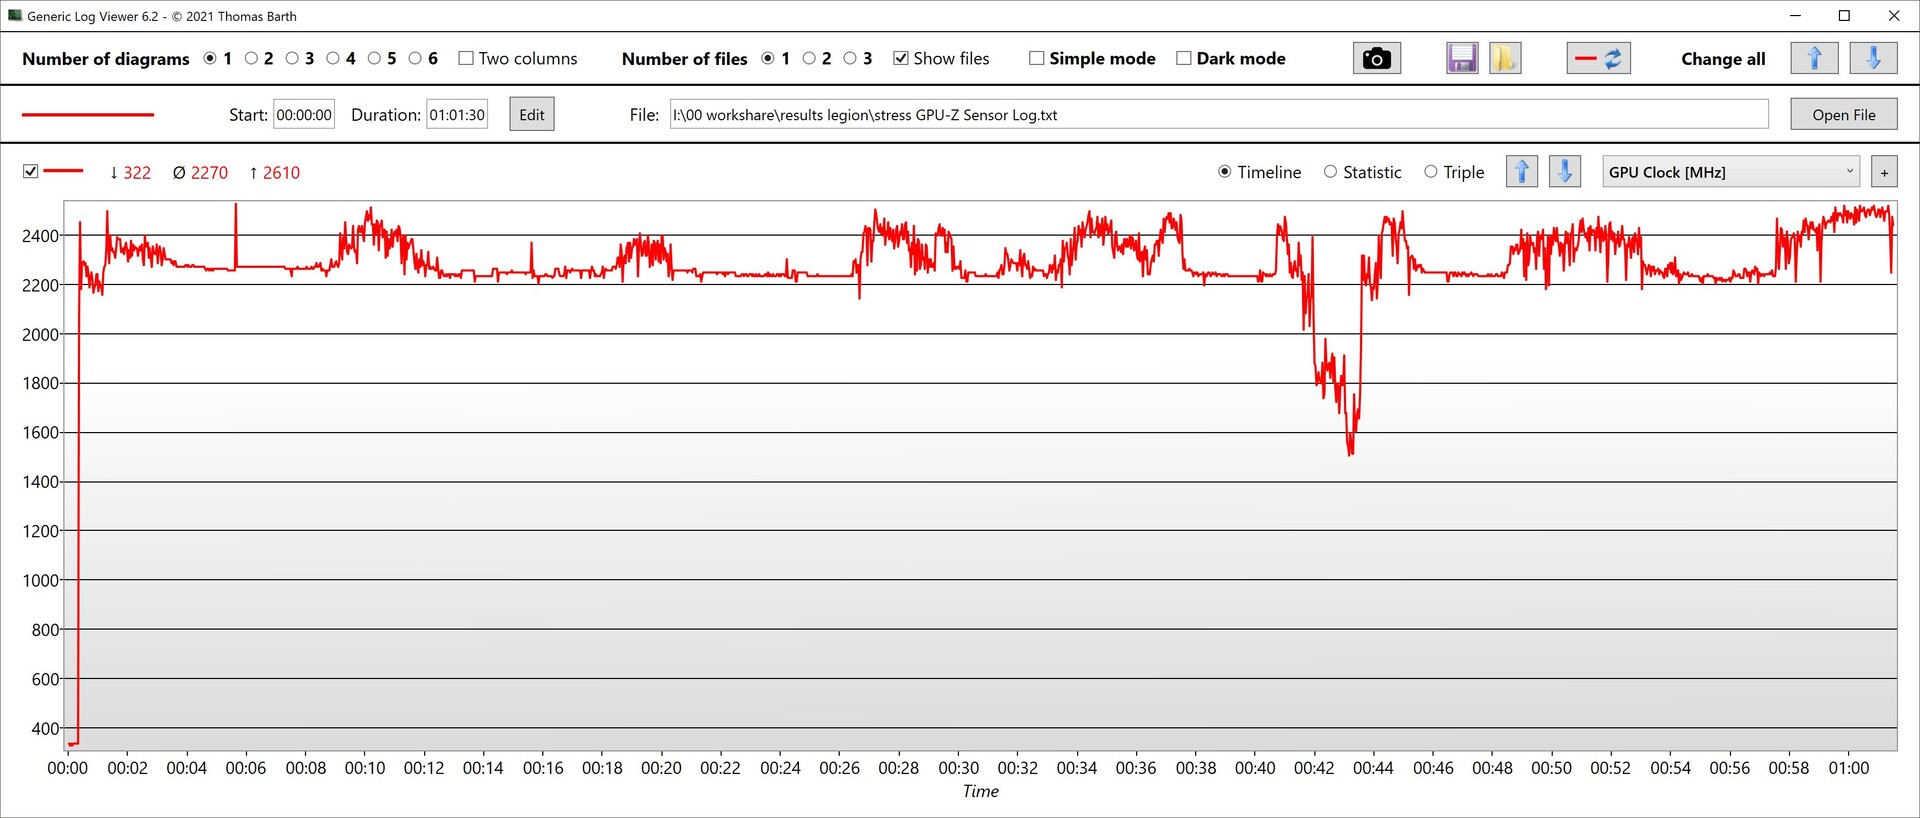
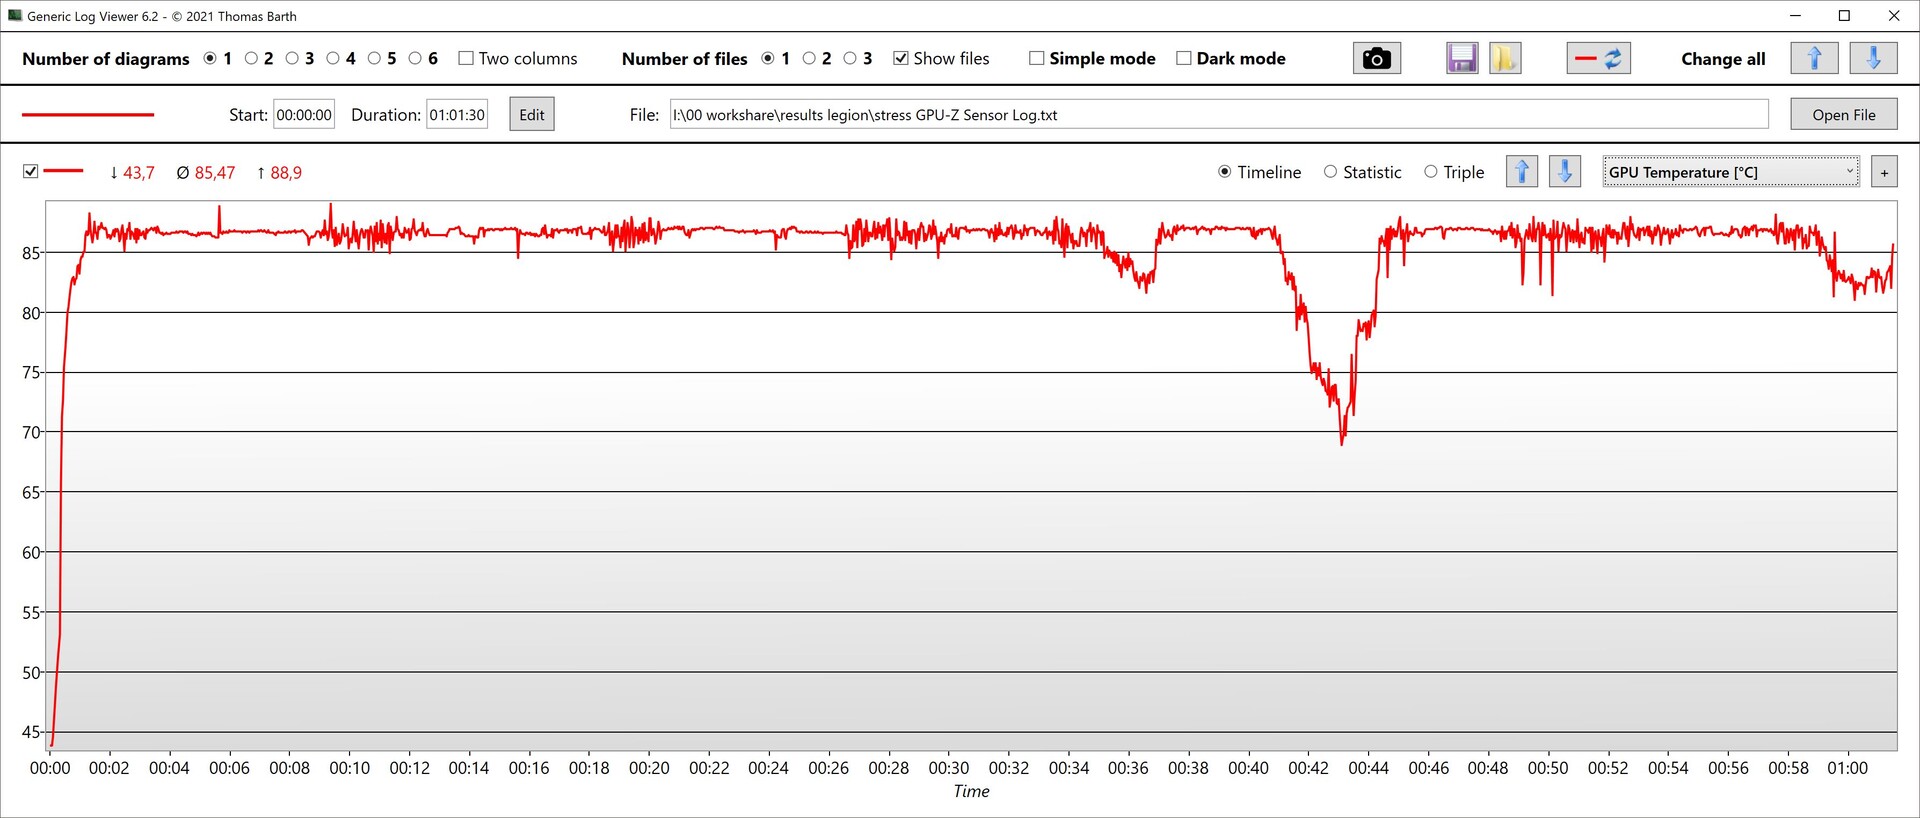
| CPU Clock (GHz) | GPU Clock (MHz) | Average CPU Temperature (°C) | Average GPU Temperature (°C) | |
| Prime95 + FurMark Stress | 2,354 | 2270 | 82 | 85 |
| Cyberpunk 2077 Stress | 1,862 | 2572 | 83 | 86 |
Speakers
The two stereo speakers are rather functional, offering balanced highs, but are not particularly loud and lack bass. A headset jack is available for connecting headphones and other analogue audio devices.
Lenovo Legion 5 Pro 16IAX10H audio analysis
(±) | speaker loudness is average but good (78.2 dB)
Bass 100 - 315 Hz
(-) | nearly no bass - on average 21.1% lower than median
(±) | linearity of bass is average (8% delta to prev. frequency)
Mids 400 - 2000 Hz
(±) | higher mids - on average 6.3% higher than median
(+) | mids are linear (6.5% delta to prev. frequency)
Highs 2 - 16 kHz
(+) | balanced highs - only 1.6% away from median
(+) | highs are linear (4.9% delta to prev. frequency)
Overall 100 - 16.000 Hz
(±) | linearity of overall sound is average (18.3% difference to median)
Compared to same class
» 58% of all tested devices in this class were better, 9% similar, 33% worse
» The best had a delta of 6%, average was 18%, worst was 132%
Compared to all devices tested
» 40% of all tested devices were better, 8% similar, 52% worse
» The best had a delta of 4%, average was 24%, worst was 134%
Schenker XMG Pro 16 (E25) audio analysis
(±) | speaker loudness is average but good (79.2 dB)
Bass 100 - 315 Hz
(±) | reduced bass - on average 14.2% lower than median
(±) | linearity of bass is average (10.6% delta to prev. frequency)
Mids 400 - 2000 Hz
(±) | higher mids - on average 8.2% higher than median
(±) | linearity of mids is average (9.9% delta to prev. frequency)
Highs 2 - 16 kHz
(+) | balanced highs - only 3.8% away from median
(+) | highs are linear (5.9% delta to prev. frequency)
Overall 100 - 16.000 Hz
(±) | linearity of overall sound is average (18.5% difference to median)
Compared to same class
» 60% of all tested devices in this class were better, 8% similar, 32% worse
» The best had a delta of 6%, average was 18%, worst was 132%
Compared to all devices tested
» 41% of all tested devices were better, 8% similar, 51% worse
» The best had a delta of 4%, average was 24%, worst was 134%
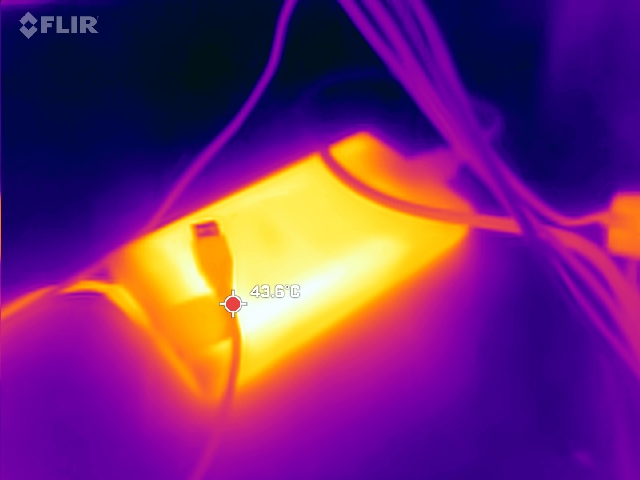
Energy management - The battery could be bigger
Power consumption
Ideally, the Legion Pro 5 consumes very little energy when idling. However, there are repeated jumps upwards over a longer period. This is an area where most RTX 5000 laptops still struggle with excessive idle consumption. With an external monitor connected to the HDMI output, the dGPU is active.
When gaming, it becomes apparent that the Legion Pro 5 consumes slightly more power than most of its competitors, given its high performance. However, the difference is rather small, and the MSI Vector 16 HX AI A2XWHG is even hungrier.
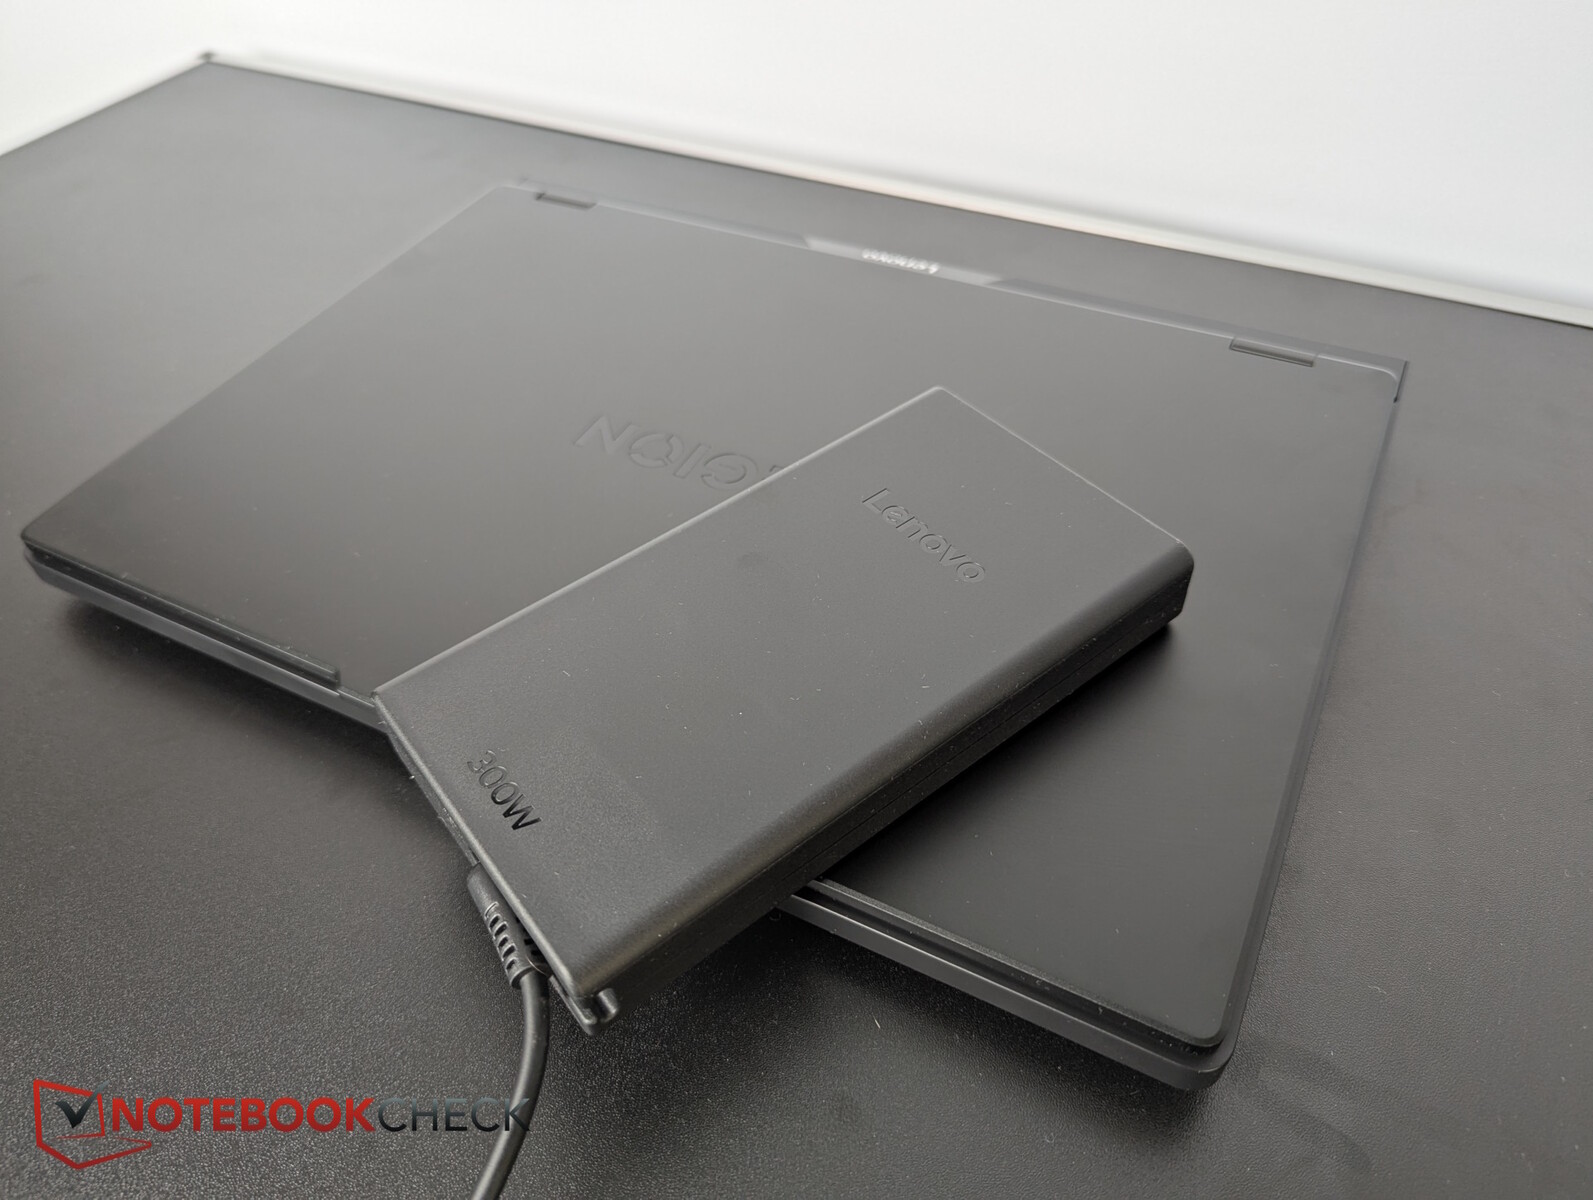
We measured short-term peak loads of up to 294 watts from the large, yet slim Lenovo power adapter. This adapter is rated for 300 watts and should therefore be able to charge the laptop well regardless of the situation.
| Off / Standby | |
| Idle | |
| Load |
|
Key:
min: | |
| Lenovo Legion 5 Pro 16IAX10H Ultra 9 275HX, GeForce RTX 5070 Ti Laptop, Western Digital PC SN8000S SDEPNRK-1T00, OLED, 2560x1600, 16" | Lenovo Legion Pro 5 16IRX9 i9-14900HX, GeForce RTX 4070 Laptop GPU, Samsung PM9A1 MZVL21T0HCLR, IPS, 2560x1600, 16" | Schenker XMG Pro 16 (E25) Ultra 9 275HX, GeForce RTX 5070 Ti Laptop, Samsung 9100 Pro 1 TB, IPS, 2560x1600, 16" | Medion Erazer Major 16 X1 MD62736 Ultra 7 255HX, GeForce RTX 5070 Ti Laptop, Phison E31 2 TB, IPS, 2560x1600, 16" | MSI Vector 16 HX AI A2XWHG Ultra 7 255HX, GeForce RTX 5070 Ti Laptop, Micron 2400 MTFDKBA512QFM, IPS, 2560x1600, 16" | MSI Vector A18 HX A9W R9 9955HX, GeForce RTX 5070 Ti Laptop, , IPS, 2560x1600, 18" | Lenovo Legion Pro 7i 16 Gen 10 Ultra 9 275HX, GeForce RTX 5080 Laptop, SK Hynix HFS001TEJ9X115N, OLED, 2560x1600, 16" | Average NVIDIA GeForce RTX 5070 Ti Laptop | Average of class Gaming | |
|---|---|---|---|---|---|---|---|---|---|
| Power Consumption | -9% | 8% | -5% | 5% | -71% | -65% | -3% | 1% | |
| Idle Minimum * (Watt) | 14 | 12.5 11% | 11.7 16% | 17.8 -27% | 7.1 49% | 20.8 -49% | 28.5 -104% | 12.4 ? 11% | 13.1 ? 6% |
| Idle Average * (Watt) | 14.3 | 24.6 -72% | 16.6 -16% | 20.7 -45% | 15.9 -11% | 52.8 -269% | 38.8 -171% | 19.7 ? -38% | 18.8 ? -31% |
| Idle Maximum * (Watt) | 20.1 | 24.8 -23% | 17.1 15% | 23.4 -16% | 29.5 -47% | 54.5 -171% | 45.6 -127% | 24.9 ? -24% | 24.4 ? -21% |
| Load Average * (Watt) | 177 | 109.6 38% | 122.4 31% | 110 38% | 124 30% | 146.6 17% | 132.2 25% | 123.6 ? 30% | 108.6 ? 39% |
| Cyberpunk 2077 ultra * (Watt) | 255 | 245 4% | 233 9% | 222 13% | 285 -12% | 318 -25% | |||
| Cyberpunk 2077 ultra external monitor * (Watt) | 255 | 241 5% | 232 9% | 217 15% | 278 -9% | 319 -25% | |||
| Load Maximum * (Watt) | 294 | 284.9 3% | 291.5 1% | 297 -1% | 336 -14% | 297.3 -1% | 384 -31% | 272 ? 7% | 255 ? 13% |
| Witcher 3 ultra * (Watt) | 218 |
* ... smaller is better
Power consumption Cyberpunk / stress test
Power consumption with an external monitor
Battery life
Unfortunately, if you unplug the Legion Pro 5, the OLED's refresh rate doesn't automatically drop to the more power-efficient 60 Hz. Manually switching to 60 Hz results in video and Wi-Fi runtimes of nearly 5 hours at a reduced brightness of 150 nits. The 80 Wh battery is often surpassed by competitors with 90 Wh and more.
| Lenovo Legion 5 Pro 16IAX10H Ultra 9 275HX, GeForce RTX 5070 Ti Laptop, 80 Wh | Lenovo Legion Pro 5 16IRX9 i9-14900HX, GeForce RTX 4070 Laptop GPU, 80 Wh | Schenker XMG Pro 16 (E25) Ultra 9 275HX, GeForce RTX 5070 Ti Laptop, 99.8 Wh | Medion Erazer Major 16 X1 MD62736 Ultra 7 255HX, GeForce RTX 5070 Ti Laptop, 80 Wh | MSI Vector 16 HX AI A2XWHG Ultra 7 255HX, GeForce RTX 5070 Ti Laptop, 90 Wh | Asus ROG Zephyrus G16 2025 5070 Ti Ultra 9 285H, GeForce RTX 5070 Ti Laptop, 90 Wh | Alienware 16 Area-51 Ultra 9 275HX, GeForce RTX 5080 Laptop, 96 Wh | Lenovo Legion Pro 7i 16 Gen 10 Ultra 9 275HX, GeForce RTX 5080 Laptop, 99 Wh | Average of class Gaming | |
|---|---|---|---|---|---|---|---|---|---|
| Battery runtime | -19% | 86% | 29% | 43% | -43% | -22% | 39% | ||
| H.264 (h) | 4.8 | 8.9 ? 85% | |||||||
| WiFi v1.3 (h) | 4.9 | 4.8 -2% | 9.1 86% | 6.3 29% | 7 43% | 2.8 -43% | 5.4 10% | 6.98 ? 42% | |
| Load (h) | 1.7 | 1.1 -35% | 0.8 -53% | 1.51 ? -11% | |||||
| Reader / Idle (h) | 6.7 | 3.1 | 8.71 ? |
Notebookcheck overall rating
When it comes to gaming, the Legion Pro 5 with its RTX 5070 Ti and brilliant OLED flexes its muscles, but for content creators, the Legion 5 might be a bit too loud.
Lenovo Legion 5 Pro 16IAX10H
- 06/24/2025 v8
Christian Hintze
 Total Sustainability Score:
 Possible alternatives compared
Image | Model / Review | Price | Weight | Height | Display |
|---|---|---|---|---|---|
1. 84.5%  | Lenovo Legion 5 Pro 16IAX10H Intel Core Ultra 9 275HX ⎘ NVIDIA GeForce RTX 5070 Ti Laptop ⎘ 32 GB Memory, 1024 GB SSD | Amazon: 1. $2,602.46 Lenovo Legion Pro 7 16IAX10H... 2. $1,809.99 Lenovo Legion Pro 5 AI Gamin... 3. $2,449.00 Lenovo Legion Pro 5i Gen 10 ... List Price: 2500 Euro | 2.4 kg | 25.95 mm | 16.00" 2560x1600 189 PPI OLED |
2. 89.3% v7 (old)  | Lenovo Legion Pro 5 16IRX9 Intel Core i9-14900HX ⎘ NVIDIA GeForce RTX 4070 Laptop GPU ⎘ 32 GB Memory, 1024 GB SSD | Amazon: List Price: 2100 USD | 2.5 kg | 26.95 mm | 16.00" 2560x1600 189 PPI IPS |
3. 87.4%  | Schenker XMG Pro 16 (E25) Intel Core Ultra 9 275HX ⎘ NVIDIA GeForce RTX 5070 Ti Laptop ⎘ 32 GB Memory, 1024 GB SSD | Amazon: 1. $140.00 16.0" WQXGA 2560(RGB)×1600 ... 2. $150.00 Replacement Screen 16.0" for... List Price: 2480€ | 2.5 kg | 26.5 mm | 16.00" 2560x1600 189 PPI IPS |
4. 85.2%  | Medion Erazer Major 16 X1 MD62736 Intel Core Ultra 7 255HX ⎘ NVIDIA GeForce RTX 5070 Ti Laptop ⎘ 32 GB Memory, SSD | Amazon: List Price: 2600 EUR | 2.5 kg | 22.7 mm | 16.00" 2560x1600 189 PPI IPS |
5. 84%  | MSI Vector 16 HX AI A2XWHG Intel Core Ultra 7 255HX ⎘ NVIDIA GeForce RTX 5070 Ti Laptop ⎘ 16 GB Memory, 512 GB SSD | Amazon: List Price: 2000 EUR | 2.6 kg | 28.6 mm | 16.00" 2560x1600 189 PPI IPS |
Transparency
The selection of devices to be reviewed is made by our editorial team. The test sample was provided to the author as a loan by the manufacturer or retailer for the purpose of this review. The lender had no influence on this review, nor did the manufacturer receive a copy of this review before publication. There was no obligation to publish this review. As an independent media company, Notebookcheck is not subjected to the authority of manufacturers, retailers or publishers.
This is how Notebookcheck is testing
Every year, Notebookcheck independently reviews hundreds of laptops and smartphones using standardized procedures to ensure that all results are comparable. We have continuously developed our test methods for around 20 years and set industry standards in the process. In our test labs, high-quality measuring equipment is utilized by experienced technicians and editors. These tests involve a multi-stage validation process. Our complex rating system is based on hundreds of well-founded measurements and benchmarks, which maintains objectivity. Further information on our test methods can be found here.

