
Verdict - The XMG Pro 16 E25 is a big upgrade
The new XMPG Pro 16 is a significant upgrade over the old model and its overall gap to the XMG Neo 16 has become noticeably smaller. The performance of the new RTX 5070 Ti Laptop is impressive and this version uses the fastest variant with a TGP of 140 watts. Together with the new Core Ultra 9 275HX, the laptop's gaming performance is equally good, although we would also love to see a model with the AMD Ryzen 9 9955HX. Although its cooling is very loud under load, its temperatures are significantly lower than on the old model, despite its increased performance.
Its IPS display does a good job and although its connectivity includes PCIe 5.0, you'll have to do without Thunderbolt 5, Advanced Optimus and Wi-Fi 7. The new Pro 16's price-to-performance ratio is still good with a starting price of around $2,270, and with comparable features, it is around $400 cheaper than the slightly bulkier Neo 16.
Pros
Cons
Price and availability
The new XMG Pro 16 (E25) is available from Bestware, with prices beginning at approximately $2,270.
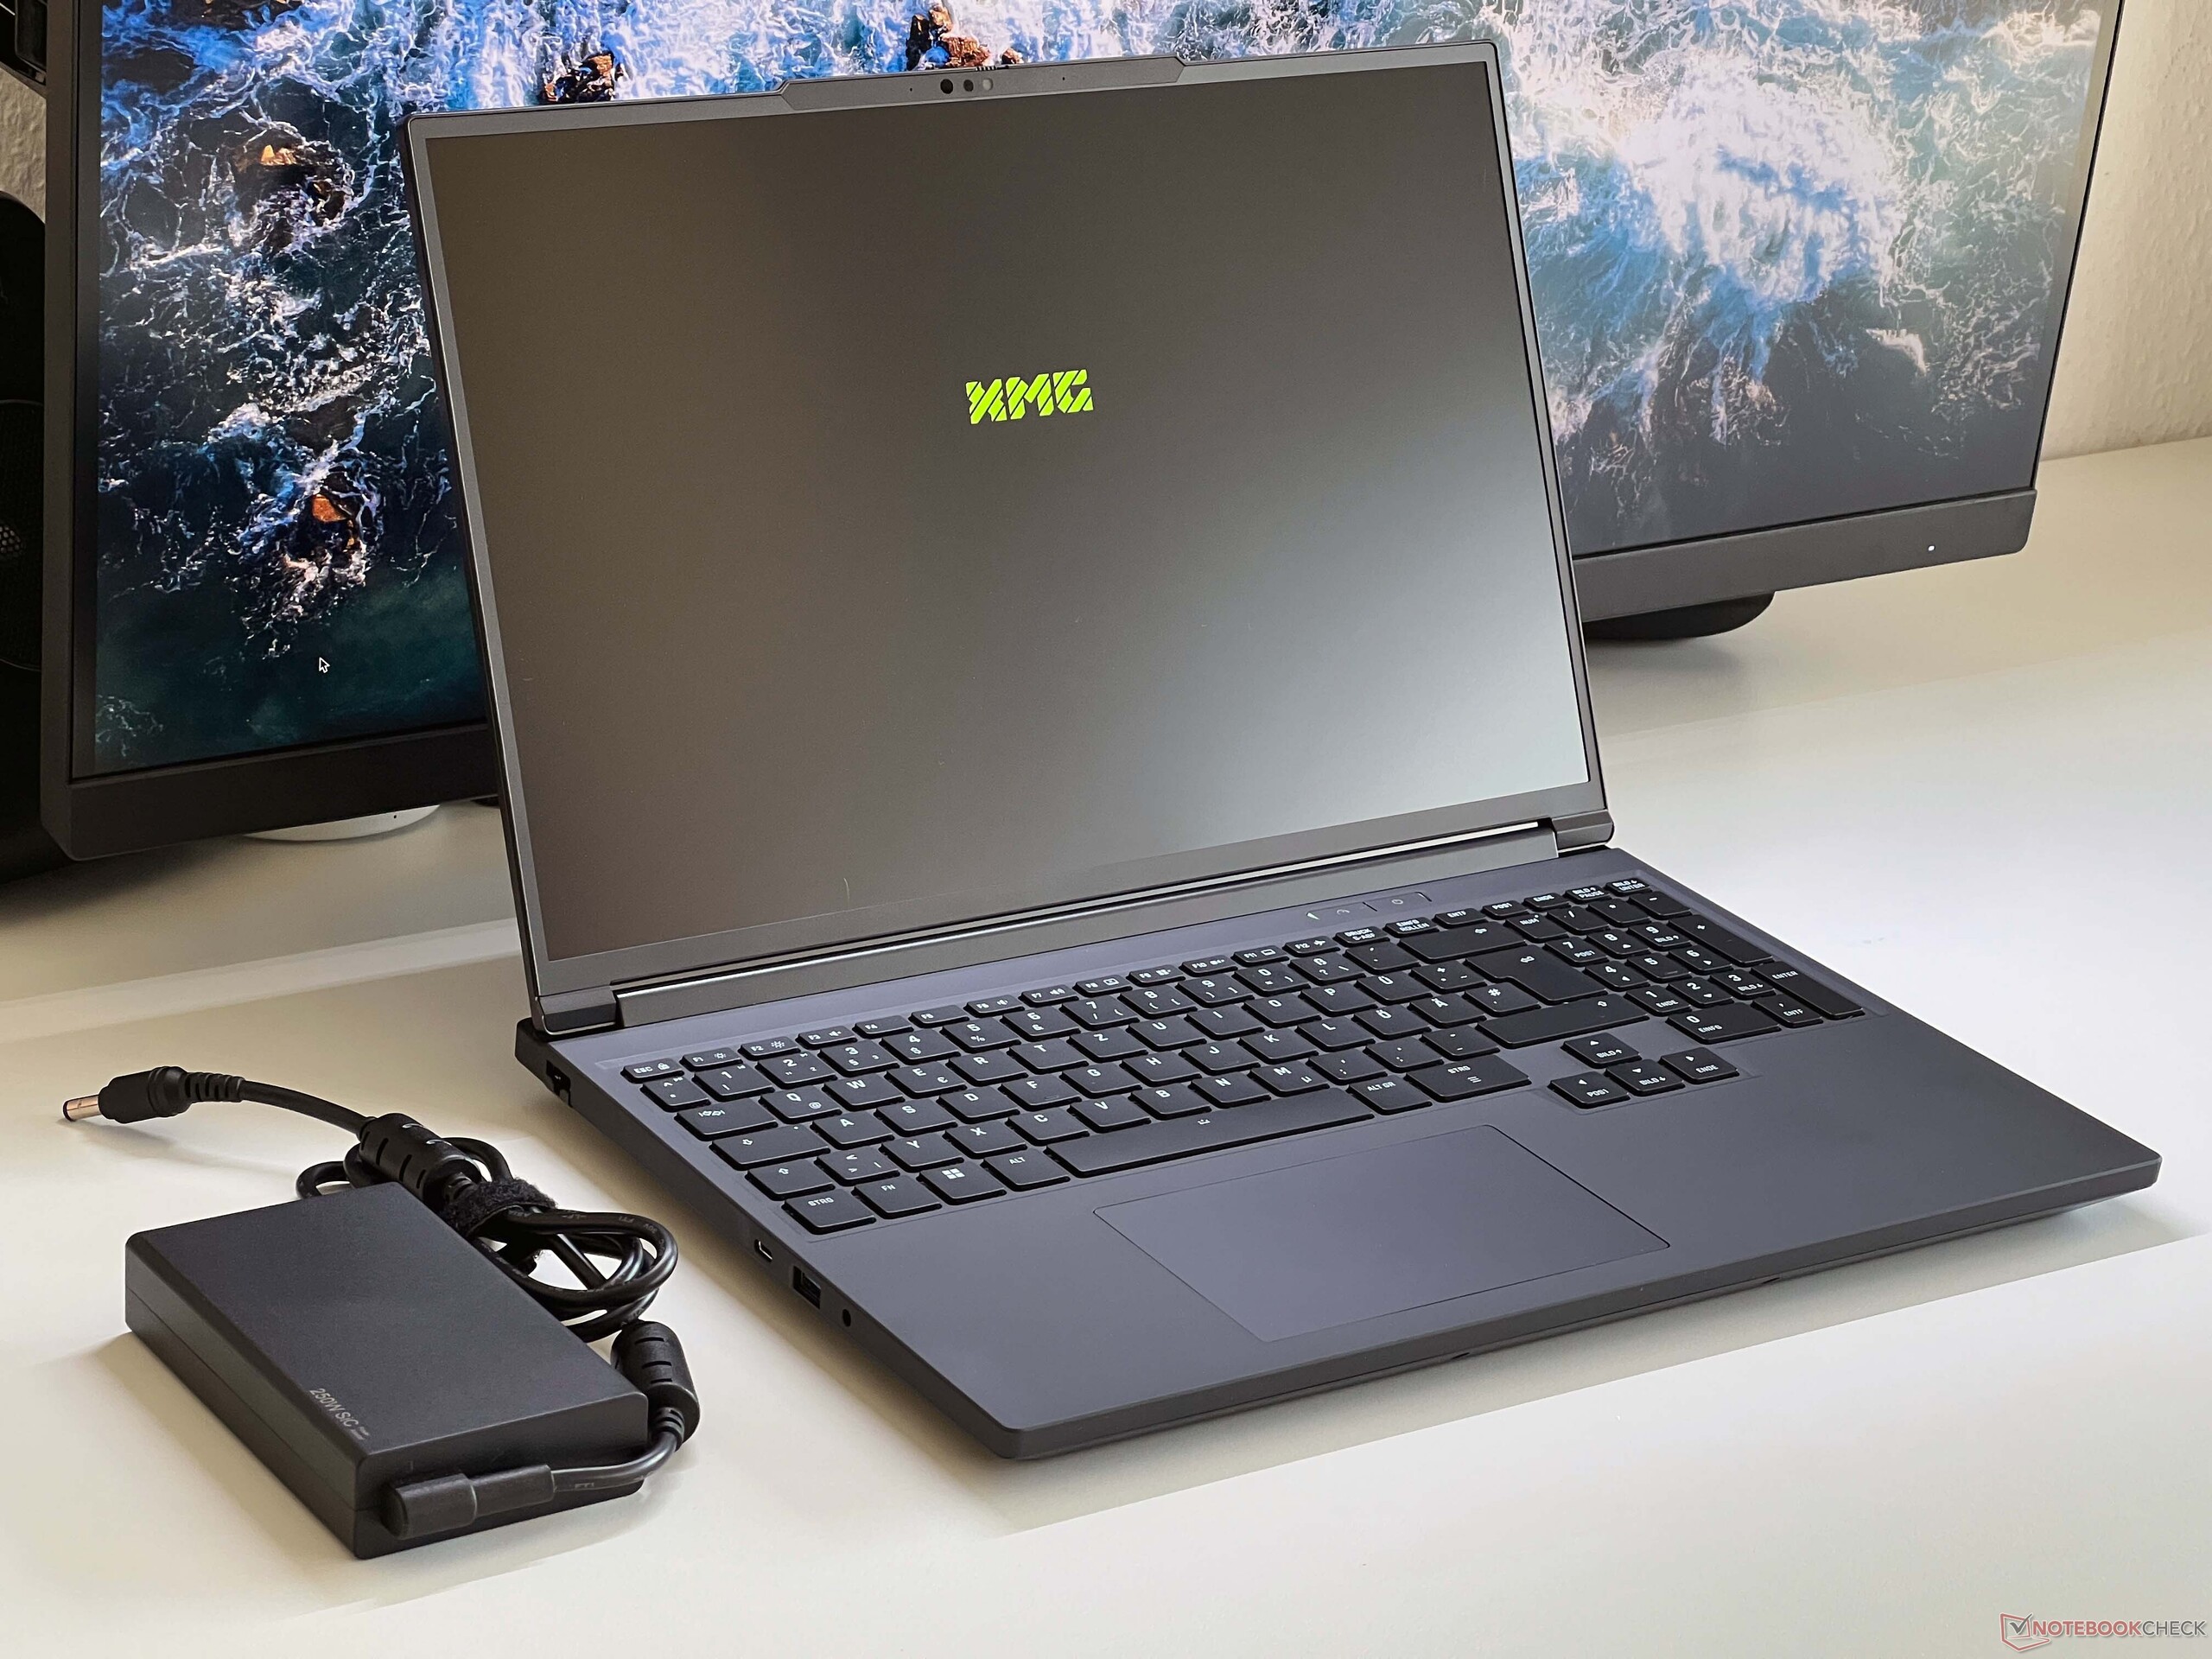
XMG's Pro 16 is a fast 16-inch laptop aimed at gamers and workstation customers. The 2025 model has been given an entirely new case as well as the GeForce RTX 5070 Ti Laptop. Buyers can choose between two processors, namely the old Core i9-13900HX and the new Core Ultra 9 275HX. It features a matte WQHD IPS panel (500 nits, 300 Hz). Our test device with the Core Ultra 9, 32 GB RAM and a fast 1-TB SSD (PCIe 5.0) costs around $2,800.
Specifications
Case & connectivity
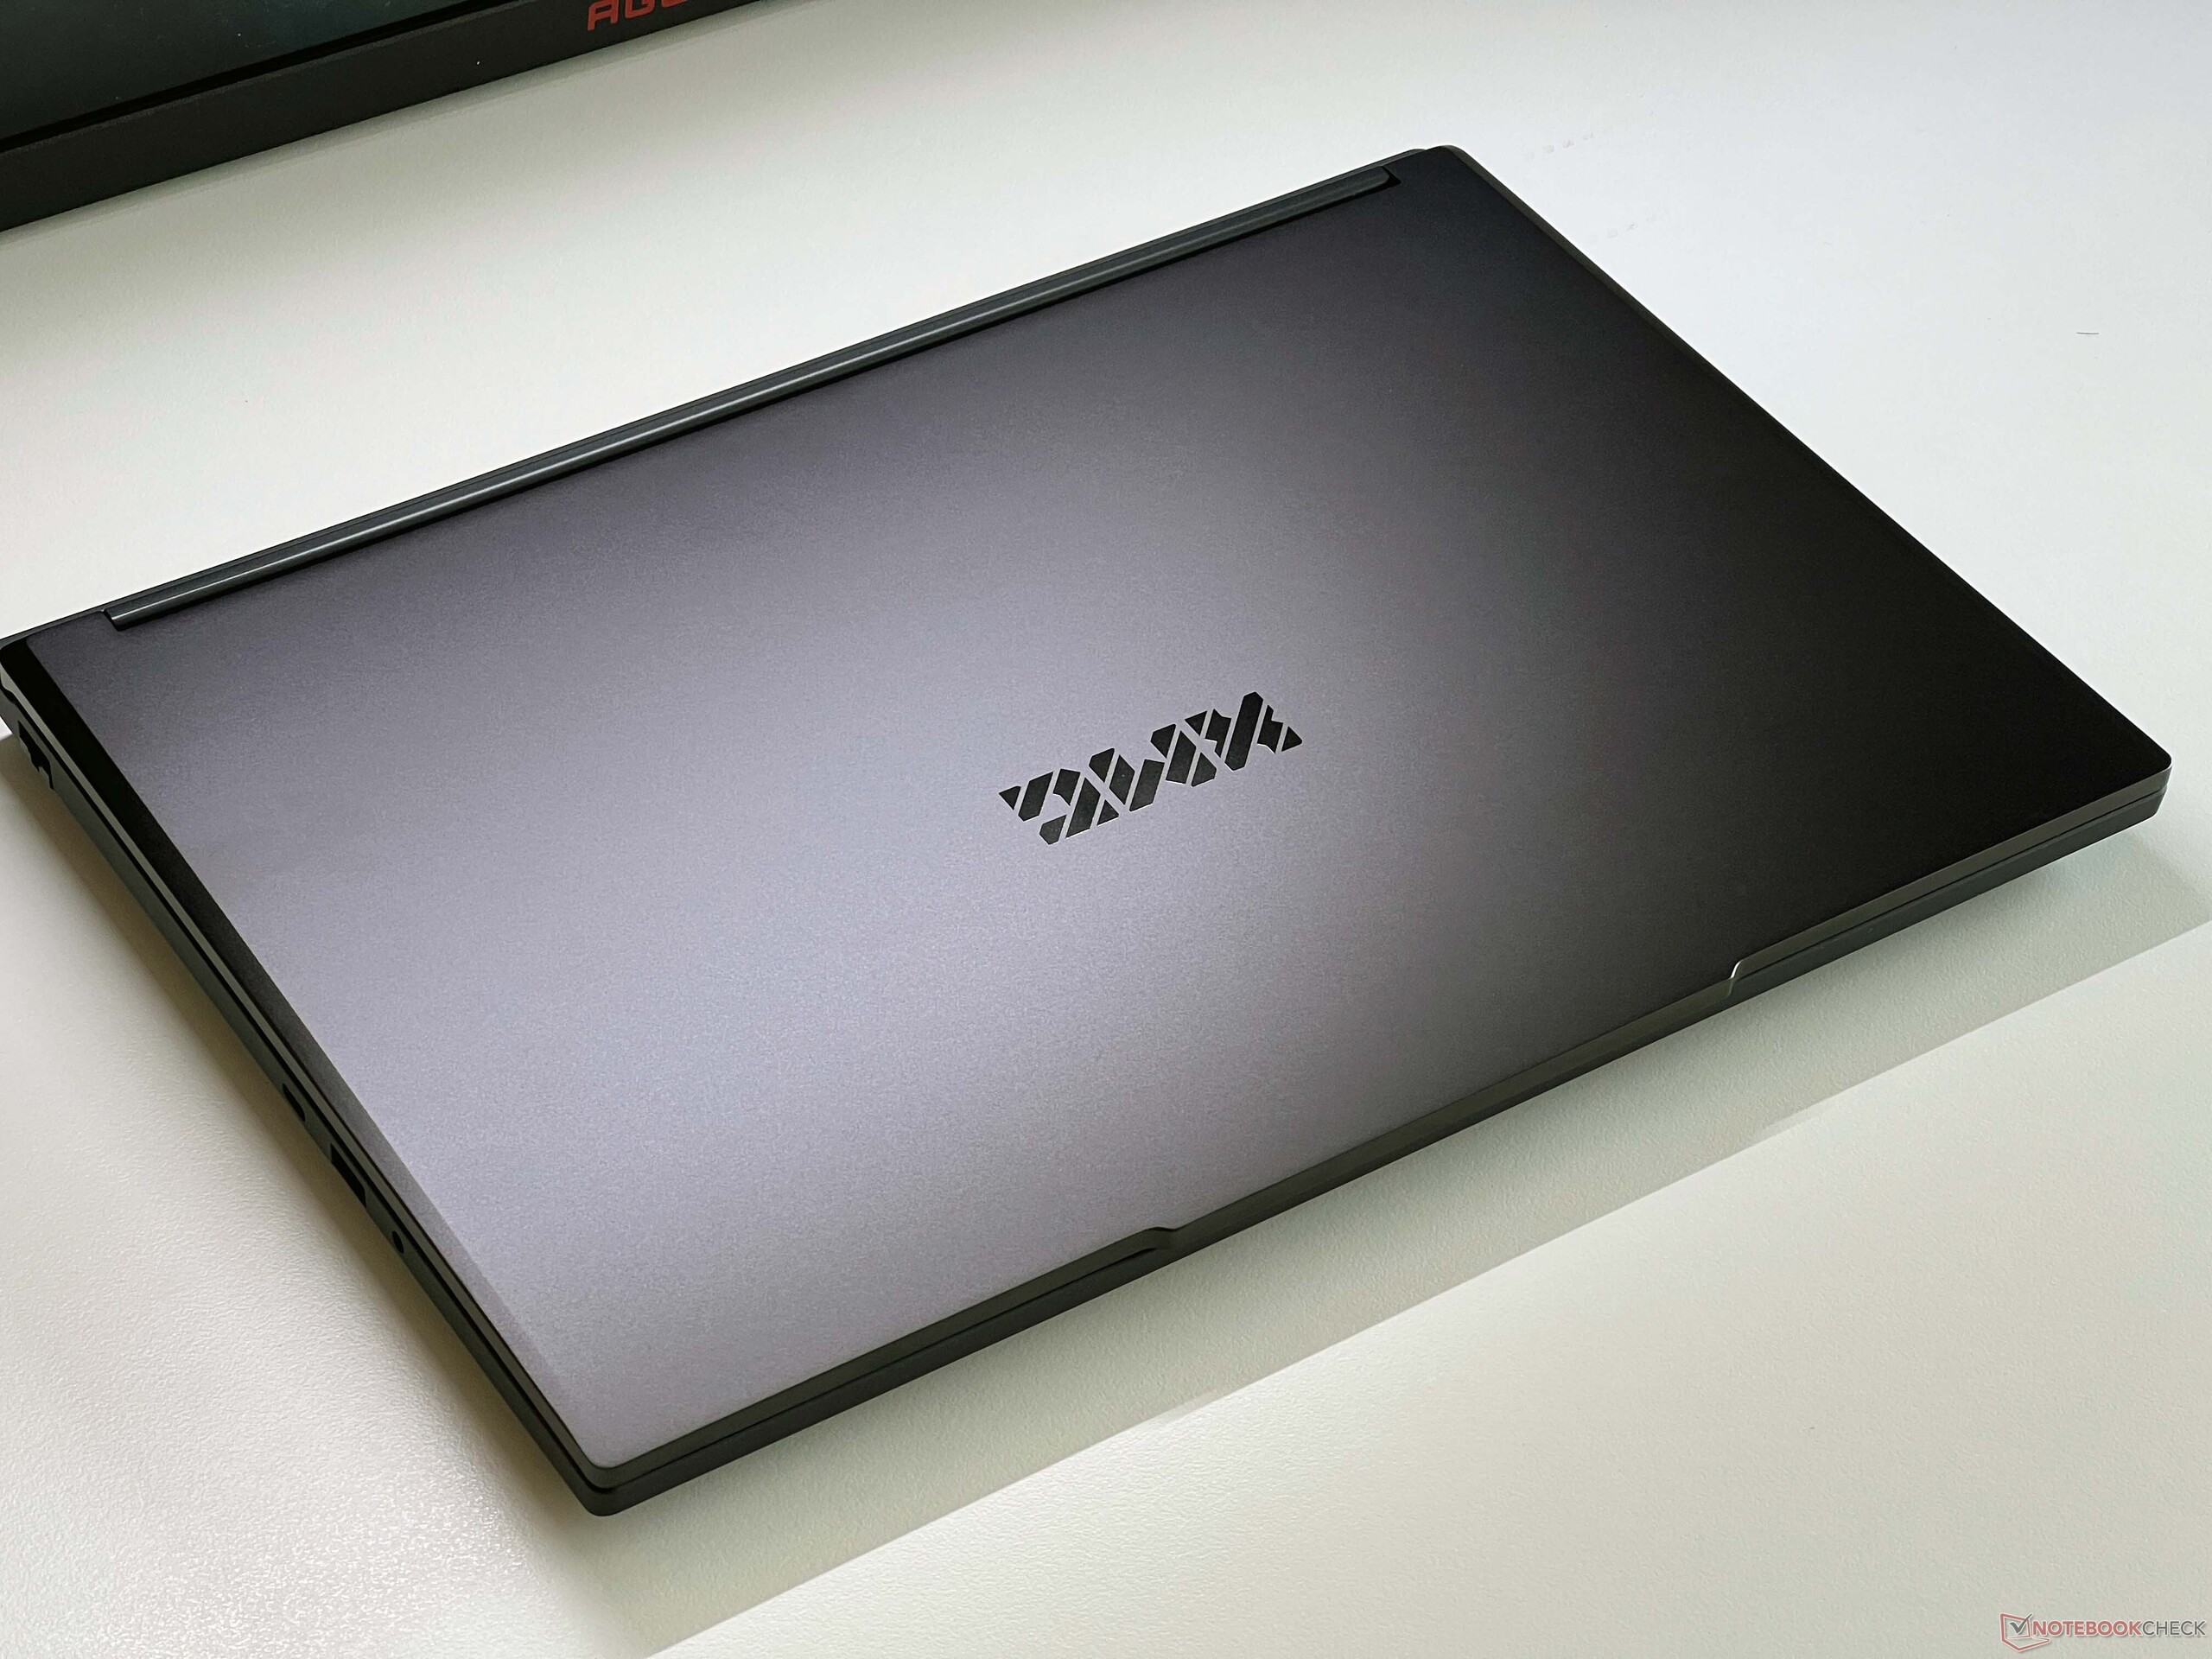
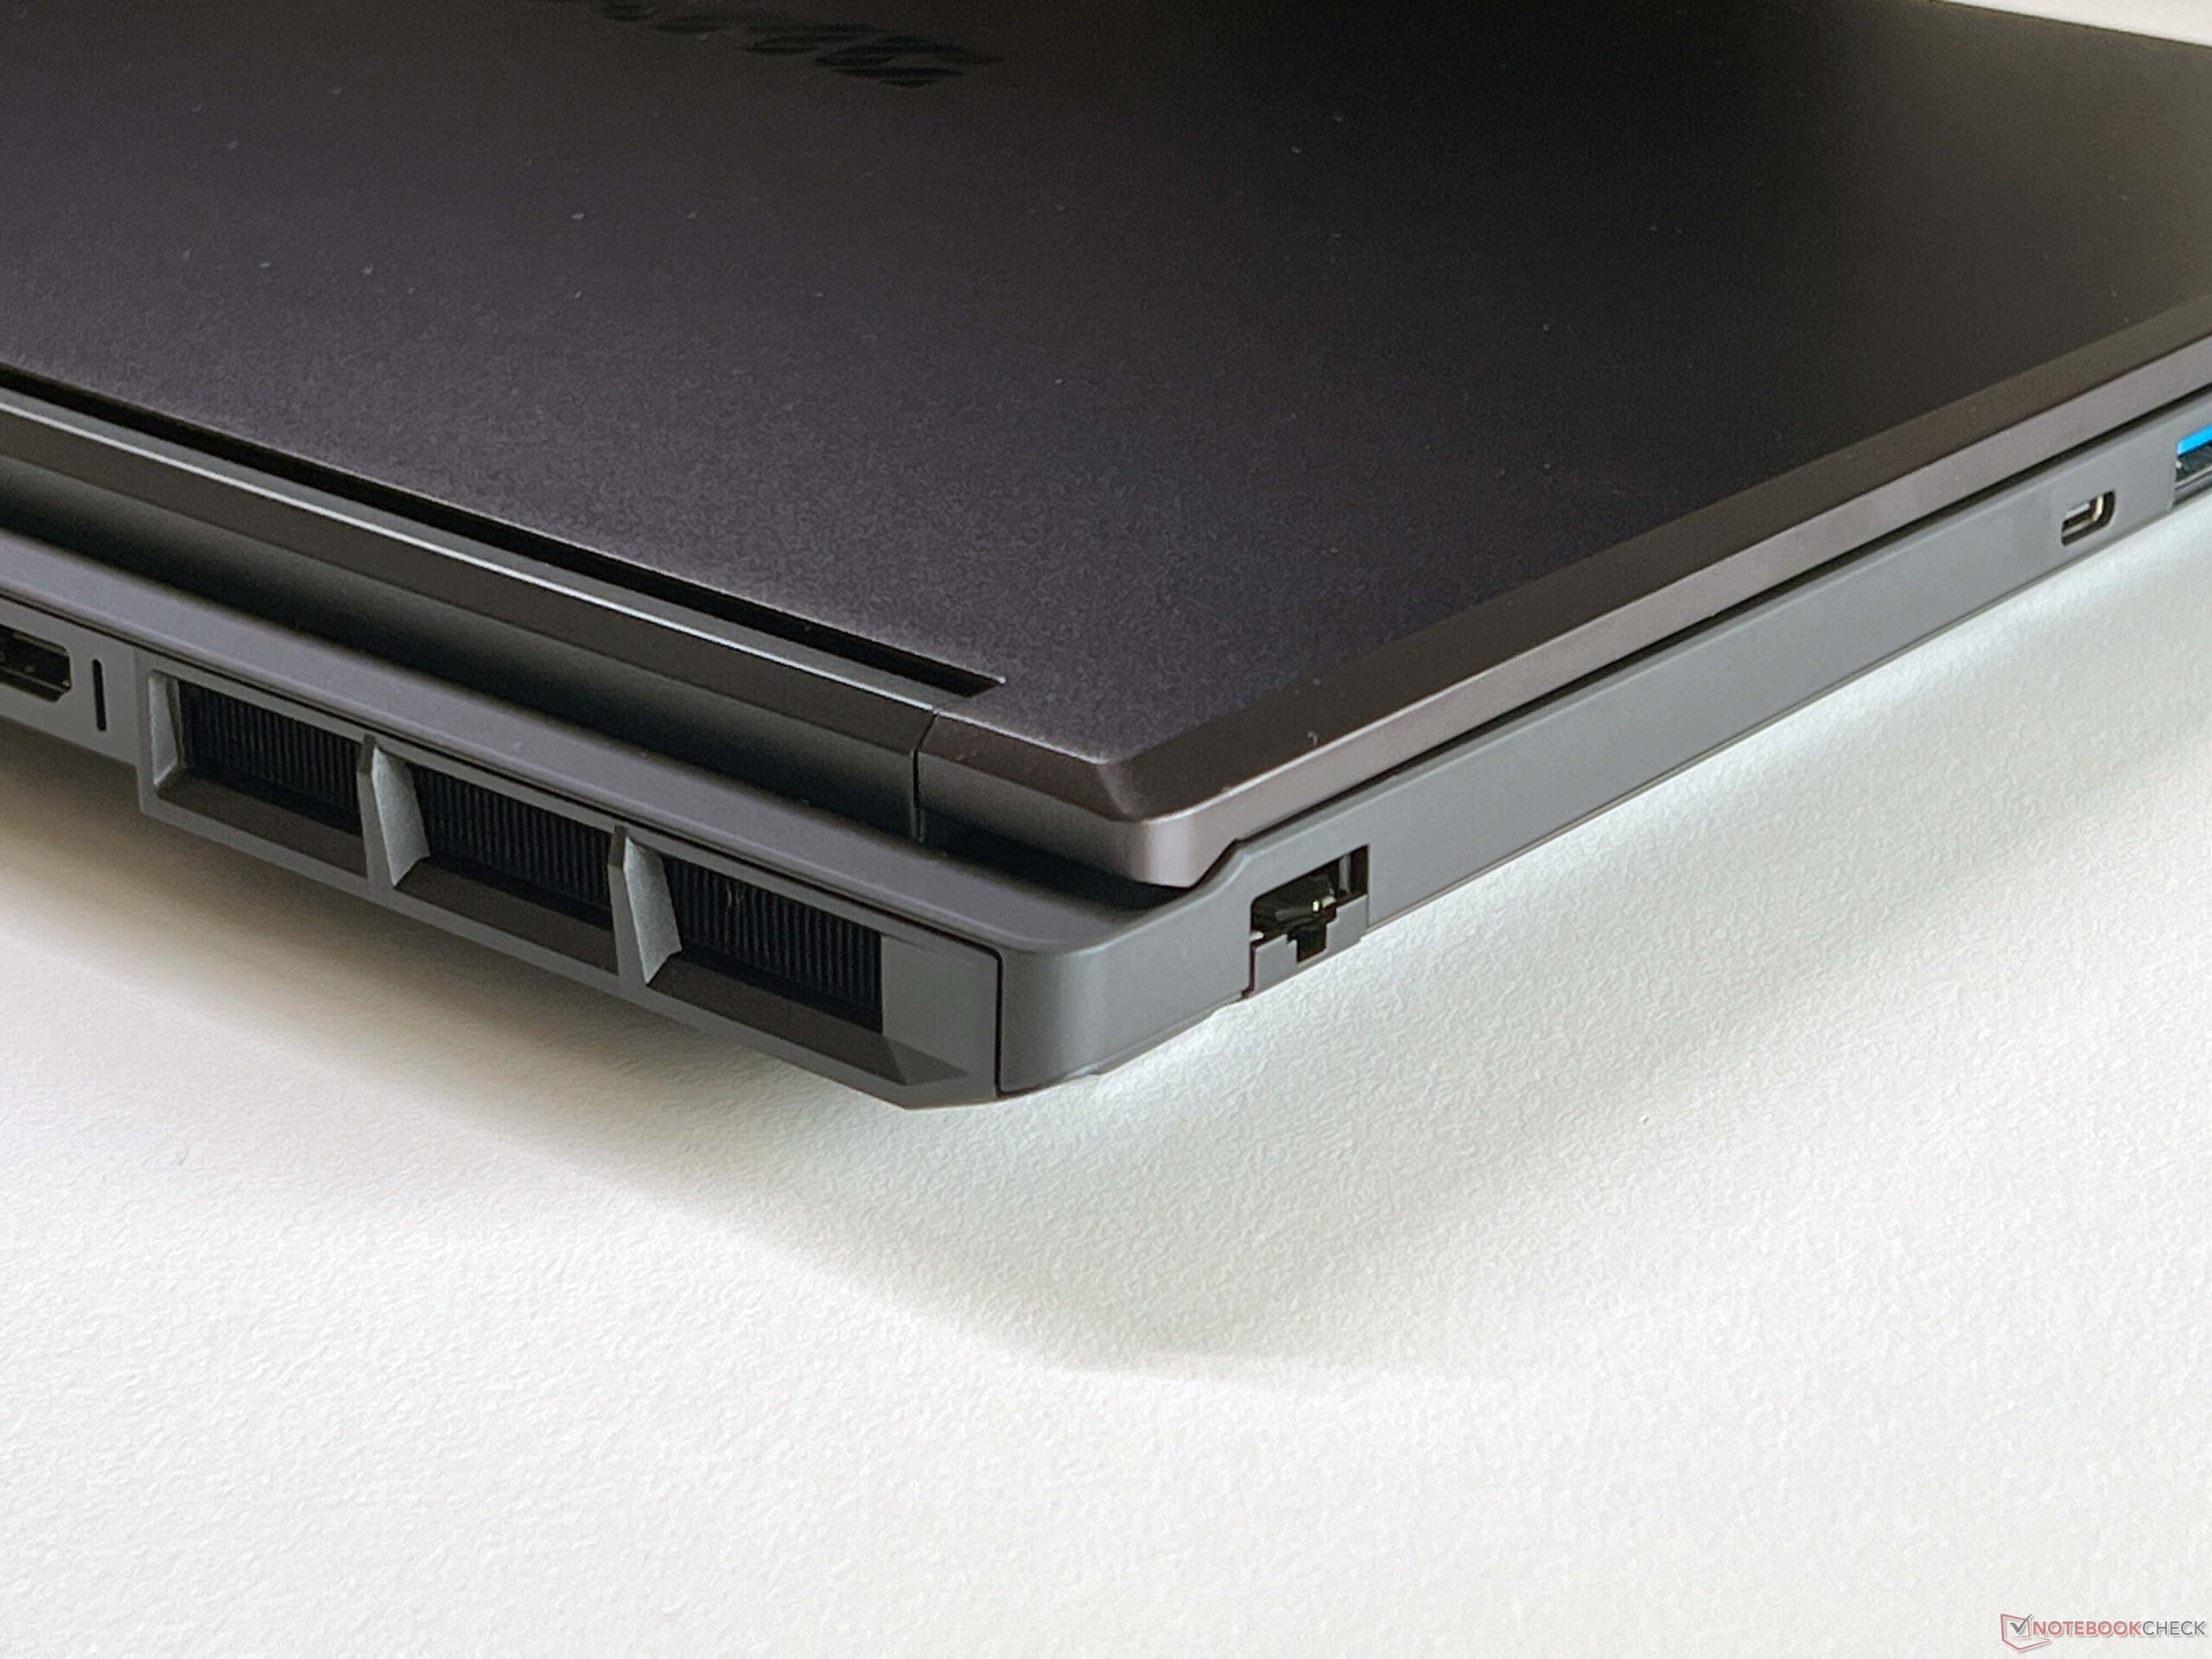
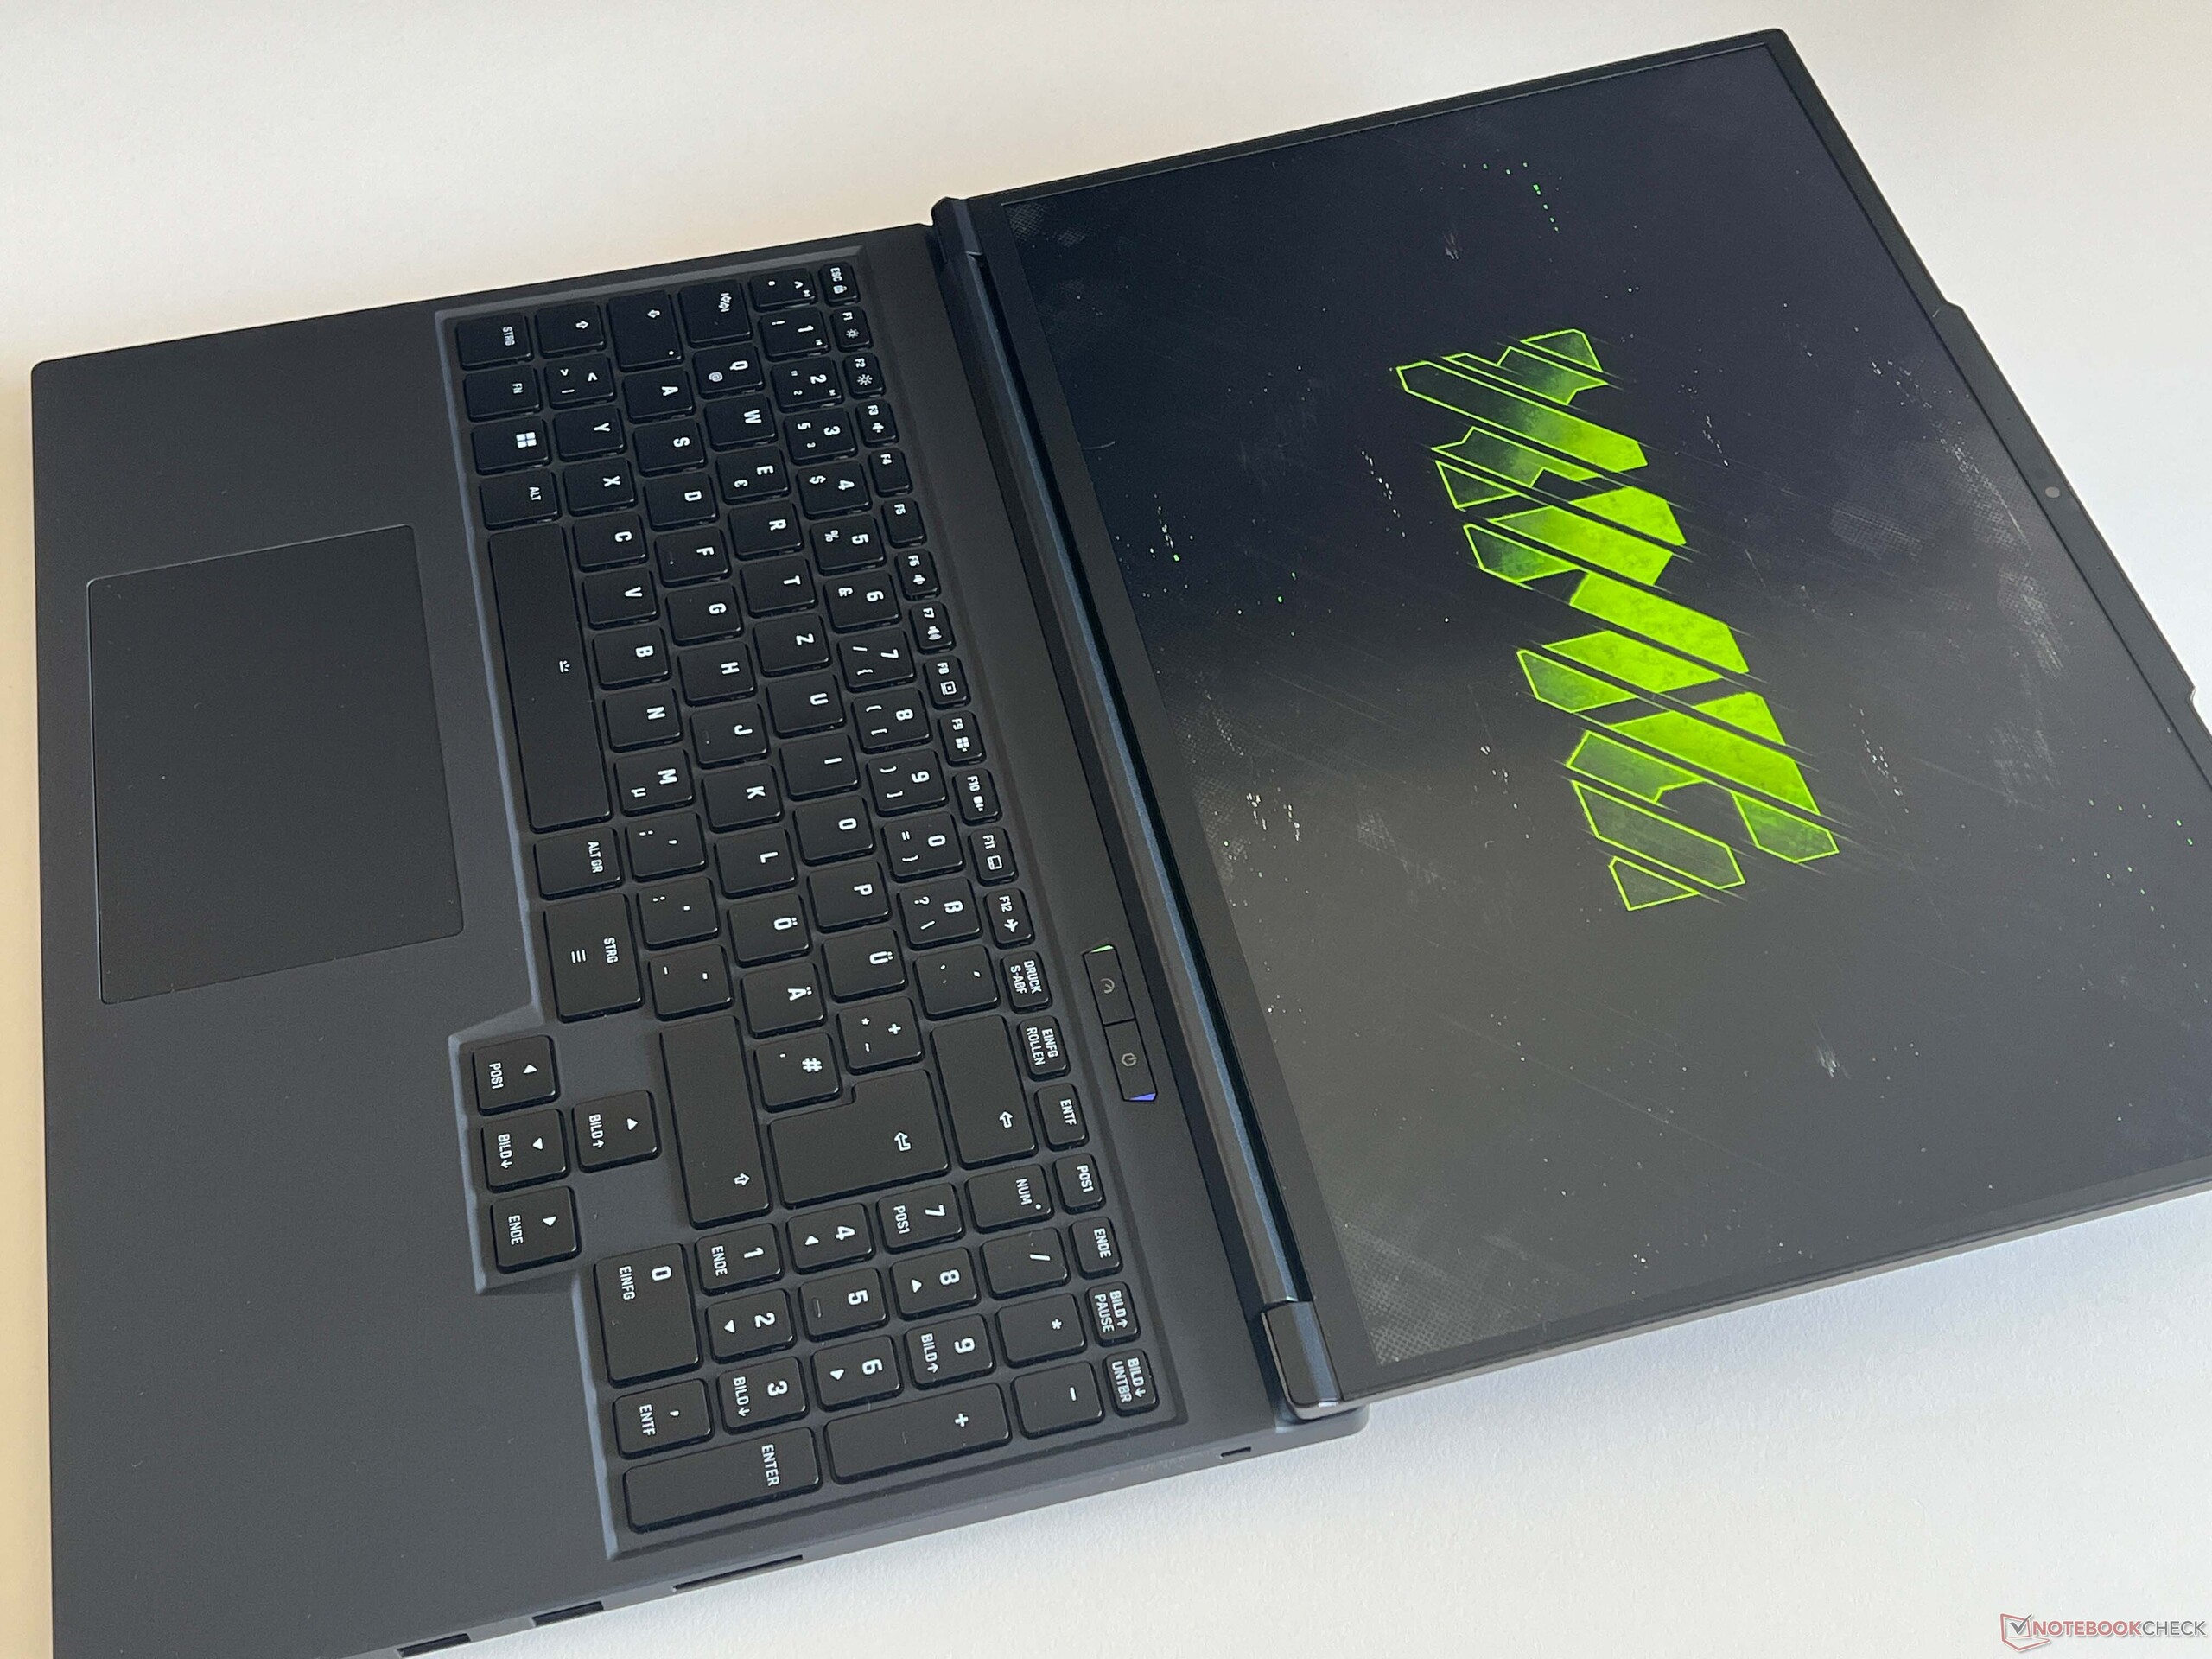
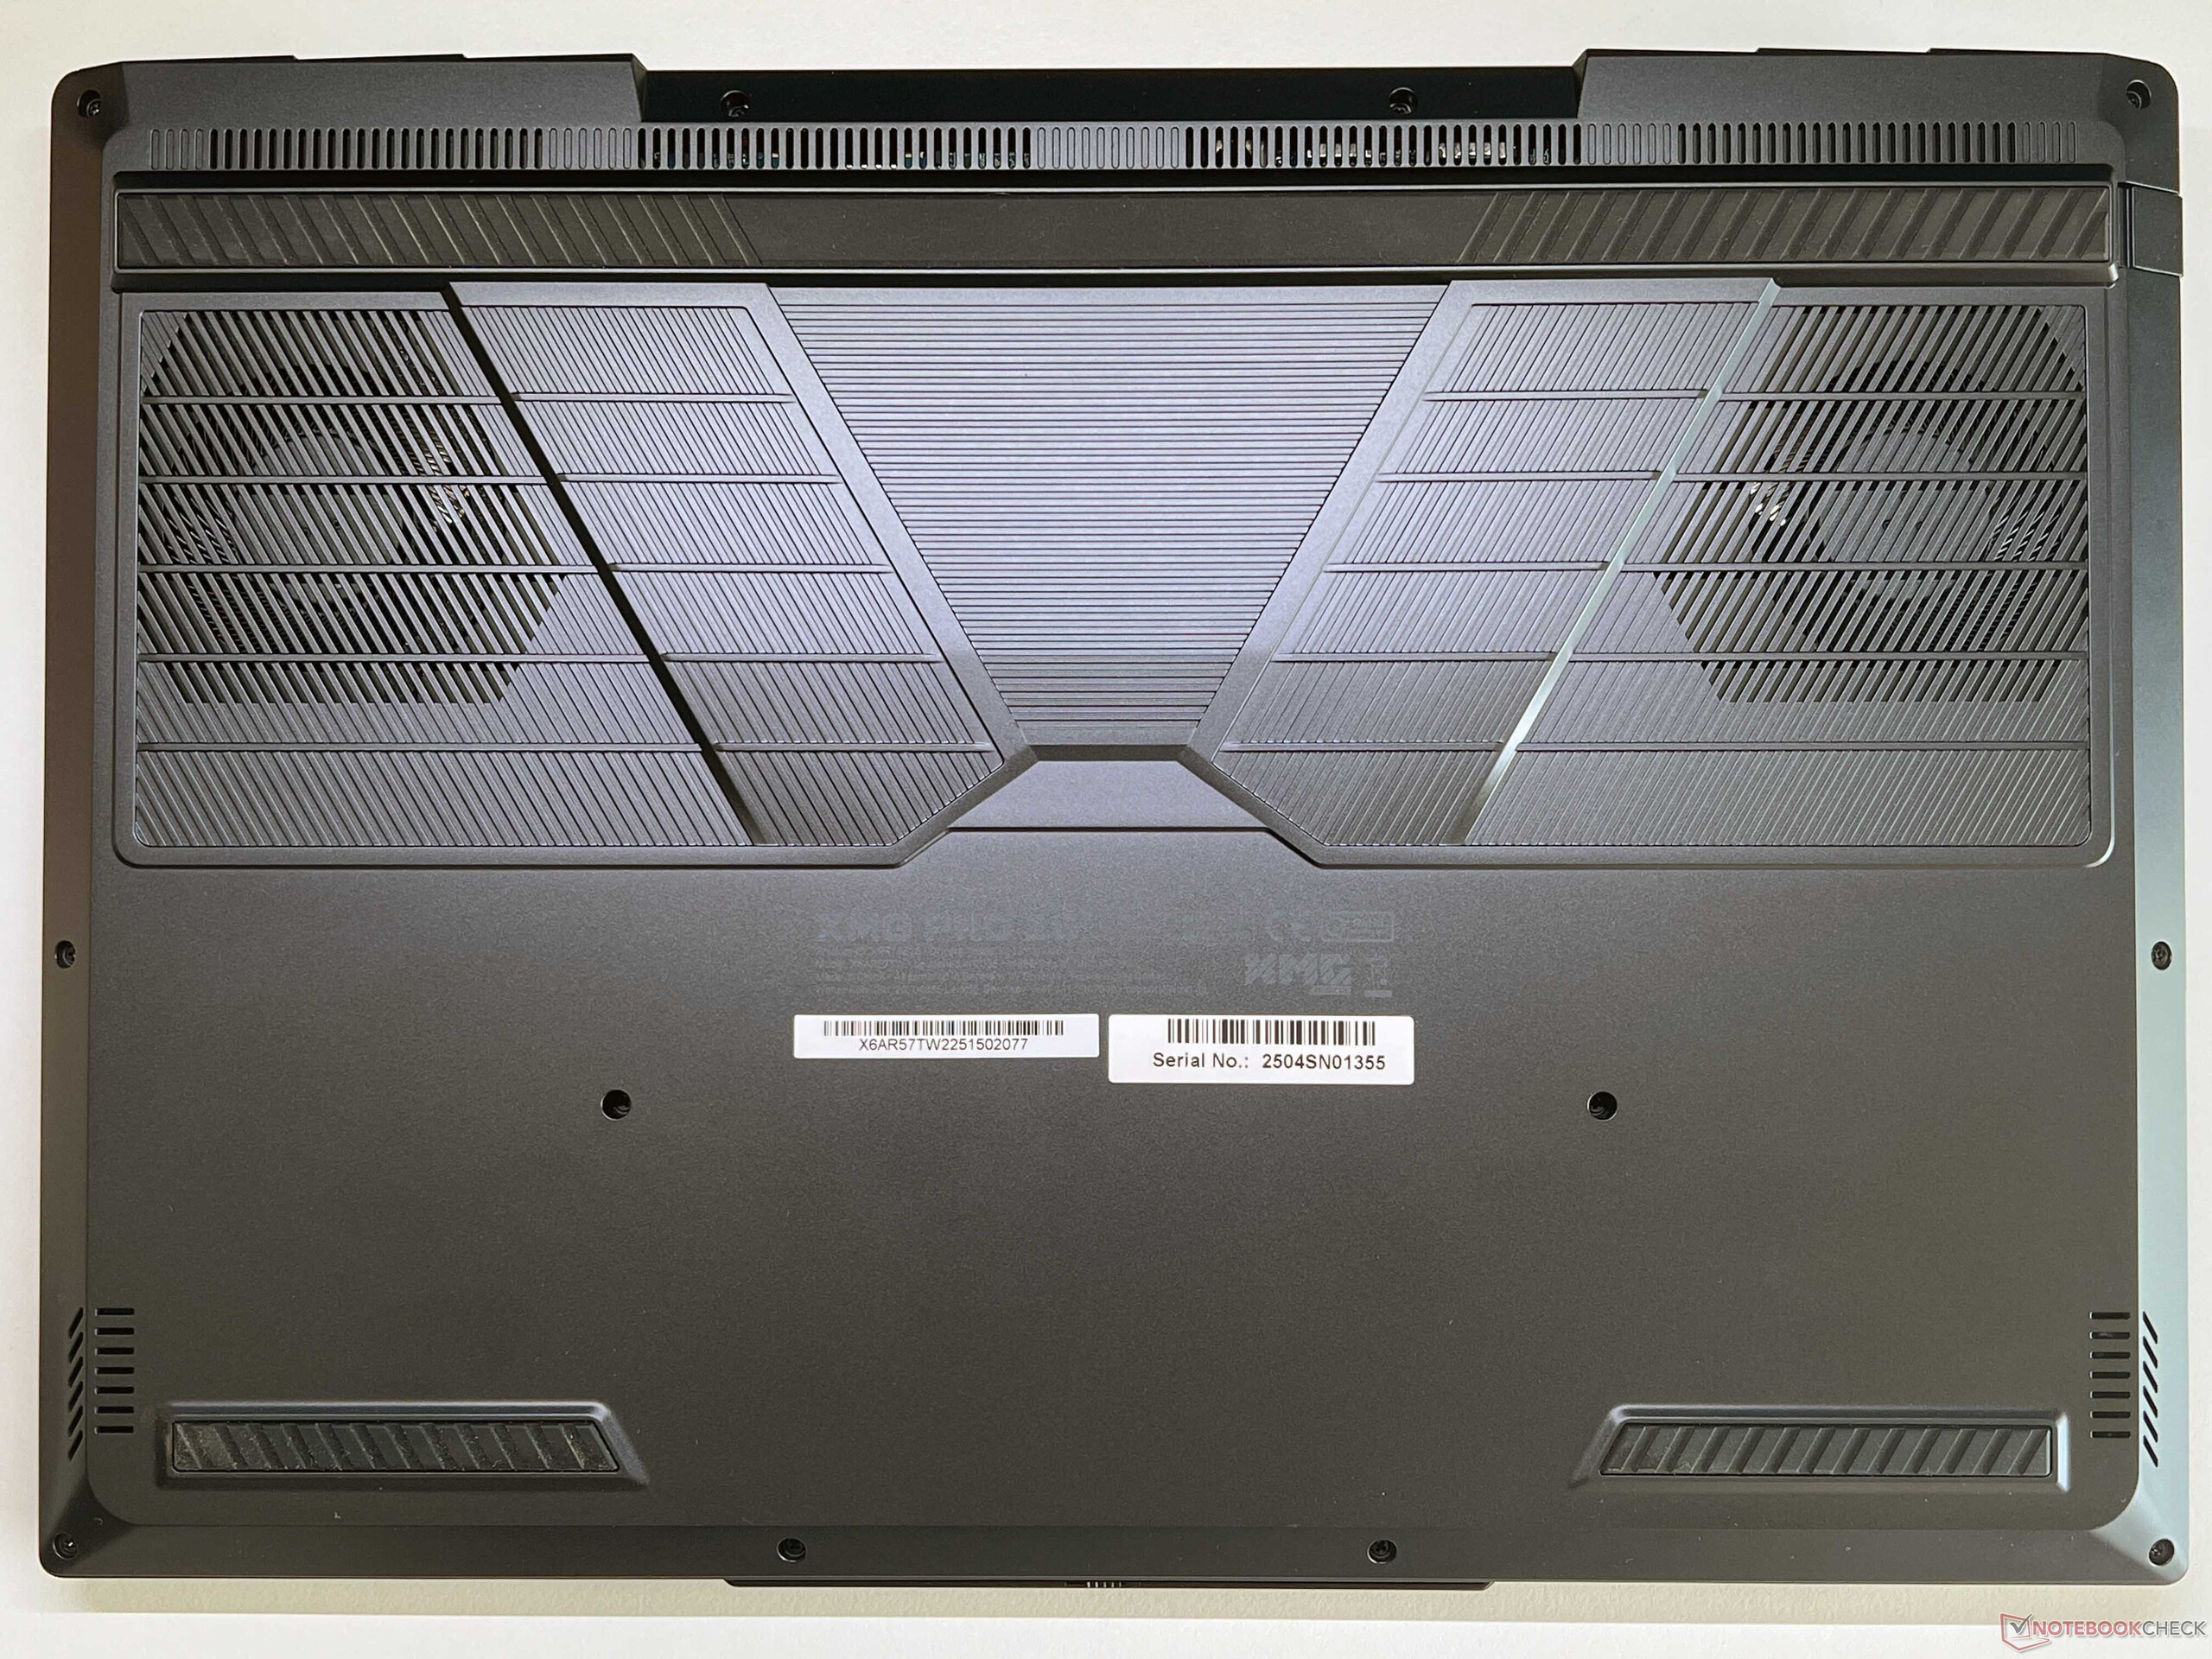
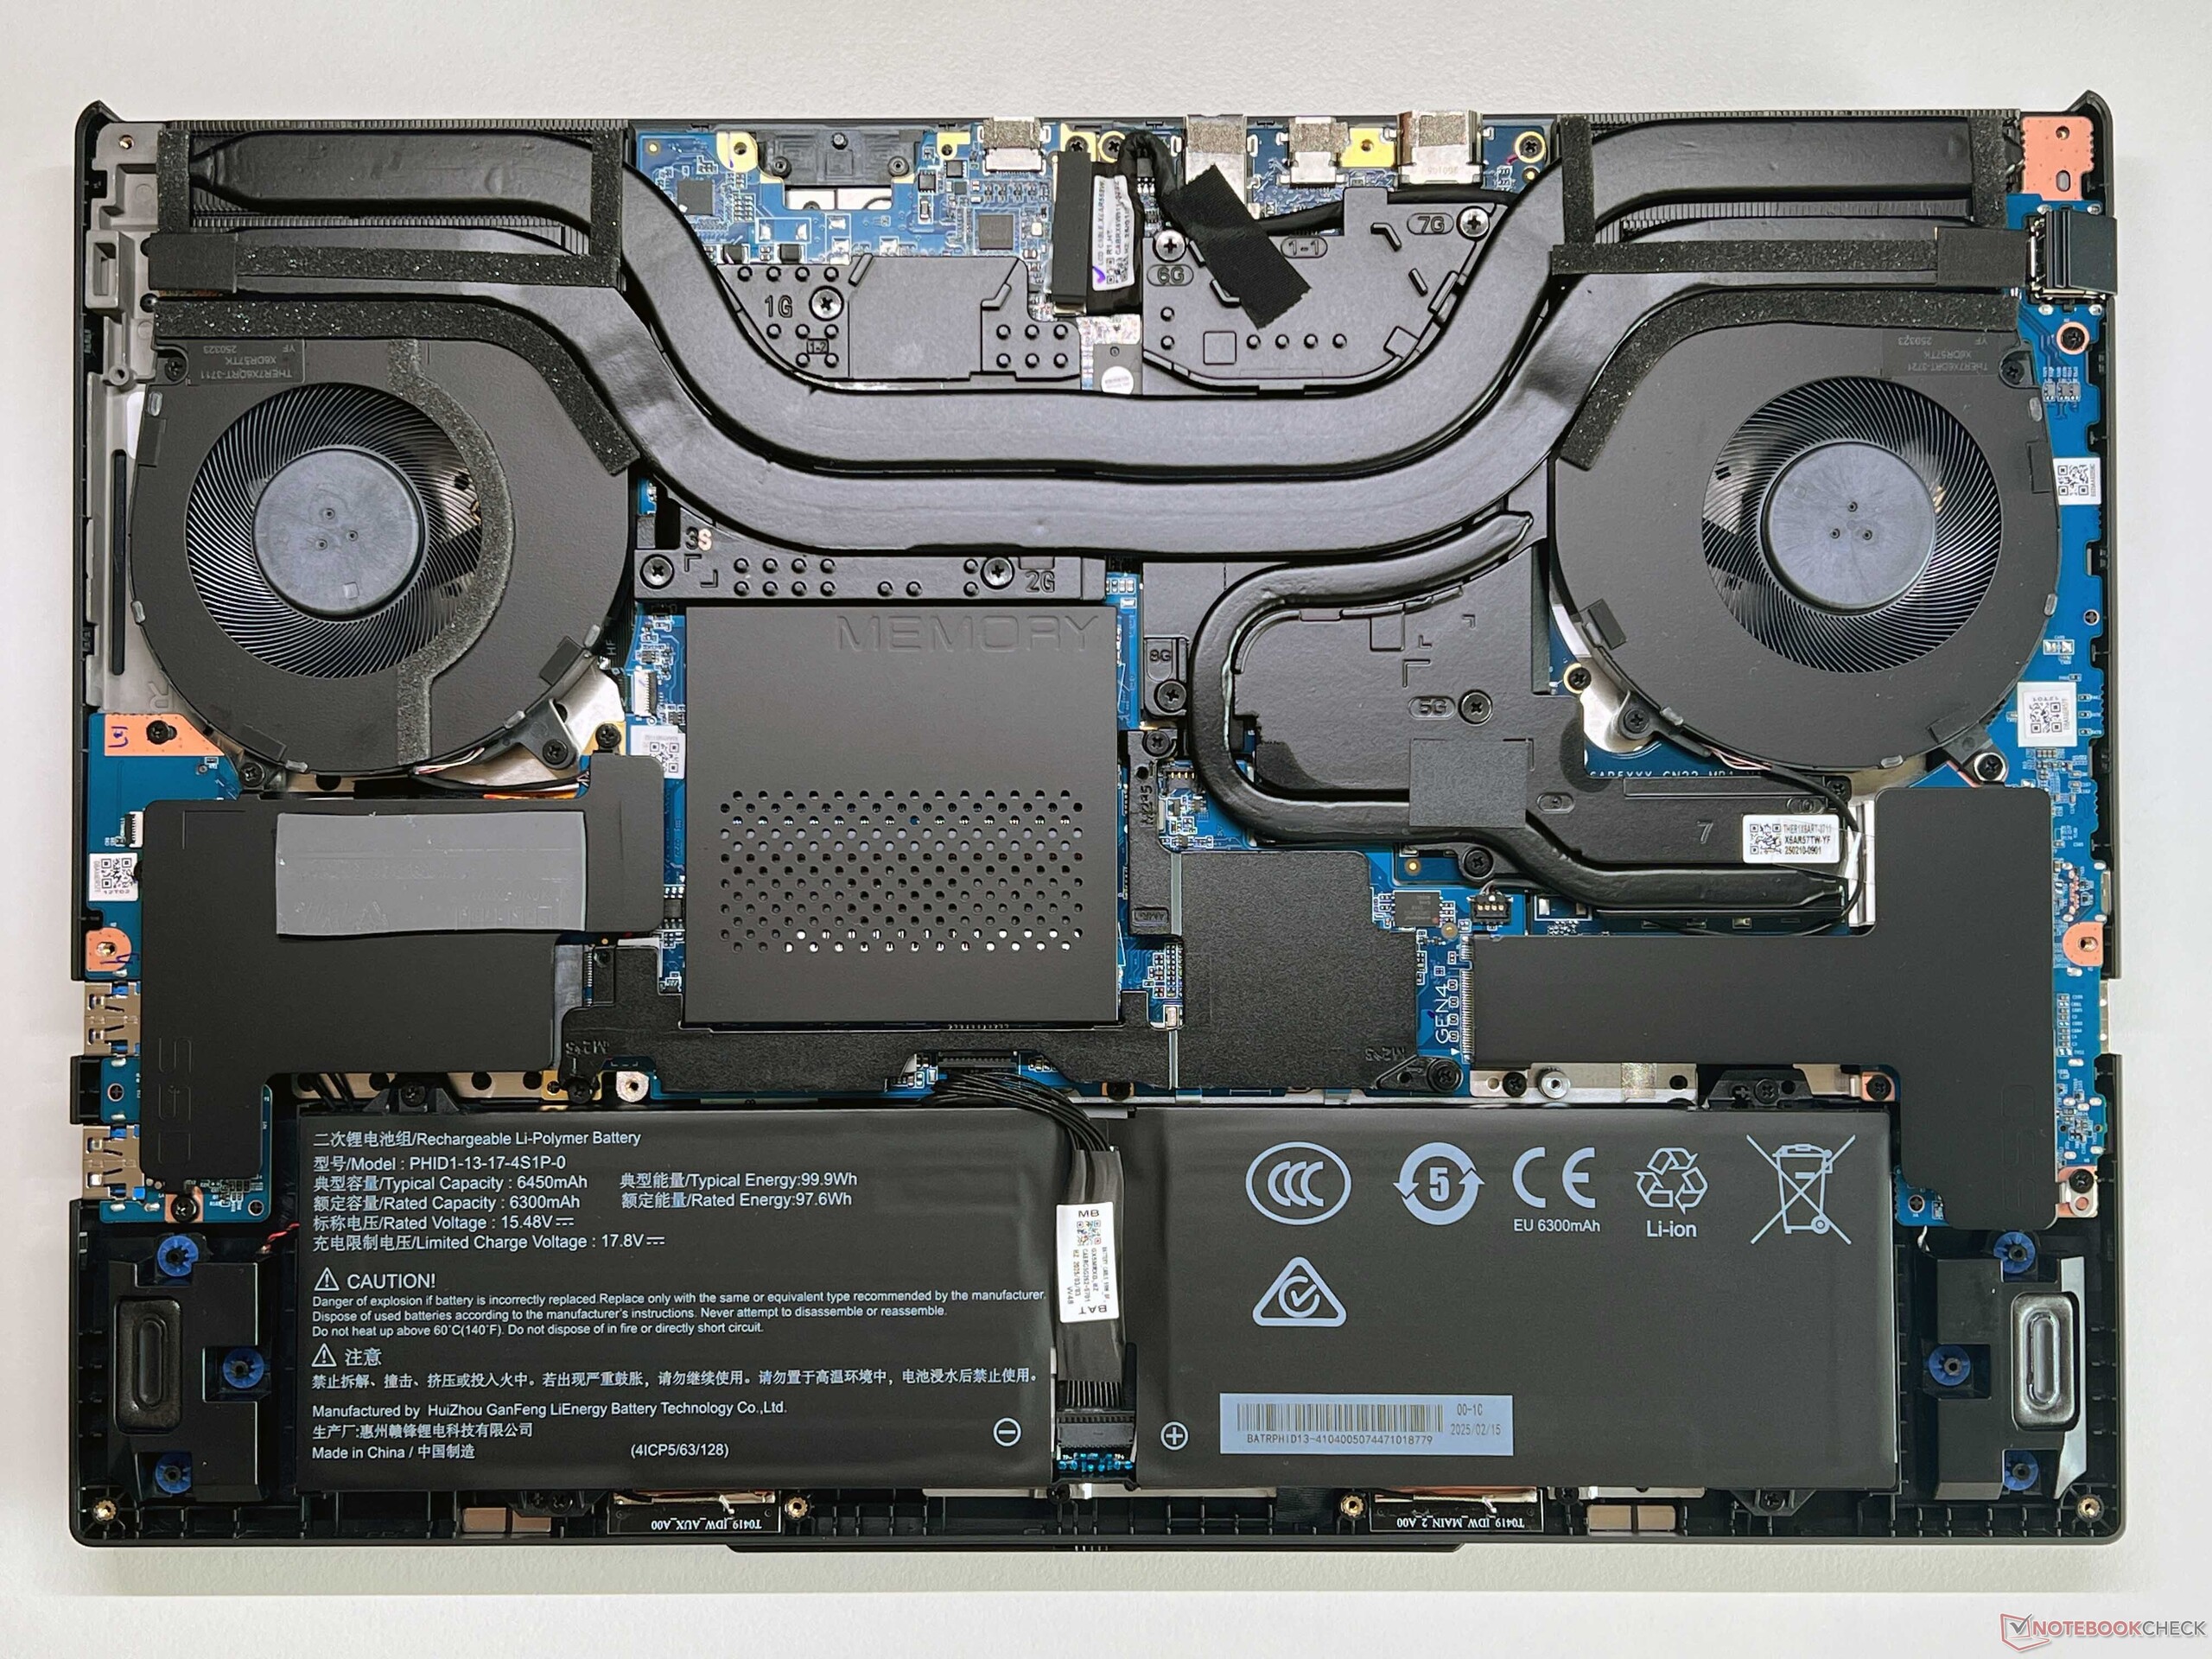
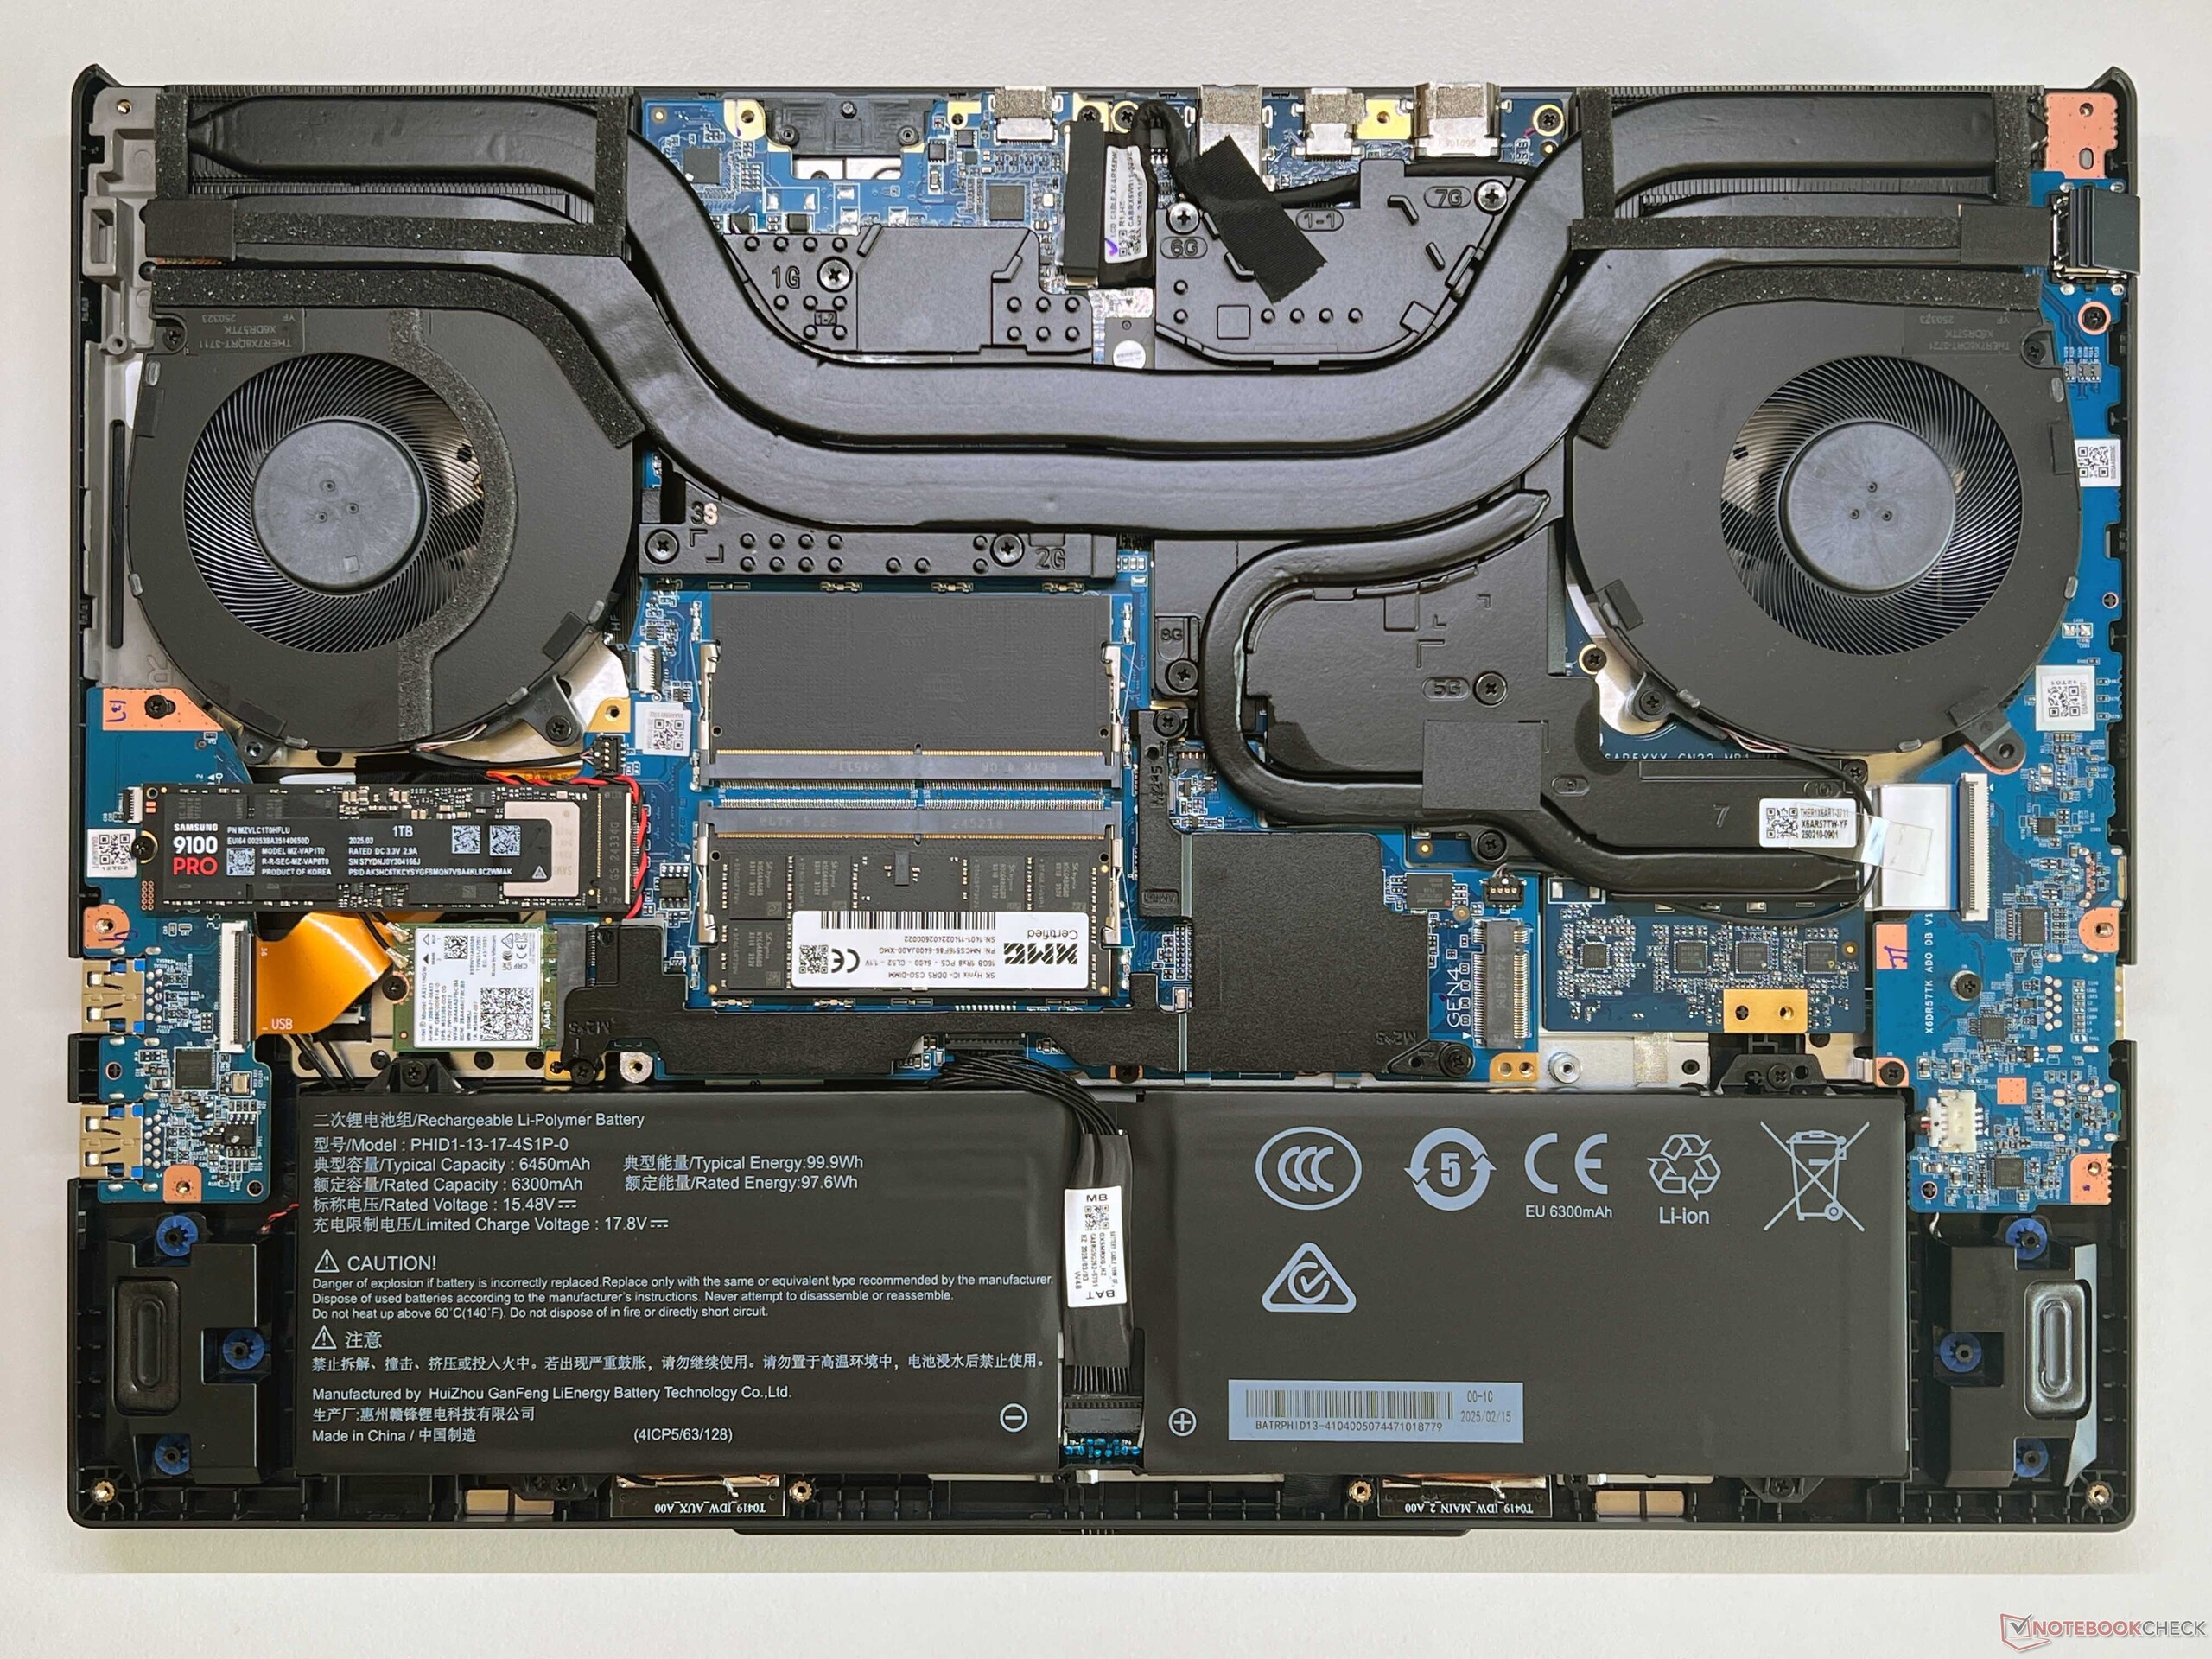
The XMG Pro 16 looks quite understated with its anthracite-colored case, and there are no lighting elements to be found at all. Its lid is made from aluminum, while its base unit and display frame are made of plastic. From a quality standpoint, we have nothing negative to say about its stability or finish, but its surfaces accumulate a lot of dirt. The hinges are well adjusted (max. opening angle almost 180 degrees) and we noted only minimal rocking during our test. The bottom cover is secured with 12 Phillips screws and can be easily removed. On the inside, you have access to the fans, battery, WLAN module, two SSD slots and two RAM slots. However, some of the components are located under additional screw-fastened covers (including thermal pads), which increases the effort needed for disassembly a little.
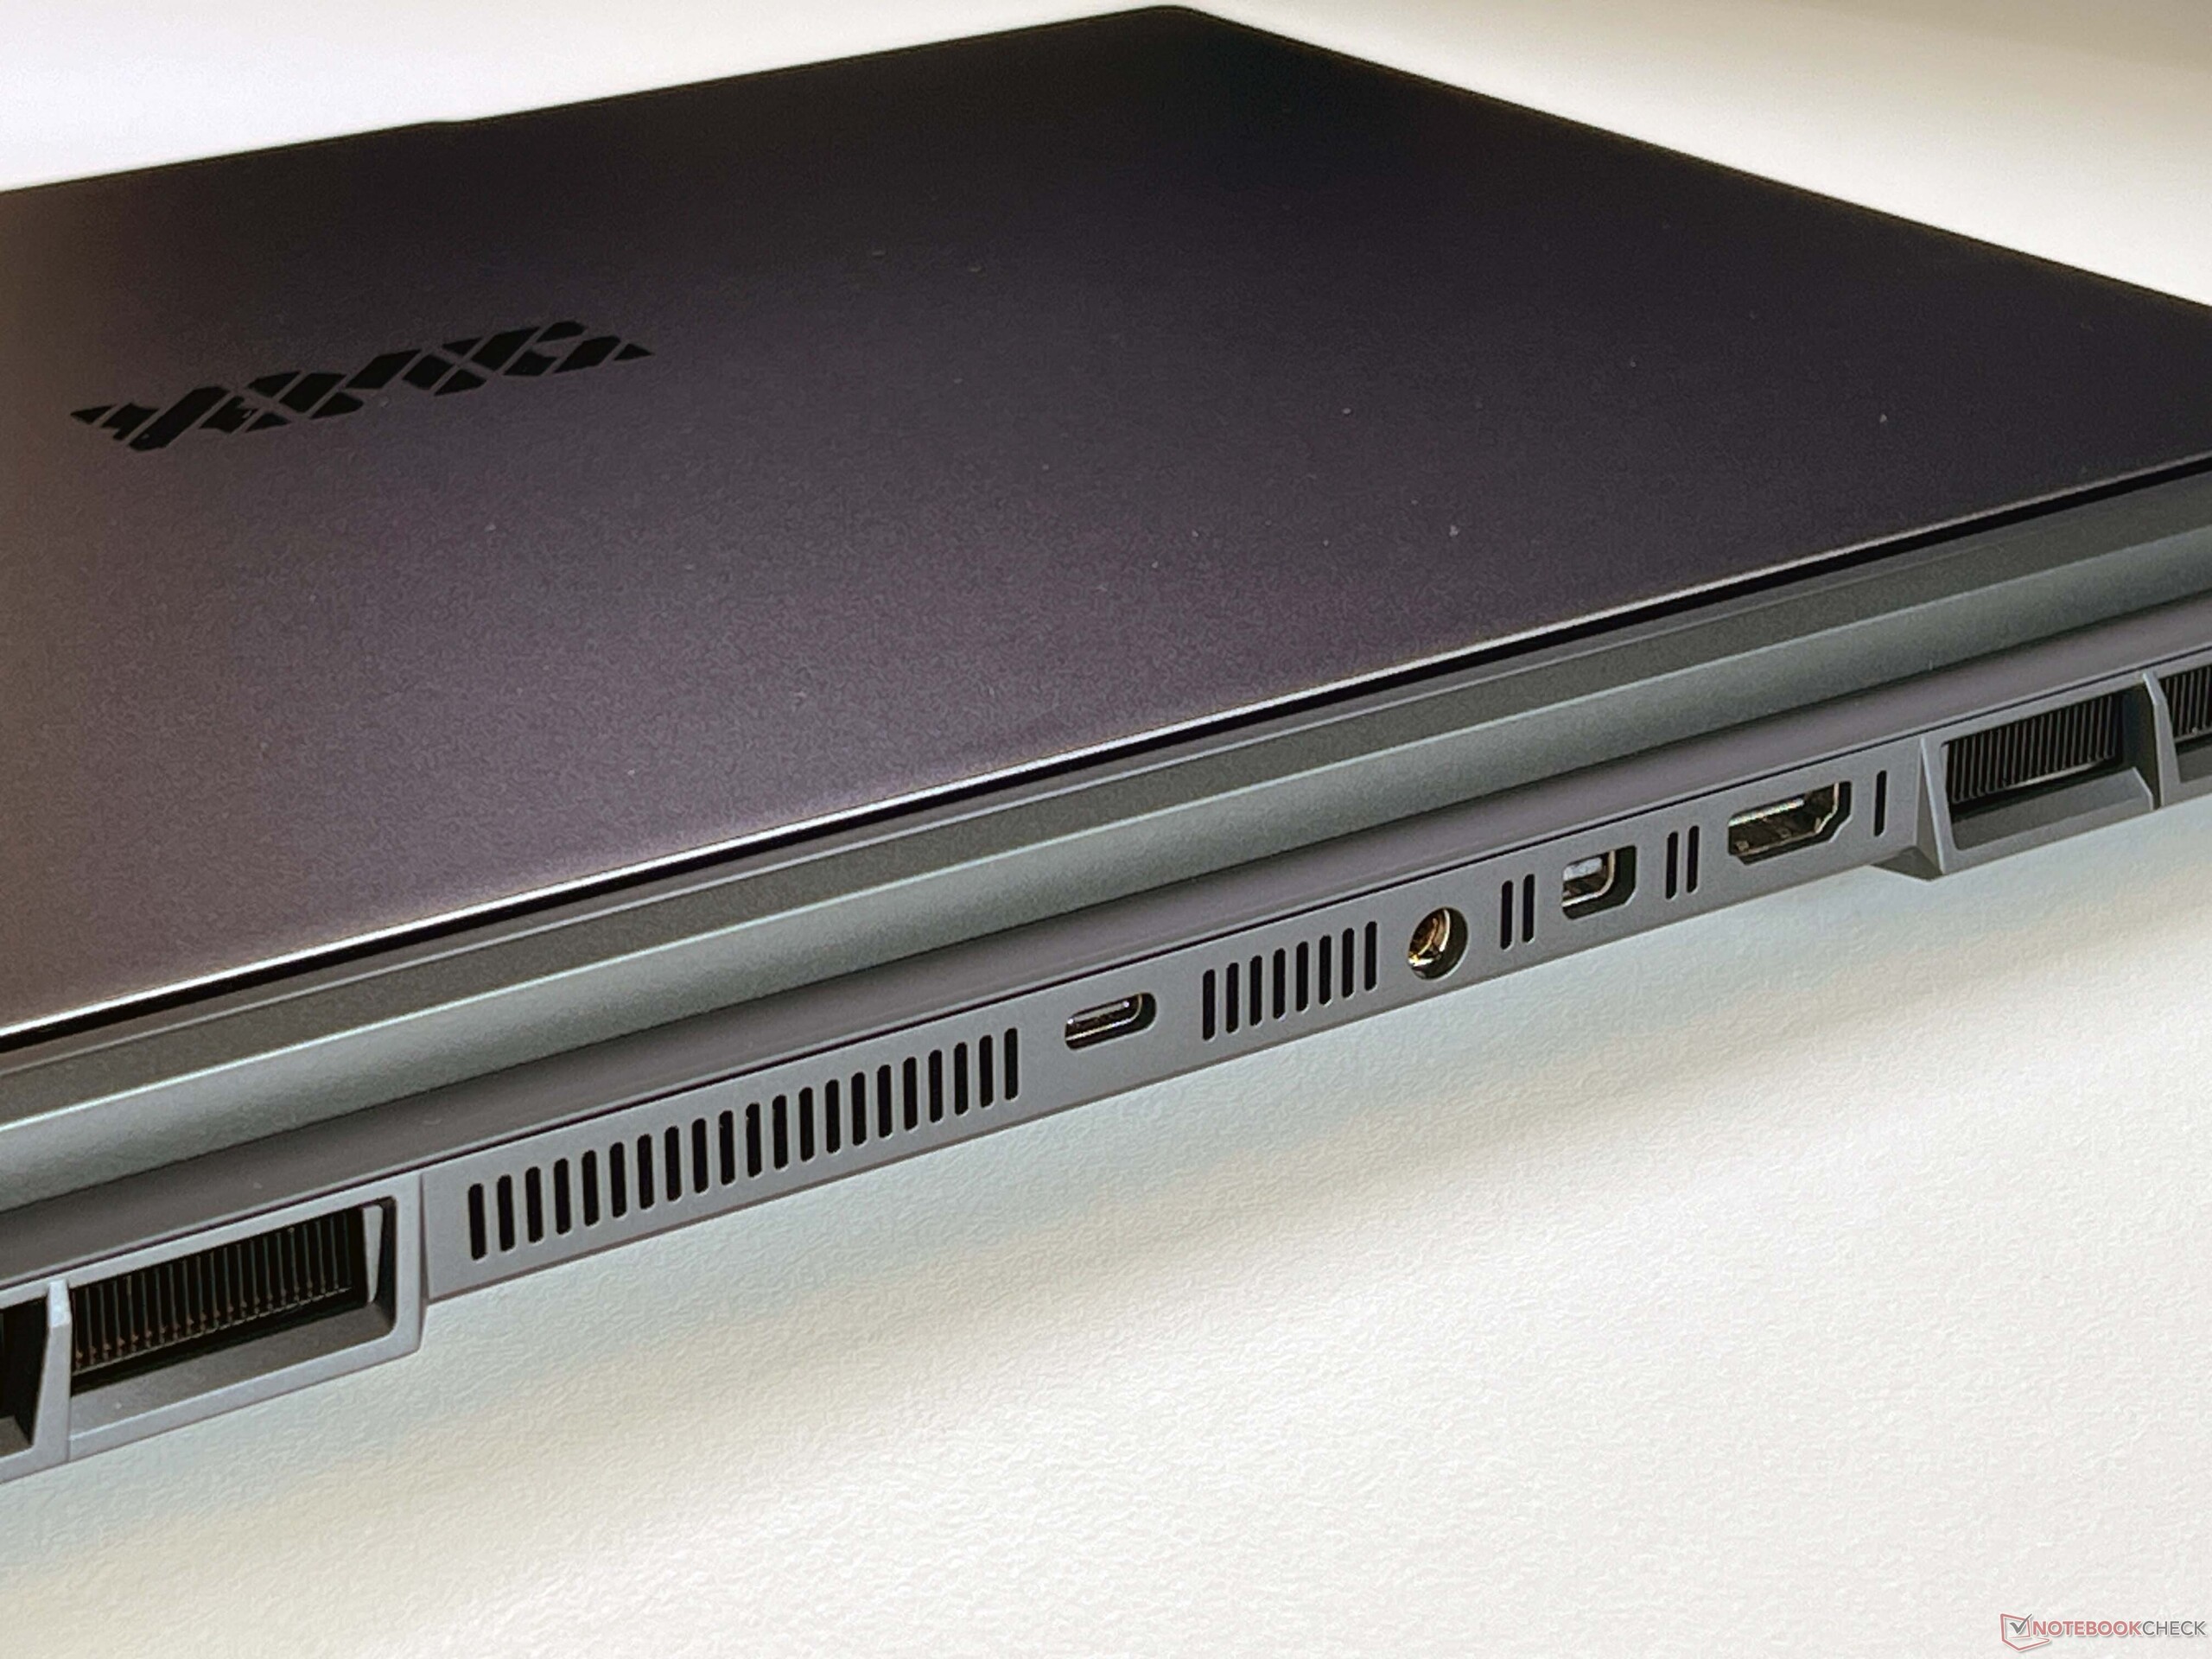
Customers of the Pro 16 will have to do without Thunderbolt 5 but otherwise, its connectivity is fine. The distribution of its ports is practical for everyday use and, unlike many current competitors, it also features connections at the back. Its fully-fledged card reader is very fast and its Wi-Fi module works reliably—but it doesn't yet support the Wi-Fi 7 standard. The device's 1080p webcam with a mechanical shutter takes average photos. It isn't a Copilot+ laptop, but it supports the webcam's Studio Effects and live subtitling.


| SD Card Reader | |
| average JPG Copy Test (av. of 3 runs) | |
| Schenker XMG Pro 16 (E25) (Angelbird AV Pro V60) | |
| Average of class Gaming (20.9 - 210, n=54, last 2 years) | |
| Schenker XMG Pro 16 Studio (Mid 24) (AV PRO microSD 128 GB V60) | |
| maximum AS SSD Seq Read Test (1GB) | |
| Schenker XMG Pro 16 (E25) (Angelbird AV Pro V60) | |
| Average of class Gaming (25.5 - 261, n=51, last 2 years) | |
| Schenker XMG Pro 16 Studio (Mid 24) (AV PRO microSD 128 GB V60) | |
| Networking | |
| Schenker XMG Pro 16 (E25) | |
| iperf3 transmit AXE11000 | |
| iperf3 receive AXE11000 | |
| Schenker XMG Pro 16 Studio (Mid 24) | |
| iperf3 transmit AXE11000 | |
| iperf3 receive AXE11000 | |
| Asus ROG Strix G16 G615 | |
| iperf3 transmit AXE11000 | |
| iperf3 receive AXE11000 | |
| Tuxedo Sirius 16 Gen 1 | |
| iperf3 transmit AXE11000 | |
| iperf3 receive AXE11000 | |
| iperf3 transmit AXE11000 6GHz | |
| iperf3 receive AXE11000 6GHz | |
| Lenovo Legion Pro 5 16IRX9 | |
| iperf3 transmit AXE11000 | |
| iperf3 receive AXE11000 | |
| iperf3 transmit AXE11000 6GHz | |
| iperf3 receive AXE11000 6GHz | |
| Lenovo Legion Pro 7i 16 Gen 10 | |
| iperf3 transmit AXE11000 | |
| iperf3 receive AXE11000 | |
| iperf3 transmit AXE11000 6GHz | |
| iperf3 receive AXE11000 6GHz | |

 GeForce RTX 5070 Ti Laptop, Ultra 9 275HX, Samsung 9100 Pro 1 TB")
 GeForce RTX 5070 Ti Laptop, Ultra 9 275HX, Samsung 9100 Pro 1 TB")
Sustainability
Schenker hasn't provided any information on the laptop's CO2 footprint or environmental certifications. Its packaging consists almost entirely of paper/cardboard.
Input devices
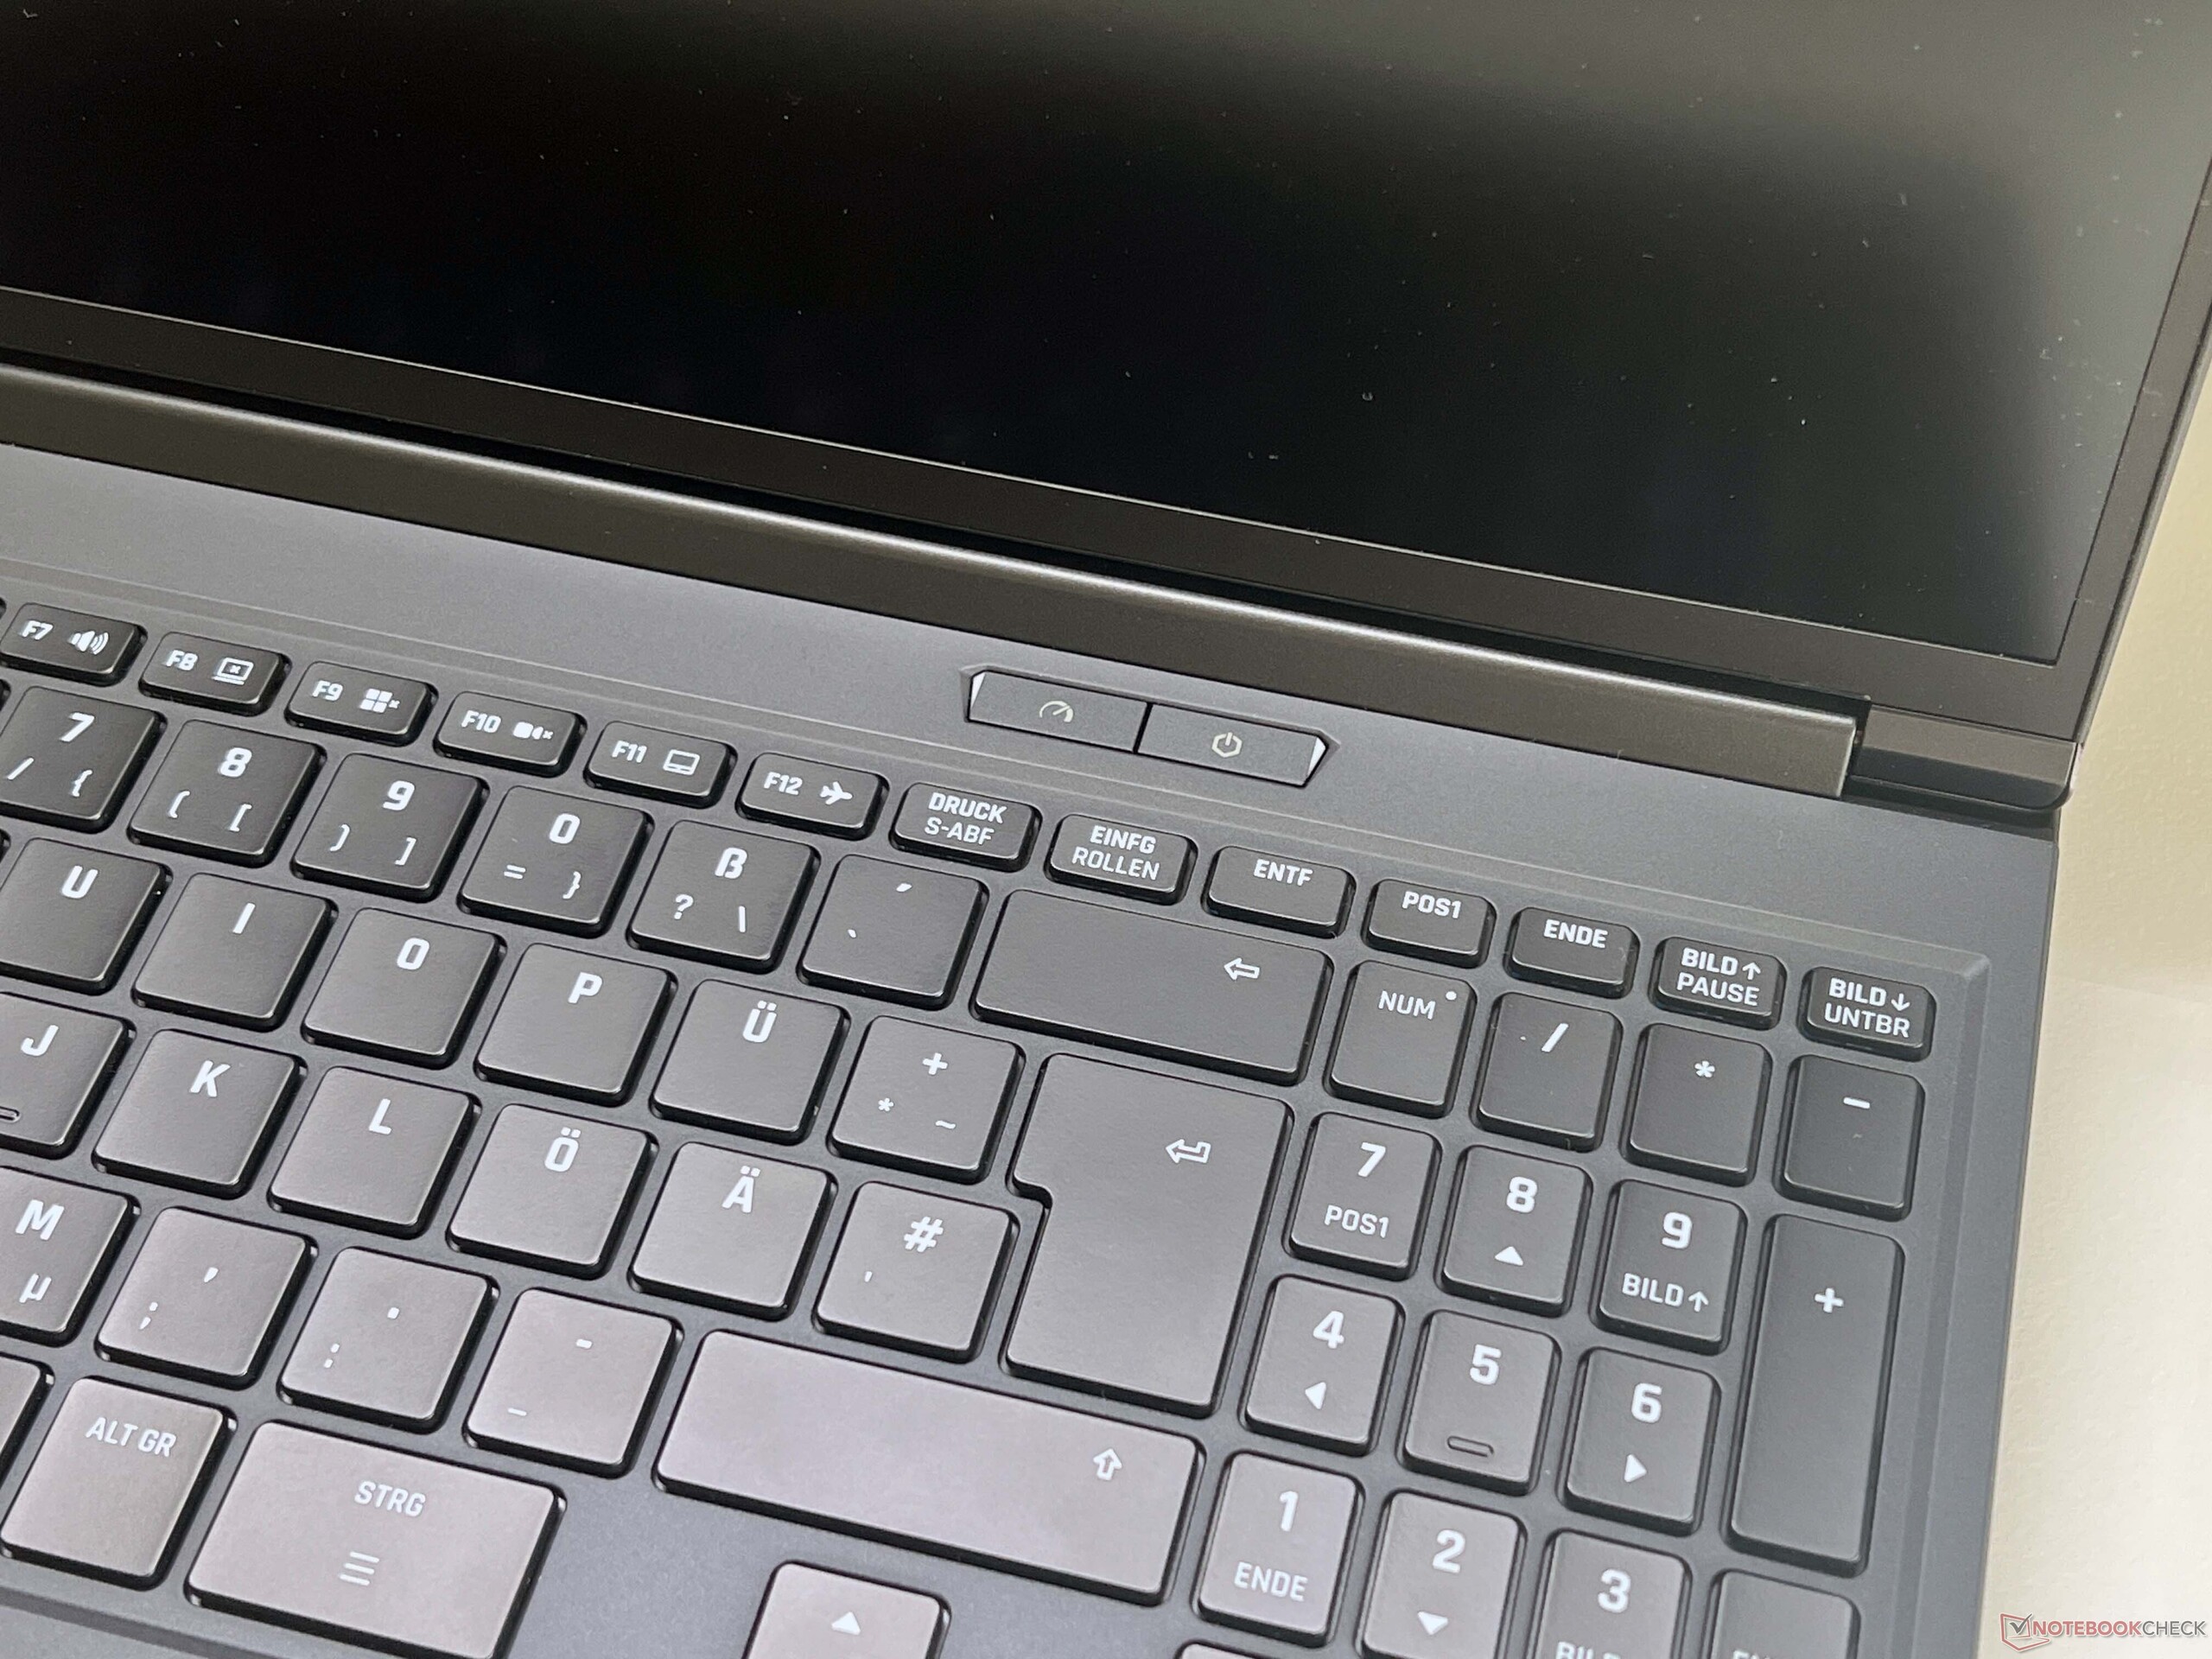
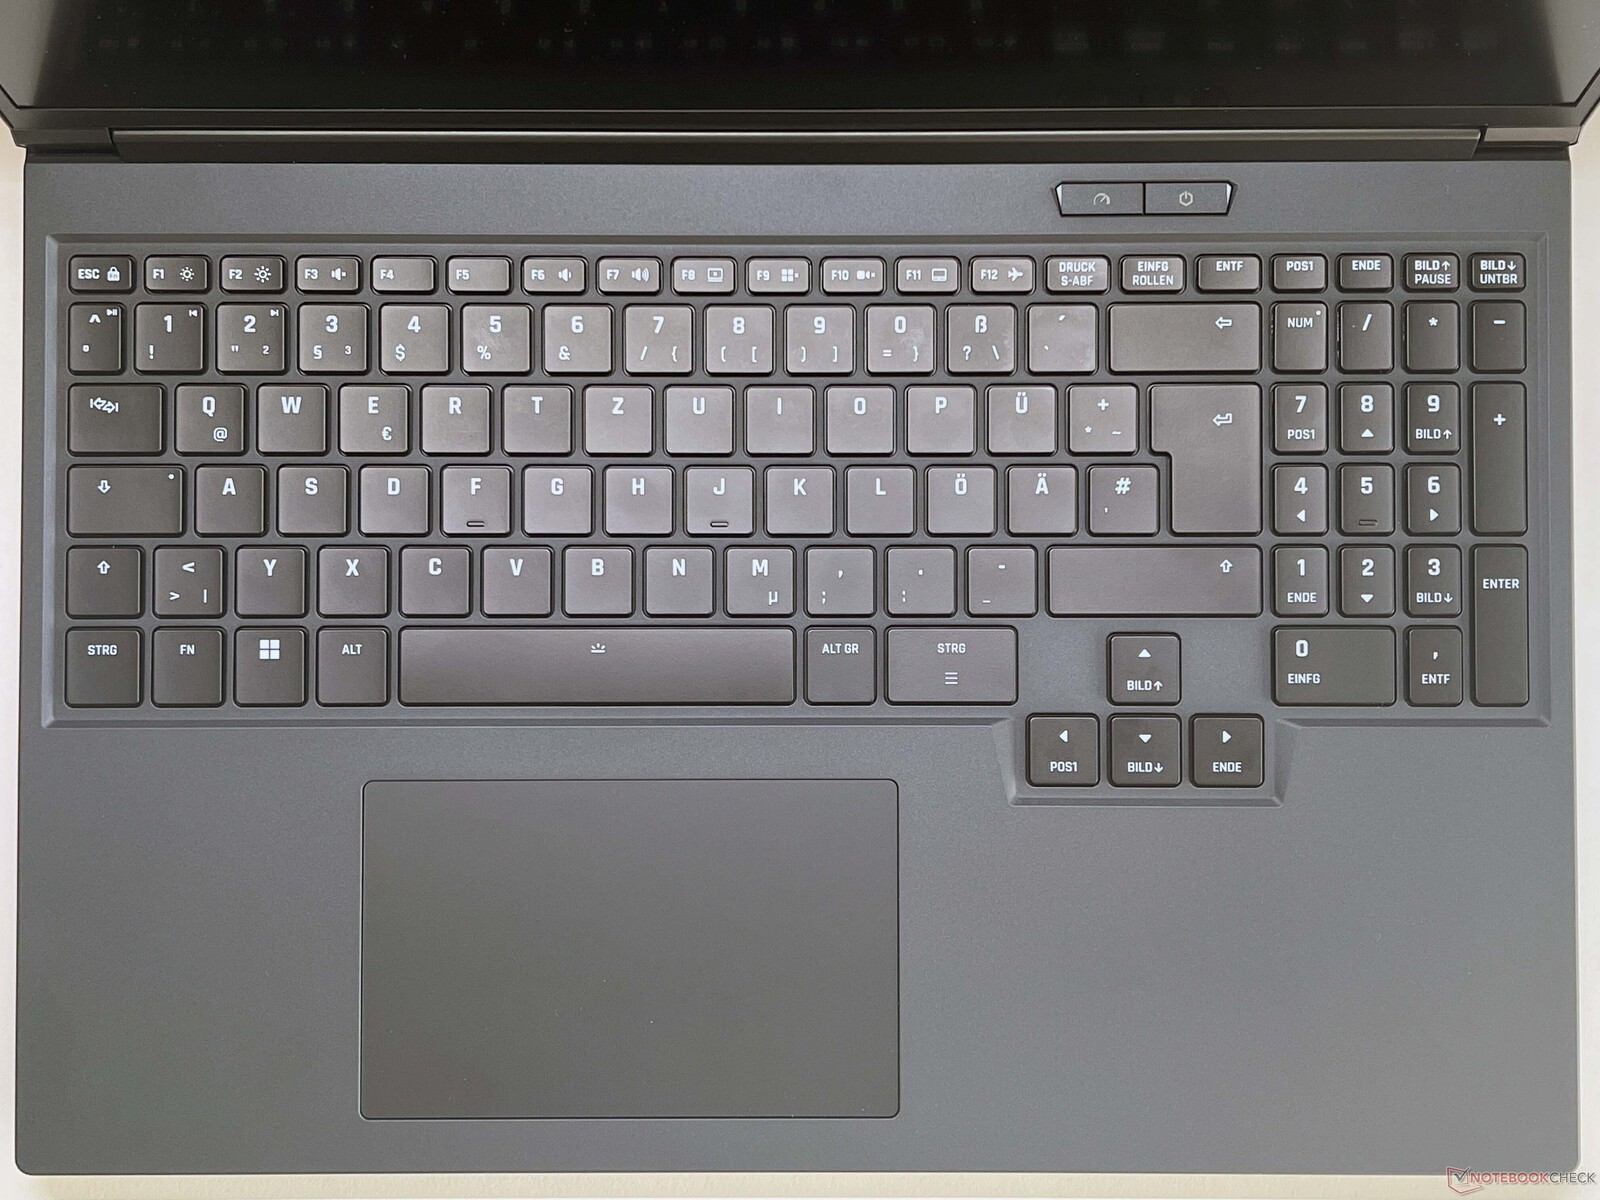
Its keyboard layout is now the same as on the Neo 16 including offset arrow keys, and it feels comfortable to type on—albeit not quite as good as its more expensive brother. Nevertheless, you can even write long texts without any problems. It features individual key backlighting (four intensity levels) and you can really get creative with the colors. Its ClickPad has become somewhat smaller (12.2 x 7.8 cm), but is still big enough. The mechanical clicks it produces sound quite loud, but it feels nice and smooth.

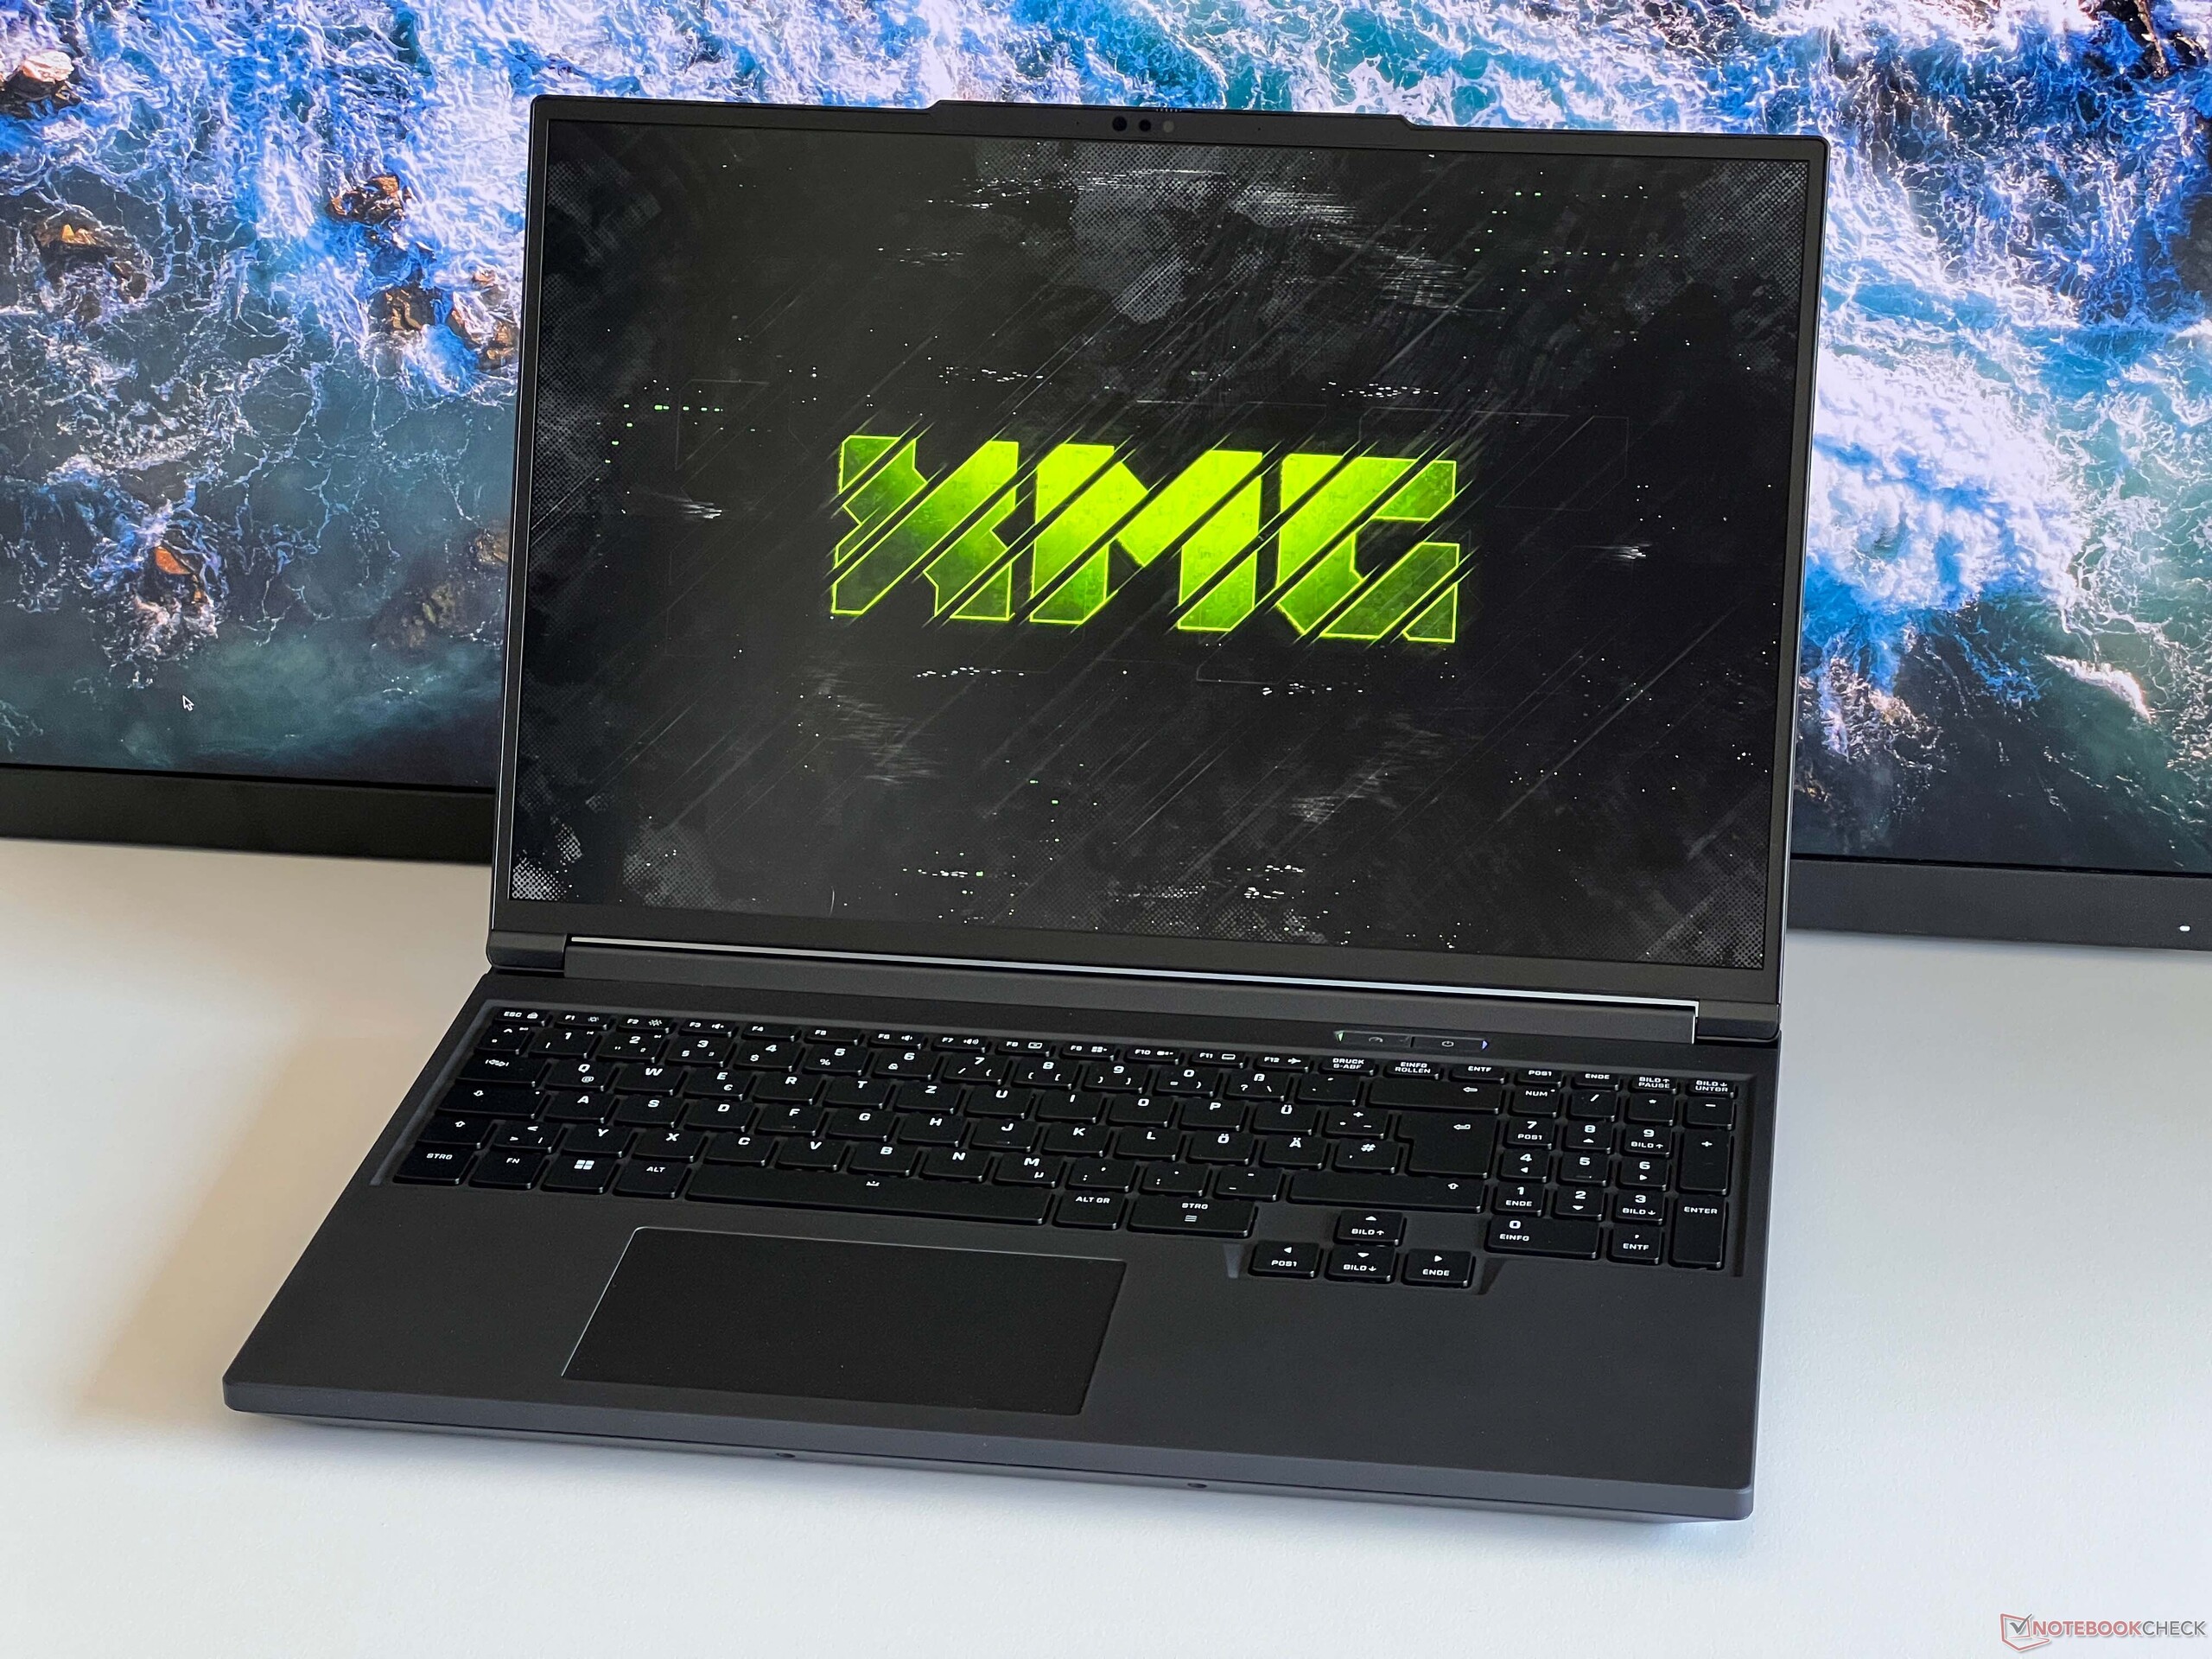
Display - IPS at 300 Hz

The Pro 16 is fitted with a WQHD IPS panel (2,560 x 1,600). Subjectively, the matte panel's image quality is very good, and movements appear super fluid thanks to its 300 Hz refresh rate. Its response times are similarly fast, and we noted no PWM flickering.
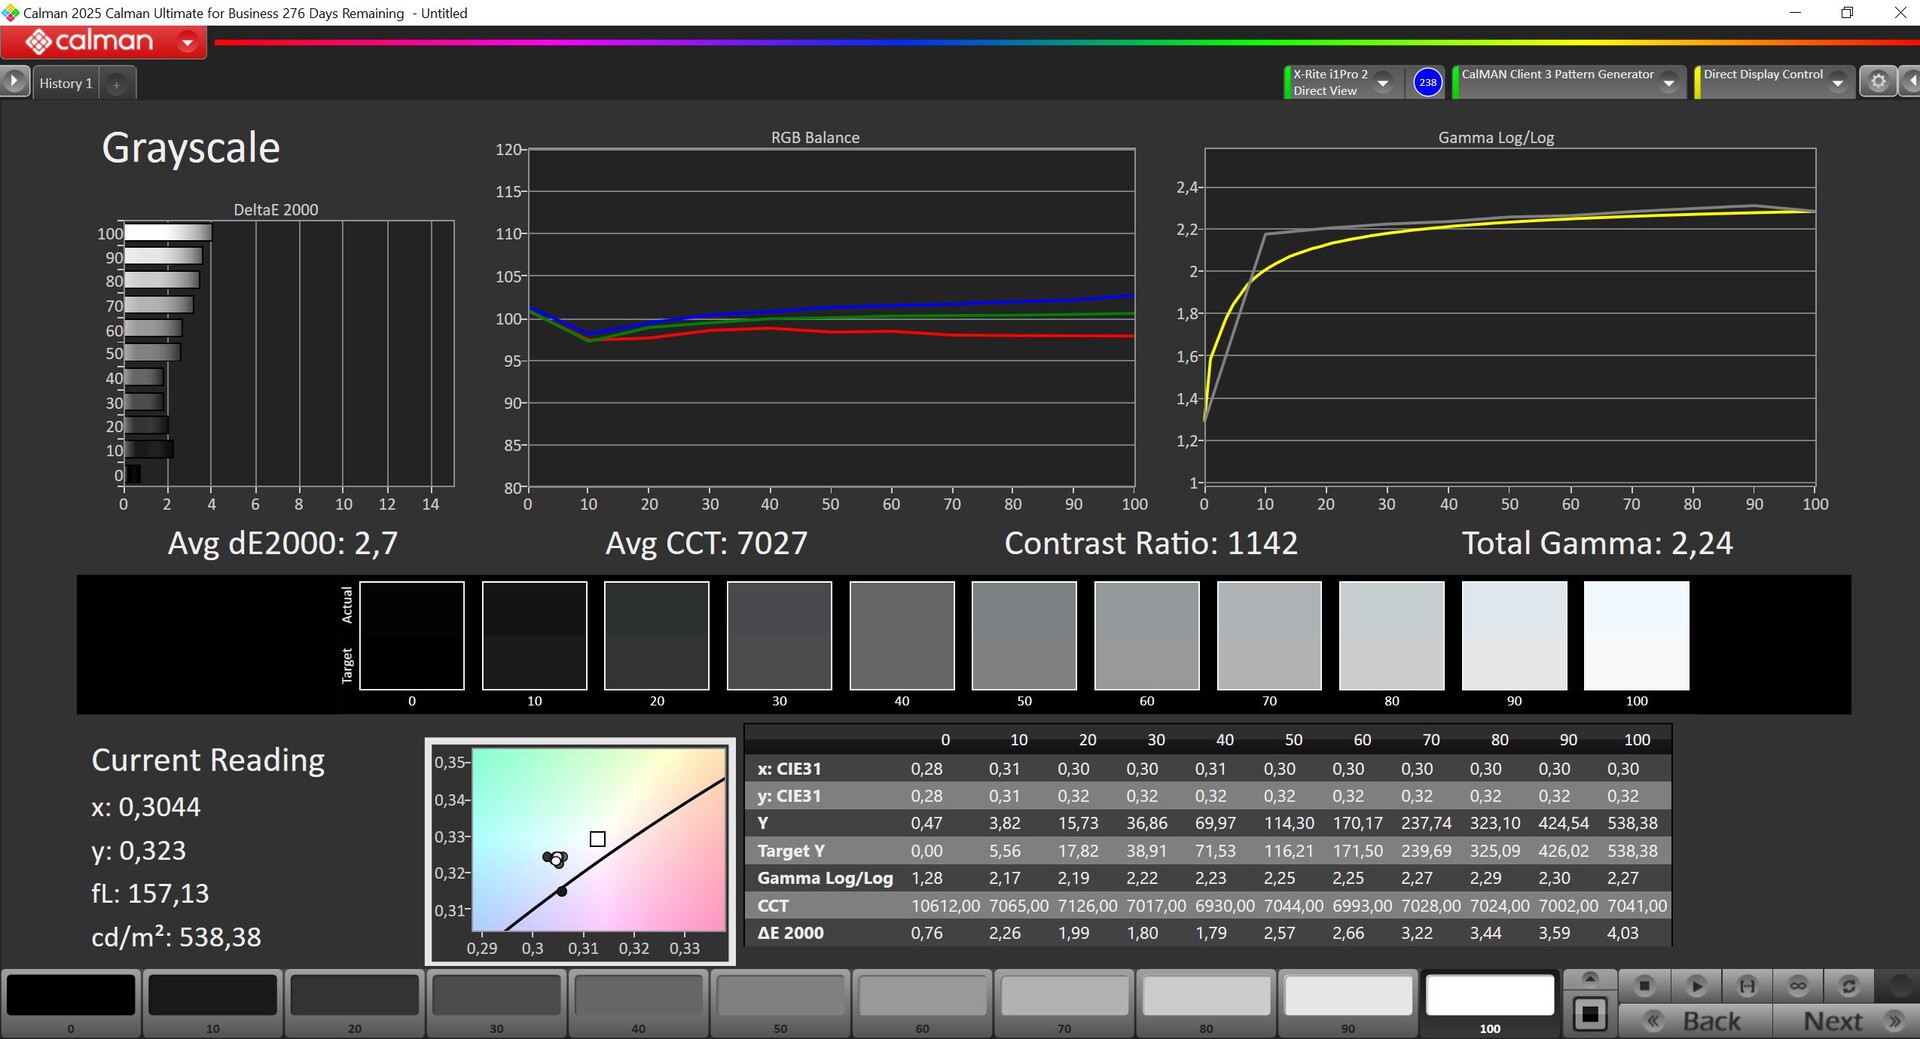
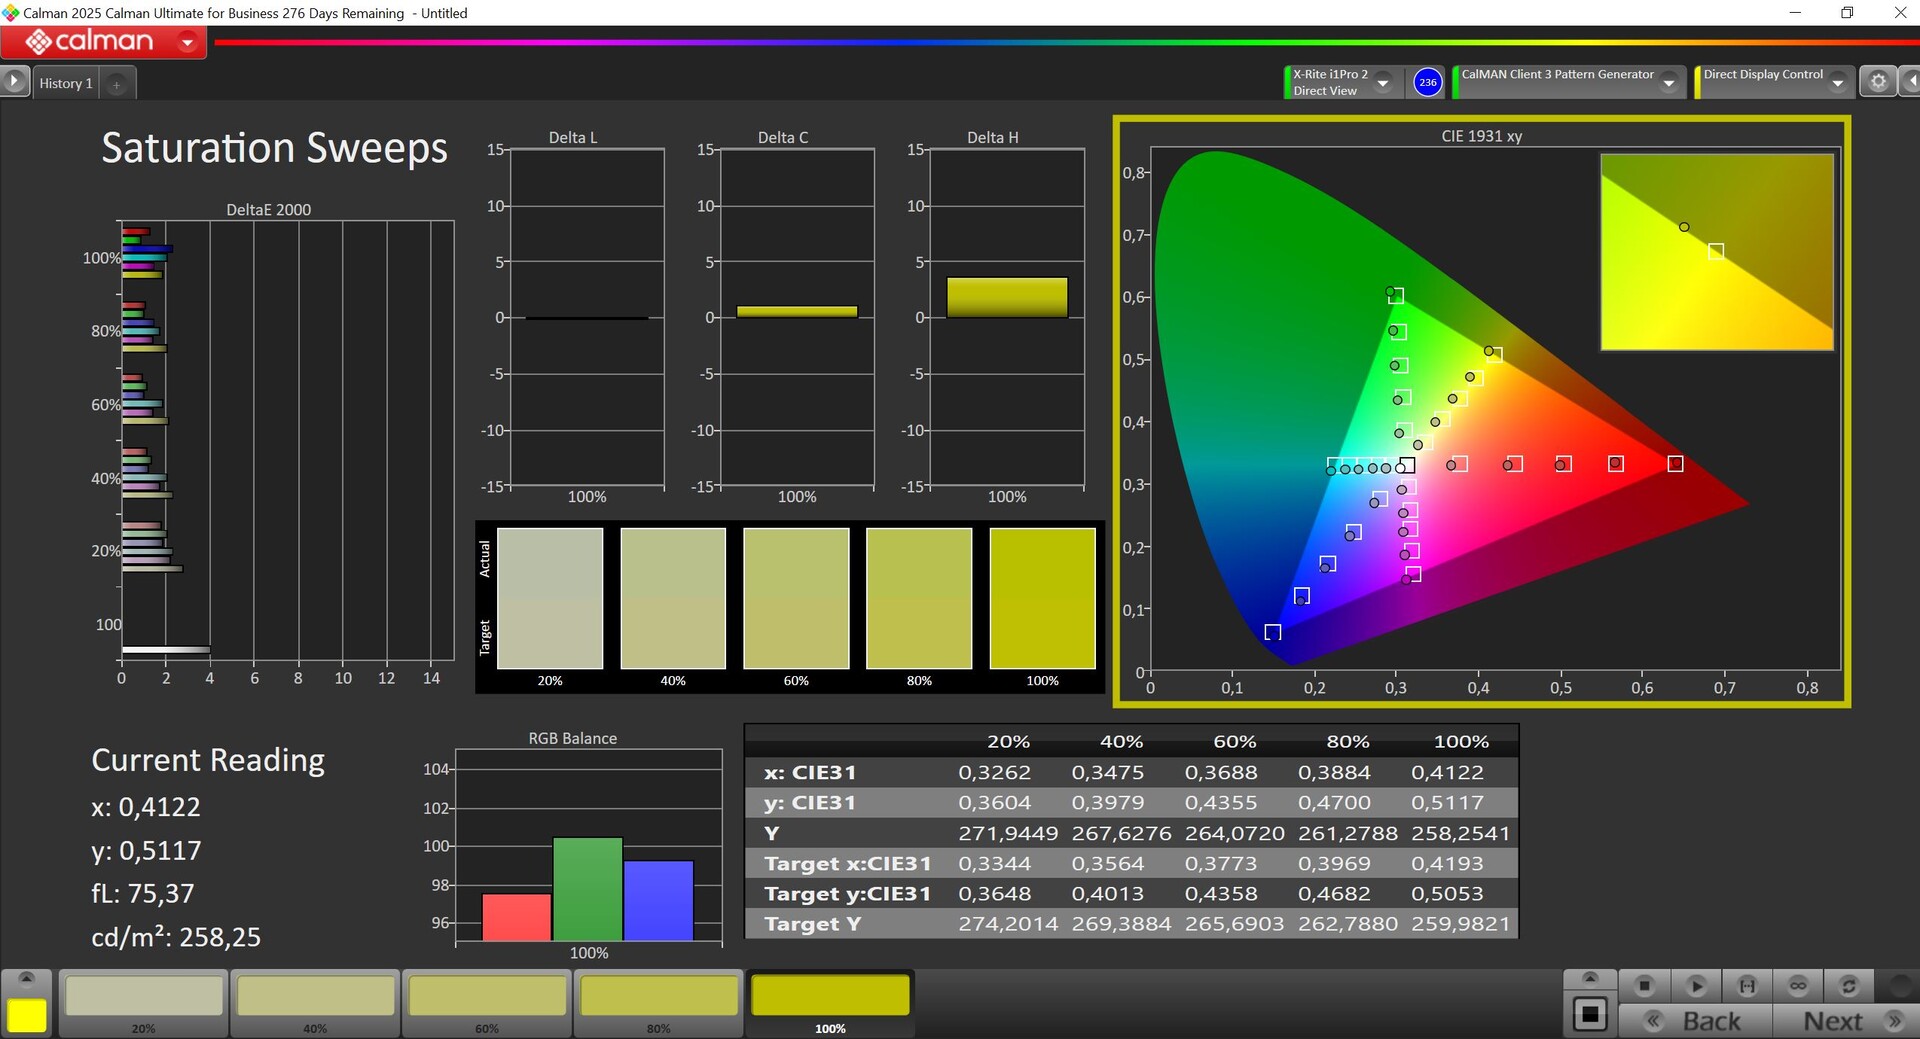
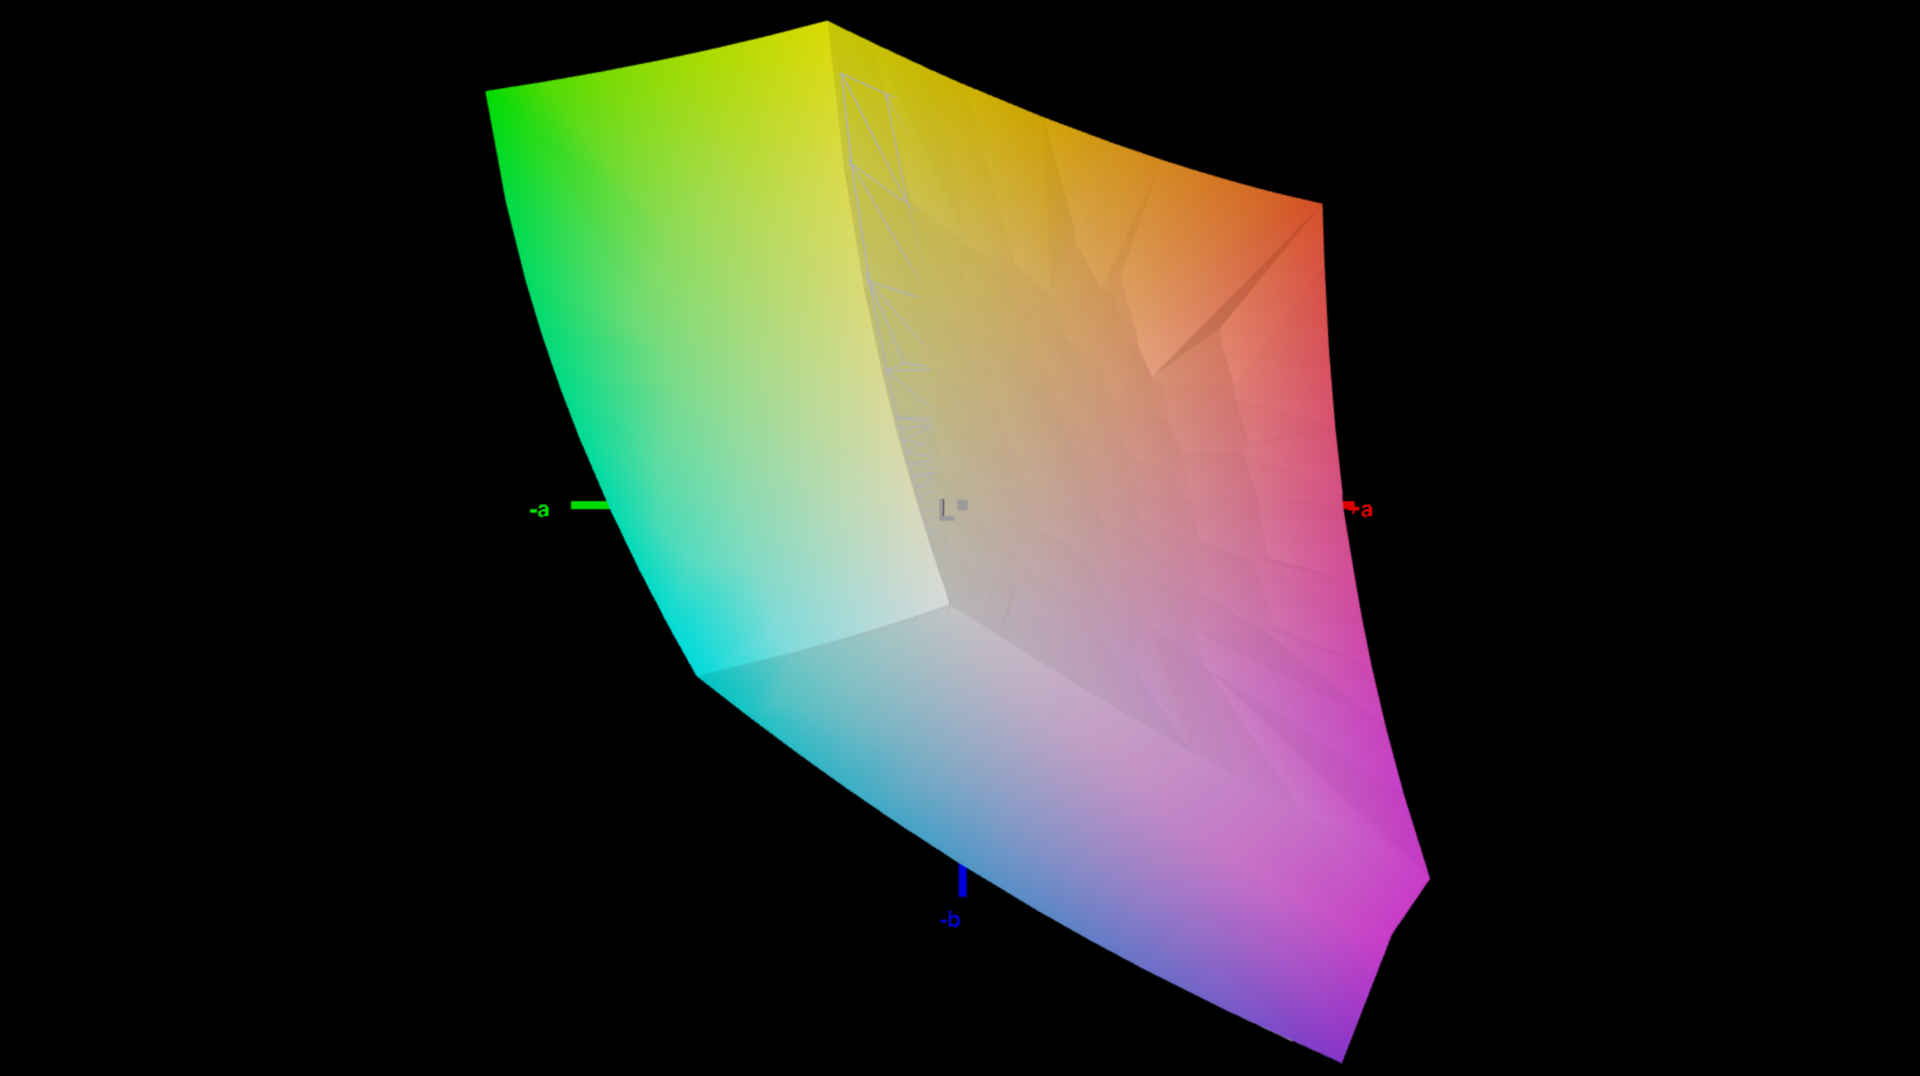
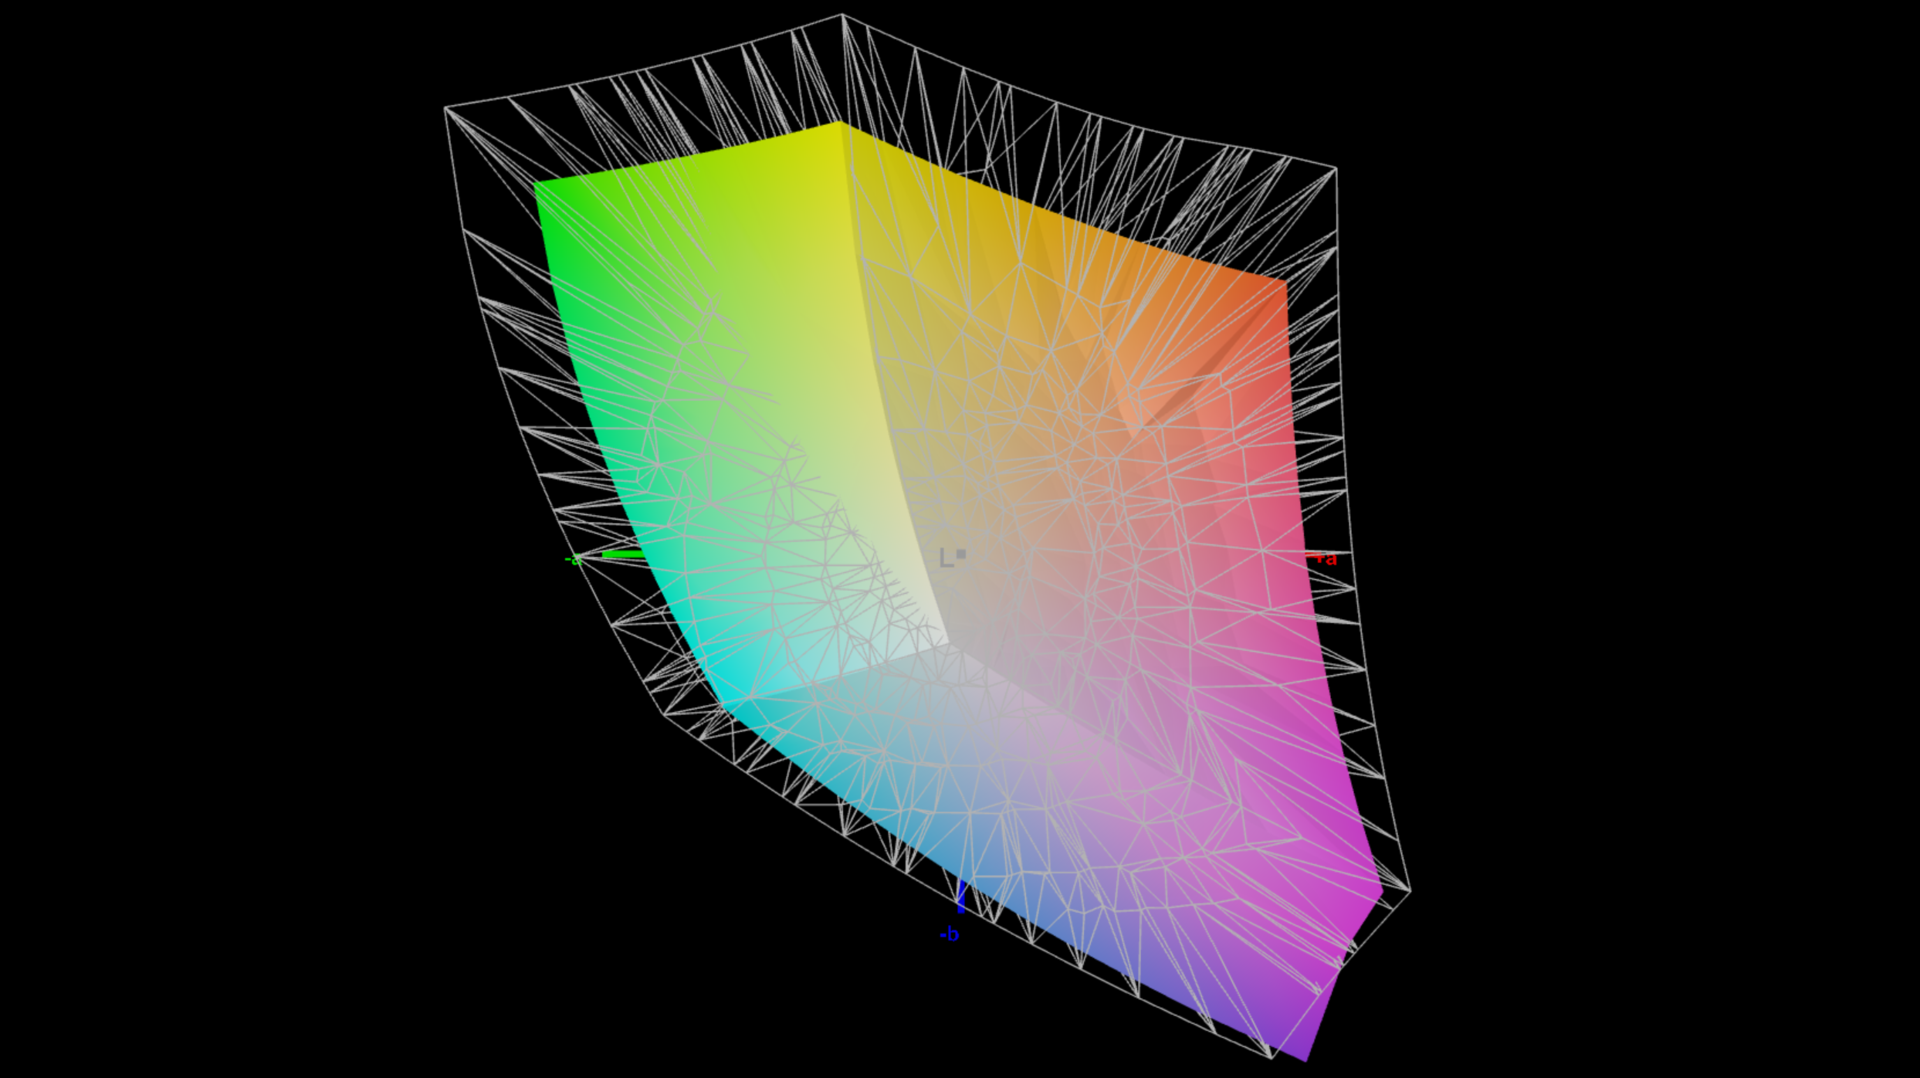
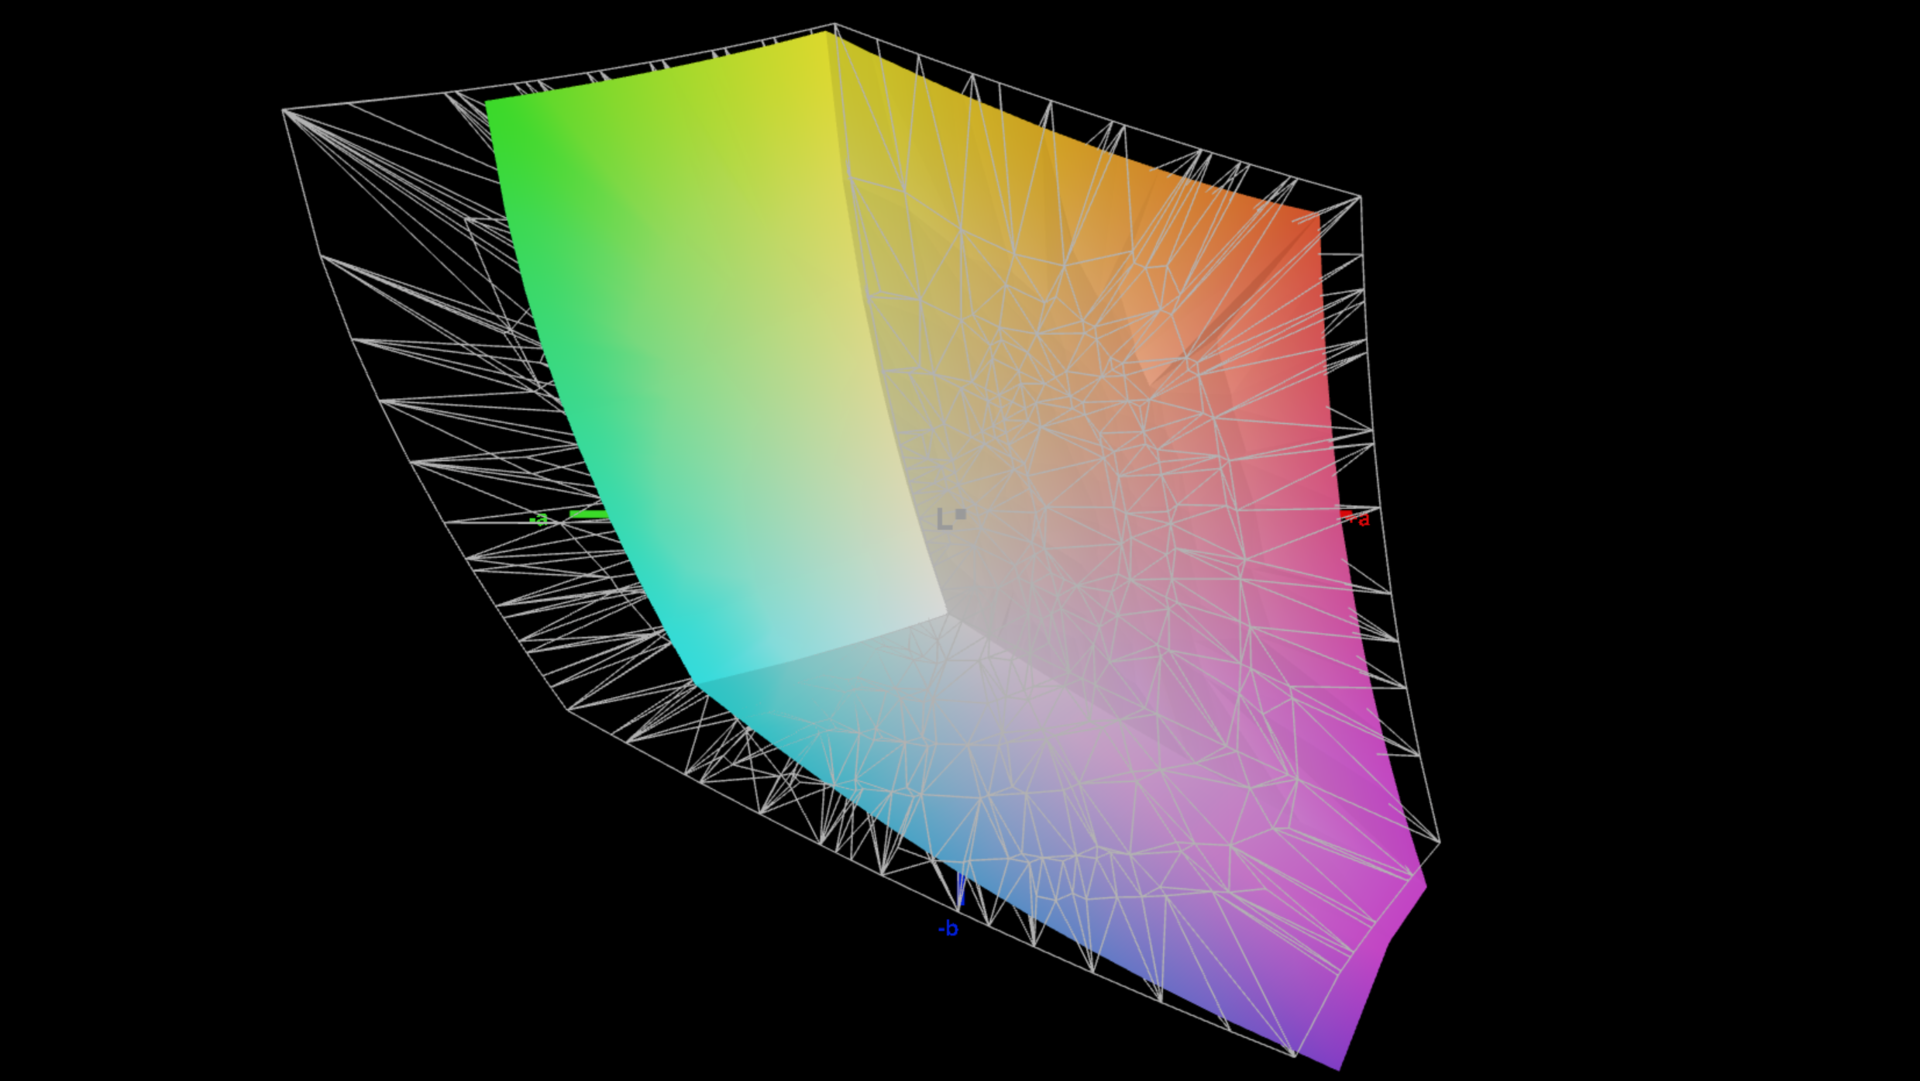
The display's brightness is just over 500 cd/m², but its maximum contrast suffers somewhat from its increased black level, with OLED or MiniLED panels performing better in this case. The factory-installed sRGB profile depicts colors very accurately but has a slight blue cast. We were able to correct this with our own calibration, but its color accuracy then deteriorated. The sRGB color space is fully covered by the panel.
| |||||||||||||||||||||||||
Brightness Distribution: 88 %
Center on Battery: 538 cd/m²
Contrast: 1145:1 (Black: 0.47 cd/m²)
ΔE ColorChecker Calman: 1.9 | ∀{0.5-29.43 Ø4.72}
ΔE Greyscale Calman: 2.7 | ∀{0.09-98 Ø4.97}
75.4% AdobeRGB 1998 (Argyll 3D)
99.8% sRGB (Argyll 3D)
74.7% Display P3 (Argyll 3D)
Gamma: 2.24
CCT: 7027 K
| Schenker XMG Pro 16 (E25) NE160QDM-NZL, IPS, 2560x1600, 16", 300 Hz | Schenker XMG Pro 16 Studio (Mid 24) BOE CQ NE160QDM-NZ1, IPS, 2560x1600, 16", 240 Hz | Asus ROG Strix G16 G615 NE160QDM-NZC, IPS, 2560x1600, 16", 240 Hz | Tuxedo Sirius 16 Gen 1 NE161QHM-NY1, IPS, 2560x1440, 16.1", 165 Hz | Lenovo Legion Pro 5 16IRX9 BOE NE160QDM-NYC, IPS, 2560x1600, 16", 165 Hz | Lenovo Legion Pro 7i 16 Gen 10 Samsung ATNA60HU01-0, OLED, 2560x1600, 16", 240 Hz | |
|---|---|---|---|---|---|---|
| Display | -5% | 17% | -7% | -5% | 19% | |
| Display P3 Coverage (%) | 74.7 | 68.8 -8% | 99.1 33% | 67.4 -10% | 69.3 -7% | 99.5 33% |
| sRGB Coverage (%) | 99.8 | 99.5 0% | 99.9 0% | 97.2 -3% | 99.4 0% | 100 0% |
| AdobeRGB 1998 Coverage (%) | 75.4 | 70.8 -6% | 89.1 18% | 69.3 -8% | 70.1 -7% | 94.4 25% |
| Response Times | -19% | 22% | -50% | -39% | 95% | |
| Response Time Grey 50% / Grey 80% * (ms) | 10.5 ? | 12.7 ? -21% | 4.6 ? 56% | 12 ? -14% | 11.9 ? -13% | 0.28 ? 97% |
| Response Time Black / White * (ms) | 5.4 ? | 6.3 ? -17% | 6.1 ? -13% | 10 ? -85% | 8.9 ? -65% | 0.43 ? 92% |
| PWM Frequency (Hz) | 1438 ? | |||||
| PWM Amplitude * (%) | 29 | |||||
| Screen | -18% | 8% | -37% | 9% | -10% | |
| Brightness middle (cd/m²) | 538 | 416 -23% | 545 1% | 302 -44% | 384 -29% | 490.4 -9% |
| Brightness (cd/m²) | 508 | 392 -23% | 536 6% | 314 -38% | 366 -28% | 498 -2% |
| Brightness Distribution (%) | 88 | 86 -2% | 89 1% | 86 -2% | 91 3% | 97 10% |
| Black Level * (cd/m²) | 0.47 | 0.38 19% | 0.41 13% | 0.38 19% | 0.35 26% | |
| Contrast (:1) | 1145 | 1095 -4% | 1329 16% | 795 -31% | 1097 -4% | |
| Colorchecker dE 2000 * | 1.9 | 2.33 -23% | 1.6 16% | 2.97 -56% | 0.97 49% | 3.2 -68% |
| Colorchecker dE 2000 max. * | 4 | 6.07 -52% | 4 -0% | 5.63 -41% | 3.57 11% | 6.04 -51% |
| Greyscale dE 2000 * | 2.7 | 3.7 -37% | 2.4 11% | 5.45 -102% | 1.5 44% | 1 63% |
| Gamma | 2.24 98% | 2.161 102% | 2.25 98% | 1.994 110% | 2.24 98% | 2.24 98% |
| CCT | 7027 93% | 7102 92% | 6737 96% | 6520 100% | 6709 97% | 6373 102% |
| Colorchecker dE 2000 calibrated * | 1.02 | 0.8 | 2.24 | 0.77 | 0.84 | |
| Total Average (Program / Settings) | -14% /
-15% | 16% /
12% | -31% /
-32% | -12% /
-2% | 35% /
17% |
* ... smaller is better

Display Response Times
| ↔ Response Time Black to White | ||
|---|---|---|
| 5.4 ms ... rise ↗ and fall ↘ combined | ↗ 1.4 ms rise |  |
| ↘ 4 ms fall | ||
| The screen shows very fast response rates in our tests and should be very well suited for fast-paced gaming. In comparison, all tested devices range from 0.1 (minimum) to 240 (maximum) ms. » 18 % of all devices are better. This means that the measured response time is better than the average of all tested devices (19.8 ms). | ||
| ↔ Response Time 50% Grey to 80% Grey | ||
| 10.5 ms ... rise ↗ and fall ↘ combined | ↗ 3.4 ms rise | 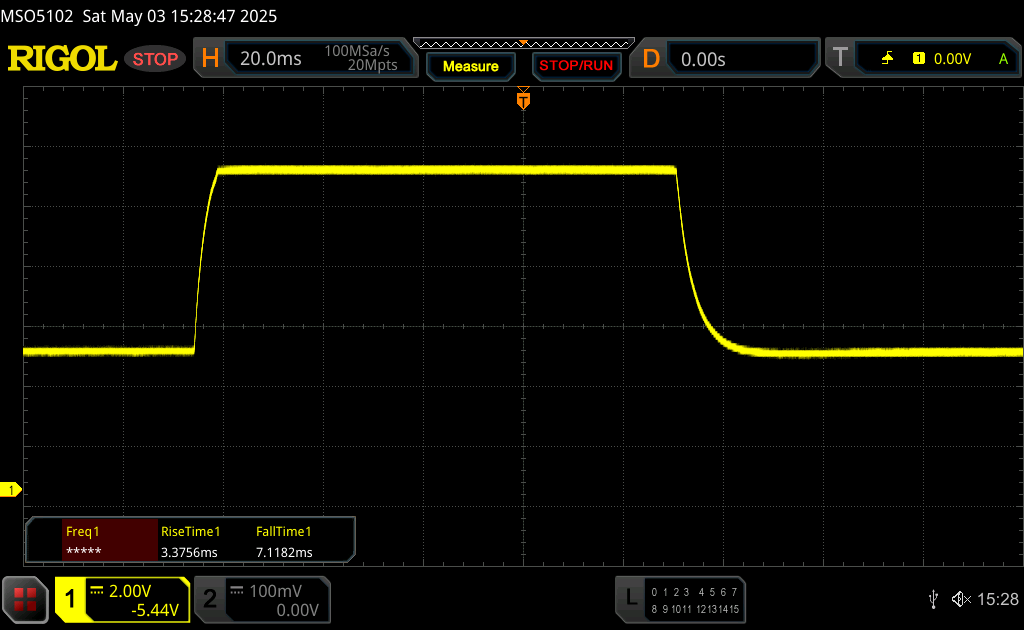 |
| ↘ 7.1 ms fall | ||
| The screen shows good response rates in our tests, but may be too slow for competitive gamers. In comparison, all tested devices range from 0.165 (minimum) to 636 (maximum) ms. » 24 % of all devices are better. This means that the measured response time is better than the average of all tested devices (31 ms). | ||
Screen Flickering / PWM (Pulse-Width Modulation)
| Screen flickering / PWM not detected | 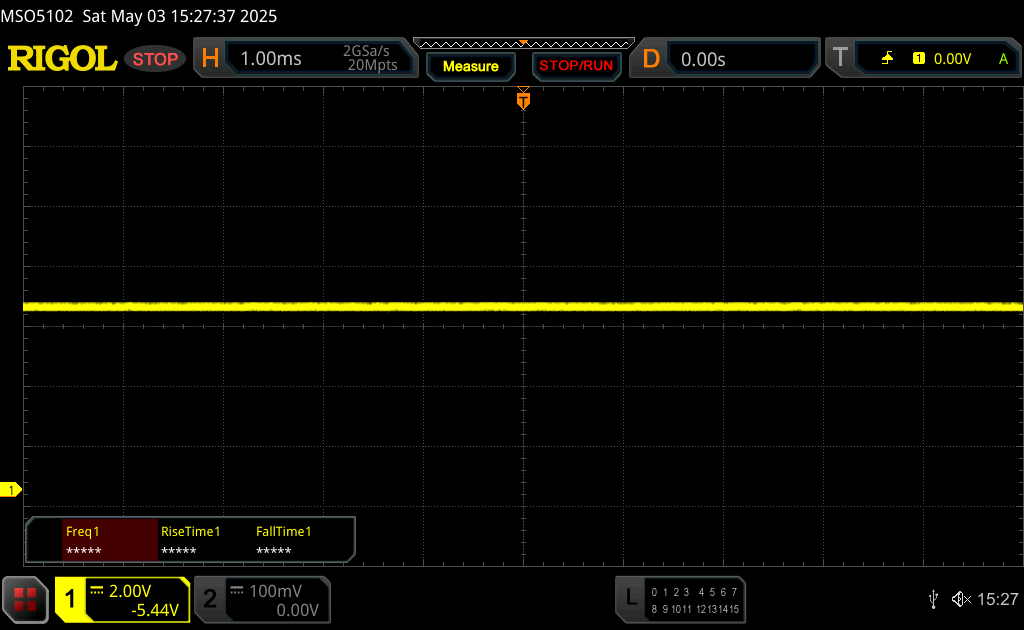 | ||
In comparison: 52 % of all tested devices do not use PWM to dim the display. If PWM was detected, an average of 7781 (minimum: 5 - maximum: 343500) Hz was measured. | |||


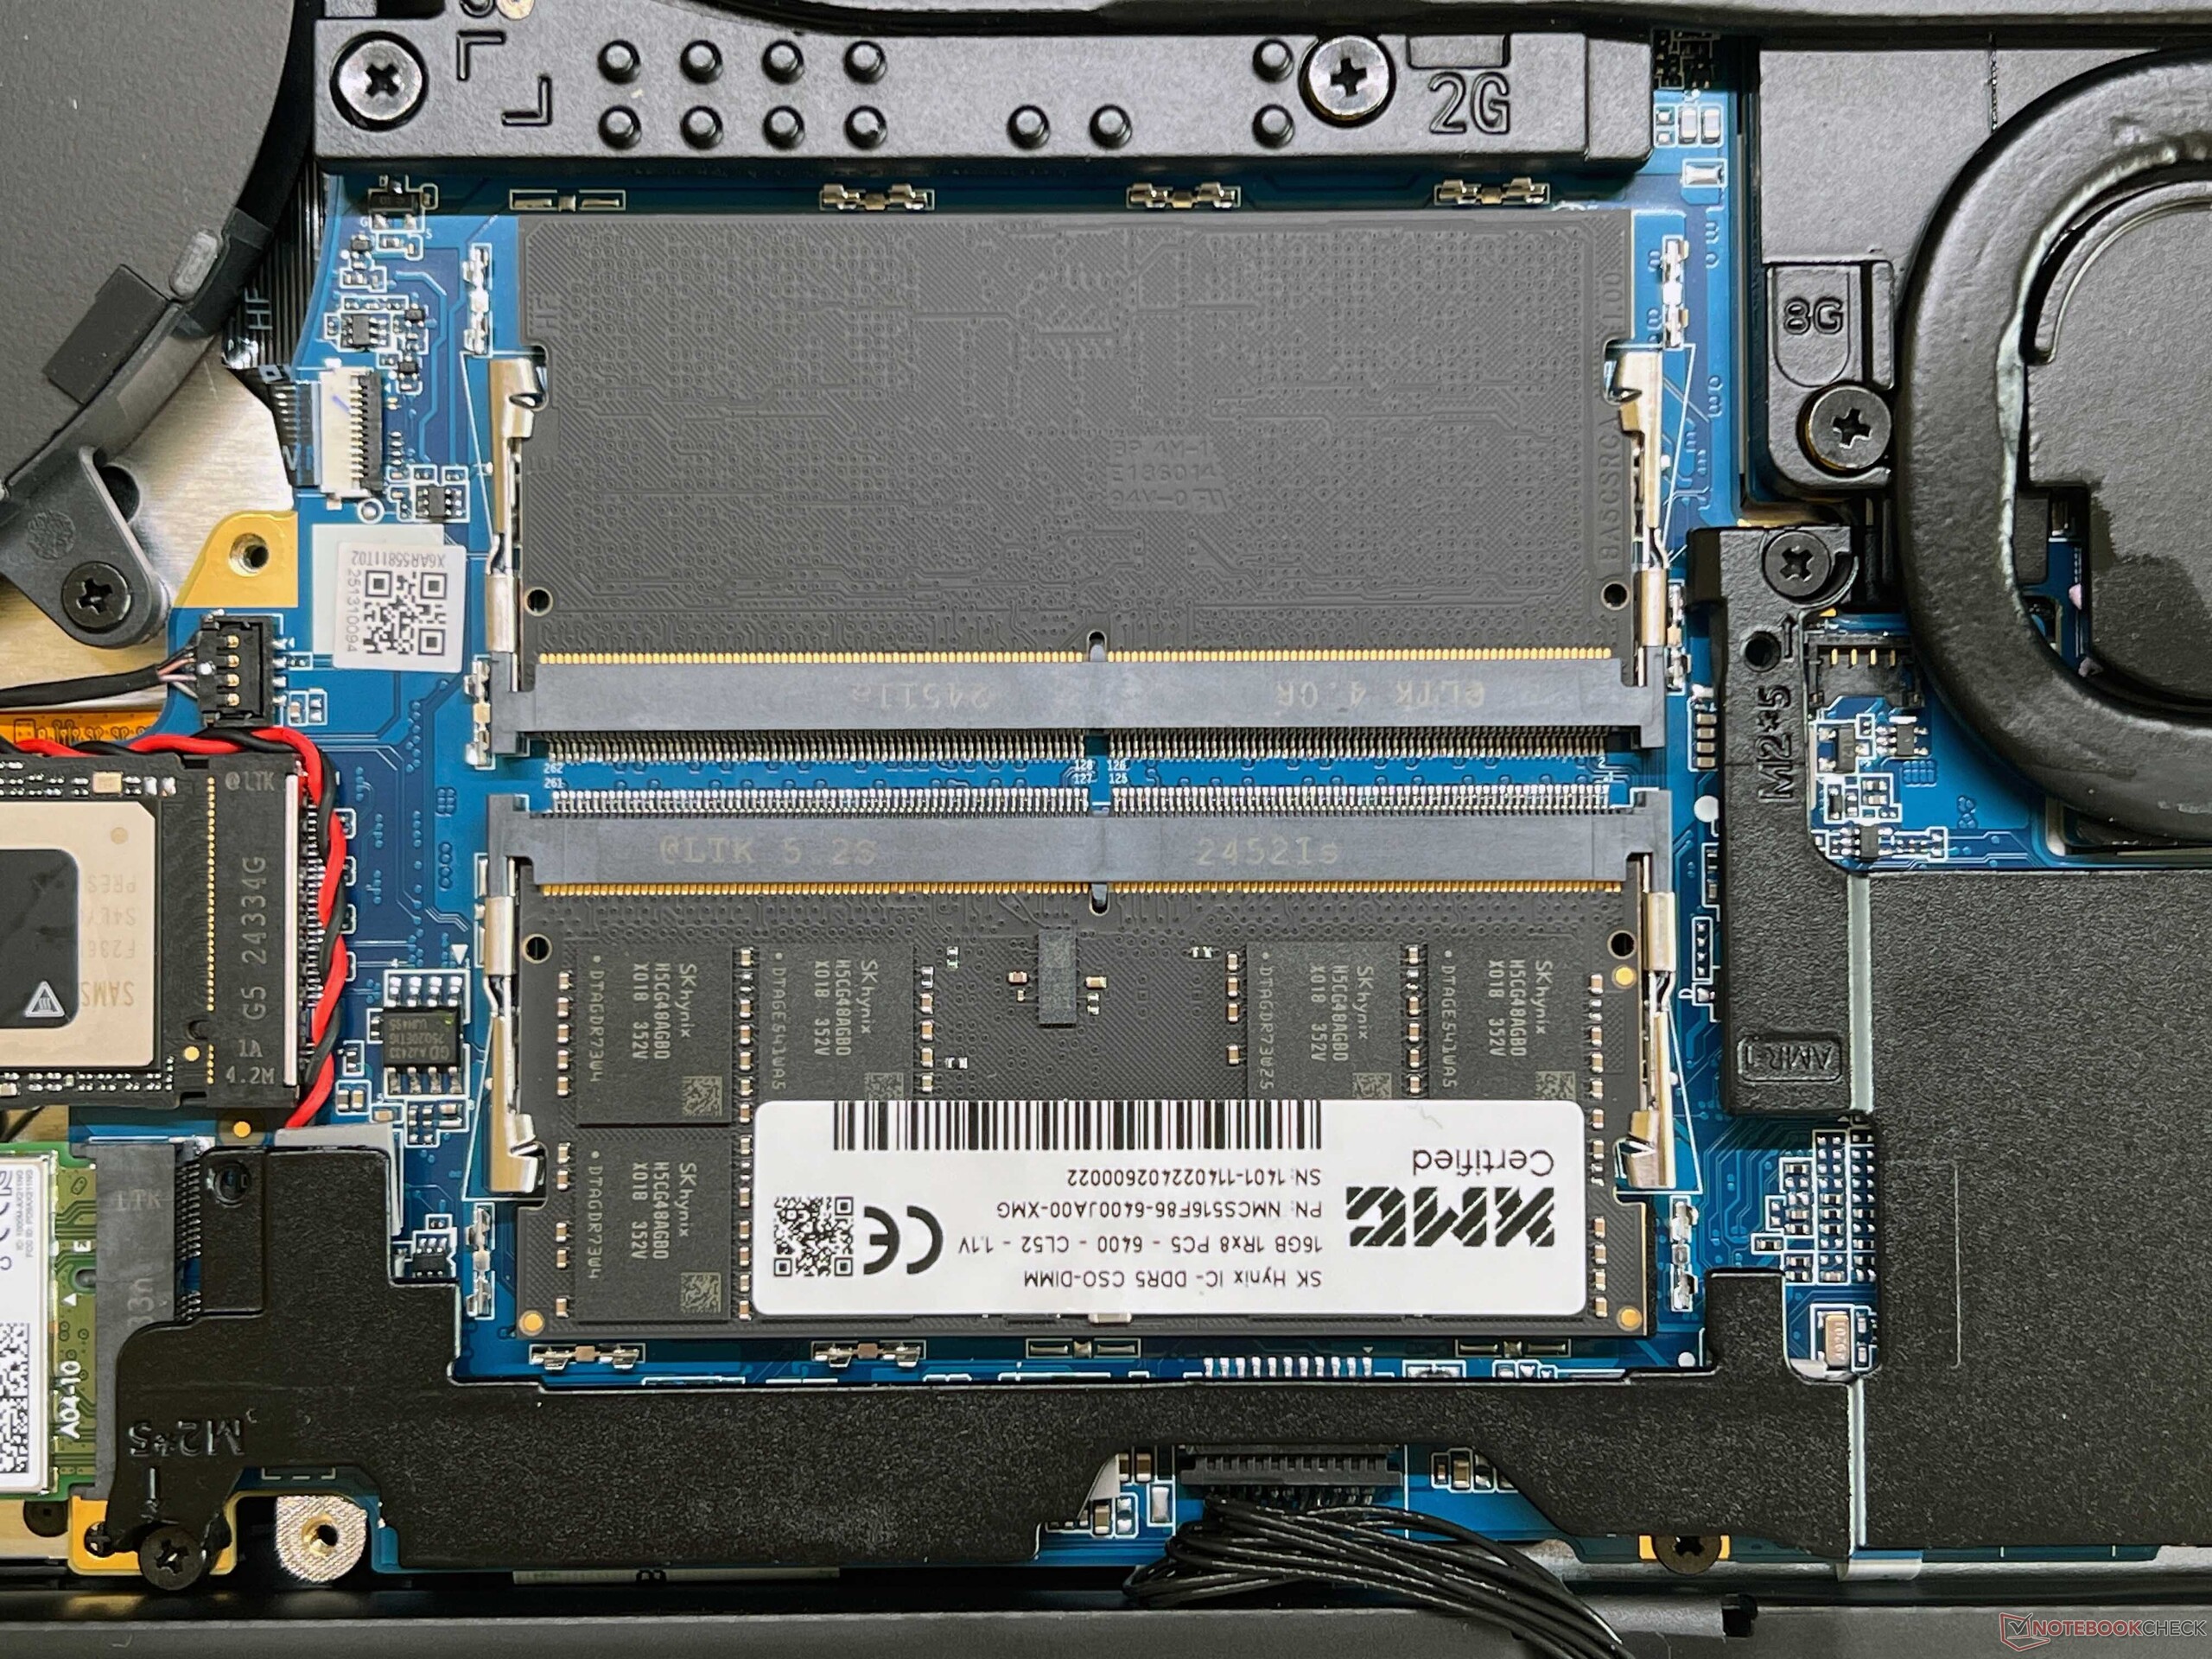
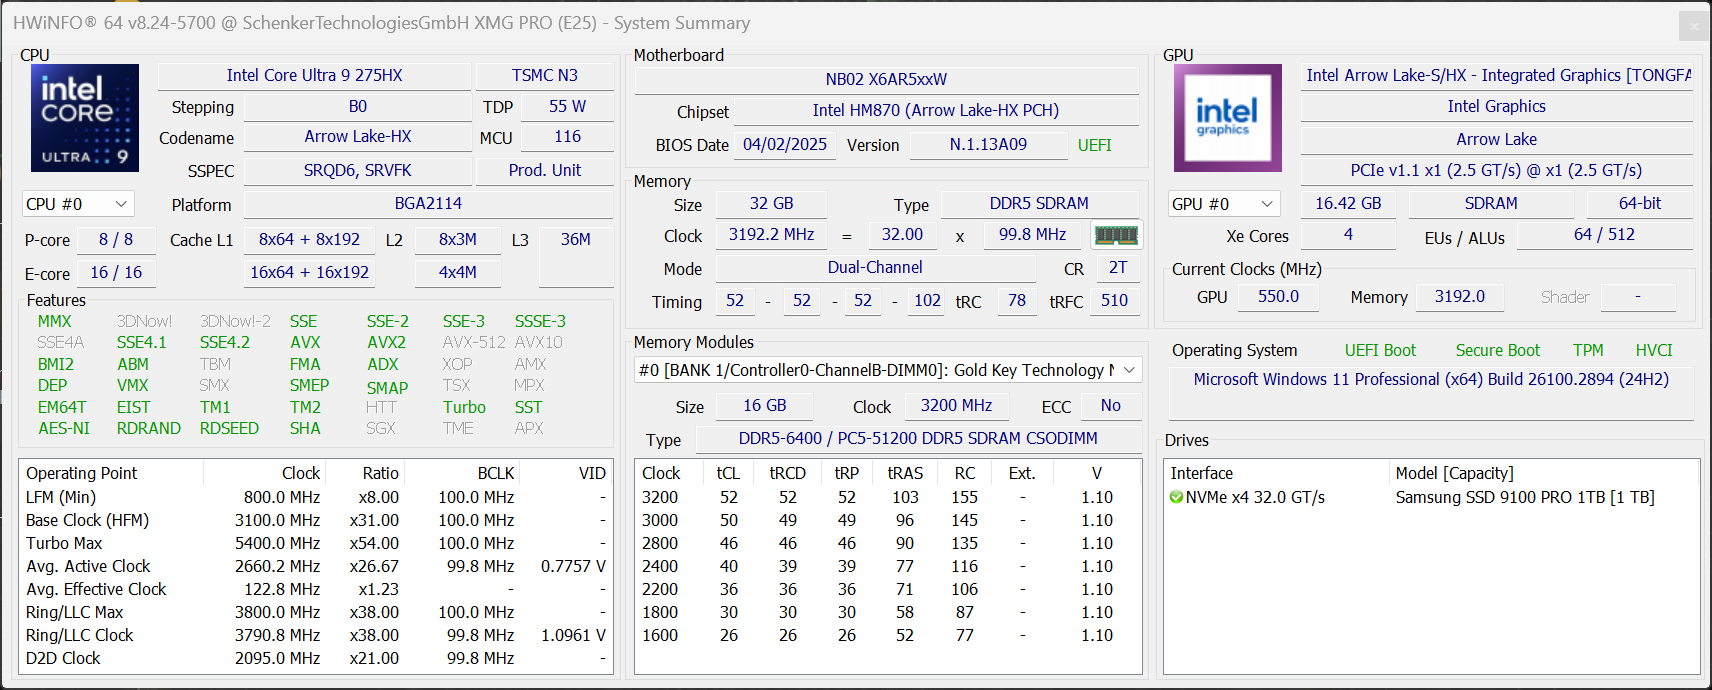
Performance - Up to 128 GB RAM
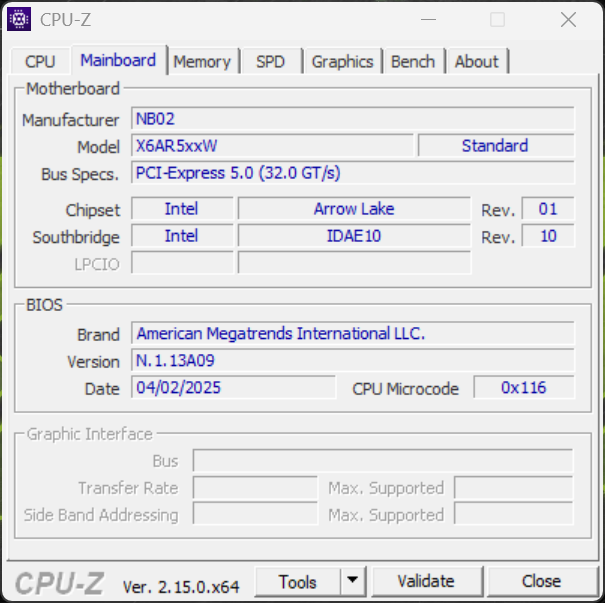
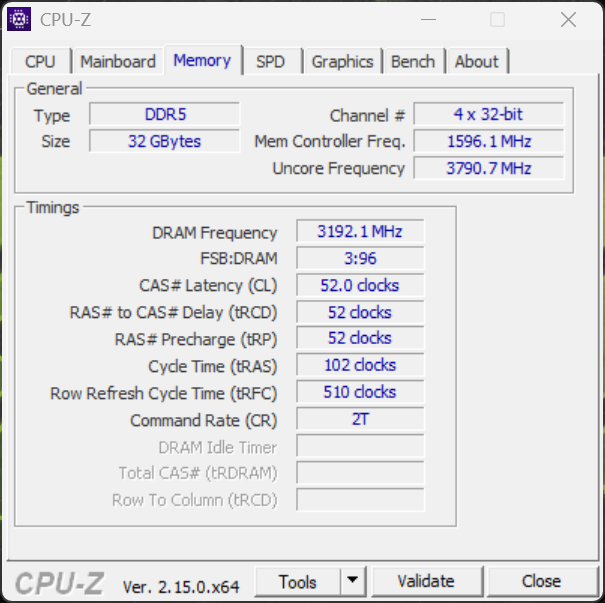
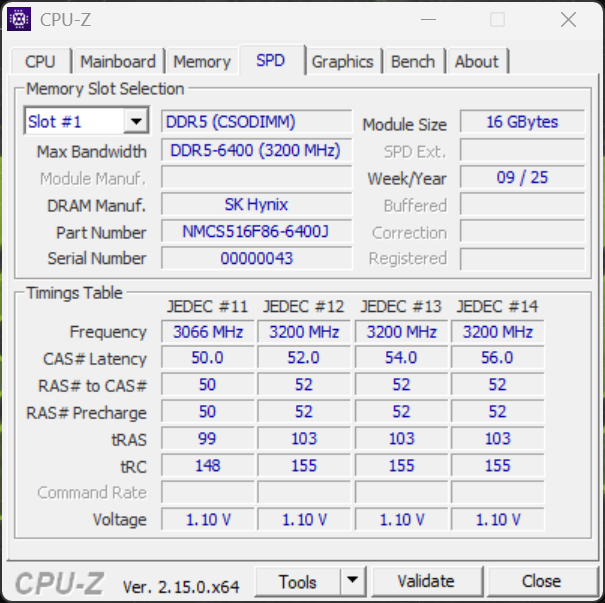
The laptop's maximum RAM capacity is influenced by the buyer's choice of processor. In conjunction with the Core Ultra 9 275HX, you can select up to 128 GB (DDR5-6400).
Testing conditions
Schenker lets users select between various energy profiles as well as a manual mode, which can all be conveniently switched between via a hotkey. We used the Overboost mode for our benchmarks and measurements. Enthusiast mode is the maximum available in battery mode.
| Energy profile | TDP | CB24 Multi | TGP | Time Spy Graphics | CP2077 QHD | max. fan noise emissions |
|---|---|---|---|---|---|---|
| Balanced | 45 watts | 1,348 points | 125 watts | 16,186 points | 78.9fps | 44.9 dB(A) |
| Enthusiast | 90/75 watts | 1,833 points | 130 watts | 16,835 points | 80.7fps | 49.4 dB(A) |
| Overboost | 150/135 watts | 2,072 points | 140 watts | 17,239 points | 81.6fps | 53.3 dB(A) |
| Battery (Enthusiast) | 40 watts | 1,234 points | 60 watts | 11,262 points | 22fps | 37 dB(A) |
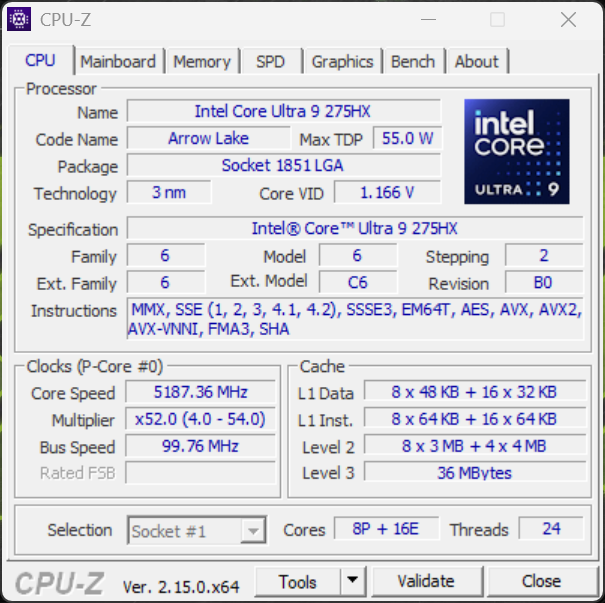
Processor - Core Ultra 9 275HX
As a result of the laptop's maximum TDP of 150 watts, it can't take advantage of the Core Ultra 9 275HX's full potential. As a result, some gaming laptops offer slightly more multi-core performance. Nevertheless, its overall performance is excellent and the Core i9-14900HX in the old XMG Pro 16 Studio was outperformed by 21% across all CPU benchmarks. In addition, its performance generally remains very stable under continuous load.
Cinebench R15 Multi continuous test
Cinebench 2024: CPU Multi Core | CPU Single Core
Cinebench R23: Multi Core | Single Core
Cinebench R20: CPU (Multi Core) | CPU (Single Core)
Cinebench R15: CPU Multi 64Bit | CPU Single 64Bit
Blender: v2.79 BMW27 CPU
7-Zip 18.03: 7z b 4 | 7z b 4 -mmt1
Geekbench 6.7: Multi-Core | Single-Core
Geekbench 5.5: Multi-Core | Single-Core
HWBOT x265 Benchmark v2.2: 4k Preset
LibreOffice : 20 Documents To PDF
R Benchmark 2.5: Overall mean
| CPU Performance rating | |
| Asus ROG Strix G16 G615 | |
| Schenker XMG Pro 16 (E25) | |
| Lenovo Legion Pro 7i 16 Gen 10 | |
| Average Intel Core Ultra 9 275HX | |
| Lenovo Legion Pro 5 16IRX9 -2! | |
| Schenker XMG Pro 16 Studio (Mid 24) | |
| Average of class Gaming | |
| Tuxedo Sirius 16 Gen 1 -10! | |
| Cinebench 2024 / CPU Multi Core | |
| Asus ROG Strix G16 G615 | |
| Lenovo Legion Pro 7i 16 Gen 10 | |
| Schenker XMG Pro 16 (E25) | |
| Average Intel Core Ultra 9 275HX (1547 - 2288, n=27) | |
| Average of class Gaming (486 - 2298, n=92, last 2 years) | |
| Schenker XMG Pro 16 Studio (Mid 24) | |
| Cinebench 2024 / CPU Single Core | |
| Schenker XMG Pro 16 (E25) | |
| Asus ROG Strix G16 G615 | |
| Lenovo Legion Pro 7i 16 Gen 10 | |
| Average Intel Core Ultra 9 275HX (123.1 - 138.2, n=27) | |
| Average of class Gaming (95 - 138.2, n=92, last 2 years) | |
| Schenker XMG Pro 16 Studio (Mid 24) | |
| Cinebench R23 / Multi Core | |
| Lenovo Legion Pro 7i 16 Gen 10 | |
| Schenker XMG Pro 16 (E25) | |
| Average Intel Core Ultra 9 275HX (30712 - 40970, n=31) | |
| Asus ROG Strix G16 G615 | |
| Lenovo Legion Pro 5 16IRX9 | |
| Schenker XMG Pro 16 Studio (Mid 24) | |
| Average of class Gaming (10488 - 40970, n=112, last 2 years) | |
| Tuxedo Sirius 16 Gen 1 | |
| Cinebench R23 / Single Core | |
| Schenker XMG Pro 16 (E25) | |
| Lenovo Legion Pro 7i 16 Gen 10 | |
| Average Intel Core Ultra 9 275HX (2009 - 2267, n=31) | |
| Asus ROG Strix G16 G615 | |
| Lenovo Legion Pro 5 16IRX9 | |
| Schenker XMG Pro 16 Studio (Mid 24) | |
| Average of class Gaming (1166 - 2356, n=112, last 2 years) | |
| Tuxedo Sirius 16 Gen 1 | |
| Cinebench R20 / CPU (Multi Core) | |
| Schenker XMG Pro 16 (E25) | |
| Lenovo Legion Pro 7i 16 Gen 10 | |
| Average Intel Core Ultra 9 275HX (12026 - 16108, n=30) | |
| Asus ROG Strix G16 G615 | |
| Lenovo Legion Pro 5 16IRX9 | |
| Schenker XMG Pro 16 Studio (Mid 24) | |
| Average of class Gaming (4029 - 16108, n=111, last 2 years) | |
| Tuxedo Sirius 16 Gen 1 | |
| Cinebench R20 / CPU (Single Core) | |
| Schenker XMG Pro 16 (E25) | |
| Asus ROG Strix G16 G615 | |
| Average Intel Core Ultra 9 275HX (774 - 870, n=30) | |
| Lenovo Legion Pro 7i 16 Gen 10 | |
| Lenovo Legion Pro 5 16IRX9 | |
| Schenker XMG Pro 16 Studio (Mid 24) | |
| Average of class Gaming (442 - 895, n=111, last 2 years) | |
| Tuxedo Sirius 16 Gen 1 | |
| Cinebench R15 / CPU Multi 64Bit | |
| Asus ROG Strix G16 G615 | |
| Lenovo Legion Pro 7i 16 Gen 10 | |
| Schenker XMG Pro 16 (E25) | |
| Average Intel Core Ultra 9 275HX (4737 - 6271, n=30) | |
| Lenovo Legion Pro 5 16IRX9 | |
| Schenker XMG Pro 16 Studio (Mid 24) | |
| Average of class Gaming (1578 - 6271, n=111, last 2 years) | |
| Tuxedo Sirius 16 Gen 1 | |
| Cinebench R15 / CPU Single 64Bit | |
| Asus ROG Strix G16 G615 | |
| Lenovo Legion Pro 7i 16 Gen 10 | |
| Schenker XMG Pro 16 (E25) | |
| Average Intel Core Ultra 9 275HX (306 - 343, n=31) | |
| Lenovo Legion Pro 5 16IRX9 | |
| Average of class Gaming (188.8 - 343, n=111, last 2 years) | |
| Tuxedo Sirius 16 Gen 1 | |
| Schenker XMG Pro 16 Studio (Mid 24) | |
| Blender / v2.79 BMW27 CPU | |
| Average of class Gaming (80 - 330, n=109, last 2 years) | |
| Schenker XMG Pro 16 Studio (Mid 24) | |
| Lenovo Legion Pro 5 16IRX9 | |
| Average Intel Core Ultra 9 275HX (82 - 116, n=29) | |
| Schenker XMG Pro 16 (E25) | |
| Lenovo Legion Pro 7i 16 Gen 10 | |
| Asus ROG Strix G16 G615 | |
| 7-Zip 18.03 / 7z b 4 | |
| Asus ROG Strix G16 G615 | |
| Lenovo Legion Pro 7i 16 Gen 10 | |
| Schenker XMG Pro 16 (E25) | |
| Lenovo Legion Pro 5 16IRX9 | |
| Average Intel Core Ultra 9 275HX (98236 - 124155, n=30) | |
| Schenker XMG Pro 16 Studio (Mid 24) | |
| Average of class Gaming (33491 - 148086, n=110, last 2 years) | |
| 7-Zip 18.03 / 7z b 4 -mmt1 | |
| Schenker XMG Pro 16 (E25) | |
| Asus ROG Strix G16 G615 | |
| Schenker XMG Pro 16 Studio (Mid 24) | |
| Lenovo Legion Pro 5 16IRX9 | |
| Average Intel Core Ultra 9 275HX (6026 - 7149, n=30) | |
| Lenovo Legion Pro 7i 16 Gen 10 | |
| Average of class Gaming (4199 - 7436, n=110, last 2 years) | |
| Geekbench 6.7 / Multi-Core | |
| Schenker XMG Pro 16 (E25) | |
| Asus ROG Strix G16 G615 | |
| Average Intel Core Ultra 9 275HX (16033 - 21668, n=33) | |
| Lenovo Legion Pro 7i 16 Gen 10 | |
| Lenovo Legion Pro 5 16IRX9 | |
| Schenker XMG Pro 16 Studio (Mid 24) | |
| Average of class Gaming (6625 - 22104, n=111, last 2 years) | |
| Tuxedo Sirius 16 Gen 1 | |
| Geekbench 6.7 / Single-Core | |
| Schenker XMG Pro 16 (E25) | |
| Lenovo Legion Pro 7i 16 Gen 10 | |
| Average Intel Core Ultra 9 275HX (2843 - 3160, n=33) | |
| Asus ROG Strix G16 G615 | |
| Lenovo Legion Pro 5 16IRX9 | |
| Average of class Gaming (1490 - 3259, n=111, last 2 years) | |
| Schenker XMG Pro 16 Studio (Mid 24) | |
| Tuxedo Sirius 16 Gen 1 | |
| Geekbench 5.5 / Multi-Core | |
| Schenker XMG Pro 16 (E25) | |
| Asus ROG Strix G16 G615 | |
| Average Intel Core Ultra 9 275HX (19105 - 25855, n=31) | |
| Lenovo Legion Pro 7i 16 Gen 10 | |
| Lenovo Legion Pro 5 16IRX9 | |
| Schenker XMG Pro 16 Studio (Mid 24) | |
| Average of class Gaming (6460 - 27010, n=110, last 2 years) | |
| Geekbench 5.5 / Single-Core | |
| Schenker XMG Pro 16 (E25) | |
| Average Intel Core Ultra 9 275HX (2033 - 2292, n=31) | |
| Lenovo Legion Pro 7i 16 Gen 10 | |
| Asus ROG Strix G16 G615 | |
| Average of class Gaming (986 - 2474, n=110, last 2 years) | |
| Lenovo Legion Pro 5 16IRX9 | |
| Schenker XMG Pro 16 Studio (Mid 24) | |
| HWBOT x265 Benchmark v2.2 / 4k Preset | |
| Asus ROG Strix G16 G615 | |
| Schenker XMG Pro 16 (E25) | |
| Lenovo Legion Pro 7i 16 Gen 10 | |
| Average Intel Core Ultra 9 275HX (30.7 - 43.8, n=30) | |
| Lenovo Legion Pro 5 16IRX9 | |
| Average of class Gaming (11.5 - 44.3, n=110, last 2 years) | |
| Schenker XMG Pro 16 Studio (Mid 24) | |
| LibreOffice / 20 Documents To PDF | |
| Average of class Gaming (19 - 88.8, n=110, last 2 years) | |
| Schenker XMG Pro 16 (E25) | |
| Schenker XMG Pro 16 Studio (Mid 24) | |
| Average Intel Core Ultra 9 275HX (33.2 - 62.1, n=30) | |
| Lenovo Legion Pro 5 16IRX9 | |
| Asus ROG Strix G16 G615 | |
| Lenovo Legion Pro 7i 16 Gen 10 | |
| R Benchmark 2.5 / Overall mean | |
| Average of class Gaming (0.3439 - 0.759, n=111, last 2 years) | |
| Average Intel Core Ultra 9 275HX (0.3943 - 0.4568, n=30) | |
| Lenovo Legion Pro 7i 16 Gen 10 | |
| Schenker XMG Pro 16 Studio (Mid 24) | |
| Schenker XMG Pro 16 (E25) | |
| Asus ROG Strix G16 G615 | |
| Lenovo Legion Pro 5 16IRX9 | |
* ... smaller is better
AIDA64: FP32 Ray-Trace | FPU Julia | CPU SHA3 | CPU Queen | FPU SinJulia | FPU Mandel | CPU AES | CPU ZLib | FP64 Ray-Trace | CPU PhotoWorxx
| Performance rating | |
| Asus ROG Strix G16 G615 | |
| Lenovo Legion Pro 7i 16 Gen 10 | |
| Average Intel Core Ultra 9 275HX | |
| Schenker XMG Pro 16 (E25) | |
| Lenovo Legion Pro 5 16IRX9 | |
| Average of class Gaming | |
| Tuxedo Sirius 16 Gen 1 | |
| Schenker XMG Pro 16 Studio (Mid 24) | |
| AIDA64 / FP32 Ray-Trace | |
| Asus ROG Strix G16 G615 | |
| Lenovo Legion Pro 7i 16 Gen 10 | |
| Average Intel Core Ultra 9 275HX (28039 - 39895, n=30) | |
| Schenker XMG Pro 16 (E25) | |
| Average of class Gaming (10227 - 85542, n=109, last 2 years) | |
| Tuxedo Sirius 16 Gen 1 | |
| Lenovo Legion Pro 5 16IRX9 | |
| Schenker XMG Pro 16 Studio (Mid 24) | |
| AIDA64 / FPU Julia | |
| Asus ROG Strix G16 G615 | |
| Lenovo Legion Pro 7i 16 Gen 10 | |
| Average Intel Core Ultra 9 275HX (140254 - 200744, n=30) | |
| Schenker XMG Pro 16 (E25) | |
| Average of class Gaming (51376 - 238426, n=109, last 2 years) | |
| Lenovo Legion Pro 5 16IRX9 | |
| Tuxedo Sirius 16 Gen 1 | |
| Schenker XMG Pro 16 Studio (Mid 24) | |
| AIDA64 / CPU SHA3 | |
| Asus ROG Strix G16 G615 | |
| Lenovo Legion Pro 7i 16 Gen 10 | |
| Average Intel Core Ultra 9 275HX (6710 - 9817, n=30) | |
| Schenker XMG Pro 16 (E25) | |
| Lenovo Legion Pro 5 16IRX9 | |
| Average of class Gaming (2180 - 9817, n=109, last 2 years) | |
| Schenker XMG Pro 16 Studio (Mid 24) | |
| Tuxedo Sirius 16 Gen 1 | |
| AIDA64 / CPU Queen | |
| Lenovo Legion Pro 5 16IRX9 | |
| Asus ROG Strix G16 G615 | |
| Lenovo Legion Pro 7i 16 Gen 10 | |
| Schenker XMG Pro 16 Studio (Mid 24) | |
| Average Intel Core Ultra 9 275HX (113887 - 140937, n=30) | |
| Schenker XMG Pro 16 (E25) | |
| Tuxedo Sirius 16 Gen 1 | |
| Average of class Gaming (49785 - 173351, n=98, last 2 years) | |
| AIDA64 / FPU SinJulia | |
| Lenovo Legion Pro 5 16IRX9 | |
| Average of class Gaming (4424 - 33636, n=109, last 2 years) | |
| Schenker XMG Pro 16 (E25) | |
| Lenovo Legion Pro 7i 16 Gen 10 | |
| Asus ROG Strix G16 G615 | |
| Tuxedo Sirius 16 Gen 1 | |
| Schenker XMG Pro 16 Studio (Mid 24) | |
| Average Intel Core Ultra 9 275HX (11172 - 14425, n=30) | |
| AIDA64 / FPU Mandel | |
| Asus ROG Strix G16 G615 | |
| Lenovo Legion Pro 7i 16 Gen 10 | |
| Average Intel Core Ultra 9 275HX (72596 - 104508, n=30) | |
| Schenker XMG Pro 16 (E25) | |
| Average of class Gaming (25115 - 128721, n=109, last 2 years) | |
| Tuxedo Sirius 16 Gen 1 | |
| Lenovo Legion Pro 5 16IRX9 | |
| Schenker XMG Pro 16 Studio (Mid 24) | |
| AIDA64 / CPU AES | |
| Tuxedo Sirius 16 Gen 1 | |
| Asus ROG Strix G16 G615 | |
| Lenovo Legion Pro 7i 16 Gen 10 | |
| Average Intel Core Ultra 9 275HX (105608 - 247074, n=30) | |
| Schenker XMG Pro 16 (E25) | |
| Lenovo Legion Pro 5 16IRX9 | |
| Schenker XMG Pro 16 Studio (Mid 24) | |
| Average of class Gaming (39258 - 247074, n=109, last 2 years) | |
| AIDA64 / CPU ZLib | |
| Asus ROG Strix G16 G615 | |
| Lenovo Legion Pro 7i 16 Gen 10 | |
| Average Intel Core Ultra 9 275HX (1582 - 2263, n=30) | |
| Schenker XMG Pro 16 (E25) | |
| Lenovo Legion Pro 5 16IRX9 | |
| Schenker XMG Pro 16 Studio (Mid 24) | |
| Average of class Gaming (574 - 2531, n=109, last 2 years) | |
| Tuxedo Sirius 16 Gen 1 | |
| AIDA64 / FP64 Ray-Trace | |
| Asus ROG Strix G16 G615 | |
| Lenovo Legion Pro 7i 16 Gen 10 | |
| Average Intel Core Ultra 9 275HX (14847 - 21854, n=30) | |
| Schenker XMG Pro 16 (E25) | |
| Average of class Gaming (5509 - 45446, n=109, last 2 years) | |
| Tuxedo Sirius 16 Gen 1 | |
| Lenovo Legion Pro 5 16IRX9 | |
| Schenker XMG Pro 16 Studio (Mid 24) | |
| AIDA64 / CPU PhotoWorxx | |
| Lenovo Legion Pro 7i 16 Gen 10 | |
| Schenker XMG Pro 16 (E25) | |
| Average Intel Core Ultra 9 275HX (37482 - 62916, n=30) | |
| Lenovo Legion Pro 5 16IRX9 | |
| Schenker XMG Pro 16 Studio (Mid 24) | |
| Asus ROG Strix G16 G615 | |
| Average of class Gaming (12271 - 89891, n=109, last 2 years) | |
| Tuxedo Sirius 16 Gen 1 | |
System performance
The Pro 16 is a super fast system, both subjectively during everyday use and in the benchmarks. There were no problems with system stability during our test.
PCMark 10: Score | Essentials | Productivity | Digital Content Creation
CrossMark: Overall | Productivity | Creativity | Responsiveness
WebXPRT 3: Overall
WebXPRT 4: Overall
Mozilla Kraken 1.1: Total
| Performance rating | |
| Asus ROG Strix G16 G615 | |
| Schenker XMG Pro 16 (E25) | |
| Average Intel Core Ultra 9 275HX, NVIDIA GeForce RTX 5070 Ti Laptop | |
| Lenovo Legion Pro 7i 16 Gen 10 | |
| Lenovo Legion Pro 5 16IRX9 | |
| Schenker XMG Pro 16 Studio (Mid 24) | |
| Average of class Gaming | |
| Tuxedo Sirius 16 Gen 1 -5! | |
| PCMark 10 / Score | |
| Lenovo Legion Pro 7i 16 Gen 10 | |
| Asus ROG Strix G16 G615 | |
| Lenovo Legion Pro 5 16IRX9 | |
| Schenker XMG Pro 16 (E25) | |
| Average Intel Core Ultra 9 275HX, NVIDIA GeForce RTX 5070 Ti Laptop (8297 - 8550, n=3) | |
| Average of class Gaming (5828 - 11574, n=96, last 2 years) | |
| Schenker XMG Pro 16 Studio (Mid 24) | |
| PCMark 10 / Essentials | |
| Schenker XMG Pro 16 (E25) | |
| Lenovo Legion Pro 5 16IRX9 | |
| Lenovo Legion Pro 7i 16 Gen 10 | |
| Asus ROG Strix G16 G615 | |
| Average Intel Core Ultra 9 275HX, NVIDIA GeForce RTX 5070 Ti Laptop (10738 - 11290, n=3) | |
| Schenker XMG Pro 16 Studio (Mid 24) | |
| Average of class Gaming (8810 - 12600, n=100, last 2 years) | |
| PCMark 10 / Productivity | |
| Schenker XMG Pro 16 Studio (Mid 24) | |
| Average of class Gaming (6845 - 21327, n=98, last 2 years) | |
| Lenovo Legion Pro 5 16IRX9 | |
| Average Intel Core Ultra 9 275HX, NVIDIA GeForce RTX 5070 Ti Laptop (9591 - 9771, n=3) | |
| Schenker XMG Pro 16 (E25) | |
| Lenovo Legion Pro 7i 16 Gen 10 | |
| Asus ROG Strix G16 G615 | |
| PCMark 10 / Digital Content Creation | |
| Lenovo Legion Pro 7i 16 Gen 10 | |
| Asus ROG Strix G16 G615 | |
| Schenker XMG Pro 16 (E25) | |
| Average Intel Core Ultra 9 275HX, NVIDIA GeForce RTX 5070 Ti Laptop (14812 - 15662, n=3) | |
| Lenovo Legion Pro 5 16IRX9 | |
| Average of class Gaming (7602 - 19657, n=98, last 2 years) | |
| Schenker XMG Pro 16 Studio (Mid 24) | |
| CrossMark / Overall | |
| Schenker XMG Pro 16 (E25) | |
| Asus ROG Strix G16 G615 | |
| Average Intel Core Ultra 9 275HX, NVIDIA GeForce RTX 5070 Ti Laptop (2116 - 2193, n=3) | |
| Schenker XMG Pro 16 Studio (Mid 24) | |
| Lenovo Legion Pro 7i 16 Gen 10 | |
| Lenovo Legion Pro 5 16IRX9 | |
| Tuxedo Sirius 16 Gen 1 | |
| Average of class Gaming (1366 - 2409, n=97, last 2 years) | |
| CrossMark / Productivity | |
| Schenker XMG Pro 16 (E25) | |
| Asus ROG Strix G16 G615 | |
| Average Intel Core Ultra 9 275HX, NVIDIA GeForce RTX 5070 Ti Laptop (1967 - 2038, n=3) | |
| Tuxedo Sirius 16 Gen 1 | |
| Lenovo Legion Pro 7i 16 Gen 10 | |
| Schenker XMG Pro 16 Studio (Mid 24) | |
| Average of class Gaming (1386 - 2254, n=97, last 2 years) | |
| Lenovo Legion Pro 5 16IRX9 | |
| CrossMark / Creativity | |
| Schenker XMG Pro 16 (E25) | |
| Average Intel Core Ultra 9 275HX, NVIDIA GeForce RTX 5070 Ti Laptop (2430 - 2531, n=3) | |
| Asus ROG Strix G16 G615 | |
| Schenker XMG Pro 16 Studio (Mid 24) | |
| Lenovo Legion Pro 7i 16 Gen 10 | |
| Lenovo Legion Pro 5 16IRX9 | |
| Average of class Gaming (1343 - 2729, n=97, last 2 years) | |
| Tuxedo Sirius 16 Gen 1 | |
| CrossMark / Responsiveness | |
| Asus ROG Strix G16 G615 | |
| Tuxedo Sirius 16 Gen 1 | |
| Schenker XMG Pro 16 (E25) | |
| Average Intel Core Ultra 9 275HX, NVIDIA GeForce RTX 5070 Ti Laptop (1740 - 1844, n=3) | |
| Lenovo Legion Pro 5 16IRX9 | |
| Schenker XMG Pro 16 Studio (Mid 24) | |
| Average of class Gaming (1226 - 2334, n=97, last 2 years) | |
| Lenovo Legion Pro 7i 16 Gen 10 | |
| WebXPRT 3 / Overall | |
| Average Intel Core Ultra 9 275HX, NVIDIA GeForce RTX 5070 Ti Laptop (328 - 532, n=3) | |
| Schenker XMG Pro 16 (E25) | |
| Lenovo Legion Pro 7i 16 Gen 10 | |
| Asus ROG Strix G16 G615 | |
| Lenovo Legion Pro 5 16IRX9 | |
| Schenker XMG Pro 16 Studio (Mid 24) | |
| Average of class Gaming (242 - 532, n=101, last 2 years) | |
| WebXPRT 4 / Overall | |
| Schenker XMG Pro 16 (E25) | |
| Asus ROG Strix G16 G615 | |
| Lenovo Legion Pro 7i 16 Gen 10 | |
| Average Intel Core Ultra 9 275HX, NVIDIA GeForce RTX 5070 Ti Laptop (306 - 341, n=3) | |
| Schenker XMG Pro 16 Studio (Mid 24) | |
| Lenovo Legion Pro 5 16IRX9 | |
| Average of class Gaming (176.4 - 354, n=101, last 2 years) | |
| Tuxedo Sirius 16 Gen 1 | |
| Mozilla Kraken 1.1 / Total | |
| Tuxedo Sirius 16 Gen 1 | |
| Average of class Gaming (391 - 590, n=106, last 2 years) | |
| Schenker XMG Pro 16 Studio (Mid 24) | |
| Lenovo Legion Pro 5 16IRX9 | |
| Average Intel Core Ultra 9 275HX, NVIDIA GeForce RTX 5070 Ti Laptop (405 - 414, n=3) | |
| Lenovo Legion Pro 7i 16 Gen 10 | |
| Asus ROG Strix G16 G615 | |
| Schenker XMG Pro 16 (E25) | |
* ... smaller is better
| PCMark 10 Score | 8550 points | |
Help | ||
| AIDA64 / Memory Copy | |
| Asus ROG Strix G16 G615 | |
| Schenker XMG Pro 16 (E25) | |
| Lenovo Legion Pro 7i 16 Gen 10 | |
| Average Intel Core Ultra 9 275HX (56003 - 94460, n=30) | |
| Lenovo Legion Pro 5 16IRX9 | |
| Schenker XMG Pro 16 Studio (Mid 24) | |
| Average of class Gaming (21750 - 129946, n=109, last 2 years) | |
| Tuxedo Sirius 16 Gen 1 | |
| AIDA64 / Memory Read | |
| Schenker XMG Pro 16 (E25) | |
| Lenovo Legion Pro 7i 16 Gen 10 | |
| Lenovo Legion Pro 5 16IRX9 | |
| Schenker XMG Pro 16 Studio (Mid 24) | |
| Average Intel Core Ultra 9 275HX (55795 - 97151, n=30) | |
| Asus ROG Strix G16 G615 | |
| Average of class Gaming (22956 - 118858, n=109, last 2 years) | |
| Tuxedo Sirius 16 Gen 1 | |
| AIDA64 / Memory Write | |
| Tuxedo Sirius 16 Gen 1 | |
| Lenovo Legion Pro 7i 16 Gen 10 | |
| Schenker XMG Pro 16 (E25) | |
| Average Intel Core Ultra 9 275HX (55663 - 116129, n=30) | |
| Lenovo Legion Pro 5 16IRX9 | |
| Average of class Gaming (22297 - 135096, n=109, last 2 years) | |
| Asus ROG Strix G16 G615 | |
| Schenker XMG Pro 16 Studio (Mid 24) | |
| AIDA64 / Memory Latency | |
| Average Intel Core Ultra 9 275HX (105.8 - 161.6, n=30) | |
| Asus ROG Strix G16 G615 | |
| Lenovo Legion Pro 7i 16 Gen 10 | |
| Average of class Gaming (75.3 - 259, n=109, last 2 years) | |
| Schenker XMG Pro 16 (E25) | |
| Tuxedo Sirius 16 Gen 1 | |
| Schenker XMG Pro 16 Studio (Mid 24) | |
| Lenovo Legion Pro 5 16IRX9 | |
* ... smaller is better
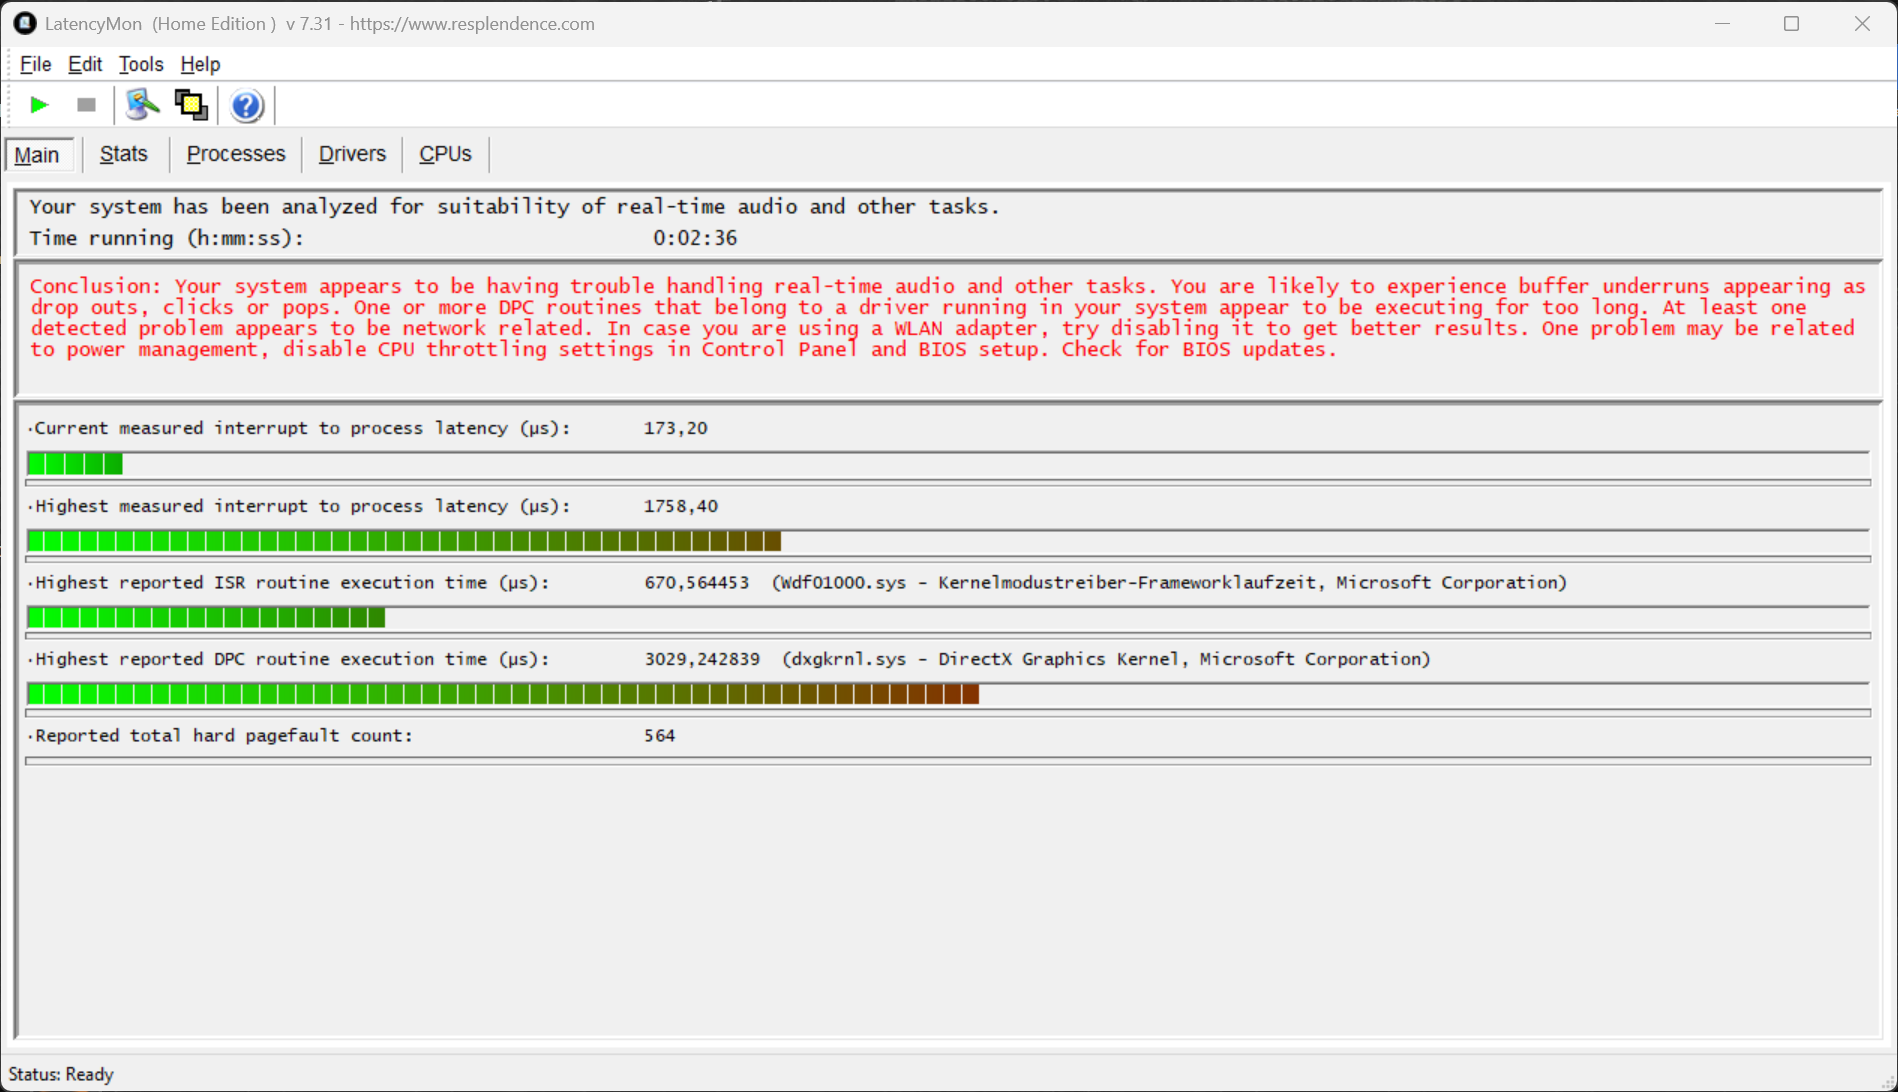
DPC latencies
During our latency test (surfing the web, 4K YouTube playback, CPU load), the test device with the current BIOS version showed slight limitations when using real-time audio applications.

| DPC Latencies / LatencyMon - interrupt to process latency (max), Web, Youtube, Prime95 | |
| Schenker XMG Pro 16 Studio (Mid 24) | |
| Schenker XMG Pro 16 (E25) | |
| Asus ROG Strix G16 G615 | |
| Lenovo Legion Pro 5 16IRX9 | |
| Lenovo Legion Pro 7i 16 Gen 10 | |
* ... smaller is better
Storage device
If you configure the XMG Pro 16 with the Core Ultra 9 275HX, then one of its two M.2 slots already supports the fast PCIe 5.0 connection. Our test device is equipped with a corresponding 9100 SSD from Samsung (1 TB, 868 GB available to the user). Its transfer rates were great during our test with a peak of more than 10 GB/s and, above all, its performance remained quite stable overall even under prolonged load (~10-12 GB/s).

* ... smaller is better
Reading continuous performance: DiskSpd Read Loop, Queue Depth 8
Graphics card
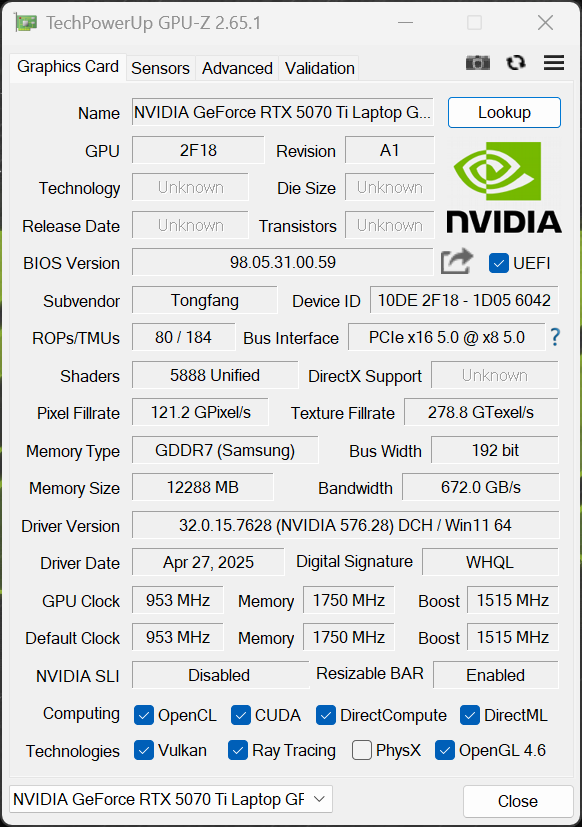
The XMG Pro 16 (E25) exclusively uses the new Nvidia GeForce RTX 5070 Ti Laptop with 12 GB VRAM. This is the fastest variant with a TGP of up to 140 watts (115 watts + 25 watts Dynamic Boost). As we have already seen in our analysis of the new Blackwell GPU, the RTX 5070 Ti Laptop additionally benefits from this high power limit when gaming, unlike the old RTX 4070 Laptop. Graphics switching takes place via the regular Optimus technology, i.e. no Advanced Optimus. Although a MUX switch is installed, the system has to be restarted to deactivate the iGPU.
We have already shown comprehensive benchmarks in our analysis and in short, the new RTX 5070 Ti Laptop is basically on par with the old RTX 4080 Laptop. The new Pro 16 had a lead of around 40% over its predecessor in the synthetic tests and around 20% in our standard 1080p gaming tests. In its native resolution, however, its lead was even greater. Overall, you can expect to play all modern games smoothly with high details; you'll only have to resort to upscaling with full ray tracing/path tracing, which we have also shown below.
| 3DMark Performance rating - Percent | |
| Lenovo Legion Pro 7i 16 Gen 10 -1! | |
| Asus ROG Strix G16 G615 | |
| Schenker XMG Pro 16 (E25) | |
| Average NVIDIA GeForce RTX 5070 Ti Laptop | |
| Average of class Gaming | |
| Lenovo Legion Pro 5 16IRX9 -1! | |
| Schenker XMG Pro 16 Studio (Mid 24) -1! | |
| Tuxedo Sirius 16 Gen 1 -3! | |
| 3DMark 11 Performance | 45656 points | |
| 3DMark Fire Strike Score | 35805 points | |
| 3DMark Time Spy Score | 17078 points | |
| 3DMark Steel Nomad Score | 4064 points | |
| 3DMark Steel Nomad Light Score | 17745 points | |
| 3DMark Steel Nomad Light Unlimited Score | 18056 points | |
Help | ||
| Blender / v3.3 Classroom OPTIX/RTX | |
| Schenker XMG Pro 16 Studio (Mid 24) | |
| Lenovo Legion Pro 5 16IRX9 | |
| Average of class Gaming (9 - 32, n=111, last 2 years) | |
| Average NVIDIA GeForce RTX 5070 Ti Laptop (13 - 19, n=14) | |
| Schenker XMG Pro 16 (E25) | |
| Lenovo Legion Pro 7i 16 Gen 10 | |
| Asus ROG Strix G16 G615 | |
| Blender / v3.3 Classroom CUDA | |
| Schenker XMG Pro 16 Studio (Mid 24) | |
| Average of class Gaming (15 - 228, n=111, last 2 years) | |
| Lenovo Legion Pro 5 16IRX9 | |
| Average NVIDIA GeForce RTX 5070 Ti Laptop (24 - 33, n=14) | |
| Schenker XMG Pro 16 (E25) | |
| Asus ROG Strix G16 G615 | |
| Lenovo Legion Pro 7i 16 Gen 10 | |
| Blender / v3.3 Classroom CPU | |
| Average of class Gaming (122 - 565, n=107, last 2 years) | |
| Schenker XMG Pro 16 Studio (Mid 24) | |
| Lenovo Legion Pro 5 16IRX9 | |
| Average NVIDIA GeForce RTX 5070 Ti Laptop (122 - 361, n=14) | |
| Lenovo Legion Pro 7i 16 Gen 10 | |
| Schenker XMG Pro 16 (E25) | |
| Asus ROG Strix G16 G615 | |
* ... smaller is better
| Setting | Alan Wake 2 (High/Ultra + PT) | Cyberpunk 2077 Phantom Liberty (RT Overdrive) |
|---|---|---|
| Native | 23.5fps | 18fps |
| DLSS Quality | 35.2fps | 35.2fps |
| DLSS Performance | 45.7fps | 52.1fps |
| DLSS Quality MFG x2 | 75.3fps | 62.8fps |
| DLSS Quality MFG x4 | 124.3fps | 111.1fps |
| Performance rating - Percent | |
| Lenovo Legion Pro 7i 16 Gen 10 -1! | |
| Asus ROG Strix G16 G615 | |
| Schenker XMG Pro 16 (E25) | |
| Lenovo Legion Pro 5 16IRX9 | |
| Average of class Gaming | |
| Schenker XMG Pro 16 Studio (Mid 24) | |
| Tuxedo Sirius 16 Gen 1 -3! | |
| Cyberpunk 2077 - 1920x1080 Ultra Preset (FSR off) | |
| Lenovo Legion Pro 7i 16 Gen 10 | |
| Asus ROG Strix G16 G615 | |
| Schenker XMG Pro 16 (E25) | |
| Average of class Gaming (17.7 - 169.9, n=120, last 2 years) | |
| Lenovo Legion Pro 5 16IRX9 | |
| Schenker XMG Pro 16 Studio (Mid 24) | |
| Tuxedo Sirius 16 Gen 1 | |
| Baldur's Gate 3 - 1920x1080 Ultra Preset AA:T | |
| Lenovo Legion Pro 7i 16 Gen 10 | |
| Asus ROG Strix G16 G615 | |
| Schenker XMG Pro 16 (E25) | |
| Average of class Gaming (59.4 - 246, n=107, last 2 years) | |
| Lenovo Legion Pro 5 16IRX9 | |
| Schenker XMG Pro 16 Studio (Mid 24) | |
| Tuxedo Sirius 16 Gen 1 | |
| GTA V - 1920x1080 Highest AA:4xMSAA + FX AF:16x | |
| Asus ROG Strix G16 G615 | |
| Schenker XMG Pro 16 (E25) | |
| Average of class Gaming (48.3 - 186.9, n=101, last 2 years) | |
| Lenovo Legion Pro 5 16IRX9 | |
| Schenker XMG Pro 16 Studio (Mid 24) | |
| Final Fantasy XV Benchmark - 1920x1080 High Quality | |
| Lenovo Legion Pro 7i 16 Gen 10 | |
| Asus ROG Strix G16 G615 | |
| Schenker XMG Pro 16 (E25) | |
| Average of class Gaming (41 - 215, n=102, last 2 years) | |
| Lenovo Legion Pro 5 16IRX9 | |
| Schenker XMG Pro 16 Studio (Mid 24) | |
| Tuxedo Sirius 16 Gen 1 | |
| Strange Brigade - 1920x1080 ultra AA:ultra AF:16 | |
| Lenovo Legion Pro 7i 16 Gen 10 | |
| Asus ROG Strix G16 G615 | |
| Average of class Gaming (76.3 - 456, n=92, last 2 years) | |
| Lenovo Legion Pro 5 16IRX9 | |
| Schenker XMG Pro 16 Studio (Mid 24) | |
| Tuxedo Sirius 16 Gen 1 | |
| Schenker XMG Pro 16 (E25) | |
| Dota 2 Reborn - 1920x1080 ultra (3/3) best looking | |
| Lenovo Legion Pro 7i 16 Gen 10 | |
| Lenovo Legion Pro 5 16IRX9 | |
| Asus ROG Strix G16 G615 | |
| Schenker XMG Pro 16 (E25) | |
| Schenker XMG Pro 16 Studio (Mid 24) | |
| Average of class Gaming (84.8 - 248, n=112, last 2 years) | |
Cyberpunk 2077 ultra FPS diagram
| low | med. | high | ultra | QHD DLSS | QHD | 4K DLSS | 4K | |
|---|---|---|---|---|---|---|---|---|
| GTA V (2015) | 161 | 147.3 | ||||||
| Dota 2 Reborn (2015) | 223 | 199.7 | 189.3 | 174.8 | ||||
| Final Fantasy XV Benchmark (2018) | 217 | 183.4 | 147.8 | 125.2 | ||||
| X-Plane 11.11 (2018) | 156.9 | 144.1 | 117.5 | |||||
| Strange Brigade (2018) | 392 | 201 | 156.5 | 136.4 | 103.8 | |||
| Baldur's Gate 3 (2023) | 157 | 109.2 | ||||||
| Cyberpunk 2077 (2023) | 188.6 | 169.2 | 144.6 | 129.9 | 91.6 | 81.6 | ||
| Alan Wake 2 (2023) | 108.9 | 103.5 | 96 | 64.5 | ||||
| F1 24 (2024) | 250 | 108 | 71.2 | |||||
| Call of Duty Black Ops 6 (2024) | 152 | 142 | 100 | 94 | 65 | |||
| Anno 117: Pax Romana (2025) | 142.3 | 107.2 | 84.4 | 47.4 | 48.7 | 34.3 | 30.5 | 19.3 |
| Call of Duty Black Ops 7 (2025) | 257 | 190 | 147 | 52 | 53 | 34 | ||
| Pragmata (2026) | 192 | 146.4 | 119.4 | 96.7 | 86 | 54 | 47.7 | |
| Forza Horizon 6 (2026) | 214 | 166 | 116 | 67 | 66 | 46 | 32 | 25 |
Emissions & energy
Noise emissions

The XMG Pro 16's fans are always active, but the noise they produce is barely audible when idling and under low load (25 dB(A)). You can also activate a passive mode in the BIOS but in this case, the fans often rev up in short bursts, which feels noisier. The device stays super quiet during everyday use, especially in Balanced mode, but its high power limits take their toll when gaming and under full load. Depending on the mode, the values here ranged from around 45 to 53 dB(A) during our test, which is why we recommend using headphones when gaming. There were no other electronic noises on our test device.
Noise level
| Idle |
| 25 / 25 / 25 dB(A) |
| Load |
| 45.5 / 53.3 dB(A) |
 | ||
30 dB silent 40 dB(A) audible 50 dB(A) loud |
||
min: | ||
| Schenker XMG Pro 16 (E25) GeForce RTX 5070 Ti Laptop, Ultra 9 275HX, Samsung 9100 Pro 1 TB | Schenker XMG Pro 16 Studio (Mid 24) GeForce RTX 4070 Laptop GPU, i9-14900HX, Samsung 990 Pro 1 TB | Asus ROG Strix G16 G615 GeForce RTX 5080 Laptop, Ultra 9 275HX, Micron 2500 1TB MTFDKBA1T0QGN | Tuxedo Sirius 16 Gen 1 Radeon RX 7600M XT, R7 7840HS, Samsung SSD 980 Pro 1TB MZ-V8P1T0BW | Lenovo Legion Pro 5 16IRX9 GeForce RTX 4070 Laptop GPU, i9-14900HX, Samsung PM9A1 MZVL21T0HCLR | Lenovo Legion Pro 7i 16 Gen 10 GeForce RTX 5080 Laptop, Ultra 9 275HX, SK Hynix HFS001TEJ9X115N | |
|---|---|---|---|---|---|---|
| Noise | -13% | -5% | -5% | -3% | 7% | |
| off / environment * (dB) | 23.3 | 25 -7% | 24 -3% | 25.1 -8% | 23.9 -3% | 22.9 2% |
| Idle Minimum * (dB) | 25 | 28 -12% | 24 4% | 25.1 -0% | 24.3 3% | 22.9 8% |
| Idle Average * (dB) | 25 | 31 -24% | 30.1 -20% | 30.4 -22% | 24.3 3% | 22.9 8% |
| Idle Maximum * (dB) | 25 | 35 -40% | 30.1 -20% | 30.4 -22% | 28.9 -16% | 26.3 -5% |
| Load Average * (dB) | 45.5 | 52 -14% | 41.1 10% | 35.2 23% | 45.8 -1% | 27.8 39% |
| Cyberpunk 2077 ultra * (dB) | 53.3 | 53 1% | 54.2 -2% | 54.2 -2% | ||
| Load Maximum * (dB) | 53.3 | 52 2% | 54.2 -2% | 54.2 -2% | 56.6 -6% | 53.9 -1% |
| Witcher 3 ultra * (dB) | 51 |
* ... smaller is better
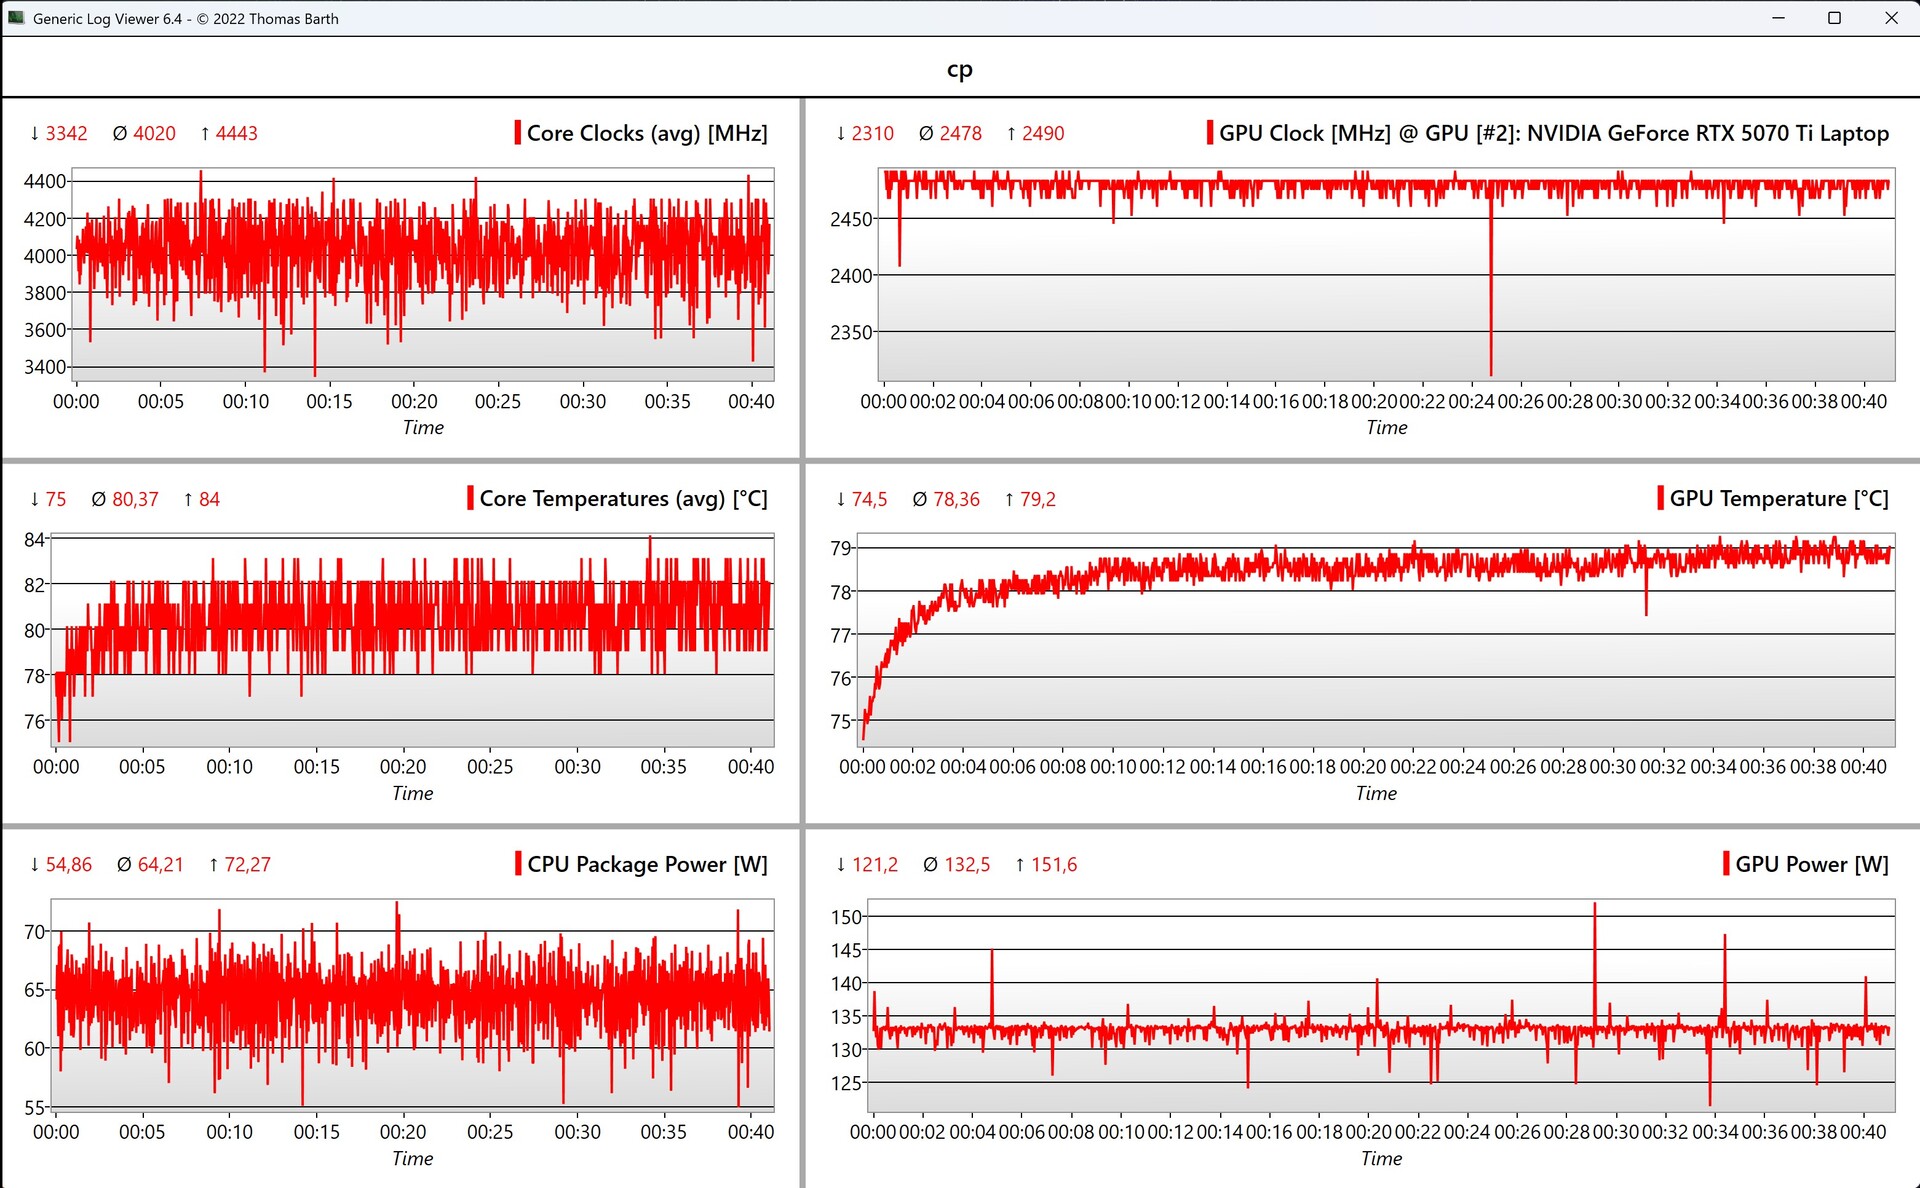
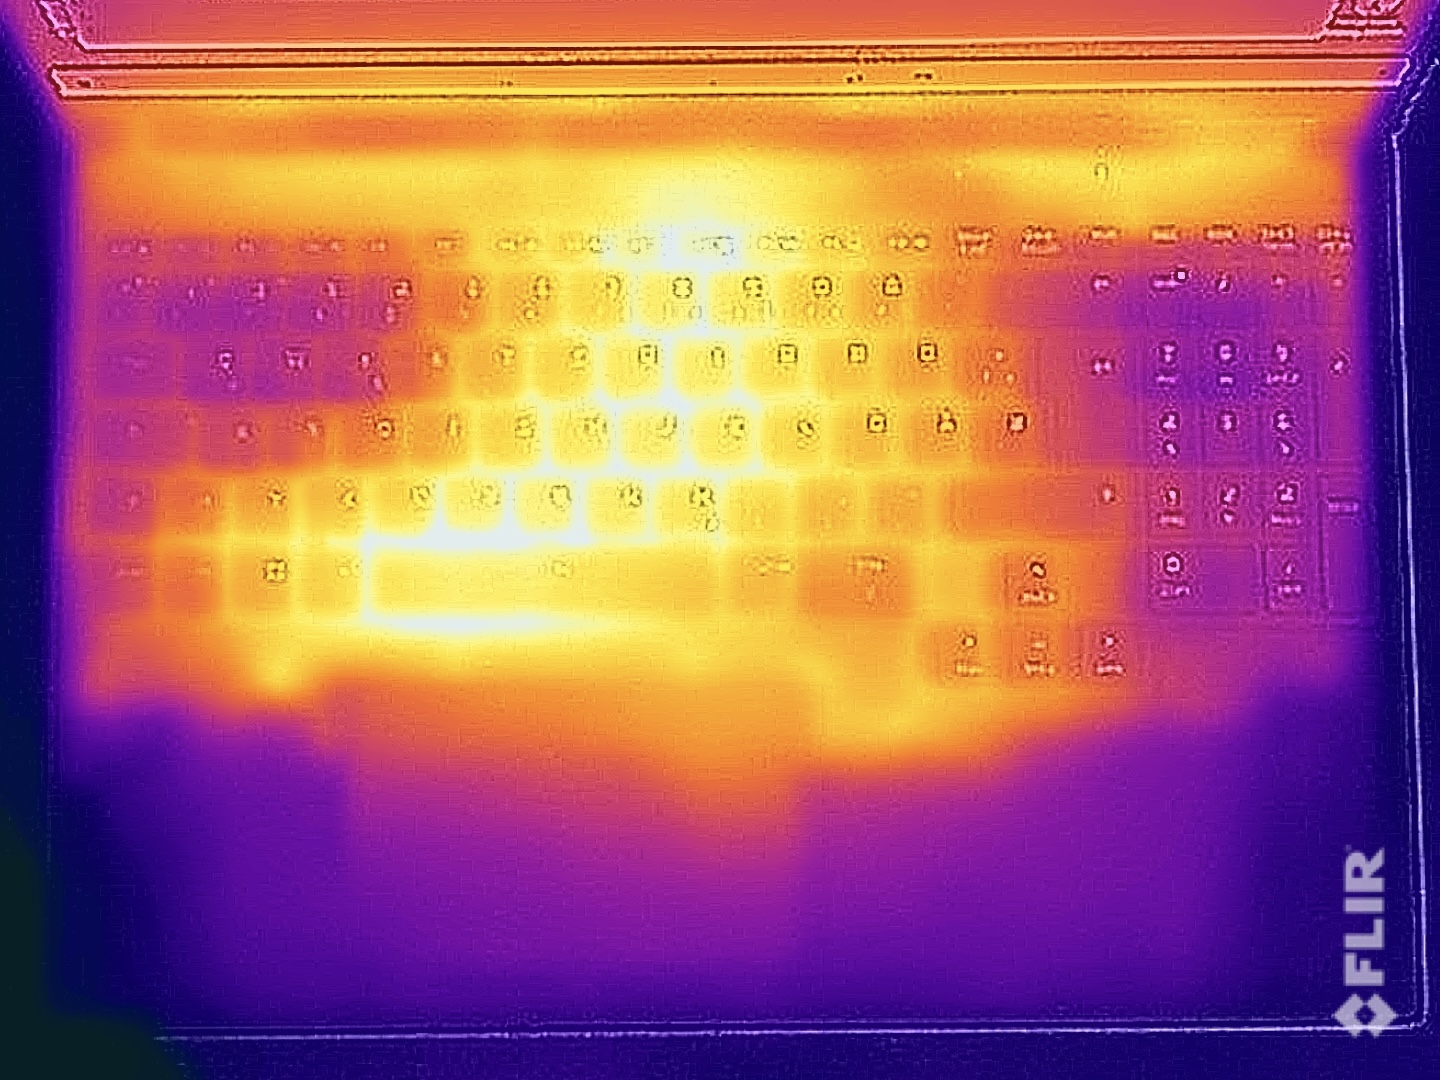
Temperature
The laptop's surfaces remain very cool in idle mode and during simple tasks, but you notice the increase in temperature under high load. Although there were no critical points during our test, a number of measuring points exceeded the 40 °C mark. Apart from slightly warm fingers, we noted no issues when typing. During the stress test, the CPU/GPU levelled off at 60 and 140 watts respectively, and the Pro 16 could permanently cool ~200 watts in total.

(±) The maximum temperature on the upper side is 43.2 °C / 110 F, compared to the average of 40.4 °C / 105 F, ranging from 21.2 to 68.8 °C for the class Gaming.
(-) The bottom heats up to a maximum of 46 °C / 115 F, compared to the average of 43.2 °C / 110 F
(+) In idle usage, the average temperature for the upper side is 27 °C / 81 F, compared to the device average of 33.9 °C / 93 F.
(-) 3: The average temperature for the upper side is 38.7 °C / 102 F, compared to the average of 33.9 °C / 93 F for the class Gaming.
(±) The palmrests and touchpad can get very hot to the touch with a maximum of 38.9 °C / 102 F.
(-) The average temperature of the palmrest area of similar devices was 28.8 °C / 83.8 F (-10.1 °C / -18.2 F).

| Schenker XMG Pro 16 (E25) Intel Core Ultra 9 275HX, NVIDIA GeForce RTX 5070 Ti Laptop | Schenker XMG Pro 16 Studio (Mid 24) Intel Core i9-14900HX, NVIDIA GeForce RTX 4070 Laptop GPU | Asus ROG Strix G16 G615 Intel Core Ultra 9 275HX, NVIDIA GeForce RTX 5080 Laptop | Tuxedo Sirius 16 Gen 1 AMD Ryzen 7 7840HS, AMD Radeon RX 7600M XT | Lenovo Legion Pro 5 16IRX9 Intel Core i9-14900HX, NVIDIA GeForce RTX 4070 Laptop GPU | Lenovo Legion Pro 7i 16 Gen 10 Intel Core Ultra 9 275HX, NVIDIA GeForce RTX 5080 Laptop | |
|---|---|---|---|---|---|---|
| Heat | -1% | 24% | 11% | 12% | 20% | |
| Maximum Upper Side * (°C) | 43.2 | 51 -18% | 39.6 8% | 54.7 -27% | 43.8 -1% | 42.6 1% |
| Maximum Bottom * (°C) | 46 | 66 -43% | 49.7 -8% | 57.1 -24% | 55.4 -20% | 41.2 10% |
| Idle Upper Side * (°C) | 27.7 | 35 -26% | 26.3 5% | 25.8 7% | 32.8 -18% | 32.6 -18% |
| Idle Bottom * (°C) | 264 | 39 85% | 27.3 90% | 32 88% | 36 86% | 32.4 88% |
* ... smaller is better
Speakers
The two stereo speakers aren't the best, as the sound is relatively weak, just like that of its predecessor.
Schenker XMG Pro 16 (E25) audio analysis
(±) | speaker loudness is average but good (79.2 dB)
Bass 100 - 315 Hz
(±) | reduced bass - on average 14.2% lower than median
(±) | linearity of bass is average (10.6% delta to prev. frequency)
Mids 400 - 2000 Hz
(±) | higher mids - on average 8.2% higher than median
(±) | linearity of mids is average (9.9% delta to prev. frequency)
Highs 2 - 16 kHz
(+) | balanced highs - only 3.8% away from median
(+) | highs are linear (5.9% delta to prev. frequency)
Overall 100 - 16.000 Hz
(±) | linearity of overall sound is average (18.5% difference to median)
Compared to same class
» 60% of all tested devices in this class were better, 8% similar, 32% worse
» The best had a delta of 6%, average was 18%, worst was 132%
Compared to all devices tested
» 41% of all tested devices were better, 8% similar, 51% worse
» The best had a delta of 4%, average was 24%, worst was 134%
Schenker XMG Pro 16 Studio (Mid 24) audio analysis
(±) | speaker loudness is average but good (79 dB)
Bass 100 - 315 Hz
(-) | nearly no bass - on average 15.1% lower than median
(±) | linearity of bass is average (13.6% delta to prev. frequency)
Mids 400 - 2000 Hz
(±) | higher mids - on average 5.3% higher than median
(+) | mids are linear (4.4% delta to prev. frequency)
Highs 2 - 16 kHz
(+) | balanced highs - only 4.4% away from median
(+) | highs are linear (4.9% delta to prev. frequency)
Overall 100 - 16.000 Hz
(±) | linearity of overall sound is average (17.7% difference to median)
Compared to same class
» 52% of all tested devices in this class were better, 10% similar, 38% worse
» The best had a delta of 6%, average was 18%, worst was 132%
Compared to all devices tested
» 35% of all tested devices were better, 8% similar, 57% worse
» The best had a delta of 4%, average was 24%, worst was 134%
Asus ROG Strix G16 G615 audio analysis
(+) | speakers can play relatively loud (82.2 dB)
Bass 100 - 315 Hz
(±) | reduced bass - on average 7.5% lower than median
(±) | linearity of bass is average (7.4% delta to prev. frequency)
Mids 400 - 2000 Hz
(+) | balanced mids - only 2.9% away from median
(+) | mids are linear (3.6% delta to prev. frequency)
Highs 2 - 16 kHz
(+) | balanced highs - only 2.8% away from median
(±) | linearity of highs is average (8.3% delta to prev. frequency)
Overall 100 - 16.000 Hz
(+) | overall sound is linear (9.4% difference to median)
Compared to same class
» 3% of all tested devices in this class were better, 2% similar, 95% worse
» The best had a delta of 6%, average was 18%, worst was 132%
Compared to all devices tested
» 3% of all tested devices were better, 1% similar, 96% worse
» The best had a delta of 4%, average was 24%, worst was 134%
Tuxedo Sirius 16 Gen 1 audio analysis
(+) | speakers can play relatively loud (85 dB)
Bass 100 - 315 Hz
(±) | reduced bass - on average 14.1% lower than median
(±) | linearity of bass is average (7.7% delta to prev. frequency)
Mids 400 - 2000 Hz
(±) | higher mids - on average 6.8% higher than median
(±) | linearity of mids is average (9.7% delta to prev. frequency)
Highs 2 - 16 kHz
(+) | balanced highs - only 3.7% away from median
(±) | linearity of highs is average (7% delta to prev. frequency)
Overall 100 - 16.000 Hz
(±) | linearity of overall sound is average (16.4% difference to median)
Compared to same class
» 42% of all tested devices in this class were better, 6% similar, 52% worse
» The best had a delta of 6%, average was 18%, worst was 132%
Compared to all devices tested
» 27% of all tested devices were better, 6% similar, 67% worse
» The best had a delta of 4%, average was 24%, worst was 134%
Lenovo Legion Pro 5 16IRX9 audio analysis
(±) | speaker loudness is average but good (80.7 dB)
Bass 100 - 315 Hz
(-) | nearly no bass - on average 19% lower than median
(±) | linearity of bass is average (10.1% delta to prev. frequency)
Mids 400 - 2000 Hz
(+) | balanced mids - only 4.7% away from median
(+) | mids are linear (5.7% delta to prev. frequency)
Highs 2 - 16 kHz
(+) | balanced highs - only 3.3% away from median
(+) | highs are linear (5.6% delta to prev. frequency)
Overall 100 - 16.000 Hz
(±) | linearity of overall sound is average (17.2% difference to median)
Compared to same class
» 46% of all tested devices in this class were better, 11% similar, 42% worse
» The best had a delta of 6%, average was 18%, worst was 132%
Compared to all devices tested
» 32% of all tested devices were better, 8% similar, 60% worse
» The best had a delta of 4%, average was 24%, worst was 134%
Lenovo Legion Pro 7i 16 Gen 10 audio analysis
(±) | speaker loudness is average but good (81.4 dB)
Bass 100 - 315 Hz
(±) | reduced bass - on average 7.6% lower than median
(±) | linearity of bass is average (9.4% delta to prev. frequency)
Mids 400 - 2000 Hz
(+) | balanced mids - only 4.1% away from median
(+) | mids are linear (4.8% delta to prev. frequency)
Highs 2 - 16 kHz
(+) | balanced highs - only 1.9% away from median
(+) | highs are linear (4.8% delta to prev. frequency)
Overall 100 - 16.000 Hz
(+) | overall sound is linear (9.4% difference to median)
Compared to same class
» 3% of all tested devices in this class were better, 2% similar, 95% worse
» The best had a delta of 6%, average was 18%, worst was 132%
Compared to all devices tested
» 3% of all tested devices were better, 1% similar, 96% worse
» The best had a delta of 4%, average was 24%, worst was 134%
Power consumption
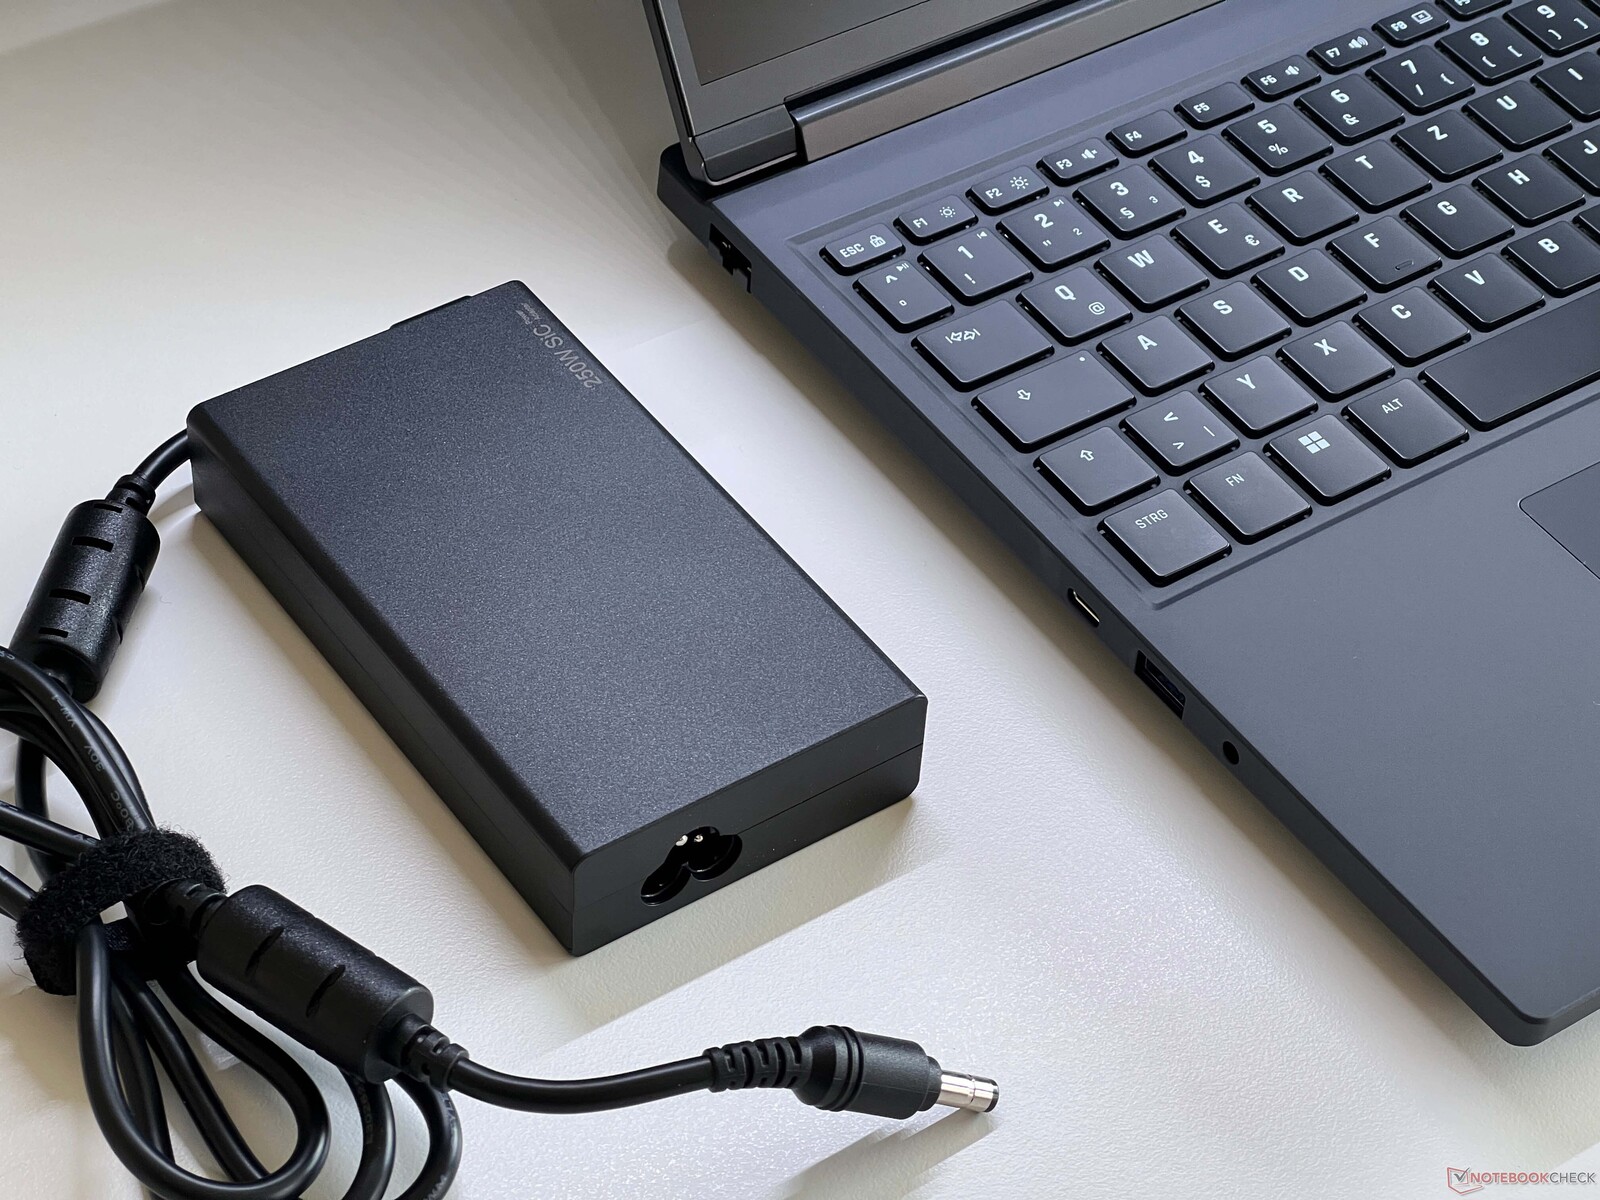
The Pro 16 is comparatively efficient in idle mode, but its values are in line with expectations under load. When gaming, you can expect around 240-250 watts and during the stress test, we briefly saw up to 290 watts before this value quickly stabilized at around 240 watts. As the supplied 250 watt power supply unit (which is very compact) can supply the 290 watts, it is completely sufficient in size. However, we measured a standby consumption of 2.1 watts, which is too high.
| Off / Standby | |
| Idle | |
| Load |
|
Key:
min: | |
| Schenker XMG Pro 16 (E25) Ultra 9 275HX, GeForce RTX 5070 Ti Laptop, Samsung 9100 Pro 1 TB, IPS, 2560x1600, 16" | Schenker XMG Pro 16 Studio (Mid 24) i9-14900HX, GeForce RTX 4070 Laptop GPU, Samsung 990 Pro 1 TB, IPS, 2560x1600, 16" | Asus ROG Strix G16 G615 Ultra 9 275HX, GeForce RTX 5080 Laptop, Micron 2500 1TB MTFDKBA1T0QGN, IPS, 2560x1600, 16" | Tuxedo Sirius 16 Gen 1 R7 7840HS, Radeon RX 7600M XT, Samsung SSD 980 Pro 1TB MZ-V8P1T0BW, IPS, 2560x1440, 16.1" | Lenovo Legion Pro 5 16IRX9 i9-14900HX, GeForce RTX 4070 Laptop GPU, Samsung PM9A1 MZVL21T0HCLR, IPS, 2560x1600, 16" | Lenovo Legion Pro 7i 16 Gen 10 Ultra 9 275HX, GeForce RTX 5080 Laptop, SK Hynix HFS001TEJ9X115N, OLED, 2560x1600, 16" | |
|---|---|---|---|---|---|---|
| Power Consumption | -51% | -12% | -13% | -18% | -78% | |
| Idle Minimum * (Watt) | 11.7 | 31 -165% | 10.8 8% | 15.9 -36% | 12.5 -7% | 28.5 -144% |
| Idle Average * (Watt) | 16.6 | 33 -99% | 17.7 -7% | 20.1 -21% | 24.6 -48% | 38.8 -134% |
| Idle Maximum * (Watt) | 17.1 | 41 -140% | 18.8 -10% | 23.5 -37% | 24.8 -45% | 45.6 -167% |
| Load Average * (Watt) | 122.4 | 114 7% | 139.4 -14% | 111.7 9% | 109.6 10% | 132.2 -8% |
| Cyberpunk 2077 ultra * (Watt) | 245 | 218 11% | 295 -20% | 318 -30% | ||
| Cyberpunk 2077 ultra external monitor * (Watt) | 241 | 196.8 18% | 291 -21% | 319 -32% | ||
| Load Maximum * (Watt) | 291.5 | 250 14% | 359.3 -23% | 240 18% | 284.9 2% | 384 -32% |
| Witcher 3 ultra * (Watt) | 228 | 218 |
* ... smaller is better
Power consumption Cyberpunk / stress test
Power consumption with external monitor
Runtimes

At a brightness of 150 cd/m² (57% of our test device's maximum brightness), the laptop's 99.8 Wh battery lasted just over 9 hours in our WLAN test at 60 Hz, and just over 6 hours at full brightness. These are significantly better values than the predecessor model (73 Wh). A complete charging process with the device switched on takes 116 minutes (80% after one hour).
| Battery Runtime | |
| WiFi Websurfing | |
| Schenker XMG Pro 16 (E25) | |
| Asus ROG Strix G16 G615 | |
| Tuxedo Sirius 16 Gen 1 | |
| Average of class Gaming (1.967 - 14.6, n=102, last 2 years) | |
| Schenker XMG Pro 16 Studio (Mid 24) | |
| Lenovo Legion Pro 7i 16 Gen 10 | |
| Lenovo Legion Pro 5 16IRX9 | |
| WiFi Websurfing max. Brightness | |
| Asus ROG Strix G16 G615 | |
| Schenker XMG Pro 16 (E25) | |
| Average of class Gaming (2.35 - 8.93, n=29, last 2 years) | |
Notebookcheck total rating
Schenker XMG Pro 16 (E25)
- 05/05/2025 v8
Andreas Osthoff
 Total Sustainability Score:
 Possible alternatives compared
Image | Model / Review | Price | Weight | Height | Display |
|---|---|---|---|---|---|
1. 87.4%  | Schenker XMG Pro 16 (E25) Intel Core Ultra 9 275HX ⎘ NVIDIA GeForce RTX 5070 Ti Laptop ⎘ 32 GB Memory, 1024 GB SSD | Amazon: List Price: 2480€ | 2.5 kg | 26.5 mm | 16.00" 2560x1600 189 PPI IPS |
2. 81.2%  | Schenker XMG Pro 16 Studio (Mid 24) Intel Core i9-14900HX ⎘ NVIDIA GeForce RTX 4070 Laptop GPU ⎘ 32 GB Memory, 1024 GB SSD | Amazon: 1. $155.00 16.0" WQXGA 2560(RGB)×1600 ... 2. $155.00 Replacement Screen 16.0" for... 3. 16.0" for Schenker XMG Pro 1... List Price: 2300 Euro | 2.3 kg | 19.9 mm | 16.00" 2560x1600 189 PPI IPS |
3. 87.3%  | Asus ROG Strix G16 G615 Intel Core Ultra 9 275HX ⎘ NVIDIA GeForce RTX 5080 Laptop ⎘ 32 GB Memory, 1024 GB SSD | Amazon: 1. $1,399.97 ASUS ROG Strix G16 (2025) Ga... 2. $2,199.99 ASUS ROG Strix G16 (2025) Ga... 3. $2,295.00 ASUS ROG Strix G16 G615LR-MS... List Price: 3299€ | 2.6 kg | 30.8 mm | 16.00" 2560x1600 189 PPI IPS |
4. 80.7%  | Tuxedo Sirius 16 Gen 1 AMD Ryzen 7 7840HS ⎘ AMD Radeon RX 7600M XT ⎘ 32 GB Memory, 1024 GB SSD | Amazon: List Price: 1666€ | 2.3 kg | 22 mm | 16.10" 2560x1440 182 PPI IPS |
5. 89.3% v7 (old)  | Lenovo Legion Pro 5 16IRX9 Intel Core i9-14900HX ⎘ NVIDIA GeForce RTX 4070 Laptop GPU ⎘ 32 GB Memory, 1024 GB SSD | Amazon: List Price: 2100 USD | 2.5 kg | 26.95 mm | 16.00" 2560x1600 189 PPI IPS |
6. 87.5%  | Lenovo Legion Pro 7i 16 Gen 10 Intel Core Ultra 9 275HX ⎘ NVIDIA GeForce RTX 5080 Laptop ⎘ 32 GB Memory, 1024 GB SSD | Amazon: List Price: 4200 USD | 2.6 kg | 26.65 mm | 16.00" 2560x1600 189 PPI OLED |
Transparency
The selection of devices to be reviewed is made by our editorial team. The test sample was provided to the author as a loan by the manufacturer or retailer for the purpose of this review. The lender had no influence on this review, nor did the manufacturer receive a copy of this review before publication. There was no obligation to publish this review. As an independent media company, Notebookcheck is not subjected to the authority of manufacturers, retailers or publishers.
This is how Notebookcheck is testing
Every year, Notebookcheck independently reviews hundreds of laptops and smartphones using standardized procedures to ensure that all results are comparable. We have continuously developed our test methods for around 20 years and set industry standards in the process. In our test labs, high-quality measuring equipment is utilized by experienced technicians and editors. These tests involve a multi-stage validation process. Our complex rating system is based on hundreds of well-founded measurements and benchmarks, which maintains objectivity. Further information on our test methods can be found here.

