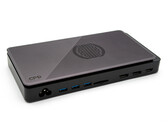
Notebookcheck Logo

AMD Radeon RX 7600M XT

AMD Radeon RX 7600M XT

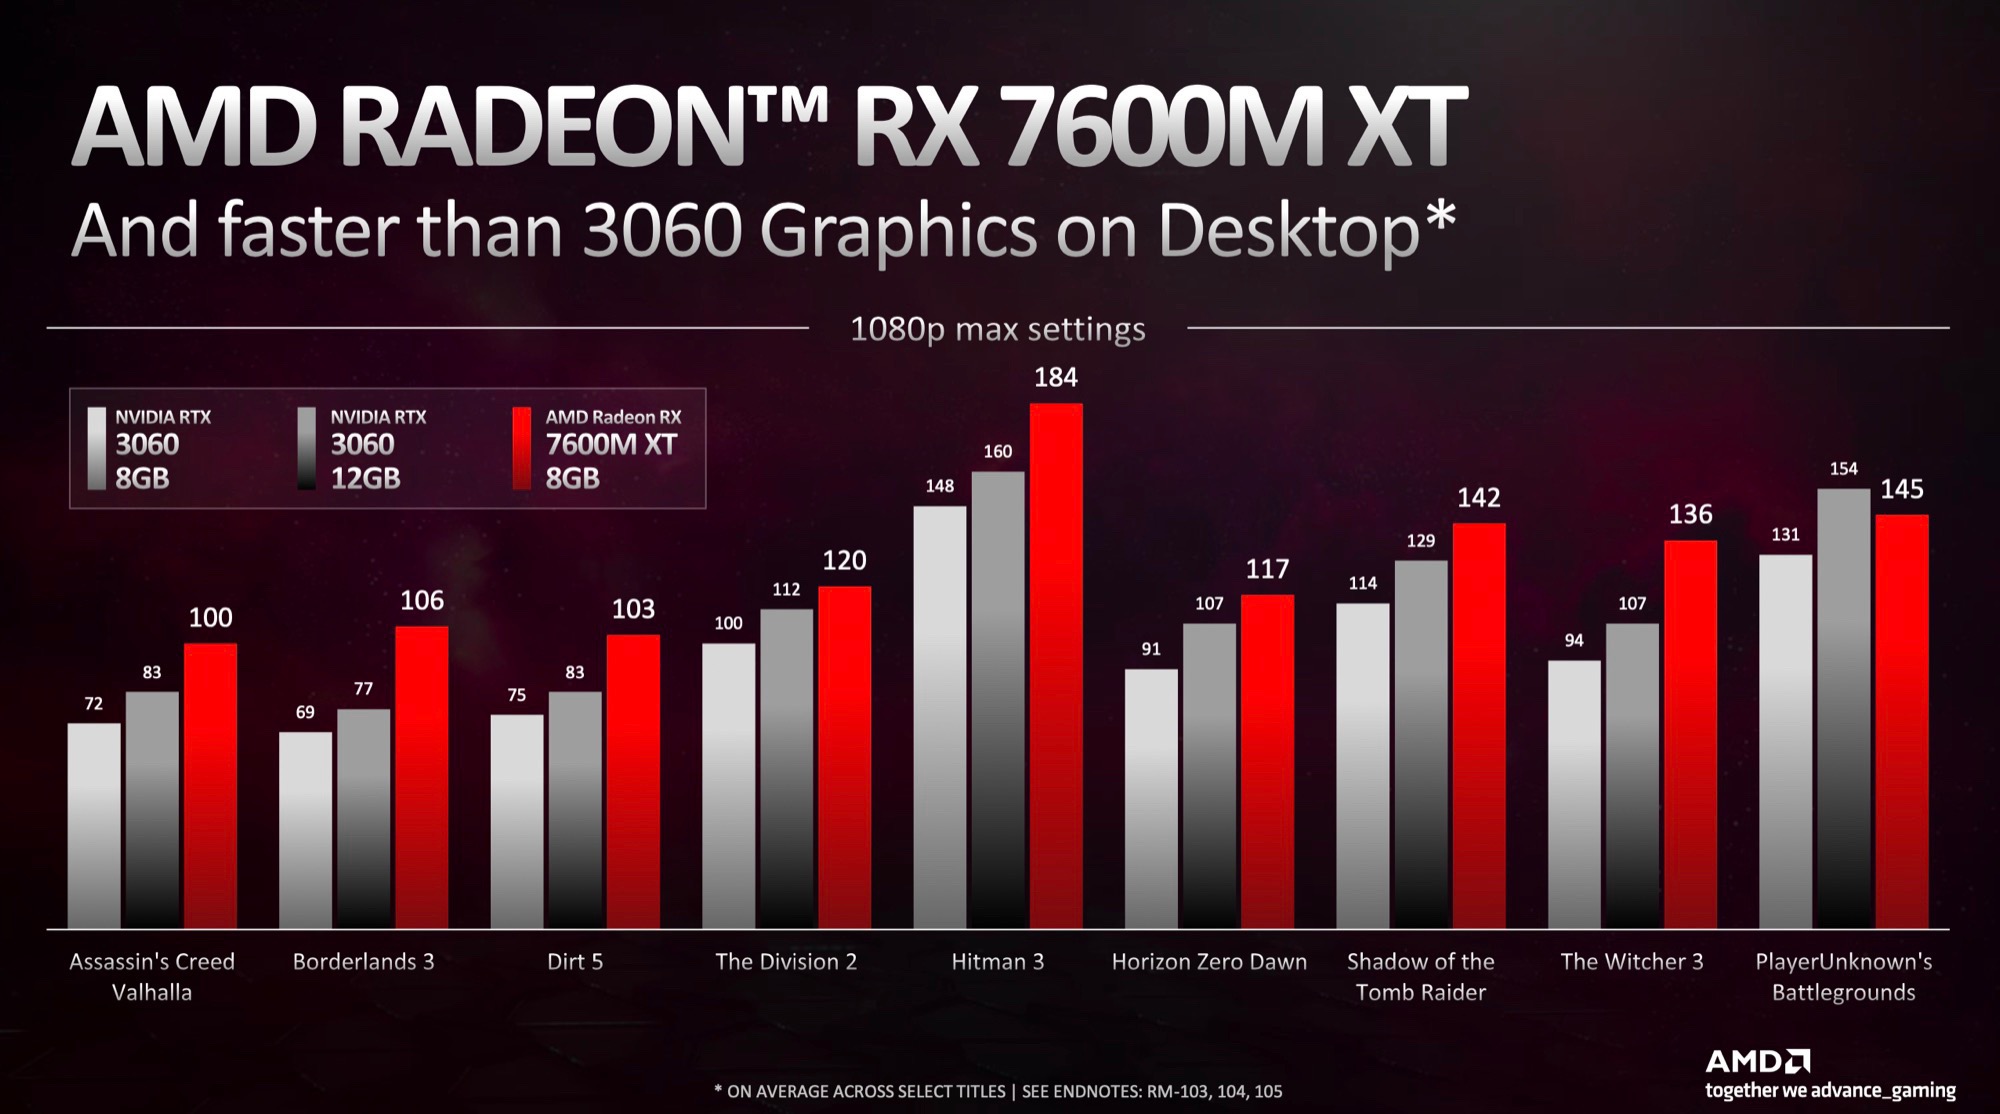
The AMD Radeon RX 7600M XT is a mobile upper mid-range graphics card based on the Navi 33 chip (RDNA 3 architecture) manufactured in 6nm. It features 2,048 cores (32 CUs - compute units) and 8 GB of fast GDDR6 graphics memory connected with a 128 Bit memory bus. The chip also includes 32 MB Infinity Cache. The clock speed of the cores will depend on the laptop according to AMD. The specified game clock speed is 2300 MHz (most likely at 120 W TGP). 

AMD compares the performance to the RTX 3060 desktop GPU and claims significantly faster frame rates in a couple of games (without Raytracing). Although the Raytracing performance did increase for RDNA 3, the GeForce GPUs are still faster in this regard.

The Navi 33 chip is manufactured at TSMC in the current 6nm process (versus 4nm of Nvidia RTX 4000 series). The power consumption (TGP) is specified at 75 to 120 Watt.

Radeon RX 7000M Series

Radeon RX 7900M compare 4608 @ 1.83 - 2.09 GHz256 Bit @ 18000 MHz
Radeon RX 7600M XT 2048 @ 2.3 GHz128 Bit @ 18000 MHz
Radeon RX 7700S compare 2048 @ 2.2 GHz128 Bit @ 18000 MHz
Radeon RX 7600M compare 1792 @ 2.07 GHz128 Bit @ 16000 MHz
Radeon RX 7600S compare 1792 @ 1.87 GHz128 Bit @ 16000 MHz
CodenameNavi 33
ArchitectureRDNA 3
Pipelines2048 - unified
ROPs64
Core Speed2300 (Boost) MHz
Theoretical Performance42.8 TFLOPS FP16, 21.4 TFLOPS FP32
CacheL3: 32 MB
Memory Speed18000 MHz
Memory Bus Width128 Bit
Memory TypeGDDR6
Max. Amount of Memory8 GB
Shared Memoryno
Memory Bandwidth288 GB/s
APIDirectX 12, Shader 6.4, OpenGL 4.6
Power Consumption120 Watt (75 - 120 Watt TGP)
Transistor Count13.3 Billion
Die Size 204 mm²
Man. Technology6 nm
Notebook Sizelarge
Date of Announcement05.01.2023
Link to Manufacturer Pagewww.amd.com

Benchmarks

Performance Rating - 3DMark 11 + Fire Strike + Time Spy
12.7 pt (38%)
Restrict / Search: Model: Max. age: years
3DMark - 3DMark Speed Way Score
min: 1507     avg: 1811     median: 1837 (12%)     max: 1975 Points
3DMark - 3DMark Steel Nomad
min: 2084     avg: 2158     median: 2151.5 (15%)     max: 2243 Points
3DMark - 3DMark Steel Nomad Light
min: 8938     avg: 9300     median: 9103 (21%)     max: 9858 Points
3DMark - 3DMark Solar Bay
min: 39212     avg: 40289     median: 40135 (16%)     max: 41520 Points
3DMark - 3DMark Fire Strike Standard Score
min: 19233     avg: 24930     median: 25600.5 (39%)     max: 28539 Points
3DMark - 3DMark Fire Strike Standard Graphics
min: 22176     avg: 28390     median: 28894.5 (27%)     max: 30684 Points
3DMark - 3DMark Ice Storm Graphics
min: 177869     avg: 412132     median: 470738 (52%)     max: 547325 Points
3DMark - 3DMark Time Spy Score
min: 9246     avg: 9920     median: 9857 (26%)     max: 11041 Points
3DMark - 3DMark Time Spy Graphics
min: 8966     avg: 9770     median: 9856 (20%)     max: 10777 Points
Restrict / Search: Model: Max. age: years
3DMark - 3DMark Ice Storm Unlimited Graphics
min: 252549     avg: 466349     median: 494478 (50%)     max: 606593 Points
3DMark - 3DMark Ice Storm Extreme Graphics
min: 172864     avg: 372224     median: 415193 (49%)     max: 483319 Points
3DMark - 3DMark Cloud Gate Score
min: 36706     avg: 58320     median: 64091 (61%)     max: 69632 Points
3DMark - 3DMark Cloud Gate Graphics
min: 136061     avg: 155465     median: 154102 (38%)     max: 168736 Points
3DMark - 3DMark Night Raid
min: 48750     avg: 59889     median: 61234.5 (58%)     max: 66617 Points
3DMark - 3DMark Night Raid Graphics Score
min: 93268     avg: 108185     median: 112024 (43%)     max: 121453 Points
3DMark 11 - 3DM11 Performance Score
min: 17827     avg: 29551     median: 31711 (38%)     max: 35108 Points
3DMark 11 - 3DM11 Performance GPU
min: 27060     avg: 38052     median: 39342 (30%)     max: 44060 Points
Restrict / Search: Model: Max. age: years
3DMark Vantage
3DM Vant. Perf. total +
3DMark Vantage - 3DM Vant. Perf. total
min: 78640     avg: 94908     median: 94691 (27%)     max: 109040 Points
3DM Vant. Perf. GPU no PhysX +
3DMark Vantage - 3DM Vant. Perf. GPU no PhysX
min: 84240     avg: 97889     median: 97707 (53%)     max: 113597 Points
Restrict / Search: Model: Max. age: years
3DMark 05 - 3DMark 05 - Standard
min: 68064     avg: 69623     median: 68268 (75%)     max: 72536 Points
Restrict / Search: Model: Max. age: years
3DMark 06 3DMark 06 - Standard 1366x768 +
3DMark 06
66217 Points (87%)
3DMark 06 - Standard 1280x1024 +
3DMark 06
min: 14066     avg: 39380     median: 42560 (56%)     max: 59090 Points
Unigine Valley 1.0 - Unigine Valley 1.0 DX
min: 91.6     avg: 97     median: 96.9 (29%)     max: 101.1 fps
Blender - Blender 3.3 Classroom HIP *
min: 65     avg: 68     median: 68 (6%)     max: 71 Seconds
SPECviewperf 12
specvp12 sw-03 +
SPECviewperf 12 - specvp12 sw-03
min: 175     avg: 209.7     median: 218 (54%)     max: 243 fps
specvp12 snx-02 +
SPECviewperf 12 - specvp12 snx-02
min: 160     avg: 180.3     median: 186 (27%)     max: 192 fps
specvp12 showcase-01 +
SPECviewperf 12 - specvp12 showcase-01
min: 91.5     avg: 115.4     median: 119 (21%)     max: 125 fps
specvp12 mediacal-01 +
SPECviewperf 12 - specvp12 mediacal-01
min: 99     avg: 115     median: 111.5 (28%)     max: 136 fps
specvp12 maya-04 +
SPECviewperf 12 - specvp12 maya-04
min: 155     avg: 193     median: 201.5 (55%)     max: 226 fps
specvp12 energy-01 +
SPECviewperf 12 - specvp12 energy-01
min: 20.4     avg: 28.2     median: 24.9 (22%)     max: 39.2 fps
specvp12 creo-01 +
SPECviewperf 12 - specvp12 creo-01
min: 73.1     avg: 87.9     median: 87 (35%)     max: 110 fps
specvp12 catia-04 +
SPECviewperf 12 - specvp12 catia-04
min: 176     avg: 216.7     median: 229.5 (36%)     max: 251 fps
specvp12 3dsmax-05 +
SPECviewperf 12 - specvp12 3dsmax-05
min: 105     avg: 196.3     median: 205.5 (31%)     max: 295 fps
SPECviewperf 13 specvp13 sw-04 +
SPECviewperf 13 - specvp13 sw-04
min: 176     avg: 200.3     median: 207 (55%)     max: 223 fps
specvp13 snx-03 +
SPECviewperf 13 - specvp13 snx-03
min: 286     avg: 324.8     median: 335.5 (37%)     max: 348 fps
specvp13 showcase-02 +
SPECviewperf 13 - specvp13 showcase-02
min: 91.6     avg: 115.4     median: 119 (20%)     max: 125 fps
specvp13 medical-02 +
SPECviewperf 13 - specvp13 medical-02
min: 163     avg: 183.8     median: 192 (33%)     max: 198 fps
specvp13 maya-05 +
SPECviewperf 13 - specvp13 maya-05
min: 255     avg: 304.5     median: 319.5 (36%)     max: 340 fps
specvp13 energy-02 +
SPECviewperf 13 - specvp13 energy-02
min: 70.4     avg: 73.2     median: 72 (23%)     max: 81.1 fps
specvp13 creo-02 +
SPECviewperf 13 - specvp13 creo-02
min: 175     avg: 232.2     median: 249 (36%)     max: 275 fps
specvp13 catia-05 +
SPECviewperf 13 - specvp13 catia-05
min: 273     avg: 329.3     median: 347.5 (38%)     max: 380 fps
specvp13 3dsmax-06 +
SPECviewperf 13 - specvp13 3dsmax-06
min: 104     avg: 196.5     median: 207.5 (32%)     max: 294 fps
SPECviewperf 2020 specvp2020 snx-04 1080p +
SPECviewperf 2020 - specvp2020 snx-04 1080p
min: 327     avg: 334.7     median: 331 (37%)     max: 346 fps
specvp2020 medical-03 1080p +
SPECviewperf 2020 - specvp2020 medical-03 1080p
min: 82.9     avg: 86     median: 86 (24%)     max: 89 fps
specvp2020 maya-06 1080p +
SPECviewperf 2020 - specvp2020 maya-06 1080p
min: 411     avg: 425.7     median: 412 (44%)     max: 454 fps
specvp2020 energy-03 1080p +
SPECviewperf 2020 - specvp2020 energy-03 1080p
min: 72     avg: 76.2     median: 74.9 (12%)     max: 81.6 fps
specvp2020 creo-03 1080p +
SPECviewperf 2020 - specvp2020 creo-03 1080p
min: 144     avg: 151.7     median: 152 (52%)     max: 159 fps
specvp2020 catia-06 1080p +
SPECviewperf 2020 - specvp2020 catia-06 1080p
min: 95.9     avg: 97.4     median: 97.2 (47%)     max: 99.2 fps
specvp2020 3dsmax-07 1080p +
SPECviewperf 2020 - specvp2020 3dsmax-07 1080p
min: 110     avg: 117.3     median: 113 (30%)     max: 129 fps
specvp2020 solidworks-05 4k +
SPECviewperf 2020 - specvp2020 solidworks-05 4k
min: 43.7     avg: 85     median: 98.4 (24%)     max: 99.5 fps
specvp2020 snx-04 4k +
SPECviewperf 2020 - specvp2020 snx-04 4k
min: 67     avg: 194     median: 211 (22%)     max: 220 fps
specvp2020 medical-03 4k +
SPECviewperf 2020 - specvp2020 medical-03 4k
min: 17.9     avg: 27.5     median: 28.9 (18%)     max: 32.1 fps
specvp2020 maya-06 4k +
SPECviewperf 2020 - specvp2020 maya-06 4k
min: 60.1     avg: 145.9     median: 161.5 (23%)     max: 171 fps
specvp2020 energy-03 4k +
SPECviewperf 2020 - specvp2020 energy-03 4k
min: 24.7     avg: 54.2     median: 49.4 (11%)     max: 90.5 fps
specvp2020 creo-03 4k +
SPECviewperf 2020 - specvp2020 creo-03 4k
min: 34.3     avg: 79.4     median: 88.6 (40%)     max: 97.5 fps
specvp2020 catia-06 4k +
SPECviewperf 2020 - specvp2020 catia-06 4k
min: 34.9     avg: 58.8     median: 62.8 (41%)     max: 64.5 fps
specvp2020 3dsmax-07 4k +
SPECviewperf 2020 - specvp2020 3dsmax-07 4k
min: 25.3     avg: 51.7     median: 57.7 (19%)     max: 63.9 fps
Cinebench R10 Cinebench R10 Shading (32bit) +
Cinebench R10 - Cinebench R10 Shading (32bit)
19221 points (14%)
Cinebench R15
Cinebench R15 OpenGL 64 Bit +
Cinebench R15 - Cinebench R15 OpenGL 64 Bit
min: 38.16     avg: 227.5     median: 227.5 (13%)     max: 416.92 fps
Cinebench R15 OpenGL Ref. Match 64 Bit +
Cinebench R15 - Cinebench R15 OpenGL Ref. Match 64 Bit
min: 97.9     avg: 98     median: 98 (98%)     max: 98 %
Basemark GPU 1.2 - Basemark GPU 1.2 Vulkan Official Medium Offscreen 1080
min: 104.6     avg: 277.8     median: 104.6 (3%)     max: 971 fps
Basemark GPU 1.2 - Basemark GPU 1.2 Vulkan Official High Offscreen 2160
min: 3.64     avg: 28.9     median: 3.6 (1%)     max: 84.2 fps
Geekbench 6.6 - Geekbench 6.6 GPU OpenCL
min: 68792     avg: 73438     median: 72513.5 (18%)     max: 79934 points
Geekbench 6.6 - Geekbench 6.6 GPU Vulkan
min: 73351     avg: 82307     median: 83067 (21%)     max: 90252 points
LuxMark v2.0 64Bit - LuxMark v2.0 Room GPU
min: 1892     avg: 3008     median: 2782 (10%)     max: 4693 Samples/s
LuxMark v2.0 64Bit - LuxMark v2.0 Sala GPU
min: 4244     avg: 6618     median: 6485 (11%)     max: 9811 Samples/s
ComputeMark v2.1 - ComputeMark v2.1 Result
min: 20214     avg: 21442     median: 21247 (18%)     max: 24186 points
Power Consumption - Furmark Stress Test Power Consumption - external Monitor *
min: 134.7     avg: 199.7     median: 194.4 (26%)     max: 259 Watt
0153045607590105120135150165180195210225240255270Tooltip
Power Consumption - The Witcher 3 Power Consumption - external Monitor *
min: 135.6     avg: 206.2     median: 222 (31%)     max: 261 Watt
0153045607590105120135150165180195210225240255270Tooltip
Power Consumption - Witcher 3 Power Consumption *
228 Watt (50%)
0153045607590105120135150165180195210225Tooltip
Power Consumption - Power Efficiency - Witcher 3 ultra
0.4 fps per Watt (33%)
Power Consumption - Power Efficiency - Witcher 3 ultra external Monitor
min: 0.3793     avg: 0.5     median: 0.4 (32%)     max: 0.791 fps per Watt
Power Consumption - Cyberpunk 2077 Power Consumption - external Monitor *
min: 206     avg: 236.7     median: 222 (28%)     max: 282 Watt
0153045607590105120135150165180195210225240255270285Tooltip
Power Consumption - Power Efficiency - Cyberpunk 2077 ultra
0.3 fps per Watt (1%)
Emissions Witcher 3 Fan Noise +
Emissions - Witcher 3 Fan Noise
57.5 dB(A) (82%)
- Range of benchmark values
red legend - Average benchmark values
* Smaller numbers mean a higher performance

Game Benchmarks

The following benchmarks stem from our benchmarks of review laptops. The performance depends on the used graphics memory, clock rate, processor, system settings, drivers, and operating systems. So the results don't have to be representative for all laptops with this GPU. For detailed information on the benchmark results, click on the fps number.

low 1920x1080
55  fps    + Compare
med. 1920x1080
51  fps    + Compare
high 1920x1080
44  fps    + Compare
ultra 1920x1080
17  fps    + Compare
QHD 2560x1440
14  fps    + Compare
QHD FSR 2560x1440
14  fps    + Compare
» With all tested laptops playable in detail settings high.
low 1920x1080
56.4  fps    + Compare
med. 1920x1080
51.7  fps    + Compare
ultra 1920x1080
20.8  fps    + Compare
QHD 2560x1440
19.5  fps    + Compare
» With all tested laptops playable in detail settings med..
Additional Benchmarks
lowest, FSR Quality, Frame Generation 1920x1080
119
low 1920x1080
19  fps    + Compare
high 1920x1080
9.6  fps    + Compare
ultra 1920x1080
8.4  fps    + Compare
» The benchmarks indicate that the game is not playable in the tested settings.
low 1920x1080
143  fps    + Compare
med. 1920x1080
129  fps    + Compare
high 1920x1080
82  fps    + Compare
ultra 1920x1080
77  fps    + Compare
QHD 2560x1440
60  fps    + Compare
4K 3840x2160
35  fps    + Compare
4K FSR 3840x2160
35  fps    + Compare
QHD FSR 2560x1440
64  fps    + Compare
» With all tested laptops playable in detail settings ultra.
Additional Benchmarks
Minimum Preset 1280x720
185
low 1920x1080
120.1  fps    + Compare + 📈 Graph
med. 1920x1080
105.5  fps    + Compare + 📈 Graph
high 1920x1080
90.8  fps    + Compare + 📈 Graph
ultra 1920x1080
52.1  fps    + Compare + 📈 Graph
QHD 2560x1440
5.8  fps    + Compare + 📈 Graph
» With all tested laptops playable in detail settings ultra.
Additional Benchmarks
Low Preset TAA 1280x720
165.5
low 1920x1080
62.1  fps    + Compare + 📈 Graph
med. 1920x1080
59.9  fps    + Compare + 📈 Graph
high 1920x1080
53.3  fps    + Compare + 📈 Graph
ultra 1920x1080
54.4  fps    + Compare + 📈 Graph
QHD 2560x1440
48.7  fps    + Compare + 📈 Graph
4K 3840x2160
23  fps    + Compare + 📈 Graph
4K FSR 3840x2160
10.3  fps    + Compare + 📈 Graph
QHD FSR 2560x1440
13.2  fps    + Compare + 📈 Graph
» With all tested laptops playable in detail settings ultra.
Additional Benchmarks
Low Preset (Super Resolution off) 1280x720
86.2
low 1920x1080
67.8  fps    + Compare + 📈 Graph
med. 1920x1080
67.2  fps    + Compare + 📈 Graph
high 1920x1080
65.6  fps    + Compare + 📈 Graph
ultra 1920x1080
63.3  fps    + Compare + 📈 Graph
QHD 2560x1440
45.2  fps    + Compare + 📈 Graph
» With all tested laptops playable in detail settings ultra.
Additional Benchmarks
Low Preset TAA 1280x720
47.4
low 1920x1080 cinem.
43.5  fps    + Compare + 📈 Graph
med. 1920x1080 cinem.
38.8  fps    + Compare + 📈 Graph
high 1920x1080 cinem.
35  fps    + Compare + 📈 Graph
ultra 1920x1080 cinem.
28.2  fps    + Compare + 📈 Graph
QHD 2560x1440 cinem.
19.5  fps    + Compare + 📈 Graph
» With all tested laptops playable in detail settings med..
Additional Benchmarks
low 1280x720 cinem.
81.6
low 1920x1080
79 87 ~ 83 fps    + Compare
med. 1920x1080
58 62 ~ 60 fps    + Compare
high 1920x1080
44 47 ~ 46 fps    + Compare
ultra 1920x1080
23 25 ~ 24 fps    + Compare
QHD 2560x1440
16 18 ~ 17 fps    + Compare
4K 3840x2160
6  fps    + Compare
» With all tested laptops playable in detail settings high.
Additional Benchmarks
low TSR 100 1280x720
139
124
low FSR 68 1280x720
174
low 1920x1080
181.8  fps    + Compare + 📈 Graph
med. 1920x1080
121.6  fps    + Compare + 📈 Graph
high 1920x1080
99.1  fps    + Compare + 📈 Graph
ultra 1920x1080
88.9  fps    + Compare + 📈 Graph
QHD 2560x1440
55.7  fps    + Compare + 📈 Graph
4K 3840x2160
25.3  fps    + Compare + 📈 Graph
4K FSR 3840x2160
35  fps    + Compare + 📈 Graph
QHD FSR 2560x1440
70.5  fps    + Compare + 📈 Graph
» With all tested laptops playable in detail settings ultra.
Additional Benchmarks
Very Low Preset 1280x720
291
low 1920x1080
154.6 155.1 ~ 155 fps    + Compare + 📈 Graph
med. 1920x1080
99.4 100.3 ~ 100 fps    + Compare + 📈 Graph
high 1920x1080
87.9 89.9 ~ 89 fps    + Compare + 📈 Graph
ultra 1920x1080
72.9 74.1 ~ 74 fps    + Compare + 📈 Graph
QHD 2560x1440
43.8 43.9 ~ 44 fps    + Compare + 📈 Graph
4K 3840x2160
19.4 22.2 ~ 21 fps    + Compare + 📈 Graph
4K FSR 3840x2160
12.7 15.7 ~ 14 fps    + Compare + 📈 Graph
» With all tested laptops playable in detail settings ultra.
Additional Benchmarks
Low Preset 1280x720
213
207
Ultra Preset + Ultra Ray Tracing + FSR Quality 2560x1440
29.5
29.2
F1 24

F1 24

2024
low 1920x1080
215 280 281 322 ~ 275 fps    + Compare
med. 1920x1080
203 213 257 269 ~ 236 fps    + Compare
high 1920x1080
27.7 38.1 159.4 190.8 195.3 ~ 122 fps    + Compare
ultra 1920x1080
23.5 29.9 33.9 ~ 29 fps    + Compare
QHD 2560x1440
7.3 9 10.9 17.7 ~ 11 fps    + Compare
4K 3840x2160
8.1 13 ~ 11 fps    + Compare
4K FSR 3840x2160
13.4  fps    + Compare
QHD FSR 2560x1440
10.9 21.8 ~ 16 fps    + Compare
» With most tested laptops playable in detail settings high.
low 1920x1080
63.8  fps    + Compare + 📈 Graph
med. 1920x1080
53.8  fps    + Compare + 📈 Graph
high 1920x1080
17.8  fps    + Compare + 📈 Graph
QHD 2560x1440
10.7  fps    + Compare + 📈 Graph
QHD FSR 2560x1440
14.4  fps    + Compare + 📈 Graph
» With all tested laptops playable in detail settings med..
low 1920x1080
121.9  fps    + Compare + 📈 Graph
med. 1920x1080
99.2  fps    + Compare + 📈 Graph
high 1920x1080
90.3  fps    + Compare + 📈 Graph
ultra 1920x1080
65.6  fps    + Compare + 📈 Graph
QHD 2560x1440
46.1  fps    + Compare + 📈 Graph
4K 3840x2160
25.1  fps    + Compare + 📈 Graph
4K FSR 3840x2160
29.5  fps    + Compare + 📈 Graph
» With all tested laptops playable in detail settings ultra.
Additional Benchmarks
Very High Preset + Quality FSR 2560x1440
51.6
low 1920x1080
107.3  fps    + Compare + 📈 Graph
med. 1920x1080
89.6  fps    + Compare + 📈 Graph
high 1920x1080
56.4 66.2 ~ 61 fps    + Compare + 📈 Graph
ultra 1920x1080
49.1 64.3 ~ 57 fps    + Compare + 📈 Graph
QHD 2560x1440
38.7 53.7 ~ 46 fps    + Compare + 📈 Graph
4K 3840x2160
26.6  fps    + Compare + 📈 Graph
4K FSR 3840x2160
10.8  fps    + Compare + 📈 Graph
» With all tested laptops playable in detail settings ultra.
Additional Benchmarks
Very Low Preset 1280x720
148.8
low 1920x1080
196.9  fps    + Compare + 📈 Graph
high 1920x1080
156.1 178.7 ~ 167 fps    + Compare + 📈 Graph
ultra 1920x1080
84.2  fps    + Compare + 📈 Graph
QHD 2560x1440
50.3  fps    + Compare + 📈 Graph
4K 3840x2160
8.2  fps    + Compare + 📈 Graph
4K FSR 3840x2160
39.4  fps    + Compare + 📈 Graph
» With all tested laptops playable in detail settings ultra.
Additional Benchmarks
Low Preset 1280x720
200
low 1920x1080
78.9  fps    + Compare + 📈 Graph
high 1920x1080
72.1  fps    + Compare + 📈 Graph
QHD 2560x1440
50.2  fps    + Compare + 📈 Graph
4K 3840x2160
26.8  fps    + Compare + 📈 Graph
4K FSR 3840x2160
29.1  fps    + Compare + 📈 Graph
» With all tested laptops playable in detail settings high.
Additional Benchmarks
Low Preset 1280x720
87.1
low 1920x1080
228  fps    + Compare + 📈 Graph
med. 1920x1080
180.2  fps    + Compare + 📈 Graph
high 1920x1080
154.8  fps    + Compare + 📈 Graph
ultra 1920x1080
118  fps    + Compare + 📈 Graph
QHD 2560x1440
71.3  fps    + Compare + 📈 Graph
4K 3840x2160
32.7  fps    + Compare + 📈 Graph
» With all tested laptops playable in detail settings ultra.
Additional Benchmarks
Very Low Preset 1280x720
267
low 1920x1080
139  fps    + Compare
med. 1920x1080
125  fps    + Compare
high 1920x1080
96  fps    + Compare
ultra 1920x1080
70  fps    + Compare
QHD 2560x1440
52  fps    + Compare
4K 3840x2160
28  fps    + Compare
4K FSR 3840x2160
44  fps    + Compare
» With all tested laptops playable in detail settings ultra.
Additional Benchmarks
Low Preset TAA 1280x720
172
low 1920x1080
143.5  fps    + Compare + 📈 Graph
med. 1920x1080
111  fps    + Compare + 📈 Graph
high 1920x1080
97  fps    + Compare + 📈 Graph
ultra 1920x1080
94.7  fps    + Compare + 📈 Graph
QHD 2560x1440
45.3  fps    + Compare + 📈 Graph
4K 3840x2160
22.7  fps    + Compare + 📈 Graph
» With all tested laptops playable in detail settings ultra.
Additional Benchmarks
Low Preset 1280x720
158
low 1920x1080
66.1  fps    + Compare + 📈 Graph
med. 1920x1080
46.1  fps    + Compare + 📈 Graph
high 1920x1080
26.7  fps    + Compare + 📈 Graph
ultra 1920x1080
15.2  fps    + Compare + 📈 Graph
QHD 2560x1440
14  fps    + Compare + 📈 Graph
» With all tested laptops playable in detail settings med..
Additional Benchmarks
Max. Performance 1280x720
156.7
Palworld

Palworld

2024
low 1920x1080
174  fps    + Compare + 📈 Graph
med. 1920x1080
151.9  fps    + Compare + 📈 Graph
high 1920x1080
94.2  fps    + Compare + 📈 Graph
ultra 1920x1080
82.7  fps    + Compare + 📈 Graph
QHD 2560x1440
57.9  fps    + Compare + 📈 Graph
4K 3840x2160
30.8  fps    + Compare + 📈 Graph
» With all tested laptops playable in detail settings ultra.
Additional Benchmarks
Very Low Preset 1280x720
217
med. 1920x1080
356  fps    + Compare + 📈 Graph
high 1920x1080
358  fps    + Compare + 📈 Graph
ultra 1920x1080
358  fps    + Compare + 📈 Graph
QHD 2560x1440
350  fps    + Compare + 📈 Graph
4K 3840x2160
170.8  fps    + Compare + 📈 Graph
» With all tested laptops playable in detail settings ultra.
low 1920x1080
172.9  fps    + Compare + 📈 Graph
med. 1920x1080
155.3  fps    + Compare + 📈 Graph
high 1920x1080
150.4  fps    + Compare + 📈 Graph
ultra 1920x1080
100.2  fps    + Compare + 📈 Graph
QHD 2560x1440
76.7  fps    + Compare + 📈 Graph
4K 3840x2160
33.3  fps    + Compare + 📈 Graph
» With all tested laptops playable in detail settings ultra.
low 1920x1080
293  fps    + Compare + 📈 Graph
med. 1920x1080
216  fps    + Compare + 📈 Graph
high 1920x1080
147.5 189.7 ~ 169 fps    + Compare + 📈 Graph
ultra 1920x1080
115.3 142 ~ 129 fps    + Compare + 📈 Graph
QHD 2560x1440
69.2 85.6 ~ 77 fps    + Compare + 📈 Graph
4K 3840x2160
36.6  fps    + Compare + 📈 Graph
» With all tested laptops playable in detail settings ultra.
Additional Benchmarks
Low Preset 1280x720
401
Epic Preset + Epic RTX Global Illumination 1920x1080
102
131.5
low 1920x1080
49 58 59 73 ~ 60 fps    + Compare
med. 1920x1080
45 53 54 66 ~ 55 fps    + Compare
high 1920x1080
37 38 38 56 ~ 42 fps    + Compare
ultra 1920x1080
27 28 31 43 ~ 32 fps    + Compare
QHD 2560x1440
18 19 22 28 ~ 22 fps    + Compare
4K 3840x2160
6.5 9 13 ~ 10 fps    + Compare
» With all tested laptops playable in detail settings high.
Additional Benchmarks
Low Preset TAA 1280x720
62
112
85
83
low 1920x1080
158 208 ~ 183 fps    + Compare
med. 1920x1080
143 183 ~ 163 fps    + Compare
high 1920x1080
96 130 ~ 113 fps    + Compare
ultra 1920x1080
83 122 ~ 103 fps    + Compare
QHD 2560x1440
61 80 ~ 71 fps    + Compare
4K 3840x2160
34 51 ~ 43 fps    + Compare
» With all tested laptops playable in detail settings ultra.
Additional Benchmarks
Minimum Preset 1280x720
302
256
low 1920x1080
140.7 150.9 ~ 146 fps    + Compare + 📈 Graph
med. 1920x1080
95.6 99.8 ~ 98 fps    + Compare + 📈 Graph
high 1920x1080
85.4 89.9 ~ 88 fps    + Compare + 📈 Graph
ultra 1920x1080
76.9 81.5 ~ 79 fps    + Compare + 📈 Graph
QHD 2560x1440
54.9 58.6 ~ 57 fps    + Compare + 📈 Graph
4K 3840x2160
30 32.7 ~ 31 fps    + Compare + 📈 Graph
» With all tested laptops playable in detail settings ultra.
Additional Benchmarks
Ultra Low Preset LowAA 1280x720
309
326
low 1920x1080
71.4 80.1 ~ 76 fps    + Compare + 📈 Graph
med. 1920x1080
60.8 70.8 ~ 66 fps    + Compare + 📈 Graph
high 1920x1080
57.2 62.9 ~ 60 fps    + Compare + 📈 Graph
QHD 2560x1440
27.7 41.6 ~ 35 fps    + Compare + 📈 Graph
4K 3840x2160
11.1 19.4 ~ 15 fps    + Compare + 📈 Graph
» With all tested laptops playable in detail settings high.
Additional Benchmarks
Low Preset 1280x720
96.6
122.6
low 1920x1080
83.3 89.1 94.4 ~ 89 fps    + Compare + 📈 Graph
med. 1920x1080
69.5 81 85.8 ~ 79 fps    + Compare + 📈 Graph
high 1920x1080
46.9 60.5 66.4 70.9 ~ 61 fps    + Compare + 📈 Graph
ultra 1920x1080
33 44.5 49.4 52 ~ 45 fps    + Compare + 📈 Graph
QHD 2560x1440
21.5 31.2 32.7 34.2 ~ 30 fps    + Compare + 📈 Graph
4K 3840x2160
4.6 16.9 17.2 ~ 13 fps    + Compare + 📈 Graph
» With most tested laptops playable in detail settings ultra.
Additional Benchmarks
Low Preset 1280x720
129.6
147.9
136.7
low 1920x1080
218.6 326.8 382.8 396.8 ~ 331 fps    + Compare
med. 1920x1080
113.8 218.9 244.5 262.1 ~ 210 fps    + Compare
high 1920x1080
88 135.7 140.1 151.7 ~ 129 fps    + Compare
ultra 1920x1080
71 107.7 109.9 120.2 ~ 102 fps    + Compare
QHD 2560x1440
55.9 71.2 75.3 77.9 ~ 70 fps    + Compare
4K 3840x2160
30.6 35.4 35.4 37.7 ~ 35 fps    + Compare
» With all tested laptops playable in detail settings ultra.
Additional Benchmarks
Low Preset 1280x720
558.3
222.6
539.7
368.3
low 1920x1080
72 130 130 139 145 ~ 123 fps    + Compare
med. 1920x1080
66 118 118 124 129 ~ 111 fps    + Compare
high 1920x1080
62 98 108 110 113 ~ 98 fps    + Compare
ultra 1920x1080
49 68 71 72 76 ~ 67 fps    + Compare
QHD 2560x1440
34 52 55 56 56 ~ 51 fps    + Compare
4K 3840x2160
23 24 30 31 33 ~ 28 fps    + Compare
» With all tested laptops playable in detail settings ultra.
Additional Benchmarks
Low Preset (Adaptive Quality Off) 1280x720
204
85
210
182
181
low 1920x1080
202  fps    + Compare + 📈 Graph
med. 1920x1080
172.2  fps    + Compare + 📈 Graph
high 1920x1080
142.7  fps    + Compare + 📈 Graph
ultra 1920x1080
128.3  fps    + Compare + 📈 Graph
QHD 2560x1440
105.3  fps    + Compare + 📈 Graph
4K 3840x2160
68.7  fps    + Compare + 📈 Graph
» With all tested laptops playable in detail settings ultra.
Additional Benchmarks
Low Preset 1280x720
248
low 1920x1080
313 348 ~ 331 fps    + Compare + 📈 Graph
med. 1920x1080
316 317 ~ 317 fps    + Compare + 📈 Graph
high 1920x1080
192.8 205 ~ 199 fps    + Compare + 📈 Graph
ultra 1920x1080
127.8 132.2 ~ 130 fps    + Compare + 📈 Graph
QHD 2560x1440
84.2 84.3 ~ 84 fps    + Compare + 📈 Graph
4K 3840x2160
39.3 42.9 ~ 41 fps    + Compare + 📈 Graph
» With all tested laptops playable in detail settings ultra.
Additional Benchmarks
Low Preset 1280x720
337
321
low 1920x1080
81.4 117 121.7 121.9 142.1 ~ 117 fps    + Compare
med. 1920x1080
70.6 91.8 93.7 96 96.8 112.2 ~ 94 fps    + Compare
high 1920x1080
61.2 79.2 80.3 81.4 81.8 84.5 93.3 ~ 80 fps    + Compare
ultra 1920x1080
55.8 70.7 71.3 73 73.2 75.8 83 ~ 72 fps    + Compare
QHD 2560x1440
32.7 38.9 44.6 45.6 45.8 45.8 51.3 ~ 44 fps    + Compare
4K 3840x2160
18.3 18.4 19.1 19.7 19.8 21 ~ 19 fps    + Compare
4K FSR 3840x2160
25  fps    + Compare
» With all tested laptops playable in detail settings ultra.
Additional Benchmarks
Low Preset (FSR off) 1280x720
163.6
98.8
199.9
169.8
172.1
104
Ray Tracing Ultra Preset (DLSS off) 1920x1080
20.4
21.9
17.1
Ray Tracing Ultra Preset + DLSS3 Quality + FG 3840x2160
1.1
Steam Deck 1280x800
171.9
102.8
Ultra Preset (FSR2 on) 1920x1080
85.8
94
81
Ray Tracing Ultra Preset (DLSS off, no Path Tracing) 3840x2160
3.2
30min Start Ultra Preset (FSR off) 1920x1080
75.6
63.1
low 1920x1080
124.3 126.7 134.2 135.8 144.5 ~ 133 fps    + Compare + 📈 Graph
med. 1920x1080
103.7 104.5 104.7 111.9 ~ 106 fps    + Compare + 📈 Graph
high 1920x1080
89.3 89.4 89.7 95.7 ~ 91 fps    + Compare + 📈 Graph
ultra 1920x1080
82.6 87.3 87.7 88.7 92.9 ~ 88 fps    + Compare + 📈 Graph
QHD 2560x1440
58.9 59.7 60.6 61.3 63.8 ~ 61 fps    + Compare + 📈 Graph
4K 3840x2160
30.2 30.3 30.5 32.2 ~ 31 fps    + Compare + 📈 Graph
» With all tested laptops playable in detail settings ultra.
Additional Benchmarks
Low Preset SMAA 1280x720
179.8
211
169.6
173.4
Lies of P

Lies of P

2023
low 1920x1080
124.7 174.3 176.1 191.6 ~ 167 fps    + Compare + 📈 Graph
med. 1920x1080
106.5 149 150.4 164.7 ~ 143 fps    + Compare + 📈 Graph
high 1920x1080
102.6 127 128.5 140.2 ~ 125 fps    + Compare + 📈 Graph
ultra 1920x1080
100.3 113.7 113.8 124.2 ~ 113 fps    + Compare + 📈 Graph
QHD 2560x1440
73.6 76.3 76.5 83.6 ~ 78 fps    + Compare + 📈 Graph
4K 3840x2160
37.7 37.8 38.1 41.6 ~ 39 fps    + Compare + 📈 Graph
» With all tested laptops playable in detail settings ultra.
Additional Benchmarks
Low Preset 1280x720
270
130
279
247
Starfield

Starfield

2023
low 1920x1080
66 77.5 82.2 ~ 75 fps    + Compare + 📈 Graph
med. 1920x1080
57.7 68.1 75.9 ~ 67 fps    + Compare + 📈 Graph
high 1920x1080
47.9 54.7 63.1 ~ 55 fps    + Compare + 📈 Graph
ultra 1920x1080
43.8 49.6 57.2 ~ 50 fps    + Compare + 📈 Graph
QHD 2560x1440
35.9 39.6 46.8 ~ 41 fps    + Compare + 📈 Graph
4K 3840x2160
22.5 23.7 30.7 ~ 26 fps    + Compare + 📈 Graph
» With all tested laptops playable in detail settings ultra.
Additional Benchmarks
Low Preset 1280x720
82.1
105.3
98.6
low 1920x1080
114.4 116.8 ~ 116 fps    + Compare + 📈 Graph
med. 1920x1080
98.4 99.7 ~ 99 fps    + Compare + 📈 Graph
high 1920x1080
91.5 93.2 ~ 92 fps    + Compare + 📈 Graph
ultra 1920x1080
59.2 82.5 ~ 71 fps    + Compare + 📈 Graph
QHD 2560x1440
61.7 77.9 ~ 70 fps    + Compare + 📈 Graph
4K 3840x2160
34.4 37 ~ 36 fps    + Compare + 📈 Graph
» With all tested laptops playable in detail settings ultra.
Additional Benchmarks
Low Preset 1280x720
119.2
118.5
low 1920x1080
73.8 79.8 ~ 77 fps    + Compare + 📈 Graph
high 1920x1080
63.2 70.3 ~ 67 fps    + Compare + 📈 Graph
ultra 1920x1080
48.5 54.4 ~ 51 fps    + Compare + 📈 Graph
QHD 2560x1440
26.1 34 ~ 30 fps    + Compare + 📈 Graph
4K 3840x2160
8 14.2 ~ 11 fps    + Compare + 📈 Graph
» With all tested laptops playable in detail settings ultra.
Additional Benchmarks
Low 1280x720
115.8
125.7
low 1920x1080
138.3 151.1 ~ 145 fps    + Compare + 📈 Graph
med. 1920x1080
132.4 144.1 ~ 138 fps    + Compare + 📈 Graph
high 1920x1080
120.5 130 ~ 125 fps    + Compare + 📈 Graph
ultra 1920x1080
97.1 105.6 ~ 101 fps    + Compare + 📈 Graph
QHD 2560x1440
67.1 72.4 ~ 70 fps    + Compare + 📈 Graph
4K 3840x2160
6.5 40.8 ~ 24 fps    + Compare + 📈 Graph
» With all tested laptops playable in detail settings ultra.
Additional Benchmarks
Low Preset 1280x720
184.1
171.2
low 1920x1080
26.5 61.8 ~ 44 fps    + Compare + 📈 Graph
med. 1920x1080
21 50.3 ~ 36 fps    + Compare + 📈 Graph
high 1920x1080
12.8 36.7 ~ 25 fps    + Compare + 📈 Graph
ultra 1920x1080
11.5 33.1 ~ 22 fps    + Compare + 📈 Graph
QHD 2560x1440
9.4 25.6 ~ 18 fps    + Compare + 📈 Graph
4K 3840x2160
6.7 17.2 ~ 12 fps    + Compare + 📈 Graph
» With most tested laptops playable in detail settings med..
Additional Benchmarks
Very Low Preset 1280x720
32
78.1
Very High Preset + Very High Raytracing TAA 1920x1080
7.1
10.4
F1 23

F1 23

2023
low 1920x1080
68.7 105.2 251 274 289 337 ~ 221 fps    + Compare
med. 1920x1080
67.1 104 247 250 265 301 ~ 206 fps    + Compare
high 1920x1080
54.7 86.5 180.6 188.4 189.9 191 213 ~ 158 fps    + Compare
ultra 1920x1080
20.5 27 28.9 30.1 32.9 39.3 41.8 ~ 32 fps    + Compare
QHD 2560x1440
6.9 10.9 14.6 14.7 17 23.9 ~ 15 fps    + Compare
4K 3840x2160
3.2 5.4 5.9 7.6 ~ 6 fps    + Compare
» With all tested laptops playable in detail settings high.
Additional Benchmarks
Ultra Low Preset TAA 1280x720
306
232
63.4
264
77.9
350
Diablo 4

Diablo 4

2023
low 1920x1080
205 253 ~ 229 fps    + Compare + 📈 Graph
med. 1920x1080
213 243 ~ 228 fps    + Compare + 📈 Graph
high 1920x1080
184.4 185.9 ~ 185 fps    + Compare + 📈 Graph
ultra 1920x1080
147.5 157.1 ~ 152 fps    + Compare + 📈 Graph
QHD 2560x1440
89.4 94.4 ~ 92 fps    + Compare + 📈 Graph
4K 3840x2160
47.2 48.3 ~ 48 fps    + Compare + 📈 Graph
» With all tested laptops playable in detail settings ultra.
Additional Benchmarks
Low Preset 1280x720
376
388
low 1920x1080
79.6 85.9 ~ 83 fps    + Compare + 📈 Graph
med. 1920x1080
70.1 76 ~ 73 fps    + Compare + 📈 Graph
high 1920x1080
66 71.1 ~ 69 fps    + Compare + 📈 Graph
ultra 1920x1080
61.3 66 ~ 64 fps    + Compare + 📈 Graph
QHD 2560x1440
37.8 40.9 ~ 39 fps    + Compare + 📈 Graph
4K 3840x2160
16.8 18.9 ~ 18 fps    + Compare + 📈 Graph
» With all tested laptops playable in detail settings ultra.
Additional Benchmarks
Low Preset 1280x720
138.4
135.5
Epic Preset + Ray Tracing 1920x1080
37.3
45.6
low 1920x1080
250 270 ~ 260 fps    + Compare + 📈 Graph
med. 1920x1080
215 232 ~ 224 fps    + Compare + 📈 Graph
high 1920x1080
161.2 175.2 ~ 168 fps    + Compare + 📈 Graph
ultra 1920x1080
114.3 124.1 ~ 119 fps    + Compare + 📈 Graph
QHD 2560x1440
79.2 84.6 ~ 82 fps    + Compare + 📈 Graph
4K 3840x2160
38.1 43.2 ~ 41 fps    + Compare + 📈 Graph
» With all tested laptops playable in detail settings ultra.
Additional Benchmarks
Low Preset Low TAA 1280x720
340
284
low 1920x1080
89.9 96.8 ~ 93 fps    + Compare + 📈 Graph
med. 1920x1080
73 78.4 ~ 76 fps    + Compare + 📈 Graph
high 1920x1080
60.2 66.1 ~ 63 fps    + Compare + 📈 Graph
ultra 1920x1080
41.6 50.7 ~ 46 fps    + Compare + 📈 Graph
QHD 2560x1440
25.4 35.7 ~ 31 fps    + Compare + 📈 Graph
4K 3840x2160
6.1 8.8 ~ 7 fps    + Compare + 📈 Graph
» With all tested laptops playable in detail settings ultra.
Additional Benchmarks
Low Preset 1280x720
119.5
129.3
low 1920x1080
135.6 153.8 ~ 145 fps    + Compare + 📈 Graph
med. 1920x1080
101.2 116.7 ~ 109 fps    + Compare + 📈 Graph
high 1920x1080
88.6 97.8 ~ 93 fps    + Compare + 📈 Graph
ultra 1920x1080
57.8 61.7 ~ 60 fps    + Compare + 📈 Graph
QHD 2560x1440
43.7 48.5 ~ 46 fps    + Compare + 📈 Graph
4K 3840x2160
10.5 20.1 ~ 15 fps    + Compare + 📈 Graph
» With all tested laptops playable in detail settings ultra.
Additional Benchmarks
Prioritize Performance Preset 1280x720
185.6
213
low 1920x1080
159.8 187 ~ 173 fps    + Compare
med. 1920x1080
142.7 161 ~ 152 fps    + Compare
high 1920x1080
109.5 123 ~ 116 fps    + Compare
ultra 1920x1080
107.9 121 ~ 114 fps    + Compare
QHD 2560x1440
79.1 88 ~ 84 fps    + Compare
4K 3840x2160
46.5 51 ~ 49 fps    + Compare
» With all tested laptops playable in detail settings ultra.
Additional Benchmarks
Minimum Settings 1280x720
263.1
292
low 1920x1080
100.4 111.6 ~ 106 fps    + Compare + 📈 Graph
med. 1920x1080
97.1 101.1 ~ 99 fps    + Compare + 📈 Graph
high 1920x1080
93 93.1 ~ 93 fps    + Compare + 📈 Graph
ultra 1920x1080
92.1 92.2 ~ 92 fps    + Compare + 📈 Graph
QHD 2560x1440
64.7 73.2 ~ 69 fps    + Compare + 📈 Graph
4K 3840x2160
35.3 39.2 ~ 37 fps    + Compare + 📈 Graph
» With all tested laptops playable in detail settings ultra.
Additional Benchmarks
Ultra Low Preset 1280x720
114.8
103.6
low 1920x1080
173.1 199.7 ~ 186 fps    + Compare + 📈 Graph
med. 1920x1080
130.9 148.6 ~ 140 fps    + Compare + 📈 Graph
high 1920x1080
79.9 89.3 ~ 85 fps    + Compare + 📈 Graph
ultra 1920x1080
60.9 67.9 ~ 64 fps    + Compare + 📈 Graph
QHD 2560x1440
46.4 50.6 ~ 49 fps    + Compare + 📈 Graph
4K 3840x2160
27.6 29.3 ~ 28 fps    + Compare + 📈 Graph
» With all tested laptops playable in detail settings ultra.
Additional Benchmarks
Low Preset 1280x720
241
284
Returnal

Returnal

2023
low 1920x1080
101 112 ~ 107 fps    + Compare
med. 1920x1080
97 103 ~ 100 fps    + Compare
high 1920x1080
87 92 ~ 90 fps    + Compare
ultra 1920x1080
73 79 ~ 76 fps    + Compare
QHD 2560x1440
53 58 ~ 56 fps    + Compare
4K 3840x2160
29 30 ~ 30 fps    + Compare
» With all tested laptops playable in detail settings ultra.
Additional Benchmarks
Low Preset 1280x720
134
146
Epic Preset + Epic Ray-Tracing 1920x1080
43
49
Epic Preset + Epic Ray-Tracing 3840x2160
9
15
low 1920x1080
141.5 149.7 ~ 146 fps    + Compare + 📈 Graph
med. 1920x1080
107.4 114.3 ~ 111 fps    + Compare + 📈 Graph
high 1920x1080
81.4 89.4 ~ 85 fps    + Compare + 📈 Graph
ultra 1920x1080
63.2 66.5 ~ 65 fps    + Compare + 📈 Graph
QHD 2560x1440
41.7 43.8 ~ 43 fps    + Compare + 📈 Graph
4K 3840x2160
22.9 23.1 ~ 23 fps    + Compare + 📈 Graph
» With all tested laptops playable in detail settings ultra.
Additional Benchmarks
Low Preset Low TAA 1280x720
180.3
165.6
Ultra Preset + Full Ray Tracing High TAA 1920x1080
28.4
28.9
Ultra Preset + Full Ray Tracing High TAA 3840x2160
1.7
2.9
low 1920x1080
79.7 80.6 ~ 80 fps    + Compare + 📈 Graph
med. 1920x1080
67.2 73.9 ~ 71 fps    + Compare + 📈 Graph