Notebook reviews with NVIDIA GeForce RTX 2080 Super Mobile graphics card
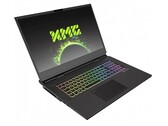
Schenker XMG Ultra 17 (Clevo X170SM-G) laptop review: Power without end
For those who don't want to make any technical compromises, the Schenker XMG Ultra 17 is the right laptop or, more precisely, desktop replacement. The gigantic 17-incher is powered by a desktop CPU and Nvidia's fastest laptop chips. You can find out whether the high cost is worth it in our review.
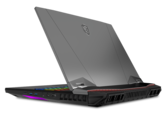
Intel Core i9-10900K, NVIDIA GeForce RTX 2080 Super Mobile, 17.3", 4.7 kgMSI GT76 Titan DT 10SGS Laptop Review: Late Game Exotic Gear
Picking up that yellow or orange drop after defeating a late game boss is always exciting. Getting that perfect stat roll might even be worth showing off. The MSI GT76 Titan has the specs and performance of an exotic drop that gamers are always grinding after.
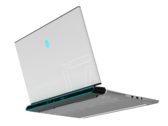
Intel Core i9-10900K, NVIDIA GeForce RTX 2080 Super Mobile, 17.3", 4.2 kgGood-bye, Max-Q: Dell Alienware m17 R3 GeForce RTX 2080 Super Laptop Review
The Alienware m17 R3 may look the same as the m17 R2 from the outside, but it has been completely redesigned on the inside. The system swaps out GeForce Max-Q GPUs for full-fledged GeForce Super options for even faster gen-over-gen performance.
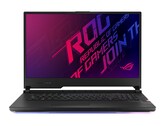
Intel Core i9-10980HK, NVIDIA GeForce RTX 2080 Super Mobile, 17.3", 3 kgAsus ROG Strix Scar 17 G732LXS laptop review: Frontier runner
While many high-end laptops are rather discreetly designed, the Strix Scar 17 is visually clearly aimed at gamers. The tested model, G732LXS, can show off with Nvidia's currently strongest notebook GPU. However, Asus has opted for the weakest TGP version of the RTX 2080 Super.
Intel Core i9-10980HK, NVIDIA GeForce RTX 2080 Super Mobile, 17.3", 2.9 kgAcer Predator Helios 700 PH717-72-93RL: Intel Core i9-10980HK, 17.30", 4.5 kg
External Review » Acer Predator Helios 700 PH717-72-93RL
Asus ROG Zephyrus Duo 15 GX550LWS-HC180T: Intel Core i9-10980HK, 15.60", 2.4 kg
External Review » Asus ROG Zephyrus Duo 15 GX550LWS-HC180T
Asus ROG Strix Scar 17 G732LXS-HG014T: Intel Core i7-10875H, 17.30", 3 kg
External Review » Asus ROG Strix SCAR 17 G732LXS-HG014T
MSI GS75 10SGS-084NL: Intel Core i9-10980HK, 17.30", 2.4 kg
External Review » MSI GS75 10SGS-084NL
MSI GT76 Titan DT 10SGS-028N: Intel Core i9-10900K, 17.30", 4.2 kg
External Review » MSI GT76 Titan DT 10SGS-028N
Medion Erazer Beast X10, i9-10980HK RTX 2080 Super: Intel Core i9-10980HK, 17.30", 2.3 kg
External Review » Medion Erazer Beast X10, i9-10980HK RTX 2080 Super
Acer Predator Helios 700 PH717-72-98YP: Intel Core i9-10980HK, 17.30", 4.5 kg
External Review » Acer Predator Helios 700 PH717-72-98YP
MSI GT76 10SGS-045 Titan DT: Intel Core i9-10900K, 17.30", 4.2 kg
External Review » MSI GT76 10SGS-045 Titan DT
Asus ROG Zephyrus Duo 15 GX550LXS-HF073T: Intel Core i7-10875H, 15.60", 2.5 kg
External Review » Asus ROG Zephyrus Duo 15 GX550LXS-HF073T
Alienware Area-51m R2, i9-10900K, RTX 2080 Super: Intel Core i9-10900K, 17.30", 4.1 kg
External Review » Alienware Area-51m R2, i9-10900K, RTX 2080 Super
Asus Strix Scar 17 G732LXS: Intel Core i9-10980HK, 17.30", 2.9 kg
External Review » Asus Strix Scar 17 G732LXS
Asus Strix Scar 17 G732LXS-HG047T: Intel Core i7-10875H, 17.30", 2.9 kg
External Review » Asus Strix Scar 17 G732LXS-HG047T
Acer Predator Triton 500 PT515-52-77P9: Intel Core i7-10875H, 15.60", 2.1 kg
External Review » Acer Predator Triton 500 PT515-52-77P9
Aorus 17X YB-9DE2152MP: Intel Core i9-10980HK, 17.30", 3.8 kg
External Review » Aorus 17X YB-9DE2152MP
Alienware m17 R3 i9, RTX 2080: Intel Core i9-10980HK, 17.30", 3 kg
External Review » Alienware m17 R3 i9, RTX 2080
Asus Strix Scar 17 G732LXS-HG109T: Intel Core i7-10875H, 17.30", 2.9 kg
External Review » Asus Strix Scar 17 G732LXS-HG109T
Asus Strix Scar 17 G732LXS-HG104T: Intel Core i9-10980HK, 17.30", 2.9 kg
External Review » Asus Strix Scar 17 G732LXS-HG104T
Asus Zephyrus Duo 15 GX550LXS-HC029R: Intel Core i9-10980HK, 15.60", 2.4 kg
External Review » Asus Zephyrus Duo 15 GX550LXS-HC029R
Asus ROG Zephyrus Duo 15 GX550LXS-HC118T: Intel Core i9-10880H, 15.60", 2.4 kg
External Review » Asus ROG Zephyrus Duo 15 GX550LXS-HC118T
Schenker XMG Ultra 17 Comet Lake: Intel Core i9-10900K, 17.30", 4.7 kg
» Schenker XMG Ultra 17: Superlative desktop replacement
MSI GT76 Titan DT 10SGS: Intel Core i9-10900K, 17.30", 4.2 kg
» MSI GT76 Titan is one of the fastest — and loudest — laptops we've tested
Alienware m17 R3 P45E: Intel Core i9-10980HK, 17.30", 3 kg
» Alienware m17 R3 runs the Core i9-10980HK faster than anyone else, but be prepared for super hot 95 C temperatures
Asus Strix Scar 17 G732LXS: Intel Core i9-10980HK, 17.30", 2.9 kg
» Asus ROG Strix Scar 17: Not only visually striking