Asus ROG Strix Scar 17 G732LXS laptop review: Frontier runner

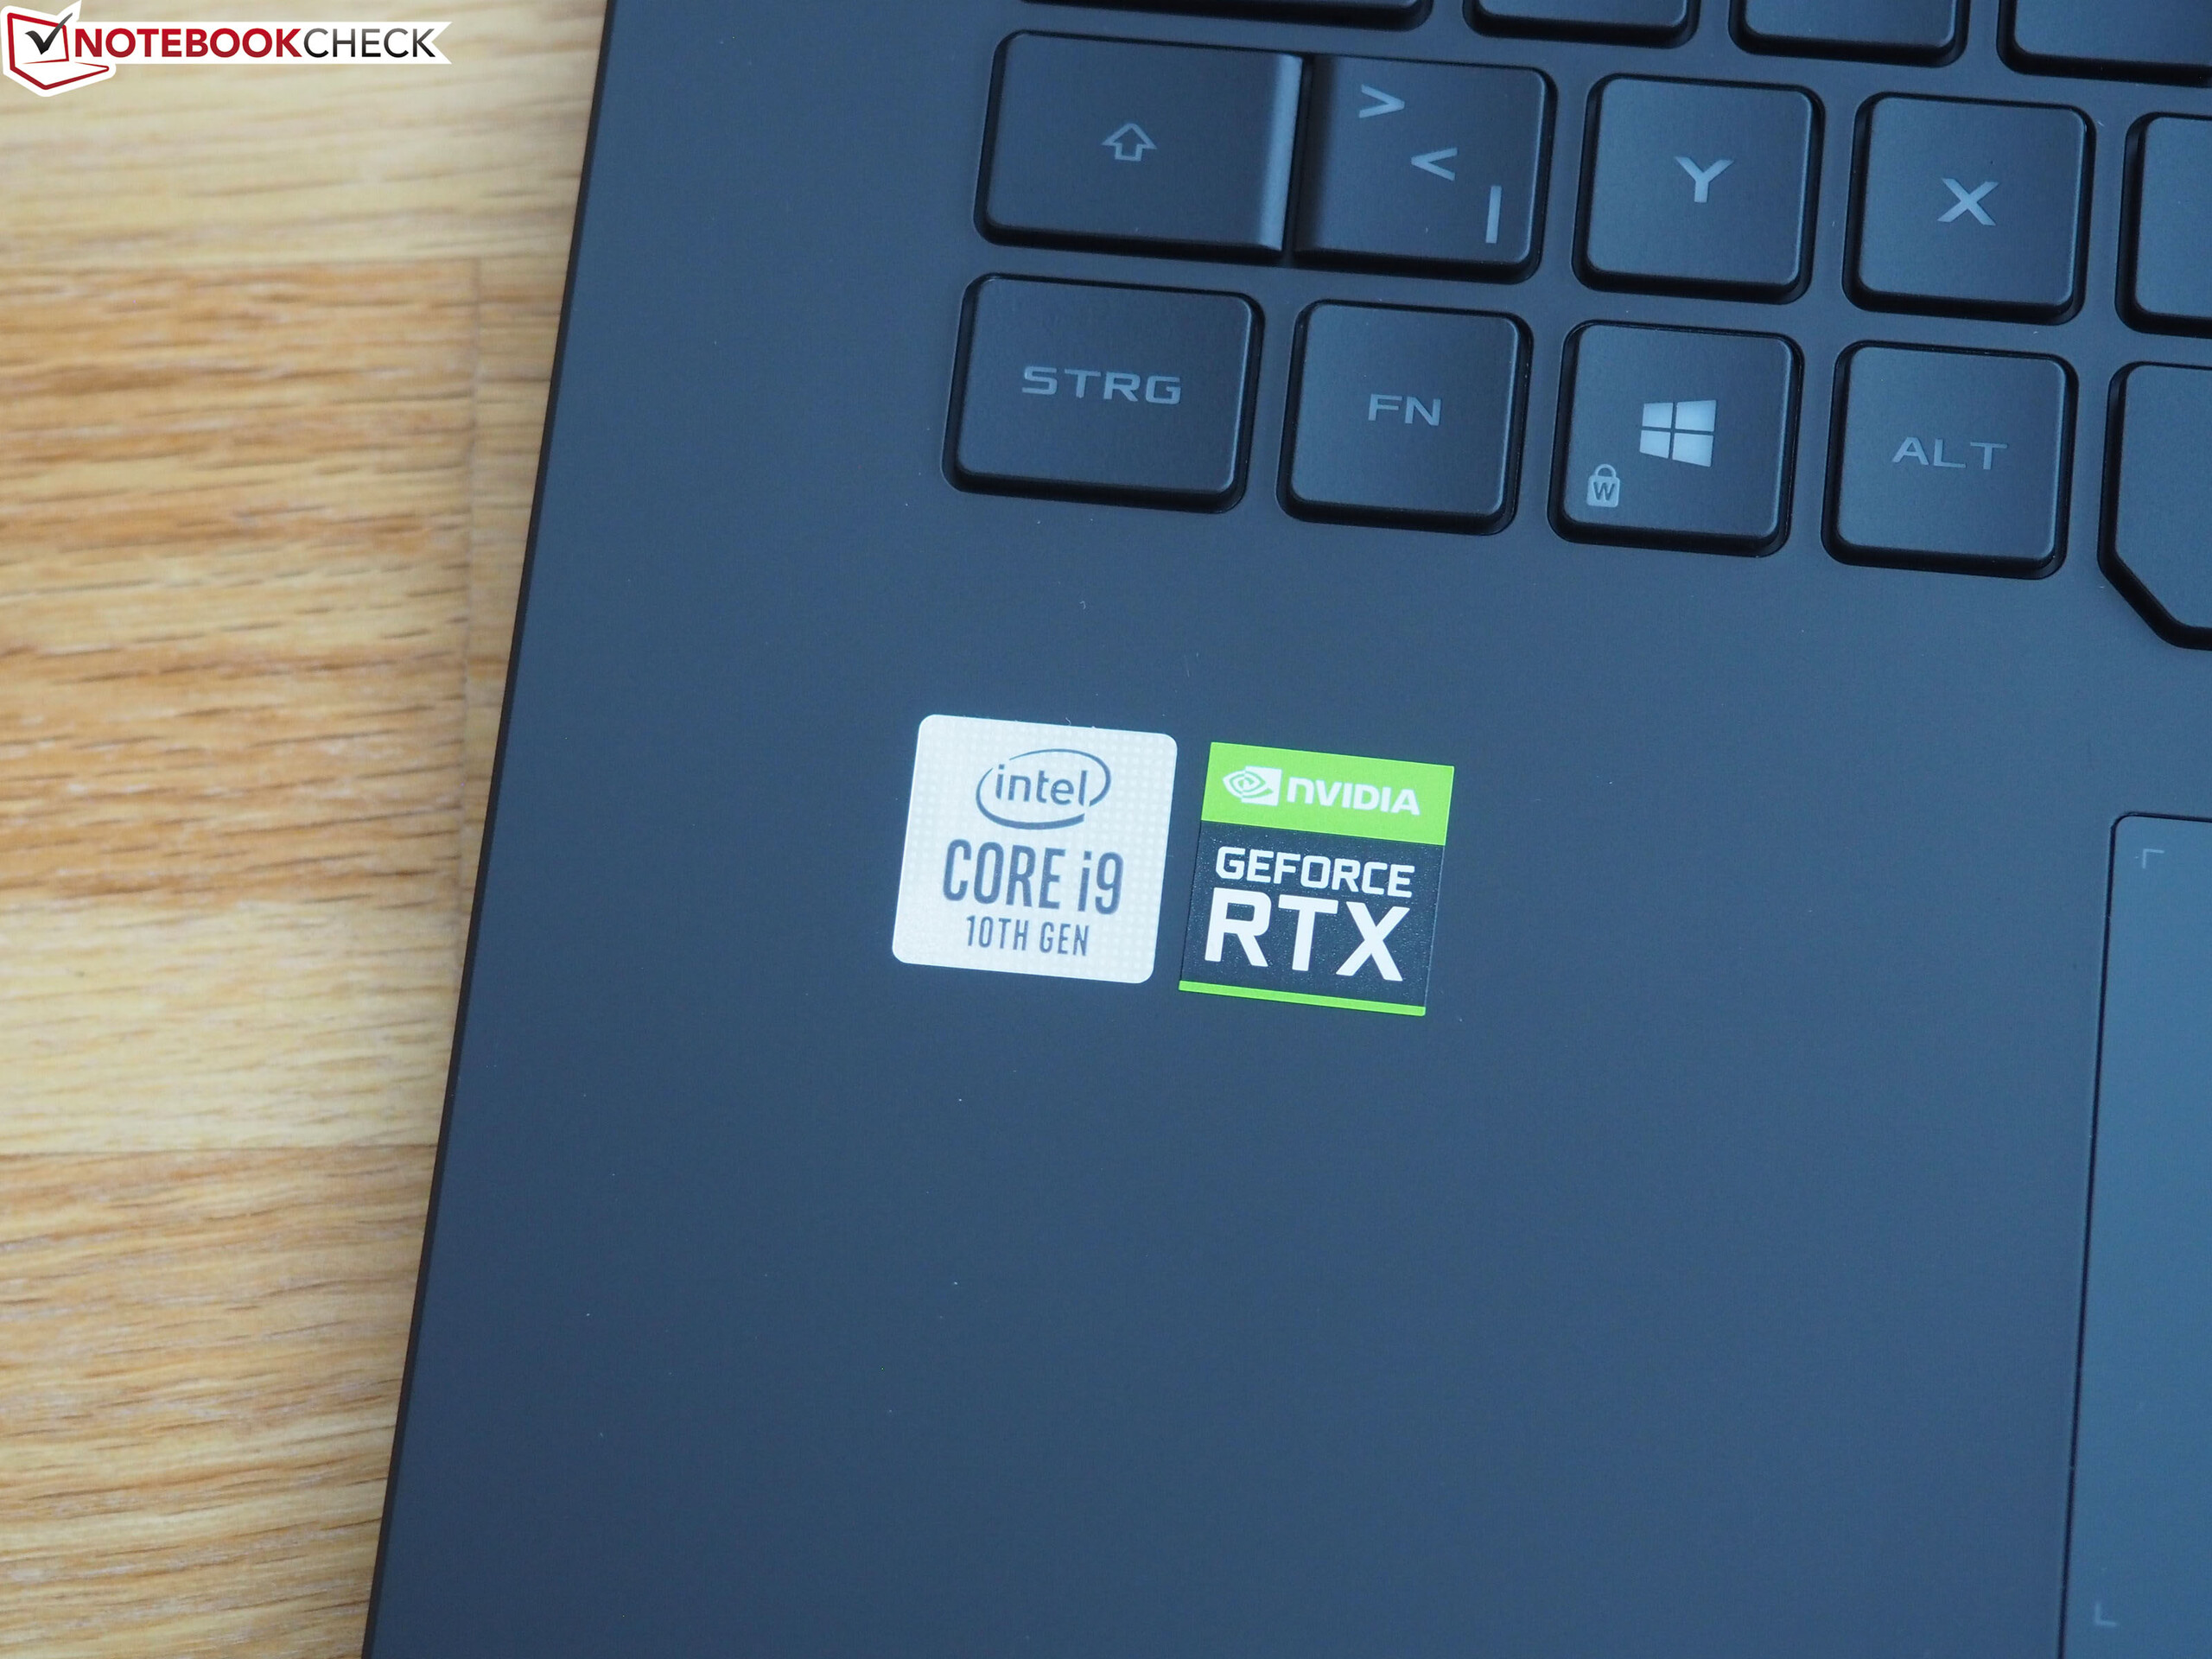
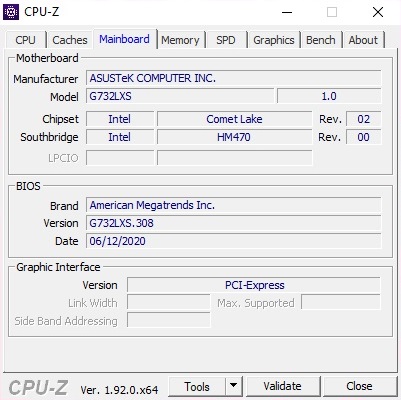
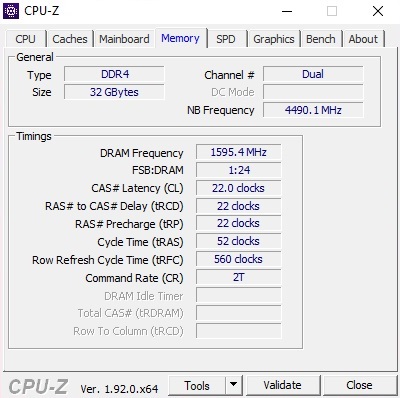
That the Strix Scar 17 isn't a budget gaming device, you can already tell from the G732LW entry level model. For around 1,800 Euros (~$2,035) buyers get a Core i7-10875H, a GeForce RTX 2070 and a 144 Hz panel. If you want more power and a faster display, you'll have to reach for the G732LWS with GeForce RTX 2070 Super and 300 Hz panel, which costs almost 2,400 Euros (~$2,745). Our test device is based on the over 3,000-Euro (~$3,431) expensive top model, the G732LXS, which, beside a Core i9-10980HK and a GeForce RTX 2080 Super offers 32 GB DDR4 RAM and 2 TB mass storage capacity (2x 1 TB SSD in RAID 0). The 300 Hz screen is of course also on board here.
Among the Strix Scar 17's competitors are other 17-inch gamers thinner than 3 cm, such as the MSI GE75, the HP Omen 17 and the Eurocom Nightsky RX17. The in-house predecessor Strix Scar III also appears in our tables as a comparison device.
Rating | Date | Model | Weight | Height | Size | Resolution | Price |
|---|---|---|---|---|---|---|---|
| 82.7 % v7 (old) | 07 / 2020 | Asus Strix Scar 17 G732LXS i9-10980HK, GeForce RTX 2080 Super Mobile | 2.9 kg | 26.5 mm | 17.30" | 1920x1080 | |
| 86.1 % v7 (old) | 05 / 2019 | MSI GE75 9SG i9-9880H, GeForce RTX 2080 Mobile | 2.7 kg | 27.5 mm | 17.30" | 1920x1080 | |
| 85.1 % v7 (old) | 08 / 2019 | HP Omen 17-cb0020ng i9-9880H, GeForce RTX 2080 Mobile | 3.3 kg | 27 mm | 17.30" | 1920x1080 | |
| 85.4 % v7 (old) | 07 / 2019 | Asus ASUS ROG Strix SCAR III G731GW-XB74 i7-9750H, GeForce RTX 2070 Mobile | 2.9 kg | 26.2 mm | 17.30" | 1920x1080 | |
| 87.4 % v6 (old) | 07 / 2019 | Eurocom Nightsky RX17 i7-9750H, GeForce RTX 2070 Mobile | 2.9 kg | 29.9 mm | 17.30" | 1920x1080 |
Case
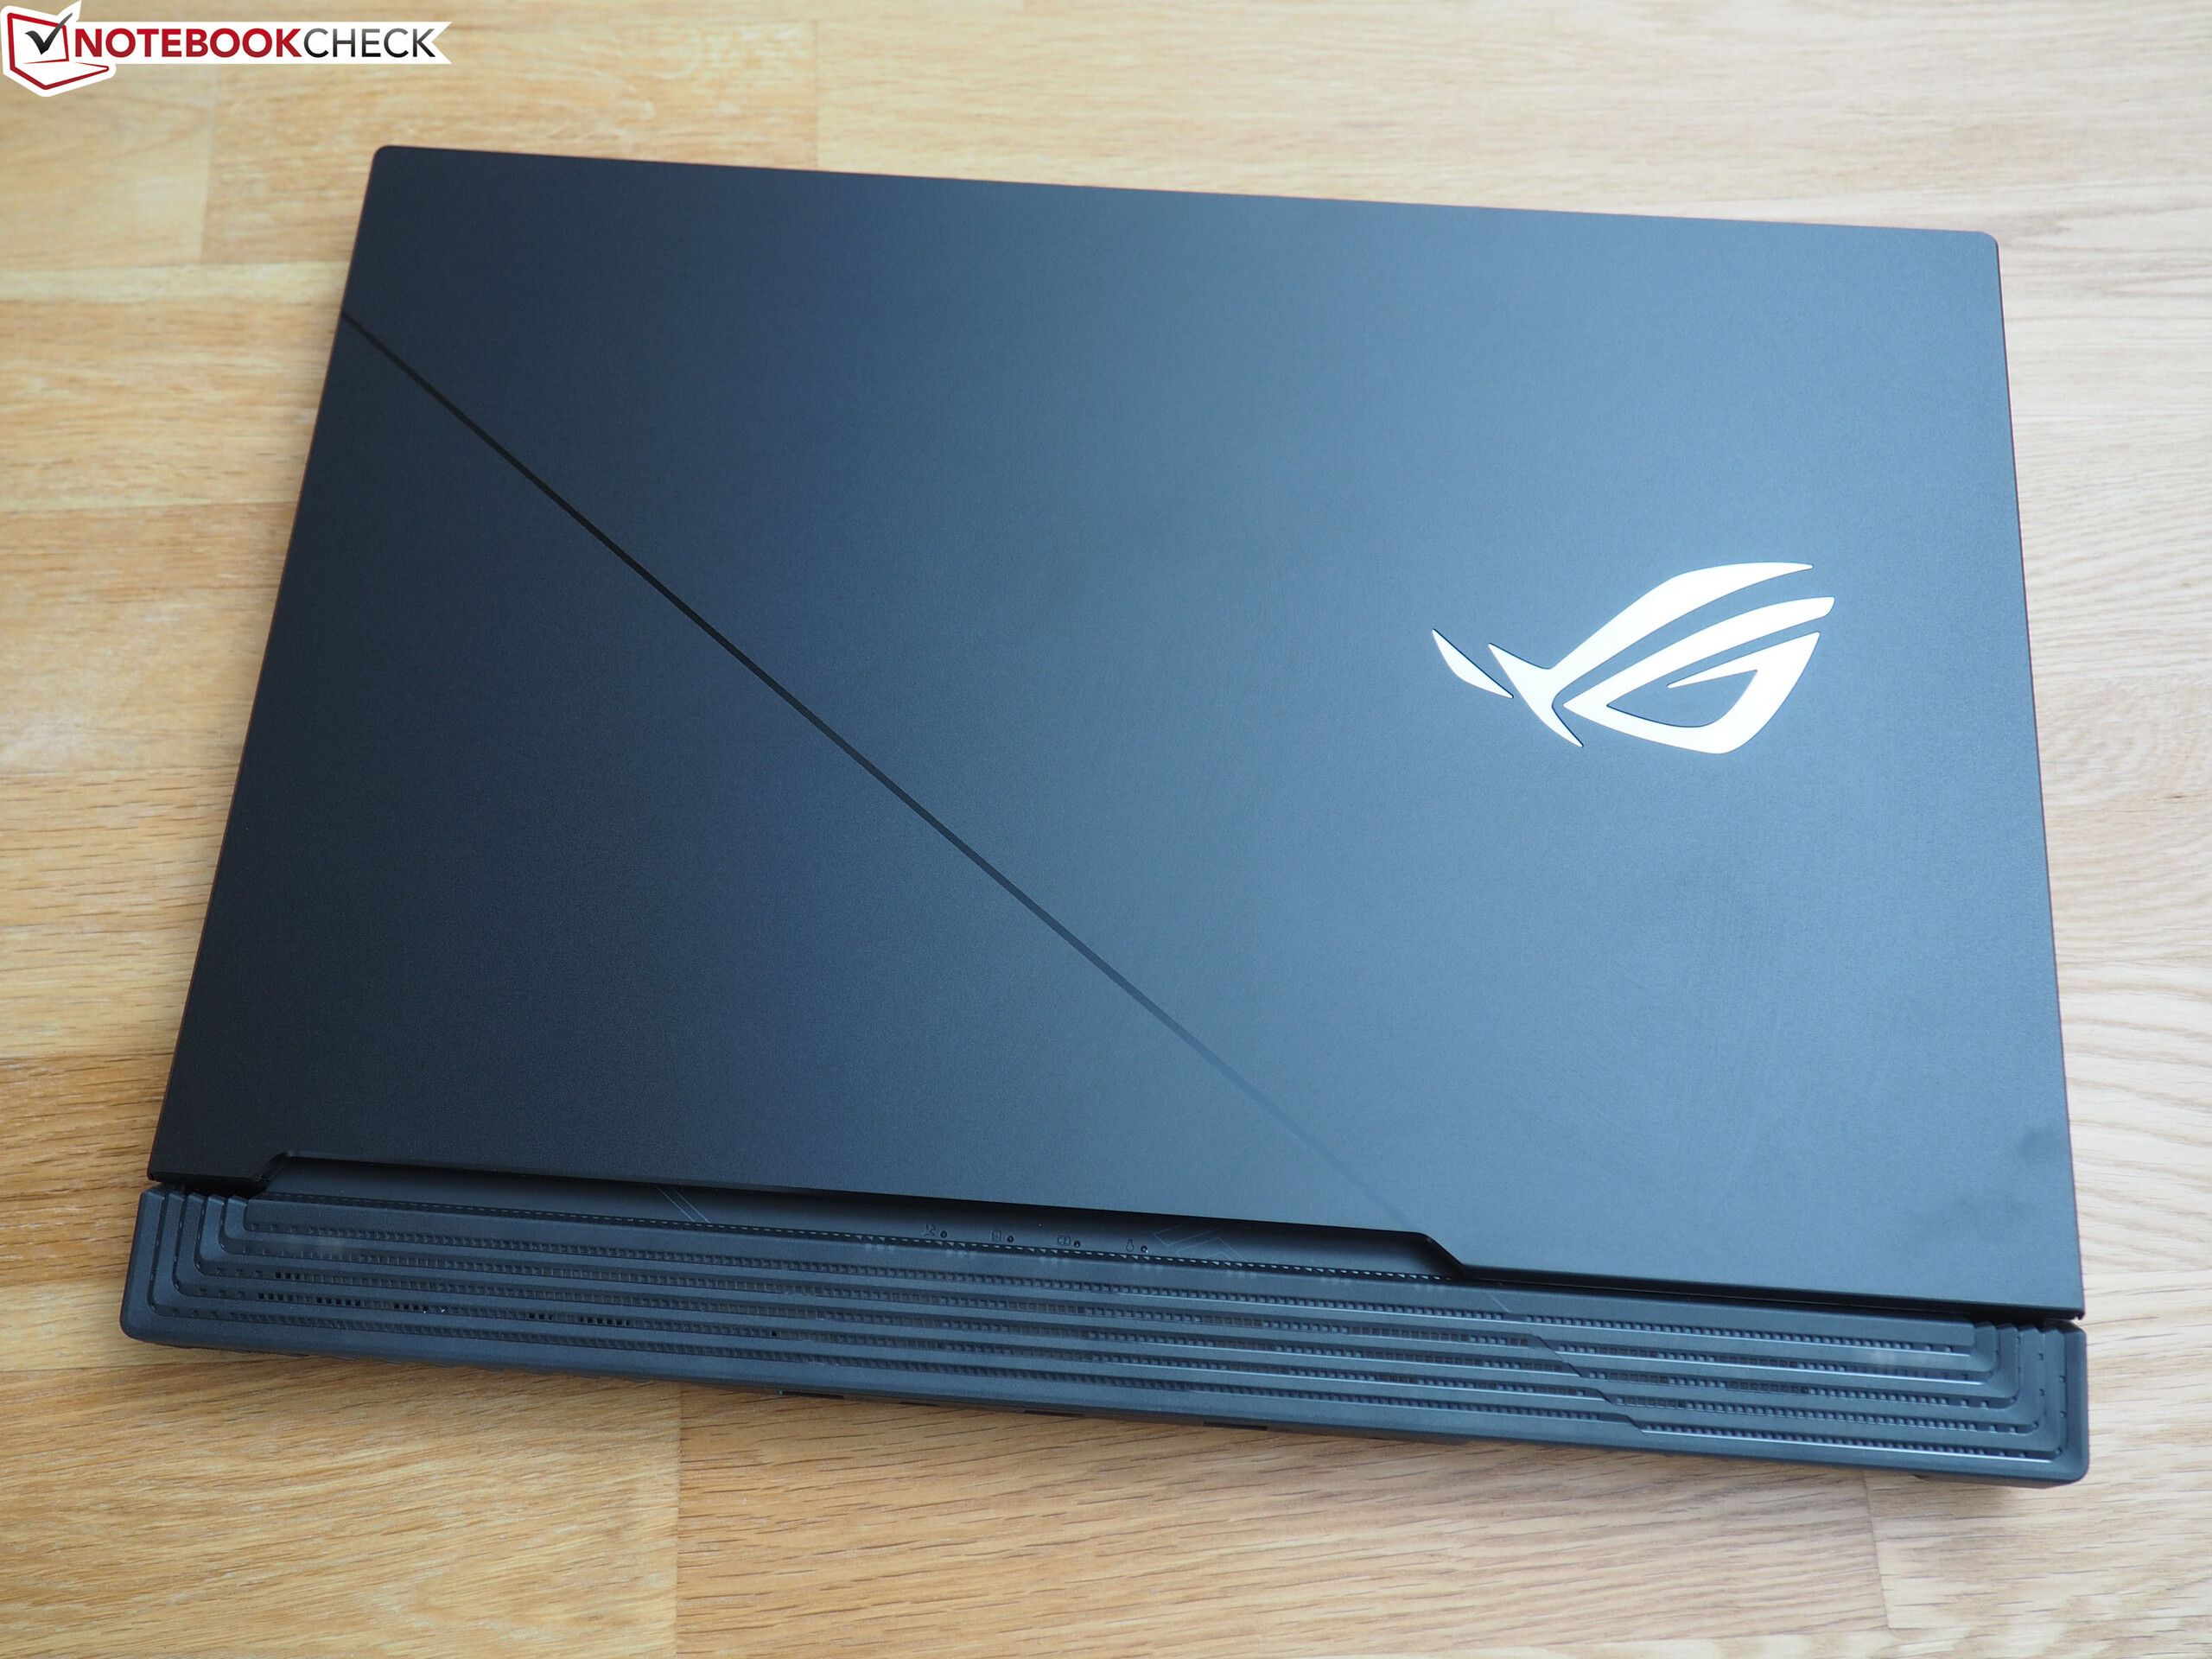
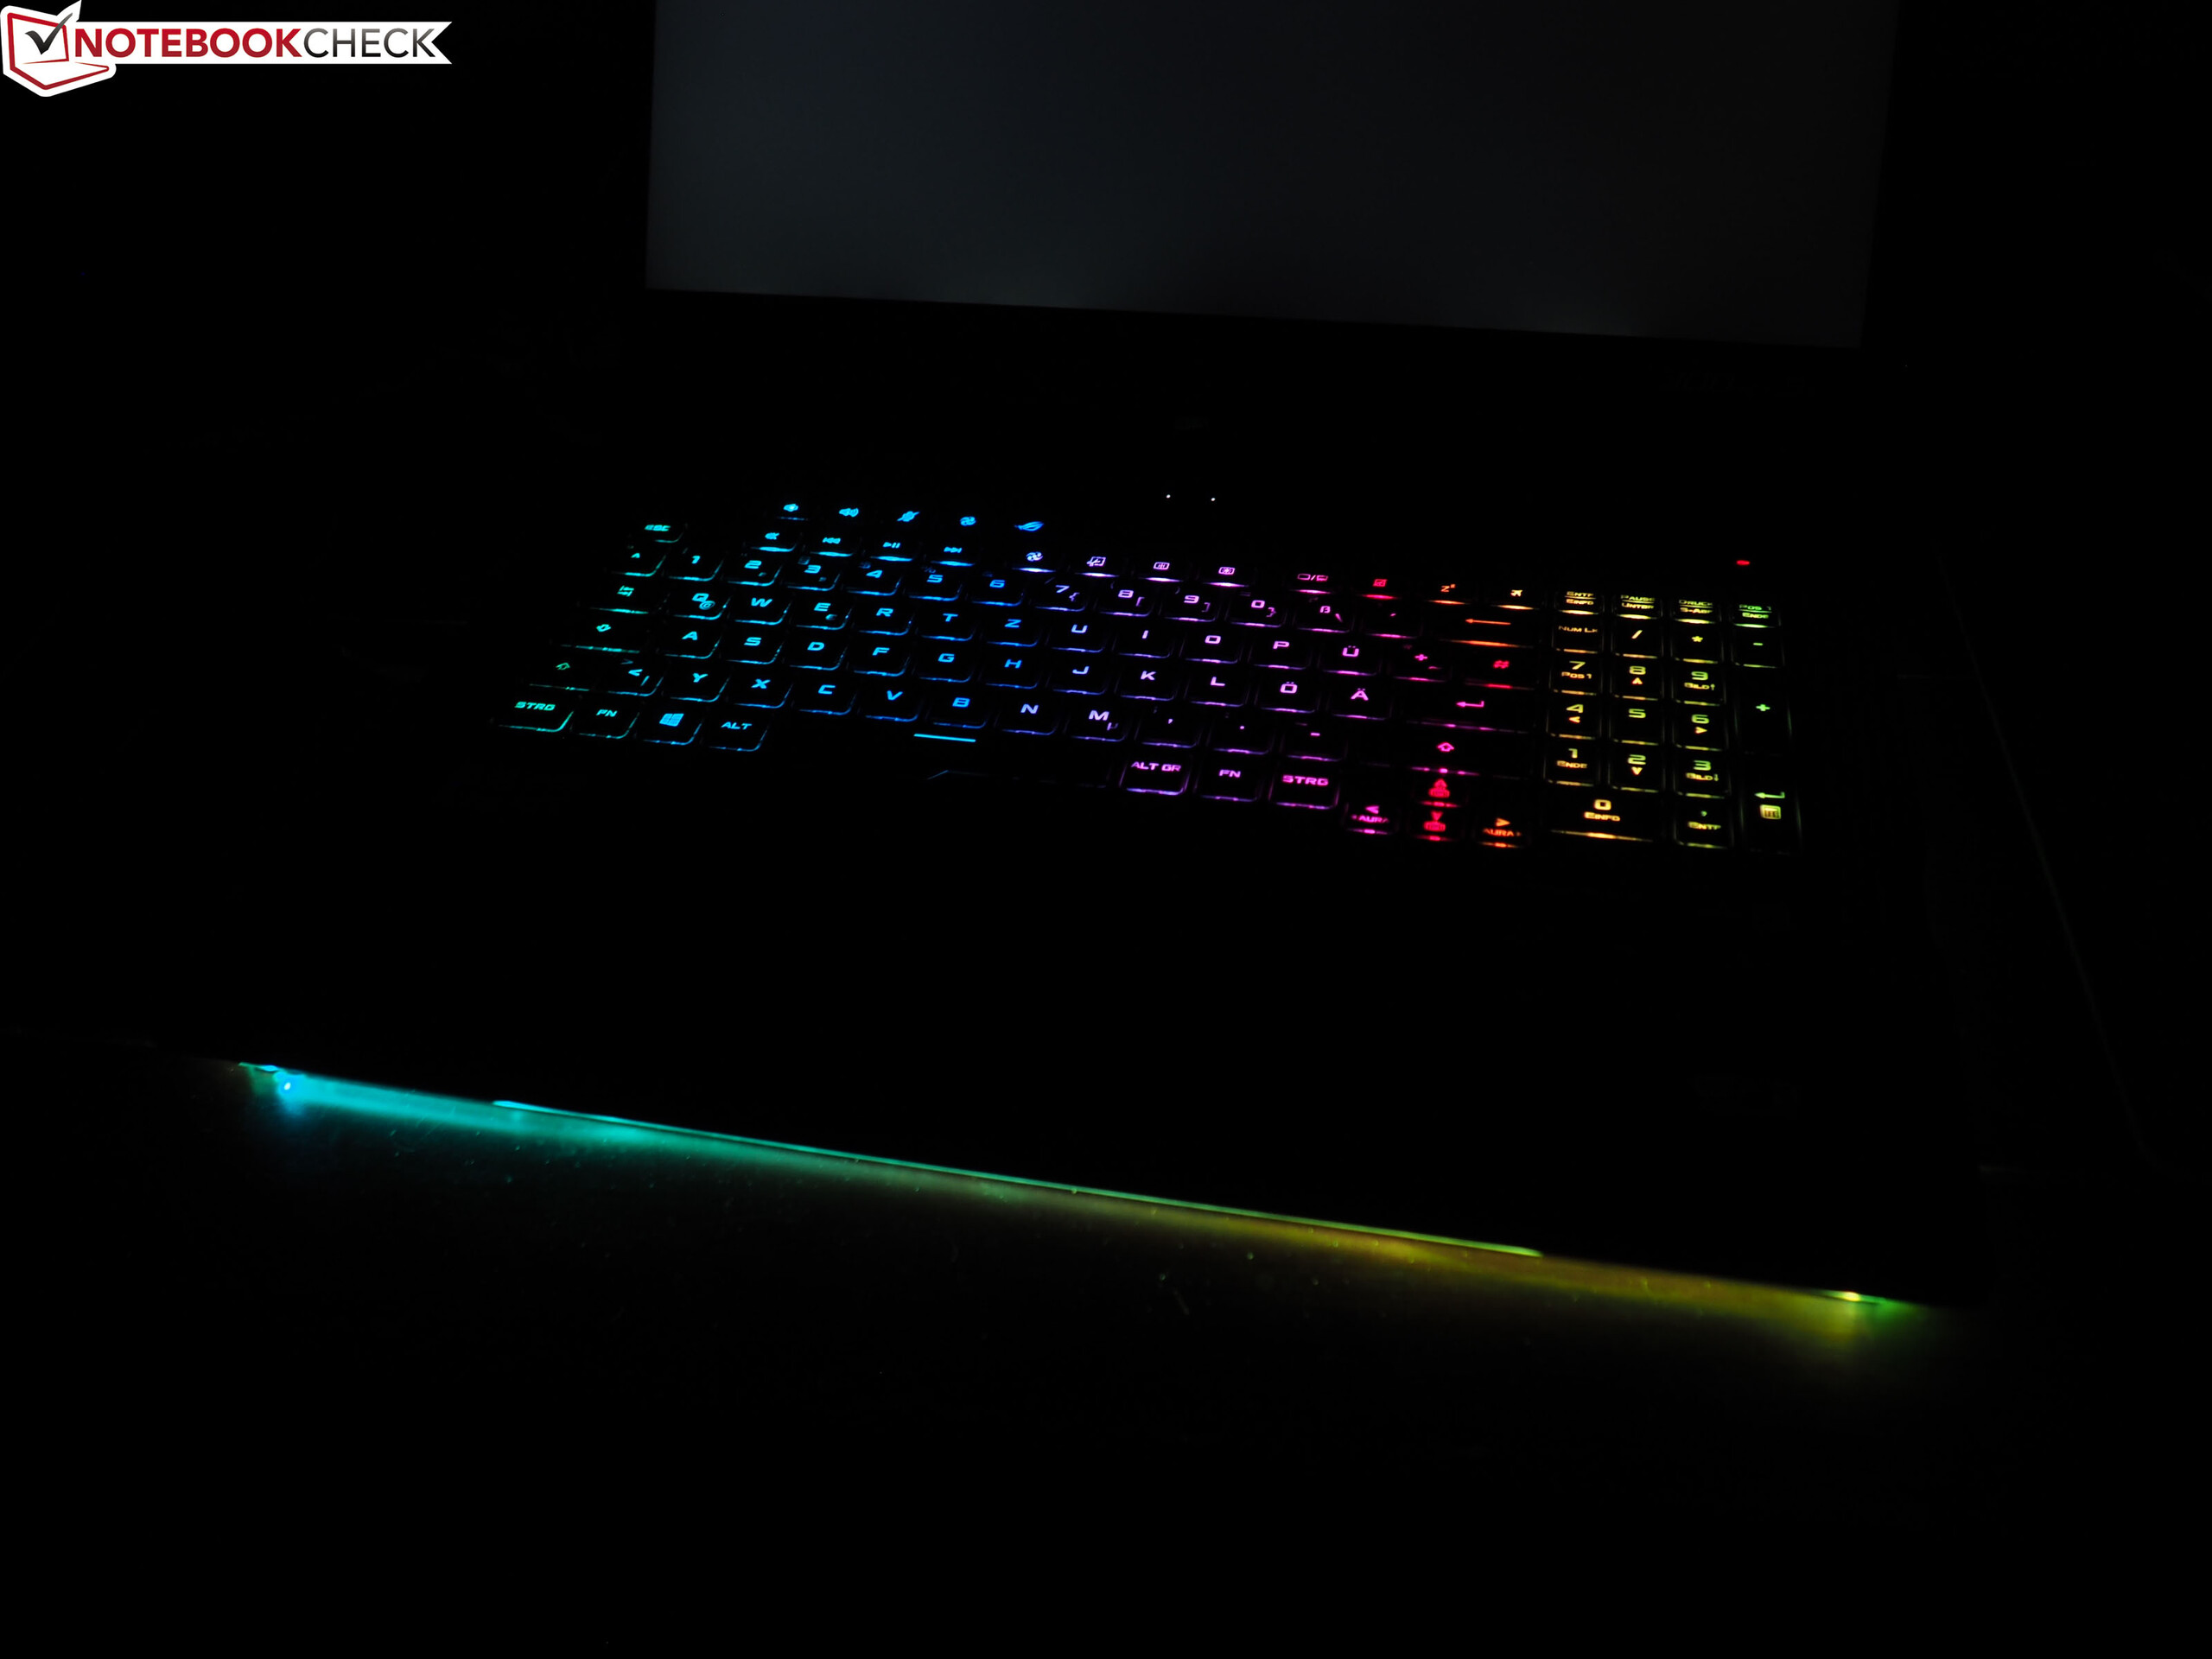
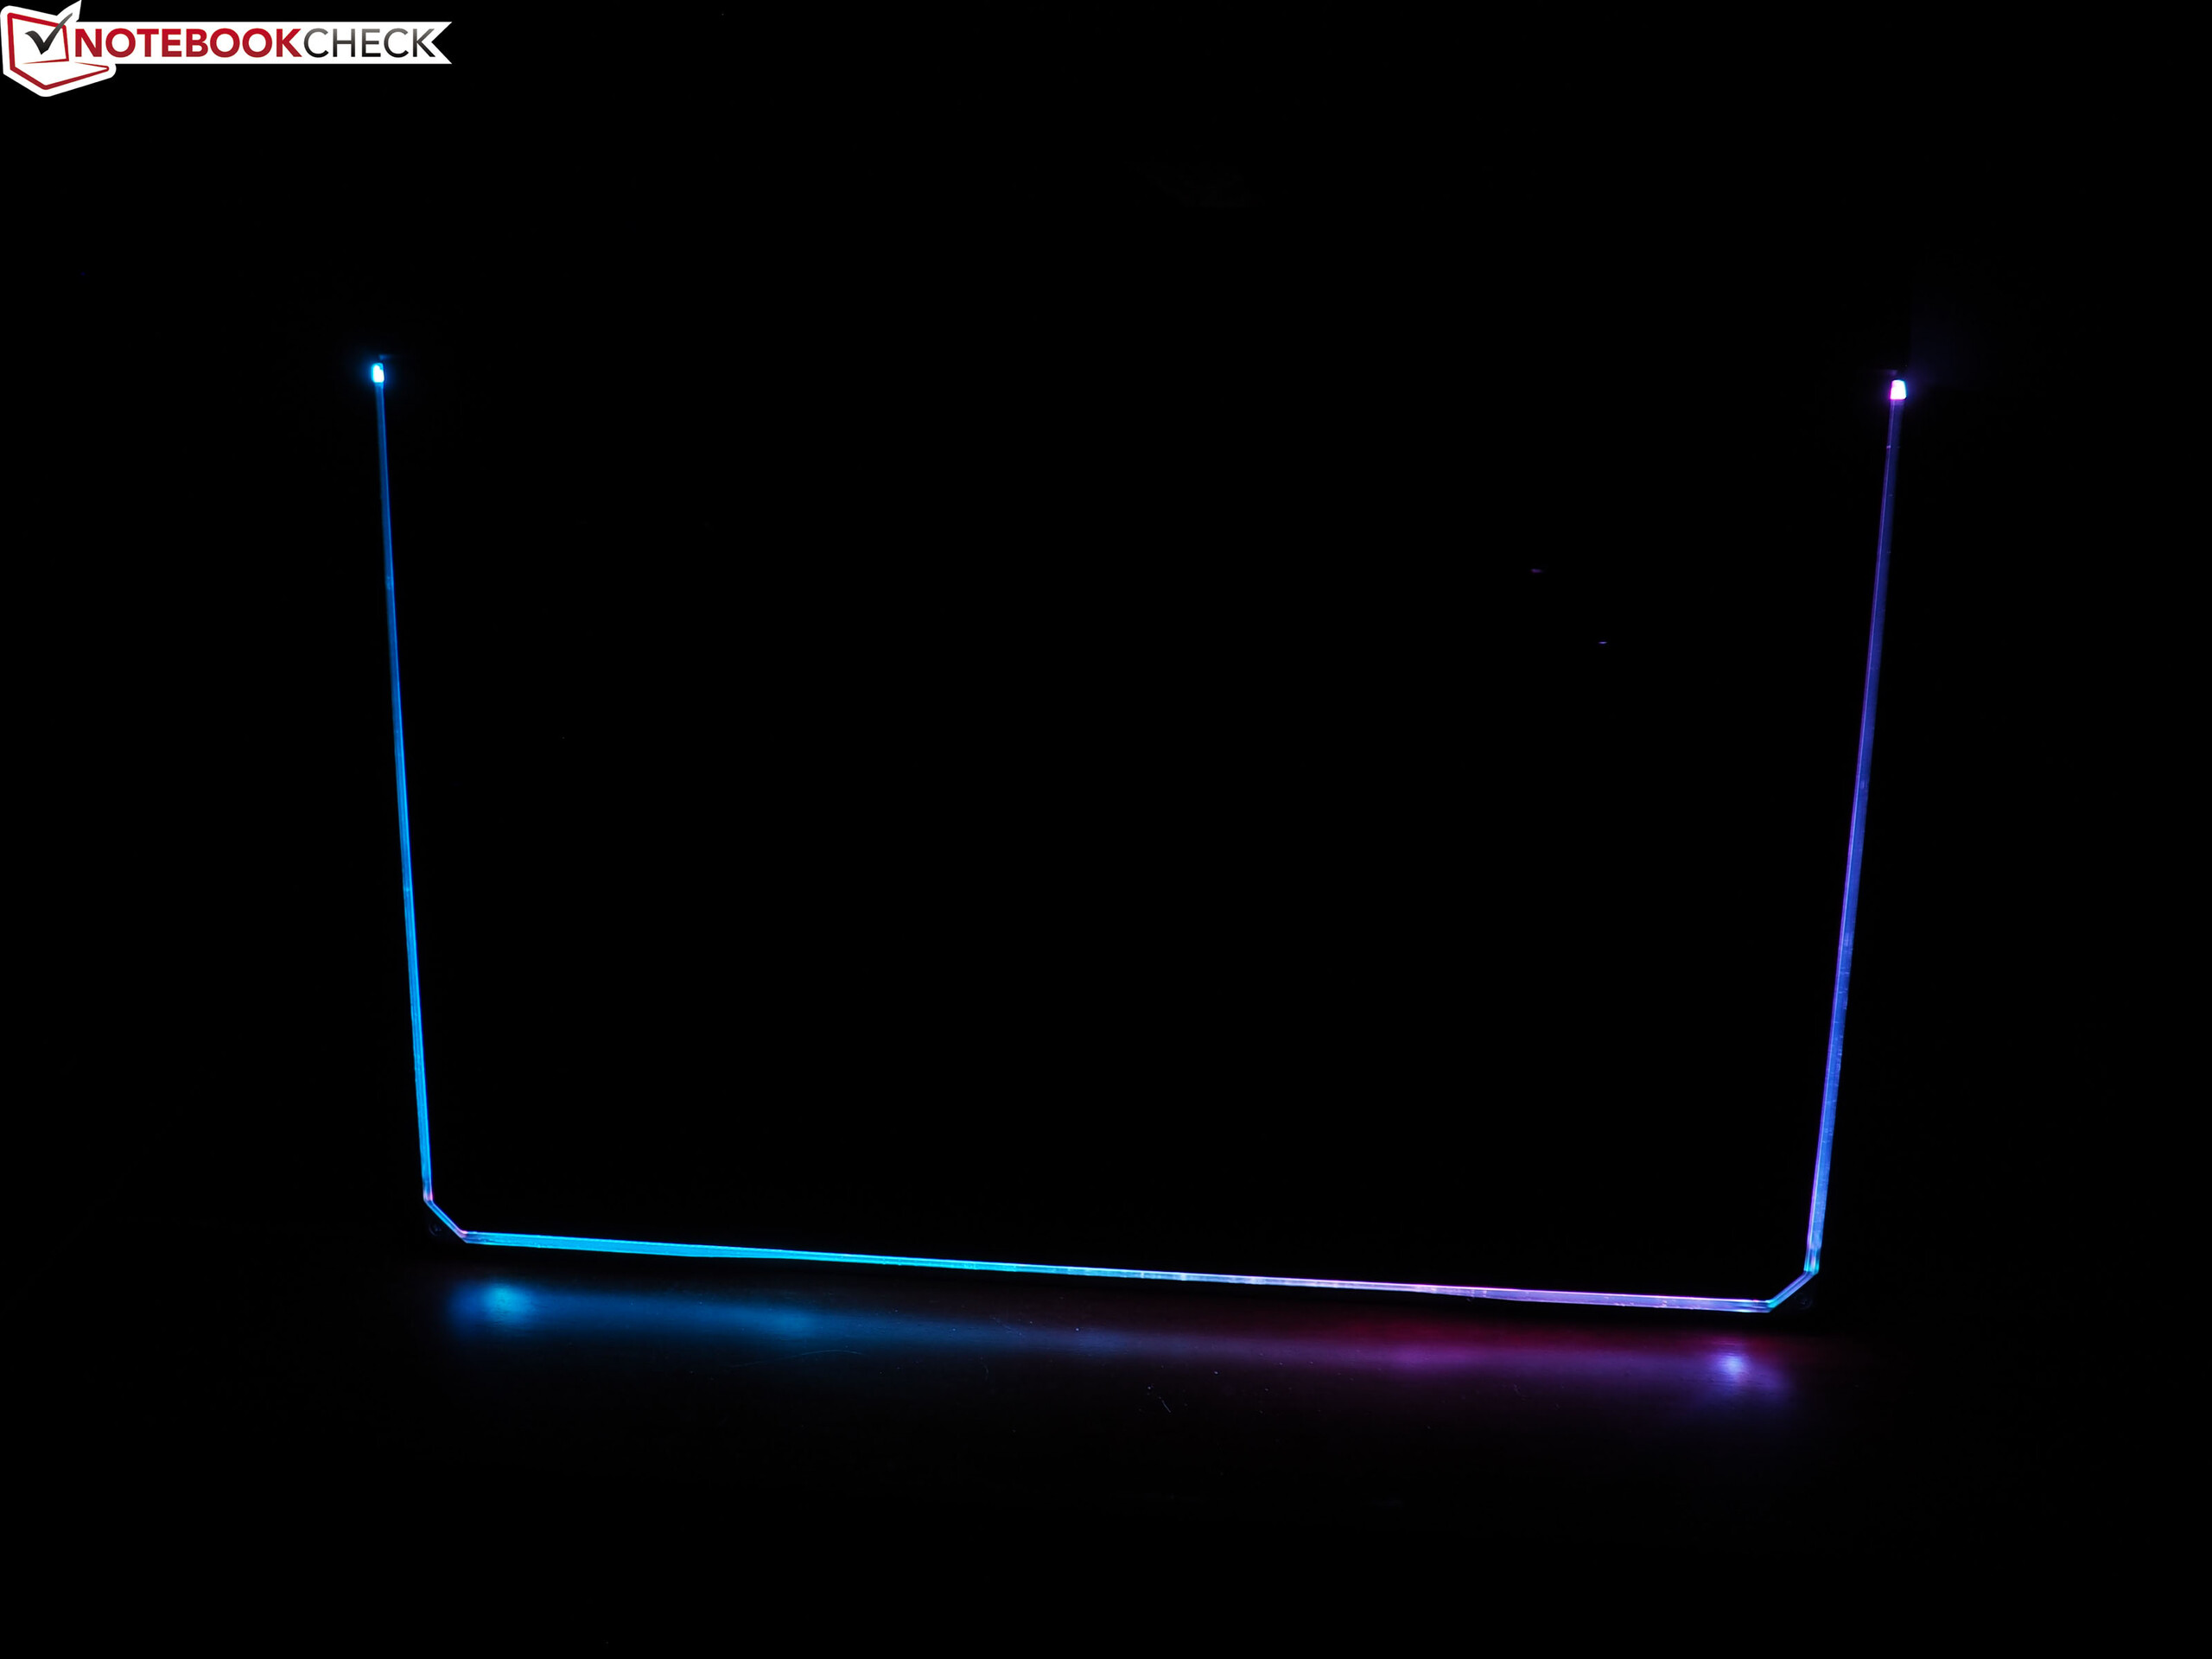
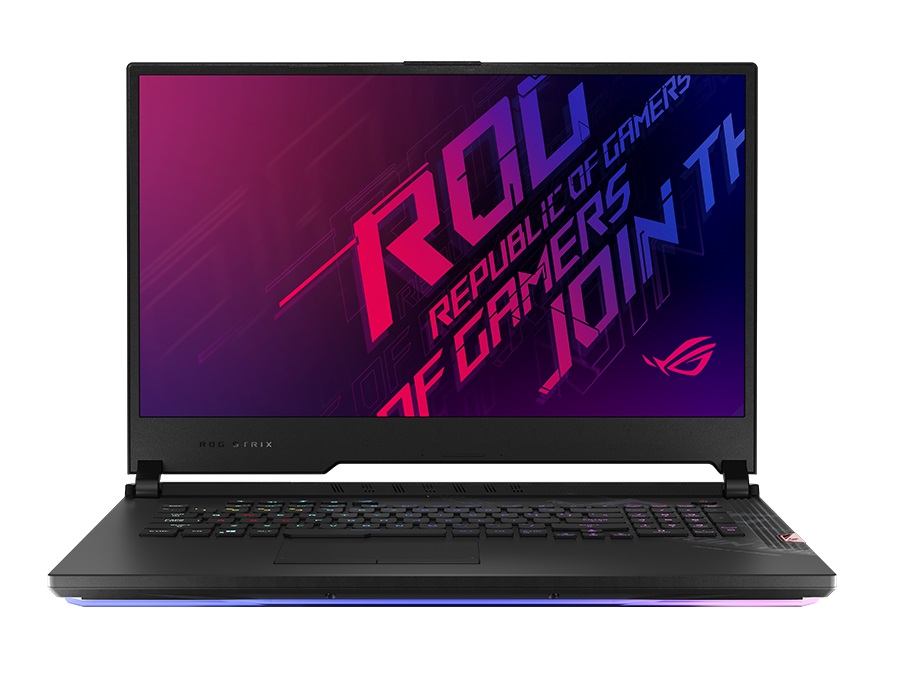
With the Scar 17 Asus primarily wants to address the gaming faction. The target group can be recognized at a first glance. The striking design clearly sets the 17-incher apart from the masses. For example, there is the metal lid, which attracts customers with a huge and illuminated ROG logo. The plastic base unit is also anything but ordinary. While the upper side catches the eye with its asymmetrical construction and is printed with numerous lettering, Asus gives the case's bottom an LED strip that extends over three of four sides (see picture gallery).
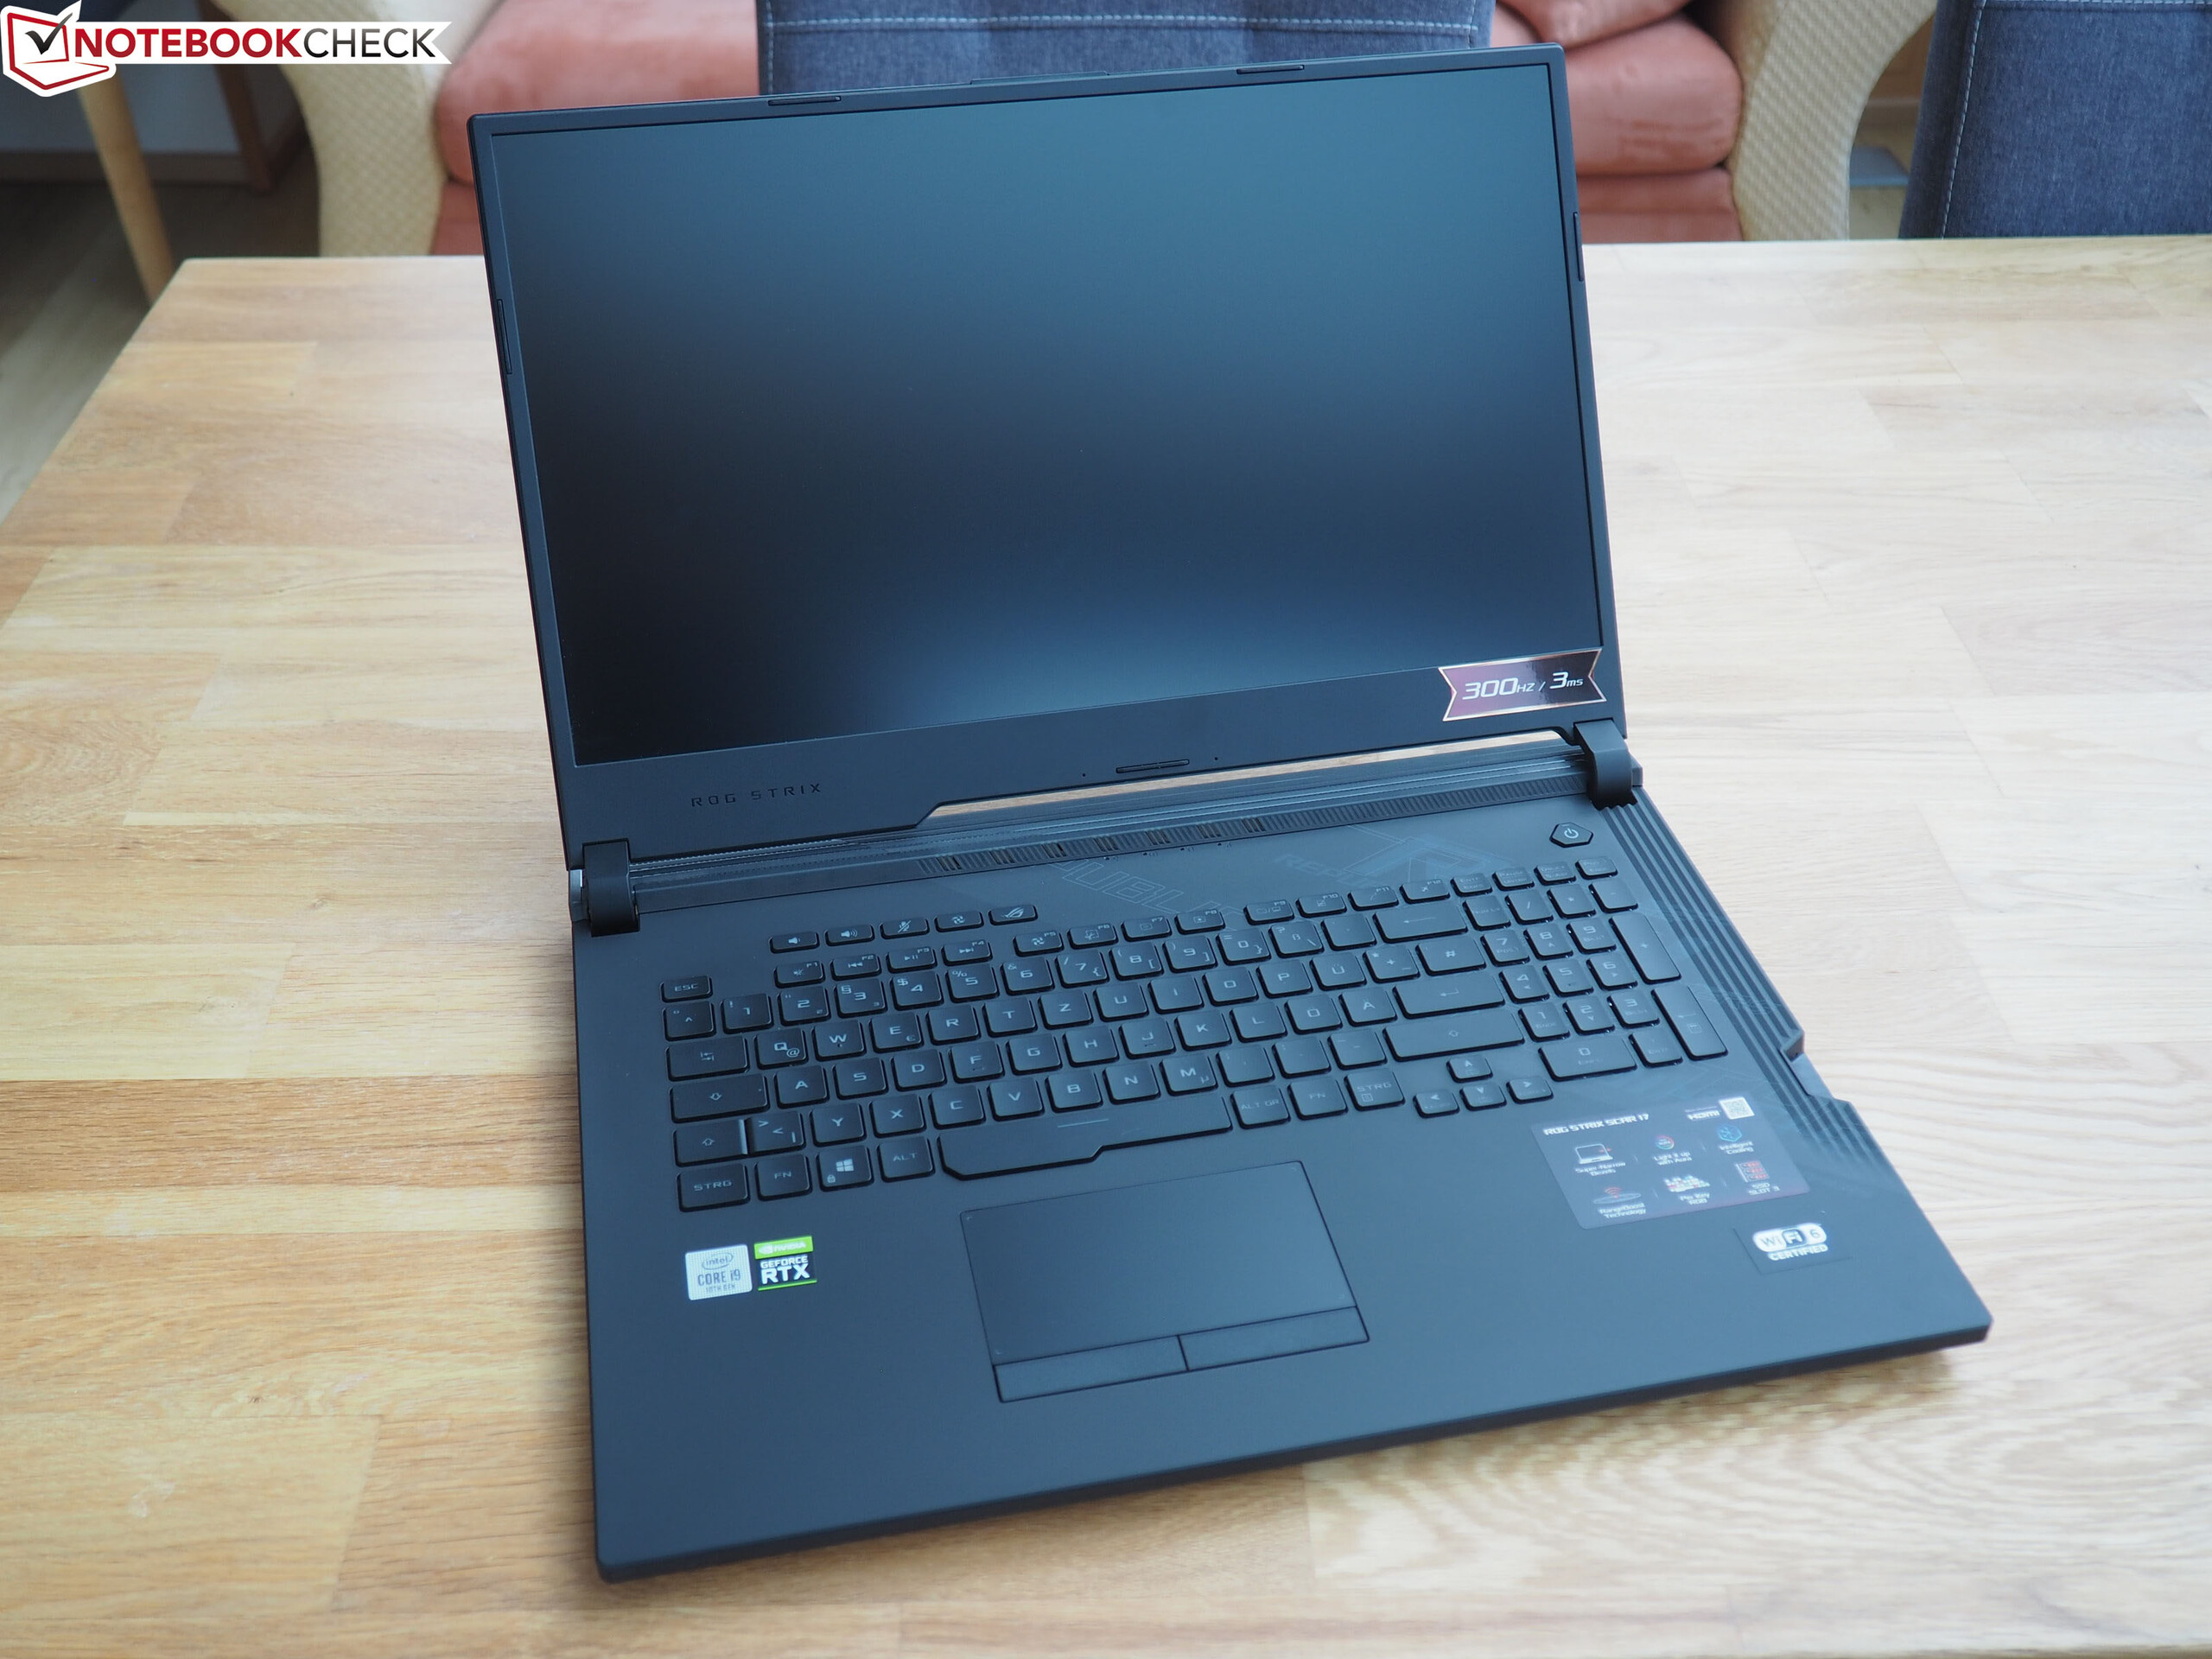
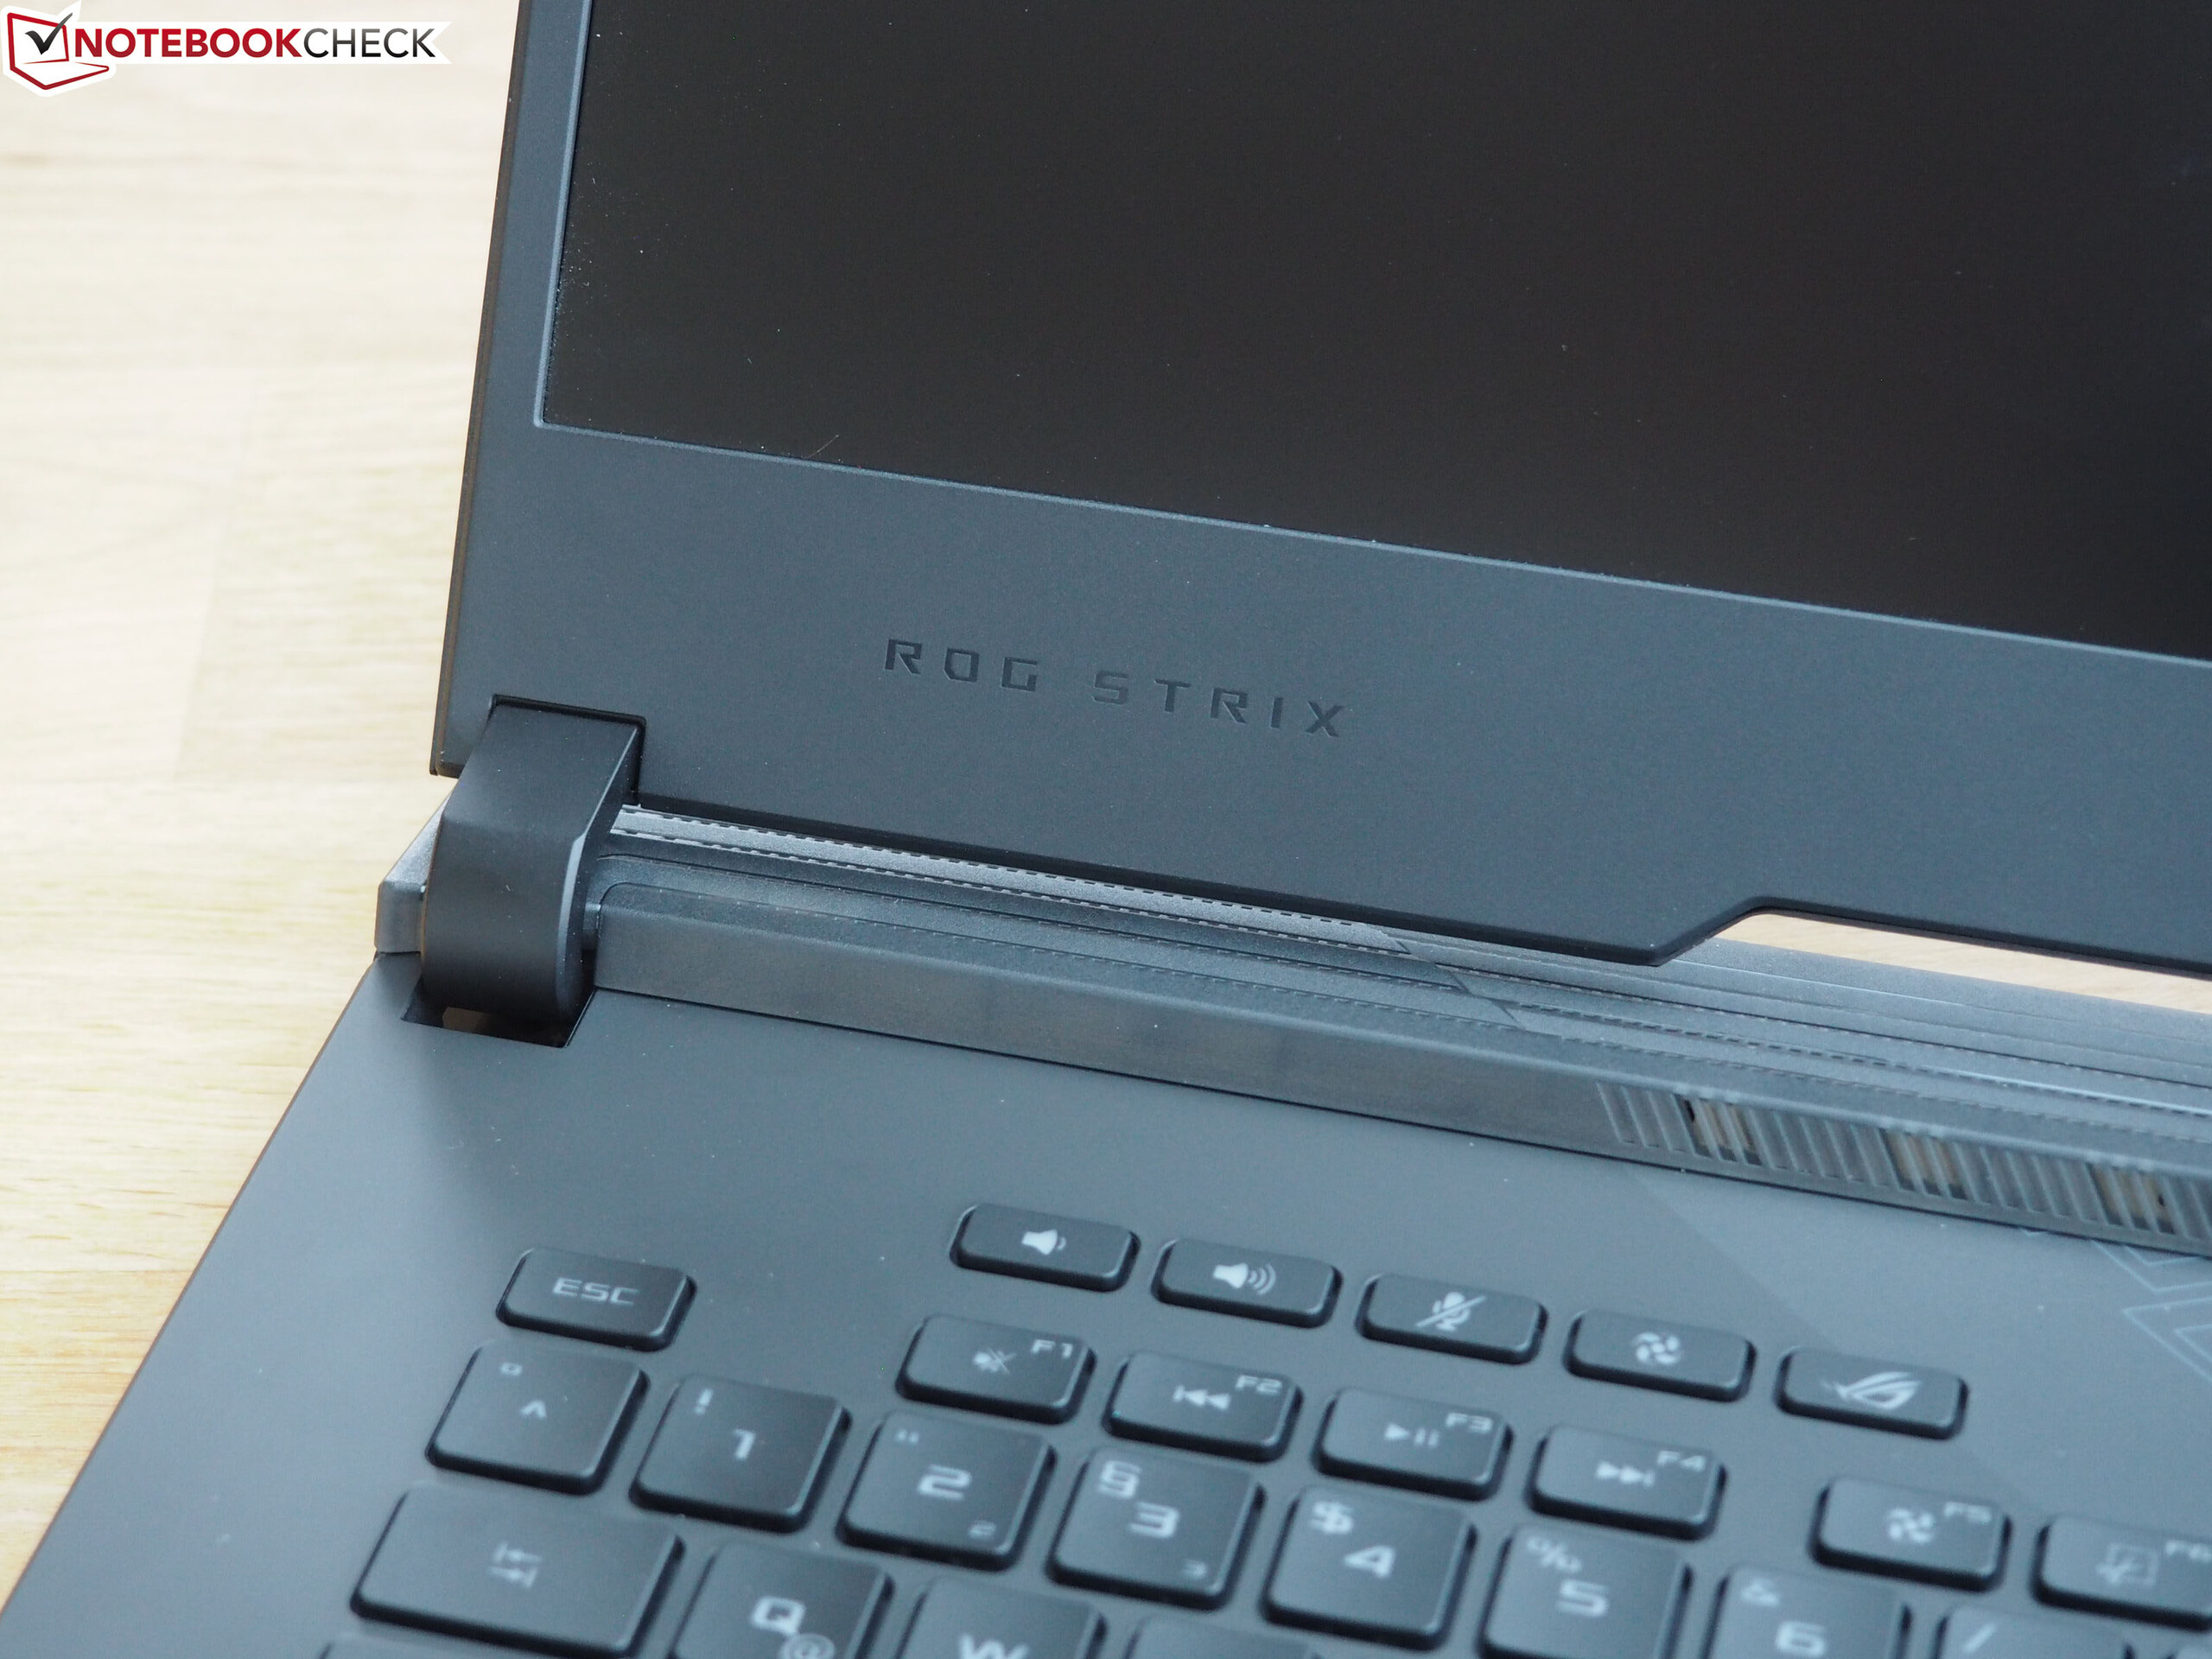

Despite the slim bezel design and a relatively low overall height (2.6 cm), the 17-inch body looks a bit clumsy, which is not only due to the design but also to the above-average construction depth of 29.3 cm. For comparison, the MSI GE75 is only 26.9 cm (27.5 cm @Eurocom Nightsky RX17). Moreover, the chassis turns out to be rickety in some places. There is little to complain about in terms of build quality and stability. The base unit can hardly be bent even under stronger pressure. What Asus could improve on, is the screen's opening angle, which turns out rather small at 120°.
Features
Connectivity
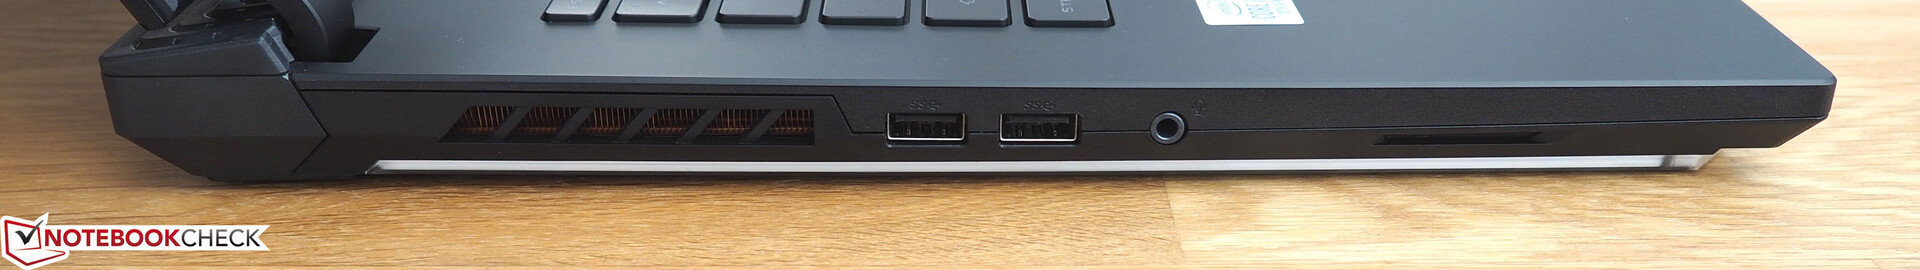
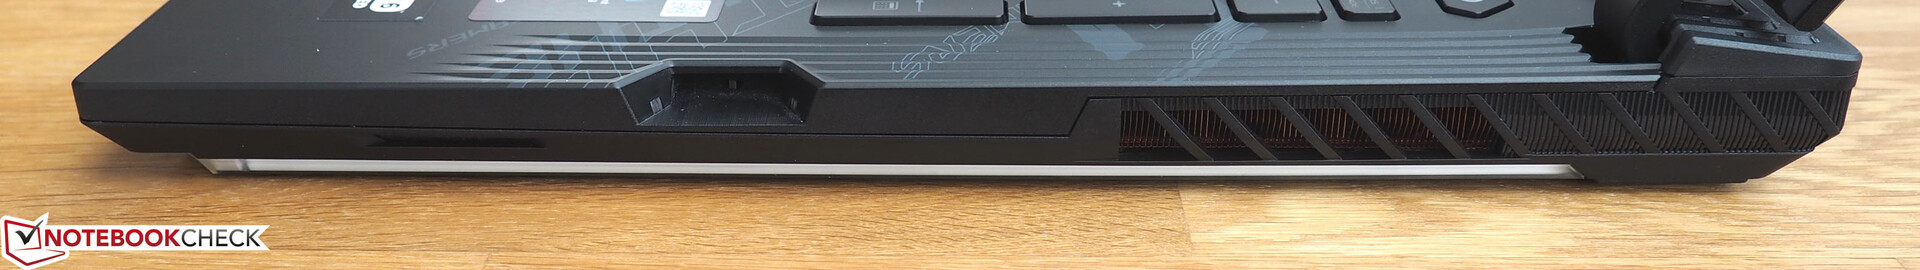
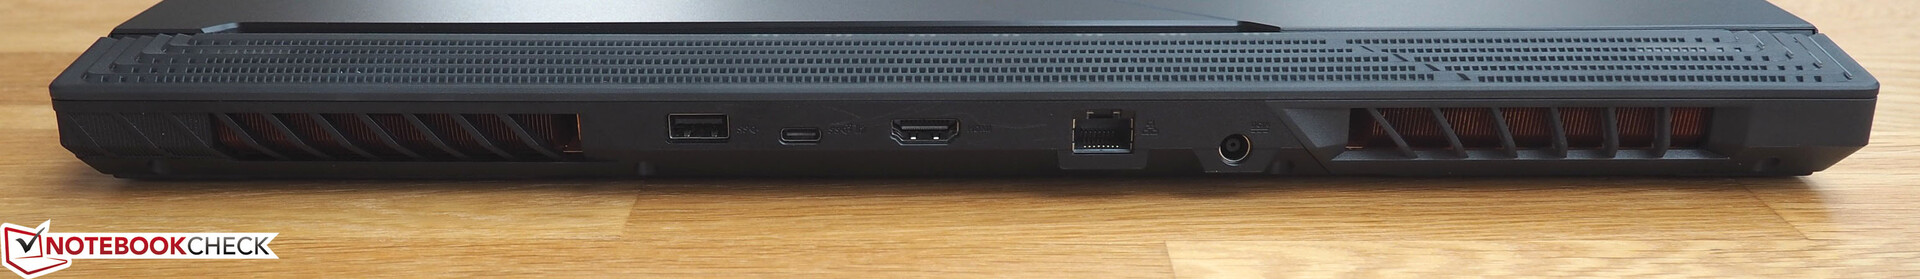
In view of the laptop's price, the connectivity is a bit meager. You'll look in vain for a cardreader or a Kensington lock. Neither a Thunderbolt 3 port nor a dedicated DisplayPort can be found. External monitors either go to the HDMI output or to the USB C 3.1 Gen2 port, which supports DisplayPort. The remaining three USB ports (Type-A) only support the 3.0 standard. The package is rounded off by an audio jack, an RJ45 port, and the so-called Keystone slot.
The Keystone is a special key, developed by Asus, which serves to individualize the device or saves its settings and is supposed to protect personal data (hidden shadow drive). Seeing the Keystone as a useful feature or as an unnecessary gimmick is something everyone has to decide upon for themselves. Since a majority of the ports are located at the rear, there is plenty of space for moving a mouse.
Communication
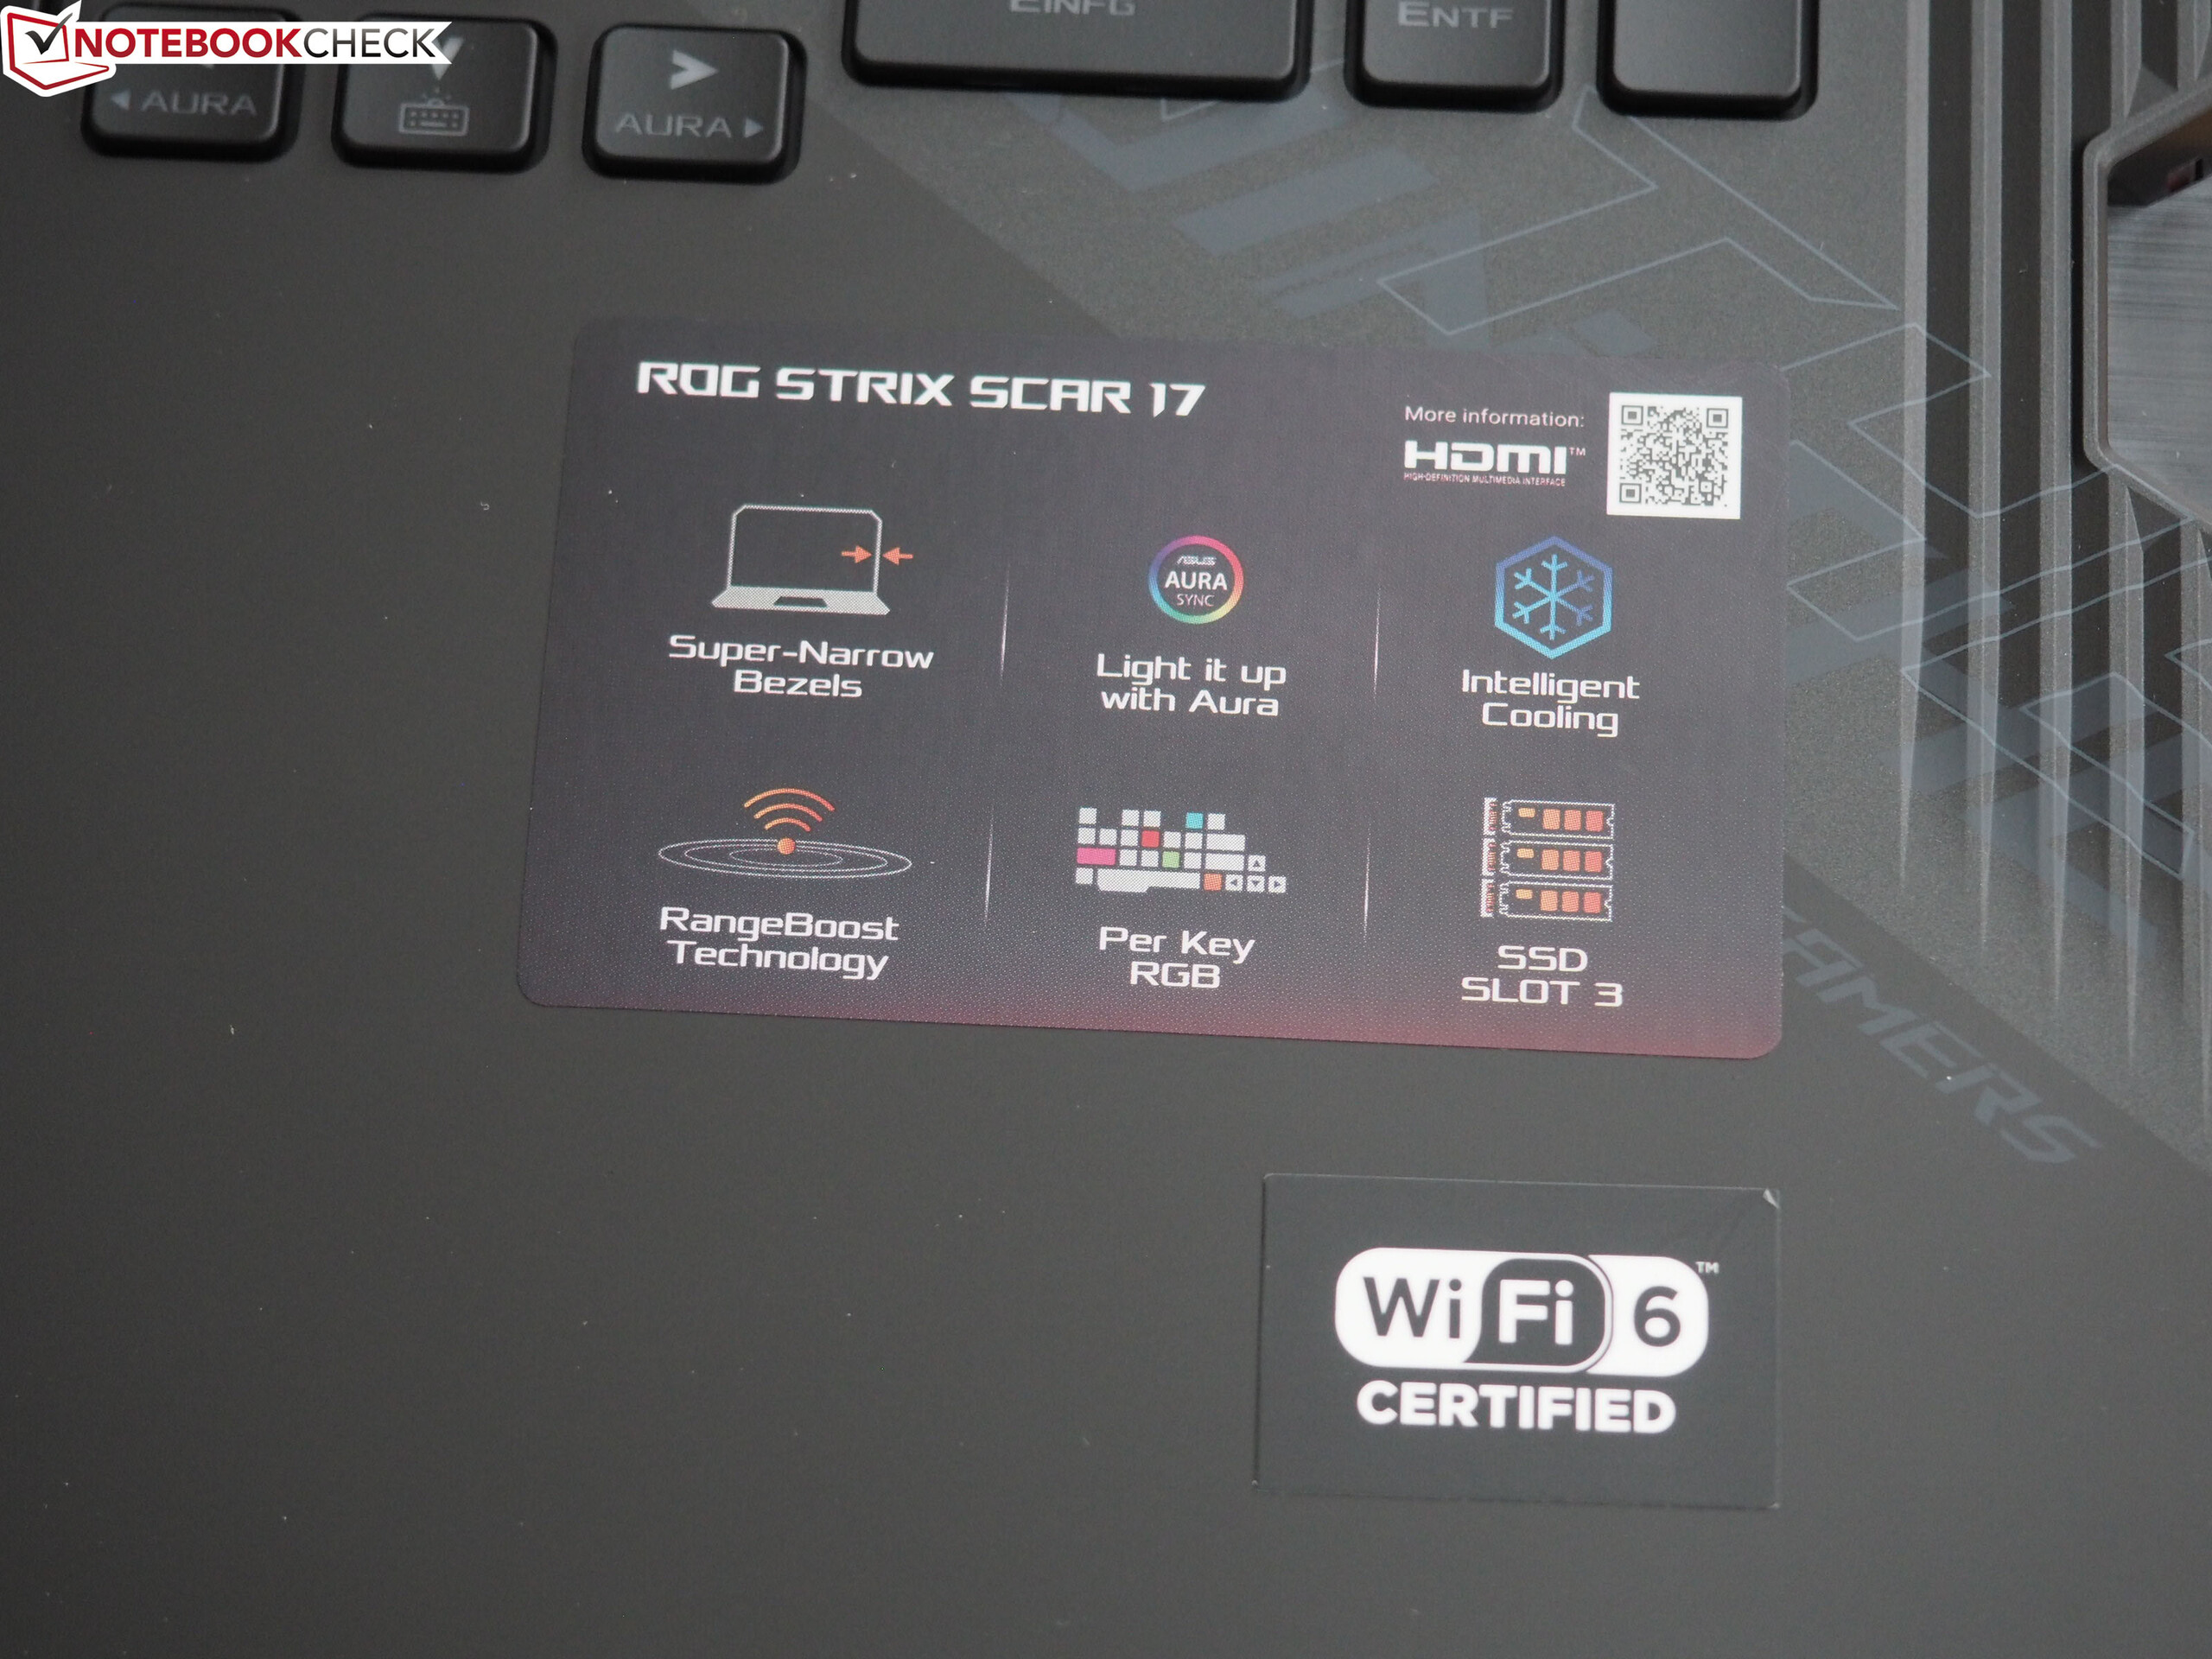
Wireless communication is provided by the cutting-edge Intel Wi-Fi 6 AX201 module, which enables the Scar 17 to reach over 1,000 Mb/s both in transmission and reception (1 m distance from the router). Note: Due to the modernized test setup, these results are not comparable with the competition.
Webcam
The Scar 17 does not have a webcam. This lowers the overall rating by about 1%.
Accessories
Contrary to most manufacturers, Asus uses a 280 watt power supply for the RTX 2080 instead of an especially massive 330 watt model (the reason is the low TGP). At 840 g, the power supply is no lightweight, though.
Maintenance
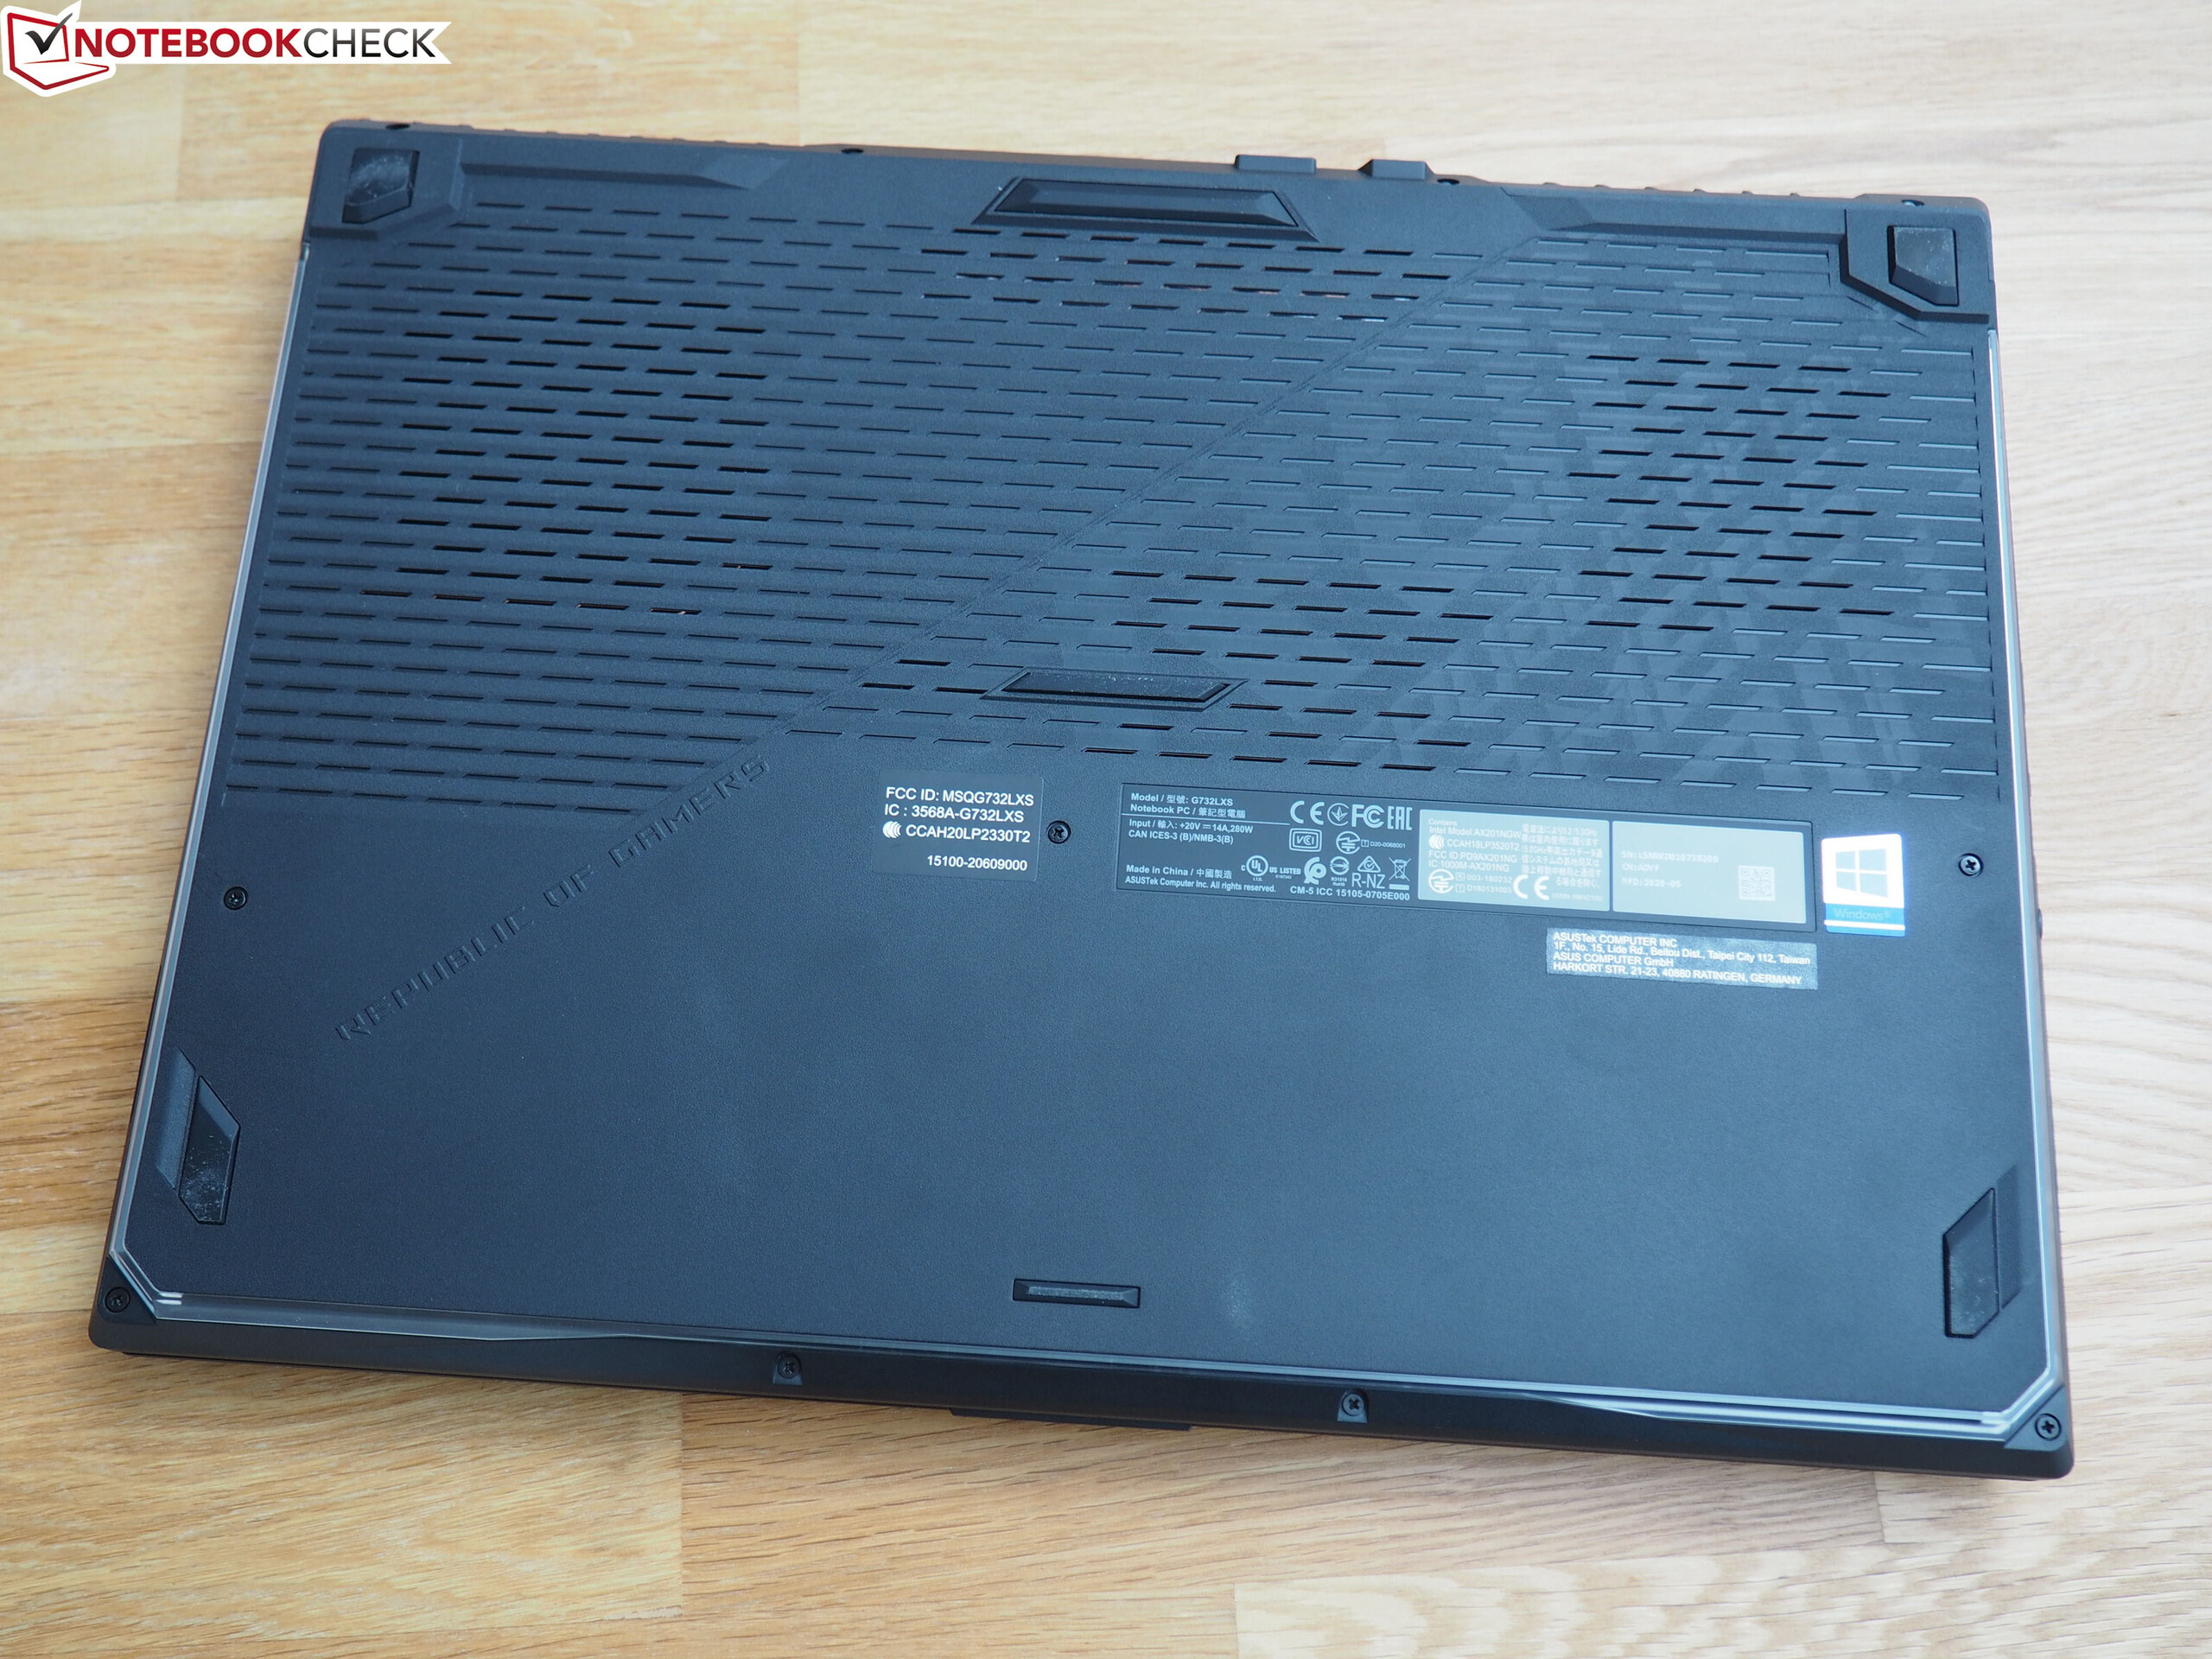
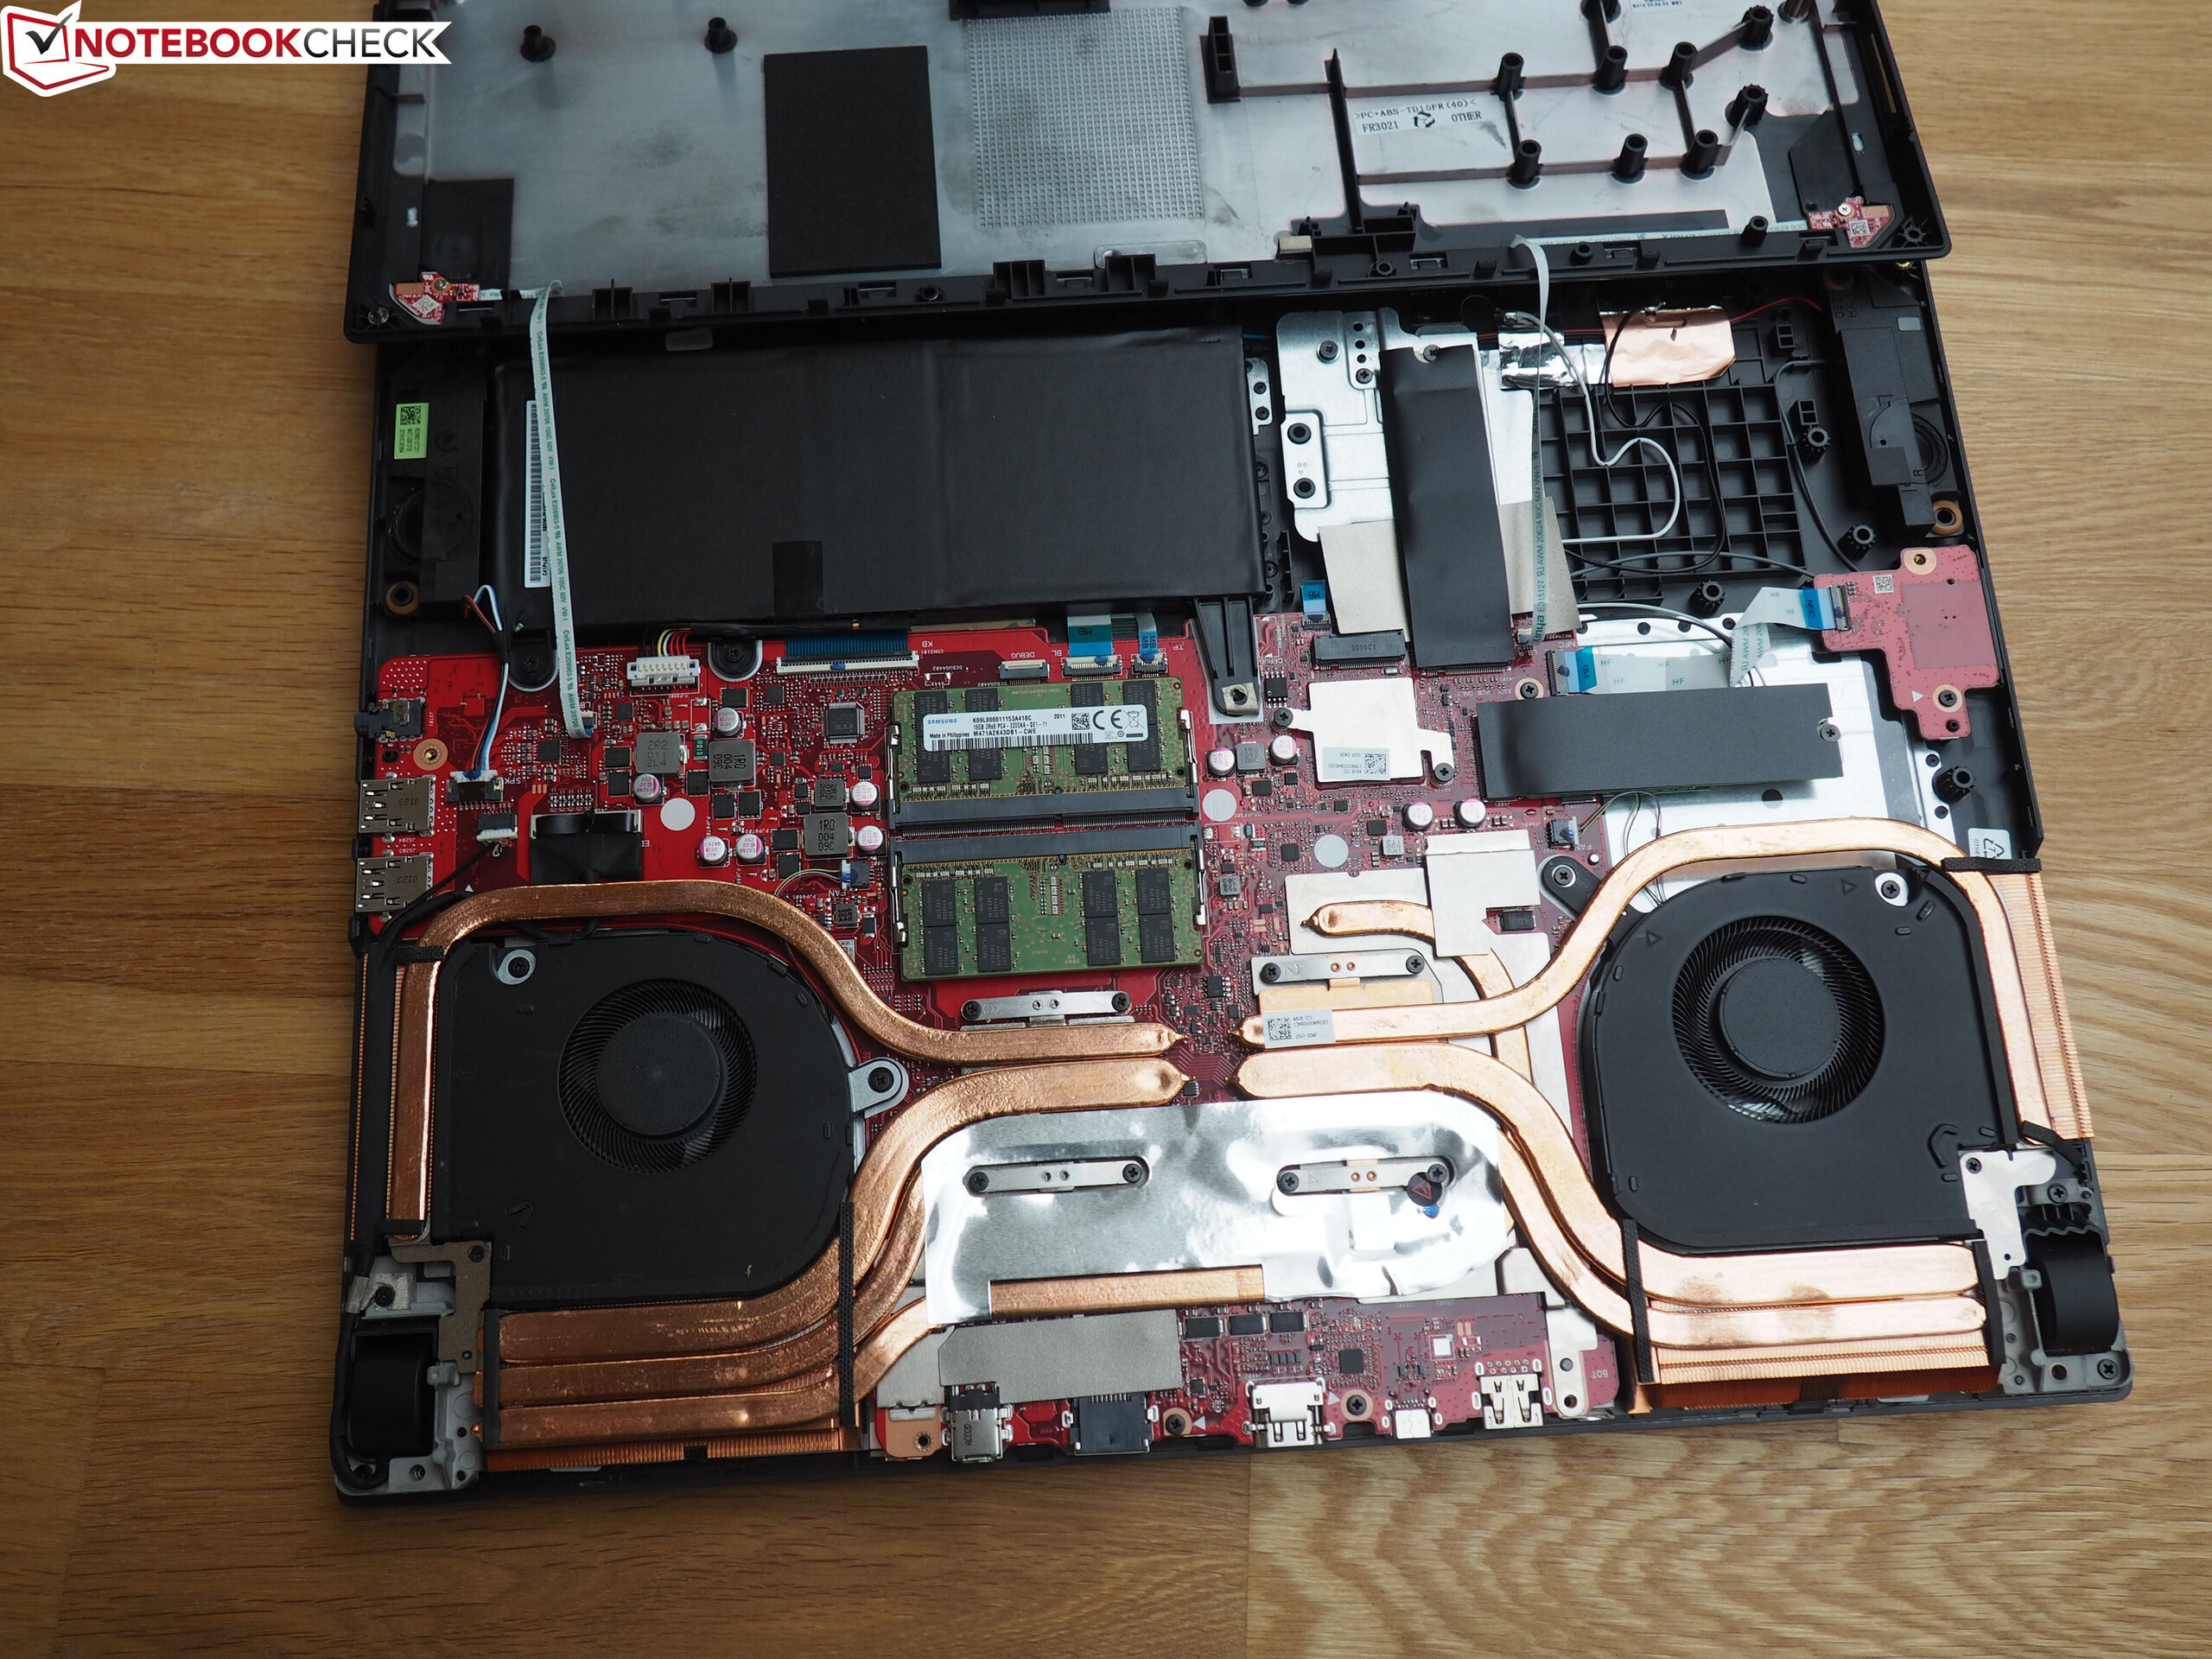
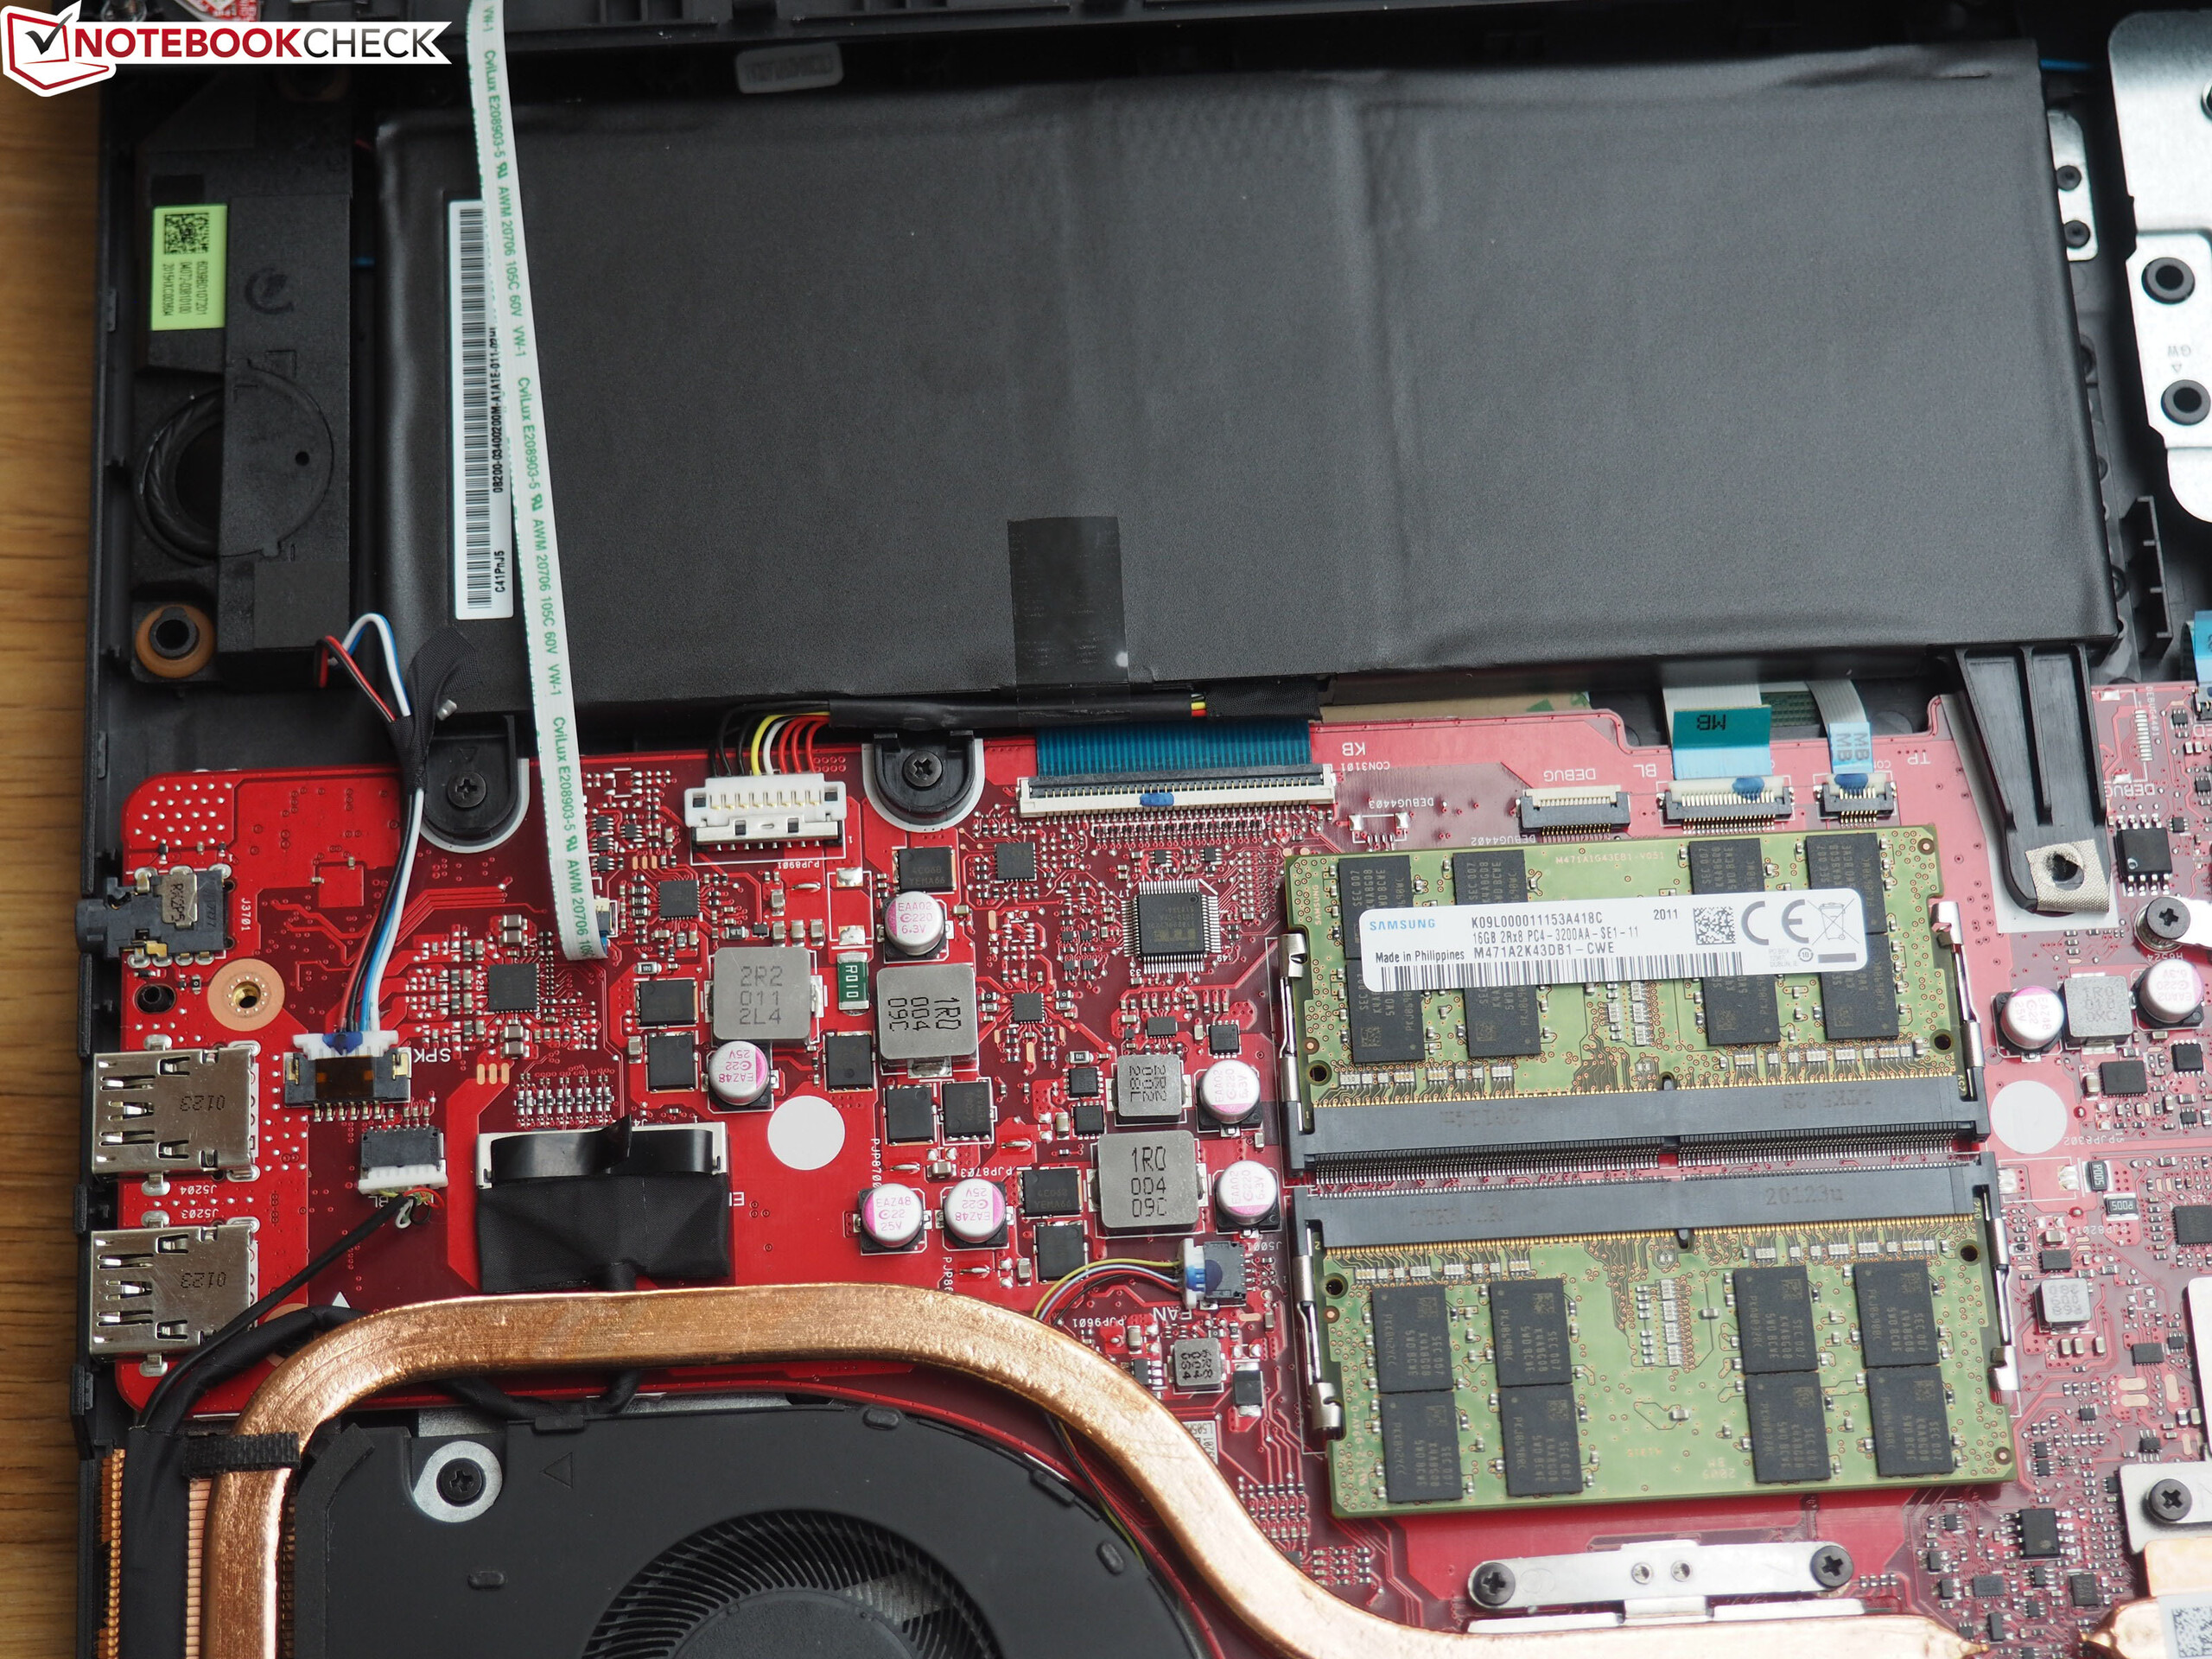
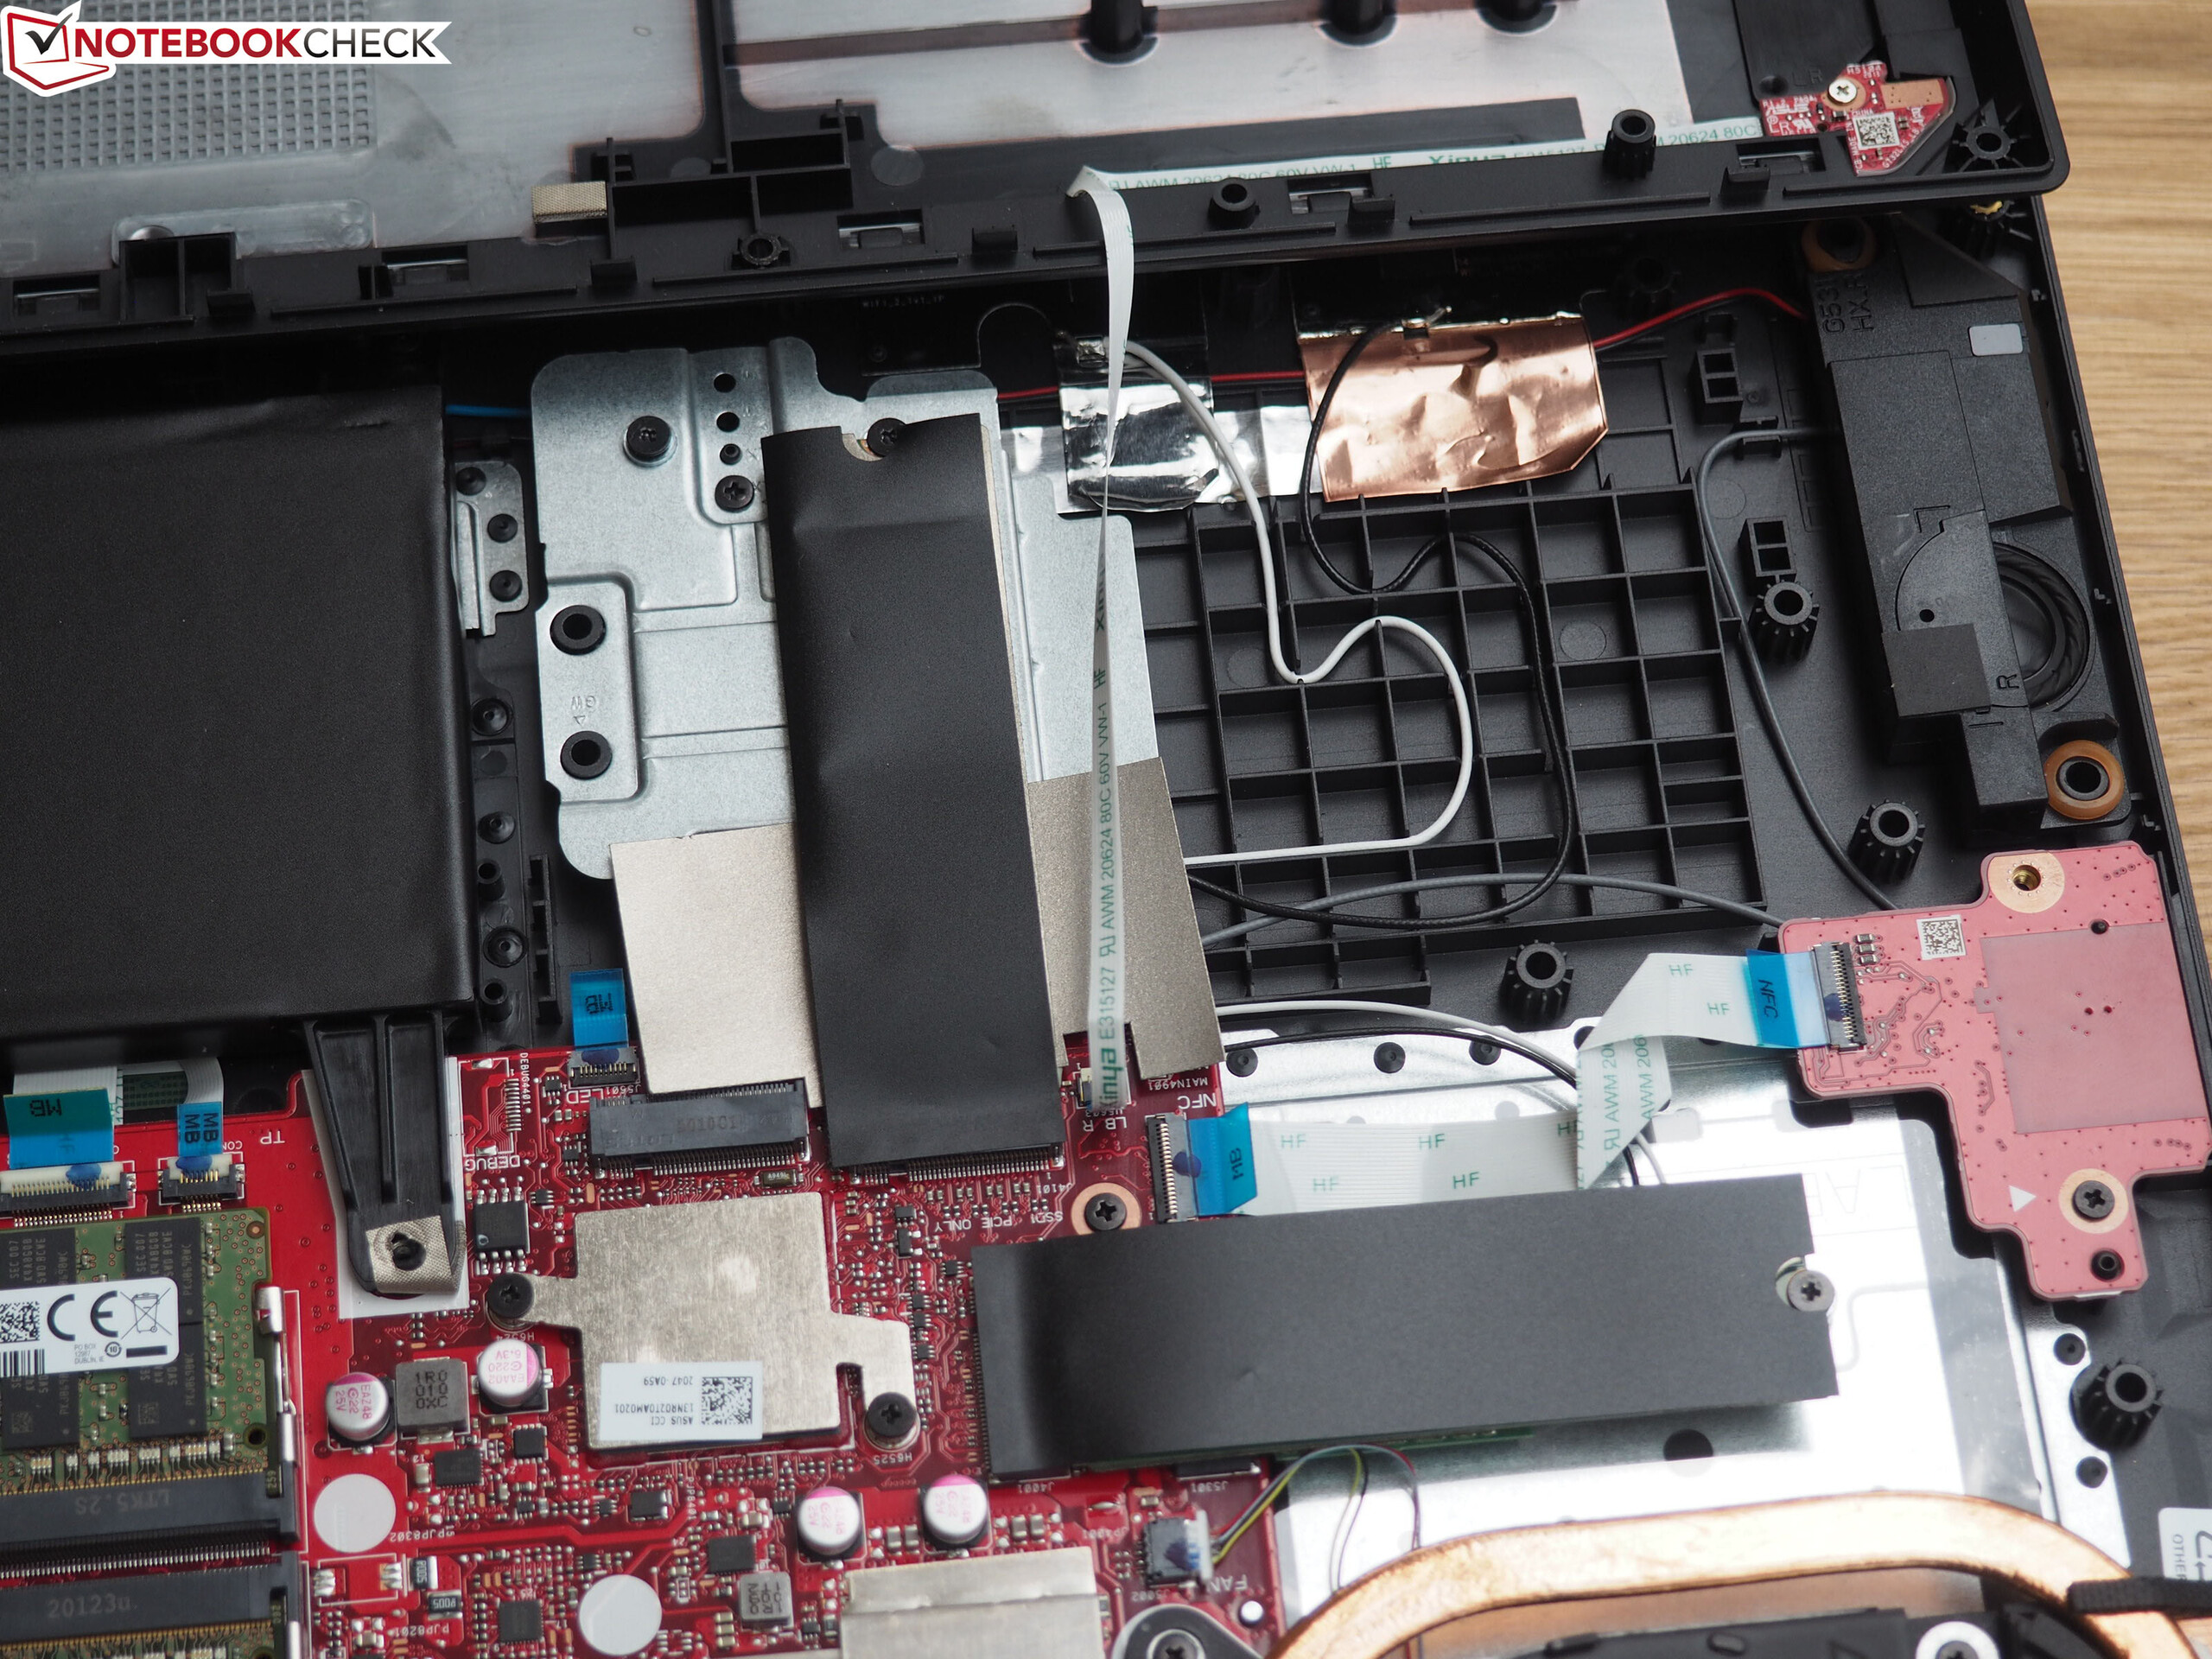
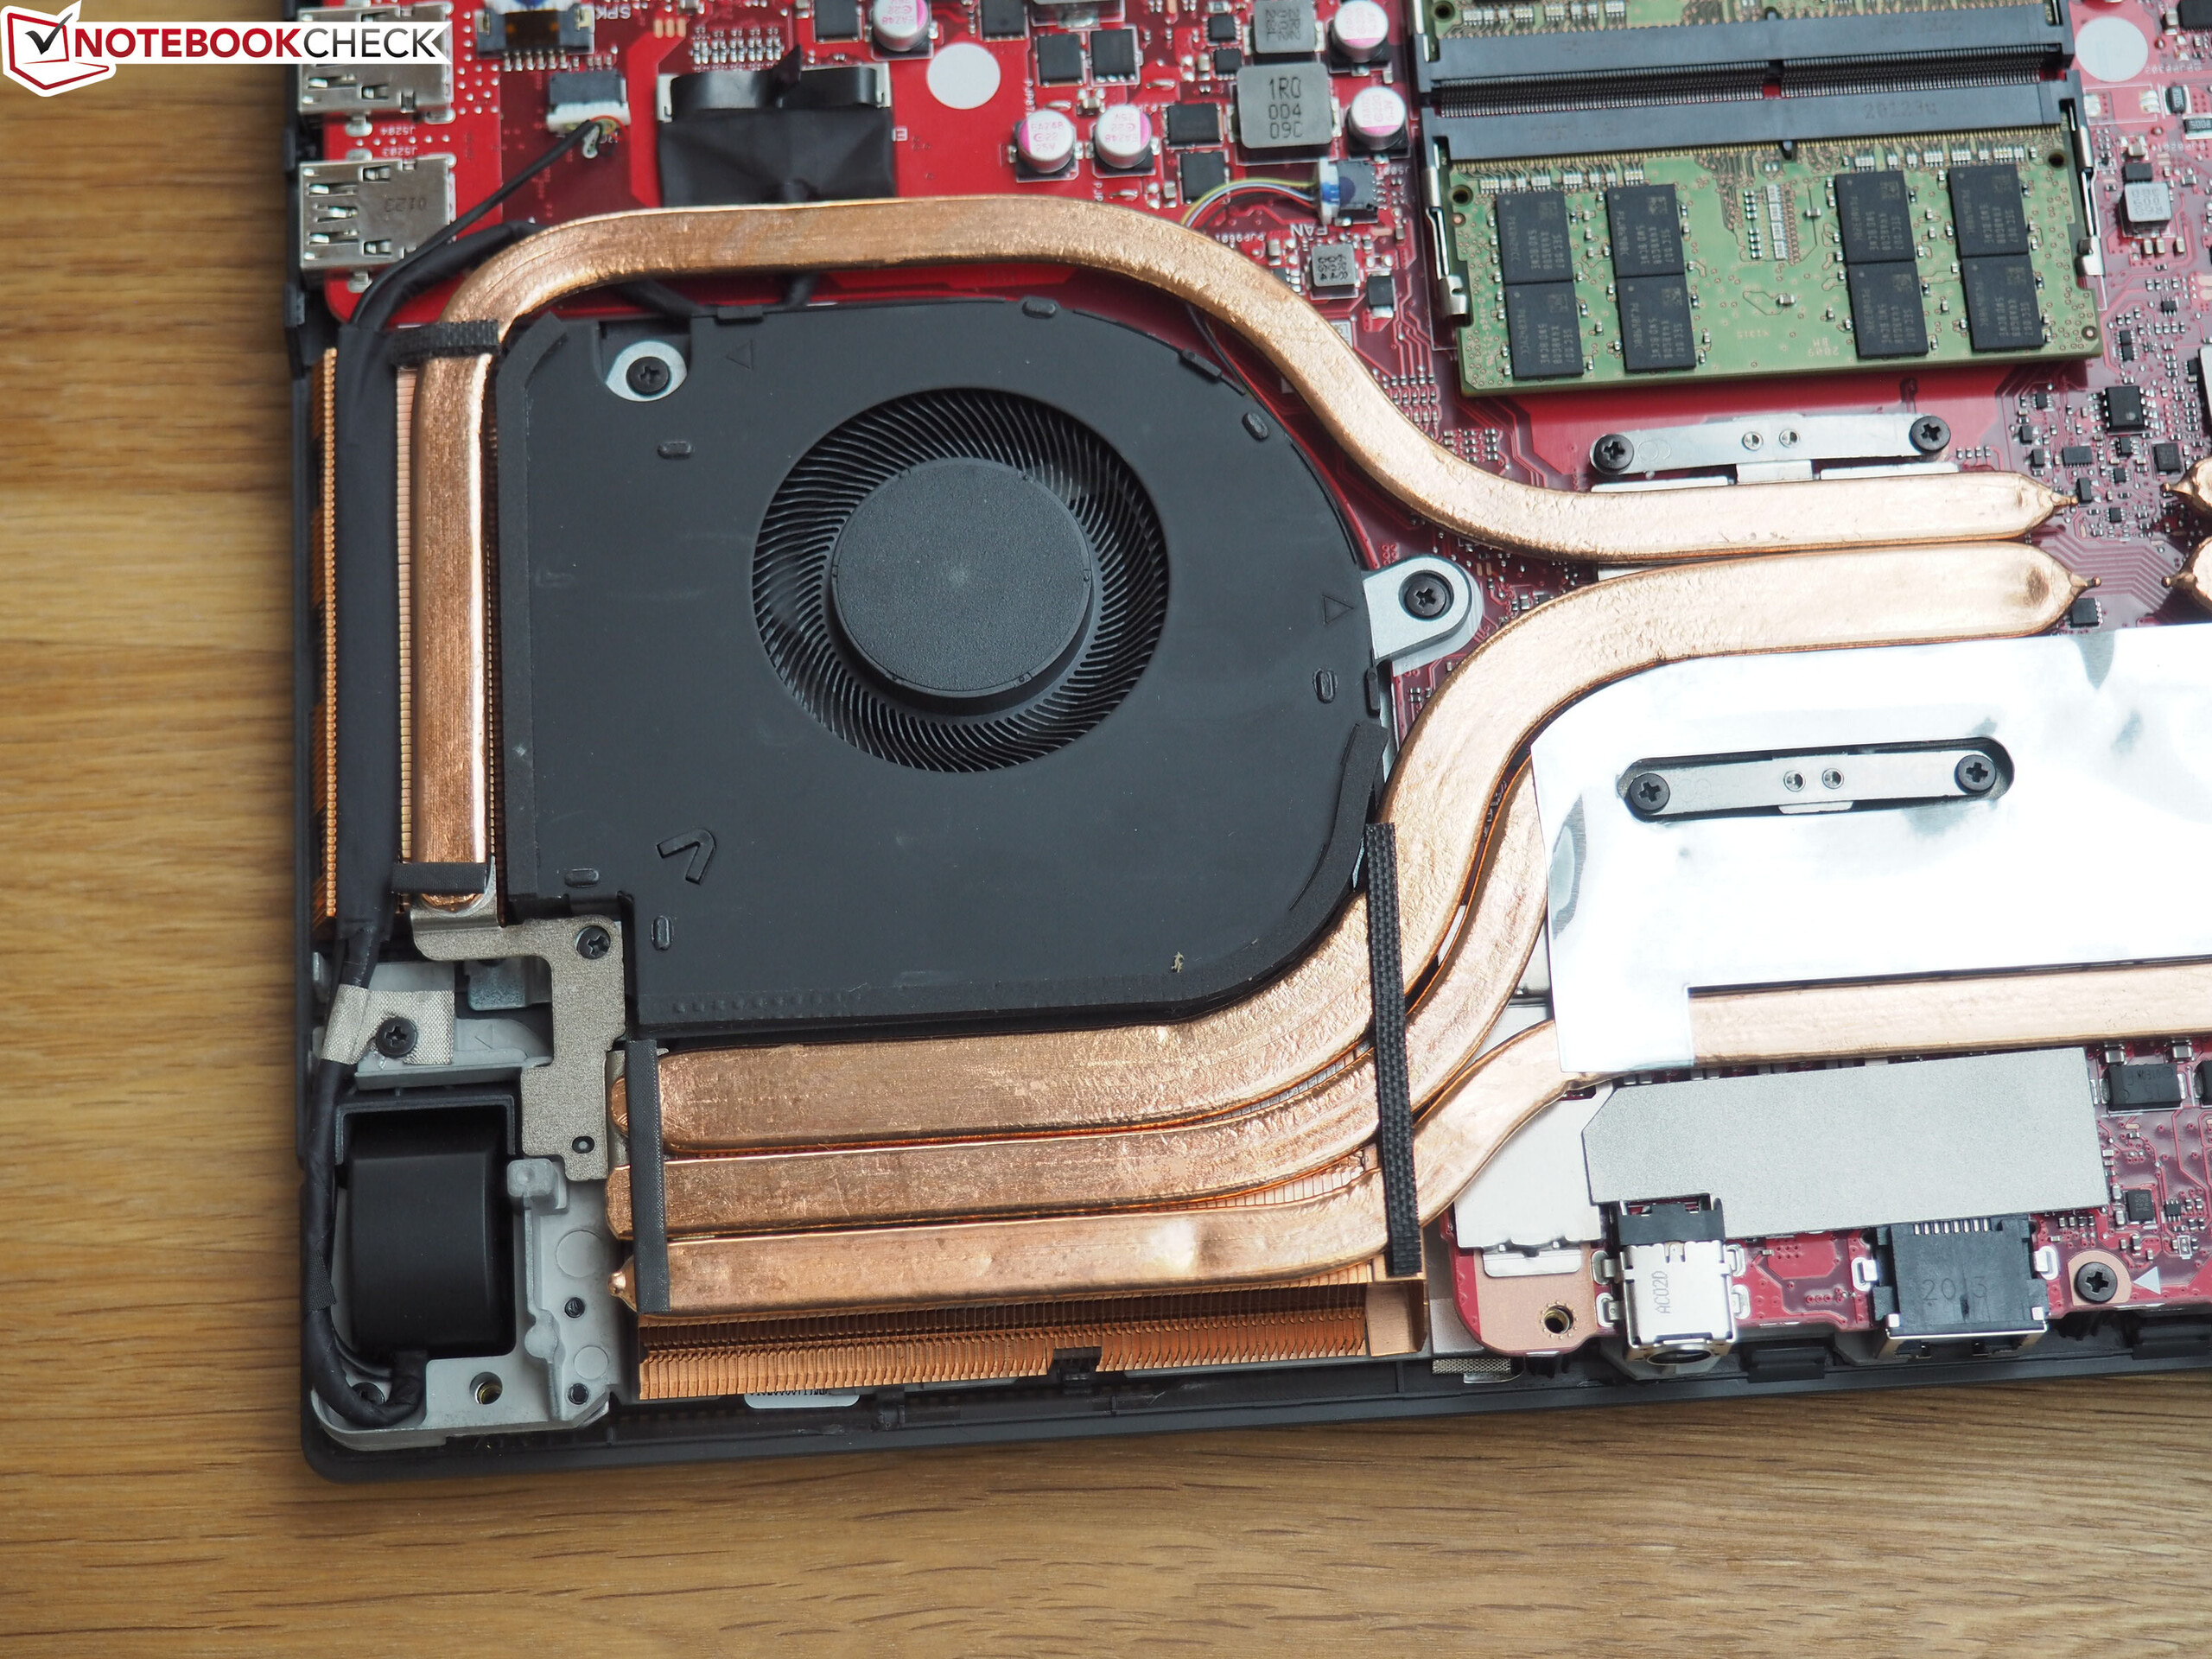
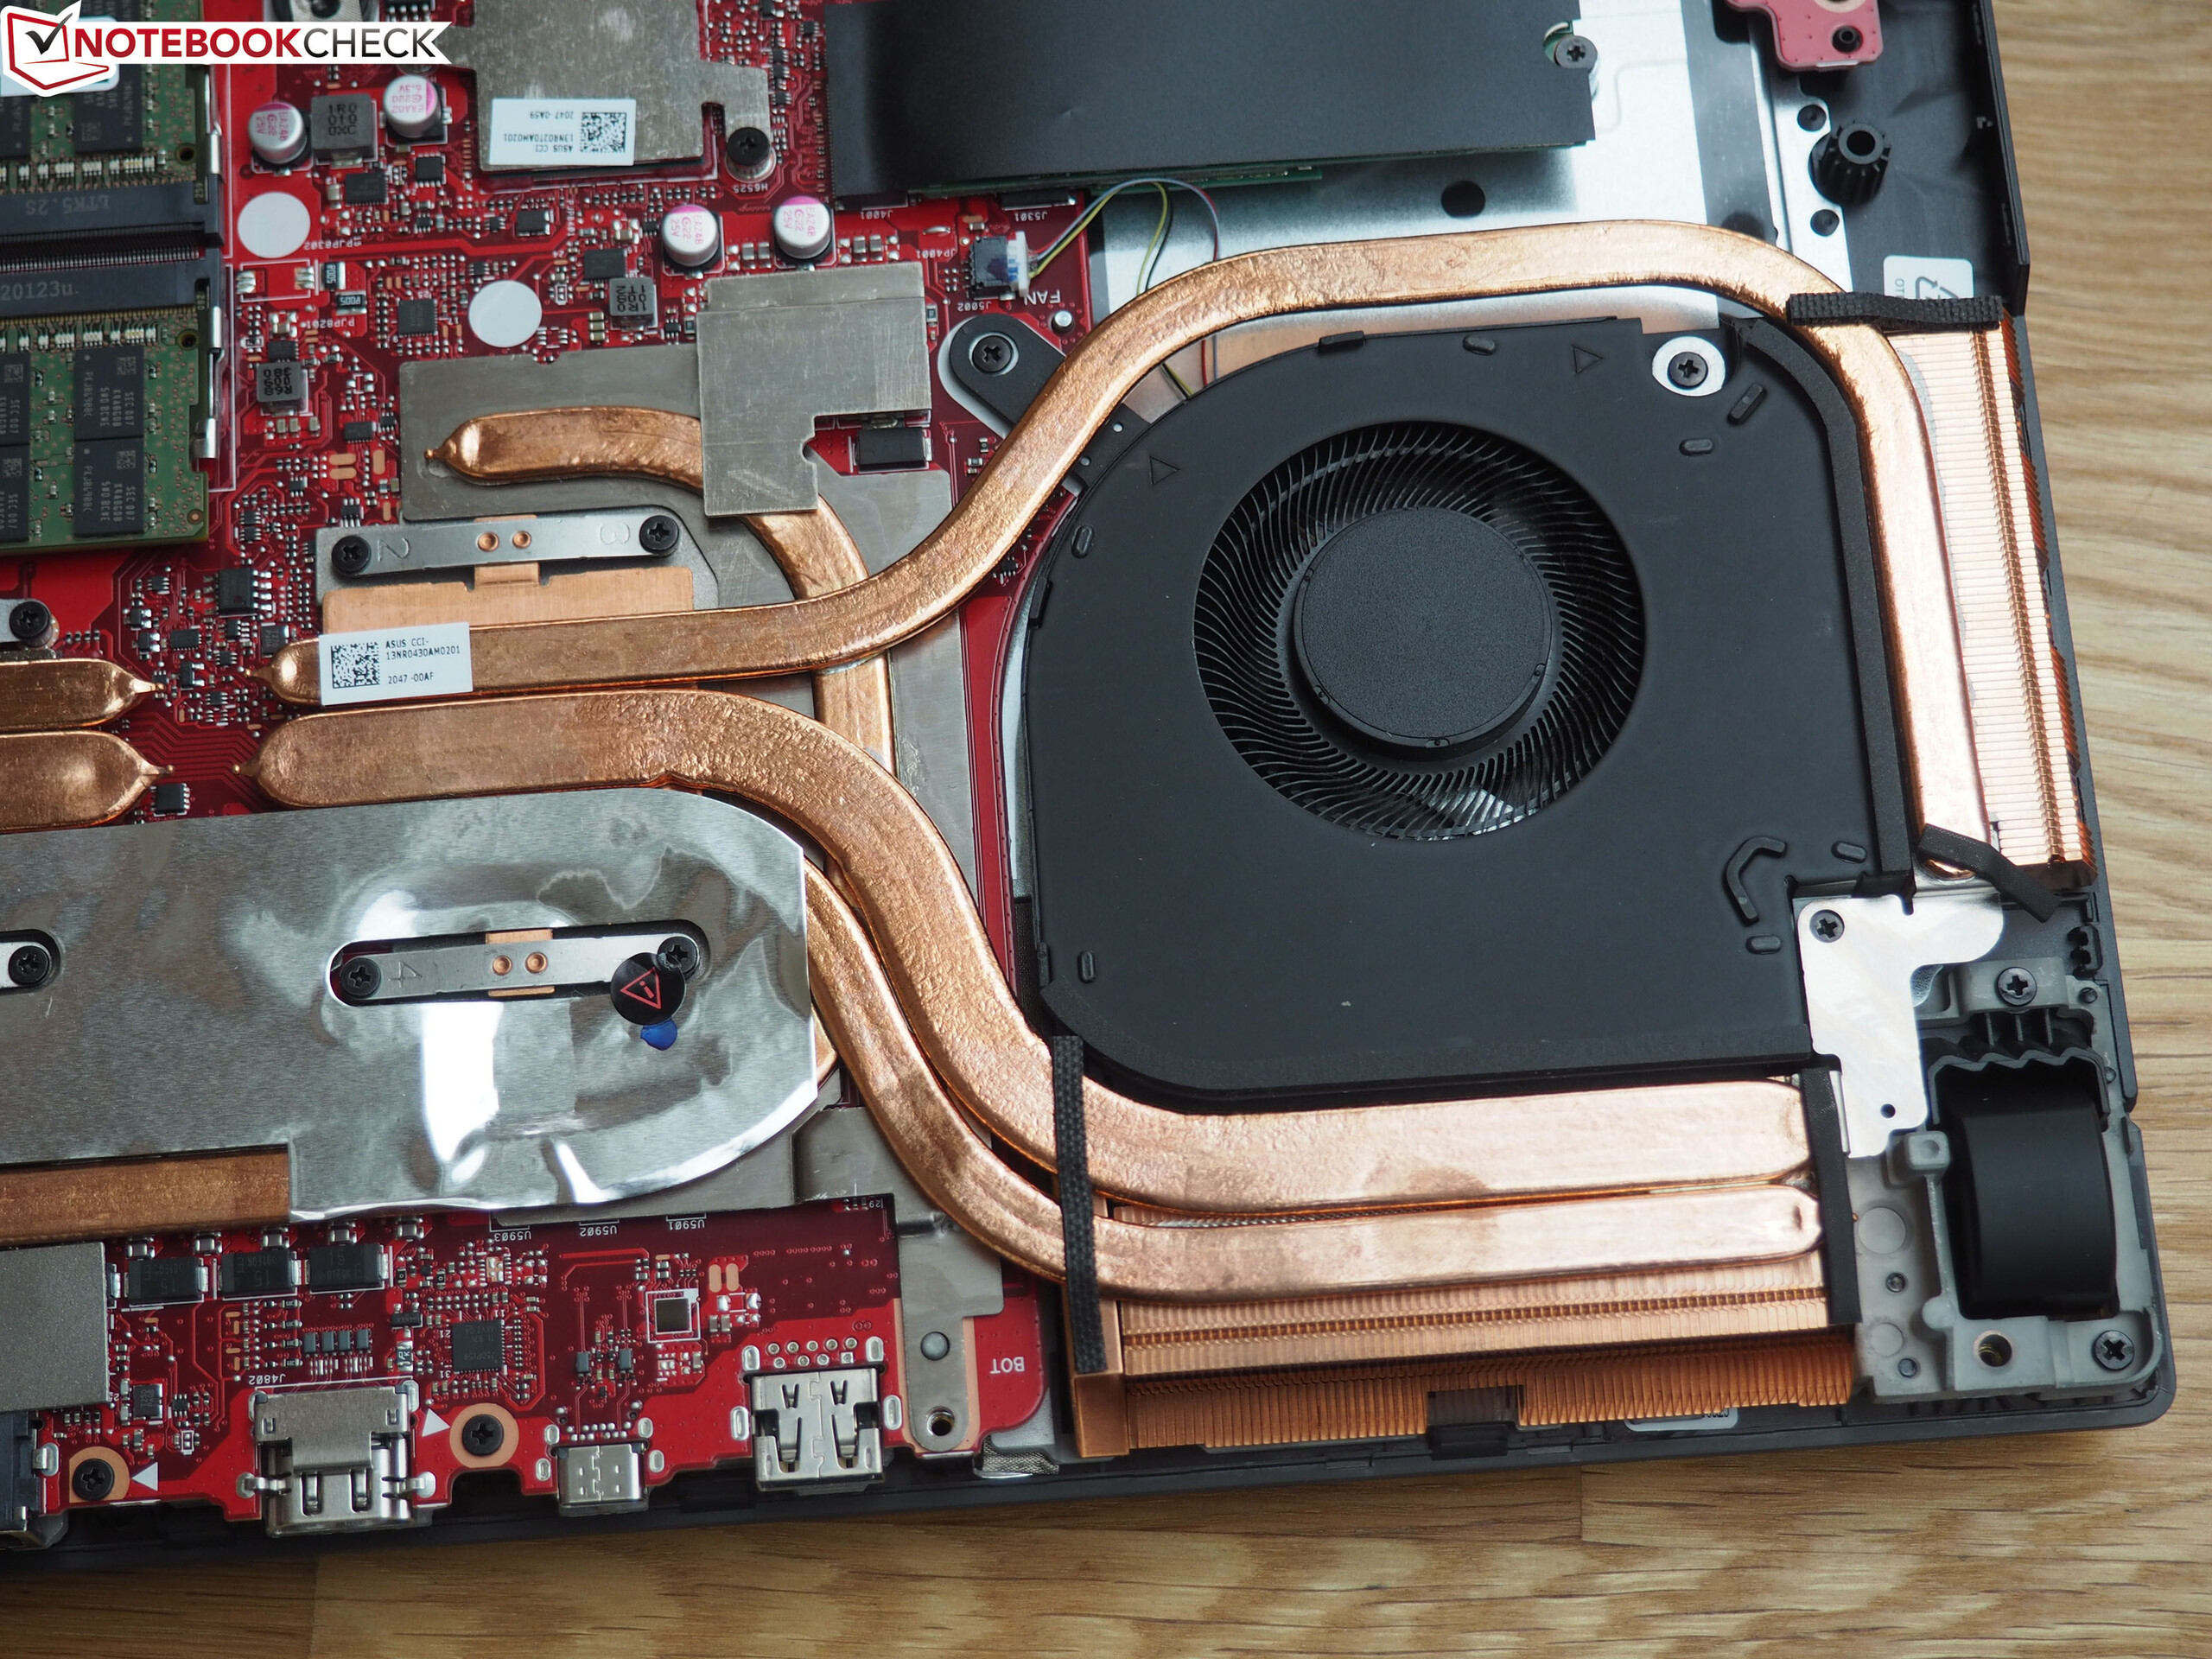
Asus has come up with a clever detail when it comes to maintenance. One of the front screws is constructed in such a way that the case bottom lifts several millimeters from the base unit's upper side when unscrewed. The components can be separated more easily through the gap. This saves the use of a flat lever tool. Two SO-DIMM banks, three M.2 slots of type 2280 and the battery are located under the hood. The cooling system consists of the traditional two fans and various heat pipes.
Input devices
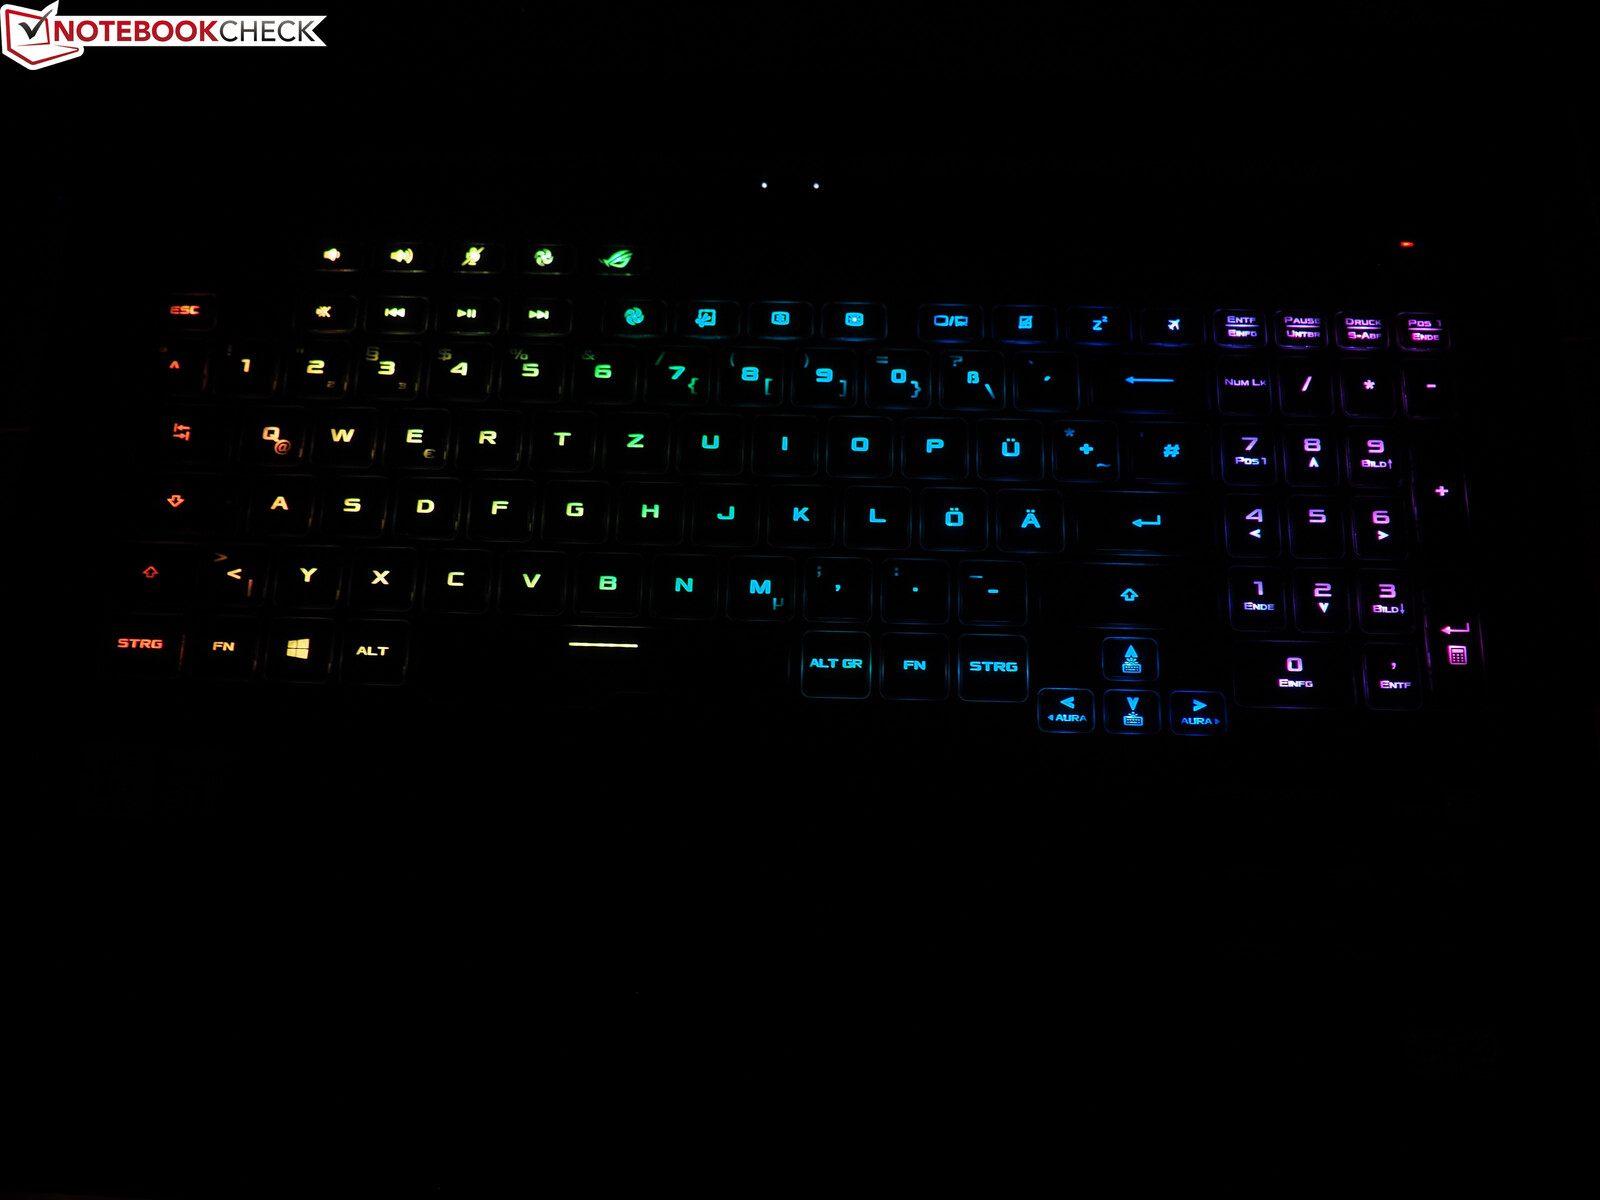
Keyboard
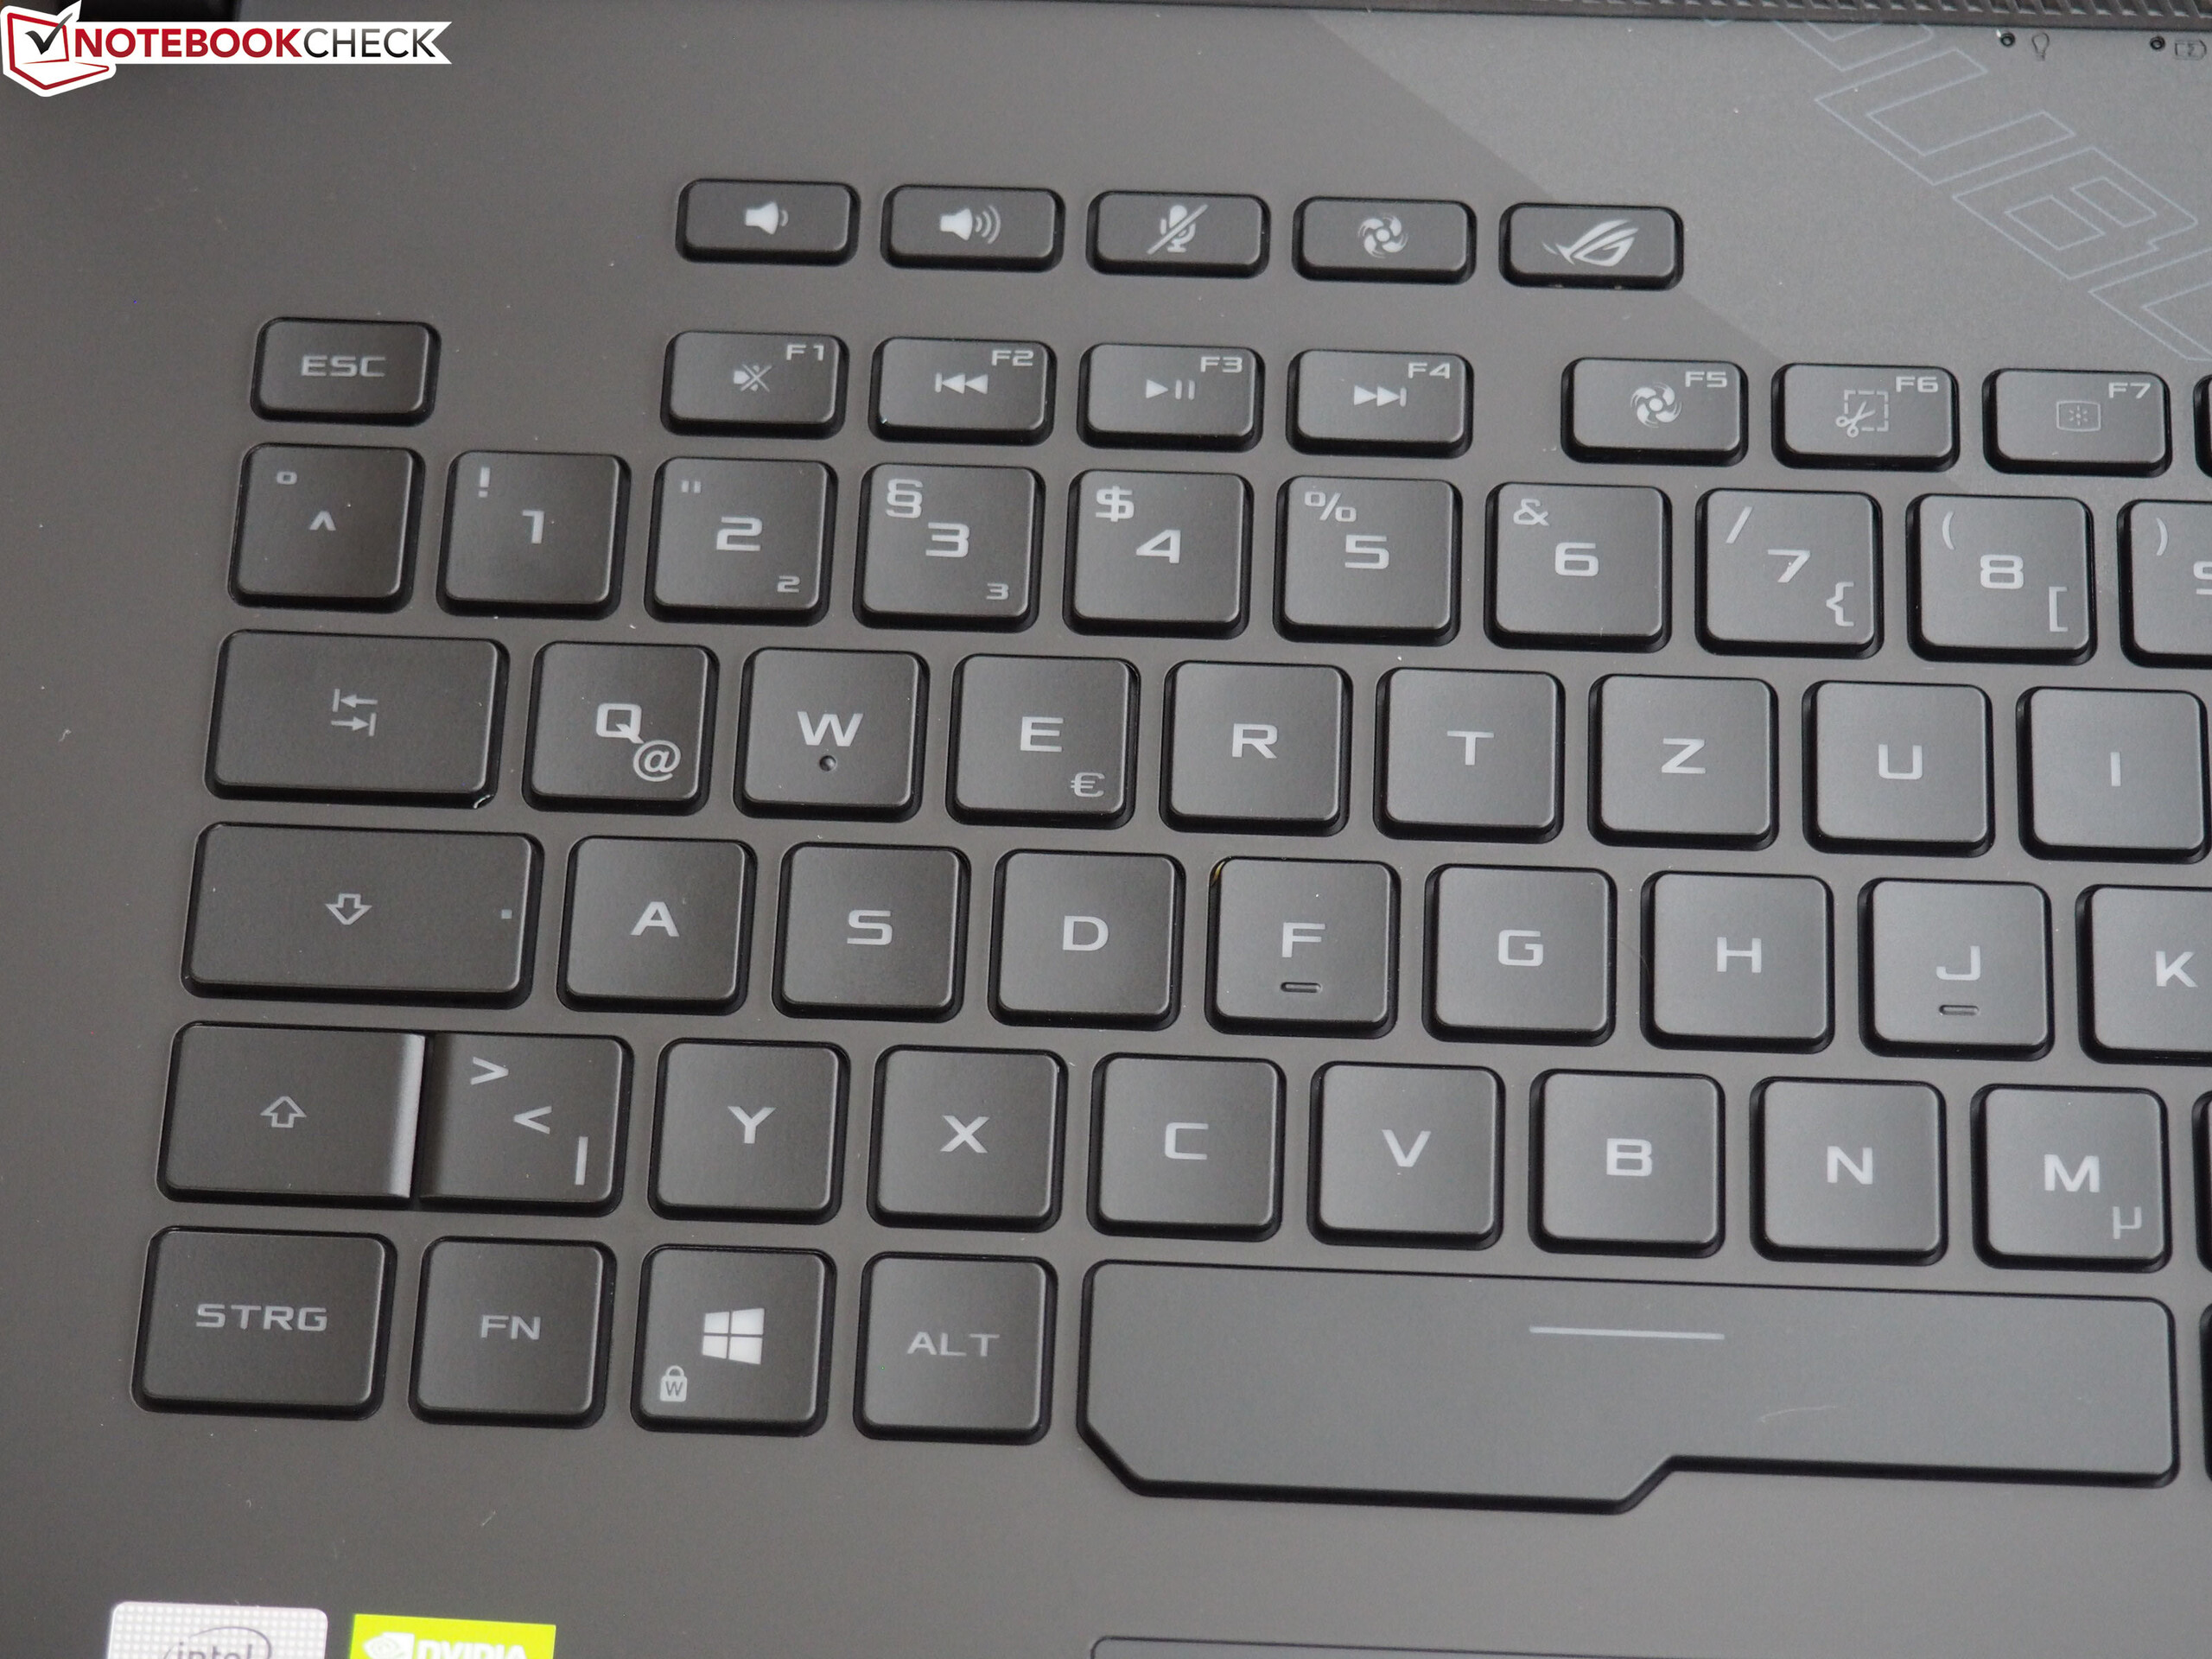
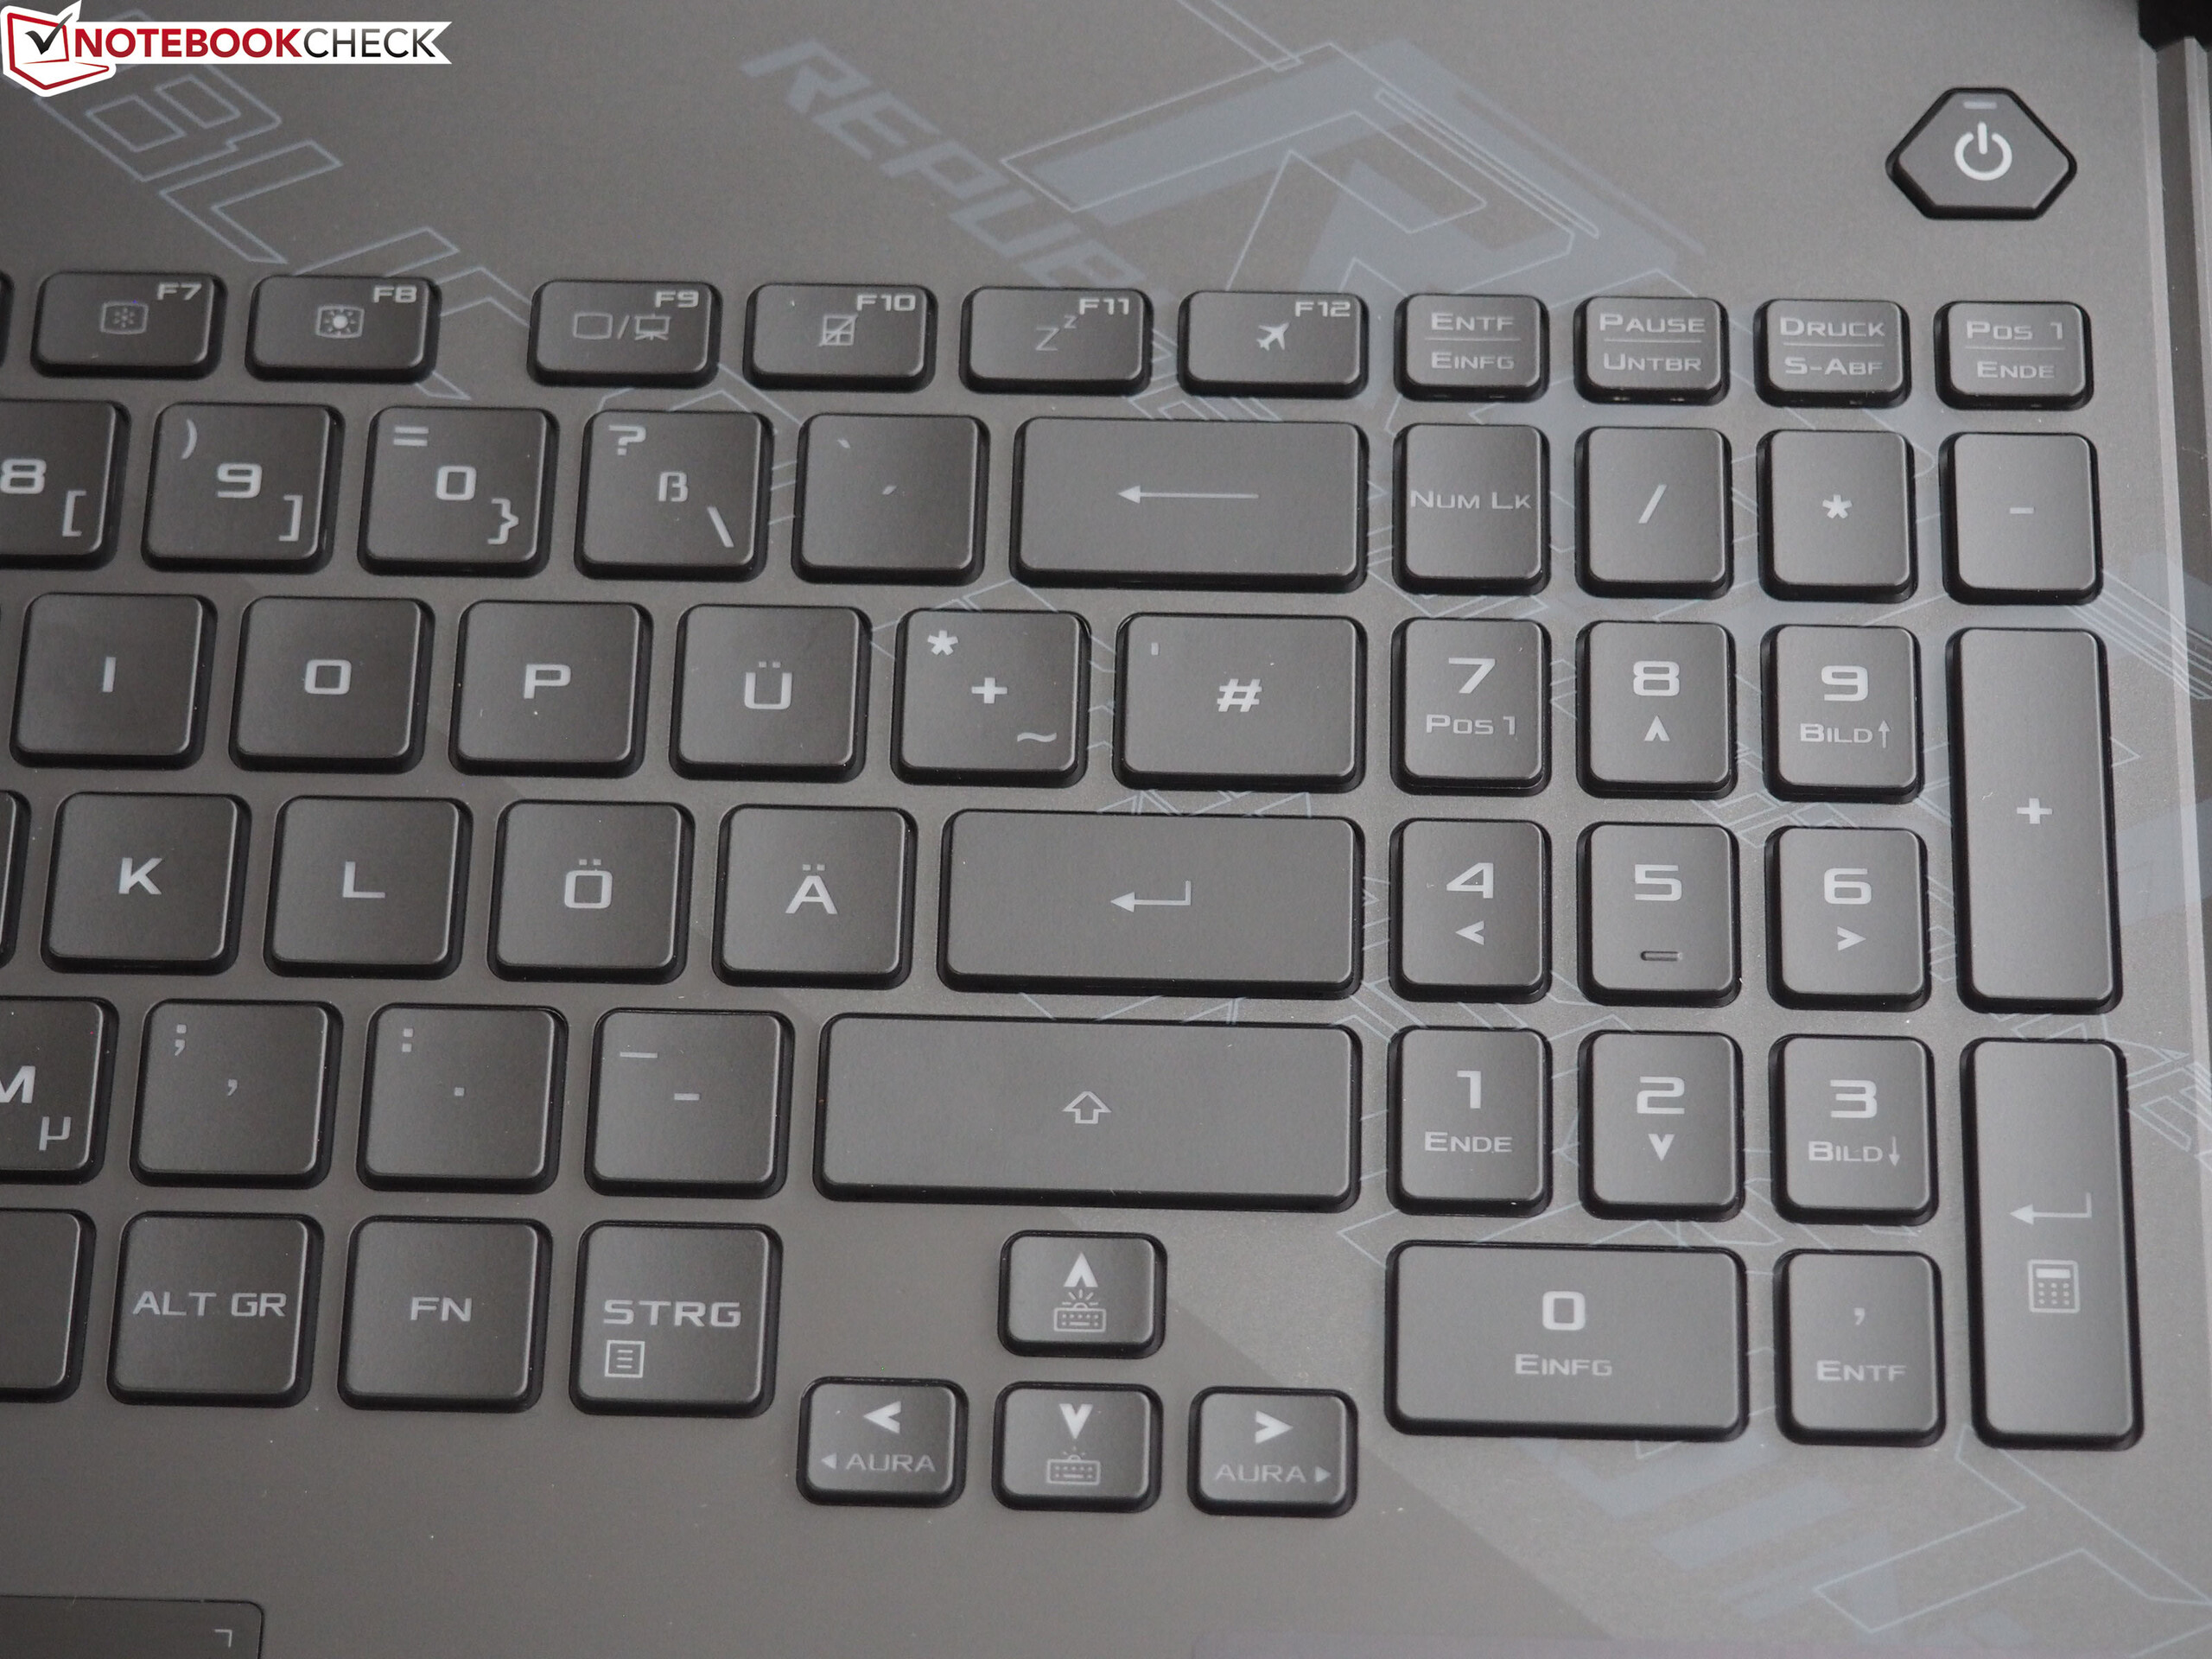
As befits a current gaming notebook, the Scar 17 offers a per key RGB illumination that can be extensively customized and adjusted in several stages. It's a bit of a pity, though, that some secondary functions are only dimly lit or not lit at all (e.g. the F keys). The relative dimensions are also not optimal. Apart from the already quite narrow keys of the numpad, the arrow keys look almost tiny and are hardly suitable for games. Especially for German customers the layout might take some time getting used to (single-line Enter key).
Otherwise, the keyboard delivers a very good performance. Typing feels pleasantly crisp and defined. Further praise is given for the halfway decent release noise. Asus has positioned a few special keys above the keyboard, which among other things allow quick volume control. Because the keyboard sits very high up, the Scar 17 has a pleasantly large wrist-rest.
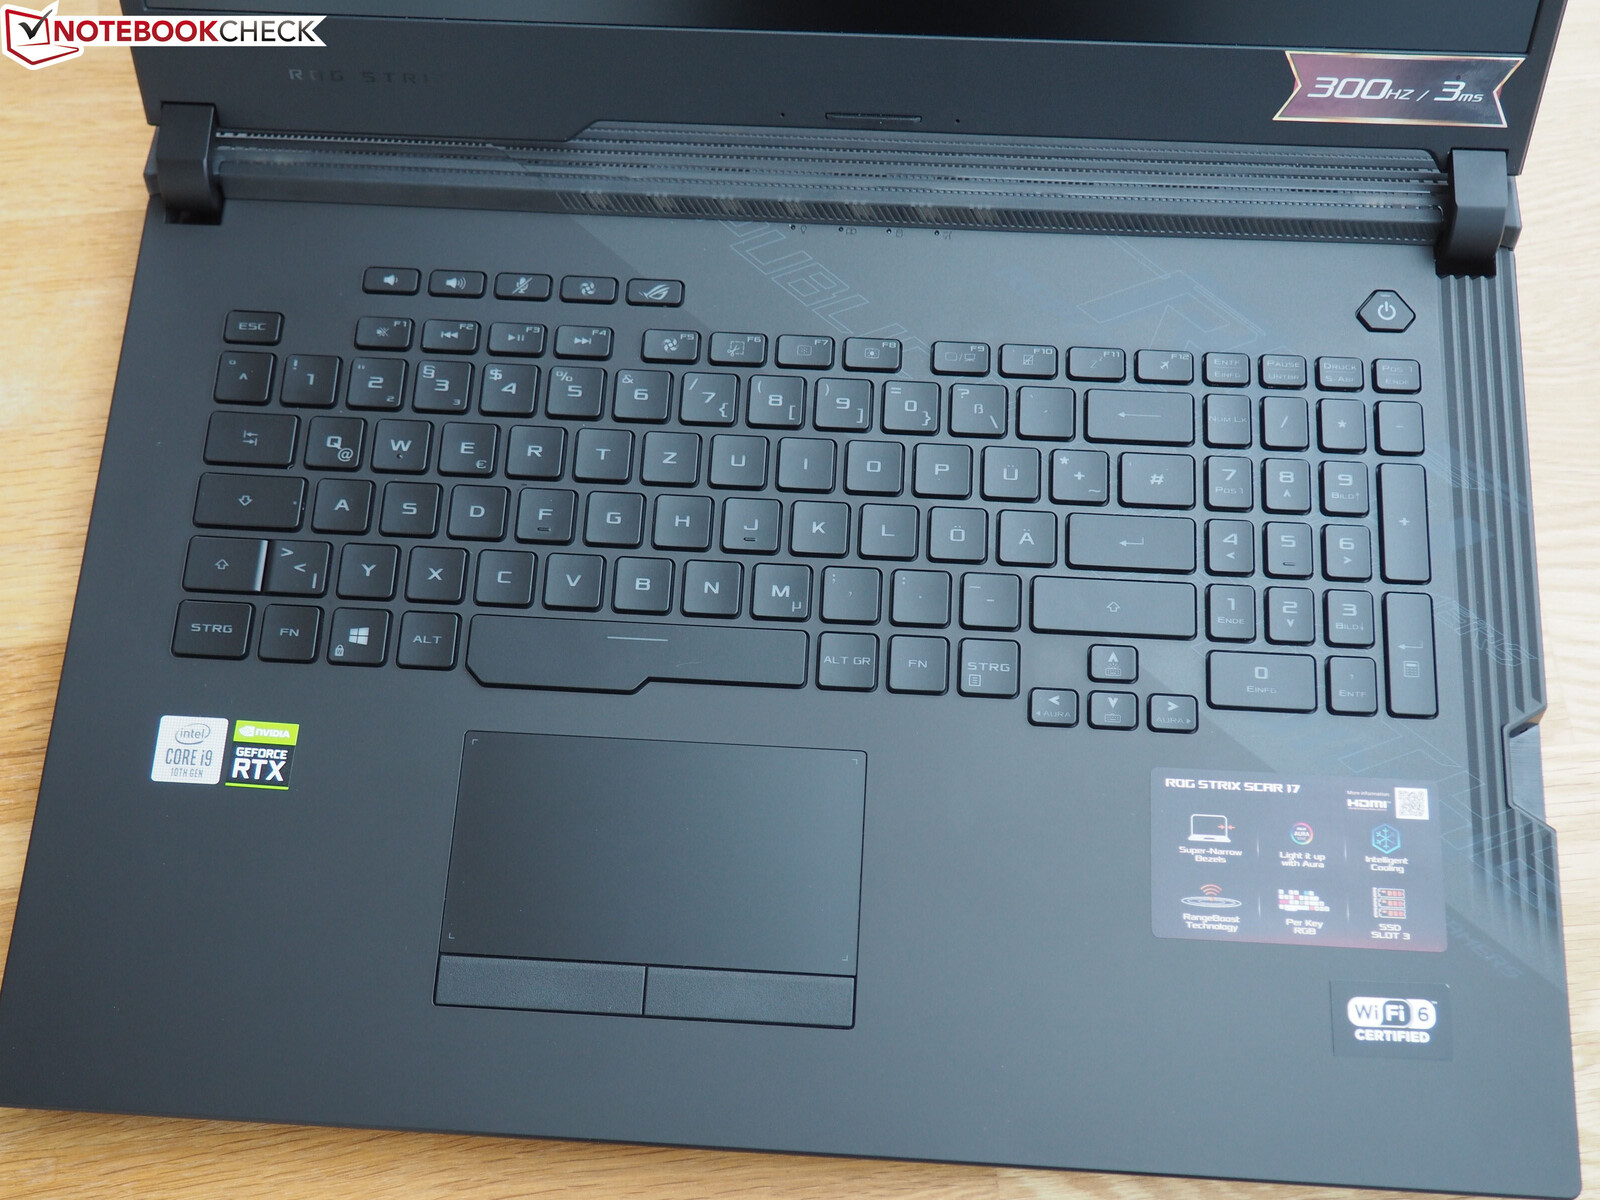
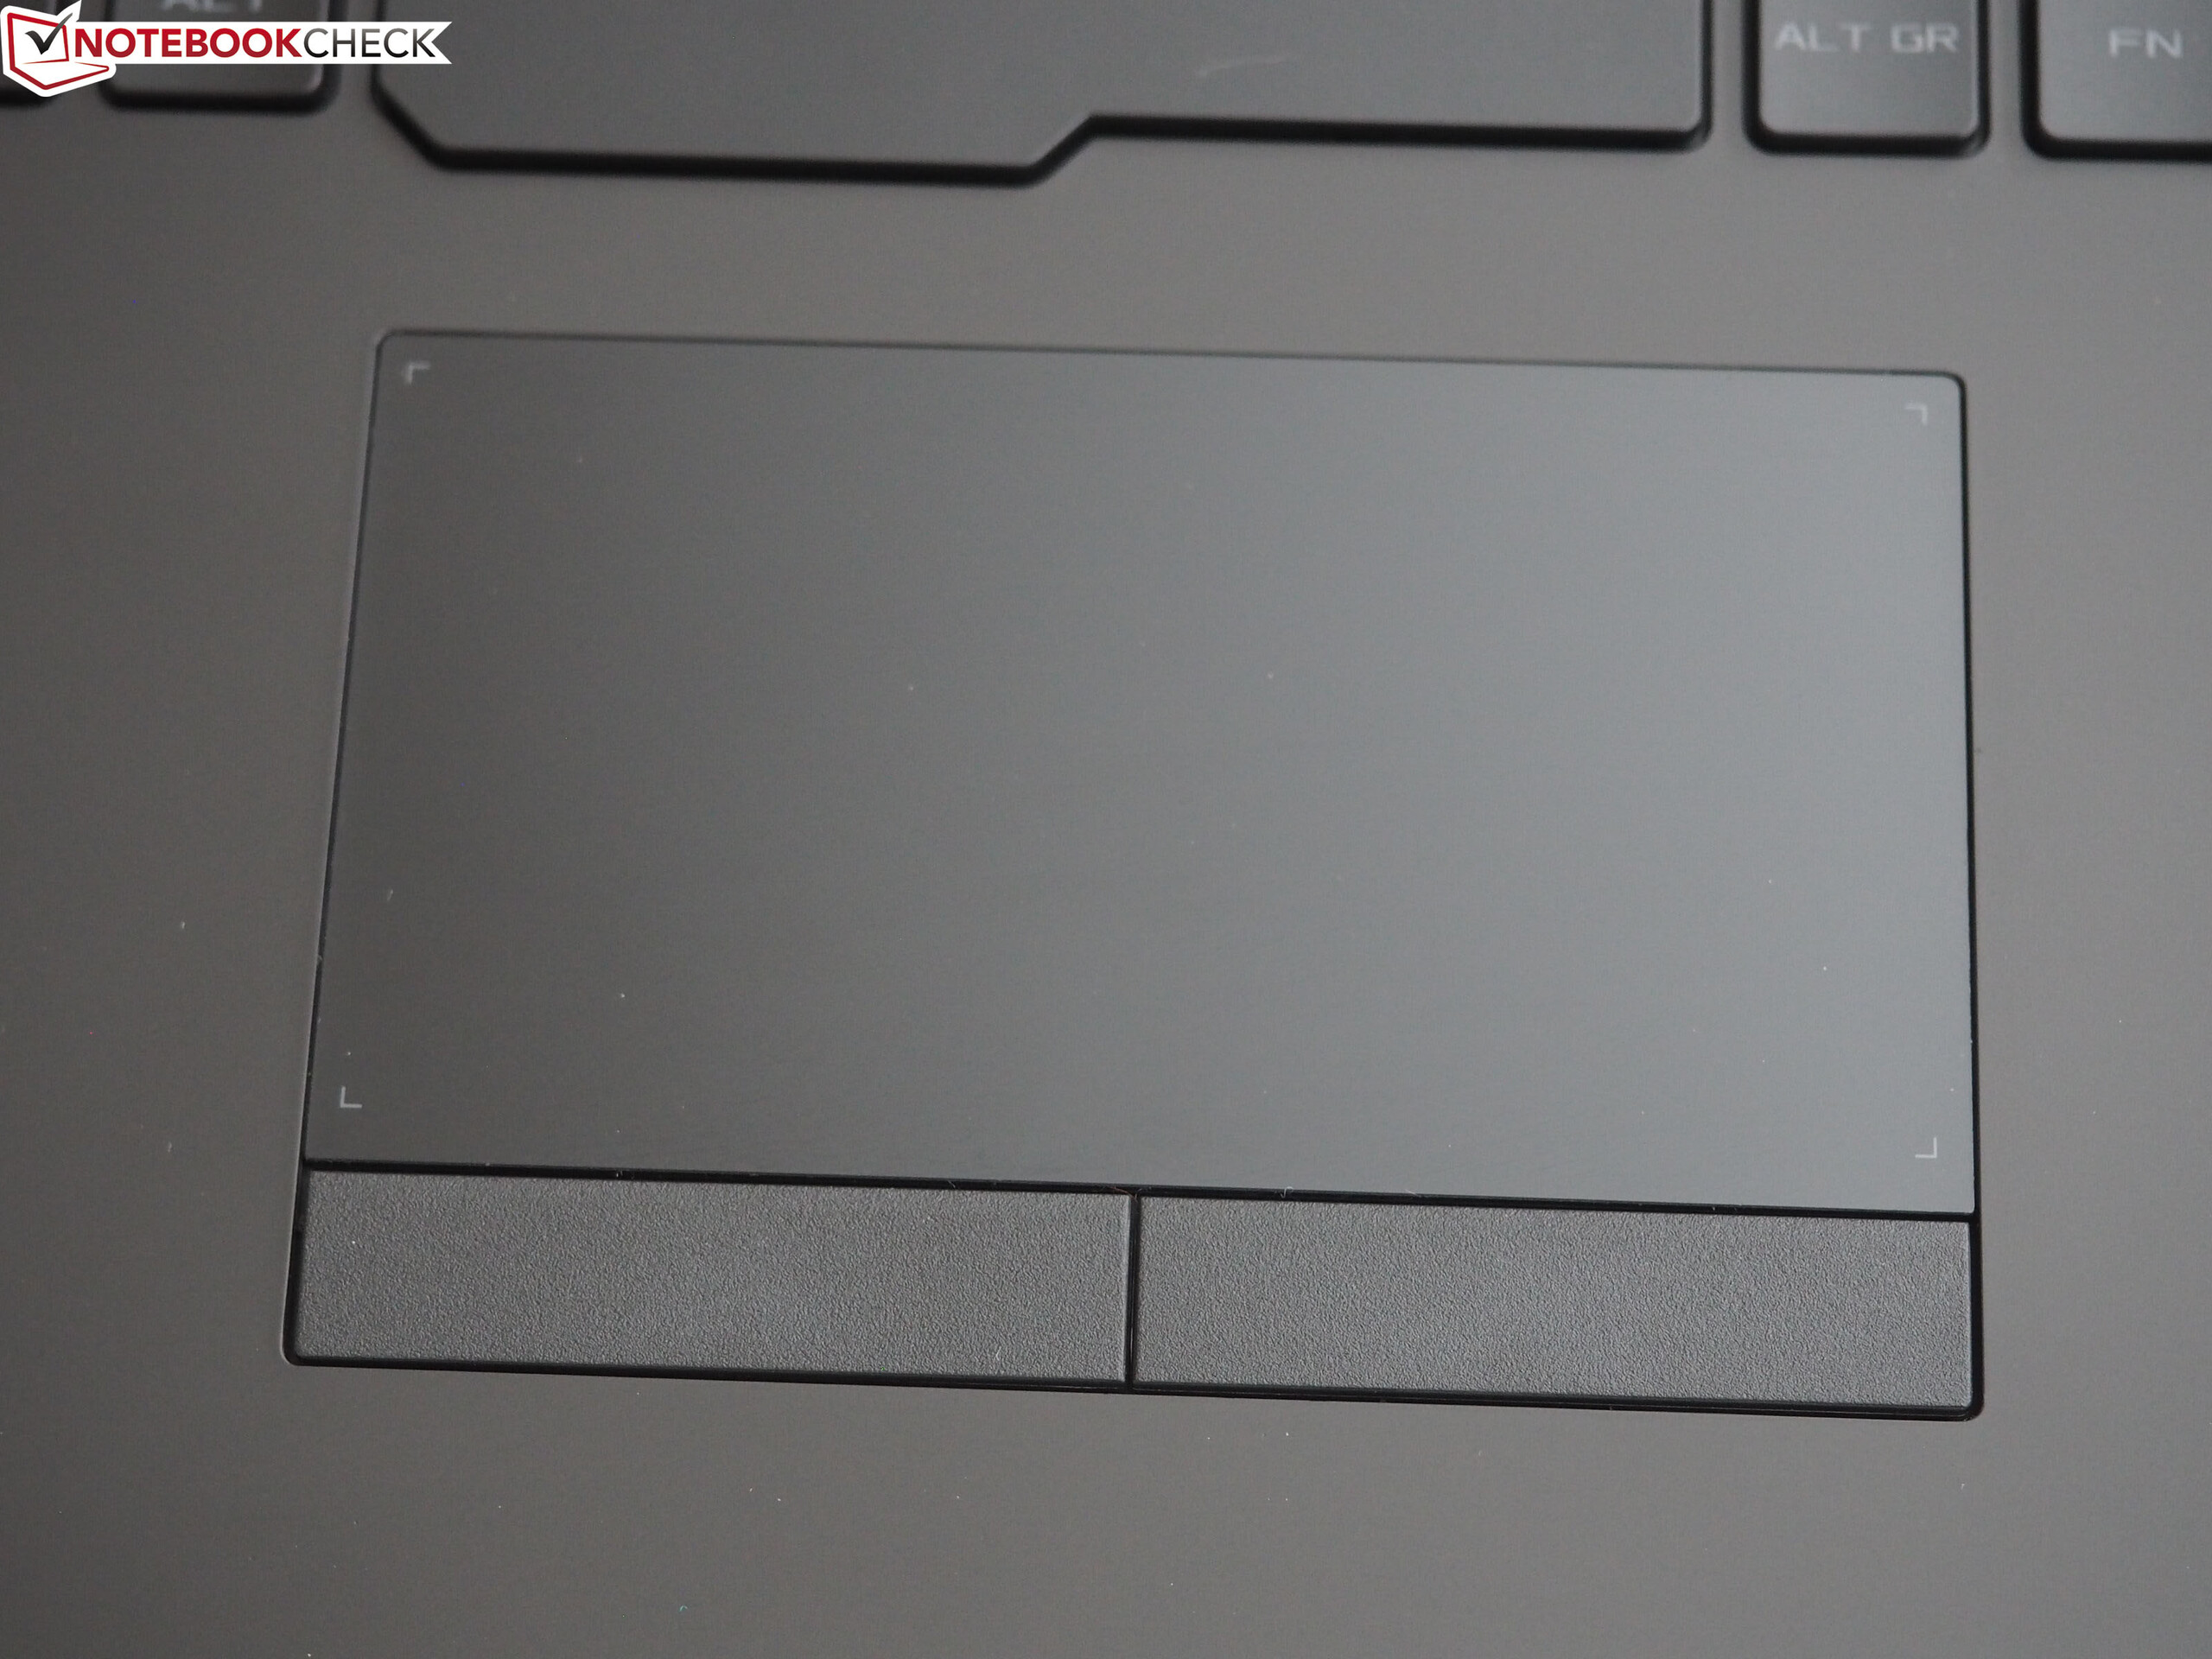
Touchpad
With a width of around 10.5 cm and a height of around 5.5 cm, the touchpad isn't very lavish for a 17-inch device, but it is at least sufficiently dimensioned. The smooth surface guarantees very good gliding characteristics. The touchpad also scores points for good gesture support. Content can be comfortably zoomed and scrolled with two fingers. Thanks to the dedicated mouse keys, inputs - unlike in some ClickPads - are recognized cleanly and precisely.
Display
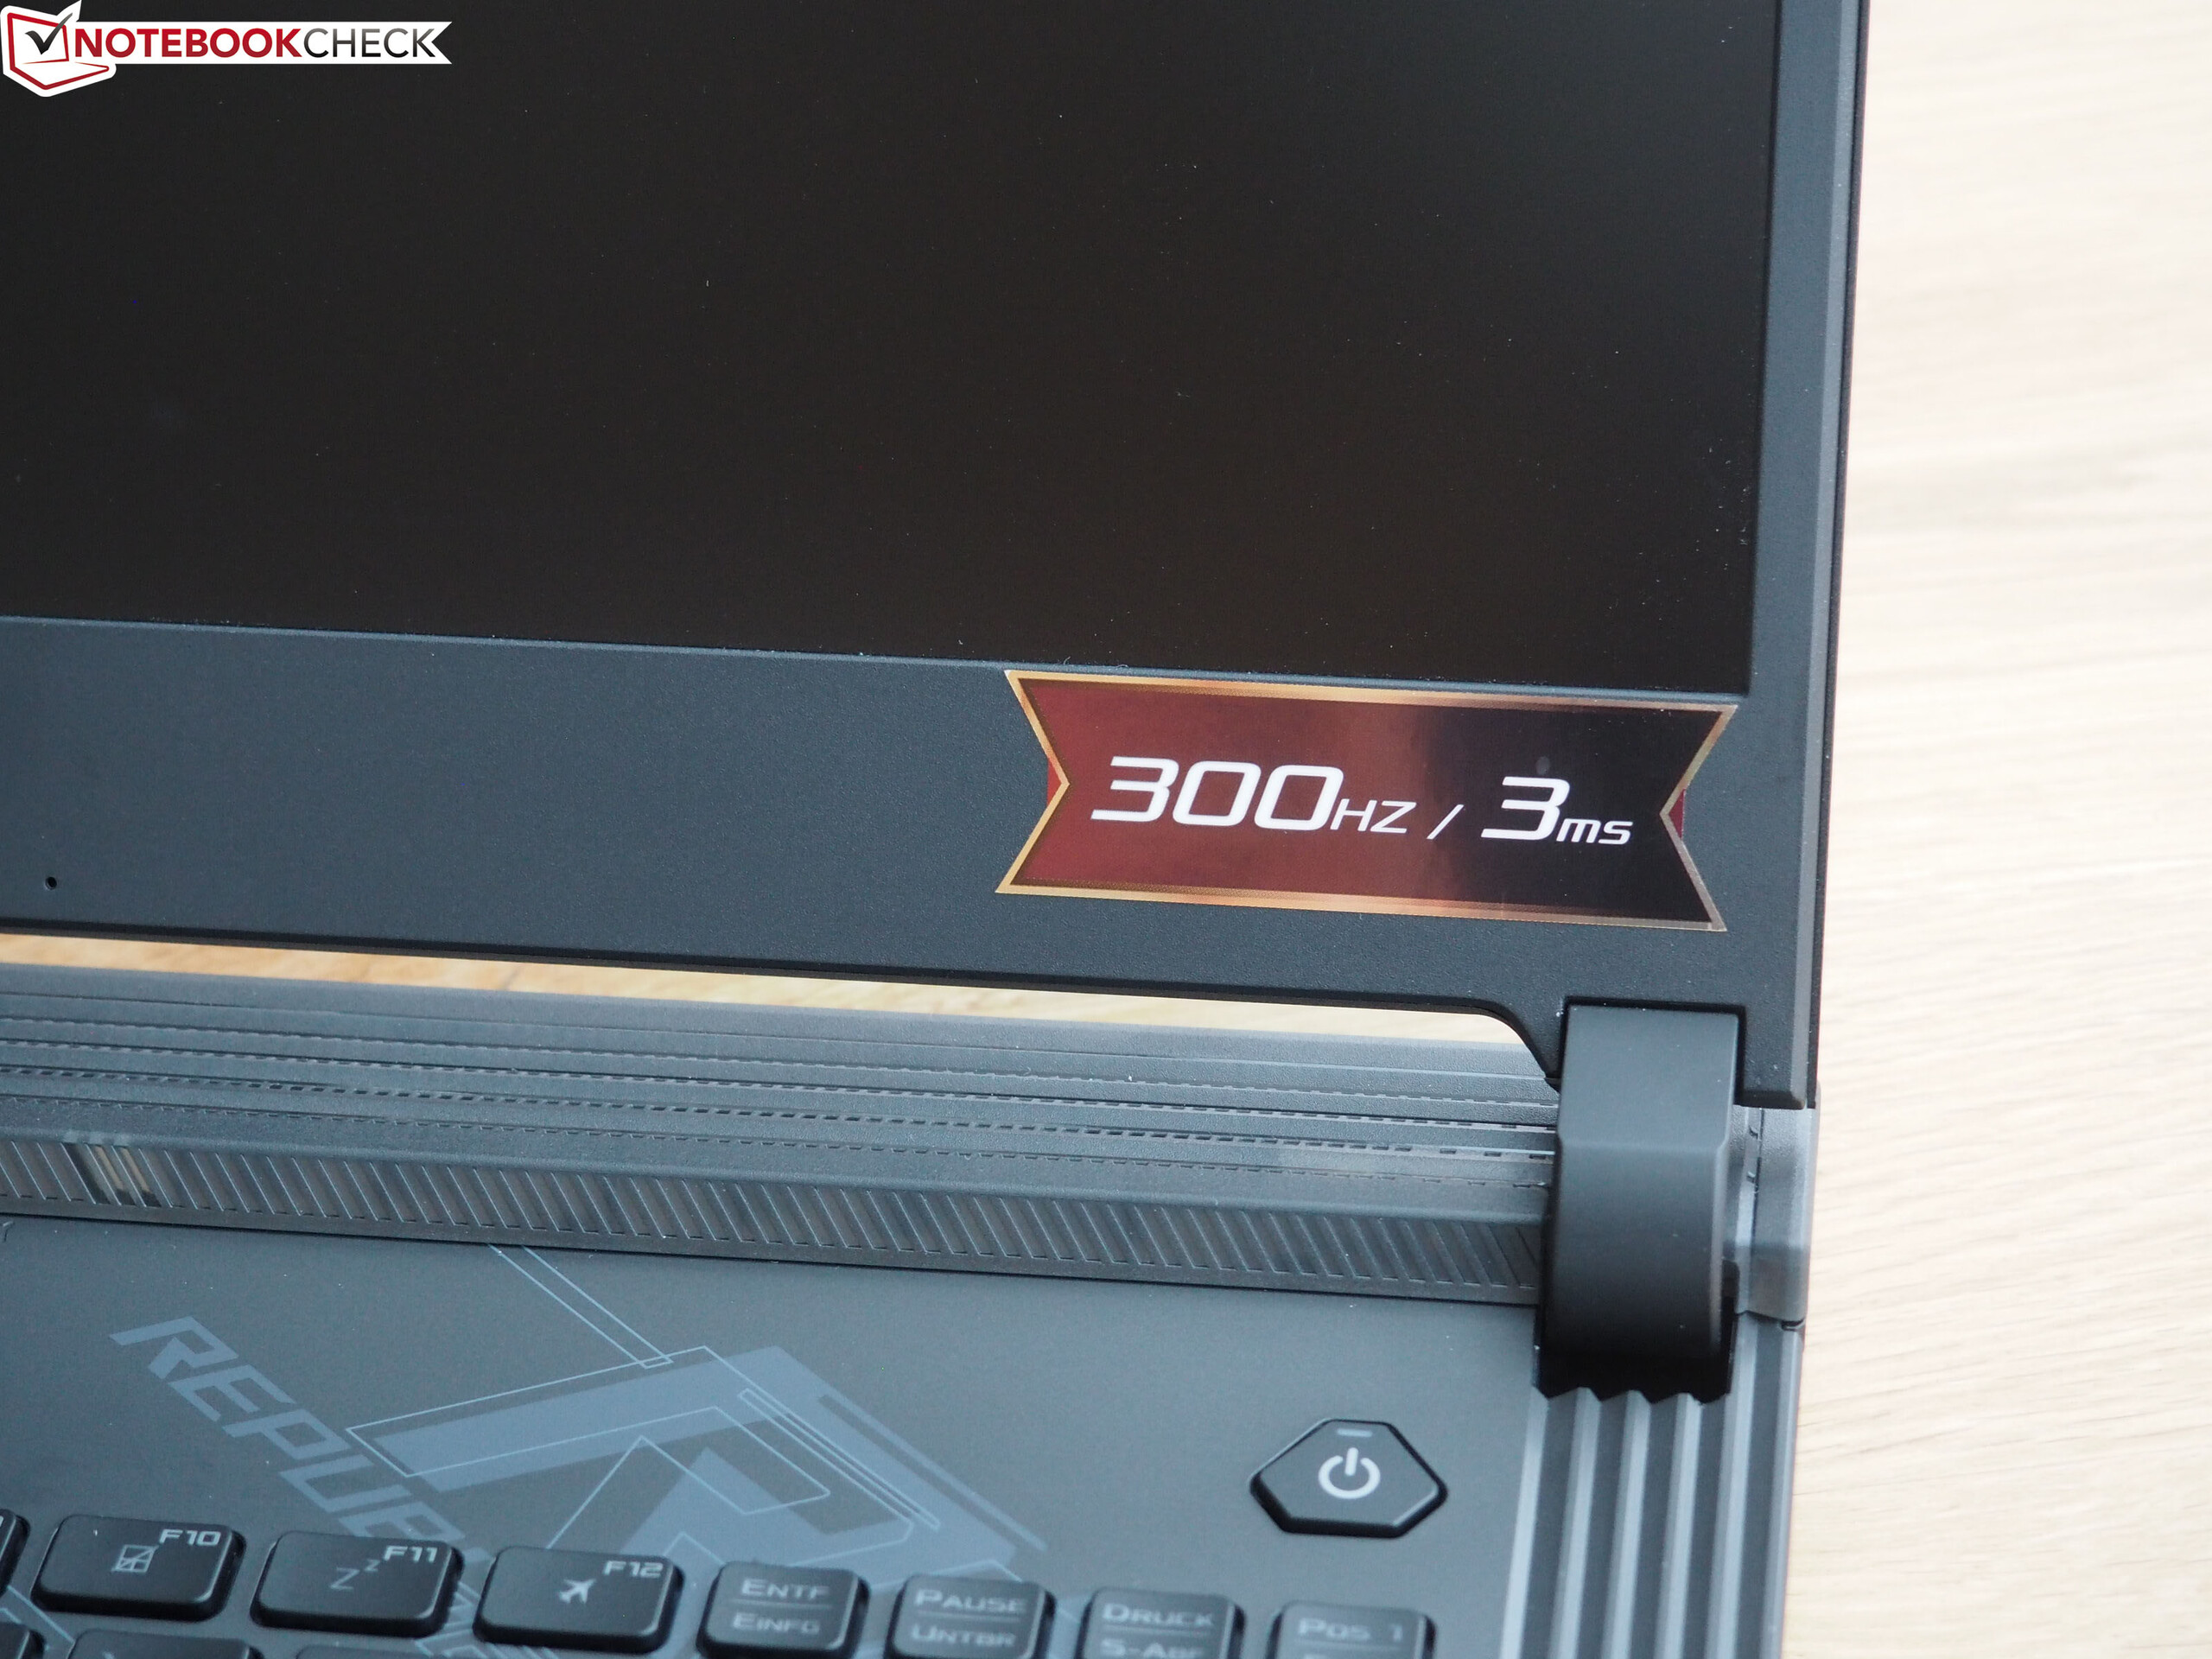
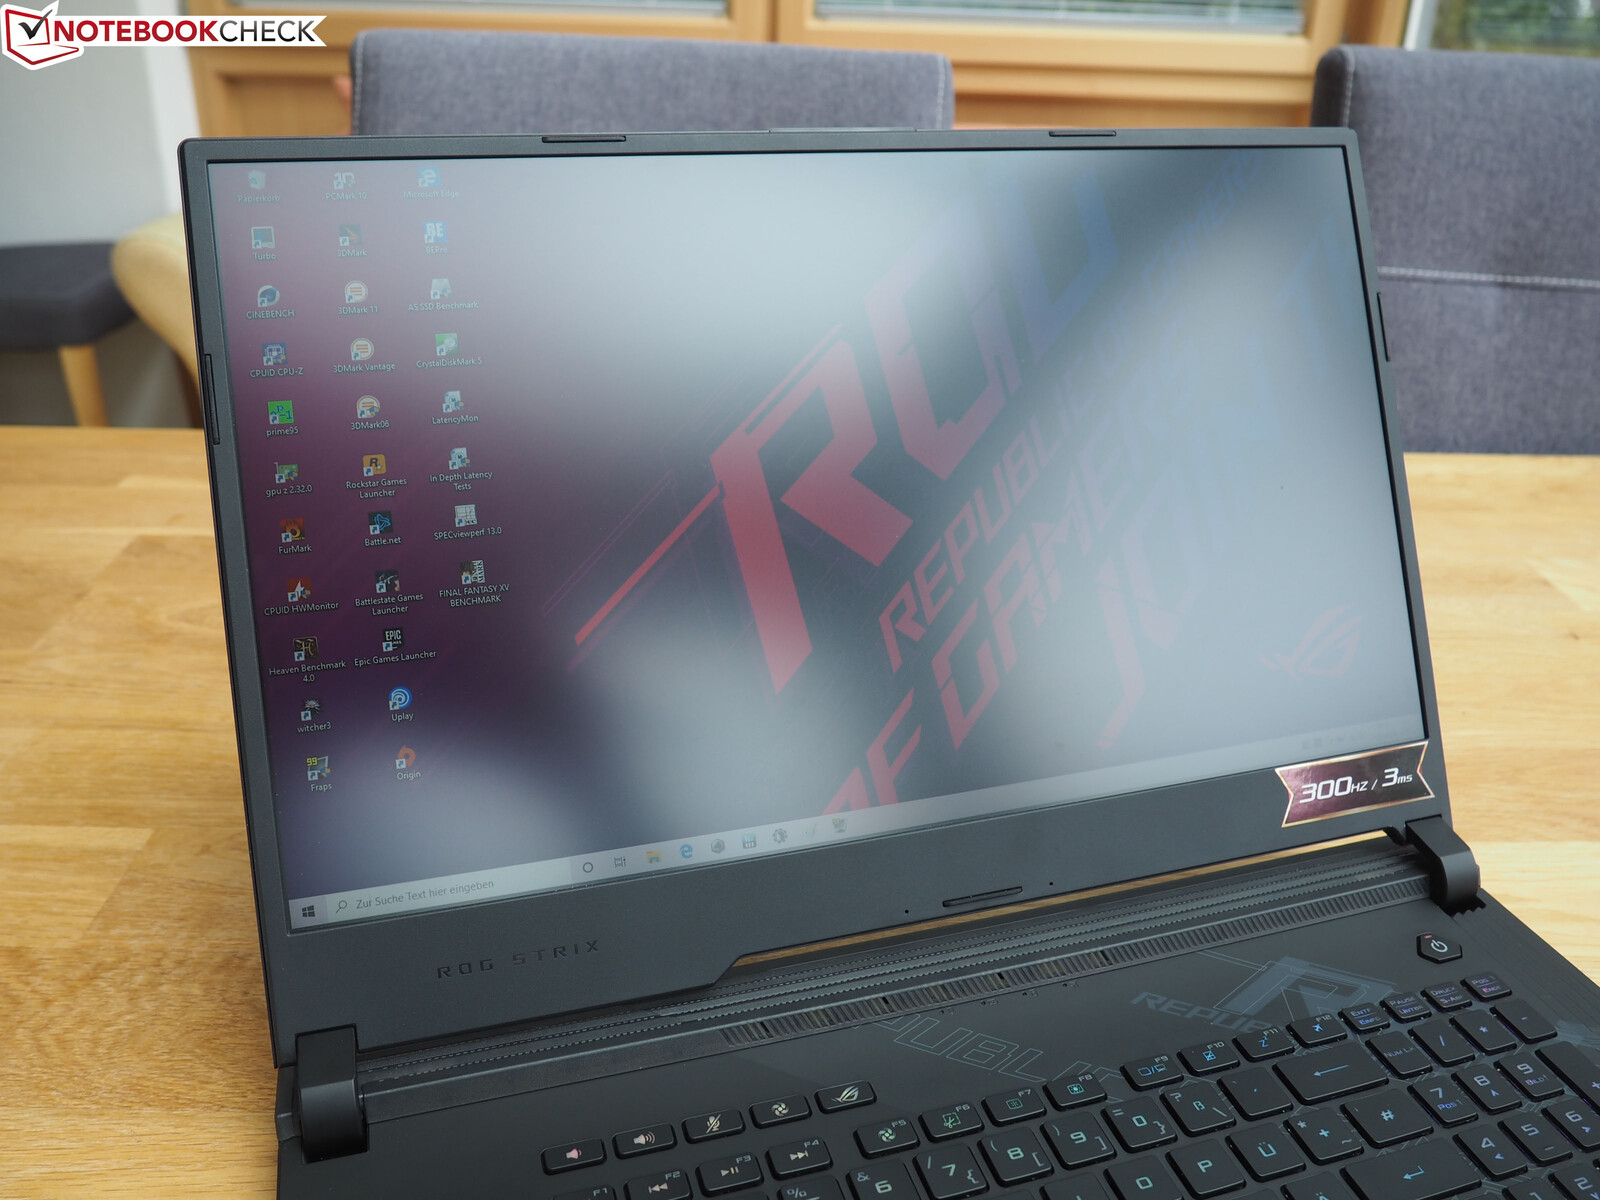
One of the biggest highlights of the Scar 17 is the lightning-fast 300 Hz display, although for most gamers 144 Hz is already enough and more than 200 Hz hardly brings any advantages.
| |||||||||||||||||||||||||
Brightness Distribution: 82 %
Center on Battery: 310 cd/m²
Contrast: 756:1 (Black: 0.41 cd/m²)
ΔE ColorChecker Calman: 2.41 | ∀{0.5-29.43 Ø4.72}
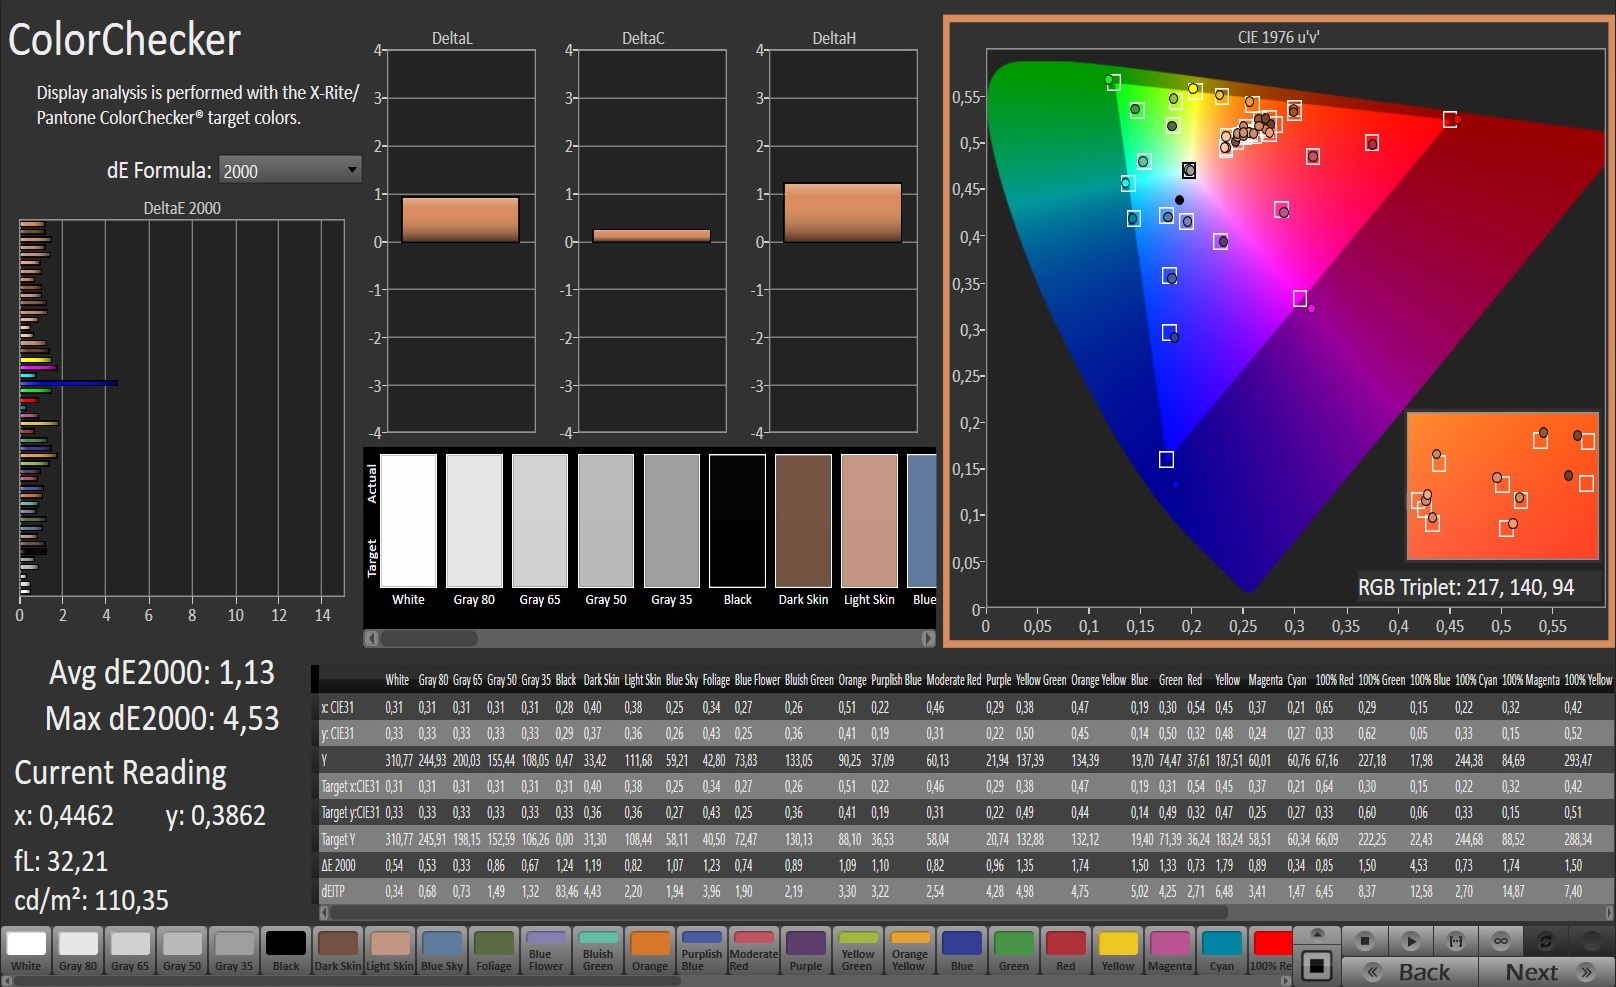
calibrated: 1.13
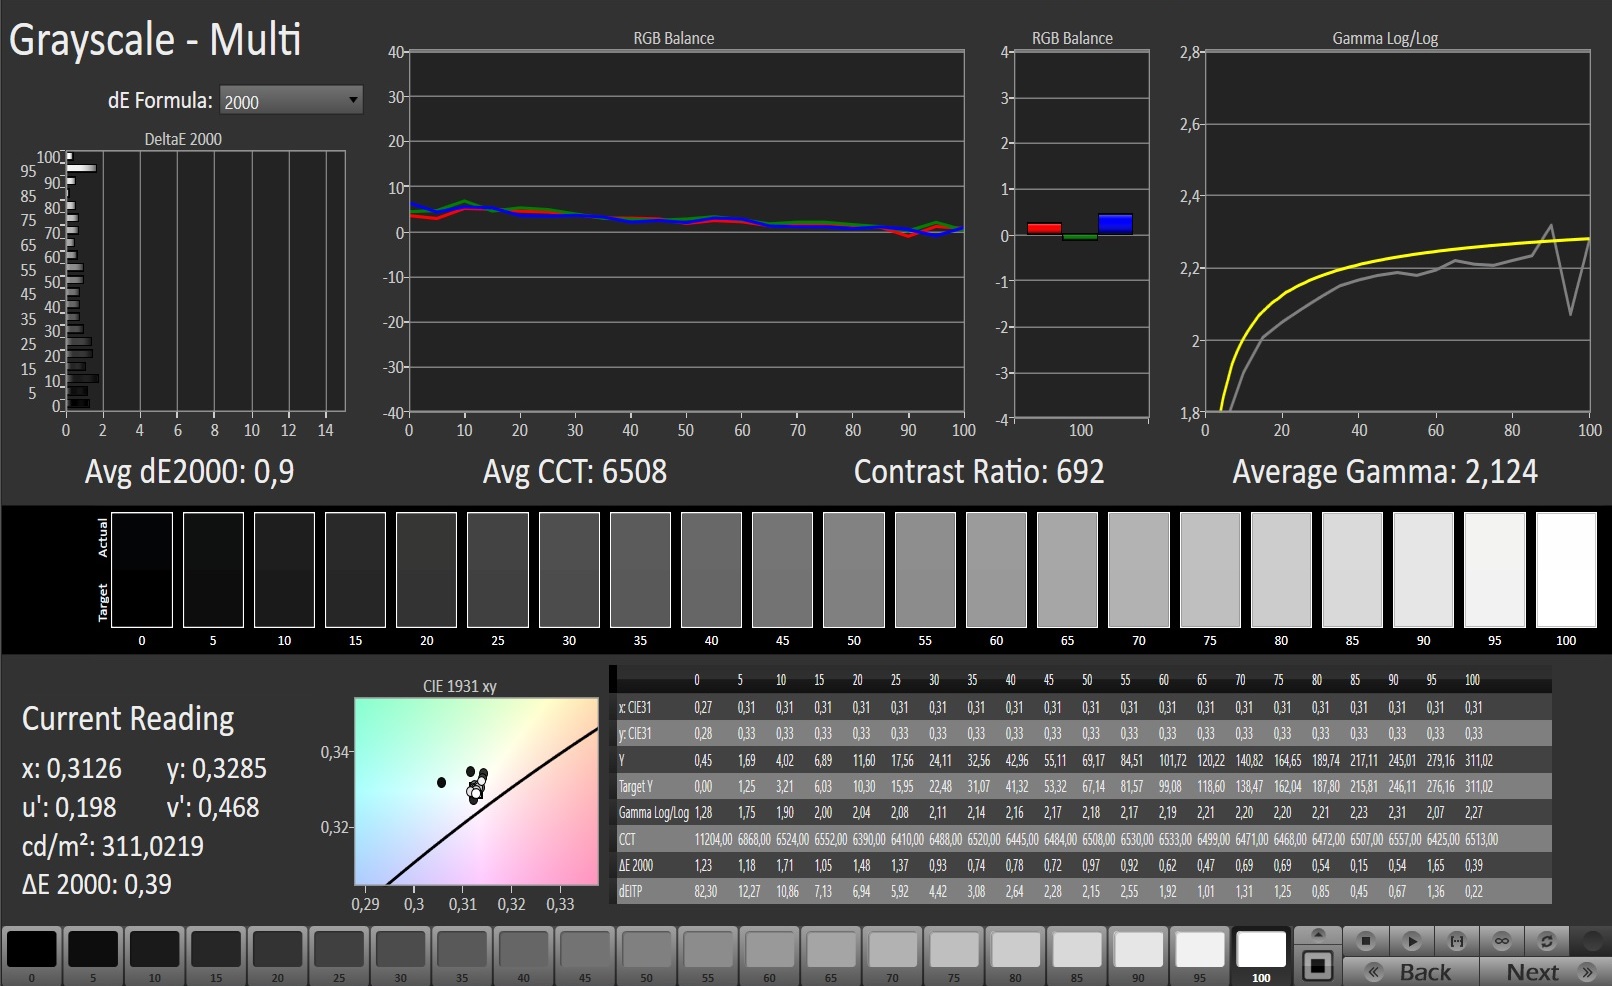
ΔE Greyscale Calman: 4.3 | ∀{0.09-98 Ø4.97}
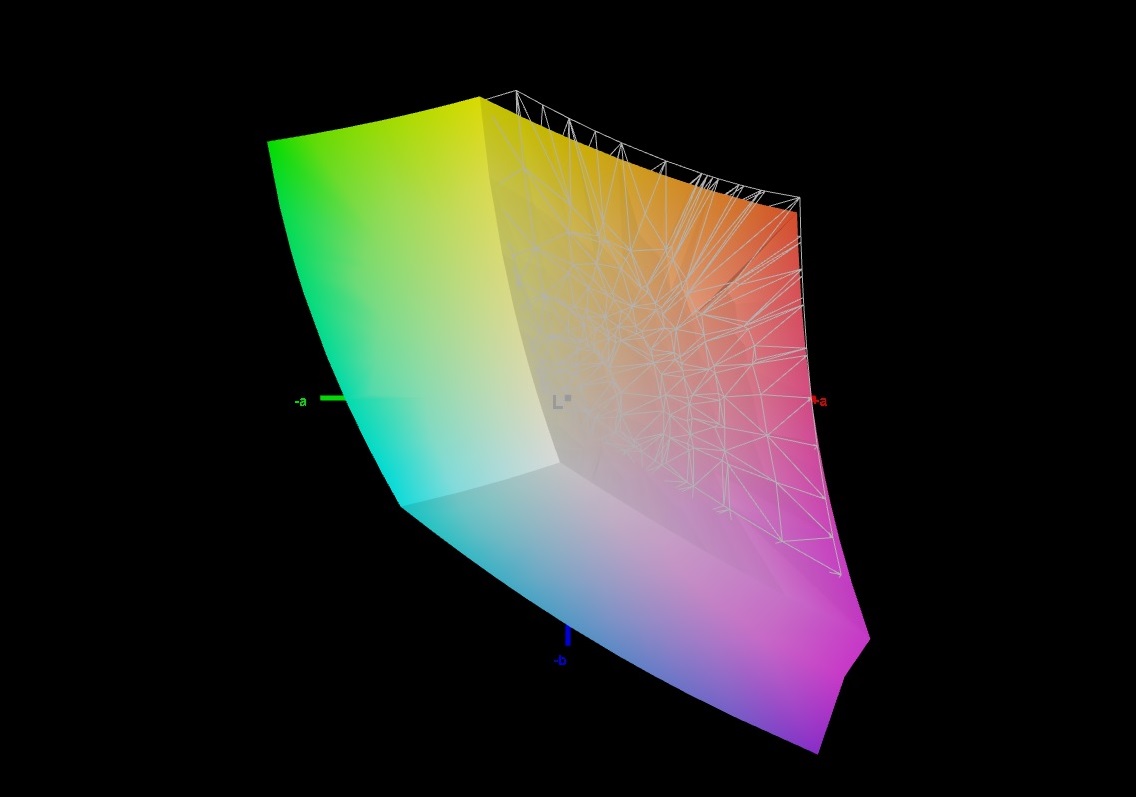
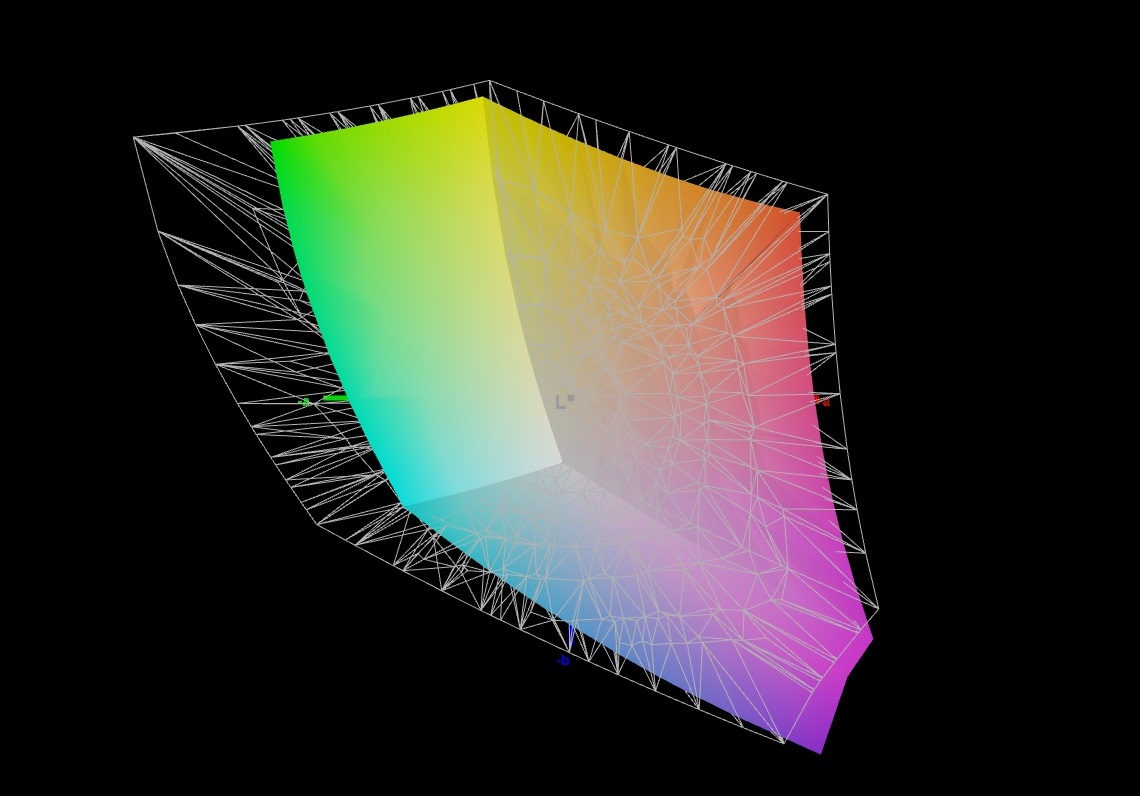
94% sRGB (Argyll 1.6.3 3D)
72% AdobeRGB 1998 (Argyll 1.6.3 3D)
71.6% AdobeRGB 1998 (Argyll 3D)
99% sRGB (Argyll 3D)
71% Display P3 (Argyll 3D)
Gamma: 2.149
CCT: 7059 K
| Asus Strix Scar 17 G732LXS LQ173M1JW03 (SHP14DC), IPS, 1920x1080 | MSI GE75 9SG Chi Mei N173HCE-G33, AHVA, 1920x1080 | HP Omen 17-cb0020ng CMN175D, IPS, 1920x1080 | Asus ASUS ROG Strix SCAR III G731GW-XB74 AU Optronics AUO409D, IPS, 1920x1080 | Eurocom Nightsky RX17 BOE NV173FHM-N44, IPS, 1920x1080 | |
|---|---|---|---|---|---|
| Display | -10% | -7% | -13% | -6% | |
| Display P3 Coverage (%) | 71 | 61.5 -13% | 63.7 -10% | 61.9 -13% | 66.1 -7% |
| sRGB Coverage (%) | 99 | 92 -7% | 96 -3% | 86.3 -13% | 93.1 -6% |
| AdobeRGB 1998 Coverage (%) | 71.6 | 63.5 -11% | 65.8 -8% | 62.9 -12% | 67.2 -6% |
| Response Times | -2% | -118% | -31% | -104% | |
| Response Time Grey 50% / Grey 80% * (ms) | 5.8 ? | 7.2 ? -24% | 17.6 ? -203% | 7.2 ? -24% | 16.4 ? -183% |
| Response Time Black / White * (ms) | 8.4 ? | 6.6 ? 21% | 11.2 ? -33% | 11.6 ? -38% | 10.4 ? -24% |
| PWM Frequency (Hz) | 26040 ? | 25510 ? | 990 ? | ||
| Screen | 24% | 26% | -26% | -9% | |
| Brightness middle (cd/m²) | 310 | 400.7 29% | 360 16% | 297.4 -4% | 298.4 -4% |
| Brightness (cd/m²) | 311 | 372 20% | 342 10% | 306 -2% | 287 -8% |
| Brightness Distribution (%) | 82 | 89 9% | 91 11% | 80 -2% | 90 10% |
| Black Level * (cd/m²) | 0.41 | 0.34 17% | 0.26 37% | 0.31 24% | 0.3 27% |
| Contrast (:1) | 756 | 1179 56% | 1385 83% | 959 27% | 995 32% |
| Colorchecker dE 2000 * | 2.41 | 1.33 45% | 1.91 21% | 4.08 -69% | 3.58 -49% |
| Colorchecker dE 2000 max. * | 8.59 | 3.51 59% | 4.08 53% | 6.88 20% | 6.29 27% |
| Colorchecker dE 2000 calibrated * | 1.13 | 1.39 -23% | 0.78 31% | 4 -254% | 2.82 -150% |
| Greyscale dE 2000 * | 4.3 | 1.3 70% | 2.72 37% | 4 7% | 3.1 28% |
| Gamma | 2.149 102% | 2.24 98% | 2.37 93% | 2.259 97% | 2.24 98% |
| CCT | 7059 92% | 6735 97% | 6692 97% | 7205 90% | 7064 92% |
| Color Space (Percent of AdobeRGB 1998) (%) | 72 | 58.2 -19% | 60 -17% | 56 -22% | 60.2 -16% |
| Color Space (Percent of sRGB) (%) | 94 | 92.1 -2% | 96 2% | 86 -9% | 92.7 -1% |
| Total Average (Program / Settings) | 4% /
14% | -33% /
2% | -23% /
-24% | -40% /
-21% |
* ... smaller is better
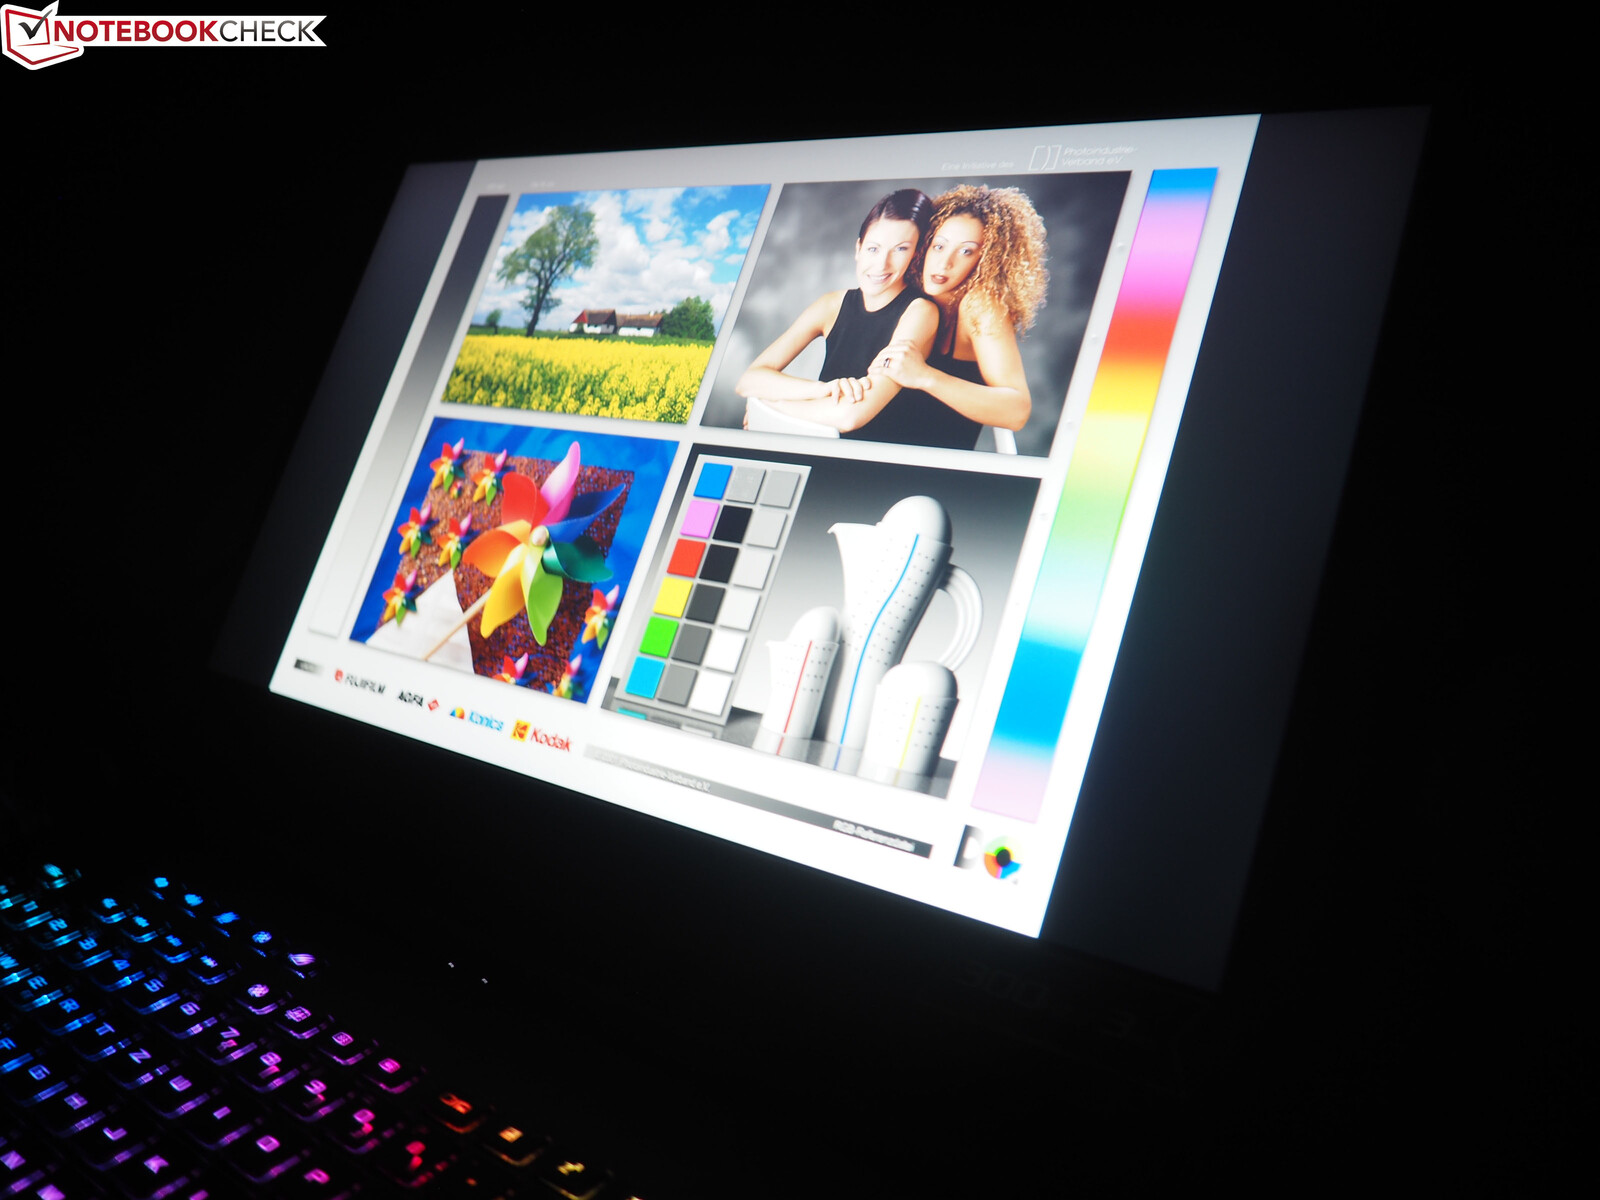
With the exception of the mediocre contrast of about 750:1 (which results from the somewhat high black value), the 17-inch screen has hardly any weaknesses. About 310 cd/m² brightness is typical for a gaming laptop and will satisfy most buyers - unless they want to use the Scar 17 outdoors.
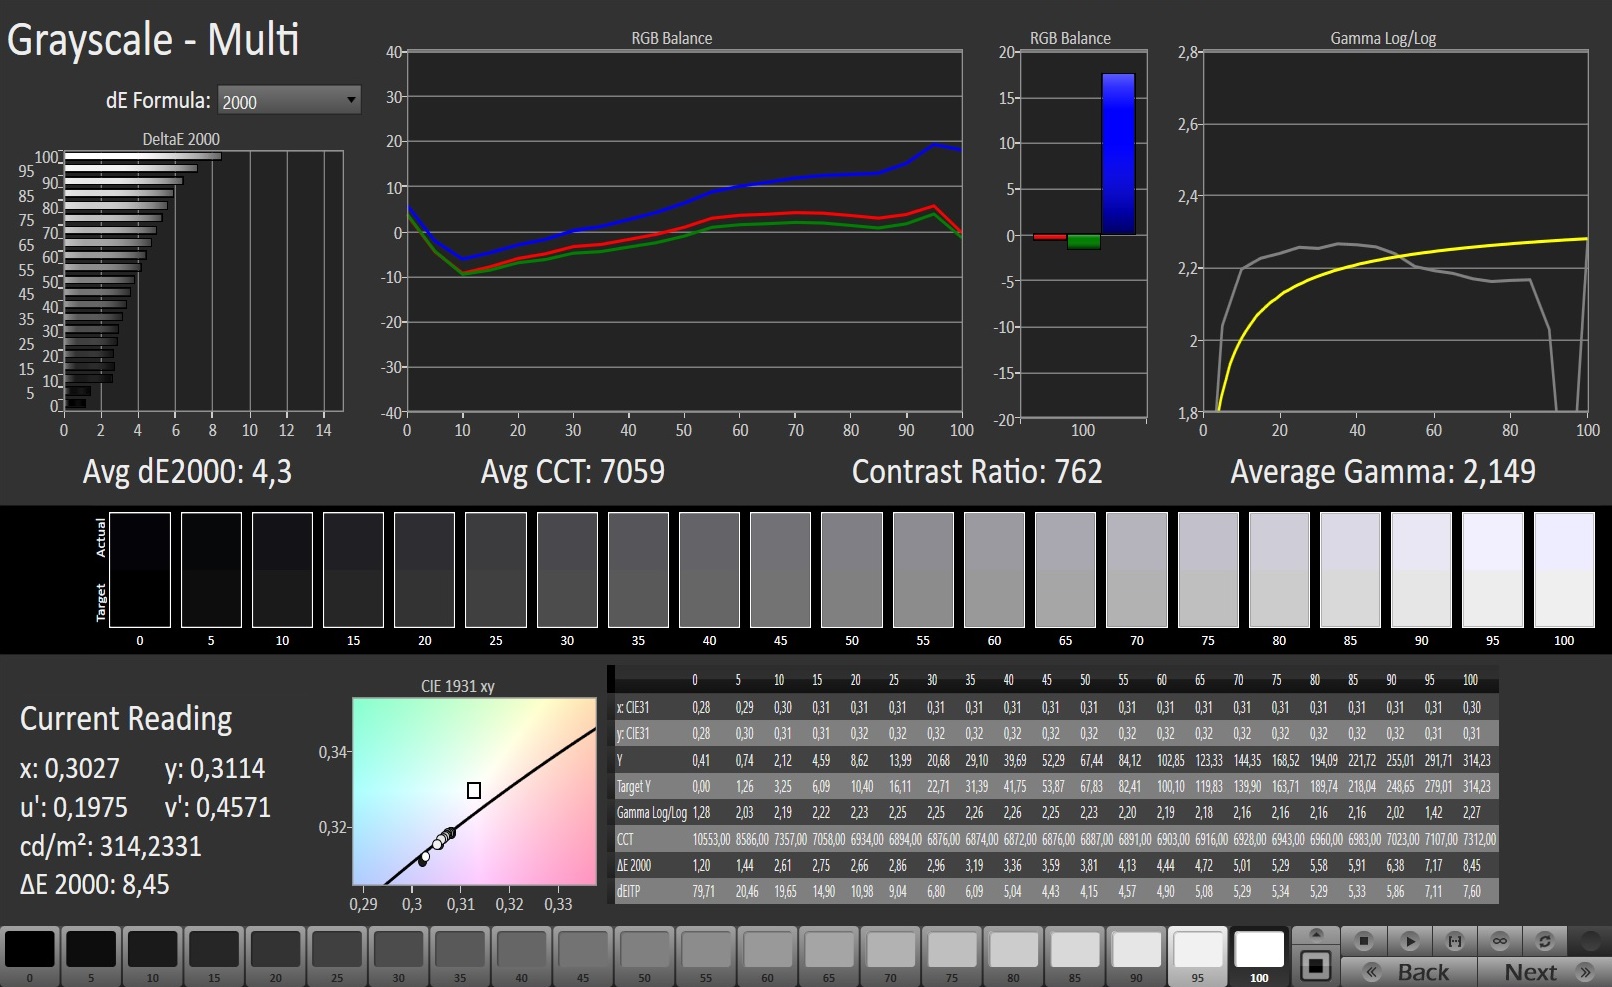
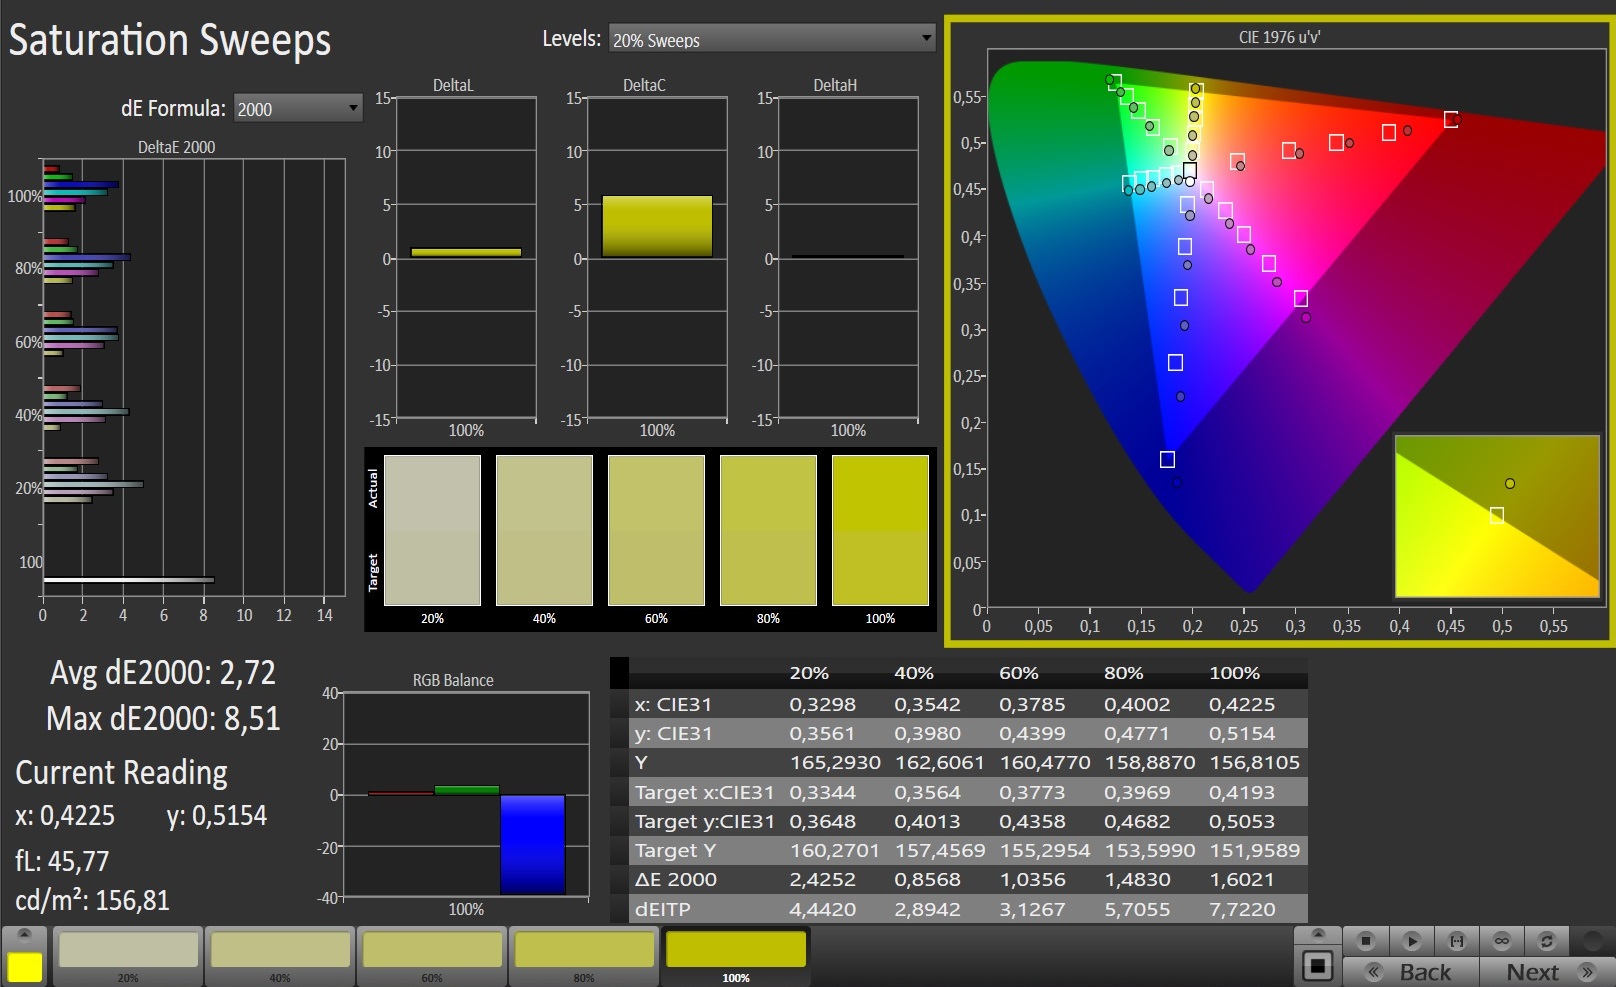
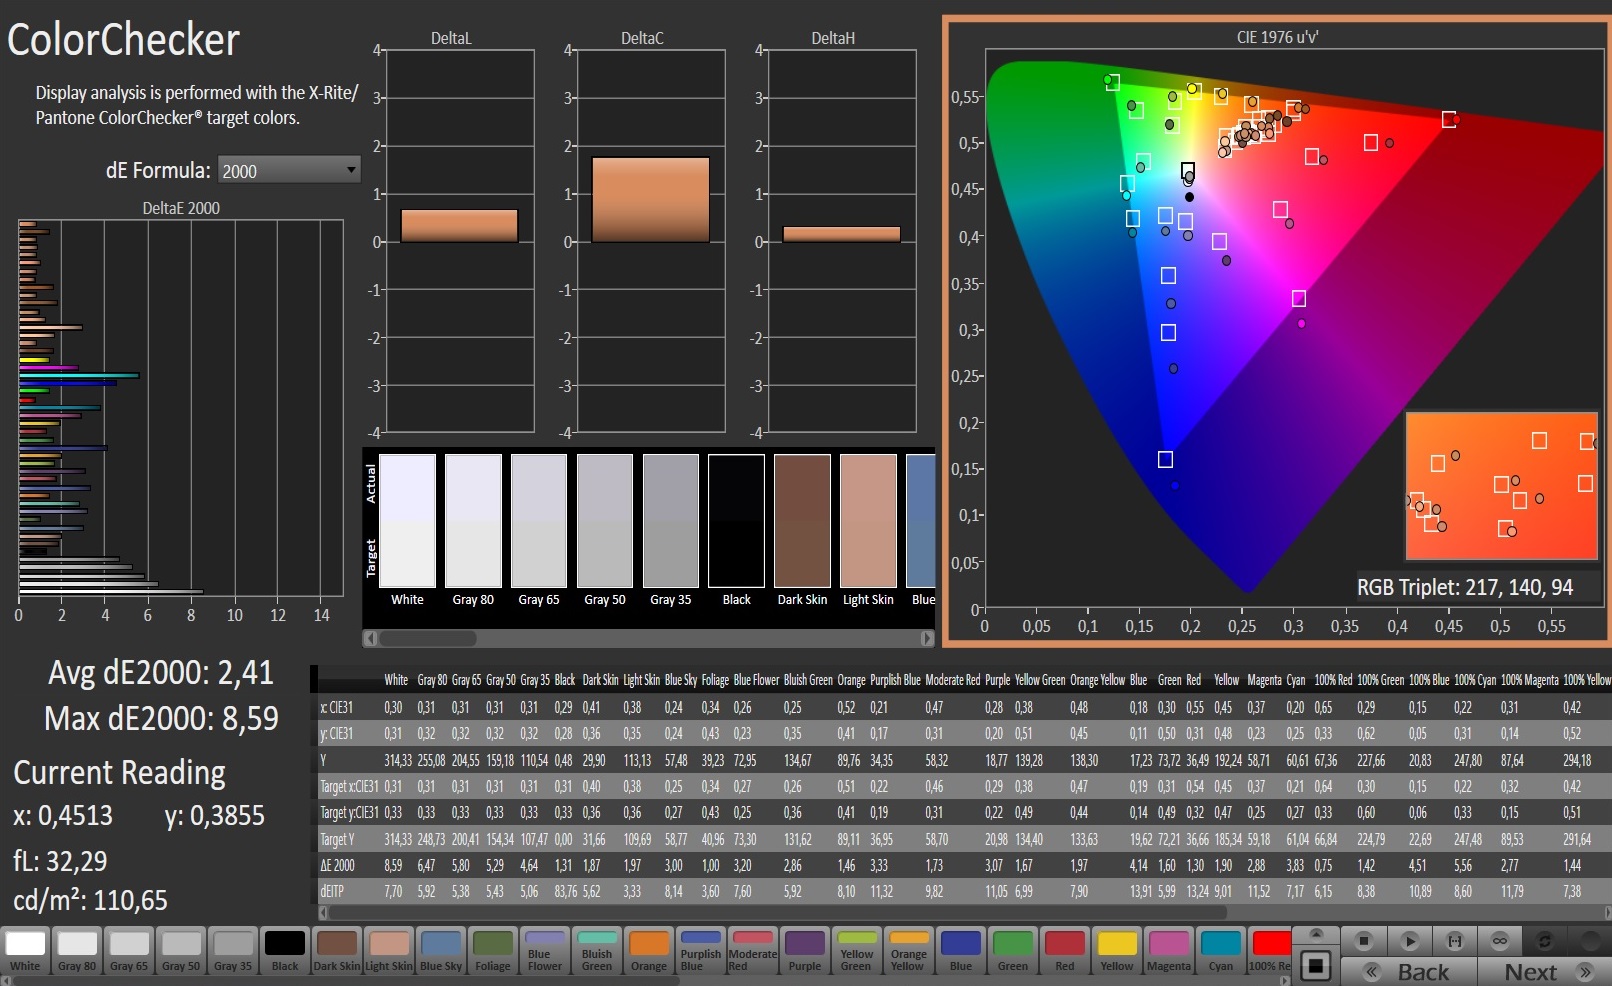
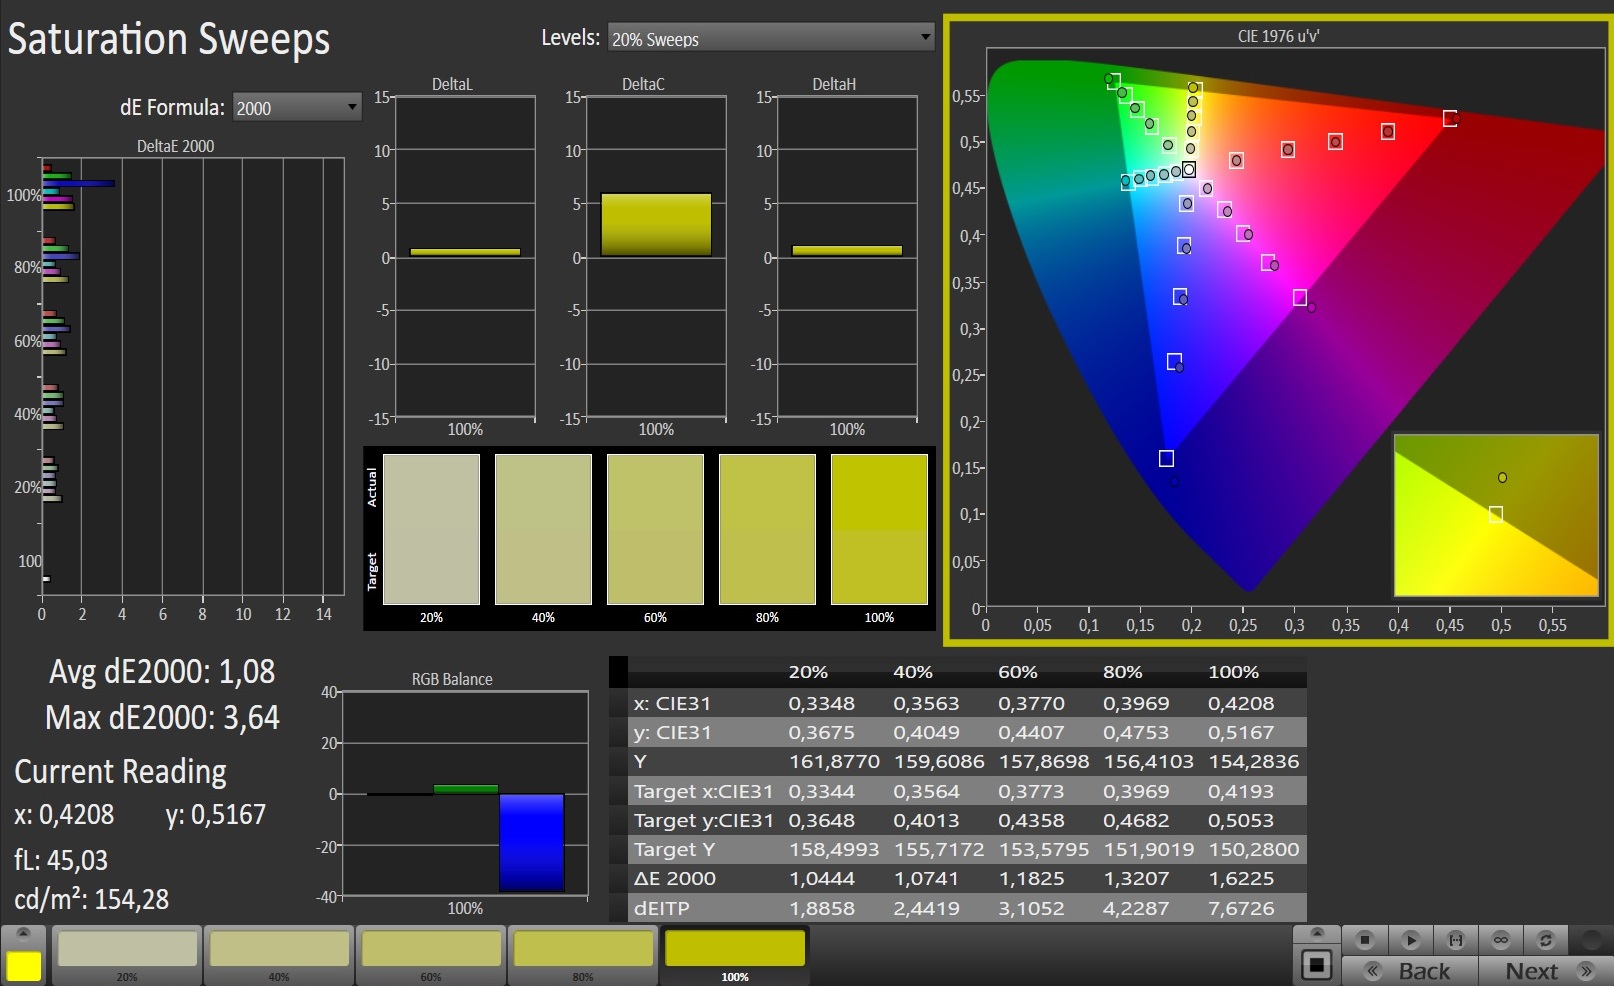
Viewing angles and color accuracy are within the usual IPS spectrum. However, the color-space coverage of 72% AdobeRGB is somewhat higher than the competition. The Full HD panel scores particularly well in the reaction test. Under 10 ms promises clean images even in fast games.
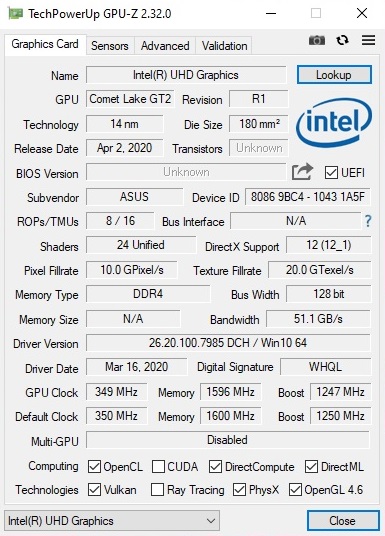
The Scar 17 has to do without Nvidia's image enhancement G-Sync. In return, the 17-incher supports Optimus GPU switching.
Display Response Times
| ↔ Response Time Black to White | ||
|---|---|---|
| 8.4 ms ... rise ↗ and fall ↘ combined | ↗ 4.4 ms rise |  |
| ↘ 4 ms fall | ||
| The screen shows fast response rates in our tests and should be suited for gaming. In comparison, all tested devices range from 0.1 (minimum) to 240 (maximum) ms. » 24 % of all devices are better. This means that the measured response time is better than the average of all tested devices (19.8 ms). | ||
| ↔ Response Time 50% Grey to 80% Grey | ||
| 5.8 ms ... rise ↗ and fall ↘ combined | ↗ 2.4 ms rise | 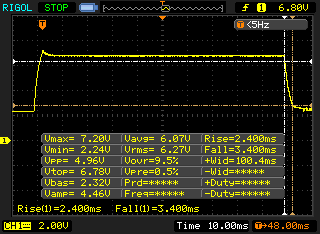 |
| ↘ 3.4 ms fall | ||
| The screen shows very fast response rates in our tests and should be very well suited for fast-paced gaming. In comparison, all tested devices range from 0.165 (minimum) to 636 (maximum) ms. » 18 % of all devices are better. This means that the measured response time is better than the average of all tested devices (31 ms). | ||
Screen Flickering / PWM (Pulse-Width Modulation)
| Screen flickering / PWM not detected | 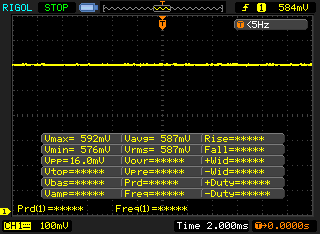 | ||
In comparison: 52 % of all tested devices do not use PWM to dim the display. If PWM was detected, an average of 7753 (minimum: 5 - maximum: 343500) Hz was measured. | |||
Test conditions
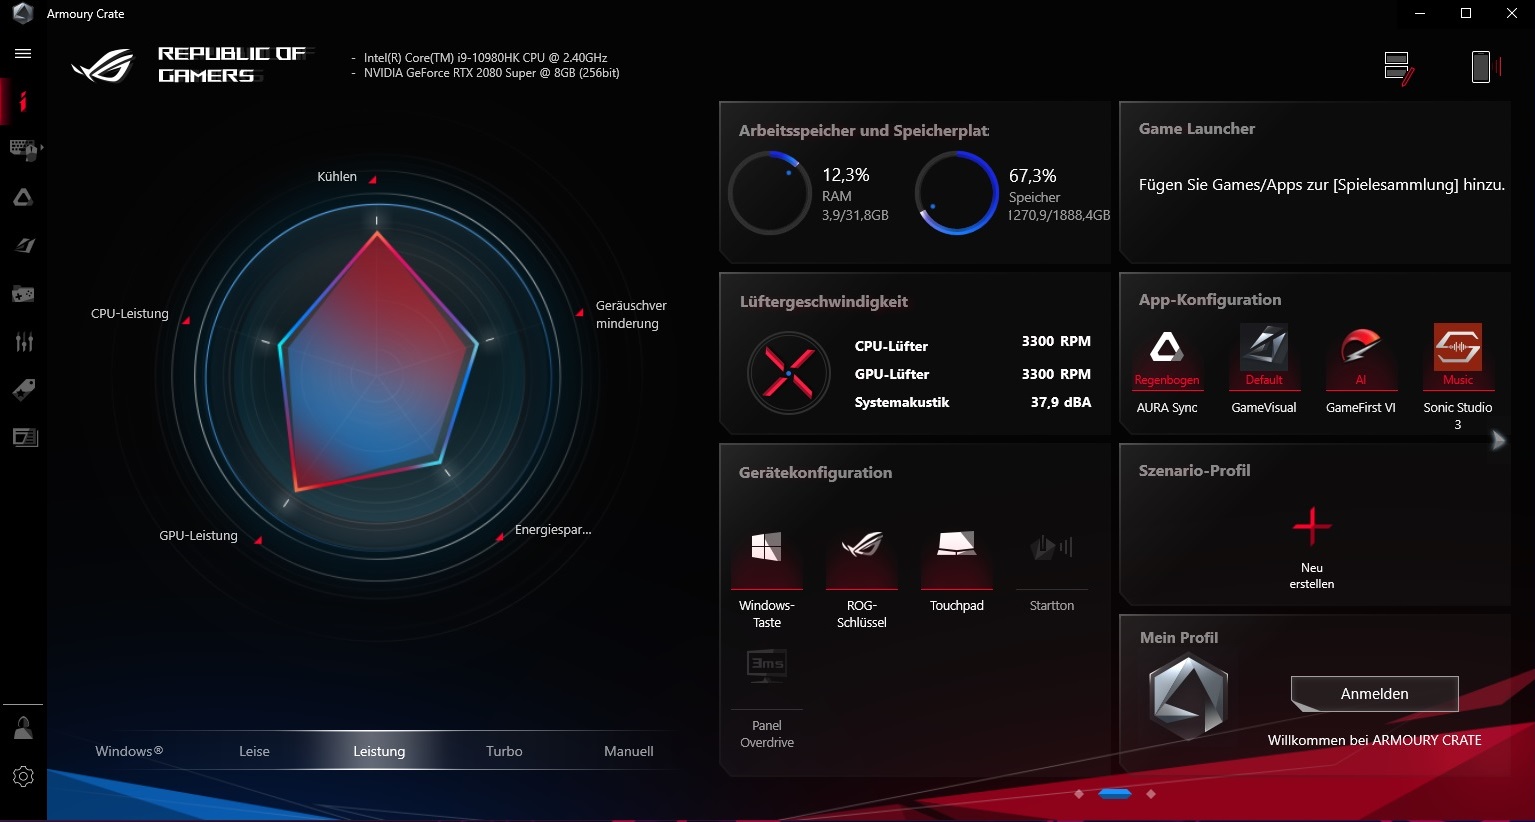
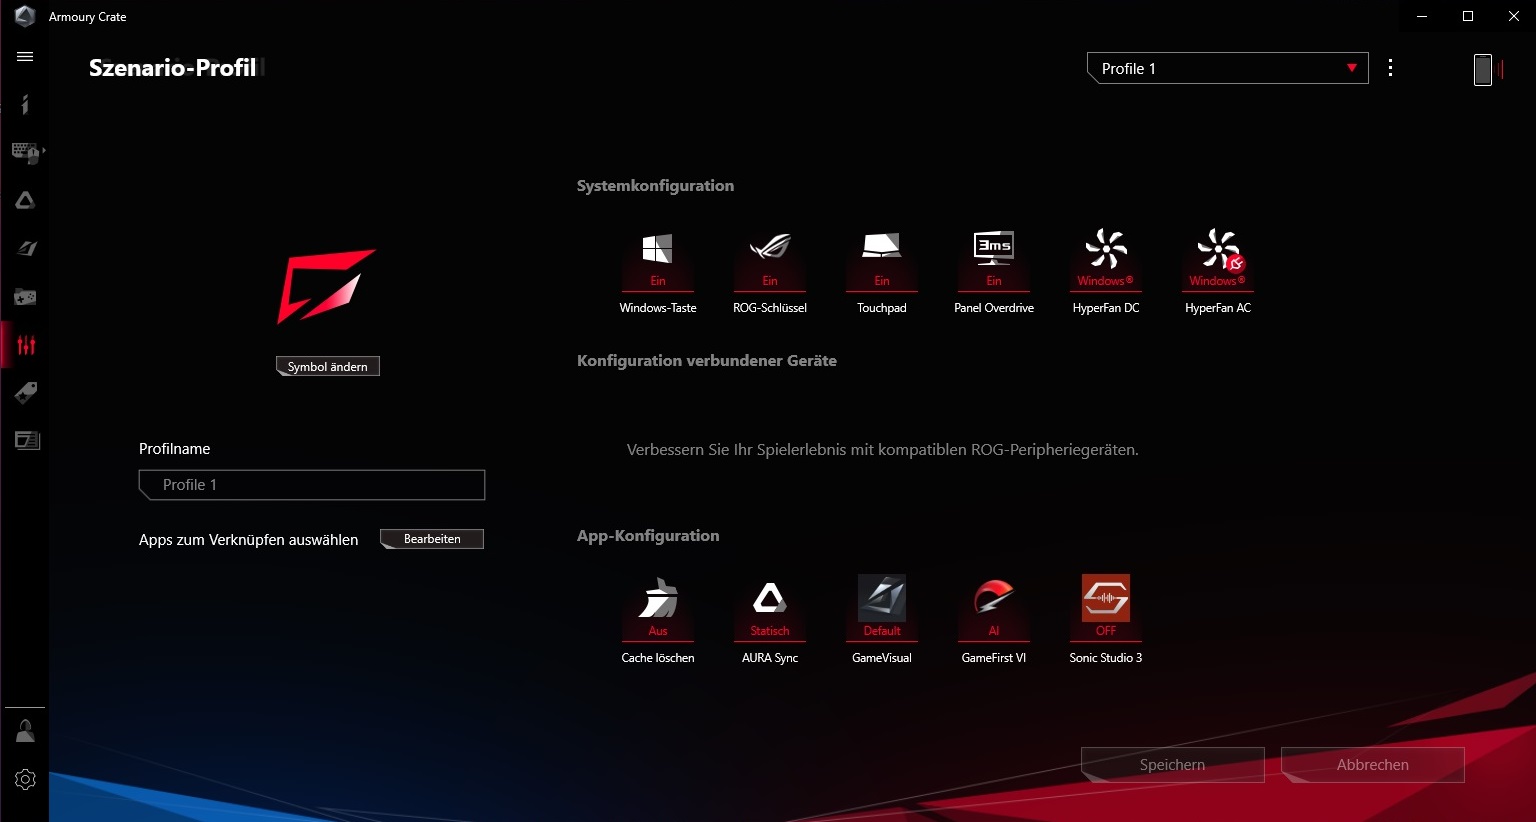
What would a gaming notebook be without powerful tuning software? The Armoury Crate from Asus is in no way inferior to the tools of the competition (e.g. the Dragon Center from MSI). Our measurements were made with the "performance" profile. According to the visualization, the turbo profile mainly affects the CPU performance. Although the graphics card's clock rate also increases by 100 MHz, in practice only about 50 MHz of this remains, which doesn't make a big difference. Due to the high noise level (more about this later), the quiet mode would be recommended for idle situations and undemanding tasks. Unfortunately, it doesn't seem to bring much improvement.
Performance
The Scar 17 ranks among the fastest laptops of 2020, and in addition to the processor, the graphics card also makes itself comfortable in the absolute high-end range. 32 GB of RAM will be enough for quite a while, too.
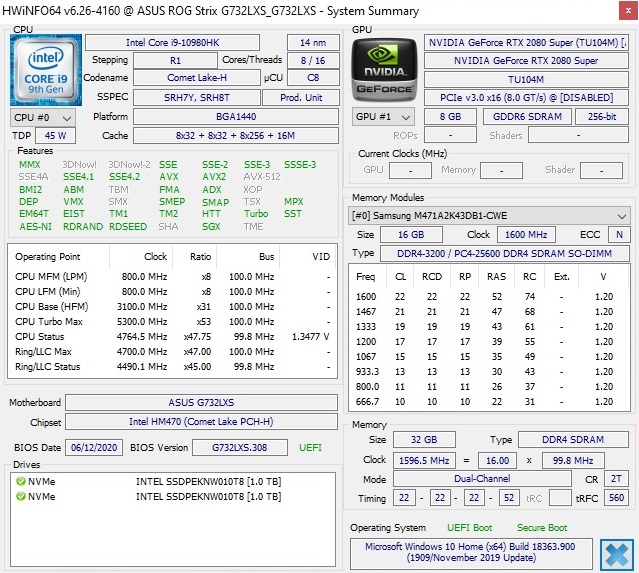
Processor
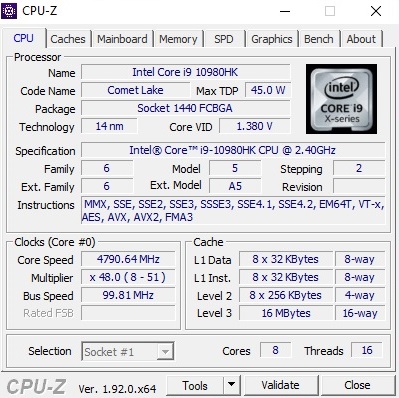
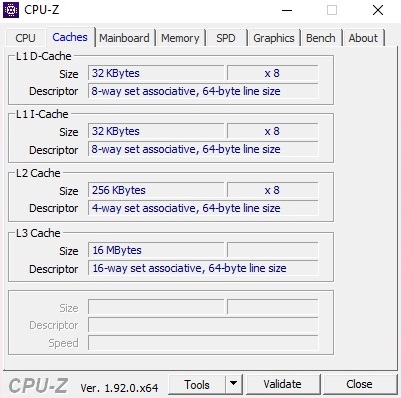
The Core i9-10980HK is an eight-core CPU from Intel's Comet Lake generation, which offers 16 MB L3 cache and can process up to 16 threads in parallel via Hyper-Threading. 45 watts TDP corresponds to the competing Ryzen 7 4800H, which however is created in the 7 nm process and not in the dusty old 14 nm process.
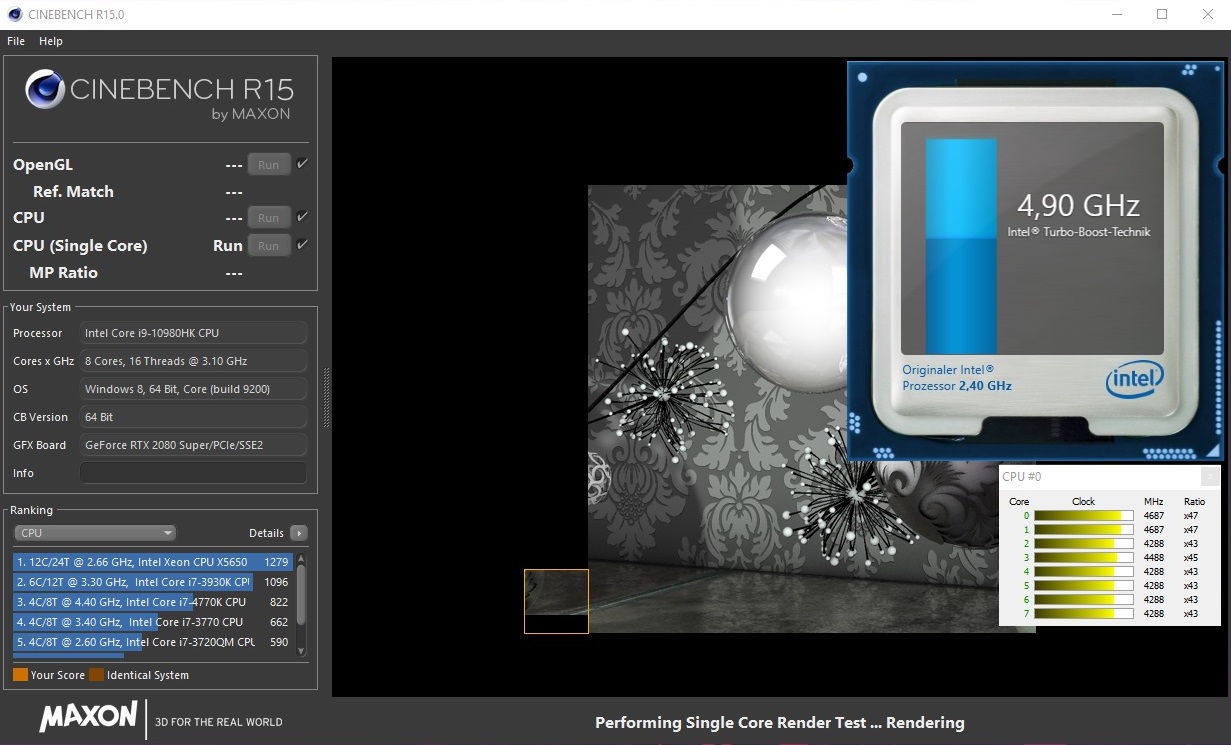
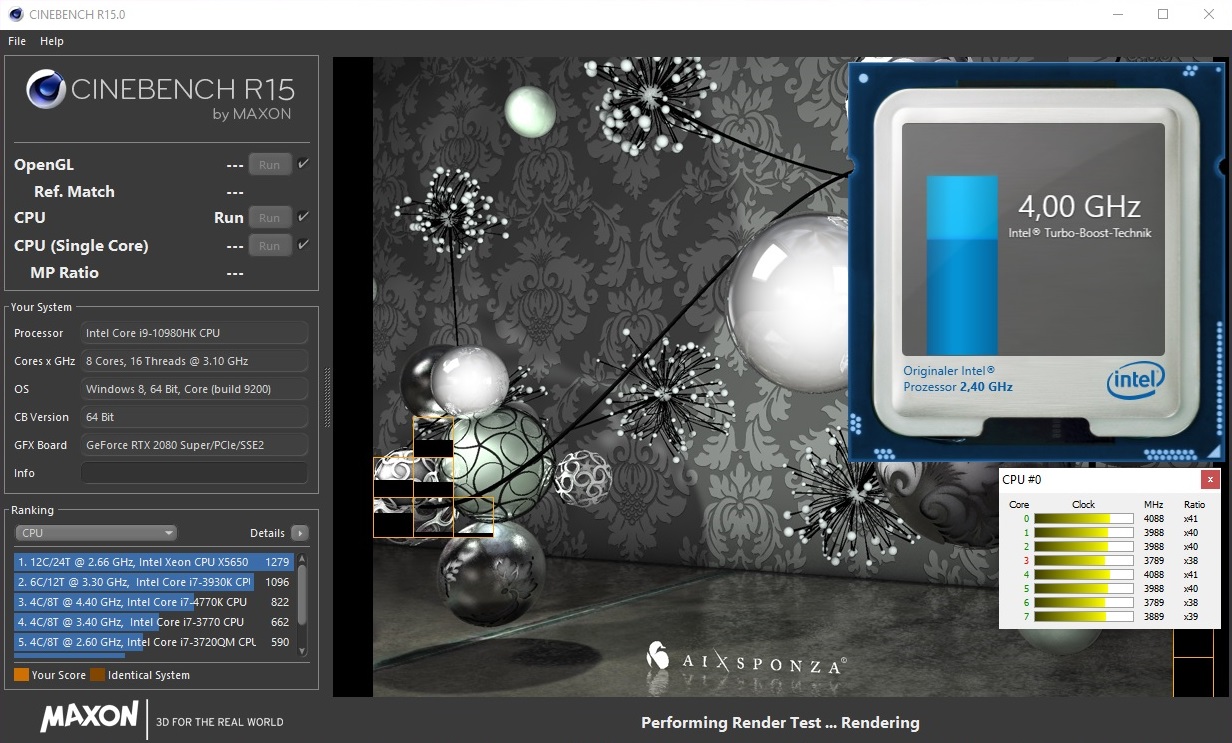
Thanks to the Turbo Boost technology, under load the base clock rate of 2.4 GHz is exceeded significantly. According to Cinebench R15, the 10980HK reaches 4.3 to 4.9 GHz in single-core scenarios, whereas the clock rate settles down to about 4.0 GHz in multi-core applications. With this result, the Scar 17 in the Cinebench loop passes the HP Omen 17-cb0020ng, but not the MSI GE75 9SG, which both feature the Core i9-9880H.
After a cold start, the 10980HK positions itself at the top of the comparison field, as the table below shows. The old six-core favorite, Core i7-9750H computes up to 30% slower.
| Blender - v2.79 BMW27 CPU | |
| MSI GE75 9SG | |
| Asus Strix Scar 17 G732LXS | |
| Average of class Gaming (80 - 330, n=103, last 2 years) | |
| Geekbench 5.5 | |
| Single-Core | |
| Average of class Gaming (986 - 2474, n=104, last 2 years) | |
| Asus Strix Scar 17 G732LXS | |
| Multi-Core | |
| Average of class Gaming (6460 - 27010, n=104, last 2 years) | |
| Asus Strix Scar 17 G732LXS | |
| HWBOT x265 Benchmark v2.2 - 4k Preset | |
| Average of class Gaming (11.5 - 44.3, n=104, last 2 years) | |
| Asus Strix Scar 17 G732LXS | |
| MSI GE75 9SG | |
| LibreOffice - 20 Documents To PDF | |
| Asus Strix Scar 17 G732LXS | |
| Average of class Gaming (33.2 - 88.8, n=104, last 2 years) | |
| R Benchmark 2.5 - Overall mean | |
| Asus Strix Scar 17 G732LXS | |
| Average of class Gaming (0.3439 - 0.759, n=105, last 2 years) | |
* ... smaller is better
System Performance
Despite SSD-RAID, the system performance is not enough for a place on the winners' rostrum. In PCMark 10, the competition is between 5 and 18% quicker. However, the PCMark results are often only partially comprehensible.
DPC Latency
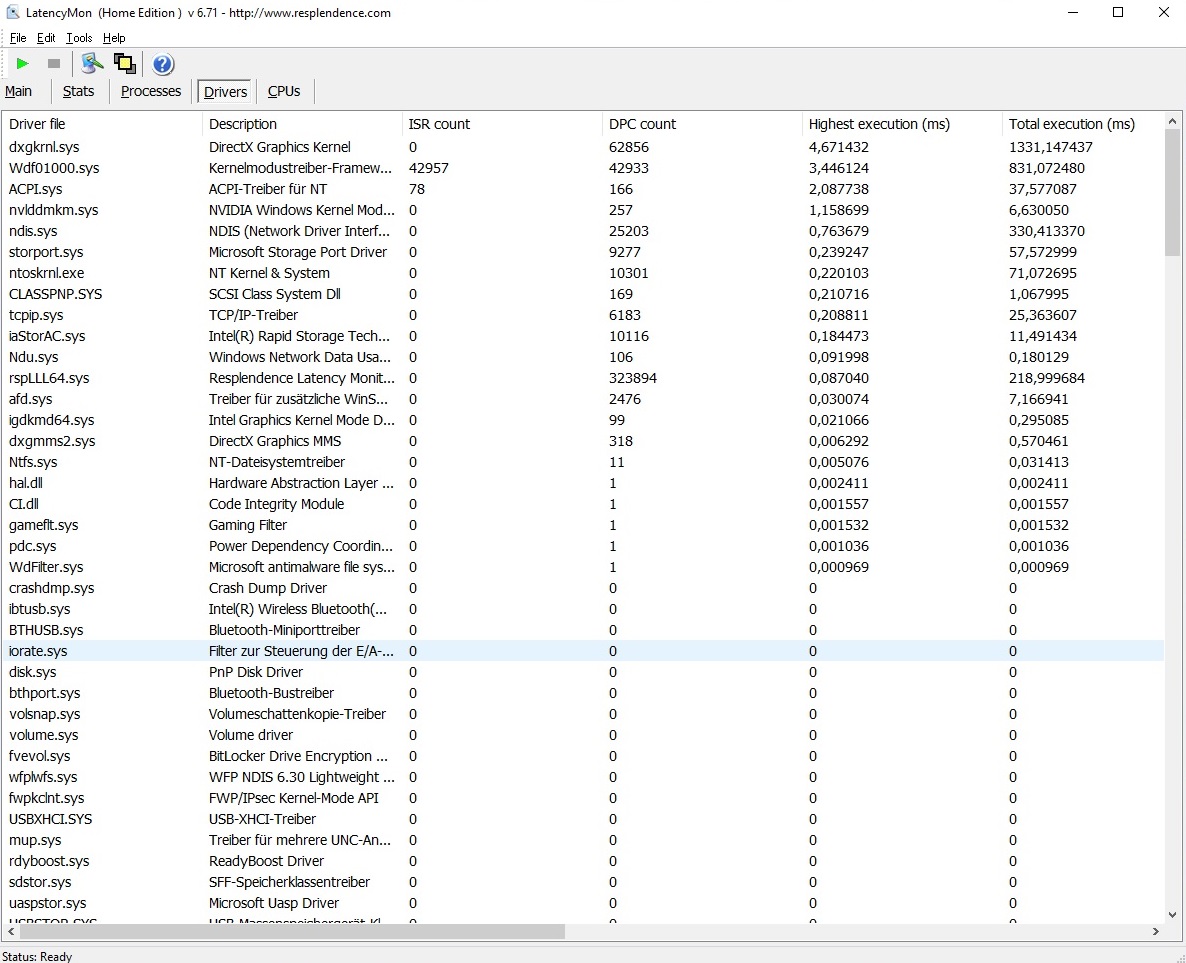
Unfortunately, the Scar 17 reveals weaknesses in the latency test. The tool LatencyMon measures very high rates here, which underpins our subjective impressions. Every now and then the system has to struggle with short hangs, which mainly occur when programs are started.
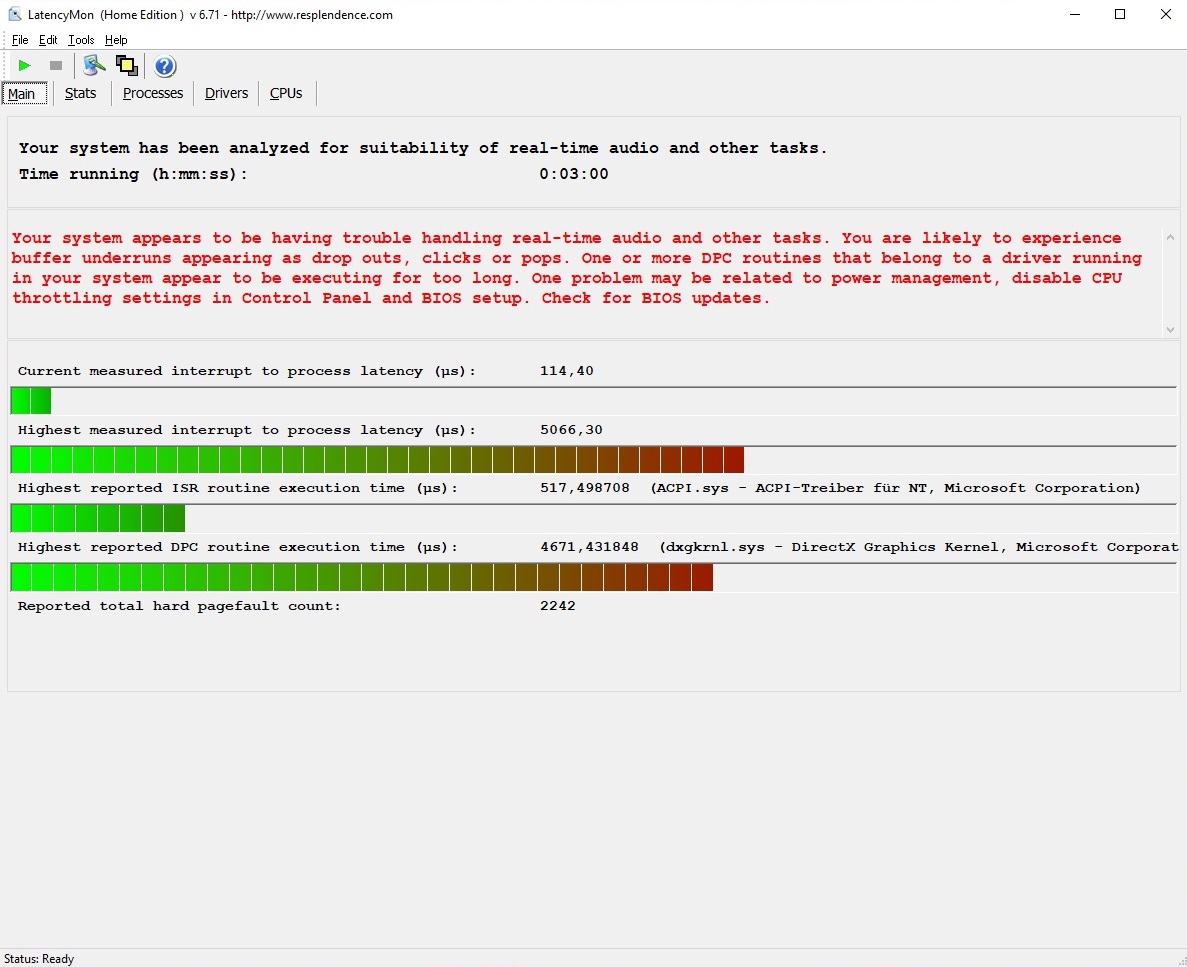
| DPC Latencies / LatencyMon - interrupt to process latency (max), Web, Youtube, Prime95 | |
| Asus Strix Scar 17 G732LXS | |
* ... smaller is better
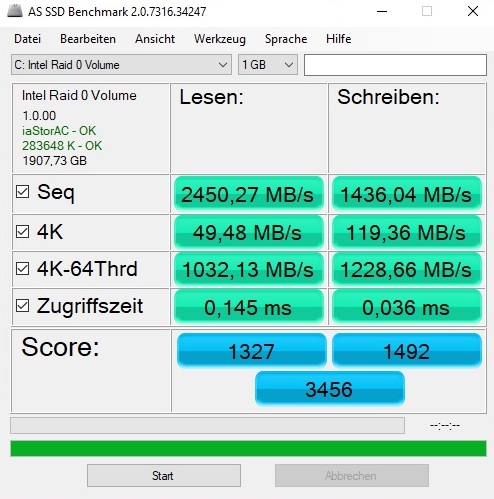
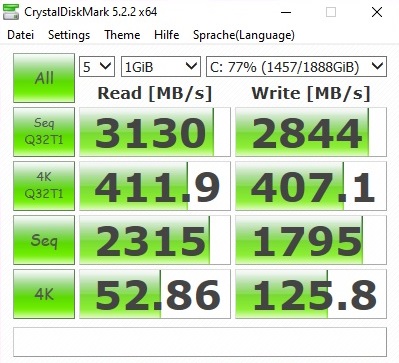
Storage Solution
The comparison with the competition proves that an SSD RAID is not always worthwhile. Both the MSI GE75 9SG and the Asus Strix Scar III with their single SSD solutions hardly fall behind in the benchmark course (AS SSD Benchmark, CrystalDiskMark, etc...). The two Intel SSD models of the 660p type certainly come with a very generous total capacity: 2 TB is enough for a lot of games.
| Asus Strix Scar 17 G732LXS 2x Intel SSD 660p 1TB SSDPEKNW010T8 (RAID 0) | MSI GE75 9SG Samsung SSD PM981 MZVLB1T0HALR | HP Omen 17-cb0020ng 2x Samsung SSD PM981 MZVLB512HAJQ (RAID 0) | Asus ASUS ROG Strix SCAR III G731GW-XB74 Intel SSD 660p 1TB SSDPEKNW010T8 | Eurocom Nightsky RX17 2x Samsung SSD 970 Pro 512GB (RAID 0) | |
|---|---|---|---|---|---|
| CrystalDiskMark 5.2 / 6 | -7% | 11% | -4% | 31% | |
| Write 4K (MB/s) | 125.8 | 116.1 -8% | 103.8 -17% | 130.1 3% | 133 6% |
| Read 4K (MB/s) | 52.9 | 44.98 -15% | 41.67 -21% | 56 6% | 61.6 16% |
| Write Seq (MB/s) | 1795 | 2370 32% | 2639 47% | 2935 64% | |
| Read Seq (MB/s) | 2315 | 1465 -37% | 2702 17% | 3118 35% | |
| Write 4K Q32T1 (MB/s) | 407.1 | 337.5 -17% | 487.3 20% | 465.7 14% | 571 40% |
| Read 4K Q32T1 (MB/s) | 411.9 | 453.6 10% | 555 35% | 547 33% | 654 59% |
| Write Seq Q32T1 (MB/s) | 2844 | 2399 -16% | 2967 4% | 1766 -38% | 3296 16% |
| Read Seq Q32T1 (MB/s) | 3130 | 3087 -1% | 3102 -1% | 1922 -39% | 3560 14% |

Continuous load read: DiskSpd Read Loop, Queue Depth 8
Graphics Card
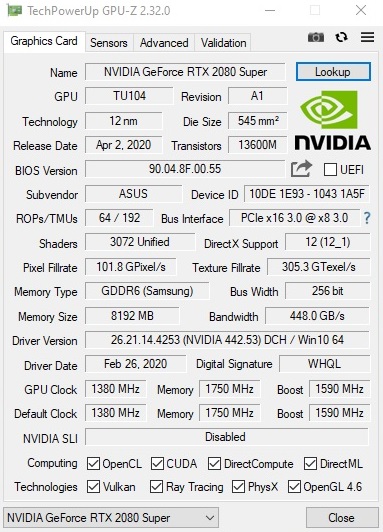
With the GeForce RTX 2080 Super, Nvidia presents a slightly revised version of the normal RTX 2080: Instead of 2,944 shader units, there are now 3,072, which theoretically provides a small performance plus.
| 3DMark 06 Standard Score | 41873 points | |
| 3DMark Vantage P Result | 69838 points | |
| 3DMark 11 Performance | 27065 points | |
| 3DMark Cloud Gate Standard Score | 49644 points | |
| 3DMark Fire Strike Score | 20902 points | |
| 3DMark Time Spy Score | 9629 points | |
Help | ||
However, since different TGP varieties exist, the "Super" suffix has only limited relevance. In order to be able to squeeze the high-end GPU into a relatively thin case, Asus only uses the 150-watt model in the Scar 17, which usually doesn't stand out from the standard RTX 2080 of the HP Omen 17 or MSI GE75.
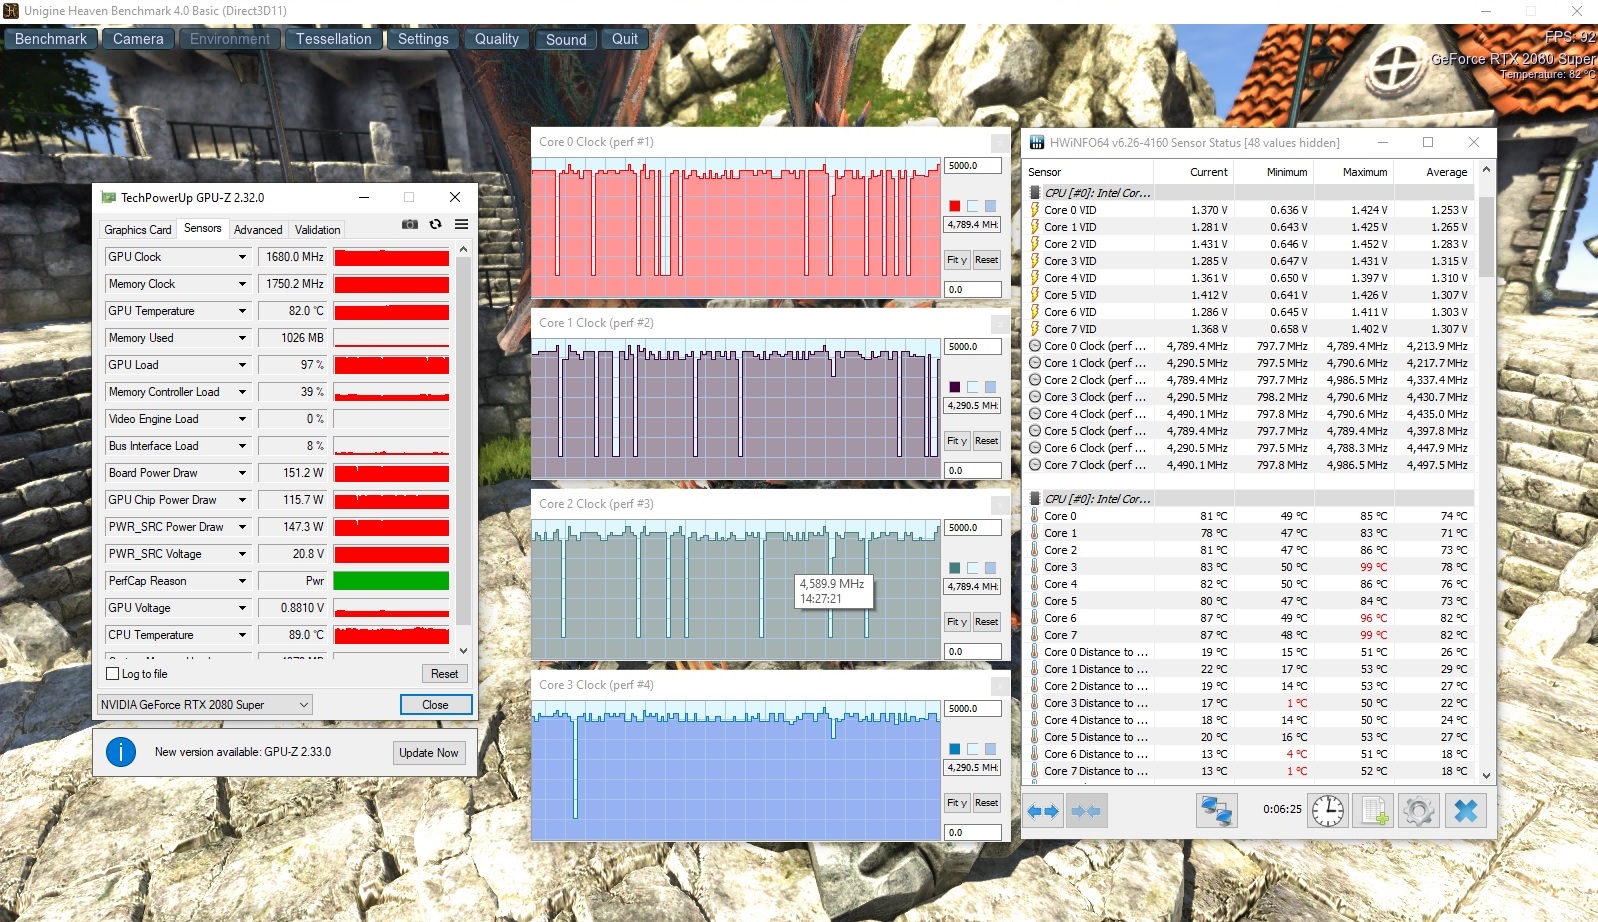
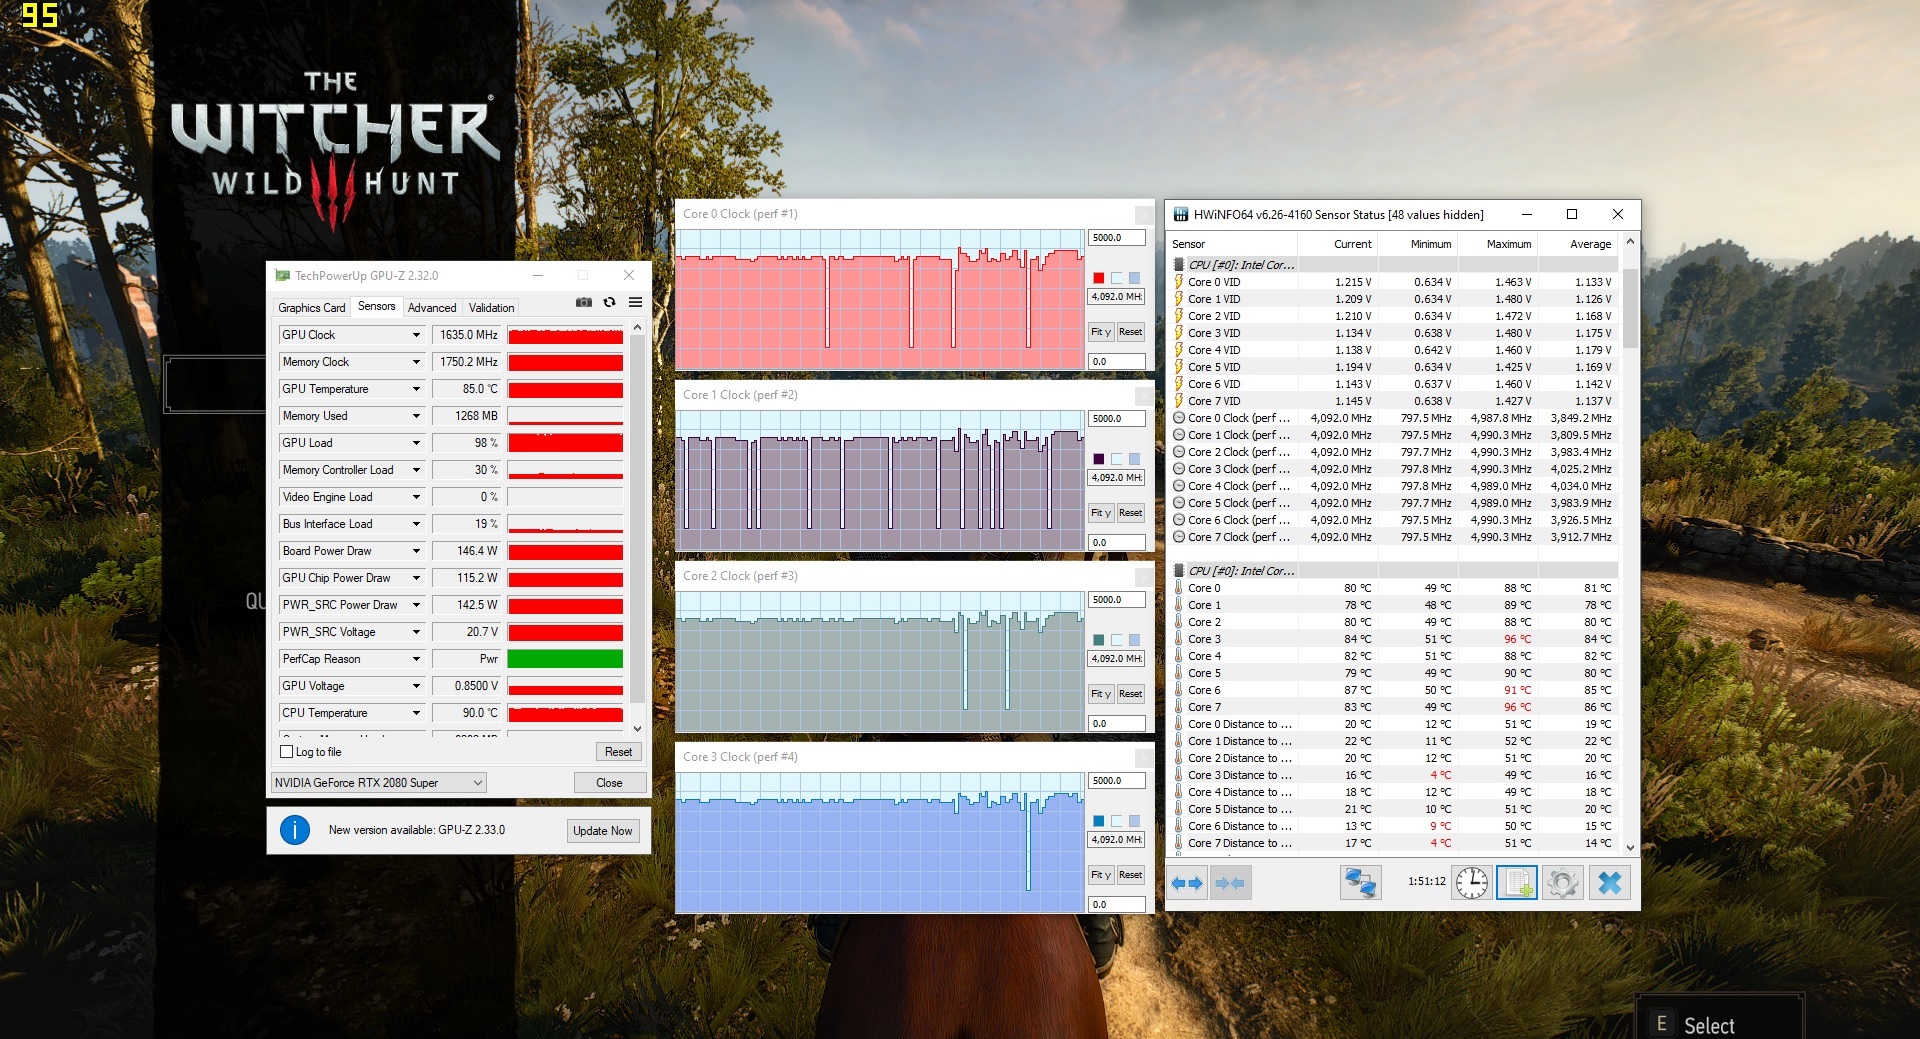
We tested how the graphics card behaves under longer 3D loads for about an hour with the role-playing game The Witcher 3. This resulted in an average clock rate of 1,600 to 1,700 MHz. Without GPU boost the core clock would be 1,380 MHz. More details about the RTX 2080 Super can be found on our benchmark page.
Gaming Performance
With the native 1920x1080 resolution, the Scar 17 has no problem at all. Even demanding titles like Red Dead Redemption 2 can be played smoothly with maximum details. Often it's even over 100 FPS. For 2560x1440 pixels, the RTX 2080 Super usually has enough reserves. It only gets tight - if at all - in the 4K range (3840x2160 pixels).
| The Witcher 3 - 1920x1080 Ultra Graphics & Postprocessing (HBAO+) | |
| Average of class Gaming (104.7 - 240, n=6, last 2 years) | |
| MSI GE75 9SG | |
| Asus Strix Scar 17 G732LXS | |
| HP Omen 17-cb0020ng | |
| Eurocom Nightsky RX17 | |
| Asus ASUS ROG Strix SCAR III G731GW-XB74 | |
| low | med. | high | ultra | QHD | 4K | |
|---|---|---|---|---|---|---|
| GTA V (2015) | 185 | 178 | 164 | 92.8 | ||
| The Witcher 3 (2015) | 280 | 178 | 93.4 | 66.4 | ||
| Dota 2 Reborn (2015) | 168 | 154 | 148 | 134 | ||
| Fortnite (2018) | 178 | 171 | 136 | 104 | 52 | |
| Final Fantasy XV Benchmark (2018) | 124 | 95.7 | 42 | |||
| Kingdom Come: Deliverance (2018) | 144 | 107 | 75.3 | 56.1 | 33.1 | |
| X-Plane 11.11 (2018) | 123 | 105 | 88.4 | |||
| Monster Hunter World (2018) | 131 | 119 | 102 | 69.1 | 36 | |
| Shadow of the Tomb Raider (2018) | 136 | 127 | 121 | 84 | 45 | |
| Assassin´s Creed Odyssey (2018) | 98 | 85 | 62 | 57 | 38 | |
| Hitman 2 (2018) | 104 | 87.8 | 80 | 77.7 | 48.4 | |
| Battlefield V (2018) | 169 | 153 | 142 | 115 | 68.7 | |
| Darksiders III (2018) | 168 | 143 | 132 | 97.2 | 50.5 | |
| Just Cause 4 (2018) | 157 | 120 | 113 | 81.2 | 46 | |
| Apex Legends (2019) | 144 | 144 | 144 | 131 | 75.4 | |
| Far Cry New Dawn (2019) | 116 | 113 | 100 | 90 | 55 | |
| Metro Exodus (2019) | 116 | 90.2 | 71 | 55.4 | 34.9 | |
| Dirt Rally 2.0 (2019) | 178 | 158 | 91.6 | 74.1 | ||
| The Division 2 (2019) | 147 | 131 | 102 | 69 | 36 | |
| Anno 1800 (2019) | 122 | 91.7 | 50.6 | 45.3 | 27.1 | |
| Rage 2 (2019) | 148 | 127 | 127 | 81.9 | 40.3 | |
| F1 2019 (2019) | 224 | 174 | 167 | 130 | 80 | |
| Control (2019) | 113 | 87.6 | 58.9 | 29.8 | ||
| Borderlands 3 (2019) | 131 | 98 | 88 | 64.6 | 35.2 | |
| FIFA 20 (2019) | 281 | 267 | 262 | 258 | 227 | |
| Ghost Recon Breakpoint (2019) | 109 | 99 | 74 | 57 | 34 | |
| GRID 2019 (2019) | 164 | 120 | 88.7 | 72.5 | 48.8 | |
| Call of Duty Modern Warfare 2019 (2019) | 145 | 136 | 115 | 83.6 | 48.3 | |
| Need for Speed Heat (2019) | 104 | 91 | 79.4 | 75.3 | 51.3 | |
| Star Wars Jedi Fallen Order (2019) | 121 | 117 | 107 | 86.4 | 49 | |
| Red Dead Redemption 2 (2019) | 117 | 79.8 | 52.9 | 42.5 | 27.6 | |
| Escape from Tarkov (2020) | 121 | 121 | 121 | 102 | 49.5 | |
| Hunt Showdown (2020) | 151 | 120 | 83.1 | 38.4 | ||
| Doom Eternal (2020) | 216 | 193 | 191 | 147 | 80.8 | |
| Gears Tactics (2020) | 226 | 144 | 106 | 70.3 | 38.4 | |
| F1 2020 (2020) | 235 | 175 | 146 | 119 | 72 |
Emissions
System Noise
The Scar 17 is one of the fastest but also one of the loudest gaming notebooks on the market. Even in idle mode, the fans are at times very present and often turn up unnecessarily loud. In 3D mode you should by default connect headphones in view of 50 to 55 dB. Noise-sensitive users however won't be satisfied with the competition, either.
Noise level
| Idle |
| 33 / 38 / 45 dB(A) |
| Load |
| 54 / 55 dB(A) |
 | ||
30 dB silent 40 dB(A) audible 50 dB(A) loud |
||
min: | ||
| Asus Strix Scar 17 G732LXS i9-10980HK, GeForce RTX 2080 Super Mobile | MSI GE75 9SG i9-9880H, GeForce RTX 2080 Mobile | HP Omen 17-cb0020ng i9-9880H, GeForce RTX 2080 Mobile | Asus ASUS ROG Strix SCAR III G731GW-XB74 i7-9750H, GeForce RTX 2070 Mobile | Eurocom Nightsky RX17 i7-9750H, GeForce RTX 2070 Mobile | Average of class Gaming | |
|---|---|---|---|---|---|---|
| Noise | 9% | 3% | 8% | 10% | 18% | |
| off / environment * (dB) | 25 | 28.2 -13% | 30 -20% | 28.2 -13% | 28 -12% | 24.1 ? 4% |
| Idle Minimum * (dB) | 33 | 30.4 8% | 34 -3% | 28.2 15% | 28 15% | 25.9 ? 22% |
| Idle Average * (dB) | 38 | 30.4 20% | 35 8% | 28.5 25% | 28.4 25% | 27.4 ? 28% |
| Idle Maximum * (dB) | 45 | 33.4 26% | 36 20% | 30 33% | 32.9 27% | 30 ? 33% |
| Load Average * (dB) | 54 | 37.1 31% | 51 6% | 51.5 5% | 45 17% | 43.3 ? 20% |
| Witcher 3 ultra * (dB) | 50 | 54.2 -8% | 47 6% | 55.3 -11% | 53.2 -6% | |
| Load Maximum * (dB) | 55 | 56.4 -3% | 51 7% | 55.3 -1% | 53.2 3% | 54.2 ? 1% |
* ... smaller is better
Temperature
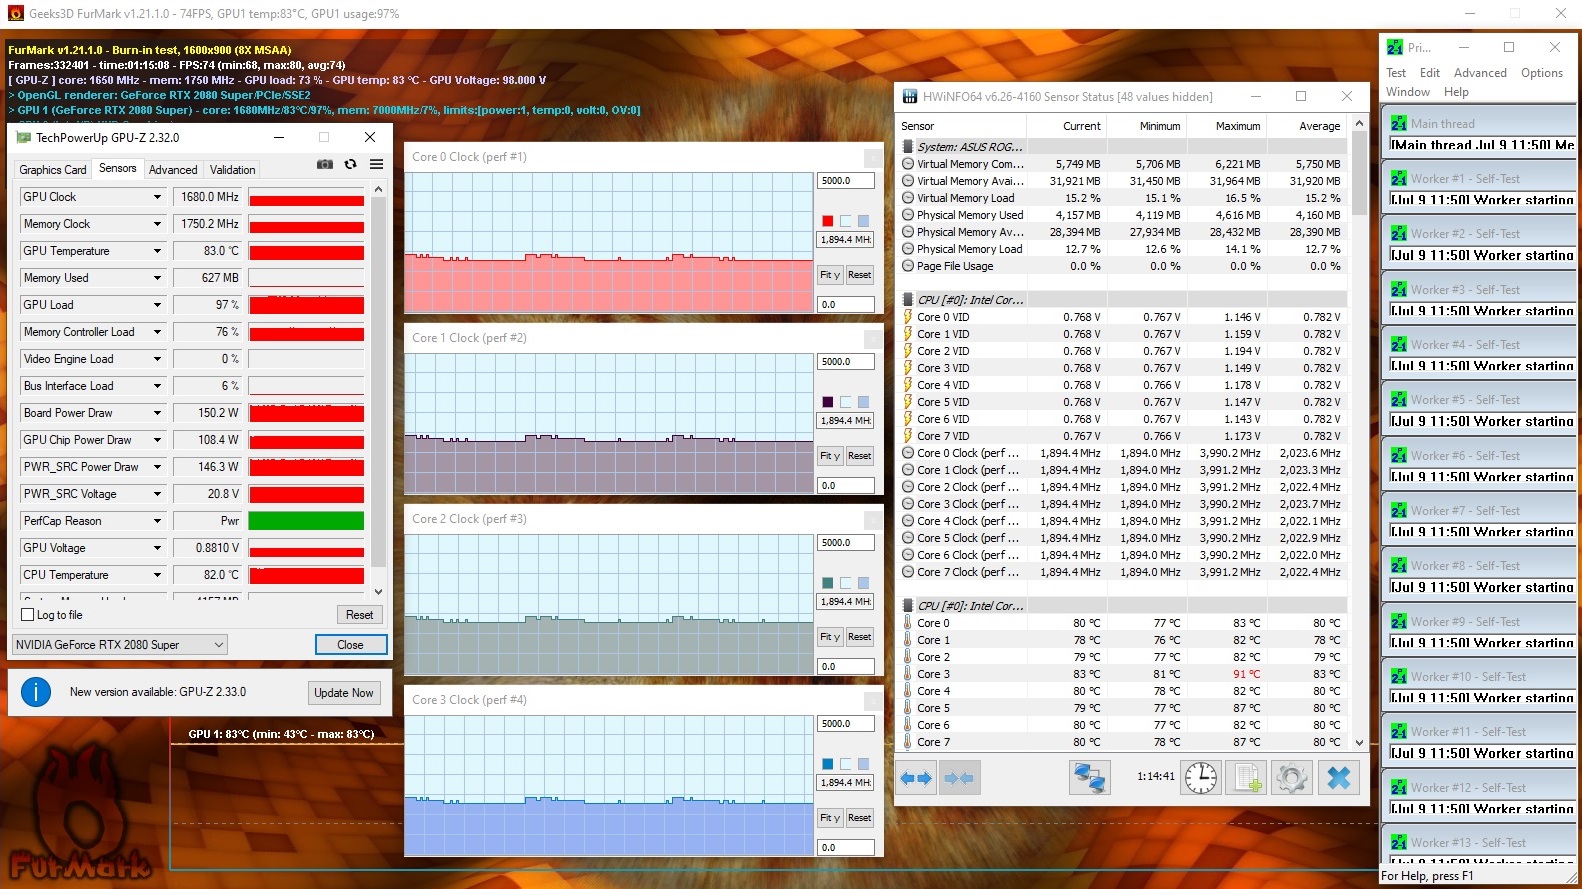
The heat generation is also subpar. Up to 59 °C on the upper side after 60 minutes of stress testing with Furmark and Prime95 represents the highest value in the test field. The remaining rates tend to favor the competition. However, the Scar 17 stays coolest in idle mode at around 30 °C. At maximum load, we were able to bring the components, Core i9-10980HK and GeForce RTX 2080 Super, to around 80 °C, which is still acceptable, whereby the CPU throttles down to around 1.9 GHz in this extreme situation.
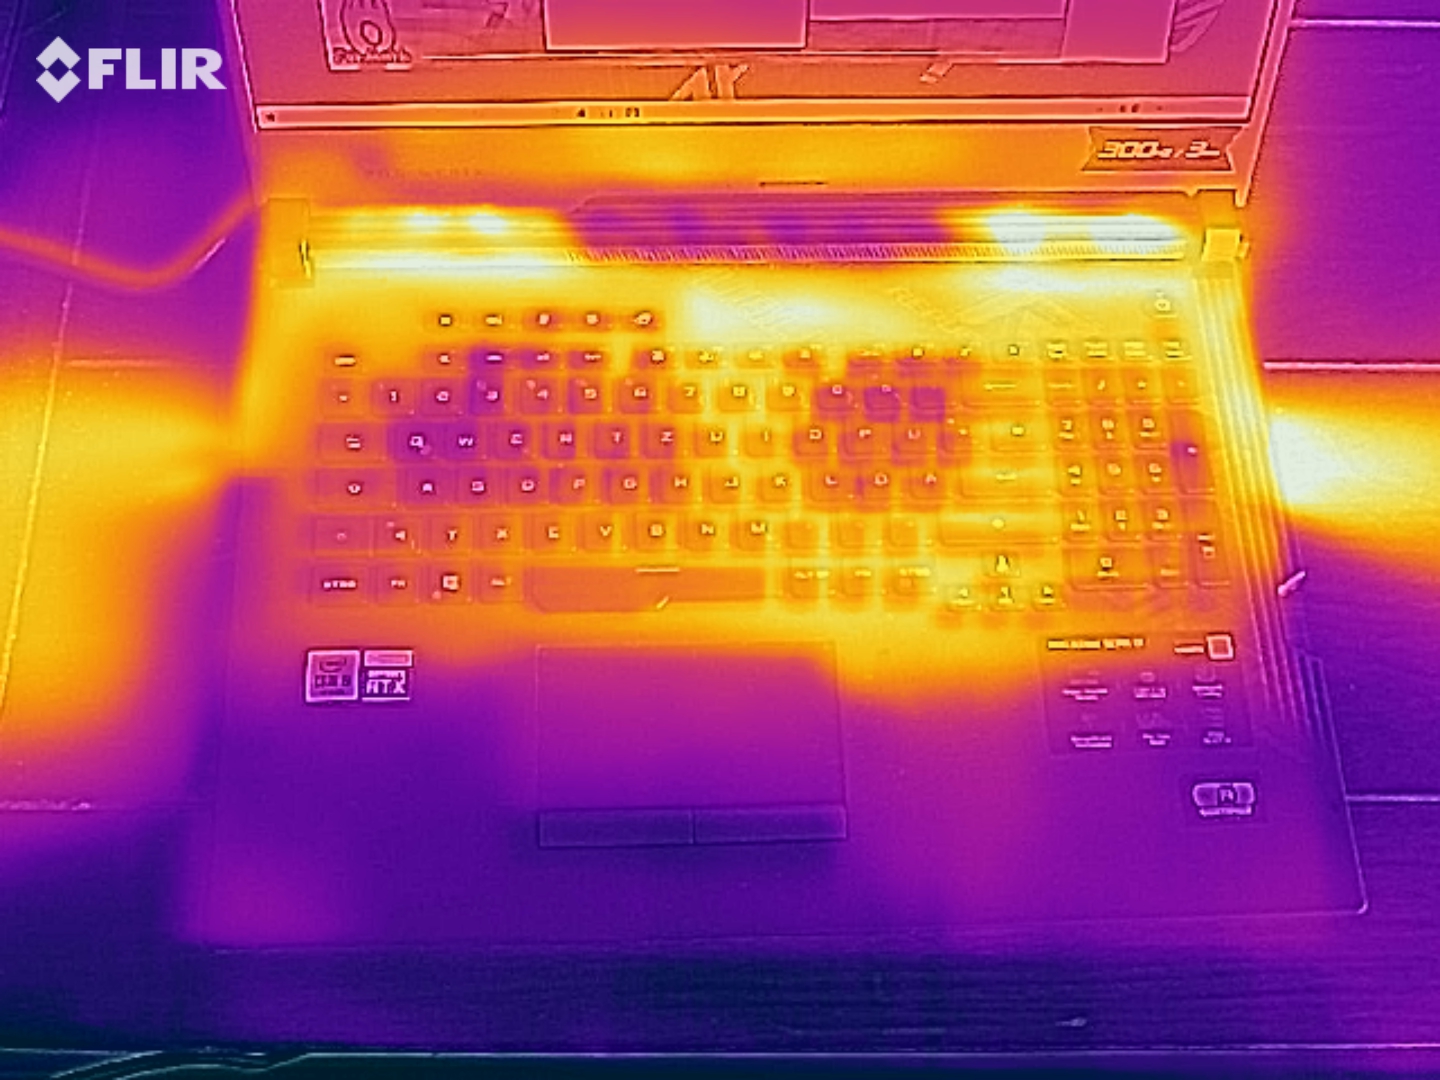
(-) The maximum temperature on the upper side is 59 °C / 138 F, compared to the average of 40.4 °C / 105 F, ranging from 21.2 to 68.8 °C for the class Gaming.
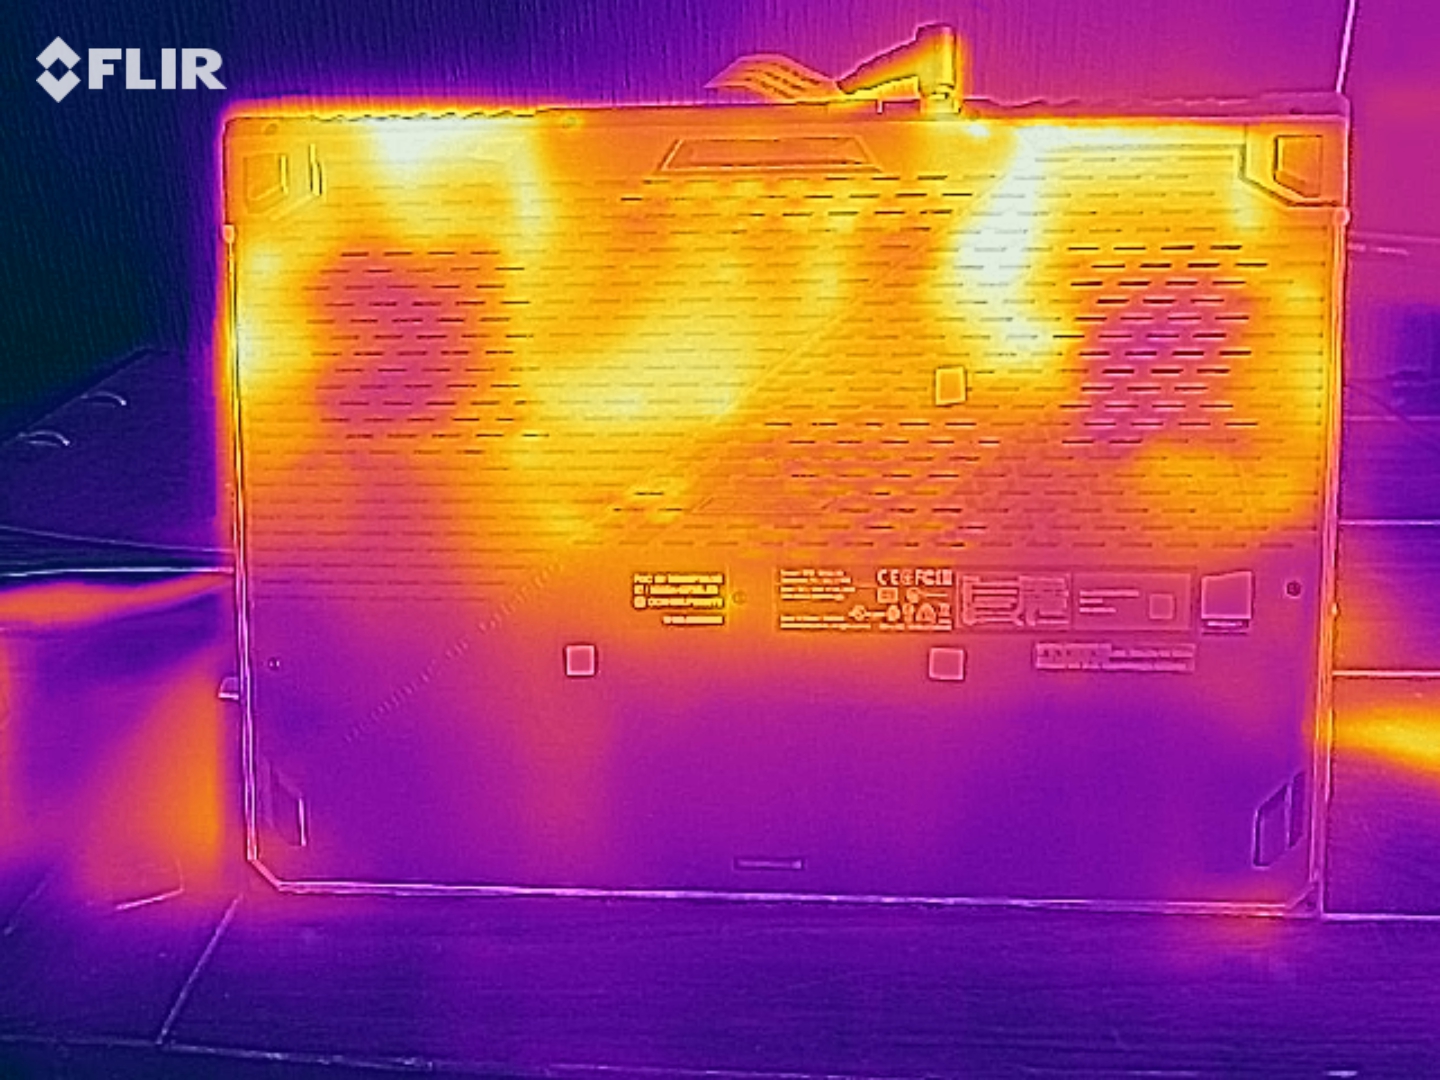
(-) The bottom heats up to a maximum of 52 °C / 126 F, compared to the average of 43.2 °C / 110 F
(+) In idle usage, the average temperature for the upper side is 28.6 °C / 83 F, compared to the device average of 33.9 °C / 93 F.
(-) Playing The Witcher 3, the average temperature for the upper side is 48.6 °C / 119 F, compared to the device average of 33.9 °C / 93 F.
(-) The palmrests and touchpad can get very hot to the touch with a maximum of 40 °C / 104 F.
(-) The average temperature of the palmrest area of similar devices was 28.8 °C / 83.8 F (-11.2 °C / -20.2 F).
| Asus Strix Scar 17 G732LXS i9-10980HK, GeForce RTX 2080 Super Mobile | MSI GE75 9SG i9-9880H, GeForce RTX 2080 Mobile | HP Omen 17-cb0020ng i9-9880H, GeForce RTX 2080 Mobile | Asus ASUS ROG Strix SCAR III G731GW-XB74 i7-9750H, GeForce RTX 2070 Mobile | Eurocom Nightsky RX17 i7-9750H, GeForce RTX 2070 Mobile | Average of class Gaming | |
|---|---|---|---|---|---|---|
| Heat | -14% | 2% | -5% | -5% | 2% | |
| Maximum Upper Side * (°C) | 59 | 48.8 17% | 47 20% | 45.2 23% | 48.6 18% | 45.2 ? 23% |
| Maximum Bottom * (°C) | 52 | 52 -0% | 54 -4% | 52 -0% | 46.8 10% | 48.2 ? 7% |
| Idle Upper Side * (°C) | 30 | 36.2 -21% | 32 -7% | 33 -10% | 35.4 -18% | 31 ? -3% |
| Idle Bottom * (°C) | 29 | 44.4 -53% | 30 -3% | 38 -31% | 38 -31% | 34.4 ? -19% |
* ... smaller is better
Speakers
The sound quality is quite good by laptop standards. The 2.0 system used by Asus provides a solid and halfway balanced sound. Audio content often sounds much more muddy and bass poorer in the competition.
Asus Strix Scar 17 G732LXS audio analysis
(±) | speaker loudness is average but good (81 dB)
Bass 100 - 315 Hz
(±) | reduced bass - on average 7.1% lower than median
(±) | linearity of bass is average (12.6% delta to prev. frequency)
Mids 400 - 2000 Hz
(±) | higher mids - on average 5.5% higher than median
(+) | mids are linear (5.1% delta to prev. frequency)
Highs 2 - 16 kHz
(+) | balanced highs - only 2.8% away from median
(+) | highs are linear (5.6% delta to prev. frequency)
Overall 100 - 16.000 Hz
(+) | overall sound is linear (12.1% difference to median)
Compared to same class
» 12% of all tested devices in this class were better, 4% similar, 84% worse
» The best had a delta of 6%, average was 18%, worst was 132%
Compared to all devices tested
» 9% of all tested devices were better, 2% similar, 88% worse
» The best had a delta of 4%, average was 23%, worst was 134%
MSI GE75 9SG audio analysis
(+) | speakers can play relatively loud (92.8 dB)
Bass 100 - 315 Hz
(±) | reduced bass - on average 12.2% lower than median
(±) | linearity of bass is average (8.7% delta to prev. frequency)
Mids 400 - 2000 Hz
(±) | higher mids - on average 6.7% higher than median
(±) | linearity of mids is average (11.5% delta to prev. frequency)
Highs 2 - 16 kHz
(+) | balanced highs - only 2.9% away from median
(±) | linearity of highs is average (7.6% delta to prev. frequency)
Overall 100 - 16.000 Hz
(±) | linearity of overall sound is average (16.5% difference to median)
Compared to same class
» 42% of all tested devices in this class were better, 7% similar, 51% worse
» The best had a delta of 6%, average was 18%, worst was 132%
Compared to all devices tested
» 28% of all tested devices were better, 6% similar, 66% worse
» The best had a delta of 4%, average was 23%, worst was 134%
Energy Management
Power Consumption
Although the Scar 17 boasts a graphics switch, the 17-incher is not an economical notebook. A maximum of 35 watts in idle mode is only surpassed by the HP Omen 17. The Asus offspring also allows itself an above average amount of energy under load with 177 to 280 watts.
| Off / Standby | |
| Idle | |
| Load |
|
Key:
min: | |
| Asus Strix Scar 17 G732LXS i9-10980HK, GeForce RTX 2080 Super Mobile | MSI GE75 9SG i9-9880H, GeForce RTX 2080 Mobile | HP Omen 17-cb0020ng i9-9880H, GeForce RTX 2080 Mobile | Asus ASUS ROG Strix SCAR III G731GW-XB74 i7-9750H, GeForce RTX 2070 Mobile | Eurocom Nightsky RX17 i7-9750H, GeForce RTX 2070 Mobile | Average of class Gaming | |
|---|---|---|---|---|---|---|
| Power Consumption | 17% | -8% | 9% | 18% | 25% | |
| Idle Minimum * (Watt) | 16 | 13.9 13% | 26 -63% | 18.2 -14% | 18.6 -16% | 13 ? 19% |
| Idle Average * (Watt) | 25 | 18.8 25% | 29 -16% | 23 8% | 22.6 10% | 18.6 ? 26% |
| Idle Maximum * (Watt) | 35 | 23.1 34% | 38 -9% | 33.1 5% | 23 34% | 24.2 ? 31% |
| Load Average * (Watt) | 177 | 112.3 37% | 106 40% | 124.8 29% | 93.4 47% | 109.2 ? 38% |
| Witcher 3 ultra * (Watt) | 227 | 231 -2% | 228 -0% | 180.8 20% | 186.4 18% | |
| Load Maximum * (Watt) | 280 | 291.5 -4% | 287 -2% | 263 6% | 233.6 17% | 256 ? 9% |
* ... smaller is better
Battery Life
Thanks to various energy-saving measures, the battery life is better than the power consumption, when connected to AC power, would suggest. In our WLAN test, which was carried out with a luminosity of around 150 cd/m², the 66 Wh battery managed around 6 hours.
| Asus Strix Scar 17 G732LXS i9-10980HK, GeForce RTX 2080 Super Mobile, 66 Wh | MSI GE75 9SG i9-9880H, GeForce RTX 2080 Mobile, 65 Wh | HP Omen 17-cb0020ng i9-9880H, GeForce RTX 2080 Mobile, 70 Wh | Asus ASUS ROG Strix SCAR III G731GW-XB74 i7-9750H, GeForce RTX 2070 Mobile, 66 Wh | Eurocom Nightsky RX17 i7-9750H, GeForce RTX 2070 Mobile, 62 Wh | Average of class Gaming | |
|---|---|---|---|---|---|---|
| Battery runtime | -17% | -43% | -33% | -48% | 3% | |
| Reader / Idle (h) | 10 | 4.2 -58% | 4.2 -58% | 4.2 -58% | 8.71 ? -13% | |
| WiFi v1.3 (h) | 5.9 | 4.9 -17% | 3.3 -44% | 3.9 -34% | 2 -66% | 7.11 ? 21% |
| Load (h) | 1.5 | 1.1 -27% | 1.4 -7% | 1.2 -20% | 1.502 ? 0% |
Pros
Cons
Verdict
With the Strix Scar 17 G732LXS, Asus sells an extremely powerful high-end laptop, which unfortunately suffers from the typical weaknesses of this category.
In addition to the heat generation, the noise level in 3D operation is also very high. On top of that, the graphics card has only earned its "Super" designation to a limited extent when comparing the performance with other RTX 2080 laptops (keyword TGP). Asus could also improve on the connectivity (no card reader, no Thunderbolt 3).
Otherwise, we liked the 17-incher very much. The Scar 17 is ahead of most competitors in terms of display (300 Hz!), input devices, sound, and battery life. However, in view of the price-performance ratio, we would recommend a cheaper model with a Core i7-10875H and GeForce RTX 2070 (Super), which will probably also stay cooler and quieter.
Asus Strix Scar 17 G732LXS
- 07/12/2020 v7 (old)
Florian Glaser
Price comparison
