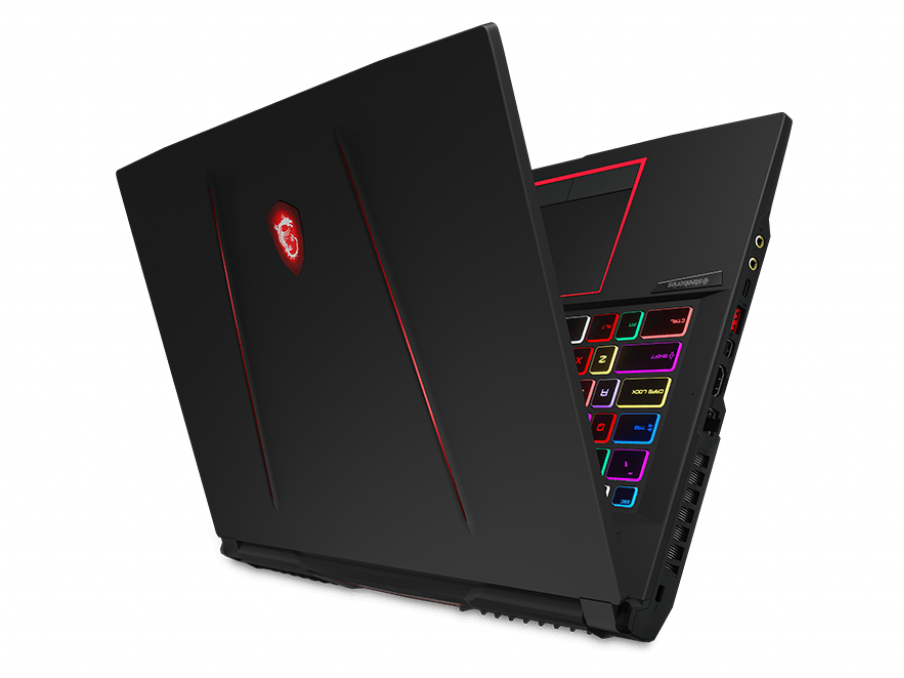
MSI GE75 Raider 9SG (Core i9-9880H, RTX 2080) Laptop Review
")
On April 23rd, MSI announced that it would update nearly its entire G Series of gaming laptops with 9th gen Intel CPUs or Nvidia GeForce GTX 16 GPUs. The unit we have here today is the GE75 9SG with the new Core i9-9880H to mark the first time that the GE75 series would include a Core i9 option at all. Last year's configuration topped out at the GE75 8SG with "only" the 8th gen Coffee Lake Core i7-8750H.
Other than the processor swap, the 2019 GE75 9SG is identical to the 2018 GE75 8SG down to even the RTX 2080 GPU. As such, we recommend checking out our existing reviews on the GE75 8SG and GE75 8SF for more information on the chassis, keyboard, connectivity features, and display. This review will instead focus on the performance differences between the GE75 9SG and last year's GE75 8SG/8SF and how much of a gain users can expect from the Core i9-9880H.
The MSI GE75 9SG with Core i9-9880H can currently be found online for $3400 USD while the Core i7-9750H configuration retails for $2700 USD. Can the jump from a Core i7 to Core i9 really justify the massive price difference?
More MSI reviews:
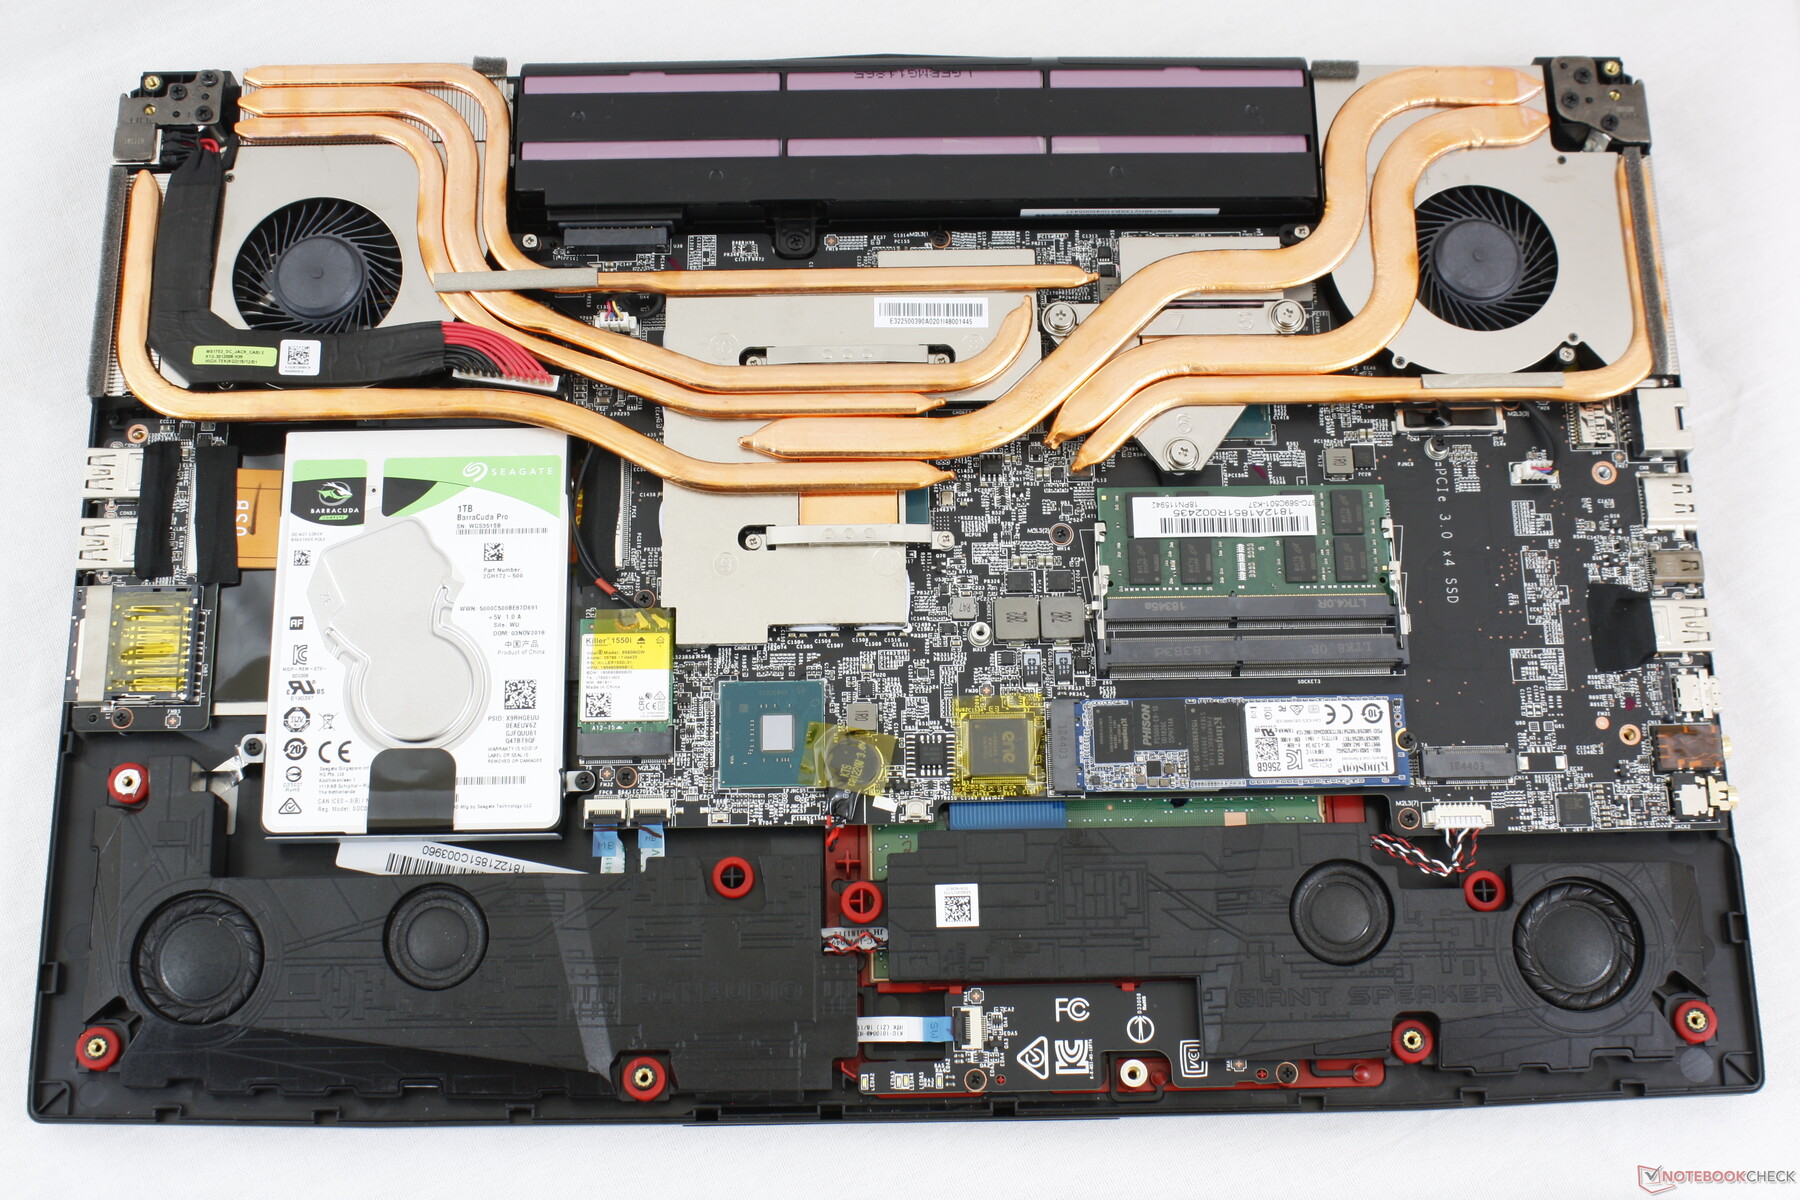
Case
SD Card Reader
| SD Card Reader | |
| average JPG Copy Test (av. of 3 runs) | |
| Dell XPS 15 9570 Core i9 UHD (Toshiba Exceria Pro SDXC 64 GB UHS-II) | |
| MSI GT75 8RG-090 Titan (Toshiba Exceria Pro SDXC 64 GB UHS-II) | |
| MSI GE75 9SG (Toshiba Exceria Pro SDXC 64 GB UHS-II) | |
| MSI GE73 8RF-008 Raider RGB (Toshiba Exceria Pro SDXC 64 GB UHS-II) | |
| maximum AS SSD Seq Read Test (1GB) | |
| Dell XPS 15 9570 Core i9 UHD (Toshiba Exceria Pro SDXC 64 GB UHS-II) | |
| MSI GT75 8RG-090 Titan (Toshiba Exceria Pro SDXC 64 GB UHS-II) | |
| MSI GE75 9SG (Toshiba Exceria Pro SDXC 64 GB UHS-II) | |
| MSI GE73 8RF-008 Raider RGB (Toshiba Exceria Pro SDXC 64 GB UHS-II) | |
Communication
| Networking | |
| iperf3 transmit AX12 | |
| MSI GT75 8RG-090 Titan | |
| MSI GE75 9SG | |
| Acer Predator Triton 700 | |
| Asus TUF FX705DY-AU072 | |
| iperf3 receive AX12 | |
| MSI GT75 8RG-090 Titan | |
| Acer Predator Triton 700 | |
| MSI GE75 9SG | |
| Asus TUF FX705DY-AU072 | |
Maintenance
Display
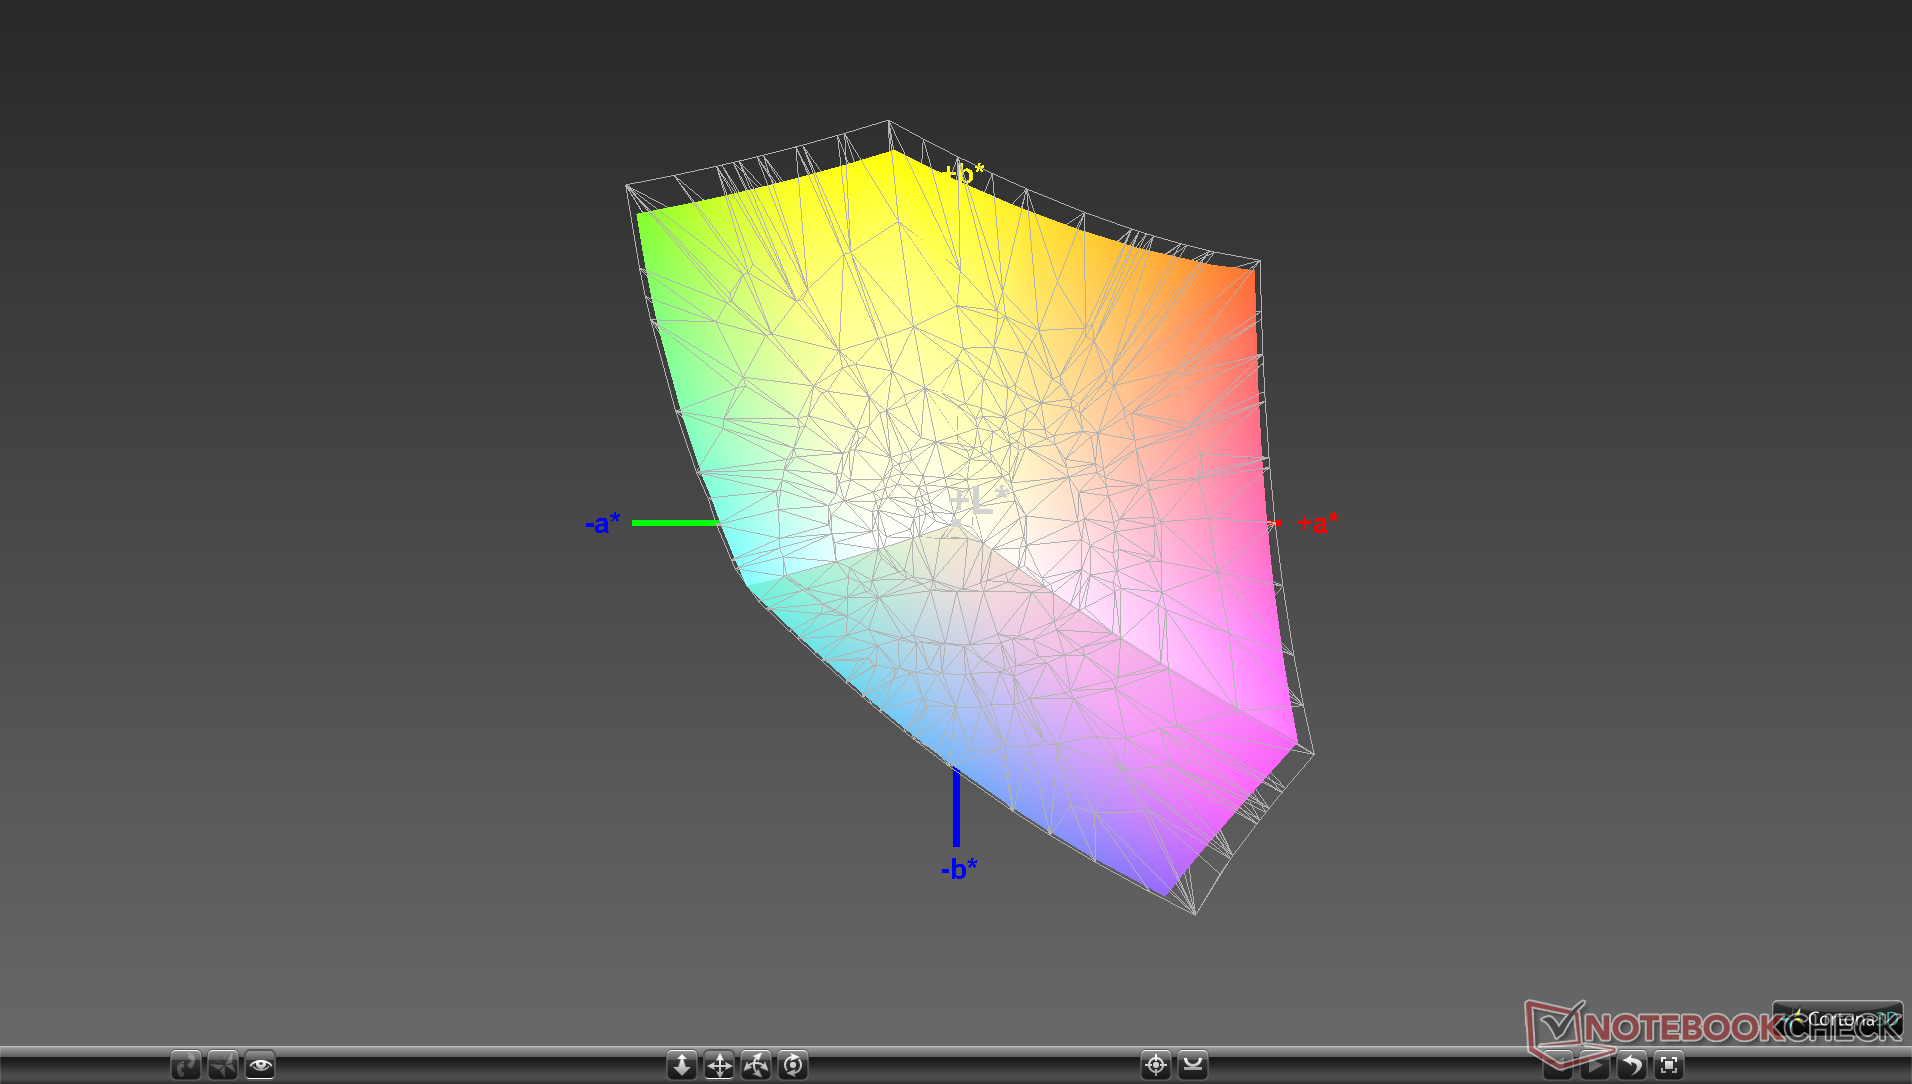
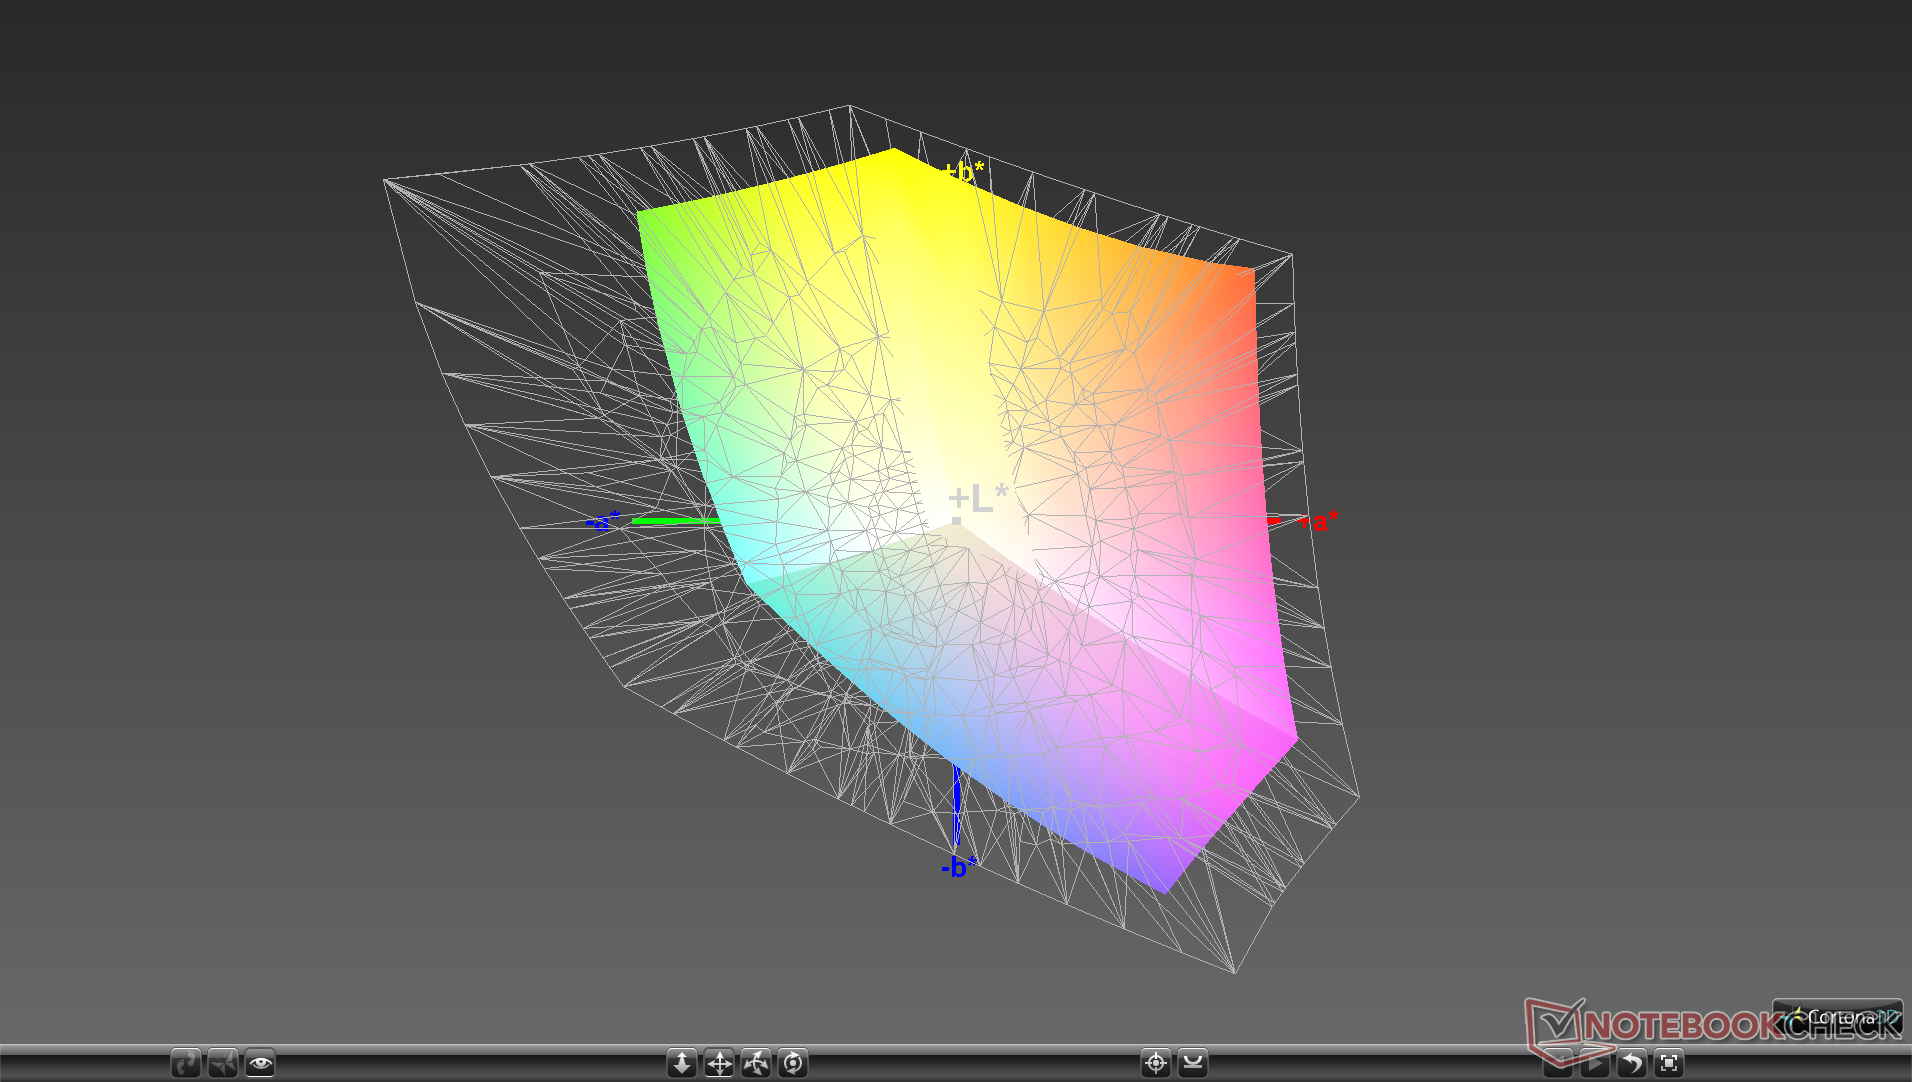
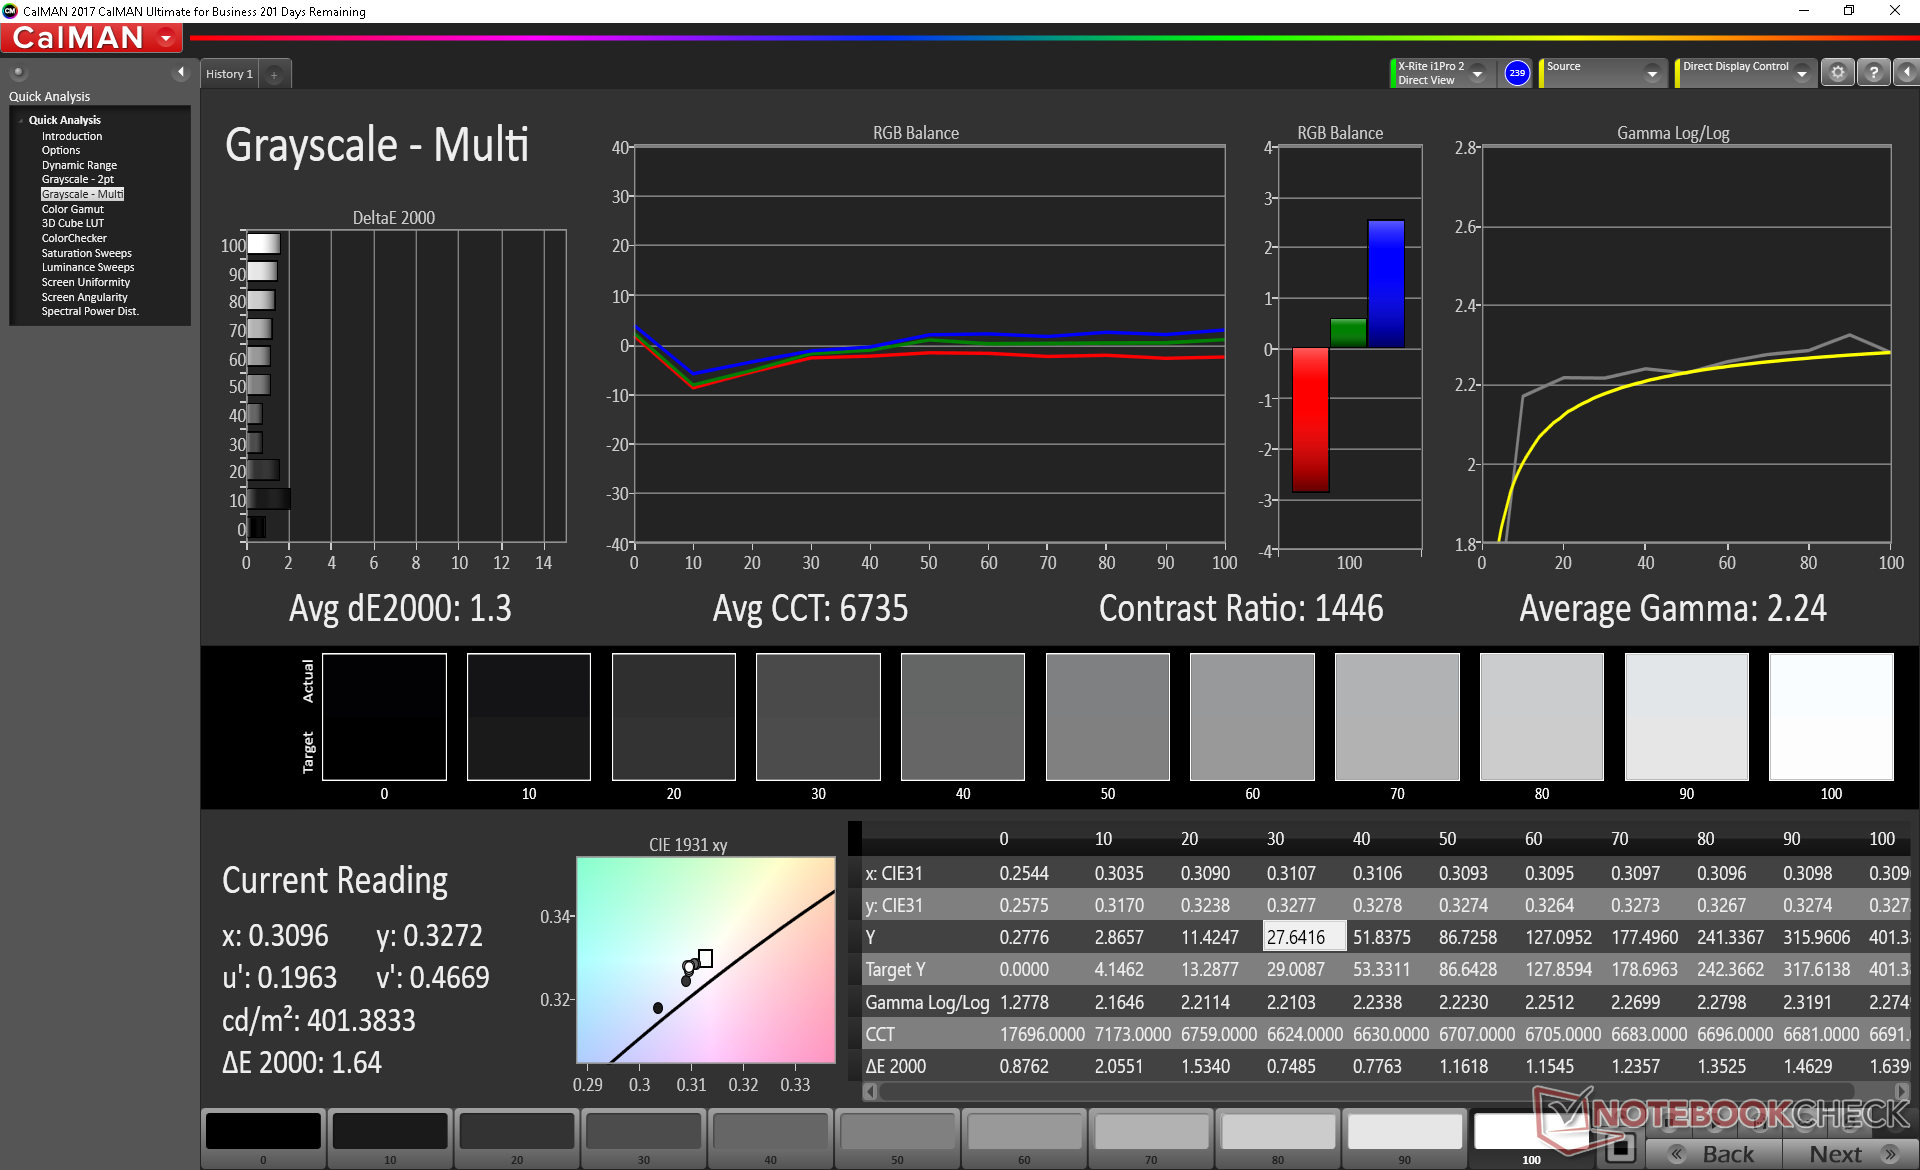
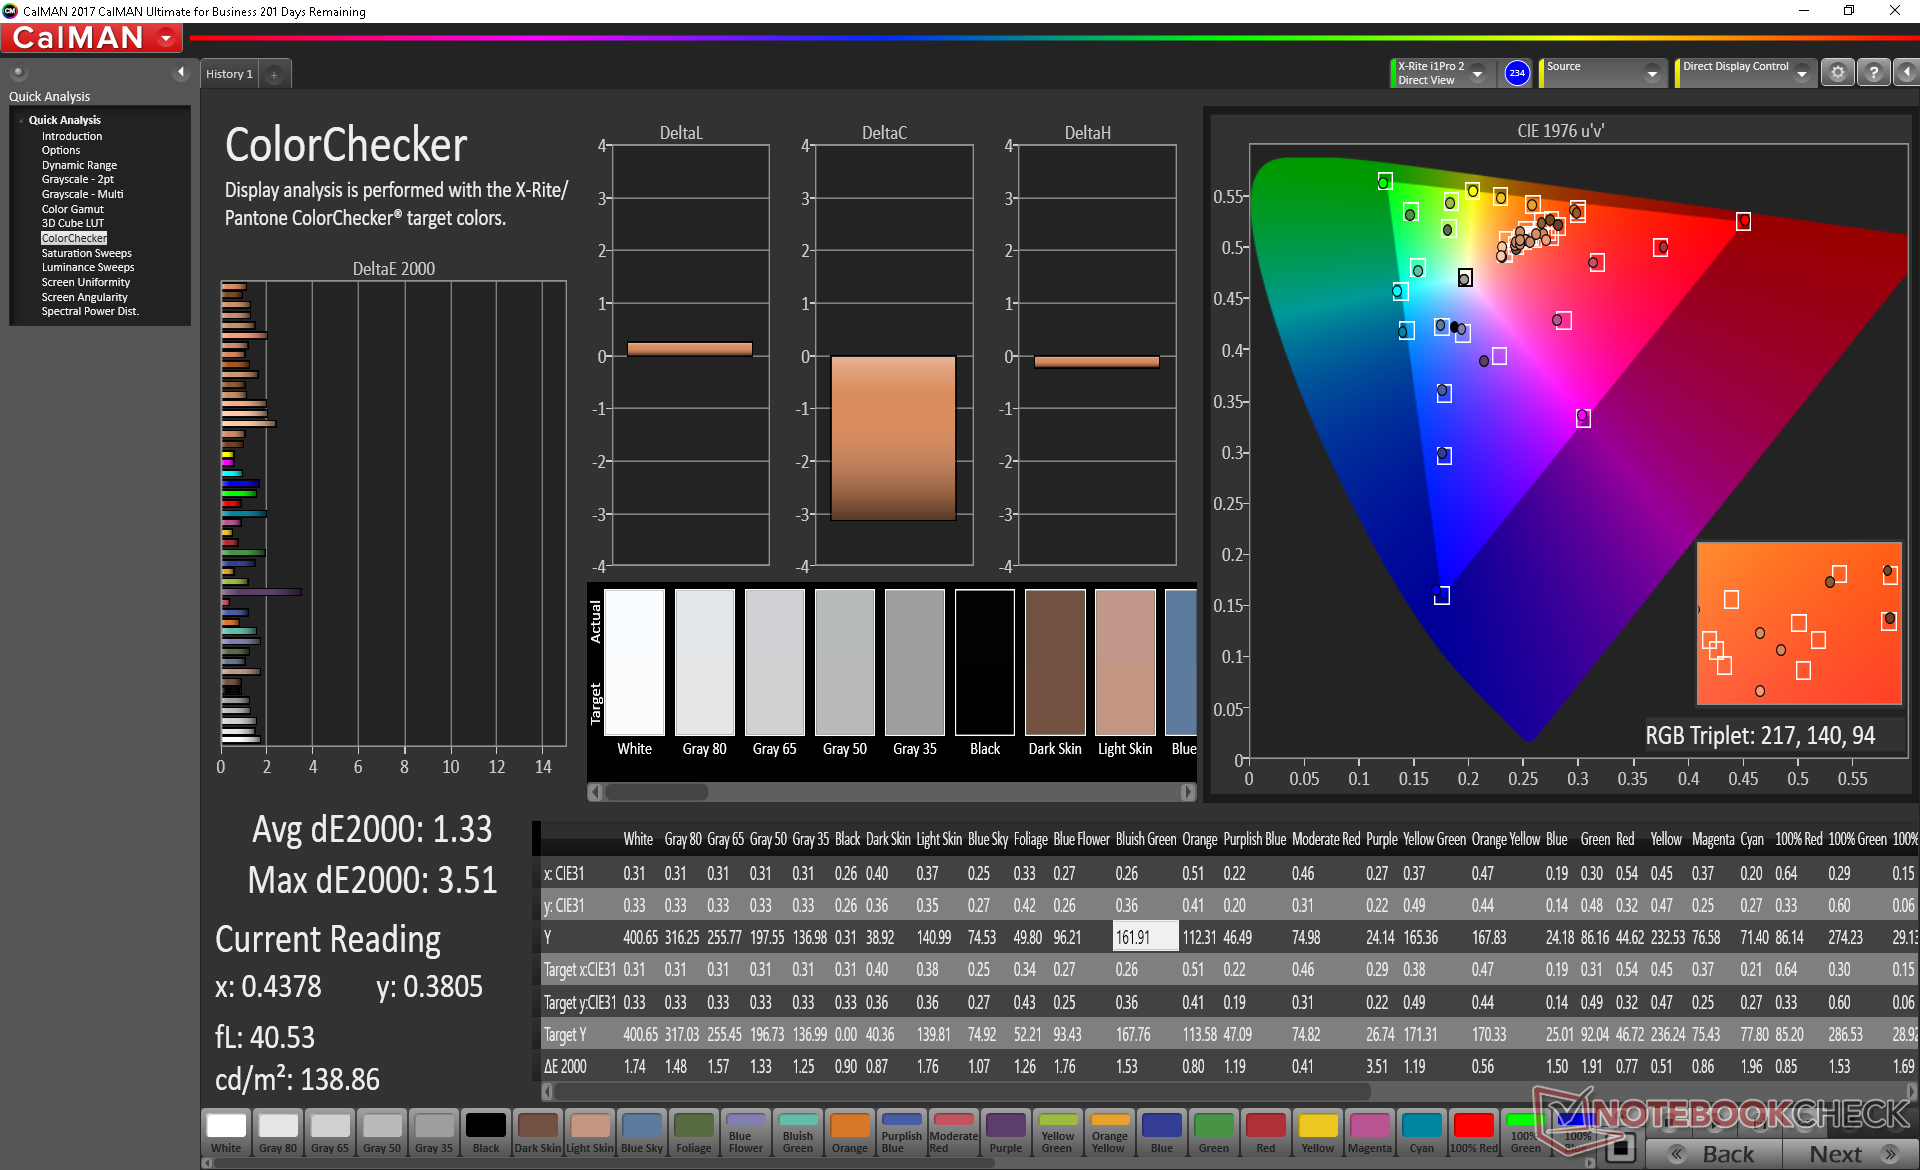
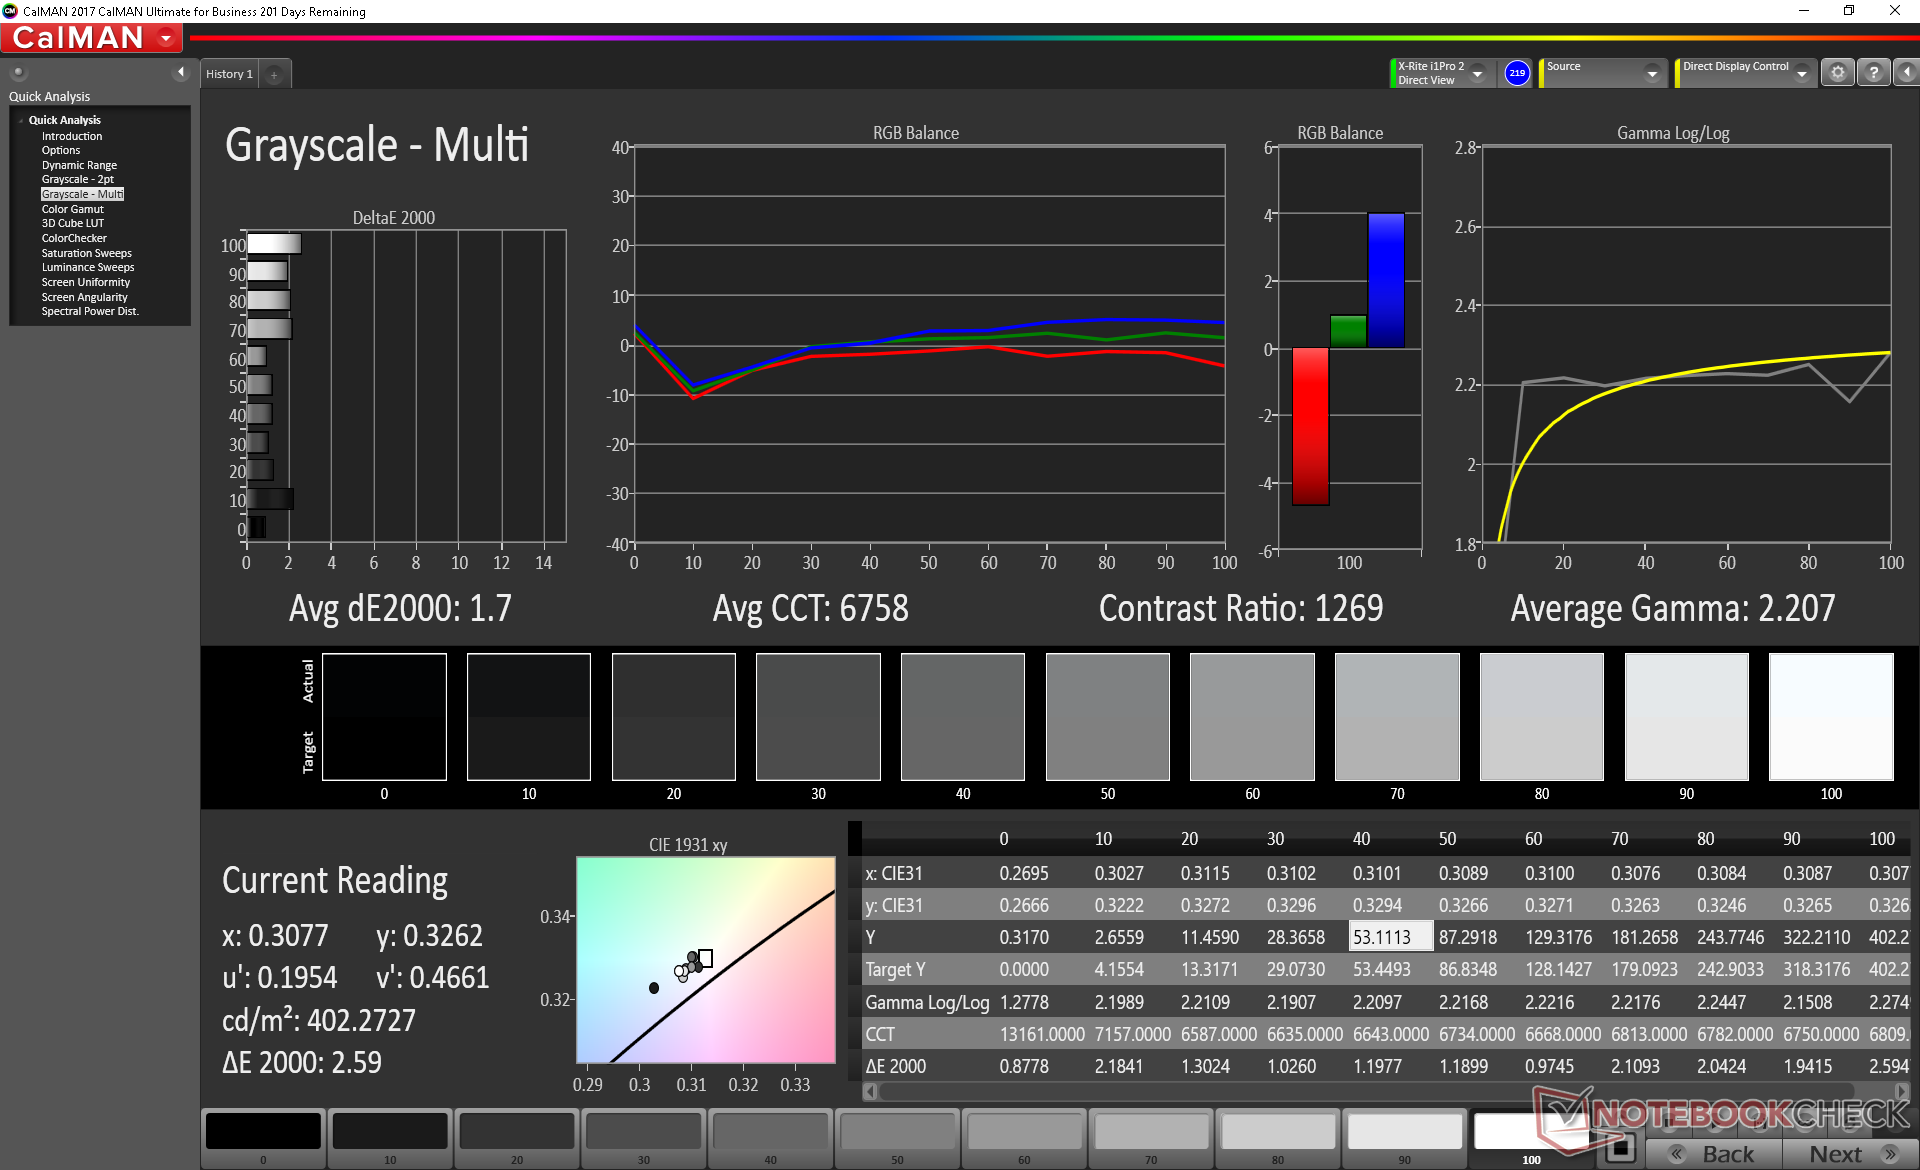
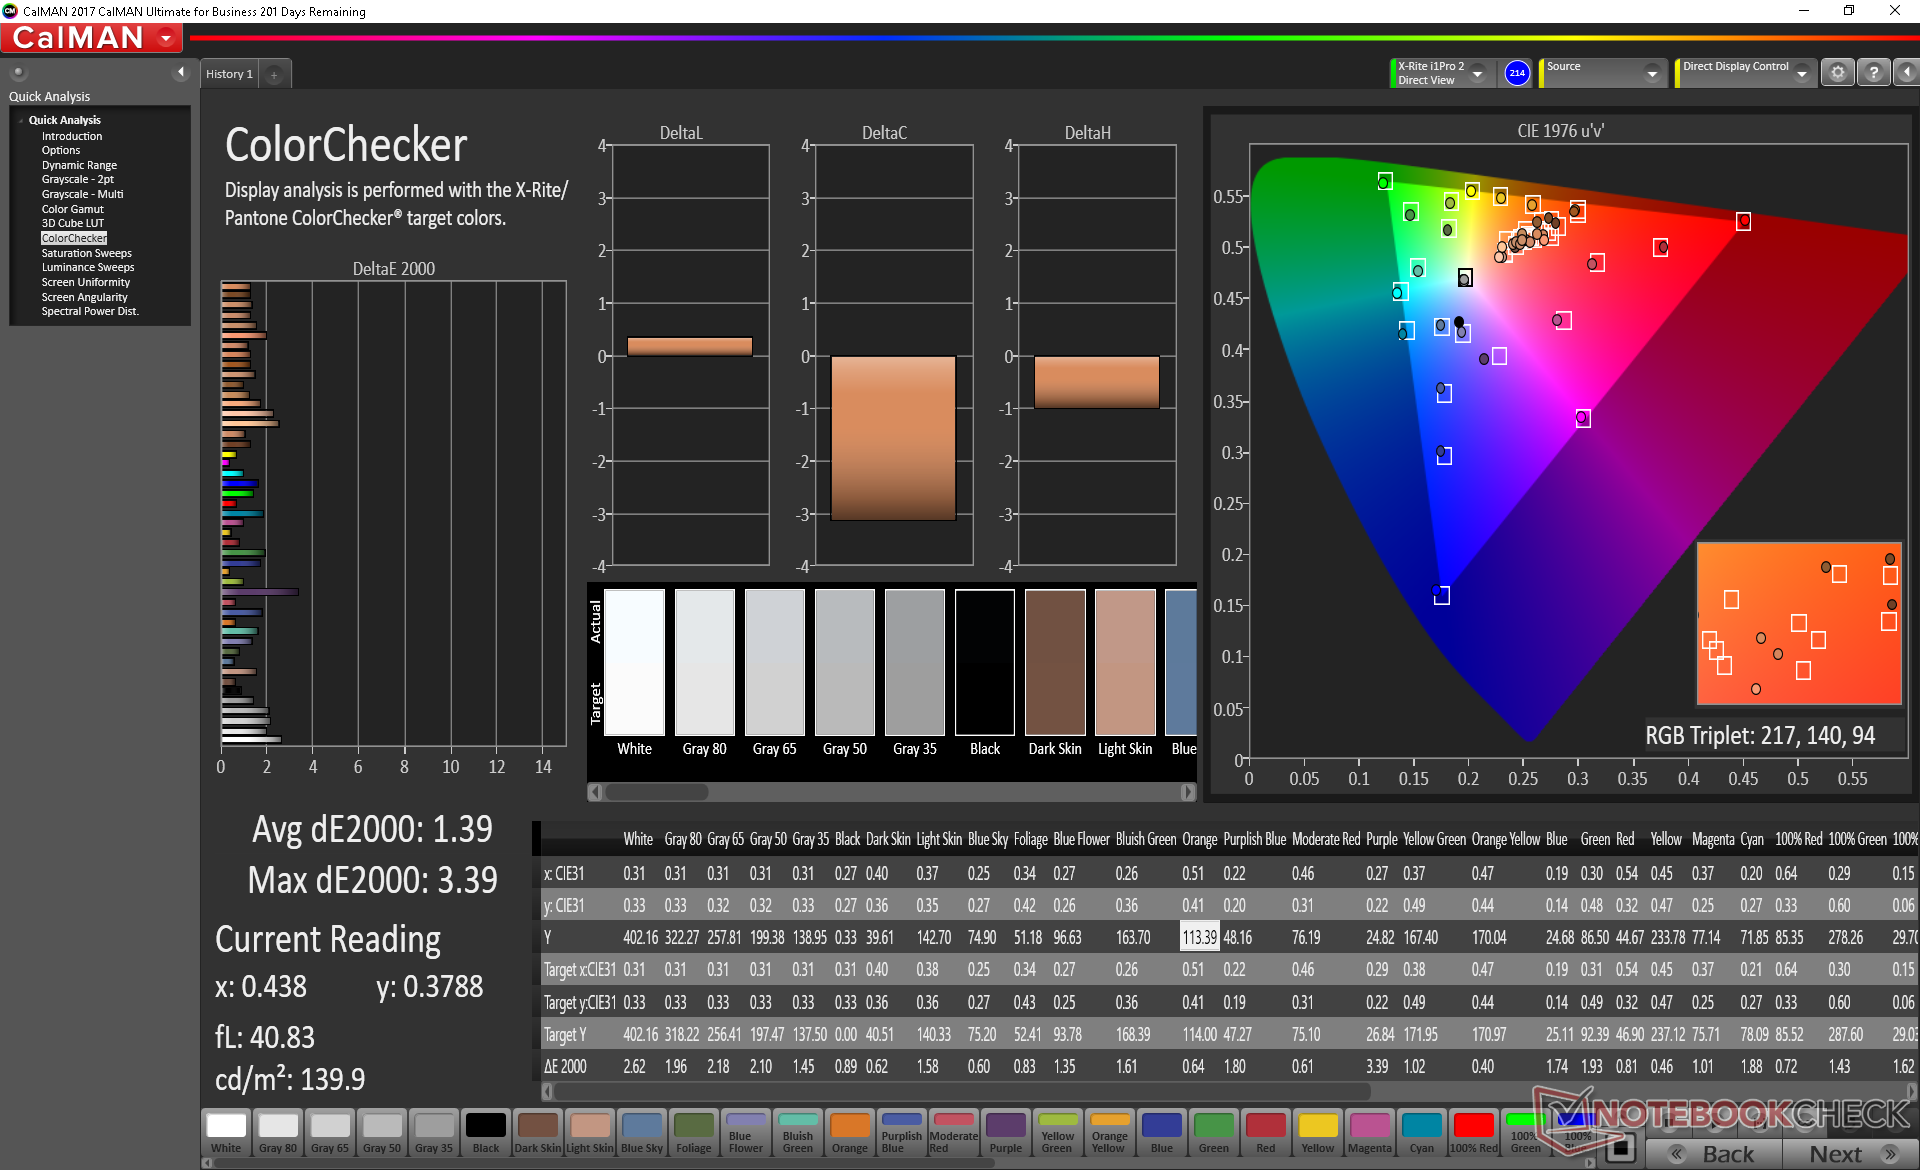
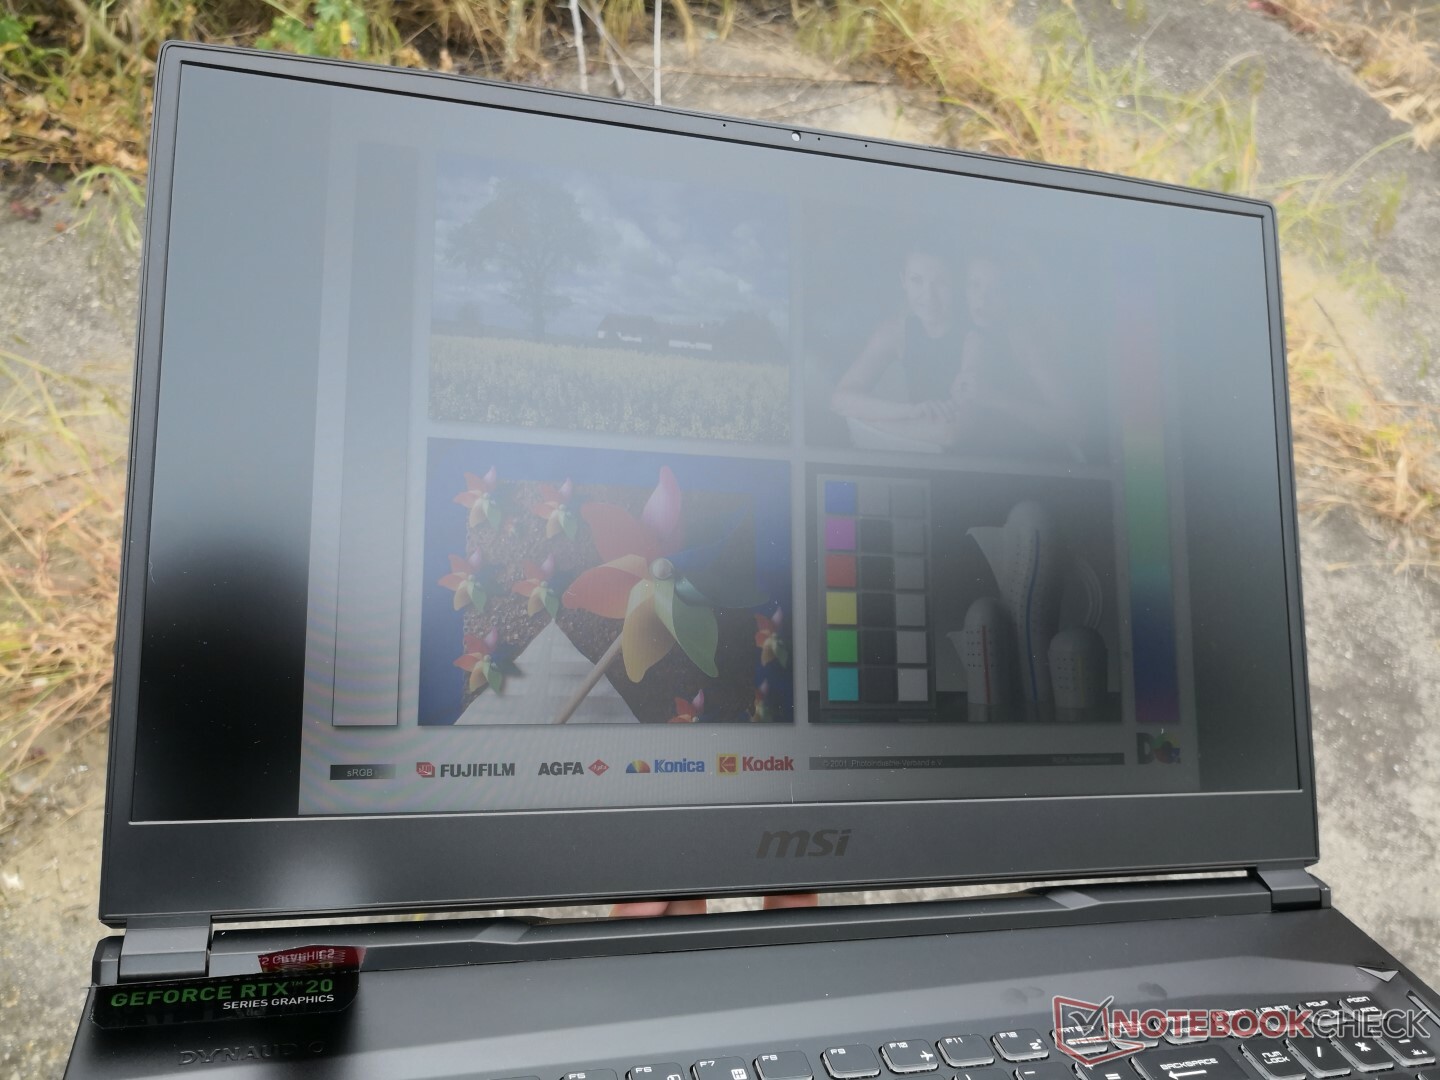
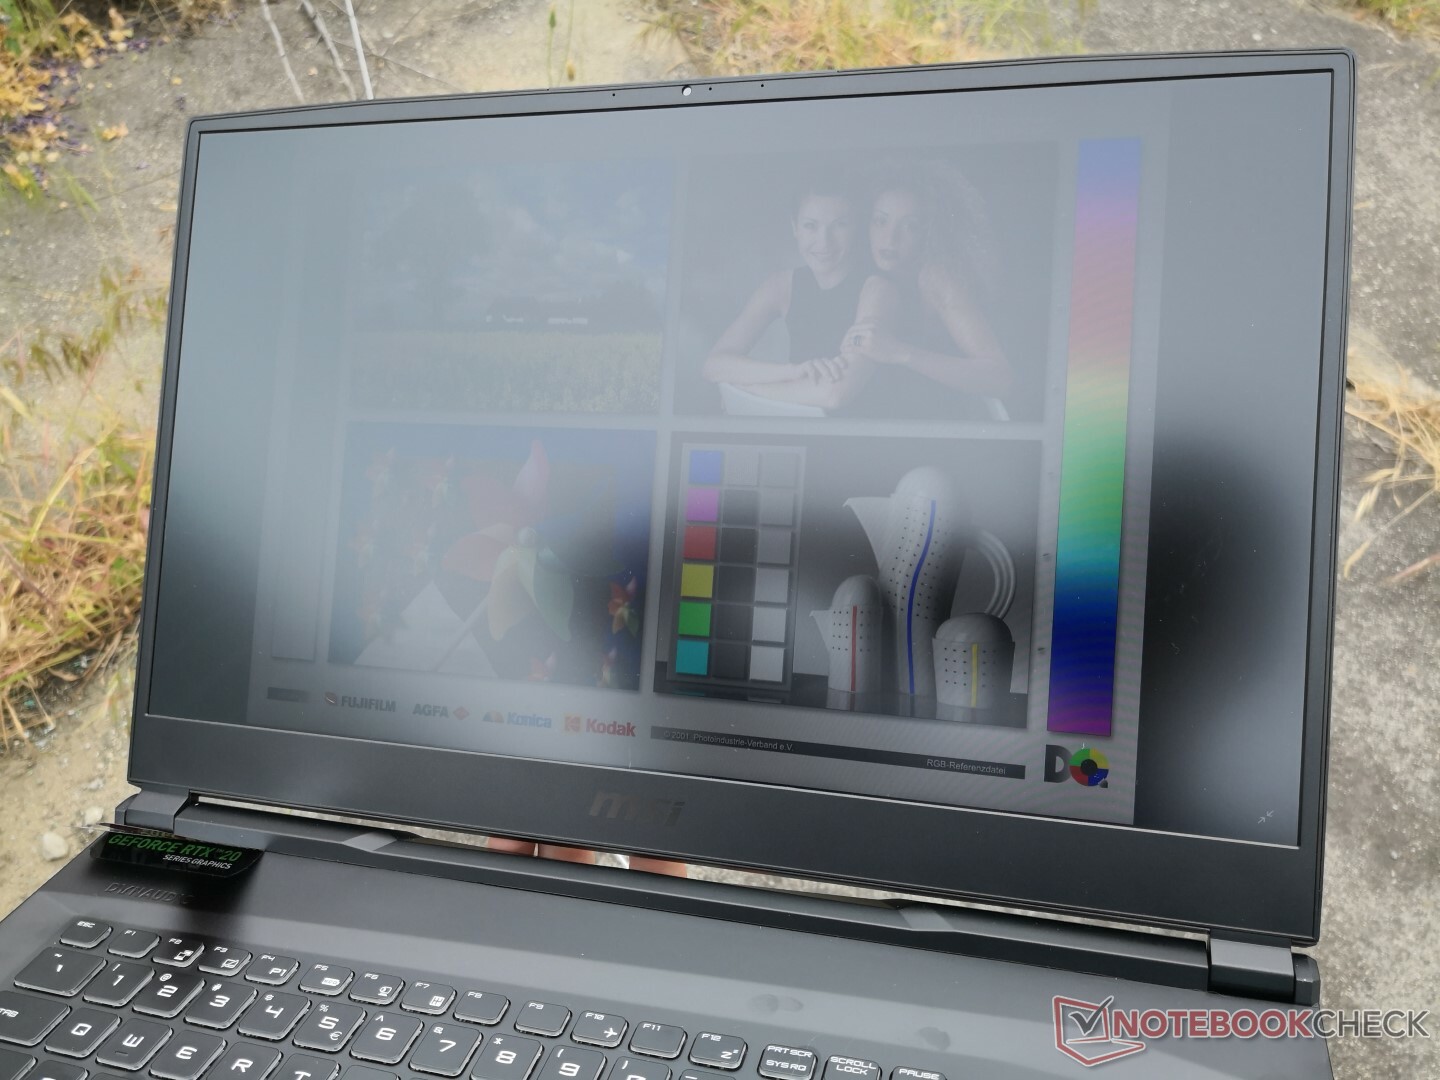
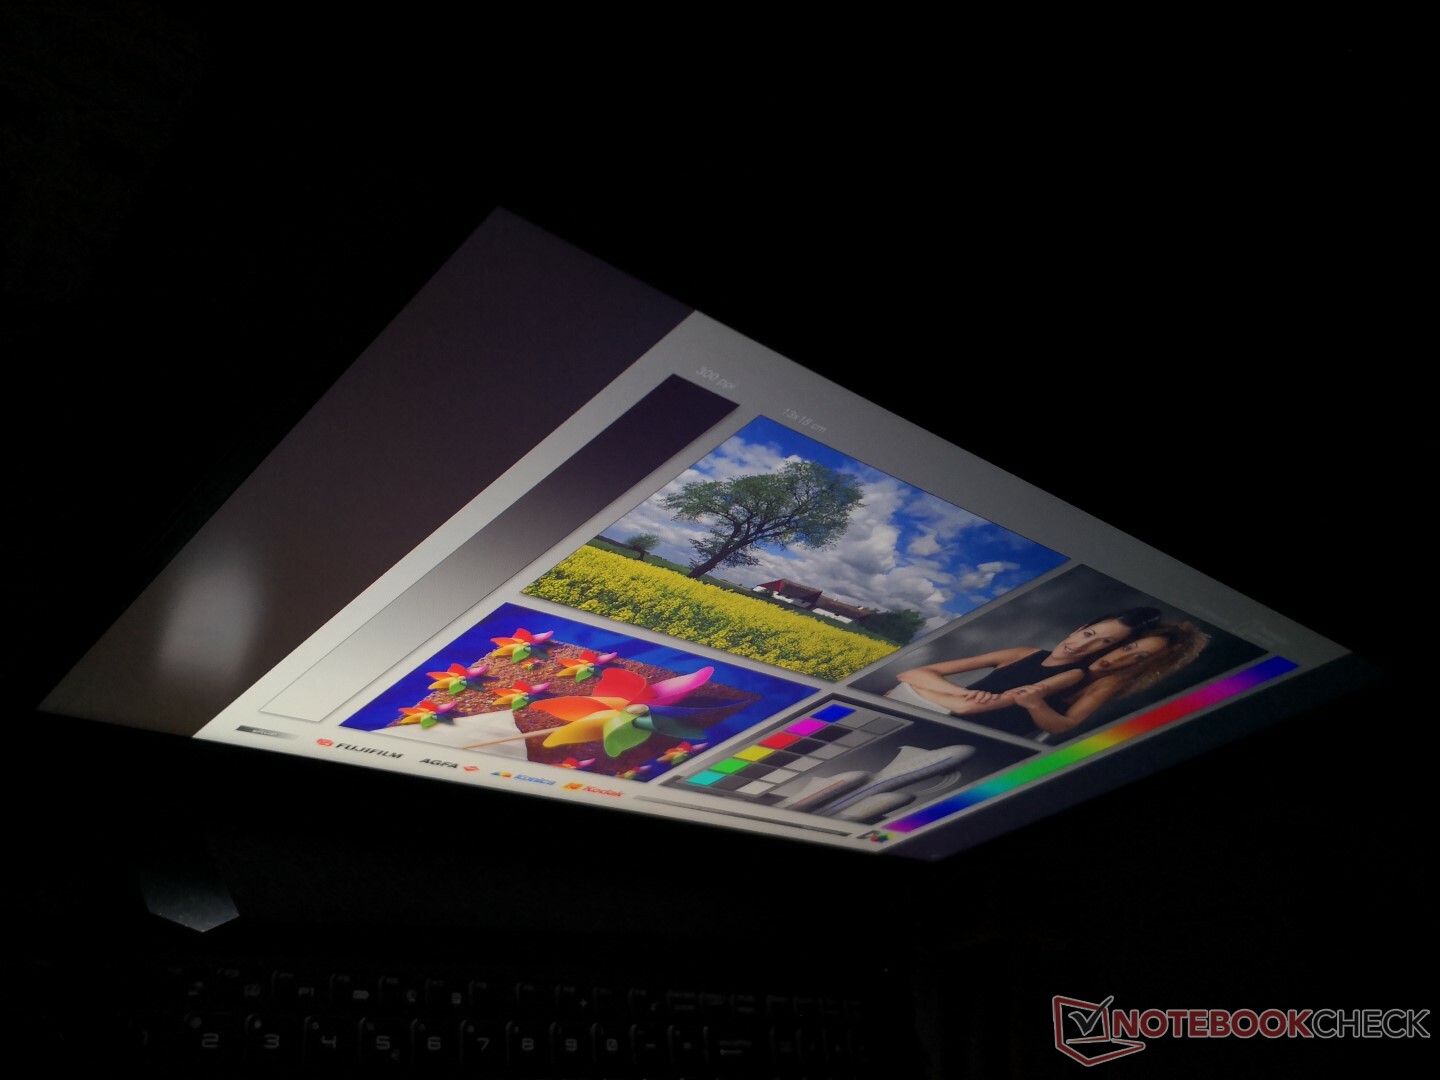
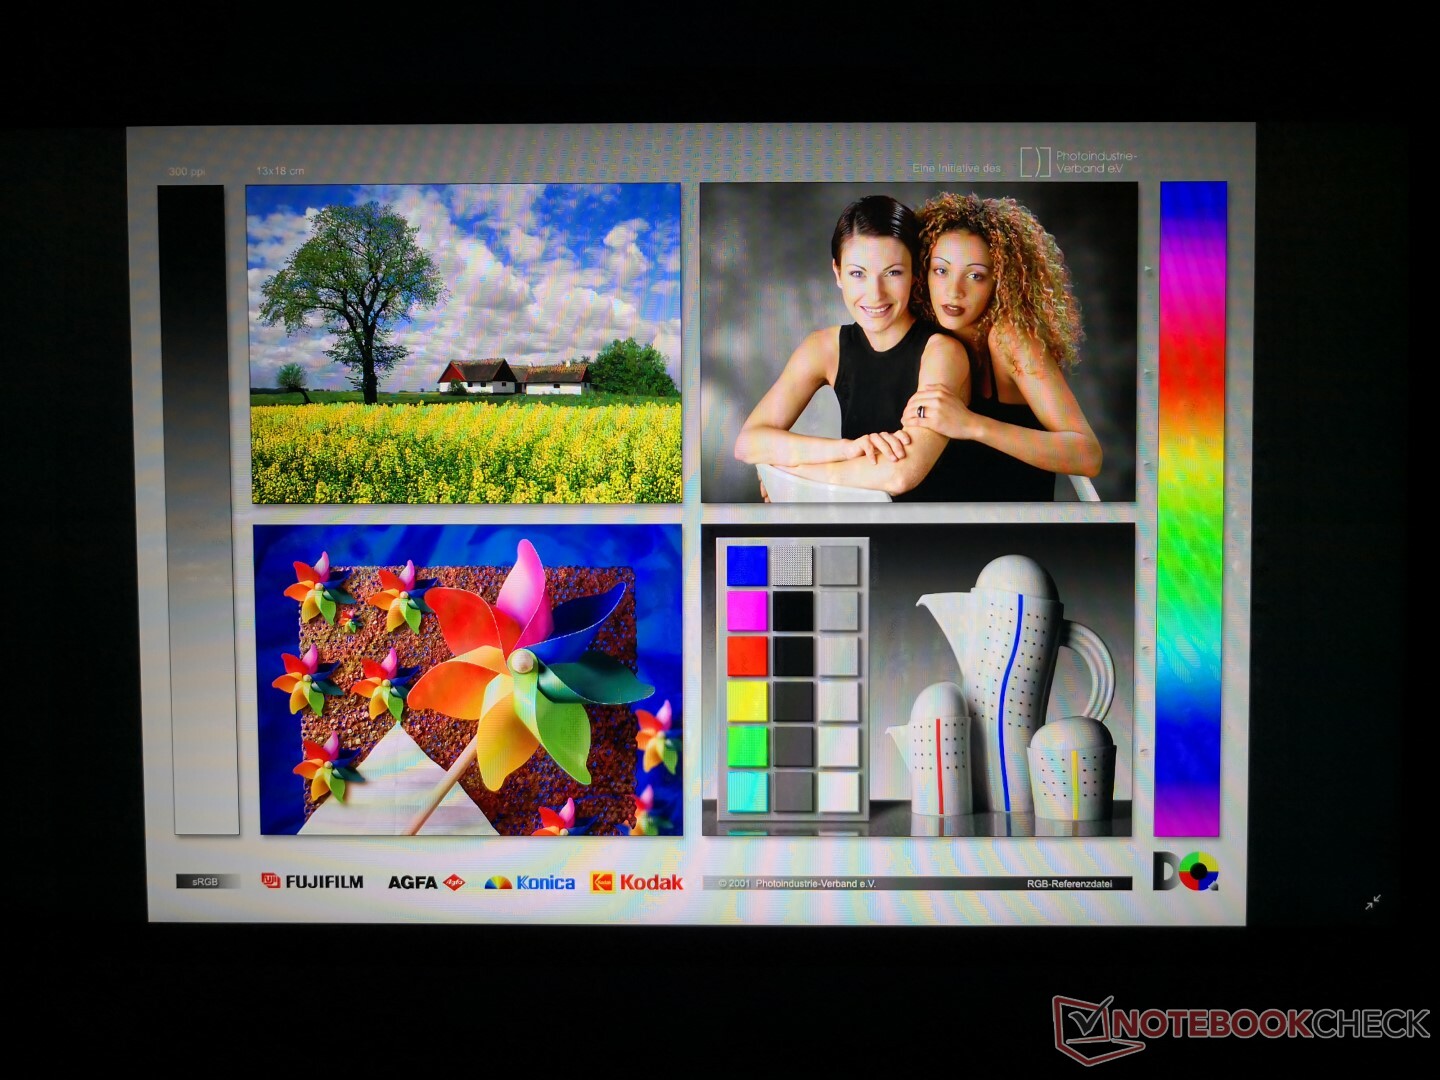
The same Chi Mei N173HCE-G33 AHVA panel graces both the GE75 9SG and GE75 8SG. Thus, all our comments on the GE75 8SG display apply here. The screen is brighter than most 17-inch gaming laptops with an excellent contrast ratio, very fast black-white and gray-gray response times to reduce ghosting, fast 144 Hz native refresh rate for smooth animations, and surprisingly accurate colors out of the box. This is a very high quality panel with almost no graininess issues unlike what we observed on the budget 17-inch Dell Inspiron 17 3780.
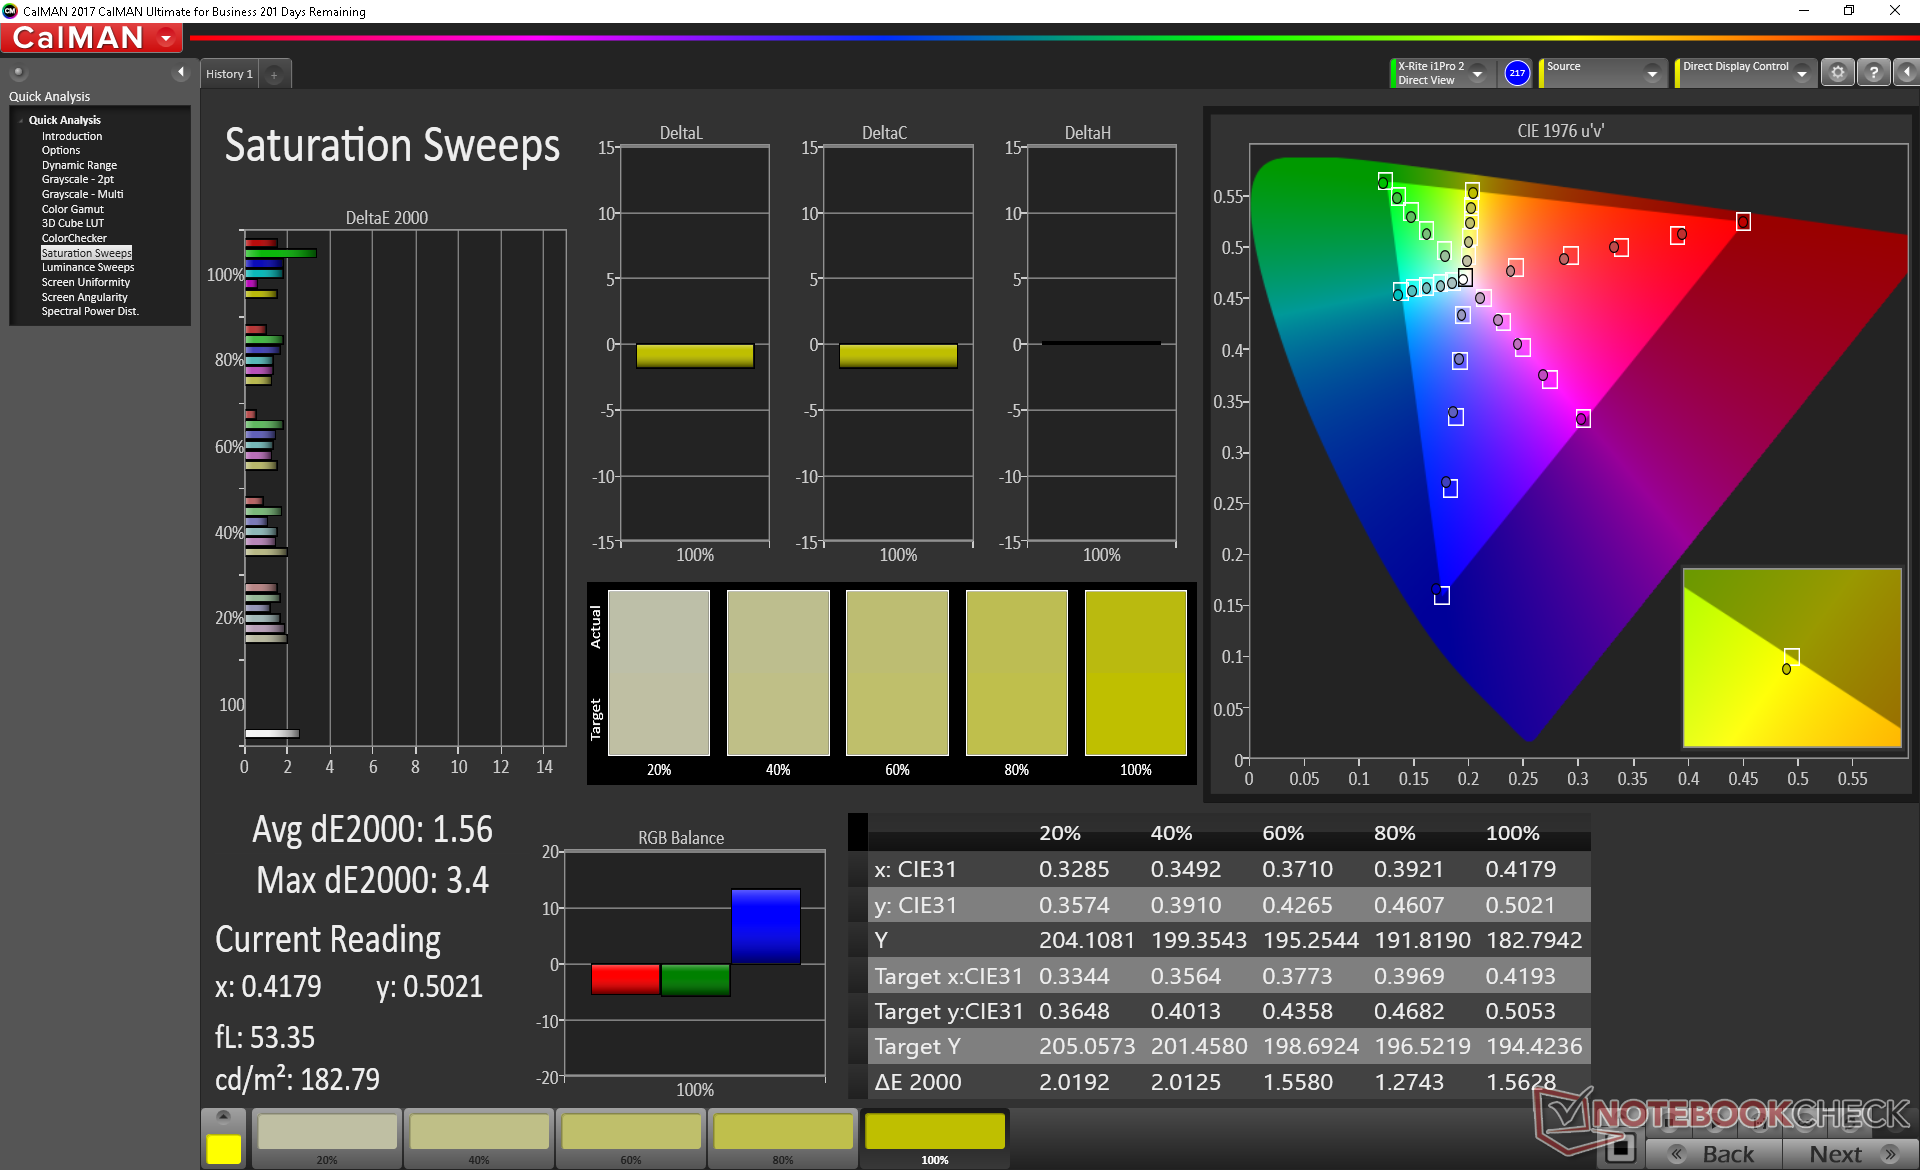
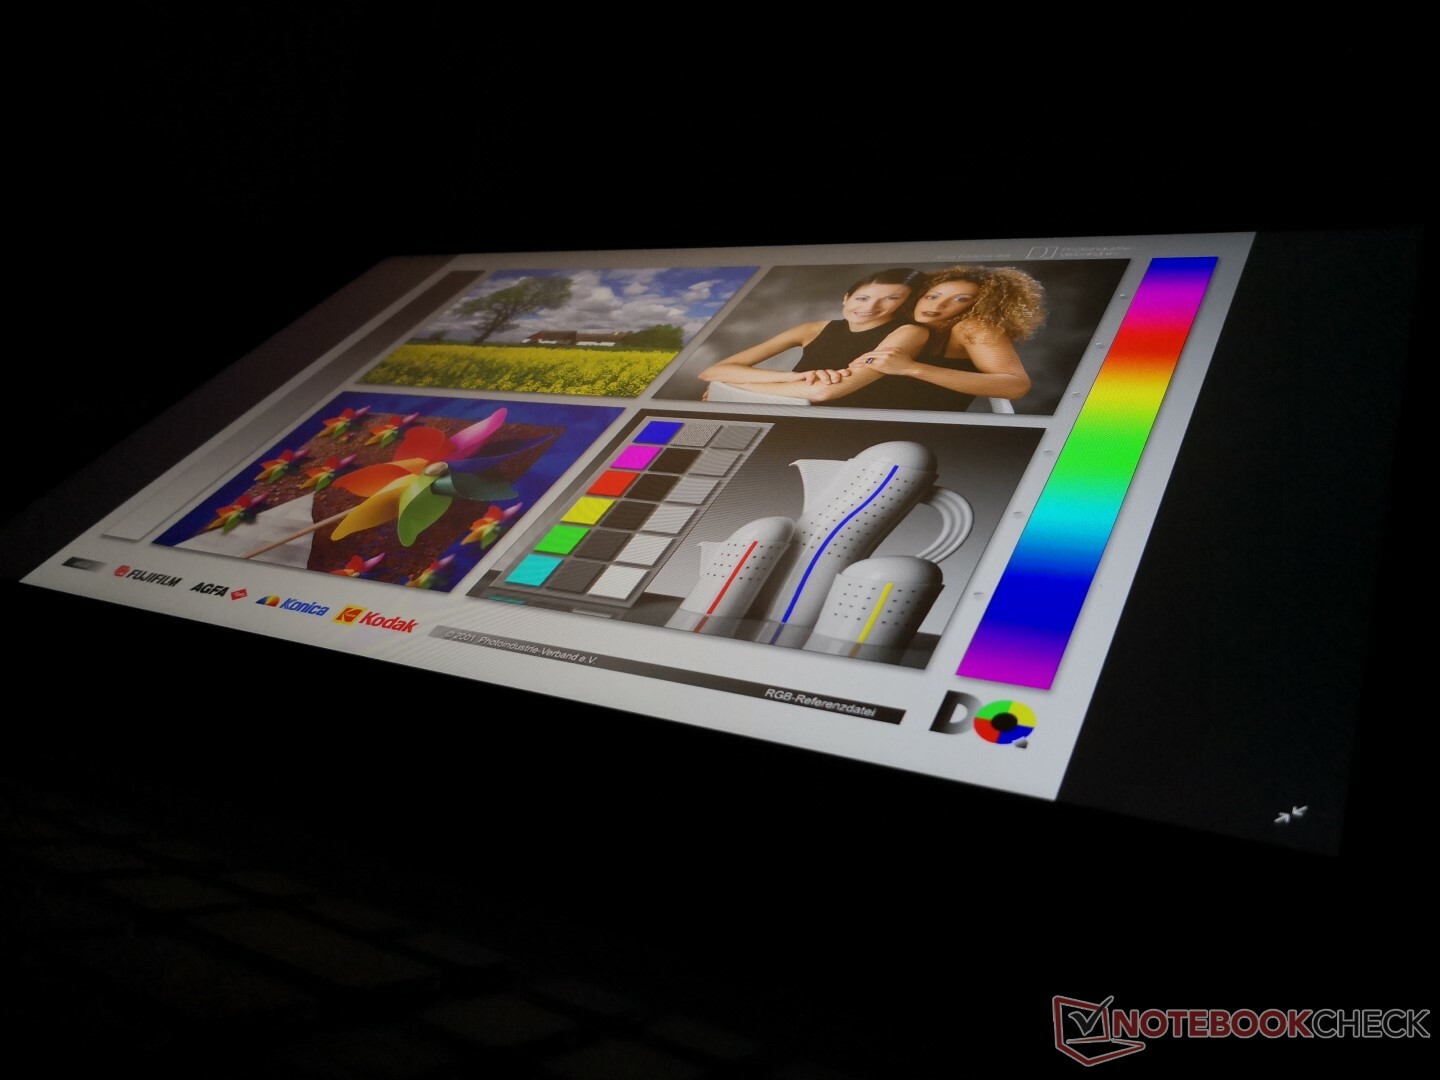
Color space covers approximately 92 percent of sRGB to be good enough for most amateur graphic artists. This is, after all, a panel designed primarily for gaming purposes. The main problem with the display is the heavy uneven backlight bleeding on our specific test unit as shown by the picture below. While some clouding is expected from most IPS-based displays, its presence here on a >$2000 gaming laptop is surprising.


| |||||||||||||||||||||||||
Brightness Distribution: 89 %
Center on Battery: 400.7 cd/m²
Contrast: 1179:1 (Black: 0.34 cd/m²)
ΔE ColorChecker Calman: 1.33 | ∀{0.5-29.43 Ø4.72}
calibrated: 1.39
ΔE Greyscale Calman: 1.3 | ∀{0.09-98 Ø4.97}
92.1% sRGB (Argyll 1.6.3 3D)
58.2% AdobeRGB 1998 (Argyll 1.6.3 3D)
63.5% AdobeRGB 1998 (Argyll 3D)
92% sRGB (Argyll 3D)
61.5% Display P3 (Argyll 3D)
Gamma: 2.24
CCT: 6735 K
| MSI GE75 9SG Chi Mei N173HCE-G33, AHVA, 17.3", 1920x1080 | Asus TUF FX705DY-AU072 AU Optronics B173HAN04.2, IPS, 17.3", 1920x1080 | Asus Zephyrus S GX701GX B173HAN04.0 (AUO409D), IPS, 17.3", 1920x1080 | MSI GT75 8RG-090 Titan CMN N173HHE-G32 (CMN1747), TN, 17.3", 1920x1080 | Acer Predator Triton 700 AUO B156HAN04.2 (AUO42ED), IPS, 15.6", 1920x1080 | MSI GE73 8RF-008 Raider RGB Chi Mei N173HHE-G32 (CMN1747), TN WLED, 17.3", 1920x1080 | |
|---|---|---|---|---|---|---|
| Display | -1% | 31% | -1% | 31% | ||
| Display P3 Coverage (%) | 61.5 | 62.9 2% | 90.9 48% | 62.5 2% | 90.8 48% | |
| sRGB Coverage (%) | 92 | 87.8 -5% | 100 9% | 88.7 -4% | 99.9 9% | |
| AdobeRGB 1998 Coverage (%) | 63.5 | 63.9 1% | 86.2 36% | 63.5 0% | 85.8 35% | |
| Response Times | -383% | -23% | 2% | -435% | -198% | |
| Response Time Grey 50% / Grey 80% * (ms) | 7.2 ? | 40 ? -456% | 7.2 ? -0% | 8 ? -11% | 44.8 ? -522% | 28 ? -289% |
| Response Time Black / White * (ms) | 6.6 ? | 27 ? -309% | 9.6 ? -45% | 5.6 ? 15% | 29.6 ? -348% | 13.6 ? -106% |
| PWM Frequency (Hz) | 26040 ? | 26000 ? | 25000 ? | |||
| Screen | -34% | -17% | -14% | -94% | -40% | |
| Brightness middle (cd/m²) | 400.7 | 322 -20% | 288 -28% | 240 -40% | 291 -27% | 273 -32% |
| Brightness (cd/m²) | 372 | 303 -19% | 287 -23% | 248 -33% | 277 -26% | 273 -27% |
| Brightness Distribution (%) | 89 | 84 -6% | 91 2% | 83 -7% | 84 -6% | 90 1% |
| Black Level * (cd/m²) | 0.34 | 0.32 6% | 0.2 41% | 0.22 35% | 0.22 35% | 0.26 24% |
| Contrast (:1) | 1179 | 1006 -15% | 1440 22% | 1091 -7% | 1323 12% | 1050 -11% |
| Colorchecker dE 2000 * | 1.33 | 2.97 -123% | 2.33 -75% | 2.14 -61% | 5.52 -315% | 3.52 -165% |
| Colorchecker dE 2000 max. * | 3.51 | 5.08 -45% | 5.34 -52% | 5.04 -44% | 10.72 -205% | 6.34 -81% |
| Colorchecker dE 2000 calibrated * | 1.39 | 2.29 -65% | 2.47 -78% | 1.54 -11% | 2.09 -50% | |
| Greyscale dE 2000 * | 1.3 | 2.26 -74% | 1.19 8% | 1.62 -25% | 6.59 -407% | 3.11 -139% |
| Gamma | 2.24 98% | 2.45 90% | 2.41 91% | 2.28 96% | 2.44 90% | 2.43 91% |
| CCT | 6735 97% | 6892 94% | 6710 97% | 6846 95% | 7816 83% | 6999 93% |
| Color Space (Percent of AdobeRGB 1998) (%) | 58.2 | 57 -2% | 57 -2% | 77 32% | 58 0% | 76 31% |
| Color Space (Percent of sRGB) (%) | 92.1 | 87 -6% | 88 -4% | 100 9% | 89 -3% | 100 9% |
| Total Average (Program / Settings) | -209% /
-87% | -14% /
-15% | 6% /
-3% | -177% /
-121% | -69% /
-46% |
* ... smaller is better

Display Response Times
| ↔ Response Time Black to White | ||
|---|---|---|
| 6.6 ms ... rise ↗ and fall ↘ combined | ↗ 3.2 ms rise | 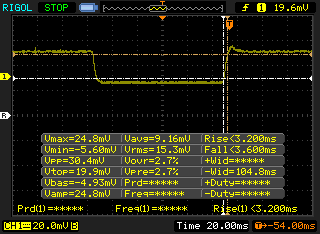 |
| ↘ 3.4 ms fall | ||
| The screen shows very fast response rates in our tests and should be very well suited for fast-paced gaming. In comparison, all tested devices range from 0.1 (minimum) to 240 (maximum) ms. » 21 % of all devices are better. This means that the measured response time is better than the average of all tested devices (19.8 ms). | ||
| ↔ Response Time 50% Grey to 80% Grey | ||
| 7.2 ms ... rise ↗ and fall ↘ combined | ↗ 3.8 ms rise | 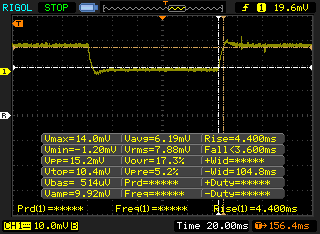 |
| ↘ 3.4 ms fall | ||
| The screen shows very fast response rates in our tests and should be very well suited for fast-paced gaming. In comparison, all tested devices range from 0.165 (minimum) to 636 (maximum) ms. » 20 % of all devices are better. This means that the measured response time is better than the average of all tested devices (31 ms). | ||
Screen Flickering / PWM (Pulse-Width Modulation)
| Screen flickering / PWM detected | 26040 Hz | ≤ 10 % brightness setting | 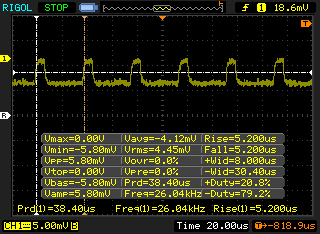 |
The display backlight flickers at 26040 Hz (worst case, e.g., utilizing PWM) Flickering detected at a brightness setting of 10 % and below. There should be no flickering or PWM above this brightness setting. The frequency of 26040 Hz is quite high, so most users sensitive to PWM should not notice any flickering. In comparison: 52 % of all tested devices do not use PWM to dim the display. If PWM was detected, an average of 7753 (minimum: 5 - maximum: 343500) Hz was measured. | |||
Performance
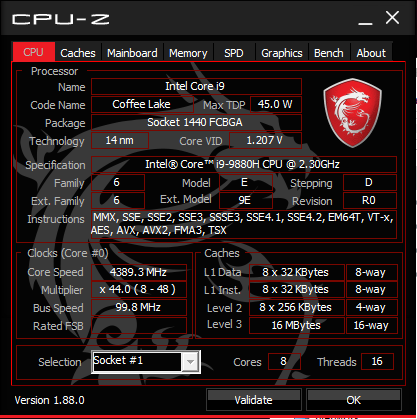
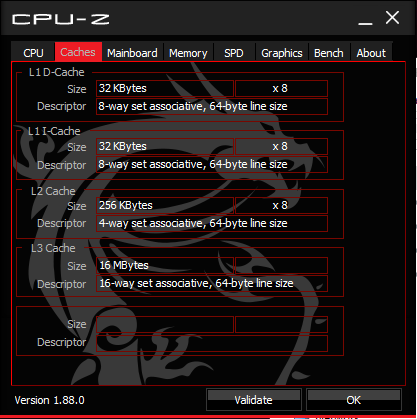
The 9th gen Core i9-9880H is indubitably the star of the show. When compared to the 8th gen Coffee Lake-H Core i7-8750H or even i9-8950HK, the i9-9880H carries two additional physical cores for a total of 16 threads versus "only" 12 threads on the aforementioned last generation processors. There is also an unlocked Core i9-9980HK CPU for potentially even faster performance than the i9-9880H although such an option is only available on the higher-end MSI GT75 series.
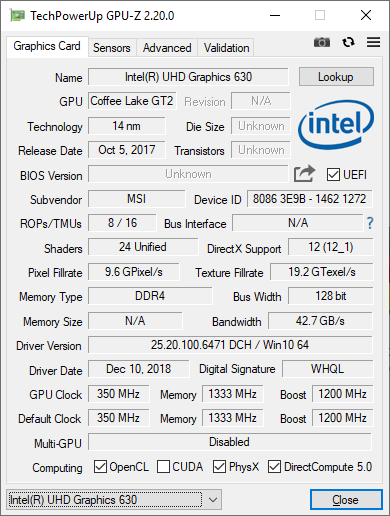
Nvidia Optimus is included for automatic graphics switching to the integrated UHD Graphics 630. G-Sync is not available as a result.
Processor
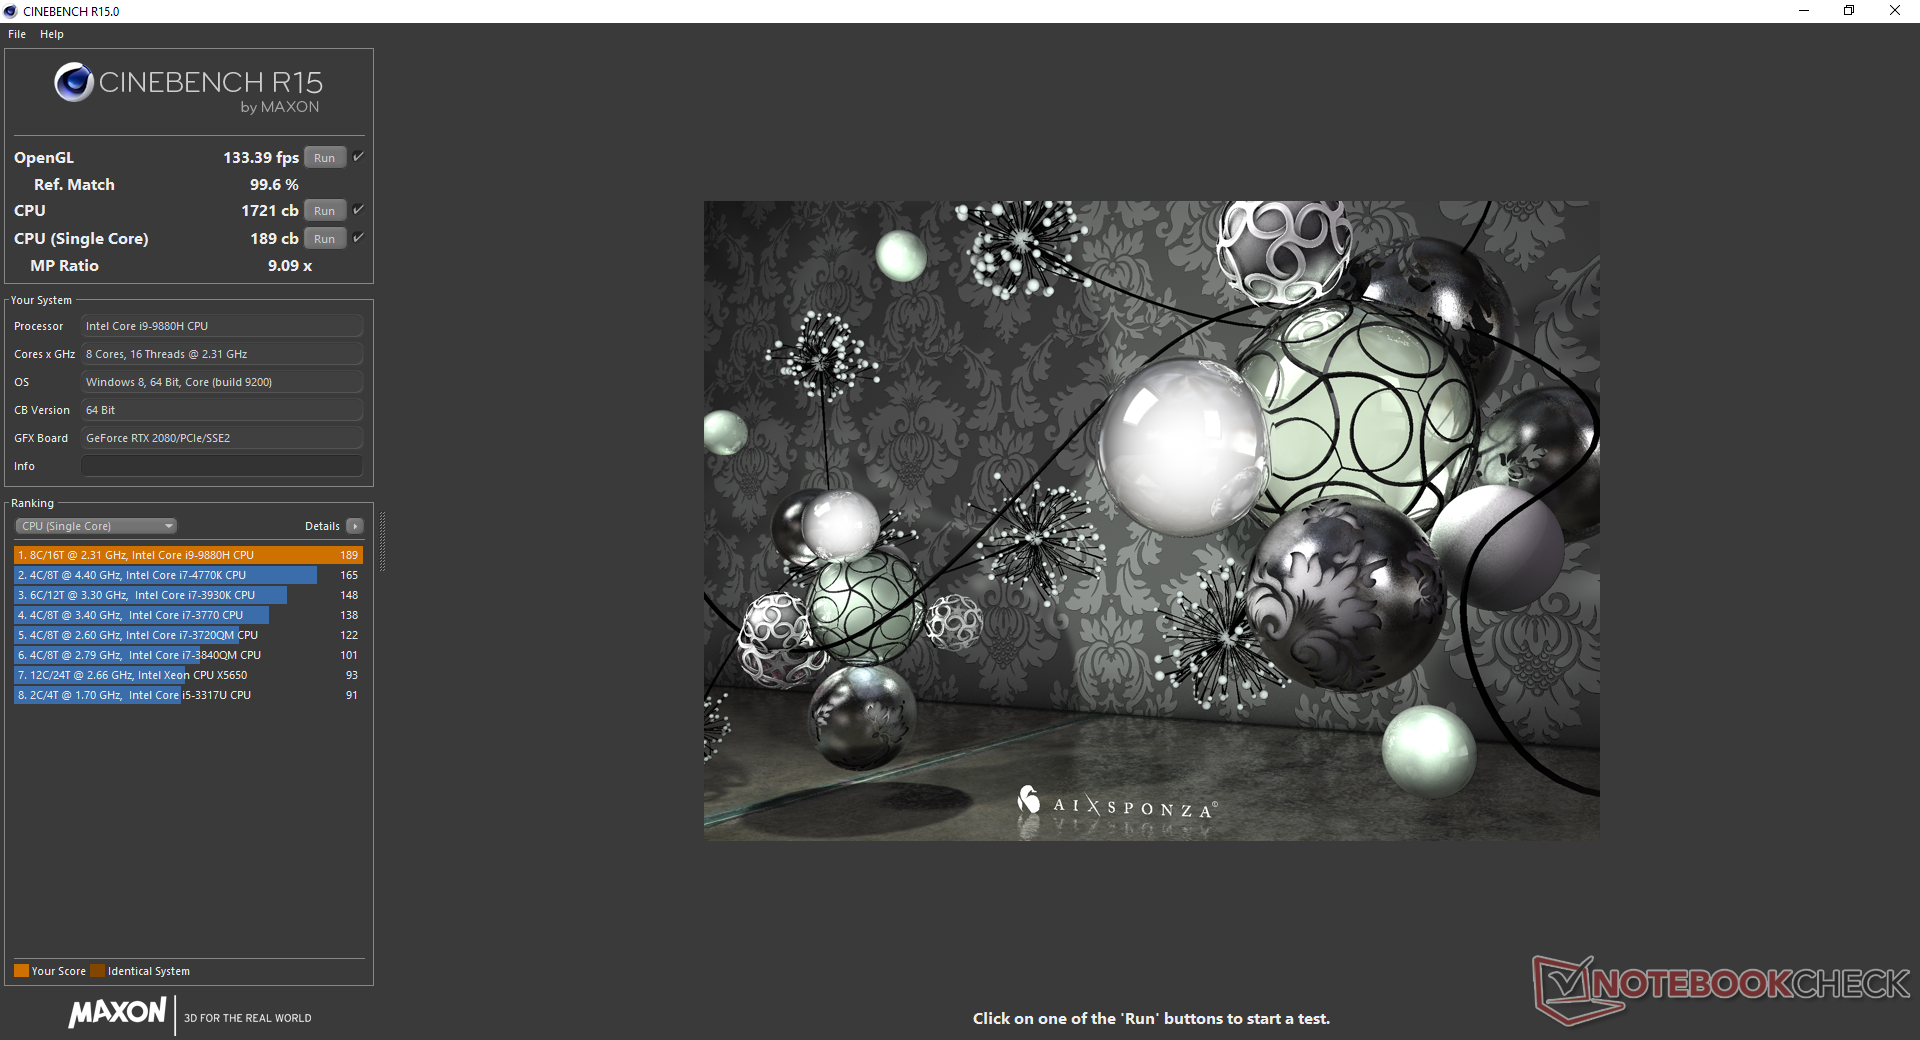
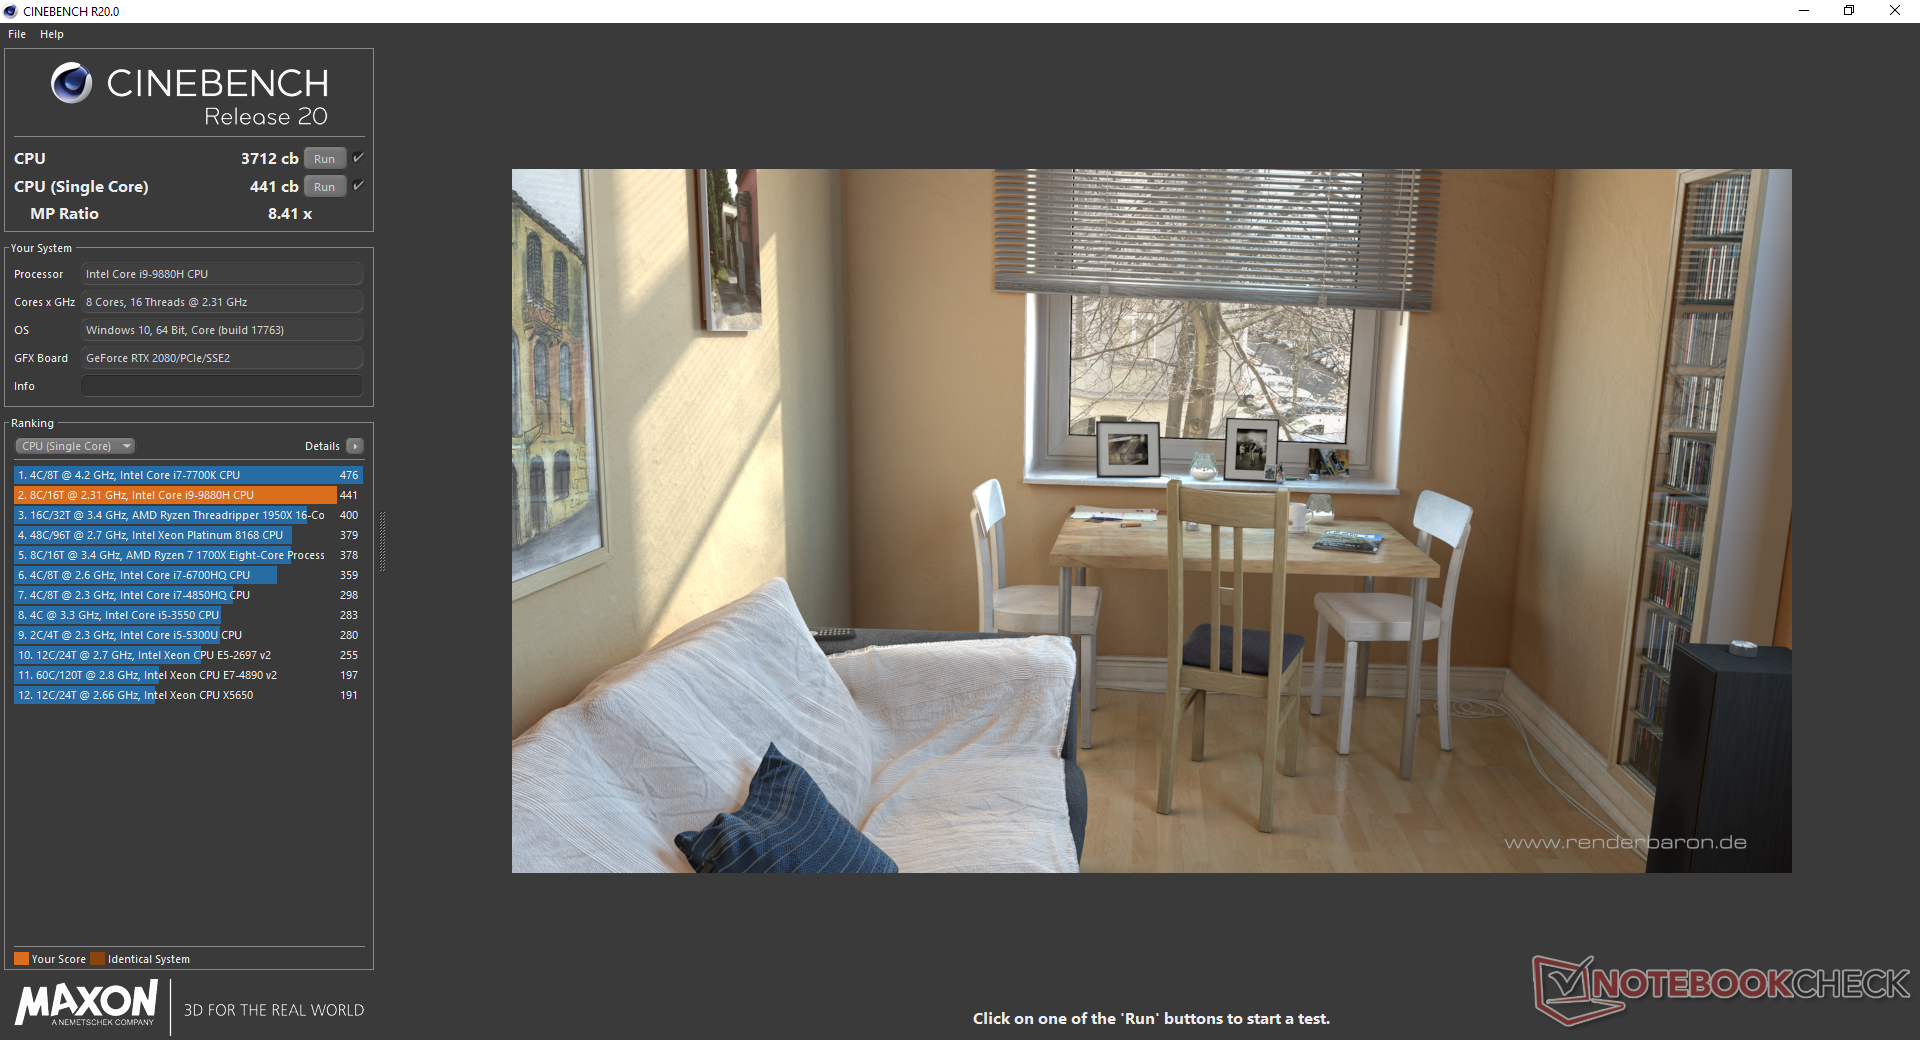
How much performance can an extra 4 threads bring to the table? When compared to the hexa-core Core i7-8750H on the GE75 8SG, the octa-core Core i9-9880H on the GE75 9SG is about 60 percent faster in multi-threaded workloads according to CineBench R15. This is also 25 percent faster than the last generation Core i9-8950HK and just 13 percent slower than the full-on desktop Core i9-9900K in the Eurocom Sky X7C. Single-thread performance, however, remains nearly identical to the 8th gen Coffee Lake-H series and so users will have to exploit all cores of the new 9th gen i9-9880H in order to see the massive performance gains.
Perhaps more surprisingly, Turbo Boost sustainability is very good. By running CineBench R15 Multi-Thread in a loop to observe CPU performance over time, the initial score of 1728 points drops to 1610 points by the third loop to represent a performance dip of just 7 percent as shown by our chart below. Clock rates drop from 3.9 GHz to a more stable 3.6 to 3.7 GHz range as detailed in our Stress Test section.
See our dedicated page on the Core i9-9880H for more technical information and benchmark comparisons.
| Cinebench R20 | |
| CPU (Multi Core) | |
| MSI GE75 9SG | |
| Average Intel Core i9-9880H (2953 - 3712, n=7) | |
| Gigabyte Aero 15 Classic-XA | |
| Asus TUF FX705DY-AU072 | |
| CPU (Single Core) | |
| Average Intel Core i9-9880H (441 - 474, n=7) | |
| MSI GE75 9SG | |
| Gigabyte Aero 15 Classic-XA | |
| Asus TUF FX705DY-AU072 | |
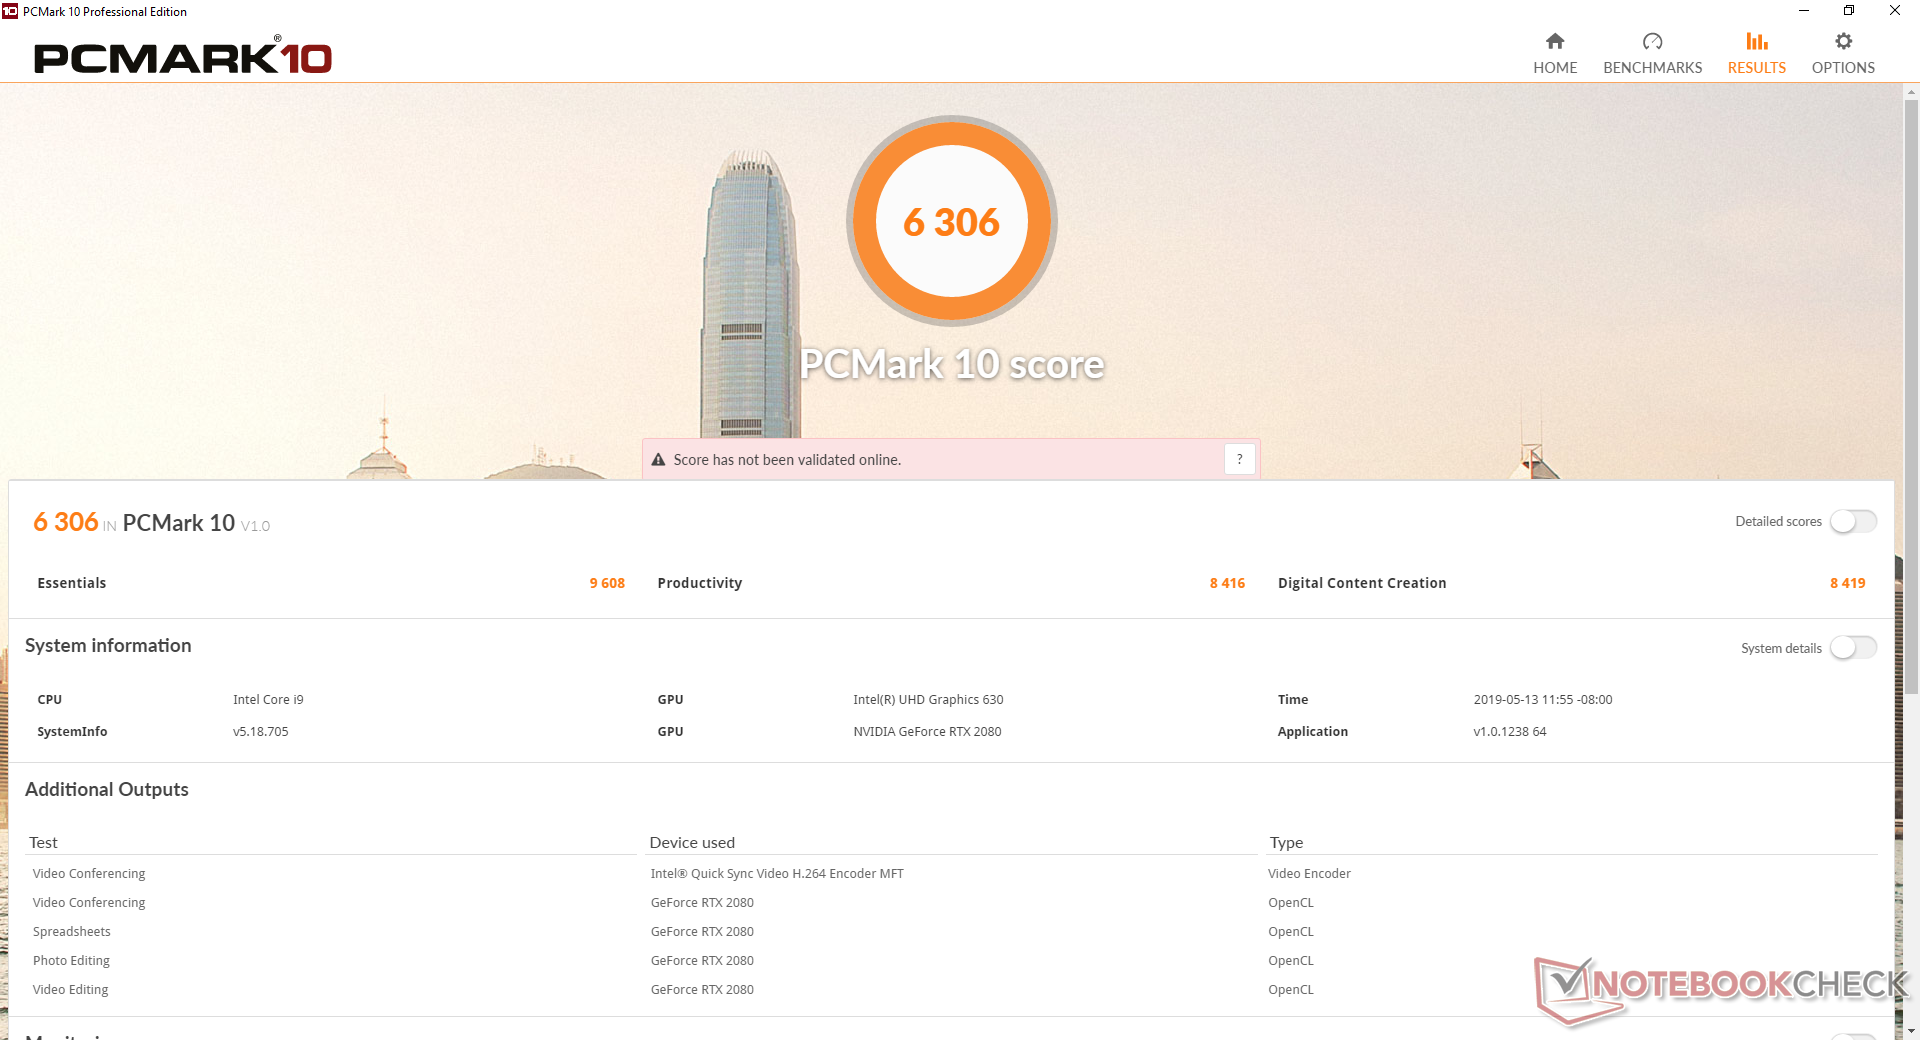
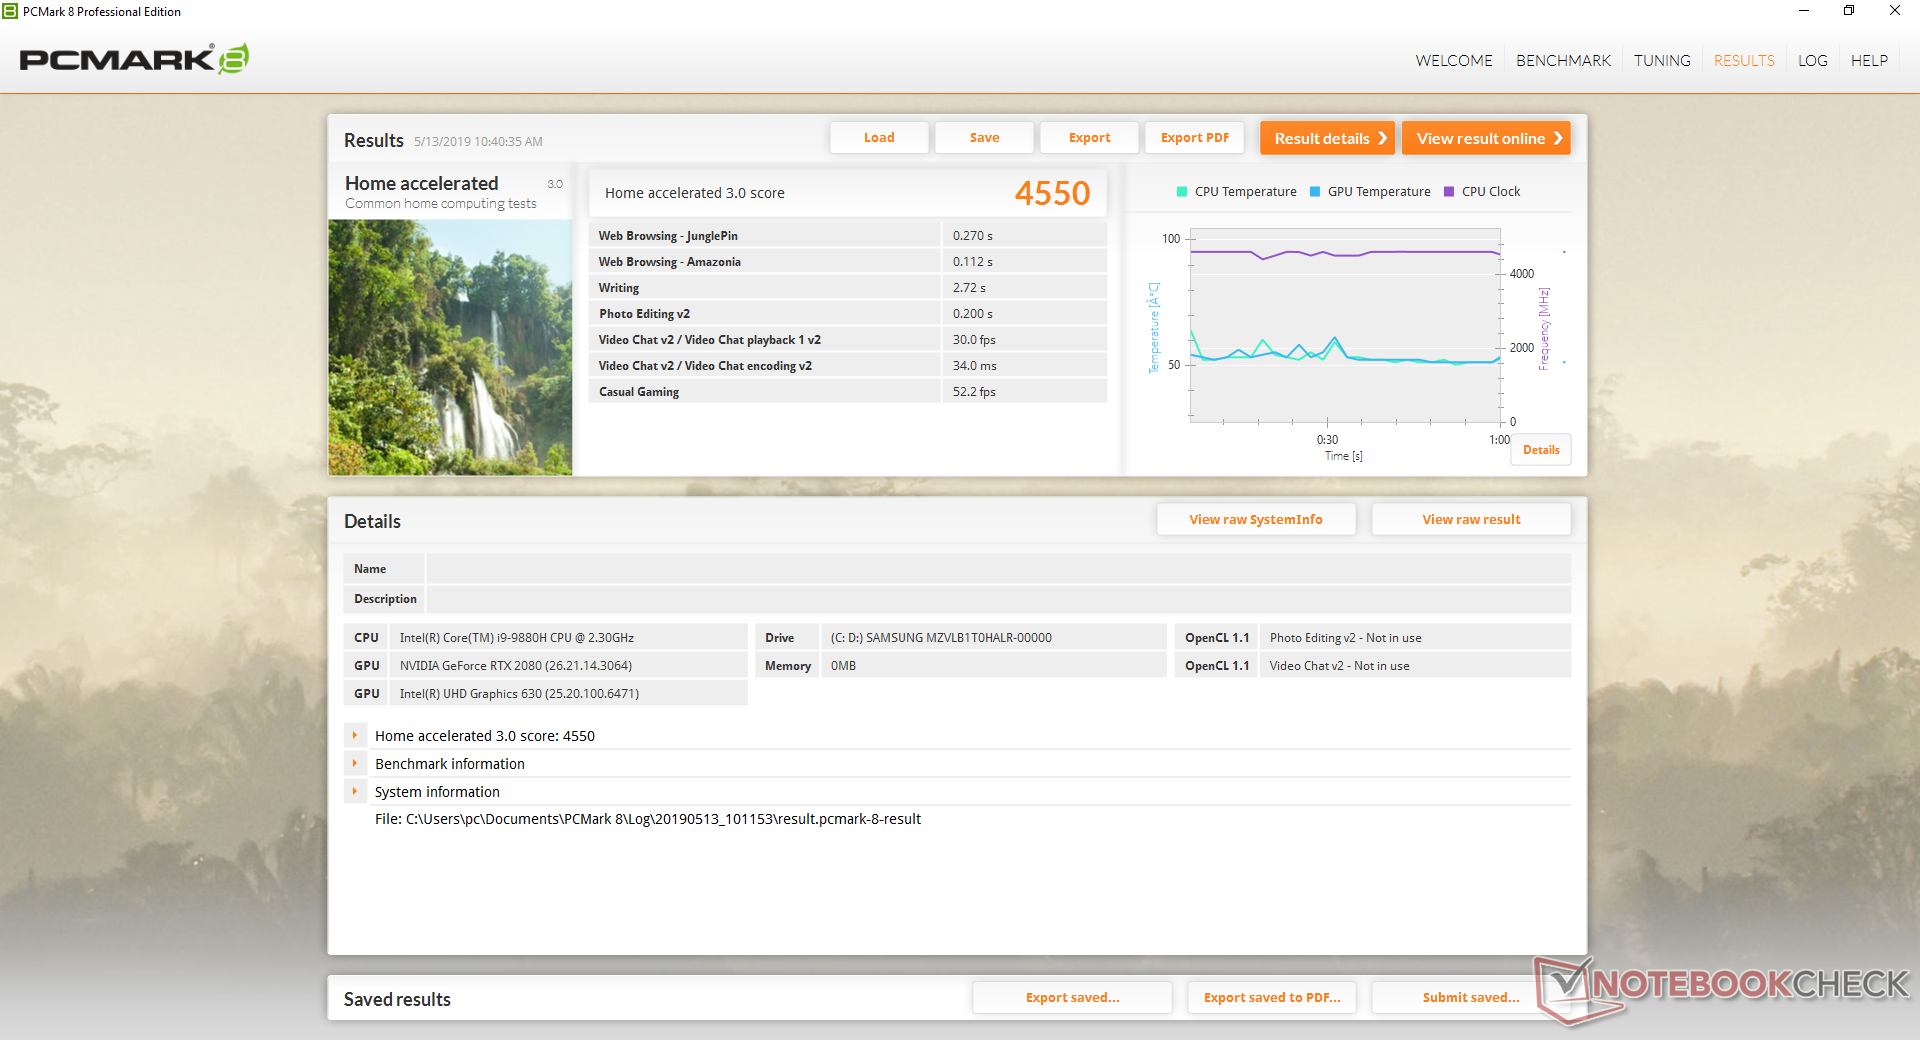
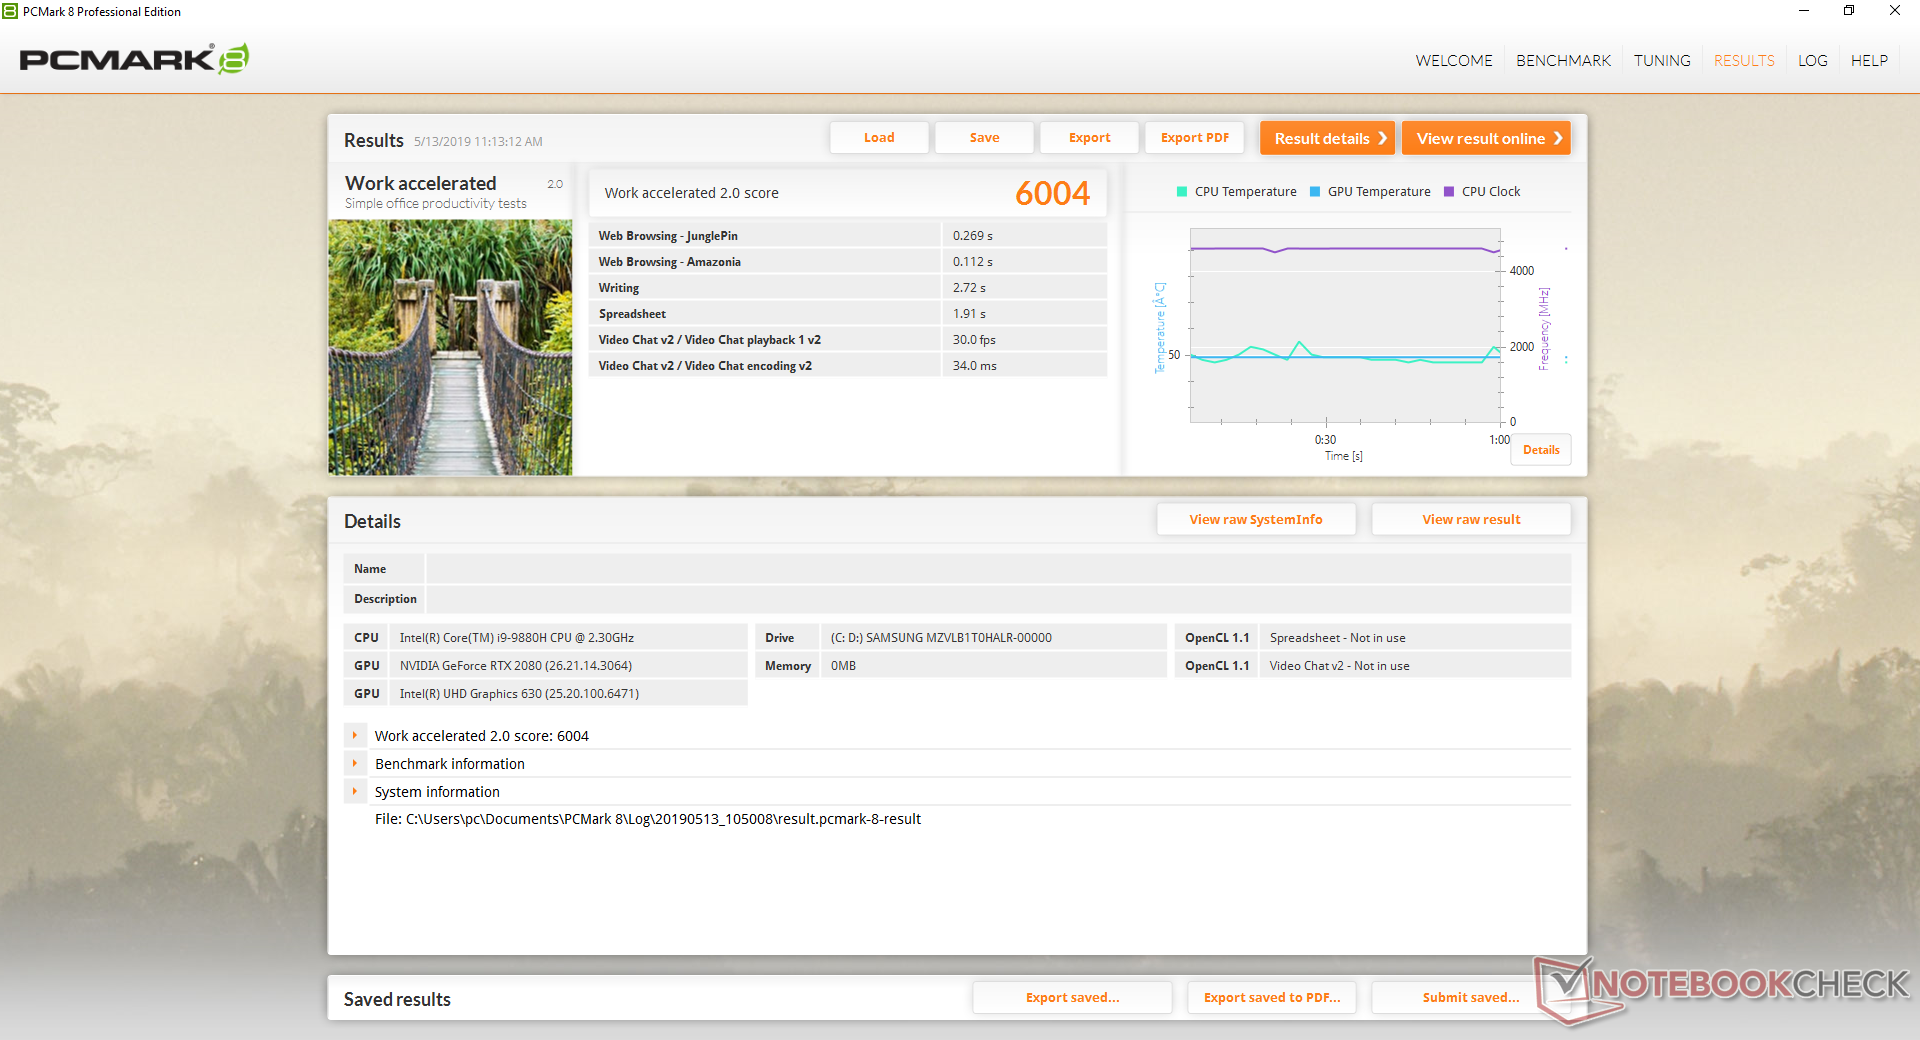
System Performance
PCMark benchmarks rank our i9-powered GE75 9SG consistently ahead of last year's i7-powered GE75 8SG by a few percentage points. This tells us that only power users who can exploit the multi-threaded performance of the Core i9-9880H will notice any advantages over the last generation Core i7-8750H as day-to-day workloads are just marginally faster when all else is equal.
| PCMark 8 | |
| Home Score Accelerated v2 | |
| Aorus X9 DT | |
| MSI GT75 8RG-090 Titan | |
| MSI GE75 8SG Raider | |
| MSI GE75 9SG | |
| Asus TUF FX705DY-AU072 | |
| Work Score Accelerated v2 | |
| Aorus X9 DT | |
| MSI GE75 9SG | |
| MSI GT75 8RG-090 Titan | |
| MSI GE75 8SG Raider | |
| Asus TUF FX705DY-AU072 | |
| PCMark 8 Home Score Accelerated v2 | 4550 points | |
| PCMark 8 Work Score Accelerated v2 | 6004 points | |
| PCMark 10 Score | 6306 points | |
Help | ||
Storage Devices
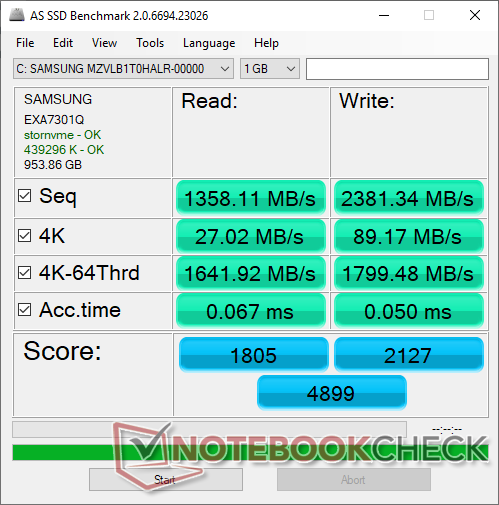
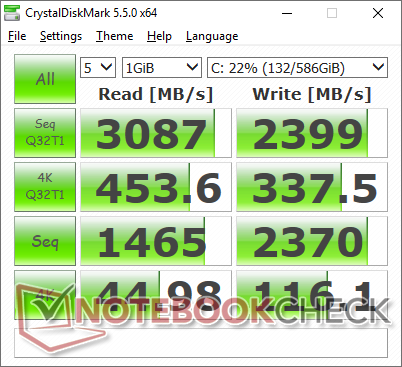
Unlike our previous two GE75 test units with Kingston SSDs, MSI has equipped this latest SKU with the more expensive Samsung PM981. Transfer rates are faster across the board at well over 2000 MB/s according to AS SSD versus just 900 MB/s on the Kingston KC400. Of course, the exact SSD included will vary depending on region and reseller and so not all GE75 9SG SKUs will ship with the Samsung PM981.
See our table of HDDs and SSDs for more benchmark comparisons.
| MSI GE75 9SG Samsung SSD PM981 MZVLB1T0HALR | Asus TUF FX705DY-AU072 Kingston RBUSNS8154P3512GJ | Asus Zephyrus S GX701GX Samsung SSD PM981 MZVLB1T0HALR | MSI GT75 8RG-090 Titan 2x Samsung PM961 MZVLW256HEHP (RAID 0) | Acer Predator Triton 700 2x SK Hynix Canvas SC300 512GB M.2 (HFS512G39MND) (RAID 0) | MSI GE73 8RF-008 Raider RGB Toshiba HG6 THNSNJ256G8NY | |
|---|---|---|---|---|---|---|
| AS SSD | -28% | 9% | 10% | -2% | -84% | |
| Seq Read (MB/s) | 1358 | 1419 4% | 911 -33% | 3058 125% | 2517 85% | 511 -62% |
| Seq Write (MB/s) | 2381 | 828 -65% | 2347 -1% | 2196 -8% | 2372 0% | 425.7 -82% |
| 4K Read (MB/s) | 27.02 | 35.71 32% | 53 96% | 38.37 42% | 41.47 53% | 14.07 -48% |
| 4K Write (MB/s) | 89.2 | 86.8 -3% | 122.5 37% | 97.7 10% | 93 4% | 38.34 -57% |
| 4K-64 Read (MB/s) | 1642 | 848 -48% | 1577 -4% | 1347 -18% | 1057 -36% | 351.4 -79% |
| 4K-64 Write (MB/s) | 1799 | 708 -61% | 1734 -4% | 1236 -31% | 913 -49% | 172.7 -90% |
| Access Time Read * (ms) | 0.067 | 0.063 6% | 0.08 -19% | 0.056 16% | 0.062 7% | 0.235 -251% |
| Access Time Write * (ms) | 0.05 | 0.044 12% | 0.031 38% | 0.038 24% | 0.041 18% | 0.097 -94% |
| Score Read (Points) | 1805 | 1026 -43% | 1721 -5% | 1691 -6% | 1350 -25% | 417 -77% |
| Score Write (Points) | 2127 | 878 -59% | 2091 -2% | 1553 -27% | 1243 -42% | 254 -88% |
| Score Total (Points) | 4899 | 2405 -51% | 4771 -3% | 4066 -17% | 3282 -33% | 881 -82% |
| Copy ISO MB/s (MB/s) | 3193 | 687 -78% | 412.5 -87% | |||
| Copy Program MB/s (MB/s) | 198.2 | 234.7 18% | 192.9 -3% | |||
| Copy Game MB/s (MB/s) | 1054 | 474.7 -55% | 295.5 -72% |
* ... smaller is better

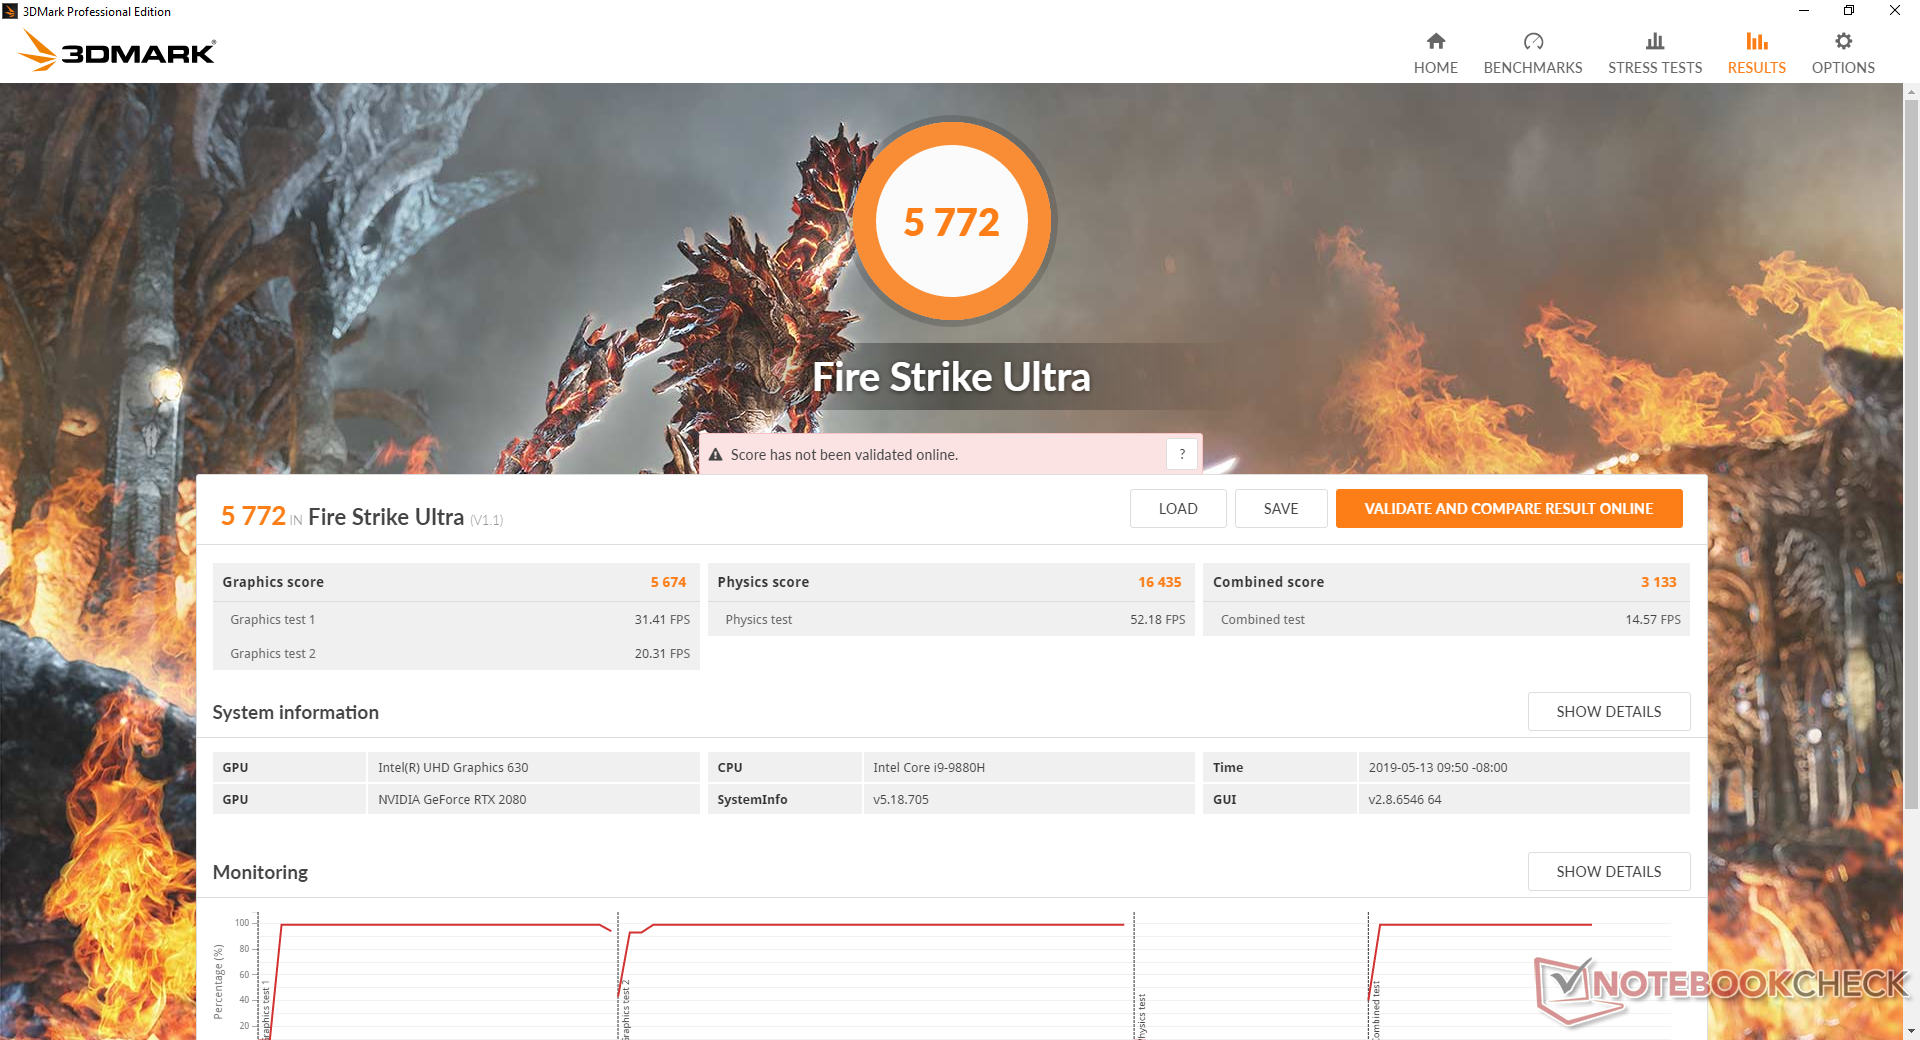
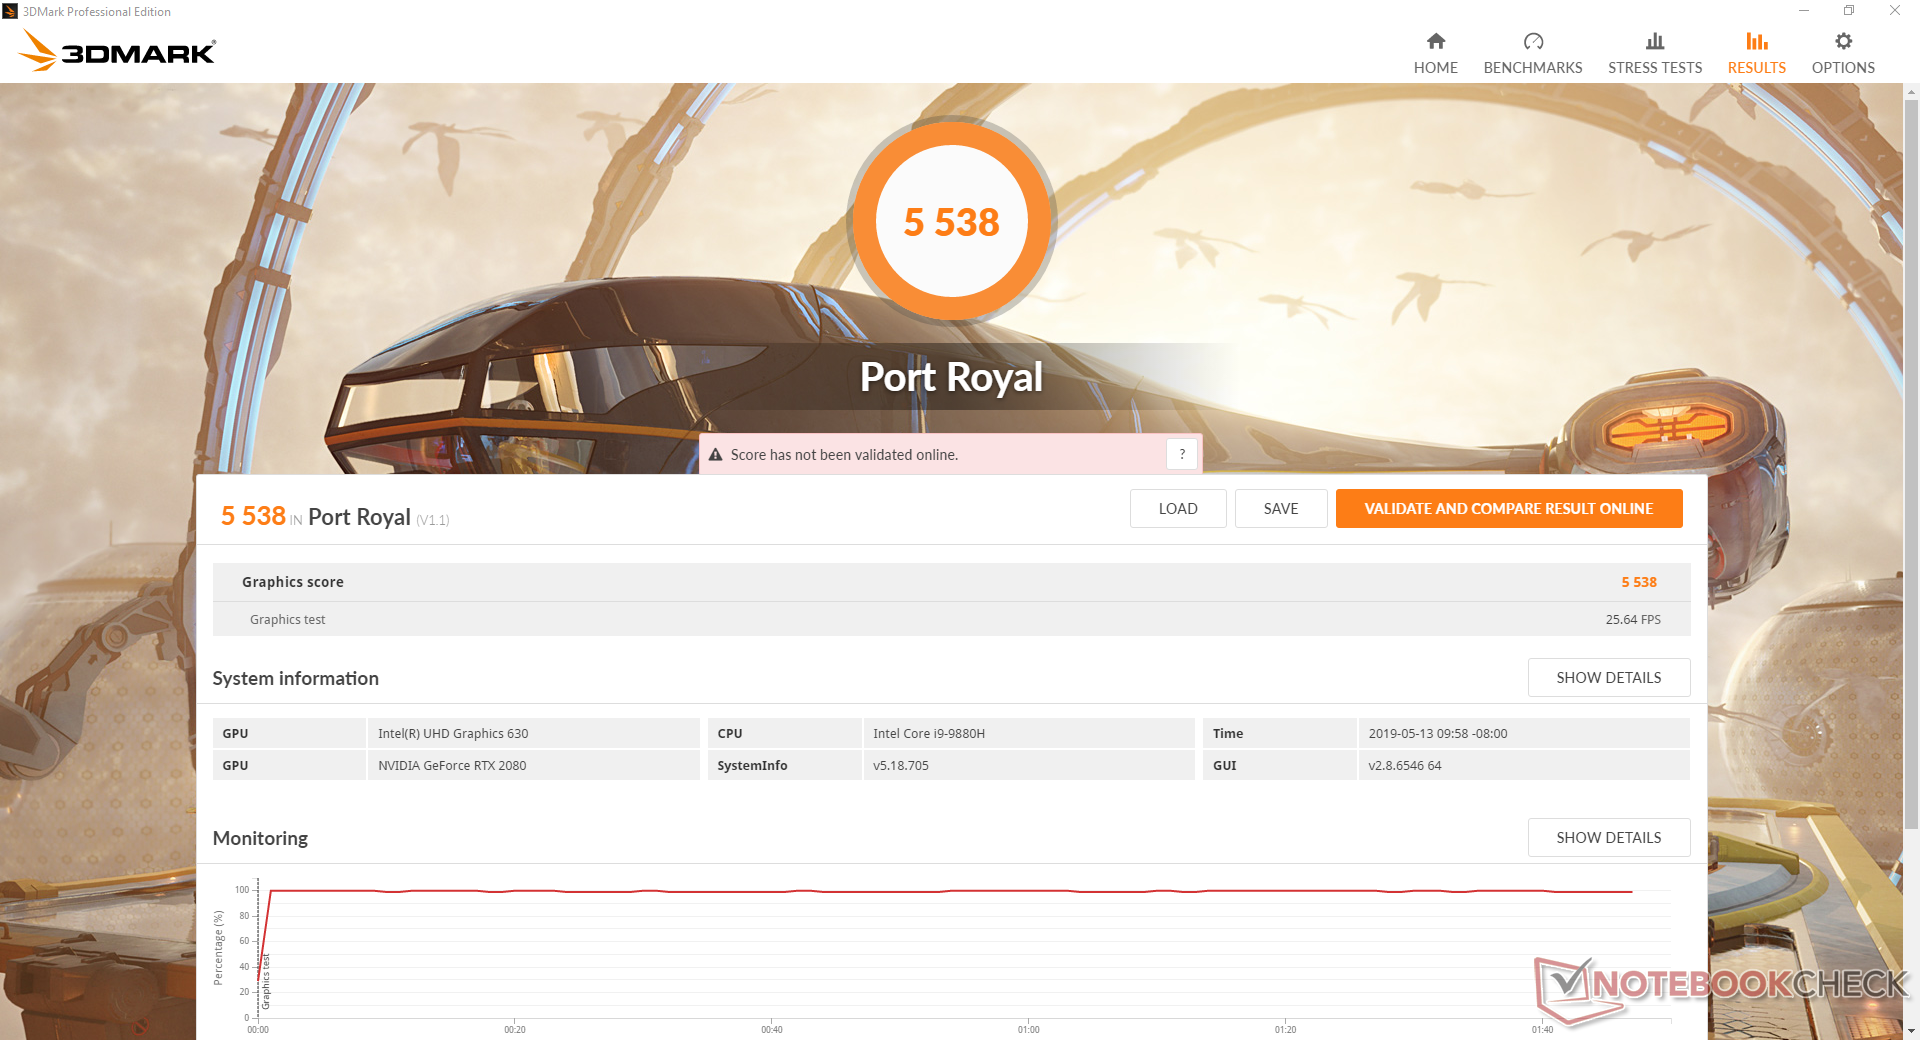
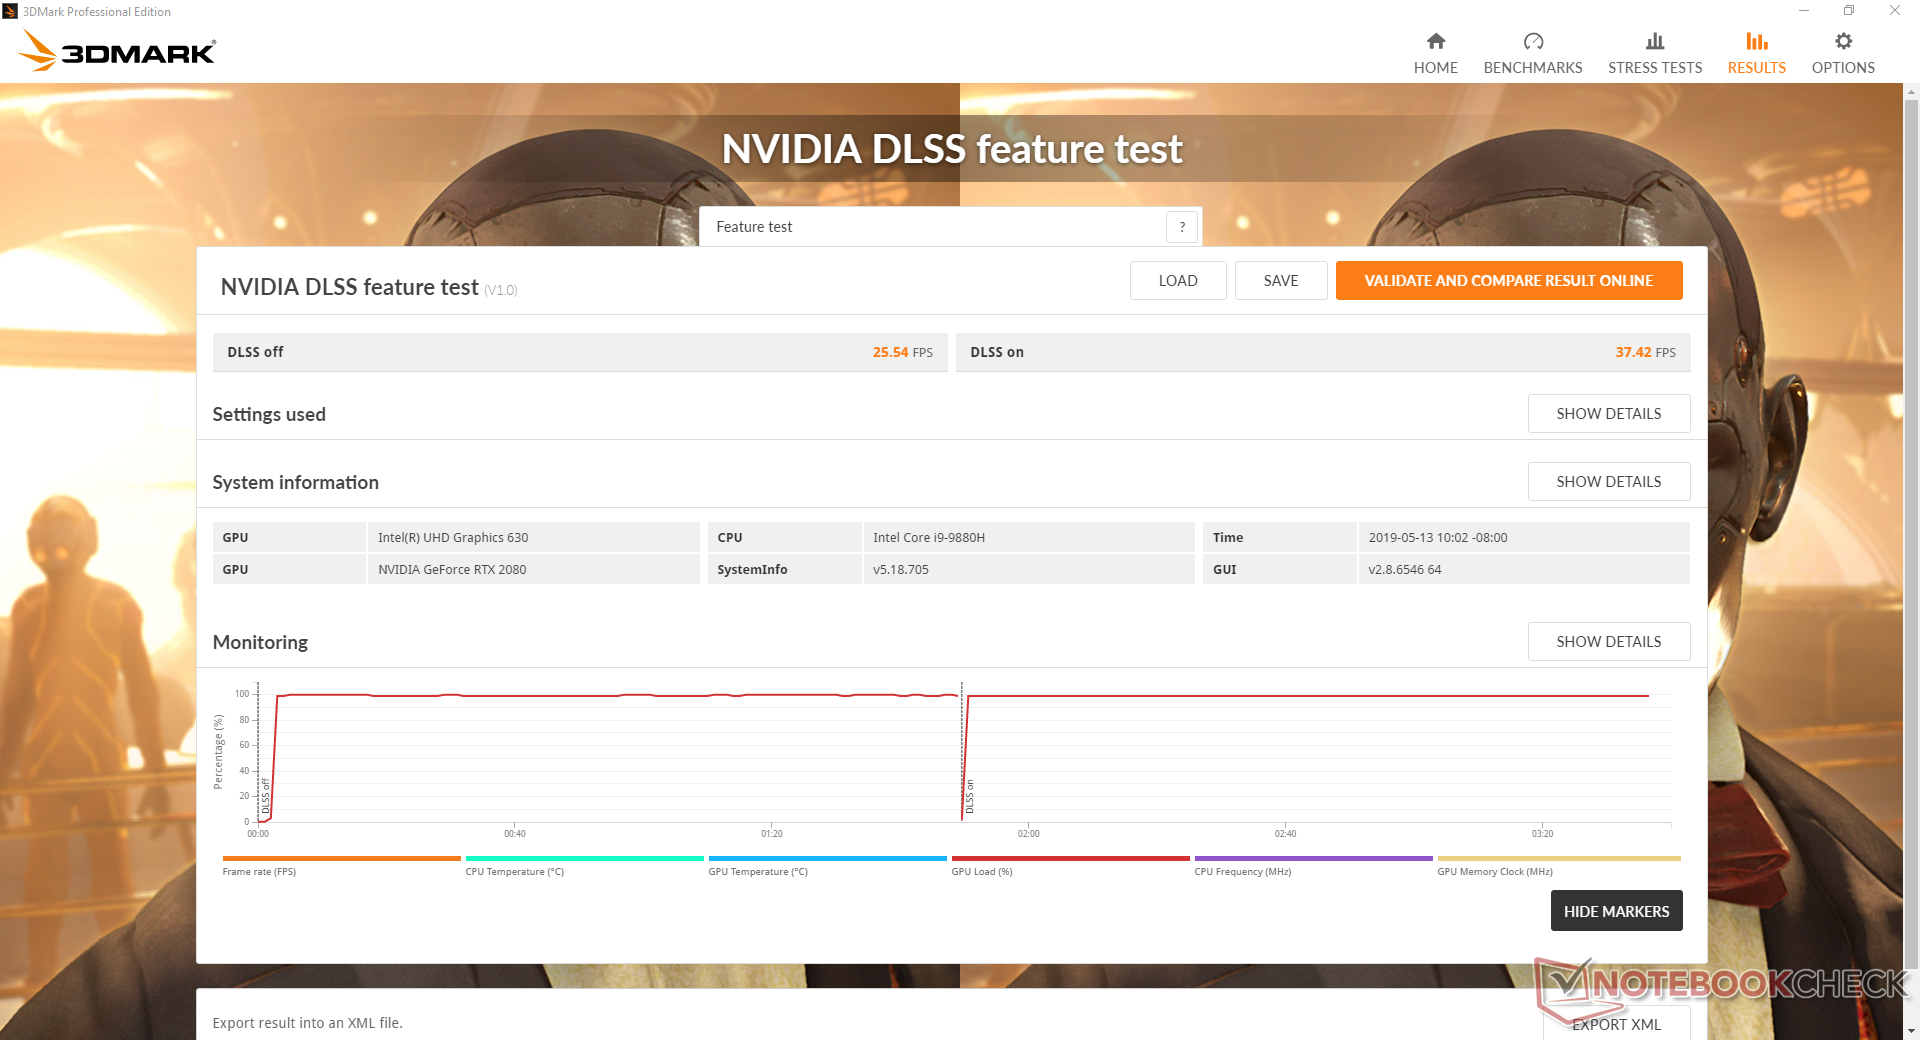
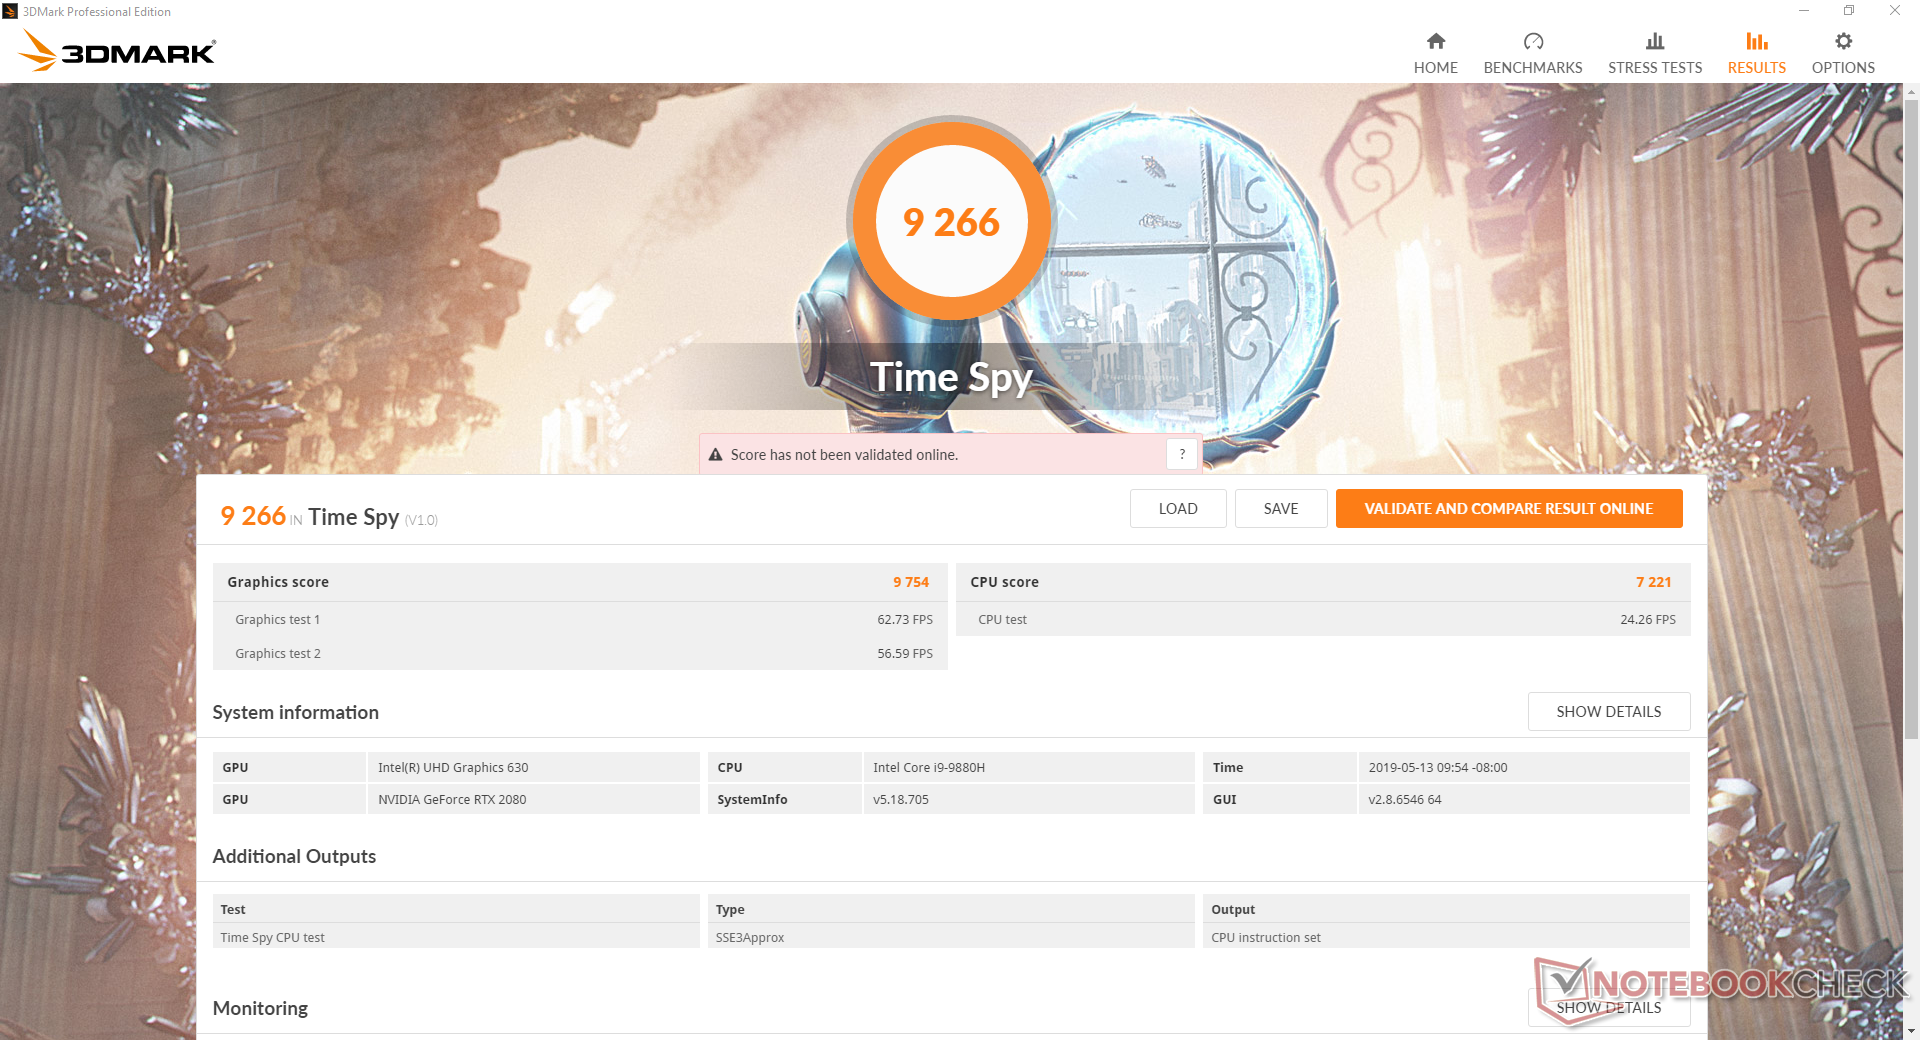
GPU Performance
The GeForce RTX 2080 performs identically to last year's GE75 despite the much faster Intel 9th gen CPU. 3DMark Time Spy results are within just 3 percent of the 2018 GE75 8SG with the 8th gen Core i7-8750H. The additional cores of the i9-9880H have minimal impact on gaming performance as most titles are not optimized for 16 simultaneous threads.
Nonetheless, the extra CPU horsepower can come in handy if targeting very high frame rates. Titles like Witcher 3 and Shadow of the Tomb Raider show 10 percent gains in FPS each which is not insignificant when targeting a stable 144 FPS. If targeting 60 FPS, however, the Core i9 will likely be overkill.
Running Witcher 3 shows no recurring frame dips to suggest smooth gaming performance and no interrupting background activity.
See our dedicated page on the GeForce RTX 2080 for more technical information and benchmark comparisons.
| 3DMark 06 Standard Score | 39973 points | |
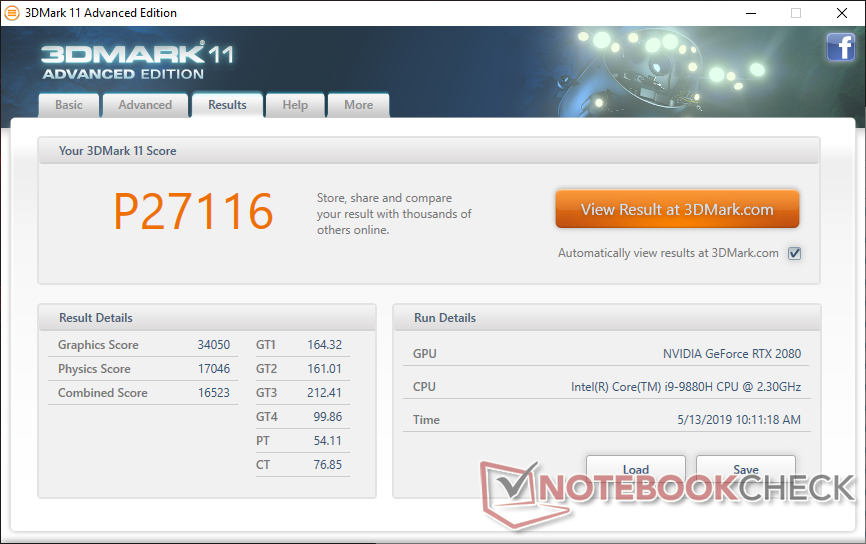
| 3DMark 11 Performance | 27116 points | |
| 3DMark Cloud Gate Standard Score | 41840 points | |
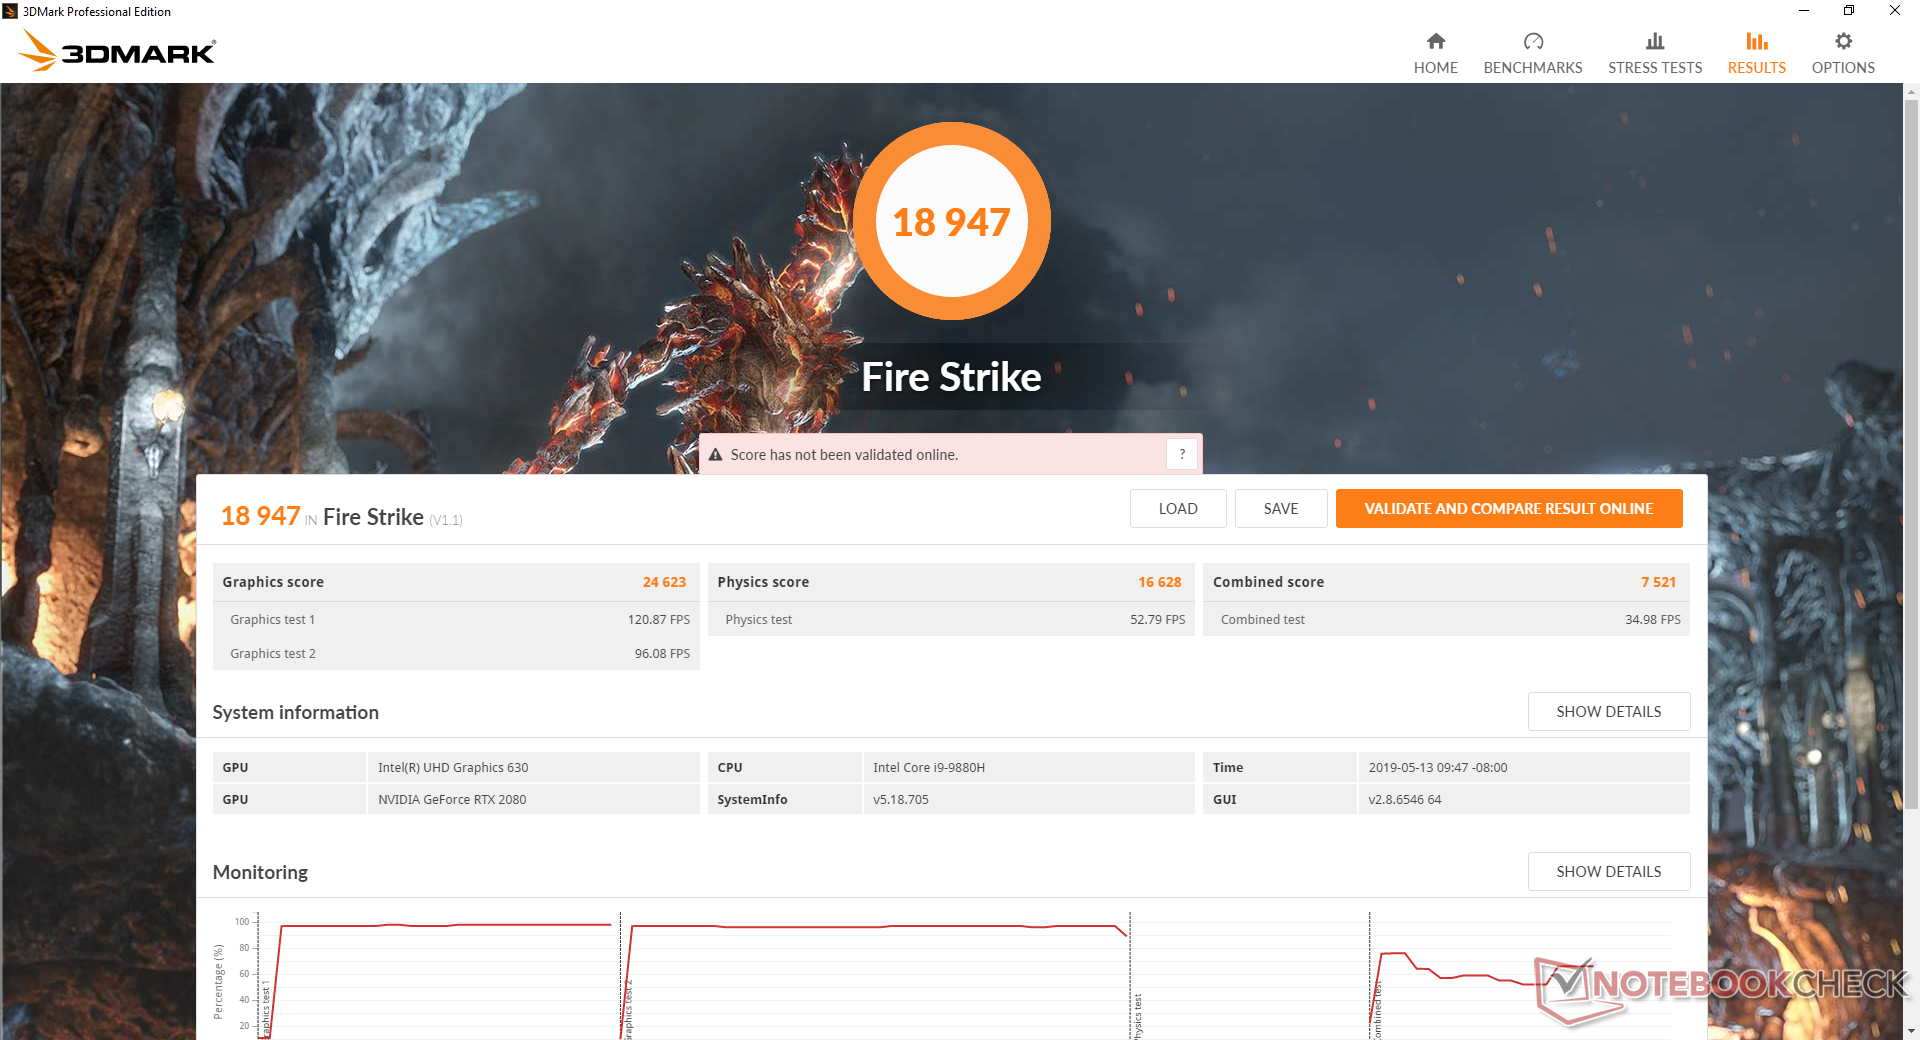
| 3DMark Fire Strike Score | 18947 points | |
| 3DMark Time Spy Score | 9266 points | |
Help | ||
| Shadow of the Tomb Raider - 1920x1080 Highest Preset AA:T | |
| MSI RTX 2080 Gaming X Trio | |
| MSI GE75 9SG | |
| Average NVIDIA GeForce RTX 2080 Mobile (69 - 124, n=7) | |
| MSI GE75 8SG Raider | |
| Asus Zephyrus S GX701GX | |
| MSI GL73 8SE-010US | |
| Schenker Compact 15 | |
| Acer Aspire Nitro 5 AN515-54-53Z2 | |
| low | med. | high | ultra | |
|---|---|---|---|---|
| BioShock Infinite (2013) | 341.4 | 303.9 | 280.7 | 190.9 |
| The Witcher 3 (2015) | 289.7 | 250.1 | 173 | 95.3 |
| Rise of the Tomb Raider (2016) | 250.6 | 187.2 | 161.7 | 144.3 |
| Shadow of the Tomb Raider (2018) | 146 | 120 | 115 | 109 |
Emissions
System Noise
Fan noise has not changed from the GE75 8SG when gaming despite the significant gains in CPU performance. In other words, the system is still very loud at 54 dB(A) when running the latest titles. We recommend headphones for gaming laptops that break the 50 dB(A) mark as the fans can become distracting.
The system fans also remain sensitive to onscreen loads. Simple tasks like web browsing or video streaming can cause the fans to pulse between 30.4 dB(A) and 33.4 dB(A) when on the High Performance profile. Thus, be sure to set the system to Power Saver mode if the extra horsepower is not needed.
Our test unit exhibits slight coil whine towards the left half of the chassis that we suspect is related to the RAM or SSD modules. It's thankfully minor enough to only be noticeable when in a completely quiet room.
| MSI GE75 9SG GeForce RTX 2080 Mobile, i9-9880H, Samsung SSD PM981 MZVLB1T0HALR | MSI GE75 8SG Raider GeForce RTX 2080 Mobile, i7-8750H, Kingston RBUSNS8154P3512GJ | Aorus X9 DT GeForce GTX 1080 Mobile, i9-8950HK, Transcend TS1TMTE850 | Asus Zephyrus S GX701GX GeForce RTX 2080 Max-Q, i7-8750H, Samsung SSD PM981 MZVLB1T0HALR | MSI GT75 8RG-090 Titan GeForce GTX 1080 Mobile, i9-8950HK, 2x Samsung PM961 MZVLW256HEHP (RAID 0) | MSI GE73 8RF-008 Raider RGB GeForce GTX 1070 Mobile, i7-8750H, Toshiba HG6 THNSNJ256G8NY | |
|---|---|---|---|---|---|---|
| Noise | -9% | -18% | -1% | -9% | -3% | |
| off / environment * (dB) | 28.2 | 30 -6% | 30 -6% | 29 -3% | 30 -6% | 30 -6% |
| Idle Minimum * (dB) | 30.4 | 30 1% | 36 -18% | 29 5% | 32 -5% | 32 -5% |
| Idle Average * (dB) | 30.4 | 34 -12% | 37 -22% | 32 -5% | 34 -12% | 33 -9% |
| Idle Maximum * (dB) | 33.4 | 37 -11% | 43 -29% | 33 1% | 37 -11% | 34 -2% |
| Load Average * (dB) | 37.1 | 52 -40% | 50 -35% | 47 -27% | 43 -16% | 41 -11% |
| Witcher 3 ultra * (dB) | 54.2 | 53 2% | 57 -5% | 49 10% | 57 -5% | 50 8% |
| Load Maximum * (dB) | 56.4 | 54 4% | 61 -8% | 51 10% | 62 -10% | 54 4% |
* ... smaller is better
Noise level
| Idle |
| 30.4 / 30.4 / 33.4 dB(A) |
| Load |
| 37.1 / 56.4 dB(A) |
 | ||
30 dB silent 40 dB(A) audible 50 dB(A) loud |
||
min: | ||
Temperature
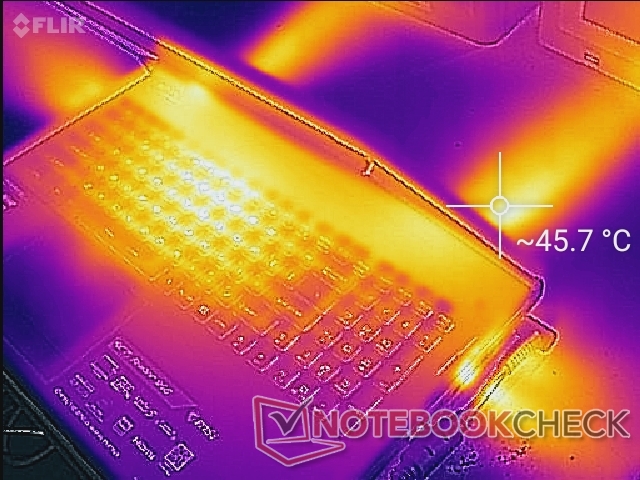
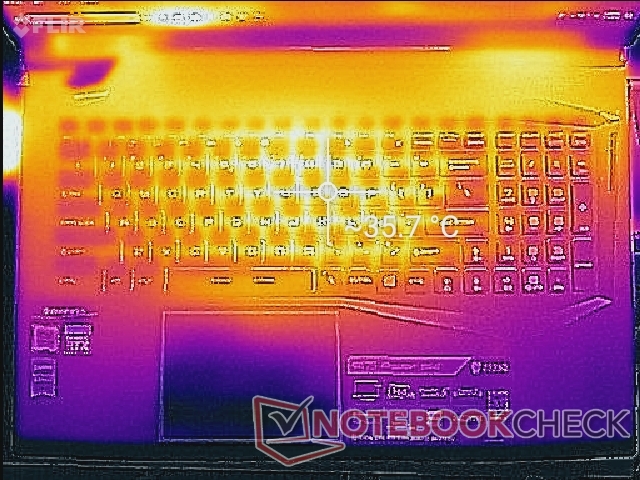
Surface temperatures are warmer than we were expecting even when idling on desktop. We're able to record a temperature of almost 36 C on the center of the keyboard just by idling on Power Saver for almost an hour compared to 25 C on last year's GE75 8SF. We suspect that there could have been background activity related to the pre-installed Norton Anti-Virus software or other automatic updates during this downtime.
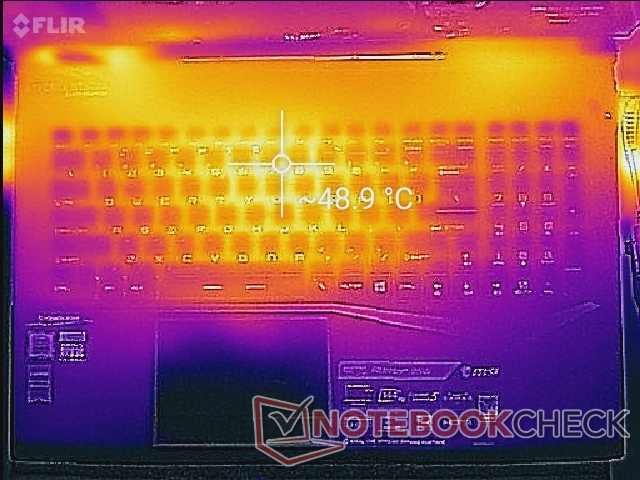
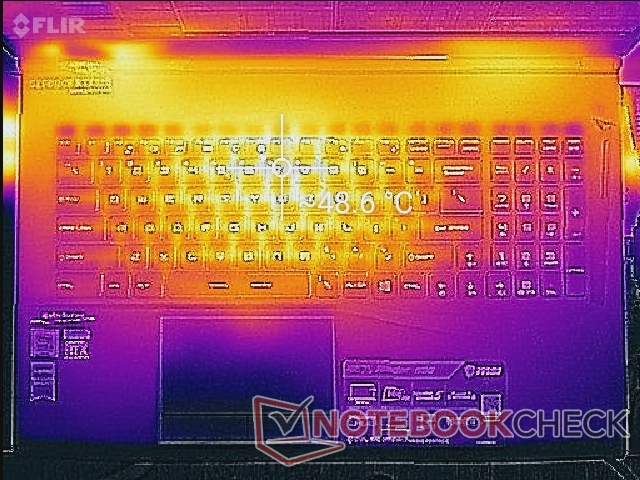
When gaming, the keyboard center can become as warm as 49 C compared to 46 C on the GE75 8SG. The palm rests, NumPad, and WASD keys will always be cooler for comfortable use since the cooling solution occupies the rear half of the chassis.


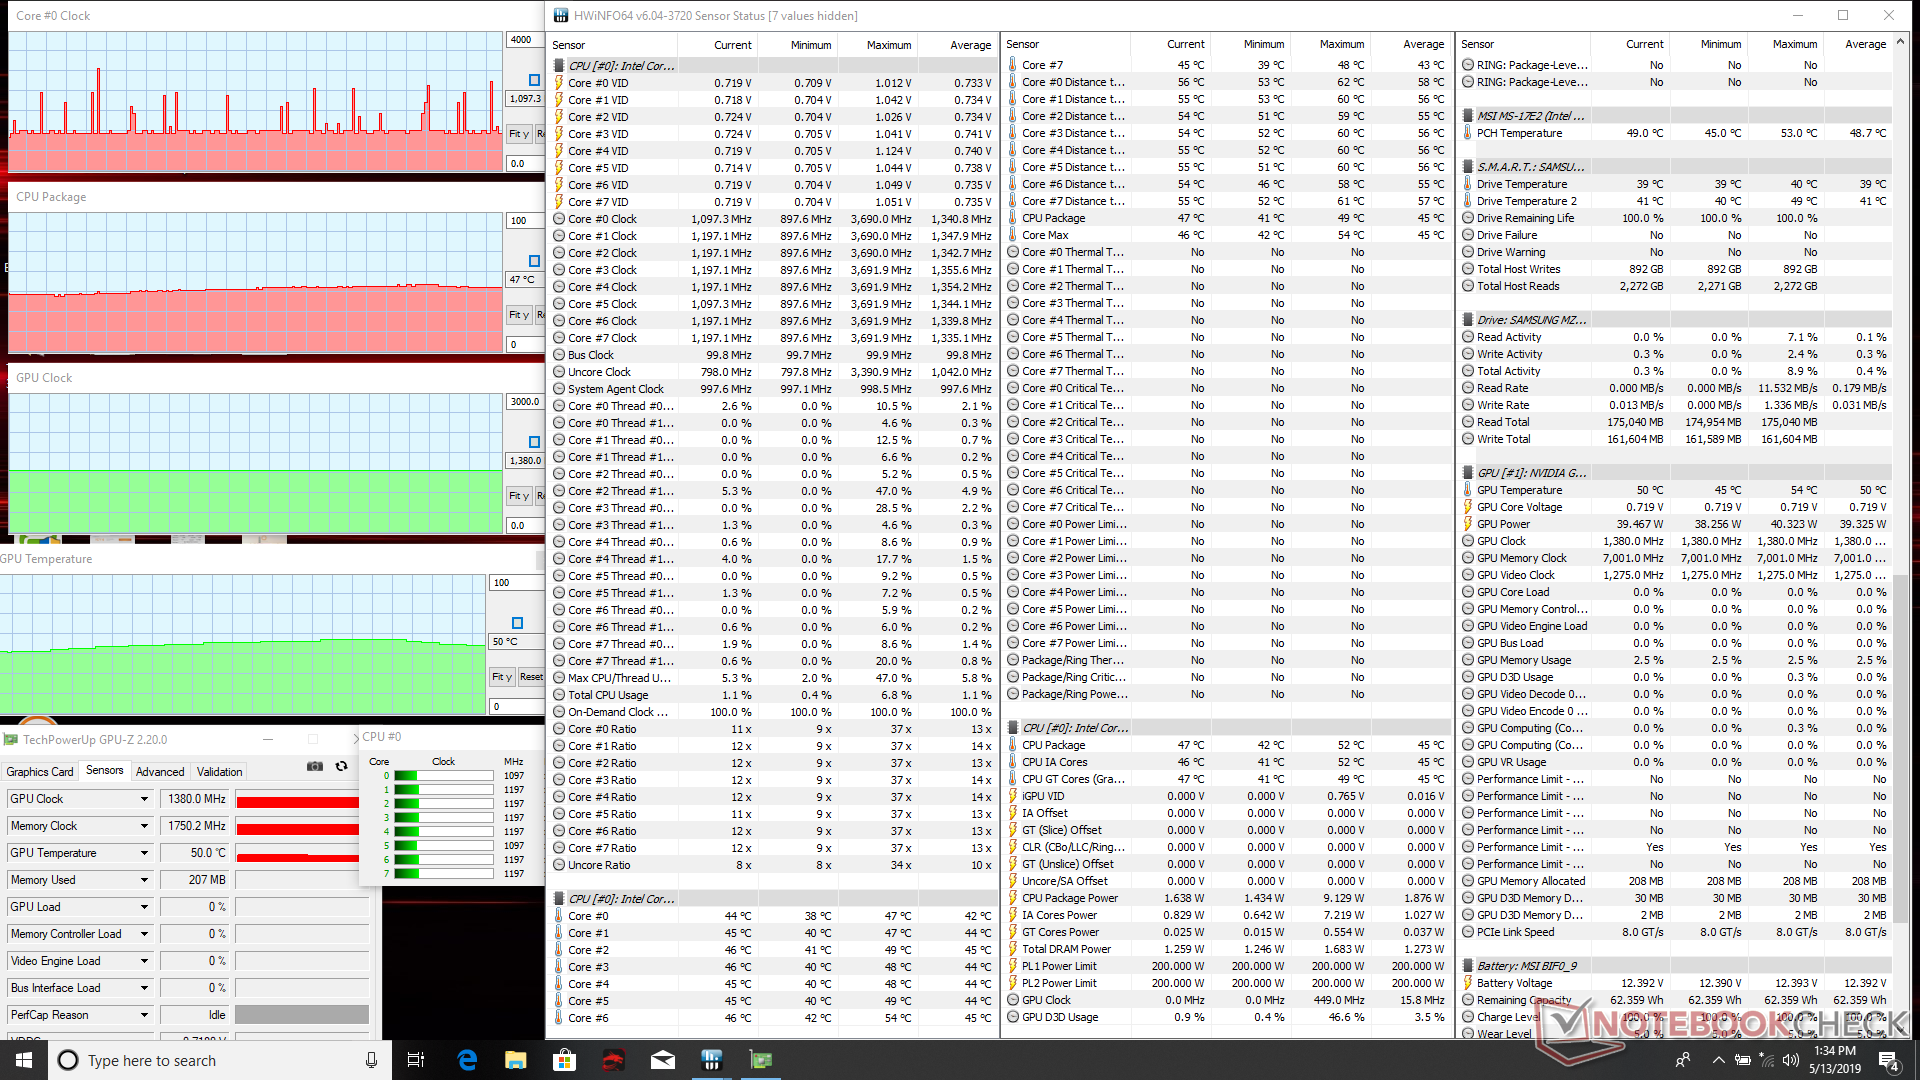
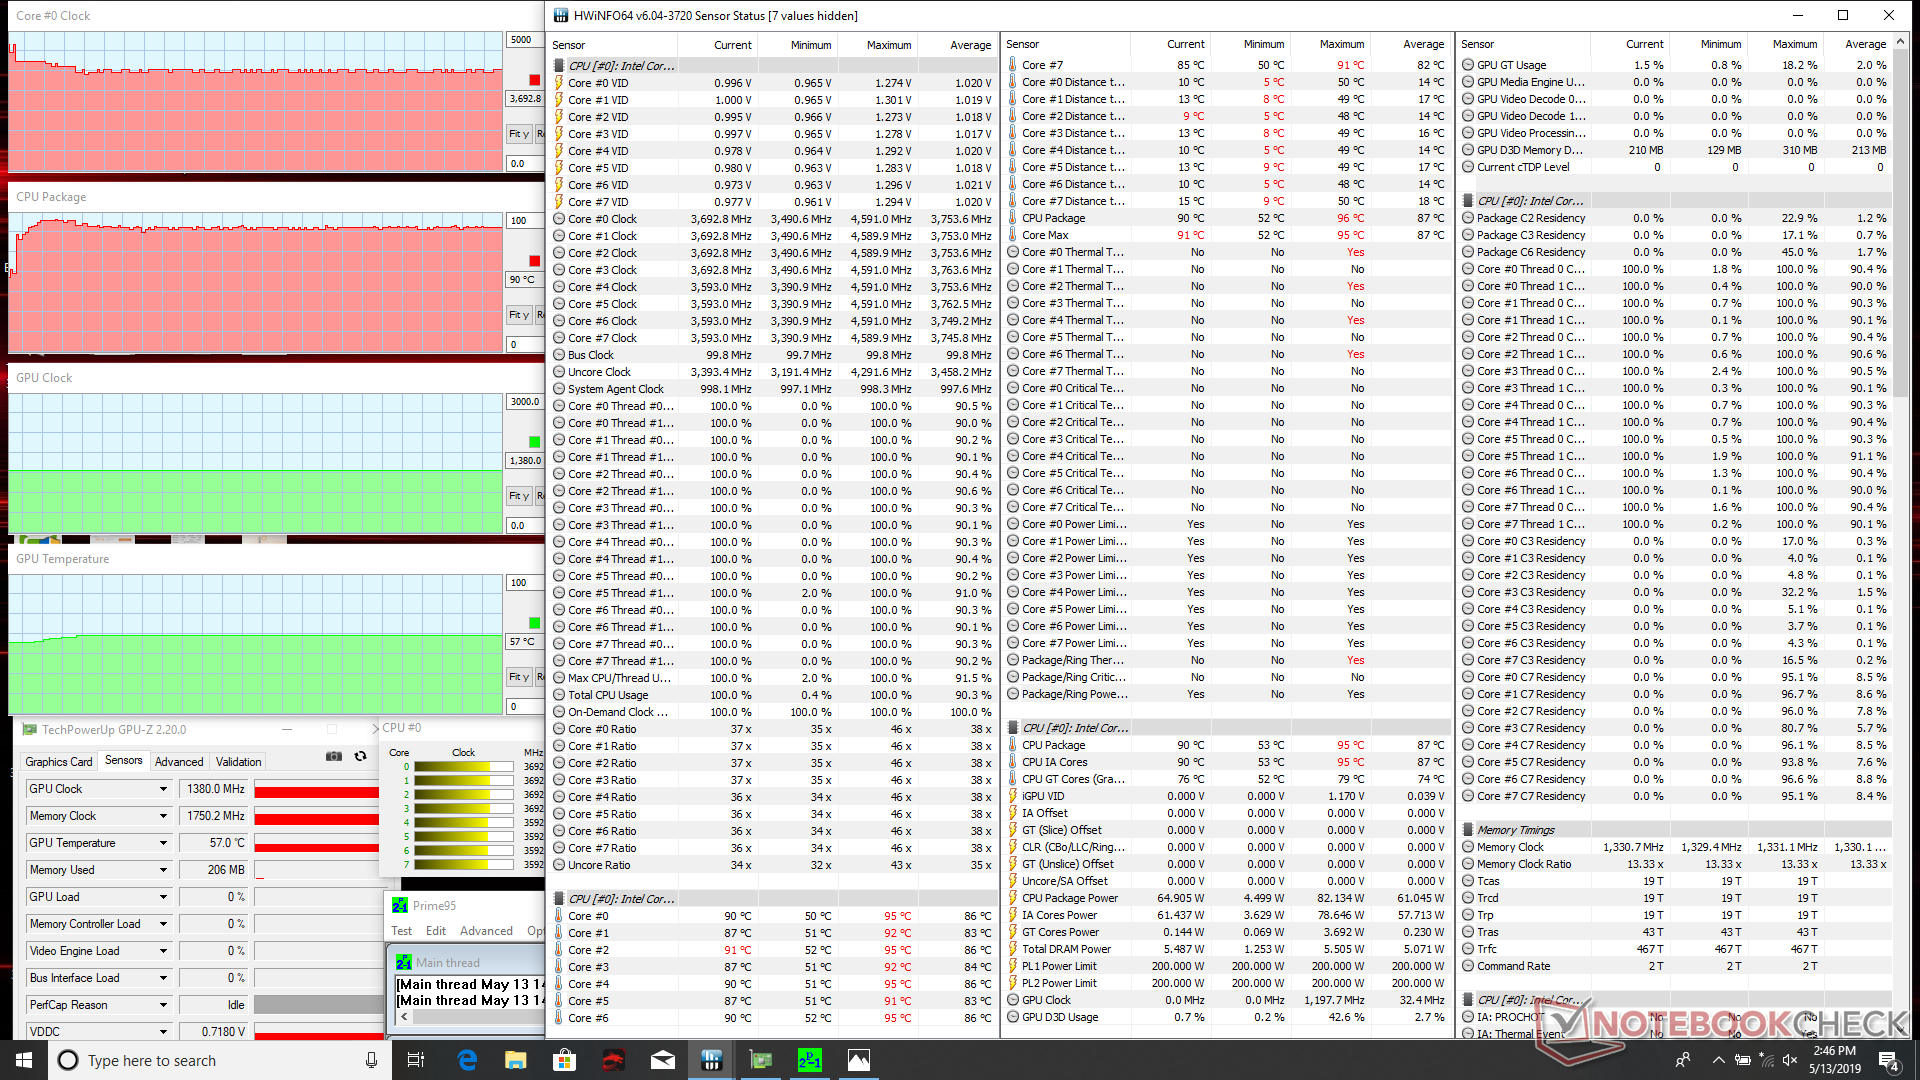
Stress Test
We stress the laptop with synthetic loads to test for any potential throttling or stability issues. When running Prime95, the CPU can be observed running at up to 3.9 GHz for the first few seconds until core temperature hits 96 C. Thereafter, clock rates stabilize at the 3.6 to 3.7 GHz range in order to maintain a more manageable core temperature of 90 C. Since the base clock rate of the Core i9-9880H is 2.3 GHz, we find this to be a respectable level of reliable Turbo Boost. These results are much faster and warmer than what we observed on the GE75 8SF where the Core i7-8750H stabilized at 3.0 GHz and 73 C when under the same conditions.
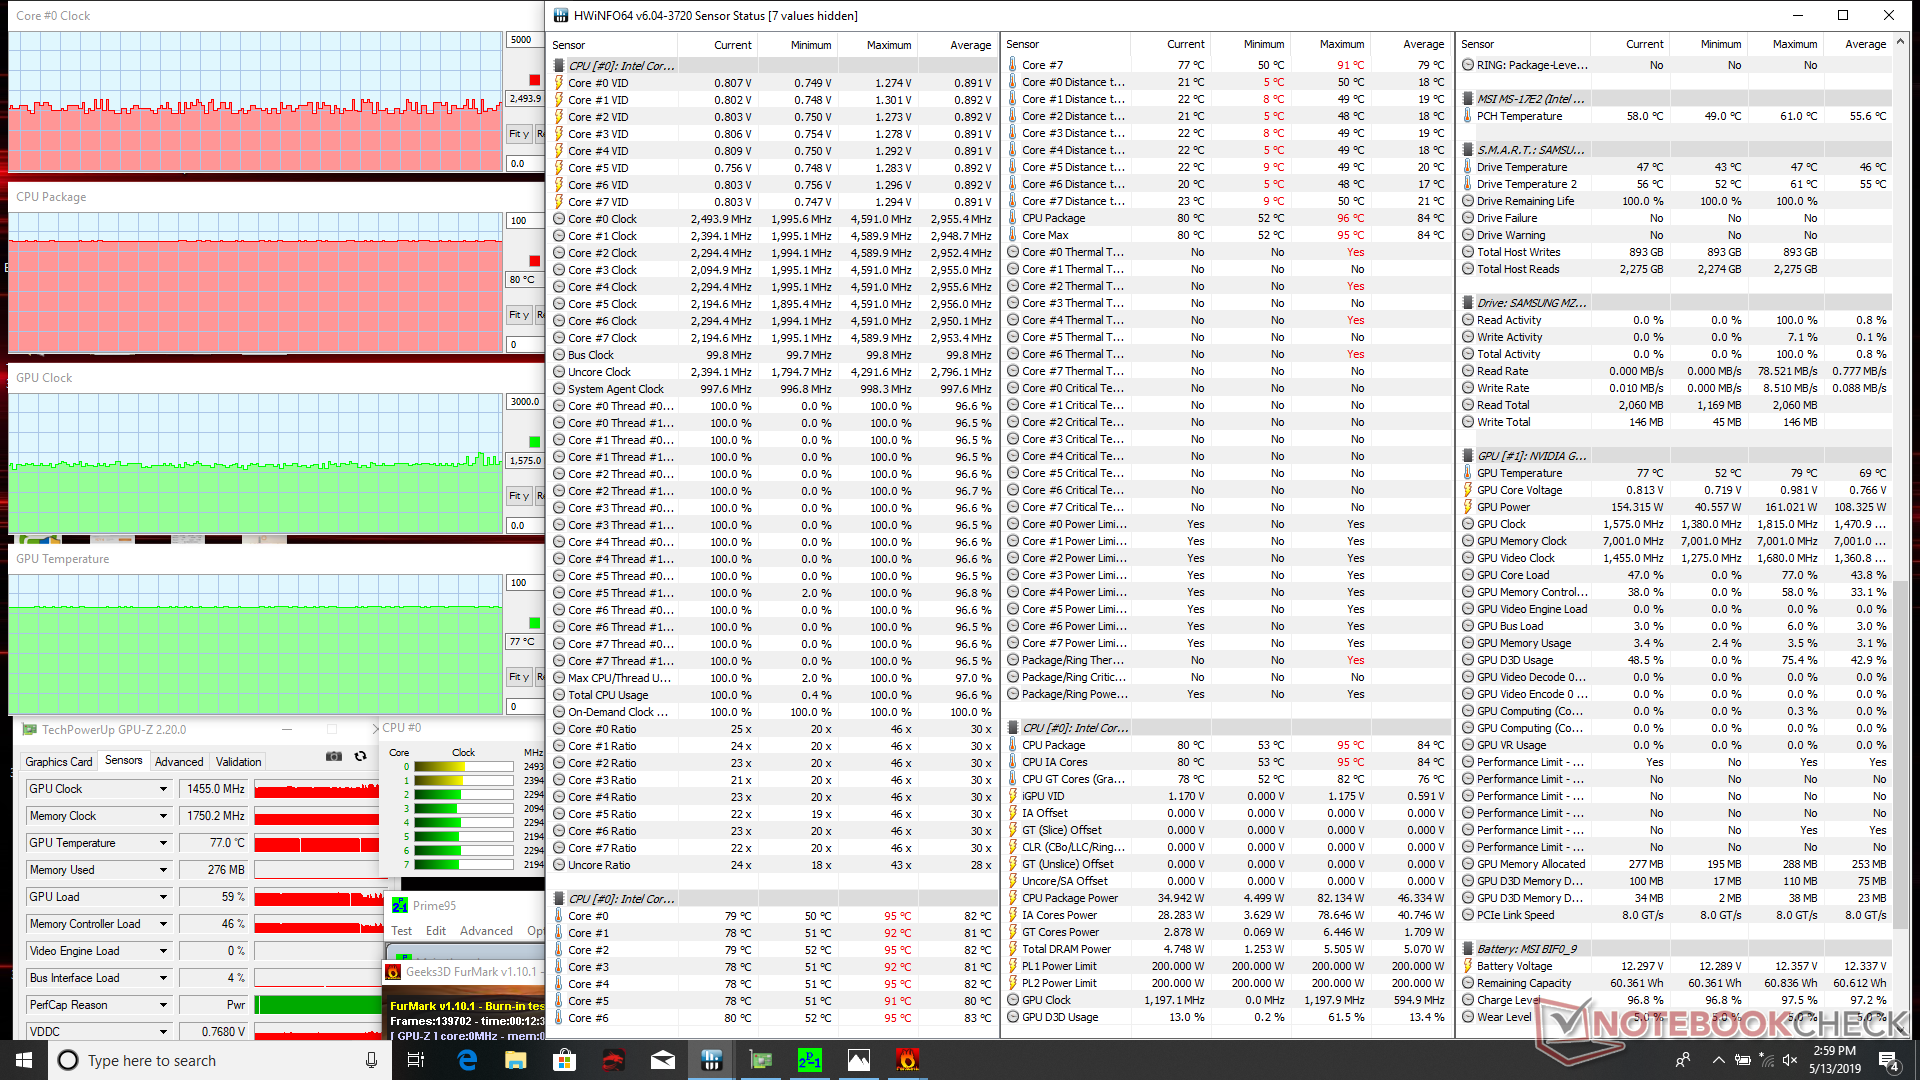
When running Prime95 and FurMark simultaneously, CPU and GPU temperatures stabilize at 80 C and 77 C, respectively, compared to 95 C and 76 C on last year's GE75 8SG with the same RTX 2080 GPU. The cooler core temperature on the GE75 9SG is due to its steeper performance throttling down to 2.4 GHz when both the CPU and GPU are stressed.
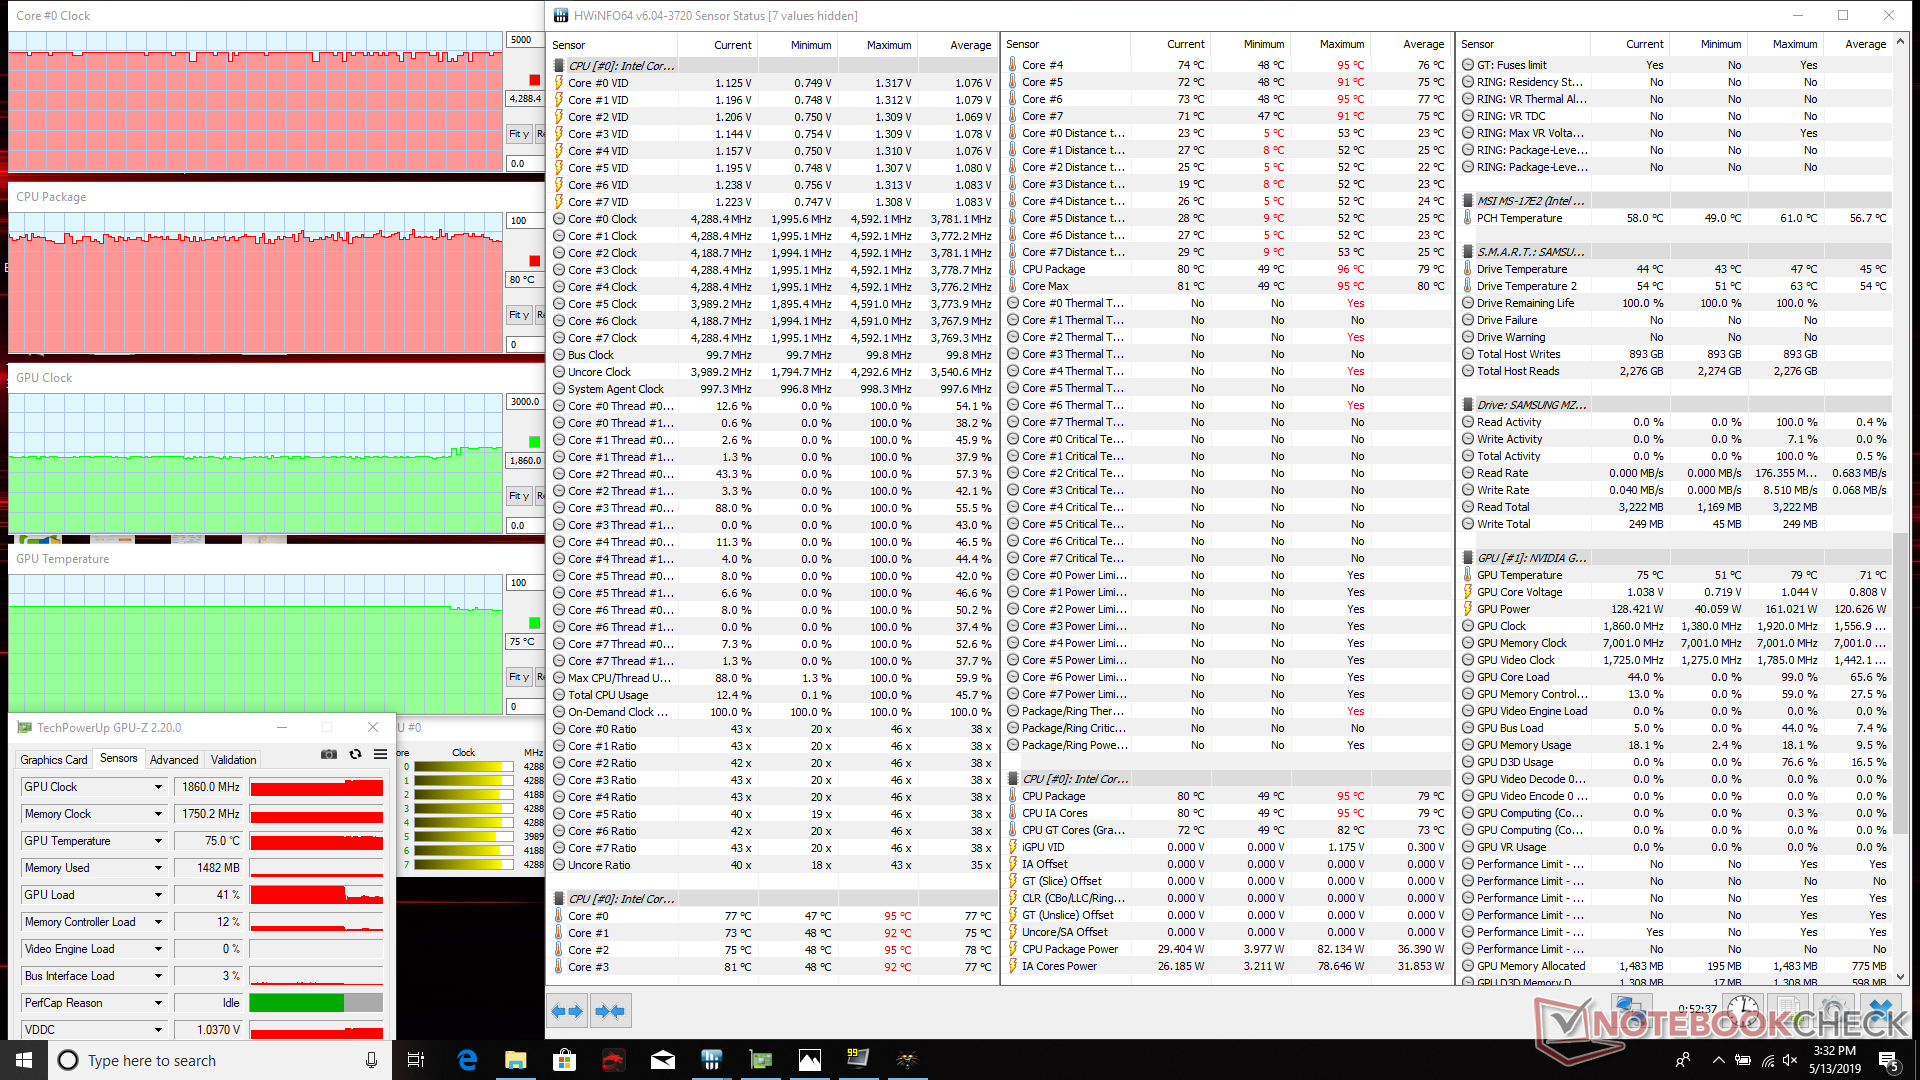
Running Witcher 3 results in stable CPU and GPU temperatures of 81 C and 76 C, respectively. These temperatures are high when compared to a gaming desktop but are otherwise normal for a high-performance gaming laptop with GTX 1080 or RTX 2080 graphics.
Running on battery power will reduce performance. A 3DMark 11 run on batteries returns Physics and Graphics scores of 9402 and 6900, respectively, compared to 17046 and 34050 points when on mains.
| CPU Clock (GHz) | GPU Clock (MHz) | Average CPU Temperature (°C) | Average GPU Temperature (°C) | |
| System Idle | -- | -- | 47 | 50 |
| Prime95 Stress | 3.6 - 3.7 | -- | 90 | 57 |
| Prime95 + FurMark Stress | 2.4 | 1575 | 80 | 77 |
| Witcher 3 Stress | 4.2 | 1800 | 81 | 76 |
(-) The maximum temperature on the upper side is 48.8 °C / 120 F, compared to the average of 40.4 °C / 105 F, ranging from 21.2 to 68.8 °C for the class Gaming.
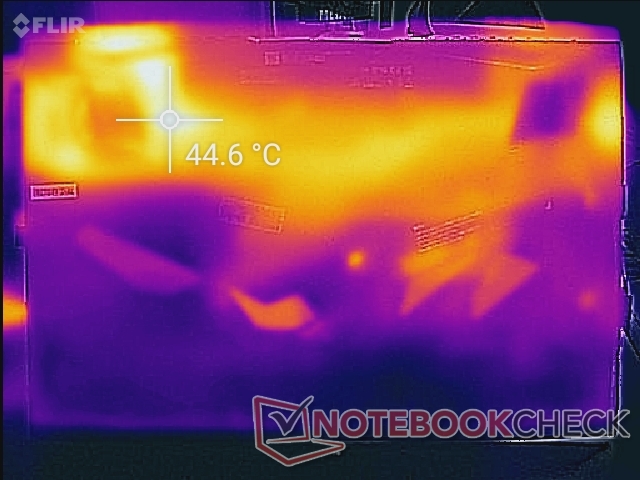
(-) The bottom heats up to a maximum of 52 °C / 126 F, compared to the average of 43.2 °C / 110 F
(+) In idle usage, the average temperature for the upper side is 31.8 °C / 89 F, compared to the device average of 33.9 °C / 93 F.
(-) Playing The Witcher 3, the average temperature for the upper side is 40 °C / 104 F, compared to the device average of 33.9 °C / 93 F.
(+) The palmrests and touchpad are reaching skin temperature as a maximum (32 °C / 89.6 F) and are therefore not hot.
(-) The average temperature of the palmrest area of similar devices was 28.8 °C / 83.8 F (-3.2 °C / -5.8 F).
Speakers

MSI GE75 9SG audio analysis
(+) | speakers can play relatively loud (92.8 dB)
Bass 100 - 315 Hz
(±) | reduced bass - on average 12.2% lower than median
(±) | linearity of bass is average (8.7% delta to prev. frequency)
Mids 400 - 2000 Hz
(±) | higher mids - on average 6.7% higher than median
(±) | linearity of mids is average (11.5% delta to prev. frequency)
Highs 2 - 16 kHz
(+) | balanced highs - only 2.9% away from median
(±) | linearity of highs is average (7.6% delta to prev. frequency)
Overall 100 - 16.000 Hz
(±) | linearity of overall sound is average (16.5% difference to median)
Compared to same class
» 42% of all tested devices in this class were better, 7% similar, 51% worse
» The best had a delta of 6%, average was 18%, worst was 132%
Compared to all devices tested
» 28% of all tested devices were better, 6% similar, 66% worse
» The best had a delta of 4%, average was 23%, worst was 134%
Apple MacBook 12 (Early 2016) 1.1 GHz audio analysis
(+) | speakers can play relatively loud (83.6 dB)
Bass 100 - 315 Hz
(±) | reduced bass - on average 11.3% lower than median
(±) | linearity of bass is average (14.2% delta to prev. frequency)
Mids 400 - 2000 Hz
(+) | balanced mids - only 2.4% away from median
(+) | mids are linear (5.5% delta to prev. frequency)
Highs 2 - 16 kHz
(+) | balanced highs - only 2% away from median
(+) | highs are linear (4.5% delta to prev. frequency)
Overall 100 - 16.000 Hz
(+) | overall sound is linear (10.2% difference to median)
Compared to same class
» 7% of all tested devices in this class were better, 2% similar, 91% worse
» The best had a delta of 5%, average was 18%, worst was 53%
Compared to all devices tested
» 5% of all tested devices were better, 1% similar, 94% worse
» The best had a delta of 4%, average was 23%, worst was 134%
Energy Management
Power Consumption
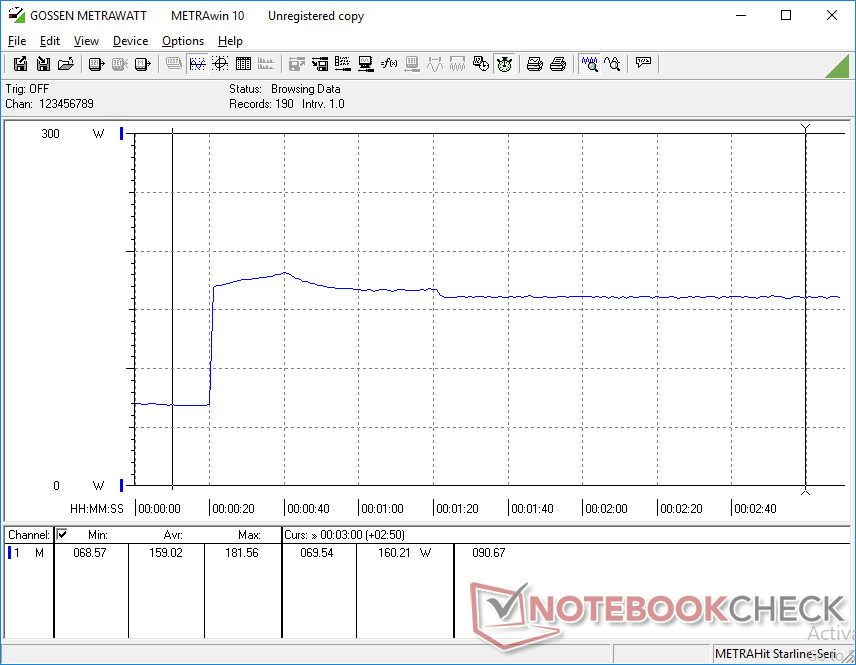
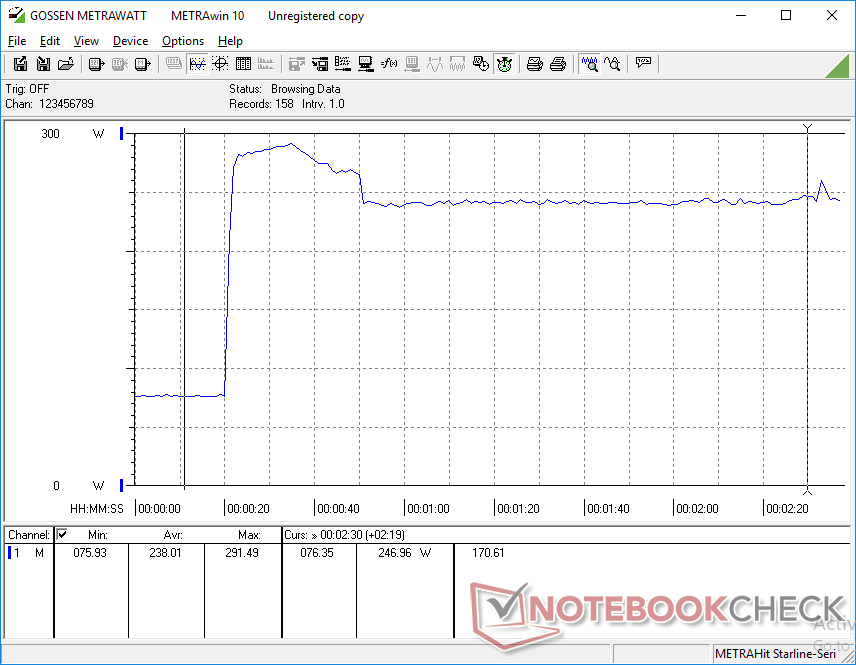
The newer GE75 with 9th gen Core i9 is slightly more power-hungry than the GE75 with 8th gen Core i7 under all tested conditions as shown by our table below. When gaming, for example, the GE75 9SG draws 231 W compared to 207 W on the GE75 8SG. The system is notably less demanding than the older GT75 with 8th gen Core i9 and GTX 1080 graphics while being 17 to 40 percent faster when gaming.
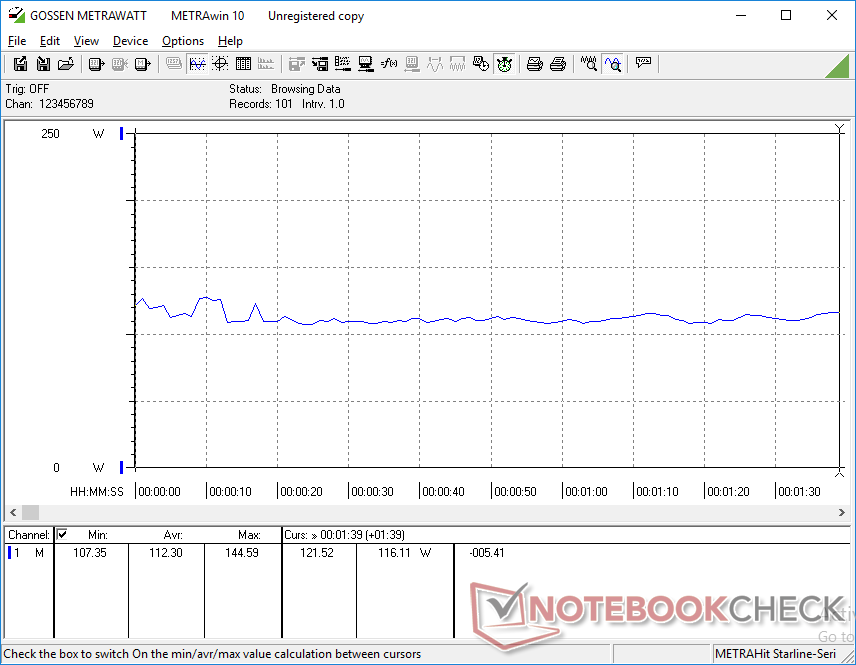
When running Prime95, consumption spikes to a maximum of 181 W during the first few seconds before dropping and stabilizing at 160 W. This behavior mimics our findings during the CineBench R15 loop test and performance stress test above.
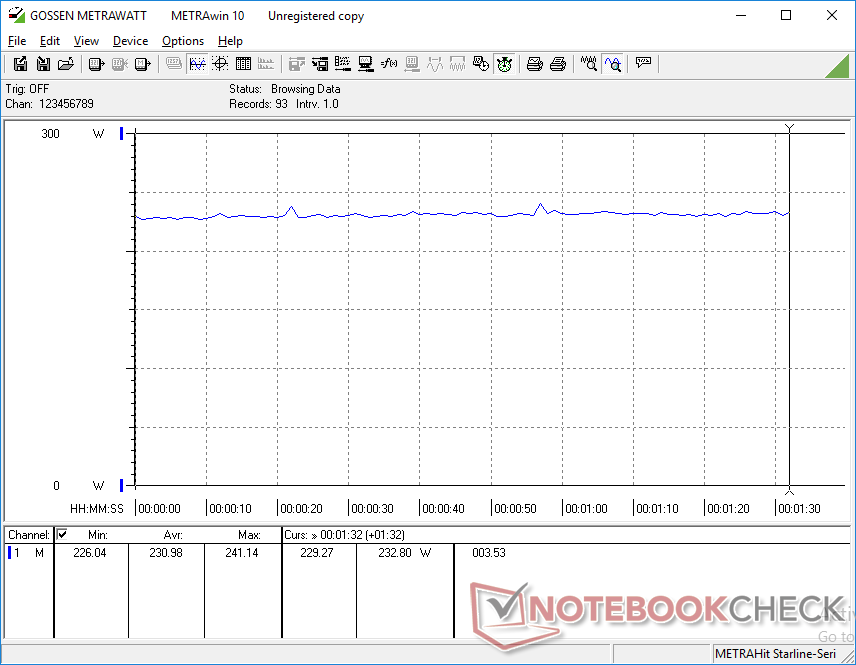
Running both Prime95 and FurMark simultaneously draws a maximum of 291 W from the large (~18 x 8.5 x 3.5 cm) 280 W AC adapter. Consumption throttles down to a more manageable 247 W after just a few seconds.
| Off / Standby | |
| Idle | |
| Load |
|
Key:
min: | |
| MSI GE75 9SG i9-9880H, GeForce RTX 2080 Mobile, Samsung SSD PM981 MZVLB1T0HALR, AHVA, 1920x1080, 17.3" | MSI GE75 8SG Raider i7-8750H, GeForce RTX 2080 Mobile, Kingston RBUSNS8154P3512GJ, AHVA, 1920x1080, 17.3" | Asus Zephyrus S GX701GX i7-8750H, GeForce RTX 2080 Max-Q, Samsung SSD PM981 MZVLB1T0HALR, IPS, 1920x1080, 17.3" | MSI GT75 8RG-090 Titan i9-8950HK, GeForce GTX 1080 Mobile, 2x Samsung PM961 MZVLW256HEHP (RAID 0), TN, 1920x1080, 17.3" | Acer Predator Triton 700 i7-7700HQ, GeForce GTX 1080 Max-Q, 2x SK Hynix Canvas SC300 512GB M.2 (HFS512G39MND) (RAID 0), IPS, 1920x1080, 15.6" | MSI GE73 8RF-008 Raider RGB i7-8750H, GeForce GTX 1070 Mobile, Toshiba HG6 THNSNJ256G8NY, TN WLED, 1920x1080, 17.3" | |
|---|---|---|---|---|---|---|
| Power Consumption | 19% | -3% | -61% | -31% | 4% | |
| Idle Minimum * (Watt) | 13.9 | 7 50% | 19 -37% | 31 -123% | 28 -101% | 15 -8% |
| Idle Average * (Watt) | 18.8 | 15 20% | 22 -17% | 35 -86% | 33 -76% | 20 -6% |
| Idle Maximum * (Watt) | 23.1 | 22 5% | 30 -30% | 45 -95% | 41 -77% | 26 -13% |
| Load Average * (Watt) | 112.3 | 92 18% | 104 7% | 130 -16% | 94 16% | 97 14% |
| Witcher 3 ultra * (Watt) | 231 | 207 10% | 167 28% | 268 -16% | 160 31% | 186 19% |
| Load Maximum * (Watt) | 291.5 | 254 13% | 203 30% | 374 -28% | 222 24% | 239 18% |
* ... smaller is better
Battery Life
Battery life has not changed from last year's GE75 8SG when running typical WLAN loads. Expect a runtime just shy of 5 hours when on the Balanced profile with Optimus set to the integrated GPU.
Recharging takes just under 2 hours with the included AC adapter. The system will charge more slowly if running extremely high CPU and GPU loads.
| MSI GE75 9SG i9-9880H, GeForce RTX 2080 Mobile, 65 Wh | Asus TUF FX705DY-AU072 R5 3550H, Radeon RX 560X (Laptop), 64 Wh | Asus Zephyrus S GX701GX i7-8750H, GeForce RTX 2080 Max-Q, 76 Wh | Acer Predator Triton 700 i7-7700HQ, GeForce GTX 1080 Max-Q, 54 Wh | MSI GE73 8RF-008 Raider RGB i7-8750H, GeForce GTX 1070 Mobile, 51 Wh | MSI GE75 8SG Raider i7-8750H, GeForce RTX 2080 Mobile, 65 Wh | |
|---|---|---|---|---|---|---|
| Battery runtime | 47% | -22% | -51% | -37% | -4% | |
| WiFi v1.3 (h) | 4.9 | 7.2 47% | 3.8 -22% | 2.4 -51% | 3.1 -37% | 4.7 -4% |
| Reader / Idle (h) | 12.6 | 5 | 2.5 | 5.1 | 7.8 | |
| Load (h) | 2 | 0.9 | 1.2 | 0.6 | 0.9 | |
| Witcher 3 ultra (h) | 0.8 |
Pros
Cons
Verdict
The Core i9-9880H is what the Core i9-8950HK should have been. The two extra cores give it the firm performance advantage it needs over both the Core i7-8750H and Core i7-9750H. The average i7-8750H is about 36 percent slower before accounting for any performance throttling.
The disadvantages are what you would expect from a faster CPU based on the same underlying architecture. Namely, core temperatures and power consumption are higher when the CPU is fully stressed. The i9-9880H stabilizes at 90 C when running Prime95 compared to 73 C on the i7-8750H SKU. Meanwhile, gaming consumes 231 W versus 207 W on last year's GE73 8SG. Applications that don't fully utilize all eight cores will see less of a performance gain over the hexa-core Core i7 series.
Of course, the GE75 9SG is just one example of the Core i9-9880H. The very wide clock rate range of the i9-9880H (2.3 - 3.8 GHz) means other OEMs may implement the same CPU at slower clock rates for potentially slower performance than what we've observed here. Nonetheless, our first taste of the 9th gen Core i9 is already looking very promising.
Enthusiasts will want to consider the 9th gen Core i9 especially if they rely on applications optimized for eight CPU cores. Gamers also have something to gain from the i9-9880H as well albeit at a much smaller 10 percent performance increase for most titles. In either case, the new CPU is in a much better place compared to last year's Core i9-8950HK.
MSI GE75 9SG
- 07/02/2020 v7 (old)
Allen Ngo
Price comparison
