Schenker XMG Ultra 17 (Clevo P775TM1-G) Laptop Review

The Ultimate series marks Schenker Technologies’ most expensive and powerful high-end laptops. While the XMG U727 and XMG Zenith 17 are available with the option of two Nvidia Pascal based GPUs, the XMG Ultra 15 and Ultra 17 are solely available with one. The 17-inch model presented in this test is powered by a choice of a GeForce GTX 1060, a GTX 1070 or the current top of its class, the GTX 1080. Befitting a high-end gaming notebook, it also can be specified with up to 64 GB of DDR4 memory (4 slots) and up to four storage devices (2x M.2-2280 & 2x 2.5-inch).
The basic configuration comes with a Core i5-8400 (2.8-4.0 GHz, 9 MB Cache) processor, which can be upgraded to a Core i5-8600K (3.6-4.3 GHz, 9 MB Cache), a Core i7-8700 (3.2-4.6 GHz, 12 MB Cache), or a Core i7-8700K (3.7-4.7 GHz, 12 MB Cache) respectively. The latter two offer Hyper-threading and are if desired, available in delidded form. This package is made complete with a choice of a Full HD display (1920x1080, 60 Hz, IPS), a WQHD monitor (2560x1440, 120 Hz, TN) or a UHD panel (3840x2160, 60 Hz, IPS).
The most basic version of the Ultra 17 is currently priced at 1699 Euros (~$2090). However, at this price customers are left with only a 500 GB HDD, 8 GB of RAM, and no included operating system. You will have to spend far more if you want our configuration, the L17-hwc, which is available at multiple online shops. With a price tag of 3500 Euros (~$4310), our configuration comes with a Core i7-8700, a GeForce GTX 1080, a UHD panel, 32 GB of RAM and a combination of a 500 GB SSD and a 2 TB HDD.
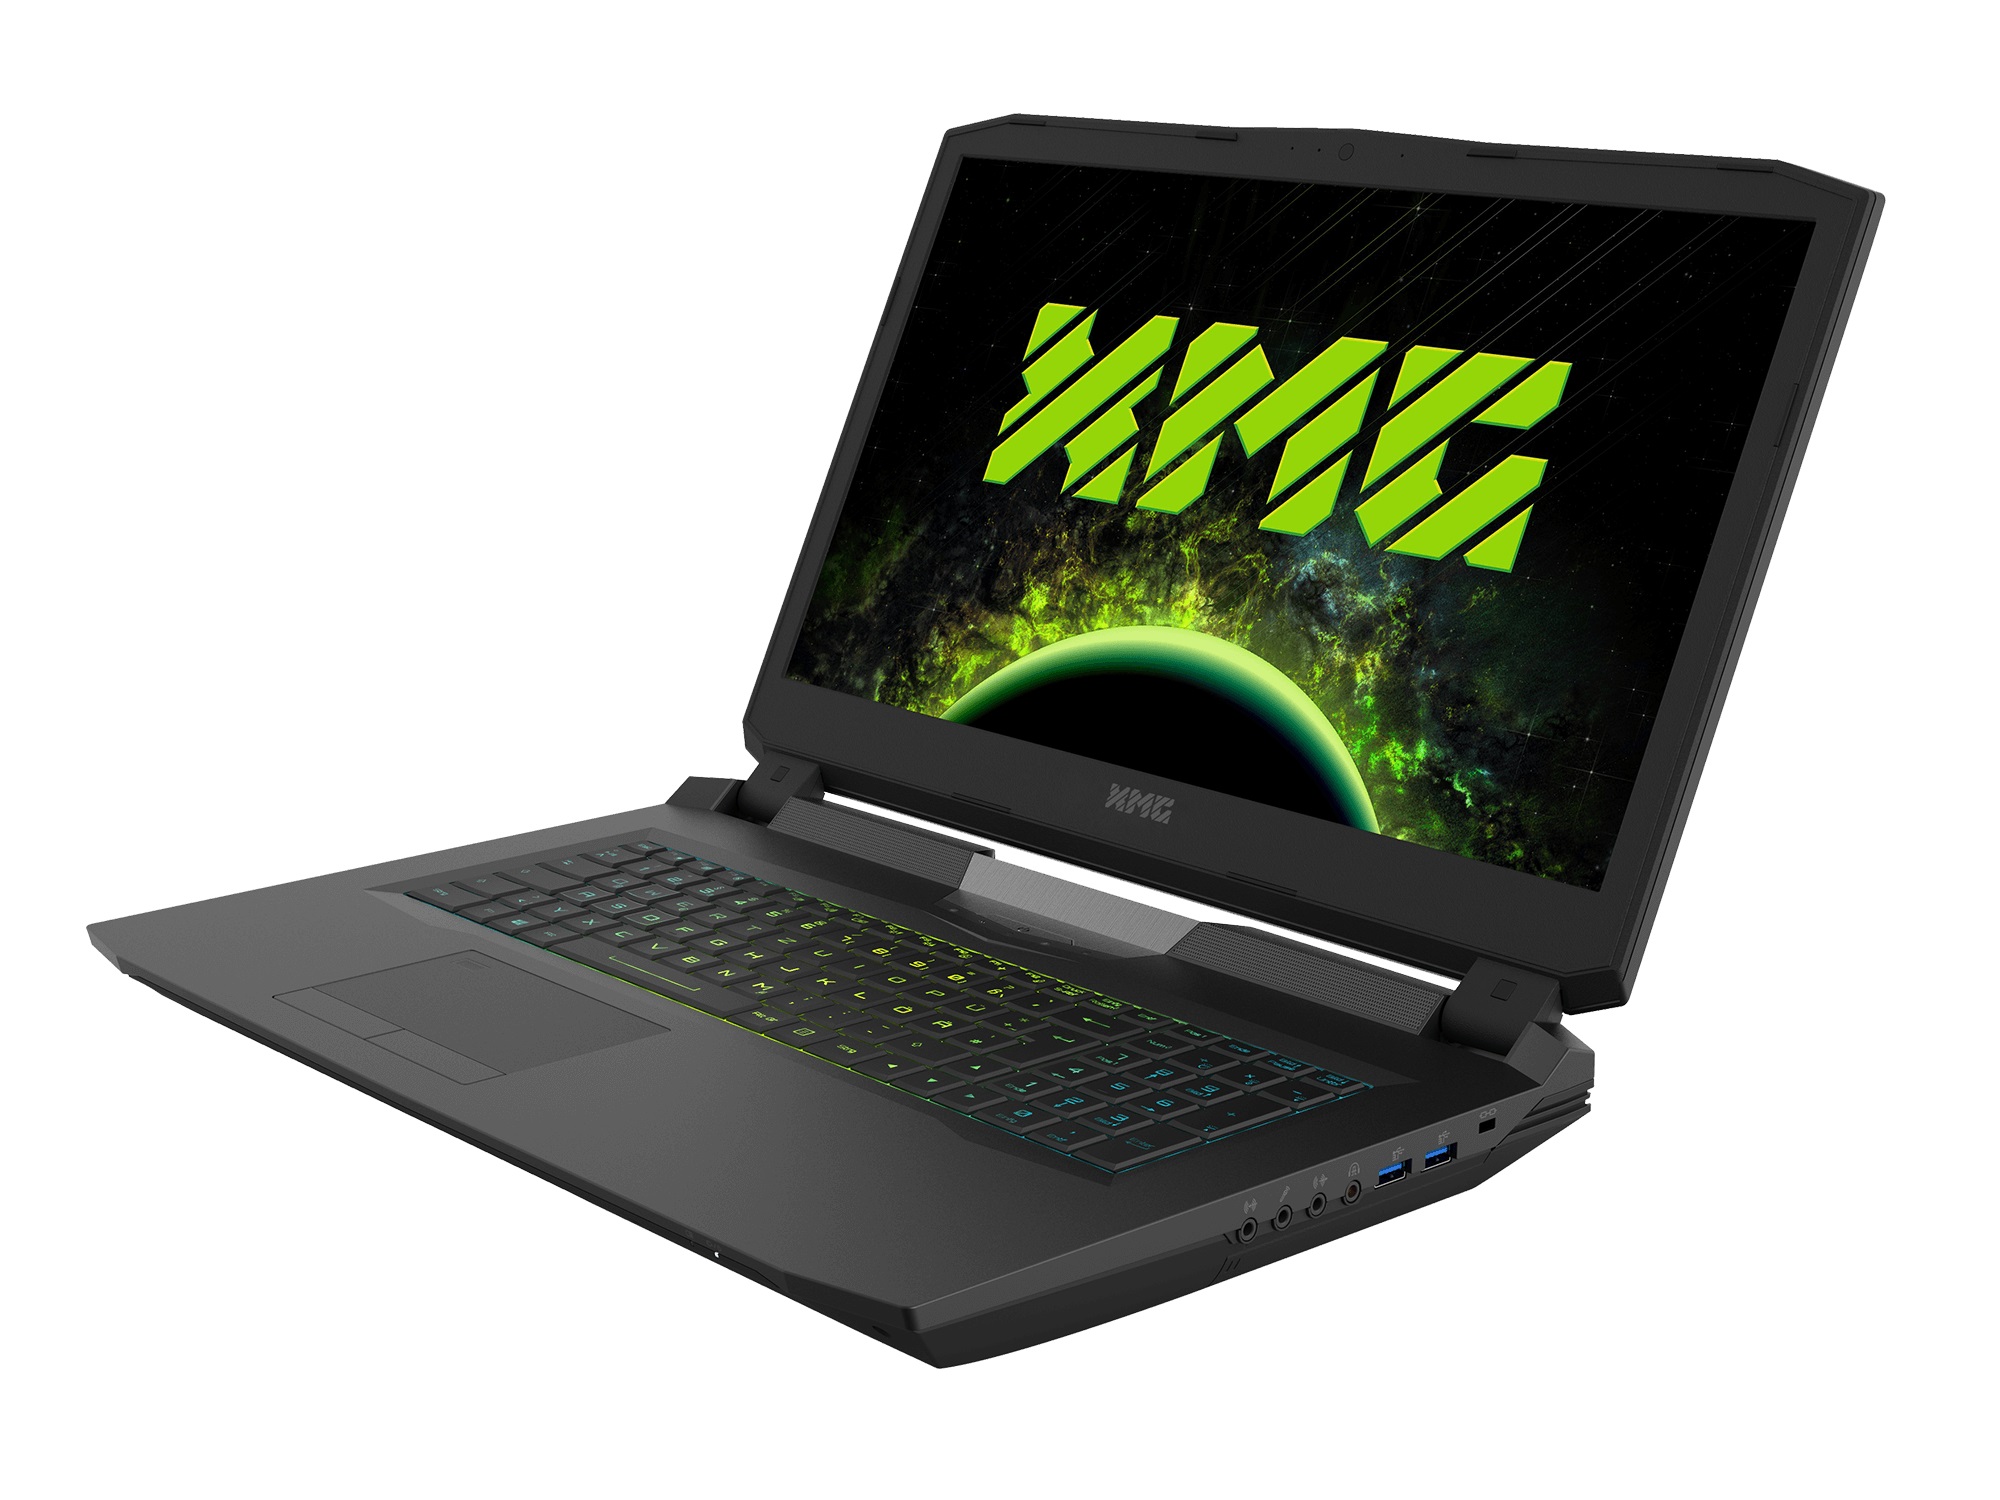
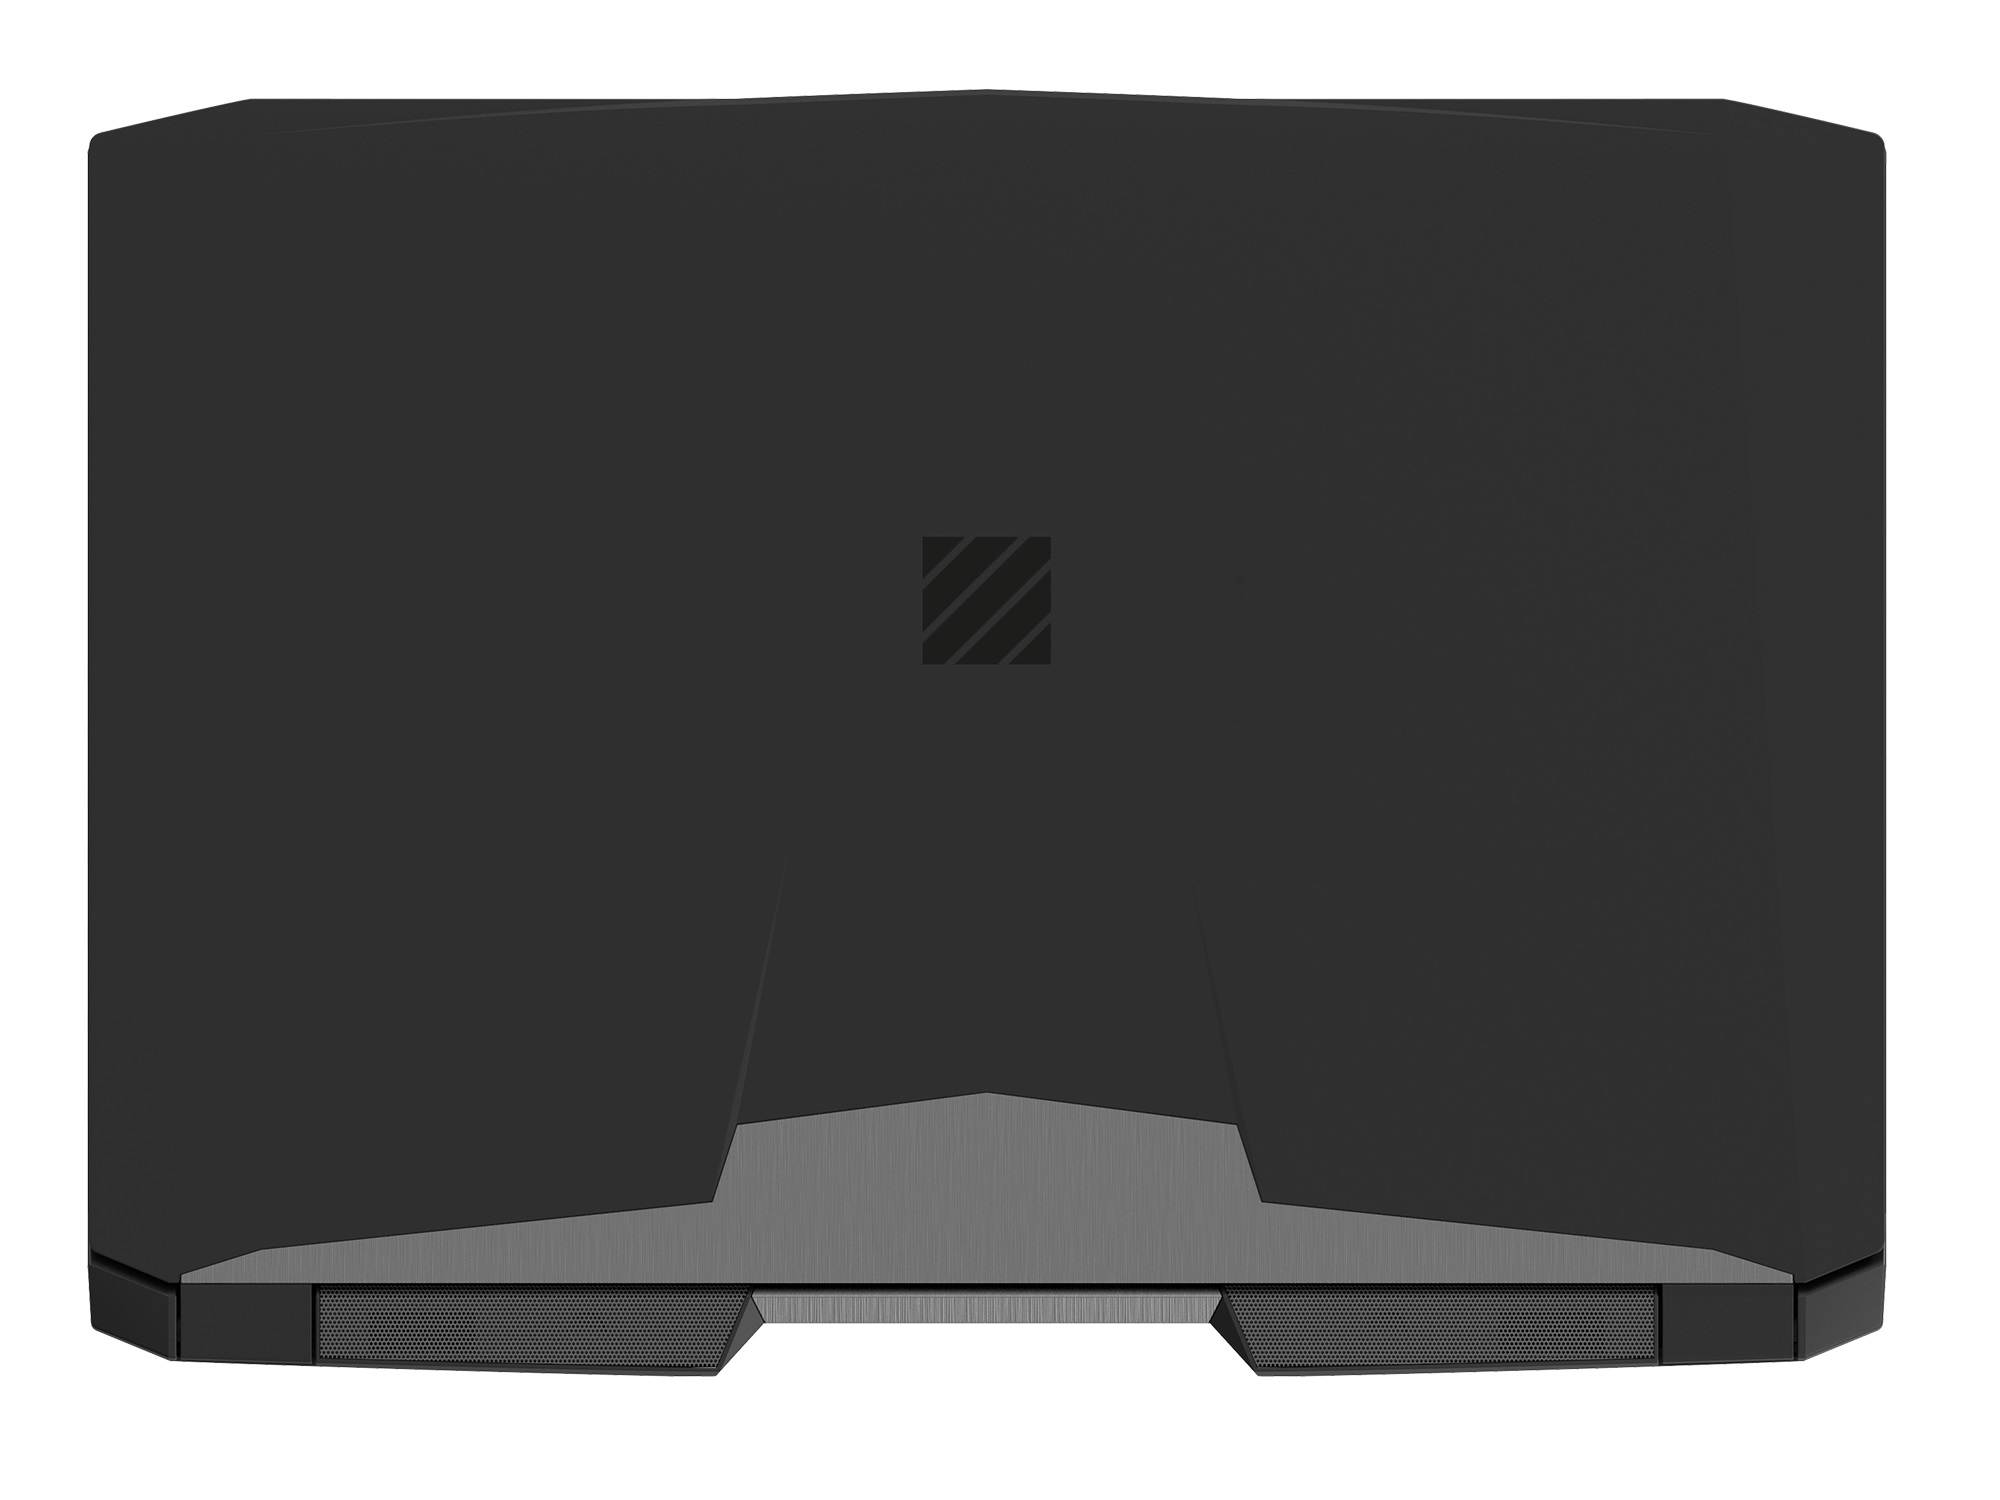
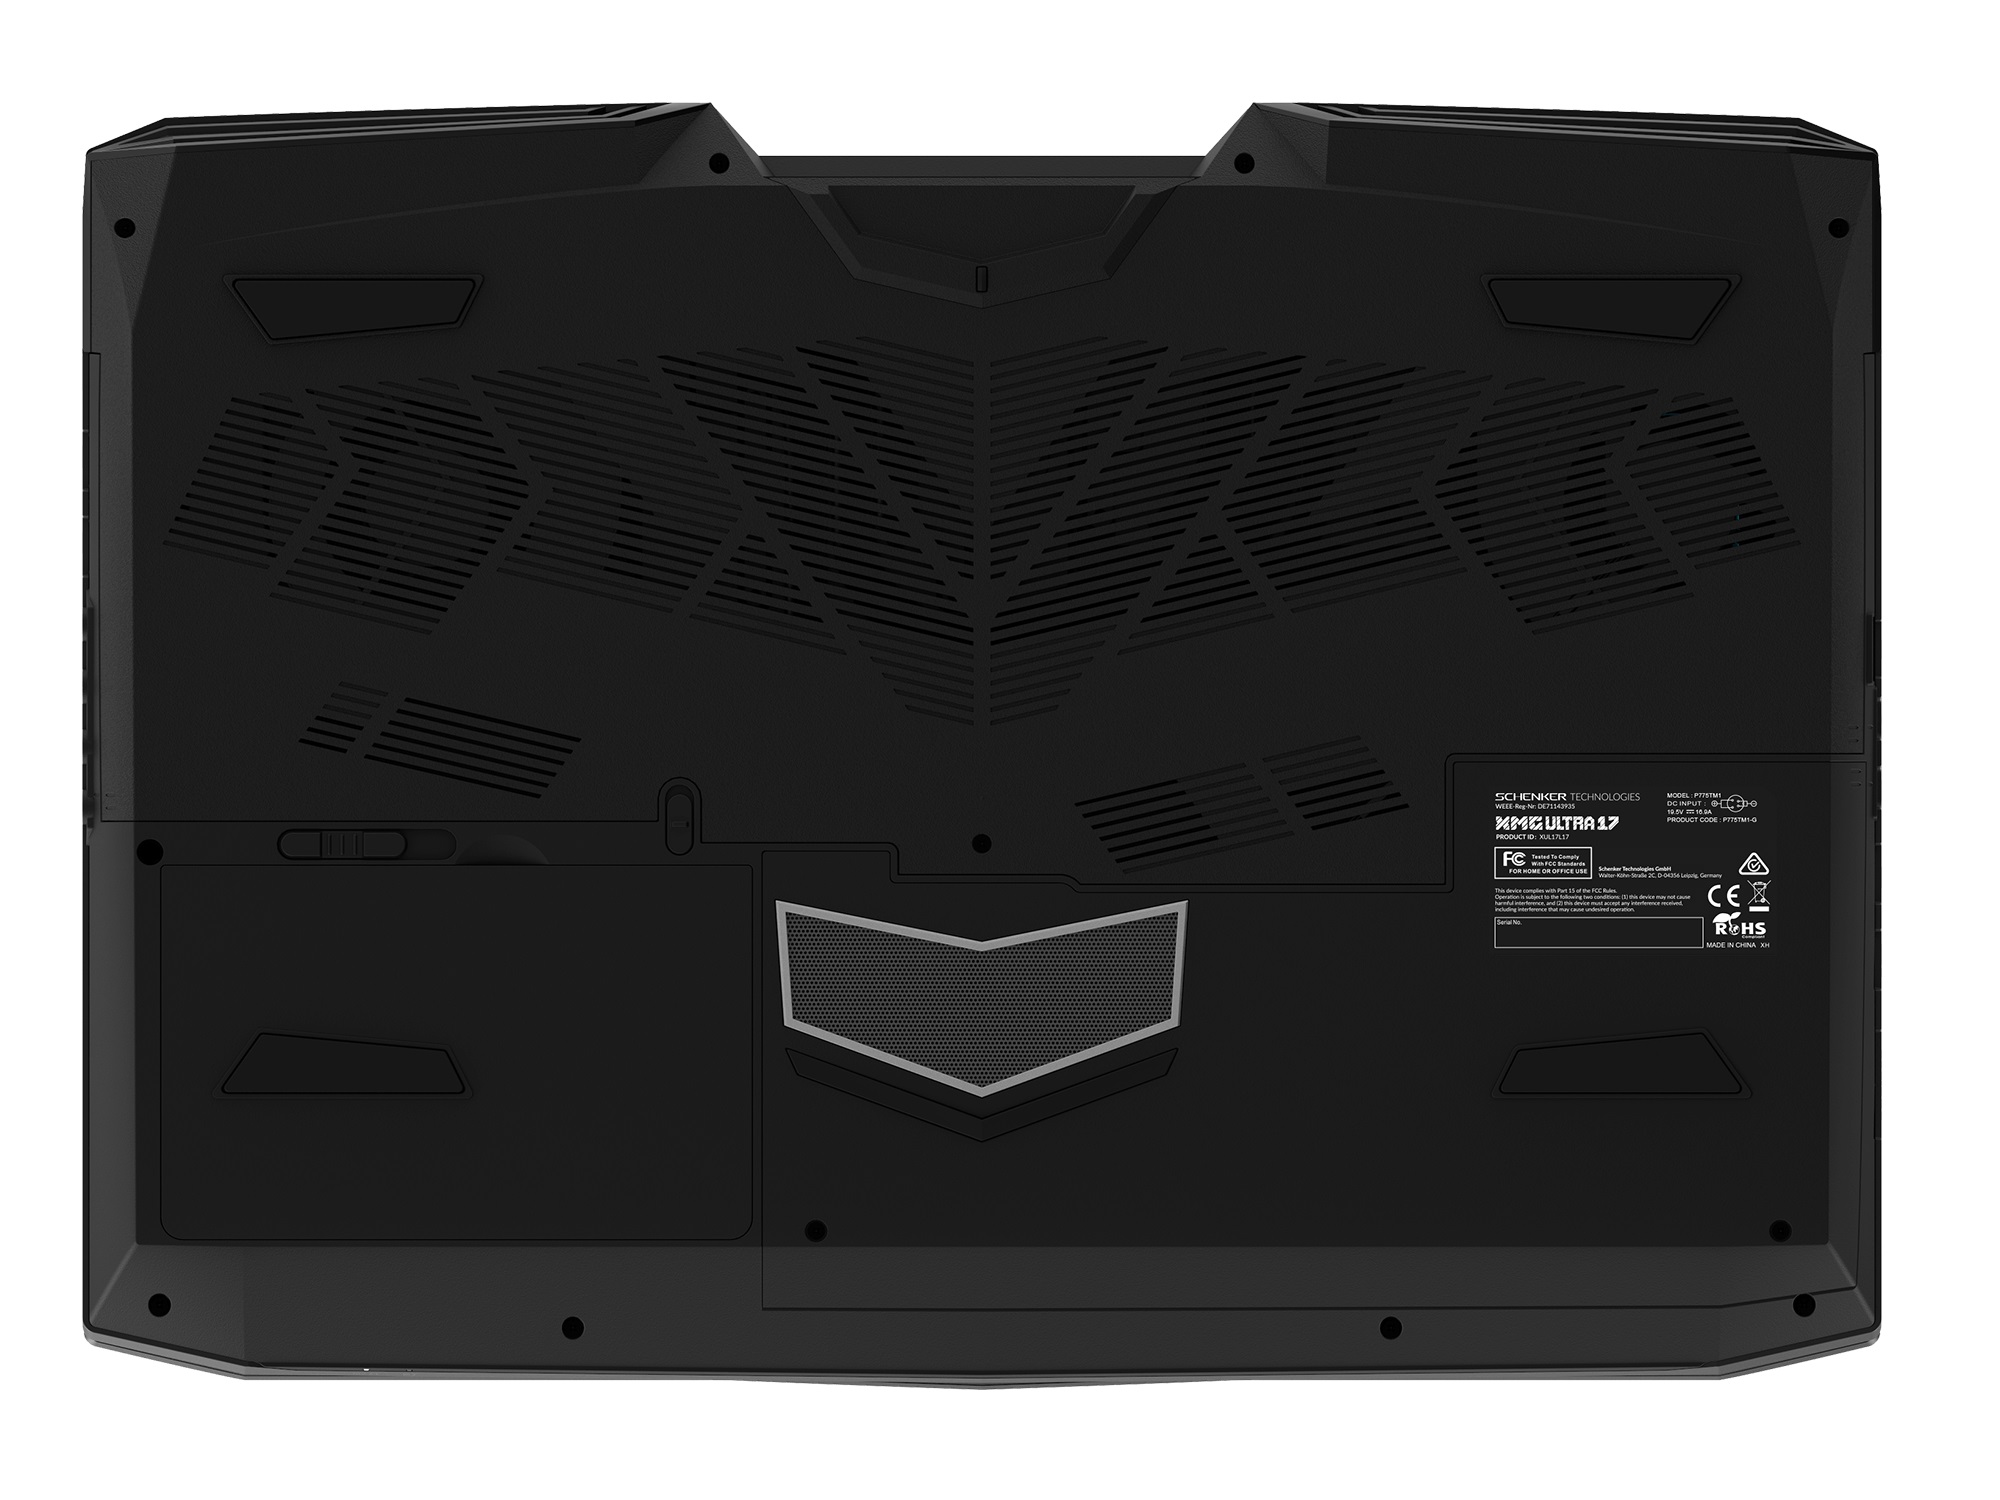
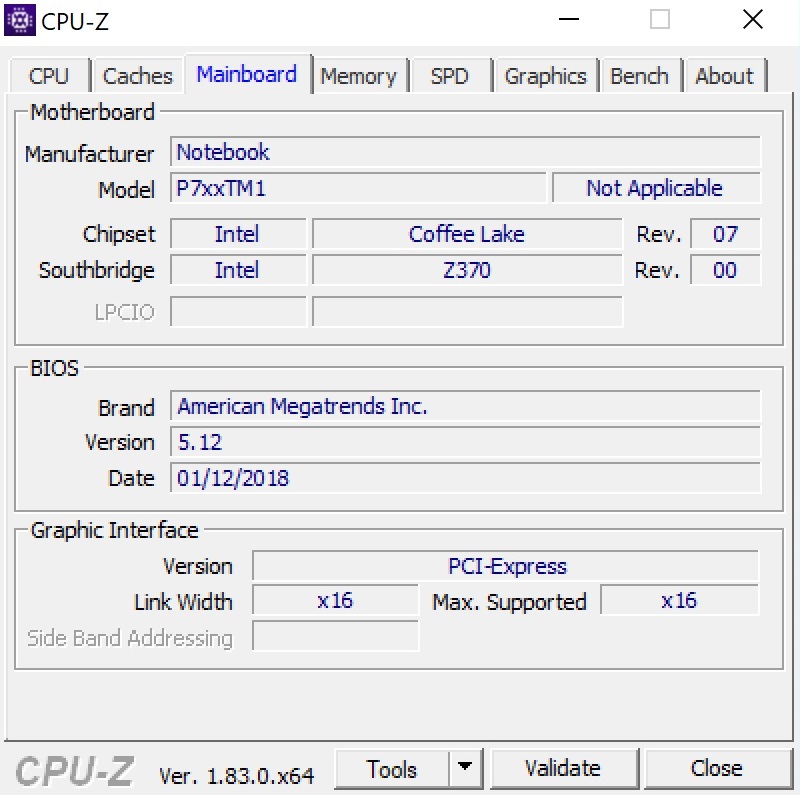
The chassis of the Ultra 17 is the P775TM1-G Barebone manufactured by Clevo, which is very similar to the already tested P775DM3-G used for the Guru Mars K. Thus, we will not go too deep into specifics such as the chassis, input devices and connectivity. That information can be found by following this link.
| SD Card Reader | |
| average JPG Copy Test (av. of 3 runs) | |
| Guru Mars K (Toshiba Exceria Pro SDXC 64 GB UHS-II) | |
| Schenker XMG Ultra 17 (Toshiba Exceria Pro SDXC 64 GB UHS-II) | |
| Average of class Gaming (20.9 - 210, n=54, last 2 years) | |
| MSI GT75VR 7RF-012 Titan Pro (Toshiba Exceria Pro SDXC 64 GB UHS-II) | |
| Acer Predator 17 X GX-792-76DL (Toshiba Exceria Pro SDXC 64 GB UHS-II) | |
| maximum AS SSD Seq Read Test (1GB) | |
| Schenker XMG Ultra 17 (Toshiba Exceria Pro SDXC 64 GB UHS-II) | |
| Guru Mars K (Toshiba Exceria Pro SDXC 64 GB UHS-II) | |
| Average of class Gaming (25.5 - 261, n=51, last 2 years) | |
| Acer Predator 17 X GX-792-76DL (Toshiba Exceria Pro SDXC 64 GB UHS-II) | |
| MSI GT75VR 7RF-012 Titan Pro (Toshiba Exceria Pro SDXC 64 GB UHS-II) | |
Display
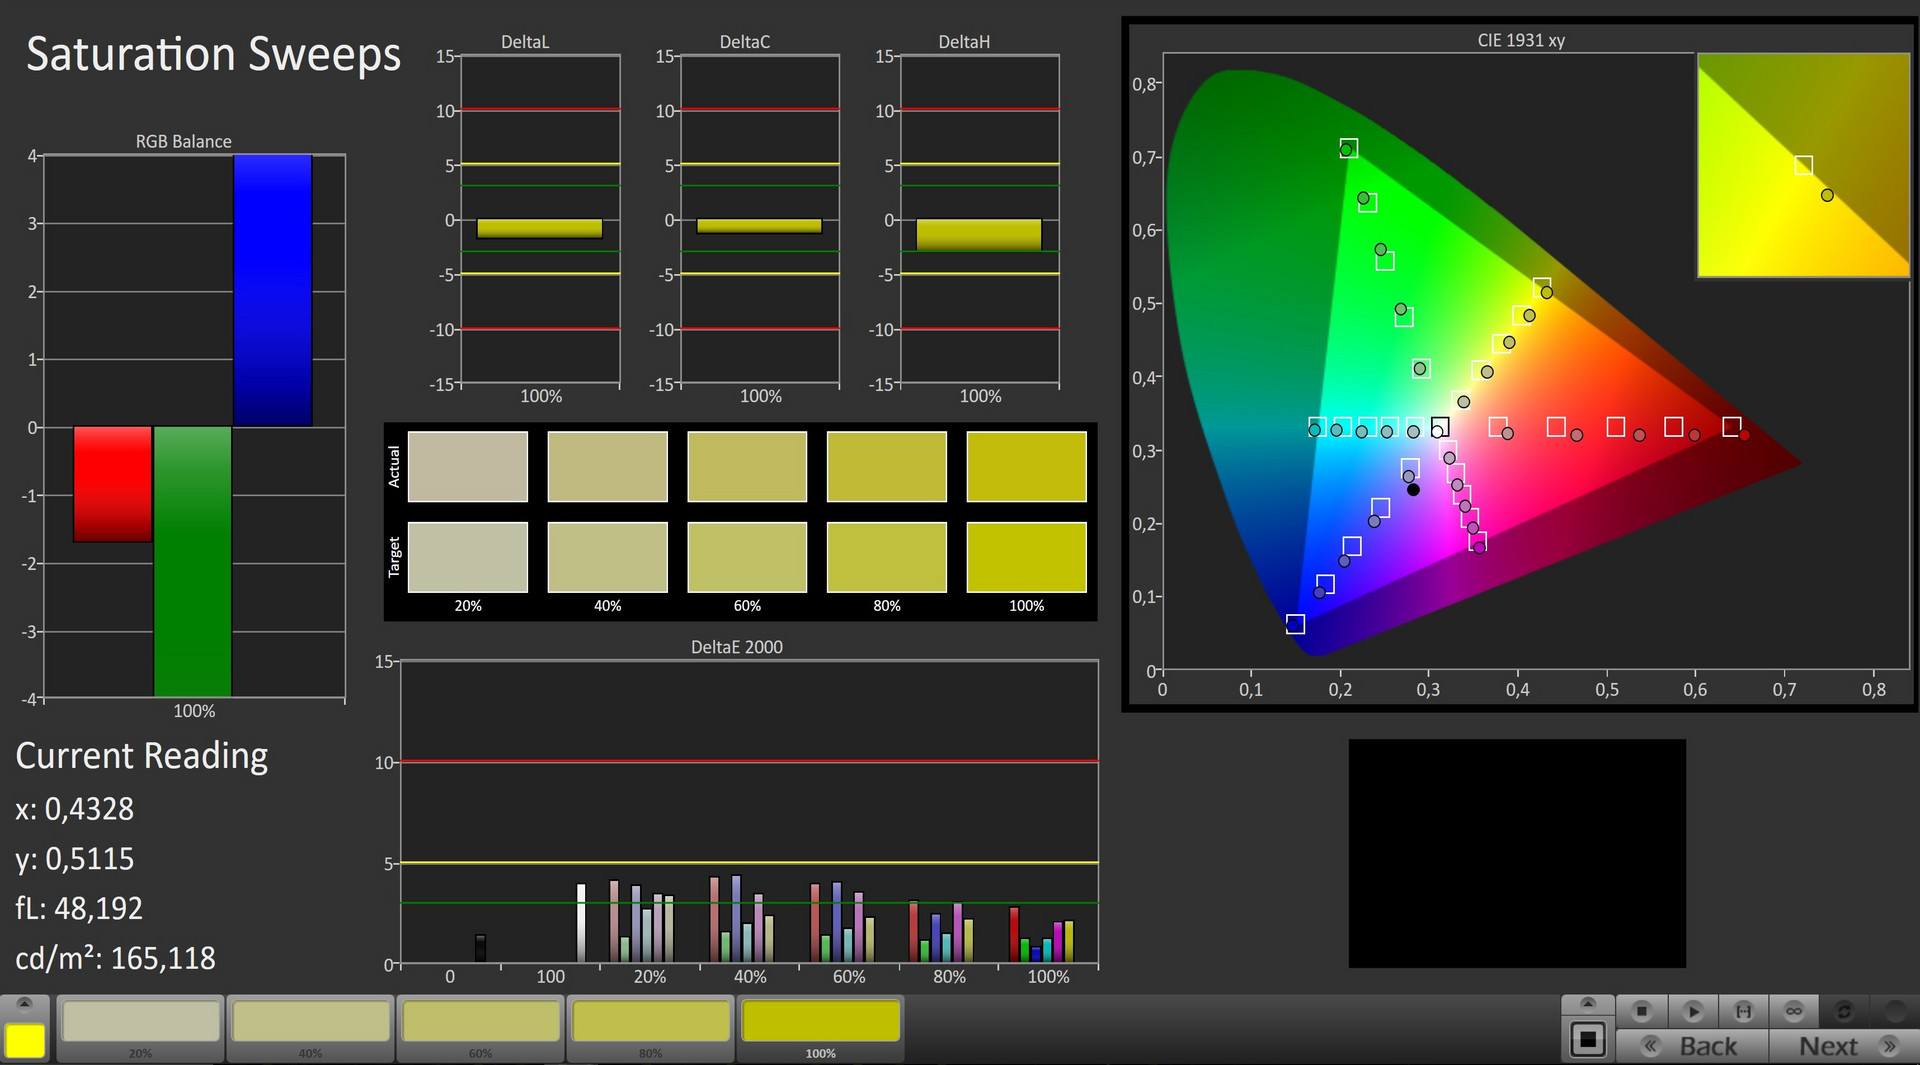
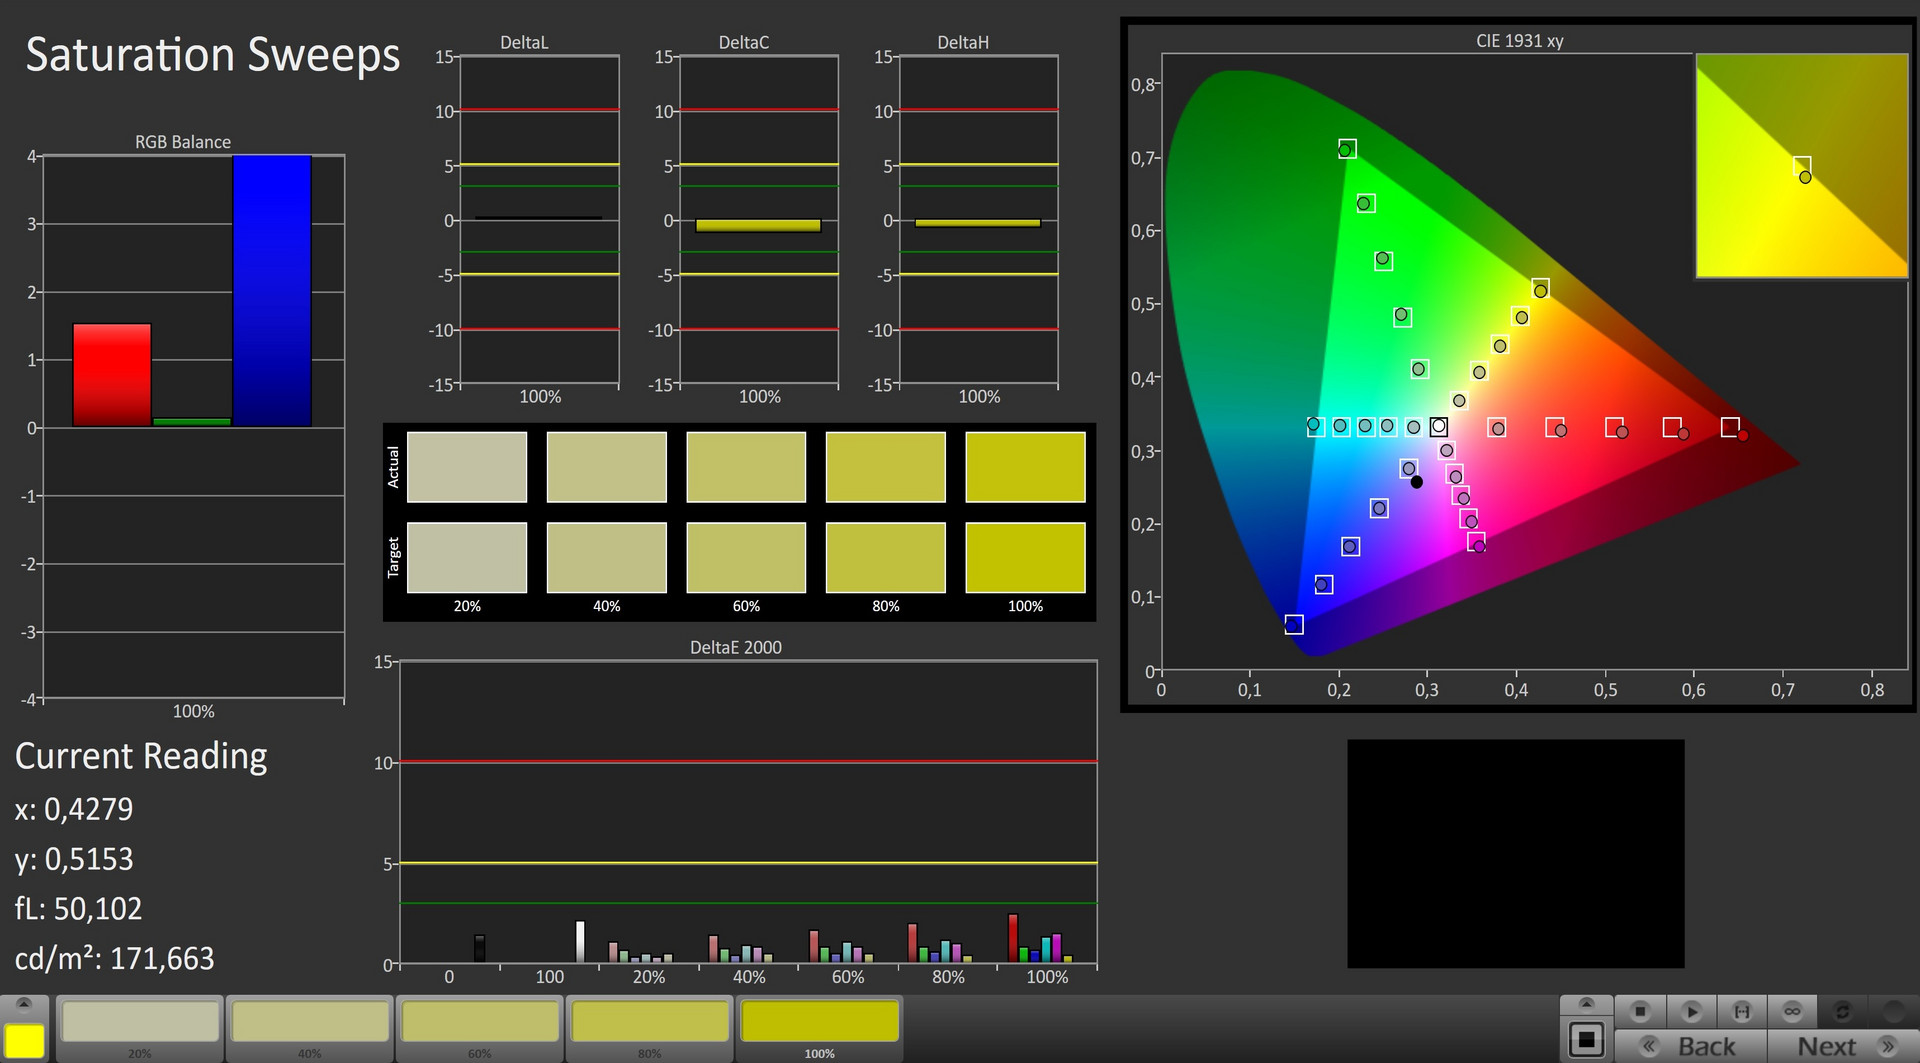
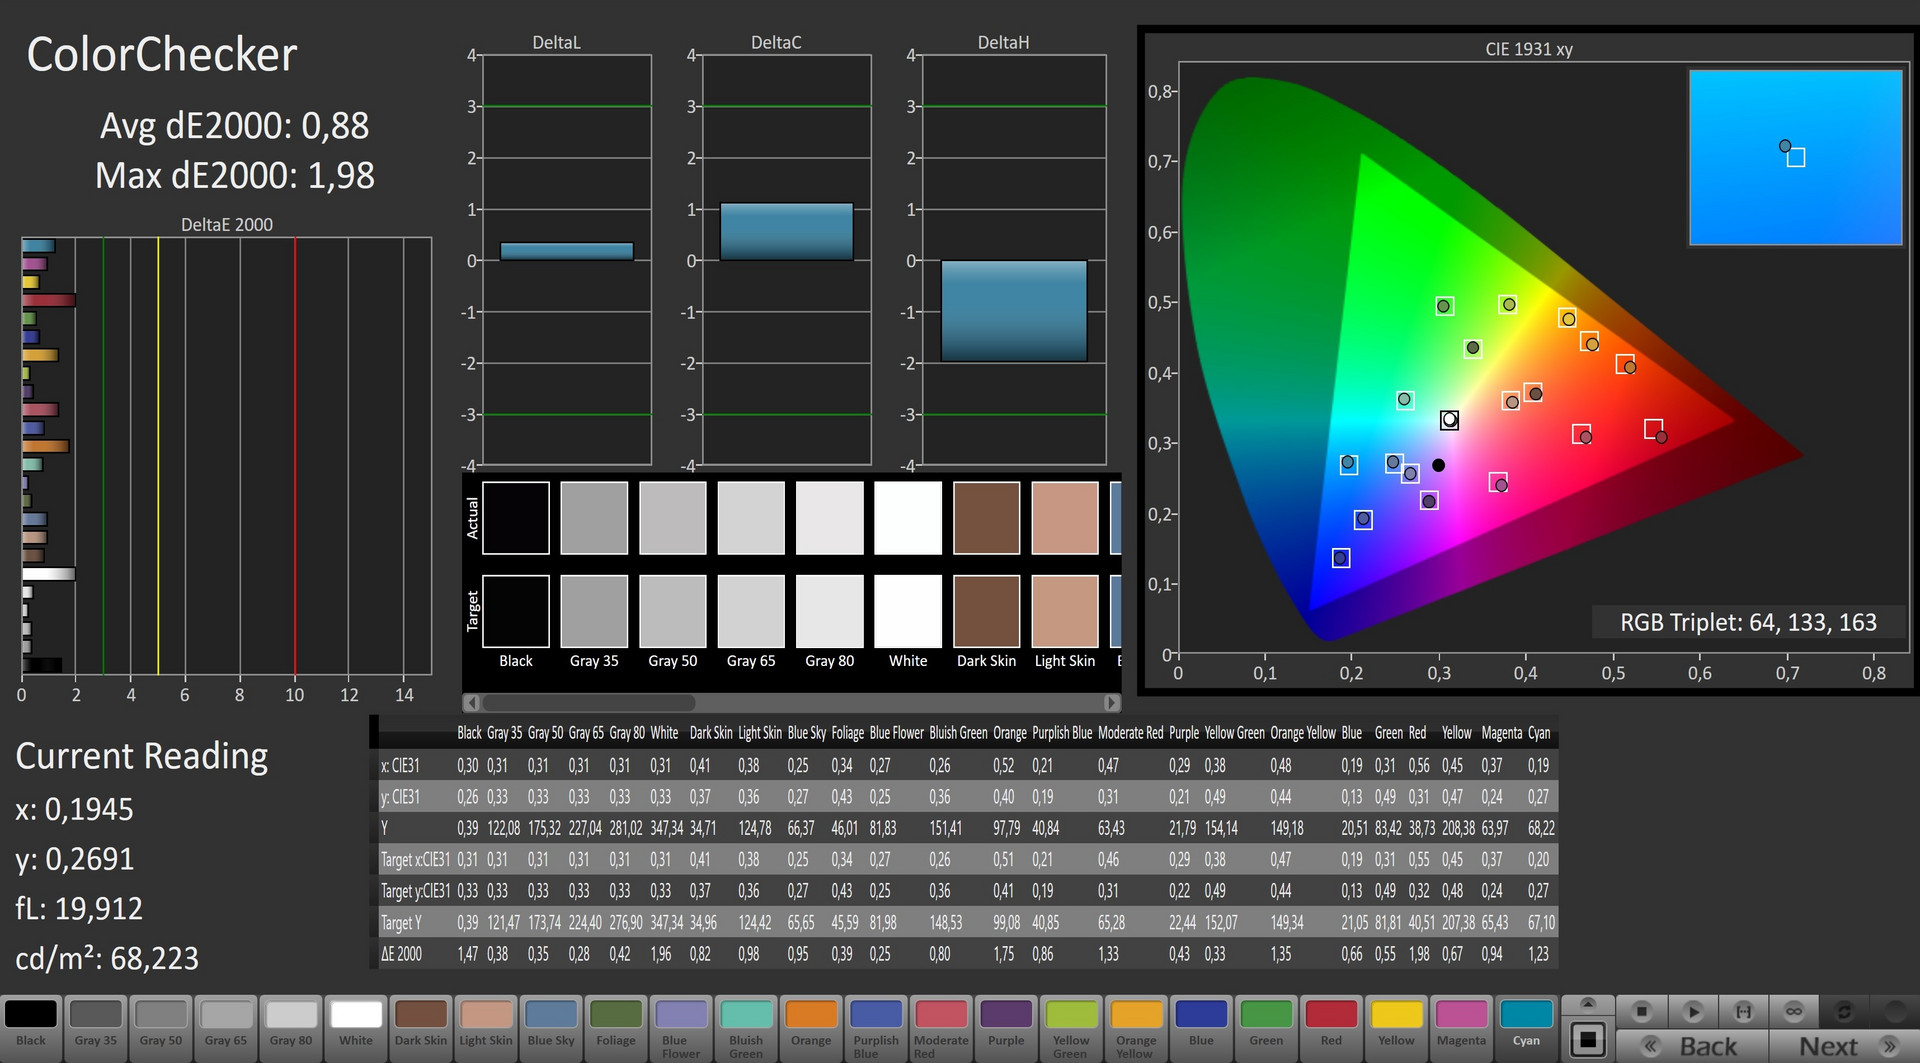
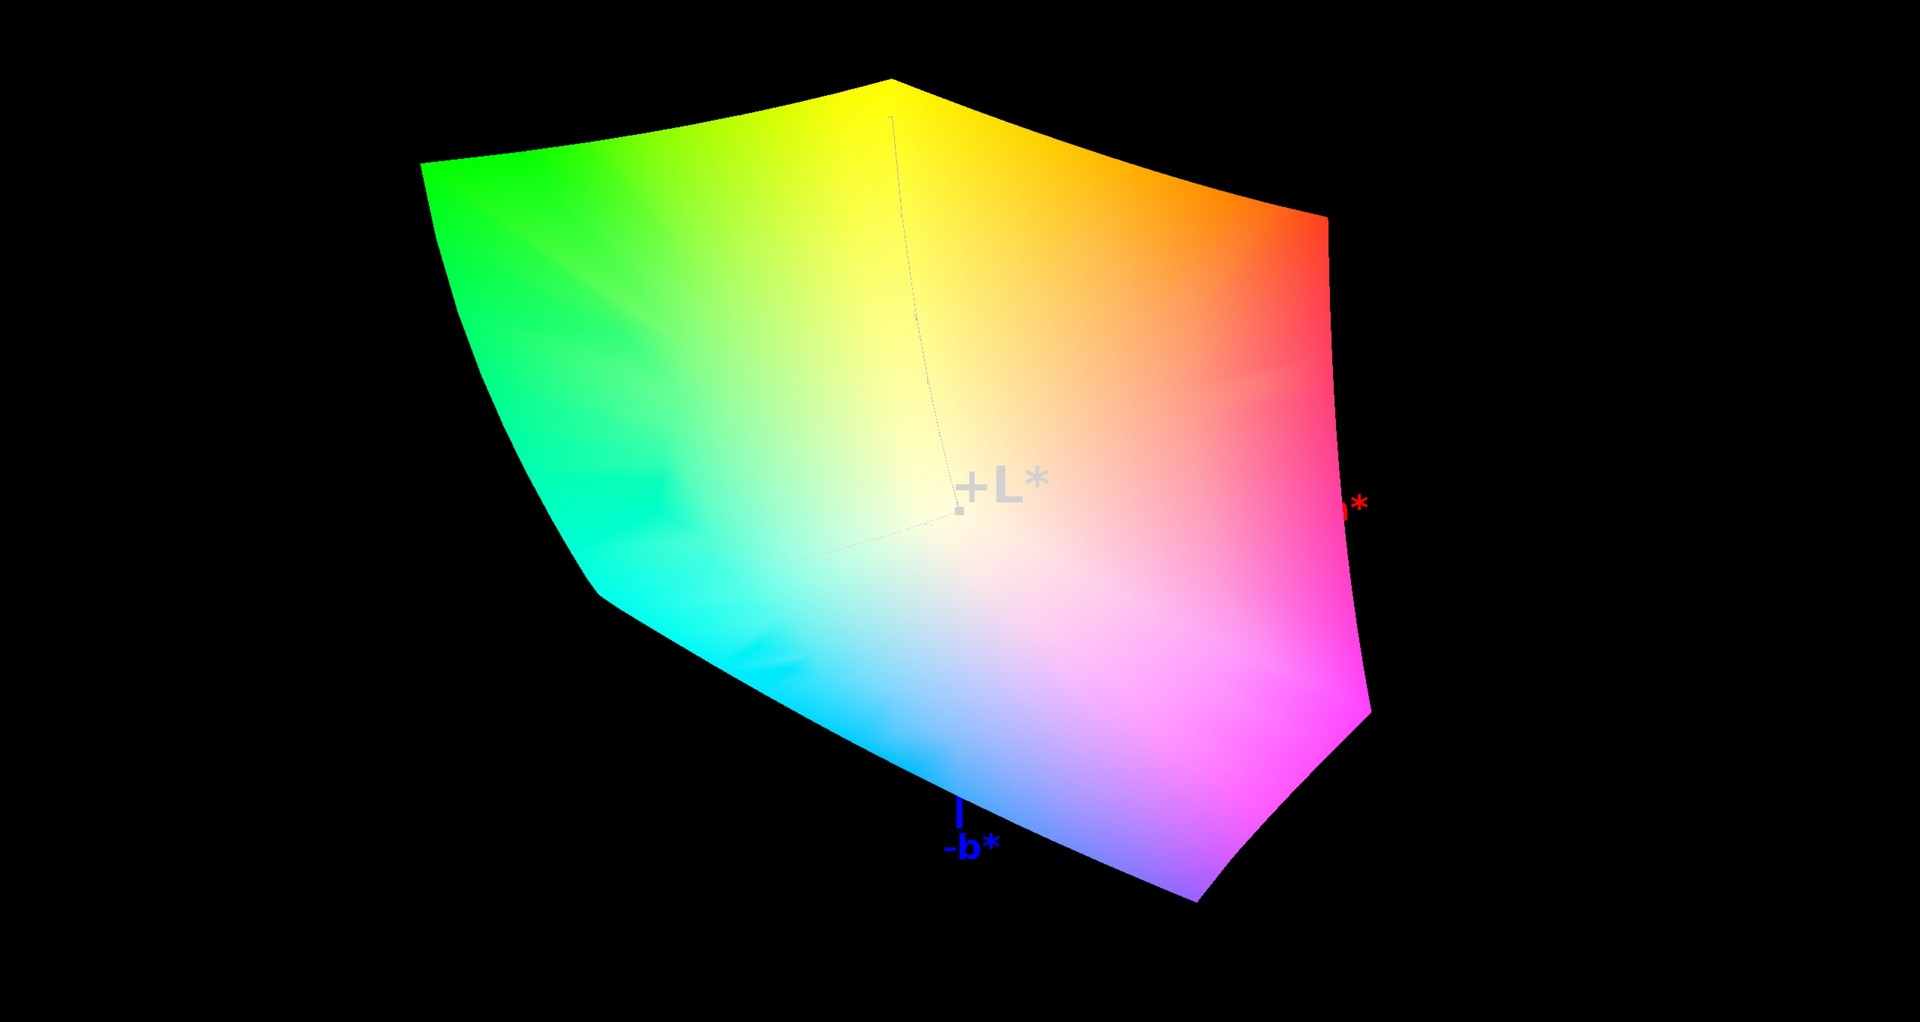
The UHD display found in our test device is already familiar to us. The AU Optronics B173ZAN01.0 is an exquisite IPS panel, which has found its way into the Schenker XMG U727 and XMG Pro 17. The 4K model shows its strength in color representation: 100% sRGB and 88% AdobeRGB are excellent results, only to be rivaled by a handful of other comparable notebooks (e. g. the MSI GT75VR offering 77% AdobeRGB).
| |||||||||||||||||||||||||
Brightness Distribution: 88 %
Center on Battery: 332 cd/m²
Contrast: 1186:1 (Black: 0.28 cd/m²)
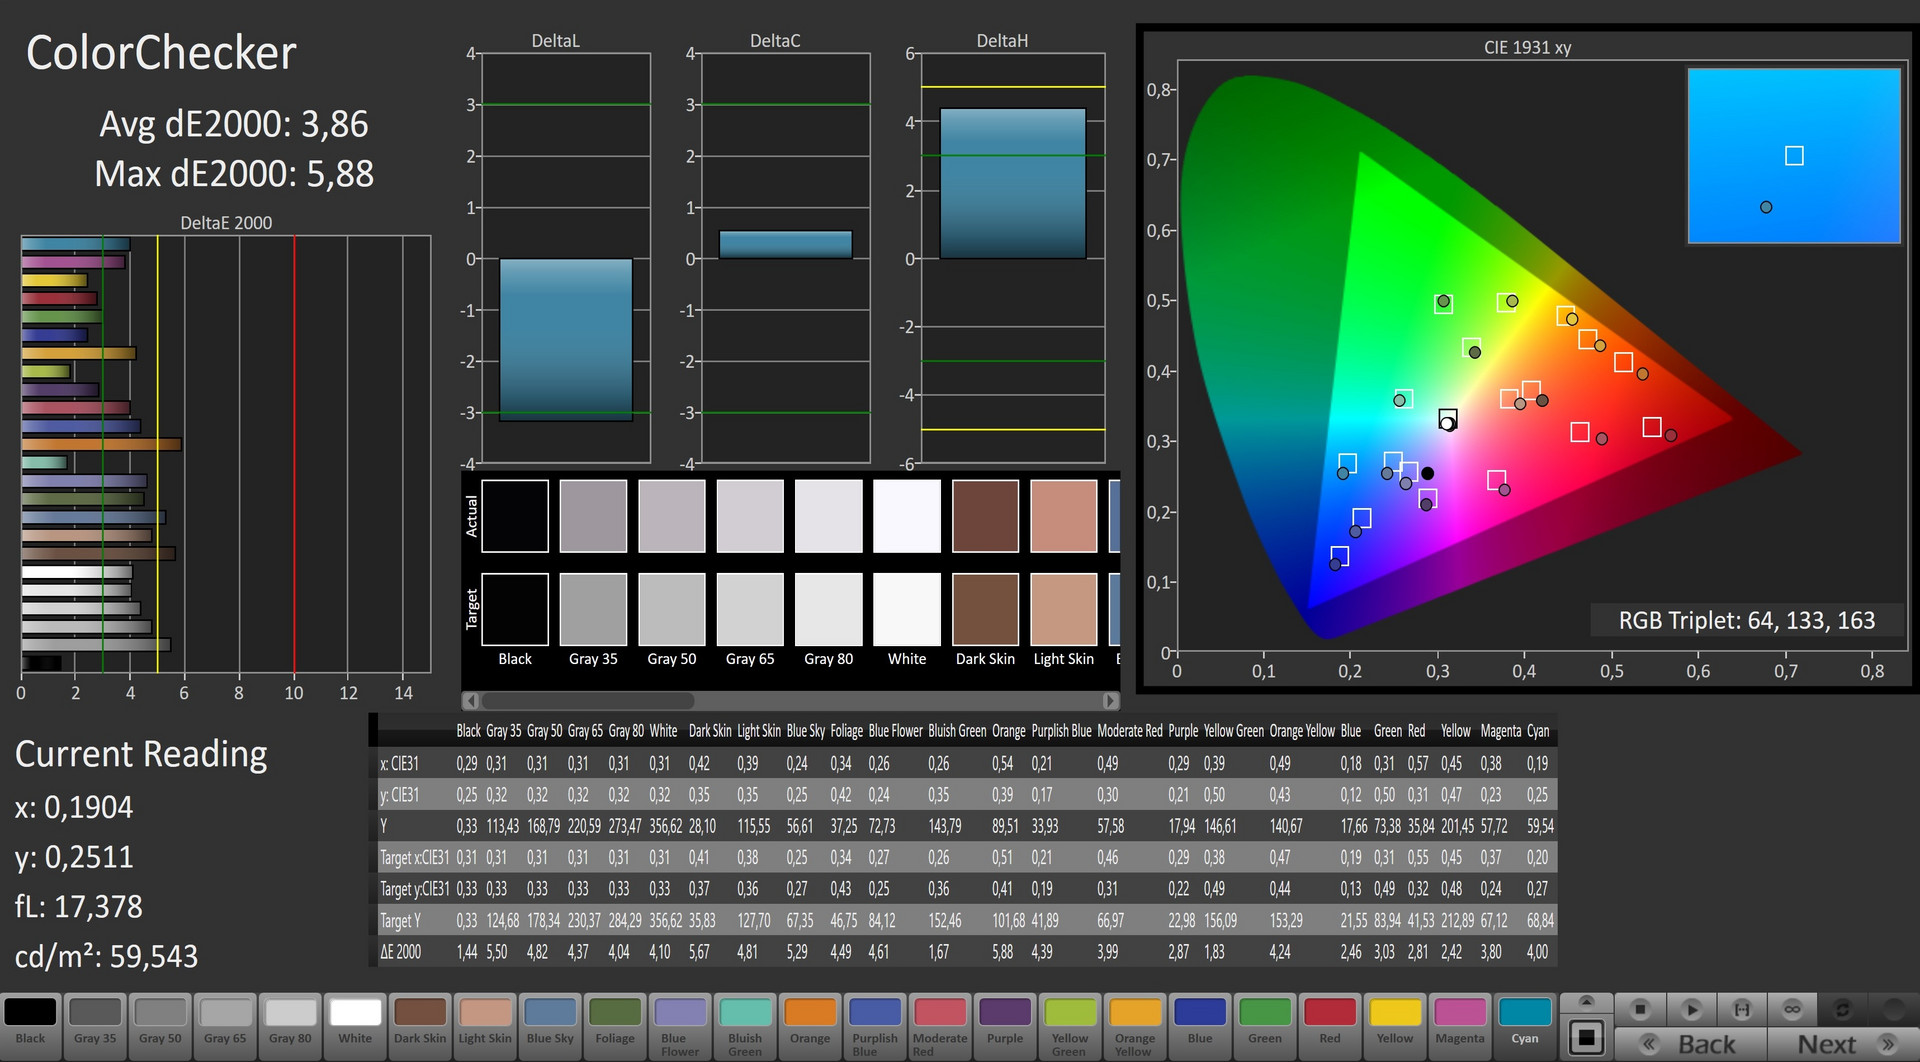
ΔE ColorChecker Calman: 3.86 | ∀{0.5-29.43 Ø4.71}
ΔE Greyscale Calman: 4.33 | ∀{0.09-98 Ø4.96}
100% sRGB (Argyll 1.6.3 3D)
88% AdobeRGB 1998 (Argyll 1.6.3 3D)
99.1% AdobeRGB 1998 (Argyll 3D)
100% sRGB (Argyll 3D)
86.4% Display P3 (Argyll 3D)
Gamma: 2.41
CCT: 6595 K
| Schenker XMG Ultra 17 AU Optronics B173ZAN01.0 (AUO109B), IPS, 3840x2160 | Guru Mars K LGD046E, IPS, 1920x1080 | Acer Predator 17 X GX-792-76DL LP173WF4-SPF5 (LGD056D), IPS, 1920x1080 | MSI GT75VR 7RF-012 Titan Pro CMN N173HHE-G32 (CMN1747), TN LED, 1920x1080 | Alienware 17 R4 TN LED, 2560x1440 | |
|---|---|---|---|---|---|
| Display | -25% | -26% | -2% | -28% | |
| Display P3 Coverage (%) | 86.4 | 67.3 -22% | 66 -24% | 90.3 5% | 61.2 -29% |
| sRGB Coverage (%) | 100 | 85.1 -15% | 83.7 -16% | 99.6 0% | 82.9 -17% |
| AdobeRGB 1998 Coverage (%) | 99.1 | 62.3 -37% | 61.2 -38% | 86.8 -12% | 60.5 -39% |
| Response Times | 5% | -8% | 74% | 40% | |
| Response Time Grey 50% / Grey 80% * (ms) | 44 ? | 37.6 ? 15% | 45 ? -2% | 11.6 ? 74% | 30 ? 32% |
| Response Time Black / White * (ms) | 24.8 ? | 26.4 ? -6% | 28 ? -13% | 6.8 ? 73% | 12.8 ? 48% |
| PWM Frequency (Hz) | 133.3 ? | 25000 ? | |||
| Screen | -7% | -10% | 13% | -31% | |
| Brightness middle (cd/m²) | 332 | 343 3% | 380 14% | 274 -17% | 402.3 21% |
| Brightness (cd/m²) | 313 | 330 5% | 362 16% | 262 -16% | 372 19% |
| Brightness Distribution (%) | 88 | 91 3% | 91 3% | 87 -1% | 86 -2% |
| Black Level * (cd/m²) | 0.28 | 0.32 -14% | 0.37 -32% | 0.26 7% | 0.62 -121% |
| Contrast (:1) | 1186 | 1072 -10% | 1027 -13% | 1054 -11% | 649 -45% |
| Colorchecker dE 2000 * | 3.86 | 3.61 6% | 4.12 -7% | 1.36 65% | 5.6 -45% |
| Colorchecker dE 2000 max. * | 5.88 | 8.16 -39% | 8.19 -39% | 4.1 30% | 9.8 -67% |
| Greyscale dE 2000 * | 4.33 | 3.03 30% | 3.95 9% | 0.64 85% | 4.7 -9% |
| Gamma | 2.41 91% | 2.41 91% | 2.47 89% | 2.19 100% | 2.14 103% |
| CCT | 6595 99% | 6568 99% | 6539 99% | 6551 99% | 7519 86% |
| Color Space (Percent of AdobeRGB 1998) (%) | 88 | 56 -36% | 55 -37% | 77 -12% | 53.7 -39% |
| Color Space (Percent of sRGB) (%) | 100 | 85 -15% | 84 -16% | 100 0% | 82.2 -18% |
| Total Average (Program / Settings) | -9% /
-9% | -15% /
-13% | 28% /
18% | -6% /
-21% |
* ... smaller is better
Another strength of the 4K display is its strong contrast of 1200:1. The black (0.28 cd/m²) and brightness (~313 cd/m²) levels deserve equal respect. Thanks to the consistent illumination, there were no inconsistencies in lighting. Furthermore, the viewing angles are great compared to TN panels.
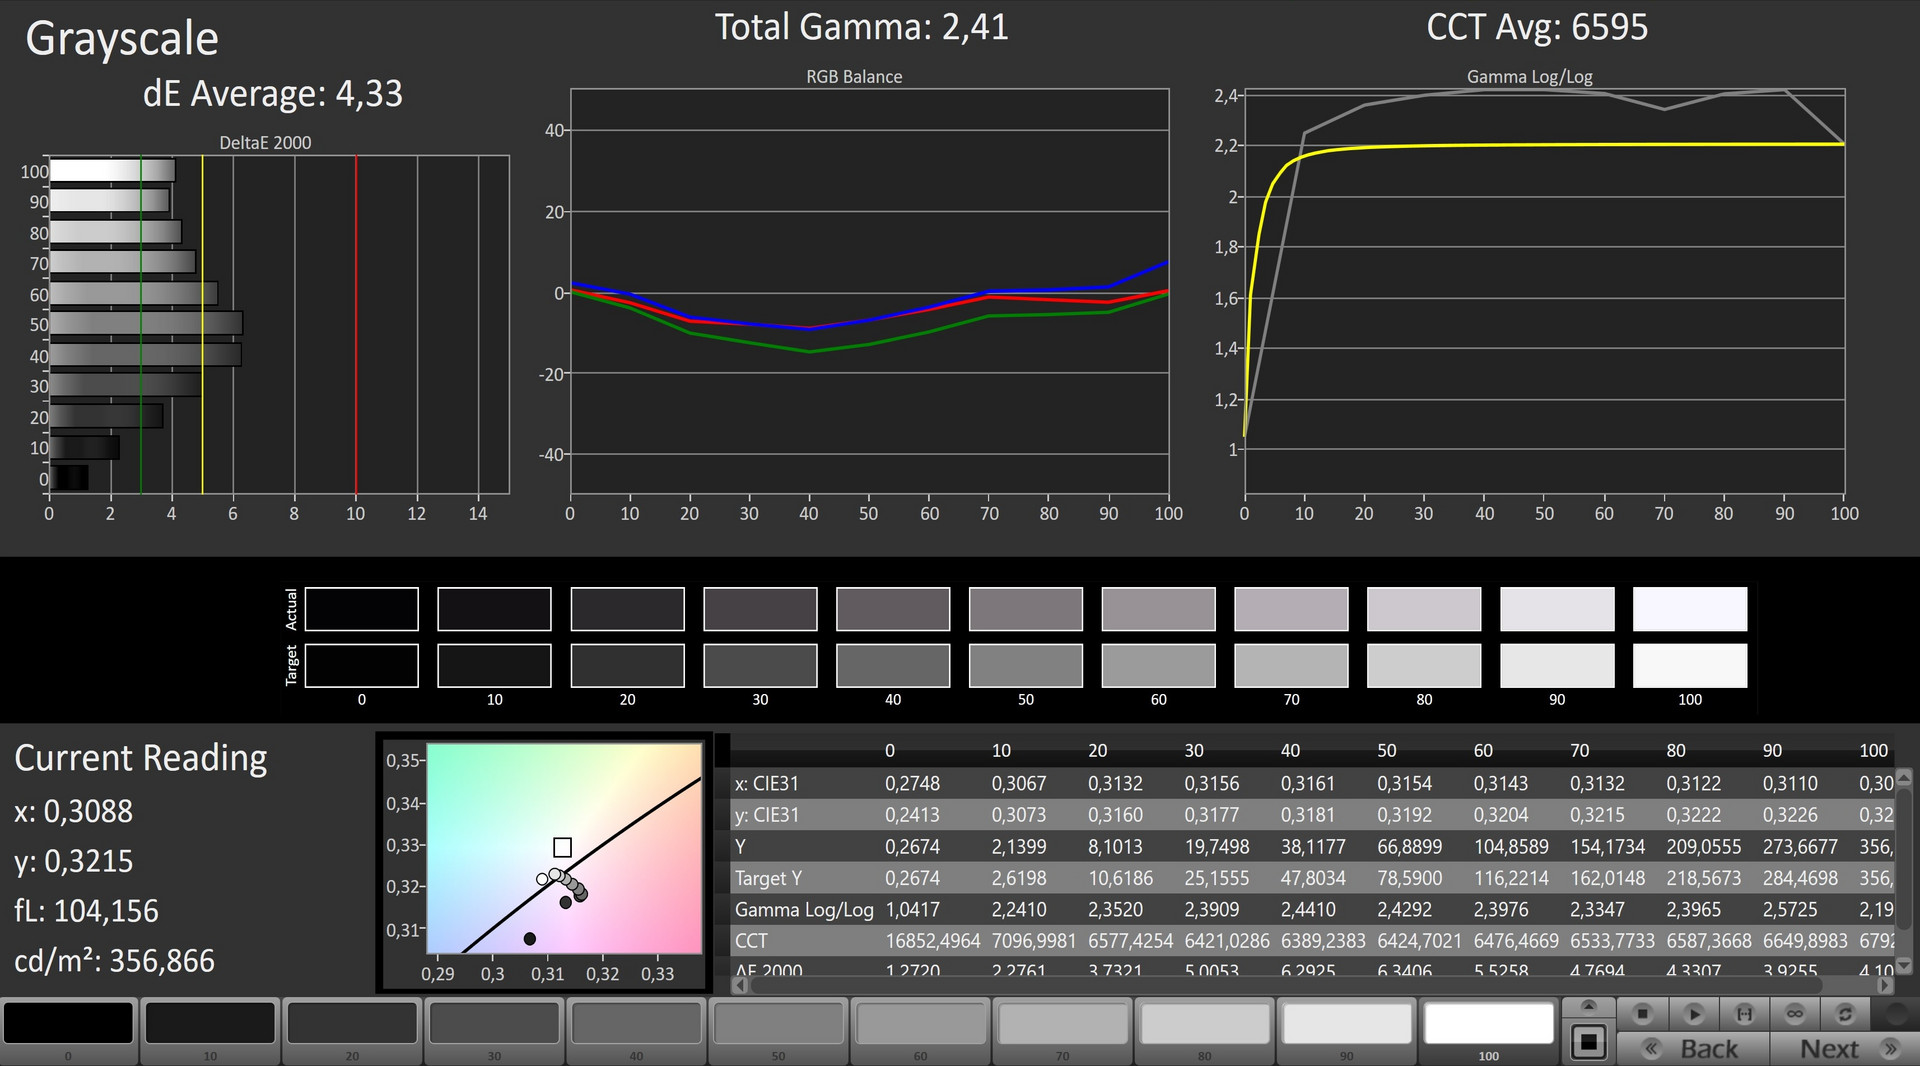
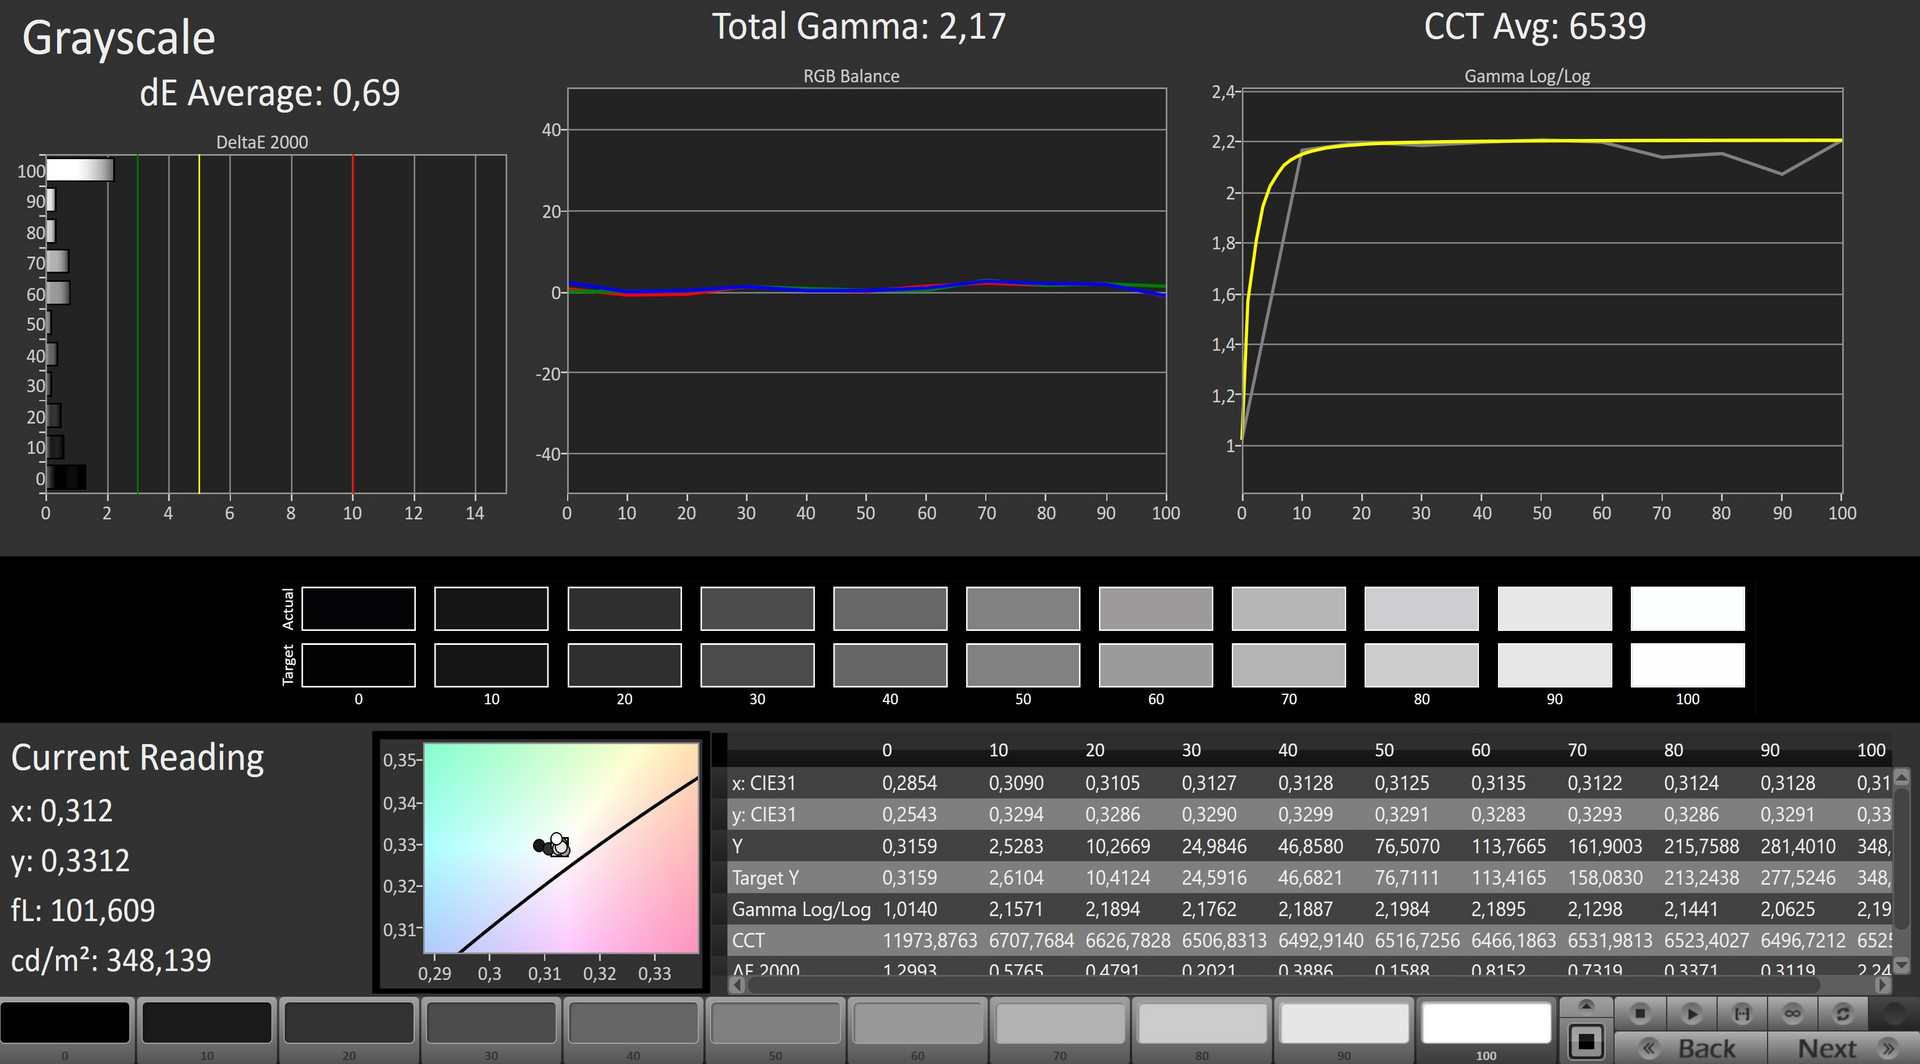

Overall, the panel is of high quality, though it should be noted that a resolution as high as UHD requires a potent GPU to match, which is why we recommend to at least go for a GTX 1070 in this case. The only weak point of the IPS based display is the high response time, which with 44 ms gray-to-gray is just average.
Display Response Times
| ↔ Response Time Black to White | ||
|---|---|---|
| 24.8 ms ... rise ↗ and fall ↘ combined | ↗ 11.6 ms rise | 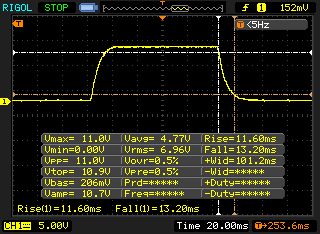 |
| ↘ 13.2 ms fall | ||
| The screen shows good response rates in our tests, but may be too slow for competitive gamers. In comparison, all tested devices range from 0.1 (minimum) to 240 (maximum) ms. » 58 % of all devices are better. This means that the measured response time is worse than the average of all tested devices (19.8 ms). | ||
| ↔ Response Time 50% Grey to 80% Grey | ||
| 44 ms ... rise ↗ and fall ↘ combined | ↗ 22.8 ms rise | 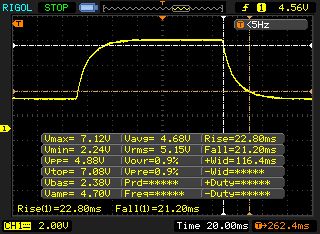 |
| ↘ 21.2 ms fall | ||
| The screen shows slow response rates in our tests and will be unsatisfactory for gamers. In comparison, all tested devices range from 0.165 (minimum) to 636 (maximum) ms. » 73 % of all devices are better. This means that the measured response time is worse than the average of all tested devices (31 ms). | ||
Screen Flickering / PWM (Pulse-Width Modulation)
| Screen flickering / PWM not detected | 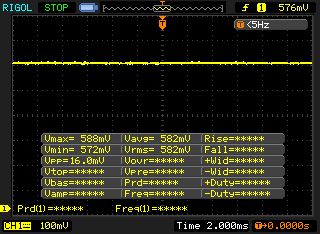 | ||
In comparison: 52 % of all tested devices do not use PWM to dim the display. If PWM was detected, an average of 7754 (minimum: 5 - maximum: 343500) Hz was measured. | |||
Performance
Considering its depth of over four centimeters (~1.57 in) and a weight of around 4.4 kilograms (~9.7 lb), the XMG Ultra 17 is one of the thickest and heaviest gaming notebooks currently on the market. This should not come as a surprise, since the 17 incher has been designed as a pure desktop replacement aimed at a stationary use case by providing ample power, ports and great upgrade options.
Processor
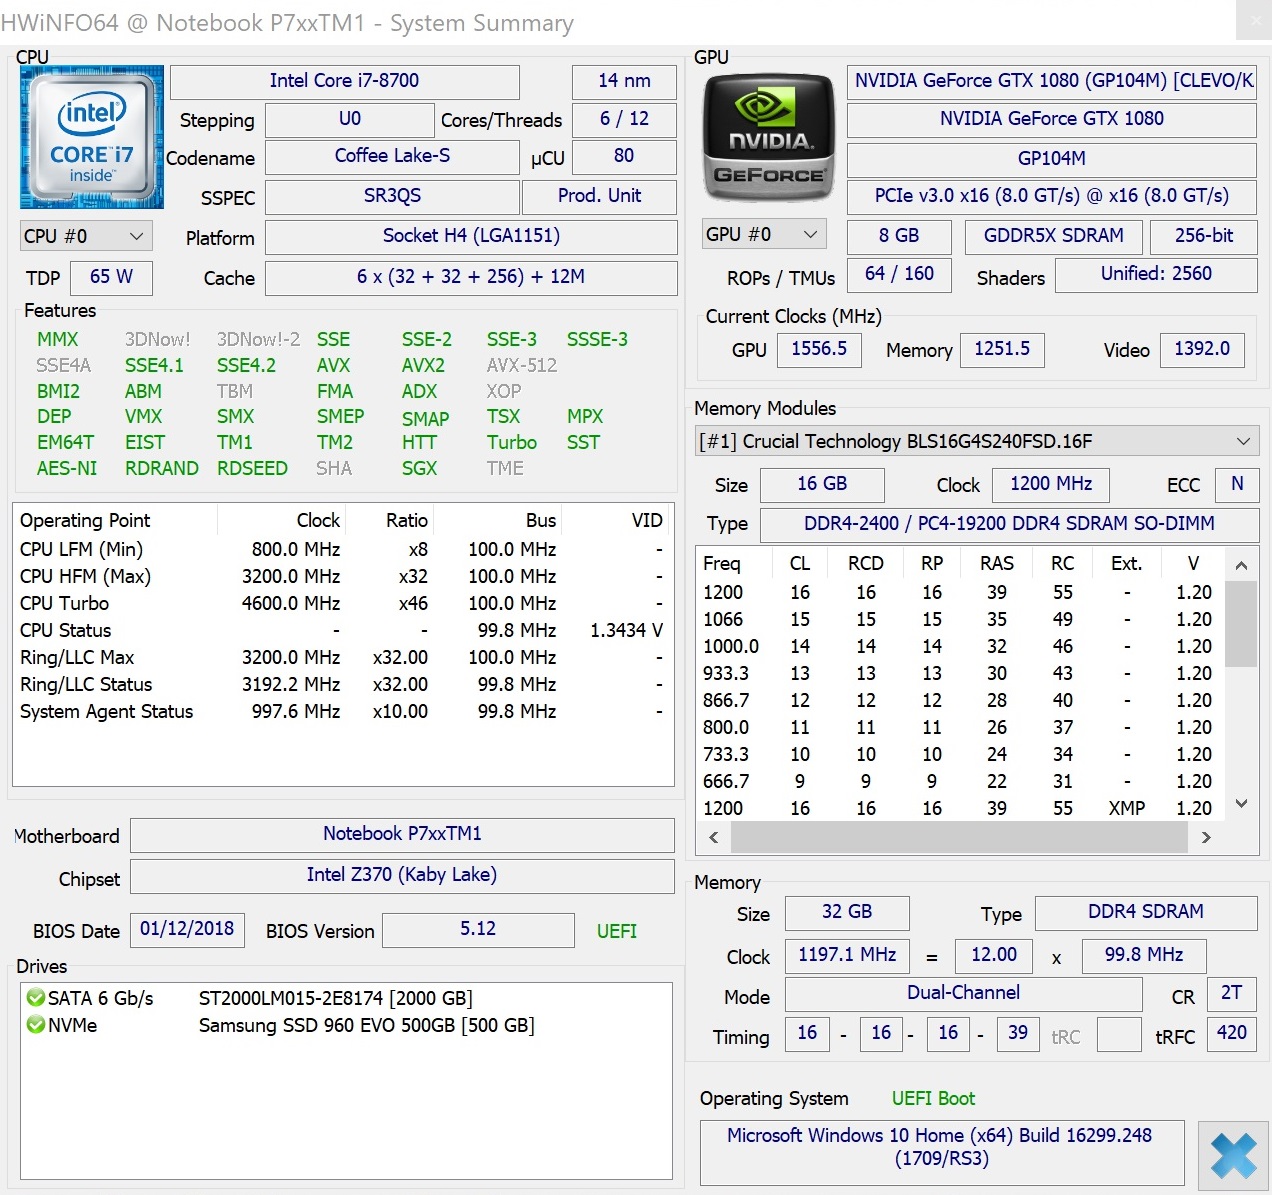
Unlike most laptops, the XMG Ultra 17 does not come with a mobile processor, but a full-fledged desktop CPU. This becomes apparent the moment you look at the TDP. While notebook favorites such as the Core i7-7700HQ and Core i7-7820HK are satisfied with a TDP of 45 W, their desktop brethren have a TDP between 65 W and 95 W. With the current Coffee-Lake generation, Intel has focused on increasing the number of cores. Six cores are now standard in the consumer sector, which seems necessary, considering the fact that AMD is offering six and eight core processors with the Ryzen series.
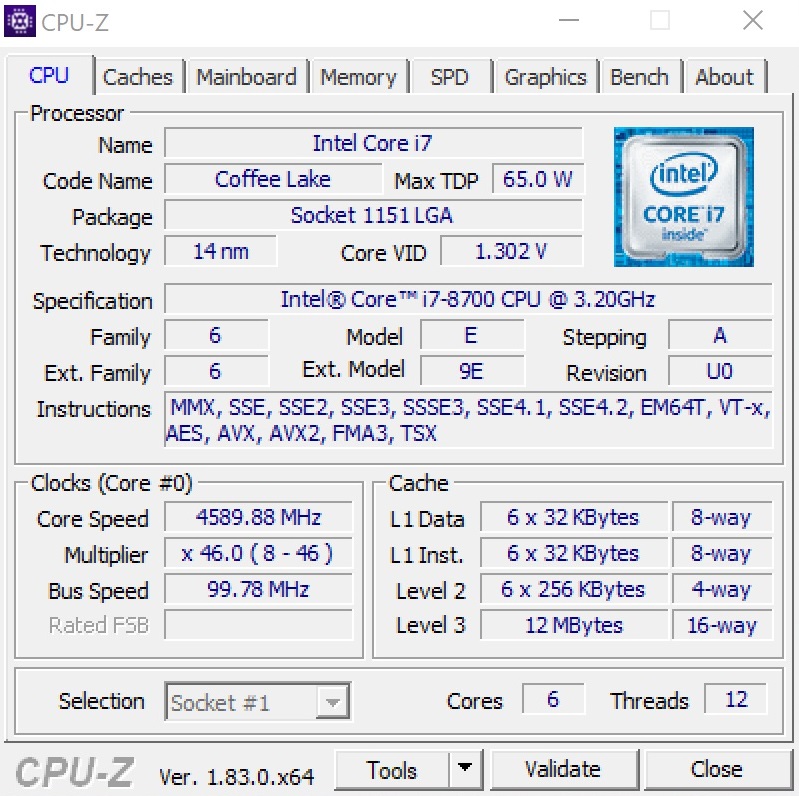
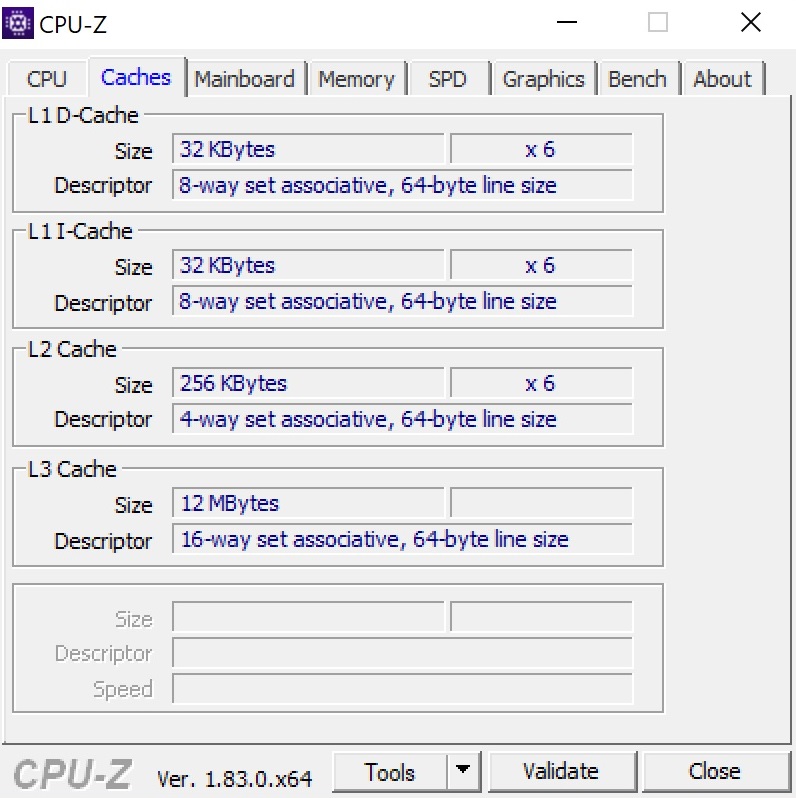
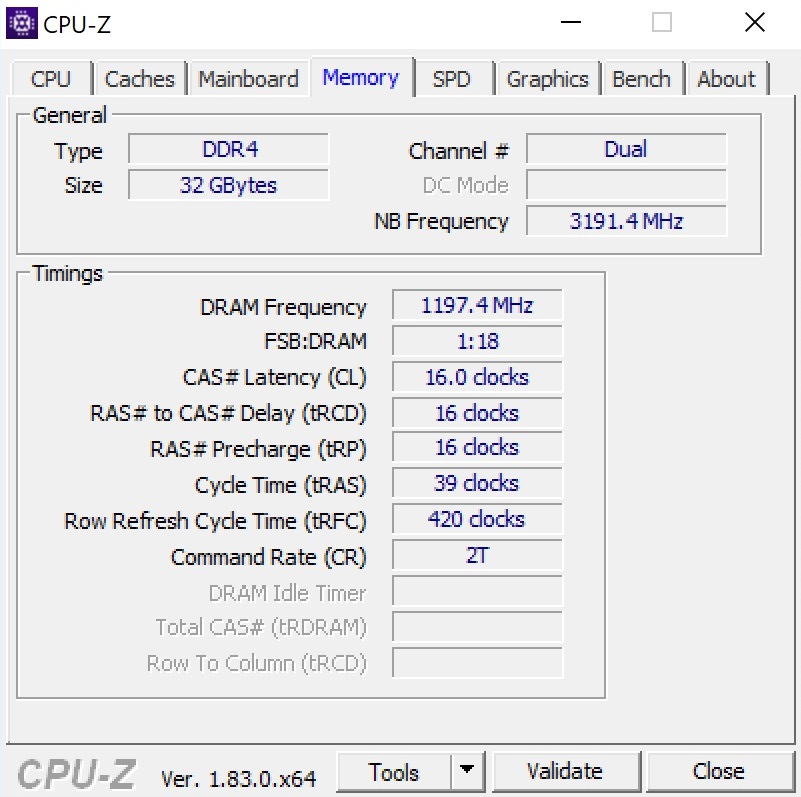
Our test configuration contains a Core i7-8700, which, while not offering a free multiplicator for overclocking, does support Hyper-threading with up to 12 threads in parallel. A 12 MB L3-Cache (6 MB @Core i7-7700HQ) is also quite impressive. Thanks to turbo boost, the frequency the processor operates at is increased during load as well.
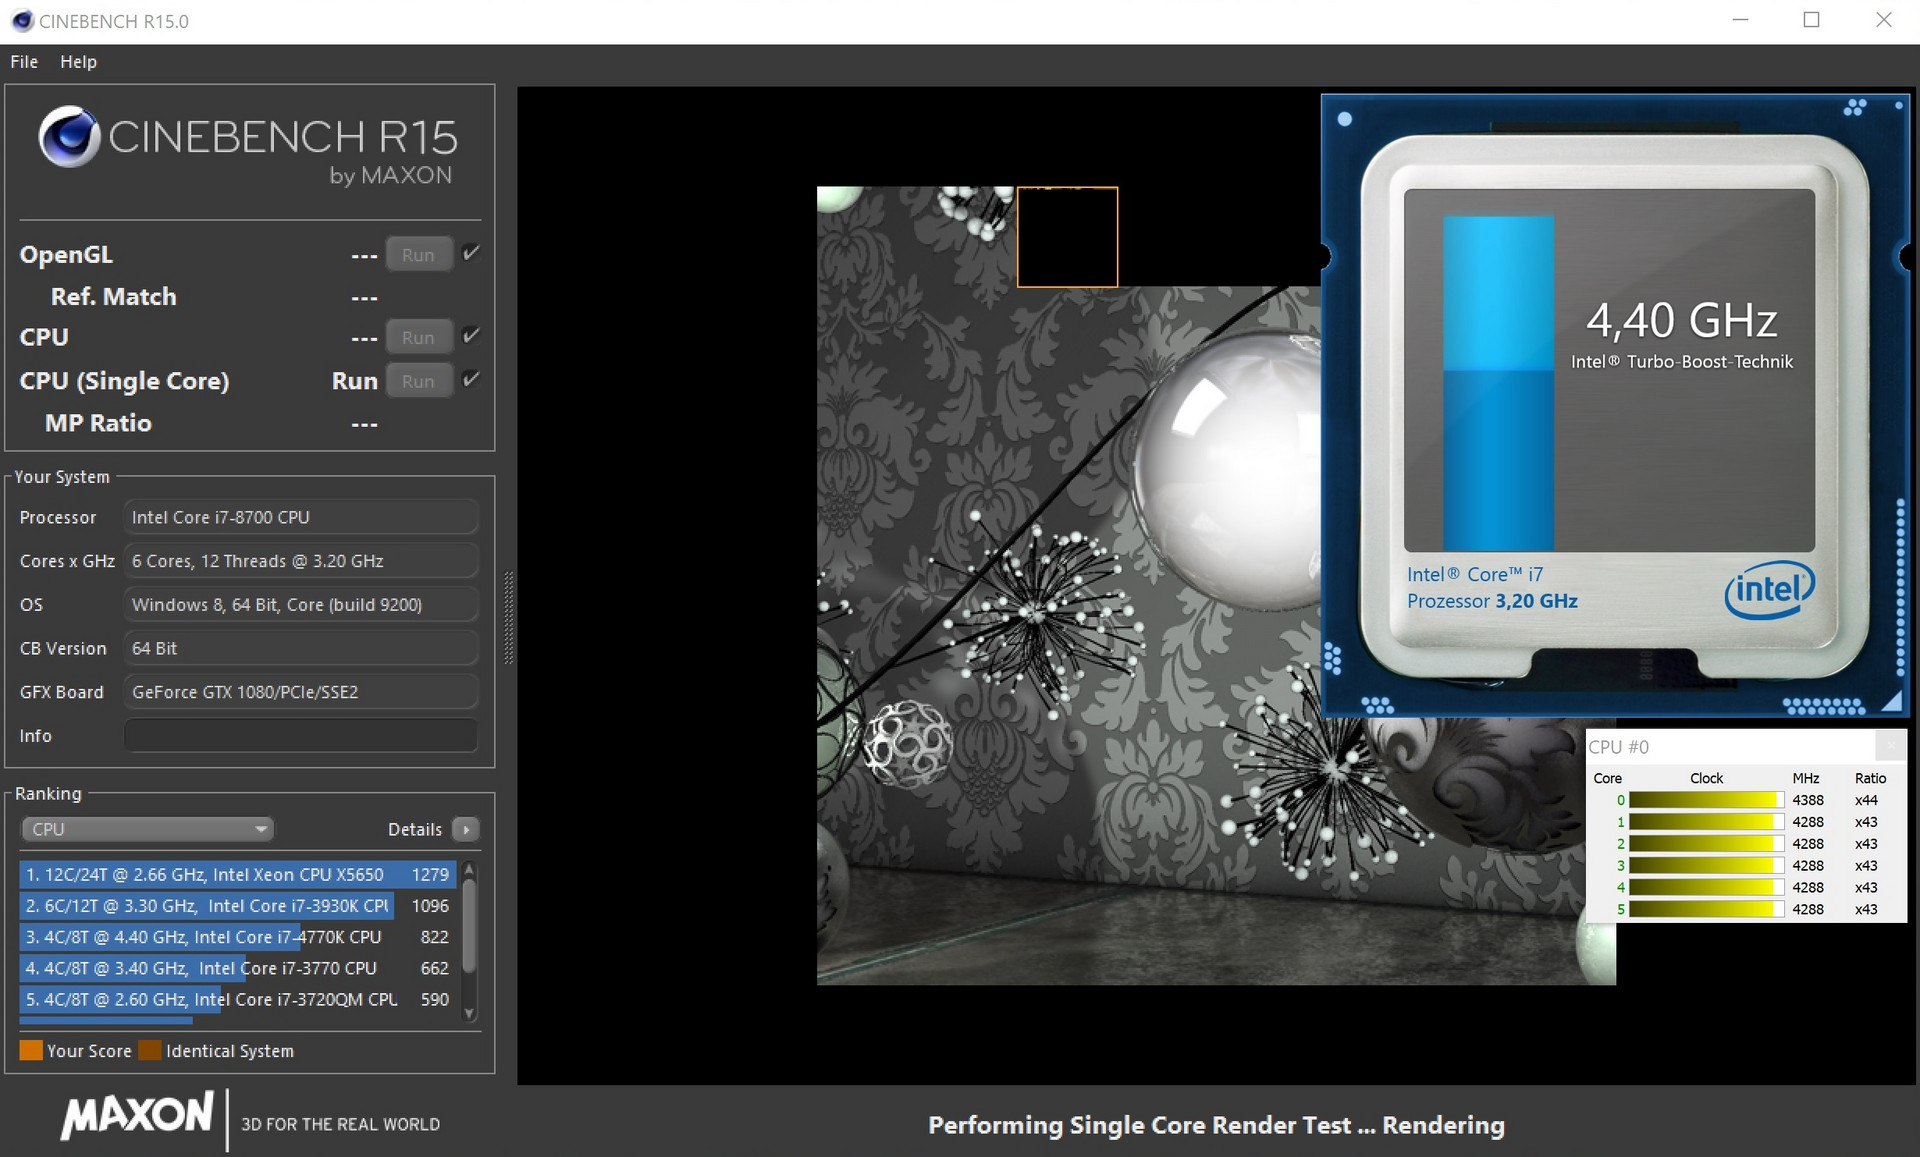
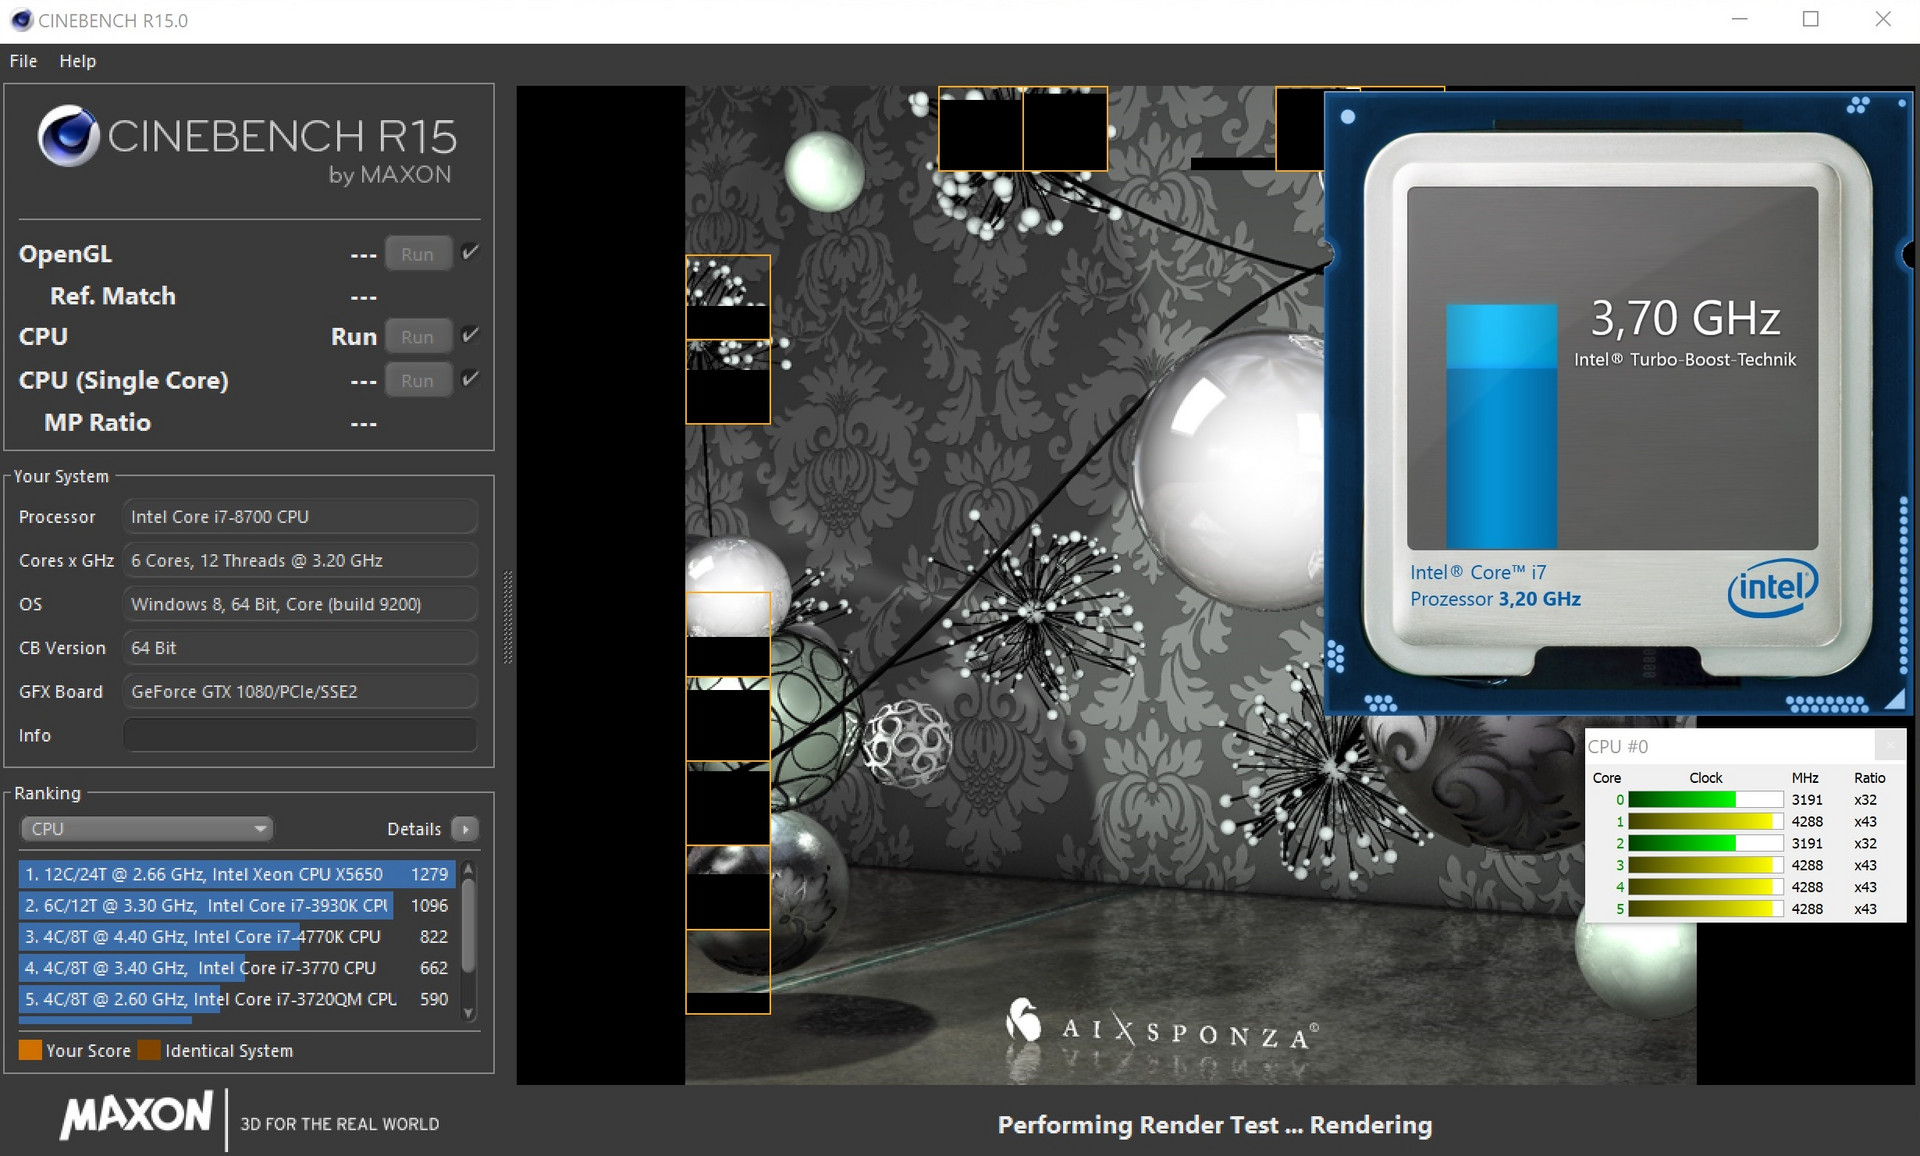
Unfortunately, the Core i7-8700 cannot utilize its full turbo potential in the XMG Ultra 17, despite its massive cooling. In single-core applications, only 4.3 GHz instead of the theoretically possible 4.6 GHz is reached. The result is even worse when all cores are stressed: Instead of boosting to a constant 4.3 GHz, the frequency varies during Cinebench testing between 4.3 GHz and 3.2 GHz (= deactivated turbo), ending in inconsistent results.
If you use the results from a cold start as a basis, the Core i7-8700 passes the Core i7-7820HK found in the MSI GT75VR by about 54% in Cinebench R15 19. The gap to the Acer Predator 17 X overclocked to 4.3 GHz still ends up between 3% and 34%. Equally interesting is a comparison with its desktop predecessor, the Core i7-7700 (3.6-4.2 GHz, 8 MB Cache). In this scenario, the Core i7-8700 wins by between 7% and 36%. The fact that it cannot get a bigger lead in multi-core scenarios is, as hinted, connected to the limited turbo. The 1.5 times higher core count should actually lead to an increase in performance by around 50%.
System performance
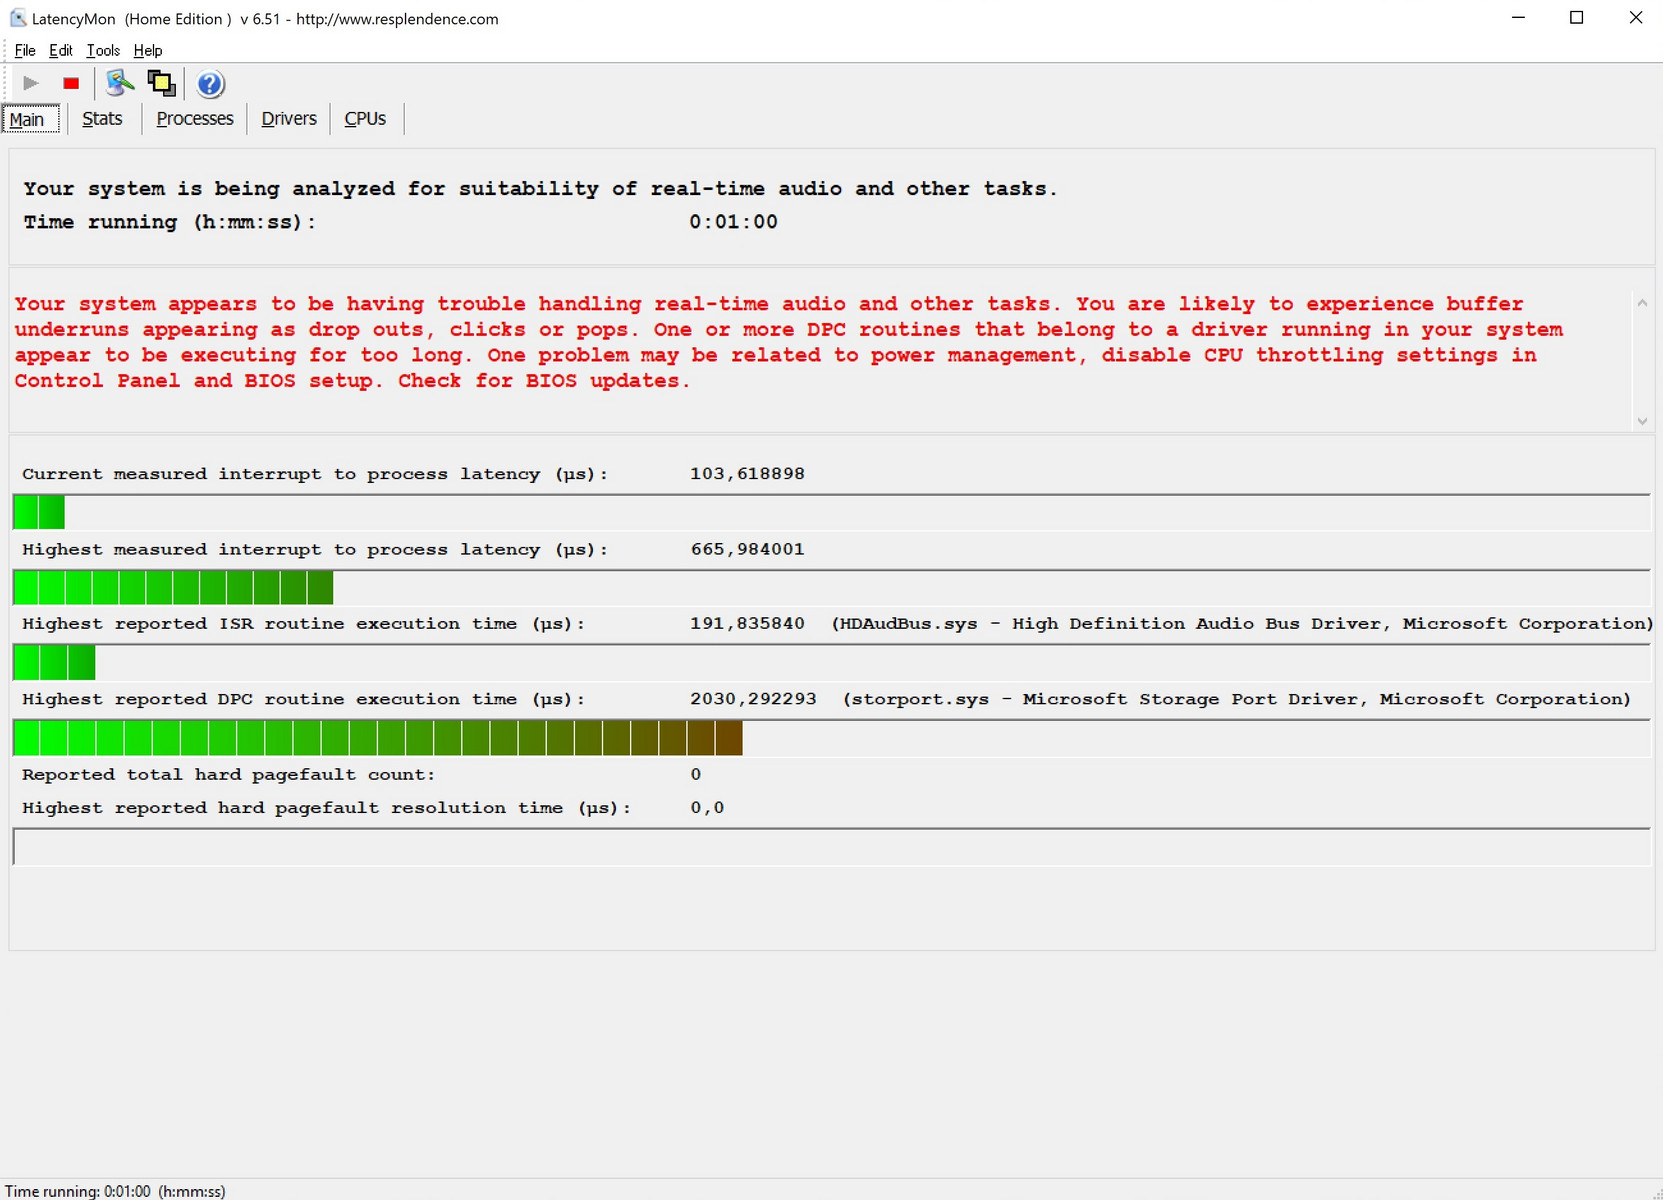
Not surprisingly, the XMG Ultra 17 has excellent system performance. This leads to 5,976 points in PCMark 10 during our testing. Neither the Guru Mars K (5,856 points) nor the MSI GT75VR (5,211 points) can beat that. Thanks to the solid-state driver, Windows boots quickly and responds fast during usage. However, Schenker could improve the latency, which in our test device, as with other Clevo Barebones, is not perfect (this is possibly connected to drivers).
| PCMark 8 Home Score Accelerated v2 | 4865 points | |
| PCMark 8 Work Score Accelerated v2 | 4849 points | |
| PCMark 10 Score | 5976 points | |
Help | ||
Storage
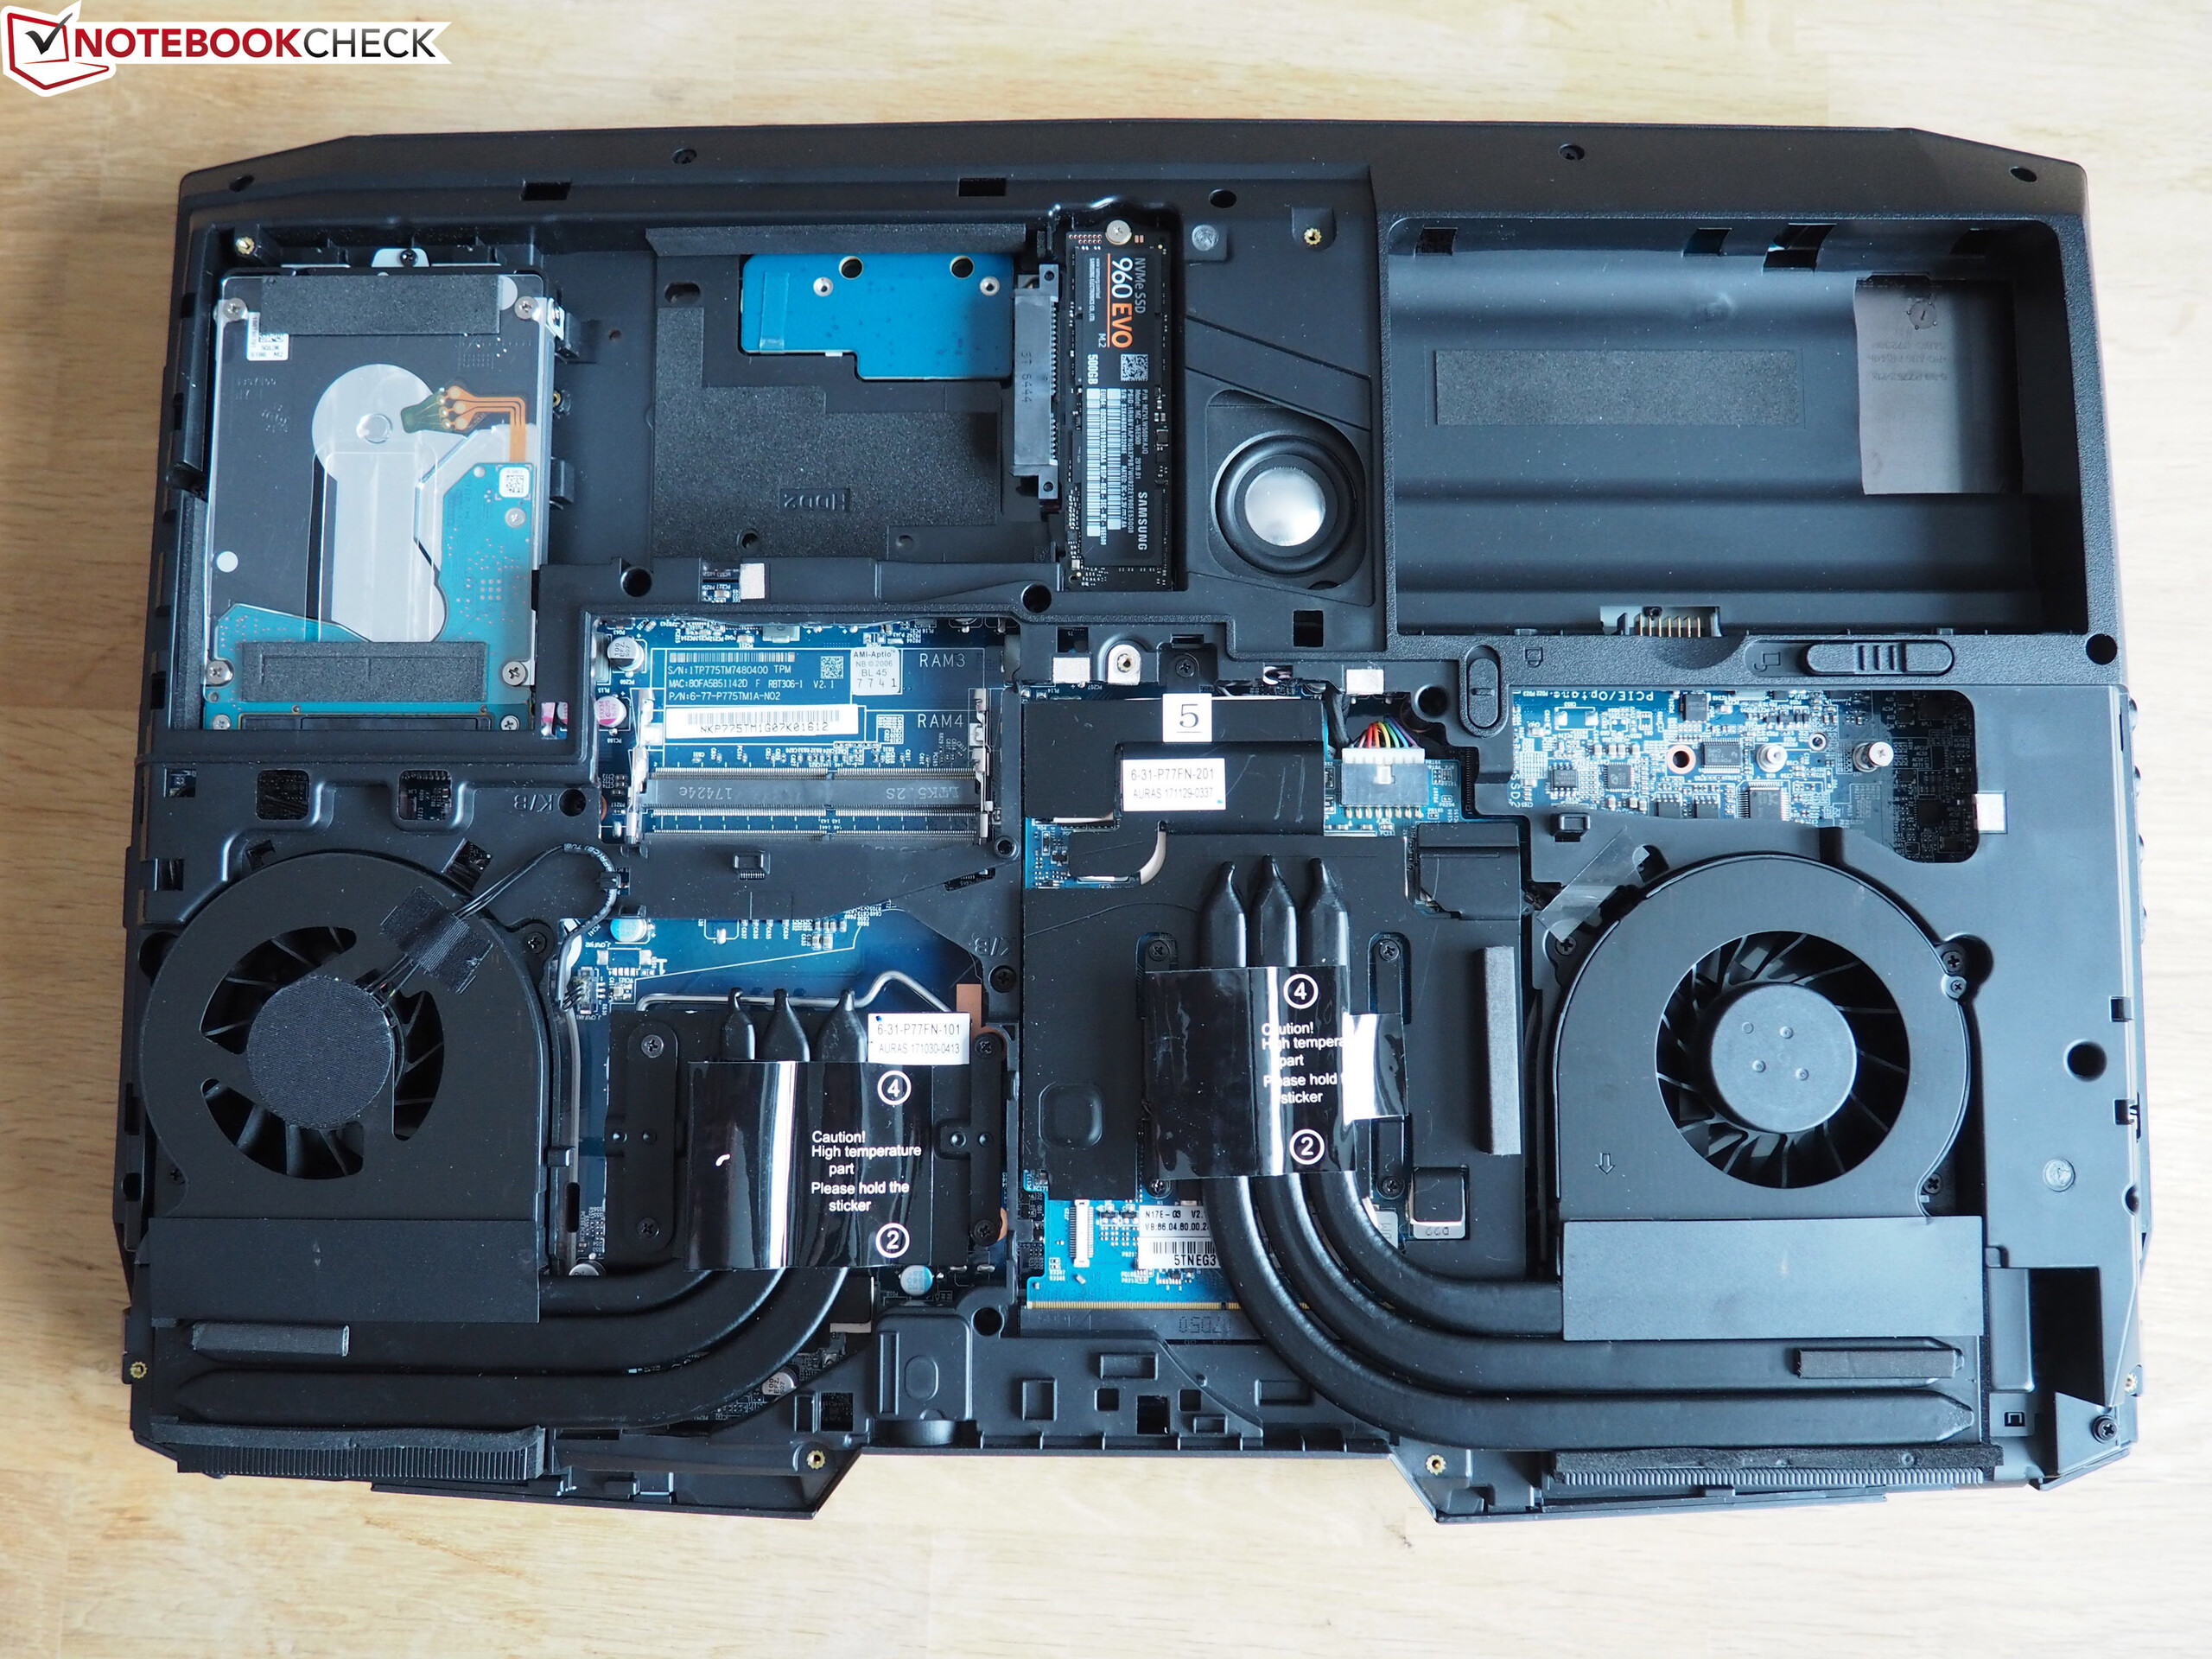
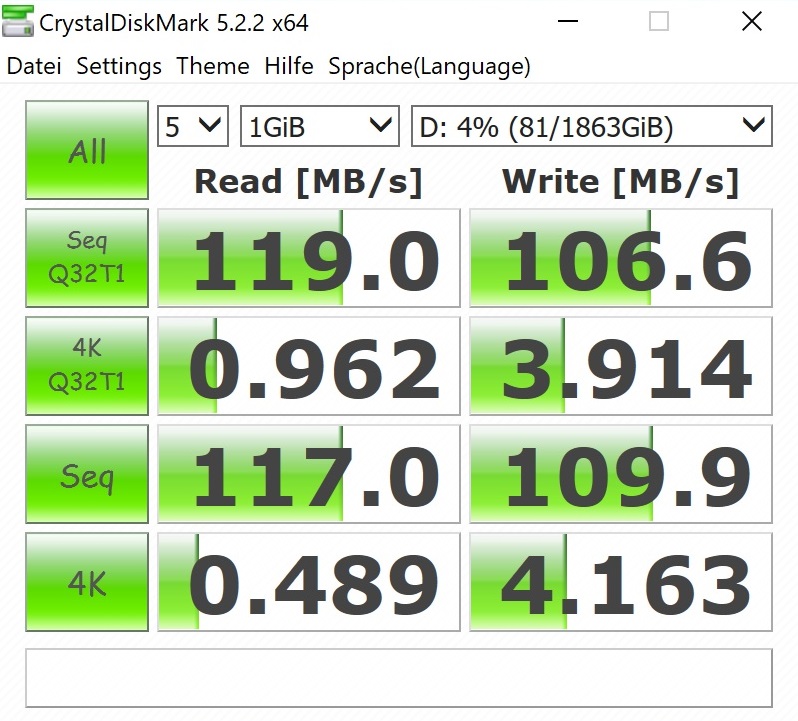
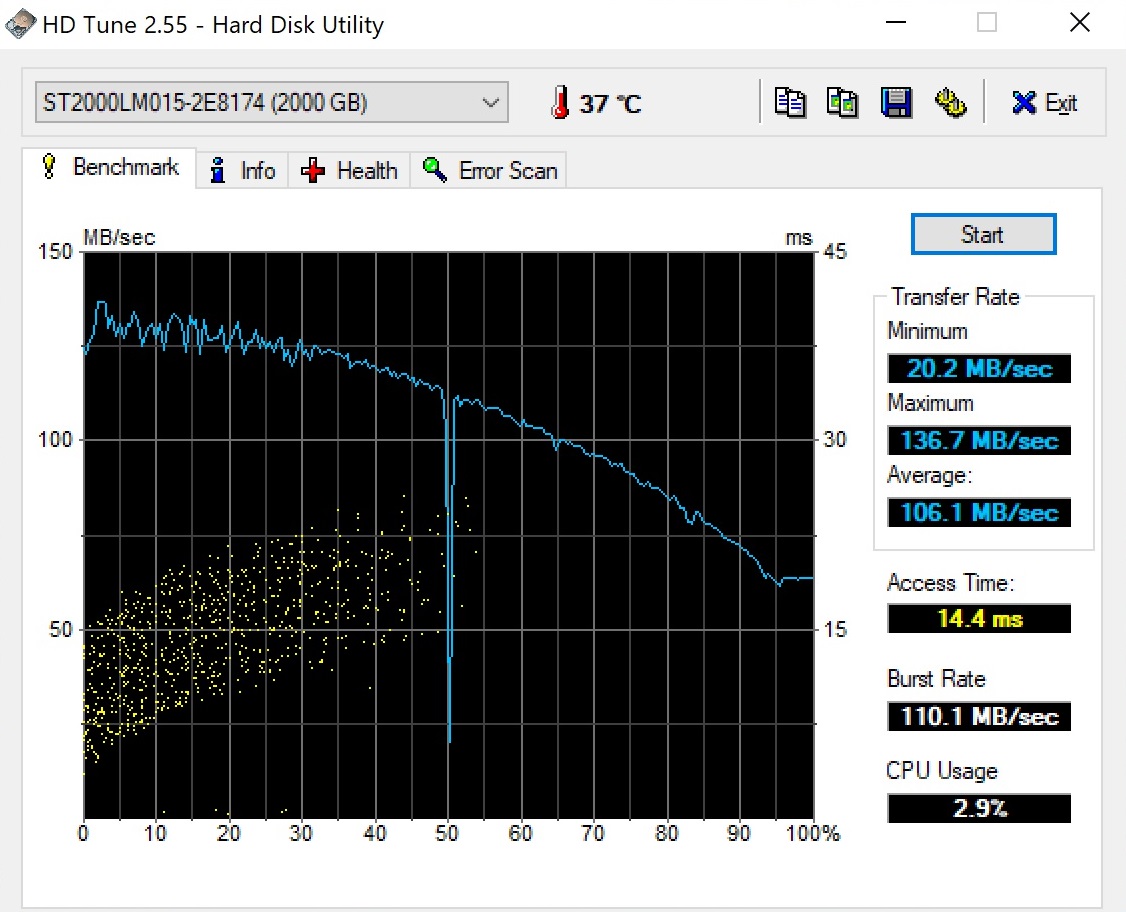
It should take users some time to fill up the provided storage space in our configuration. While larger file formats (e. g. movie collections) can be migrated to the large 2 TB HDD, the SSD provides a space for more frequently used applications and games.
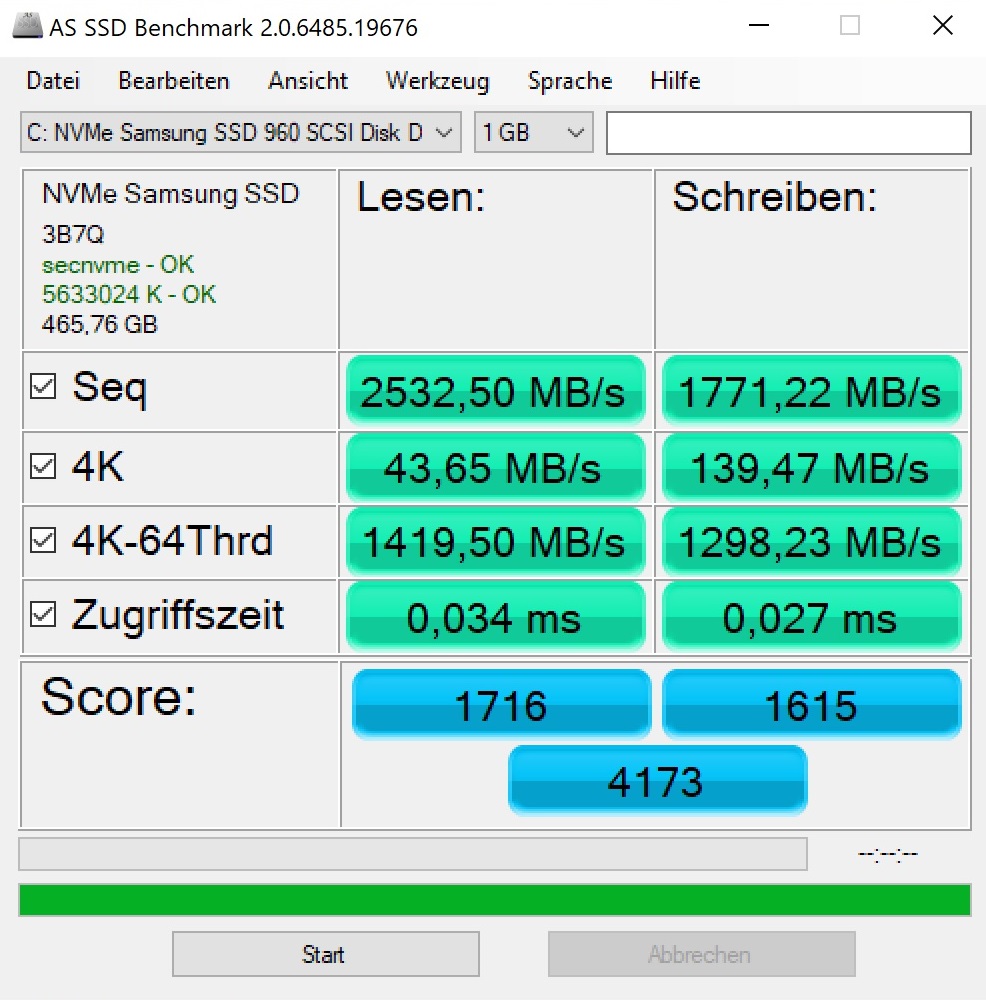
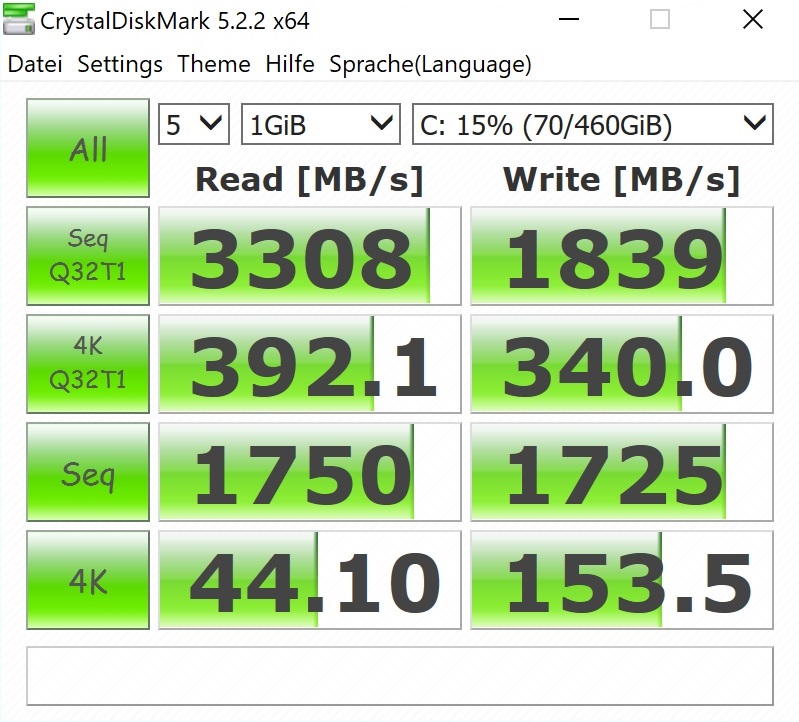
The 960 Evo from Samsung in particular provides great value for money. The reviewed 500 GB model offers both great sequential results and a high speed when dealing with small files. The 500 GB drives found in the Acer Predator 17 X (Toshiba) and Alienware 17 R4 (SK Hynix) are on average 20% behind. And that, despite the fact that the latter is also based on NVMe technology. Users who would like to fully utilize the storage potential that the Ultra 17 offers have access to one empty M.2-2280 slot and an empty 2.5-inch bay.
| Schenker XMG Ultra 17 Samsung SSD 960 Evo 500GB m.2 NVMe | Guru Mars K Samsung SSD 960 Evo 500GB m.2 NVMe | Acer Predator 17 X GX-792-76DL Toshiba NVMe THNSN5512GPU7 | MSI GT75VR 7RF-012 Titan Pro 2x Samsung SM961 MZVPW256HEGL NVMe (RAID 0) | Alienware 17 R4 SK Hynix PC300 NVMe 512 GB | Average Samsung SSD 960 Evo 500GB m.2 NVMe | |
|---|---|---|---|---|---|---|
| AS SSD | -23% | 1% | -39% | -3% | ||
| Seq Read (MB/s) | 2533 | 2261 -11% | 3137 24% | 1752 -31% | 2433 ? -4% | |
| Seq Write (MB/s) | 1771 | 1338 -24% | 2352 33% | 735 -58% | 1647 ? -7% | |
| 4K Read (MB/s) | 43.65 | 39.52 -9% | 50.1 15% | 35.61 -18% | 45.5 ? 4% | |
| 4K Write (MB/s) | 139.5 | 133.8 -4% | 128.8 -8% | 113.4 -19% | 142.4 ? 2% | |
| Score Read (Points) | 1716 | 1118 -35% | 1412 -18% | 831 -52% | 1645 ? -4% | |
| Score Write (Points) | 1615 | 930 -42% | 1289 -20% | 858 -47% | 1518 ? -6% | |
| Score Total (Points) | 4173 | 2581 -38% | 3392 -19% | 2072 -50% | 3968 ? -5% |

GPU
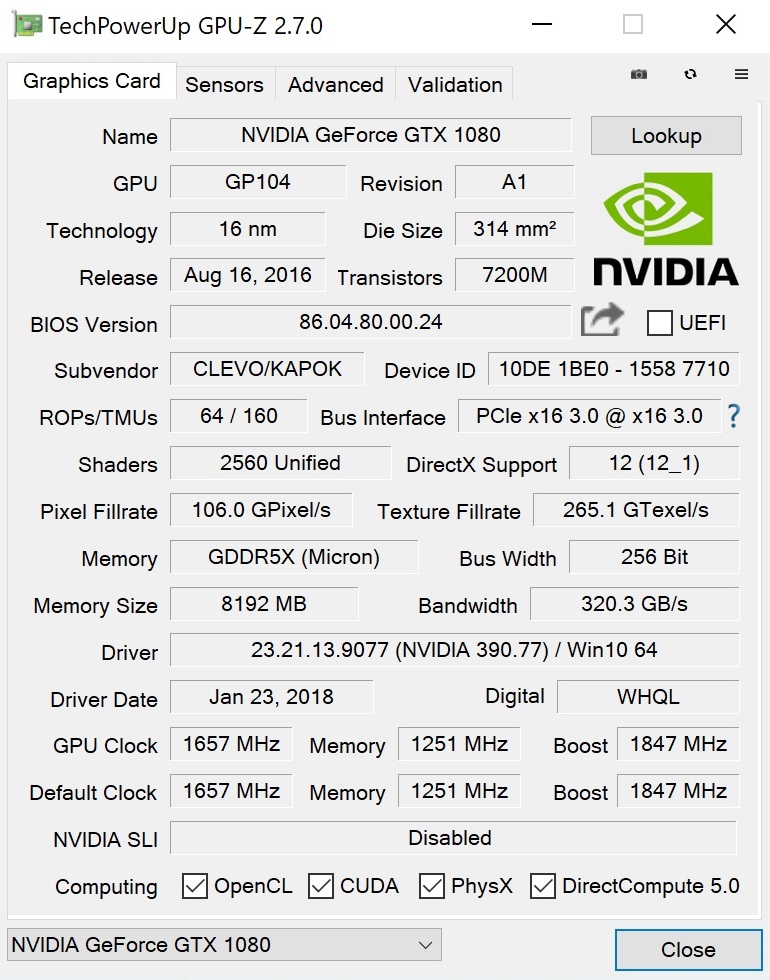
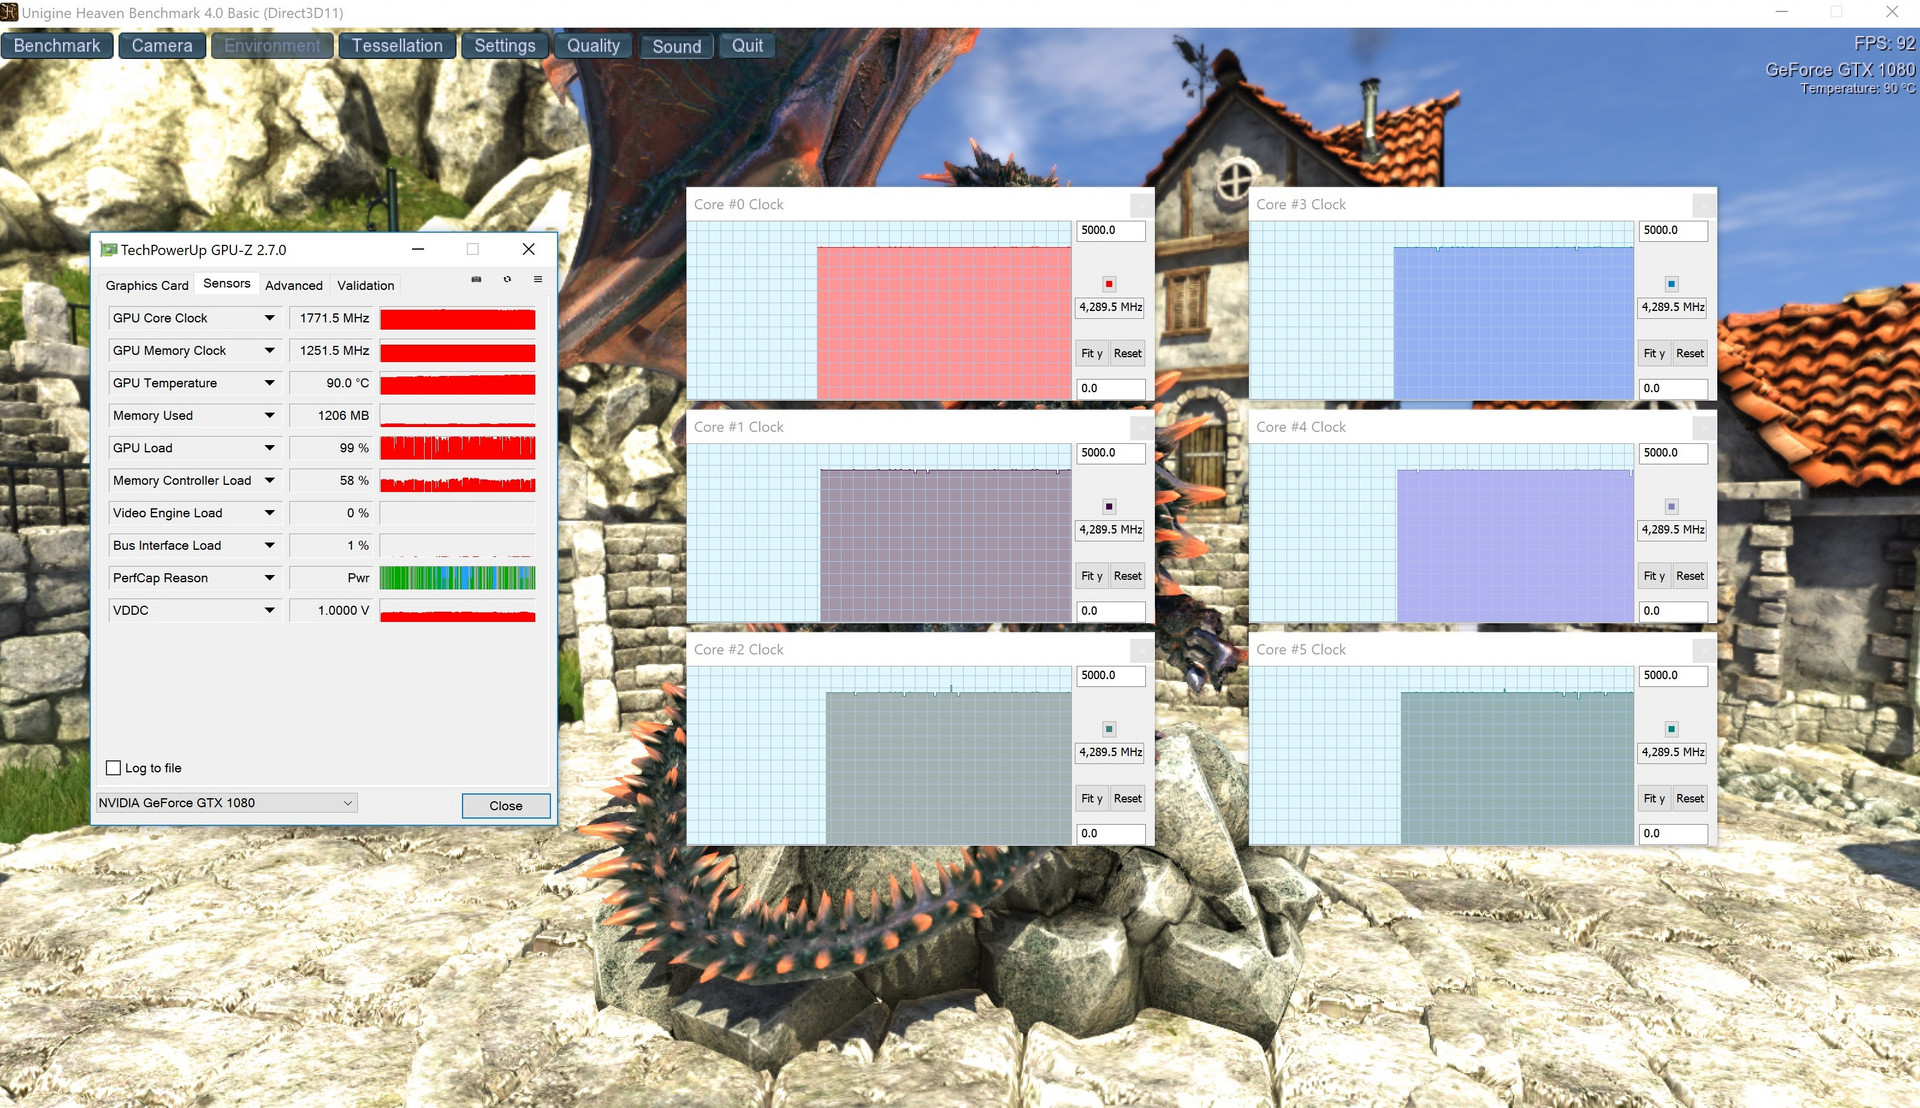
Core gamers, whose focus is on great graphical fidelity will require a GeForce GTX 1080 to fully benefit from the UHD resolution. Nvidia’s Pascal flagship contains 2,560 shader units and 8 GB of GDDR5X RAM, connected via a 256-Bit interface. While the CPU of the XMG Ultra 17 suffers from unstable turbo frequencies, the GPU can fully utilize its boost. 1,770 MHz during the Unigine Heaven 4.0 benchmark show good clock speeds under load, which, according to GPU-Z may reach from 1,657 MHz to 1,847 MHz.
Our benchmark course shows that the GeForce GTX 1080 has, as is to be expected, good performance, though the desktop processor is not noticeable during GPU testing. Conventional notebooks with a mobile CPU can achieve similar results. An Advantage of the Ultra 17 though is its upgradability. Both CPU and GPU are not soldered down.
| 3DMark 06 Standard Score | 30222 points | |
| 3DMark 11 Performance | 22034 points | |
| 3DMark Cloud Gate Standard Score | 37952 points | |
| 3DMark Fire Strike Score | 17997 points | |
| 3DMark Time Spy Score | 6942 points | |
Help | ||
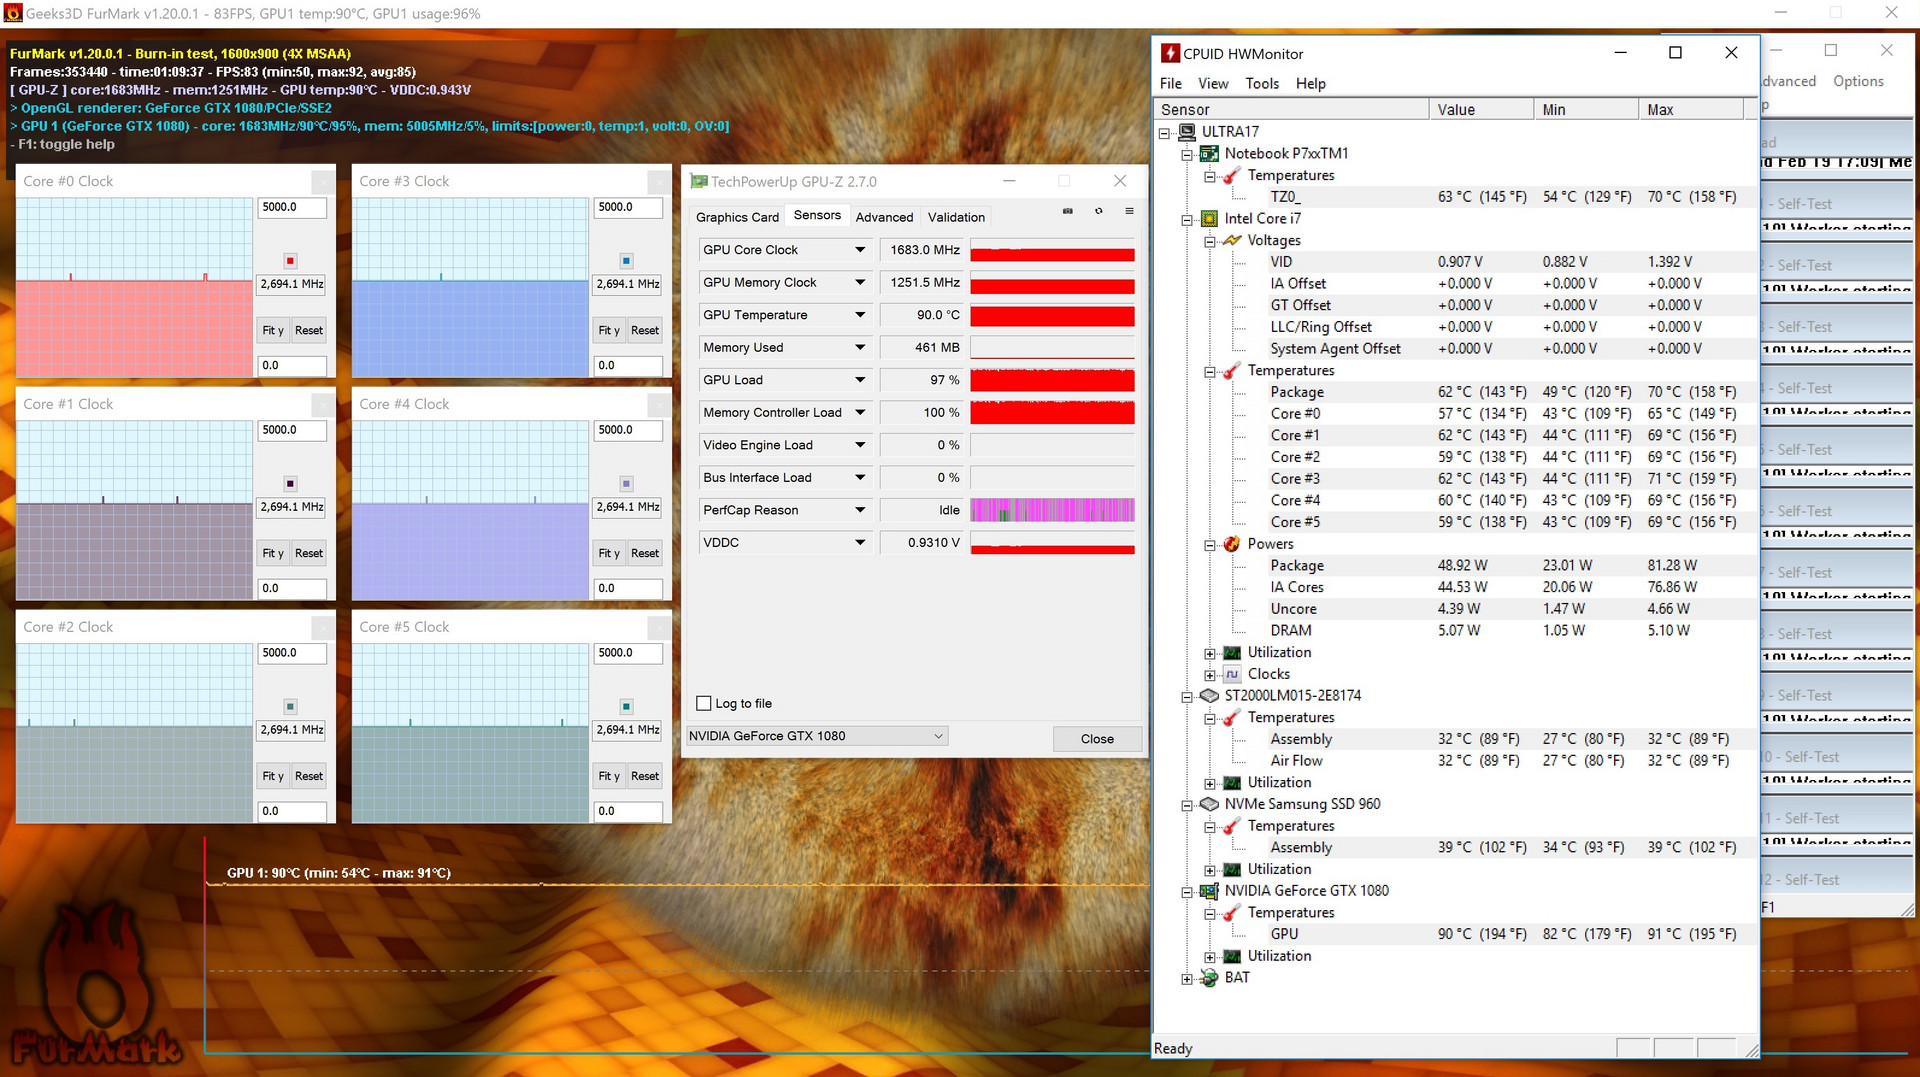
To see whether prolonged gaming sessions would cause problems for this 17-incher, we tested it with 60 minutes of “The Witcher 3” gameplay. The results leave us with mixed feelings. While the GeForce GTX 1080 does boost to a massive 1,720 MHz, it reaches a temperature of 90 °C (194 °F). Interestingly, the Core i7-8700 shows the opposite picture: Despite staying at acceptable temperatures, the turbo boost gets completely disabled.
Gaming Performance
The fact that 3,840x2,160 can strain and even overwhelm high-end chips is noticeable when looking at newer games. Demanding games such as “Final Fantasy XV” or “Kingdom Come Deliverance” on higher settings are able to bring even a GeForce GTX 1080 to its limit.
| The Witcher 3 | |
| 3840x2160 High Graphics & Postprocessing (Nvidia HairWorks Off) | |
| Average of class Gaming (114 - 170.9, n=4, last 2 years) | |
| Guru Mars K | |
| MSI GT75VR 7RF-012 Titan Pro | |
| Schenker XMG Ultra 17 | |
| Average NVIDIA GeForce GTX 1080 Mobile (44.4 - 55.8, n=11) | |
| Acer Predator 17 X GX-792-76DL | |
| 1920x1080 Ultra Graphics & Postprocessing (HBAO+) | |
| Average of class Gaming (104.7 - 240, n=7, last 2 years) | |
| Alienware 17 R4 | |
| MSI GT75VR 7RF-012 Titan Pro | |
| Guru Mars K | |
| Schenker XMG Ultra 17 | |
| Average NVIDIA GeForce GTX 1080 Mobile (61.7 - 78.1, n=23) | |
| Acer Predator 17 X GX-792-76DL | |
Aside from that, high to maximum settings are usually playable, though often only 40-60 FPS are attainable on UHD. For the GTX 1070 we recommend the WQHD panel, and if you want to get the GTX 1060, you should consider going with the Full HD display.
| low | med. | high | ultra | 4K | |
|---|---|---|---|---|---|
| The Witcher 3 (2015) | 142 | 75.6 | 51.3 | ||
| FIFA 18 (2017) | 289 | 286 | 249 | ||
| Wolfenstein II: The New Colossus (2017) | 136 | 127 | 52.1 | ||
| Assassin´s Creed Origins (2017) | 86 | 76 | 39 | ||
| Call of Duty WWII (2017) | 160 | 131 | 63.2 | ||
| Need for Speed Payback (2017) | 137 | 131 | 48.9 | ||
| Star Wars Battlefront 2 (2017) | 137 | 115 | 39.6 | ||
| Fortnite (2018) | 194 | 141 | 41.4 | ||
| Final Fantasy XV Benchmark (2018) | 74.4 | 31.8 | |||
| Kingdom Come: Deliverance (2018) | 104 | 76.8 | 25.8 |
Emissions
System noise
From their slim 14-inch to their massive 17-inch offerings: Clevo Barebones usually are hampered by their awful fan controller. Sadly, the cooling system found in the P775TM1-G chassis is also plagued by these issues. The system gets rather loud, even when considering the desktop-grade processor inside. While the XMG Ultra 17 stays at “only” 45 dB(A) during 3DMark 06, the 52 dB(A) in “The Witcher 3” or even up to 60 dB(A) under full load are very high and force gamers to use a headset.
Even during light tasks or while opening programs, we have to criticize the system in this respect. The cooling has a tendency to randomly spin up, something a lot of users are going to find annoying. Updates and the booting process also tend to get the fans up to 40 dB(A). However, those inclined to optimize will be able to make manual adjustments via the preinstalled control center.
Noise level
| Idle |
| 34 / 35 / 40 dB(A) |
| Load |
| 45 / 60 dB(A) |
 | ||
30 dB silent 40 dB(A) audible 50 dB(A) loud |
||
min: | ||
| Schenker XMG Ultra 17 GeForce GTX 1080 Mobile, i7-8700 | Guru Mars K GeForce GTX 1080 Mobile, i7-7700 | Acer Predator 17 X GX-792-76DL GeForce GTX 1080 Mobile, i7-7820HK | MSI GT75VR 7RF-012 Titan Pro GeForce GTX 1080 Mobile, i7-7820HK | Alienware 17 R4 GeForce GTX 1080 Mobile, i7-7820HK | |
|---|---|---|---|---|---|
| Noise | 0% | 6% | 0% | 2% | |
| off / environment * (dB) | 30 | 29 3% | 30 -0% | 30 -0% | 28.2 6% |
| Idle Minimum * (dB) | 34 | 36 -6% | 33 3% | 33 3% | 35.6 -5% |
| Idle Average * (dB) | 35 | 37 -6% | 35 -0% | 34 3% | 35.6 -2% |
| Idle Maximum * (dB) | 40 | 40 -0% | 37 7% | 38 5% | 35.7 11% |
| Load Average * (dB) | 45 | 45 -0% | 40 11% | 44 2% | 50.2 -12% |
| Witcher 3 ultra * (dB) | 52 | 50 4% | 56 -8% | 50.2 3% | |
| Load Maximum * (dB) | 60 | 55 8% | 50 17% | 62 -3% | 50.2 16% |
* ... smaller is better
Temperature
The temperatures are good. With the exception of the GPU, which can get fairly hot under load, all other components stay relatively cool. The (limited to 2.7 GHz) Core i7-8700 did not exceed 71 °C (~160 °F) when using tools such as FurMark or Prime95.
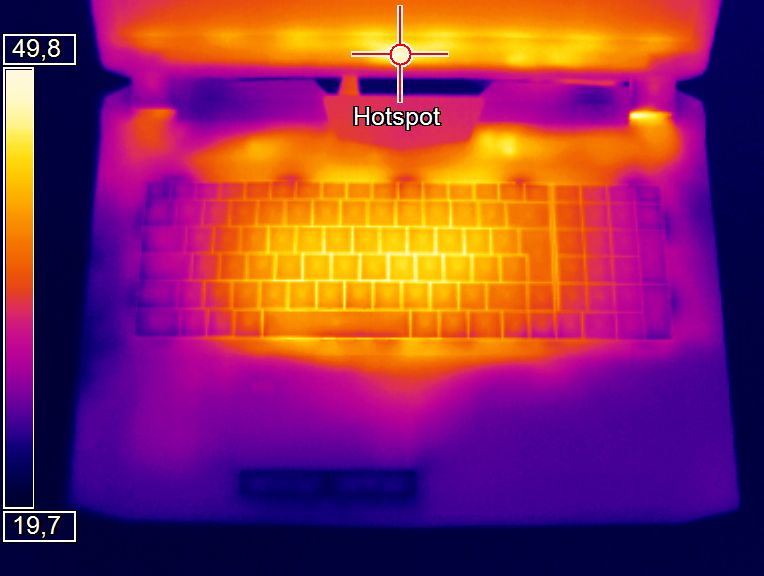
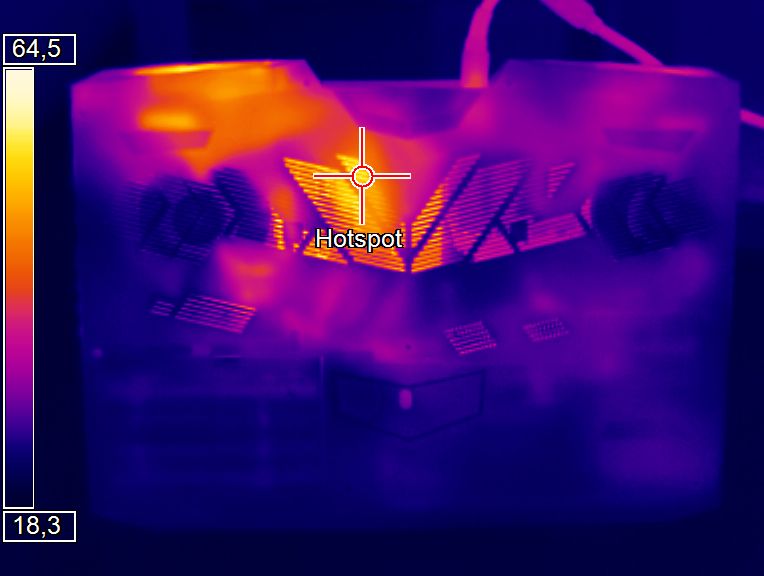
The chassis also stays fairly cool on the outside. A maximum of 41 °C (~106 °F) on the top and 51 °C (~124 °F) on the bottom after 60 minutes of “The Witcher 3” are good results. Furthermore, the hand rest stays cool under all circumstances and the device does not heat up that much while idling.
(±) The maximum temperature on the upper side is 41 °C / 106 F, compared to the average of 40.4 °C / 105 F, ranging from 21.2 to 68.8 °C for the class Gaming.
(-) The bottom heats up to a maximum of 48 °C / 118 F, compared to the average of 43.2 °C / 110 F
(+) In idle usage, the average temperature for the upper side is 27.8 °C / 82 F, compared to the device average of 33.9 °C / 93 F.
(±) Playing The Witcher 3, the average temperature for the upper side is 35.2 °C / 95 F, compared to the device average of 33.9 °C / 93 F.
(+) The palmrests and touchpad are cooler than skin temperature with a maximum of 30 °C / 86 F and are therefore cool to the touch.
(±) The average temperature of the palmrest area of similar devices was 28.8 °C / 83.8 F (-1.2 °C / -2.2 F).
| Schenker XMG Ultra 17 GeForce GTX 1080 Mobile, i7-8700 | Guru Mars K GeForce GTX 1080 Mobile, i7-7700 | Acer Predator 17 X GX-792-76DL GeForce GTX 1080 Mobile, i7-7820HK | MSI GT75VR 7RF-012 Titan Pro GeForce GTX 1080 Mobile, i7-7820HK | Alienware 17 R4 GeForce GTX 1080 Mobile, i7-7820HK | |
|---|---|---|---|---|---|
| Heat | -1% | 0% | -11% | -5% | |
| Maximum Upper Side * (°C) | 41 | 46 -12% | 44.2 -8% | 46 -12% | 49.6 -21% |
| Maximum Bottom * (°C) | 48 | 46 4% | 43 10% | 57 -19% | 56 -17% |
| Idle Upper Side * (°C) | 30 | 32 -7% | 32.4 -8% | 34 -13% | 29.6 1% |
| Idle Bottom * (°C) | 35 | 31 11% | 32.8 6% | 35 -0% | 29.2 17% |
* ... smaller is better
Speakers
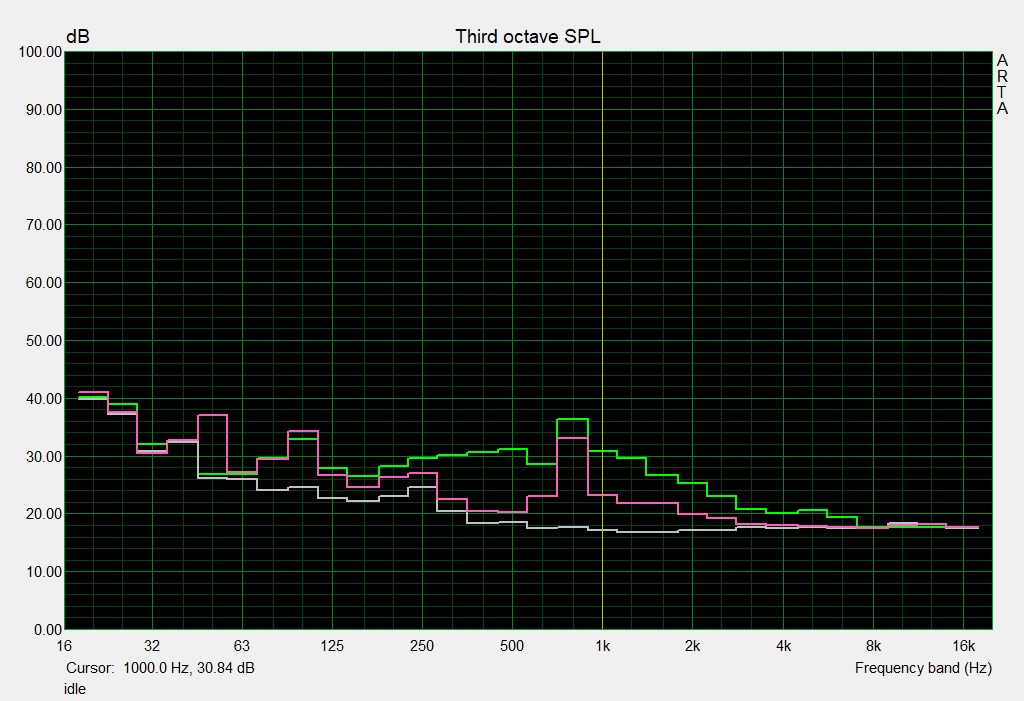
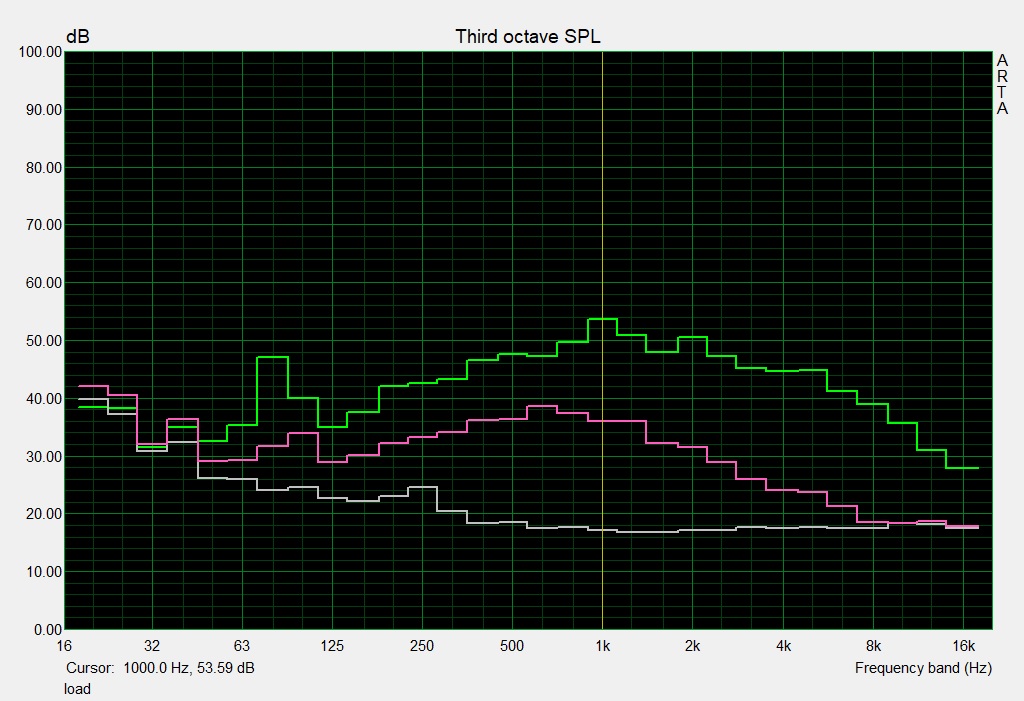
Schenker XMG Ultra 17 audio analysis
(±) | speaker loudness is average but good (79 dB)
Bass 100 - 315 Hz
(+) | good bass - only 4.1% away from median
(±) | linearity of bass is average (12.2% delta to prev. frequency)
Mids 400 - 2000 Hz
(±) | higher mids - on average 5.5% higher than median
(+) | mids are linear (6.5% delta to prev. frequency)
Highs 2 - 16 kHz
(+) | balanced highs - only 1.4% away from median
(+) | highs are linear (2% delta to prev. frequency)
Overall 100 - 16.000 Hz
(+) | overall sound is linear (11% difference to median)
Compared to same class
» 7% of all tested devices in this class were better, 3% similar, 89% worse
» The best had a delta of 6%, average was 18%, worst was 132%
Compared to all devices tested
» 6% of all tested devices were better, 2% similar, 92% worse
» The best had a delta of 4%, average was 23%, worst was 134%
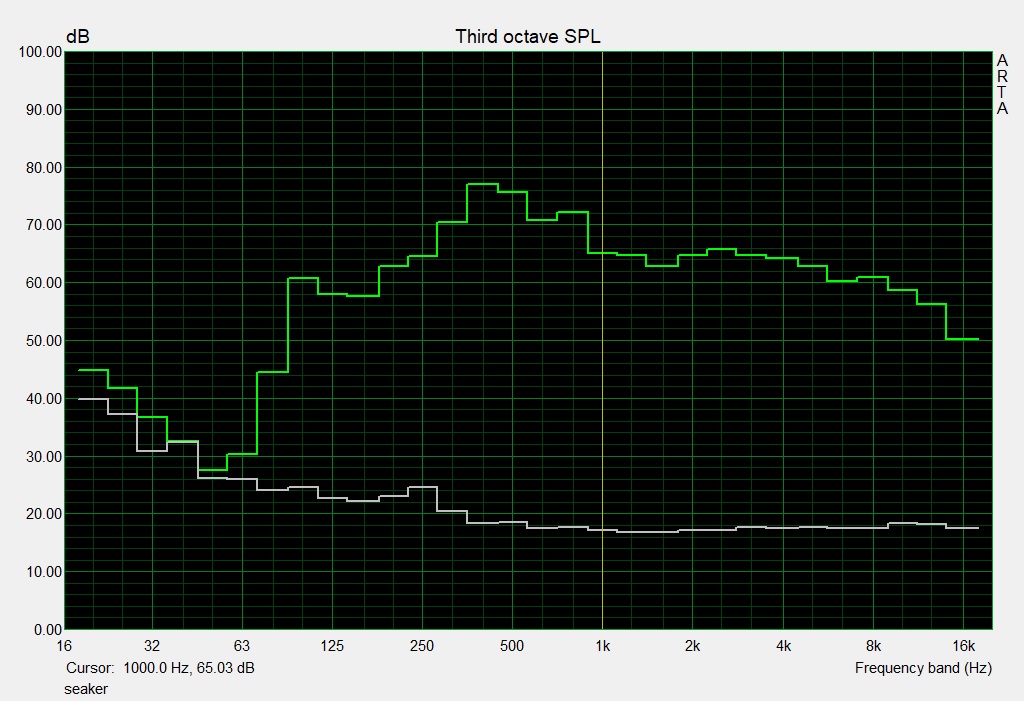
Acer Predator 17 X GX-792-76DL audio analysis
(+) | speakers can play relatively loud (86 dB)
Bass 100 - 315 Hz
(±) | reduced bass - on average 9.6% lower than median
(±) | linearity of bass is average (9.3% delta to prev. frequency)
Mids 400 - 2000 Hz
(+) | balanced mids - only 2.6% away from median
(+) | mids are linear (4.9% delta to prev. frequency)
Highs 2 - 16 kHz
(+) | balanced highs - only 3.9% away from median
(+) | highs are linear (6.7% delta to prev. frequency)
Overall 100 - 16.000 Hz
(+) | overall sound is linear (11.1% difference to median)
Compared to same class
» 8% of all tested devices in this class were better, 3% similar, 89% worse
» The best had a delta of 6%, average was 18%, worst was 132%
Compared to all devices tested
» 7% of all tested devices were better, 2% similar, 91% worse
» The best had a delta of 4%, average was 23%, worst was 134%
Comparison (Use checkboxes above!)
Energy management
Energy consumption
The combination of a desktop CPU, high-end GPU, a UHD display and no GPU switching results in a rather high energy consumption. 32-45 W while idling is something that only a few other gaming notebooks reach. The same goes for the 237 W in “The Witcher 3” and the 331 W under full load. Not surprisingly, the GTX 1080 variant comes packed with a massive 330 W power supply.
| Off / Standby | |
| Idle | |
| Load |
|
Key:
min: | |
| Schenker XMG Ultra 17 GeForce GTX 1080 Mobile, i7-8700 | Guru Mars K GeForce GTX 1080 Mobile, i7-7700 | Acer Predator 17 X GX-792-76DL GeForce GTX 1080 Mobile, i7-7820HK | MSI GT75VR 7RF-012 Titan Pro GeForce GTX 1080 Mobile, i7-7820HK | Alienware 17 R4 GeForce GTX 1080 Mobile, i7-7820HK | |
|---|---|---|---|---|---|
| Power Consumption | -3% | 12% | -7% | 2% | |
| Idle Minimum * (Watt) | 32 | 31 3% | 27 16% | 34 -6% | 37.5 -17% |
| Idle Average * (Watt) | 38 | 37 3% | 32 16% | 41 -8% | 37.6 1% |
| Idle Maximum * (Watt) | 45 | 44 2% | 41 9% | 50 -11% | 37.6 16% |
| Load Average * (Watt) | 96 | 116 -21% | 102 -6% | 106 -10% | 122.4 -28% |
| Witcher 3 ultra * (Watt) | 237 | 259 -9% | 257 -8% | 180.3 24% | |
| Load Maximum * (Watt) | 331 | 312 6% | 248 25% | 320 3% | 277.4 16% |
* ... smaller is better
Battery life
Despite its massive capacity (82 Wh), the swappable Li-Ion battery is not suitable for mobile use. Even on the lowest brightness with only one open text file on display, the notebook reaches 0% after less than 3 hours. 2:22 hours of internet surfing via WLAN and 2:28 hours of HD video playback on medium brightness are not ideal either. The 3D performance also suffers by one third during battery operation (tested with “The Witcher 3”).
| Schenker XMG Ultra 17 GeForce GTX 1080 Mobile, i7-8700, 82 Wh | Guru Mars K GeForce GTX 1080 Mobile, i7-7700, 82 Wh | Acer Predator 17 X GX-792-76DL GeForce GTX 1080 Mobile, i7-7820HK, 88.8 Wh | MSI GT75VR 7RF-012 Titan Pro GeForce GTX 1080 Mobile, i7-7820HK, 75 Wh | Alienware 17 R4 GeForce GTX 1080 Mobile, i7-7820HK, 99 Wh | Average of class Gaming | |
|---|---|---|---|---|---|---|
| Battery runtime | 25% | 57% | 1% | 32% | 165% | |
| Reader / Idle (h) | 2.7 | 3.3 22% | 5.2 93% | 3 11% | 4.6 70% | 8.27 ? 206% |
| H.264 (h) | 2.5 | 2.6 4% | 3.4 36% | 2.5 0% | 8.32 ? 233% | |
| WiFi v1.3 (h) | 2.4 | 4.2 75% | 2.4 0% | 3 25% | 7.11 ? 196% | |
| Load (h) | 1.2 | 1.8 50% | 1.5 25% | 1.1 -8% | 1.2 0% | 1.502 ? 25% |
Verdict
Pros
Cons
The XMG Ultra 17 is designed for demanding gamers who do not want a tower PC (anymore), but like the upgradability and connectivity of a classic desktop. This is the type of buyer Schenker Technologies is trying to attract with this 17-inch monster.
On the plus side, there are the great input devices and the exceptional UHD display with G-Sync support, whose color representation is best in class. The performance is also excellent: Intel’s Coffee Lake-CPU and Nvidia's Pascal GPU guarantee high performance, though today's games will rarely benefit from six cores as long as the processor supports SMT.
Improvements could be made in terms of the fan controller, which, typical for Barebone manufacturer Clevo, is far from perfect. Decent battery life should not be expected either.
Schenker XMG Ultra 17
- 02/23/2018 v6 (old)
Florian Glaser
Price comparison
