Schenker XMG Ultra 17 (Core i9-9900K, RTX 2080) Clevo P775TM1-G Laptop Review
Nvidia has replaced its GeForce GTX 10 series cards with the RTX 20 series, which brings real-time ray-tracing to consumer GPUs for the first time. Hence, it is time for OEMs to upgrade their flagship gaming laptops to tease out the last ounce of performance. Schenker has upgraded its XMG Ultra 17 from a GeForce GTX 1080 to an RTX 2080, which should deliver better frame rates when gaming at 4K. It remains to be seen whether the new Ultra 17 can handle this extra power though as its predecessor struggled to maintain consistent performance with the GeForce GTX 1080. Schenker also offers the Ultra 17 with an RTX 2060 or RTX 2070, which are both more power-efficient GPUs than the RTX 2080.
The previous Ultra 17 was already expensive, but its RTX-powered successors are even pricier. Our review unit costs around 4,500 Euros (~$5,093) on Schenker’s website, which is almost 10% more expensive than its predecessor.
Laptops with RTX GPUs are still relatively rare, which means that we can only compare the Ultra 17 against a few devices. Our comparison devices will include the ASUS ROG G703GX and the Acer Predator Triton 500, the latter of which is powered by the RTX 2080 Max-Q, for reference. We shall also compare our review unit against its GeForce GTX 1080-powered predecessor and the Razer Blade 15, which has an RTX 2070 Max-Q GPU.
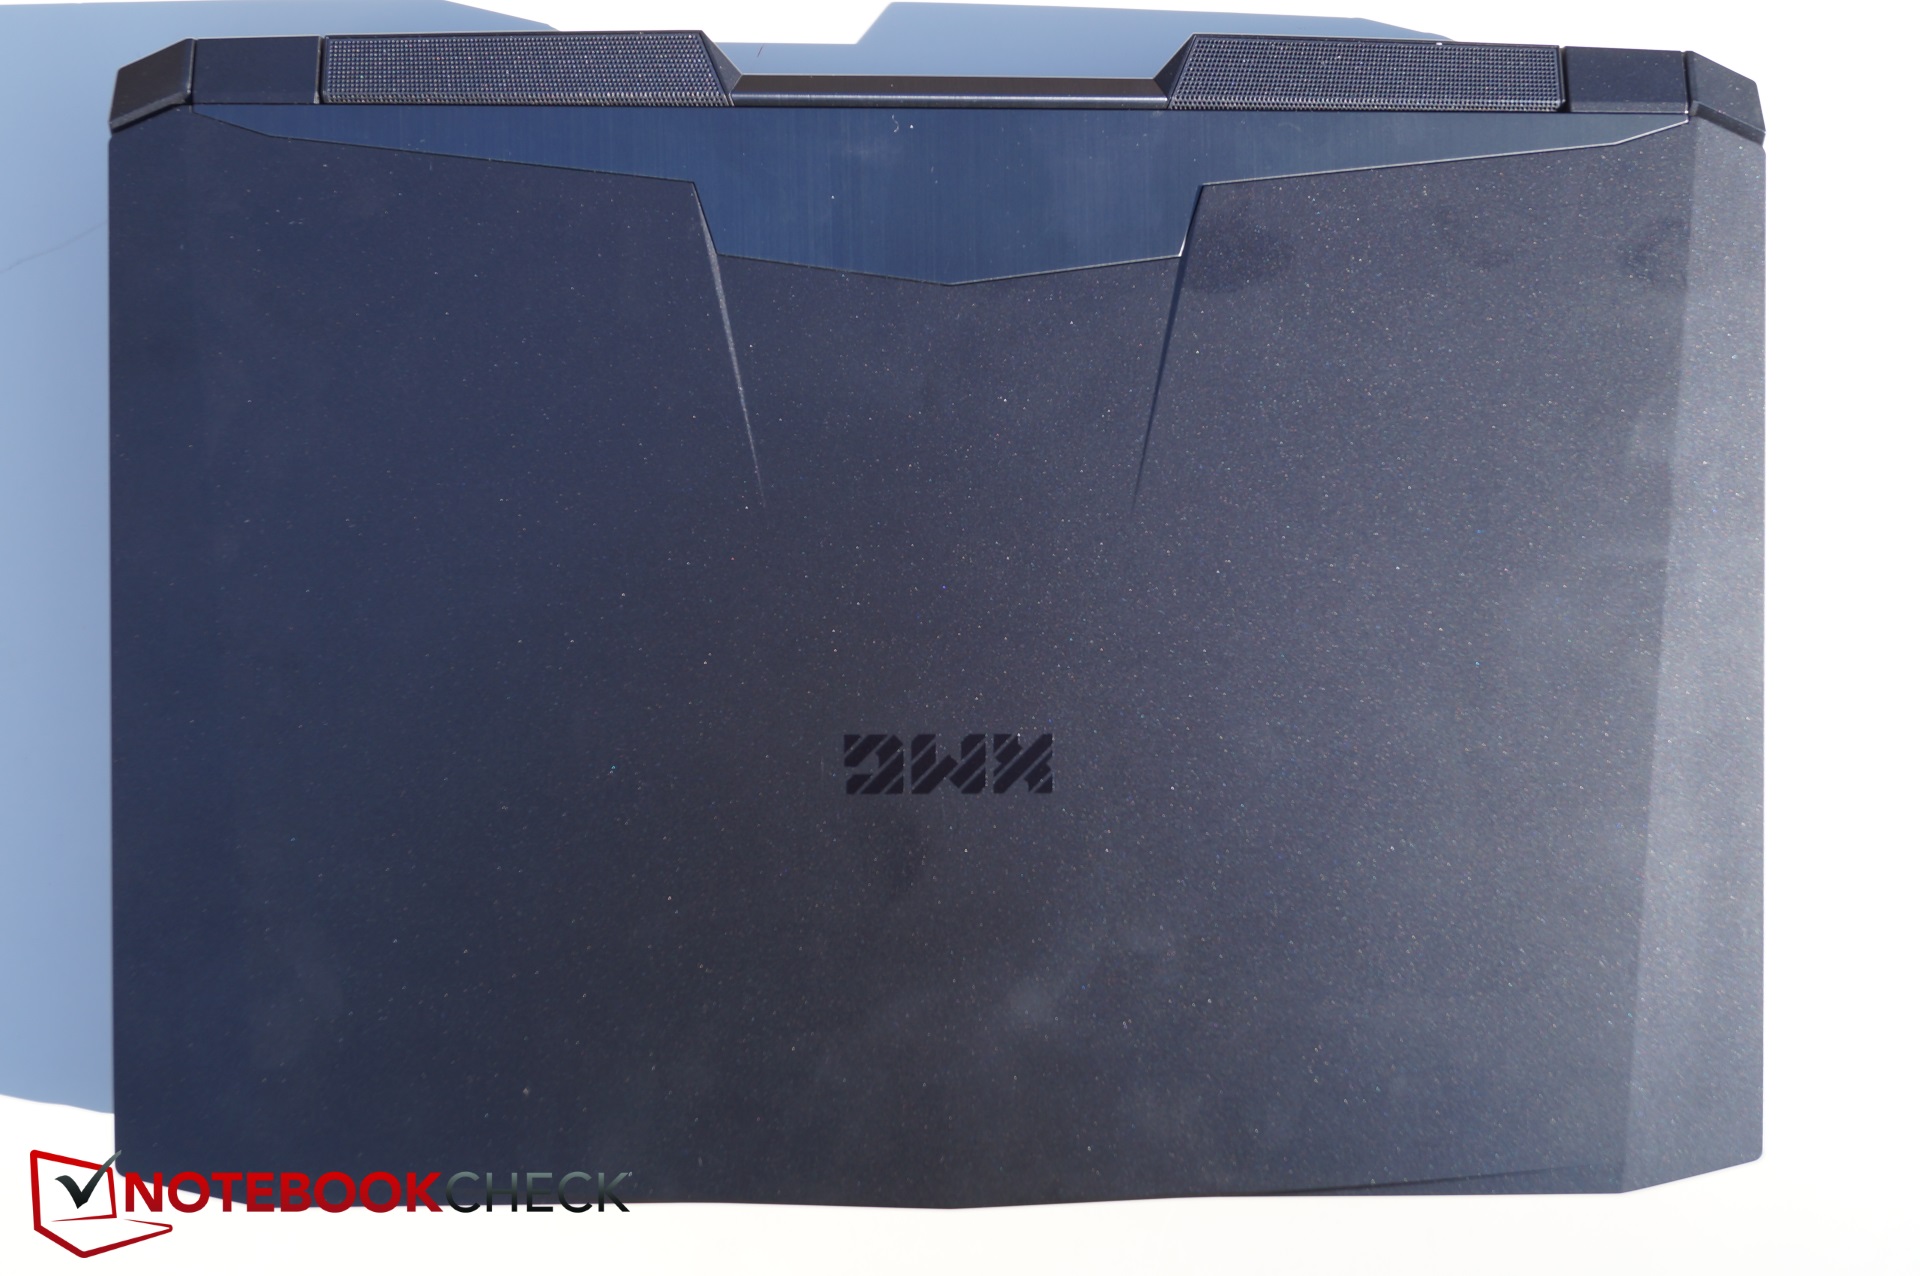
Case
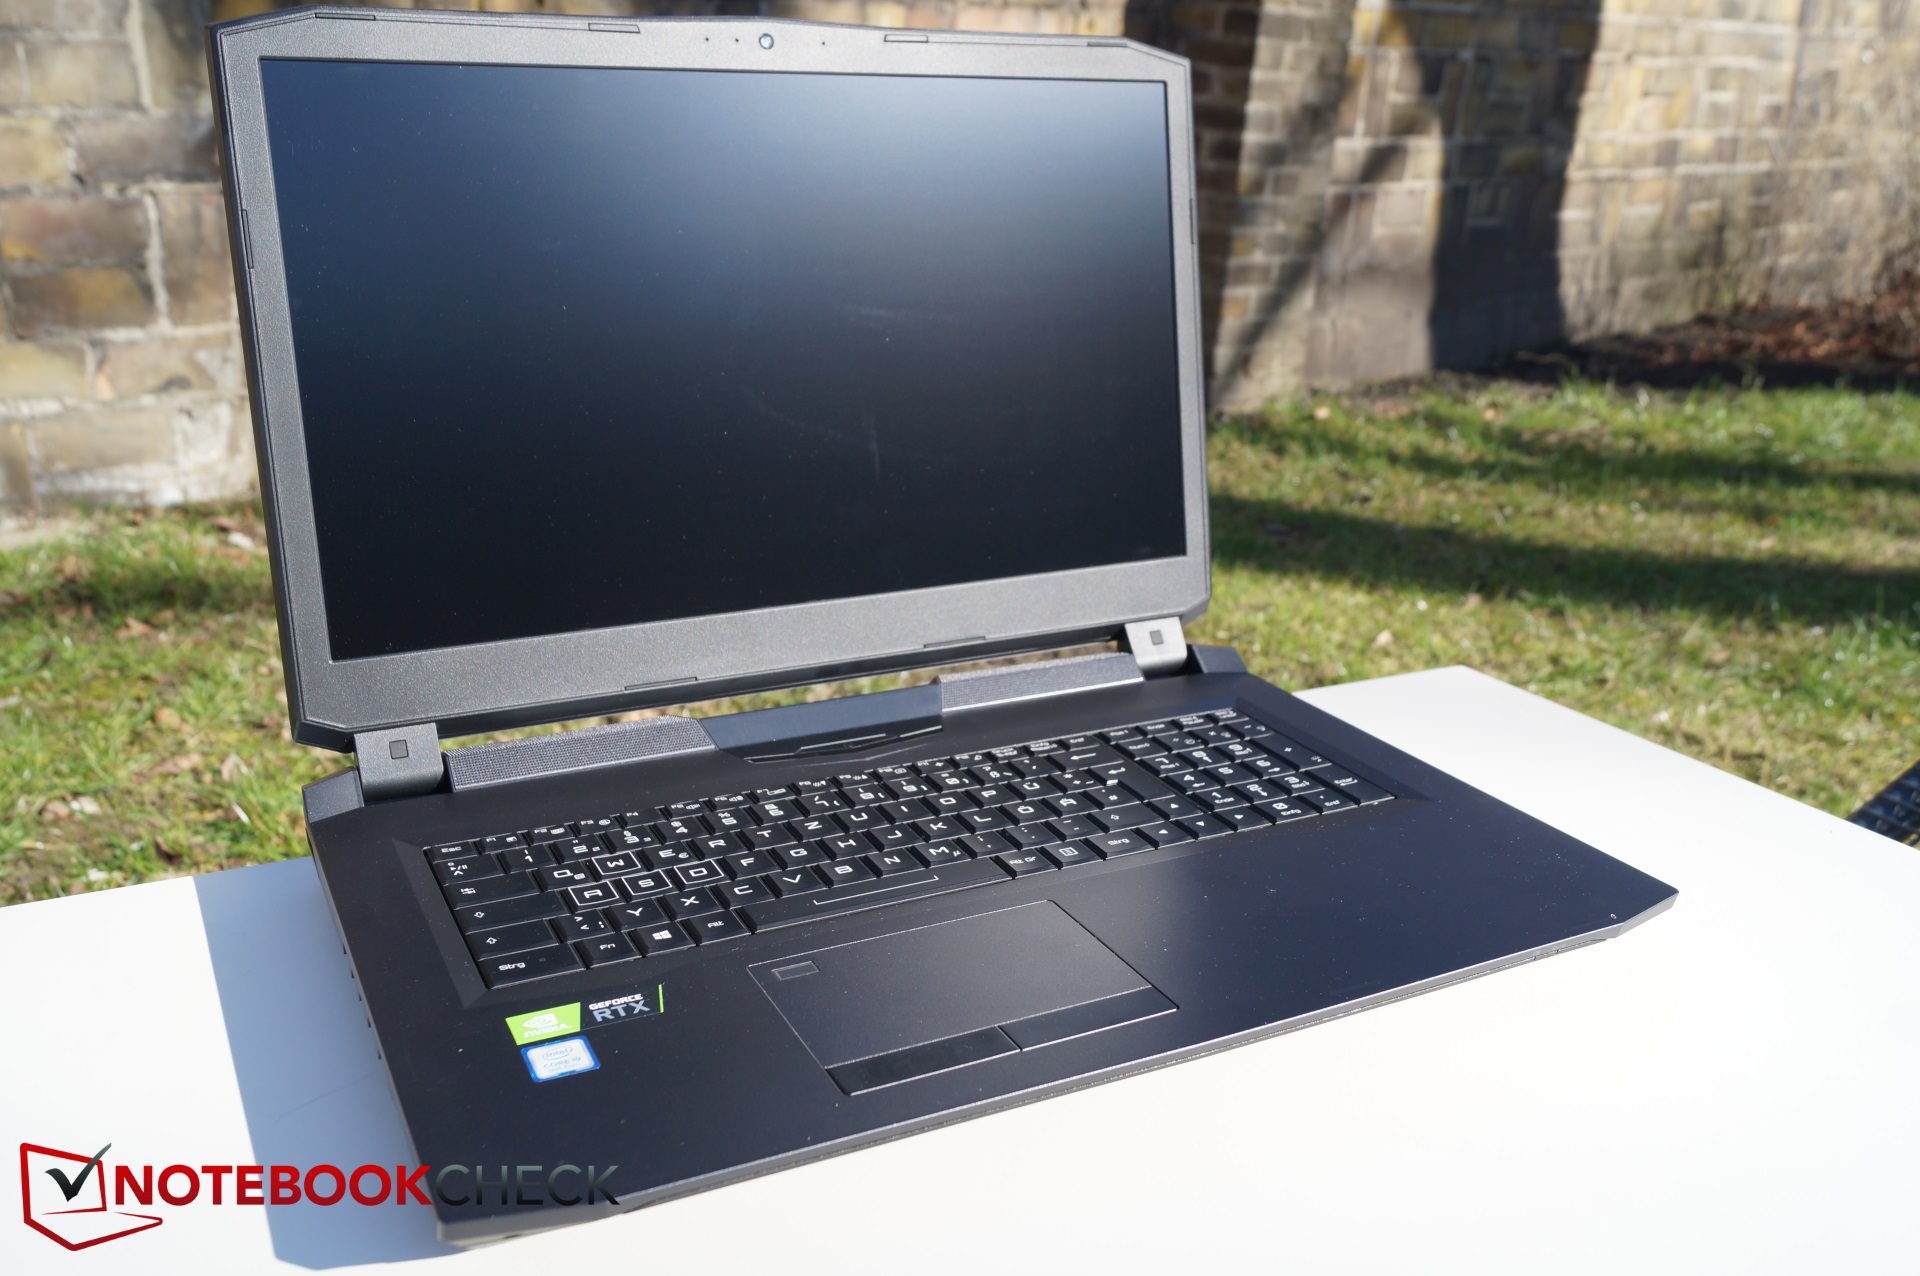
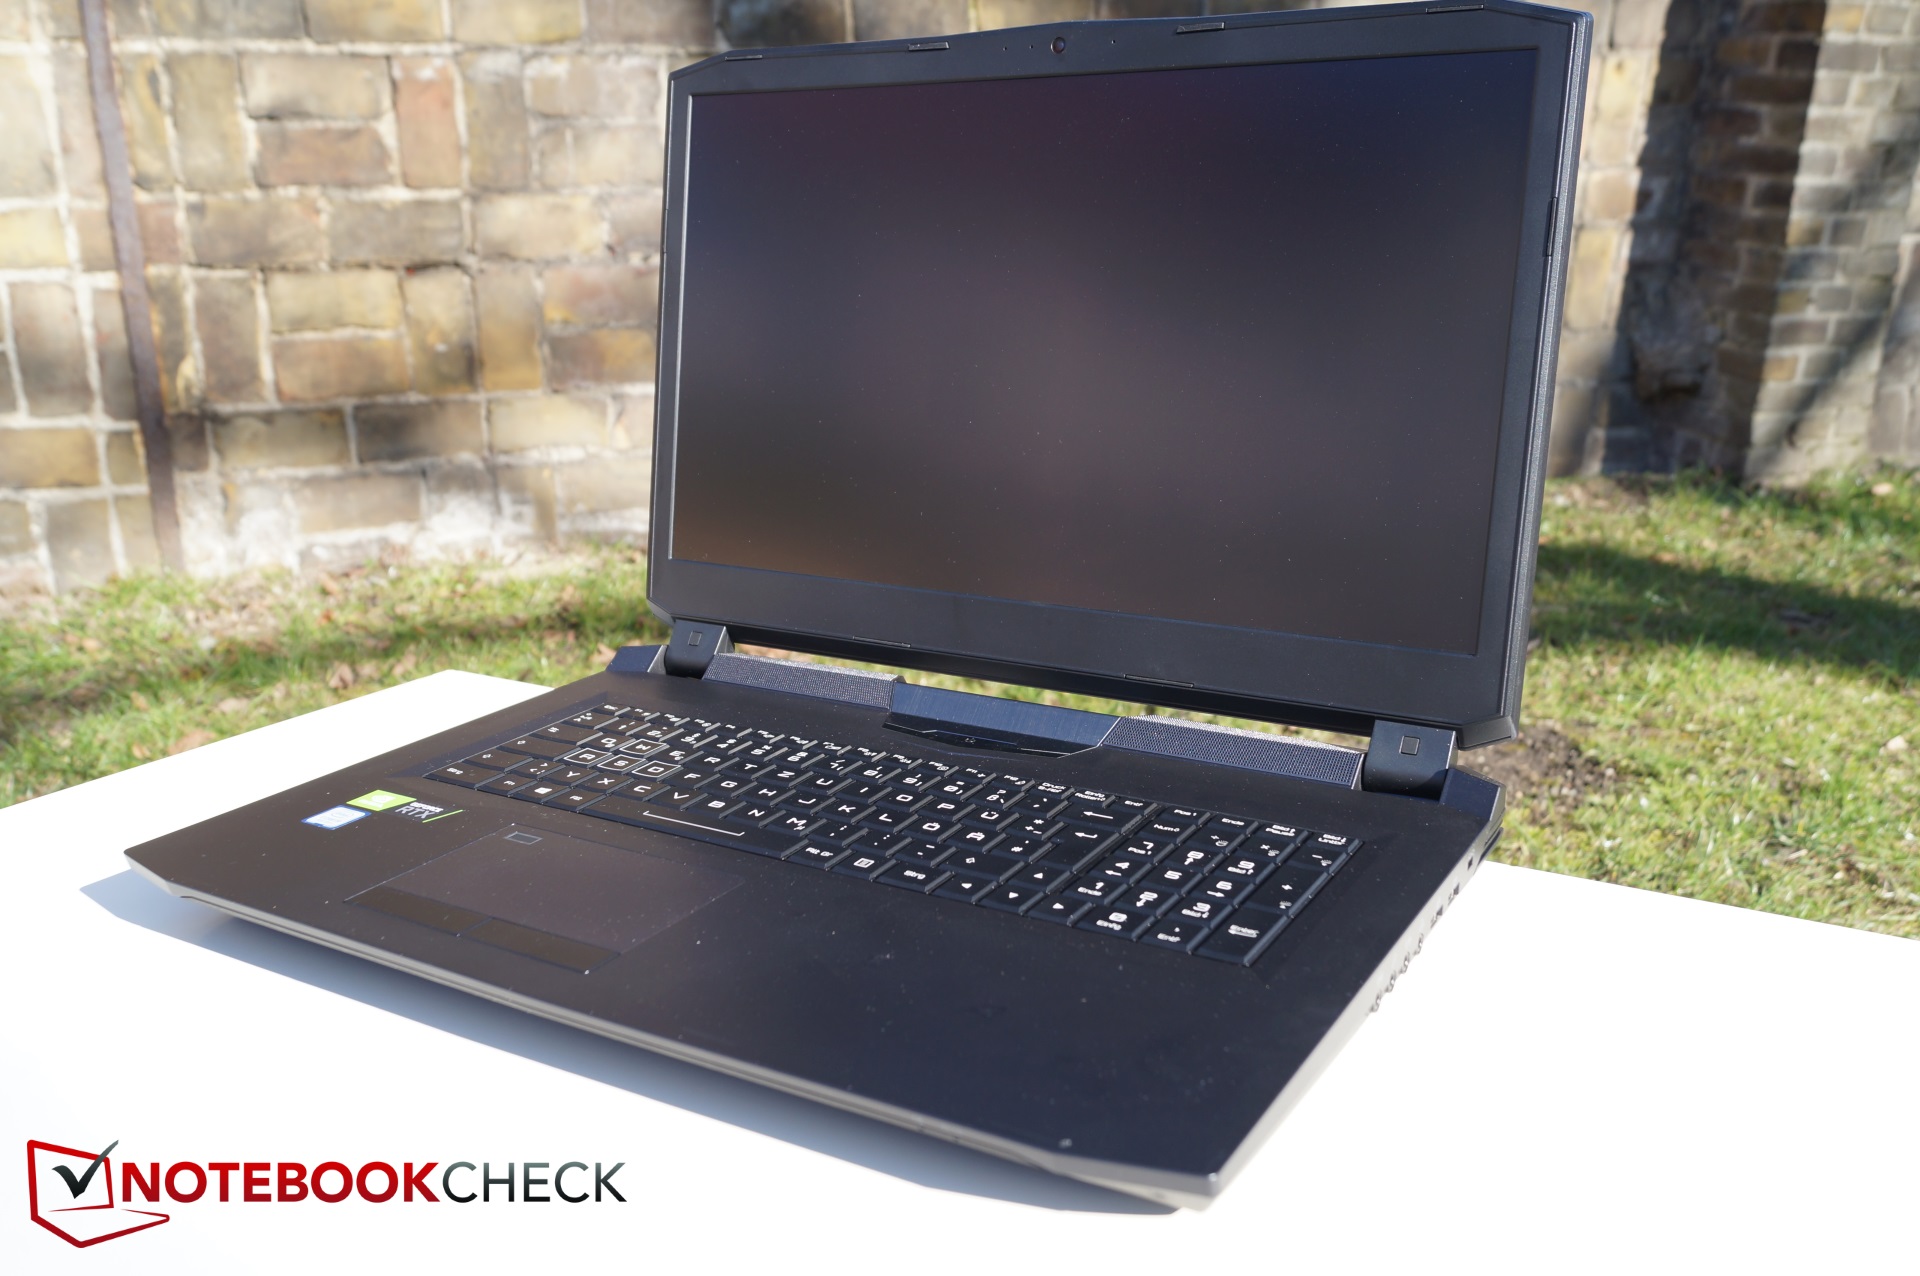
Schenker continues to use almost the same Clevo barebones case that we first saw the company use four years ago with the XMG U716. If you ignore the fingerprint reader and the redistributed ports, then the Ultra 17 looks much like its four-year-old predecessor and even the Guru Mars K, which we reviewed in 2017. The latter has a Clevo P775DM3-G barebones case, but it looks identical to the P775TM1-G that Schenker has used with the new Ultra 17.
The case is made entirely from plastic, with its two aluminium strips being decorative rather than offering structural support. However, our review unit feels sturdy despite the materials that Schenker has used, although it will creak slightly under pressure. We hardly noticed this during our time with the device though. The display lid is surprisingly stiff too. Unfortunately, the bottom of the display frame does not sit flush with the display, which means that we can slip a finger between the two and lift the frame slightly.
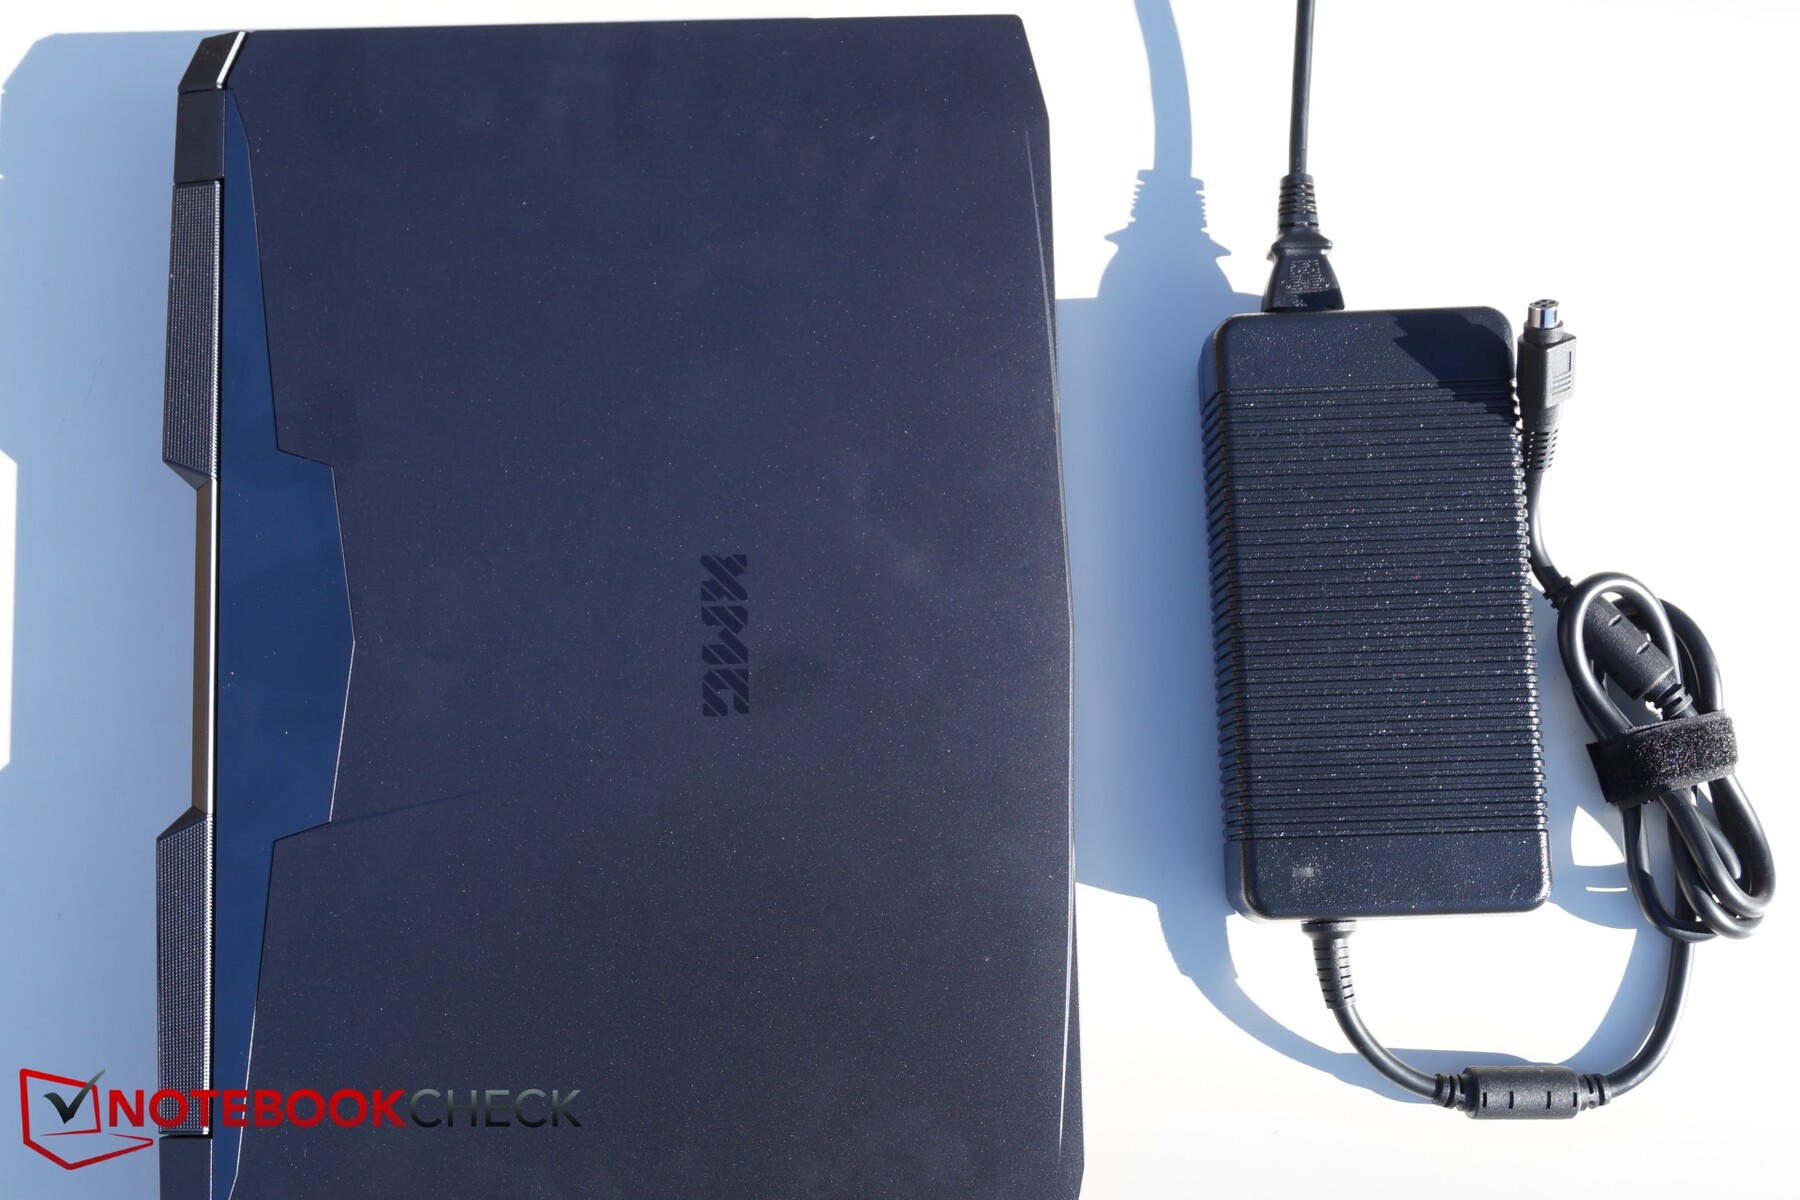
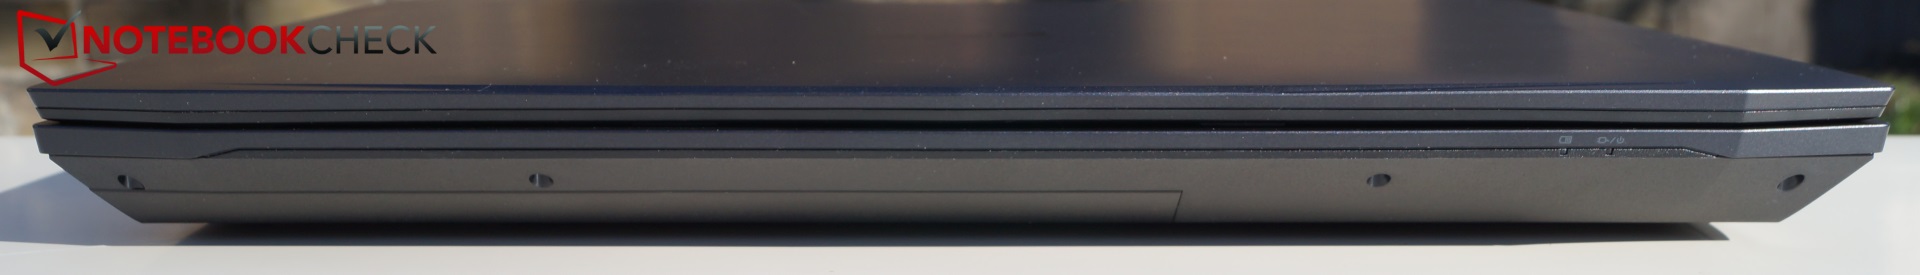
The case is large and bulky even for a 17-inch laptop too. While the Ultra 17’s huge dimensions should provide better cooling than more-compact laptops, it restricts the device to only really being used on a desk; carrying a 4.3 kg and 41 mm thick laptop around plus its charger is simply impractical.
We have chosen to compare our review unit against other 17-inch laptops here as many of our main comparison devices are 15-inch laptops, which would not be a fair comparison. While the Ultra 17 looks clunky and bulky, it is 1 cm thinner than the ROG G703GX and 1.7 cm thinner than the MSI GT75 8RG. The Aorus X9 DT and HP Omen X 17 are noticeably thinner than our review unit, but overall the Ultra 17 remains one of the most compact 17-inch gaming laptops on the market.
The Ultra 17 is lighter than the class average too, with some of our comparison devices weighing up to 4.9 kg. It is worth keeping in mind that the Aorus X9 DT is around 600 g lighter though.
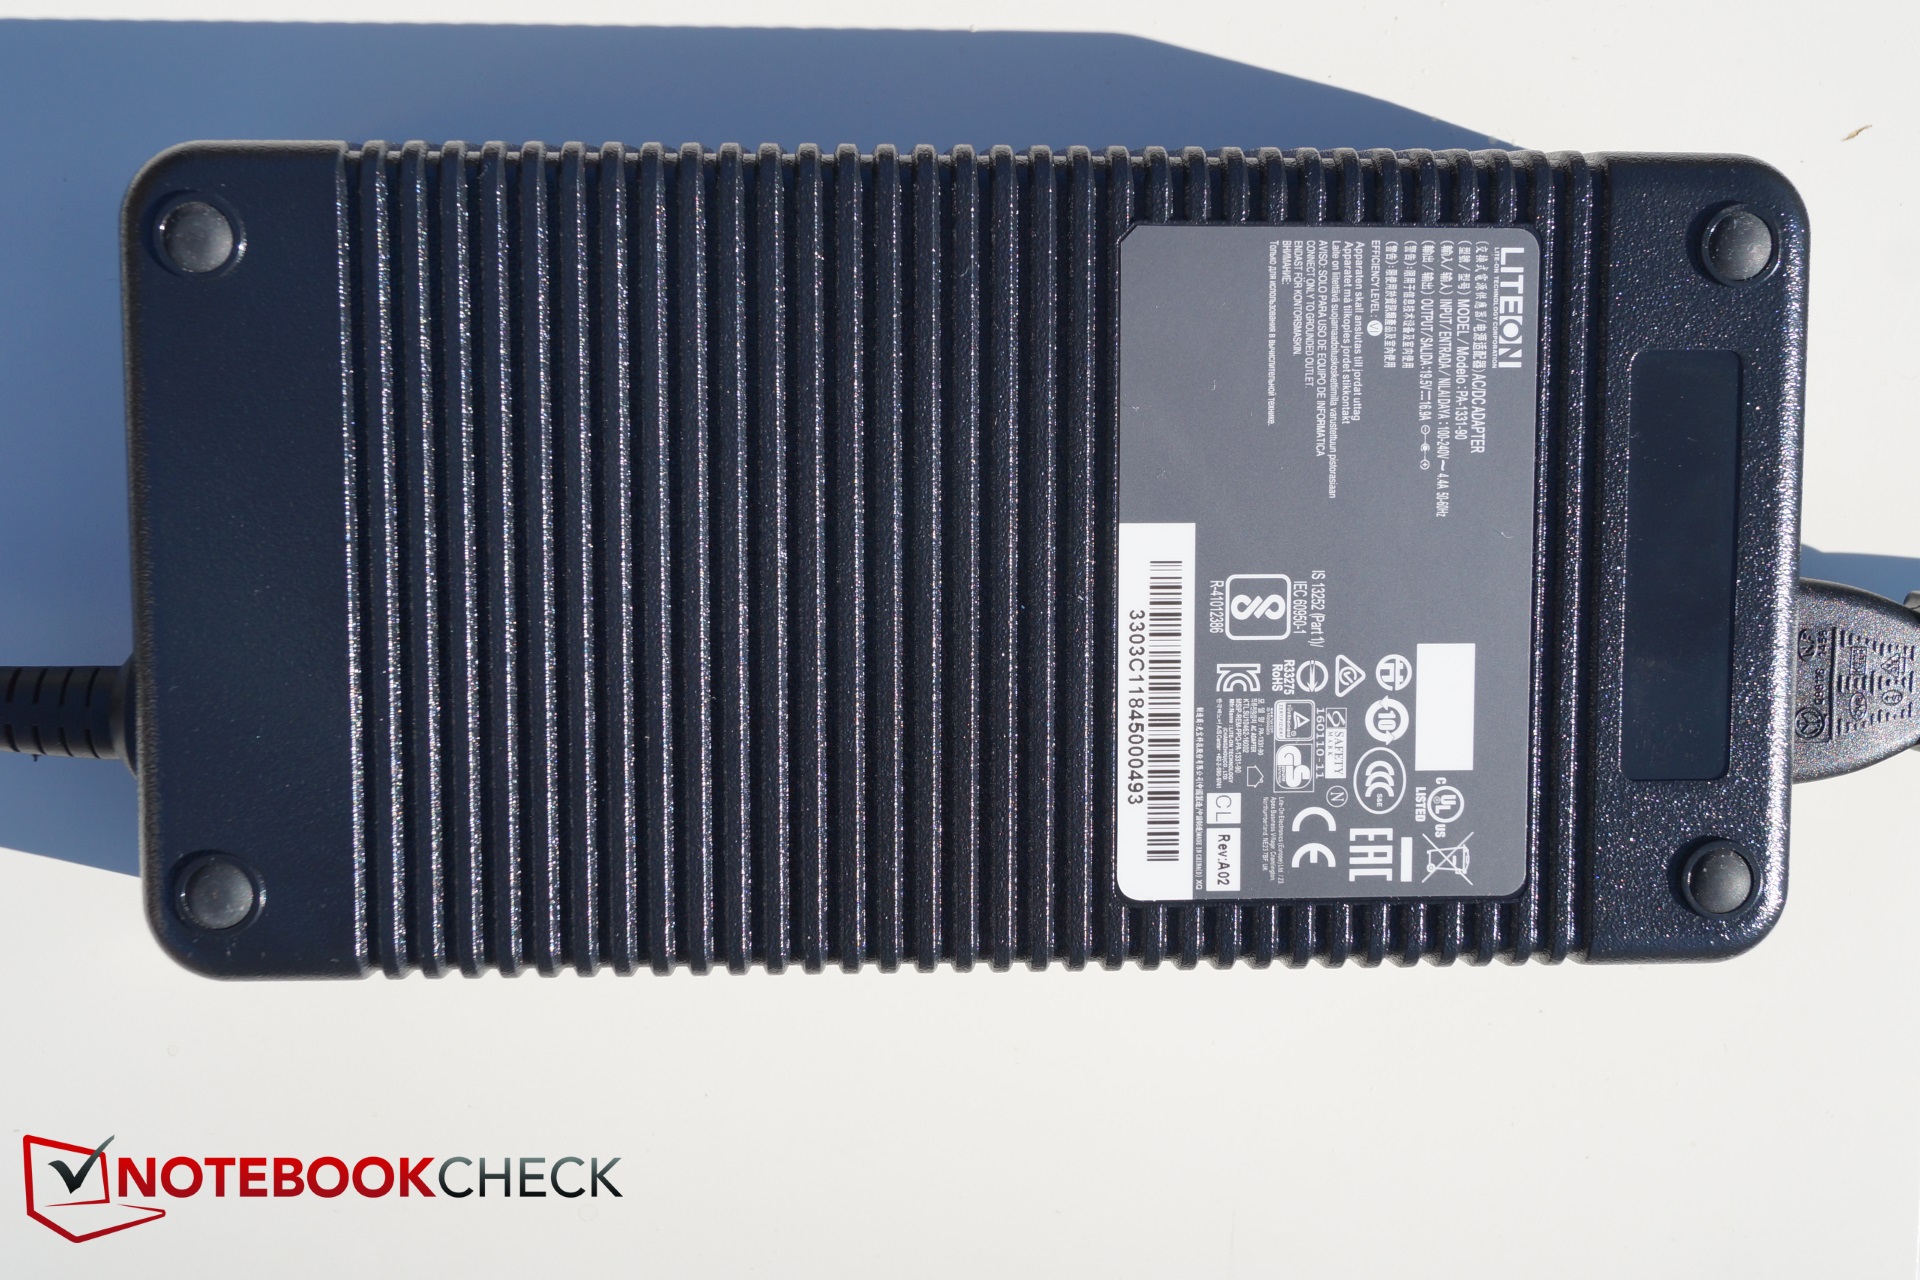
Incidentally, the Ultra 17 comes with a huge power supply that is heavy enough to carry around on its own, let alone with the laptop too. The power supply that Schenker included with our review unit weighs 1.3 kg, which is about as heavy as most 13-inch ultrabooks or thin and light business laptops.
Connectivity
I/O
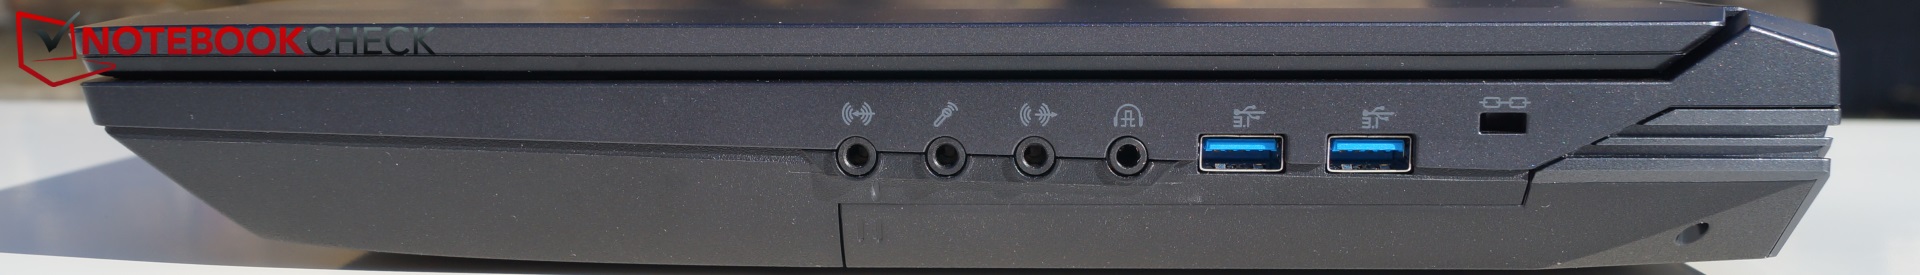
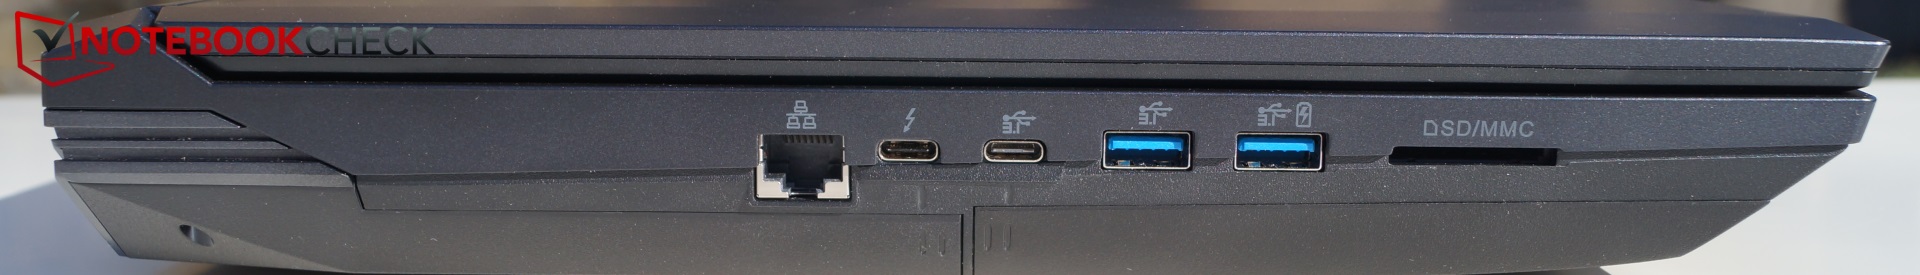
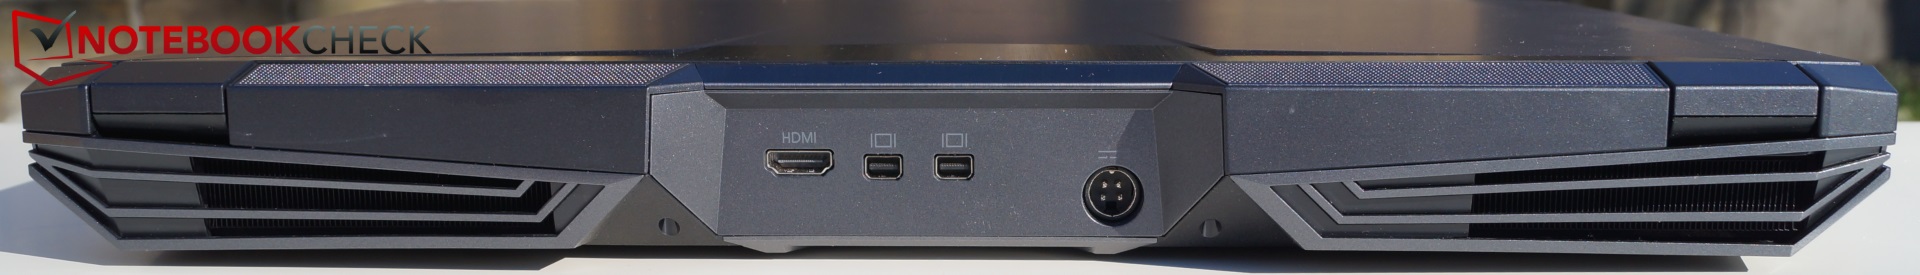
The Ultra 17 has the same ports as its predecessor, but it remains well stocked, nonetheless. Strikingly, the device has four audio connections on its right-hand side along with three video-outputs that are distributed across the back panel. There are also six USB ports, four of which being Type-A, while the other two are Type-C with one also being Thunderbolt 3.
That being said, having a plethora of ports is no good if they are packed close together, but the Ultra 17’s are distributed well, although we would have preferred to see the Type-A ports further apart. You may struggle to use an external mouse if you are using all four audio outs, but this is a minor gripe.
SD Card Reader
Our review unit has the same SD reader as its predecessor and thus achieved almost identical values in our tests. Both models have well above average transfer speeds and are on par with the ROG G703GX, albeit the latter averaged 18% faster read speeds.
| SD Card Reader | |
| average JPG Copy Test (av. of 3 runs) | |
| Schenker XMG Ultra 17 Coffee Lake Refresh (Toshiba Exceria Pro SDXC 64 GB UHS-II) | |
| Schenker XMG Ultra 17 Turing (Toshiba Exceria Pro SDXC 64 GB UHS-II) | |
| Asus ROG G703GX (Toshiba Exceria Pro SDXC 64 GB UHS-II) | |
| Average of class Gaming (20.9 - 210, n=54, last 2 years) | |
| maximum AS SSD Seq Read Test (1GB) | |
| Asus ROG G703GX (Toshiba Exceria Pro SDXC 64 GB UHS-II) | |
| Schenker XMG Ultra 17 Turing (Toshiba Exceria Pro SDXC 64 GB UHS-II) | |
| Schenker XMG Ultra 17 Coffee Lake Refresh (Toshiba Exceria Pro SDXC 64 GB UHS-II) | |
| Average of class Gaming (25.5 - 261, n=51, last 2 years) | |
Communication
Our review unit is equipped with a Killer Wireless AC 1550 module, which is a 10-Euro (~$11) upgrade over the default Intel Wireless-AC 9260. Both modules support Bluetooth 5 and achieve excellent transmission speeds. The Ultra 17 averaged class-leading transmission speeds in iperf3 Client and finished a close third behind its predecessor and the Razer Blade 15 in the other iperf3 Client test that we ran. In short, all the devices in our comparison tables have impressive Wi-Fi performance that is well above average. You can use the Gigabit LAN port for a wired connection too.
Security
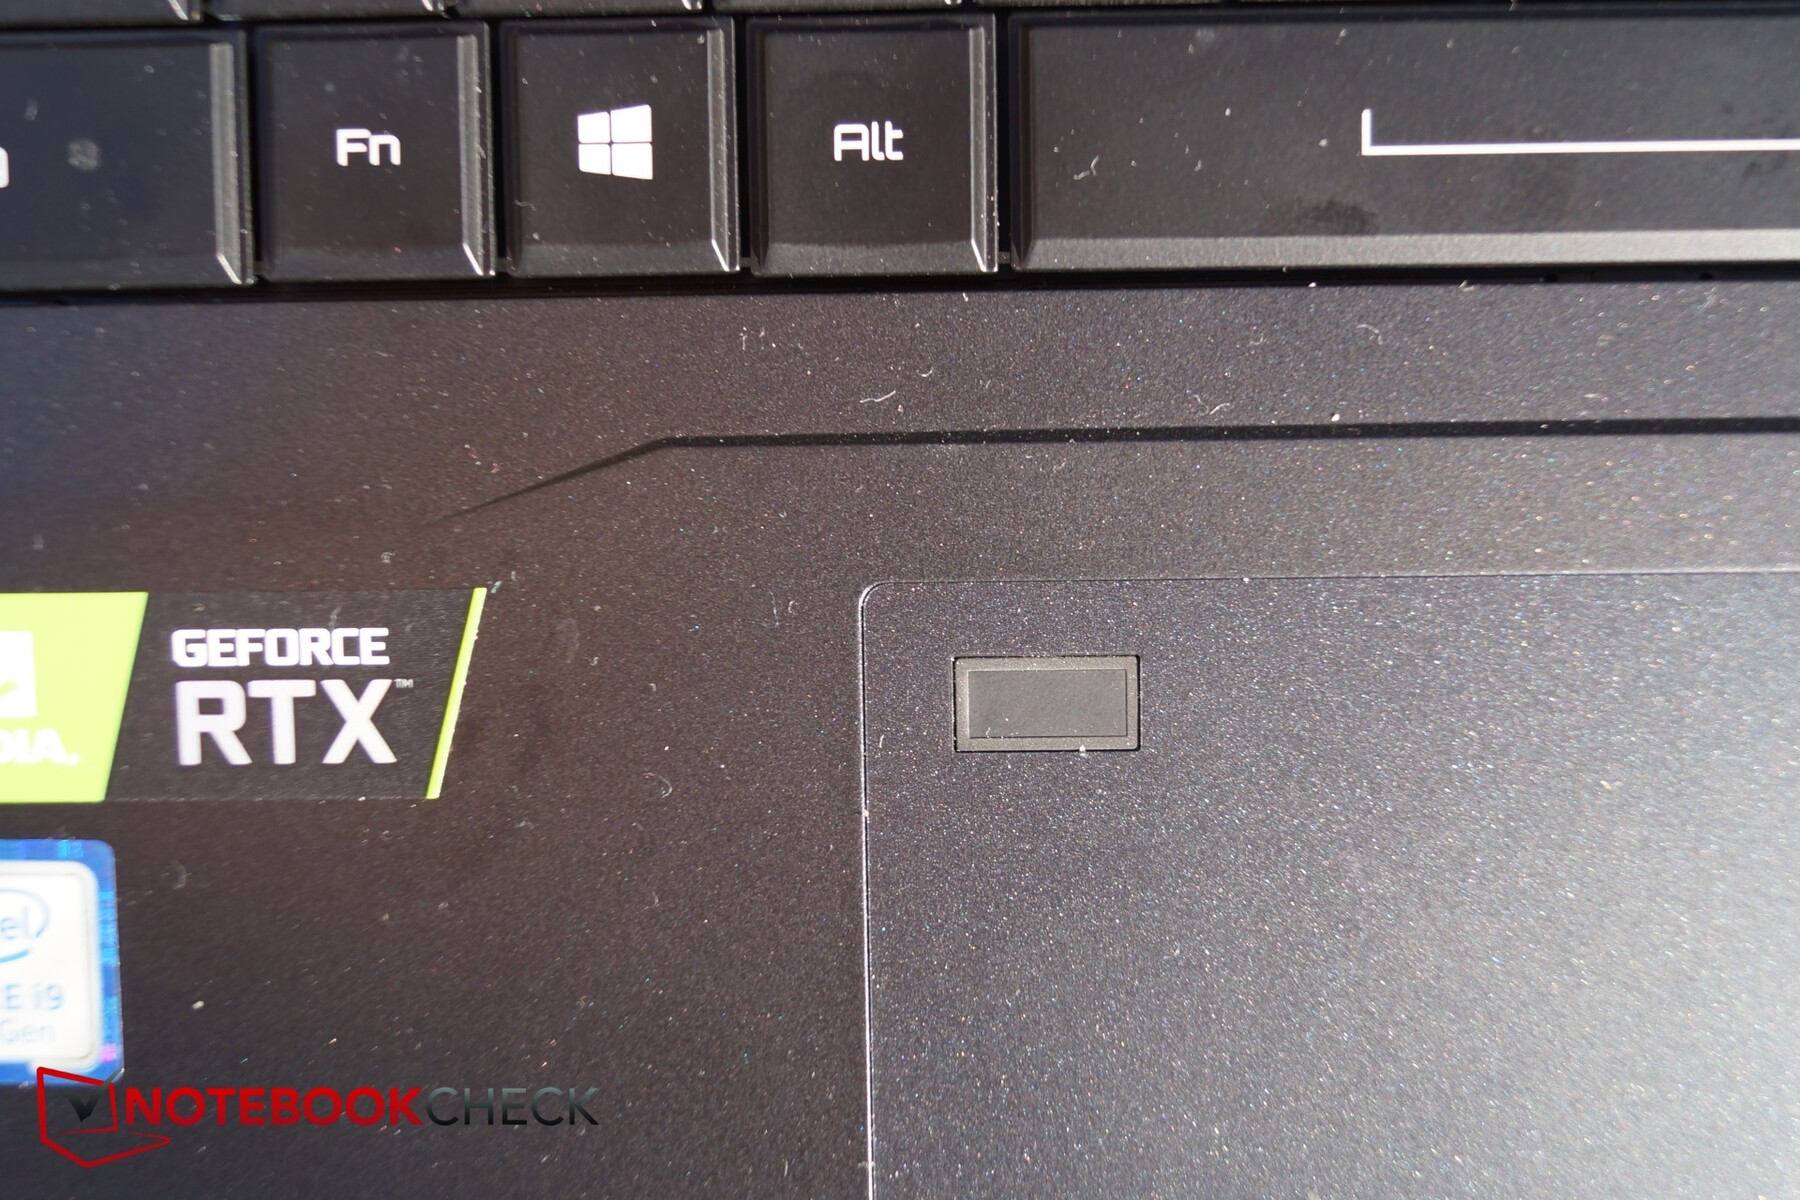
Schenker has equipped the Ultra 17 with a few security features, which is surprising for a gaming laptop. The device has a Trusted Platform Module 2.0 (TPM 2.0) as all devices that ship with Windows 10 must have, along with a Kensington lock slot and a fingerprint sensor that sits in the upper left-hand corner of the trackpad.
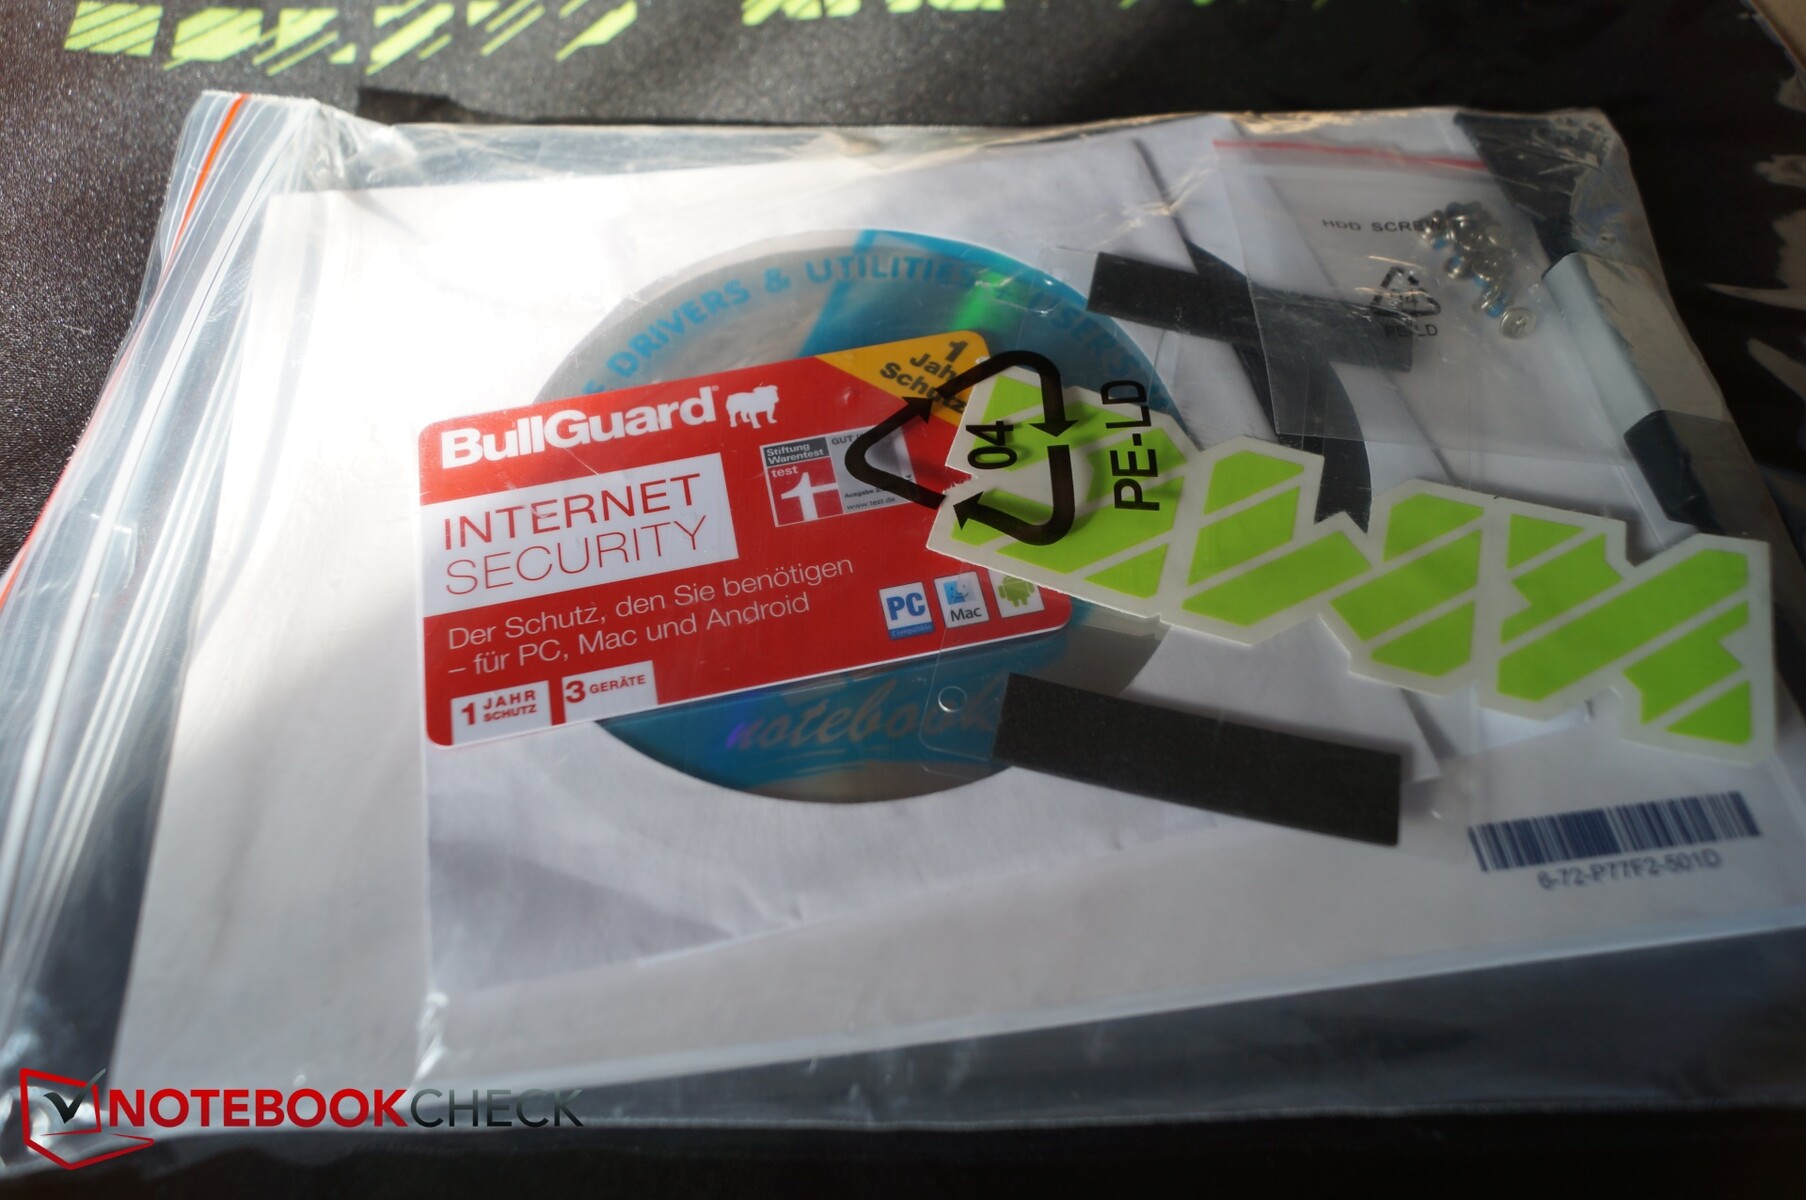
Accessories
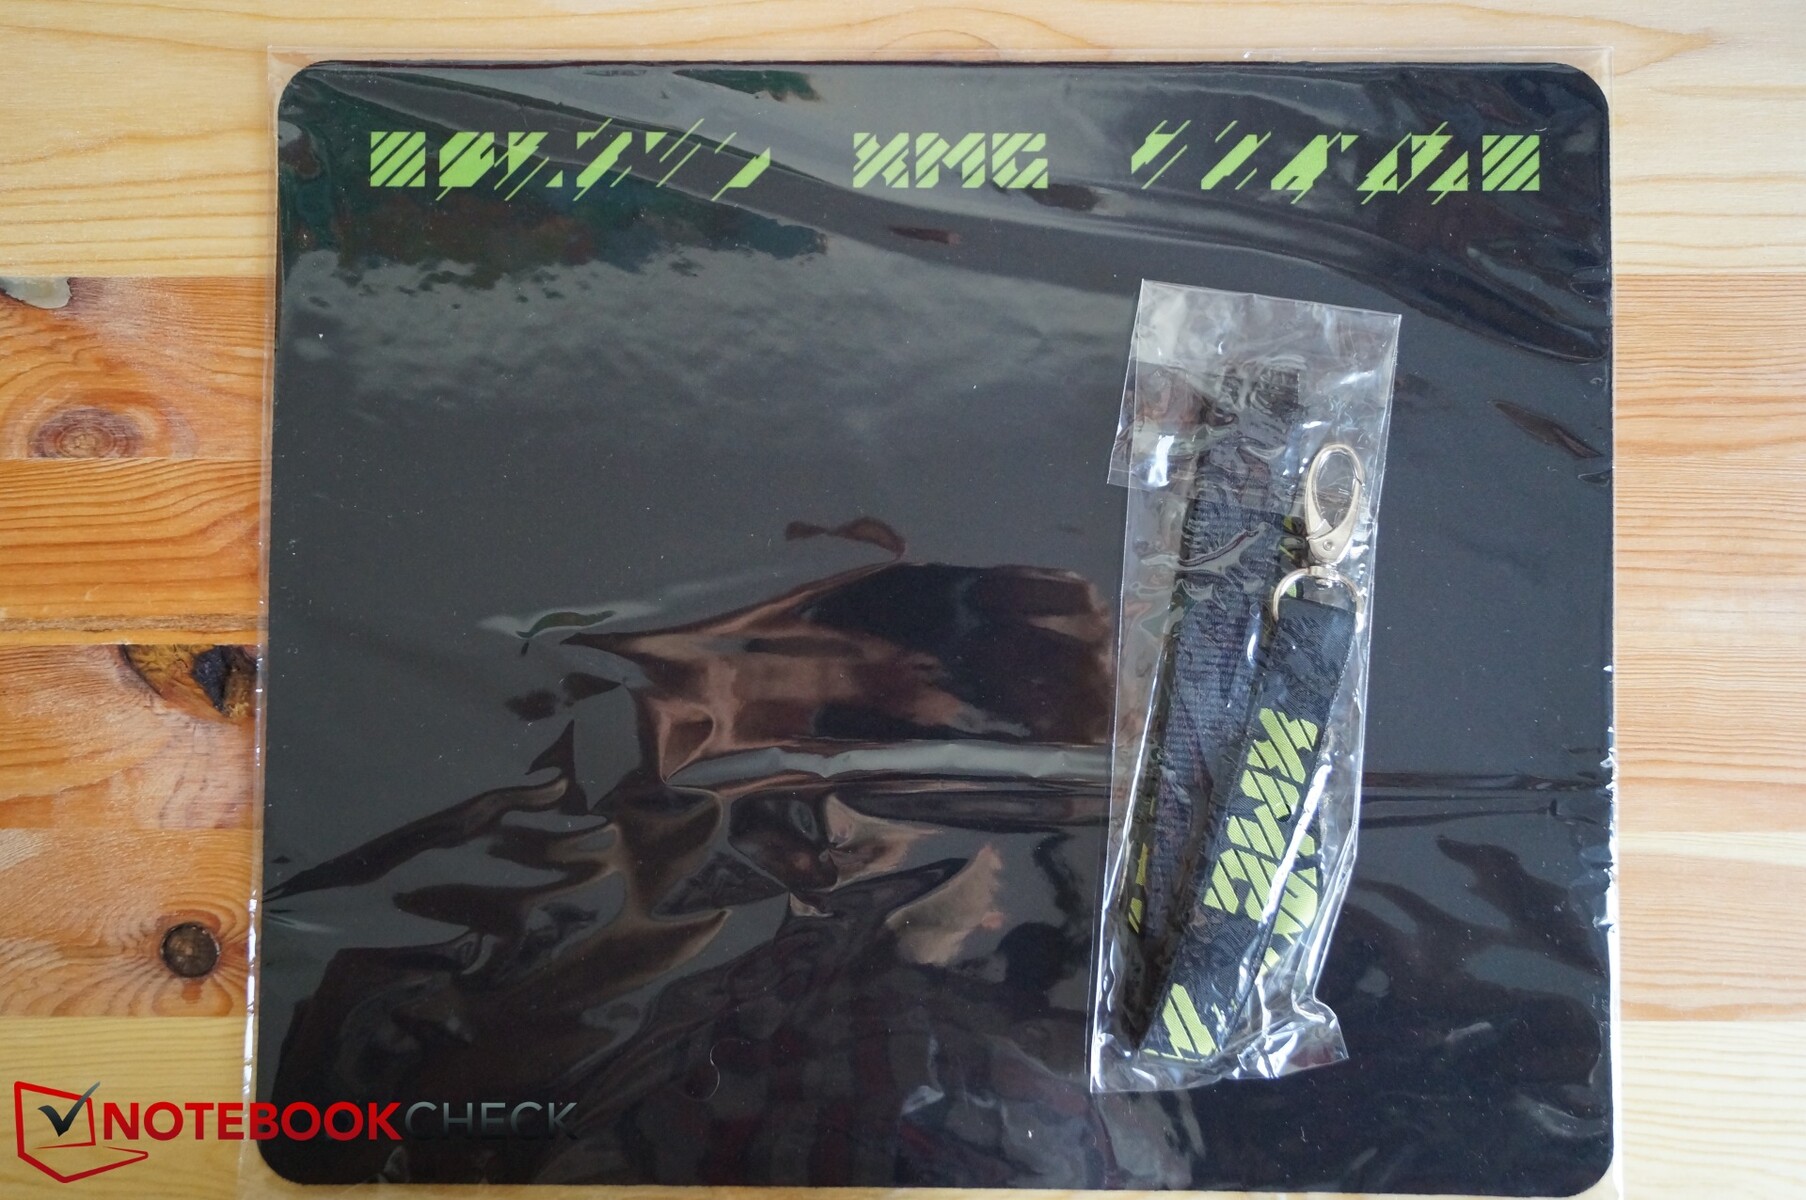
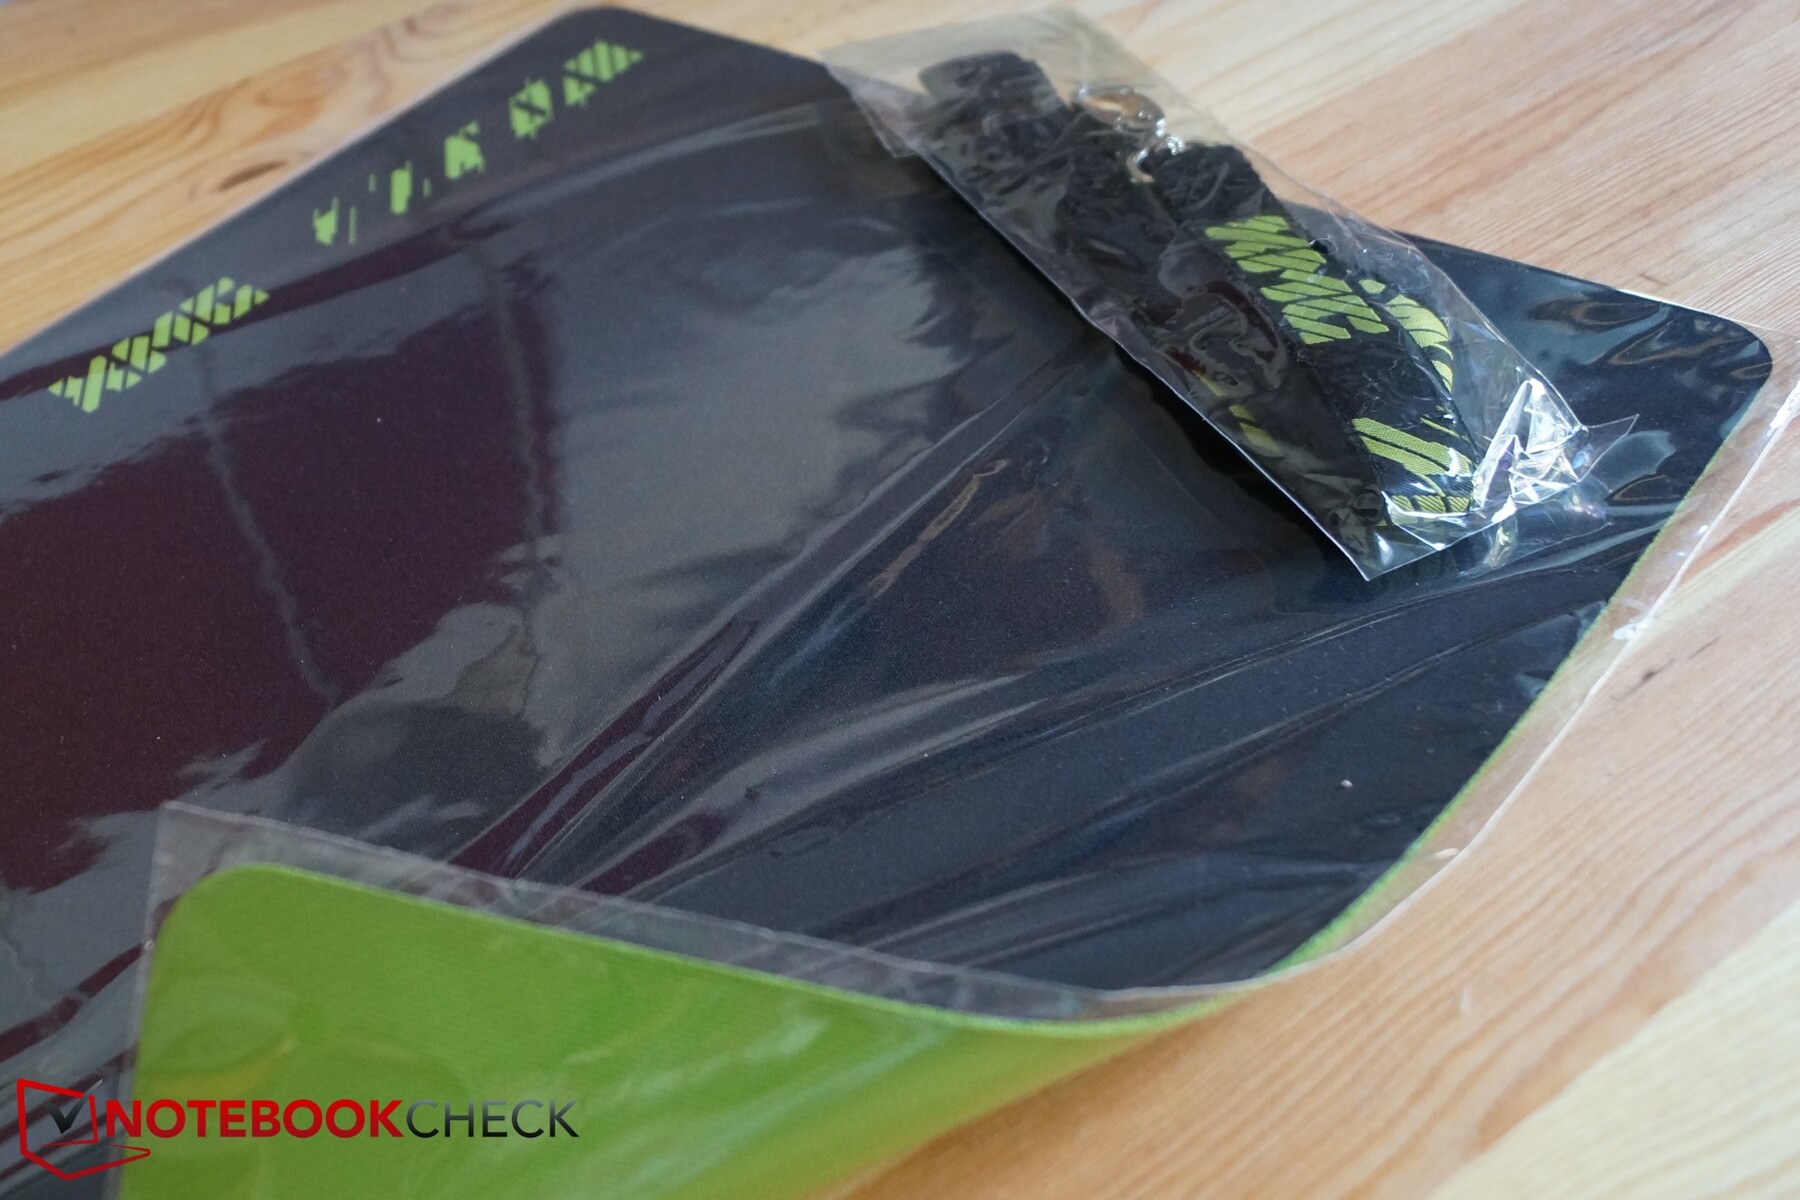
Schenker has not splashed out on accessories considering the price of our review unit. The company includes a user manual, a driver DVD and some screws for drive bays. There are also a few nice touches like a one-year BullGuard Internet Security code, a lanyard, an "XMG" sticker, a 16 GB USB stick containing a digital manual and drivers along with a large gaming mousepad. The latter has a rubberised non-stick bottom to help keep it in place as you game.
Maintenance
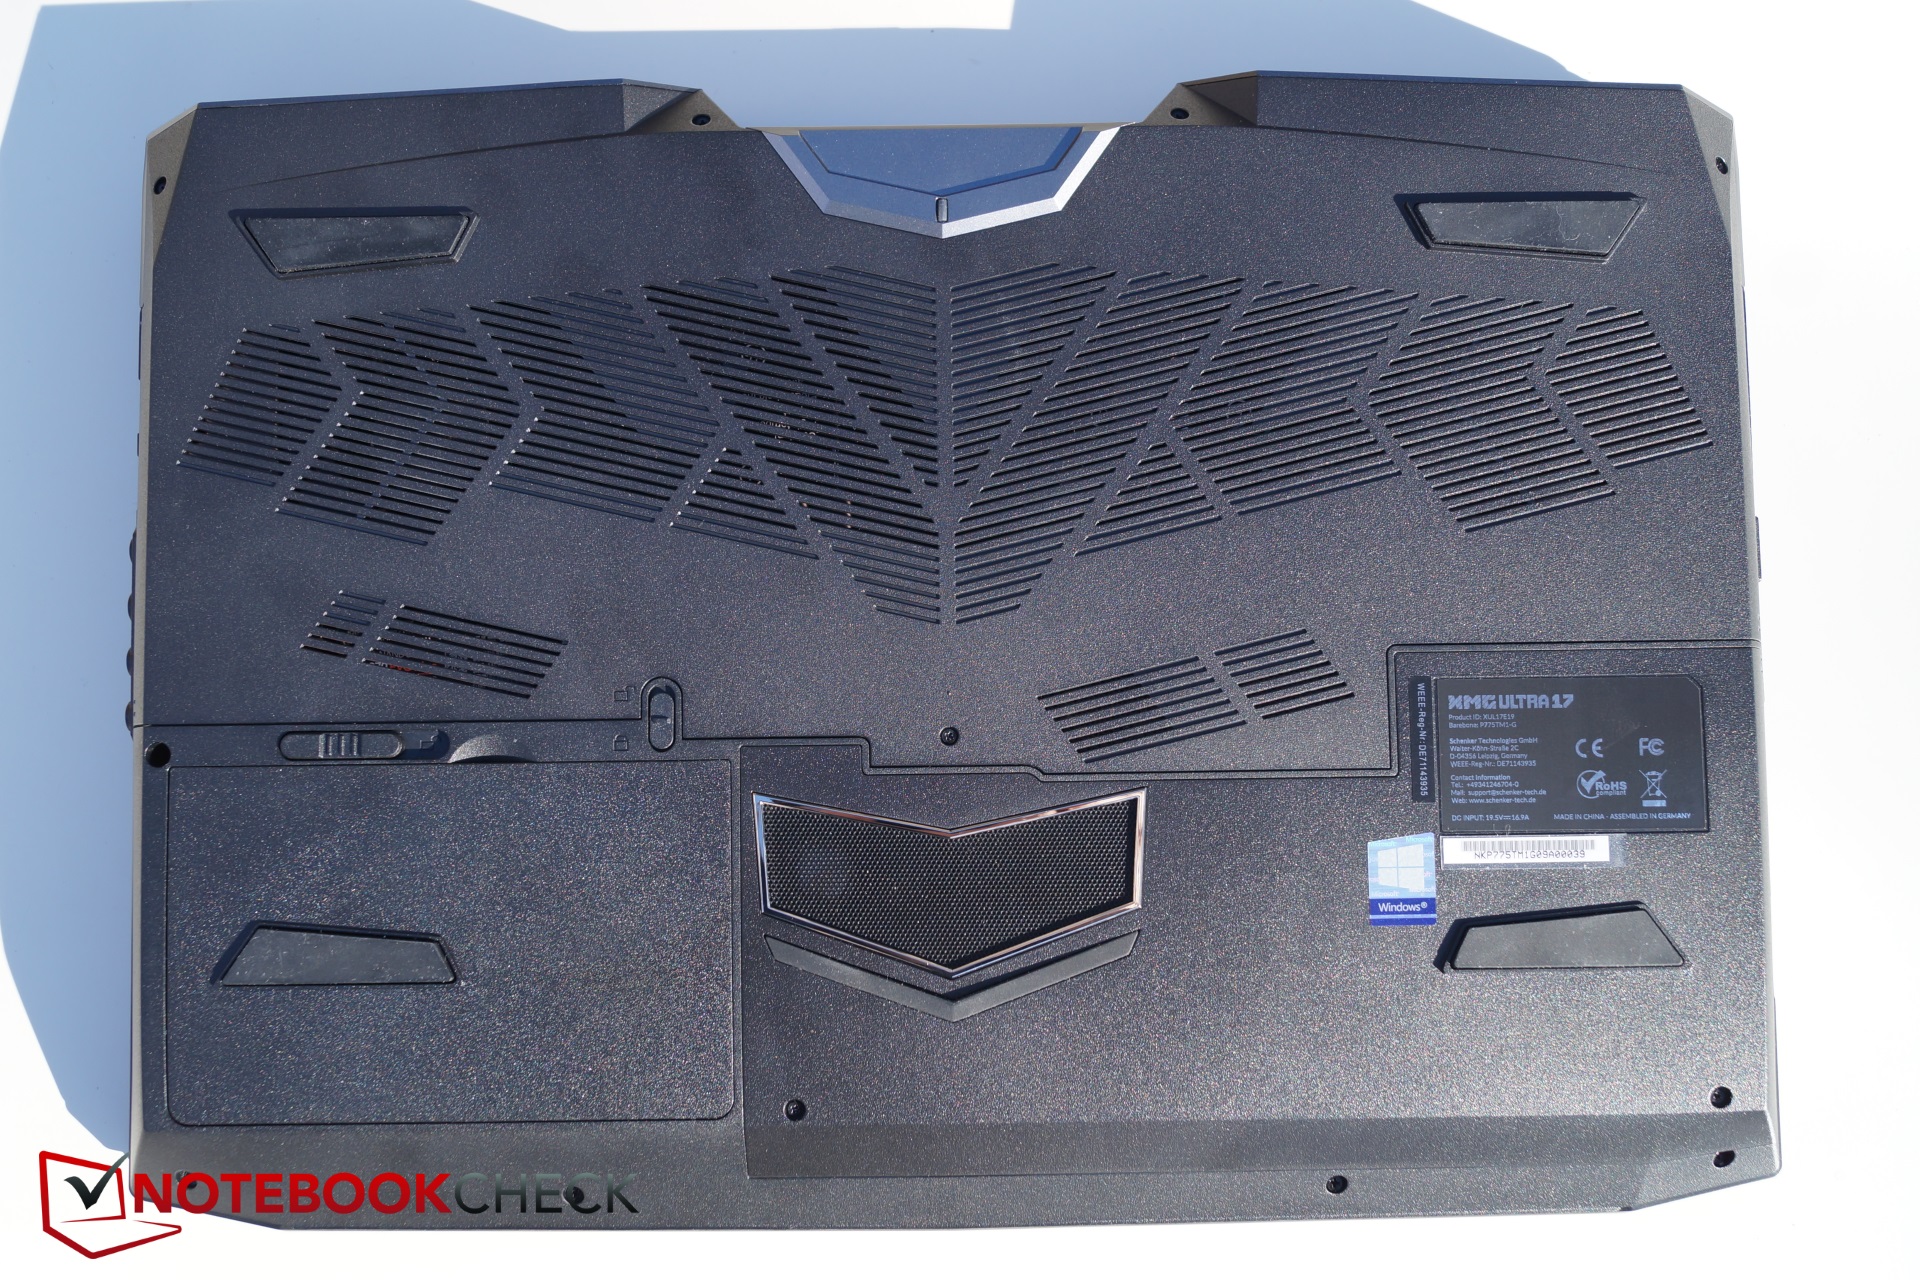
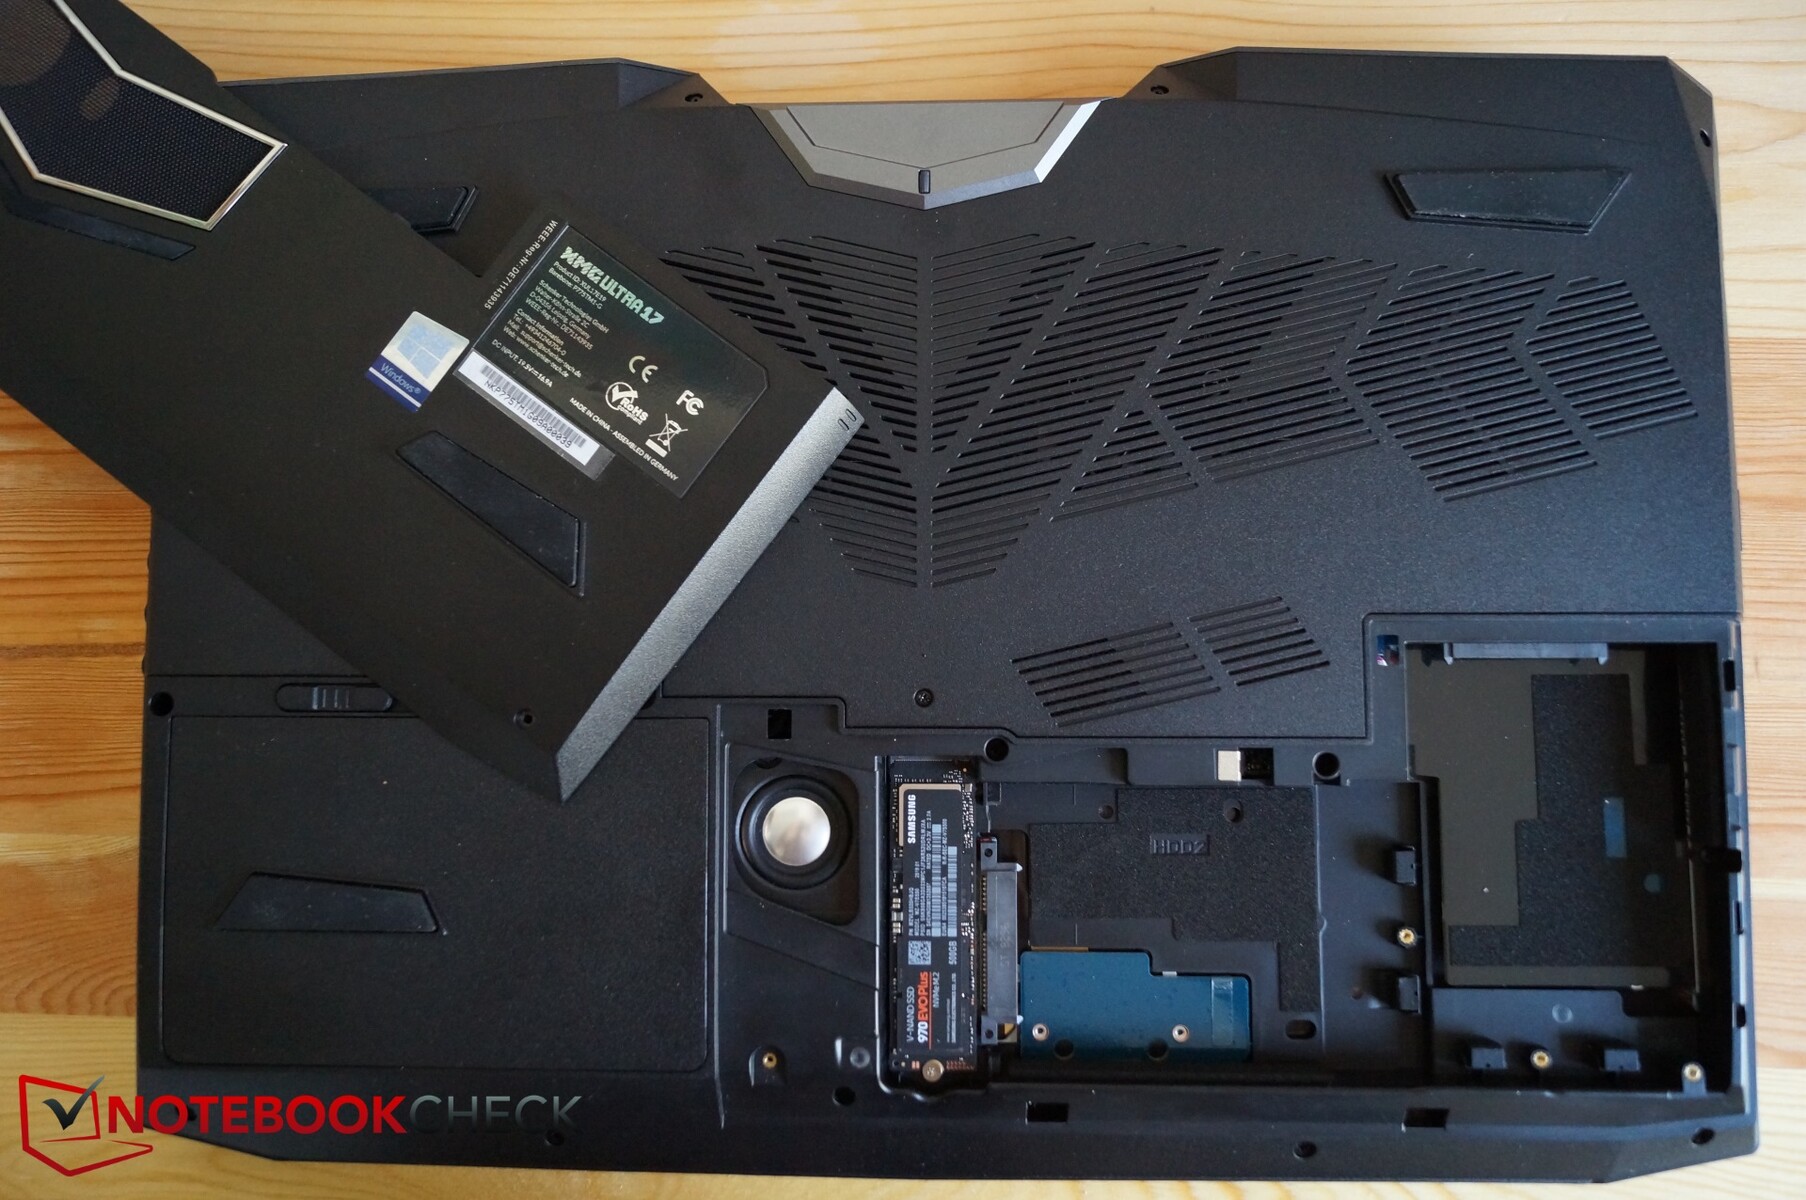
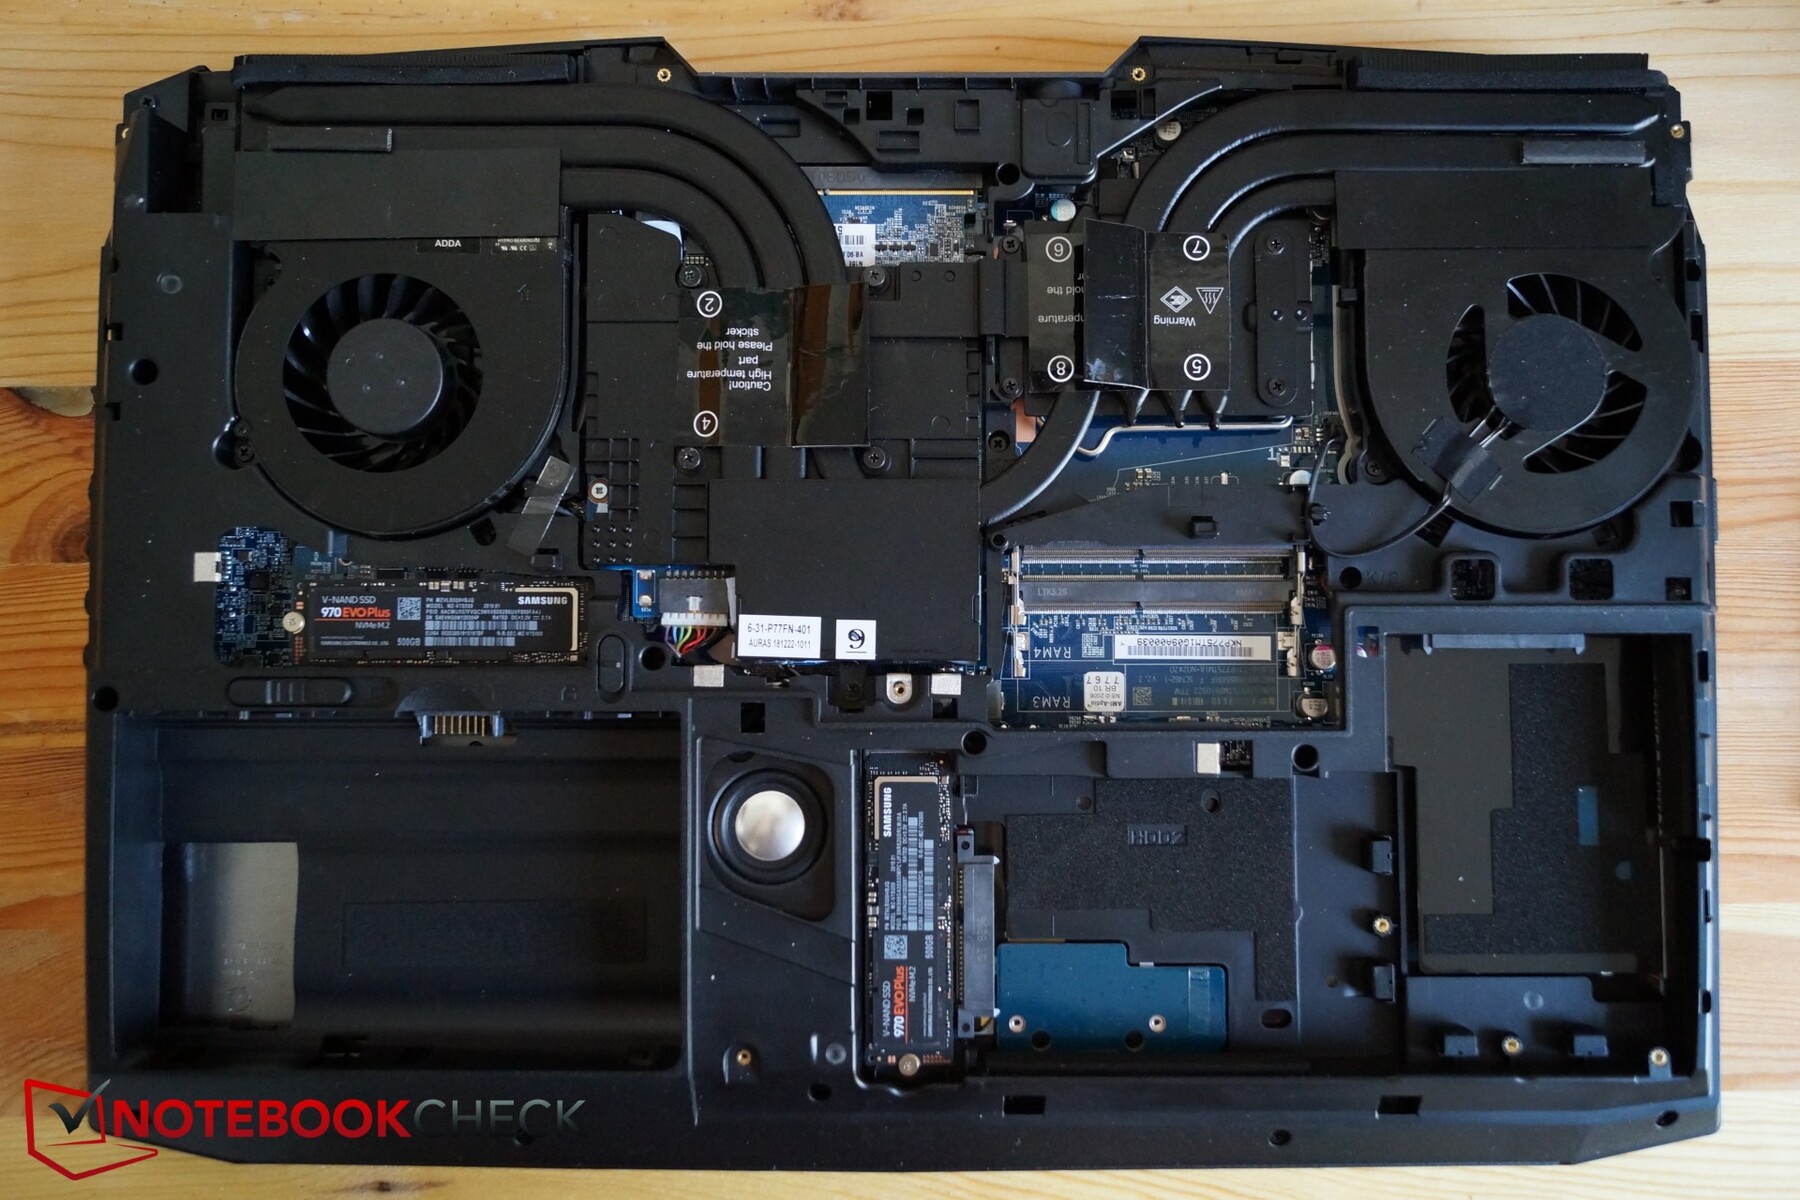
The Ultra 17 remains easy to repair and maintain. There are two maintenance flaps on the bottom that are secured with a few screws. Loosening these allows you to simply lift the flaps up by the rubber feet, foregoing having to use the cumbersome levers that Schenker also includes. Unfortunately, the company does not state this procedure in the manual, but there are tutorials on YouTube should you become stuck while trying to open the machine.
Beneath the smaller of the two flaps are an M.2 slot and two 2.5-inch bays. The main SSD, which brings the total drive bays to four, sits under the larger maintenance cover. Removing the latter also gives access to the fans along with RAM slots 3 and 4; the first two are behind the keyboard. There are copious heatpipes too, beneath which sits a socketed CPU, which is rare for a laptop as most are soldered to the motherboard. Hence, you could upgrade the CPU at some point should you need or want to do so.

Warranty
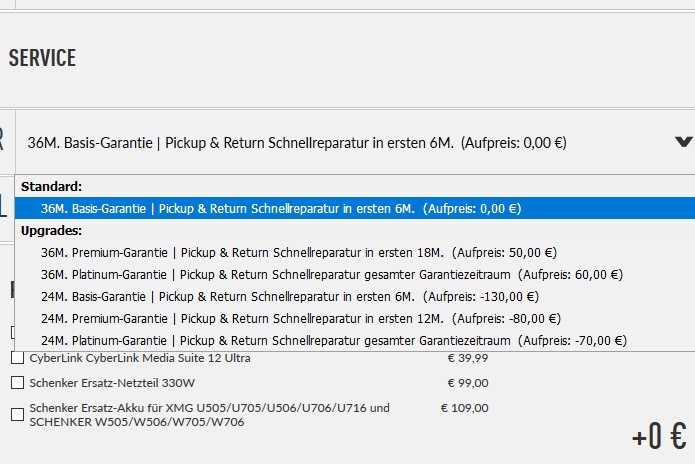
The Ultra 17 comes with 36 months warranty by default that Schenker describes as its “Basic Warranty”, for which it offers a fast pickup and returns service for the first six months of the warranty period. The company also offers “Premium Warranty” and “Platinum Warranty” options, which cost 50 Euros (~$56) and 60 Euros (~$67) more, respectively. The former extends the pickup and return service to 18 months and the latter for the whole warranty period.
You could also save 130 Euros (~$145) and opt for the 24-month basic warranty instead. Schenker also offers premium and platinum 24-month warranties. Please see our Guarantees, Return policies and Warranties FAQ for country-specific information.
Input Devices
Keyboard
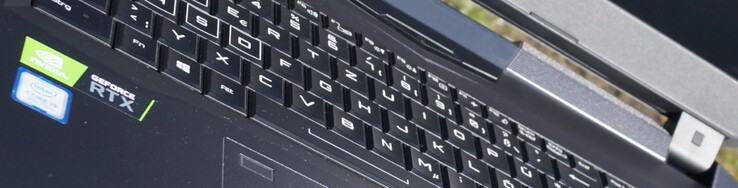
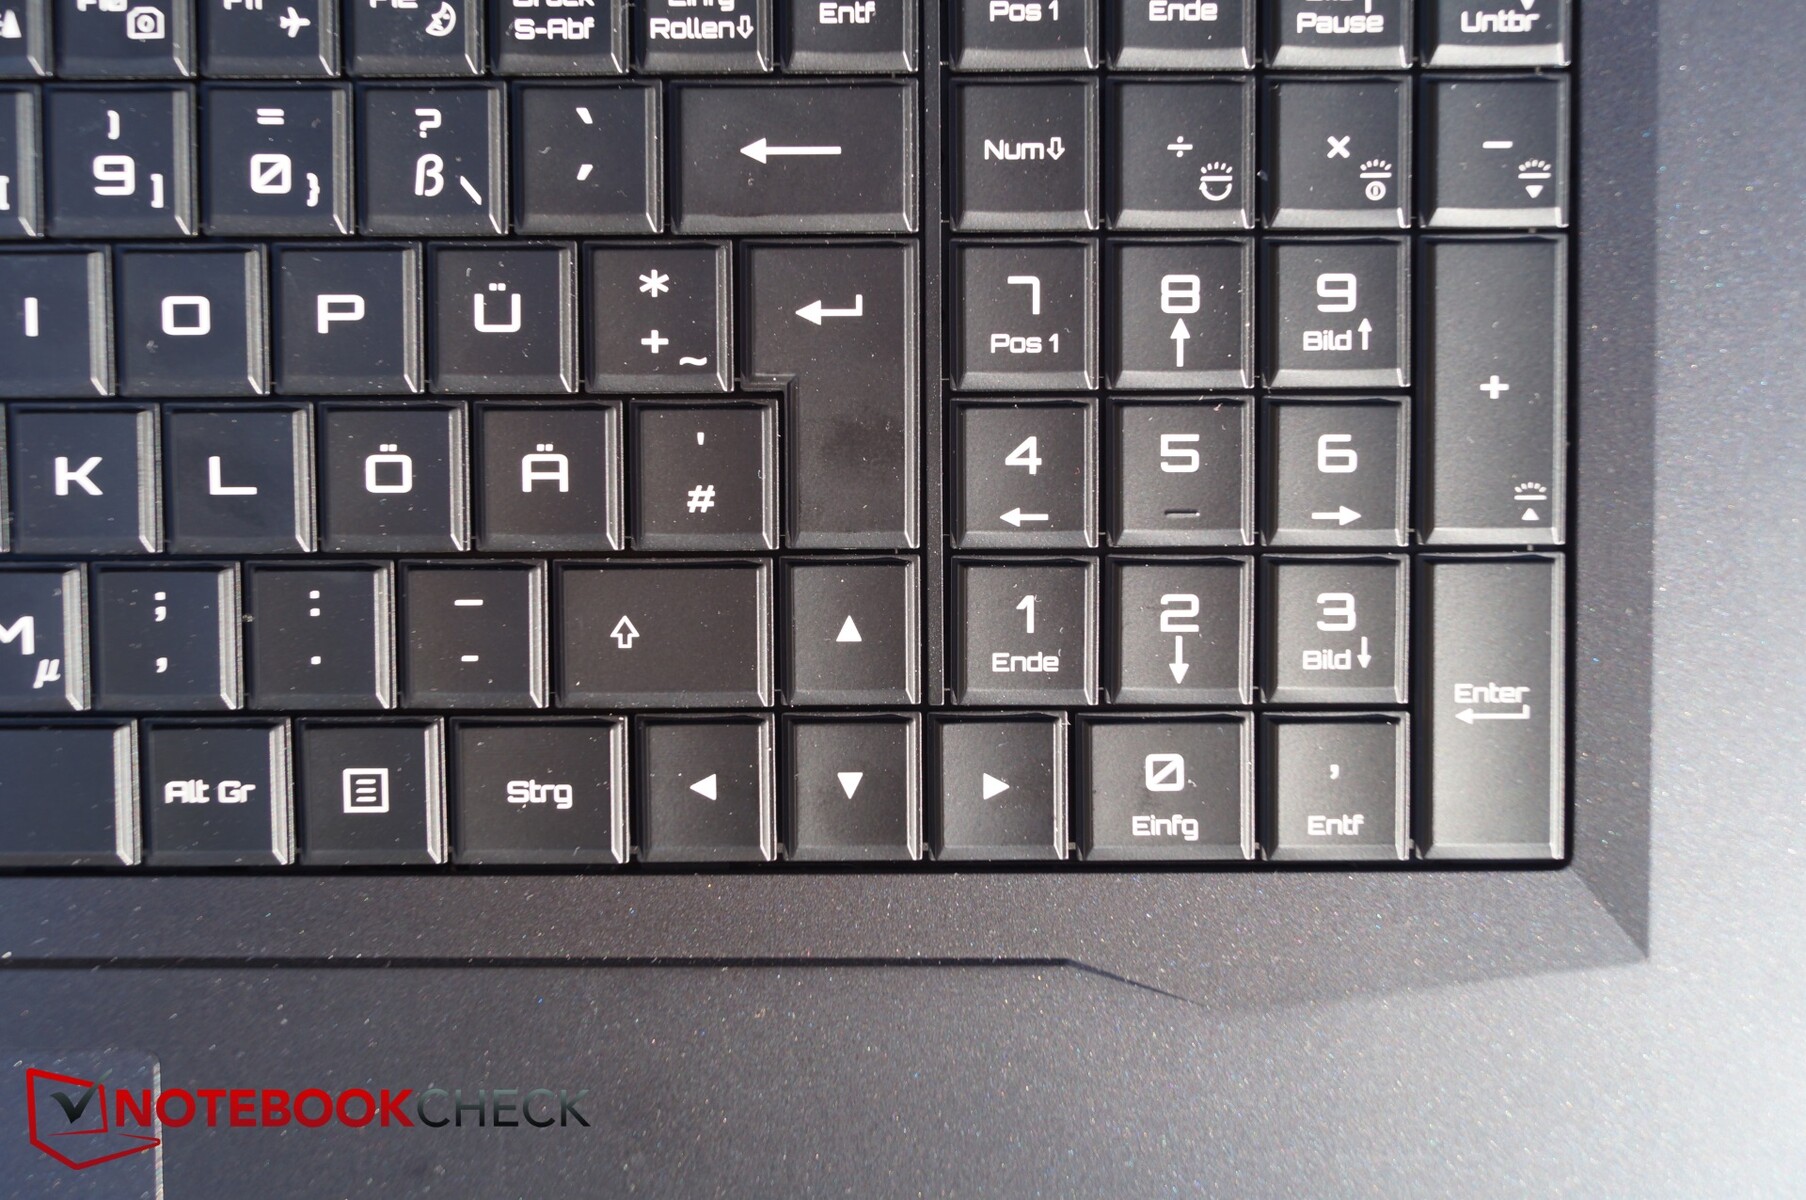
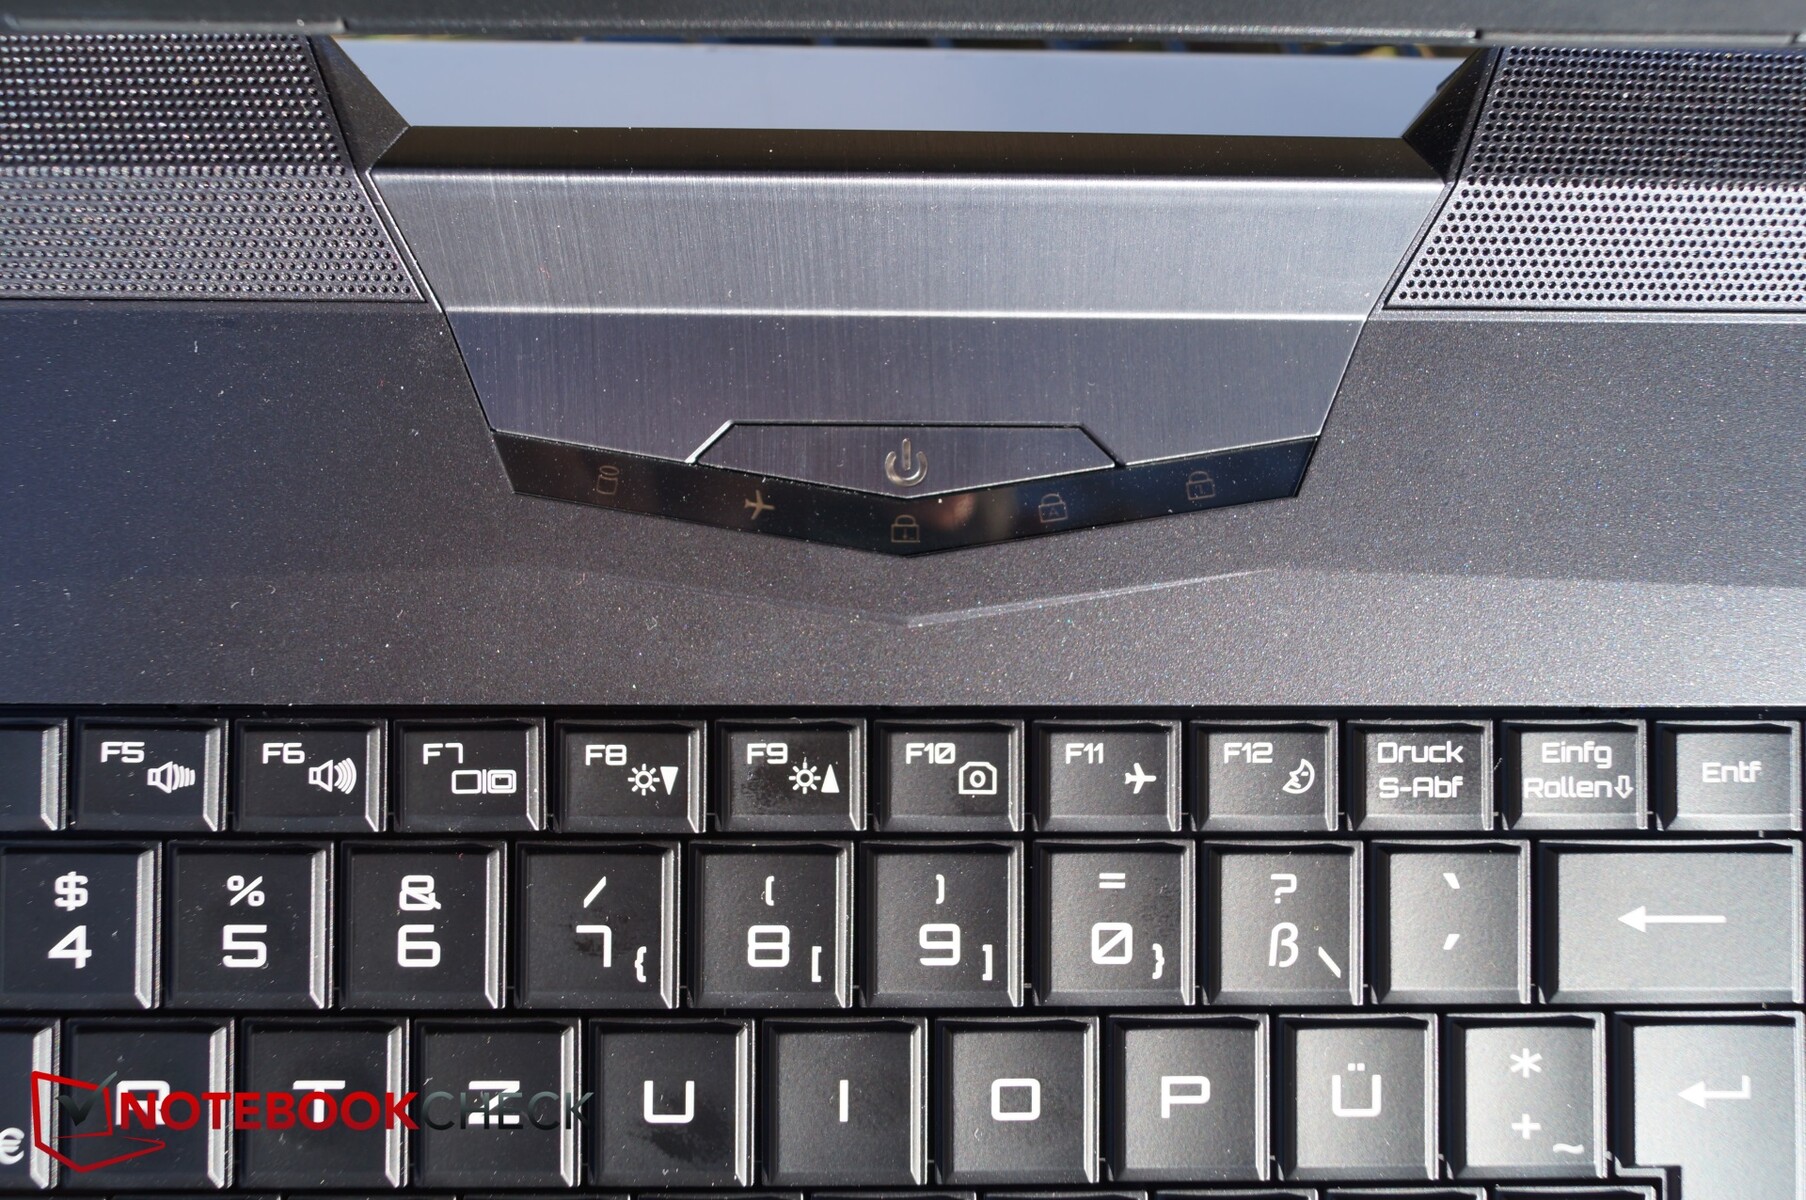
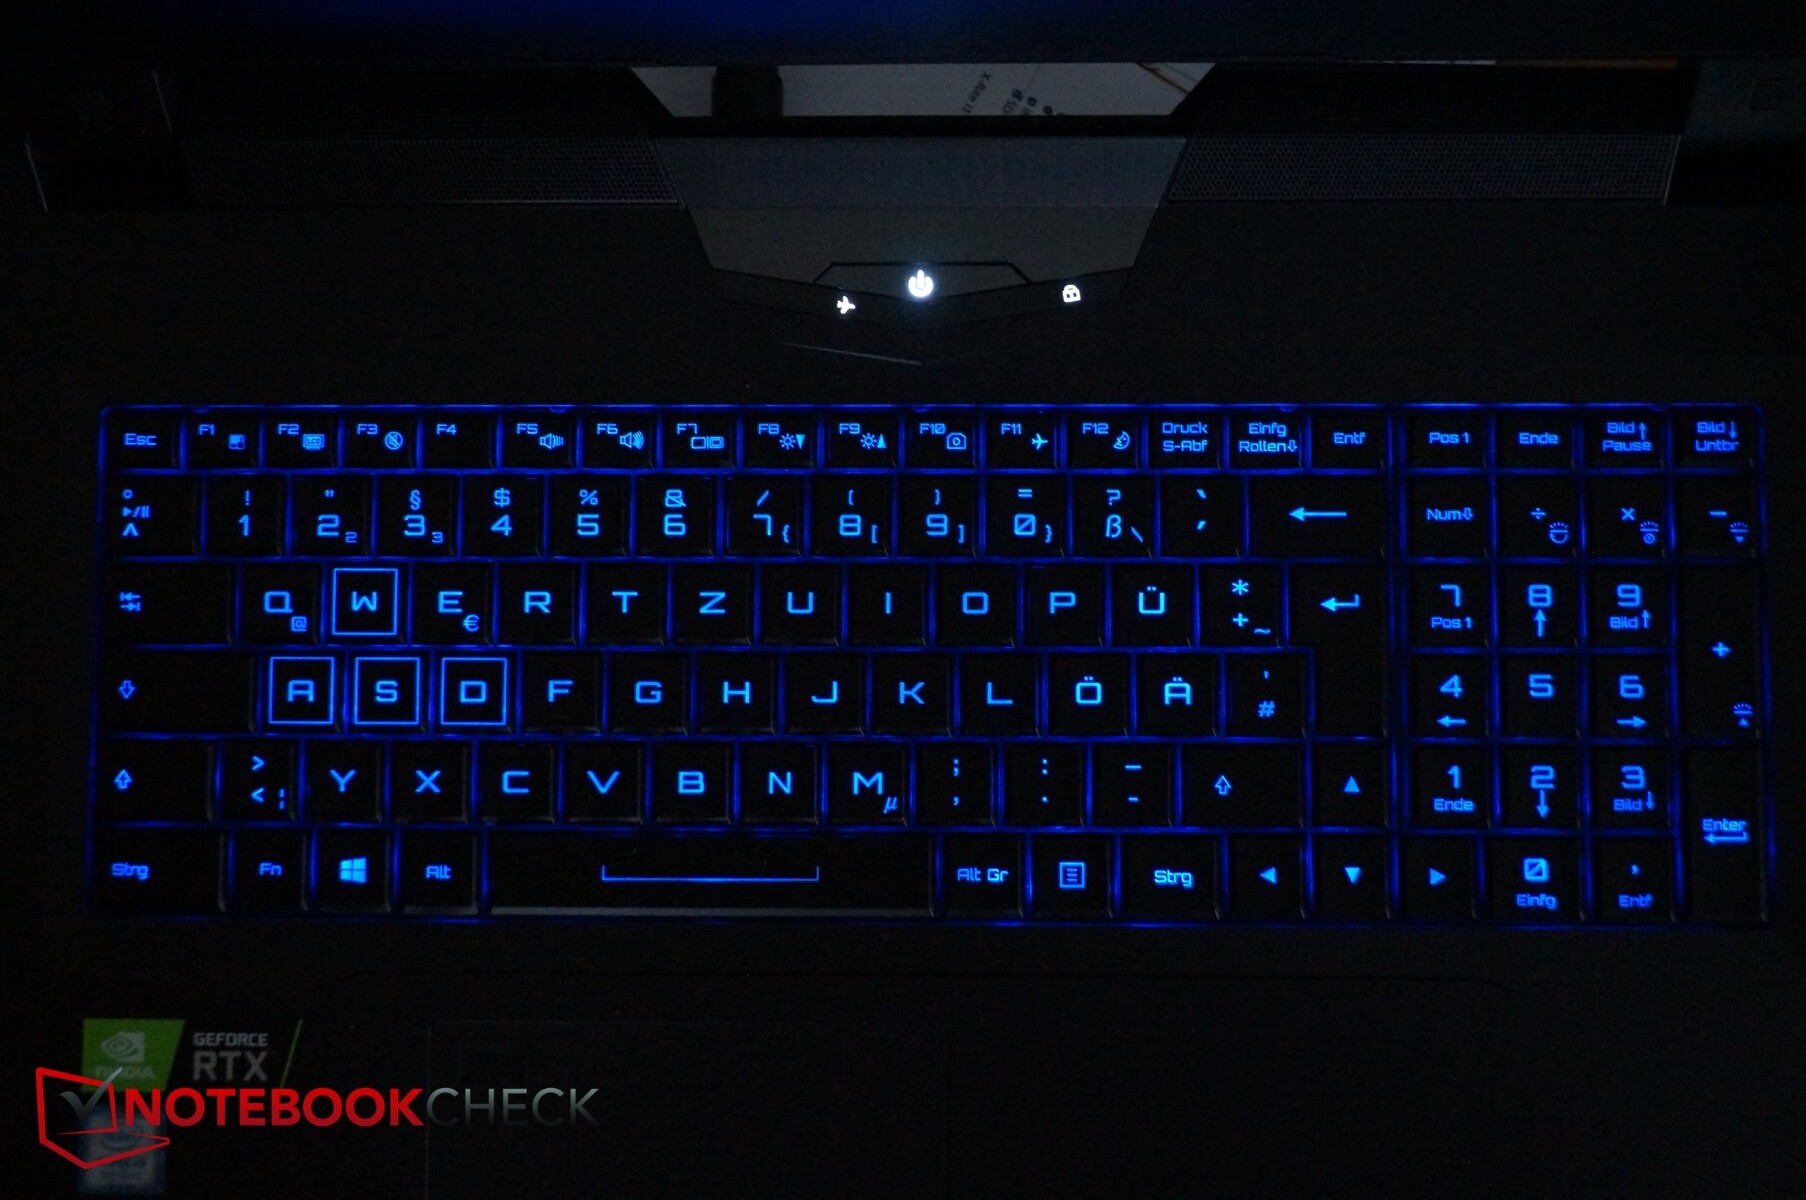
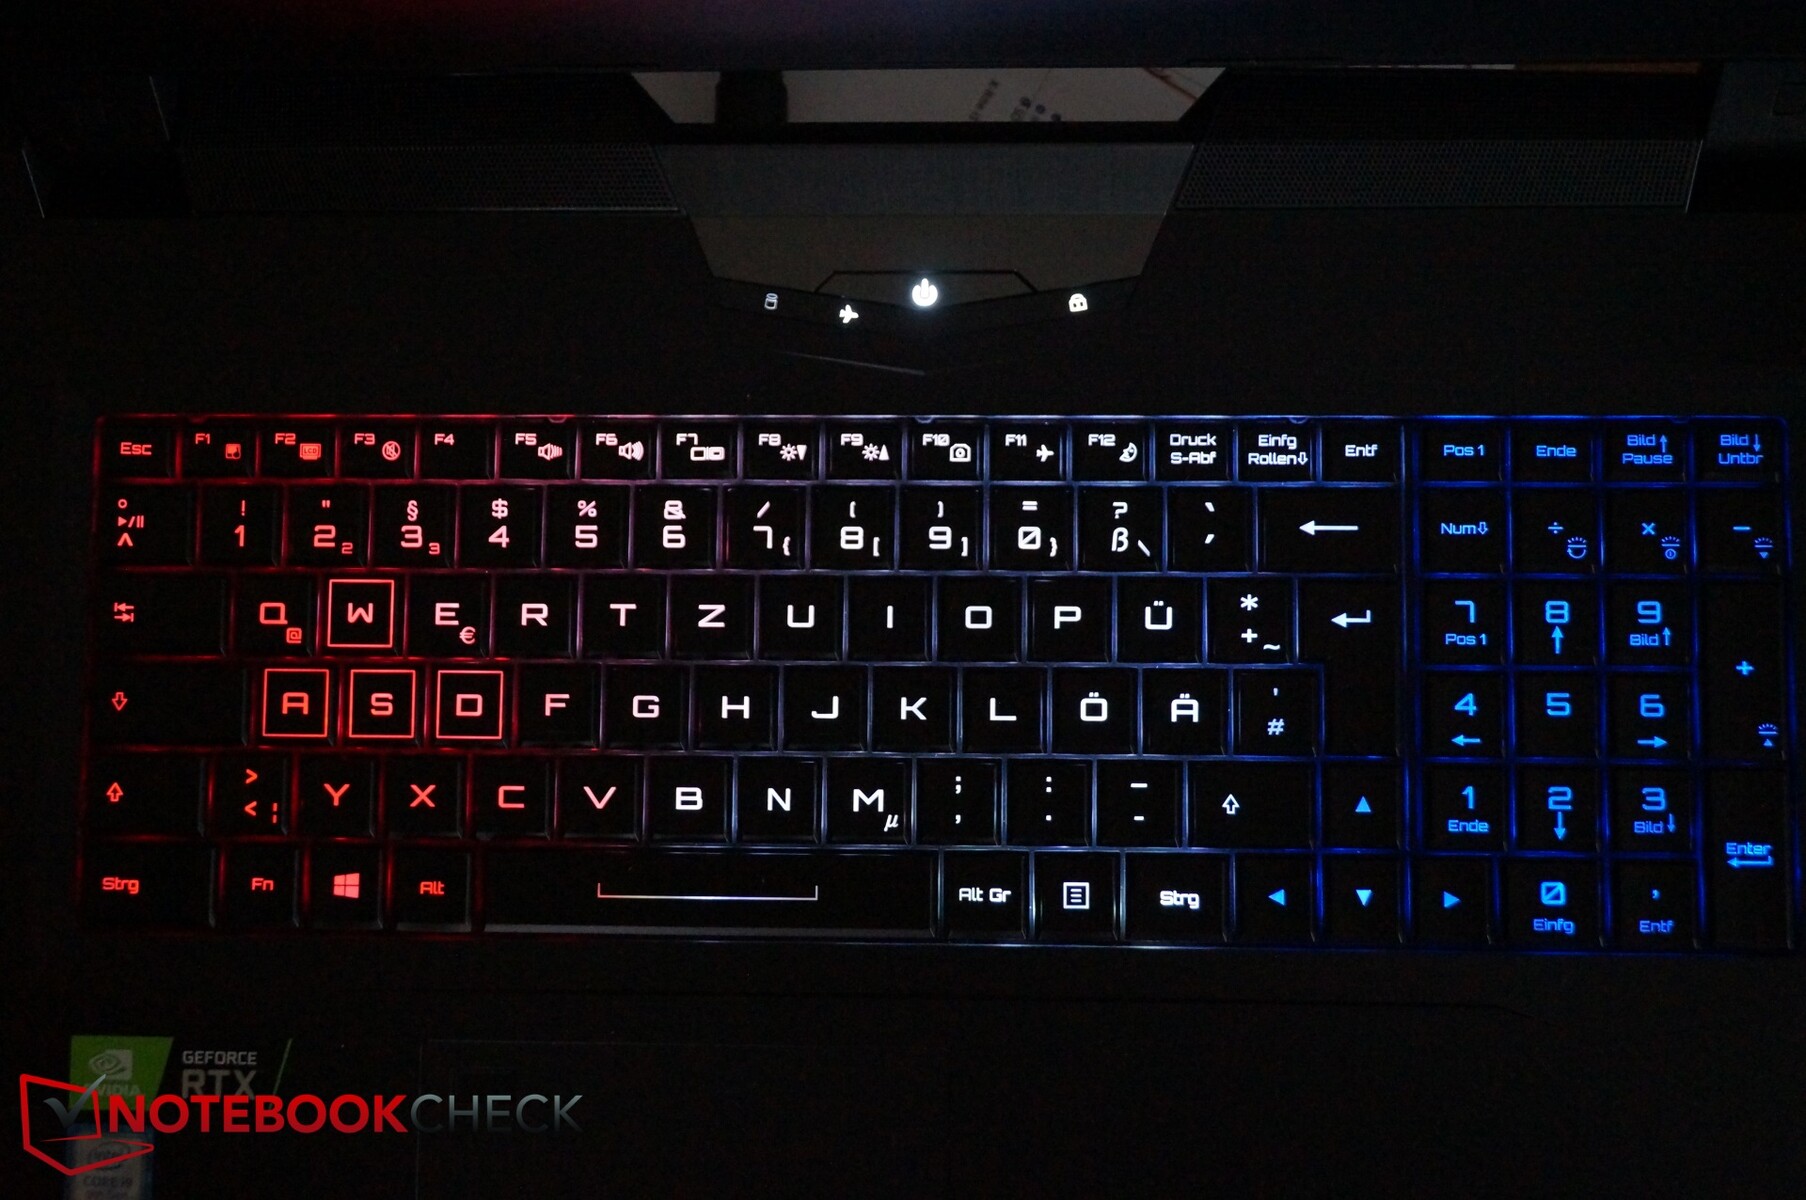
The Ultra 17 has a tidy-looking and clearly laid-out keyboard. The keys are pleasantly large, but there are no gaps between them, so you might find yourself accidentally pressing the wrong key until you get acclimatised to using the laptop. Unfortunately, the same applies to the number pad on the right side, while the right arrow key sits below the 1 key, which may annoy some people. The device also has a large power button that sits in the centre at the top of the keyboard, below which there are some system LEDs.
The keyboard is great to type on by gaming laptop standards. The keys have just the right mix of feedback without feeling too hard or soft. We were able to type quickly on our review unit and the keys make a noticeable clicking sound when pressed, but not annoyingly so.
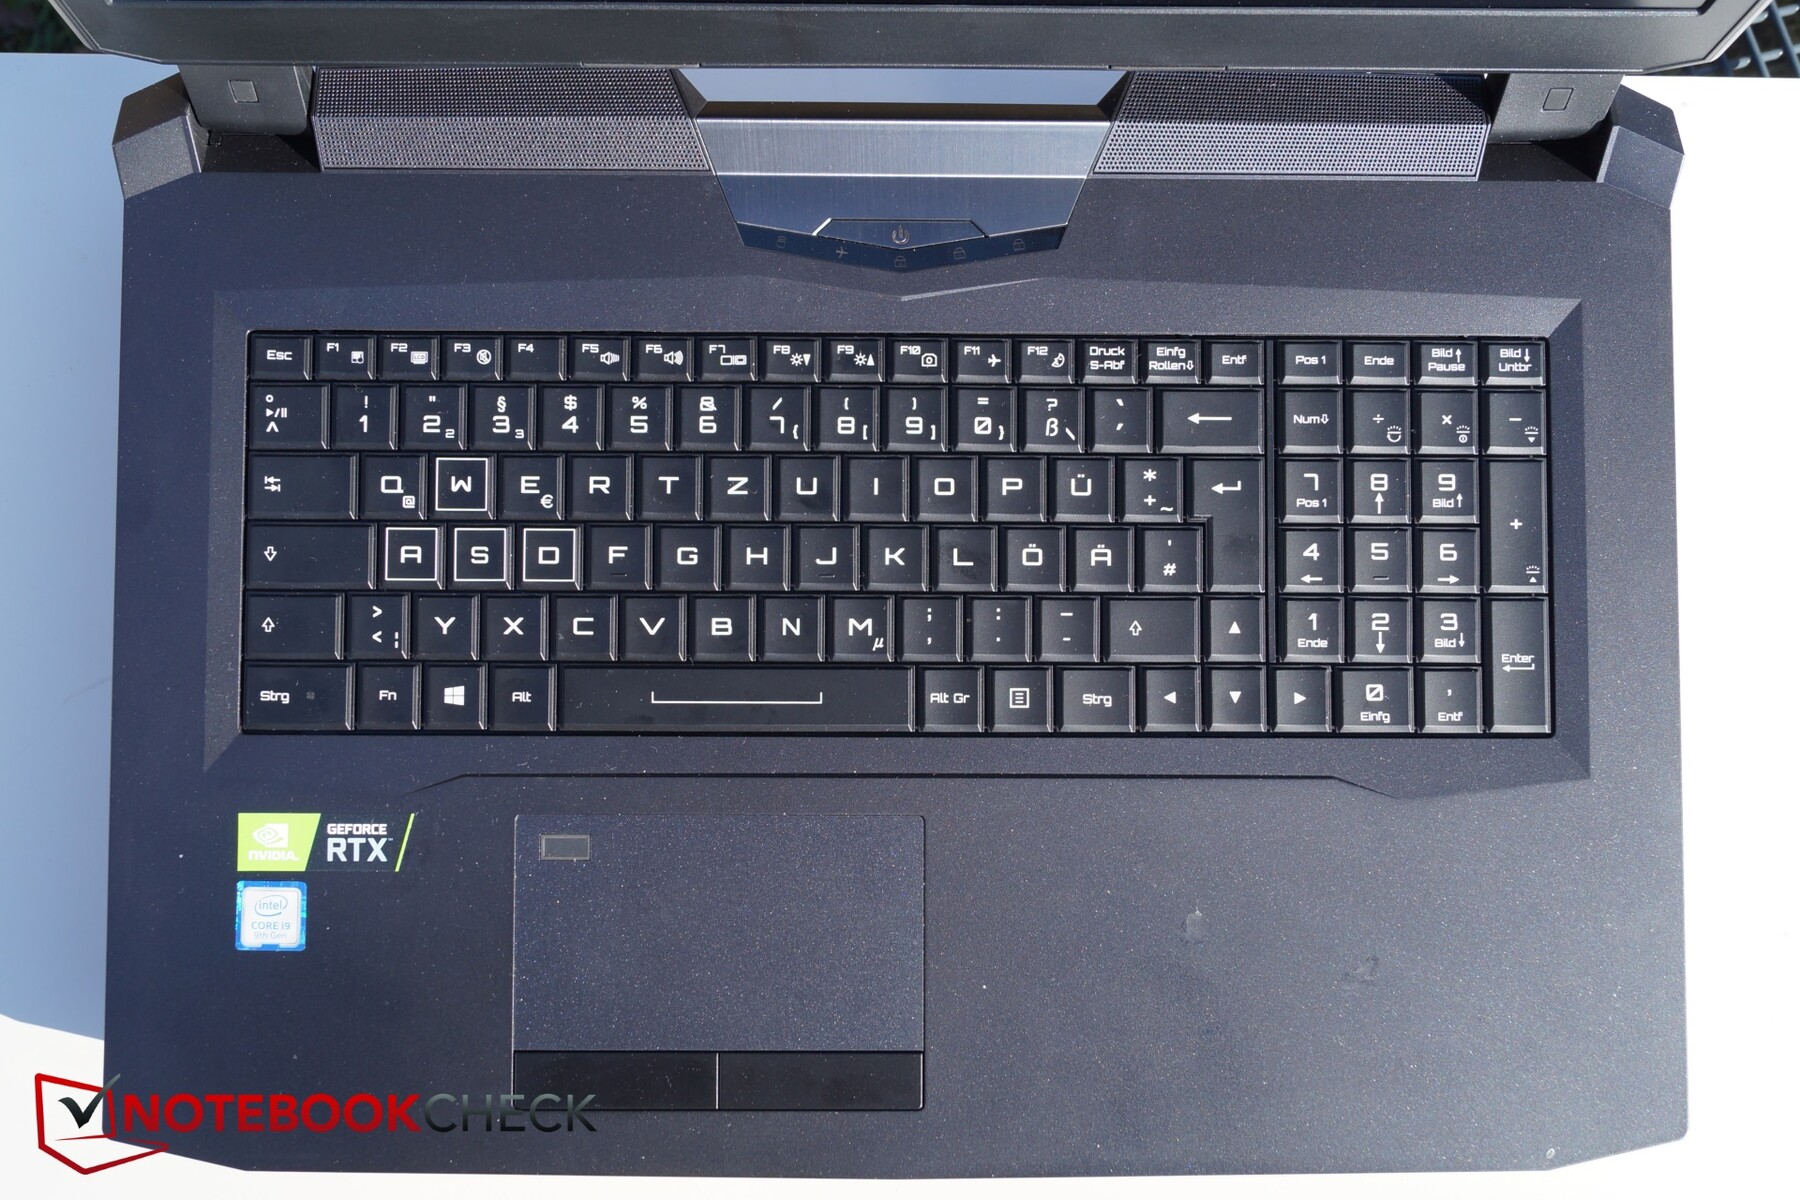
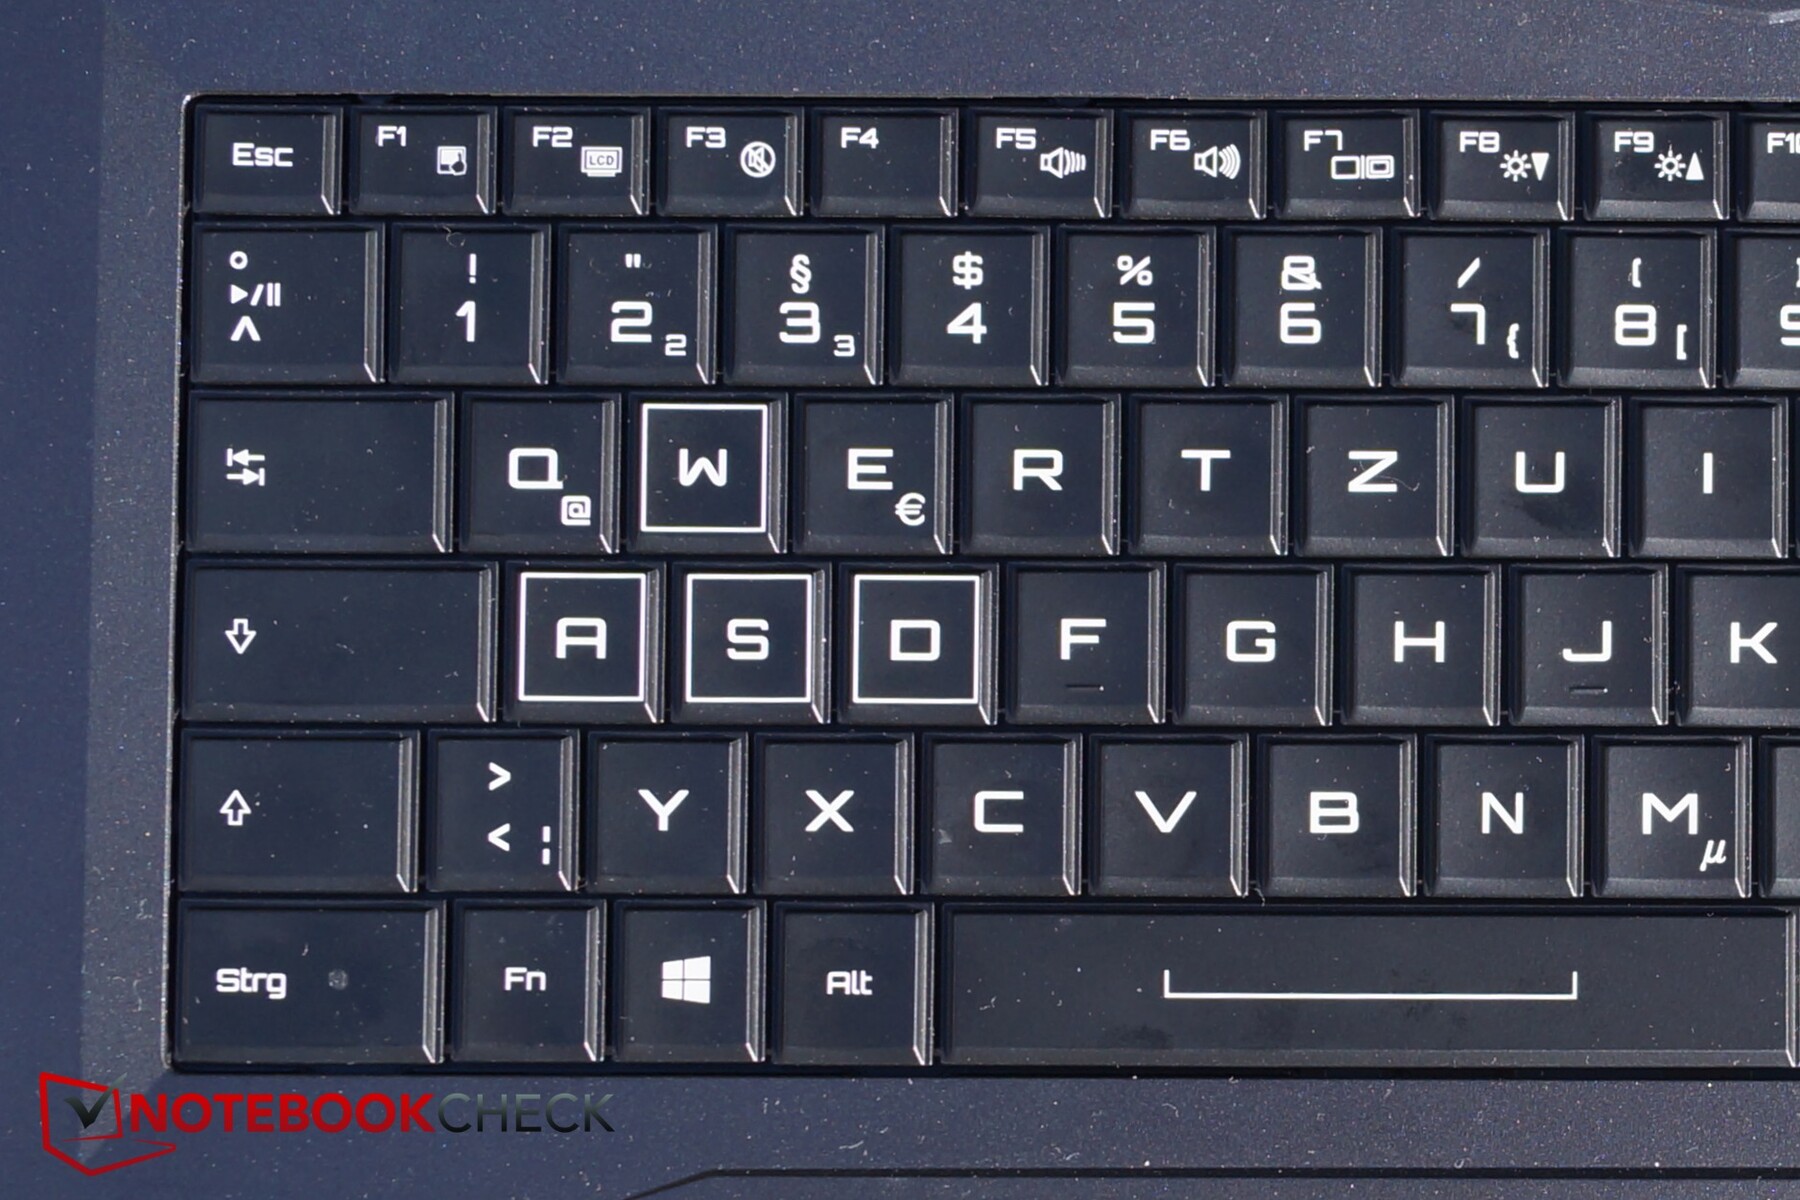
The keys are labelled clearly too, while the white border around the WASD keys is a nice touch. The function keys are half-sized as with most keyboards, but their labelling is legible too.
Schenker has also included RGB backlighting, as is common with gaming laptops. The Ultra 17 comes with software preinstalled that allows you to customise the backlighting to your preferences. There are three lighting zones as demonstrated by the photos below, but you can set the whole keyboard to the same colour too. The backlighting has three stages too.
Trackpad
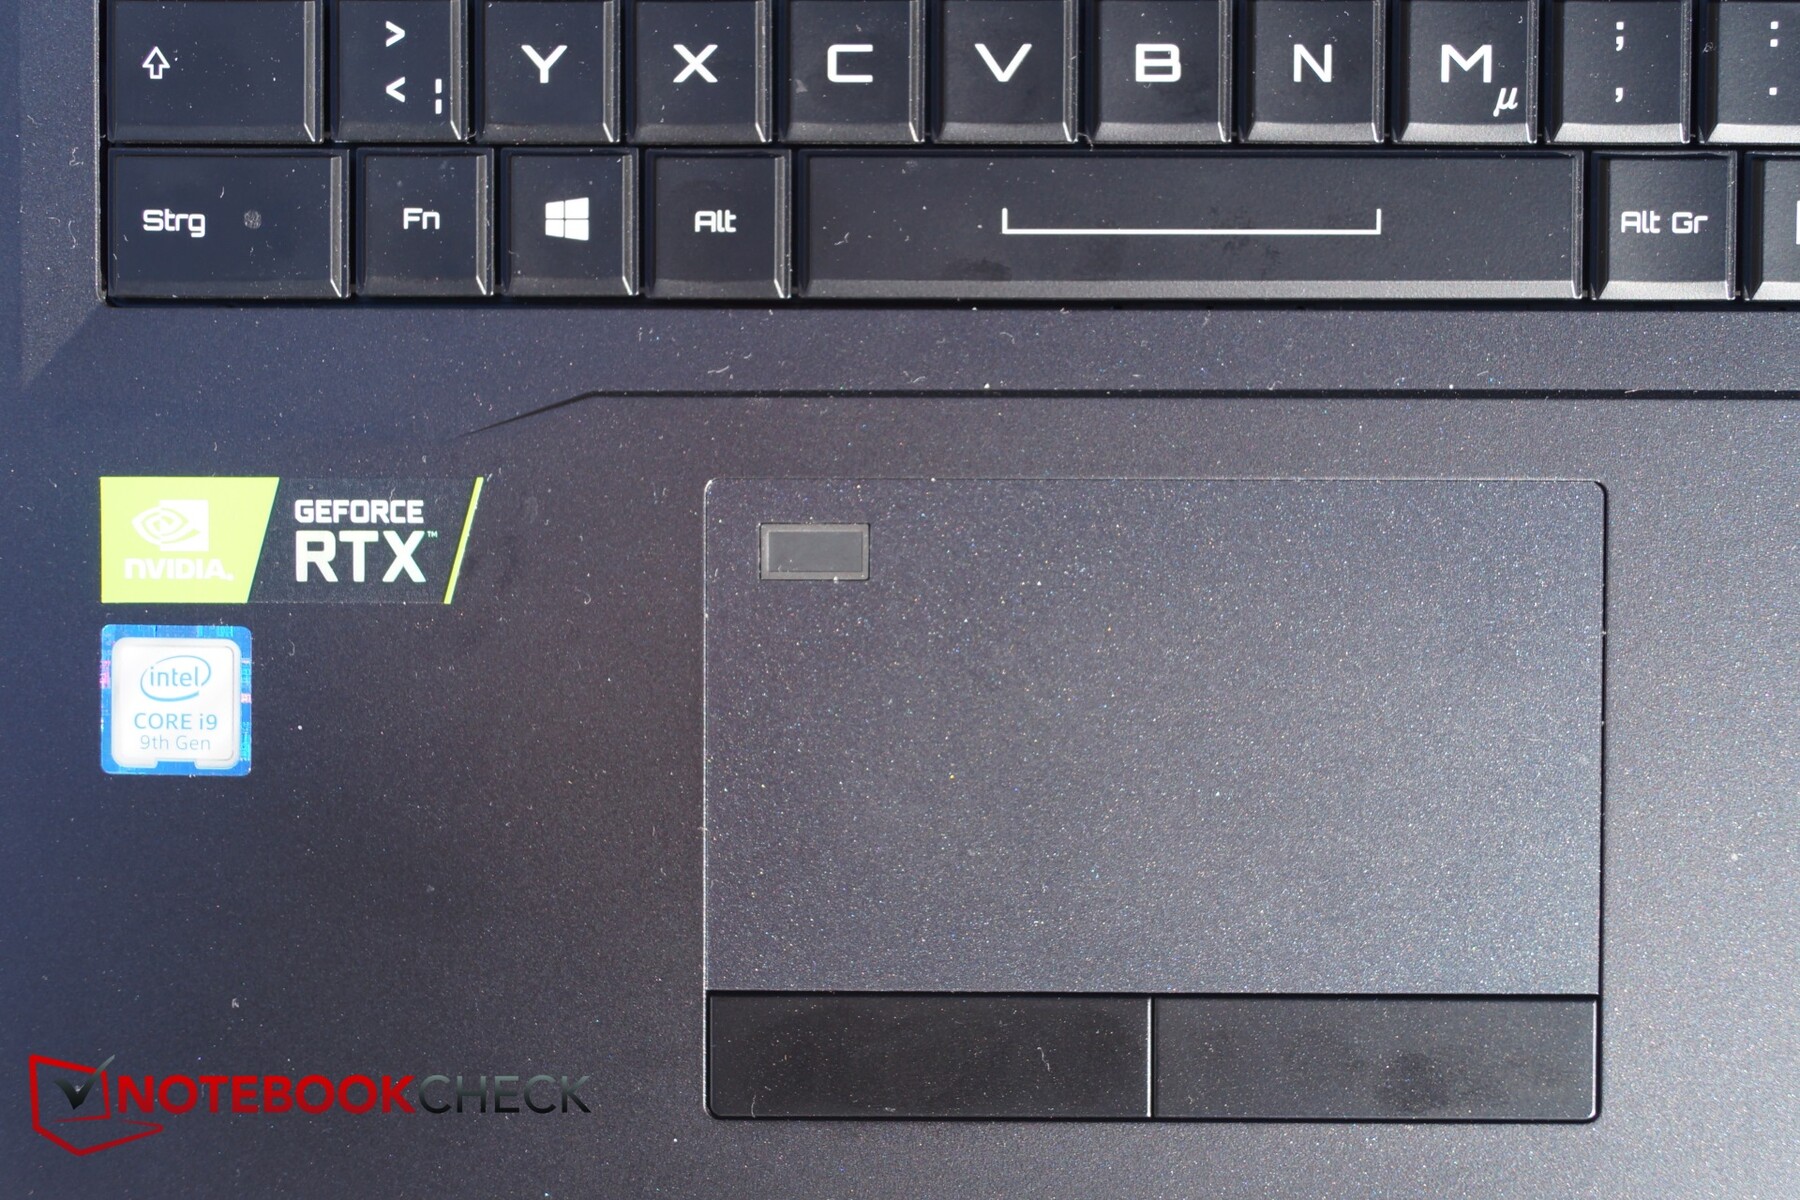
The trackpad is good, but it is not as easy to use as the large glass on laptops like the Gigabyte Aero 15-X9 or the Razer Blade 15. In practice, we found it to be a decent mouse alternative because it is fairly large. We did not accidentally trigger the fingerprint sensor during our tests too, so you be worried about doing that.
The Ultra 17 has dedicated mouse buttons that worked well throughout our tests. There is a gap between the trackpad and the buttons, should you should not accidentally press either button as you are using the trackpad. The buttons have comparatively soft pressure points that might not be crisp enough for some people. The keys have a long stroke though and emit a pleasant clicking sound when pressed.
Unfortunately, the trackpad temporarily stopped working in all the games that we ran on our review unit. The trackpad and mouse buttons would suddenly stop working in-game, which is unacceptable for this to happen with any laptop, let alone one that costs 4,500 Euros (~$5,093). We are unsure whether this is a localised issue to our review unit or whether it is a wider driver-related issue.
Display

Our test device has a 17.3-inch 4K display, but Schenker also sells a 1080p 144 Hz version should you prefer gaming at higher refresh rates. Both displays are IPS panels and have G-sync support, but this means that no model supports Nvidia Optimus, which increases power consumption as the system cannot switch between GPUs to save power.
Our review unit has an AU Optronics AUO10B panel, which is the same display with which Schenker equipped its predecessor. Correspondingly, both displays achieve similar values, although there is a degree of variance, which is common as no two displays are identical. Our review unit achieves an average maximum brightness of 328 cd/m², which is marginally darker than the display in its predecessor but is on par with our comparison devices overall. The screen is only 82% evenly lit though, which is worse than all our comparison devices and will make large areas of colour look less homogenous than on devices like the Acer Predator Triton 500 or the Razer Blade 15.
Positively, our review unit suffers from hardly any backlight bleeding or haloing, which is common with IPS panels. There is a minor amount of clouding in the upper left of the display, but we hardly noticed this in daily use; it is only obvious in a dark room, and even then it is a comparatively minor amount of backlight bleeding.
| |||||||||||||||||||||||||
Brightness Distribution: 82 %
Center on Battery: 343 cd/m²
Contrast: 1106:1 (Black: 0.31 cd/m²)
ΔE ColorChecker Calman: 5.03 | ∀{0.5-29.43 Ø4.72}
calibrated: 0.86
ΔE Greyscale Calman: 6.29 | ∀{0.09-98 Ø4.97}
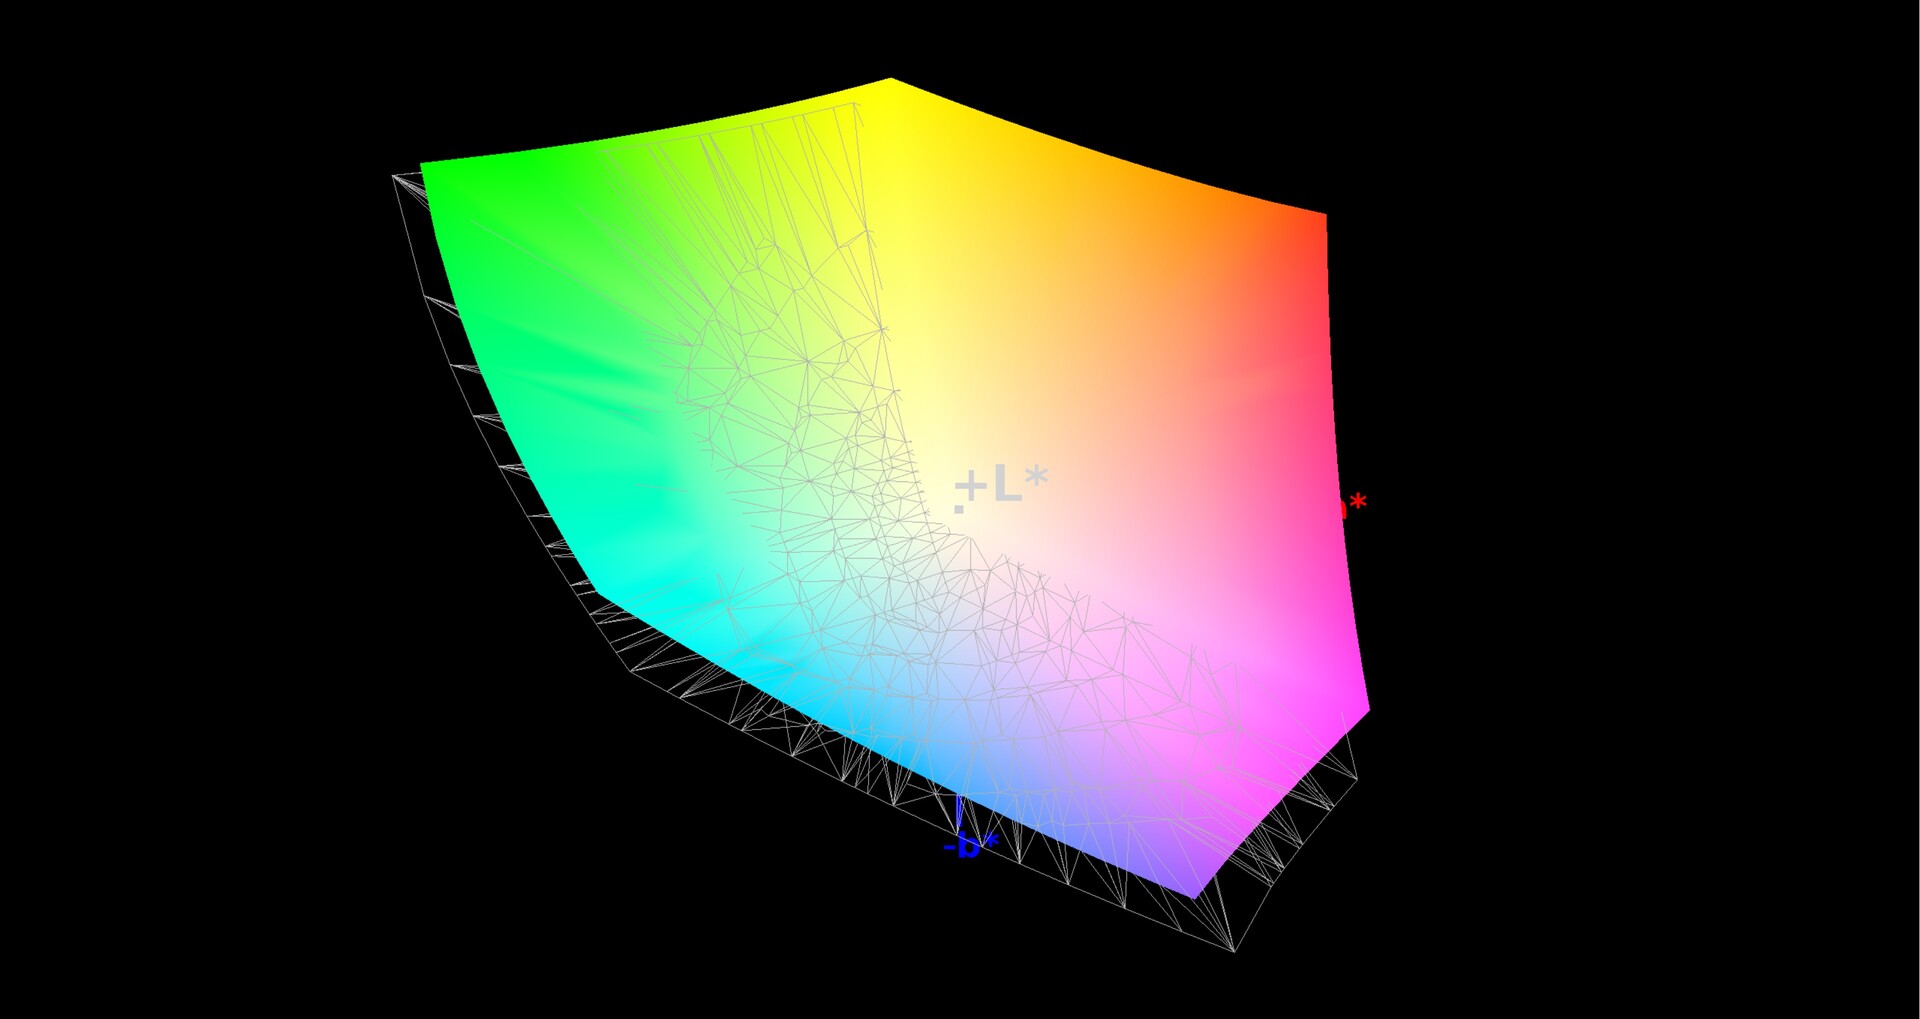
100% sRGB (Argyll 1.6.3 3D)
88% AdobeRGB 1998 (Argyll 1.6.3 3D)
99.1% AdobeRGB 1998 (Argyll 3D)
100% sRGB (Argyll 3D)
86.3% Display P3 (Argyll 3D)
Gamma: 2.38
CCT: 6389 K
| Schenker XMG Ultra 17 Turing AU Optronics B173ZAN01.0 (AUO109B), IPS, 3840x2160, 17.3" | Asus ROG G703GX AU Optronics B173HAN03.2 (AUO329D), IPS, 1920x1080, 17.3" | Schenker XMG Ultra 17 Coffee Lake Refresh AU Optronics B173ZAN (AUO109B), IPS, 3840x2160, 17.3" | Acer Predator Triton 500 AU Optronics B156HAN08.2 (AUO82ED), IPS, 1920x1080, 15.6" | Razer Blade 15 RTX 2070 Max-Q LG Philips LGD05C0, IPS, 1920x1080, 15.6" | |
|---|---|---|---|---|---|
| Display | -22% | -0% | -22% | -21% | |
| Display P3 Coverage (%) | 86.3 | 64.1 -26% | 85.8 -1% | 64.2 -26% | 65.3 -24% |
| sRGB Coverage (%) | 100 | 93.3 -7% | 99.9 0% | 92.6 -7% | 94.9 -5% |
| AdobeRGB 1998 Coverage (%) | 99.1 | 65.6 -34% | 98.9 0% | 65.7 -34% | 66.3 -33% |
| Response Times | 70% | -2% | 65% | 53% | |
| Response Time Grey 50% / Grey 80% * (ms) | 41.6 ? | 7.2 ? 83% | 41.2 ? 1% | 8 ? 81% | 16.8 ? 60% |
| Response Time Black / White * (ms) | 21.6 ? | 9.6 ? 56% | 22.4 ? -4% | 11.2 ? 48% | 11.6 ? 46% |
| PWM Frequency (Hz) | |||||
| Screen | -10% | 2% | -13% | -5% | |
| Brightness middle (cd/m²) | 343 | 296 -14% | 349 2% | 304 -11% | 314.7 -8% |
| Brightness (cd/m²) | 328 | 279 -15% | 339 3% | 299 -9% | 312 -5% |
| Brightness Distribution (%) | 82 | 85 4% | 87 6% | 89 9% | 90 10% |
| Black Level * (cd/m²) | 0.31 | 0.25 19% | 0.41 -32% | 0.27 13% | 0.38 -23% |
| Contrast (:1) | 1106 | 1184 7% | 851 -23% | 1126 2% | 828 -25% |
| Colorchecker dE 2000 * | 5.03 | 4.77 5% | 4.04 20% | 4.66 7% | 2.56 49% |
| Colorchecker dE 2000 max. * | 7.91 | 9.08 -15% | 6.01 24% | 9.65 -22% | 4.89 38% |
| Colorchecker dE 2000 calibrated * | 0.86 | 1.46 -70% | 0.93 -8% | 1.72 -100% | 1.71 -99% |
| Greyscale dE 2000 * | 6.29 | 5.83 7% | 4.19 33% | 5.53 12% | 3.4 46% |
| Gamma | 2.38 92% | 2.47 89% | 2.44 90% | 2.5 88% | 2.3 96% |
| CCT | 6389 102% | 8076 80% | 6411 101% | 8028 81% | 6435 101% |
| Color Space (Percent of AdobeRGB 1998) (%) | 88 | 60 -32% | 87 -1% | 60 -32% | 60.7 -31% |
| Color Space (Percent of sRGB) (%) | 100 | 93 -7% | 100 0% | 93 -7% | 94.6 -5% |
| Total Average (Program / Settings) | 13% /
-2% | 0% /
1% | 10% /
-5% | 9% /
-1% |
* ... smaller is better
Our review unit also has a good contrast ratio thanks to its low black value, which we measure at 0.31 cd/m². The 1080p displays of the ROG G703GX and the Predator Triton 500 achieve better results here, but colours look vibrant on the Ultra 17, nonetheless.
The device has acceptable DeltaE colour deviations out of the box too, but these can be improved to better than ideal values with additional calibration. We have included our calibrated ICC profile should you wish to it.
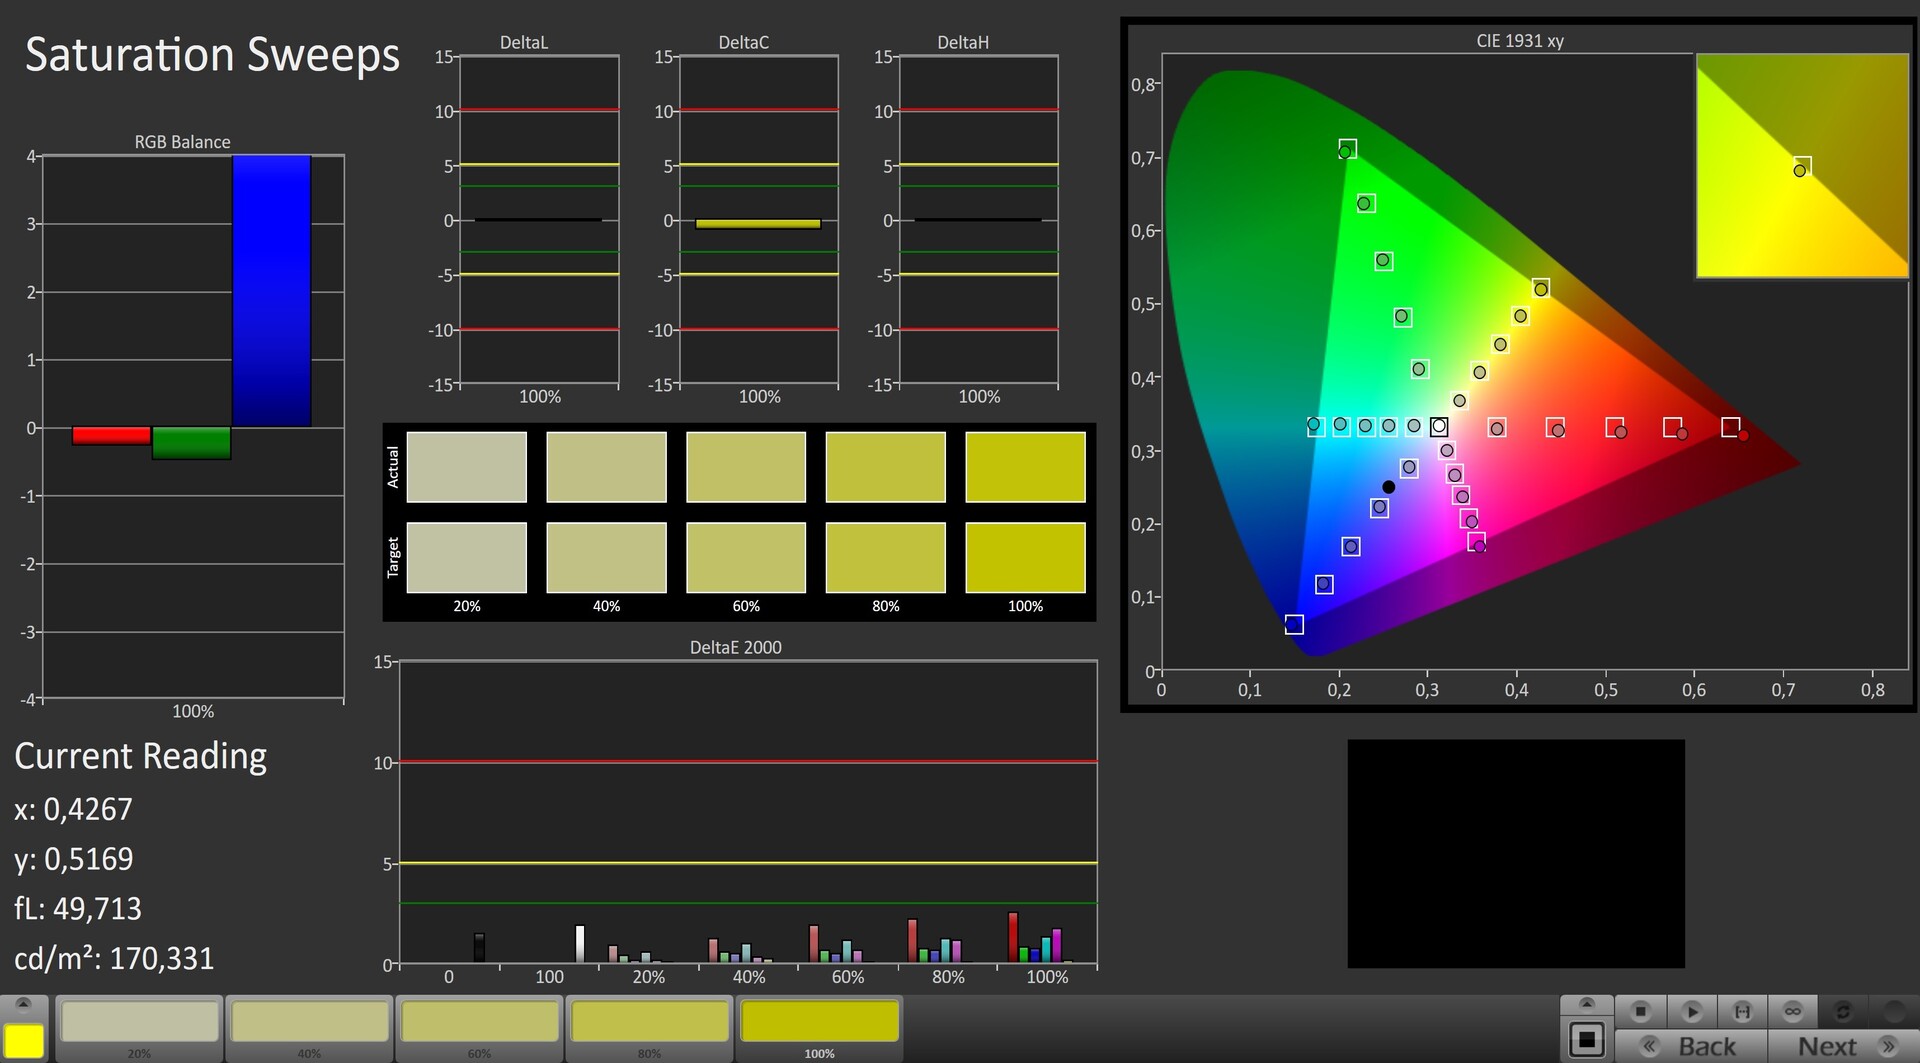
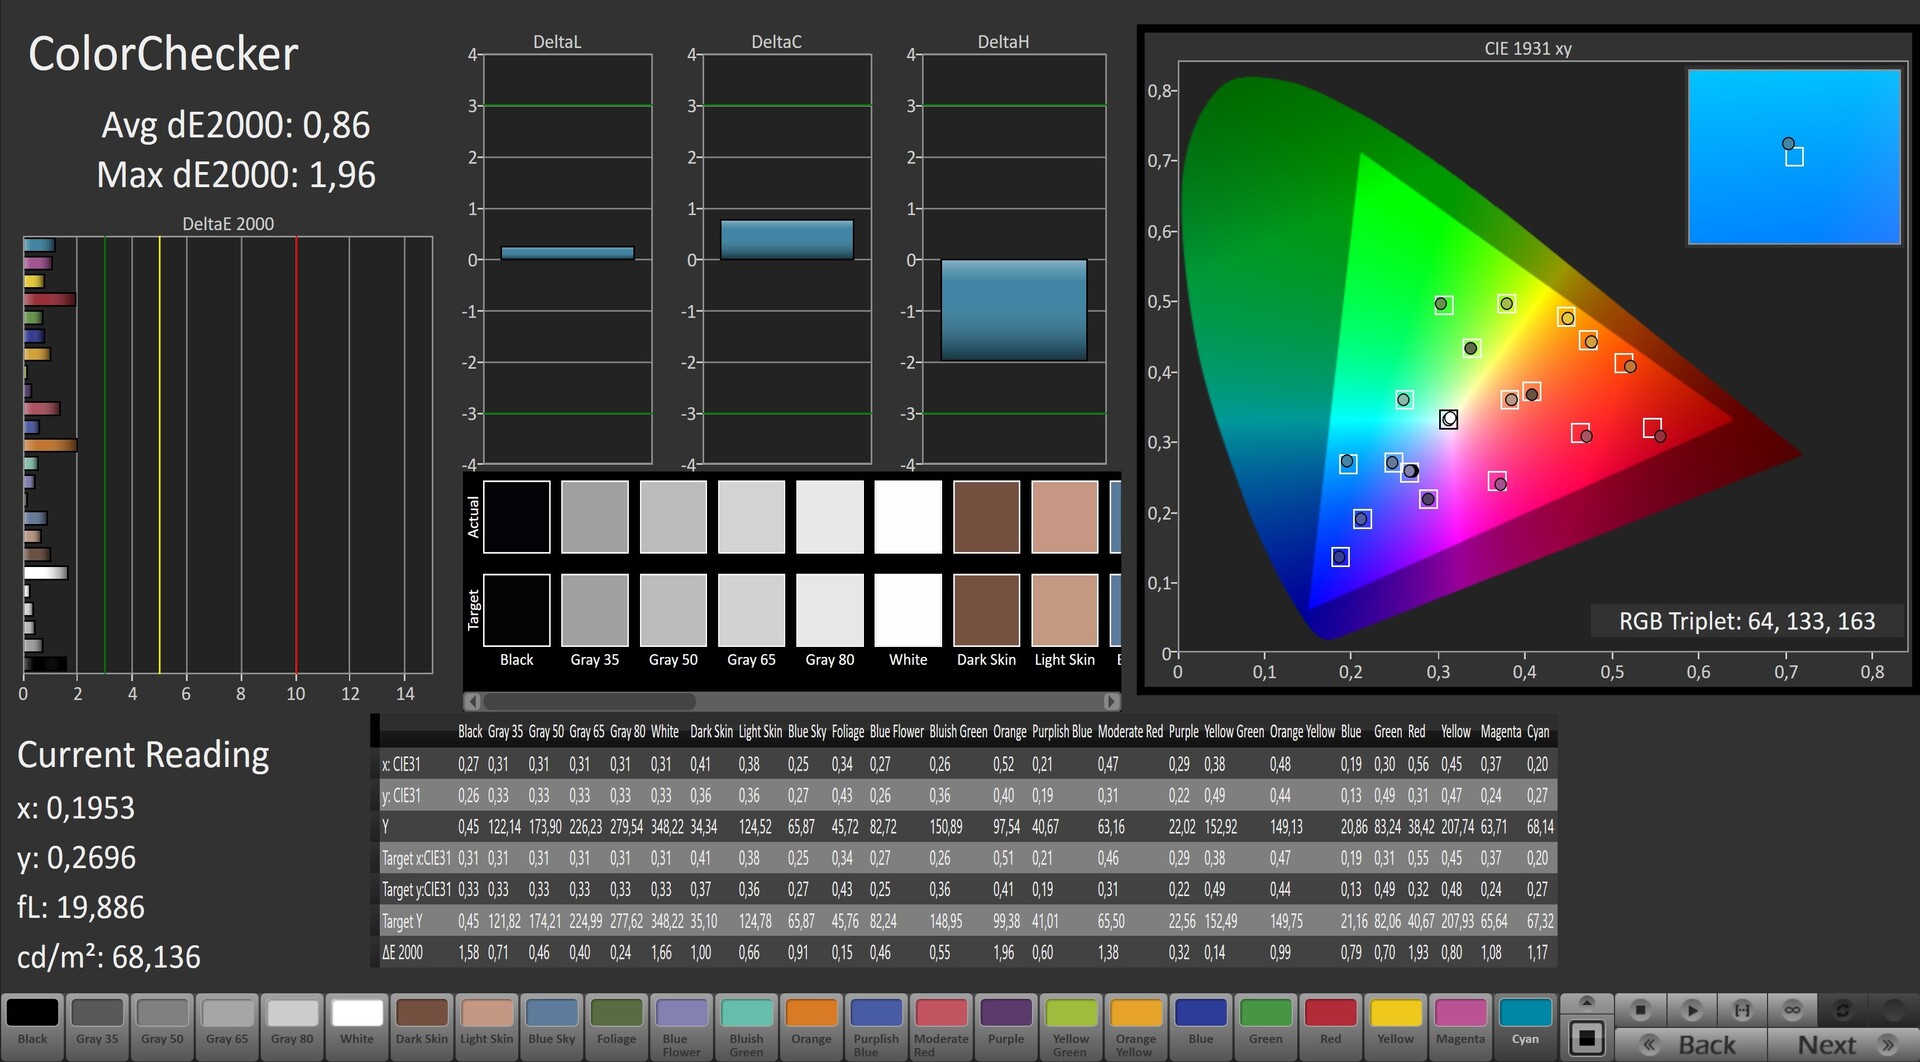
The same applies to our review unit’s colour-space coverage. CalMAN measures 100% sRGB coverage and 88% AdobeRGB coverage, which is considerably better than all but its predecessor out of our comparison devices.

The only other criticism we have of our review unit’s display besides its mediocre maximum brightness is its response times, which are below what we would expect of an expensive gaming laptop. Our comparison devices generally have response times of less than 20 ms, which is less than half of the 41.6 ms grey-to-grey response times that we measured with our review unit. While most people will not notice the difference in daily use, the Ultra 17’s slow response times may be an issue for those who like to play fast-paced first-person shooters. Apart from that, the Ultra 17 has an excellent UHD display.
Display Response Times
| ↔ Response Time Black to White | ||
|---|---|---|
| 21.6 ms ... rise ↗ and fall ↘ combined | ↗ 9.6 ms rise | 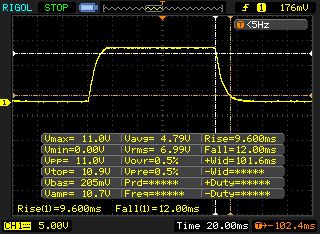 |
| ↘ 12 ms fall | ||
| The screen shows good response rates in our tests, but may be too slow for competitive gamers. In comparison, all tested devices range from 0.1 (minimum) to 240 (maximum) ms. » 48 % of all devices are better. This means that the measured response time is similar to the average of all tested devices (19.8 ms). | ||
| ↔ Response Time 50% Grey to 80% Grey | ||
| 41.6 ms ... rise ↗ and fall ↘ combined | ↗ 20.4 ms rise | 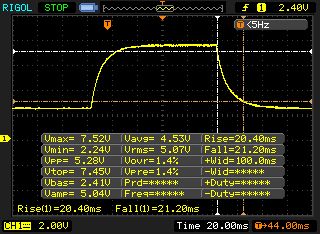 |
| ↘ 21.2 ms fall | ||
| The screen shows slow response rates in our tests and will be unsatisfactory for gamers. In comparison, all tested devices range from 0.165 (minimum) to 636 (maximum) ms. » 67 % of all devices are better. This means that the measured response time is worse than the average of all tested devices (31 ms). | ||
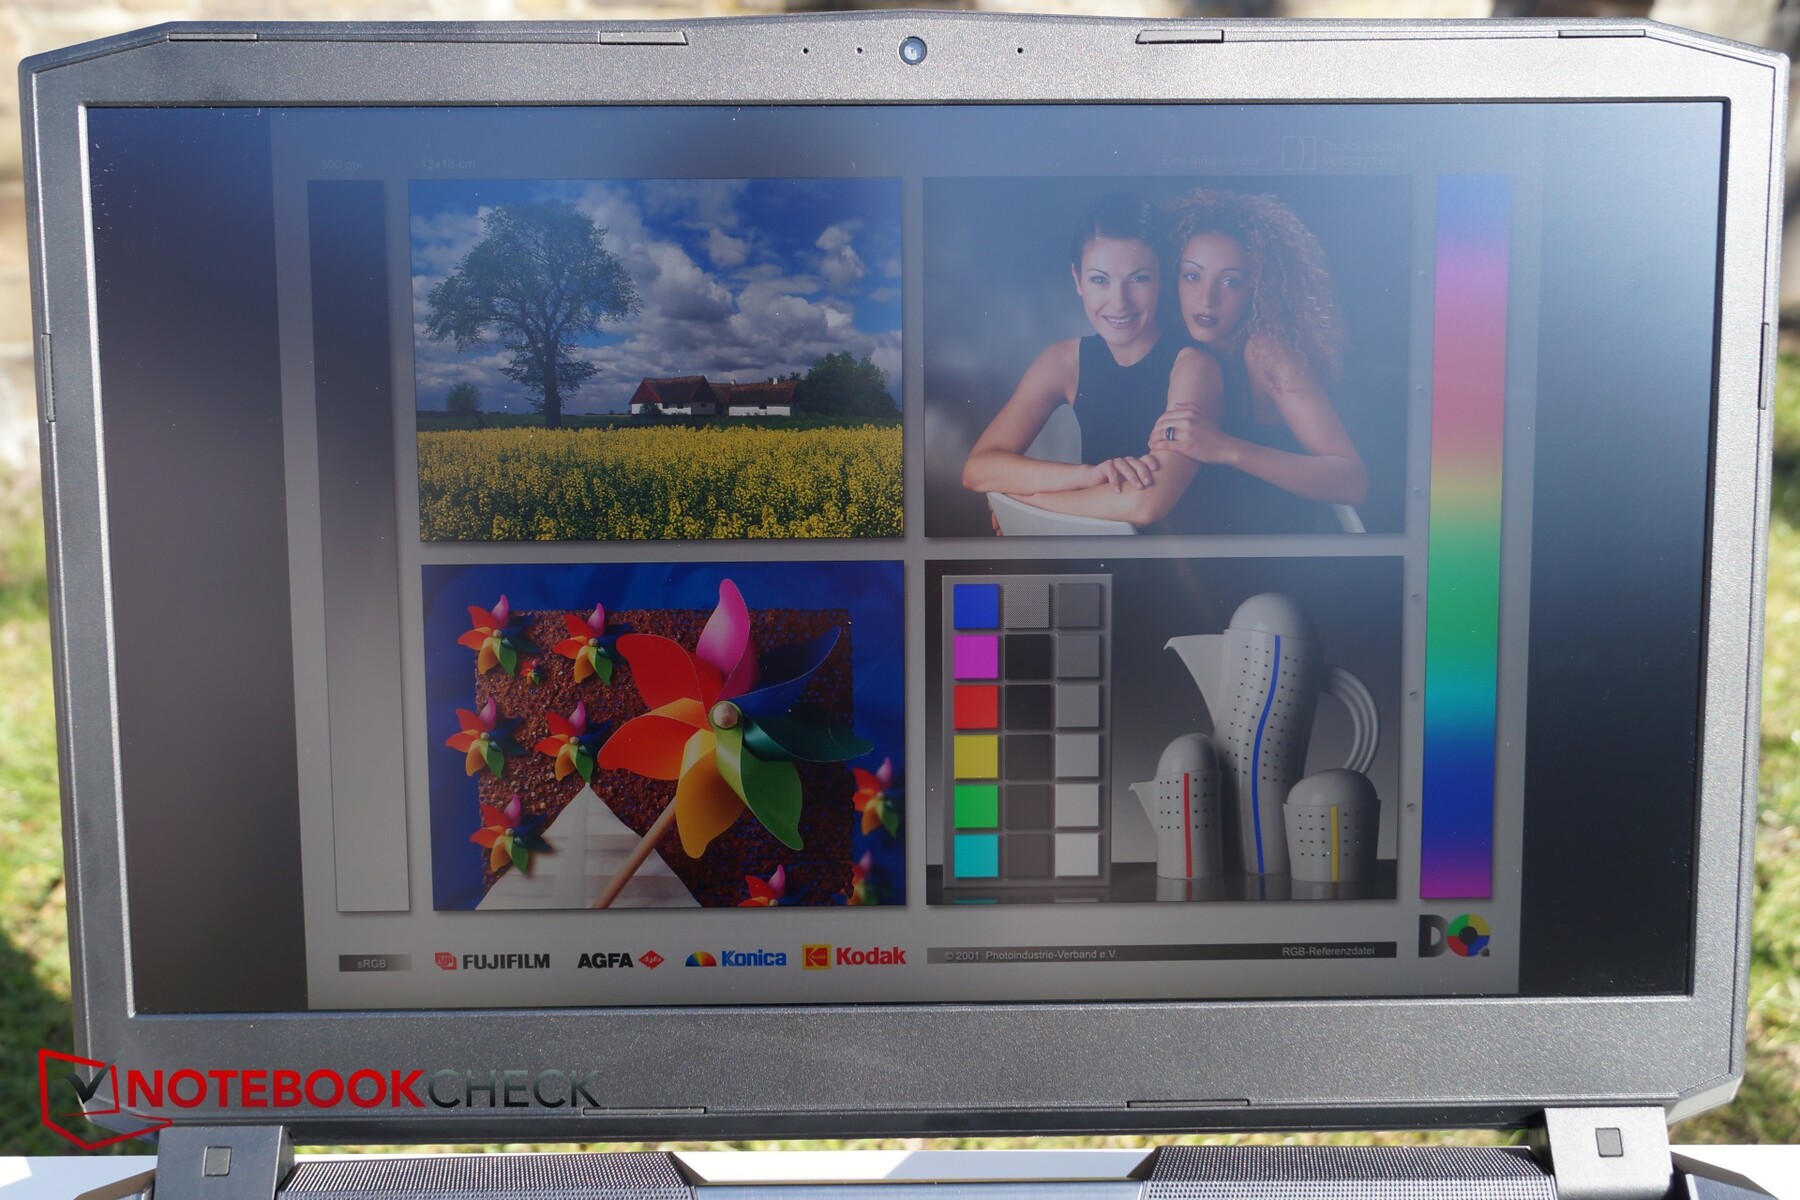
The Ultra 17 is easy to use outdoors thanks to its matte IPS display, which diffuses reflections well. The screen remains readable even in direct sunlight, although it will look washed-out as demonstrated by the photo to the right.
Screen Flickering / PWM (Pulse-Width Modulation)
| Screen flickering / PWM not detected |  | ||
In comparison: 52 % of all tested devices do not use PWM to dim the display. If PWM was detected, an average of 7747 (minimum: 5 - maximum: 343500) Hz was measured. | |||
Our review unit has stable viewing angles too, making it ideal for co-op lovers. In short, the display should remain readable from practically any angle, although there is some loss of brightness at acute viewing angles.

Performance
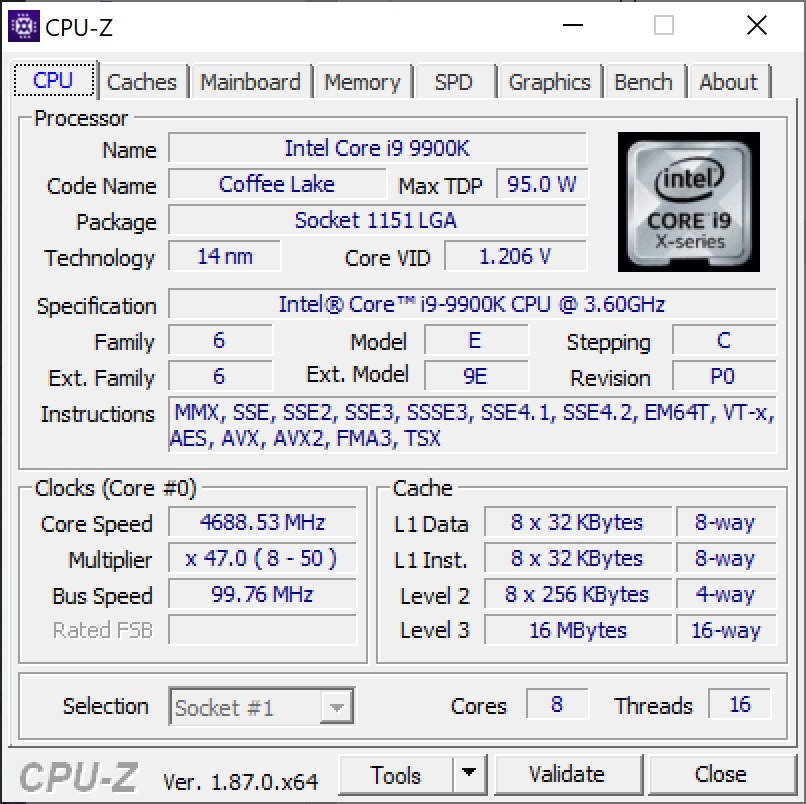
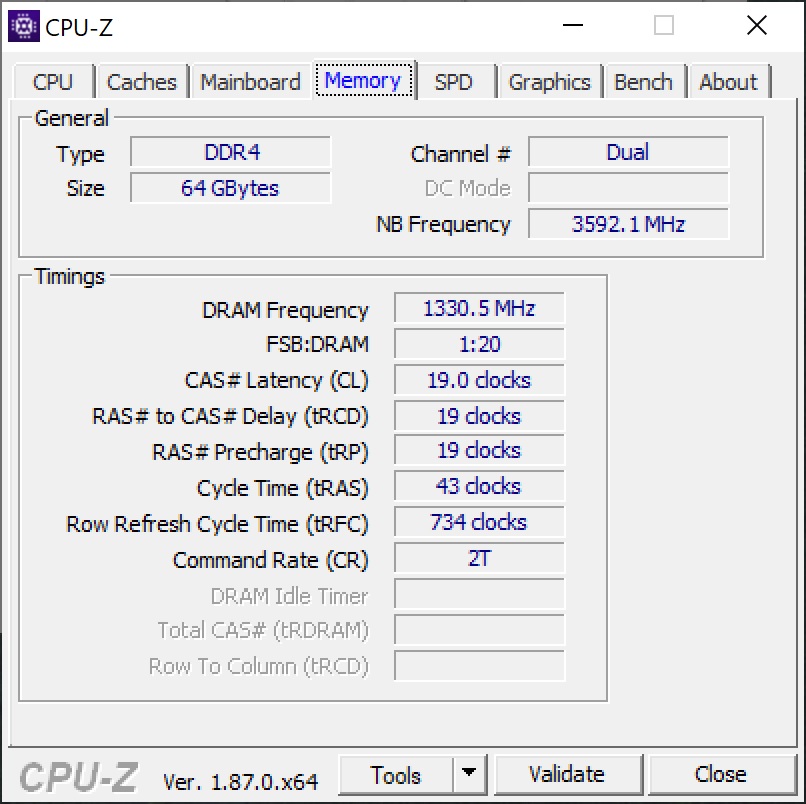
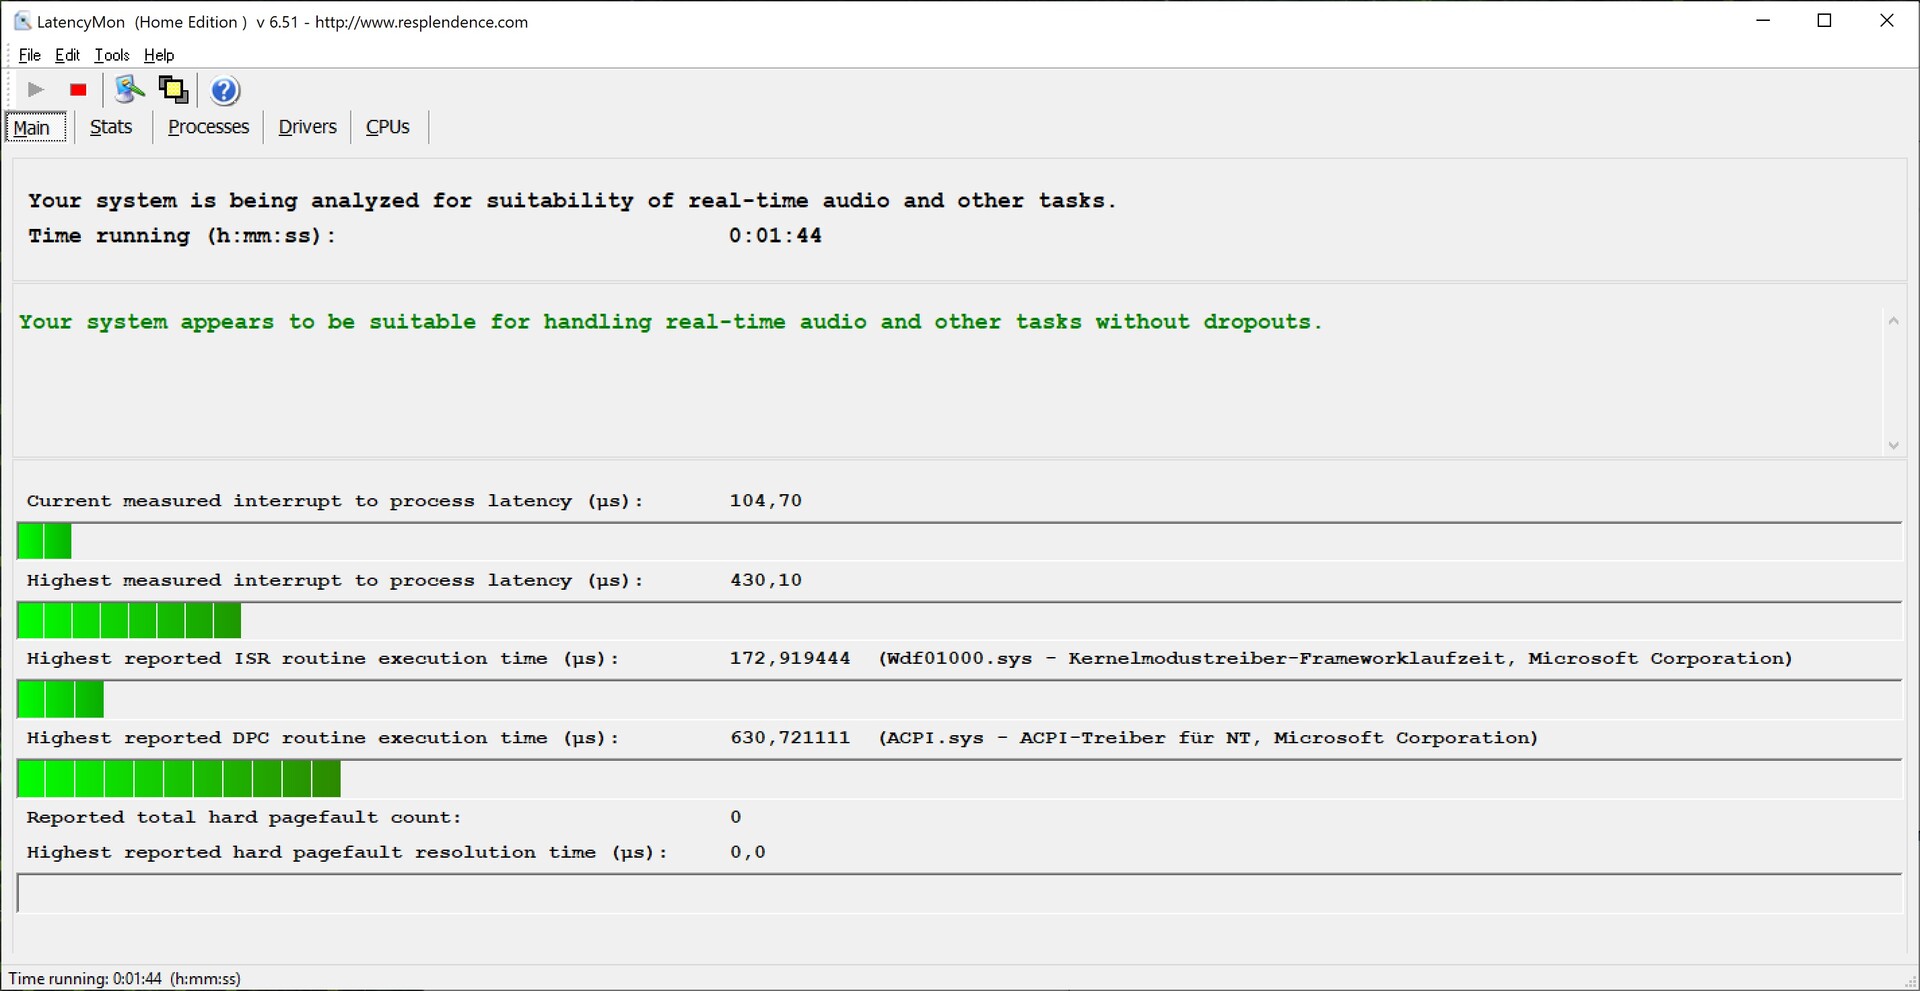
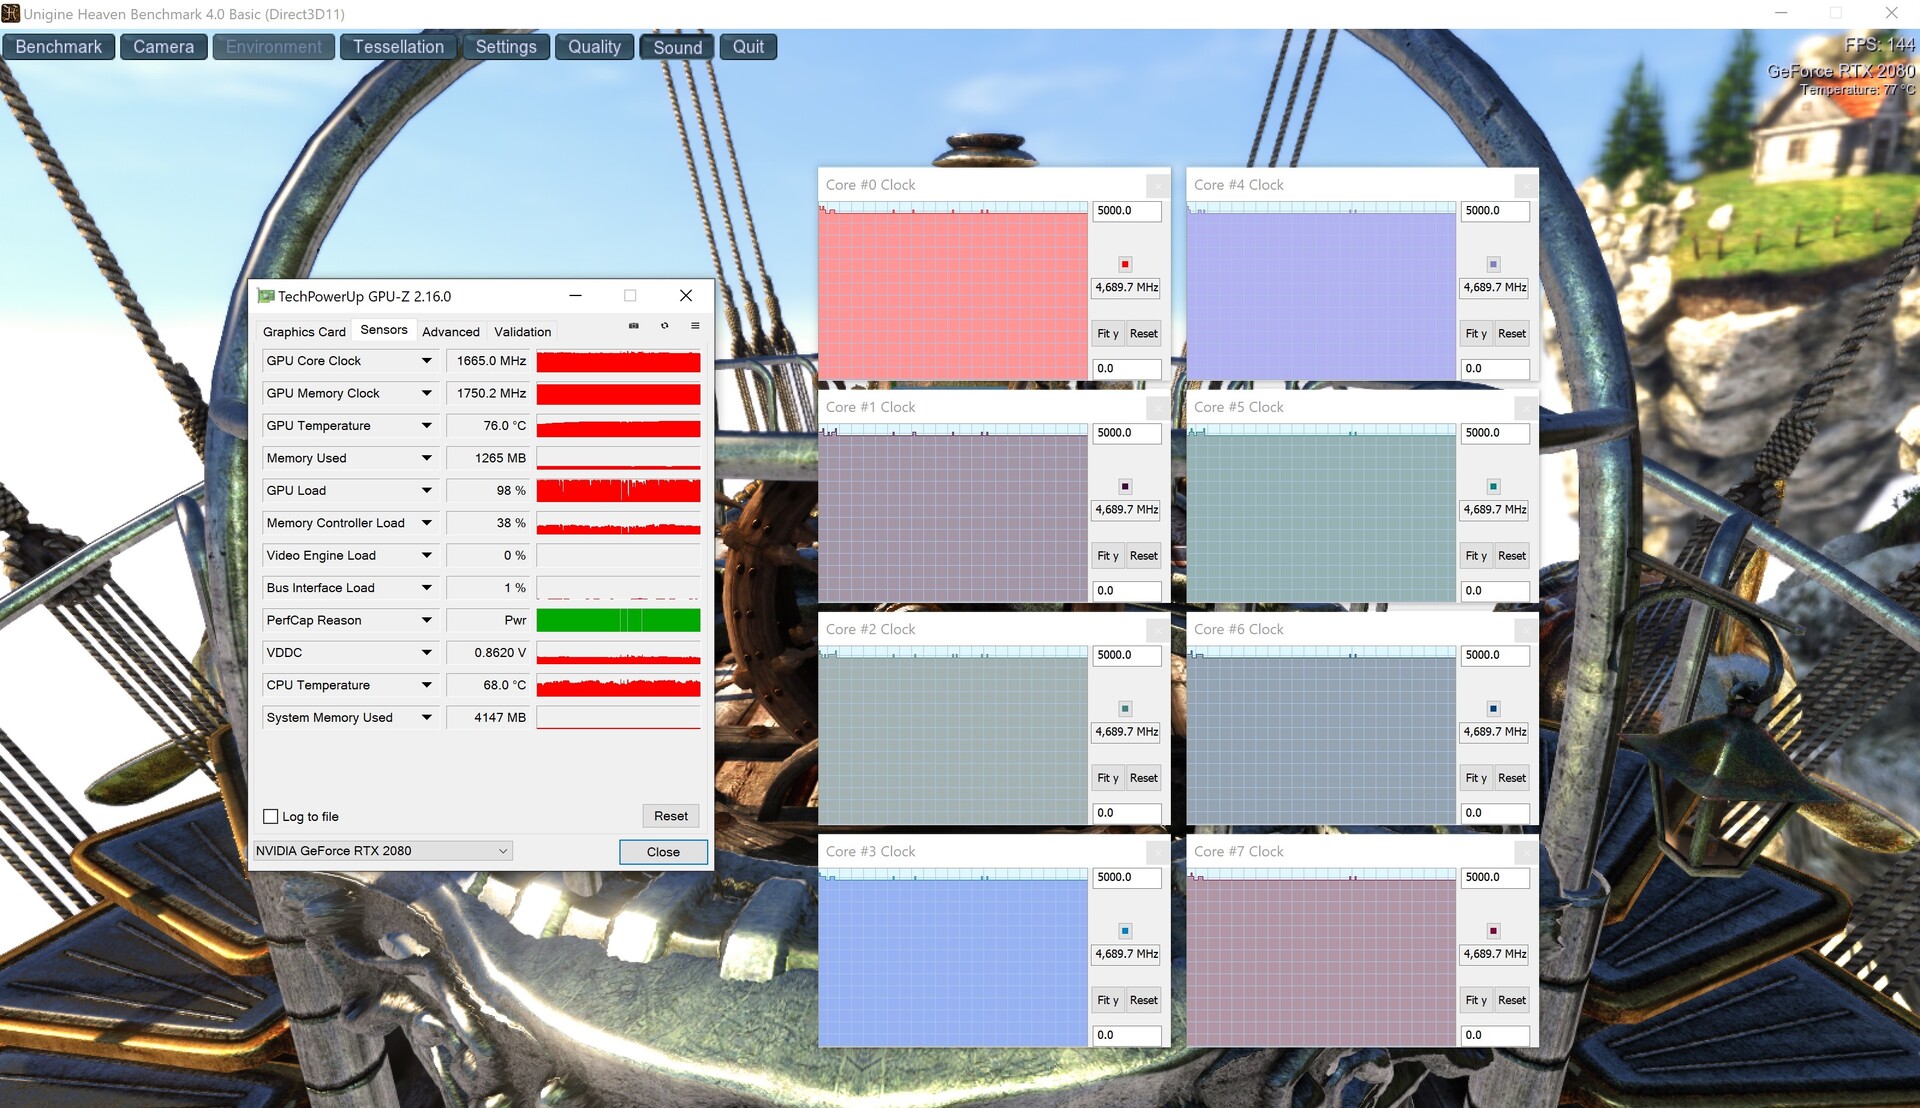
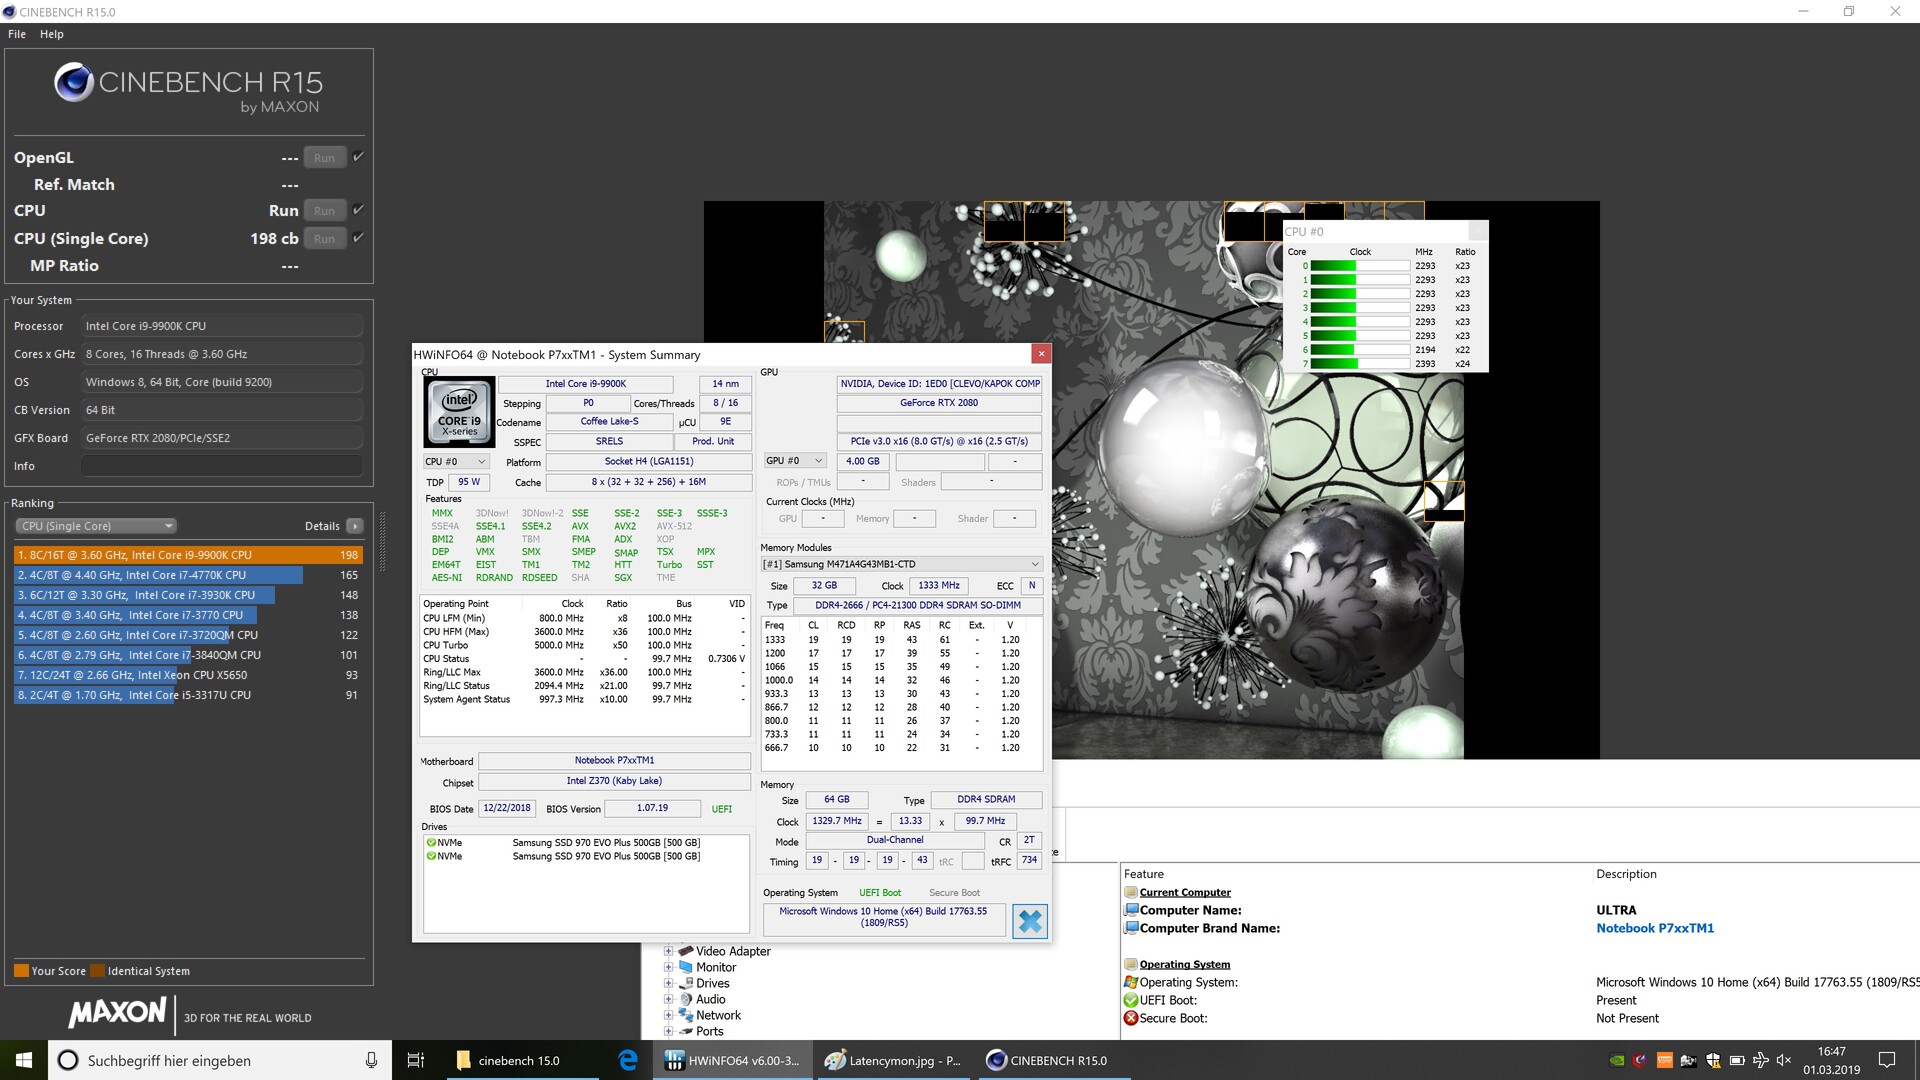
The Ultra 17 is a true gaming laptop and is powerful enough for almost any task that you could throw at it. Its Core i9-9900K processor is currently Intel’s most powerful mobile chip, while its GeForce RTX 2080 GPU is Nvidia’s flagship mobile graphics card. The CPU can clock up to 5 GHz clock and has eight cores, which is complemented by a whopping 64 GB of RAM along with two fast SSDs. On paper, the Ultra 17 is one of the best packages that you could currently buy. Our review unit has no latency issues too, as measured by LatencyMon.
Processor
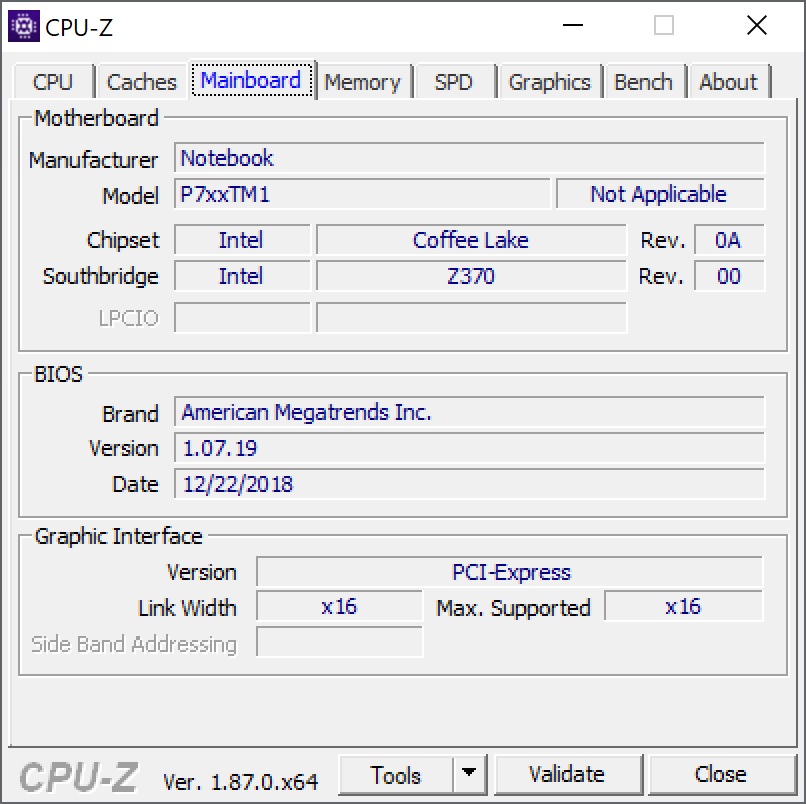
The Core i9-9900K is based on Intel's Coffee Lake architecture and can utilise Hyper-Threading to execute up to 16 threads simultaneously. The CPU has a 3.6 GHz base clock speed and can reach up to 5 GHz on a single core with Intel Turbo Boost. Its K suffix indicates that the processor has an unlocked multiplier and can be overclocked, although it must be connected to a Z390 chipset for this to be possible. Unfortunately, the Ultra 17 has an older Z370 chipset motherboard instead.
It is worth noting that the Ultra 17 cannot use the processor’s integrated Intel UHD Graphics 630 as G-Sync always forces the laptop to use its dedicated GPU instead.
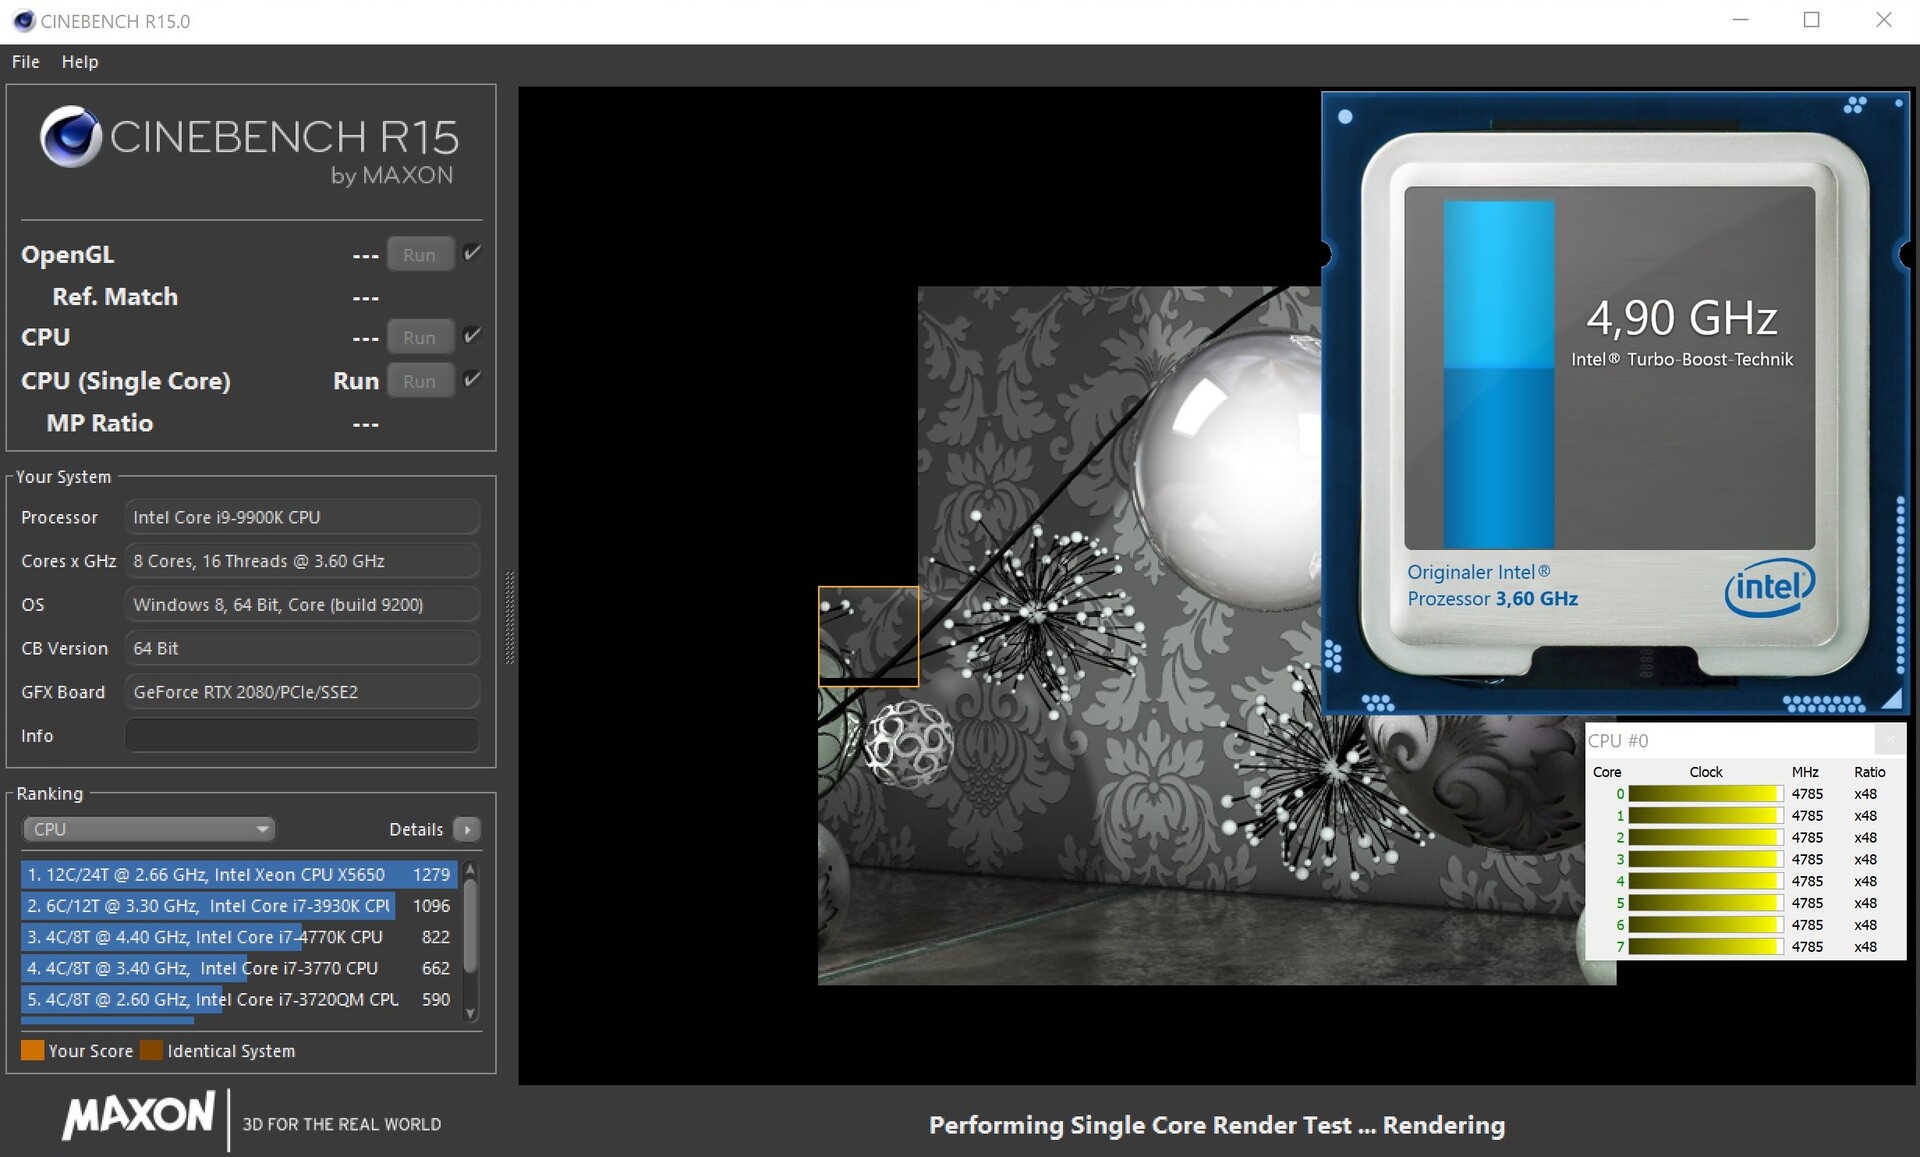
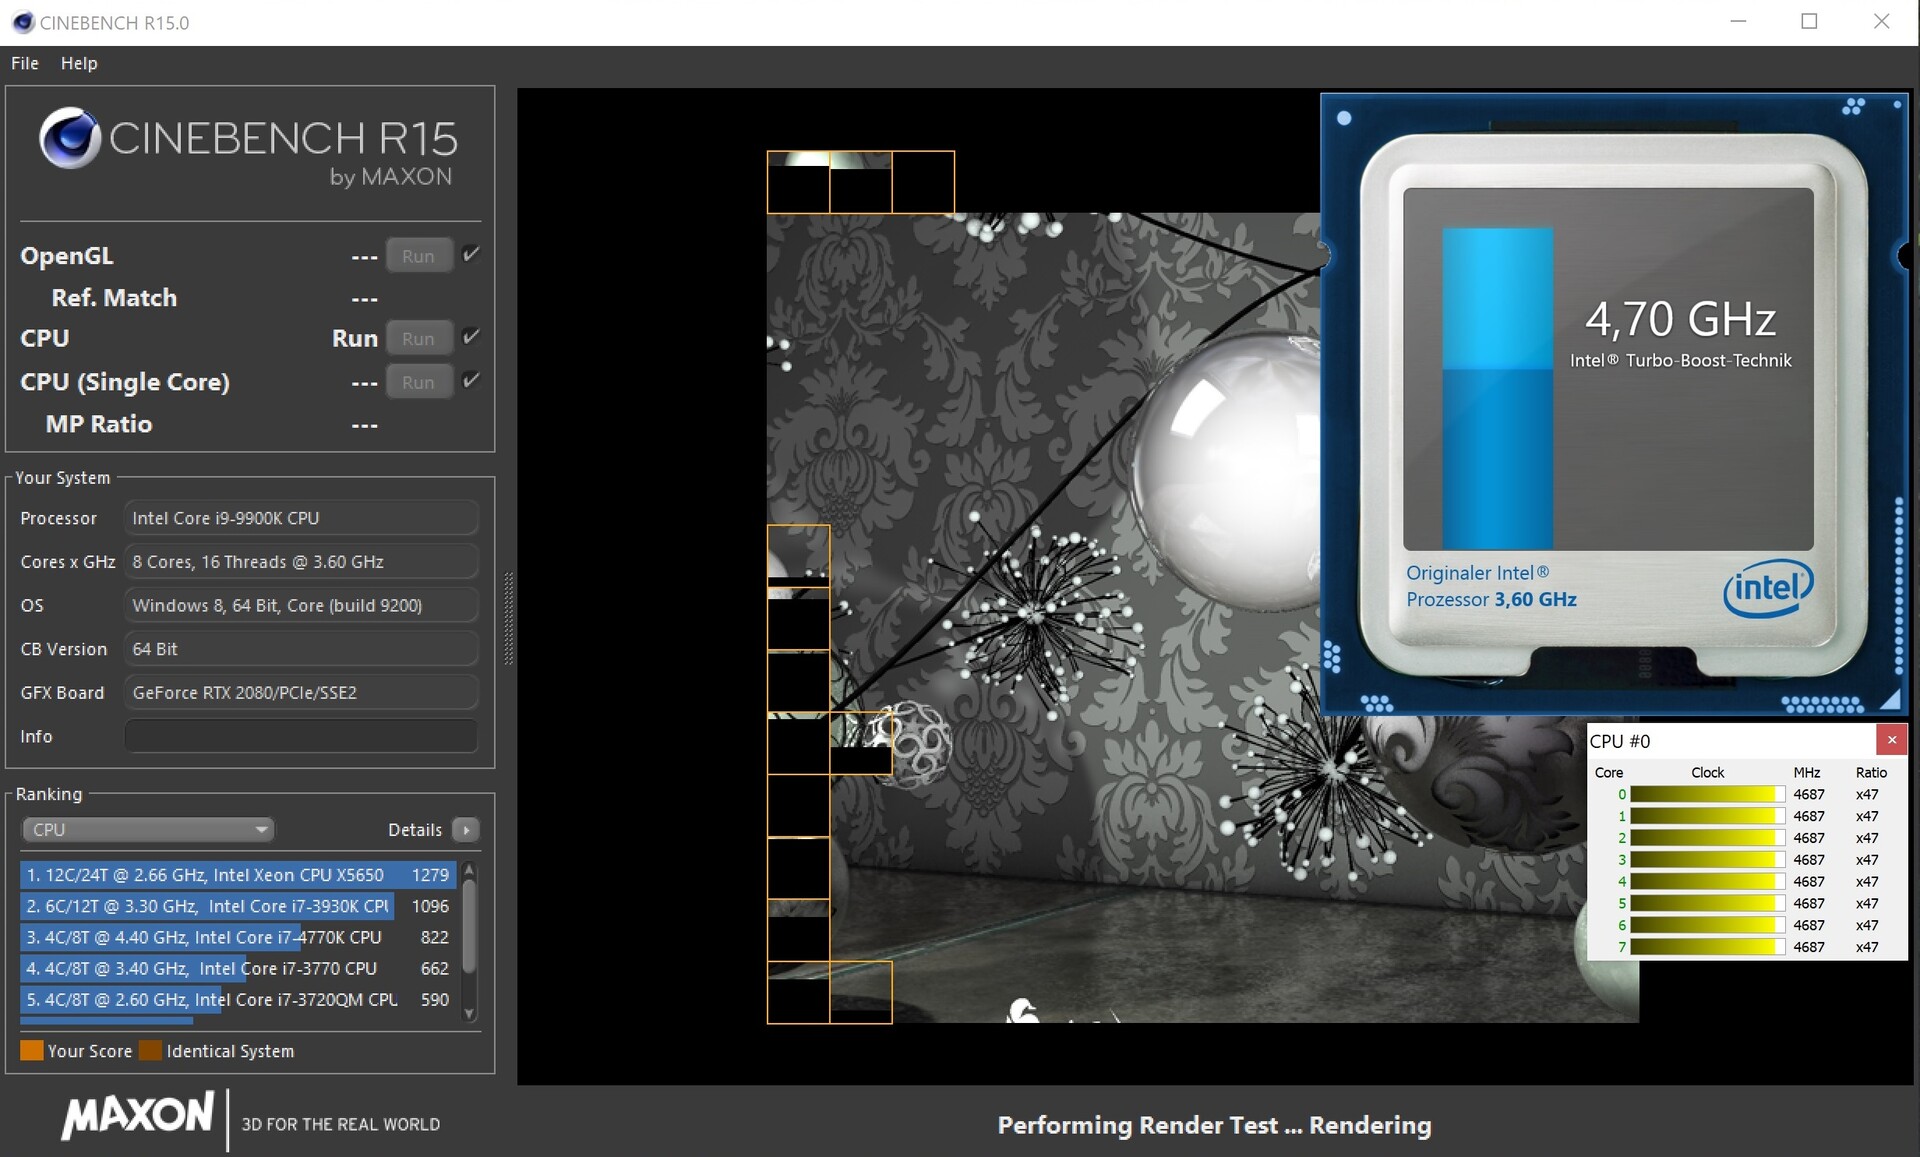
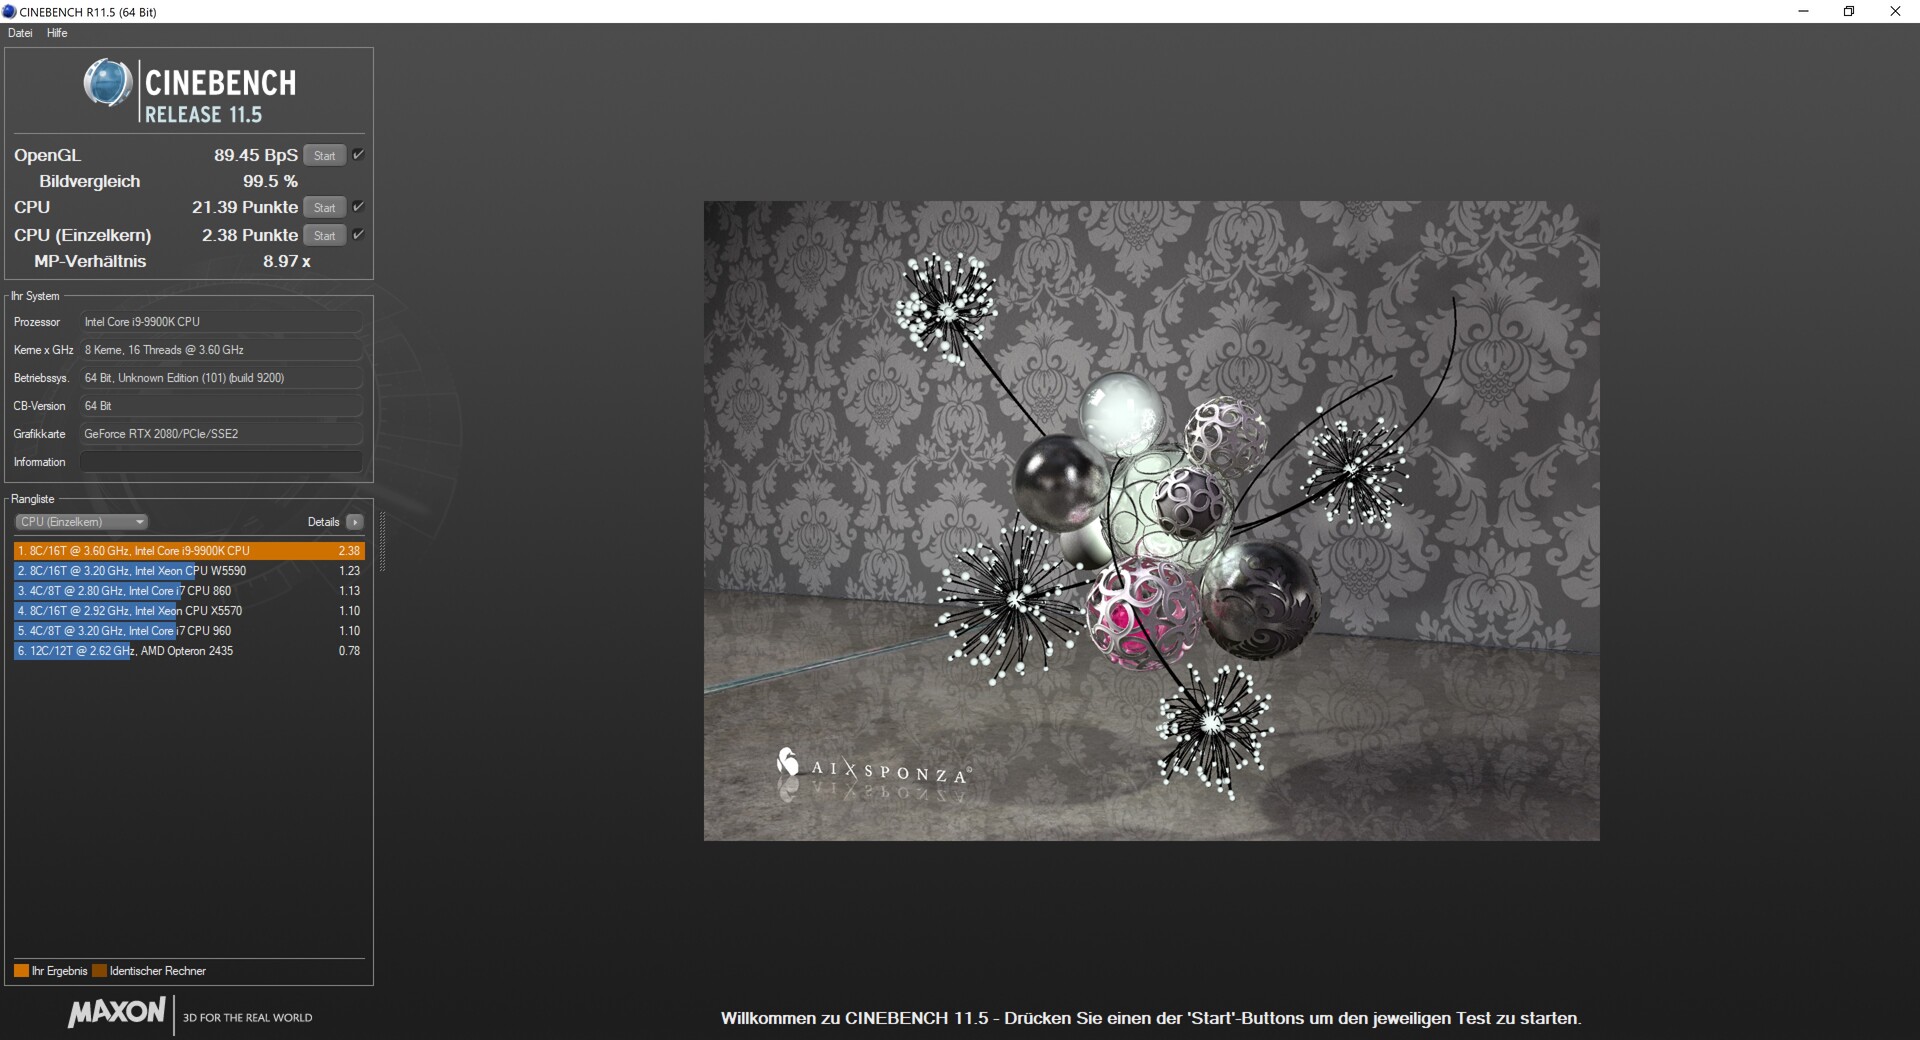
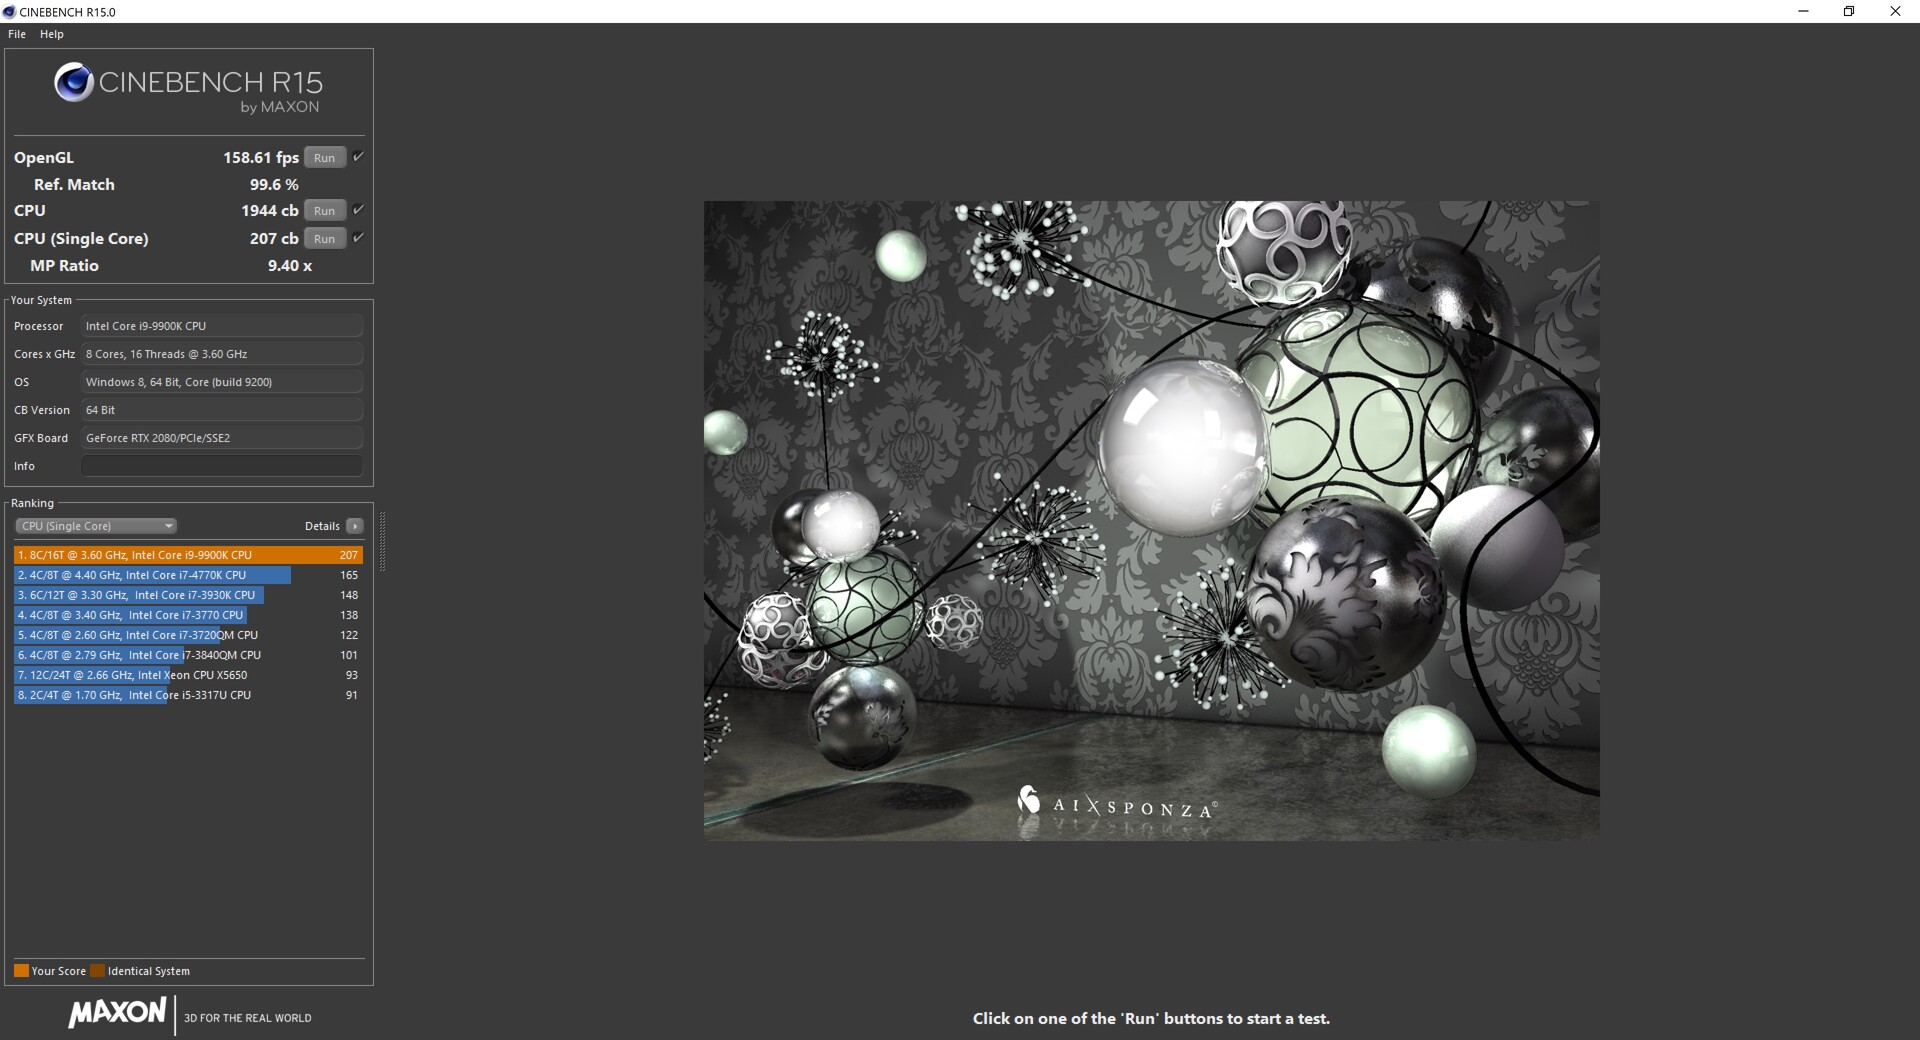
We subjected our review unit to a looped Cinebench R15 benchmark that we ran for around 30 minutes to determine how well the machine managed its performance under sustained load. The results are impressive. The device initially scored 1,932 points, which rose to 1,934 points in the second benchmark pass-through. The system then throttled slightly and finished below its first two scores, but this corresponds to about a 5% loss of performance. The Ultra 17 outperformed its predecessor throughout this looped benchmark and maintained more-consistent scores too. In short, it appears that the new Ultra 17 manages its performance better than last year’s model.
The Ultra 17 also noticeably outscores our comparison devices in CB 15, although most are equipped with the theoretically less-powerful Core i7-8750H processor. Still, it outscores its predecessor in both CB 15 benchmarks, albeit marginally. Overall, the Ultra 17 has excellent CPU performance for a gaming laptop when connected to mains power.
However, our review unit throttles heavily when it runs on battery. The CPU downclocks to 2.3 GHz in CB R15, which is well below its 3.6 GHz base clock speed. Correspondingly, scores drop from 1,944 points to 940 points, which is a huge reduction in performance. We suspect that few people will use the Ultra 17 away from a power source though.
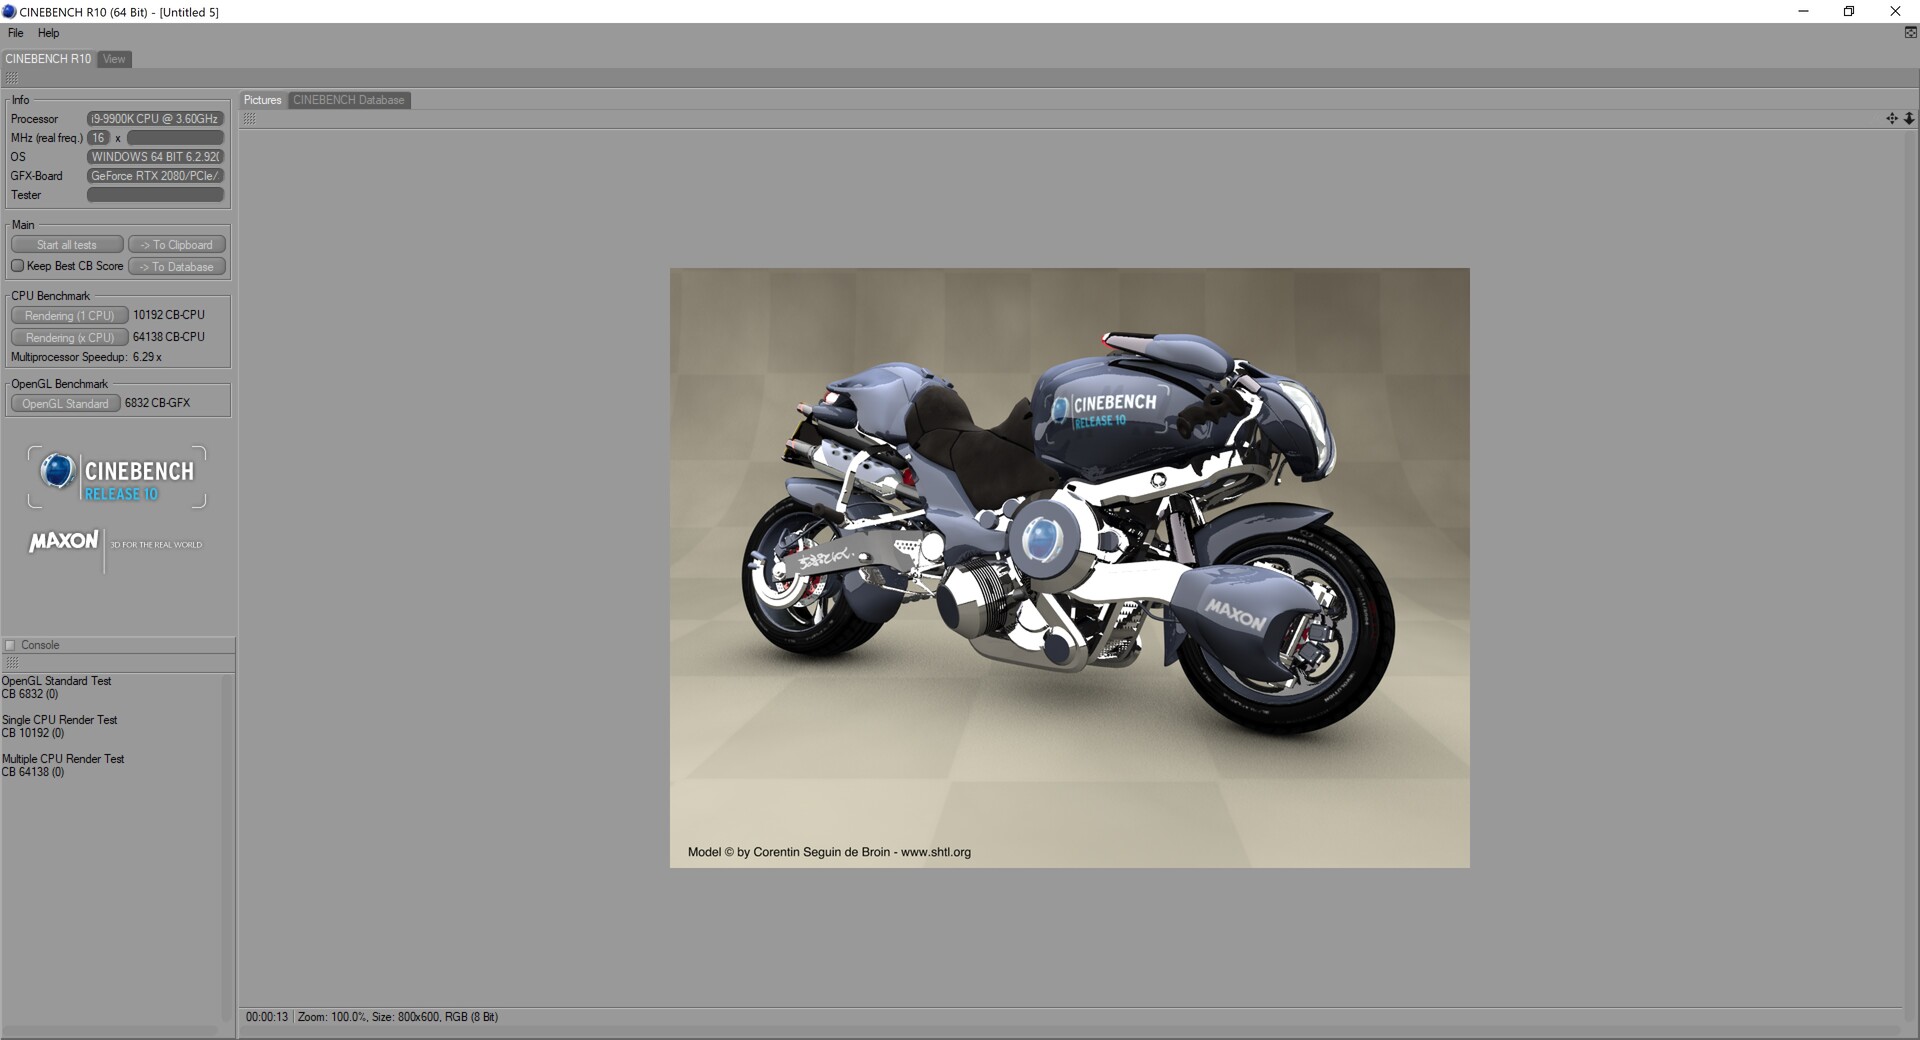
| Cinebench R10 | |
| Rendering Single CPUs 64Bit | |
| Average of class Gaming (17067 - 17085, n=2, last 2 years) | |
| Schenker XMG Ultra 17 Turing | |
| Rendering Multiple CPUs 64Bit | |
| Average of class Gaming (14159 - 144628, n=2, last 2 years) | |
| Schenker XMG Ultra 17 Turing | |
System Performance
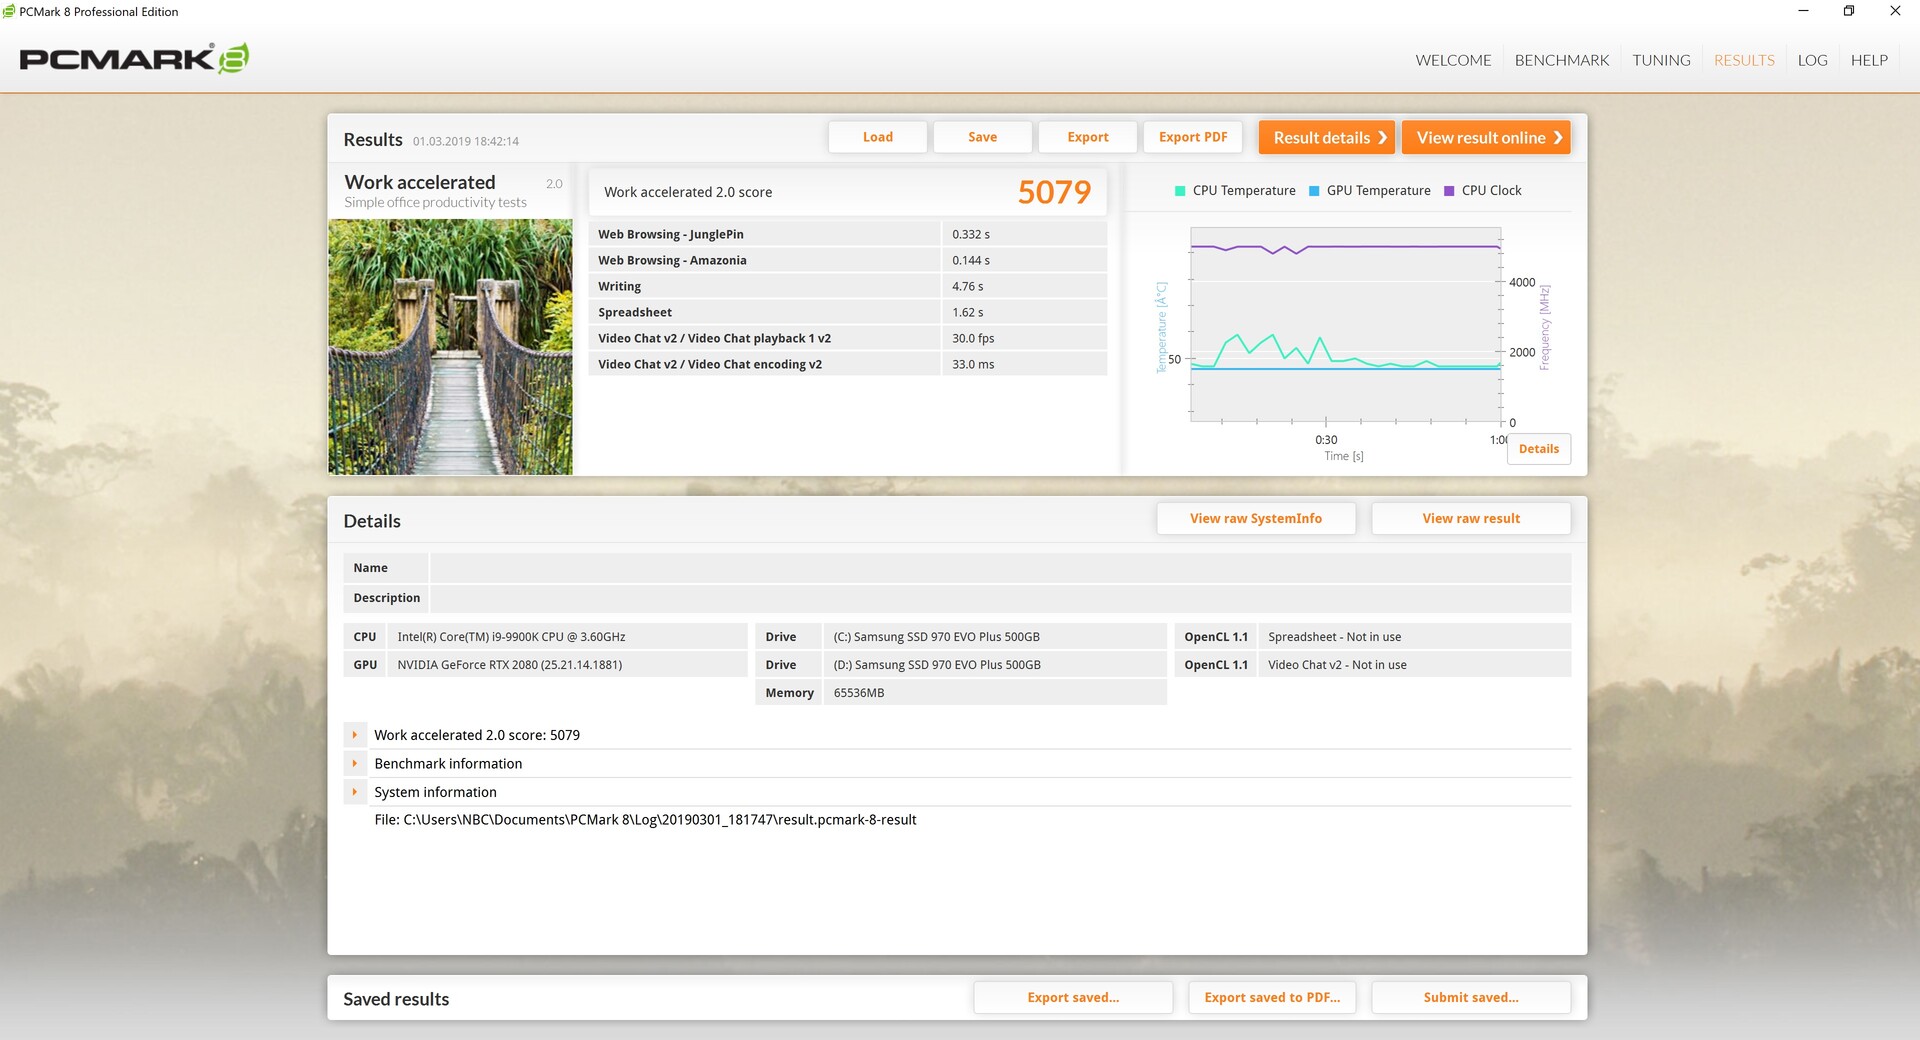
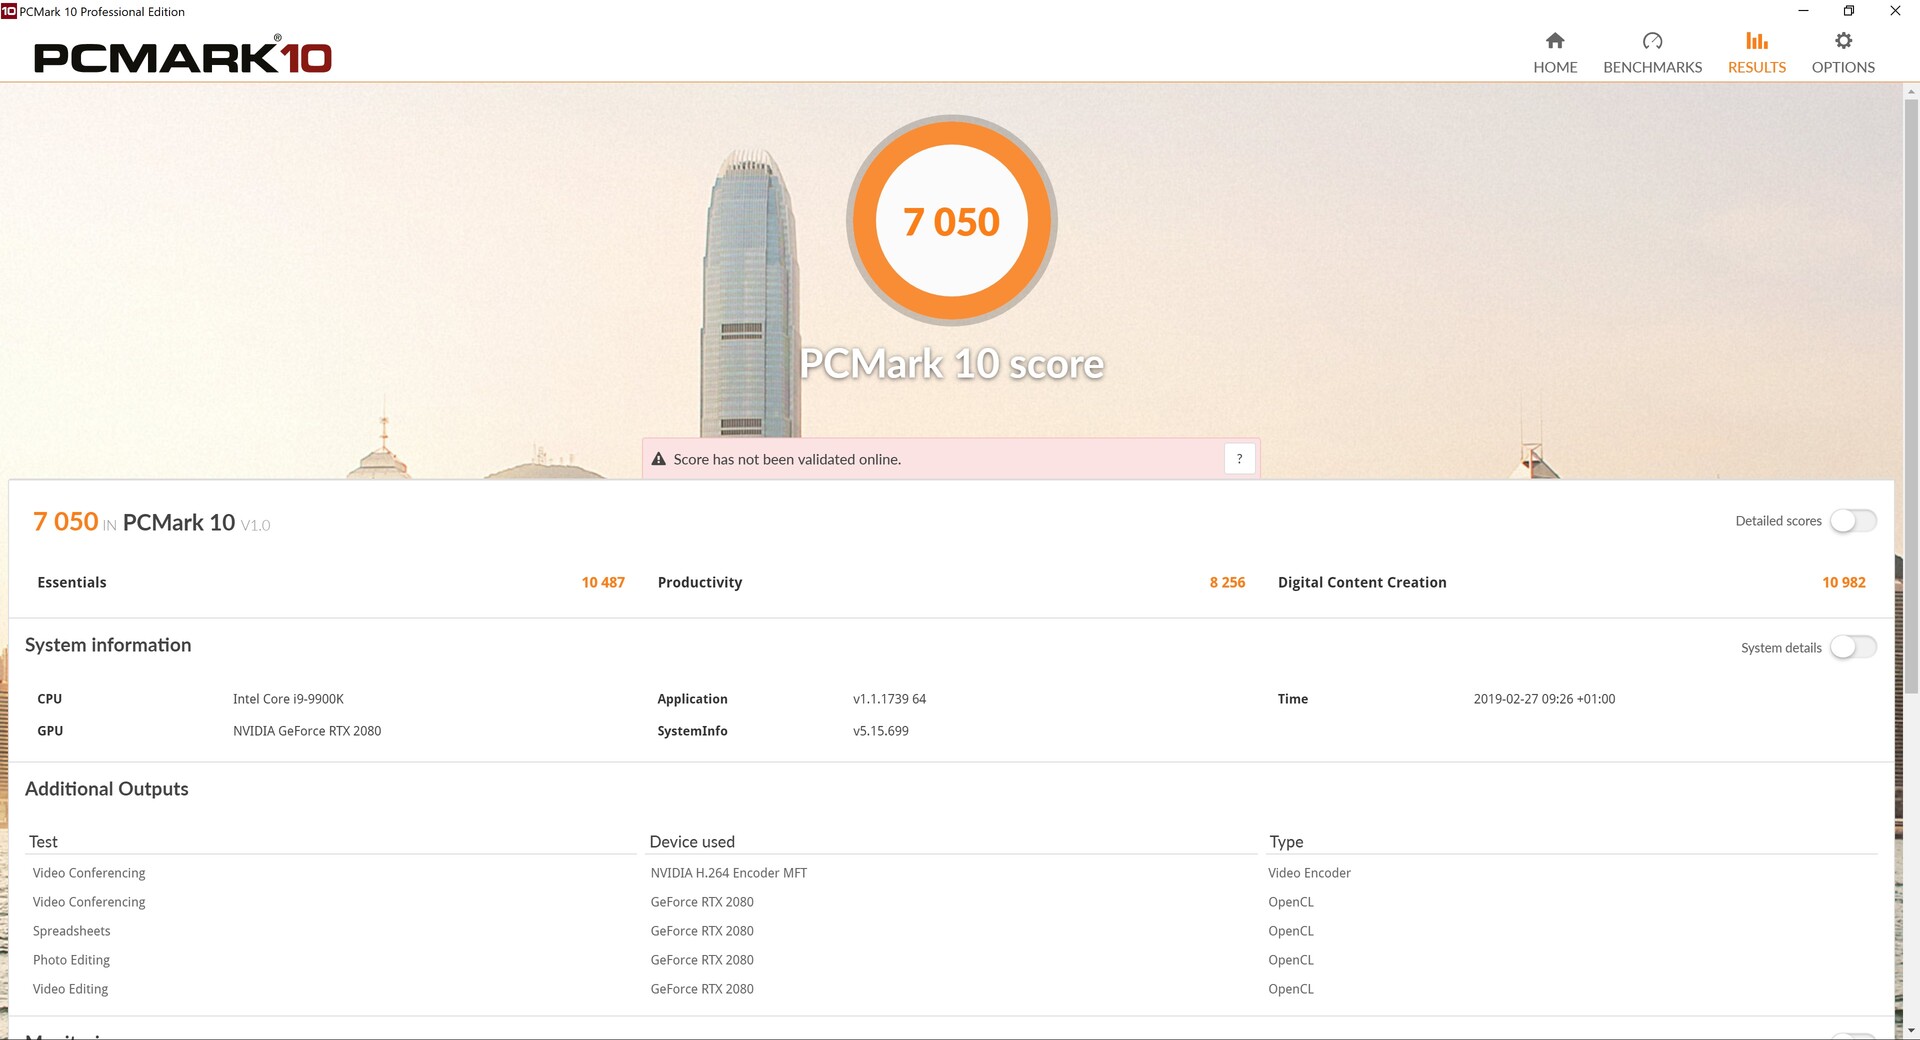
The Ultra 17 and its predecessor are considerably ahead of our comparison devices in PCMark 10 benchmarks, despite the former having double the RAM. It is a different story in PCMark 8, but the benchmark is now outdated, and its results are more indicative of a laptop’s performance than for demonstrating differences between devices.
Our review unit felt lightning-fast throughout our tests regardless of how hard we pushed it. We noticed no delays or stutters, which is to be expected of such a powerful system.
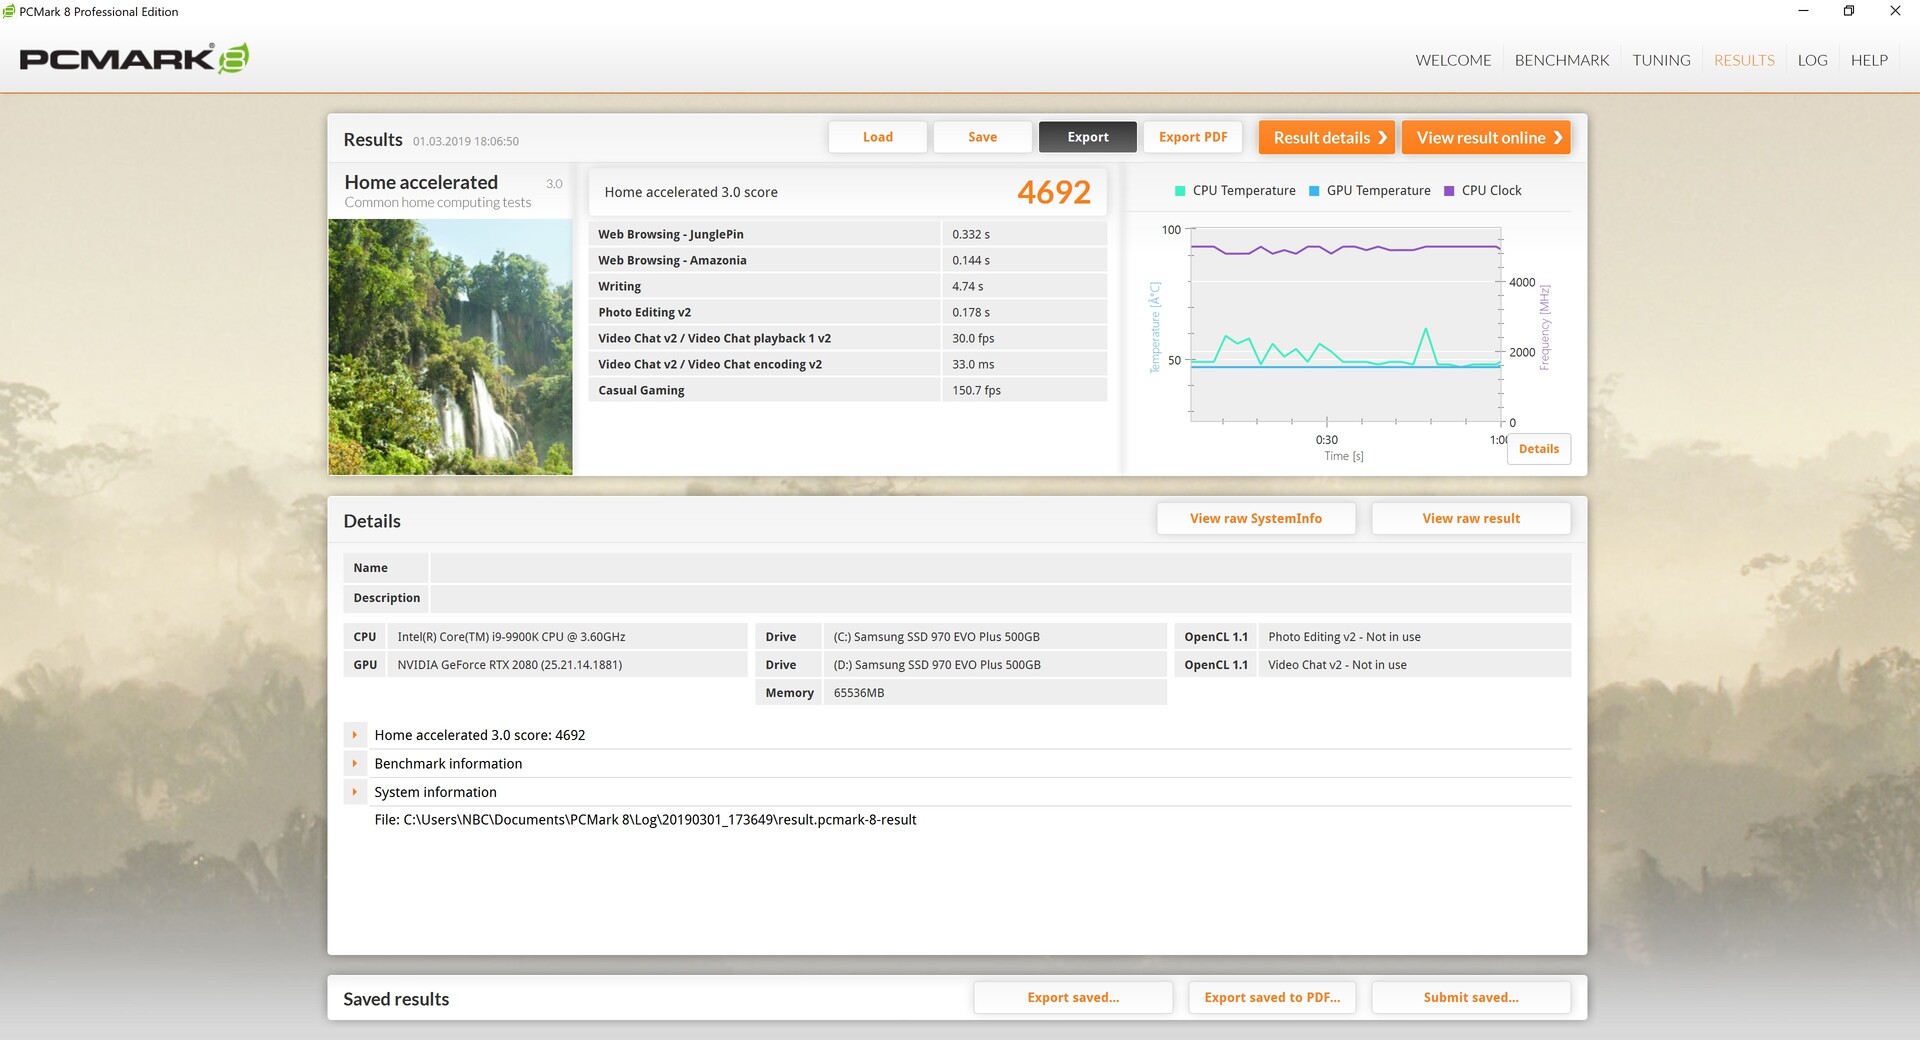
| PCMark 8 Home Score Accelerated v2 | 4692 points | |
| PCMark 8 Work Score Accelerated v2 | 5079 points | |
| PCMark 10 Score | 7050 points | |
Help | ||
Storage Devices
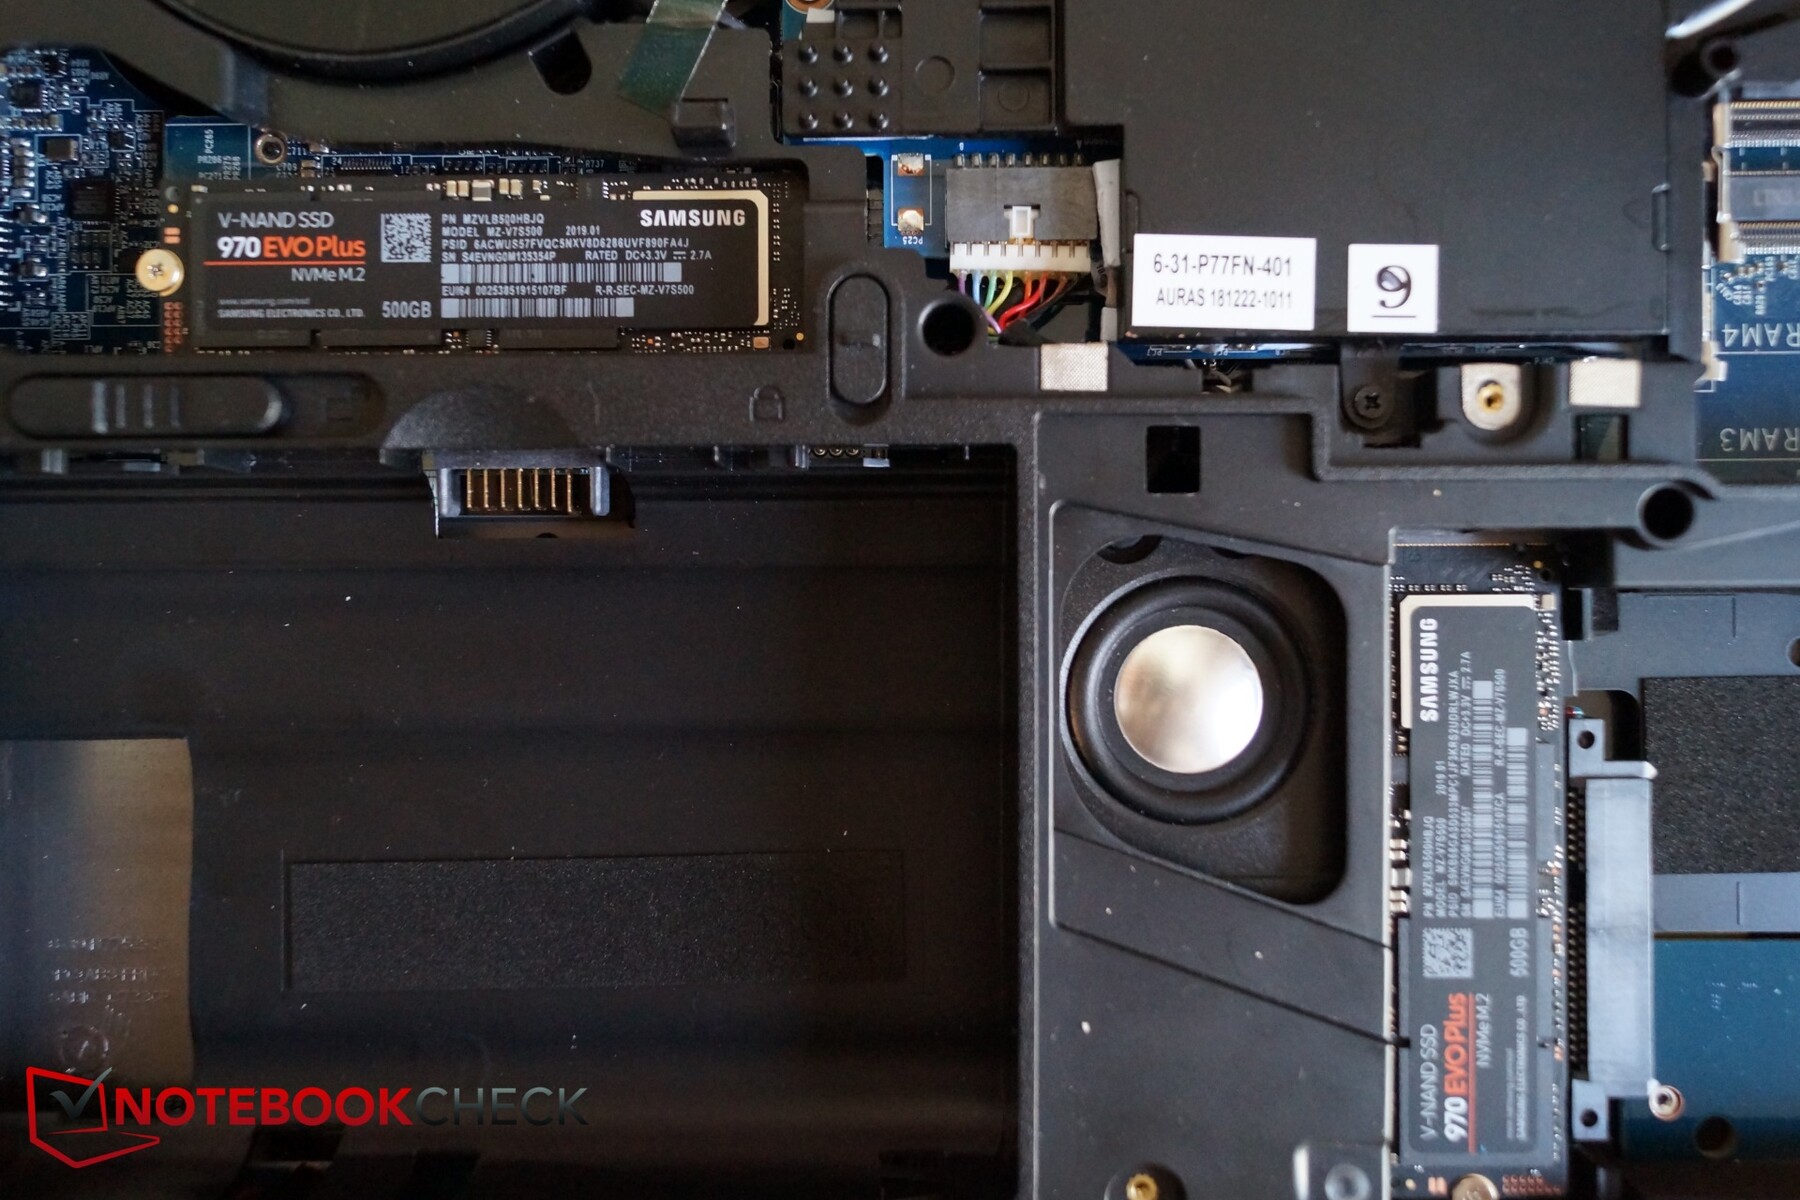
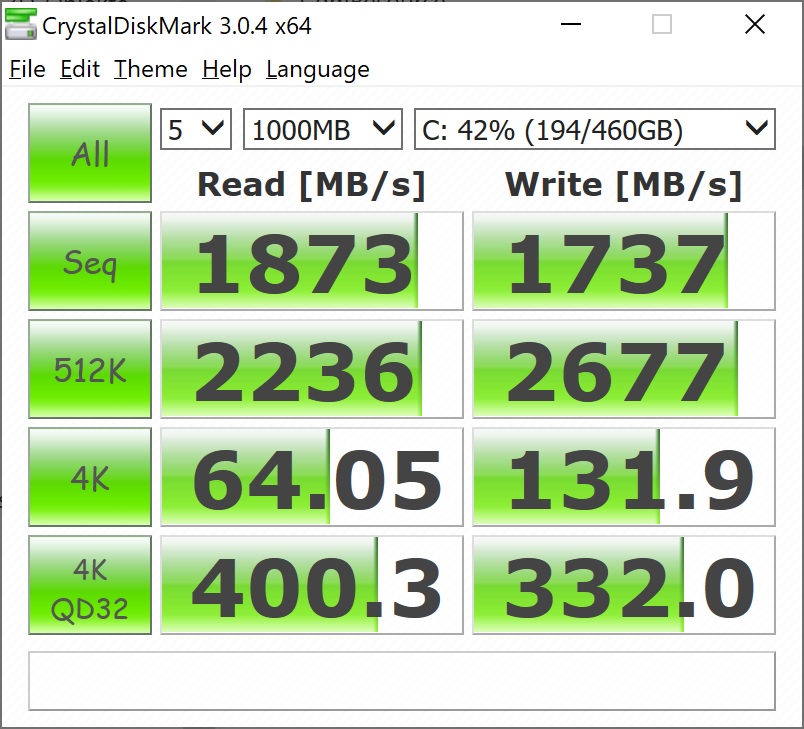
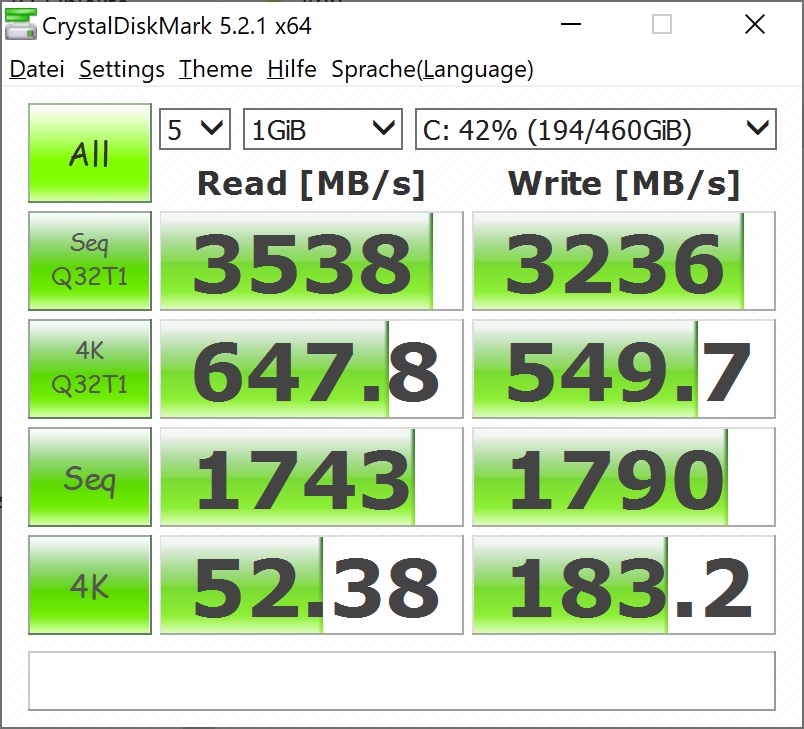
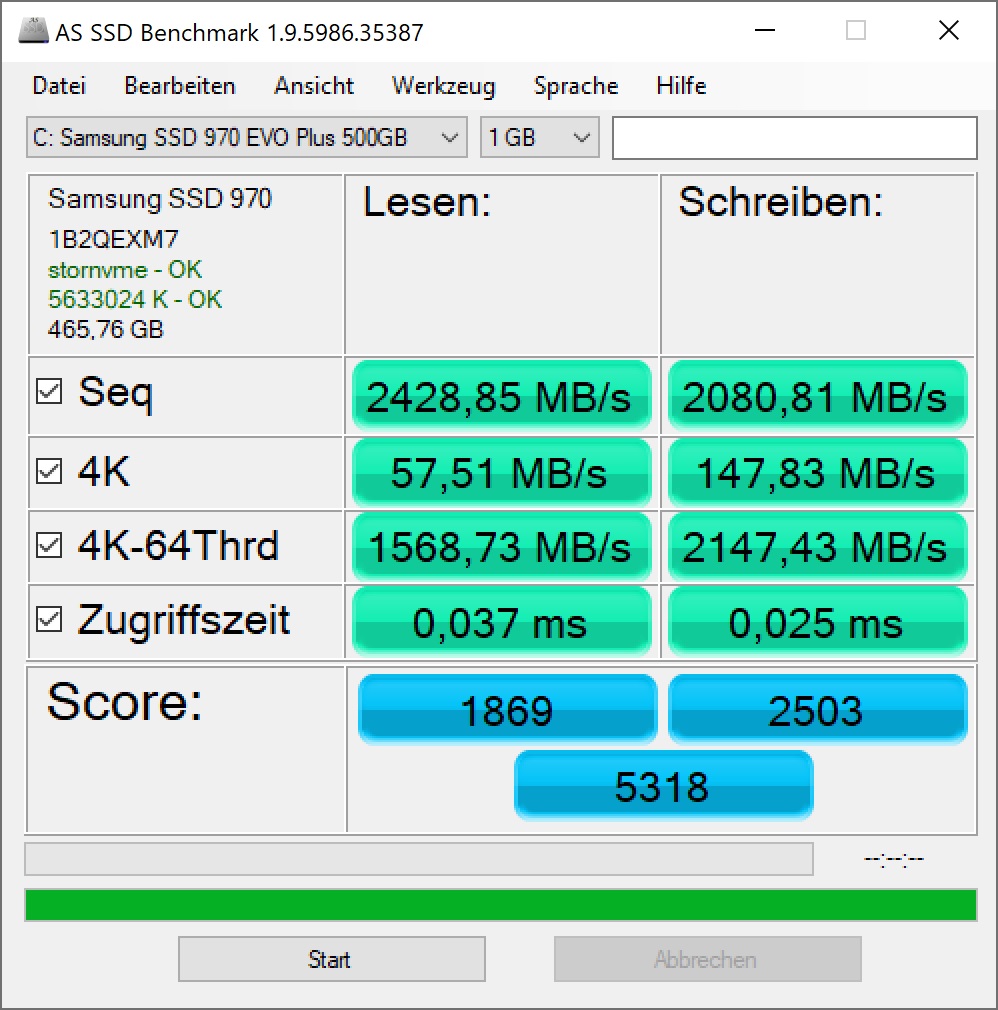
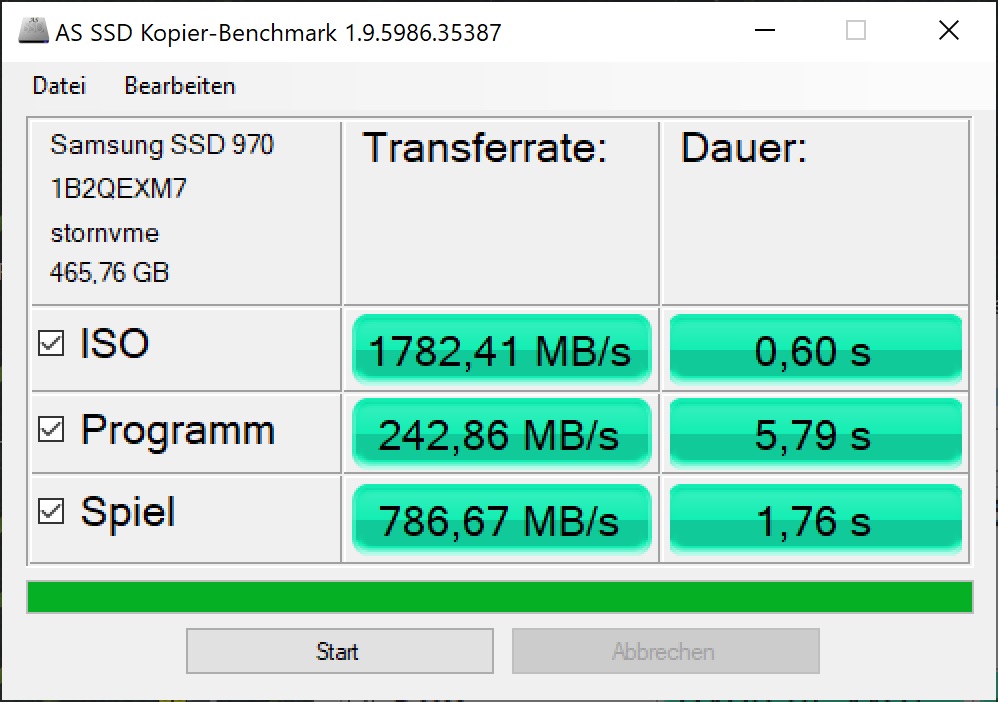
Schenker has equipped the Ultra 17 with two 500 GB Samsung 970 EVO Plus SSDs, which is currently one of the fastest consumer drives on the market. You can find out more information about the 970 EVO Plus in our review or in our HDD/SSD benchmark tables.
The Ultra 17 performed well in both AS SSD and CrystalDiskMark benchmarks, albeit it averaged 5% lower transfer speeds than we would have expected. Our review unit finished between 16% and 31% ahead of our comparison devices in CrystalDiskMark 5.2/6 though, underlining how fast its two SSDs are.
| Schenker XMG Ultra 17 Turing Samsung SSD 970 EVO Plus 500GB | Asus ROG G703GX Samsung SSD PM981 MZVLB512HAJQ | Schenker XMG Ultra 17 Coffee Lake Refresh Samsung SSD 970 Pro 1TB | Acer Predator Triton 500 2x WDC PC SN720 SDAPNTW-256G-1014 (RAID 0) | Razer Blade 15 RTX 2070 Max-Q Samsung SSD PM981 MZVLB512HAJQ | |
|---|---|---|---|---|---|
| CrystalDiskMark 5.2 / 6 | -25% | -16% | -15% | -31% | |
| Write 4K (MB/s) | 183.2 | 90.4 -51% | 129.6 -29% | 93.6 -49% | 93.9 -49% |
| Read 4K (MB/s) | 52.4 | 39.19 -25% | 53.3 2% | 38.82 -26% | 40.56 -23% |
| Write Seq (MB/s) | 1790 | 1863 4% | 1863 4% | 2455 37% | 1468 -18% |
| Read Seq (MB/s) | 1743 | 2100 20% | 1670 -4% | 2107 21% | 1540 -12% |
| Write 4K Q32T1 (MB/s) | 550 | 260.2 -53% | 310 -44% | 298.7 -46% | 293.5 -47% |
| Read 4K Q32T1 (MB/s) | 648 | 297 -54% | 397 -39% | 338.7 -48% | 346 -47% |
| Write Seq Q32T1 (MB/s) | 3236 | 1870 -42% | 2739 -15% | 2902 -10% | 1941 -40% |
| Read Seq Q32T1 (MB/s) | 3538 | 3471 -2% | 3495 -1% | 3536 0% | 3266 -8% |

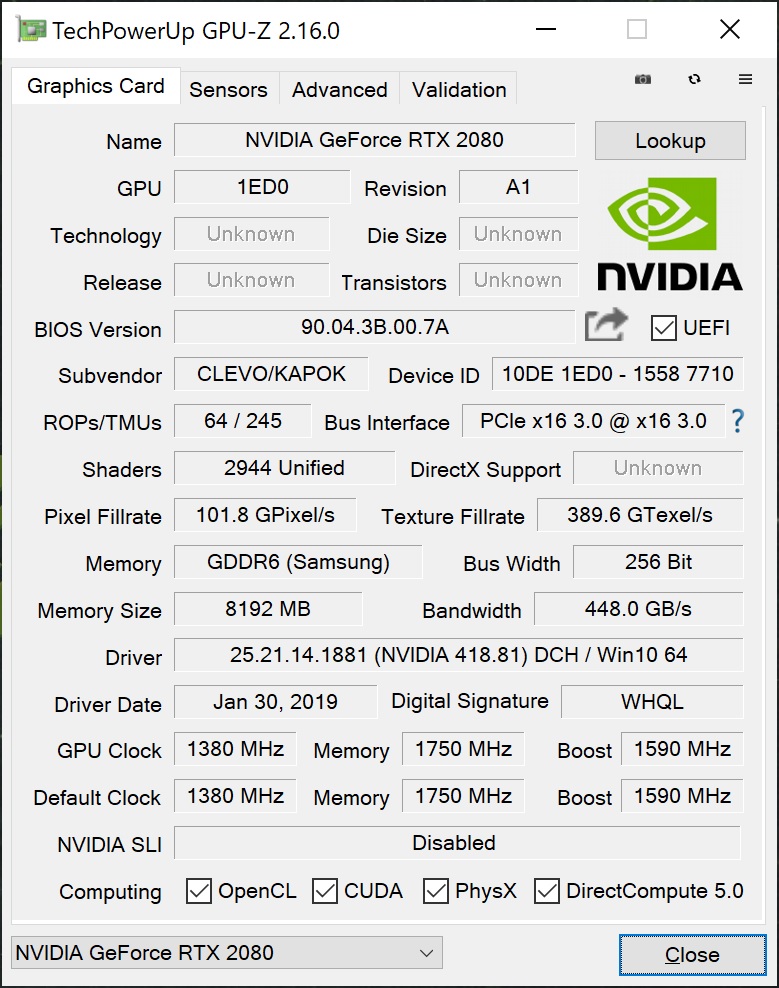
Graphics Card
The GeForce RTX 2080 is currently Nvidia's flagship mobile GPU and is the most-powerful laptop GPU that money can buy. The RTX 2080 has a slightly lower clock speed than its desktop counterpart, while Nvidia has also reduced its thermal design power (TDP) from 215 W to 150 W. Both cards have 8 GB of VRAM and a 256-bit interface, which means that it should be powerful enough to handle all triple-A games at maximum graphics in 4K.
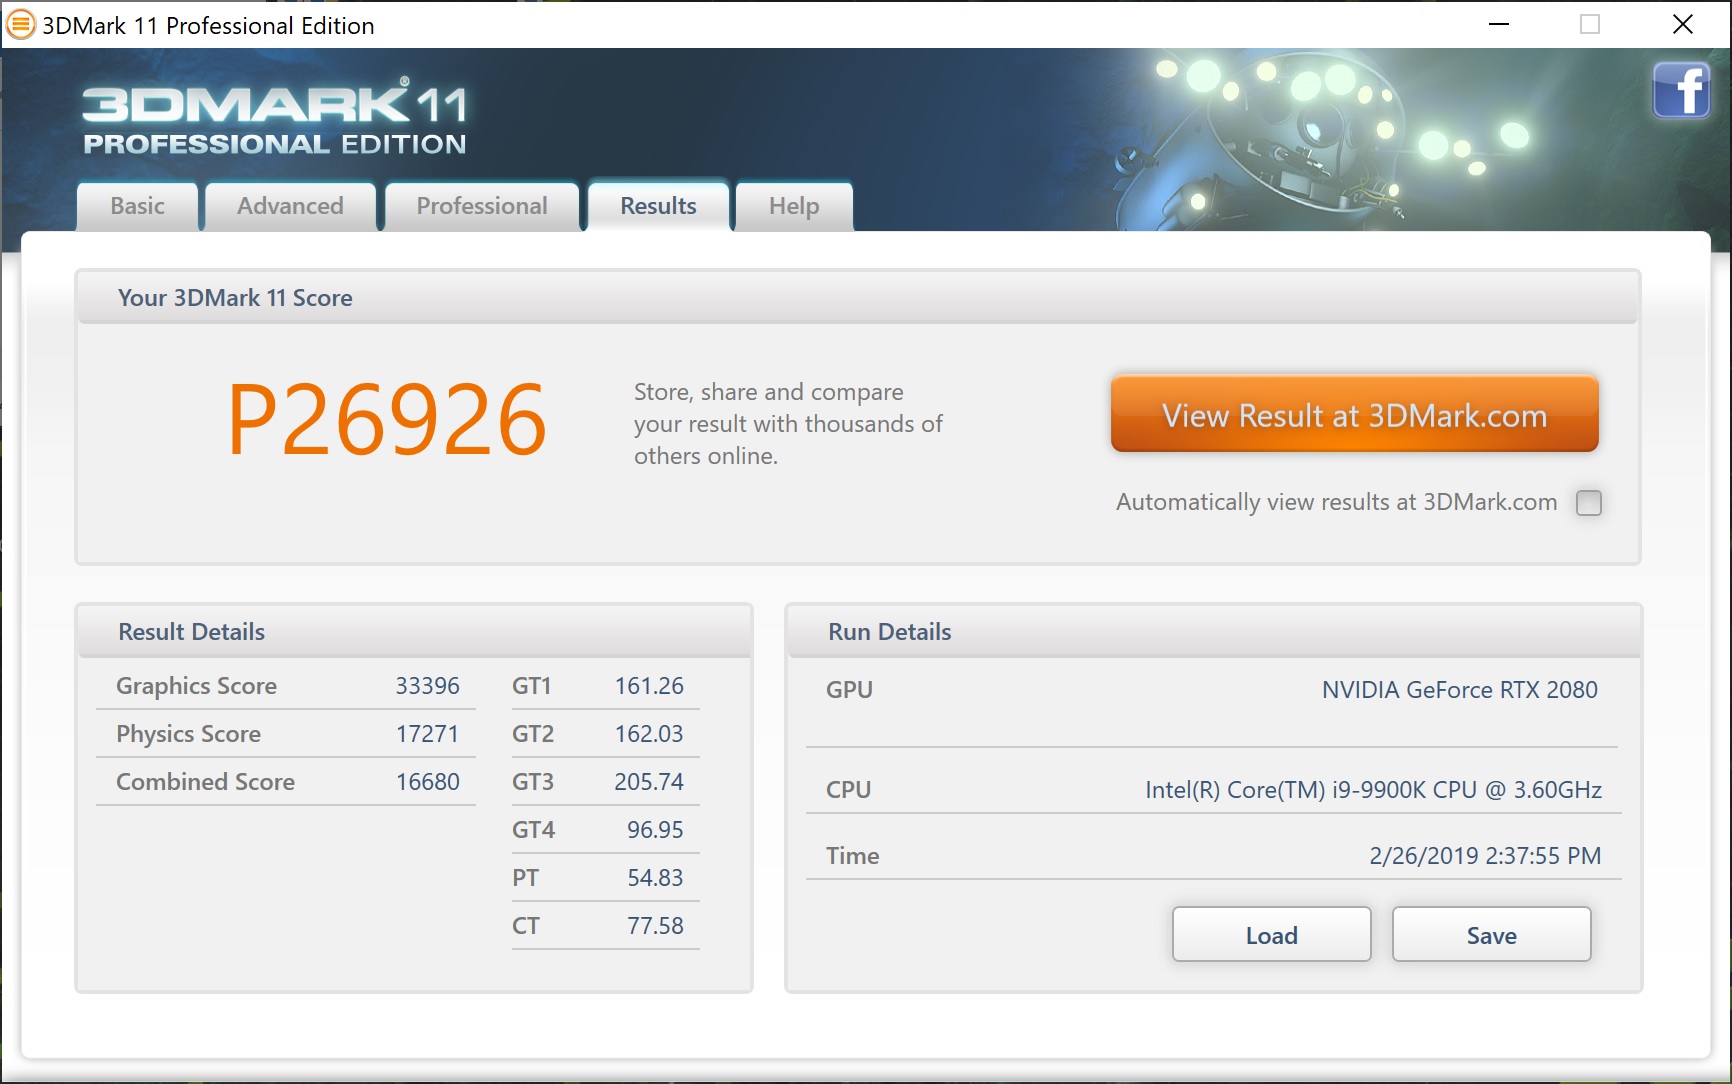
3DMark benchmarks give somewhat contradictory results. While our review unit outscores its predecessor by 17% in 3DMark11, the Predator Triton 500 scored 2% less than the latter despite having a more-powerful GPU. A similar pattern occurs in other 3DMark benchmarks too, although to a smaller extent. In short, it appears that the GeForce RTX 2080 Max-Q cannot outperform the GeForce GTX 1080 in benchmarks.
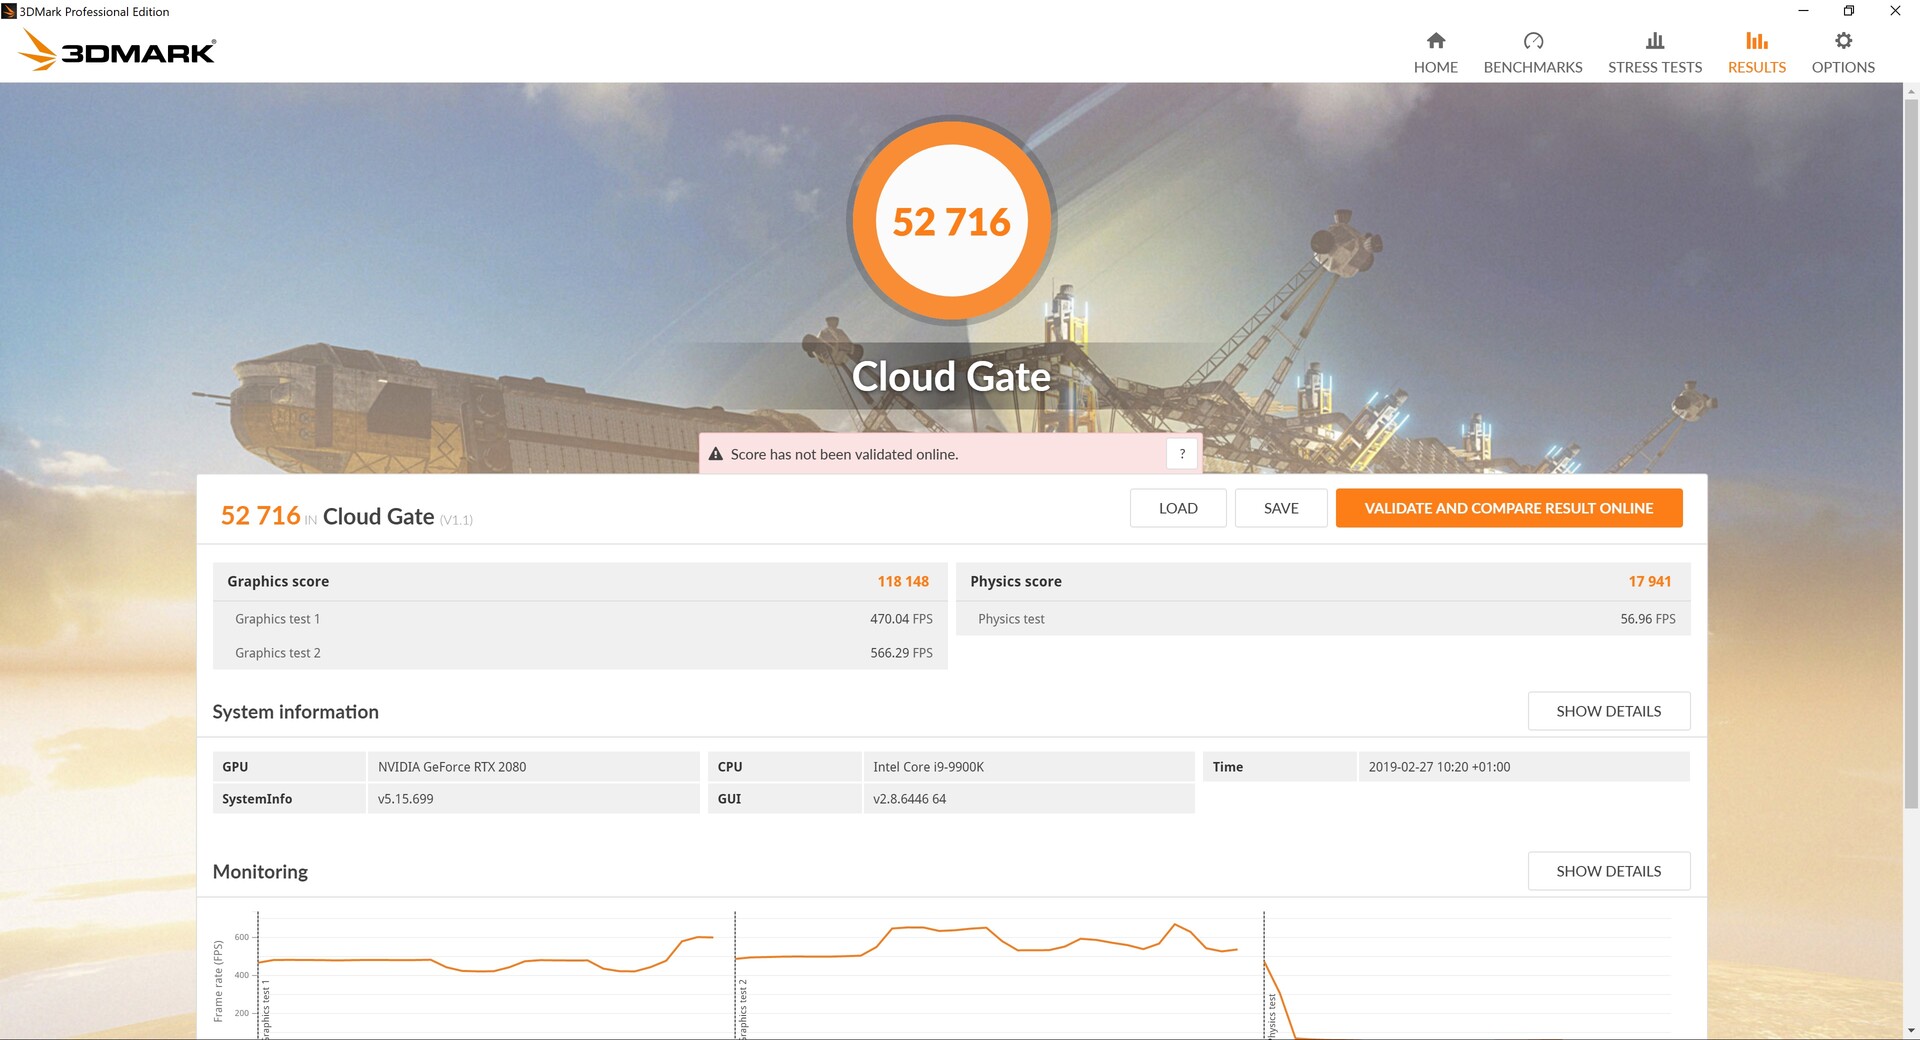
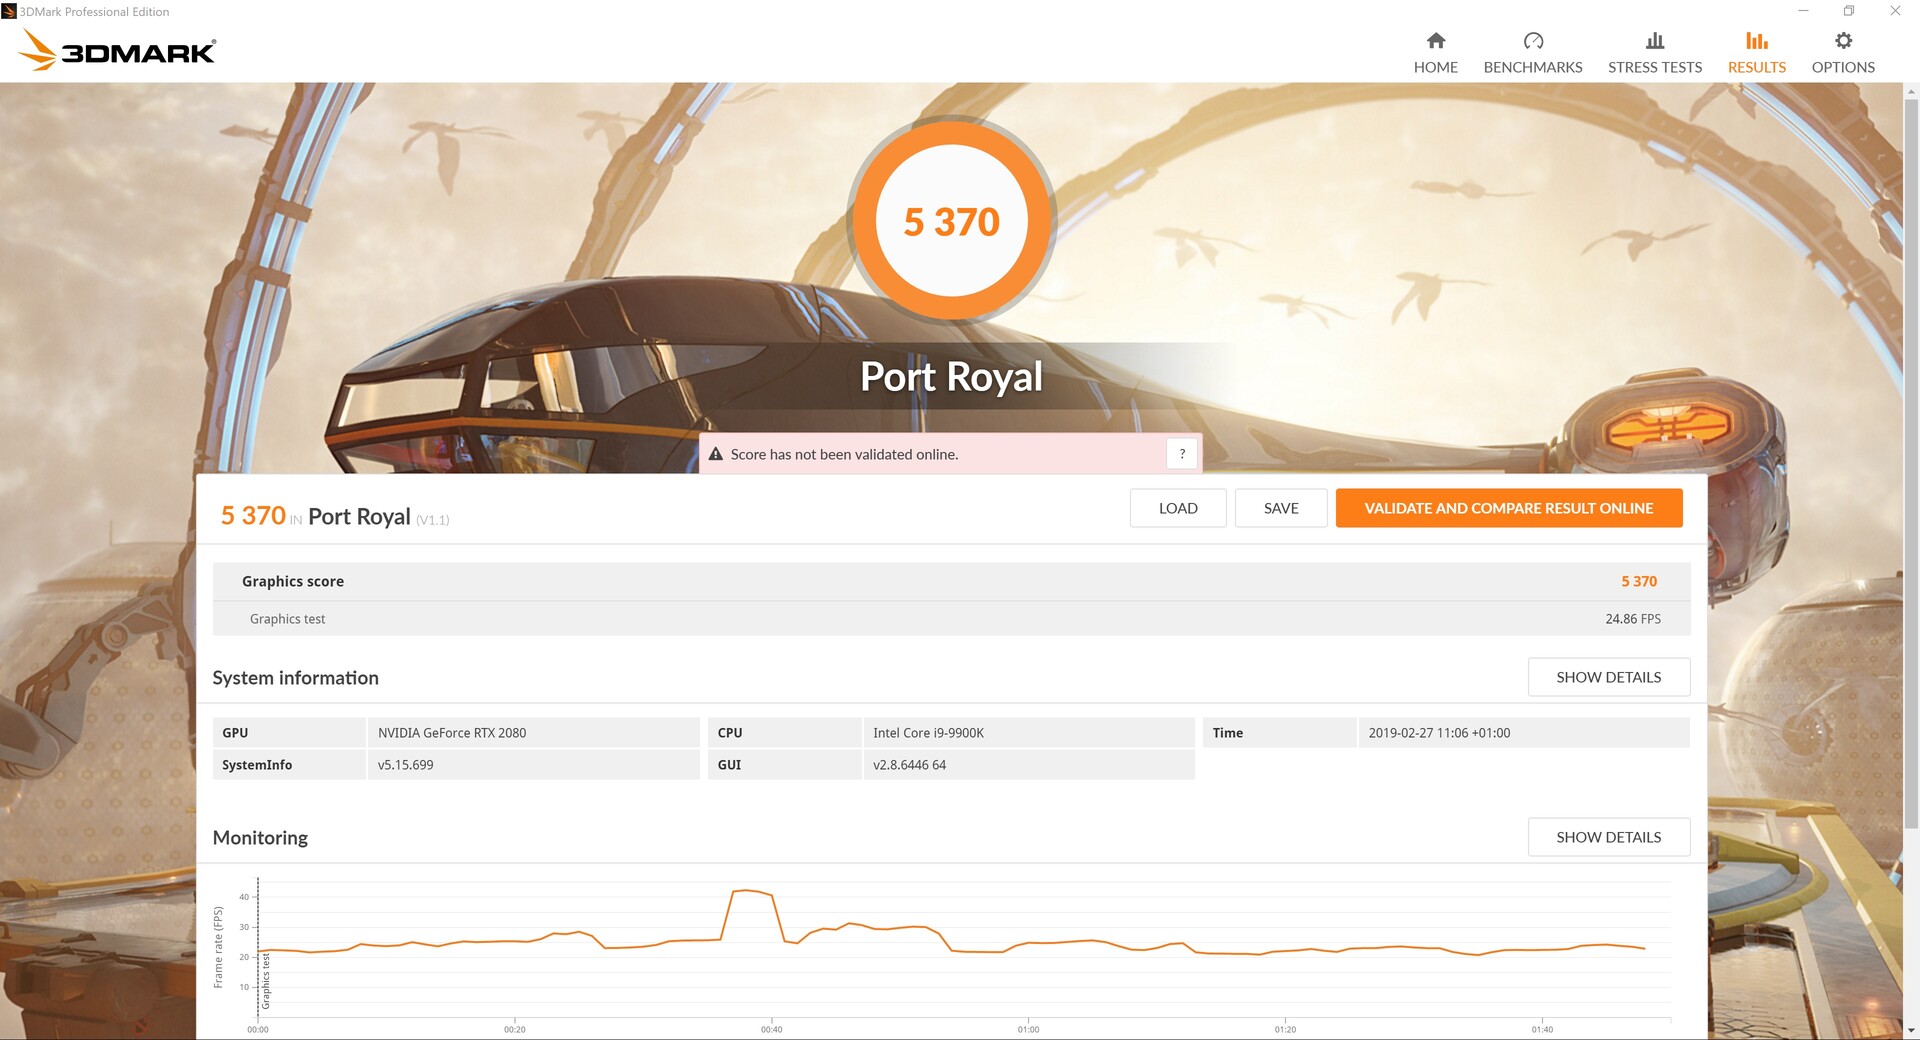
Our review unit falls around 5% short of the ROG G703GX in the Port Royal benchmark, which specifically tests a device’s ray-tracing capabilities. In general, the Ultra 17 falls just short of expected values for an RTX 2080-powered laptop, but not worryingly so.

| 3DMark 11 Performance | 26926 points | |
| 3DMark Cloud Gate Standard Score | 52716 points | |
| 3DMark Fire Strike Score | 20760 points | |
Help | ||
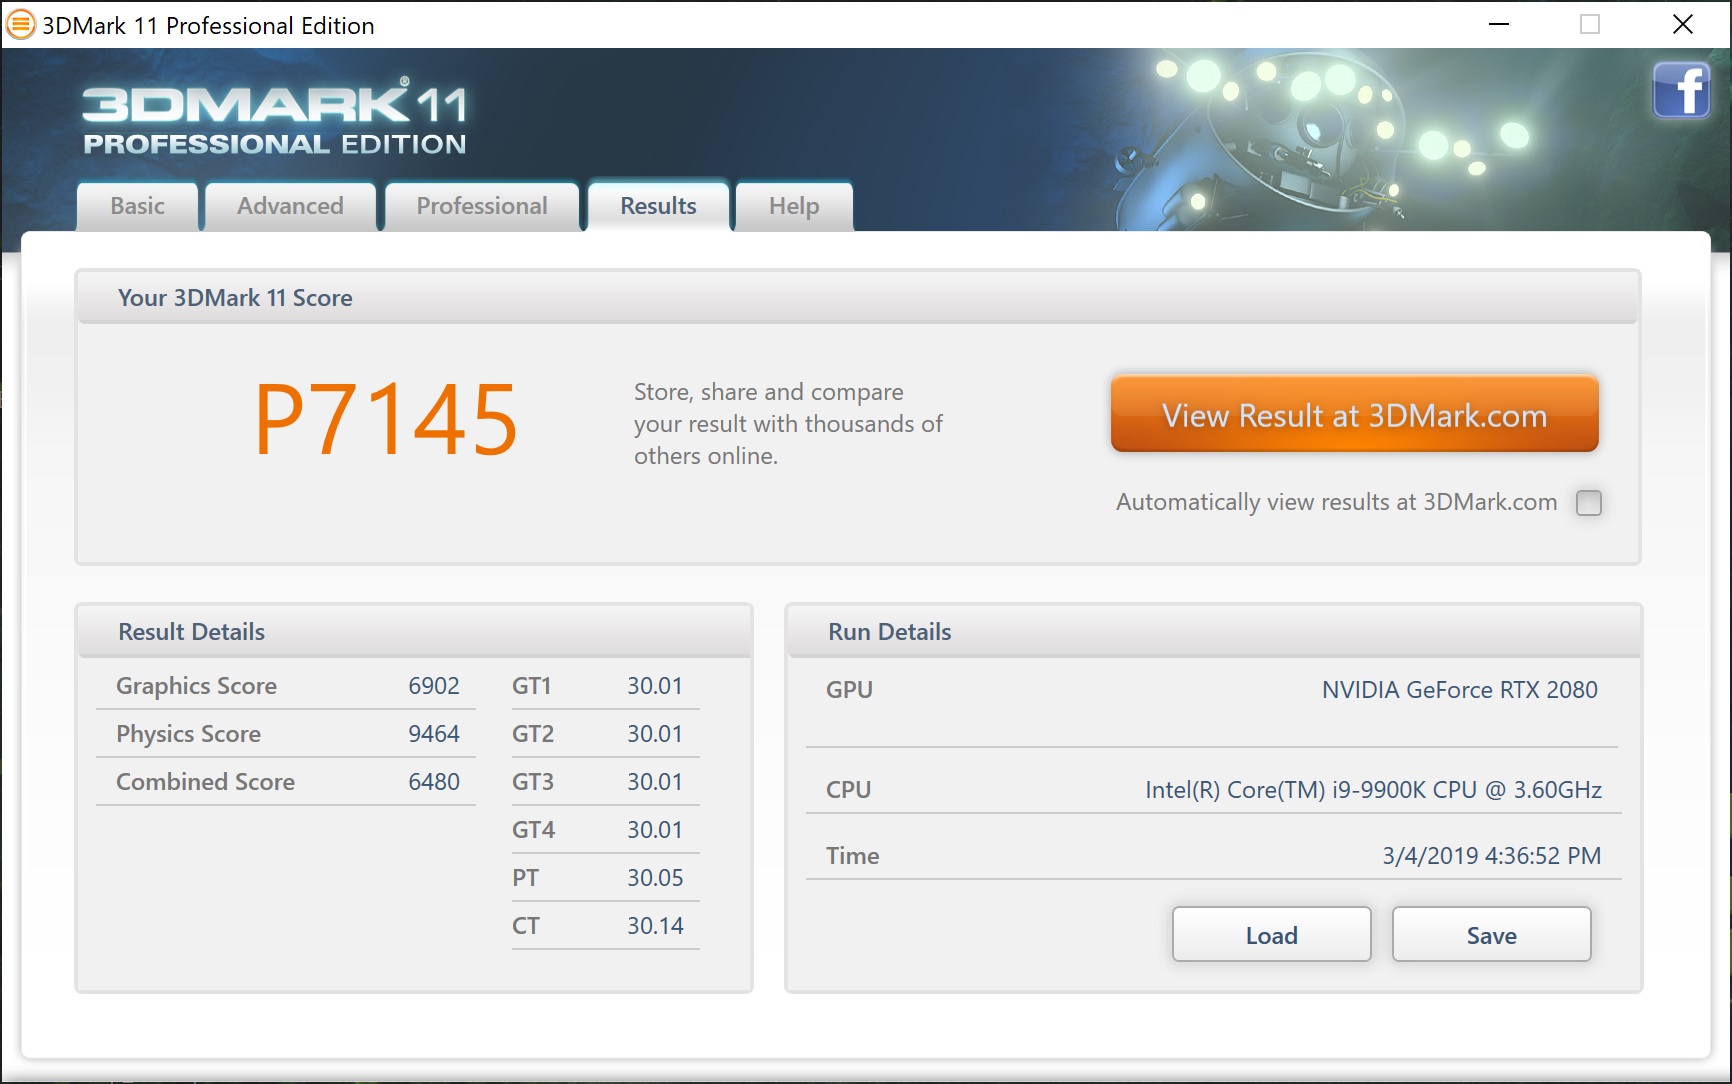
It is worth noting that the GPU throttles even harder than the CPU does. Our review unit scored 26,926 points in 3DMark 11 but only reached 7,145 points on battery, which represents around a 75% loss of performance. We set the power management to maximum performance in both scenarios too. In short, the Ultra 17 throttles so heavily on battery that you will struggle to play even moderately demanding games at enjoyable frame rates.
Gaming Performance
The Ultra 17 performs exceptionally well in games, as you might expect from a laptop featuring a core i9-9900K and an RTX 2080. Modern triple-A titles like The Witcher 3 and Rise of the Tomb Raider cause our review unit to hardly break a sweat even at 4K and maximum graphics. Some games like The Witcher 3 average marginally less than 60 FPS, which may only become an issue if you want to game at high-resolution in VR, for example. Moreover, the Ultra 17 may struggle to play games in 4K with ray-tracing enabled and may require dropping the resolution to 1080p to achieve smooth frame rates.
Our review unit blows away our comparison devices at low resolutions and graphics levels, but it falls short of the ROG G703GX in 4K and maximum graphics. Overall, the RTX 2080 generally achieves around 30% higher frame rates than the RTX 2070 Max-Q in the Razer Blade 15.
| The Witcher 3 | |
| 1920x1080 High Graphics & Postprocessing (Nvidia HairWorks Off) | |
| Average of class Gaming (n=1last 2 years) | |
| Asus ROG G703GX | |
| Acer Predator Triton 500 | |
| Schenker XMG Ultra 17 Turing | |
| Razer Blade 15 RTX 2070 Max-Q | |
| 1920x1080 Ultra Graphics & Postprocessing (HBAO+) | |
| Average of class Gaming (104.7 - 240, n=6, last 2 years) | |
| Asus ROG G703GX | |
| Schenker XMG Ultra 17 Turing | |
| Acer Predator Triton 500 | |
| Razer Blade 15 RTX 2070 Max-Q | |
| Schenker XMG Ultra 17 Coffee Lake Refresh | |
| Rise of the Tomb Raider | |
| 1920x1080 Very High Preset AA:FX AF:16x | |
| Schenker XMG Ultra 17 Turing | |
| Razer Blade 15 RTX 2070 Max-Q | |
| 1920x1080 High Preset AA:FX AF:4x | |
| Schenker XMG Ultra 17 Turing | |
| Razer Blade 15 RTX 2070 Max-Q | |
| Doom | |
| 1920x1080 Ultra Preset AA:SM | |
| Schenker XMG Ultra 17 Turing | |
| 1920x1080 High Preset AA:FX | |
| Schenker XMG Ultra 17 Turing | |
We also subjected the Ultra 17 to an hour-long play-through of The Witcher 3, to see whether it could maintain its initial frame rates over a prolonged period. Perhaps expectedly, our review unit does so and even achieves higher frame rates by the end of our gaming test than it did at the start. The device averages around 40 FPS more than its predecessor too.
| low | med. | high | ultra | 4K | |
|---|---|---|---|---|---|
| The Witcher 3 (2015) | 335.4 | 266.8 | 135.6 | 94.5 | 55.8 |
| Rise of the Tomb Raider (2016) | 275.8 | 207.8 | 168.2 | 144.3 | 64.4 |
| Doom (2016) | 176.8 | 171.2 | 161.3 | 159.7 | 91.8 |
Emissions
Fan Noise
The Ultra 17 is no silent assassin. While our review unit often gets as loud as the ROG G703GX, its fans reach a maximum of 58 dB(A) in games like The Witcher 3, which is 6 dB(A) more than the ROG G703GX reached. In short, we would suggest using headphones or connecting the Ultra 17 to external speakers while gaming because the fans will drown out the speakers.
We found the speakers annoying during our tests not because of their pitch or frequency but because of their propensity to ramp up aggressively under low load. Schenker should adjust the Ultra 17’s fan curve in our opinion as the fans could be quieter than they currently are with no consequences.
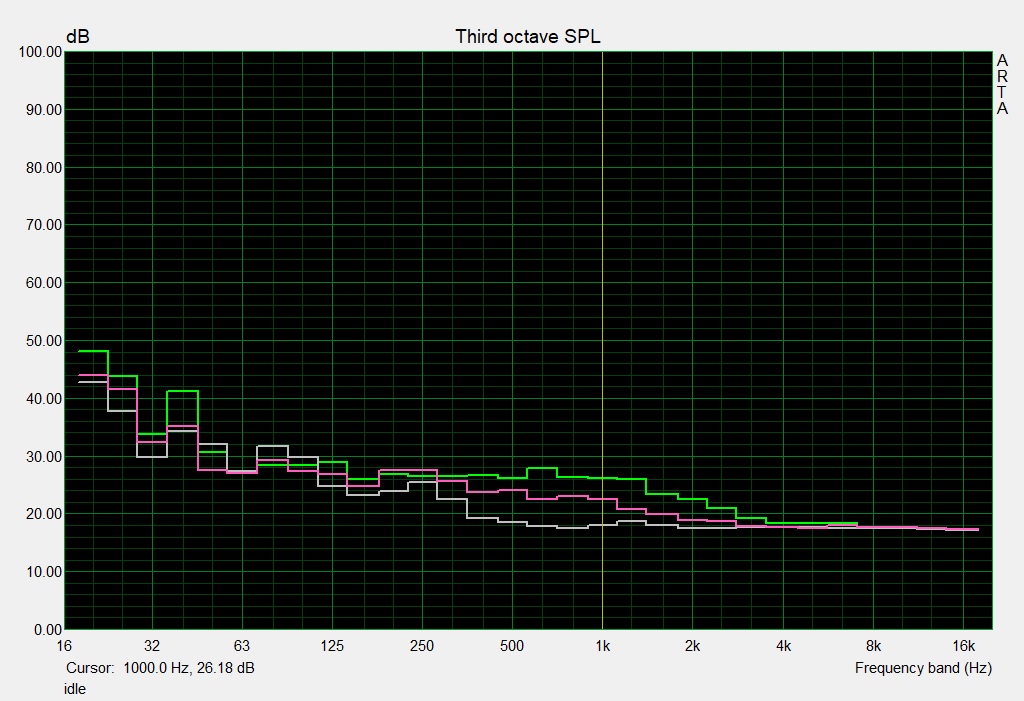
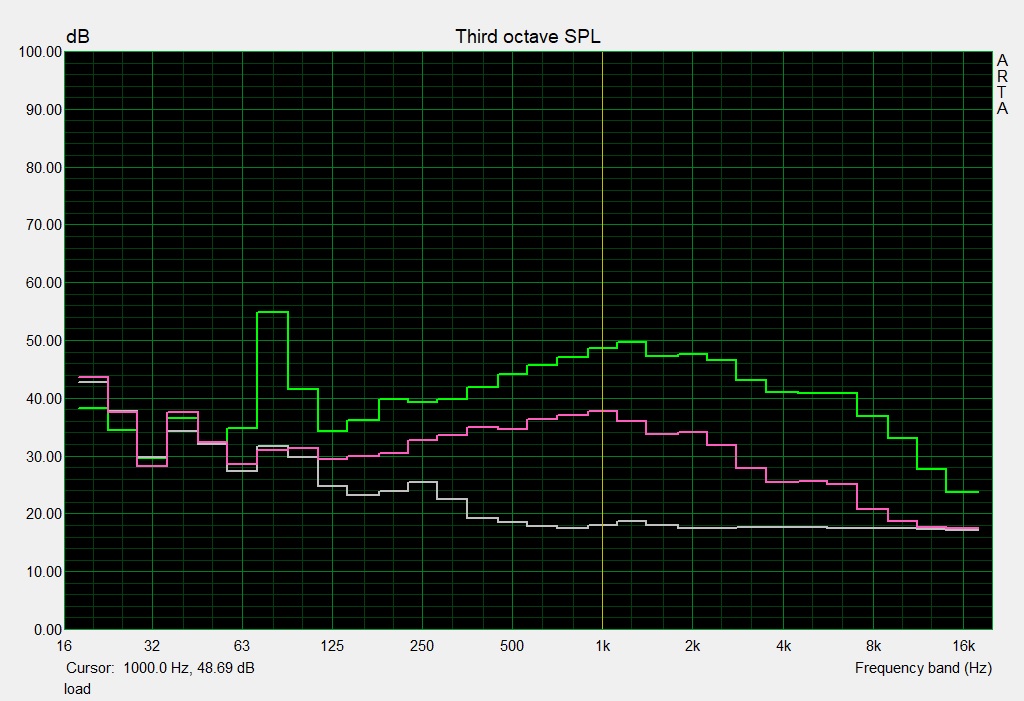
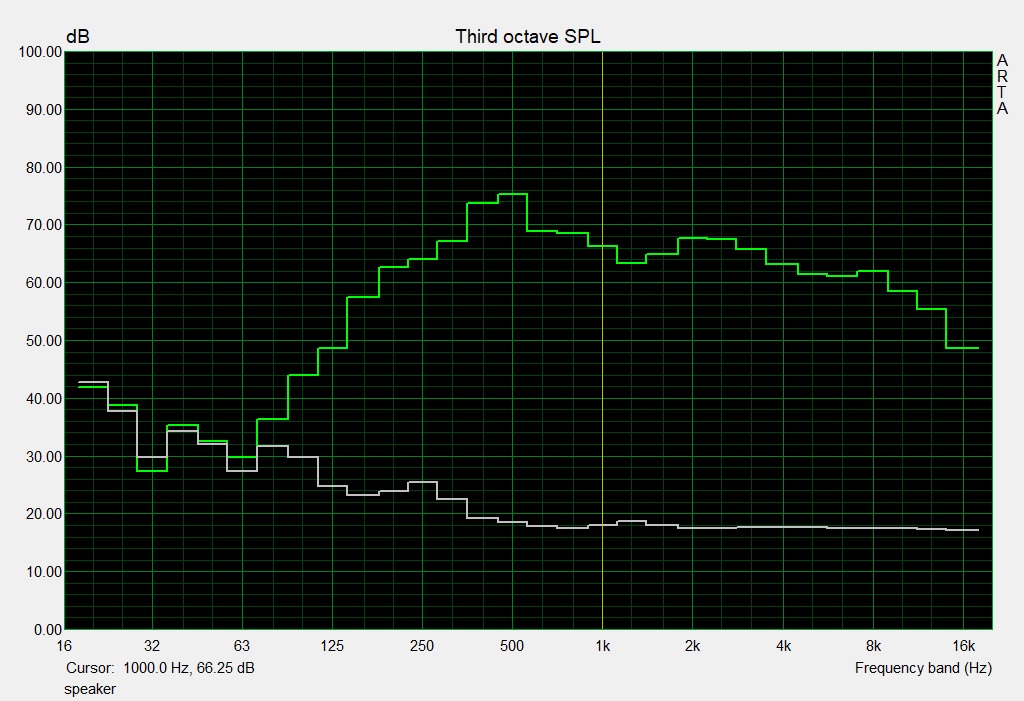
Noise level
| Idle |
| 30 / 33 / 35 dB(A) |
| Load |
| 44 / 58 dB(A) |
 | ||
30 dB silent 40 dB(A) audible 50 dB(A) loud |
||
min: | ||
| Schenker XMG Ultra 17 Turing GeForce RTX 2080 Mobile, i9-9900K | Asus ROG G703GX GeForce RTX 2080 Mobile, i7-8750H | Schenker XMG Ultra 17 Coffee Lake Refresh GeForce GTX 1080 Mobile, i9-9900K | Acer Predator Triton 500 GeForce RTX 2080 Max-Q, i7-8750H | Razer Blade 15 RTX 2070 Max-Q GeForce RTX 2070 Max-Q, i7-8750H | |
|---|---|---|---|---|---|
| Noise | -1% | -5% | 6% | 14% | |
| off / environment * (dB) | 30 | 30 -0% | 30 -0% | 29 3% | 28.8 4% |
| Idle Minimum * (dB) | 30 | 30 -0% | 33 -10% | 30 -0% | 28.8 4% |
| Idle Average * (dB) | 33 | 35 -6% | 35 -6% | 32 3% | 28.8 13% |
| Idle Maximum * (dB) | 35 | 41 -17% | 43 -23% | 34 3% | 29.4 16% |
| Load Average * (dB) | 44 | 44 -0% | 43 2% | 44 -0% | 35.7 19% |
| Witcher 3 ultra * (dB) | 55 | 51 7% | 53 4% | 46 16% | 42.5 23% |
| Load Maximum * (dB) | 58 | 52 10% | 59 -2% | 47 19% | 45 22% |
* ... smaller is better
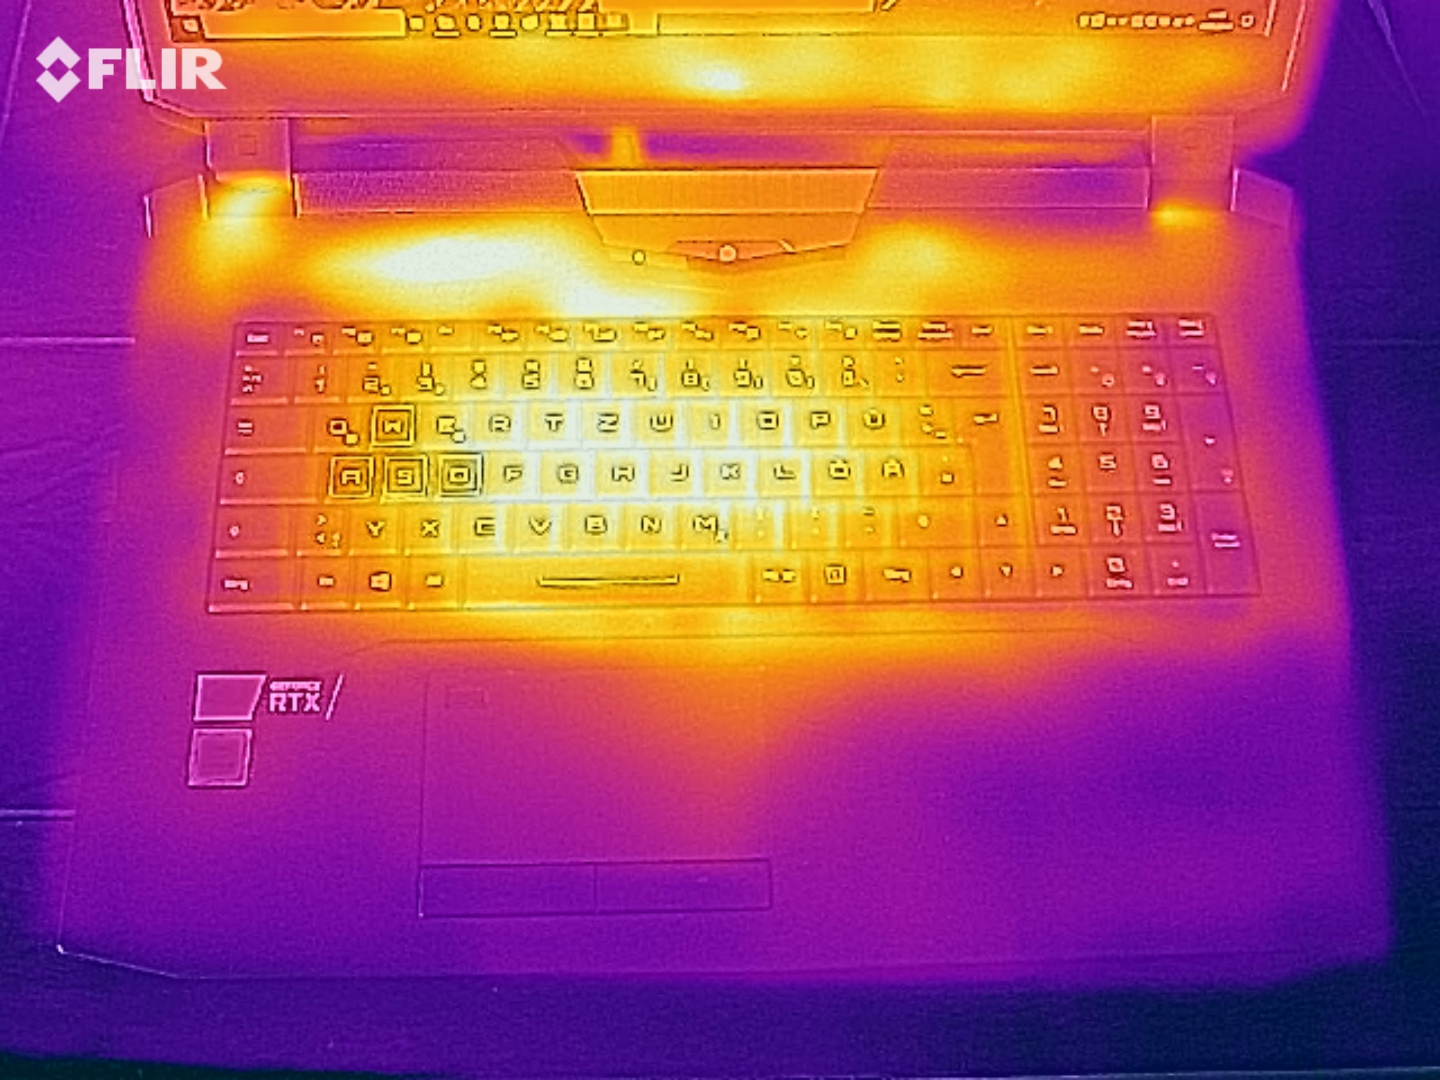
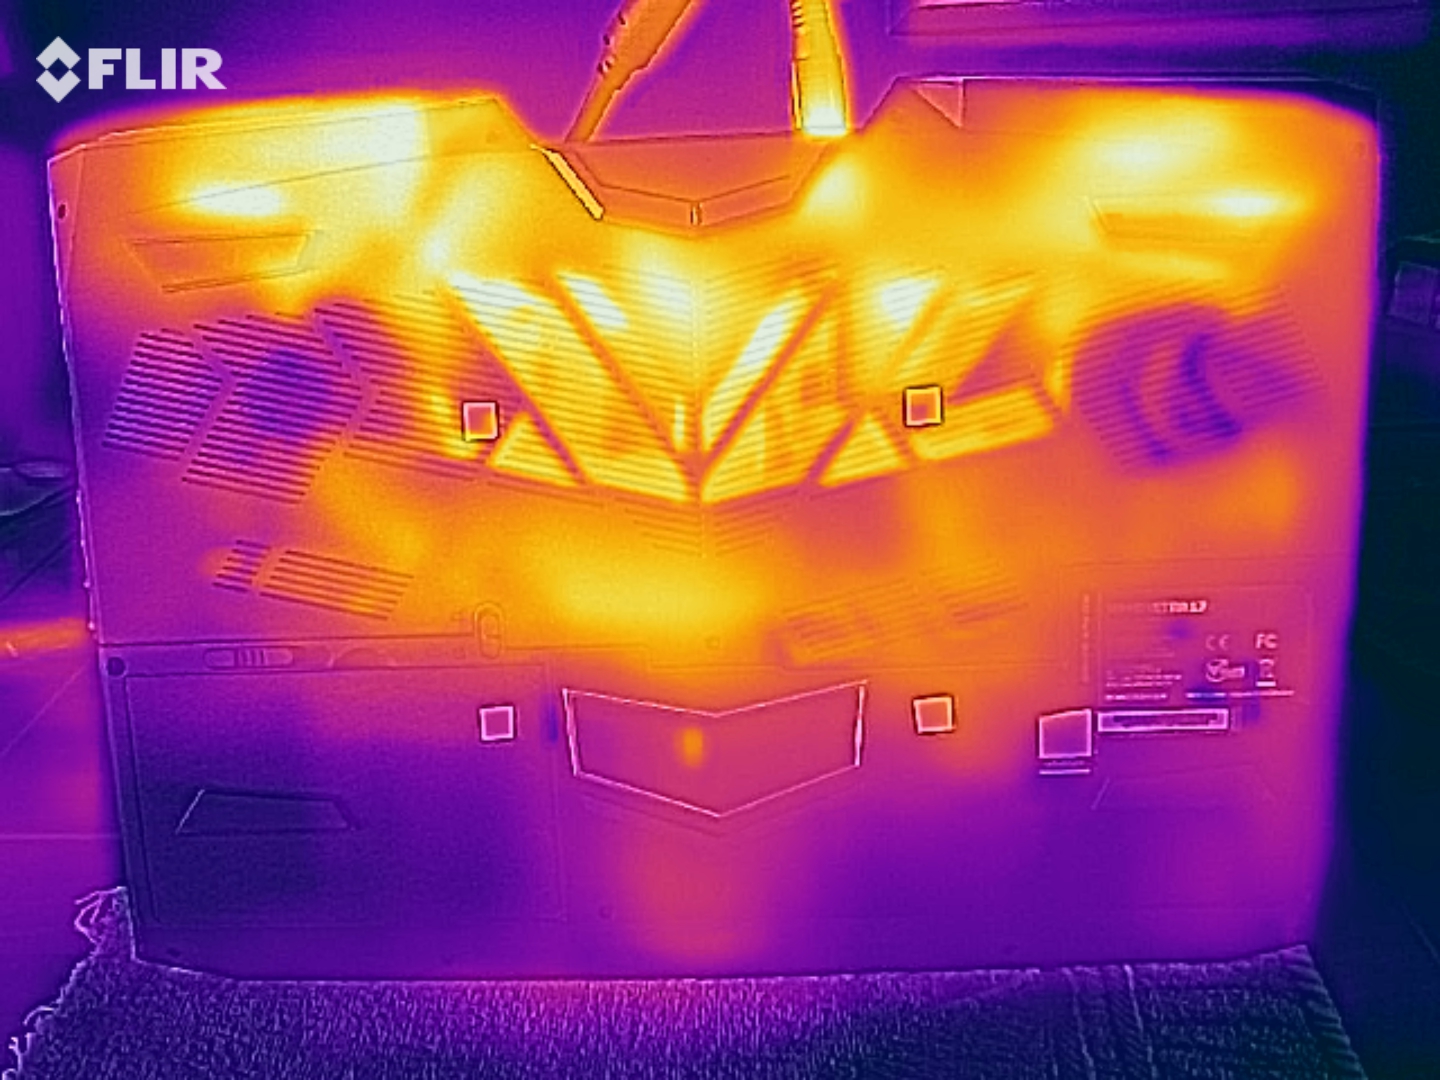
Temperature
The Ultra 17 is a comparatively cool gaming laptop. Surface temperatures on our review unit never exceeded 46 °C during our tests, which makes the device cooler than the ROG G703GX. Likewise, the palm rest remains pleasantly cool even when the device is being pushed hard, although the keyboard will feel warm to the touch apart from the WASD keys. Overall, we are impressed at how well the Ultra 17 manages its temperatures, albeit this comes at the cost of intrusive fan noise.
| Schenker XMG Ultra 17 Turing GeForce RTX 2080 Mobile, i9-9900K | Asus ROG G703GX GeForce RTX 2080 Mobile, i7-8750H | Schenker XMG Ultra 17 Coffee Lake Refresh GeForce GTX 1080 Mobile, i9-9900K | Acer Predator Triton 500 GeForce RTX 2080 Max-Q, i7-8750H | Razer Blade 15 RTX 2070 Max-Q GeForce RTX 2070 Max-Q, i7-8750H | |
|---|---|---|---|---|---|
| Heat | -1% | 3% | -8% | 7% | |
| Maximum Upper Side * (°C) | 45 | 50 -11% | 44 2% | 49 -9% | 49 -9% |
| Maximum Bottom * (°C) | 45 | 50 -11% | 45 -0% | 58 -29% | 49 -9% |
| Idle Upper Side * (°C) | 36 | 30 17% | 32 11% | 33 8% | 25.4 29% |
| Idle Bottom * (°C) | 33 | 33 -0% | 33 -0% | 33 -0% | 27.2 18% |
* ... smaller is better
(±) The maximum temperature on the upper side is 45 °C / 113 F, compared to the average of 40.4 °C / 105 F, ranging from 21.2 to 68.8 °C for the class Gaming.
(±) The bottom heats up to a maximum of 45 °C / 113 F, compared to the average of 43.2 °C / 110 F
(+) In idle usage, the average temperature for the upper side is 31.1 °C / 88 F, compared to the device average of 33.9 °C / 93 F.
(±) Playing The Witcher 3, the average temperature for the upper side is 34.9 °C / 95 F, compared to the device average of 33.9 °C / 93 F.
(+) The palmrests and touchpad are cooler than skin temperature with a maximum of 31 °C / 87.8 F and are therefore cool to the touch.
(-) The average temperature of the palmrest area of similar devices was 28.8 °C / 83.8 F (-2.2 °C / -4 F).
Stress Test
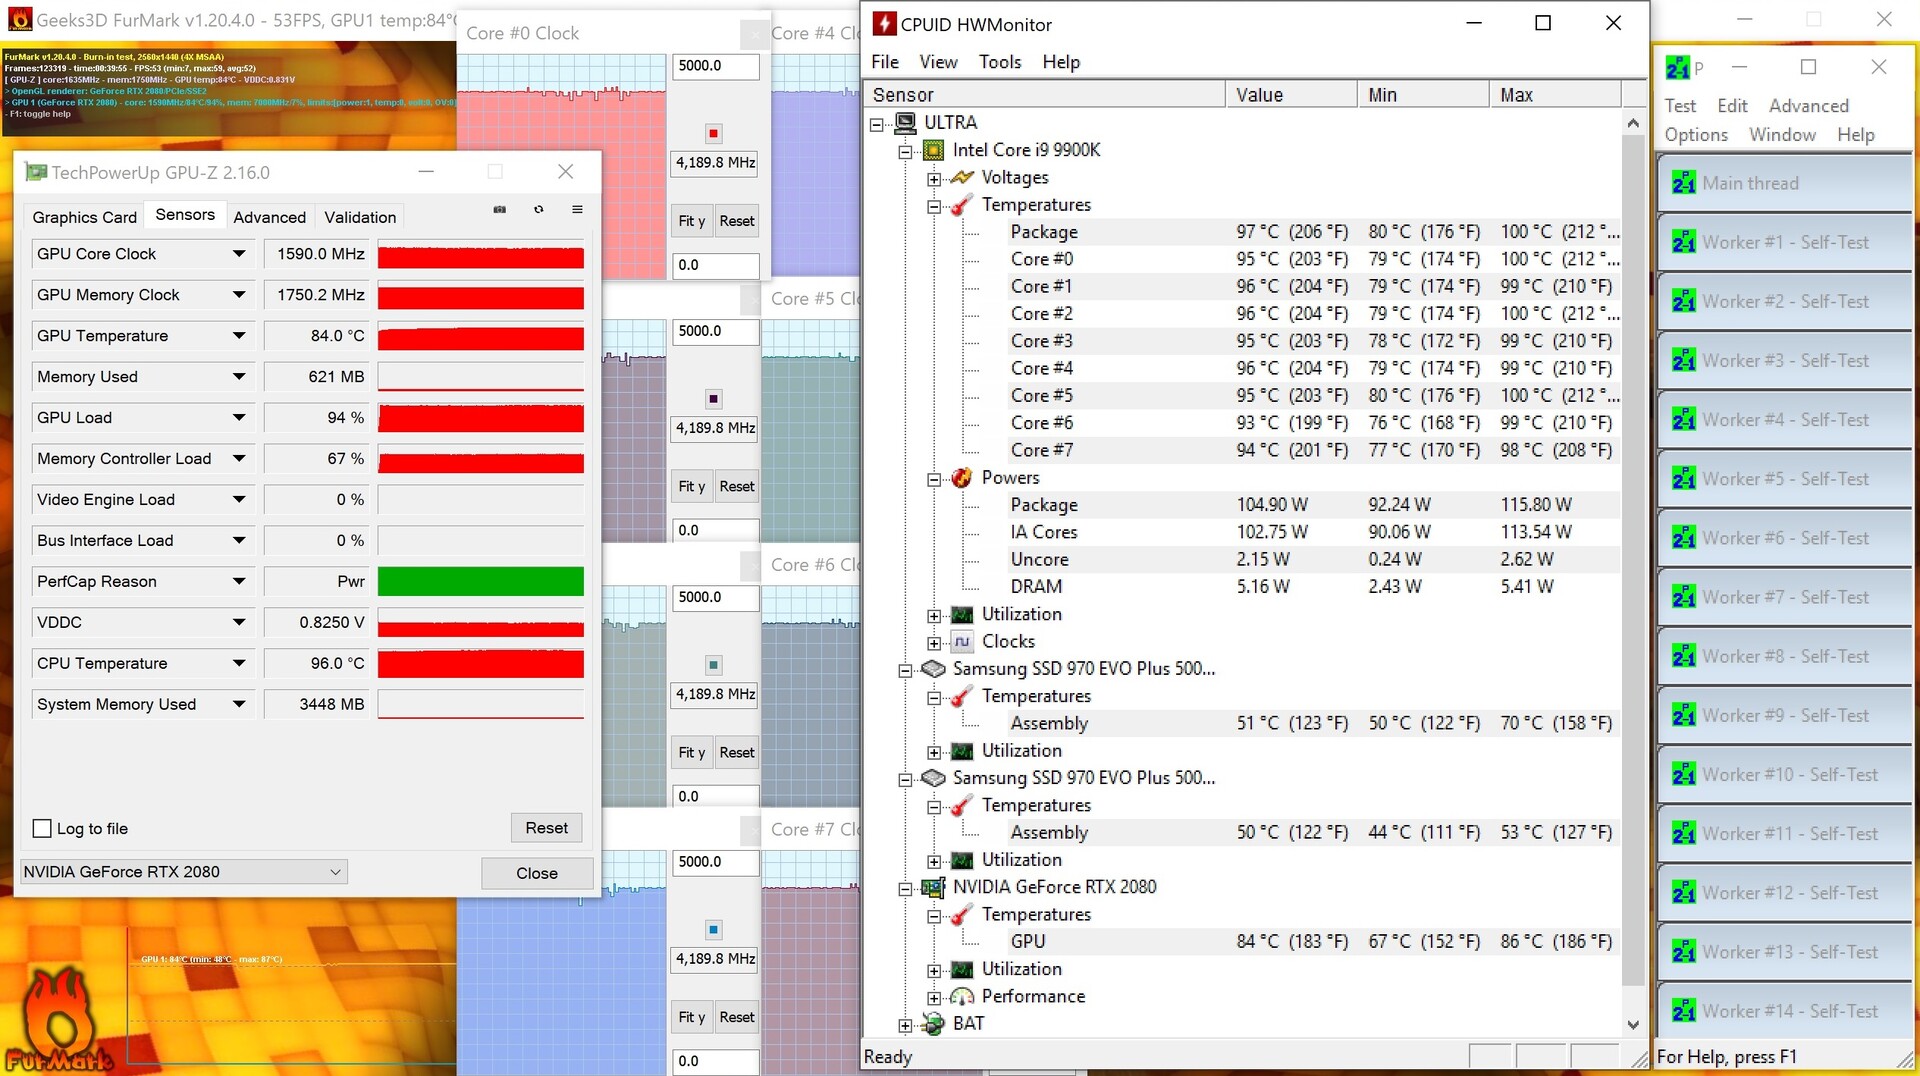
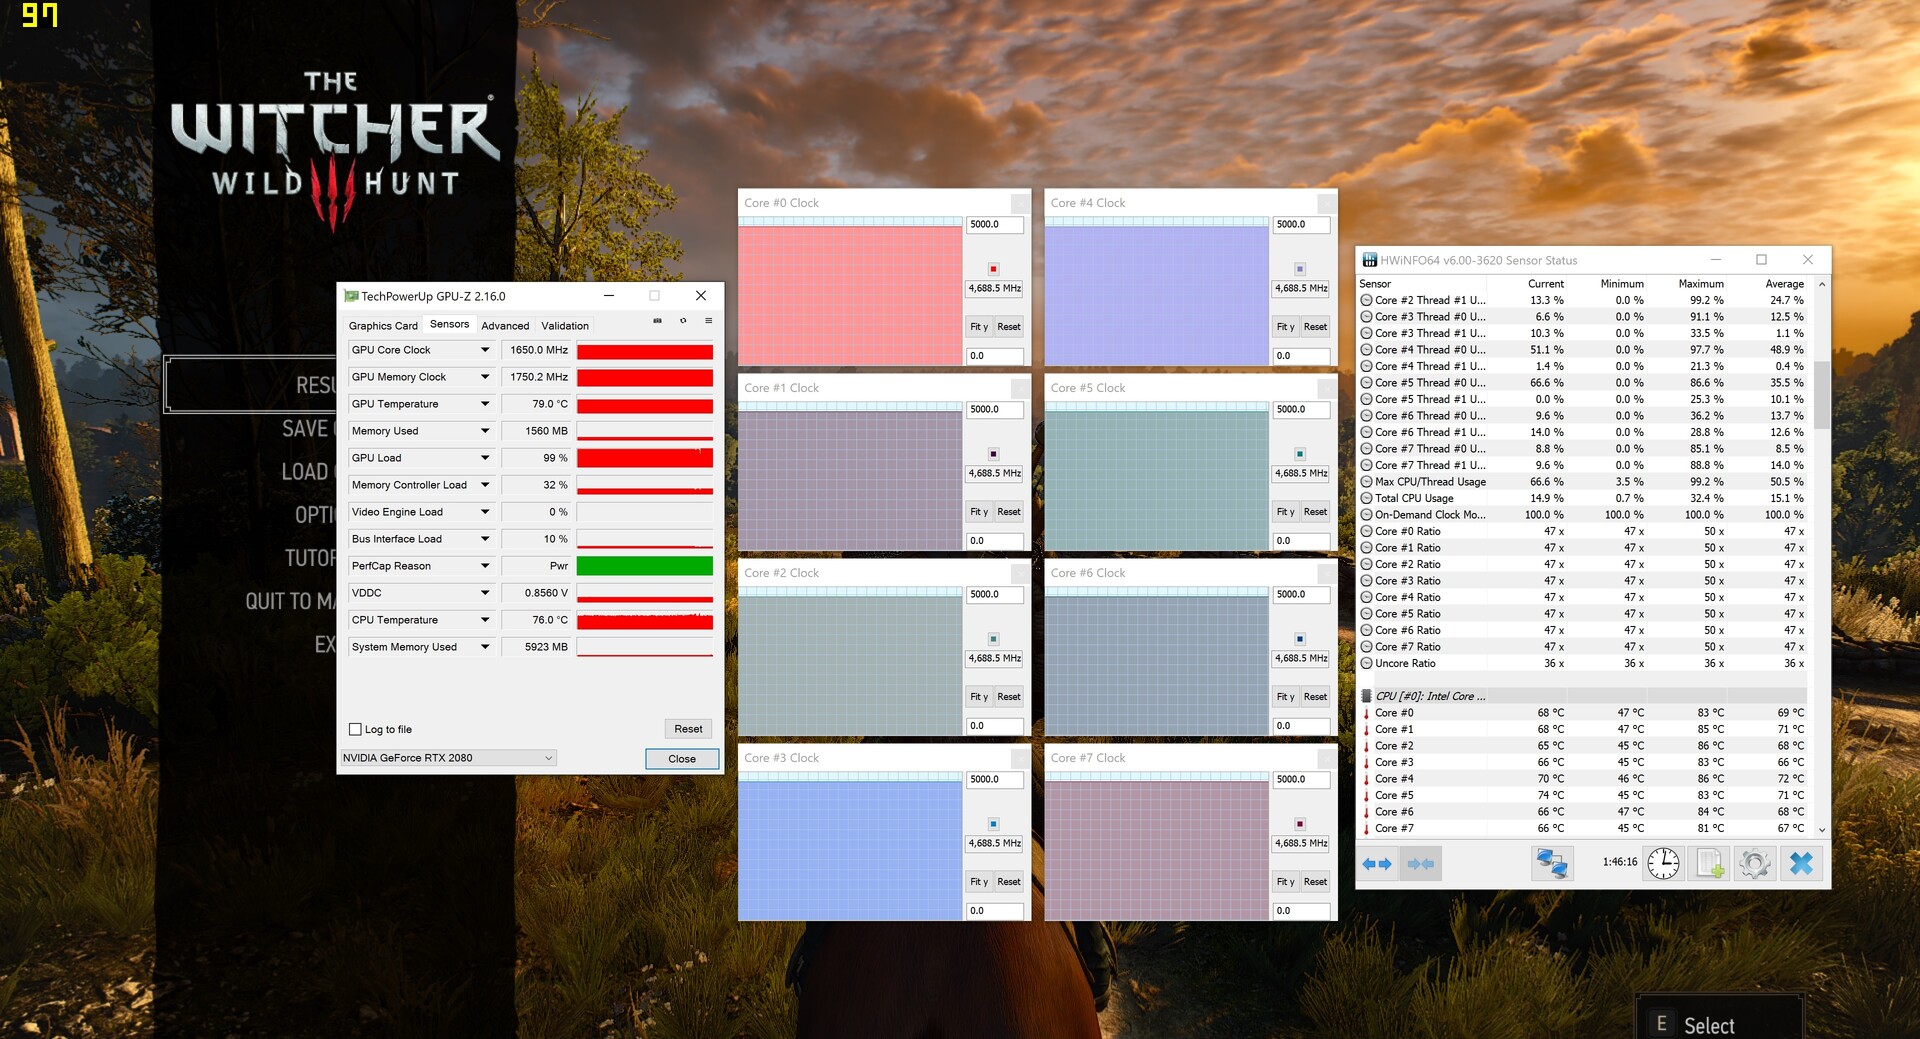
We also subjected our review unit to a stress test to determine whether the system throttles under extreme load. We run FurMark and Prime95 in parallel for an hour, during which the CPU averaged 4.2 GHz, which is well above its base clock speed. The fans reached 58 dB(A) too, which helped keep CPU core temperatures to around 95 °C, which is a few degrees short of its 100 °C Tjunction Max, which is the temperature at which the CPU will thermal throttle.
The GPU does not thermal throttle either, although it cannot operate at its boost clock speed. It averaged around 60 MHz less during our stress test than it did in our The Witcher 3 test, while its core temperatures averaged 84 °C. In short, the Ultra 17 manages its internal temperatures well too.
Speakers
Considering the power and technology that manufacturers can now cram into small Bluetooth speakers, it is puzzling to see so many large laptops with disappointing speaker systems. The Ultra 17 has a 2.1 speaker system that looks promising on paper, but it could only partially meet our expectations during our tests. While its subwoofer delivers some bass frequencies, the speakers do not sound any fuller than laptops with decent stereo speakers. In short, the speakers are not a flop, but they should deliver better low frequencies than they currently do.
Fortunately, the Ultra 17 has plenty of audio outputs to connect headphones, microphones or speakers. You could connect the laptop to Bluetooth headphones or speakers too, which should work well thanks to support for Bluetooth 5.
Schenker XMG Ultra 17 Turing audio analysis
(±) | speaker loudness is average but good (79 dB)
Bass 100 - 315 Hz
(±) | reduced bass - on average 7.1% lower than median
(±) | linearity of bass is average (11.6% delta to prev. frequency)
Mids 400 - 2000 Hz
(±) | higher mids - on average 5% higher than median
(+) | mids are linear (6.3% delta to prev. frequency)
Highs 2 - 16 kHz
(+) | balanced highs - only 2.6% away from median
(+) | highs are linear (3.3% delta to prev. frequency)
Overall 100 - 16.000 Hz
(+) | overall sound is linear (13.6% difference to median)
Compared to same class
» 20% of all tested devices in this class were better, 7% similar, 73% worse
» The best had a delta of 6%, average was 18%, worst was 132%
Compared to all devices tested
» 15% of all tested devices were better, 4% similar, 82% worse
» The best had a delta of 4%, average was 23%, worst was 134%
Schenker XMG Ultra 17 Coffee Lake Refresh audio analysis
(±) | speaker loudness is average but good (80 dB)
Bass 100 - 315 Hz
(±) | reduced bass - on average 5.4% lower than median
(±) | linearity of bass is average (13% delta to prev. frequency)
Mids 400 - 2000 Hz
(±) | higher mids - on average 7.1% higher than median
(±) | linearity of mids is average (8% delta to prev. frequency)
Highs 2 - 16 kHz
(+) | balanced highs - only 1.9% away from median
(+) | highs are linear (3.2% delta to prev. frequency)
Overall 100 - 16.000 Hz
(+) | overall sound is linear (13.2% difference to median)
Compared to same class
» 19% of all tested devices in this class were better, 4% similar, 77% worse
» The best had a delta of 6%, average was 18%, worst was 132%
Compared to all devices tested
» 13% of all tested devices were better, 3% similar, 84% worse
» The best had a delta of 4%, average was 23%, worst was 134%
Power Management
Power Consumption
We expected the Ultra 17 to have high power consumption because of its powerful components, and it did not disappoint. Our review unit consumed a minimum of 39 W at idle, which rose to 346 W during our stress test and 259 W while playing The Witcher 3. In short, look elsewhere if you want a gaming laptop that is kind on your electricity bill, as the Ultra 17 is not the device for you. However, our review unit consumed 10% less in our The Witcher 3 test than the ROG G703GX, which is surprising considering that the latter has a weaker CPU and a lower resolution display. Overall, the Ultra 17 has higher power consumption than all our comparison devices, but we expected as much considering that it has a 4K display and currently the most-powerful laptop CPU/GPU combination around.

As we mentioned at the start of the review, Schenker includes a 330 W power supply, which proved too weak to charge our review unit during our stress test. However, you should have no issues during most tasks and even if you push the system hard in games, as our review unit consumed a maximum of 259 W while playing The Witcher 3.
| Off / Standby | |
| Idle | |
| Load |
|
Key:
min: | |
| Schenker XMG Ultra 17 Turing i9-9900K, GeForce RTX 2080 Mobile | Asus ROG G703GX i7-8750H, GeForce RTX 2080 Mobile | Schenker XMG Ultra 17 Coffee Lake Refresh i9-9900K, GeForce GTX 1080 Mobile | Acer Predator Triton 500 i7-8750H, GeForce RTX 2080 Max-Q | Razer Blade 15 RTX 2070 Max-Q i7-8750H, GeForce RTX 2070 Max-Q | Average of class Gaming | |
|---|---|---|---|---|---|---|
| Power Consumption | 27% | 19% | 45% | 54% | 43% | |
| Idle Minimum * (Watt) | 39 | 5 87% | 33 15% | 16 59% | 10.4 73% | 13 ? 67% |
| Idle Average * (Watt) | 45 | 24 47% | 42 7% | 22 51% | 14.6 68% | 18.7 ? 58% |
| Idle Maximum * (Watt) | 55 | 42 24% | 49 11% | 32 42% | 16.3 70% | 24.3 ? 56% |
| Load Average * (Watt) | 122 | 112 8% | 93 24% | 89 27% | 88.5 27% | 110.2 ? 10% |
| Witcher 3 ultra * (Watt) | 259 | 284 -10% | 156 40% | 147 43% | 155.4 40% | |
| Load Maximum * (Watt) | 346 | 320 8% | 293 15% | 173 50% | 182.4 47% | 258 ? 25% |
* ... smaller is better
Battery Life
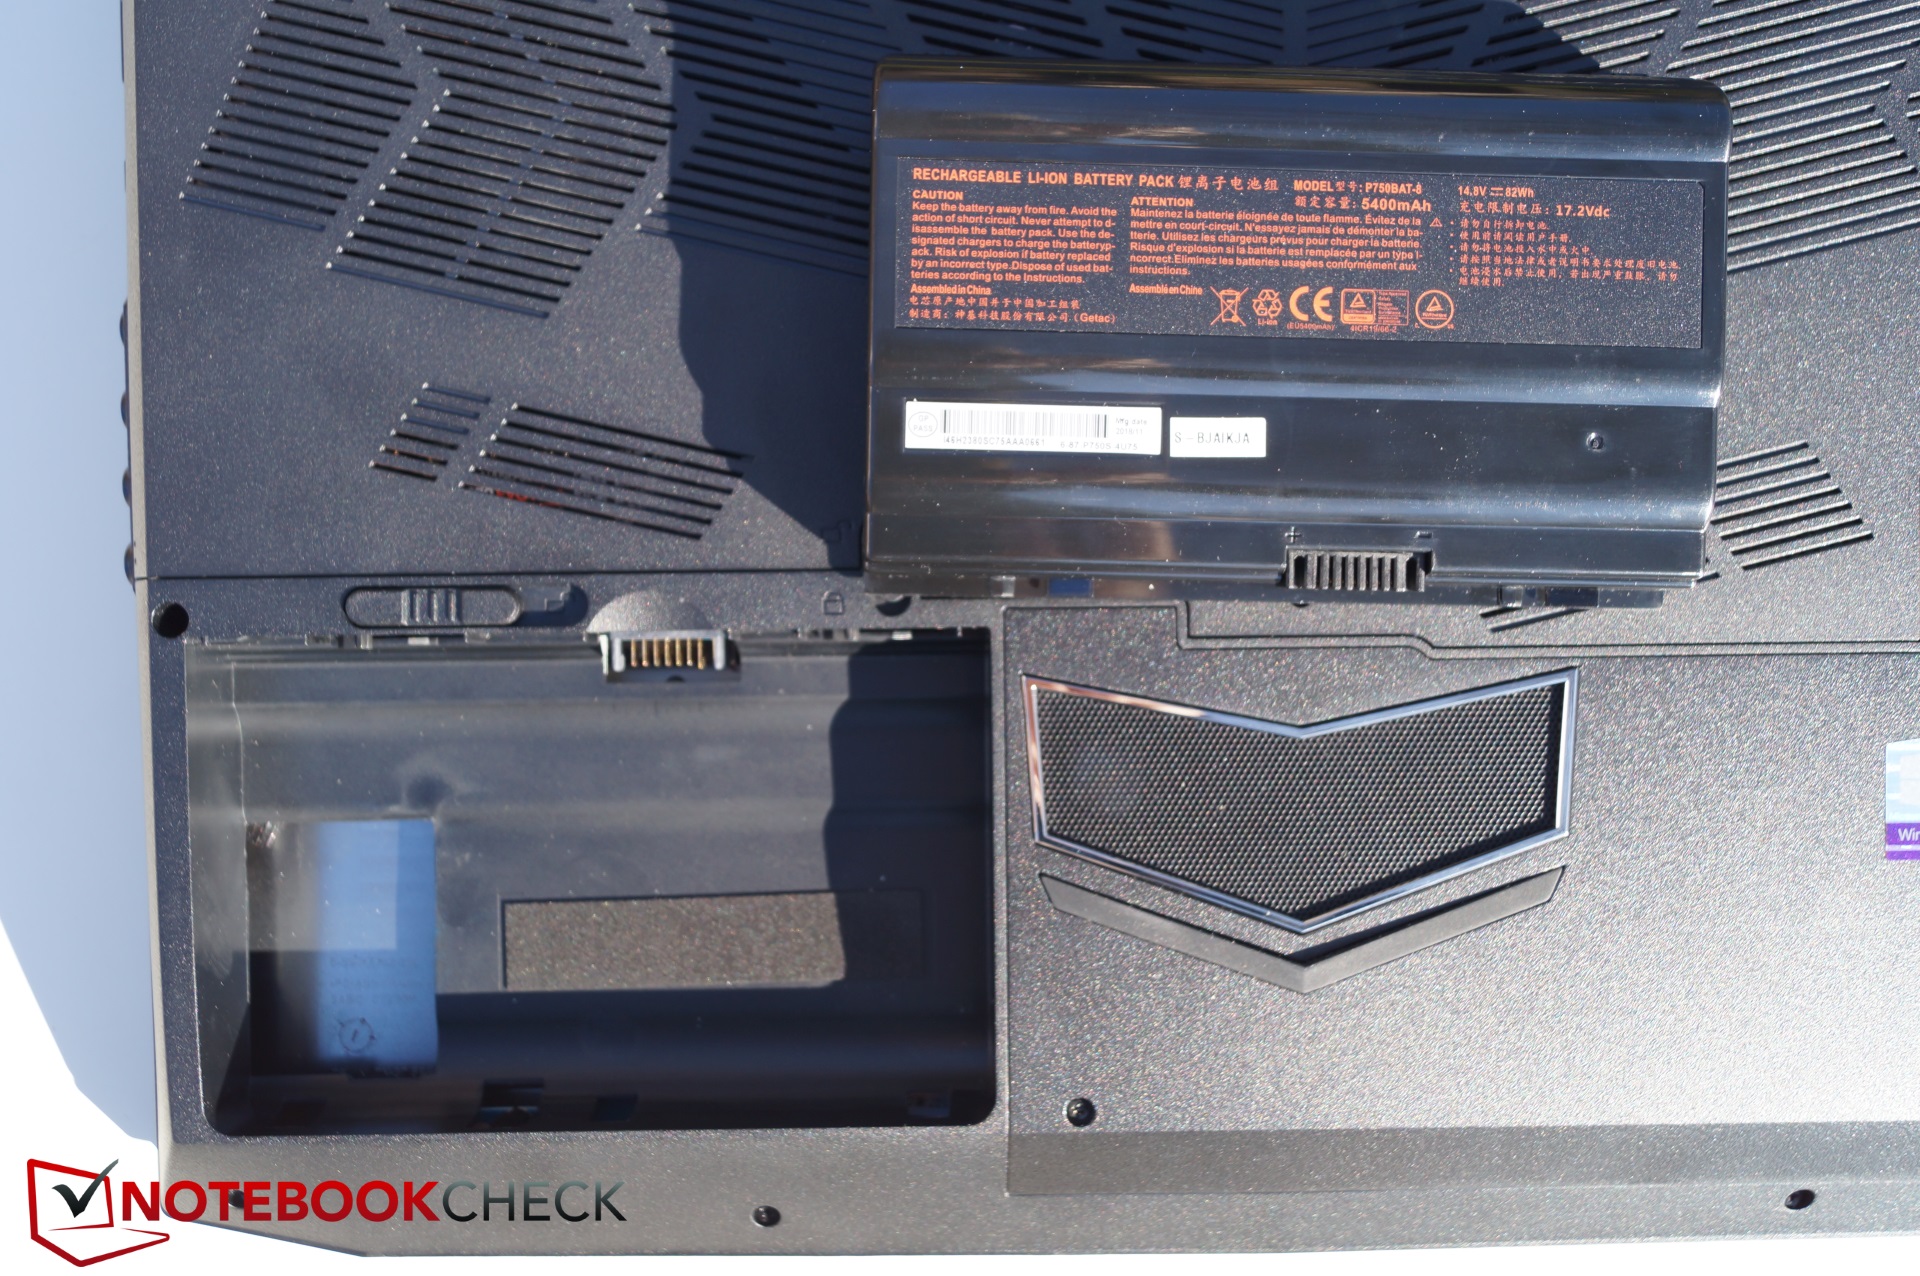
The Ultra 17 has an 82 Wh replaceable battery, which is on par with the capacities of our comparison devices, apart from the 96 Wh battery in the ROG G703GX. We would recommend buying an additional battery or two if you plan to use the Ultra 17 on the move though, as it has dreadful battery life even by gaming laptop standards.
Our review unit lasted just 2:45 hours at idle before it needed recharging, which dropped to 2:15 hours on Wi-Fi and if we played an H.264 video on a loop. Likewise, the Ultra 17 ran out of battery just 1:05 hours under sustained load. It is worth noting that its predecessor achieved comparable runtimes, but our other comparison devices lasted significantly longer than both Schenker laptops.
| Schenker XMG Ultra 17 Turing i9-9900K, GeForce RTX 2080 Mobile, 82 Wh | Asus ROG G703GX i7-8750H, GeForce RTX 2080 Mobile, 96 Wh | Schenker XMG Ultra 17 Coffee Lake Refresh i9-9900K, GeForce GTX 1080 Mobile, 82 Wh | Acer Predator Triton 500 i7-8750H, GeForce RTX 2080 Max-Q, 82 Wh | Razer Blade 15 RTX 2070 Max-Q i7-8750H, GeForce RTX 2070 Max-Q, 80 Wh | Average of class Gaming | |
|---|---|---|---|---|---|---|
| Battery runtime | 59% | -1% | 55% | 175% | 184% | |
| Reader / Idle (h) | 2.8 | 5 79% | 2.9 4% | 5.6 100% | 11.4 307% | 8.71 ? 211% |
| H.264 (h) | 2.3 | 3.8 65% | 8.64 ? 276% | |||
| WiFi v1.3 (h) | 2.3 | 4 74% | 1.9 -17% | 3.2 39% | 6.5 183% | 7.15 ? 211% |
| Load (h) | 1.1 | 1.3 18% | 1.2 9% | 1.4 27% | 1.5 36% | 1.502 ? 37% |
Pros
Cons
Verdict
The Schenker XMG Ultra 17 is an excellent choice for those who are looking for an alternative to a gaming desktop PC. Our review unit is packed full of the most powerful components on the market, while its socketed CPU leaves room for upgrades that few other laptops currently offer.
However, we would have expected more from such an expensive device. Our review unit throttles too heavily when running on battery for our liking; although we appreciate that few people would leave the Ultra 17 unplugged anyway because of its short battery life.
The Schenker XMG Ultra 17 is a worthy upgrade over its predecessor and offers first-class gaming performance. However, it is let down in our eyes by loud fans, its exorbitant price and its heavy throttling on battery.
Schenker must fix the trackpad problem though as it is almost unusable when playing games because of its frequent dropped connections. The speakers are underwhelming too, as are the display’s reaction times. Moreover, while our review unit manages its temperatures well, it does so with intrusively, and often unnecessarily, loud fans.
With that said, the Ultra 17 offers excellent gaming performance, numerous ports, outstanding maintenance options, a decent keyboard and an otherwise impressive 4K display. In short, Schenker has got a lot right with its new Ultra 17, but it misses out on our top marks because of a few frustrating shortcomings.
Schenker XMG Ultra 17 Turing
- 05/14/2020 v7 (old)
Christian Hintze
Price comparison

