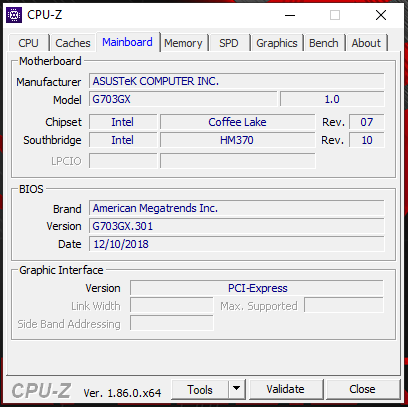
Asus ROG G703GX (i7-8750H, RTX 2080) Laptop Review
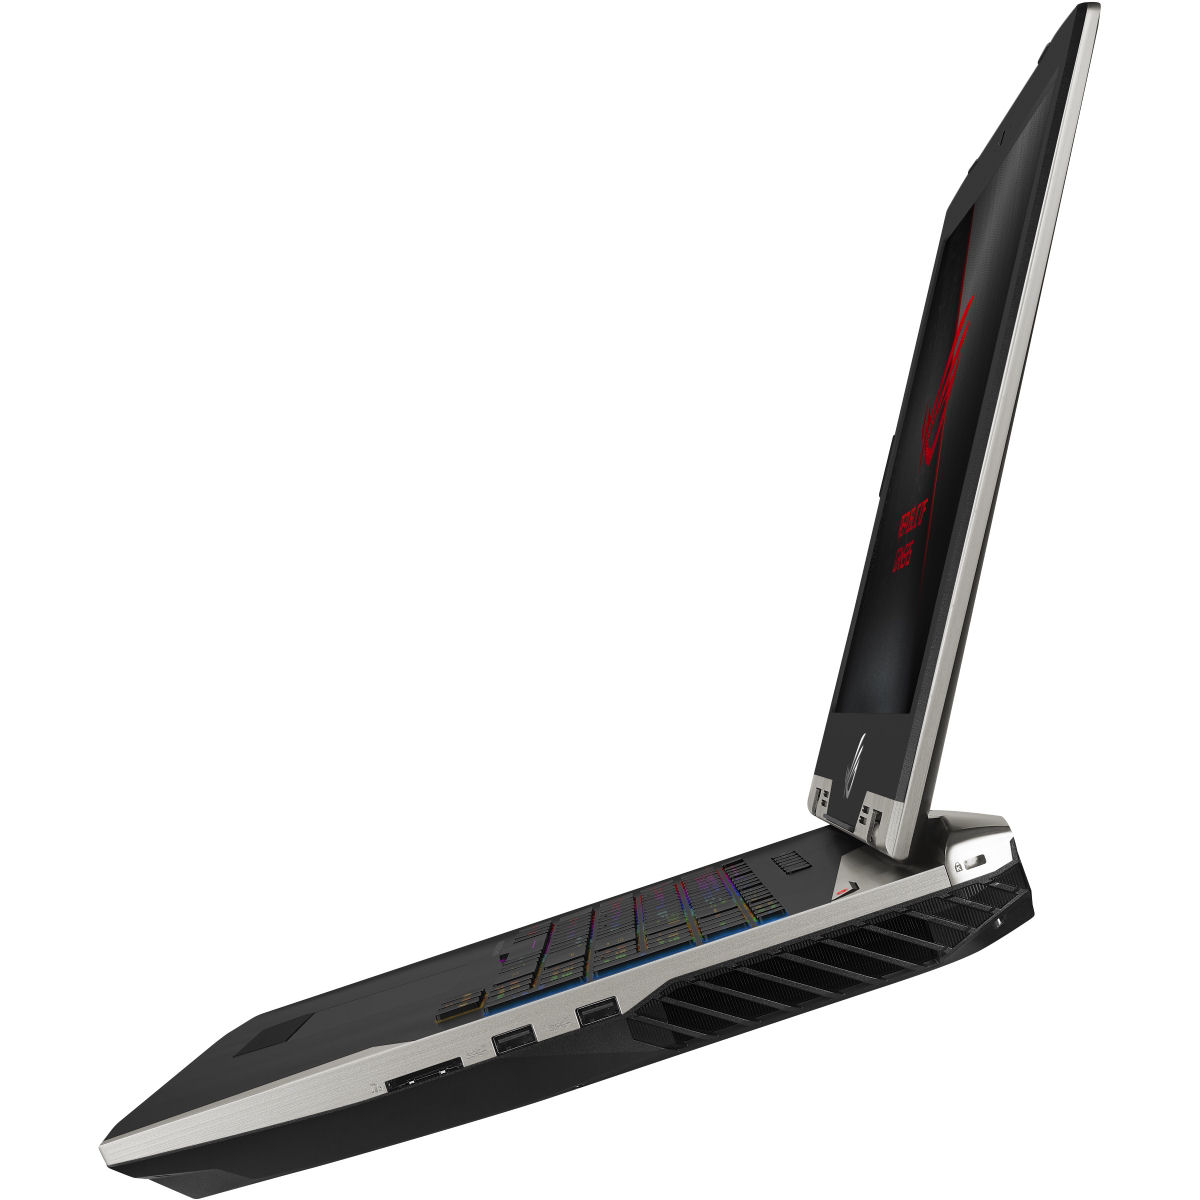
The Asus G703GX belongs to the high-end gaming notebooks in the 17.3-inch format. The inside of the notebook is filled with the most current technology: a Coffee-Lake hexa-core processor, an NVMe SSD, Thunderbolt 3, and a brand-new GeForce RTX 2080 graphics core. The notebook is not unknown to us. With the Asus ROG Chimera G703GI and the Asus ROG Chimera G703, we already tested two similar predecessors, with the 703GI being its direct predecessor. While that is also equipped with a Coffee-Lake processor, the GPU is a GeForce GTX 1080. The competitors of the G703GX include devices like the Acer Predator Helios 500 PH517-51, the Schenker XMG Ultra 17, and the Aorus X7 DT v8.
Since the G703GX, the G703GI, and the G703 have an identical build, we are not addressing the case, equipment, input devices, speakers, and display here - except where there are differences. You can find the corresponding information in the reviews of the ROG Chimera G703GI and the ROG Chimera G703.
Changes/Upgrades
- The G703GX has a larger battery capacity than its predecessors (96 Wh vs. 71 Wh).
- You can switch between G-Sync and Optimus (it was only G-Sync before).
- The Gigabit Ethernet slot now supports transfer speeds of up to 2500 Mb/s.
| SD Card Reader | |
| average JPG Copy Test (av. of 3 runs) | |
| Asus Chimera G703GI (Toshiba Exceria Pro SDXC 64 GB UHS-II) | |
| Aorus X7 DT v8 (Toshiba Exceria Pro SDXC 64 GB UHS-II) | |
| Schenker XMG Ultra 17 (Toshiba Exceria Pro SDXC 64 GB UHS-II) | |
| Asus ROG G703GX (Toshiba Exceria Pro SDXC 64 GB UHS-II) | |
| Average of class Gaming (20.9 - 210, n=54, last 2 years) | |
| maximum AS SSD Seq Read Test (1GB) | |
| Asus Chimera G703GI (Toshiba Exceria Pro SDXC 64 GB UHS-II) | |
| Aorus X7 DT v8 (Toshiba Exceria Pro SDXC 64 GB UHS-II) | |
| Asus ROG G703GX (Toshiba Exceria Pro SDXC 64 GB UHS-II) | |
| Schenker XMG Ultra 17 (Toshiba Exceria Pro SDXC 64 GB UHS-II) | |
| Average of class Gaming (25.5 - 261, n=51, last 2 years) | |
Display - 144 Hz with G-Sync
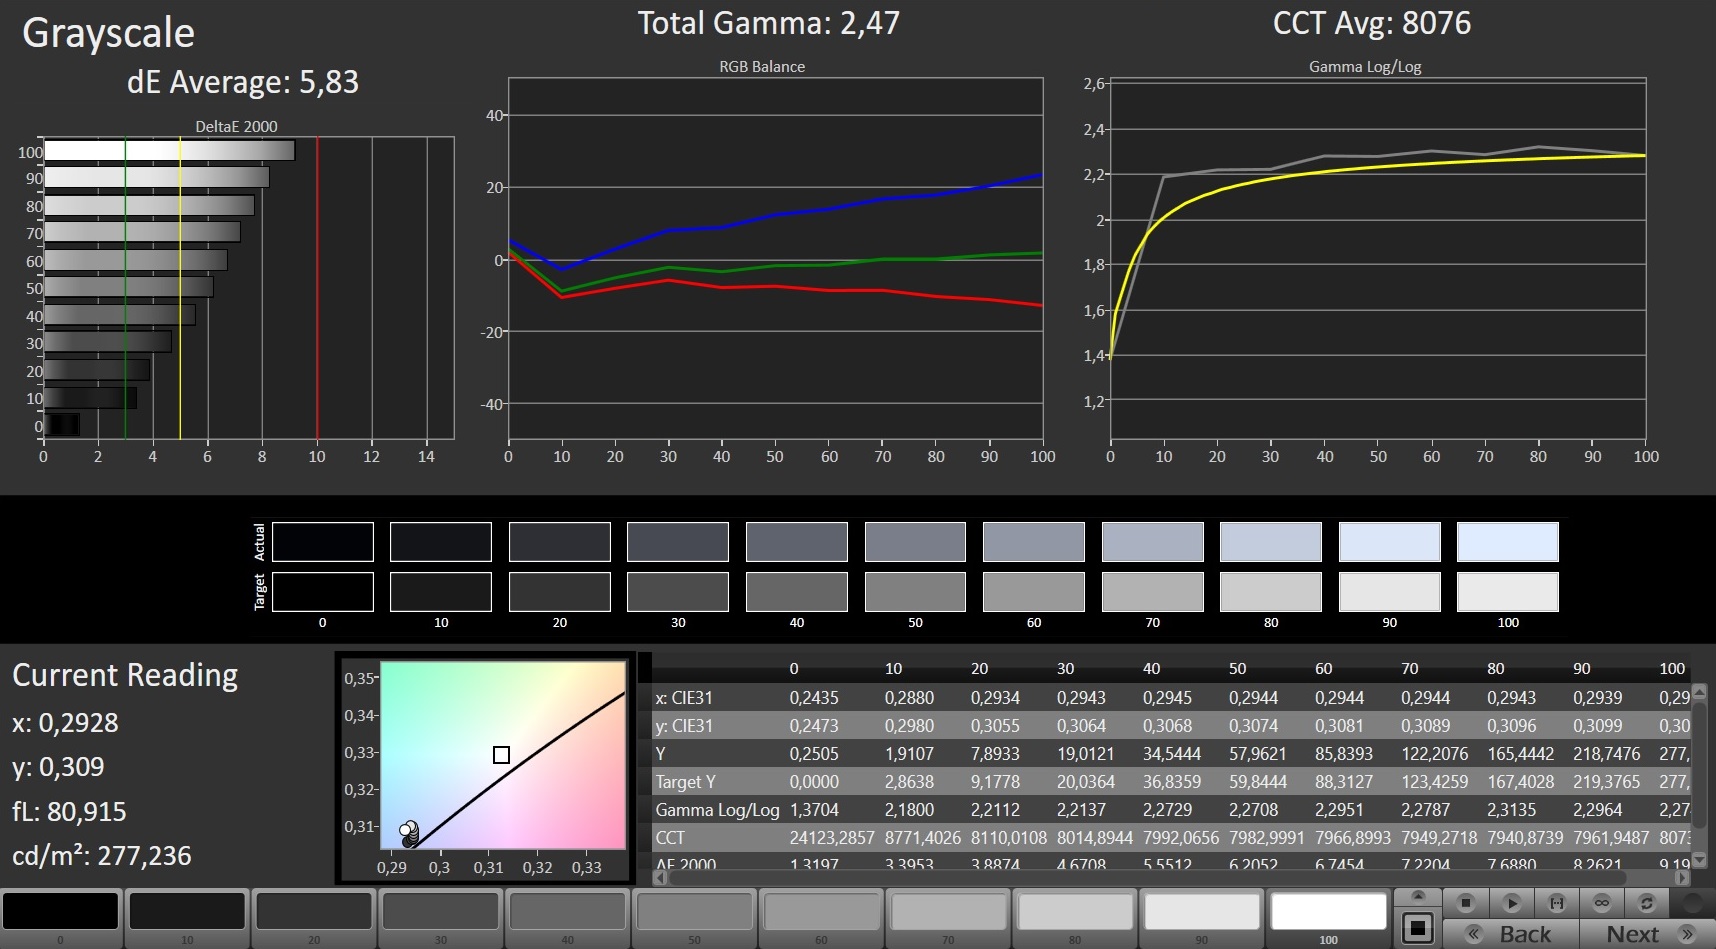
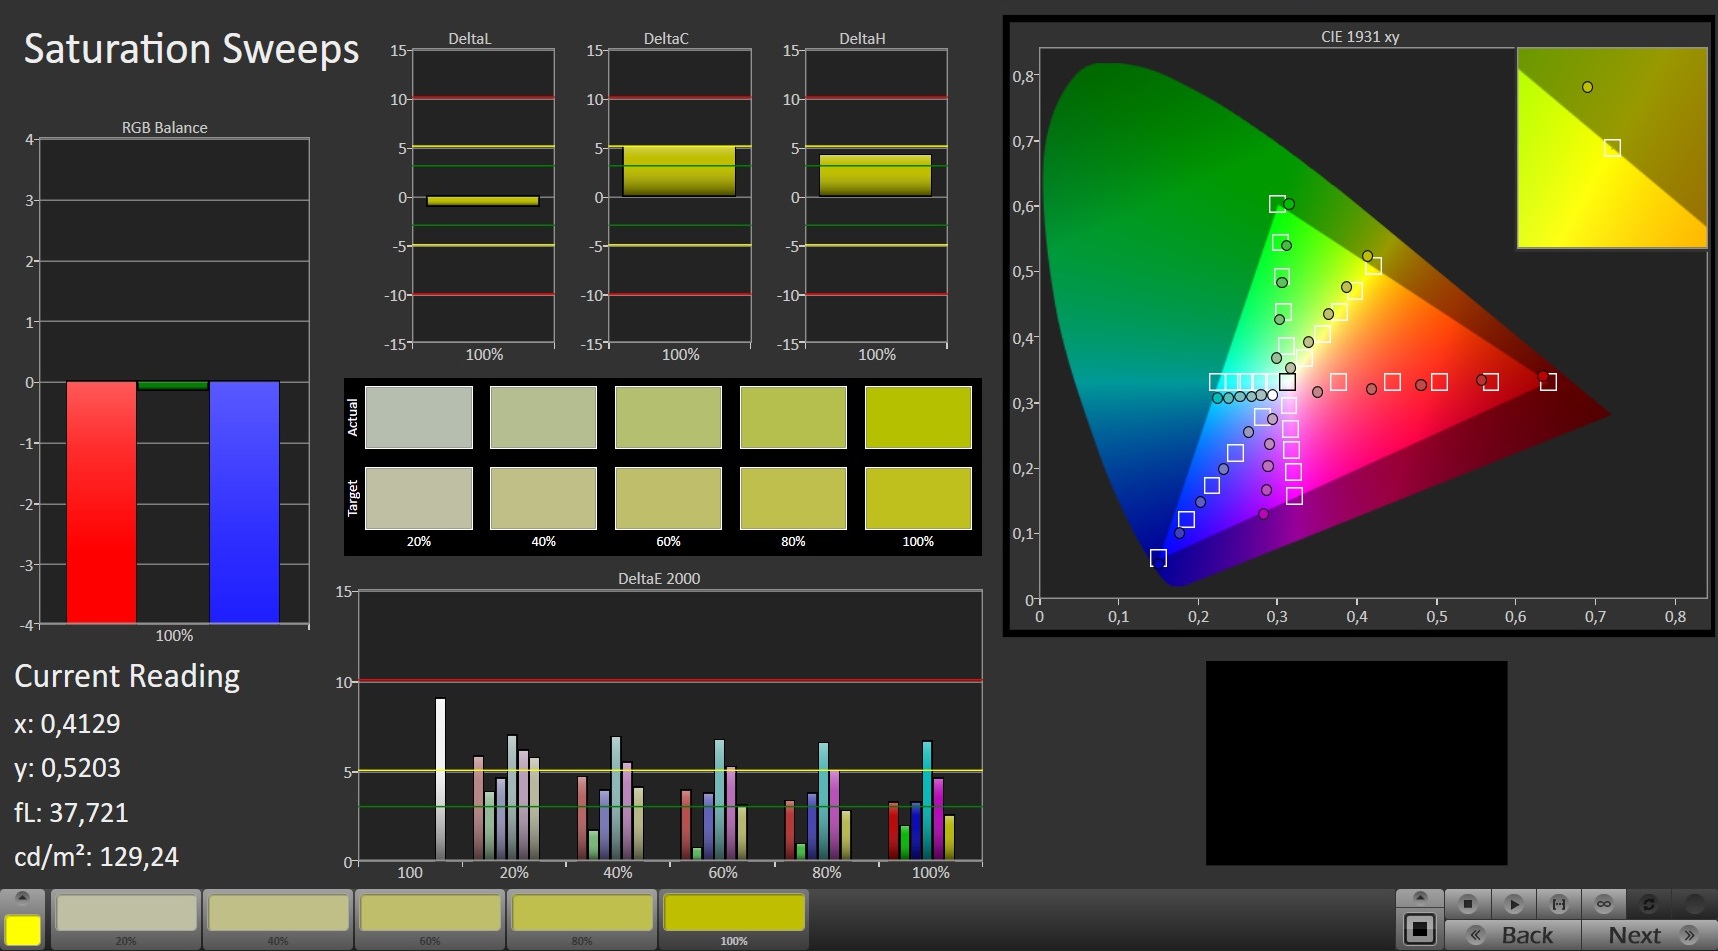
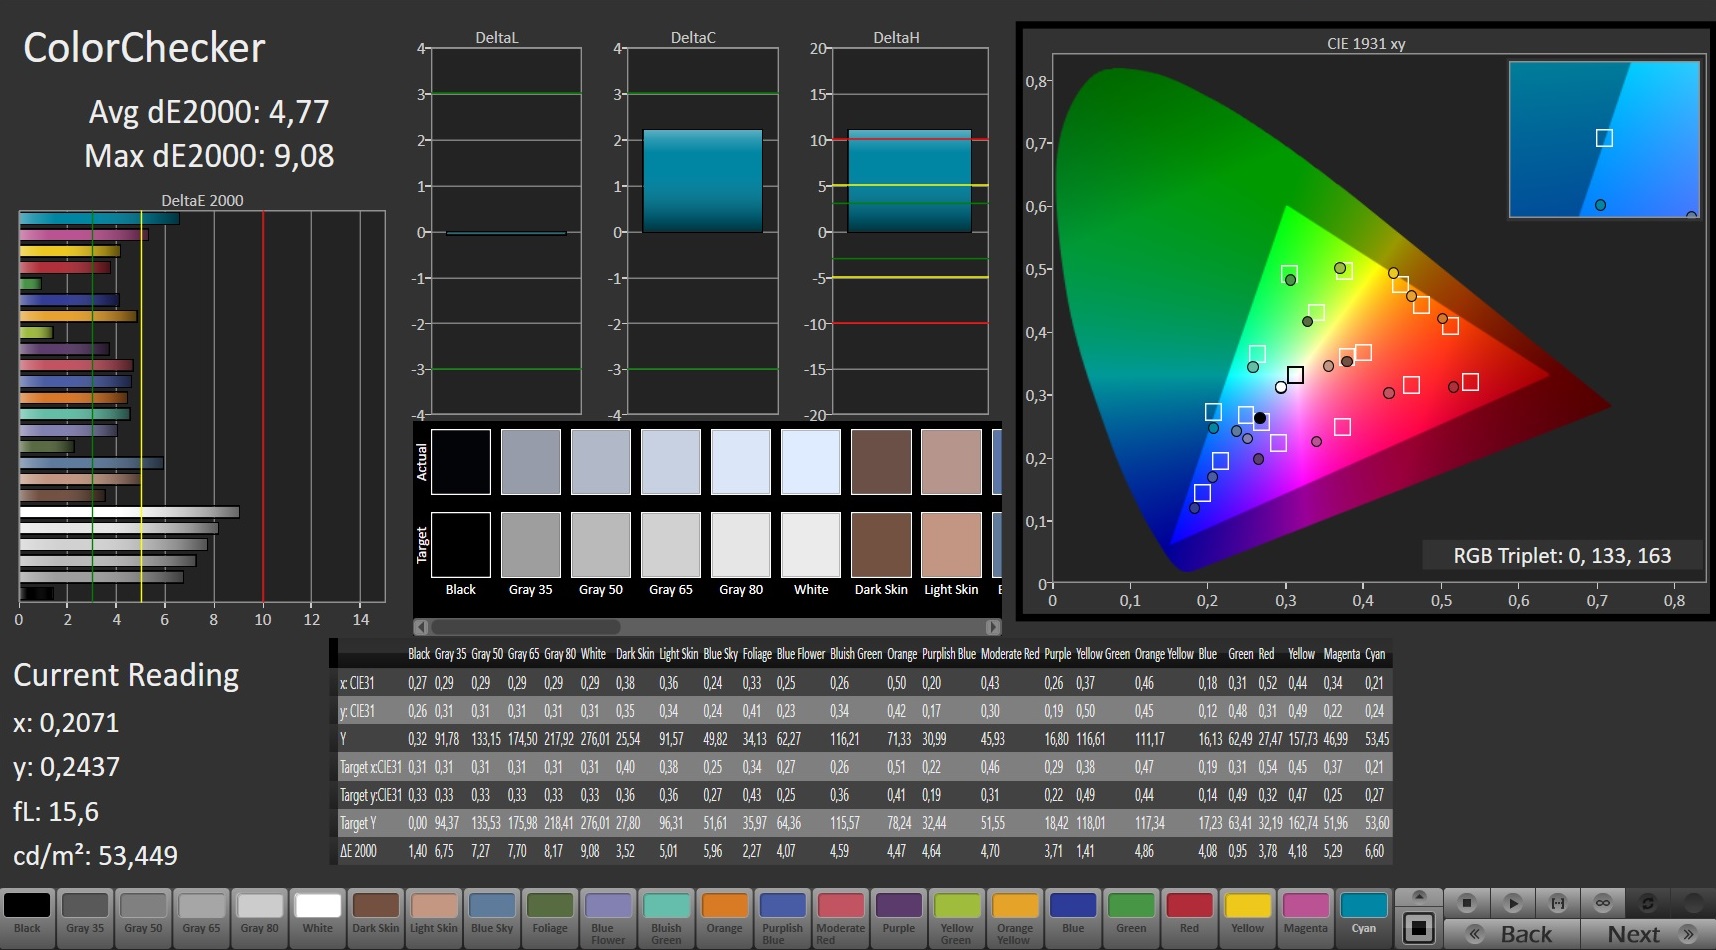
The G703GX is equipped with a matte 17.3-inch IPS display that has a native resolution of 1920x1080 pixels. The 144-Hz display offers good contrast and decent brightness. The same display was used in the predecessor model. Nonetheless, there are some small differences in the measured values, which is a normal phenomenon, since two identically built panels are never 100% identical.
Like in the old G703, G-Sync is also available here. With G-Sync, the frame repeat rates of display and GPU are dynamically adjusted to each other, which is supposed to bring an image that is as smooth as possible, particularly during computer games. However, all our measurements were done with active graphics switching.
| |||||||||||||||||||||||||
Brightness Distribution: 85 %
Center on Battery: 296 cd/m²
Contrast: 1184:1 (Black: 0.25 cd/m²)
ΔE ColorChecker Calman: 4.77 | ∀{0.5-29.43 Ø4.73}
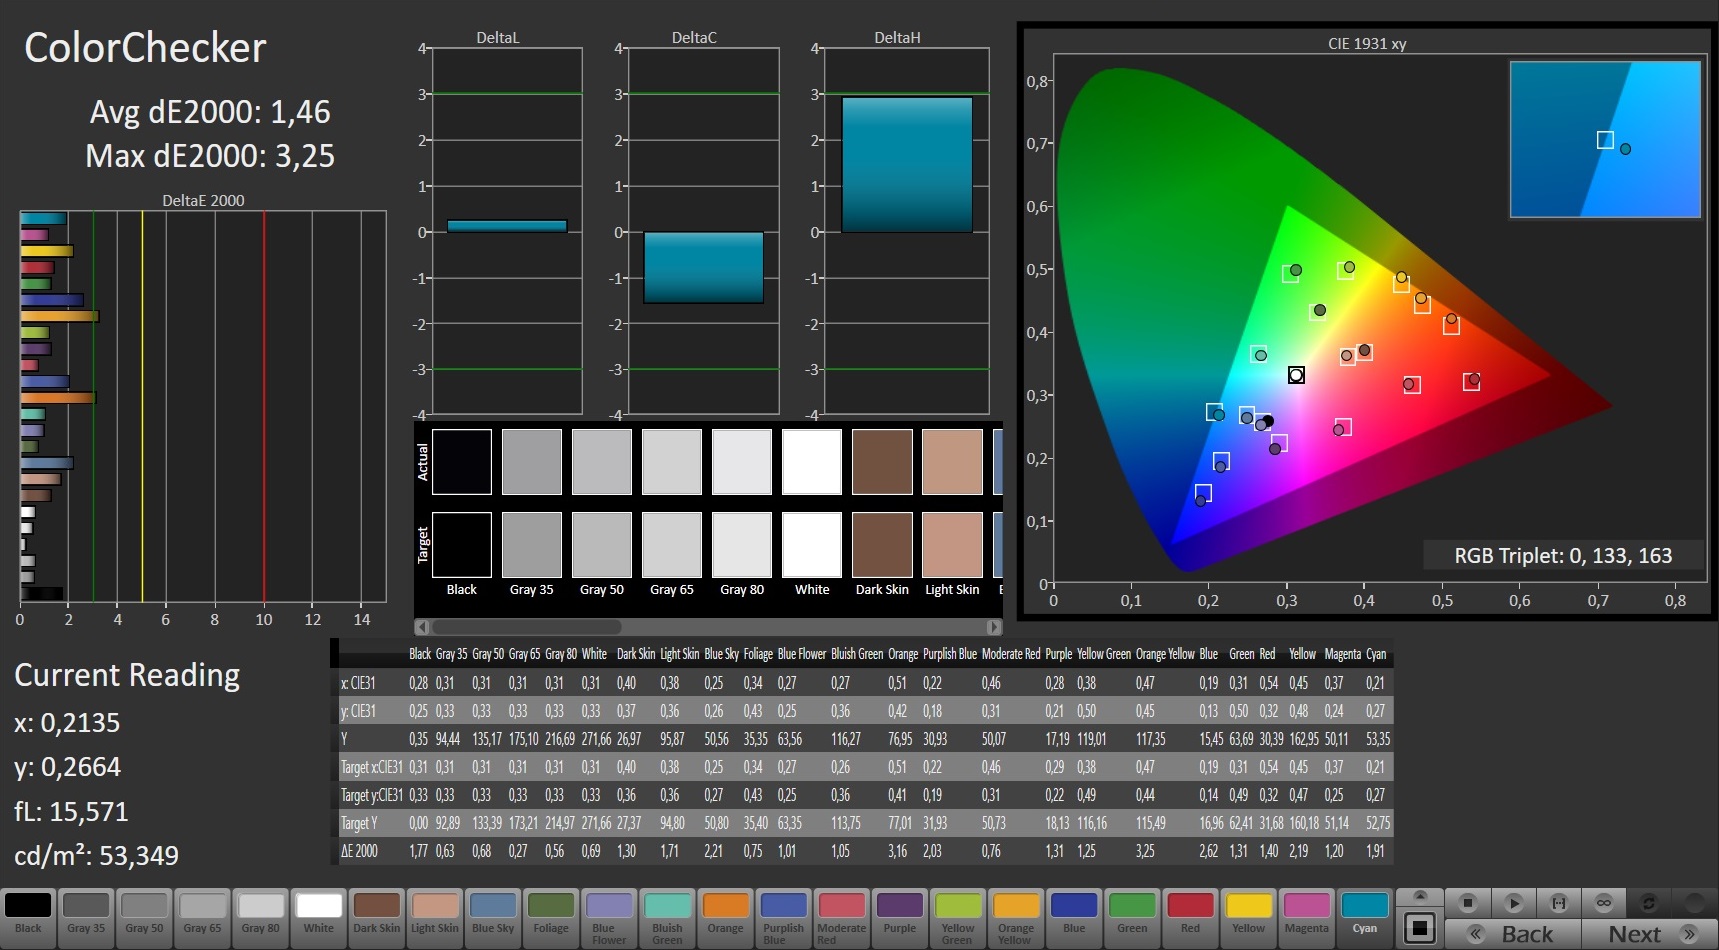
calibrated: 1.46
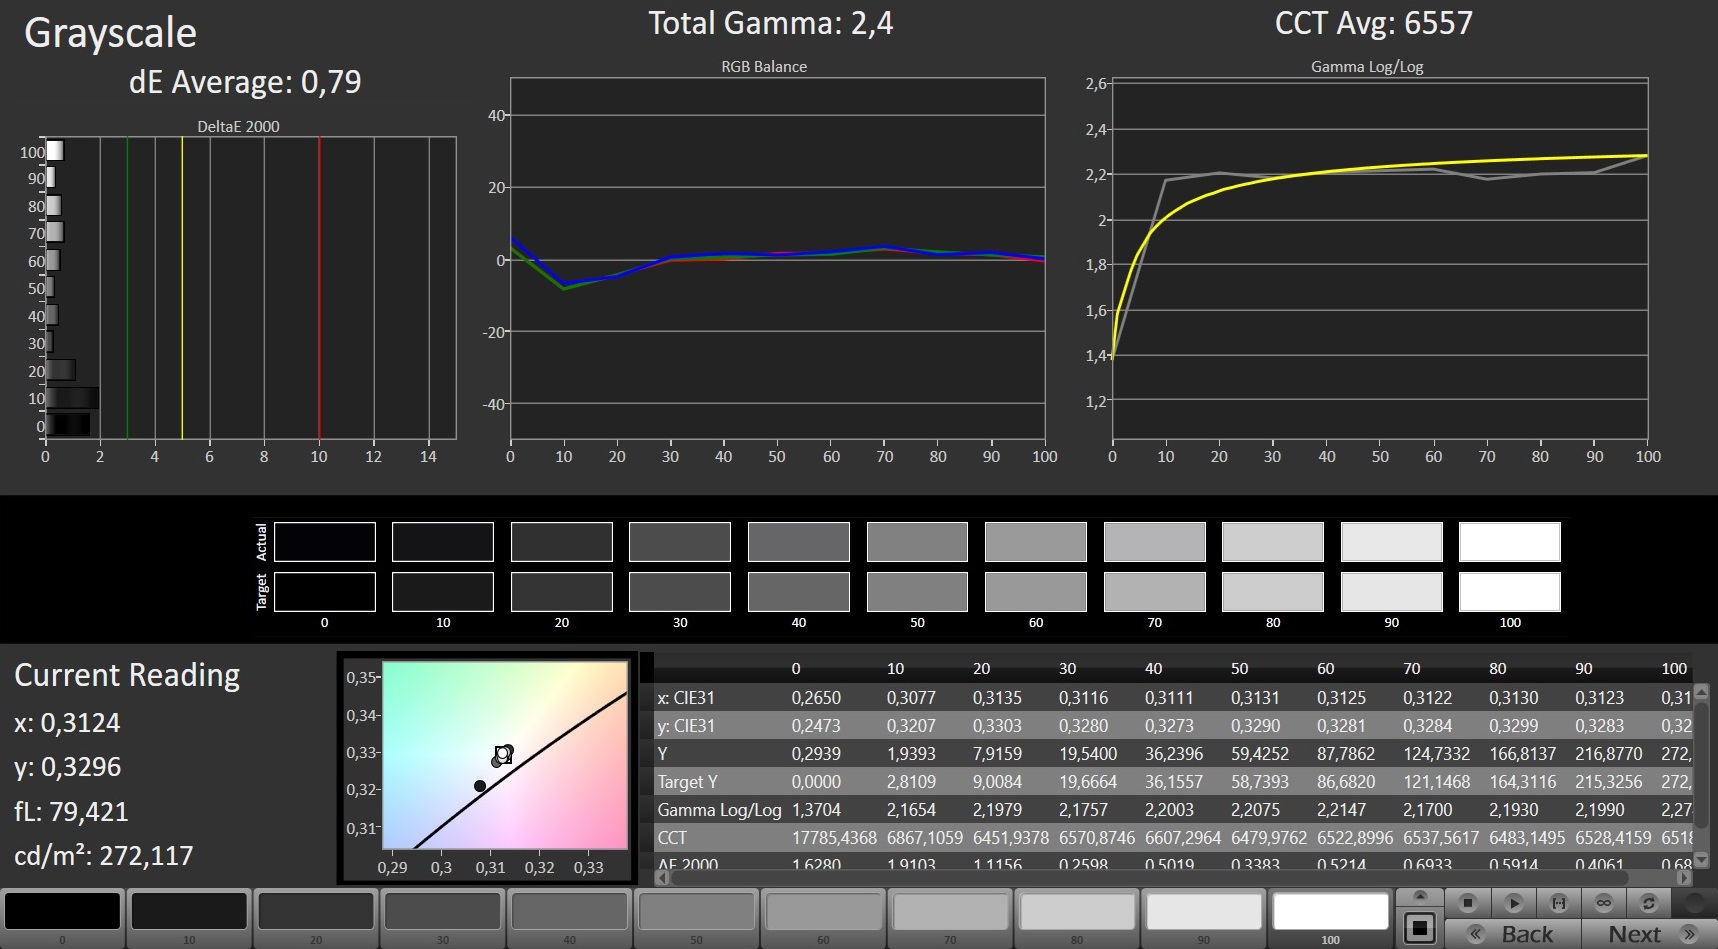
ΔE Greyscale Calman: 5.83 | ∀{0.09-98 Ø4.97}
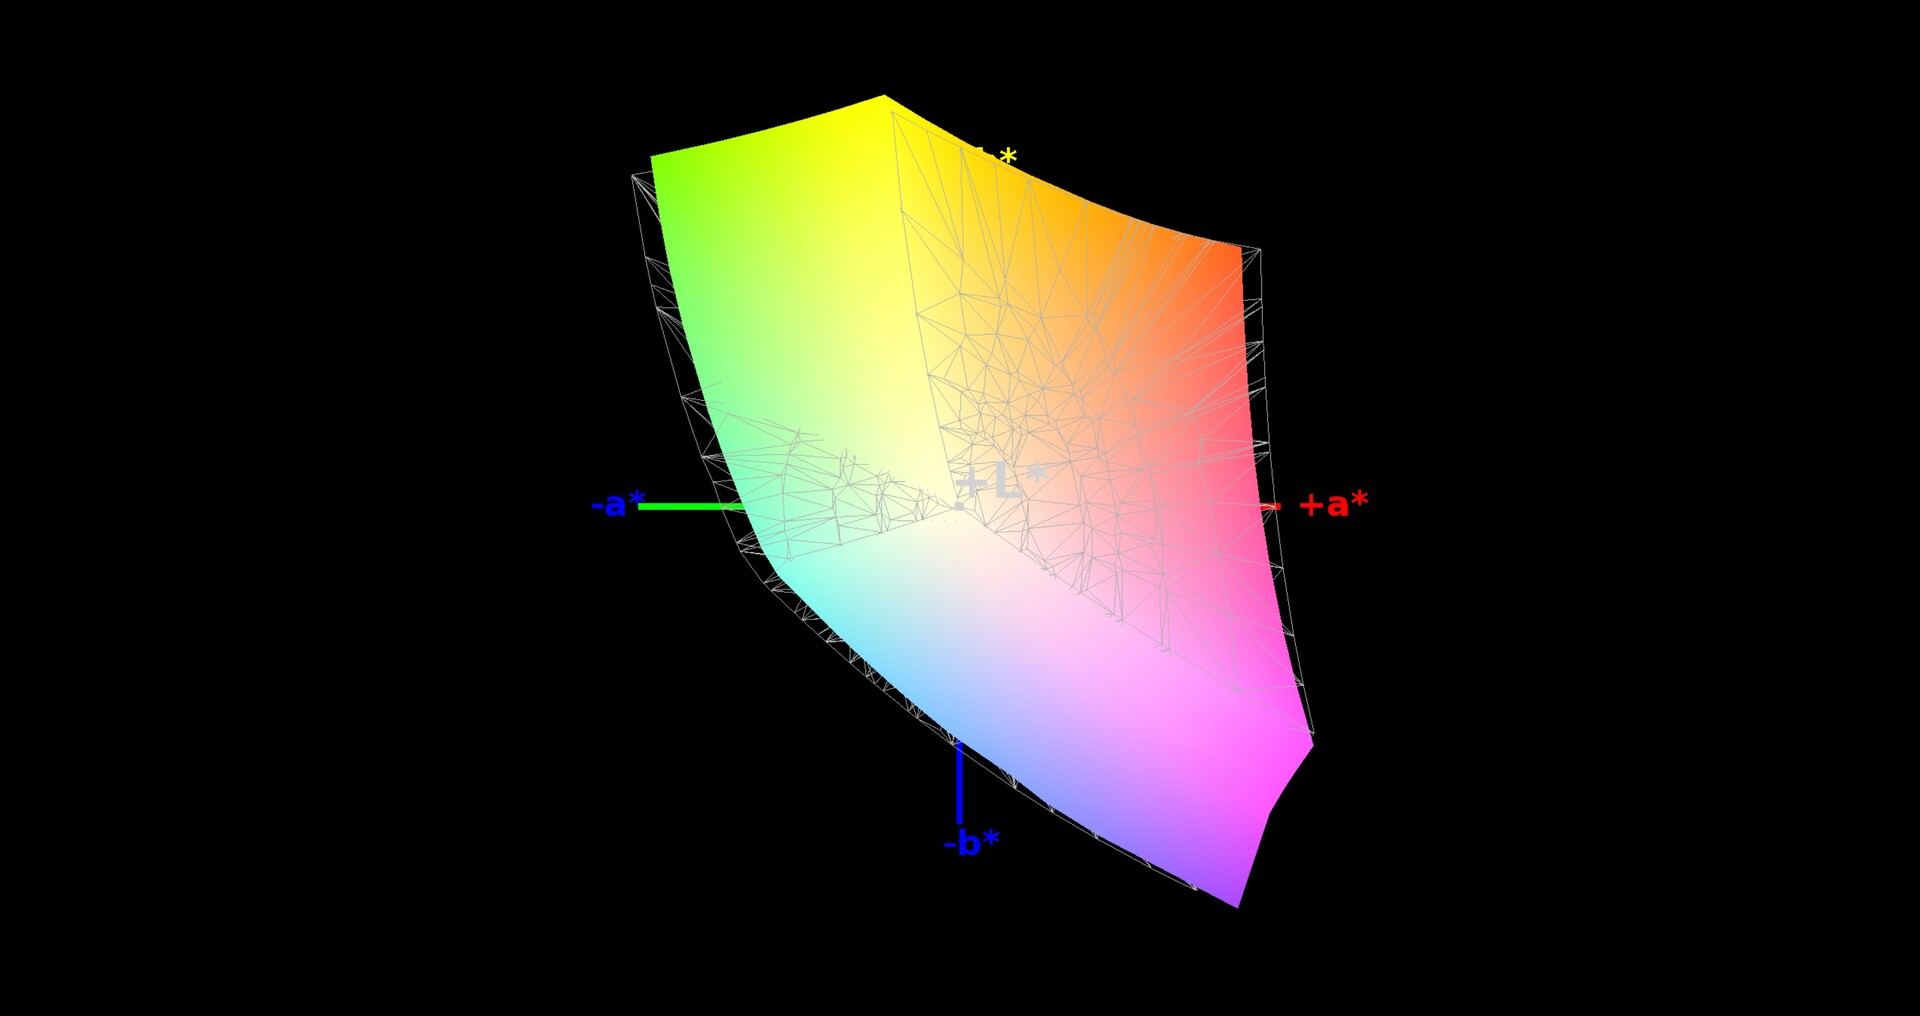
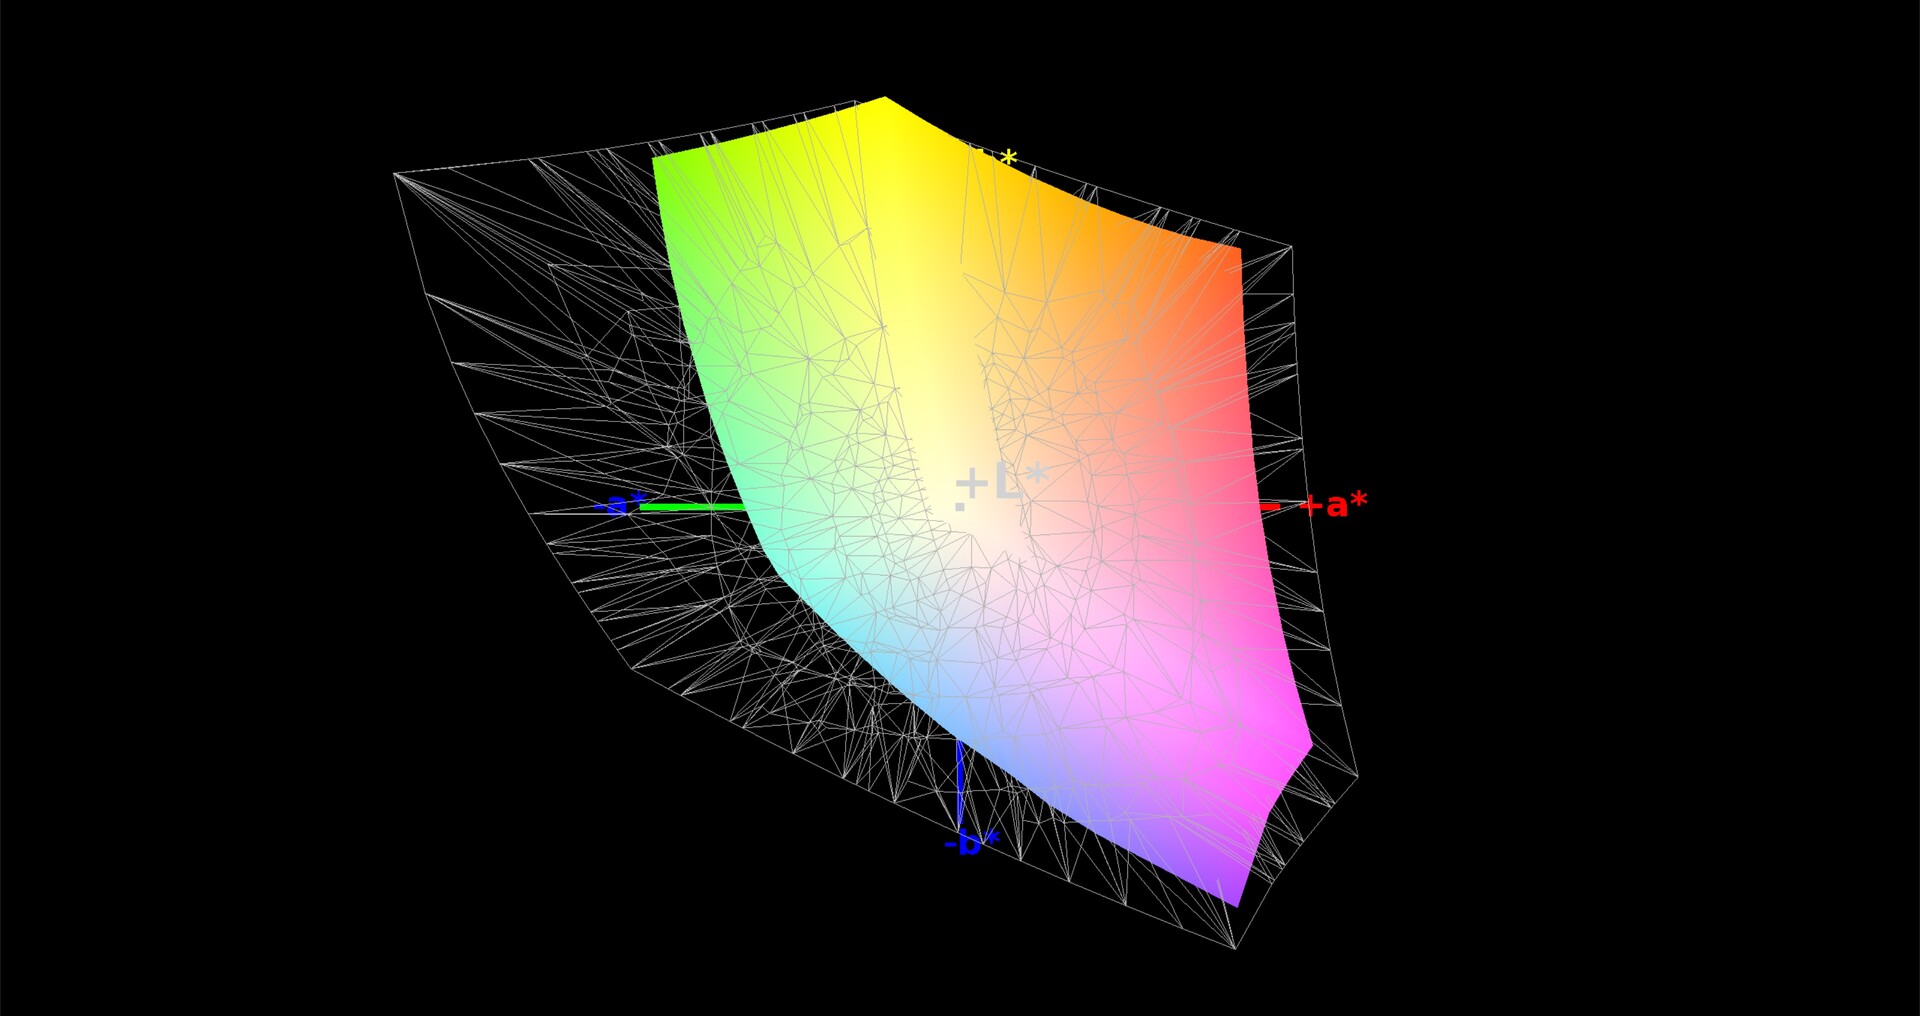
93% sRGB (Argyll 1.6.3 3D)
60% AdobeRGB 1998 (Argyll 1.6.3 3D)
65.6% AdobeRGB 1998 (Argyll 3D)
93.3% sRGB (Argyll 3D)
64.1% Display P3 (Argyll 3D)
Gamma: 2.47
CCT: 8076 K
| Asus ROG G703GX AU Optronics B173HAN03.2 (AUO329D), IPS, 1920x1080 | Acer Predator Helios 500 PH517-51-79BY AUO_B173HAN03, IPS, 1920x1080 | Aorus X7 DT v8 AU Optronics B173HAN03.0 (AUO309D), IPS, 1920x1080 | Asus Chimera G703GI B173HAN03.2 (AUO329D), IPS, 1920x1080 | Schenker XMG Ultra 17 AU Optronics B173ZAN01.0 (AUO109B), IPS, 3840x2160 | |
|---|---|---|---|---|---|
| Display | -1% | 0% | 1% | 31% | |
| Display P3 Coverage (%) | 64.1 | 64.4 0% | 65.3 2% | 65.8 3% | 86.4 35% |
| sRGB Coverage (%) | 93.3 | 91.3 -2% | 91.2 -2% | 92.6 -1% | 100 7% |
| AdobeRGB 1998 Coverage (%) | 65.6 | 65.6 0% | 66.3 1% | 67 2% | 99.1 51% |
| Response Times | -44% | -88% | -1% | -335% | |
| Response Time Grey 50% / Grey 80% * (ms) | 7.2 ? | 14 ? -94% | 18 ? -150% | 6.4 ? 11% | 44 ? -511% |
| Response Time Black / White * (ms) | 9.6 ? | 9 ? 6% | 12 ? -25% | 10.8 ? -13% | 24.8 ? -158% |
| PWM Frequency (Hz) | |||||
| Screen | -23% | 19% | 10% | 15% | |
| Brightness middle (cd/m²) | 296 | 335 13% | 297 0% | 285 -4% | 332 12% |
| Brightness (cd/m²) | 279 | 300 8% | 281 1% | 275 -1% | 313 12% |
| Brightness Distribution (%) | 85 | 82 -4% | 84 -1% | 82 -4% | 88 4% |
| Black Level * (cd/m²) | 0.25 | 0.7 -180% | 0.23 8% | 0.22 12% | 0.28 -12% |
| Contrast (:1) | 1184 | 479 -60% | 1291 9% | 1295 9% | 1186 0% |
| Colorchecker dE 2000 * | 4.77 | 4.99 -5% | 2.19 54% | 3.18 33% | 3.86 19% |
| Colorchecker dE 2000 max. * | 9.08 | 9.32 -3% | 4.81 47% | 5.99 34% | 5.88 35% |
| Colorchecker dE 2000 calibrated * | 1.46 | 1.93 -32% | 1.73 -18% | ||
| Greyscale dE 2000 * | 5.83 | 5.2 11% | 1.31 78% | 2.93 50% | 4.33 26% |
| Gamma | 2.47 89% | 2.49 88% | 2.42 91% | 2.45 90% | 2.41 91% |
| CCT | 8076 80% | 7719 84% | 6464 101% | 7165 91% | 6595 99% |
| Color Space (Percent of AdobeRGB 1998) (%) | 60 | 59 -2% | 59 -2% | 60 0% | 88 47% |
| Color Space (Percent of sRGB) (%) | 93 | 91 -2% | 91 -2% | 93 0% | 100 8% |
| Total Average (Program / Settings) | -23% /
-22% | -23% /
1% | 3% /
7% | -96% /
-28% |
* ... smaller is better
Display Response Times
| ↔ Response Time Black to White | ||
|---|---|---|
| 9.6 ms ... rise ↗ and fall ↘ combined | ↗ 4.4 ms rise | 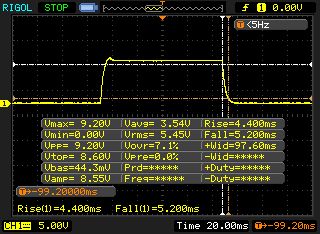 |
| ↘ 5.2 ms fall | ||
| The screen shows fast response rates in our tests and should be suited for gaming. In comparison, all tested devices range from 0.1 (minimum) to 240 (maximum) ms. » 26 % of all devices are better. This means that the measured response time is better than the average of all tested devices (19.9 ms). | ||
| ↔ Response Time 50% Grey to 80% Grey | ||
| 7.2 ms ... rise ↗ and fall ↘ combined | ↗ 3.8 ms rise | 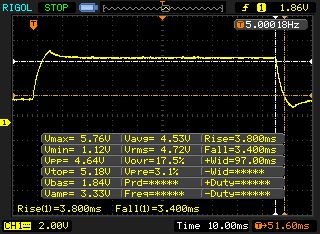 |
| ↘ 3.4 ms fall | ||
| The screen shows very fast response rates in our tests and should be very well suited for fast-paced gaming. In comparison, all tested devices range from 0.165 (minimum) to 636 (maximum) ms. » 20 % of all devices are better. This means that the measured response time is better than the average of all tested devices (31.1 ms). | ||
Screen Flickering / PWM (Pulse-Width Modulation)
| Screen flickering / PWM not detected |  | ||
In comparison: 52 % of all tested devices do not use PWM to dim the display. If PWM was detected, an average of 7794 (minimum: 5 - maximum: 343500) Hz was measured. | |||
Performance - Turing power on board
With the G703GX, Asus delivers a high-end gaming notebook in the 17.3-inch format that can play all the current games smoothly. For our test unit, you have to pay about 4000 Euros (~$4518; $4000 in the US for a model with i9-8950HK and 1.5 TB SSD RAID-0), and other equipment configurations are also available.

Test Conditions
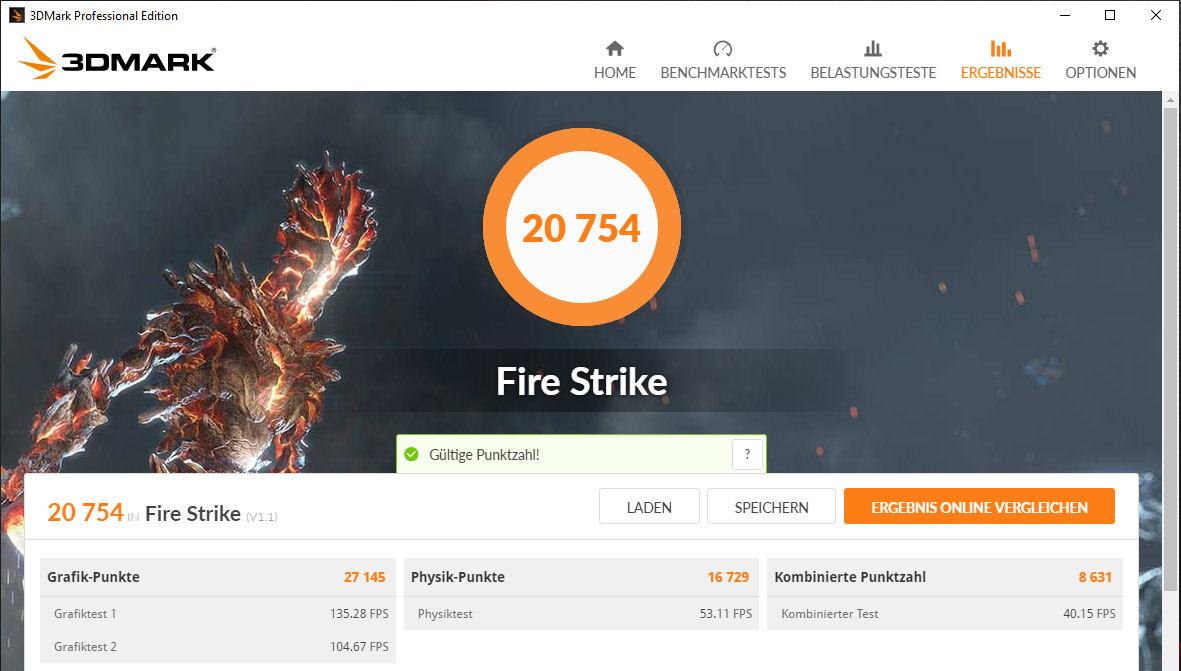
The Armoury-Crate tool allows the selection of the power management scheme among other things. This determines the behavior of the G703GX. The options "Quiet," "Balanced," "Turbo," "Manual," and "Windows" are available. If you select the latter, Windows power management takes control. While this was the option we chose for running our tests, we also ran a few benchmarks with the Turbo mode activated. You can find the results in the corresponding charts and tables.
Processor
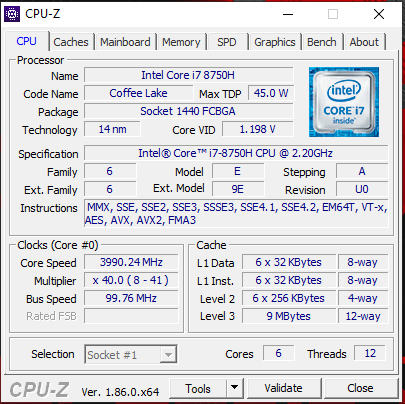
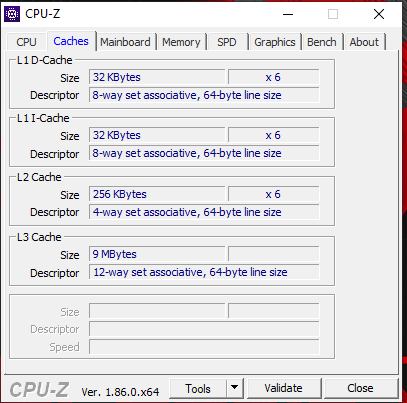
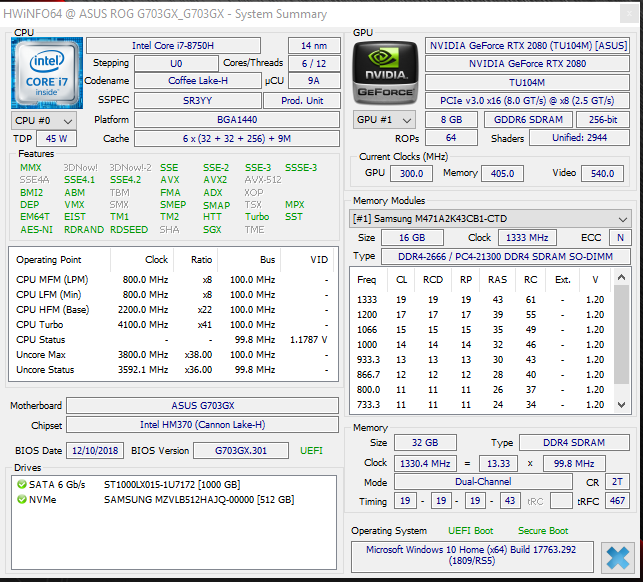
The G703GX is driven by an Intel Core i7-8750H (Coffee Lake) hexa-core processor. We can find this mobile CPU (TDP: 45 watts) in many gaming notebooks. This is the successor of the Core i7-7700HQ (Kaby Lake) quad-core processor. The 8750H runs at a basic clock speed of 2.2 GHz, and you can increase the clock speed via Turbo up to 3.9 GHz (six cores), 4 GHz (four cores) or 4.1 GHz (single and two cores).
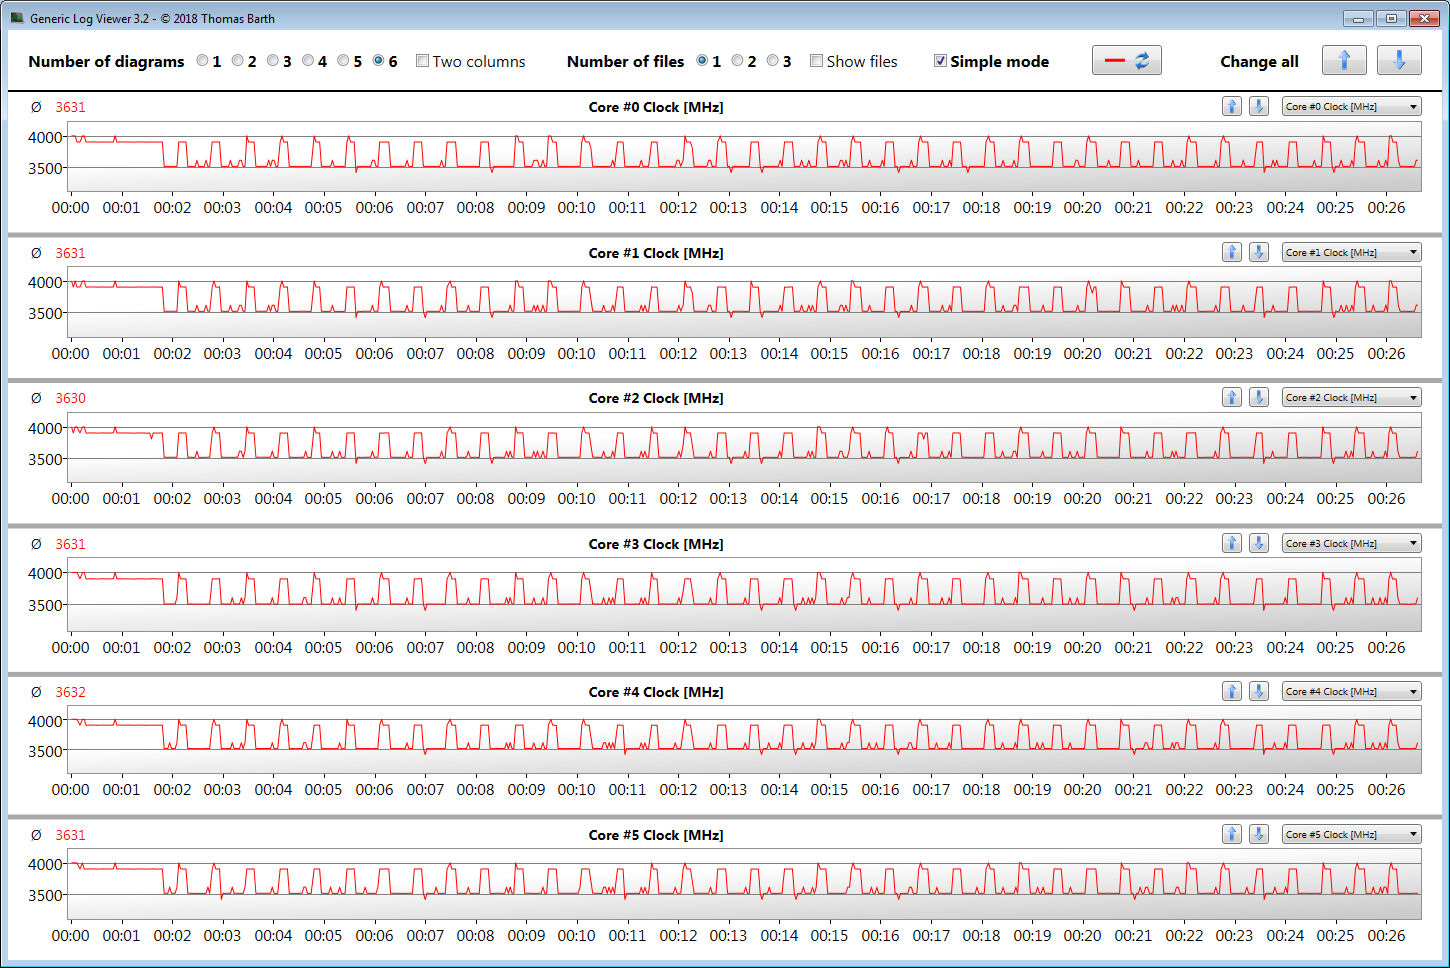
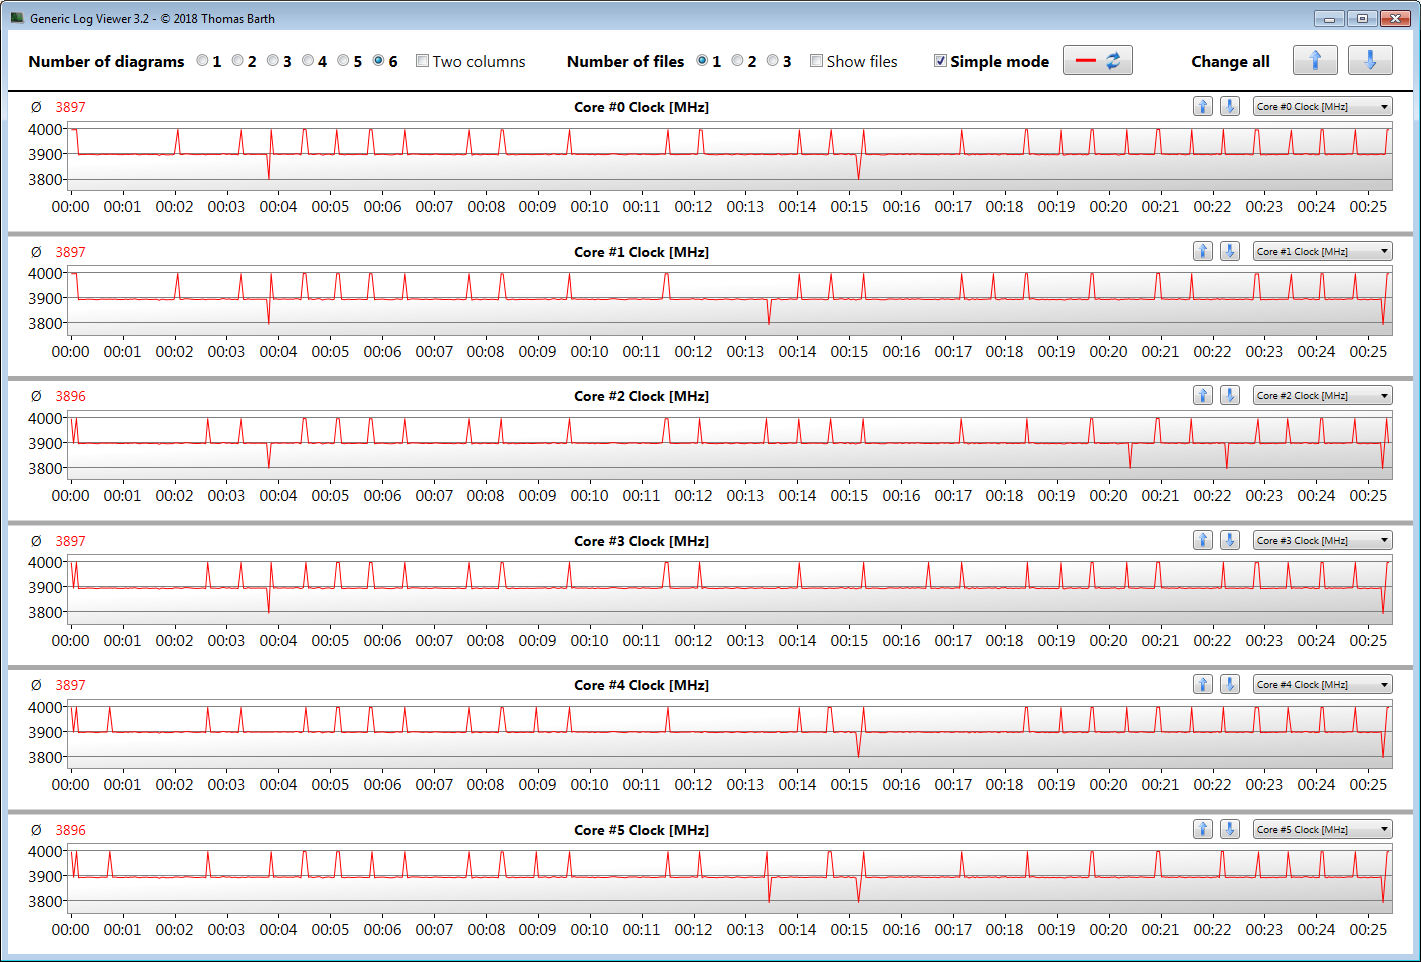
The processor runs through the multi-thread tests of the Cinebench benchmarks at 3.9 GHz and the single-thread tests at 3.9 - 4.1 GHz. While these are the values in mains operation, the CPU runs at 800 MHz in battery operation.
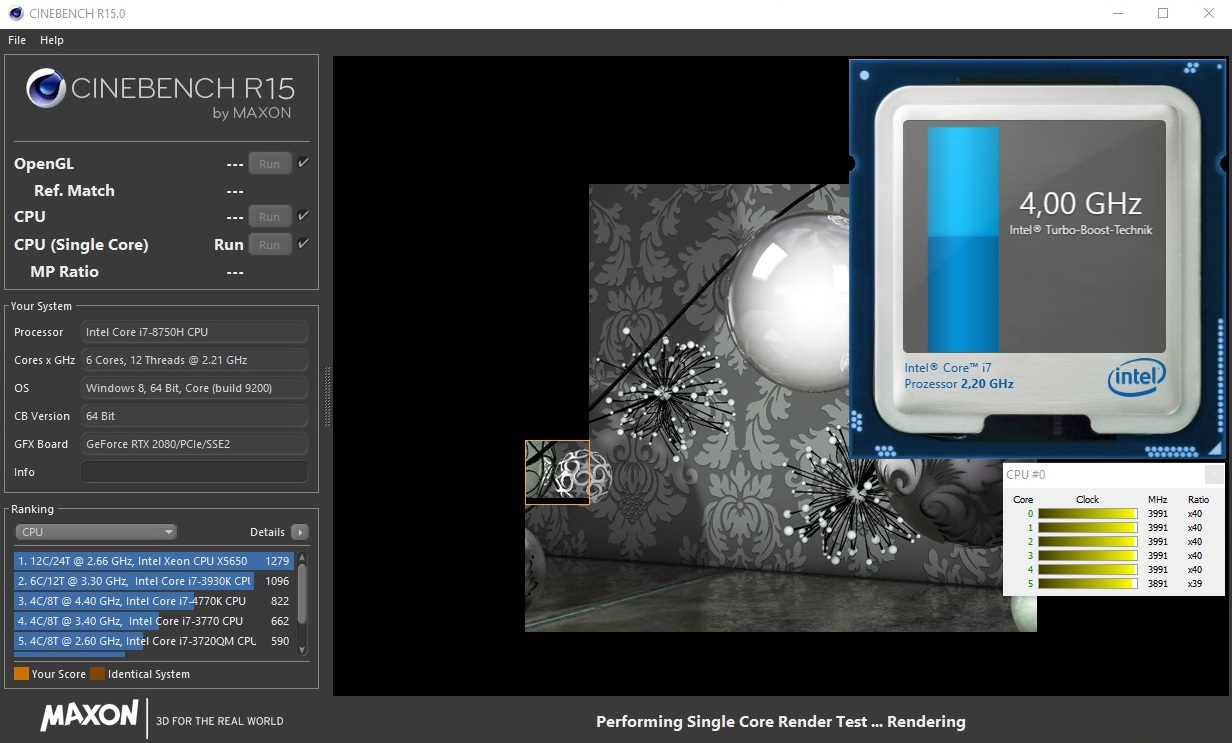
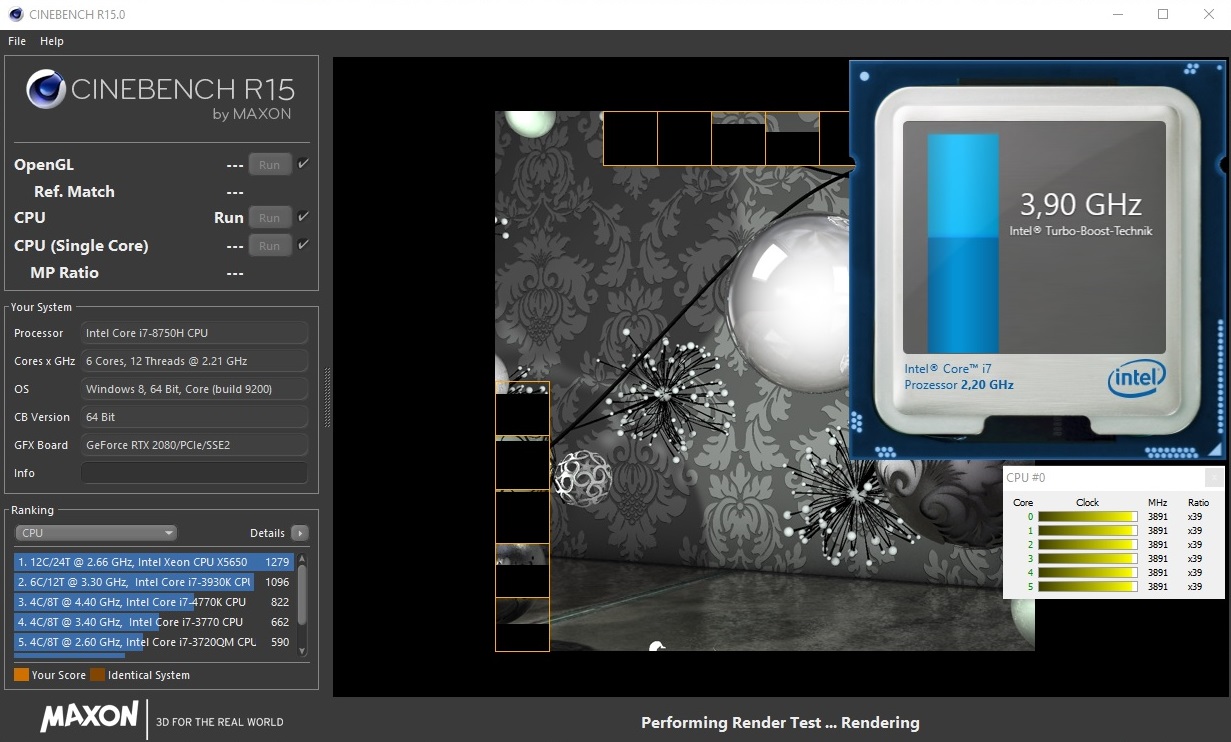
We evaluate whether the CPU Turbo can also be maintained constantly in mains operation by running the multi-thread test of the Cinebench-R15 benchmarks for about 30 minutes in a constant loop. The results drop slightly from the first to the fourth run and then remain at a constant level. With the Turbo mode activated, the CPU is able to maintain its higher speeds constantly.
| Cinebench R10 | |
| Rendering Single 32Bit | |
| Average of class Gaming (7457 - 11779, n=8, last 2 years) | |
| Schenker XMG Ultra 17 | |
| Asus ROG G703GX | |
| Rendering Multiple CPUs 32Bit | |
| Average of class Gaming (42932 - 81339, n=8, last 2 years) | |
| Asus ROG G703GX | |
| Schenker XMG Ultra 17 | |
| Geekbench 3 | |
| 32 Bit Multi-Core Score | |
| Asus ROG G703GX | |
| Schenker XMG Ultra 17 | |
| 32 Bit Single-Core Score | |
| Schenker XMG Ultra 17 | |
| Asus ROG G703GX | |
| Geekbench 4.0 | |
| 64 Bit Multi-Core Score | |
| Average of class Gaming (40469 - 76142, n=4, last 2 years) | |
| Asus ROG G703GX | |
| 64 Bit Single-Core Score | |
| Average of class Gaming (7589 - 9053, n=4, last 2 years) | |
| Asus ROG G703GX | |
| Geekbench 4.4 | |
| 64 Bit Multi-Core Score | |
| Average of class Gaming (89200 - 97490, n=2, last 2 years) | |
| Asus ROG G703GX | |
| 64 Bit Single-Core Score | |
| Average of class Gaming (9335 - 9492, n=2, last 2 years) | |
| Asus ROG G703GX | |
| Mozilla Kraken 1.1 - Total | |
| Asus ROG G703GX (Edge 44) | |
| Schenker XMG Ultra 17 (Edge 41) | |
| Acer Predator Helios 500 PH517-51-79BY | |
| Average of class Gaming (391 - 590, n=105, last 2 years) | |
| Octane V2 - Total Score | |
| Average of class Gaming (87588 - 139447, n=30, last 2 years) | |
| Acer Predator Helios 500 PH517-51-79BY | |
| Asus ROG G703GX (Edge 44) | |
| JetStream 1.1 - 1.1 Total | |
| Average of class Gaming (518 - 647, n=5, last 2 years) | |
| Schenker XMG Ultra 17 (Edge 41) | |
| Asus ROG G703GX (Edge 44) | |
| Acer Predator Helios 500 PH517-51-79BY | |
* ... smaller is better
System Performance
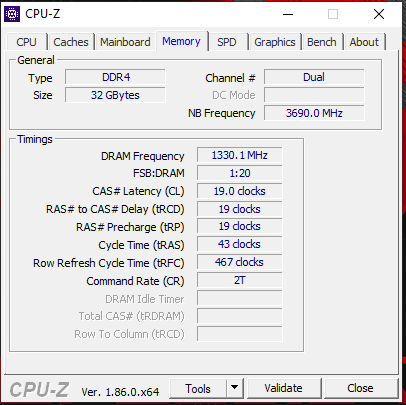
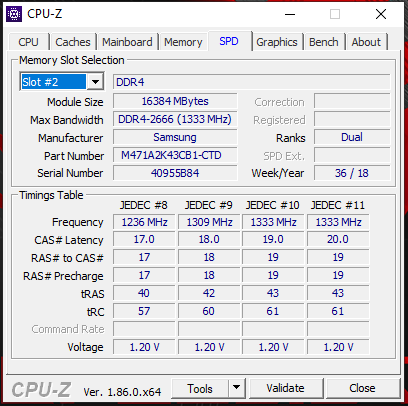
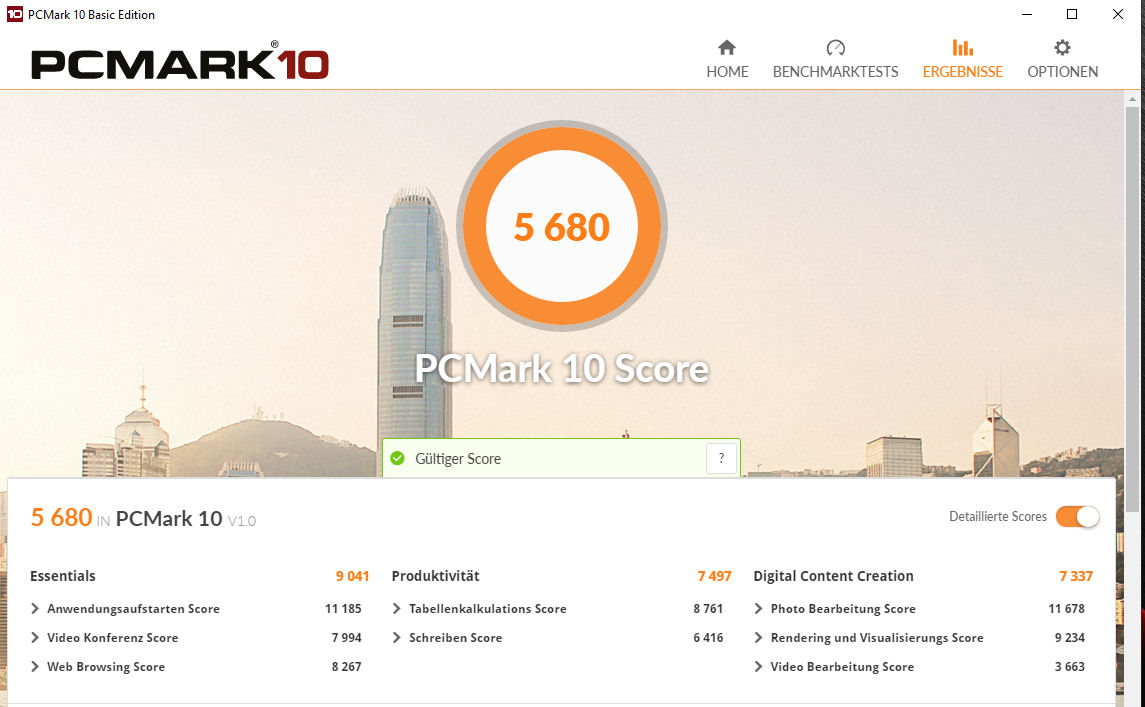
An NVMe SSD, a powerful hexa-core processor, and the working memory running in dual-channel mode ensure a fast and smooth-running system. We did not encounter any problems, and the 8750H offers sufficient power reserves for the coming years. The dedicated graphics core enables playing computer games. The very good results in the PC-Mark benchmarks confirm that the Asus computer is also well equipped for power-hungry applications beyond gaming.
| PCMark 7 Score | 6734 points | |
| PCMark 8 Home Score Accelerated v2 | 4622 points | |
| PCMark 8 Creative Score Accelerated v2 | 5305 points | |
| PCMark 8 Work Score Accelerated v2 | 5697 points | |
| PCMark 10 Score | 5680 points | |
Help | ||
| PCMark 10 - Score | |
| Average of class Gaming (5828 - 11574, n=95, last 2 years) | |
| Asus Chimera G703GI | |
| Schenker XMG Ultra 17 | |
| Asus ROG G703GX | |
| Acer Predator Helios 500 PH517-51-79BY | |
| Aorus X7 DT v8 | |
Storage Solution
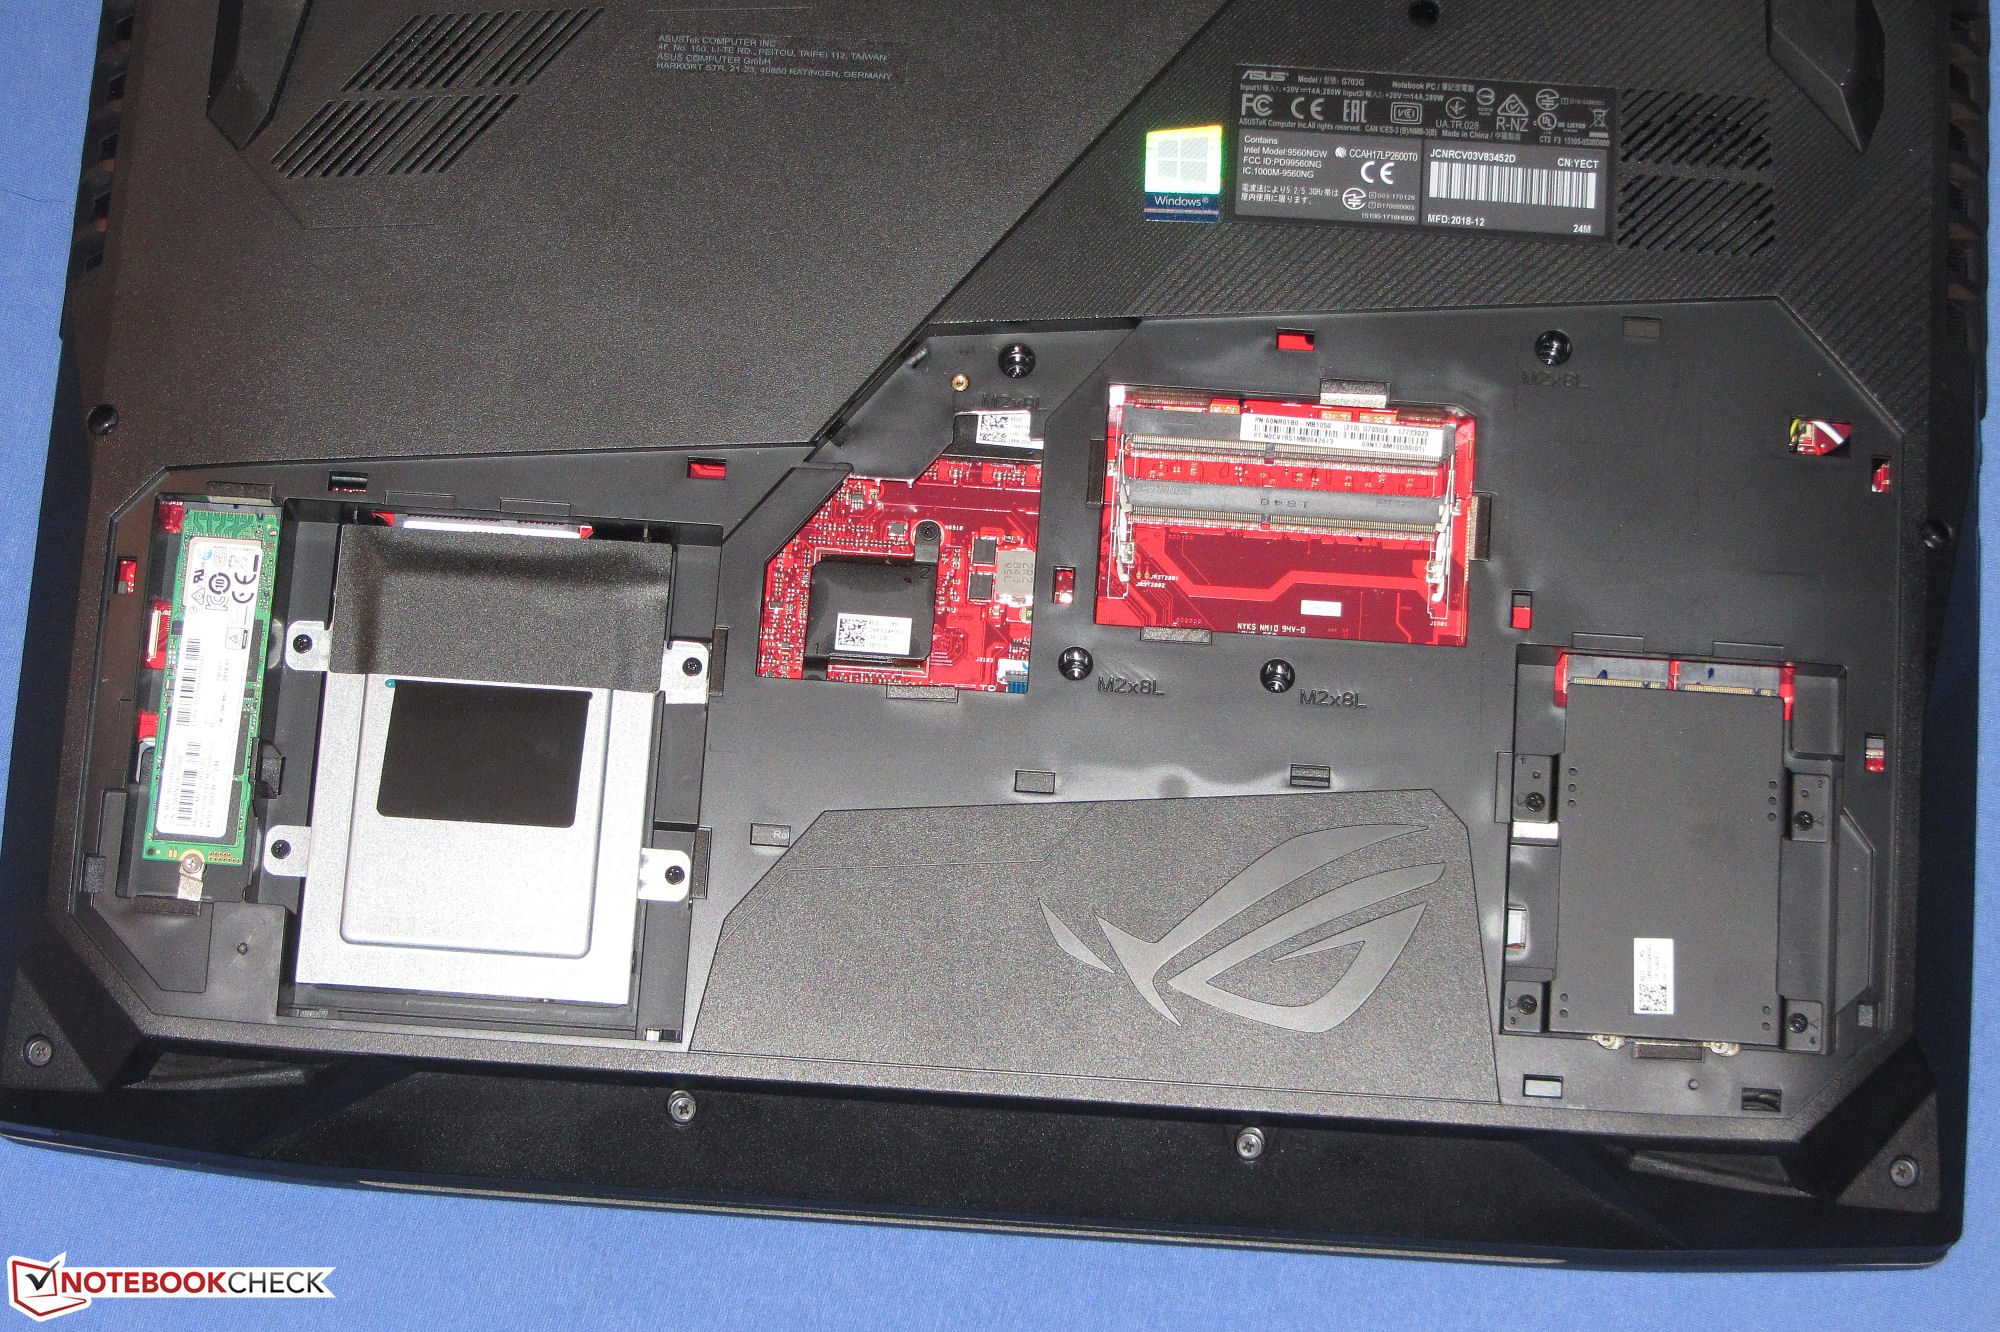
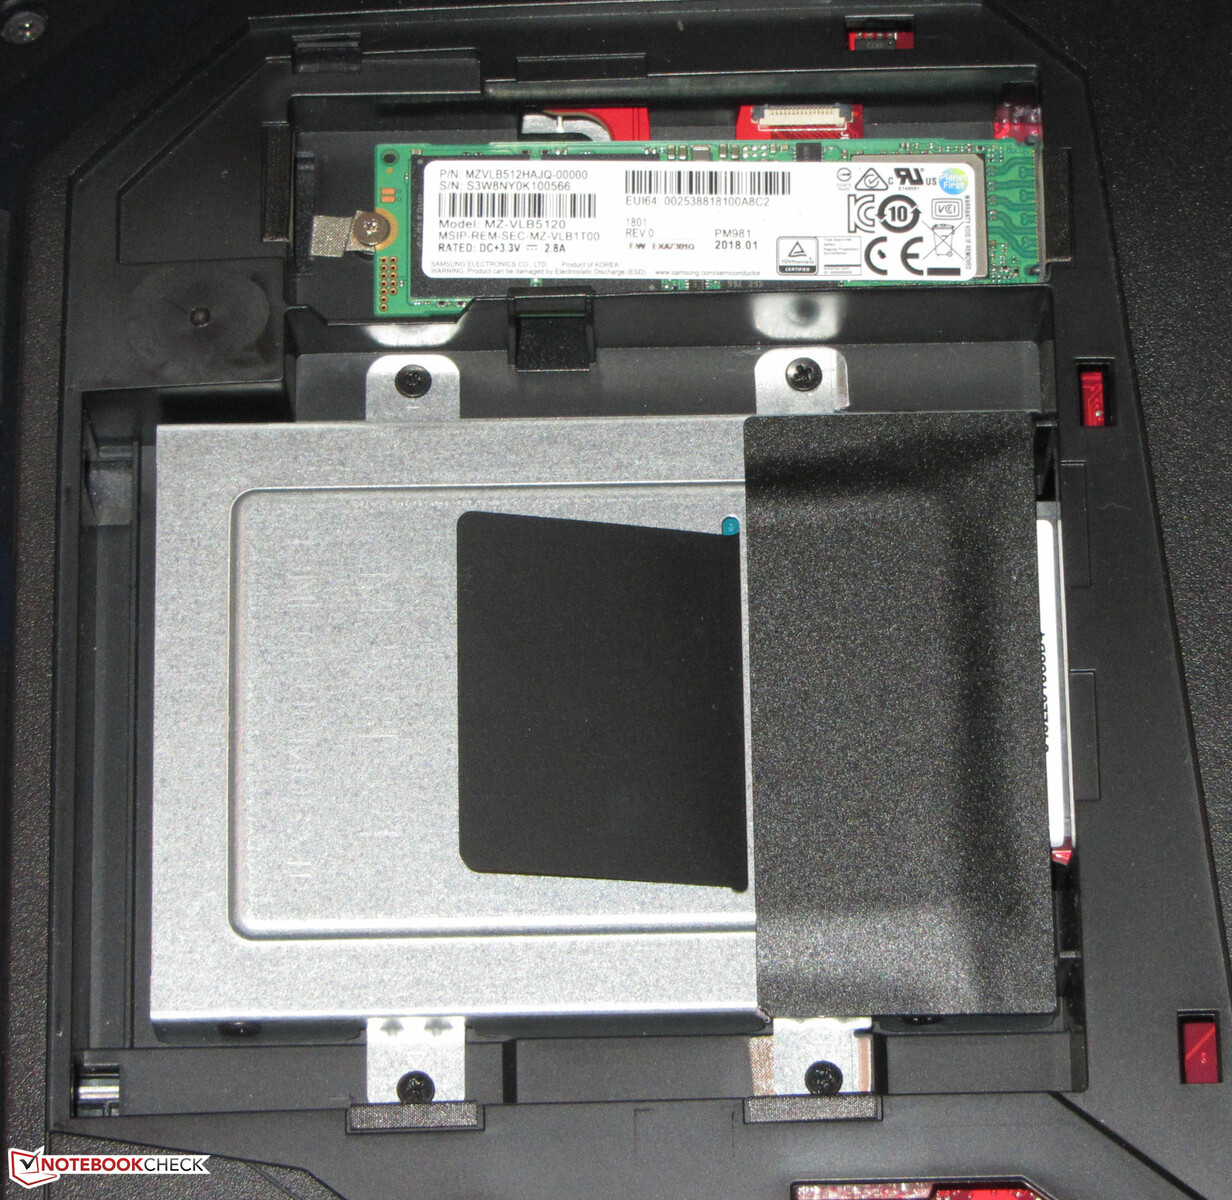
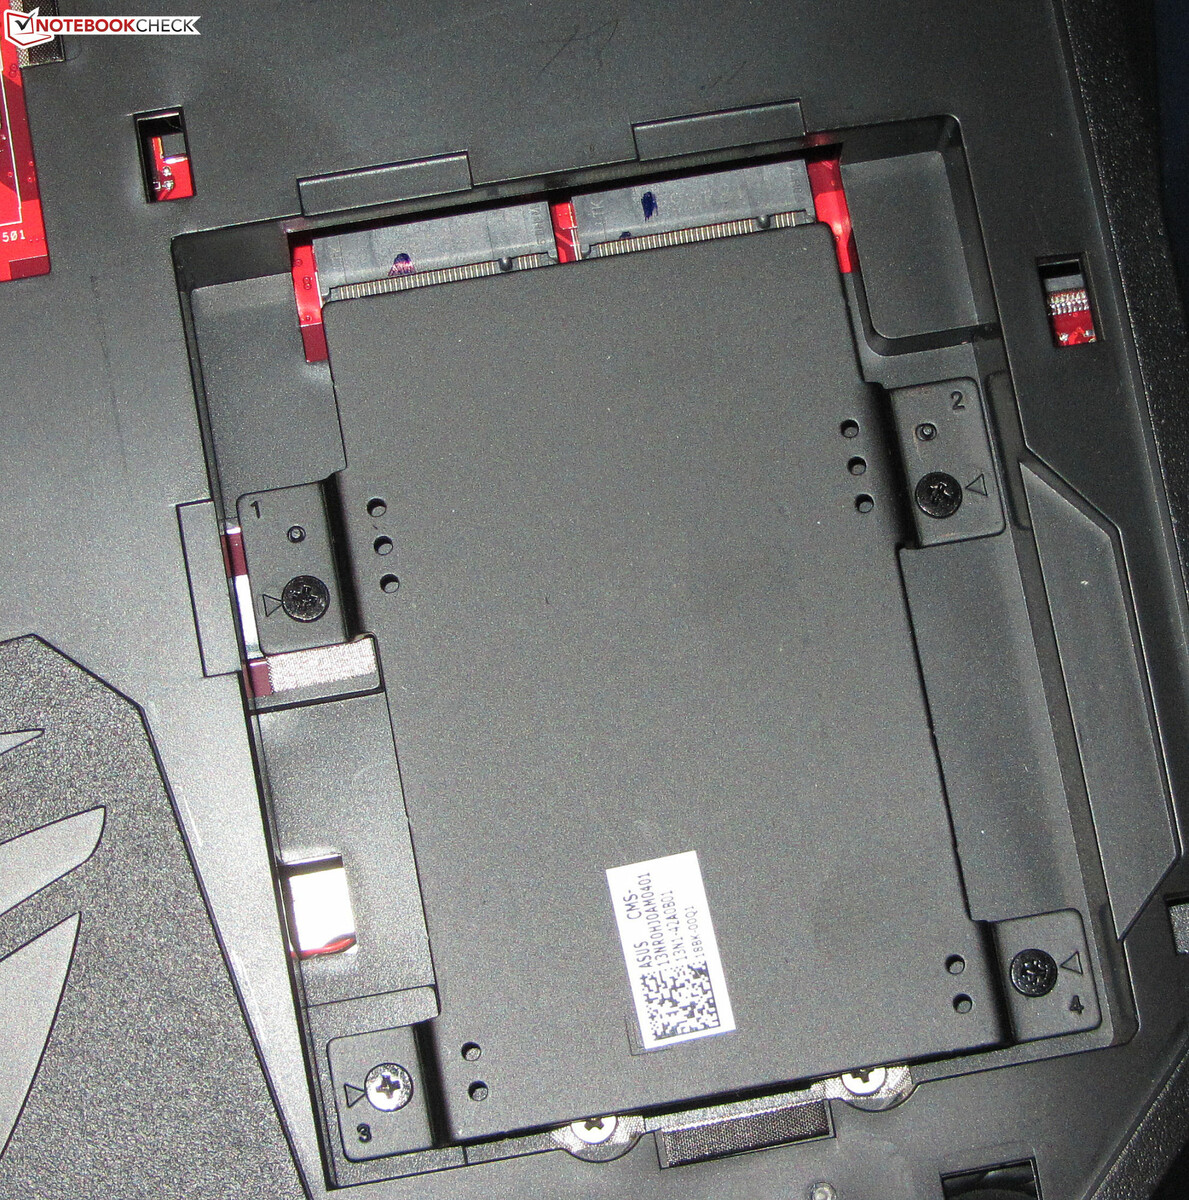
An NVMe SSD from Samsung serves as the system drive. This is an M.2-2280 model with a total capacity of 512 GB. In the state of delivery, about 426 GB of this remain available, with the rest of the storage being used by the recovery partition and the Windows installation. The SSD delivers very good transfer rates. NVMe SSDs are connected via PCI Express 3.0 x4, which enables significantly higher transfer rates than a connection via SATA III. In addition to the SSD, the notebook also has a 2.5-inch hard drive (1 TB, 5400 rpm).
However, this is not the end of it. Behind the maintenance hatch of the G703GX are also two additional M.2-2280 slots. If all the slots were occupied by SSDs, you could run them in RAID-0 mode. In this case, you could write to the SSDs in parallel, which would be accompanied by a considerable increase of the transfer rates. The SSDs would appear as a single SSD in the system.

| Asus ROG G703GX Samsung SSD PM981 MZVLB512HAJQ | Acer Predator Helios 500 PH517-51-79BY SK hynix SSD Canvas SC300 HFS256GD9MNE-6200A | Aorus X7 DT v8 Toshiba NVMe THNSN5512GPU7 | Asus Chimera G703GI 2x Intel 760p 512 GB + 1x Samsung SM961 512 GB (RAID) | Schenker XMG Ultra 17 Samsung SSD 960 Evo 500GB m.2 NVMe | |
|---|---|---|---|---|---|
| CrystalDiskMark 5.2 / 6 | -30% | -12% | 92% | 14% | |
| Write 4K (MB/s) | 90.4 | 79.2 -12% | 88.6 -2% | 130.2 44% | 153.5 70% |
| Read 4K (MB/s) | 39.19 | 39.69 1% | 30.76 -22% | 57.3 46% | 44.1 13% |
| Write Seq (MB/s) | 1863 | 950 -49% | 1340 -28% | 4049 117% | 1725 -7% |
| Read Seq (MB/s) | 2100 | 1087 -48% | 1362 -35% | 5325 154% | 1750 -17% |
| Write 4K Q32T1 (MB/s) | 260.2 | 189.6 -27% | 305.7 17% | 383.2 47% | 340 31% |
| Read 4K Q32T1 (MB/s) | 297 | 304 2% | 366.8 24% | 424.9 43% | 392.1 32% |
| Write Seq Q32T1 (MB/s) | 1870 | 948 -49% | 1562 -16% | 4316 131% | 1839 -2% |
| Read Seq Q32T1 (MB/s) | 3471 | 1488 -57% | 2414 -30% | 8905 157% | 3308 -5% |
Graphics Card
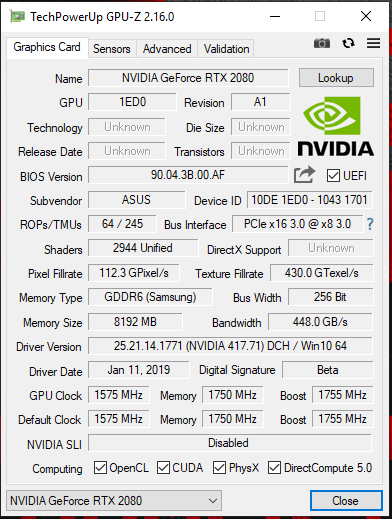
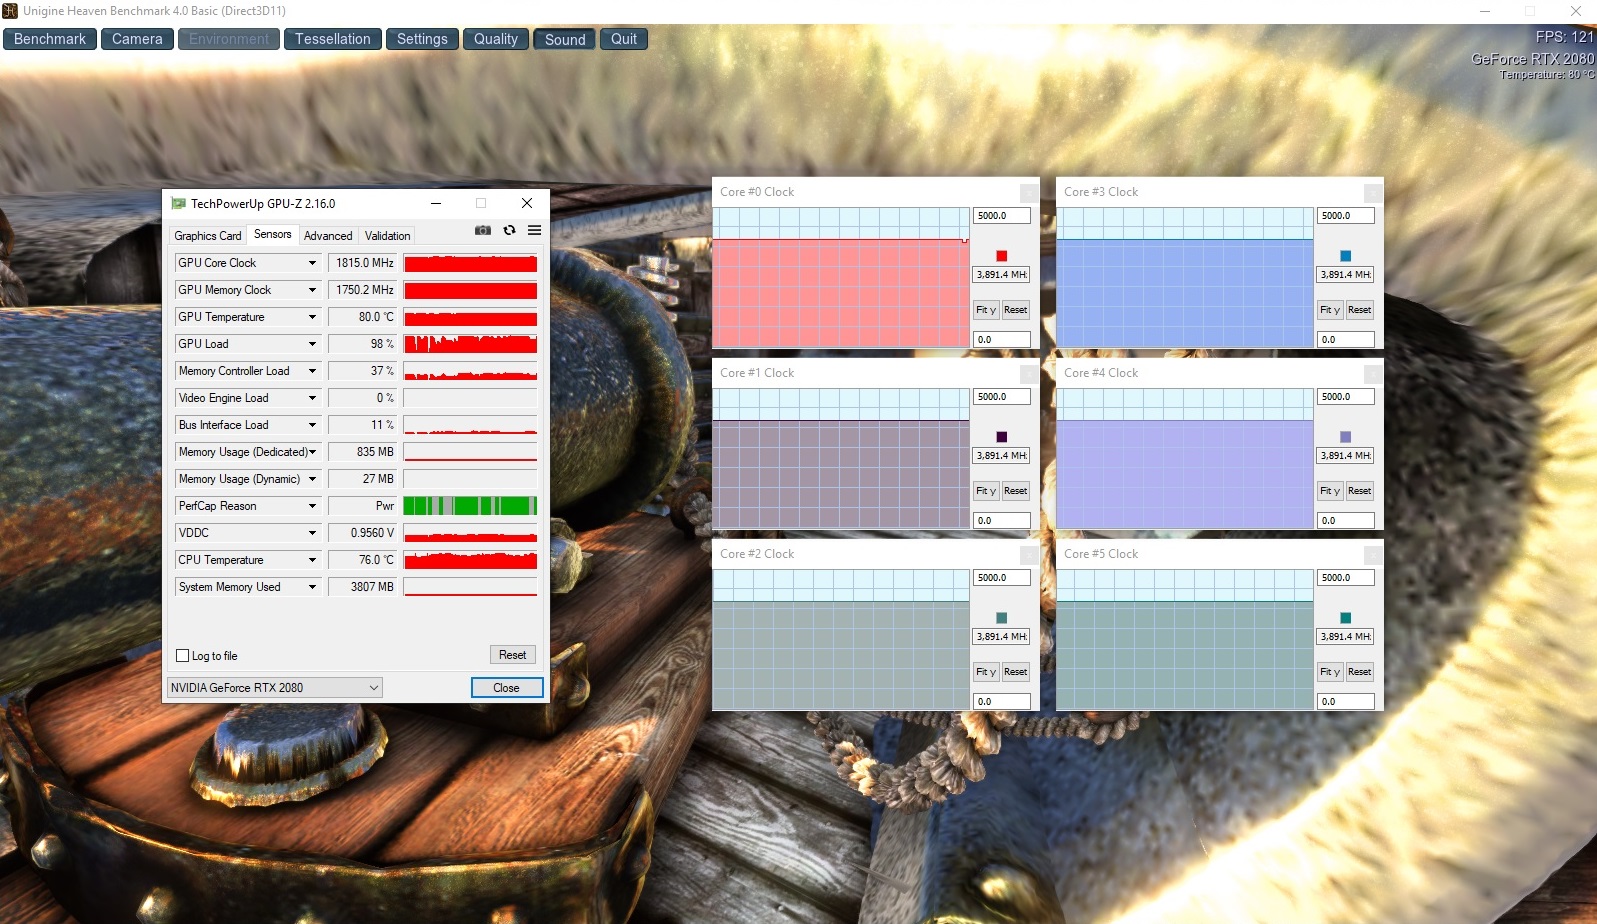
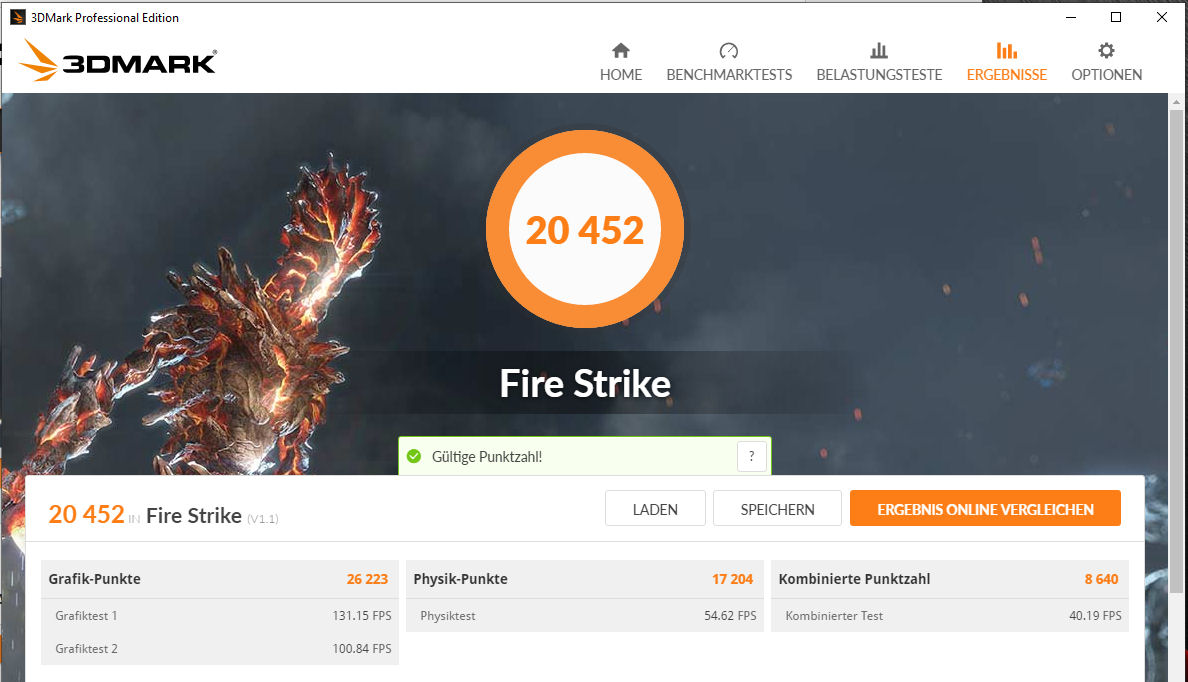
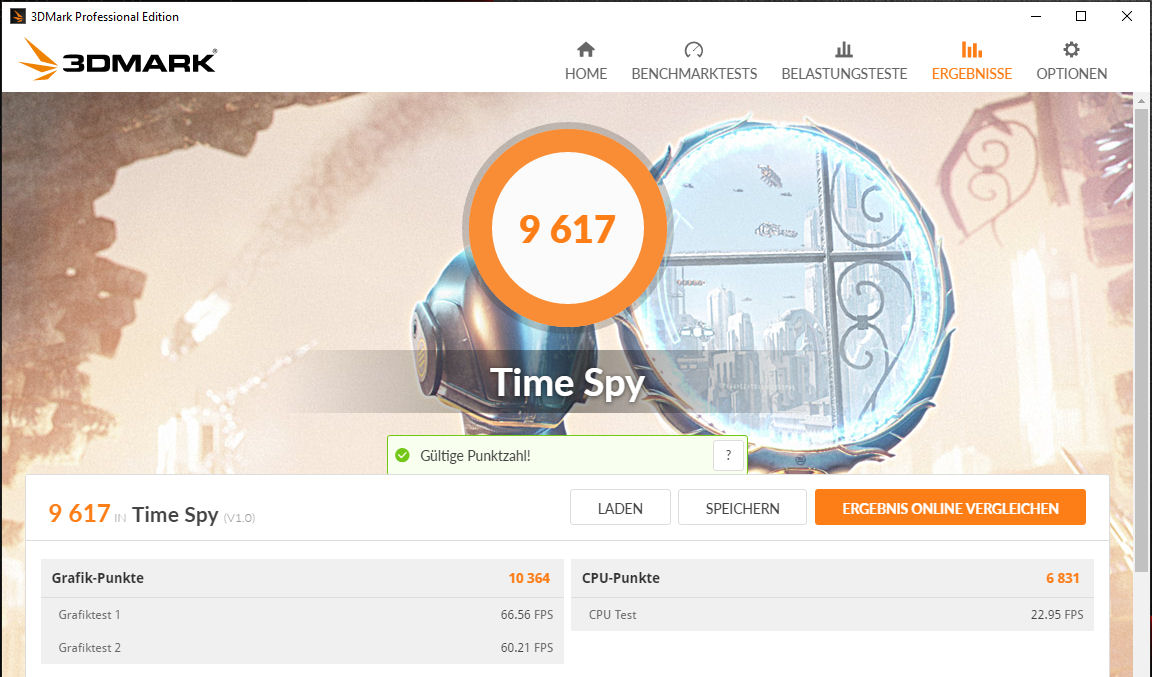
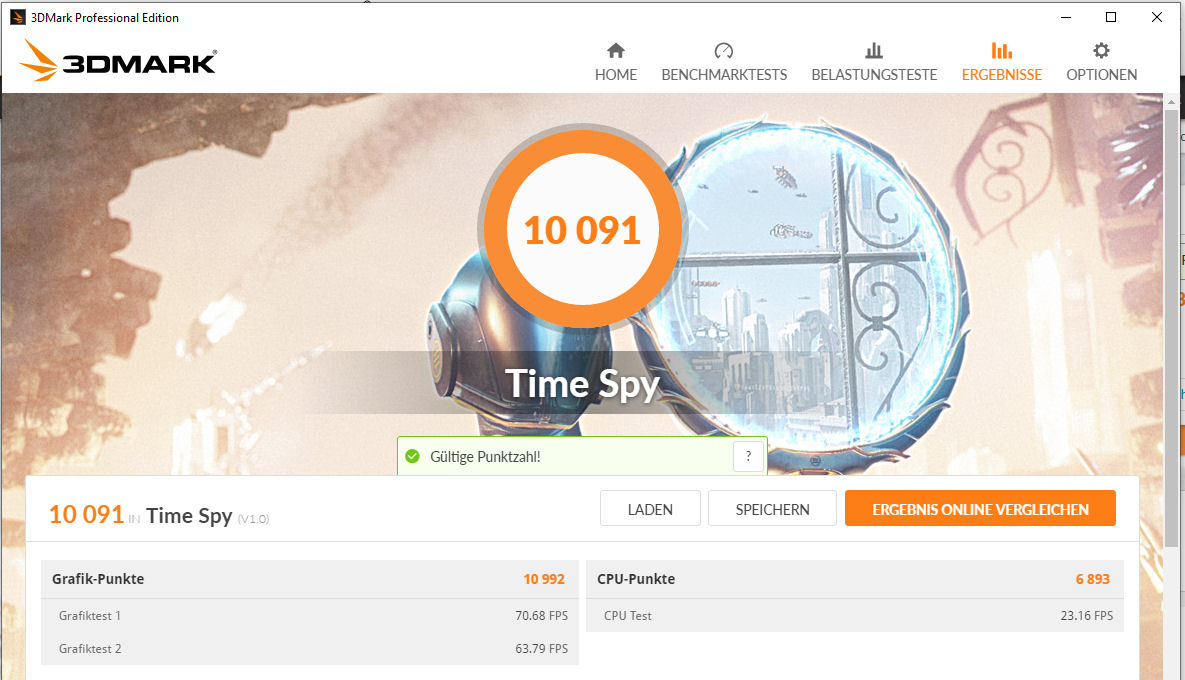
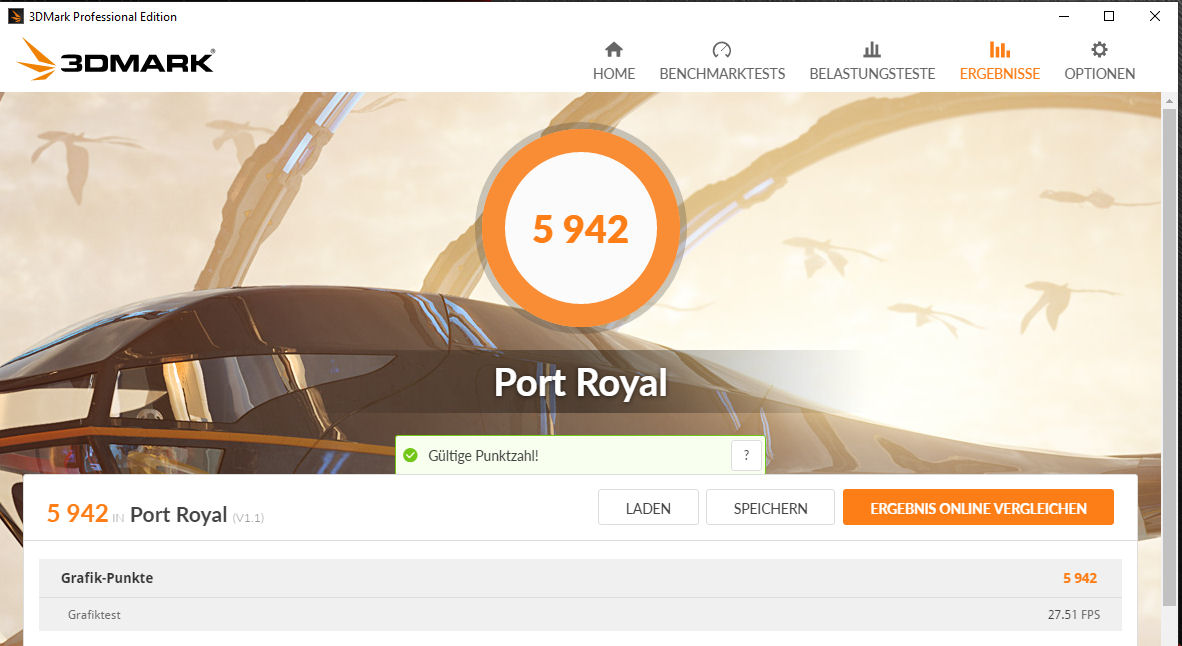
The brand-new GeForce RTX 2080 graphics core found its way into the G703GX. This GPU represents Nvidia's current top model for notebooks. The Turing core supports DirectX 12 and reaches maximum speeds of up to 1935 MHz. However, this value cannot be maintained constantly. During our tests, we measured an operation speed of about 1815 MHz on average. The GPU is accompanied by a total of 8192 MB GDDR6 graphics storage. The results in the 3DMark benchmarks turn out good. With active Turbo mode, the results increase by only a few percentage points. In all cases, the RTX 2080 fares significantly better than its predecessor, the GTX 1080.
You also do not have to make do without a switching graphics solution (Optimus). While Intel's integrated UHD Graphics 630 GPU is used during everyday and battery operation, more demanding applications such as computer games are handled by Nvidia's graphics core.

| 3DMark 06 Standard Score | 35591 points | |
| 3DMark 11 Performance | 24624 points | |
| 3DMark Ice Storm Standard Score | 117607 points | |
| 3DMark Cloud Gate Standard Score | 37209 points | |
| 3DMark Fire Strike Score | 20452 points | |
| 3DMark Fire Strike Extreme Score | 11801 points | |
| 3DMark Time Spy Score | 9617 points | |
Help | ||
| 3DMark | |
| 2560x1440 Port Royal Graphics | |
| Average of class Gaming (4395 - 17286, n=70, last 2 years) | |
| Asus ROG G703GX (Turbo-Mode) | |
| Asus ROG G703GX | |
| Schenker XMG Ultra 15 | |
| 2560x1440 Time Spy Graphics | |
| Average of class Gaming (5012 - 26212, n=119, last 2 years) | |
| Asus ROG G703GX (Turbo-Mode) | |
| Asus ROG G703GX | |
| Schenker XMG Ultra 15 | |
| Schenker XMG Ultra 17 | |
| Acer Predator Helios 500 PH517-51-79BY | |
| 1920x1080 Fire Strike Graphics | |
| Average of class Gaming (12242 - 62849, n=120, last 2 years) | |
| Asus ROG G703GX (Turbo-Mode) | |
| Asus ROG G703GX | |
| Schenker XMG Ultra 15 | |
| Asus Chimera G703GI | |
| Schenker XMG Ultra 17 | |
| Aorus X7 DT v8 | |
| Acer Predator Helios 500 PH517-51-79BY | |
| 3DMark 11 - 1280x720 Performance GPU | |
| Average of class Gaming (21841 - 80022, n=108, last 2 years) | |
| Asus ROG G703GX (Turbo-Mode) | |
| Asus ROG G703GX | |
| Schenker XMG Ultra 15 | |
| Asus Chimera G703GI | |
| Schenker XMG Ultra 17 | |
| Aorus X7 DT v8 | |
Gaming Performance
The CPU/GPU combination of the G703GX brings all the games you can find in our database smoothly to the matte screen in Full-HD resolution and maximum quality settings. Resolutions beyond Full HD also pose no great challenge to the GPU. But in order to use such resolutions, you would have to connect the corresponding external monitor.
While the G703GX produces better results through the bank in the 3D-Mark benchmarks than notebooks that have a GeForce GTX-1080 graphics core on board, things do not look as clear-cut in practice when gaming. A look at our comparison chart shows that sometimes the G703GX is clearly ahead and other times it remains clearly behind. The latter happens particularly in CPU-heavy games such as "Far Cry 5." The reason is quickly found: The GTX-1080 notebooks that we tested have stronger processors than the G703GX and thus fare better correspondingly.
| low | med. | high | ultra | |
|---|---|---|---|---|
| BioShock Infinite (2013) | 298.3 | 264.1 | 247.8 | 180.7 |
| GTA V (2015) | 164 | 159.6 | 126.4 | 75 |
| The Witcher 3 (2015) | 280.8 | 210.2 | 169.6 | 99.7 |
| X-Plane 11.11 (2018) | 98.2 | 86.2 | 73.1 | |
| Far Cry 5 (2018) | 123 | 104 | 97 | 96 |
| Shadow of the Tomb Raider (2018) | 124 | 115 | 111 | 106 |
| Call of Duty Black Ops 4 (2018) | 143.8 | 119.1 | 124.6 | 120 |
| Battlefield V (2018) | 157.2 | 117.6 | 118.3 | 117.4 |
| Darksiders III (2018) | 171.9 | 111 | 104.2 | 102.9 |
| The Witcher 3 - 1920x1080 Ultra Graphics & Postprocessing (HBAO+) | |
| Average of class Gaming (95 - 240, n=8, last 2 years) | |
| Asus ROG G703GX | |
| Schenker XMG Ultra 15 | |
| Aorus X9 DT | |
| MSI GT75 8RG-090 Titan | |
| Asus Chimera G703GI | |
| Schenker XMG Ultra 17 | |
| MSI GT63 Titan 8RG-046 | |
| Aorus X7 DT v8 | |
| Acer Predator Helios 500 PH517-51-79BY | |
| BioShock Infinite - 1920x1080 Ultra Preset, DX11 (DDOF) | |
| Asus ROG G703GX | |
| MSI GT63 Titan 8RG-046 | |
| Far Cry 5 - 1920x1080 Ultra Preset AA:T | |
| Average of class Gaming (70 - 151, n=10, last 2 years) | |
| Schenker XMG Ultra 15 | |
| Aorus X9 DT | |
| MSI GT75 8RG-090 Titan | |
| Asus Chimera G703GI | |
| Asus ROG G703GX | |
| Shadow of the Tomb Raider - 1920x1080 Highest Preset AA:T | |
| Asus ROG G703GX | |
| Average of class Gaming (96 - 116, n=2, last 2 years) | |
| Schenker XMG Ultra 15 | |
| Call of Duty Black Ops 4 - 1920x1080 Very High / On | |
| Schenker XMG Ultra 15 | |
| Asus ROG G703GX | |
| Darksiders III - 1920x1080 Epic | |
| Schenker XMG Ultra 15 | |
| Asus ROG G703GX | |
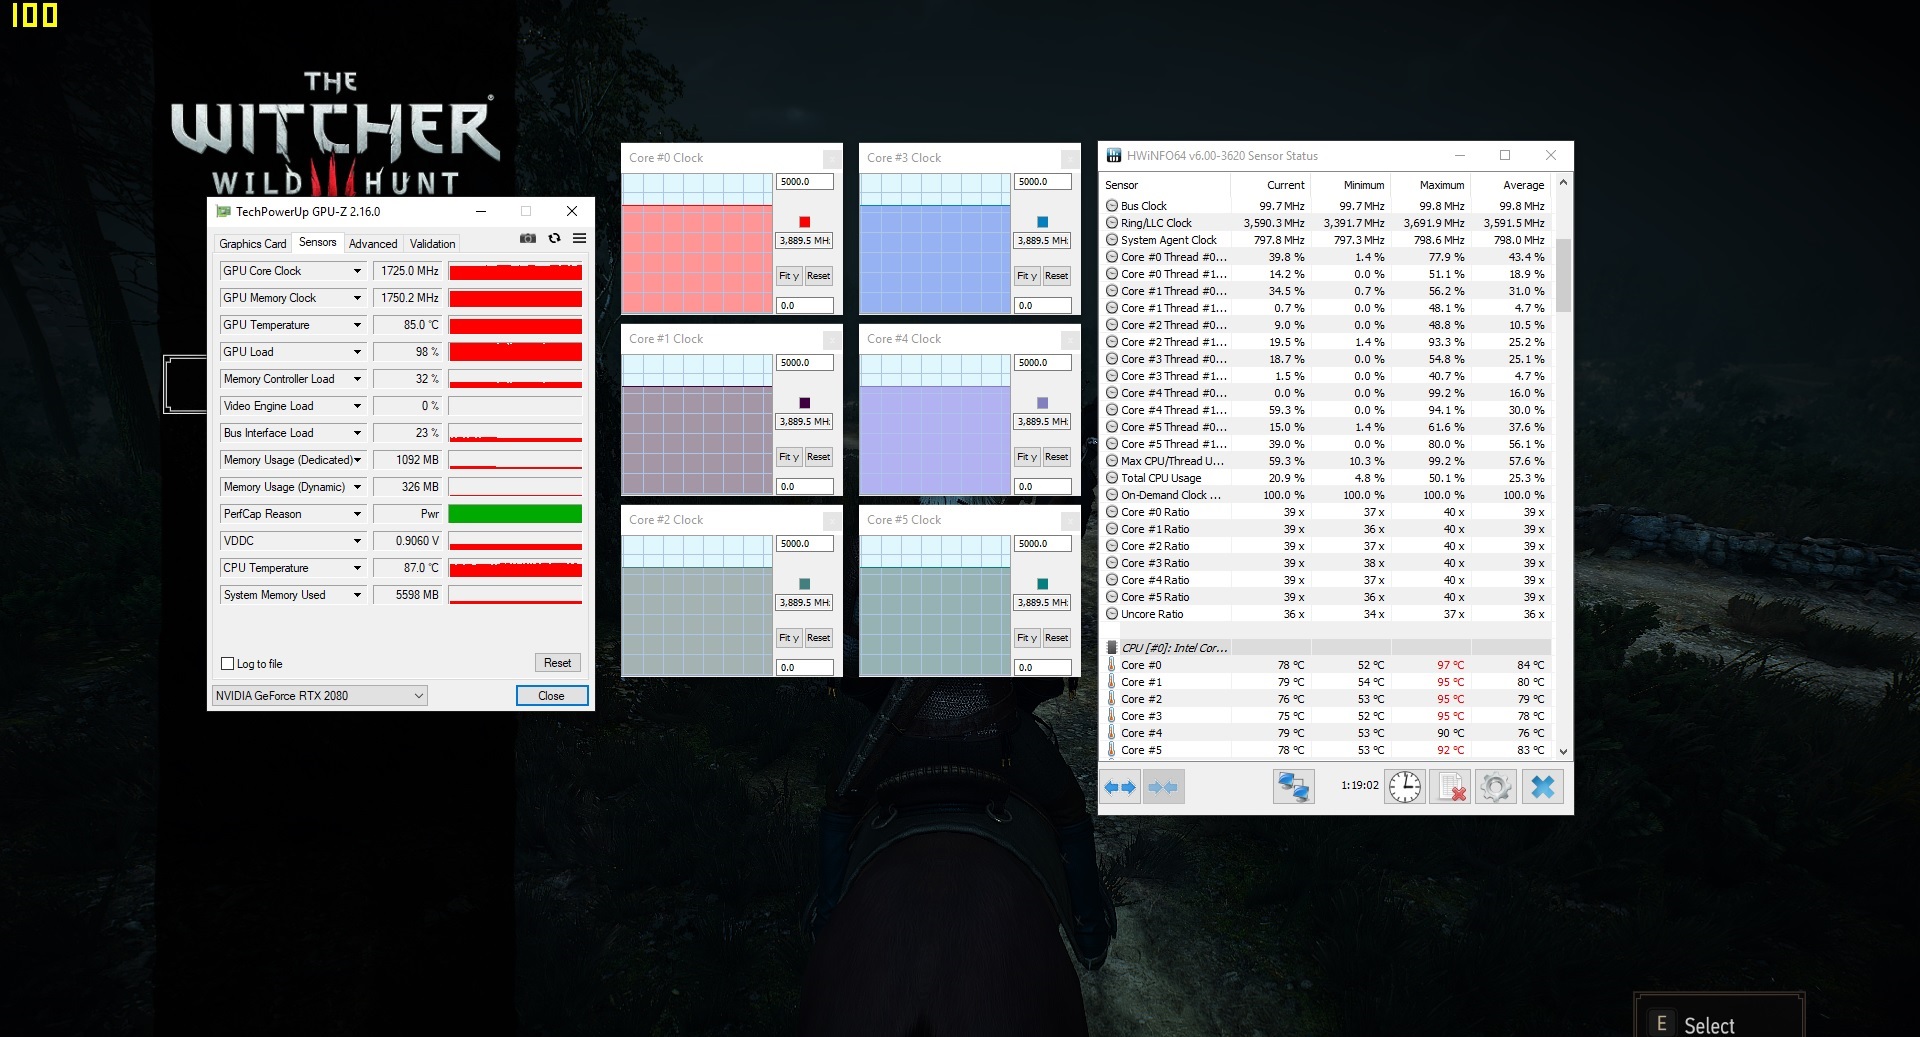
In order to evaluate whether the frame rates can also remain constant over a long period, we run the game "The Witcher 3" for about 60 minutes in Full-HD resolution and maximum quality settings. During the whole time, the character of the player is not moved. While the frame rates drop slightly during the course of the test, they remain at a playable level. There are no noticeable performance drops.
Emissions - Not without headphones
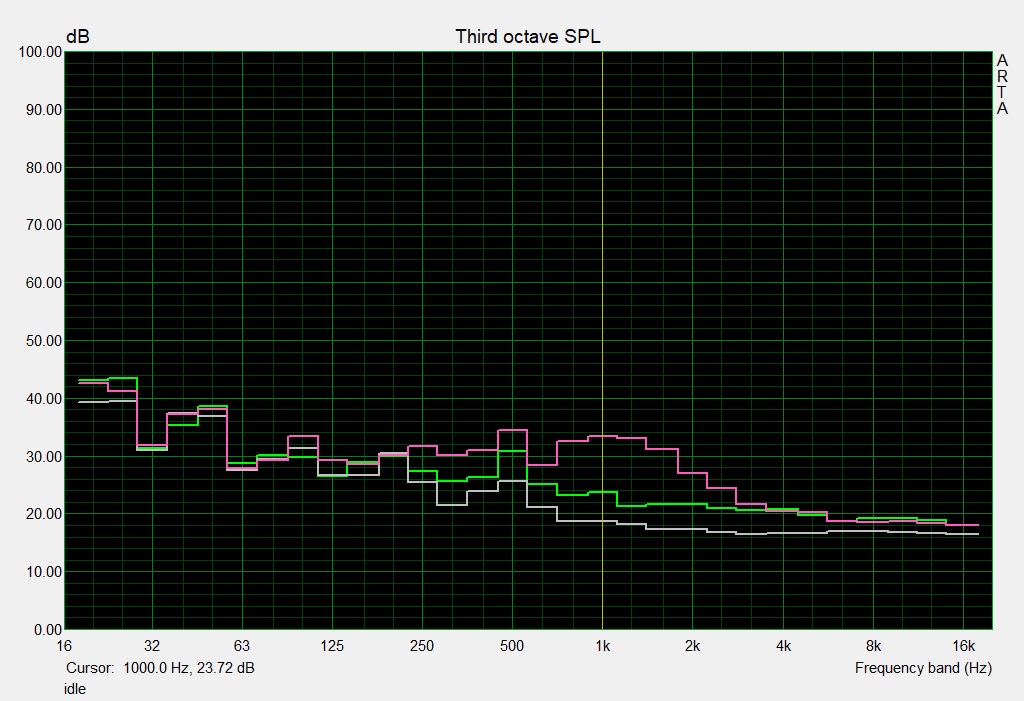
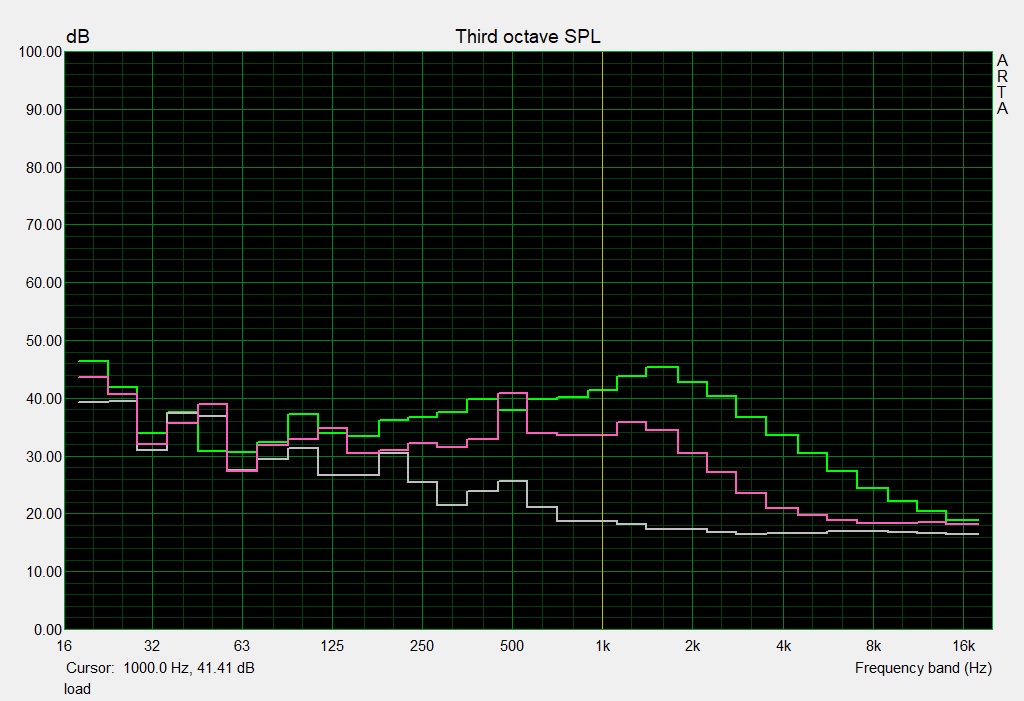
System Noise
It should not surprise that a notebook of this performance class is not one of the quietest of its kind. During idle operation and under low loads, the fans generally run constantly. They are rarely turned off, and even then the system is not completely quiet, but we can hear a quiet rattling or hum from the inside. Under load, the fans rev up significantly. During our stress test (Prime95 and FurMark run for at least one hour), the noise level increases up to 52 dB(A). Under loads within the medium range, the value varies between 41 and 49 dB(A), and during the Witcher-3 test it is about 51 dB(A).
Noise level
| Idle |
| 30 / 35 / 41 dB(A) |
| HDD |
| 33 dB(A) |
| Load |
| 44 / 52 dB(A) |
 | ||
30 dB silent 40 dB(A) audible 50 dB(A) loud |
||
min: | ||
| Asus ROG G703GX i7-8750H, GeForce RTX 2080 Mobile | Acer Predator Helios 500 PH517-51-79BY i7-8750H, GeForce GTX 1070 Mobile | Aorus X7 DT v8 i7-8850H, GeForce GTX 1080 Mobile | Asus Chimera G703GI i9-8950HK, GeForce GTX 1080 Mobile | Schenker XMG Ultra 17 i7-8700, GeForce GTX 1080 Mobile | Average of class Gaming | |
|---|---|---|---|---|---|---|
| Noise | 6% | -3% | -3% | -4% | 14% | |
| off / environment * (dB) | 30 | 30.4 -1% | 29 3% | 29 3% | 30 -0% | 24.1 ? 20% |
| Idle Minimum * (dB) | 30 | 31.2 -4% | 35 -17% | 30 -0% | 34 -13% | 25.8 ? 14% |
| Idle Average * (dB) | 35 | 35.3 -1% | 36 -3% | 34 3% | 35 -0% | 27.4 ? 22% |
| Idle Maximum * (dB) | 41 | 35.3 14% | 41 -0% | 42 -2% | 40 2% | 30 ? 27% |
| Load Average * (dB) | 44 | 44.4 -1% | 43 2% | 53 -20% | 45 -2% | 43 ? 2% |
| Witcher 3 ultra * (dB) | 51 | 41 20% | 53 -4% | 51 -0% | 52 -2% | |
| Load Maximum * (dB) | 52 | 45.2 13% | 54 -4% | 53 -2% | 60 -15% | 54 ? -4% |
* ... smaller is better
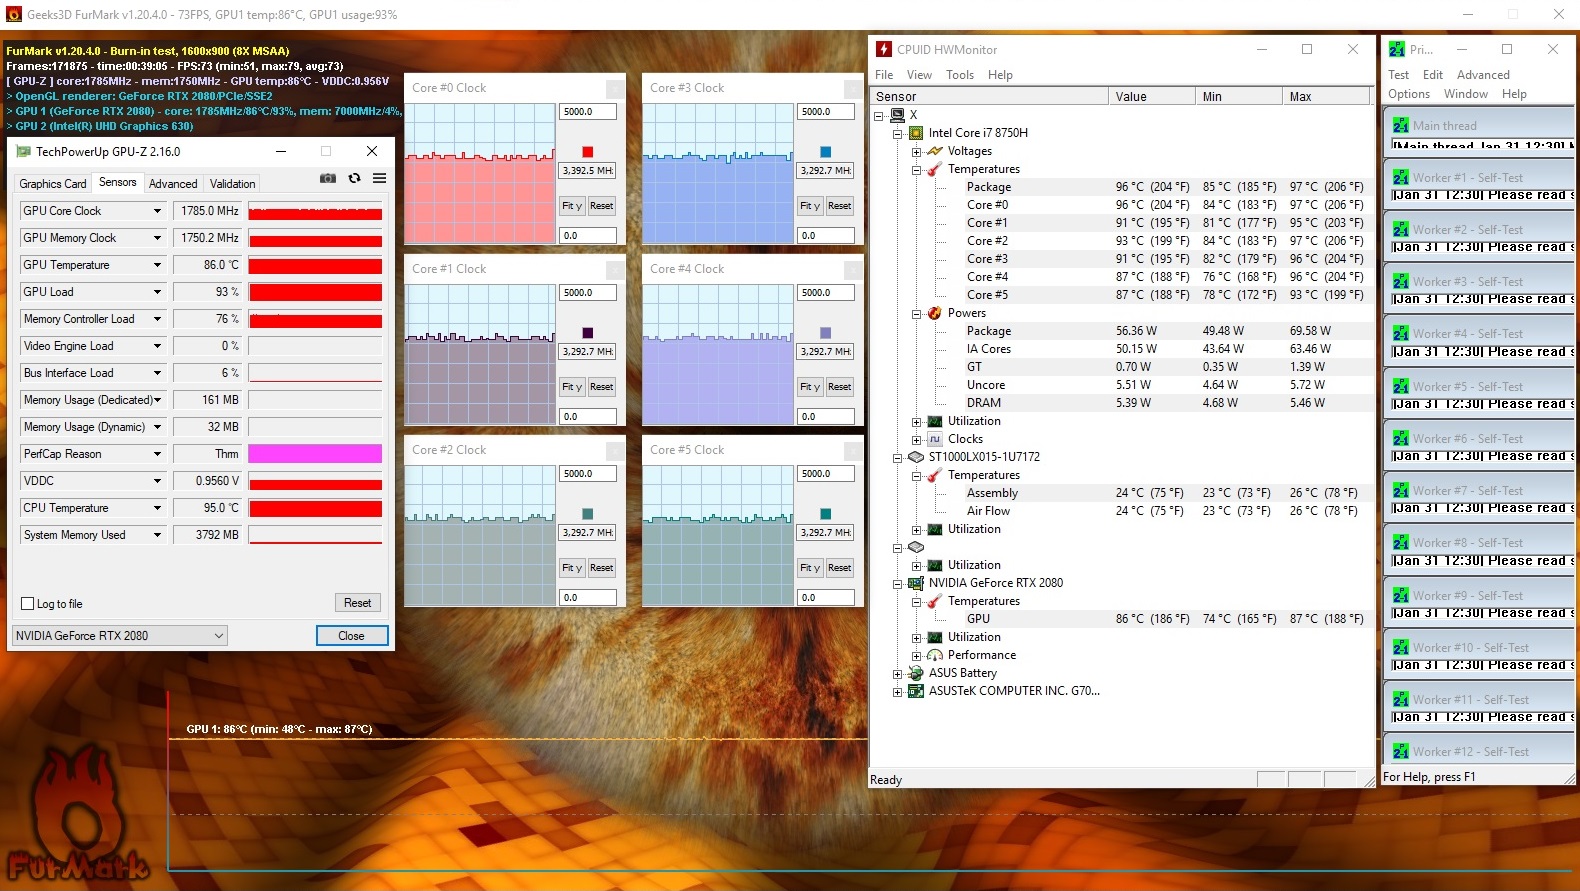
Temperature
In mains and in battery operation, the Asus gaming notebook runs through our stress test (at least 60 minutes Prime95 & FurMark) in different ways. When plugged in, the processor runs at 3.3 - 3.4 GHz, and the graphics core runs at a speed of about 1785 MHz. In battery operation, the CPU is throttled to 800 MHz and the speed of the GPU is 300 MHz.
Despite the very powerful hardware, the warming of the notebook is relatively moderate. During the stress test, the temperature reaches 50 °C (122 °F) at two measurement spots. In everyday operation, the values remain in the green range. The stress test represents an extreme scenario that does not happen like that in everyday operation. We evaluate in this test whether the system remains stable even under full load.
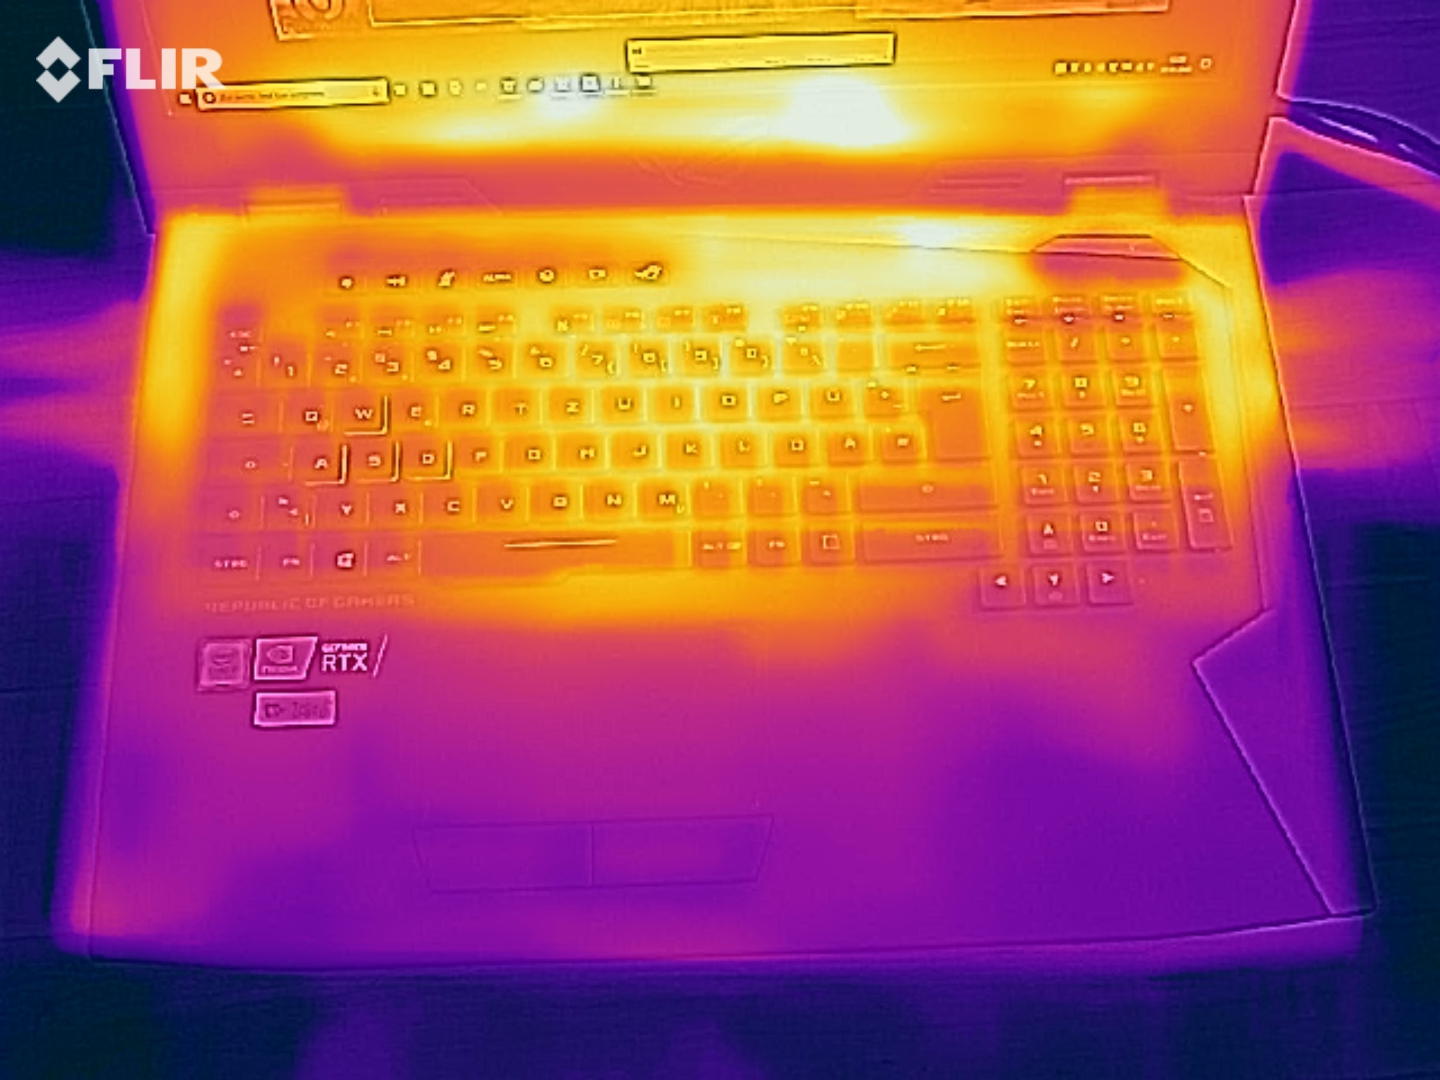
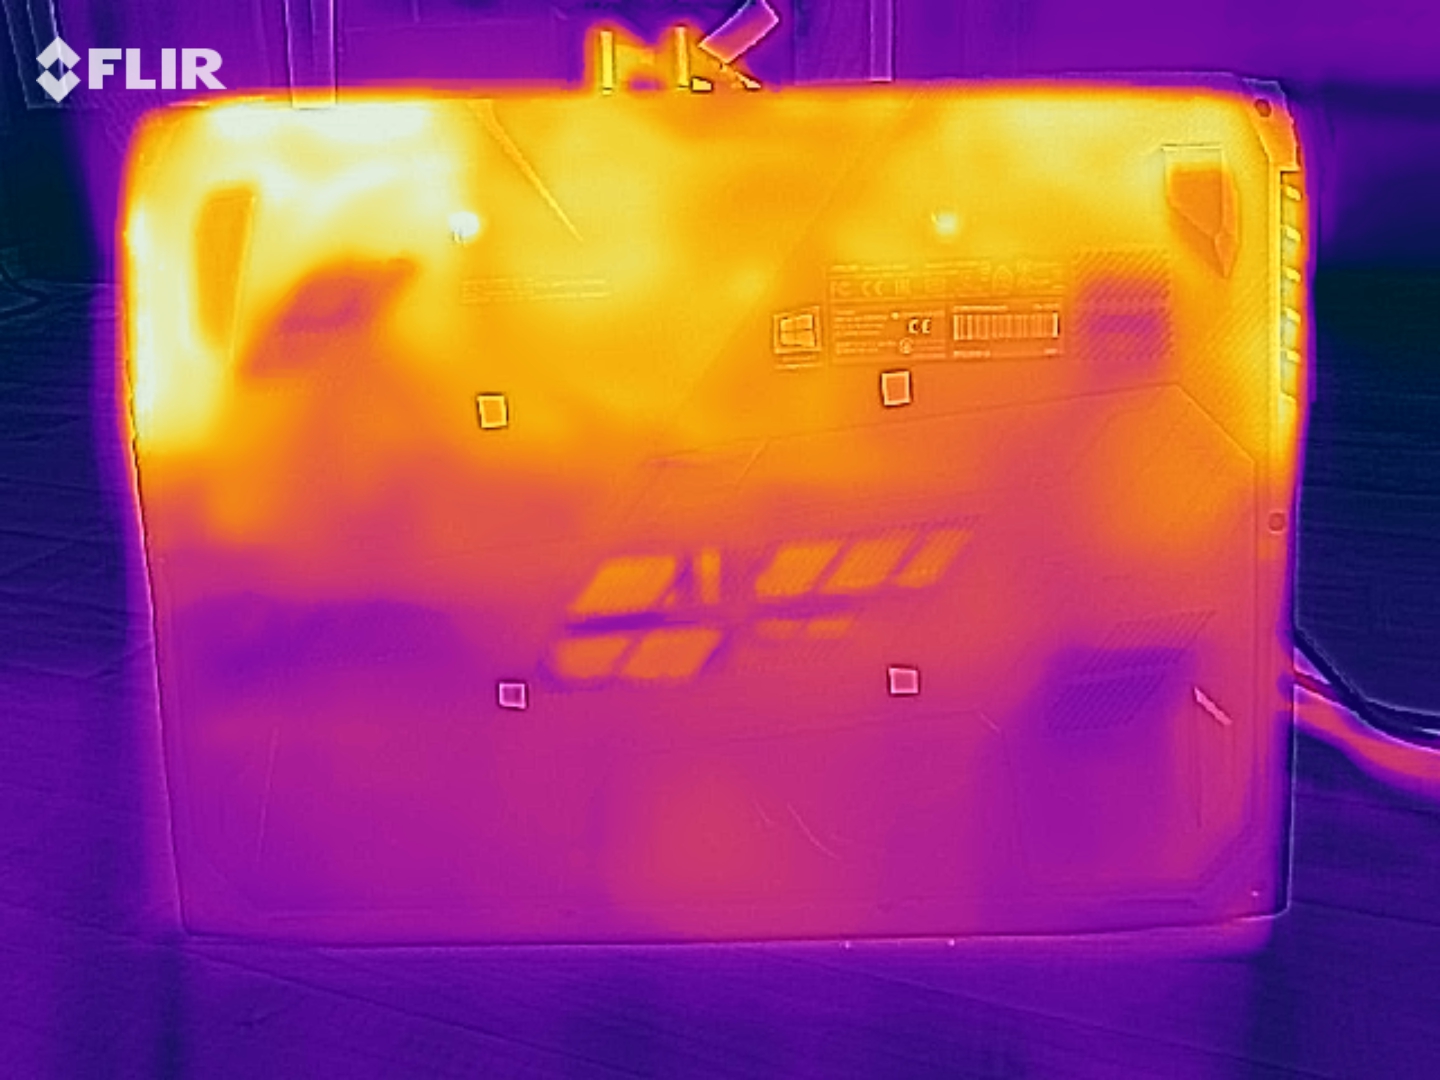
(-) The maximum temperature on the upper side is 50 °C / 122 F, compared to the average of 40.4 °C / 105 F, ranging from 21.2 to 68.8 °C for the class Gaming.
(-) The bottom heats up to a maximum of 50 °C / 122 F, compared to the average of 43.2 °C / 110 F
(+) In idle usage, the average temperature for the upper side is 28.3 °C / 83 F, compared to the device average of 33.9 °C / 93 F.
(±) Playing The Witcher 3, the average temperature for the upper side is 37.2 °C / 99 F, compared to the device average of 33.9 °C / 93 F.
(+) The palmrests and touchpad are cooler than skin temperature with a maximum of 28 °C / 82.4 F and are therefore cool to the touch.
(±) The average temperature of the palmrest area of similar devices was 28.8 °C / 83.8 F (+0.8 °C / 1.4 F).
| Asus ROG G703GX i7-8750H, GeForce RTX 2080 Mobile | Acer Predator Helios 500 PH517-51-79BY i7-8750H, GeForce GTX 1070 Mobile | Aorus X7 DT v8 i7-8850H, GeForce GTX 1080 Mobile | Asus Chimera G703GI i9-8950HK, GeForce GTX 1080 Mobile | Schenker XMG Ultra 17 i7-8700, GeForce GTX 1080 Mobile | Average of class Gaming | |
|---|---|---|---|---|---|---|
| Heat | 9% | -1% | -2% | 4% | 2% | |
| Maximum Upper Side * (°C) | 50 | 42.6 15% | 51 -2% | 50 -0% | 41 18% | 45.2 ? 10% |
| Maximum Bottom * (°C) | 50 | 37.2 26% | 63 -26% | 50 -0% | 48 4% | 48 ? 4% |
| Idle Upper Side * (°C) | 30 | 33.6 -12% | 27 10% | 32 -7% | 30 -0% | 31.1 ? -4% |
| Idle Bottom * (°C) | 33 | 31 6% | 28 15% | 33 -0% | 35 -6% | 34.2 ? -4% |
* ... smaller is better
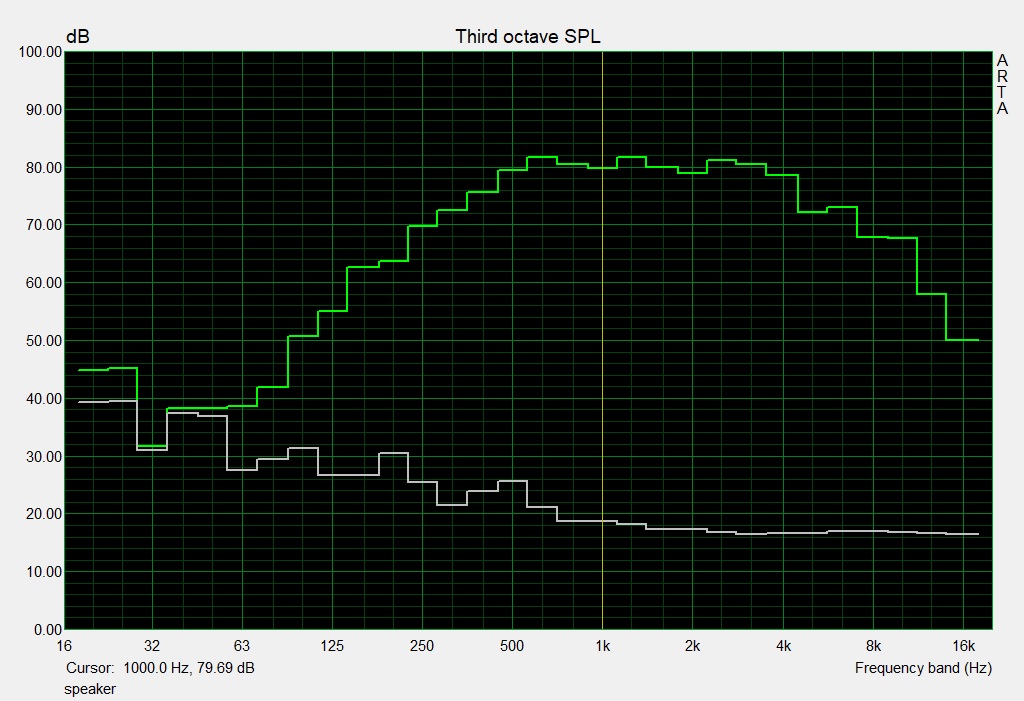
Speakers
Asus ROG G703GX audio analysis
(+) | speakers can play relatively loud (91 dB)
Bass 100 - 315 Hz
(±) | reduced bass - on average 13.3% lower than median
(±) | linearity of bass is average (8.9% delta to prev. frequency)
Mids 400 - 2000 Hz
(+) | balanced mids - only 4% away from median
(+) | mids are linear (3.4% delta to prev. frequency)
Highs 2 - 16 kHz
(±) | reduced highs - on average 5.1% lower than median
(+) | highs are linear (4.4% delta to prev. frequency)
Overall 100 - 16.000 Hz
(±) | linearity of overall sound is average (15.4% difference to median)
Compared to same class
» 34% of all tested devices in this class were better, 7% similar, 59% worse
» The best had a delta of 6%, average was 18%, worst was 132%
Compared to all devices tested
» 22% of all tested devices were better, 4% similar, 73% worse
» The best had a delta of 4%, average was 24%, worst was 134%
Asus Chimera G703GI audio analysis
(+) | speakers can play relatively loud (89 dB)
Bass 100 - 315 Hz
(±) | reduced bass - on average 8.9% lower than median
(+) | bass is linear (6.4% delta to prev. frequency)
Mids 400 - 2000 Hz
(+) | balanced mids - only 3.1% away from median
(+) | mids are linear (2.4% delta to prev. frequency)
Highs 2 - 16 kHz
(+) | balanced highs - only 4.4% away from median
(+) | highs are linear (3.2% delta to prev. frequency)
Overall 100 - 16.000 Hz
(+) | overall sound is linear (11.8% difference to median)
Compared to same class
» 11% of all tested devices in this class were better, 4% similar, 85% worse
» The best had a delta of 6%, average was 18%, worst was 132%
Compared to all devices tested
» 8% of all tested devices were better, 3% similar, 89% worse
» The best had a delta of 4%, average was 24%, worst was 134%
Power Management - Very hungry
Power Consumption
During idle operation, the power consumption varies a lot, and we measure values between 5 and 42 watts. During the stress test, the consumption increases up to 320 watts. With this, the consumption remains significantly below the 560 watts the two included power supplies can offer. Since the consumption is only 40 watts above the specified performance of a single power supply, we tried to run some tests with only one of the power supplies connected. While the system does not become unstable, the battery is discharging in many situations - for example, while running many of the gaming benchmarks.
| Off / Standby | |
| Idle | |
| Load |
|
Key:
min: | |
| Asus ROG G703GX i7-8750H, GeForce RTX 2080 Mobile | Acer Predator Helios 500 PH517-51-79BY i7-8750H, GeForce GTX 1070 Mobile | Aorus X7 DT v8 i7-8850H, GeForce GTX 1080 Mobile | Asus Chimera G703GI i9-8950HK, GeForce GTX 1080 Mobile | Schenker XMG Ultra 17 i7-8700, GeForce GTX 1080 Mobile | Average of class Gaming | |
|---|---|---|---|---|---|---|
| Power Consumption | -42% | -59% | -95% | -96% | -15% | |
| Idle Minimum * (Watt) | 5 | 20.4 -308% | 23 -360% | 29 -480% | 32 -540% | 13.2 ? -164% |
| Idle Average * (Watt) | 24 | 26.5 -10% | 33 -38% | 37 -54% | 38 -58% | 18.9 ? 21% |
| Idle Maximum * (Watt) | 42 | 37 12% | 37 12% | 46 -10% | 45 -7% | 24.3 ? 42% |
| Load Average * (Watt) | 112 | 129 -15% | 115 -3% | 156 -39% | 96 14% | 108 ? 4% |
| Witcher 3 ultra * (Watt) | 284 | 186 35% | 225 21% | 252 11% | 237 17% | |
| Load Maximum * (Watt) | 320 | 216 32% | 281 12% | 314 2% | 331 -3% | 254 ? 21% |
* ... smaller is better
Battery Life
In our realistic WLAN test, the G703GX achieves a runtime of 3:58 h. Via a script, we simulate the load when calling up websites. The "Balanced" power profile is active, and the display brightness is adjusted to about 150 cd/m². The 17.3-inch notebook lasts for 3:46 h in our video test, where we run the short film "Big Buck Bunny" (H.264 coding, 1920x1080 pixels) in a constant loop. The "Power Saving" mode is active and the brightness reduced to 150 cd/m².
The G703GX offers a better battery life than its predecessor. The reason is quickly found, since the battery of our current test unit has a larger capacity (96 Wh vs. 71 Wh).
| Asus ROG G703GX i7-8750H, GeForce RTX 2080 Mobile, 96 Wh | Schenker XMG Ultra 17 i7-8700, GeForce GTX 1080 Mobile, 82 Wh | Acer Predator Helios 500 PH517-51-79BY i7-8750H, GeForce GTX 1070 Mobile, 72 Wh | Aorus X7 DT v8 i7-8850H, GeForce GTX 1080 Mobile, 94.24 Wh | Asus Chimera G703GI i9-8950HK, GeForce GTX 1080 Mobile, 71 Wh | Average of class Gaming | |
|---|---|---|---|---|---|---|
| Battery runtime | -32% | -9% | -2% | -40% | 70% | |
| Reader / Idle (h) | 5 | 2.7 -46% | 4.2 -16% | 4.9 -2% | 2.8 -44% | 8.71 ? 74% |
| H.264 (h) | 3.8 | 2.5 -34% | 8.26 ? 117% | |||
| WiFi v1.3 (h) | 4 | 2.4 -40% | 2.9 -27% | 3.8 -5% | 2.2 -45% | 7.02 ? 76% |
| Load (h) | 1.3 | 1.2 -8% | 1.5 15% | 1.3 0% | 0.9 -31% | 1.47 ? 13% |
| Witcher 3 ultra (h) | 1.1 |
Verdict
Pros
Cons
The Asus ROG G703GX is able to bring all the current computer games smoothly to the matte Full-HD screen. You do not need to concern yourself with the quality settings, and during all games, the settings can be adjusted to the maximum. The GeForce RTX 2080 and the Coffee-Lake hexa-core processor offer sufficient computing performance for the next few years.
The Asus ROG G703GX is one of the best and fastest high-end gaming notebooks currently available.
A lightning-fast NVMe SSD ensures a fast running system. In addition, there is a 1-TB hard drive on board. Replacing the two drives would not be a problem, and you could also add more SSDs, since two additional M.2-2280 slots are waiting behind a maintenance hatch.
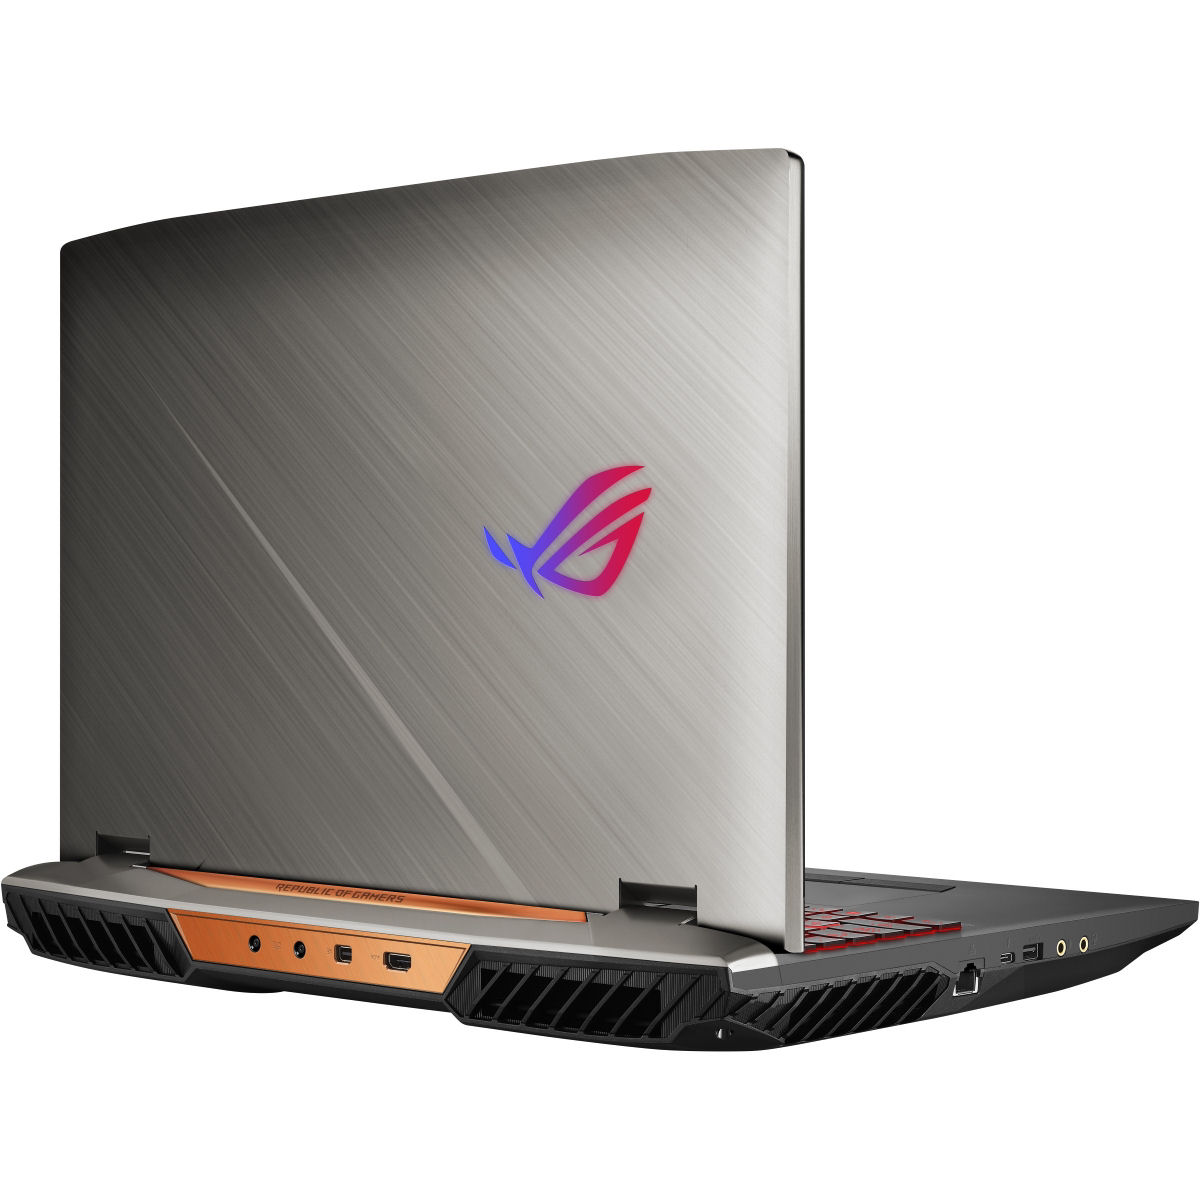
The G-Sync capable 144-Hz IPS display pleases with a good contrast, stable viewing angles, and good response times. The brightness value is okay, but could have been higher. The battery life is decent for a device of this performance class. The effect of a larger capacity battery compared to the predecessor is noticeable here. This is accompanied by modern connections such as Thunderbolt 3 and 2.5-Gigabit Ethernet.
Asus ROG G703GX
- 05/14/2020 v7 (old)
Sascha Mölck
Price comparison

