Asus ROG Chimera G703GI (i9 8950HK, GTX 1080, Full HD) Laptop Review

Our test device's predecessor, which we reviewed at the beginning of 2018, was equipped with a quad-core CPU from Intel's Kaby Lake series (Core i7-7820HK). But the brand-new top model in the ROG Chimera G703 line has something better up its sleeve: The most powerful hexa-core laptop CPU on the market, the Core i9-8950HK. Those looking to save a little money will also be satisfied with the less expensive edition, which has a very fast Core i7-8750H at its command. In both cases, the laptop does the game graphics justice with a matte IPS Full HD screen that supports 144 Hz and Nvidia's G-Sync technology (Optimus is not present).
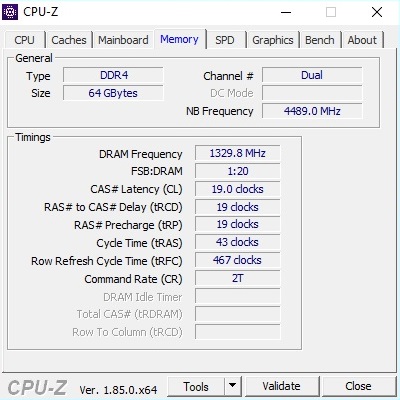
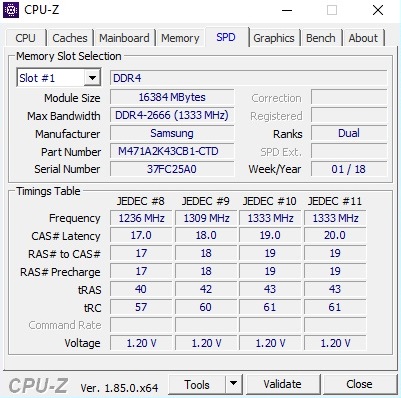
The amount of RAM and storage space depends on the model. In contrast to the versions available in Germany, which offer a maximum of 32 GB RAM and two SSDs, our test device is outfitted with 64 GB RAM and three solid state drives. This hardly has any impact on the benchmark results and our overall rating, however.
Because Asus made almost no changes to the case, we will not cover the case, connections or input devices in detail. For more information on these subjects, please see our review of the old G703.
One small but important difference, however, is located on the back of the laptop. While the Kaby Lake variant only needed one power connection (330-watt power supply), Asus' Coffee Lake version comes with two 280-watt power supplies. Together they weigh a hulking 1.67 kg (3.68 lbs) and can be a little bothersome in practice. On a positive note, all of the USB ports now support the modern 3.1 Gen 2 standard.
The G703GI's competition consists of other 17-inch hexa-core gaming laptops with GeForce GTX 1080 cards, including the Aorus X9 DT, the MSI GT75 8RG and the Schenker XMG Ultra 17. These laptops appear in our tables as comparison devices.
Note: The optional overclocking (Turbo Gear Mode "Extreme" in the Gaming Center) was only activated for our tests under load. The idle tests were carried out in "Standard" mode. Due to the intense level of noise generated by the fan when set to maximum (Fan Overboost "Overboost"), this should not be considered a legitimate option. The setting was turned on when we received the device, but we deactivated it for our tests. We used the "Balanced" mode instead.
| SD Card Reader | |
| average JPG Copy Test (av. of 3 runs) | |
| Aorus X9 DT (Toshiba Exceria Pro SDXC 64 GB UHS-II) | |
| Asus Chimera G703GI (Toshiba Exceria Pro SDXC 64 GB UHS-II) | |
| Schenker XMG Ultra 17 (Toshiba Exceria Pro SDXC 64 GB UHS-II) | |
| Asus G703 (Toshiba Exceria Pro SDXC 64 GB UHS-II) | |
| Average of class Gaming (20.9 - 210, n=54, last 2 years) | |
| MSI GT75 8RG-090 Titan (Toshiba Exceria Pro SDXC 64 GB UHS-II) | |
| maximum AS SSD Seq Read Test (1GB) | |
| Asus Chimera G703GI (Toshiba Exceria Pro SDXC 64 GB UHS-II) | |
| Aorus X9 DT (Toshiba Exceria Pro SDXC 64 GB UHS-II) | |
| Asus G703 (Toshiba Exceria Pro SDXC 64 GB UHS-II) | |
| Schenker XMG Ultra 17 (Toshiba Exceria Pro SDXC 64 GB UHS-II) | |
| Average of class Gaming (25.5 - 261, n=51, last 2 years) | |
| MSI GT75 8RG-090 Titan (Toshiba Exceria Pro SDXC 64 GB UHS-II) | |
| Networking | |
| iperf3 transmit AX12 | |
| Asus Chimera G703GI | |
| MSI GT75 8RG-090 Titan | |
| Aorus X9 DT | |
| Schenker XMG Ultra 17 | |
| Asus G703 | |
| iperf3 receive AX12 | |
| Schenker XMG Ultra 17 | |
| MSI GT75 8RG-090 Titan | |
| Asus G703 | |
| Asus Chimera G703GI | |
| Aorus X9 DT | |
Display
Although their labels look nearly identical, Asus did in fact choose a somewhat different panel for the company's new G703 (AUO B173HAN03.2 instead of the AUO B173HAN03.0).
| |||||||||||||||||||||||||
Brightness Distribution: 82 %
Center on Battery: 285 cd/m²
Contrast: 1295:1 (Black: 0.22 cd/m²)
ΔE ColorChecker Calman: 3.18 | ∀{0.5-29.43 Ø4.73}
calibrated: 1.73
ΔE Greyscale Calman: 2.93 | ∀{0.09-98 Ø4.97}
93% sRGB (Argyll 1.6.3 3D)
60% AdobeRGB 1998 (Argyll 1.6.3 3D)
67% AdobeRGB 1998 (Argyll 3D)
92.6% sRGB (Argyll 3D)
65.8% Display P3 (Argyll 3D)
Gamma: 2.45
CCT: 7165 K
| Asus Chimera G703GI B173HAN03.2 (AUO329D), IPS, 1920x1080 | Asus G703 AUO B173HAN03.0 (AUO309D), IPS, 1920x1080 | MSI GT75 8RG-090 Titan CMN N173HHE-G32 (CMN1747), TN, 1920x1080 | Aorus X9 DT AUO B173HAN03.0 (AUO309D), IPS, 1920x1080 | Schenker XMG Ultra 17 AU Optronics B173ZAN01.0 (AUO109B), IPS, 3840x2160 | |
|---|---|---|---|---|---|
| Display | -0% | 25% | 0% | 29% | |
| Display P3 Coverage (%) | 65.8 | 65.5 0% | 90.9 38% | 66.8 2% | 86.4 31% |
| sRGB Coverage (%) | 92.6 | 92.4 0% | 100 8% | 92.1 -1% | 100 8% |
| AdobeRGB 1998 Coverage (%) | 67 | 66.6 -1% | 86.2 29% | 67.3 0% | 99.1 48% |
| Response Times | -90% | 12% | -99% | -359% | |
| Response Time Grey 50% / Grey 80% * (ms) | 6.4 ? | 17.6 ? -175% | 8 ? -25% | 18.4 ? -187% | 44 ? -588% |
| Response Time Black / White * (ms) | 10.8 ? | 11.2 ? -4% | 5.6 ? 48% | 12 ? -11% | 24.8 ? -130% |
| PWM Frequency (Hz) | 26000 ? | ||||
| Screen | -15% | 9% | 15% | -1% | |
| Brightness middle (cd/m²) | 285 | 274 -4% | 240 -16% | 280 -2% | 332 16% |
| Brightness (cd/m²) | 275 | 268 -3% | 248 -10% | 262 -5% | 313 14% |
| Brightness Distribution (%) | 82 | 80 -2% | 83 1% | 86 5% | 88 7% |
| Black Level * (cd/m²) | 0.22 | 0.29 -32% | 0.22 -0% | 0.22 -0% | 0.28 -27% |
| Contrast (:1) | 1295 | 945 -27% | 1091 -16% | 1273 -2% | 1186 -8% |
| Colorchecker dE 2000 * | 3.18 | 3.99 -25% | 2.14 33% | 1.78 44% | 3.86 -21% |
| Colorchecker dE 2000 max. * | 5.99 | 7.33 -22% | 5.04 16% | 3.91 35% | 5.88 2% |
| Colorchecker dE 2000 calibrated * | 1.73 | 1.79 -3% | 1.54 11% | ||
| Greyscale dE 2000 * | 2.93 | 4.14 -41% | 1.62 45% | 0.74 75% | 4.33 -48% |
| Gamma | 2.45 90% | 2.58 85% | 2.28 96% | 2.43 91% | 2.41 91% |
| CCT | 7165 91% | 7352 88% | 6846 95% | 6494 100% | 6595 99% |
| Color Space (Percent of AdobeRGB 1998) (%) | 60 | 60 0% | 77 28% | 60 0% | 88 47% |
| Color Space (Percent of sRGB) (%) | 93 | 92 -1% | 100 8% | 92 -1% | 100 8% |
| Total Average (Program / Settings) | -35% /
-21% | 15% /
12% | -28% /
-3% | -110% /
-43% |
* ... smaller is better
The change of displays is definitely a positive one, given that both the reaction time and the contrast have improved. Where the predecessor only managed a ratio of around 950:1, the Coffee Lake model reaches 1300:1 – a superb result. The display's brightness (average 275 cd/m²) and black value (0.22 cd/m²) are also quite respectable, though the G703 could stand to glow more brightly outdoors.
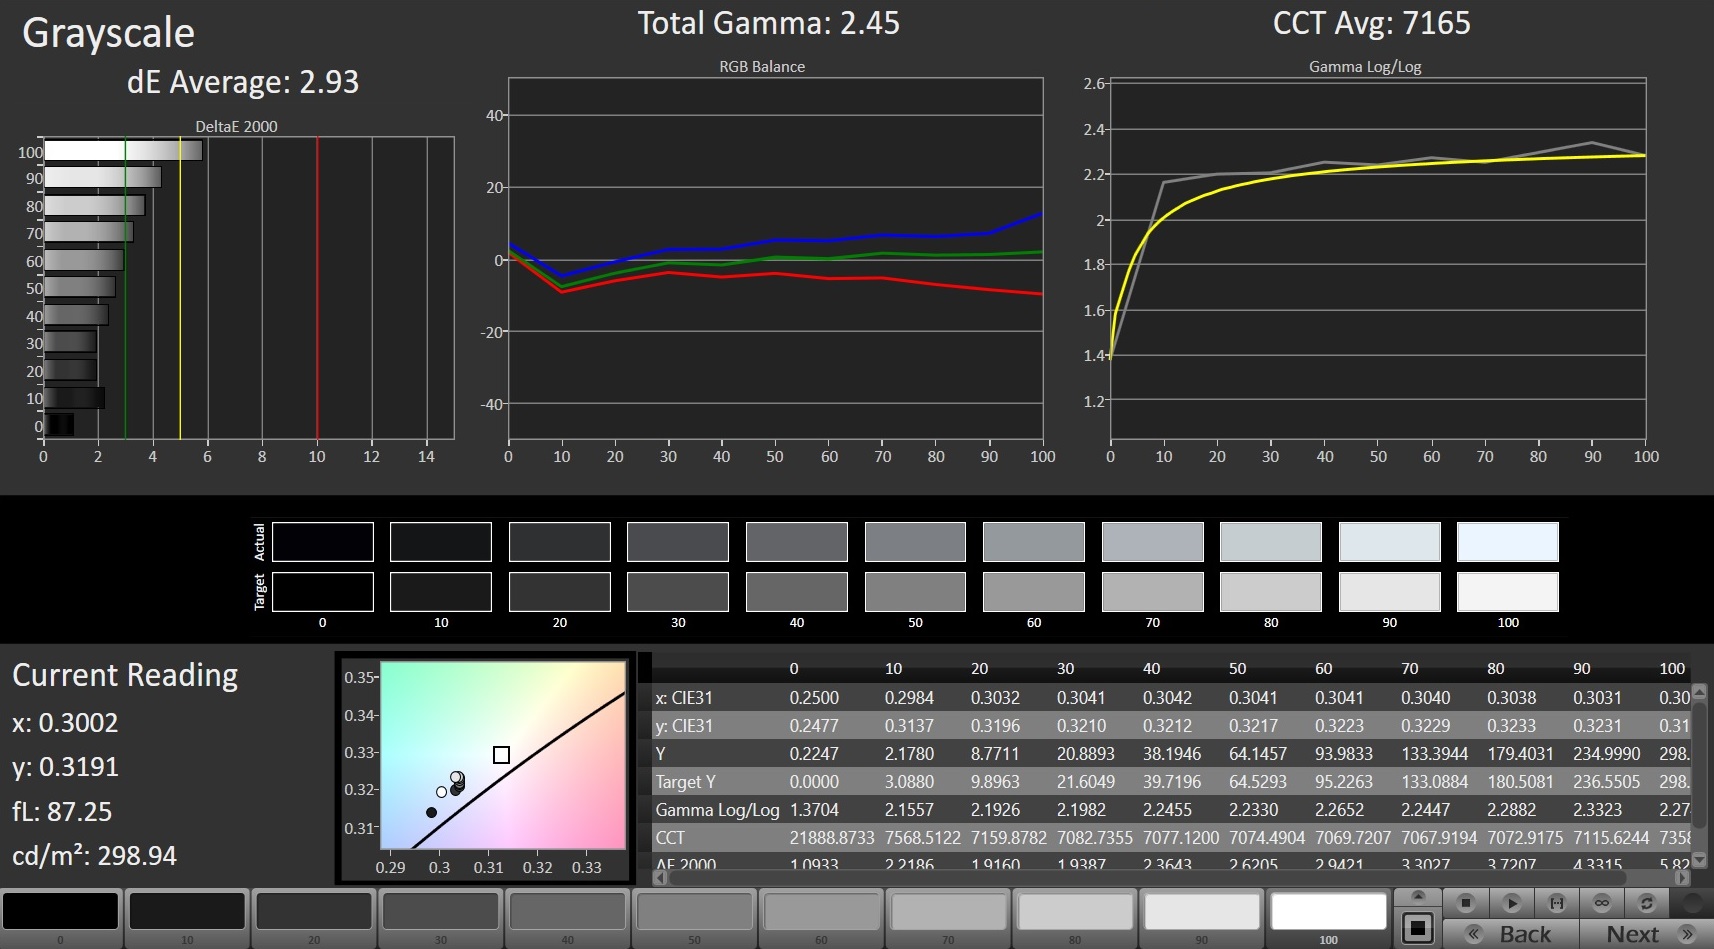
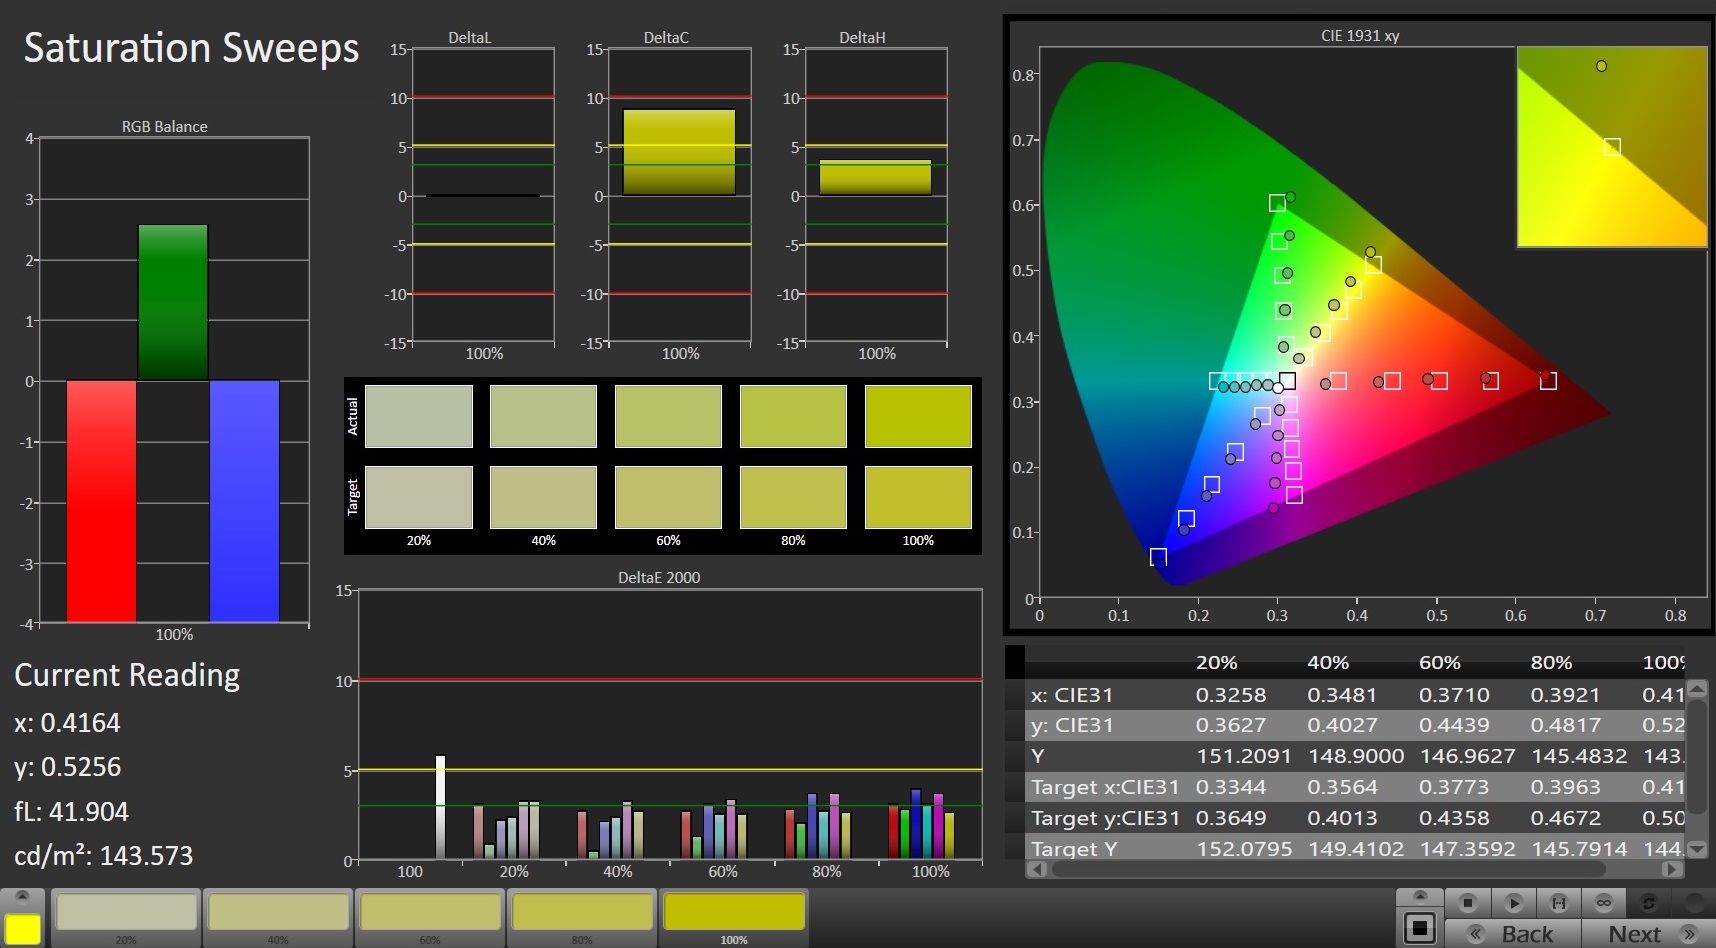
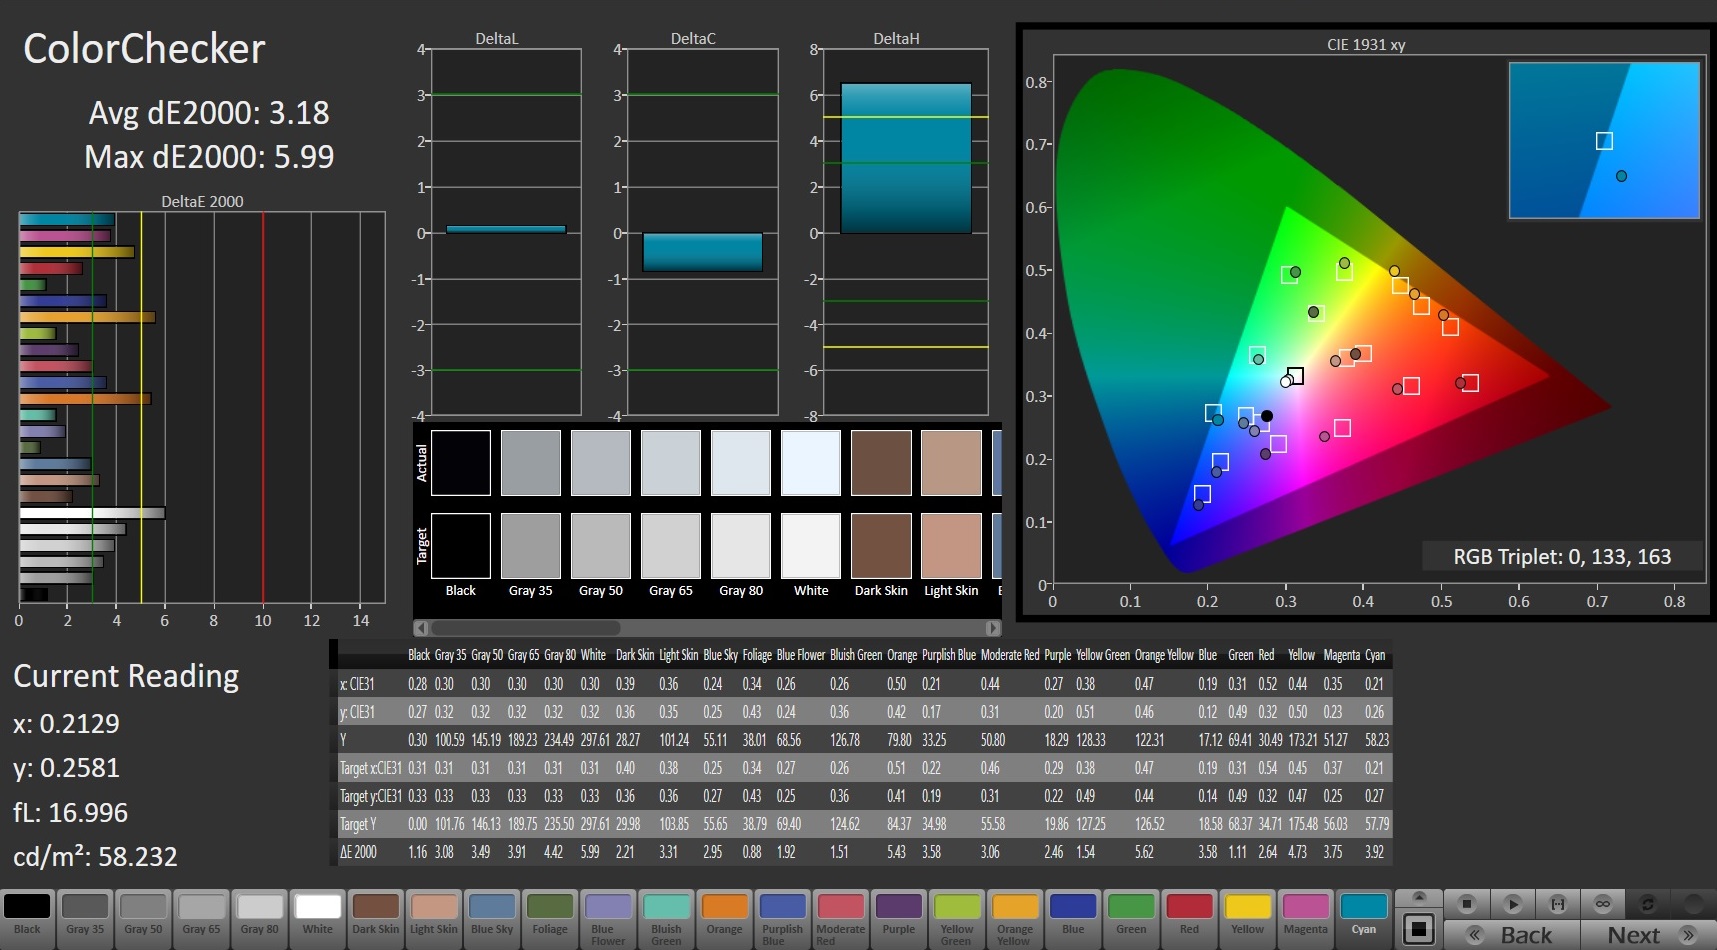
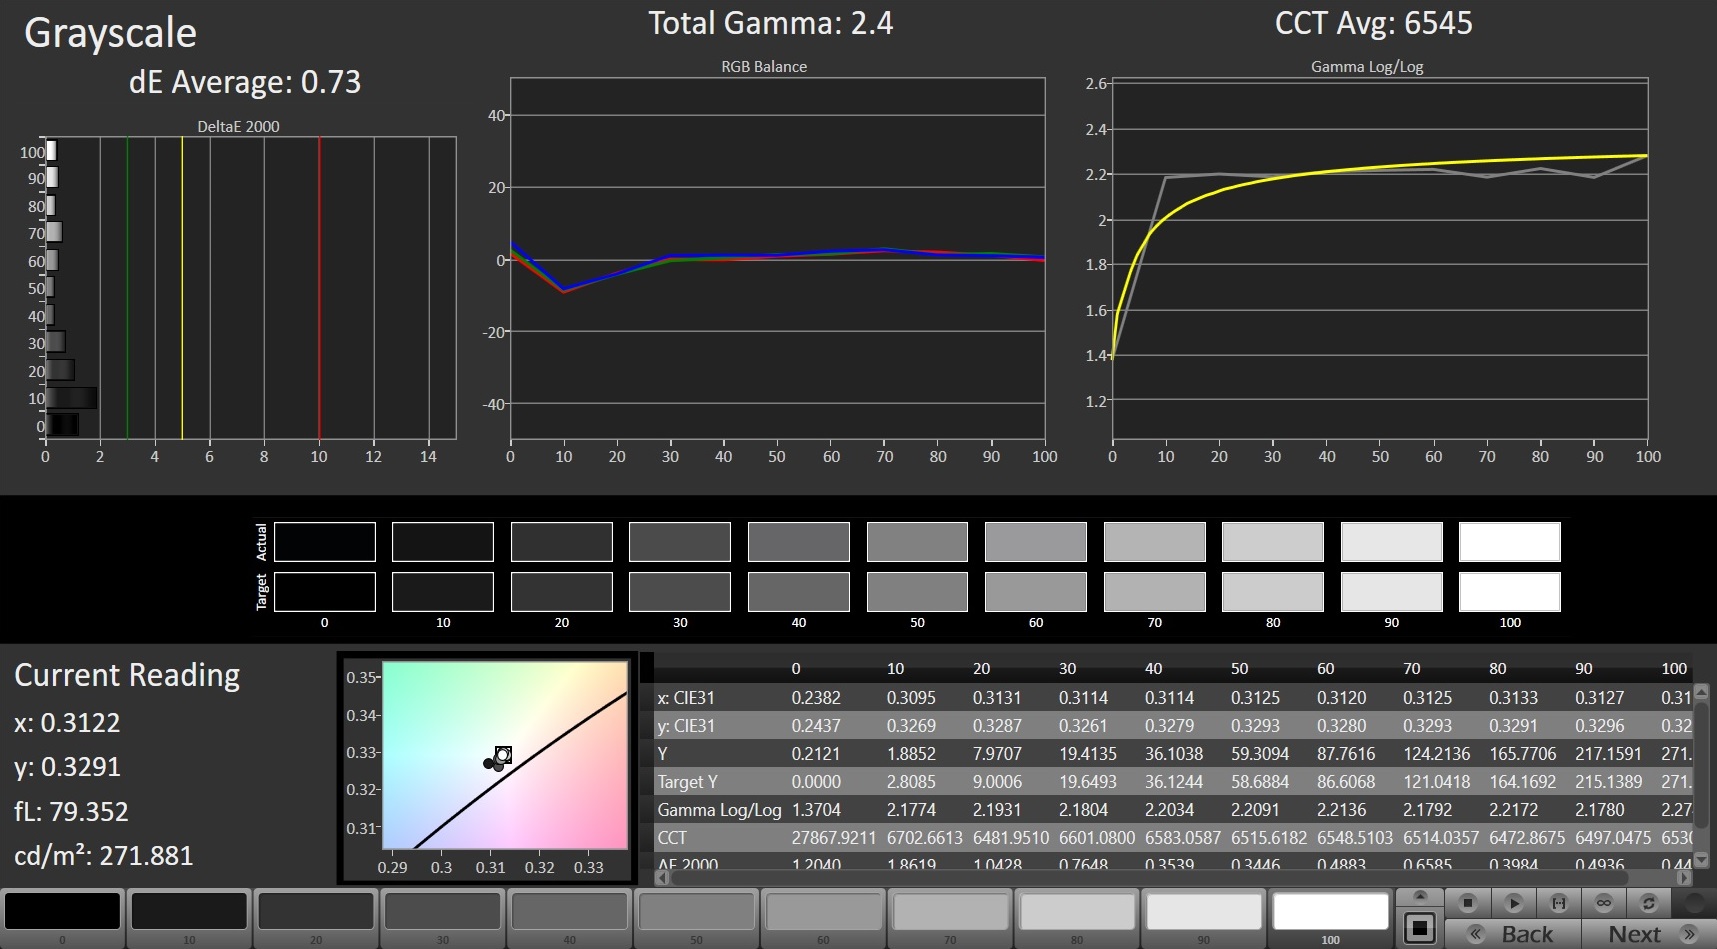
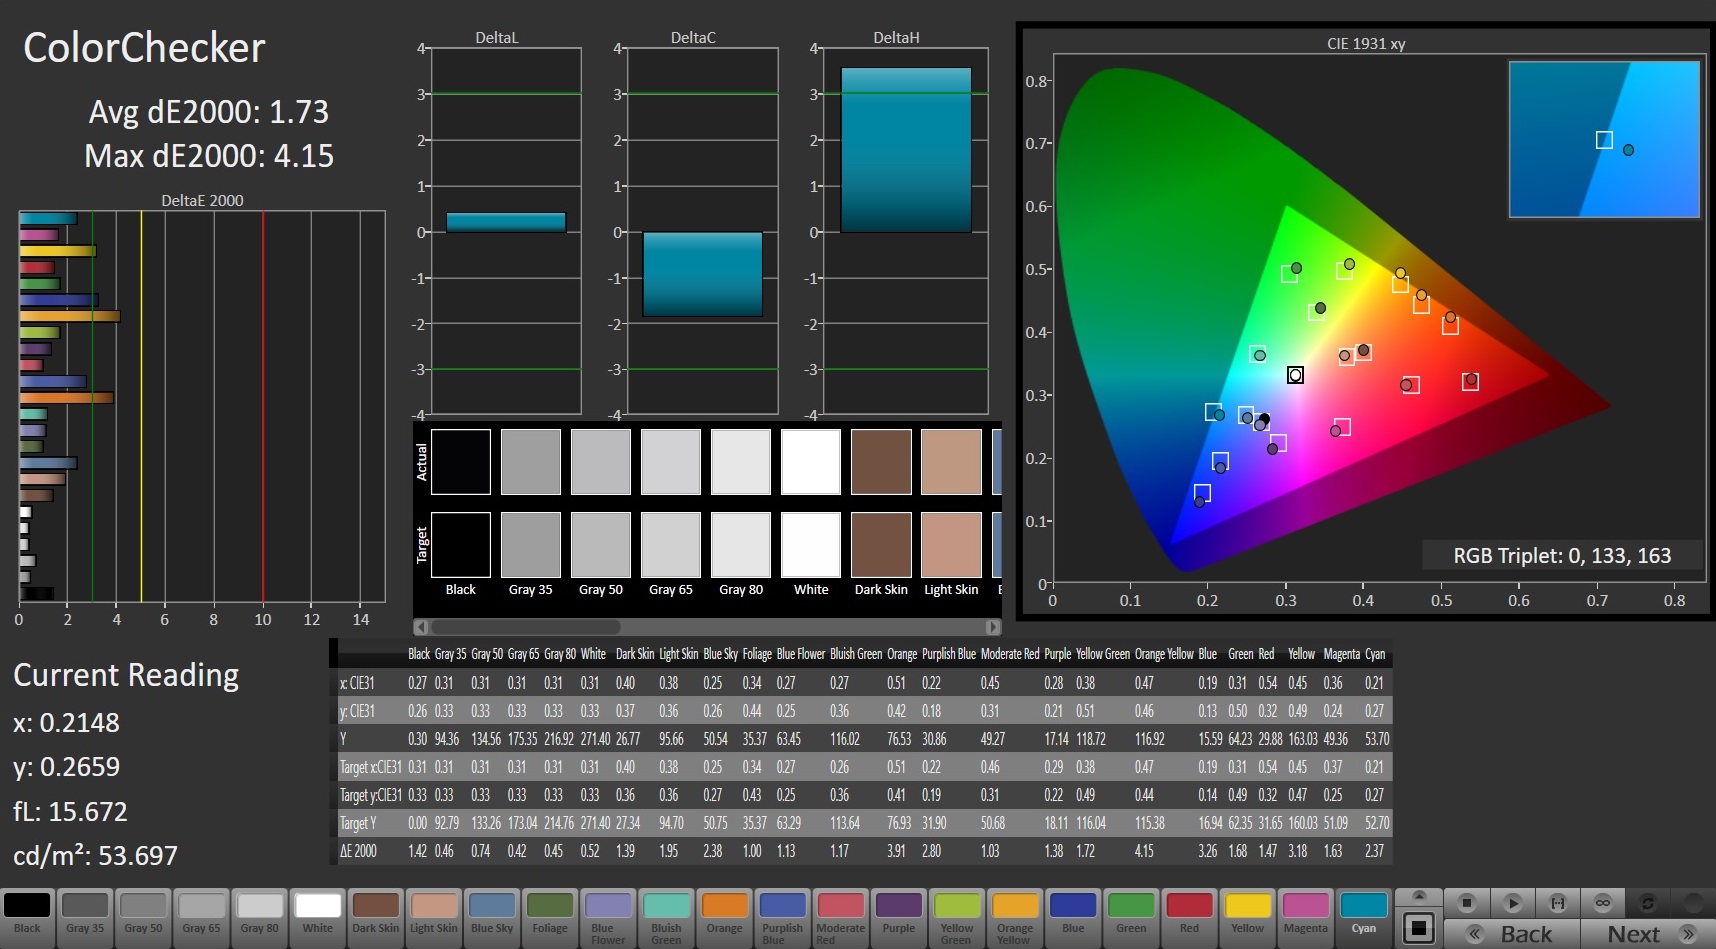
In the realm of color accuracy, the 17-inch screen earns the right to gloat. DeltaE 2000 values of 2.93 (grayscale) and 3.18 (ColorChecker) fall within the ideal range. Most buyers are unlikely to notice the slight blue cast, and it can be eliminated with calibration.
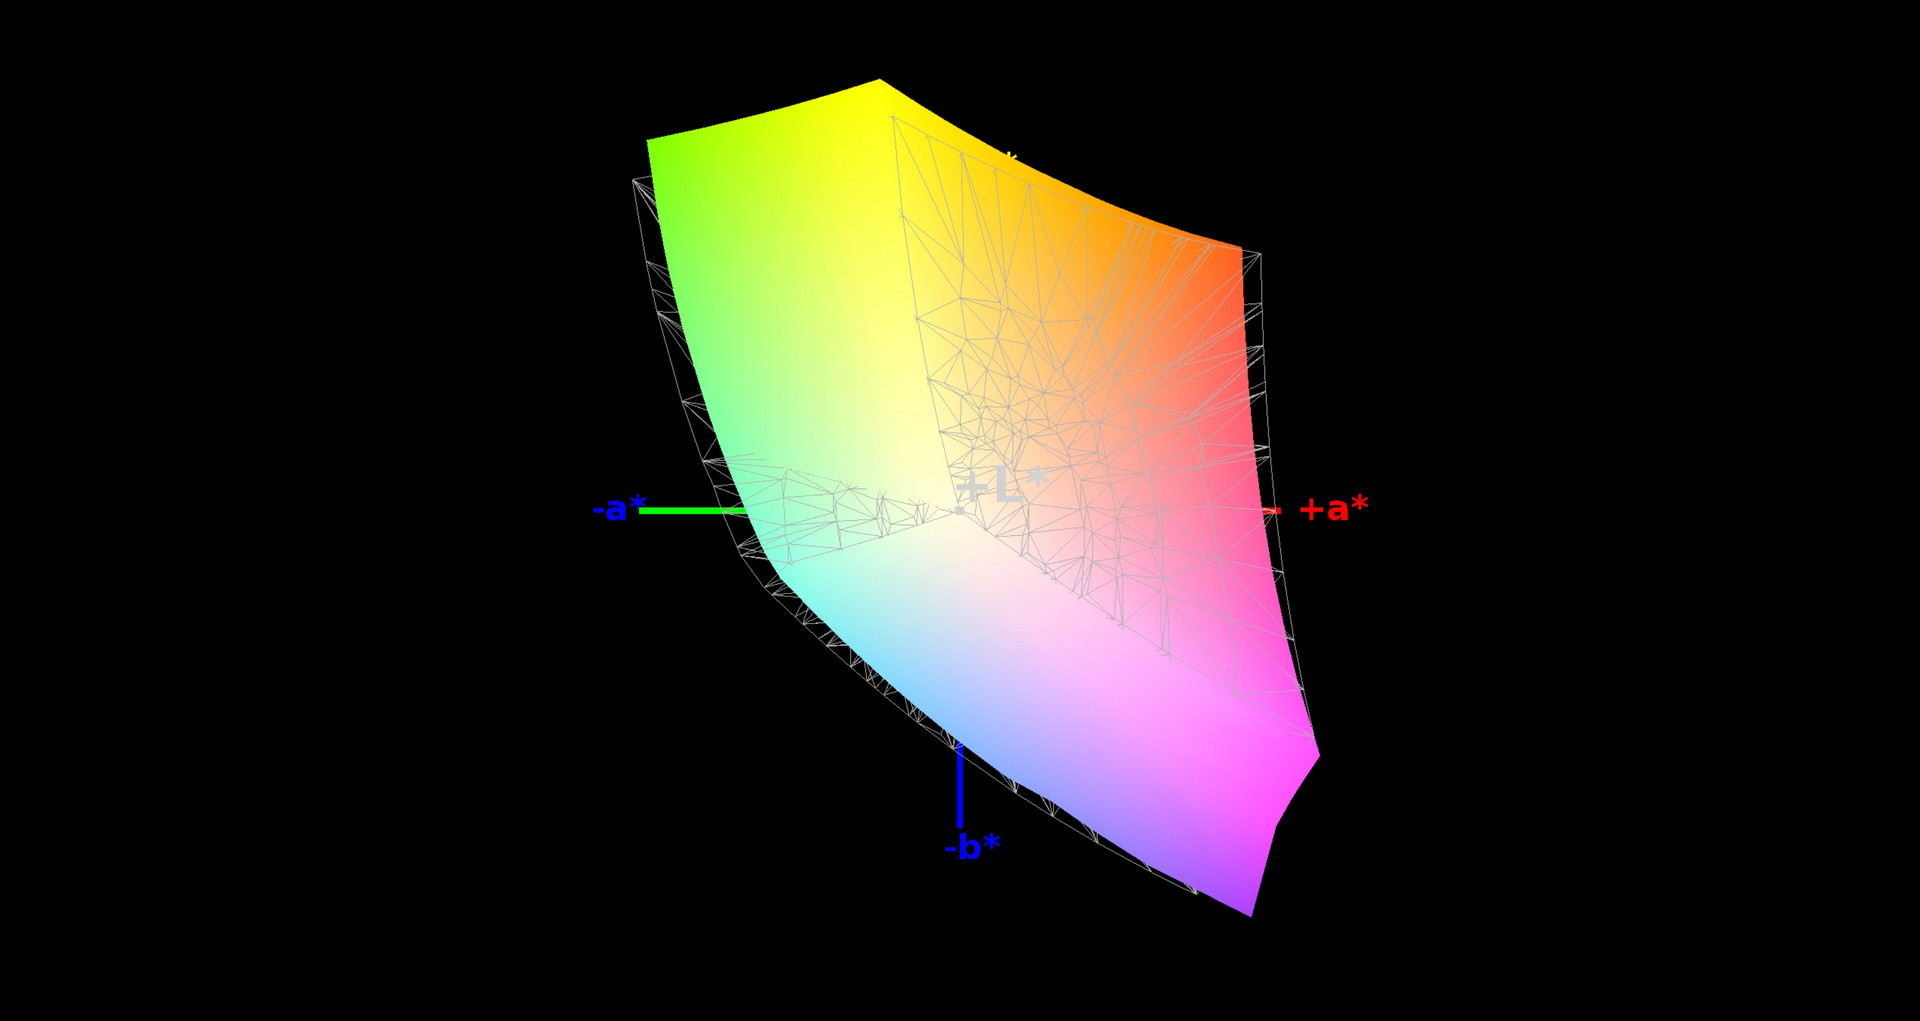

The panel's brightness distribution proves to be a bigger issue. Our test device exhibits halation along the edges of the screen—a circumstance unbefitting of a laptop in this price range, at least at this intensity. Unfortunately, this problem affects numerous high-end laptops. There is hardly anything to criticize when it comes to color-space coverage: 90% sRGB and 60% Adobe RGB are more than sufficient for a gaming laptop.
Display Response Times
| ↔ Response Time Black to White | ||
|---|---|---|
| 10.8 ms ... rise ↗ and fall ↘ combined | ↗ 6 ms rise | 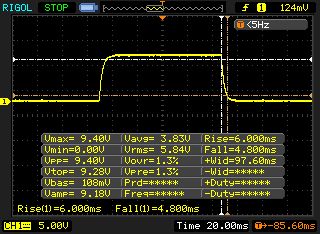 |
| ↘ 4.8 ms fall | ||
| The screen shows good response rates in our tests, but may be too slow for competitive gamers. In comparison, all tested devices range from 0.1 (minimum) to 240 (maximum) ms. » 29 % of all devices are better. This means that the measured response time is better than the average of all tested devices (19.9 ms). | ||
| ↔ Response Time 50% Grey to 80% Grey | ||
| 6.4 ms ... rise ↗ and fall ↘ combined | ↗ 3.4 ms rise | 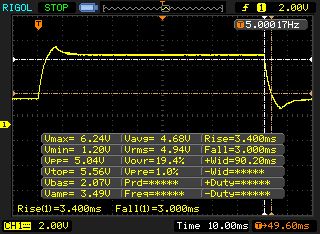 |
| ↘ 3 ms fall | ||
| The screen shows very fast response rates in our tests and should be very well suited for fast-paced gaming. In comparison, all tested devices range from 0.165 (minimum) to 636 (maximum) ms. » 19 % of all devices are better. This means that the measured response time is better than the average of all tested devices (31.1 ms). | ||
Screen Flickering / PWM (Pulse-Width Modulation)
| Screen flickering / PWM not detected | 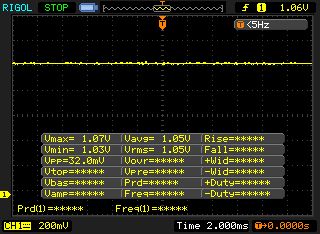 | ||
In comparison: 52 % of all tested devices do not use PWM to dim the display. If PWM was detected, an average of 7794 (minimum: 5 - maximum: 343500) Hz was measured. | |||
Performance
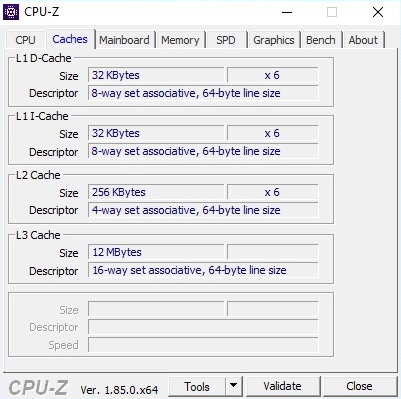
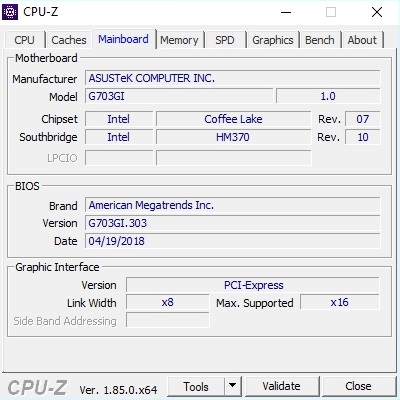
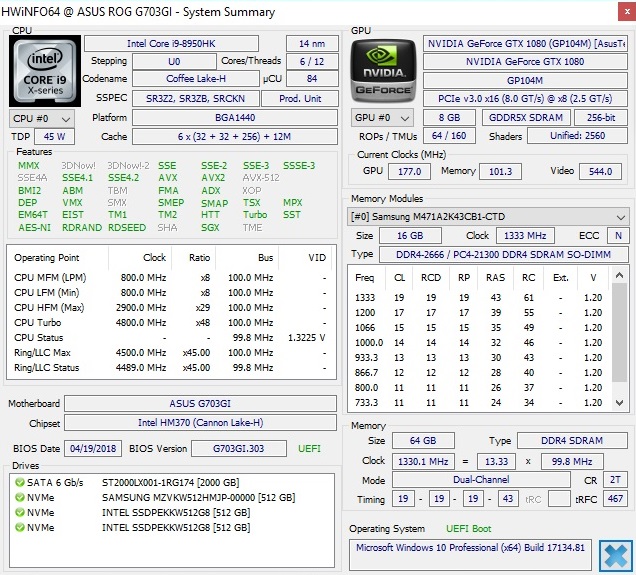
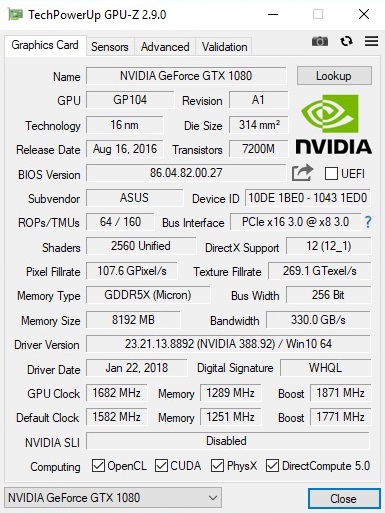
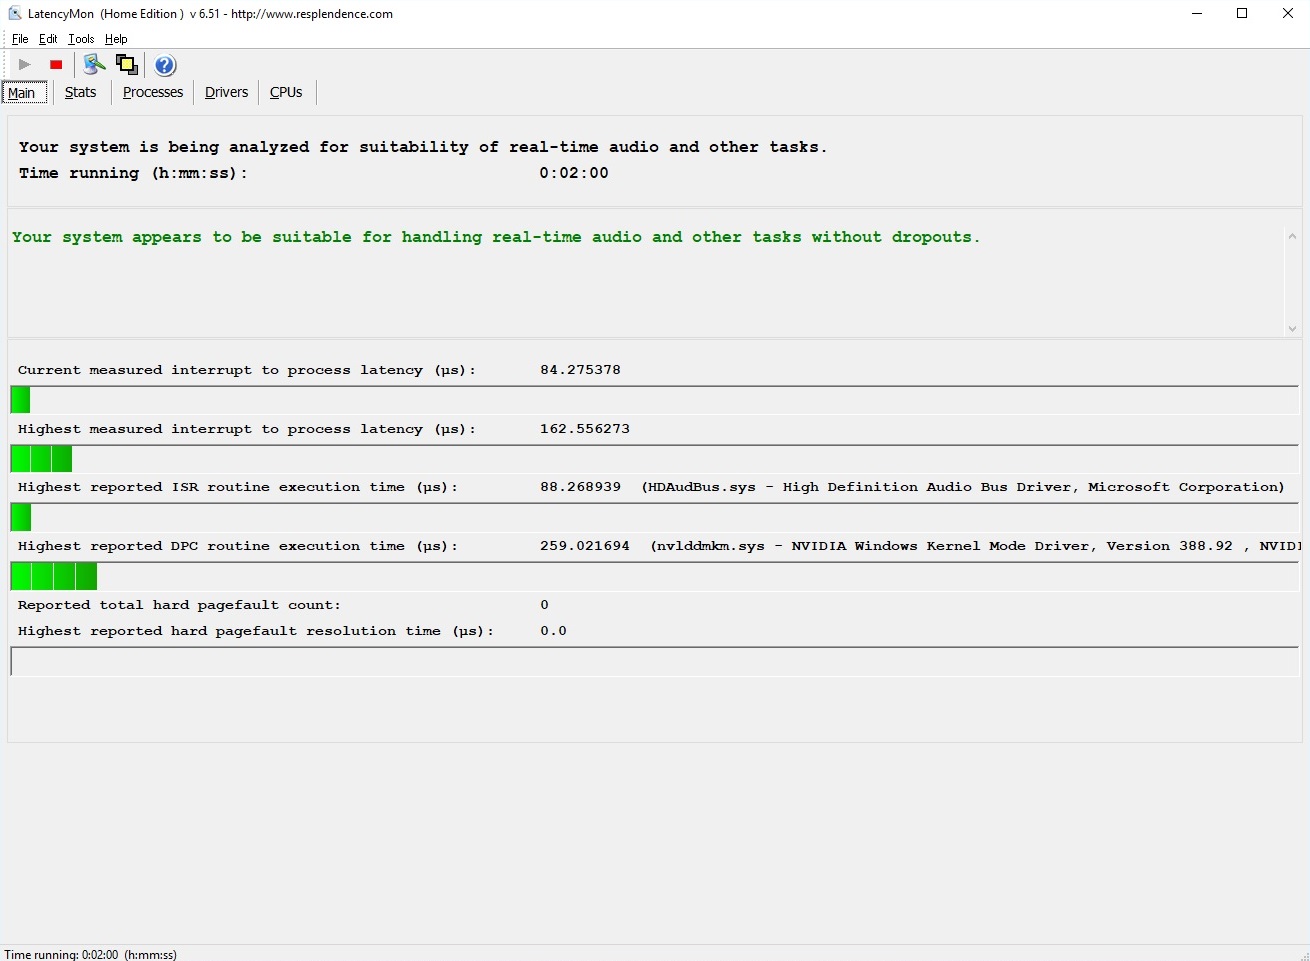
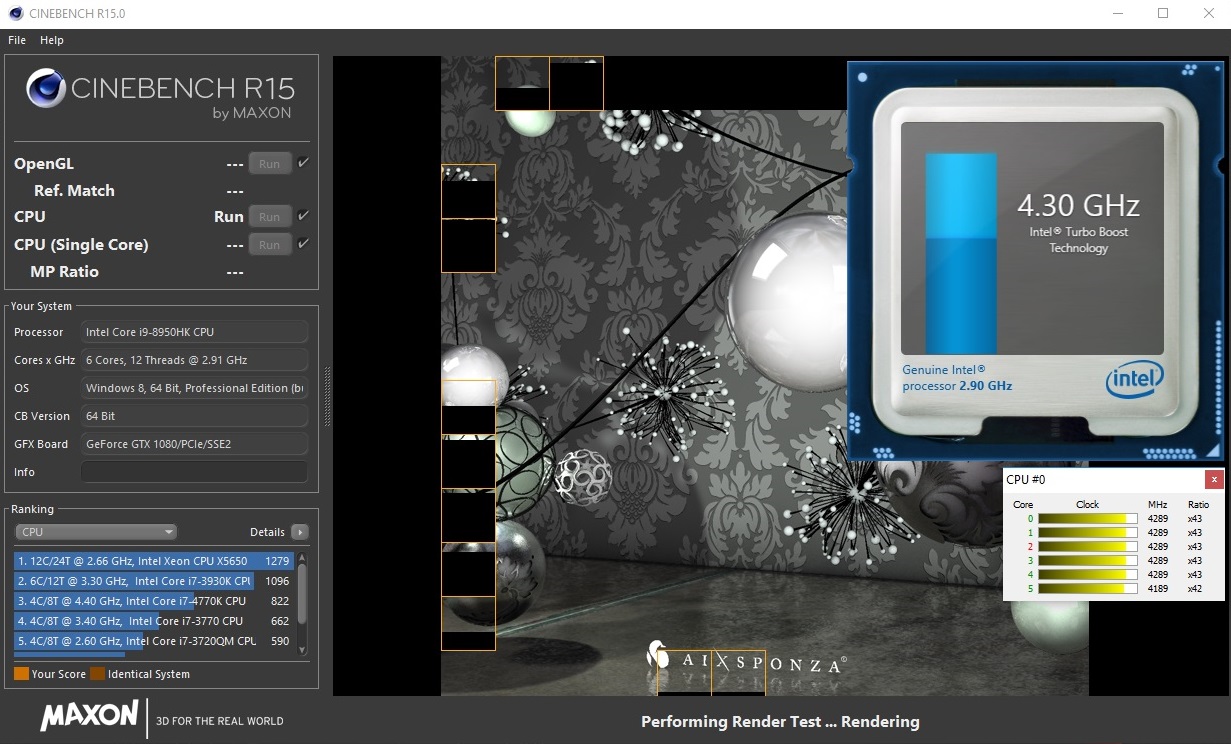
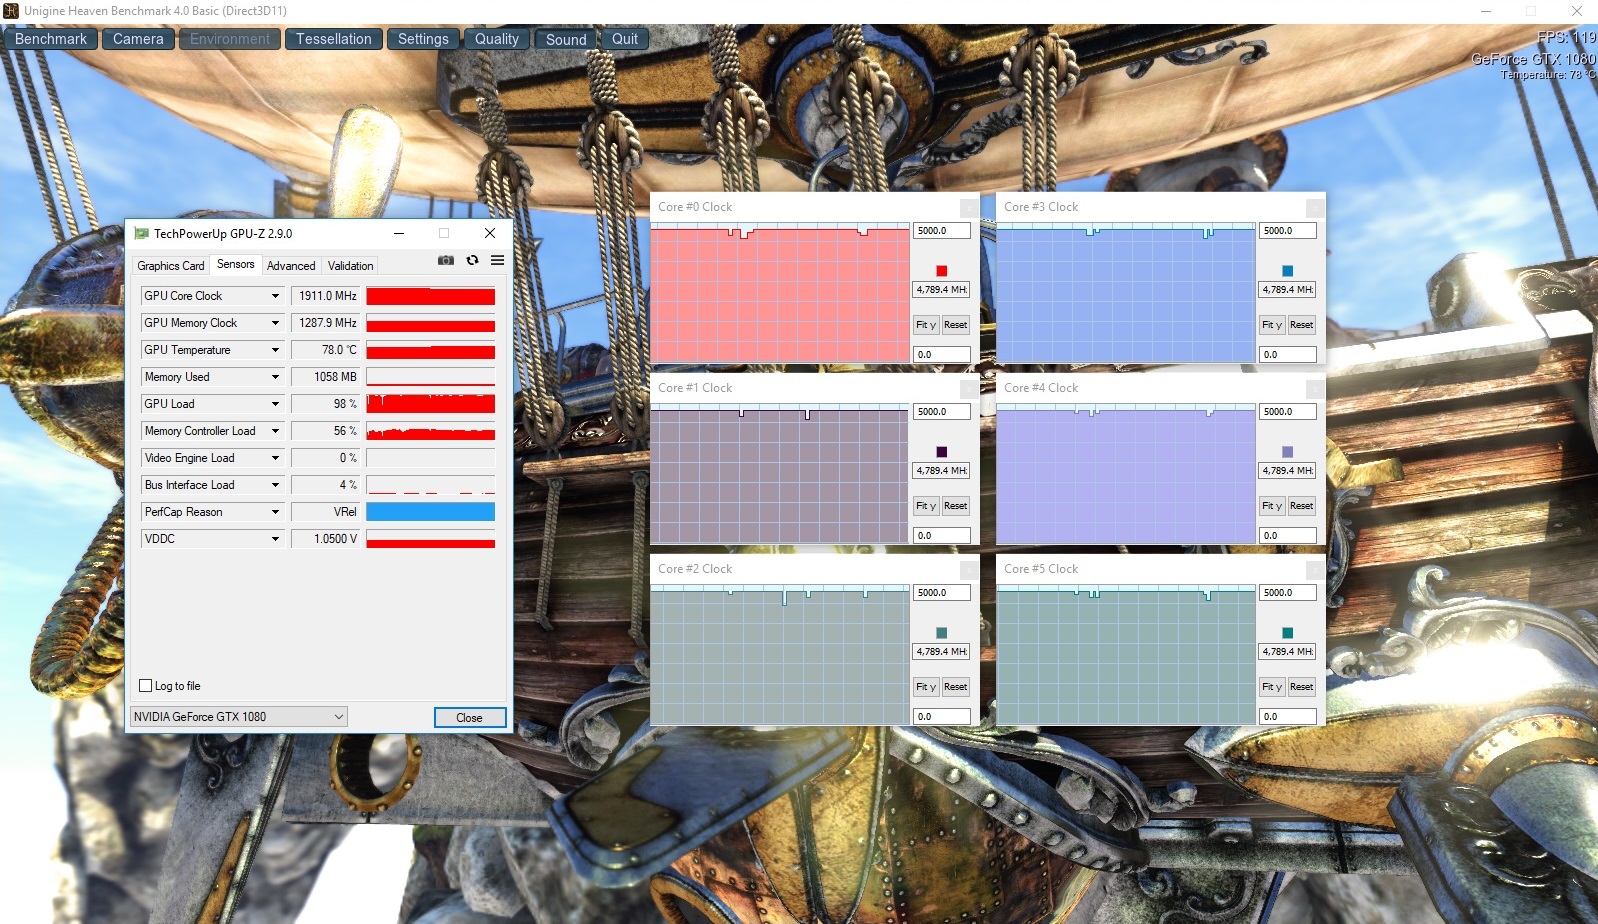
Before we take a look at the laptop's performance, here are a few screenshots from various tools that demonstrate the capacities of the components.
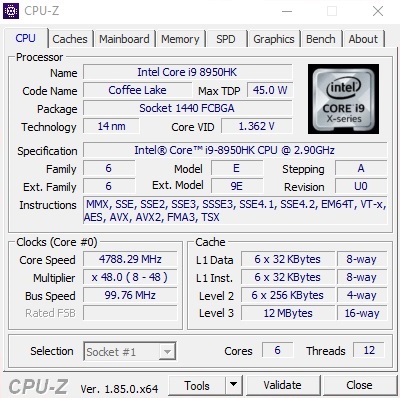
Processor
Maximum power at a luxury price: That sums up the G703's top model. While the Core i7-8750H—with "only" 9 MB of L3 cache and speeds of between 2.2 and 4.1 GHz—is somewhat attractive in terms of its price, the sinfully expensive Core i9-8950HK gleams with its gigantic 12 MB of L3 cache and 2.9 to 4.8 GHz clock speed. Because both chips are hexa-cores that can process 12 threads in parallel using Hyper-Threading, the surcharge will only be worthwhile for a tiny fraction of users.
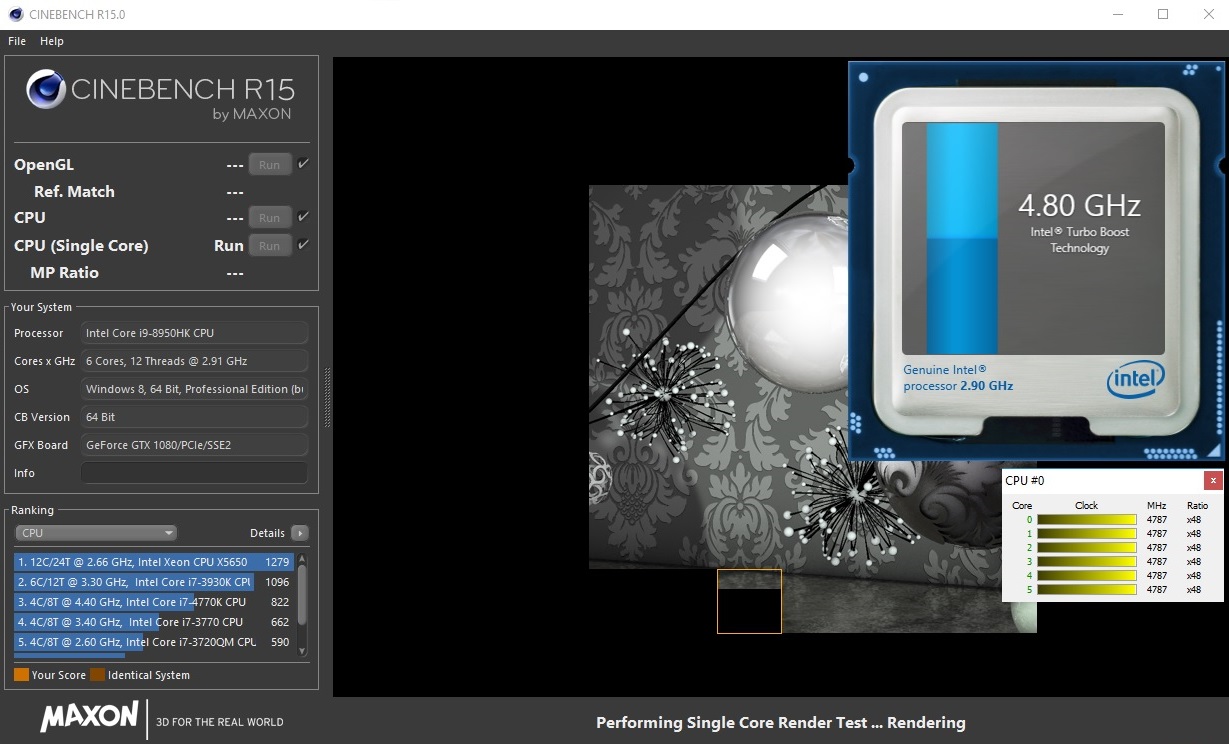
Even so, Intel deserves great respect for the Core i9-8950HK's performance. With 1312 vs. 932 points, the new G703 races ahead of the predecessor's Core i7-7820HK (8 MB L3 cache, 2.9 to 3.9 GHz, overclocked in factory default to 4.3 GHz) by a margin of just over 40% in the Cinebench R15 multi-core test.
Unfortunately, the hexa-core CPU cannot maintain its full turbo over longer periods. In our Cinebench loop, the performance dropped by about 15% from the second run onward. Even in the first run, the Core i9-8950HK's clock speed fluctuated between 2.9 and 4.8 GHz, whereby it reached an average of 4.3 GHz. It is worth mentioning that most of the Coffee Lake laptops we have reviewed to this point have not been able to maintain their turbo's full potency—though the loss is not always so substantial.
System Performance
Speaking of potency: The 17-inch laptop offers outstanding system performance. In both PCMark 10 and PCMark 8, our test configuration takes first place among the comparison devices. No wonder, given that the G703GI has the most RAM and the largest number of solid state drives.
| PCMark 10 - Score | |
| Average of class Gaming (5828 - 11574, n=95, last 2 years) | |
| Asus Chimera G703GI | |
| MSI GT75 8RG-090 Titan | |
| Aorus X9 DT | |
| Schenker XMG Ultra 17 | |
| Asus G703 | |
| PCMark 8 | |
| Home Score Accelerated v2 | |
| Asus Chimera G703GI | |
| Asus G703 | |
| Aorus X9 DT | |
| MSI GT75 8RG-090 Titan | |
| Average of class Gaming (n=1last 2 years) | |
| Schenker XMG Ultra 17 | |
| Work Score Accelerated v2 | |
| Asus Chimera G703GI | |
| Aorus X9 DT | |
| Asus G703 | |
| MSI GT75 8RG-090 Titan | |
| Schenker XMG Ultra 17 | |
| Average of class Gaming (n=1last 2 years) | |
| PCMark 8 Home Score Accelerated v2 | 6093 points | |
| PCMark 8 Work Score Accelerated v2 | 6281 points | |
| PCMark 10 Score | 6607 points | |
Help | ||
Storage Devices
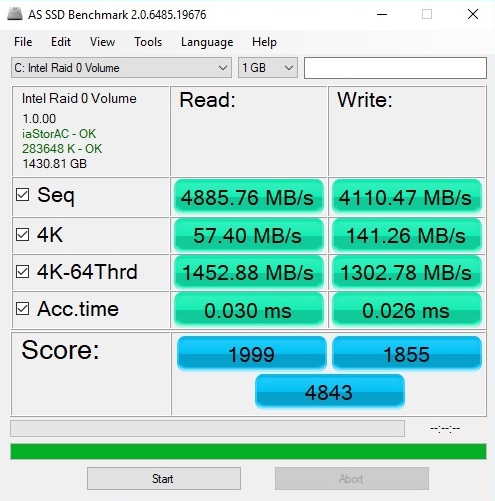
In the realm of mass storage, our test model certainly has the right to boast. Three NVMe drives in RAID 0 mode (2x Intel + 1x Samsung) work together to achieve a superb level of performance, the likes of which we have never seen before. Whether reading or writing: In the AS SSD benchmark's sequential test, at over 4000 MB/s, the G703 brings out the big guns. To compare: The predecessor's SSD duo is about 40% slower in the sequential tests.
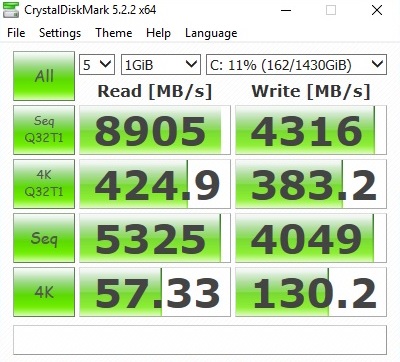
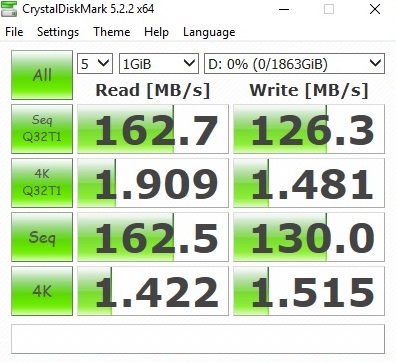
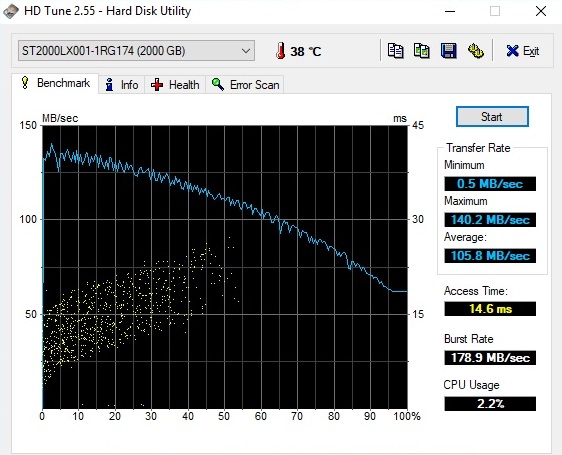
Nor did Asus make any compromises when it comes to storage space. 3x 512 GB should be plenty, even for large game and film collections. But as if that were not enough: As secondary mass storage, the manufacturer also tucked a 2 TB Seagate SSHD under the hood. Adding up the capacity of each drive, we arrive at a luxuriant 3.5 TB. The German series models are only endowed with a maximum of 2.5 TB (2 TB Hybrid + 2x 256 GB SSD).
| Asus Chimera G703GI 2x Intel 760p 512 GB + 1x Samsung SM961 512 GB (RAID) | Asus G703 2x Samsung SM961 MZVKW512HMJP NVMe (RAID 0) | MSI GT75 8RG-090 Titan 2x Samsung PM961 MZVLW256HEHP (RAID 0) | Aorus X9 DT Transcend TS1TMTE850 | Schenker XMG Ultra 17 Samsung SSD 960 Evo 500GB m.2 NVMe | |
|---|---|---|---|---|---|
| AS SSD | -20% | -28% | -57% | -24% | |
| Seq Read (MB/s) | 4886 | 3177 -35% | 3058 -37% | 1518 -69% | 2533 -48% |
| Seq Write (MB/s) | 4110 | 2556 -38% | 2196 -47% | 1019 -75% | 1771 -57% |
| 4K Read (MB/s) | 57.4 | 47.61 -17% | 38.37 -33% | 22.23 -61% | 43.65 -24% |
| 4K Write (MB/s) | 141.3 | 148.4 5% | 97.7 -31% | 98.9 -30% | 139.5 -1% |
| Score Read (Points) | 1999 | 1633 -18% | 1691 -15% | 828 -59% | 1716 -14% |
| Score Write (Points) | 1855 | 1519 -18% | 1553 -16% | 916 -51% | 1615 -13% |
| Score Total (Points) | 4843 | 3962 -18% | 4066 -16% | 2145 -56% | 4173 -14% |

Graphics Card
The front runner from Nvidia's Pascal generation serves as the laptop's graphics card. The GeForce GTX 1080 is designed for passionate gamers who want to enjoy modern titles at maximum settings. The DirectX 12 model already performs impressively in the benchmark show-jumping course.
| 3DMark - 1920x1080 Fire Strike Graphics | |
| Average of class Gaming (12242 - 62849, n=120, last 2 years) | |
| Aorus X9 DT | |
| Asus G703 | |
| Asus Chimera G703GI | |
| MSI GT75 8RG-090 Titan | |
| Schenker XMG Ultra 17 | |
| 3DMark 11 - 1280x720 Performance GPU | |
| Average of class Gaming (21841 - 80022, n=108, last 2 years) | |
| Asus Chimera G703GI | |
| Asus G703 | |
| MSI GT75 8RG-090 Titan | |
| Schenker XMG Ultra 17 | |
| Aorus X9 DT | |
In order to coax every last ounce of performance out of the system, in Turbo Gear Mode Extreme the GPU is overclocked by exactly 100 MHz, jumping from the standard 1582 MHz up to 1682 MHz. However, this increase in speed does not always show up in the benchmark results. While the G703 rushes past the competition in 3DMark 11, in the 3DMark 13 Fire Strike test we see no difference compared to laptops with non-overclocked GeForce GTX 1080s.
| 3DMark 11 Performance | 23488 points | |
| 3DMark Ice Storm Standard Score | 214443 points | |
| 3DMark Cloud Gate Standard Score | 38913 points | |
| 3DMark Fire Strike Score | 18999 points | |
Help | ||
We ran the heavyweight RPG The Witcher 3 for around an hour to test how the 17-inch laptop manages under sustained graphics load. Thanks to its automatic GPU boost—inspired by Intel's Turbo Boost—in 3D mode the GTX 1080 climbs high above its baseline. An average of 1898 MHz is an excellent result and ultimately points to the G703's efficient cooling system.
Gaming Performance
Because Asus chose to restrict the display to a Full HD panel with 1920x1080 pixels, the GeForce GTX 1080 rarely reaches its limits. The IPS screen's 144 Hz is not always fully utilized at maximum settings, but at (very) high details the number often exceeds 100 fps—as examples like The Witcher 3 and Far Cry 5 prove.
| The Witcher 3 - 1920x1080 Ultra Graphics & Postprocessing (HBAO+) | |
| Average of class Gaming (95 - 240, n=8, last 2 years) | |
| Asus G703 | |
| Aorus X9 DT | |
| MSI GT75 8RG-090 Titan | |
| Asus Chimera G703GI | |
| Schenker XMG Ultra 17 | |
The G703 would also be able to run many games smoothly at 2560x1440 pixels (i.e. on a WQHD display). Things only start to get shaky for the GTX 1080 in the 4K range, as they do for every current graphics card—whether for laptops or desktop PCs. Once a CPU has a certain number of cores and/or threads at its command, it no longer plays a definitive role in determining performance power. As a result, the Core i7-8750H is also perfectly suitable for avid gamers.
| low | med. | high | ultra | |
|---|---|---|---|---|
| The Witcher 3 (2015) | 145 | 76.7 | ||
| Far Cry 5 (2018) | 113 | 103 |
Emissions
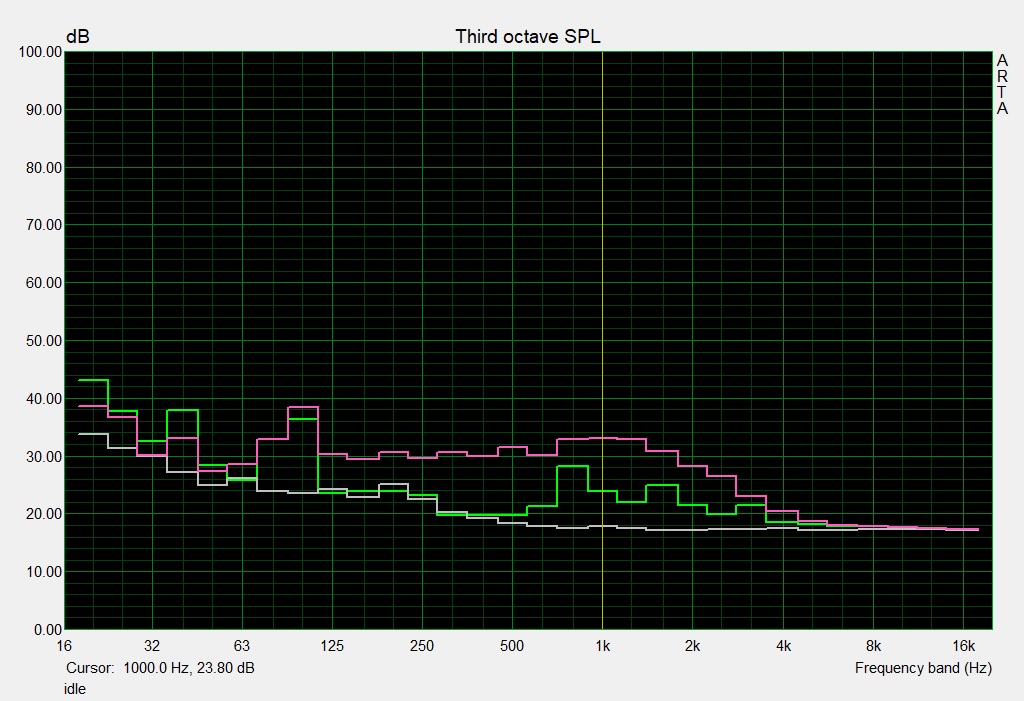
Although the 17-inch laptop is often substantially more sedate when the maximum fan setting is turned off, even in balanced mode, the system cannot be described as quiet.
True, the fans and the HDD sometimes deactivate completely in idle mode, leaving the G703 more or less silent (unfortunately, there is a component that whistles/whirs if one listens closely). But presumably harmless tasks such as booting, starting up programs, or running updates and installations often cause the fans to increase their speed significantly. This could be irritating to many users. In idle mode we measured an average sound pressure level of around 34 dB, putting our test device more or less on par with the MSI GT75 8RG here.
Under load, the high-end laptop's behavior is noticeably more pleasant than those of its competitors. While the MSI GT75 8RG and the Aorus X9 DT reach a disruptively loud 57 dB (max. 61-62 dB @stress test) in The Witcher 3, the ROG Chimera goes about its work at 51 dB (53 dB @stress test). Even at this lower noise level, gamers who are sensitive to bothersome sounds will still be better off with a headset here.
Noise level
| Idle |
| 30 / 34 / 42 dB(A) |
| HDD |
| 31 dB(A) |
| Load |
| 53 / 53 dB(A) |
 | ||
30 dB silent 40 dB(A) audible 50 dB(A) loud |
||
min: | ||
| Asus Chimera G703GI i9-8950HK, GeForce GTX 1080 Mobile | Asus G703 i7-7820HK, GeForce GTX 1080 Mobile | MSI GT75 8RG-090 Titan i9-8950HK, GeForce GTX 1080 Mobile | Aorus X9 DT i9-8950HK, GeForce GTX 1080 Mobile | Schenker XMG Ultra 17 i7-8700, GeForce GTX 1080 Mobile | Average of class Gaming | |
|---|---|---|---|---|---|---|
| Noise | 0% | -1% | -8% | -2% | 16% | |
| off / environment * (dB) | 29 | 30 -3% | 30 -3% | 30 -3% | 30 -3% | 24.1 ? 17% |
| Idle Minimum * (dB) | 30 | 35 -17% | 32 -7% | 36 -20% | 34 -13% | 25.8 ? 14% |
| Idle Average * (dB) | 34 | 36 -6% | 34 -0% | 37 -9% | 35 -3% | 27.4 ? 19% |
| Idle Maximum * (dB) | 42 | 38 10% | 37 12% | 43 -2% | 40 5% | 30 ? 29% |
| Load Average * (dB) | 53 | 46 13% | 43 19% | 50 6% | 45 15% | 43 ? 19% |
| Witcher 3 ultra * (dB) | 51 | 48 6% | 57 -12% | 57 -12% | 52 -2% | |
| Load Maximum * (dB) | 53 | 54 -2% | 62 -17% | 61 -15% | 60 -13% | 54 ? -2% |
* ... smaller is better
Temperature
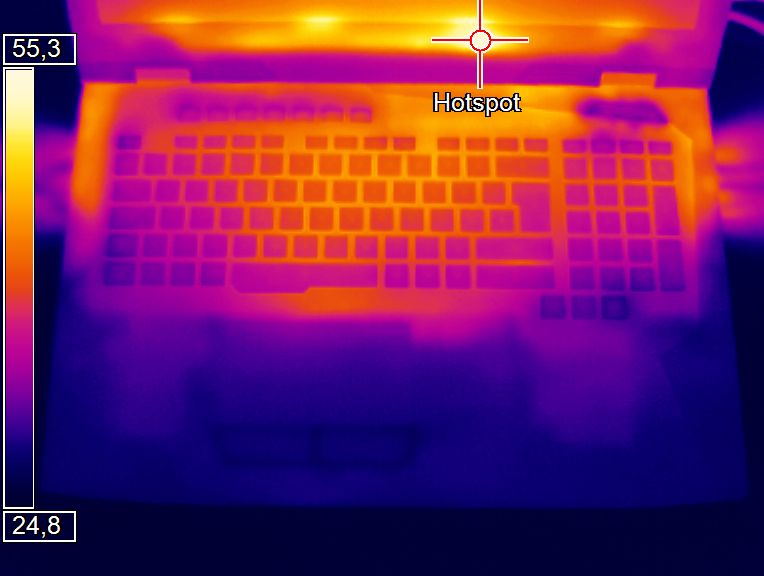
From our perspective, the laptop's temperatures are unremarkable. As is true of most devices, the case remains pleasantly cool in idle mode. Under load, the rear third of the device—where the fans are located—warms up the most. A maximum of 50 °C (122 °F) on both the top and bottom of the machine is not the best result we have seen, but it is acceptable for a high-end system. The palm rest always remains cool, which prevents longer gaming sessions from becoming agonizing.
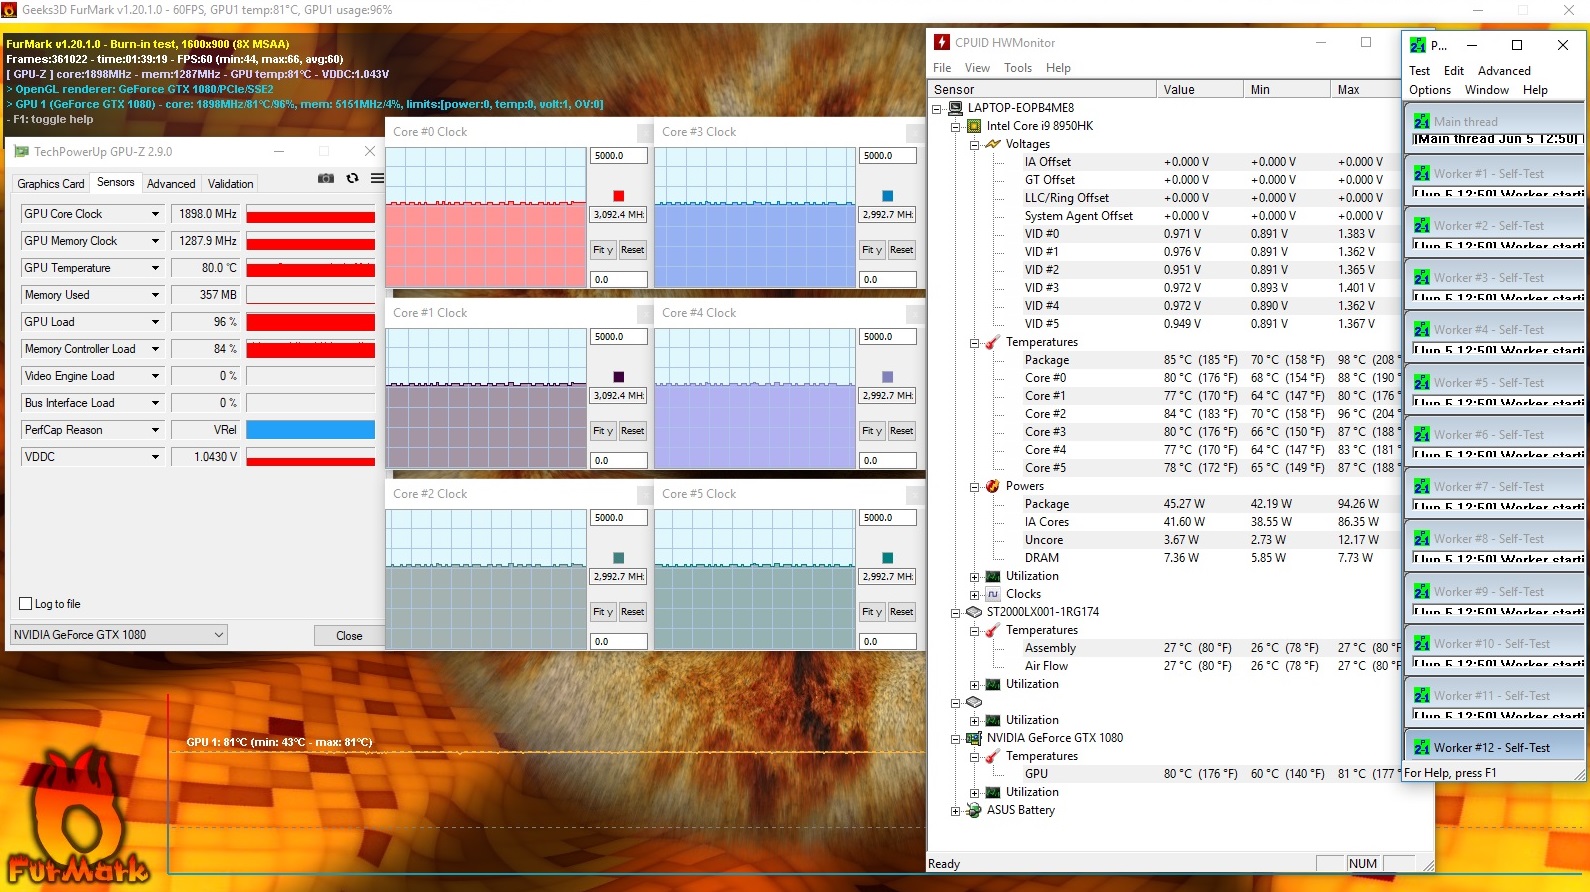
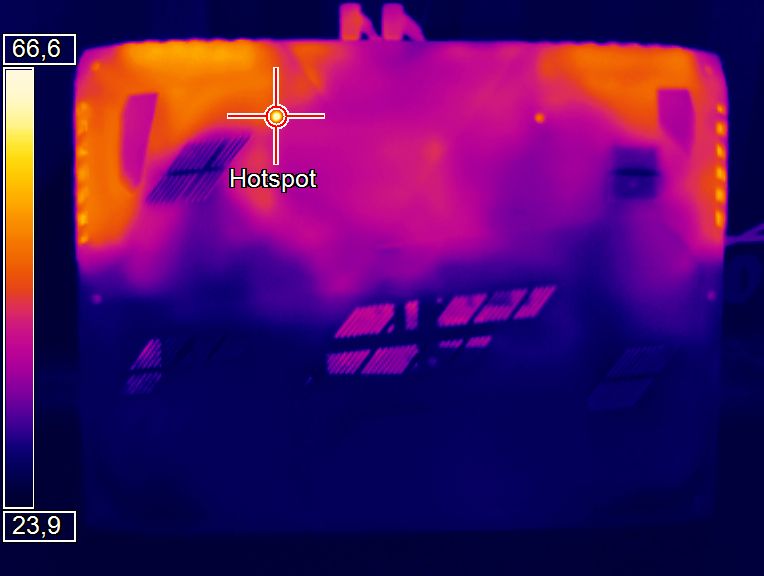
In 3D mode, the components get considerably hotter. After 60 minutes under full load with the tools Furmark and Prime95, the GeForce GTX 1080 warmed to around 80 °C (176 °F). The Core i9-8950HK first heated to almost 100 °C (212 °F) but proceeded to lower its clock frequency from 4.8 to 3.0 GHz due to the high temperatures.
(-) The maximum temperature on the upper side is 50 °C / 122 F, compared to the average of 40.4 °C / 105 F, ranging from 21.2 to 68.8 °C for the class Gaming.
(-) The bottom heats up to a maximum of 50 °C / 122 F, compared to the average of 43.2 °C / 110 F
(+) In idle usage, the average temperature for the upper side is 29.8 °C / 86 F, compared to the device average of 33.9 °C / 93 F.
(±) Playing The Witcher 3, the average temperature for the upper side is 37.4 °C / 99 F, compared to the device average of 33.9 °C / 93 F.
(+) The palmrests and touchpad are cooler than skin temperature with a maximum of 30 °C / 86 F and are therefore cool to the touch.
(±) The average temperature of the palmrest area of similar devices was 28.8 °C / 83.8 F (-1.2 °C / -2.2 F).
| Asus Chimera G703GI i9-8950HK, GeForce GTX 1080 Mobile | Asus G703 i7-7820HK, GeForce GTX 1080 Mobile | MSI GT75 8RG-090 Titan i9-8950HK, GeForce GTX 1080 Mobile | Aorus X9 DT i9-8950HK, GeForce GTX 1080 Mobile | Schenker XMG Ultra 17 i7-8700, GeForce GTX 1080 Mobile | Average of class Gaming | |
|---|---|---|---|---|---|---|
| Heat | -2% | 9% | 8% | 6% | 3% | |
| Maximum Upper Side * (°C) | 50 | 55 -10% | 47 6% | 43 14% | 41 18% | 45.2 ? 10% |
| Maximum Bottom * (°C) | 50 | 54 -8% | 53 -6% | 55 -10% | 48 4% | 48 ? 4% |
| Idle Upper Side * (°C) | 32 | 29 9% | 26 19% | 27 16% | 30 6% | 31.1 ? 3% |
| Idle Bottom * (°C) | 33 | 32 3% | 27 18% | 29 12% | 35 -6% | 34.2 ? -4% |
* ... smaller is better
Speakers
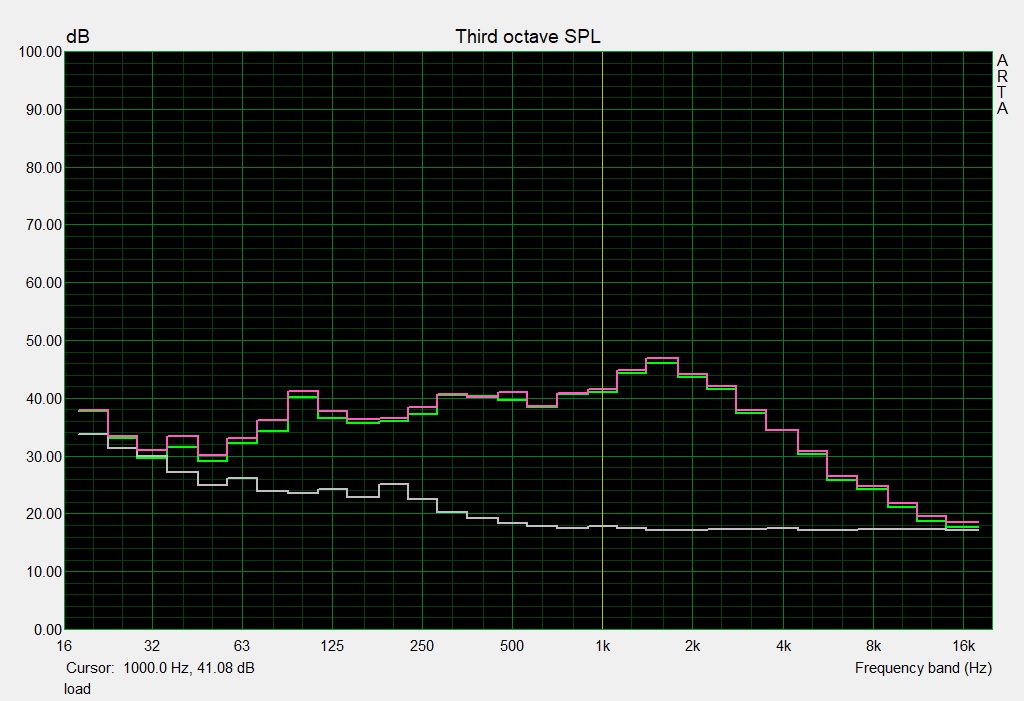
Asus Chimera G703GI audio analysis
(+) | speakers can play relatively loud (89 dB)
Bass 100 - 315 Hz
(±) | reduced bass - on average 8.9% lower than median
(+) | bass is linear (6.4% delta to prev. frequency)
Mids 400 - 2000 Hz
(+) | balanced mids - only 3.1% away from median
(+) | mids are linear (2.4% delta to prev. frequency)
Highs 2 - 16 kHz
(+) | balanced highs - only 4.4% away from median
(+) | highs are linear (3.2% delta to prev. frequency)
Overall 100 - 16.000 Hz
(+) | overall sound is linear (11.8% difference to median)
Compared to same class
» 11% of all tested devices in this class were better, 4% similar, 85% worse
» The best had a delta of 6%, average was 18%, worst was 132%
Compared to all devices tested
» 8% of all tested devices were better, 3% similar, 89% worse
» The best had a delta of 4%, average was 24%, worst was 134%
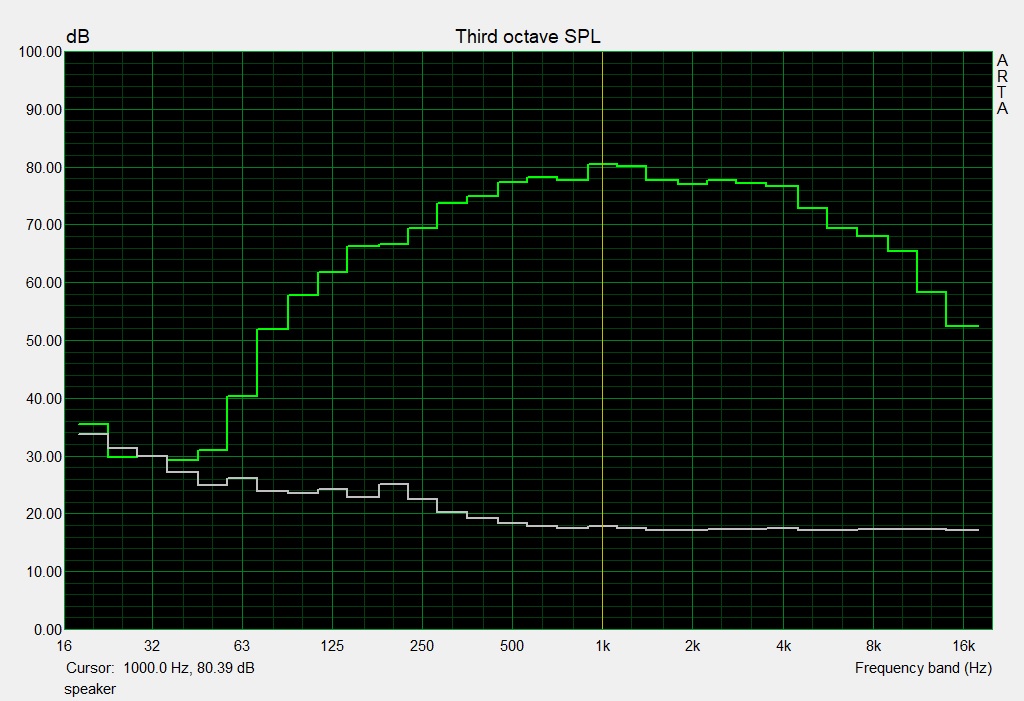
MSI GT75 8RG-090 Titan audio analysis
(+) | speakers can play relatively loud (94 dB)
Bass 100 - 315 Hz
(±) | reduced bass - on average 9.4% lower than median
(±) | linearity of bass is average (8.7% delta to prev. frequency)
Mids 400 - 2000 Hz
(±) | higher mids - on average 6.8% higher than median
(±) | linearity of mids is average (8.4% delta to prev. frequency)
Highs 2 - 16 kHz
(±) | higher highs - on average 5% higher than median
(±) | linearity of highs is average (7.8% delta to prev. frequency)
Overall 100 - 16.000 Hz
(+) | overall sound is linear (14.4% difference to median)
Compared to same class
» 27% of all tested devices in this class were better, 7% similar, 66% worse
» The best had a delta of 6%, average was 18%, worst was 132%
Compared to all devices tested
» 18% of all tested devices were better, 4% similar, 78% worse
» The best had a delta of 4%, average was 24%, worst was 134%
Energy Management
As to be expected, the G703GI needs a lot of energy. The combination of powerful hardware and a lack of graphics-switching causes the device to use a considerable amount of energy even in idle mode, though 29-46 watts is reminiscent of the competition.
But the G703GI really gets down to business under load. At 156 to 314 watts, the 17-inch laptop is one of the hungriest devices on the market. However, we still cannot understand why the computer needs two 280-watt power supplies. According to our measurements, a 330-watt model or a 180-watt duo would have been enough.
| Off / Standby | |
| Idle | |
| Load |
|
Key:
min: | |
| Asus Chimera G703GI i9-8950HK, GeForce GTX 1080 Mobile | Asus G703 i7-7820HK, GeForce GTX 1080 Mobile | MSI GT75 8RG-090 Titan i9-8950HK, GeForce GTX 1080 Mobile | Aorus X9 DT i9-8950HK, GeForce GTX 1080 Mobile | Schenker XMG Ultra 17 i7-8700, GeForce GTX 1080 Mobile | Average of class Gaming | |
|---|---|---|---|---|---|---|
| Power Consumption | 10% | -1% | 5% | 5% | 40% | |
| Idle Minimum * (Watt) | 29 | 26 10% | 31 -7% | 28 3% | 32 -10% | 13.2 ? 54% |
| Idle Average * (Watt) | 37 | 30 19% | 35 5% | 37 -0% | 38 -3% | 18.9 ? 49% |
| Idle Maximum * (Watt) | 46 | 37 20% | 45 2% | 40 13% | 45 2% | 24.3 ? 47% |
| Load Average * (Watt) | 156 | 123 21% | 130 17% | 109 30% | 96 38% | 108 ? 31% |
| Witcher 3 ultra * (Watt) | 252 | 257 -2% | 268 -6% | 256 -2% | 237 6% | |
| Load Maximum * (Watt) | 314 | 341 -9% | 374 -19% | 353 -12% | 331 -5% | 254 ? 19% |
* ... smaller is better
Battery Life
Because the ROG Chimera was designed as a desktop replacement, long battery life was not on the list of priorities. As a result, it is entirely unsurprising that the 17-inch laptop quickly runs out of steam without its power supply. Even at minimum display brightness, the device shuts off after 3 hours in idle mode. Around 2 hours for surfing the Internet over Wi-Fi at medium brightness is nothing to boast about either. If the brightness is set to maximum and the system is confronted with 3D applications, the 71 Wh battery does not even last 60 minutes.
| Asus Chimera G703GI i9-8950HK, GeForce GTX 1080 Mobile, 71 Wh | Asus G703 i7-7820HK, GeForce GTX 1080 Mobile, 71 Wh | MSI GT75 8RG-090 Titan i9-8950HK, GeForce GTX 1080 Mobile, 75 Wh | Aorus X9 DT i9-8950HK, GeForce GTX 1080 Mobile, 94.24 Wh | Schenker XMG Ultra 17 i7-8700, GeForce GTX 1080 Mobile, 82 Wh | Average of class Gaming | |
|---|---|---|---|---|---|---|
| Battery runtime | 11% | 29% | 46% | 13% | 164% | |
| Reader / Idle (h) | 2.8 | 3.3 18% | 3.8 36% | 4.2 50% | 2.7 -4% | 8.71 ? 211% |
| WiFi v1.3 (h) | 2.2 | 2.5 14% | 3.2 45% | 2.4 9% | 7.02 ? 219% | |
| Load (h) | 0.9 | 0.9 0% | 1.1 22% | 1.3 44% | 1.2 33% | 1.47 ? 63% |
| H.264 (h) | 2.4 | 2.9 | 2.5 | 8.26 ? |
Pros
Cons
Verdict
Like its predecessor, the new Coffee Lake edition of the Asus ROG Chimera G703 is one of the best high-end laptops for avid gamers.
If we factor out its heavy weight and thick build, the case has a lot of strengths. The attraction of the 17-inch powerhouse lies not only with its quick and contrast-rich 144 Hz display with stable viewing angles and G-Sync support, but it is also with its modern connections (Thunderbolt 3) and good input devices.
In the realm of performance, there is simply nothing to criticize. In the device's native resolution, the hexa-core CPU and GeForce GTX 1080 run every game on the market at a fluid frame rate. The laptop does make a lot of noise under load, but other competitors like the MSI GT75 8RG and Aorus X9 DT get even louder in 3D mode.
All aspects considered together, the computer scores just enough for a rating of "Very Good". In our Gaming Top 10, the G703 once again snatches a leading position.
Asus Chimera G703GI
- 06/07/2018 v6 (old)
Florian Glaser
Price comparison
