ASUS ROG G703GXR Laptop Review: A high-end old-school gamer

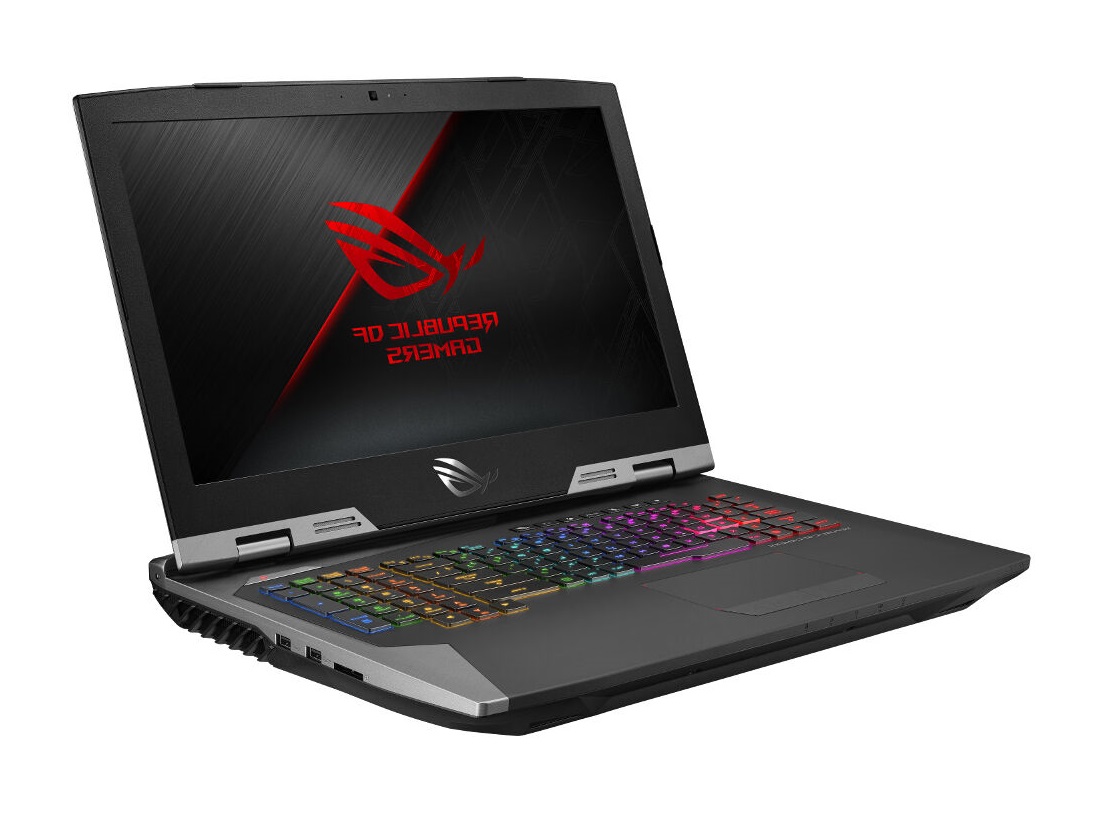
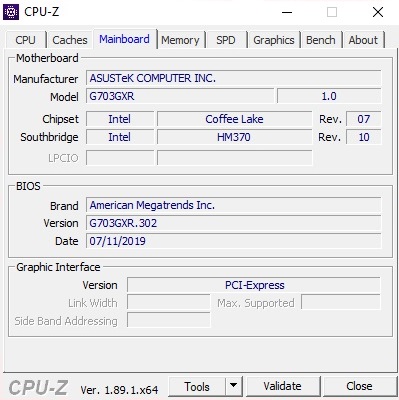
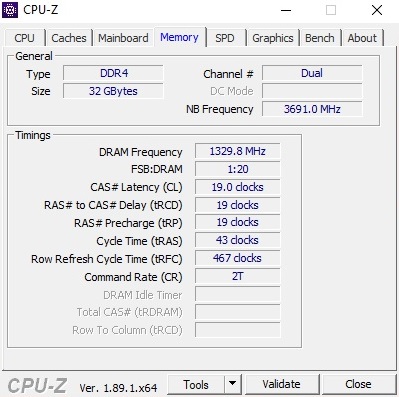
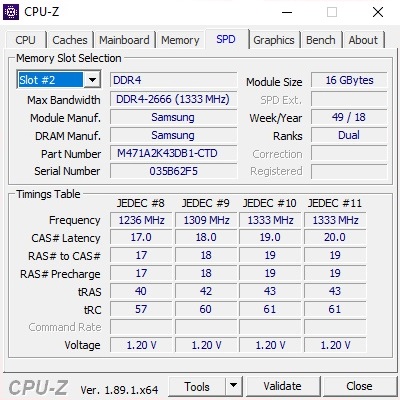
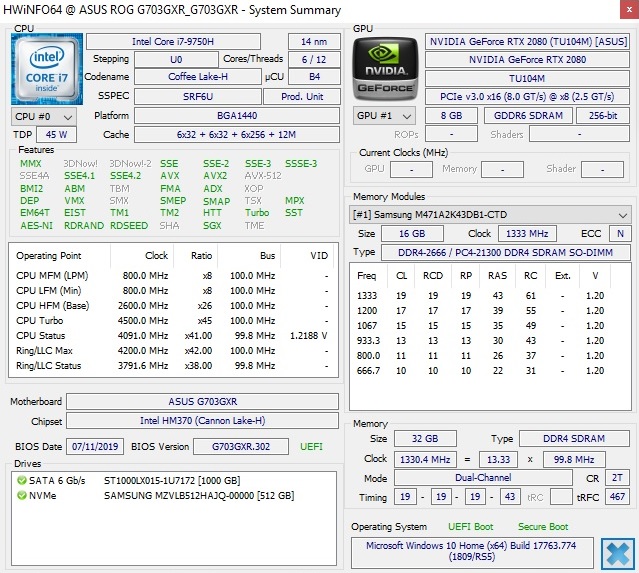
Notebooksbilliger.de kindly provided our test device for this review, which ASUS calls the ROG G703GXR-EV003T. The laptop currently costs 3,900 Euros (~US$4,282) and comes with an Intel Core i7-9750H processor, NVIDIA GeForce RTX 2080 GPU and 32 GB of dual-channel DDR4-2666 RAM. ASUS includes a 512 GB SSD and a 1 TB SSHD too.
The G703GXR weighs a whopping 4.65 kg and is 48 mm thick, making it one of the heavier gaming laptops currently on the market. While the Acer Predator Helios 700 is just as heavy and thick as our review unit, other GeForce RTX 2080-based laptops like the MSI GE75 Raider 9SG and HP Omen 17 are noticeably thinner and lighter. All three will be our comparison devices for this review.
The G703GXR, to our knowledge, has the same case, ports and input devices as its predecessor. Please see our ROG G703GX review for our thoughts on these areas.
Rating | Date | Model | Weight | Height | Size | Resolution | Price |
|---|---|---|---|---|---|---|---|
| 85.8 % v7 (old) | 10 / 2019 | Asus ROG G703GXR i7-9750H, GeForce RTX 2080 Mobile | 4.7 kg | 48 mm | 17.30" | 1920x1080 | |
| 82.5 % v7 (old) | 09 / 2019 | Acer Predator Helios 700 PH717-71-785M i7-9750H, GeForce RTX 2080 Mobile | 4.8 kg | 42 mm | 17.30" | 1920x1080 | |
| 85.1 % v7 (old) | 08 / 2019 | HP Omen 17-cb0020ng i9-9880H, GeForce RTX 2080 Mobile | 3.3 kg | 27 mm | 17.30" | 1920x1080 | |
| 86.1 % v7 (old) | 05 / 2019 | MSI GE75 9SG i9-9880H, GeForce RTX 2080 Mobile | 2.7 kg | 27.5 mm | 17.30" | 1920x1080 |
| SD Card Reader | |
| average JPG Copy Test (av. of 3 runs) | |
| Asus ROG G703GXR (Toshiba Exceria Pro SDXC 64 GB UHS-II) | |
| Average of class Gaming (20.9 - 210, n=54, last 2 years) | |
| HP Omen 17-cb0020ng (Toshiba Exceria Pro SDXC 64 GB UHS-II) | |
| MSI GE75 9SG (Toshiba Exceria Pro SDXC 64 GB UHS-II) | |
| maximum AS SSD Seq Read Test (1GB) | |
| Asus ROG G703GXR (Toshiba Exceria Pro SDXC 64 GB UHS-II) | |
| Average of class Gaming (25.5 - 261, n=51, last 2 years) | |
| HP Omen 17-cb0020ng (Toshiba Exceria Pro SDXC 64 GB UHS-II) | |
| MSI GE75 9SG (Toshiba Exceria Pro SDXC 64 GB UHS-II) | |
| Networking | |
| iperf3 transmit AX12 | |
| HP Omen 17-cb0020ng | |
| Acer Predator Helios 700 PH717-71-785M | |
| MSI GE75 9SG | |
| Asus ROG G703GXR | |
| iperf3 receive AX12 | |
| Acer Predator Helios 700 PH717-71-785M | |
| Asus ROG G703GXR | |
| HP Omen 17-cb0020ng | |
| MSI GE75 9SG | |
Display
Although the G703GXR has a slightly newer display than its predecessor, the two devices achieve almost identical values in our tests. Its 1080p panel has a 144 Hz refresh rate and relatively short response times. The panel is not only G-Sync compatible, but it is also NVIDIA Optimus compatible too.
| |||||||||||||||||||||||||
Brightness Distribution: 91 %
Center on Battery: 290 cd/m²
Contrast: 1450:1 (Black: 0.2 cd/m²)
ΔE ColorChecker Calman: 4.77 | ∀{0.5-29.43 Ø4.71}
calibrated: 1.46
ΔE Greyscale Calman: 5.83 | ∀{0.09-98 Ø4.96}
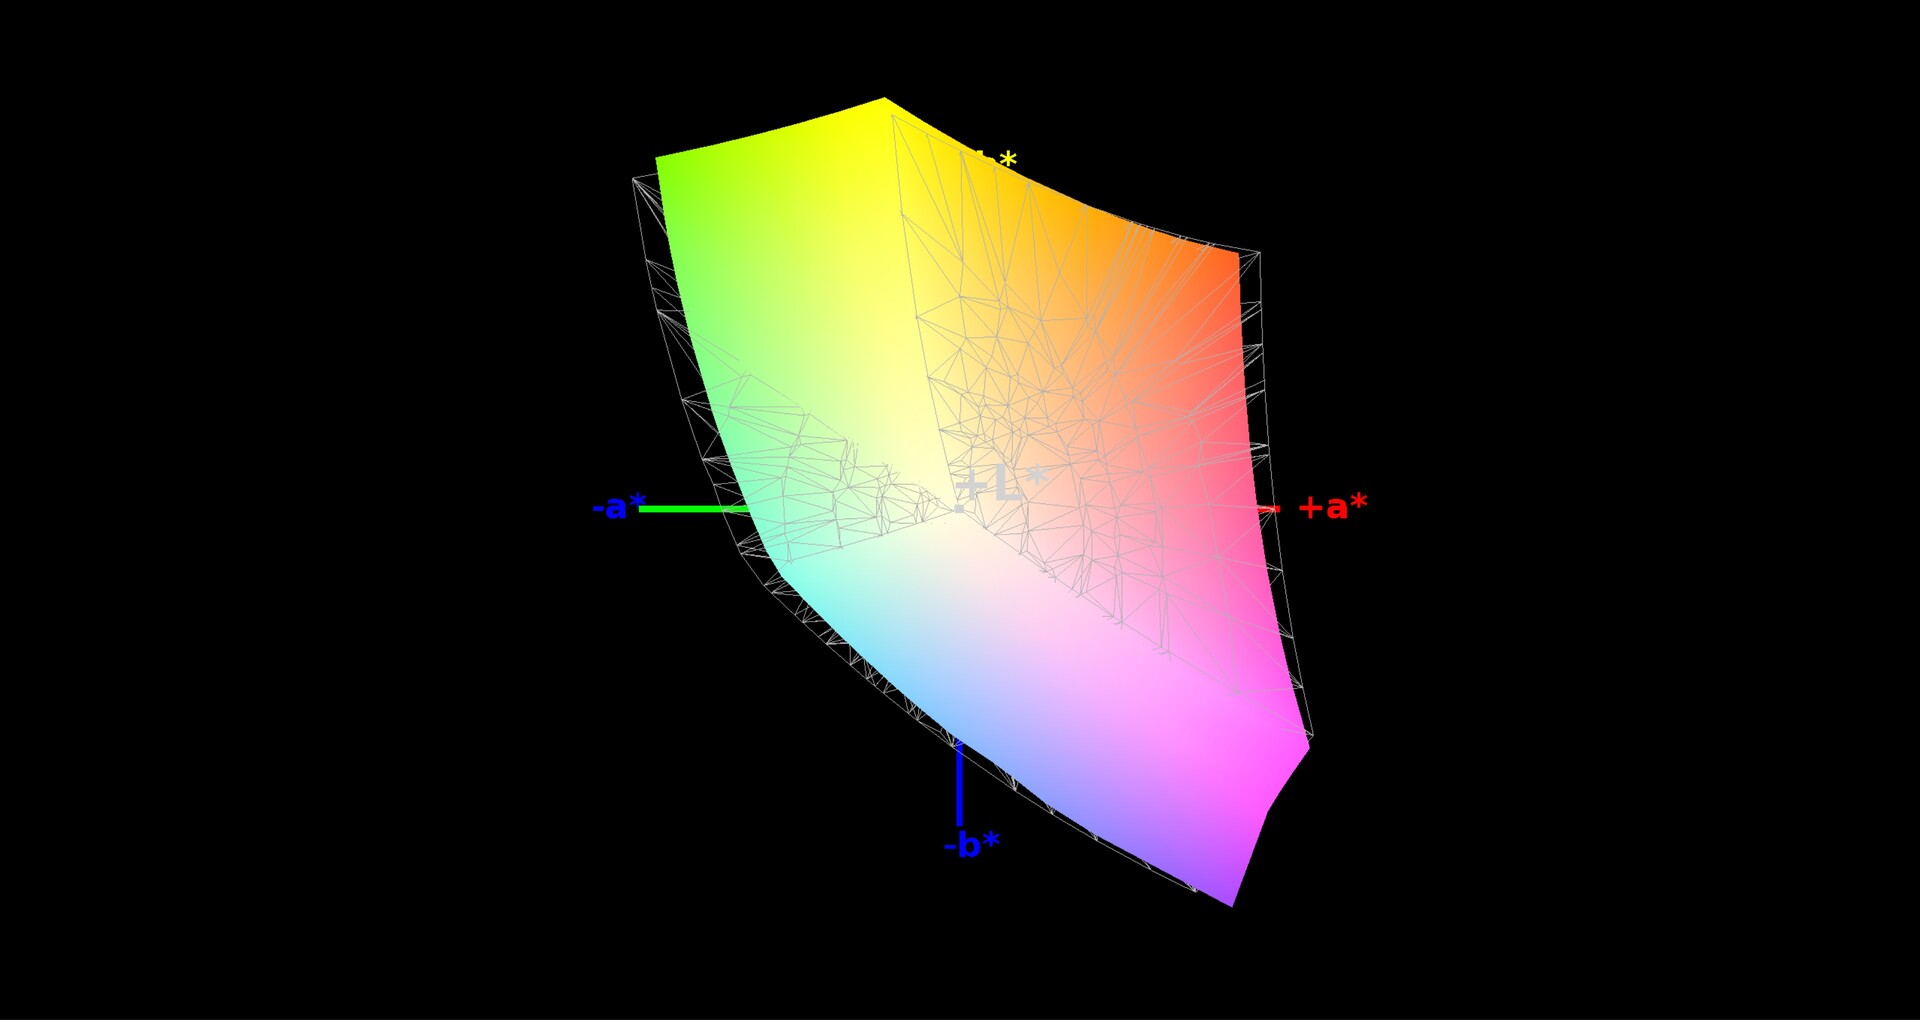
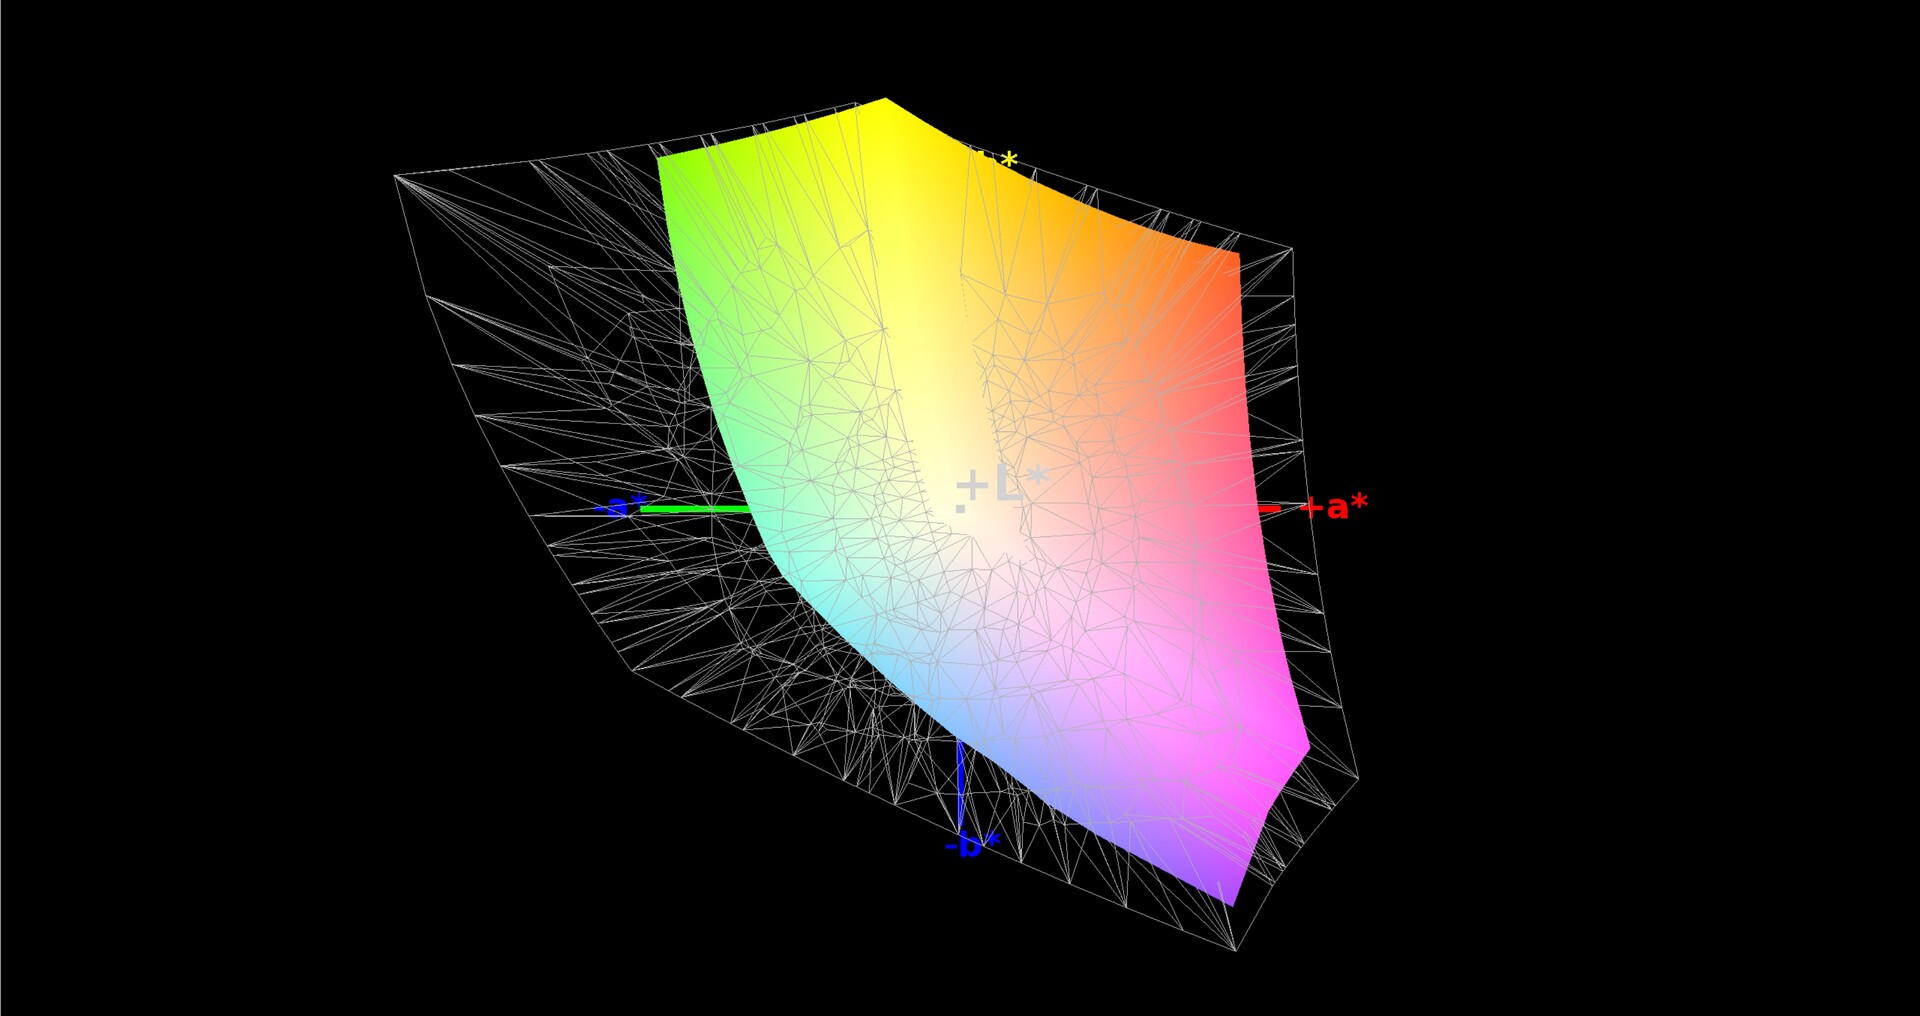
92% sRGB (Argyll 1.6.3 3D)
59% AdobeRGB 1998 (Argyll 1.6.3 3D)
64.7% AdobeRGB 1998 (Argyll 3D)
92% sRGB (Argyll 3D)
63.2% Display P3 (Argyll 3D)
Gamma: 2.47
CCT: 8076 K
| Asus ROG G703GXR AU Optronics B173HAN04.0 (AUO409D), IPS, 1920x1080 | Acer Predator Helios 700 PH717-71-785M AU Optronics B173HAN03.1 (AUO319D), IPS, 1920x1080 | HP Omen 17-cb0020ng CMN175D, IPS, 1920x1080 | MSI GE75 9SG Chi Mei N173HCE-G33, AHVA, 1920x1080 | Asus ROG G703GX AU Optronics B173HAN03.2 (AUO329D), IPS, 1920x1080 | |
|---|---|---|---|---|---|
| Display | 1% | 2% | -2% | 1% | |
| Display P3 Coverage (%) | 63.2 | 64.4 2% | 63.7 1% | 61.5 -3% | 64.1 1% |
| sRGB Coverage (%) | 92 | 92.1 0% | 96 4% | 92 0% | 93.3 1% |
| AdobeRGB 1998 Coverage (%) | 64.7 | 65.5 1% | 65.8 2% | 63.5 -2% | 65.6 1% |
| Response Times | -77% | -81% | 18% | 6% | |
| Response Time Grey 50% / Grey 80% * (ms) | 6.4 ? | 16.8 ? -163% | 17.6 ? -175% | 7.2 ? -13% | 7.2 ? -13% |
| Response Time Black / White * (ms) | 12.8 ? | 11.6 ? 9% | 11.2 ? 13% | 6.6 ? 48% | 9.6 ? 25% |
| PWM Frequency (Hz) | 25510 ? | 26040 ? | |||
| Screen | -10% | 21% | 18% | -4% | |
| Brightness middle (cd/m²) | 290 | 288 -1% | 360 24% | 400.7 38% | 296 2% |
| Brightness (cd/m²) | 281 | 271 -4% | 342 22% | 372 32% | 279 -1% |
| Brightness Distribution (%) | 91 | 85 -7% | 91 0% | 89 -2% | 85 -7% |
| Black Level * (cd/m²) | 0.2 | 0.2 -0% | 0.26 -30% | 0.34 -70% | 0.25 -25% |
| Contrast (:1) | 1450 | 1440 -1% | 1385 -4% | 1179 -19% | 1184 -18% |
| Colorchecker dE 2000 * | 4.77 | 5.79 -21% | 1.91 60% | 1.33 72% | 4.77 -0% |
| Colorchecker dE 2000 max. * | 9.08 | 11.89 -31% | 4.08 55% | 3.51 61% | 9.08 -0% |
| Colorchecker dE 2000 calibrated * | 1.46 | 1.89 -29% | 0.78 47% | 1.39 5% | 1.46 -0% |
| Greyscale dE 2000 * | 5.83 | 6.92 -19% | 2.72 53% | 1.3 78% | 5.83 -0% |
| Gamma | 2.47 89% | 2.46 89% | 2.37 93% | 2.24 98% | 2.47 89% |
| CCT | 8076 80% | 8433 77% | 6692 97% | 6735 97% | 8076 80% |
| Color Space (Percent of AdobeRGB 1998) (%) | 59 | 60 2% | 60 2% | 58.2 -1% | 60 2% |
| Color Space (Percent of sRGB) (%) | 92 | 92 0% | 96 4% | 92.1 0% | 93 1% |
| Total Average (Program / Settings) | -29% /
-16% | -19% /
5% | 11% /
14% | 1% /
-2% |
* ... smaller is better
The display should also appeal to multimedia fans. The panel in our review unit has an impressively low 0.2 cd/m² black value, which combined with its 281 cd/m² average maximum brightness results in an excellent 1,450:1 contrast ratio. All media, including movies, games and photos, looks vivid. There is little to complain about with colour-space coverage either, as our review unit covers 92% of sRGB and 59% of AdobeRGB.
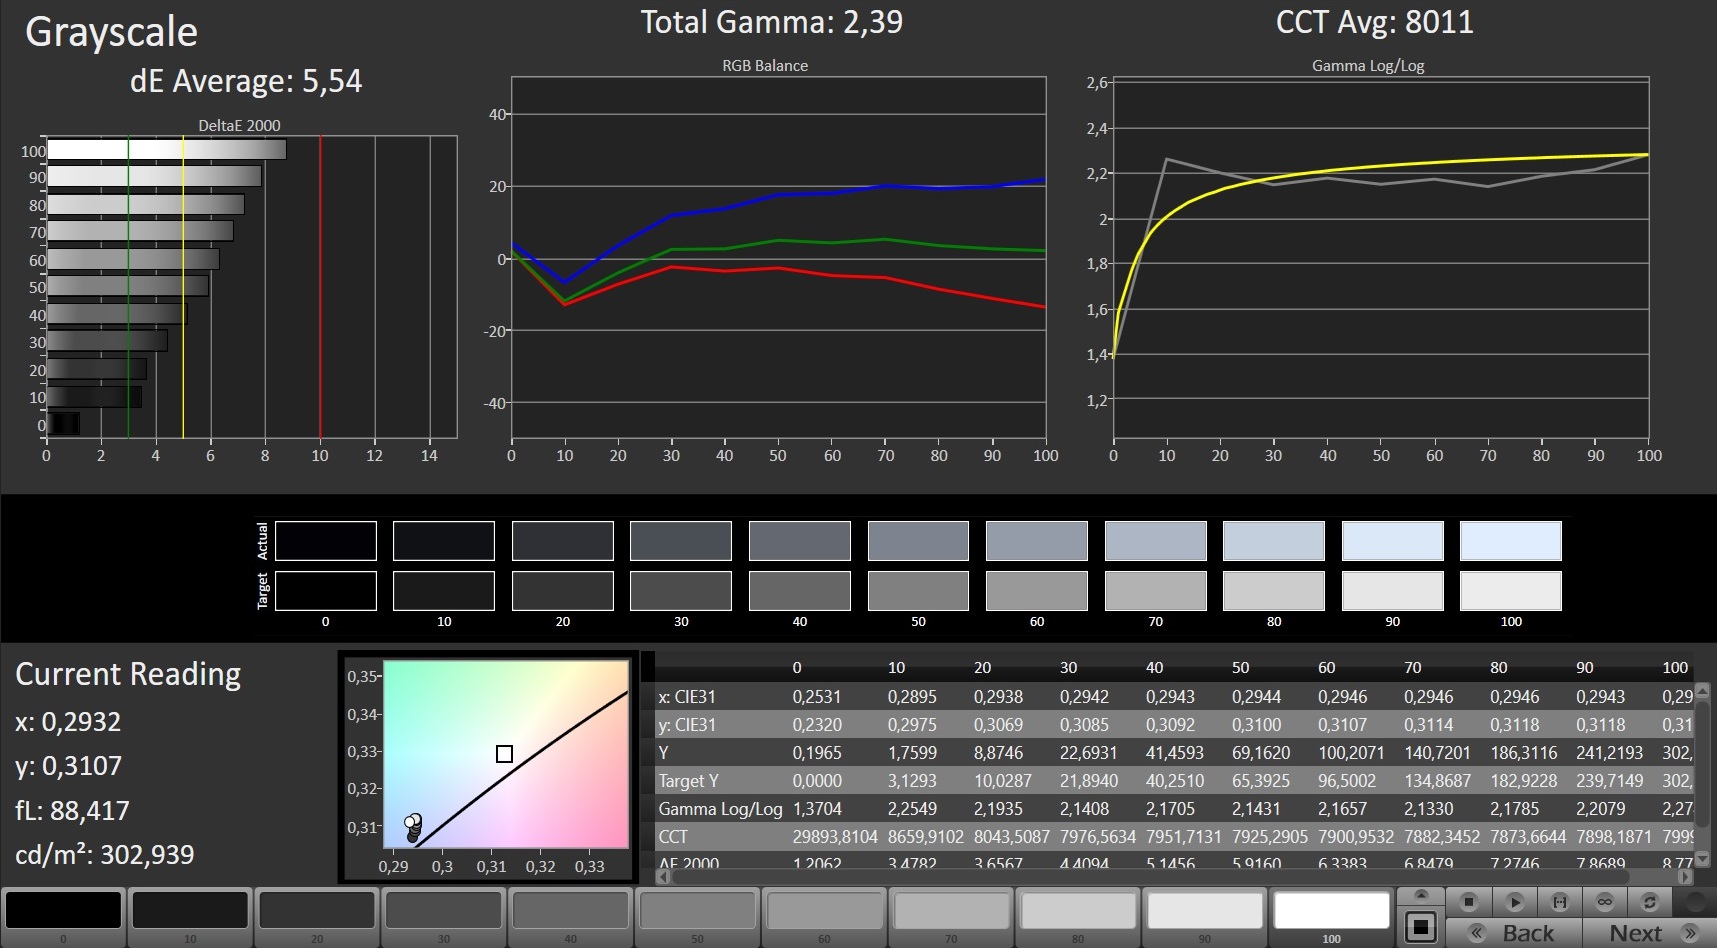
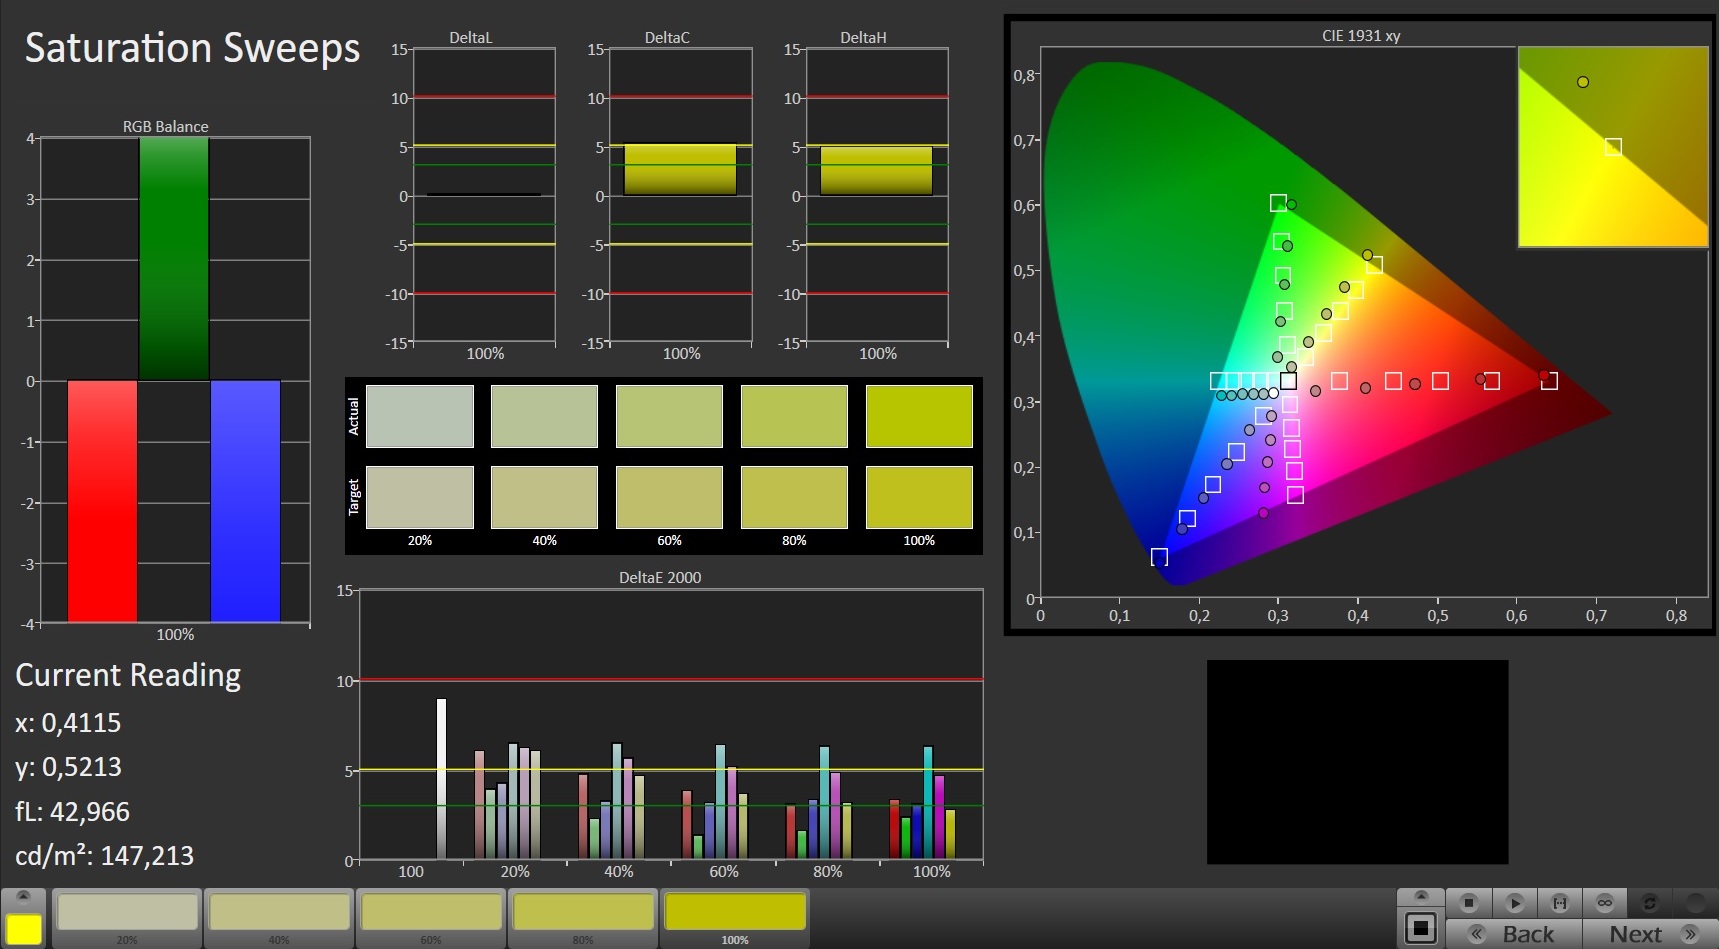
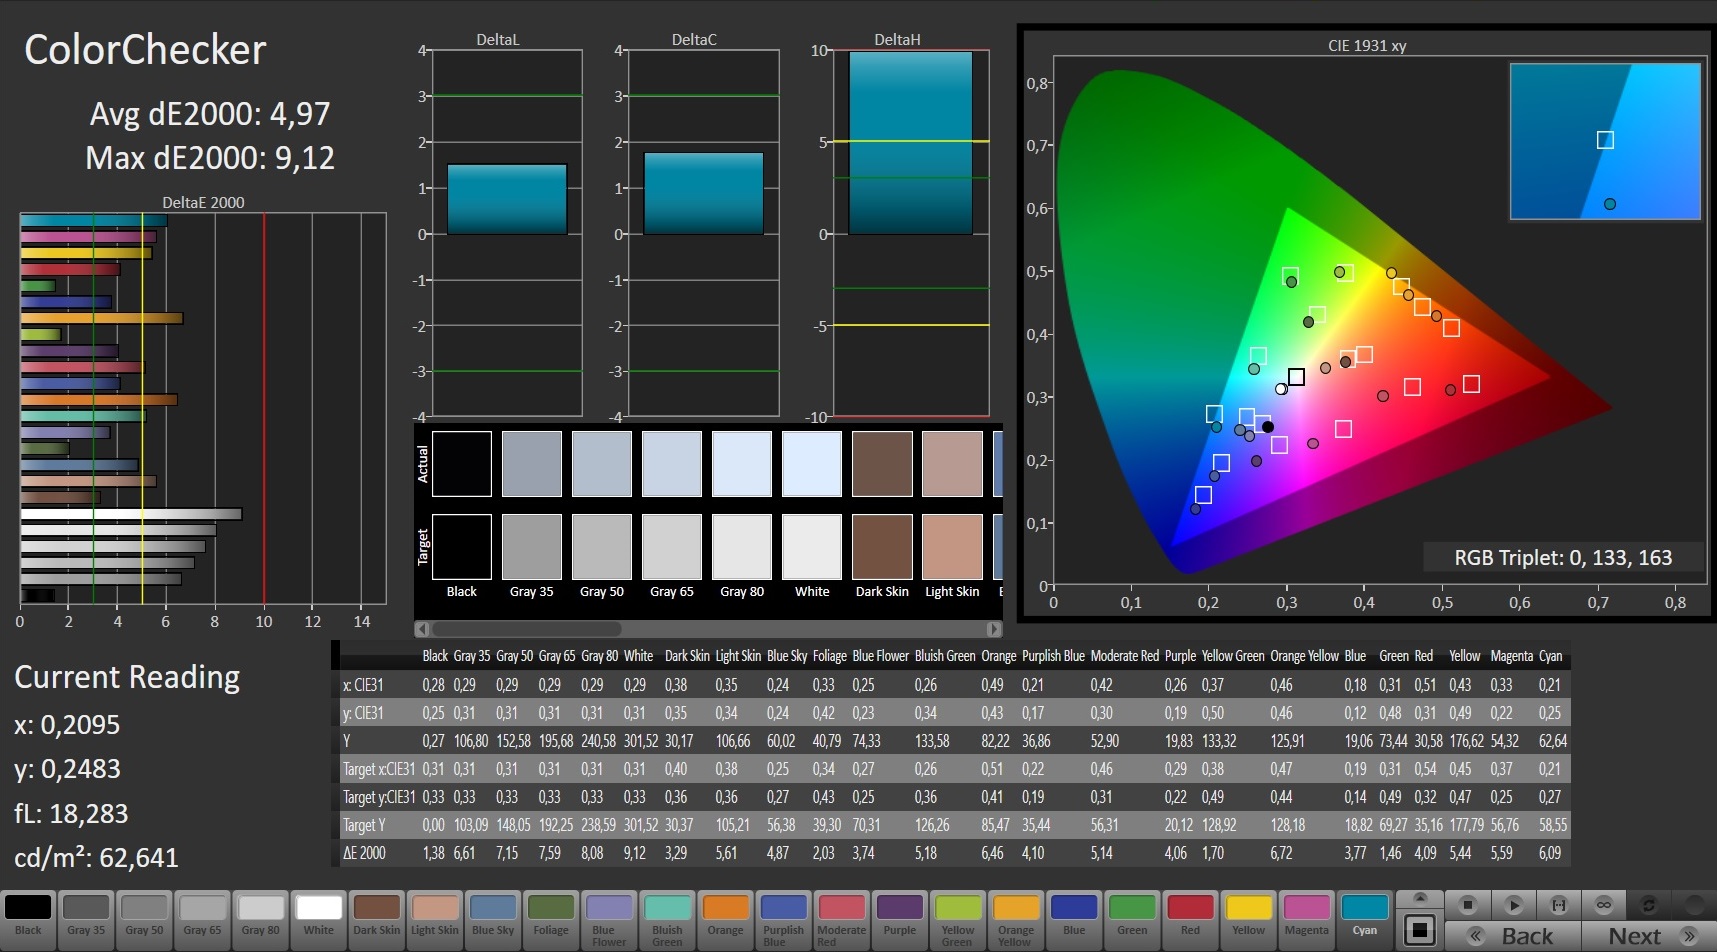
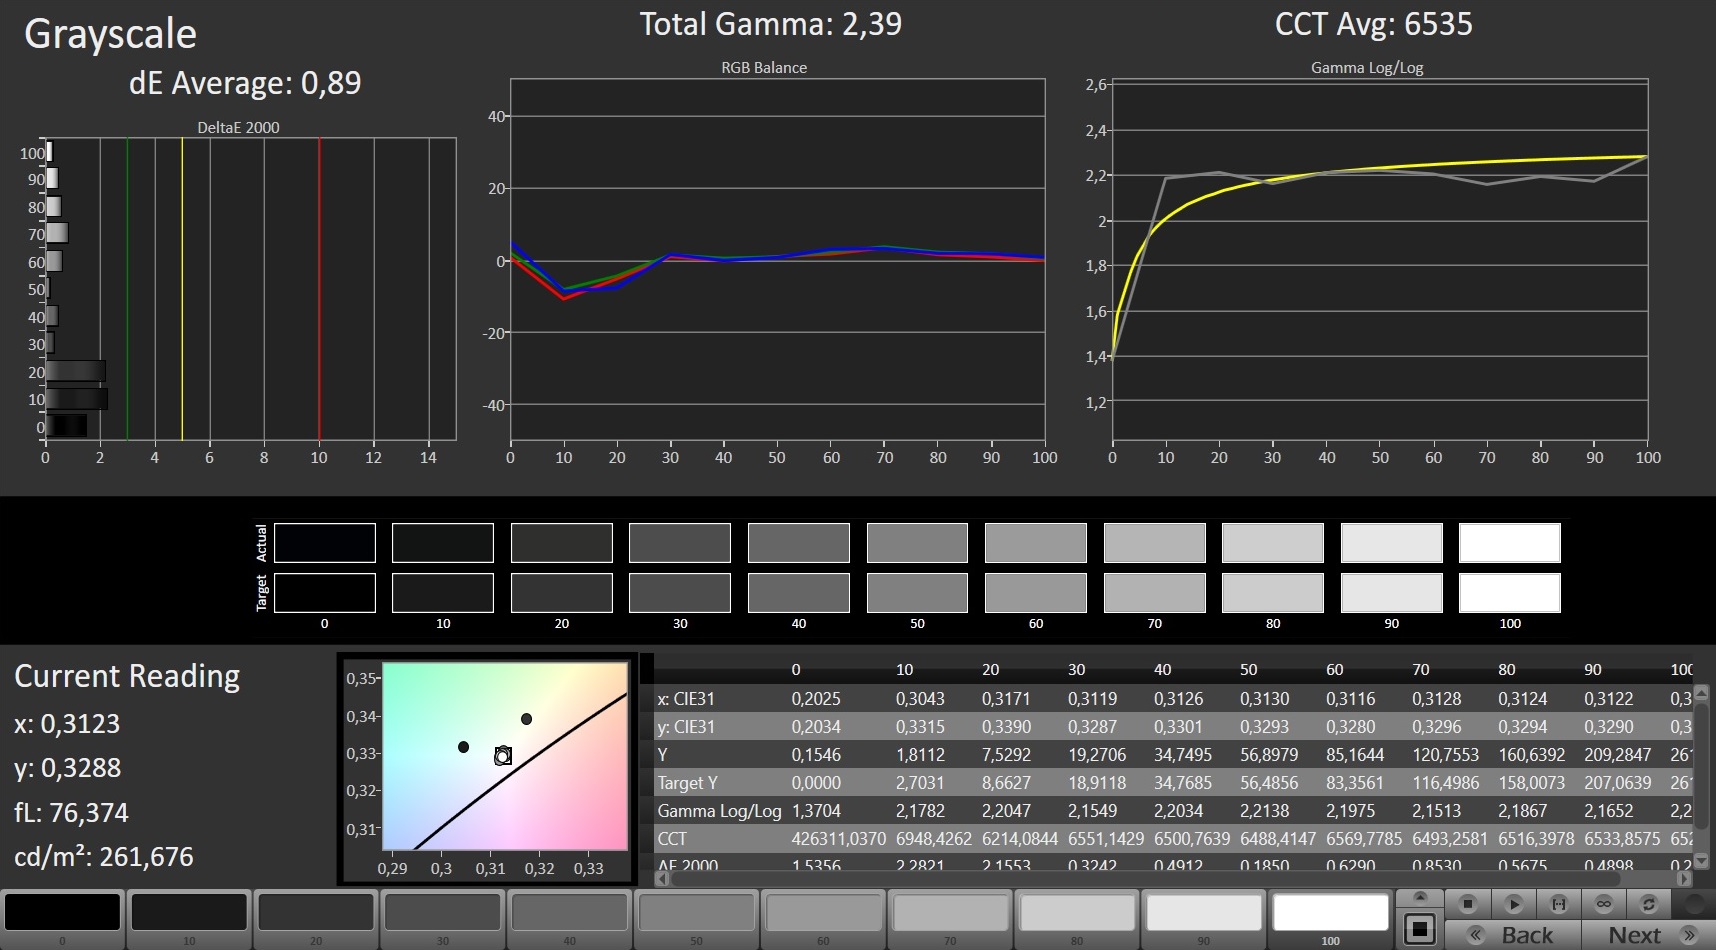
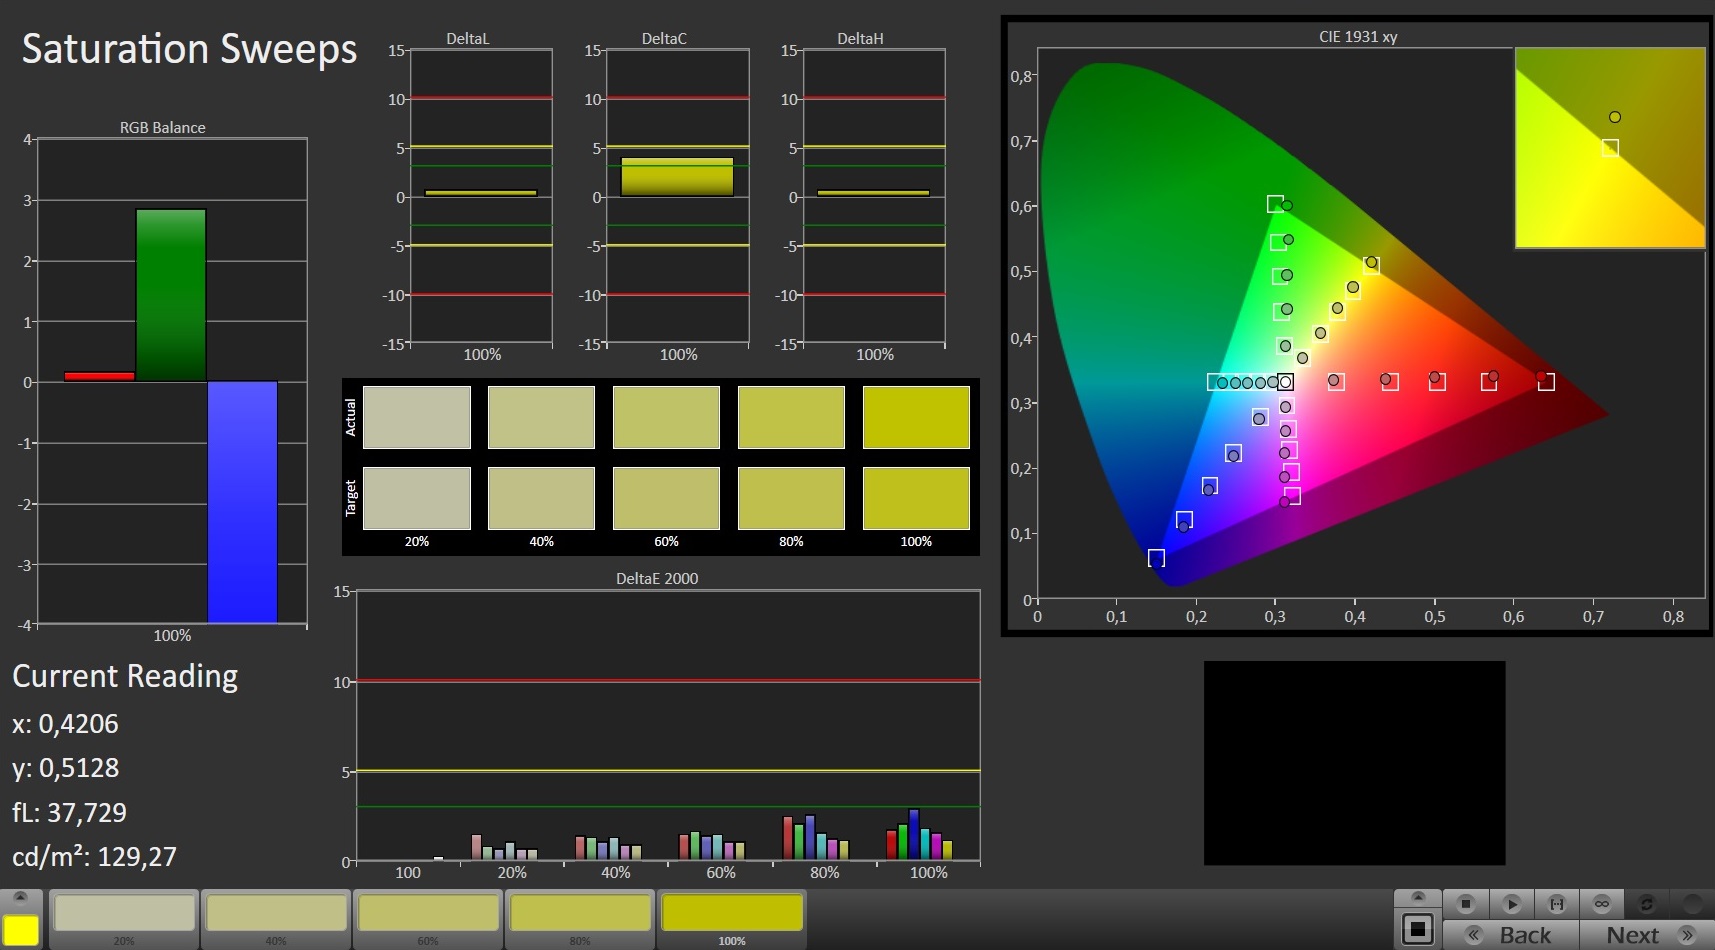
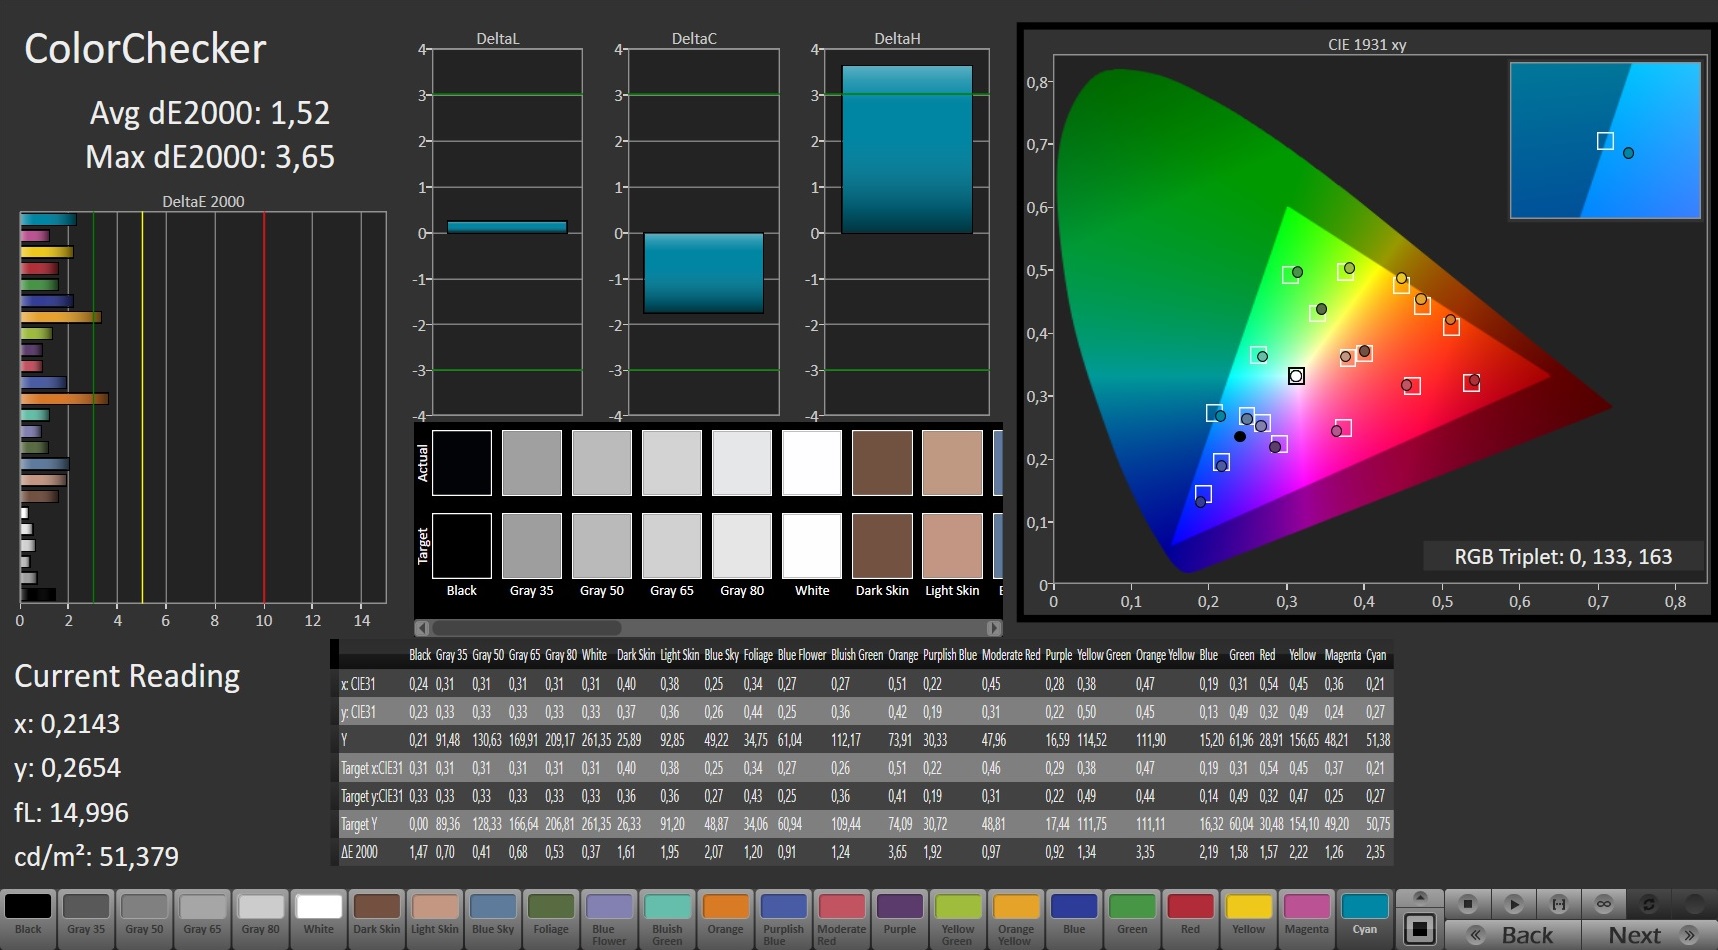
ASUS could have improved colour accuracy slightly, though. CalMAN demonstrated that the display has a blue tint to it, which impacts on the display's colour temperature. Likewise, we would have preferred a brighter display, but only the HP Omen 17 and MSI GE75 Raider 9SG exceed our 300 cd/m² luminosity threshold.
The display also has decent viewing angles. You should have no issues with reading the screen even from oblique angles.
Display Response Times
| ↔ Response Time Black to White | ||
|---|---|---|
| 12.8 ms ... rise ↗ and fall ↘ combined | ↗ 7.6 ms rise | 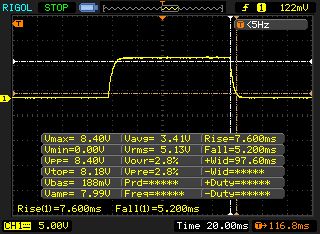 |
| ↘ 5.2 ms fall | ||
| The screen shows good response rates in our tests, but may be too slow for competitive gamers. In comparison, all tested devices range from 0.1 (minimum) to 240 (maximum) ms. » 33 % of all devices are better. This means that the measured response time is better than the average of all tested devices (19.8 ms). | ||
| ↔ Response Time 50% Grey to 80% Grey | ||
| 6.4 ms ... rise ↗ and fall ↘ combined | ↗ 3.4 ms rise | 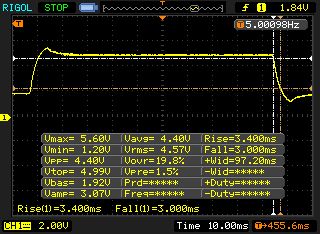 |
| ↘ 3 ms fall | ||
| The screen shows very fast response rates in our tests and should be very well suited for fast-paced gaming. In comparison, all tested devices range from 0.165 (minimum) to 636 (maximum) ms. » 19 % of all devices are better. This means that the measured response time is better than the average of all tested devices (31 ms). | ||
Screen Flickering / PWM (Pulse-Width Modulation)
| Screen flickering / PWM not detected | 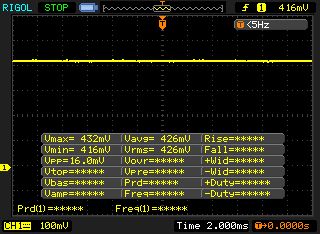 | ||
In comparison: 52 % of all tested devices do not use PWM to dim the display. If PWM was detected, an average of 7754 (minimum: 5 - maximum: 343500) Hz was measured. | |||
Test Conditions
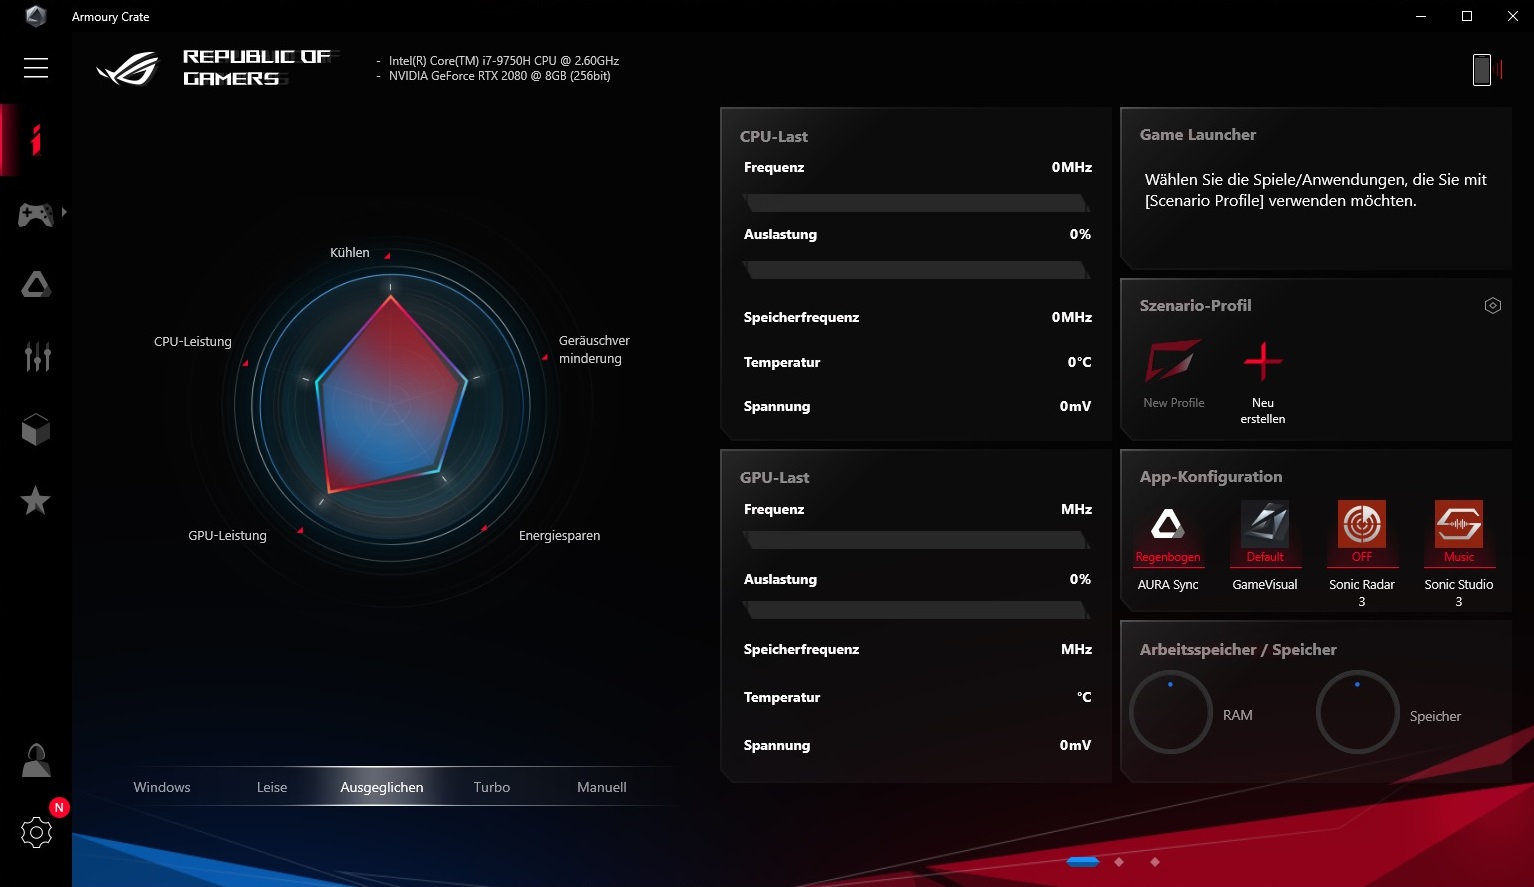
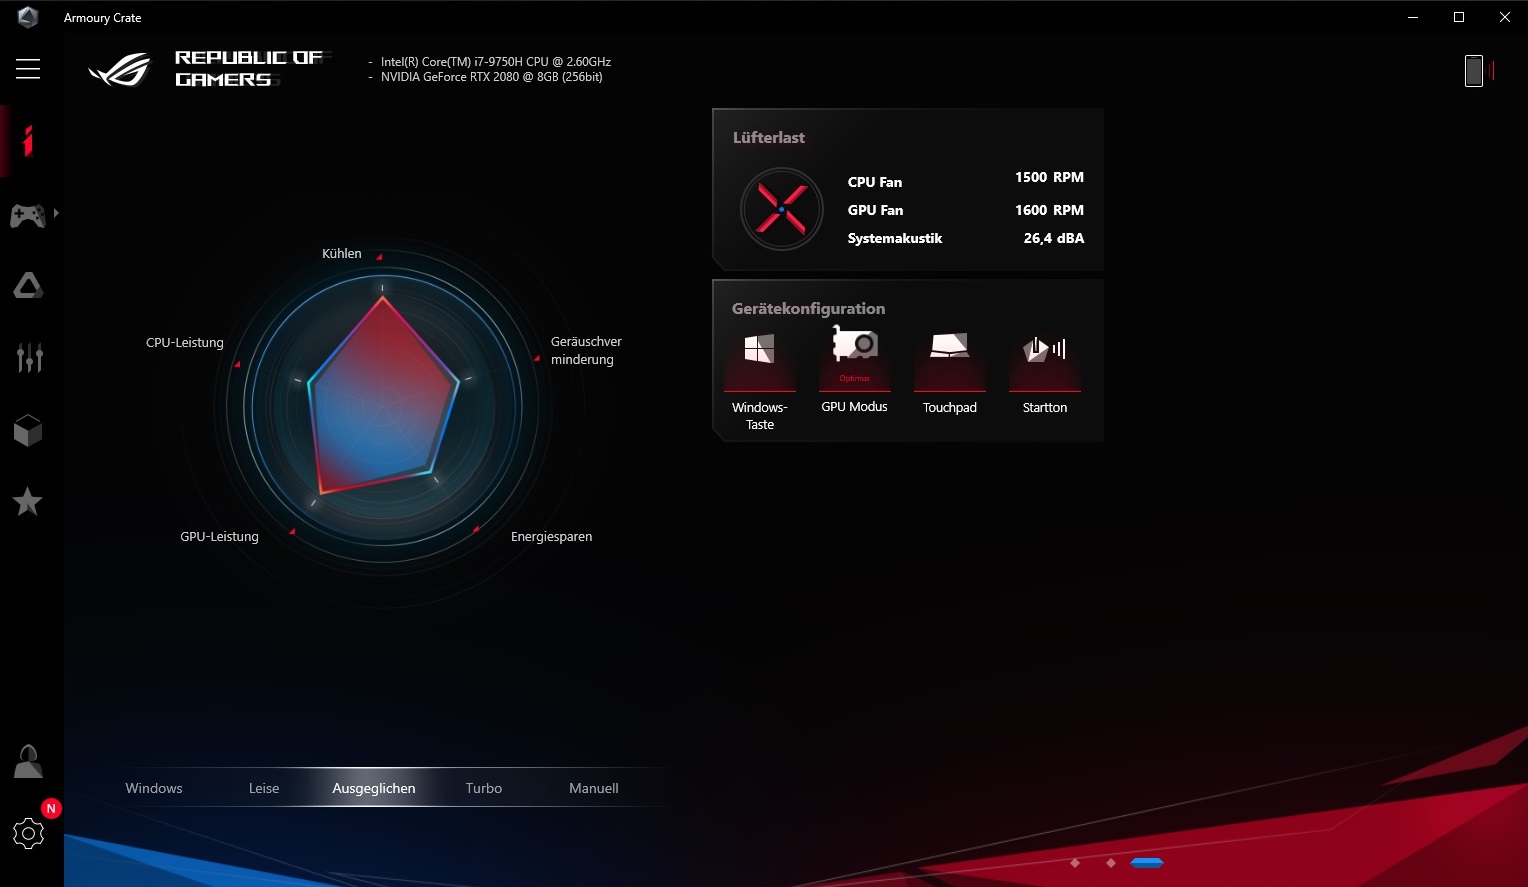
ASUS preinstalls its in-house Armory Crate software, which contains several system settings options. We conducted all our tests with the device set to the Balanced Windows 10 power plan, while we left the GPU on NVIDIA Optimus. The latter allows the system to switch between its integrated and dedicated GPUs to reduce power consumption, an effect of which is significantly better battery life than if G-Sync were enabled. G-Sync can improve graphics details, though.
Performance
Below are several screenshots and tables demonstrating the CPU, GPU, RAM and storage devices in various states.
Processor
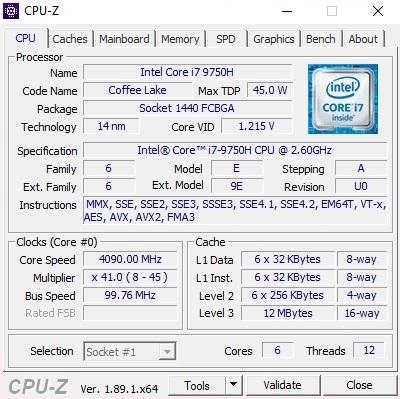
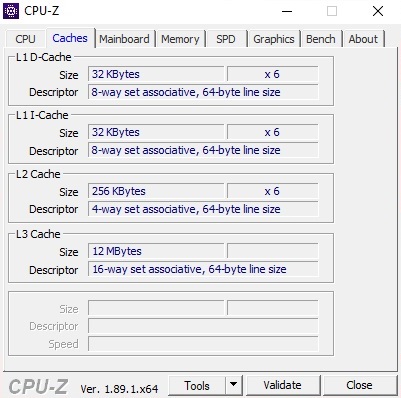
The Intel Core i7-9750H is currently one of the most popular gaming laptop processors on the market. The hexa-core chip is based on a 14 nm FinFET process and supports Intel Hyper-Threading, allowing it to execute up to 12 threads simultaneously. The CPU has a 45 W thermal design power (TDP) and has 12 MB of L3 cache.
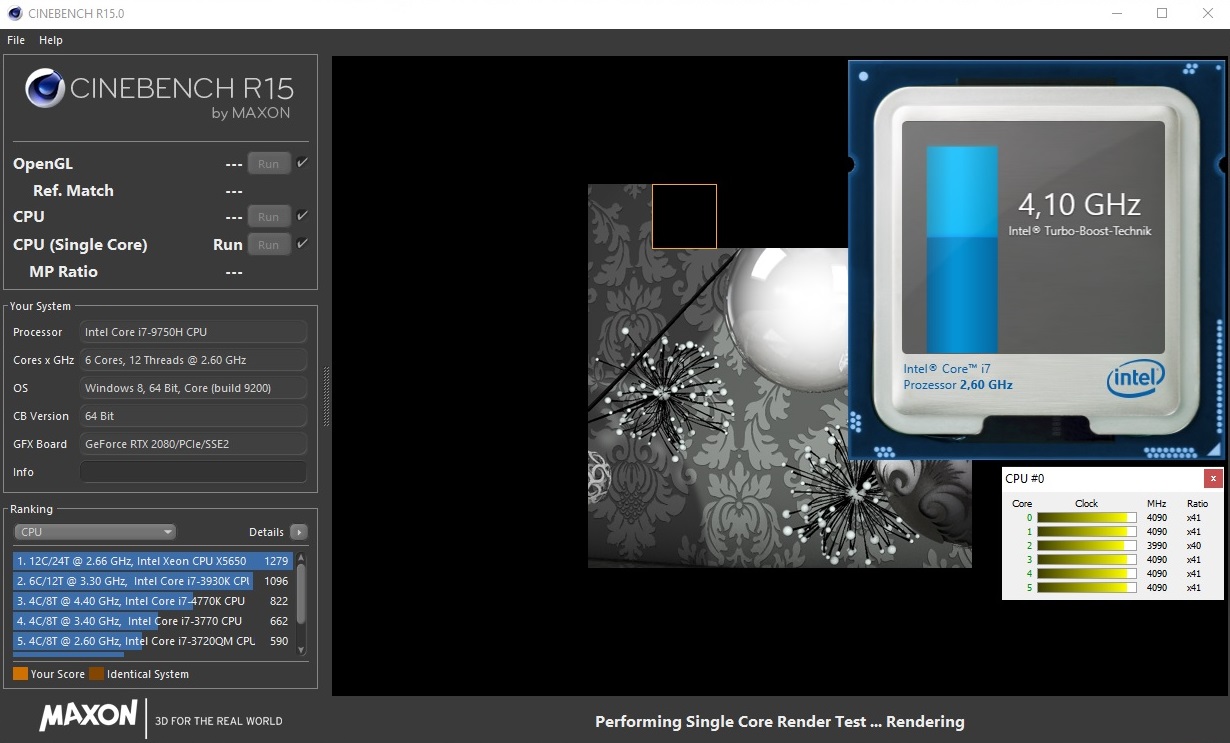
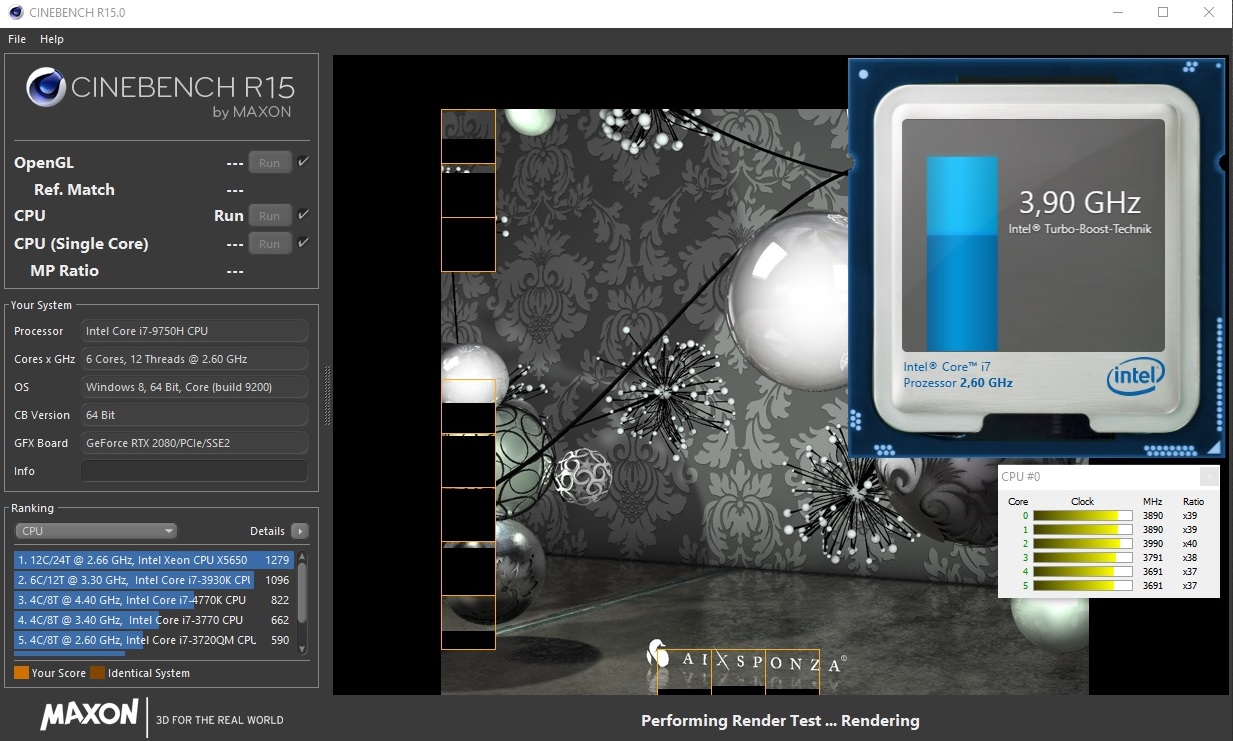
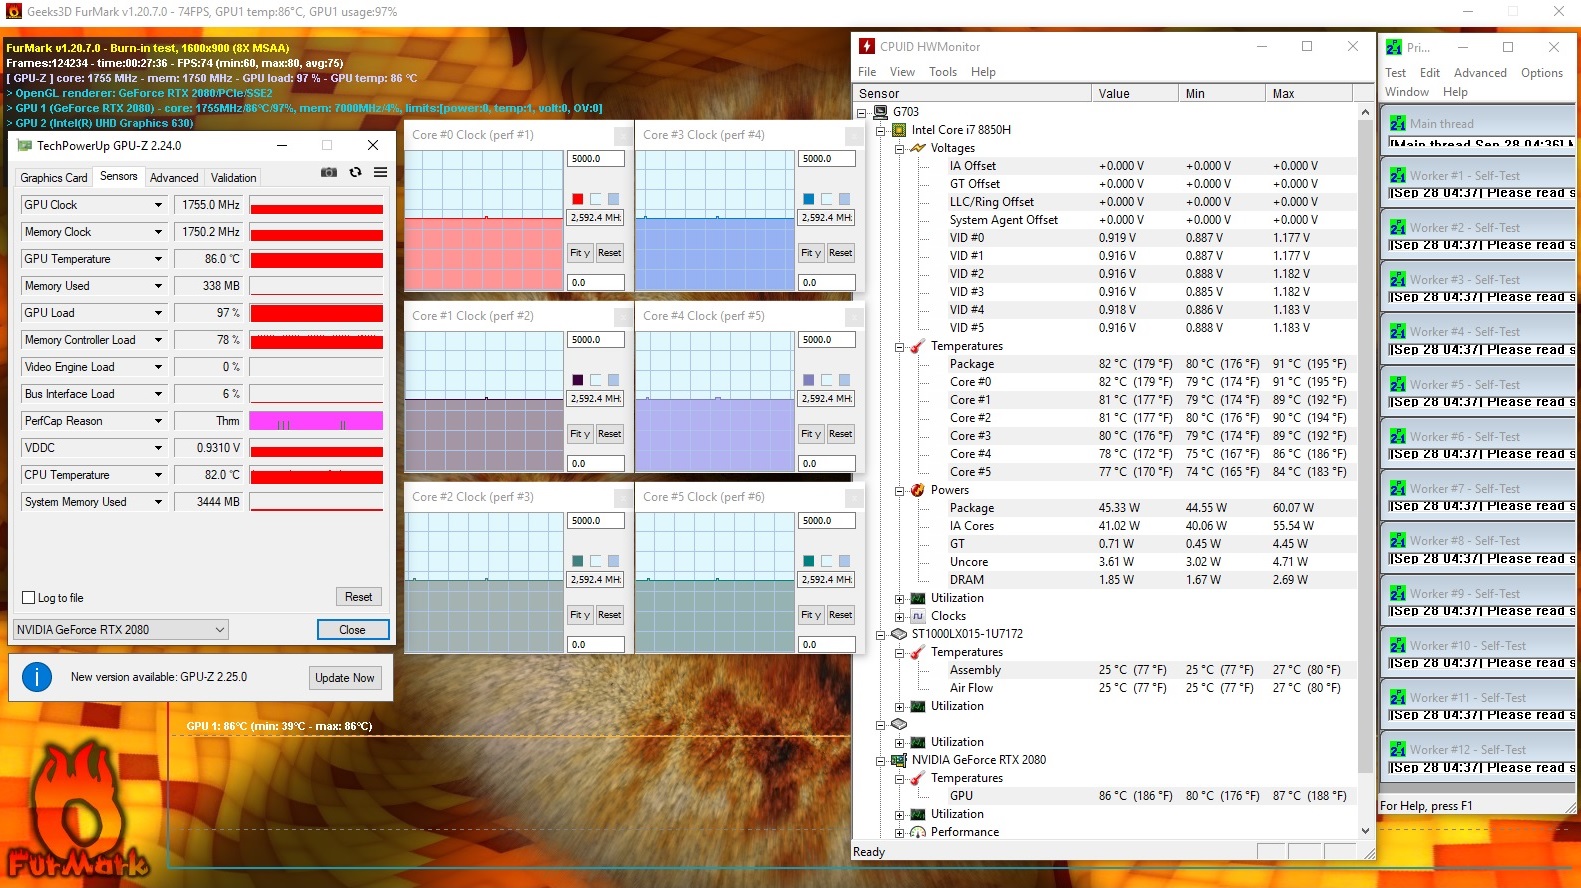
The Core i7-9750H has a 2.6 GHz base clock that it can boost to 4.5 GHz across all cores when required. The CPU cannot quite reach its potential during synthetic benchmarks, though. While it operates at between 4.0 and 4.1 GHz in single-core tasks, it can only peak at between 3.7 and 4.0 GHz in multi-core work.
The G703GXR consistently maintained its CPU performance during synthetic benchmarks, as our Cinebench R15 Multi 64bit loop below shows. By contrast, all our comparison devices throttle heavily in the same test.
System Performance
Our review unit is only powerful enough to finish fourth in PCMark 10. The SSD is the bottleneck here, with the MSI GE75 Raider 9SG having a faster drive, while the Acer Predator Helios 700 and HP Omen 17 run SSDs in a RAID setup. Subjectively, the G703GXR performed smoothly throughout our tests, with the OS and programs loading quickly. We would expect this from a 2019 gaming laptop, though.
Storage Devices
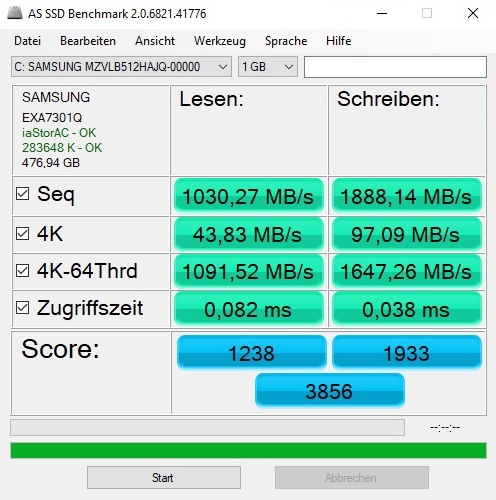
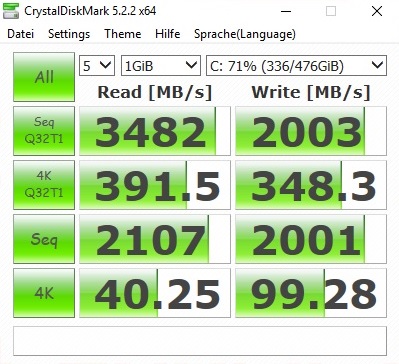
ASUS has equipped the G703GXR with a 512 GB Samsung PM981, one of the fastest SSDs currently on the market. The M.2 drive performed well in CrystalDiskMark, both with smaller and larger file transfers.
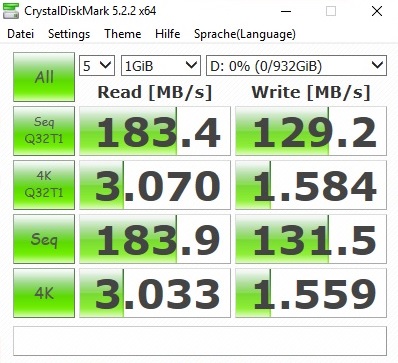
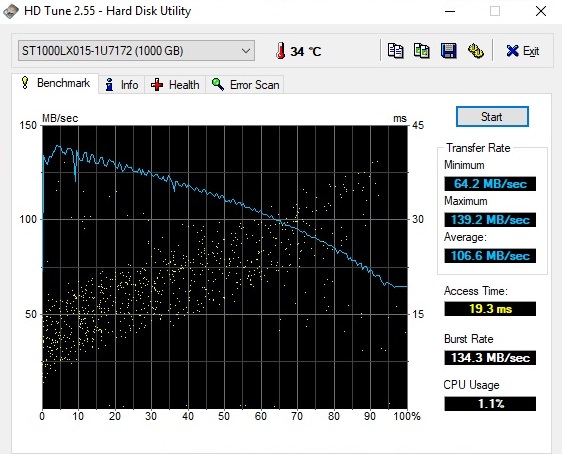
The G703GXR also has a 1 TB Seagate FireCuda ST1000LX015, so you need not buy another drive for storing all your games. The drive is not as fast as an SSD, but it will load games quickly. ASUS has equipped the G703GXR with an additional M.2 drive bay too, should you need more storage.
| Asus ROG G703GXR Samsung SSD PM981 MZVLB512HAJQ | Acer Predator Helios 700 PH717-71-785M 2x WDC PC SN720 SDAPNTW-512G-1014 (RAID 0) | HP Omen 17-cb0020ng 2x Samsung SSD PM981 MZVLB512HAJQ (RAID 0) | MSI GE75 9SG Samsung SSD PM981 MZVLB1T0HALR | |
|---|---|---|---|---|
| CrystalDiskMark 5.2 / 6 | 28% | 24% | 5% | |
| Write 4K (MB/s) | 99.3 | 115.3 16% | 103.8 5% | 116.1 17% |
| Read 4K (MB/s) | 40.25 | 41.79 4% | 41.67 4% | 44.98 12% |
| Write Seq (MB/s) | 2001 | 2841 42% | 2639 32% | 2370 18% |
| Read Seq (MB/s) | 2107 | 2547 21% | 2702 28% | 1465 -30% |
| Write 4K Q32T1 (MB/s) | 348.3 | 498.6 43% | 487.3 40% | 337.5 -3% |
| Read 4K Q32T1 (MB/s) | 391.5 | 555 42% | 555 42% | 453.6 16% |
| Write Seq Q32T1 (MB/s) | 2003 | 3123 56% | 2967 48% | 2399 20% |
| Read Seq Q32T1 (MB/s) | 3482 | 3476 0% | 3102 -11% | 3087 -11% |

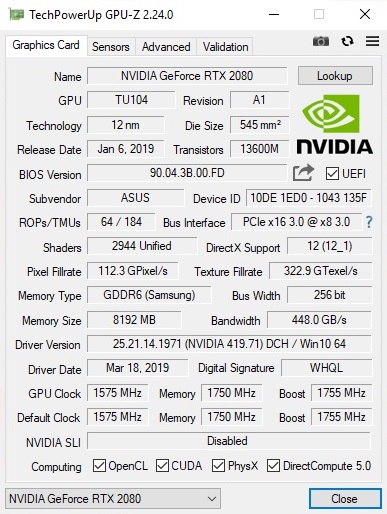
Graphics Card
The GeForce RTX 2080 currently remains NVIDIA's strongest laptop GPU. The DirectX 12-capable high-end graphics card has 2,944 shader units and is based on a 12 nm FinFET process. The GeForce RTX 2080 has 8 GB of GDDR6 VRAM on a 256-bit interface, meaning that it should be future-proofed for at least a few years yet.
| 3DMark 11 Performance | 24850 points | |
| 3DMark Cloud Gate Standard Score | 38299 points | |
| 3DMark Fire Strike Score | 20164 points | |
| 3DMark Time Spy Score | 9526 points | |
Help | ||
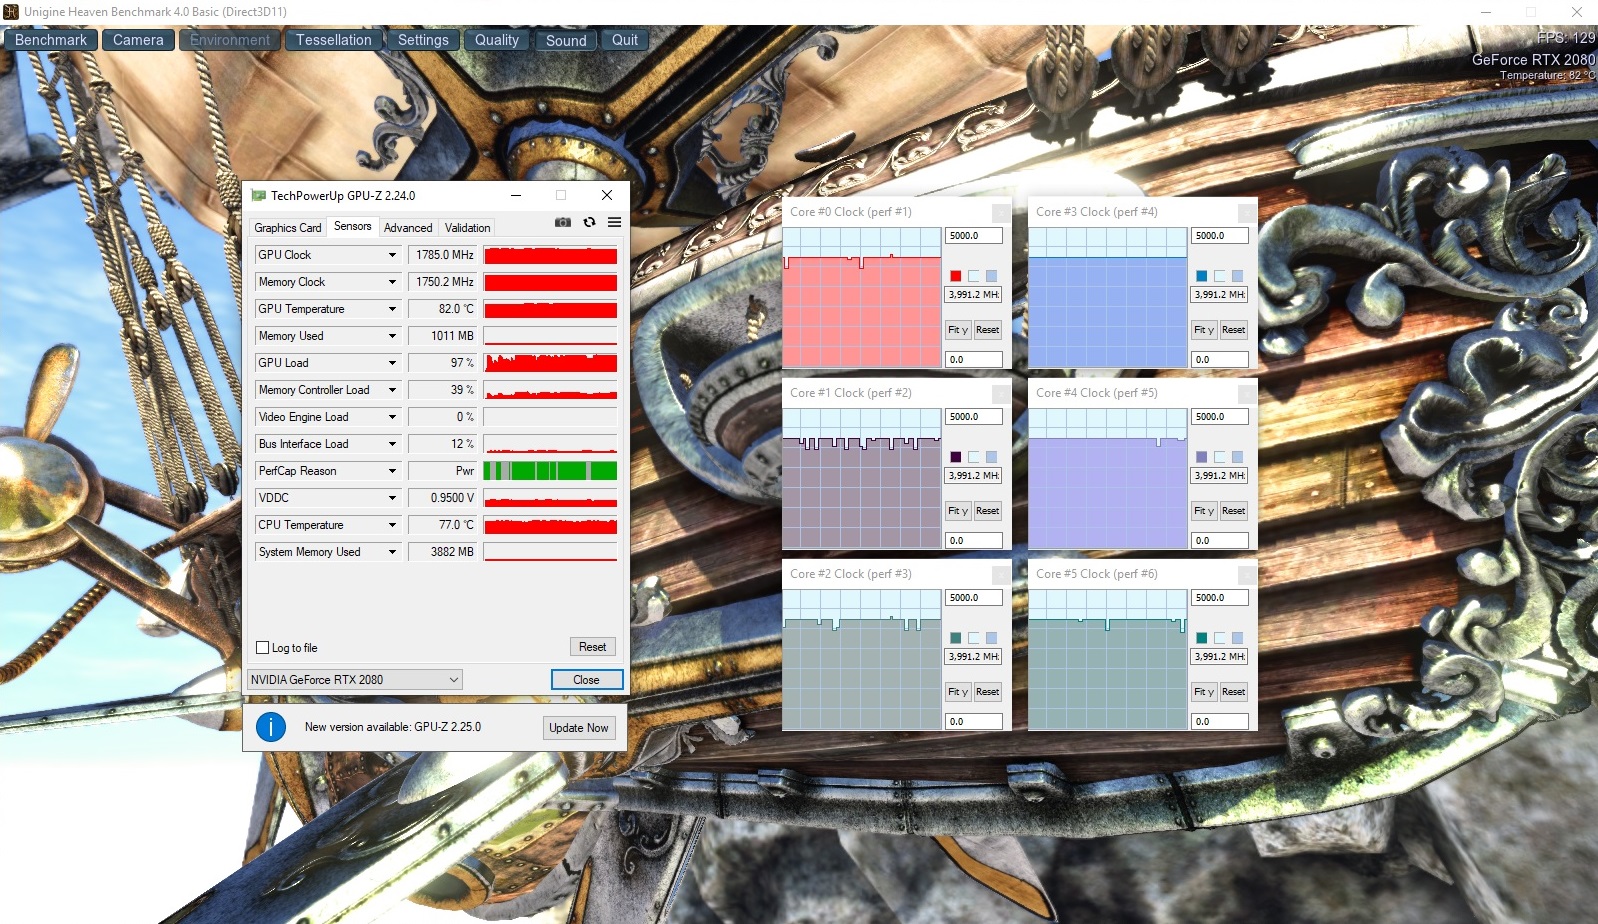
The GeForce RTX 2080 has a 1,575 MHz base clock, but it can average between 1,700 and 1,800 MHz under load. We managed to elicit up to 1,935 MHz during our tests, but not consistently.
The G703GXR performed valiantly during synthetic GPU benchmarks. Only the Acer Predator Helios 700 performed slightly better than our review unit, with the MSI GE75 Raider 9SG and HP Omen 17 falling slightly behind. However, we expected as much considering that both devices have thinner designs than the G703GXR and thus have weaker cooling.
| 3DMark 11 - 1280x720 Performance GPU | |
| Average of class Gaming (21841 - 80022, n=104, last 2 years) | |
| Acer Predator Helios 700 PH717-71-785M | |
| Asus ROG G703GXR | |
| MSI GE75 9SG | |
| HP Omen 17-cb0020ng | |
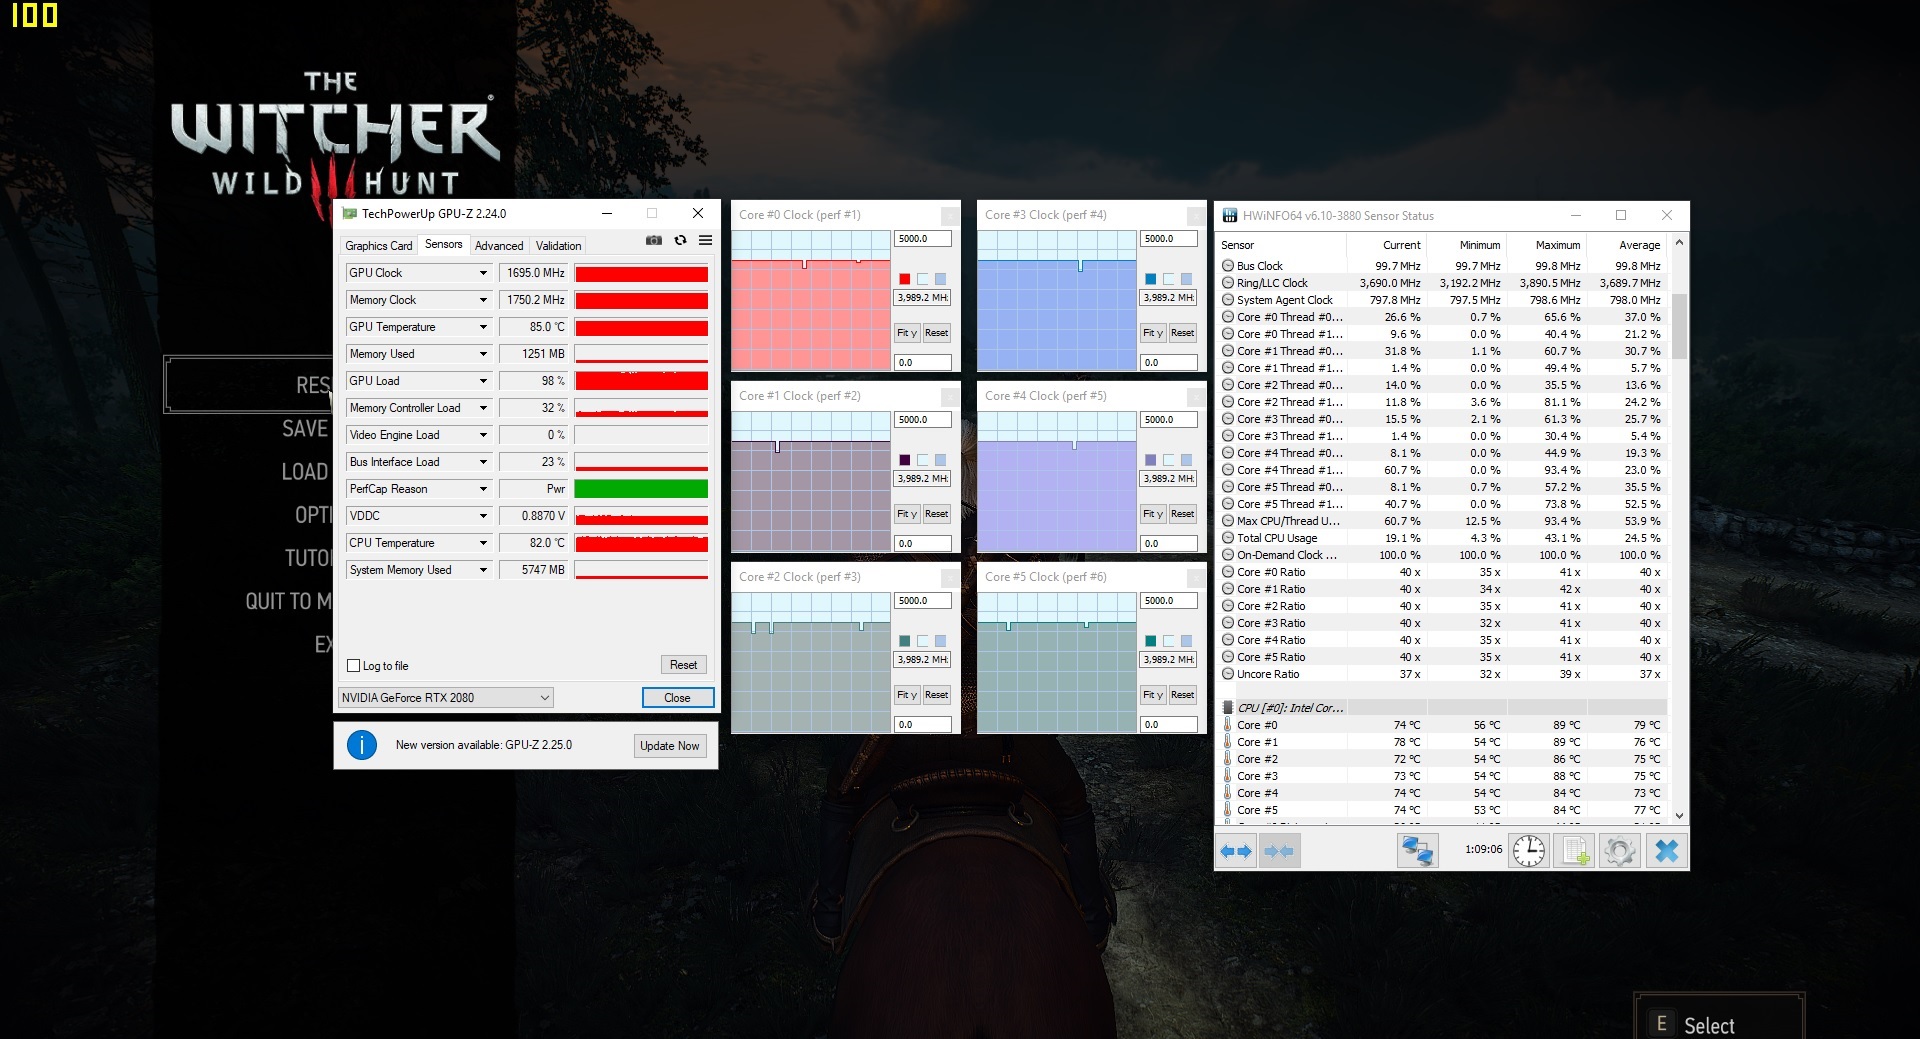
Additionally, the GPU never throttles just like the CPU. We verified this by running The Witcher 3 for an hour on the ultra preset at 1080p, the results of which you can see below.
Gaming Performance
As you might expect, the GeForce RTX 2080 handles most modern triple-A titles with ease, so long as you play at native resolutions. Out of the 11 games that we tested, all but one averaged above 60 FPS at maximum graphics, so the G703GXR can take advantage of its 144 display. The device can even reach 100 FPS on the ultra preset in undemanding games like Fortnite and FIFA 20 too.
| The Witcher 3 - 1920x1080 Ultra Graphics & Postprocessing (HBAO+) | |
| Average of class Gaming (104.7 - 240, n=7, last 2 years) | |
| Acer Predator Helios 700 PH717-71-785M | |
| Asus ROG G703GXR | |
| MSI GE75 9SG | |
| HP Omen 17-cb0020ng | |
The GeForce RTX 2080 should have no problem with gaming at 2560x1440 resolution, which you have seen referred to elsewhere as UHD. The G703GXR reaches its limits at 4K, though.
| low | med. | high | ultra | |
|---|---|---|---|---|
| The Witcher 3 (2015) | 165 | 97.1 | ||
| Fortnite (2018) | 148 | 133 | ||
| Hitman 2 (2018) | 76 | 73.1 | ||
| Anthem (2019) | 96.9 | 91 | ||
| The Division 2 (2019) | 116 | 92 | ||
| Anno 1800 (2019) | 70 | 40.8 | ||
| Rage 2 (2019) | 110 | 108 | ||
| F1 2019 (2019) | 83 | 80 | ||
| Control (2019) | 91.7 | |||
| Borderlands 3 (2019) | 91.8 | 79.4 | ||
| FIFA 20 (2019) | 202 | 201 |
Emissions
Fan Noise
The G703GXR runs relatively quietly when idling, but it can reach between 33 to 35 dB(A). Activating silent mode within Armory Crate allows the device to run silently, though. The fans never reached their full capacity when running in either mode at idle, which is better than some of our comparison devices.
Unsurprisingly, the fans get much louder under load. Our review reached 50 dB(A) when playing The Witcher 3, making it 3 dB(A) louder than the HP Omen 17. By contrast, the MSI GE75 Raider 9SG peaked at 54 dB(A) during the same test, while the Acer Predator Helios 700 reached a noticeably louder 57 dB(A). In short, none of these devices are suitable for noise-sensitive gamers unless you have headphones to hand.
Noise level
| Idle |
| 33 / 34 / 35 dB(A) |
| Load |
| 38 / 54 dB(A) |
 | ||
30 dB silent 40 dB(A) audible 50 dB(A) loud |
||
min: | ||
| Asus ROG G703GXR i7-9750H, GeForce RTX 2080 Mobile | Acer Predator Helios 700 PH717-71-785M i7-9750H, GeForce RTX 2080 Mobile | HP Omen 17-cb0020ng i9-9880H, GeForce RTX 2080 Mobile | MSI GE75 9SG i9-9880H, GeForce RTX 2080 Mobile | Average of class Gaming | |
|---|---|---|---|---|---|
| Noise | -7% | -4% | 3% | 10% | |
| off / environment * (dB) | 30 | 30 -0% | 30 -0% | 28.2 6% | 24.1 ? 20% |
| Idle Minimum * (dB) | 33 | 30 9% | 34 -3% | 30.4 8% | 26 ? 21% |
| Idle Average * (dB) | 34 | 34 -0% | 35 -3% | 30.4 11% | 27.4 ? 19% |
| Idle Maximum * (dB) | 35 | 45 -29% | 36 -3% | 33.4 5% | 30.1 ? 14% |
| Load Average * (dB) | 38 | 40 -5% | 51 -34% | 37.1 2% | 43.6 ? -15% |
| Witcher 3 ultra * (dB) | 50 | 57 -14% | 47 6% | 54.2 -8% | |
| Load Maximum * (dB) | 54 | 60 -11% | 51 6% | 56.4 -4% | 54.2 ? -0% |
* ... smaller is better
Temperature
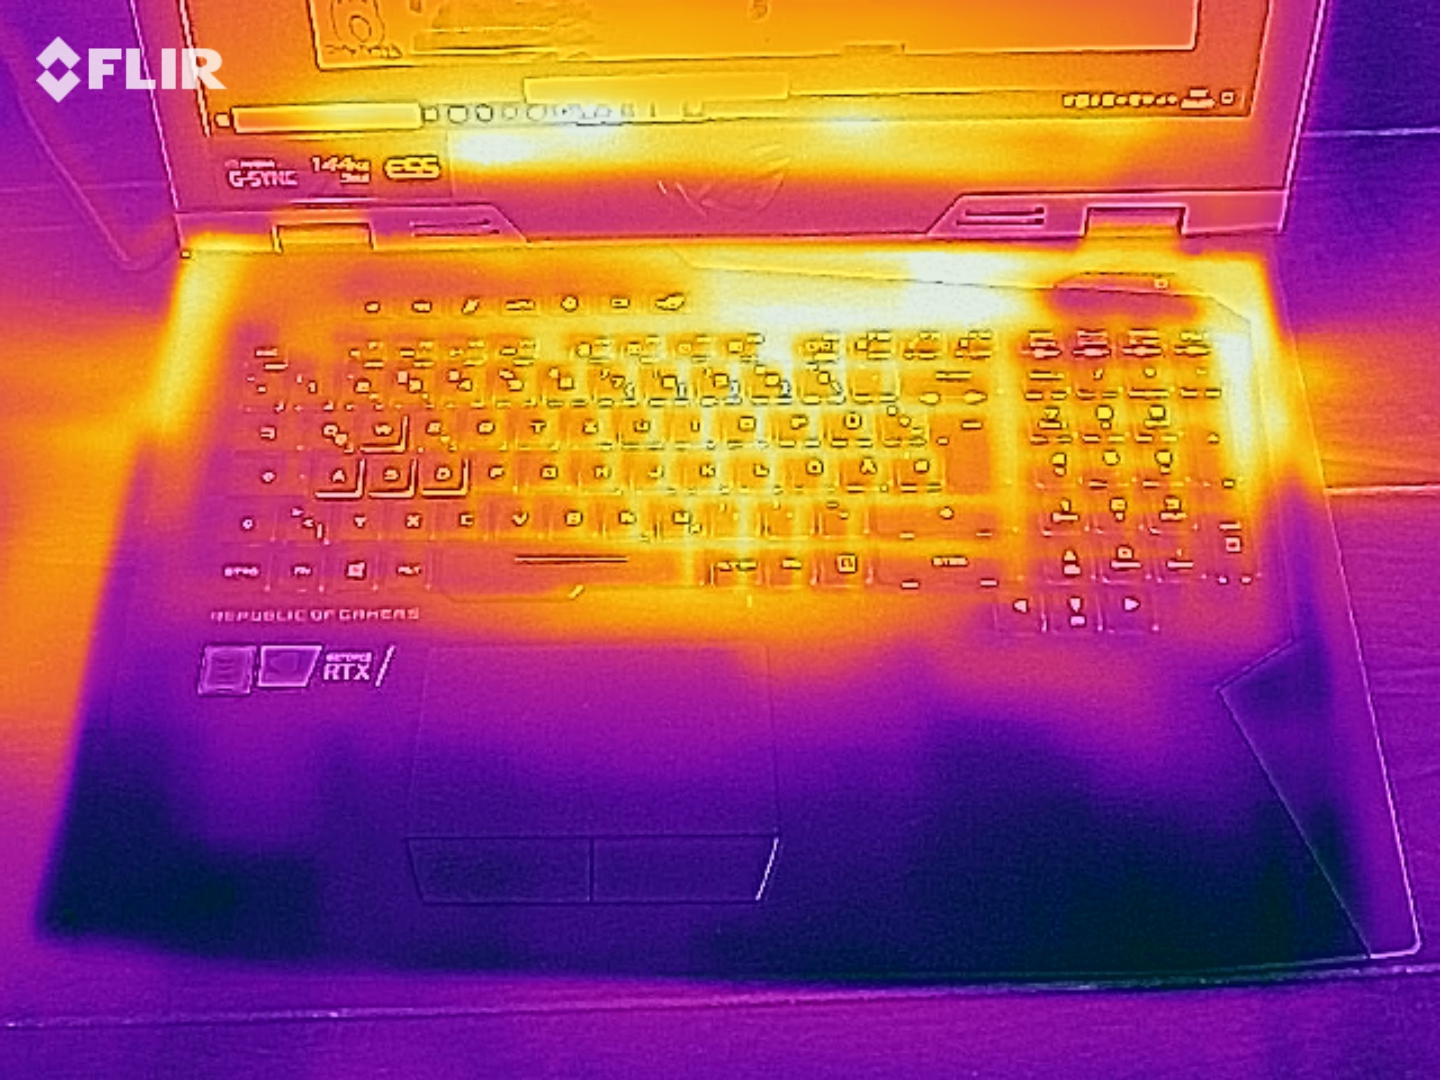
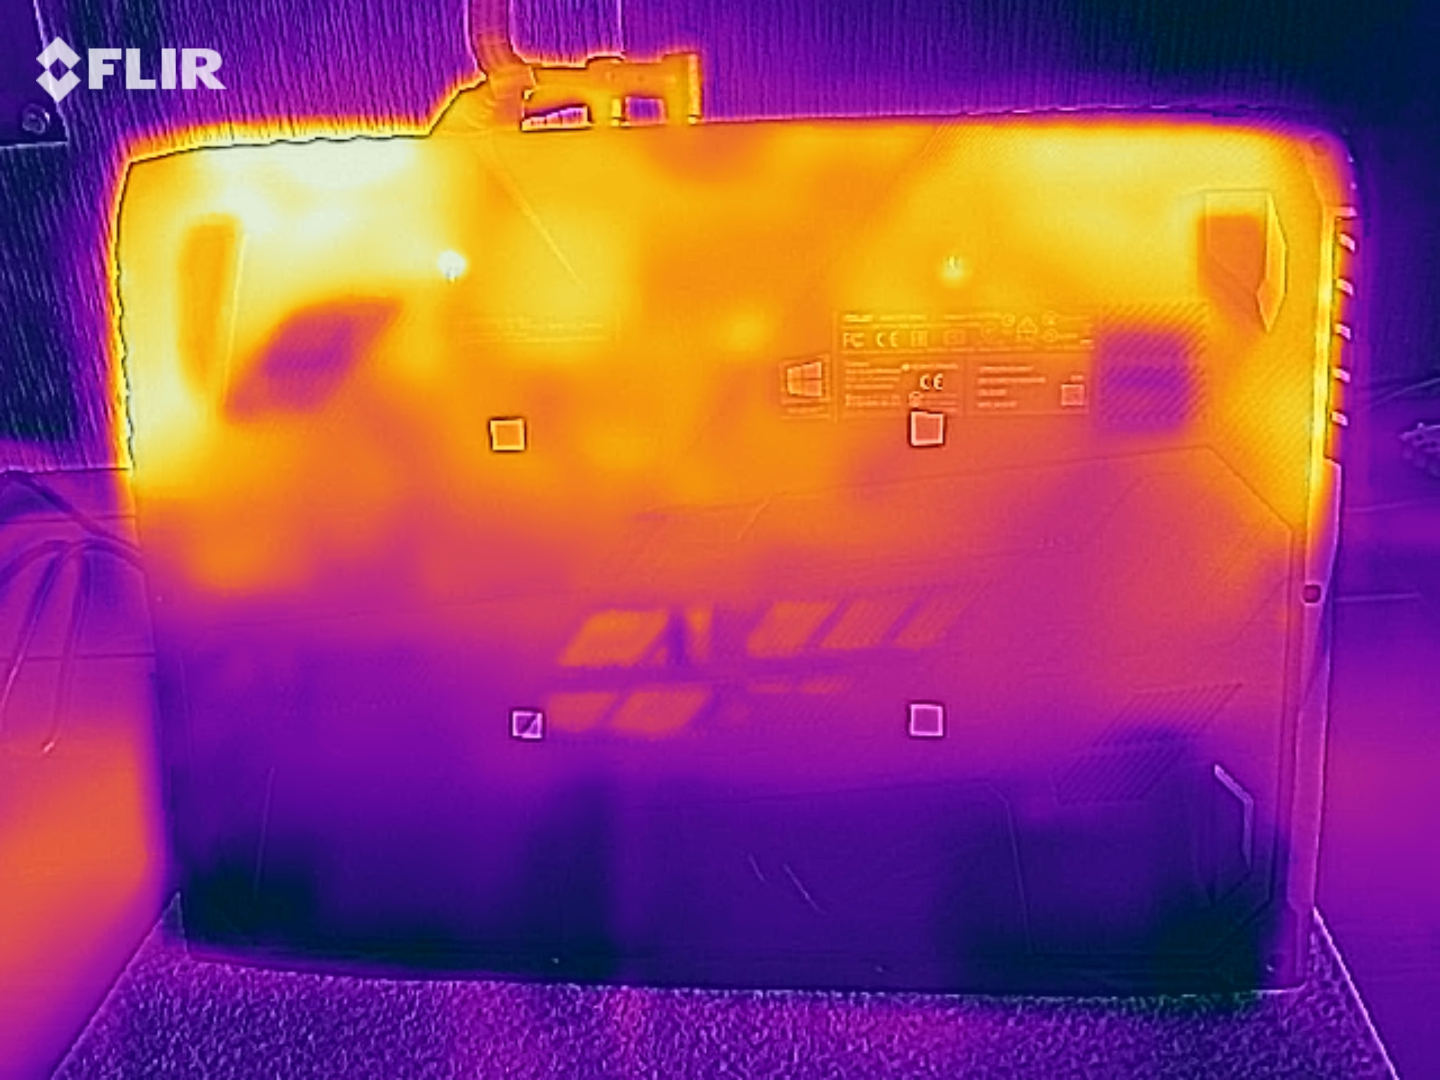
One of the biggest advantages of a massive chassis is airflow. Theoretically, improved airflow should result in lower surface temperatures, and that is the case with the G703GXR. Surface temperatures peaked at 46 °C on the top case of our review unit and 49 °C on its underside during our combined FurMark & Prime95 stress test, which is reasonable for a high-end gaming laptop. The palm rest never exceeded 30 °C either, which is pleasant.
Surface temperatures fluctuated between 25 °C and 32 °C at idle too. Hence, the G703GXR should run coolly during undemanding tasks.
(-) The maximum temperature on the upper side is 46 °C / 115 F, compared to the average of 40.4 °C / 105 F, ranging from 21.2 to 68.8 °C for the class Gaming.
(-) The bottom heats up to a maximum of 49 °C / 120 F, compared to the average of 43.2 °C / 110 F
(+) In idle usage, the average temperature for the upper side is 28.8 °C / 84 F, compared to the device average of 33.9 °C / 93 F.
(±) Playing The Witcher 3, the average temperature for the upper side is 35.4 °C / 96 F, compared to the device average of 33.9 °C / 93 F.
(+) The palmrests and touchpad are cooler than skin temperature with a maximum of 27 °C / 80.6 F and are therefore cool to the touch.
(±) The average temperature of the palmrest area of similar devices was 28.8 °C / 83.8 F (+1.8 °C / 3.2 F).
| Asus ROG G703GXR i7-9750H, GeForce RTX 2080 Mobile | Acer Predator Helios 700 PH717-71-785M i7-9750H, GeForce RTX 2080 Mobile | HP Omen 17-cb0020ng i9-9880H, GeForce RTX 2080 Mobile | MSI GE75 9SG i9-9880H, GeForce RTX 2080 Mobile | Average of class Gaming | |
|---|---|---|---|---|---|
| Heat | 4% | -2% | -17% | -1% | |
| Maximum Upper Side * (°C) | 46 | 37 20% | 47 -2% | 48.8 -6% | 45.2 ? 2% |
| Maximum Bottom * (°C) | 49 | 40 18% | 54 -10% | 52 -6% | 48.1 ? 2% |
| Idle Upper Side * (°C) | 31 | 34 -10% | 32 -3% | 36.2 -17% | 31 ? -0% |
| Idle Bottom * (°C) | 32 | 36 -13% | 30 6% | 44.4 -39% | 34.2 ? -7% |
* ... smaller is better
Speakers
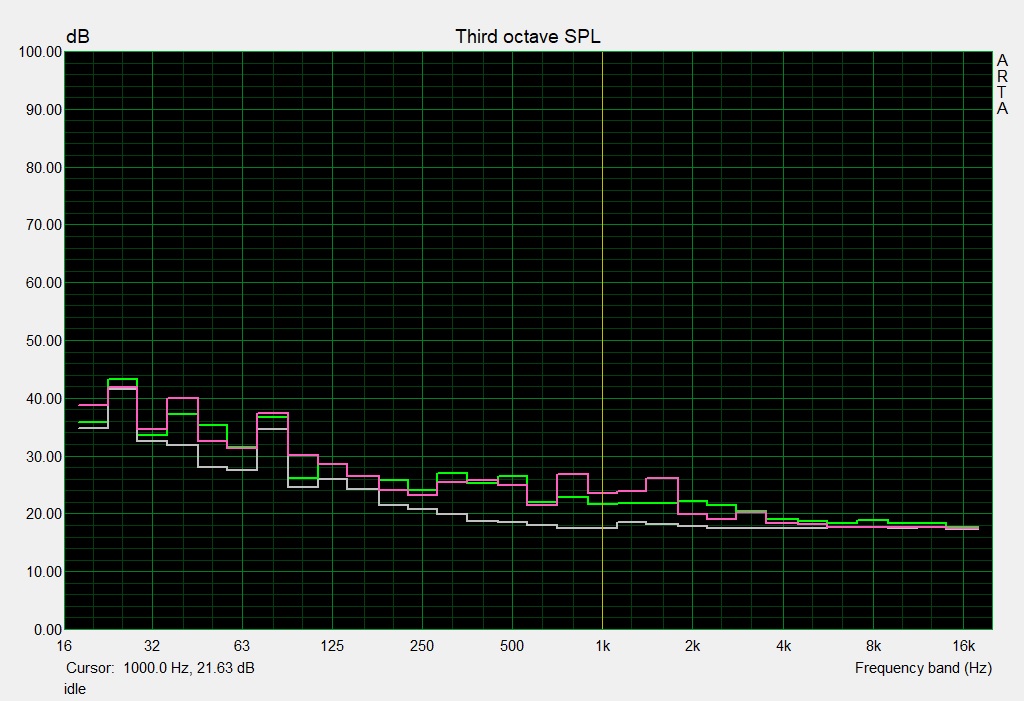
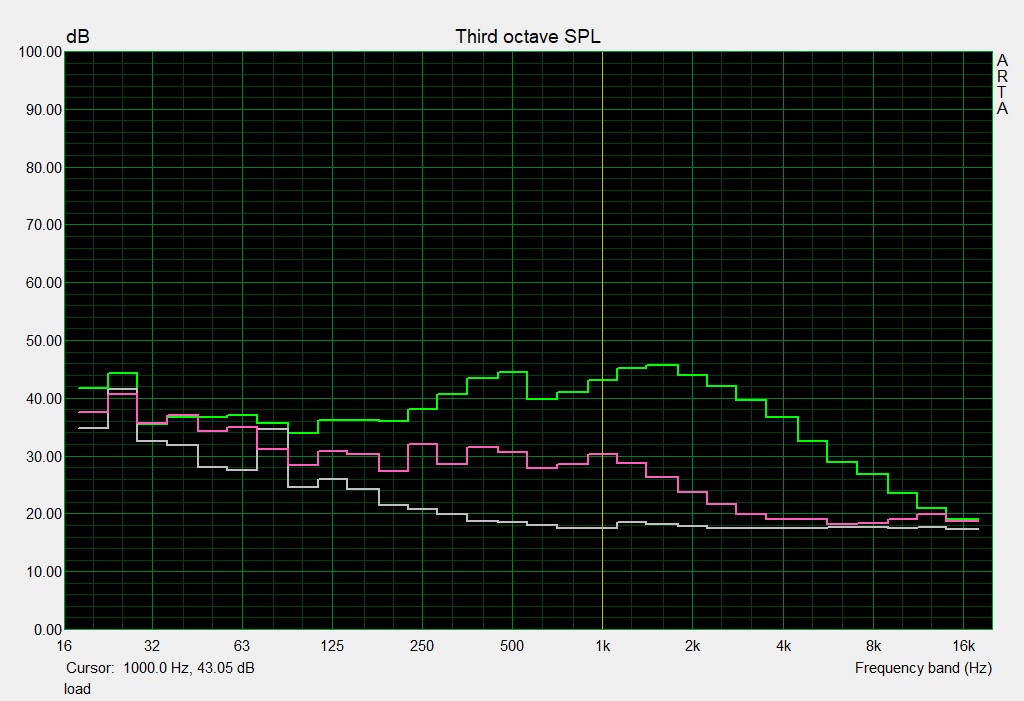
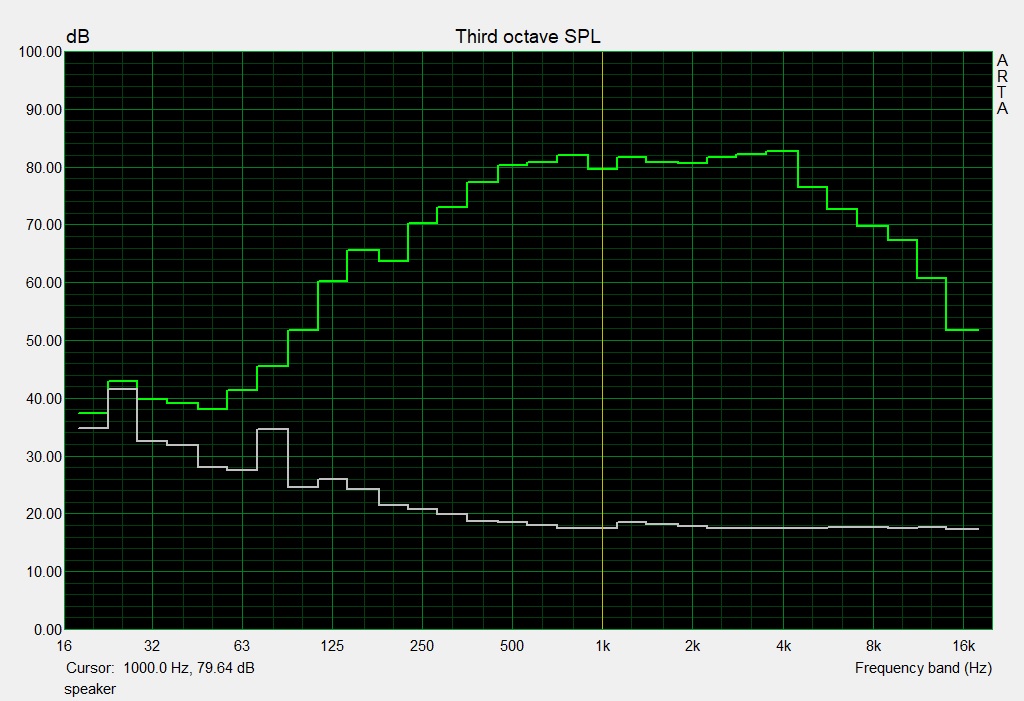
Asus ROG G703GXR audio analysis
(+) | speakers can play relatively loud (92 dB)
Bass 100 - 315 Hz
(±) | reduced bass - on average 13.2% lower than median
(±) | linearity of bass is average (8.9% delta to prev. frequency)
Mids 400 - 2000 Hz
(+) | balanced mids - only 3.1% away from median
(+) | mids are linear (3.1% delta to prev. frequency)
Highs 2 - 16 kHz
(±) | reduced highs - on average 5.4% lower than median
(+) | highs are linear (4.2% delta to prev. frequency)
Overall 100 - 16.000 Hz
(+) | overall sound is linear (14.8% difference to median)
Compared to same class
» 30% of all tested devices in this class were better, 7% similar, 63% worse
» The best had a delta of 6%, average was 18%, worst was 132%
Compared to all devices tested
» 20% of all tested devices were better, 4% similar, 76% worse
» The best had a delta of 4%, average was 23%, worst was 134%
Acer Predator Helios 700 PH717-71-785M audio analysis
(+) | speakers can play relatively loud (83 dB)
Bass 100 - 315 Hz
(-) | nearly no bass - on average 15.4% lower than median
(±) | linearity of bass is average (11.8% delta to prev. frequency)
Mids 400 - 2000 Hz
(+) | balanced mids - only 2.2% away from median
(+) | mids are linear (5.7% delta to prev. frequency)
Highs 2 - 16 kHz
(+) | balanced highs - only 2.1% away from median
(+) | highs are linear (5.7% delta to prev. frequency)
Overall 100 - 16.000 Hz
(+) | overall sound is linear (12.9% difference to median)
Compared to same class
» 17% of all tested devices in this class were better, 4% similar, 79% worse
» The best had a delta of 6%, average was 18%, worst was 132%
Compared to all devices tested
» 12% of all tested devices were better, 3% similar, 85% worse
» The best had a delta of 4%, average was 23%, worst was 134%
Power Management
Power Consumption
Despite supporting graphics switching, the G703GXR still needs a relatively large amount of power when idling. We recorded our review unit consuming between 27 and 39 W when idling with G-Sync enabled, which rose to between 124 and 338 W under load, making the ROG G703GXR more power-hungry than all our comparison devices. A 330 W power supply would have been just enough to keep the device charging even under load according to our tests, but ASUS has included 560 W across two power supplies for safety. Carrying two chargers around will probably prove annoying in daily use, though.
| Off / Standby | |
| Idle | |
| Load |
|
Key:
min: | |
| Asus ROG G703GXR i7-9750H, GeForce RTX 2080 Mobile | Acer Predator Helios 700 PH717-71-785M i7-9750H, GeForce RTX 2080 Mobile | HP Omen 17-cb0020ng i9-9880H, GeForce RTX 2080 Mobile | MSI GE75 9SG i9-9880H, GeForce RTX 2080 Mobile | Average of class Gaming | |
|---|---|---|---|---|---|
| Power Consumption | 2% | 11% | 28% | 33% | |
| Idle Minimum * (Watt) | 27 | 28 -4% | 26 4% | 13.9 49% | 13 ? 52% |
| Idle Average * (Watt) | 32 | 34 -6% | 29 9% | 18.8 41% | 19 ? 41% |
| Idle Maximum * (Watt) | 39 | 45 -15% | 38 3% | 23.1 41% | 24.6 ? 37% |
| Load Average * (Watt) | 124 | 98 21% | 106 15% | 112.3 9% | 110.7 ? 11% |
| Witcher 3 ultra * (Watt) | 274 | 263 4% | 228 17% | 231 16% | |
| Load Maximum * (Watt) | 338 | 307 9% | 287 15% | 291.5 14% | 259 ? 23% |
* ... smaller is better
Battery Life
Although the G703GXR does not receive top marks for its power consumption, it still manages to have decent battery life thanks to its 96 Wh battery. By comparison, our comparison devices have between 65 and 72 Wh cells. Under perfect conditions, our review unit can last just over 8 hours. Moreover, the G703GXR lasted 6:07 hours in our Wi-Fi battery life test, which is much longer than our comparison devices managed. However, runtimes drop dramatically under load and with G-Sync enabled. Our review unit lasted for just 1:01 hours, so gaming on the go is hardly feasible.
| Asus ROG G703GXR i7-9750H, GeForce RTX 2080 Mobile, 96 Wh | Acer Predator Helios 700 PH717-71-785M i7-9750H, GeForce RTX 2080 Mobile, 72 Wh | HP Omen 17-cb0020ng i9-9880H, GeForce RTX 2080 Mobile, 70 Wh | MSI GE75 9SG i9-9880H, GeForce RTX 2080 Mobile, 65 Wh | Average of class Gaming | |
|---|---|---|---|---|---|
| Battery runtime | -33% | -28% | -20% | 23% | |
| Reader / Idle (h) | 8.1 | 3.6 -56% | 4.2 -48% | 8.27 ? 2% | |
| WiFi v1.3 (h) | 6.1 | 2.8 -54% | 3.3 -46% | 4.9 -20% | 7.11 ? 17% |
| Load (h) | 1 | 1.1 10% | 1.1 10% | 1.502 ? 50% |
Pros
Cons
Verdict
The Asus ROG G703GXR is designed for gamers who primarily play at home.
The ROG G703GXR is unsuitable for being carried around and used as a mobile gaming laptop due to its size and weight. However, if you have no problem with a beefy chassis, then the ROG G703GXR will make for a great gaming companion and has no major flaws. Its maintenance options could be better in our opinion, for example, but any gripes we have are minor.
ASUS has equipped the device with good input devices and a wide selection of ports too, including Thunderbolt 3. Additionally, the ROG G703GXR has a high-contrast and responsive IPS display. The choice between G-Sync for better image quality and Optimus for better battery life also deserves praise. Moreover, we like that the laptop can maintain peak CPU and GPU performance under load. ASUS has achieved a decent compromise between power, temperature and volume too. Overall, the ROG G703GXR is an excellent old-school gaming laptop.
Asus ROG G703GXR
- 05/14/2020 v7 (old)
Florian Glaser
Price comparison

