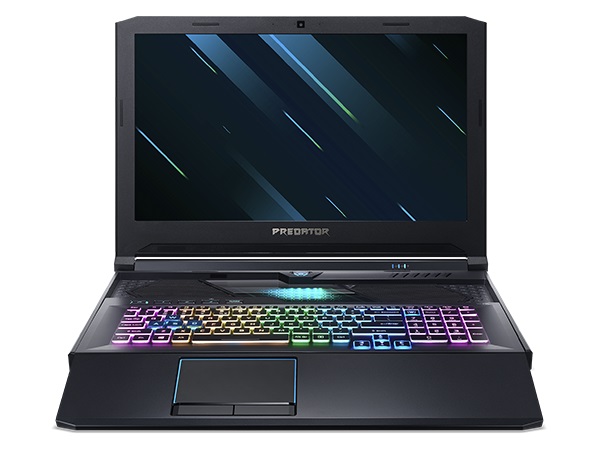
Acer Predator Helios 700 Laptop Review: Innovative gaming laptop with a lot of features

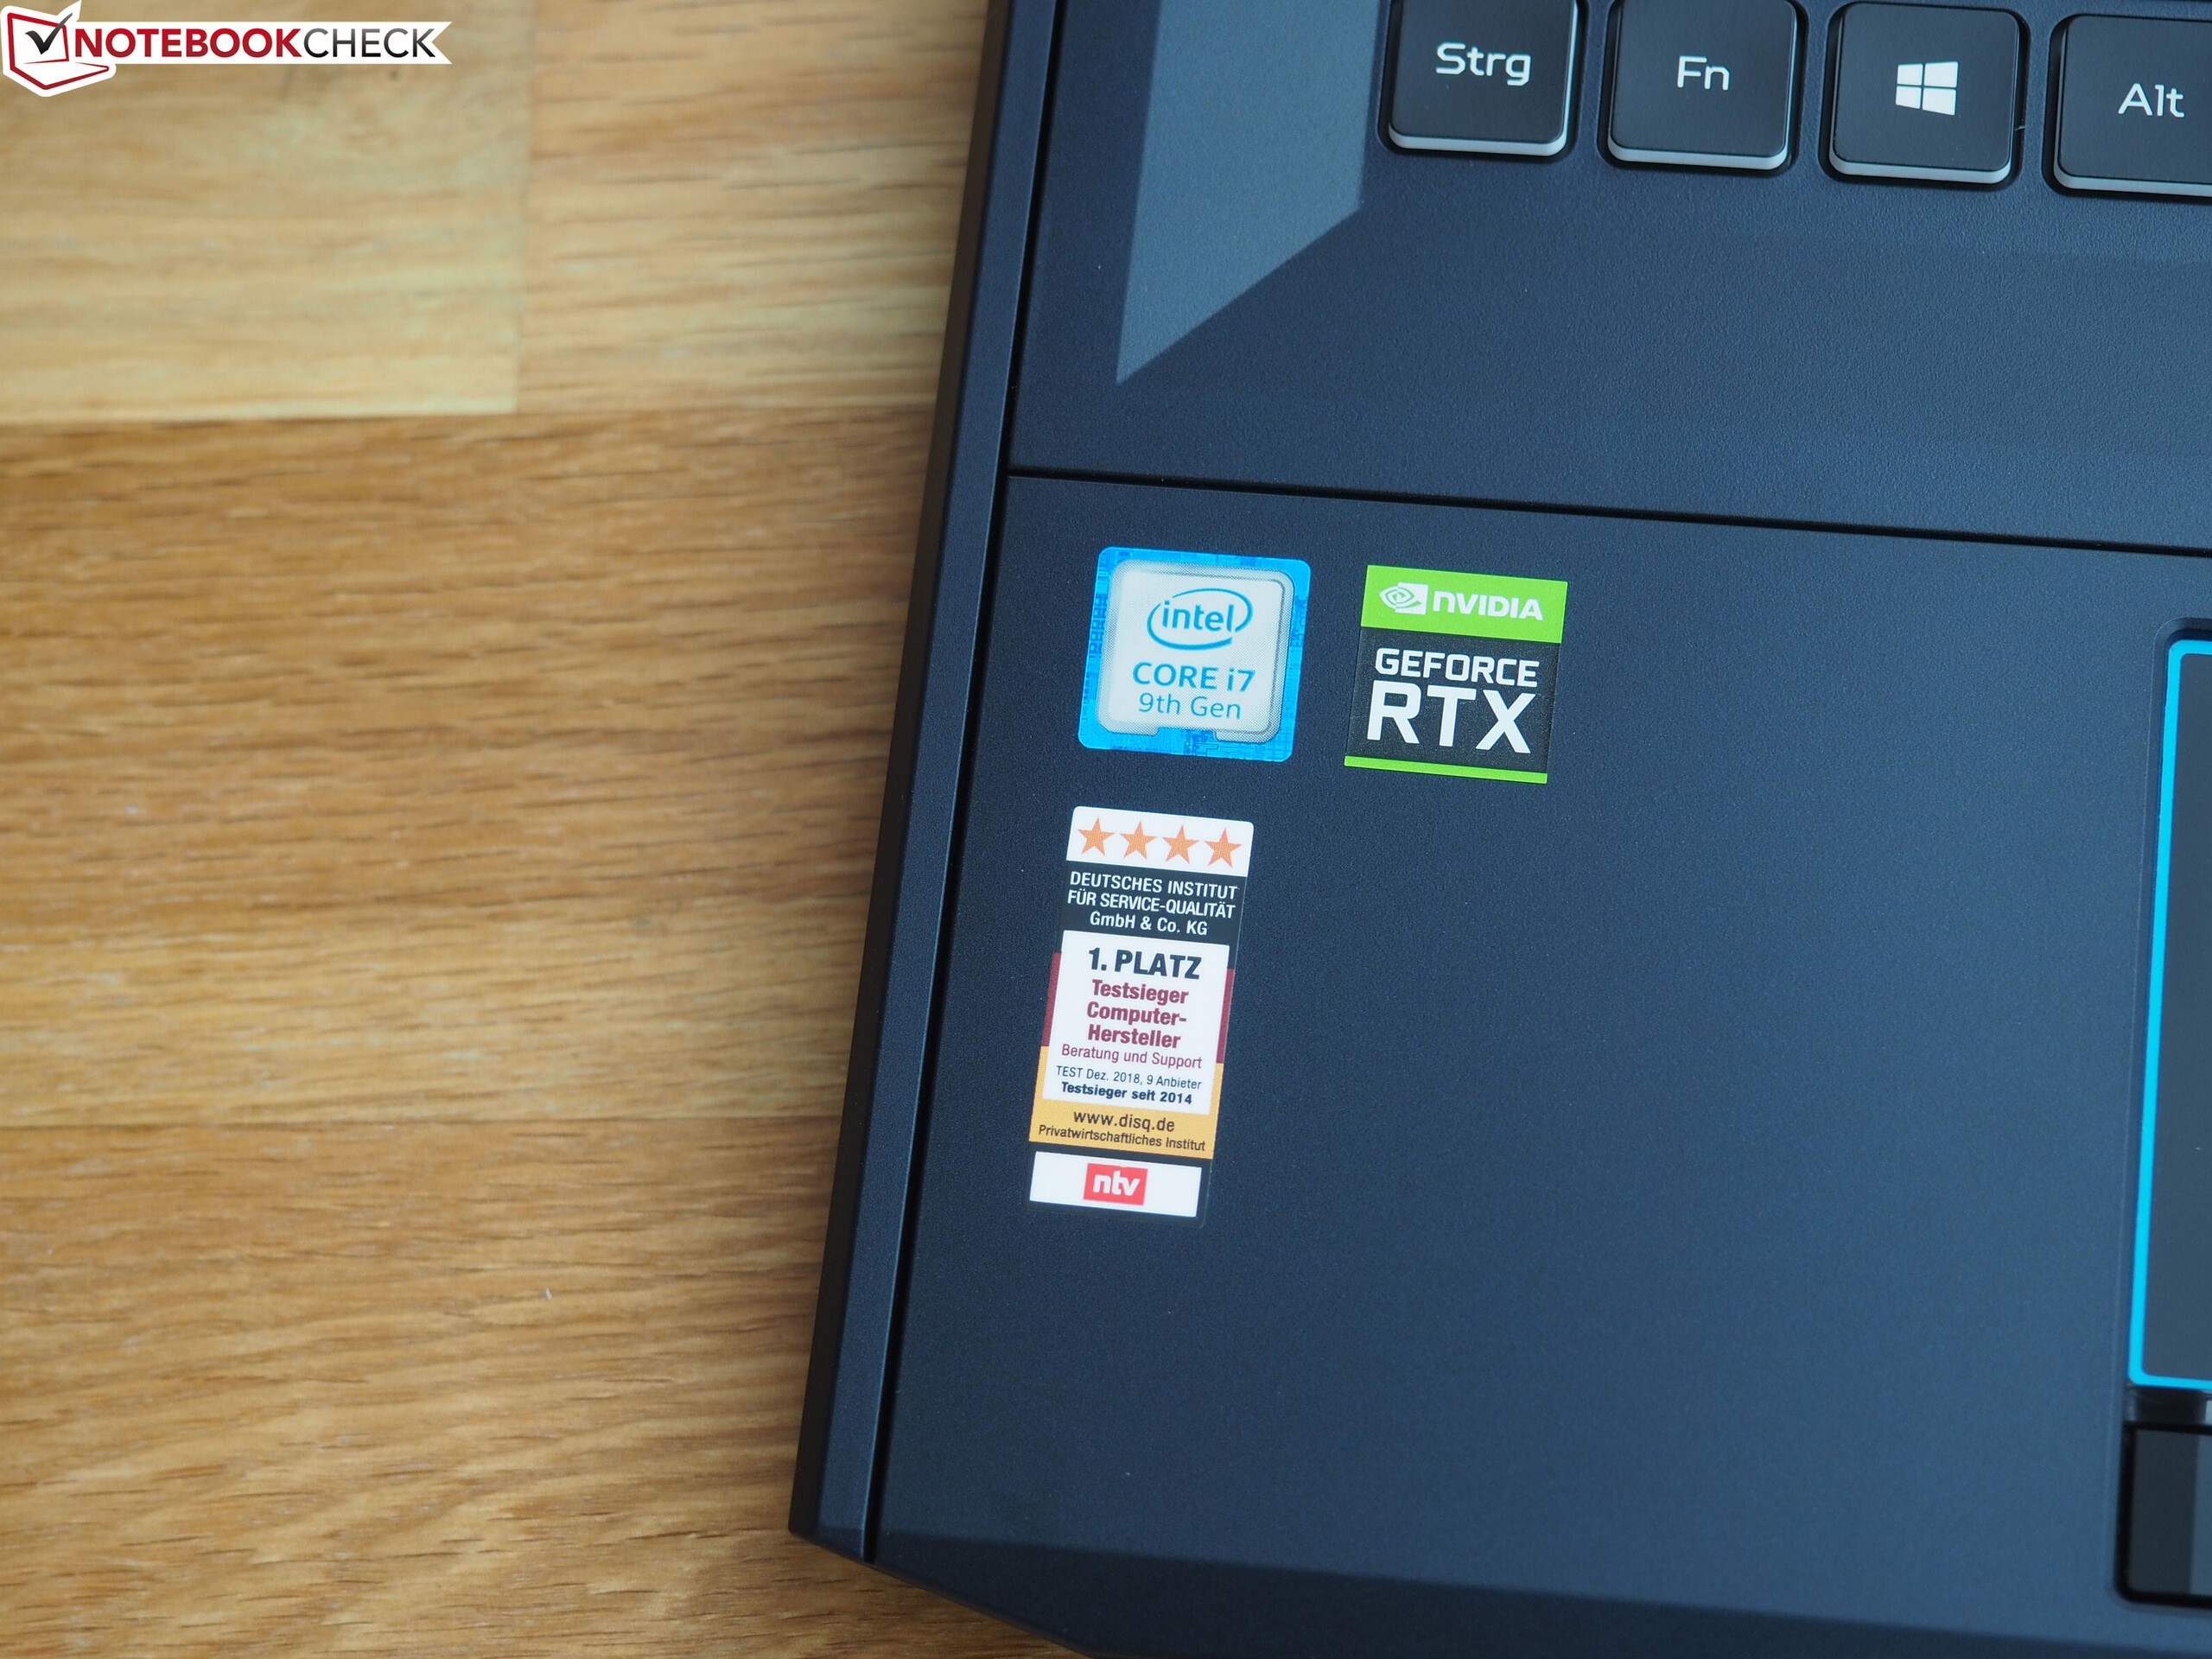
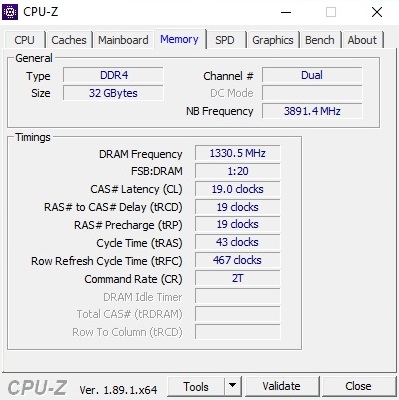
The Predator Helios 700 is clearly directed at passionate gamers who don't want to make any compromises in terms of performance, connectivity and features. Depending on the configuration, it runs on either a GeForce RTX 2070 or an RTX 2080 as its graphics solution. The processor is either a Core i7-9750H (six cores) or a Core i9-9980HK (eight cores), both from Intel. It is equipped with between 32 and 64 GB of DDR4 RAM and between 512 GB and 4 TB of storage (SSD, SSD RAID, or a combination of SSD and HDD).
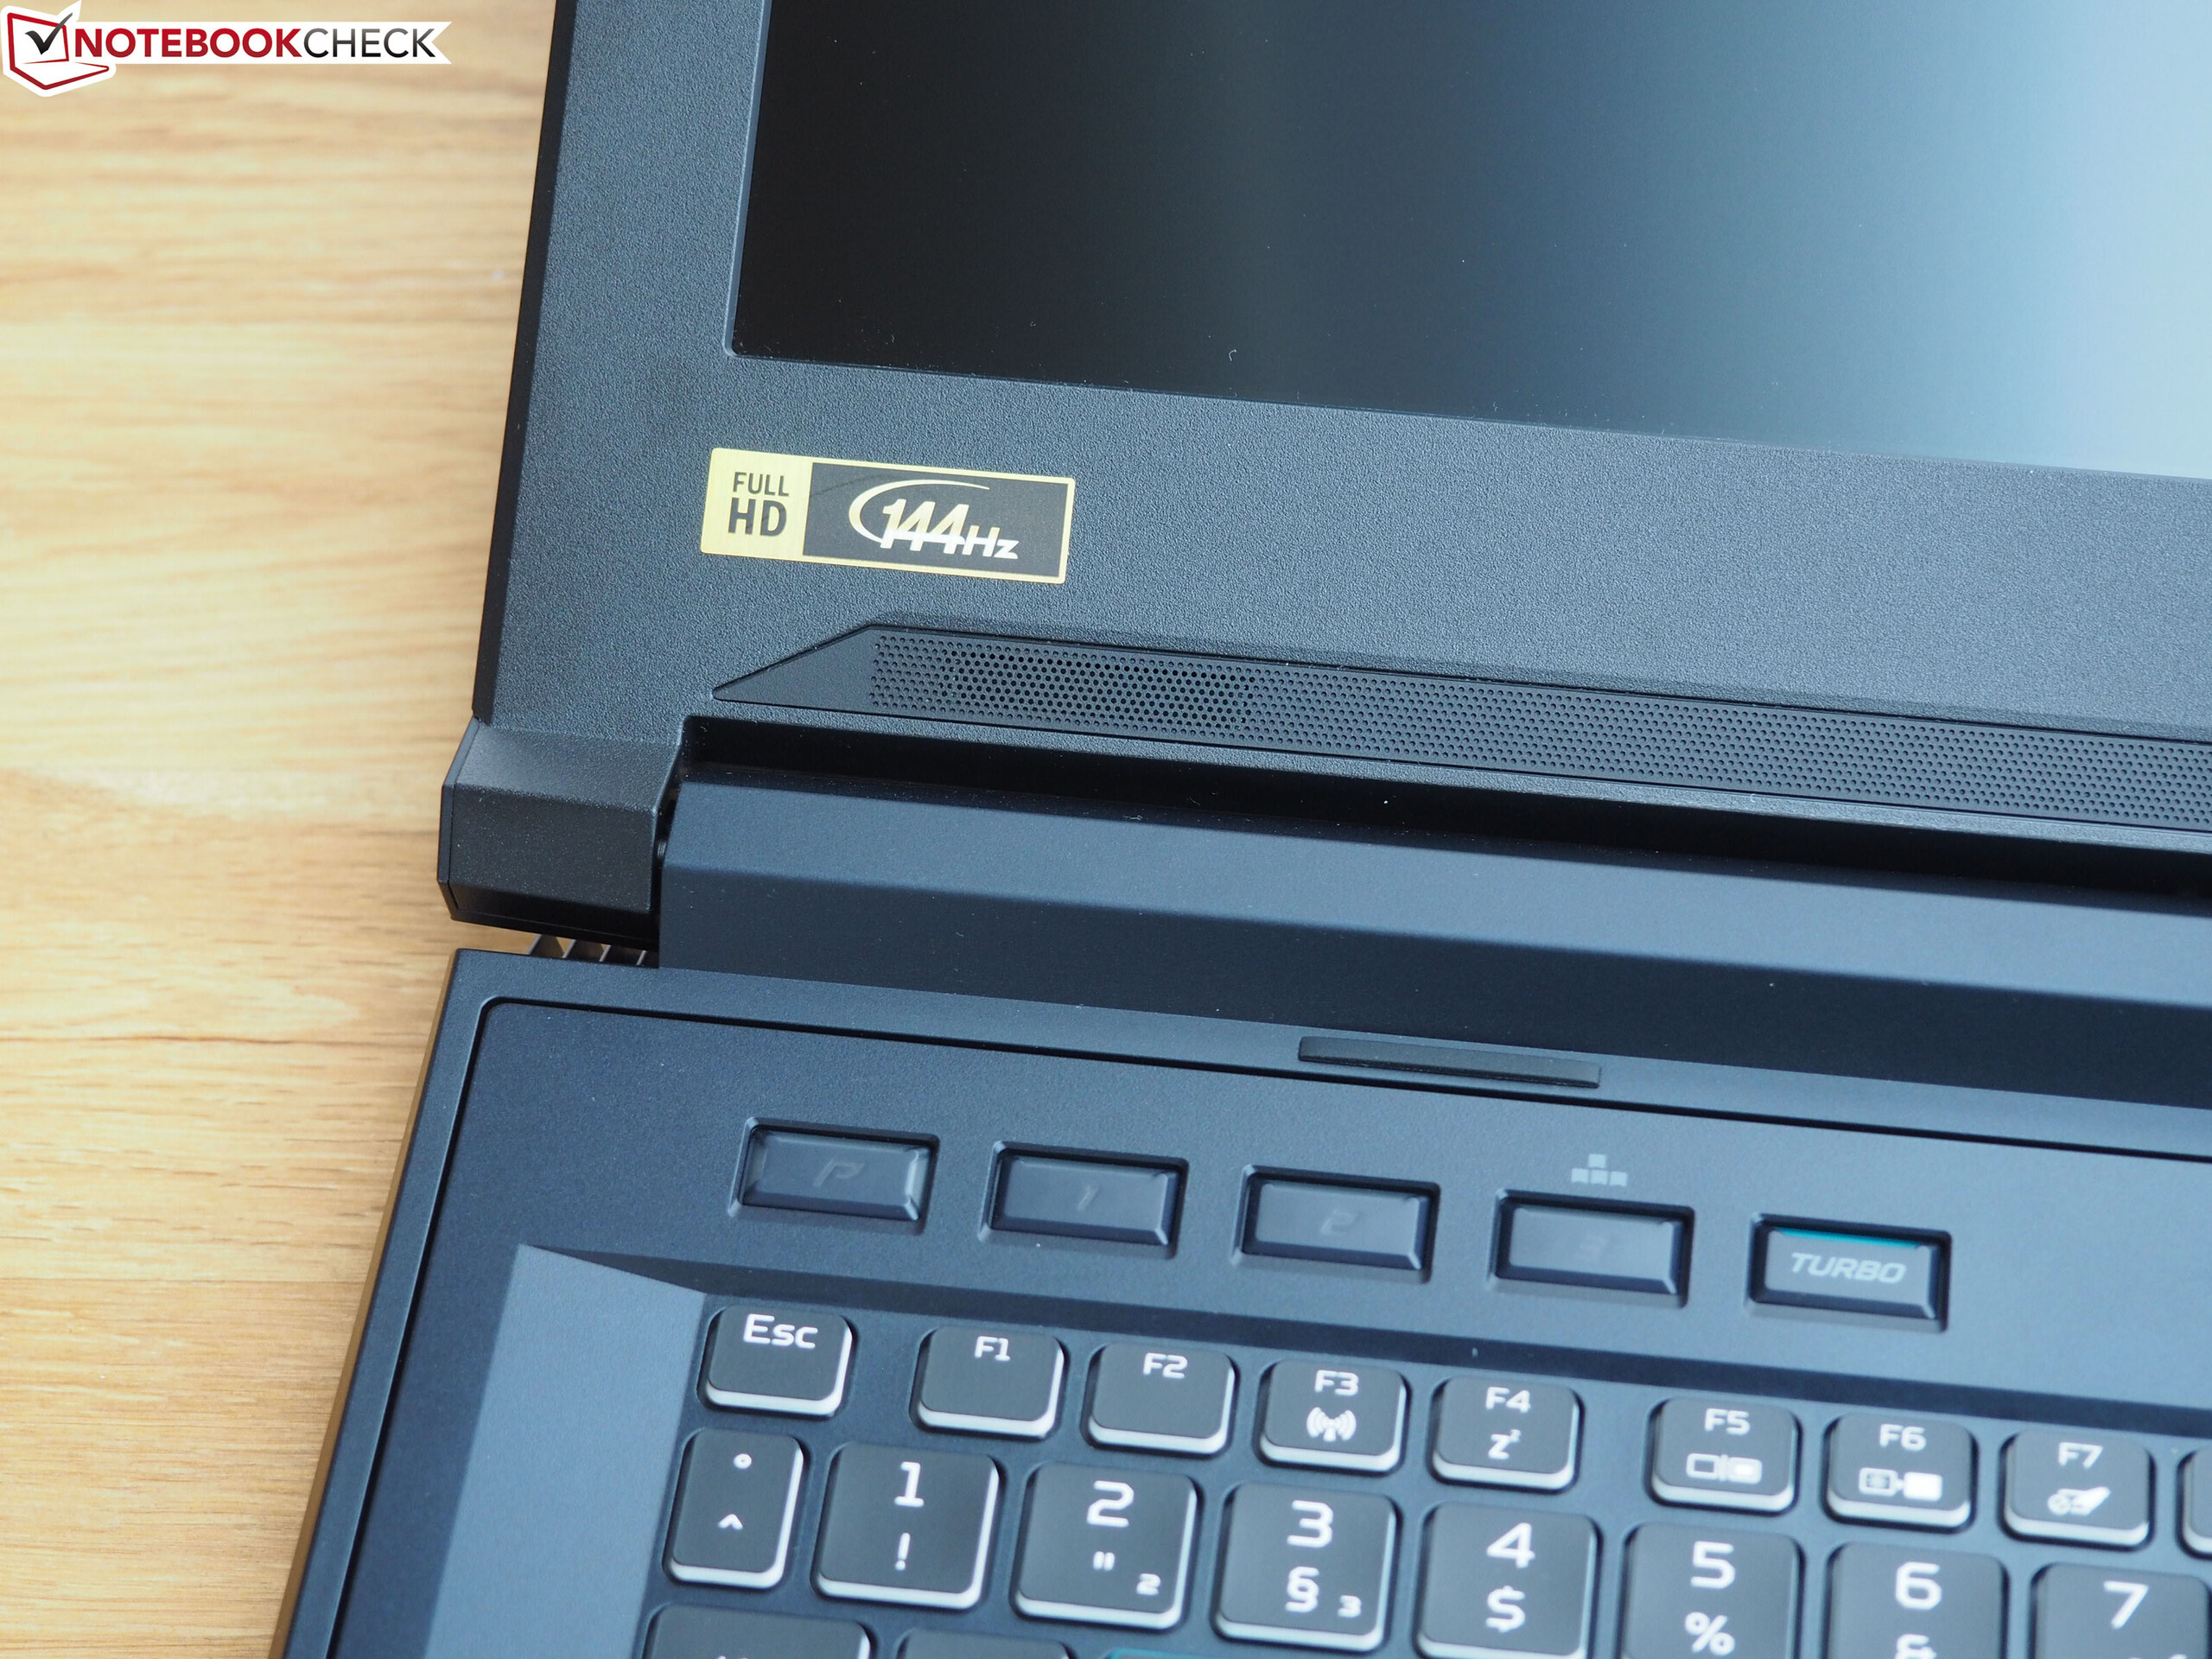
The display remains the same in all configurations: A matte 144-Hz IPS panel with G-Sync (which means that the device does not support the graphics-switching technology Optimus). Our test unit, which includes the Core i7-9750H, the GeForce RTX 2080, 32 GB of RAM and two 512-GB SSDs, is currently available for around $2500.
The competitors of the Helios 700 are other 17-inch gamers equipped with Nvidia's strongest Turing GPU such as the MSI GE75 9SG, the MSI GT76 9SG, the HP Omen 17, the Schenker XMG Ultra 17 and the Alienware Area 51m. These devices have been included in our comparison tables.
Case
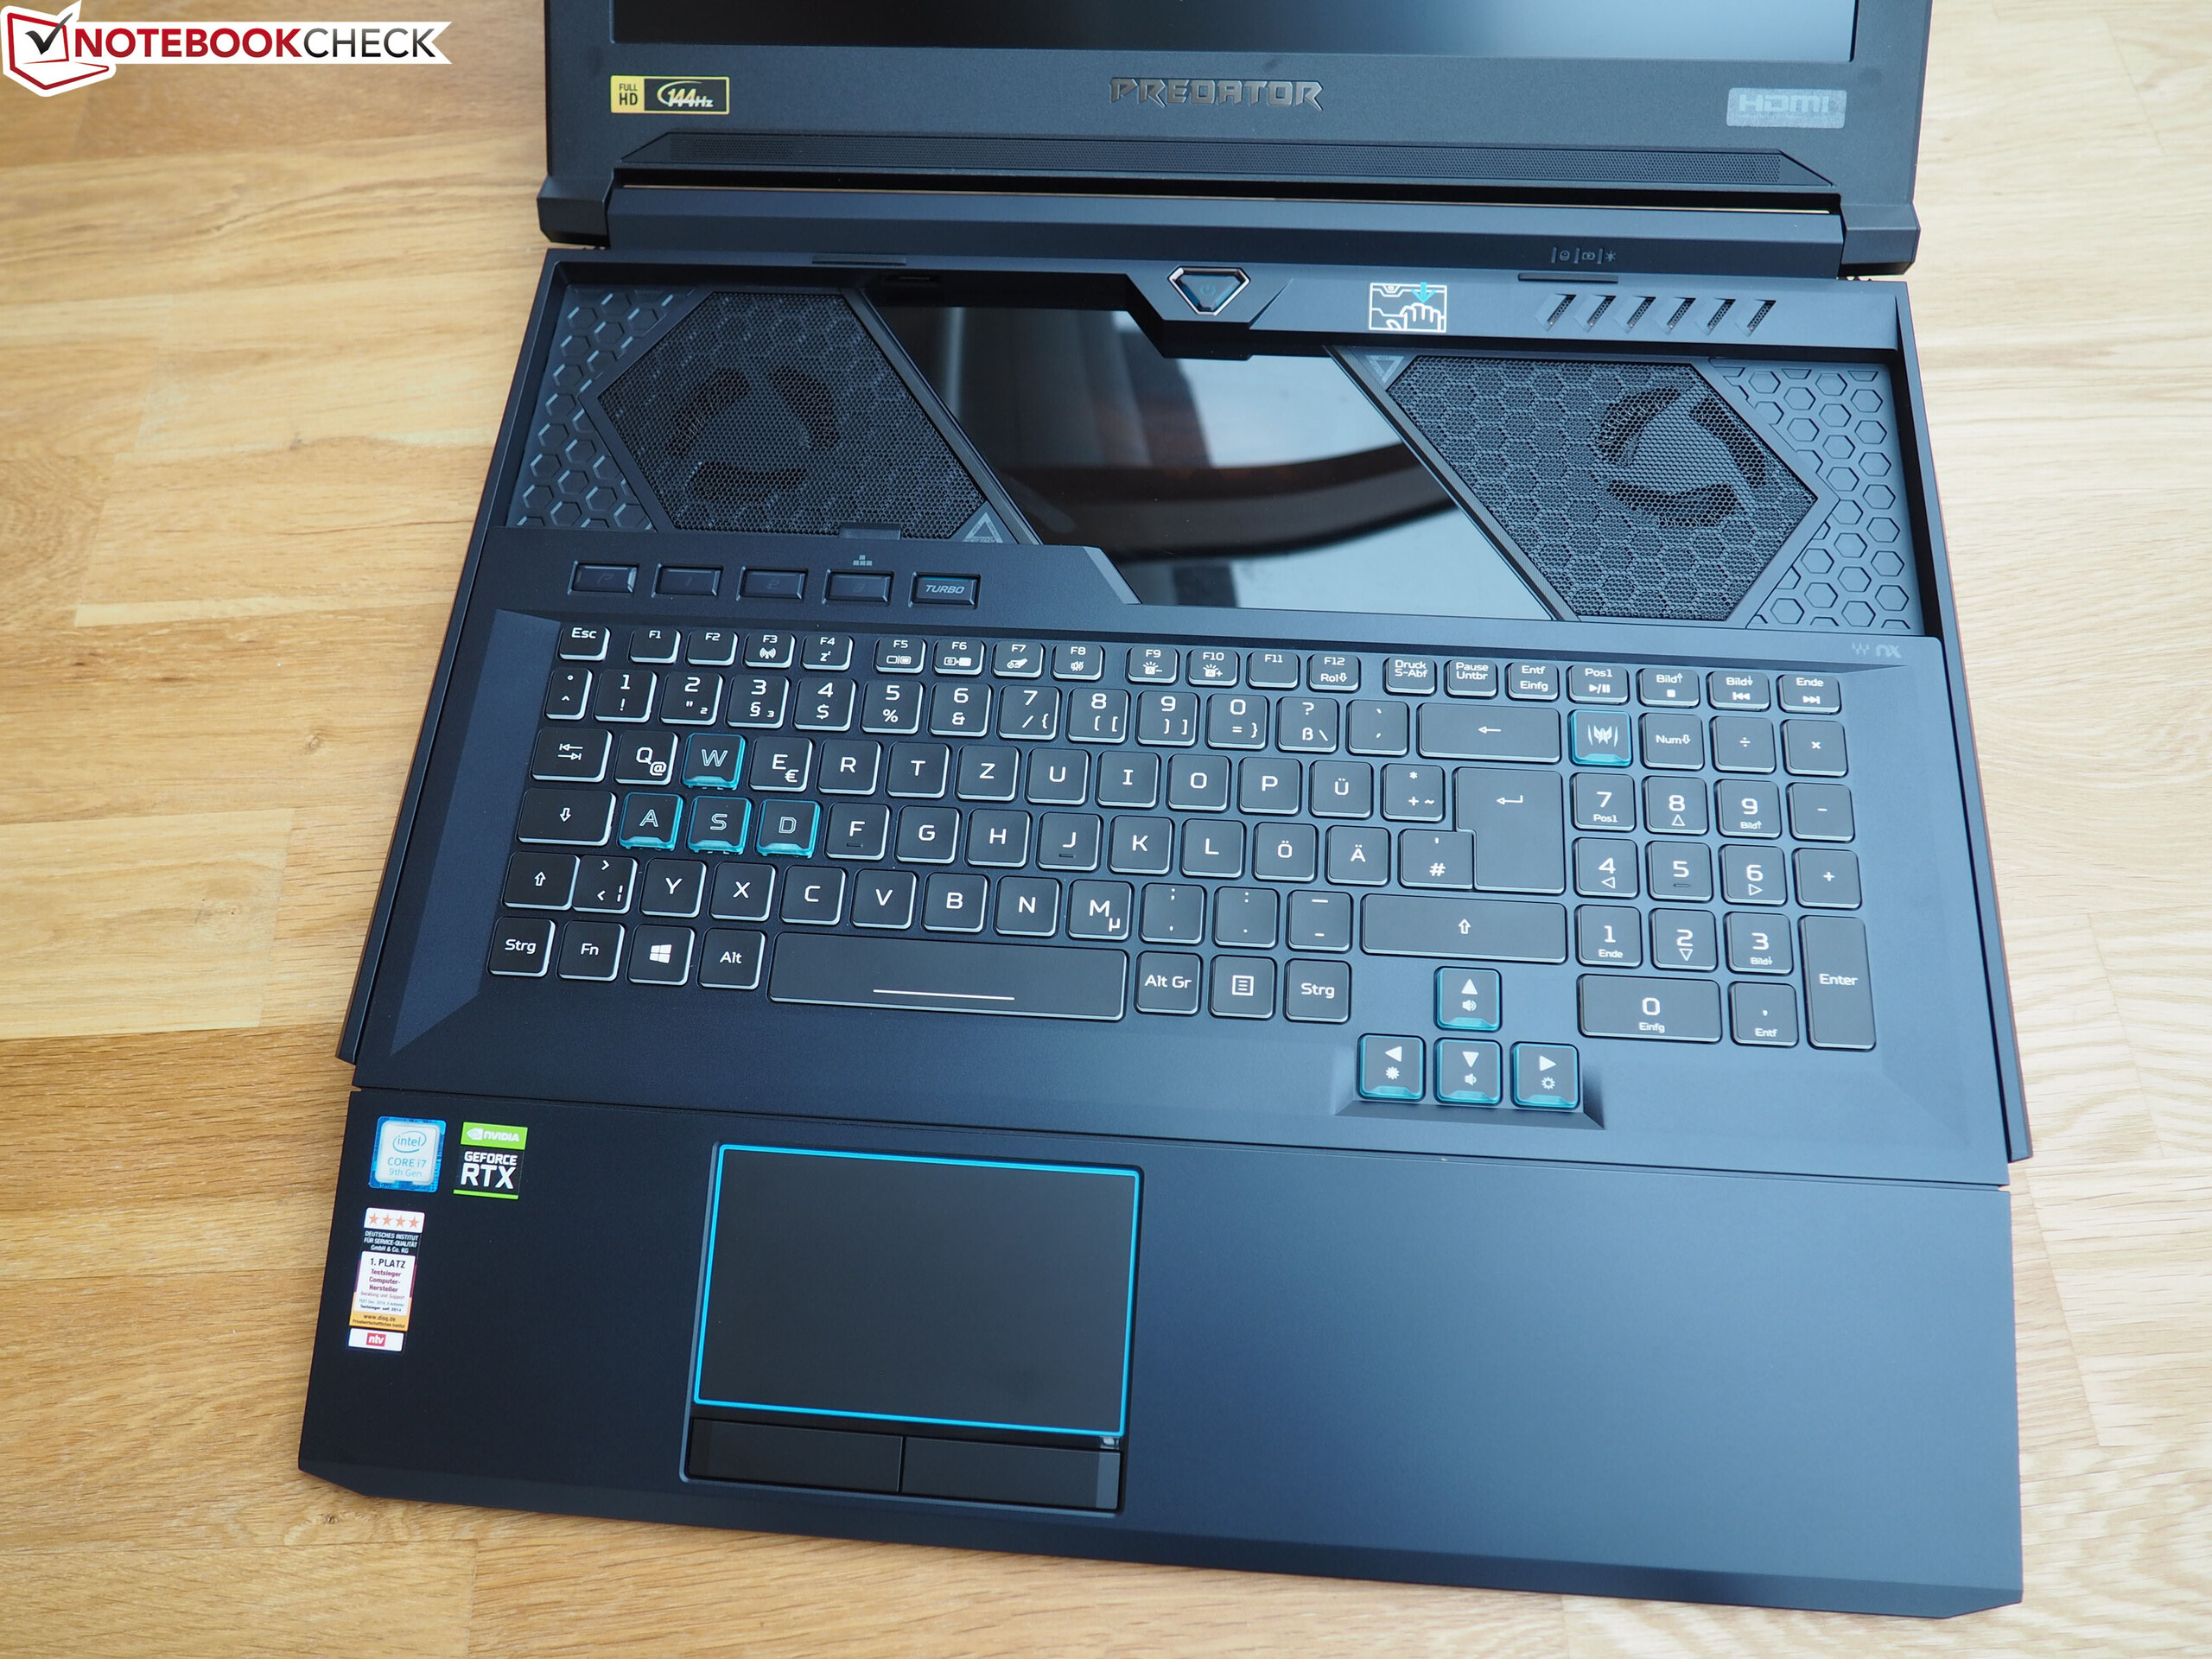
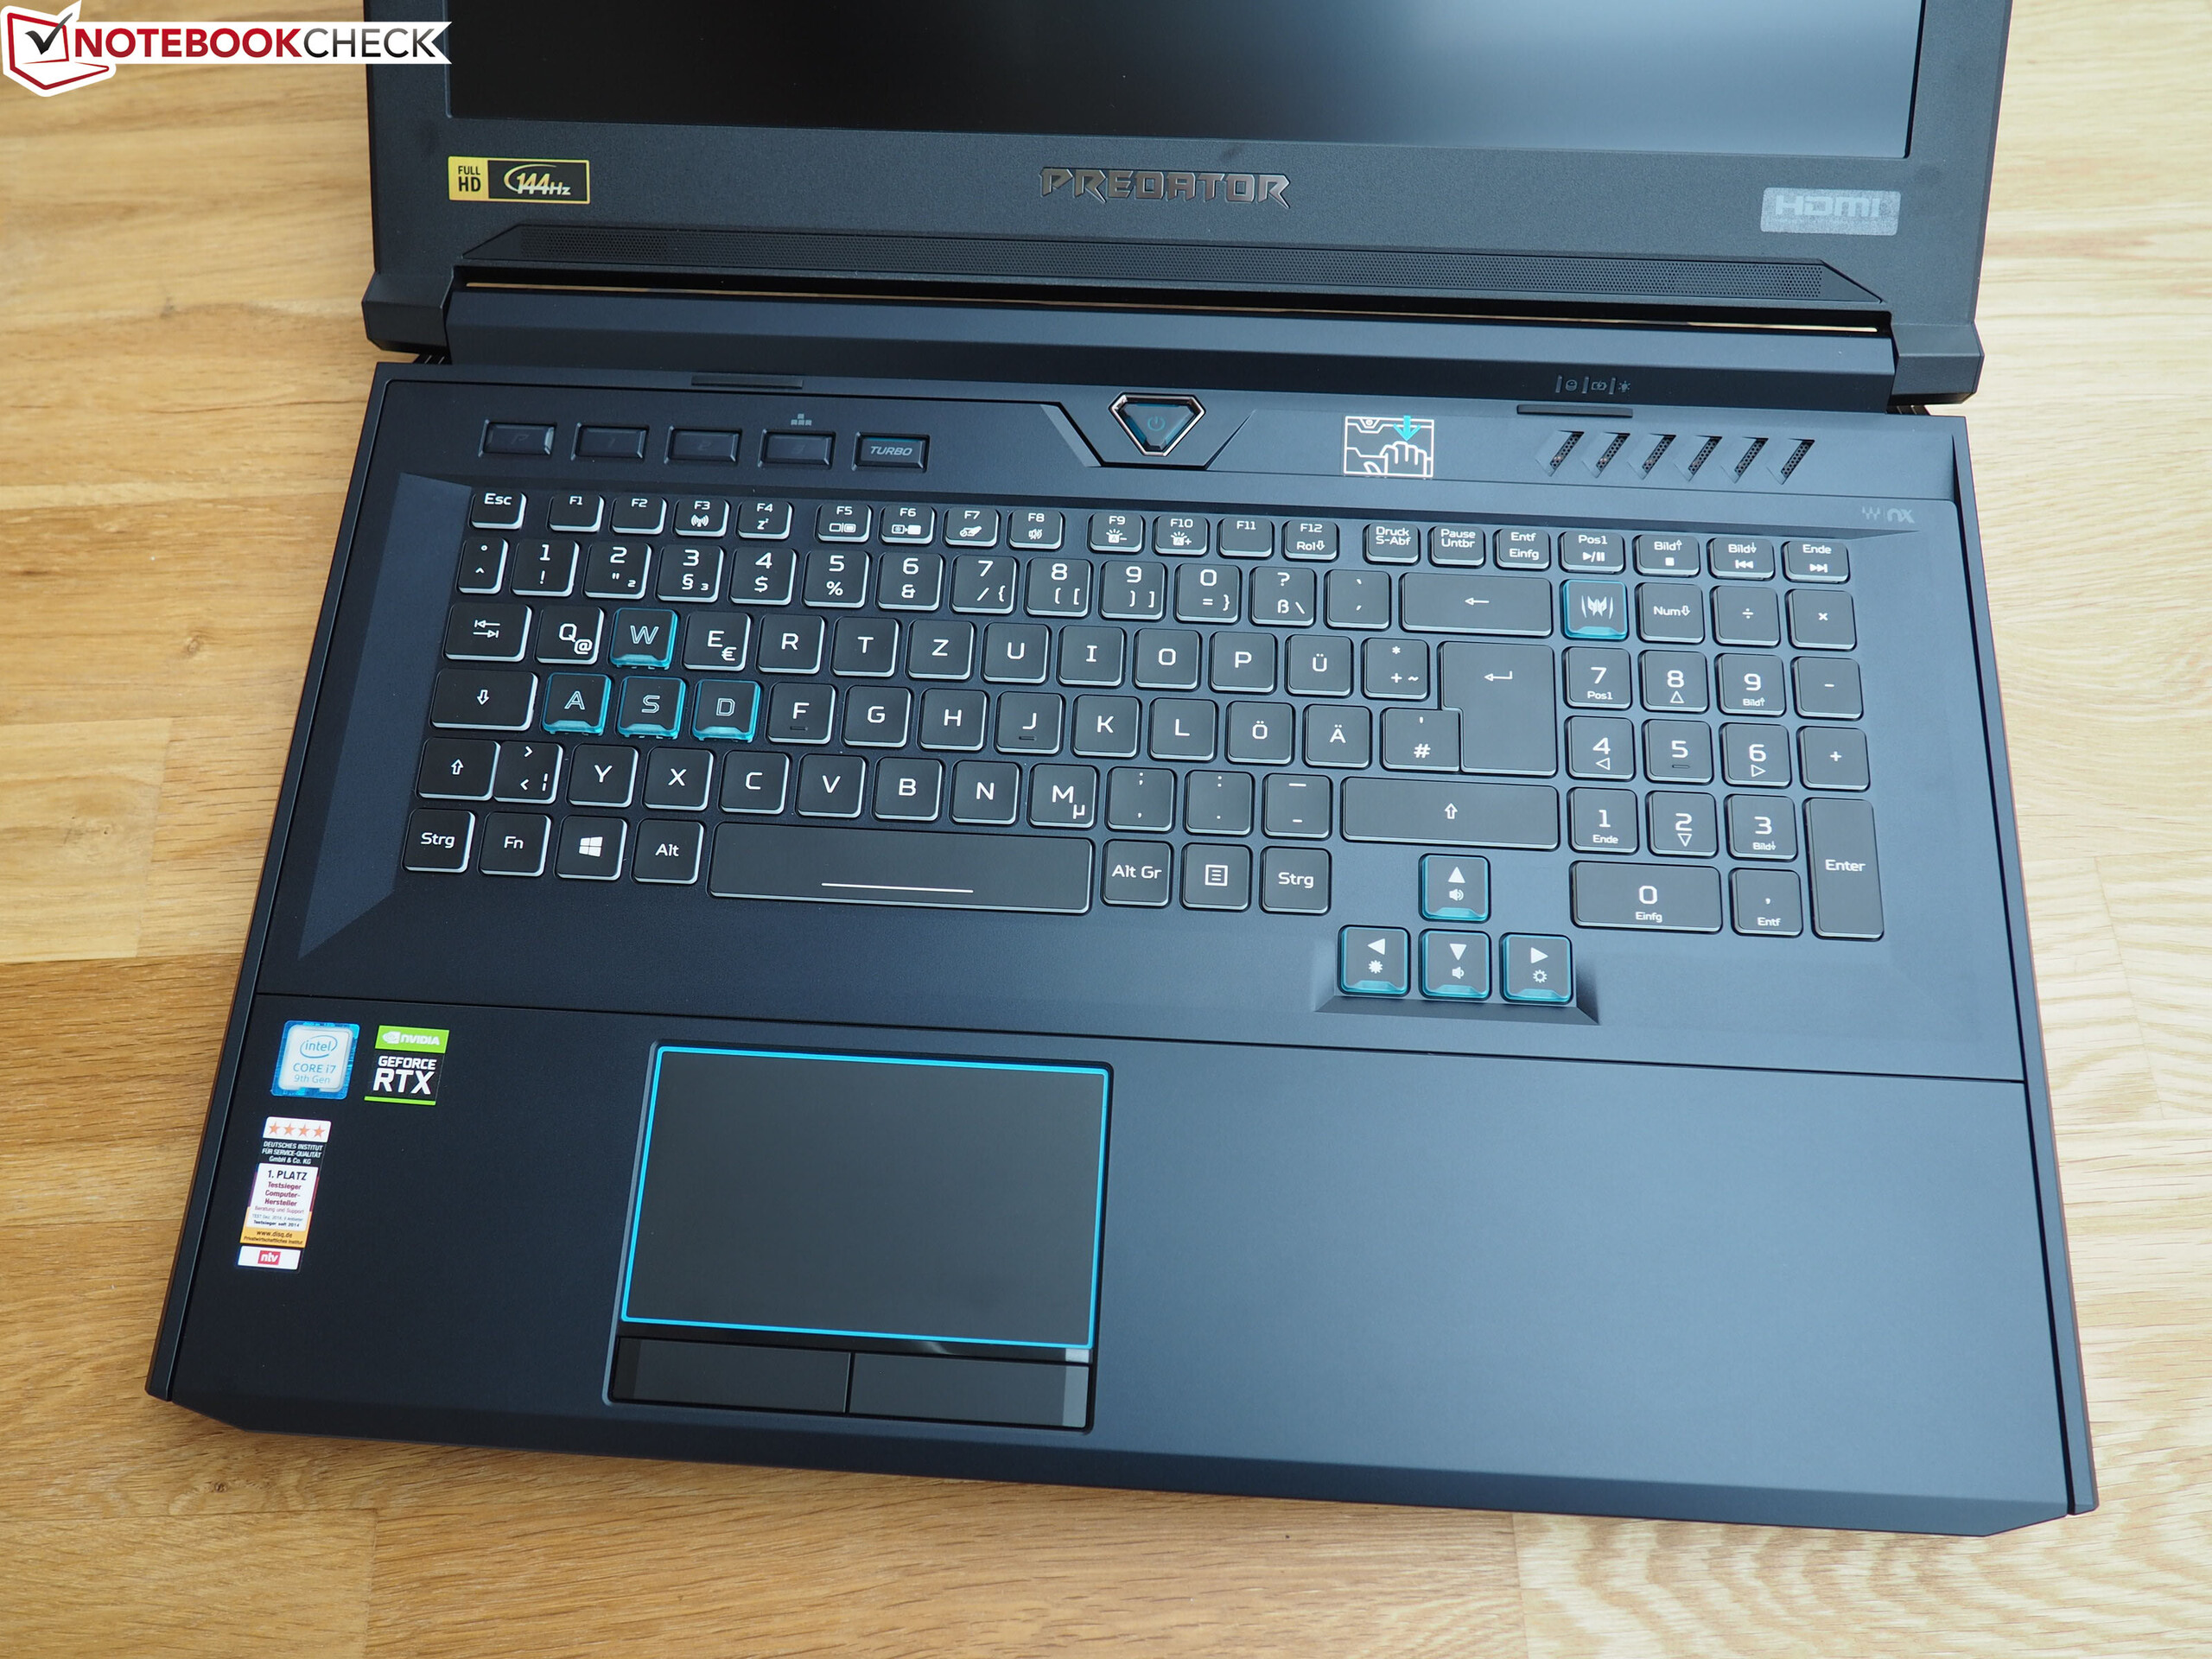
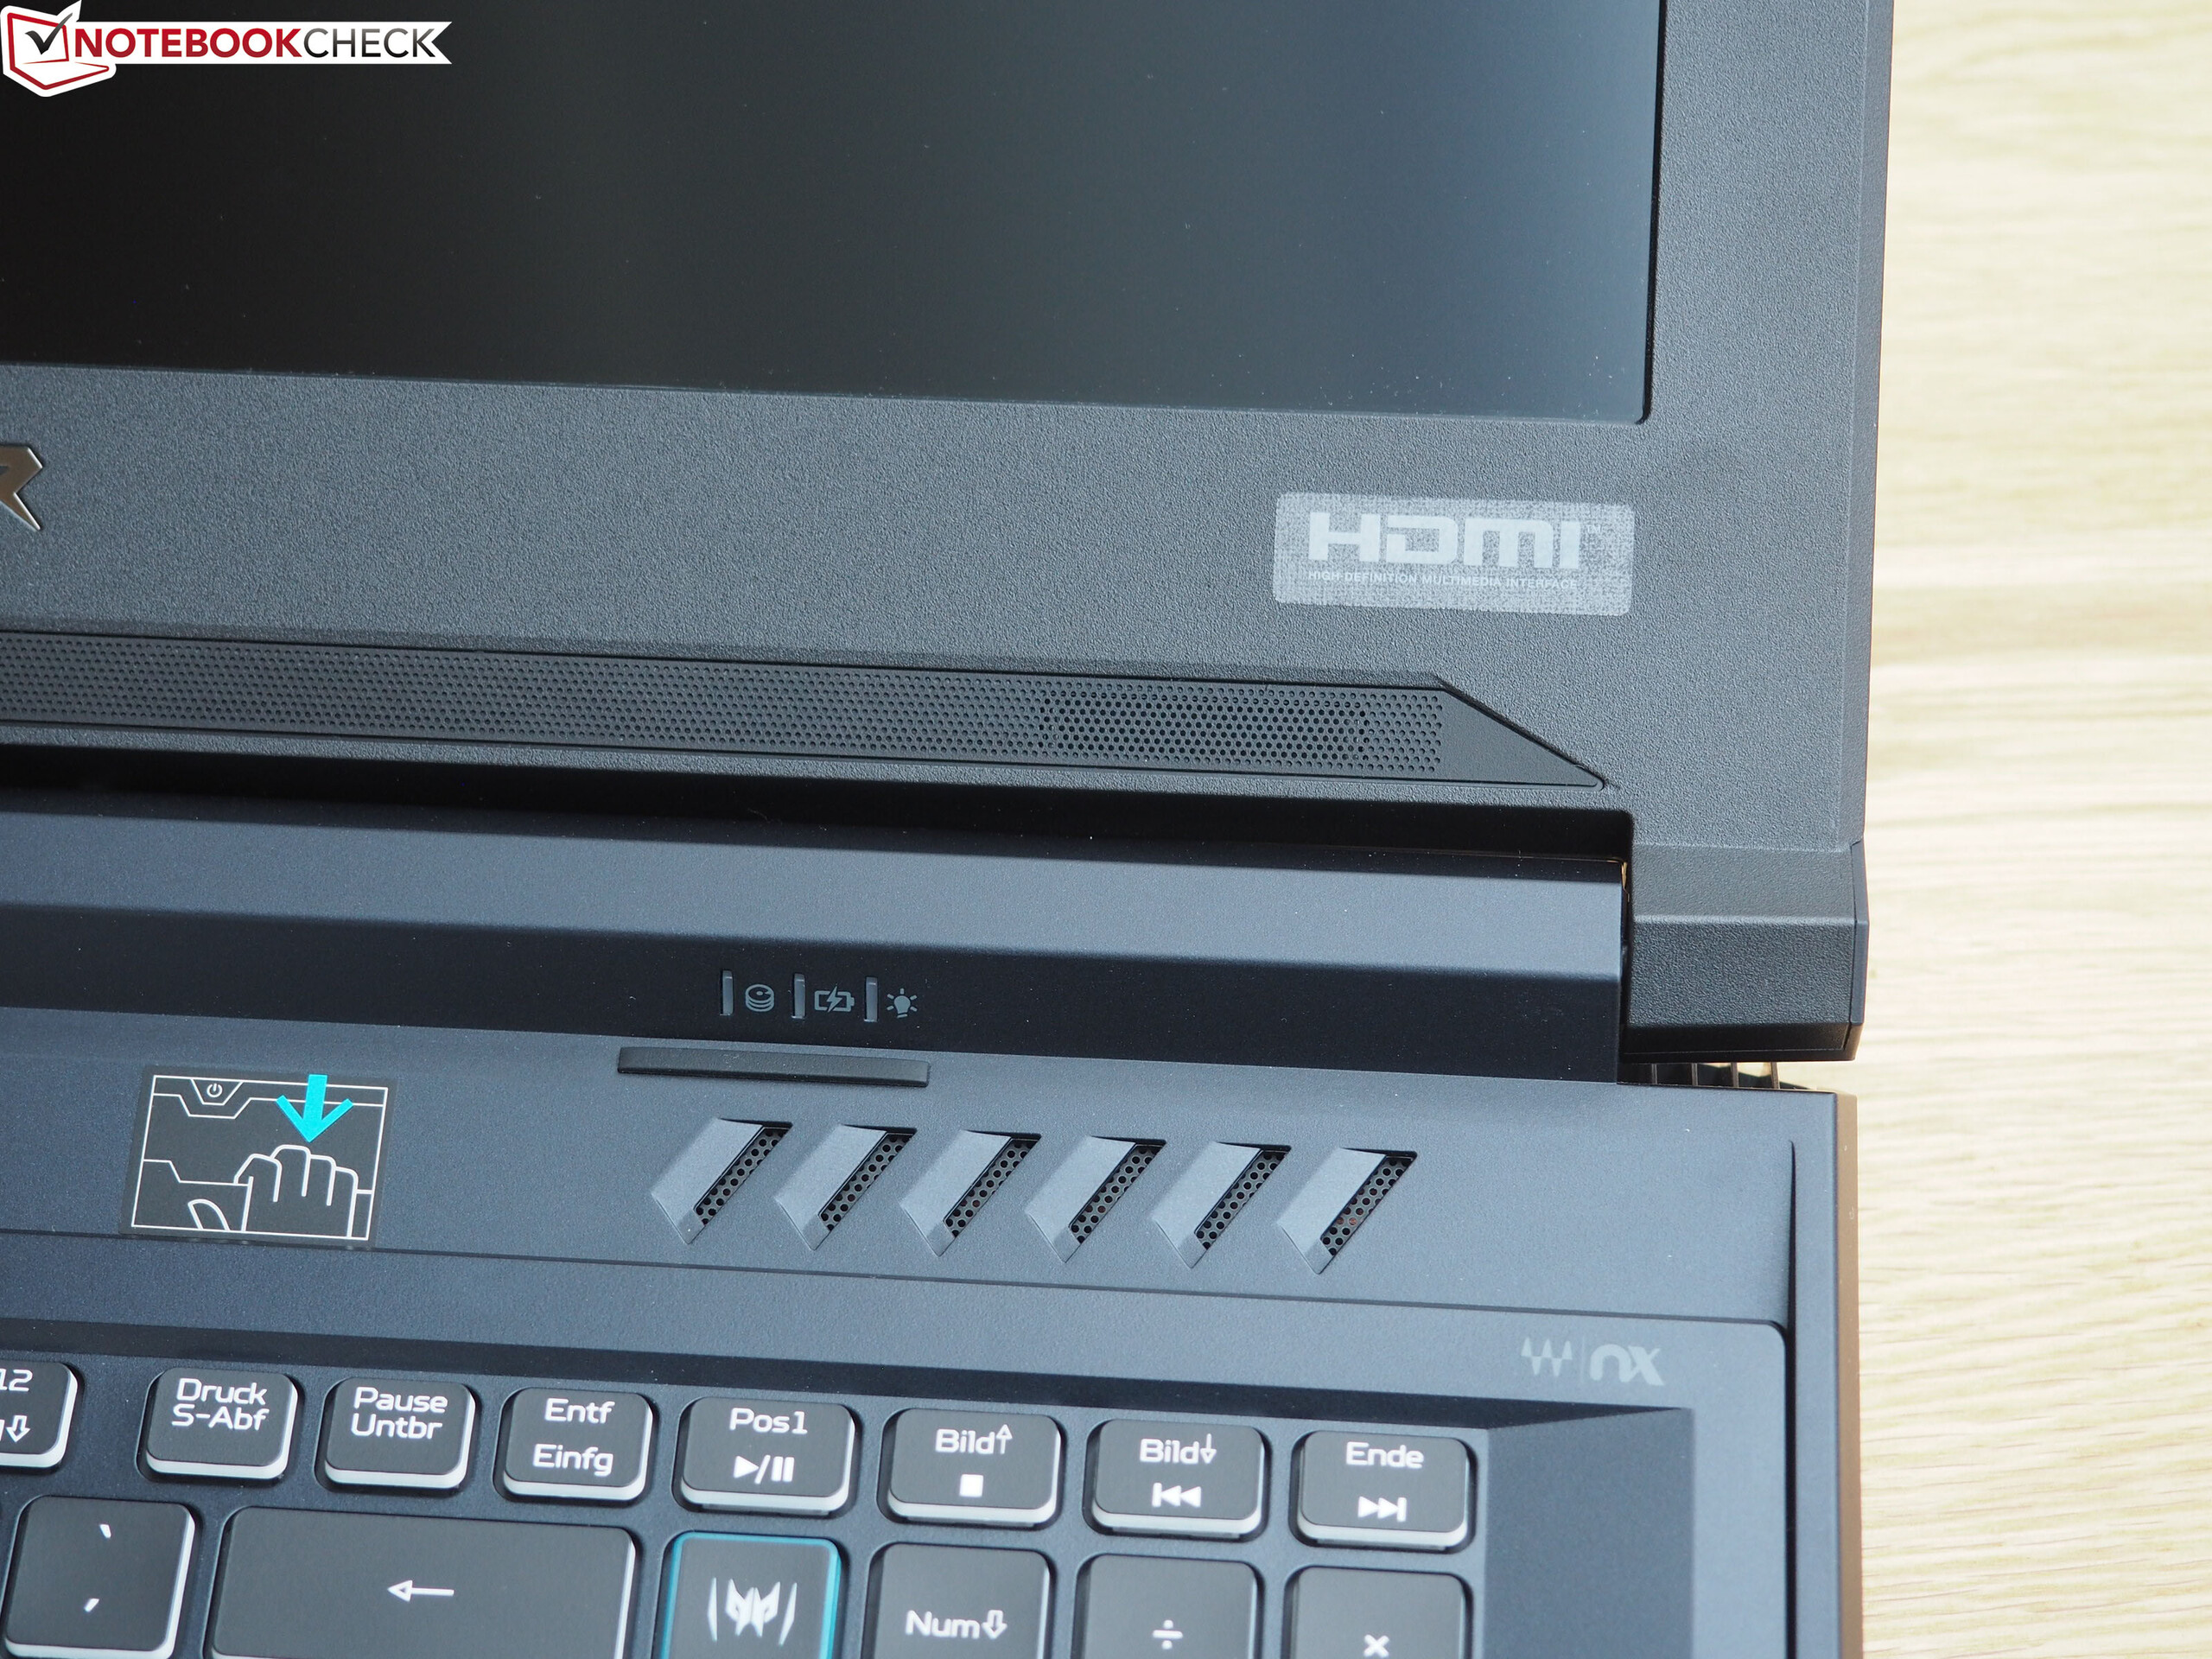
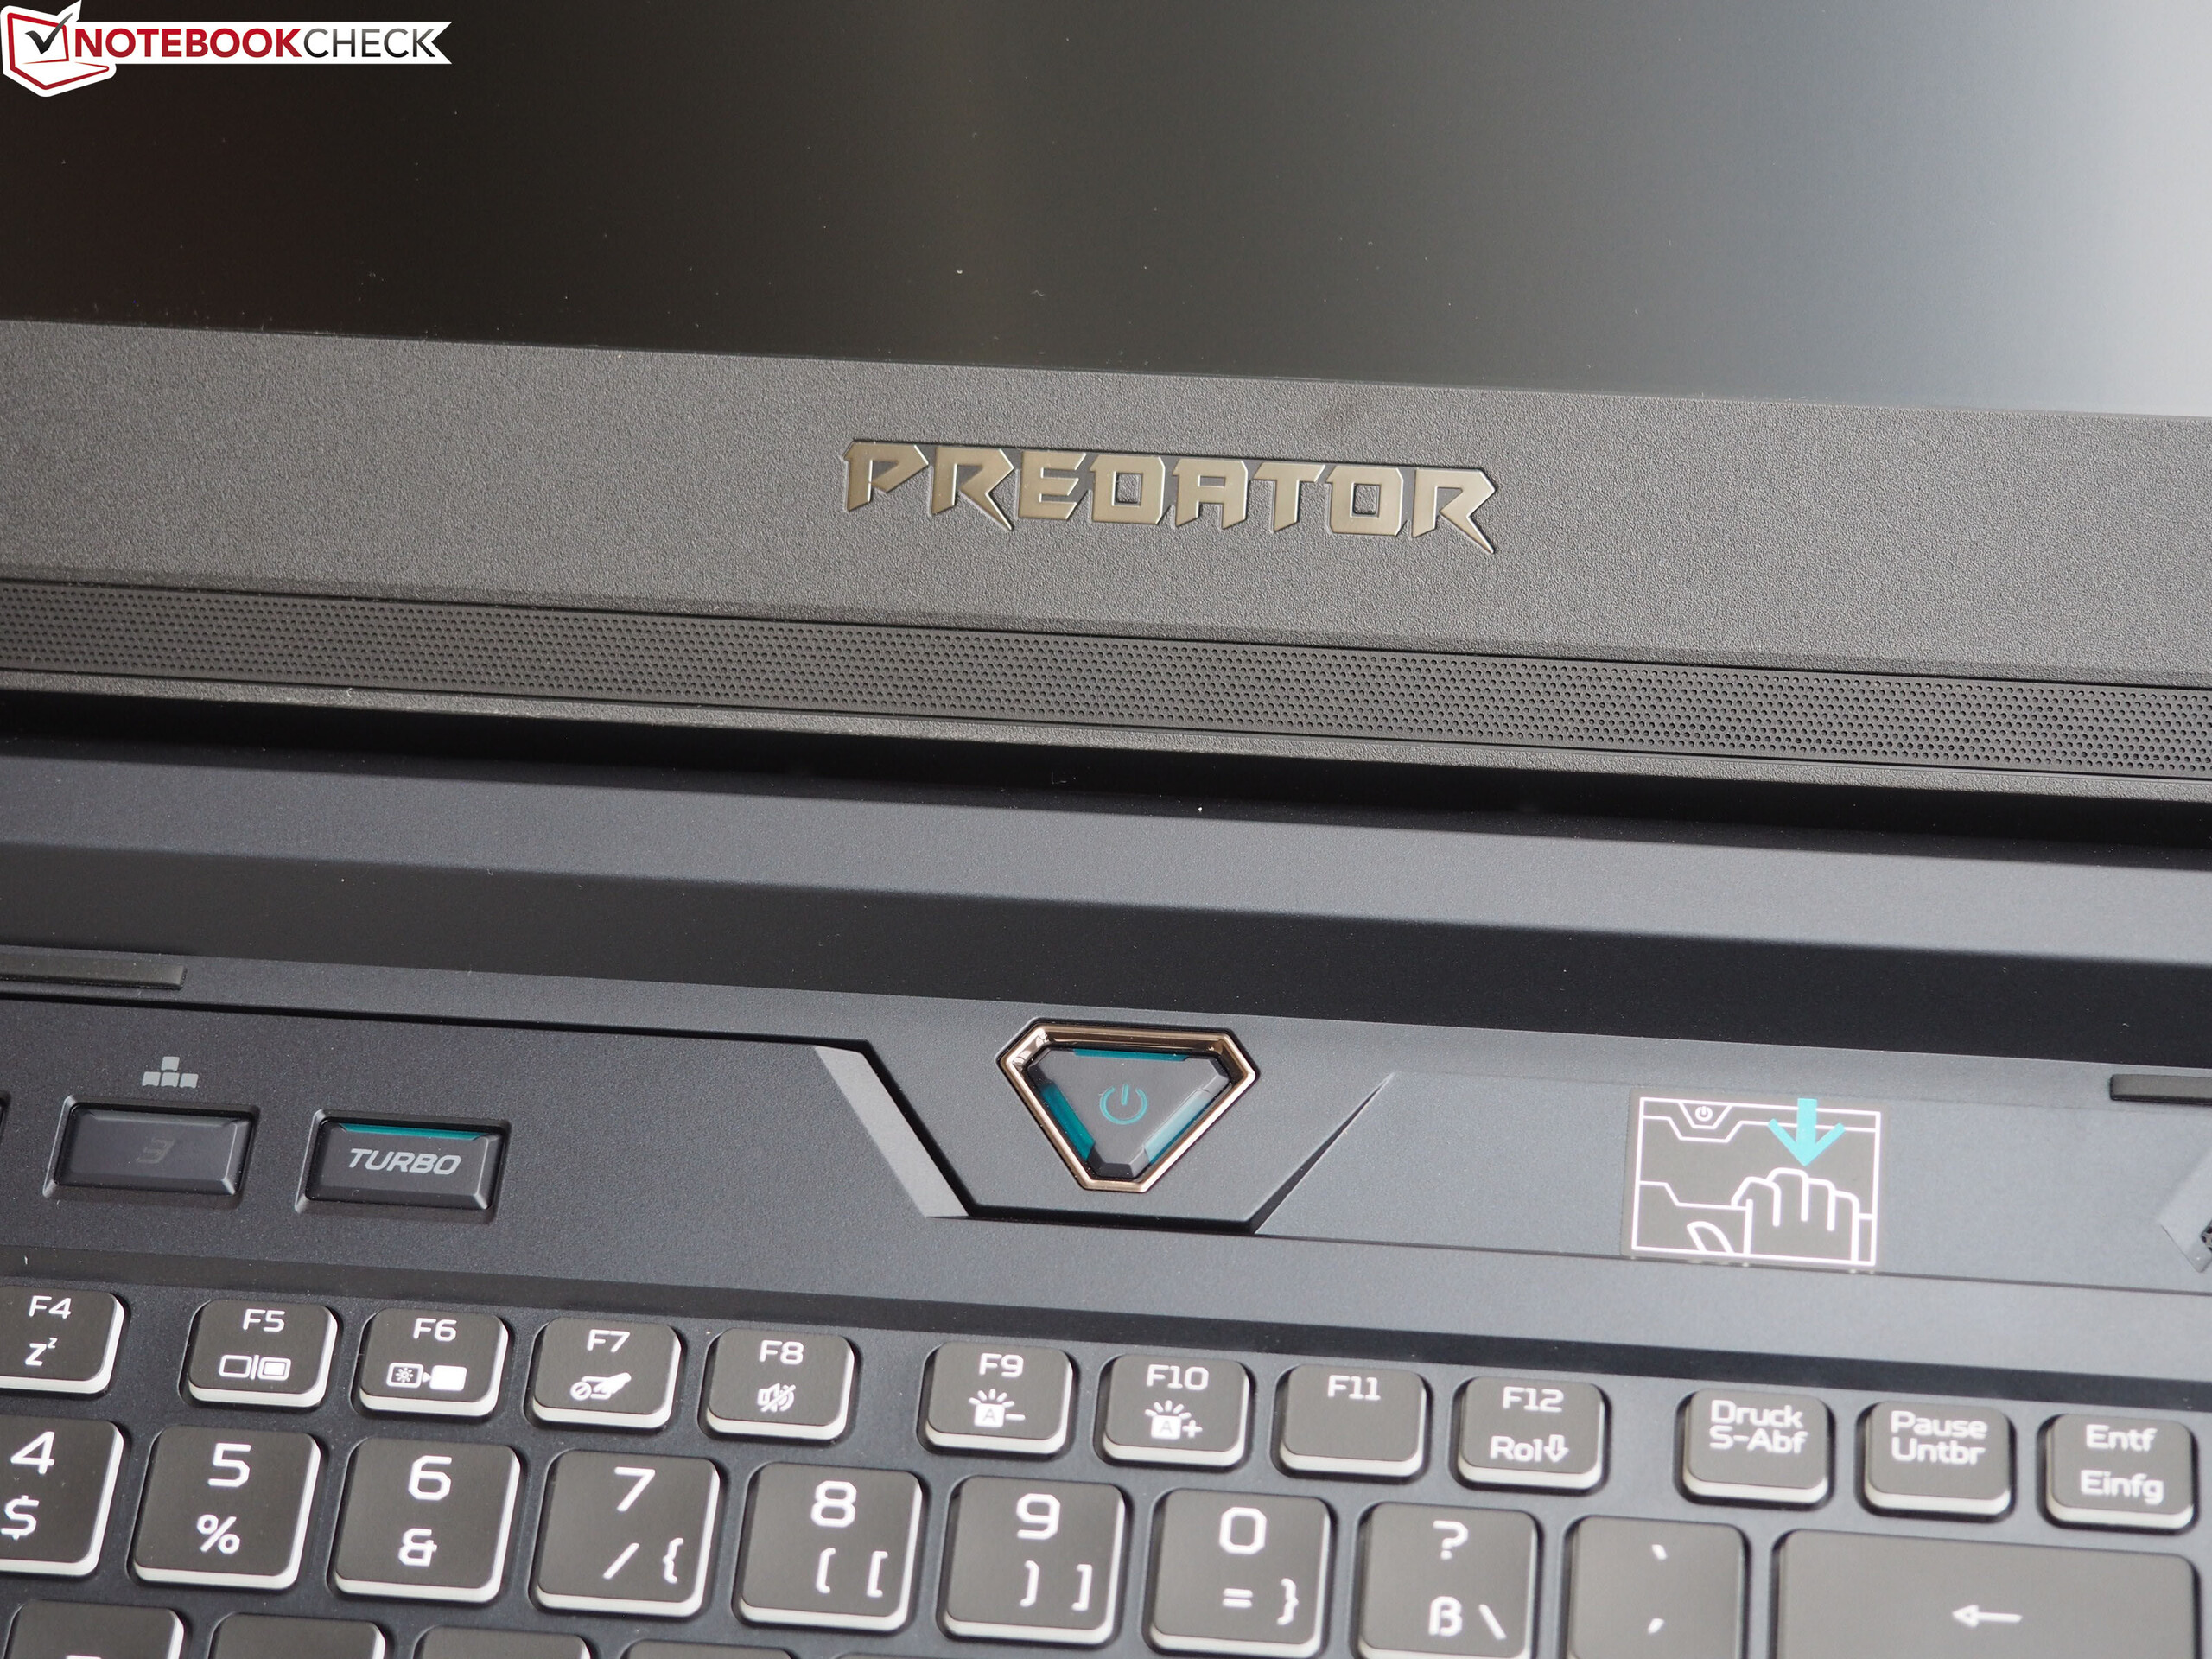
At first glance, the case of the Helios 700 looks quite similar to that of the Helios 500, which we tested with a Core i7-8750H and a GeForce GTX 1070 in 2018. But if you look a little closer, you will soon notice several differences. Apart from the many small changes, which are mainly cosmetic, we'd mainly like to mention the top of the base unit, which now has a sliding mechanism (see photos) that enables the user to slide the input devices (keyboard and touchpad) forward. This simultaneously looks good and improves cooling.
The sliding mechanism, which is fixed with a magnet, is very easy to use and we encountered no issues with it during testing. The Helios 700 generally has good workmanship - there were no overhanging edges or uneven gaps.
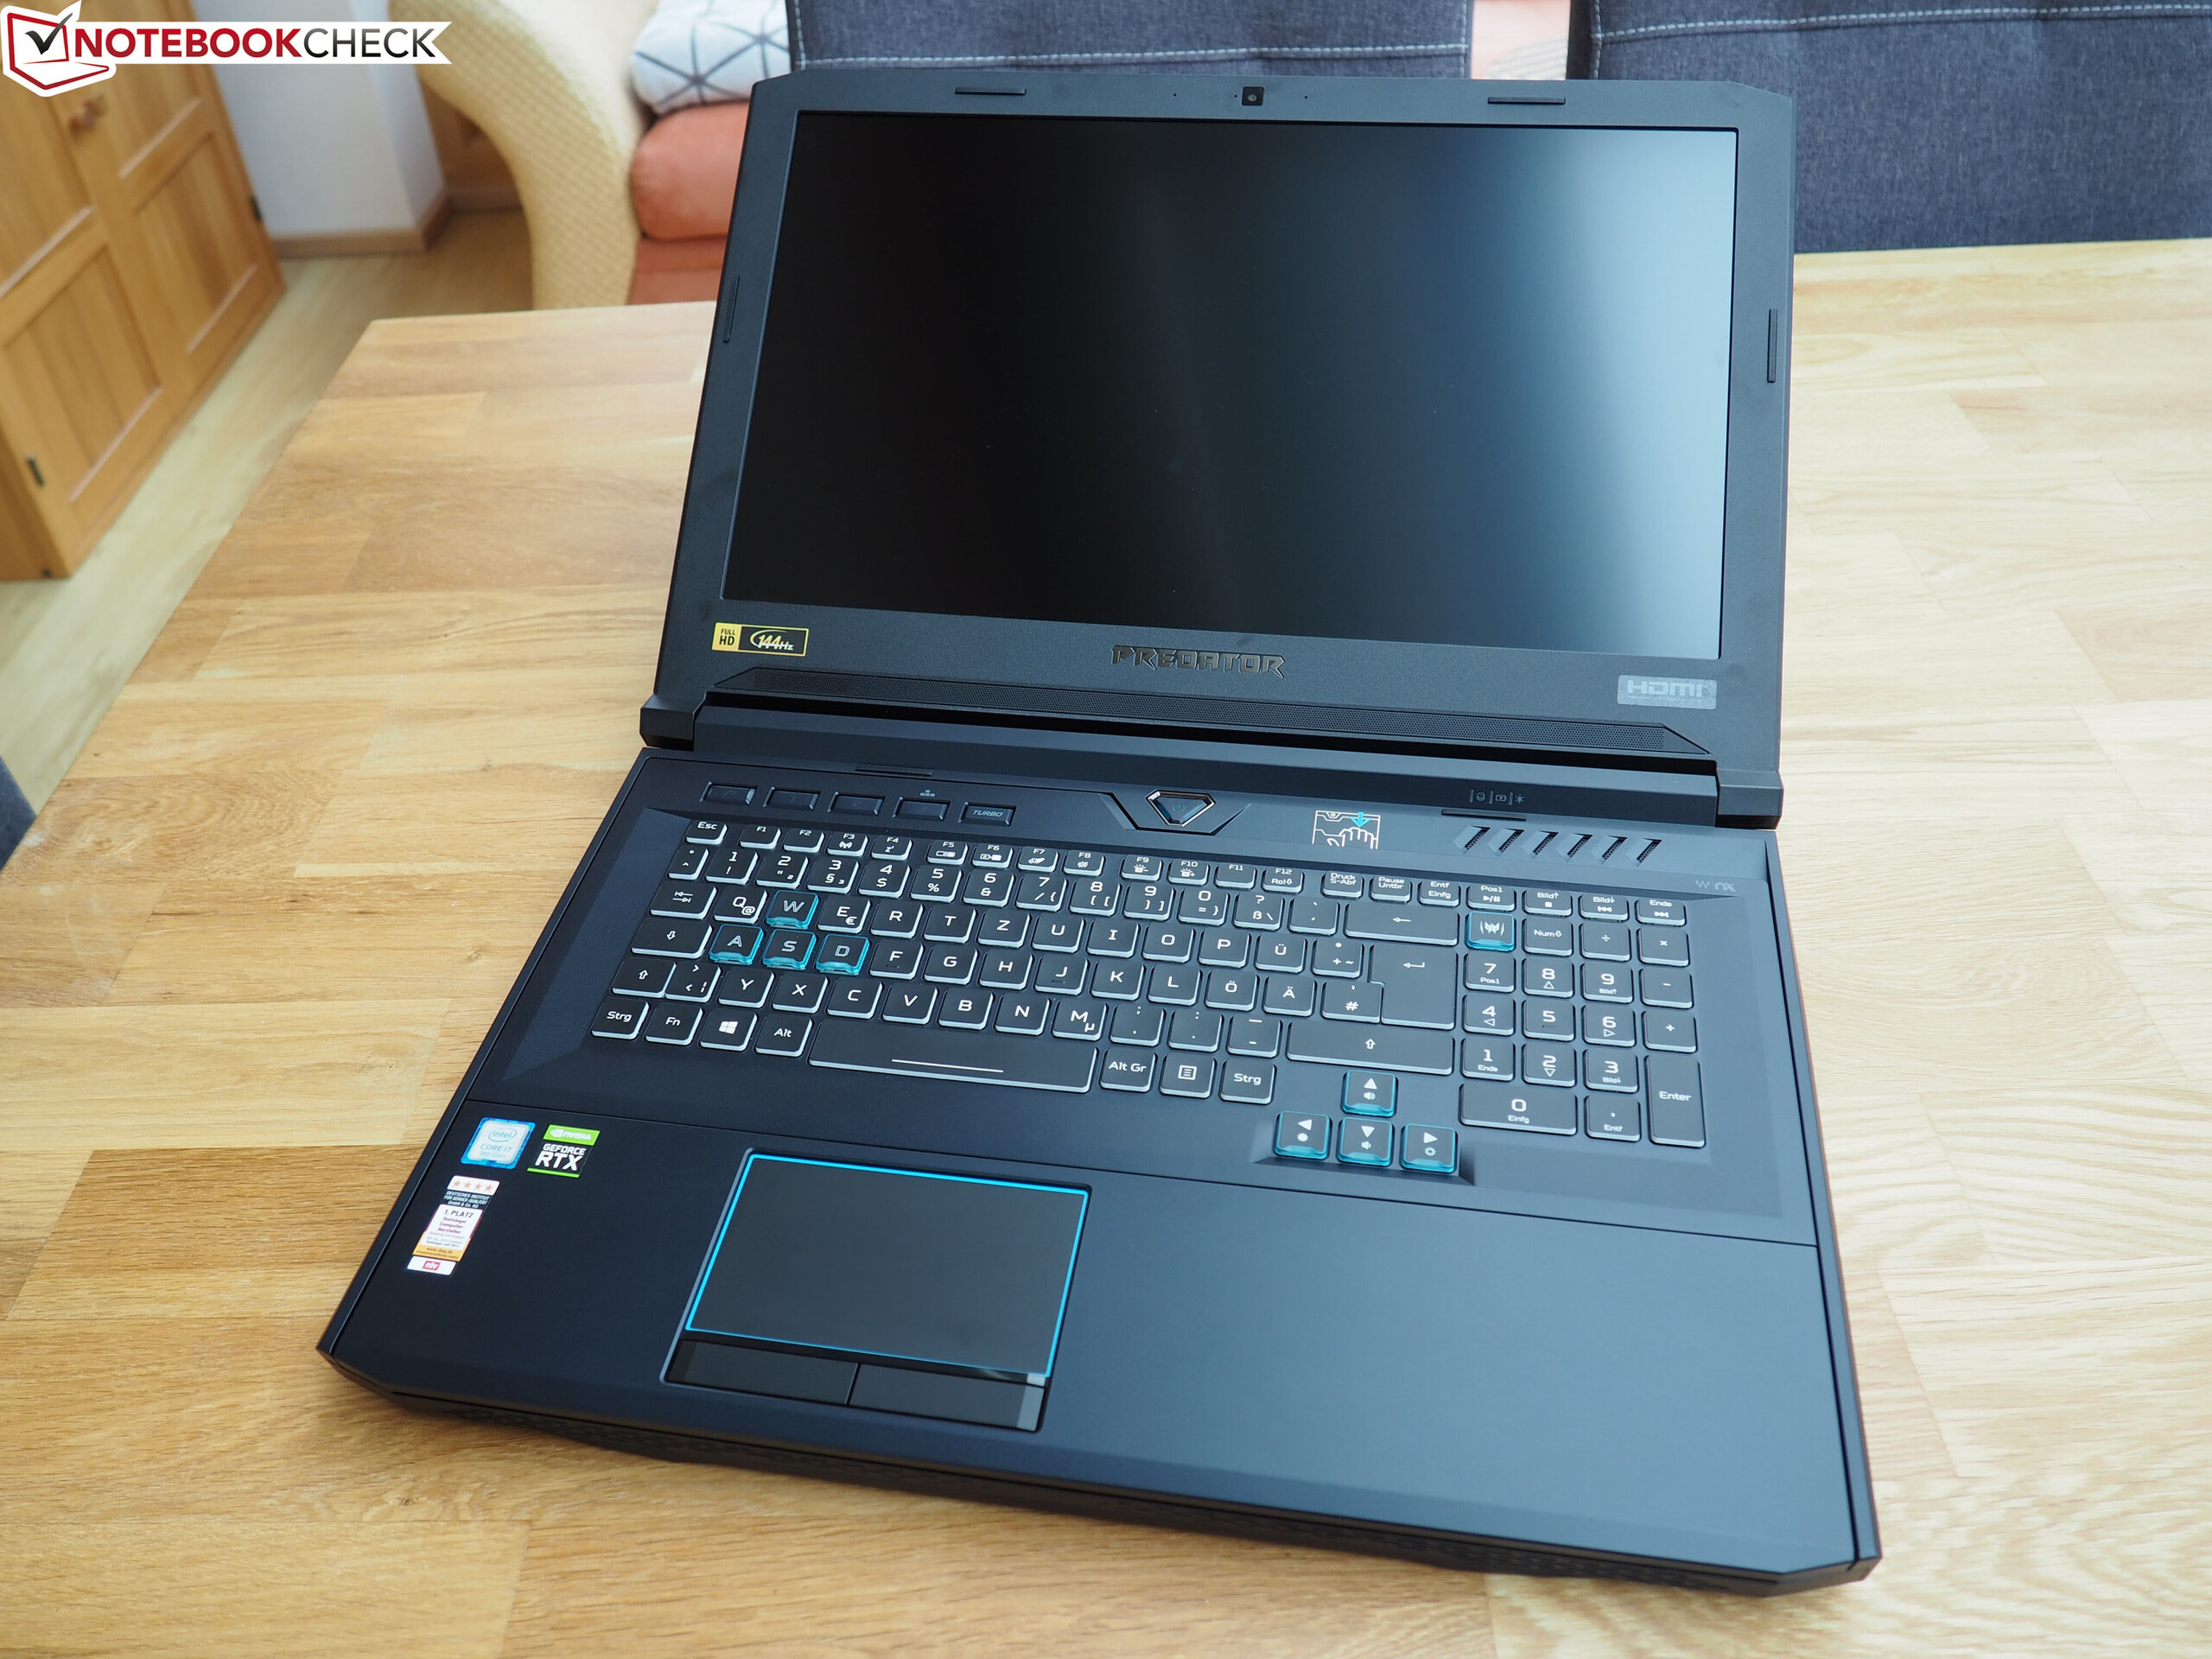
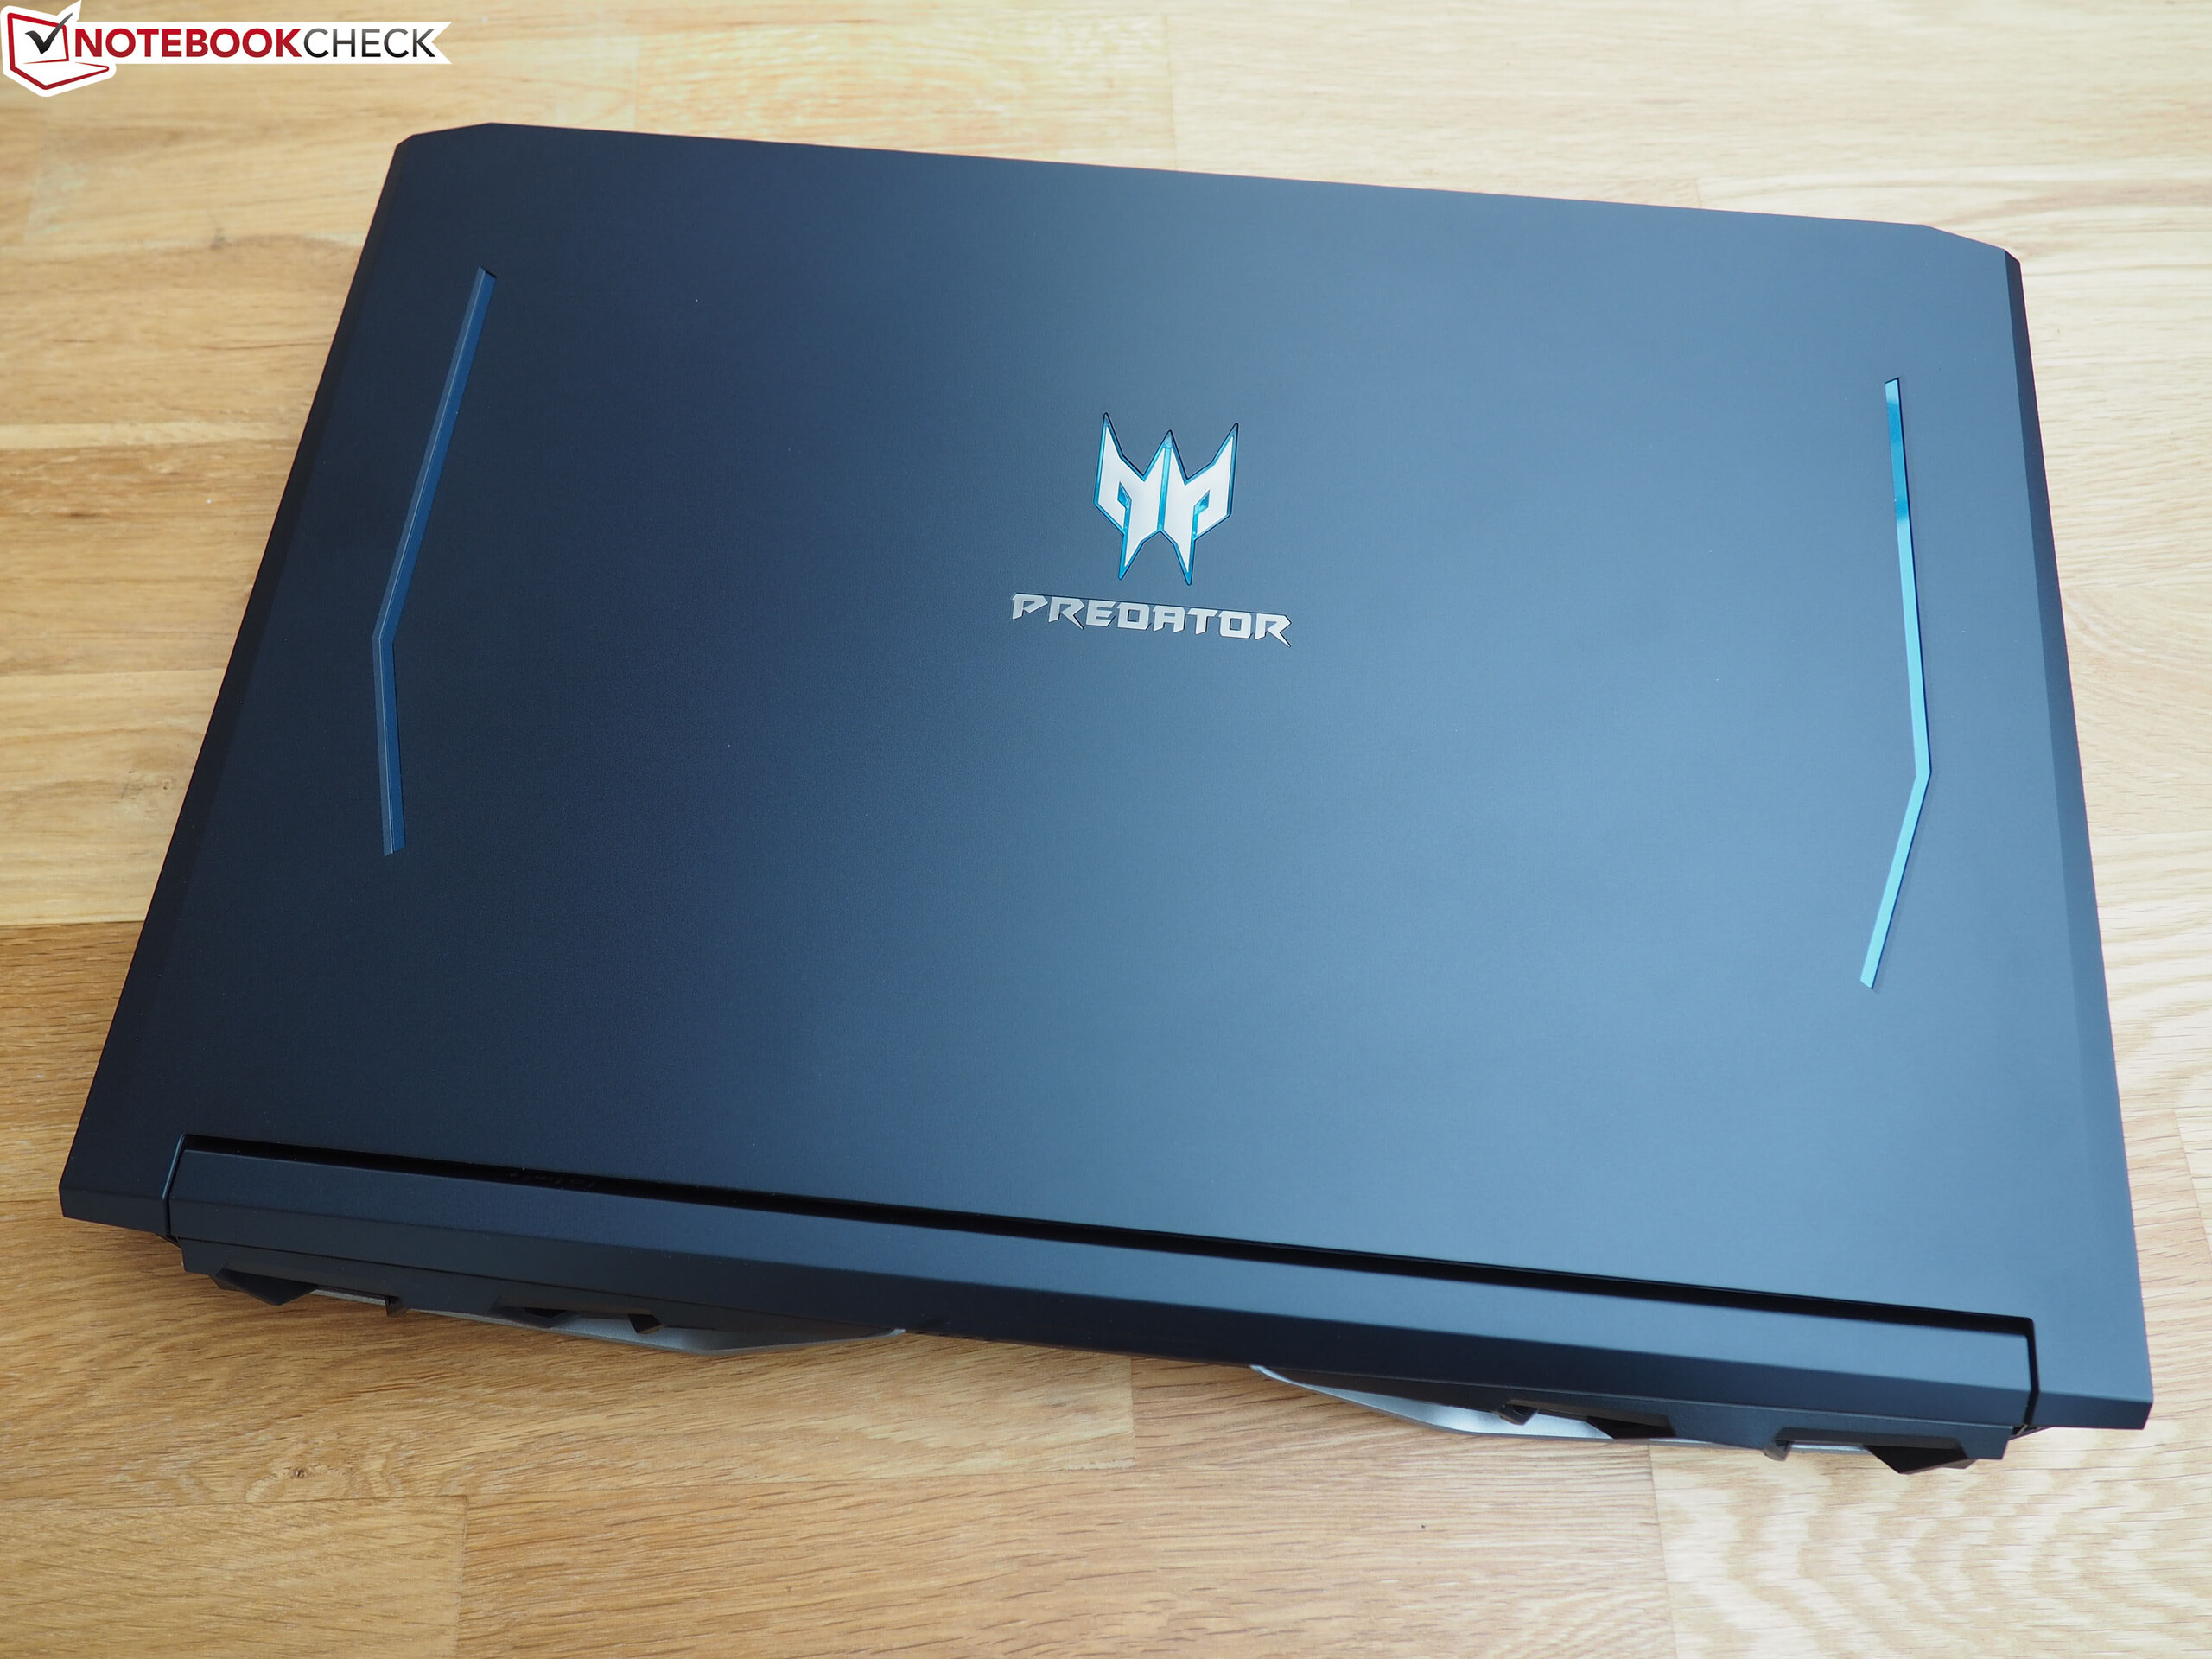
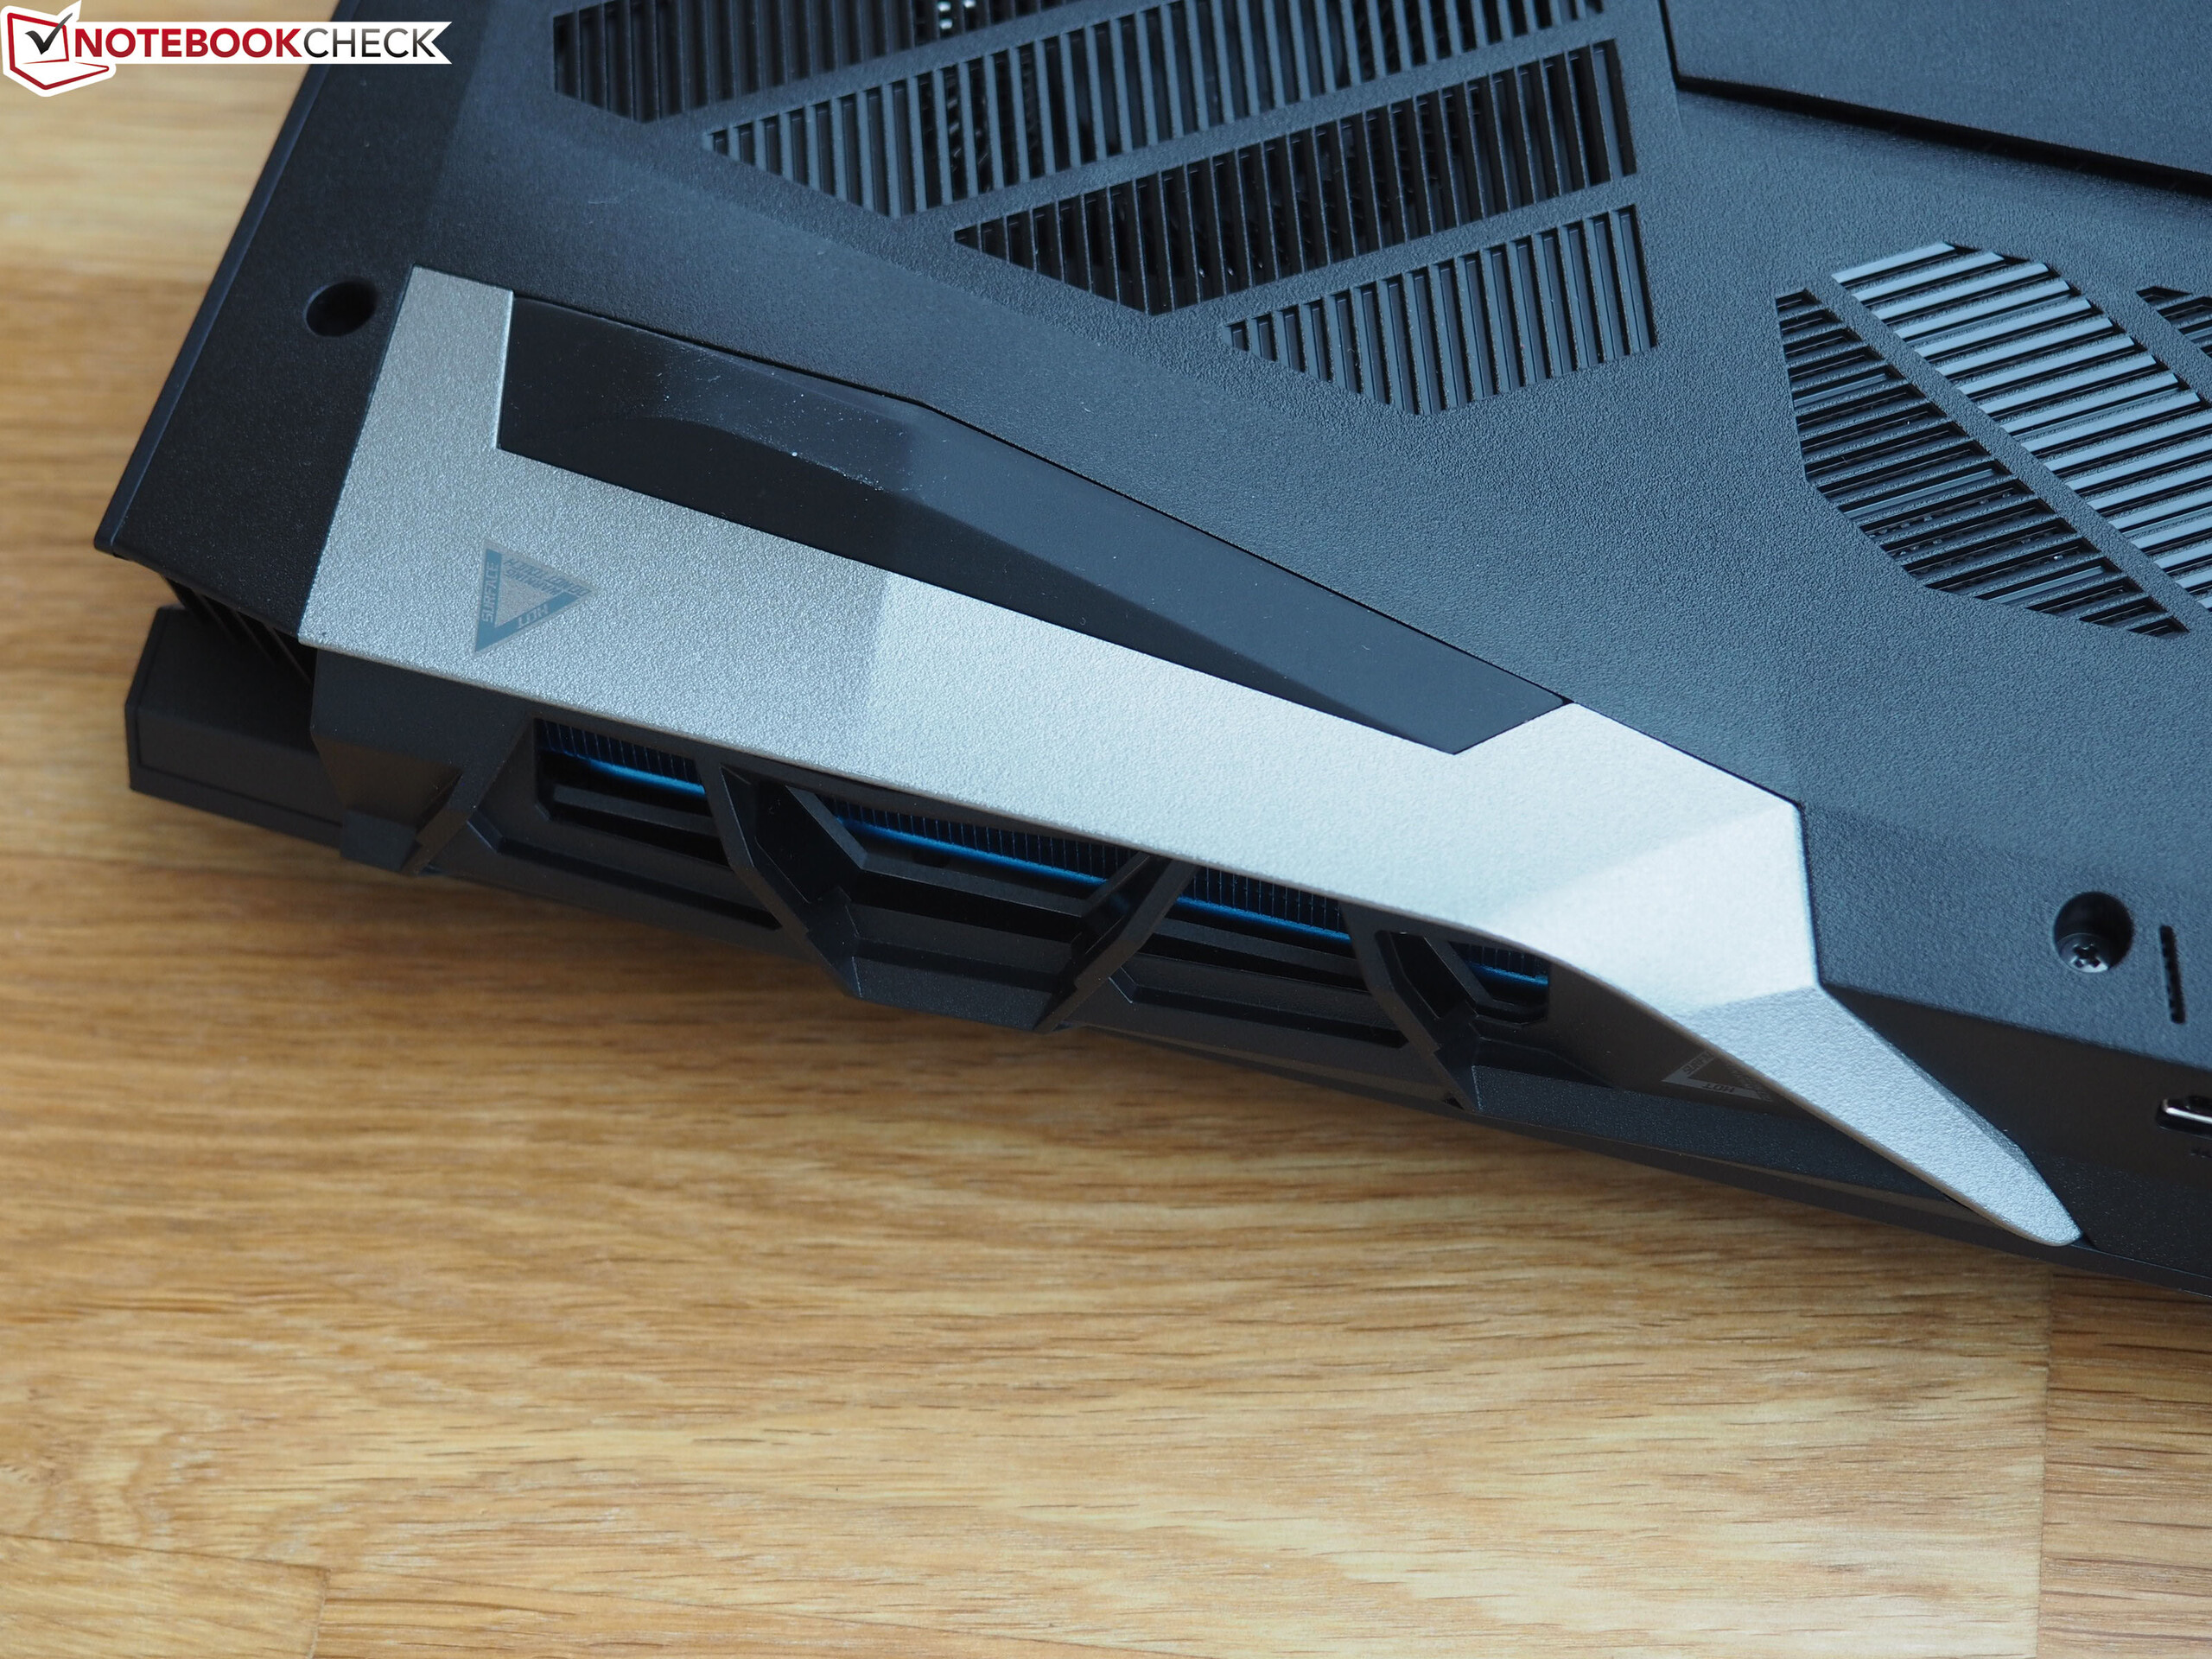
Acer could have chosen better material quality for its high-range gamer. At a price of $2500 some users might have expected metal surfaces. The Helios 700 is made entirely out of plastic. Its weight is considerable despite the missing aluminum surface: The 17-inch device weighs 4.8 kg. The competition, on the other hand, ranges from "only" 2.7 to 4.3 kg. The height of the device is average, although we consider 4.2 cm to be quite thick. We were rather disappointed by the device's general footprint at 43 x 29.2 cm. This is rather large even for a 17-inch notebook. As the Helios 700 does not have a modern slim-bezel design and instead has very wide screen bezels (reminiscent of older notebook models), it has a low screen-to-body ratio of only 65%.
On the whole, the case appears comparatively plump and unwieldy. We cannot give it top marks due to the strong creaking it produces when warping the rather unstable display lid. The pressure-resistant base unit does a lot better in terms of stability.
Connectivity
Ports
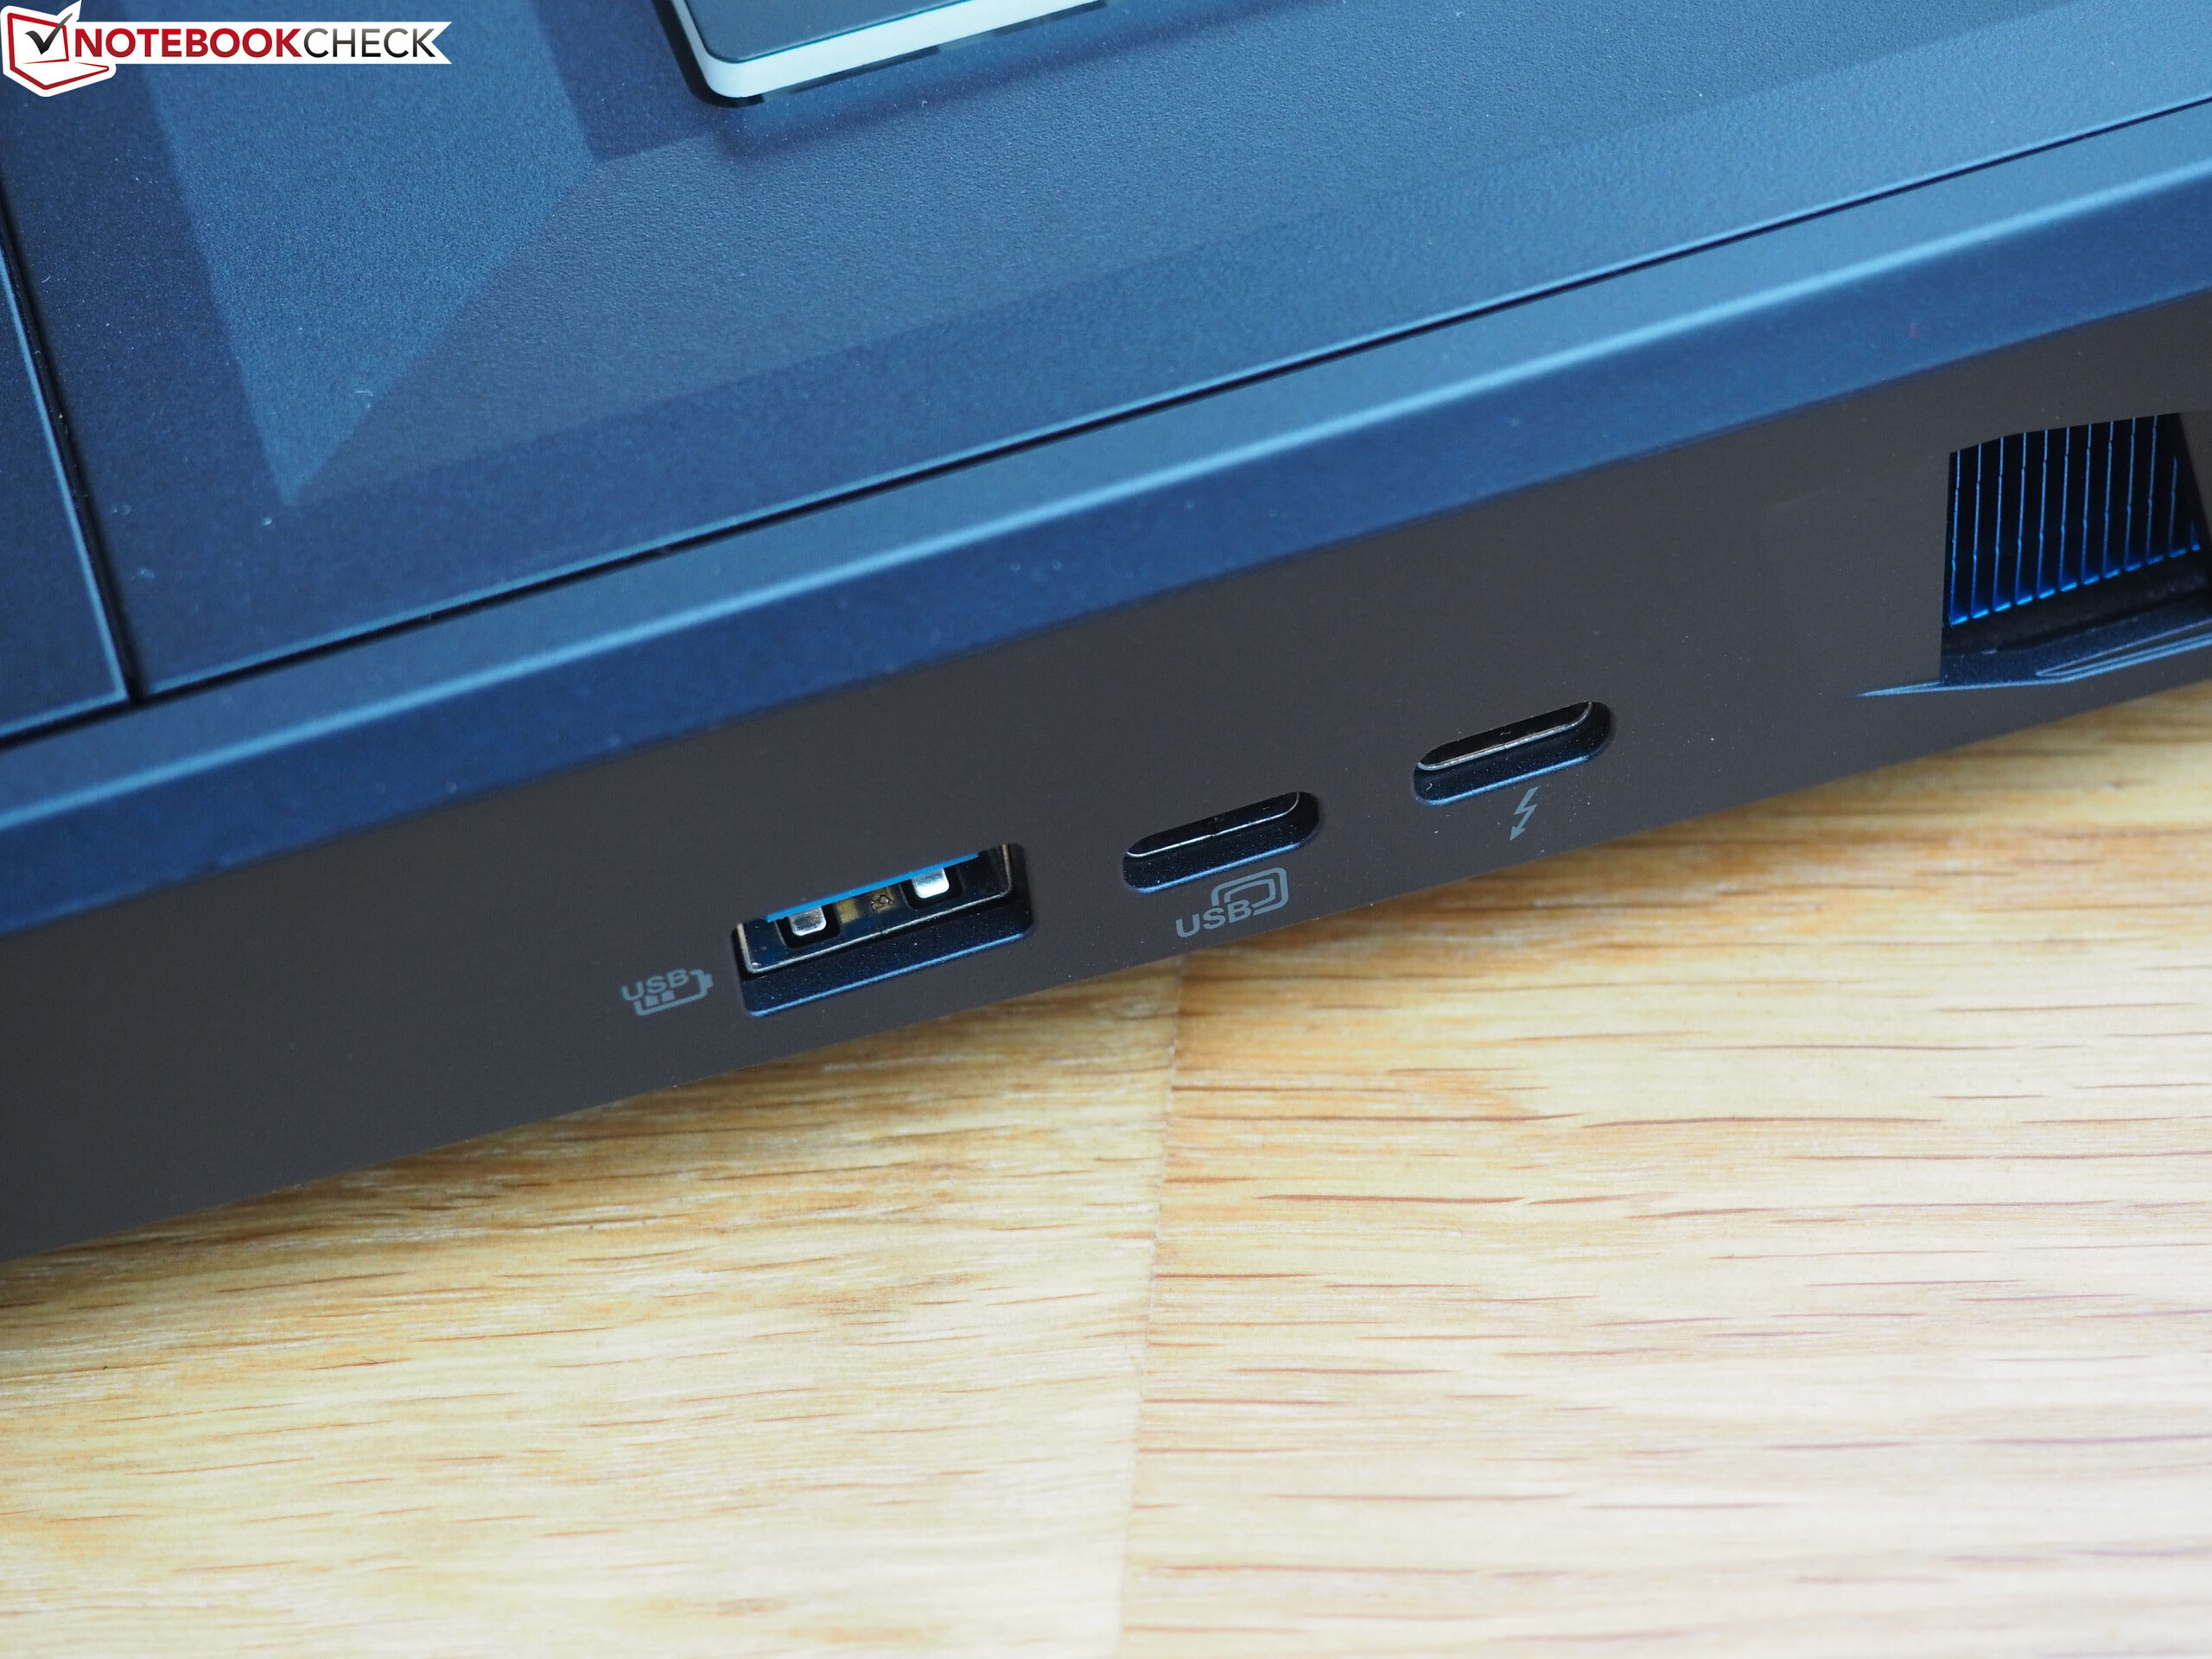
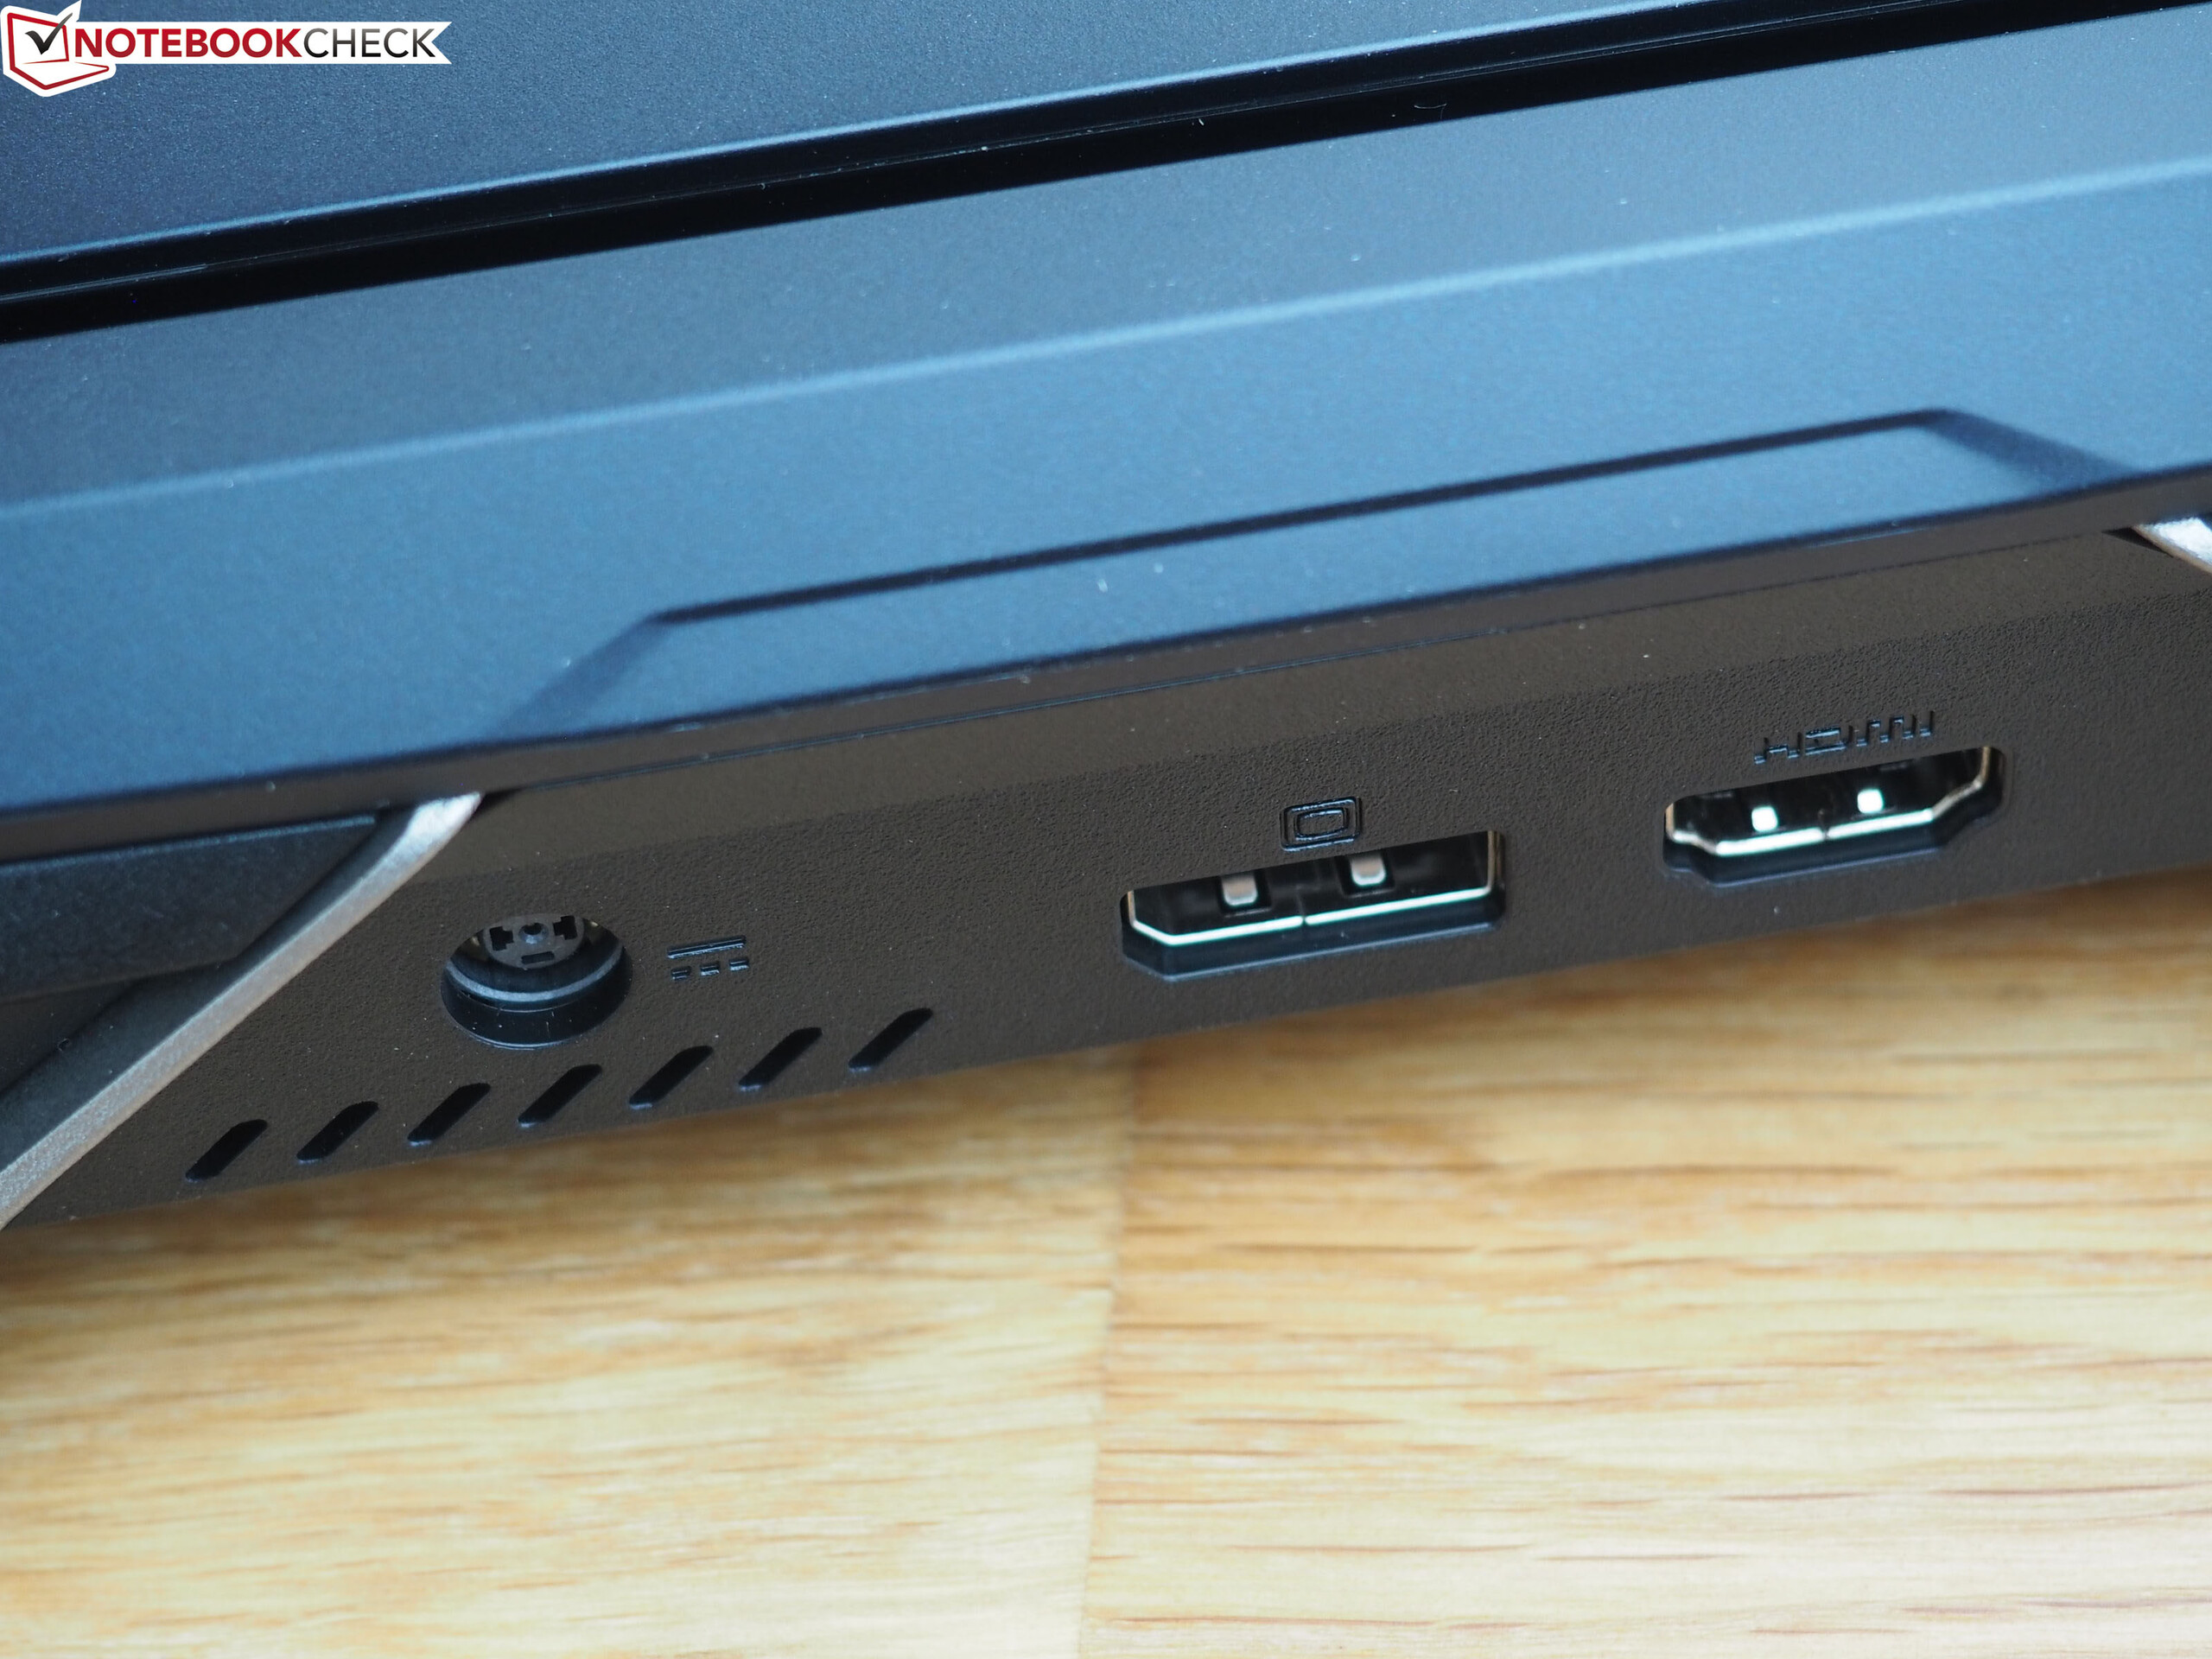
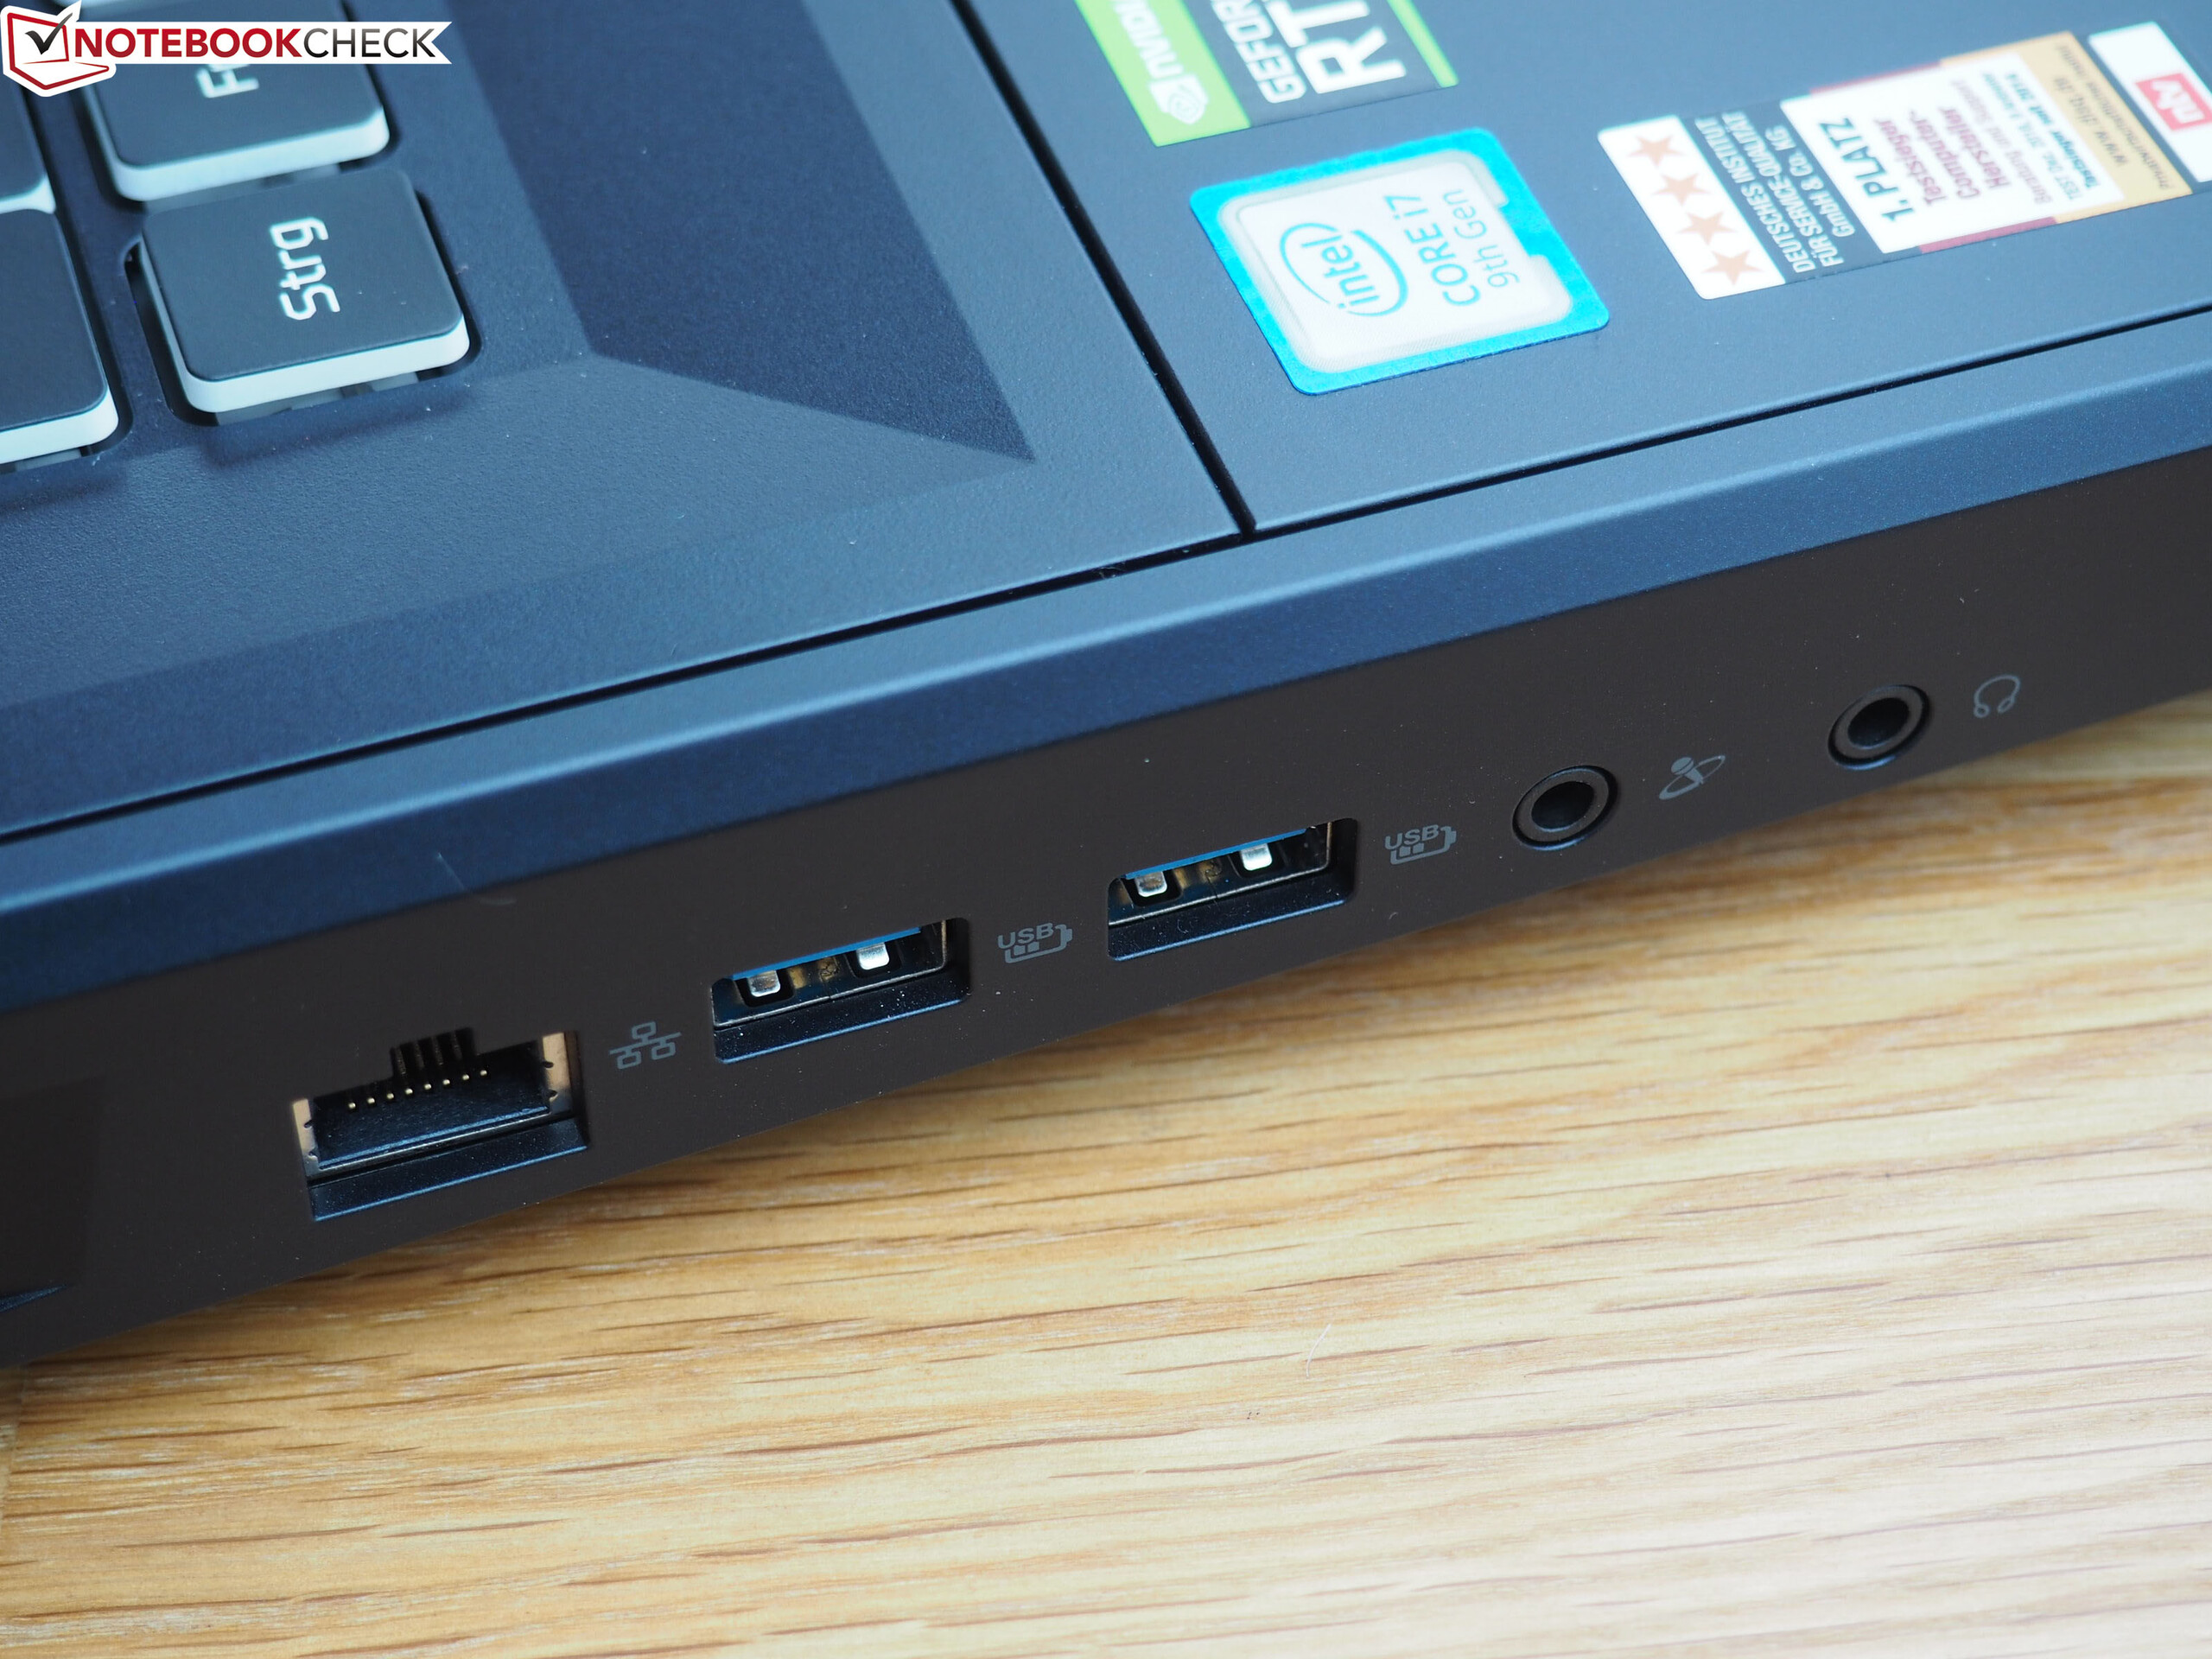
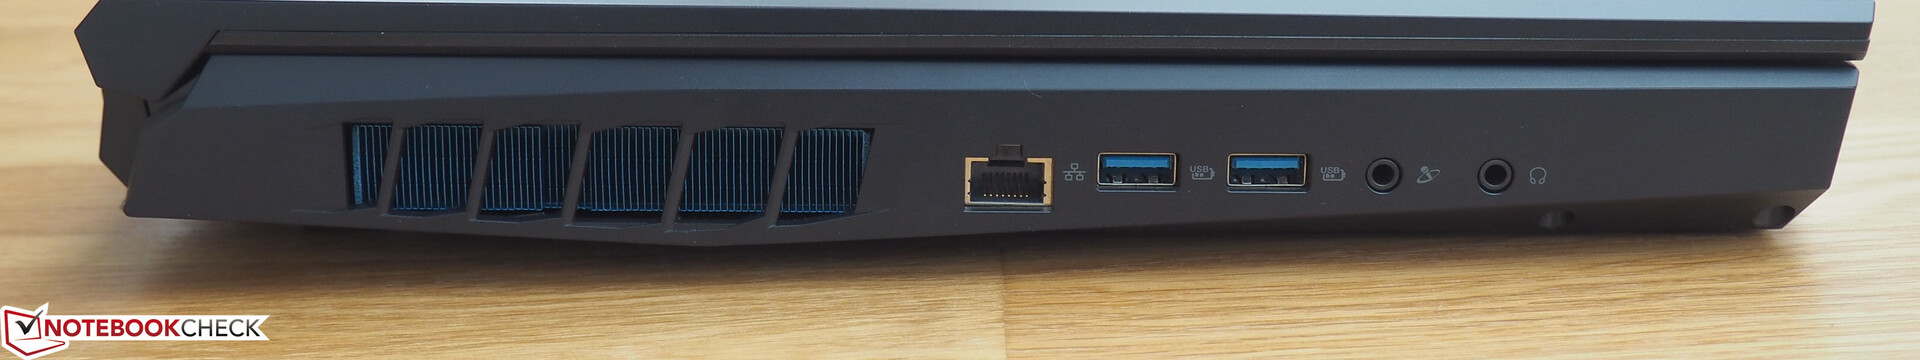
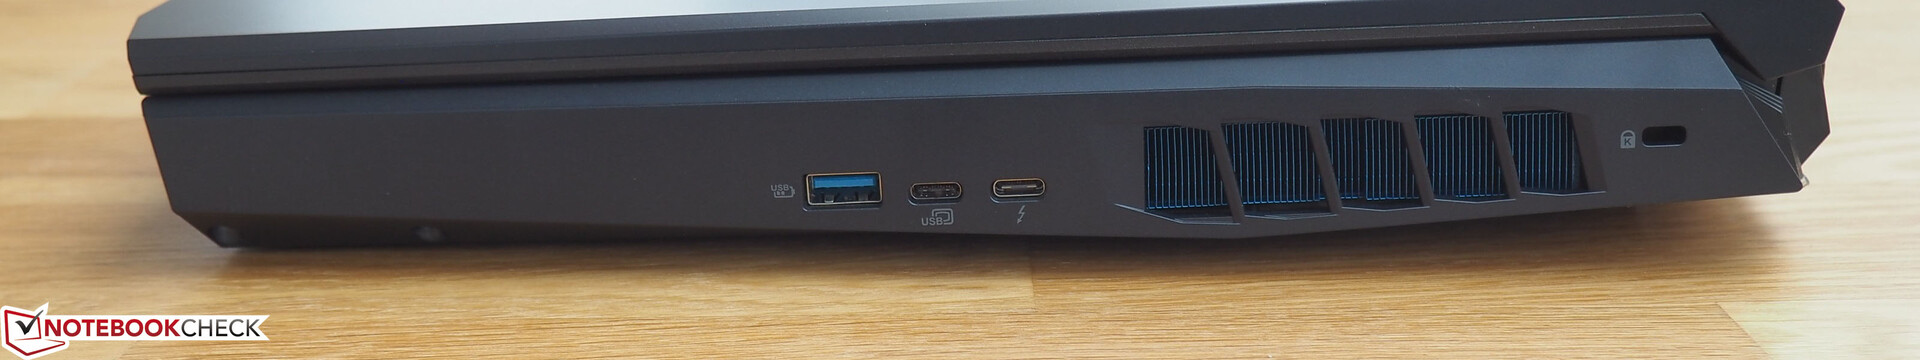
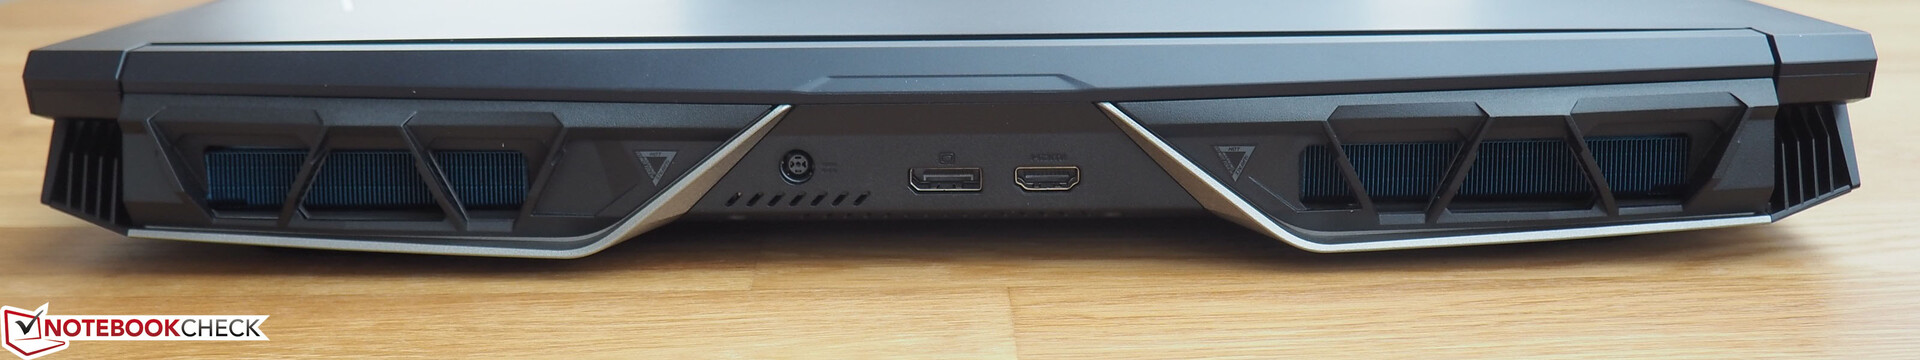
We would like to praise Acer for its wide port selection. While the Helios 700 does not feature an SD card reader (why, we cannot say), it has everything else a gamer could desire, from two audio jacks and two digital video outputs (HDMI and DisplayPort) to an RJ45 port and a Kensington lock. The whole package is completed with five USB 3.1 Gen 2 ports, two of which are in Type-C format (with one supporting Thunderbolt 3).
The distribution of the ports is mixed. While positioning some ports along the back is a good idea to free up space for the use of a physical mouse, the connectors on the sides are very far to the front, basically counteracting this advantage.
Communication
Wireless communication is taken care of by the very up-to-date Killer module Wi-Fi 6 AX1650x, which offers great speeds both when sending and when receiving data. It positions the Helios 700 on third place in our comparison field (only the MSI GT76 9SD and the HP Omen 17 are a little faster). The Killer Controller E3000 offers similar cable-based network speeds.
Maintenance
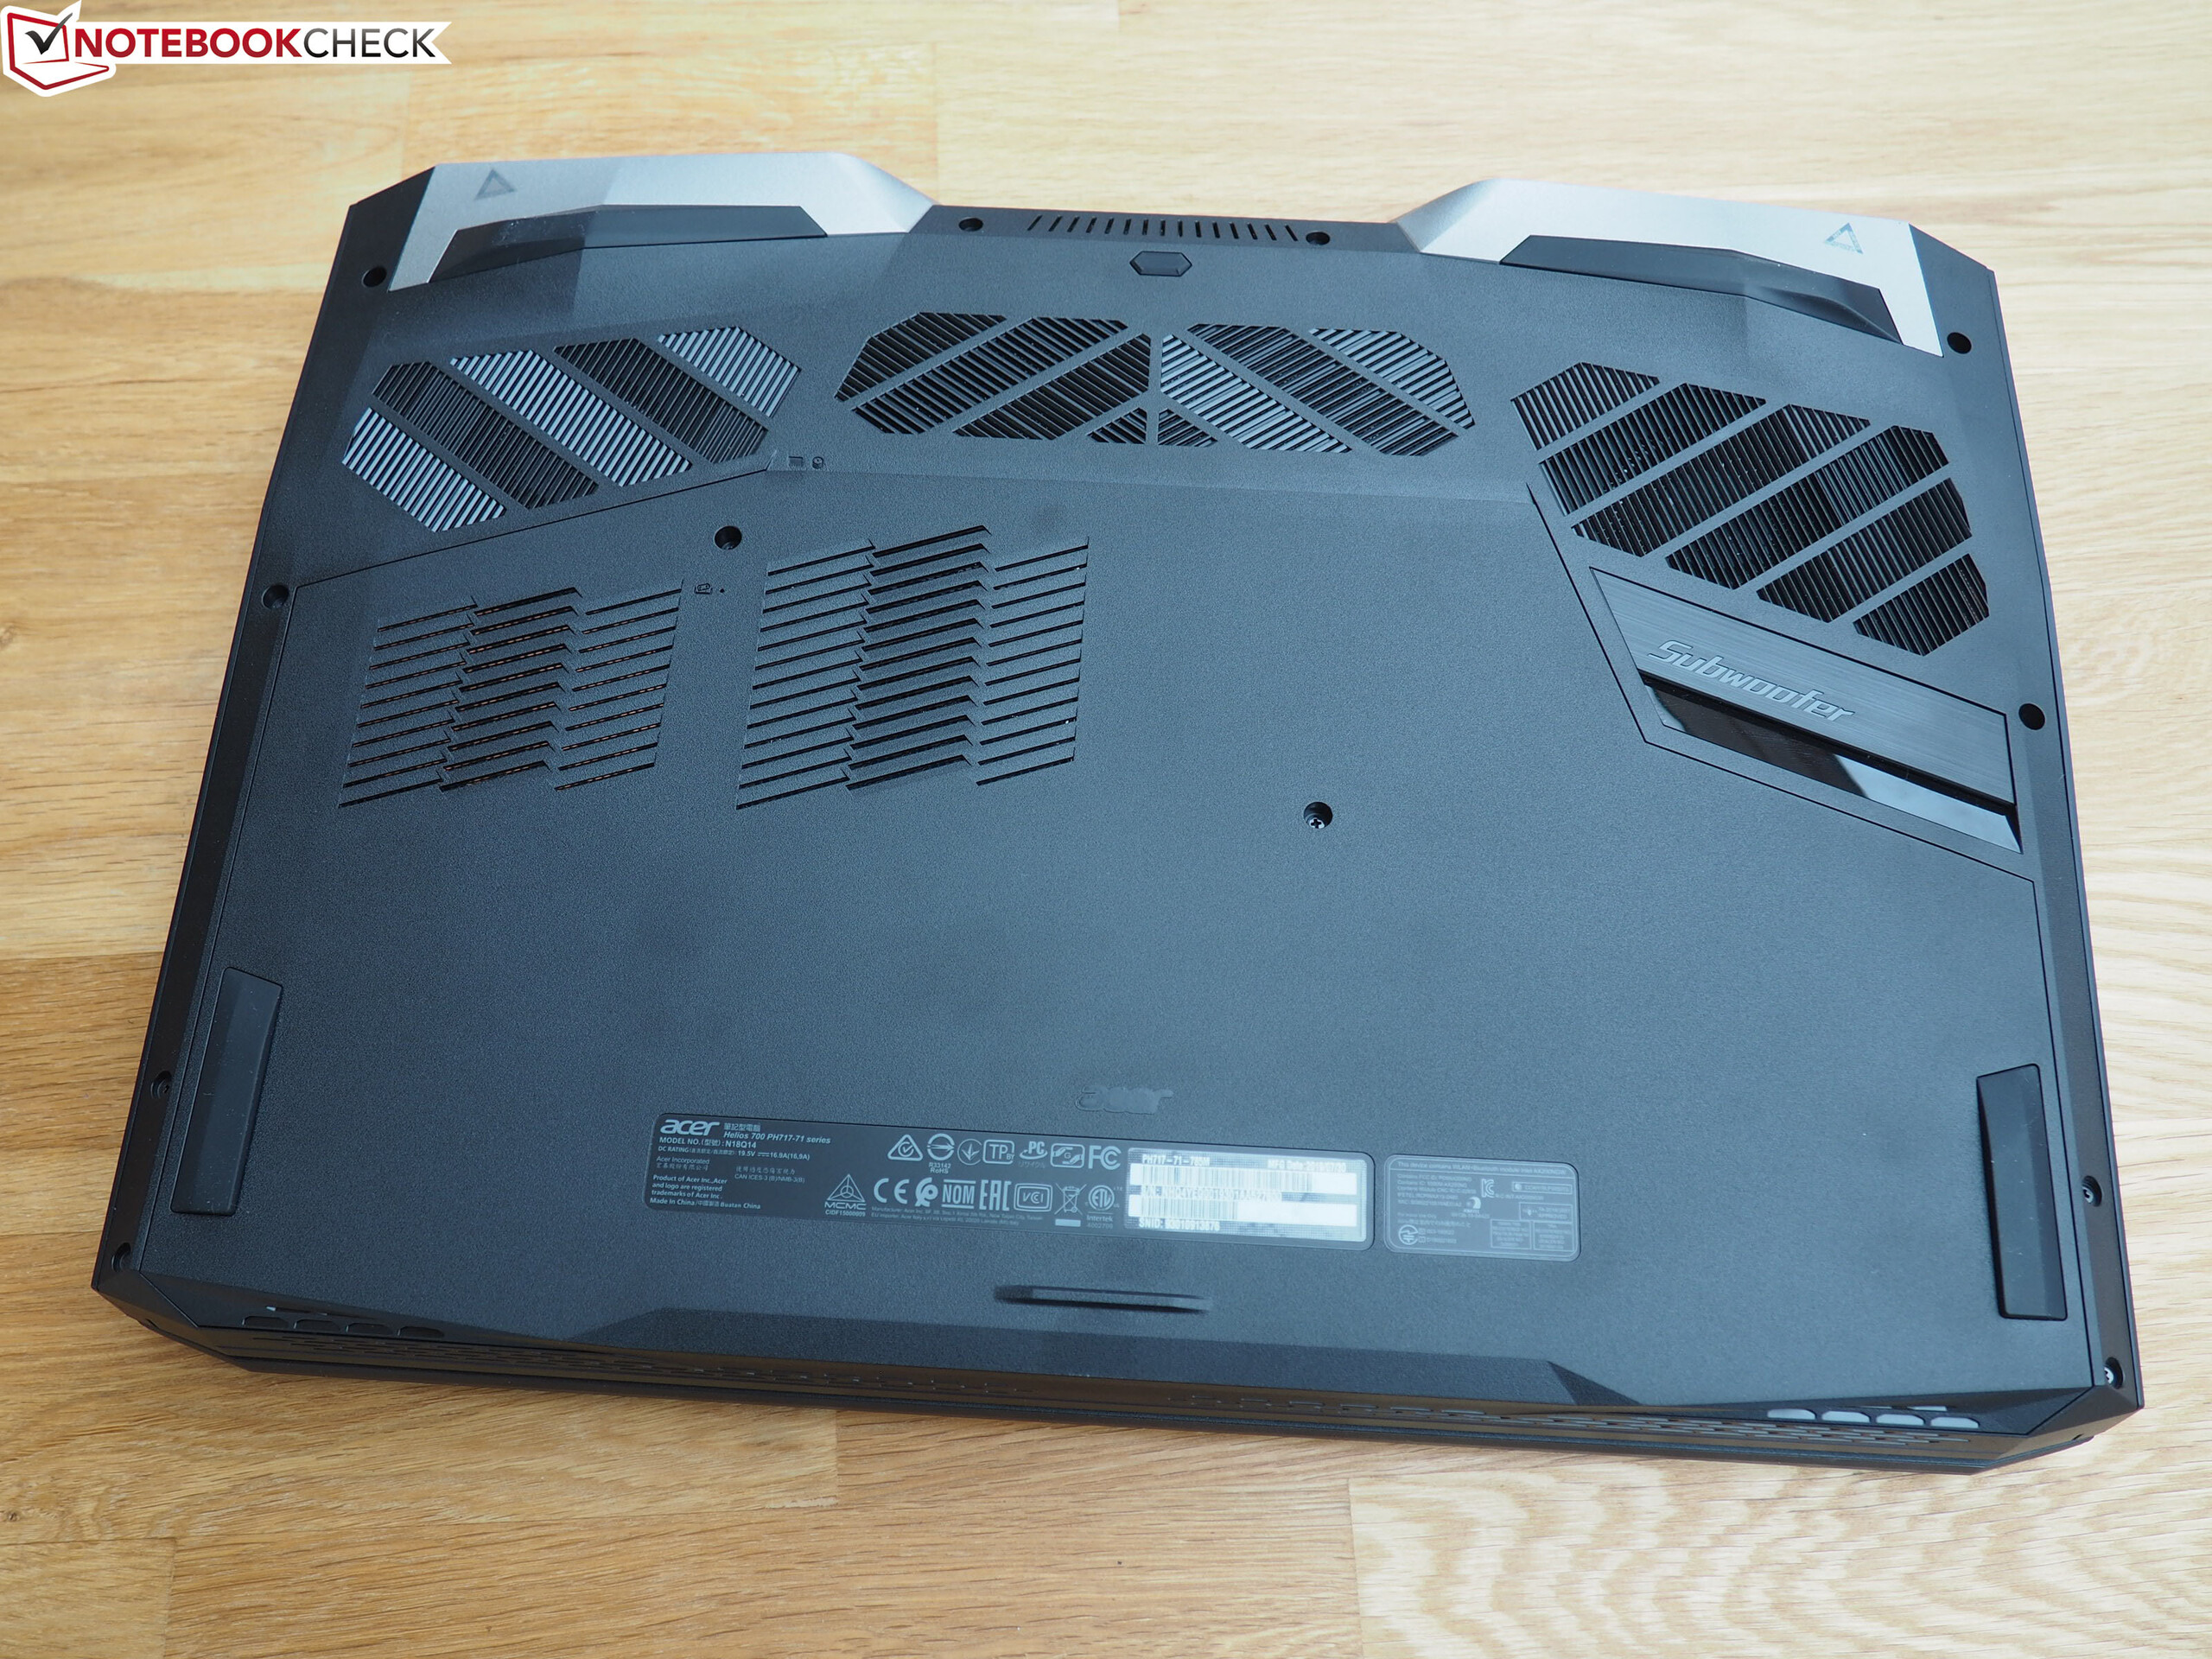
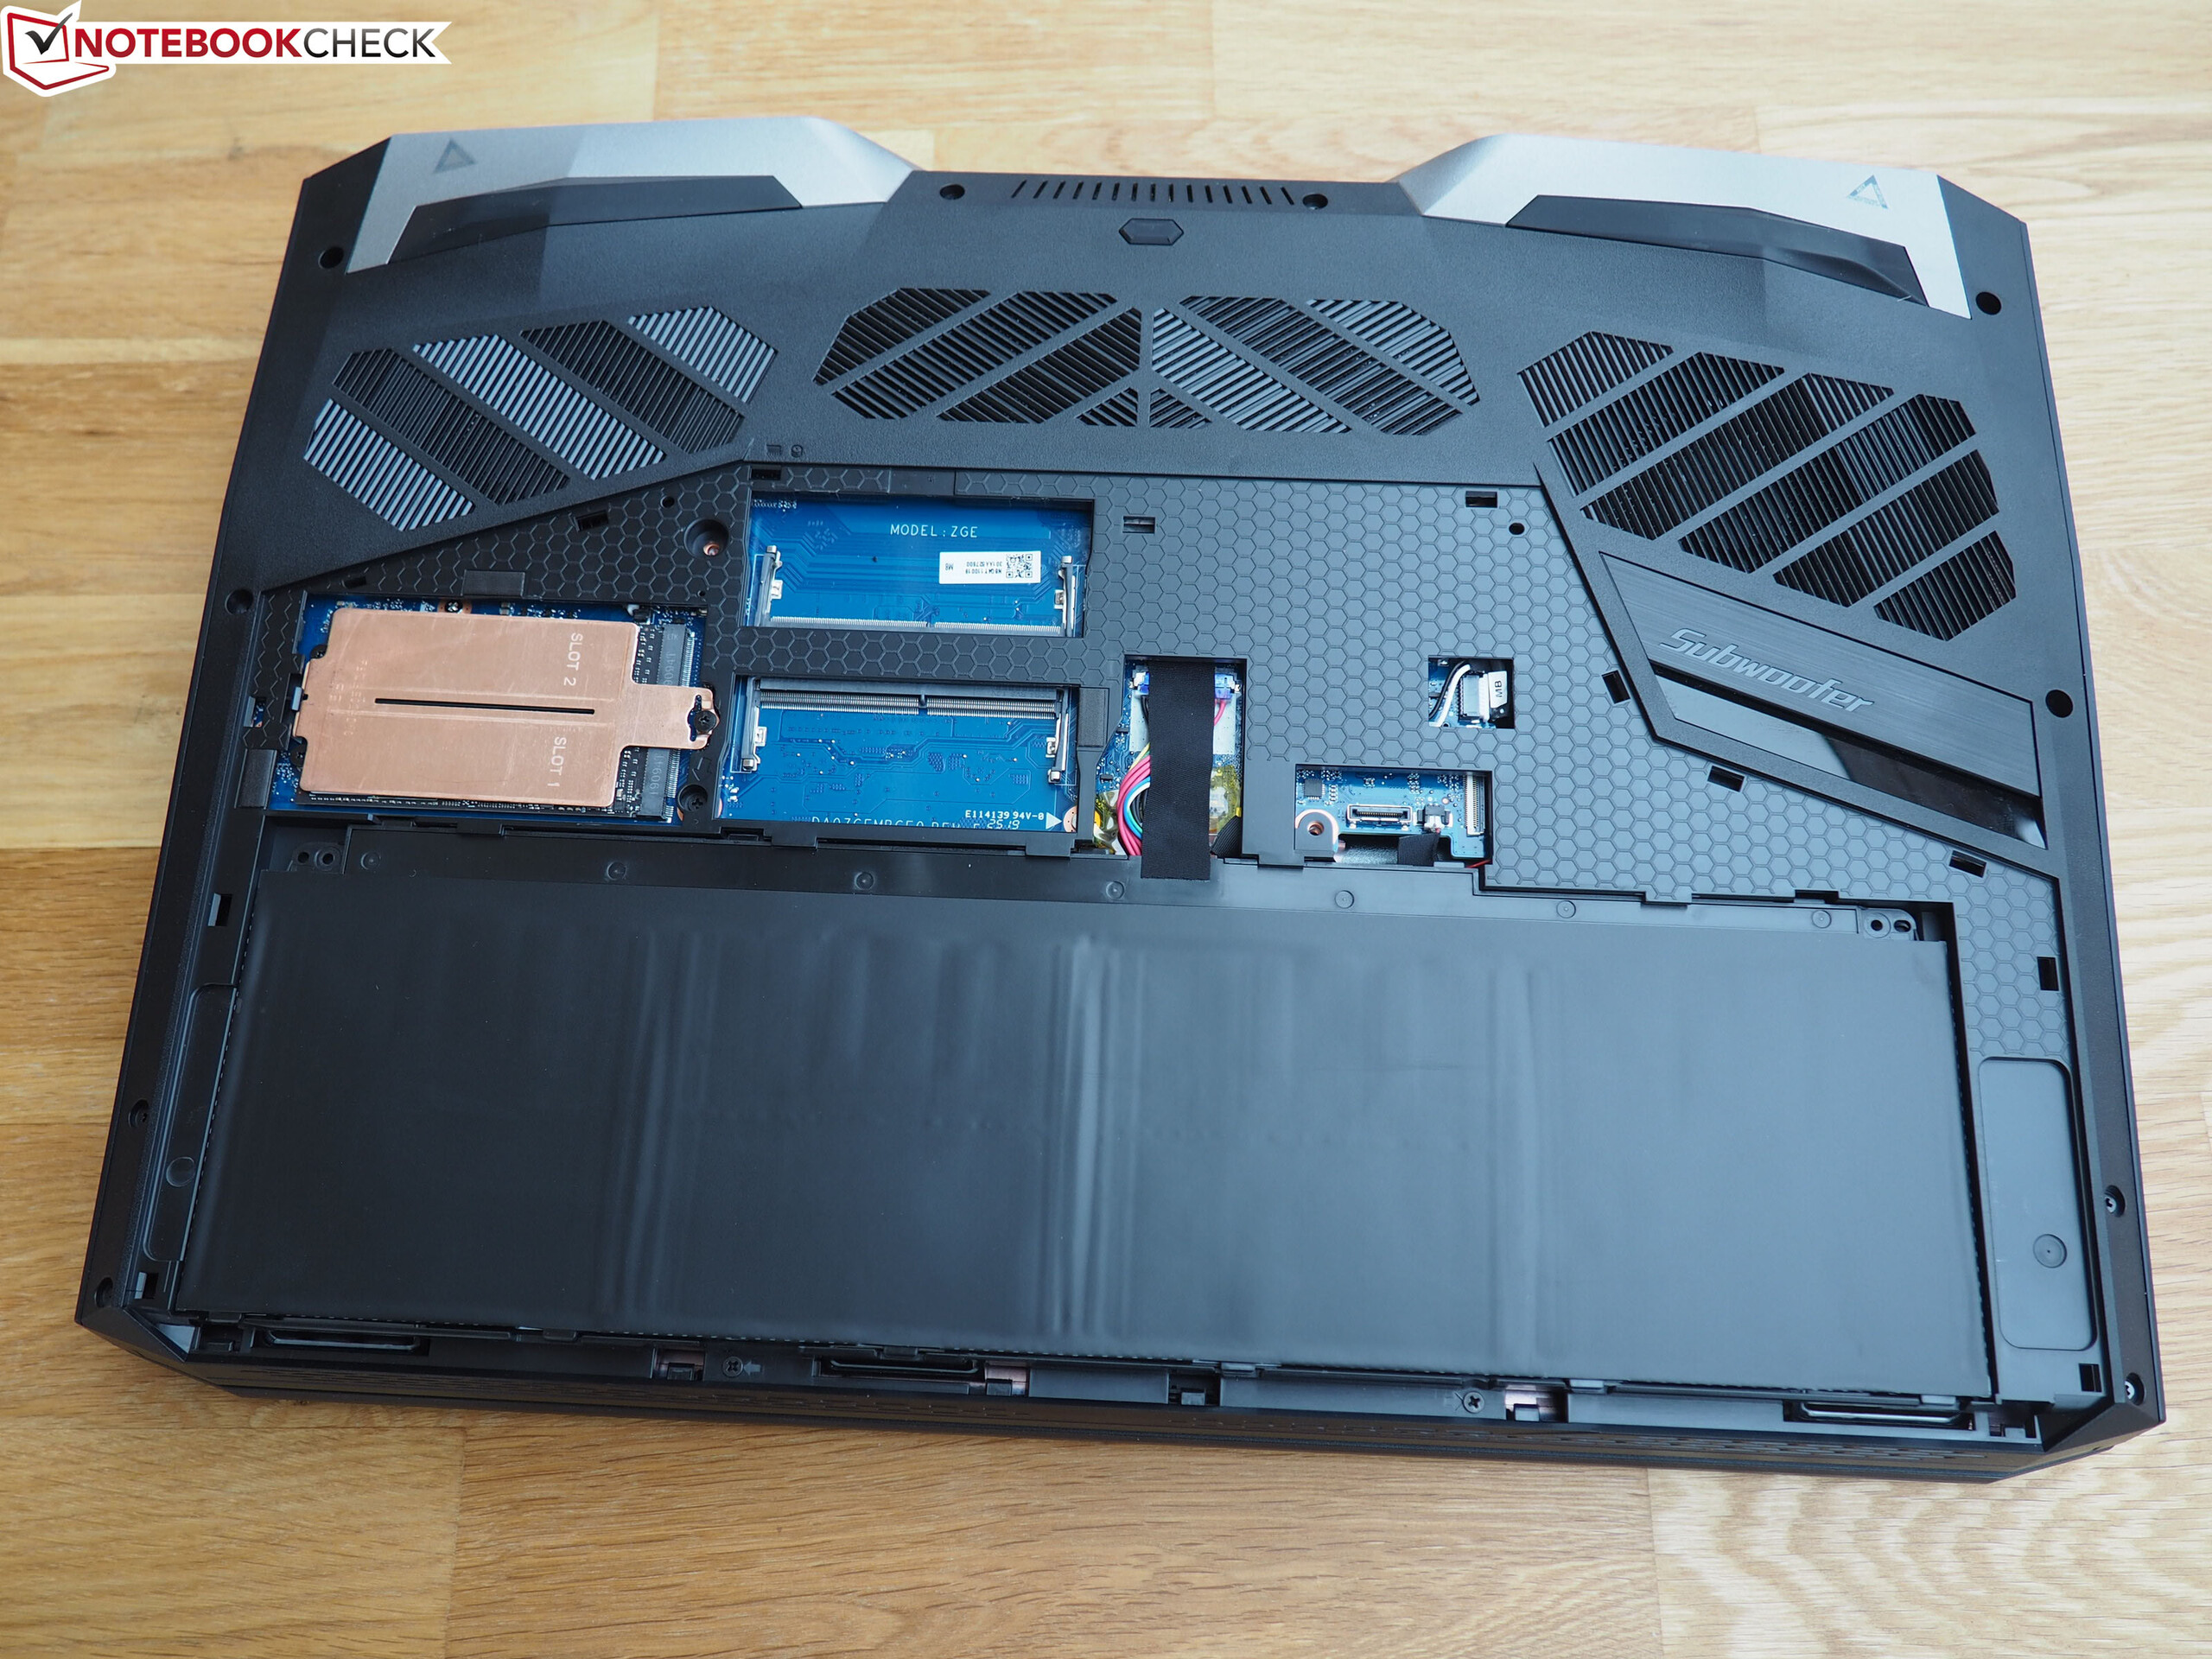
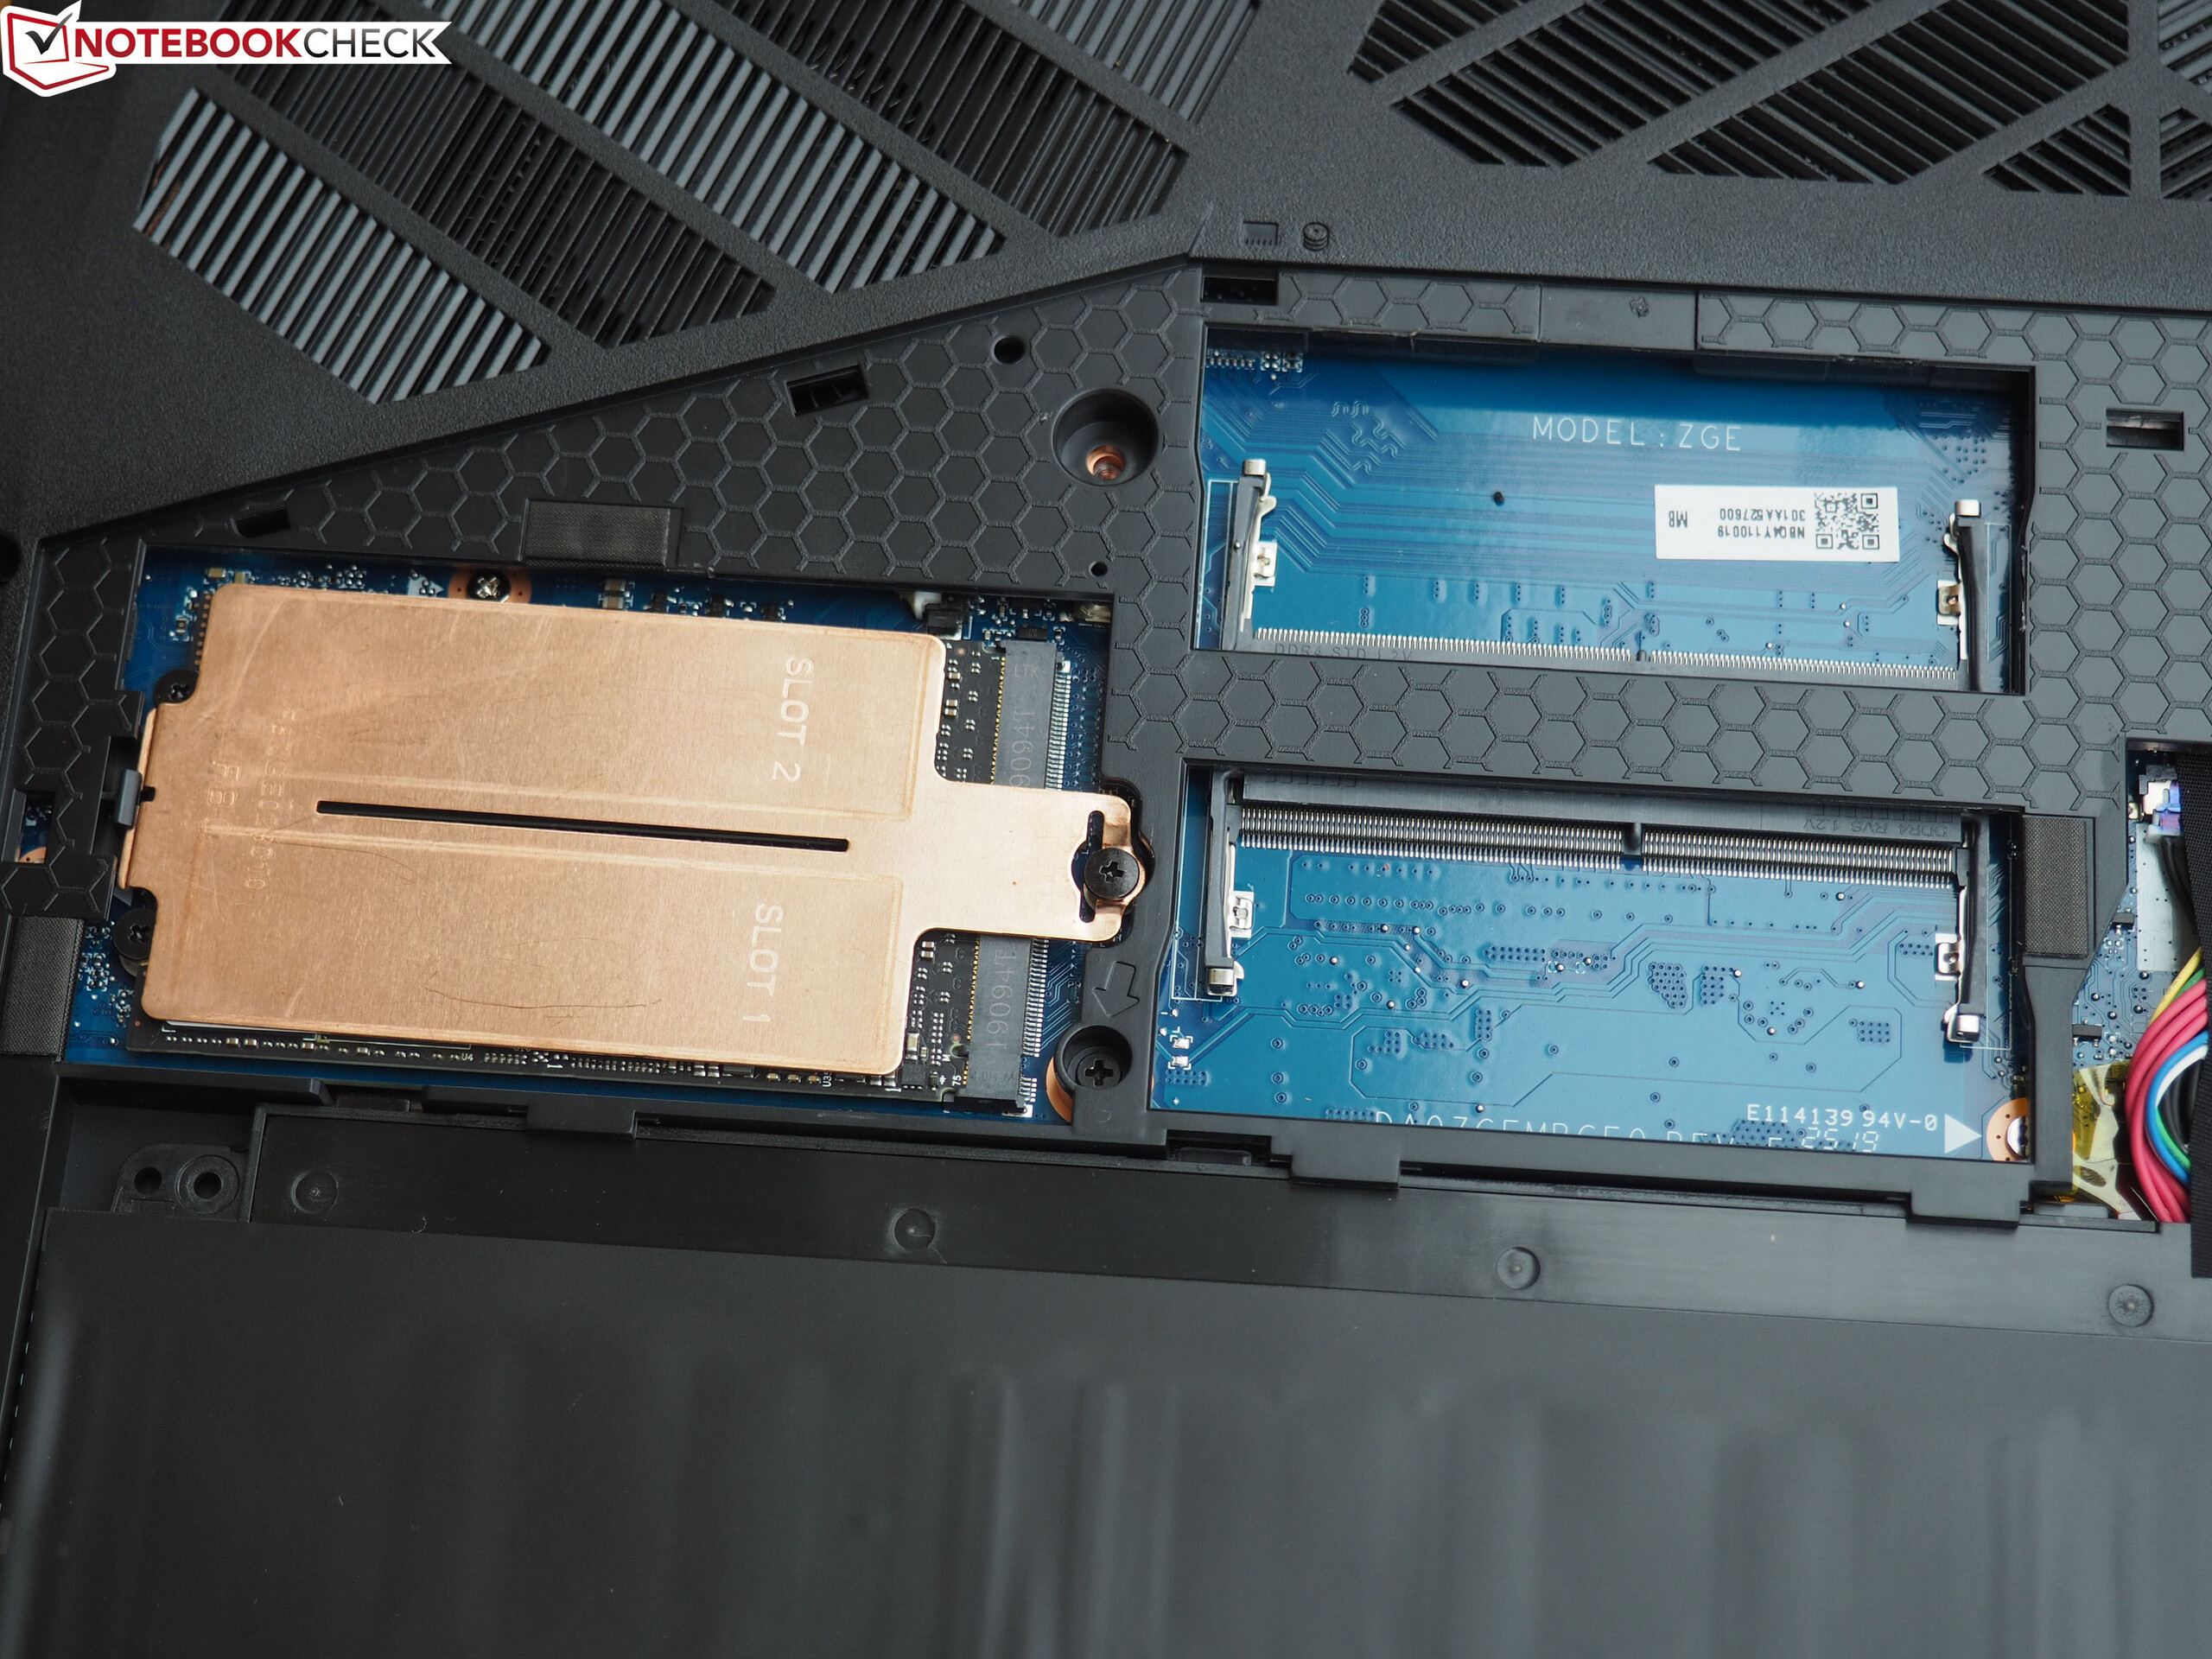
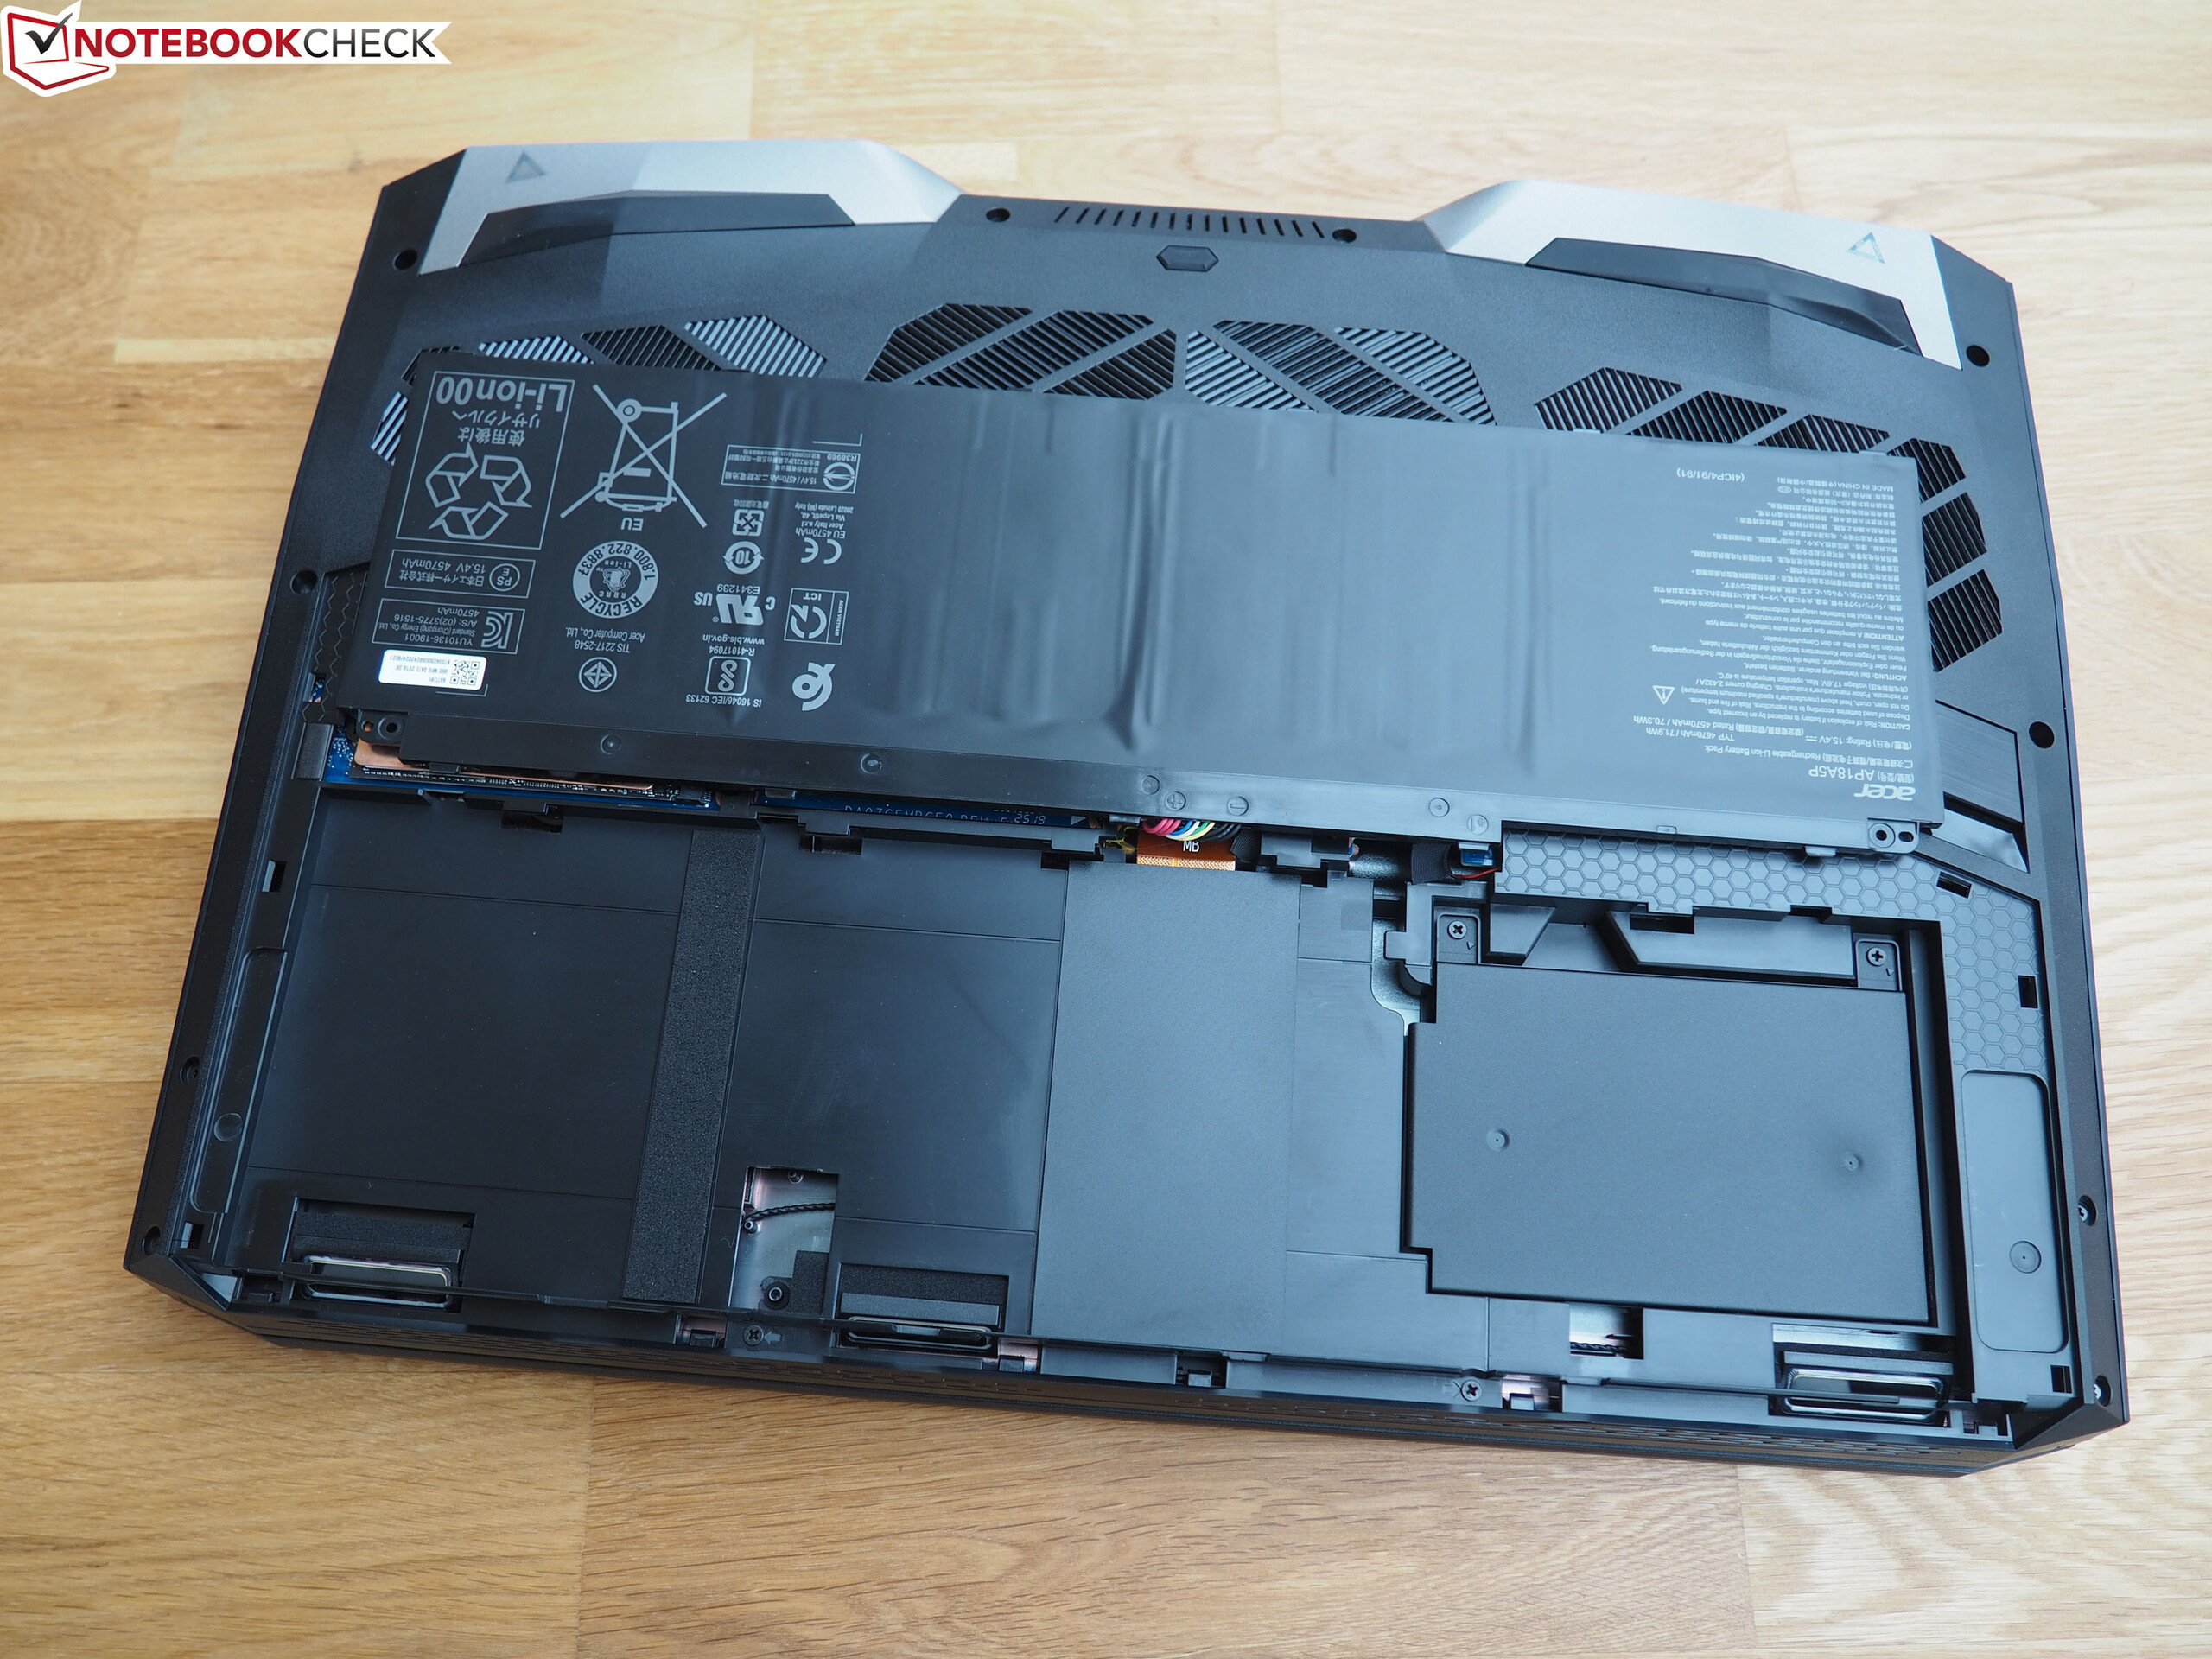
Acer has two maintenance levels. While users can access the battery, the secondary (currently empty) RAM slots and the storage bays (2x M.2 and 1x 2.5-inch) via a maintenance hatch, which only requires loosening two screws, they will have to remove the entire bottom cover to get to the remaining hardware. We decided not to try this out on the device that was provided to us for security reasons.
Accessories
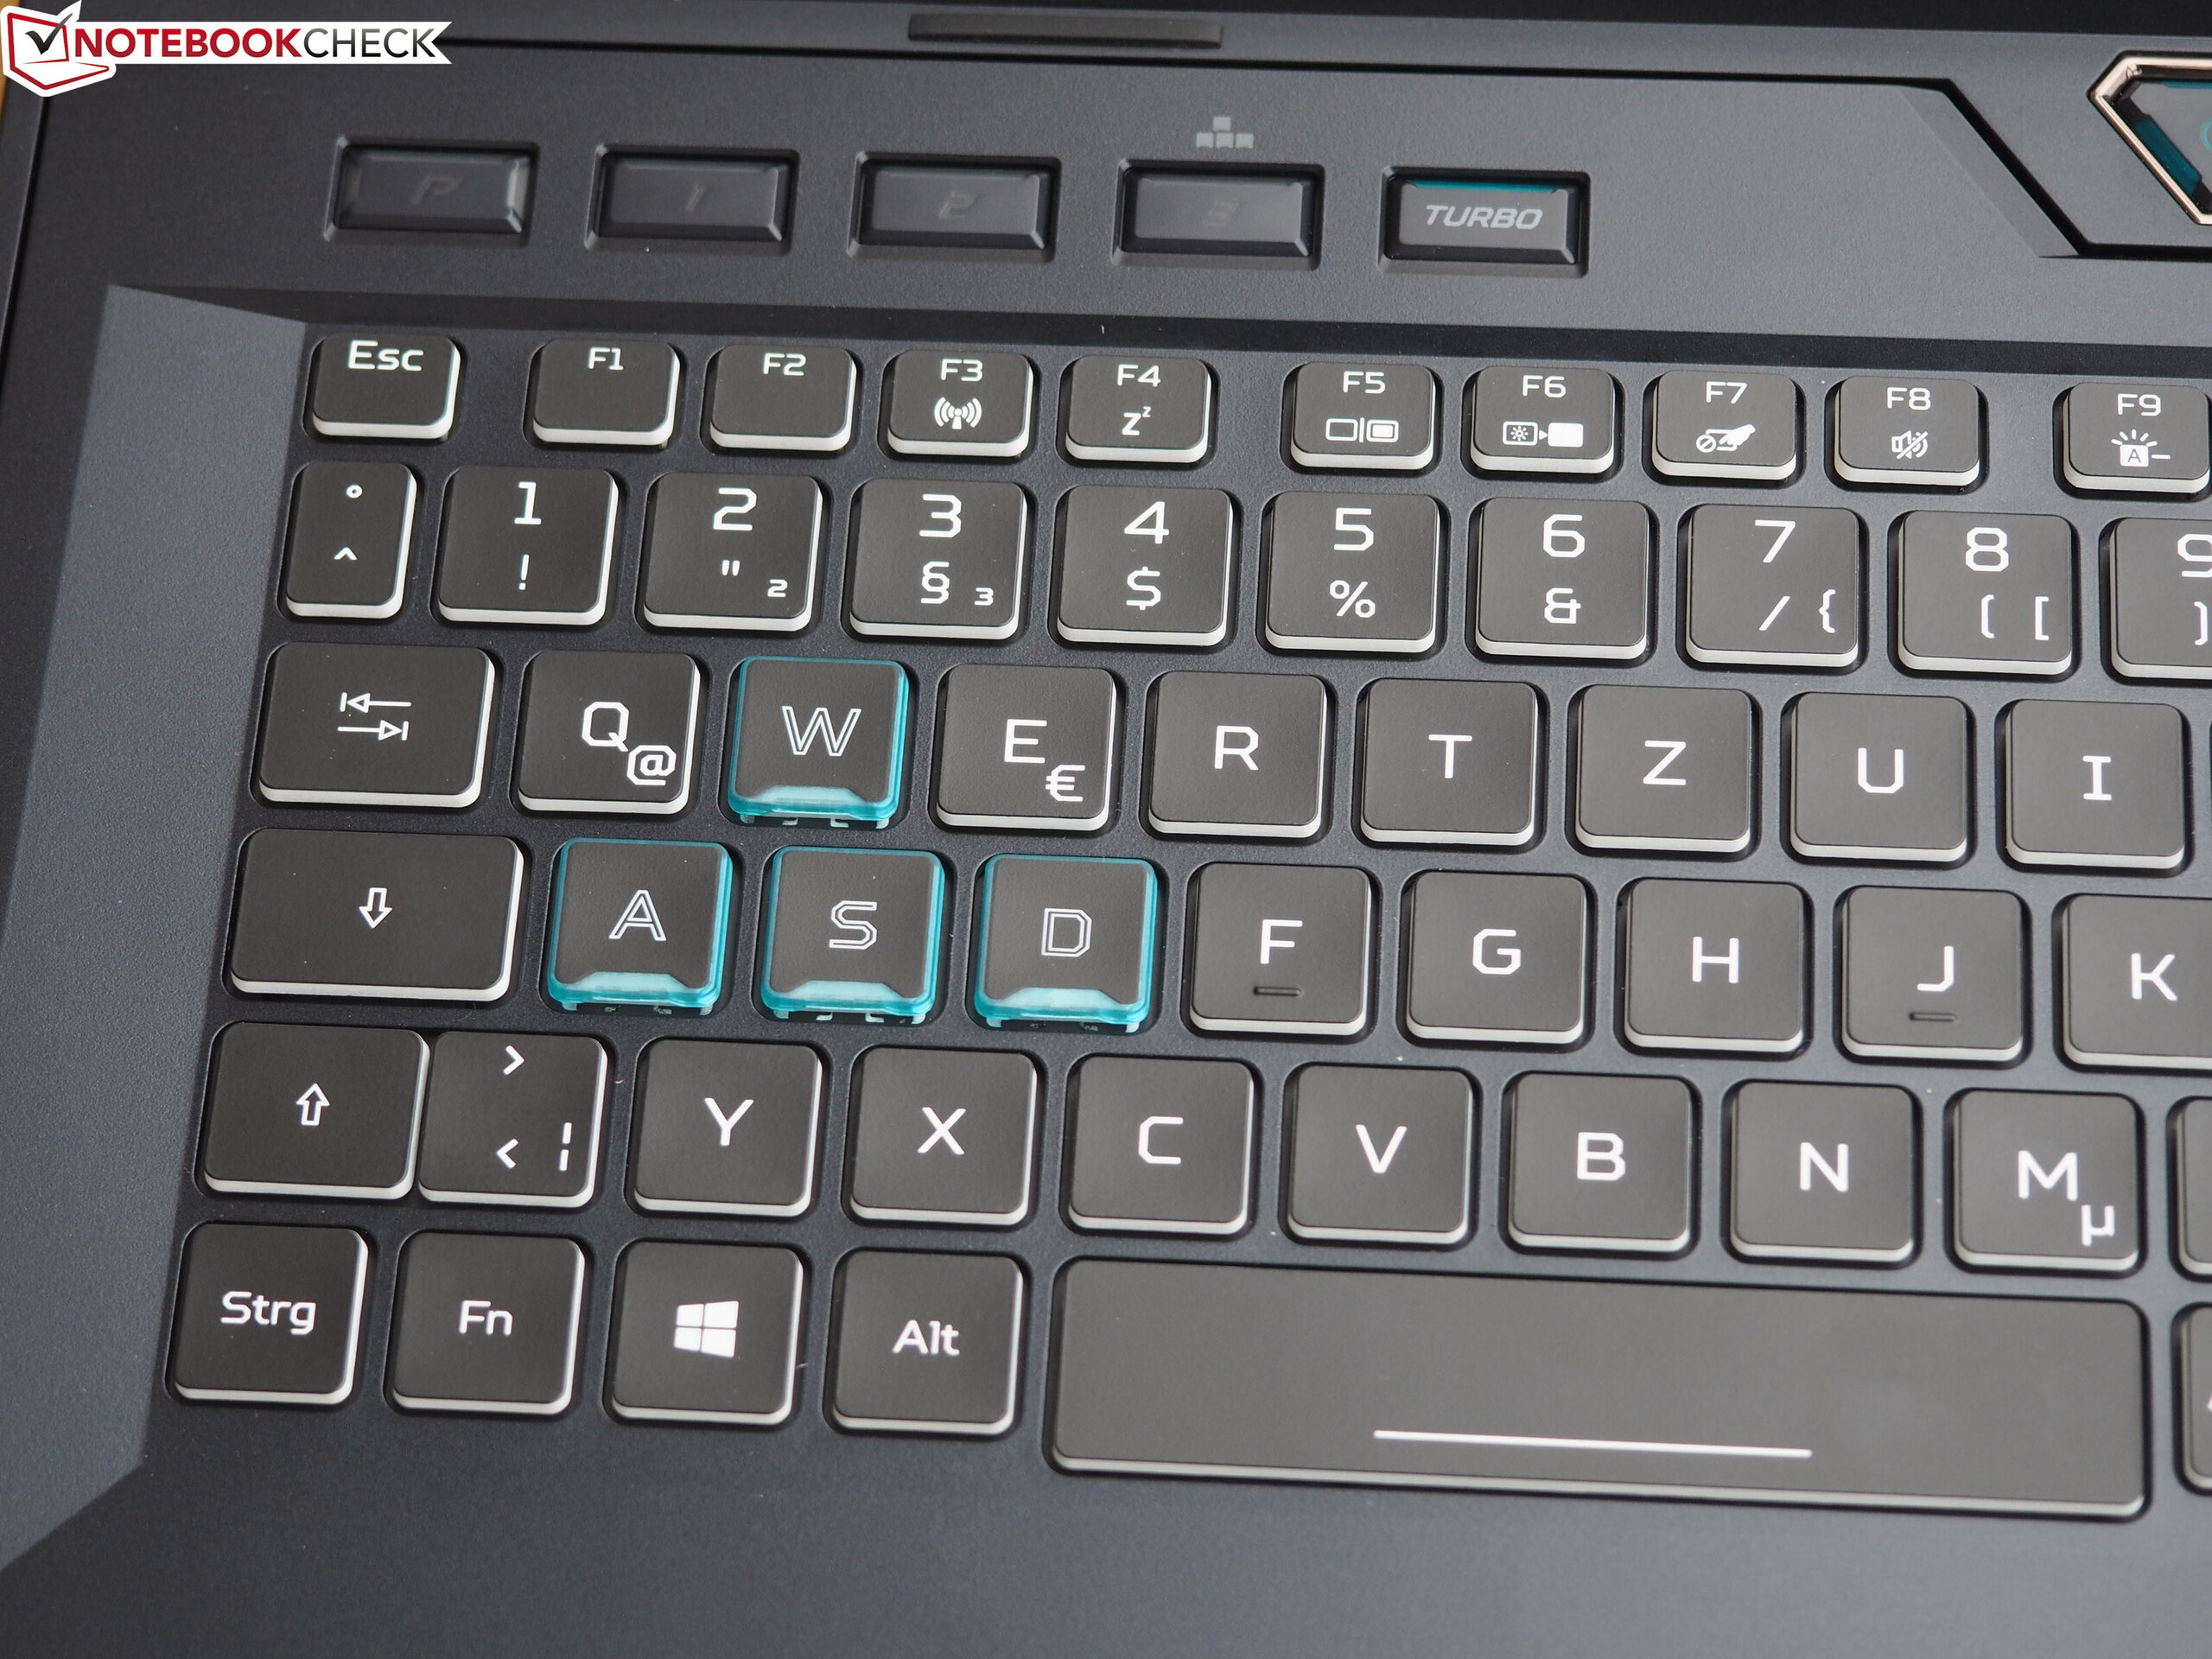
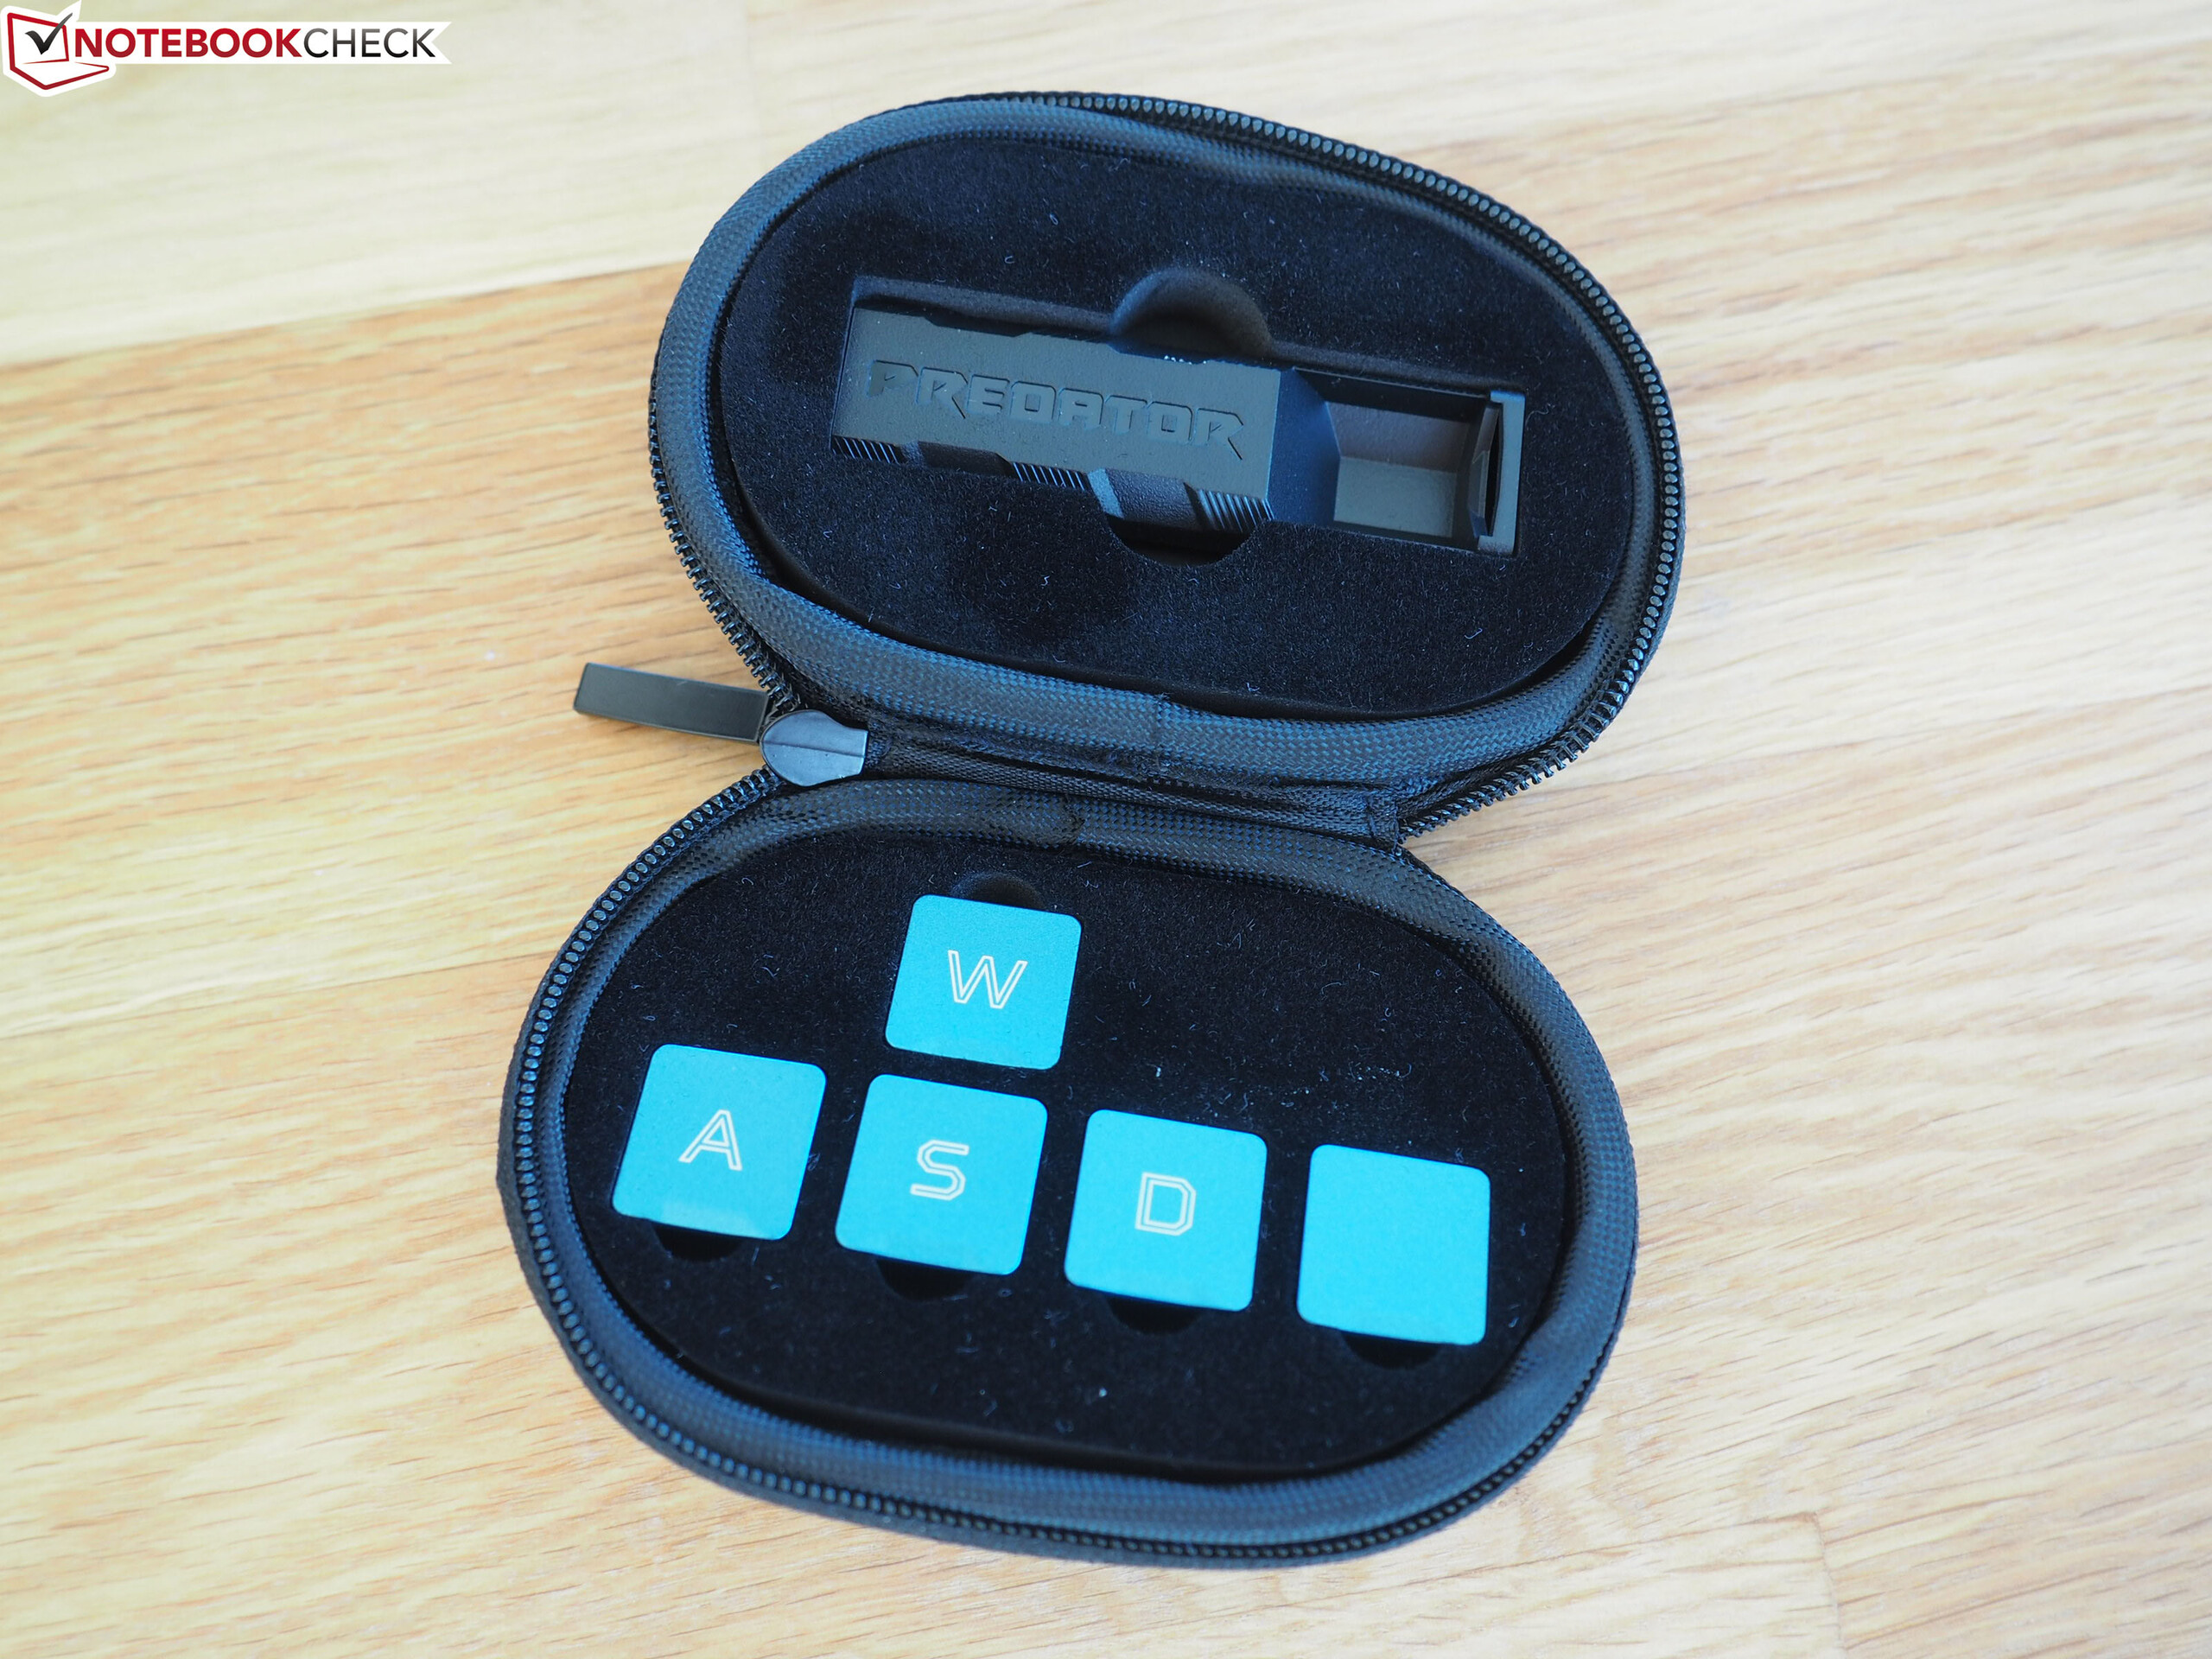
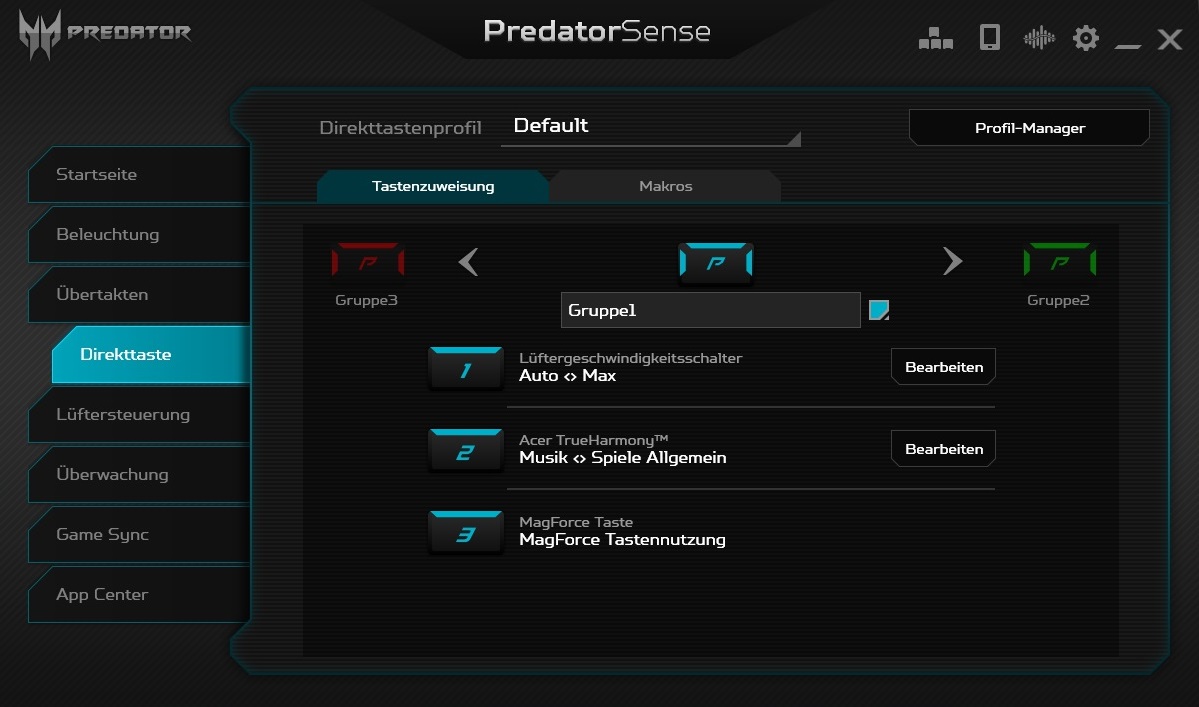
Unlike most notebooks, which have a rather sparse scope of delivery, the Helios 700 includes some interesting accessories. Buyers will find four blue WASD keys, so-called MagForce keys, which can be inserted into the keyboard instead of the standard WASD keys and are supposed to imitate the pressure point and gradual pressure control of a gamepad's analog joystick. Gamers will have to decide for themselves whether this is a useful feature or an unnecessary gimmick.
Software
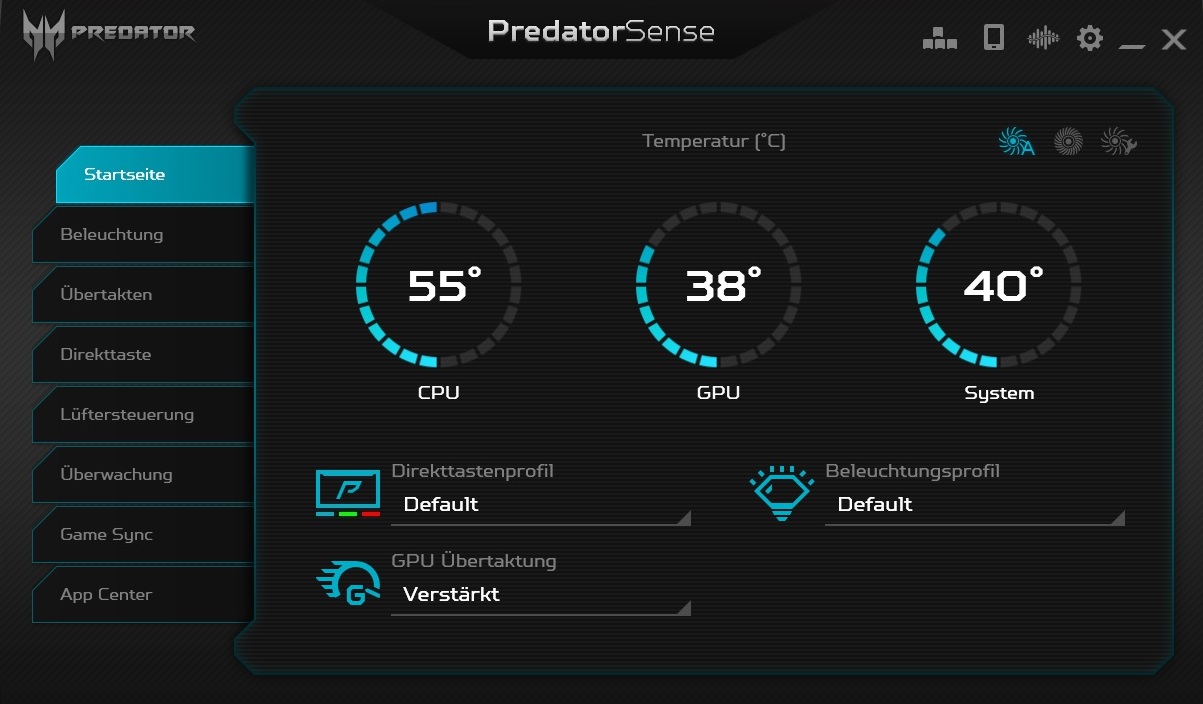
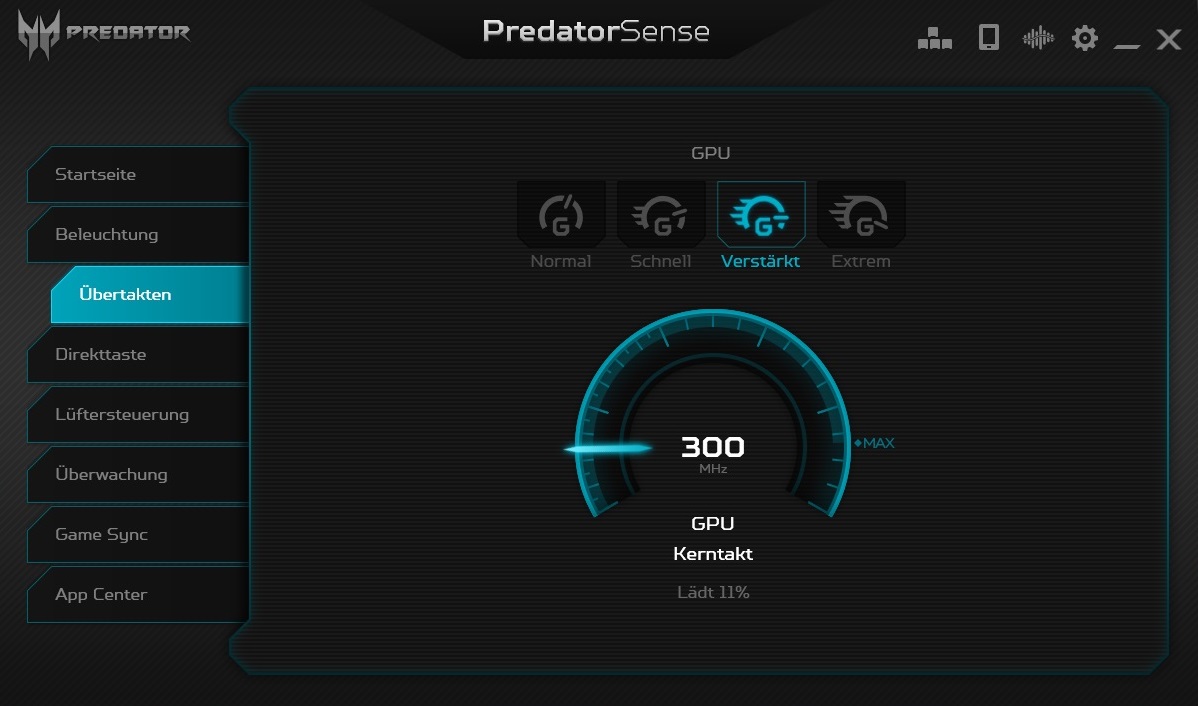
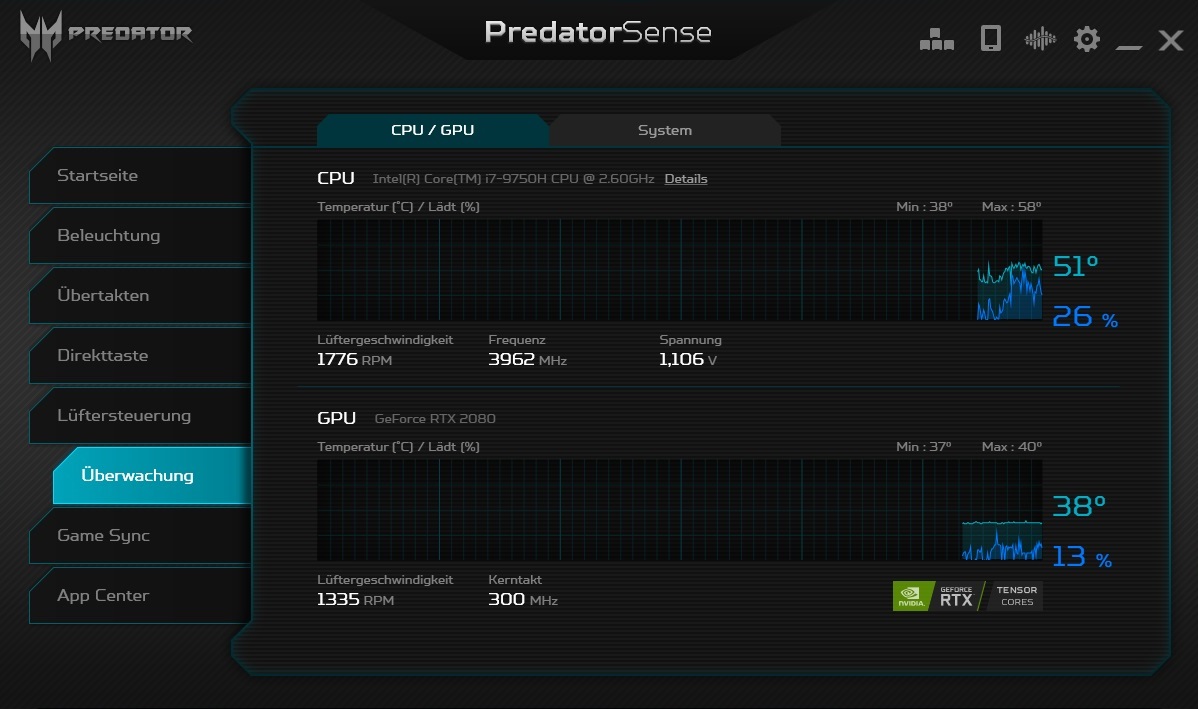
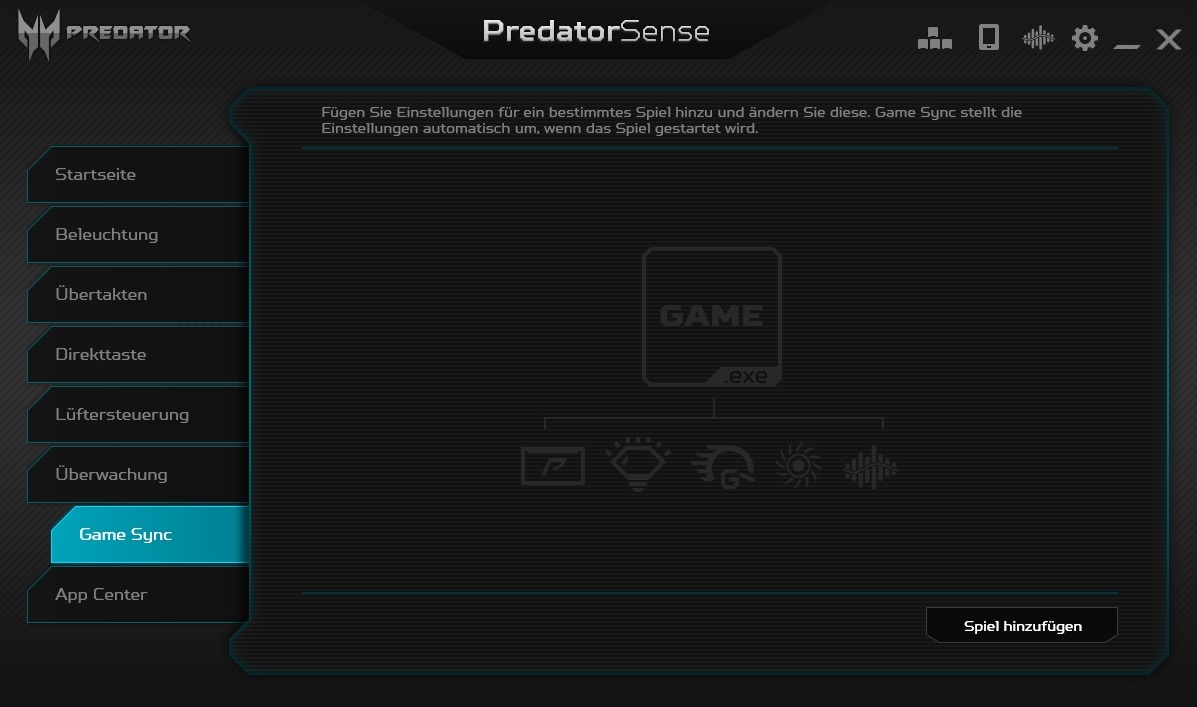
Tuning fans will be pleased to find that the Helios 700 not only features the exchangeable WASD keys but also includes the PredatorSense tool. This lets users make numerous changes to the software, hardware, and case settings as well as monitor the system (total of eight menus). We were particularly interested in the overclocking menu, which impacts the GPU's turbo. While we had the normal mode running for our idle tests, we changed the mode to "fast" for the load tests. This activates automatically as soon as you slide the input devices open, thereby improving the cooling solution. The cooling fan was always set to automatic.
Warranty
The Helios 700 has a one year mail-in or carry-in warranty.
Input Devices
Keyboard
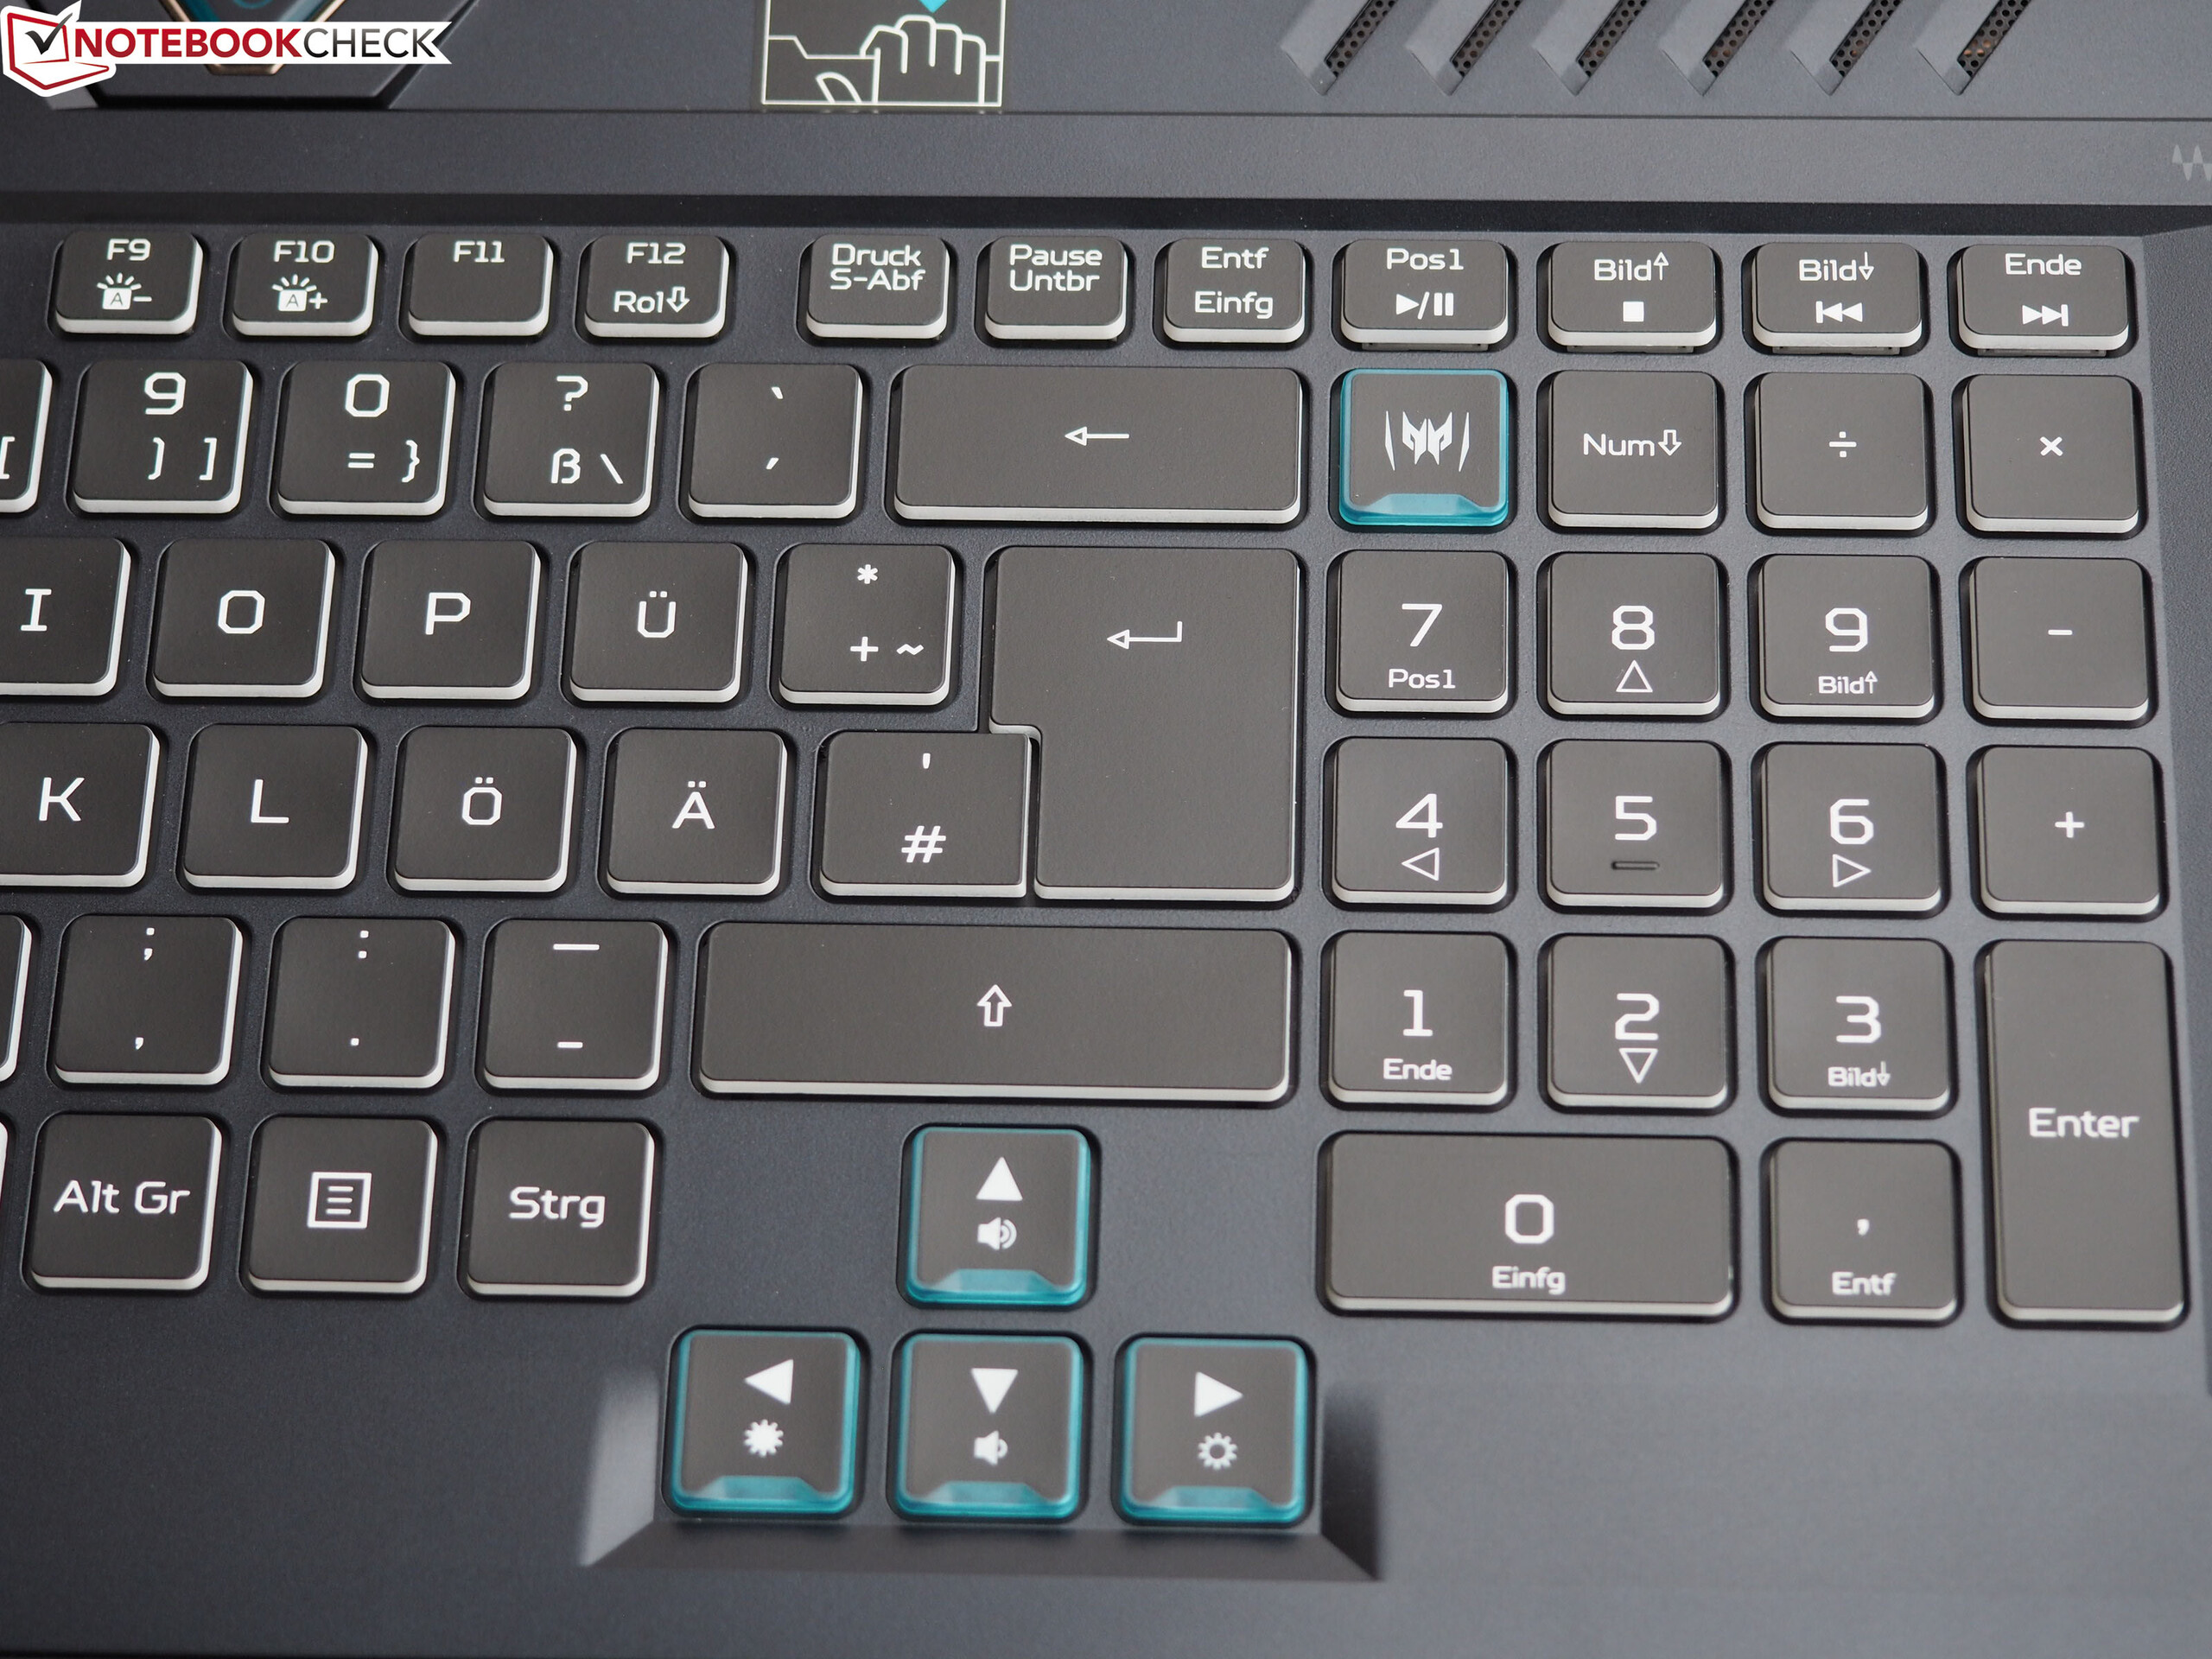
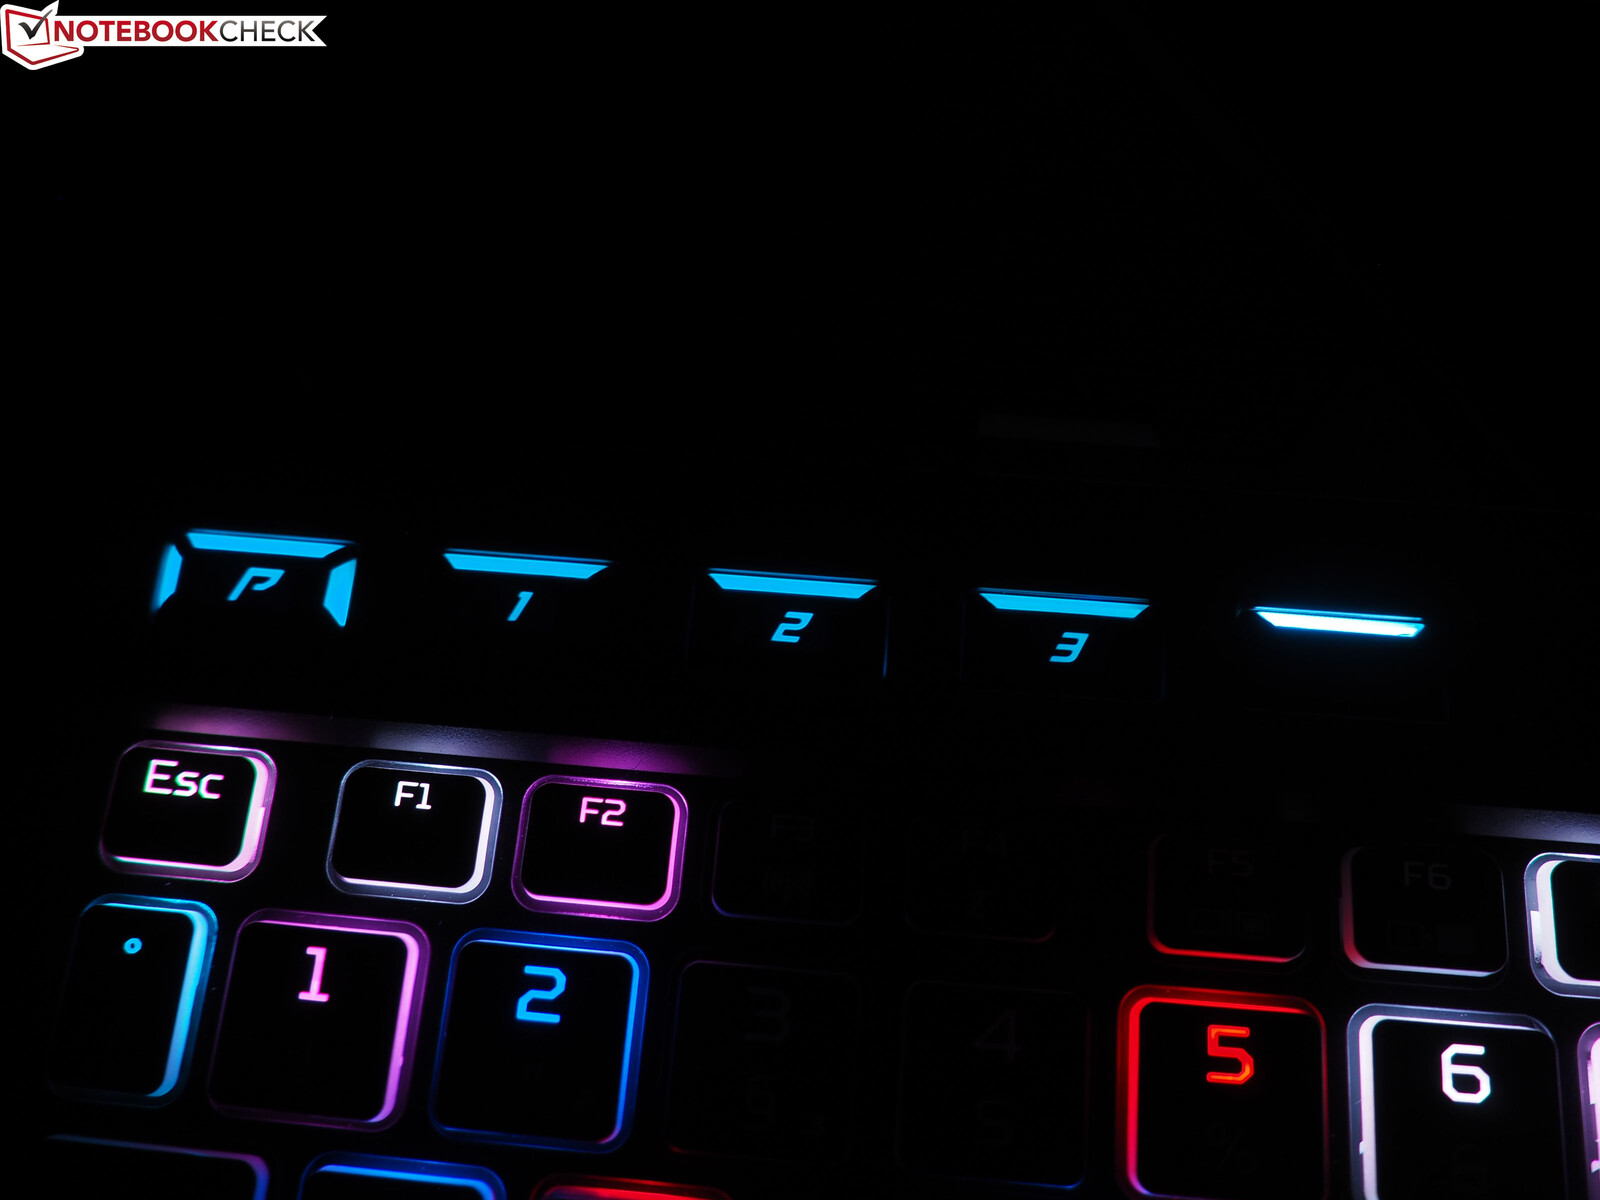
The Acer's keyboard can be considered good to very good. Except for the narrow row of function keys, all keys are decently dimensioned and even the arrow keys, which can be terribly small on many laptops, have a normal size. Frequent typists will be happy with the keyboard as well thanks to the full, clear pressure point and drop. The classic layout also means that users will get used to it quickly. The dedicated number pad and special keys above the keyboard will be appreciated by many users.
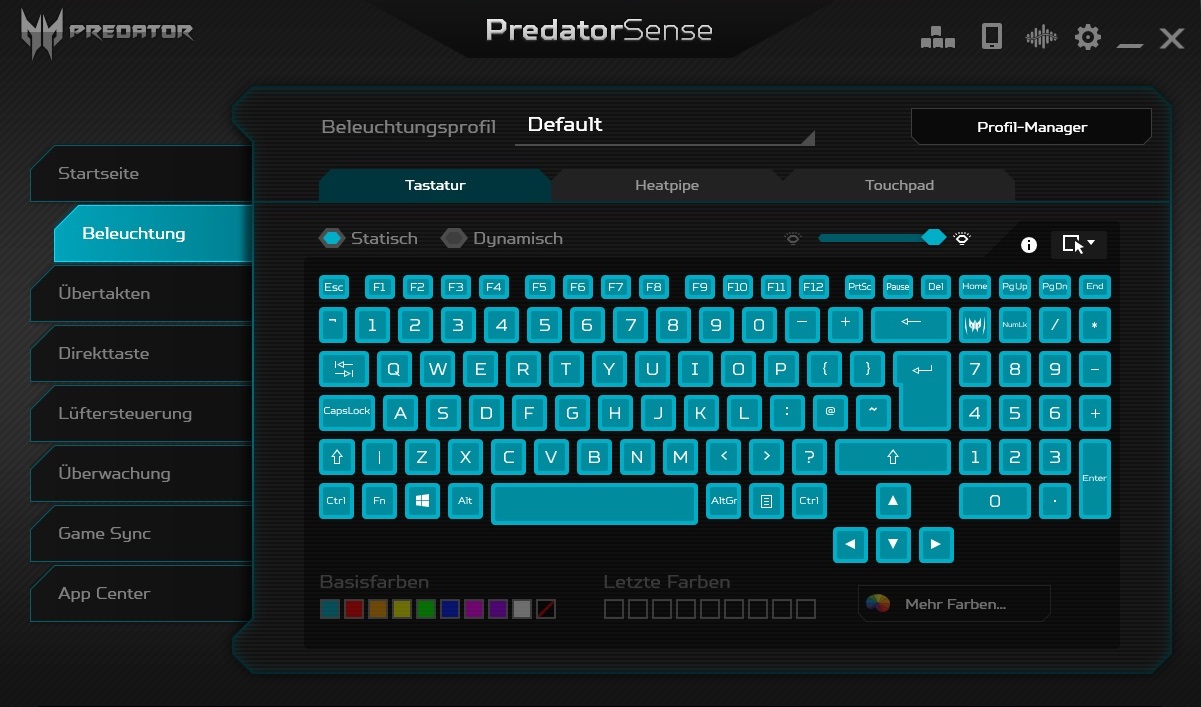
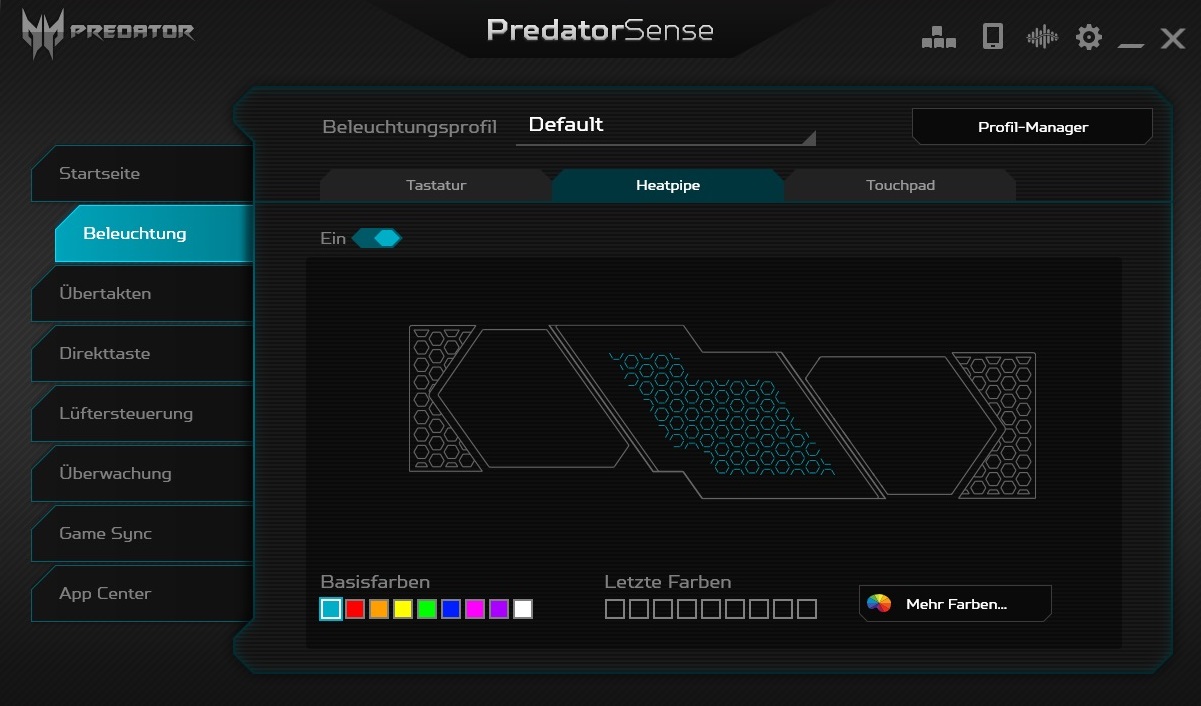
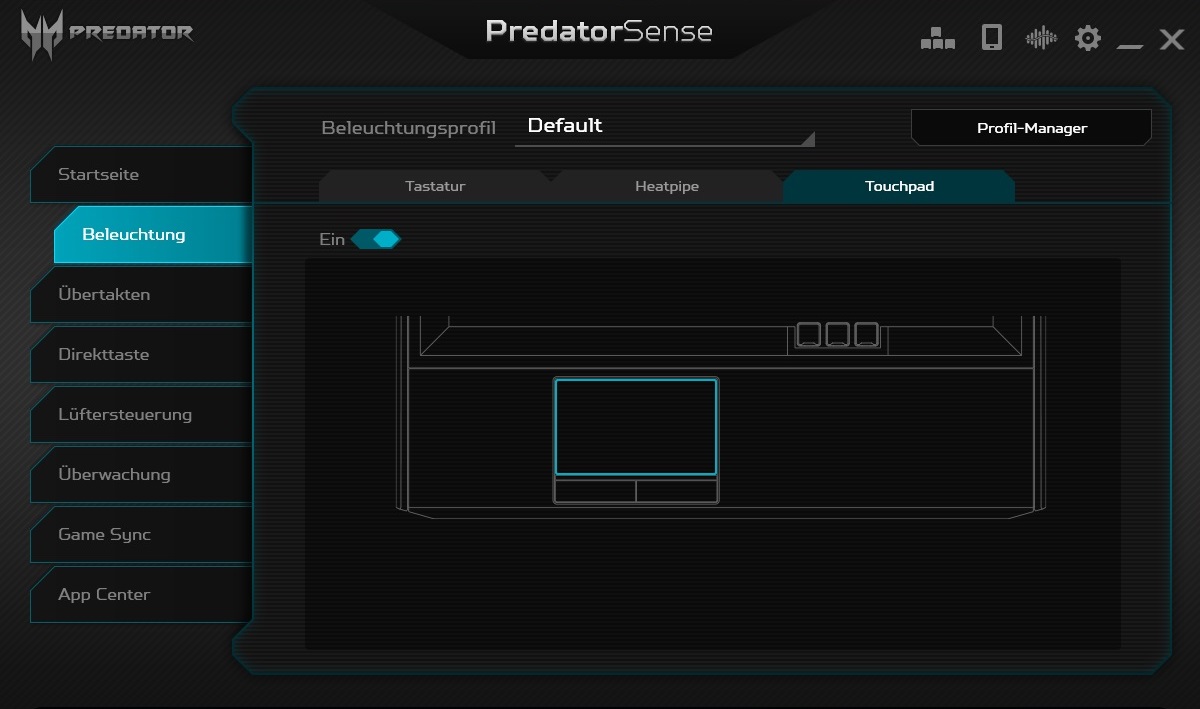
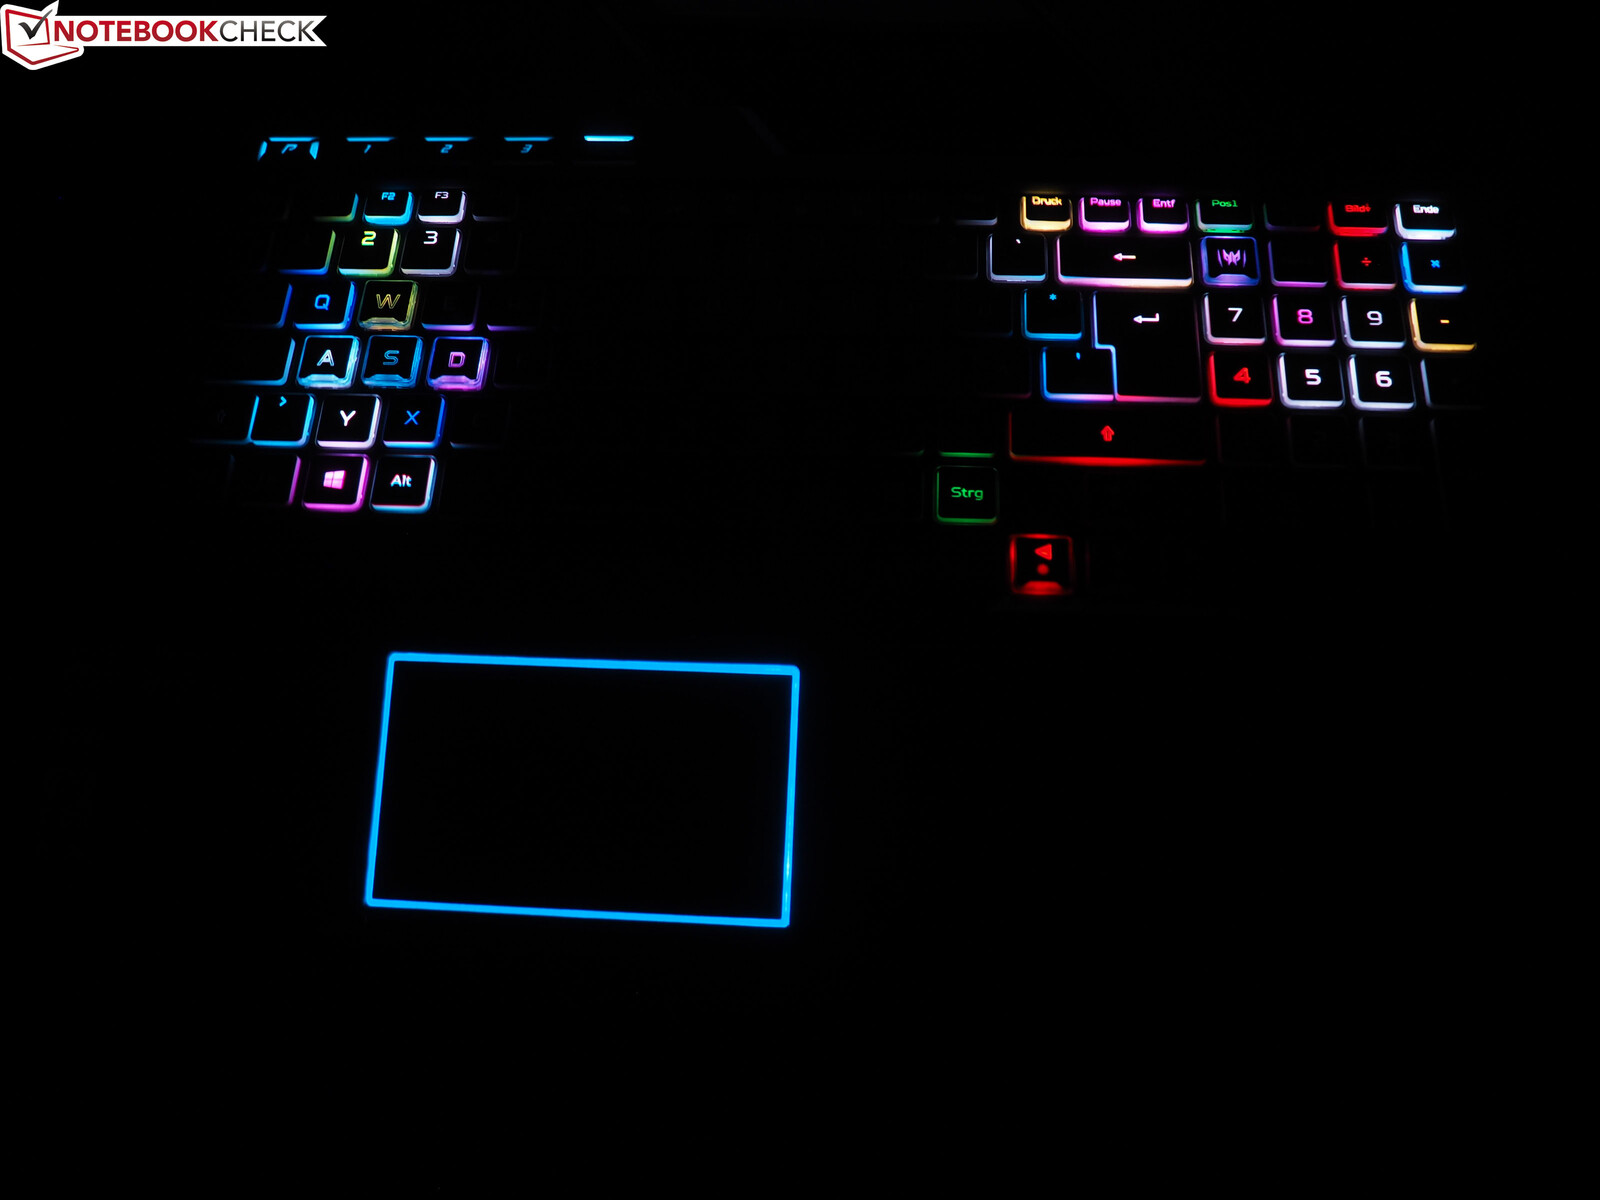
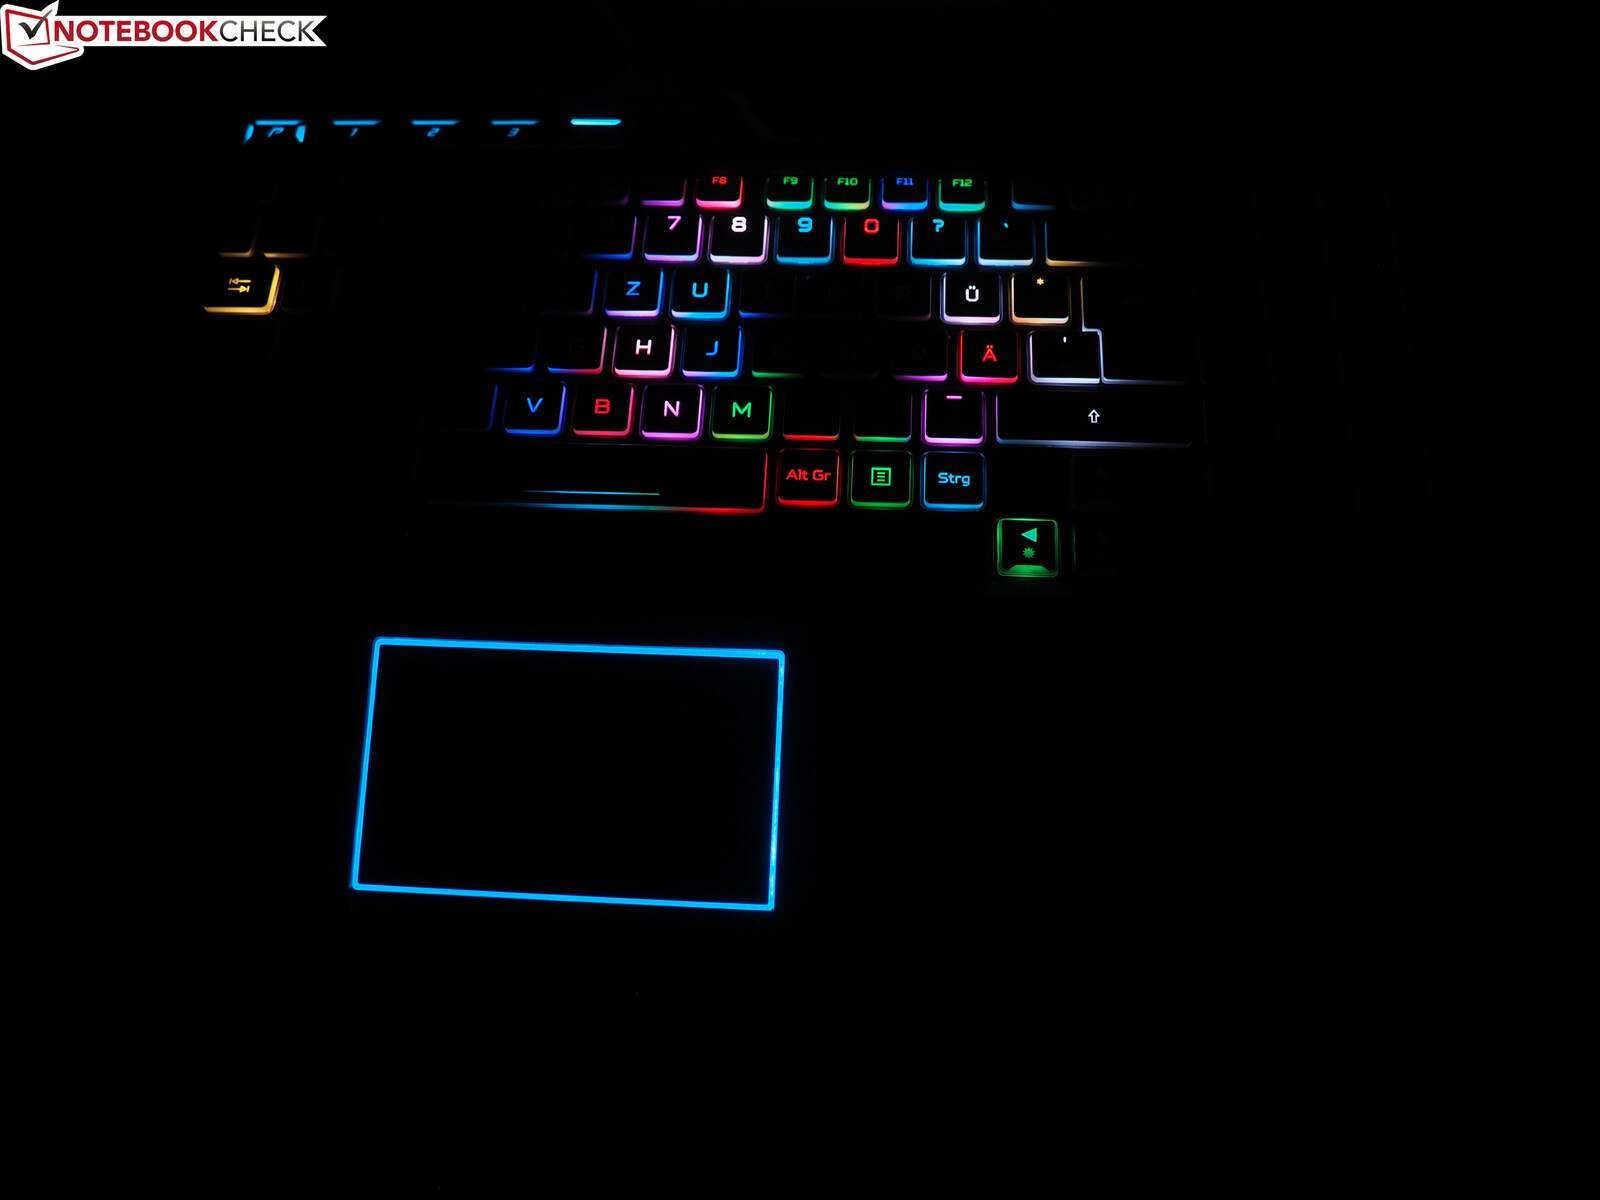
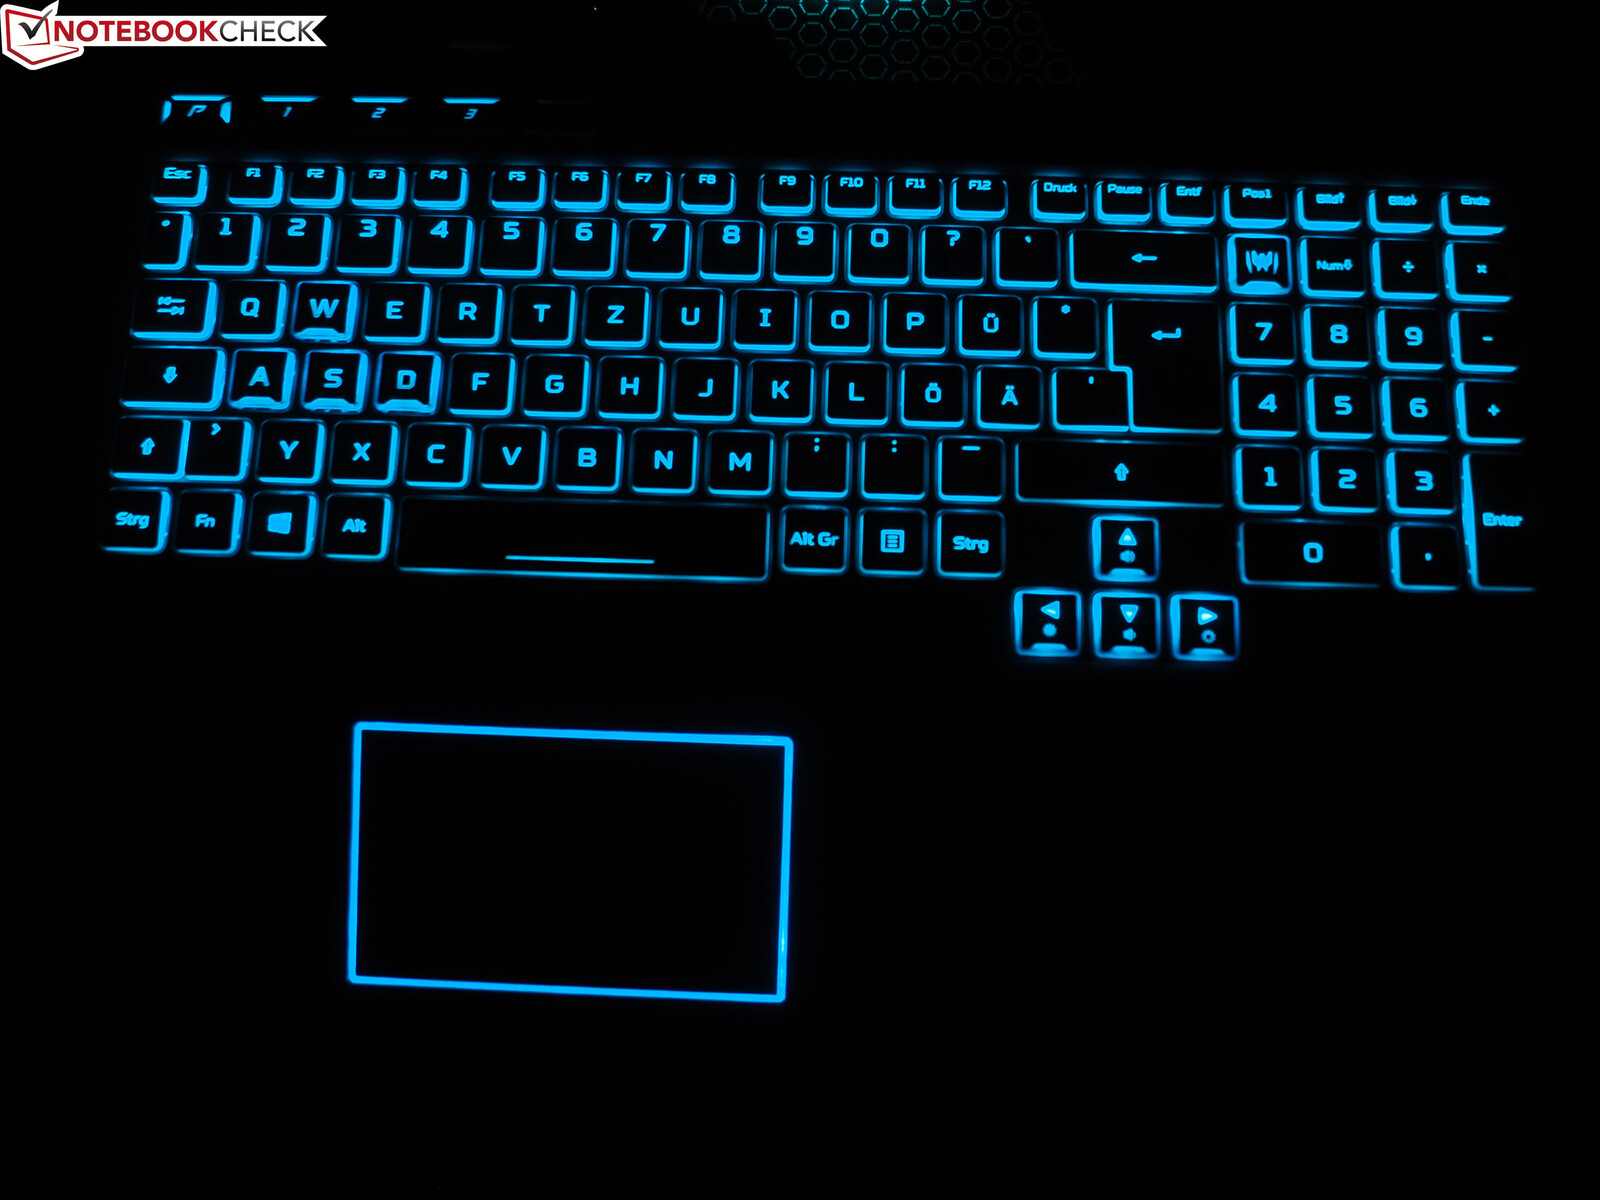
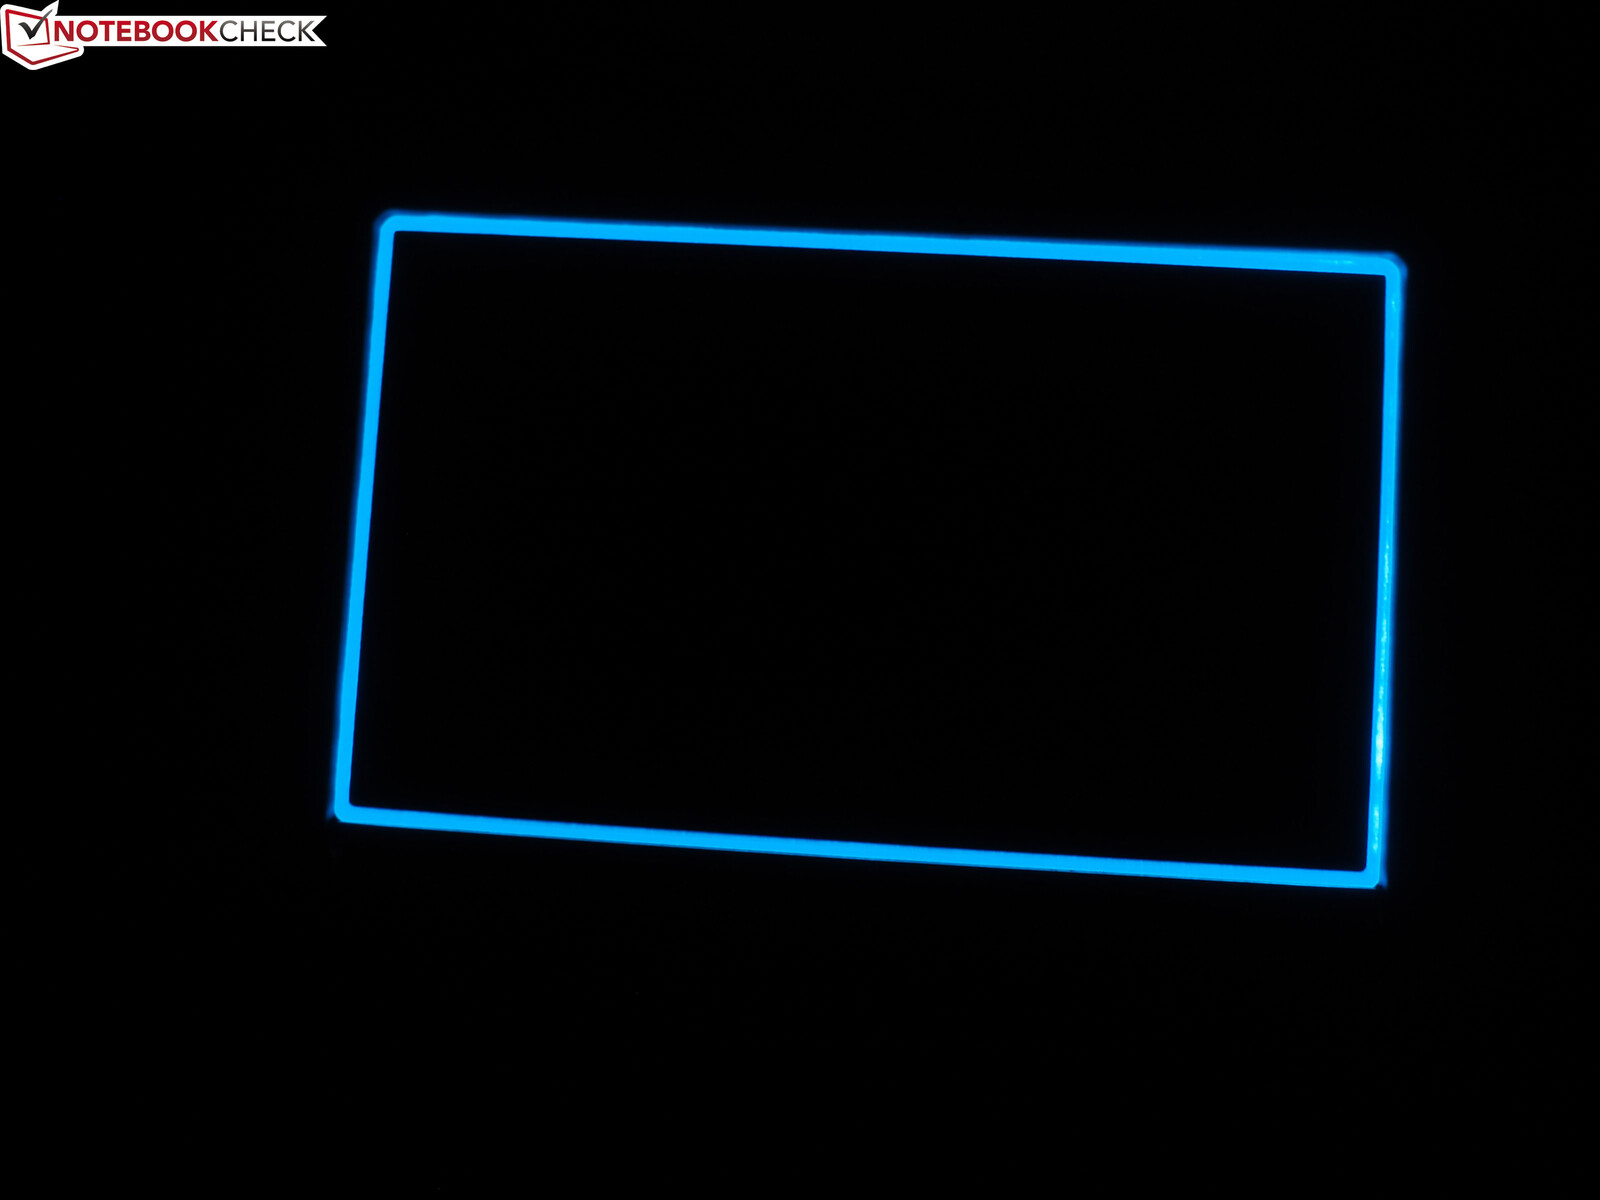
Another highlight is the even RGB backlighting with several brightness levels, which can be customized by the user (including a colorful disco mode). A small drawback: The keys' secondary functions aren't backlit. Not only the keyboard, but also the touchpad, the glass surface between the ventilation slots and the logo on the back have backlighting, which improves orientation.

Touchpad
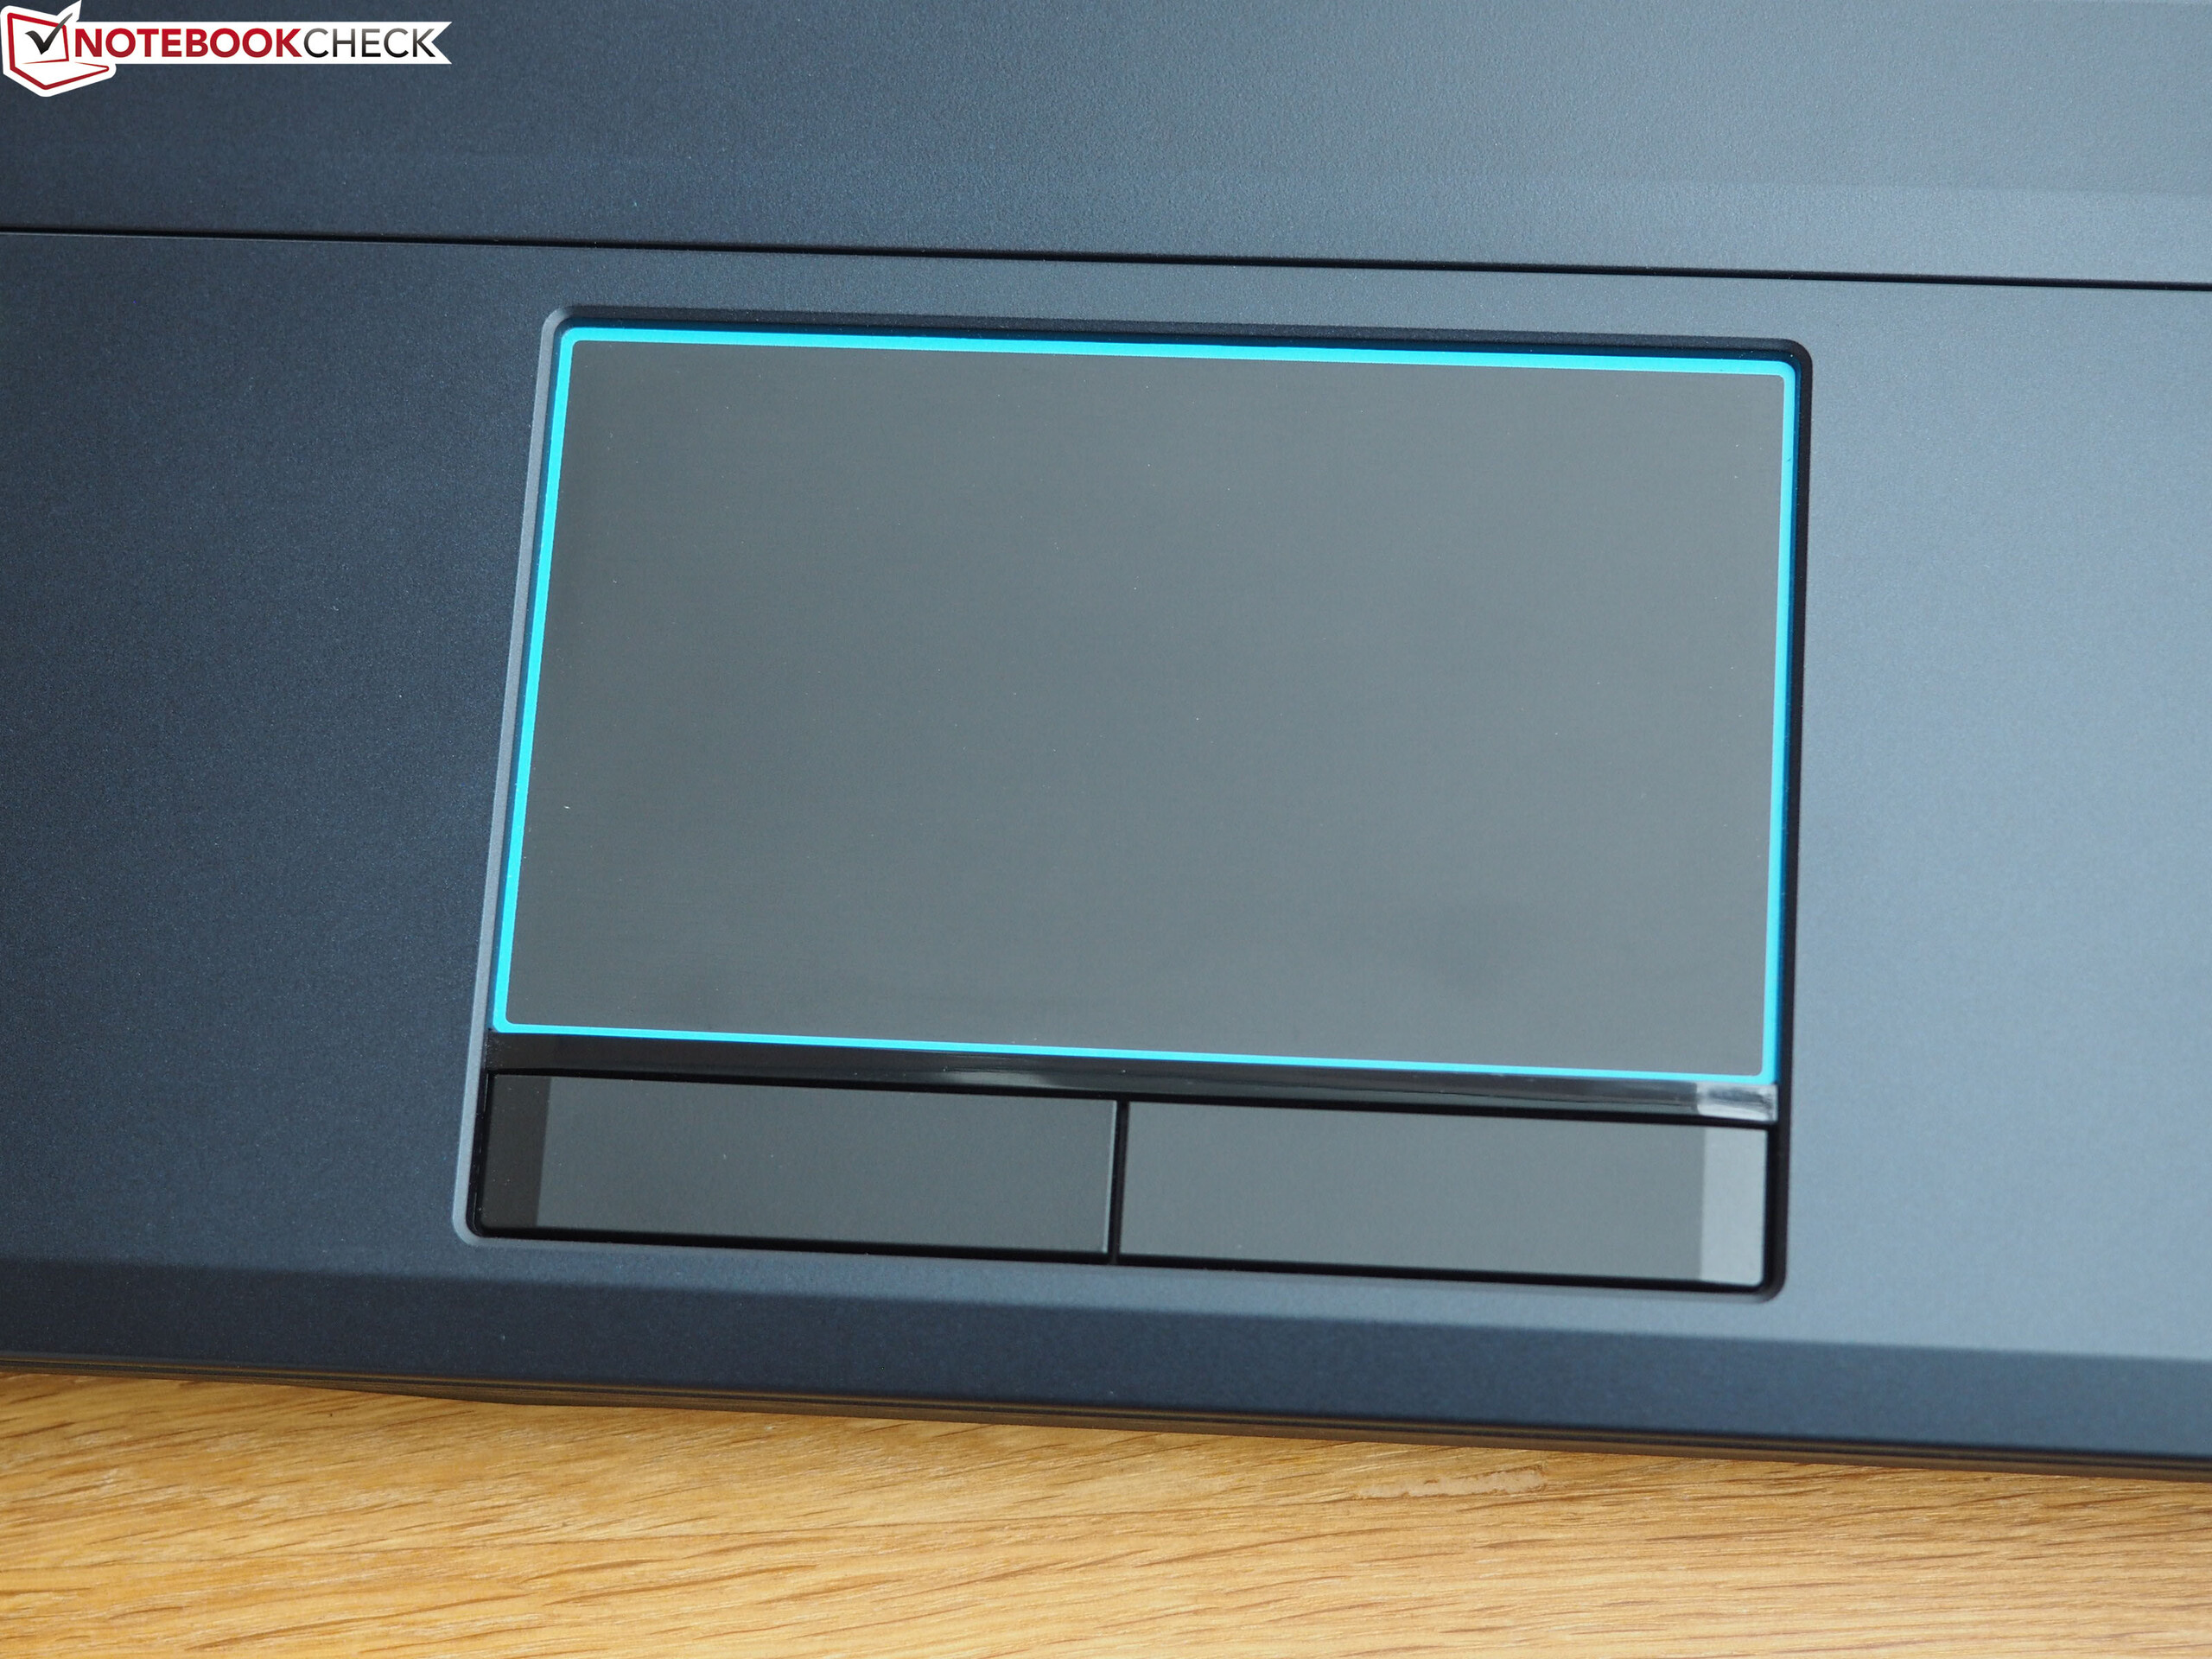
The overall impression we got of the touchpad was not quite as good as that of the keyboard. Its largest weakness is that it is let too far into the base unit, an issue we already criticized on older Acer notebooks because it makes it unnecessarily difficult to reach and use the dedicated mouse keys.
The touchpad is quite ordinary otherwise. It has a surface of 10.5 x 6.2 cm, which is acceptable for a 17-inch device. Gliding is good thanks to the smooth finish and, of course, the touchpad supports several multi-touch gestures. The touchpad responded smoothly and reliably to our two-finger gestures for zooming and scrolling.
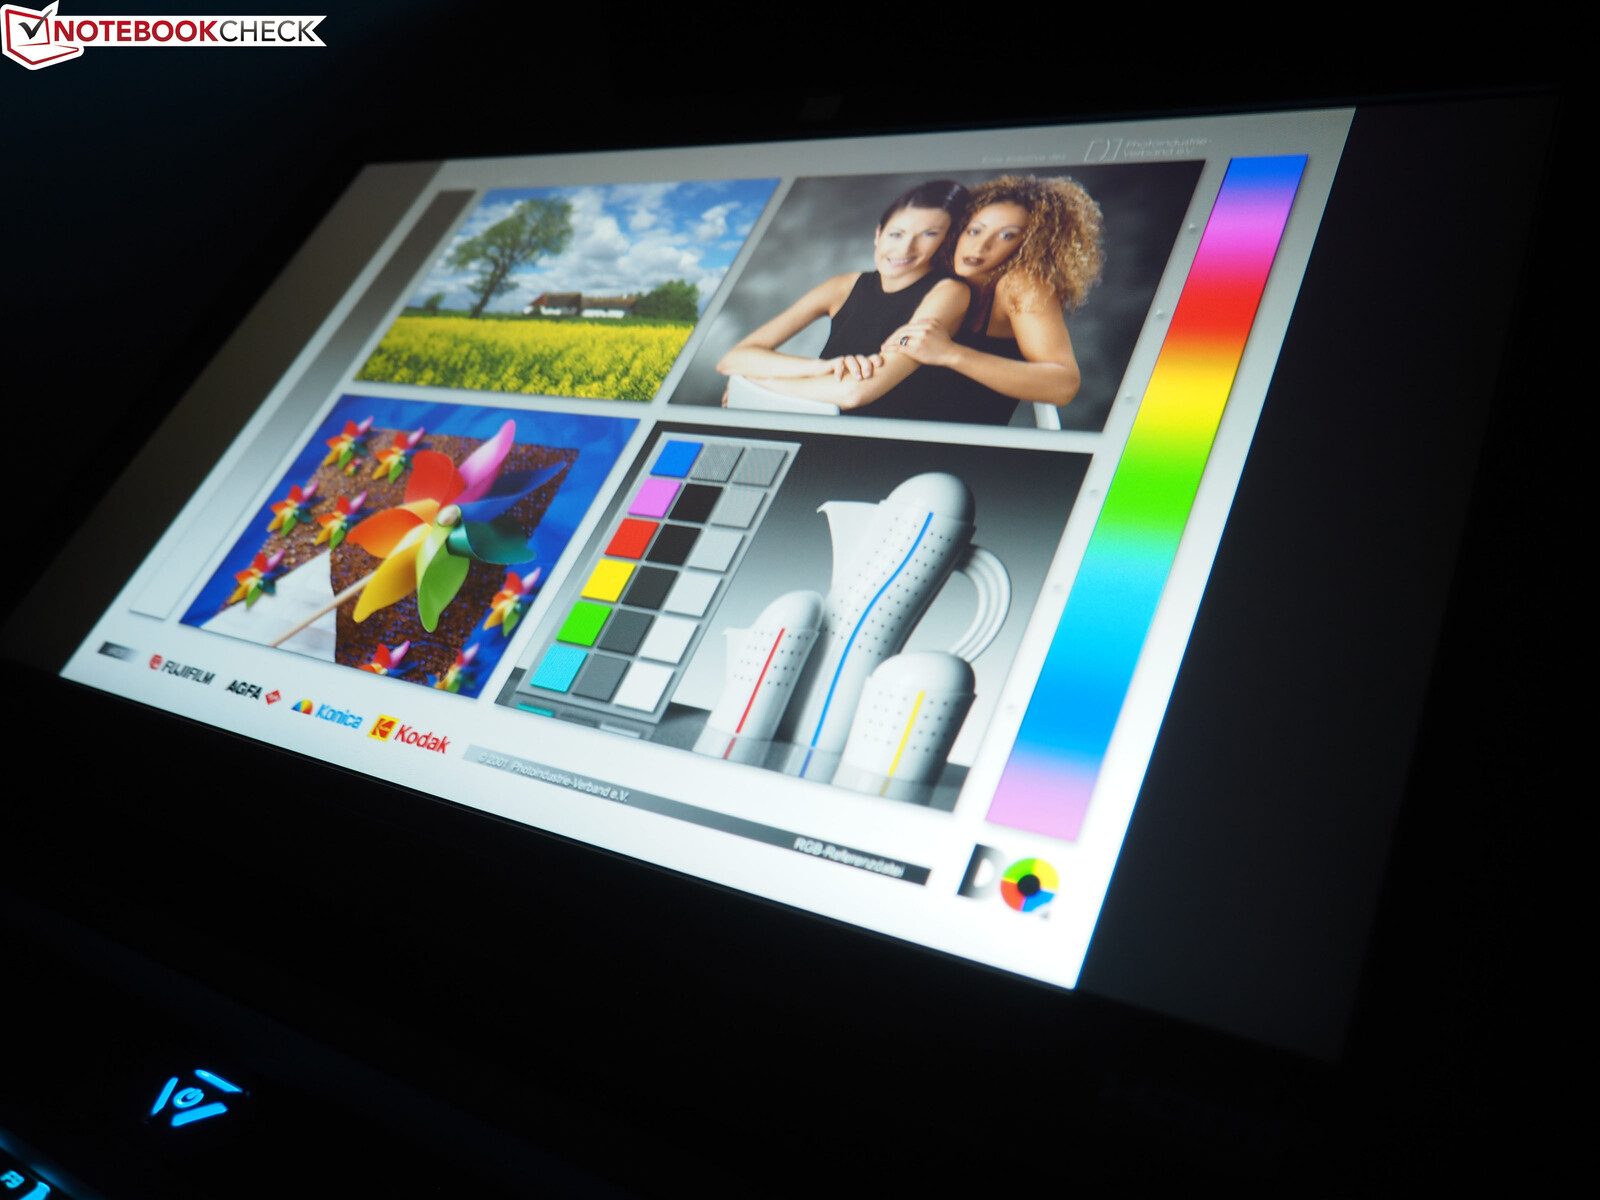
Display
Not surprisingly, Acer has equipped the Helios 700 with a Full HD display with IPS technology. Thanks to 144 Hz and Nvidia's image optimization technology G-Sync, the panel can display 3D content smoothly - provided the GPU has sufficient power available.
| |||||||||||||||||||||||||
Brightness Distribution: 85 %
Center on Battery: 288 cd/m²
Contrast: 1440:1 (Black: 0.2 cd/m²)
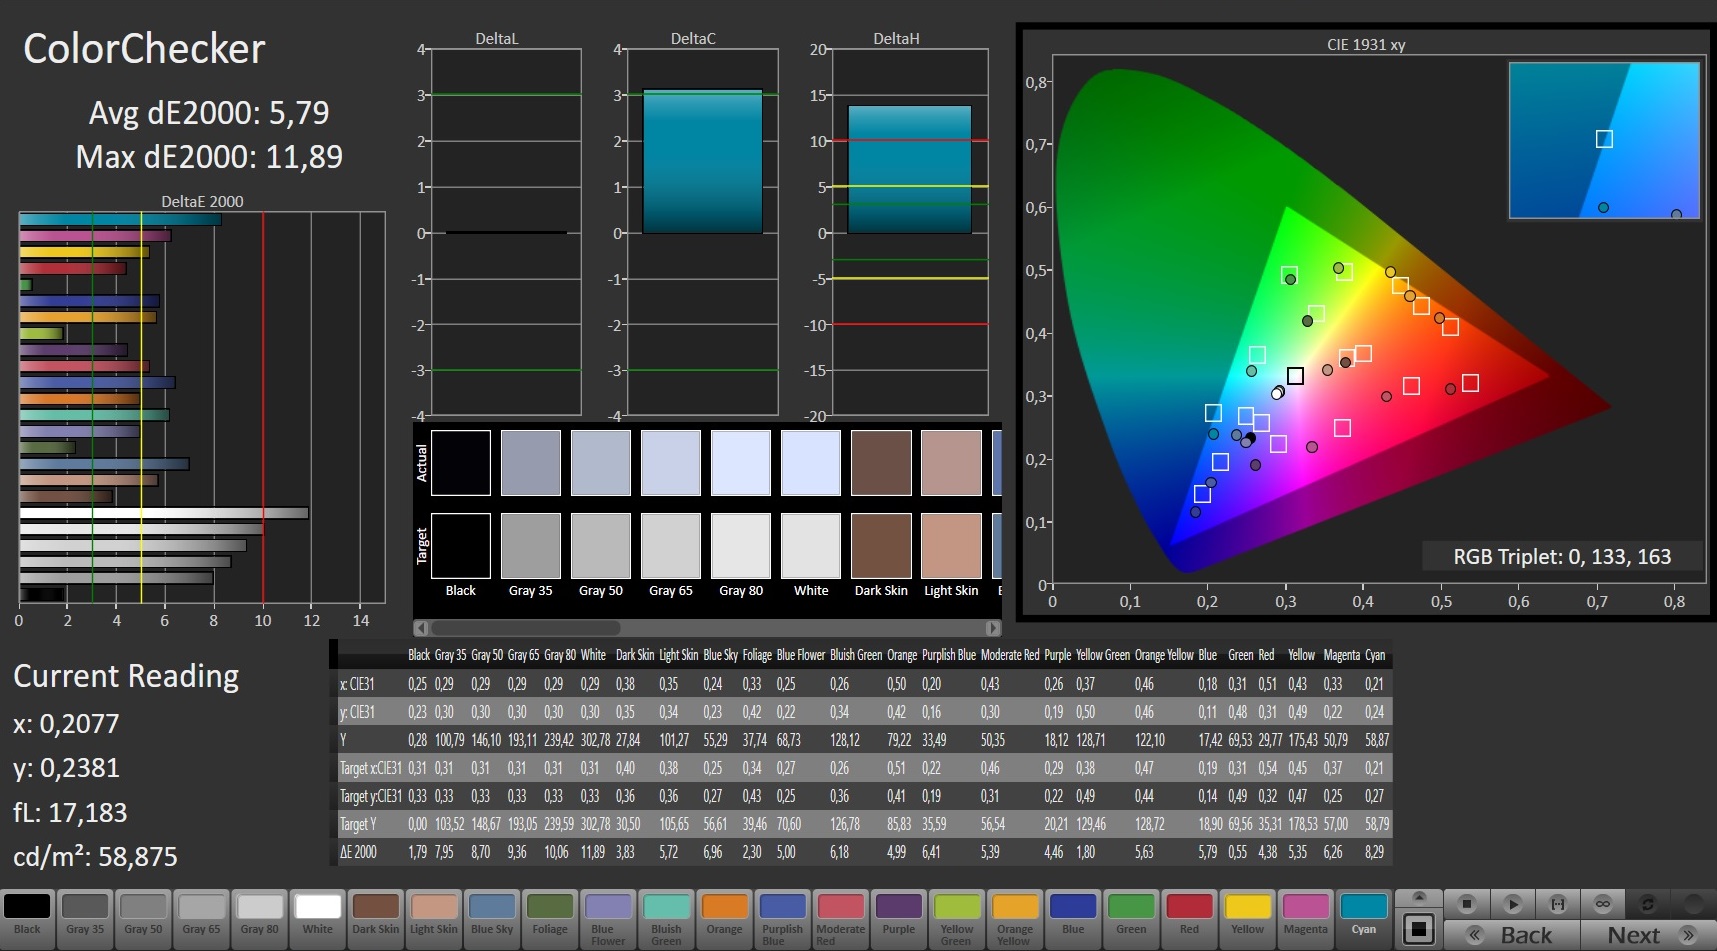
ΔE ColorChecker Calman: 5.79 | ∀{0.5-29.43 Ø4.72}
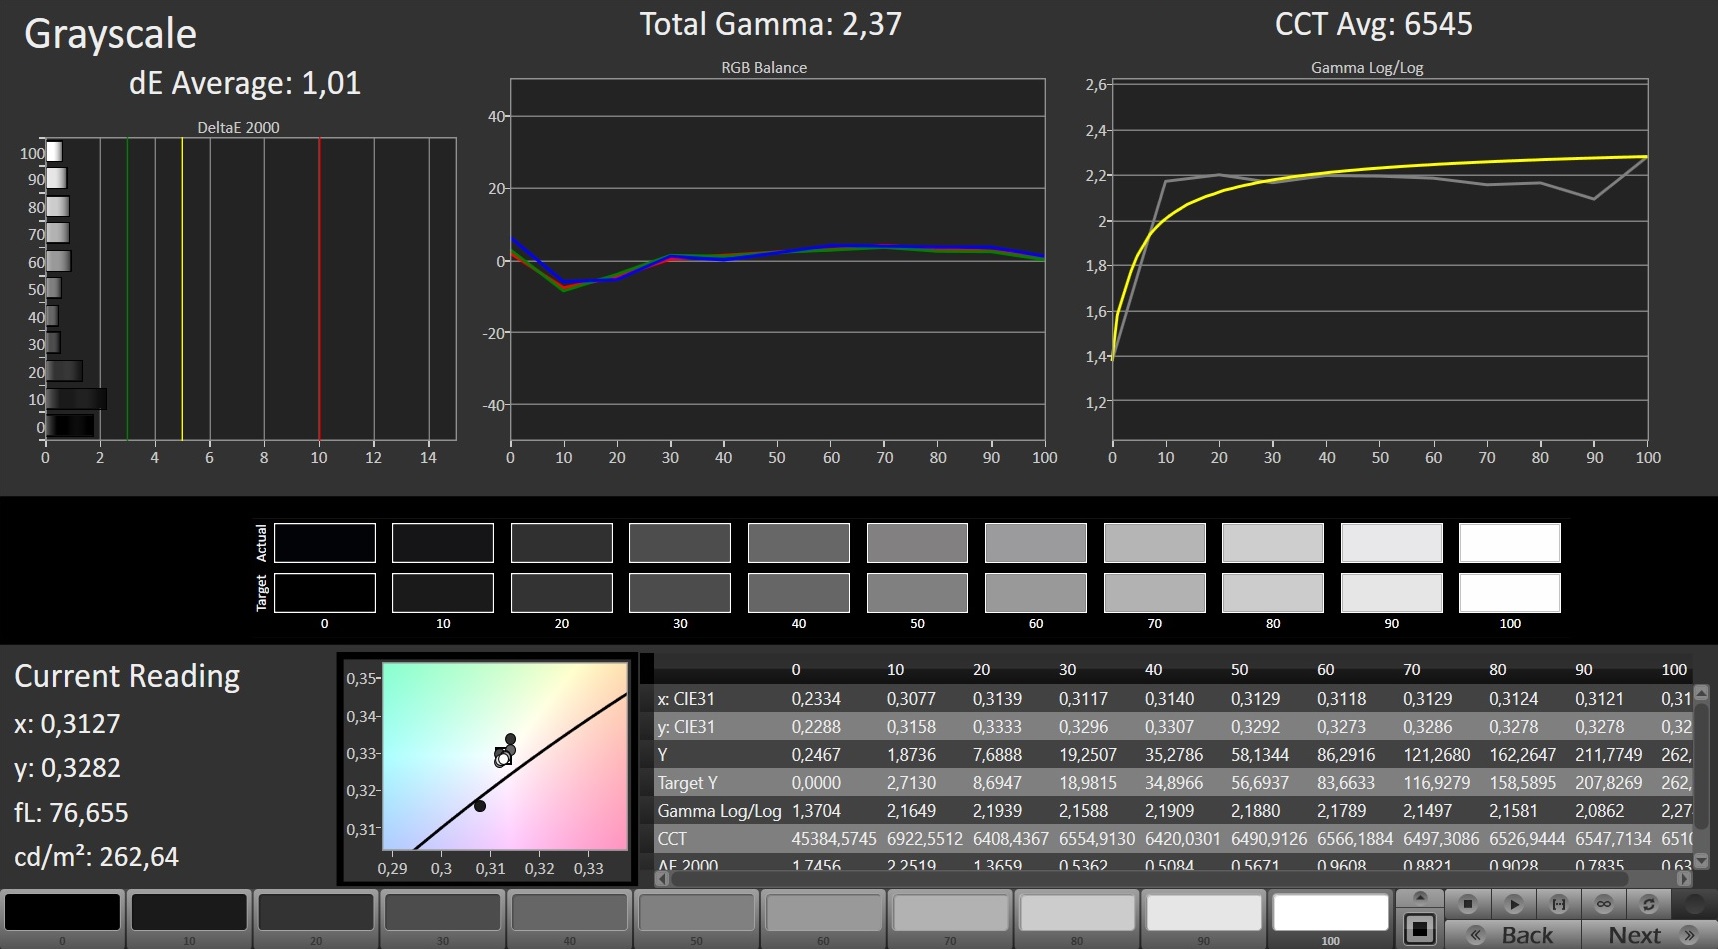
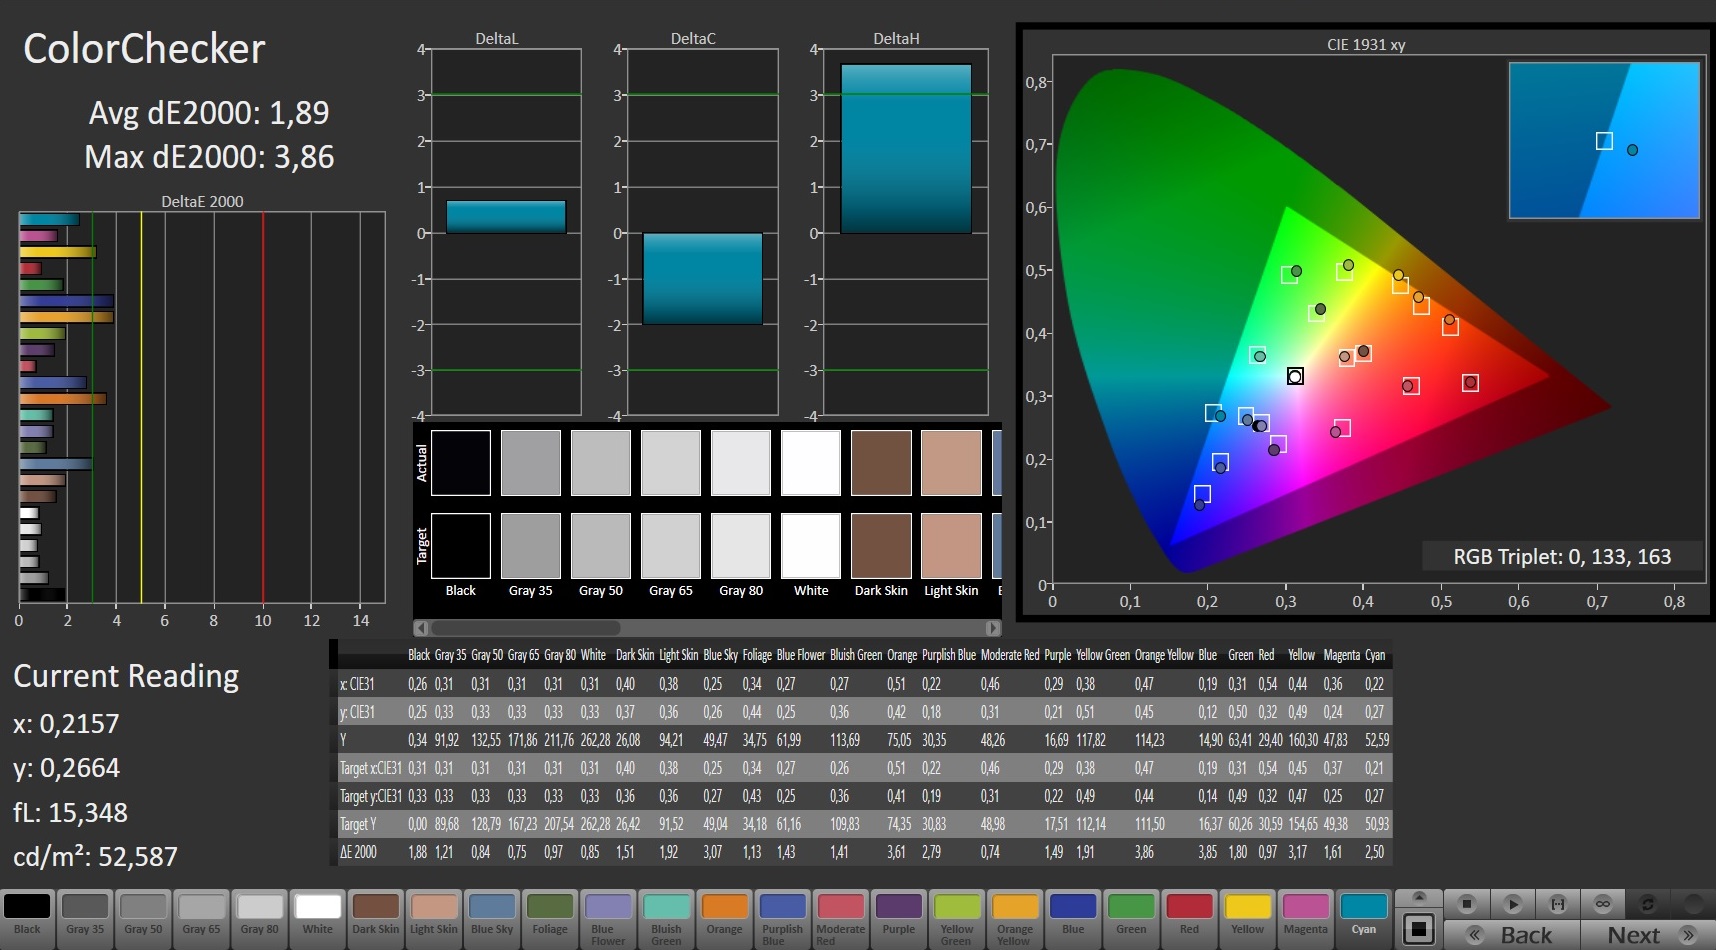
calibrated: 1.89
ΔE Greyscale Calman: 6.92 | ∀{0.09-98 Ø4.97}
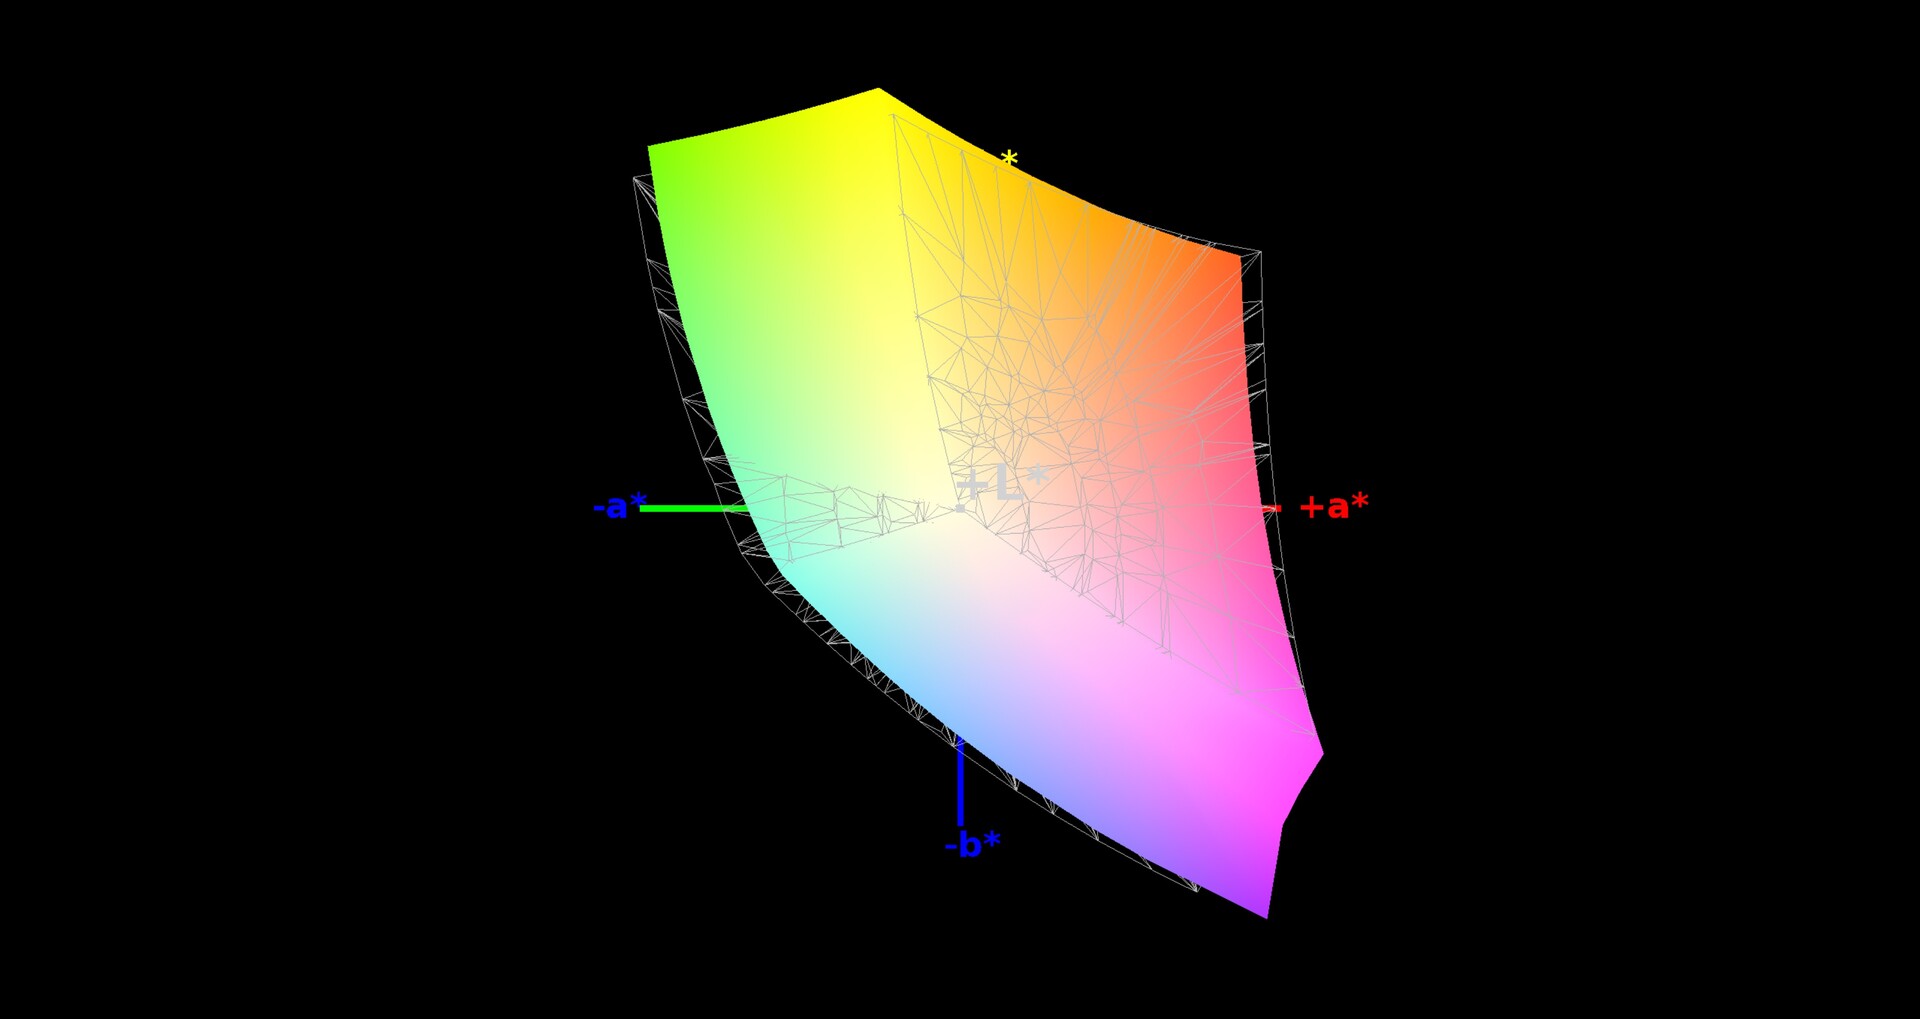
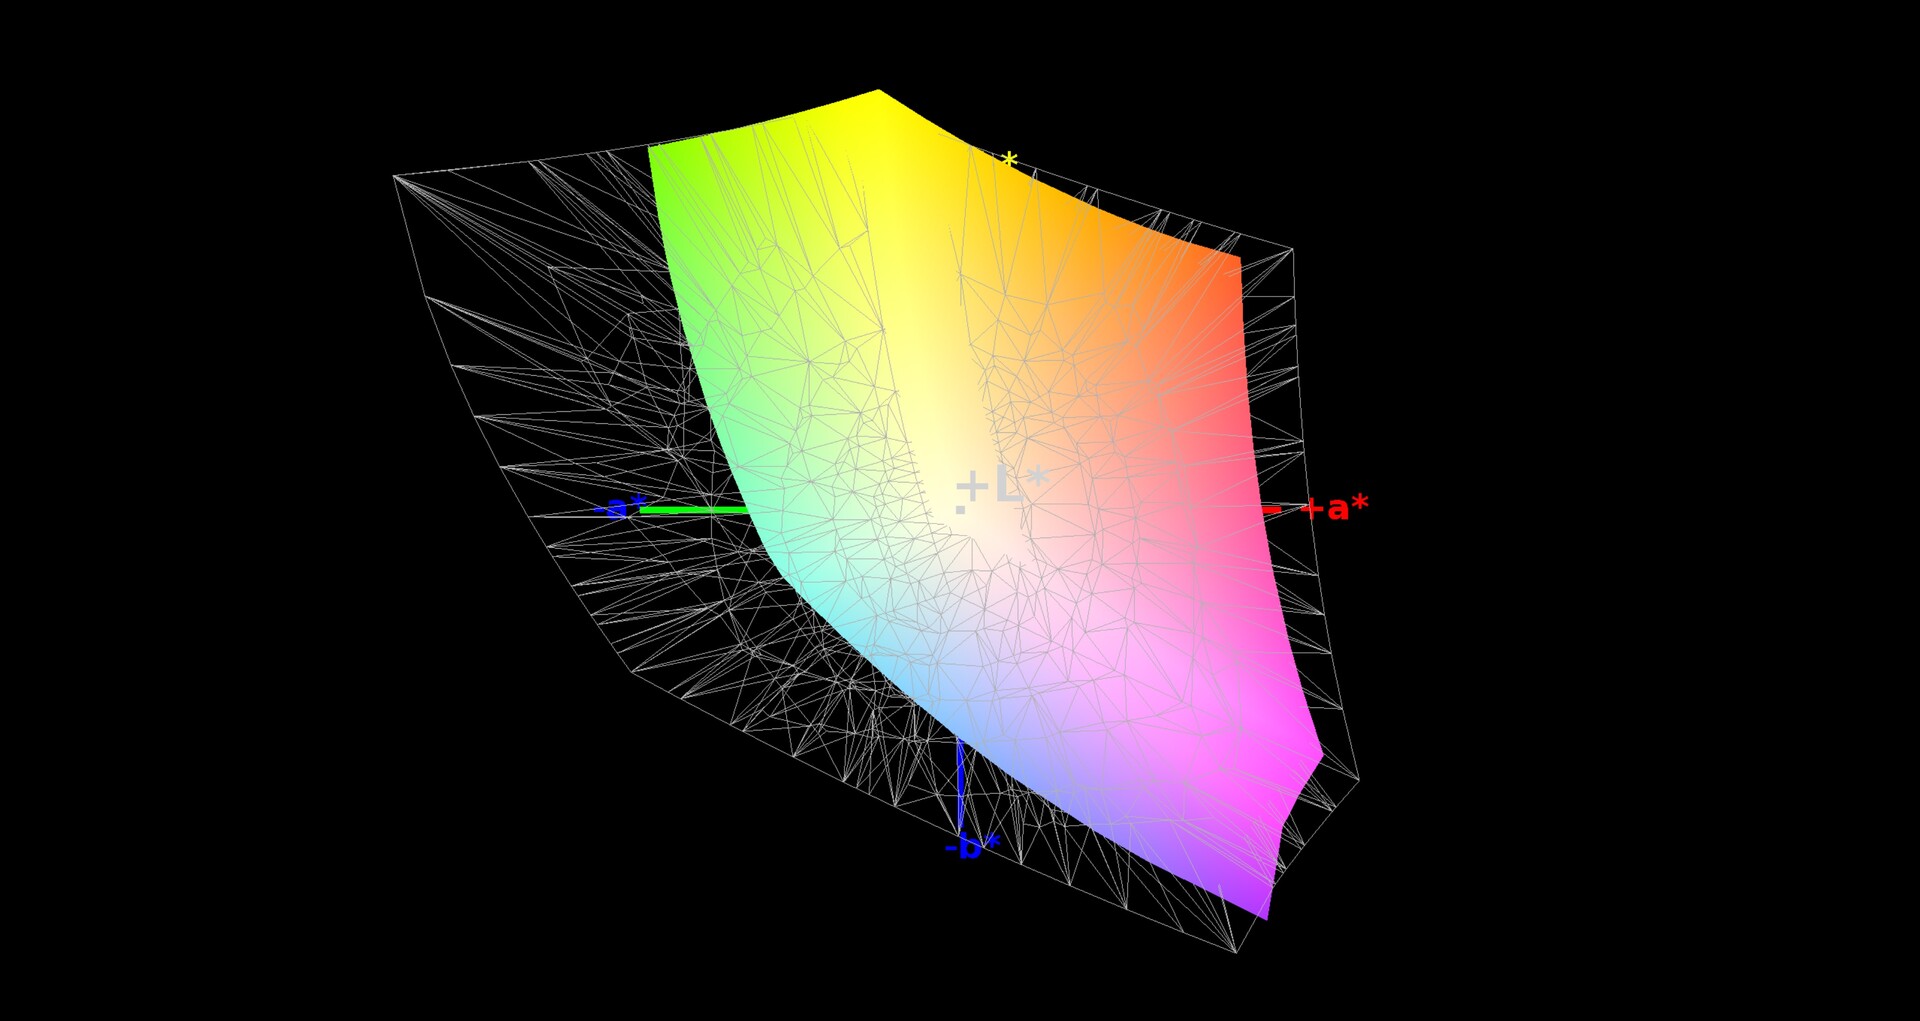
92% sRGB (Argyll 1.6.3 3D)
60% AdobeRGB 1998 (Argyll 1.6.3 3D)
65.5% AdobeRGB 1998 (Argyll 3D)
92.1% sRGB (Argyll 3D)
64.4% Display P3 (Argyll 3D)
Gamma: 2.46
CCT: 8433 K
| Acer Predator Helios 700 PH717-71-785M AU Optronics B173HAN03.1 (AUO319D), IPS, 1920x1080 | HP Omen 17-cb0020ng CMN175D, IPS, 1920x1080 | MSI GE75 9SG Chi Mei N173HCE-G33, AHVA, 1920x1080 | MSI GT76 Titan DT 9SG Chi Mei N173HCE-G33 (CMN175C), IPS, 1920x1080 | Schenker XMG Ultra 17 Turing AU Optronics B173ZAN01.0 (AUO109B), IPS, 3840x2160 | Alienware Area-51m i9-9900K RTX 2080 LG Philips 173WFG, IPS, 1920x1080 | |
|---|---|---|---|---|---|---|
| Display | 1% | -3% | -1% | 31% | 3% | |
| Display P3 Coverage (%) | 64.4 | 63.7 -1% | 61.5 -5% | 62.3 -3% | 86.3 34% | 66.3 3% |
| sRGB Coverage (%) | 92.1 | 96 4% | 92 0% | 93.4 1% | 100 9% | 96.9 5% |
| AdobeRGB 1998 Coverage (%) | 65.5 | 65.8 0% | 63.5 -3% | 64.3 -2% | 99.1 51% | 66.5 2% |
| Response Times | -1% | 50% | 33% | -117% | 14% | |
| Response Time Grey 50% / Grey 80% * (ms) | 16.8 ? | 17.6 ? -5% | 7.2 ? 57% | 8 ? 52% | 41.6 ? -148% | 13.2 ? 21% |
| Response Time Black / White * (ms) | 11.6 ? | 11.2 ? 3% | 6.6 ? 43% | 10 ? 14% | 21.6 ? -86% | 10.8 ? 7% |
| PWM Frequency (Hz) | 25510 ? | 26040 ? | 26040 ? | |||
| Screen | 26% | 22% | 23% | 11% | -6% | |
| Brightness middle (cd/m²) | 288 | 360 25% | 400.7 39% | 396 38% | 343 19% | 335.2 16% |
| Brightness (cd/m²) | 271 | 342 26% | 372 37% | 373 38% | 328 21% | 297 10% |
| Brightness Distribution (%) | 85 | 91 7% | 89 5% | 89 5% | 82 -4% | 82 -4% |
| Black Level * (cd/m²) | 0.2 | 0.26 -30% | 0.34 -70% | 0.33 -65% | 0.31 -55% | 0.66 -230% |
| Contrast (:1) | 1440 | 1385 -4% | 1179 -18% | 1200 -17% | 1106 -23% | 508 -65% |
| Colorchecker dE 2000 * | 5.79 | 1.91 67% | 1.33 77% | 2.04 65% | 5.03 13% | 2.02 65% |
| Colorchecker dE 2000 max. * | 11.89 | 4.08 66% | 3.51 70% | 3.85 68% | 7.91 33% | 7.23 39% |
| Colorchecker dE 2000 calibrated * | 1.89 | 0.78 59% | 1.39 26% | 0.82 57% | 0.86 54% | 1.17 38% |
| Greyscale dE 2000 * | 6.92 | 2.72 61% | 1.3 81% | 2.83 59% | 6.29 9% | 3.2 54% |
| Gamma | 2.46 89% | 2.37 93% | 2.24 98% | 2.49 88% | 2.38 92% | 2.16 102% |
| CCT | 8433 77% | 6692 97% | 6735 97% | 7113 91% | 6389 102% | 6746 96% |
| Color Space (Percent of AdobeRGB 1998) (%) | 60 | 60 0% | 58.2 -3% | 59 -2% | 88 47% | 61.3 2% |
| Color Space (Percent of sRGB) (%) | 92 | 96 4% | 92.1 0% | 94 2% | 100 9% | 96.9 5% |
| Total Average (Program / Settings) | 9% /
18% | 23% /
21% | 18% /
19% | -25% /
-1% | 4% /
-2% |
* ... smaller is better
The other aspects of our panel (AU Optronics B173HAN03.1) are mixed. While its brightness is lower than those of its competition at around 271 cd/m², the low black value of 0.2 cd/m² ensures an above-average contrast ratio of 1440:1 and positions our panel at the top of our comparison field.
The Helios 700 doesn't do quite as well in terms of color accuracy. Our CalMAN results show that the screen's colors are rather imprecise and suffer from a blue cast. Only the Schenker XMG Ultra 17's display has similarly bad results ex-works. Fortunately, our calibration significantly improved the results (the ICC file is available for download above).
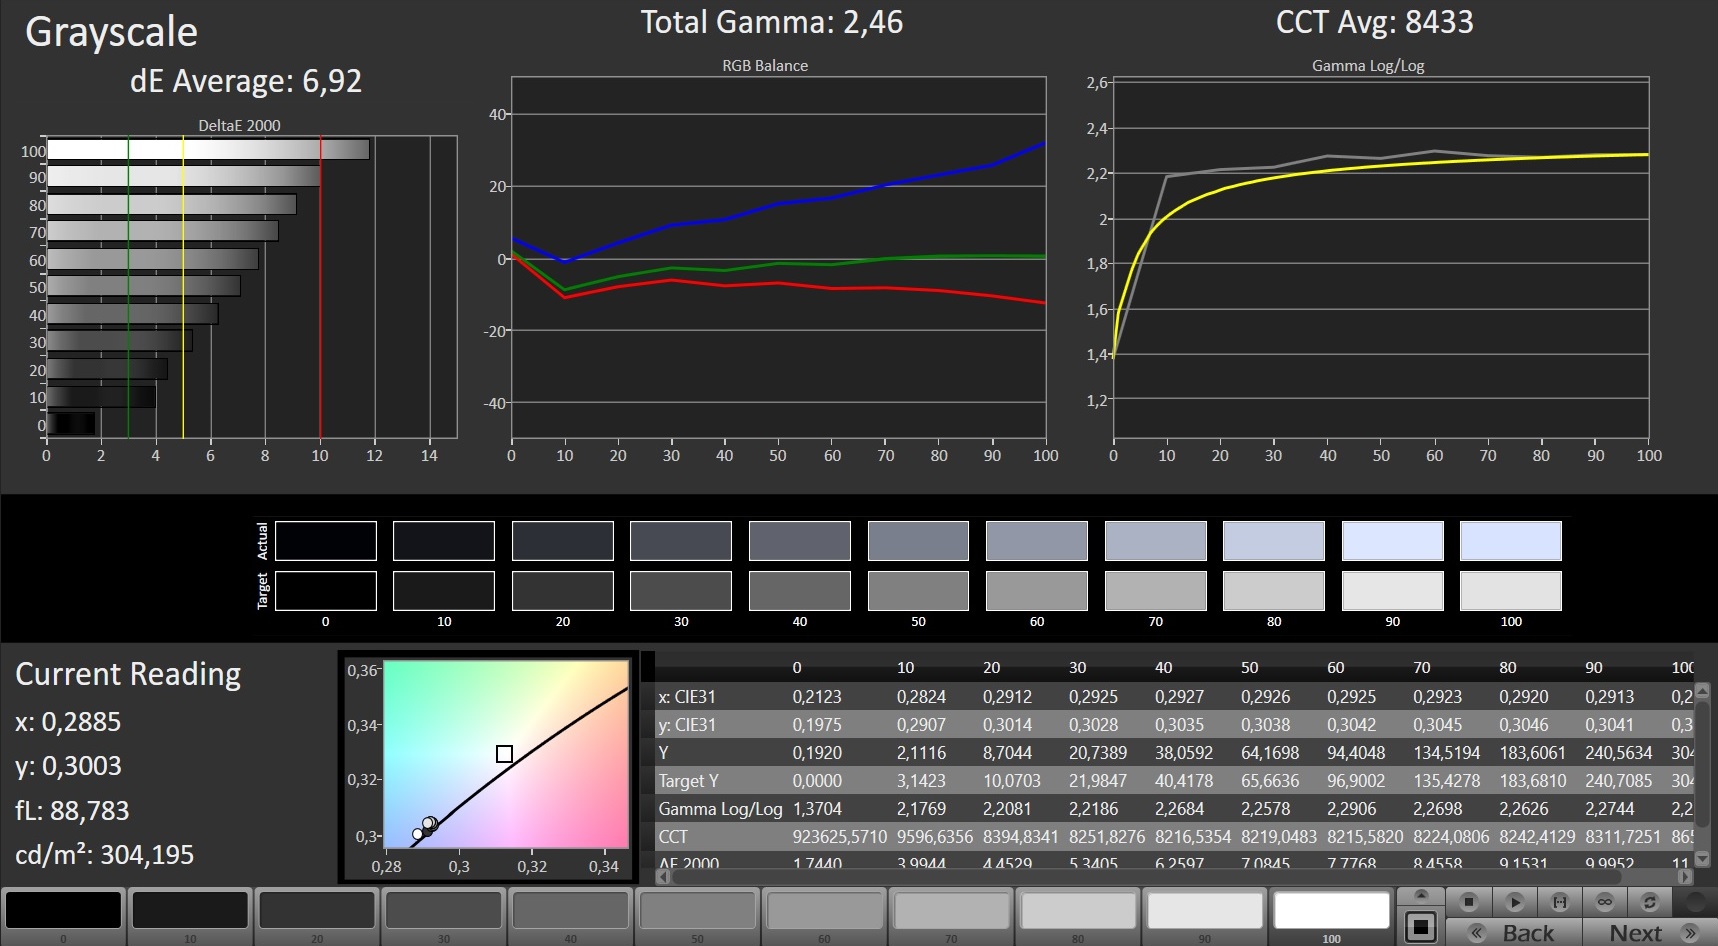
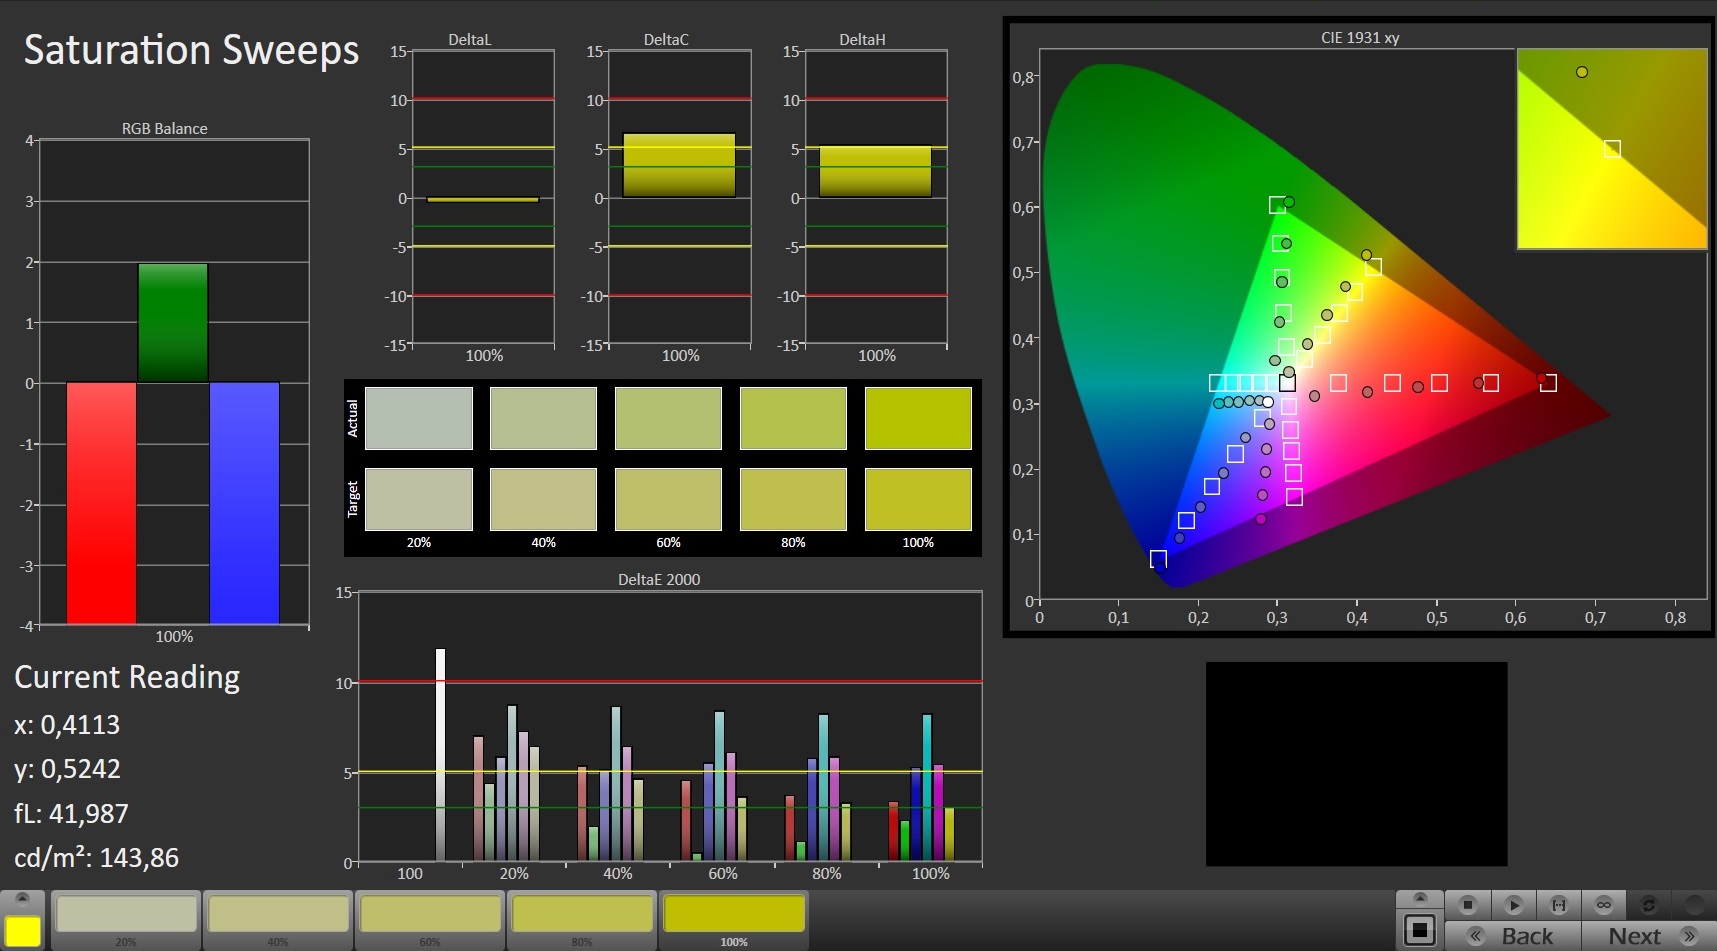
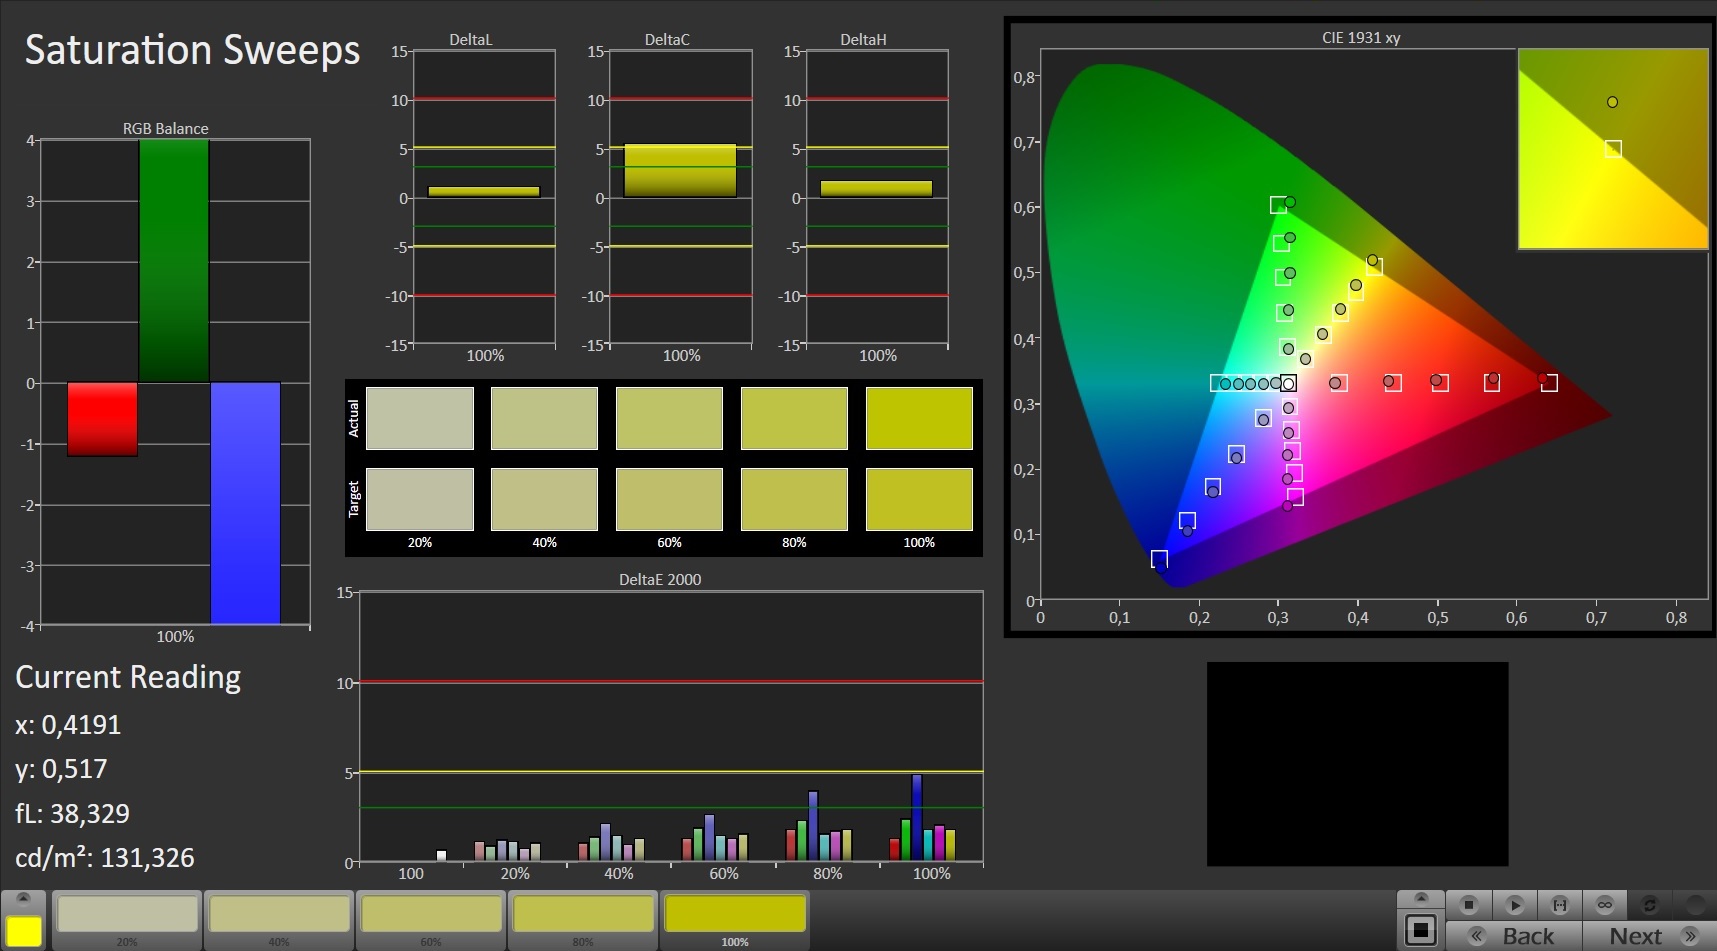
The color-space coverage is decent: 92% of the sRGB and 60% of the AdobeRGB color spaces are typical for a gaming notebook. What is somewhat annoying, however, is that our 17-inch notebook has quite a lot of backlight bleeding along the top and bottom edge.
We did not measure any PWM flickering. The response time should be sufficient for most gamers: 11.6 ms black-to-white and 16.8 ms gray-to-gray should almost always guarantee a clean image.

Display Response Times
| ↔ Response Time Black to White | ||
|---|---|---|
| 11.6 ms ... rise ↗ and fall ↘ combined | ↗ 6 ms rise | 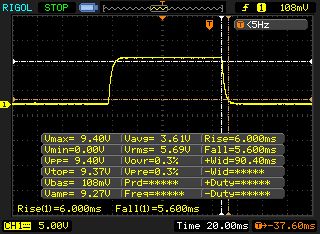 |
| ↘ 5.6 ms fall | ||
| The screen shows good response rates in our tests, but may be too slow for competitive gamers. In comparison, all tested devices range from 0.1 (minimum) to 240 (maximum) ms. » 31 % of all devices are better. This means that the measured response time is better than the average of all tested devices (19.8 ms). | ||
| ↔ Response Time 50% Grey to 80% Grey | ||
| 16.8 ms ... rise ↗ and fall ↘ combined | ↗ 8.4 ms rise | 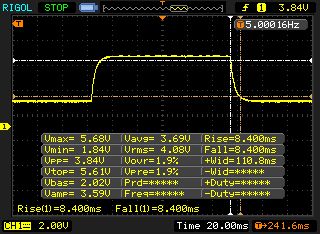 |
| ↘ 8.4 ms fall | ||
| The screen shows good response rates in our tests, but may be too slow for competitive gamers. In comparison, all tested devices range from 0.165 (minimum) to 636 (maximum) ms. » 31 % of all devices are better. This means that the measured response time is better than the average of all tested devices (31 ms). | ||
Screen Flickering / PWM (Pulse-Width Modulation)
| Screen flickering / PWM not detected |  | ||
In comparison: 52 % of all tested devices do not use PWM to dim the display. If PWM was detected, an average of 7747 (minimum: 5 - maximum: 343500) Hz was measured. | |||
Performance
The price of the Helios 700 is a strong indicator that we are dealing with a high-end device. The configuration of our test unit with a six-core CPU, 32 GB of RAM, and SSD RAID should provide sufficient stamina now and for years to come. Nvidia's GeForce RTX 2080 only reaches its limits with a QHD or 4K display.
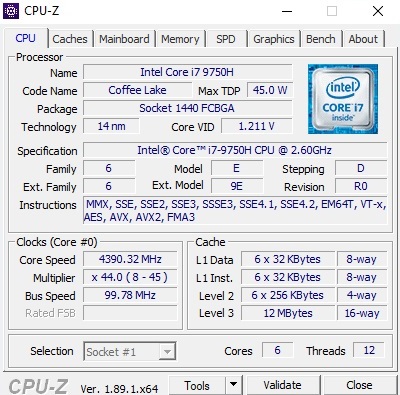
Processor
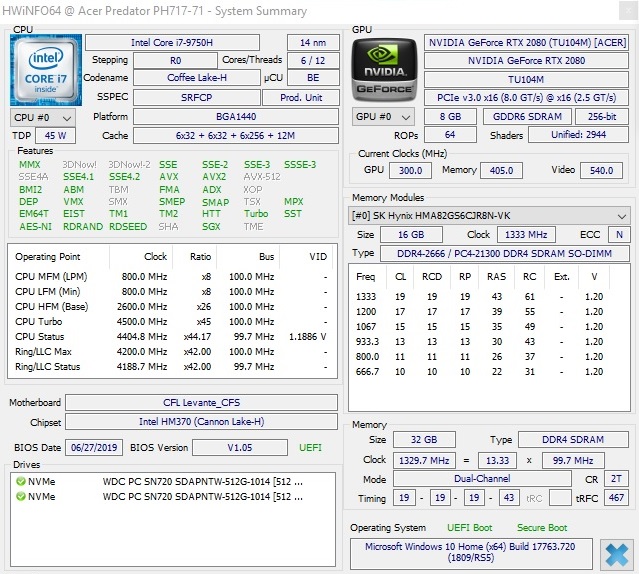
If you would like to save some money, you would be better off choosing the Helios 700 configuration with the Core i7-9750H instead of the Core i9-9980HK. While the former Coffee Lake CPU "only" has six cores (and 12 instead of 16 threads), this will hardly make a difference in everyday use since most 3D applications are limited by the GPU. At least currently.
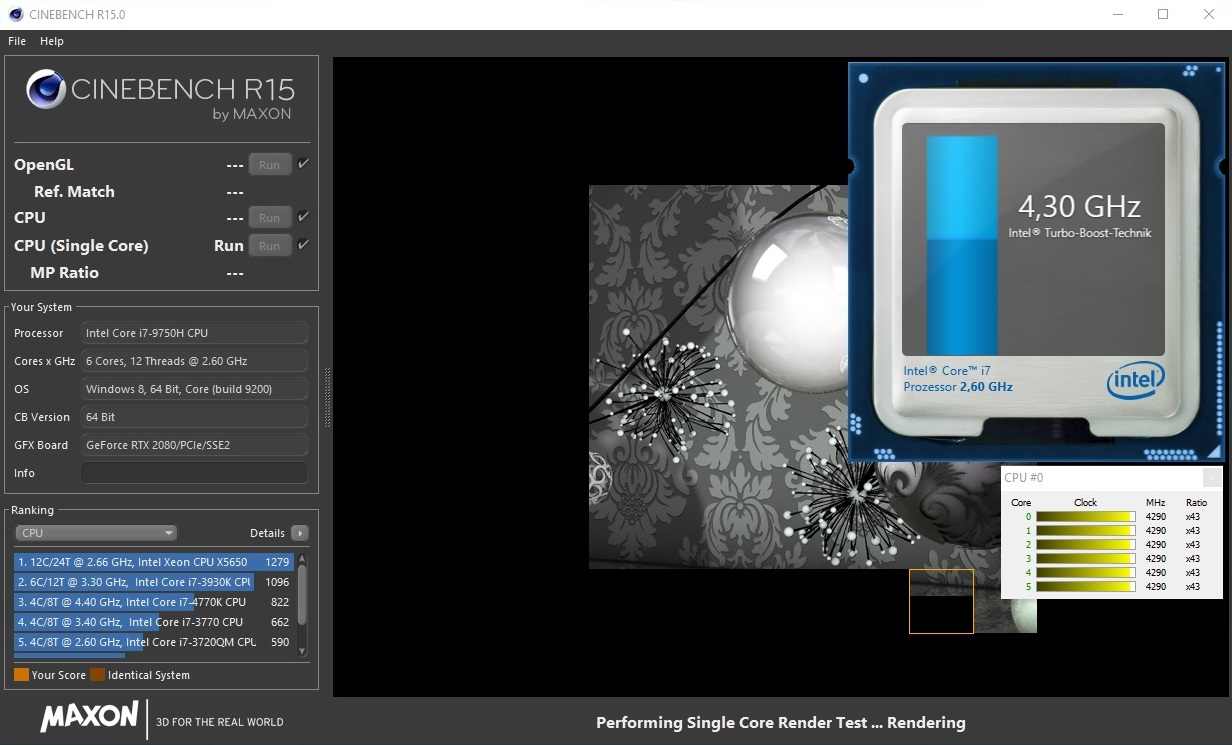
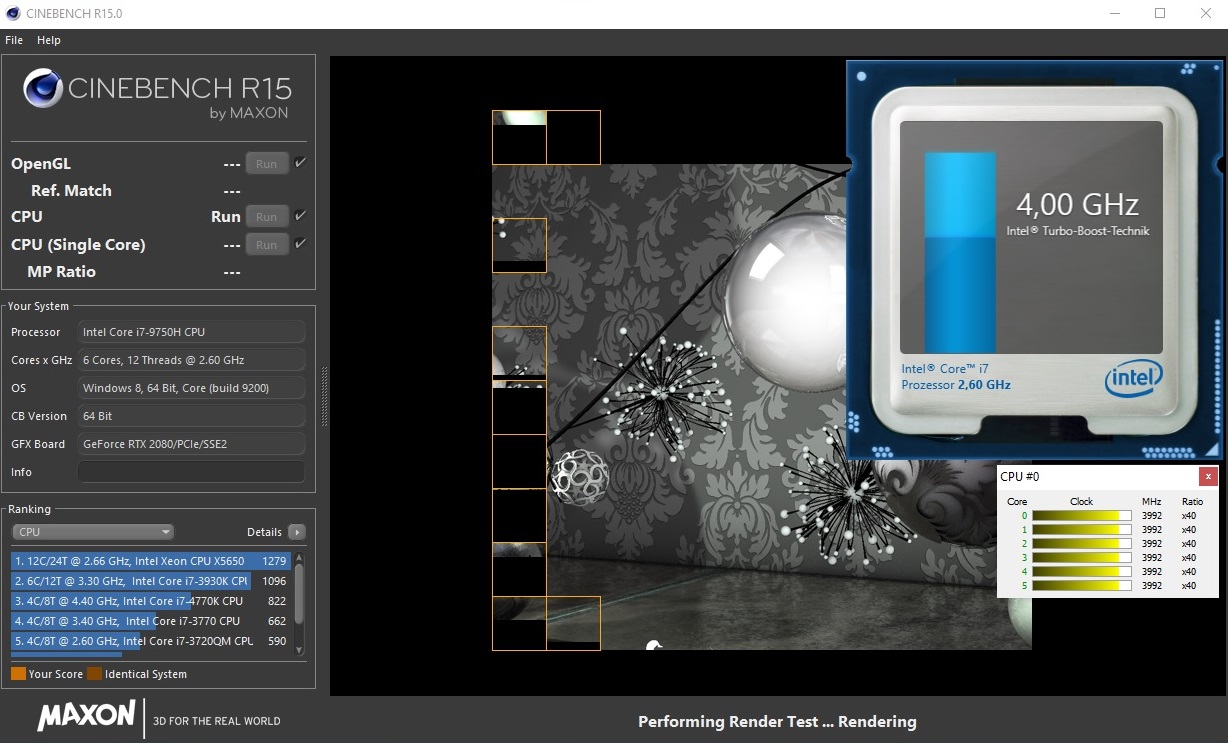
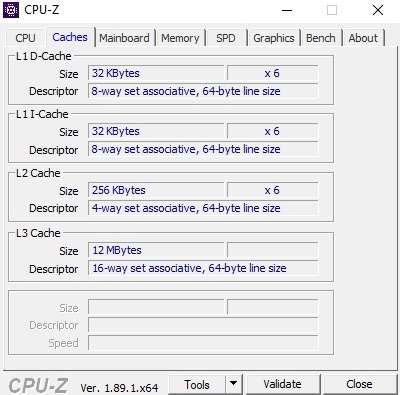
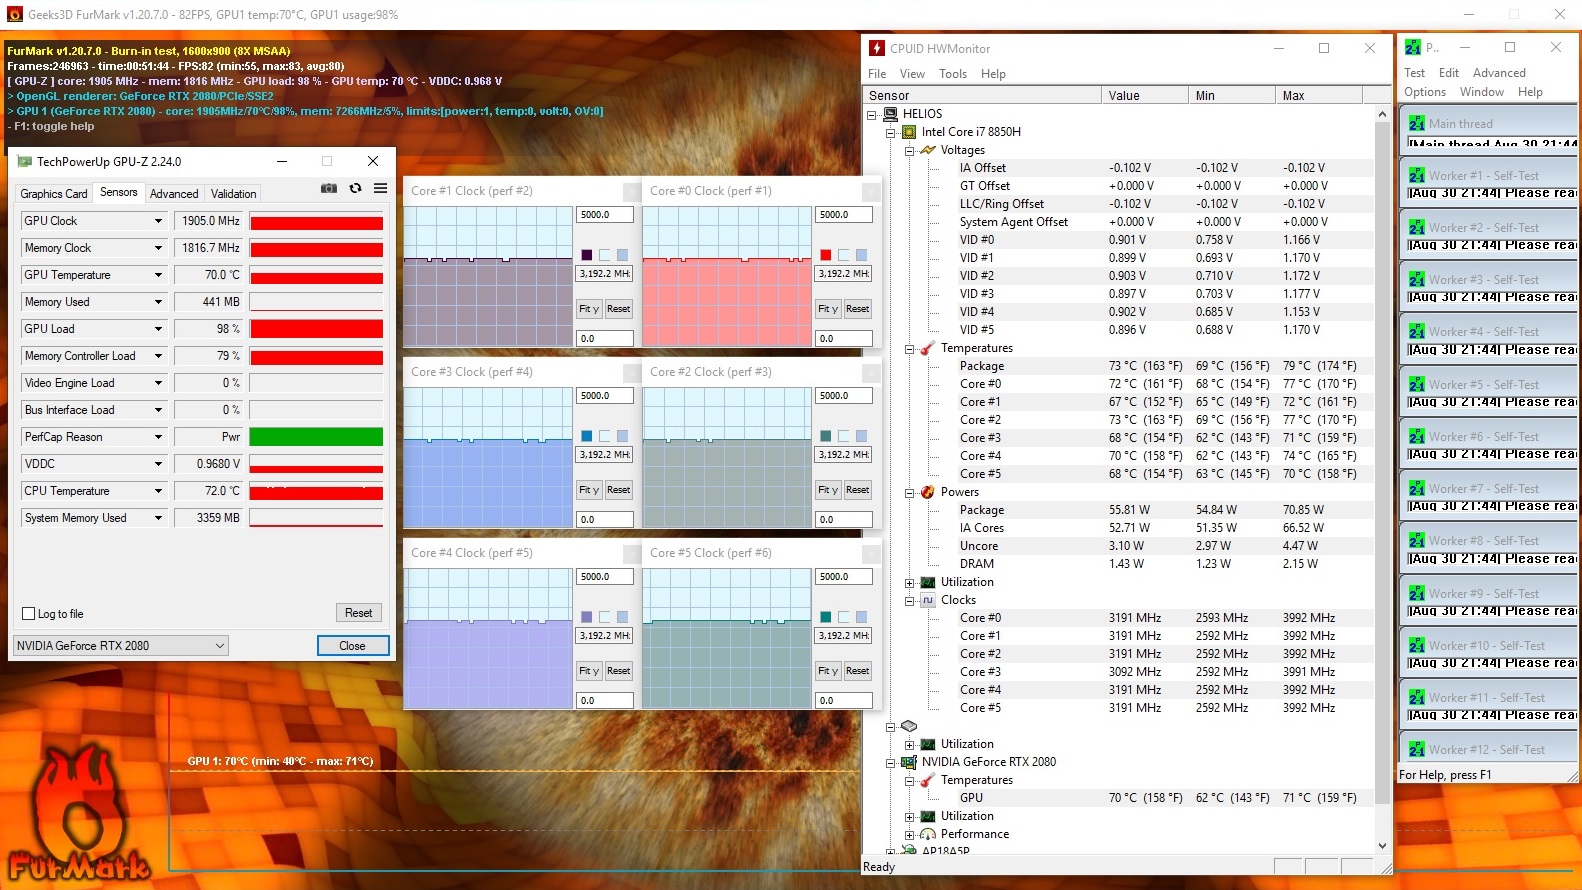
The i7-9750H, manufactured using the 14-nm process, has a 12-MP L3 cache. Its TDP is specified as 45 watts and the base clock rate is 2.6 GHz. Intel's turbo boost feature enables the CPU to significantly increase its clock rate - provided there is sufficient cooling. We measured a clock rate of 4.1 to 4.2 GHz in our CineBench R15 single-core test; the CPU settled at around 3.7 to 3.8 GHz in the multi-core test after reaching 4.0 GHz at first. That's quite decent for an i7-9750H.
This clocking behavior places the Helios 700 almost on par with the HP Omen 17 in our CineBench loop (see graph) as this device only manages to make limited use of its eight CPU cores. The Core i9-9880H in the MSI GE75 9SG, on the other hand, is significantly faster. Overall, the Core i7-9750H in our Helios 700 reaches the expected performance level.
System Performance
The Helios 700 continues to do what it's supposed to when it comes to system performance. While it only makes second to last place with 6453 points in PCMark 10, we would subjectively describe the system performance as very fast with a great overall performance (boot performance, startup and loading times etc.). In the end, the difference to the competitors' benchmark results isn't particularly big.
Storage Devices
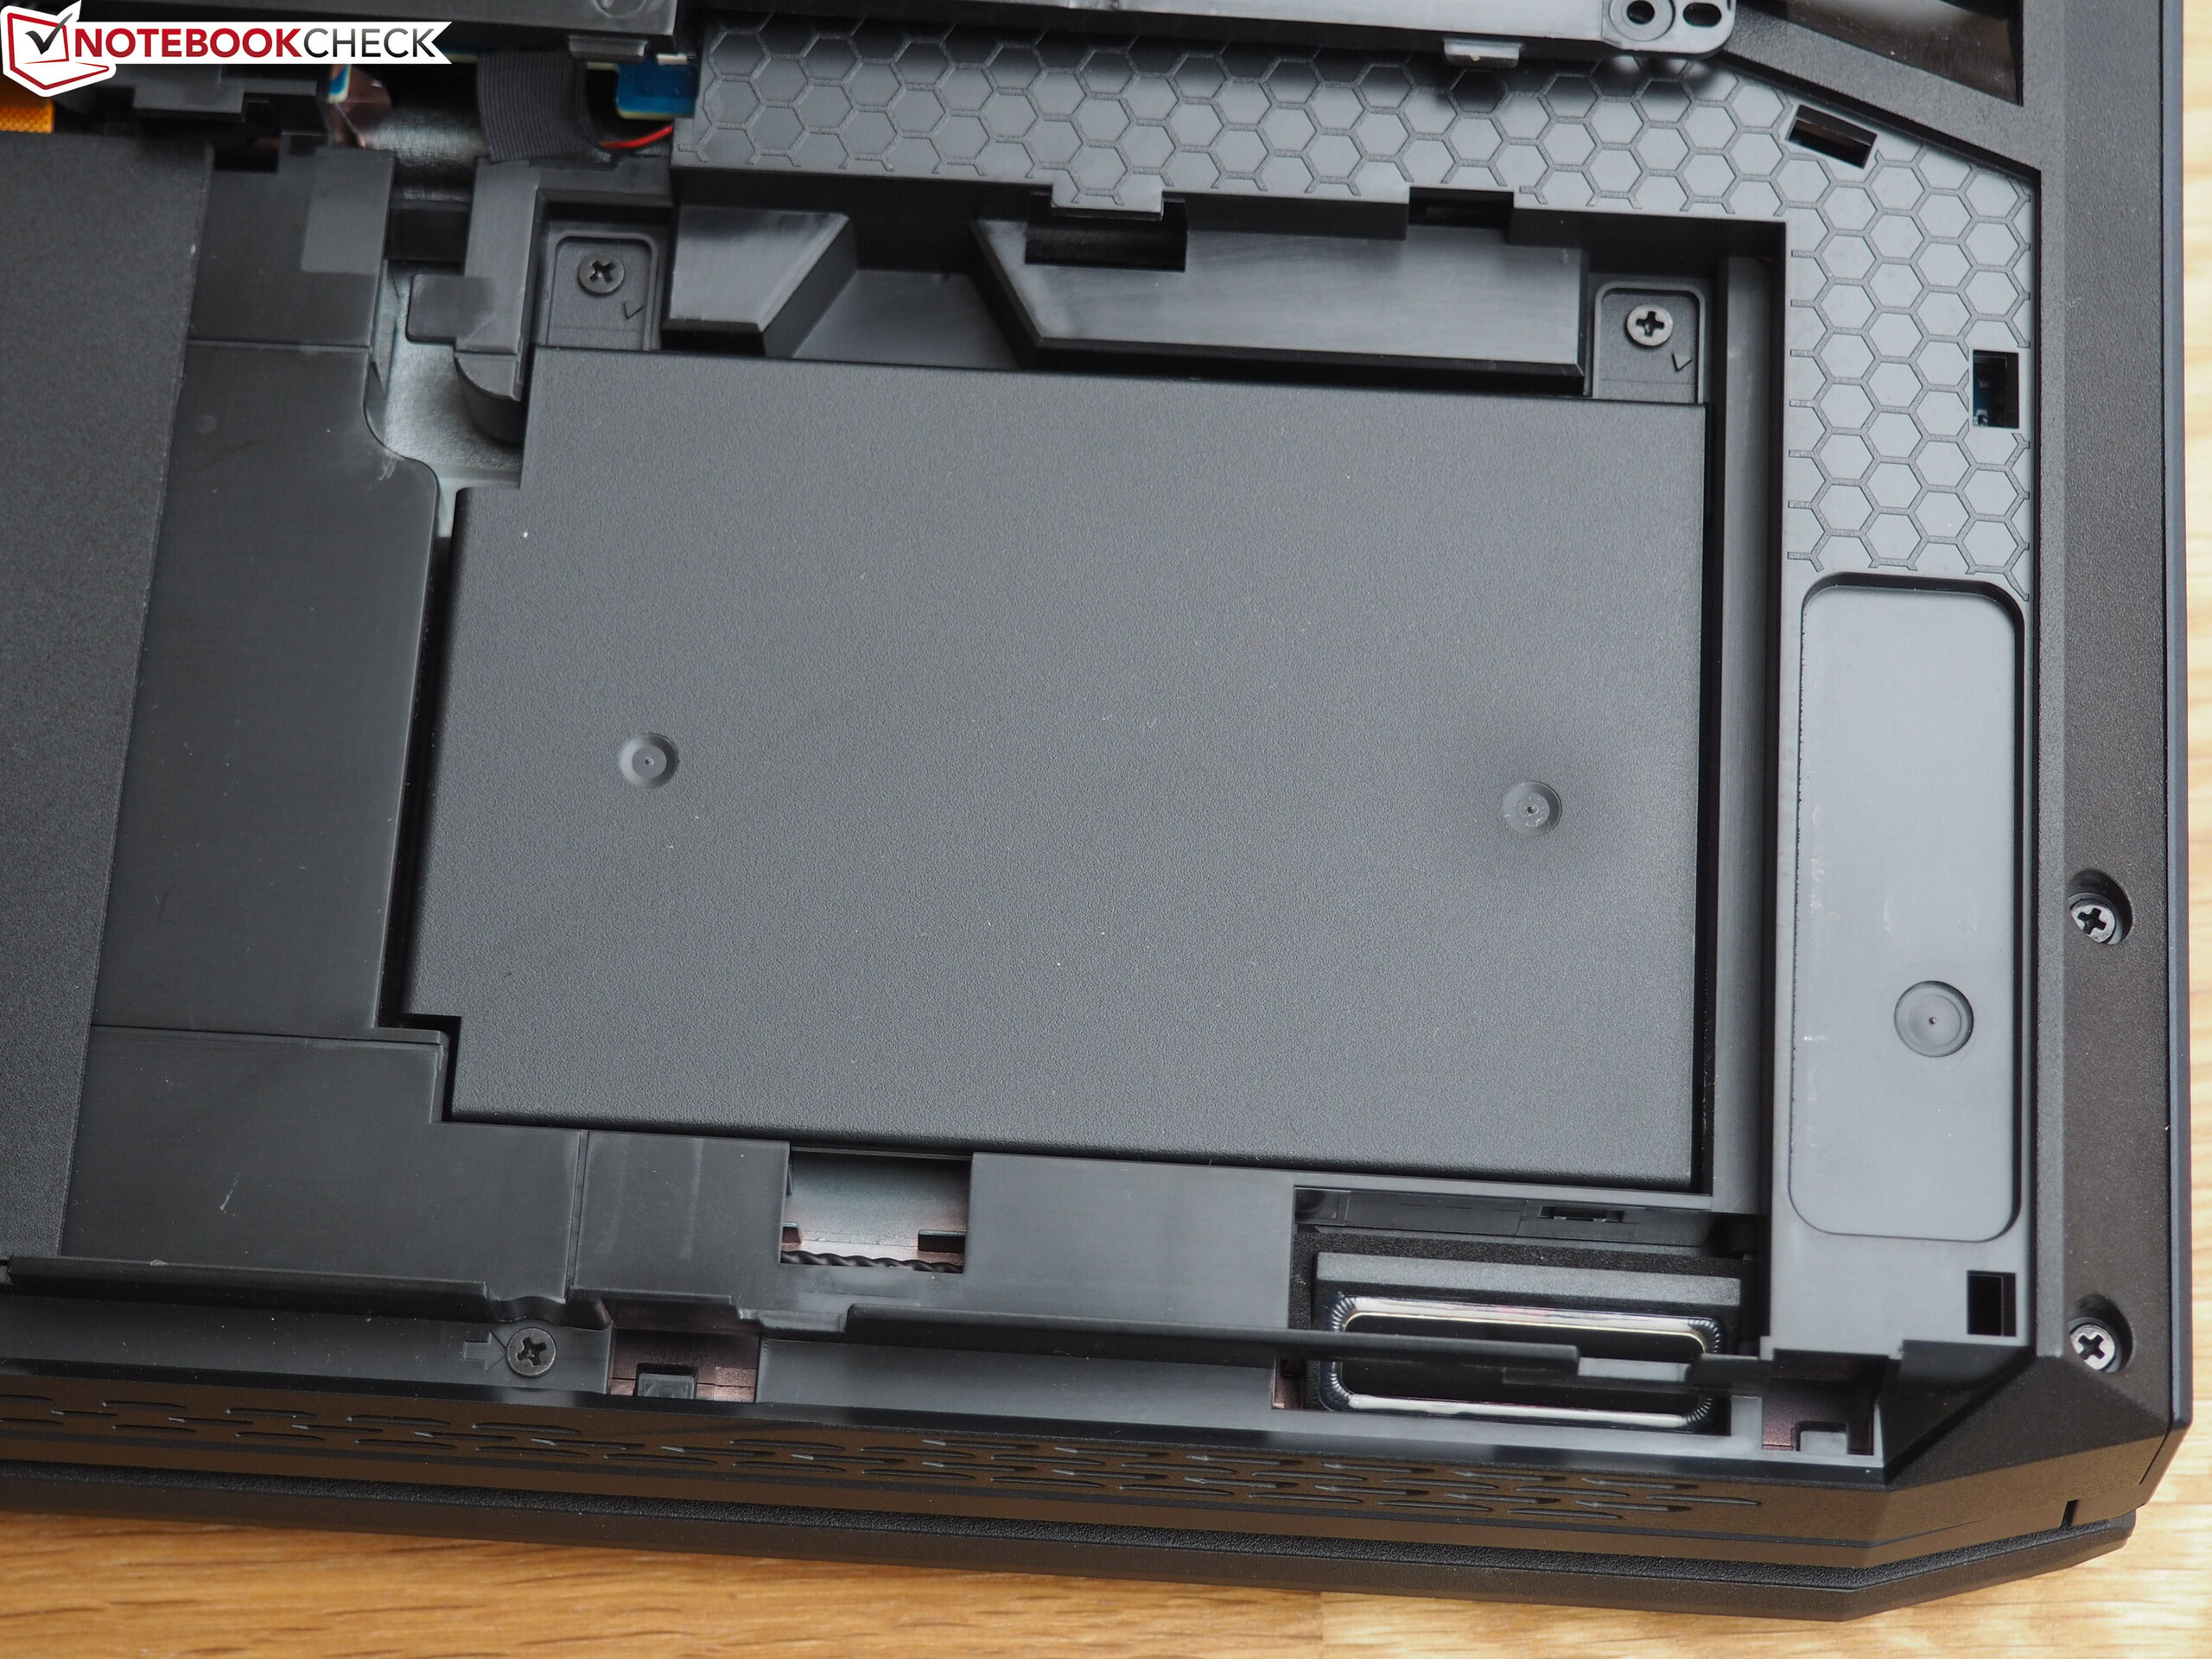
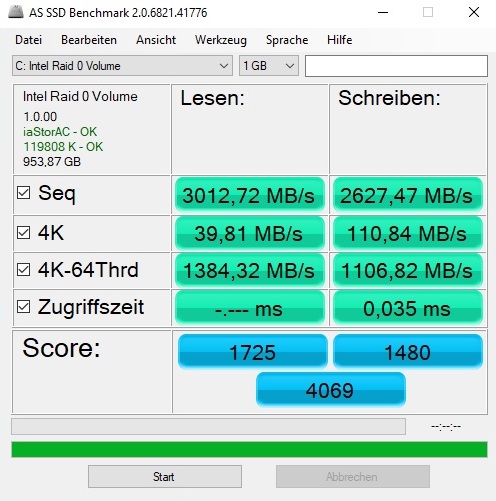
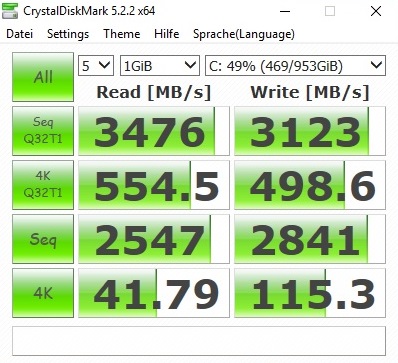
Like most competitors, our Helios 700 test unit uses an SSD RAID consisting of two 512-GB PCIe drives from Western Digital (PC SN720). The sequential read and write rates of over 2000 MB/s place this RAID system towards the top of our comparison field. Users wishing to expand storage capacity can use the free 2.5-inch bay (below the battery), for which Acer has provided a suitable cover. Other Helios 700 configurations are already equipped with an HDD in addition to the SSD.
| Acer Predator Helios 700 PH717-71-785M 2x WDC PC SN720 SDAPNTW-512G-1014 (RAID 0) | HP Omen 17-cb0020ng 2x Samsung SSD PM981 MZVLB512HAJQ (RAID 0) | MSI GE75 9SG Samsung SSD PM981 MZVLB1T0HALR | MSI GT76 Titan DT 9SG 2x Samsung PM961 MZVLW256HEHP (RAID 0) | Schenker XMG Ultra 17 Turing Samsung SSD 970 EVO Plus 500GB | Alienware Area-51m i9-9900K RTX 2080 2x SK Hynix PC400 512GB (RAID 0) | |
|---|---|---|---|---|---|---|
| CrystalDiskMark 5.2 / 6 | -4% | -17% | -15% | 6% | 1% | |
| Write 4K (MB/s) | 115.3 | 103.8 -10% | 116.1 1% | 101.4 -12% | 183.2 59% | 111.1 -4% |
| Read 4K (MB/s) | 41.79 | 41.67 0% | 44.98 8% | 40.57 -3% | 52.4 25% | 45.47 9% |
| Write Seq (MB/s) | 2841 | 2639 -7% | 2370 -17% | 2229 -22% | 1790 -37% | 2454 -14% |
| Read Seq (MB/s) | 2547 | 2702 6% | 1465 -42% | 2528 -1% | 1743 -32% | 2212 -13% |
| Write 4K Q32T1 (MB/s) | 498.6 | 487.3 -2% | 337.5 -32% | 379.6 -24% | 550 10% | 622 25% |
| Read 4K Q32T1 (MB/s) | 555 | 555 0% | 453.6 -18% | 421.9 -24% | 648 17% | 695 25% |
| Write Seq Q32T1 (MB/s) | 3123 | 2967 -5% | 2399 -23% | 2439 -22% | 3236 4% | 2675 -14% |
| Read Seq Q32T1 (MB/s) | 3476 | 3102 -11% | 3087 -11% | 3199 -8% | 3538 2% | 3184 -8% |

Graphics
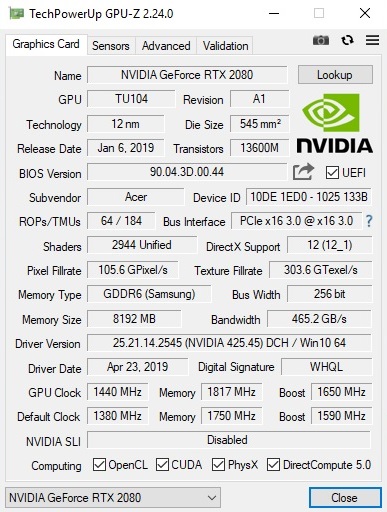
No matter which Nvidia chip you choose: The preinstalled PredatorSense tools let you overclock it significantly. It provides four modes ranging from "normal" to "extreme". Our 3D tests were done at "fast". This increases the RTX 2080's memory clock rate to 1817 MHz (from 1750 MHz). The GPU clock rate, meanwhile, increases from 1380 to 1440 MHz.
| 3DMark 11 Performance | 26029 points | |
| 3DMark Cloud Gate Standard Score | 42055 points | |
| 3DMark Fire Strike Score | 21258 points | |
| 3DMark Time Spy Score | 9875 points | |
Help | ||
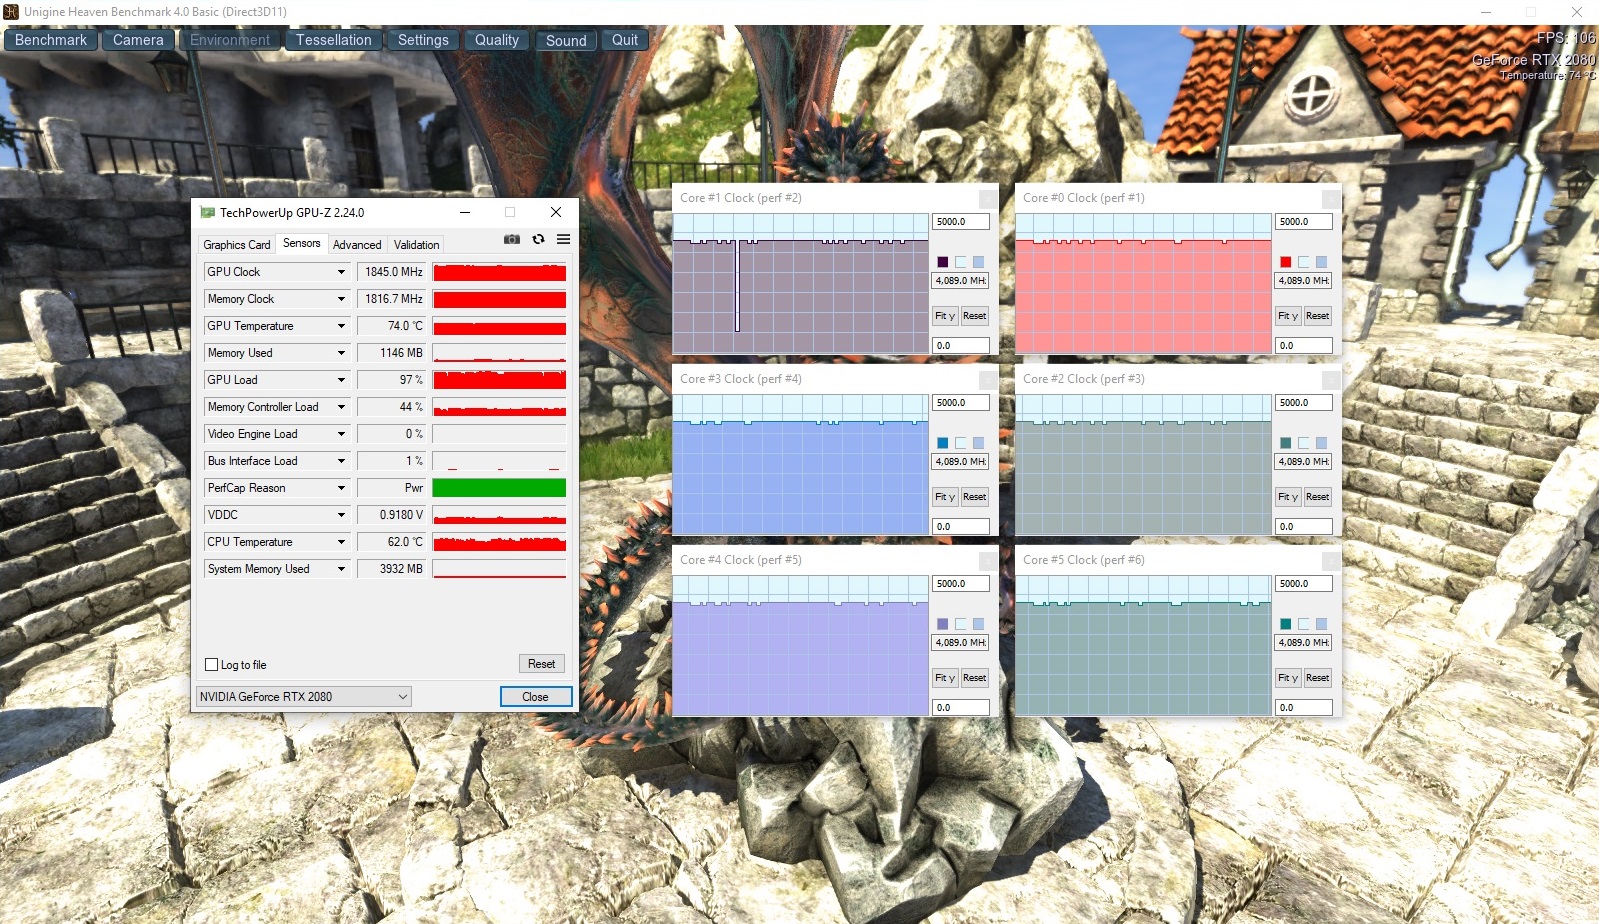
The GPU boost (automatic overclocking similar to Intel's turbo boost) can reach significantly higher values in everyday use. The GPU-Z tool, for example, measured up to 2025 MHz during the render test. This is a brilliant result. Users can expect around 1800 MHz while gaming, as shown by our tests with the Unigine Heaven 4.0 benchmark and The Witcher 3.
The 3DMark results confirm that it's definitely worth overclocking the GPU with PredatorSense. The Helios 700 can even beat the Alienware Area 51m, which up until now was considered the best RTX 2080 device, albeit narrowly.
We tried to find out whether this high performance could be kept up over a longer period of time by running The Witcher 3 for 60 minutes. The graph clearly shows that the frame rate remains impressively linear.
Gaming Performance
Apart from games that rely heavily on the CPU, such as Anno 1800, the Helios 700 manages to overtake most of its competition in our gaming benchmarks. It's between 4 and 15% faster in The Witcher 3, although the difference between 92 and 105 fps is hardly noticeable in practice (1920x1080, maximum details).
| The Witcher 3 - 1920x1080 Ultra Graphics & Postprocessing (HBAO+) | |
| Average of class Gaming (104.7 - 240, n=6, last 2 years) | |
| Acer Predator Helios 700 PH717-71-785M | |
| Alienware Area-51m i9-9900K RTX 2080 | |
| MSI GT76 Titan DT 9SG | |
| MSI GE75 9SG | |
| Schenker XMG Ultra 17 Turing | |
| HP Omen 17-cb0020ng | |
In general, the GeForce RTX 2080 manages to display all current games at maximum settings. Ten out of 14 tested titles were even displayed at over 100 fps, which the 144-Hz screen benefits from.
| low | med. | high | ultra | |
|---|---|---|---|---|
| The Witcher 3 (2015) | 187 | 105 | ||
| Final Fantasy XV Benchmark (2018) | 108 | |||
| Kingdom Come: Deliverance (2018) | 117 | 78.6 | ||
| Monster Hunter World (2018) | 138 | 112 | ||
| FIFA 19 (2018) | 301 | 256 | ||
| Apex Legends (2019) | 144 | 144 | ||
| Far Cry New Dawn (2019) | 106 | 94 | ||
| Metro Exodus (2019) | 93.4 | 77.4 | ||
| Anthem (2019) | 108 | 104 | ||
| Dirt Rally 2.0 (2019) | 171 | 114 | ||
| The Division 2 (2019) | 134 | 108 | ||
| Anno 1800 (2019) | 74.8 | 43.6 | ||
| Rage 2 (2019) | 125 | 124 | ||
| F1 2019 (2019) | 155 | 152 |
Emissions
System Noise
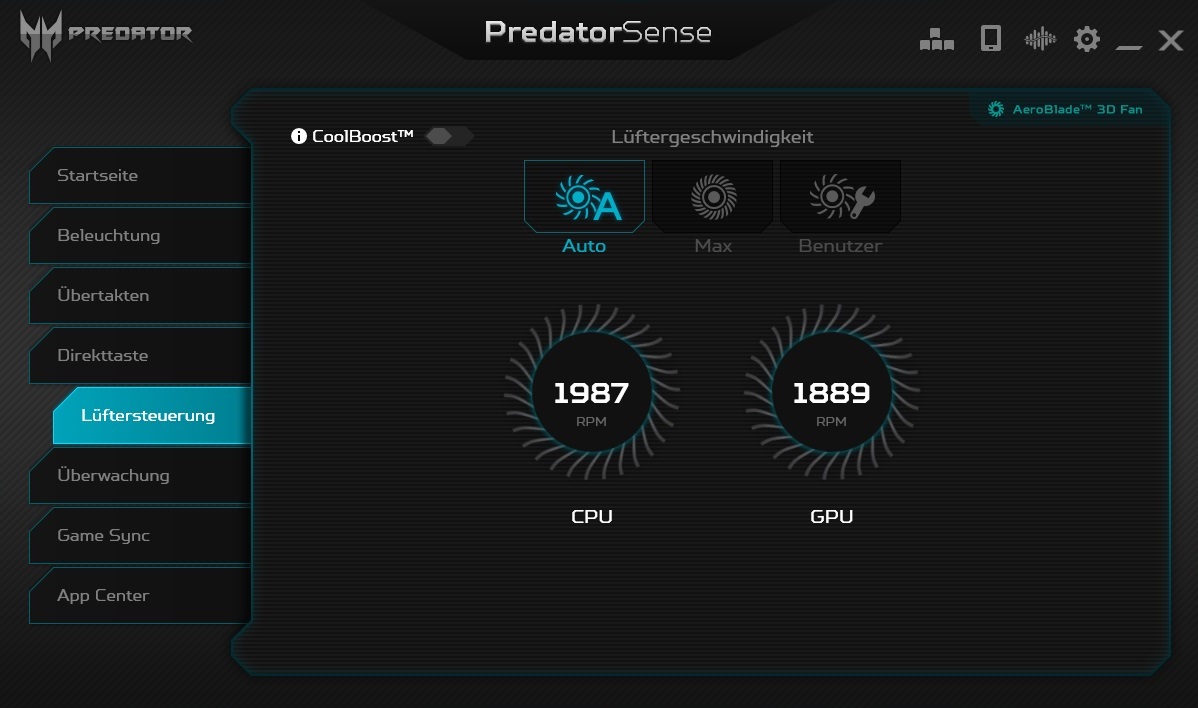
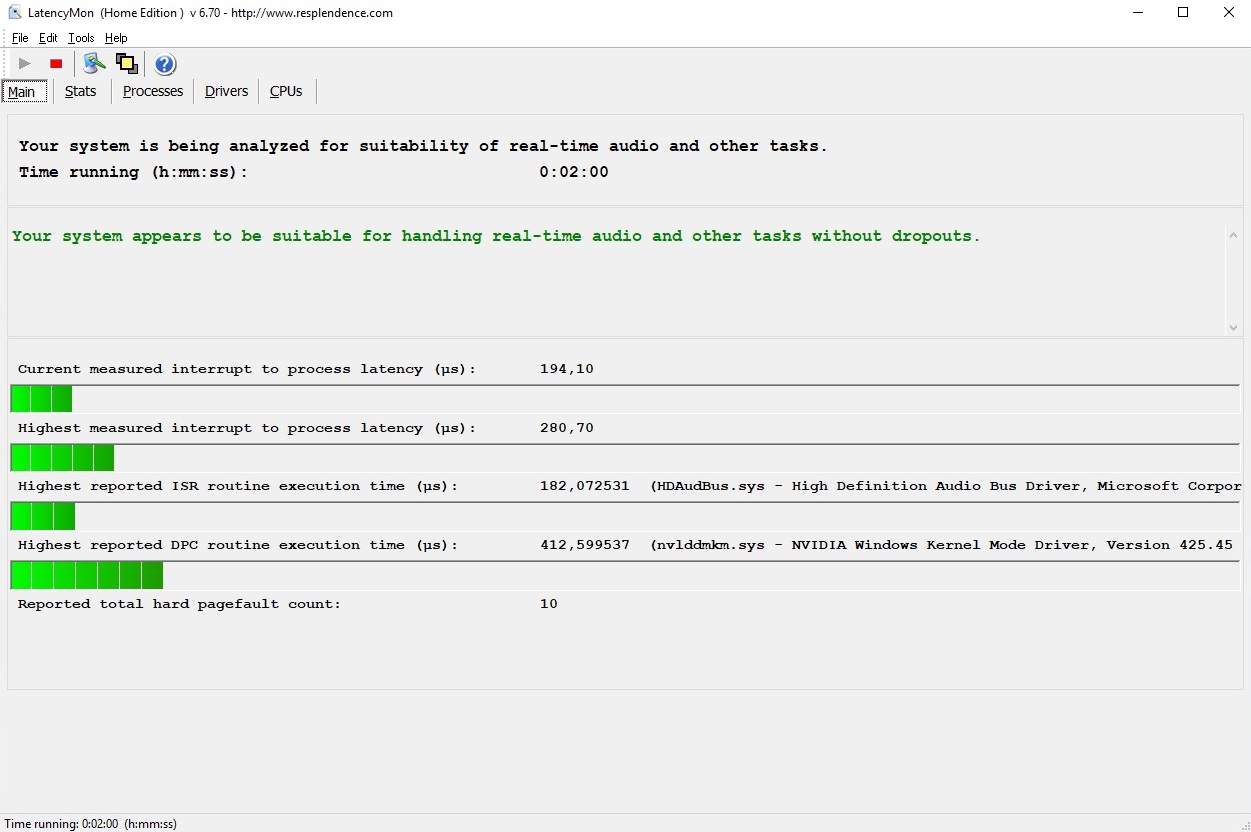
One of the biggest disadvantages of the 17-inch device is its meager fan control. While idling, we encountered regular short-lived but strong increases in fan RPM at every GPU mode. This behavior is occasionally connected to light background activities such as Windows updates, but on other occasions it seems to occur randomly.
The system noise could also be improved under load. While the fan runs quite steadily in "normal" mode, it varies extremely in "fast" mode. For example, we measured between 40 and 50 dB(A) during the 3DMark06 test and between 47 and 57 dB(A) during The Witcher 3. This makes it quite difficult to compare the Helios 700's system noise with those of its competition. But generally speaking, gaming sessions aren't enjoyable without headphones on any RTX 2080 laptop. 60 dB(A) under maximum load is quite significant. Therefore, we would recommend users who don't need maximum performance to run the Helios 700 in "normal" mode.
Noise level
| Idle |
| 30 / 34 / 45 dB(A) |
| Load |
| 40 / 60 dB(A) |
 | ||
30 dB silent 40 dB(A) audible 50 dB(A) loud |
||
min: | ||
| Acer Predator Helios 700 PH717-71-785M i7-9750H, GeForce RTX 2080 Mobile | HP Omen 17-cb0020ng i9-9880H, GeForce RTX 2080 Mobile | MSI GE75 9SG i9-9880H, GeForce RTX 2080 Mobile | MSI GT76 Titan DT 9SG i9-9900K, GeForce RTX 2080 Mobile | Schenker XMG Ultra 17 Turing i9-9900K, GeForce RTX 2080 Mobile | Alienware Area-51m i9-9900K RTX 2080 i9-9900K, GeForce RTX 2080 Mobile | Average of class Gaming | |
|---|---|---|---|---|---|---|---|
| Noise | 1% | 9% | -2% | 3% | 2% | 15% | |
| off / environment * (dB) | 30 | 30 -0% | 28.2 6% | 30 -0% | 30 -0% | 28.1 6% | 24.1 ? 20% |
| Idle Minimum * (dB) | 30 | 34 -13% | 30.4 -1% | 33 -10% | 30 -0% | 28.1 6% | 25.9 ? 14% |
| Idle Average * (dB) | 34 | 35 -3% | 30.4 11% | 34 -0% | 33 3% | 28.6 16% | 27.4 ? 19% |
| Idle Maximum * (dB) | 45 | 36 20% | 33.4 26% | 44 2% | 35 22% | 51 -13% | 30.1 ? 33% |
| Load Average * (dB) | 40 | 51 -27% | 37.1 7% | 47 -18% | 44 -10% | 51 -27% | 43.6 ? -9% |
| Witcher 3 ultra * (dB) | 57 | 47 18% | 54.2 5% | 53 7% | 55 4% | 51 11% | |
| Load Maximum * (dB) | 60 | 51 15% | 56.4 6% | 59 2% | 58 3% | 51 15% | 54.2 ? 10% |
* ... smaller is better
Temperature
The advantage of this subpar system noise situation is that the surface temperatures remain very cool. We measured a maximum of 40 °C on the bottom and 37 °C on the top of the base unit (we only measured the areas around the input devices, not the ventilation slots) - this is surprisingly low for a high-end notebook.
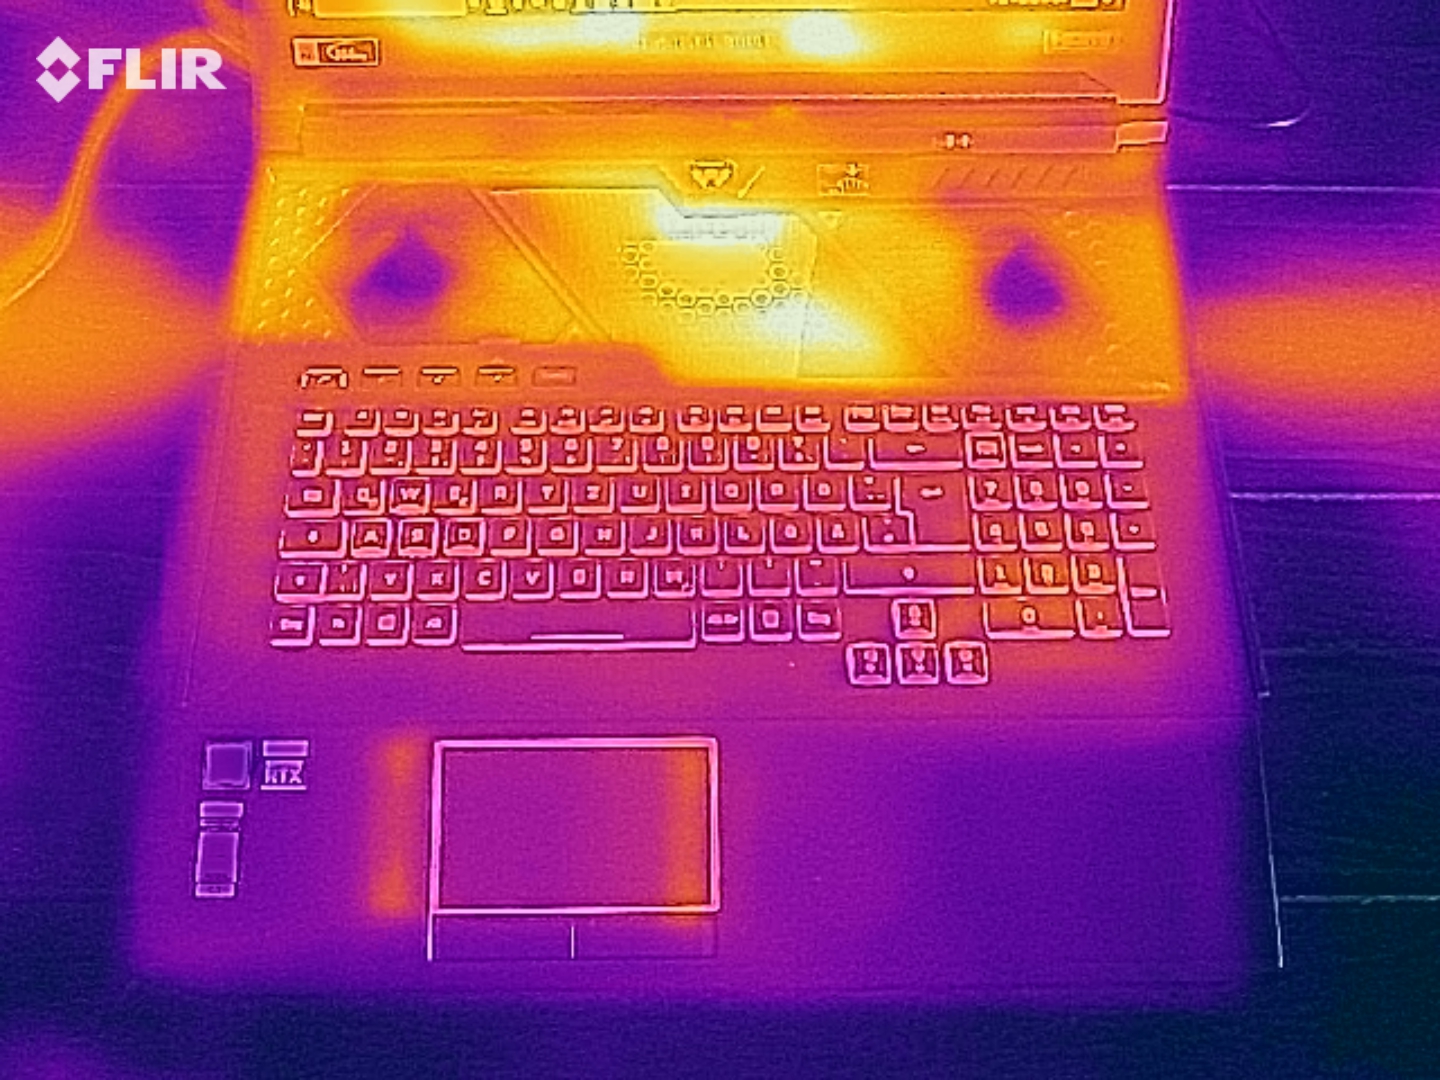
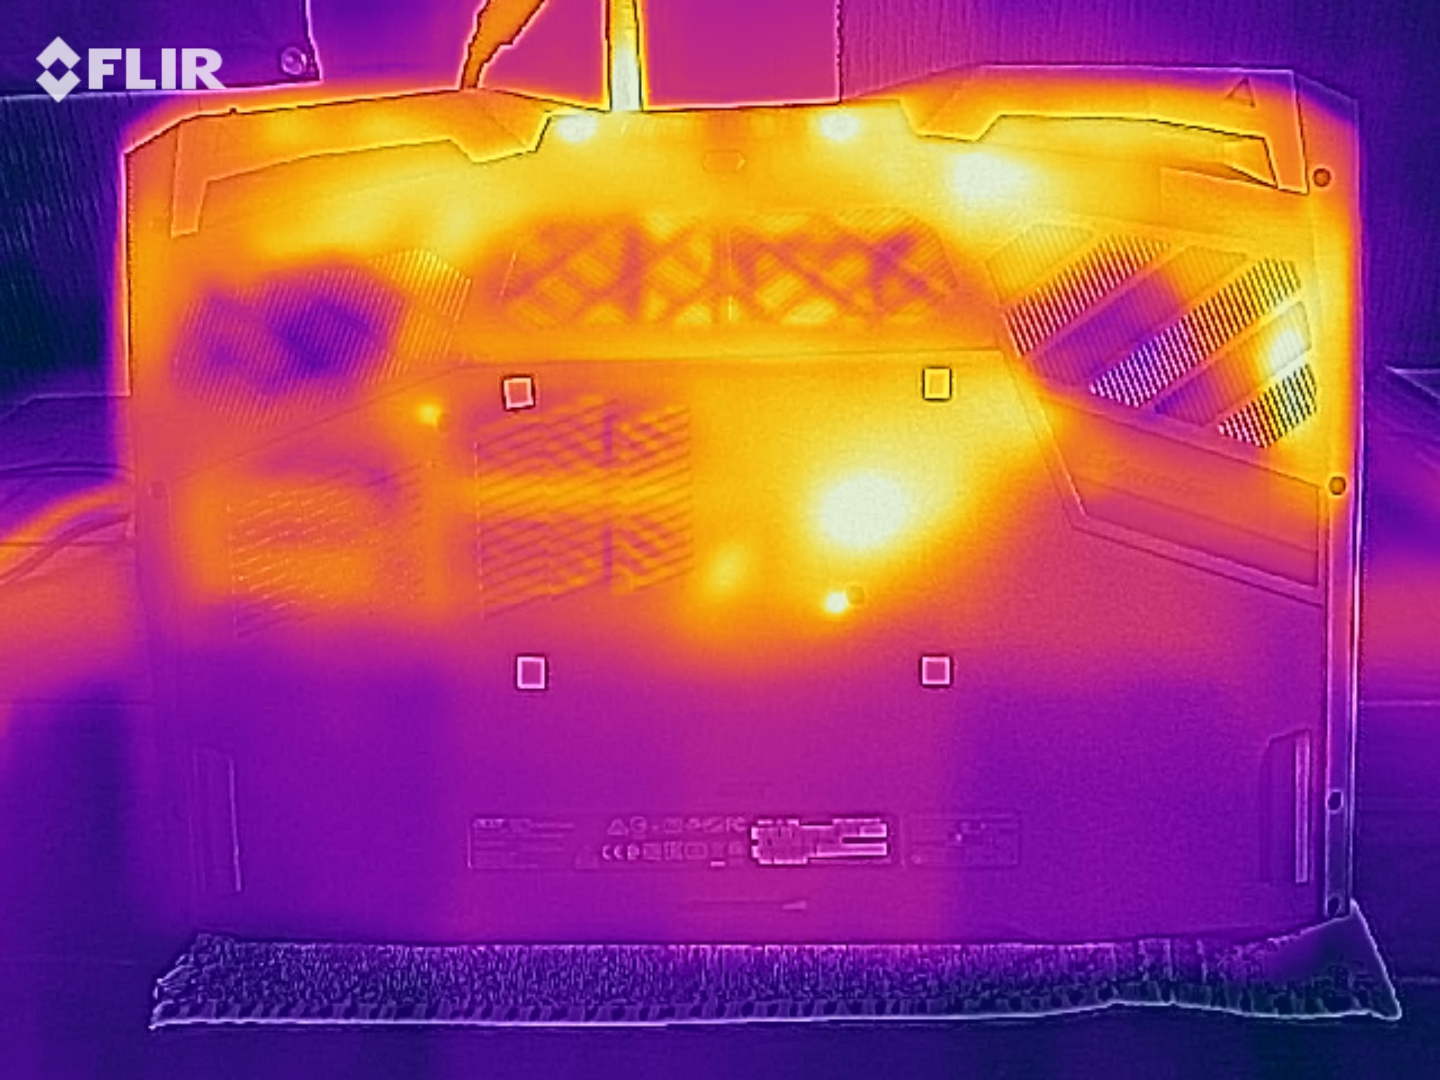
The CPU and GPU temperatures are particularly interesting. The screenshots show that the GPU mode primarily impacts the clock rates and fan noise and not the temperatures, both when running The Witcher 3 and during the stress test (an hour of Prime95 and FurMark).
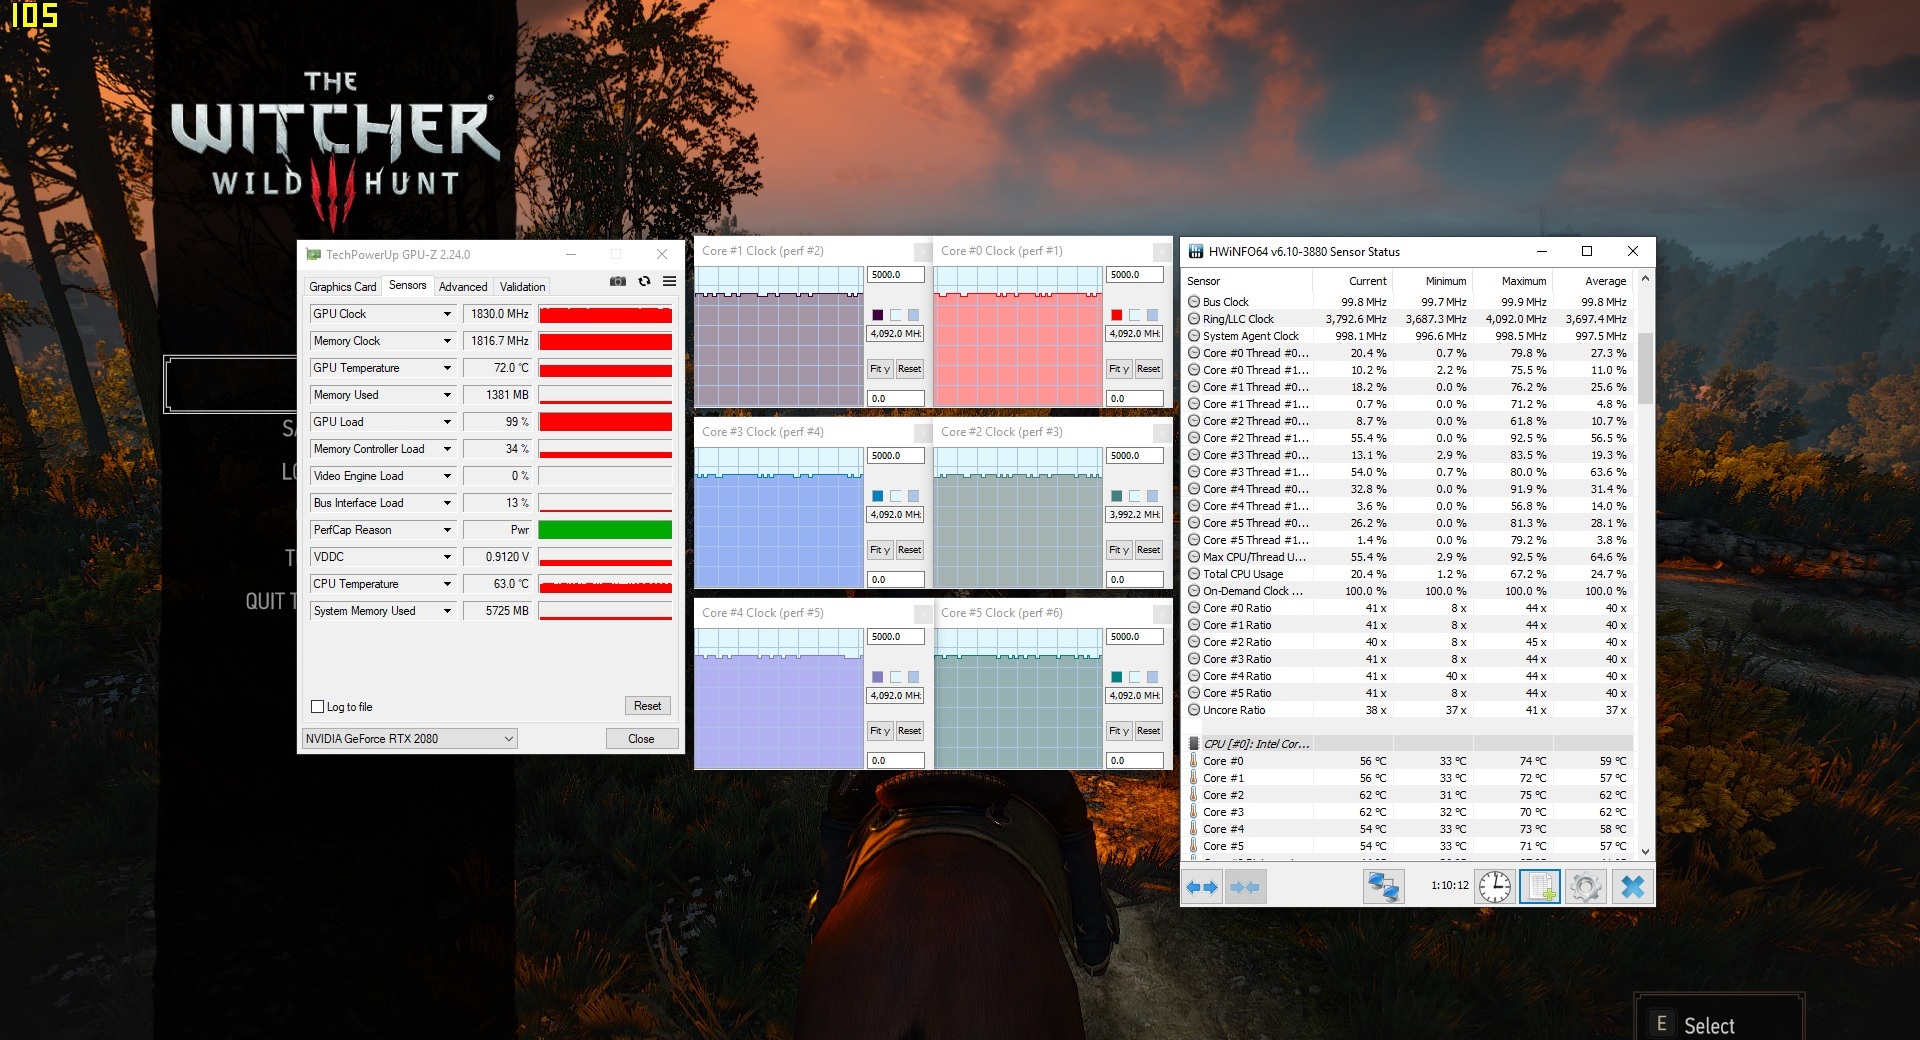
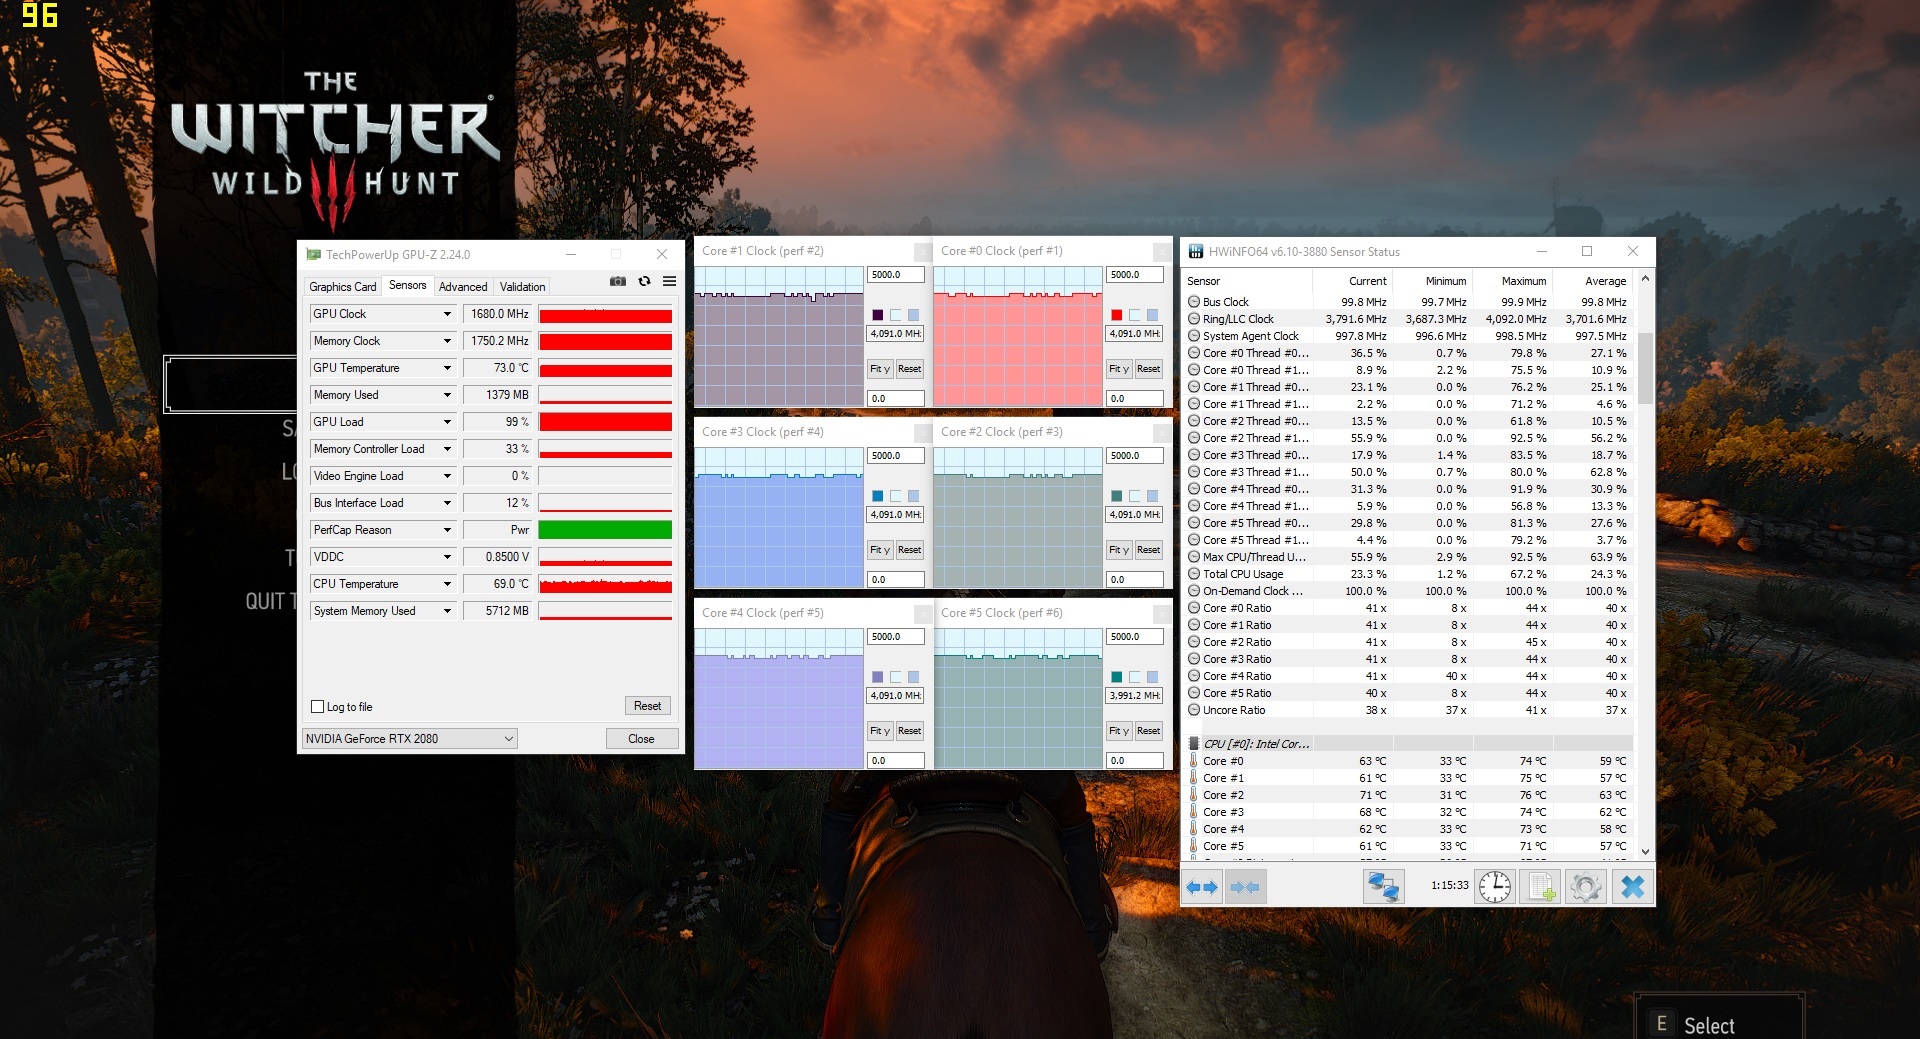
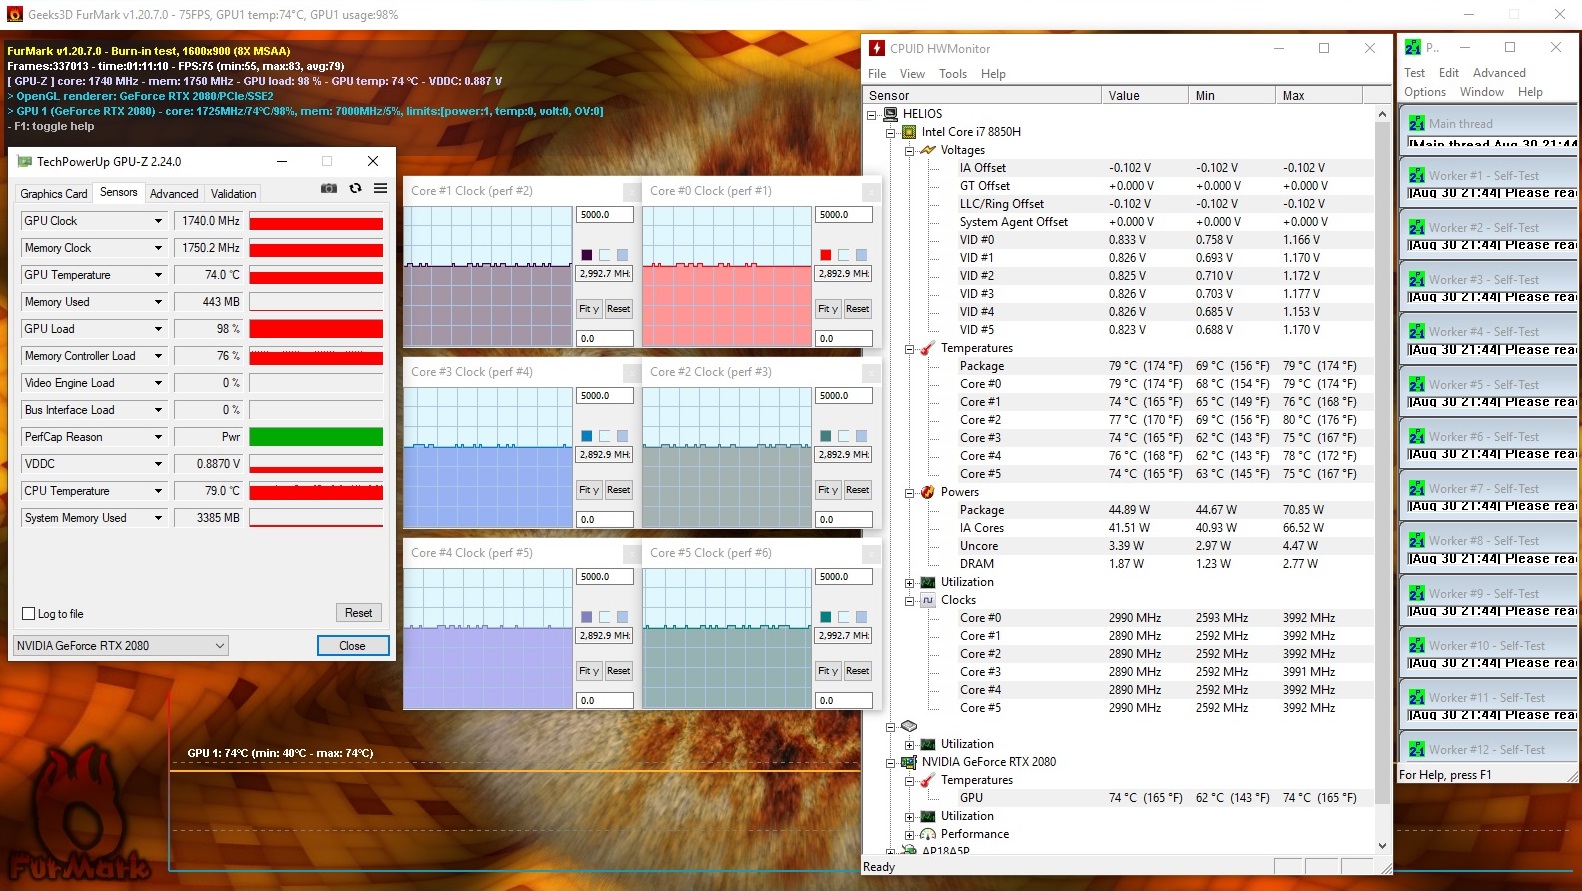
While the Core i7-9750H is about 300 MHz slower in "normal" mode than in "fast" mode, the performance of the RTX 2080 drops by 165 MHz. The temperature change is limited to a maximum of 10 °C.
(+) The maximum temperature on the upper side is 37 °C / 99 F, compared to the average of 40.4 °C / 105 F, ranging from 21.2 to 68.8 °C for the class Gaming.
(±) The bottom heats up to a maximum of 40 °C / 104 F, compared to the average of 43.2 °C / 110 F
(+) In idle usage, the average temperature for the upper side is 31.1 °C / 88 F, compared to the device average of 33.9 °C / 93 F.
(+) Playing The Witcher 3, the average temperature for the upper side is 30.4 °C / 87 F, compared to the device average of 33.9 °C / 93 F.
(+) The palmrests and touchpad are cooler than skin temperature with a maximum of 30 °C / 86 F and are therefore cool to the touch.
(±) The average temperature of the palmrest area of similar devices was 28.8 °C / 83.8 F (-1.2 °C / -2.2 F).
| Acer Predator Helios 700 PH717-71-785M i7-9750H, GeForce RTX 2080 Mobile | HP Omen 17-cb0020ng i9-9880H, GeForce RTX 2080 Mobile | MSI GE75 9SG i9-9880H, GeForce RTX 2080 Mobile | MSI GT76 Titan DT 9SG i9-9900K, GeForce RTX 2080 Mobile | Schenker XMG Ultra 17 Turing i9-9900K, GeForce RTX 2080 Mobile | Alienware Area-51m i9-9900K RTX 2080 i9-9900K, GeForce RTX 2080 Mobile | Average of class Gaming | |
|---|---|---|---|---|---|---|---|
| Heat | -10% | -23% | -9% | -8% | -16% | -7% | |
| Maximum Upper Side * (°C) | 37 | 47 -27% | 48.8 -32% | 51 -38% | 45 -22% | 47 -27% | 45.2 ? -22% |
| Maximum Bottom * (°C) | 40 | 54 -35% | 52 -30% | 57 -43% | 45 -13% | 58.8 -47% | 48.2 ? -21% |
| Idle Upper Side * (°C) | 34 | 32 6% | 36.2 -6% | 26 24% | 36 -6% | 31 9% | 31 ? 9% |
| Idle Bottom * (°C) | 36 | 30 17% | 44.4 -23% | 28 22% | 33 8% | 35 3% | 34.3 ? 5% |
* ... smaller is better
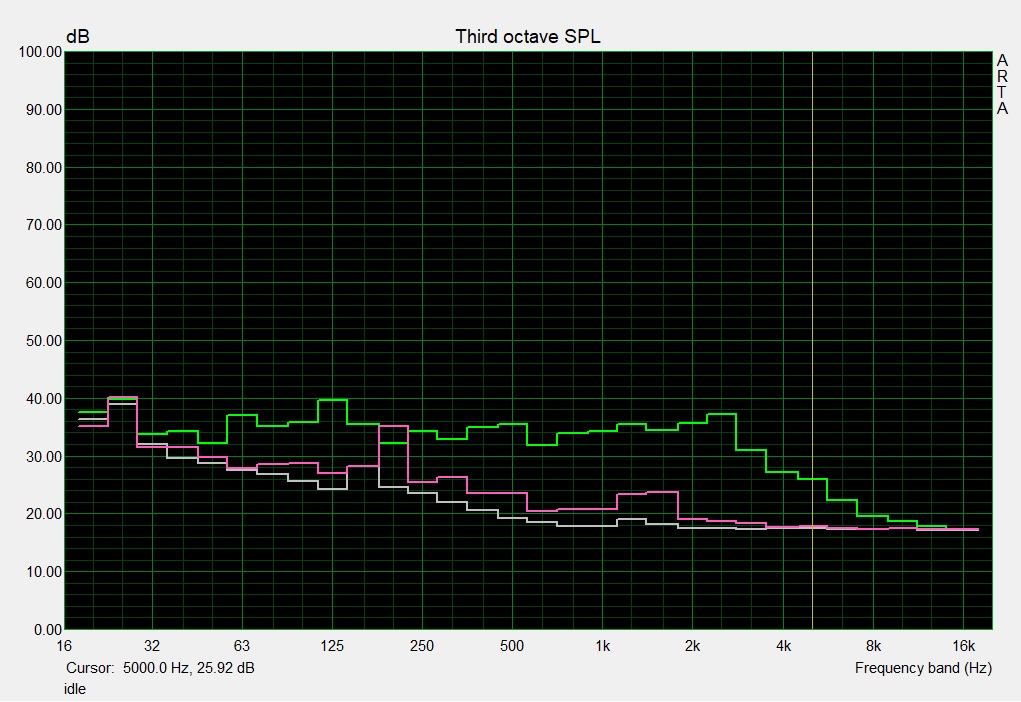
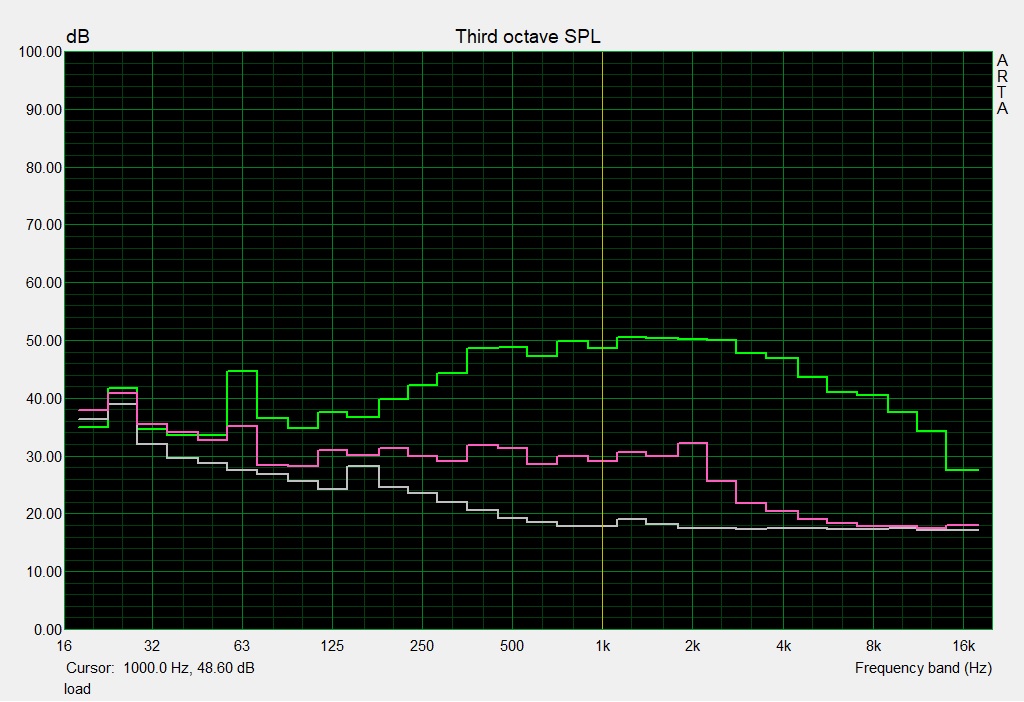
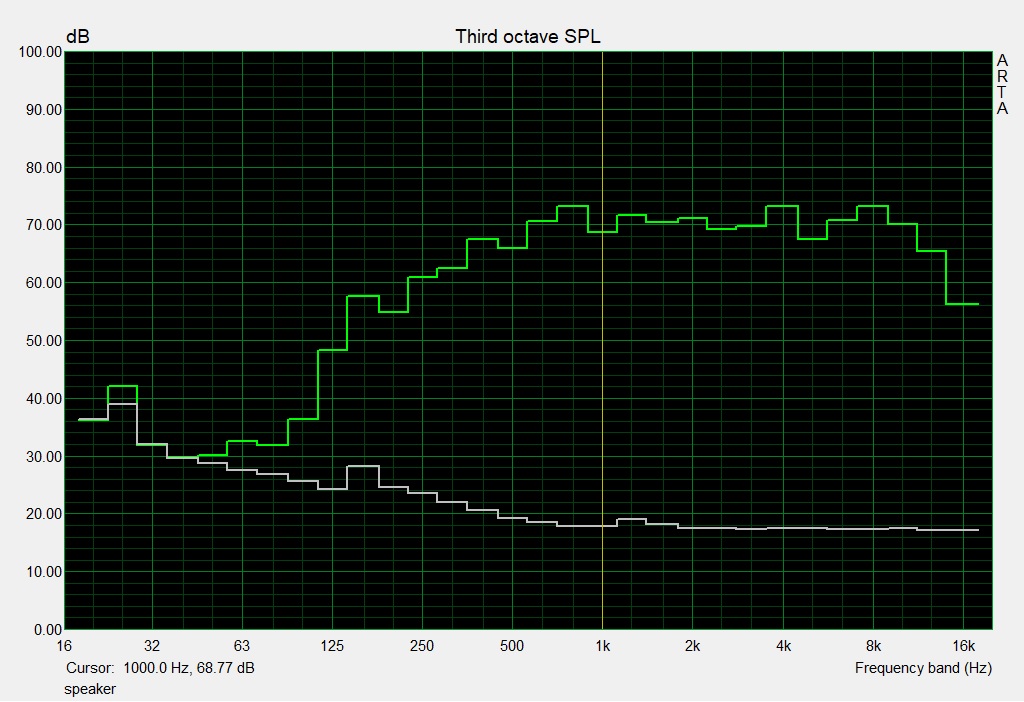
Speaker
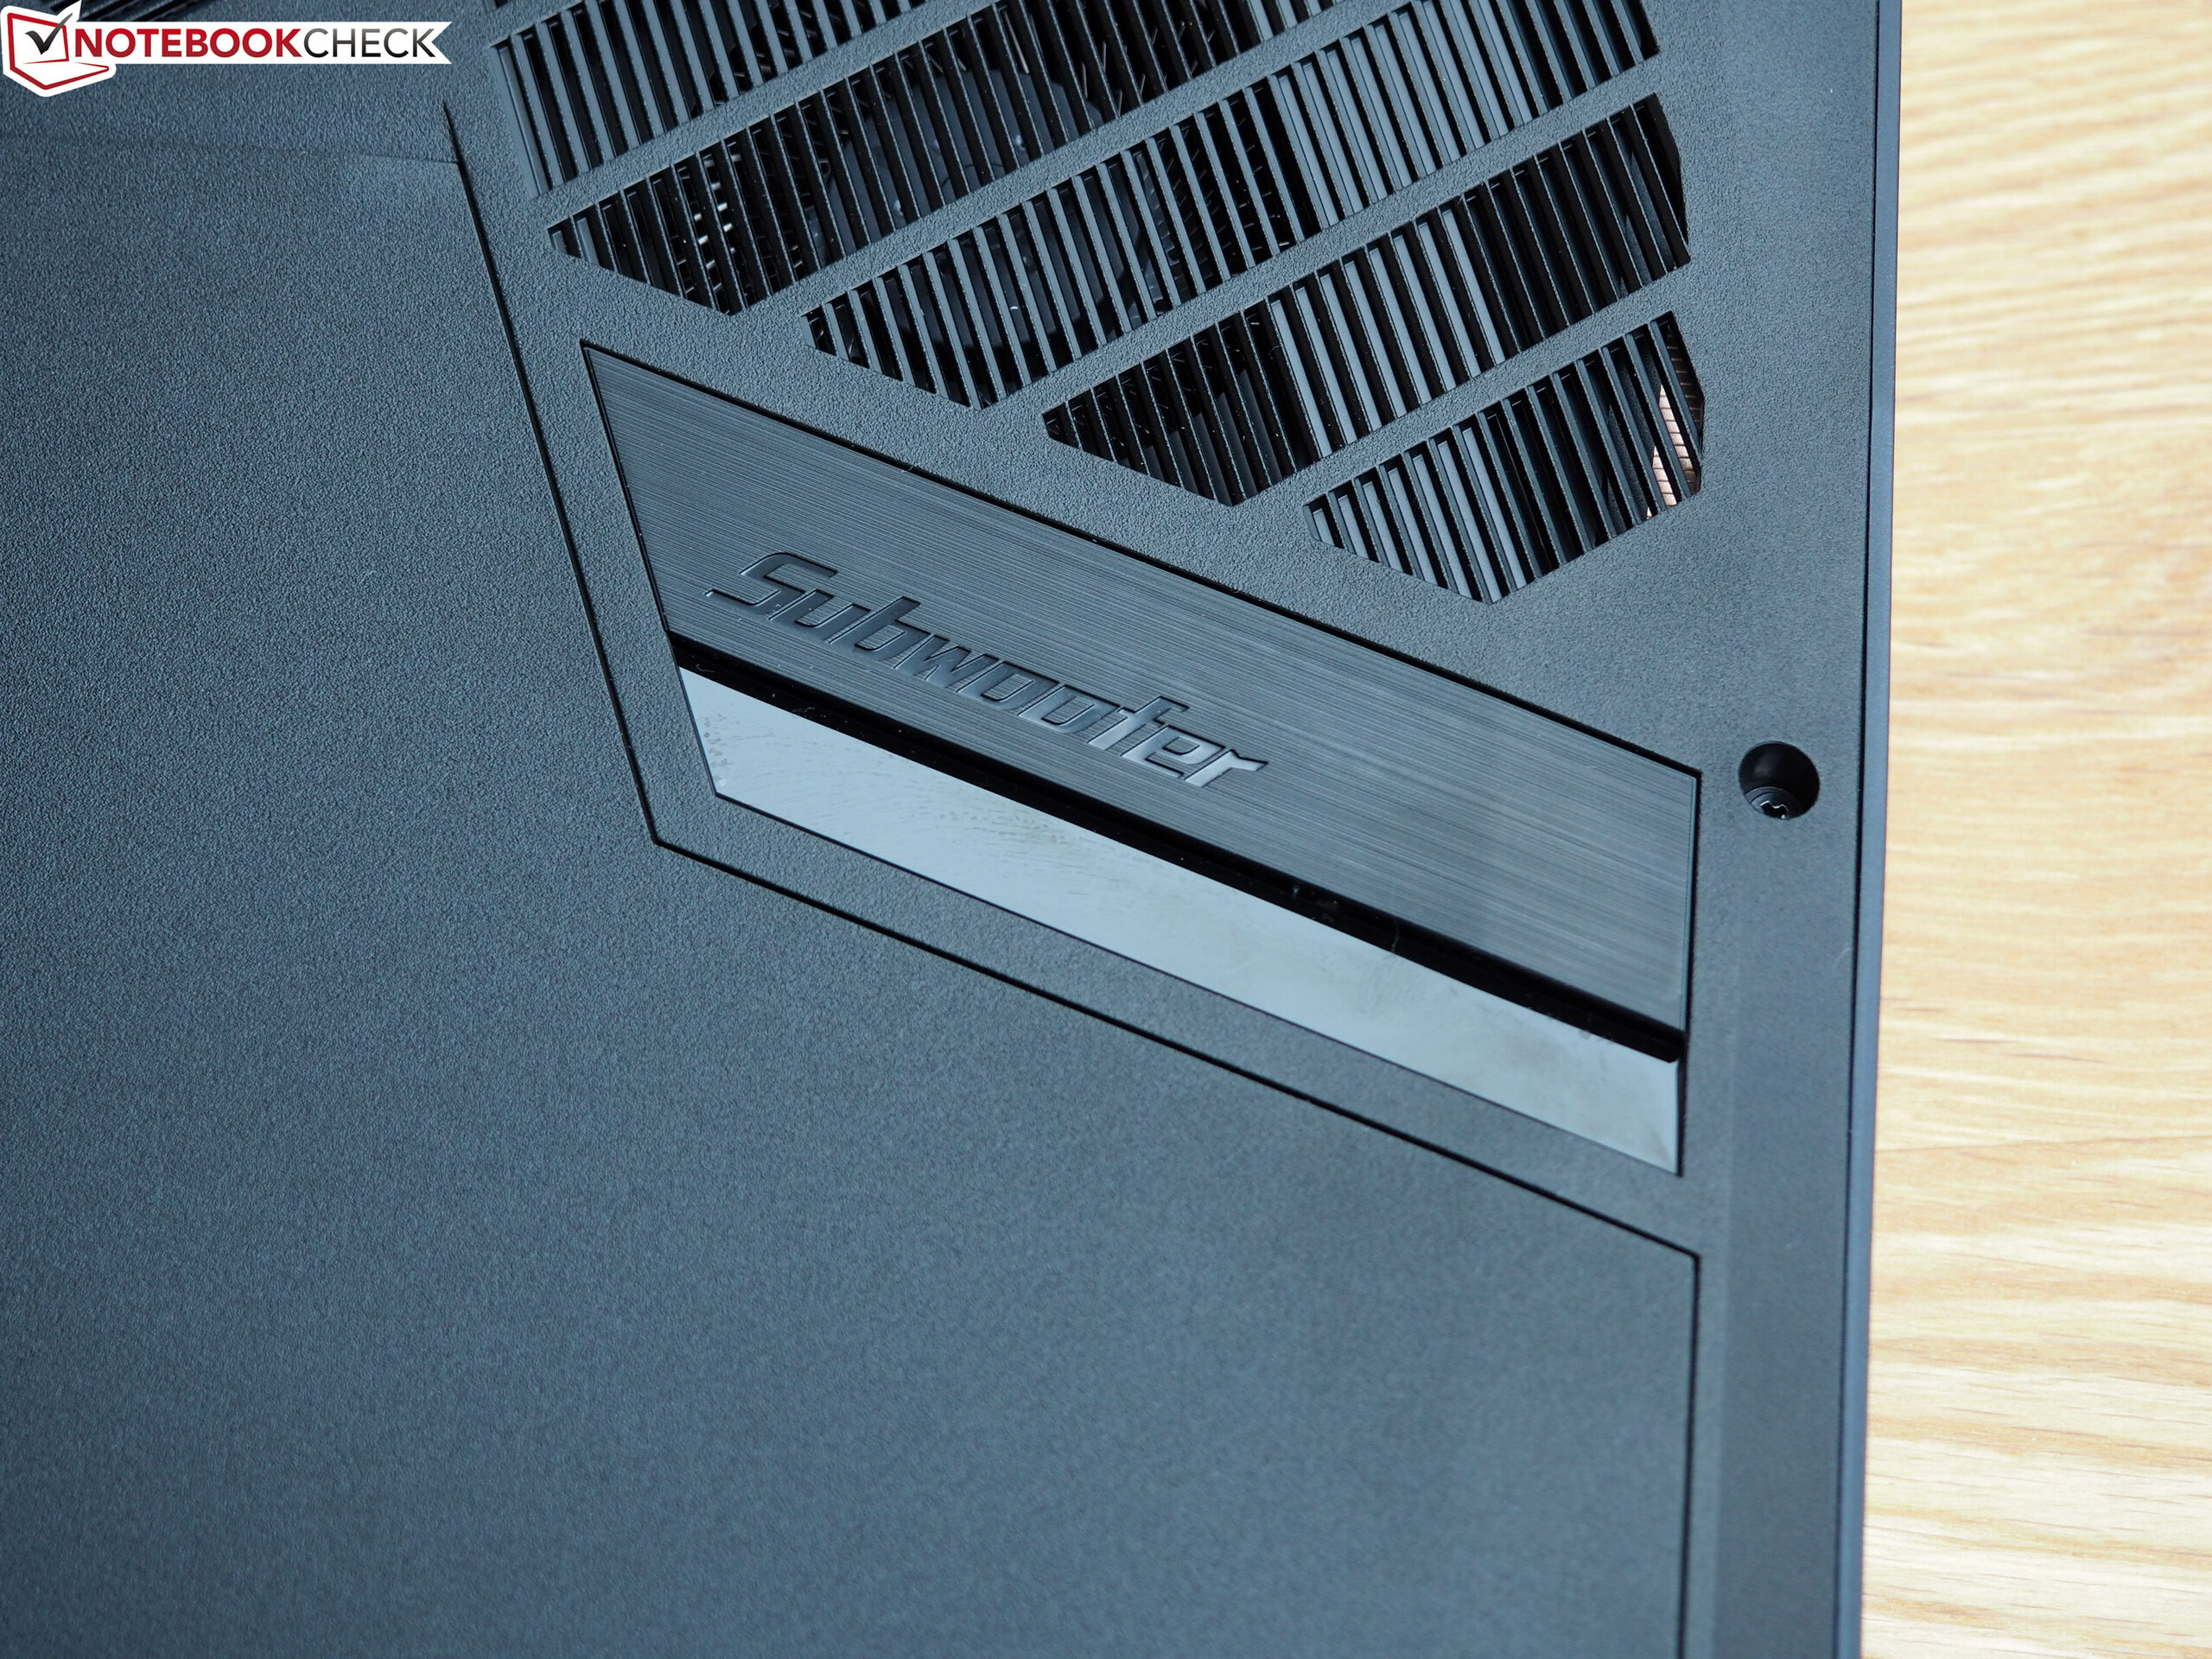
The audio quality of the Helios 700 can easily keep up with those of its competition. Although the bass could still be a little stronger, mids and highs are reproduced well according to our audio analysis, resulting in a good rating for this category. According to Acer, the Helios 700 is equipped with a 5.1 system with five speakers (top) and a subwoofer (bottom).
Acer Predator Helios 700 PH717-71-785M audio analysis
(+) | speakers can play relatively loud (83 dB)
Bass 100 - 315 Hz
(-) | nearly no bass - on average 15.4% lower than median
(±) | linearity of bass is average (11.8% delta to prev. frequency)
Mids 400 - 2000 Hz
(+) | balanced mids - only 2.2% away from median
(+) | mids are linear (5.7% delta to prev. frequency)
Highs 2 - 16 kHz
(+) | balanced highs - only 2.1% away from median
(+) | highs are linear (5.7% delta to prev. frequency)
Overall 100 - 16.000 Hz
(+) | overall sound is linear (12.9% difference to median)
Compared to same class
» 17% of all tested devices in this class were better, 4% similar, 79% worse
» The best had a delta of 6%, average was 18%, worst was 132%
Compared to all devices tested
» 12% of all tested devices were better, 3% similar, 85% worse
» The best had a delta of 4%, average was 23%, worst was 134%
Alienware Area-51m i9-9900K RTX 2080 audio analysis
(+) | speakers can play relatively loud (82.3 dB)
Bass 100 - 315 Hz
(±) | reduced bass - on average 11% lower than median
(±) | linearity of bass is average (14.5% delta to prev. frequency)
Mids 400 - 2000 Hz
(+) | balanced mids - only 3.4% away from median
(±) | linearity of mids is average (7.8% delta to prev. frequency)
Highs 2 - 16 kHz
(+) | balanced highs - only 2.8% away from median
(±) | linearity of highs is average (9.4% delta to prev. frequency)
Overall 100 - 16.000 Hz
(+) | overall sound is linear (11.9% difference to median)
Compared to same class
» 12% of all tested devices in this class were better, 4% similar, 84% worse
» The best had a delta of 6%, average was 18%, worst was 132%
Compared to all devices tested
» 9% of all tested devices were better, 2% similar, 89% worse
» The best had a delta of 4%, average was 23%, worst was 134%
Energy Management
Power Consumption
Due to the missing graphics-switching option, the Helios 700 is significantly more power-hungry while idling than the MSI competitors GE75 and GT76, which both support Nvidia's Optimus technology. The 17-inch device requires between 28 and 45 watts in this scenario, which does not look promising in terms of battery life. The Acer notebook consumes between 98 and 307 watts under load. Again, this is above average for a gaming notebook, although the RTX 2080 competition equipped with a desktop CPU (Core i9-9900K) consumes even more.
| Off / Standby | |
| Idle | |
| Load |
|
Key:
min: | |
| Acer Predator Helios 700 PH717-71-785M i7-9750H, GeForce RTX 2080 Mobile | HP Omen 17-cb0020ng i9-9880H, GeForce RTX 2080 Mobile | MSI GE75 9SG i9-9880H, GeForce RTX 2080 Mobile | MSI GT76 Titan DT 9SG i9-9900K, GeForce RTX 2080 Mobile | Schenker XMG Ultra 17 Turing i9-9900K, GeForce RTX 2080 Mobile | Alienware Area-51m i9-9900K RTX 2080 i9-9900K, GeForce RTX 2080 Mobile | Average of class Gaming | |
|---|---|---|---|---|---|---|---|
| Power Consumption | 8% | 24% | 13% | -21% | -12% | 30% | |
| Idle Minimum * (Watt) | 28 | 26 7% | 13.9 50% | 14 50% | 39 -39% | 23.3 17% | 13 ? 54% |
| Idle Average * (Watt) | 34 | 29 15% | 18.8 45% | 18 47% | 45 -32% | 33.5 1% | 18.7 ? 45% |
| Idle Maximum * (Watt) | 45 | 38 16% | 23.1 49% | 23 49% | 55 -22% | 38.4 15% | 24.3 ? 46% |
| Load Average * (Watt) | 98 | 106 -8% | 112.3 -15% | 114 -16% | 122 -24% | 114.1 -16% | 110.2 ? -12% |
| Witcher 3 ultra * (Watt) | 263 | 228 13% | 231 12% | 283 -8% | 259 2% | 339.5 -29% | |
| Load Maximum * (Watt) | 307 | 287 7% | 291.5 5% | 443 -44% | 346 -13% | 485.1 -58% | 258 ? 16% |
* ... smaller is better
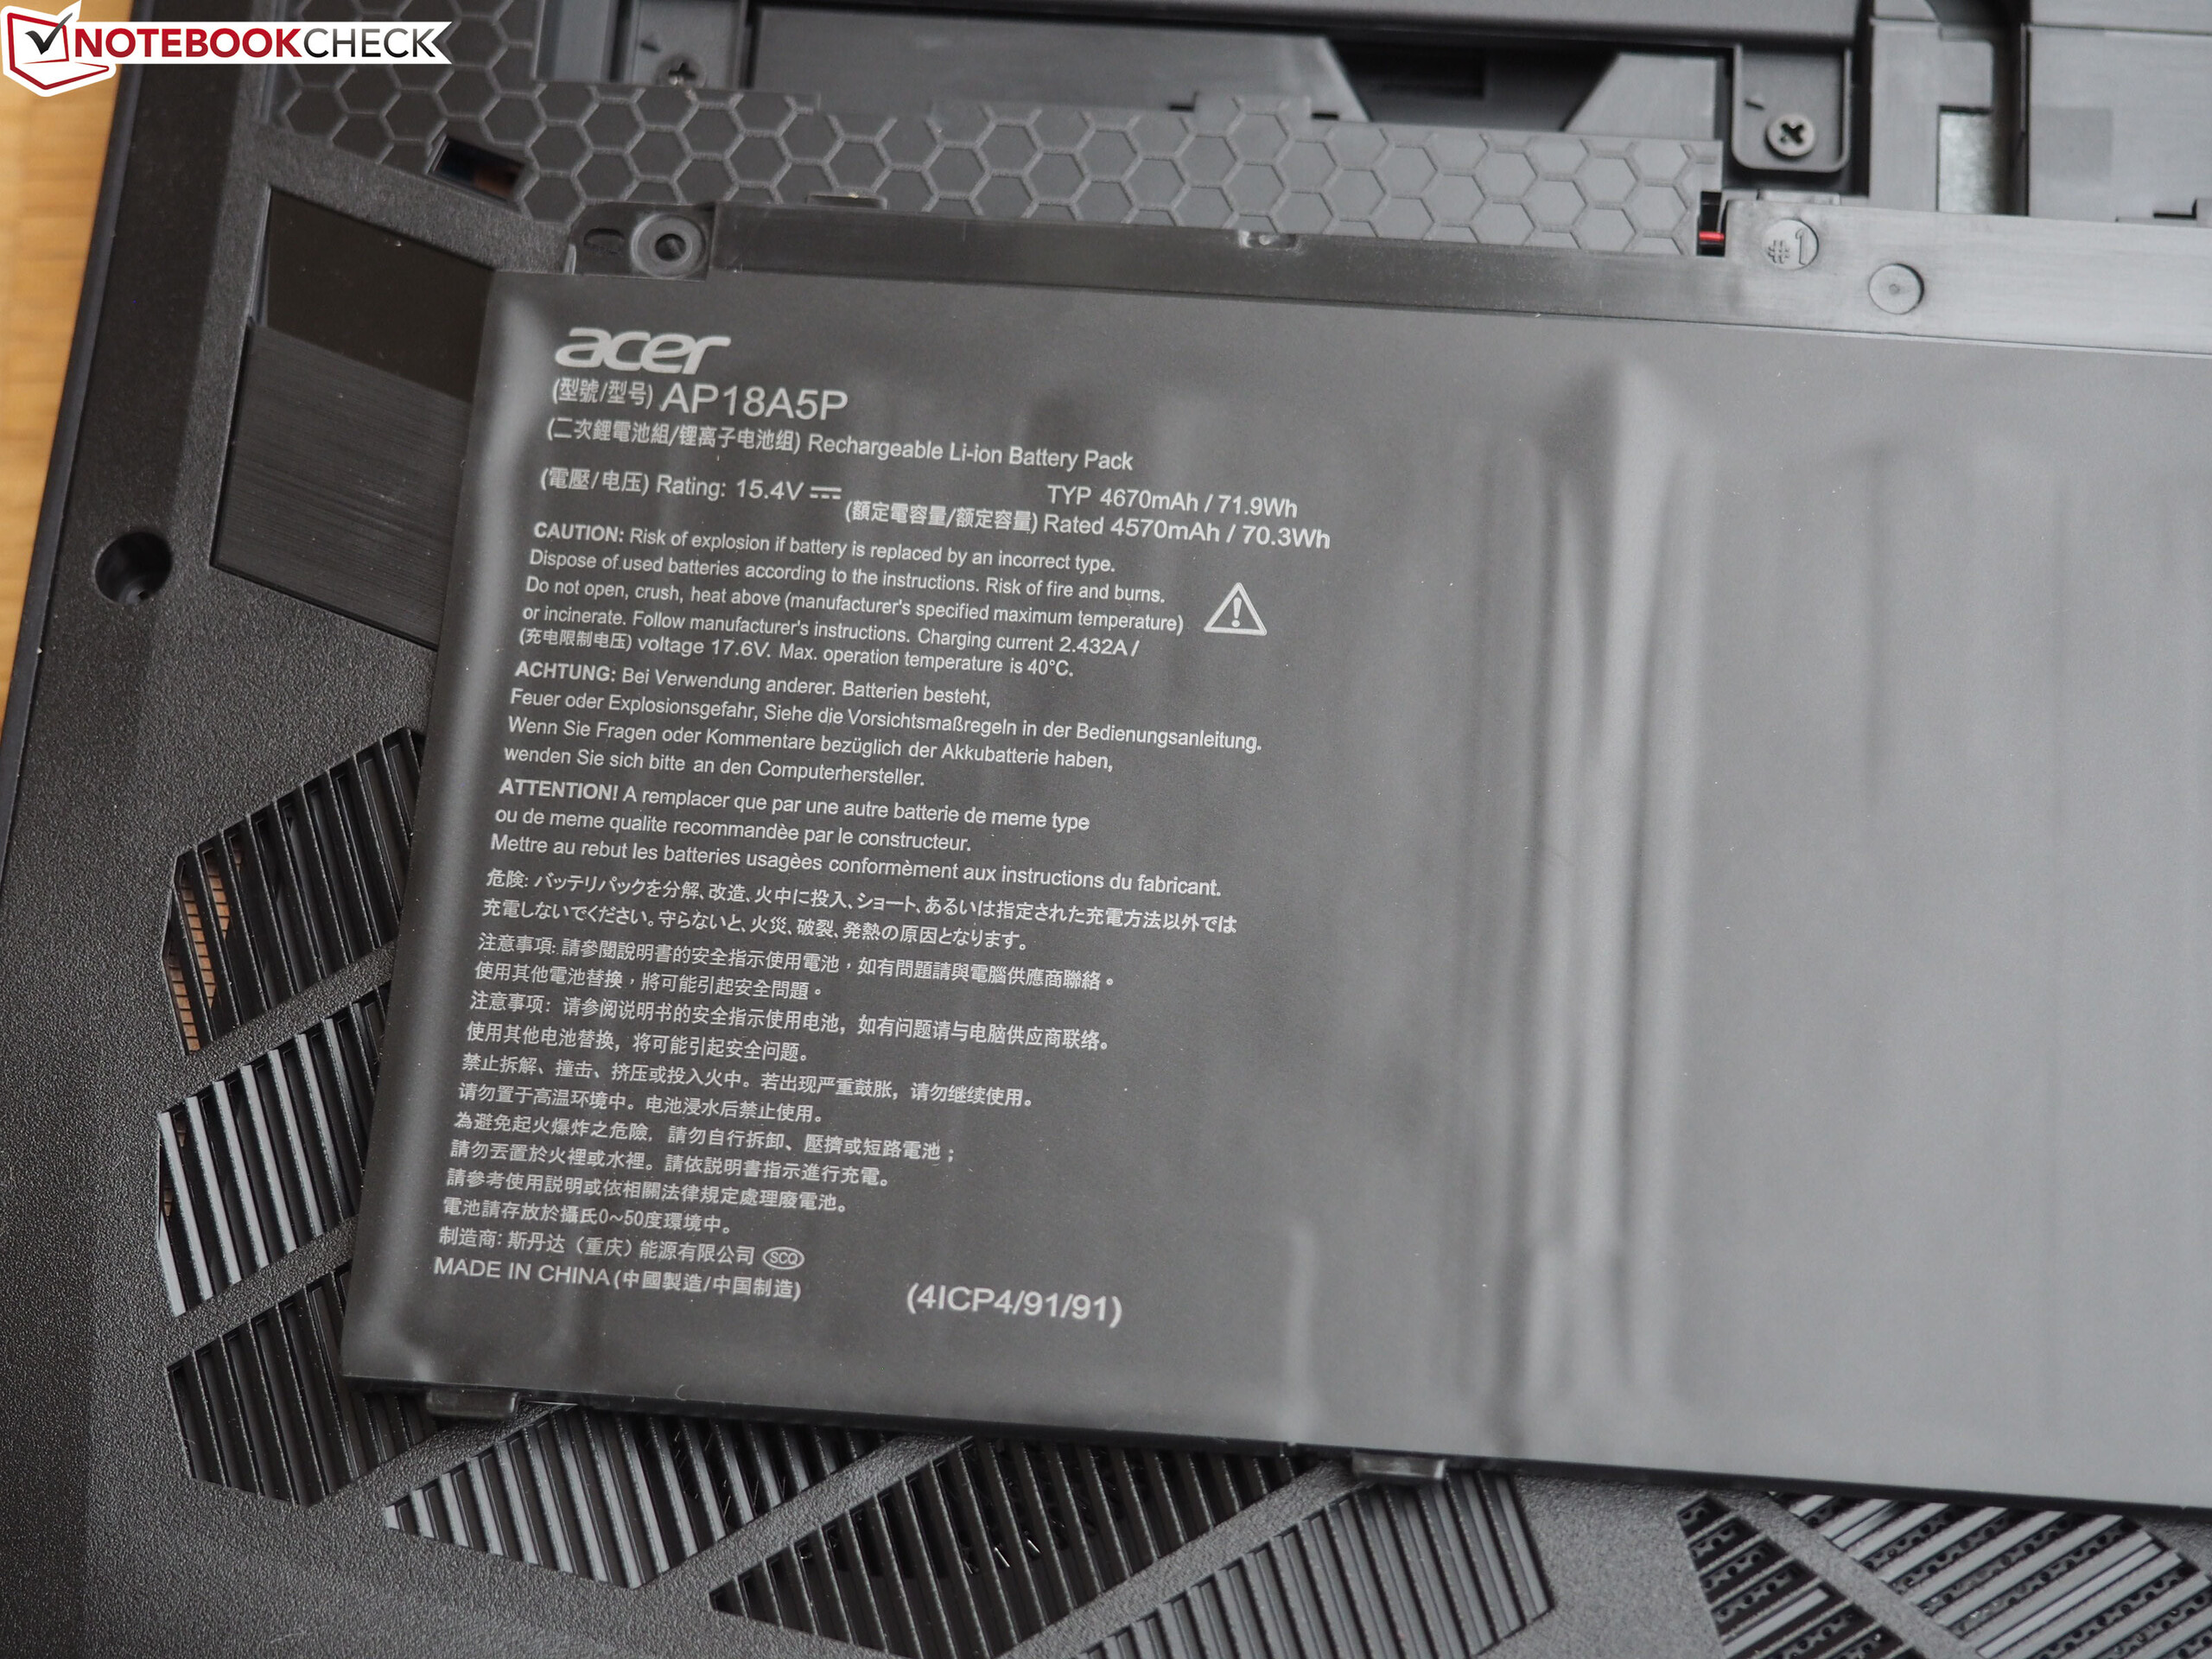
Battery Life
The Helios 700's battery life cannot be considered one of its strengths. The combination of high energy consumption and mediocre battery capacity (72 Wh is very low for a notebook of this size and price) prevents long sessions away from a socket. Our test unit managed between 1 hour and a maximum of 3.5 hours on battery.
| Acer Predator Helios 700 PH717-71-785M i7-9750H, GeForce RTX 2080 Mobile, 72 Wh | HP Omen 17-cb0020ng i9-9880H, GeForce RTX 2080 Mobile, 70 Wh | MSI GE75 9SG i9-9880H, GeForce RTX 2080 Mobile, 65 Wh | MSI GT76 Titan DT 9SG i9-9900K, GeForce RTX 2080 Mobile, 90 Wh | Schenker XMG Ultra 17 Turing i9-9900K, GeForce RTX 2080 Mobile, 82 Wh | Alienware Area-51m i9-9900K RTX 2080 i9-9900K, GeForce RTX 2080 Mobile, 90 Wh | Average of class Gaming | |
|---|---|---|---|---|---|---|---|
| Battery runtime | 12% | 75% | 50% | -13% | -18% | 111% | |
| Reader / Idle (h) | 3.6 | 4.2 17% | 6.8 89% | 2.8 -22% | 2.6 -28% | 8.71 ? 142% | |
| WiFi v1.3 (h) | 2.8 | 3.3 18% | 4.9 75% | 5 79% | 2.3 -18% | 2.1 -25% | 7.15 ? 155% |
| Load (h) | 1.1 | 1.1 0% | 0.9 -18% | 1.1 0% | 1.1 0% | 1.502 ? 37% | |
| H.264 (h) | 2.3 | 8.64 ? |
Pros
Cons
Verdict
The Predator Helios 700 is a very interesting gaming notebook from Acer that features plenty of ideas and innovations - from exchangeable WASD keys to a sliding mechanism for the input devices - although Acer doesn't use this improved cooling system to limit the noise emissions but to improve performance.
The manufacturer overclocks its GeForce GPU in order to get the most out of it. The device remains comfortably cool even while overclocking but instead becomes very loud. It wasn't so much the general noise level that bothered us but more the fluctuating RPM rates, which were often unfounded. In short: Acer should definitely work on its cooling system.
Further weaknesses are the fact that the touchpad is let into the base unit too far, the missing card reader, and the bad battery life. The case gave us a mixed impression. While gamers will be pleased by the many ports, the good keyboard, the strong speakers, and the many backlighting options, the heavy build (no slim bezel) and the high weight are not really up to date anymore for 2019. We were pleased with the high-contrast 144-Hz display despite certain weaknesses (color accuracy, brightness, and brightness distribution).
All in all, Acer fans who are interested in playing every modern game at high details and have the necessary cash available should definitely take a closer look at this 17-inch device. Anybody else might prefer a more classic (and probably cheaper) high-end notebook without all the bells and whistles of the Predator Helios 700 (e.g. Helios 300 or Triton 500).
Caution: The Predator Helios 700 is one of the first gaming notebooks that was evaluated based on the extended (and more difficult) v7 ratings and therefore appears to have worse results than its recently tested high-end competition. In future, all new gamers will have to pass v7 rating.
Acer Predator Helios 700 PH717-71-785M
- 05/14/2020 v7 (old)
Florian Glaser
Price comparison

