Acer Predator Helios 300 (i5-8300H, GTX 1050 Ti, Full-HD) Laptop Review

While the 2017 version of the attractively priced Predator Helios 300 came with Intel’s Kaby Lake CPUs, the 2018 generation comes with brand-new Coffee Lake processors. Depending on the model, you can get either a Core i5-8300H (four cores/eight threads) or Core i7-8750H (six cores/twelve threads).
The operating system (Windows 10 Home 64-Bit) is installed on a 128 GB or 256 GB SSD. There is also a 1-TB HDD on board. The amount of RAM ranges between 8 and 16 GB. The laptop comes with either the mid-range GeForce GTX 1050 Ti (4 GB) or the high-end GeForce GTX 1060 (6 GB). The notebook features a 1080p IPS display. It does not support G-Sync, but it supports Nvidia's Optimus Technology.
Because Acer has not made any changes to the case, we shall skip the sections in this review that deal with the case, connectivity and the input devices. You can find all the missing information in the review of the predecessor model.
The competing devices include other low-priced 17-inch gaming notebooks such as the Asus ROG Strix GL702ZC (AMD Power), the Asus ROG Strix GL753VE and Acer’s own Aspire V17 Nitro BE. Can the Acer Predator Helios 300 get a spot in our “top 10 budget gaming notebooks” list?
| SD Card Reader | |
| average JPG Copy Test (av. of 3 runs) | |
| Average of class Gaming (20.9 - 210, n=54, last 2 years) | |
| Acer Predator Helios 300 (Toshiba Exceria Pro SDXC 64 GB UHS-II) | |
| Acer Predator Helios 300 PH317-52-51M6 (Toshiba Exceria Pro SDXC 64 GB UHS-II) | |
| Asus GL753VE-DS74 (Toshiba Exceria Pro SDXC 64 GB UHS-II) | |
| Asus ROG Strix GL702ZC-GC204T (Toshiba Exceria Pro SDXC 64 GB UHS-II) | |
| Acer Aspire Nitro BE VN7-793G-5811 (Toshiba Exceria Pro SDXC 64 GB UHS-II) | |
| maximum AS SSD Seq Read Test (1GB) | |
| Average of class Gaming (25.5 - 261, n=51, last 2 years) | |
| Asus GL753VE-DS74 (Toshiba Exceria Pro SDXC 64 GB UHS-II) | |
| Asus ROG Strix GL702ZC-GC204T (Toshiba Exceria Pro SDXC 64 GB UHS-II) | |
| Acer Predator Helios 300 PH317-52-51M6 (Toshiba Exceria Pro SDXC 64 GB UHS-II) | |
| Acer Predator Helios 300 (Toshiba Exceria Pro SDXC 64 GB UHS-II) | |
| Acer Aspire Nitro BE VN7-793G-5811 (Toshiba Exceria Pro SDXC 64 GB UHS-II) | |
Display - Mixed feelings
Even though the Acer Predator Helios 300 uses the same panel as the predecessor (LG Philips LP173WF4-SPF5), the contrast ratio and the brightness are slightly different. Such deviations are quite natural. However, the panel inherits the same strengths and weaknesses.
| |||||||||||||||||||||||||
Brightness Distribution: 89 %
Center on Battery: 365 cd/m²
Contrast: 1141:1 (Black: 0.32 cd/m²)
ΔE ColorChecker Calman: 6.51 | ∀{0.5-29.43 Ø4.72}
calibrated: 2.9
ΔE Greyscale Calman: 7.65 | ∀{0.09-98 Ø4.97}
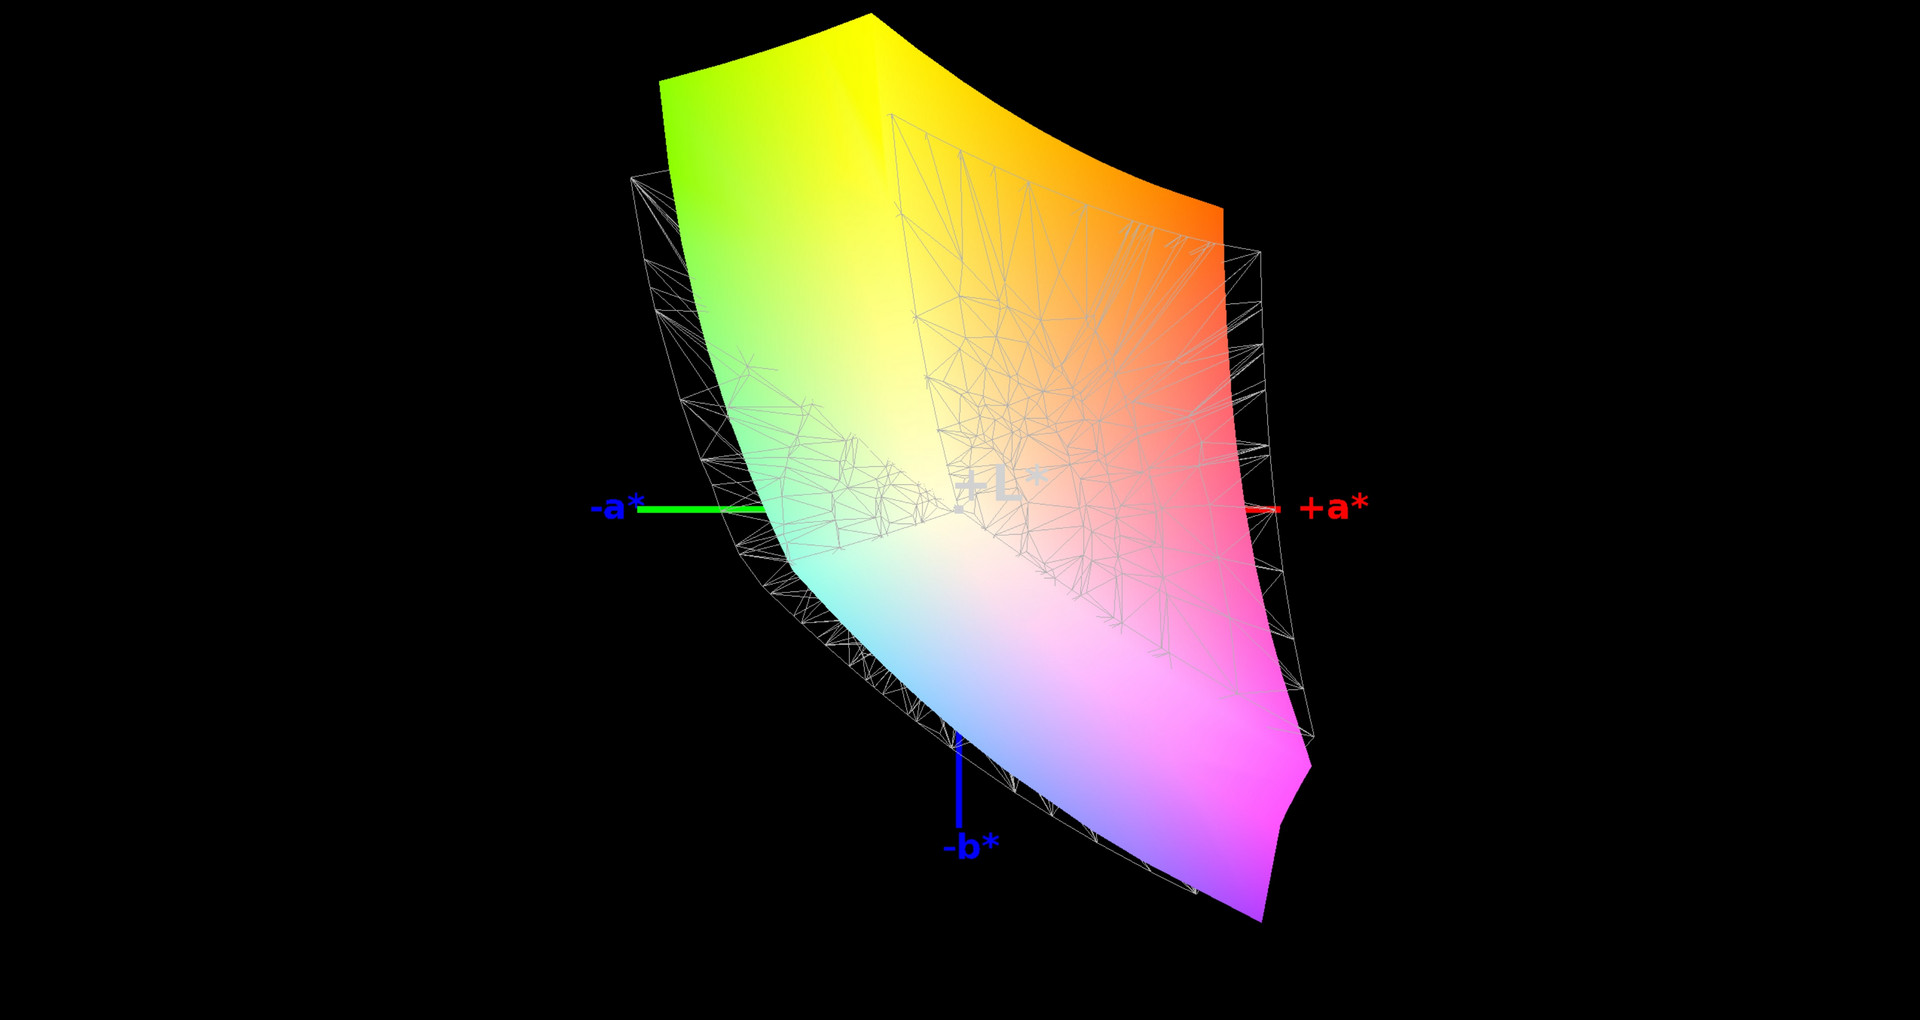
86% sRGB (Argyll 1.6.3 3D)
56% AdobeRGB 1998 (Argyll 1.6.3 3D)
63% AdobeRGB 1998 (Argyll 3D)
86.1% sRGB (Argyll 3D)
67.1% Display P3 (Argyll 3D)
Gamma: 2.64
CCT: 8066 K
| Acer Predator Helios 300 PH317-52-51M6 LG Philips LP173WF4-SPF5 (LGD056D), IPS, 1920x1080 | Acer Predator Helios 300 LG LP173WF4-SPF5 (LGD056D), AH-IPS, WLED, 1920x1080 | Acer Aspire Nitro BE VN7-793G-5811 AU Optronics, IPS, 1920x1080 | Asus GL753VE-DS74 LG Philips LP173WF4-SPF3, IPS, 1920x1080 | Asus ROG Strix GL702ZC-GC204T LG Philips LP173WF4-SPF5, IPS, 1920x1080 | |
|---|---|---|---|---|---|
| Display | 0% | -2% | -4% | ||
| Display P3 Coverage (%) | 67.1 | 66.8 0% | 63.1 -6% | 65.4 -3% | |
| sRGB Coverage (%) | 86.1 | 85.8 0% | 86.5 0% | 82.6 -4% | |
| AdobeRGB 1998 Coverage (%) | 63 | 62.8 0% | 63.3 0% | 60.4 -4% | |
| Response Times | 5% | -15% | 0% | -3% | |
| Response Time Grey 50% / Grey 80% * (ms) | 36 ? | 36 ? -0% | 38 ? -6% | 36 ? -0% | 36 ? -0% |
| Response Time Black / White * (ms) | 22 ? | 20 ? 9% | 27 ? -23% | 22 ? -0% | 23 ? -5% |
| PWM Frequency (Hz) | 122000 ? | 119000 ? | |||
| Screen | 9% | 6% | 10% | 5% | |
| Brightness middle (cd/m²) | 365 | 384 5% | 301 -18% | 366 0% | 415 14% |
| Brightness (cd/m²) | 341 | 373 9% | 270 -21% | 348 2% | 365 7% |
| Brightness Distribution (%) | 89 | 93 4% | 79 -11% | 90 1% | 82 -8% |
| Black Level * (cd/m²) | 0.32 | 0.35 -9% | 0.38 -19% | 0.35 -9% | 0.42 -31% |
| Contrast (:1) | 1141 | 1097 -4% | 792 -31% | 1046 -8% | 988 -13% |
| Colorchecker dE 2000 * | 6.51 | 4.81 26% | 3.49 46% | 4.4 32% | 4.95 24% |
| Colorchecker dE 2000 max. * | 12.32 | 8.69 29% | 7.49 39% | 9.7 21% | 9.34 24% |
| Colorchecker dE 2000 calibrated * | 2.9 | ||||
| Greyscale dE 2000 * | 7.65 | 5.33 30% | 1.88 75% | 3 61% | 4.69 39% |
| Gamma | 2.64 83% | 2.45 90% | 2.35 94% | 2.1 105% | 2.33 94% |
| CCT | 8066 81% | 7137 91% | 6587 99% | 6362 102% | 6485 100% |
| Color Space (Percent of AdobeRGB 1998) (%) | 56 | 56 0% | 56 0% | 56 0% | 54 -4% |
| Color Space (Percent of sRGB) (%) | 86 | 86 0% | 86 0% | 86 0% | 82 -5% |
| Total Average (Program / Settings) | 5% /
7% | -4% /
2% | 5% /
8% | -1% /
2% |
* ... smaller is better
The display offers an excellent contrast ratio. Thanks to the relatively high average brightness of 341 cd/m² and the usable black value of 0.32 cd/m², the 17-incher easily cracks the 1000:1 mark. The color space coverage is sufficient for gaming and multimedia purposes. 86% of sRGB and 56% of AdobeRGB are good values.
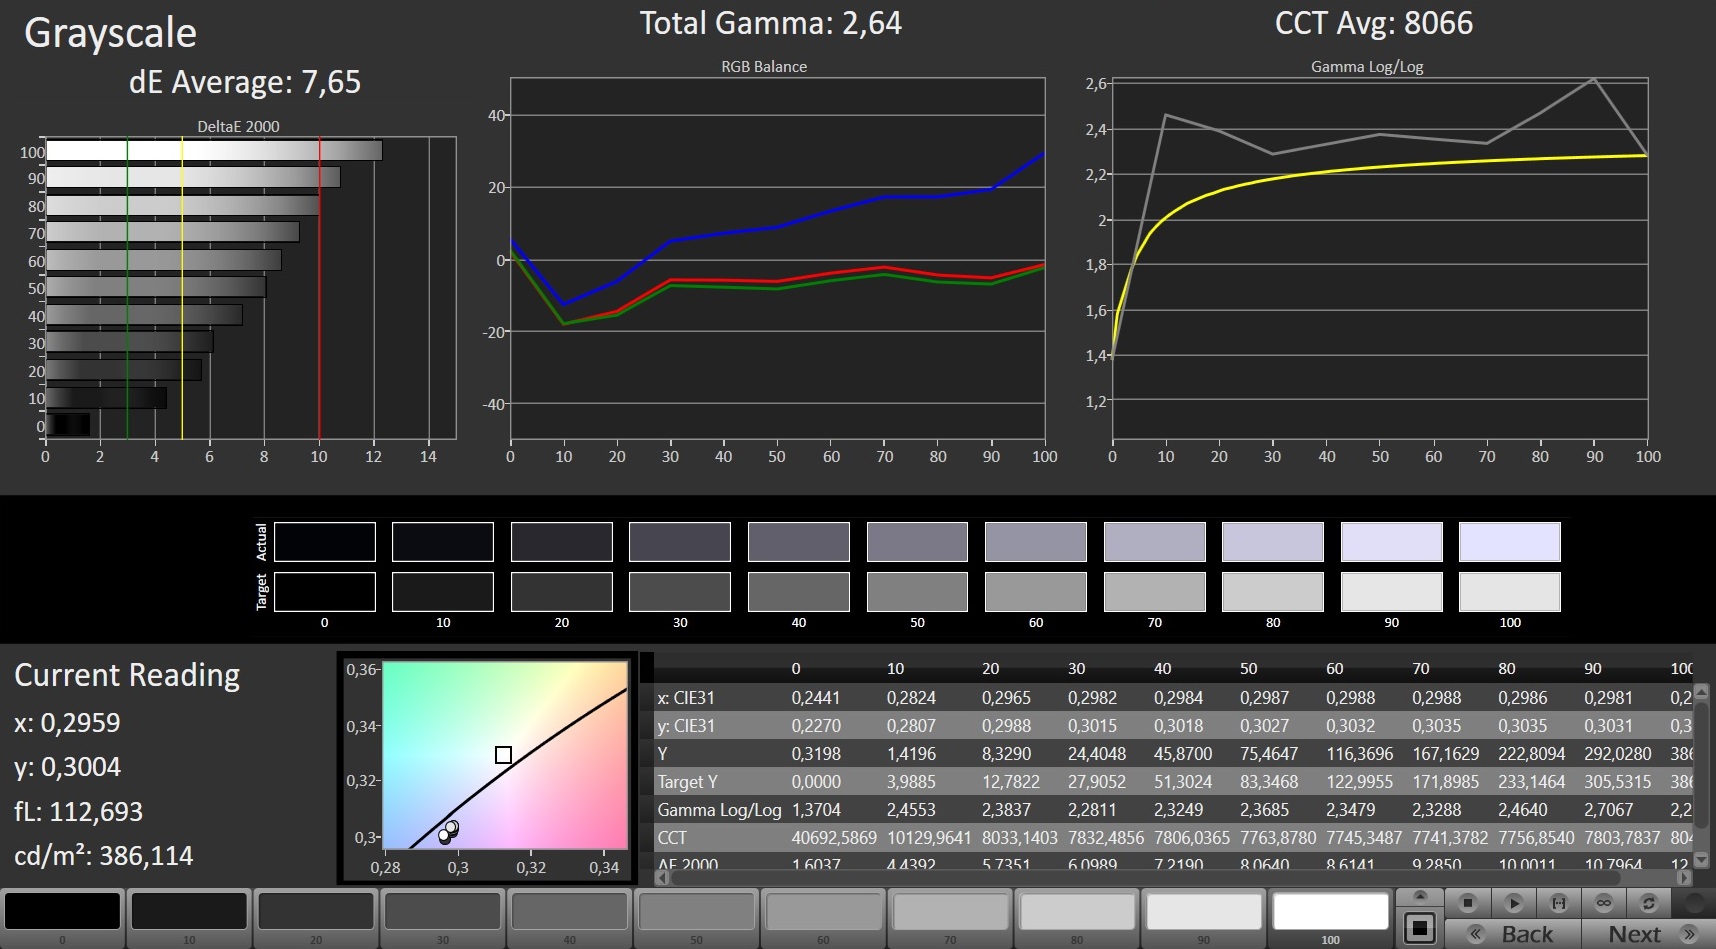
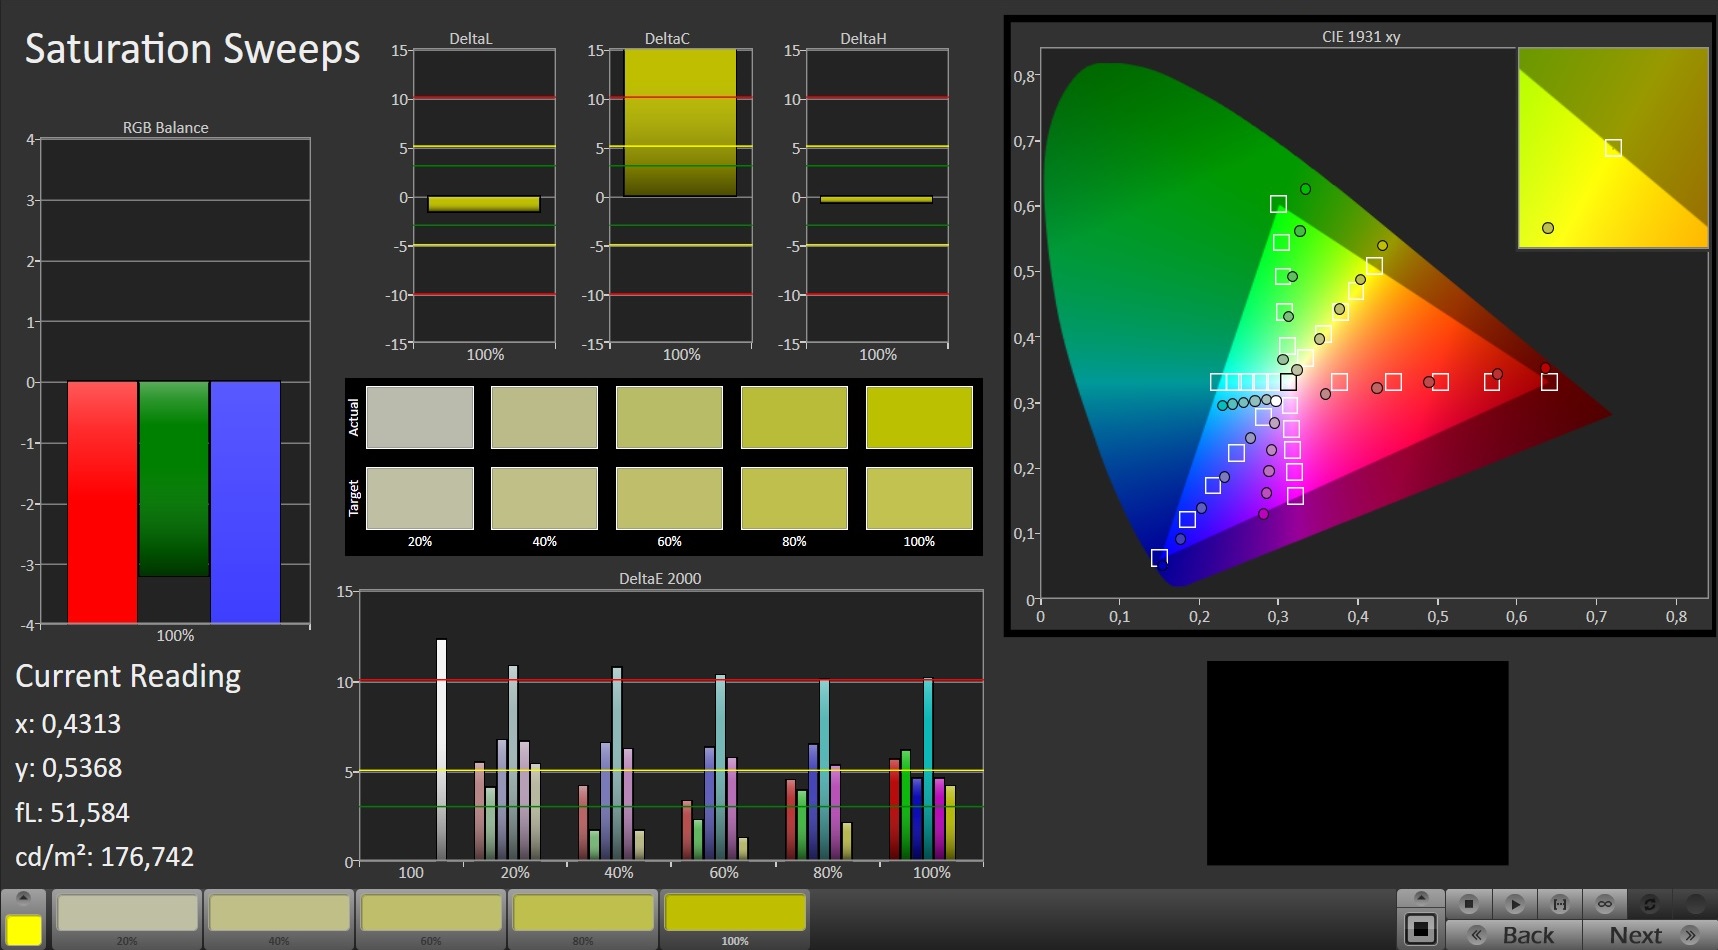
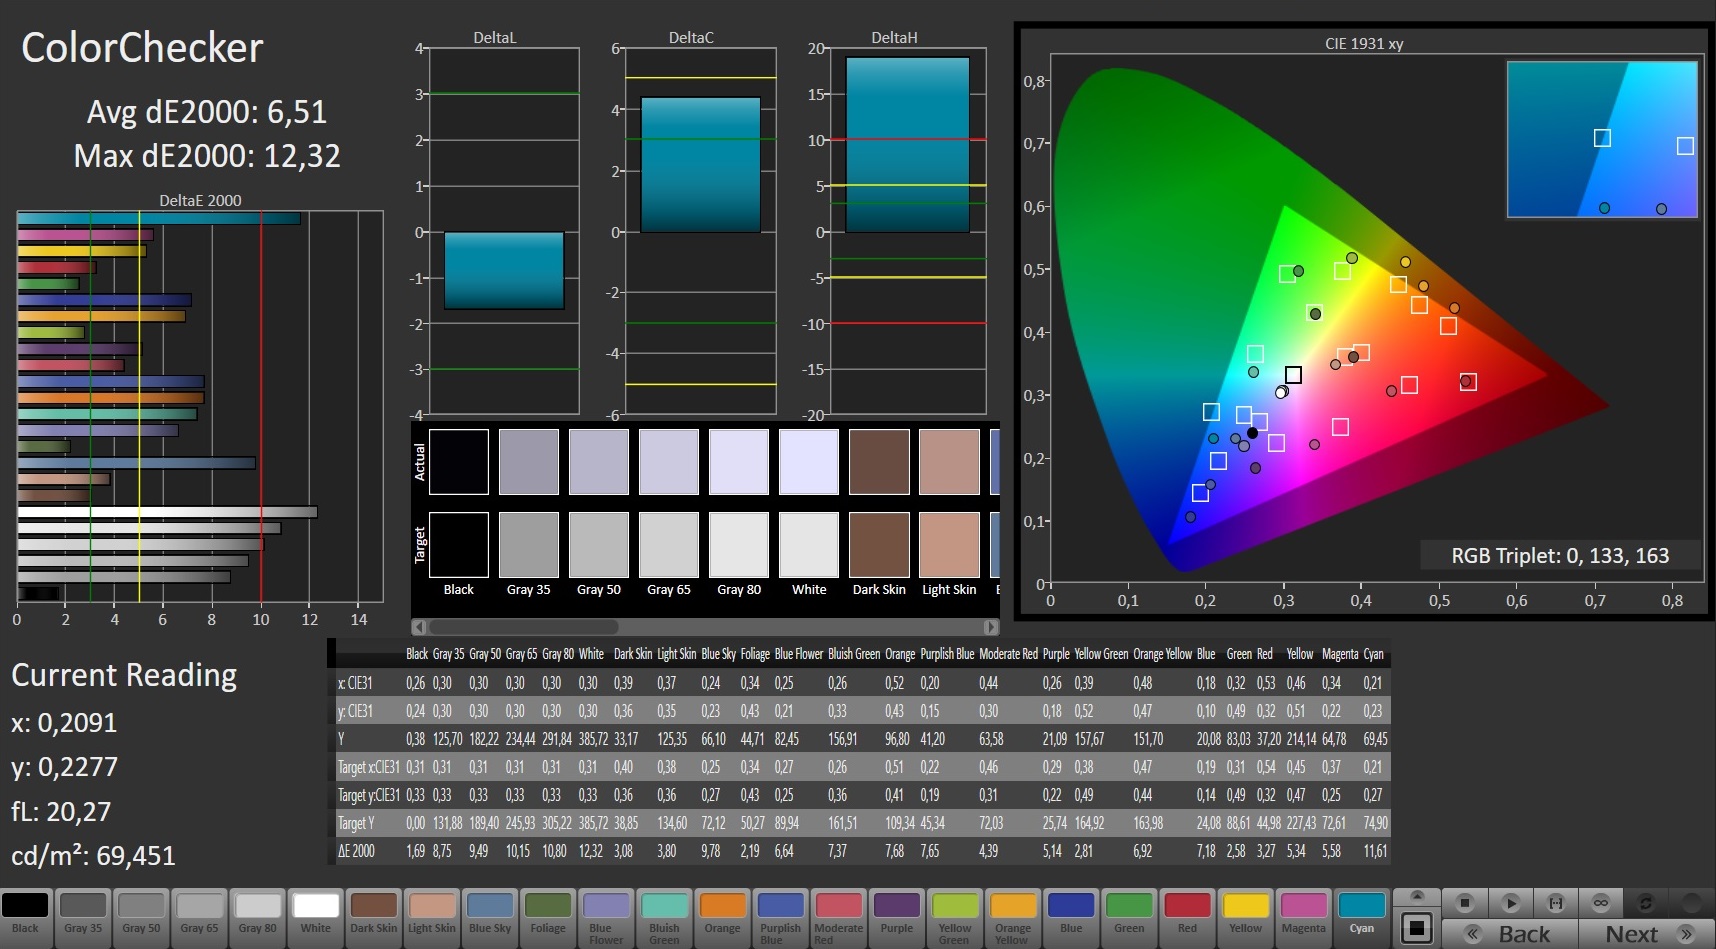
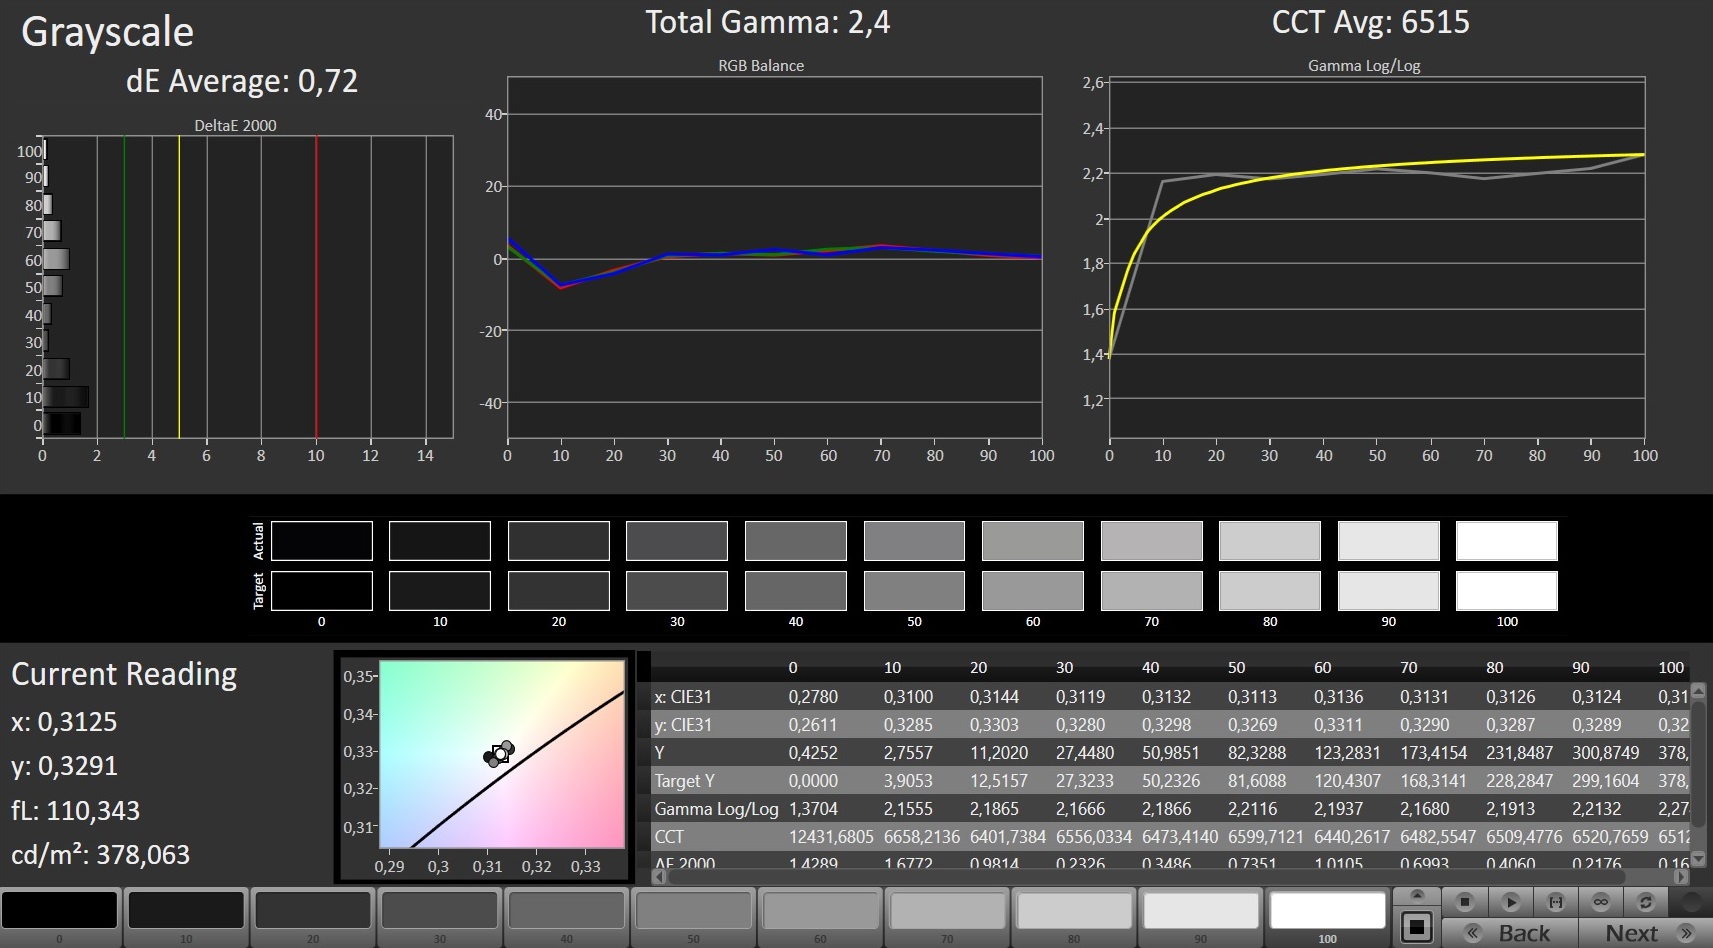
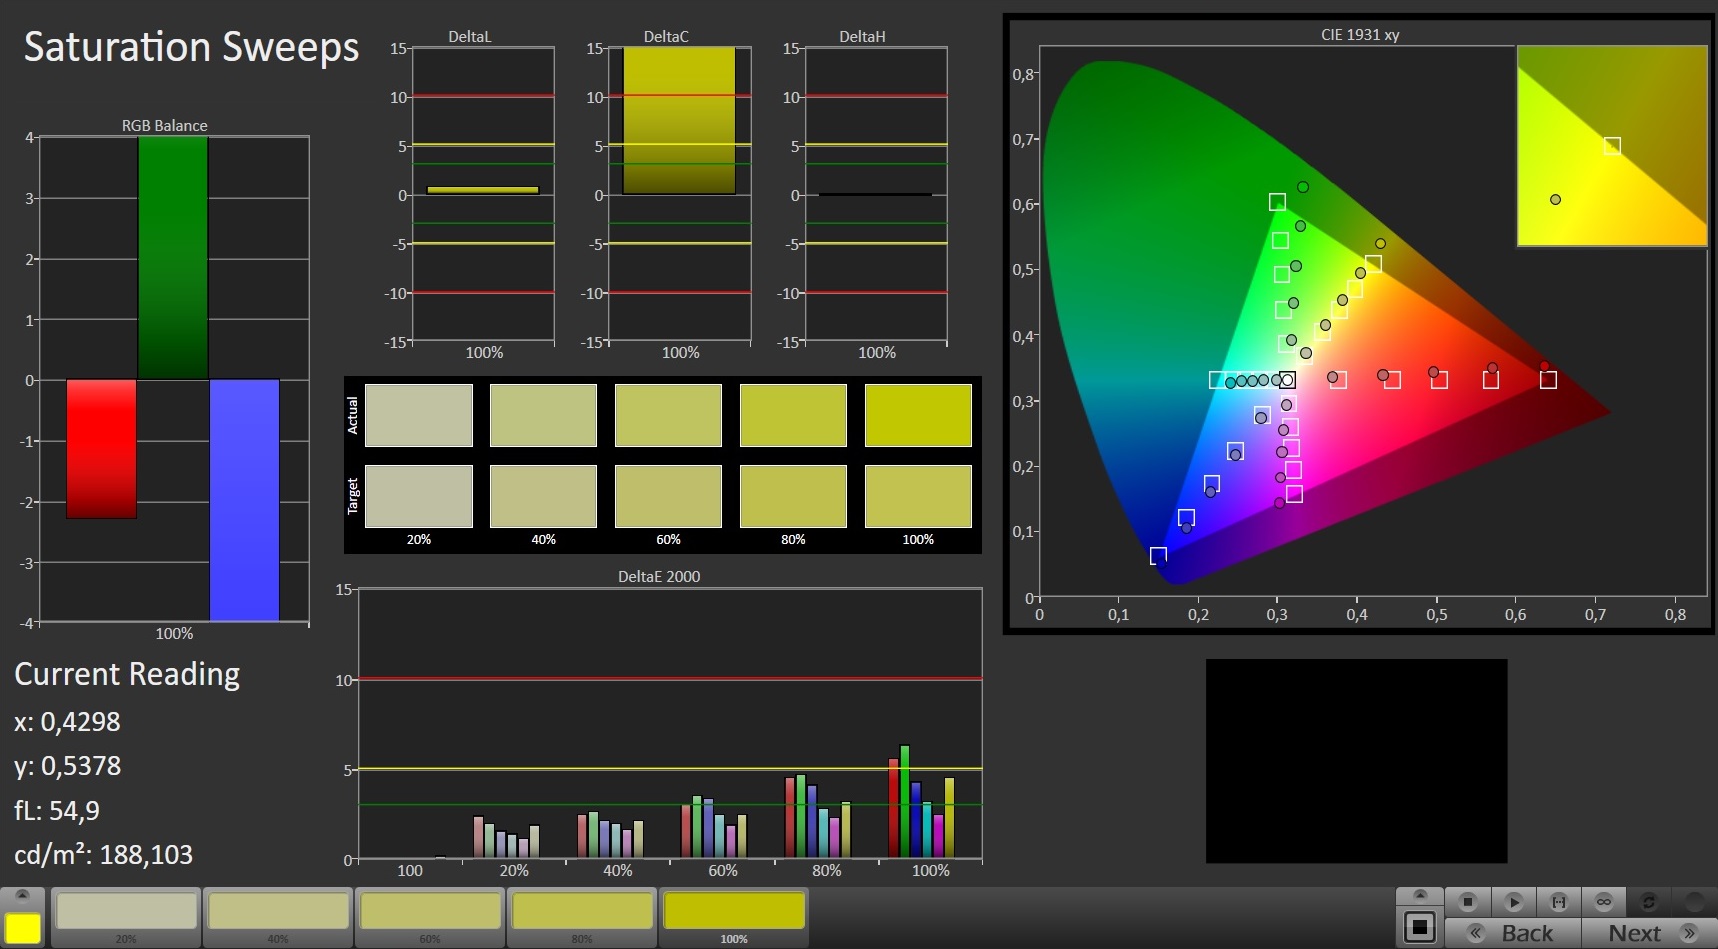
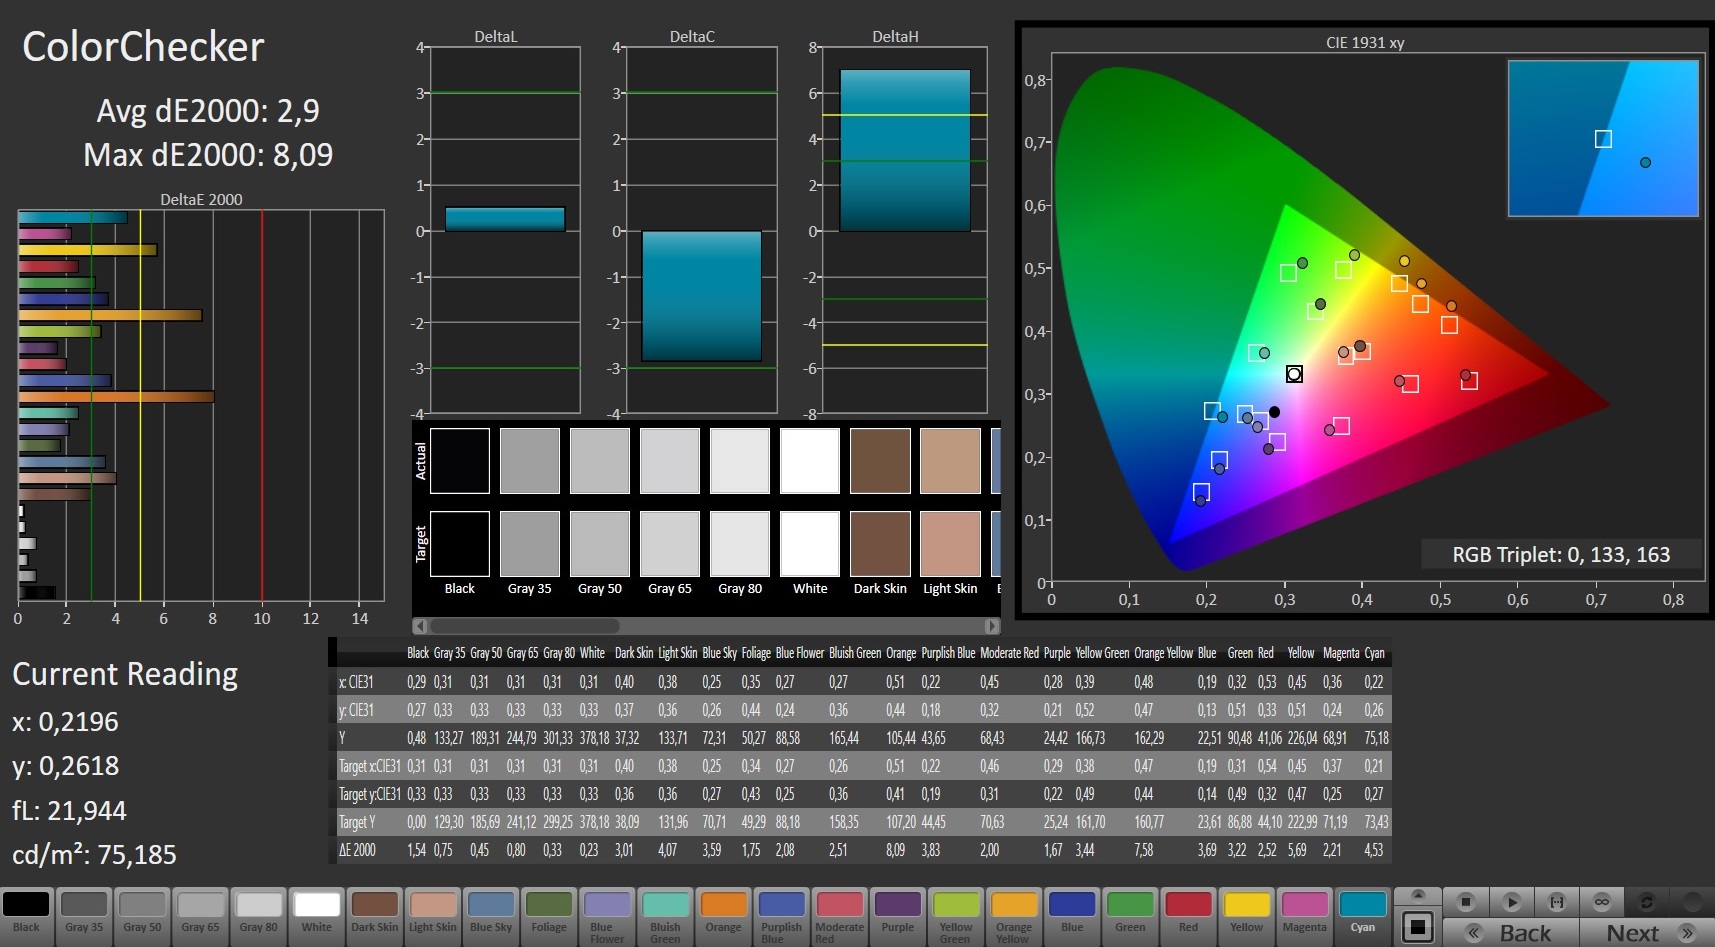
The color accuracy is less impressive. Right out of the box, the panel suffers from a bluish cast, which can be removed by means of calibration (those who do not have appropriate tools can try our ICC profile). Just like the predecessor, our current device has to contend with screen bleeding at the edges, which has a negative impact on the picture quality and can prove annoying in some situations (such as watching movies through a letterboxe).

The response times are quite ordinary. It takes the display 22 ms to switch from black to white and 36 ms to switch from gray to gray. This is typical for IPS panels.
Display Response Times
| ↔ Response Time Black to White | ||
|---|---|---|
| 22 ms ... rise ↗ and fall ↘ combined | ↗ 10.4 ms rise | 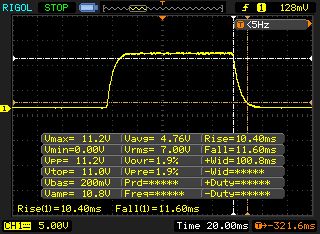 |
| ↘ 11.6 ms fall | ||
| The screen shows good response rates in our tests, but may be too slow for competitive gamers. In comparison, all tested devices range from 0.1 (minimum) to 240 (maximum) ms. » 48 % of all devices are better. This means that the measured response time is worse than the average of all tested devices (19.8 ms). | ||
| ↔ Response Time 50% Grey to 80% Grey | ||
| 36 ms ... rise ↗ and fall ↘ combined | ↗ 18.8 ms rise | 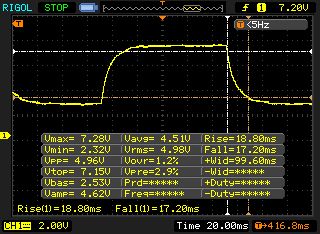 |
| ↘ 17.2 ms fall | ||
| The screen shows slow response rates in our tests and will be unsatisfactory for gamers. In comparison, all tested devices range from 0.165 (minimum) to 636 (maximum) ms. » 50 % of all devices are better. This means that the measured response time is worse than the average of all tested devices (31 ms). | ||
Screen Flickering / PWM (Pulse-Width Modulation)
| Screen flickering / PWM detected | 122000 Hz | ≤ 95 % brightness setting | 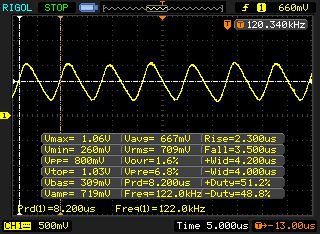 |
The display backlight flickers at 122000 Hz (worst case, e.g., utilizing PWM) Flickering detected at a brightness setting of 95 % and below. There should be no flickering or PWM above this brightness setting. The frequency of 122000 Hz is quite high, so most users sensitive to PWM should not notice any flickering. In comparison: 52 % of all tested devices do not use PWM to dim the display. If PWM was detected, an average of 7781 (minimum: 5 - maximum: 343500) Hz was measured. | |||
Performance - For casual gamers
Processor
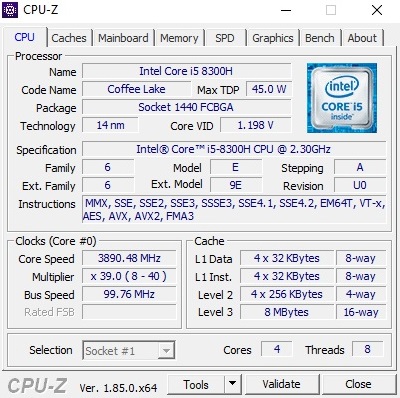
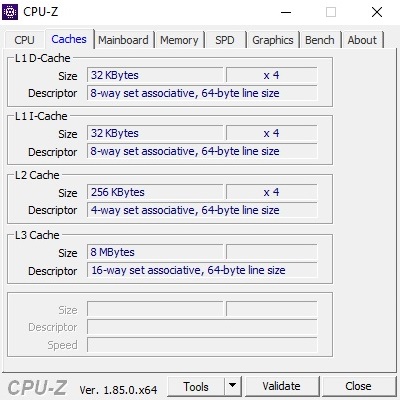
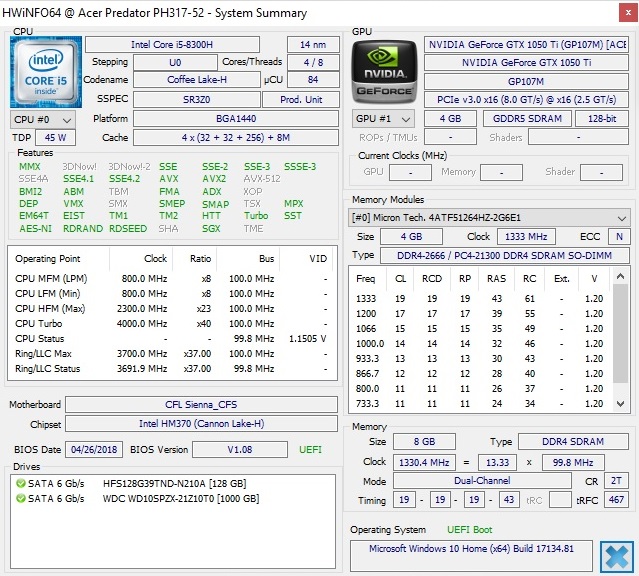
Most of the notebooks with Coffee Lake CPUs that we have reviewed thus far were powered by a hexa-core processor from the Core i7 series. However, the Helios 300 is powered by a quad-core CPU. Unlike the older Core i5 processors, the new Core i5 chip, the Core i5-8300H, supports Hyper-Threading, which means that it can process up to eight threads at the same time.
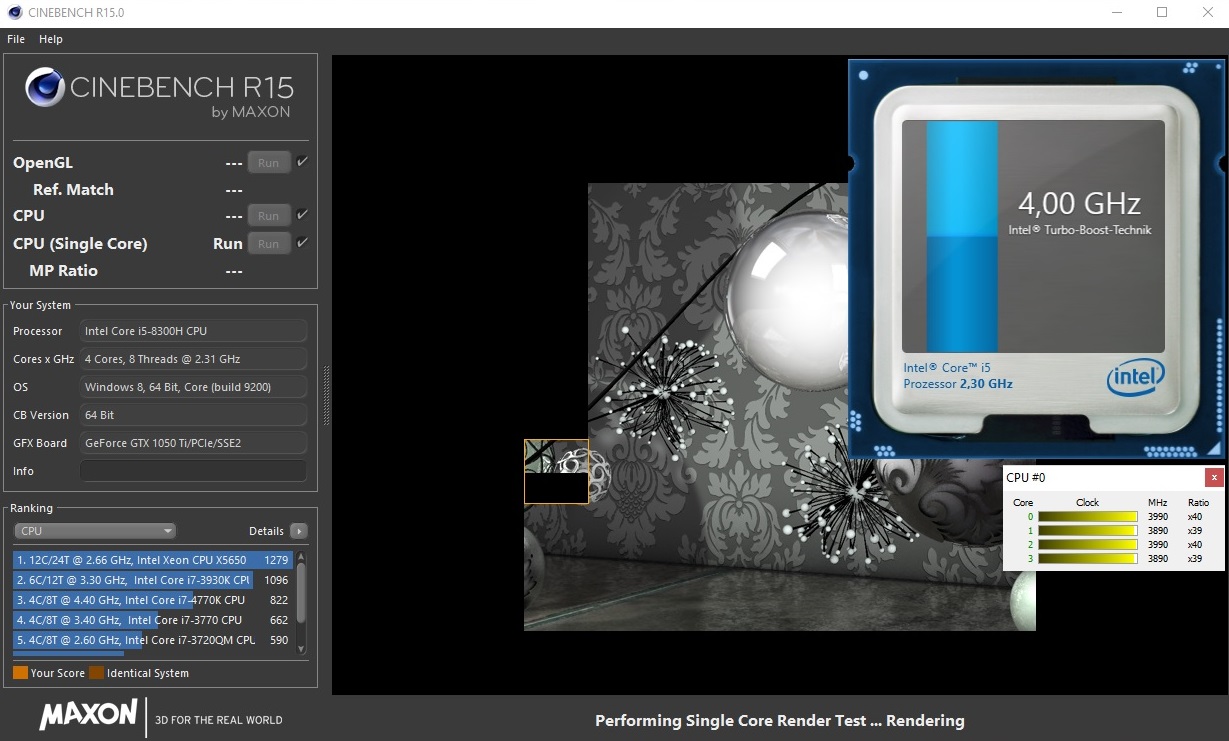
Thanks to a high boost clock of 4.0 GHz (single core), the Core i5-8300H is able to beat top-end processors from the Kaby Lake generation. In the multicore section of the Cinebench R15 benchmark, it actually manages to beat the Core i7-7700HQ by 10%. It beats its predecessor, the Core i5-7300HQ, by almost 60%.
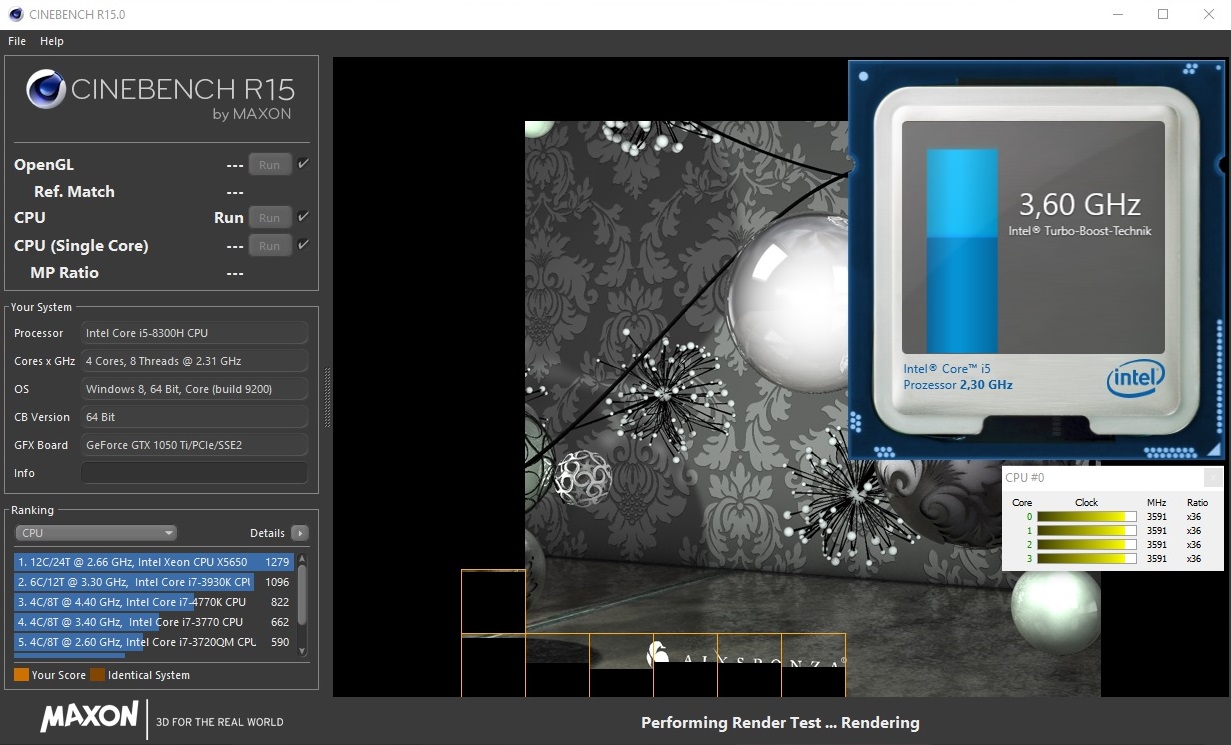
As often happens, the Core i5-8300H cannot maintain its full performance over an extended period of time. In our Cinebench R15 benchmark loop, the CPU runs at 3.9 GHz during the first benchmark run. In the subsequent benchmark runs, the clock rate fluctuates between 3.2 and 3.9 GHz. All in all, under continuous load, the CPU loses almost 5% of its performance. This kind of drop in performance will be noticed.
System Performance
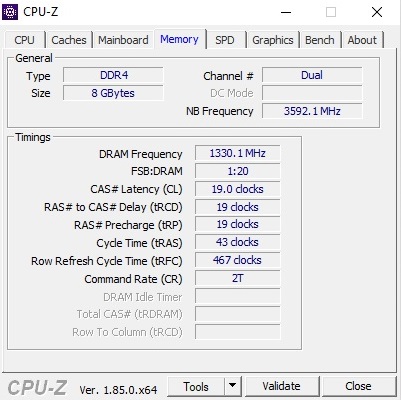
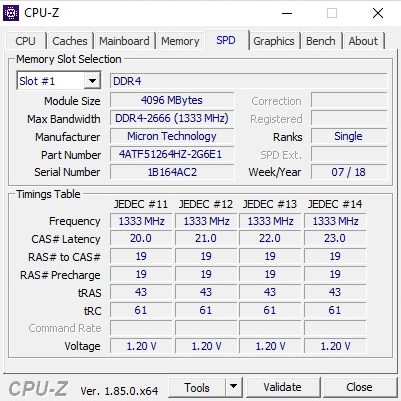
Even though the base configuration comes with only 8 GB of RAM (two sticks of DDR4 2666 MHz RAM), the Predator Helios 300 performs surprisingly well in the system benchmarks. The 17-incher takes first place in the “Work” section of the PCMark 8 benchmark and second place in the “Home” section.
| PCMark 8 Home Score Accelerated v2 | 4253 points | |
| PCMark 8 Work Score Accelerated v2 | 5347 points | |
Help | ||
Storage Devices
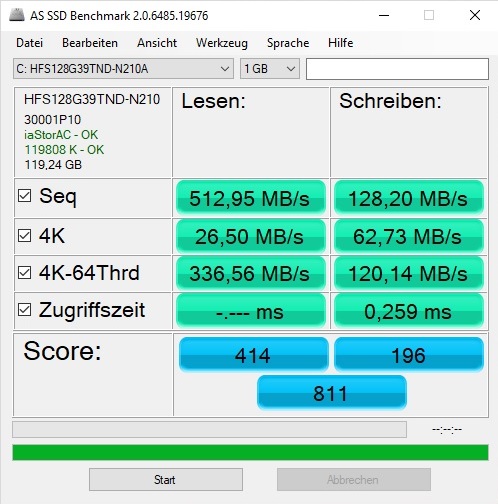
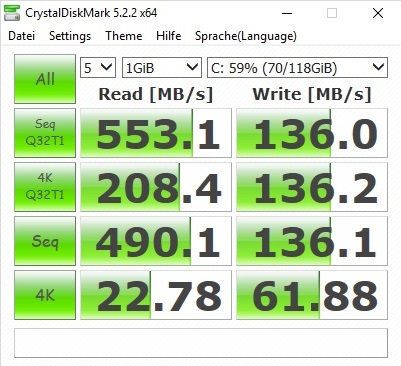
Subjectively, the Predator Helios 300 does not feel very responsive. The Helios 300 actually features a 128 GB SATA-III SSD from Hynix, but, because it has a very low write speed, it feels more like an HDD (a fast one at that) than an SSD. In our opinion, Acer has made too many cuts here. A PCIe SSD in the Asus GL753VE is significantly faster.
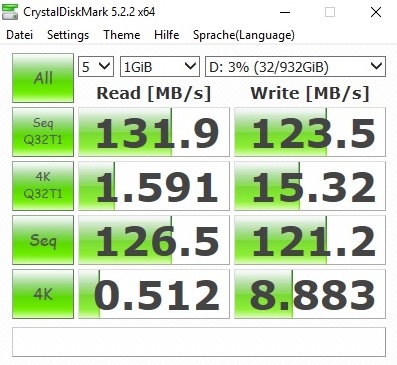
Because the SSD has such a small capacity, you will have to rely on the secondary drive most of the time. The 1 TB 5400 RPM HDD from Western Digital offers more than enough space for video games and movies.
| Acer Predator Helios 300 PH317-52-51M6 Hynix HFS128G39TND | Acer Predator Helios 300 Intel SSD 600p SSDPEKKW512G7 | Acer Aspire Nitro BE VN7-793G-5811 Seagate Mobile HDD 1TB ST1000LM035 | Asus GL753VE-DS74 Intel SSD 600p SSDPEKKW512G7 | Asus ROG Strix GL702ZC-GC204T Seagate Mobile HDD 1TB ST1000LX015-1U7172 | |
|---|---|---|---|---|---|
| AS SSD | 141% | 142% | |||
| Seq Read (MB/s) | 513 | 1558 204% | 1500 192% | ||
| Seq Write (MB/s) | 128.2 | 552 331% | 558 335% | ||
| 4K Read (MB/s) | 26.5 | 29.02 10% | 32.5 23% | ||
| 4K Write (MB/s) | 62.7 | 111.3 78% | 119.7 91% | ||
| Score Read (Points) | 414 | 690 67% | 681 64% | ||
| Score Write (Points) | 196 | 588 200% | 575 193% | ||
| Score Total (Points) | 811 | 1588 96% | 1566 93% |

Graphics Card
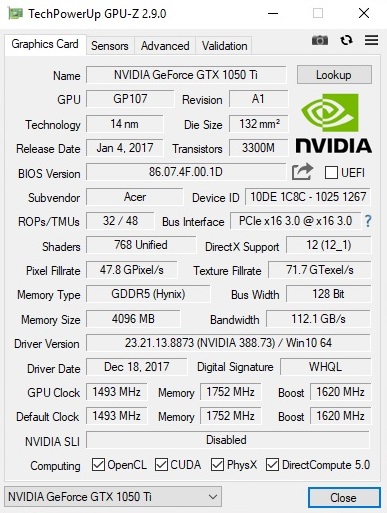
Those who identify as casual gamers should be more than happy with the GeForce GTX 1050 Ti. The DirectX 12 model belongs to Nvidia’s Pascal family of GPUs and has 4 GB of GDDR5 VRAM and a 128-bit wide bus.
The Predator Helios 300 performs as well as the competition in the GPU benchmarks. In the “Fire Strike” section of the 3DMark 13 benchmark, the 17-incher slots in between the V17 Nitro BE and the Asus GL753VE, both of which feature a GTX 1050 Ti. Notebooks with a GTX 1060 are almost 60 % faster. The Radeon RX 580 in the Asus GL702ZC is about 50% faster than the GTX 1050 Ti.
| 3DMark 11 Performance | 9101 points | |
| 3DMark Ice Storm Standard Score | 85238 points | |
| 3DMark Cloud Gate Standard Score | 22710 points | |
| 3DMark Fire Strike Score | 6685 points | |
Help | ||
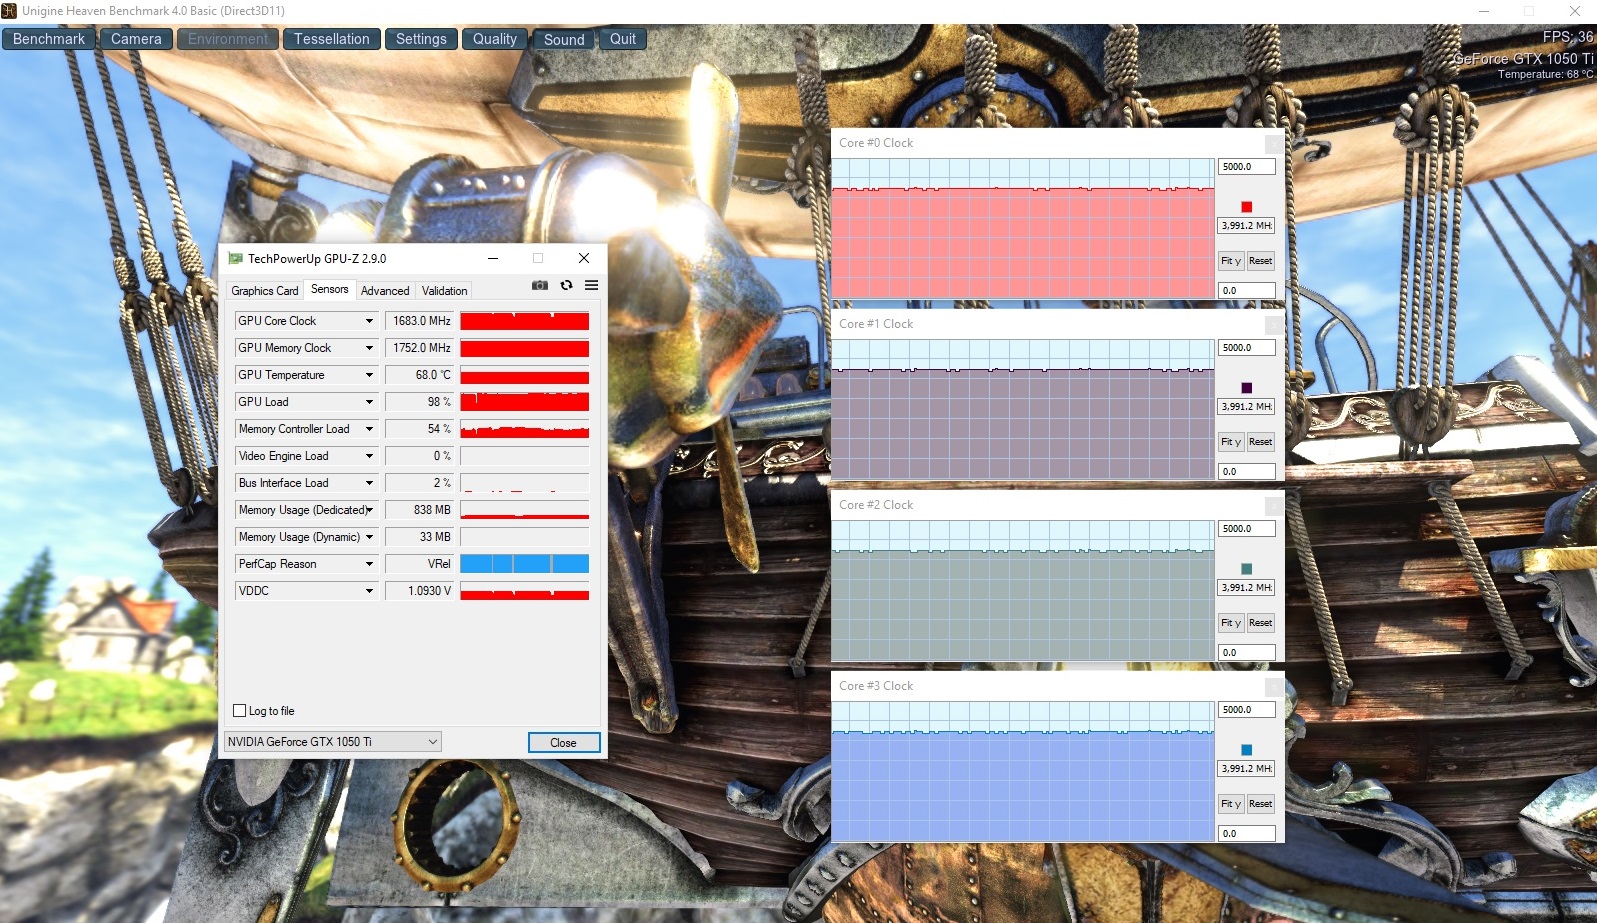
Having observed the CPU behavior under load, we move on to examine the GPU behavior. To be more exact, here we look at how the clock speeds behave under continuous load. For this, we run “The Witcher 3” for one hour on the highest settings. The Helios 300 performs very well in this test with the average core clock coming in at 1658 MHz (base clock: 1493 MHz, boost clock: 1709 MHz).
Gaming Performance
The GeForce GTX 1050 Ti should be able to run most modern titles on high to maximum settings at 1080p. Having said that, the graphics settings will have to be reduced in extremely demanding or poorly optimized games such as “The Evil Within 2”.
| The Witcher 3 | |
| 1920x1080 Ultra Graphics & Postprocessing (HBAO+) | |
| Average of class Gaming (95 - 240, n=8, last 2 years) | |
| Acer Predator Helios 300 | |
| Asus ROG Strix GL702ZC-GC204T | |
| Asus GL753VE-DS74 | |
| Acer Predator Helios 300 PH317-52-51M6 | |
| Acer Aspire Nitro BE VN7-793G-5811 | |
| 1920x1080 High Graphics & Postprocessing (Nvidia HairWorks Off) | |
| Average of class Gaming (181 - 341, n=3, last 2 years) | |
| Acer Predator Helios 300 | |
| Asus ROG Strix GL702ZC-GC204T | |
| Acer Aspire Nitro BE VN7-793G-5811 | |
| Acer Predator Helios 300 PH317-52-51M6 | |
If you want to be able to run games at higher resolutions or if you want some future-proofing, then you should get a notebook with a high-end GPU such as the GeForce GTX 1060 or the Radeon RX 580. These graphics cards will last much longer.
| low | med. | high | ultra | |
|---|---|---|---|---|
| The Witcher 3 (2015) | 46.7 | 26 | ||
| Playerunknown's Battlegrounds (PUBG) (2017) | 62.4 | 41.4 | ||
| The Evil Within 2 (2017) | 31.5 | 30.7 | ||
| ELEX (2017) | 43.4 | 32.7 | ||
| Wolfenstein II: The New Colossus (2017) | 56.9 | 52.5 | ||
| Call of Duty WWII (2017) | 63.4 | 47.9 | ||
| Fortnite (2018) | 76.7 | 54.6 | ||
| Kingdom Come: Deliverance (2018) | 38.9 | 28.8 |
Emissions - Unremarkable
System Noise
The Helios 300 is not particularly loud for a gaming notebook. Under full load, we measured a sound pressure level of 51 dB(A). When gaming, the system noise peaked at 45 dB(A), which is not an unreasonable value.
When idle, the 17-incher is relatively quiet. However, the fans spin up from time to time. Here, we measured an average sound pressure level of 31 dB(A). This is a pretty good result. At times, both the fans and the hard drive become inactive. When this happens, the notebook is absolutely silent (expect for the coil whine that we assume is coming from the SSD).
Noise level
| Idle |
| 29 / 31 / 33 dB(A) |
| HDD |
| 31 dB(A) |
| Load |
| 45 / 51 dB(A) |
 | ||
30 dB silent 40 dB(A) audible 50 dB(A) loud |
||
min: | ||
| Acer Predator Helios 300 PH317-52-51M6 i5-8300H, GeForce GTX 1050 Ti Mobile | Acer Predator Helios 300 i7-7700HQ, GeForce GTX 1060 Mobile | Acer Aspire Nitro BE VN7-793G-5811 i5-7300HQ, GeForce GTX 1050 Ti Mobile | Asus GL753VE-DS74 i7-7700HQ, GeForce GTX 1050 Ti Mobile | Asus ROG Strix GL702ZC-GC204T R5 1600, Radeon RX 580 (Laptop) | Average of class Gaming | |
|---|---|---|---|---|---|---|
| Noise | -2% | 8% | -2% | -3% | 8% | |
| off / environment * (dB) | 29 | 31 -7% | 29.7 -2% | 29.1 -0% | 30.2 -4% | 24.1 ? 17% |
| Idle Minimum * (dB) | 29 | 31 -7% | 30.2 -4% | 33.3 -15% | 30.6 -6% | 25.8 ? 11% |
| Idle Average * (dB) | 31 | 32 -3% | 30.2 3% | 33.3 -7% | 32.7 -5% | 27.4 ? 12% |
| Idle Maximum * (dB) | 33 | 33 -0% | 30.6 7% | 33.4 -1% | 32.7 1% | 29.9 ? 9% |
| Load Average * (dB) | 45 | 44 2% | 33.8 25% | 42.6 5% | 38.9 14% | 43 ? 4% |
| Witcher 3 ultra * (dB) | 45 | 46 -2% | 39.5 12% | 46.8 -4% | 53.4 -19% | |
| Load Maximum * (dB) | 51 | 50 2% | 42.6 16% | 46.8 8% | 50.6 1% | 54 ? -6% |
* ... smaller is better
Temperature
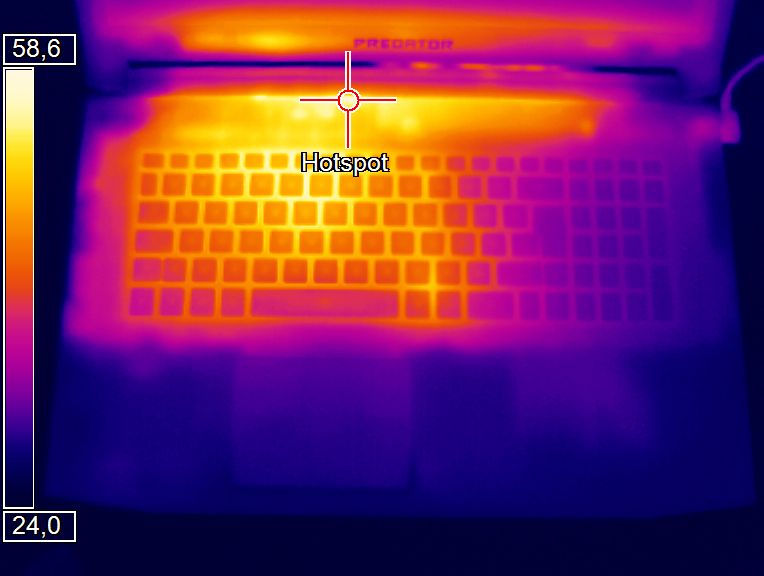
The temperatures are within normal range. While the case temperatures remain mostly below 30 °C (86 °F) when idle, under load the temperatures can rise up to 50 °C (122 °F). Because the wrist rest area remains cool under load, long gaming sessions should not be a problem. However, you should not be putting the notebook in your lap while gaming.
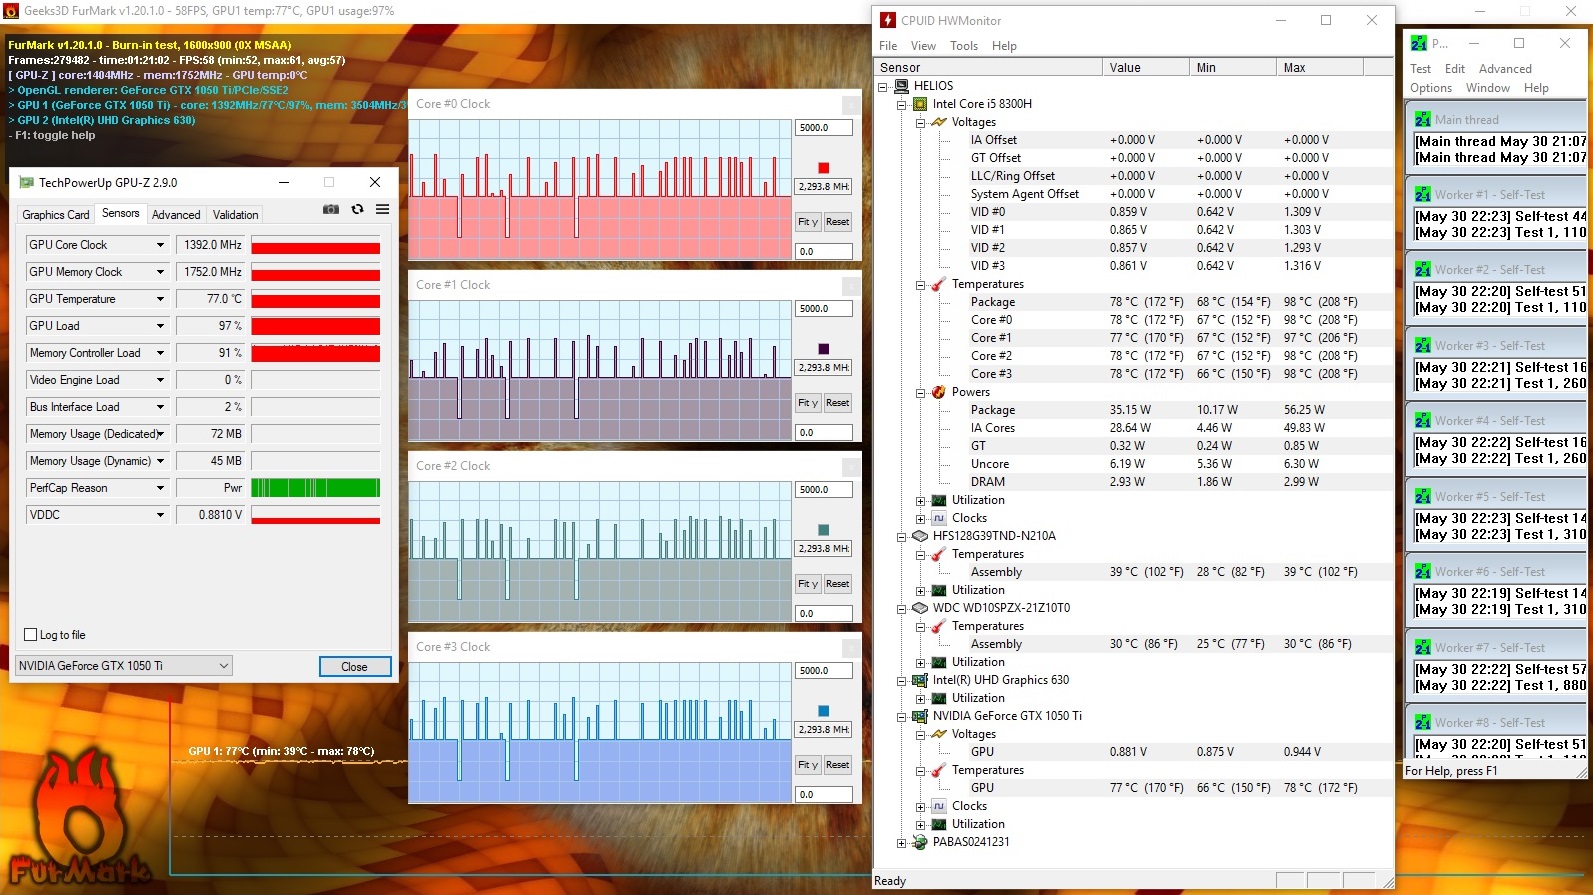
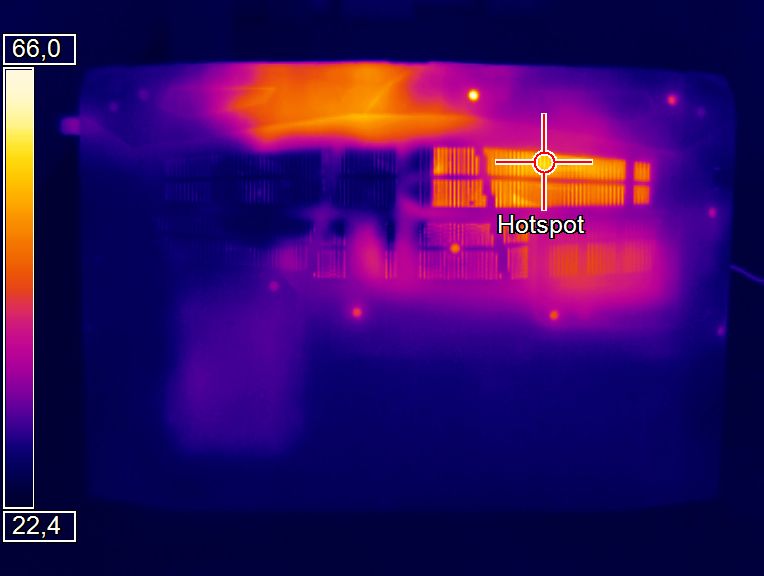
Now let us take a quick look inside the case: After our 60-minute stress test with FurMark and Prime95, the GeForce GTX 1050 Ti is moderately hot at 77 °C (170.6 °F), whereby the clock speed is slightly reduced (1392 MHz). The Core i5-8300H cannot maintain its full performance under continuous load. The CPU reaches almost 100 °C (212 °F) when it runs at full speed and 80 °C (176 °F) when it operates at 2.3 GHz (the base clock of the CPU).
(-) The maximum temperature on the upper side is 50 °C / 122 F, compared to the average of 40.4 °C / 105 F, ranging from 21.2 to 68.8 °C for the class Gaming.
(-) The bottom heats up to a maximum of 52 °C / 126 F, compared to the average of 43.2 °C / 110 F
(+) In idle usage, the average temperature for the upper side is 28.2 °C / 83 F, compared to the device average of 33.9 °C / 93 F.
(-) Playing The Witcher 3, the average temperature for the upper side is 39.3 °C / 103 F, compared to the device average of 33.9 °C / 93 F.
(+) The palmrests and touchpad are cooler than skin temperature with a maximum of 31 °C / 87.8 F and are therefore cool to the touch.
(-) The average temperature of the palmrest area of similar devices was 28.8 °C / 83.8 F (-2.2 °C / -4 F).
| Acer Predator Helios 300 PH317-52-51M6 i5-8300H, GeForce GTX 1050 Ti Mobile | Acer Predator Helios 300 i7-7700HQ, GeForce GTX 1060 Mobile | Acer Aspire Nitro BE VN7-793G-5811 i5-7300HQ, GeForce GTX 1050 Ti Mobile | Asus GL753VE-DS74 i7-7700HQ, GeForce GTX 1050 Ti Mobile | Asus ROG Strix GL702ZC-GC204T R5 1600, Radeon RX 580 (Laptop) | Average of class Gaming | |
|---|---|---|---|---|---|---|
| Heat | -10% | 9% | 29% | -8% | 3% | |
| Maximum Upper Side * (°C) | 50 | 57 -14% | 48 4% | 35.8 28% | 54.3 -9% | 45.2 ? 10% |
| Maximum Bottom * (°C) | 52 | 59 -13% | 40.8 22% | 36.4 30% | 51 2% | 47.9 ? 8% |
| Idle Upper Side * (°C) | 33 | 36 -9% | 29.9 9% | 22.2 33% | 36 -9% | 31.1 ? 6% |
| Idle Bottom * (°C) | 30 | 31 -3% | 29.8 1% | 22.2 26% | 34.3 -14% | 34.2 ? -14% |
* ... smaller is better
Speakers
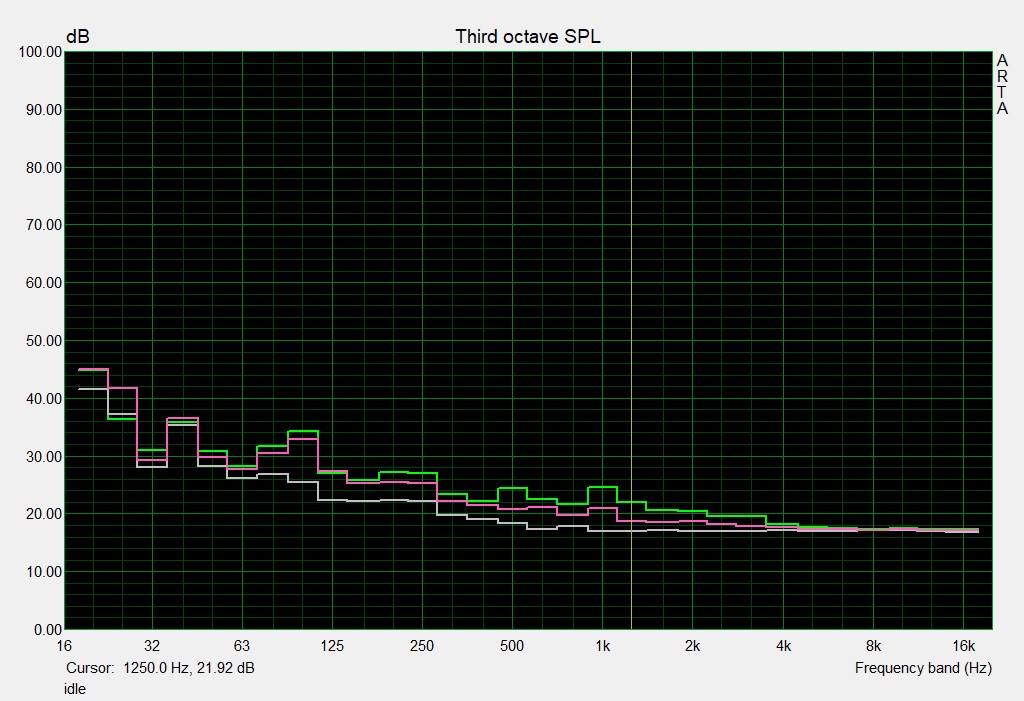
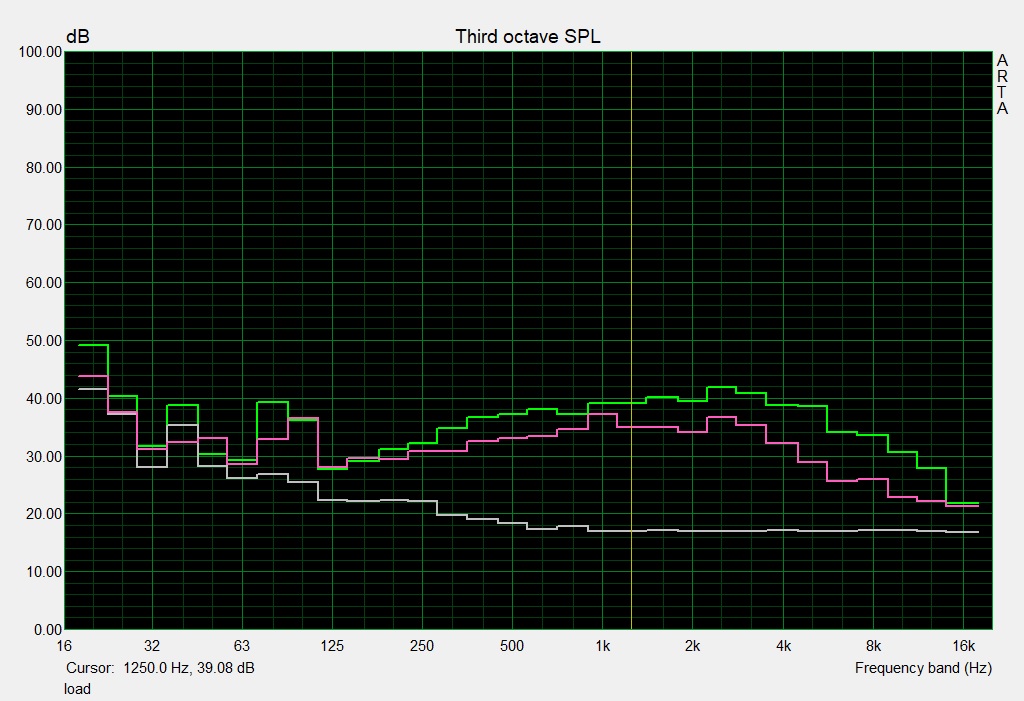
Acer Predator Helios 300 PH317-52-51M6 audio analysis
(+) | speakers can play relatively loud (82 dB)
Bass 100 - 315 Hz
(±) | reduced bass - on average 10.8% lower than median
(-) | bass is not linear (15.2% delta to prev. frequency)
Mids 400 - 2000 Hz
(±) | higher mids - on average 9.7% higher than median
(+) | mids are linear (6.7% delta to prev. frequency)
Highs 2 - 16 kHz
(+) | balanced highs - only 3.2% away from median
(+) | highs are linear (5.6% delta to prev. frequency)
Overall 100 - 16.000 Hz
(±) | linearity of overall sound is average (18.4% difference to median)
Compared to same class
» 59% of all tested devices in this class were better, 9% similar, 33% worse
» The best had a delta of 6%, average was 18%, worst was 132%
Compared to all devices tested
» 41% of all tested devices were better, 8% similar, 52% worse
» The best had a delta of 4%, average was 24%, worst was 134%
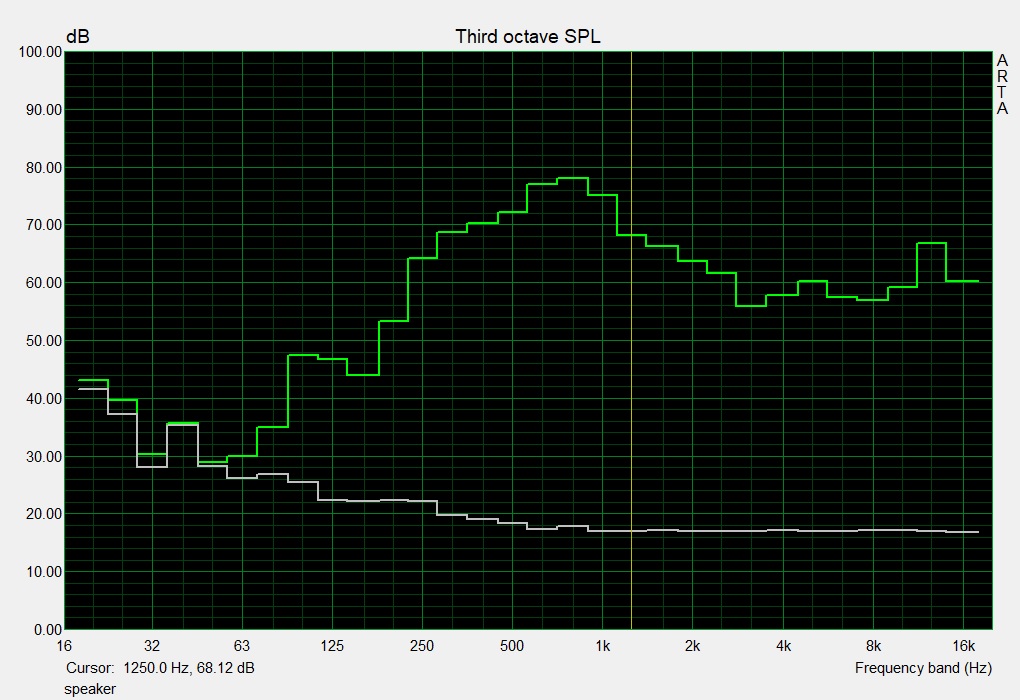
Acer Aspire Nitro BE VN7-793G-5811 audio analysis
(±) | speaker loudness is average but good (72 dB)
Bass 100 - 315 Hz
(±) | reduced bass - on average 6.9% lower than median
(+) | bass is linear (5.5% delta to prev. frequency)
Mids 400 - 2000 Hz
(+) | balanced mids - only 4.5% away from median
(+) | mids are linear (6.3% delta to prev. frequency)
Highs 2 - 16 kHz
(+) | balanced highs - only 1.1% away from median
(+) | highs are linear (3.5% delta to prev. frequency)
Overall 100 - 16.000 Hz
(+) | overall sound is linear (11.5% difference to median)
Compared to same class
» 18% of all tested devices in this class were better, 4% similar, 78% worse
» The best had a delta of 5%, average was 17%, worst was 45%
Compared to all devices tested
» 8% of all tested devices were better, 2% similar, 90% worse
» The best had a delta of 4%, average was 24%, worst was 134%
Energy Management - The Helios 300 lasts for a while
Energy Consumption
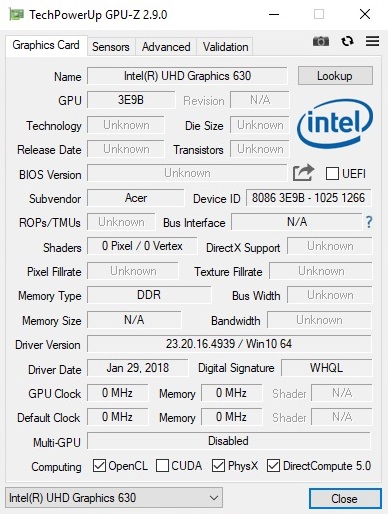
Thanks to Nvidia’s Optimus Technology (which enables automatic switching between a dedicated and an integrated graphics adapter), the Helios 300 is very energy efficient at idle. It draws only 6 to 13 watts when idle, which is a very good result. However, things are different under load: An average power draw of 95 watts in the first scene of the 3DMark 06 benchmark is quite high for a GTX 1050 Ti-based notebook. Here, the Asus GL753VE draws only 82 watts. In “The Witcher 3”, the Helios 300 draws almost as much power as the competition (102 watts). During the stress test, the power consumption peaked at 134 watts. The included 135-watt AC adapter should have no trouble supplying the laptop with enough energy.
| Off / Standby | |
| Idle | |
| Load |
|
Key:
min: | |
| Acer Predator Helios 300 PH317-52-51M6 i5-8300H, GeForce GTX 1050 Ti Mobile | Acer Predator Helios 300 i7-7700HQ, GeForce GTX 1060 Mobile | Acer Aspire Nitro BE VN7-793G-5811 i5-7300HQ, GeForce GTX 1050 Ti Mobile | Asus GL753VE-DS74 i7-7700HQ, GeForce GTX 1050 Ti Mobile | Asus ROG Strix GL702ZC-GC204T R5 1600, Radeon RX 580 (Laptop) | Average of class Gaming | |
|---|---|---|---|---|---|---|
| Power Consumption | -24% | -12% | -2% | -329% | -84% | |
| Idle Minimum * (Watt) | 6 | 7 -17% | 8.7 -45% | 7.5 -25% | 49 -717% | 13.2 ? -120% |
| Idle Average * (Watt) | 9 | 13 -44% | 12.4 -38% | 11.3 -26% | 60 -567% | 18.9 ? -110% |
| Idle Maximum * (Watt) | 13 | 20 -54% | 15.4 -18% | 11.8 9% | 68 -423% | 24.3 ? -87% |
| Load Average * (Watt) | 95 | 81 15% | 73 23% | 82.1 14% | 150 -58% | 108.3 ? -14% |
| Witcher 3 ultra * (Watt) | 102 | 127 -25% | 98 4% | 96.3 6% | 214 -110% | |
| Load Maximum * (Watt) | 134 | 162 -21% | 130 3% | 116.6 13% | 262 -96% | 254 ? -90% |
* ... smaller is better
Battery Life
Besides an outstanding price, the Helios 300 also offers an outstanding battery life. The Predator Helios 300 can last for 100 minutes under full load (maximum rightness) and up to 12 hours when idle (minimum brightness). In our Wi-FI test, in which the brightness is set to medium, the laptop lasts for about 6 hours. The 48 Wh battery in the Helios 300 is not especially large.
| Acer Predator Helios 300 PH317-52-51M6 i5-8300H, GeForce GTX 1050 Ti Mobile, 48 Wh | Acer Predator Helios 300 i7-7700HQ, GeForce GTX 1060 Mobile, 48 Wh | Acer Aspire Nitro BE VN7-793G-5811 i5-7300HQ, GeForce GTX 1050 Ti Mobile, 52.5 Wh | Asus GL753VE-DS74 i7-7700HQ, GeForce GTX 1050 Ti Mobile, 48 Wh | Asus ROG Strix GL702ZC-GC204T R5 1600, Radeon RX 580 (Laptop), 74 Wh | Average of class Gaming | |
|---|---|---|---|---|---|---|
| Battery runtime | -27% | -22% | -38% | -78% | -7% | |
| Reader / Idle (h) | 11.8 | 10.2 -14% | 8.7 -26% | 8.71 ? -26% | ||
| WiFi v1.3 (h) | 5.9 | 4.7 -20% | 4.6 -22% | 3.9 -34% | 1.3 -78% | 7.04 ? 19% |
| Load (h) | 1.7 | 0.9 -47% | 0.8 -53% | 1.47 ? -14% | ||
| H.264 (h) | 4.7 | 8.26 ? |
Verdict - The price is right
Pros
Cons
Even though Acer has cut a lot of corners to get the price down (slow SSD, few ports, poor sound quality), the Predator Helios 300 is still a great device.
The input devices and the build quality are definitely not top-notch. Having said that, a few flaws are to be expected from a 1000-Euro ($1178) device.
Buyers will not be disappointed when it comes to performance. Even the base configuration with the Core i5-8300H and the GeForce GTX 1050 Ti can run most modern titles at 1080p. However, the IPS display, which has a high brightness and a good contrast ratio, suffers from screen bleeding and poor color reproduction. The thermals and the system noise are quite unremarkable.
All in all, the 17-incher is an exciting offer for price-conscious gamers. The battery life also speaks in favor of the device.
Acer Predator Helios 300 PH317-52-51M6
- 06/02/2018 v6 (old)
Florian Glaser
Price comparison
