Dell G3 17 3779 (i5-8300H, GTX 1050, SSD, IPS) Laptop Review

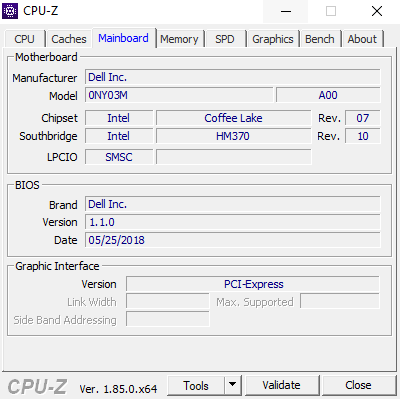
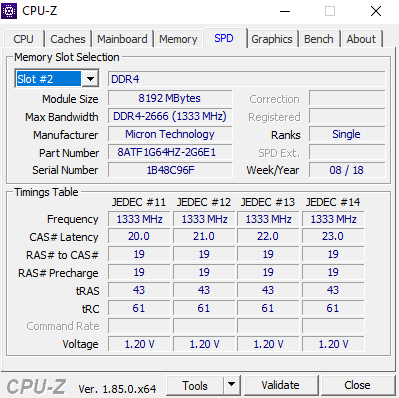
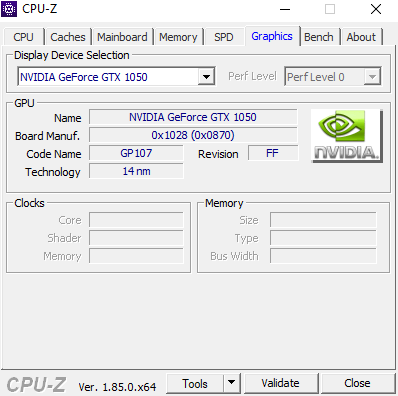
As an affordable alternative to the high-price Alienware devices Dell presents the G3 series, which becomes the successor to the Inspiron notebooks. This series starts at only 799 Euros (~$937; starting at $800 in the US), which at first glance does not look like much for a 17-inch laptop with gaming ambitions. In order to check whether a purchase is actually worthwhile, we selected exactly this model for a comparison test. With the brand-new Intel Core i5-8300H and 8 GB of working memory as well as an Nvidia GeForce GTX 1050, the Dell G3 17 3779 offers acceptable equipment. In terms of the storage solution, our test unit offers an SSD with 128 GB of storage and a conventional 1-TB hard drive for your game collection.
Anyone with the necessary change can also purchase the Dell G3 17 with a GeForce GTX 1050 Ti or even a GeForce GTX 1060 Max-Q. Alternatively there is also a hexa-core CPU of the newest Coffee-Lake generation with the Intel Core i7-8750H. For the top model, Dell has set the price at 1089 Euros (~$1277; $1050 in the US).
The competitors here come from Acer, Asus, and MSI. You can find a list of the comparison devices and their equipment in the following table. The only thing worth mentioning here is that only the Acer Predator Helios 300 is equipped with a similar storage solution.
| Acer Predator Helios 300 | Asus ROG Strix GL702 | MSI GL72 7RDX | Acer Aspire V17 Nitro | Asus VivoBook Pro 17 | |
| CPU | Intel Core i5-8300H | AMD Ryzen 5 1600 | Intel Core i7-7700HQ | Intel Core i5-7300HQ | Intel Core i7-8550U |
| GPU | Nvidia GeForce GTX 1050 Ti | AMD Radeon RX 580 | Nvidia GeForce GTX 1050 | Nvidia GeForce GTX 1050 Ti | Nvidia GeForce GTX 1050 |
| Display | 17.3 in 1920x1080 (IPS) | 17.3 in 1920x1080 (IPS) | 17.3 in 1920x1080 (IPS) | 17.3 in 1920x1080 (IPS) | 17.3 in 1920x1080 (IPS) |
| RAM | 8 GB DDR4 | 8 GB DDR4 | 8 GB DDR4 | 8 GB DDR4 | 16 GB DDR4 |
| Storage | 128 GB SSD + 1 TB HDD | 1 TB HDD | 1 TB HDD | 1 TB HDD | 512 GB SSD (NVMe) |
| Evaluation | 82% | 83% | 82% | 87% | 83% |
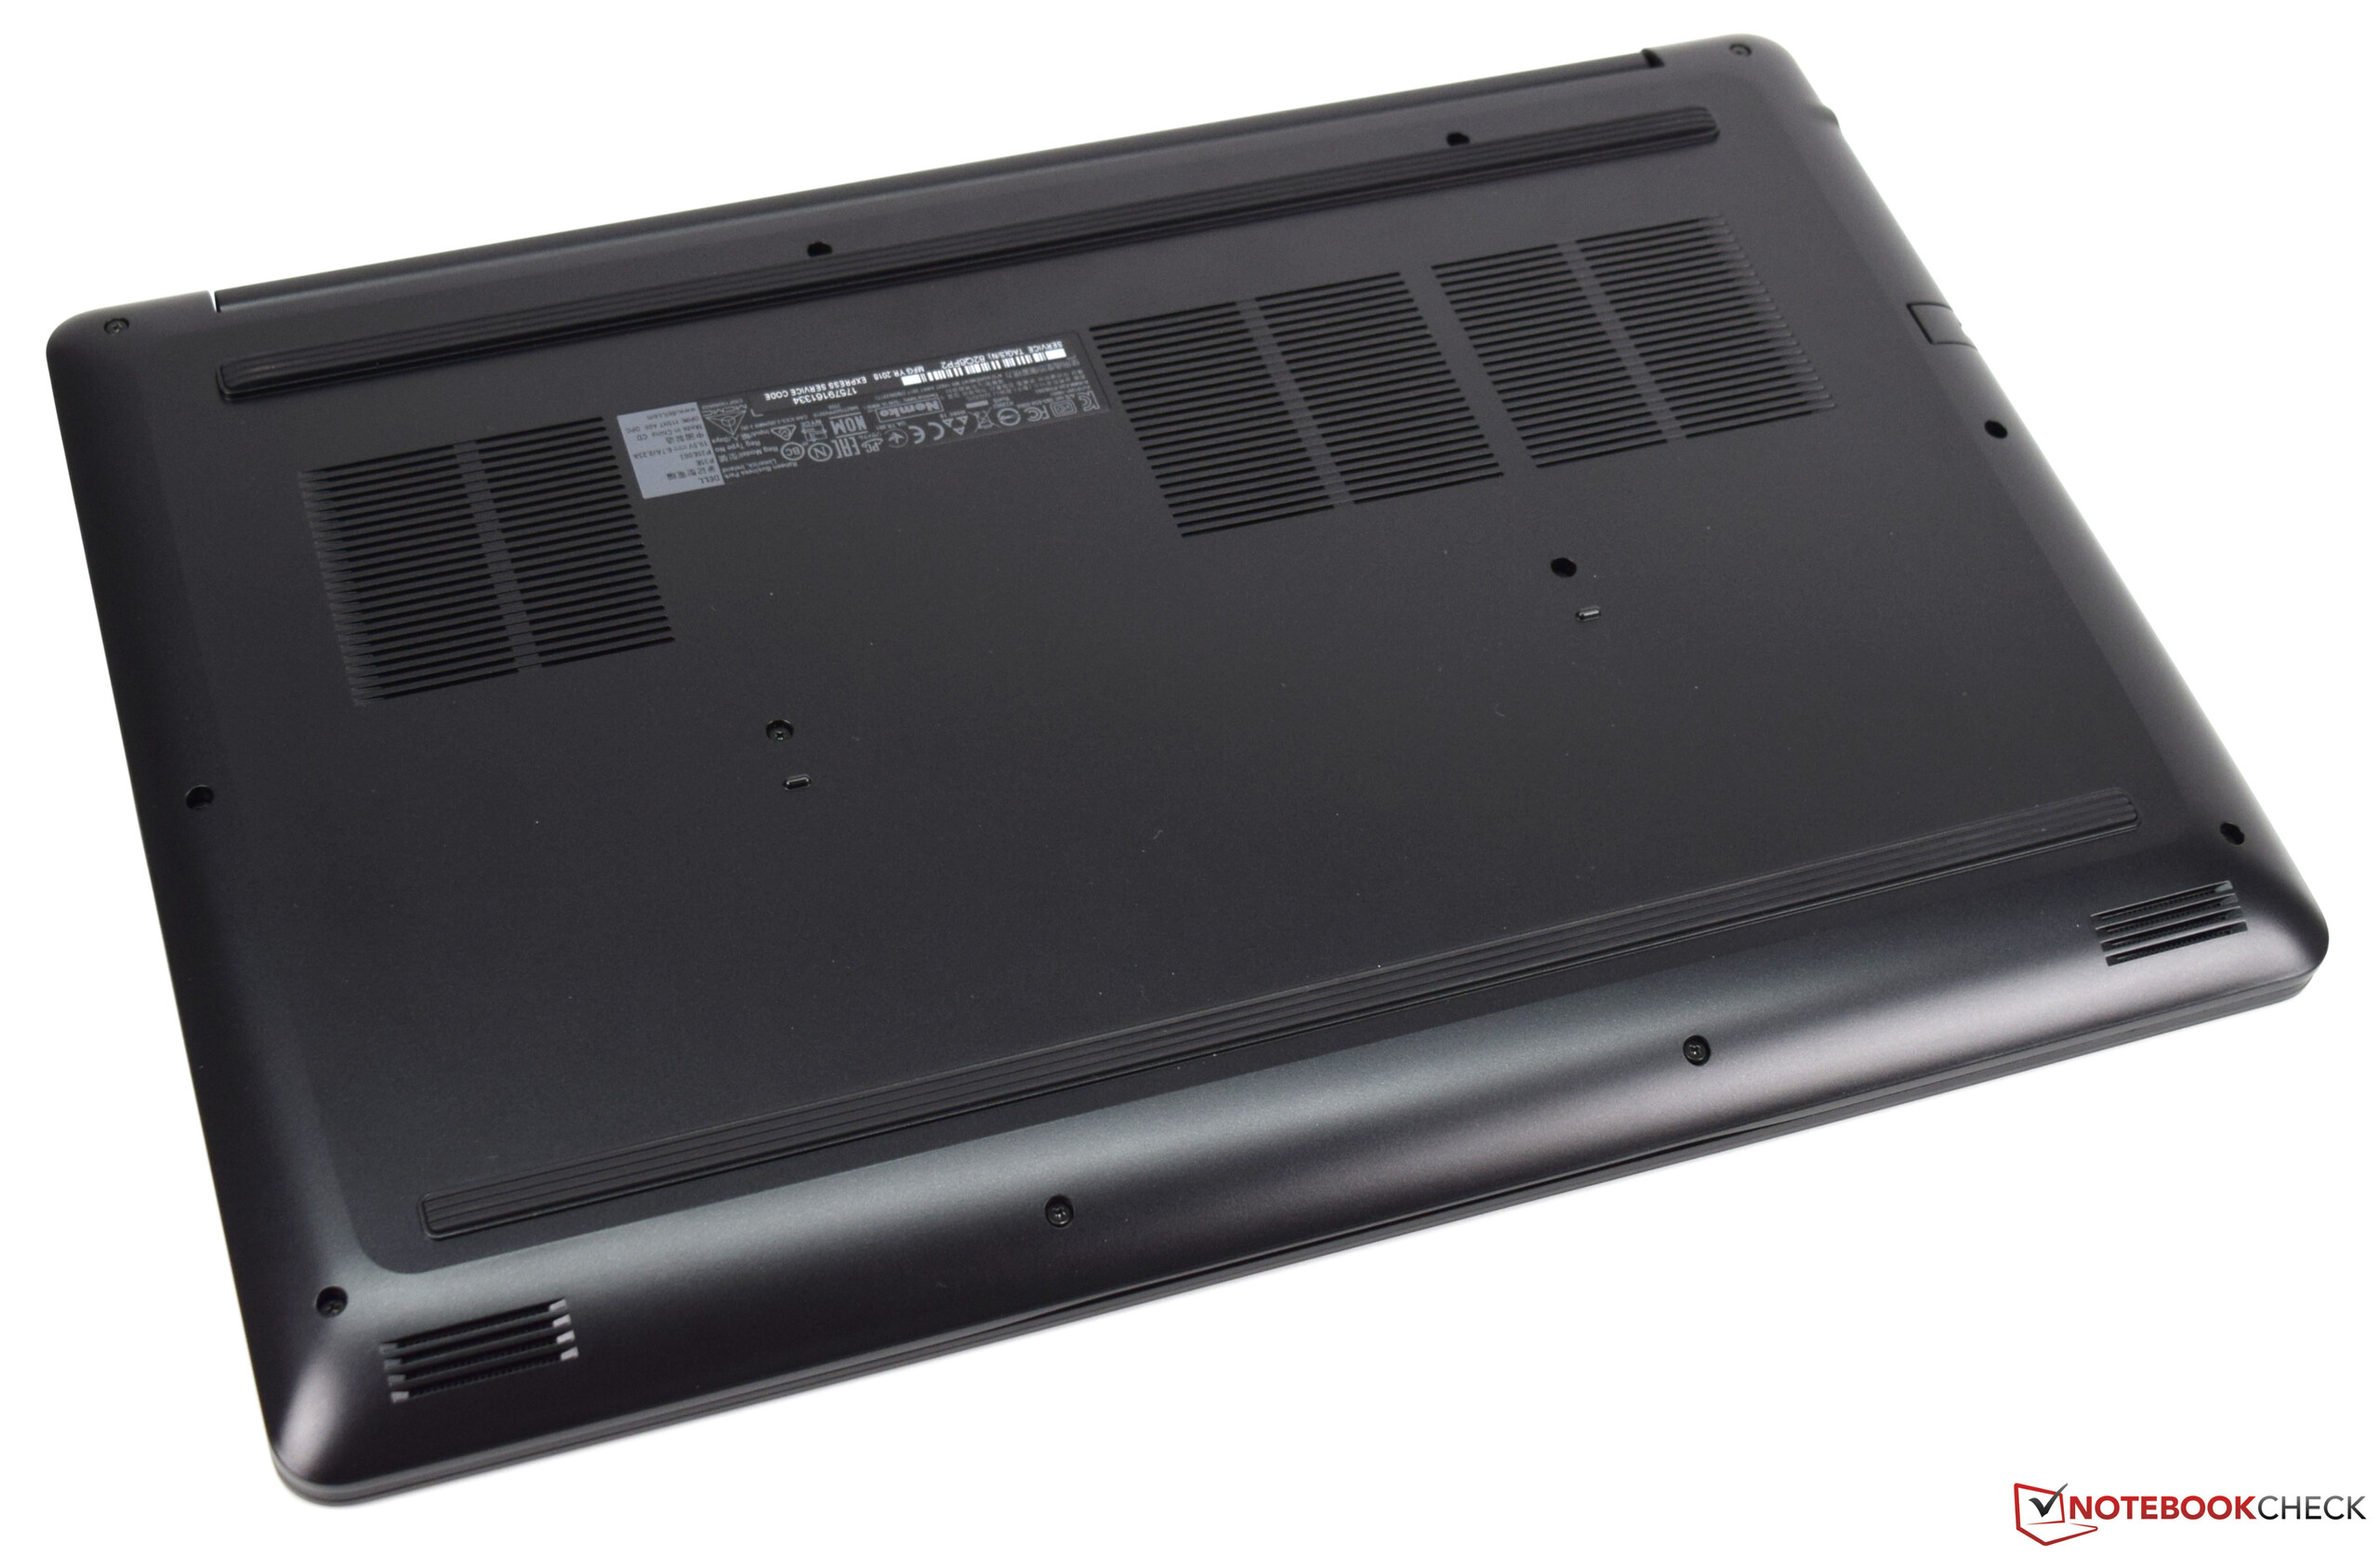
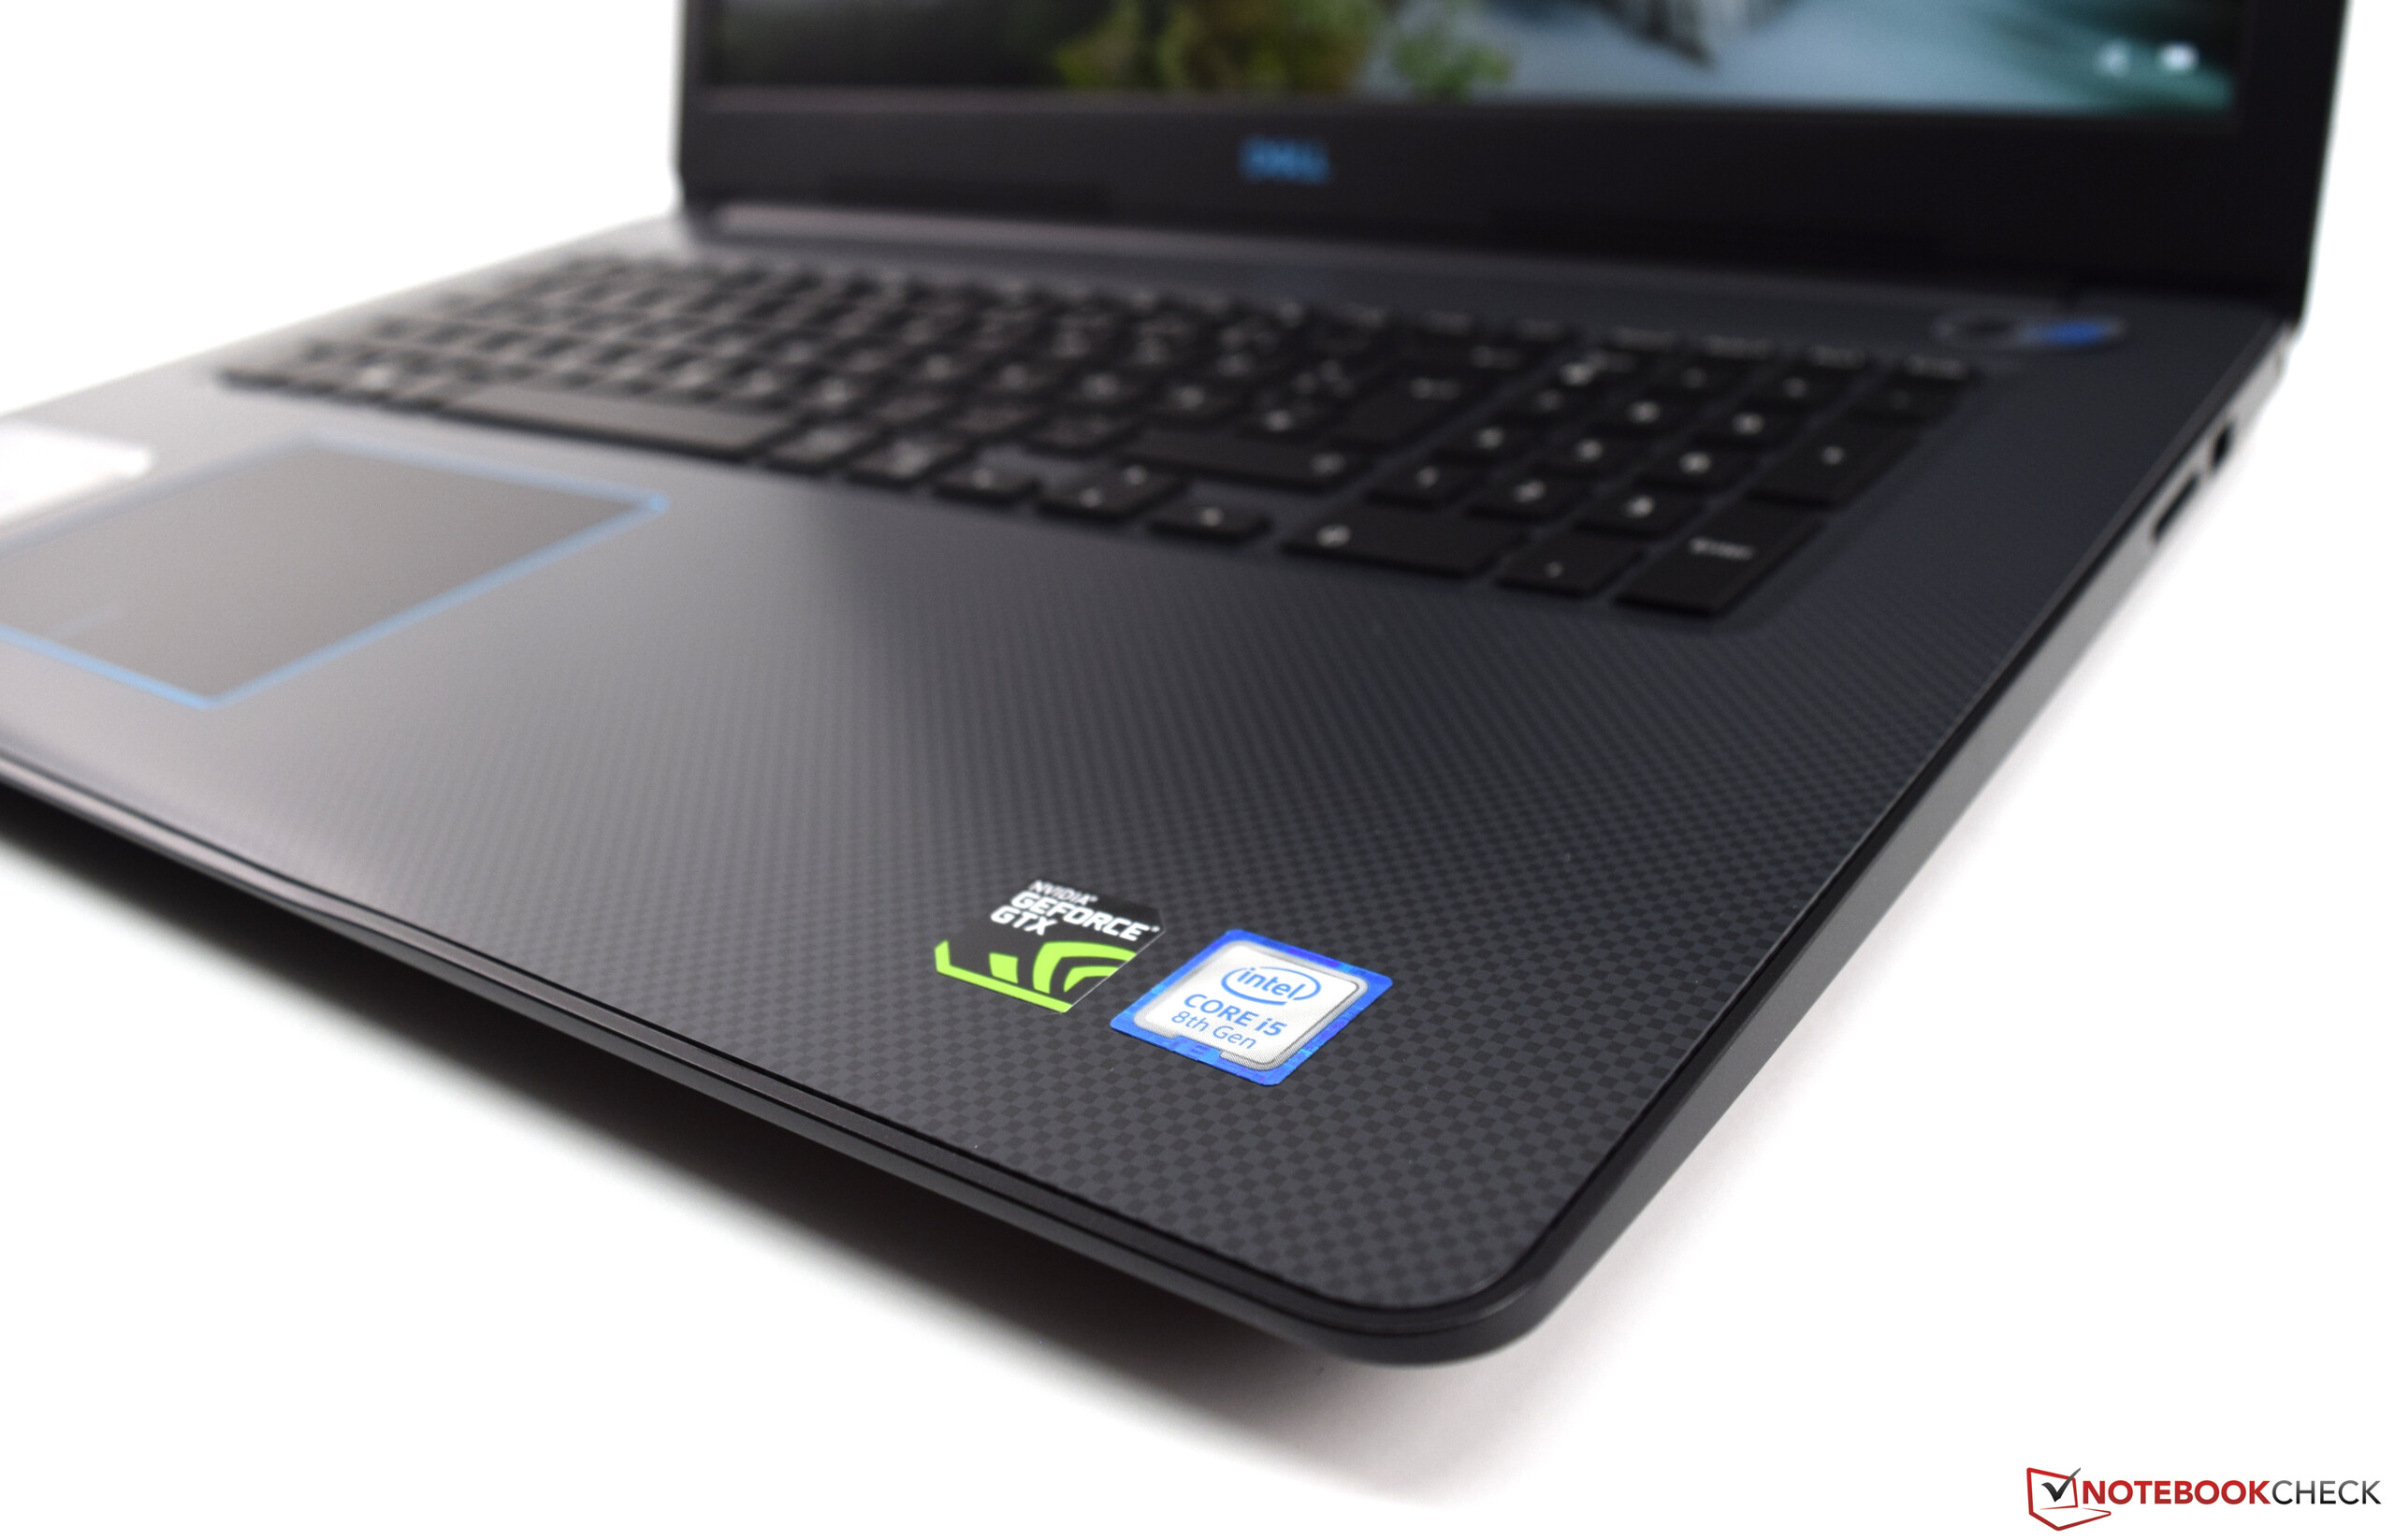
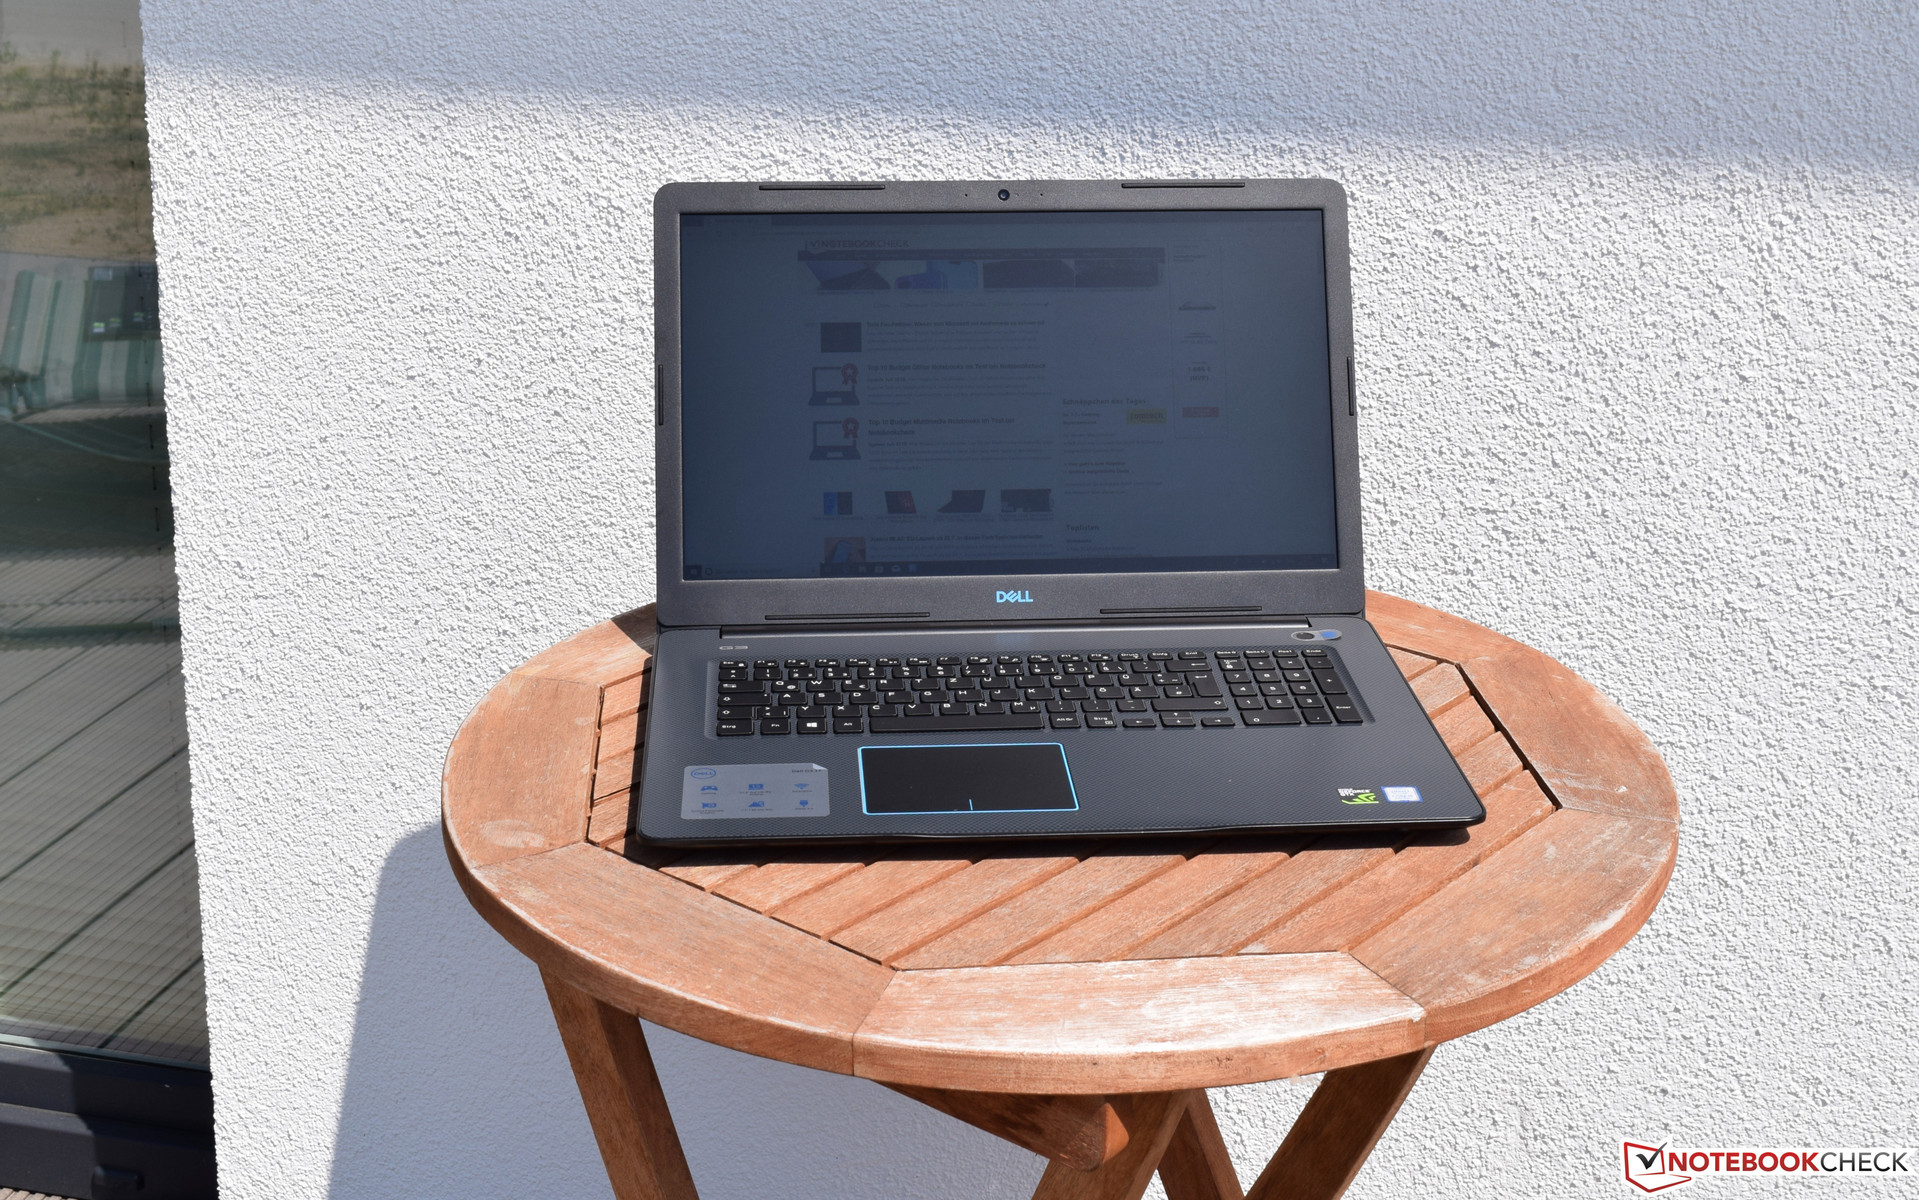
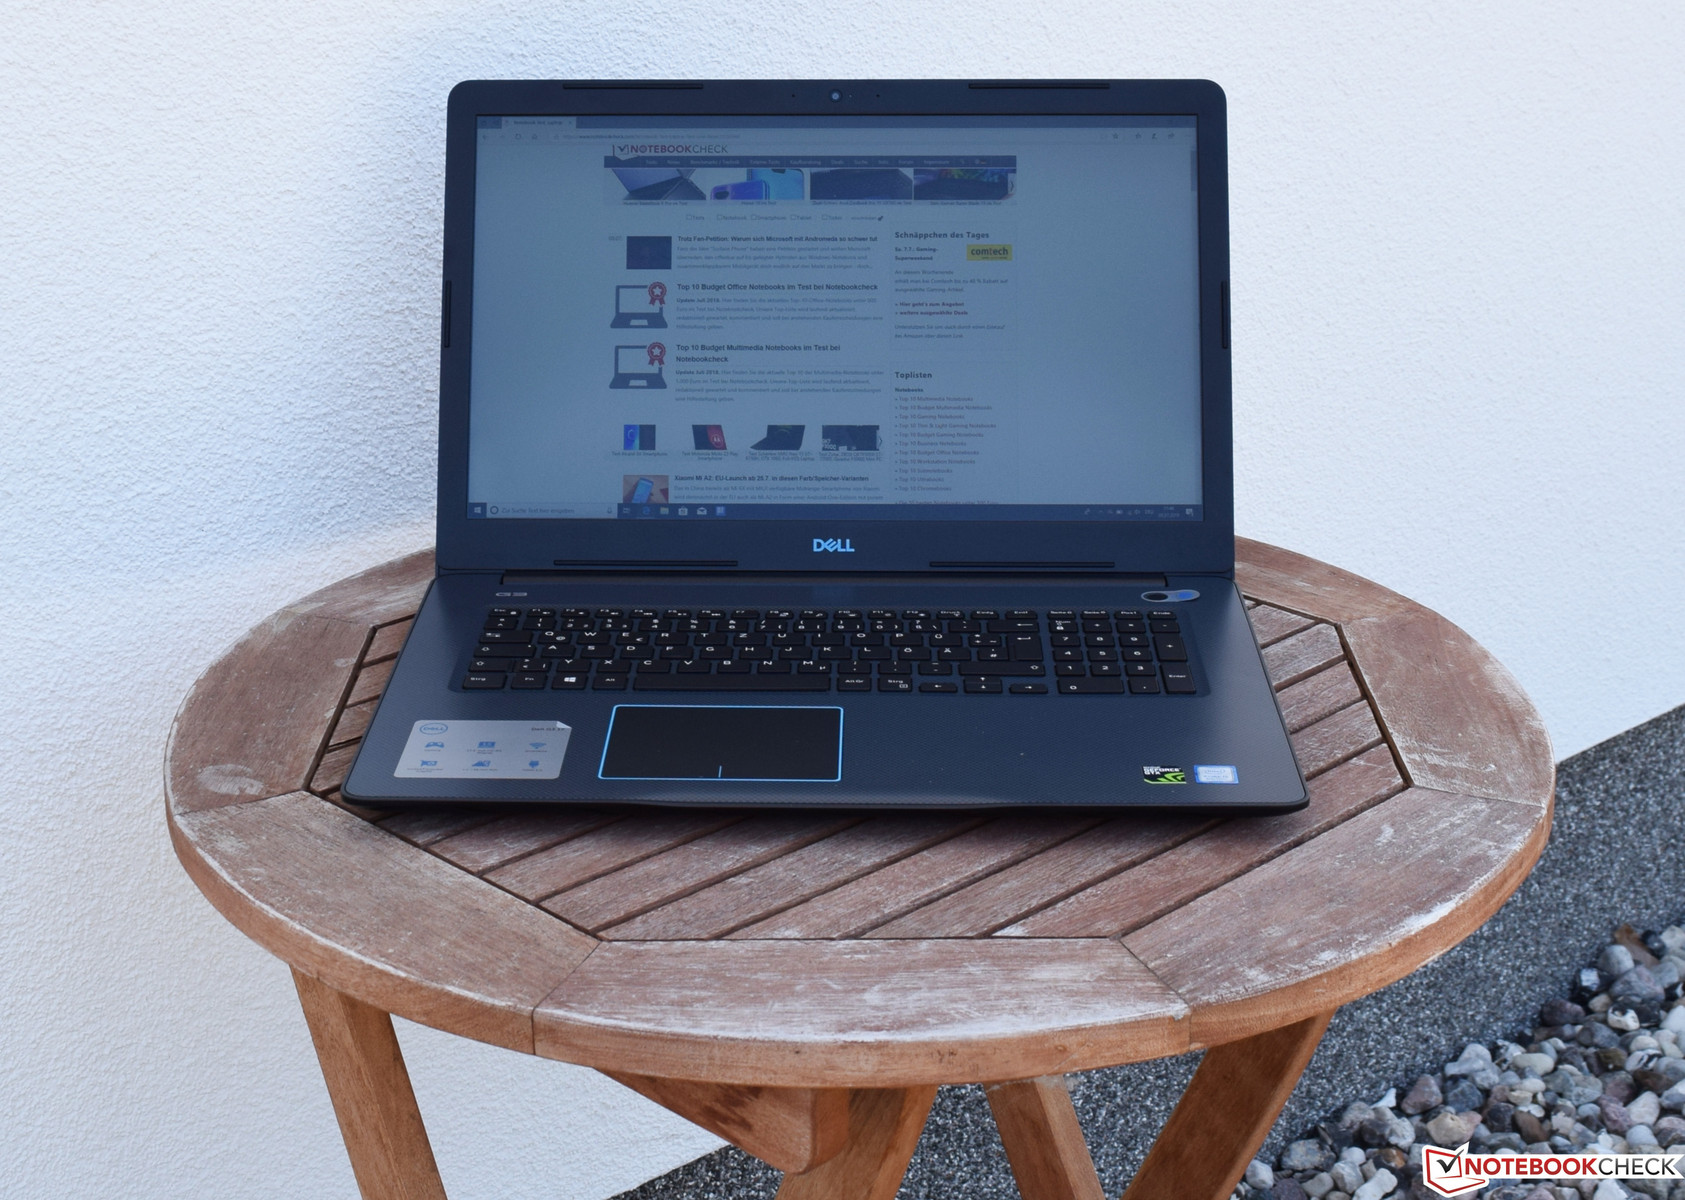
Case - Plastic anywhere you look in the Dell G3
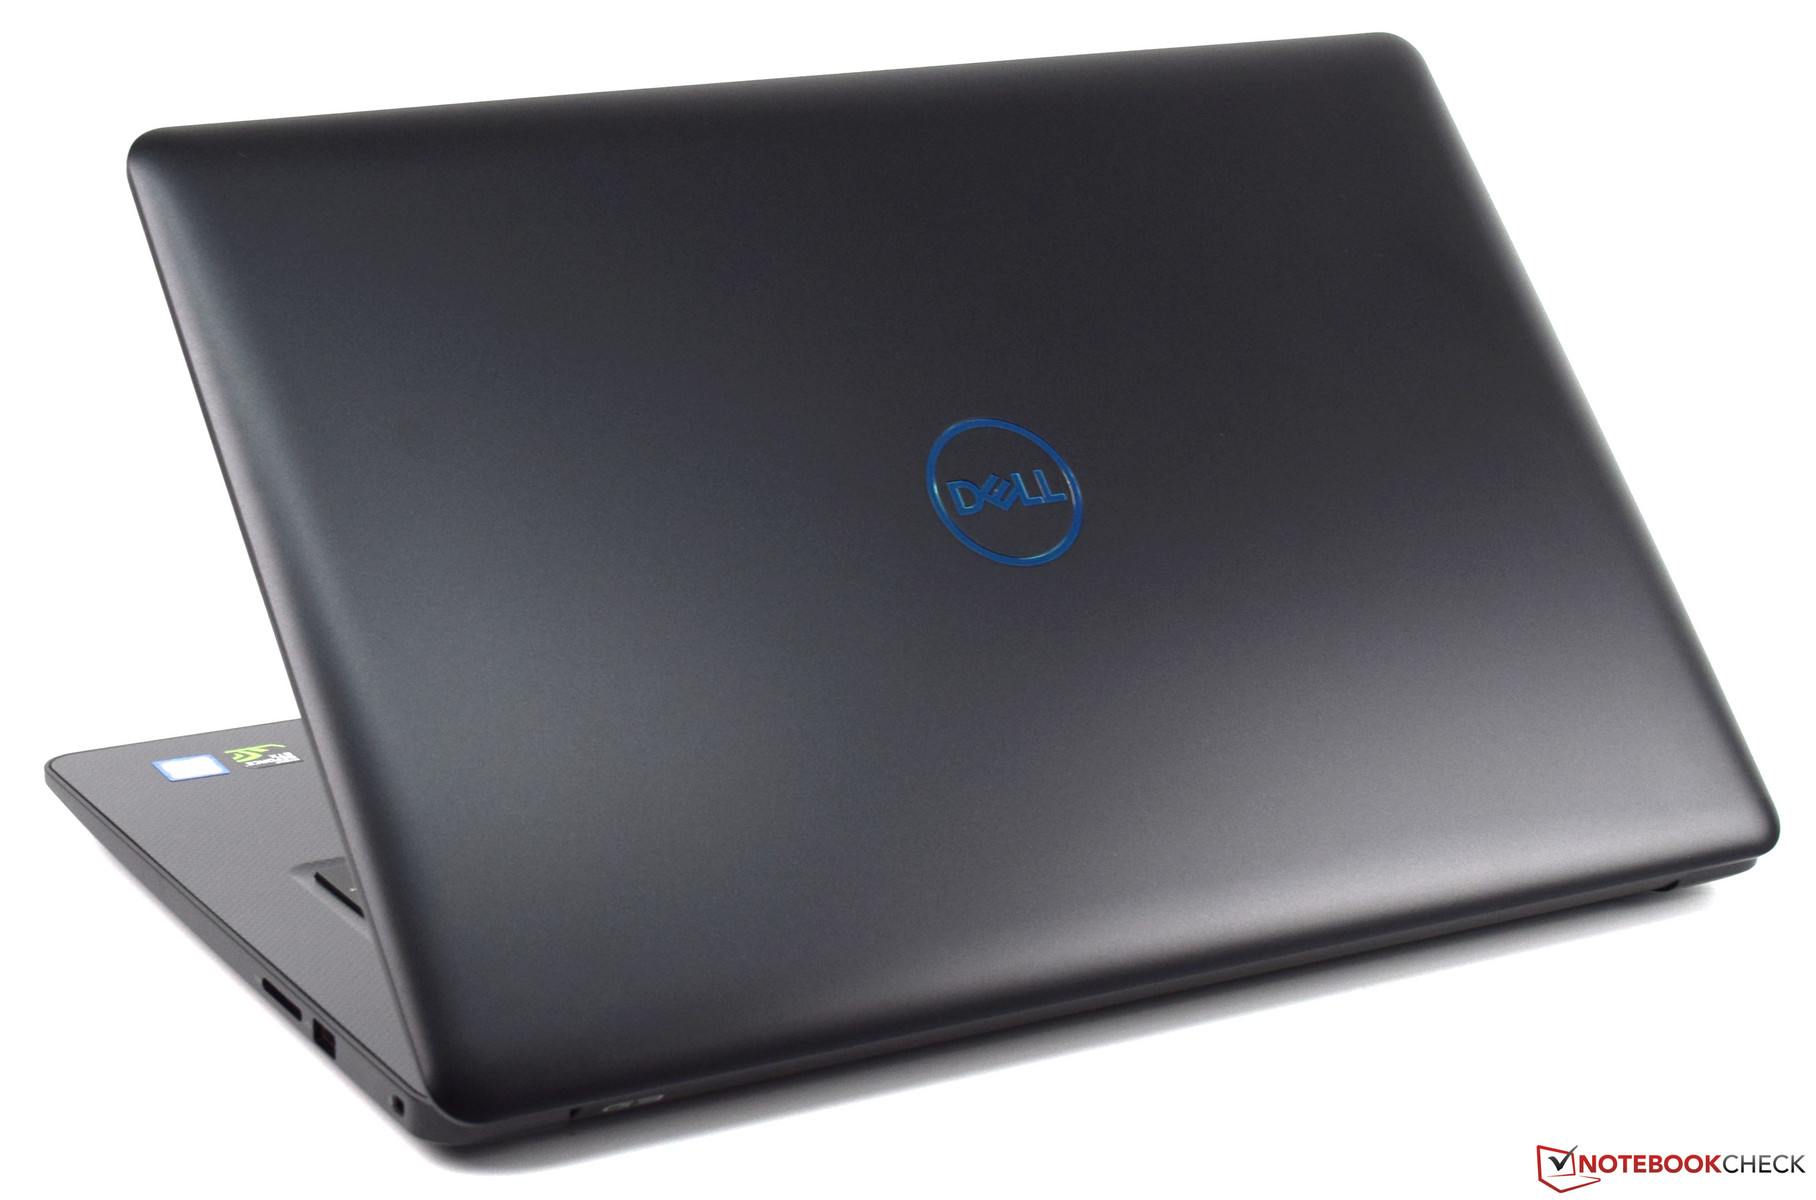
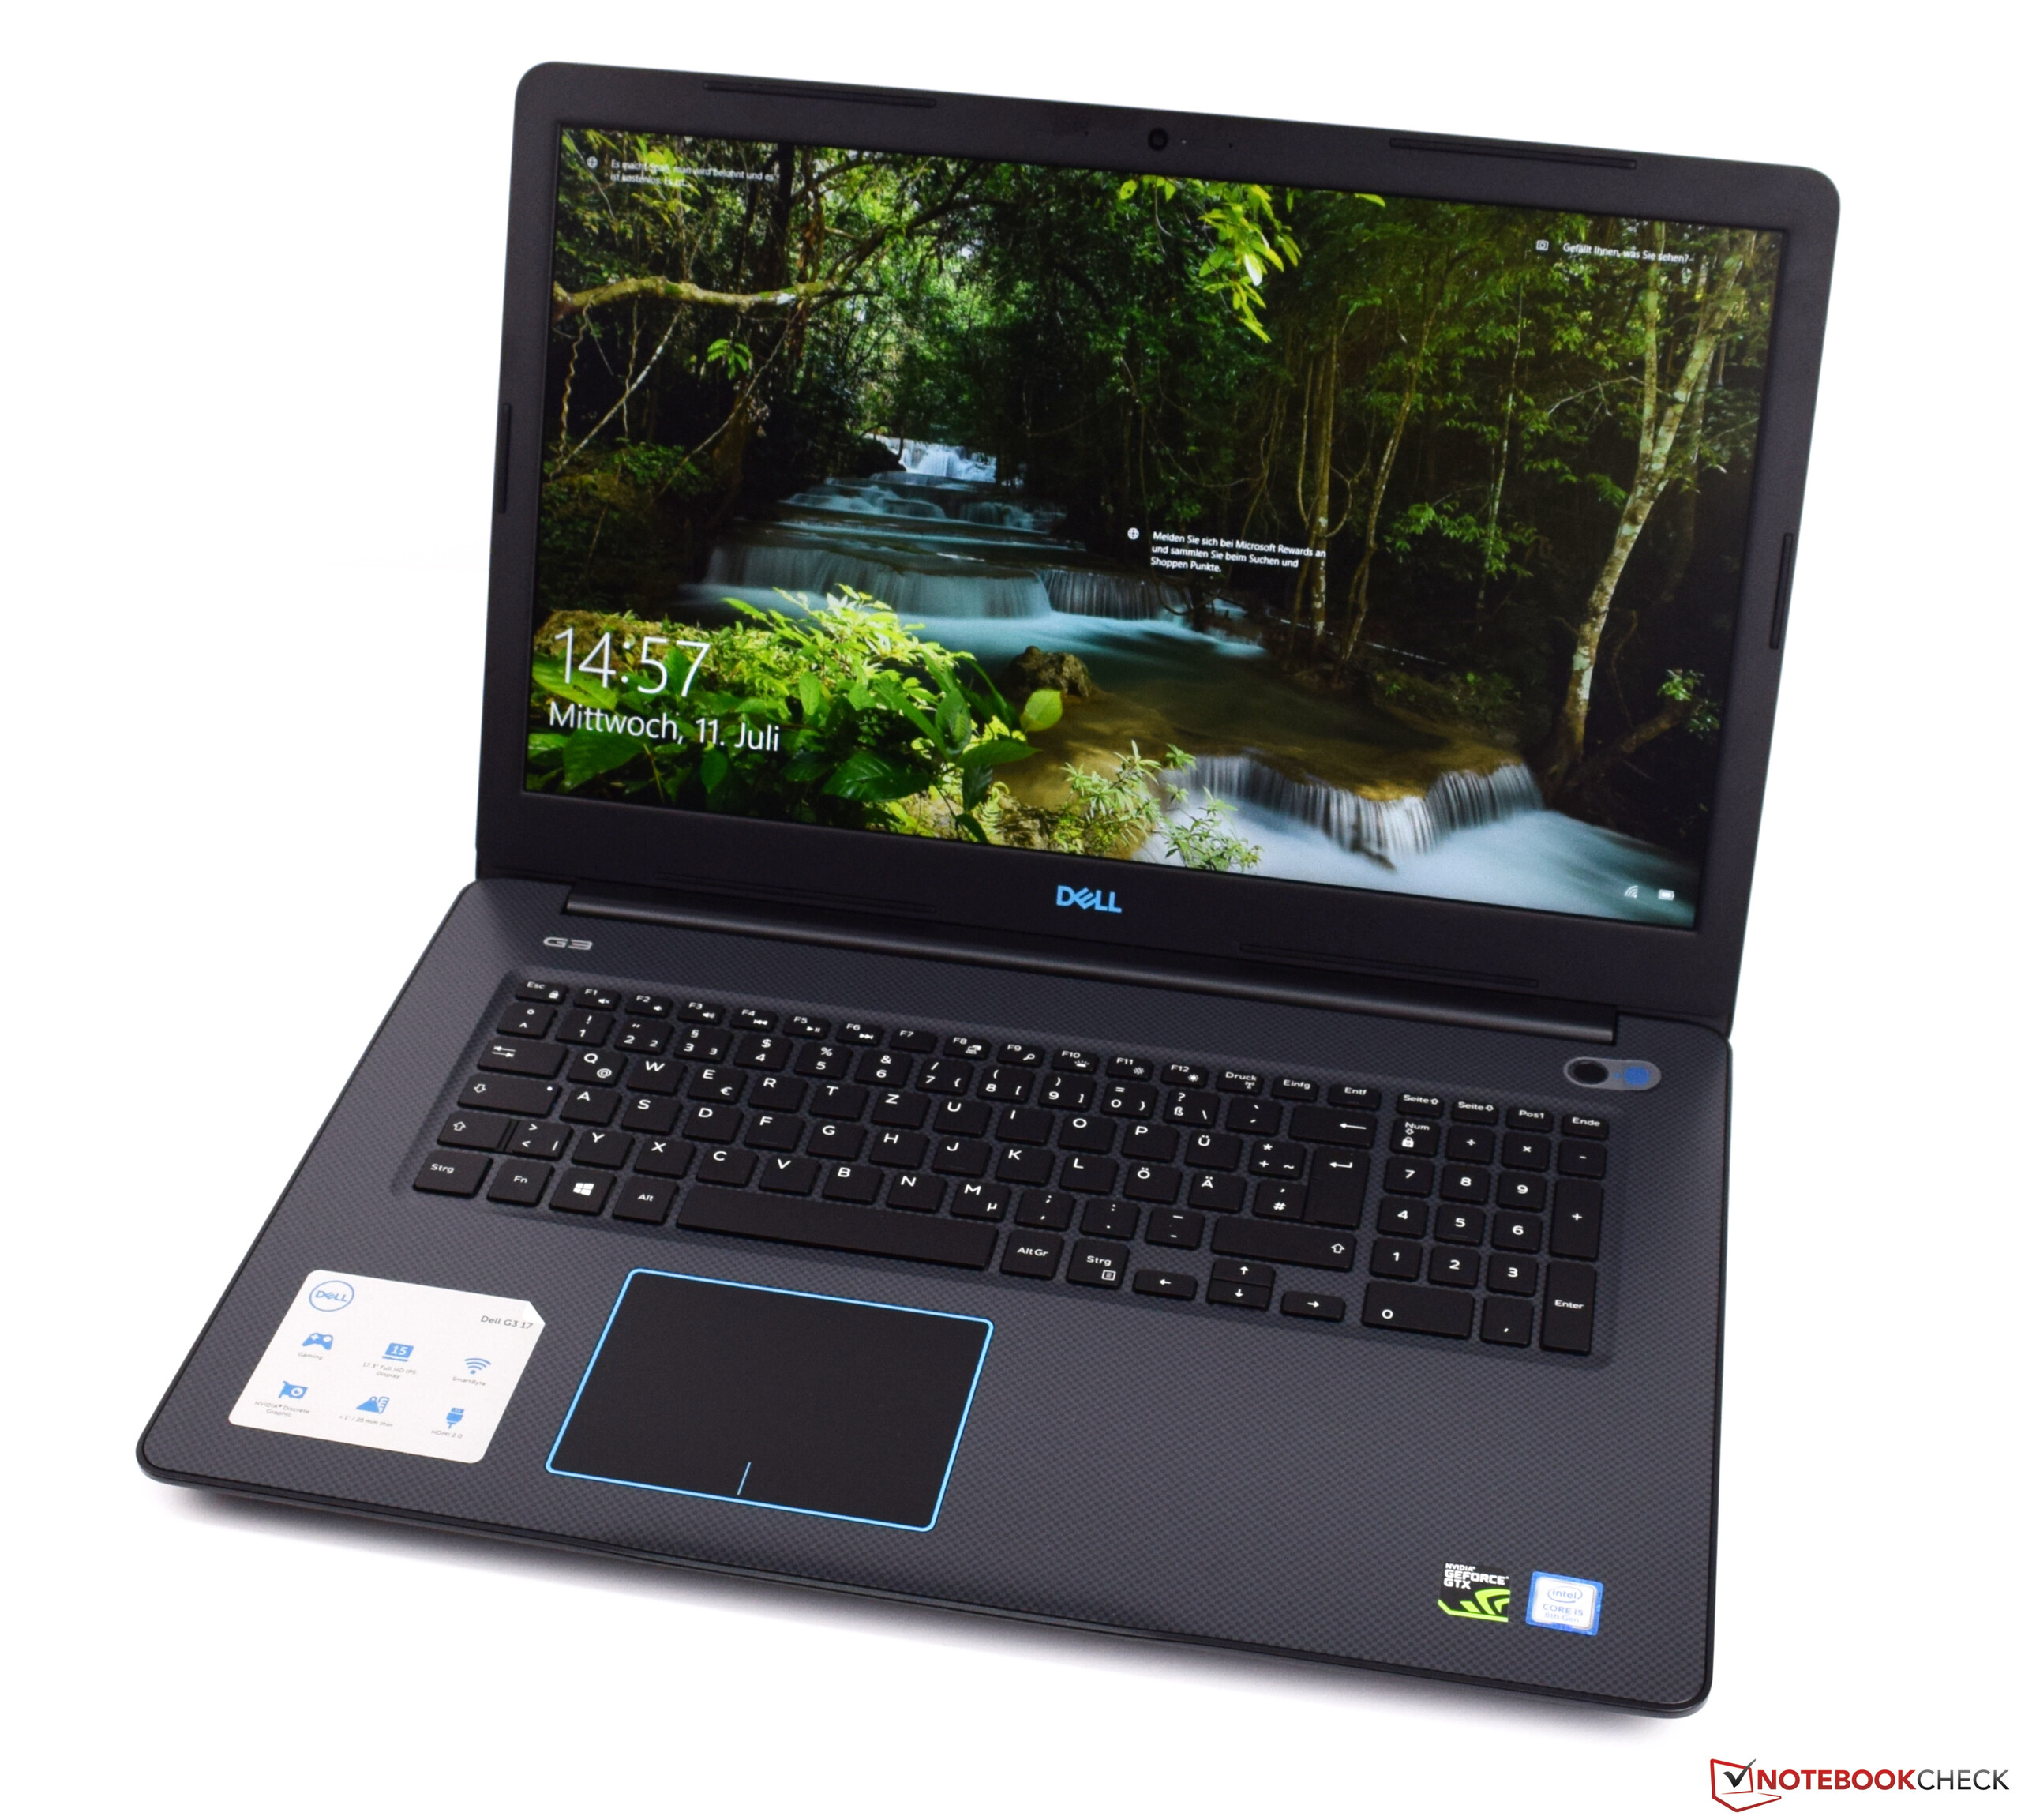
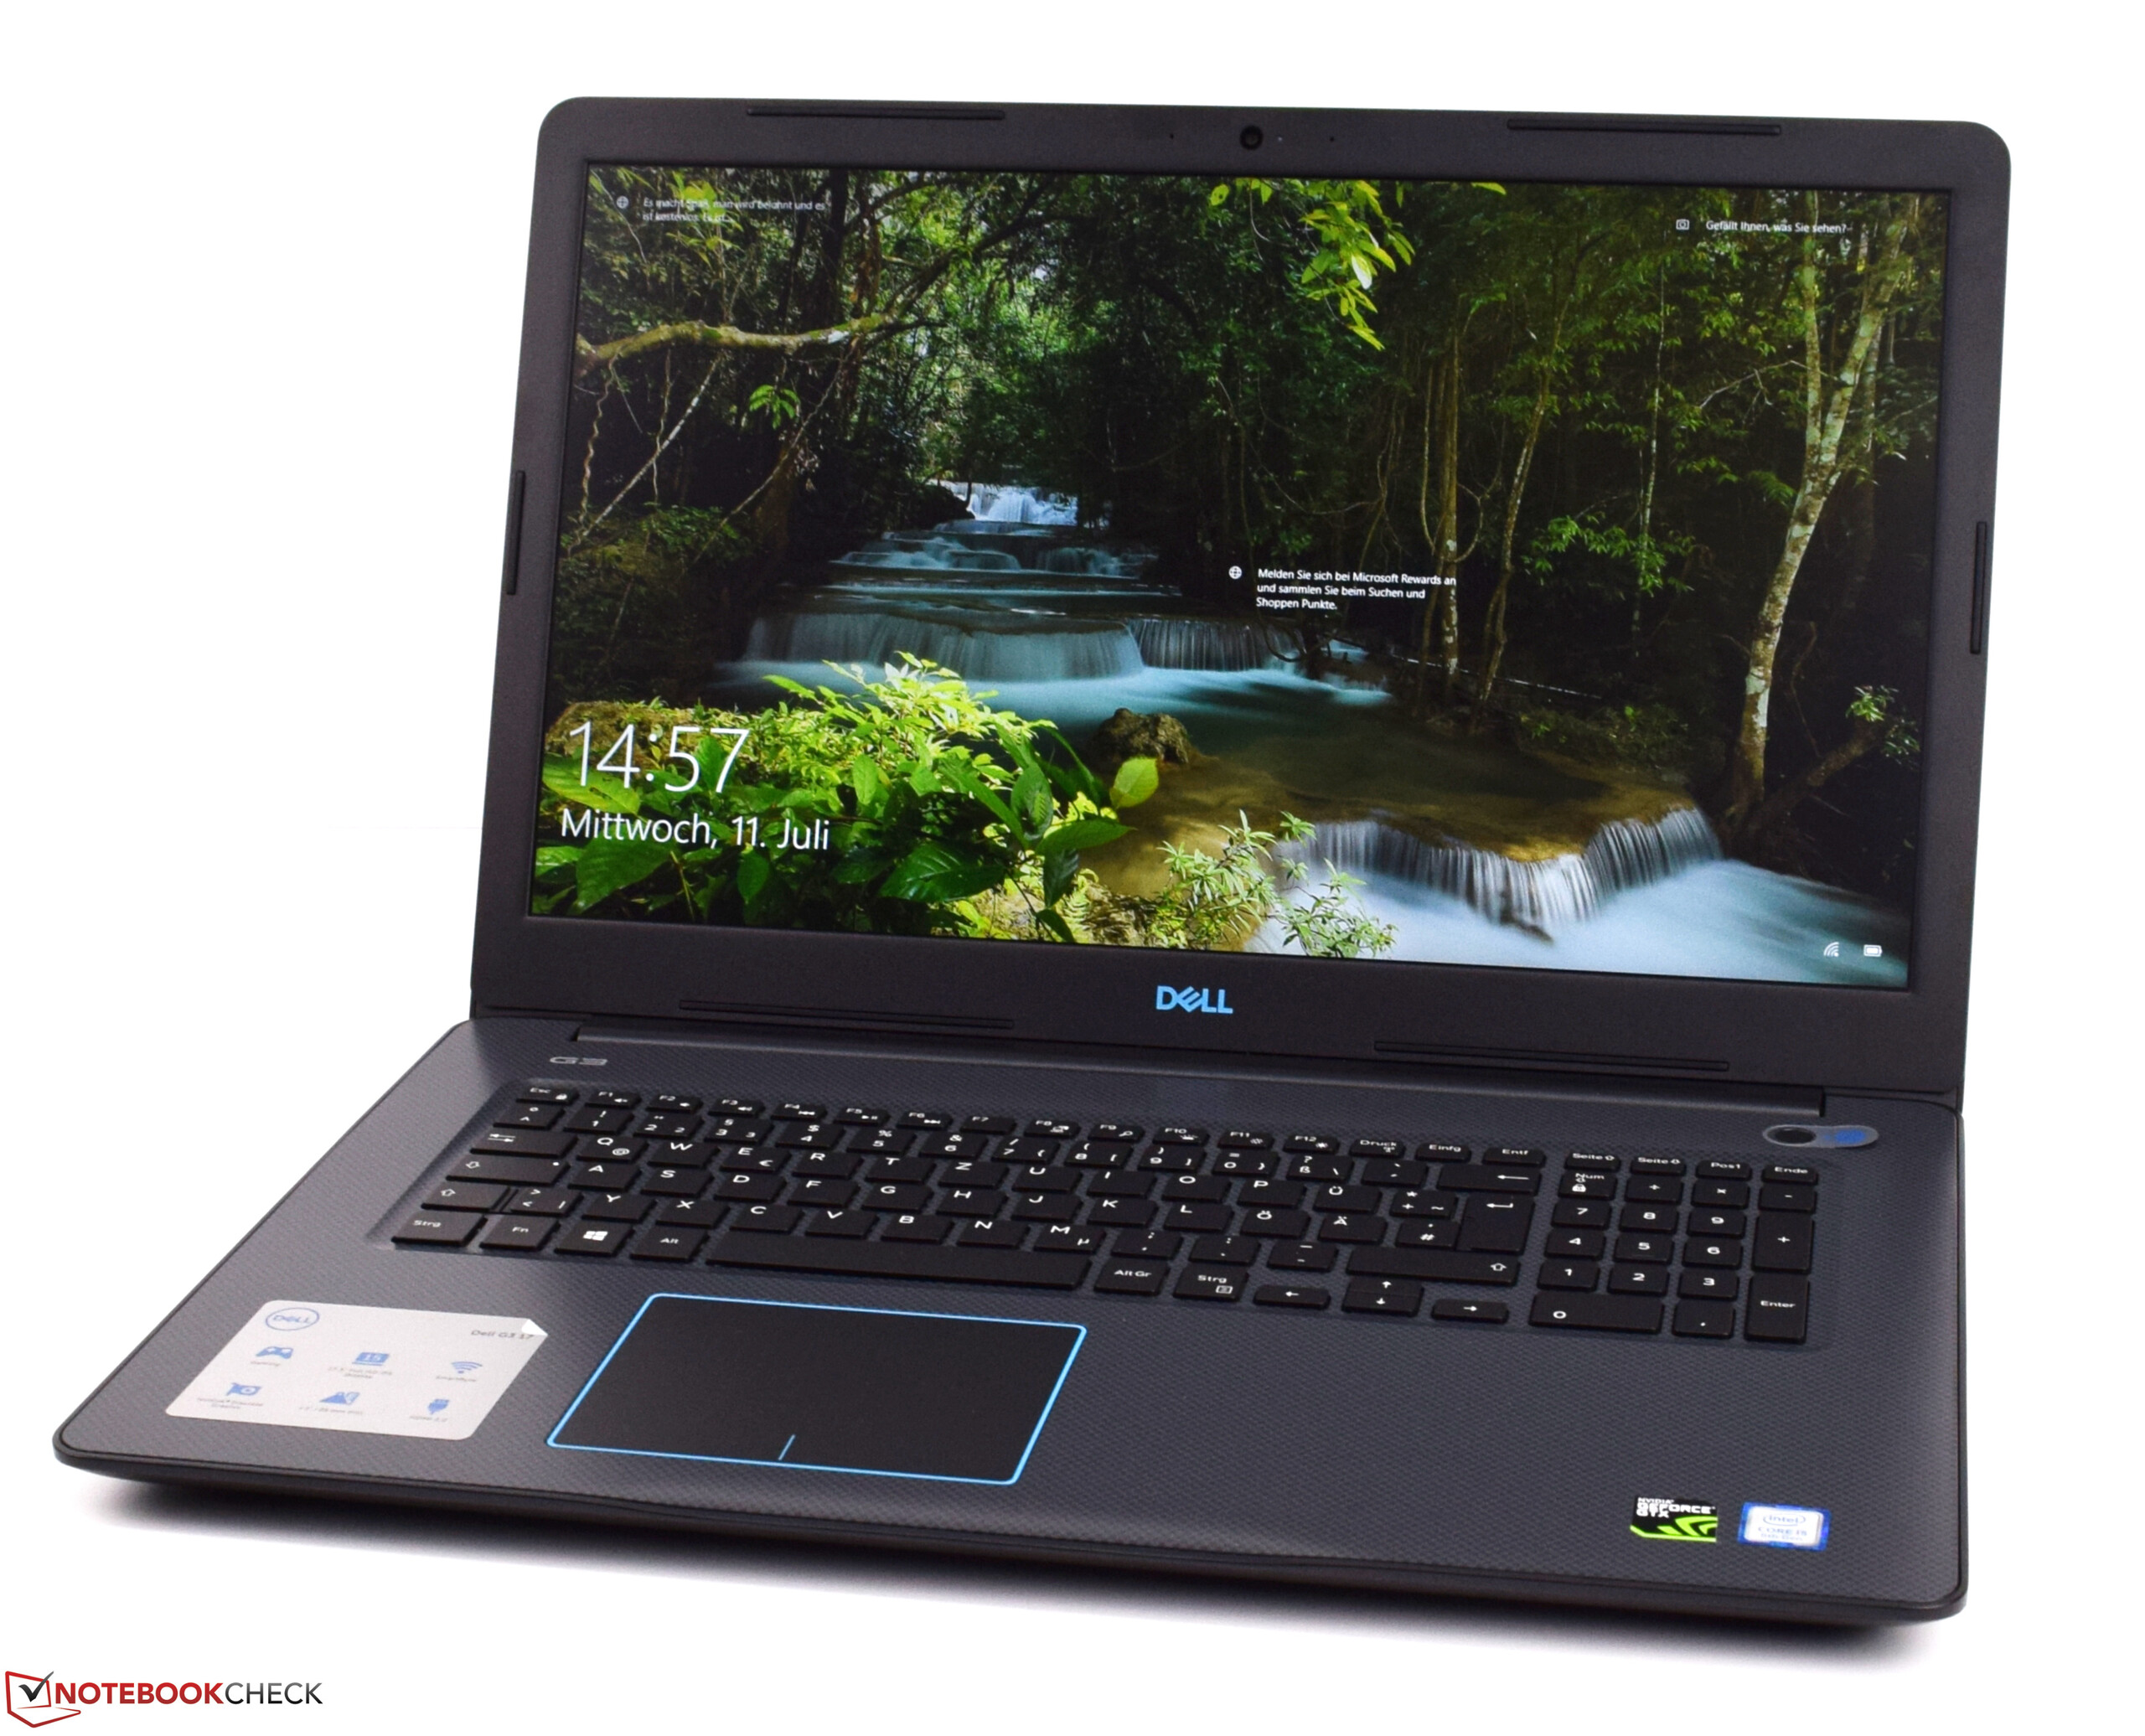
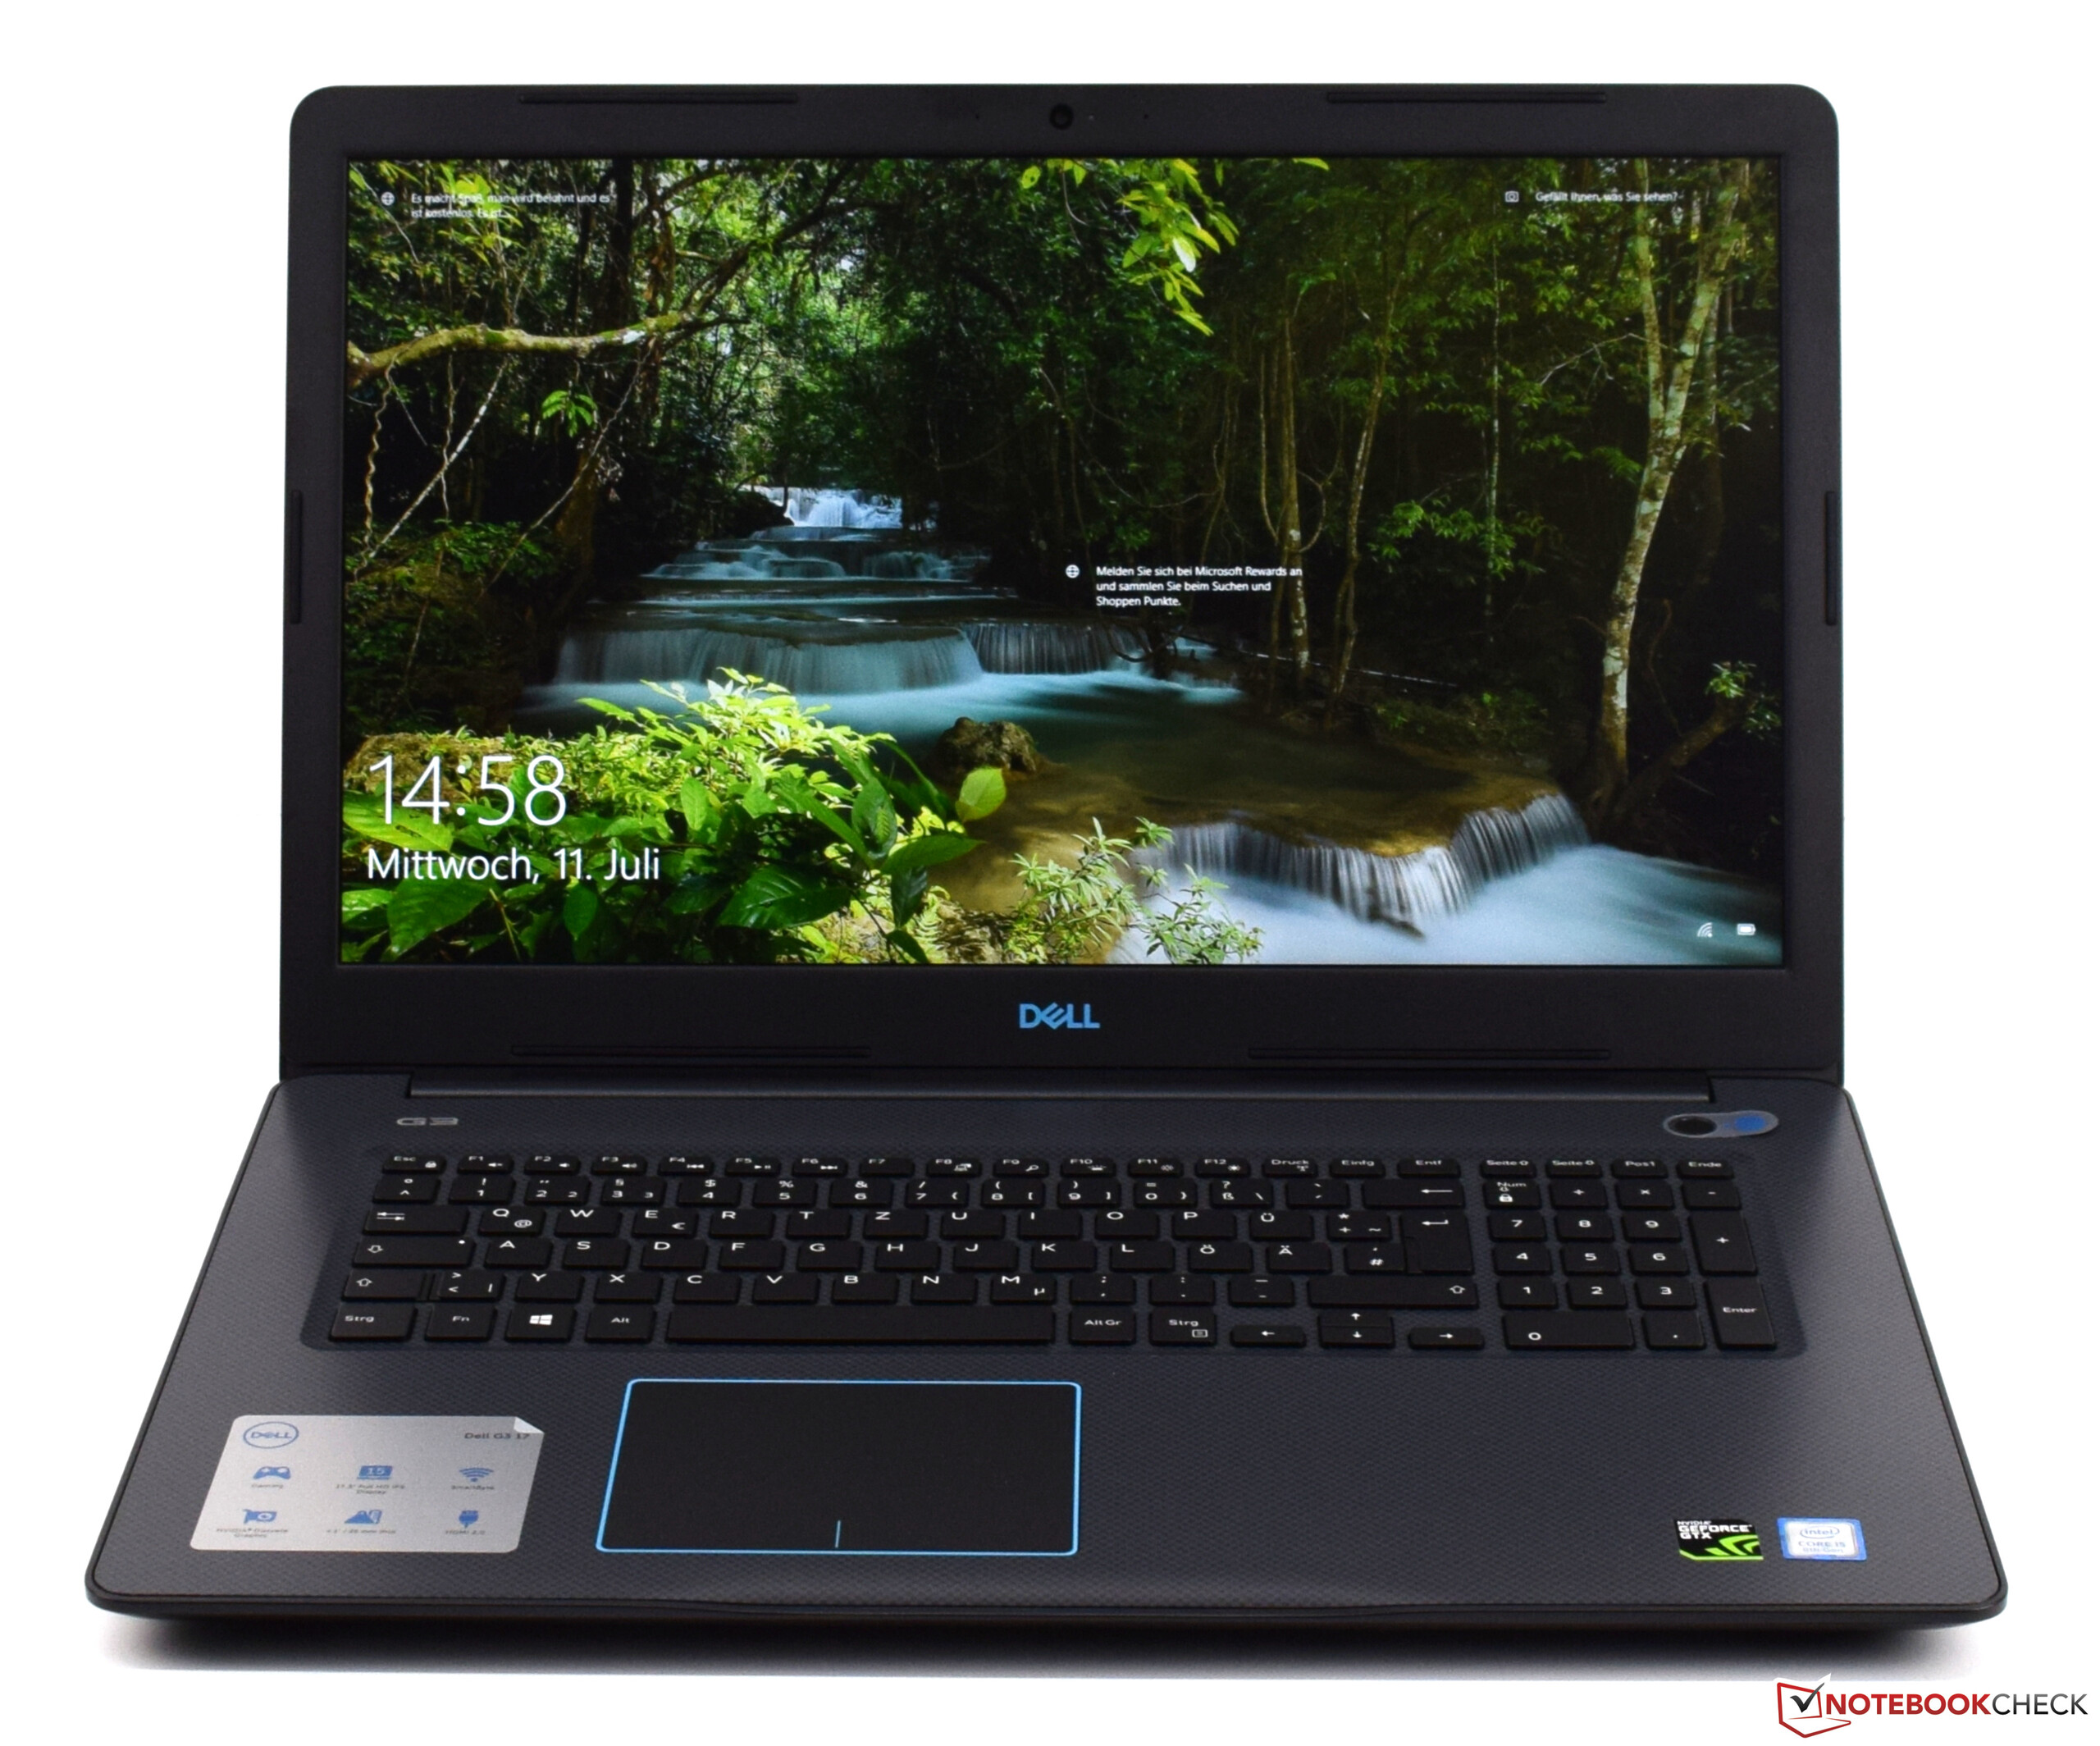
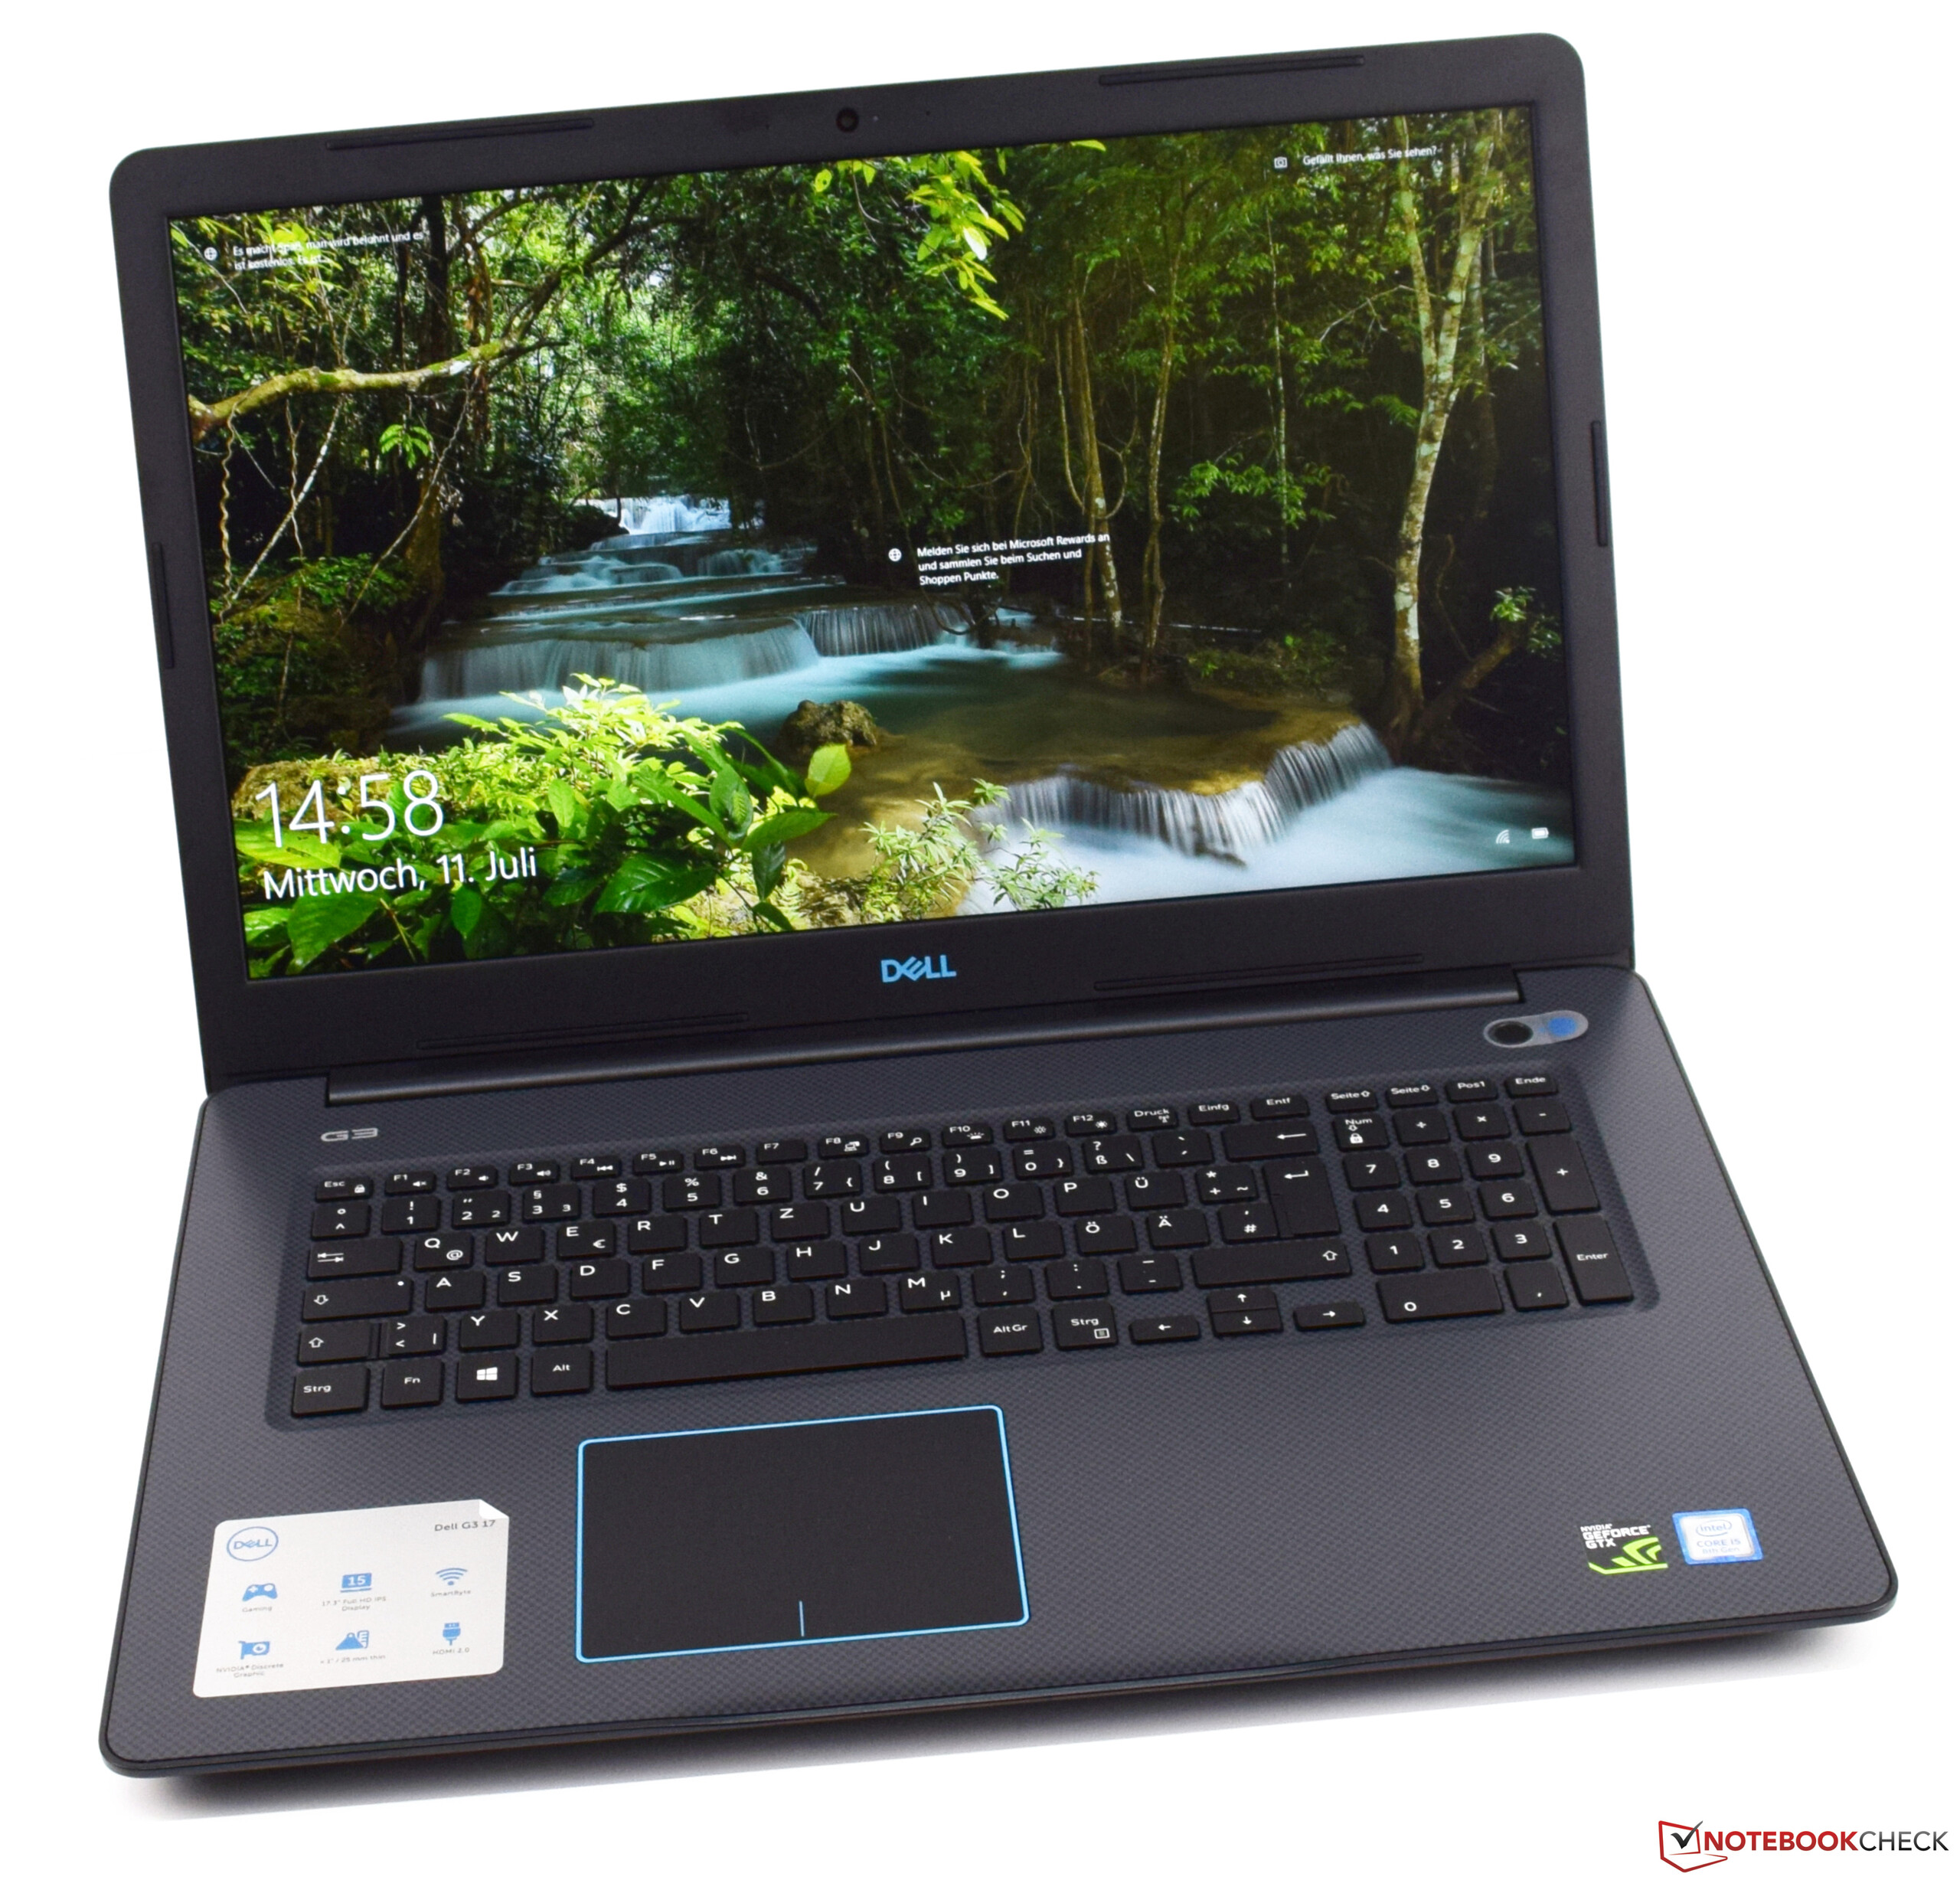
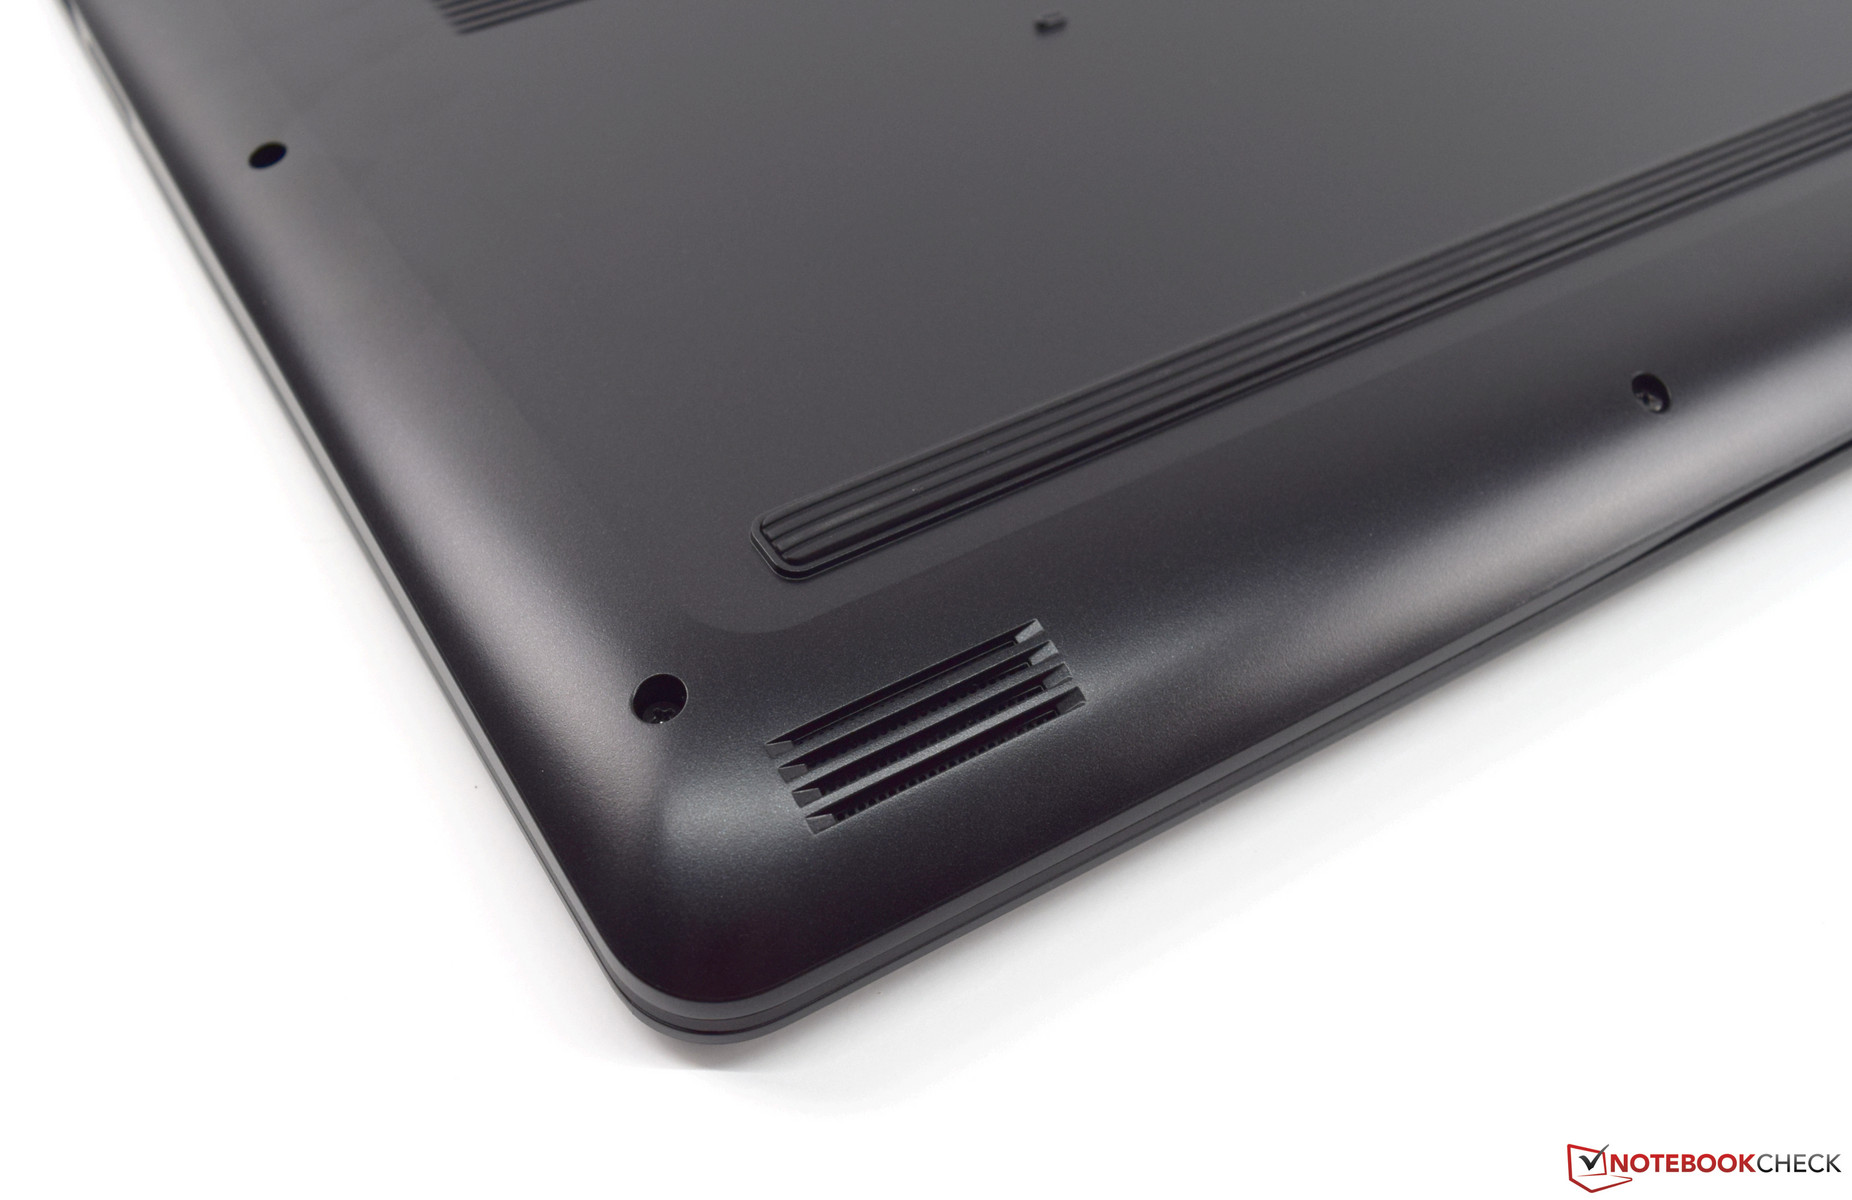
The Dell G3 17 is mainly made of plastic and thus does not have a very high-quality appearance. The Dell G3 17 also does not offer anything to stand out visually, as for example the Dell G5 15. The workmanship is good and we have nothing to complain about, since all the gaps are even and we were unable to find any sharp edges in our test unit. In black and gray with a few blue accents, the color palette of the G3 17 is rather restrained. The matte black display lid mars the impression quickly, since fingerprints become immediately visible on this surface. In terms of stability, many 17-inchers have some problems due to their size. This is also the case for the Dell G3 17, where even though the base shows some good resistance to pressure, it can be warped relatively easily. The display lid is robust and can only be warped slightly with some effort. The pressure test also turns out to be good here, since we cannot see any waves forming on the panel.
While the hinges are a bit hard to move, they still cannot prevent some wobbling. You cannot open the Dell G3 17 lid with one hand. The opening angle is 135 degrees, which is sufficient.
Size Comparison
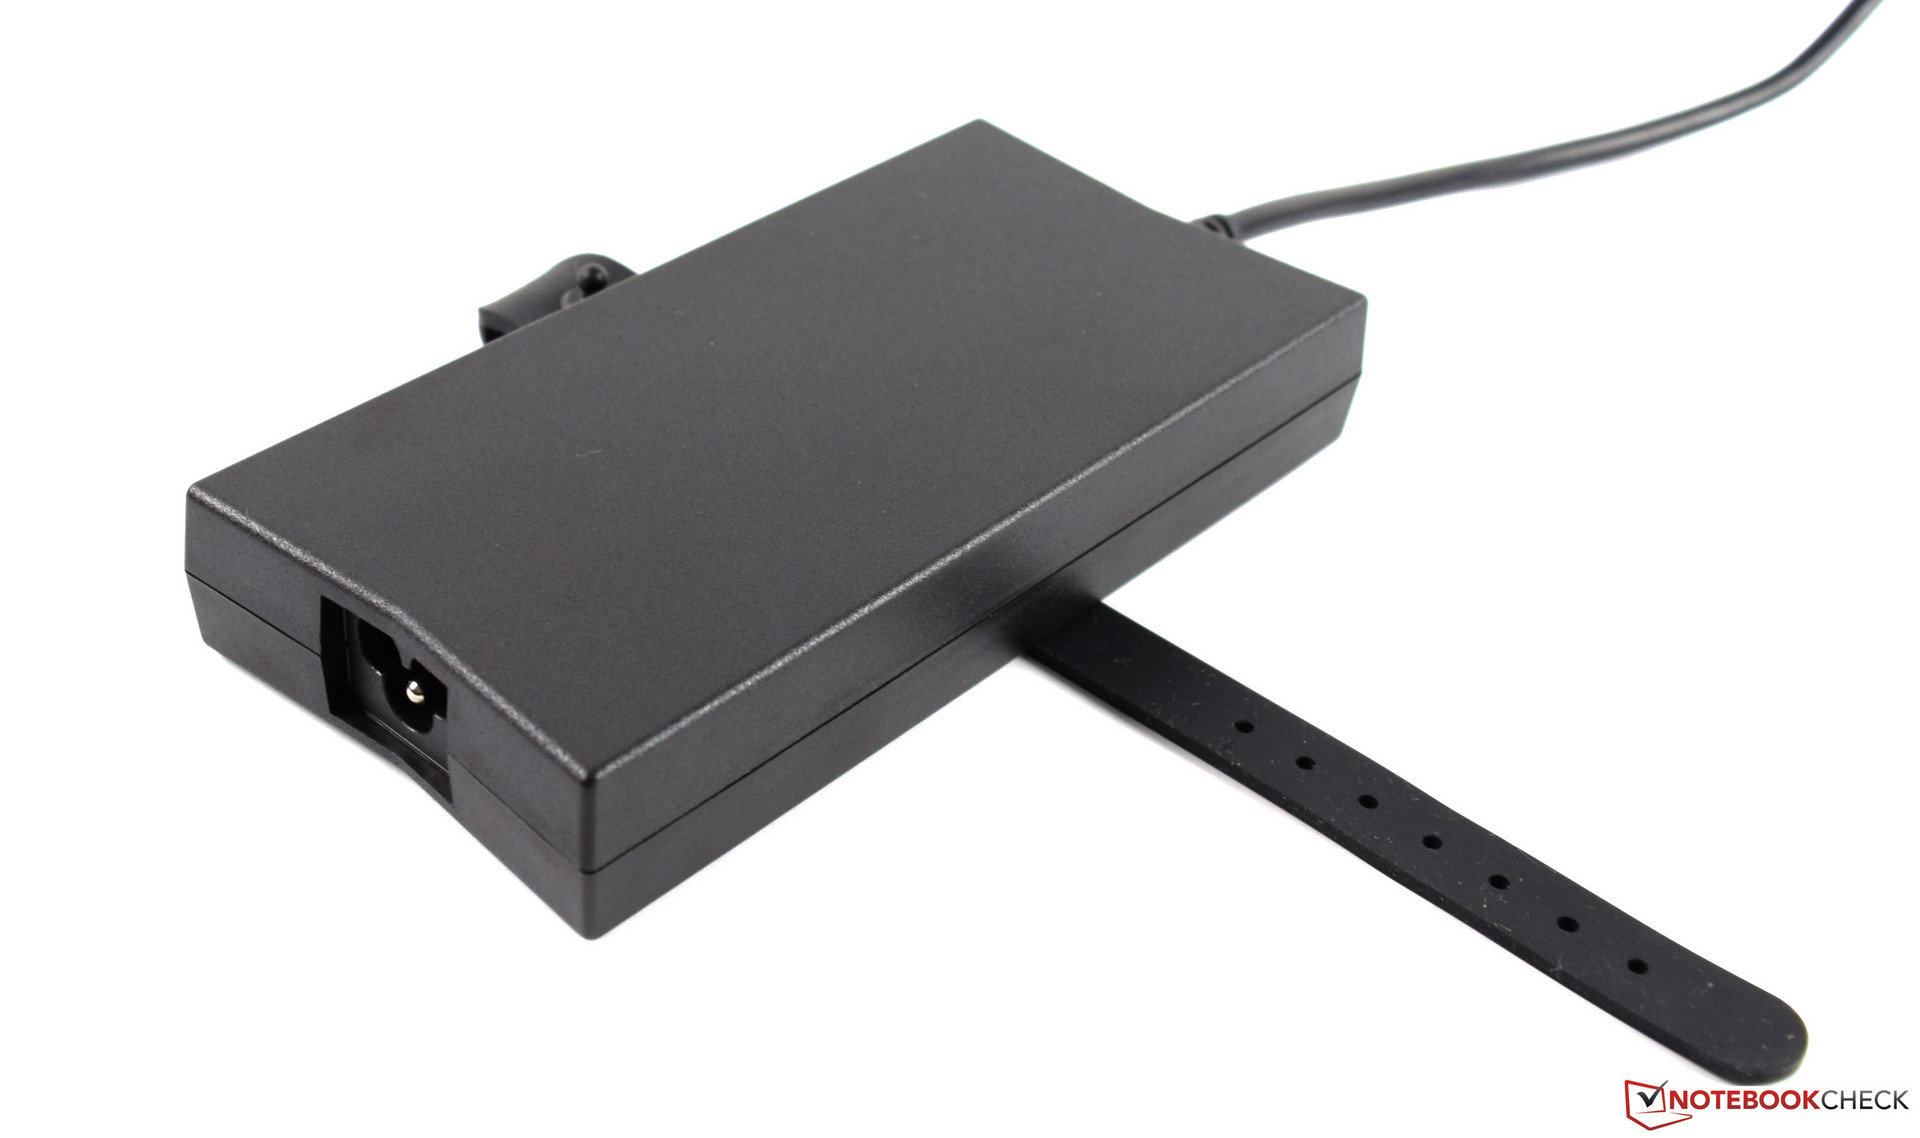
The Dell G3 17 has a footprint of 41.5 x 27.9 cm (~16.3 x 11 in), which places it in the middle of the field of our comparison devices. With a thickness of only 25 mm (~1 in), the 17-inch notebook does not appear bulky, and with the barely 3 kg (~6.6 lb) that the Dell G3 17 brings to the scale, it is also not too heavy. The 130-watt power supply adds another 635 grams (~1.4 lb).
Features - The Dell G3 17 only optionally with Thunderbolt 3
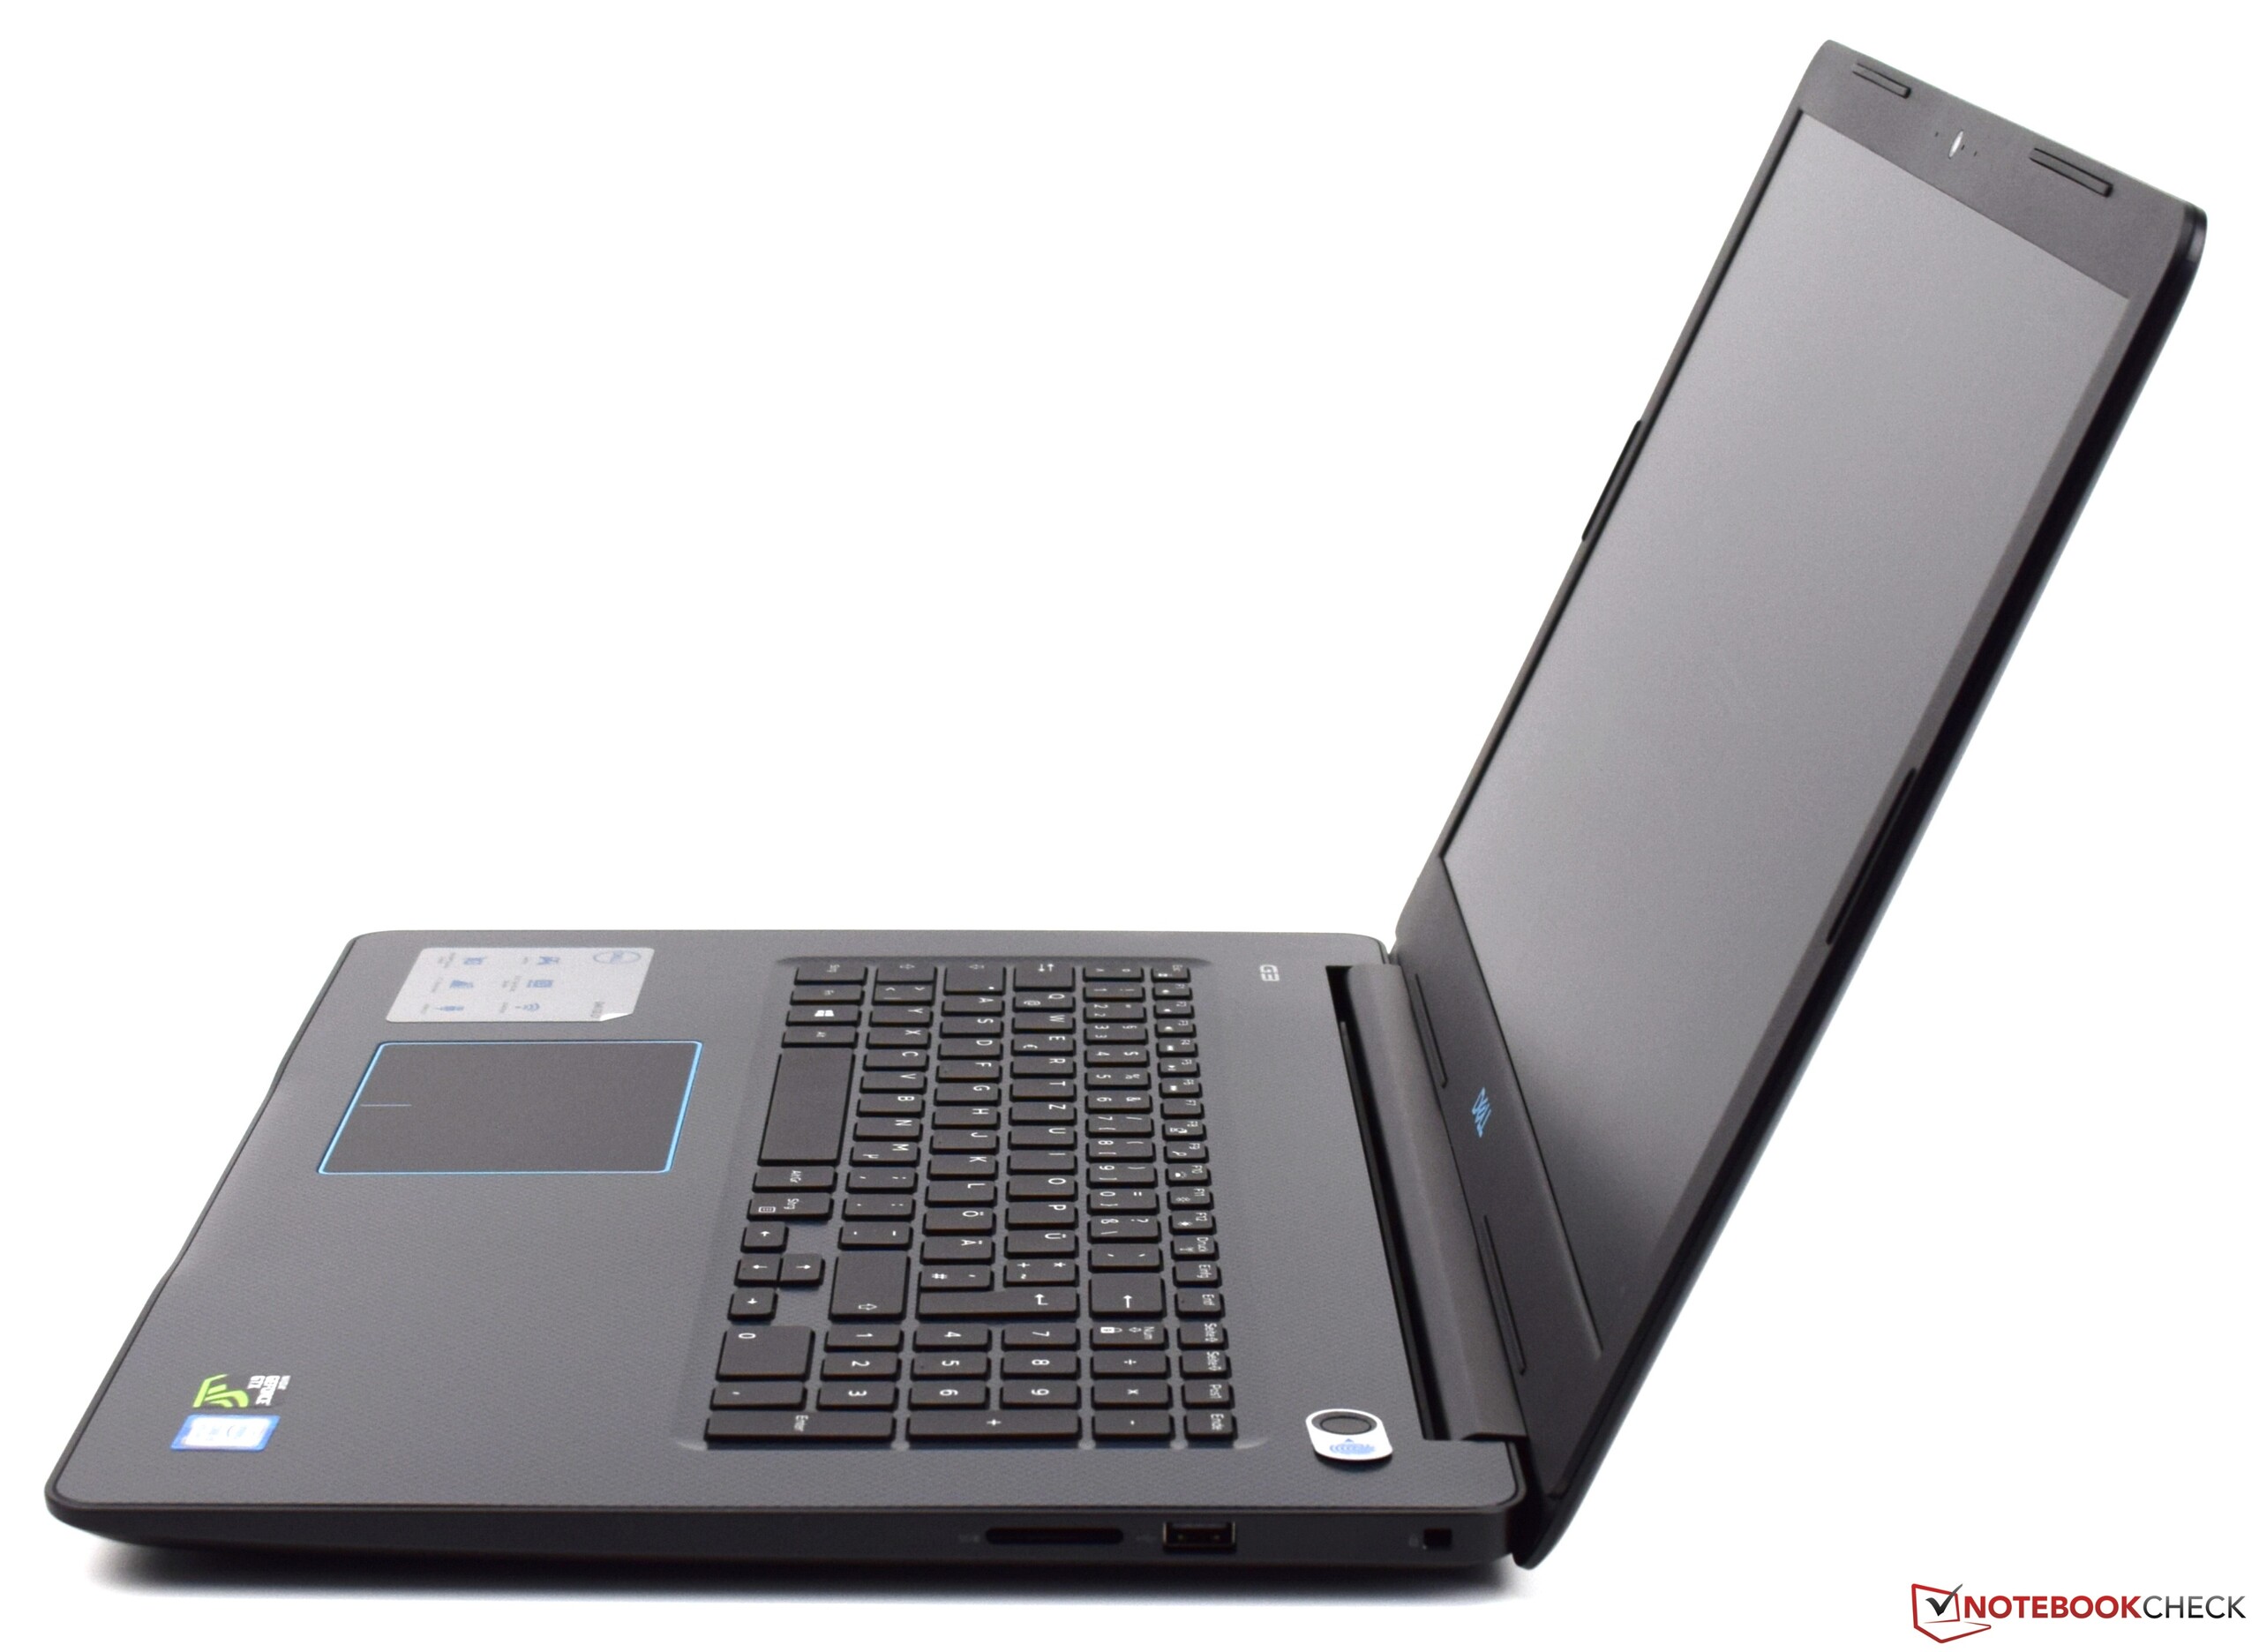
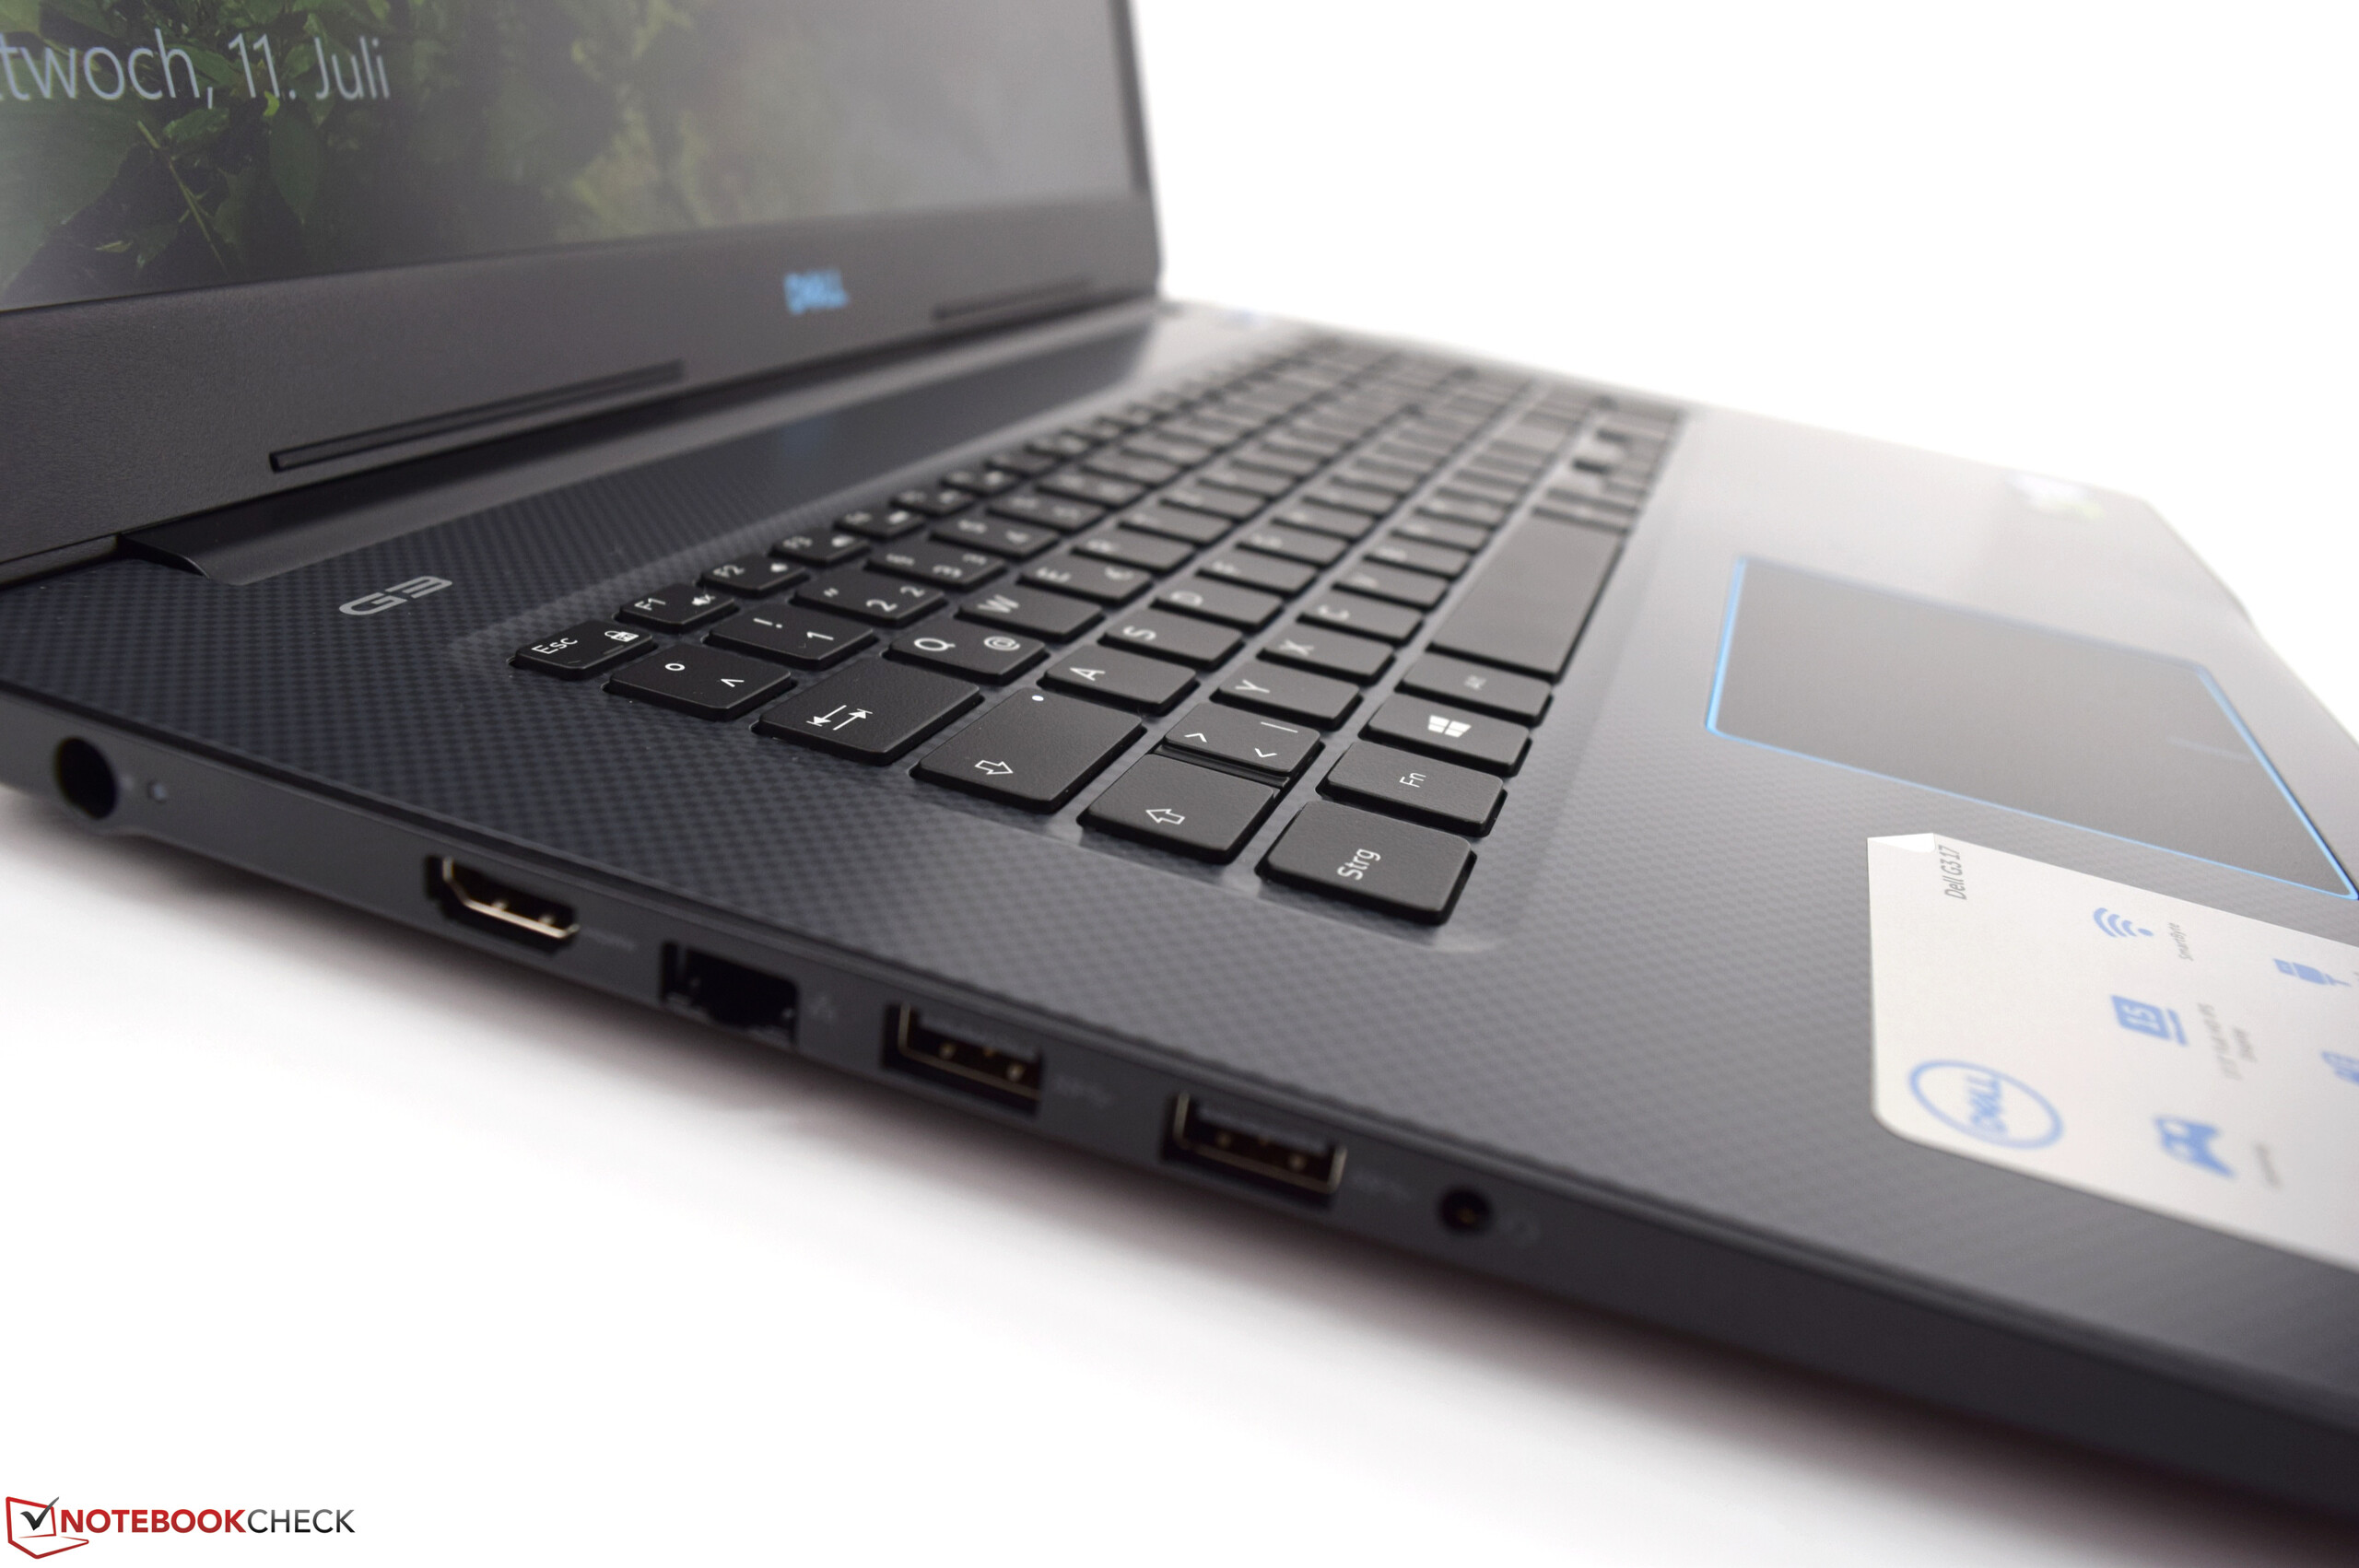
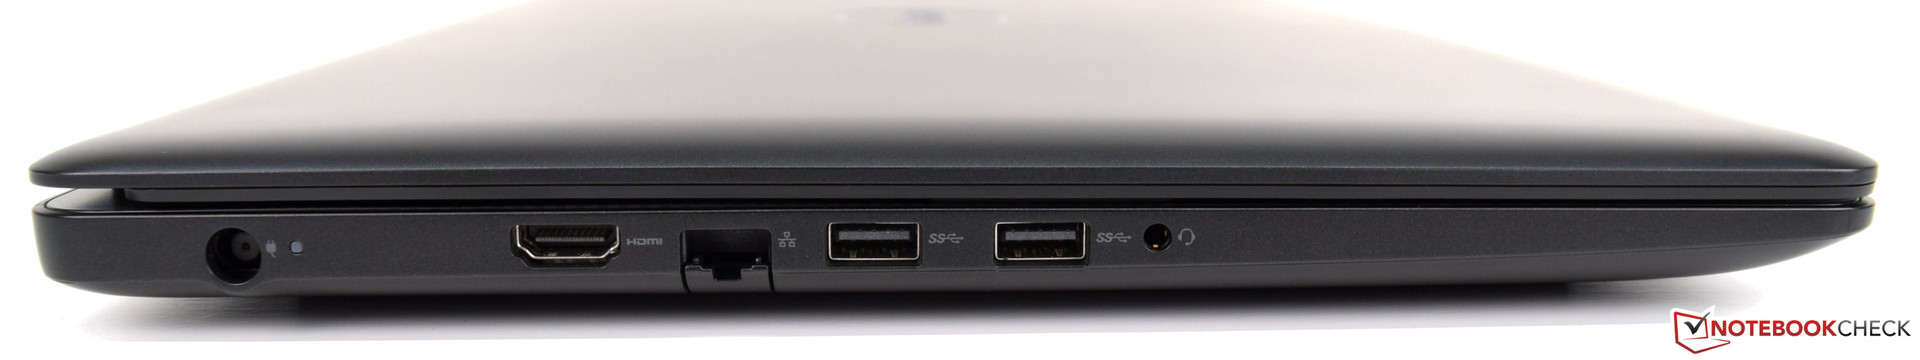
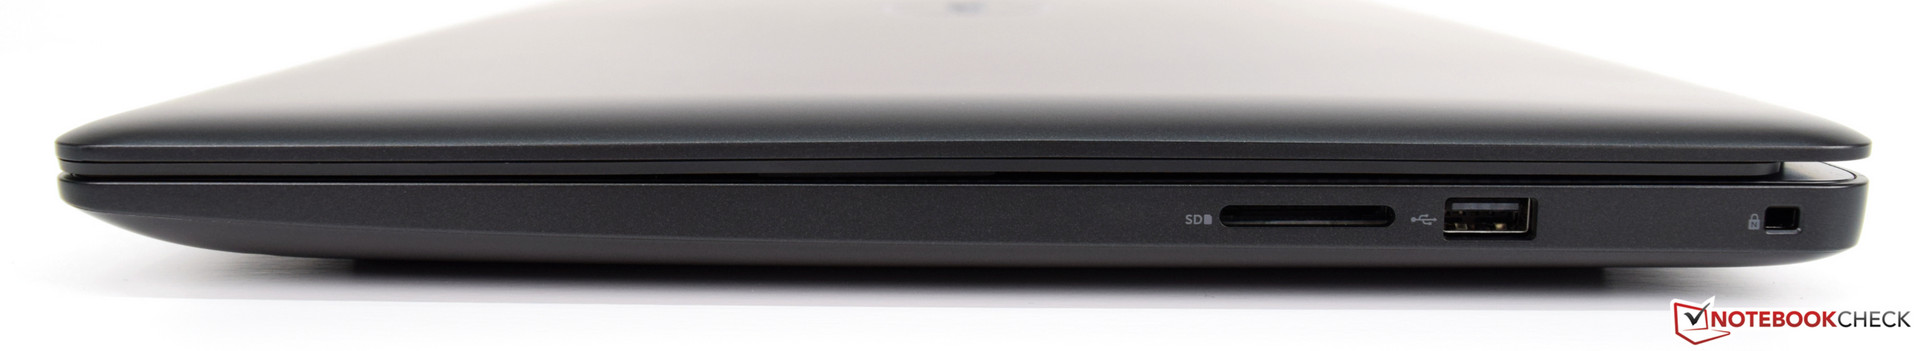
The offered connections are quite limited for a 17-inch laptop. Of the three built-in USB connections, only two have the 3.1 specification, and the USB port next to the storage card reader on the right side only offers 2.0 speed. On the left side, where most of the connections are located, our Dell G3 17 test model also offers an HDMI-2.0 port and a network port.
Dell advertises an optional Thunderbolt port, which is only integrated starting with the configuration that is equipped with the Nvidia GeForce GTX 1050 Ti. We do not understand why this feature is not available to users with the entry-level model. The positioning of the connections is good and there is sufficient space between them.
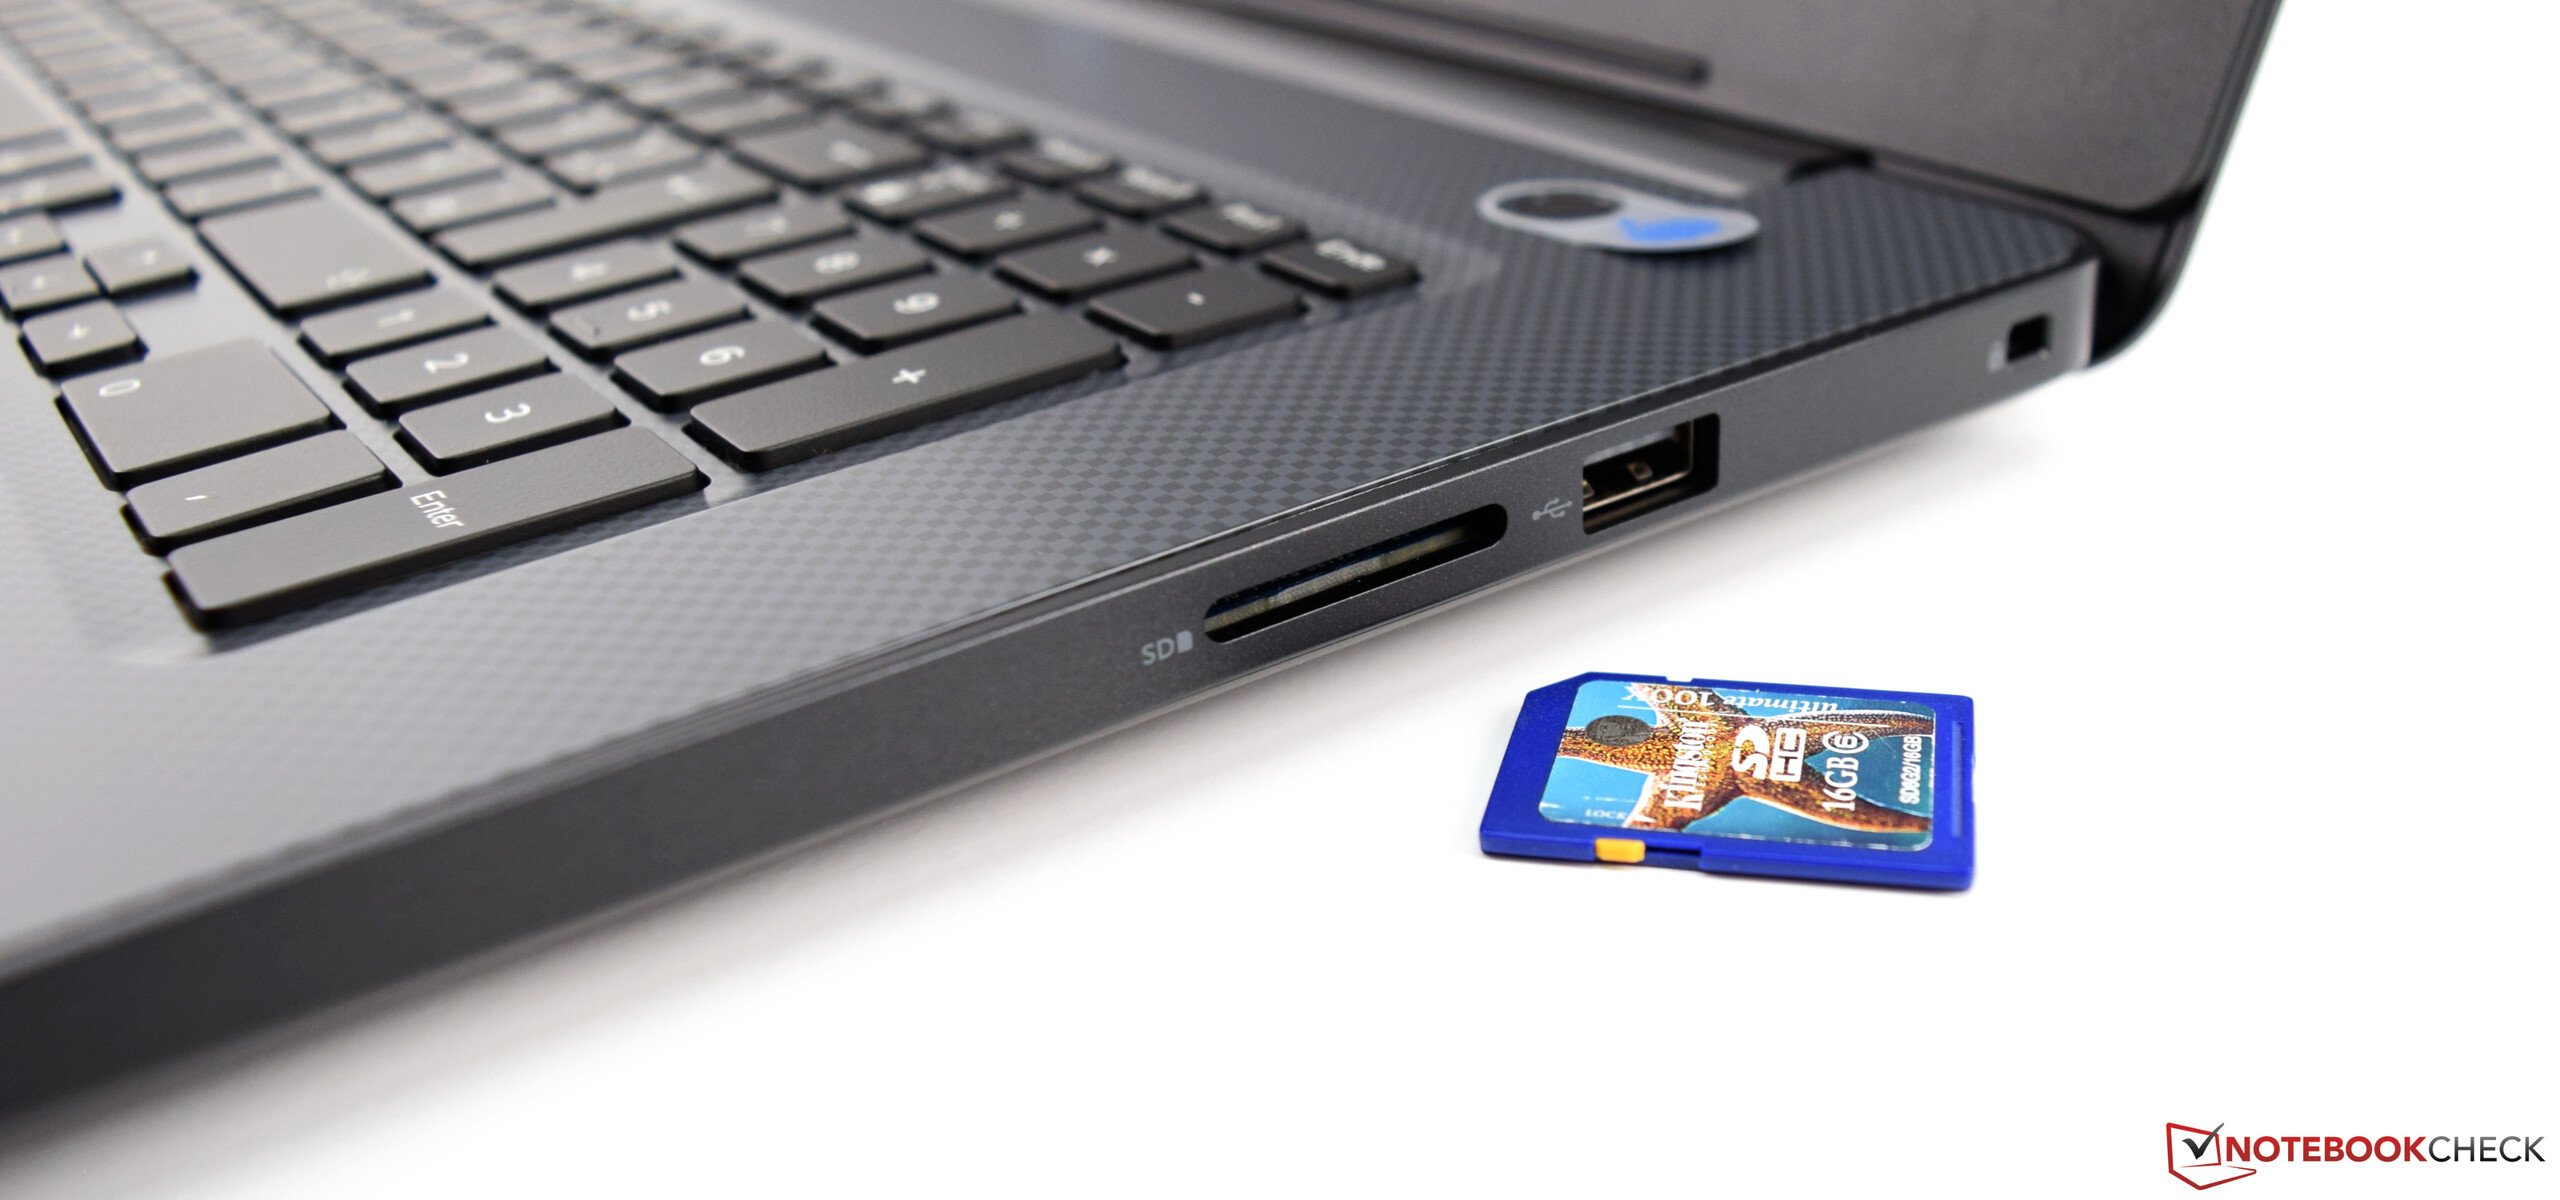
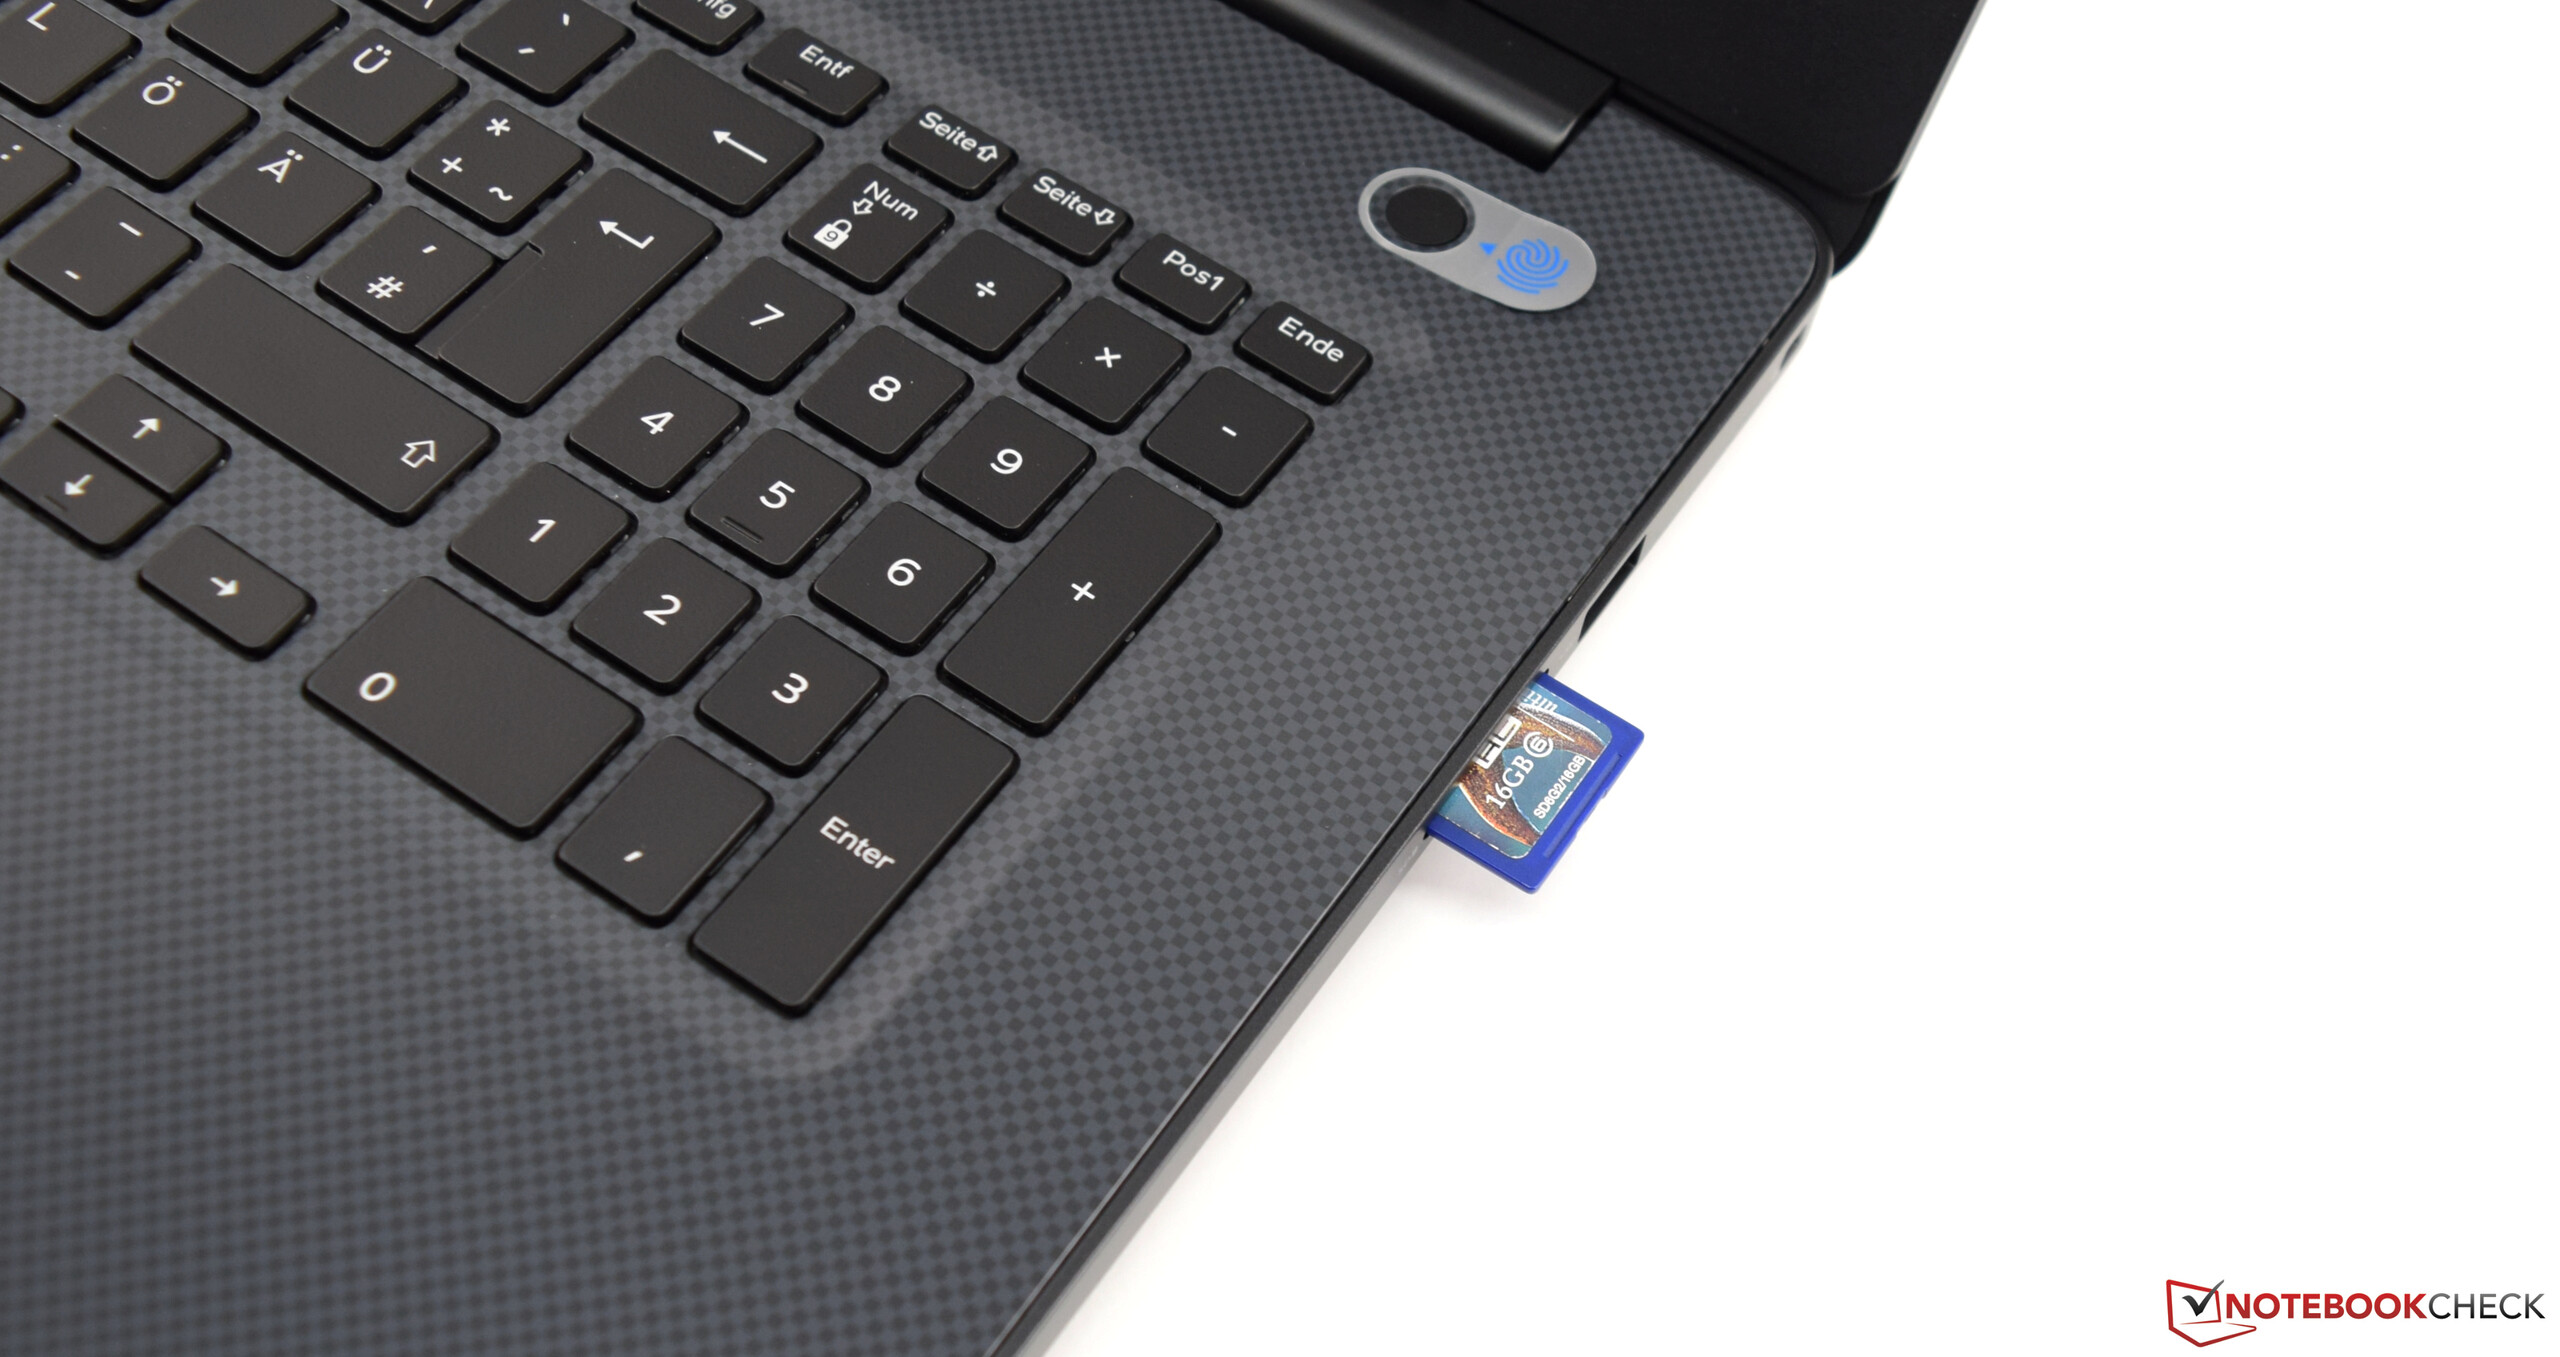
SD Card Reader
The Dell G3 17 3779 is equipped with an SD card reader, which is located on the right side and can handle all the usual storage cards. The test shows that the card reader unfortunately only runs at USB-2.0 speed. Only the Acer Predator Helios 300 is able to move slightly ahead in our test. Compared to the device class, all the comparison devices, including our test unit, limp significantly behind. We used our Toshiba reference storage card (Exceria Pro SDXC 64 GB UHS-II) for this test.
| SD Card Reader - average JPG Copy Test (av. of 3 runs) | |
| Average of class Gaming (20.9 - 210, n=54, last 2 years) | |
| Acer Predator Helios 300 PH317-52-51M6 (Toshiba Exceria Pro SDXC 64 GB UHS-II) | |
| Asus ROG Strix GL702ZC-GC204T (Toshiba Exceria Pro SDXC 64 GB UHS-II) | |
| Asus VivoBook Pro 17 N705UD-EH76 (Toshiba Exceria Pro SDXC 64 GB UHS-II) | |
| Dell G3 17 3779 (Toshiba Exceria Pro SDXC 64 GB UHS-II) | |
| Acer Aspire Nitro BE VN7-793G-5811 (Toshiba Exceria Pro SDXC 64 GB UHS-II) | |
| MSI GL72 7RDX-602 (Toshiba Exceria Pro SDXC 64 GB UHS-II) | |
Communication
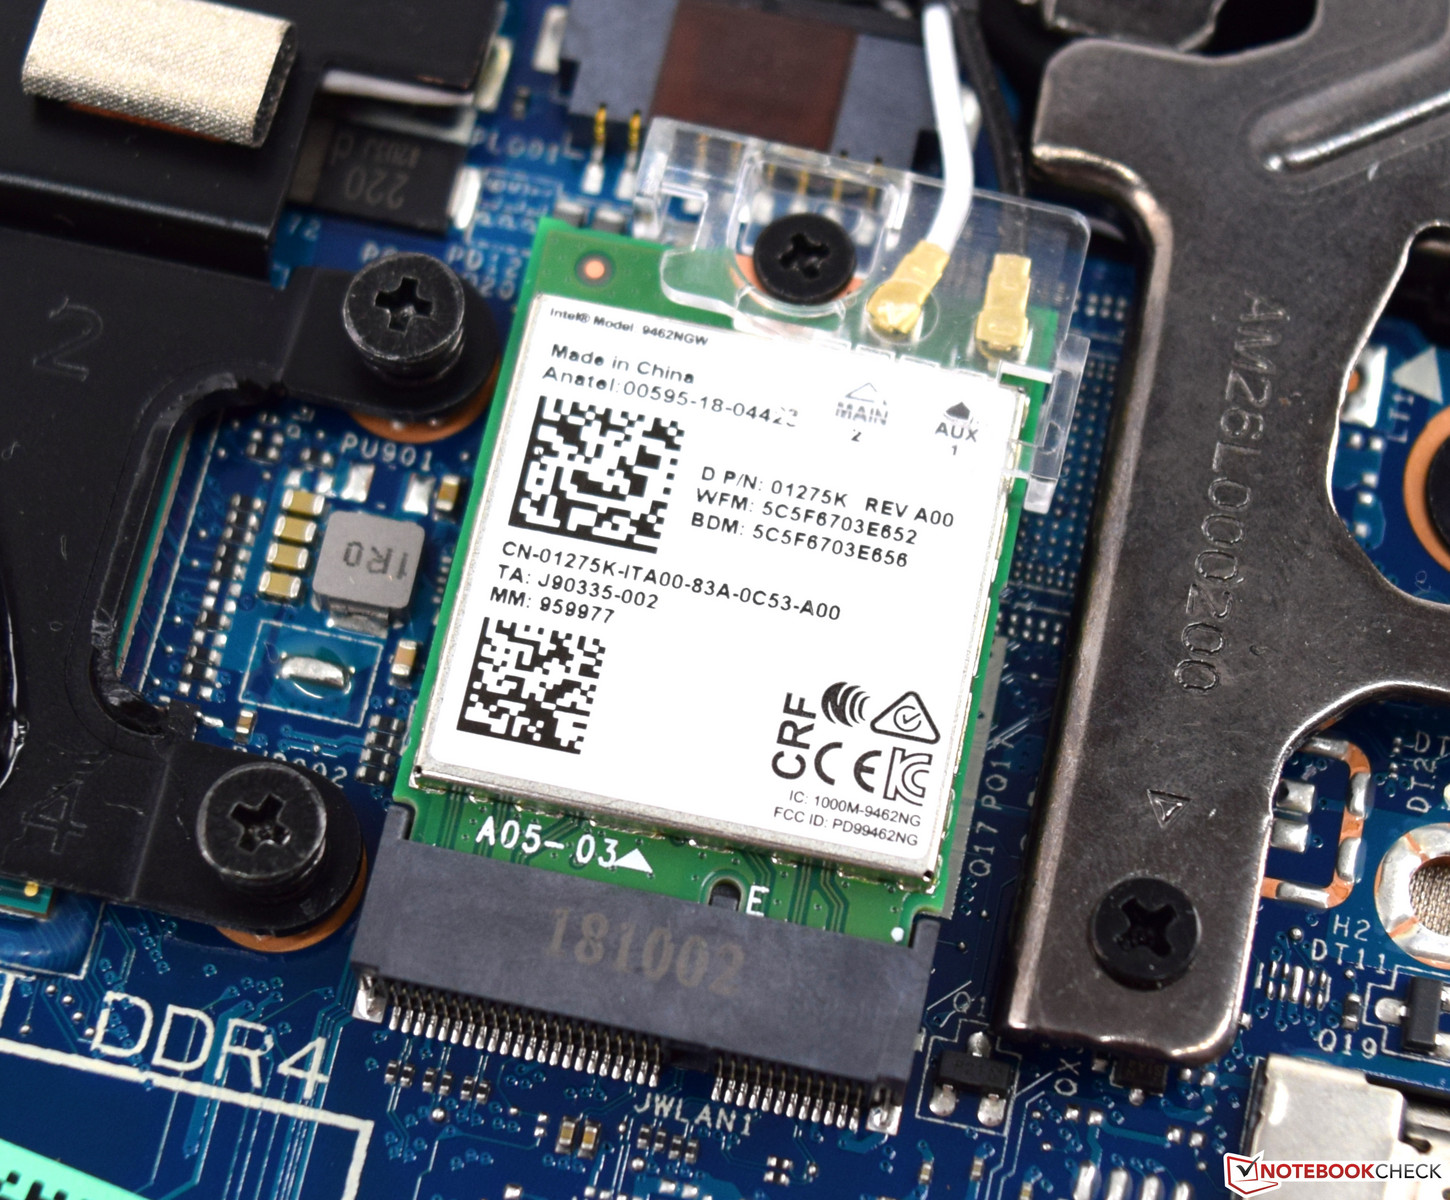
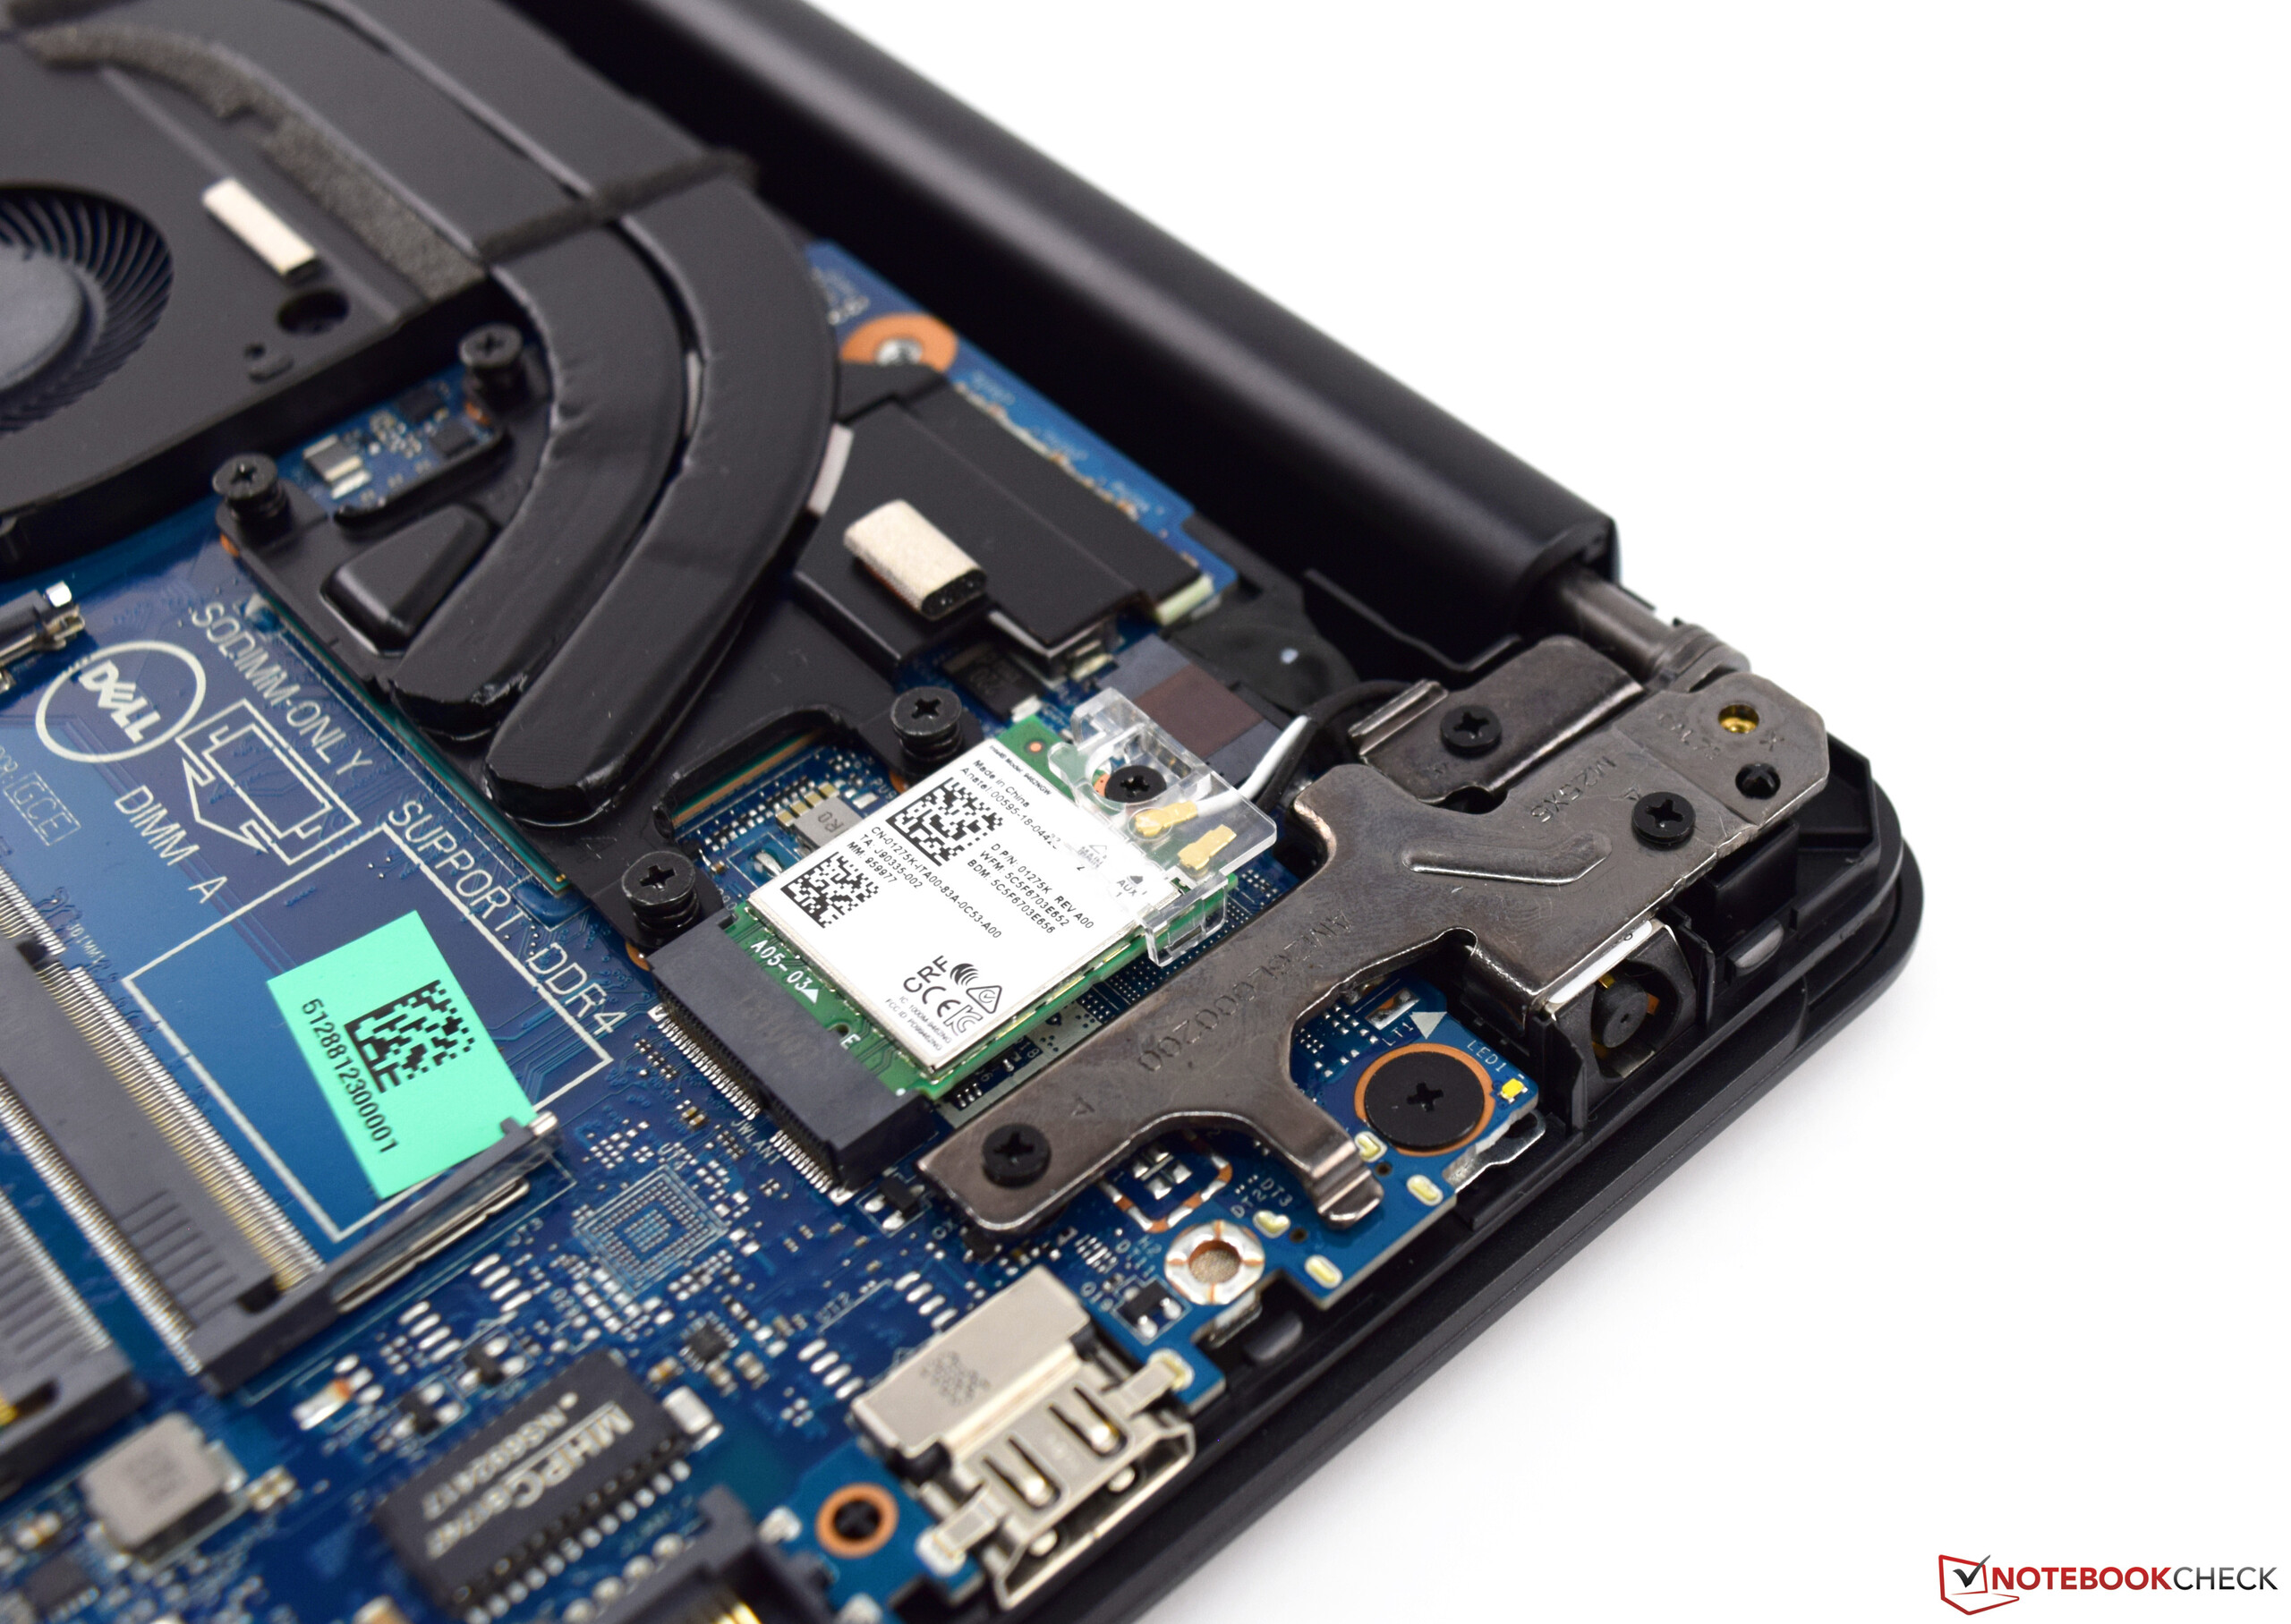
The wireless communication is handled by the Intel Wireless-AC 9462 WLAN module. This 1x1 dual-band module offers WLAN-AC and in addition also the newest version (5.0) of Bluetooth. In our measurements where we simulate an optimal scenario, the Dell G3 17 3779 unfortunately only achieved an average result, remaining behind our expectations. During sending, our test unit achieved an average transfer rate of 321 Mb/s and during receiving only 284 Mb/s. While this is sufficient for most applications, in the test the Wireless-AC 9462 module does not reach the maximum speed specified by the manufacturer (433 Mb/s).
If the WLAN connection is not sufficient then you can also use the Ethernet connection. The Realtek chip offers speeds of up to 1 Gb/s and worked without any problems during our test period.
Security
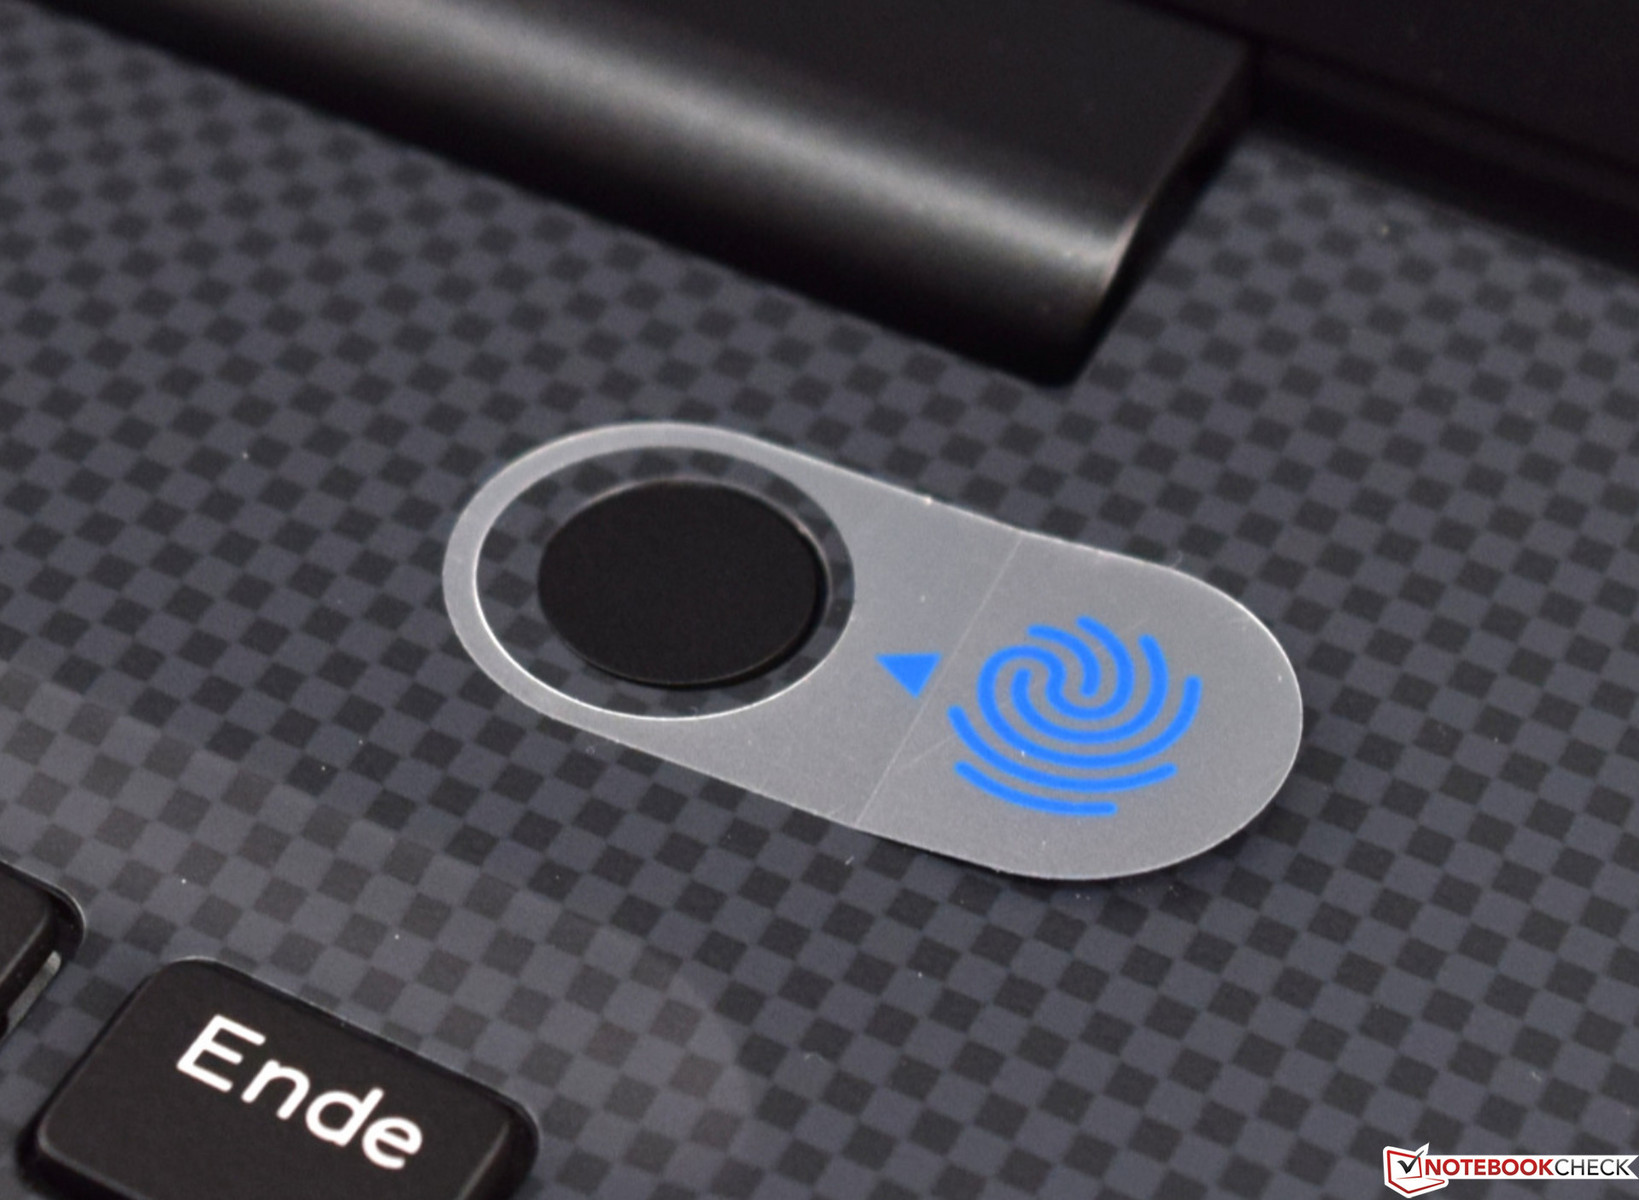
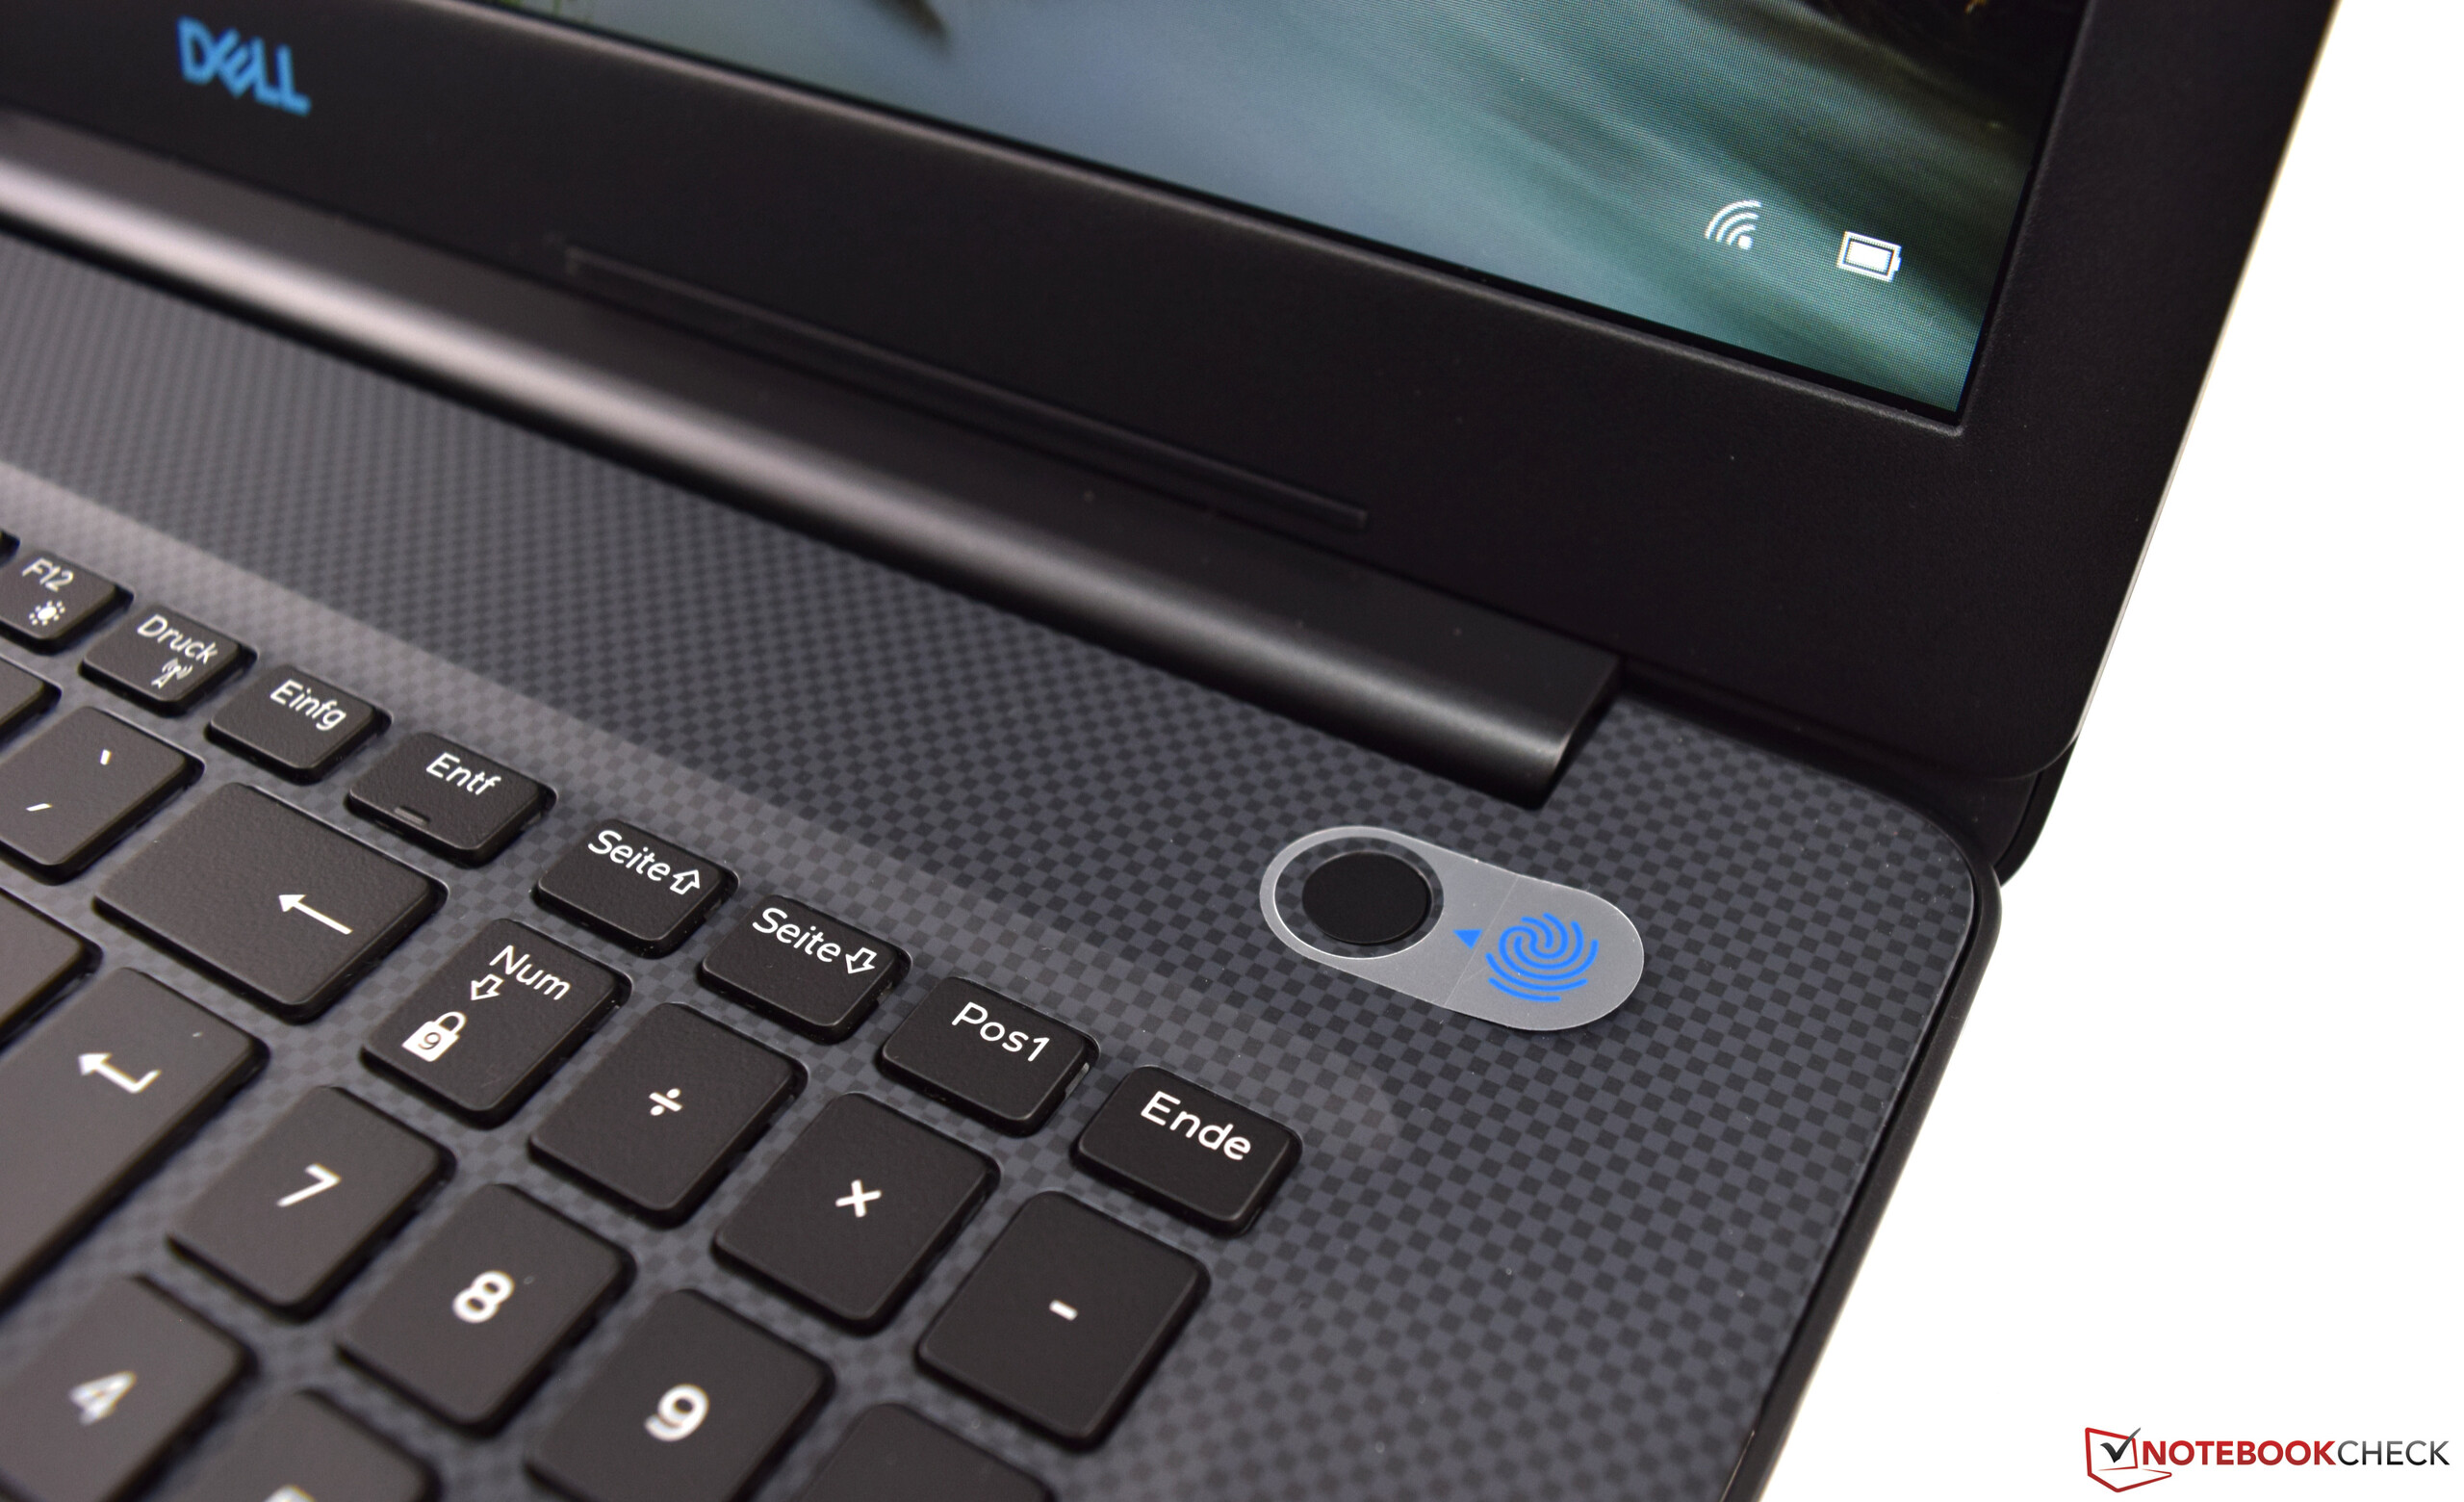
In terms of security, the Dell G3 17 3779 offers a TPM and a fingerprint sensor that is integrated into the power button. We are already familiar with this from the smaller Dell G5 15 5587. After it has been set up, it facilitates the Windows login (Windows Hello). McAfee LifeSafe serves as the security software, and a 12-month subscription is included with the purchase by non-business consumers. A license extension to 36 months costs a one-time payment of 35 Euros (~$41).
Accessories
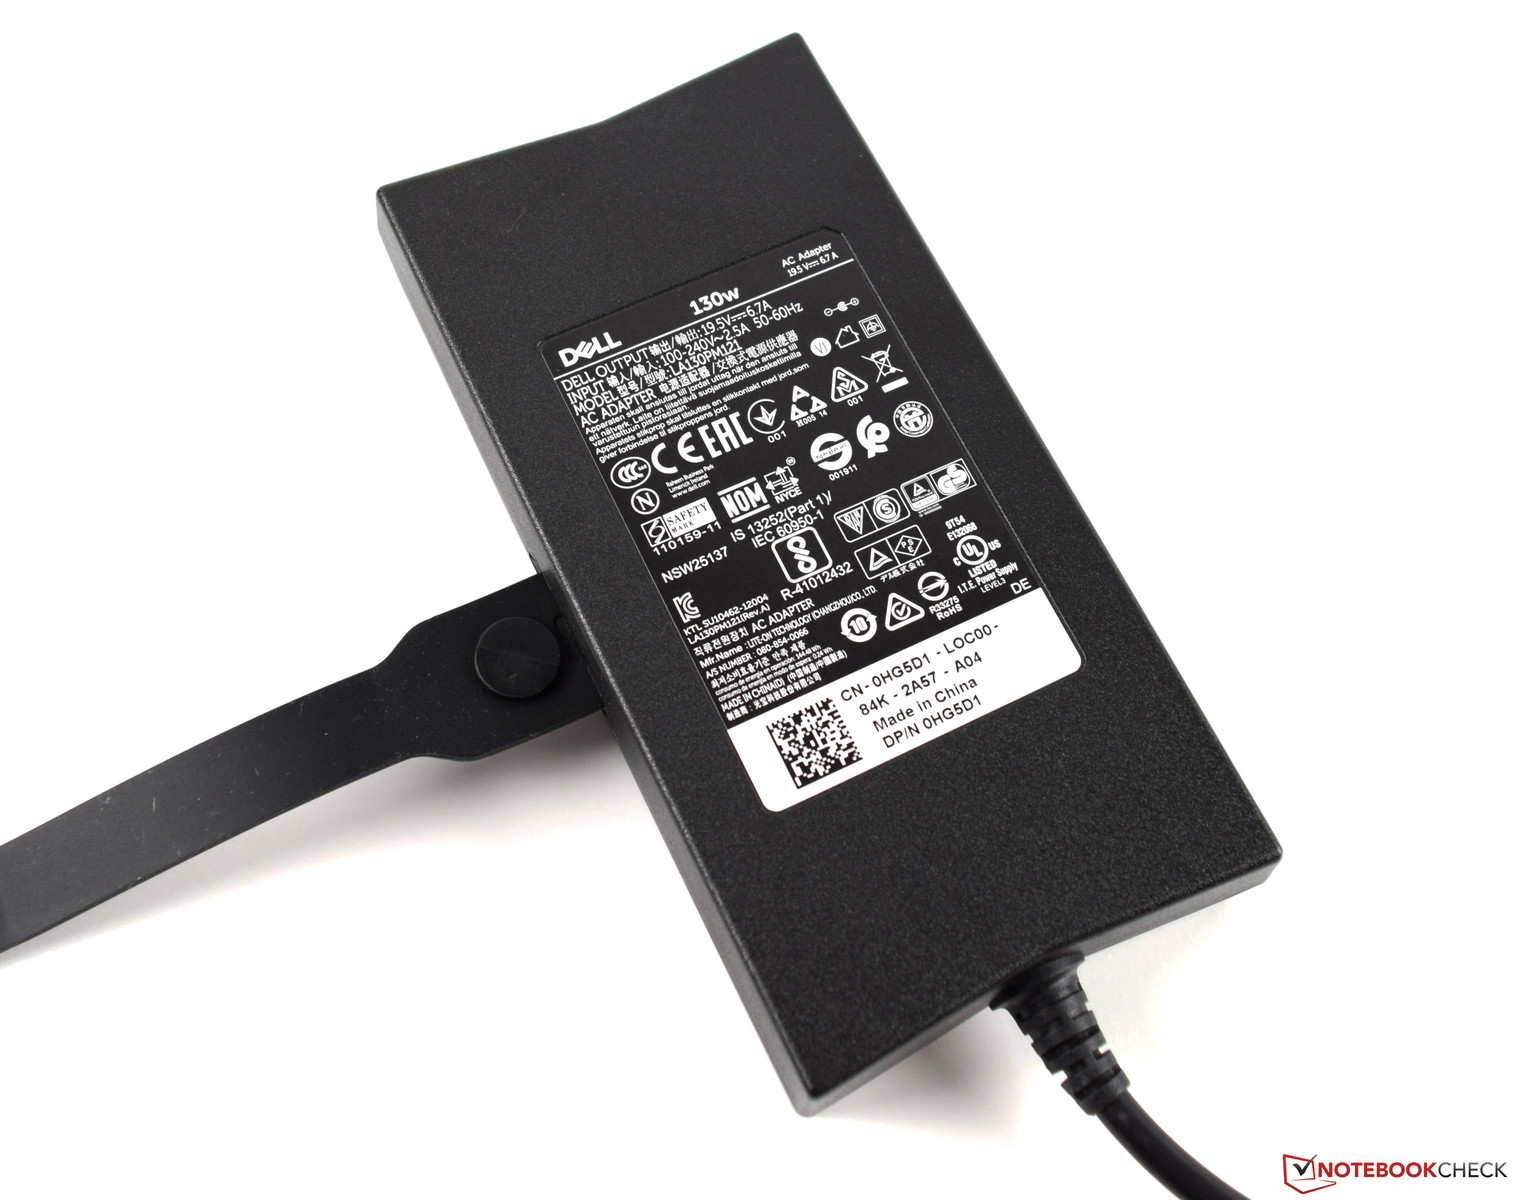
In addition to the device, the 130-watt power supply and various security and warranty information is also included. The more powerful power supply (180 Watt) is only available for the Dell G3 17 with the GeForce GTX 1060 Max-Q.
Operating System
The Dell G3 17 3779 is offered with the 64-bit version of Microsoft Windows 10 Home. As with the Dell G5 15 5587, support for Ubuntu is also available.
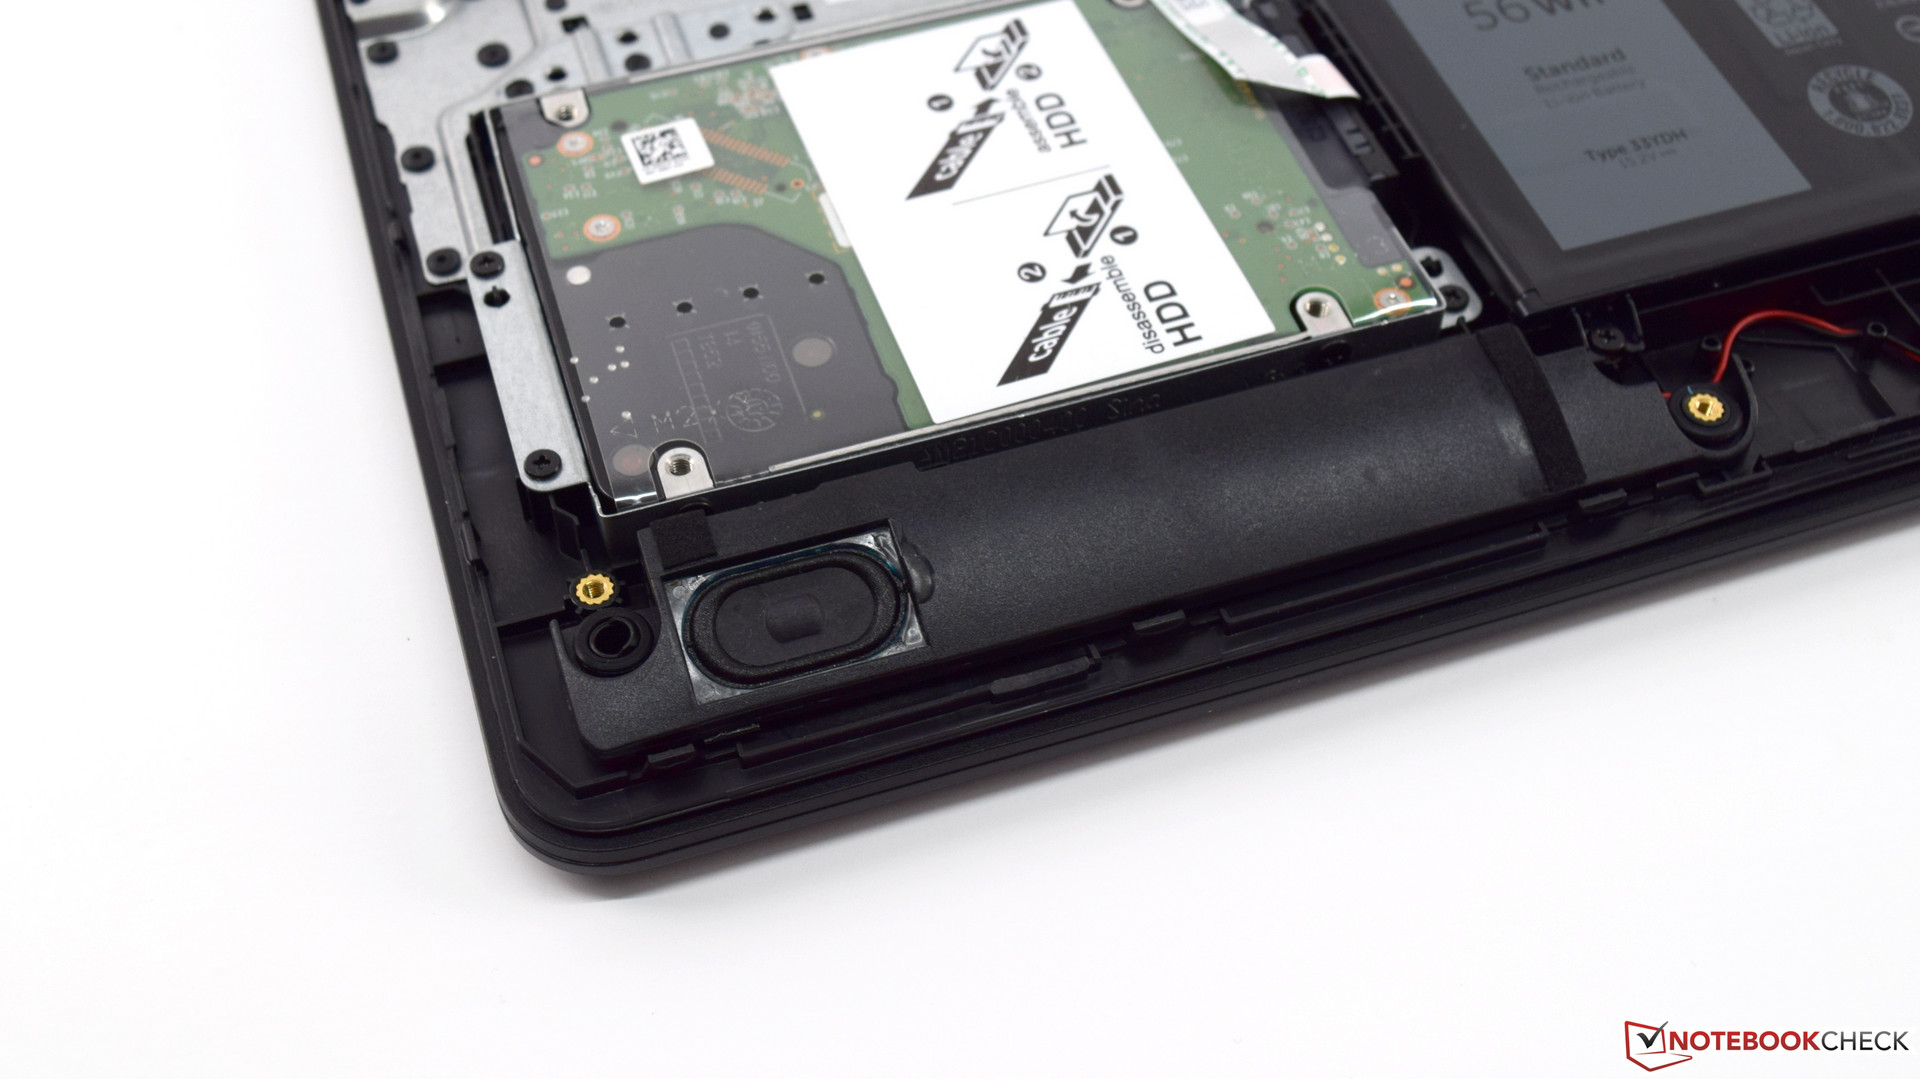
Maintenance
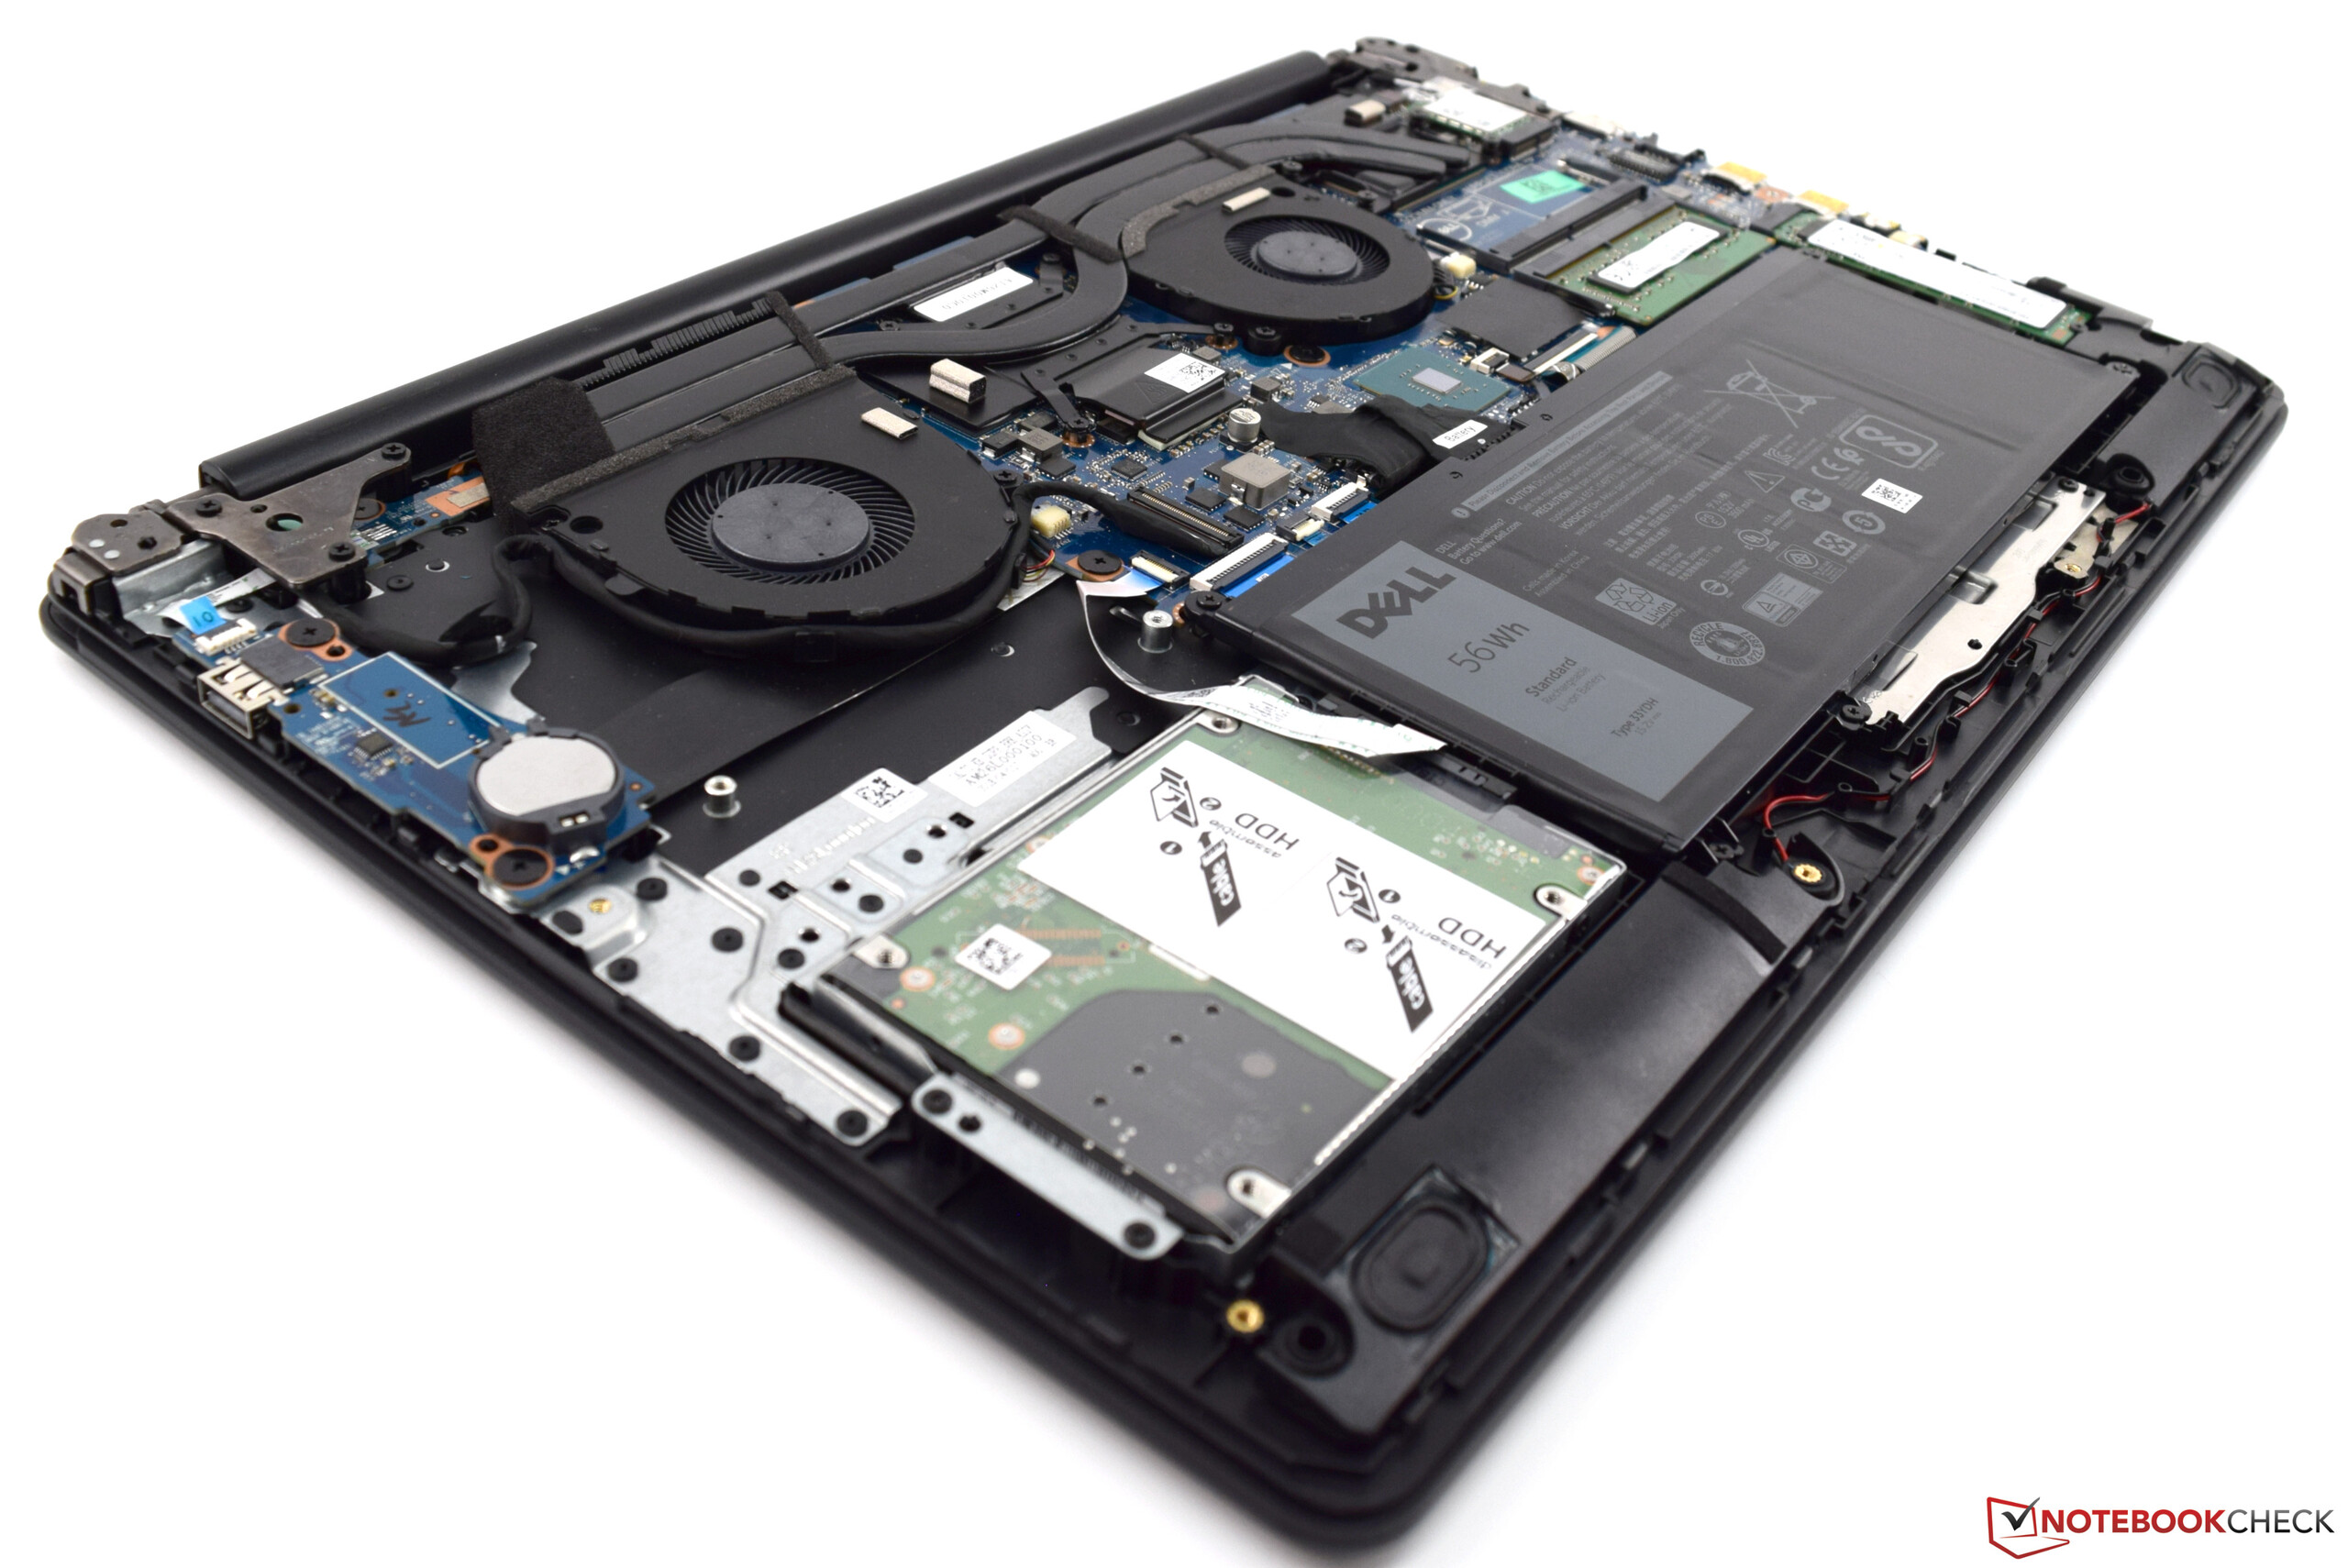
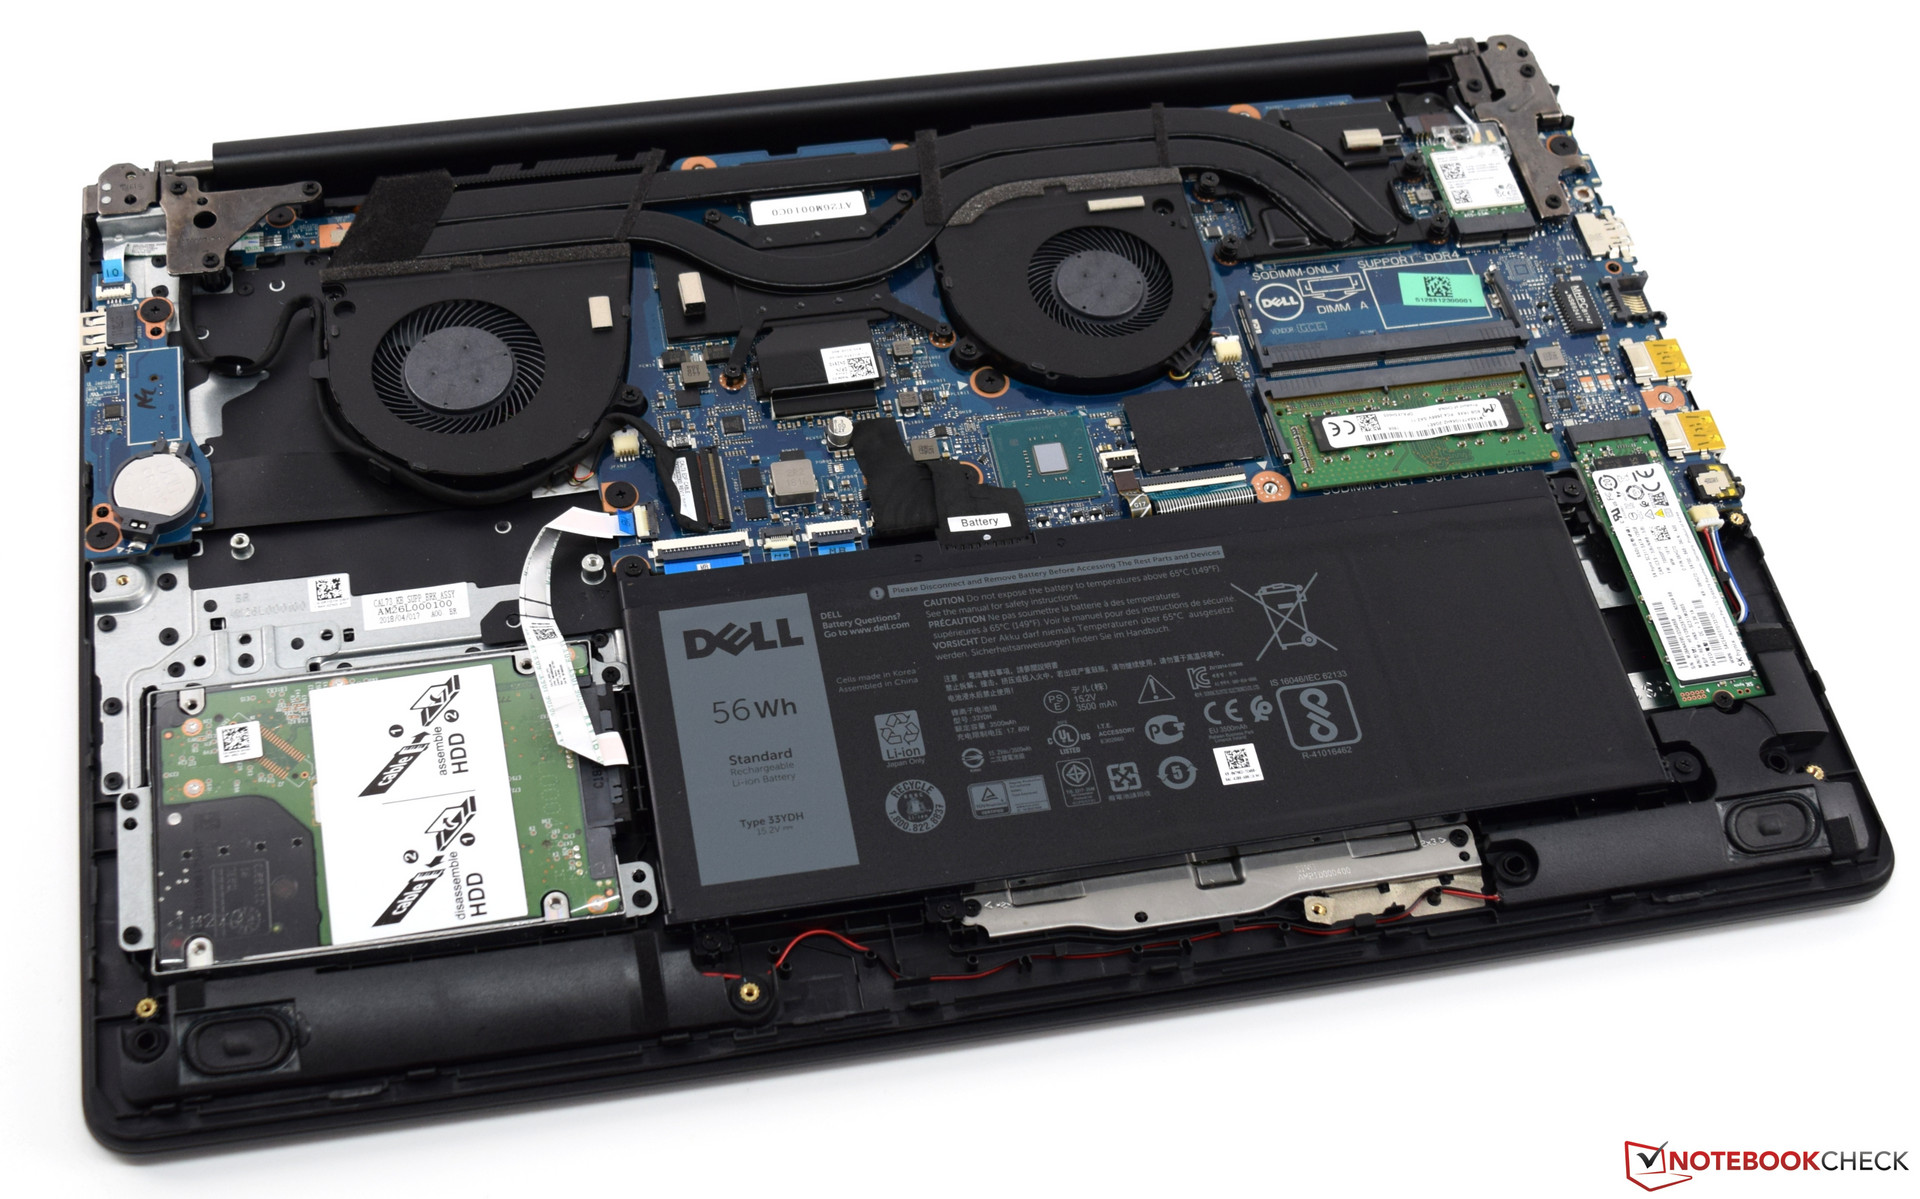
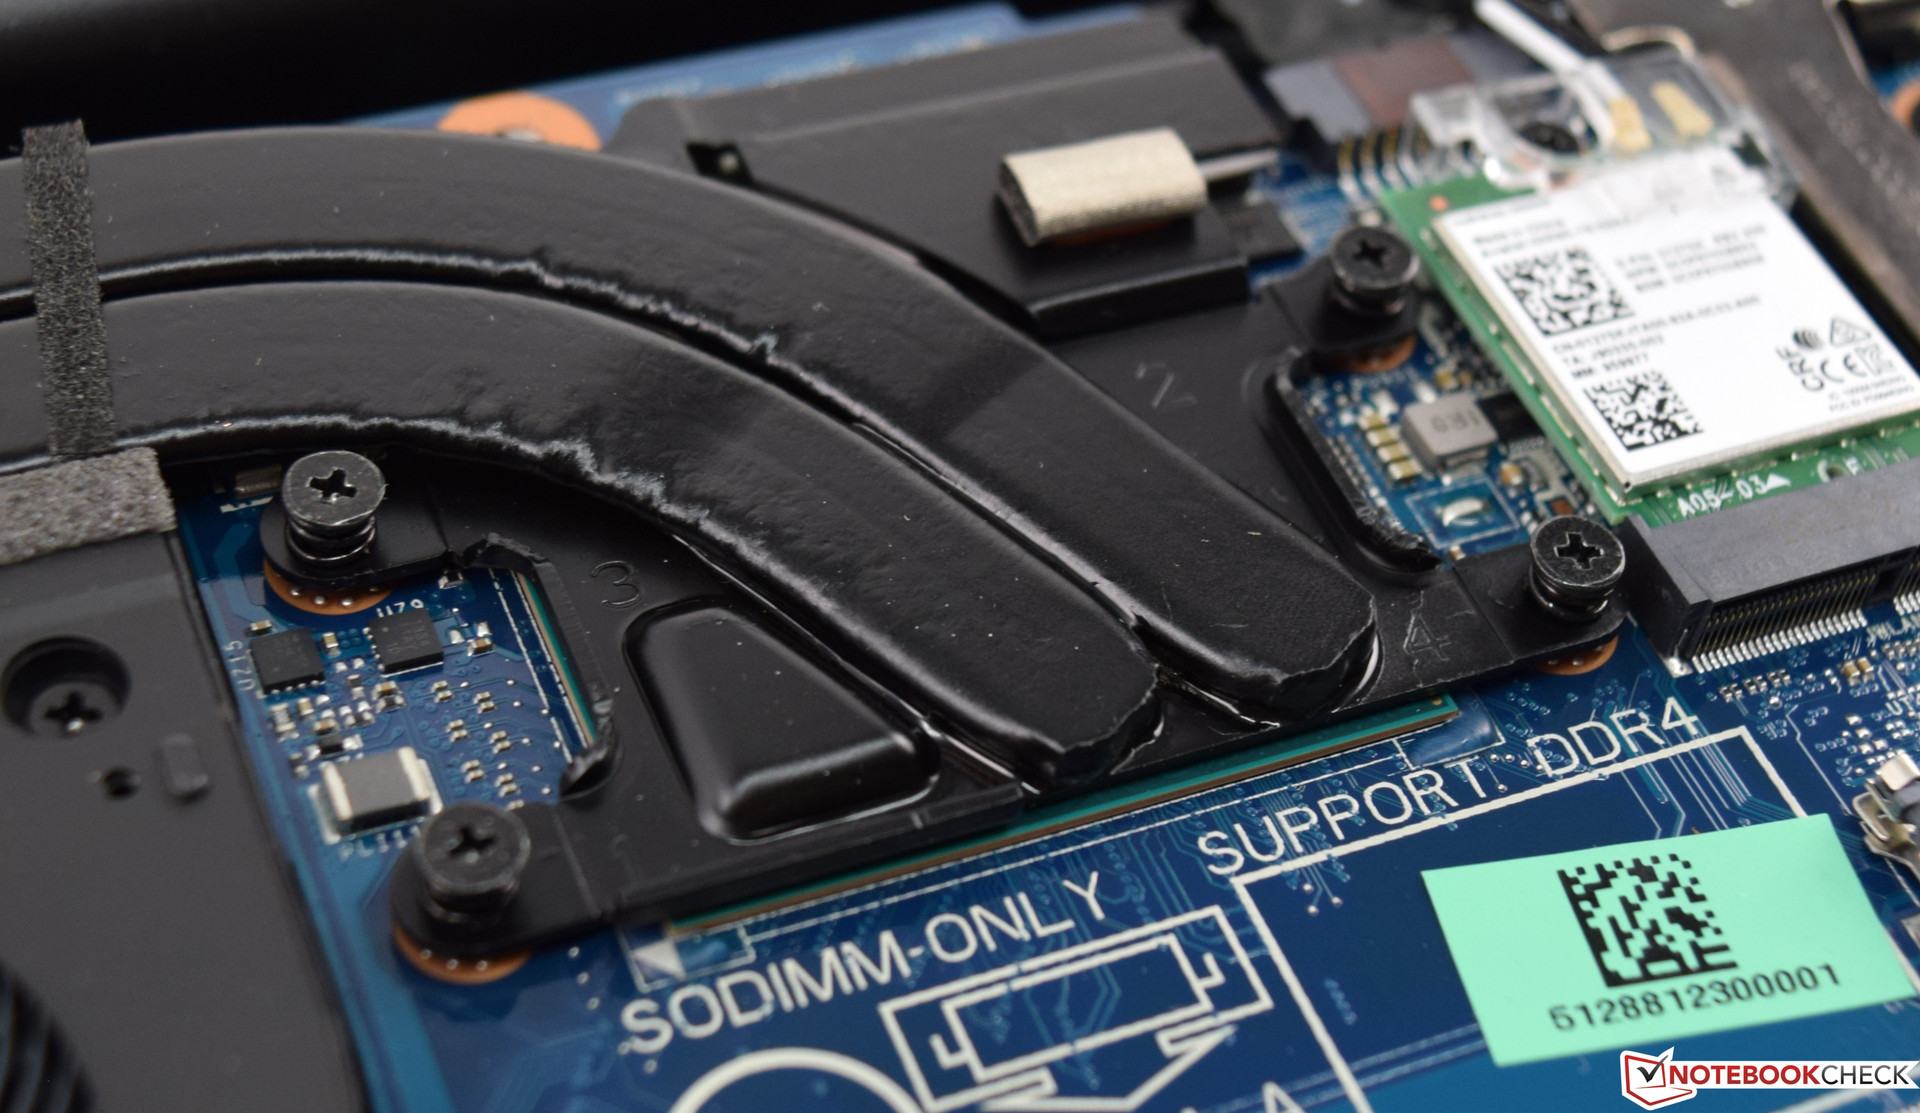
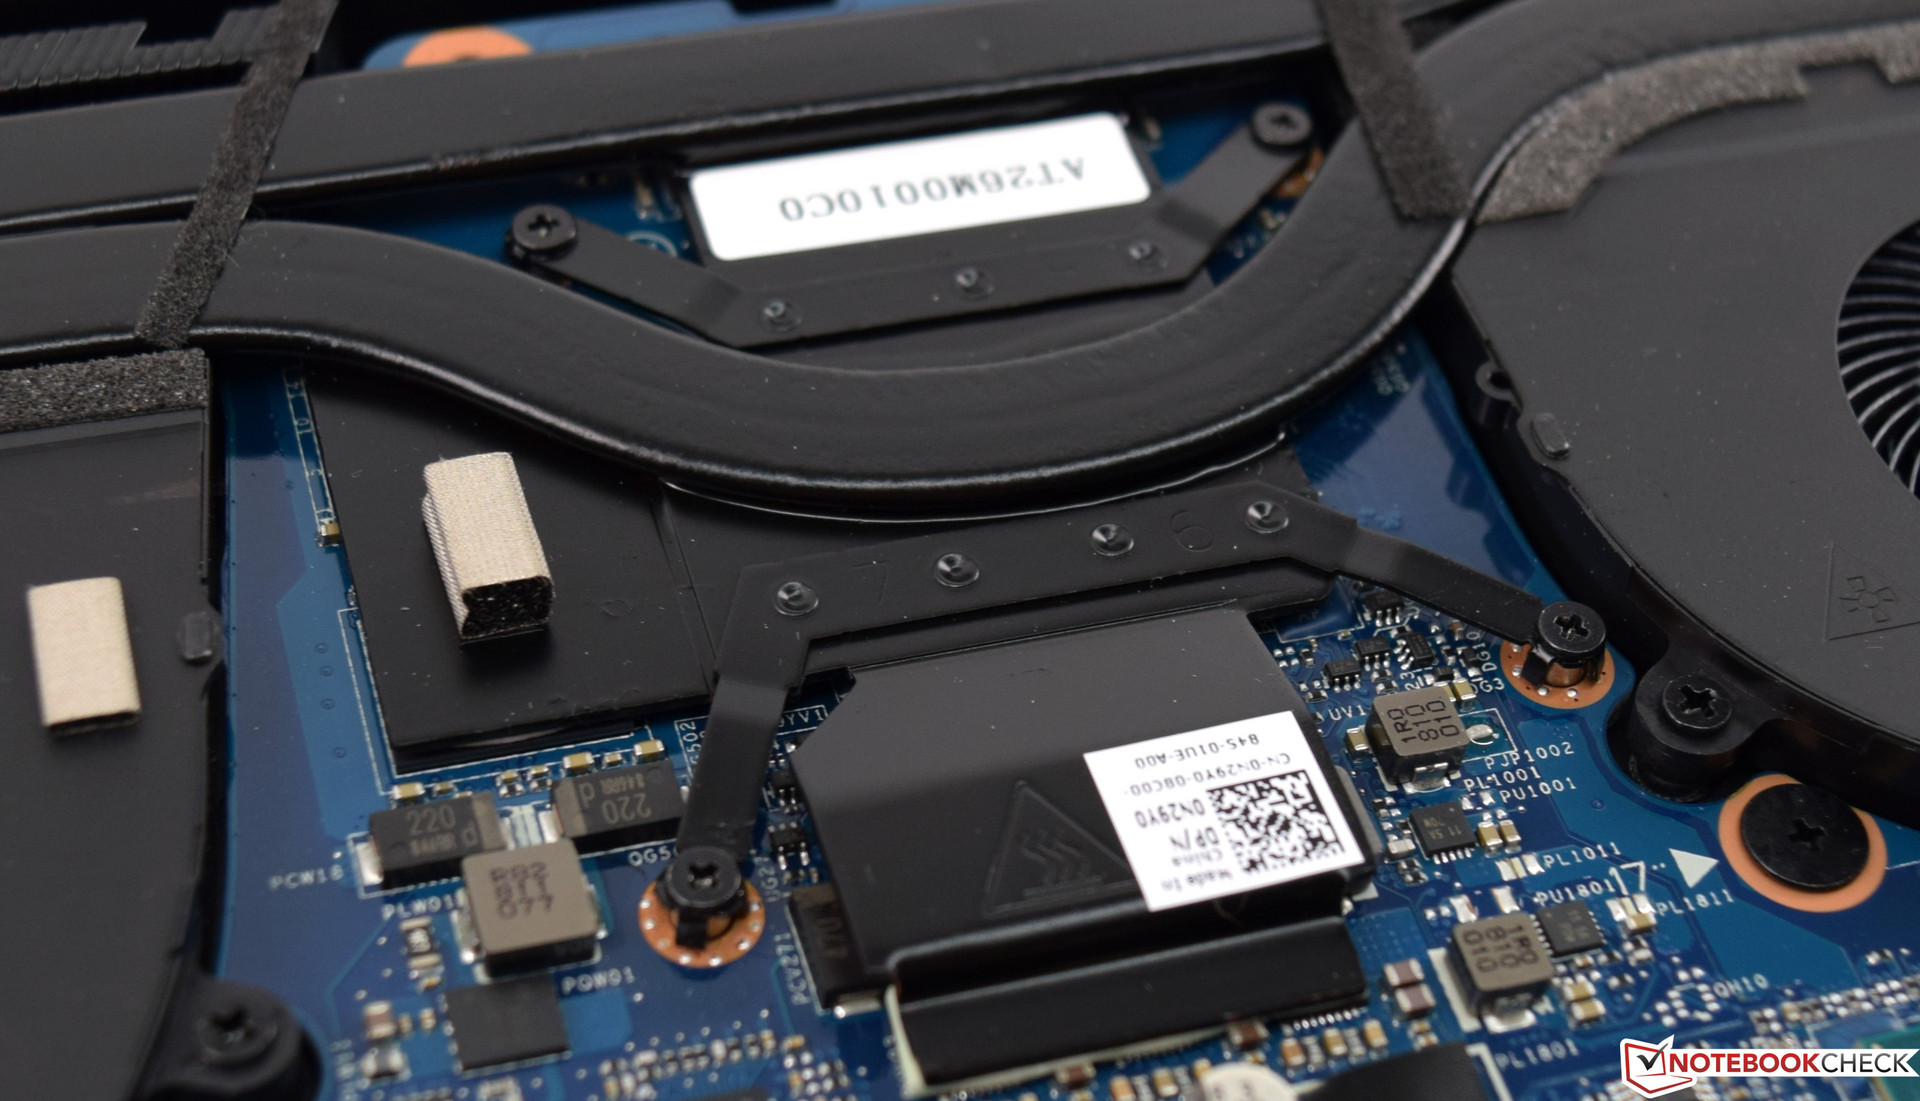
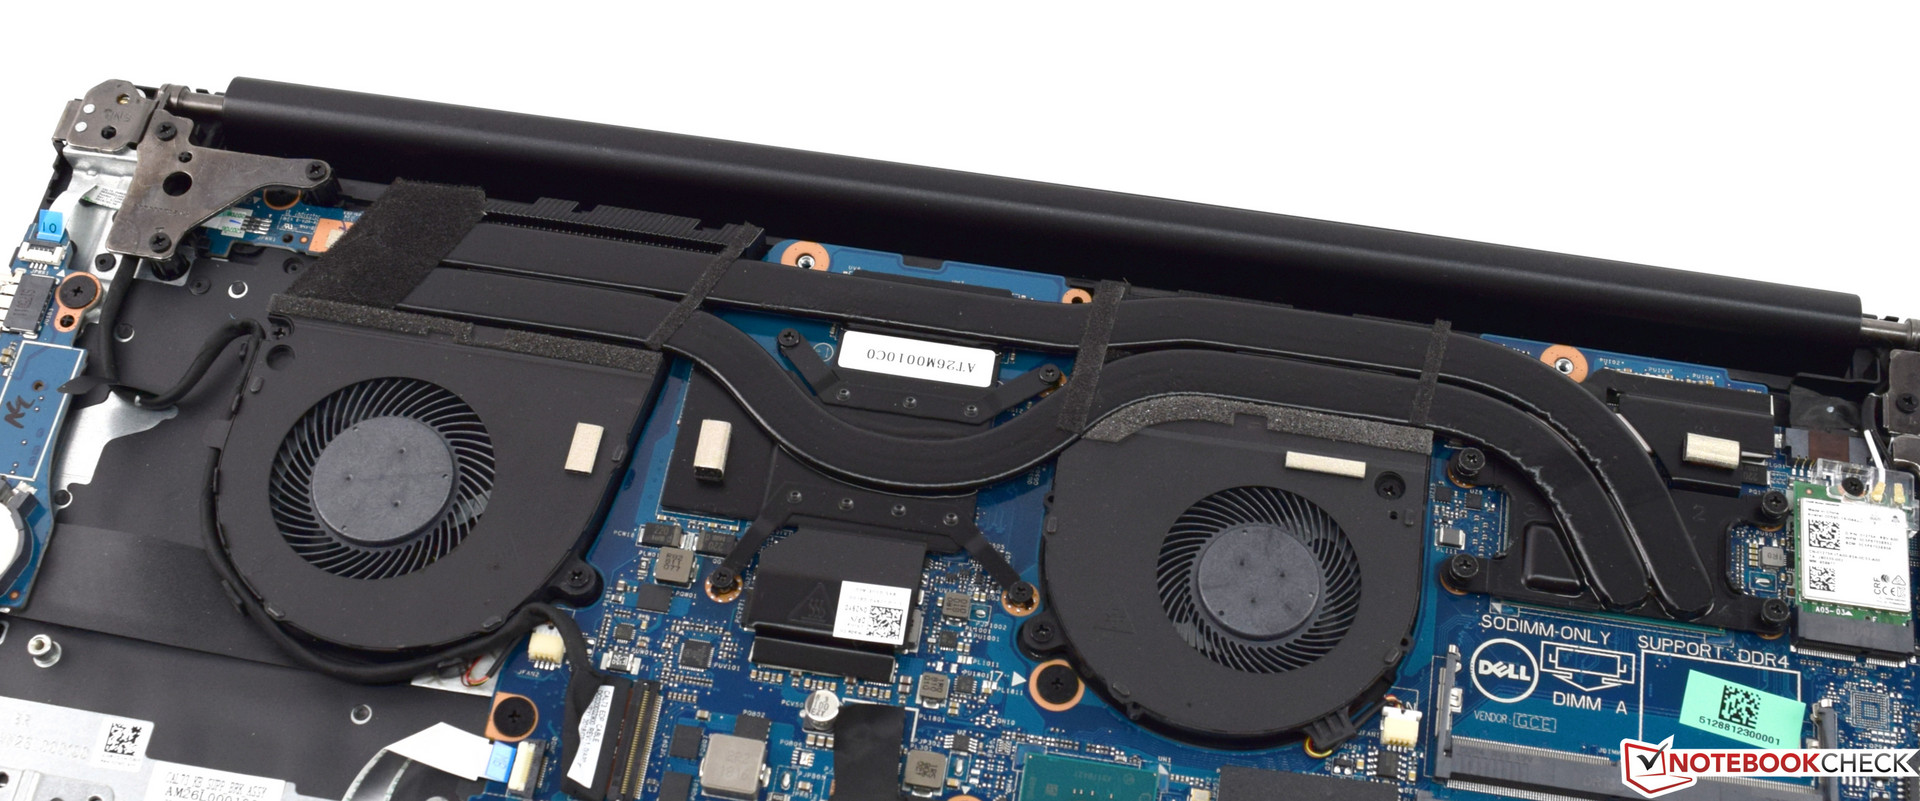
The Dell G3 17 3779 does not have a separate maintenance hatch. To access the insides, you need to take off the whole bottom cover. After removing the numerous screws, the cover continues to sit tightly connected to the base and has to be pried off carefully. We definitely recommend using the appropriate tool here, and at this point we would like to advise that damages from unqualified disassembly are not covered by the warranty.
After the bottom cover has been removed, you can easily access the built-in components. Cleaning the fans also becomes easy. Our test unit does not offer much space for a quick upgrade, and we only find an empty RAM slot.
Warranty
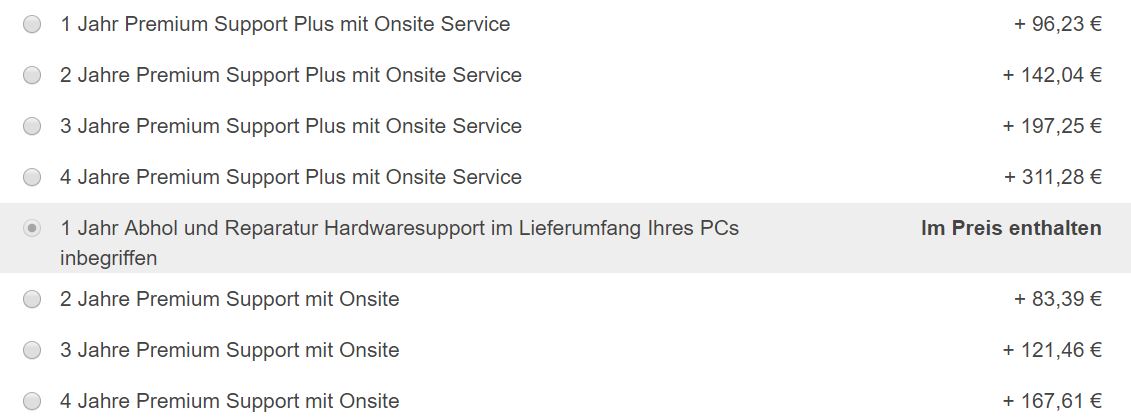
During the purchase, you receive one year of pickup-and-repair hardware support. The premium version with onsite service for four years costs a one-time payment of 311 Euros (~$365). Those who do not need four years can also select a warranty of two or three years. Please see our Guarantees, Return policies and Warranties FAQ for country-specific information.
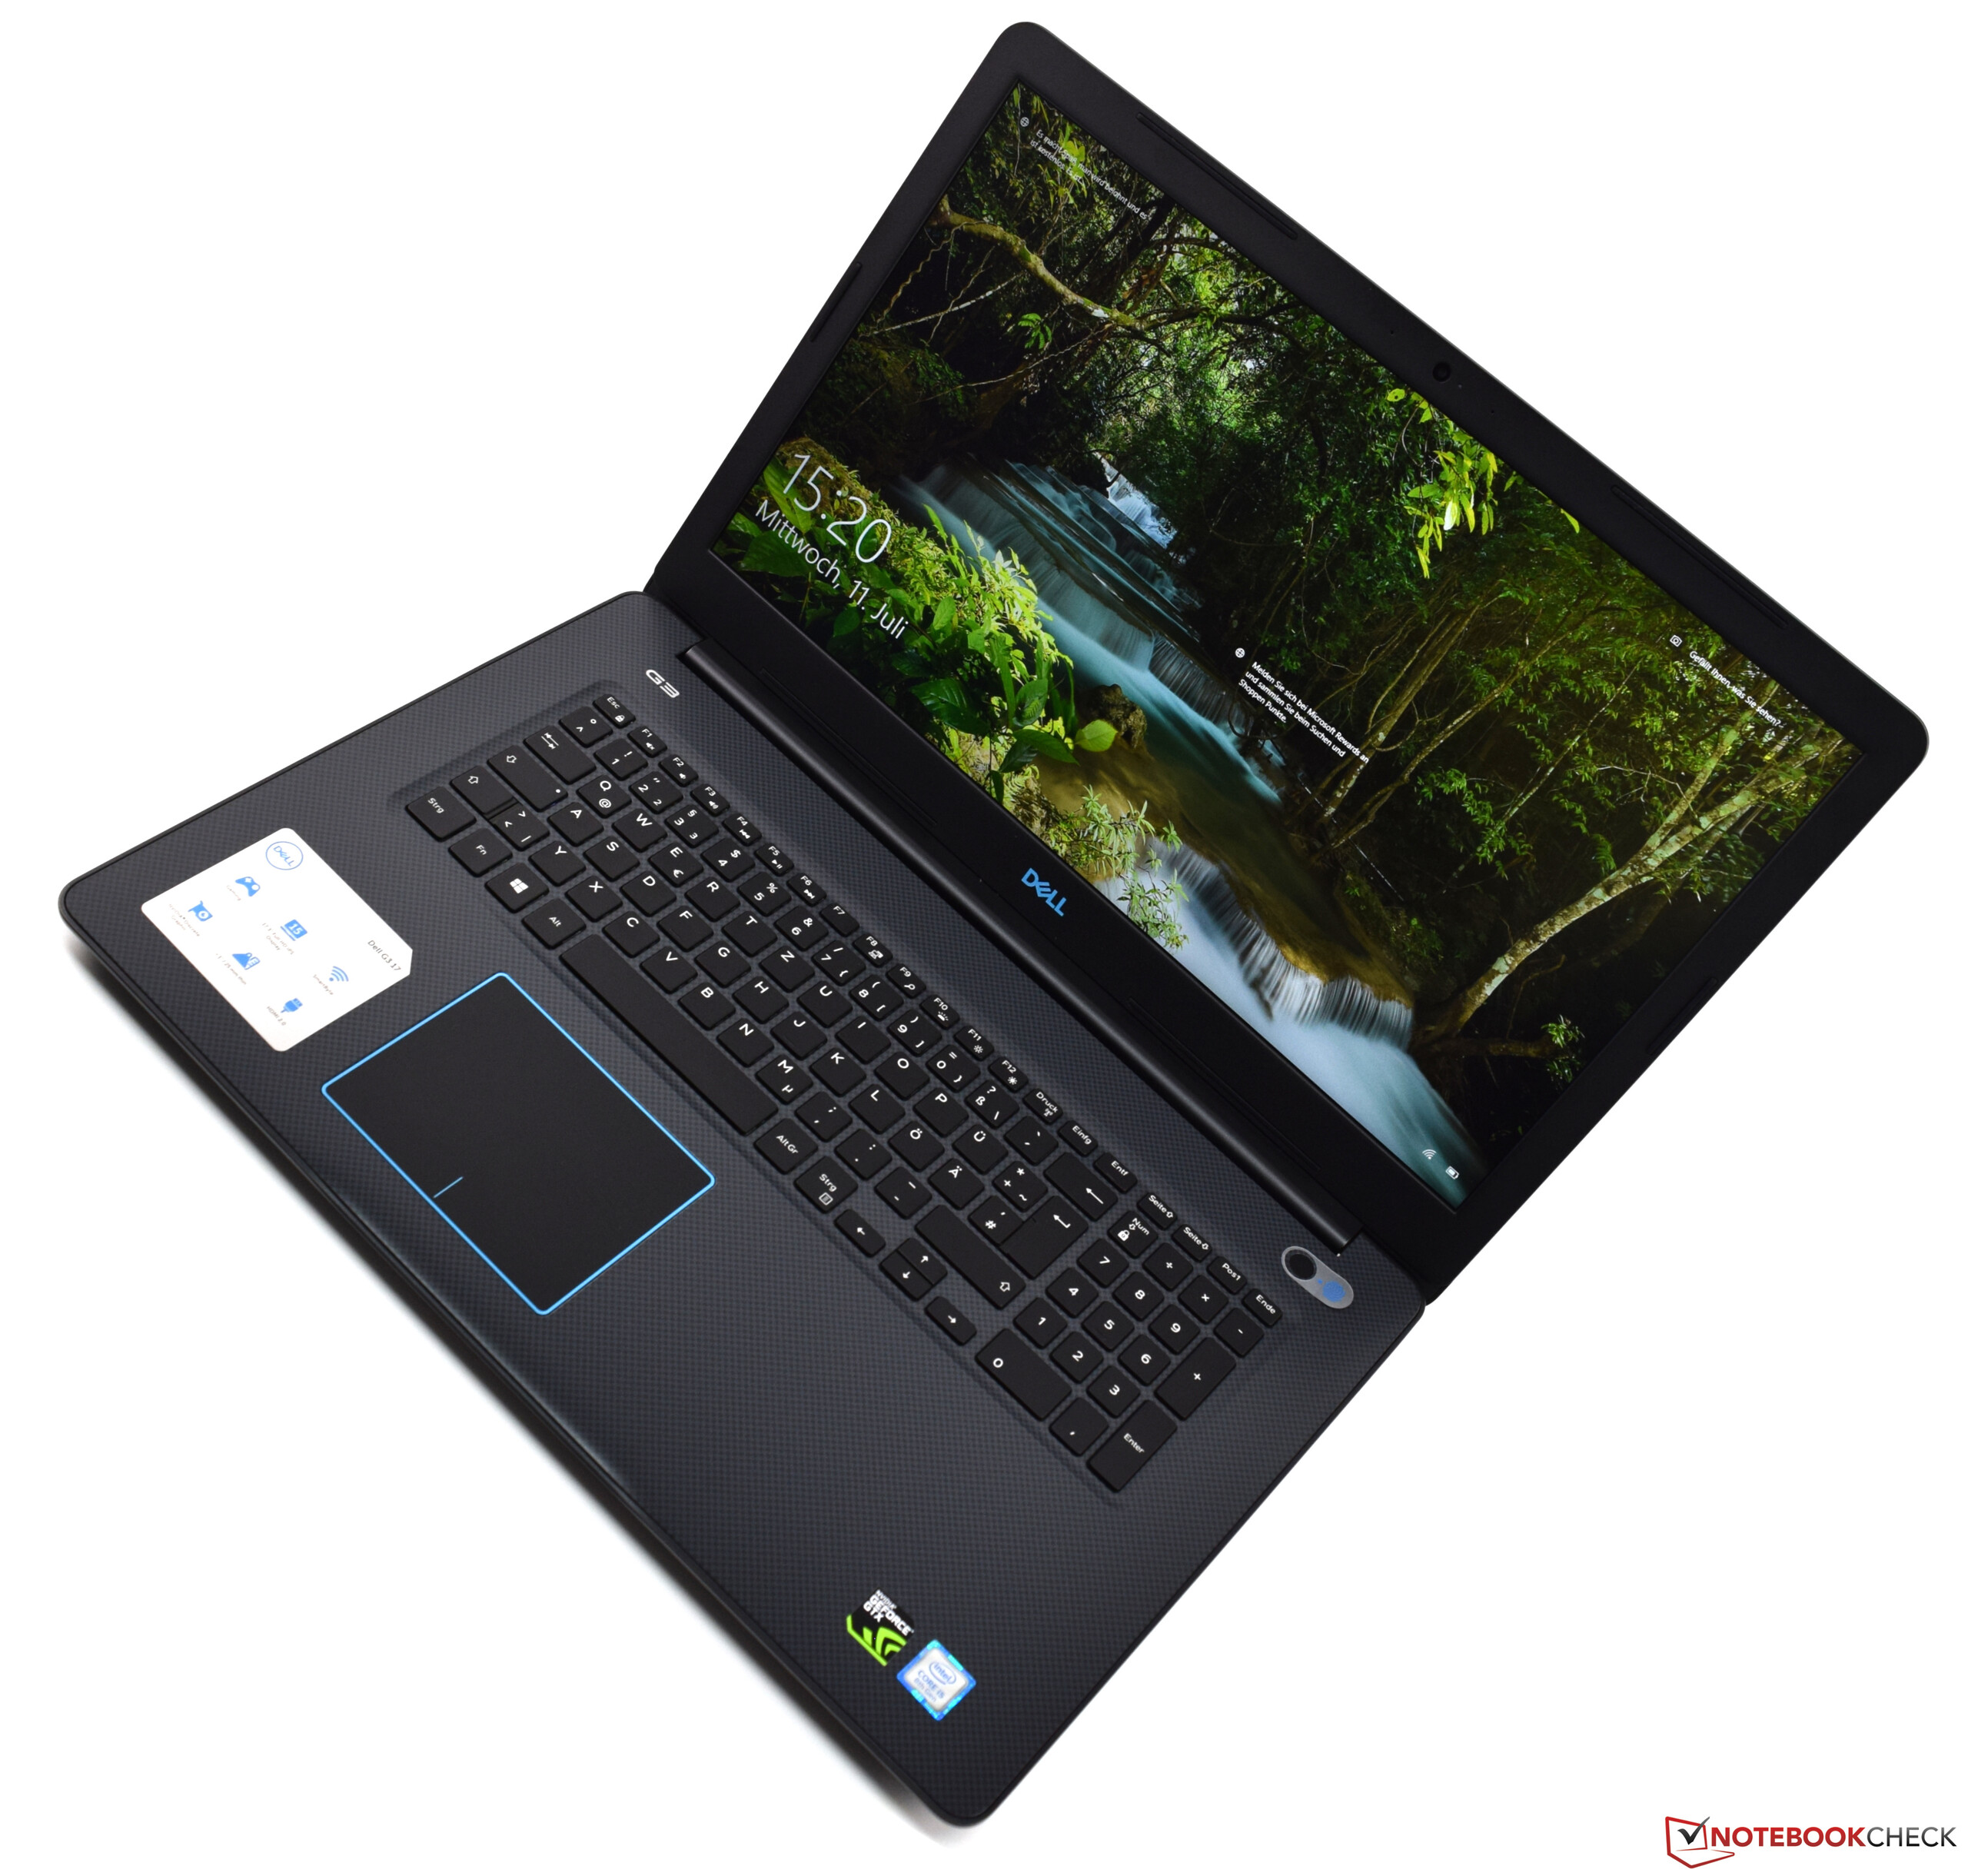
Input Devices - Acceptable input devices in the Dell laptop
Keyboard
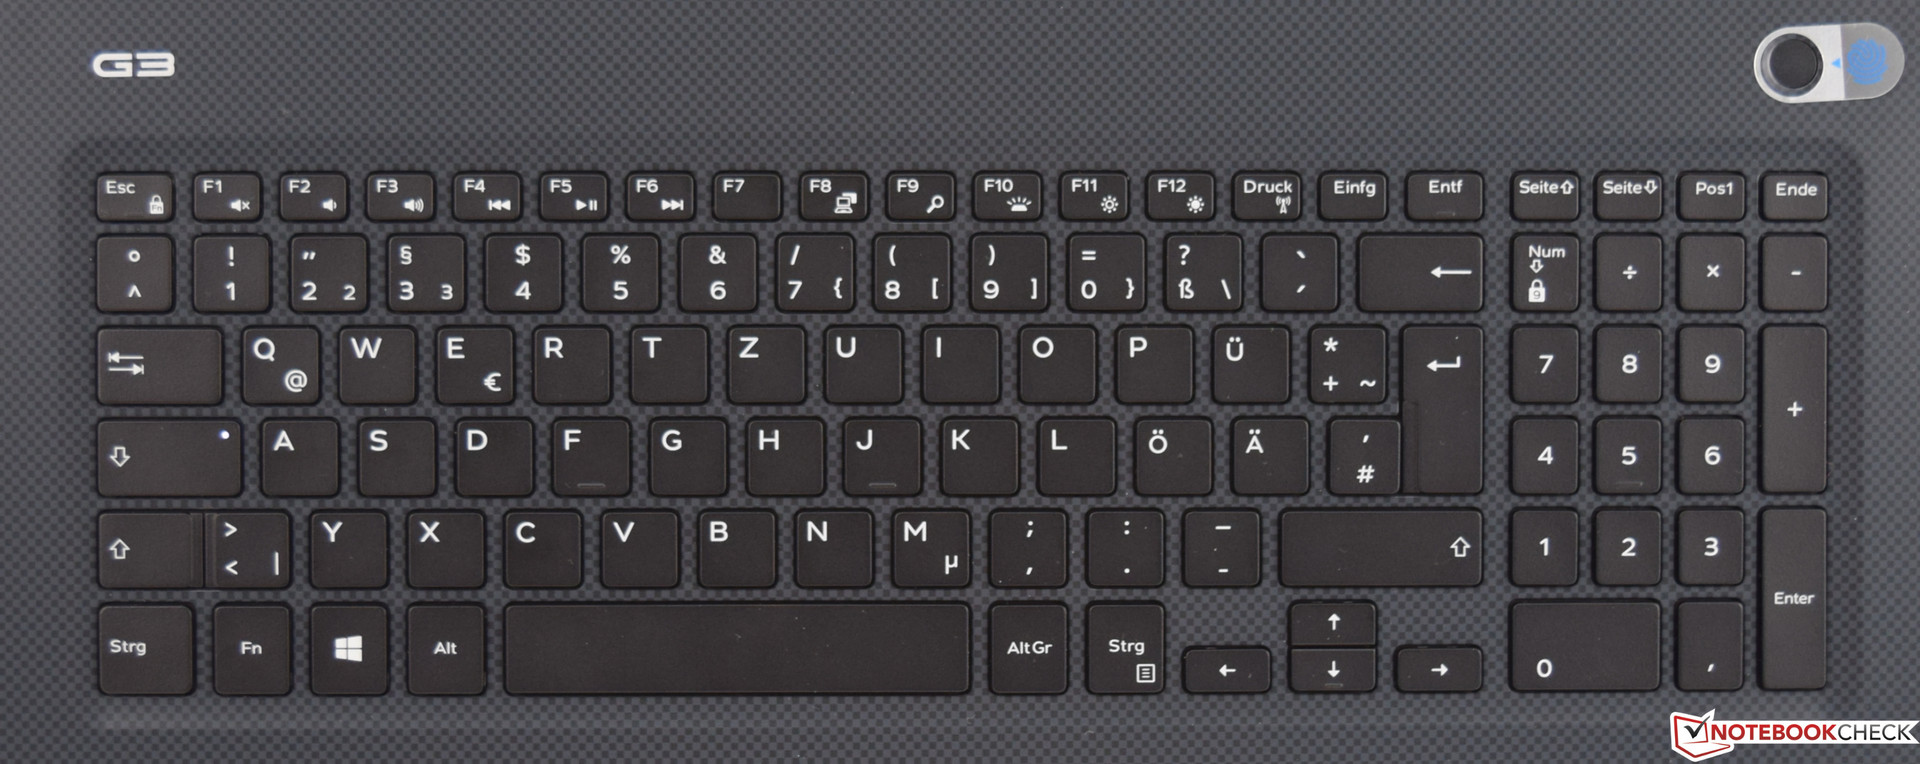
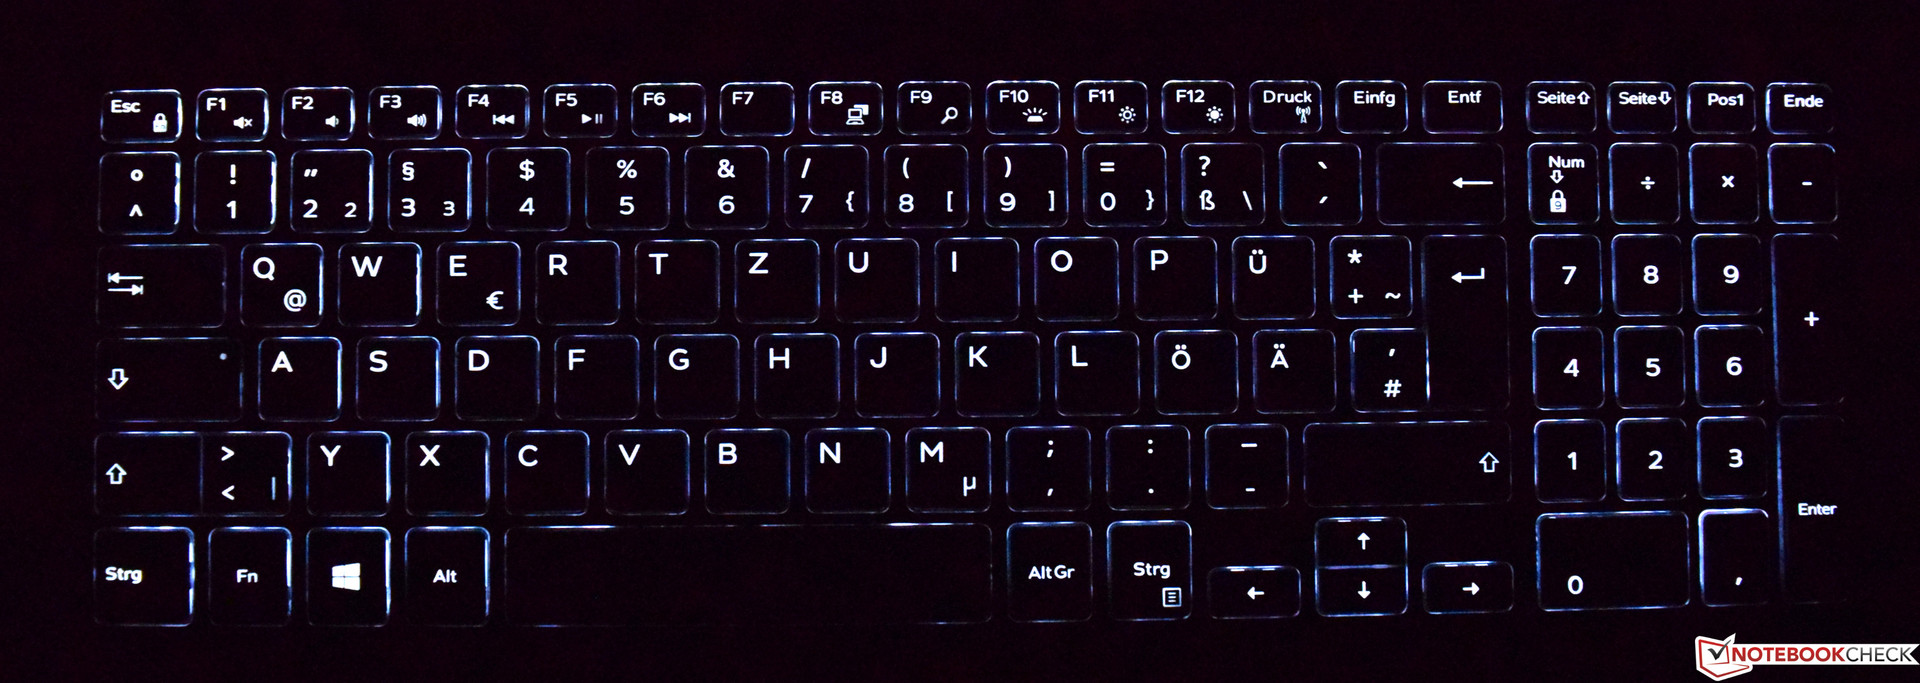
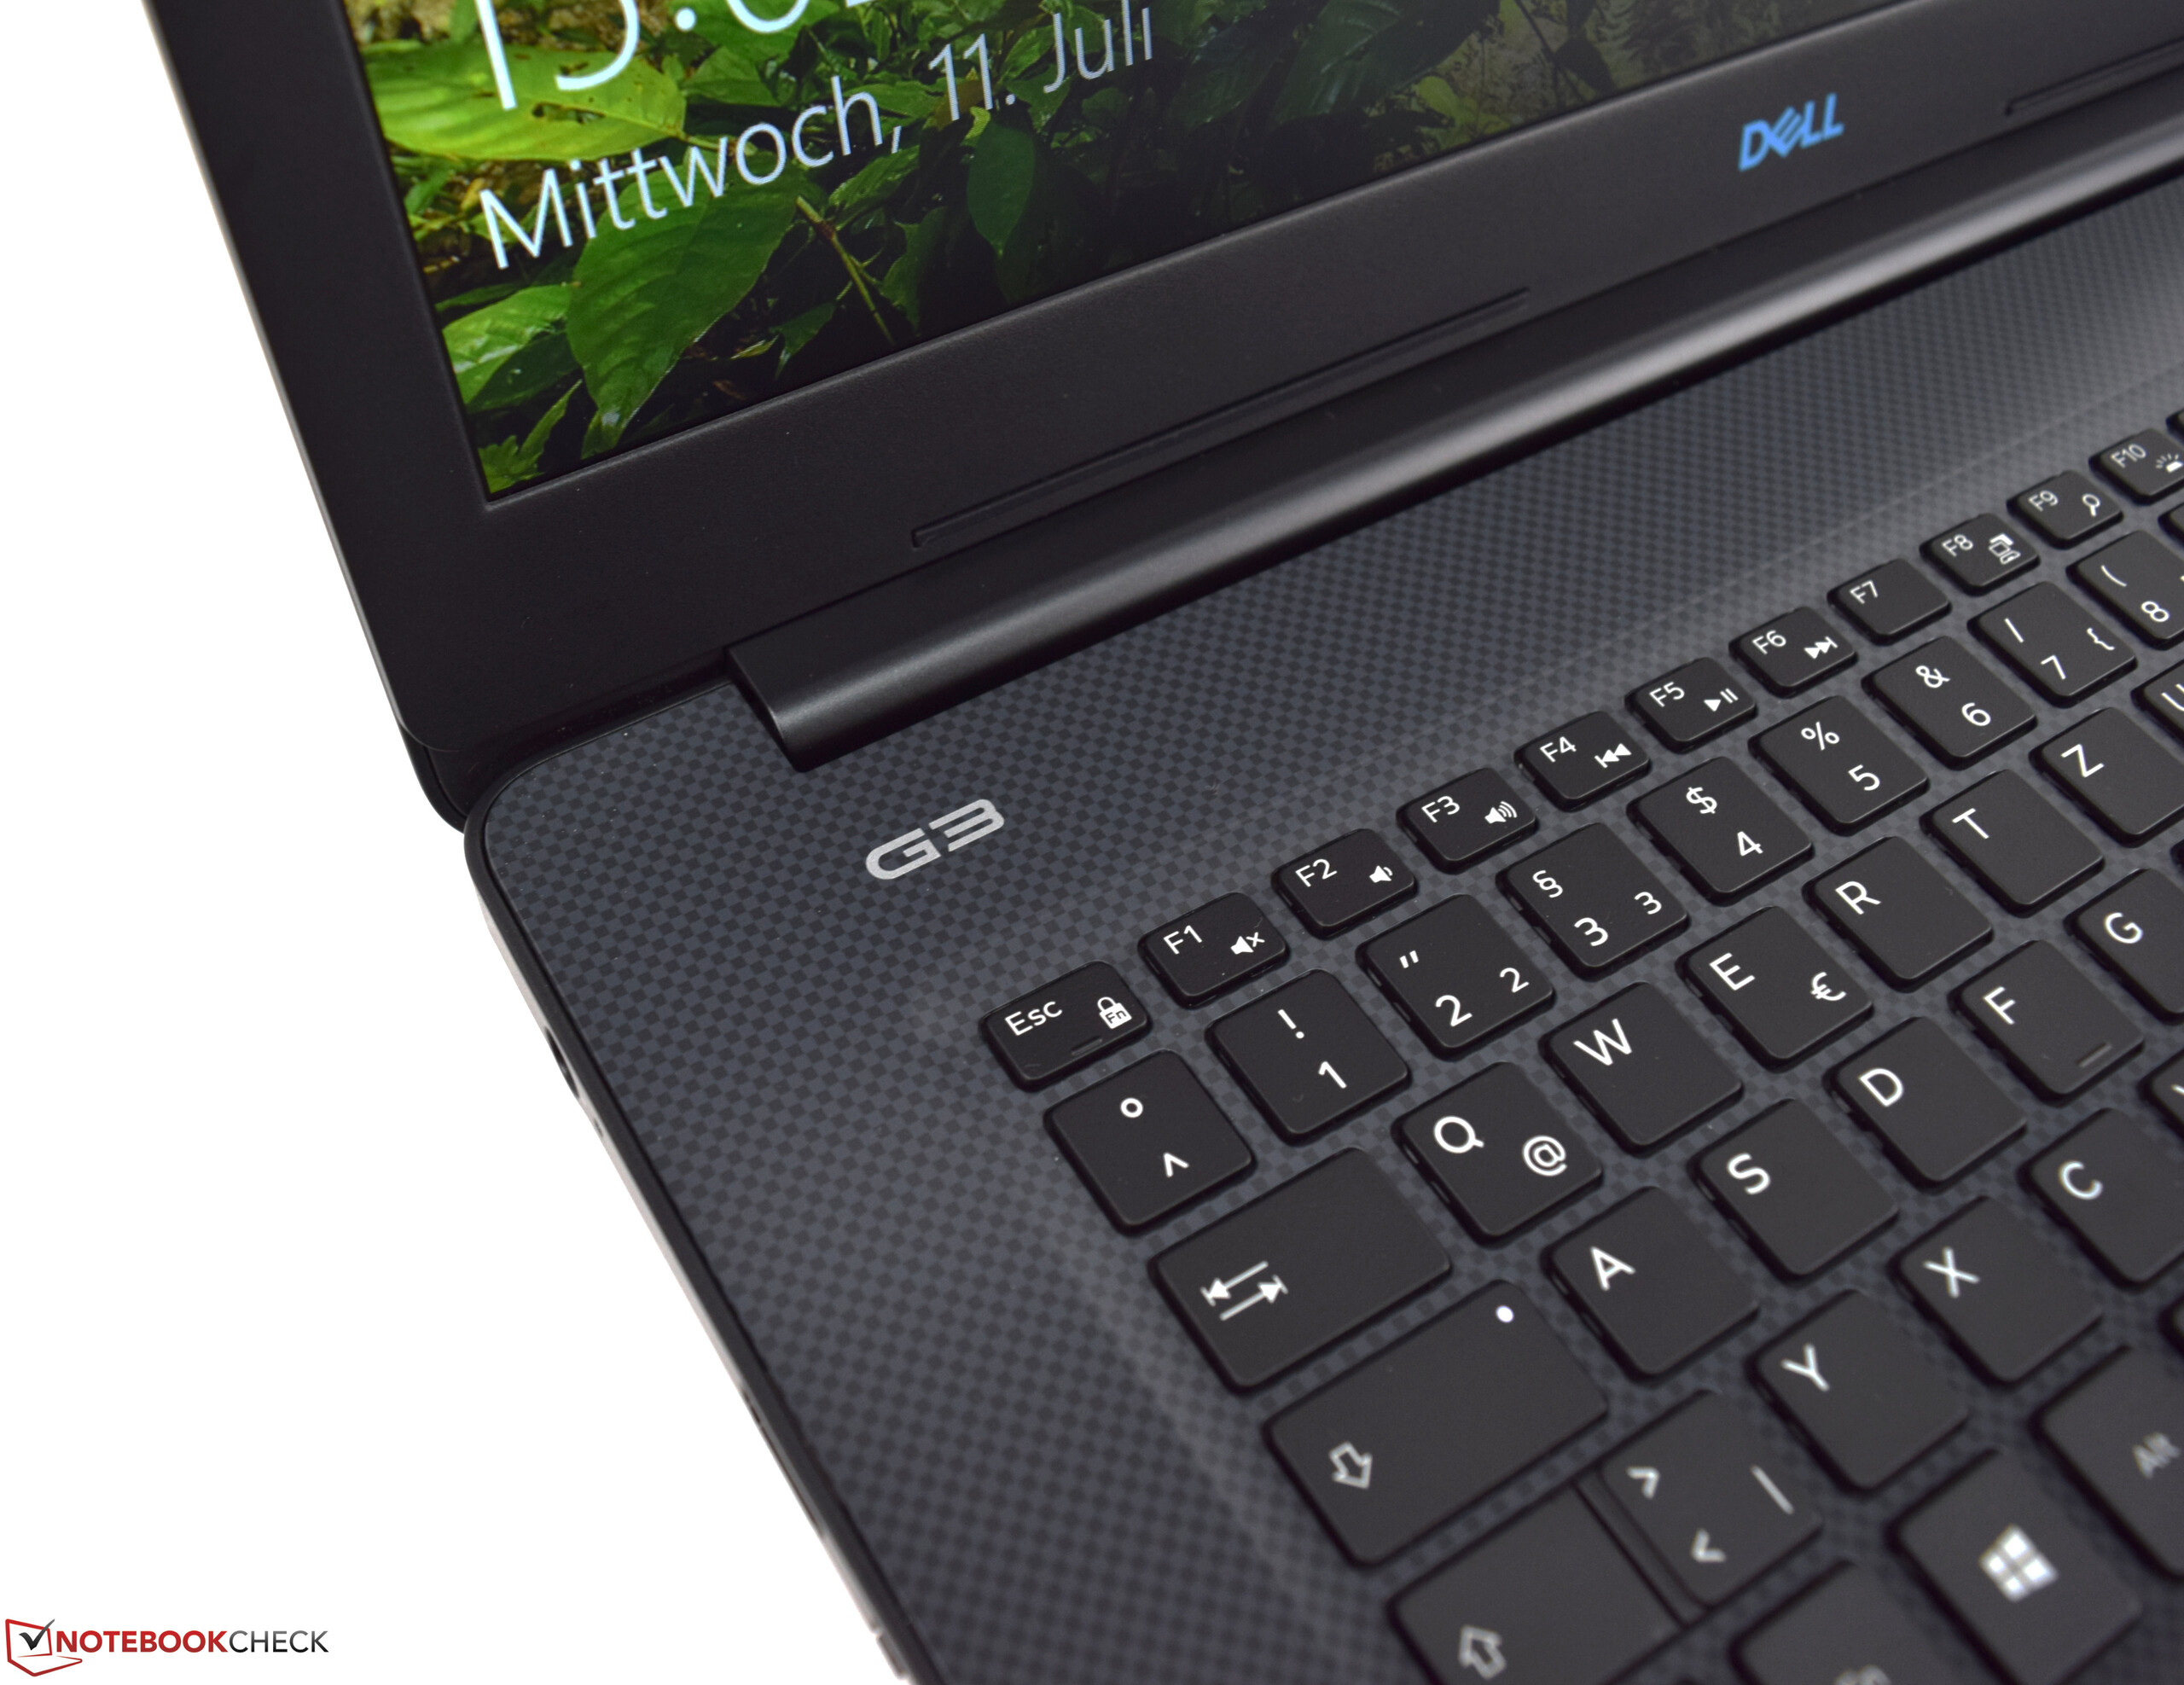
The Dell G3 17 3779 sports a six-row chiclet keyboard, which with its white lettering harmonizes well with the device visually. The keys are slightly recessed in the base, so that the keyboard is at the same level as the palm rest. The keyboard has splash protection and is equipped with a two-step backlight.
At 15 x 15 mm (~0.6 x 0.6 in), the keys are not large but are sized sufficiently. The keys of the number block are another millimeter smaller (~0.04 in). In the beginning, the arrow keys need some getting used to, since they are significantly smaller. The typing noise is pleasantly quiet and not annoying. Only the Space key draws some attention when typing quickly. The stroke is relatively short and the pressure point is noticeable, even though it could have been crisper.
Touchpad
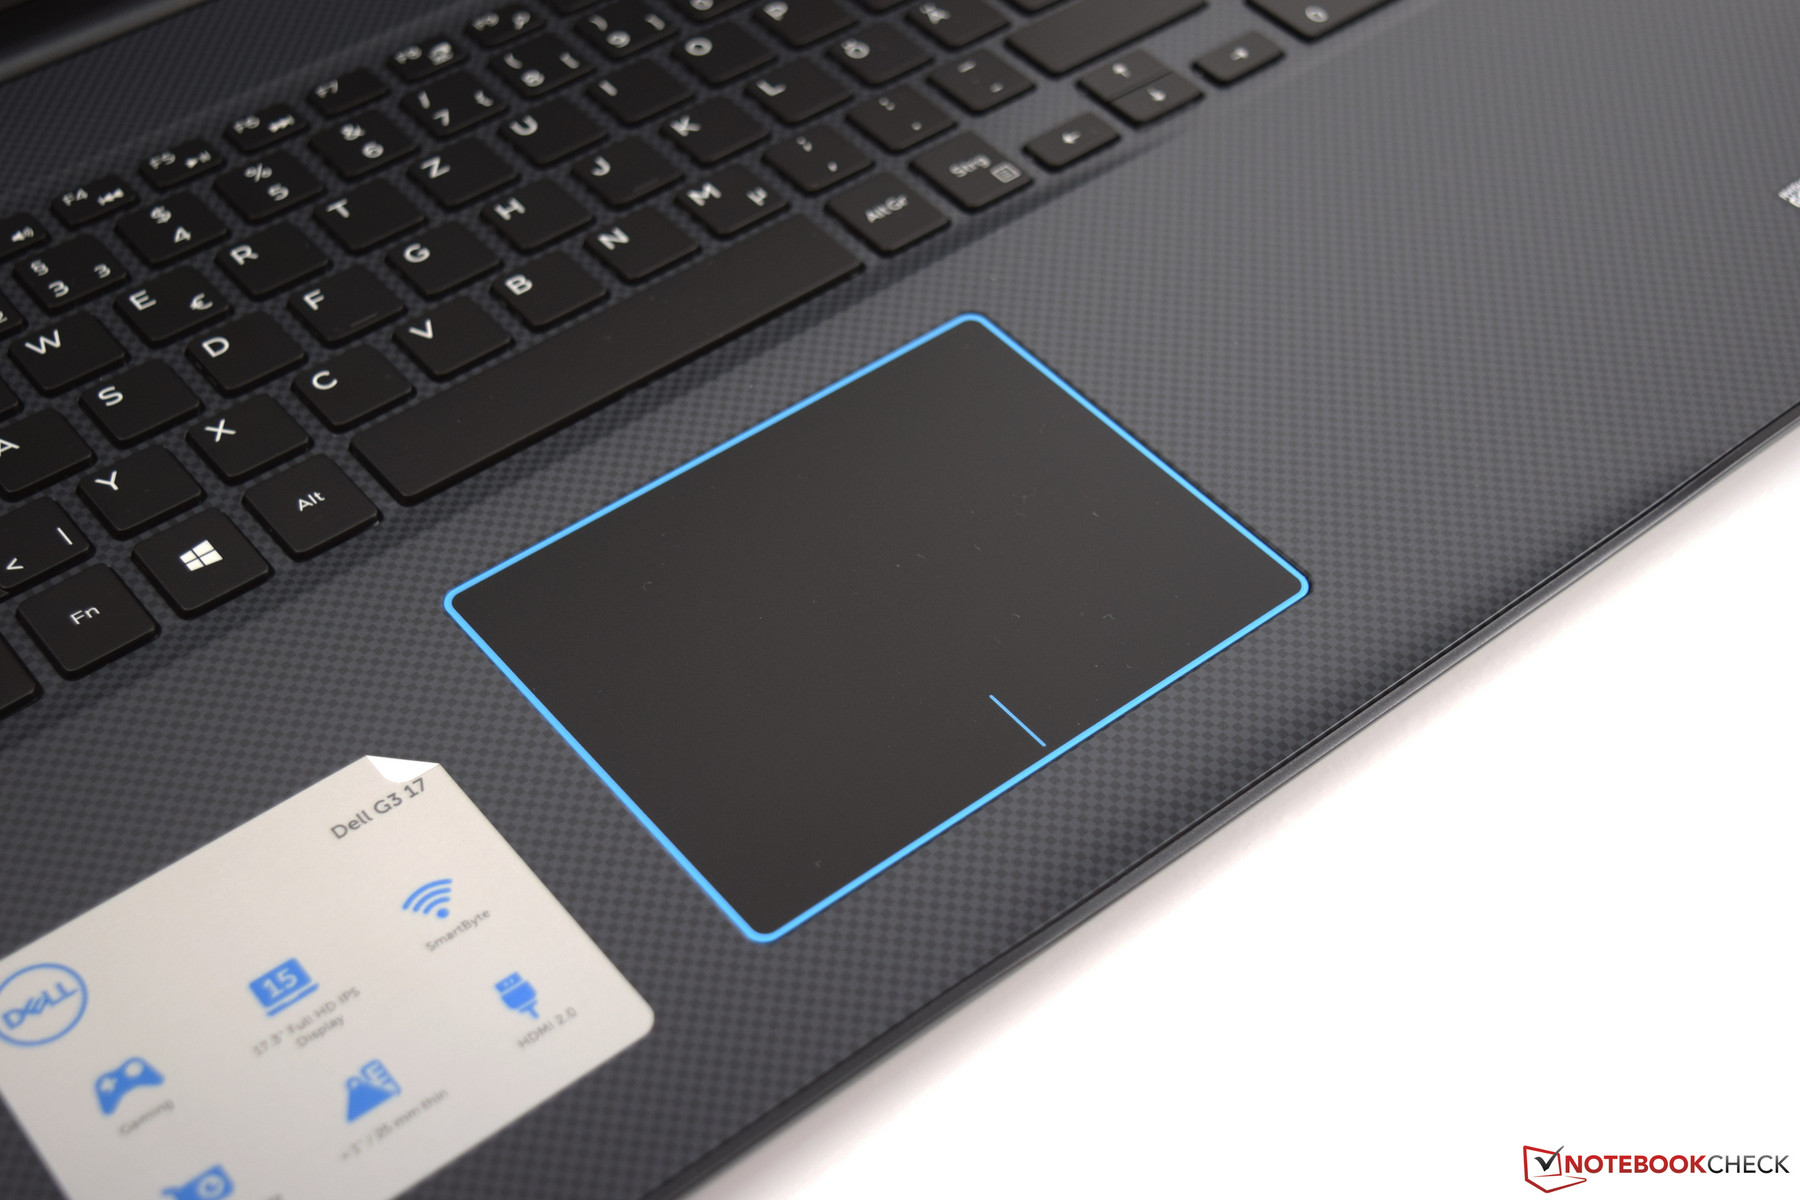
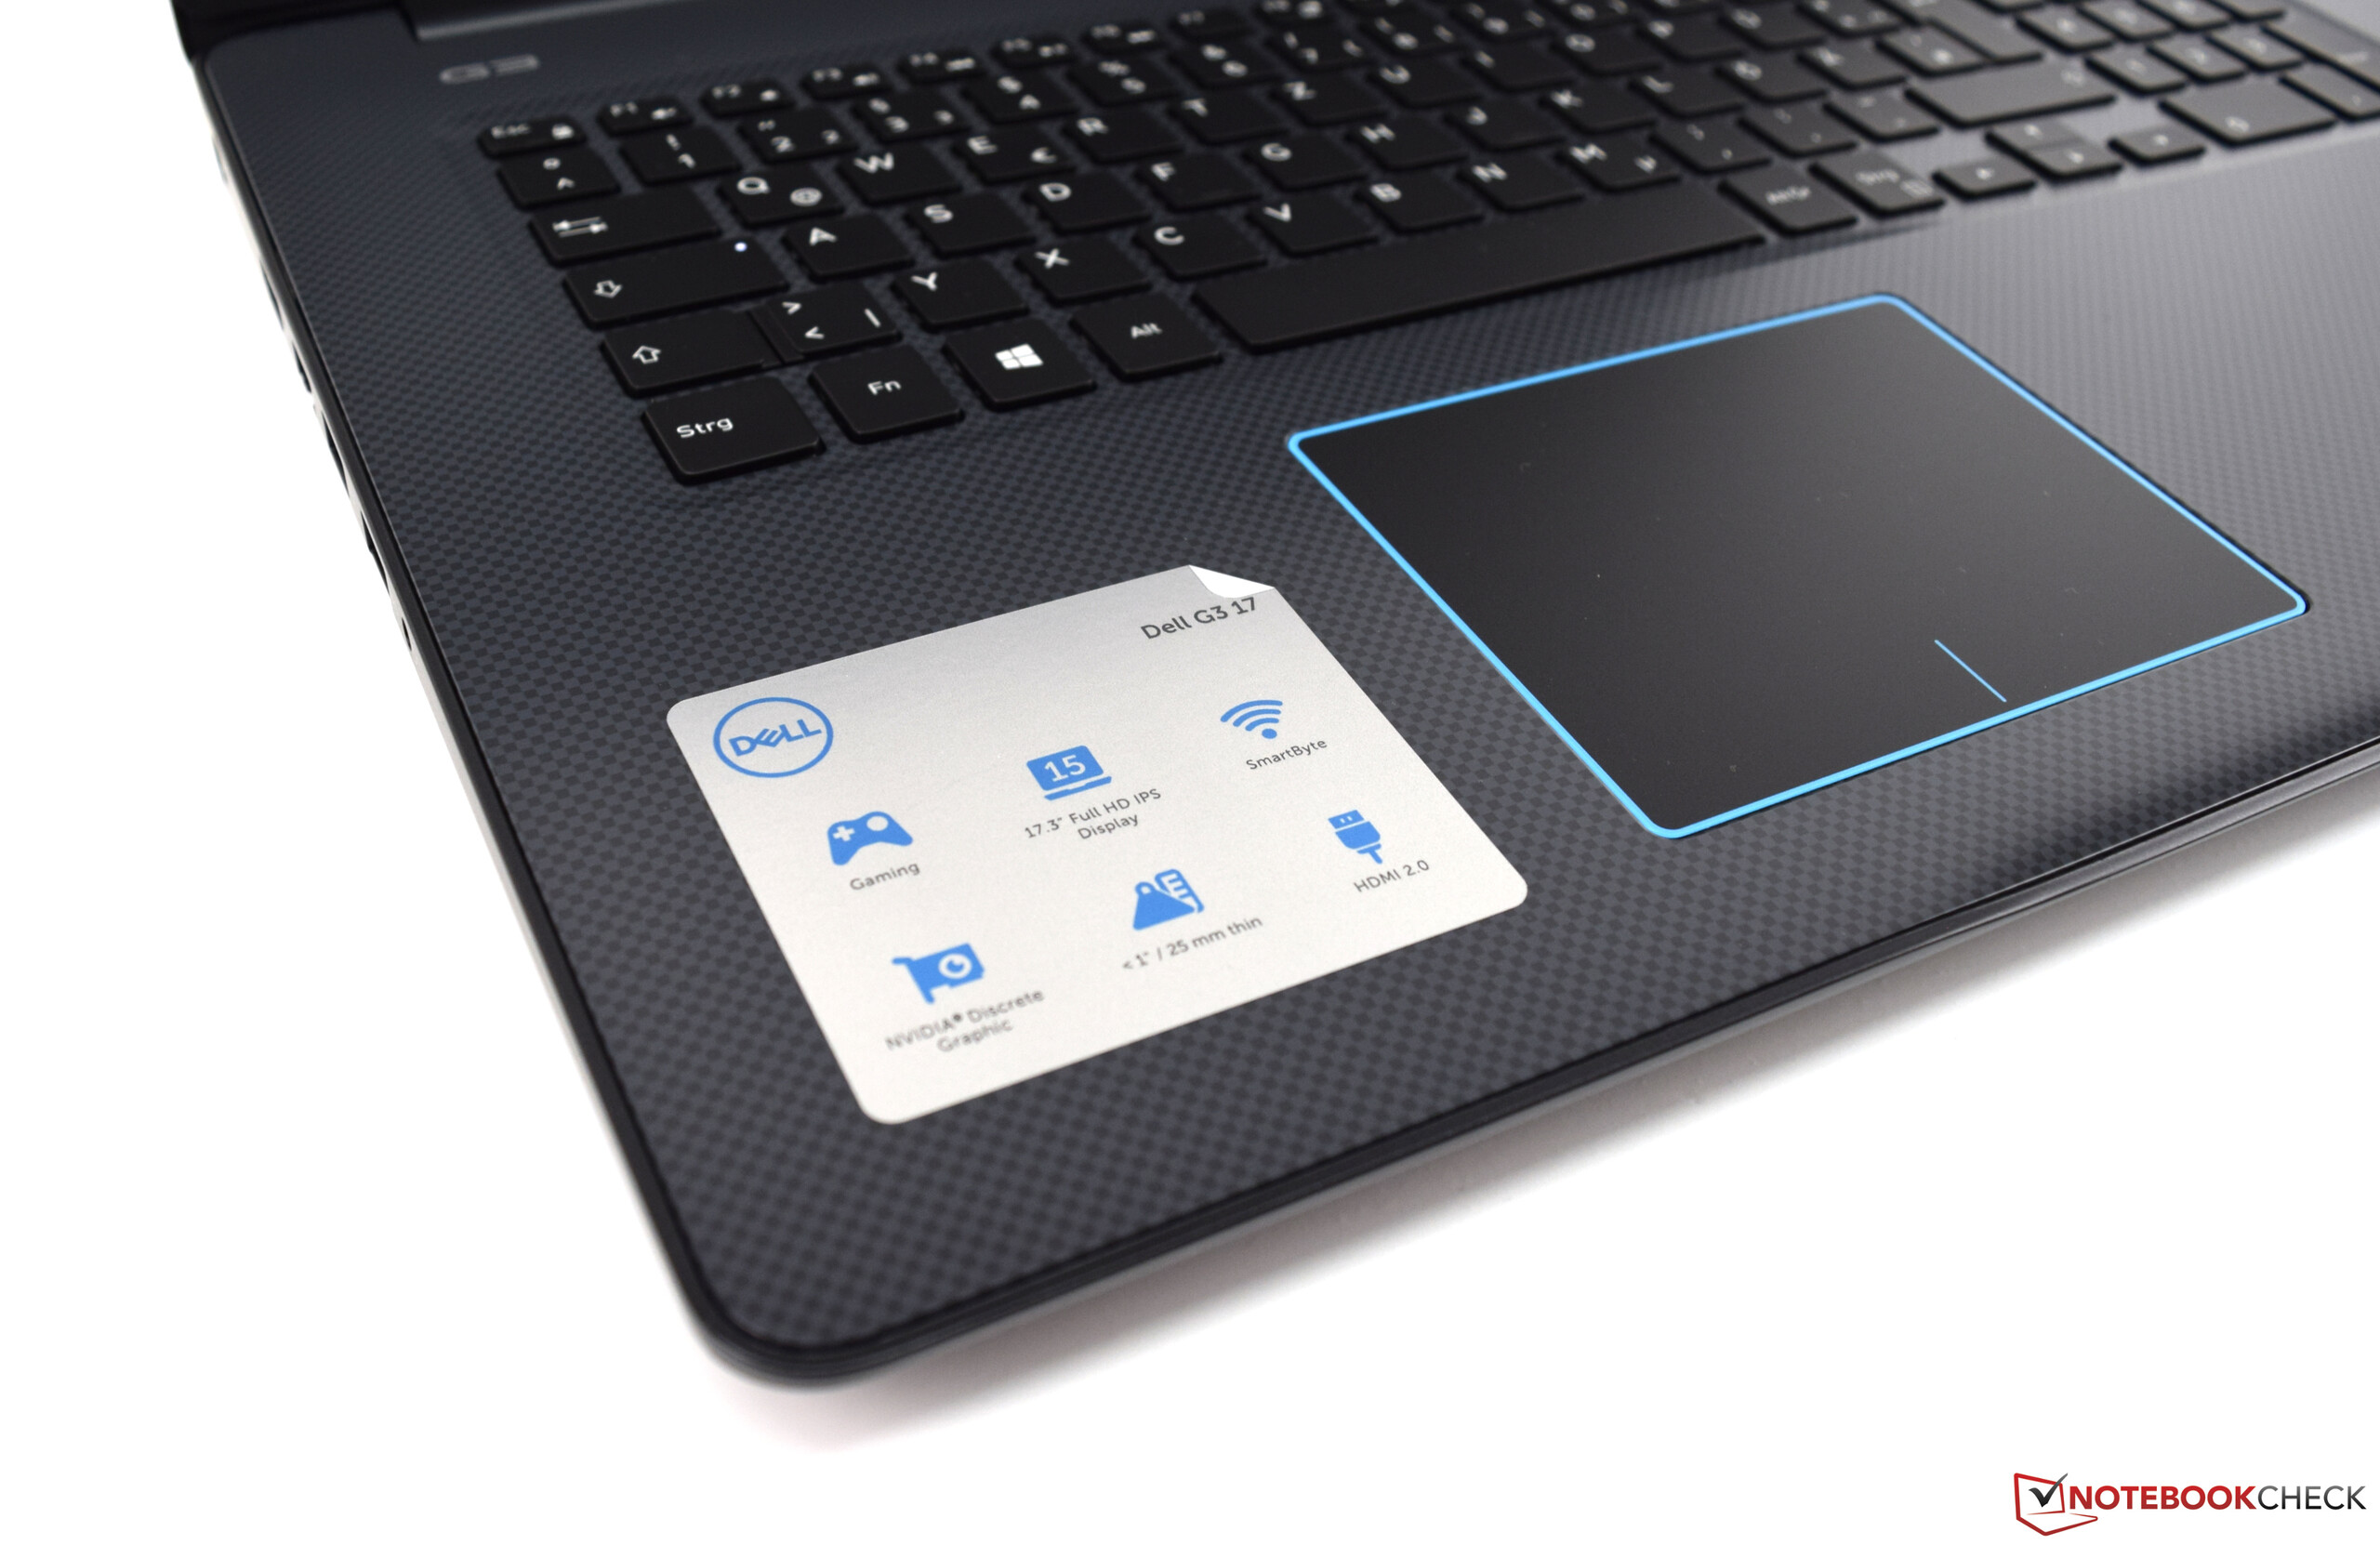
At 10.5 x 8.1 cm (~4.1 x 3.2 in), the touchpad has the same size as in the Dell G5 15. It is visually highlighted with a blue line around the edges. While the input area is sufficiently large for multitouch input, there would have been sufficient space for a larger ClickPad. The slightly roughened surface feels comfortable, but you might have some slight problems with sweaty fingers in terms of the sliding characteristics. We also noticed some areas in the four corners that did not operate accurately in our test unit.
The two input keys are integrated into the lower area. We only see a visual separation line on the input surface. The stroke is short and input is rewarded with a clicking sound that is clearly audible and too loud in our opinion. Since this is a gaming device, an external mouse will be used primarily, so the ClickPad serves its purpose as an occasional mouse replacement sufficiently well.
Display - No alternatives in the selection of the Dell G3 17 display
Our Dell G3 17 3779 is equipped with a 17-inch IPS panel made by AU Optronics. 1920x1080 pixels at this display size results in a pixel density of 127 ppi. Unfortunately, there are no alternative displays such as a 4K panel or G-Sync support.
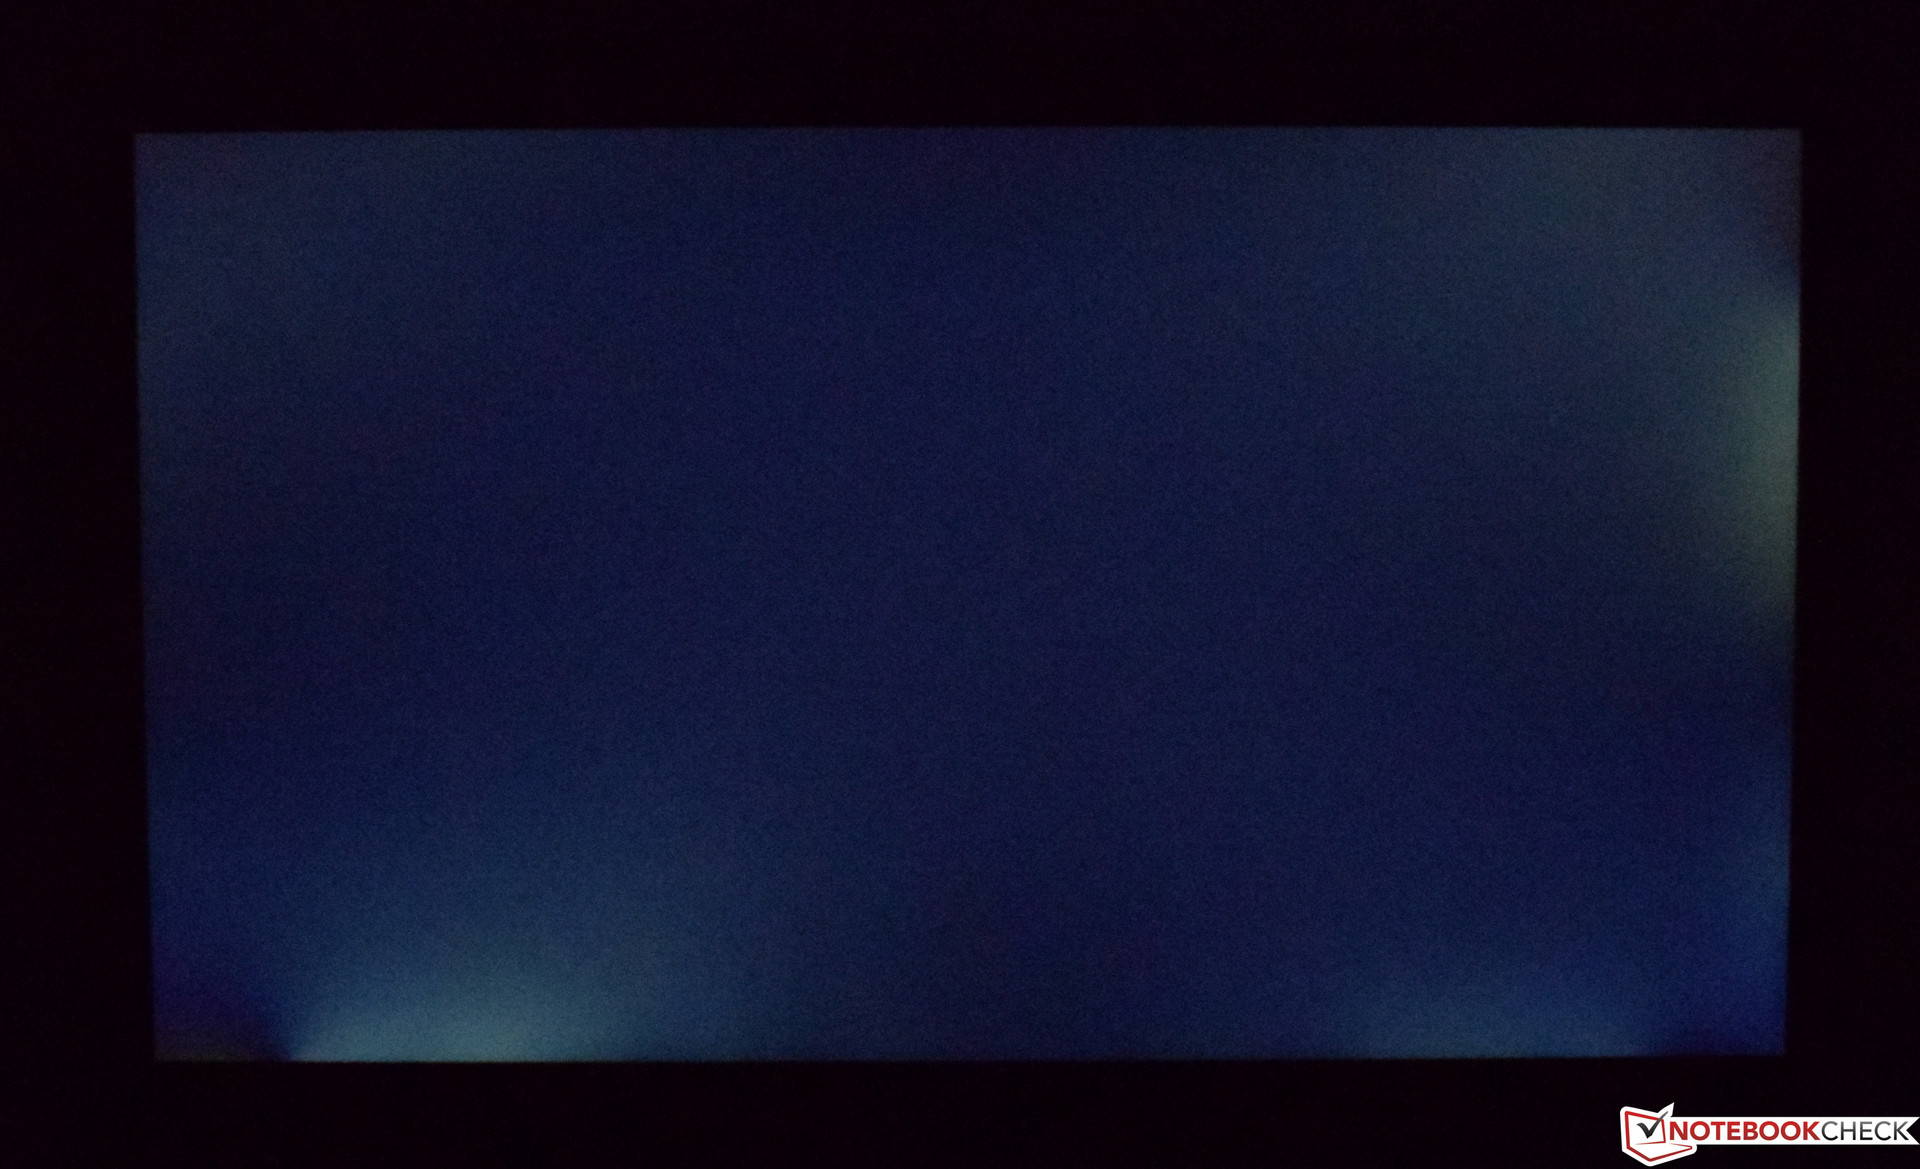
However, Dell did not really do anything wrong with the built-in display, since the matte surface prevents reflections and the average display brightness is quite good at 323 cd/m², even if the Acer Predator Helios 300 and the two Asus devices achieve better values here. At 89%, the brightness distribution is also decent, and the contrast ratio (1042:1) is on a level we expect from an IPS display. We did not notice any PWM for brightness control in our test unit.
On the other hand, we did not expect the extreme clouding that can even be seen frequently in our test unit during normal operation. Due to the manufacturing tolerances, we suspect that this very clearly visible clouding can only be found in our device, and we assume that this is not a general problem of the G3 series.
| |||||||||||||||||||||||||
Brightness Distribution: 89 %
Center on Battery: 323 cd/m²
Contrast: 1042:1 (Black: 0.31 cd/m²)
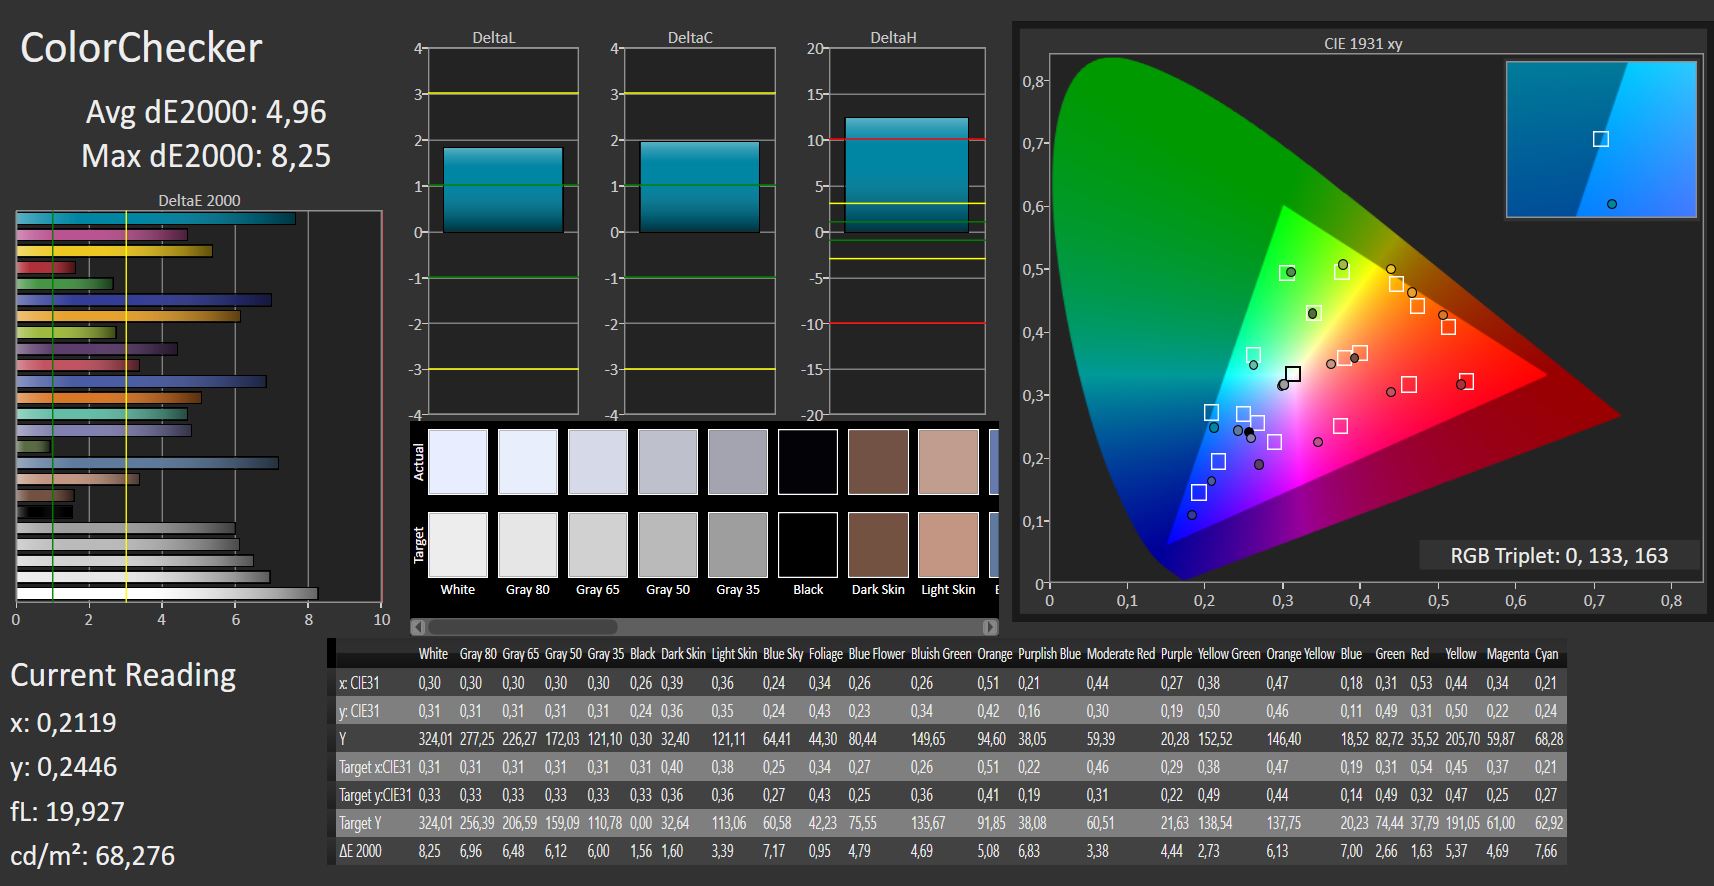
ΔE ColorChecker Calman: 4.96 | ∀{0.5-29.43 Ø4.71}
ΔE Greyscale Calman: 5.65 | ∀{0.09-98 Ø4.96}
90% sRGB (Argyll 1.6.3 3D)
58% AdobeRGB 1998 (Argyll 1.6.3 3D)
64.9% AdobeRGB 1998 (Argyll 3D)
89.8% sRGB (Argyll 3D)
63.9% Display P3 (Argyll 3D)
Gamma: 2.24
CCT: 7441 K
| Dell G3 17 3779 AUO, B173HAN01.3, 1920x1080, 17.3" | Acer Predator Helios 300 PH317-52-51M6 LG Philips LP173WF4-SPF5 (LGD056D), 1920x1080, 17.3" | Asus ROG Strix GL702ZC-GC204T LG Philips LP173WF4-SPF5, 1920x1080, 17.3" | MSI GL72 7RDX-602 Chi Mei CMN1735 N173HGE-E11, 1920x1080, 17.3" | Acer Aspire Nitro BE VN7-793G-5811 AU Optronics, 1920x1080, 17.3" | Asus VivoBook Pro 17 N705UD-EH76 LP173WF4-SPF5, 1920x1080, 17.3" | |
|---|---|---|---|---|---|---|
| Display | -1% | -4% | 3% | -2% | 0% | |
| Display P3 Coverage (%) | 63.9 | 67.1 5% | 65.4 2% | 65.2 2% | 63.1 -1% | 67.9 6% |
| sRGB Coverage (%) | 89.8 | 86.1 -4% | 82.6 -8% | 94.3 5% | 86.5 -4% | 86.8 -3% |
| AdobeRGB 1998 Coverage (%) | 64.9 | 63 -3% | 60.4 -7% | 65.6 1% | 63.3 -2% | 63.5 -2% |
| Response Times | 10% | 9% | 12% | -2% | 15% | |
| Response Time Grey 50% / Grey 80% * (ms) | 38 ? | 36 ? 5% | 36 ? 5% | 29 ? 24% | 38 ? -0% | 30.8 ? 19% |
| Response Time Black / White * (ms) | 26 ? | 22 ? 15% | 23 ? 12% | 26 ? -0% | 27 ? -4% | 23.2 ? 11% |
| PWM Frequency (Hz) | 122000 ? | 961 | 119000 ? | |||
| Screen | -9% | -1% | -42% | 2% | -1% | |
| Brightness middle (cd/m²) | 323 | 365 13% | 415 28% | 299 -7% | 301 -7% | 376.2 16% |
| Brightness (cd/m²) | 306 | 341 11% | 365 19% | 274 -10% | 270 -12% | 355 16% |
| Brightness Distribution (%) | 89 | 89 0% | 82 -8% | 80 -10% | 79 -11% | 89 0% |
| Black Level * (cd/m²) | 0.31 | 0.32 -3% | 0.42 -35% | 0.25 19% | 0.38 -23% | 0.42 -35% |
| Contrast (:1) | 1042 | 1141 10% | 988 -5% | 1196 15% | 792 -24% | 896 -14% |
| Colorchecker dE 2000 * | 4.96 | 6.51 -31% | 4.95 -0% | 12.92 -160% | 3.49 30% | 4.21 15% |
| Colorchecker dE 2000 max. * | 8.25 | 12.32 -49% | 9.34 -13% | 19.91 -141% | 7.49 9% | 8.31 -1% |
| Greyscale dE 2000 * | 5.65 | 7.65 -35% | 4.69 17% | 13.16 -133% | 1.88 67% | 5.5 3% |
| Gamma | 2.24 98% | 2.64 83% | 2.33 94% | 2.36 93% | 2.35 94% | 2.335 94% |
| CCT | 7441 87% | 8066 81% | 6485 100% | 15046 43% | 6587 99% | 7056 92% |
| Color Space (Percent of AdobeRGB 1998) (%) | 58 | 56 -3% | 54 -7% | 60 3% | 56 -3% | 57 -2% |
| Color Space (Percent of sRGB) (%) | 90 | 86 -4% | 82 -9% | 94 4% | 86 -4% | 87 -3% |
| Colorchecker dE 2000 calibrated * | 2.9 | 3.95 | ||||
| Total Average (Program / Settings) | 0% /
-5% | 1% /
-1% | -9% /
-26% | -1% /
1% | 5% /
2% |
* ... smaller is better

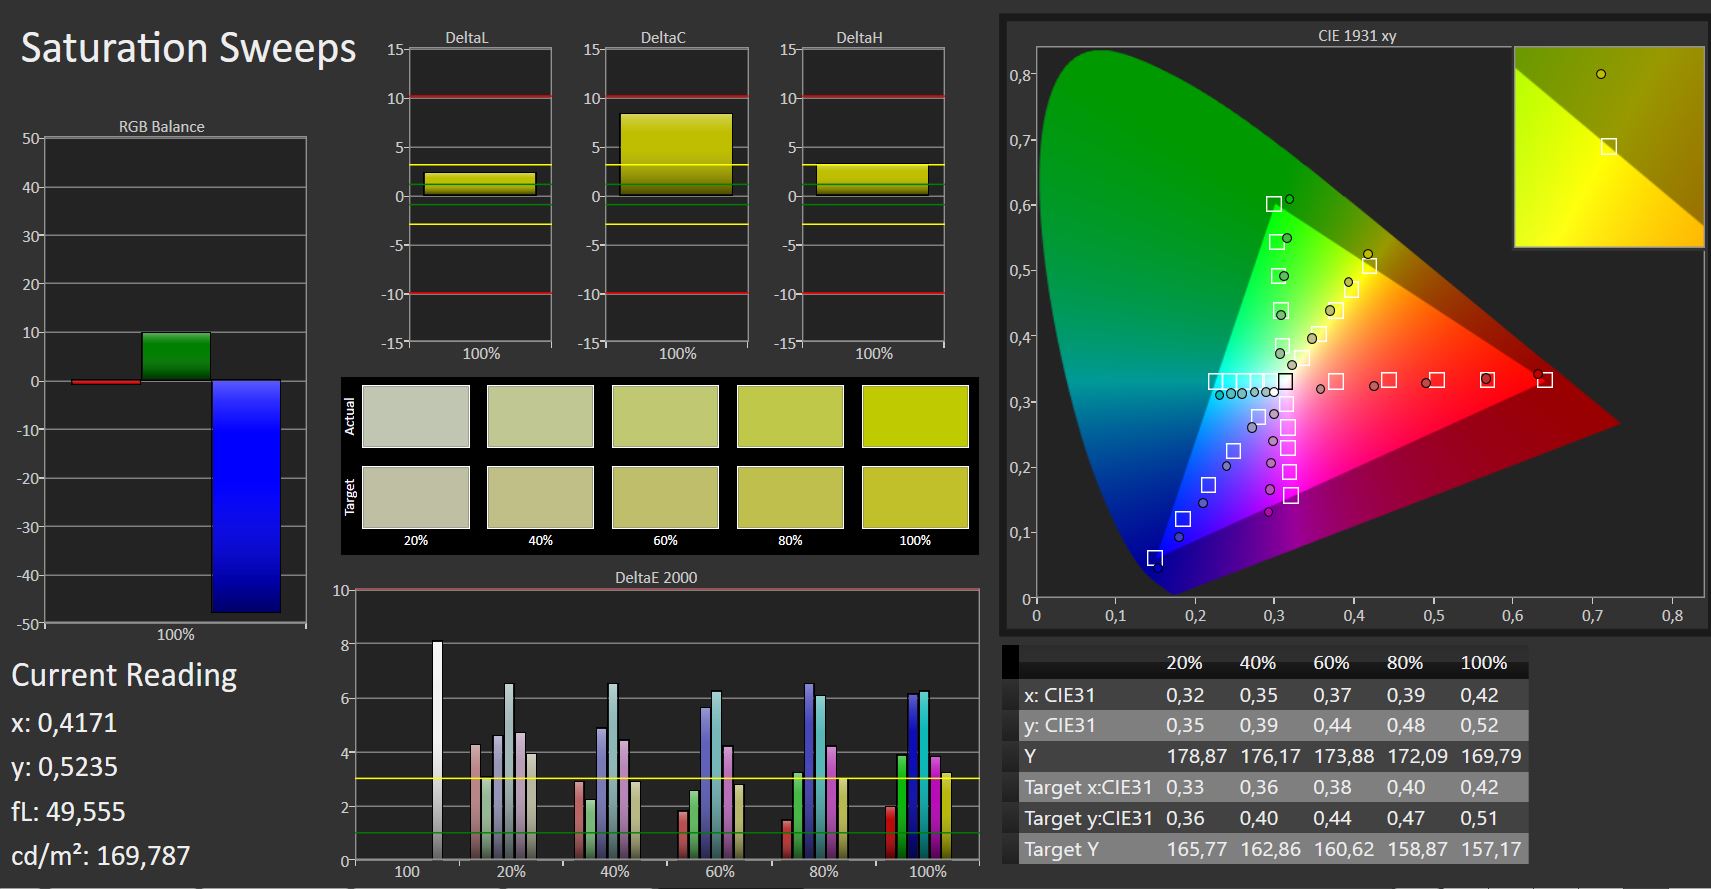
The strong clouding results in some significant quality reductions when displaying dark scenes. If we disregard the clouding, the IPS panel offers a good color reproduction without appearing artificial. In the state of delivery, the measured DeltaE-2000 deviations are only slightly elevated. Only the Acer Aspire Nitro BE is able to deliver better values here. We calibrated the display of our Dell G3 17 3779 and linked the corresponding ICC profile. You can find the link for download above the comparison table. In terms of the color-space coverage, our test unit leaves a good impression, and at 90% (sRGB) and 58% (AdobeRGB), the Dell G3 17 3779 places second. While our test unit cannot quite reach the MSI GL72 with this good color-space coverage, our test unit is actually quite suited for image or video-processing.

Despite its matte display surface, those who want to work with the Dell G3 17 3779 outdoors should look for a shady place. In direct sunlight, the display brightness is not sufficient to work without problems.
Display Response Times
| ↔ Response Time Black to White | ||
|---|---|---|
| 26 ms ... rise ↗ and fall ↘ combined | ↗ 15 ms rise | 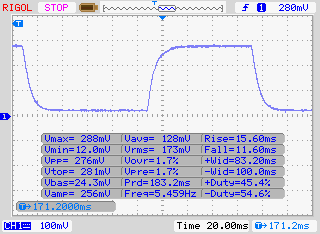 |
| ↘ 11 ms fall | ||
| The screen shows relatively slow response rates in our tests and may be too slow for gamers. In comparison, all tested devices range from 0.1 (minimum) to 240 (maximum) ms. » 63 % of all devices are better. This means that the measured response time is worse than the average of all tested devices (19.8 ms). | ||
| ↔ Response Time 50% Grey to 80% Grey | ||
| 38 ms ... rise ↗ and fall ↘ combined | ↗ 18 ms rise | 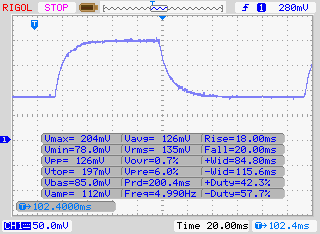 |
| ↘ 20 ms fall | ||
| The screen shows slow response rates in our tests and will be unsatisfactory for gamers. In comparison, all tested devices range from 0.165 (minimum) to 636 (maximum) ms. » 55 % of all devices are better. This means that the measured response time is worse than the average of all tested devices (31 ms). | ||
Screen Flickering / PWM (Pulse-Width Modulation)
| Screen flickering / PWM not detected | 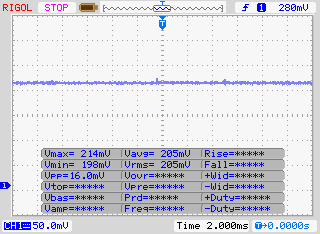 | ||
In comparison: 52 % of all tested devices do not use PWM to dim the display. If PWM was detected, an average of 7754 (minimum: 5 - maximum: 343500) Hz was measured. | |||
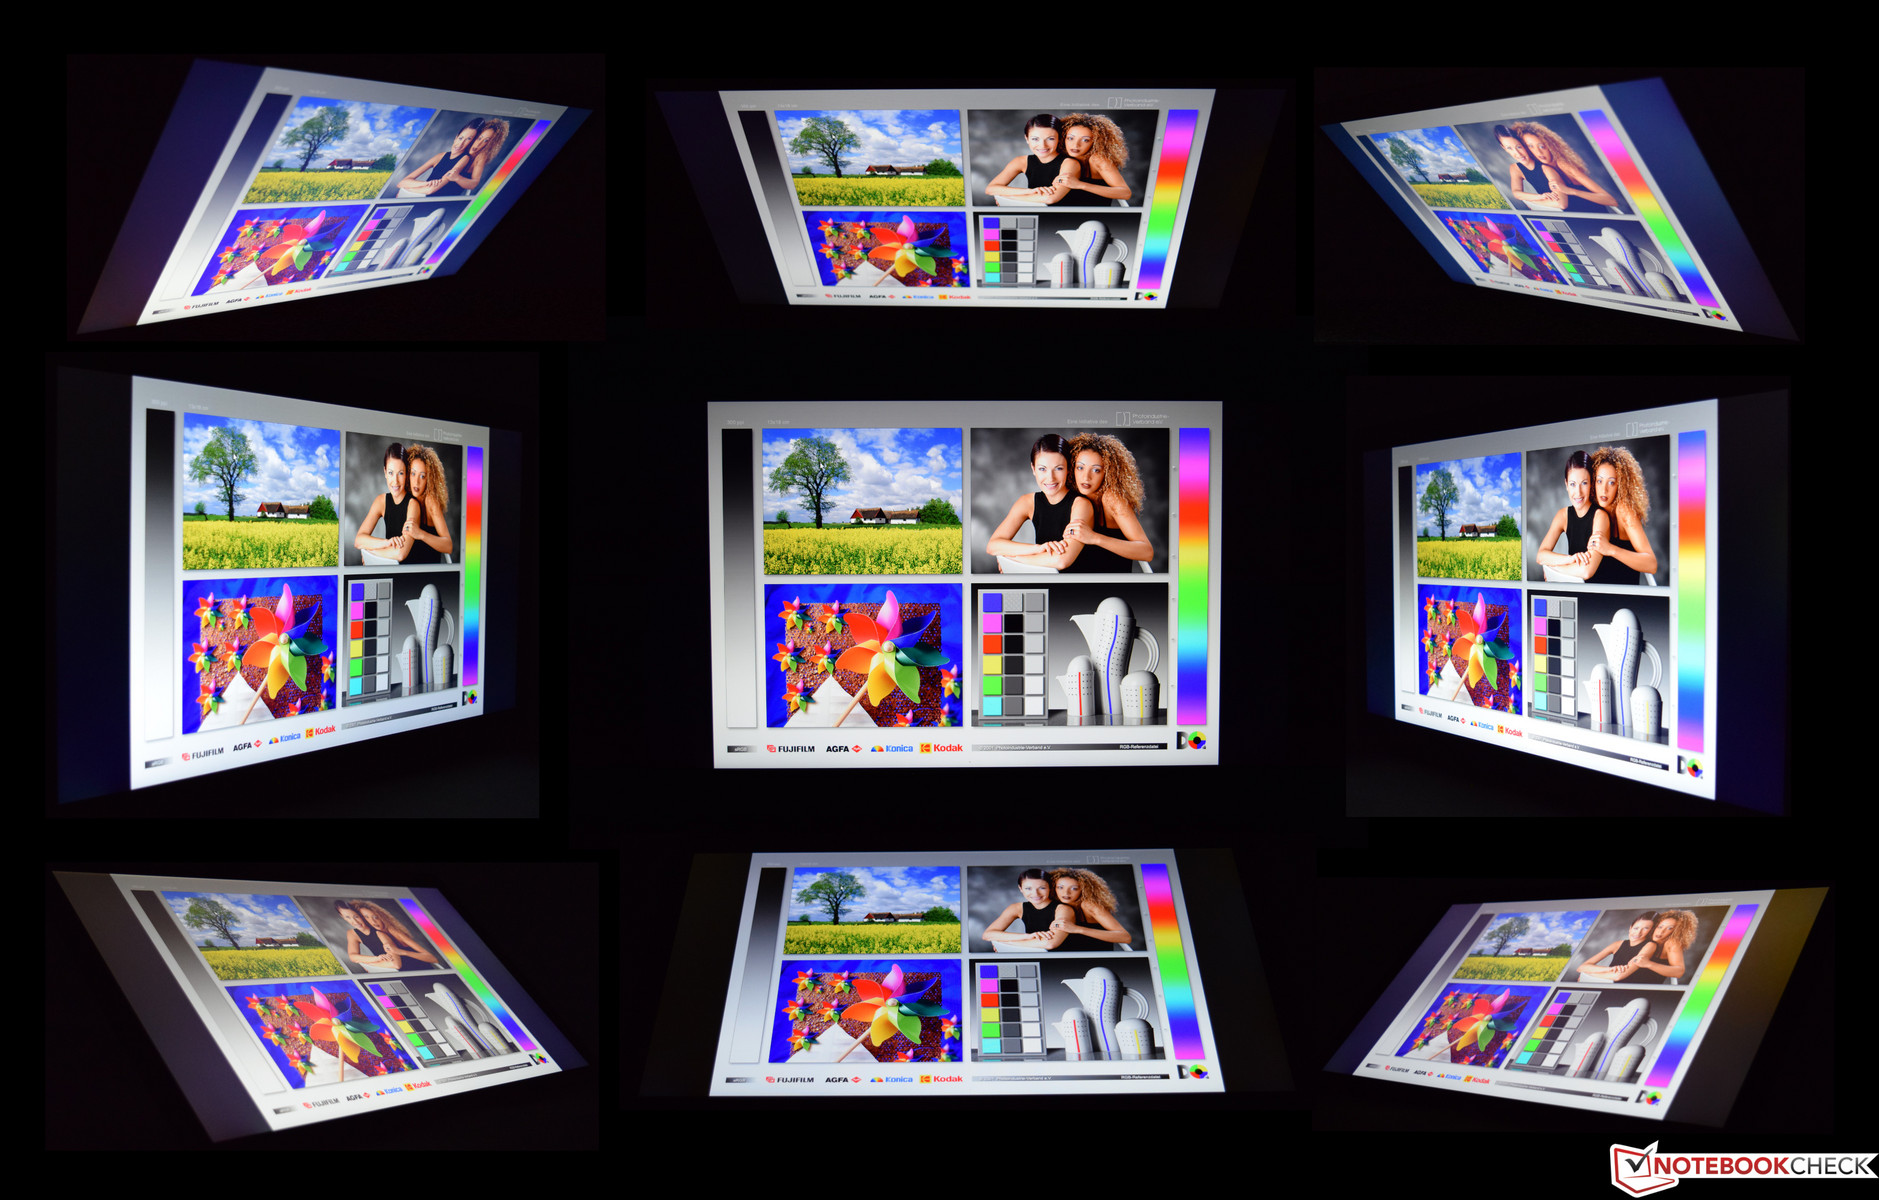
In the viewing-angle test, the Dell G3 17 3779 shows a result typical for IPS panels. The test image can be seen very well from almost all the viewing angles. We only see some slight color changes in the corner images, but this does not lead to any limitations during everyday operation.
Performance - Dell laptop also with six cores if needed
With an Intel Core i5-8300H and an Nvidia GeForce GTX 1050, our test unit offers a solid basis for a gaming notebook and even goes easy on the budget. As the storage solution, Dell has equipped the G3 17 3779 with a small SSD (128 GB) and a conventional hard drive (1 TB) for various games. Anyone who does not want to do without a six-core processor can also purchase the Dell G3 17 with the Intel Core i7-8750H. However, since many games do not make full use of the number of computing cores, the advantage to the i5-8300H is not necessarily a decisive purchasing factor. Investing in a better GPU might make more sense, even if the Core i7-8750H is also included then. That is to say, the Dell G3 17 is also available with a GeForce GTX 1050 Ti or a GeForce GTX 1060 Max-Q.


Processor
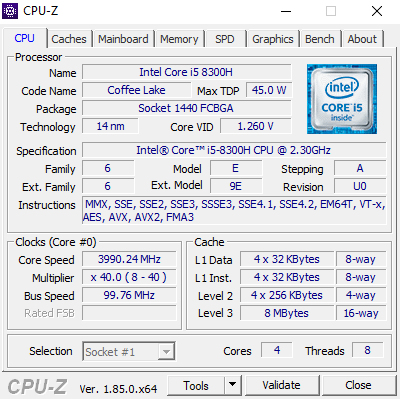
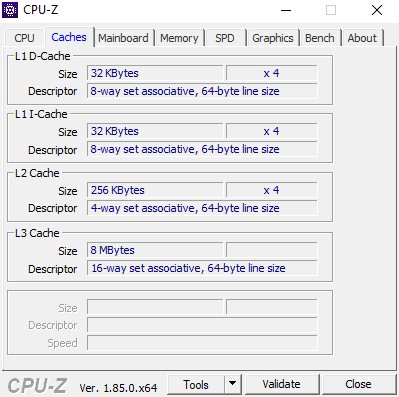
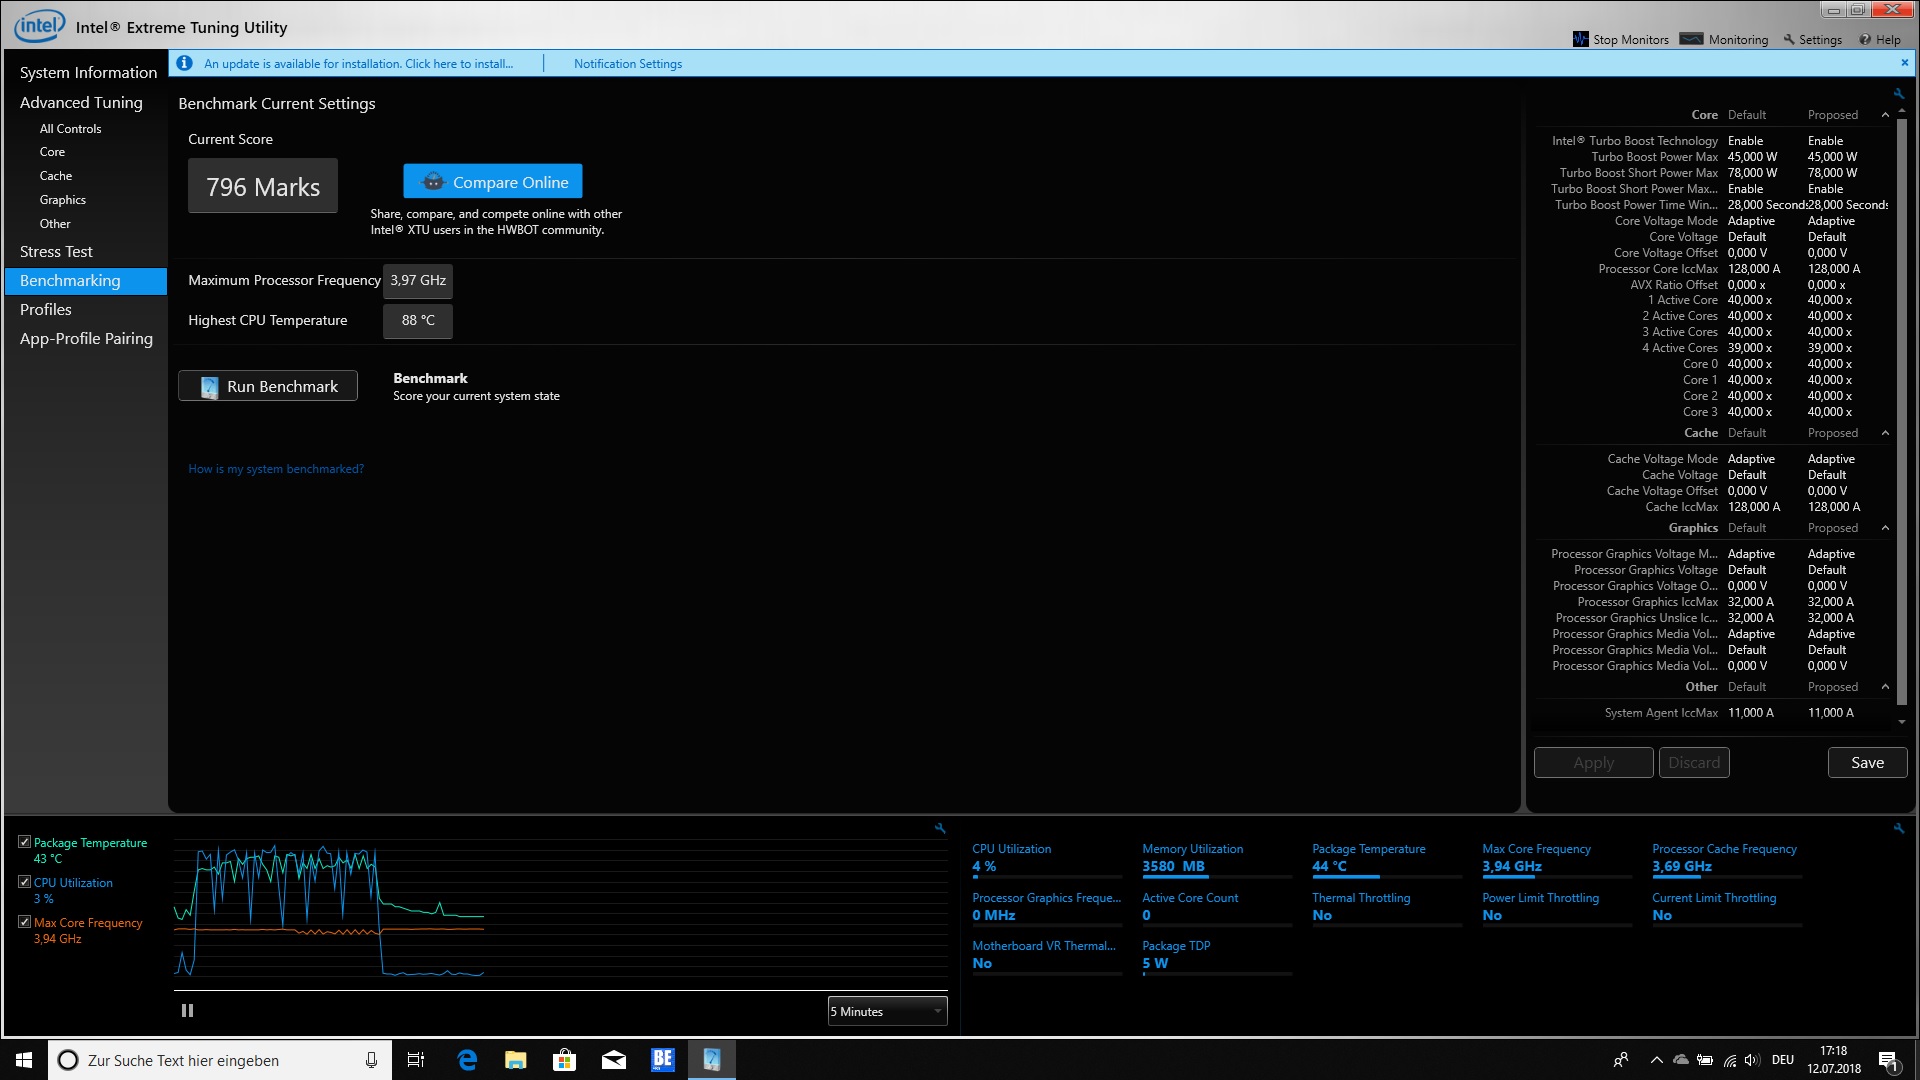
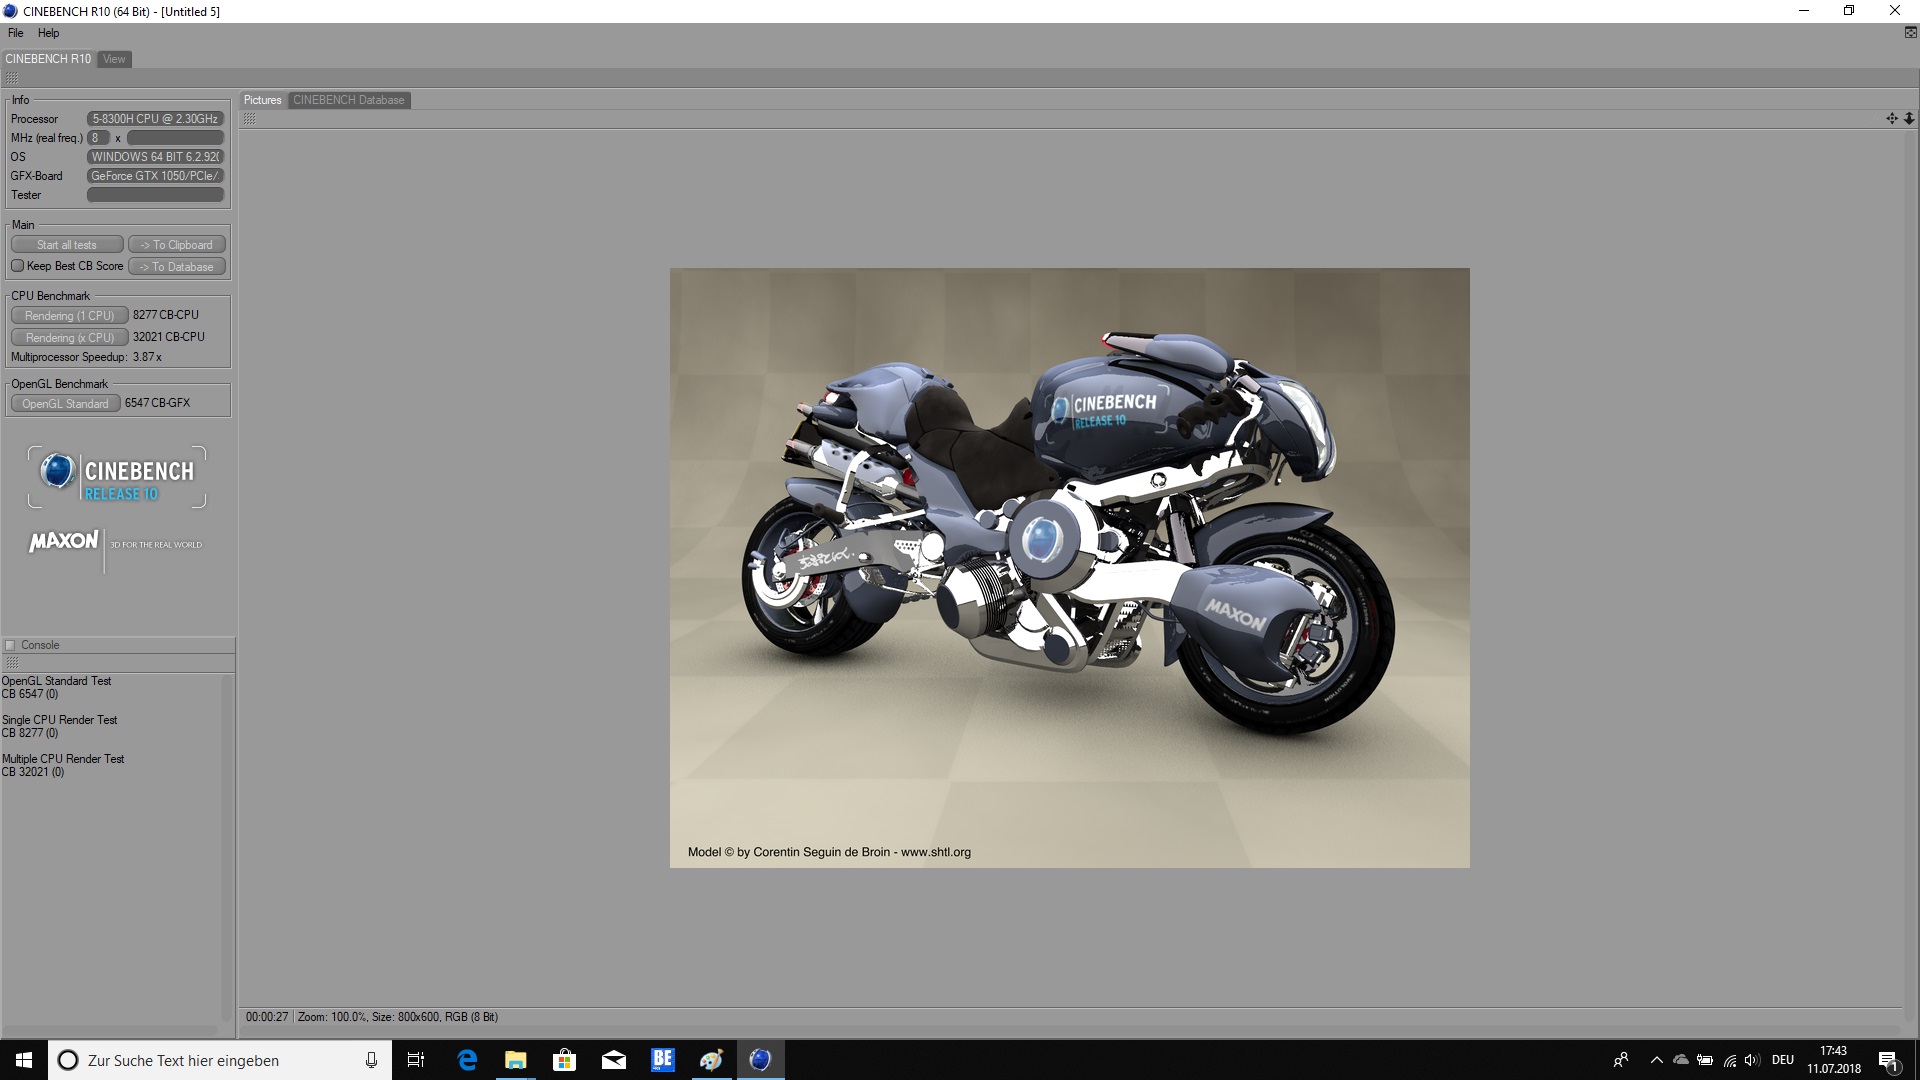
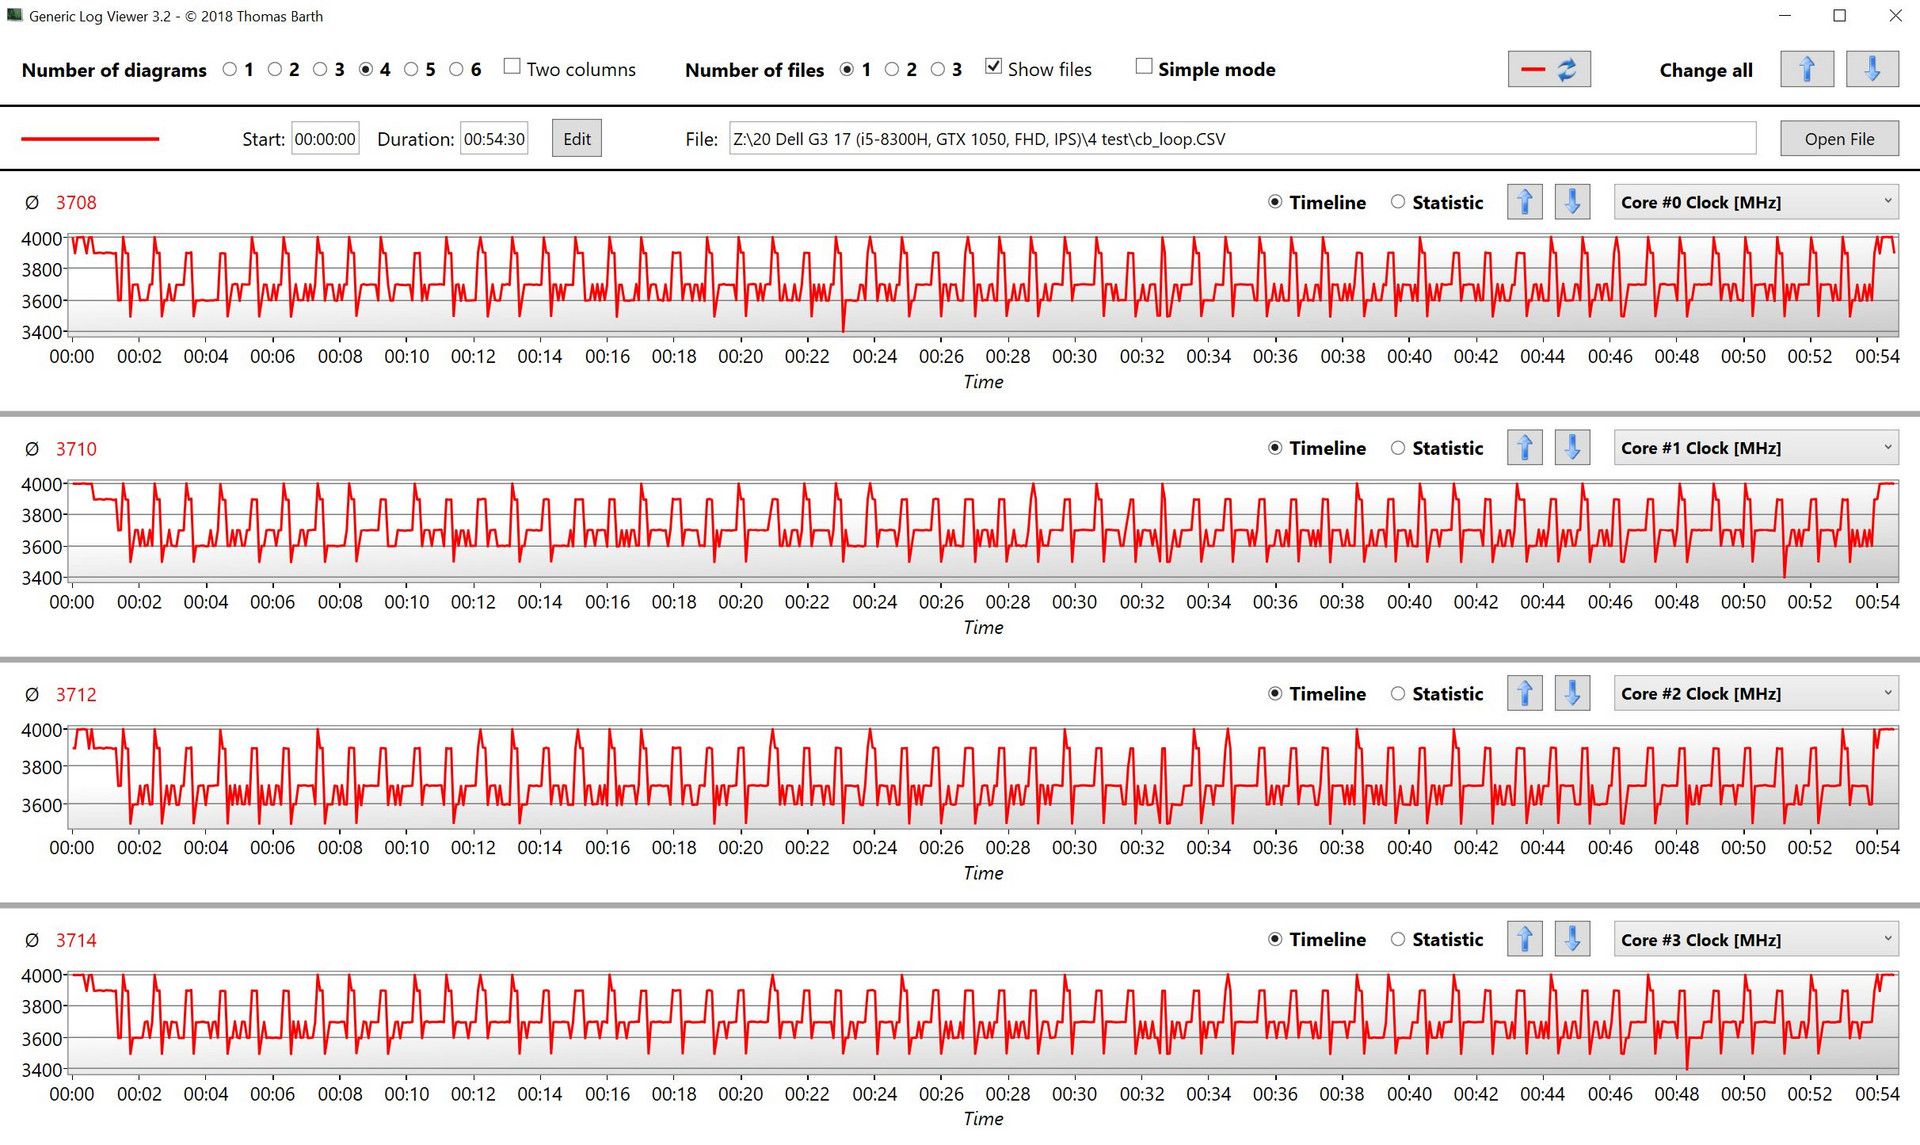
The Intel Core i5-8300H belongs to the current Coffee-Lake series and offers four physical computing cores including Hyper-Threading. The quad-core processor has a basic clock speed of 2.3 GHz, which can be increased dynamically up to 4.0 GHz, depending on load and cooling. The Intel Core i5-8300H is specified with a TDP of 45 watts. For the Turbo mode, the SoC can also use up to 78 watts.
In the single-core test, the new processor can assert itself very well and comes out significantly above the average of the class. The multi-thread performance of the new processor is also impressive and is at the same level as that of the Acer Predator Helios 300. Only the Asus ROG Strix is able to clearly move ahead in the comparison, due to its six computing cores including SMT (Simultaneous Multi-threading). On the other hand, the AMD Ryzen 5 1600 remains 20% behind in the single-core performance.
You can find additional benchmarks on the Intel Core i5-8300H here.
| Cinebench R10 | |
| Rendering Single CPUs 64Bit | |
| Average of class Gaming (17067 - 19487, n=3, last 2 years) | |
| Average Intel Core i5-8300H (8277 - 8506, n=2) | |
| Dell G3 17 3779 | |
| Rendering Multiple CPUs 64Bit | |
| Average of class Gaming (14159 - 165835, n=3, last 2 years) | |
| Dell G3 17 3779 | |
| Average Intel Core i5-8300H (28616 - 32021, n=2) | |
* ... smaller is better
In the test with the Cinebench R15 multi loop, the Dell G3 17 3779 has to prove itself under constant load. After the first run, there is a slight performance drop that turns out relatively small at 40 points. Continuing, the performance of the Intel Core i5-8300H remains constant and levels out at 760 points. This 5% performance drop during constant load is quite acceptable. The Acer Predator Helios 300 shows an almost identical performance with the Intel Core i5-8300H in the Cinebench R15 multi loop.
System Performance
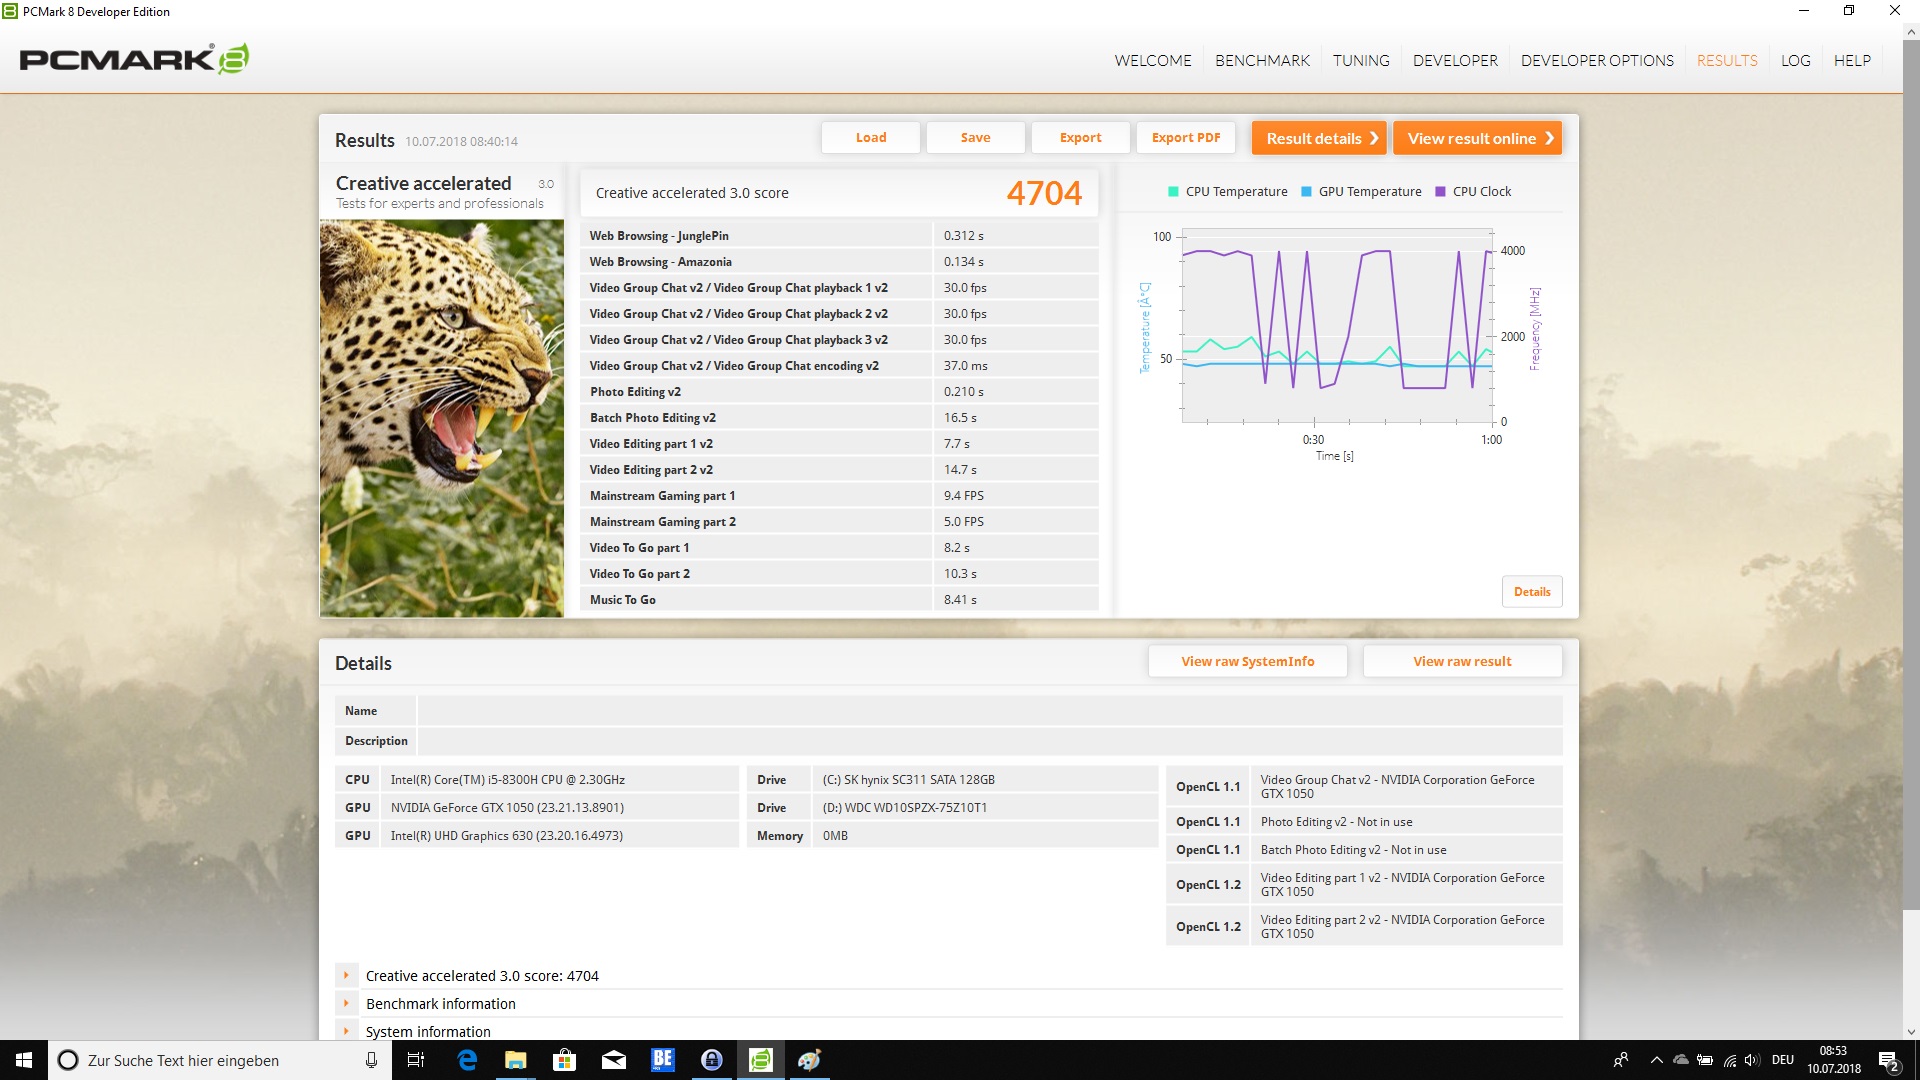
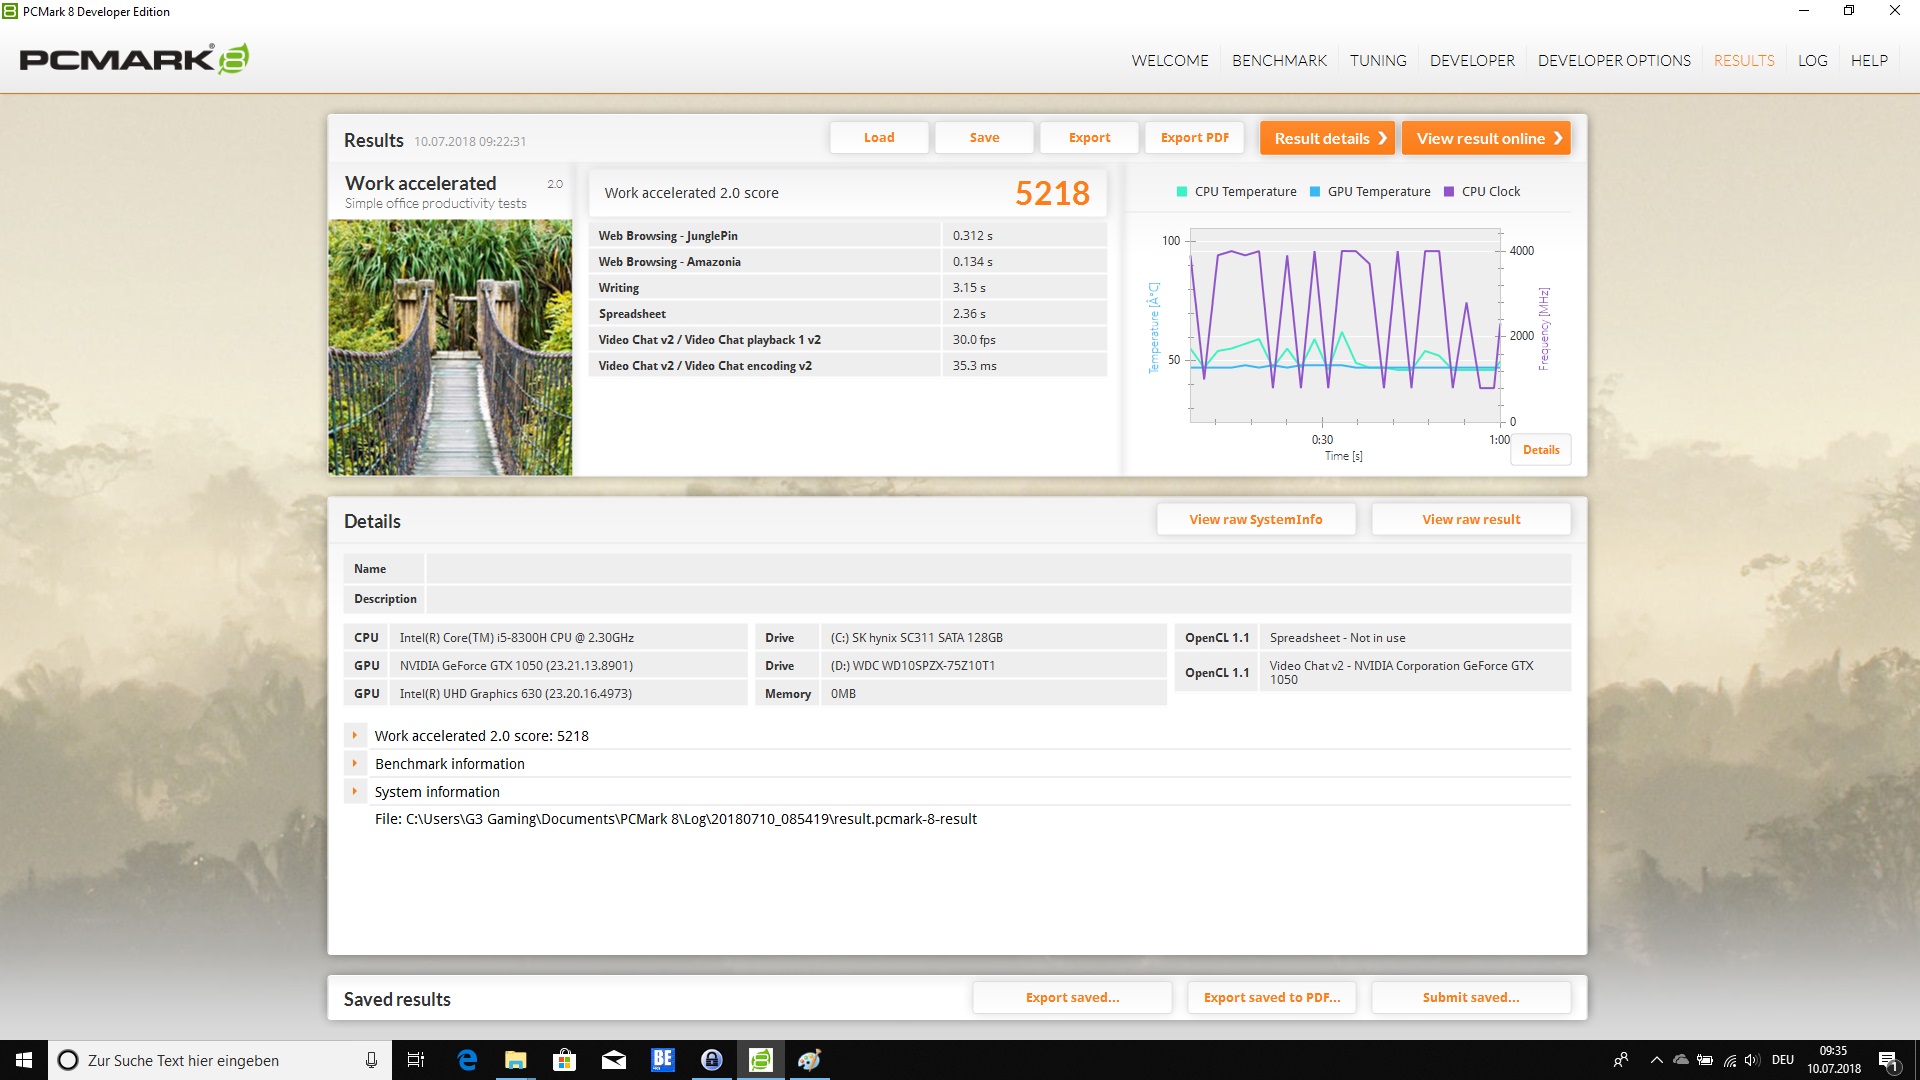
The system performance of the Dell G3 17 3779 is good. In the synthetic benchmarks, our test unit places in the good middle of the field. The distance to the top is often only a few points, which prevents a better placement of our graphics test. The combination of the SSD and HDD in particular benefits the quite smoothly running system. With 8 GB, the RAM is not particularly large, but it is currently still sufficient for most games. An upgrade to 16 GB can be done without any problems. During the test period, the device ran fast and without any latencies worth mentioning.
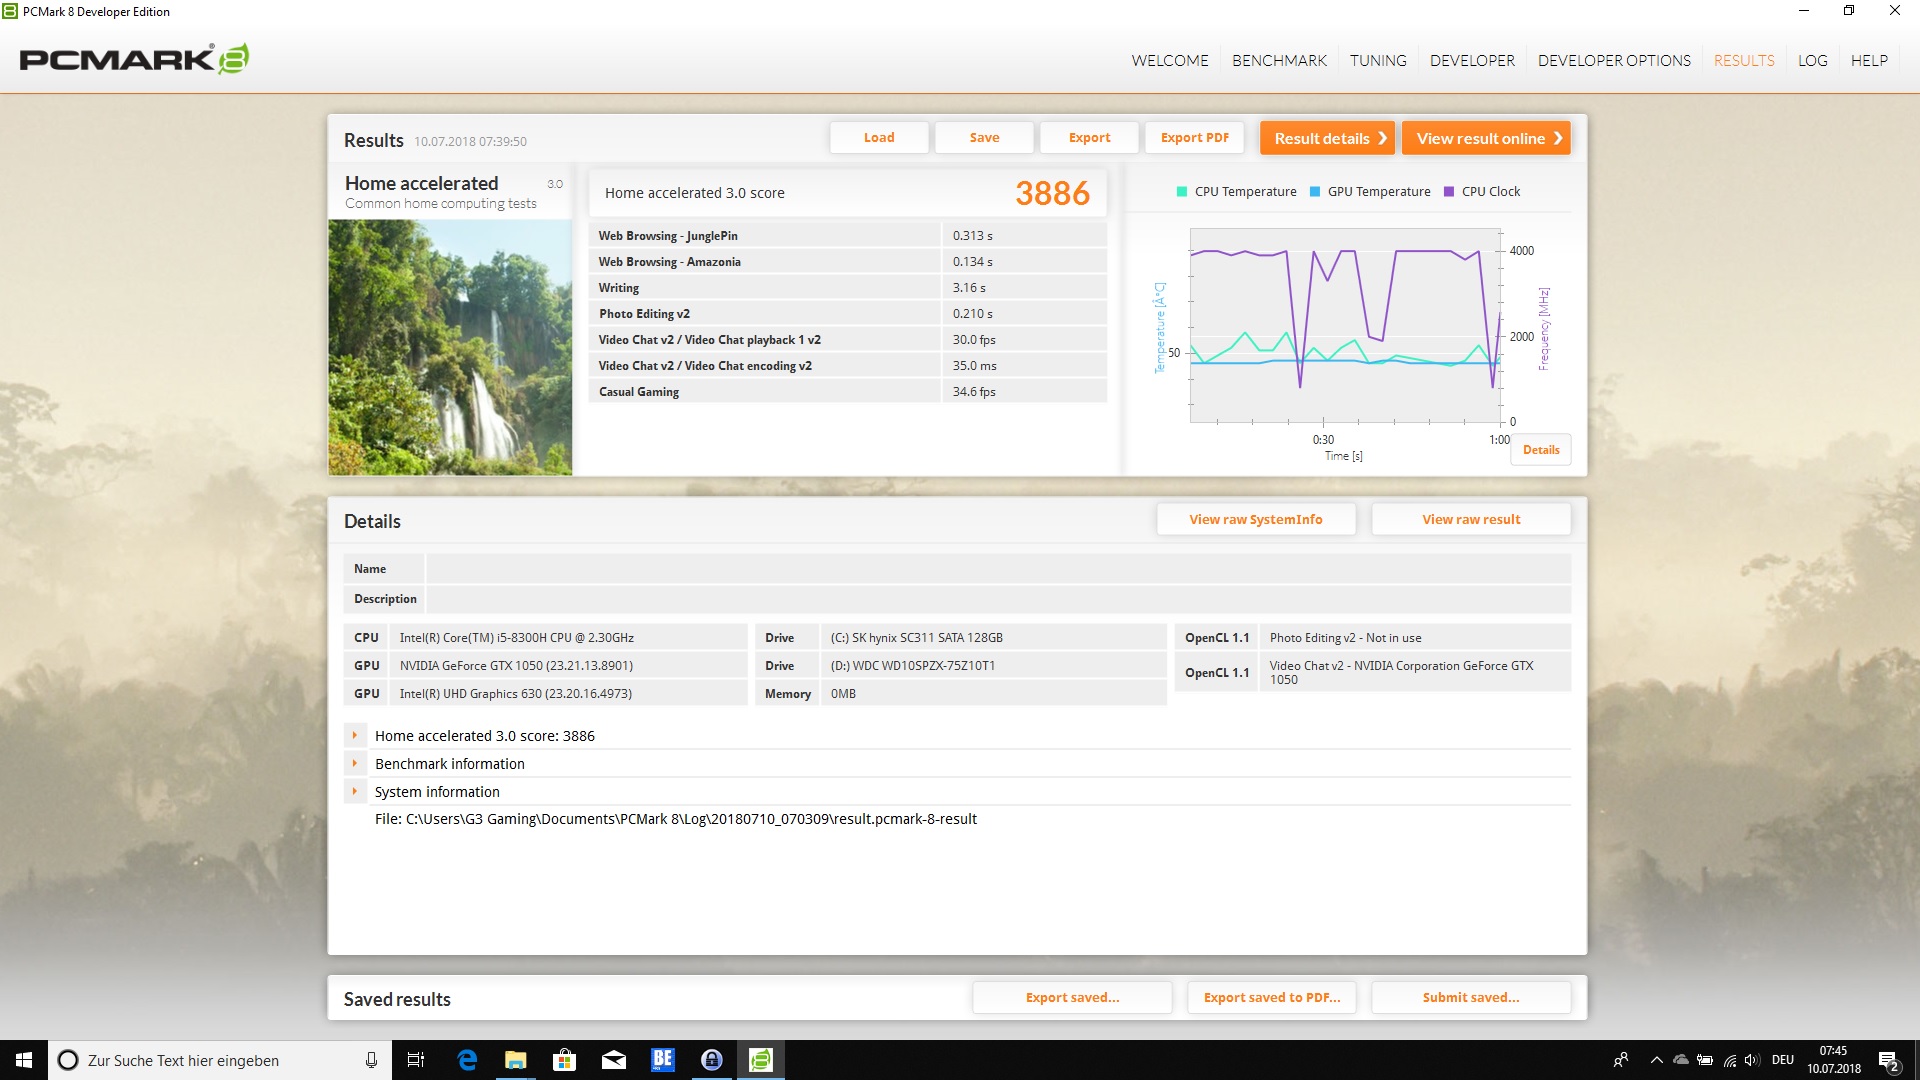
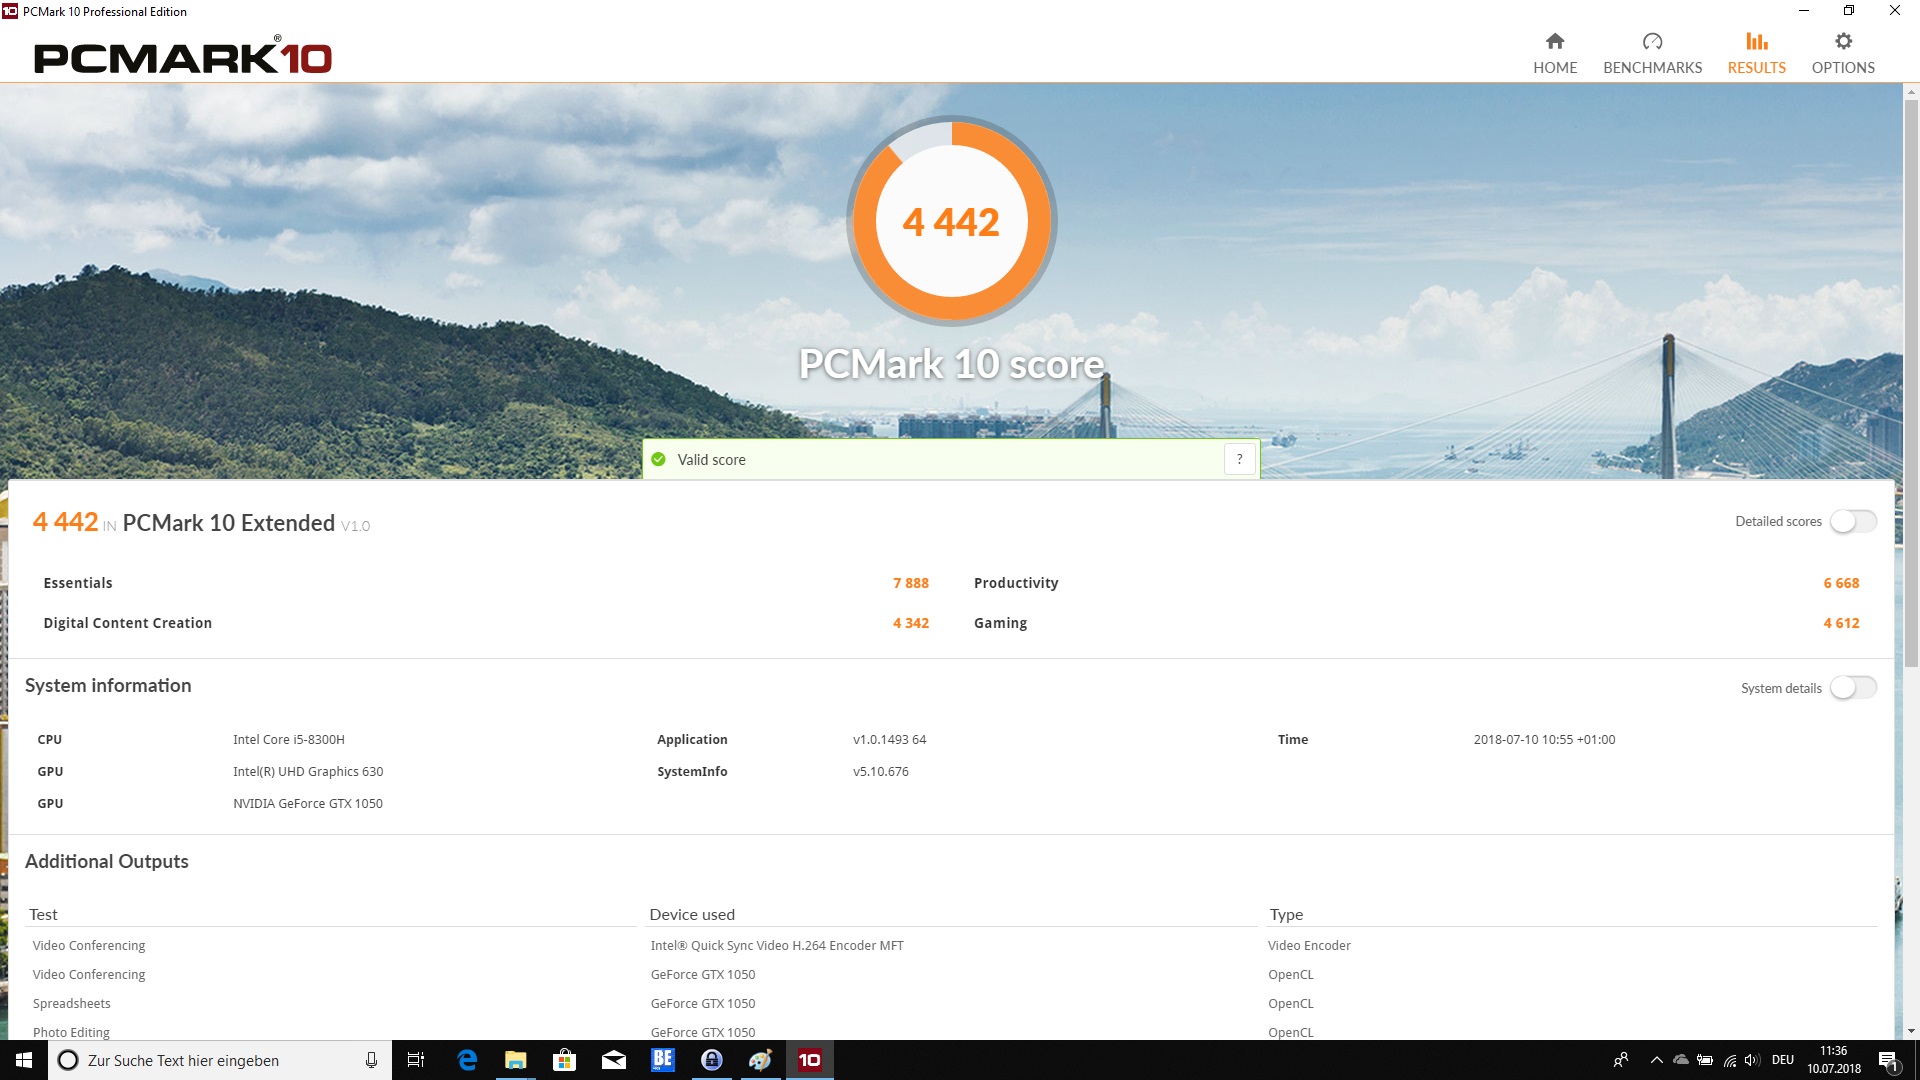
| PCMark 8 Home Score Accelerated v2 | 3886 points | |
| PCMark 8 Creative Score Accelerated v2 | 4704 points | |
| PCMark 8 Work Score Accelerated v2 | 5218 points | |
| PCMark 10 Score | 4442 points | |
Help | ||
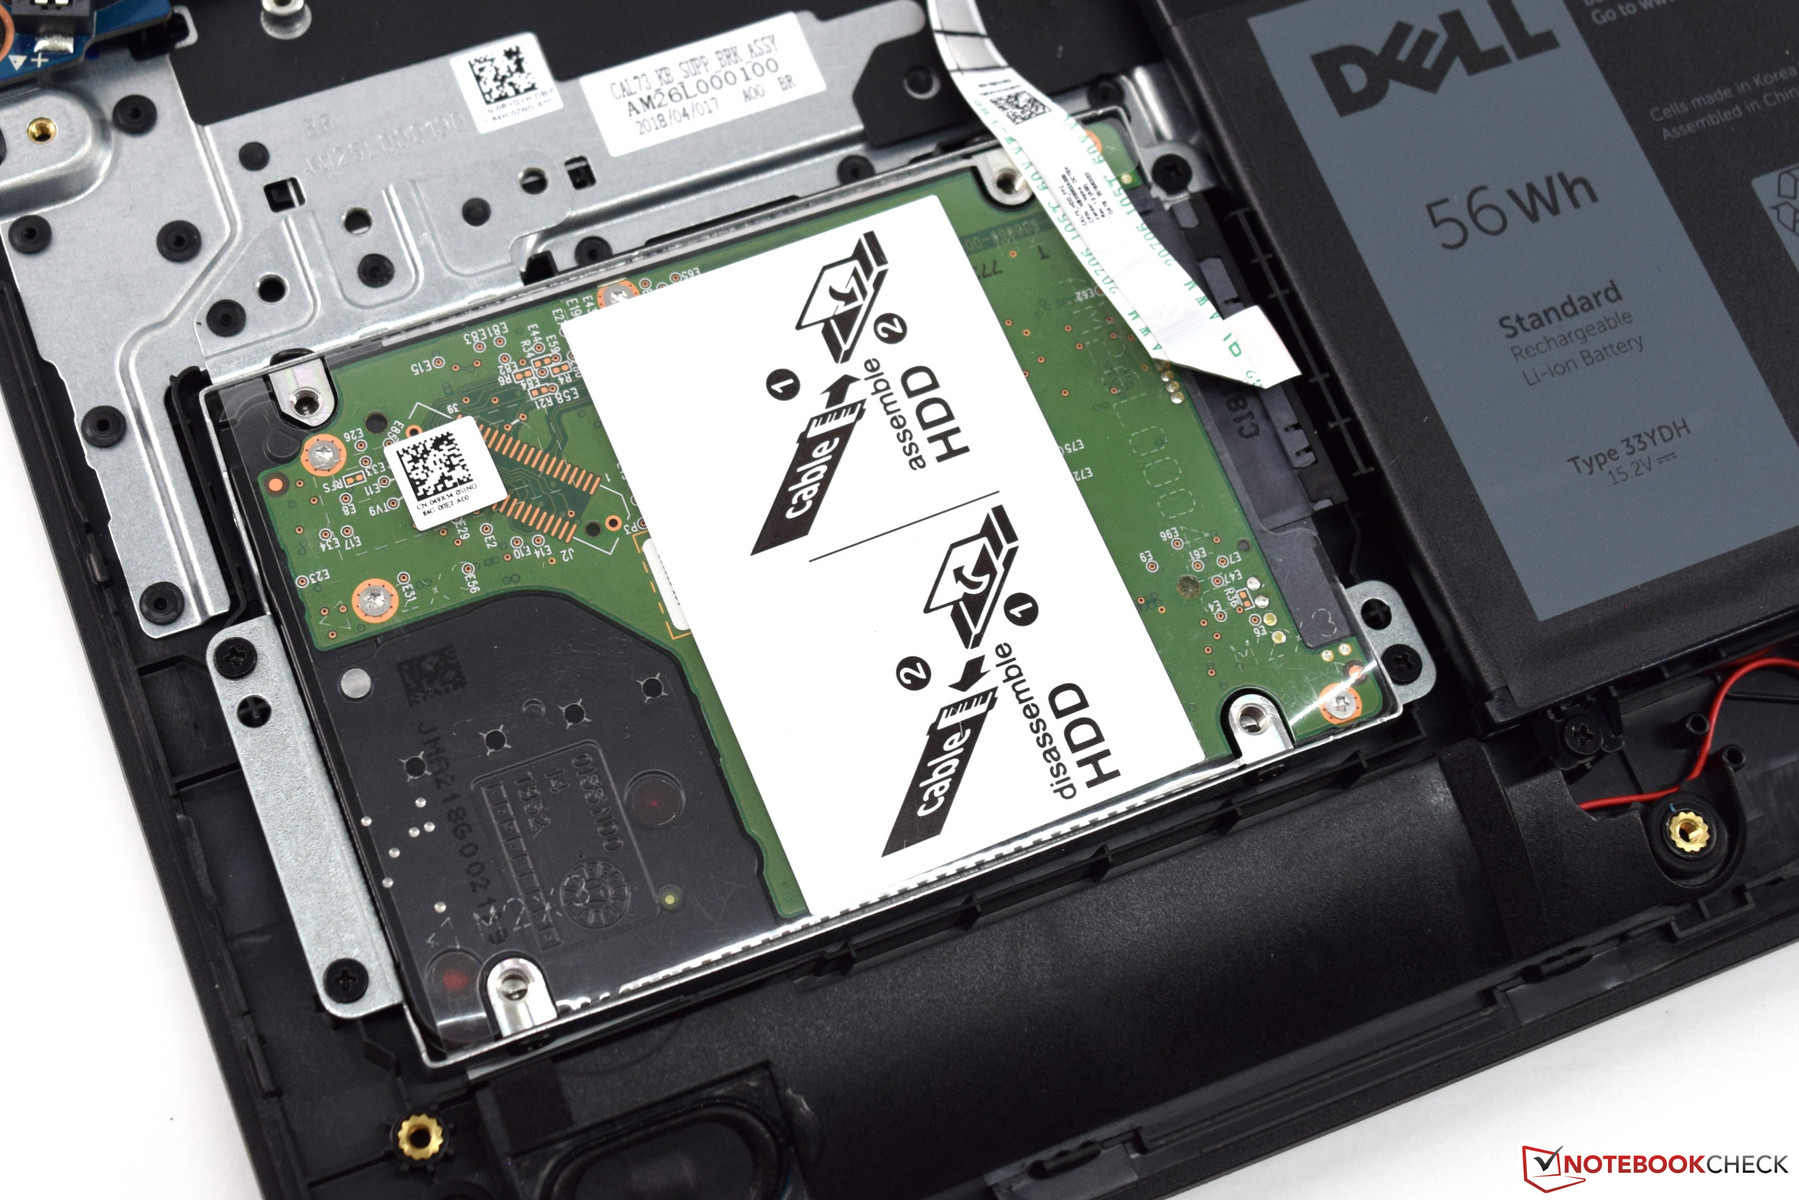
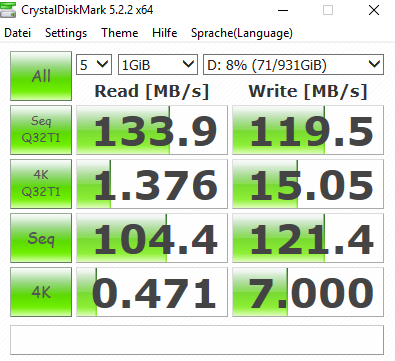
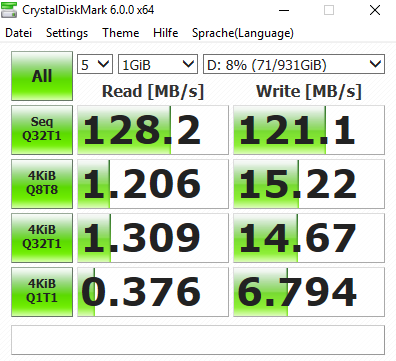
Storage Solution
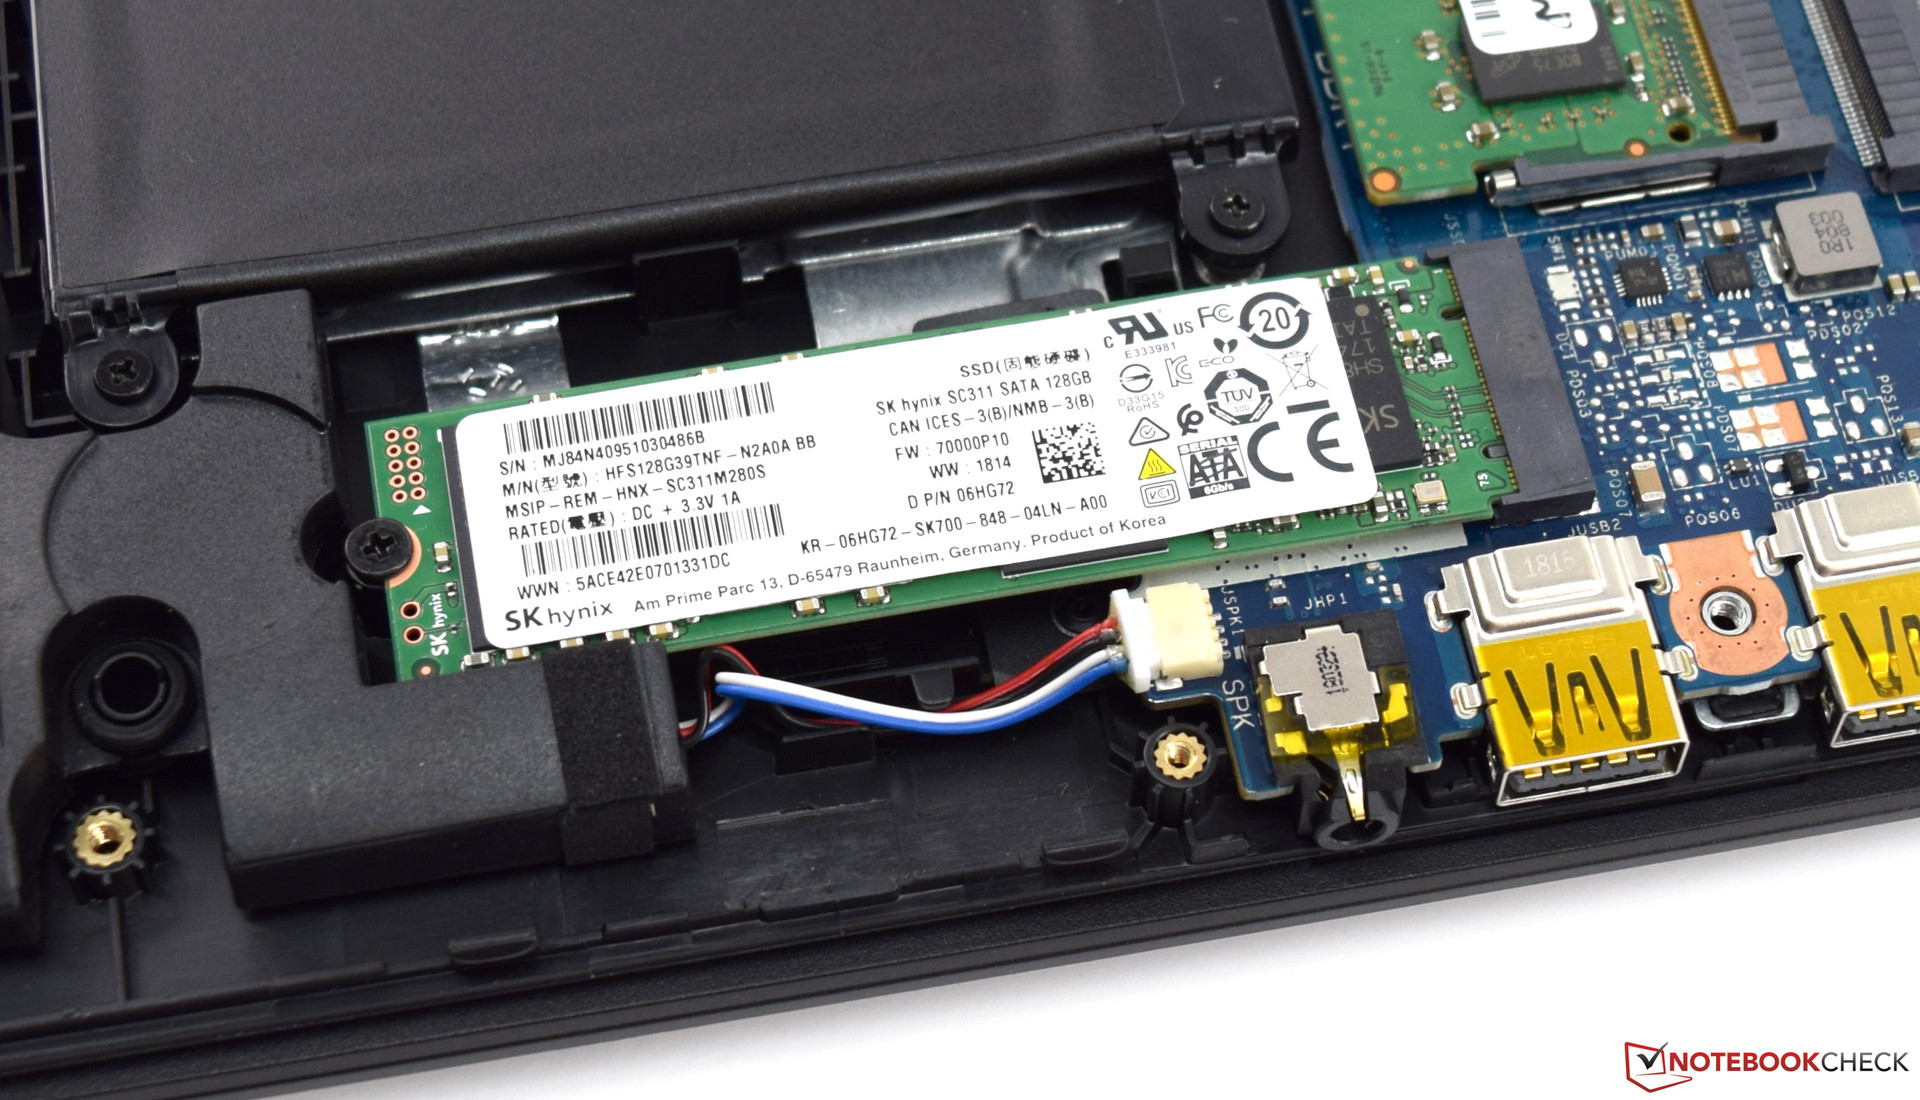
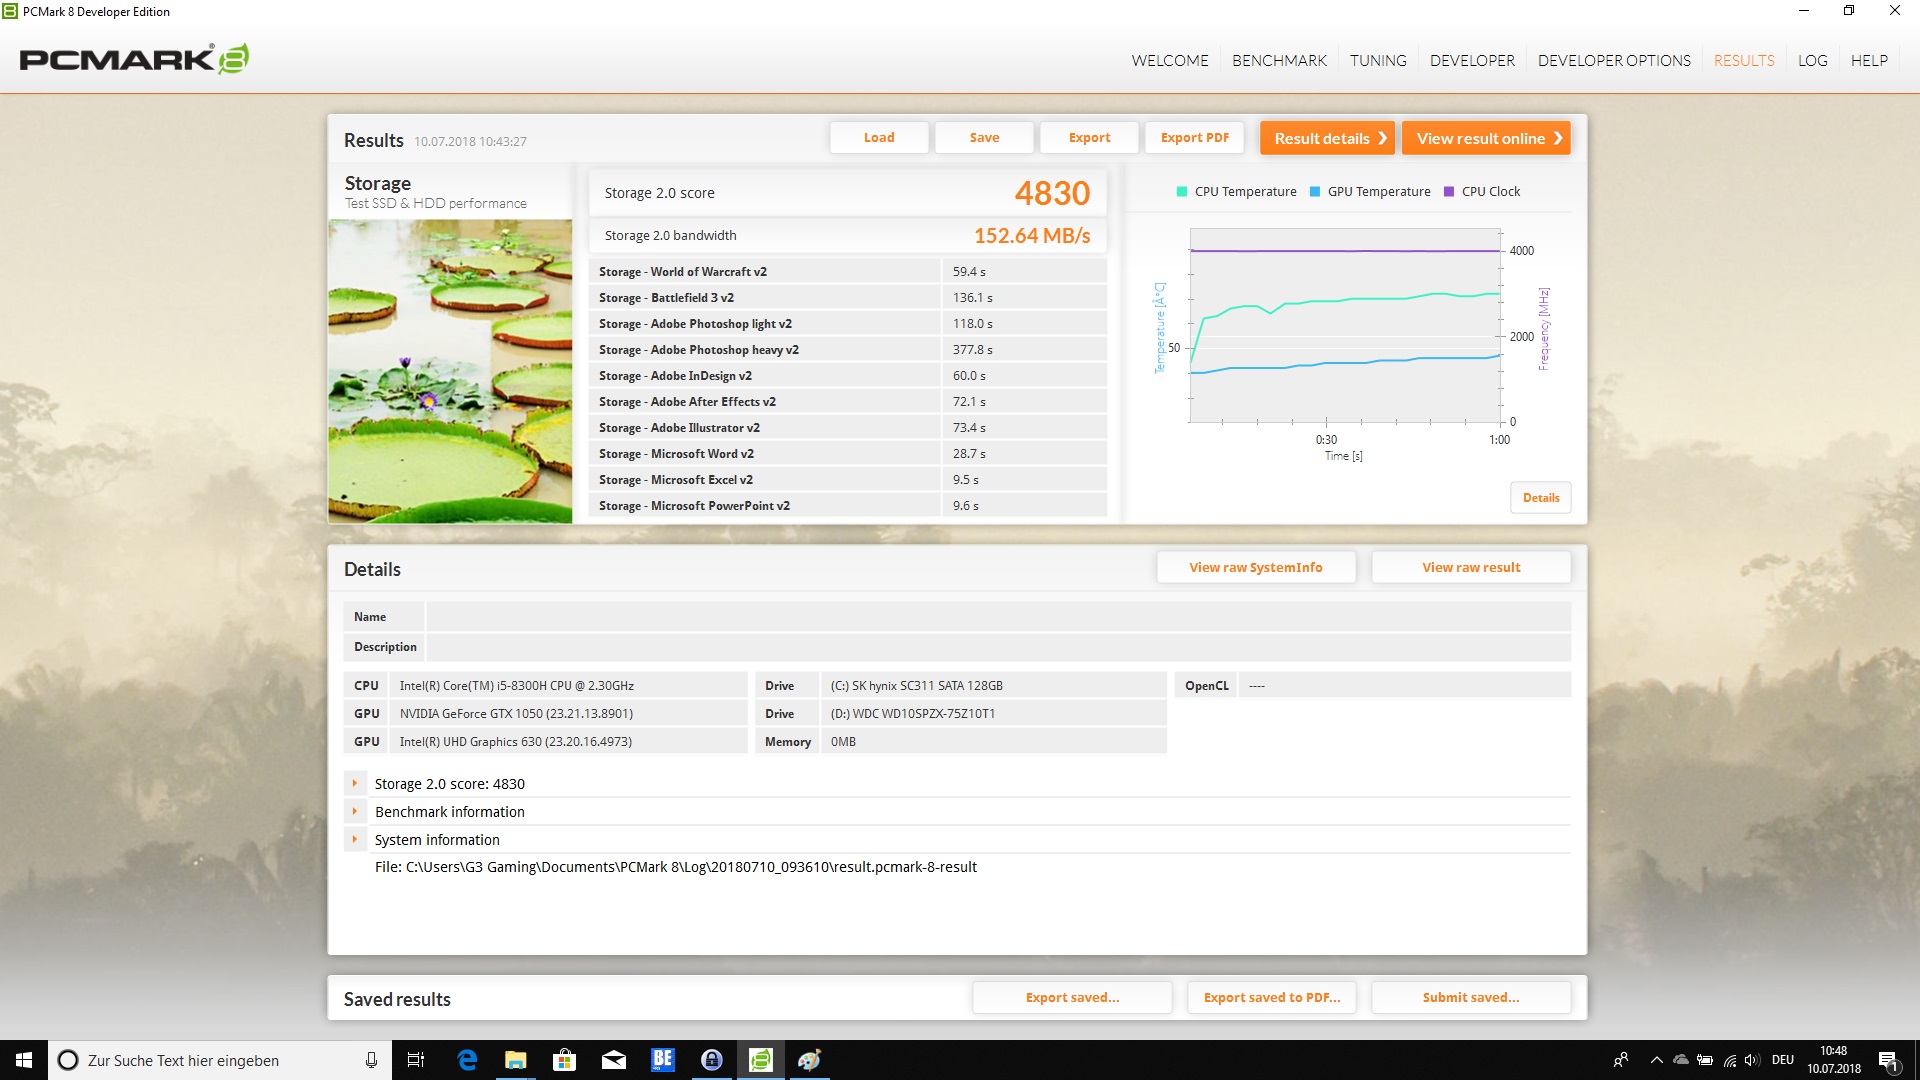
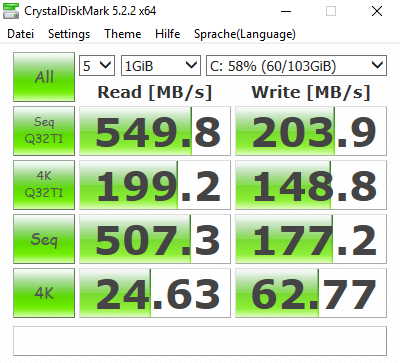
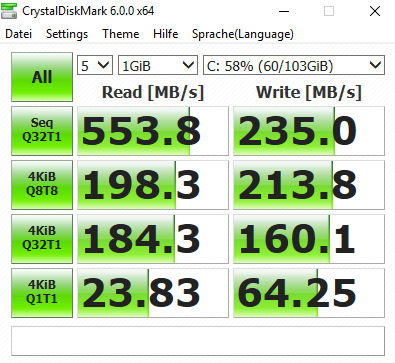
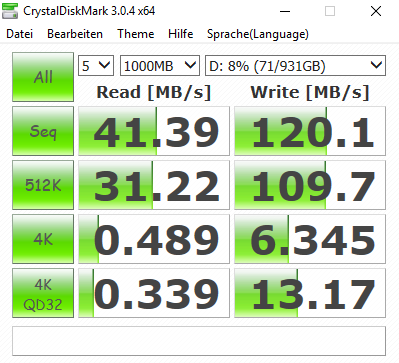
As the storage solution, our Dell G3 17 3779 test unit offers an SSD with 128 GB of storage as well as a conventional hard drive from Western Digital with 1 TB of storage. The SSD from SK Hynix runs at SATA speed, which is much faster than a conventional hard drive, but it is still significantly below the performance of an SSD with NVMe support.
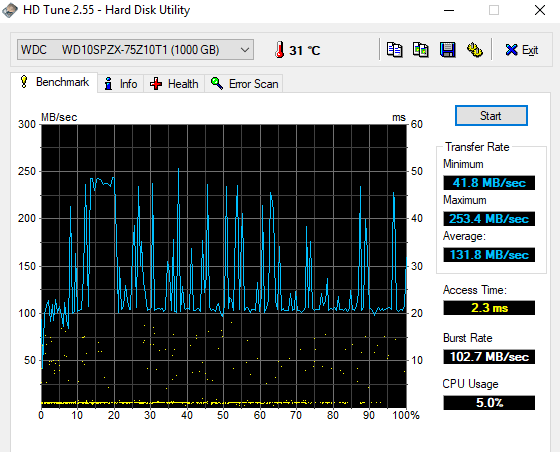
The Western Digital hard drive offers sufficient storage space and achieves an average transfer rate of 131.8 MB/s in the test, which is a good value for a hard drive that runs at 5400 rpm.
Unfortunately, Dell only offers the G3 17 with this storage solution, and the buyer is left with replacing the storage with larger models after the purchase as the only option.

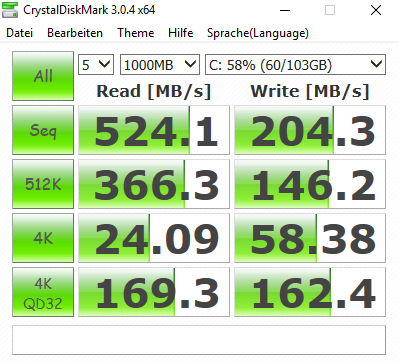
| Dell G3 17 3779 SK hynix SC311 SATA | Asus ROG Strix GL702ZC-GC204T Seagate Mobile HDD 1TB ST1000LX015-1U7172 | MSI GL72 7RDX-602 HGST Travelstar 7K1000 HTS721010A9E630 | Acer Aspire Nitro BE VN7-793G-5811 Seagate Mobile HDD 1TB ST1000LM035 | Average SK hynix SC311 SATA | |
|---|---|---|---|---|---|
| CrystalDiskMark 3.0 | -81% | -82% | -80% | 27% | |
| Read Seq (MB/s) | 524 | 92.5 -82% | 135.3 -74% | 117.6 -78% | 507 ? -3% |
| Write Seq (MB/s) | 204.3 | 105.1 -49% | 127 -38% | 109.1 -47% | 372 ? 82% |
| Read 512 (MB/s) | 366.3 | 37.67 -90% | 45.57 -88% | 39.93 -89% | 367 ? 0% |
| Write 512 (MB/s) | 146.2 | 101.8 -30% | 58.3 -60% | 98.6 -33% | 282 ? 93% |
| Read 4k (MB/s) | 24.09 | 0.484 -98% | 0.582 -98% | 0.435 -98% | 22.9 ? -5% |
| Write 4k (MB/s) | 58.4 | 0.169 -100% | 1.022 -98% | 3.152 -95% | 50.3 ? -14% |
| Read 4k QD32 (MB/s) | 169.3 | 1.294 -99% | 1.068 -99% | 1.008 -99% | 208 ? 23% |
| Write 4k QD32 (MB/s) | 162.4 | 0.221 -100% | 1.102 -99% | 4.705 -97% | 231 ? 42% |

Graphics Card
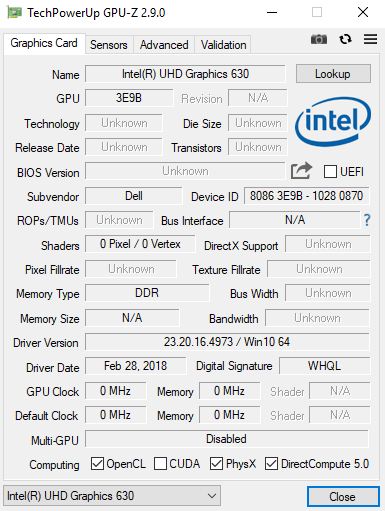
With the Intel UHD Graphics 630, the Dell G3 17 3779 offers an energy-efficient solution that handles the display output for 2D operation and takes some load off the processor when playing high-resolution videos thanks to the integrated hardware decoder.
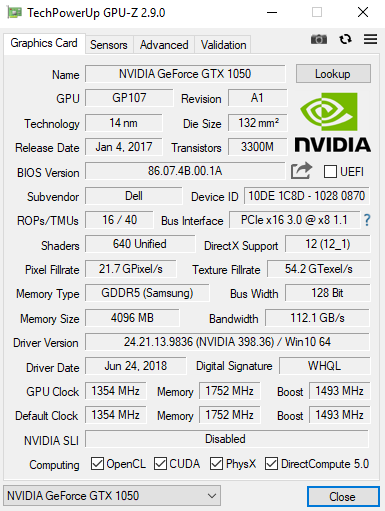
For 3D applications, it is switched to the dedicated graphics adapter via Nvidia Optimus, and then the Nvidia GeForce GTX 1050 takes over the graphics calculations. The GeForce GTX 1050 has its own 4-GB GDDR5 VRAM and a clock speed of 1354 - 1493 MHz in Boost mode. In the synthetic benchmarks, our test unit performs on the expected level and places below the devices with the GeForce GTX 1050 Ti. The Asus ROG Strix remains unchallenged in first place. Its built-in AMD Radeon RX 580 can even take on the GeForce GTX 1060 without any trouble.
For direct comparison, we also included the Dell G5 15 5587 in this segment, in order to compare the performance with the GeForce GTX 1060 Max-Q.
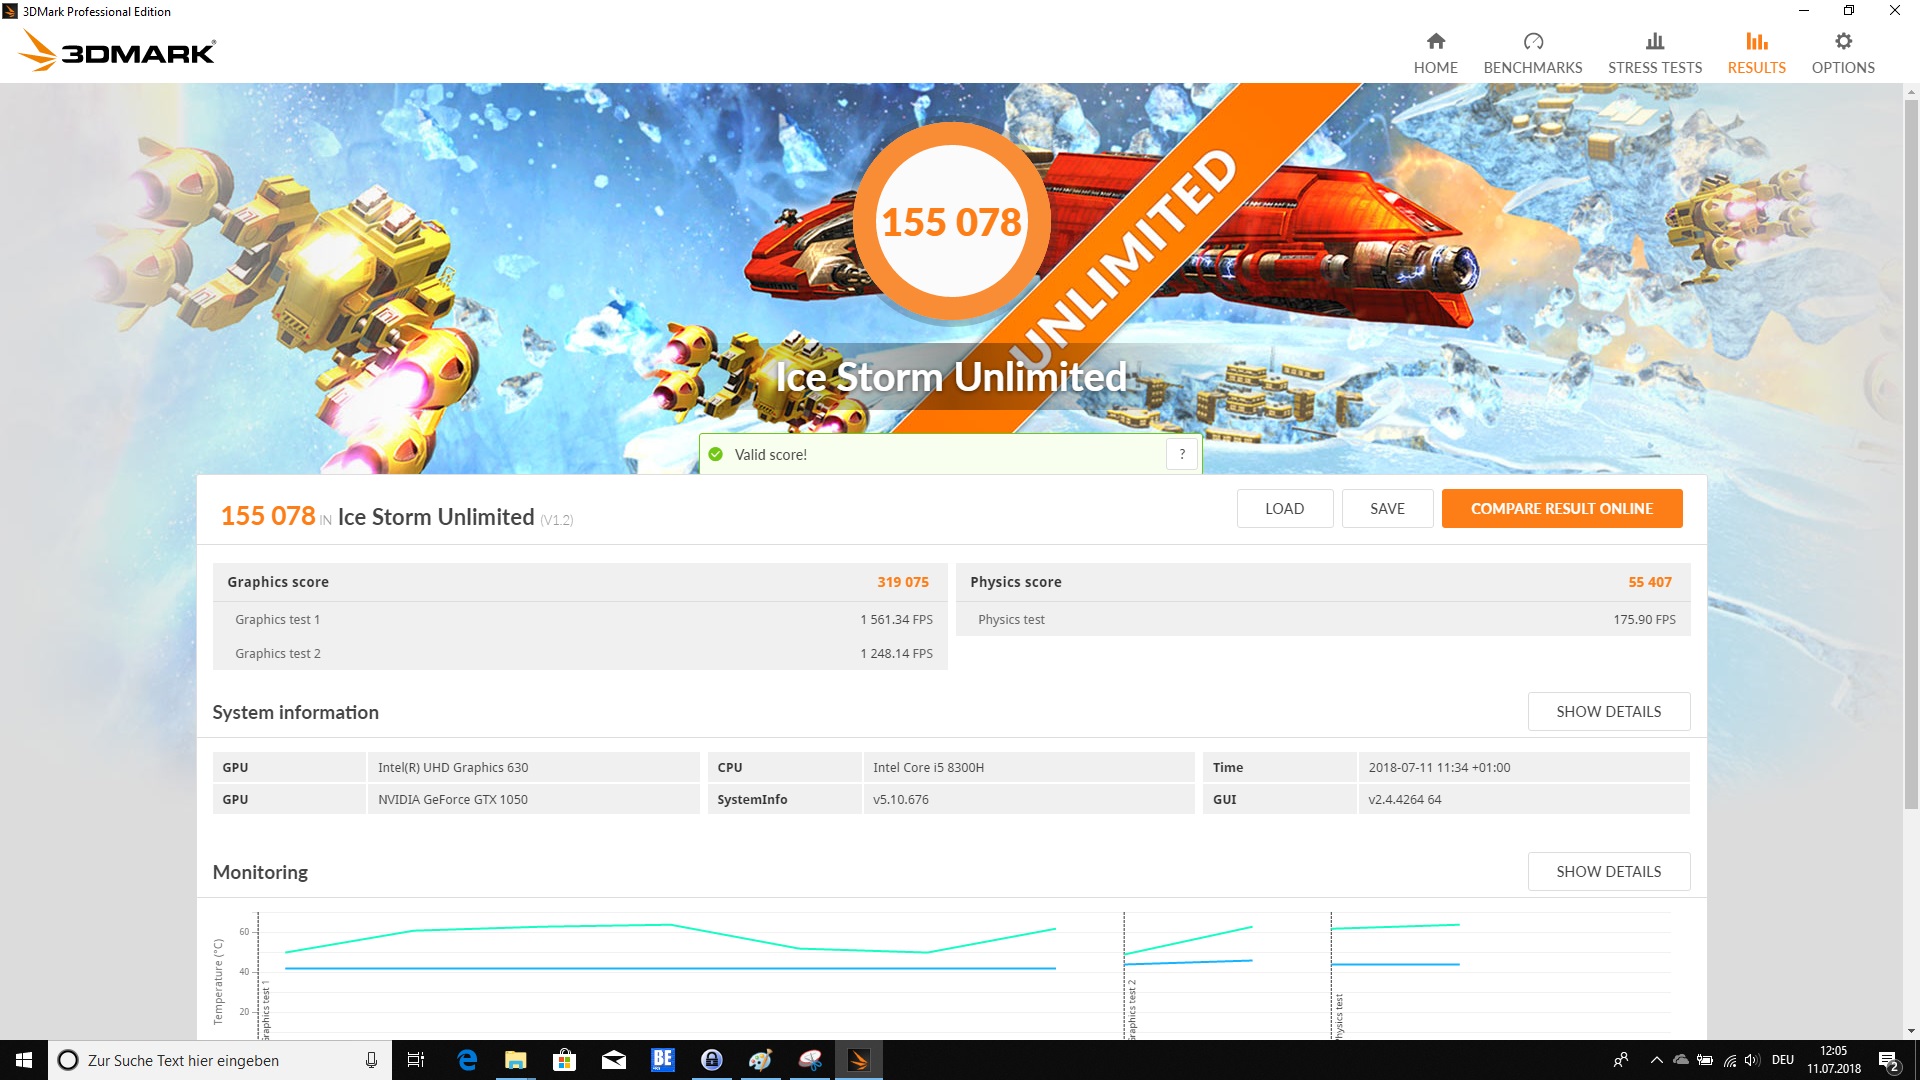
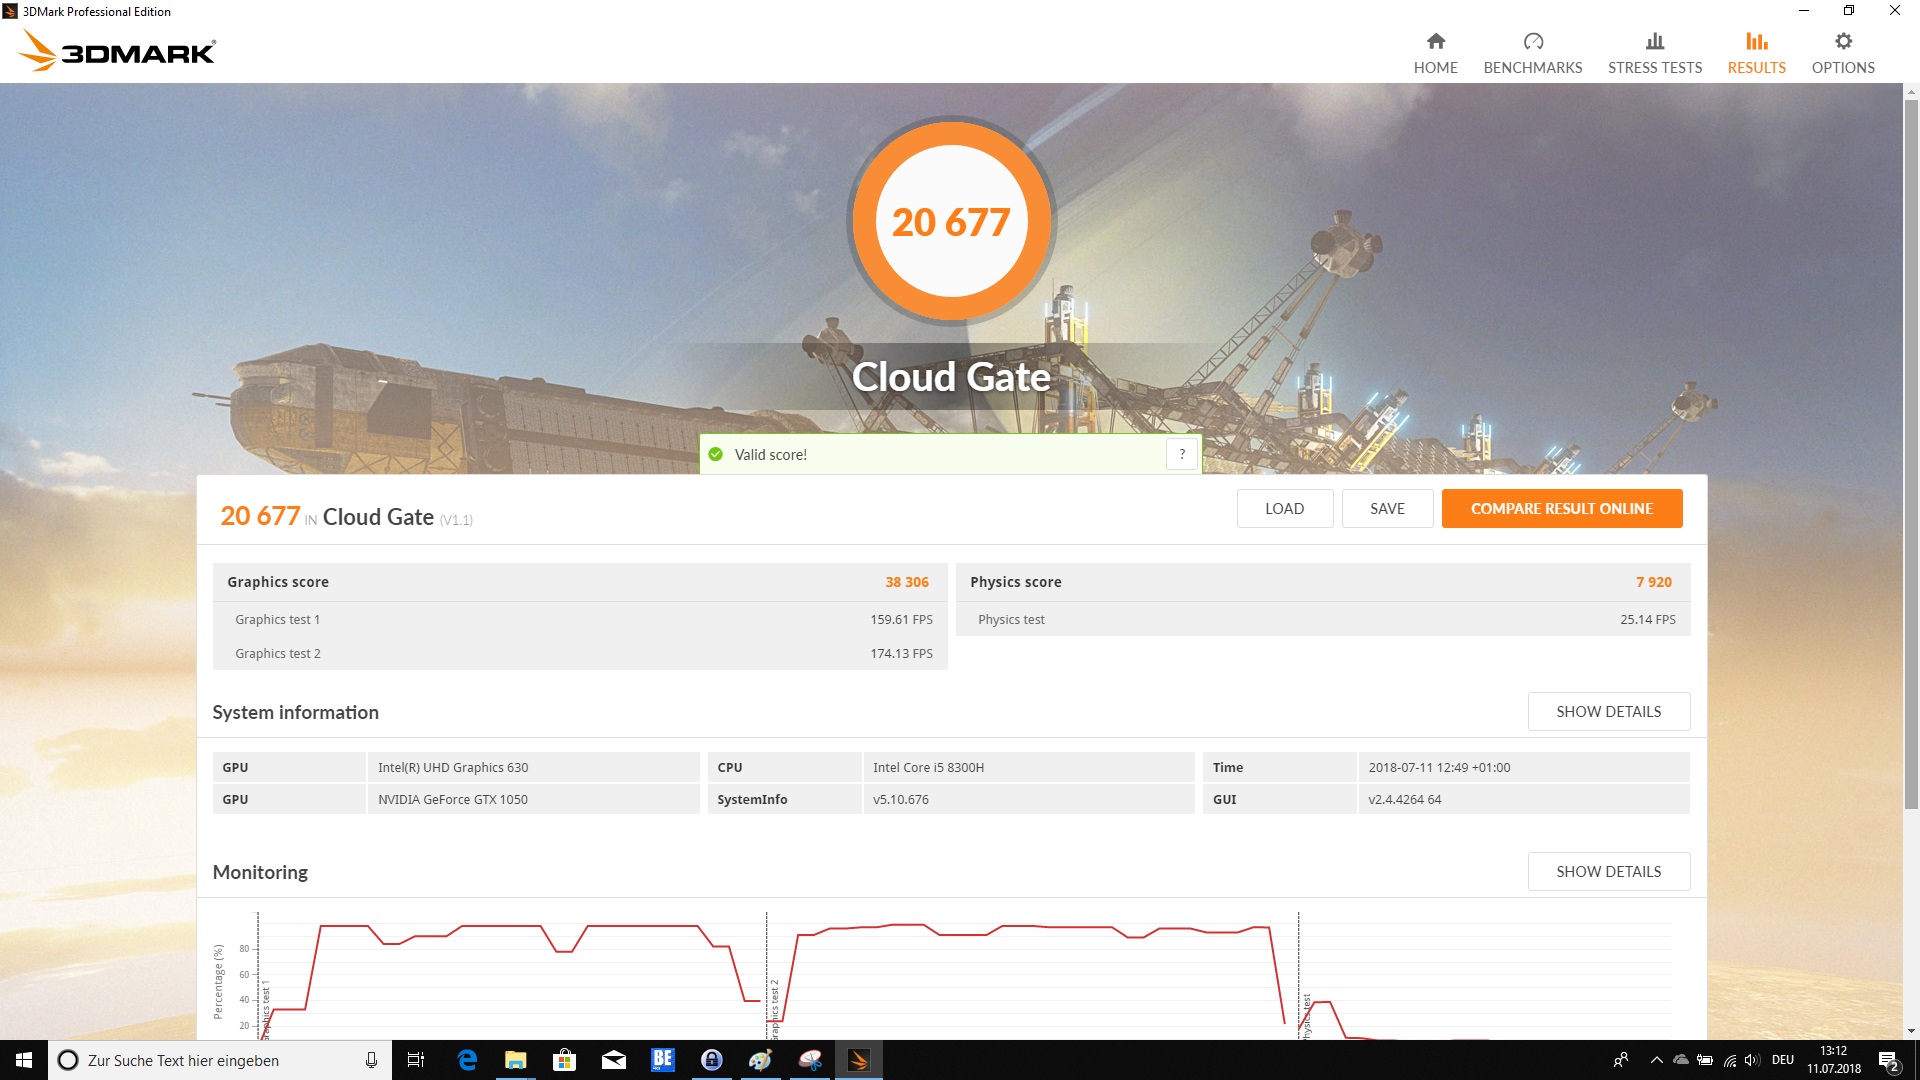
You can find further benchmarks on the Intel UHD Graphics 630 and the Nvidia GeForce GTX 1050 here.
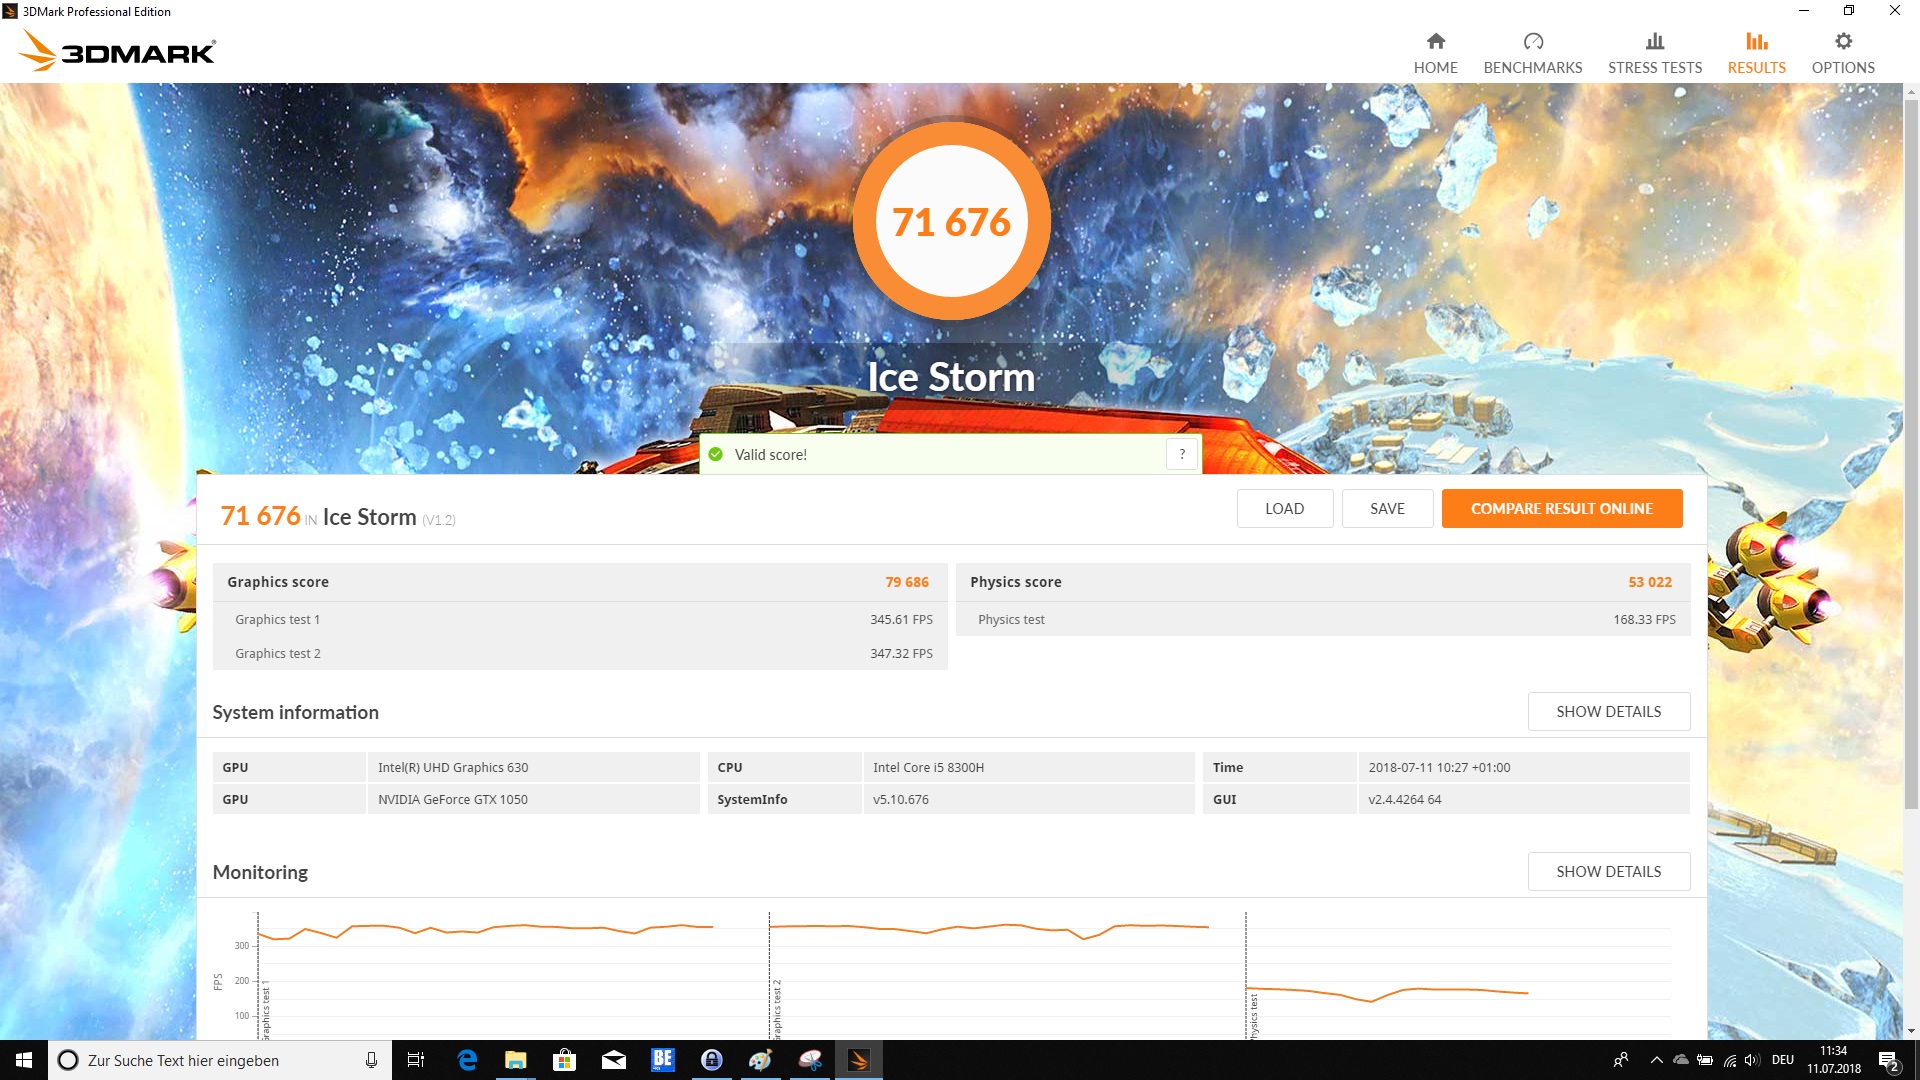

| 3DMark 11 Performance | 7784 points | |
| 3DMark Ice Storm Standard Score | 71676 points | |
| 3DMark Cloud Gate Standard Score | 20677 points | |
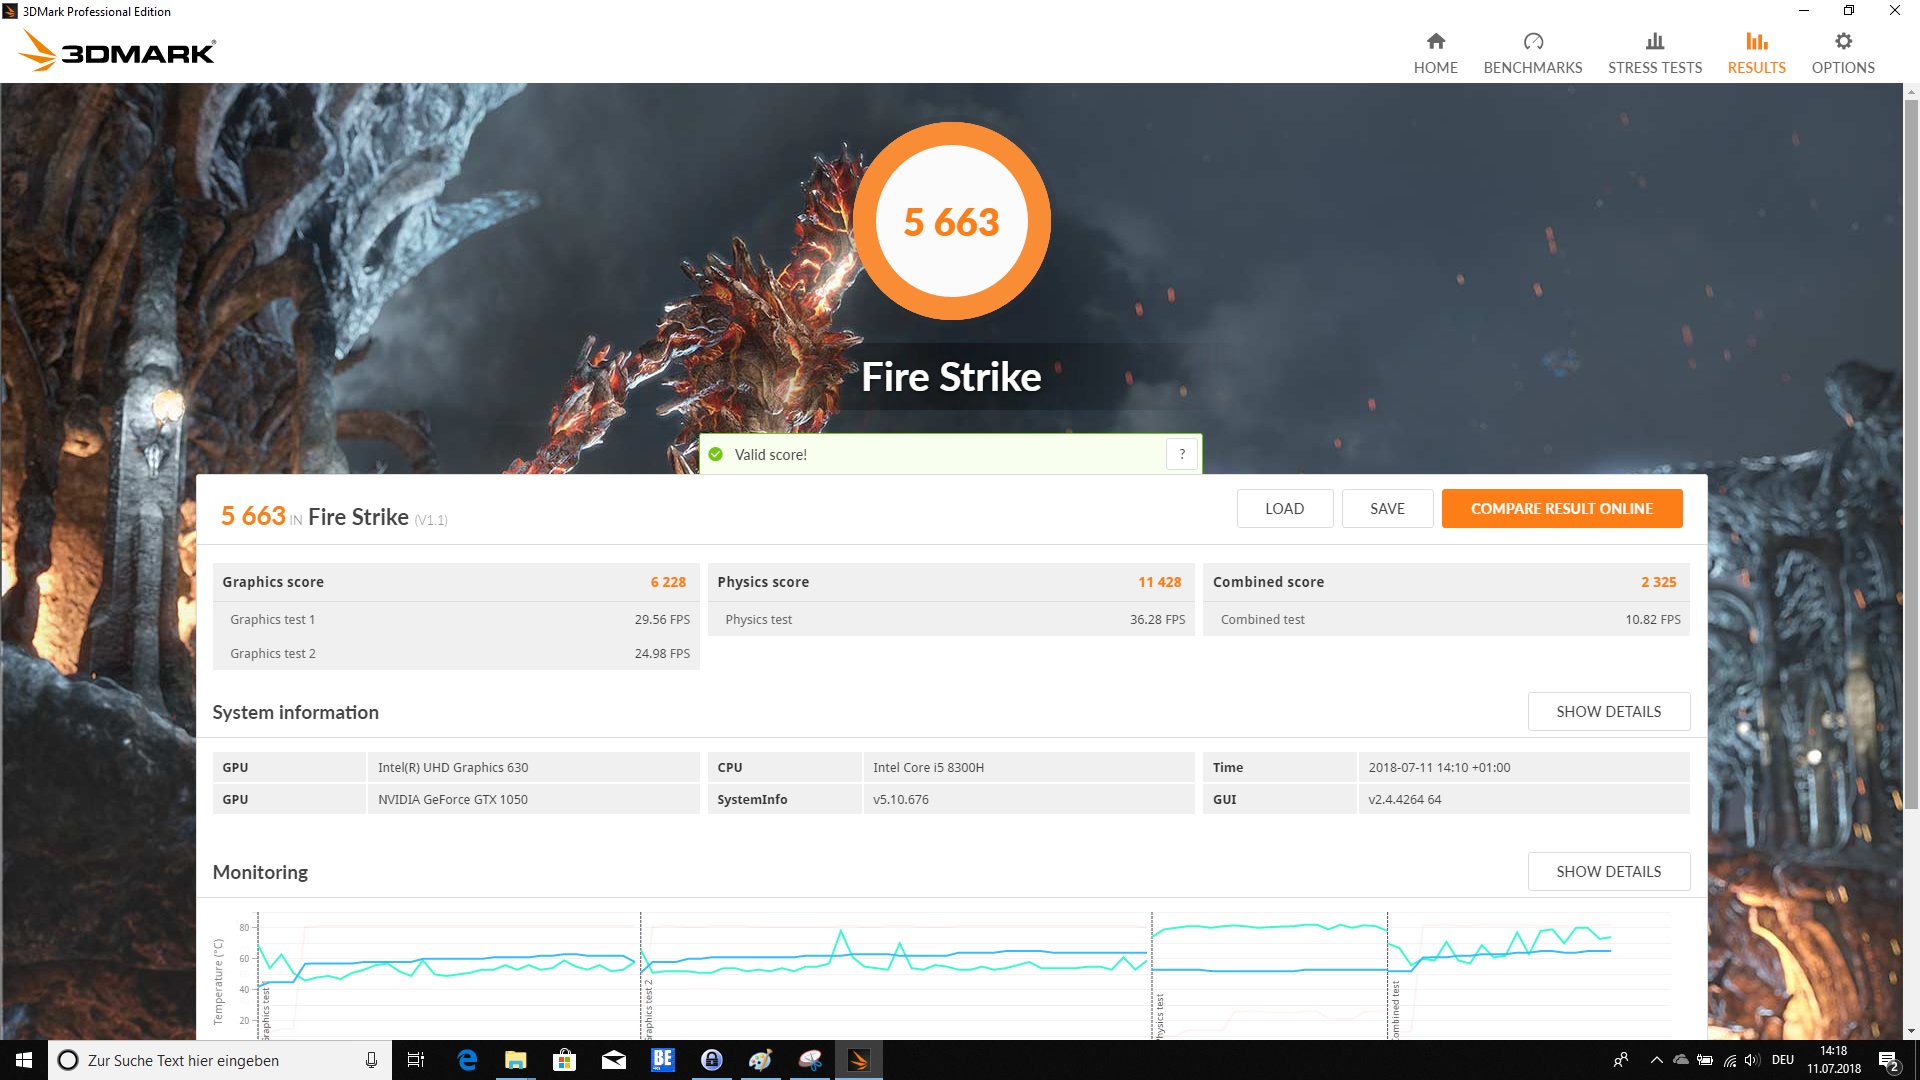
| 3DMark Fire Strike Score | 5663 points | |
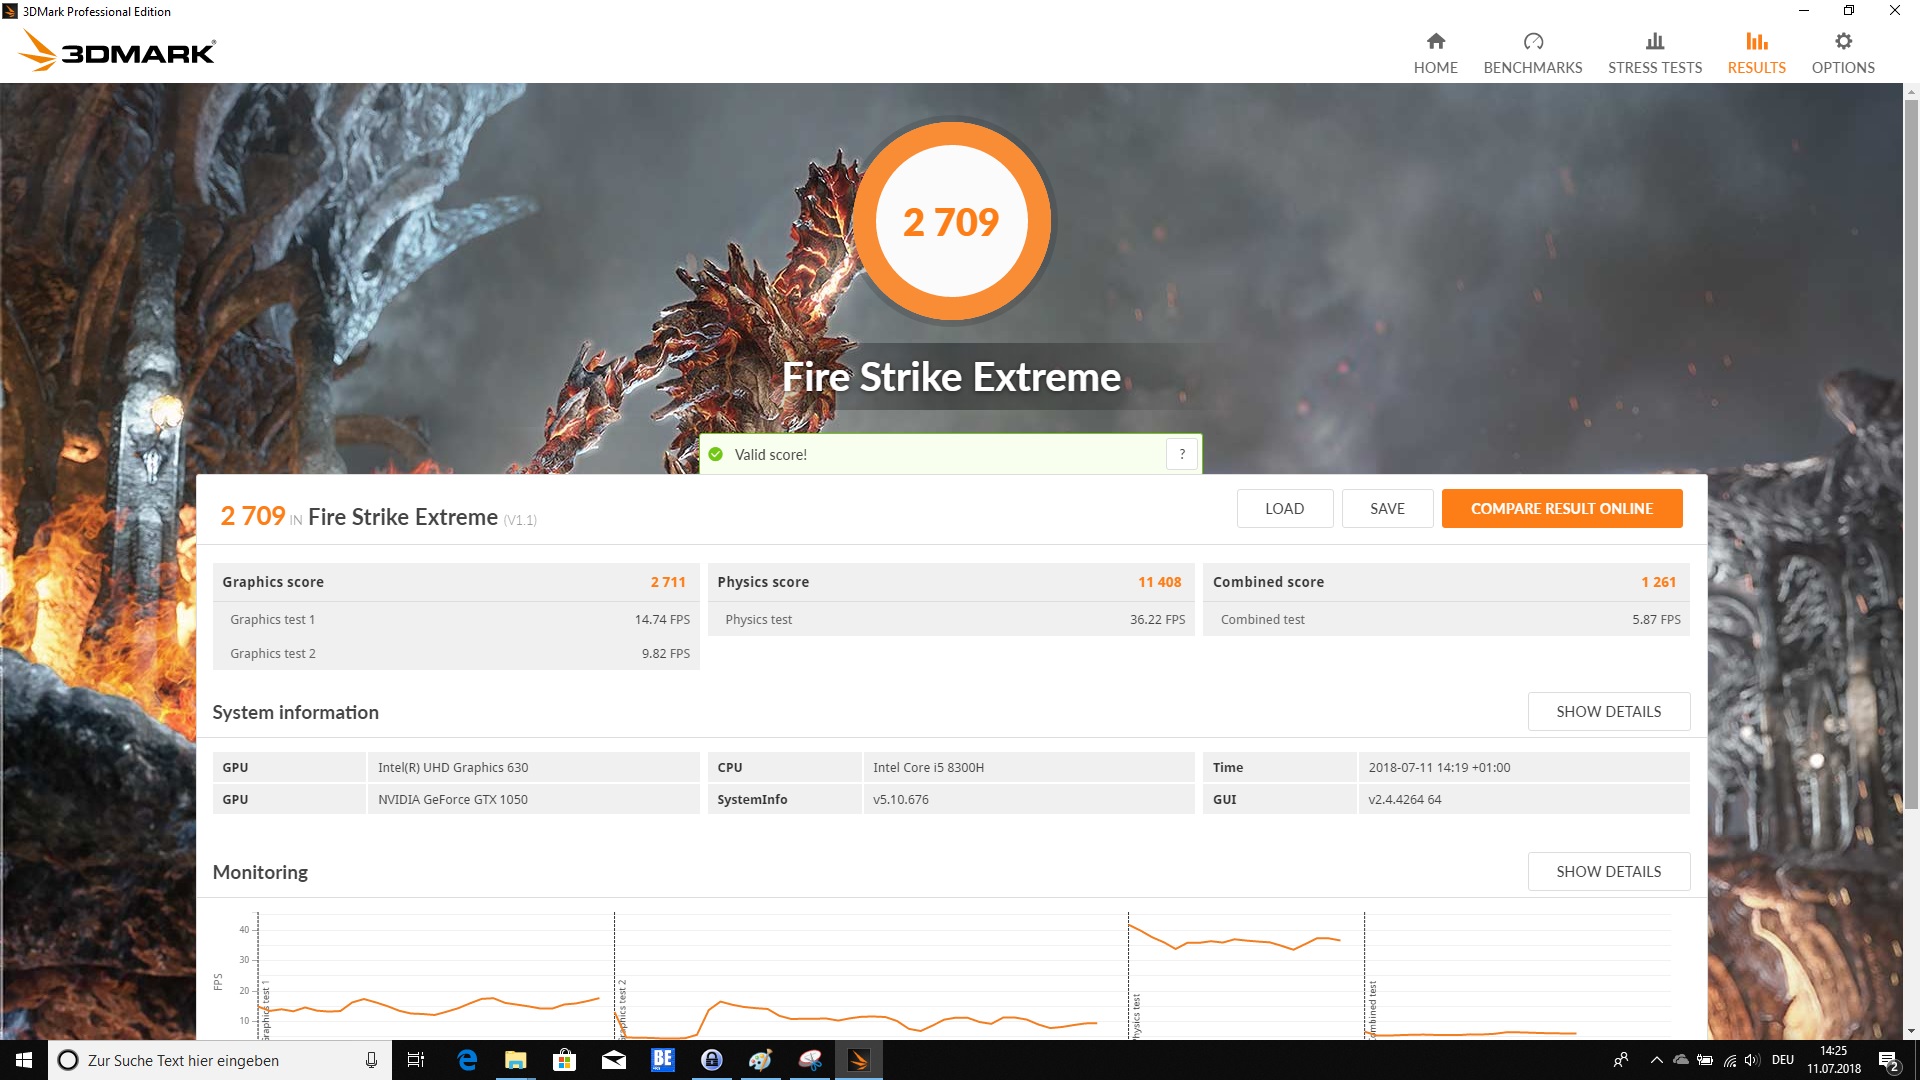
| 3DMark Fire Strike Extreme Score | 2709 points | |
Help | ||
Gaming Performance
The Dell G3 17 3779 as equipped in our test unit offers a solid gaming performance. With the Nvidia GeForce GTX 1050 as a lower mid-range GPU, you can even play more current games smoothly in their native resolution and at High preset. However, more-demanding games such as The Witcher 3 require the Medium preset in order to be displayed without stutters. If you wish to check additional results of the Nvidia GeForce GTX 1050, we point to our extensive overview with many gaming benchmarks.
| low | med. | high | ultra | |
|---|---|---|---|---|
| BioShock Infinite (2013) | 224.2 | 176.4 | 157.8 | 64.3 |
| The Witcher 3 (2015) | 114.5 | 71 | 40.3 | 21.6 |
| Rise of the Tomb Raider (2016) | 120.7 | 69.2 | 38.2 | 33.6 |
| Far Cry 5 (2018) | 74 | 40 | 37 | 33 |
Emissions - A hot Dell notebook
Noise Emissions
Gaming laptops are often loud, and anyone entertaining the thought of buying a gaming-capable notebook should not consider noise emissions as their most important purchase criteria. The Dell G3 17 3779 is no exception here, even though at 30.5 - 32.1 dB(A) during idle, we do not measure an extreme level. The device is almost always audible. Under load, the two fans rev up quite a bit and at 43.4 dB(A), they produce clearly audible fan noise. The Acer Predator Helios 300 and also the Asus ROG Strix are even louder at more than 50 dB(A).
All in all, the noise level is okay for a gaming device.
Noise level
| Idle |
| 30.5 / 31.1 / 32.1 dB(A) |
| Load |
| 43.4 / 39.2 dB(A) |
 | ||
30 dB silent 40 dB(A) audible 50 dB(A) loud |
||
min: | ||
| Dell G3 17 3779 GeForce GTX 1050 Mobile, i5-8300H, SK hynix SC311 SATA | Acer Predator Helios 300 PH317-52-51M6 GeForce GTX 1050 Ti Mobile, i5-8300H, Hynix HFS128G39TND | Asus ROG Strix GL702ZC-GC204T Radeon RX 580 (Laptop), R5 1600, Seagate Mobile HDD 1TB ST1000LX015-1U7172 | MSI GL72 7RDX-602 GeForce GTX 1050 Mobile, i7-7700HQ, HGST Travelstar 7K1000 HTS721010A9E630 | Acer Aspire Nitro BE VN7-793G-5811 GeForce GTX 1050 Ti Mobile, i5-7300HQ, Seagate Mobile HDD 1TB ST1000LM035 | Asus VivoBook Pro 17 N705UD-EH76 GeForce GTX 1050 Mobile, i5-8550U, Samsung PM961 NVMe MZVLW512HMJP | |
|---|---|---|---|---|---|---|
| Noise | -5% | -4% | -3% | 4% | 6% | |
| off / environment * (dB) | 30.5 | 29 5% | 30.2 1% | 30.8 -1% | 29.7 3% | 28.3 7% |
| Idle Minimum * (dB) | 30.5 | 29 5% | 30.6 -0% | 32.4 -6% | 30.2 1% | 28.3 7% |
| Idle Average * (dB) | 31.1 | 31 -0% | 32.7 -5% | 32.4 -4% | 30.2 3% | 29 7% |
| Idle Maximum * (dB) | 32.1 | 33 -3% | 32.7 -2% | 32.8 -2% | 30.6 5% | 29 10% |
| Load Average * (dB) | 43.4 | 45 -4% | 38.9 10% | 40.9 6% | 33.8 22% | 36.7 15% |
| Load Maximum * (dB) | 39.2 | 51 -30% | 50.6 -29% | 43.6 -11% | 42.6 -9% | 42.8 -9% |
| Witcher 3 ultra * (dB) | 45 | 53.4 | 39.5 | 44.7 |
* ... smaller is better
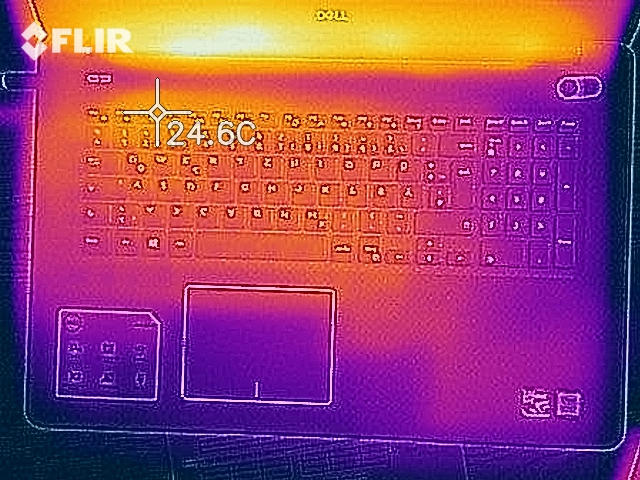
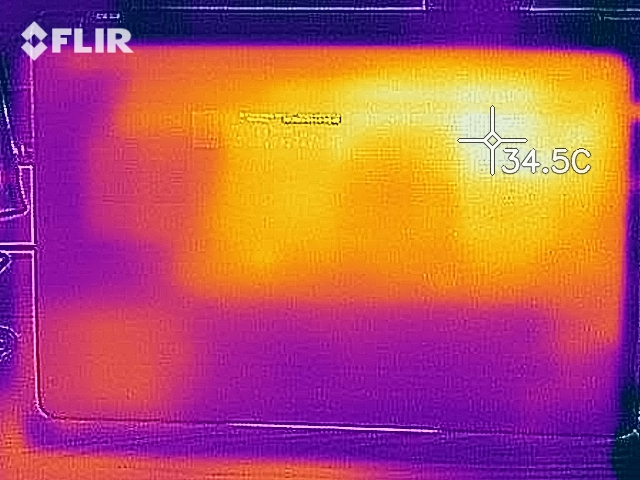
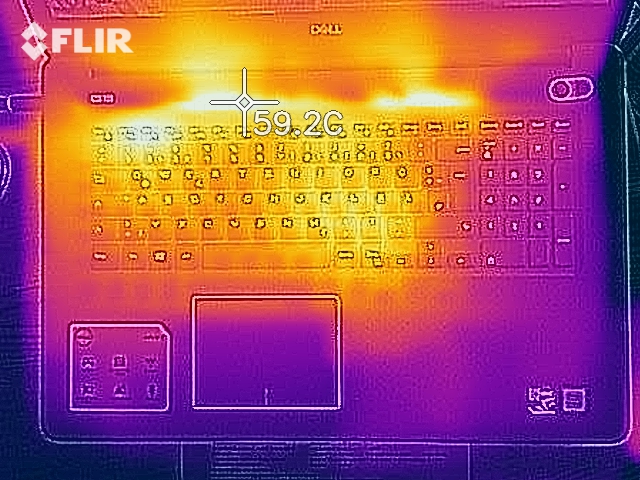
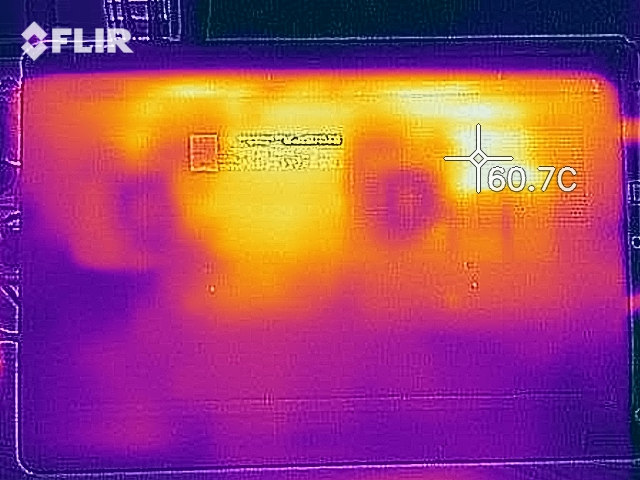
Temperature
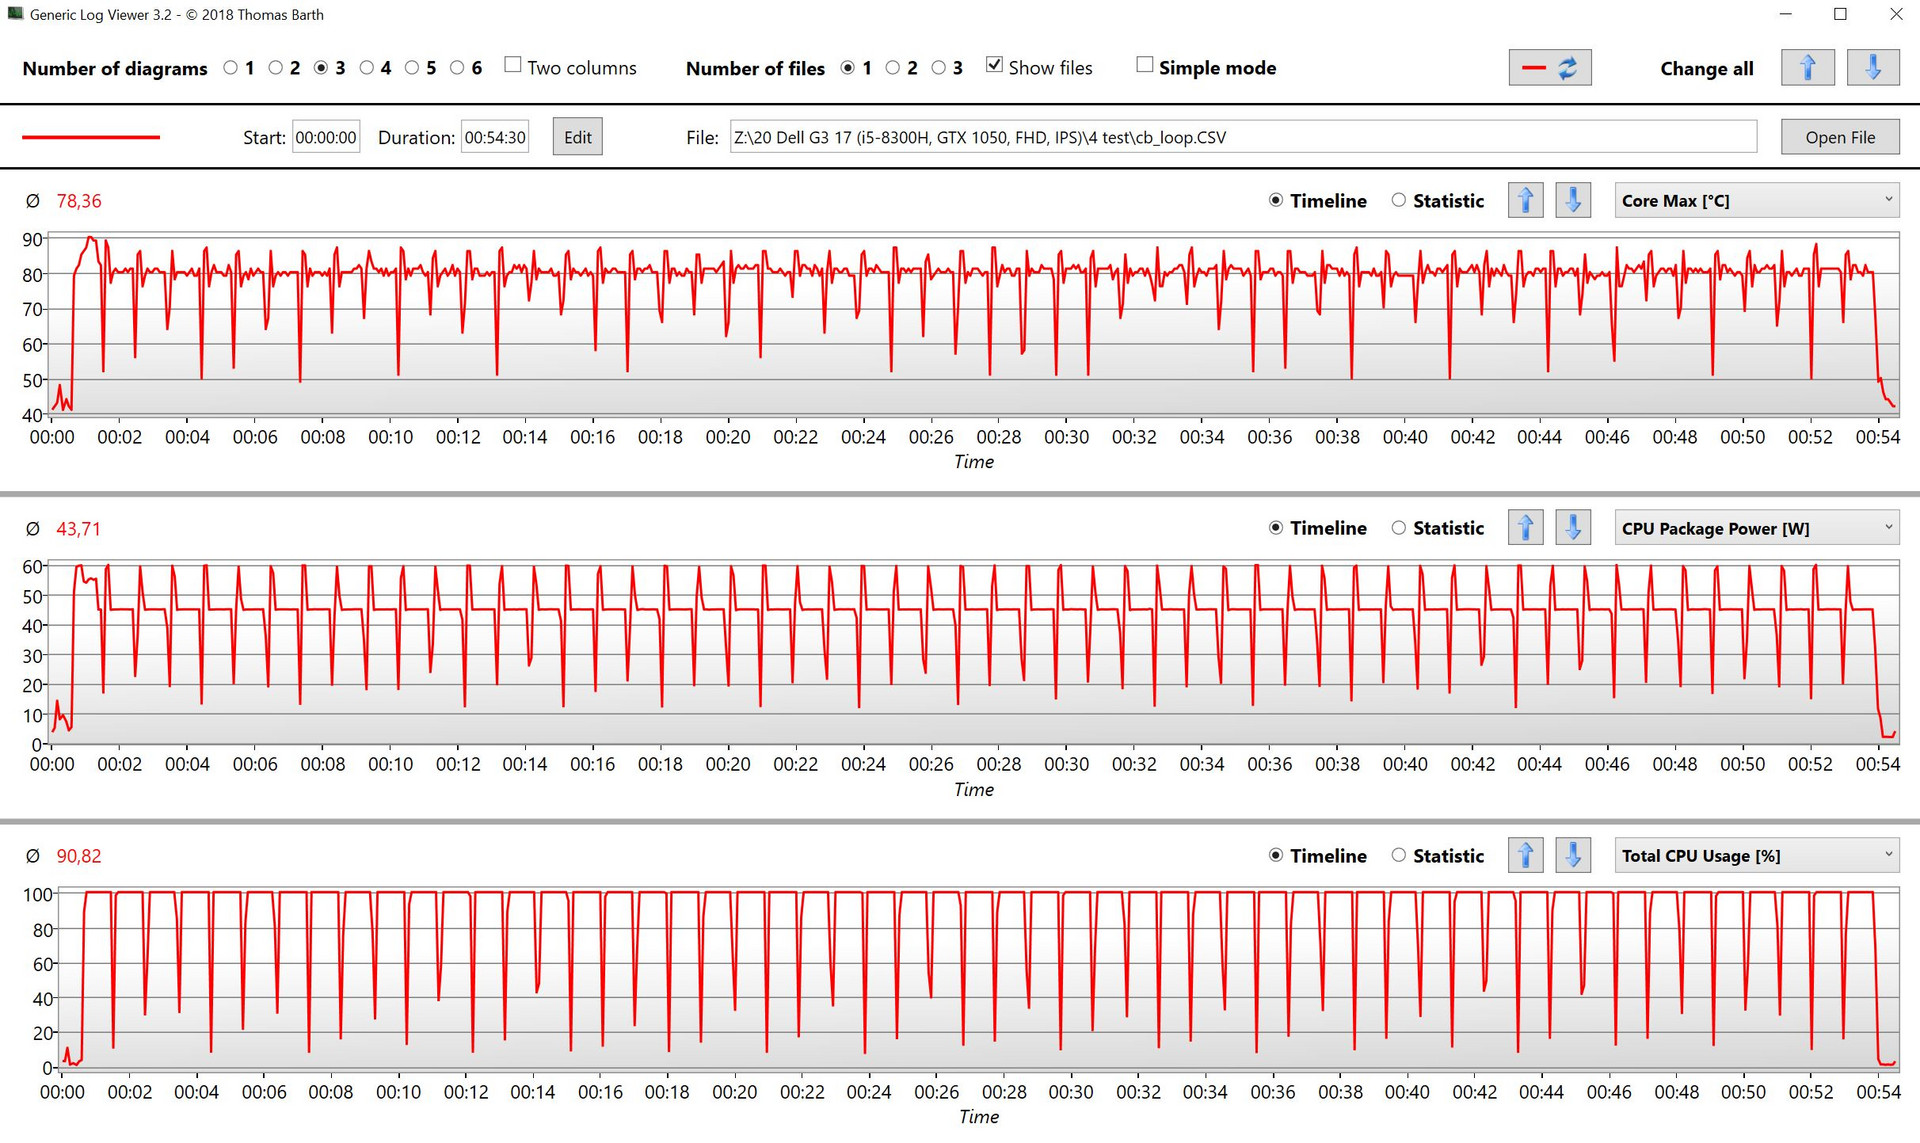
Until now, the benchmarks did not indicate a significant heating problem in the Dell G3 17 3779. However, the measured case temperatures speak for themselves. During idle operation, the case temperatures remain just below 30 °C (86 °F) on average and even during load only increase by another 10 °C (50 °F). But some separate hot spots become significantly hotter and achieve an unpleasant maximum value of 60.5 °C (141 °F) here in our comparison. The Dell G3 17 3779 should not be used on your lap under load, since it can quickly become uncomfortable in the long run.
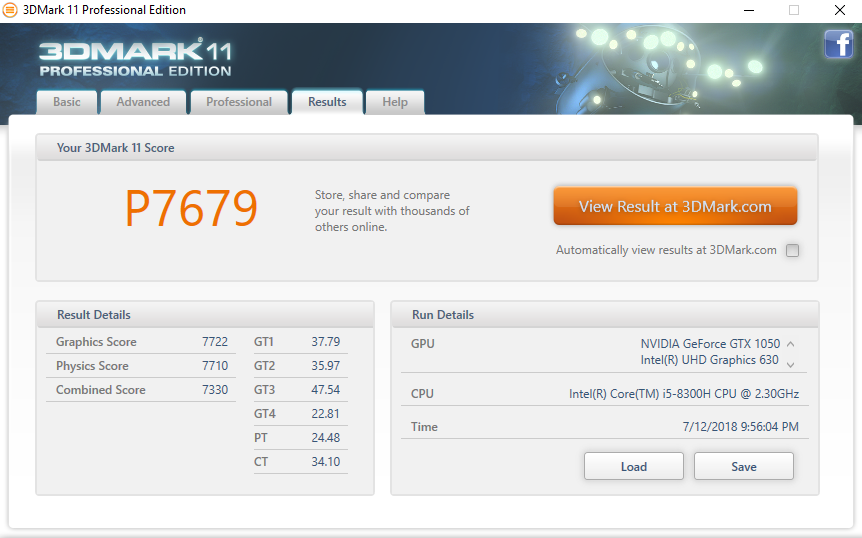
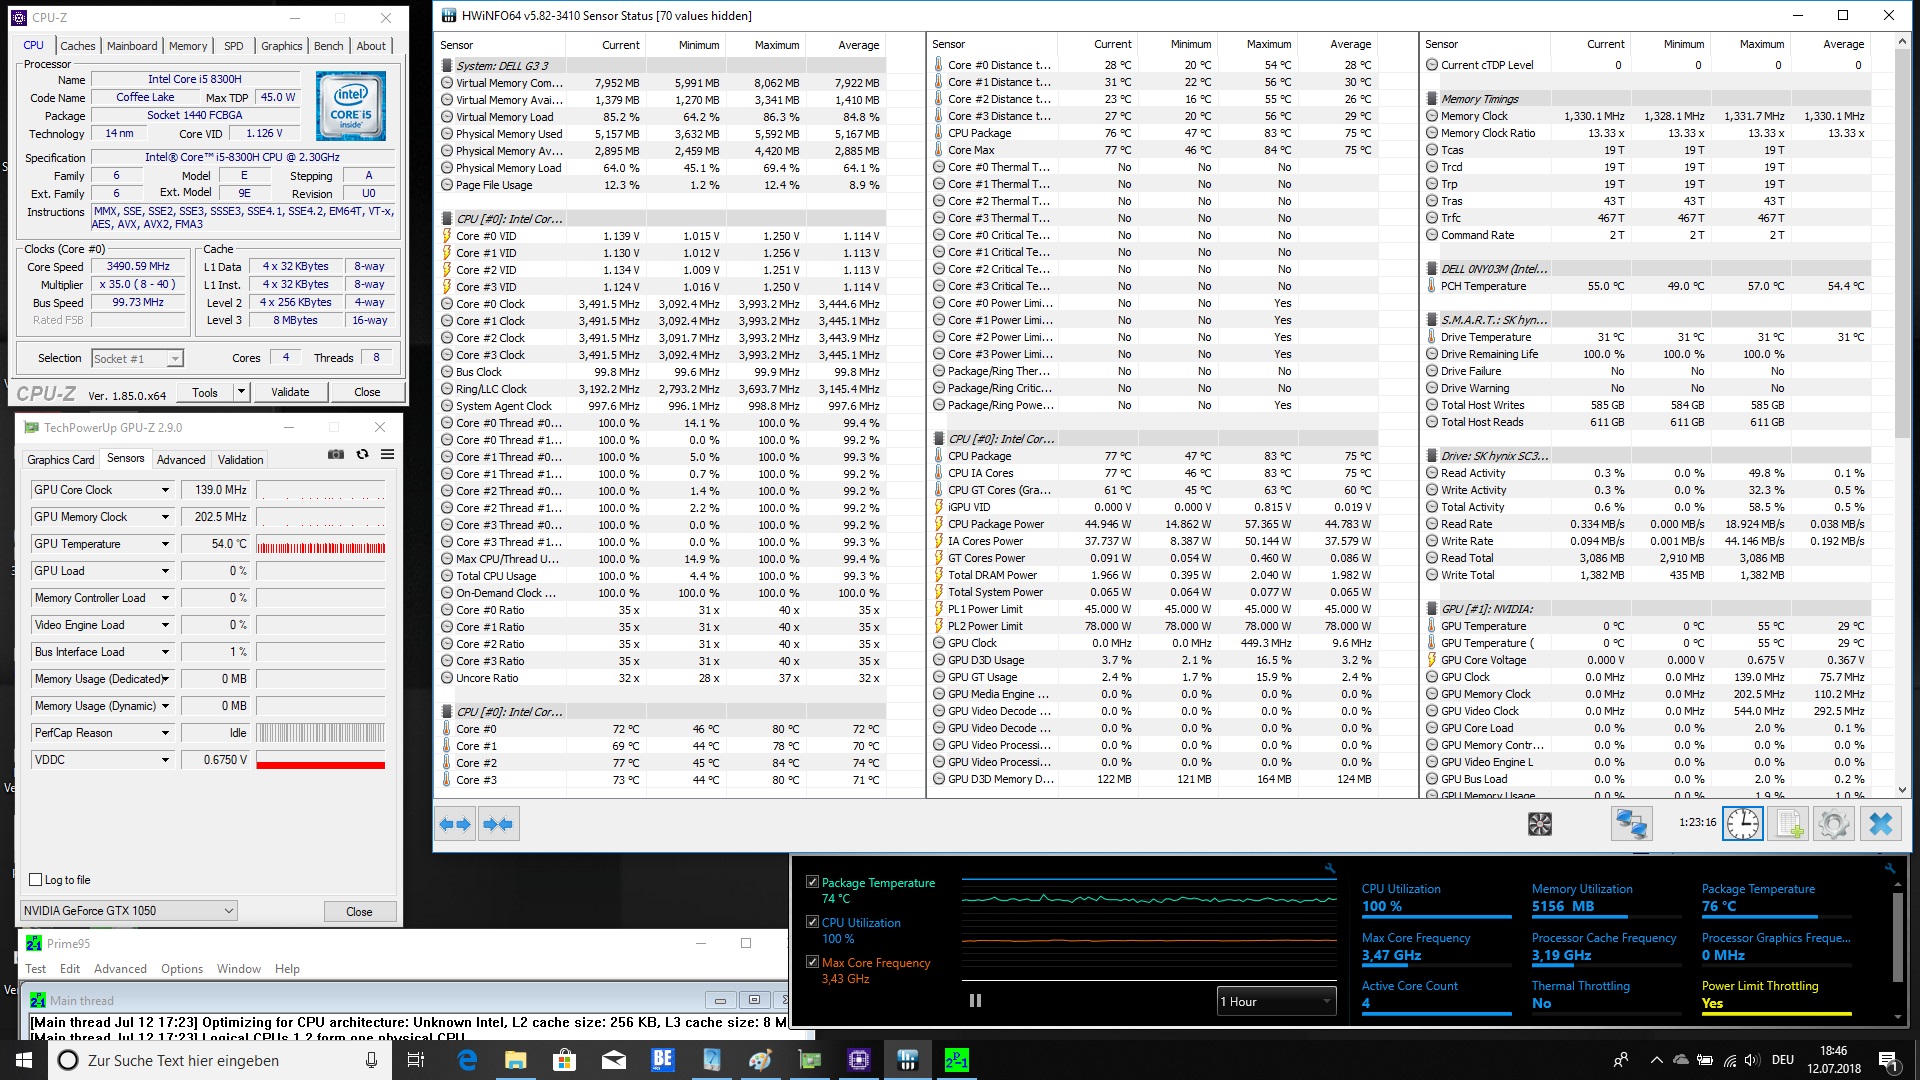
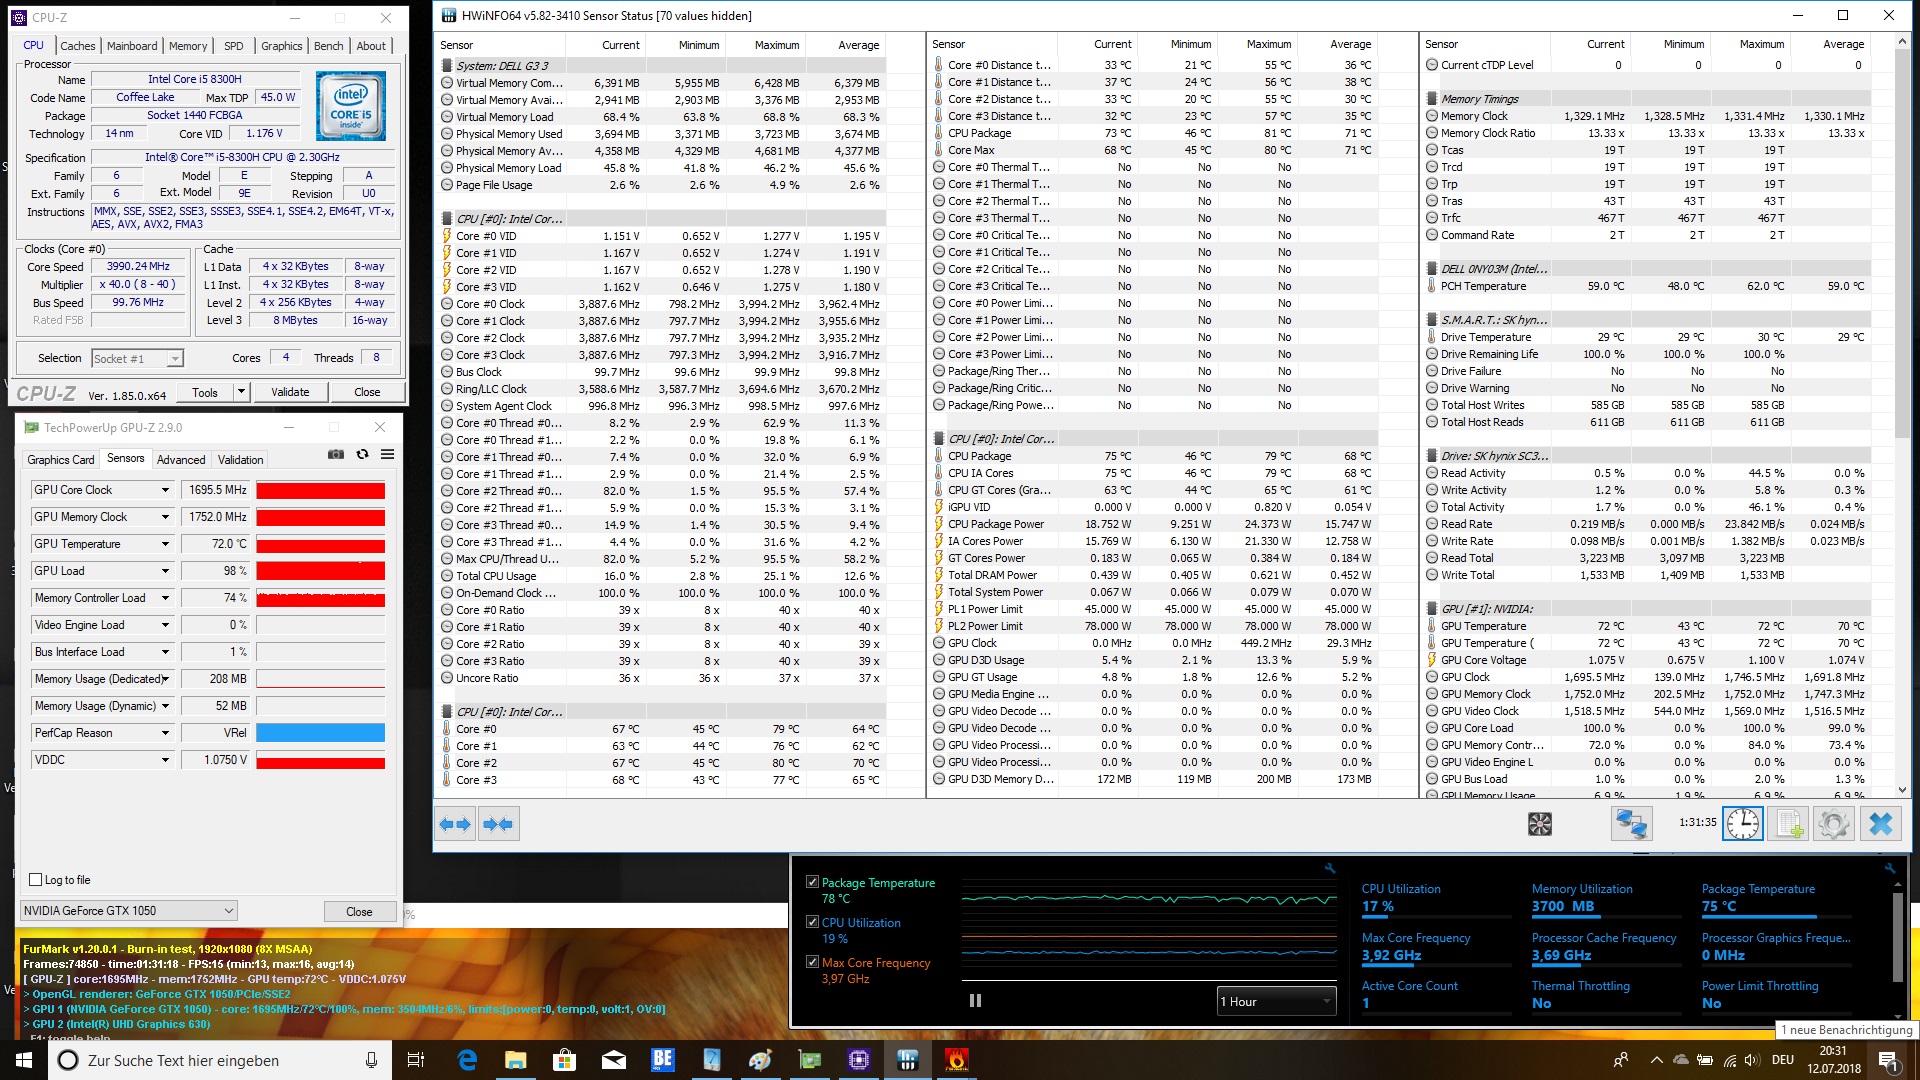
During the hour-long load test where we mistreated the device by simultaneously running the Prime95 and FurMark programs, the processor heated up to a maximum of 95 °C (203 °F) and the graphics processor heated up to 83 °C (181 °F). Even though thermal throttling intervened in the processor, it still maintained a surprisingly good clock speed of 3.2 GHz (basic clock speed: 2.3 GHz) during the load test. We did not notice any signs of thermal throttling in the Nvidia GeForce GTX 1050. The 3DMark11 test we ran directly afterwards also showed that the constant load does not have a negative effect on the performance.
(-) The maximum temperature on the upper side is 53 °C / 127 F, compared to the average of 40.4 °C / 105 F, ranging from 21.2 to 68.8 °C for the class Gaming.
(-) The bottom heats up to a maximum of 60.5 °C / 141 F, compared to the average of 43.2 °C / 110 F
(+) In idle usage, the average temperature for the upper side is 28 °C / 82 F, compared to the device average of 33.9 °C / 93 F.
(+) The palmrests and touchpad are cooler than skin temperature with a maximum of 27.6 °C / 81.7 F and are therefore cool to the touch.
(±) The average temperature of the palmrest area of similar devices was 28.8 °C / 83.8 F (+1.2 °C / 2.1 F).
| Dell G3 17 3779 GeForce GTX 1050 Mobile, i5-8300H, SK hynix SC311 SATA | Acer Predator Helios 300 PH317-52-51M6 GeForce GTX 1050 Ti Mobile, i5-8300H, Hynix HFS128G39TND | Asus ROG Strix GL702ZC-GC204T Radeon RX 580 (Laptop), R5 1600, Seagate Mobile HDD 1TB ST1000LX015-1U7172 | MSI GL72 7RDX-602 GeForce GTX 1050 Mobile, i7-7700HQ, HGST Travelstar 7K1000 HTS721010A9E630 | Acer Aspire Nitro BE VN7-793G-5811 GeForce GTX 1050 Ti Mobile, i5-7300HQ, Seagate Mobile HDD 1TB ST1000LM035 | Asus VivoBook Pro 17 N705UD-EH76 GeForce GTX 1050 Mobile, i5-8550U, Samsung PM961 NVMe MZVLW512HMJP | |
|---|---|---|---|---|---|---|
| Heat | 4% | -3% | 10% | 13% | 2% | |
| Maximum Upper Side * (°C) | 53 | 50 6% | 54.3 -2% | 45 15% | 48 9% | 46 13% |
| Maximum Bottom * (°C) | 60.5 | 52 14% | 51 16% | 44 27% | 40.8 33% | 56.2 7% |
| Idle Upper Side * (°C) | 30.3 | 33 -9% | 36 -19% | 29 4% | 29.9 1% | 28.6 6% |
| Idle Bottom * (°C) | 32 | 30 6% | 34.3 -7% | 34.2 -7% | 29.8 7% | 37.6 -18% |
* ... smaller is better
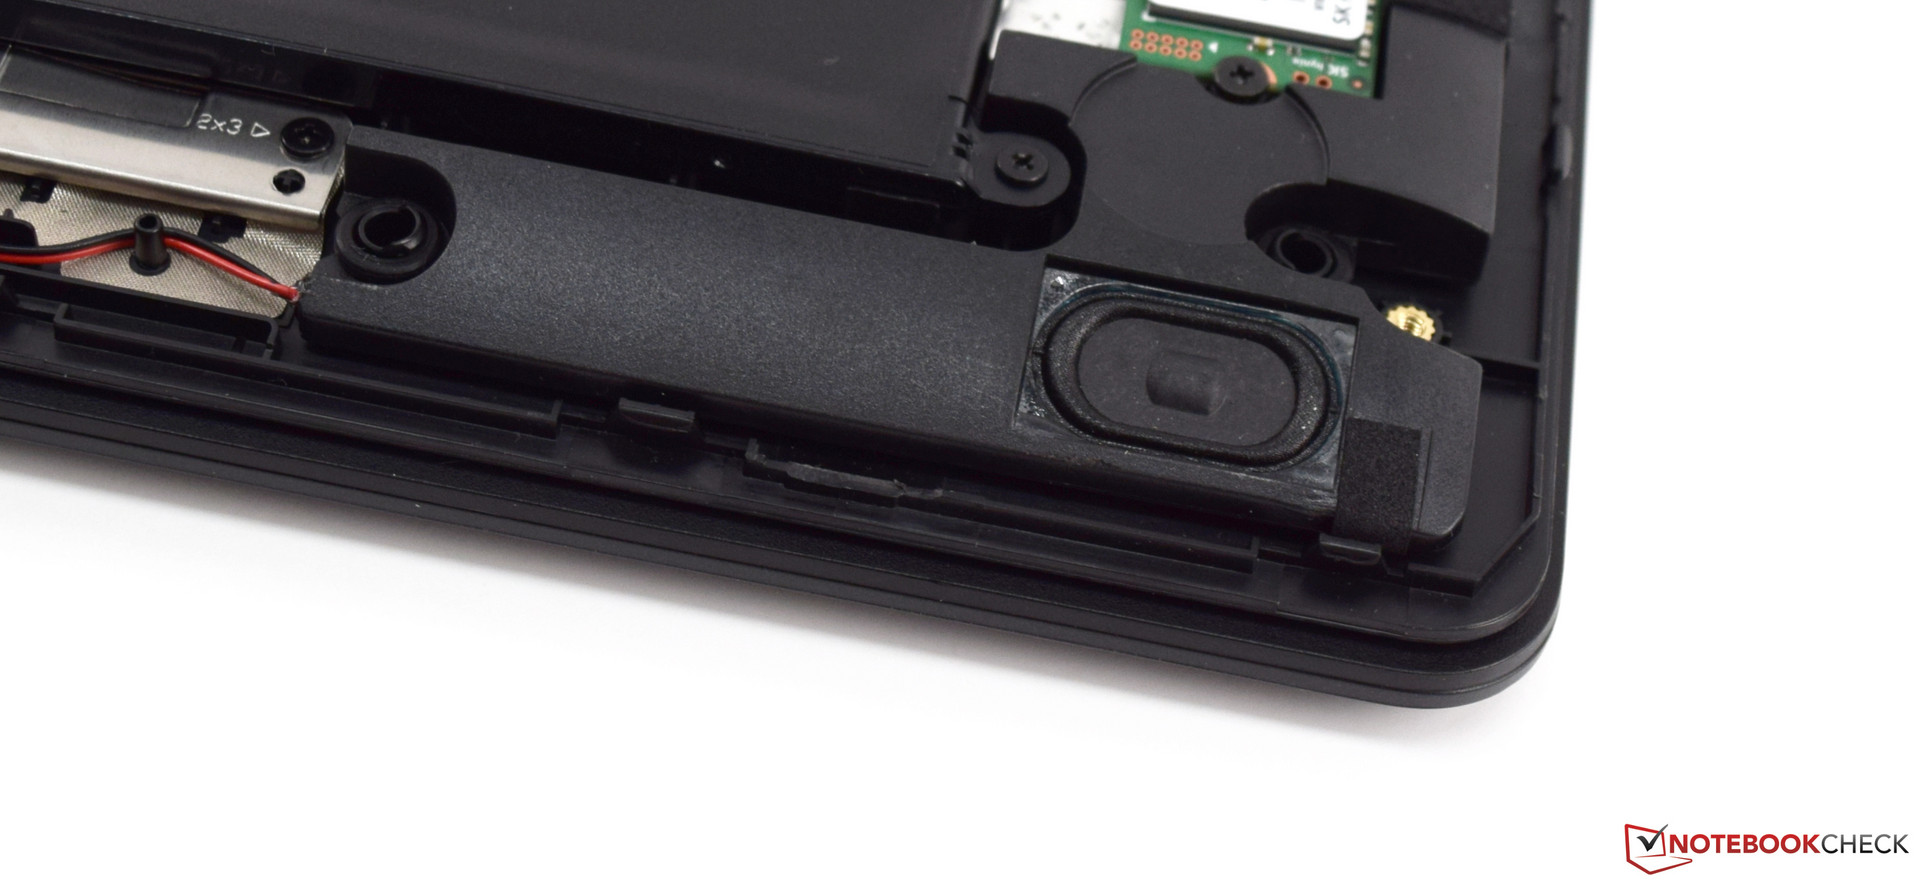
Speaker
Dell has positioned the speakers in the front area of the G3 17 3779. The openings are directed slightly towards the front towards the user. Dell does not use a subwoofer here, which we find somewhat regrettable. The volume of the stereo speakers is sufficient and also clear and understandable at maximum volume. Unfortunately, the highs and mids are prevalent and we can only imagine the bass. A separate subwoofer would definitely be an advantage here, and there would have been still space for it inside. However, the offered quality is sufficient for video-calling such as skyping, and the sound quality of recordings using the built-in microphones was also sufficient. The Dell G3 17 3779 also offers a combined 3.5-mm audio port on the right side for external speakers.
Power Management - Energy-efficient and lasting Dell G3 17
Power Consumption
As mentioned earlier, the power consumption is very good for a gaming laptop. When we look more in detail at the single values, they also remain within an acceptable range. During idle, the Dell G3 17 3779 is content with 7.7 - 15.5 watts. Under load, the consumption increases up to a maximum of 106 watts and then levels out at 95 watts. With the exception of the Asus ROG Strix, the values of all the comparison devices are close.
Our test unit includes a 130-watt power supply which provides sufficient power. We did not notice any discharging of the battery during full load.
Note:
Only the Dell G3 17 3779 models with the GeForce GTX 1050 and the GeForce GTX 1050 Ti include the 130-watt power supply. The slightly more powerful Dell G3 17 based on the GeForce GTX 1060 Max-Q includes a 180-watt power supply instead.
| Off / Standby | |
| Idle | |
| Load |
|
Key:
min: | |
| Dell G3 17 3779 i5-8300H, GeForce GTX 1050 Mobile, SK hynix SC311 SATA, IPS, 1920x1080, 17.3" | Acer Predator Helios 300 PH317-52-51M6 i5-8300H, GeForce GTX 1050 Ti Mobile, Hynix HFS128G39TND, IPS, 1920x1080, 17.3" | Asus ROG Strix GL702ZC-GC204T R5 1600, Radeon RX 580 (Laptop), Seagate Mobile HDD 1TB ST1000LX015-1U7172, IPS, 1920x1080, 17.3" | MSI GL72 7RDX-602 i7-7700HQ, GeForce GTX 1050 Mobile, HGST Travelstar 7K1000 HTS721010A9E630, TN LED, 1920x1080, 17.3" | Acer Aspire Nitro BE VN7-793G-5811 i5-7300HQ, GeForce GTX 1050 Ti Mobile, Seagate Mobile HDD 1TB ST1000LM035, IPS, 1920x1080, 17.3" | Asus VivoBook Pro 17 N705UD-EH76 i5-8550U, GeForce GTX 1050 Mobile, Samsung PM961 NVMe MZVLW512HMJP, IPS, 1920x1080, 17.3" | Average NVIDIA GeForce GTX 1050 Mobile | Average of class Gaming | |
|---|---|---|---|---|---|---|---|---|
| Power Consumption | 10% | -282% | -14% | -0% | 22% | 11% | -65% | |
| Idle Minimum * (Watt) | 7.7 | 6 22% | 49 -536% | 9.6 -25% | 8.7 -13% | 5.06 34% | 6.99 ? 9% | 13 ? -69% |
| Idle Average * (Watt) | 14 | 9 36% | 60 -329% | 15 -7% | 12.4 11% | 10.3 26% | 10.7 ? 24% | 19 ? -36% |
| Idle Maximum * (Watt) | 15.5 | 13 16% | 68 -339% | 16.5 -6% | 15.4 1% | 10.7 31% | 12.7 ? 18% | 24.6 ? -59% |
| Load Average * (Watt) | 95 | 95 -0% | 150 -58% | 104 -9% | 73 23% | 83 13% | 82.9 ? 13% | 110.7 ? -17% |
| Load Maximum * (Watt) | 106 | 134 -26% | 262 -147% | 129 -22% | 130 -23% | 99.9 6% | 115.3 ? -9% | 259 ? -144% |
| Witcher 3 ultra * (Watt) | 102 | 214 | 98 | 92.4 |
* ... smaller is better
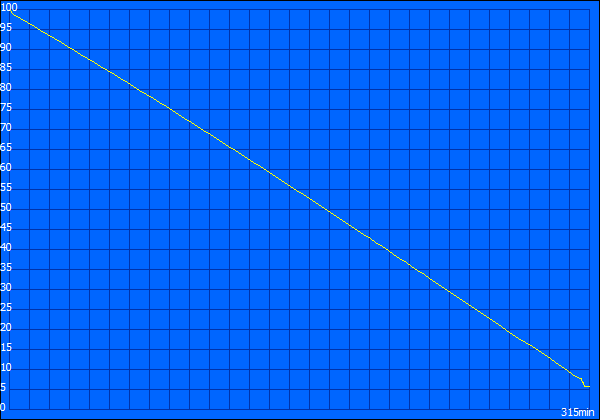
Battery Life

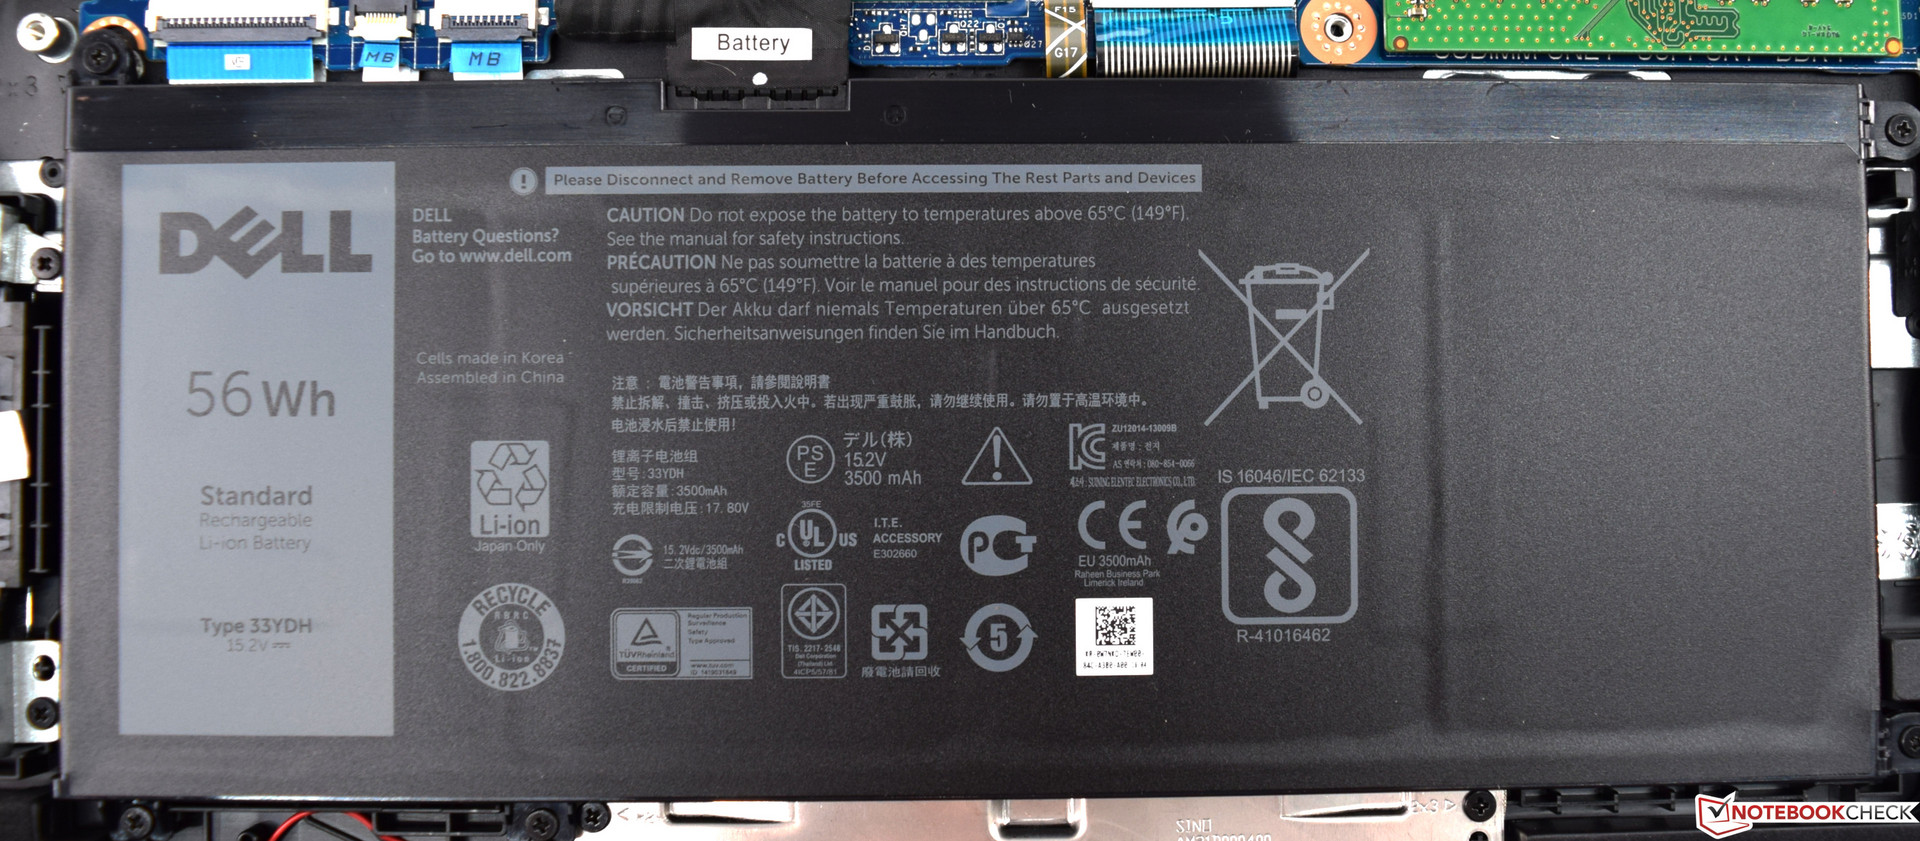
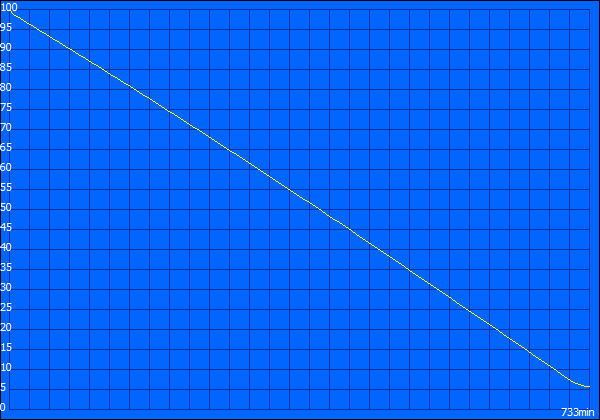
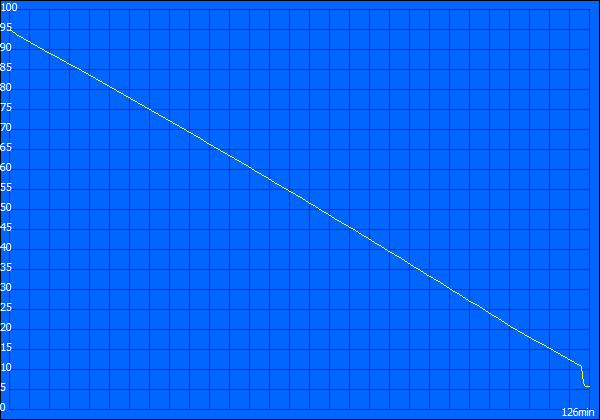
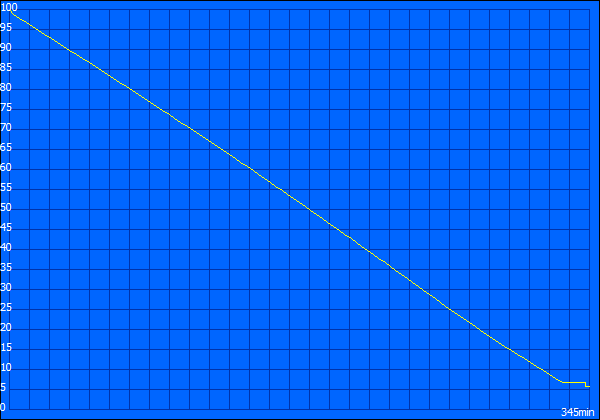
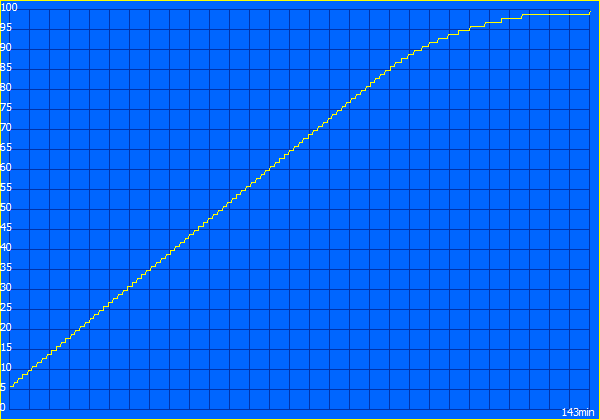
In terms of its battery life, the Dell G3 17 3779 makes a surprisingly good impression. The built-in 56-Wh battery offers the same capacity as in the Dell G5 15 5587. In our comparison here, our test unit has the second-largest battery after the Asus ROG Strix (74 Wh). The battery life is decent for a gaming laptop. The Dell G3 17 3779 lasted for 5:45 hours in our realistic WLAN test where we adjusted the display brightness to 150 cd/m² to keep the conditions similar. This means that the display brightness had to be lowered by five steps (50%). With a good two hours even under load, our test unit also achieved a very good result. Anyone who likes to watch movies is also rewarded, as you can easily watch two or three movies in the good five hours before the battery has to be recharged again. A complete recharge takes almost 2.5 hours.
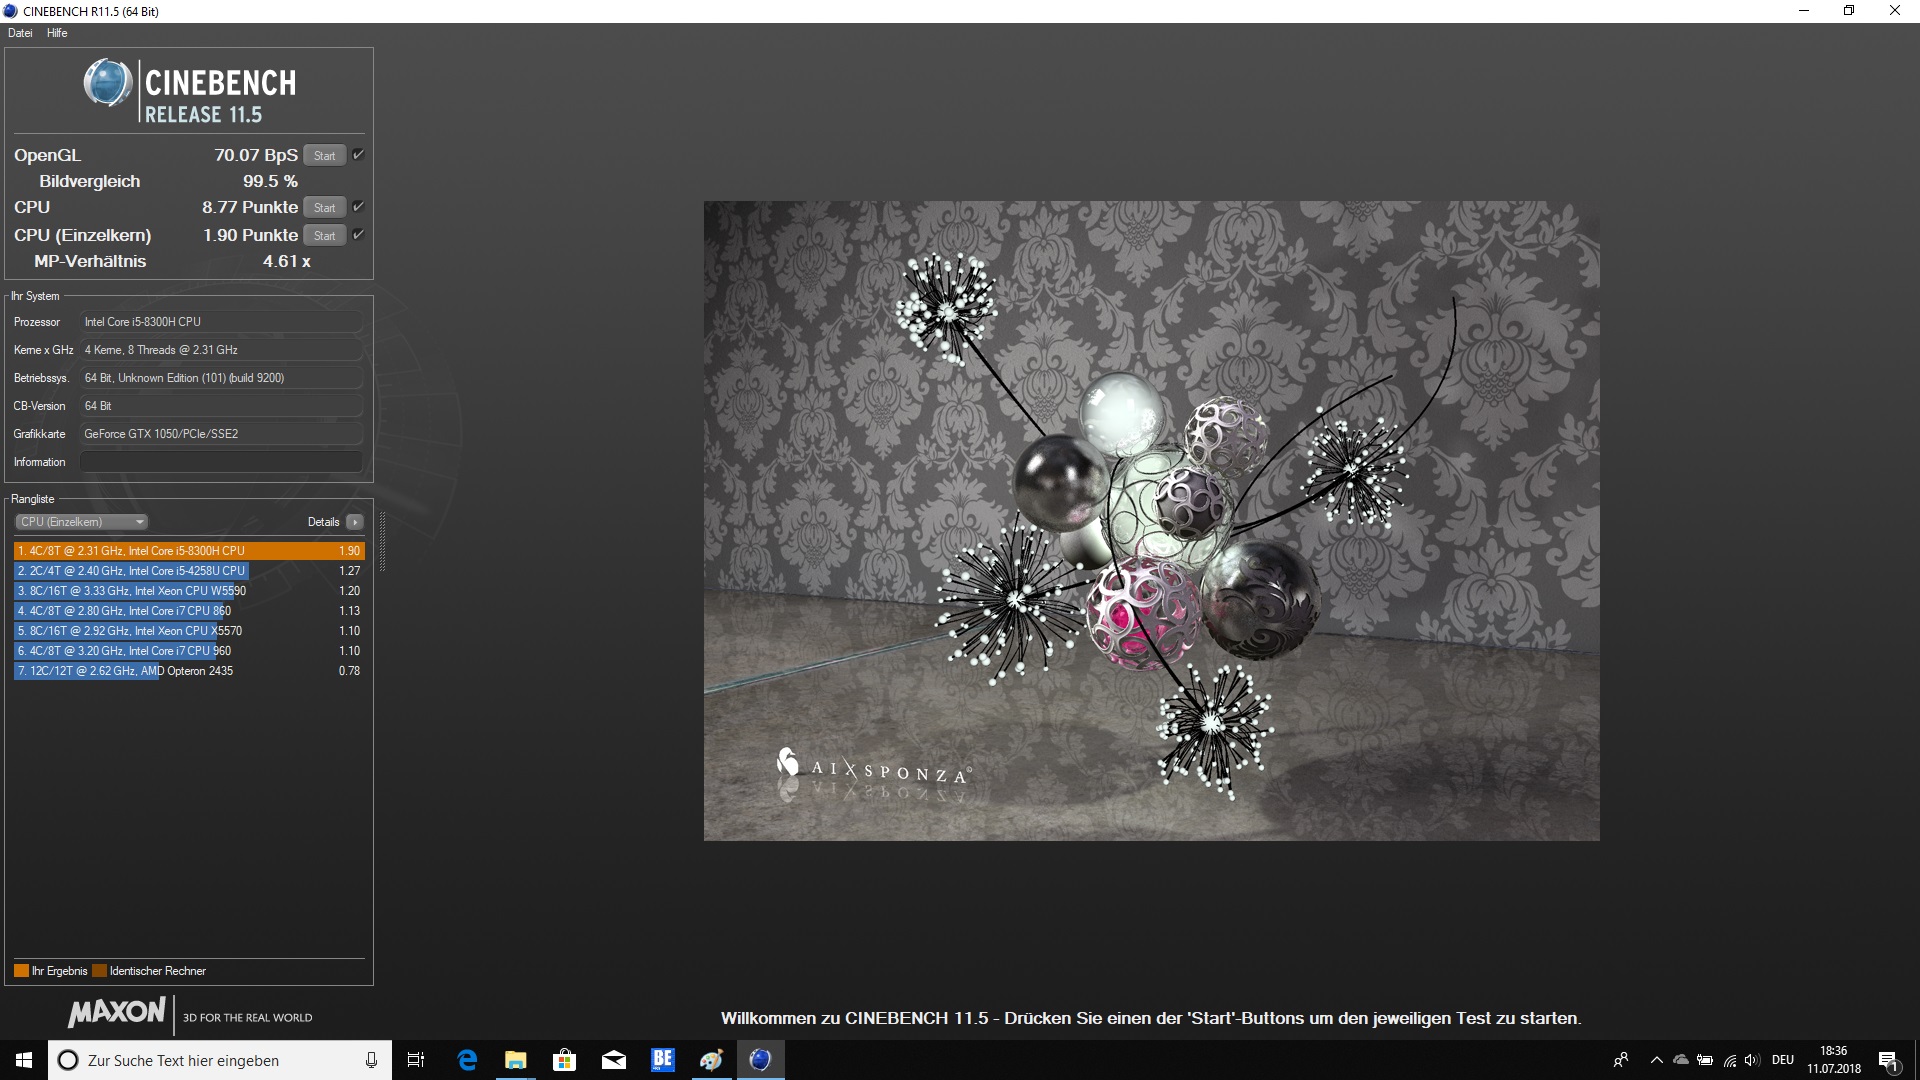
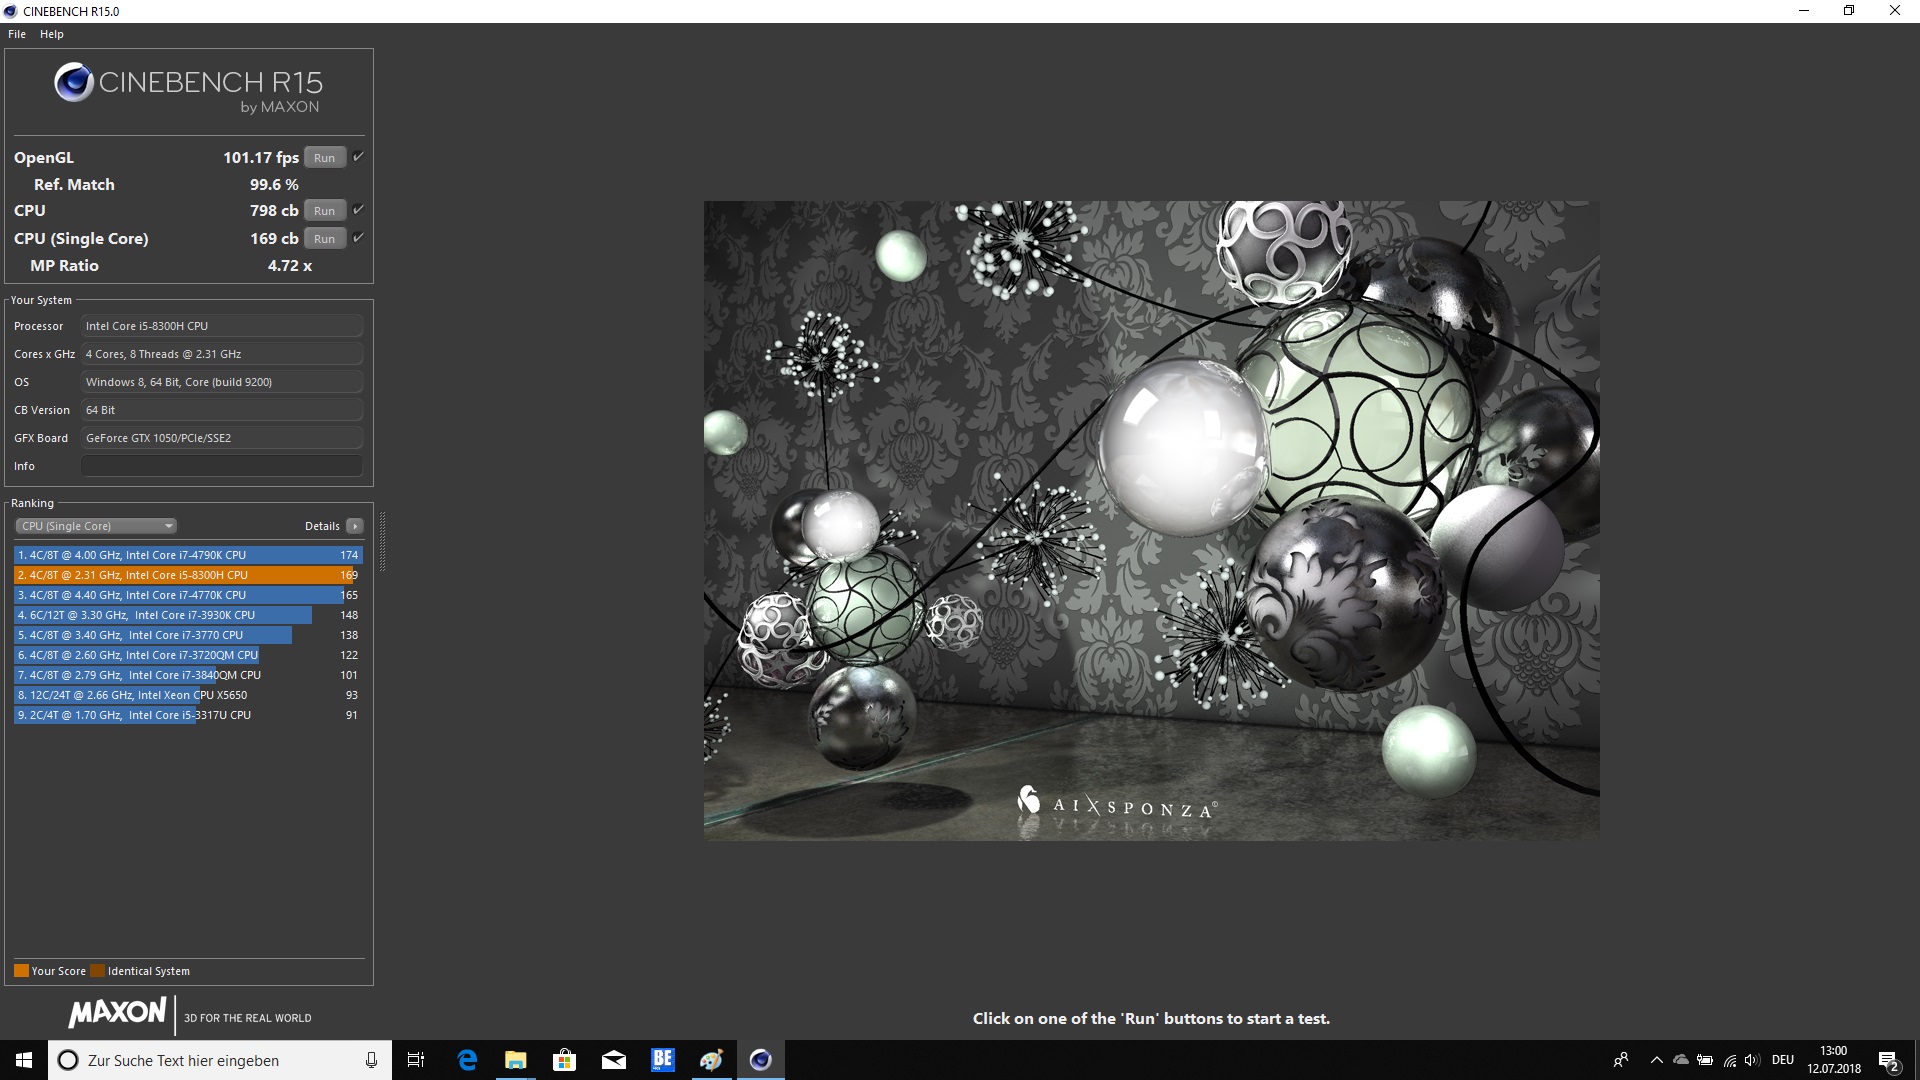
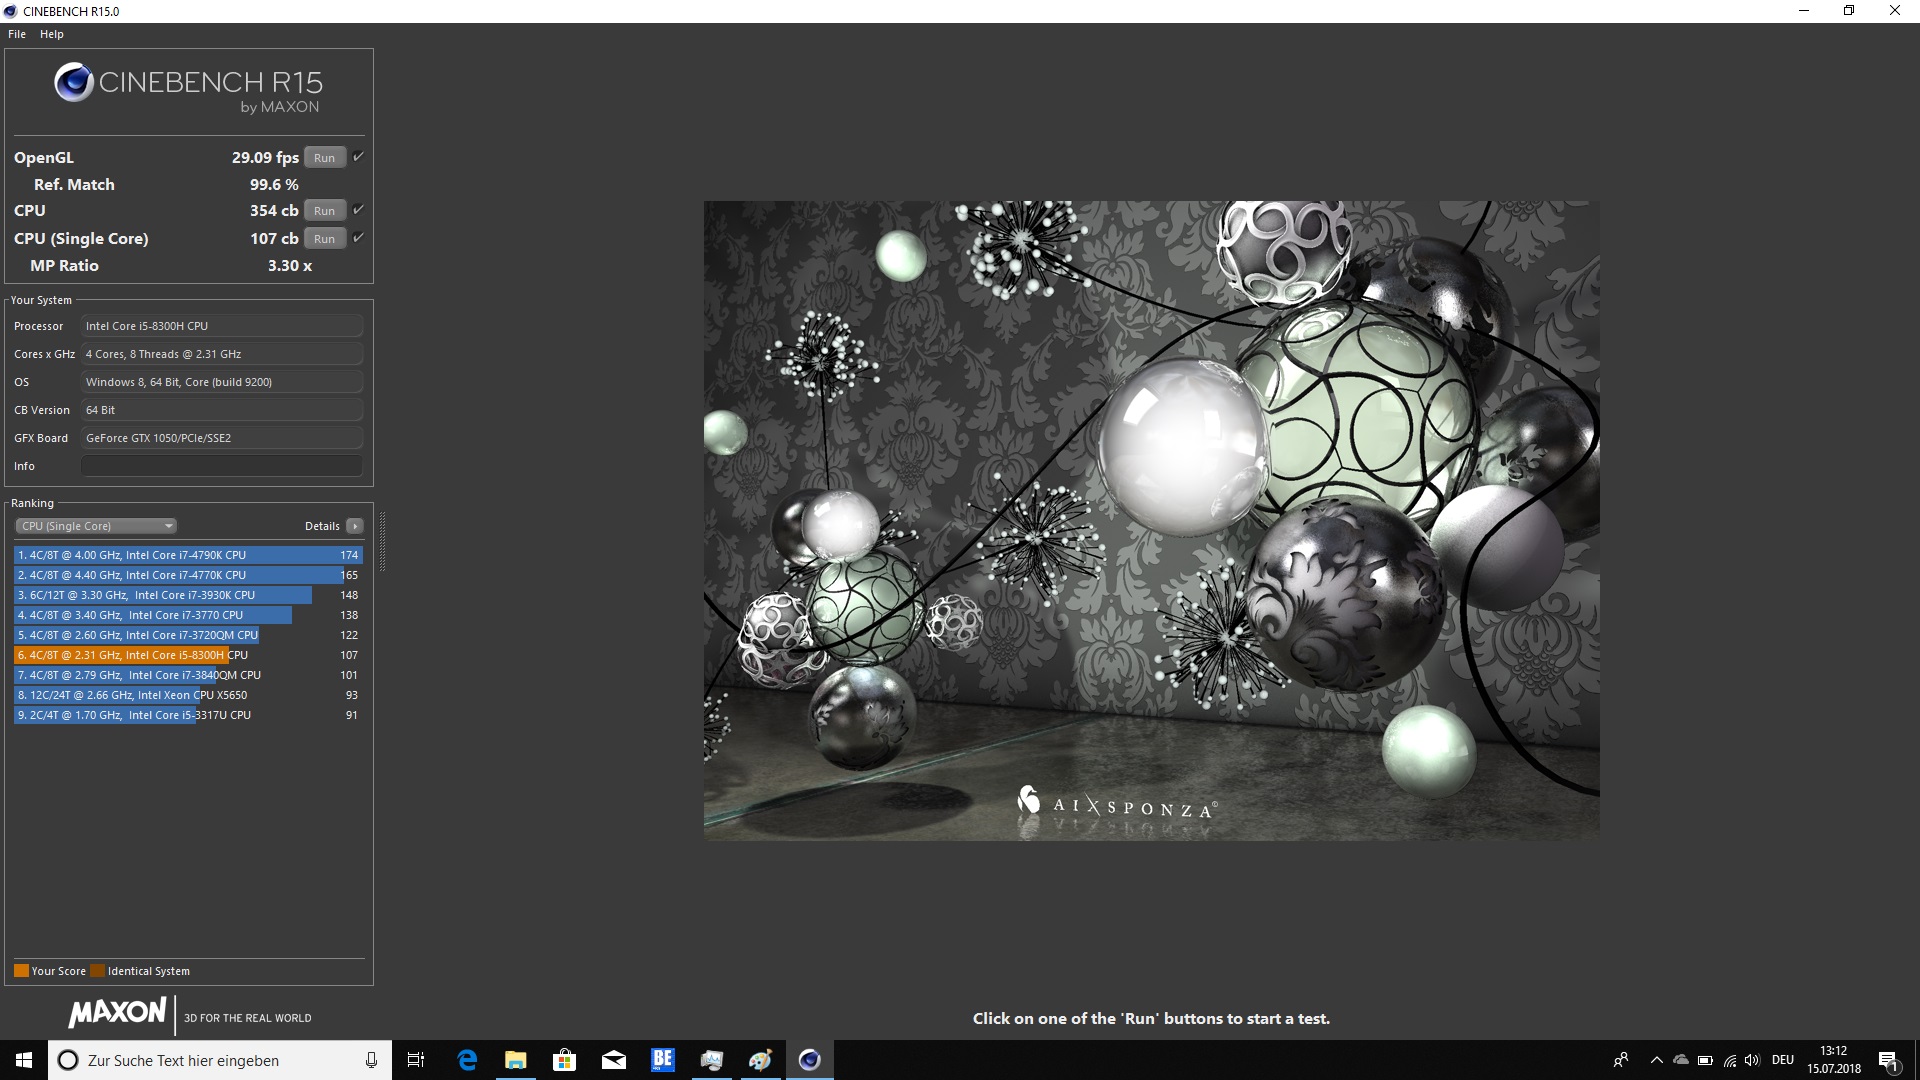
However, the Dell G3 17 3779 also has a strong disadvantage during battery operation! The performance of the CPU and GPU are drastically throttled in battery operation, which you can clearly see in our example of the 3DMark11 benchmark, where the Dell only achieves 1932 points in battery operation. The CPU clock speed is throttled to about 1.9 GHz in battery operation, and the Turbo mode is deactivated. This also results in a considerable decrease of the CPU performance, as the Cinebench R15 in battery operation screenshot shows.
| Dell G3 17 3779 i5-8300H, GeForce GTX 1050 Mobile, 56 Wh | Acer Predator Helios 300 PH317-52-51M6 i5-8300H, GeForce GTX 1050 Ti Mobile, 48 Wh | Asus ROG Strix GL702ZC-GC204T R5 1600, Radeon RX 580 (Laptop), 74 Wh | MSI GL72 7RDX-602 i7-7700HQ, GeForce GTX 1050 Mobile, 43.2 Wh | Acer Aspire Nitro BE VN7-793G-5811 i5-7300HQ, GeForce GTX 1050 Ti Mobile, 52.5 Wh | Asus VivoBook Pro 17 N705UD-EH76 i5-8550U, GeForce GTX 1050 Mobile, 42 Wh | Average of class Gaming | |
|---|---|---|---|---|---|---|---|
| Battery runtime | -7% | -78% | -53% | -21% | -41% | 5% | |
| Reader / Idle (h) | 12.2 | 11.8 -3% | 5.5 -55% | 8.27 ? -32% | |||
| H.264 (h) | 5.3 | 2.8 -47% | 8.32 ? 57% | ||||
| WiFi v1.3 (h) | 5.8 | 5.9 2% | 1.3 -78% | 3.4 -41% | 4.6 -21% | 4.4 -24% | 7.11 ? 23% |
| Load (h) | 2.1 | 1.7 -19% | 0.7 -67% | 0.9 -57% | 1.502 ? -28% |
Verdict - An affordable Dell gaming notebook
Pros
Cons

With the Dell G3 17 3779, the manufacturer has an affordable gaming notebook in its portfolio that can become part of the shortlist. The newest Coffee-Lake processors can be selected, and with the Nvidia GeForce GTX 1050, Dell also uses a decent graphics card. For the requested sales price of 799 Euros (~$937), you also get 8 GB of RAM and a storage solution with a combination of an SSD and HDD. With this, the 17-inch notebook offers a very good basis for entry into the world of gaming. The processor offers a decent performance without taxing the device in battery operation.
The Dell G3 17 3779 primarily attracts with its good price-performance ratio. A lot of device for relatively little money; this is what Dell is offering with the new G3 17 series.
As good as this may sound, there are also some reasons for complaint. The case, which is mainly made from plastic, does not make a recognizable impression, and fingerprints become quickly visible on the matte display lid. While Dell does not make many mistakes in general in the extensive subject of the display, in our case, the pronounced clouding leaves a bad taste. Otherwise, the IPS display offers very good color-space coverage, a matte display surface, and a decent brightness.
While the storage card reader remains significantly below the average, we are pleased that Dell still offers this at all, since more often than not it is removed without a replacement. We also expected significantly more in the WLAN performance, since the Dell G3 17 3779 remained about 50% behind the device class.
The case temperatures are a little high in our opinion. Due to the heat build-up, there is thermal throttling for the CPU, but fortunately this does not have too extreme of an effect. An Intel Core i7-8750H might have a harder time here.
Finally, we can say that Dell offers a decent gaming device with the G3 17 3779 without leaving a massive hole in your household budget.
Dell G3 17 3779
- 07/19/2018 v6 (old)
Sebastian Bade
Price comparison
