Asus ROG Chimera G703 (i7-7820HK, GTX 1080, Full HD) Laptop Review
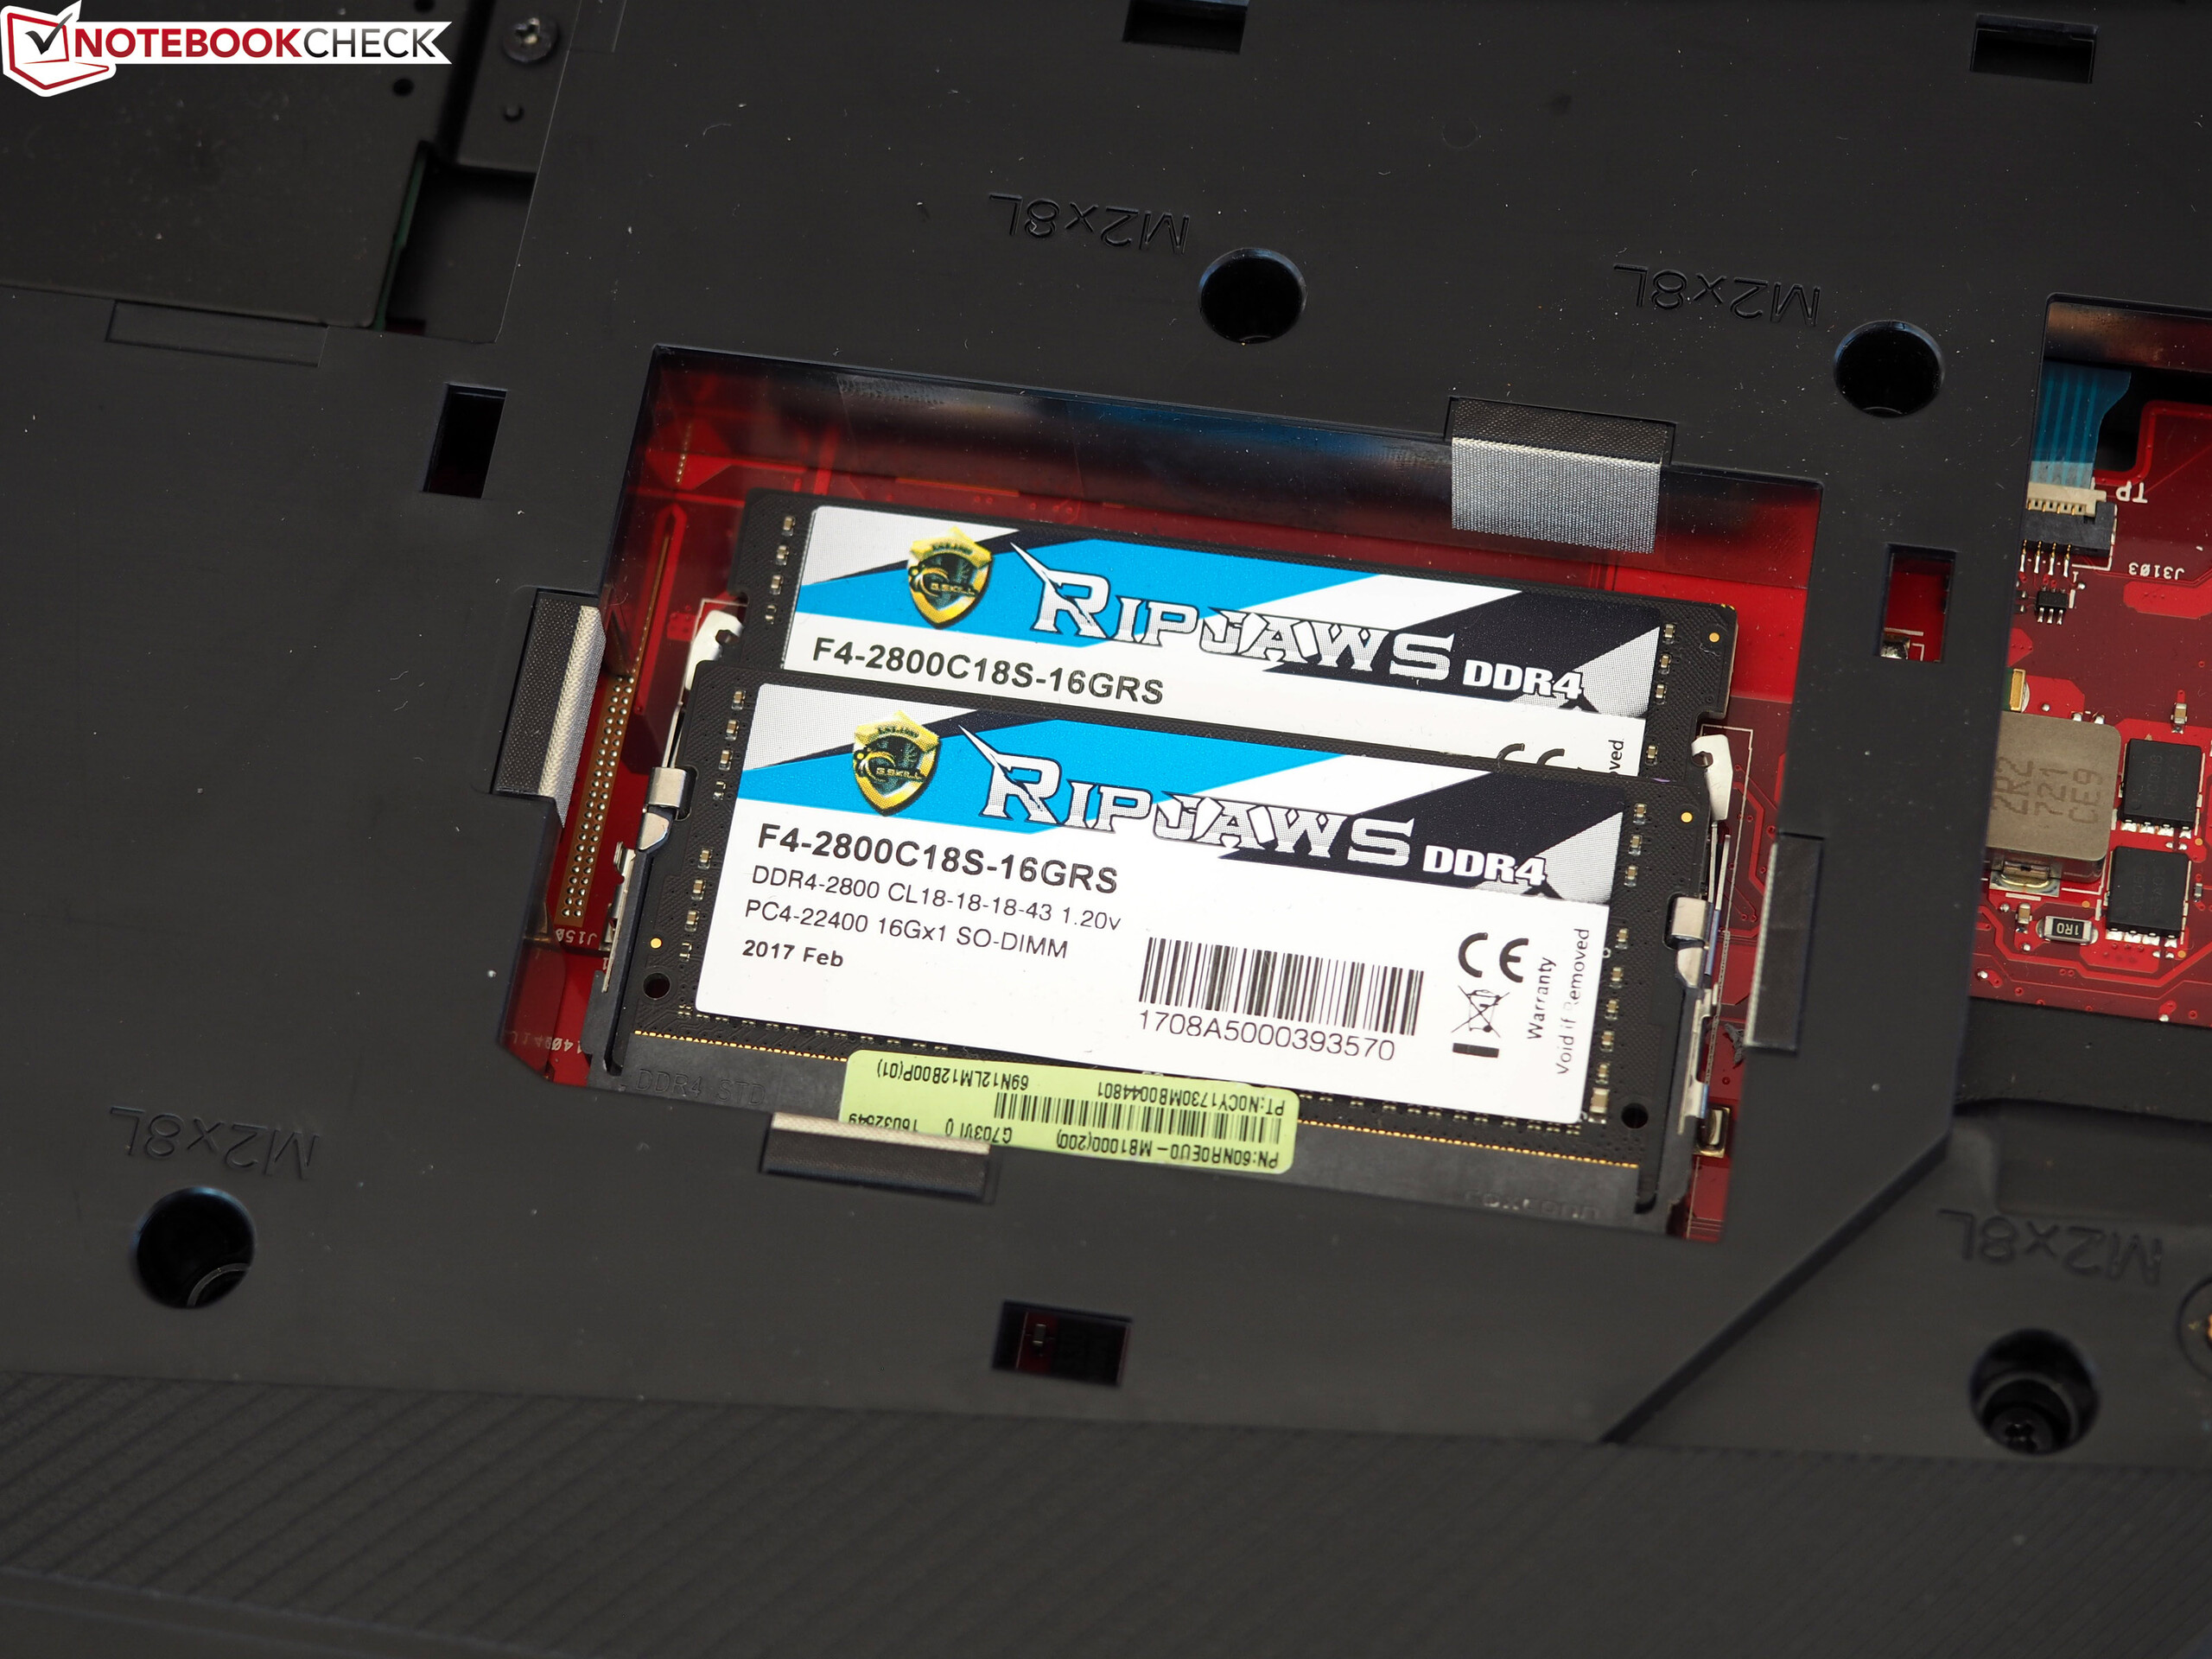
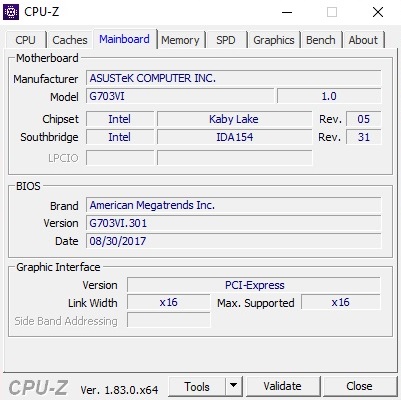
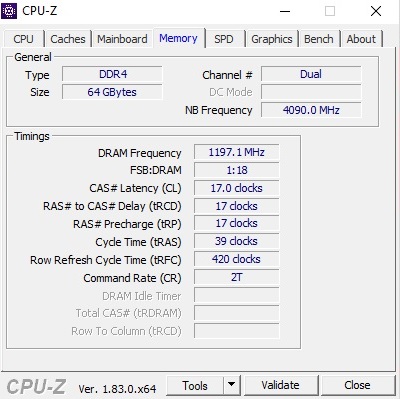
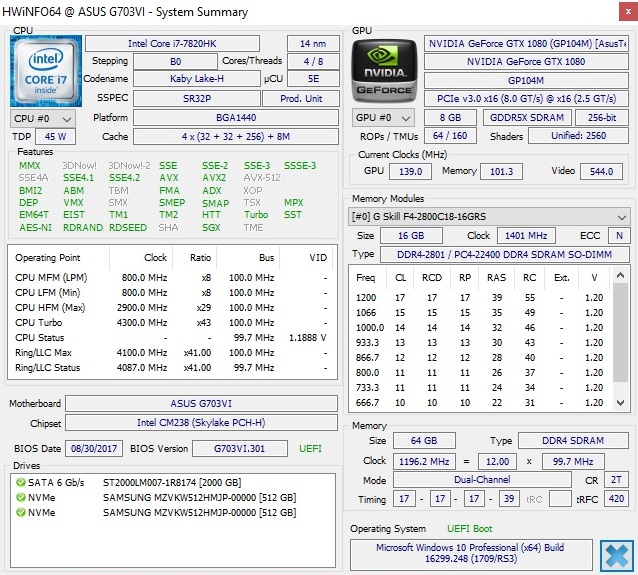
In contrast to the successful ROG G752, which is "only" equipped with a GeForce GTX 1060 or GTX 1070, in the ROG G703, Nvidia's currently most powerful Pascal chip for notebooks, the GeForce GTX 1080, is used. The DirectX-12 accelerator is accompanied by a Core i7-7820HK. The rest of the equipment is not bad either. For example, our UK version was equipped with 64 GB of DDR4-RAM (4x 16 GB DDR4-2800 @ 2,400 MHz) and a combination of a 2 TB HDD and a 1 TB SSD-RAID (2x 512 GB NVMe). The extremely fast 144 Hz IPS display with G-Sync support turns out to be another highlight.
In Germany, the above configuration is not available yet, even though the G703VI-E5089T model, which costs about 3600 Euros (~$4433) has identical specifications except for the working memory which is half the size (32 GB DDR4; in the US a version with smaller drives costs ~$3,500). Correspondingly, the results and evaluation of the German variant should turn out very similar.
The competitors of the ROG Chimera G703 include other 17-inch gaming notebooks with the GeForce GTX 1080, such as the Schenker XMG Ultra 17, the Acer Predator 17 X, the MSI GT75VR, and the Alienware 17 R4, which are all included as comparison devices in this test.
Case
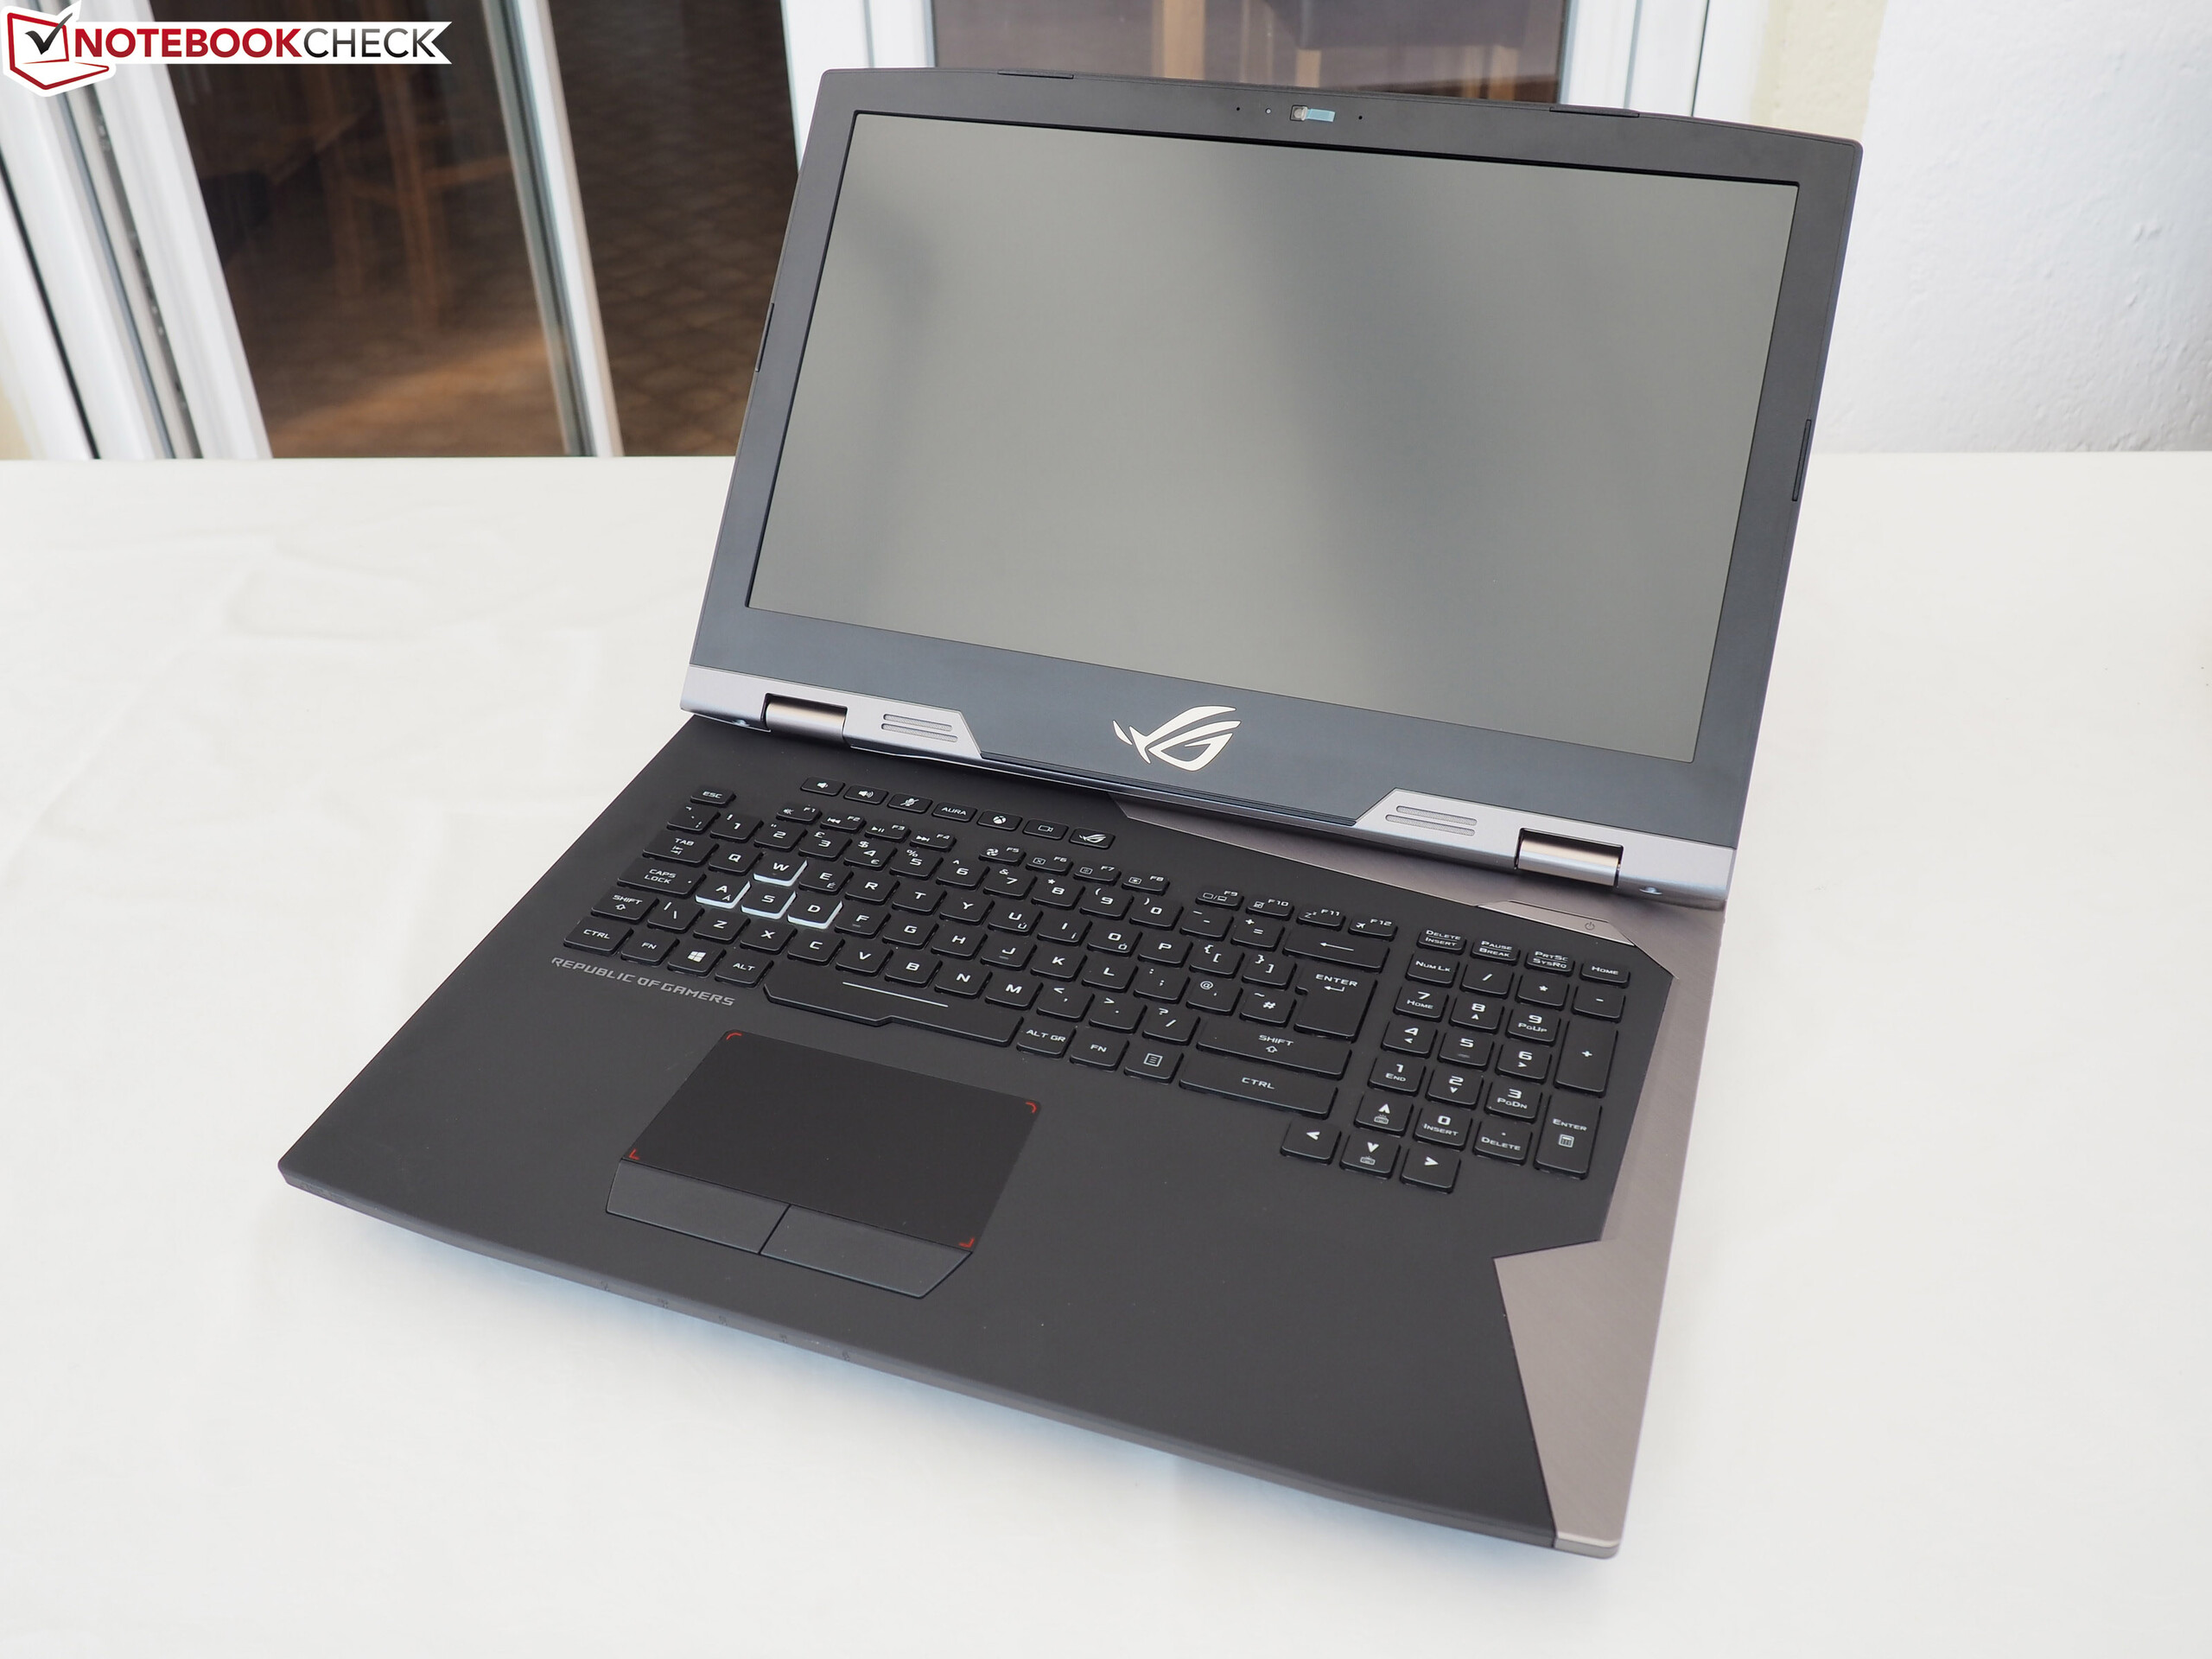
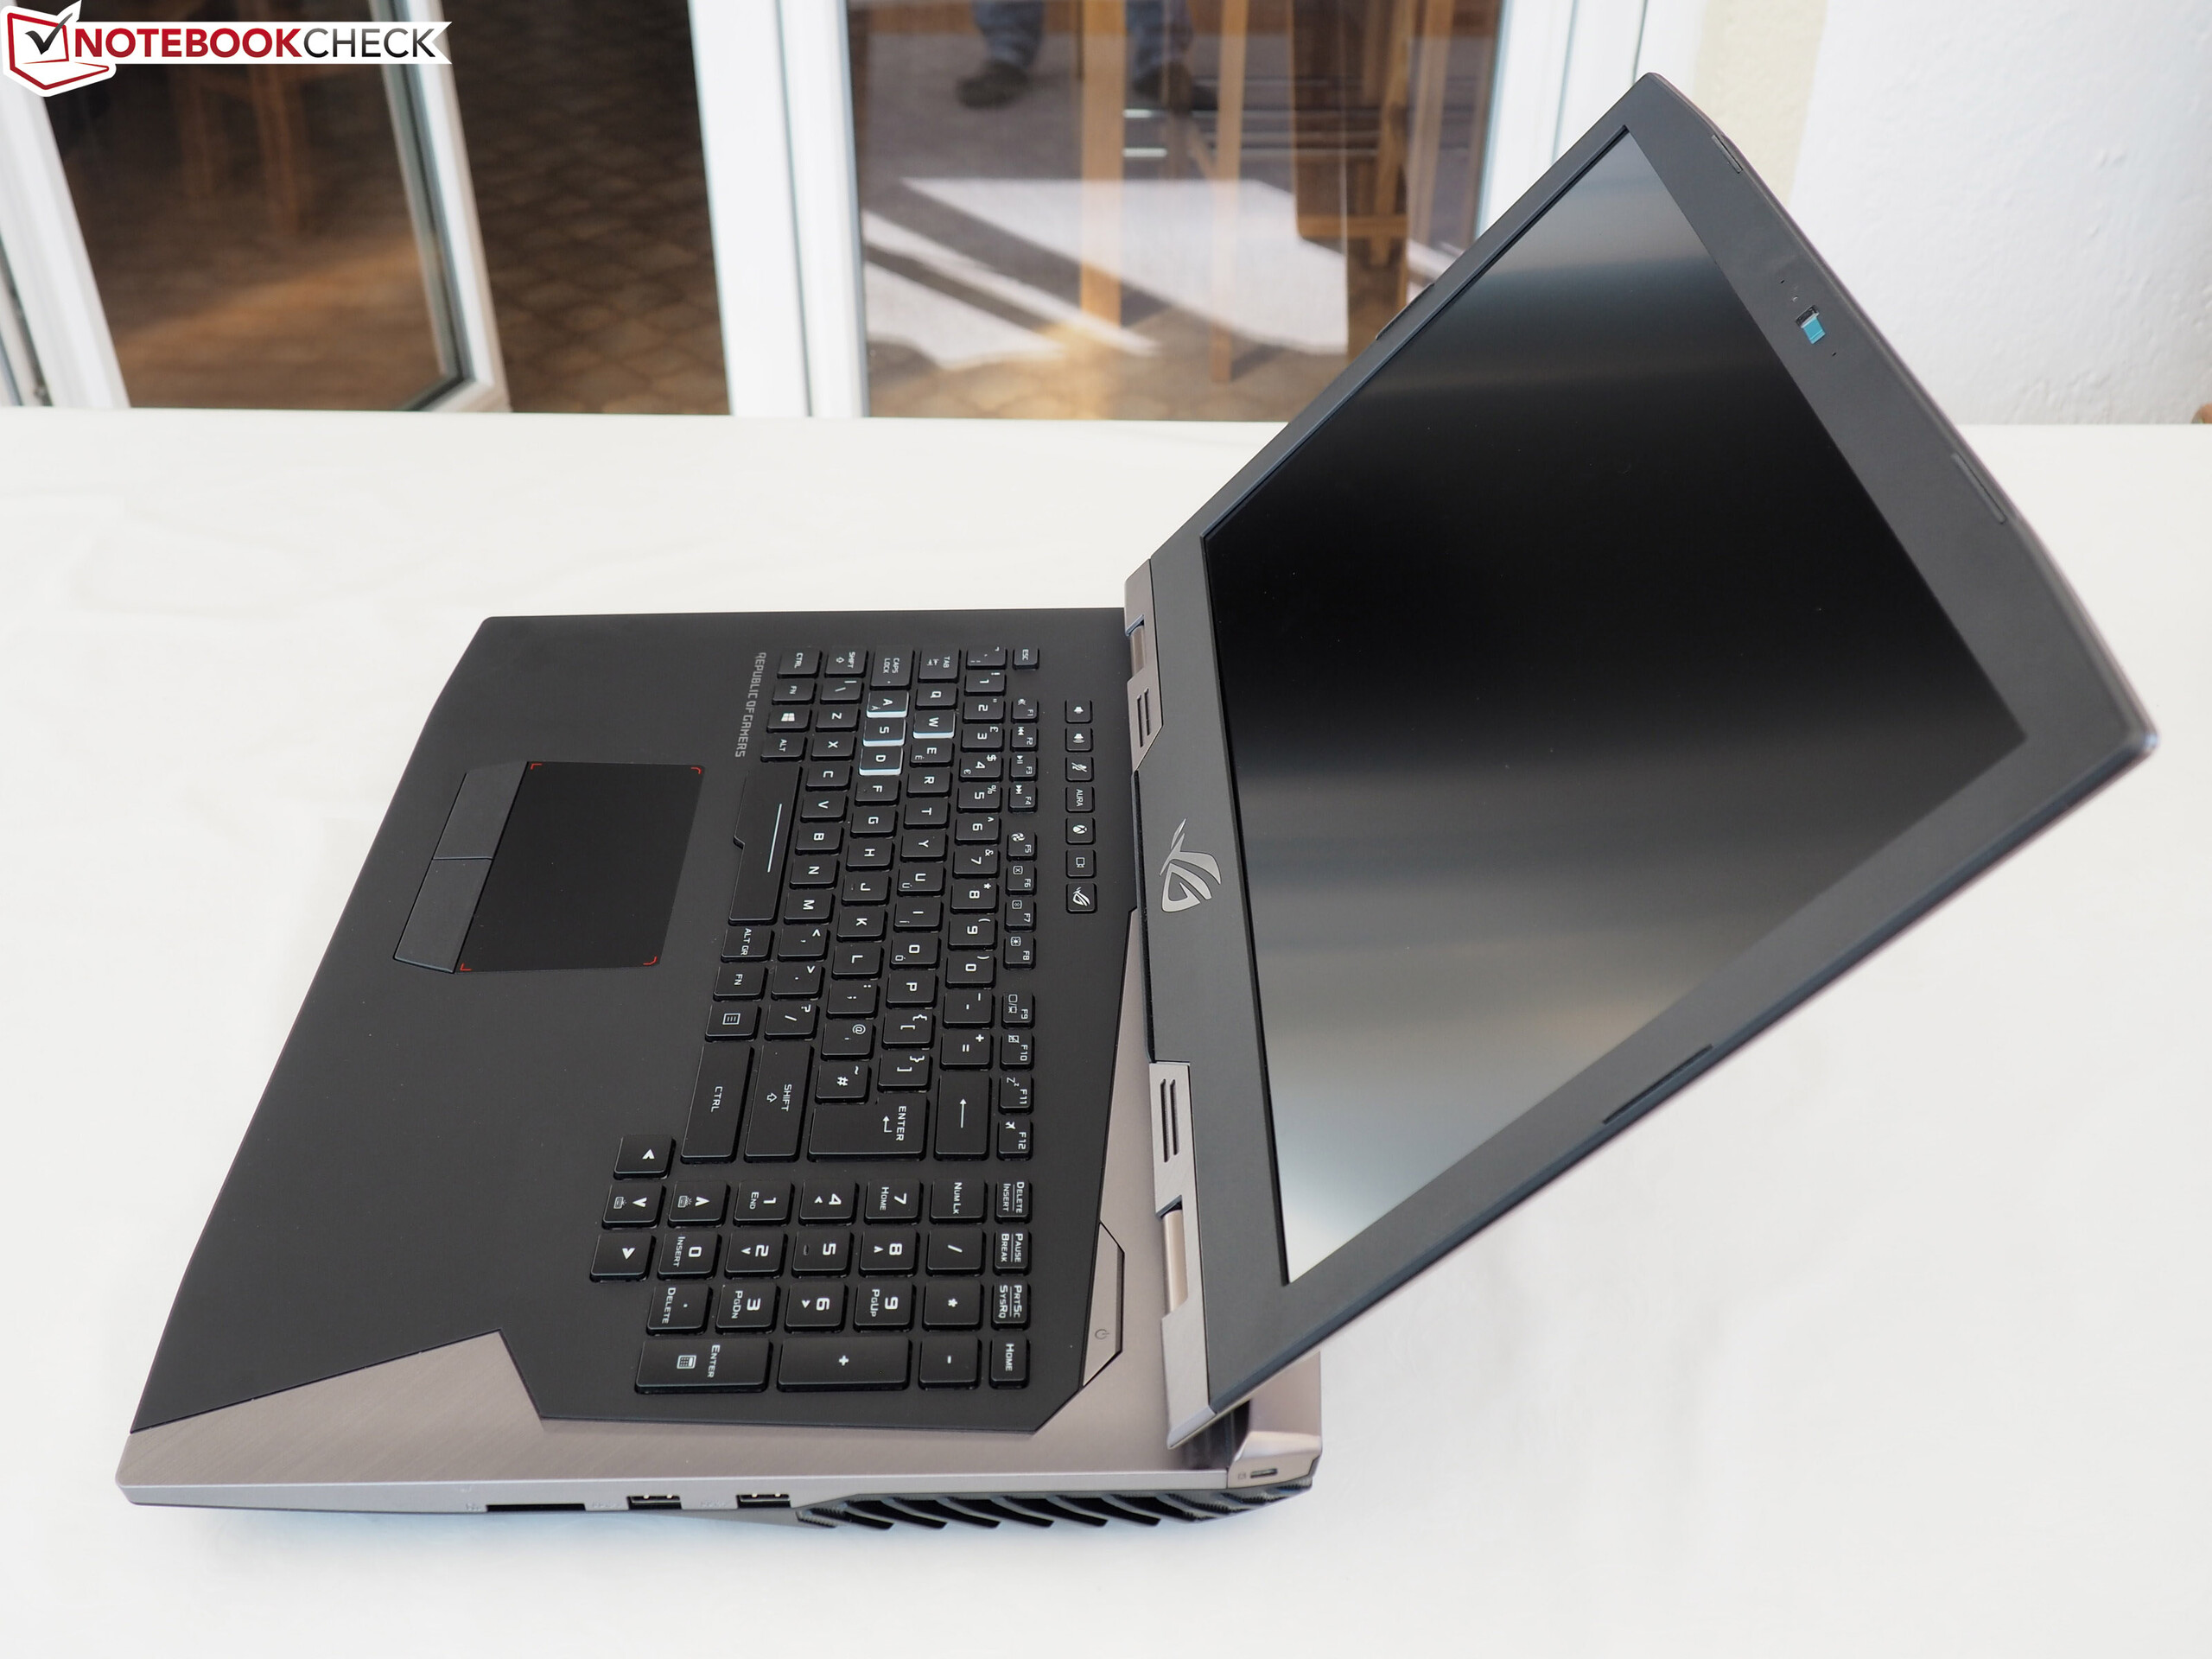
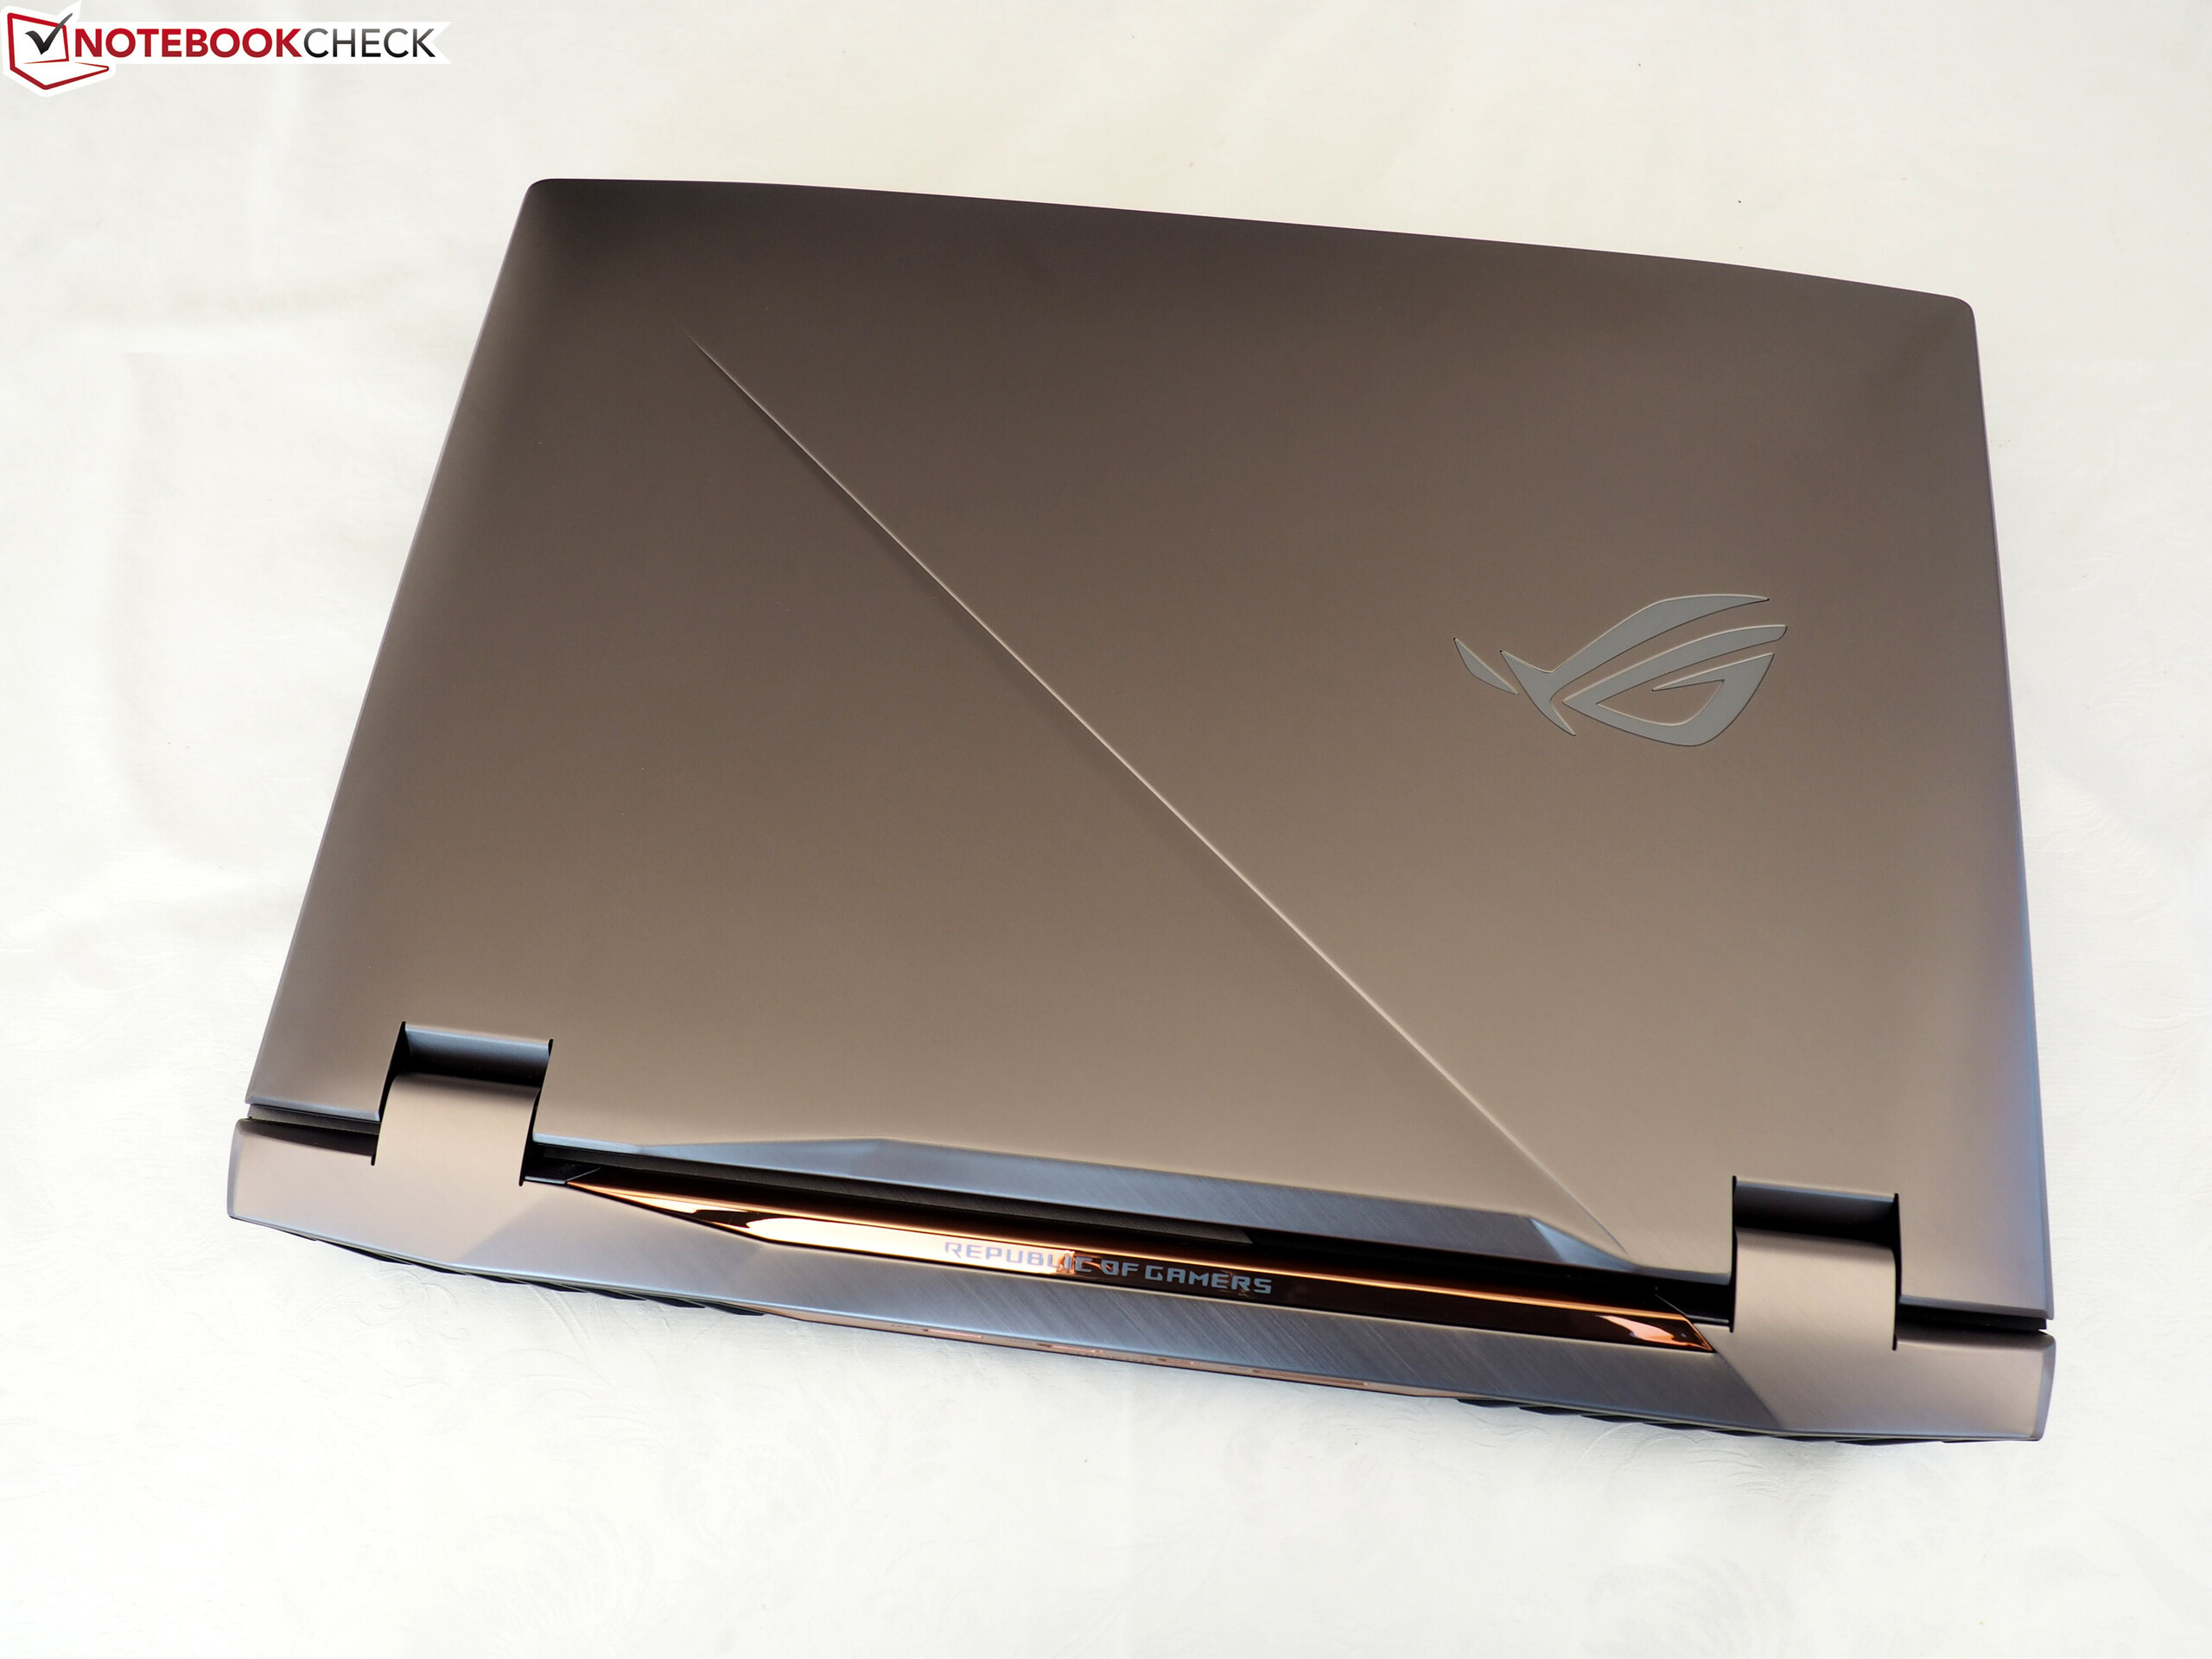
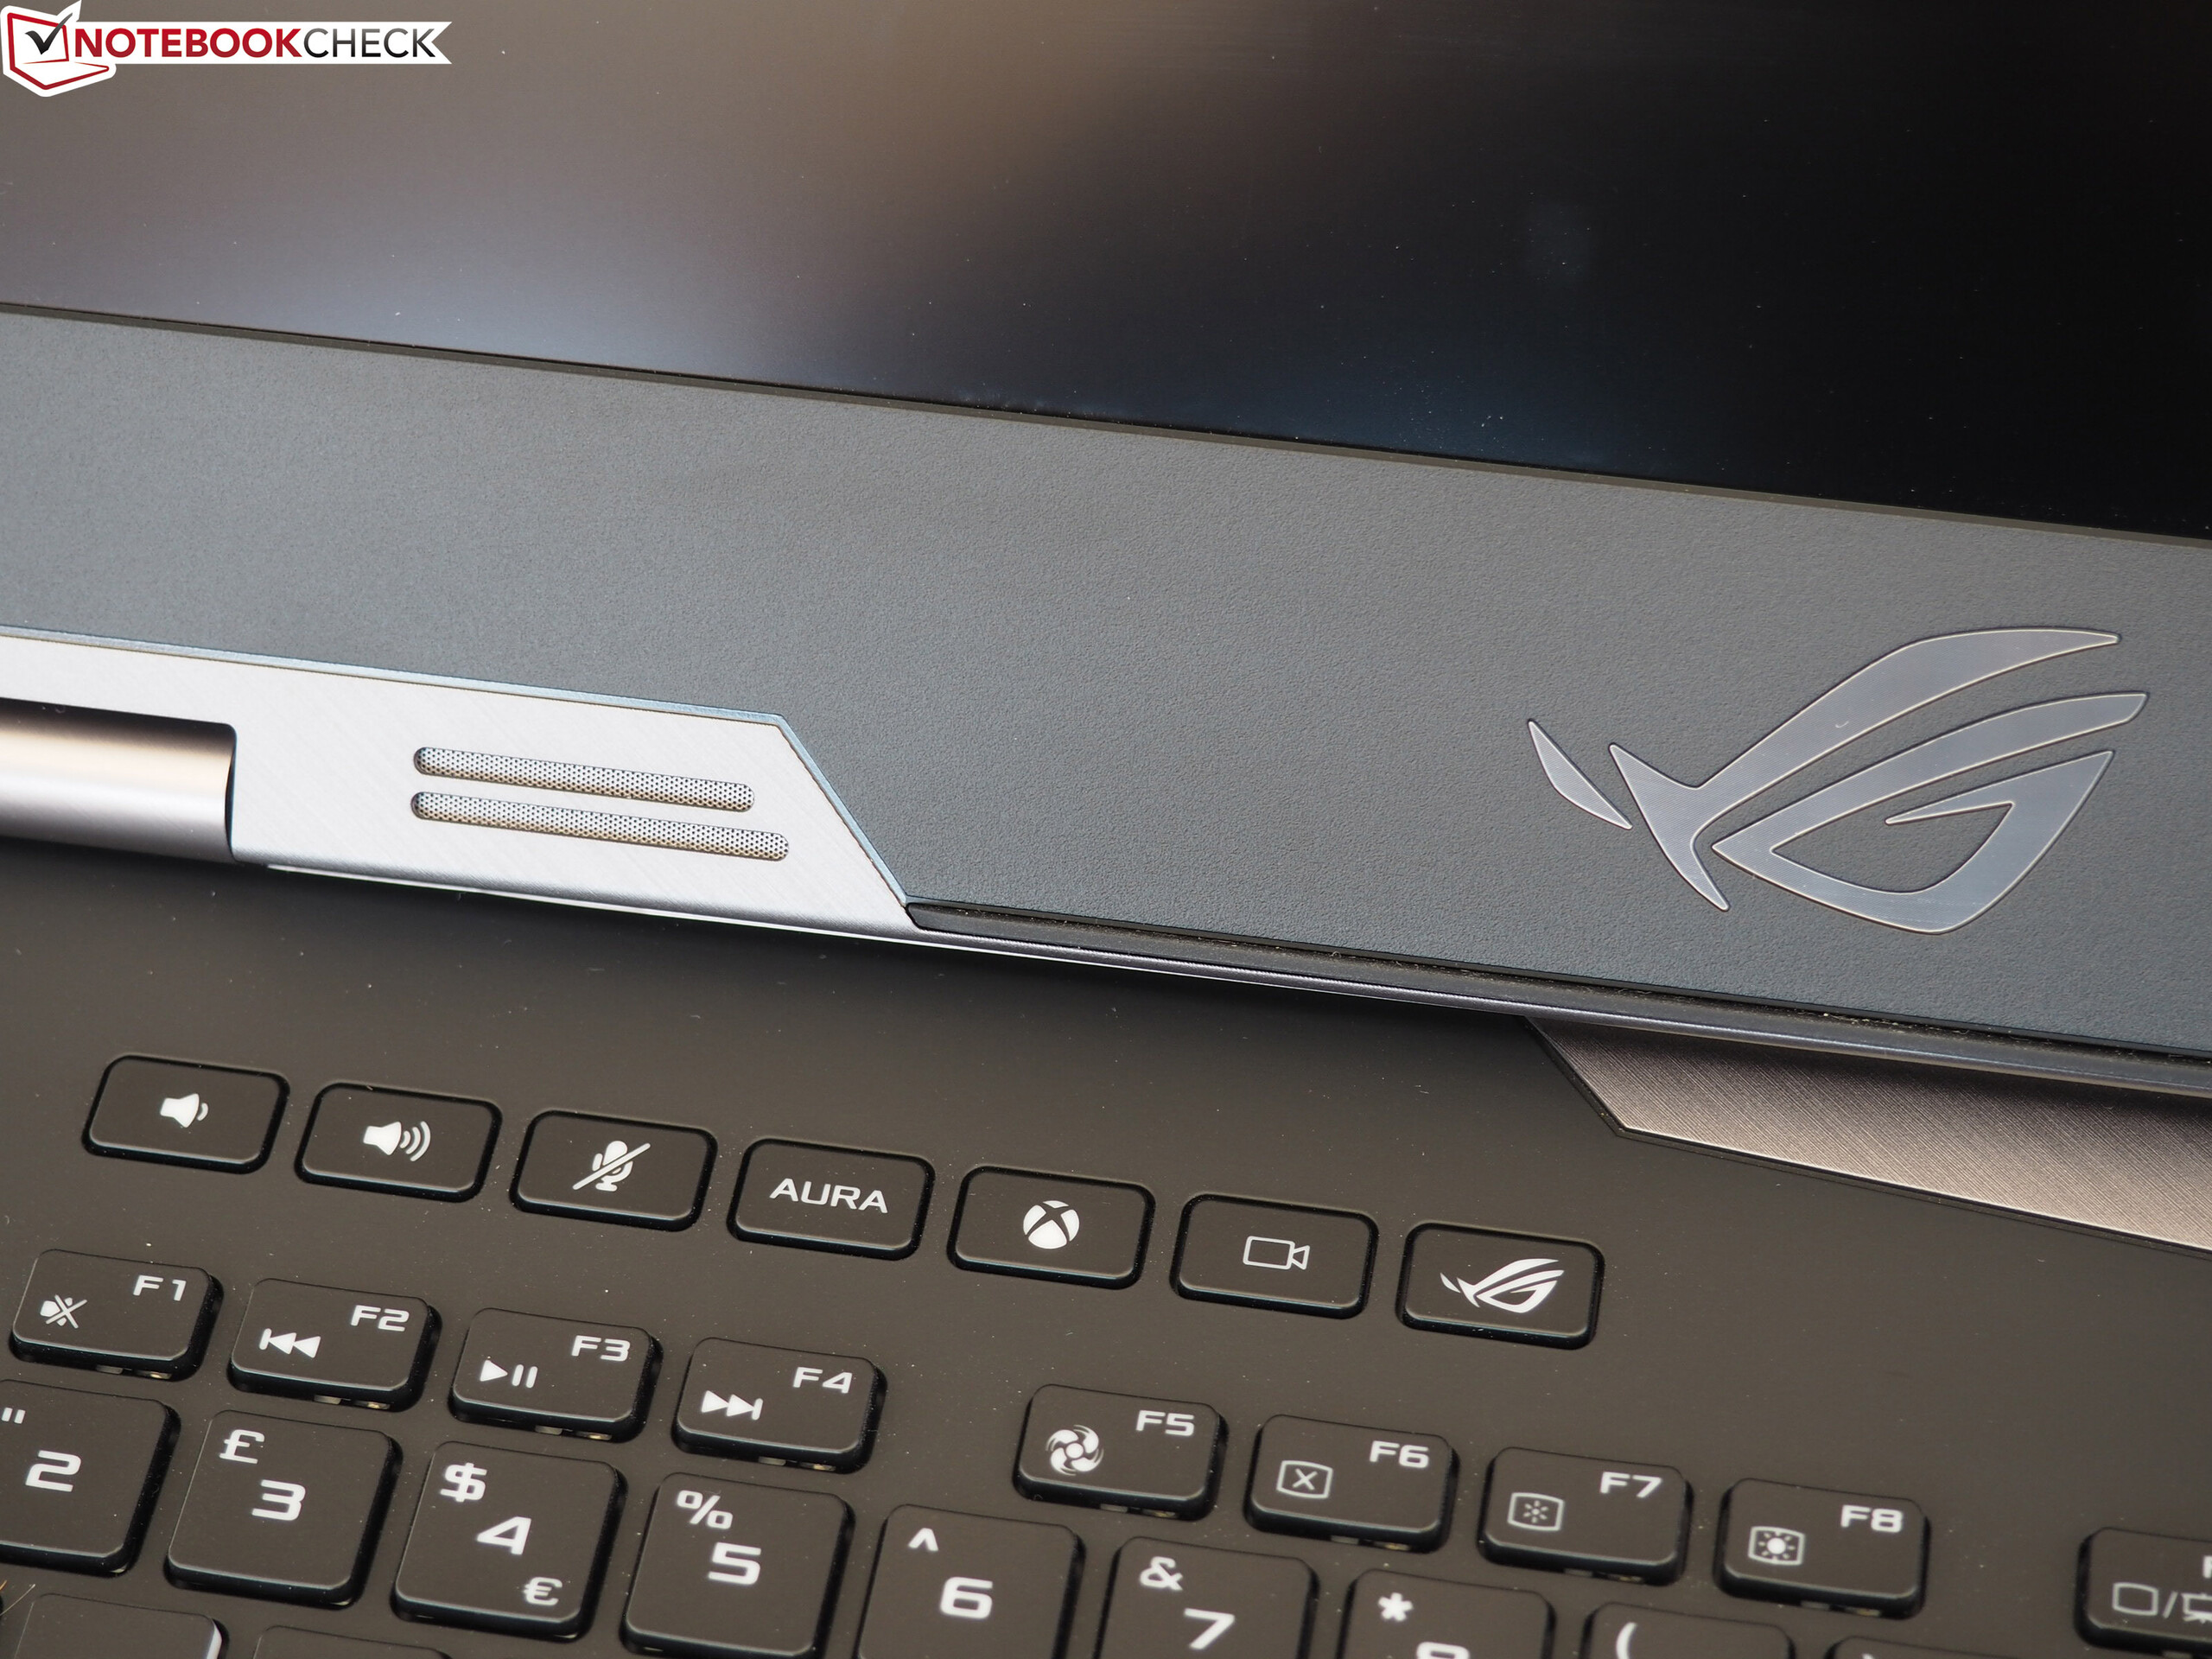
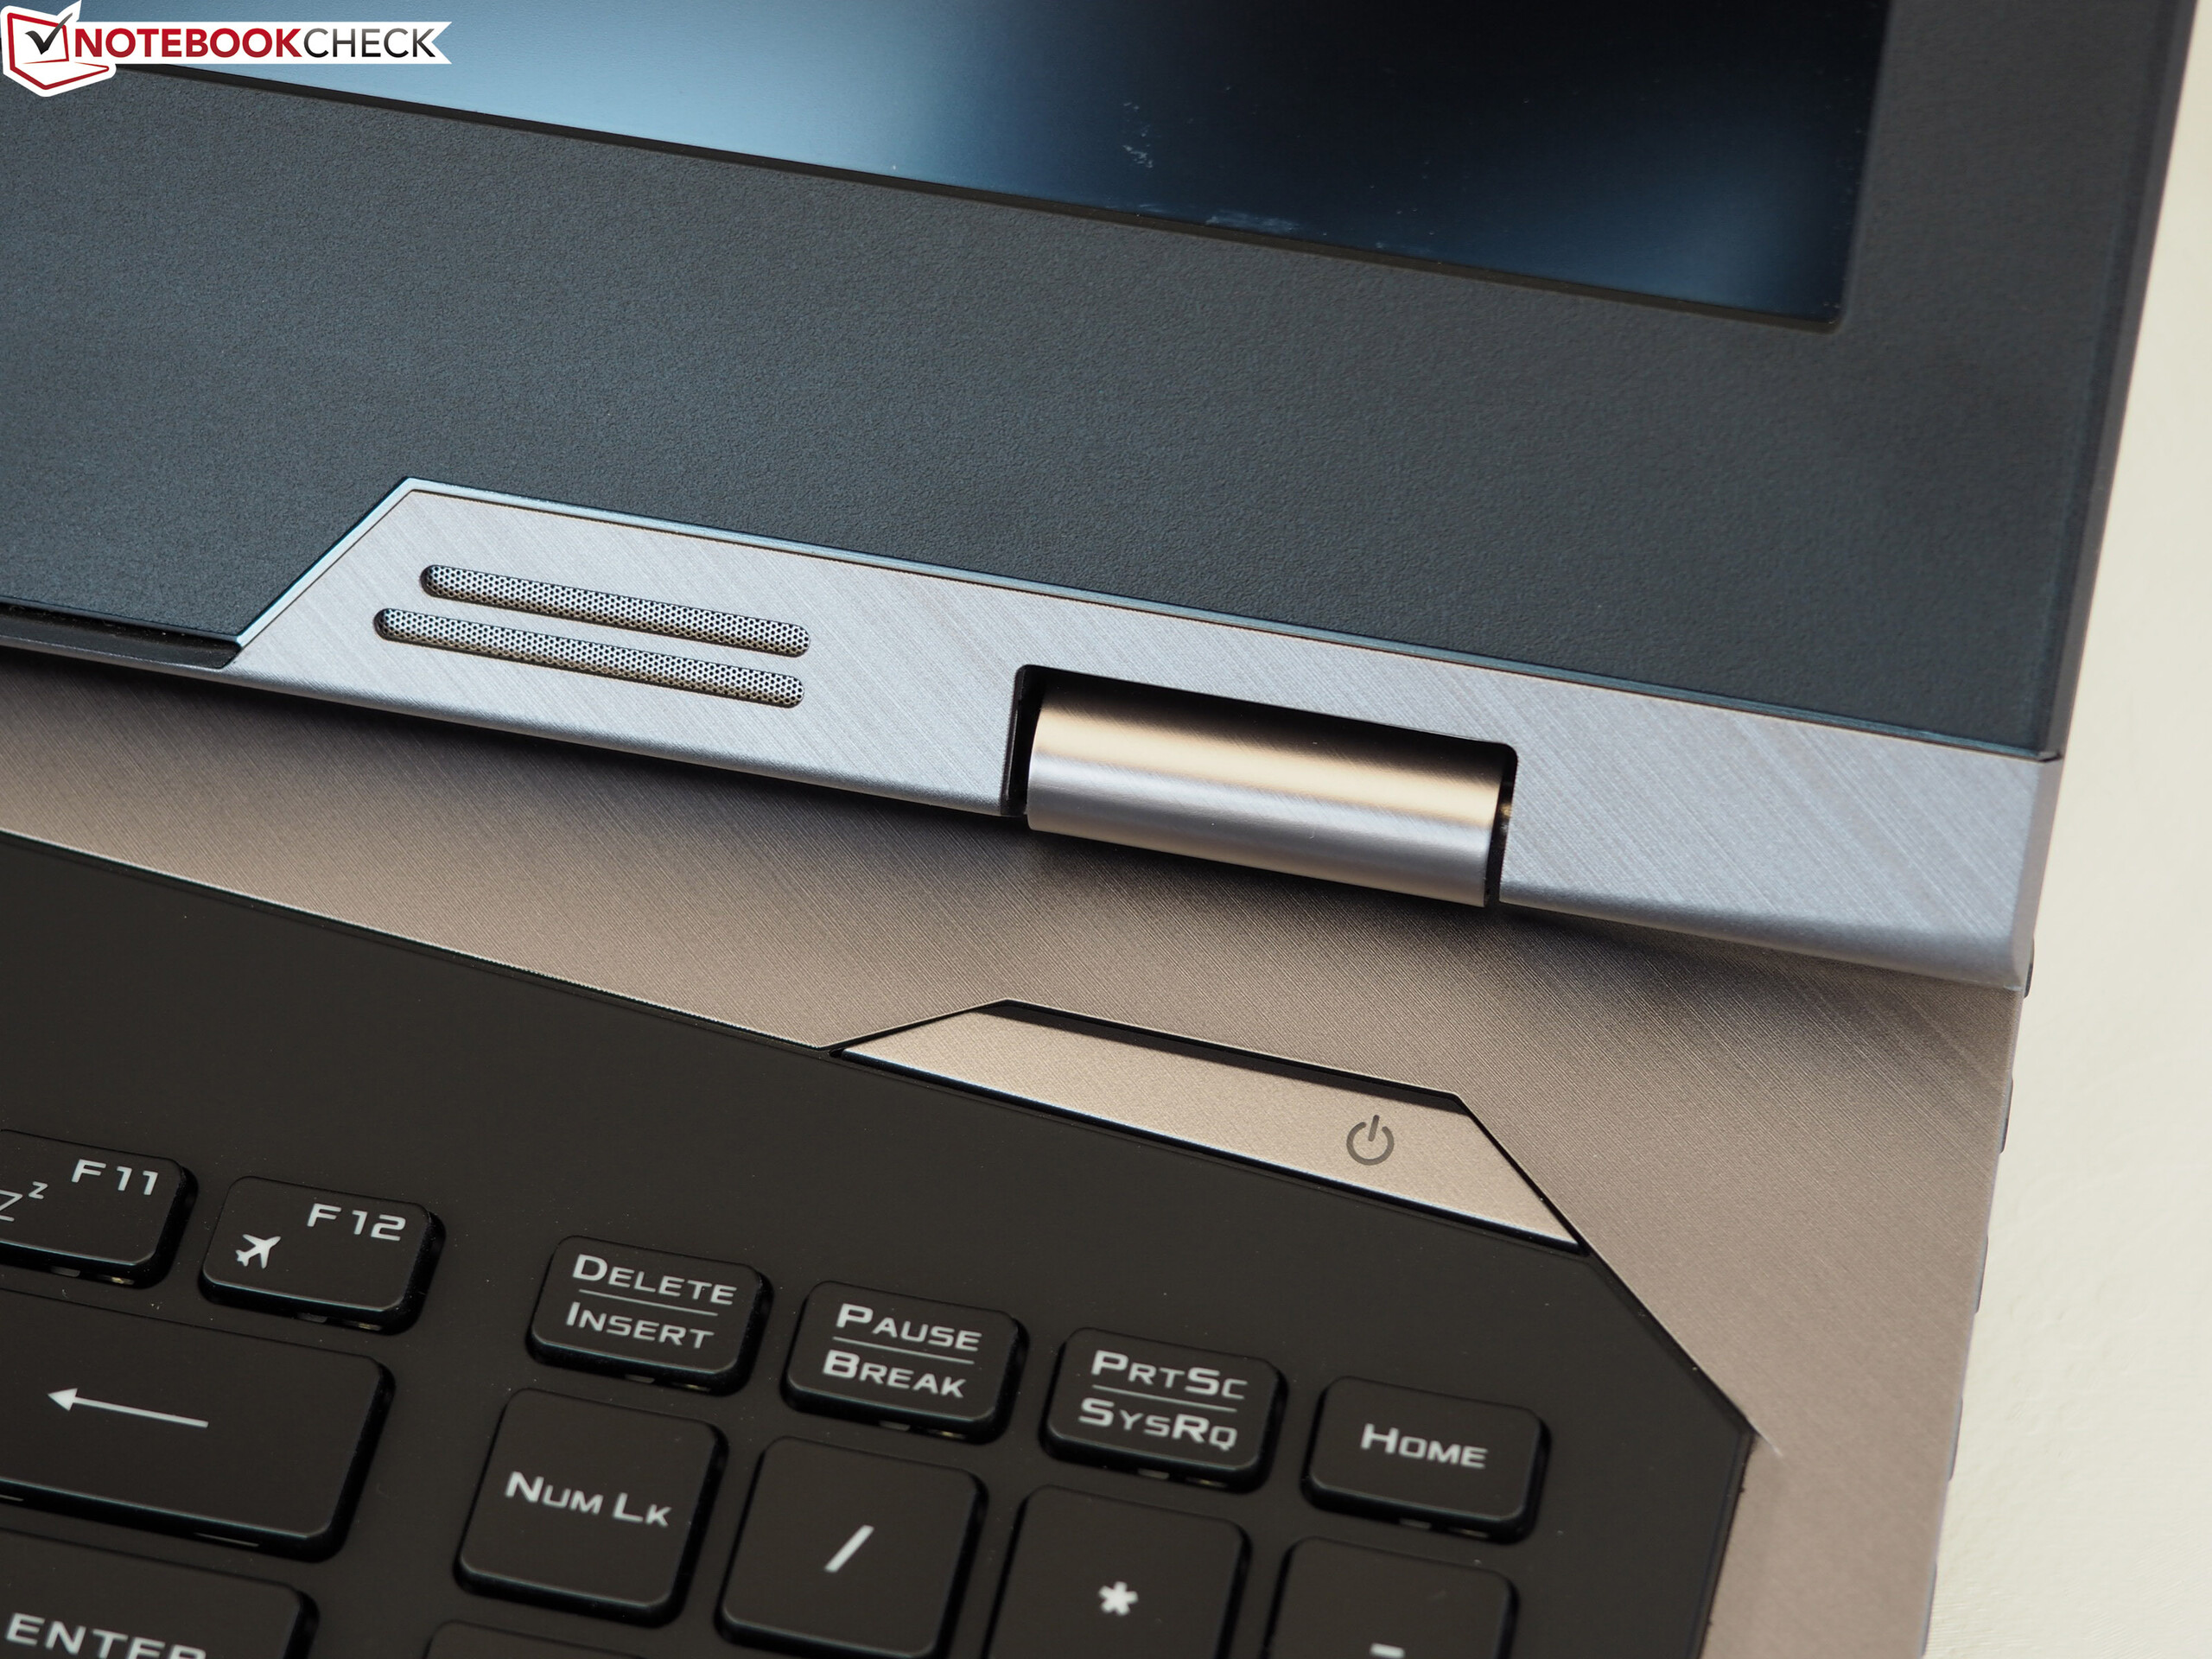
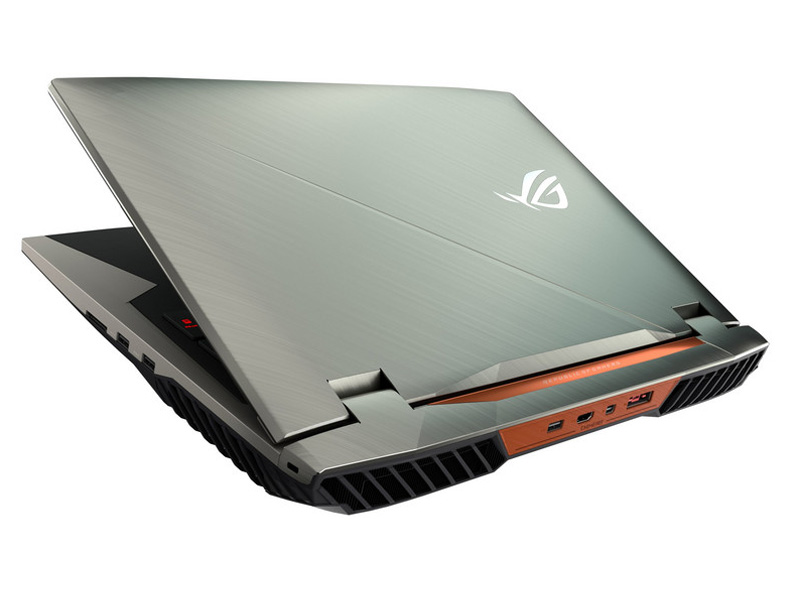
While the design of most notebooks is symmetrical, Asus pursues an individual approach in the design of its gaming cases. In the case of the G703, not only is the top of the base unit asymmetrical, as we have already seen in the G752, but the lid is asymmetrical as well. Of course, it depends on your own tastes whether you can appreciate the numerous slants and color changes. While the design of the 17-incher appears very fresh with its silver elements in our opinion, we would have liked slightly less visual gimmicks here and there (for example on the bottom of the case).
There is hardly anything to complain about in terms of the materials. This also goes for the lid, which is made from brushed aluminum. The soft-touch finish of the high-quality palm rest also strikes a good impression, but it tends to become dirty quickly (due to its materials). In particular greasy palms will easily leave prints. In order to keep the weight from being too high, the bottom of the case is made of plastic.
We would call the stability of the case good. Even when using more force, the base unit hardly budges under pressure, if at all. As in many other notebooks, things are not so good with the lid, which can be twisted significantly using two hands and then it creaks unpleasantly. The workmanship could also use some improvements. In our test unit, the gaps between the display and the frame varied considerably, and this diminished our impression of the quality. However, taking all the aspects into account, the case still delivers a good impression.

Looking at the weight and dimensions, you can see that the 17-inch notebook is meant more for stationary operation. 4.7 kg (~10.4 lb) is quite an uncomfortable weight to transport. With this value, the G703 is heavier than the competition, which reaches 4.3 to 4.4 kg (~9.5 - 9.7 lb). Only the MSI GT75VR weighs almost the same. In terms of its thickness, at 51 mm (2 in) the G703 ends up between the Acer Predator 17 X (45 mm, ~1.8 in) and the MSI GT75VR (58 mm, ~2.3 in).
Features
Connections
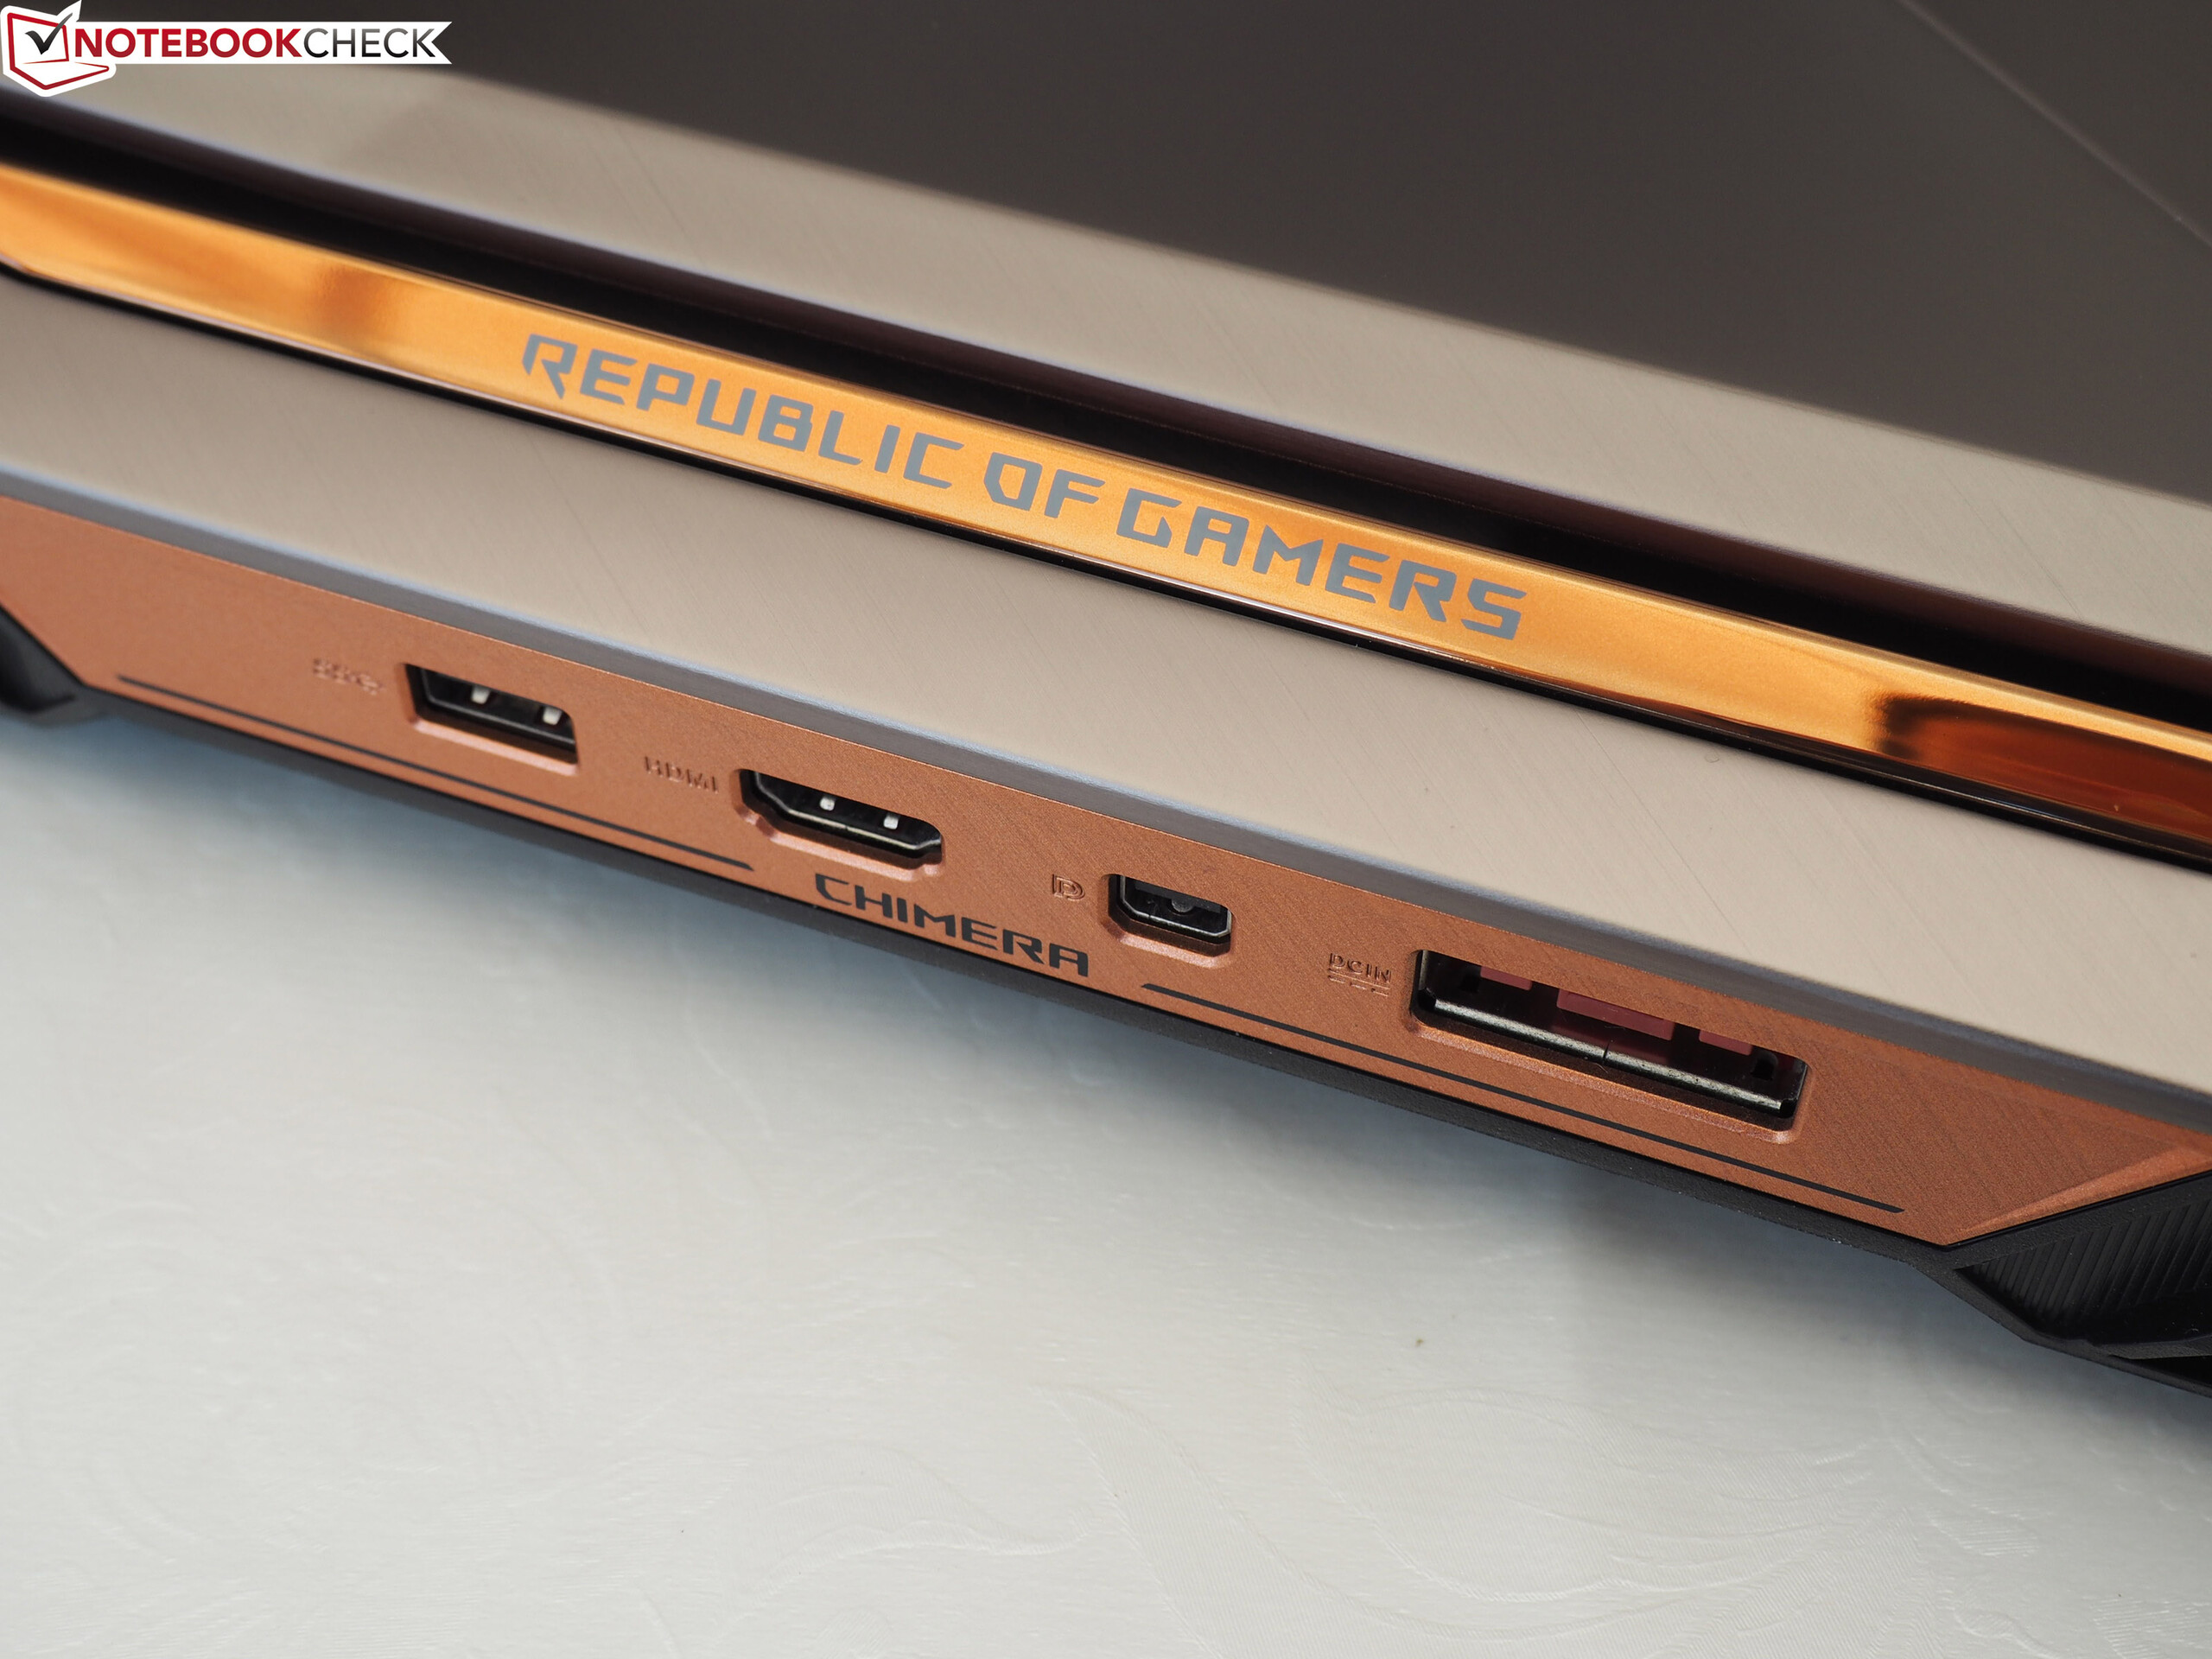
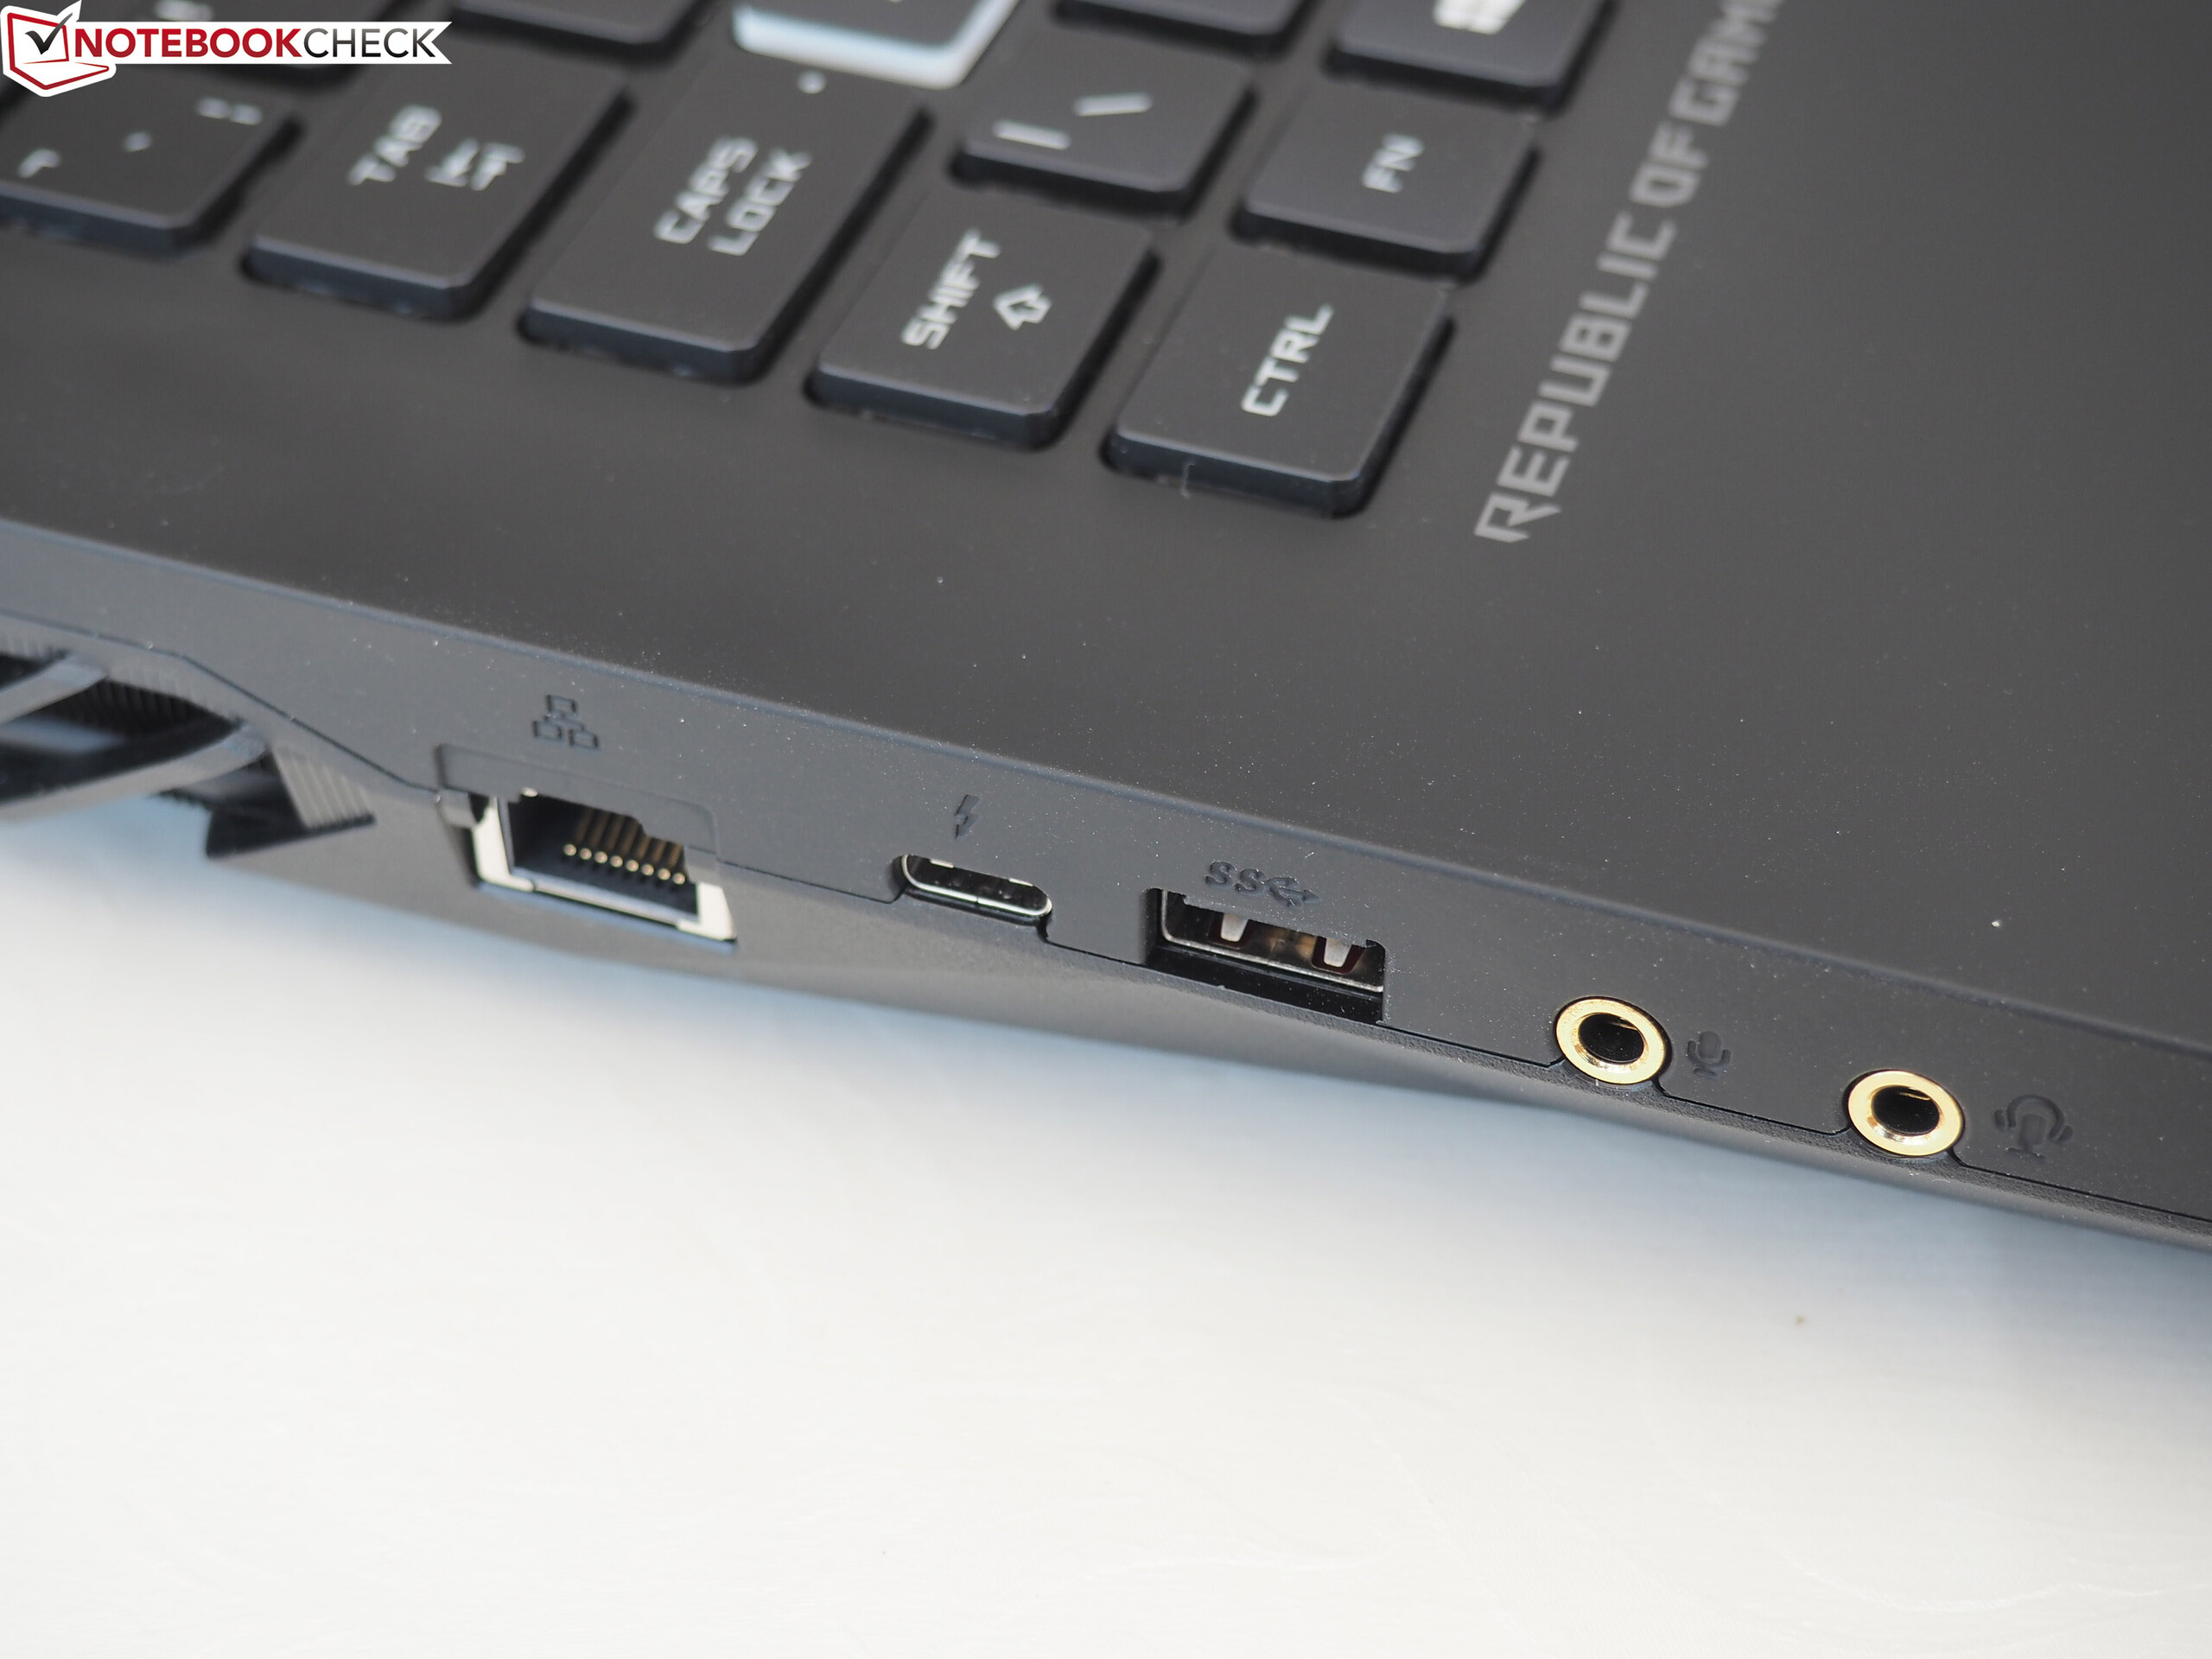
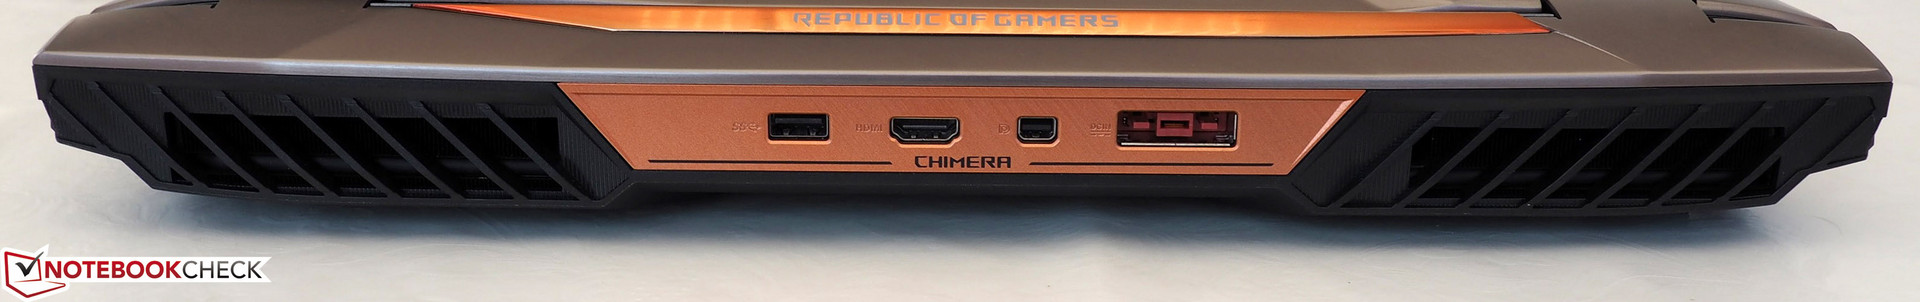
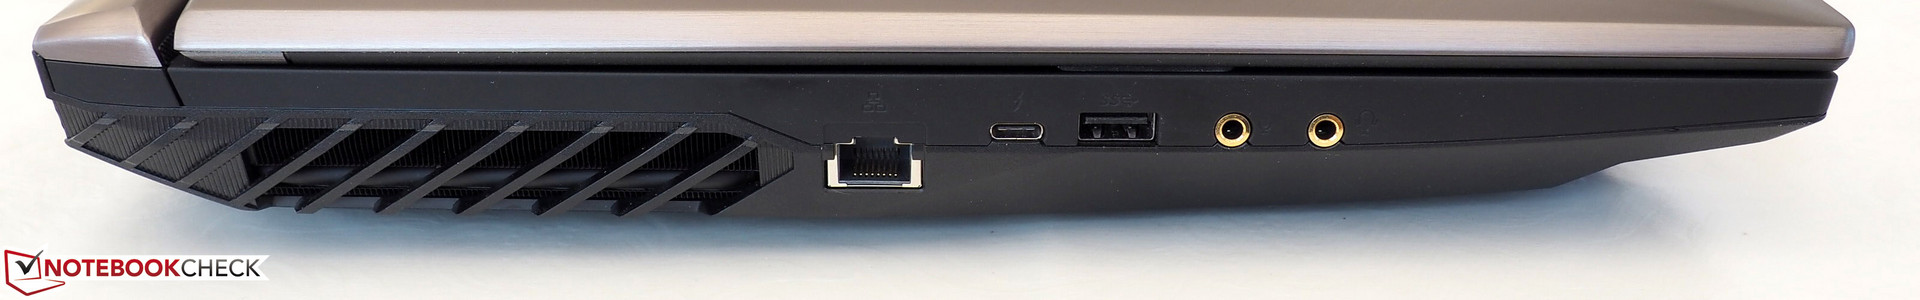
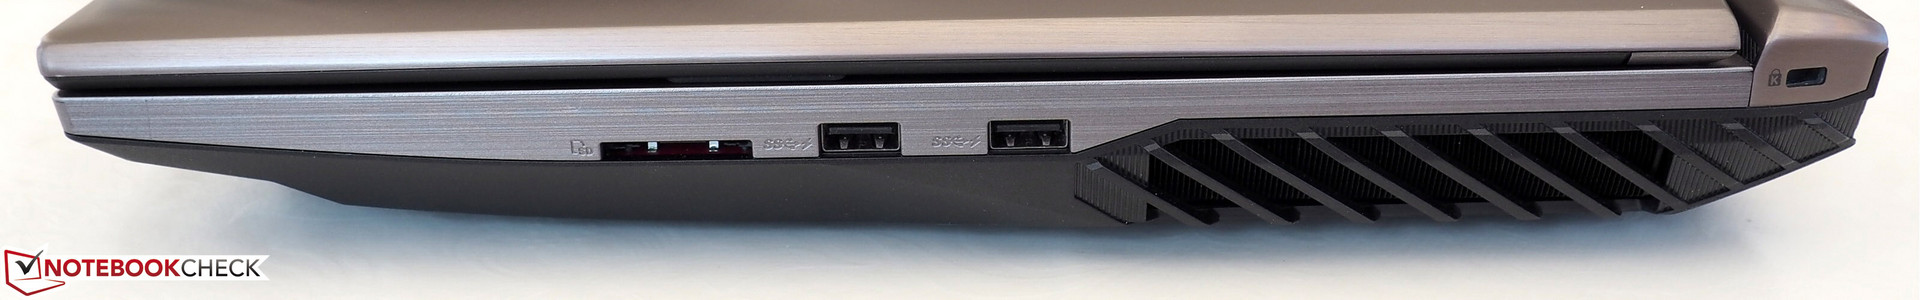
Asus appears to have listened to the complaints from buyers and the press and has positioned the connections much more intelligently than in other versions of its gaming notebooks. The G701 and G752 17-inch siblings had to live with a positioning that was too far towards the front before, causing annoying collisions with plugged-in cables when using the mouse. Although the positions in the G703 are not perfect either with its fan openings on the sides, there is more room for movement now.
Many of the most important and often used connections are now on the back. Overall, the 17-incher can score with four USB-3.0 ports, two audio ports, two display ports (HDMI & Mini-DisplayPort), an RJ45 port, a card reader, and a Kensington lock. The whole package is rounded-off by a modern Thunderbolt-3 port, which theoretically allows you to connect an external GPU.
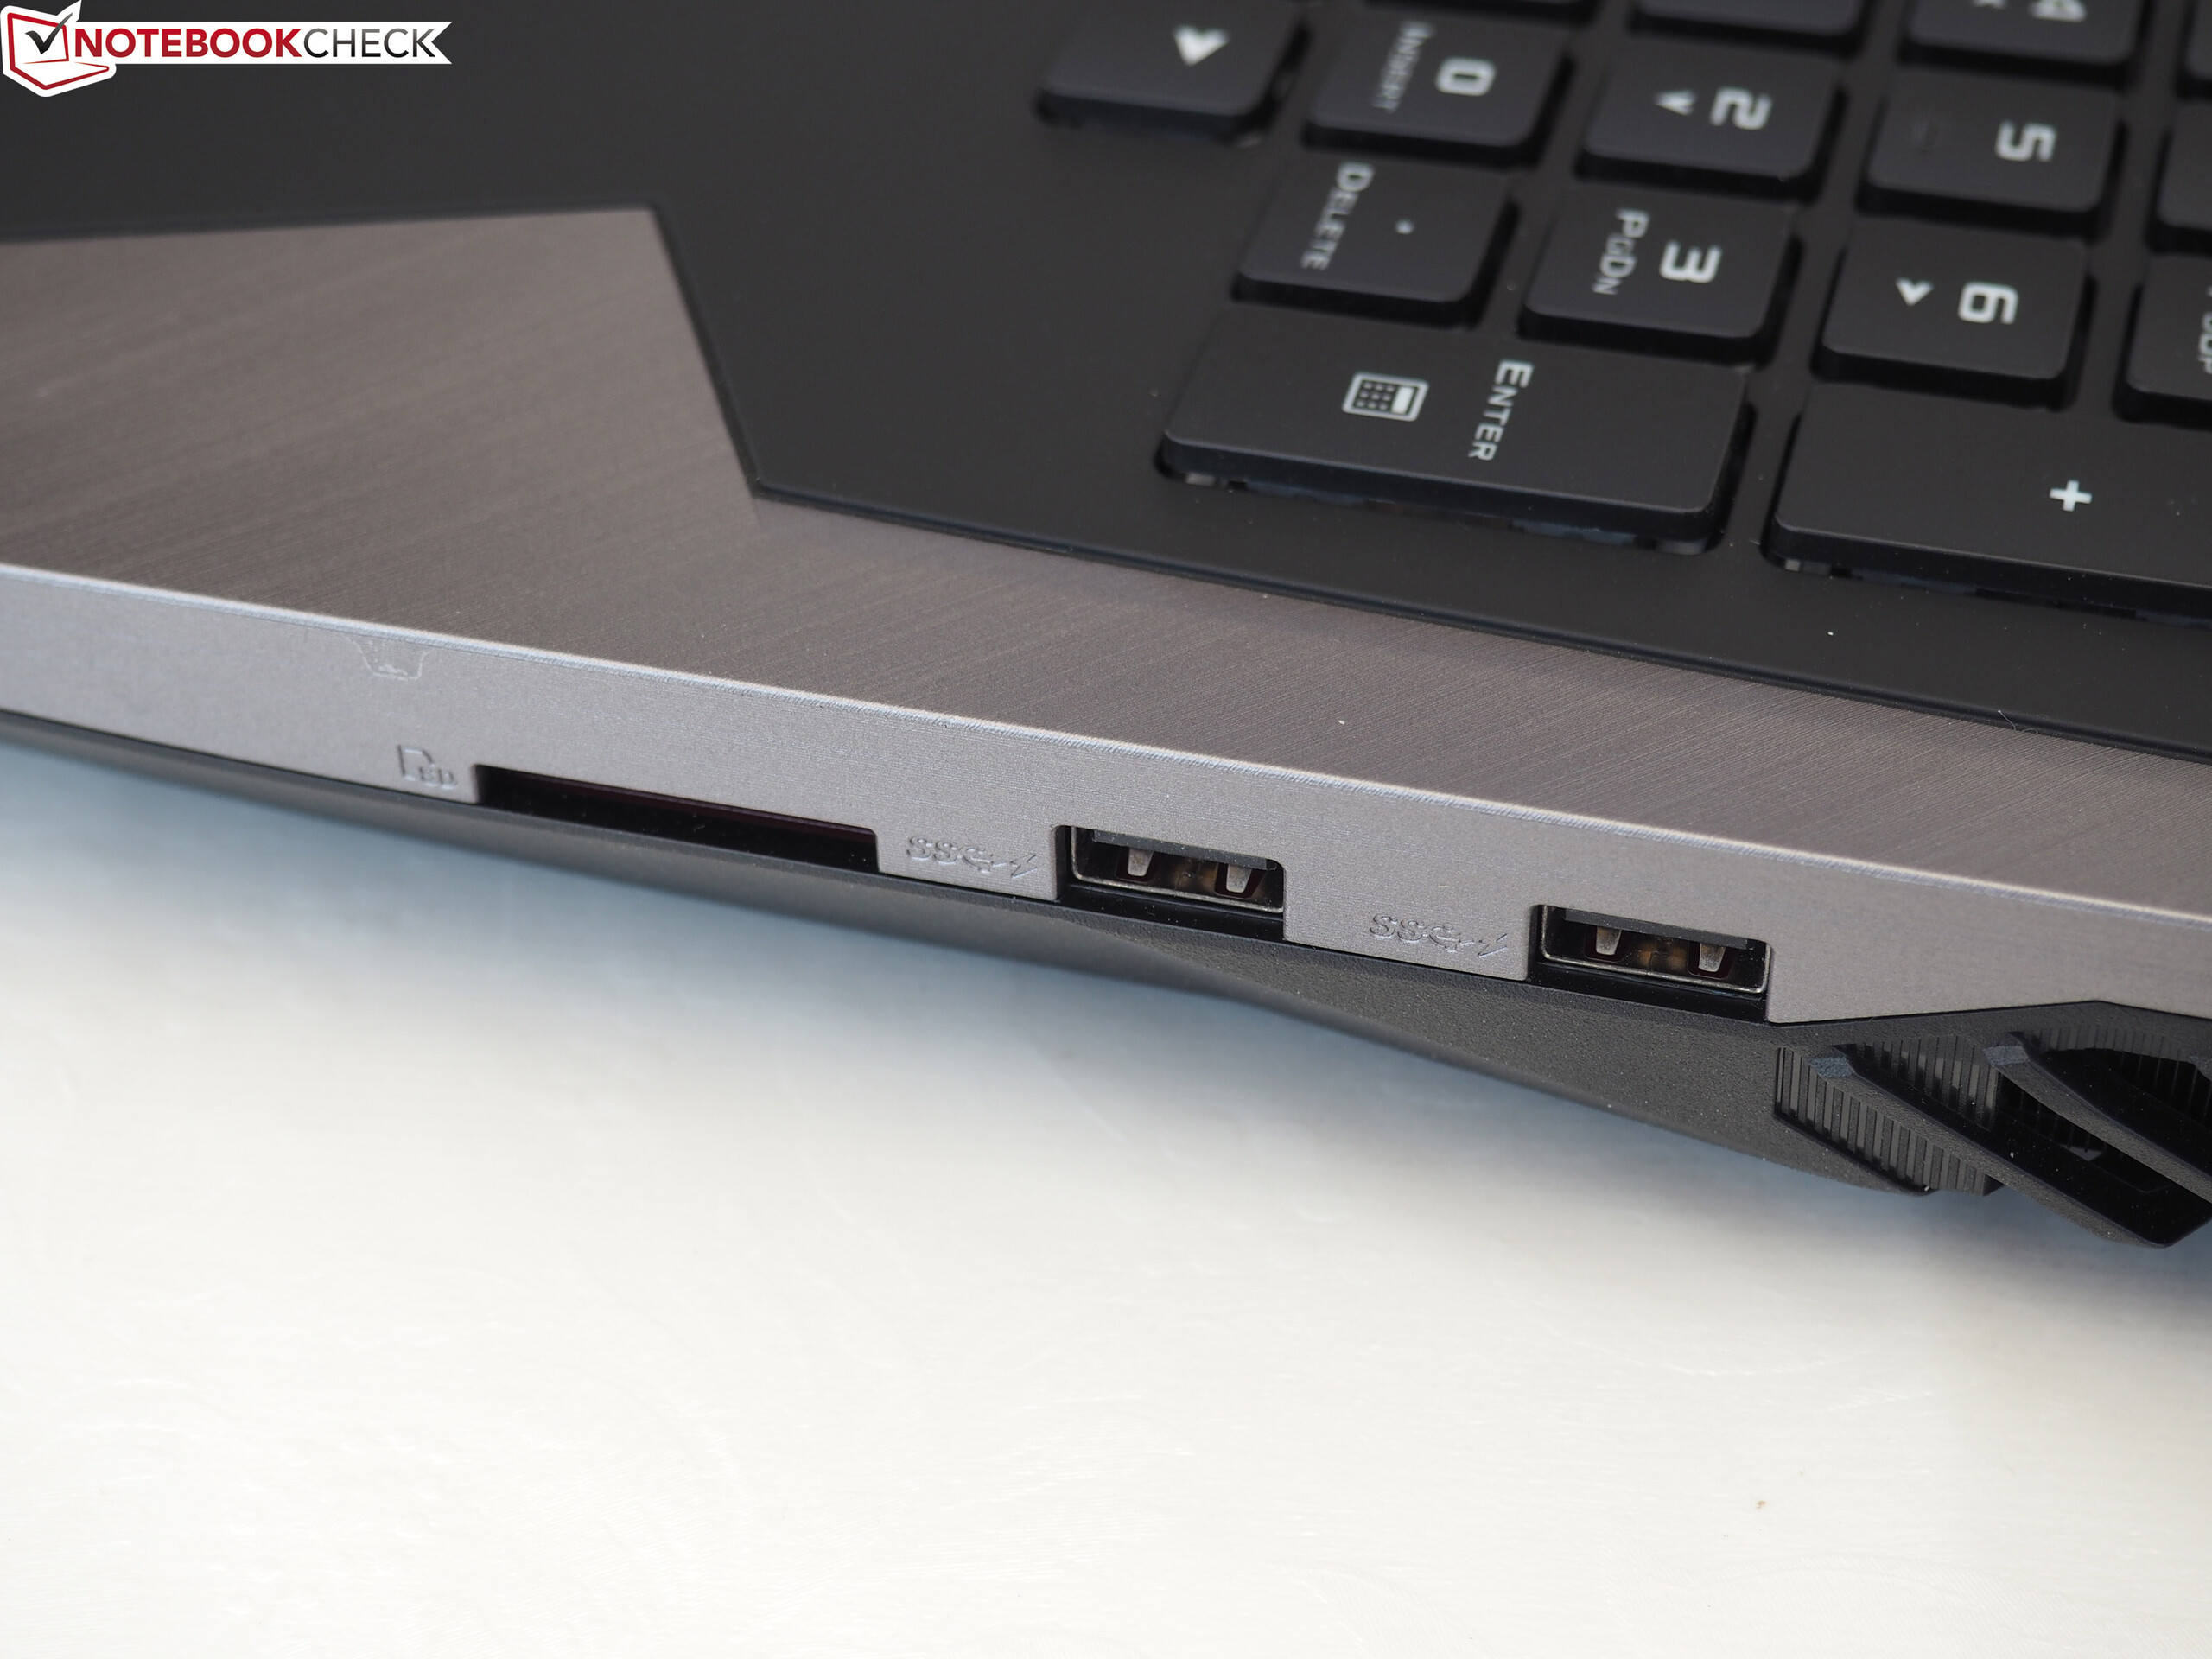
SD-Card Reader
As the MSI GT75VR and the Acer Predator 17 X show, fast card readers cannot be taken for granted. While the two competitors remain below 100 MB/s in the test with our reference card, the ROG G703 manages between 182 MB/s (transfer of images) and 240 MB/s (sequential reads). Only the Schenker XMG Ultra 17 can approach these values with its 187 and 208 MB/s rates.
| SD Card Reader | |
| average JPG Copy Test (av. of 3 runs) | |
| Schenker XMG Ultra 17 (Toshiba Exceria Pro SDXC 64 GB UHS-II) | |
| Asus G703 (Toshiba Exceria Pro SDXC 64 GB UHS-II) | |
| Average of class Gaming (20.9 - 210, n=54, last 2 years) | |
| MSI GT75VR 7RF-012 Titan Pro (Toshiba Exceria Pro SDXC 64 GB UHS-II) | |
| Acer Predator 17 X GX-792-76DL (Toshiba Exceria Pro SDXC 64 GB UHS-II) | |
| maximum AS SSD Seq Read Test (1GB) | |
| Asus G703 (Toshiba Exceria Pro SDXC 64 GB UHS-II) | |
| Schenker XMG Ultra 17 (Toshiba Exceria Pro SDXC 64 GB UHS-II) | |
| Average of class Gaming (25.5 - 261, n=51, last 2 years) | |
| Acer Predator 17 X GX-792-76DL (Toshiba Exceria Pro SDXC 64 GB UHS-II) | |
| MSI GT75VR 7RF-012 Titan Pro (Toshiba Exceria Pro SDXC 64 GB UHS-II) | |
Communication
In the wireless communication, our Chimera misses a top spot. In contrast to its competitors, the 17-incher does not use a wireless module from Rivet Networks (Killer 1435 or 1535) but uses one from Intel. Even though the Wireless-AC 8265 plays at the top in the reception performance, its sending speeds are slightly lower.
Software
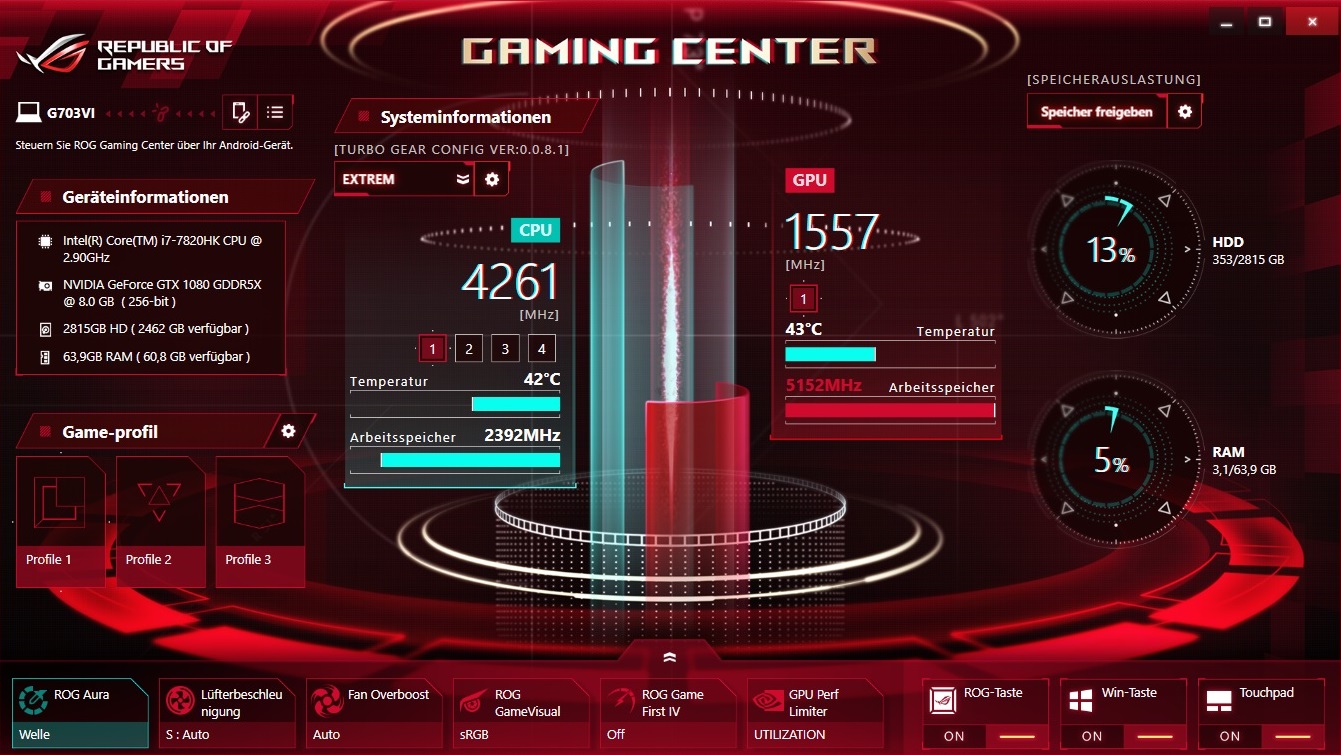
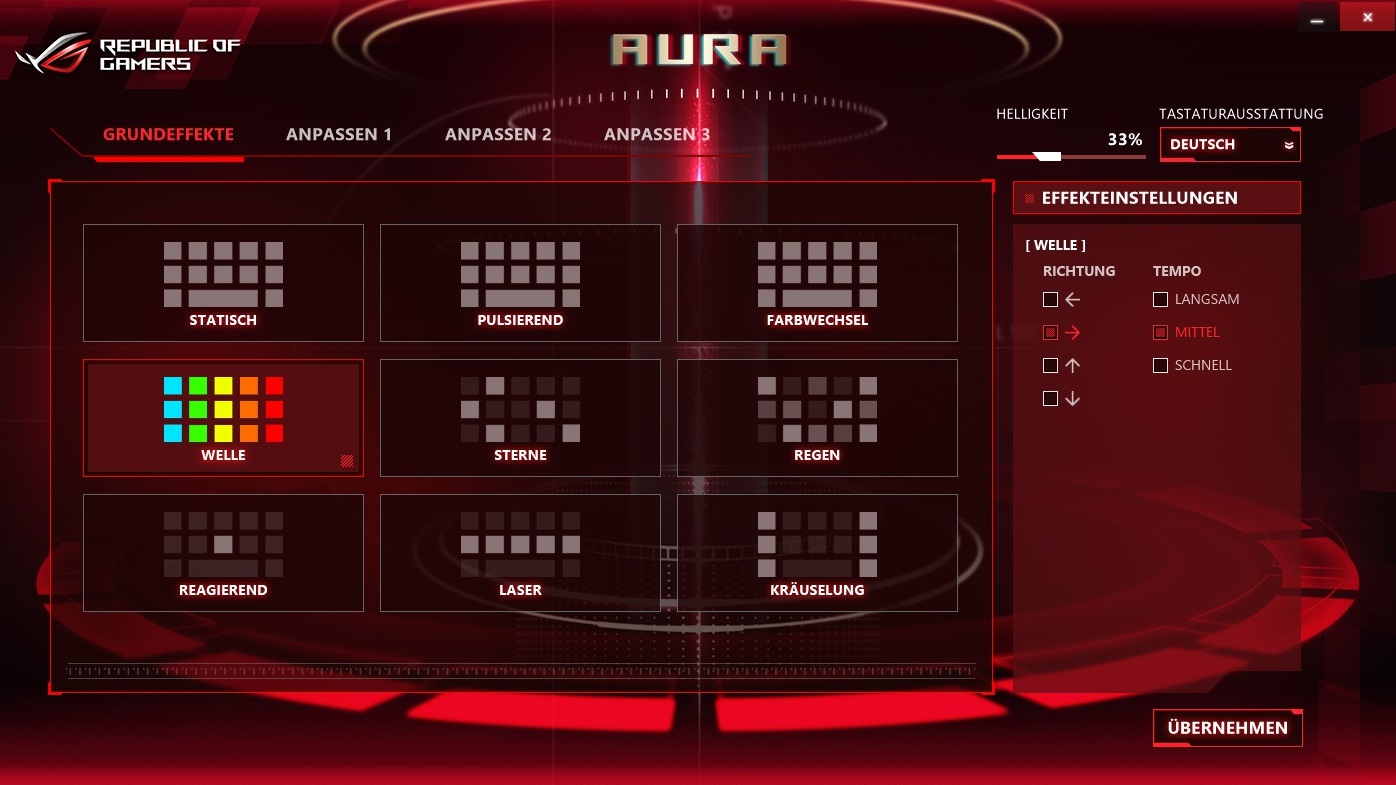
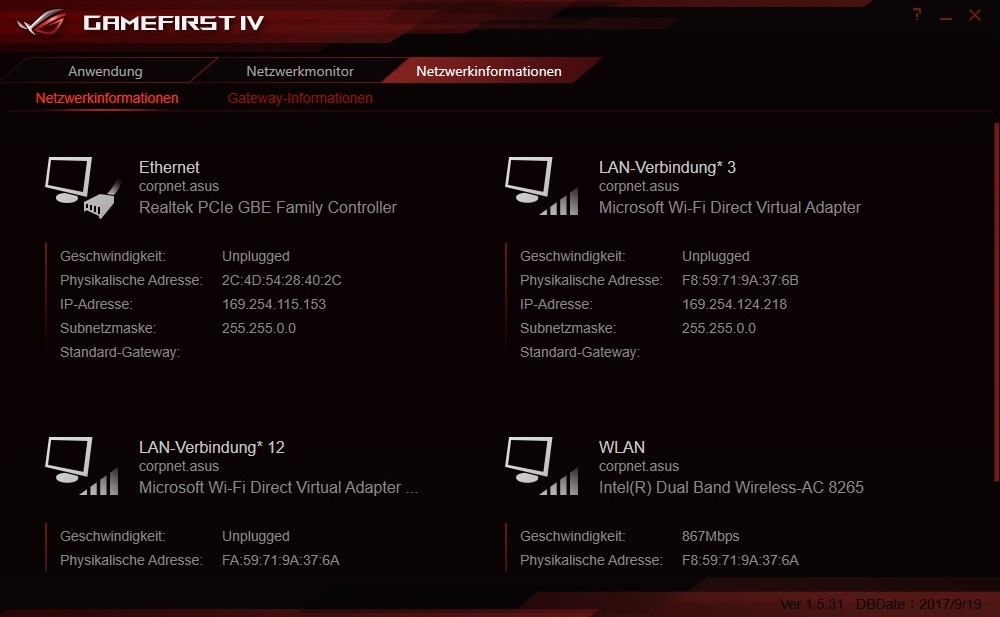
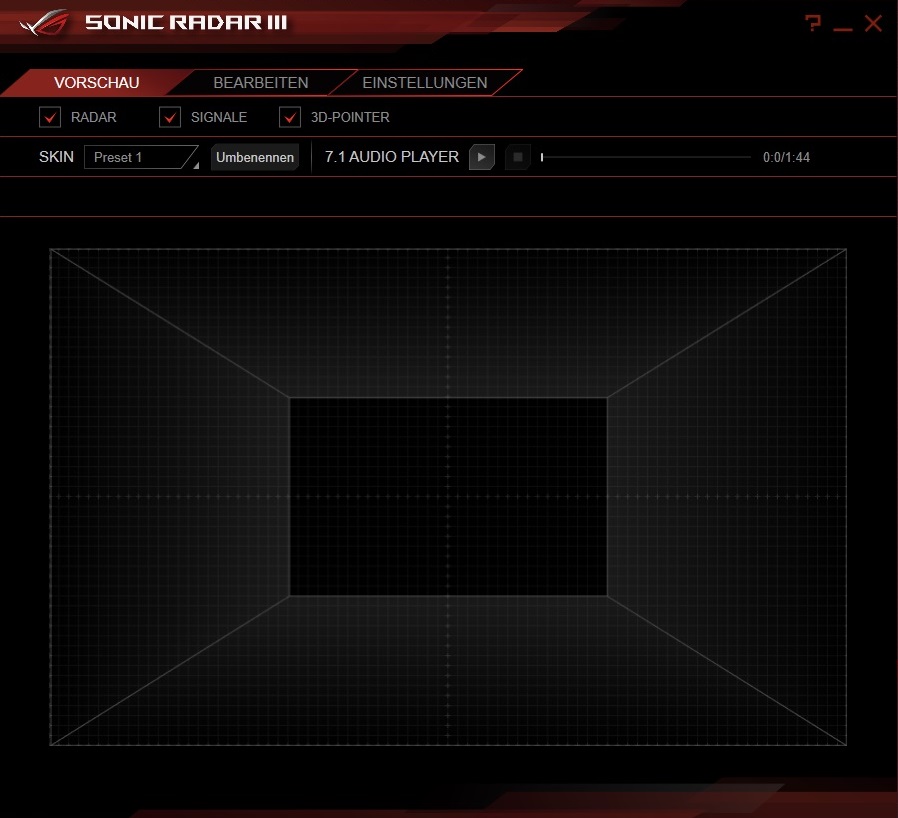
In terms of software, Asus does not permit anything to go wrong. The so-called Gaming Center forms a central hub which offers dozens of monitoring options (clock speed, temperature, etc.) and settings options (for example for the fans). Additional programs also allow you to fiddle with the keyboard illumination, the network traffic, and the sound (see screenshots). As a significant feature, we should also mention the built-in overclocking. The Extreme Turbo-Gear mode, which is activated by default, accelerates the CPU and GPU noticeably, as we will analyze more in detail later.
Accessories
Our test unit for the press had to make do with a Spartan amount of accessories. In addition to the notebook itself, the box only contained the 330-Watt power supply, which weighs about 1.3 kg (~2.9 lb) and measures about 20 x 10 x 4 cm (~7.9 x 3.9 x 1.6 in).
Maintenance
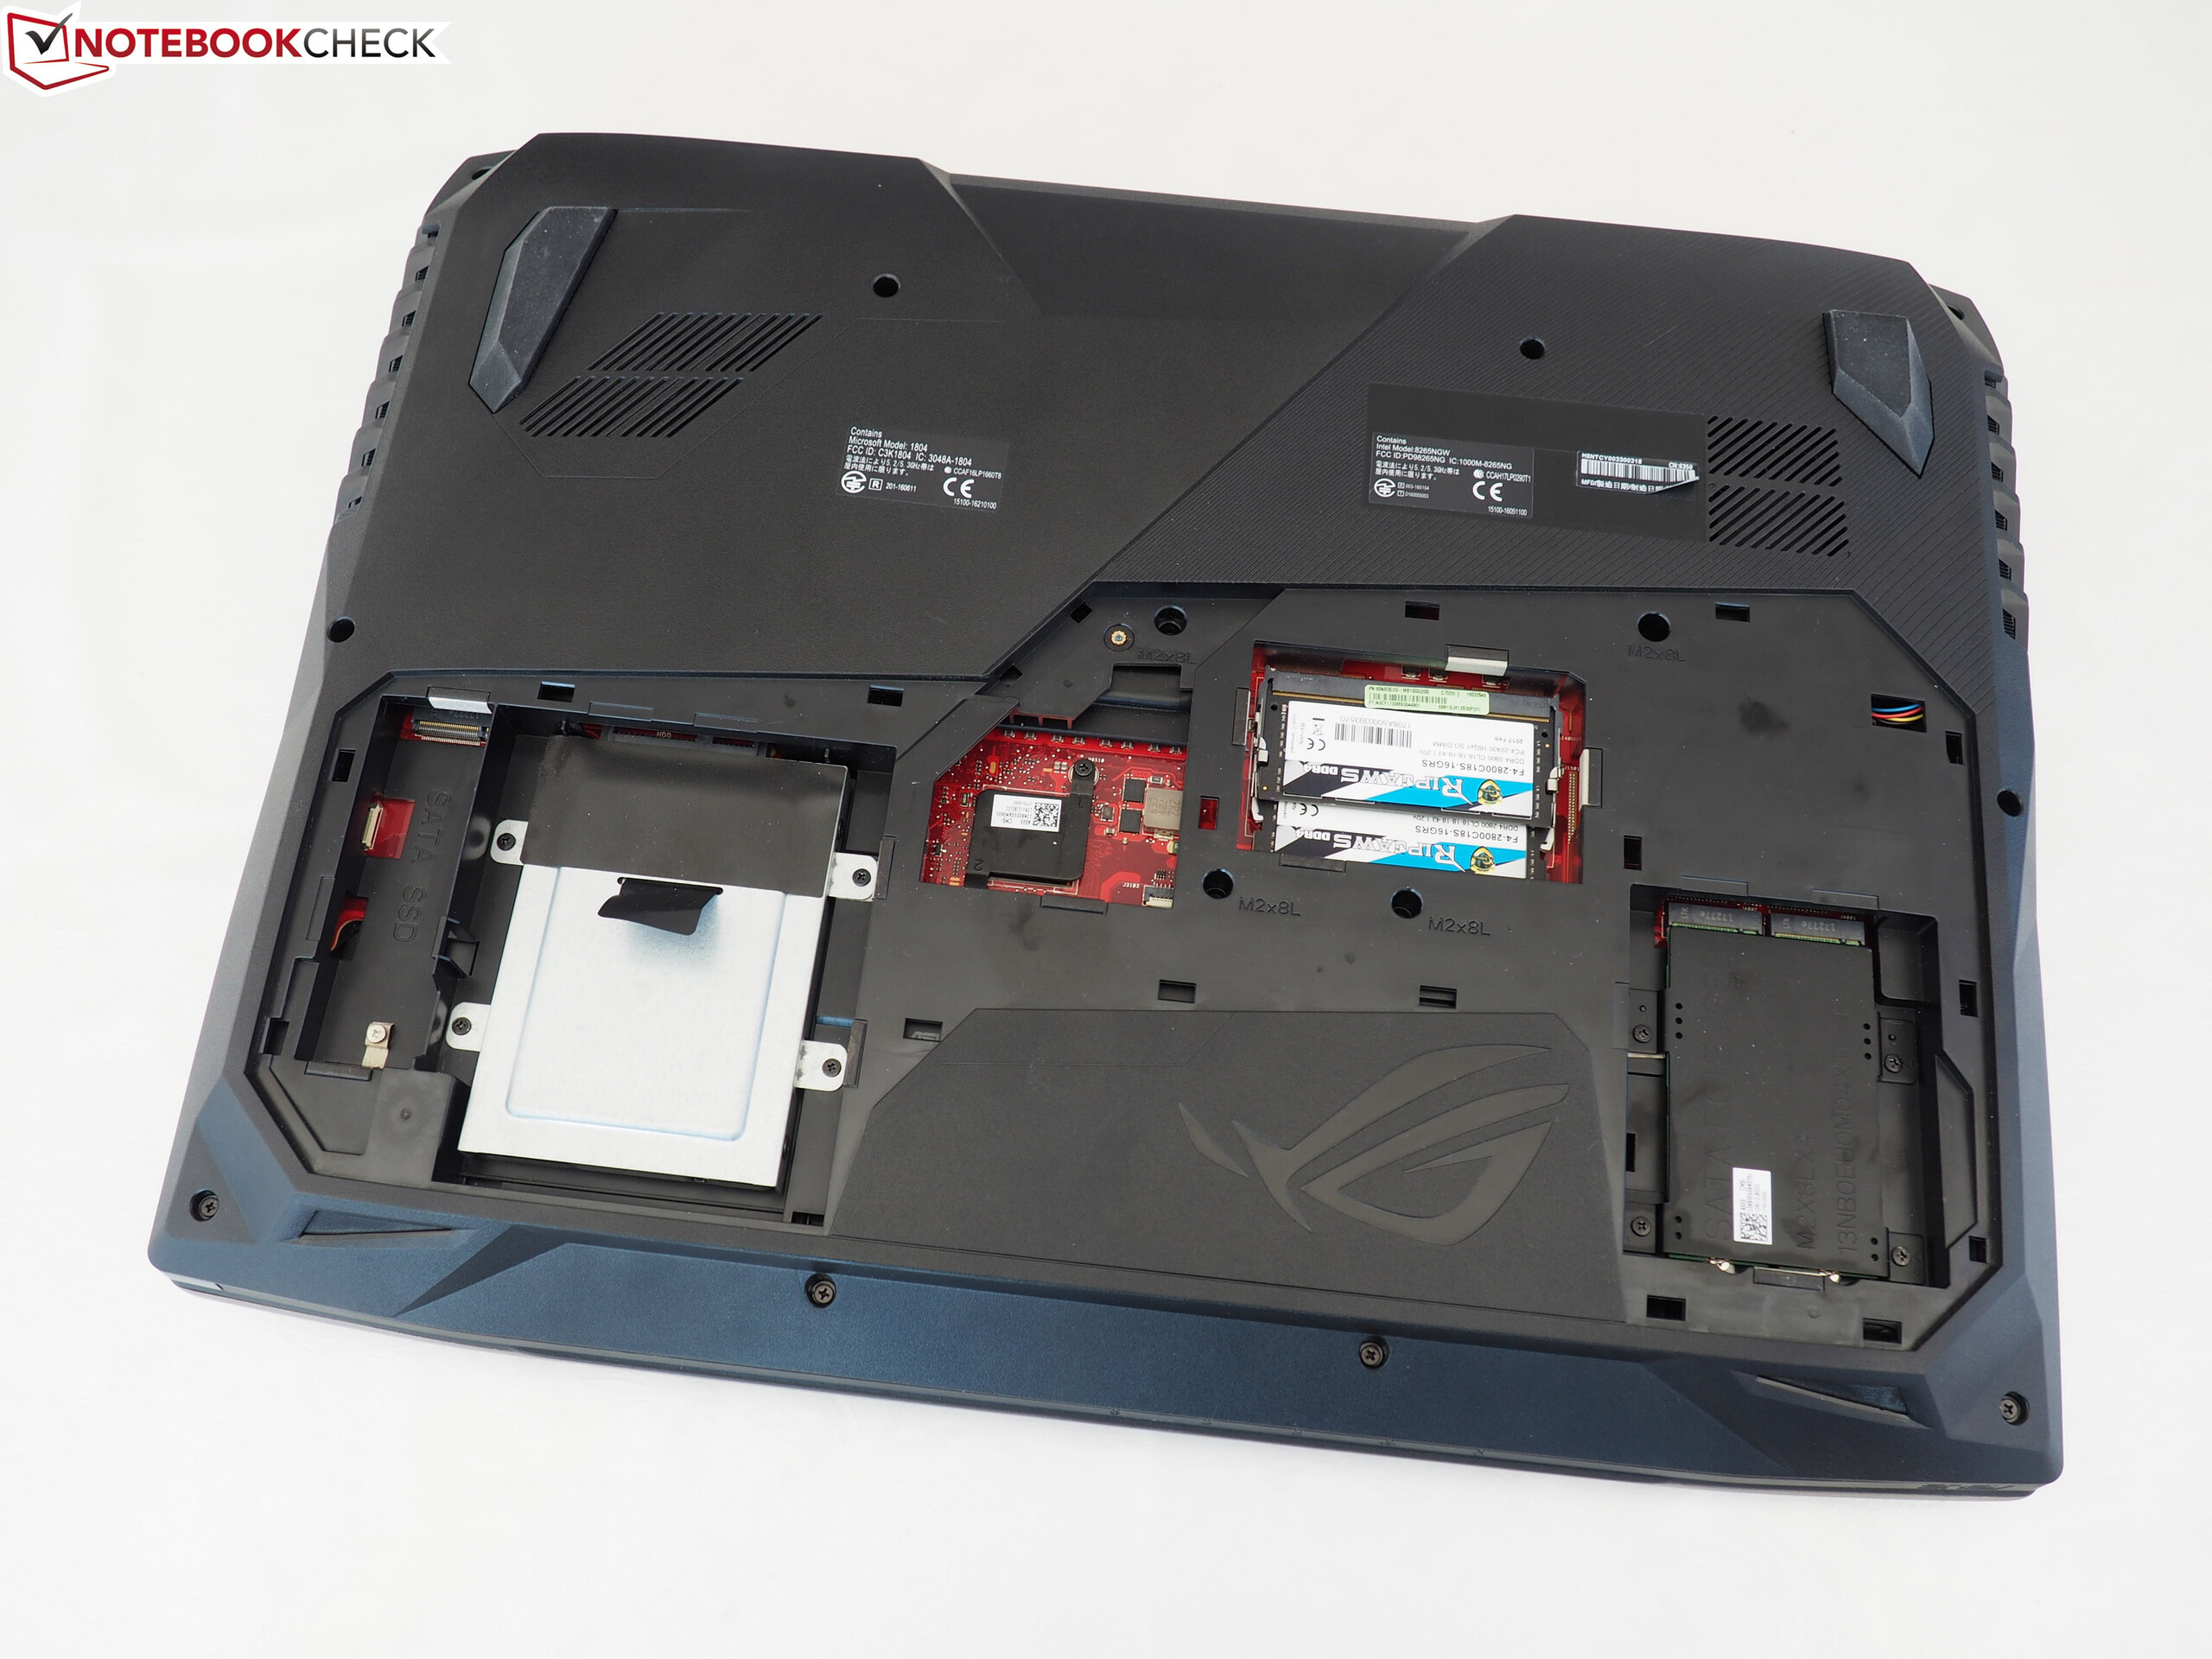
The maintenance options can best be described by the word "limited." Anyone who removes the maintenance flap from the bottom of the case, which is easily done, only gets access to the storage and half of the RAM slots. In order to reach the cooling system, the battery, and the rest of the RAM, you would need to completely take the notebook apart, which would be rather difficult for non-professionals. This is a lot easier in other notebooks (such as the Schenker XMG Ultra 17). But since the CPU and GPU are soldered in, you cannot upgrade the core hardware later anyways.
Warranty
The pick-up and return warranty covers 24 months. Please see our Guarantees, Return Policies and Warranties FAQ for country-specific information.
Input Devices
Keyboard
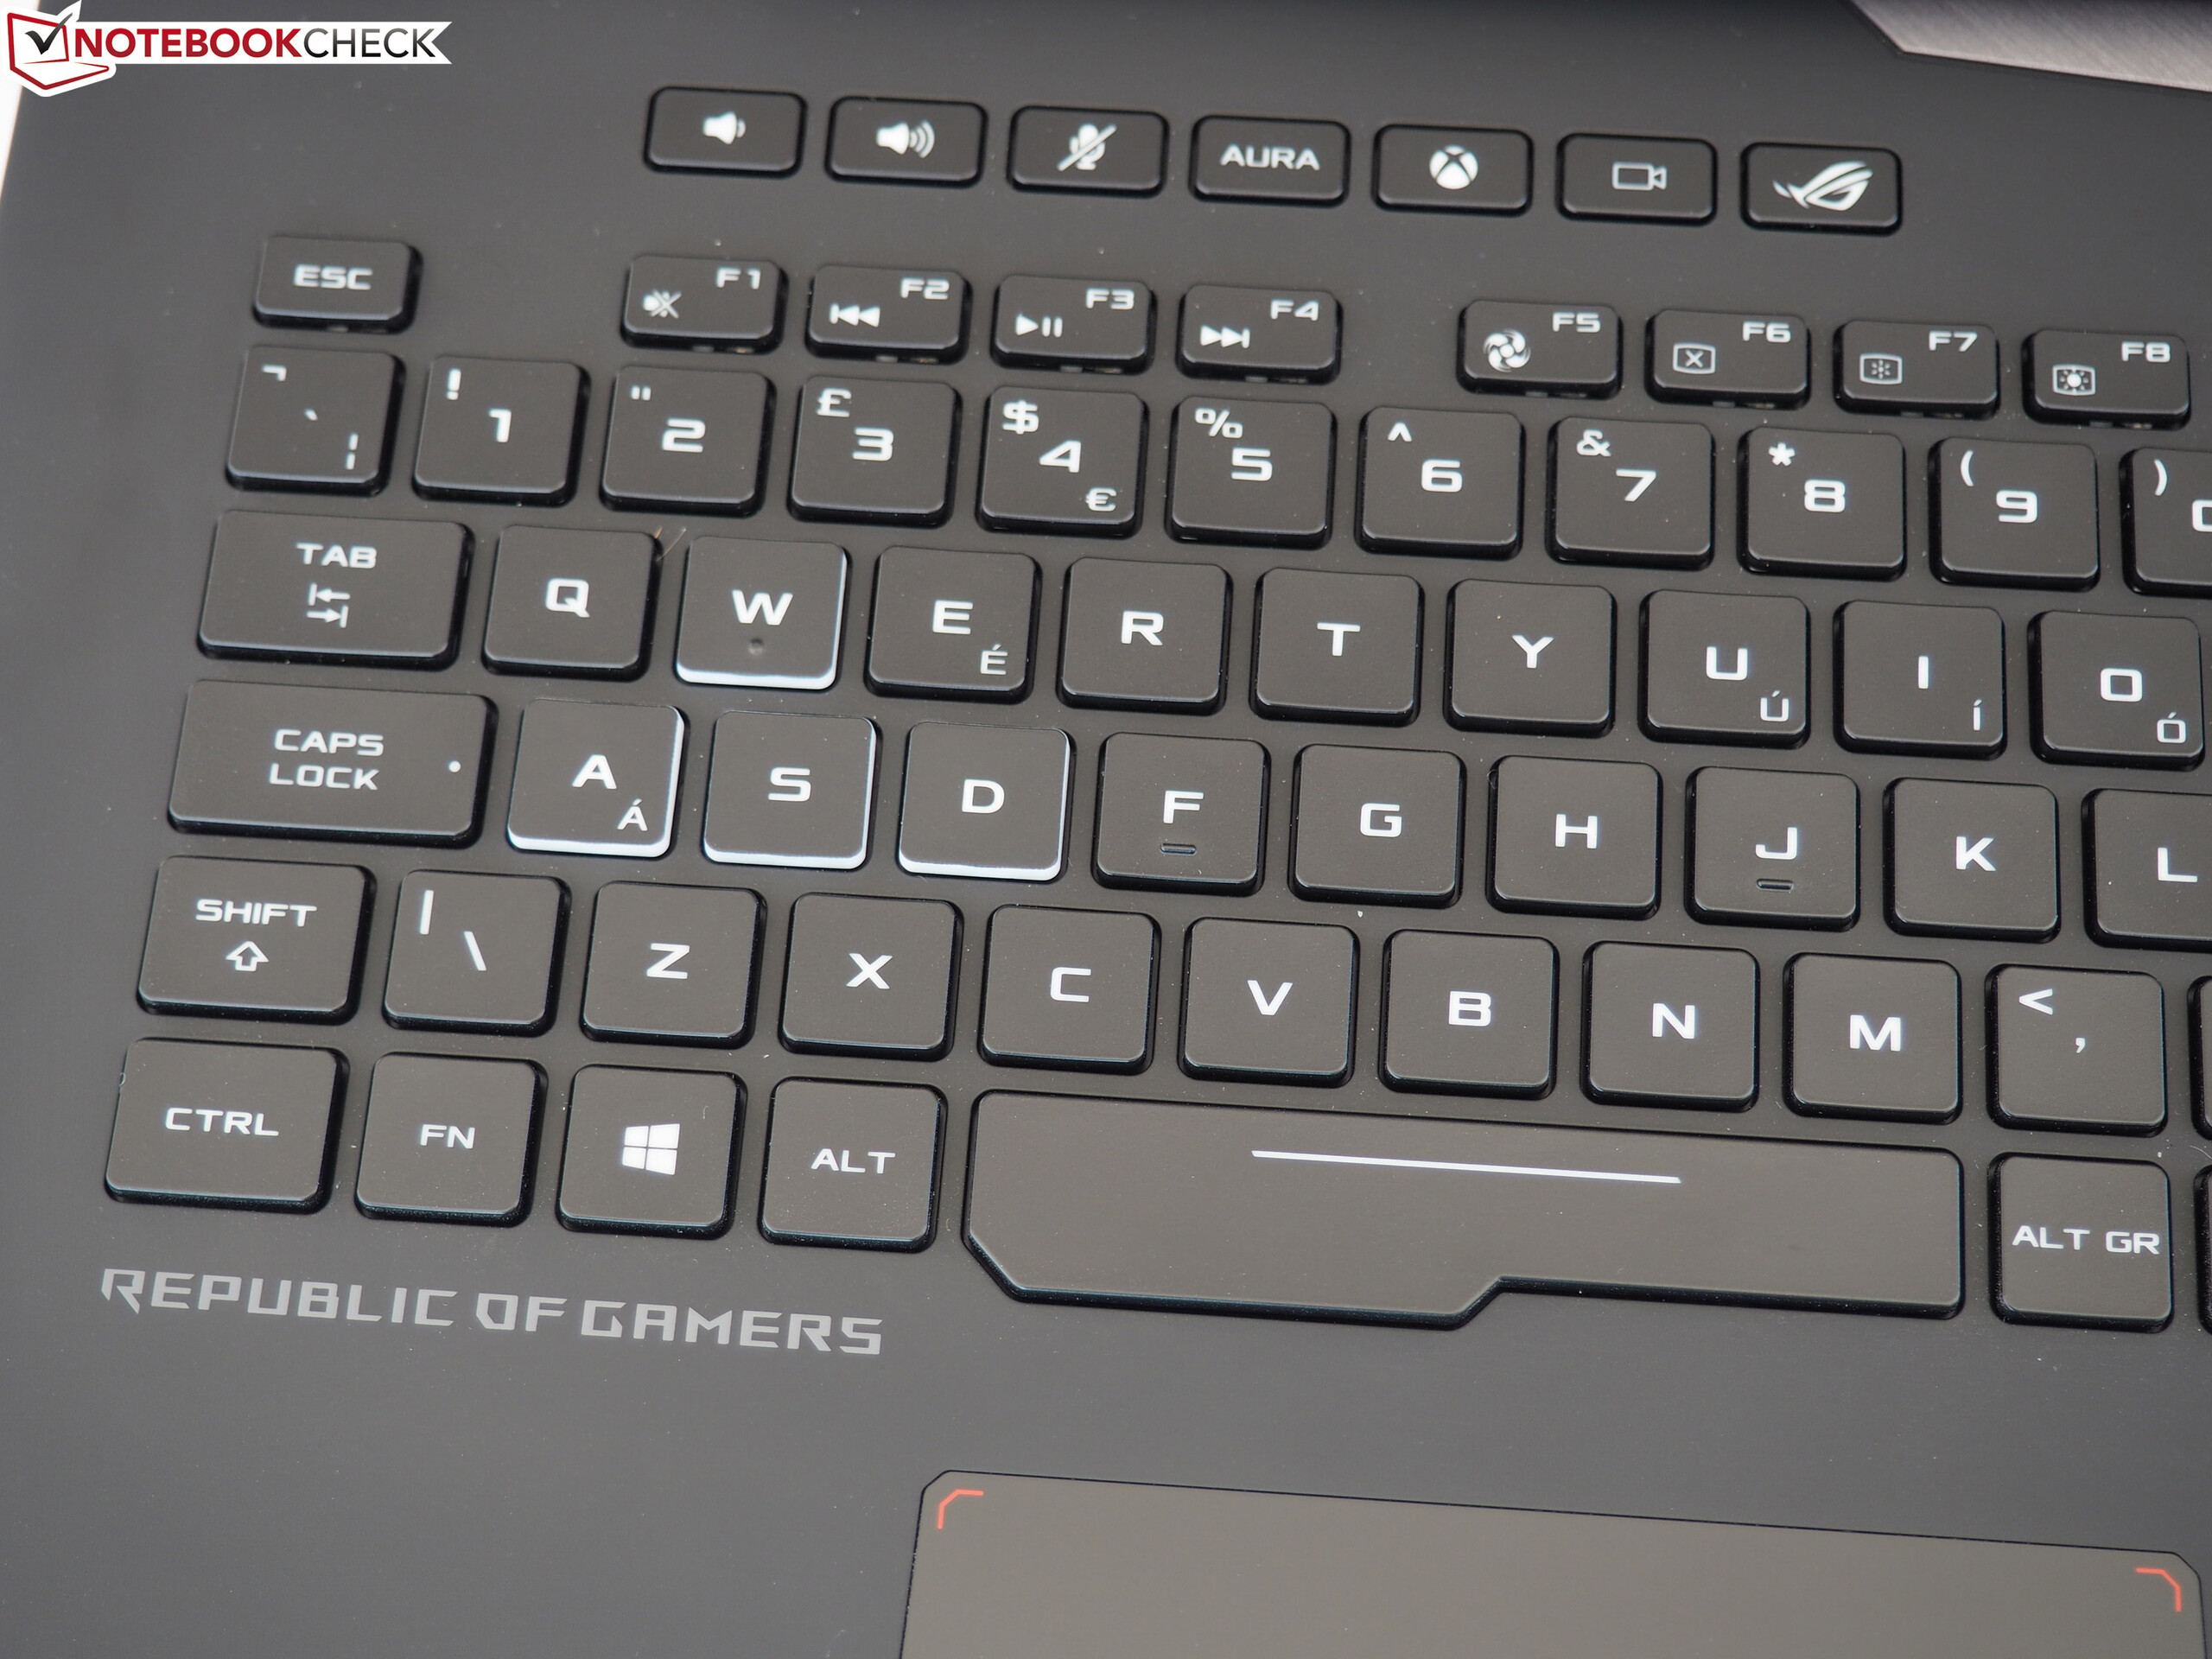
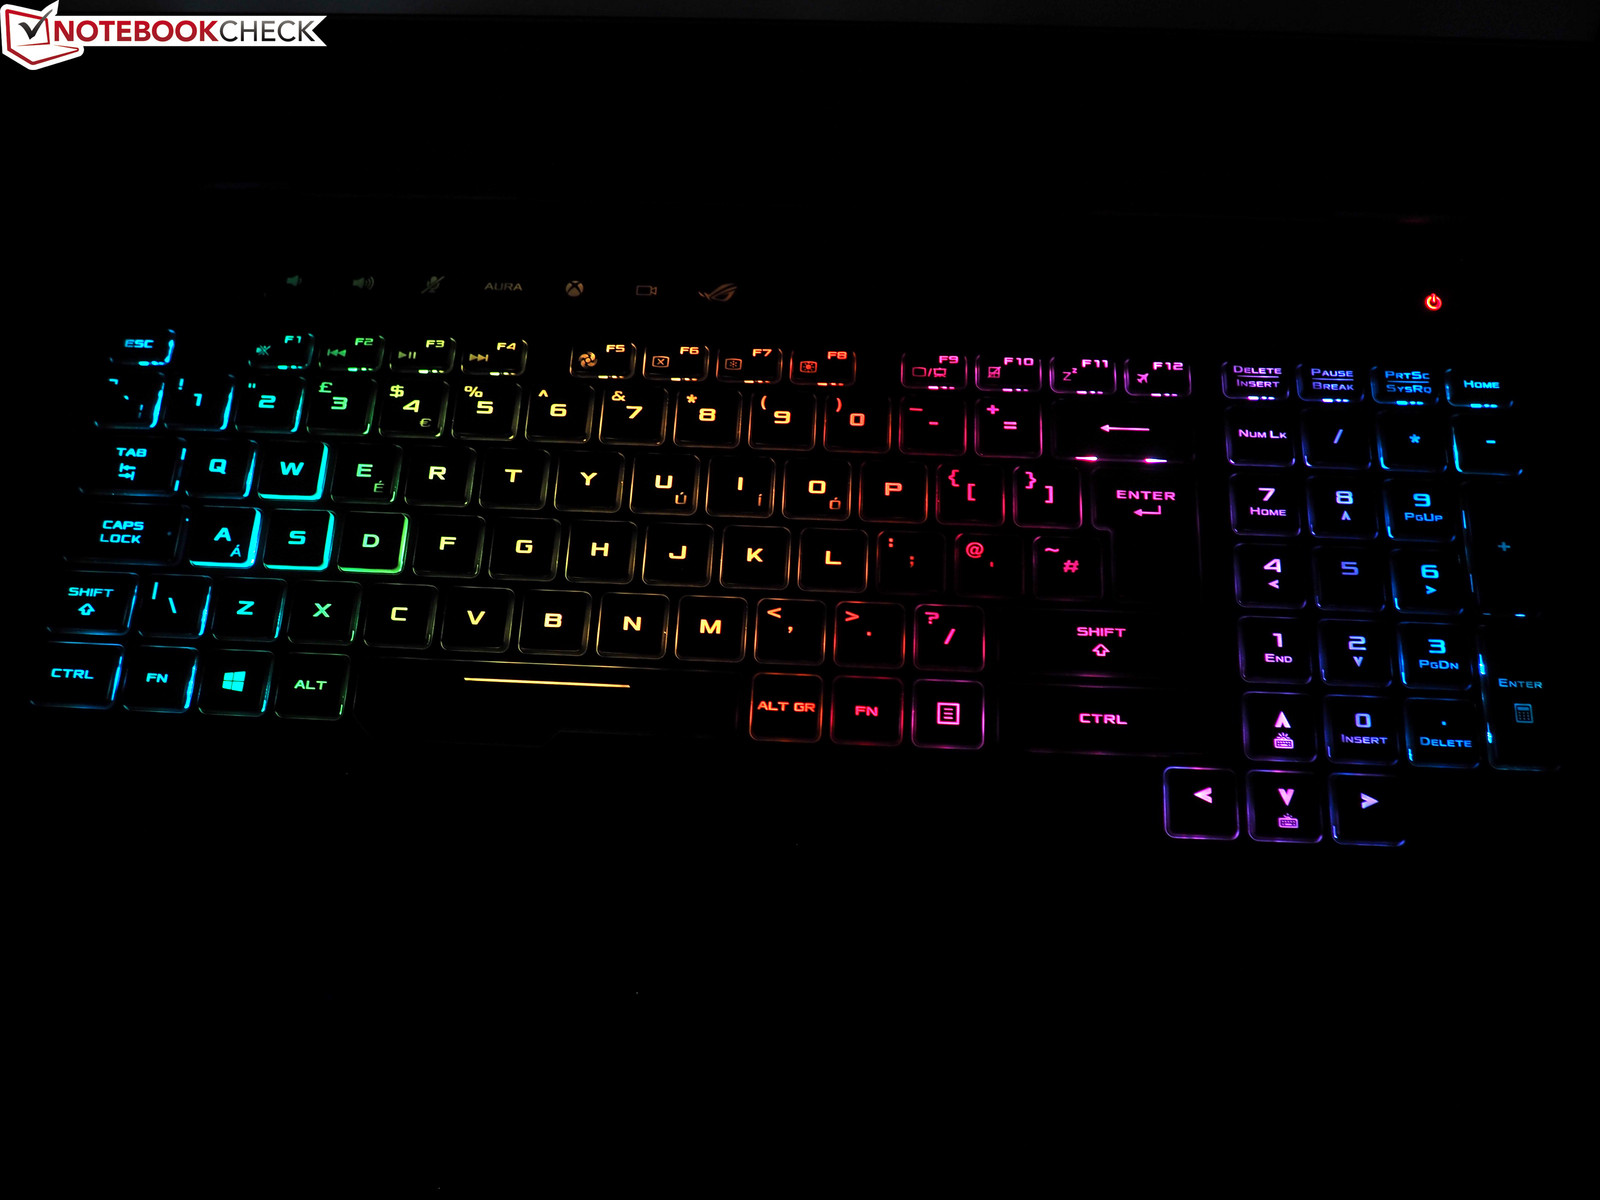
Fans of illumination are definitely well-served by the ROG 703. As should be the case for a current gaming notebook, the keyboard can offer a multi-stepped and pleasantly bright RGB illumination (including various modes). The quality of the keyboard is on a high to very-high level. While the keys still felt slightly spongy in the G752 and G701, the Chimera convinces with a very crisp feedback, which reminds us of the mechanical keyboard of the GT75VR. The relatively long stroke and the loud typing noise seem to be inspired by the MSI Pendant as well.
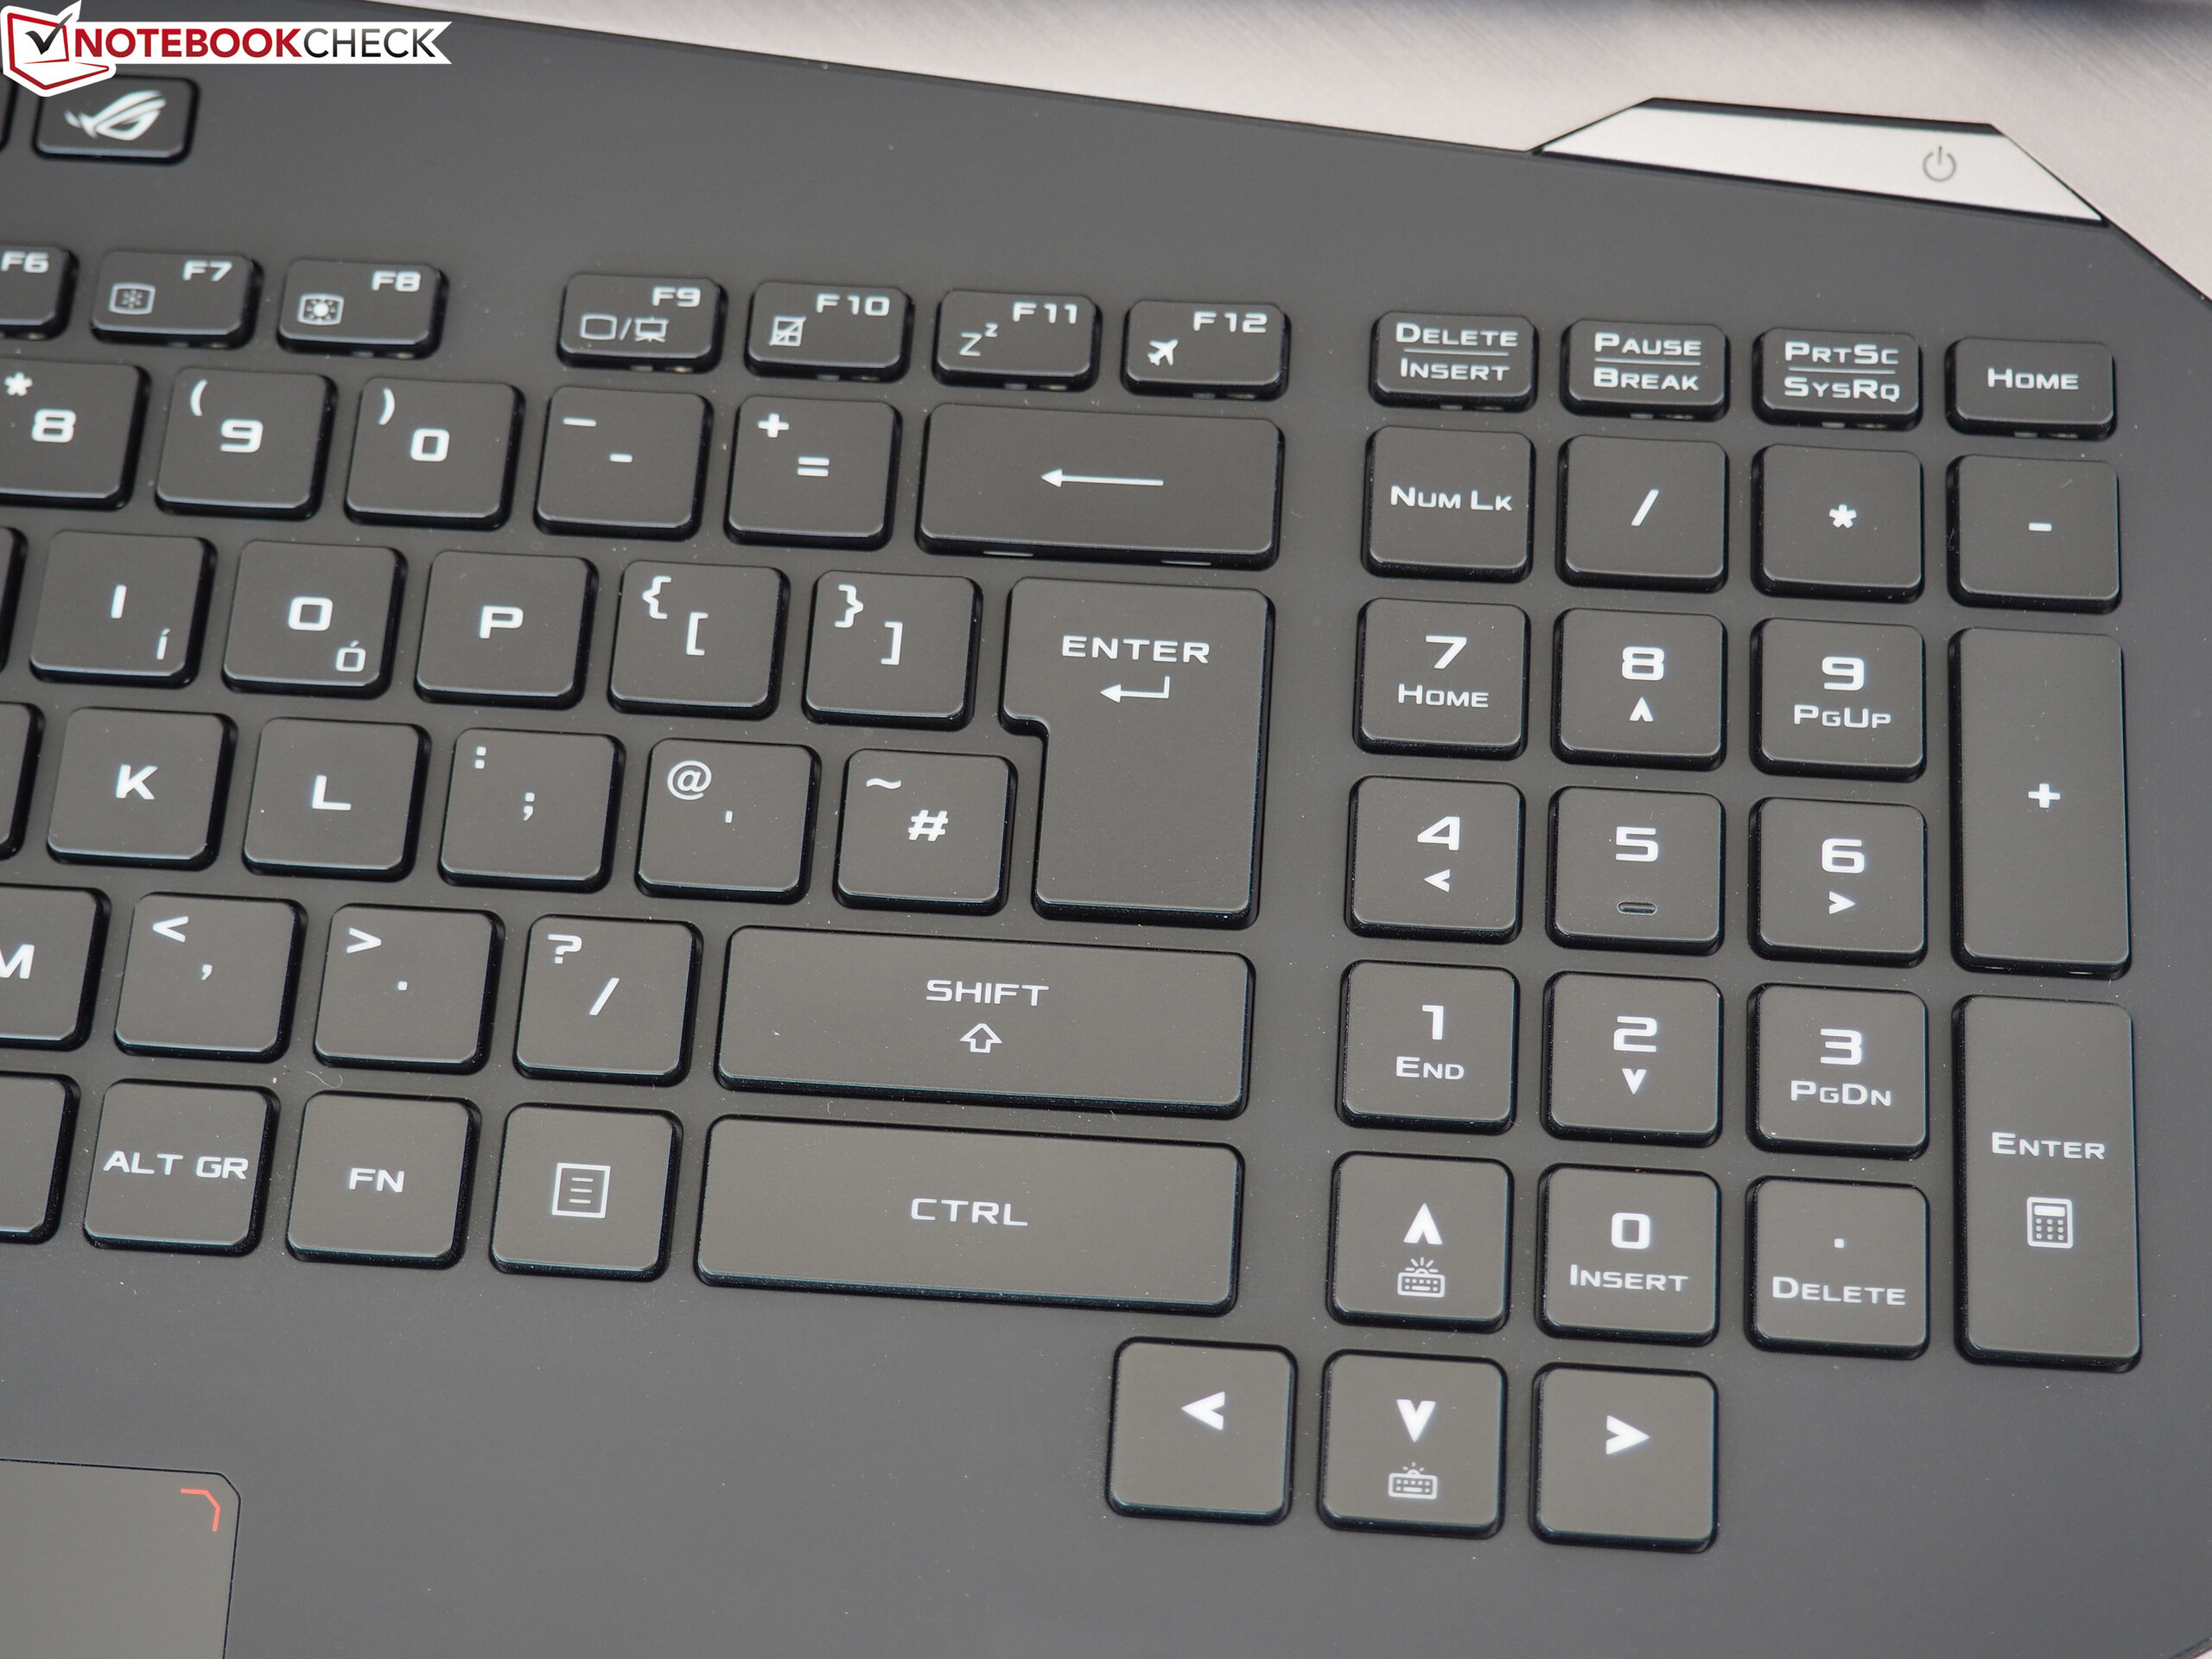
Fortunately, Asus uses another approach in the layout. The G703 makes do without any more daring experimentation and keeps to the standard to a large extent. Advantages compared to the GT75VR consist of the four instead of three-column number block and the more sensibly separated and organized F-row. The arrow keys reach into the block of number keys and not into the main block. There are also positive points for the practical special keys above the keyboard. For example, they allow you to adjust the volume and deactivate the microphone.
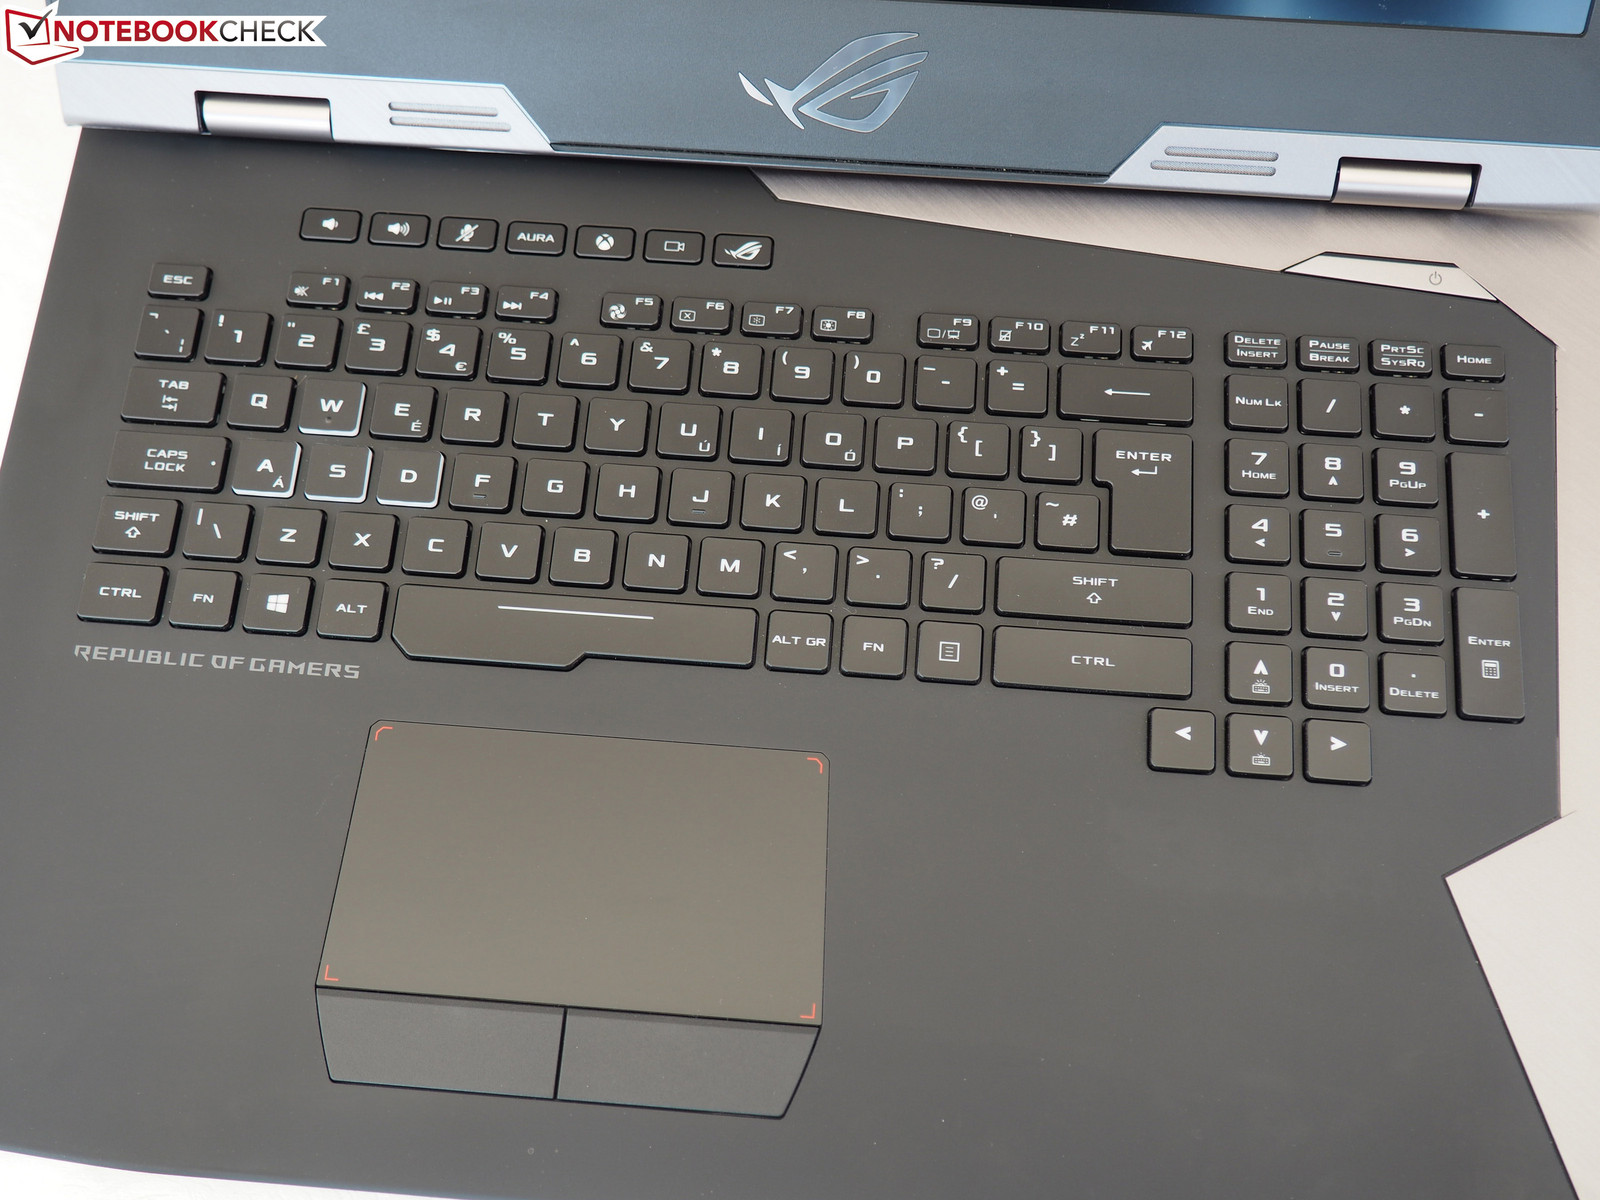
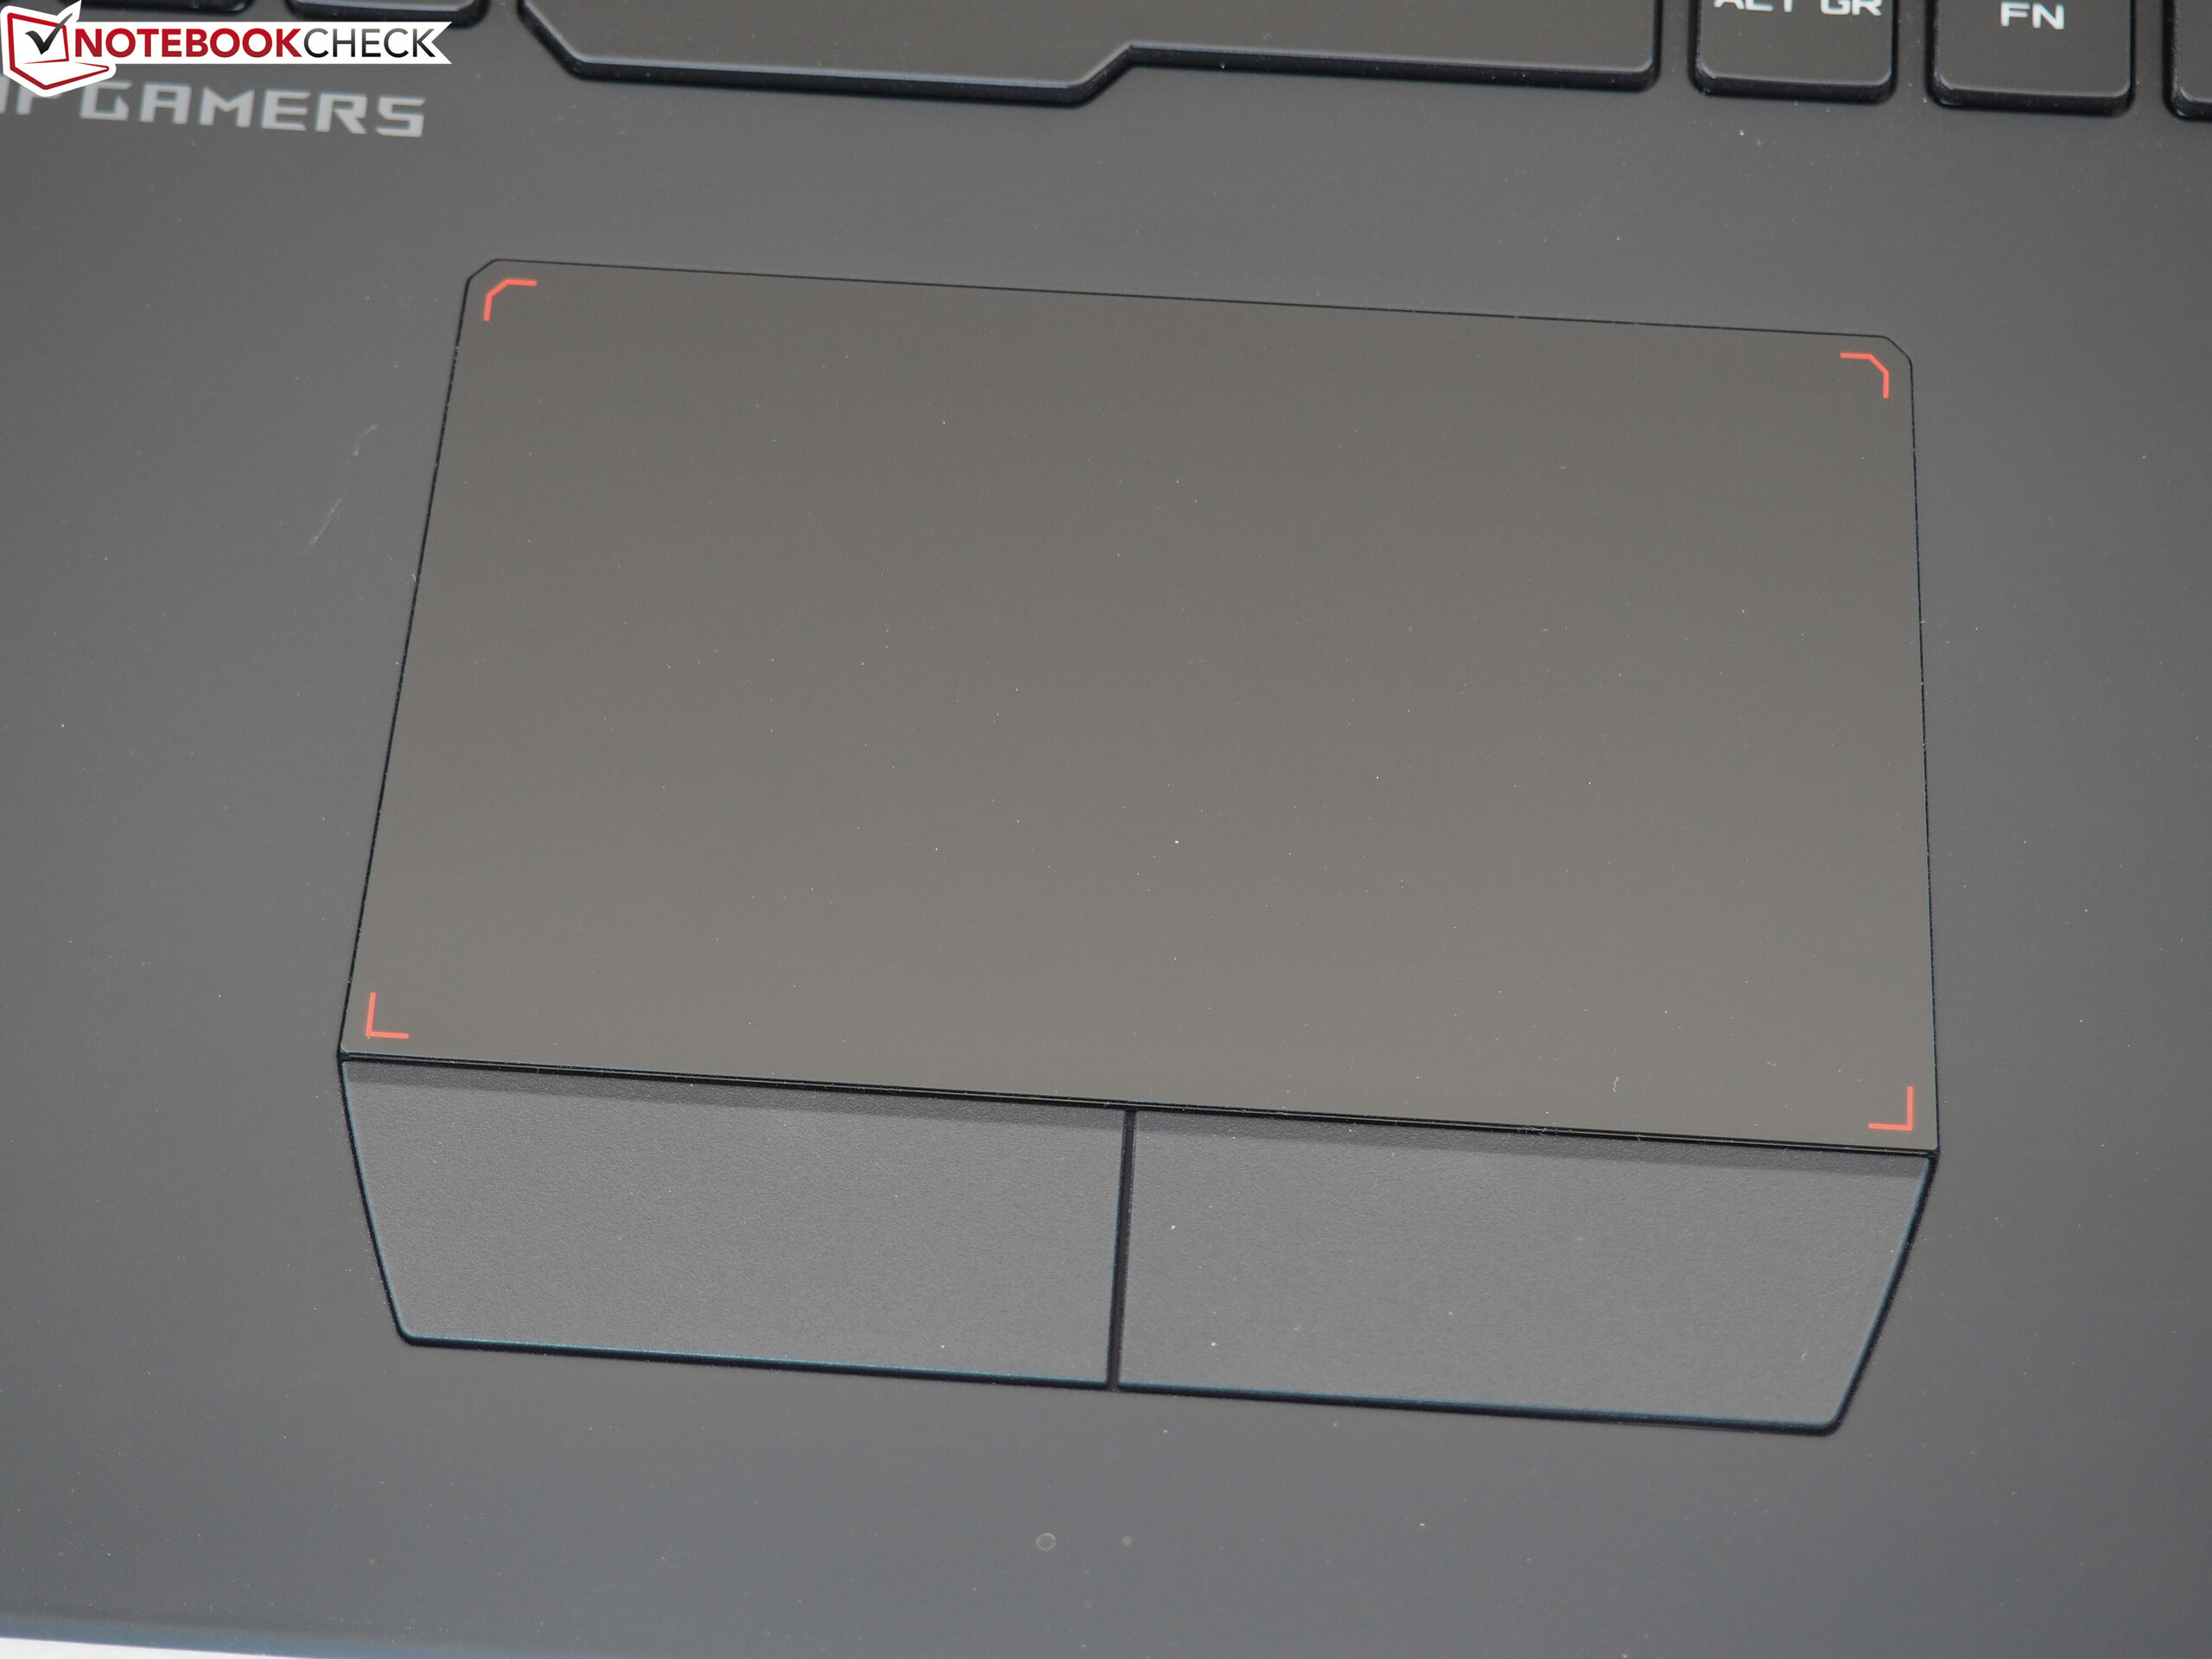
Touchpad
The touchpad also achieves a reference level. On the positive side we have the comfortably smooth surface that makes sliding pleasant and also the ample size of 11.2 x 6.8 cm (~4.4 x 2.7 in). Since it is a conventional touchpad with dedicated keys (even if they appear slightly loose), left and right clicks are always recognized reliably. The same goes for the multi-touch support (zooming and scrolling via two-finger gestures) which most often works flawlessly. Asus could possibly make some improvements in the precision, which should be a tad more exact.
Display
After 60–75 Hz have been the standards for displays for years, now more and more 120 and 144 Hz monitors are appearing. Asus and many other manufacturers are bringing this trend into the notebook segment as well.
| |||||||||||||||||||||||||
Brightness Distribution: 80 %
Center on Battery: 274 cd/m²
Contrast: 945:1 (Black: 0.29 cd/m²)
ΔE ColorChecker Calman: 3.99 | ∀{0.5-29.43 Ø4.71}
calibrated: 1.79
ΔE Greyscale Calman: 4.14 | ∀{0.09-98 Ø4.96}
92% sRGB (Argyll 1.6.3 3D)
60% AdobeRGB 1998 (Argyll 1.6.3 3D)
66.6% AdobeRGB 1998 (Argyll 3D)
92.4% sRGB (Argyll 3D)
65.5% Display P3 (Argyll 3D)
Gamma: 2.58
CCT: 7352 K
| Asus G703 AUO B173HAN03.0 (AUO309D), IPS, 1920x1080 | Schenker XMG Ultra 17 AU Optronics B173ZAN01.0 (AUO109B), IPS, 3840x2160 | Acer Predator 17 X GX-792-76DL LP173WF4-SPF5 (LGD056D), IPS, 1920x1080 | MSI GT75VR 7RF-012 Titan Pro CMN N173HHE-G32 (CMN1747), TN LED, 1920x1080 | Alienware 17 R4 TN LED, 2560x1440 | |
|---|---|---|---|---|---|
| Display | 30% | -5% | 25% | -9% | |
| Display P3 Coverage (%) | 65.5 | 86.4 32% | 66 1% | 90.3 38% | 61.2 -7% |
| sRGB Coverage (%) | 92.4 | 100 8% | 83.7 -9% | 99.6 8% | 82.9 -10% |
| AdobeRGB 1998 Coverage (%) | 66.6 | 99.1 49% | 61.2 -8% | 86.8 30% | 60.5 -9% |
| Response Times | -136% | -153% | 37% | -42% | |
| Response Time Grey 50% / Grey 80% * (ms) | 17.6 ? | 44 ? -150% | 45 ? -156% | 11.6 ? 34% | 30 ? -70% |
| Response Time Black / White * (ms) | 11.2 ? | 24.8 ? -121% | 28 ? -150% | 6.8 ? 39% | 12.8 ? -14% |
| PWM Frequency (Hz) | 25000 ? | ||||
| Screen | 15% | 4% | 26% | -16% | |
| Brightness middle (cd/m²) | 274 | 332 21% | 380 39% | 274 0% | 402.3 47% |
| Brightness (cd/m²) | 268 | 313 17% | 362 35% | 262 -2% | 372 39% |
| Brightness Distribution (%) | 80 | 88 10% | 91 14% | 87 9% | 86 8% |
| Black Level * (cd/m²) | 0.29 | 0.28 3% | 0.37 -28% | 0.26 10% | 0.62 -114% |
| Contrast (:1) | 945 | 1186 26% | 1027 9% | 1054 12% | 649 -31% |
| Colorchecker dE 2000 * | 3.99 | 3.86 3% | 4.12 -3% | 1.36 66% | 5.6 -40% |
| Colorchecker dE 2000 max. * | 7.33 | 5.88 20% | 8.19 -12% | 4.1 44% | 9.8 -34% |
| Colorchecker dE 2000 calibrated * | 1.79 | ||||
| Greyscale dE 2000 * | 4.14 | 4.33 -5% | 3.95 5% | 0.64 85% | 4.7 -14% |
| Gamma | 2.58 85% | 2.41 91% | 2.47 89% | 2.19 100% | 2.14 103% |
| CCT | 7352 88% | 6595 99% | 6539 99% | 6551 99% | 7519 86% |
| Color Space (Percent of AdobeRGB 1998) (%) | 60 | 88 47% | 55 -8% | 77 28% | 53.7 -10% |
| Color Space (Percent of sRGB) (%) | 92 | 100 9% | 84 -9% | 100 9% | 82.2 -11% |
| Total Average (Program / Settings) | -30% /
-2% | -51% /
-19% | 29% /
27% | -22% /
-18% |
* ... smaller is better
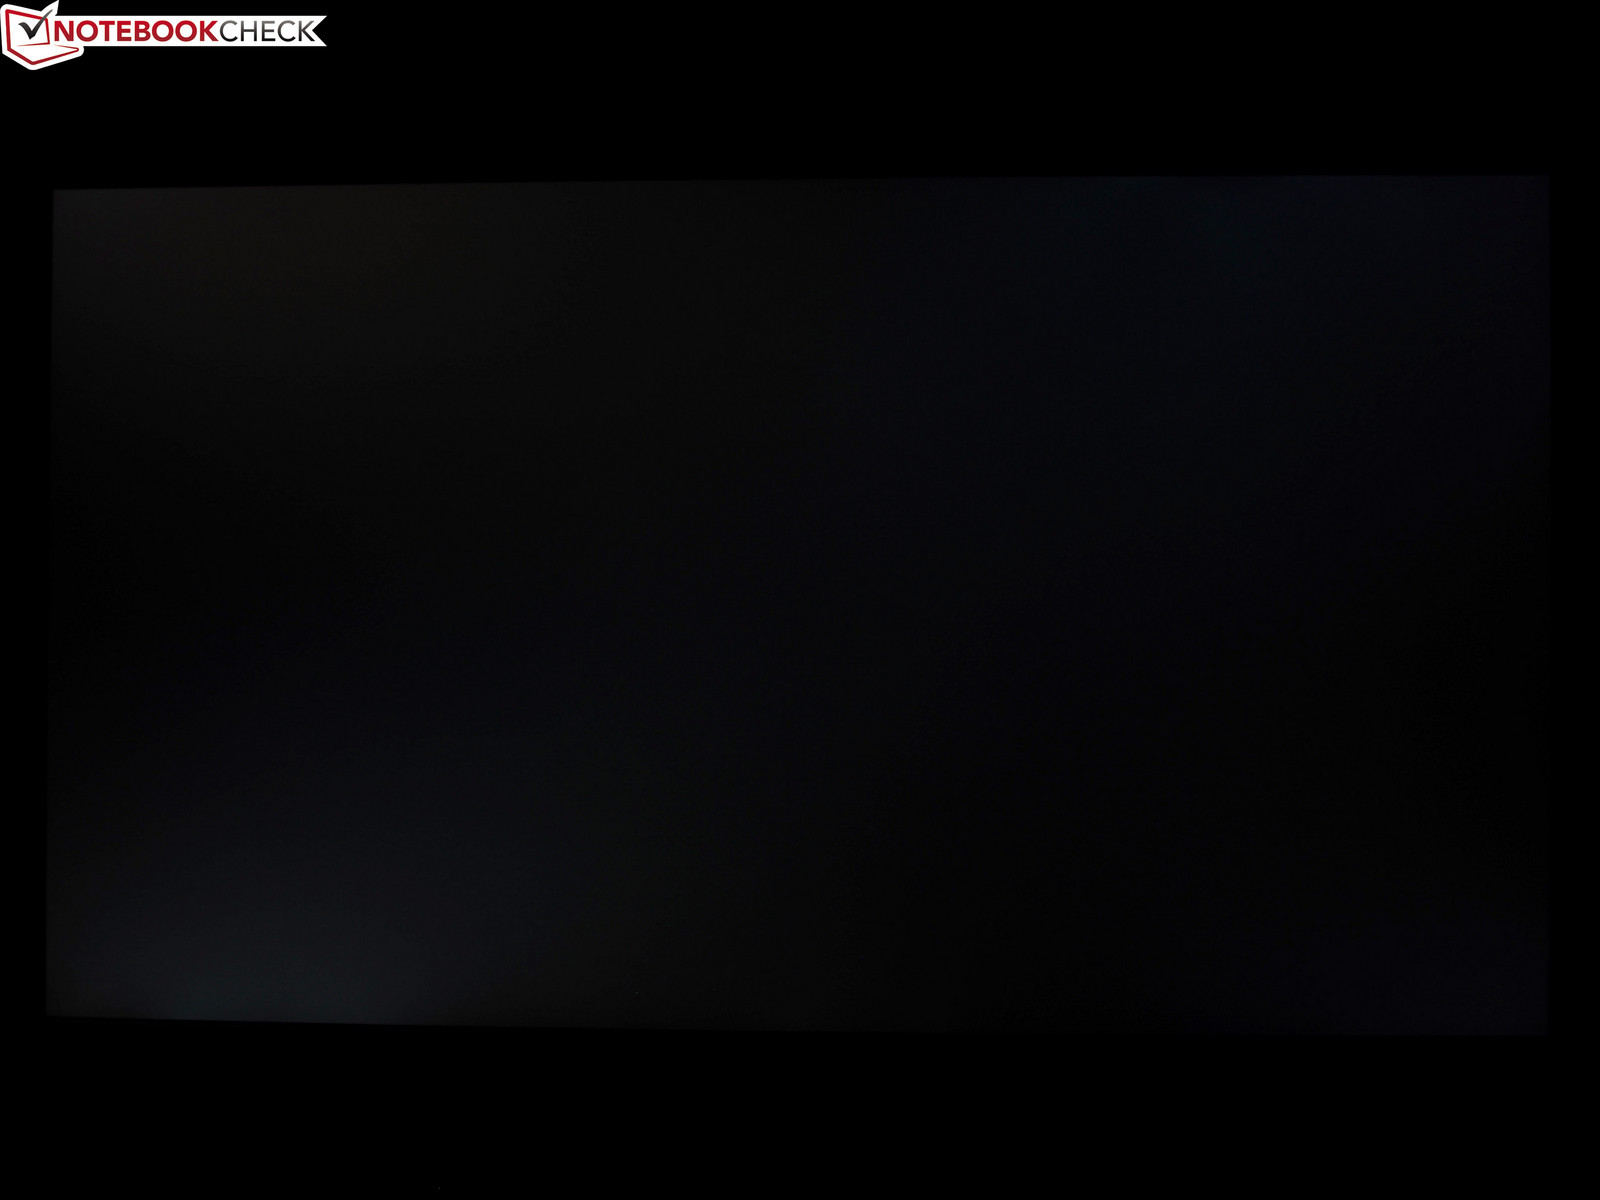
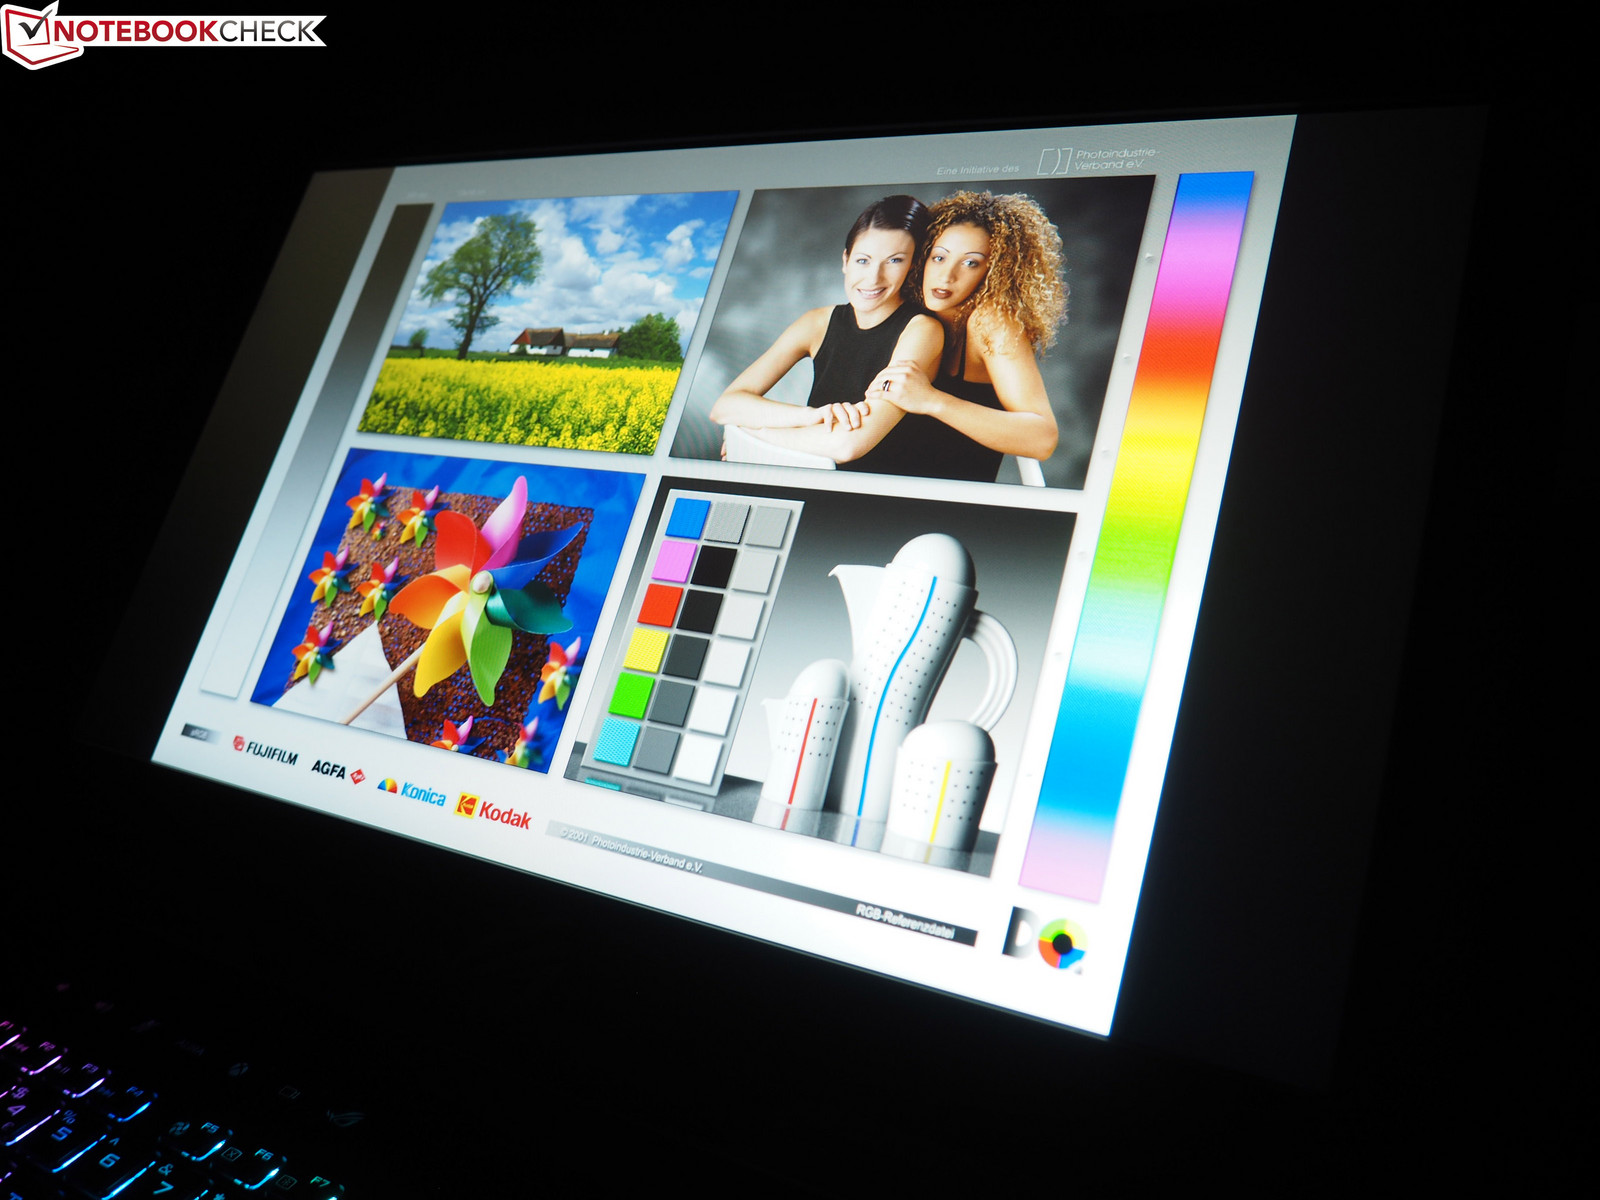
With the AUO B173HAN03.0, the ROG G703 has a 17.3-inch IPS panel, which supports Nvidia's G-Sync technology, fitting to the high display frequency. This ensures a softer image without tearing. If you disregard the mediocre brightness (around 268 cd/m²) and the clouding in the edge areas that is present in our test unit (see photo below), the display used has many strengths. Although a black value of 0.29 cd/m² and a contrast of almost 950:1 are not top values, they are more than okay for a laptop.
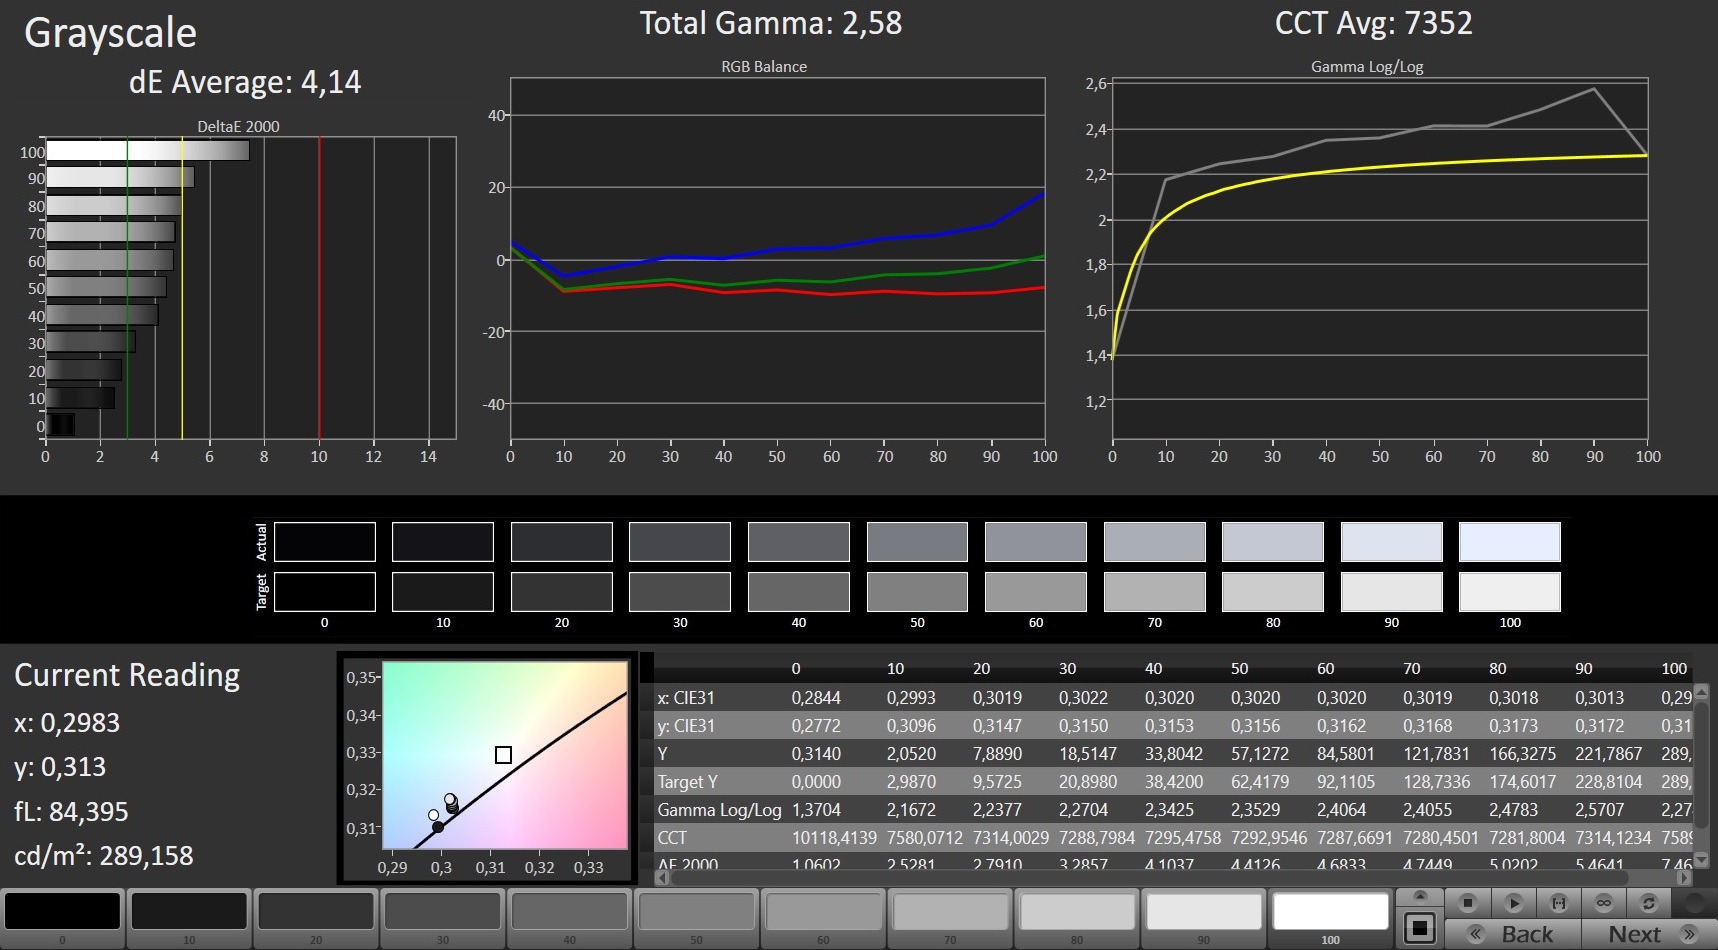
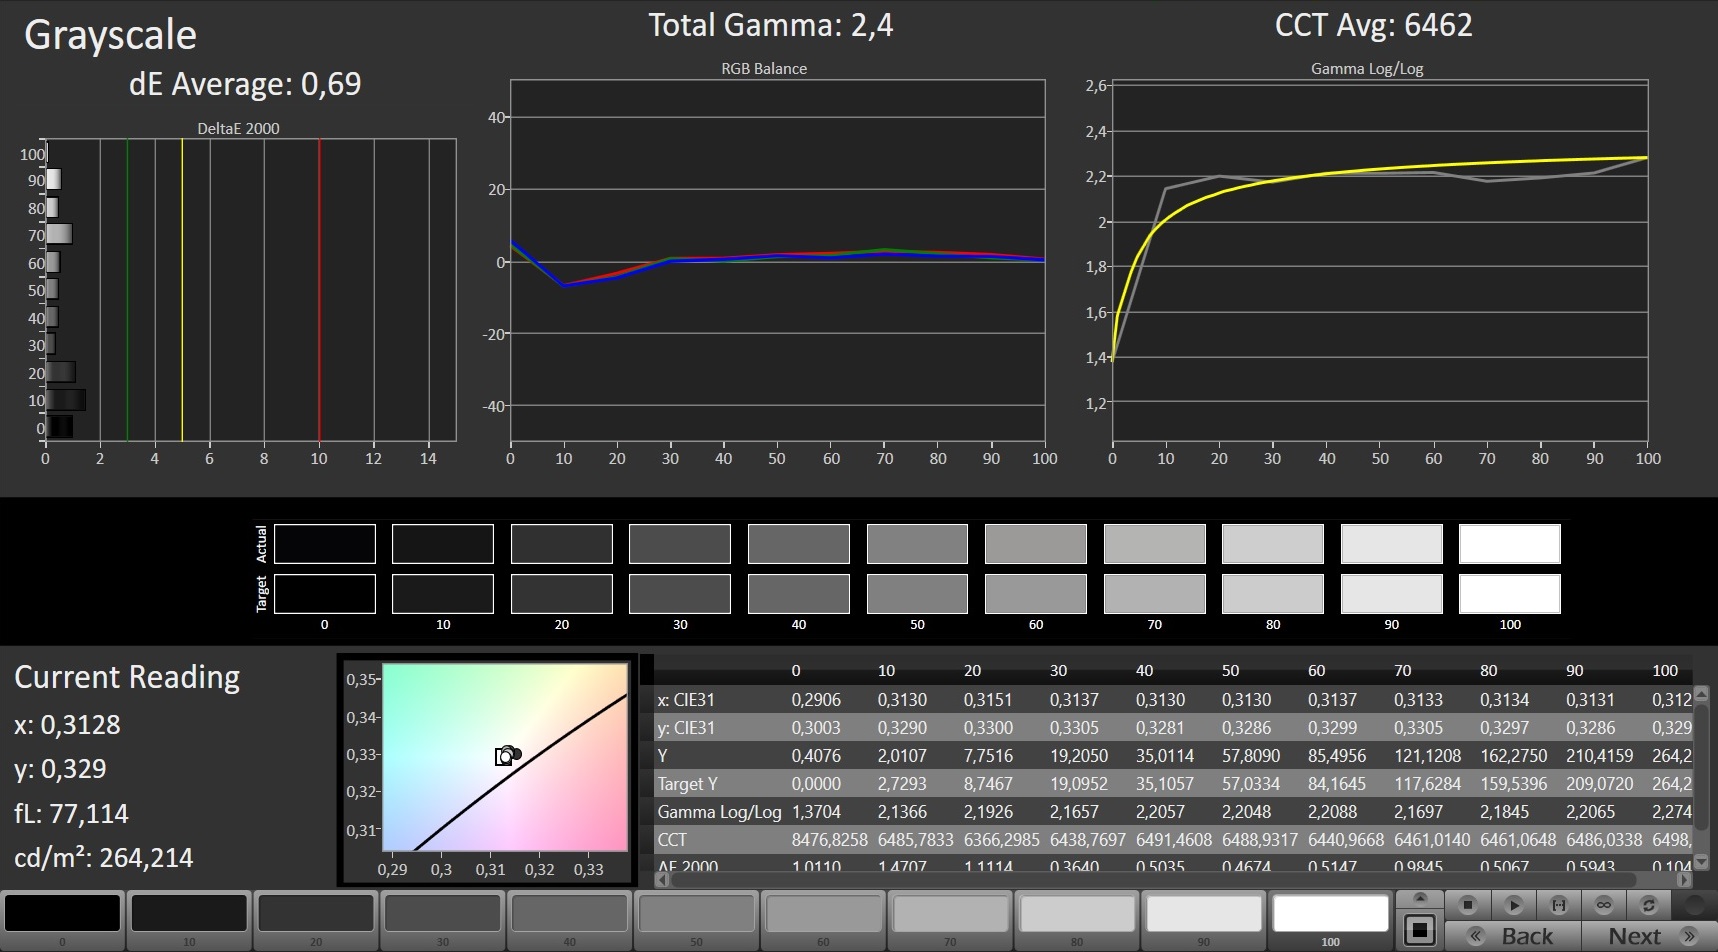
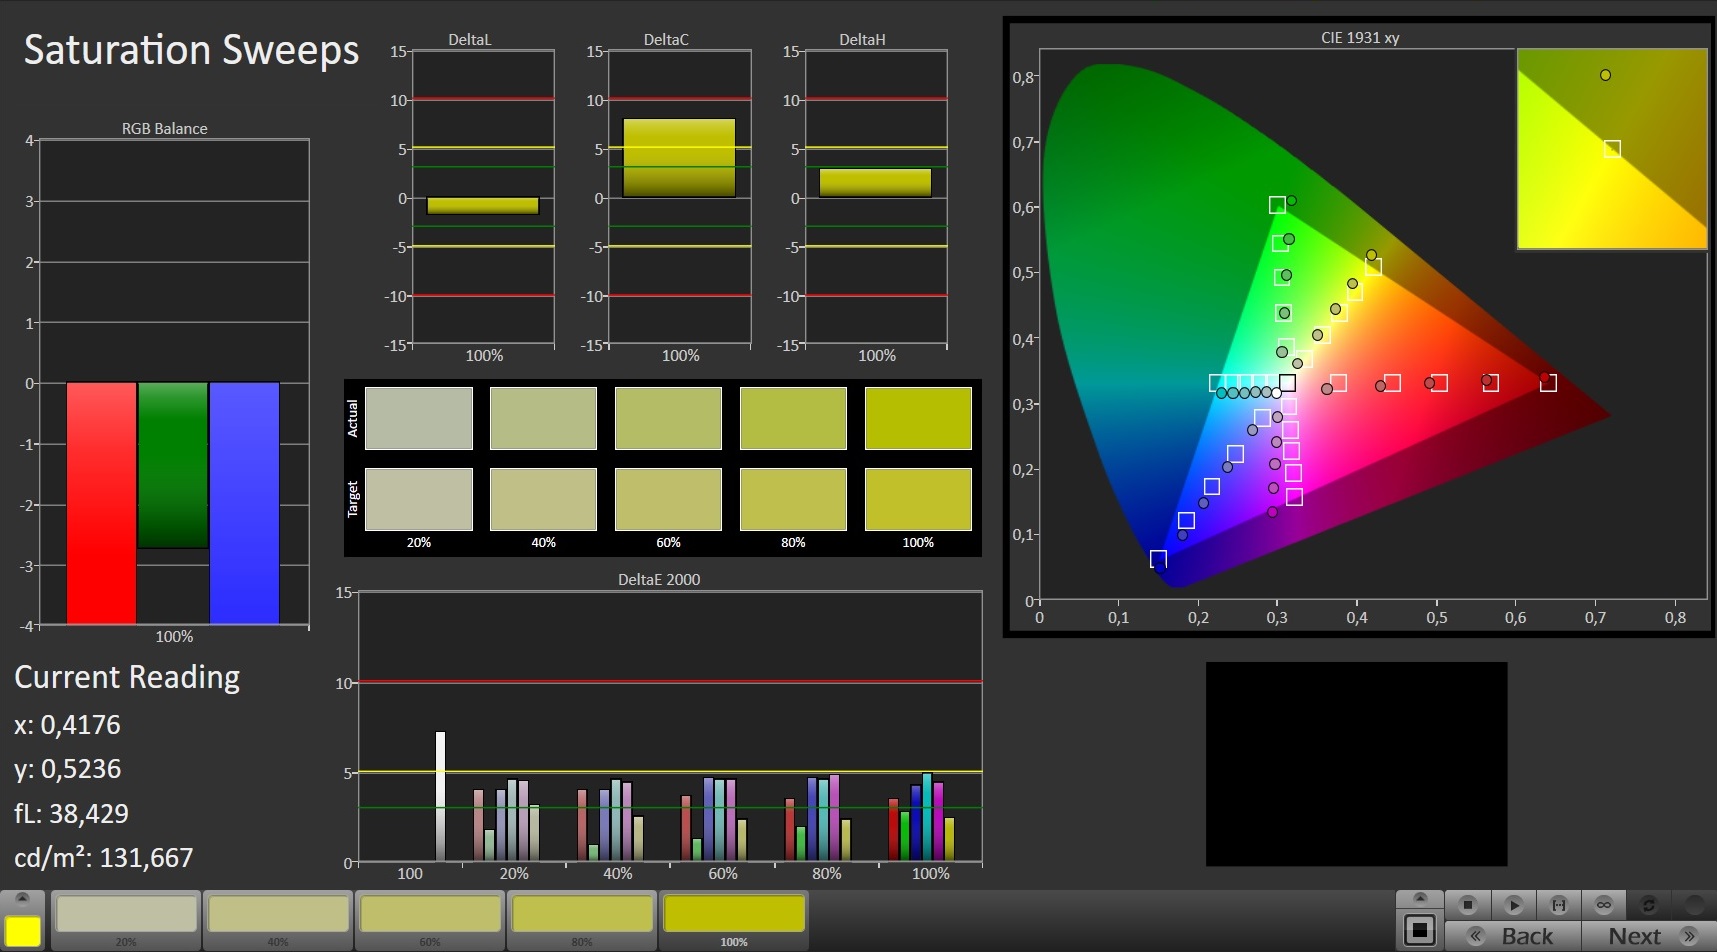
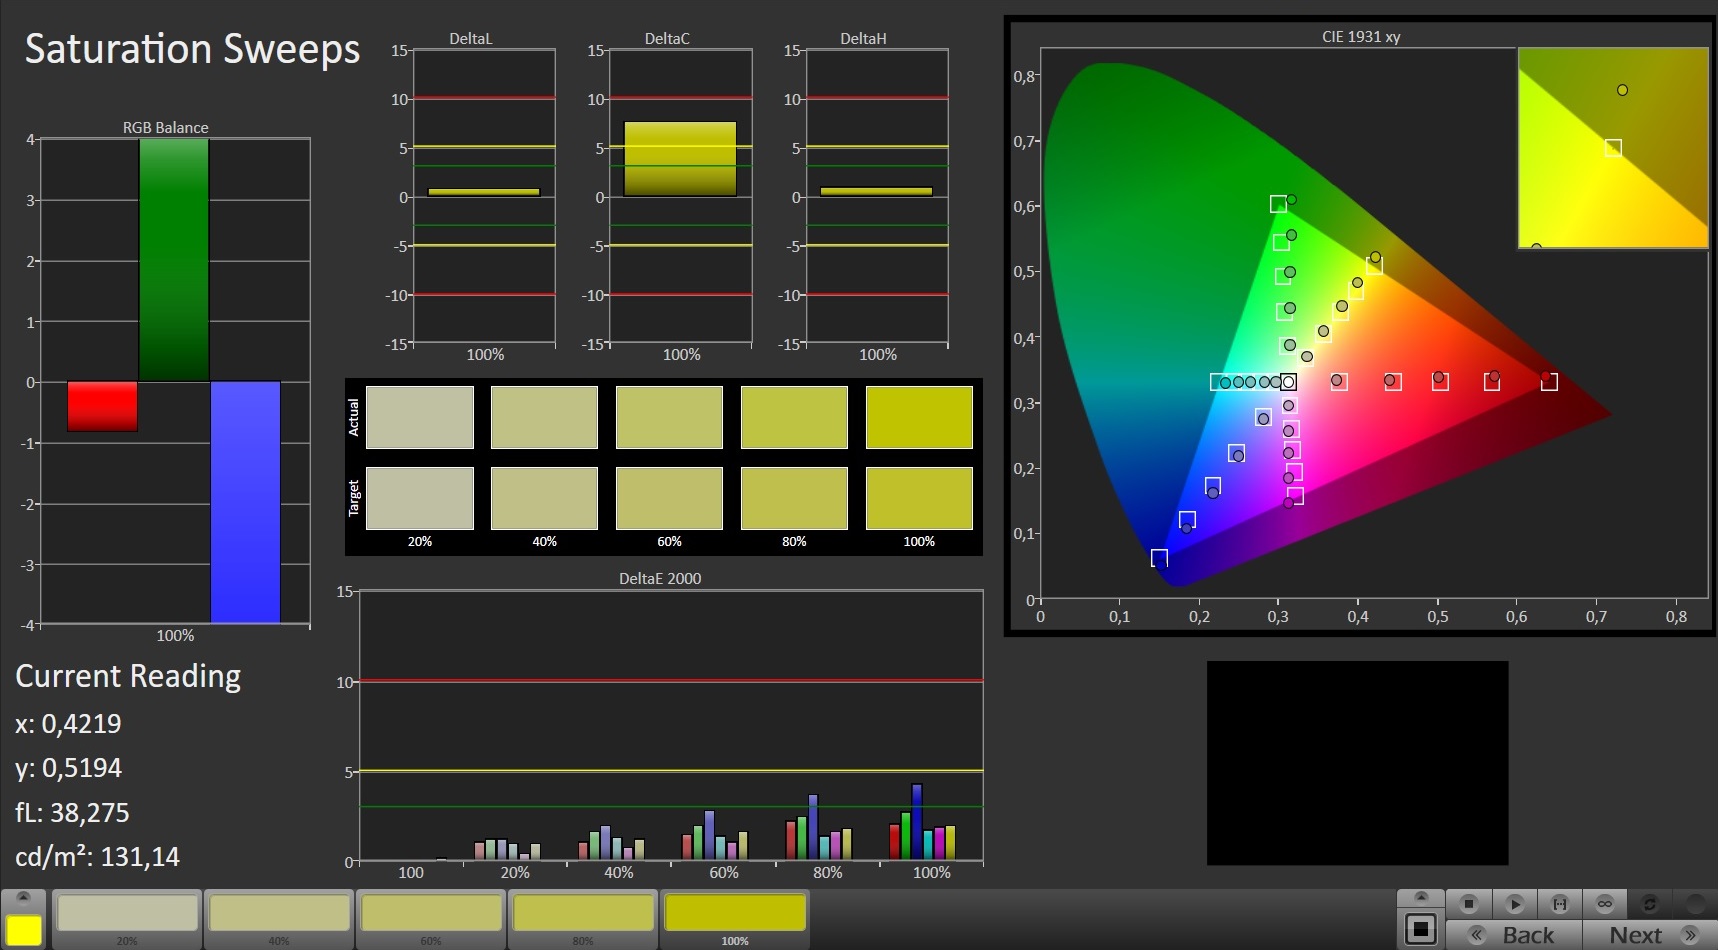
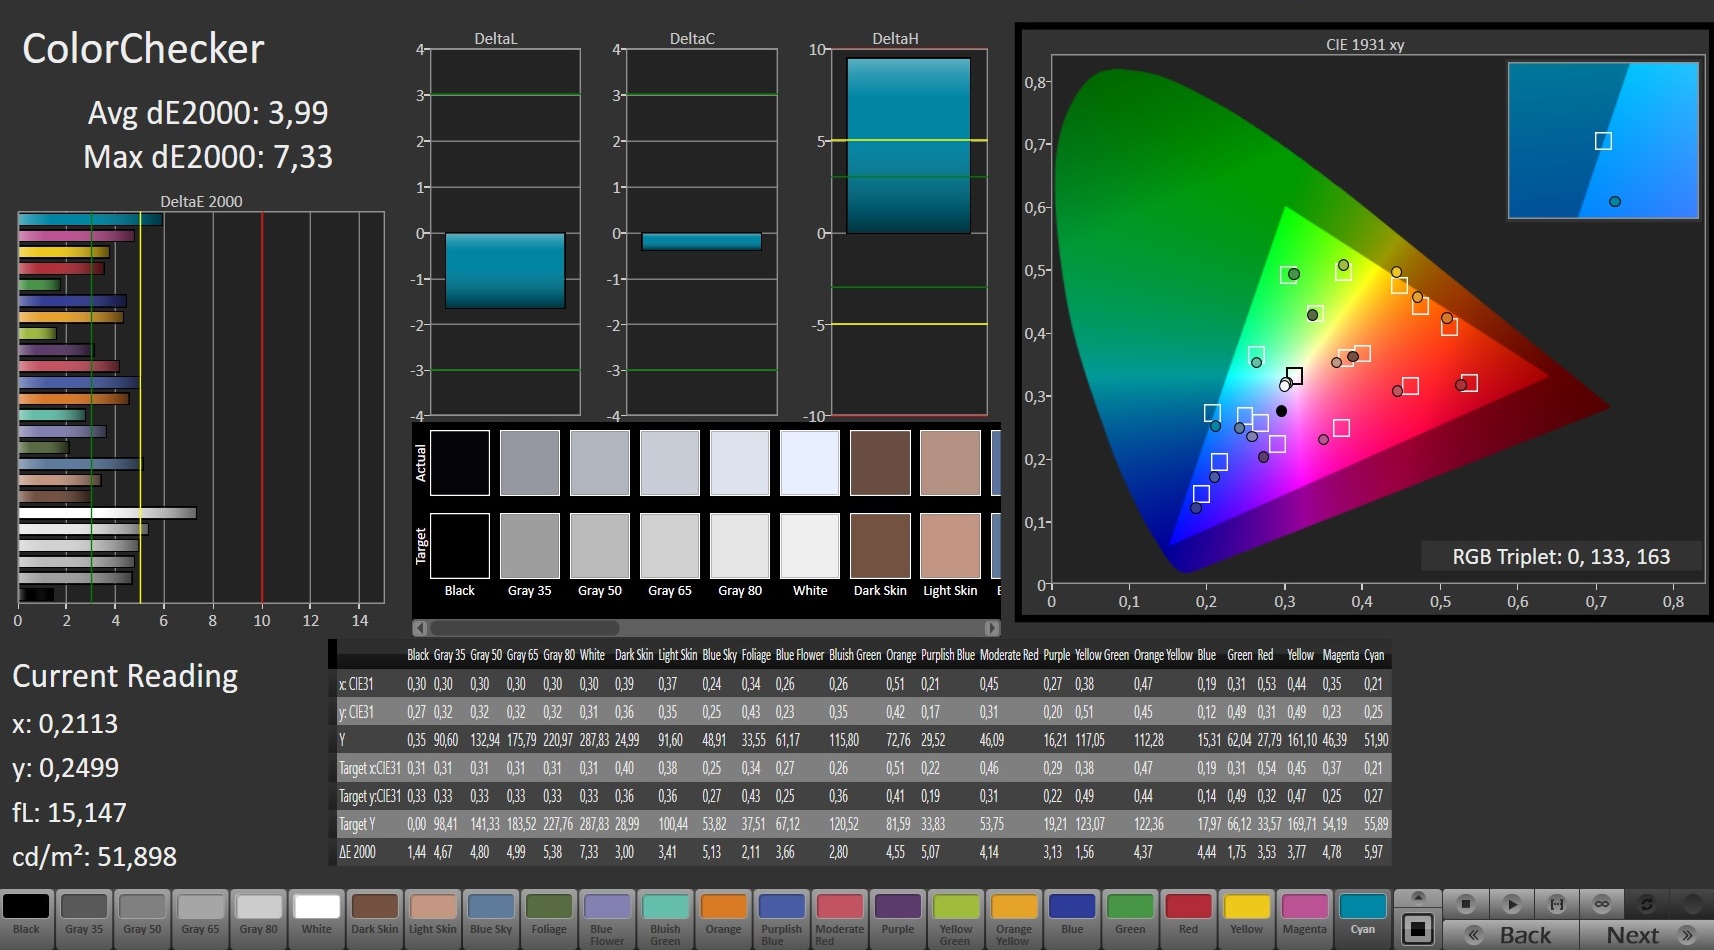
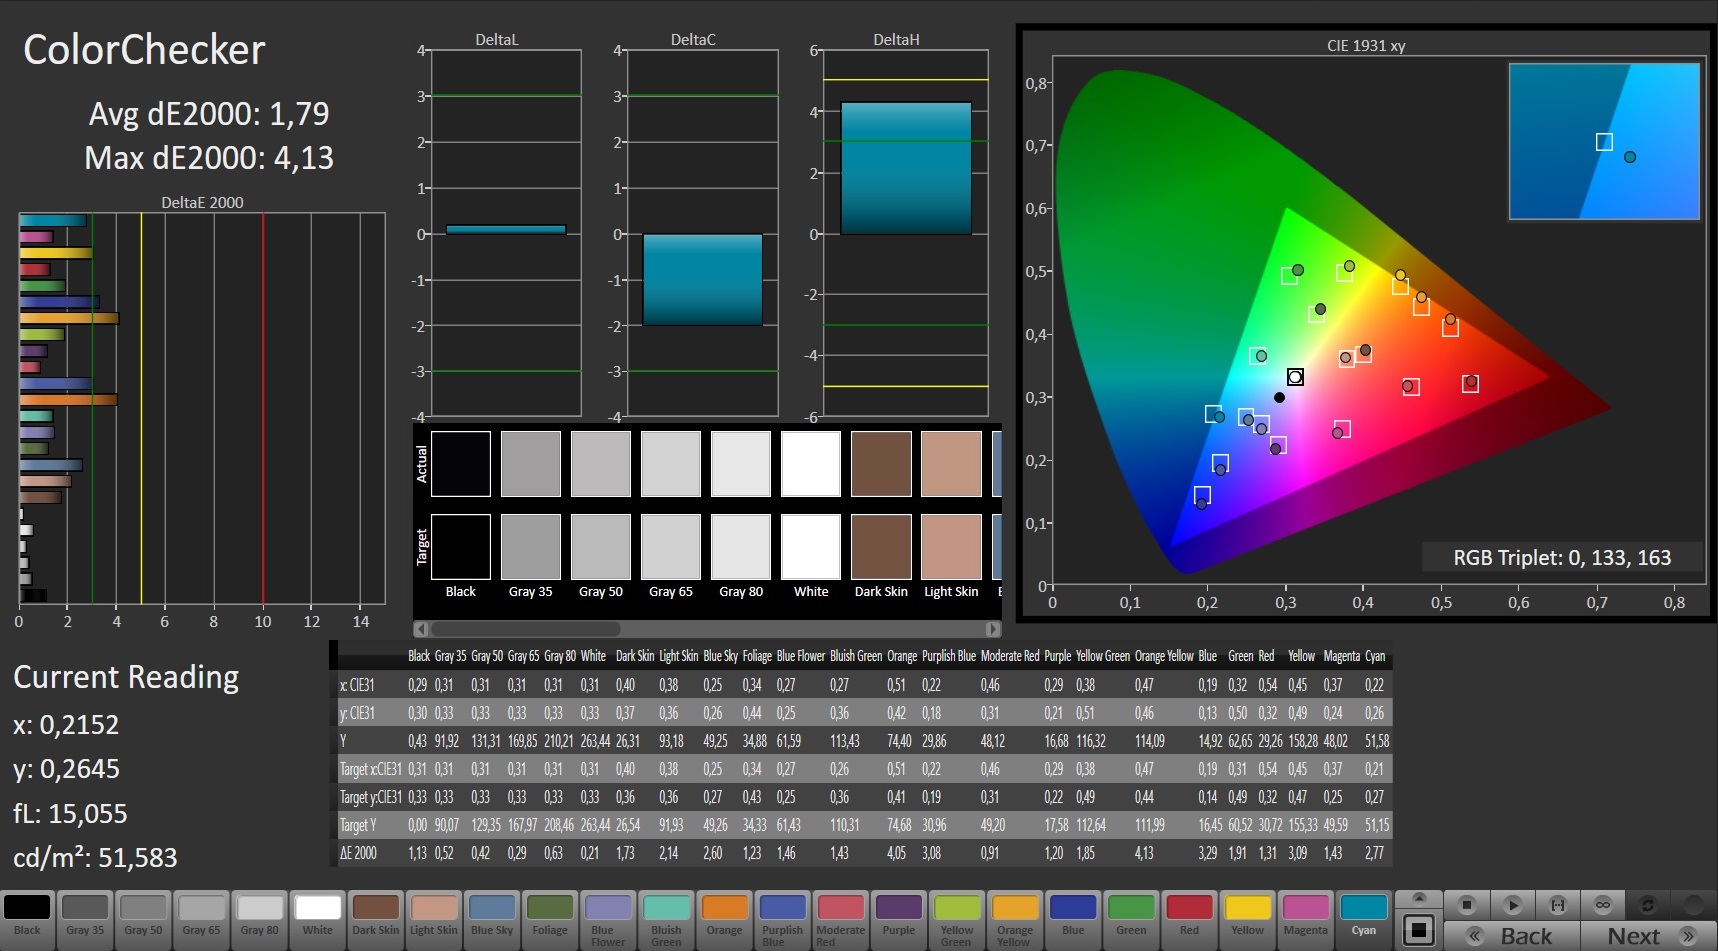
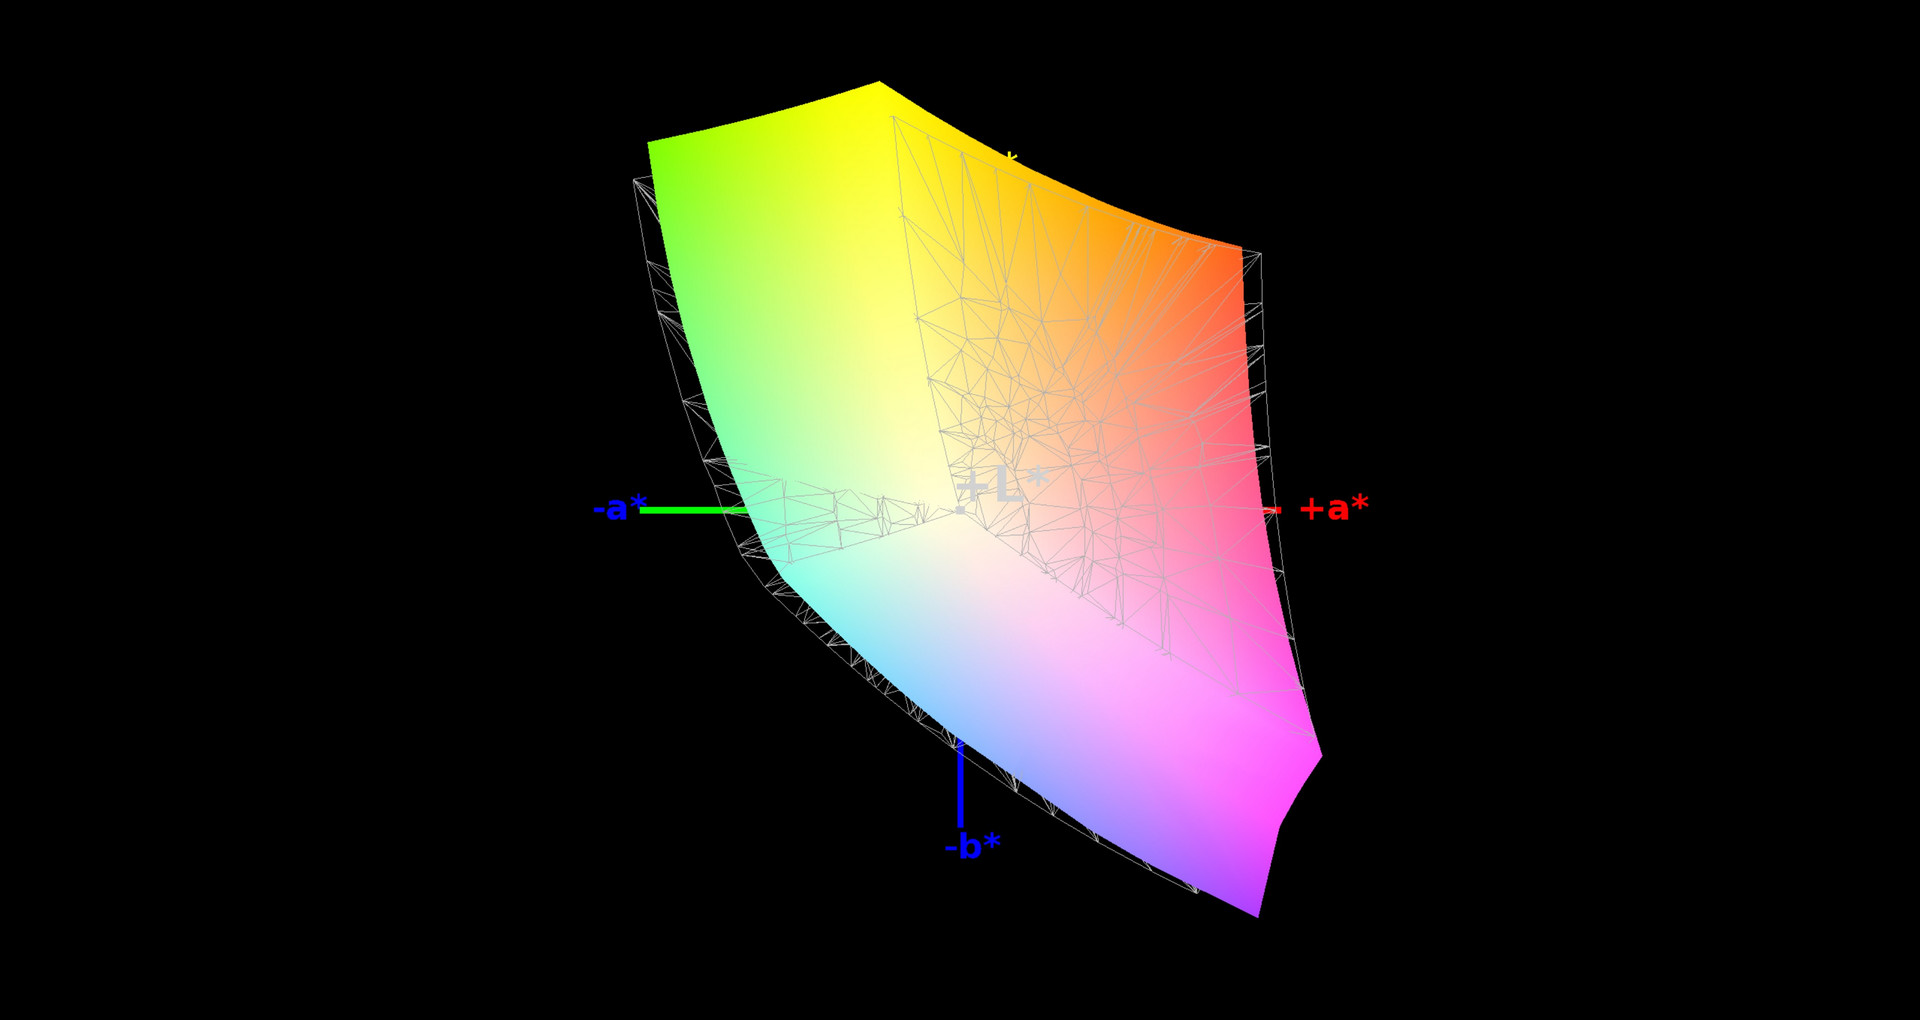
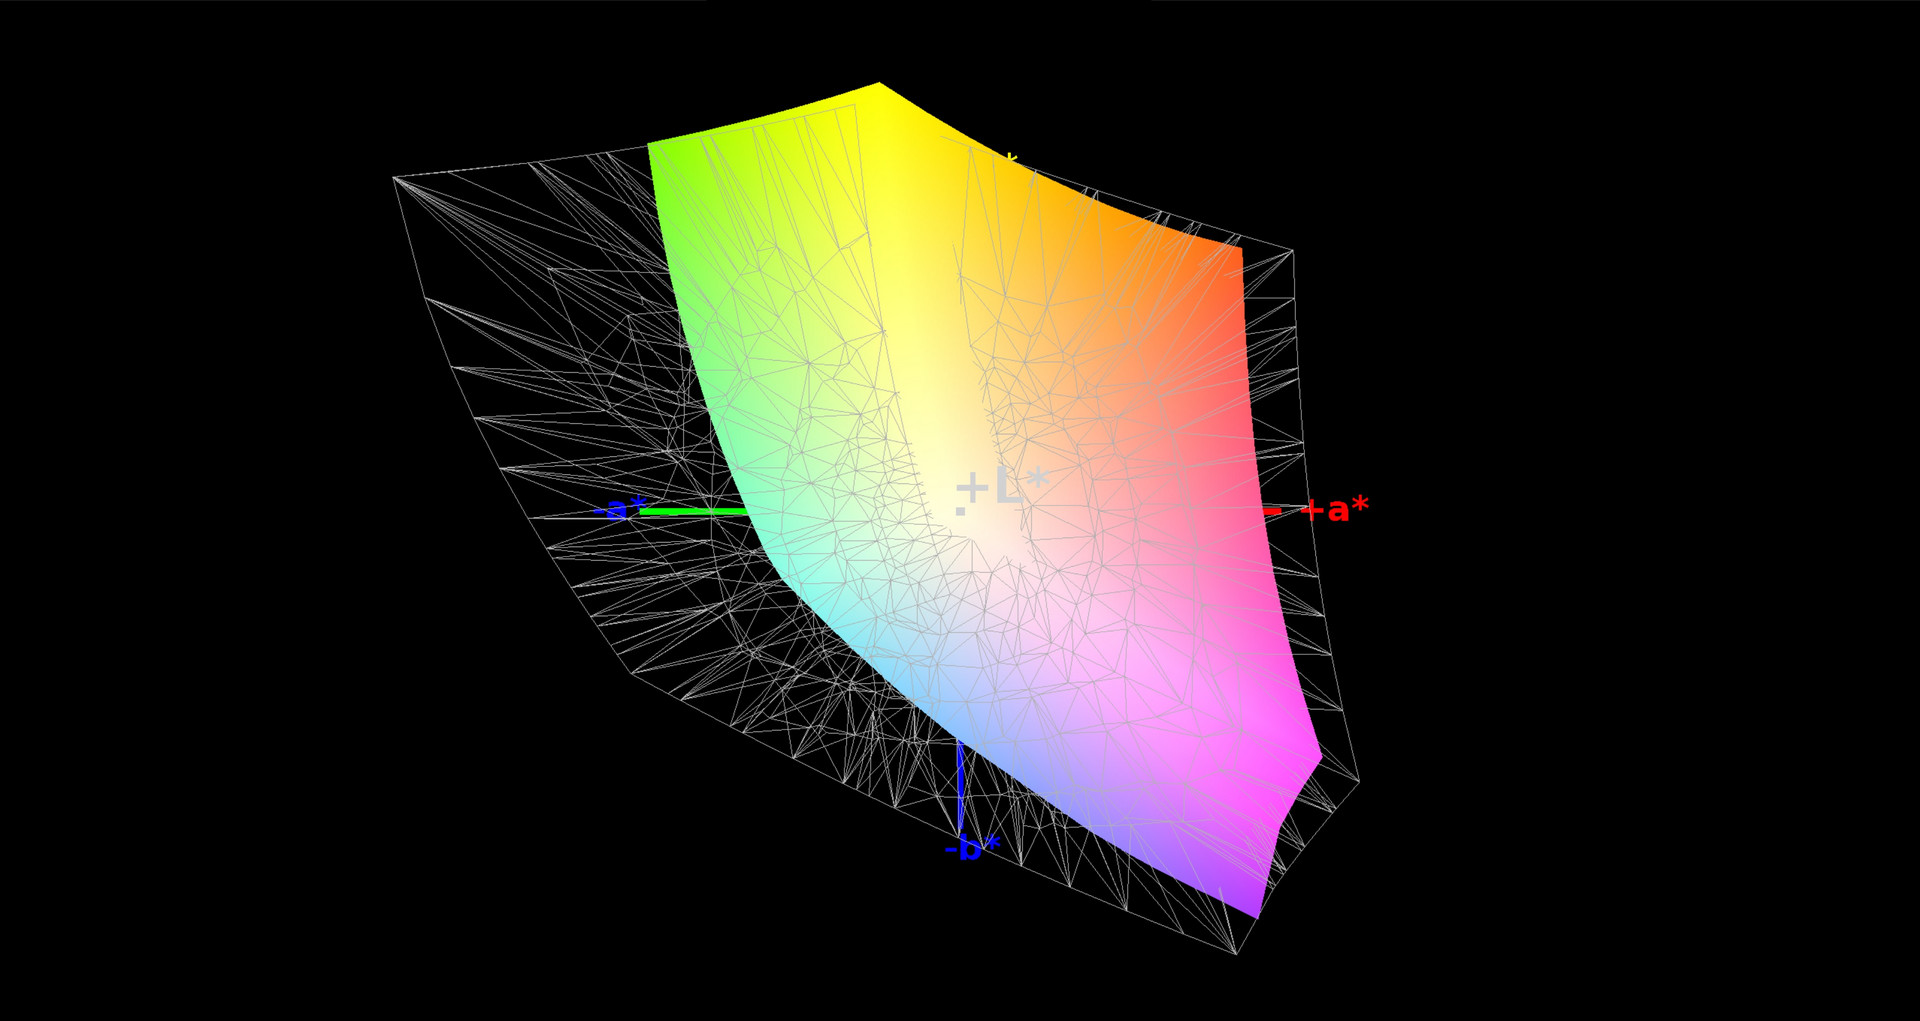
At 92% sRGB and 60% AdobeRGB, the color space is also great, at least from the point of view of gaming. However, due to the slight blue tint, professional users should consider calibration or install our ICC file, which is linked above. If needed, you can also simply change the display mode in the Gaming Center (GameVisual). All the measurements were performed in the sRGB standard setting.
We were positively surprised by the reaction time. At this point it should be well-known that IPS panels offer good viewing-angle stability. However, in terms of the reaction speed, TN panels have an advantage most of the time. With a relatively fast 11.2 ms (black-to-white) and 17.6 ms (gray-to-gray), the Asus G703 is an exception here. The IPS displays of the Schenker XMG Ultra 17 and Acer Predator 17 X need more than 20 and 40 ms respectively.
Display Response Times
| ↔ Response Time Black to White | ||
|---|---|---|
| 11.2 ms ... rise ↗ and fall ↘ combined | ↗ 6 ms rise |  |
| ↘ 5.2 ms fall | ||
| The screen shows good response rates in our tests, but may be too slow for competitive gamers. In comparison, all tested devices range from 0.1 (minimum) to 240 (maximum) ms. » 30 % of all devices are better. This means that the measured response time is better than the average of all tested devices (19.8 ms). | ||
| ↔ Response Time 50% Grey to 80% Grey | ||
| 17.6 ms ... rise ↗ and fall ↘ combined | ↗ 8.4 ms rise | 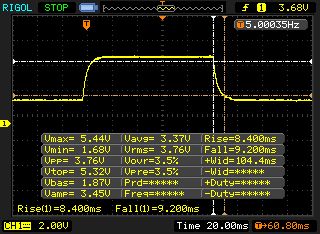 |
| ↘ 9.2 ms fall | ||
| The screen shows good response rates in our tests, but may be too slow for competitive gamers. In comparison, all tested devices range from 0.165 (minimum) to 636 (maximum) ms. » 32 % of all devices are better. This means that the measured response time is better than the average of all tested devices (30.9 ms). | ||
Screen Flickering / PWM (Pulse-Width Modulation)
| Screen flickering / PWM not detected |  | ||
In comparison: 52 % of all tested devices do not use PWM to dim the display. If PWM was detected, an average of 7744 (minimum: 5 - maximum: 343500) Hz was measured. | |||
Performance
Even though with Intel's Coffee-Lake architecture and AMD's Ryzen generation, six and eight-core CPUs are just around the corner and will proceed on their victory march in 2018, the quad-core chip of the Asus G703 still belongs to the high-end range. Gamers will be particularly pleased with the powerful GeForce GTX 1080. An SSD RAID and 64 GB of DDR4-RAM reinforce the luxury claims.
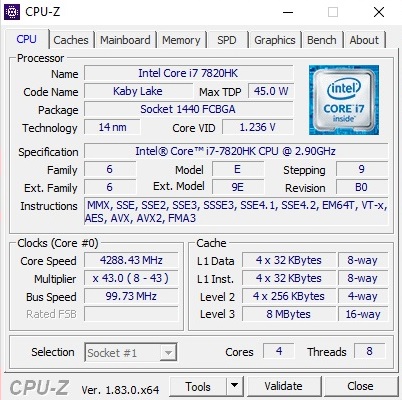

Processor
As mentioned above, the Chimera masters a functionality called Turbo Gear, which besides the graphics card also overclocks the processor. While the GPU speed is increased by 100 MHz on average, the Core i7-7820HK runs at a maximum of 4.3 GHz instead of 3.9 GHz.

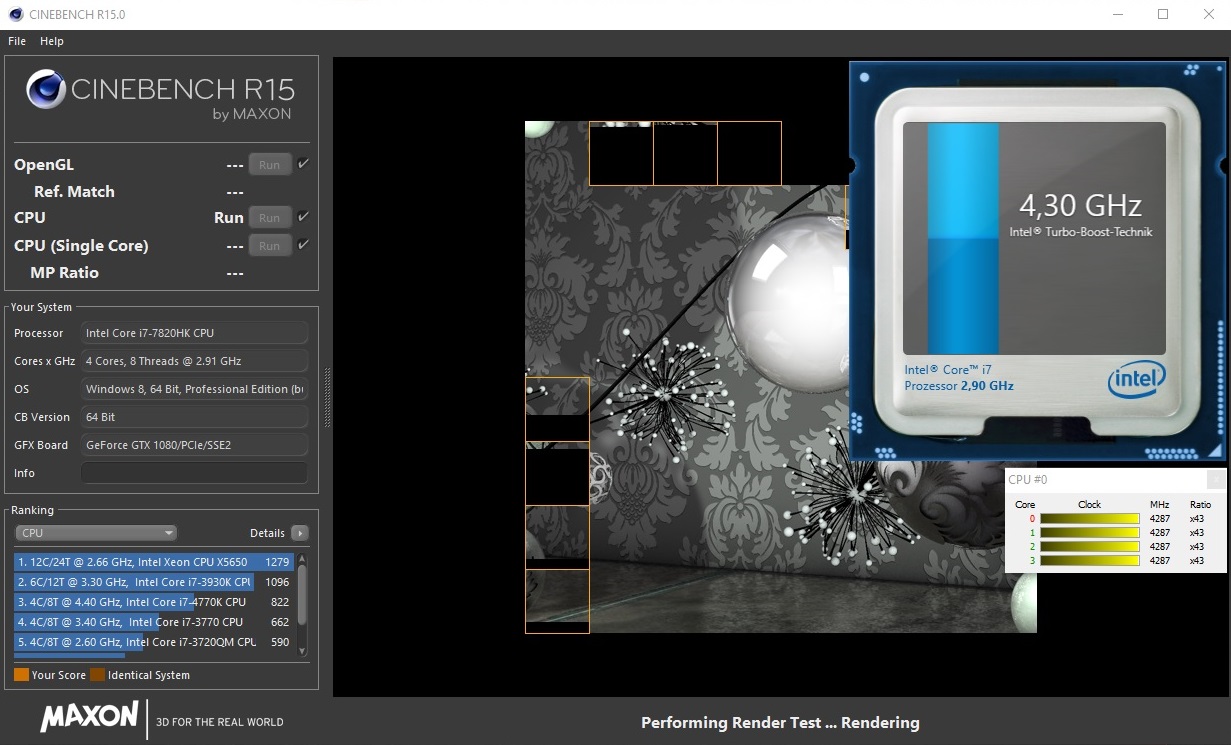
In contrast to Intel's Turbo-Boost technology which adjusts the speed dynamically to the load of the single cores (for example, 3.5 GHz @ quad-core load), Turbo Gear is designed to maintain the 4.3 GHz constantly, with the exception of longer stress scenarios. The G703 mastered our Cinebench loop (at least 30 minutes multi-core test) without any problems.
The 17-inch racer is ahead in the benchmarks accordingly. Even the Acer Predator 17 X, whose Core i7-7820HK also overclocks to 4.3 GHz, falls behind by a few percentage points. The advantage to a 7820HK notebook without OC is about 20%. Note that the graphics chip (HD Graphics 630) integrated into the processor remains always inactive due to the lack of Optimus technology.
System Performance
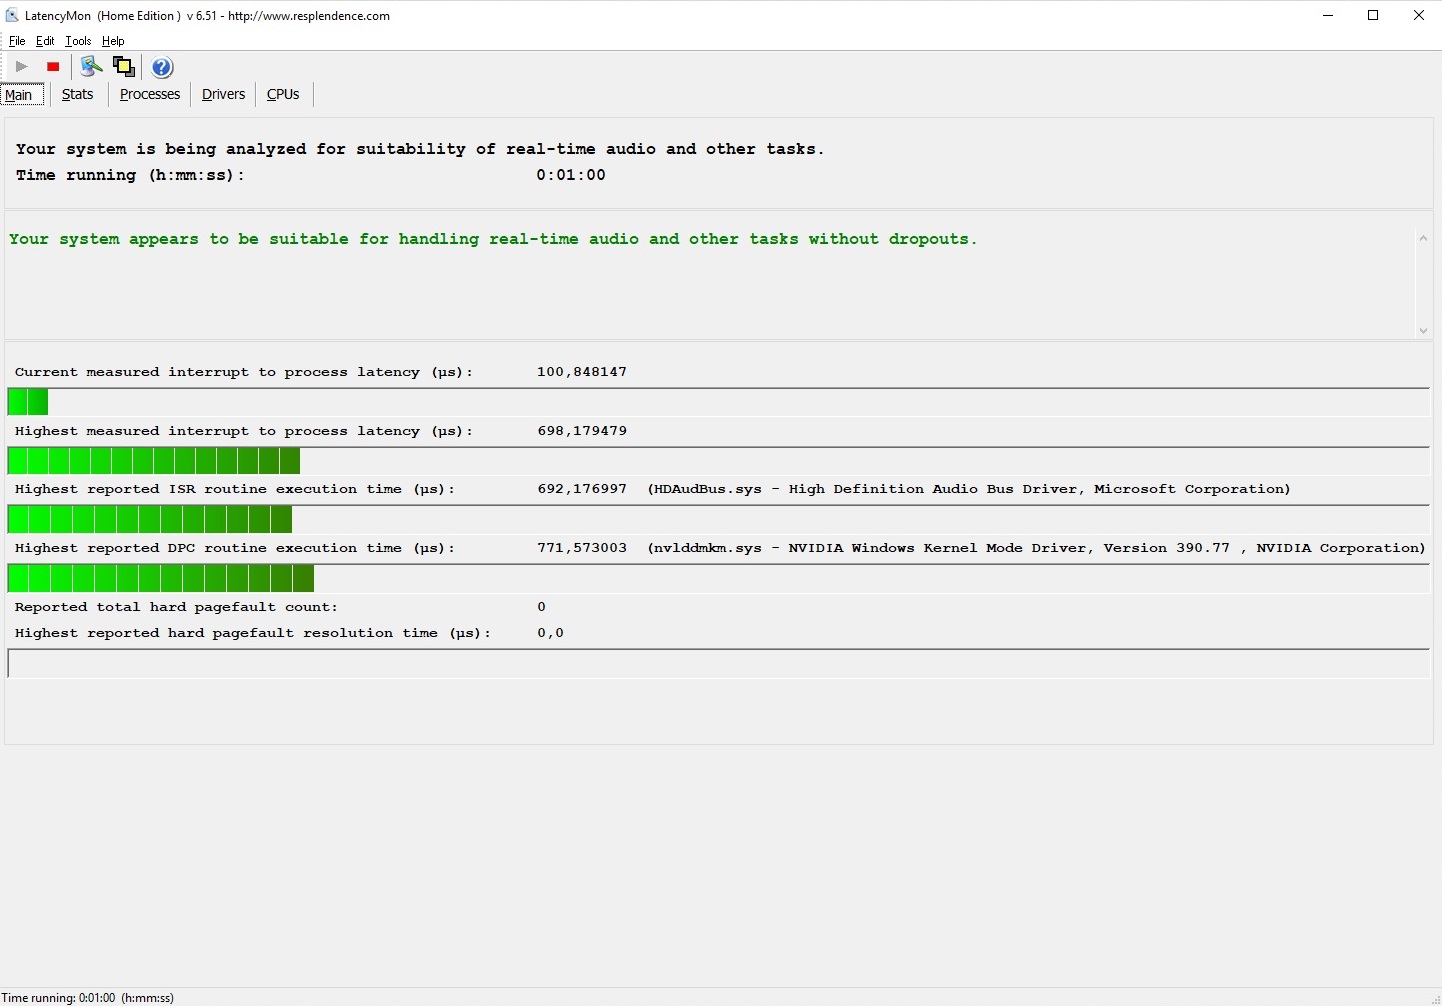
For a price of more than 3000 Euros (~$3694), buyers should expect an extremely high system performance. In brief: The G703 delivers this in all respects. Thanks to the high-end components, the ample amount of RAM, and the SSD duo, the 17-incher also offers sufficient power for the most demanding applications, be in the gaming or in the multimedia areas. Since the operating system is located on solid state drives, Windows 10 boots up extremely fast and loads programs in a very short time. In all other areas, the system also reacts comfortably fast, and things like high latencies are foreign to the G703.
| PCMark 8 Home Score Accelerated v2 | 5944 points | |
| PCMark 8 Work Score Accelerated v2 | 6016 points | |
| PCMark 10 Score | 5035 points | |
Help | ||
Storage Solution
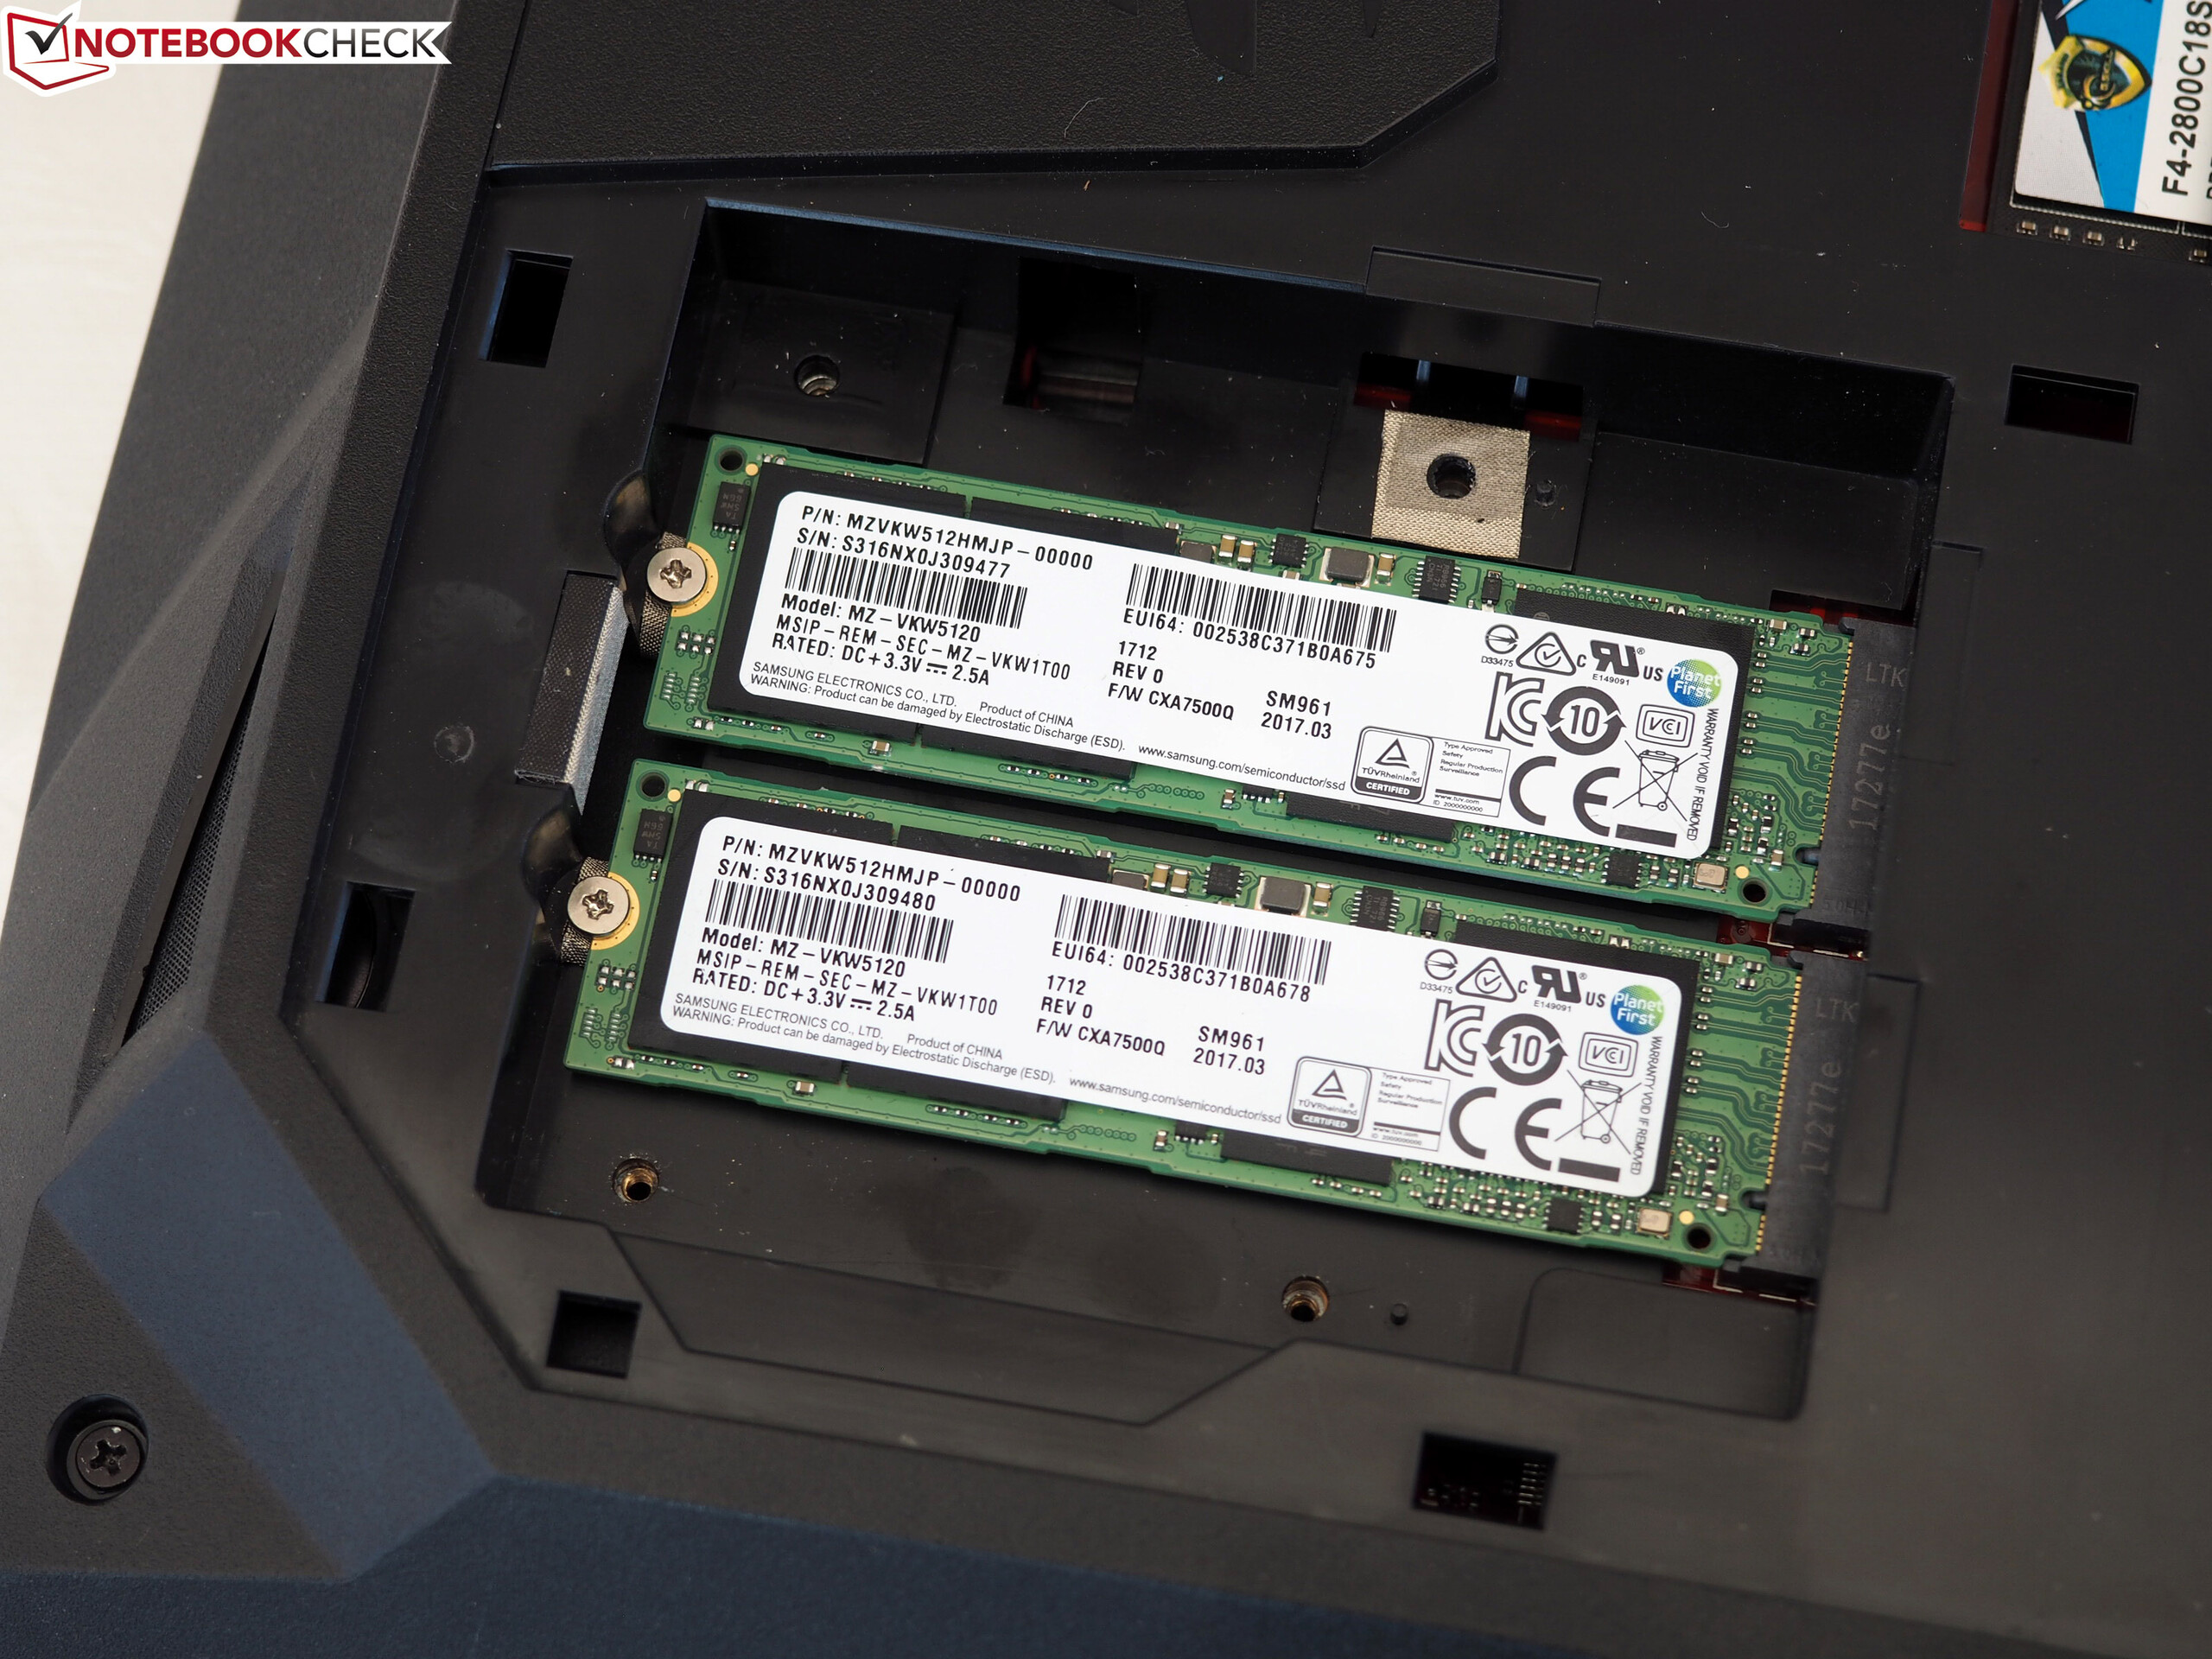
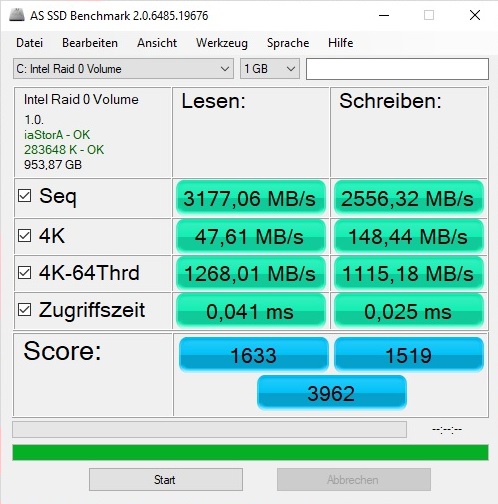
While most notebook manufacturers are content with a single SSD, Asus has equipped our test configuration with two solid state drives that run together in RAID-0 mode. Although subjectively, such a combination only has a limited influence on the speeds; the storage benchmarks show what is possible with the RAID technology in terms of performance values. 3,177 MB/s during sequential reads and 2,556 MB/s during sequential writes (AS SSD benchmark) belong to the best rates we have ever seen.
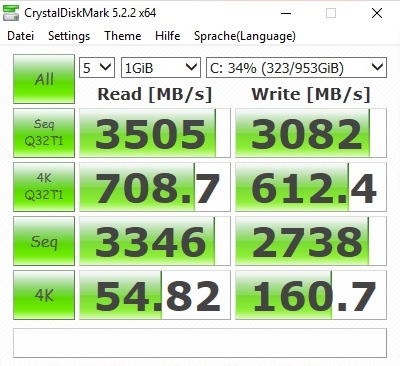
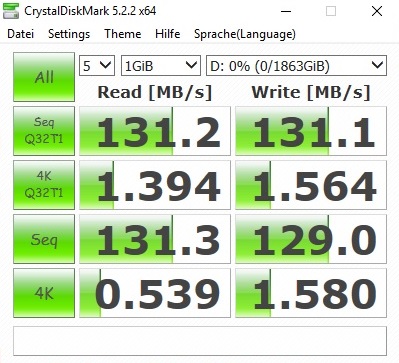
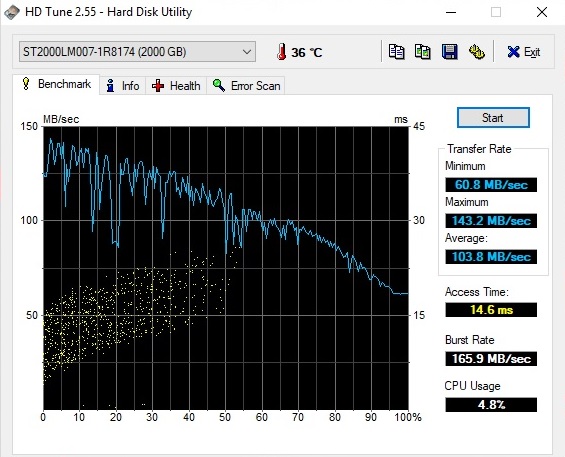
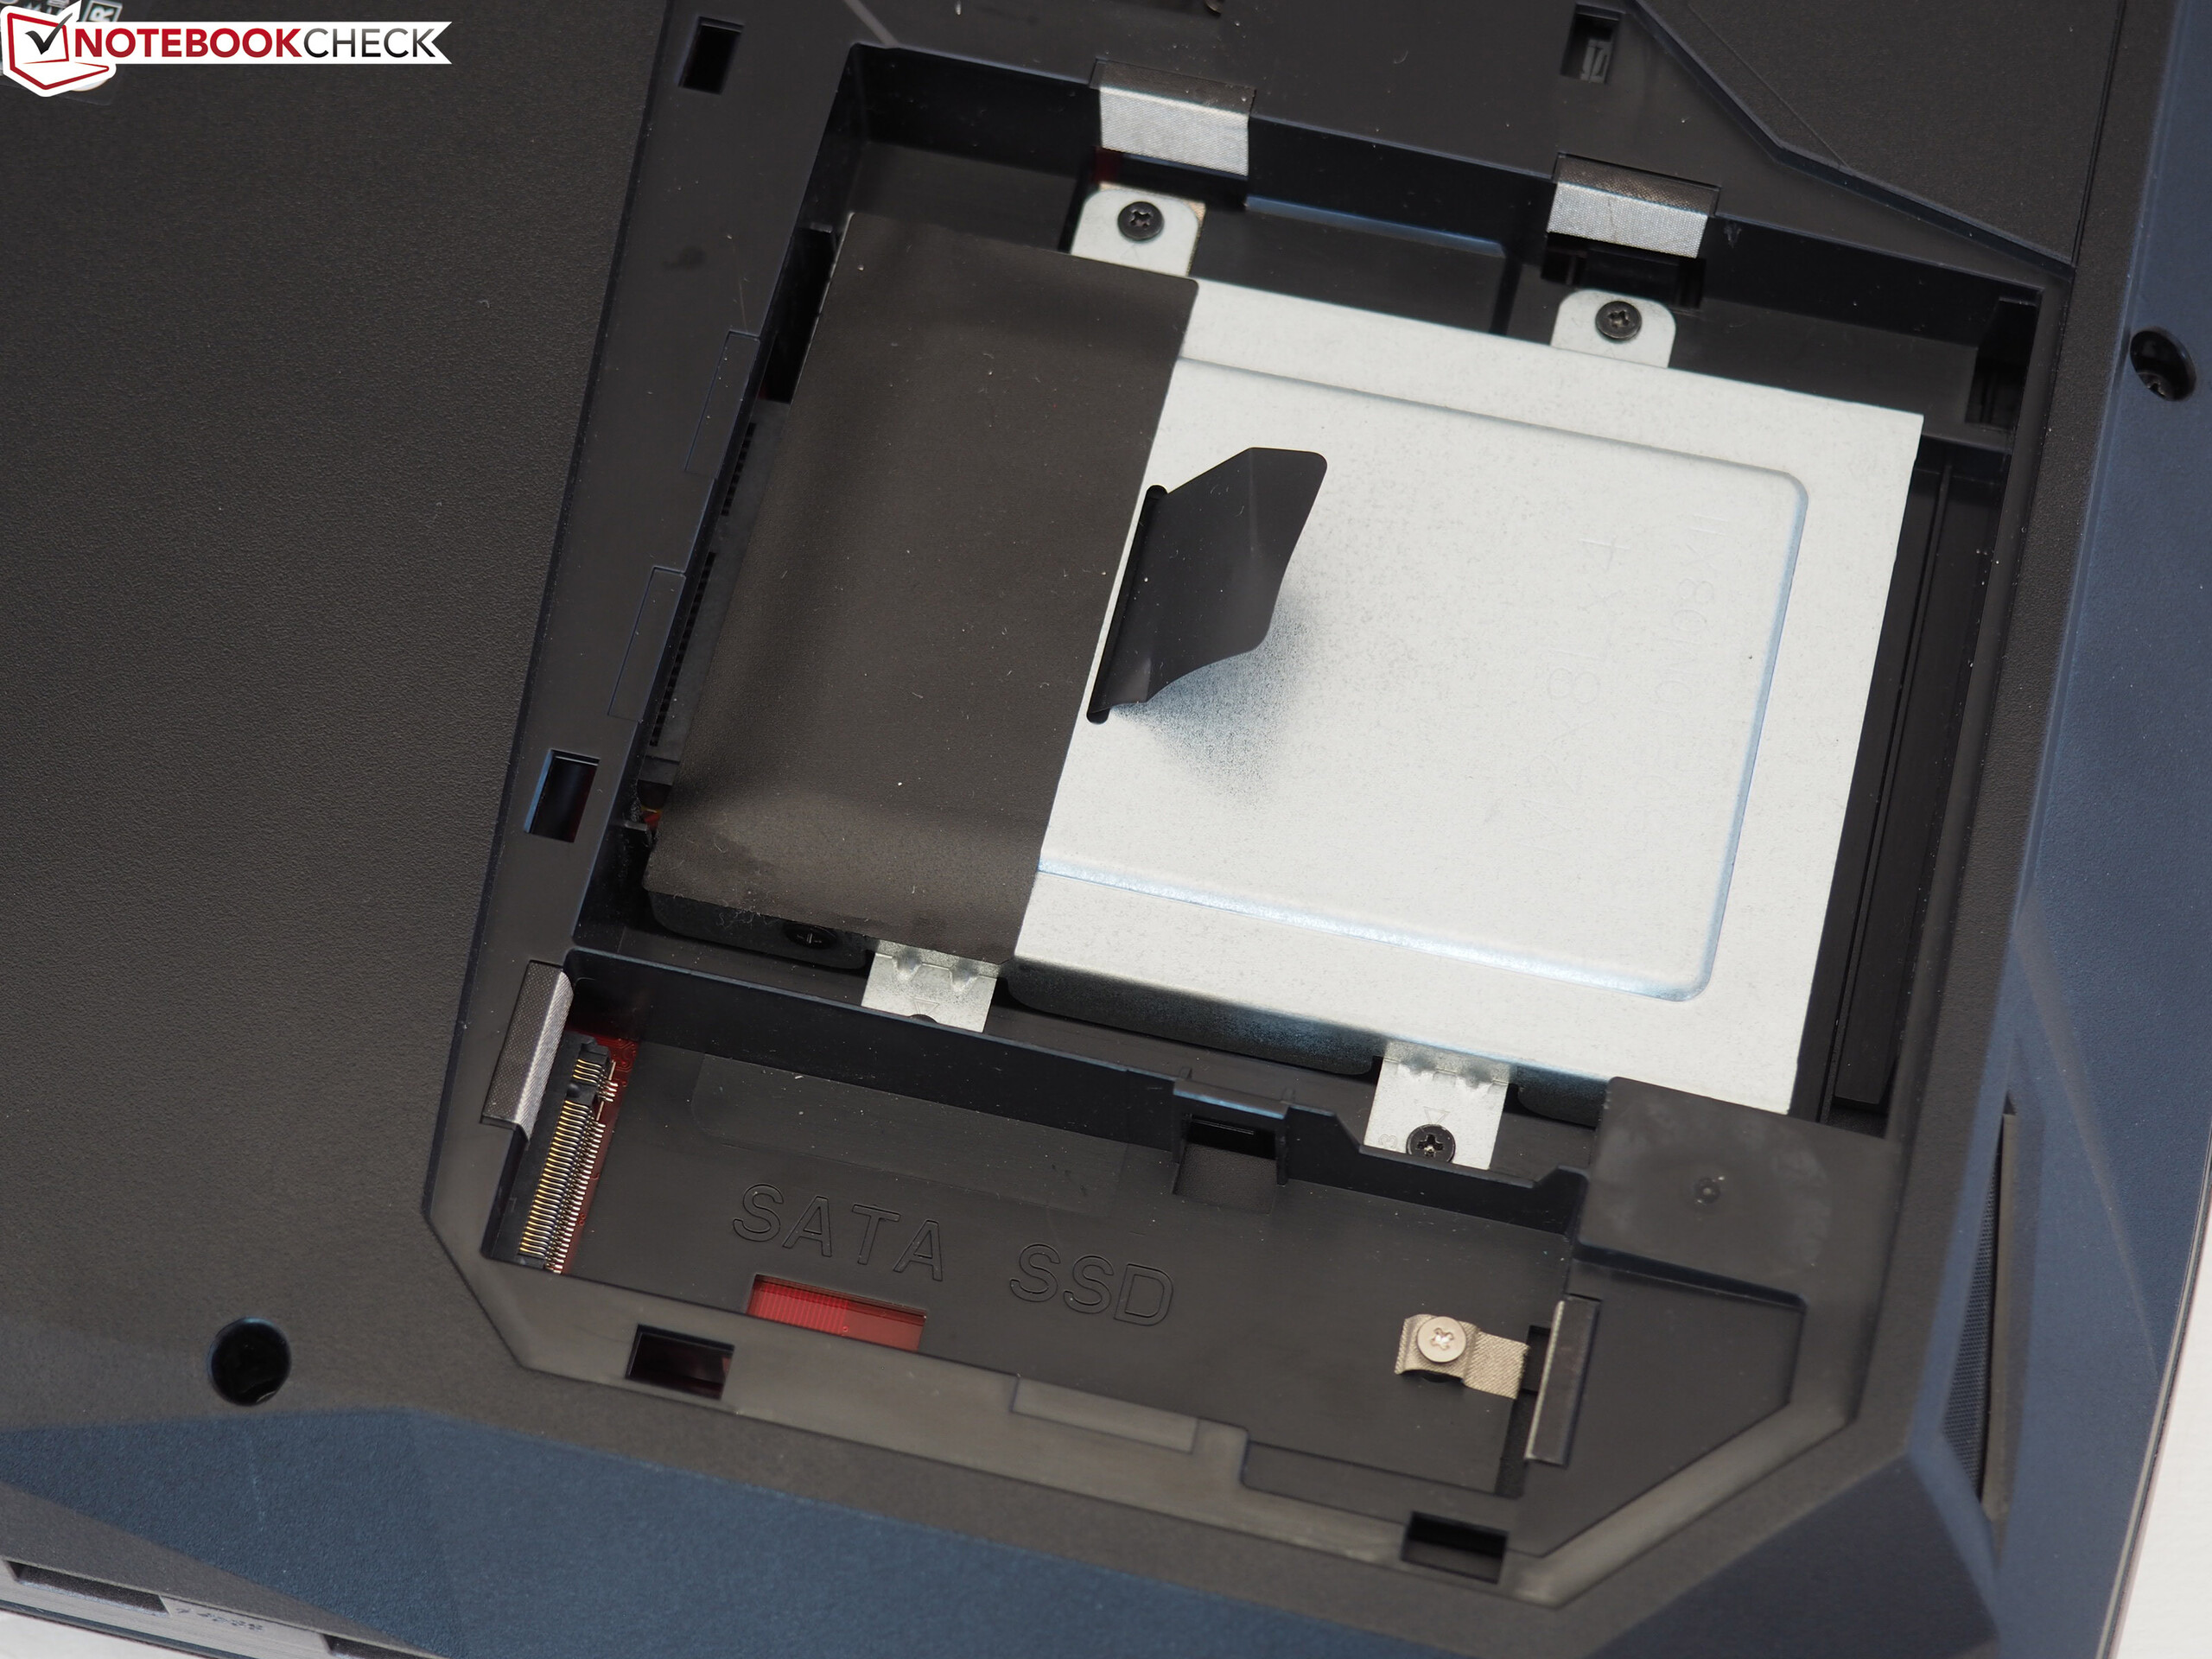
In case space on the two 512 GB SSDs (Samsung SM961) should become tight one day, the G703 also offers a classical HDD with a 2 TB capacity (Seagate Mobile). The 17-incher can be equipped with up to four storage drives in total. Under the hood are one 2.5-inch slot, two PCIe/NVMe-capable M.2 slots, and one M.2 slot which supports only SATA-III and which was still empty in our test unit.
| Asus G703 2x Samsung SM961 MZVKW512HMJP NVMe (RAID 0) | Schenker XMG Ultra 17 Samsung SSD 960 Evo 500GB m.2 NVMe | Acer Predator 17 X GX-792-76DL Toshiba NVMe THNSN5512GPU7 | MSI GT75VR 7RF-012 Titan Pro 2x Samsung SM961 MZVPW256HEGL NVMe (RAID 0) | Alienware 17 R4 SK Hynix PC300 NVMe 512 GB | Average 2x Samsung SM961 MZVKW512HMJP NVMe (RAID 0) | |
|---|---|---|---|---|---|---|
| AS SSD | -7% | -30% | -9% | -44% | 0% | |
| Seq Read (MB/s) | 3177 | 2533 -20% | 2261 -29% | 3137 -1% | 1752 -45% | 3177 ? 0% |
| Seq Write (MB/s) | 2556 | 1771 -31% | 1338 -48% | 2352 -8% | 735 -71% | 2556 ? 0% |
| 4K Read (MB/s) | 47.61 | 43.65 -8% | 39.52 -17% | 50.1 5% | 35.61 -25% | 47.6 ? 0% |
| 4K Write (MB/s) | 148.4 | 139.5 -6% | 133.8 -10% | 128.8 -13% | 113.4 -24% | 148.4 ? 0% |
| Score Read (Points) | 1633 | 1716 5% | 1118 -32% | 1412 -14% | 831 -49% | 1633 ? 0% |
| Score Write (Points) | 1519 | 1615 6% | 930 -39% | 1289 -15% | 858 -44% | 1519 ? 0% |
| Score Total (Points) | 3962 | 4173 5% | 2581 -35% | 3392 -14% | 2072 -48% | 3962 ? 0% |

Graphics Card
Anyone who does not want to compromise in terms of the image quality and performance is well served by the current top choice, the GeForce GTX 1080. The DirectX-12 model from Nvidia's Pascal series offers 2560 shaders and 8 GB of GDDR5X-VRAM.
| 3DMark 11 Performance | 21293 points | |
| 3DMark Cloud Gate Standard Score | 35865 points | |
| 3DMark Fire Strike Score | 17502 points | |
Help | ||
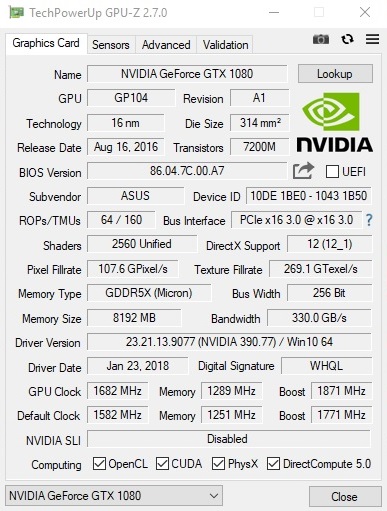
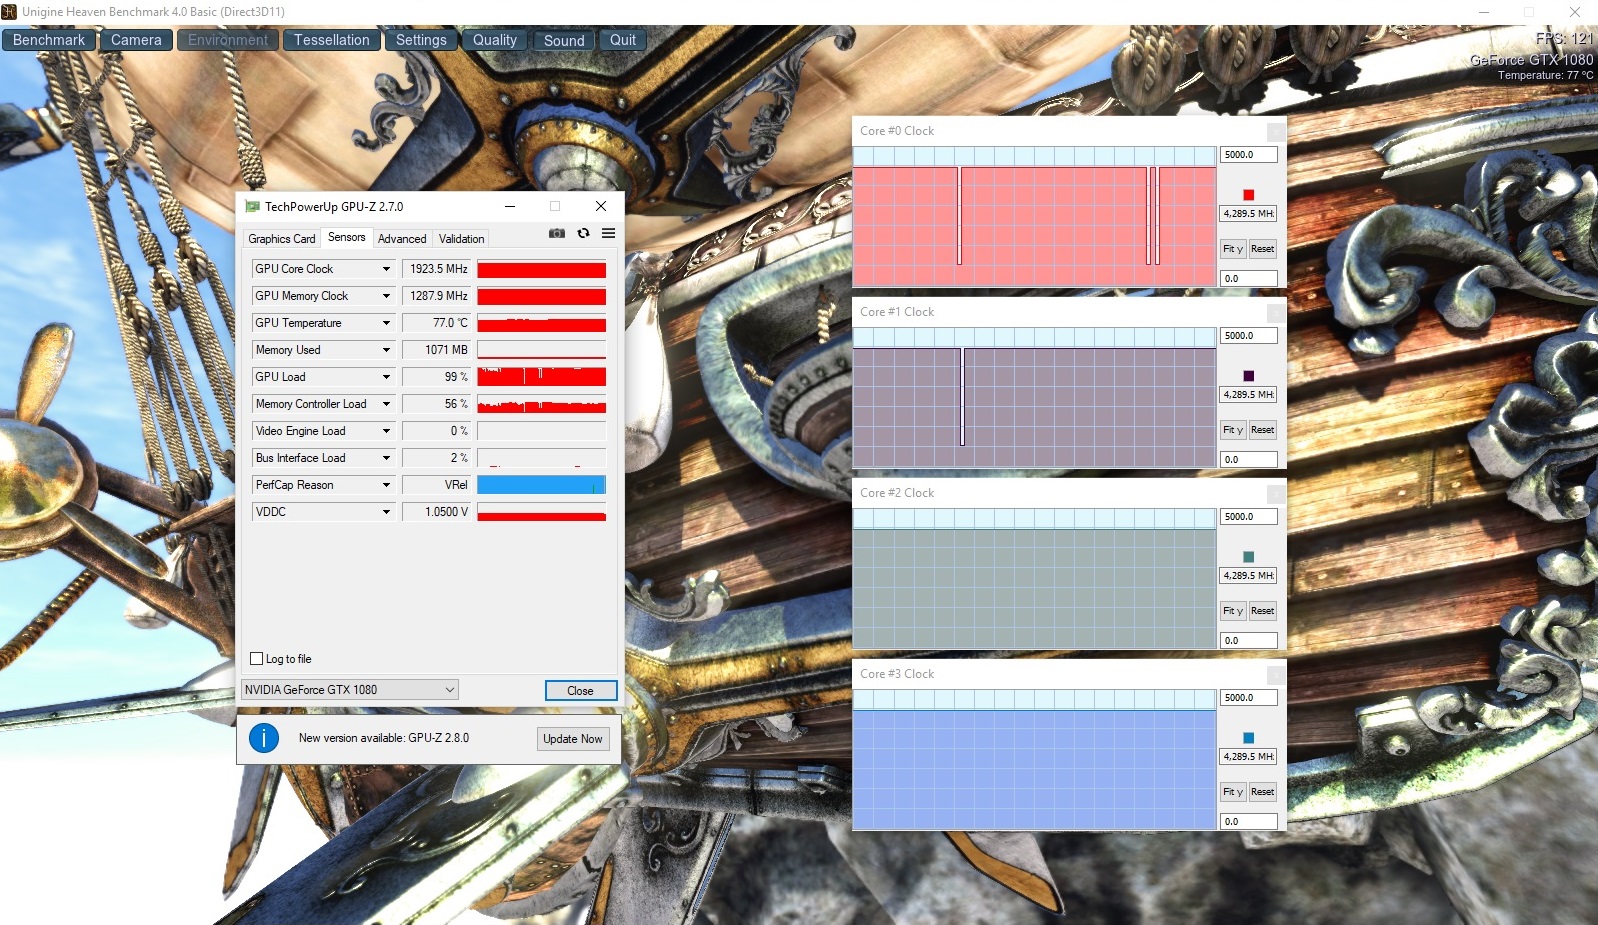
Like the CPU, the GPU is also overclocked via Turbo Gear. Instead of 1,582–1,771 MHz, the core reaches 1,682–1,871 MHz according to the GPU-Z tool. Because Nvidia's GPU Boost leaves a lot of room on top in terms of the clock speed, the values achieved in practice are much higher. For example, the GeForce GTX 1080 leveled out at 1,924 MHz in the Unigine Heaven 4.0 benchmark, which could break some records. In the optimal case, the GPU even climbs up to a respectable 1,974 MHz.
Using the computing-intensive RPG hit The Witcher 3 for 60 minutes, we tested whether the high performance can be maintained over longer periods of time. The result deserves our highest admiration: An average of 1,911 MHz for the GPU and 4,300 MHz for the CPU point to a powerful cooling system. Other gaming notebooks often begin to have trouble here. The G703 executes the graphics benchmarks unobtrusively. In 3DMark 11 and the Fire-Strike test of 3DMark 13, the 17-incher remains comfortably at the level of the GTX-1080 competitors.
Gaming Performance
While a Full HD panel with 60 Hz would be underwhelming for the performance capabilities of the GTX 1080, the high-end GPU can fully shine with a 144 Hz display. All 12 games we tested raced ahead at more than 60 FPS in maximum details, and in seven games it was even more than 100 FPS.
| The Witcher 3 - 1920x1080 Ultra Graphics & Postprocessing (HBAO+) | |
| Average of class Gaming (104.7 - 240, n=7, last 2 years) | |
| Alienware 17 R4 | |
| Asus G703 | |
| MSI GT75VR 7RF-012 Titan Pro | |
| Schenker XMG Ultra 17 | |
| Average NVIDIA GeForce GTX 1080 Mobile (61.7 - 78.1, n=23) | |
| Acer Predator 17 X GX-792-76DL | |
If you prefer a higher resolution rather than higher FPS numbers, Asus also sells a variant of the G703 with a UHD display (3840x2160 pixels). According to our information, there is no WQHD model.
| low | med. | high | ultra | |
|---|---|---|---|---|
| The Witcher 3 (2015) | 148 | 77.9 | ||
| FIFA 18 (2017) | 357 | 348 | ||
| The Evil Within 2 (2017) | 78.3 | 76.1 | ||
| ELEX (2017) | 119 | 104 | ||
| Wolfenstein II: The New Colossus (2017) | 145 | 125 | ||
| Assassin´s Creed Origins (2017) | 98 | 83 | ||
| Call of Duty WWII (2017) | 160 | 136 | ||
| Need for Speed Payback (2017) | 144 | 135 | ||
| Star Wars Battlefront 2 (2017) | 147 | 124 | ||
| Fortnite (2018) | 216 | 159 | ||
| Final Fantasy XV Benchmark (2018) | 80 | |||
| Kingdom Come: Deliverance (2018) | 100 | 76.4 |
Emissions
Noise Emissions
Even though the G703 is heavily overclocked, it remains quieter under load than most of the other GTX-1080 products. Okay, this is relative: An average of 48 dB in The Witcher 3 is very noticeable and not for those with weak nerves. However, numerous gaming laptops cross the 50 dB mark here. Besides the Alienware 17 R4 (50 dB), the Schenker XMG Ultra 17 (52 dB) and the MSI GT75VR (56 dB) also draw strong attention. Compared to the other devices, the fans don't whir with a high-frequency noise, but their sound has rather lower frequencies. The fact that after longer periods of load, the fans lower their speed again very quickly deserves additional praise.
In idle mode, the G703 also deserves fewer complaints than some of the other 17-inch competitors. Whereas the Clevo barebones for example often tend to rev up, in the G703 sudden, unexplainable jumps in the fan noise occur rather rarely. They only happen if they are provoked by CPU or GPU-heavy tasks or the opening of applications. If the system simply idles along, at 35–36 dB the 17-incher reaches an acceptable level for gaming notebooks. In the ideal case (longer inactivity and power-saving options activated), the fans and the HDD are completely deactivated.
Noise level
| Idle |
| 35 / 36 / 38 dB(A) |
| Load |
| 46 / 54 dB(A) |
 | ||
30 dB silent 40 dB(A) audible 50 dB(A) loud |
||
min: | ||
| Asus G703 GeForce GTX 1080 Mobile, i7-7820HK | Schenker XMG Ultra 17 GeForce GTX 1080 Mobile, i7-8700 | Acer Predator 17 X GX-792-76DL GeForce GTX 1080 Mobile, i7-7820HK | MSI GT75VR 7RF-012 Titan Pro GeForce GTX 1080 Mobile, i7-7820HK | Alienware 17 R4 GeForce GTX 1080 Mobile, i7-7820HK | |
|---|---|---|---|---|---|
| Noise | -2% | 5% | -2% | 1% | |
| off / environment * (dB) | 30 | 30 -0% | 30 -0% | 30 -0% | 28.2 6% |
| Idle Minimum * (dB) | 35 | 34 3% | 33 6% | 33 6% | 35.6 -2% |
| Idle Average * (dB) | 36 | 35 3% | 35 3% | 34 6% | 35.6 1% |
| Idle Maximum * (dB) | 38 | 40 -5% | 37 3% | 38 -0% | 35.7 6% |
| Load Average * (dB) | 46 | 45 2% | 40 13% | 44 4% | 50.2 -9% |
| Witcher 3 ultra * (dB) | 48 | 52 -8% | 56 -17% | 50.2 -5% | |
| Load Maximum * (dB) | 54 | 60 -11% | 50 7% | 62 -15% | 50.2 7% |
* ... smaller is better
Temperature
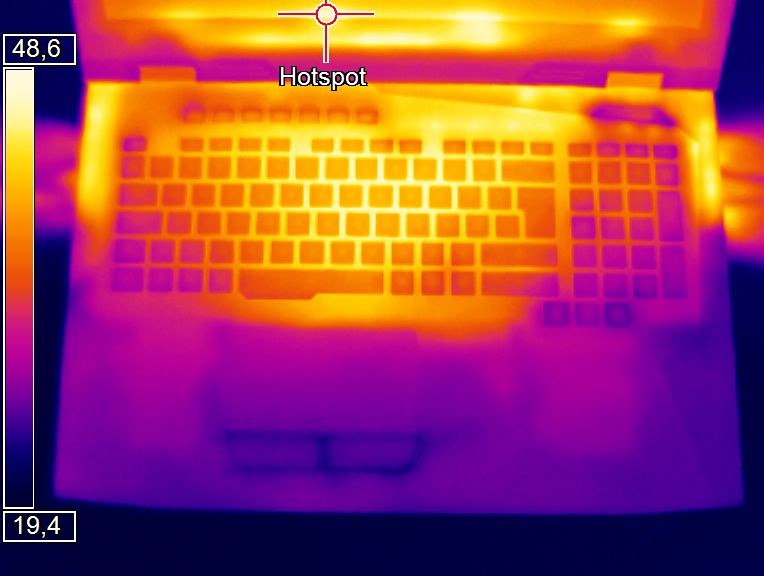
There are also no ugly surprises in the case temperatures. While up to 55 °C (131 °F) on top and up to 54 °C (129 °F) on the bottom initially sound like a lot, they are limited to the back third of the notebook, and the palm rest remains surprisingly cool at 26–28 °C (79–82 °F) even under full load. In The Witcher 3, we were able to measure 50 or 48 °C (122 or 118 °F) at most in the hot spots of the device. After 60 minutes of gaming load, the WASD area only warmed up to 37 °C (99 °F).
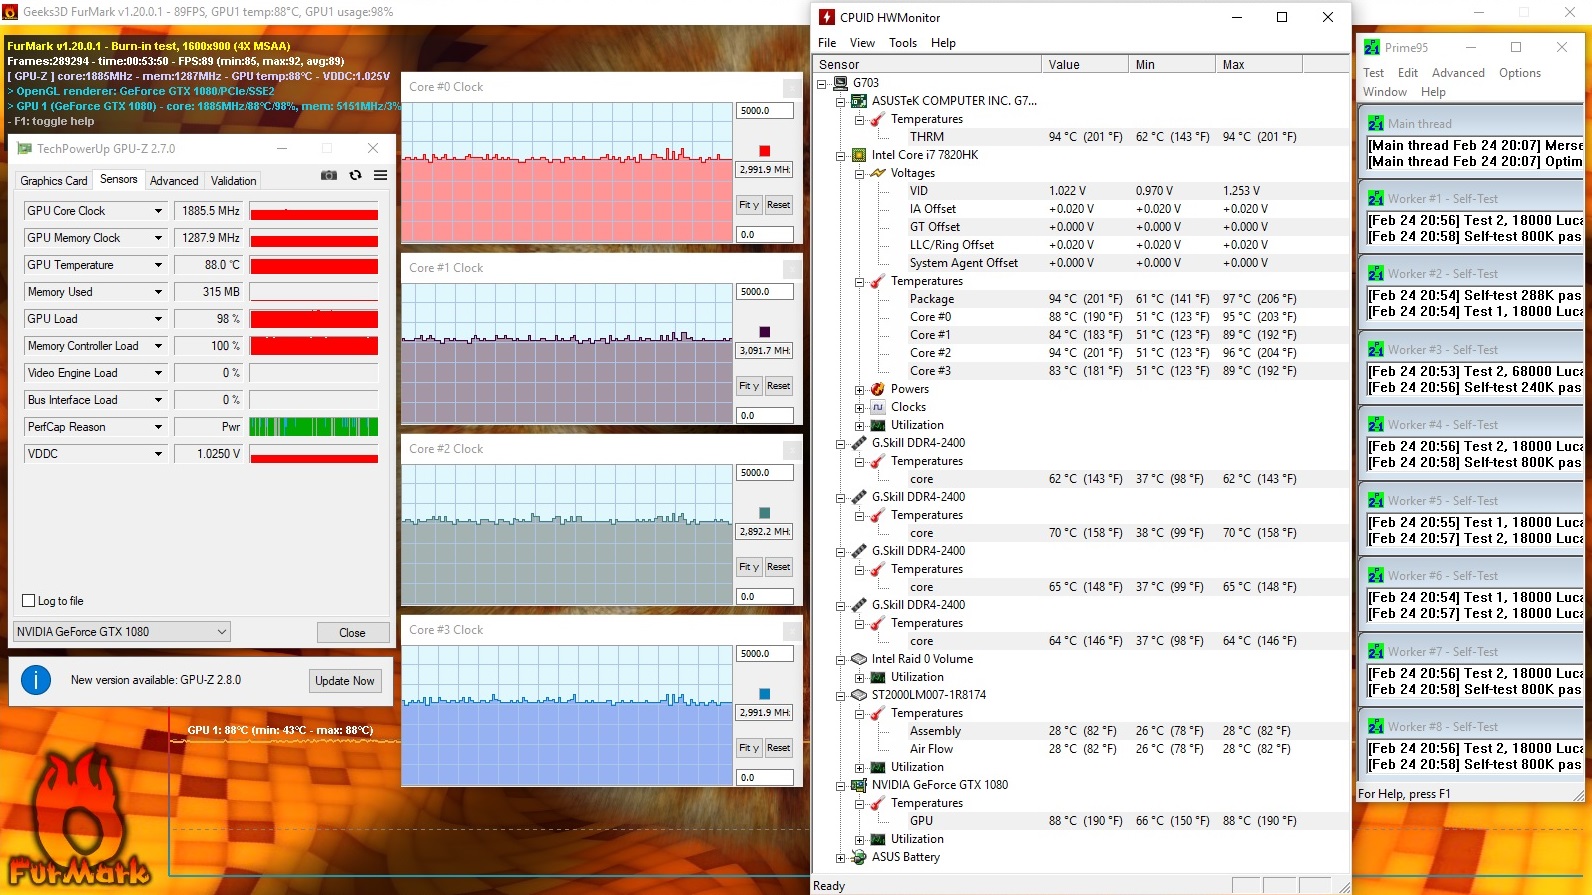
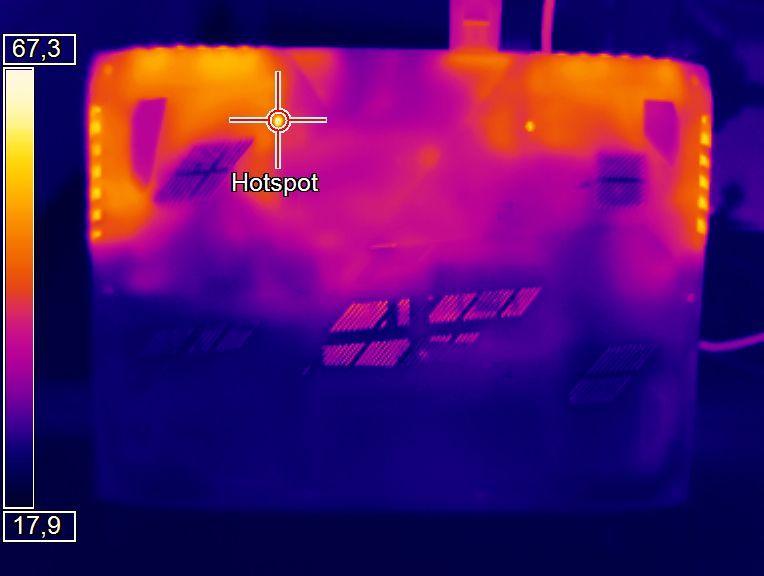
The insides of the G703 get significantly hotter. A maximum GPU temperature of 88 °C (190 °F) and a maximum CPU temperature of 97 °C (207 °F, according to the HWMonitor tool) come close to the limits. Yet neither the GeForce GTX 1080 nor the Core i7-7820HK throttle, which not all high-end notebooks can claim. During everyday gaming, you do not need to worry about the temperatures of the components, since even the more demanding games will tax the system less than our stress test with the Furmark and Prime95 tools. For example, The Witcher 3 only heated up the GTX 1080 to 80 °C (176 °F).
(-) The maximum temperature on the upper side is 55 °C / 131 F, compared to the average of 40.4 °C / 105 F, ranging from 21.2 to 68.8 °C for the class Gaming.
(-) The bottom heats up to a maximum of 54 °C / 129 F, compared to the average of 43.2 °C / 110 F
(+) In idle usage, the average temperature for the upper side is 27.1 °C / 81 F, compared to the device average of 33.9 °C / 93 F.
(±) Playing The Witcher 3, the average temperature for the upper side is 36.2 °C / 97 F, compared to the device average of 33.9 °C / 93 F.
(+) The palmrests and touchpad are cooler than skin temperature with a maximum of 28 °C / 82.4 F and are therefore cool to the touch.
(±) The average temperature of the palmrest area of similar devices was 28.8 °C / 83.8 F (+0.8 °C / 1.4 F).
| Asus G703 GeForce GTX 1080 Mobile, i7-7820HK | Schenker XMG Ultra 17 GeForce GTX 1080 Mobile, i7-8700 | Acer Predator 17 X GX-792-76DL GeForce GTX 1080 Mobile, i7-7820HK | MSI GT75VR 7RF-012 Titan Pro GeForce GTX 1080 Mobile, i7-7820HK | Alienware 17 R4 GeForce GTX 1080 Mobile, i7-7820HK | |
|---|---|---|---|---|---|
| Heat | 6% | 7% | -4% | 3% | |
| Maximum Upper Side * (°C) | 55 | 41 25% | 44.2 20% | 46 16% | 49.6 10% |
| Maximum Bottom * (°C) | 54 | 48 11% | 43 20% | 57 -6% | 56 -4% |
| Idle Upper Side * (°C) | 29 | 30 -3% | 32.4 -12% | 34 -17% | 29.6 -2% |
| Idle Bottom * (°C) | 32 | 35 -9% | 32.8 -2% | 35 -9% | 29.2 9% |
* ... smaller is better
Speakers
The sound of the speakers of the 17-inch racer is quite acceptable. Even though at times games, movies, and music may sound slightly muffled, in other respects the sound does not need to hide behind the competitors. For example, the Chimera offers a decent bass, and with its high maximum volume (89 dB), it is also suitable for larger rooms and distances from the notebook.
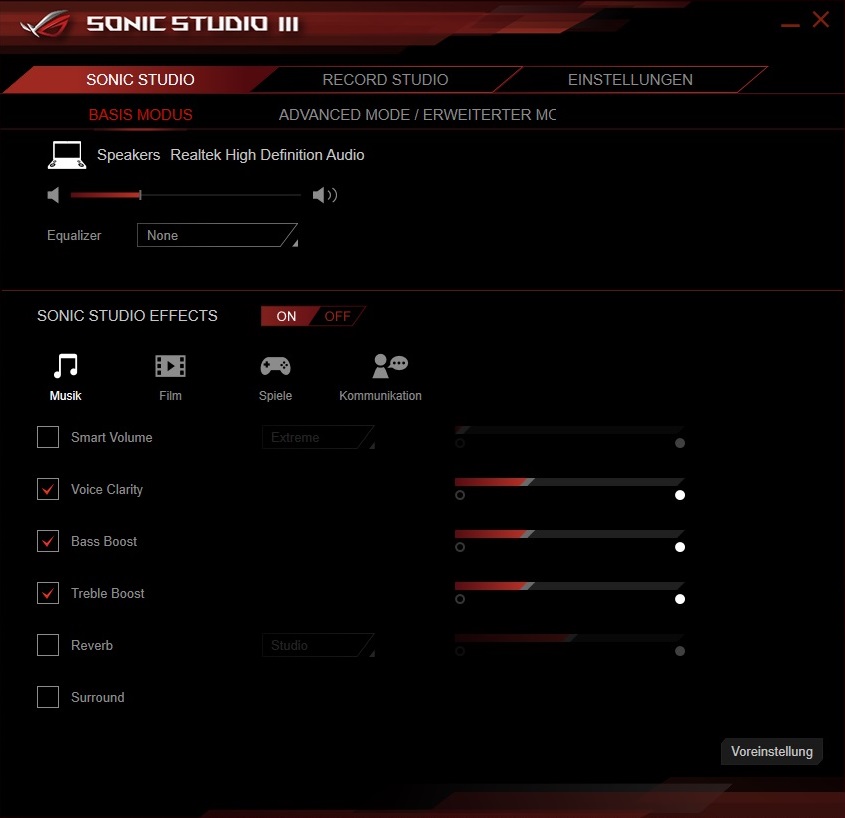
Tuning enthusiasts should also be able to have their fun with the preinstalled audio software (Sonic Studio III), which offers several profiles and sound improvements. Overall, we liked the performance of the two loudspeakers that are positioned at the front. External speakers or a headset are not absolutely necessary for the G703. However, buyers of the more affordable G752 should think about using alternative methods (worse sound).
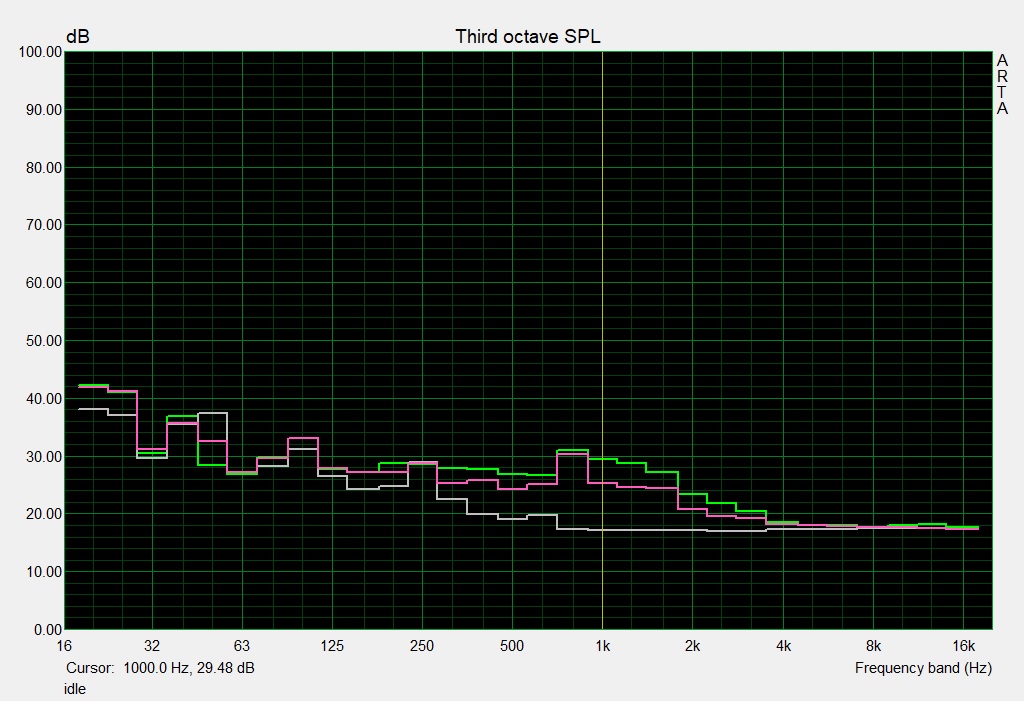
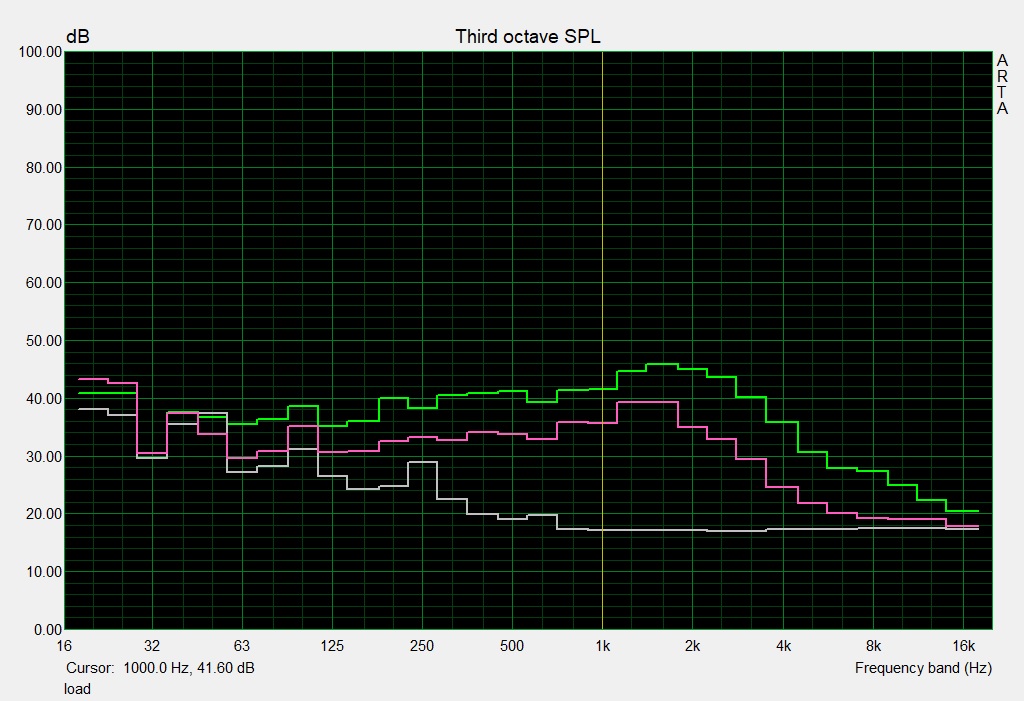
Asus G703 audio analysis
(+) | speakers can play relatively loud (89 dB)
Bass 100 - 315 Hz
(±) | reduced bass - on average 7.5% lower than median
(+) | bass is linear (5.9% delta to prev. frequency)
Mids 400 - 2000 Hz
(+) | balanced mids - only 4.8% away from median
(+) | mids are linear (5% delta to prev. frequency)
Highs 2 - 16 kHz
(±) | reduced highs - on average 5.4% lower than median
(+) | highs are linear (6.8% delta to prev. frequency)
Overall 100 - 16.000 Hz
(+) | overall sound is linear (11.1% difference to median)
Compared to same class
» 8% of all tested devices in this class were better, 3% similar, 89% worse
» The best had a delta of 6%, average was 18%, worst was 132%
Compared to all devices tested
» 7% of all tested devices were better, 2% similar, 91% worse
» The best had a delta of 4%, average was 23%, worst was 134%
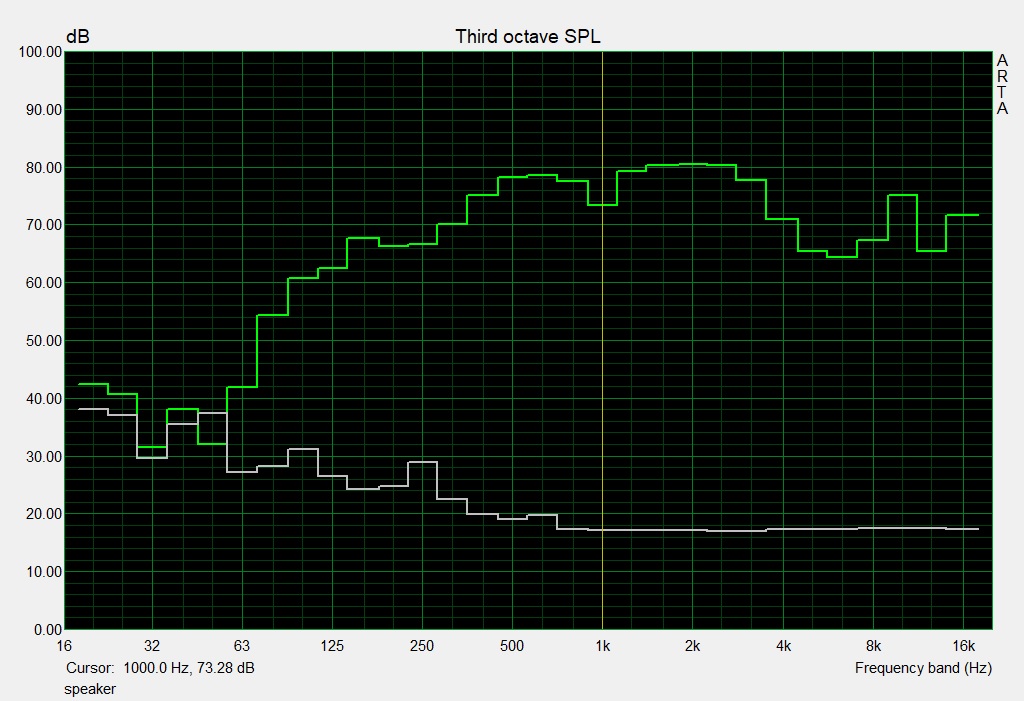
Schenker XMG Ultra 17 audio analysis
(±) | speaker loudness is average but good (79 dB)
Bass 100 - 315 Hz
(+) | good bass - only 4.1% away from median
(±) | linearity of bass is average (12.2% delta to prev. frequency)
Mids 400 - 2000 Hz
(±) | higher mids - on average 5.5% higher than median
(+) | mids are linear (6.5% delta to prev. frequency)
Highs 2 - 16 kHz
(+) | balanced highs - only 1.4% away from median
(+) | highs are linear (2% delta to prev. frequency)
Overall 100 - 16.000 Hz
(+) | overall sound is linear (11% difference to median)
Compared to same class
» 7% of all tested devices in this class were better, 3% similar, 89% worse
» The best had a delta of 6%, average was 18%, worst was 132%
Compared to all devices tested
» 6% of all tested devices were better, 2% similar, 92% worse
» The best had a delta of 4%, average was 23%, worst was 134%
Frequency comparison (checkboxes selectable!)
Power Management
Power Consumption
A great disadvantage of the CPU and GPU overclocking is the enormous power consumption. At 123–341 watts under load, the G703 consumes even more power than the Schenker XMG Ultra 17, which uses a desktop processor with 65 instead of 45 watts TDP. In idle mode, the situation is much better. 26–37 watts is typical for a high-end notebook that runs without graphics switching.
| Off / Standby | |
| Idle | |
| Load |
|
Key:
min: | |
| Asus G703 GeForce GTX 1080 Mobile, i7-7820HK | Schenker XMG Ultra 17 GeForce GTX 1080 Mobile, i7-8700 | Acer Predator 17 X GX-792-76DL GeForce GTX 1080 Mobile, i7-7820HK | MSI GT75VR 7RF-012 Titan Pro GeForce GTX 1080 Mobile, i7-7820HK | Alienware 17 R4 GeForce GTX 1080 Mobile, i7-7820HK | |
|---|---|---|---|---|---|
| Power Consumption | -7% | 4% | -14% | -4% | |
| Idle Minimum * (Watt) | 26 | 32 -23% | 27 -4% | 34 -31% | 37.5 -44% |
| Idle Average * (Watt) | 30 | 38 -27% | 32 -7% | 41 -37% | 37.6 -25% |
| Idle Maximum * (Watt) | 37 | 45 -22% | 41 -11% | 50 -35% | 37.6 -2% |
| Load Average * (Watt) | 123 | 96 22% | 102 17% | 106 14% | 122.4 -0% |
| Witcher 3 ultra * (Watt) | 257 | 237 8% | 257 -0% | 180.3 30% | |
| Load Maximum * (Watt) | 341 | 331 3% | 248 27% | 320 6% | 277.4 19% |
* ... smaller is better
Battery Life
In the battery life section, the G703 places last. 2:31 hours of Internet surfing via WLAN and 2:23 hours of watching HD movies (medium brightness) will not knock anybody's socks off. Even when the notebook is only occupied with a text document and the brightness is adjusted to the minimum level, the lights go out after just 3:20 hours. The Predator 17 X at least manages 5:13 hours here. No wonder, since the Acer has a much stronger battery with 89 instead of 71 Wh. Apropos power: Without a power supply, the 3D performance drops by about a third. We recently observed the same result with the Schenker XMG Ultra 17.
| Asus G703 GeForce GTX 1080 Mobile, i7-7820HK, 71 Wh | Schenker XMG Ultra 17 GeForce GTX 1080 Mobile, i7-8700, 82 Wh | Acer Predator 17 X GX-792-76DL GeForce GTX 1080 Mobile, i7-7820HK, 88.8 Wh | MSI GT75VR 7RF-012 Titan Pro GeForce GTX 1080 Mobile, i7-7820HK, 75 Wh | Alienware 17 R4 GeForce GTX 1080 Mobile, i7-7820HK, 99 Wh | Average of class Gaming | |
|---|---|---|---|---|---|---|
| Battery runtime | 4% | 59% | 3% | 31% | 158% | |
| Reader / Idle (h) | 3.3 | 2.7 -18% | 5.2 58% | 3 -9% | 4.6 39% | 7.84 ? 138% |
| H.264 (h) | 2.4 | 2.5 4% | 3.4 42% | 2.5 4% | 8.27 ? 245% | |
| WiFi v1.3 (h) | 2.5 | 2.4 -4% | 4.2 68% | 2.4 -4% | 3 20% | 7.08 ? 183% |
| Load (h) | 0.9 | 1.2 33% | 1.5 67% | 1.1 22% | 1.2 33% | 1.496 ? 66% |
Verdict
Pros
Cons
As far as powerful desktop replacements are concerned, the ROG Chimera G703 can grab a spot on the winners' podium without any trouble.
Asus put together a very successful package here, which does not allow itself any larger missteps. Not only do we positively recall the first rate input devices (keyboard incl. RGB illumination) but also the many connections (such as Thunderbolt 3). The display and sound quality also know how to convince. Particularly the IPS display with its combination of 144 Hz and G-Sync represents a real argument for purchase.
The performance is also beyond any reproach. In order to justify the hefty purchase price, Asus has equipped the 17-incher with an abundance of high-end components, be it the GeForce GTX 1080 or the Core i7-7820HK, which can offer their highest performance thanks to overclocking. The SSD-RAID and the amount of RAM are also worth noticing.
On the negative side, we have to hold its high weight, the thick design, the low battery life, and the background noise in 3D operation (at least when the OC function is active) against the G703.
Despite these weaknesses, the ROG Chimera will land a very high place in our Top 10 Gaming Laptops list.
Asus G703
- 02/27/2018 v6 (old)
Florian Glaser
Price comparison
