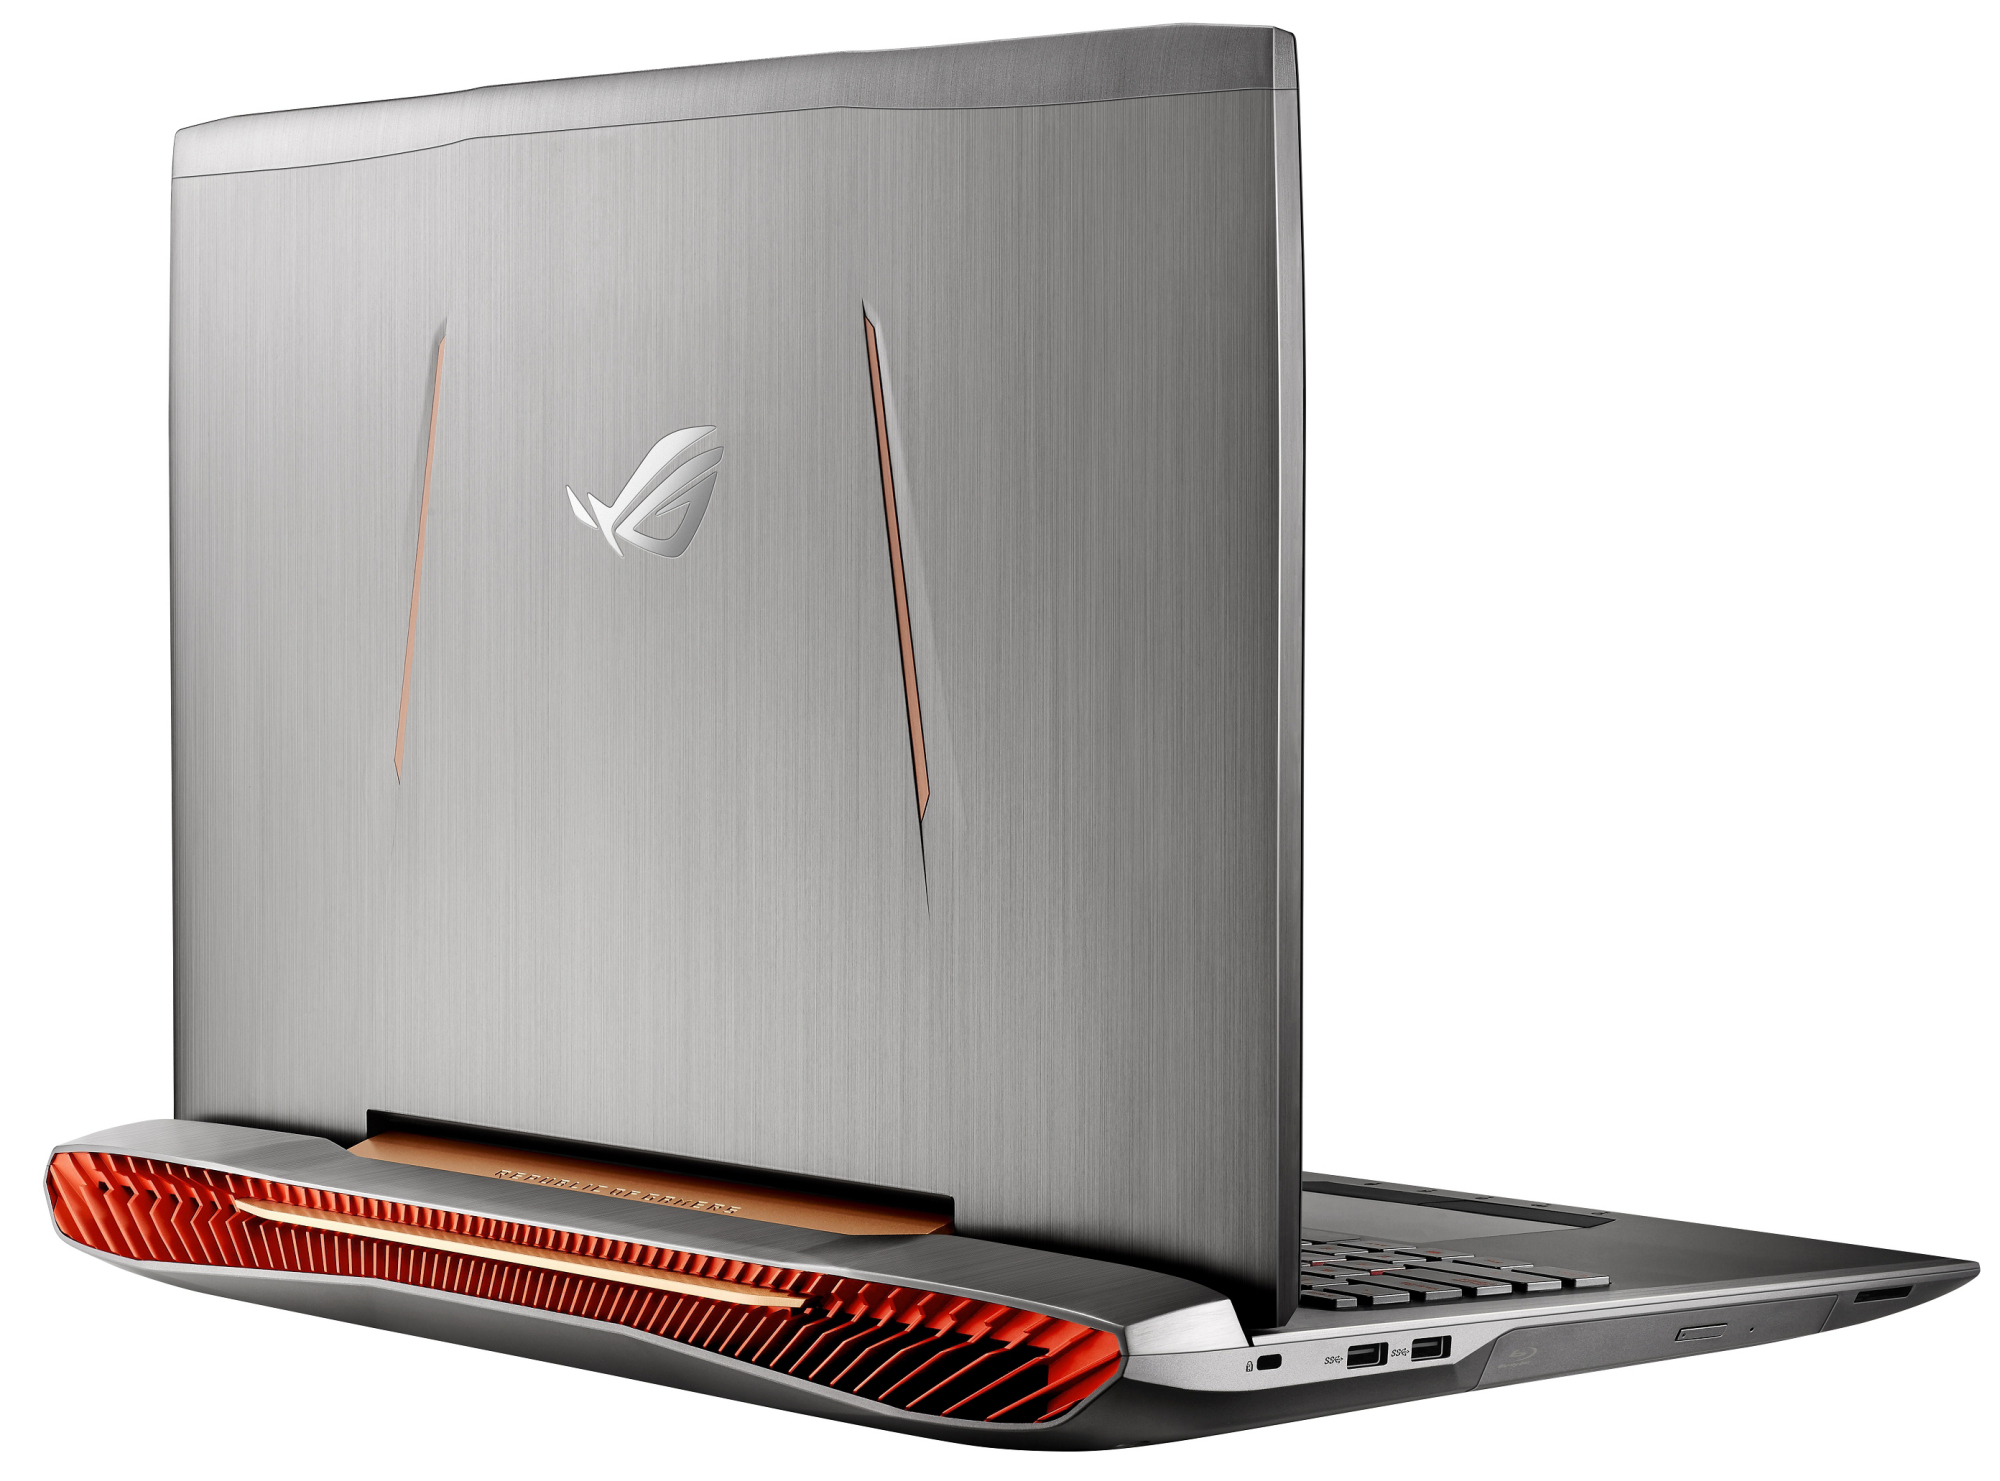
Asus ROG G752VS (7700HQ, GTX 1070, FHD) Laptop Review
For the original German review, see here.
This is not the first time we review the Asus G752VS; the G752VS-XB78K was still equipped with a Skylake processor. The new model uses a modern Kaby Lake chip, but the graphics card is identical. The new notebook is once again equipped with the GeForce GTX 1070 GPU. Rivals for the Asus are other laptops like the Acer Predator 17, Nexoc G734IV, MSI GT72VR 7RE-433 as well as the Alienware 17 R4.
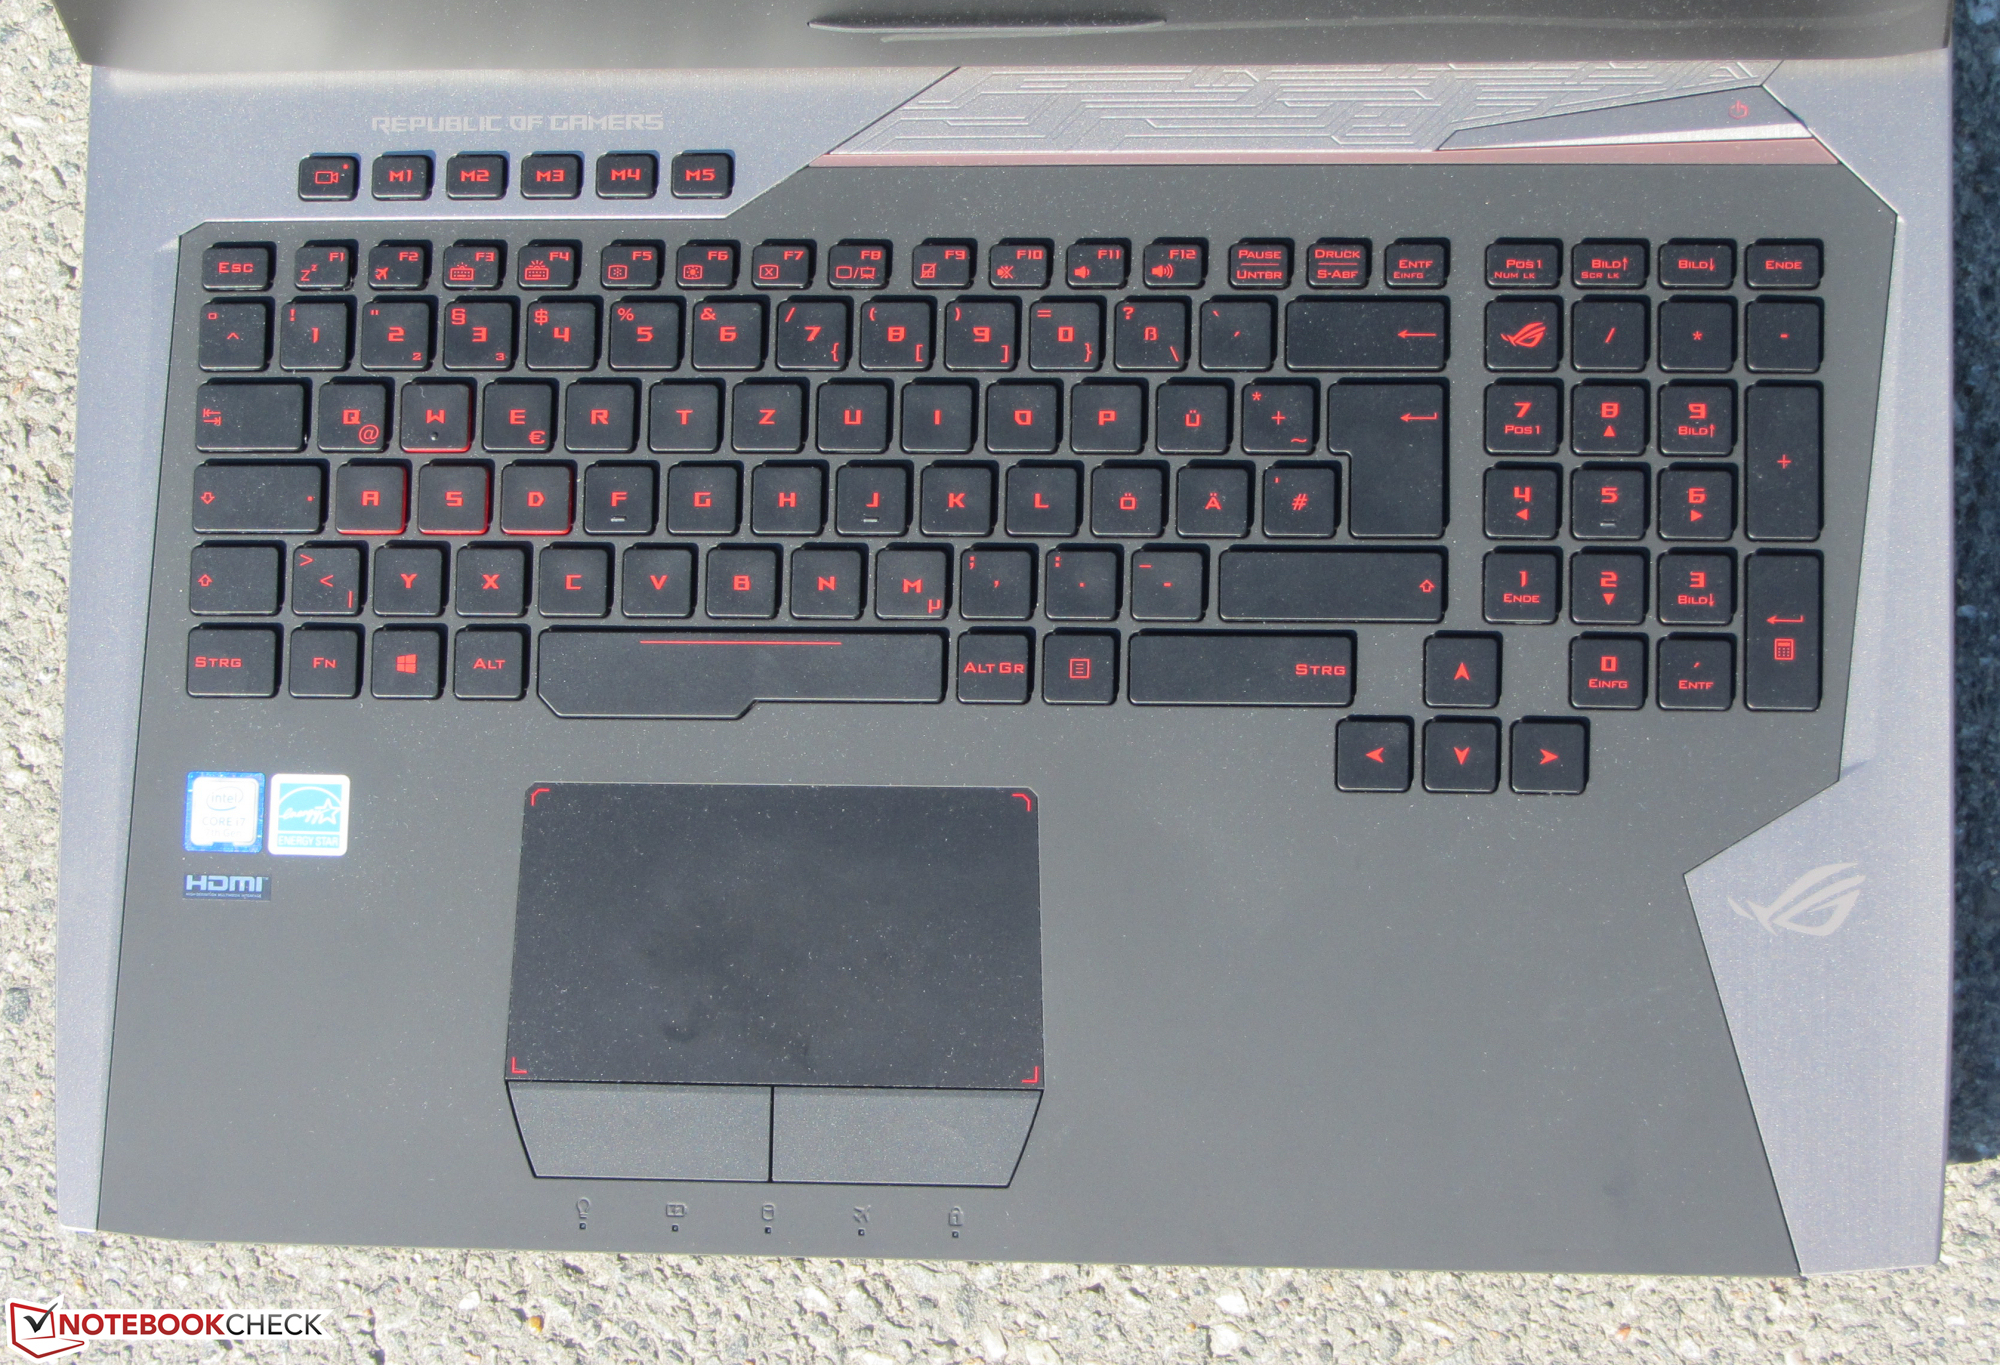
The two G752VS models have identical constructions, so we will not cover the sections Case, Connectivity, Input Devices, and Speakers. All the corresponding information is available in the review of the Asus G752VS-XB78K.
| SD Card Reader | |
| average JPG Copy Test (av. of 3 runs) | |
| MSI GT72VR 7RE-433 | |
| Acer Predator 17 G9-793-70PJ | |
| Gigabyte P57X v7 | |
| Asus G752VS-BA338T | |
| Asus G752VS-XB78K | |
| Nexoc G734IV | |
| maximum AS SSD Seq Read Test (1GB) | |
| MSI GT72VR 7RE-433 | |
| Gigabyte P57X v7 | |
| Acer Predator 17 G9-793-70PJ | |
| Nexoc G734IV | |
| Asus G752VS-BA338T | |
| Asus G752VS-XB78K | |
| Networking | |
| iperf3 transmit AX12 | |
| Acer Predator 17 G9-793-70PJ | |
| MSI GT72VR 7RE-433 | |
| Alienware 17 R4 | |
| Nexoc G734IV | |
| Asus G752VS-BA338T | |
| iperf3 receive AX12 | |
| Acer Predator 17 G9-793-70PJ | |
| Asus G752VS-BA338T | |
| Nexoc G734IV | |
| MSI GT72VR 7RE-433 | |
| Alienware 17 R4 | |
Display
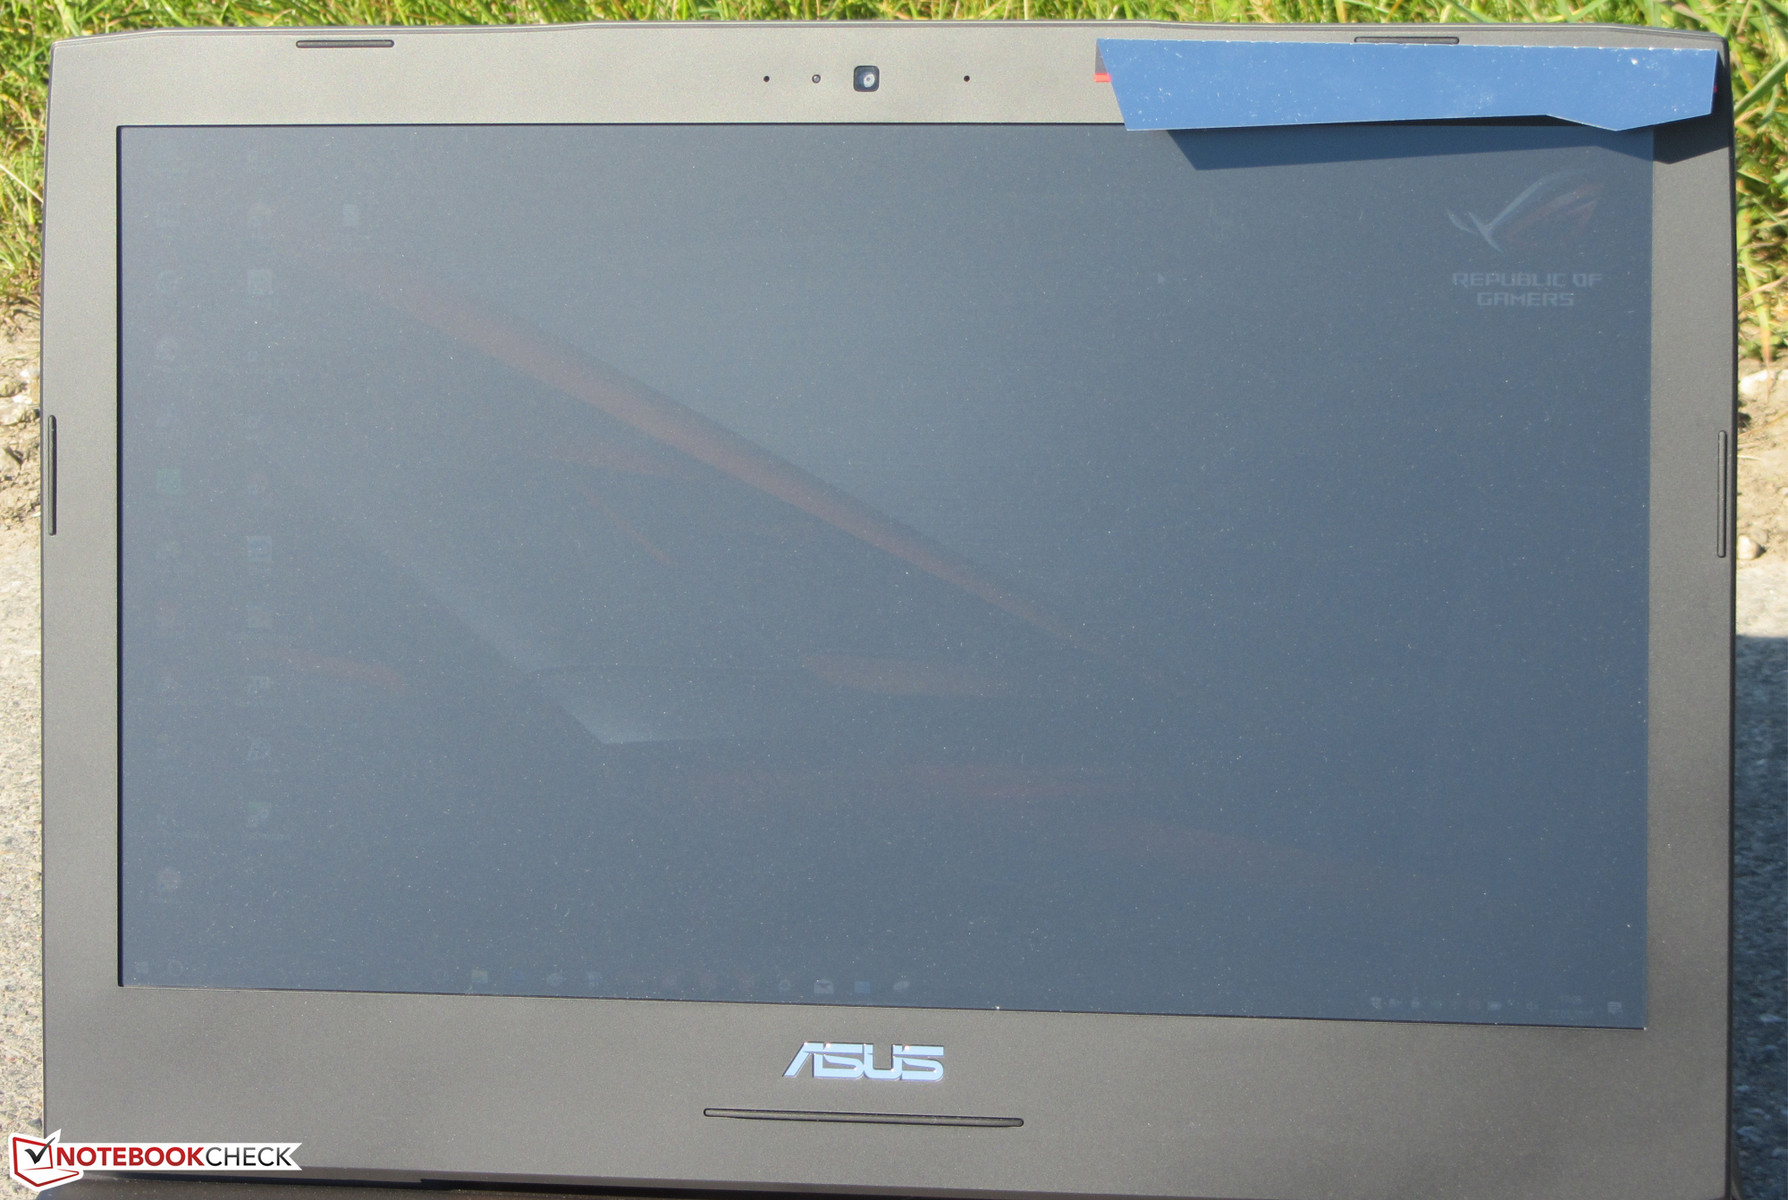
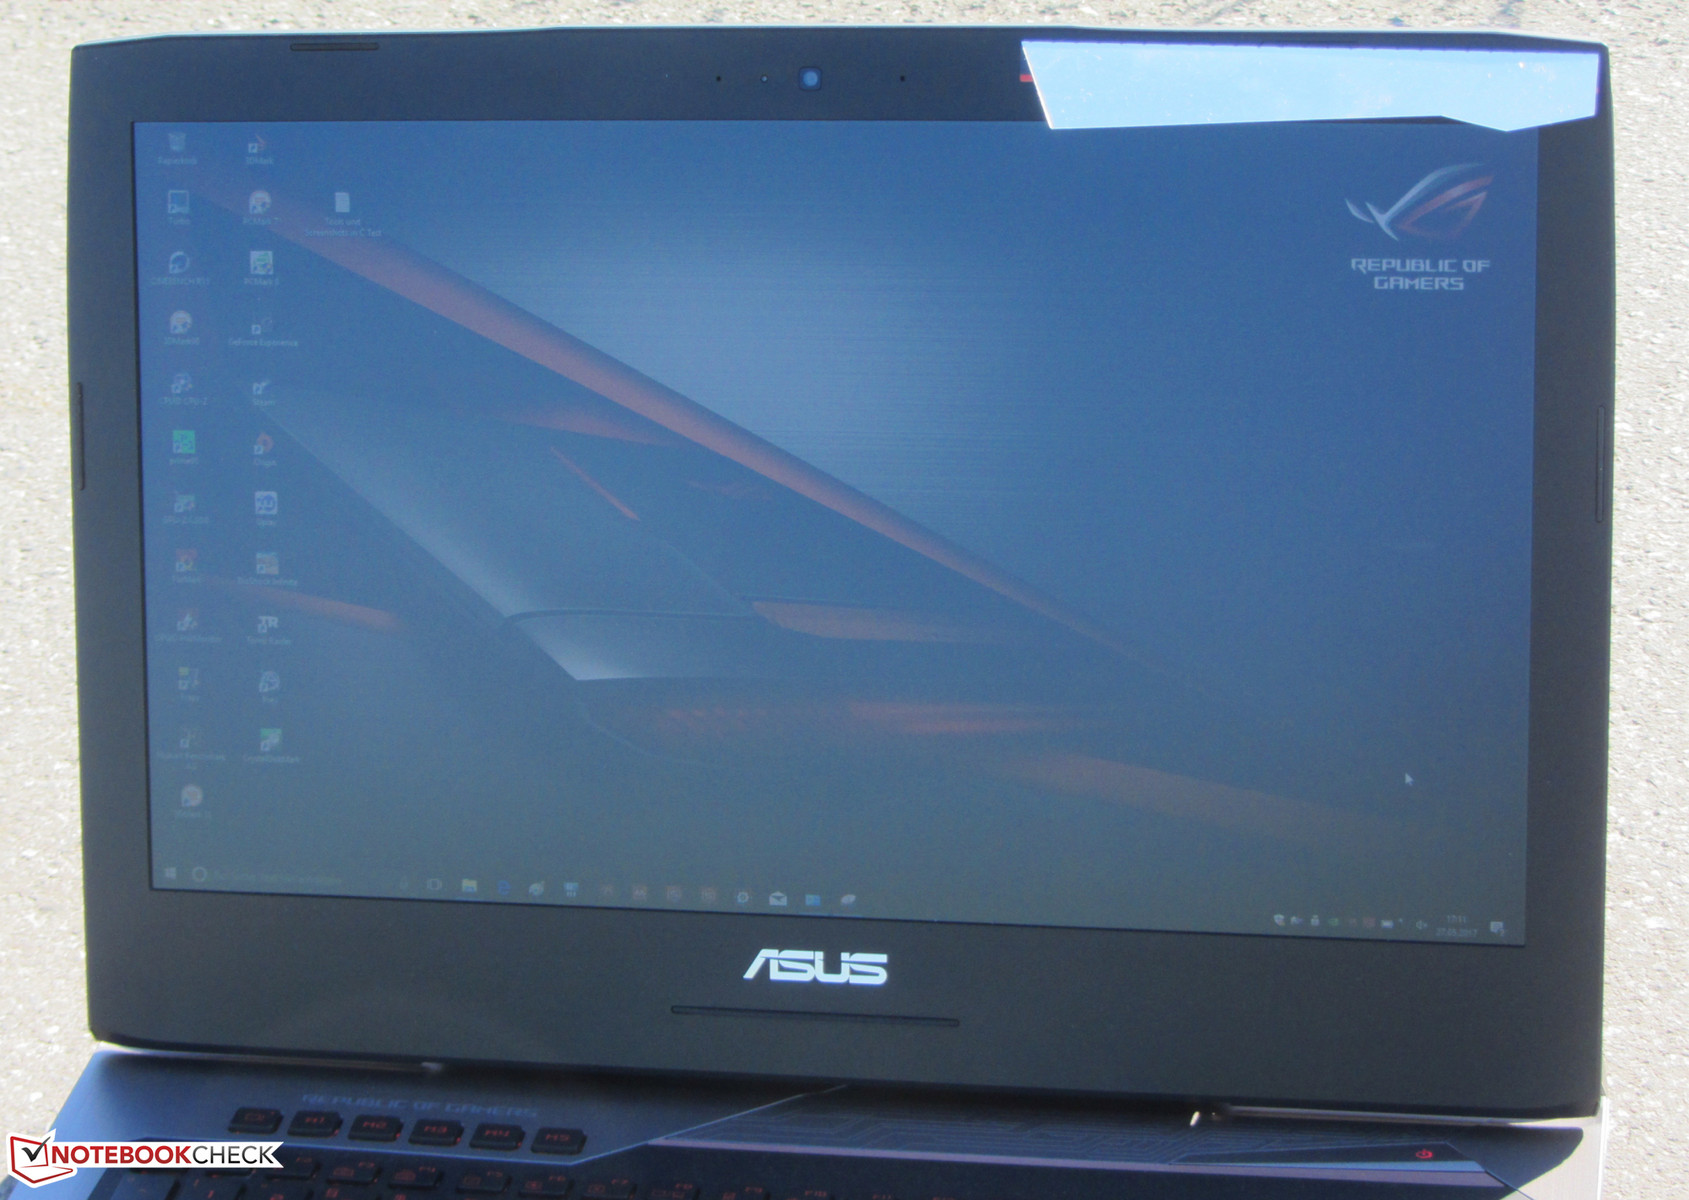
The matte 17.3-inch display of the G752VS has a native resolution of 1920x1080 pixels. Both the luminance (300.3 nits) and contrast (959:1) are good. We can see clear backlight bleeding in the bottom corners on a dark screen. The lack of PWM flickering is a positive aspect.
The 120 Hz panel supports Nvidia's G-Sync technology. It allows the dynamic adjustment of the refresh rate from the display and graphics card. This is supposed to create a smoother picture – especially when you play games.
| |||||||||||||||||||||||||
Brightness Distribution: 88 %
Center on Battery: 307 cd/m²
Contrast: 959:1 (Black: 0.32 cd/m²)
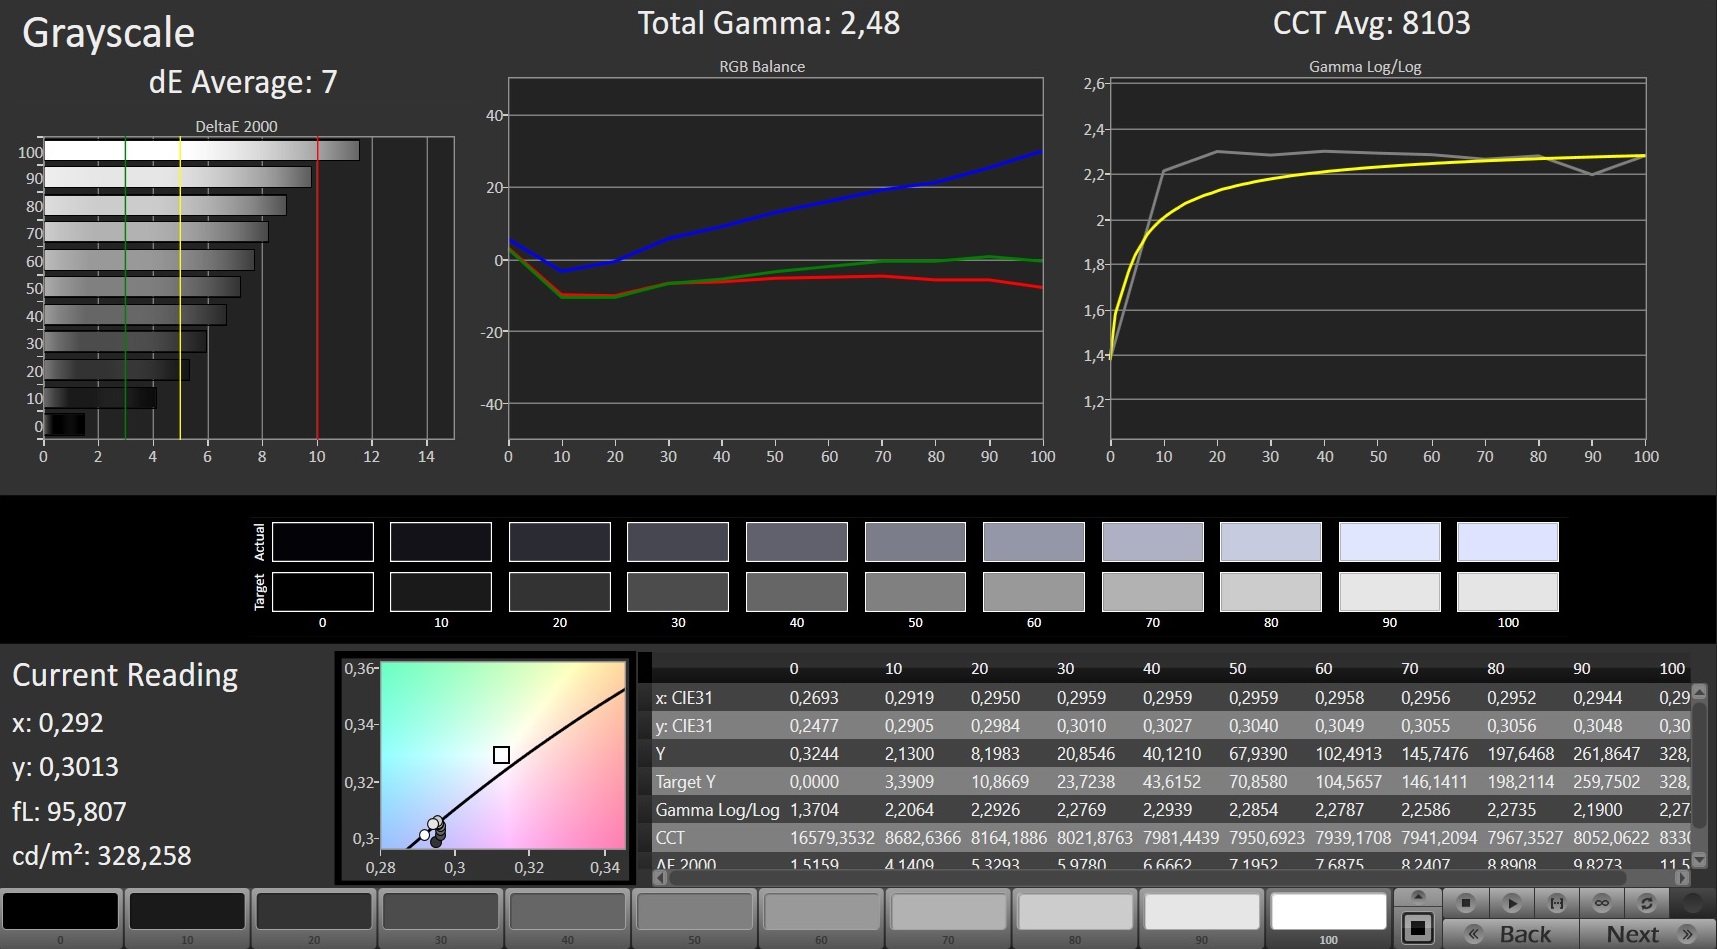
ΔE ColorChecker Calman: 5.53 | ∀{0.5-29.43 Ø4.73}
ΔE Greyscale Calman: 7 | ∀{0.09-98 Ø4.97}
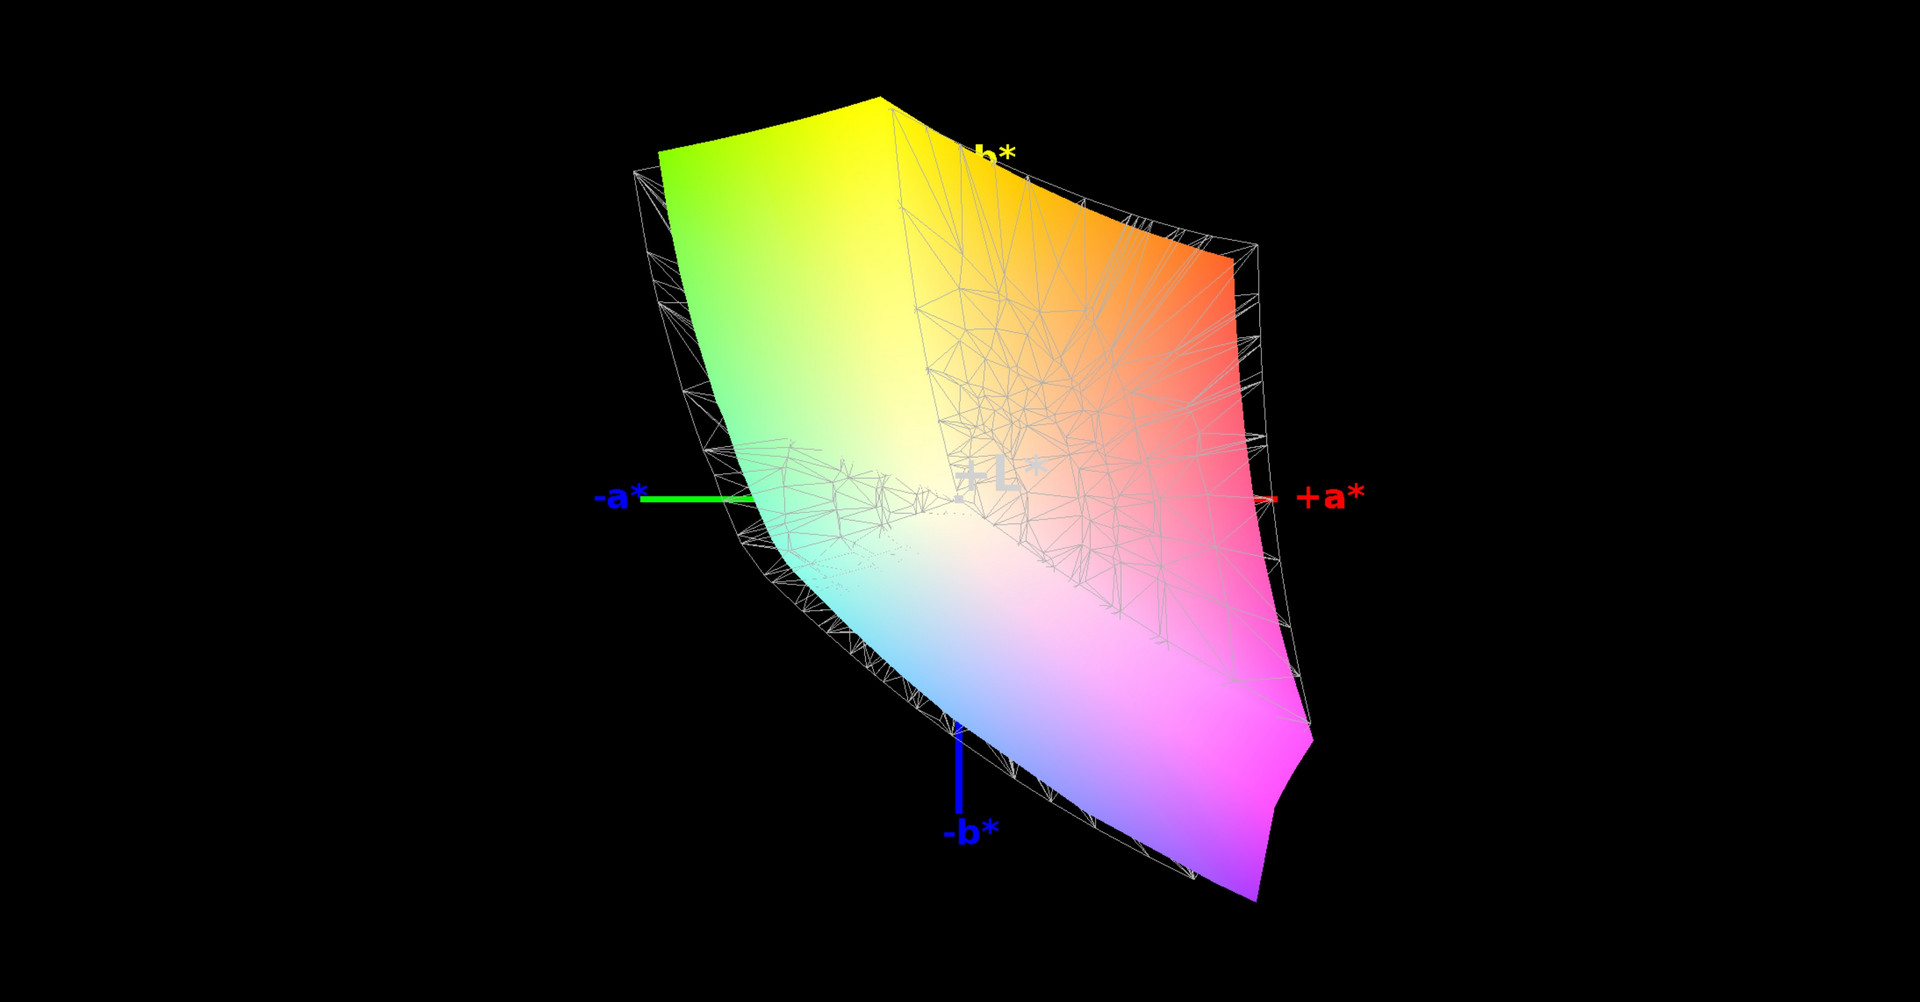
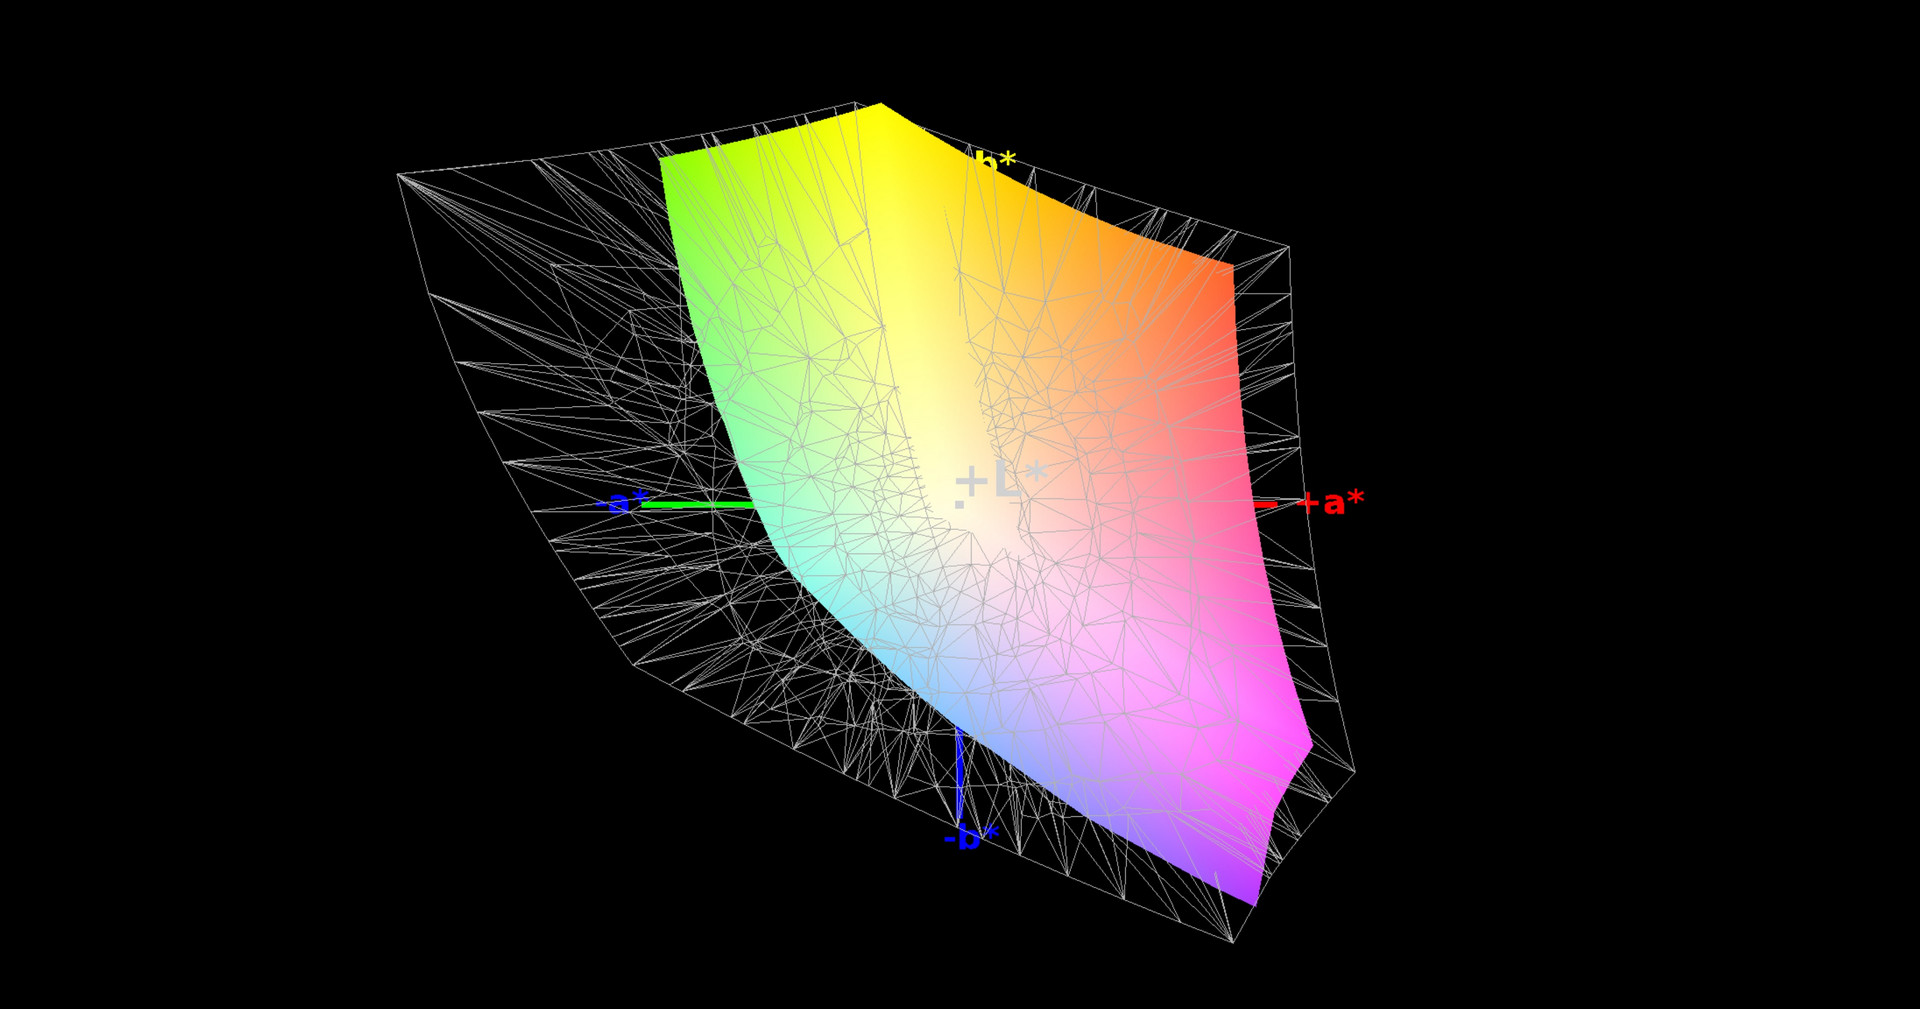
90% sRGB (Argyll 1.6.3 3D)
58% AdobeRGB 1998 (Argyll 1.6.3 3D)
62.8% AdobeRGB 1998 (Argyll 3D)
90.3% sRGB (Argyll 3D)
61.6% Display P3 (Argyll 3D)
Gamma: 2.48
CCT: 8103 K
| Asus G752VS-BA338T AU Optronics B173HAN01.1 (AUO119D), IPS, 1920x1080 | Asus G752VS-XB78K LG Philips LP173WF4-SPF3 (LGD04E8), IPS, 1920x1080 | MSI GT72VR 7RE-433 Chi Mei N173HHE-G32 (CMN1747), TN LED, 1920x1080 | Gigabyte P57X v7 SHP145E, IPS, 3840x2160 | Nexoc G734IV LG Philips LP173WF4-SPD1 (LGD046C), IPS, 1920x1080 | Acer Predator 17 G9-793-70PJ AU Optronics B173ZAN01.0 (AUO109B), IPS, 3840x2160 | Alienware 17 R4 TN LED, 2560x1440 | |
|---|---|---|---|---|---|---|---|
| Display | 1% | 3% | 37% | -1% | 36% | -4% | |
| Display P3 Coverage (%) | 61.6 | 66.9 9% | 68.3 11% | 87.8 43% | 66.2 7% | 86.4 40% | 61.2 -1% |
| sRGB Coverage (%) | 90.3 | 85.2 -6% | 86.7 -4% | 100 11% | 83.7 -7% | 99.9 11% | 82.9 -8% |
| AdobeRGB 1998 Coverage (%) | 62.8 | 62.3 -1% | 63.4 1% | 98.9 57% | 61.2 -3% | 99.1 58% | 60.5 -4% |
| Response Times | 5% | 46% | -67% | -13% | -19% | 34% | |
| Response Time Grey 50% / Grey 80% * (ms) | 36 ? | 38 ? -6% | 29 ? 19% | 55.6 ? -54% | 42 ? -17% | 50 ? -39% | 30 ? 17% |
| Response Time Black / White * (ms) | 26 ? | 22 ? 15% | 7 ? 73% | 46.8 ? -80% | 28 ? -8% | 25.6 ? 2% | 12.8 ? 51% |
| PWM Frequency (Hz) | 1000 ? | ||||||
| Screen | 14% | -9% | 17% | 12% | 22% | -4% | |
| Brightness middle (cd/m²) | 307 | 328 7% | 299 -3% | 441.3 44% | 348 13% | 343 12% | 402.3 31% |
| Brightness (cd/m²) | 300 | 317 6% | 277 -8% | 408 36% | 336 12% | 328 9% | 372 24% |
| Brightness Distribution (%) | 88 | 88 0% | 87 -1% | 86 -2% | 91 3% | 84 -5% | 86 -2% |
| Black Level * (cd/m²) | 0.32 | 0.3 6% | 0.27 16% | 0.44 -38% | 0.32 -0% | 0.29 9% | 0.62 -94% |
| Contrast (:1) | 959 | 1093 14% | 1107 15% | 1003 5% | 1088 13% | 1183 23% | 649 -32% |
| Colorchecker dE 2000 * | 5.53 | 3.74 32% | 9.65 -75% | 5.1 8% | 4.13 25% | 4.01 27% | 5.6 -1% |
| Colorchecker dE 2000 max. * | 11.54 | 8.97 22% | 15.43 -34% | 9.8 15% | 9.21 20% | 6.03 48% | 9.8 15% |
| Greyscale dE 2000 * | 7 | 2.67 62% | 9.68 -38% | 4.3 39% | 3.52 50% | 4.7 33% | 4.7 33% |
| Gamma | 2.48 89% | 2.41 91% | 1.89 116% | 2.08 106% | 2.32 95% | 2.4 92% | 2.14 103% |
| CCT | 8103 80% | 6861 95% | 11652 56% | 7345 88% | 6228 104% | 6451 101% | 7519 86% |
| Color Space (Percent of AdobeRGB 1998) (%) | 58 | 56 -3% | 75 29% | 87 50% | 55 -5% | 88 52% | 53.7 -7% |
| Color Space (Percent of sRGB) (%) | 90 | 85 -6% | 100 11% | 100 11% | 84 -7% | 100 11% | 82.2 -9% |
| Total Average (Program / Settings) | 7% /
10% | 13% /
1% | -4% /
10% | -1% /
6% | 13% /
19% | 9% /
1% |
* ... smaller is better
Screen Flickering / PWM (Pulse-Width Modulation)
| Screen flickering / PWM not detected | 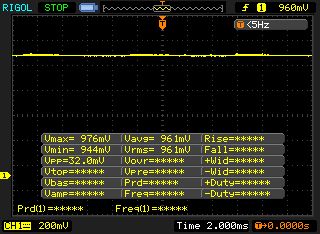 | ||
In comparison: 52 % of all tested devices do not use PWM to dim the display. If PWM was detected, an average of 7798 (minimum: 5 - maximum: 343500) Hz was measured. | |||
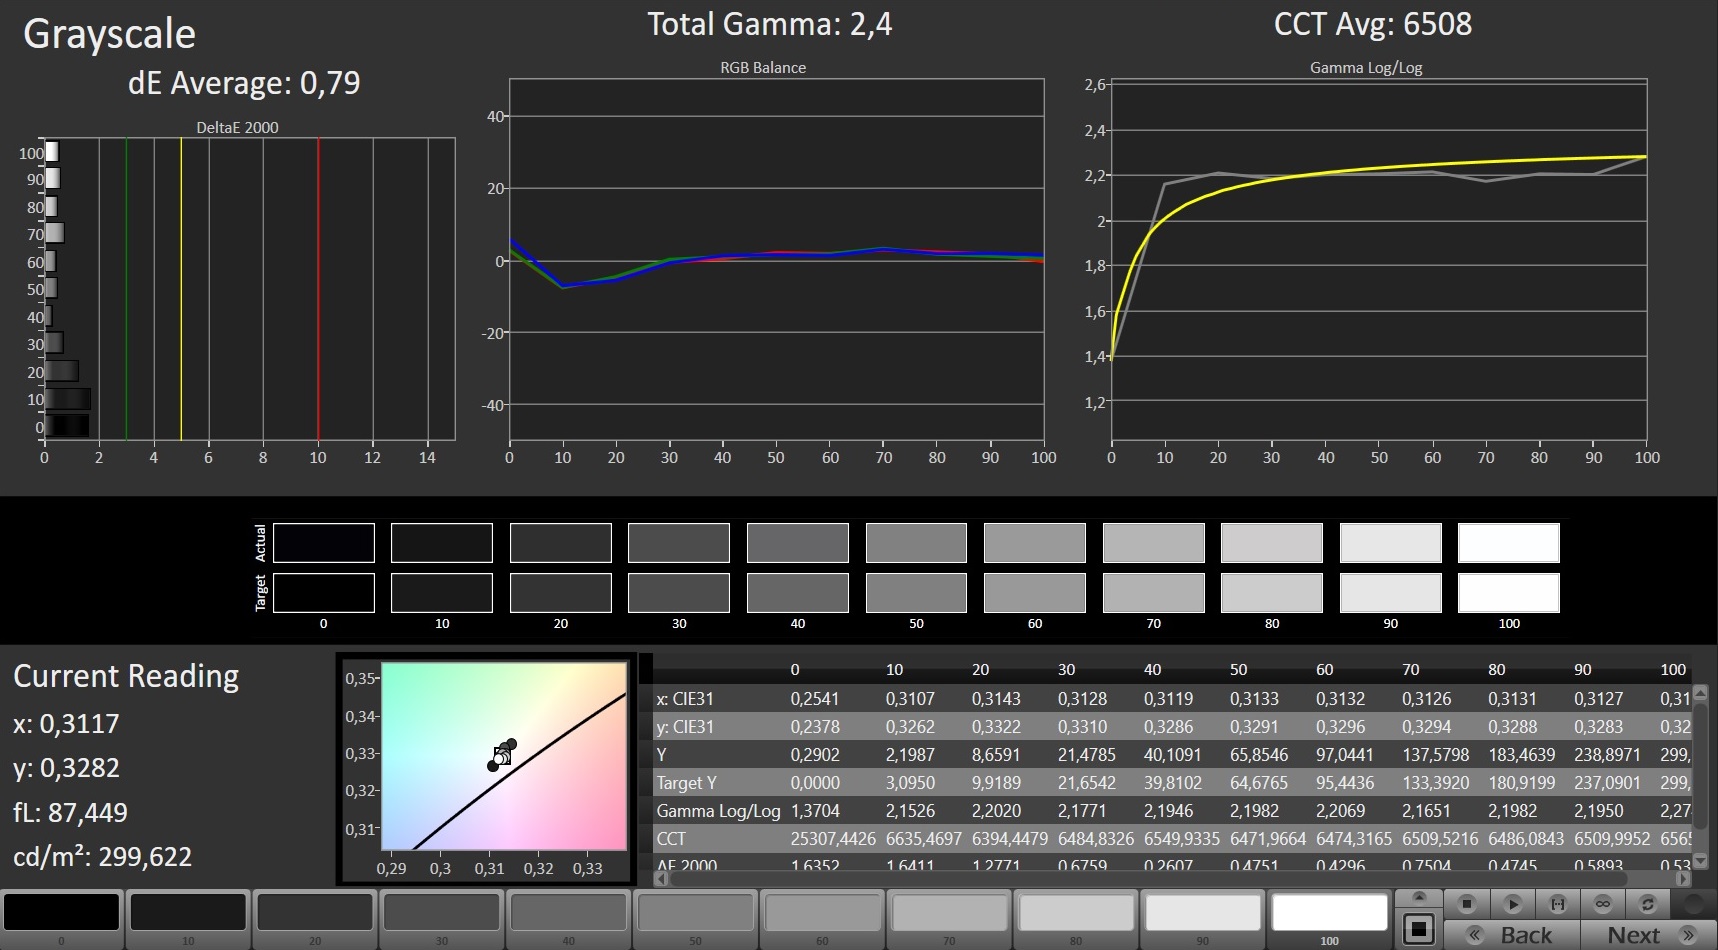
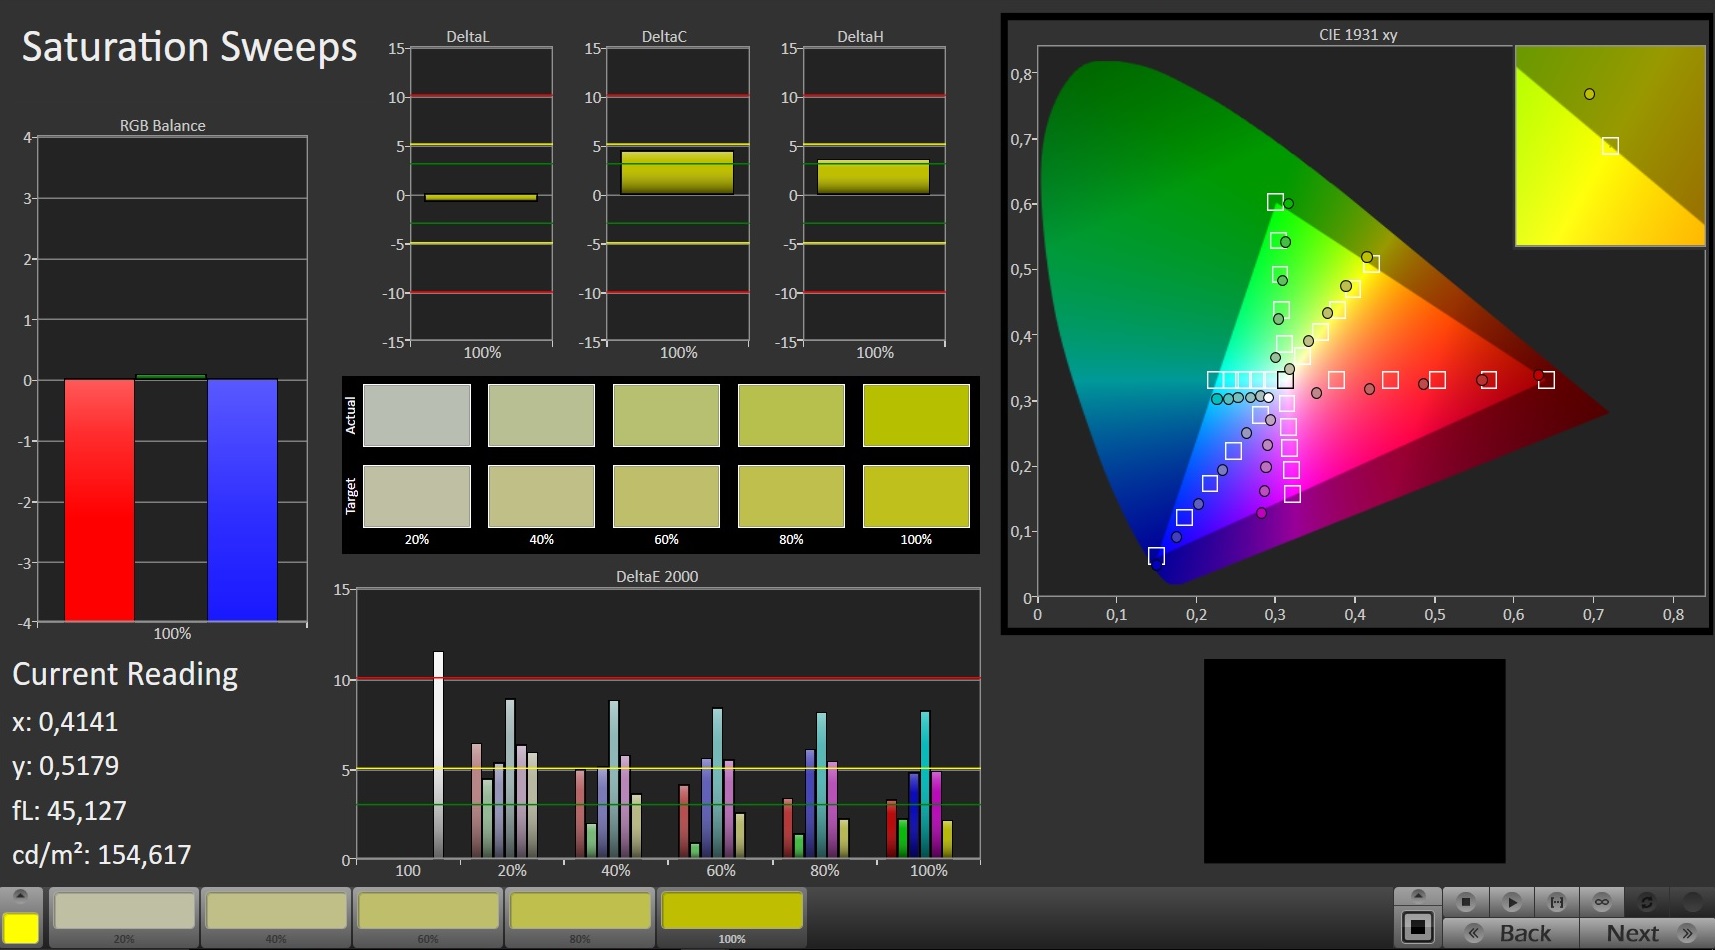
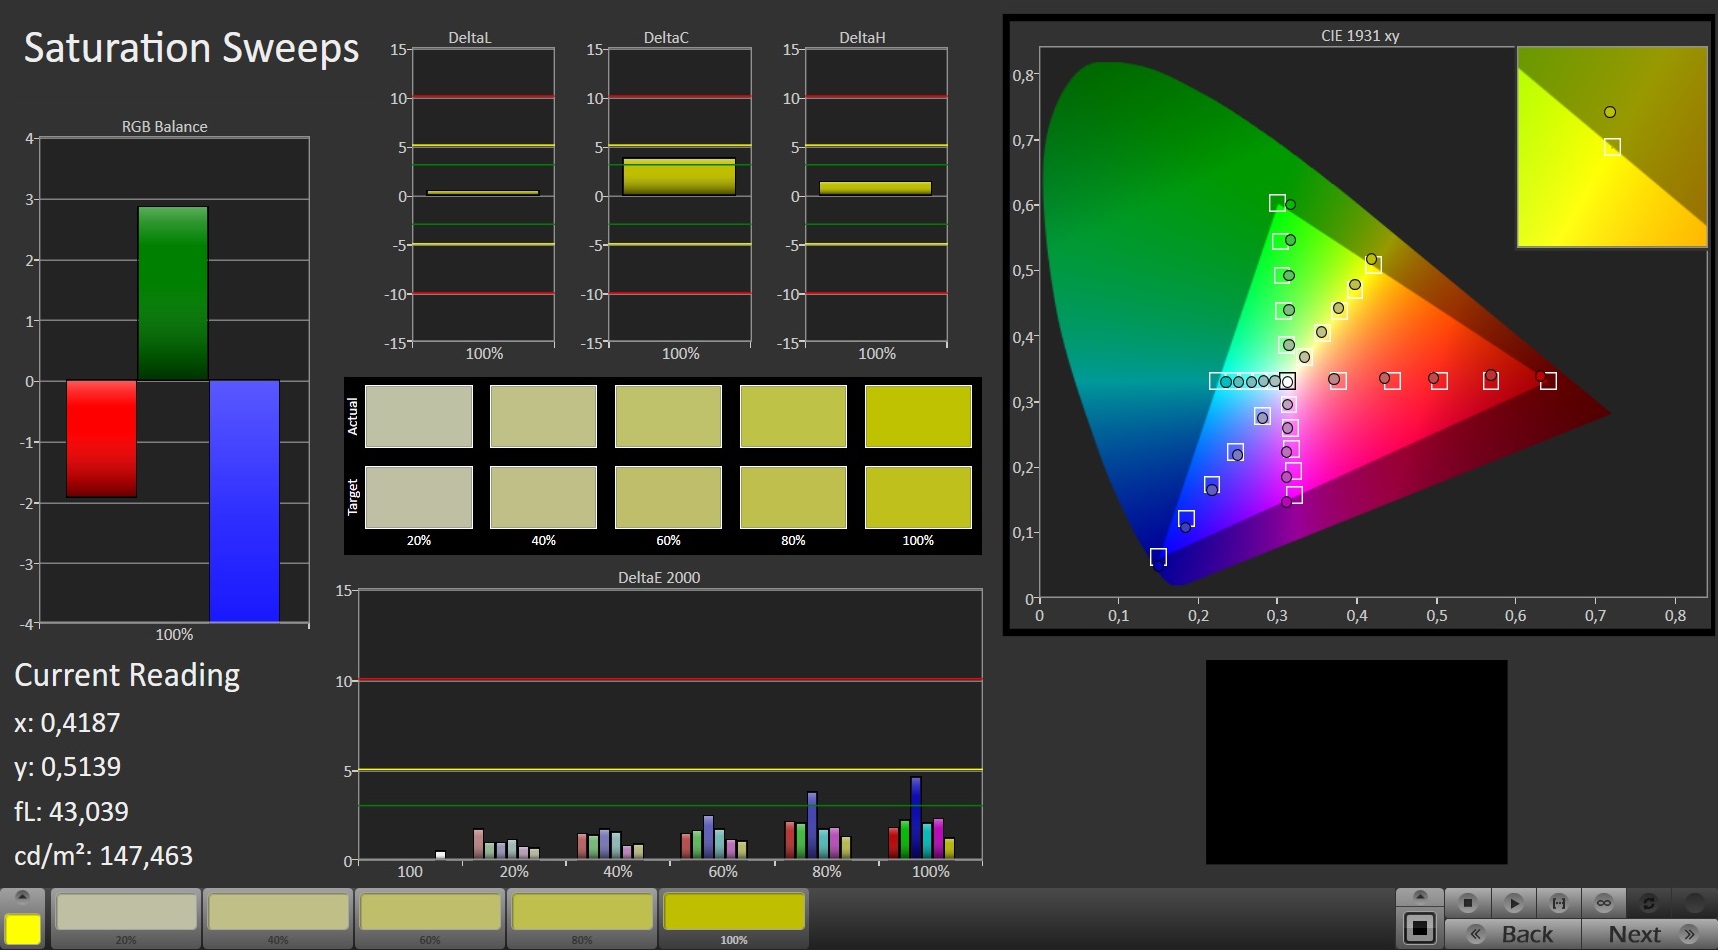
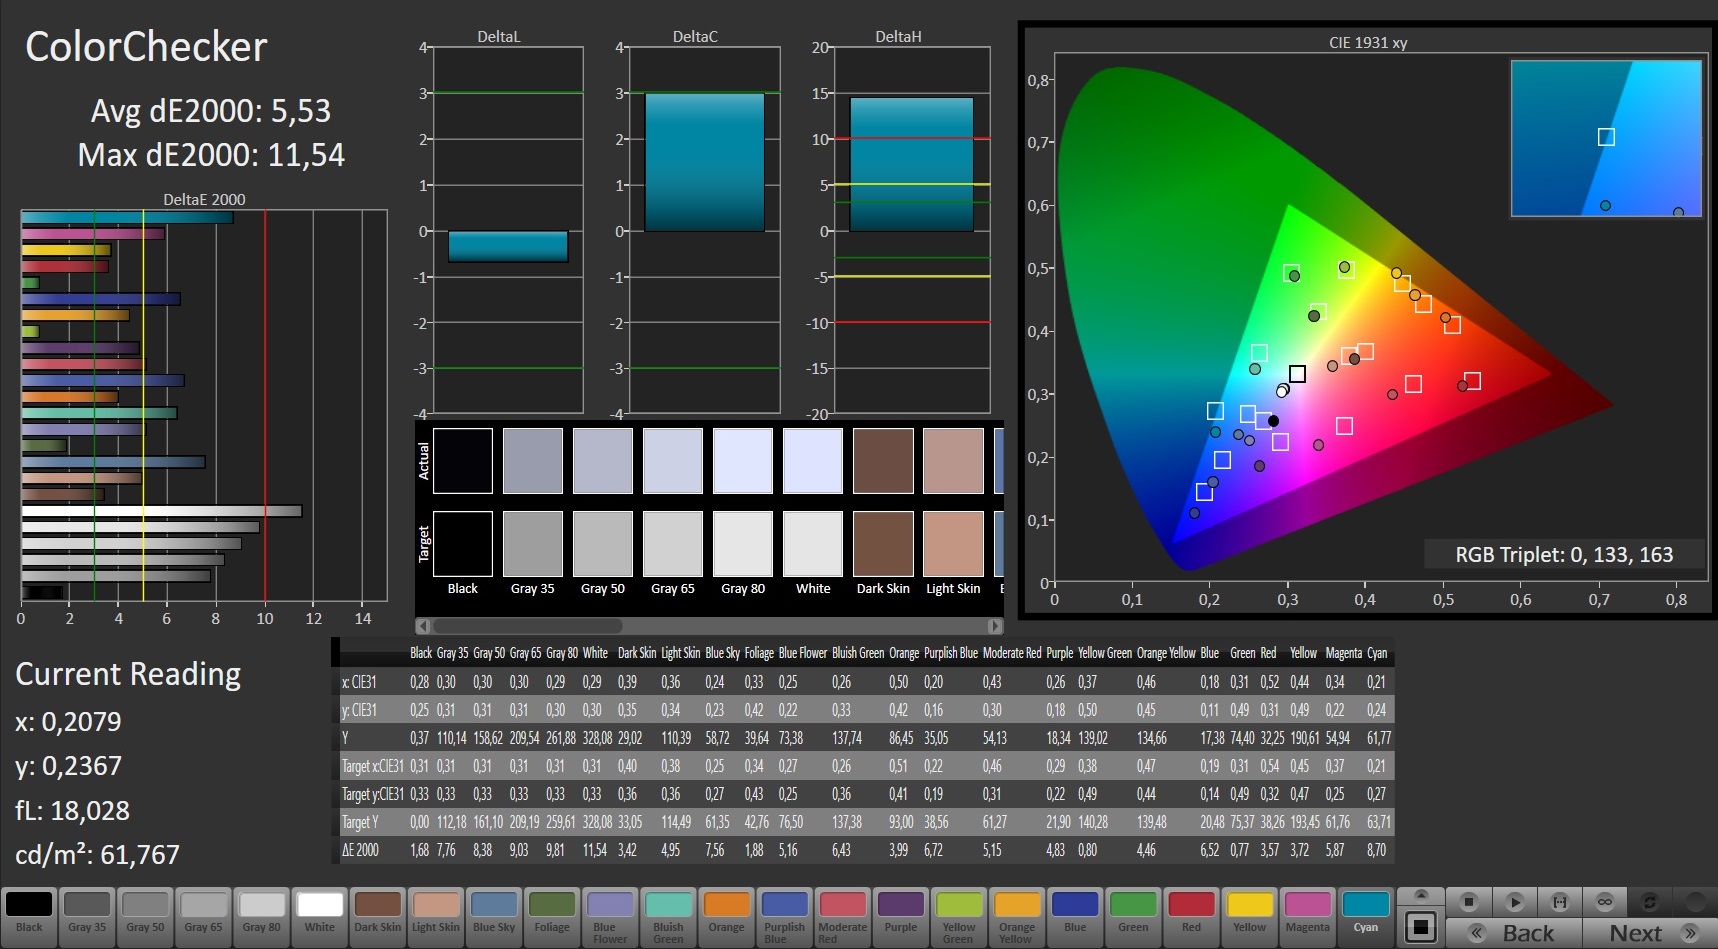
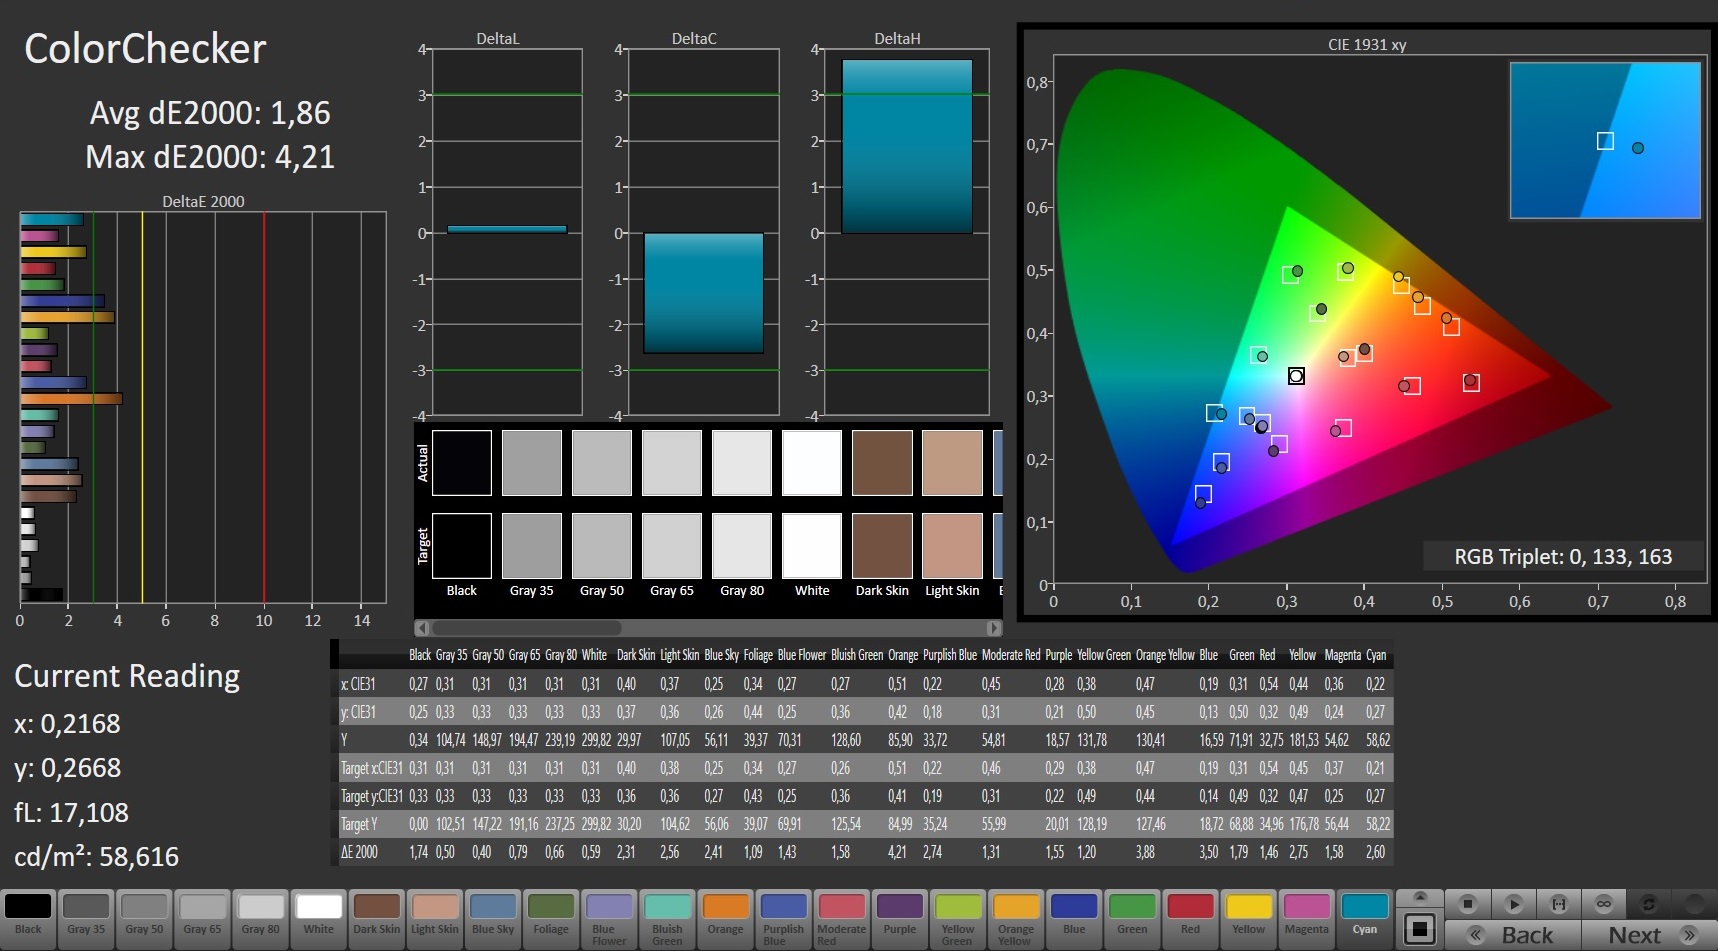
We can measure an average DeltaE-2000 color deviation of 5.53 ex-works; the target value is less than 3. The display also has a slight blue cast. A calibration improves the situation: The color deviation drops to 1.86 and is within the target range. The blue cast is gone as well and the grayscale performance is more balanced. The display does not cover the AdobeRGB or sRGB gamuts; we only determine 58% (AdobeRGB) and 90% (sRGB), respectively.
You can use our color profile to improve the performance of your panel. However, you have to make sure that your laptop uses the same display model (manufacturer + model number). Otherwise, the color performance could even be worse. Notebook manufacturers often use displays from multiple suppliers.
Display Response Times
| ↔ Response Time Black to White | ||
|---|---|---|
| 26 ms ... rise ↗ and fall ↘ combined | ↗ 14.4 ms rise | 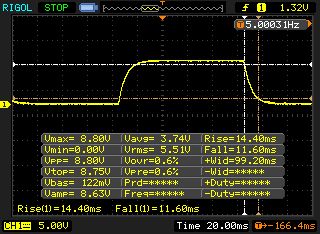 |
| ↘ 11.6 ms fall | ||
| The screen shows relatively slow response rates in our tests and may be too slow for gamers. In comparison, all tested devices range from 0.1 (minimum) to 240 (maximum) ms. » 62 % of all devices are better. This means that the measured response time is worse than the average of all tested devices (19.9 ms). | ||
| ↔ Response Time 50% Grey to 80% Grey | ||
| 36 ms ... rise ↗ and fall ↘ combined | ↗ 18 ms rise | 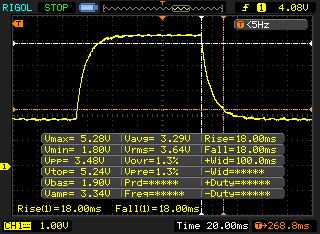 |
| ↘ 18 ms fall | ||
| The screen shows slow response rates in our tests and will be unsatisfactory for gamers. In comparison, all tested devices range from 0.165 (minimum) to 636 (maximum) ms. » 50 % of all devices are better. This means that the measured response time is worse than the average of all tested devices (31.1 ms). | ||
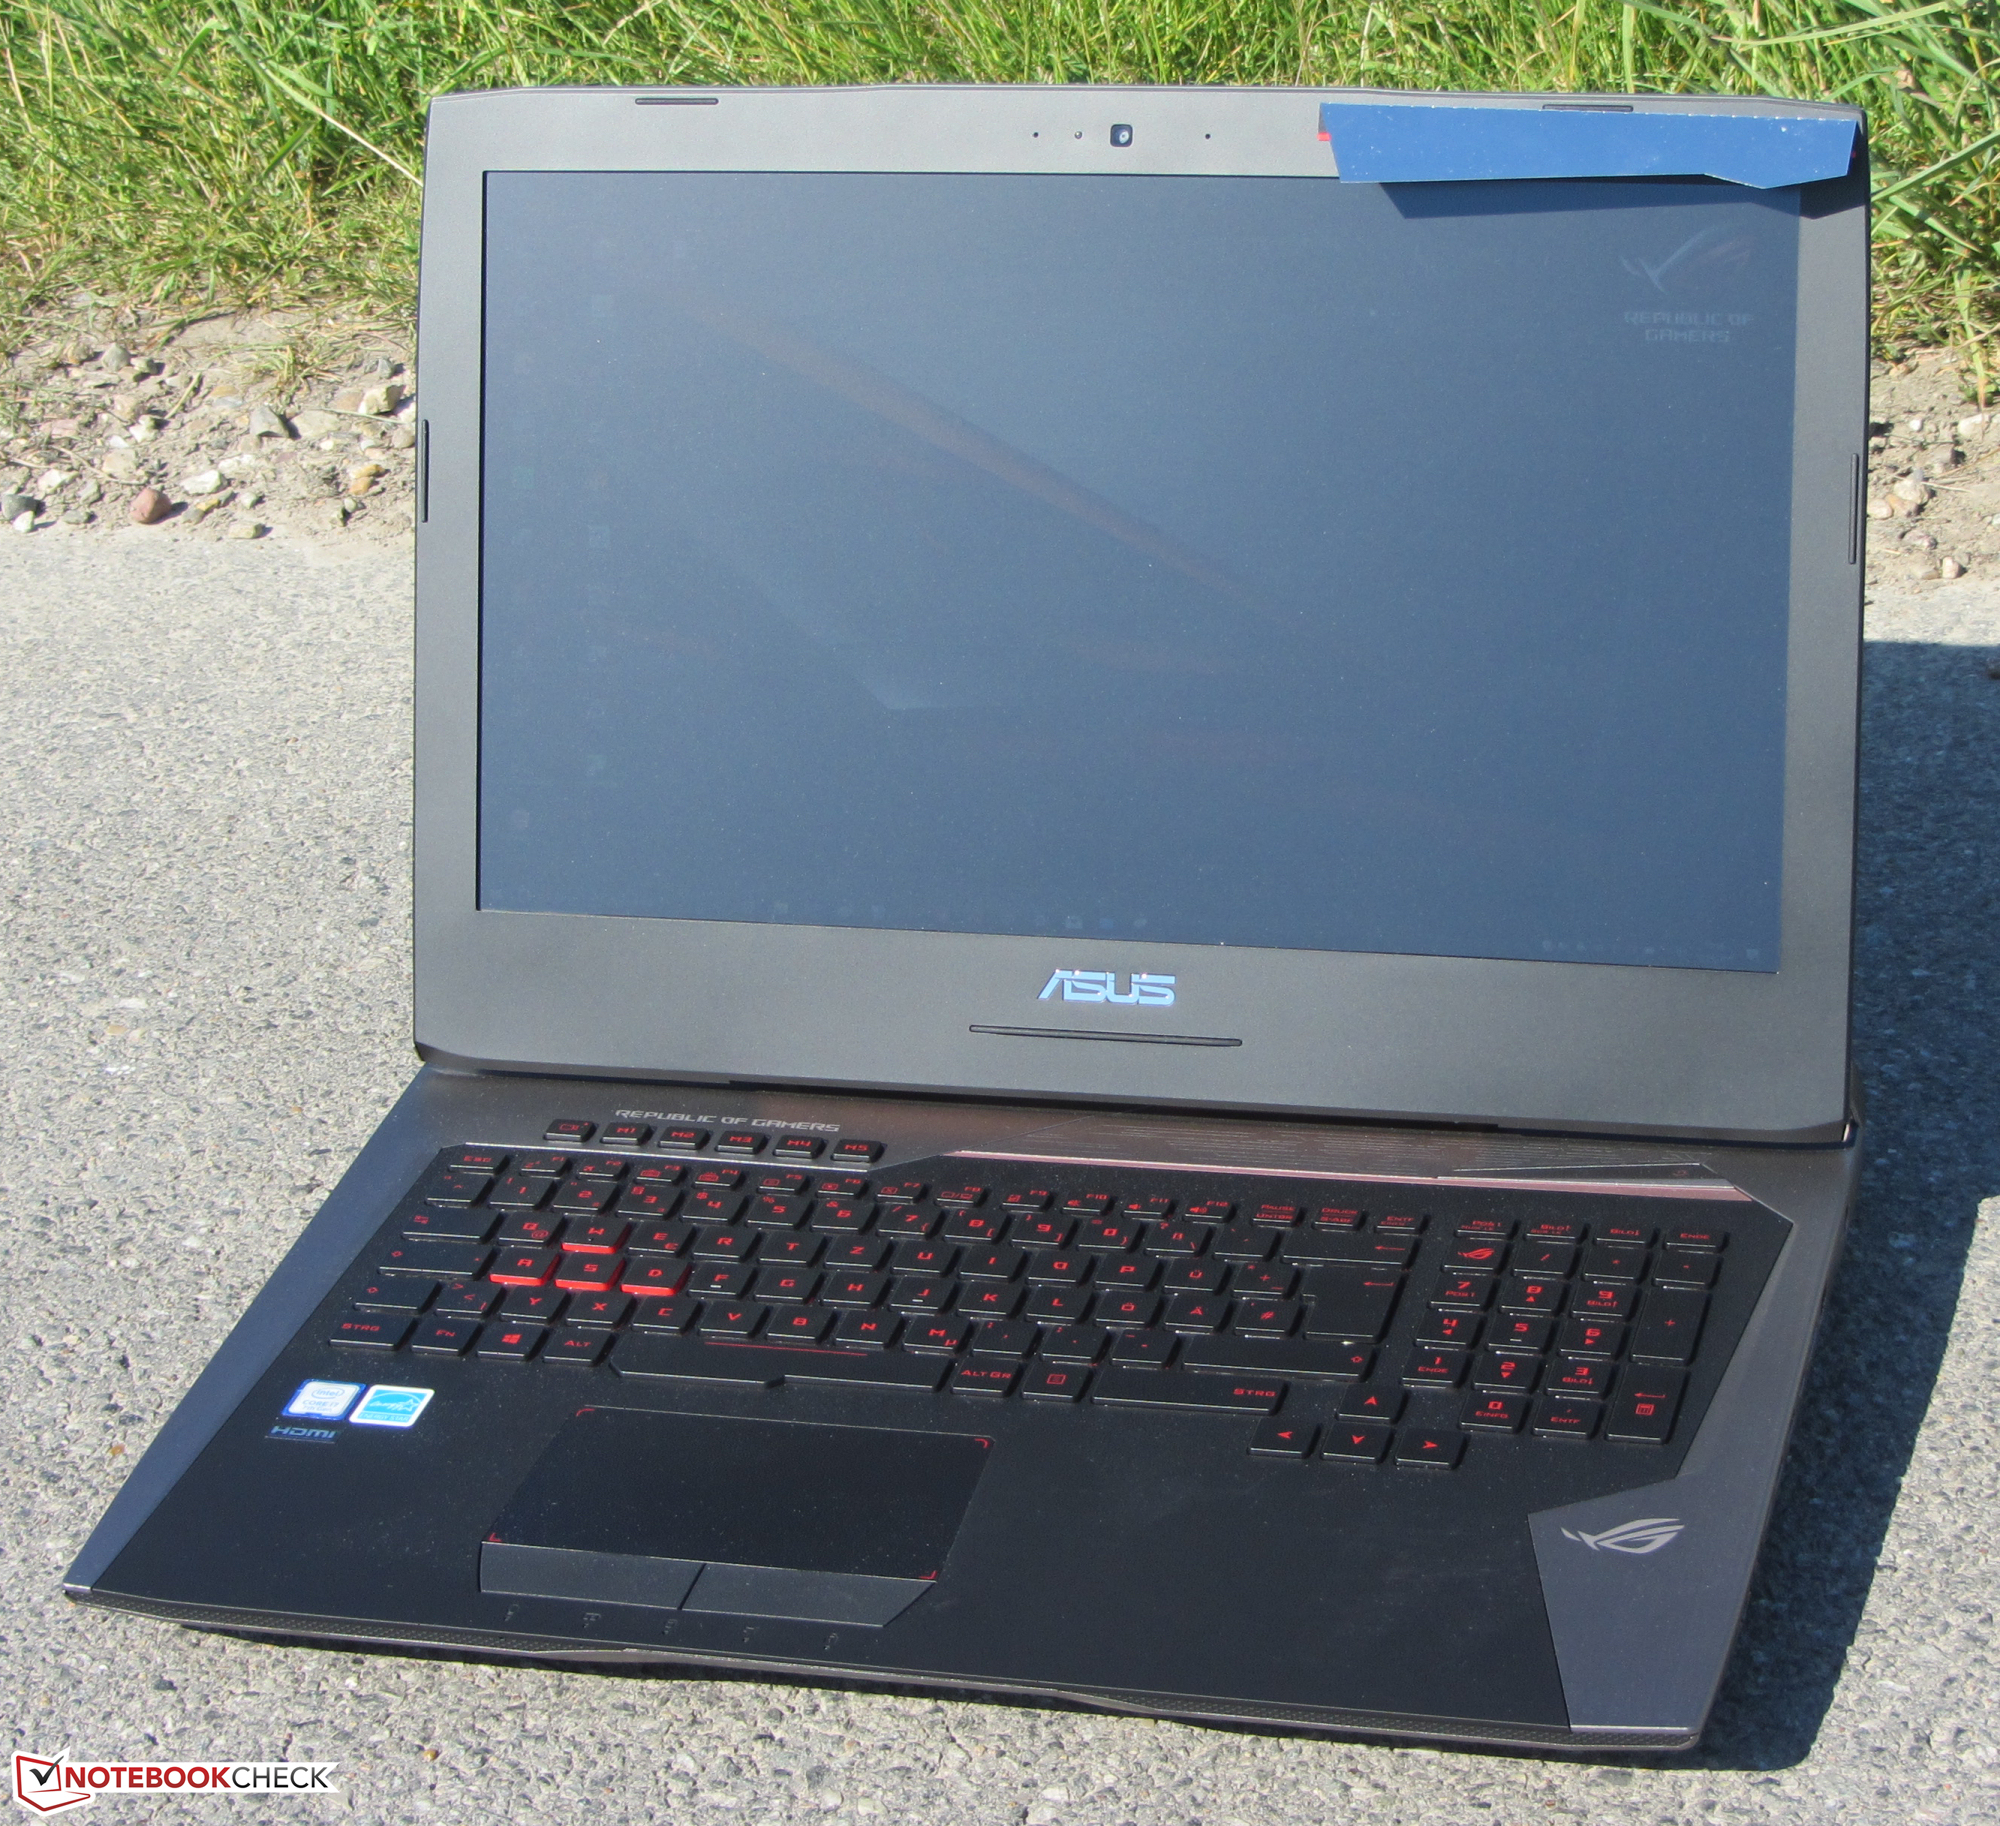
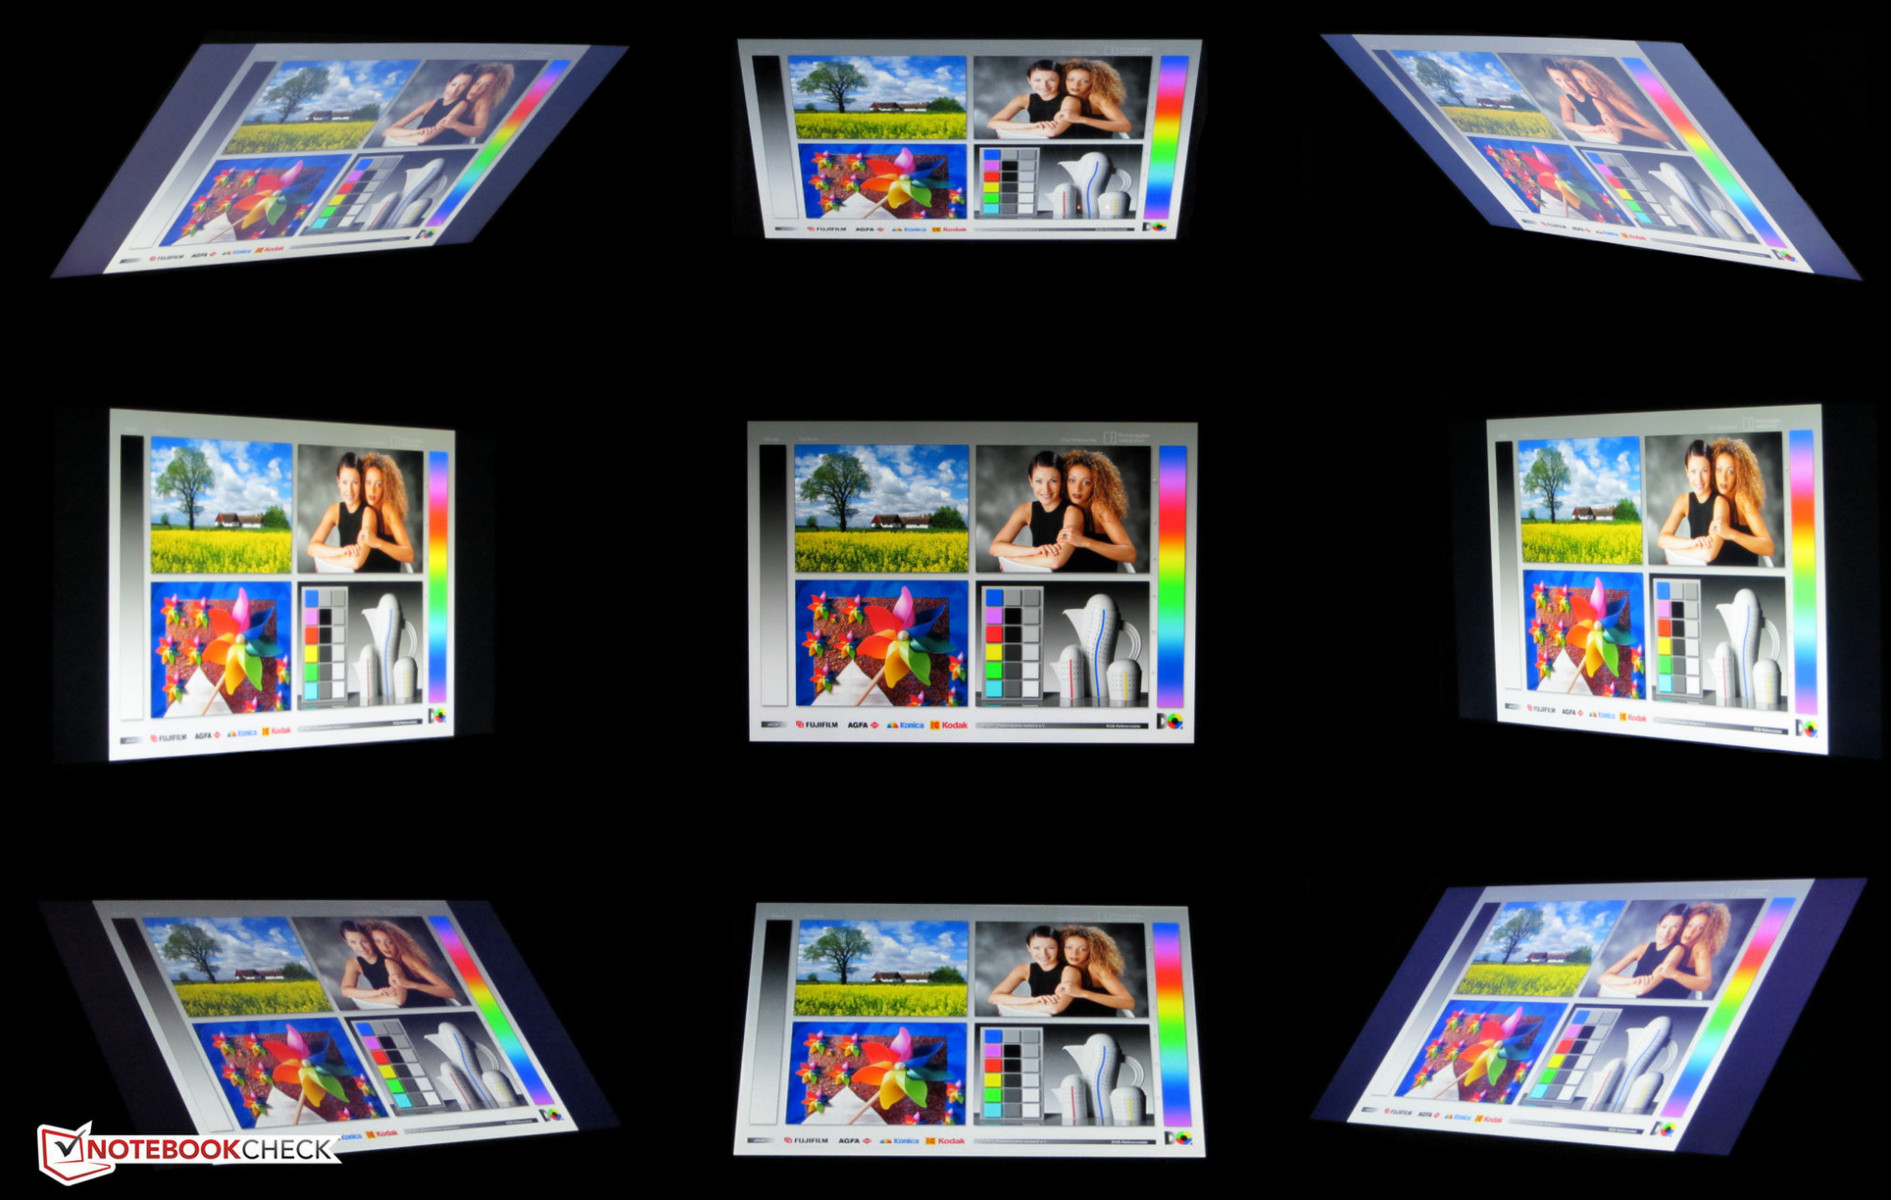
Asus equips the G752VS with an IPS panel providing wide viewing angles. This means you can see the display content from every position. It is possible to use the system outdoors as long as the sun is not shining too bright.
Performance
The Asus G752VS is a 17.3-inch gaming laptop and our test model retails for about 2500 Euros (~$2799). Asus offers other SKUs with prices starting at around 1700 Euros (~$1903).

Processor
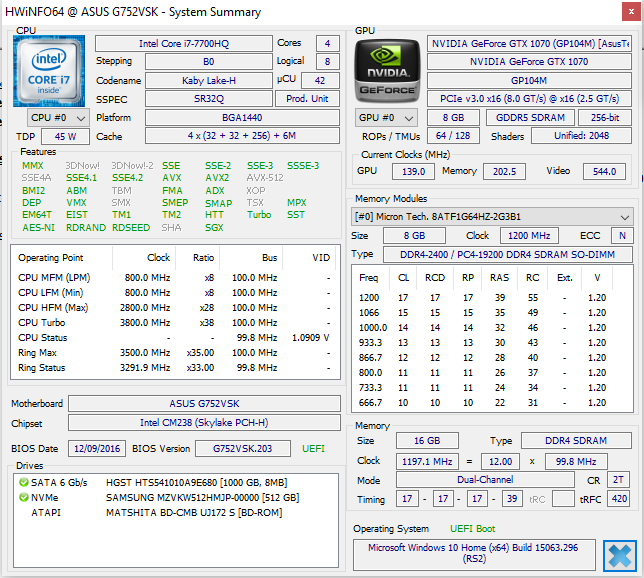
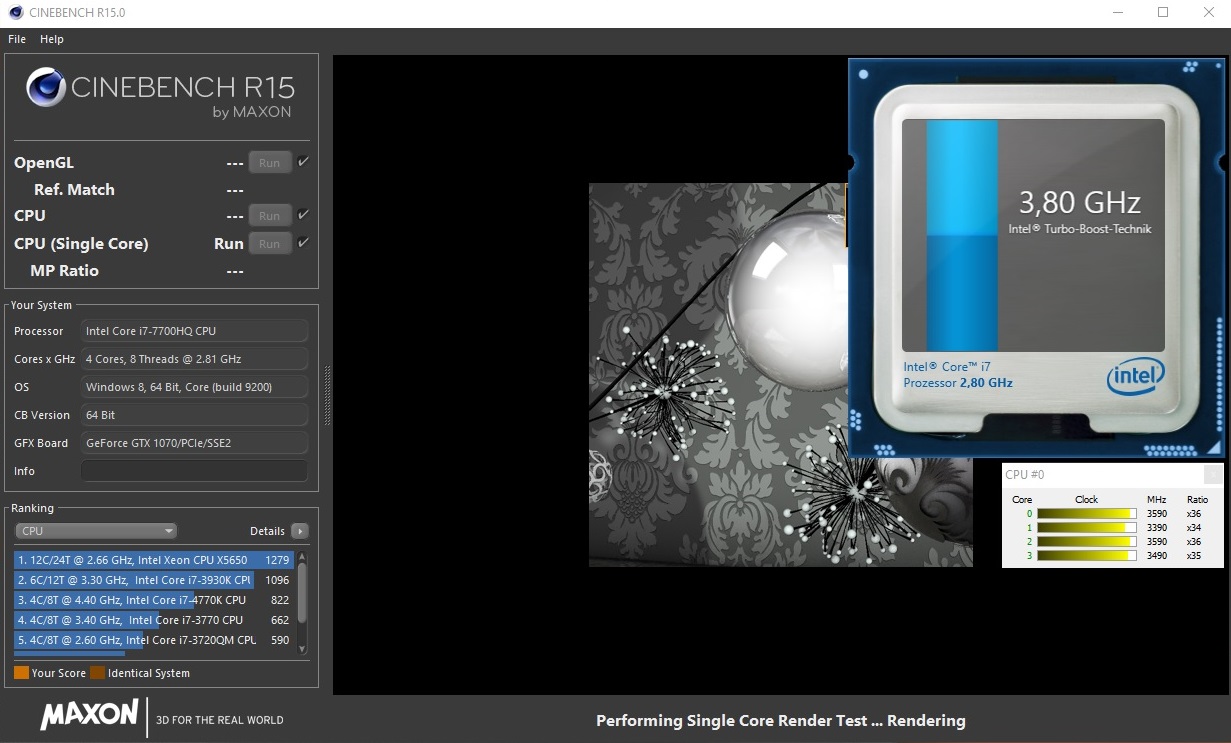
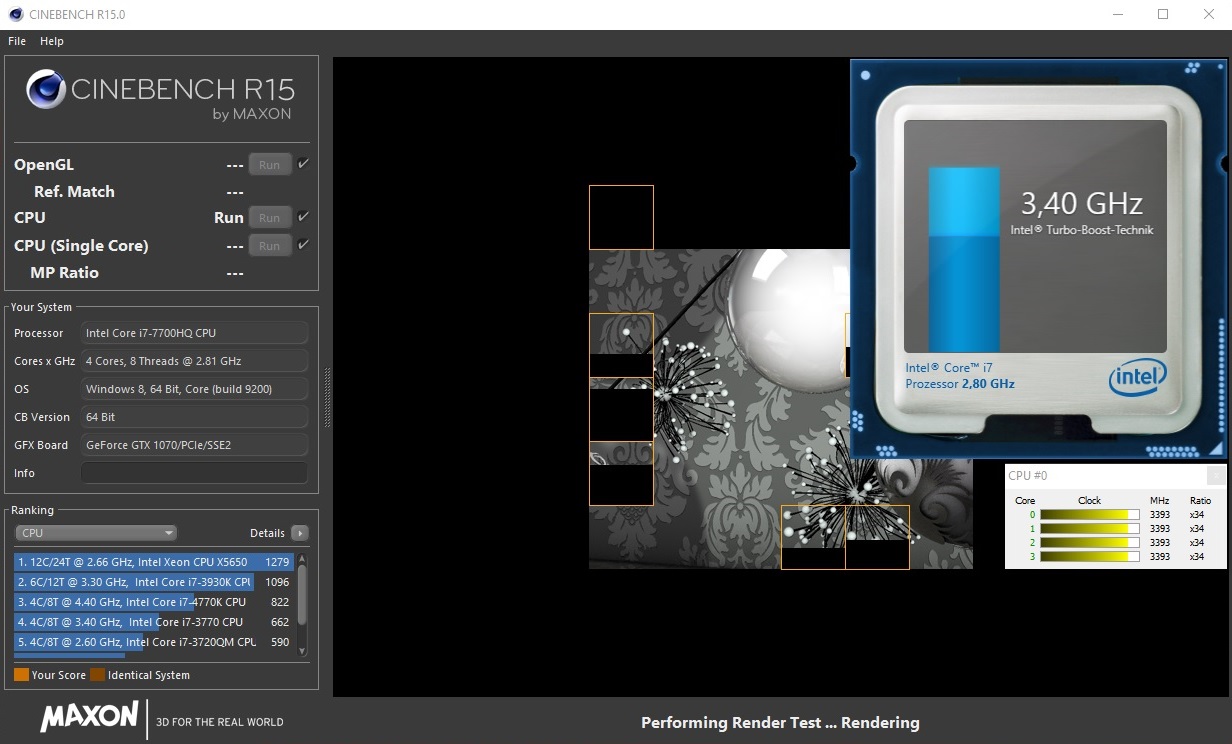
The heart of the G752VS is a Core i7-7700HQ quad-core processor based on the Kaby Lake architecture. There are no big differences compared to the previous Core i7-6700HQ; Kaby Lake is basically just an optimized version of Skylake. The base frequency of the processor is 2.8 GHz, which can be raised to 3.4 GHz (four cores), 3.6 GHz (two cores) or 3.8 GHz (one core), respectively.
The processor can always maintain its maximum performance during the benchmarks, both on mains and battery power. We use a loop of the Cinebench R15 Multi Test (30 minutes) to check the performance over long periods. The results are generally on the same level and there is no performance drop.
| Cinebench R10 | |
| Rendering Multiple CPUs 32Bit | |
| Alienware 17 R4 | |
| Asus G752VS-XB78K | |
| Asus G752VS-BA338T | |
| MSI GT72VR 7RE-433 | |
| Nexoc G734IV | |
| Rendering Single 32Bit | |
| Alienware 17 R4 | |
| Asus G752VS-XB78K | |
| Asus G752VS-BA338T | |
| MSI GT72VR 7RE-433 | |
| Nexoc G734IV | |
| Geekbench 3 | |
| 32 Bit Multi-Core Score | |
| Nexoc G734IV | |
| Asus G752VS-BA338T | |
| MSI GT72VR 7RE-433 | |
| 32 Bit Single-Core Score | |
| Asus G752VS-BA338T | |
| Nexoc G734IV | |
| MSI GT72VR 7RE-433 | |
| Geekbench 4.0 | |
| 64 Bit Multi-Core Score | |
| Nexoc G734IV | |
| Asus G752VS-BA338T | |
| MSI GT72VR 7RE-433 | |
| 64 Bit Single-Core Score | |
| Asus G752VS-BA338T | |
| Nexoc G734IV | |
| MSI GT72VR 7RE-433 | |
| Geekbench 4.4 | |
| 64 Bit Multi-Core Score | |
| Asus G752VS-BA338T | |
| 64 Bit Single-Core Score | |
| Asus G752VS-BA338T | |
| JetStream 1.1 - 1.1 Total | |
| Asus G752VS-BA338T | |
| Nexoc G734IV | |
| MSI GT72VR 7RE-433 | |
| Asus G752VS-XB78K | |
| Alienware 17 R4 | |
System Performance
A look at the spec sheet of the Asus shows the powerful components, which is supported by excellent scores in PCMark benchmarks. The notebook is suited for all kinds of applications that require a lot of processing power, including picture and video editing besides gaming. You can still improve the performance even further by adding a second NVMe-SSD. The two SSDs can be used in a RAID-0 configuration, which would reduce loading times. The addition of two more memory modules would have a positive impact on the overall performance as well.
| PCMark 7 Score | 6805 points | |
| PCMark 8 Home Score Accelerated v2 | 5103 points | |
| PCMark 8 Creative Score Accelerated v2 | 8191 points | |
| PCMark 8 Work Score Accelerated v2 | 5410 points | |
Help | ||
Storage Devices
The system drive is a blazing-fast NVMe-SSD provided by Samsung. It is an M.2 model (2280) with a total storage capacity of 512 GB. The transfer rates of the SSD are excellent. The laptop offers a second M.2-2280 slot, which supports a fast NVMe-SSD as well. Both drives can be configured in a RAID-0 or RAID-1 system. You also get a conventional 2.5-inch hard drive (1 TB, 5400 rpm).

| Asus G752VS-BA338T Samsung SM961 MZVKW512HMJP m.2 PCI-e | MSI GT72VR 7RE-433 Kingston RBU-SNS8152S3256GG5 | Gigabyte P57X v7 Transcend MTS800 256GB M.2 (TS256GMTS800) | Nexoc G734IV Samsung SM961 MZVKW512HMJP m.2 PCI-e | Alienware 17 R4 SK Hynix PC300 NVMe 512 GB | Asus G752VS-XB78K Toshiba NVMe THNSN5512GPU7 | |
|---|---|---|---|---|---|---|
| CrystalDiskMark 3.0 | -49% | -58% | -6% | -11% | 19% | |
| Read Seq (MB/s) | 2791 | 521 -81% | 517 -81% | 2268 -19% | 1277 -54% | 1718 -38% |
| Write Seq (MB/s) | 1596 | 311.8 -80% | 305.7 -81% | 1559 -2% | 786 -51% | 1305 -18% |
| Read 512 (MB/s) | 400.8 | 403.1 1% | 315 -21% | 413.8 3% | 894 123% | 1250 212% |
| Write 512 (MB/s) | 1606 | 332.3 -79% | 306.1 -81% | 1167 -27% | 659 -59% | 1438 -10% |
| Read 4k (MB/s) | 55.1 | 33.35 -39% | 26.04 -53% | 54 -2% | 38.11 -31% | 44.42 -19% |
| Write 4k (MB/s) | 163.8 | 111.1 -32% | 82.3 -50% | 154.9 -5% | 128.5 -22% | 154.4 -6% |
| Read 4k QD32 (MB/s) | 607 | 331.1 -45% | 281.3 -54% | 634 4% | 628 3% | 744 23% |
| Write 4k QD32 (MB/s) | 527 | 318.3 -40% | 296 -44% | 509 -3% | 531 1% | 578 10% |
GPU Performance
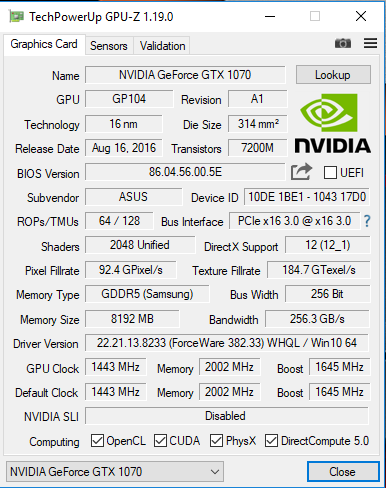
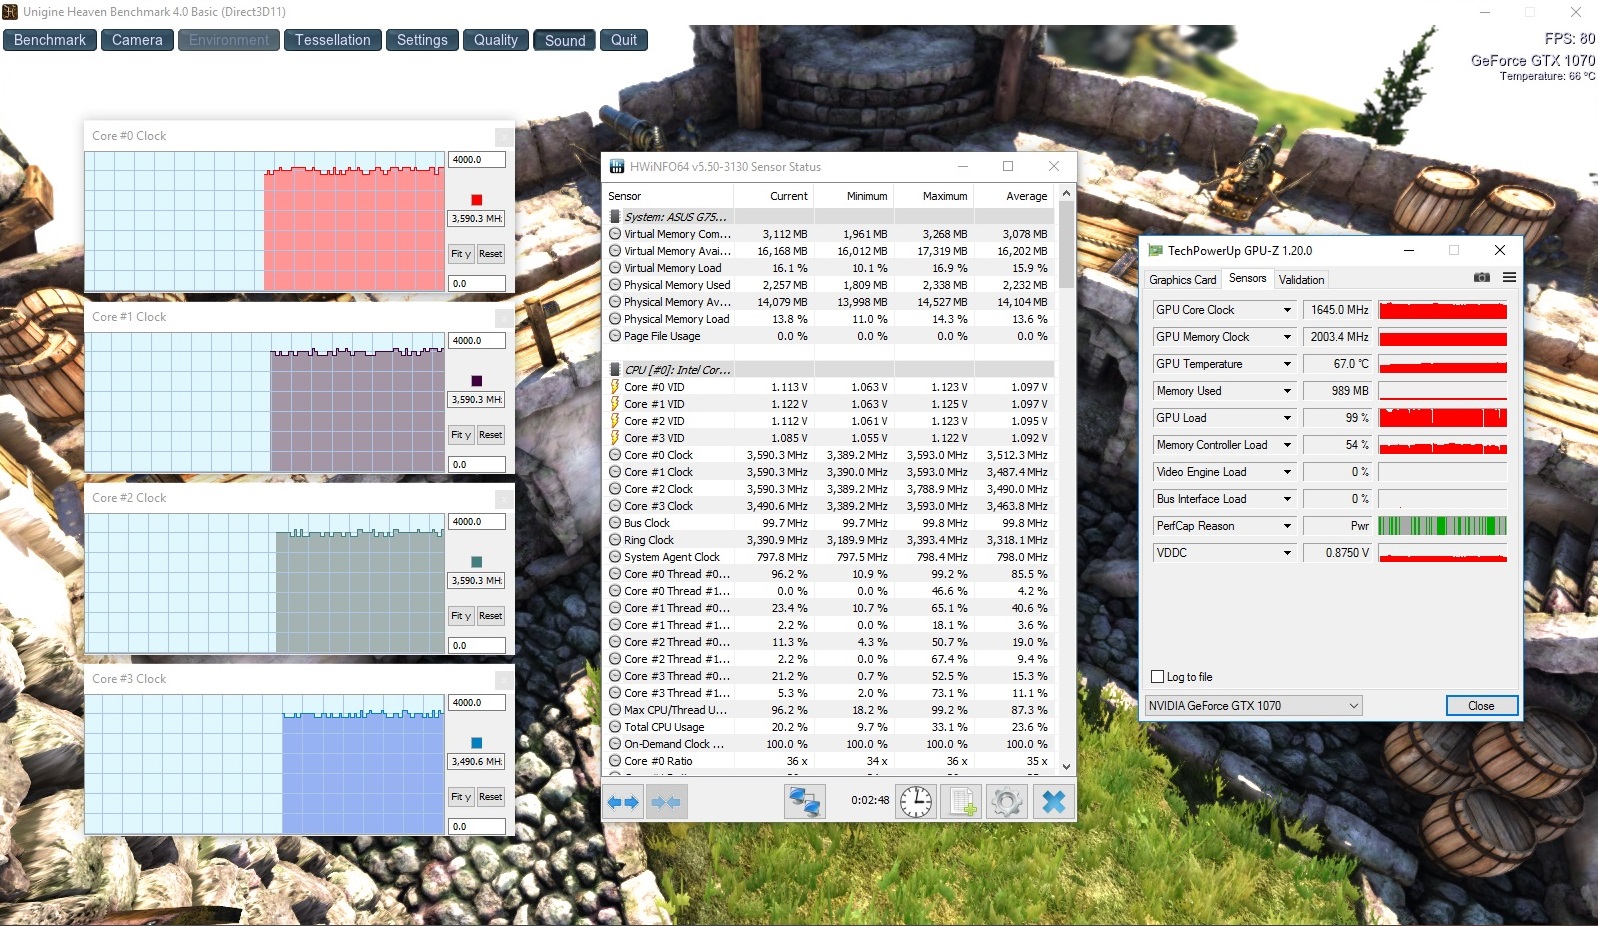
Nvidia's GeForce GTX 1070 is a high-end graphics card with DirectX-12 support and maximum core clock of up to 1898 MHz. However, this value cannot be maintained over long periods. We determined an average clock of around 1600 MHz during our tests. It is possible to overclock the GPU automatically via Turbo Gear Mode "Extreme" in the Gaming Center. This results in a maximum core clock of 2 GHz, but once again only for a short time. The GPU is equipped with 8192 MB GDDR5-VRAM. The results in the 3DMark benchmarks are on the expected level for this GPU.
The integrated HD Graphics 630 GPU is turned off and cannot be activated. The G752VS does not support switchable graphics.

| 3DMark 06 Standard Score | 30279 points | |
| 3DMark 11 Performance | 17222 points | |
| 3DMark Ice Storm Standard Score | 122763 points | |
| 3DMark Cloud Gate Standard Score | 26609 points | |
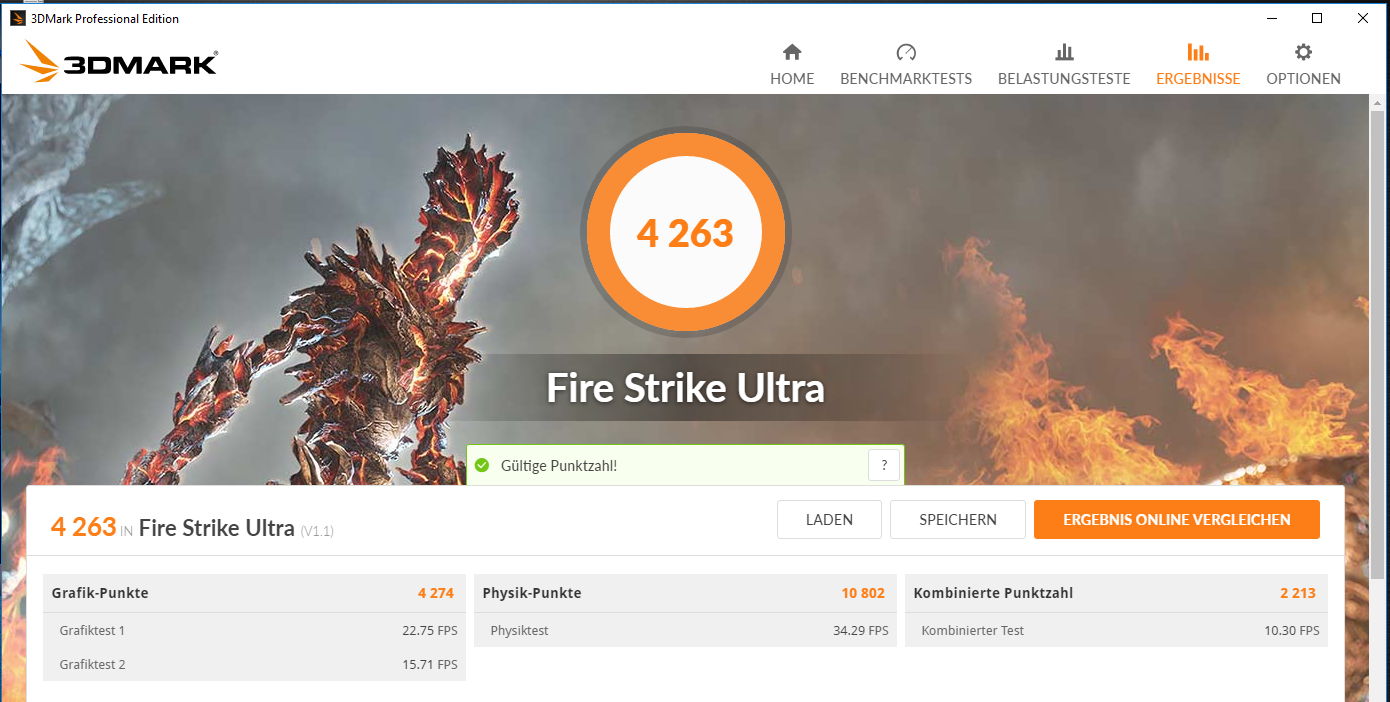
| 3DMark Fire Strike Score | 14277 points | |
| 3DMark Fire Strike Extreme Score | 7961 points | |
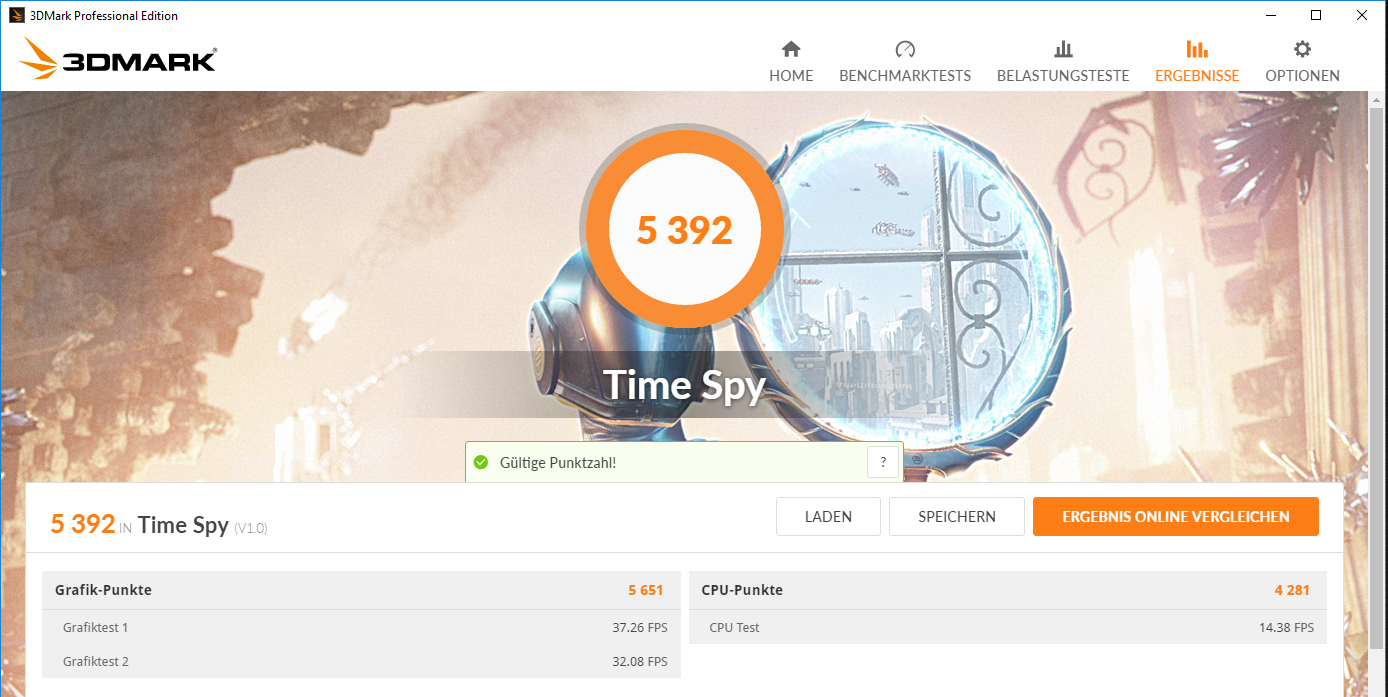
| 3DMark Time Spy Score | 5392 points | |
Help | ||
| 3DMark - 1920x1080 Fire Strike Graphics | |
| Alienware 17 R4 | |
| Asus G752VS-BA338T | |
| MSI GT72VR 7RE-433 | |
| Nexoc G734IV | |
| Gigabyte P57X v7 | |
| Acer Predator 17 G9-793-70PJ | |
| Asus G752VS-XB78K | |
| 3DMark 11 - 1280x720 Performance GPU | |
| Alienware 17 R4 | |
| Asus G752VS-BA338T | |
| Gigabyte P57X v7 | |
| MSI GT72VR 7RE-433 | |
| Acer Predator 17 G9-793-70PJ | |
| Asus G752VS-XB78K | |
| Nexoc G734IV | |
Gaming Performance
It is not surprising that the laptop can handle smooth gameplay in all modern titles considering the powerful hardware equipment. You can always play in the native FHD resolution of the panel and you do not have to reduce graphics details, either. You can either use high or even maximum details.
We use the game The Witcher 3 to check the performance under sustained workloads. The game is running for about 60 minutes in the FHD resolution and maximum settings. The character is standing still during this time. The frame rate drops from 61-63 fps to 57-61 after a couple of minutes and stay on this level. This is not a big drop by any means.
| BioShock Infinite - 1920x1080 Ultra Preset, DX11 (DDOF) | |
| Alienware 17 R4 | |
| Asus G752VS-BA338T | |
| Asus G752VS-XB78K | |
| MSI GT72VR 7RE-433 | |
| Gigabyte P57X v7 | |
| Nexoc G734IV | |
| The Witcher 3 - 1920x1080 Ultra Graphics & Postprocessing (HBAO+) | |
| Alienware 17 R4 | |
| Asus G752VS-BA338T | |
| Acer Predator 17 G9-793-70PJ | |
| Asus G752VS-XB78K | |
| Far Cry Primal - 1920x1080 Ultra Preset AA:SM | |
| Asus G752VS-XB78K | |
| Asus G752VS-BA338T | |
| Rise of the Tomb Raider - 1920x1080 Very High Preset AA:FX AF:16x | |
| Alienware 17 R4 | |
| Asus G752VS-BA338T | |
| Asus G752VS-XB78K | |
| Nexoc G734IV | |
| For Honor - 1920x1080 Extreme Preset AA:T AF:16x | |
| Asus G752VS-BA338T | |
| Acer Predator 17 G9-793-70PJ | |
| low | med. | high | ultra | |
|---|---|---|---|---|
| Tomb Raider (2013) | 431.5 | 407.8 | 339 | 192 |
| BioShock Infinite (2013) | 260.3 | 220.8 | 207.5 | 139.4 |
| The Witcher 3 (2015) | 228.1 | 184.4 | 117 | 59.6 |
| Rise of the Tomb Raider (2016) | 219.7 | 180.1 | 117.7 | 99 |
| Far Cry Primal (2016) | 118 | 103 | 93 | 86 |
| For Honor (2017) | 242.6 | 160 | 154 | 113.4 |
| Ghost Recon Wildlands (2017) | 127 | 96.3 | 91 | 54.4 |
| Prey (2017) | 142 | 140.2 | 135.2 | 132.5 |
Emissions
System Noise
The G752VS does not produce a lot of noise while idling and the fans are sometimes even standing still. They are running at low speeds most of the time, but they are hardly audible because the 2.5-inch drive is louder. The situation changes when you stress the system. We can measure 49 dB(A) during the stress test and between 42-45 dB(A) in the Witcher 3 test.
Noise level
| Idle |
| 30 / 32 / 36 dB(A) |
| HDD |
| 34 dB(A) |
| DVD |
| 40 / dB(A) |
| Load |
| 43 / 49 dB(A) |
 | ||
30 dB silent 40 dB(A) audible 50 dB(A) loud |
||
min: | ||
| Asus G752VS-BA338T i7-7700HQ, GeForce GTX 1070 Mobile | MSI GT72VR 7RE-433 i7-7700HQ, GeForce GTX 1070 Mobile | Gigabyte P57X v7 i7-7700HQ, GeForce GTX 1070 Mobile | Nexoc G734IV i7-7700HQ, GeForce GTX 1070 Mobile | Acer Predator 17 G9-793-70PJ i7-7700HQ, GeForce GTX 1070 Mobile | Alienware 17 R4 i7-7820HK, GeForce GTX 1080 Mobile | Asus G752VS-XB78K 6820HK, GeForce GTX 1070 Mobile | |
|---|---|---|---|---|---|---|---|
| Noise | -1% | 0% | -13% | -4% | -8% | 3% | |
| off / environment * (dB) | 30 | 31 -3% | 29 3% | 30 -0% | 31 -3% | 28.2 6% | 30 -0% |
| Idle Minimum * (dB) | 30 | 34 -13% | 30.4 -1% | 34 -13% | 32 -7% | 35.6 -19% | 31 -3% |
| Idle Average * (dB) | 32 | 35 -9% | 32.1 -0% | 35 -9% | 35 -9% | 35.6 -11% | 32 -0% |
| Idle Maximum * (dB) | 36 | 37 -3% | 32.1 11% | 46 -28% | 38 -6% | 35.7 1% | 33 8% |
| Load Average * (dB) | 43 | 37 14% | 45.6 -6% | 49 -14% | 42 2% | 50.2 -17% | 40 7% |
| Witcher 3 ultra * (dB) | 43 | 44 -2% | 50.2 -17% | ||||
| Load Maximum * (dB) | 49 | 44 10% | 51.5 -5% | 56 -14% | 50 -2% | 50.2 -2% | 47 4% |
* ... smaller is better
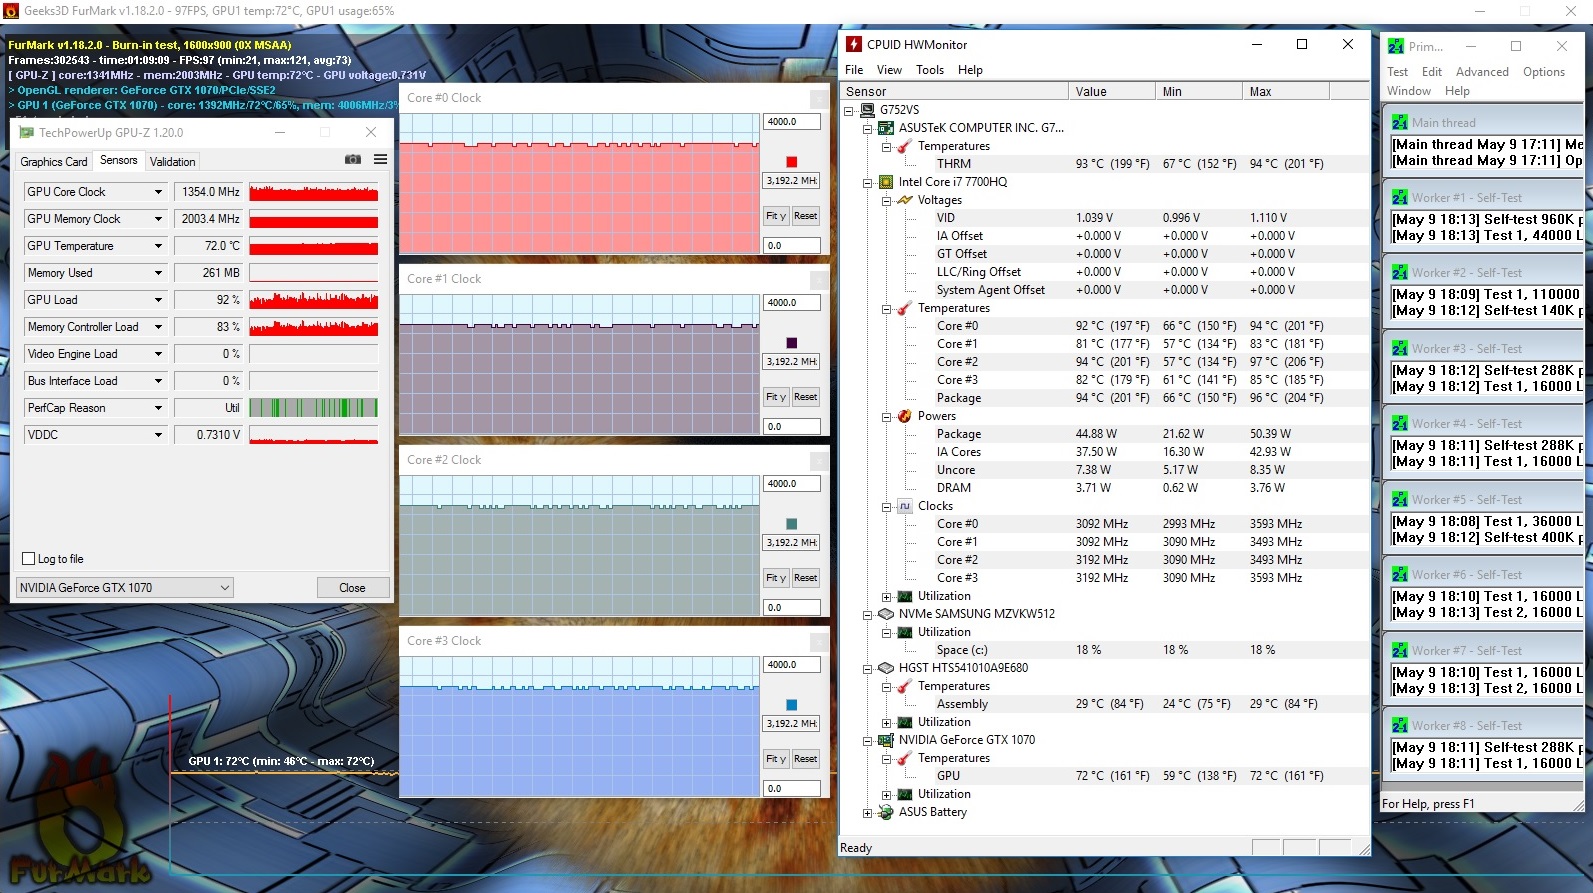
Temperature
Our stress test with the tools Prime95 and FurMark for at least one hour is executed differently by the Asus notebook on mains and battery power. With the attached power adapter, both the processor (3.1-3.2 GHz) and the graphics card (~1400 MHz) manage high clocks, but the clocks are fluctuating between low and high values on battery power.
The laptop does not get overly warm. We can only measure more than 40 °C (104 °F) at two spots during our stress test. The temperatures are even lower during the Witcher 3 test (game is running for 1 hour at maximum details/FHD).
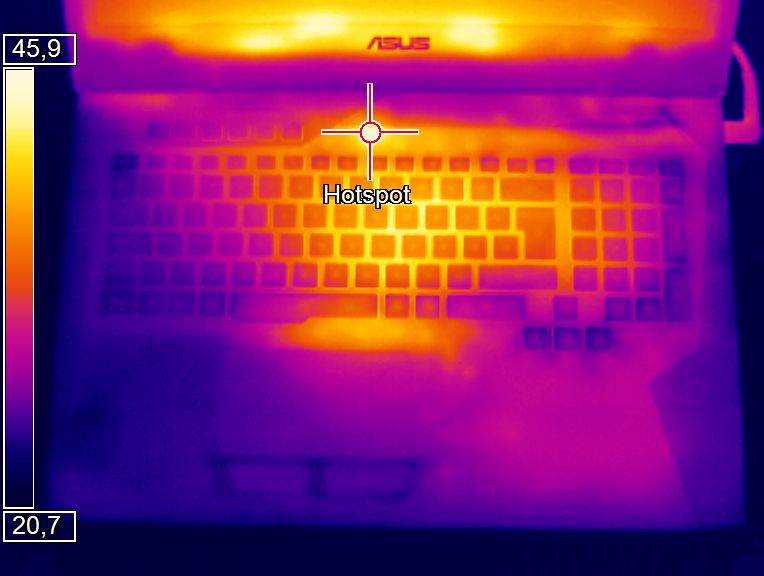
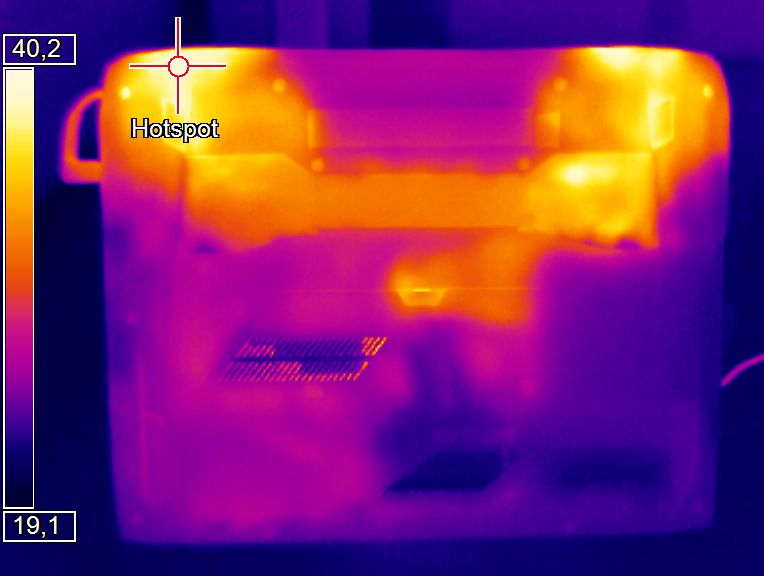
(±) The maximum temperature on the upper side is 41 °C / 106 F, compared to the average of 40.4 °C / 105 F, ranging from 21.2 to 68.8 °C for the class Gaming.
(+) The bottom heats up to a maximum of 39.3 °C / 103 F, compared to the average of 43.2 °C / 110 F
(+) In idle usage, the average temperature for the upper side is 26.8 °C / 80 F, compared to the device average of 33.9 °C / 93 F.
(+) Playing The Witcher 3, the average temperature for the upper side is 31.3 °C / 88 F, compared to the device average of 33.9 °C / 93 F.
(+) The palmrests and touchpad are cooler than skin temperature with a maximum of 27.6 °C / 81.7 F and are therefore cool to the touch.
(±) The average temperature of the palmrest area of similar devices was 28.8 °C / 83.8 F (+1.2 °C / 2.1 F).
| Asus G752VS-BA338T i7-7700HQ, GeForce GTX 1070 Mobile | MSI GT72VR 7RE-433 i7-7700HQ, GeForce GTX 1070 Mobile | Gigabyte P57X v7 i7-7700HQ, GeForce GTX 1070 Mobile | Nexoc G734IV i7-7700HQ, GeForce GTX 1070 Mobile | Acer Predator 17 G9-793-70PJ i7-7700HQ, GeForce GTX 1070 Mobile | Alienware 17 R4 i7-7820HK, GeForce GTX 1080 Mobile | Asus G752VS-XB78K 6820HK, GeForce GTX 1070 Mobile | |
|---|---|---|---|---|---|---|---|
| Heat | -4% | -20% | -15% | 1% | -18% | -7% | |
| Maximum Upper Side * (°C) | 41 | 41.5 -1% | 51.2 -25% | 48.1 -17% | 39.1 5% | 49.6 -21% | 42.9 -5% |
| Maximum Bottom * (°C) | 39.3 | 50.6 -29% | 56.8 -45% | 59.3 -51% | 42.1 -7% | 56 -42% | 41.5 -6% |
| Idle Upper Side * (°C) | 28.8 | 26.4 8% | 29.2 -1% | 28.2 2% | 27.9 3% | 29.6 -3% | 31.6 -10% |
| Idle Bottom * (°C) | 27.3 | 25.4 7% | 29.2 -7% | 26 5% | 26.1 4% | 29.2 -7% | 29.5 -8% |
* ... smaller is better
Speakers
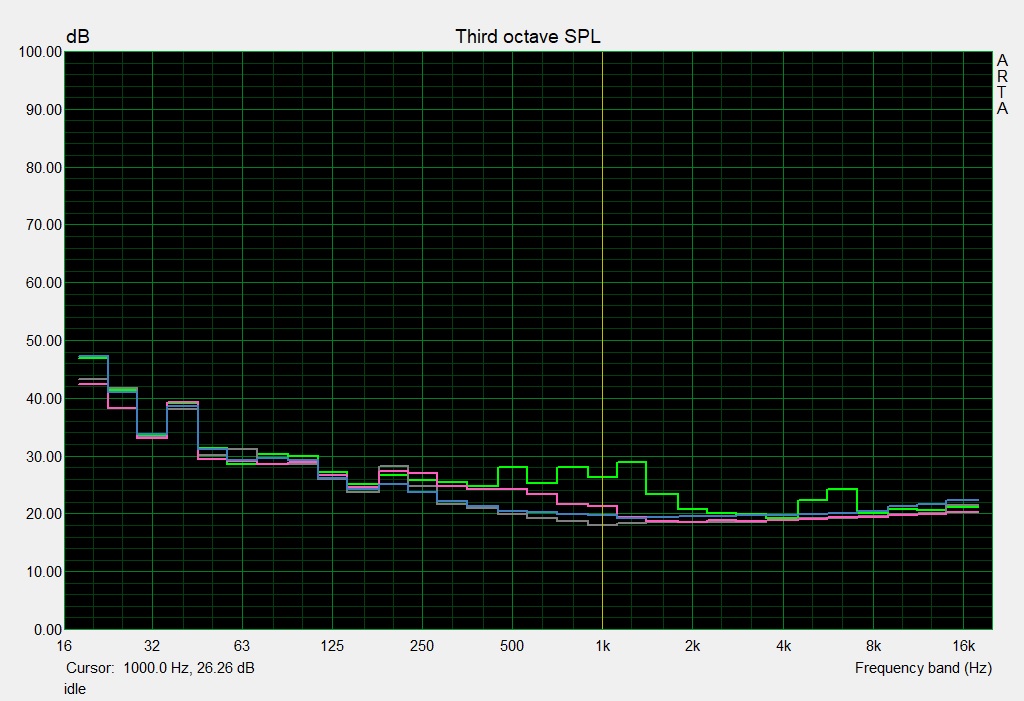
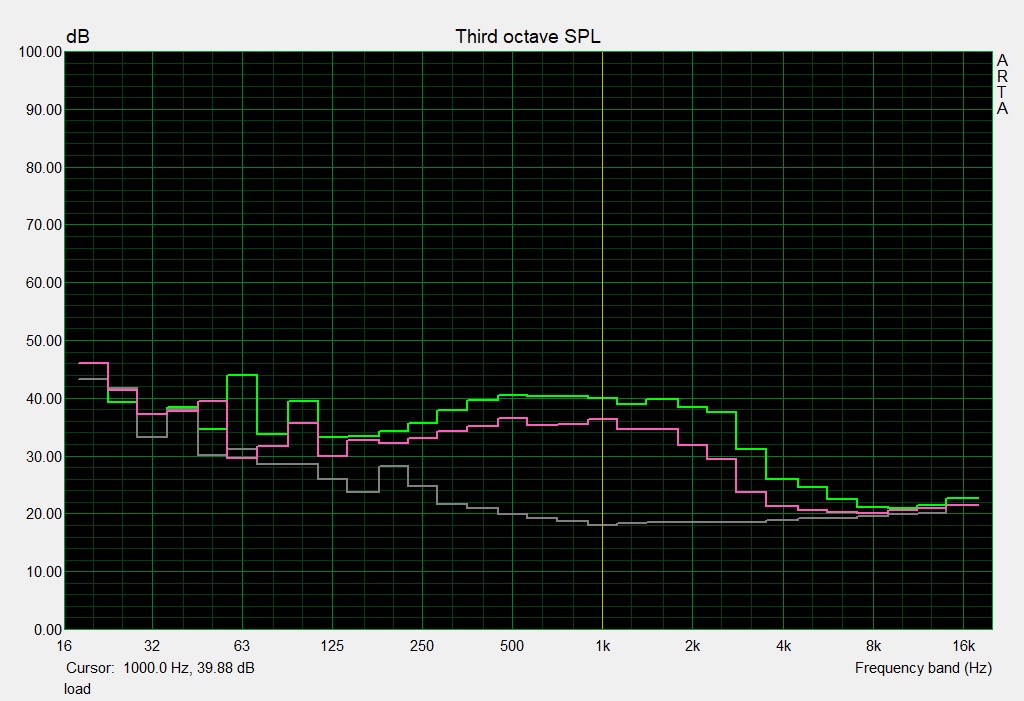
Asus G752VS-BA338T audio analysis
(±) | speaker loudness is average but good (80 dB)
Bass 100 - 315 Hz
(±) | reduced bass - on average 9.4% lower than median
(±) | linearity of bass is average (11.1% delta to prev. frequency)
Mids 400 - 2000 Hz
(+) | balanced mids - only 4.2% away from median
(+) | mids are linear (6% delta to prev. frequency)
Highs 2 - 16 kHz
(±) | reduced highs - on average 7.7% lower than median
(±) | linearity of highs is average (10% delta to prev. frequency)
Overall 100 - 16.000 Hz
(±) | linearity of overall sound is average (21.2% difference to median)
Compared to same class
» 76% of all tested devices in this class were better, 4% similar, 19% worse
» The best had a delta of 6%, average was 18%, worst was 132%
Compared to all devices tested
» 59% of all tested devices were better, 7% similar, 34% worse
» The best had a delta of 4%, average was 24%, worst was 134%
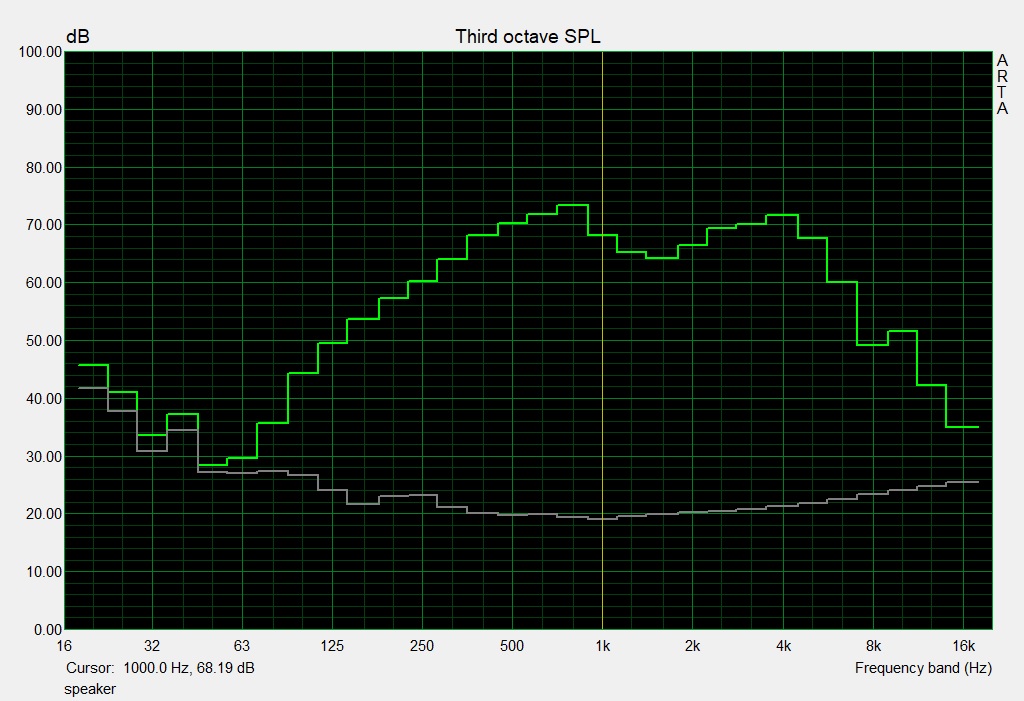
Acer Predator 17 G9-793-70PJ audio analysis
(+) | speakers can play relatively loud (87 dB)
Bass 100 - 315 Hz
(±) | reduced bass - on average 5.5% lower than median
(±) | linearity of bass is average (8% delta to prev. frequency)
Mids 400 - 2000 Hz
(+) | balanced mids - only 2.9% away from median
(+) | mids are linear (3.5% delta to prev. frequency)
Highs 2 - 16 kHz
(±) | reduced highs - on average 5.2% lower than median
(+) | highs are linear (6.2% delta to prev. frequency)
Overall 100 - 16.000 Hz
(+) | overall sound is linear (10.3% difference to median)
Compared to same class
» 6% of all tested devices in this class were better, 2% similar, 93% worse
» The best had a delta of 6%, average was 18%, worst was 132%
Compared to all devices tested
» 5% of all tested devices were better, 1% similar, 94% worse
» The best had a delta of 4%, average was 24%, worst was 134%
Frequency Comparison (Checkboxes select/deselectable!)
Energy Management
Power Consumption
Our consumption measurements do not reveal any surprises. We can determine 27 watts while idling on average – a normal result for a gaming notebook with deactivated iGPU. This value increases to 206 watts during the stress test. The 230-watt power adapter is sufficient for the GL752VS. The Witcher 3 test pulls around 165 watts from the socket.
| Off / Standby | |
| Idle | |
| Load |
|
Key:
min: | |
| Asus G752VS-BA338T i7-7700HQ, GeForce GTX 1070 Mobile | MSI GT72VR 7RE-433 i7-7700HQ, GeForce GTX 1070 Mobile | Gigabyte P57X v7 i7-7700HQ, GeForce GTX 1070 Mobile | Nexoc G734IV i7-7700HQ, GeForce GTX 1070 Mobile | Acer Predator 17 G9-793-70PJ i7-7700HQ, GeForce GTX 1070 Mobile | Alienware 17 R4 i7-7820HK, GeForce GTX 1080 Mobile | Asus G752VS-XB78K 6820HK, GeForce GTX 1070 Mobile | |
|---|---|---|---|---|---|---|---|
| Power Consumption | 4% | -13% | 20% | -14% | -37% | -10% | |
| Idle Minimum * (Watt) | 21 | 20 5% | 15.7 25% | 12 43% | 23 -10% | 37.5 -79% | 24 -14% |
| Idle Average * (Watt) | 27 | 27 -0% | 23.4 13% | 17 37% | 33 -22% | 37.6 -39% | 31 -15% |
| Idle Maximum * (Watt) | 32 | 31 3% | 23.5 27% | 22 31% | 40 -25% | 37.6 -18% | 36 -13% |
| Load Average * (Watt) | 86 | 86 -0% | 184.6 -115% | 86 -0% | 94 -9% | 122.4 -42% | 94 -9% |
| Witcher 3 ultra * (Watt) | 165 | 177 -7% | 180.3 -9% | ||||
| Load Maximum * (Watt) | 206 | 184 11% | 233.1 -13% | 224 -9% | 228 -11% | 277.4 -35% | 204 1% |
* ... smaller is better
Battery Runtime
The Asus laptop manages a runtime of 4:53 hours in our realistic WLAN test where we simulate web browsing via script. The power profile "Balanced" is active and the luminance is set to ~150 nits. The video test with a loop of the short movie Big Buck Bunny (H.264, 1920x1080 pixels) determines a runtime of 4:17 hours for the G752VS (wireless modules off, power-saver, display luminance 150 nits).
| Asus G752VS-BA338T i7-7700HQ, GeForce GTX 1070 Mobile, 90 Wh | MSI GT72VR 7RE-433 i7-7700HQ, GeForce GTX 1070 Mobile, 83 Wh | Gigabyte P57X v7 i7-7700HQ, GeForce GTX 1070 Mobile, 75.81 Wh | Nexoc G734IV i7-7700HQ, GeForce GTX 1070 Mobile, 60 Wh | Acer Predator 17 G9-793-70PJ i7-7700HQ, GeForce GTX 1070 Mobile, 88 Wh | Alienware 17 R4 i7-7820HK, GeForce GTX 1080 Mobile, 99 Wh | Asus G752VS-XB78K 6820HK, GeForce GTX 1070 Mobile, 90 Wh | |
|---|---|---|---|---|---|---|---|
| Battery runtime | -17% | -30% | -19% | -20% | -34% | -25% | |
| Reader / Idle (h) | 7.4 | 5.3 -28% | 4.3 -42% | 7.7 4% | 5.4 -27% | 4.6 -38% | 5.2 -30% |
| H.264 (h) | 4.3 | 3.8 -12% | 3.3 -23% | 3.1 -28% | |||
| WiFi v1.3 (h) | 4.9 | 3.8 -22% | 2.6 -47% | 3.4 -31% | 3.6 -27% | 3 -39% | 3.5 -29% |
| Load (h) | 1.6 | 1.5 -6% | 1.6 0% | 1.2 -25% | 1.5 -6% | 1.2 -25% | 1.4 -13% |
Verdict
Pros
Cons
The G752VS-BA338T is the Kaby Lake model from Asus' 17-inch gaming laptop series. The new Core i7-7700HQ processor is not much faster compared to the Skylake models.
The Kaby Lake processor results in longer battery runtimes thanks to improved efficiency.
The CPU/GPU combination can handle all modern games in the Full HD resolution with high up to maximum details. Nvidia's G-Sync technology ensures smooth pictures on the 120 Hz display and the graphics card still has sufficient headroom for higher resolutions. However, this requires an external monitor.
The noise emissions are not too bad despite the powerful hardware. This is also the case for the temperature development. Asus equips the notebook with a fast NVMe-SSD and there is even a free slot for a second NVMe-SSD. A conventional 2.5-inch hard drive is included as well. It is no problem to replace the drives thanks to the maintenance hatch.
Asus G752VS-BA338T
- 05/30/2017 v6 (old)
Sascha Mölck
Price comparison

