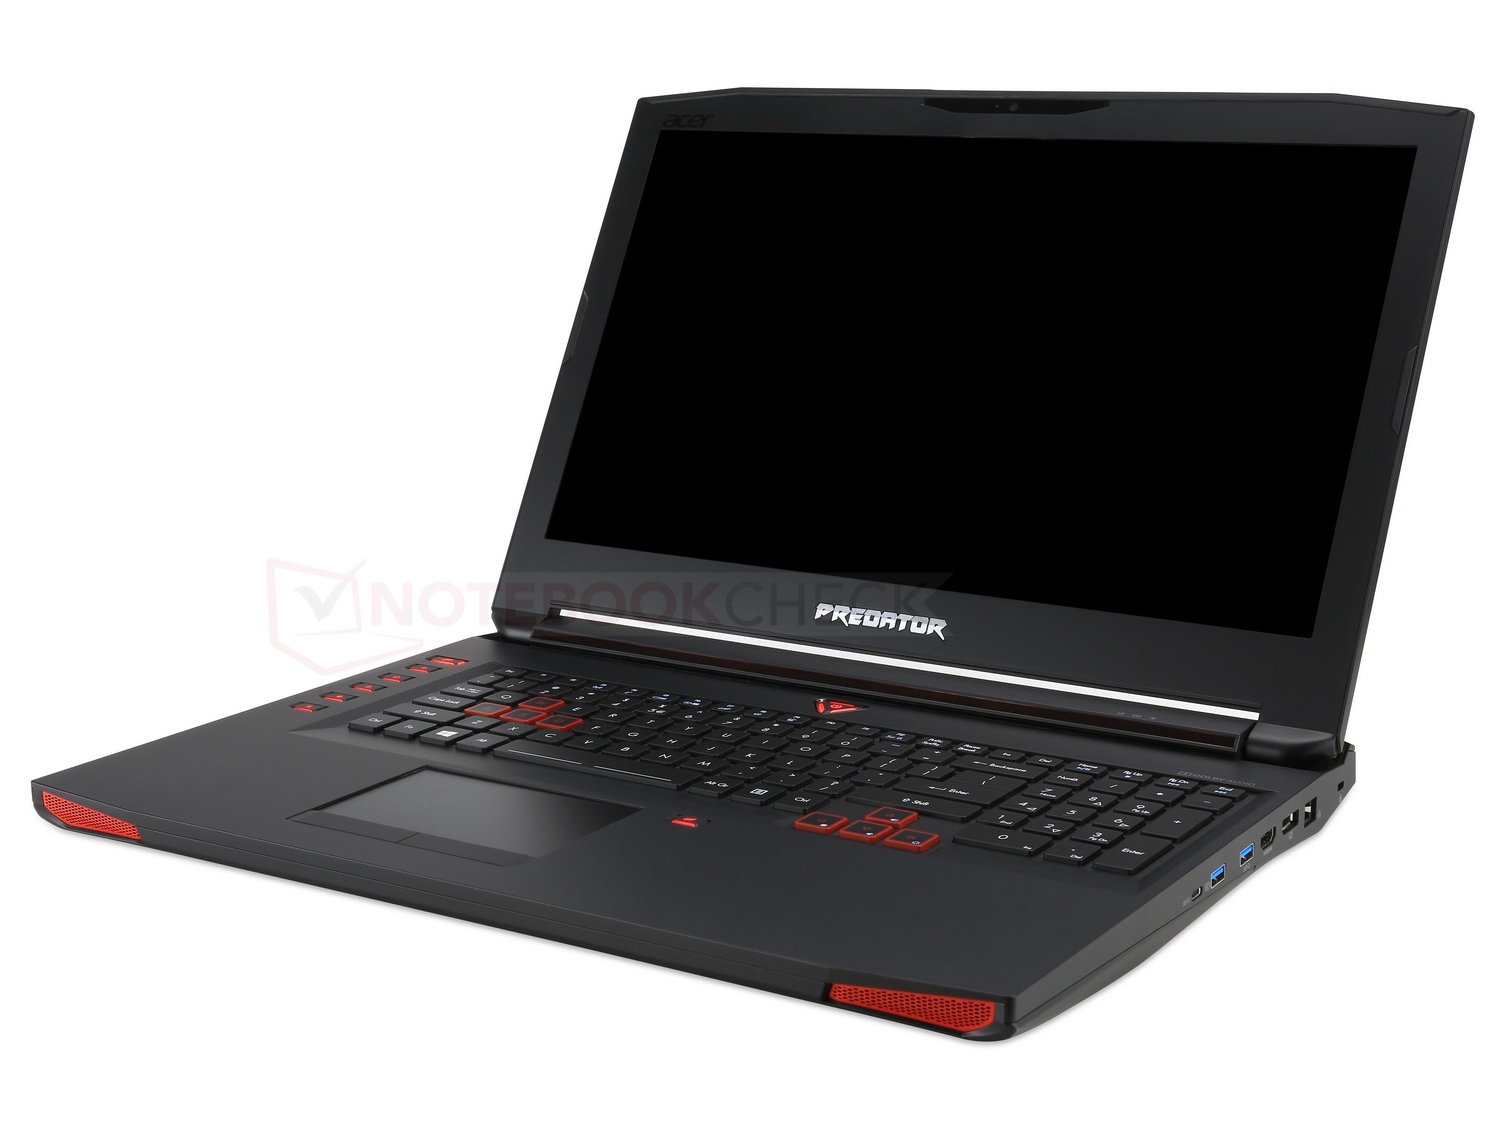
Acer Predator 17 (7700HQ, GTX 1070, UHD) Laptop Review

Anyone looking for a powerful high-end notebook that offers more power than a GeForce GTX 1050 Ti (Aspire VX5-591G) or GeForce GTX 1060 (Aspire VN7-593G) will find it in the Predator series. Starting at 2000 Euros (~$2238), the massive gaming giants are either equipped with a GeForce GTX 1070 (Predator 17) or the front-runner from Nvidia's Pascal-generation, the GeForce GTX 1080 (Predator 17 X), which promises sufficient performance for demanding games. Depending on the model, there is 16 to 64 GB DDR4-RAM and a 256 GB to 512 GB SSD plus up to 1 TB HDD.
Either a Core i7-7700HQ with a 2.8 to 3.8 GHz clock speed or a Core i7-7820HK with a 2.9 to 3.9 GHz clock speed and free multiplier serves as the processor. The display is either a conventional FHD display (1920x1080 pixels) or a razor-sharp UHD panel (3840x2160 pixels). Our test unit, which is labeled as G9-793-70PJ and was provided by notebooksbilliger.de, currently costs around 2800 Euros (~$3133). Even though you can also get notebooks with a GTX 1080 for this price, the 4K display and the 512-GB SSD are what make it so expensive. In the US, an Acer Predator 17, which doesn't have the 4K display but is otherwise similar, is available for around $1750.
Updates
As mentioned above, Acer trusts the existing Predator-17 basis and delivers a product that is identical to a far extent. Thus for the categories of the case, features, and input devices, we refer to our review of the G9-793-77LG, which aside from a few details is identical to the newer generation. The most important change is the processor, although that does not make too much of a difference in practice. To remain up to date, Acer replaces Intel's Skylake architecture with Kaby Lake, which is around 10% faster.
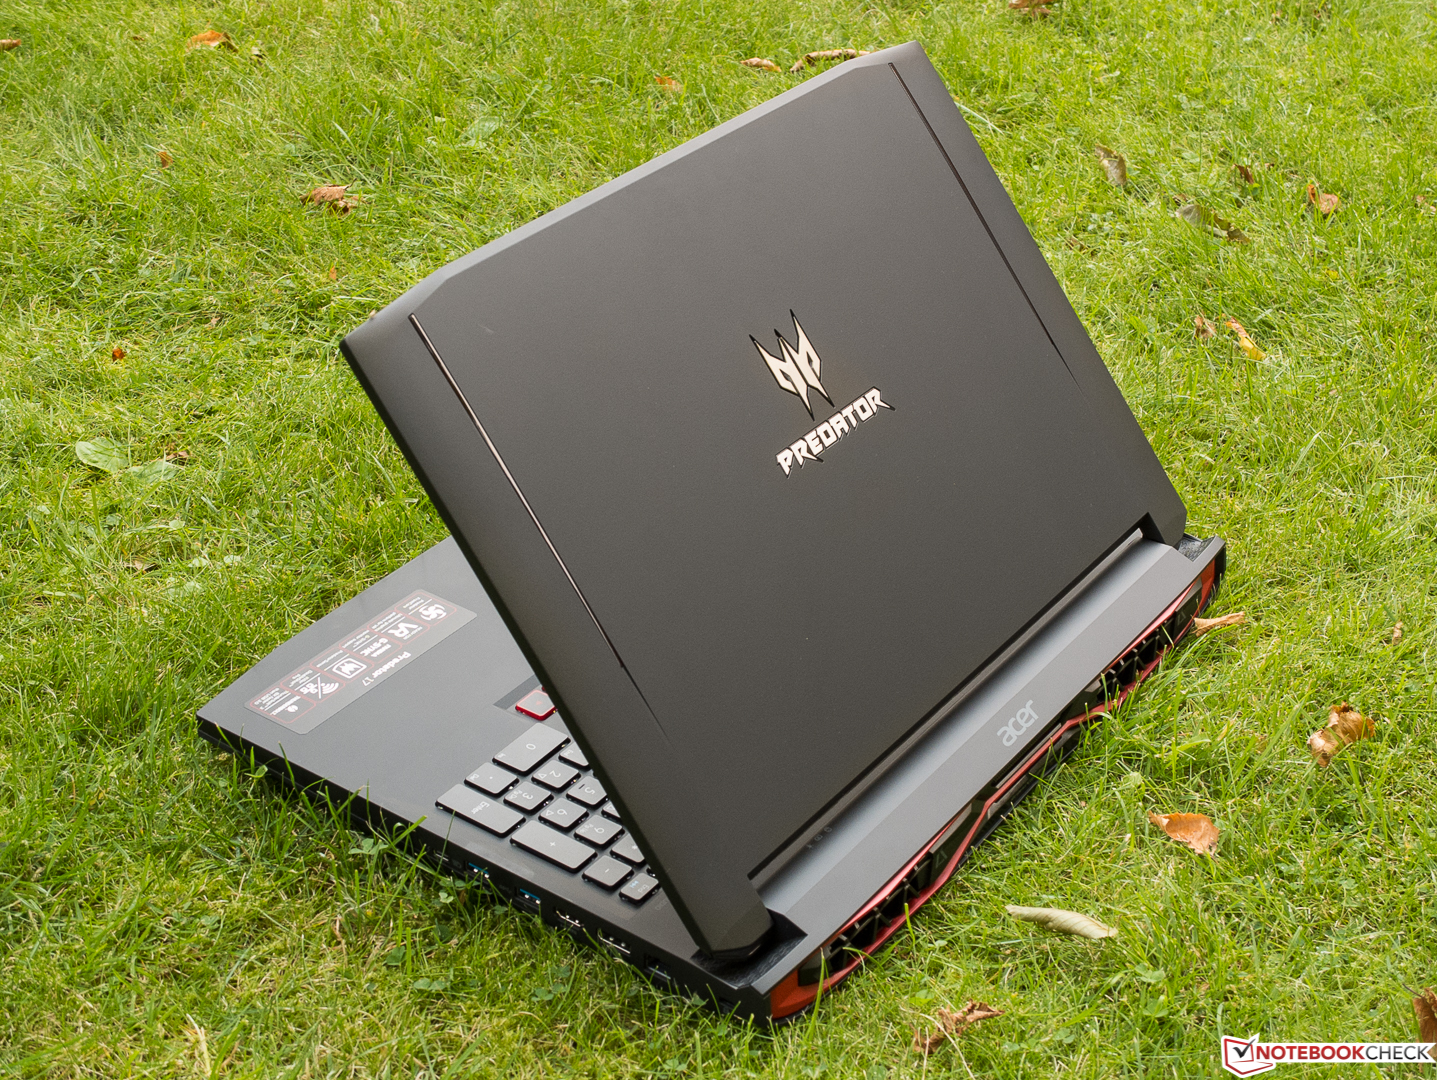
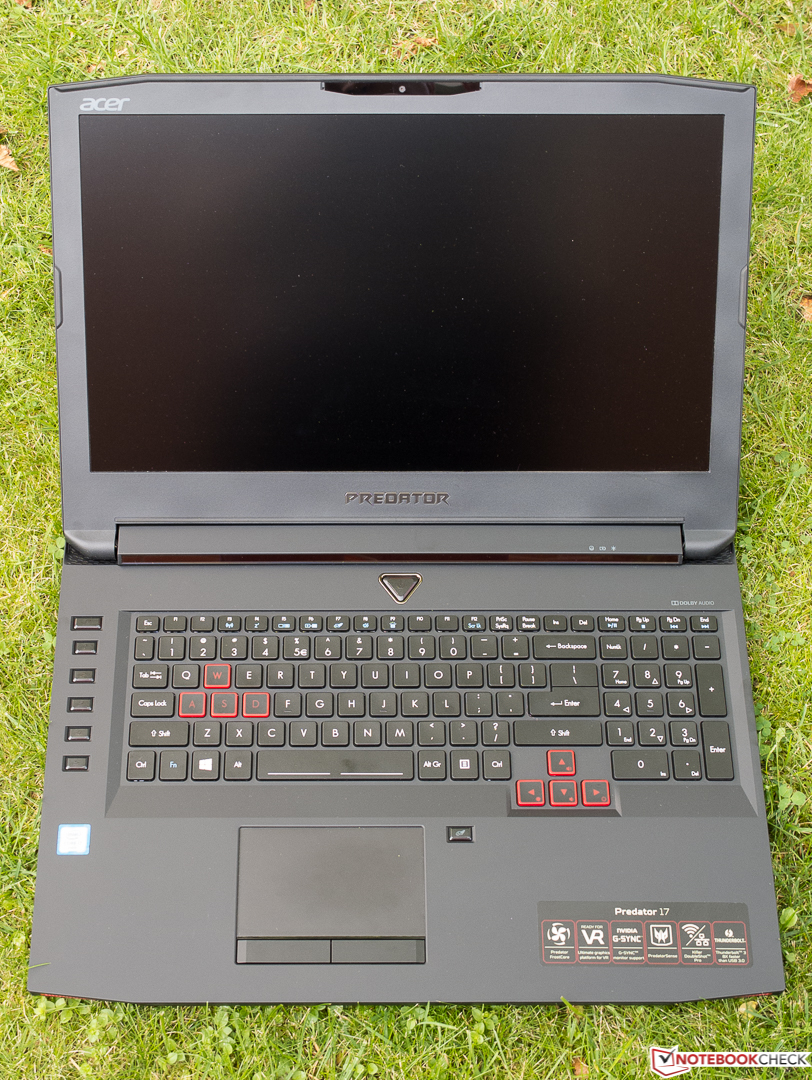


In terms of weight and size, nothing has changed. At almost 4.3 kg (~9.48 lb) and a height of 4.0 cm (1.57 in), the Predator 17 is still very heavy and unwieldy.
| SD Card Reader | |
| average JPG Copy Test (av. of 3 runs) | |
| Schenker XMG U727 2017 | |
| MSI GT72VR 7RE-433 | |
| Acer Predator 17 X GX-792-76DL | |
| Acer Predator 17 G9-793-70PJ | |
| Asus G752VS-XB78K | |
| maximum AS SSD Seq Read Test (1GB) | |
| Schenker XMG U727 2017 | |
| MSI GT72VR 7RE-433 | |
| Acer Predator 17 X GX-792-76DL | |
| Acer Predator 17 G9-793-70PJ | |
| Asus G752VS-XB78K | |
| Networking | |
| iperf3 transmit AX12 | |
| Acer Predator 17 X GX-792-76DL | |
| Acer Predator 17 G9-793-70PJ | |
| MSI GT72VR 7RE-433 | |
| Schenker XMG U727 2017 | |
| iperf3 receive AX12 | |
| Acer Predator 17 G9-793-70PJ | |
| Schenker XMG U727 2017 | |
| Acer Predator 17 X GX-792-76DL | |
| MSI GT72VR 7RE-433 | |
Display
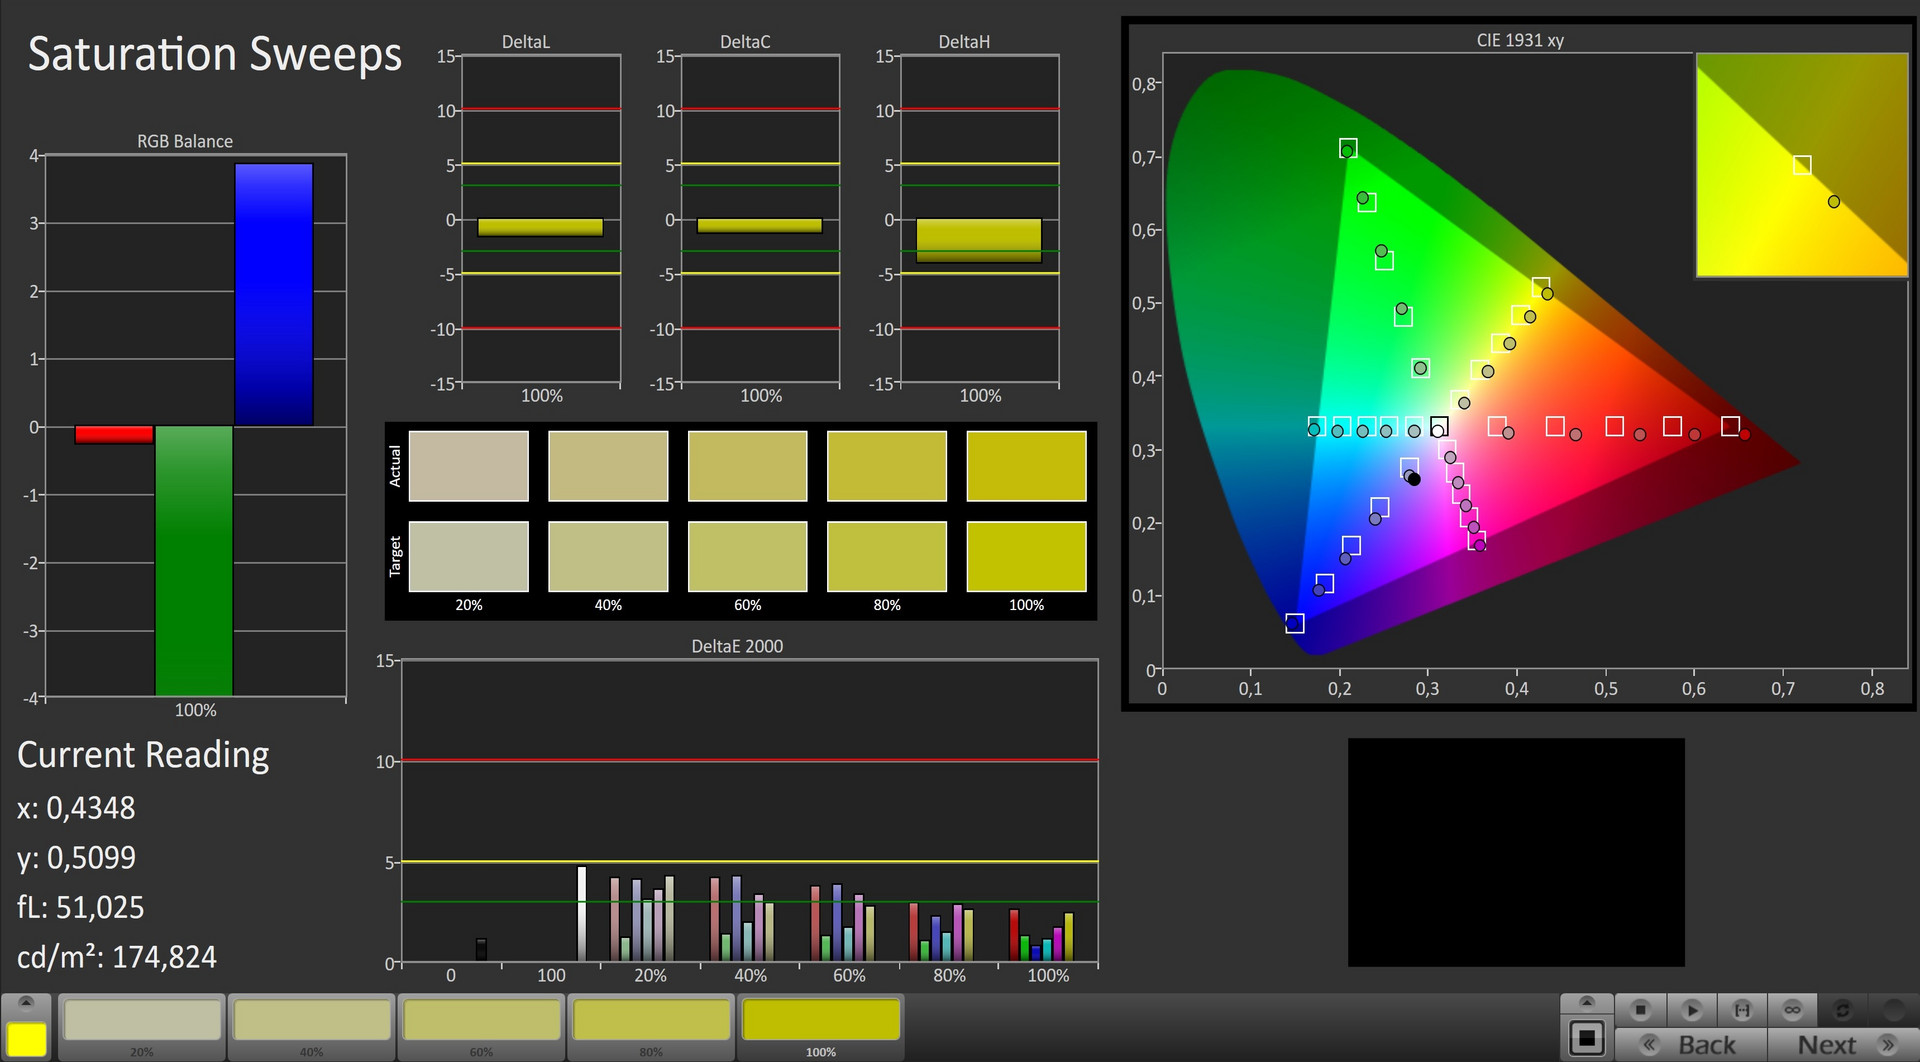
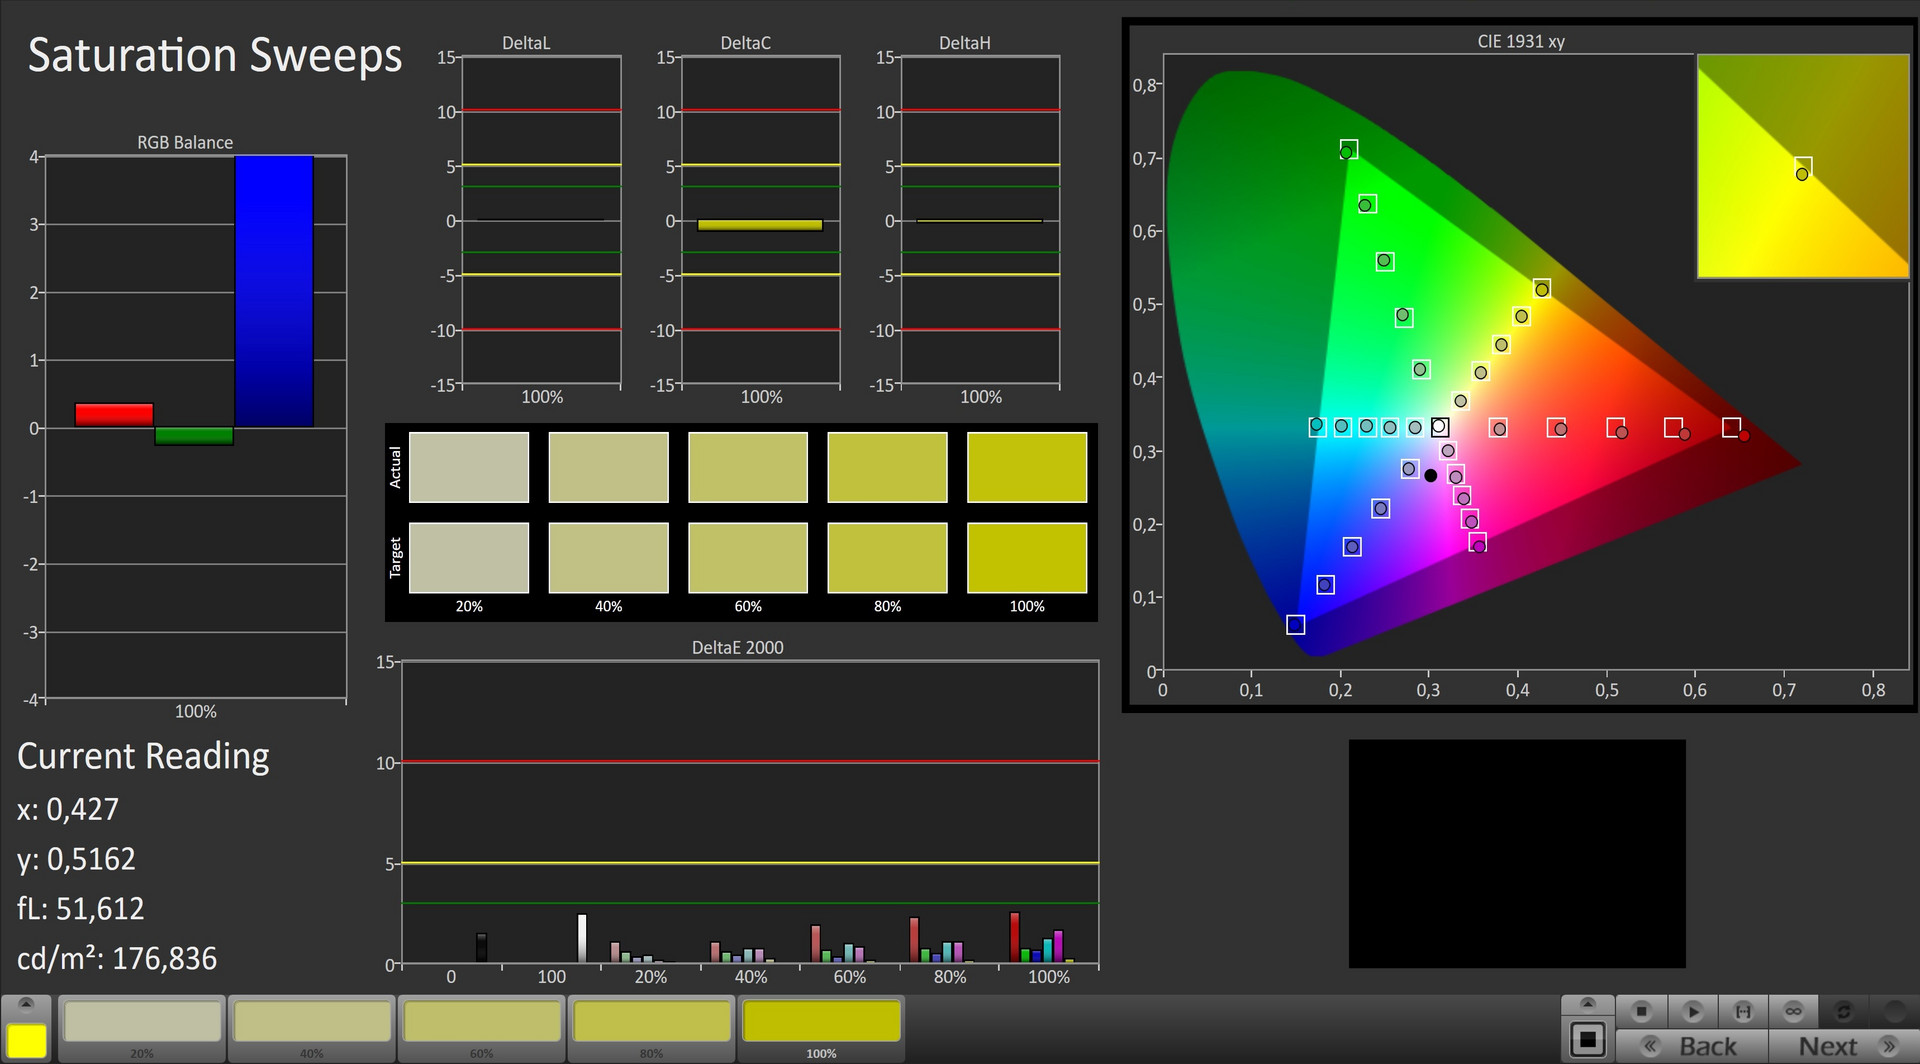
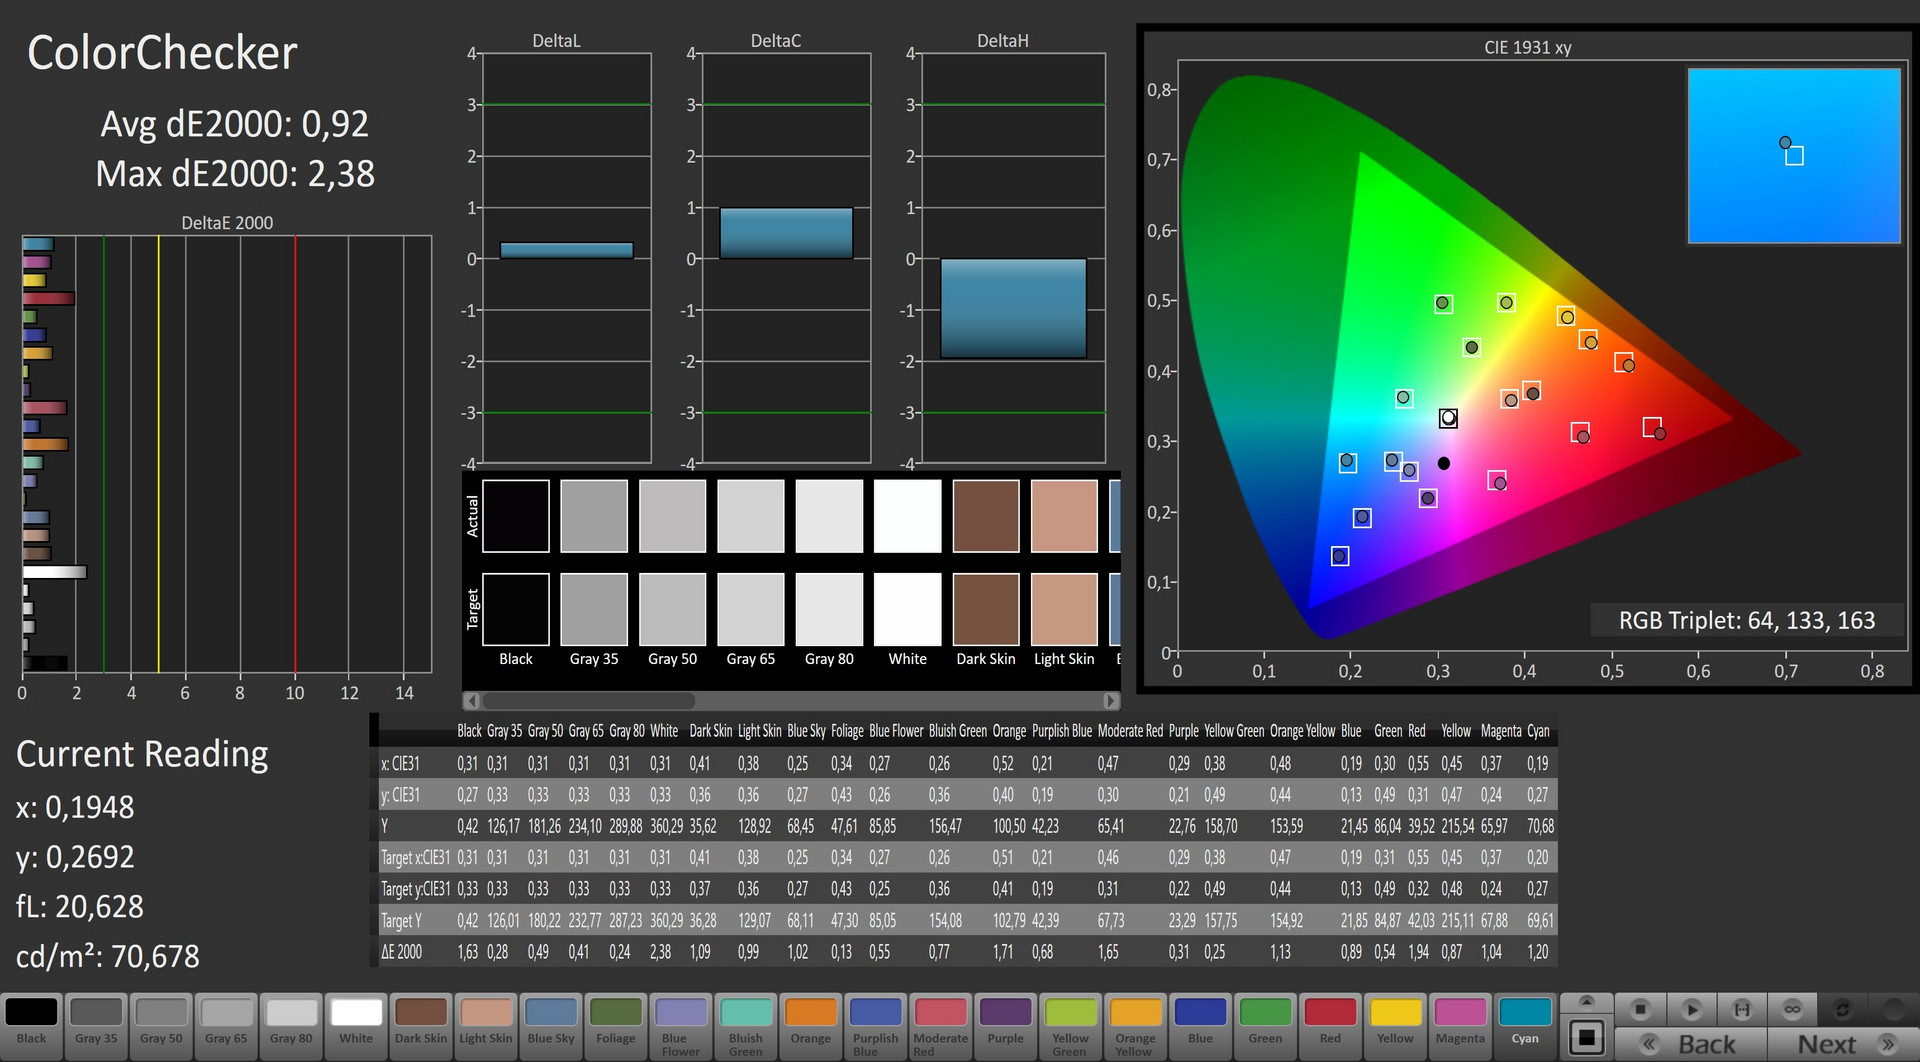
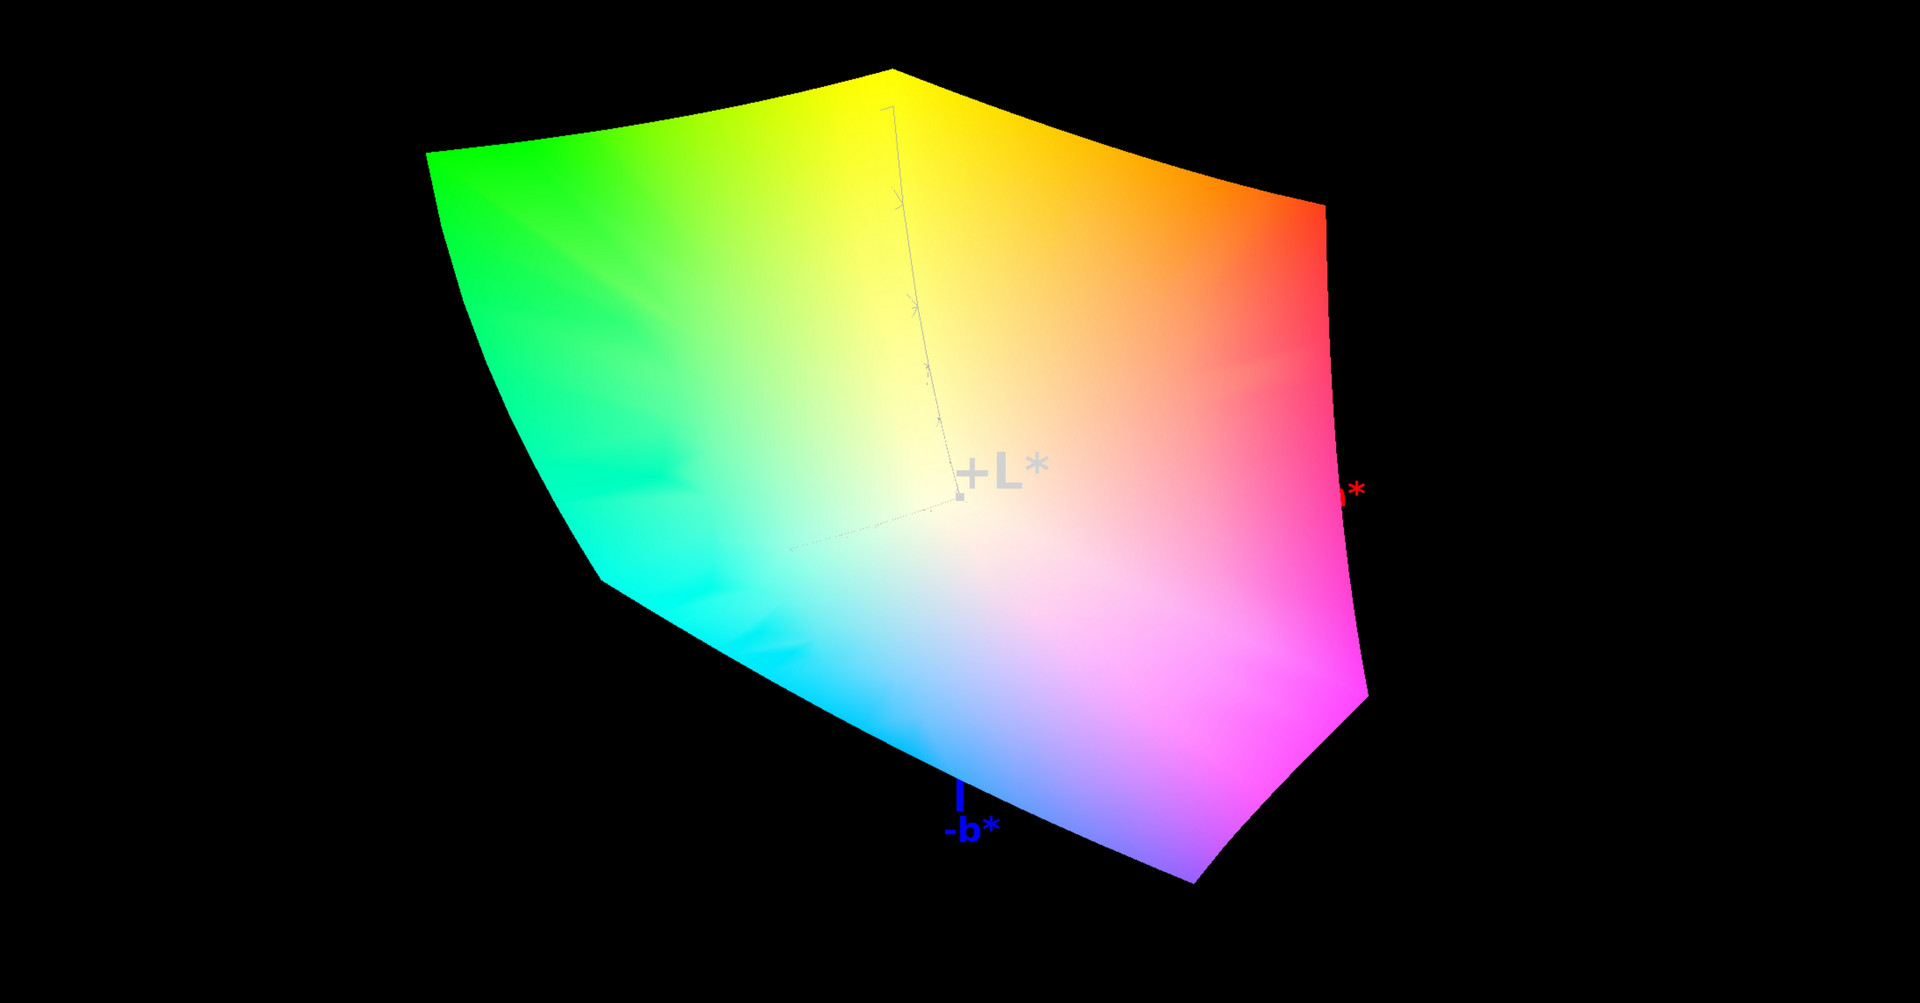
In regard to the G-Sync capable 4K display, there is no news. This is good, because the AU Optronics B173ZAN01.0 panel already delighted us with its ample color space in the predecessor. Only very few competitors manage 100% sRGB and 88% AdobeRGB. The brightness of around 328 cd/m² and a 0.29 cd/m² black value are not bad for this notebook segment either. The test unit can achieve a contrast of 1100:1, which is a very good value.
| |||||||||||||||||||||||||
Brightness Distribution: 84 %
Center on Battery: 343 cd/m²
Contrast: 1183:1 (Black: 0.29 cd/m²)
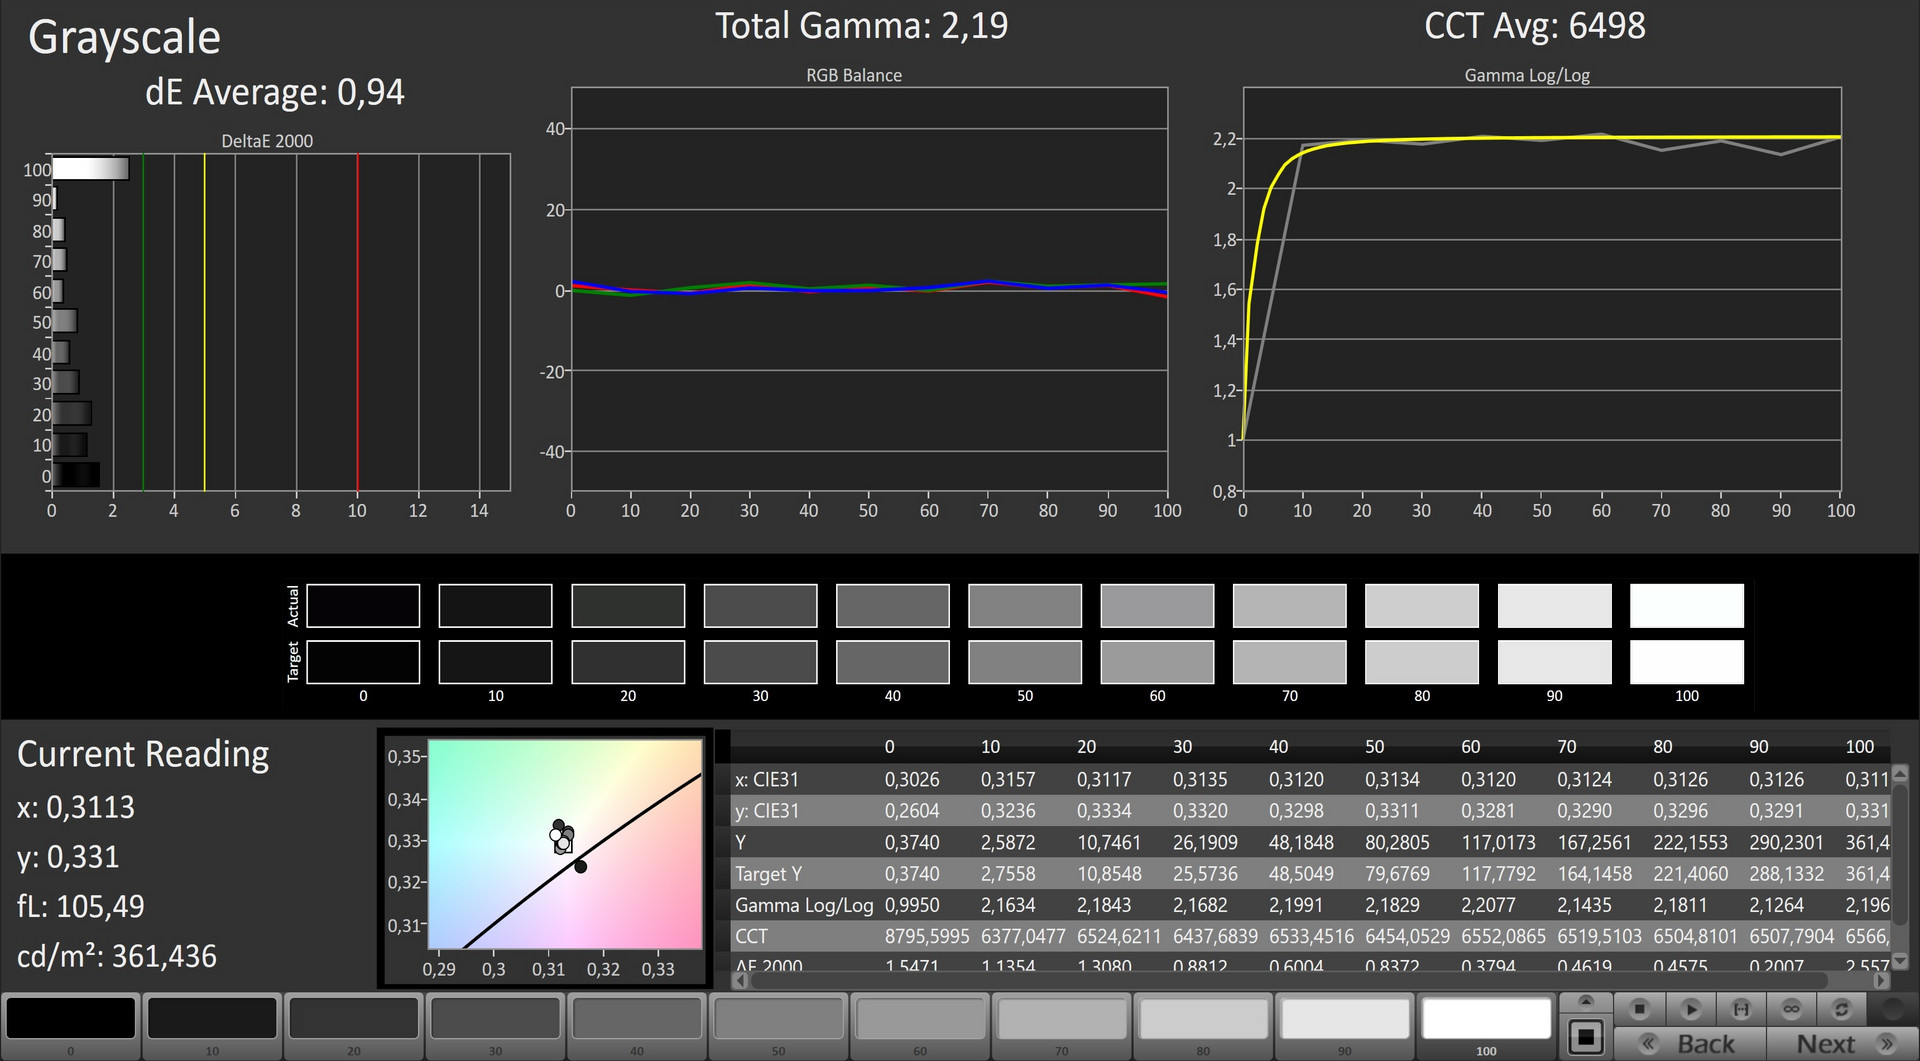
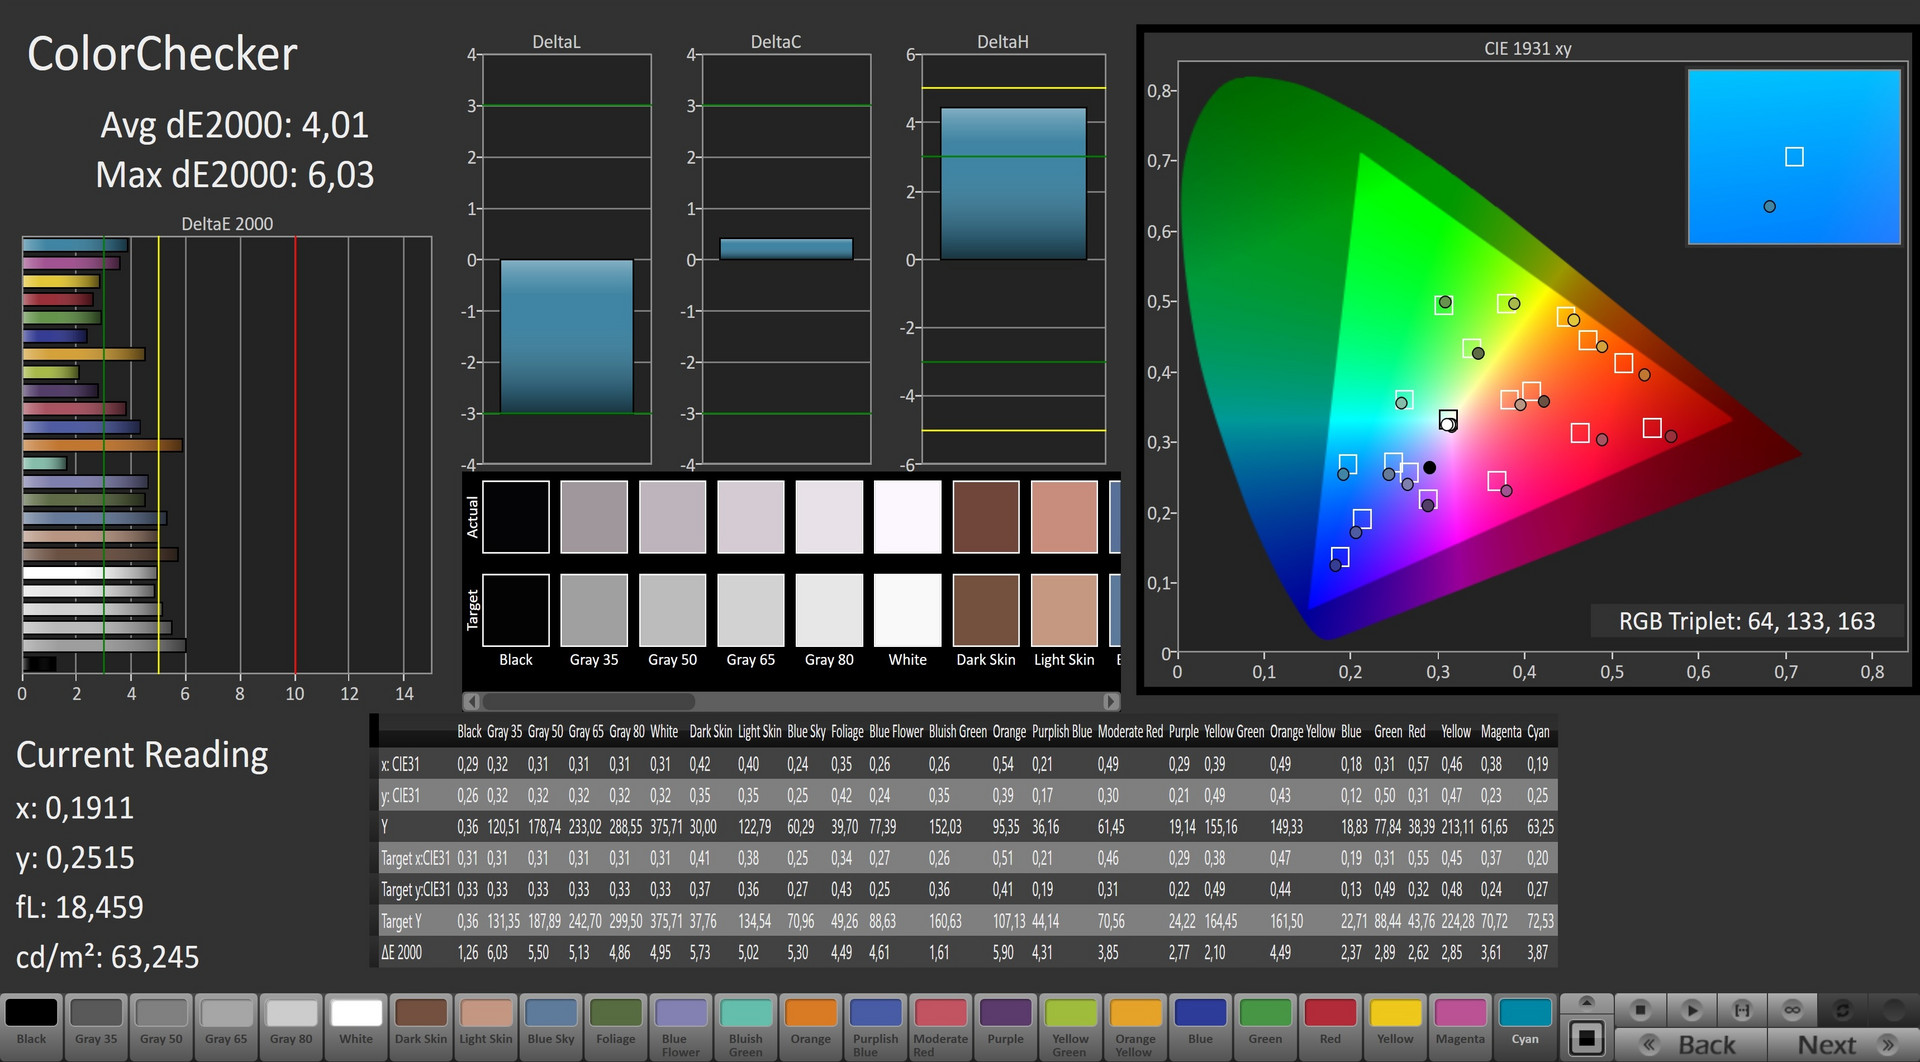
ΔE ColorChecker Calman: 4.01 | ∀{0.5-29.43 Ø4.72}
ΔE Greyscale Calman: 4.7 | ∀{0.09-98 Ø4.97}
100% sRGB (Argyll 1.6.3 3D)
88% AdobeRGB 1998 (Argyll 1.6.3 3D)
99.1% AdobeRGB 1998 (Argyll 3D)
99.9% sRGB (Argyll 3D)
86.4% Display P3 (Argyll 3D)
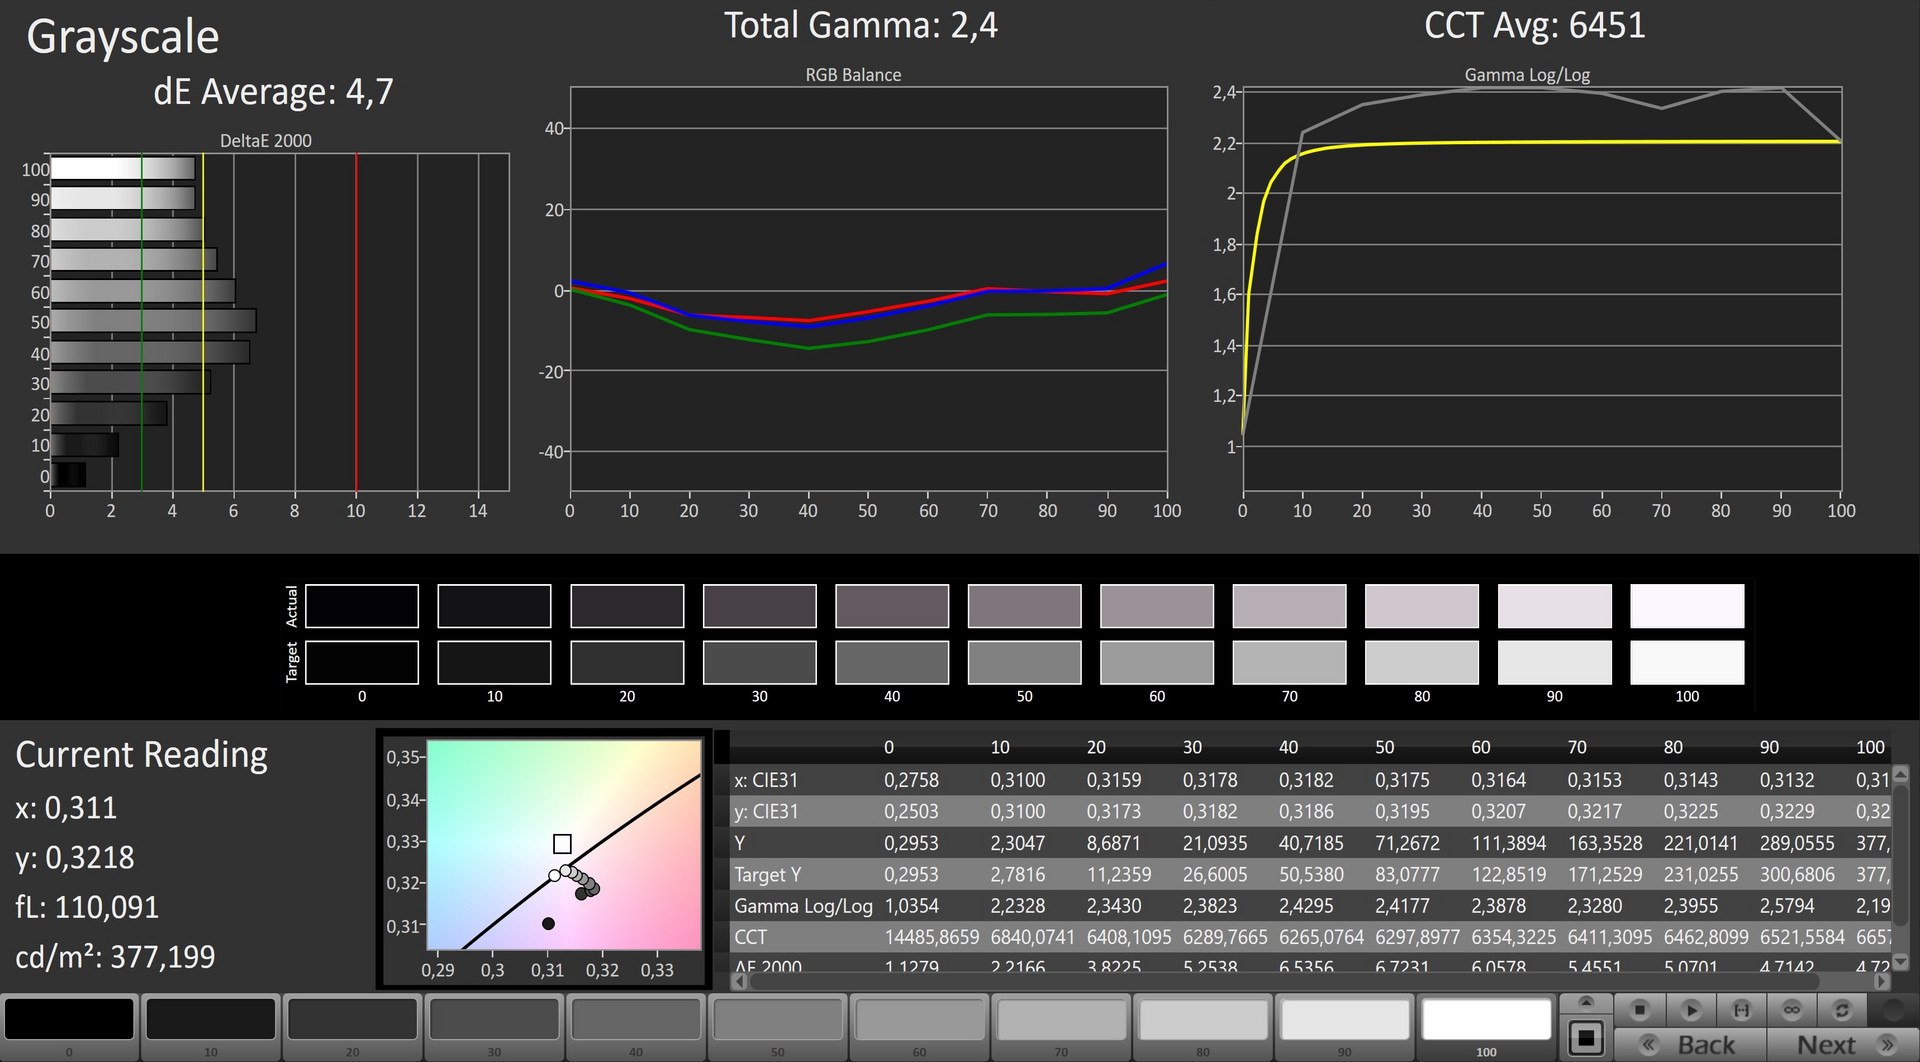
Gamma: 2.4
CCT: 6451 K
| Acer Predator 17 G9-793-70PJ AU Optronics B173ZAN01.0 (AUO109B), 3840x2160 | MSI GT72VR 7RE-433 Chi Mei N173HHE-G32 (CMN1747), 1920x1080 | Asus G752VS-XB78K LG Philips LP173WF4-SPF3 (LGD04E8), 1920x1080 | Acer Predator 17 X GX-792-76DL LP173WF4-SPF5 (LGD056D), 1920x1080 | Schenker XMG U727 2017 AU Optronics B173ZAN01.0 (AUO109B), 3840x2160 | |
|---|---|---|---|---|---|
| Display | -23% | -25% | -26% | 0% | |
| Display P3 Coverage (%) | 86.4 | 68.3 -21% | 66.9 -23% | 66 -24% | 86.6 0% |
| sRGB Coverage (%) | 99.9 | 86.7 -13% | 85.2 -15% | 83.7 -16% | 99.9 0% |
| AdobeRGB 1998 Coverage (%) | 99.1 | 63.4 -36% | 62.3 -37% | 61.2 -38% | 99.5 0% |
| Response Times | 58% | 19% | 1% | 2% | |
| Response Time Grey 50% / Grey 80% * (ms) | 50 ? | 29 ? 42% | 38 ? 24% | 45 ? 10% | 44 ? 12% |
| Response Time Black / White * (ms) | 25.6 ? | 7 ? 73% | 22 ? 14% | 28 ? -9% | 28 ? -9% |
| PWM Frequency (Hz) | |||||
| Screen | -44% | -6% | -9% | 8% | |
| Brightness middle (cd/m²) | 343 | 299 -13% | 328 -4% | 380 11% | 362 6% |
| Brightness (cd/m²) | 328 | 277 -16% | 317 -3% | 362 10% | 344 5% |
| Brightness Distribution (%) | 84 | 87 4% | 88 5% | 91 8% | 85 1% |
| Black Level * (cd/m²) | 0.29 | 0.27 7% | 0.3 -3% | 0.37 -28% | 0.35 -21% |
| Contrast (:1) | 1183 | 1107 -6% | 1093 -8% | 1027 -13% | 1034 -13% |
| Colorchecker dE 2000 * | 4.01 | 9.65 -141% | 3.74 7% | 4.12 -3% | 2.46 39% |
| Colorchecker dE 2000 max. * | 6.03 | 15.43 -156% | 8.97 -49% | 8.19 -36% | 4.26 29% |
| Greyscale dE 2000 * | 4.7 | 9.68 -106% | 2.67 43% | 3.95 16% | 2.9 38% |
| Gamma | 2.4 92% | 1.89 116% | 2.41 91% | 2.47 89% | 2.31 95% |
| CCT | 6451 101% | 11652 56% | 6861 95% | 6539 99% | 6120 106% |
| Color Space (Percent of AdobeRGB 1998) (%) | 88 | 75 -15% | 56 -36% | 55 -37% | 88 0% |
| Color Space (Percent of sRGB) (%) | 100 | 100 0% | 85 -15% | 84 -16% | 100 0% |
| Total Average (Program / Settings) | -3% /
-26% | -4% /
-7% | -11% /
-11% | 3% /
6% |
* ... smaller is better
The color accuracy turns out only mediocre, however. Our measurements using the CalMAN software show DeltaE-2000 deviations of almost 4.7 (Grayscale) and 4.0 (ColorChecker). Professional users who want to use the Predator 17 for photo and video projects can breathe easy, however: via calibration, these values can be pushed down to below 1 and so remain within the ideal limit. The corresponding ICC-file is linked above, next to the Distribution of Brightness image above the illumination chart.

Speaking of illumination, halos can be seen in the test unit "only" at the bottom edge. Whether you are bothered by this, depends on a personal impression. Thanks to the matte display surface and the brightness which is quite high, the Predator 17 can be used outside, although the battery life, size, and weight will set some limits to that.
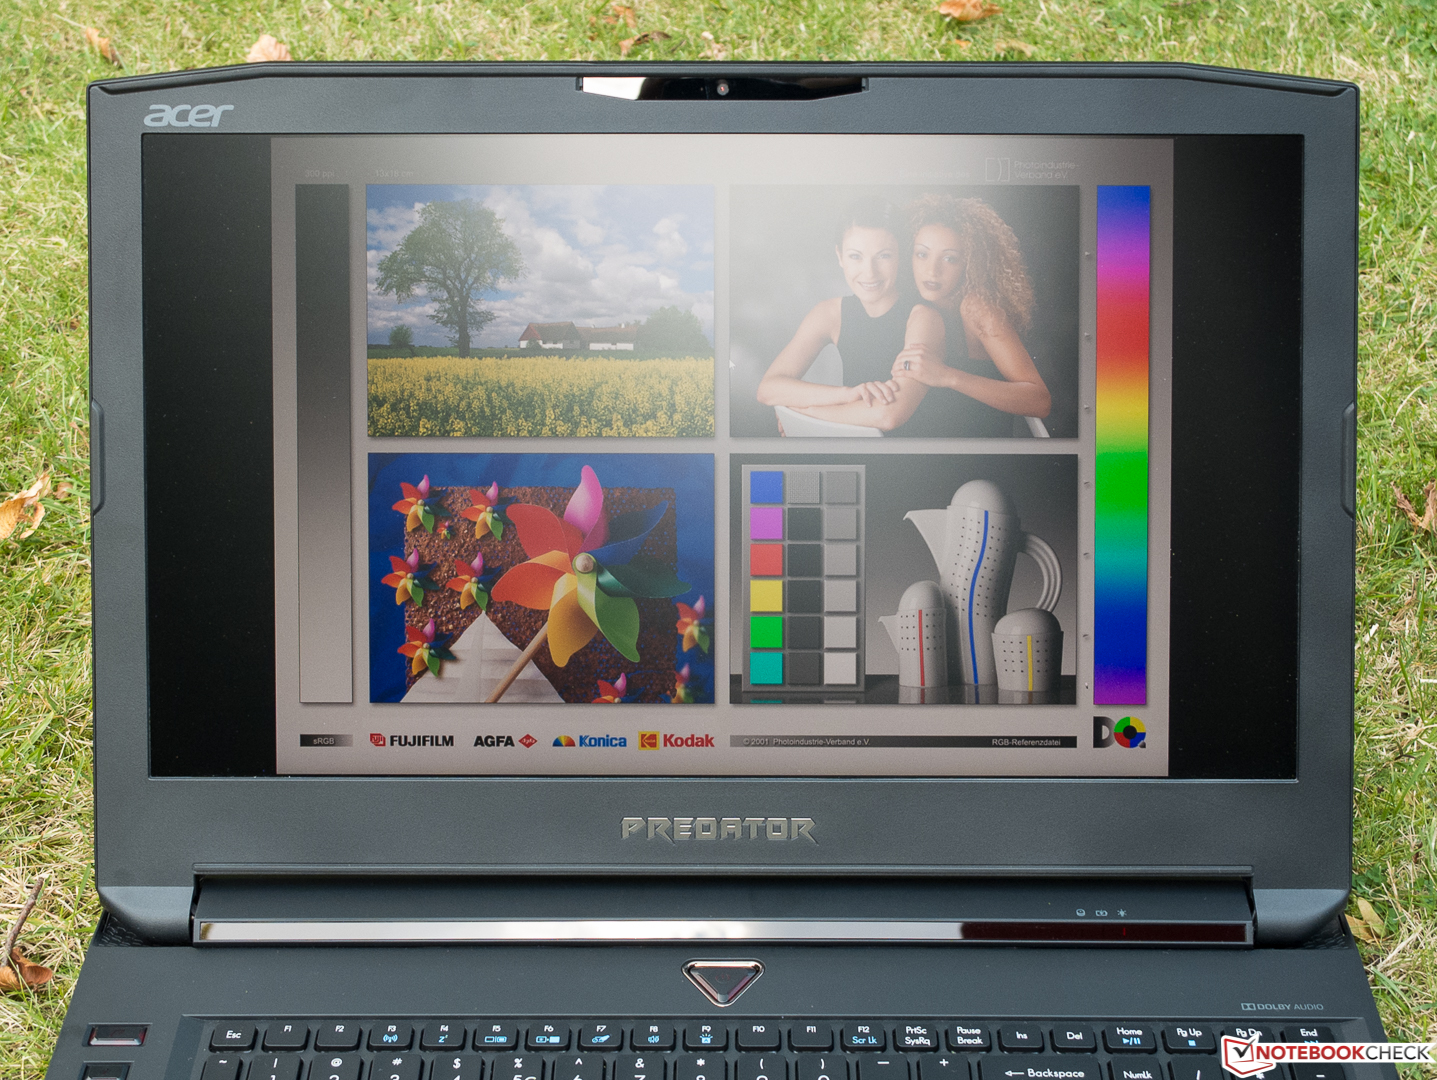


Finally, some words about the viewing-angle stability: as typical for IPS displays, this is rather good, as our picture also shows.
Display Response Times
| ↔ Response Time Black to White | ||
|---|---|---|
| 25.6 ms ... rise ↗ and fall ↘ combined | ↗ 11.2 ms rise | 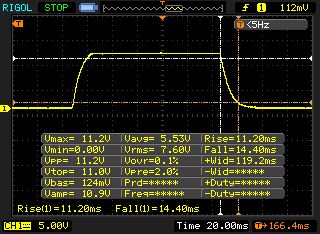 |
| ↘ 14.4 ms fall | ||
| The screen shows relatively slow response rates in our tests and may be too slow for gamers. In comparison, all tested devices range from 0.1 (minimum) to 240 (maximum) ms. » 61 % of all devices are better. This means that the measured response time is worse than the average of all tested devices (19.8 ms). | ||
| ↔ Response Time 50% Grey to 80% Grey | ||
| 50 ms ... rise ↗ and fall ↘ combined | ↗ 24.4 ms rise | 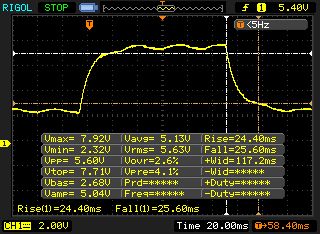 |
| ↘ 25.6 ms fall | ||
| The screen shows slow response rates in our tests and will be unsatisfactory for gamers. In comparison, all tested devices range from 0.165 (minimum) to 636 (maximum) ms. » 86 % of all devices are better. This means that the measured response time is worse than the average of all tested devices (31 ms). | ||
Screen Flickering / PWM (Pulse-Width Modulation)
| Screen flickering / PWM not detected | 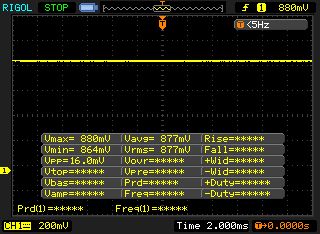 | ||
In comparison: 52 % of all tested devices do not use PWM to dim the display. If PWM was detected, an average of 7747 (minimum: 5 - maximum: 343500) Hz was measured. | |||
Performance
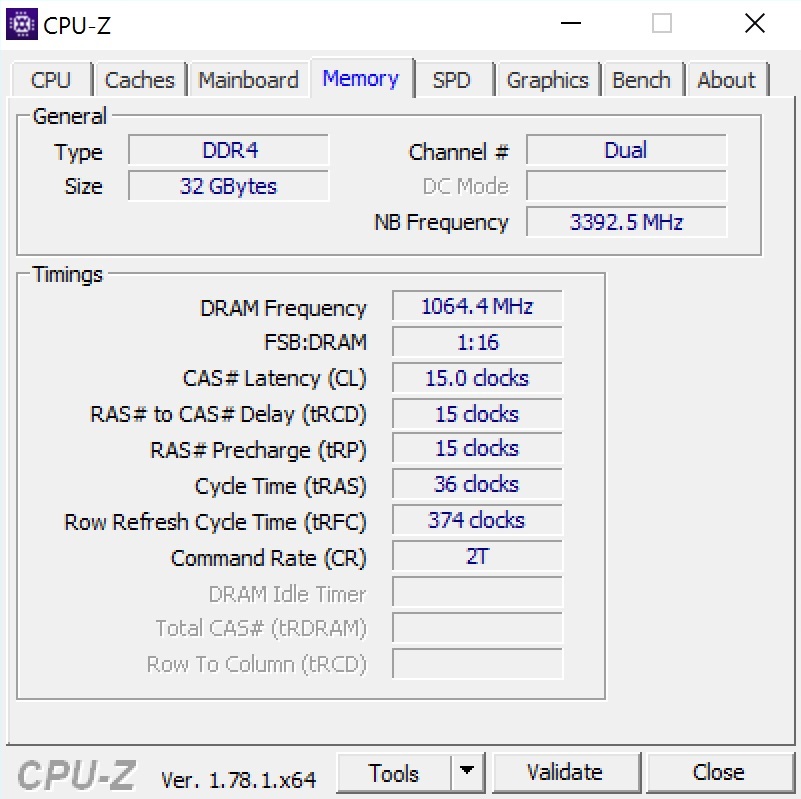
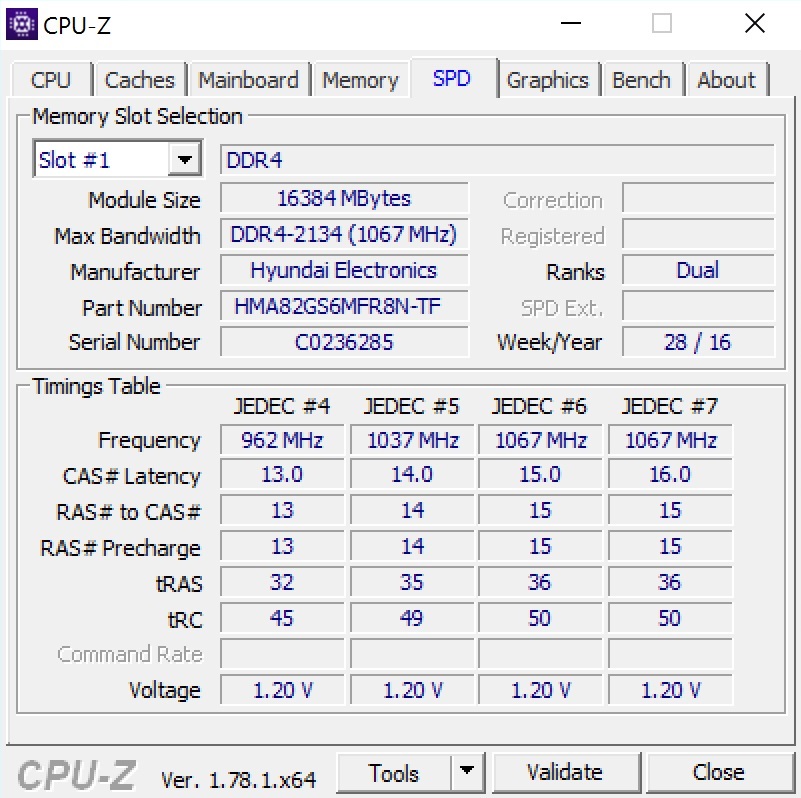
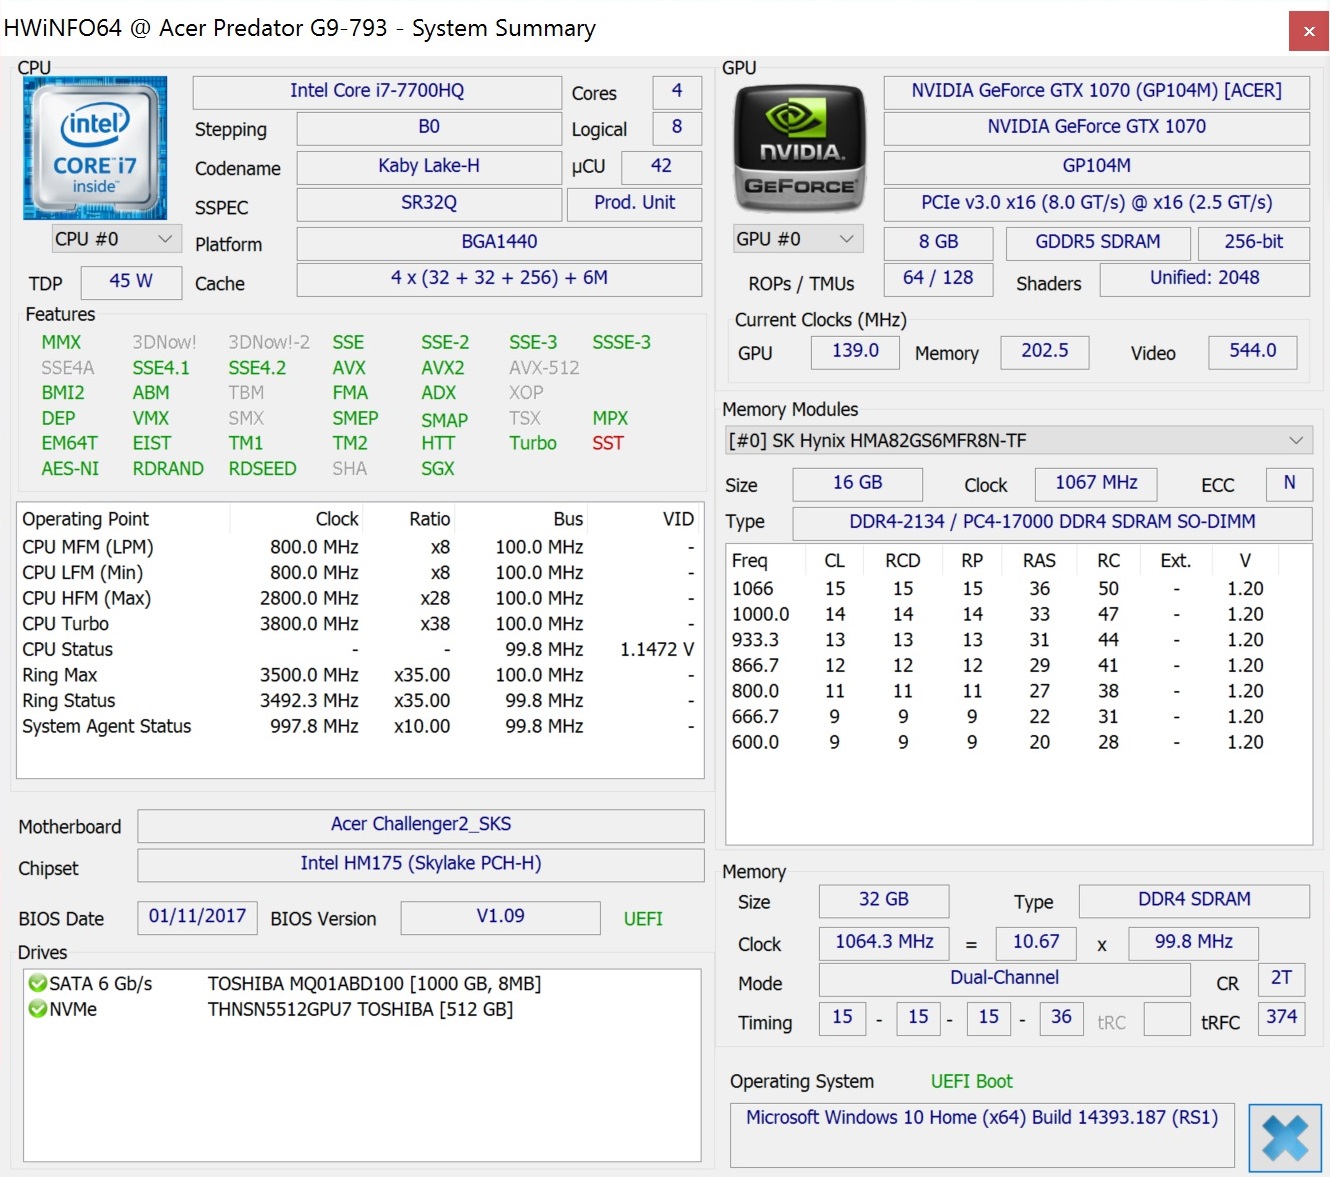
With its high-end components, the tested Predator 17 G9-793-70PJ is comfortable at the top end of the food chain. A quad-core processor with Hyper-Threading, a DirectX-12 GPU with 8 GB of VRAM, and 32 GB of working memory (2x 16 GB DDR4-2133) should provide enough reserves for the next gaming hits – at least if you lower the resolution from Ultra HD to Full HD in an emergency.
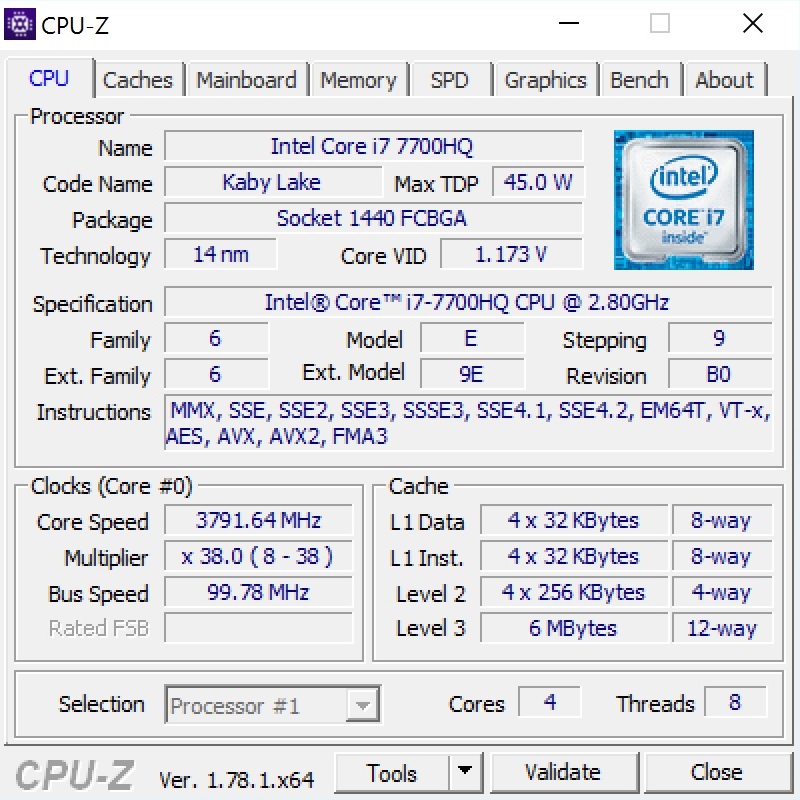

Processor
Like the rest of the gaming-laptop manufacturers, upon the launch of Intel's Kaby-Lake generation, Acer takes advantage of the current favorable situation and provides the Predator series with a fresh CPU.
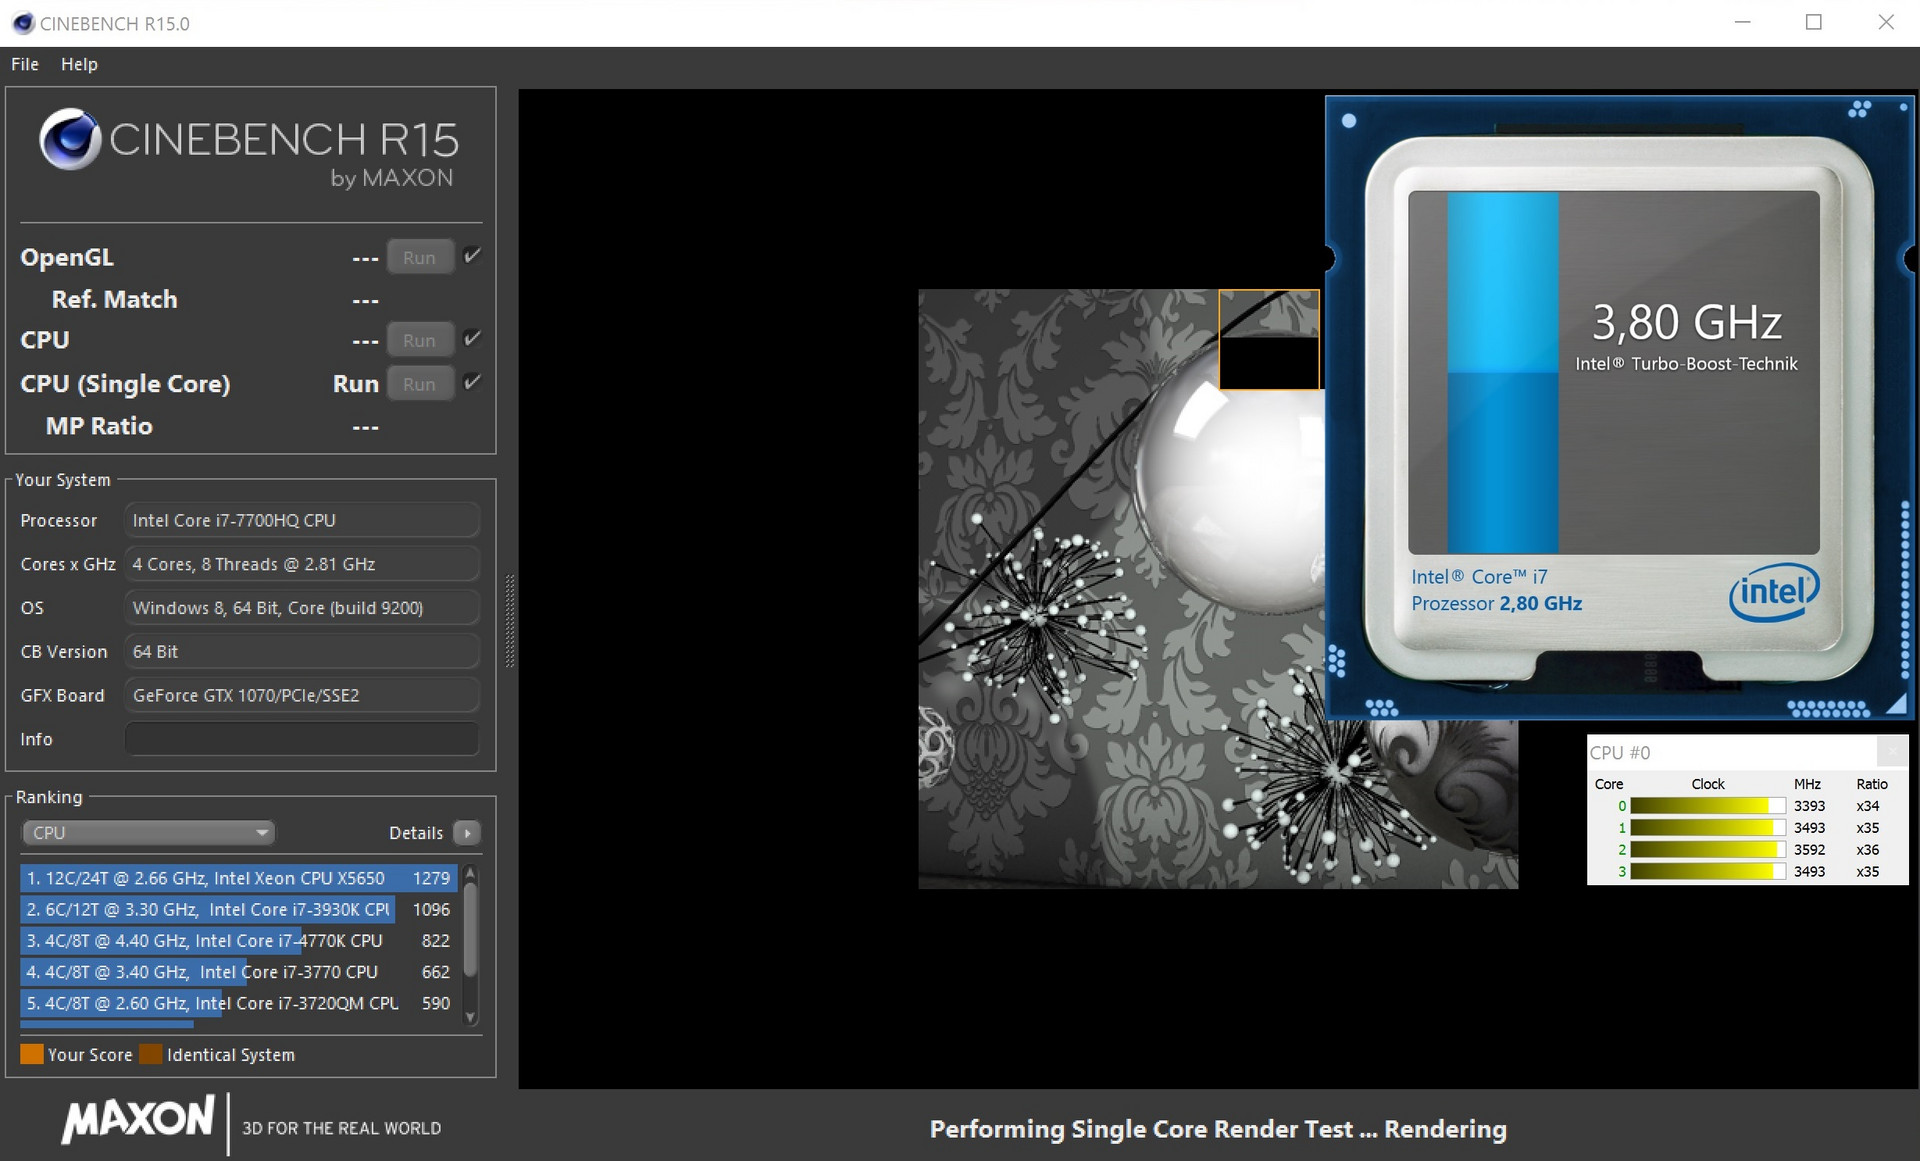
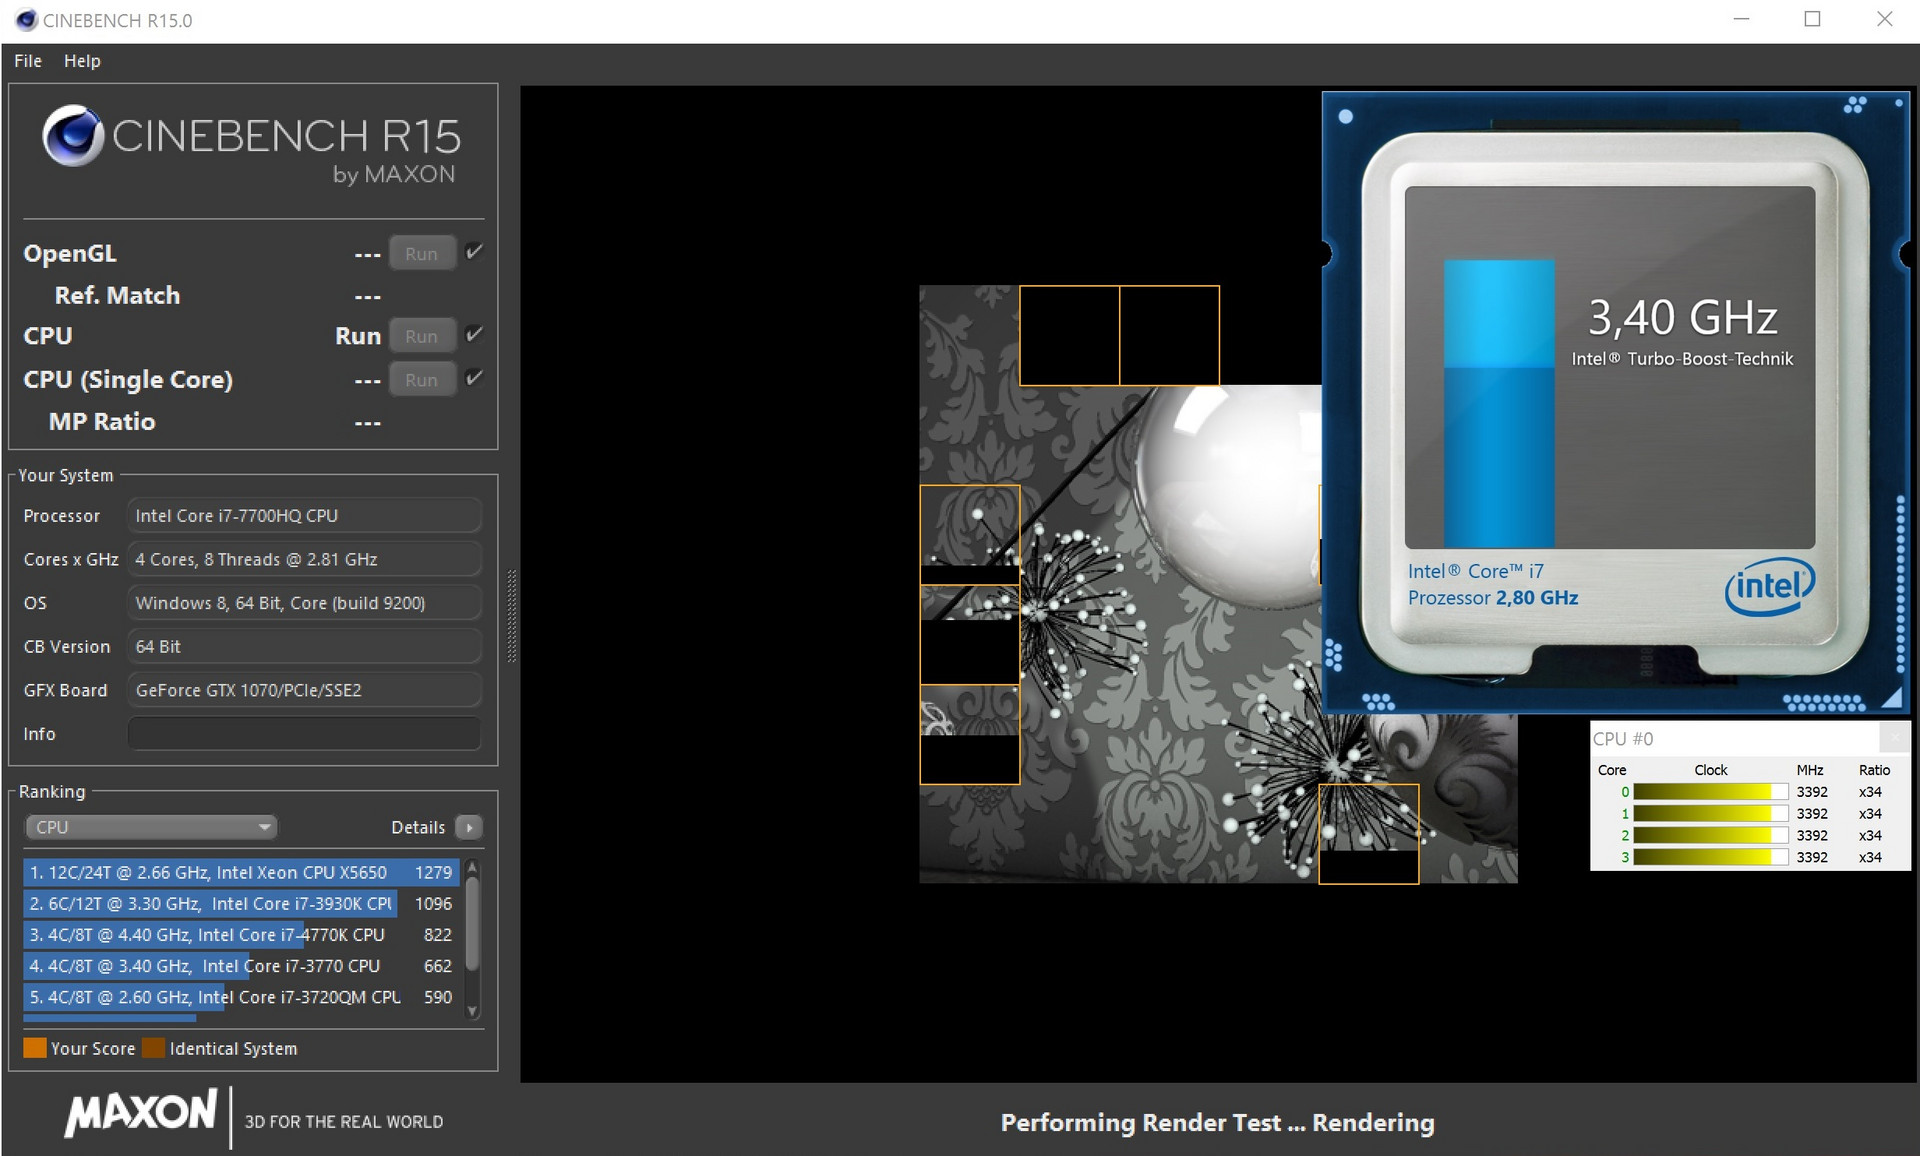
The "standard model," the Core i7-7700HQ, offers a very good performance, which the Predator 17 can also maintain for longer periods of time. After half-an-hour of Cinebench R15 (see chart), the results still remained on a high level. No wonder, since the CPU achieves between 3.4 and 3.8 GHz, which corresponds to the maximum Turbo levels for multi and single-core load.
As expected, other notebooks with the Core i7-7700HQ (such as the MSI GT72VR 7RE) perform similarly. More power is offered by the Core i7-7820HK of the Acer Predator 17 X and the Core i7-7700K of the Schenker XMG U727, which are between 15% and 31% faster in the benchmarks.
System Performance
Probably because of the higher computing demands of the 4K display, the Predator 17 and the Schenker XMG U727 cannot quite achieve the performance of the competition in PCMark 8. Subjectively, there is no reason for complaint. Thanks to the NVMe SSD and the high-end hardware, the system runs comfortably smooth and reacts exceptionally fast in any situation.
| PCMark 8 | |
| Home Score Accelerated v2 | |
| Acer Predator 17 X GX-792-76DL | |
| Asus G752VS-XB78K | |
| MSI GT72VR 7RE-433 | |
| Schenker XMG U727 2017 | |
| Acer Predator 17 G9-793-70PJ | |
| Work Score Accelerated v2 | |
| Acer Predator 17 X GX-792-76DL | |
| Asus G752VS-XB78K | |
| MSI GT72VR 7RE-433 | |
| Schenker XMG U727 2017 | |
| Acer Predator 17 G9-793-70PJ | |
| PCMark 7 - Score | |
| Schenker XMG U727 2017 | |
| Acer Predator 17 X GX-792-76DL | |
| Asus G752VS-XB78K | |
| Acer Predator 17 G9-793-70PJ | |
| MSI GT72VR 7RE-433 | |
| PCMark 7 Score | 6692 points | |
| PCMark 8 Home Score Accelerated v2 | 4395 points | |
| PCMark 8 Work Score Accelerated v2 | 4541 points | |
Help | ||
Storage Solution
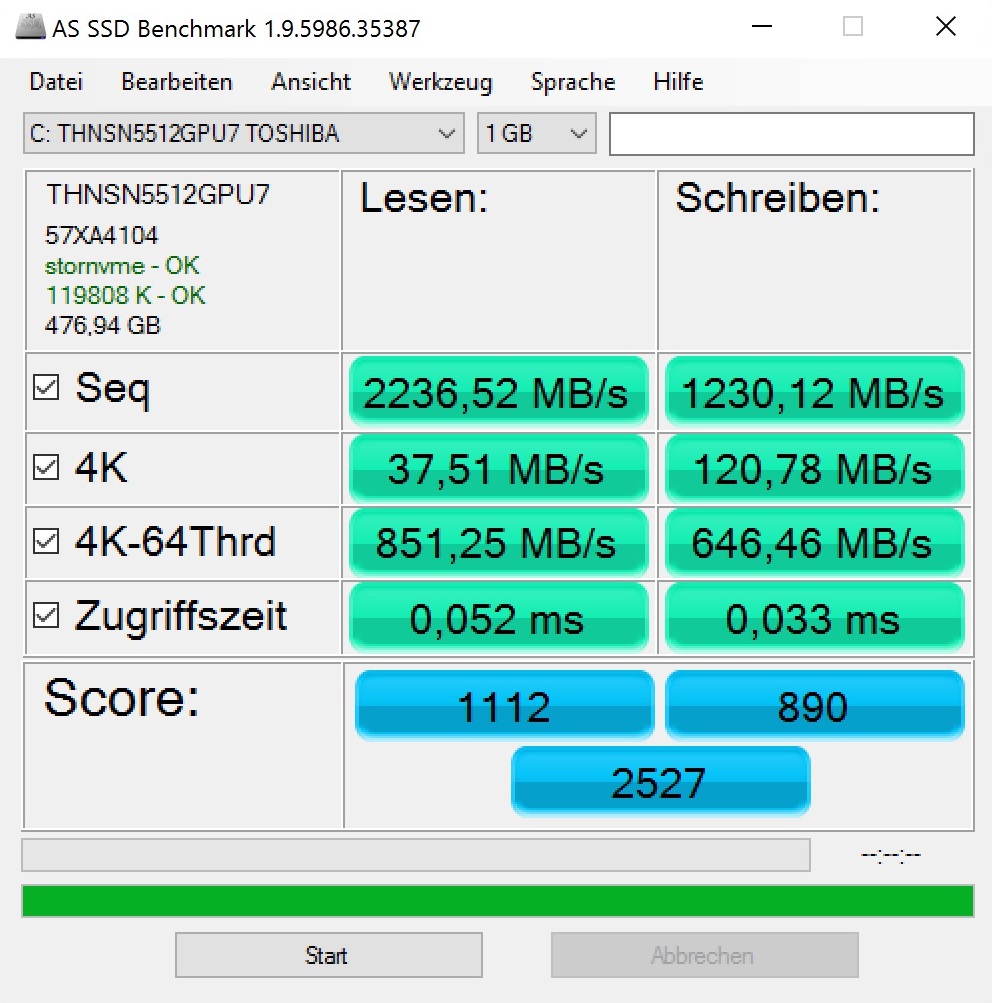
Even if most users will not notice any difference between a SATA-III SSD and a PCIe SSD, in most of the more expensive notebooks the latter is almost exclusively used. The 512-GB model of the Predator 17 comes from Toshiba and in the AS SSD benchmark it settles between the weaker Kingston drive of the MSI GT72VR and the faster Samsung drive of the Schenker XMG U727.
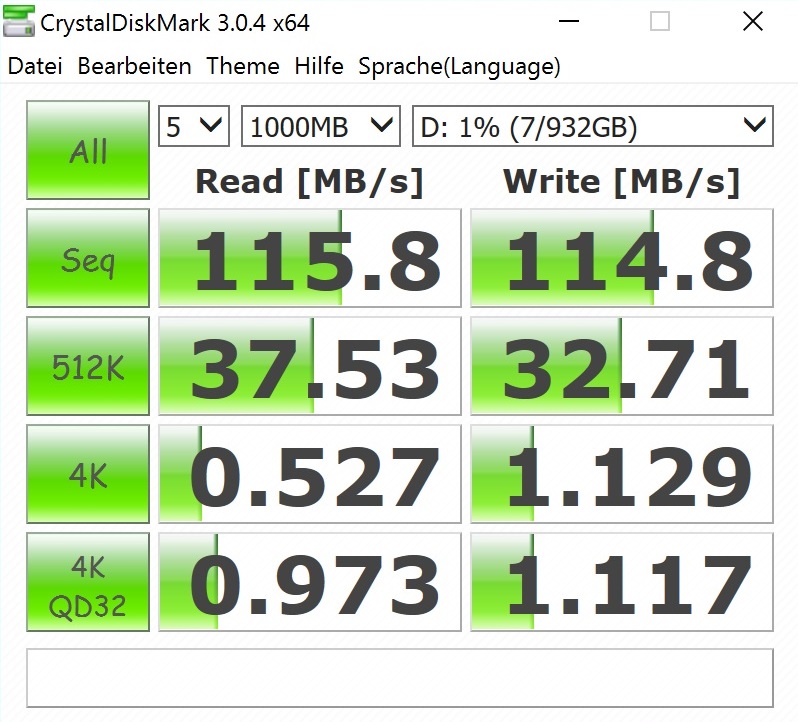
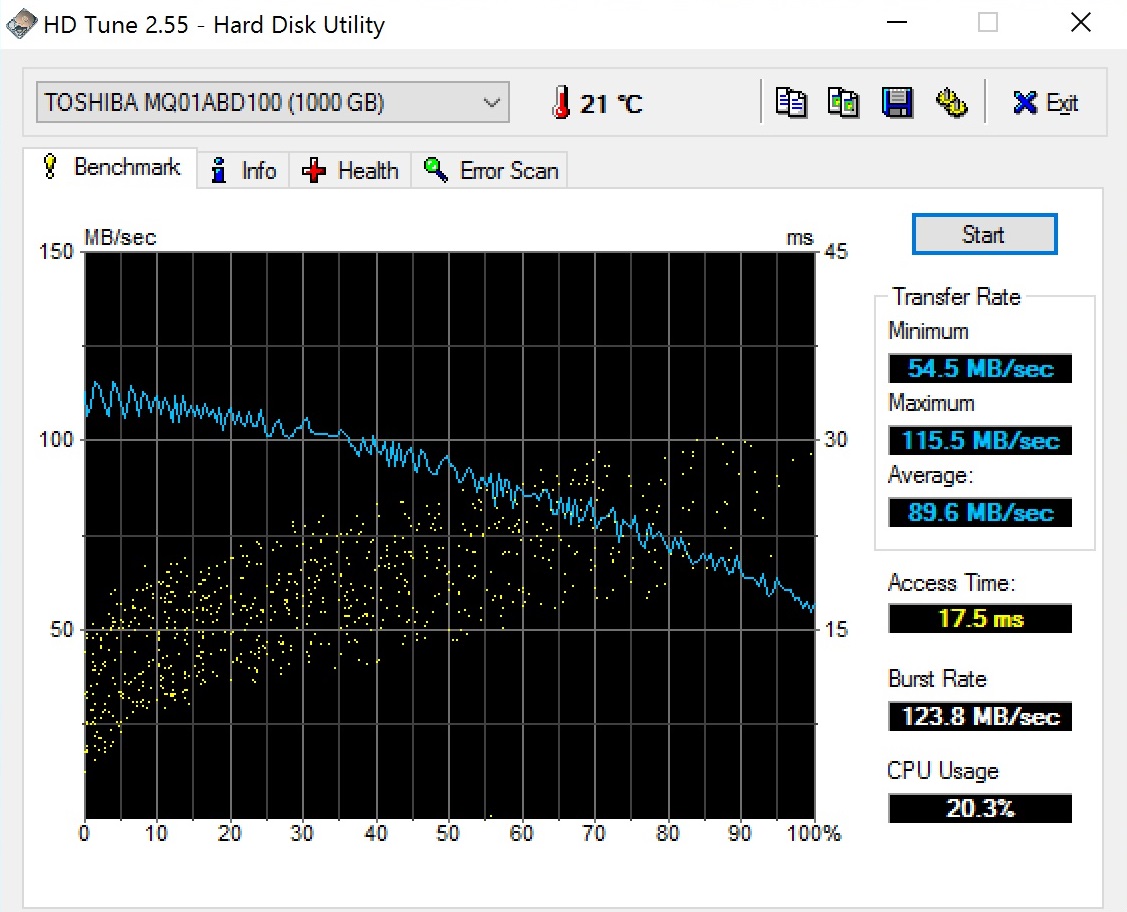
More than 1200 MB/s in the sequential writes and more than 2200 MB/s in the sequential reads show what the PCIe models can do. To avoid running out of space when having a larger collection of videos and games, besides the M.2 SSD there is also a 2.5-inch HDD with a 1 TB capacity (5400 rpm).
| Acer Predator 17 G9-793-70PJ Toshiba NVMe THNSN5512GPU7 | MSI GT72VR 7RE-433 Kingston RBU-SNS8152S3256GG5 | Asus G752VS-XB78K Toshiba NVMe THNSN5512GPU7 | Acer Predator 17 X GX-792-76DL Toshiba NVMe THNSN5512GPU7 | Schenker XMG U727 2017 Samsung SM961 MZVPW256 m.2 PCI-e | |
|---|---|---|---|---|---|
| AS SSD | -45% | 5% | 38% | ||
| Seq Read (MB/s) | 2237 | 509 -77% | 2261 1% | 2746 23% | |
| Seq Write (MB/s) | 1230 | 282.1 -77% | 1338 9% | 1445 17% | |
| 4K Read (MB/s) | 37.51 | 40.04 7% | 39.52 5% | 56.8 51% | |
| 4K Write (MB/s) | 120.8 | 95.8 -21% | 133.8 11% | 175.9 46% | |
| Score Total (Points) | 2547 | 1142 -55% | 2581 1% | 3938 55% |

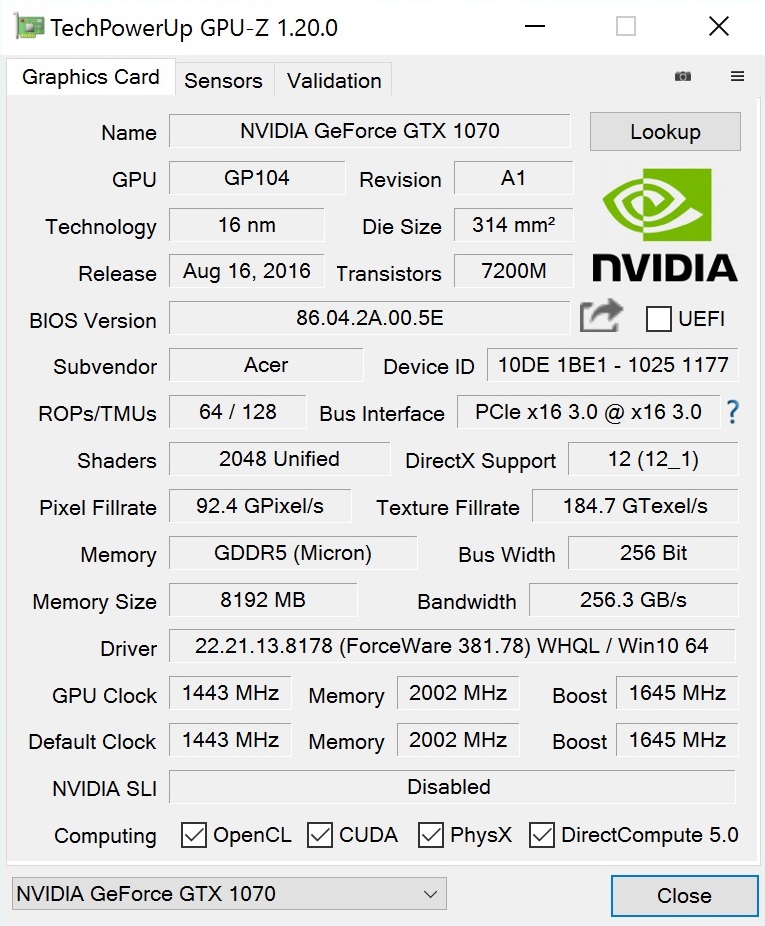
Graphics Card
While the GeForce GTX 1060 is meant more for the Full HD resolution, the GeForce GTX 1070 is absolutely qualified for 4K gaming. Nvidia's currently second most powerful notebook chip offers an ample 8 GB of GDDR5 VRAM and normally runs at between 1443 and 1645 MHz.
Anyone who wants to tease slightly more performance out of the Predator 17 has the option to adjust the clock speed with the preinstalled PredatorSense tool. In the "Faster" mode between 1513 and 1715 MHz is reached, and "Turbo" even accelerates the GeForce GTX 1070 core to between 1583 and 1785 MHz. All the measurements in the test report were taken in the "Normal" mode, which corresponds to the standard clock speeds.
| 3DMark | |
| 1920x1080 Fire Strike Graphics | |
| Acer Predator 17 X GX-792-76DL | |
| Schenker XMG U727 2017 | |
| MSI GT72VR 7RE-433 | |
| Acer Predator 17 G9-793-70PJ | |
| Asus G752VS-XB78K | |
| 2560x1440 Time Spy Graphics | |
| Acer Predator 17 X GX-792-76DL | |
| Schenker XMG U727 2017 | |
| MSI GT72VR 7RE-433 | |
| Asus G752VS-XB78K | |
| Acer Predator 17 G9-793-70PJ | |
| 3DMark 11 - 1280x720 Performance GPU | |
| Schenker XMG U727 2017 | |
| Acer Predator 17 X GX-792-76DL | |
| MSI GT72VR 7RE-433 | |
| Acer Predator 17 G9-793-70PJ | |
| Asus G752VS-XB78K | |
There are no surprises in the synthetic graphics tests. The Predator 17 comes out at the same level as the GTX-1070 competition, the MSI GT72VR and the Asus G752VS. Notebooks with the GeForce 1080 such as the Predator 17 X and the Schenker XMG U727 are 30% faster.
| 3DMark 11 Performance | 16430 points | |
| 3DMark Cloud Gate Standard Score | 27050 points | |
| 3DMark Fire Strike Score | 13353 points | |
| 3DMark Time Spy Score | 5059 points | |
Help | ||
Gaming Performance
As long as you forego maximum details when needed and don't expect butter-smooth frame-rates (>60 FPS), the GeForce GTX 1070 is also armed for 3840x2160 pixels. With the exception of Dawn of War 3, all the titles tested are playable more or less smoothly in our UHD setting.
| low | med. | high | ultra | 4K | |
|---|---|---|---|---|---|
| The Witcher 3 (2015) | 104 | 59.4 | 38.7 | ||
| For Honor (2017) | 142 | 106 | 43.6 | ||
| Ghost Recon Wildlands (2017) | 84.6 | 49.5 | 32.3 | ||
| Mass Effect Andromeda (2017) | 77.7 | 68.9 | 31.6 | ||
| Warhammer 40.000: Dawn of War III (2017) | 57.8 | 51.4 | 18.2 | ||
| Prey (2017) | 134 | 129 | 46.7 |
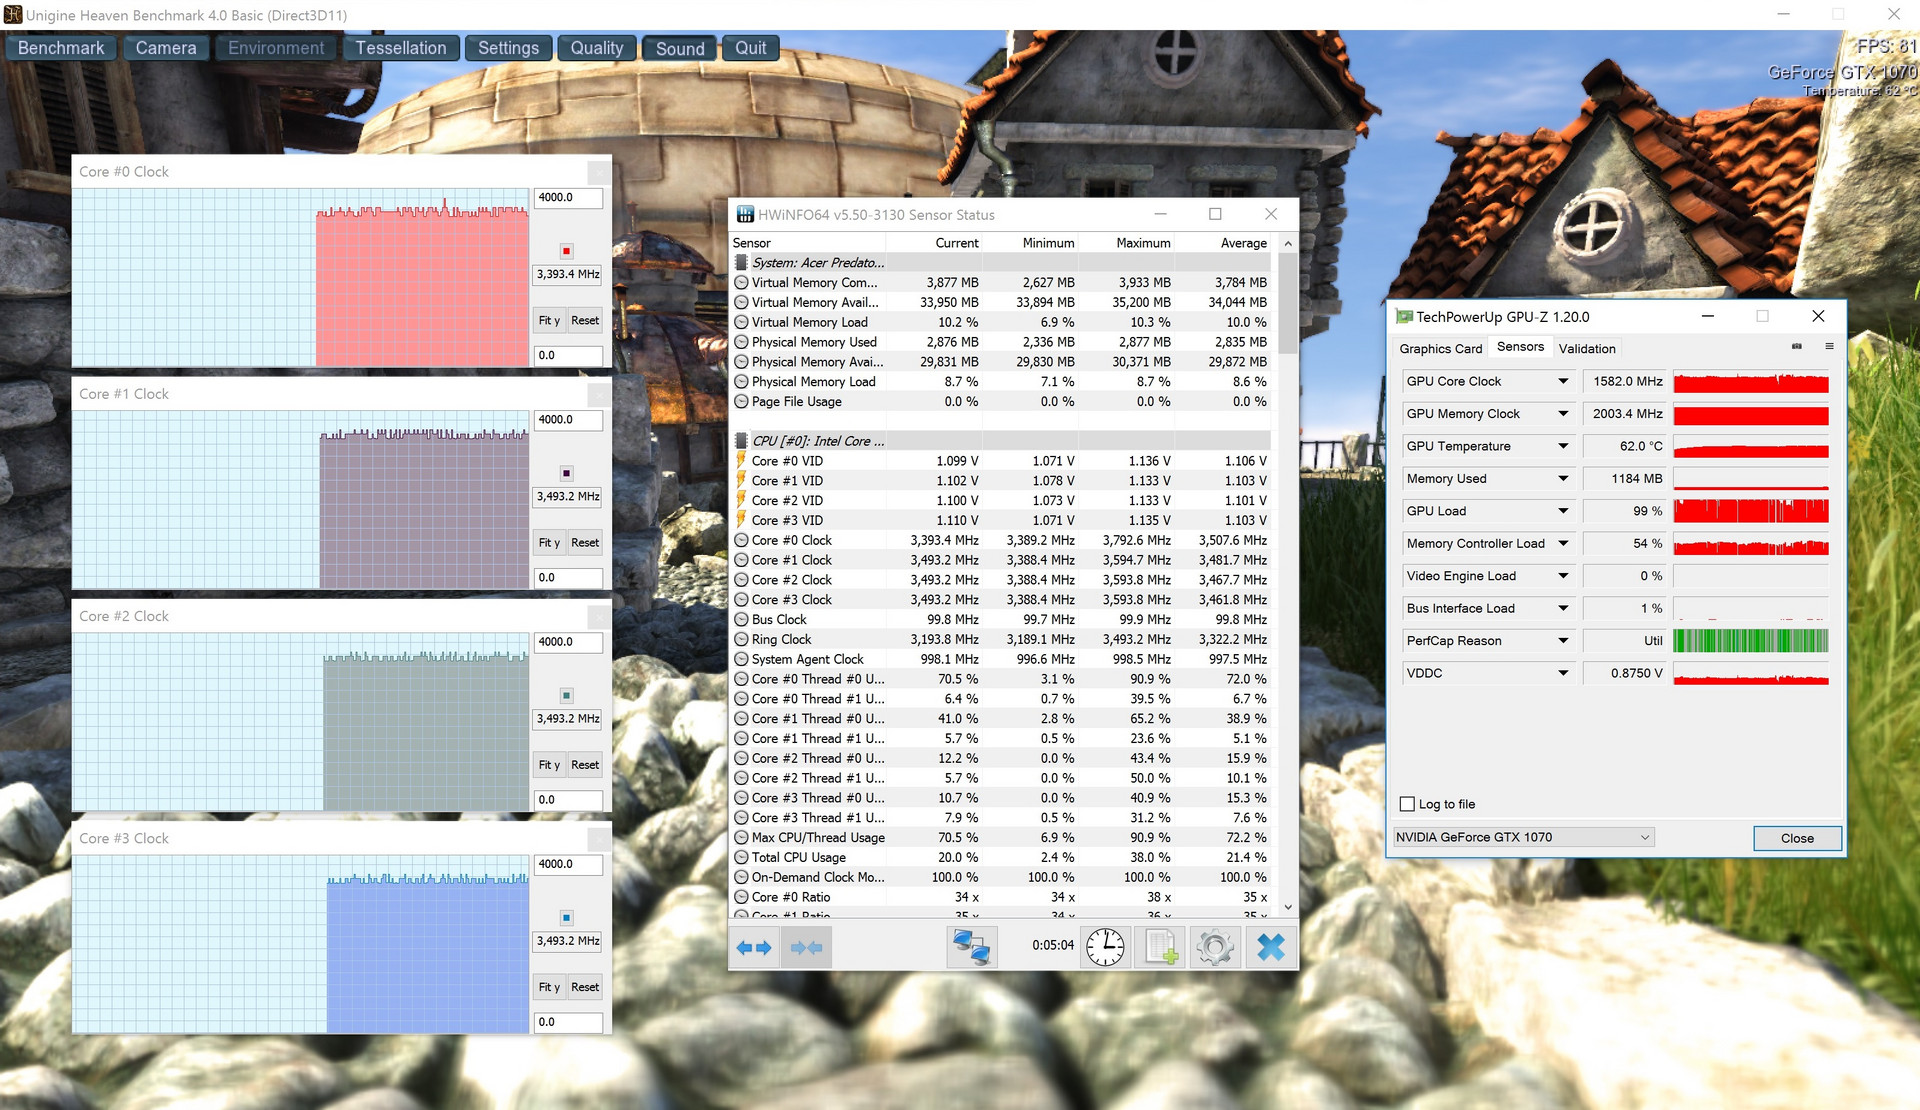
As before in the CPU section, we also evaluated whether the performance of the GPU remains stable during longer sessions. In the 60-minute test with The Witcher 3 role-playing game, there was nothing remarkable. The FPS values remained constant to a large degree (54 to 61 at FHD/Ultra). Due to the drop off in the Turbo, the performance slows down a little with time.
Emissions
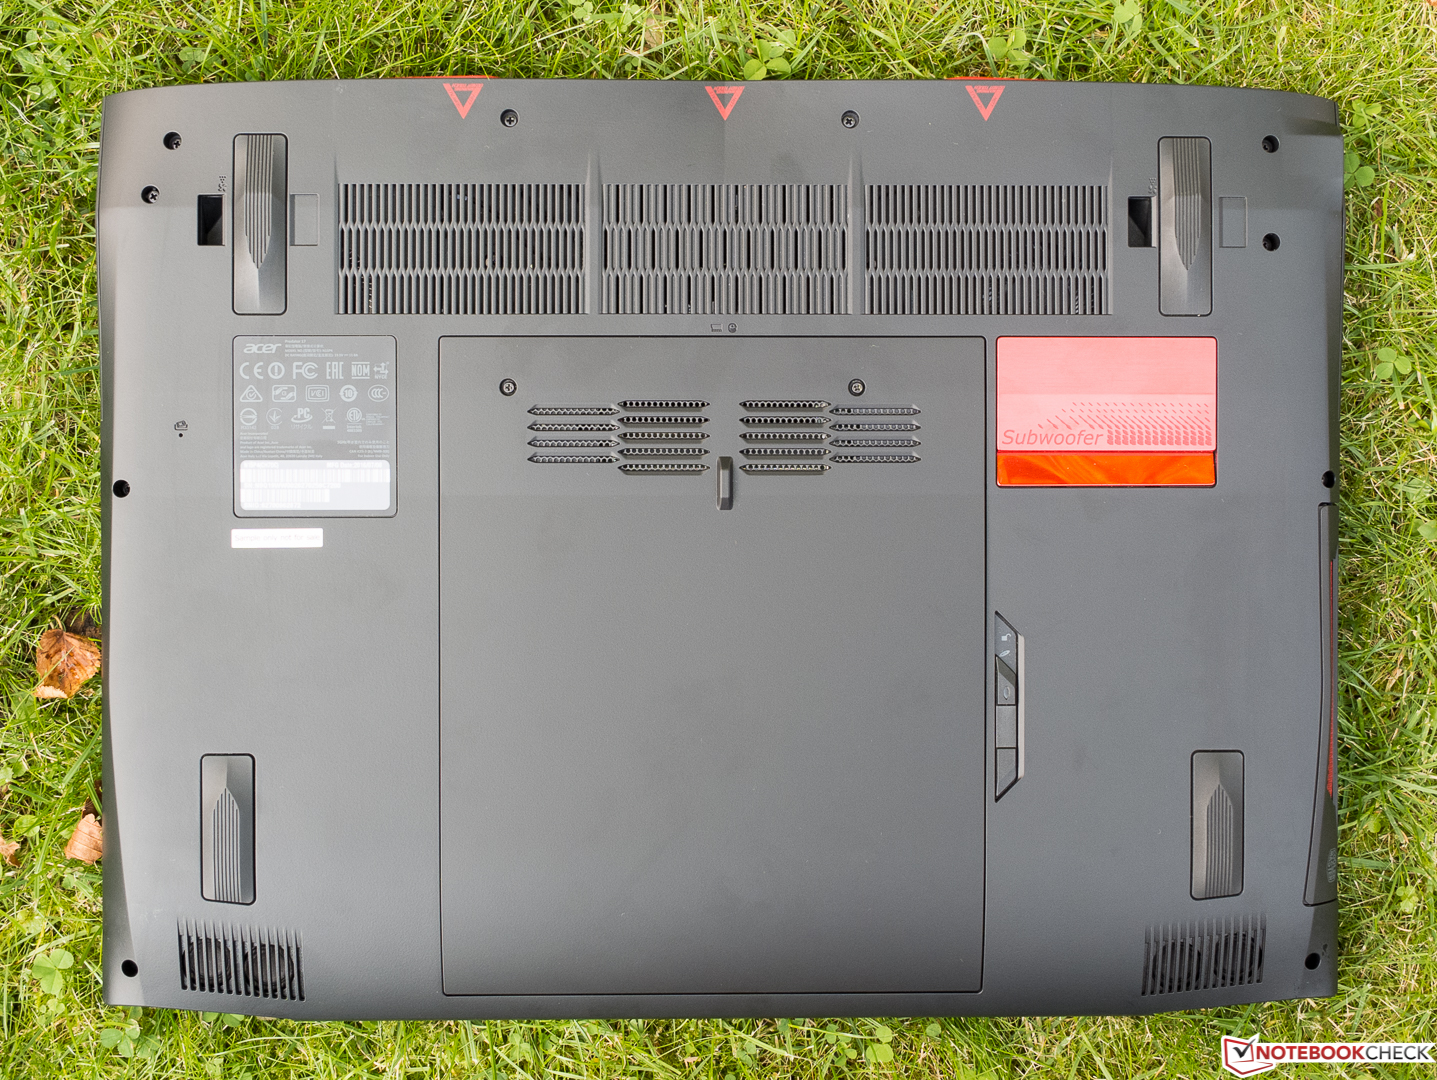
To improve the cooling of the Predator 17, Acer adds an extra fan called FrostCore, which can be inserted instead of the optical drive (DVD burner) and was also integrated during our measurements.
Noise Emissions
The noise development of the Predator is not very remarkable. Almost 32 to 35 dB in the idle mode (with a slight revving up to 38 dB, for example during the booting sequence) and 42 to 50 dB during load (44 dB with The Witcher 3) are neither very good nor very bad for a gaming notebook.
With these values, the Predator ranges at about the same level as the competition that has a similar thickness. The 17-incher is never completely silent and the fans are always active even during longer idling periods.
Noise level
| Idle |
| 32 / 35 / 38 dB(A) |
| HDD |
| 35 dB(A) |
| Load |
| 42 / 50 dB(A) |
 | ||
30 dB silent 40 dB(A) audible 50 dB(A) loud |
||
min: | ||
| Acer Predator 17 G9-793-70PJ i7-7700HQ, GeForce GTX 1070 Mobile | MSI GT72VR 7RE-433 i7-7700HQ, GeForce GTX 1070 Mobile | Asus G752VS-XB78K 6820HK, GeForce GTX 1070 Mobile | Acer Predator 17 X GX-792-76DL i7-7820HK, GeForce GTX 1080 Mobile | Schenker XMG U727 2017 i7-7700K, GeForce GTX 1080 Mobile | |
|---|---|---|---|---|---|
| Noise | 4% | 7% | 1% | -2% | |
| off / environment * (dB) | 31 | 31 -0% | 30 3% | 30 3% | 30 3% |
| Idle Minimum * (dB) | 32 | 34 -6% | 31 3% | 33 -3% | 31 3% |
| Idle Average * (dB) | 35 | 35 -0% | 32 9% | 35 -0% | 34 3% |
| Idle Maximum * (dB) | 38 | 37 3% | 33 13% | 37 3% | 37 3% |
| Load Average * (dB) | 42 | 37 12% | 40 5% | 40 5% | 44 -5% |
| Witcher 3 ultra * (dB) | 44 | 51 -16% | |||
| Load Maximum * (dB) | 50 | 44 12% | 47 6% | 50 -0% | 52 -4% |
* ... smaller is better
Temperature
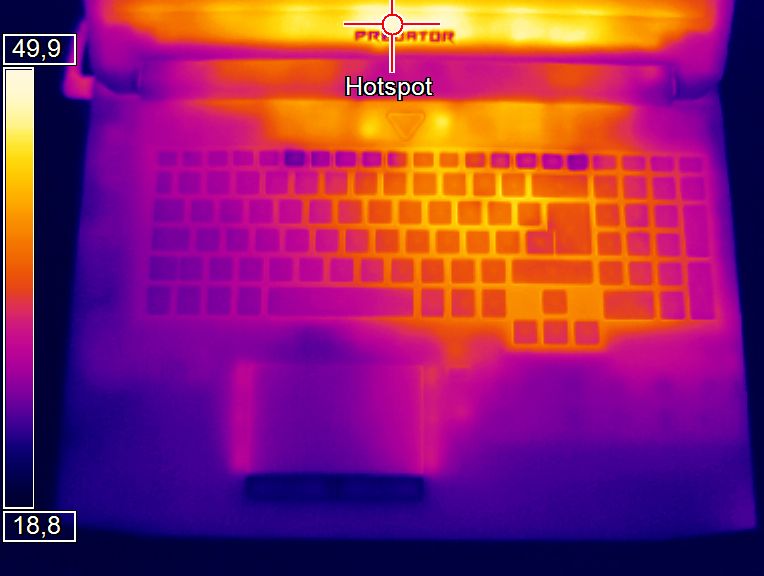
Thanks to the FrostCore if nothing else, the case remains comfortably cool, even during 3D operation. Here the palm rest stands out, which still feels comfortable at a maximum of 31 °C (88 °F) even in stress situations. The Predator 17 completed the idle test with an average of 25 °C (top, 77 °F) and 23 °C (bottom, 73 °F), which is also an excellent result.
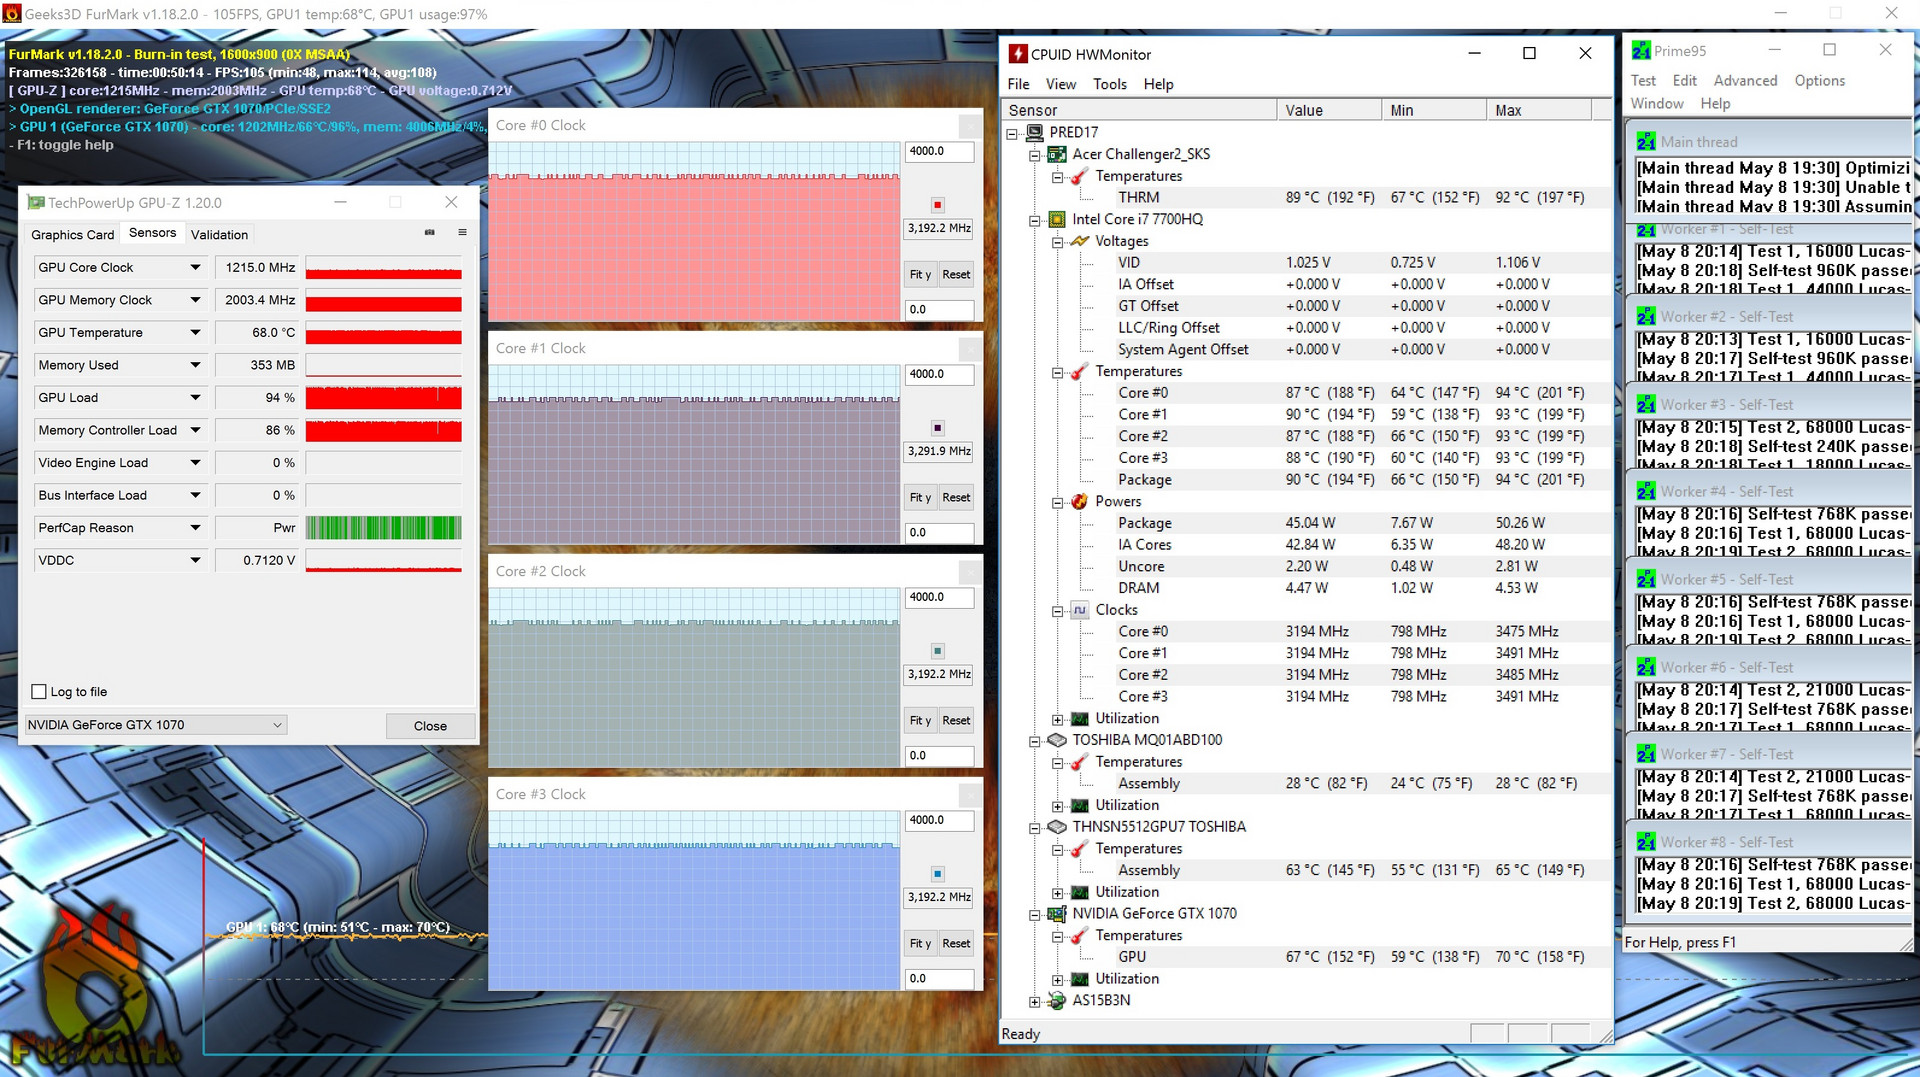
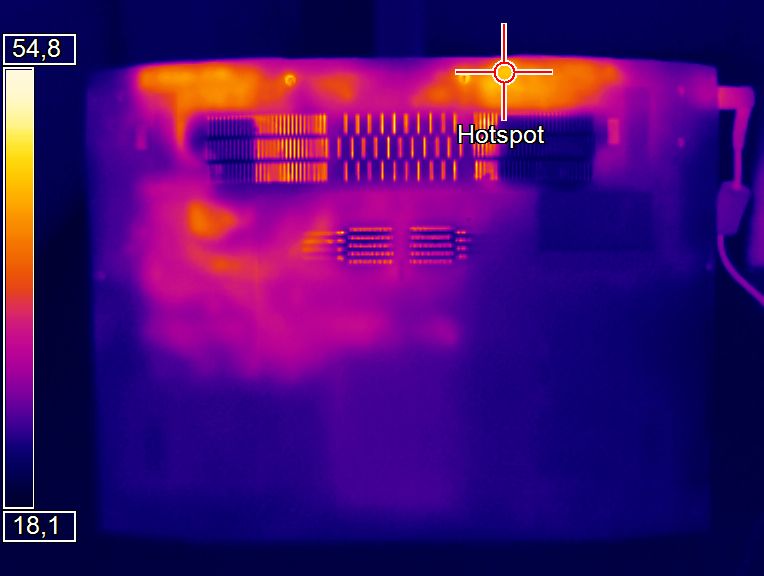
Underneath the hood, it is mainly the processor that heats up. While the GeForce GTX 1070 (which was slightly throttled) reached only a maximum of 70 °C (158 °F) after an hour of full load with the Furmark and Prime95 tools, the Core i7-7700HQ (which is not throttled) reached up to 94 °C (201 °F).
(+) The maximum temperature on the upper side is 39.1 °C / 102 F, compared to the average of 40.4 °C / 105 F, ranging from 21.2 to 68.8 °C for the class Gaming.
(±) The bottom heats up to a maximum of 42.1 °C / 108 F, compared to the average of 43.2 °C / 110 F
(+) In idle usage, the average temperature for the upper side is 25.3 °C / 78 F, compared to the device average of 33.9 °C / 93 F.
(±) Playing The Witcher 3, the average temperature for the upper side is 33.3 °C / 92 F, compared to the device average of 33.9 °C / 93 F.
(+) The palmrests and touchpad are cooler than skin temperature with a maximum of 31.8 °C / 89.2 F and are therefore cool to the touch.
(-) The average temperature of the palmrest area of similar devices was 28.8 °C / 83.8 F (-3 °C / -5.4 F).
| Acer Predator 17 G9-793-70PJ i7-7700HQ, GeForce GTX 1070 Mobile | MSI GT72VR 7RE-433 i7-7700HQ, GeForce GTX 1070 Mobile | Asus G752VS-XB78K 6820HK, GeForce GTX 1070 Mobile | Acer Predator 17 X GX-792-76DL i7-7820HK, GeForce GTX 1080 Mobile | Schenker XMG U727 2017 i7-7700K, GeForce GTX 1080 Mobile | |
|---|---|---|---|---|---|
| Heat | -5% | -9% | -14% | -27% | |
| Maximum Upper Side * (°C) | 39.1 | 41.5 -6% | 42.9 -10% | 44.2 -13% | 47.5 -21% |
| Maximum Bottom * (°C) | 42.1 | 50.6 -20% | 41.5 1% | 43 -2% | 56 -33% |
| Idle Upper Side * (°C) | 27.9 | 26.4 5% | 31.6 -13% | 32.4 -16% | 34.5 -24% |
| Idle Bottom * (°C) | 26.1 | 25.4 3% | 29.5 -13% | 32.8 -26% | 33.6 -29% |
* ... smaller is better
Speakers
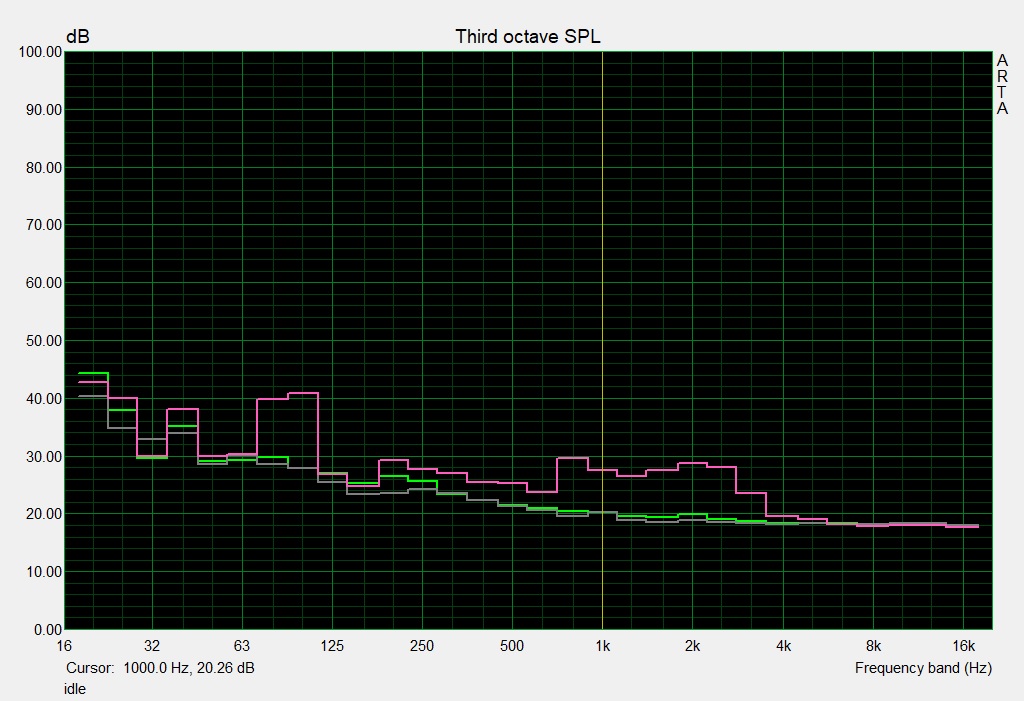
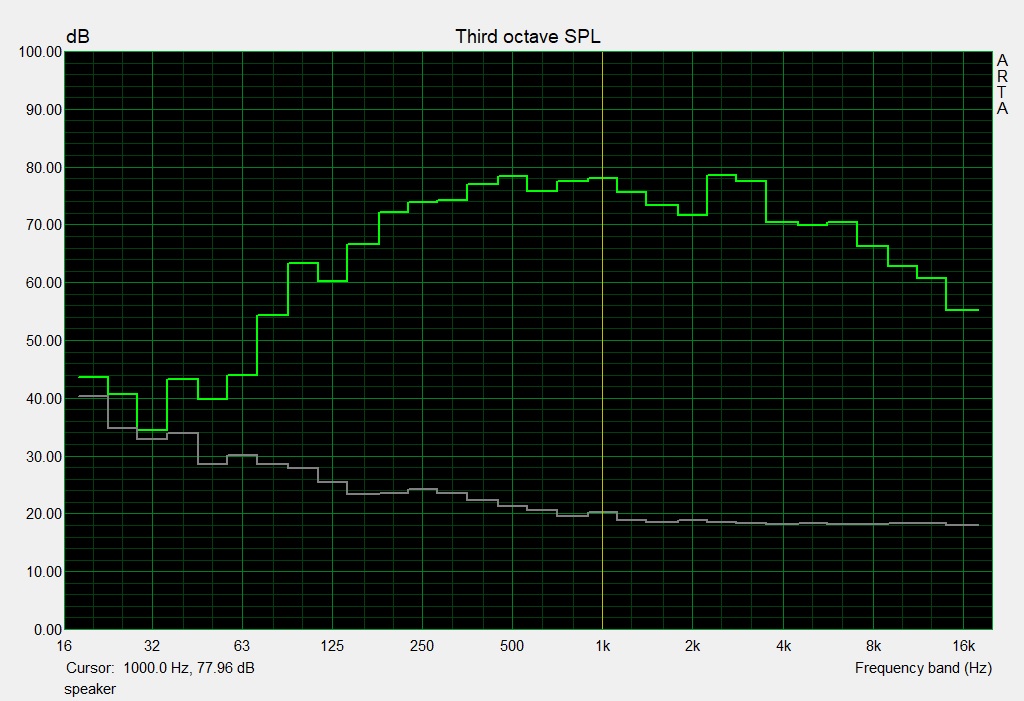
Acer Predator 17 G9-793-70PJ audio analysis
(+) | speakers can play relatively loud (87 dB)
Bass 100 - 315 Hz
(±) | reduced bass - on average 5.5% lower than median
(±) | linearity of bass is average (8% delta to prev. frequency)
Mids 400 - 2000 Hz
(+) | balanced mids - only 2.9% away from median
(+) | mids are linear (3.5% delta to prev. frequency)
Highs 2 - 16 kHz
(±) | reduced highs - on average 5.2% lower than median
(+) | highs are linear (6.2% delta to prev. frequency)
Overall 100 - 16.000 Hz
(+) | overall sound is linear (10.3% difference to median)
Compared to same class
» 6% of all tested devices in this class were better, 2% similar, 93% worse
» The best had a delta of 6%, average was 18%, worst was 132%
Compared to all devices tested
» 5% of all tested devices were better, 1% similar, 94% worse
» The best had a delta of 4%, average was 23%, worst was 134%
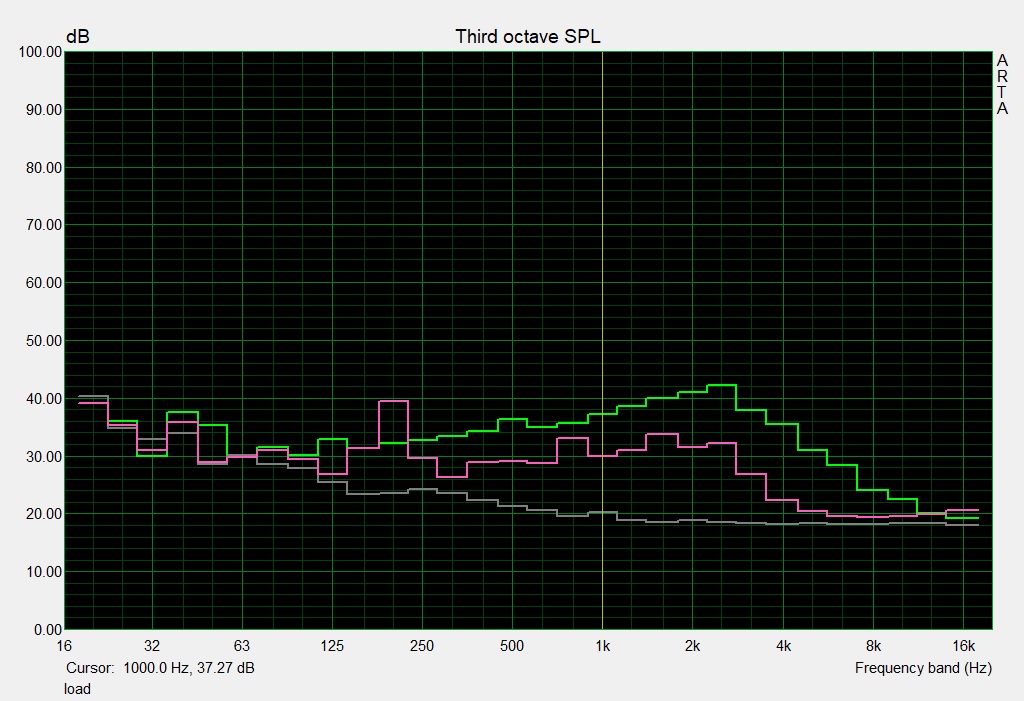
MSI GT72VR 7RE-433 audio analysis
(+) | speakers can play relatively loud (87 dB)
Bass 100 - 315 Hz
(±) | reduced bass - on average 5.4% lower than median
(±) | linearity of bass is average (11.3% delta to prev. frequency)
Mids 400 - 2000 Hz
(±) | higher mids - on average 5% higher than median
(+) | mids are linear (4.1% delta to prev. frequency)
Highs 2 - 16 kHz
(+) | balanced highs - only 4.7% away from median
(+) | highs are linear (5.7% delta to prev. frequency)
Overall 100 - 16.000 Hz
(+) | overall sound is linear (11.7% difference to median)
Compared to same class
» 11% of all tested devices in this class were better, 4% similar, 85% worse
» The best had a delta of 6%, average was 18%, worst was 132%
Compared to all devices tested
» 8% of all tested devices were better, 3% similar, 89% worse
» The best had a delta of 4%, average was 23%, worst was 134%
Frequency diagram in comparison (checkboxes above can be checked/unchecked!)
Power Management
Power Consumption
The sacrifice of graphics-switching (Nvidia Optimus) expresses itself especially in the power consumption and battery life. During idle operation, we got between 23 and 40 watts for the high-end gamer, and during load we measured almost 94 watts (3DMark 06), 177 watts (The Witcher 3), and 228 watts (stress test). With a nominal capacity of 230 watts, the power supply is sized sufficiently.
| Off / Standby | |
| Idle | |
| Load |
|
Key:
min: | |
| Acer Predator 17 G9-793-70PJ i7-7700HQ, GeForce GTX 1070 Mobile | MSI GT72VR 7RE-433 i7-7700HQ, GeForce GTX 1070 Mobile | Asus G752VS-XB78K 6820HK, GeForce GTX 1070 Mobile | Acer Predator 17 X GX-792-76DL i7-7820HK, GeForce GTX 1080 Mobile | Schenker XMG U727 2017 i7-7700K, GeForce GTX 1080 Mobile | |
|---|---|---|---|---|---|
| Power Consumption | 16% | 5% | -7% | -43% | |
| Idle Minimum * (Watt) | 23 | 20 13% | 24 -4% | 27 -17% | 32 -39% |
| Idle Average * (Watt) | 33 | 27 18% | 31 6% | 32 3% | 43 -30% |
| Idle Maximum * (Watt) | 40 | 31 22% | 36 10% | 41 -2% | 51 -27% |
| Load Average * (Watt) | 94 | 86 9% | 94 -0% | 102 -9% | 138 -47% |
| Witcher 3 ultra * (Watt) | 177 | 279 -58% | |||
| Load Maximum * (Watt) | 228 | 184 19% | 204 11% | 248 -9% | 350 -54% |
* ... smaller is better
Battery Life
Depending on the display brightness and system demands, the runtime is between 1.5 hours (high load, maximum brightness) and 5.5 hours (idle, minimum brightness). During Windows everyday-life operation (video, web, etc.), you can last for 3 to 4 hours without a power supply with medium brightness. Even though all the competitors have a battery with at least 80 Wh, the results of none of the devices can really convince. But these notebooks are primarily designed as desktop replacements. During The Witcher 3 (FHD & Ultra), the performance slows down by 20% in battery mode.
| Acer Predator 17 G9-793-70PJ i7-7700HQ, GeForce GTX 1070 Mobile, 88 Wh | MSI GT72VR 7RE-433 i7-7700HQ, GeForce GTX 1070 Mobile, 83 Wh | Asus G752VS-XB78K 6820HK, GeForce GTX 1070 Mobile, 90 Wh | Acer Predator 17 X GX-792-76DL i7-7820HK, GeForce GTX 1080 Mobile, 88.8 Wh | Schenker XMG U727 2017 i7-7700K, GeForce GTX 1080 Mobile, 89 Wh | |
|---|---|---|---|---|---|
| Battery runtime | 1% | -5% | 4% | -15% | |
| Reader / Idle (h) | 5.4 | 5.3 -2% | 5.2 -4% | 5.2 -4% | 3.7 -31% |
| WiFi v1.3 (h) | 3.6 | 3.8 6% | 3.5 -3% | 4.2 17% | 2.8 -22% |
| Load (h) | 1.5 | 1.5 0% | 1.4 -7% | 1.5 0% | 1.6 7% |
| H.264 (h) | 3.8 | 3.1 | 3.4 |
Verdict
Pros
Cons
Since our Skylake test, our verdict on the visually extravagant Predator remains almost unchanged.
With the featured equipment, the Kaby-Lake version also scores with an excellent UHD panel, which plays at the top in most disciplines (such as viewing angle, contrast, and color space).
Added to that is a first-class performance which can be even further increased via PredatorSense (optional GPU over-clocking). The future-proofing is taken care of as well, be it in form of the 32 GB of RAM, the high capacity of the drives (SSD-HDD combination), or the Thunderbolt-3 port.
We see the disadvantages in the size and weight. Anyone who often transports their notebook should rather buy a more compact device that supports Optimus (since it tends to have better battery life). However, core gamers who primarily play stationary should hardly be bothered by this.
Acer Predator 17 G9-793-70PJ
- 05/20/2017 v6 (old)
Florian Glaser
Price comparison
