Acer Aspire VX5-591G (7700HQ, FHD, GTX 1050 Ti) Laptop Review

For the original German review, see here.
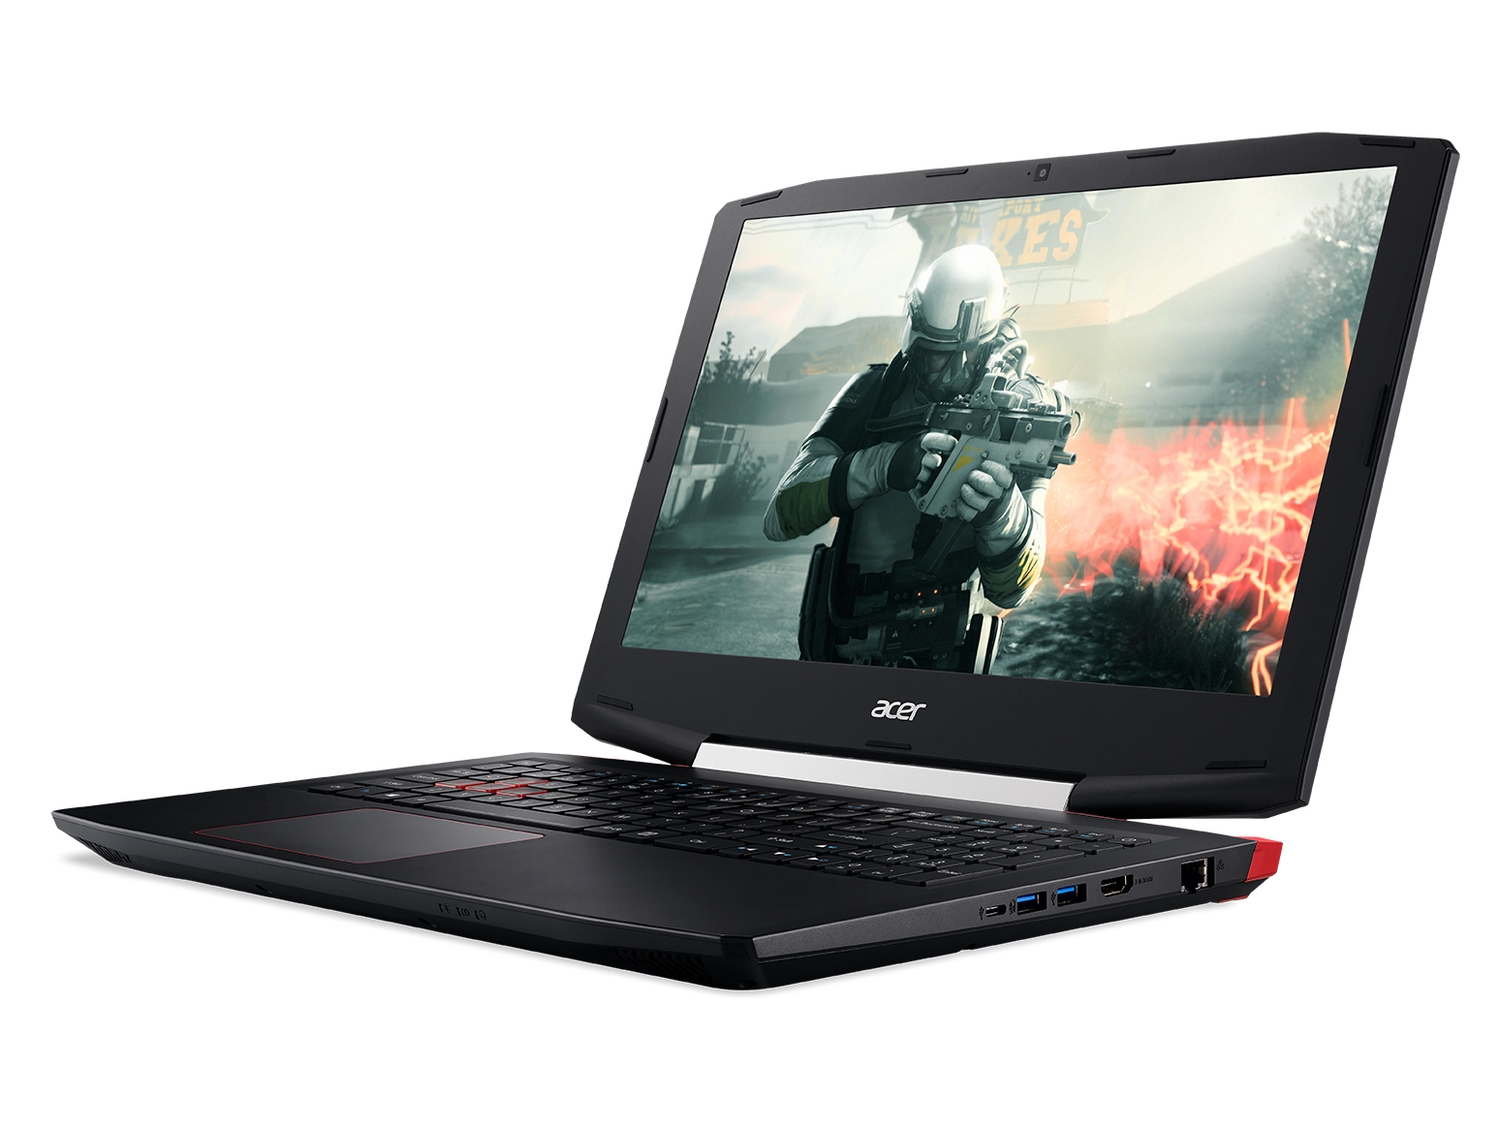
We normally place laptops with a GeForce GTX 1050 Ti in the multimedia section. Exceptions are made when the manufacturer explicitly labels the device as a gaming laptop, which is not the case here. The weight of 2.5 kg is a bit unusual; most multimedia laptops of this category are sooner found in the 2 kg range. At test time, 26 versions of the VX5-591G could be found in a major Berlin price comparison, some with other CPUs and GPUs, and with or without an operating system or with preloaded Linux.
In addition to the mid-range graphics card with 4 GB of dedicated VRAM, Intel's fast Core i7-7700HQ alongside 8 GB of RAM operates in the Aspire VX5-591G-75C4 VX15 priced at just over 1000 Euros (~$1061) at test time. The matte IPS panel has a resolution of 1920x1080 pixels and does not use G-Sync in favor of Nvidia Optimus. The storage device is a conventional 1 TB hard drive. Acer does not install an optical drive. Windows 10 Home is preloaded.
The search for suitable comparison laptops for this test was not easy. Besides an identical screen diagonal, we particularly placed focus on a fairly comparable price. Thus, some devices are very different in terms of configuration, dimensions, and weight. However, we also considered the identical version with a 256-GB SSD priced at approximately 1200 Euros (~$1273) since we do not believe that many potential buyers will opt for the version we are testing here. The participants and the relevant specs are:
- Dell XPS 15 2017 9560 (i5-7300HQ, 8 GB RAM, GTX 1050, Full HD, 2 kg)
- Asus Zenbook UX510UW-CN044T (i7-6500U, 8 GB RAM, GTX 960M, Full HD, 2 kg)
- Acer Aspire V15 Nitro BE VN7-593G (i7-7700HQ, 8 GB RAM, GTX 1060, Full HD, 2.5 kg)
The advantage here is that we can compare the performance of the diverse components, some from different hardware generations, well.
We published an in-depth preview article concerning Acer's Aspire VX5-591G (VX15) early this year, and would recommend it as further reading to complement this test.
Case
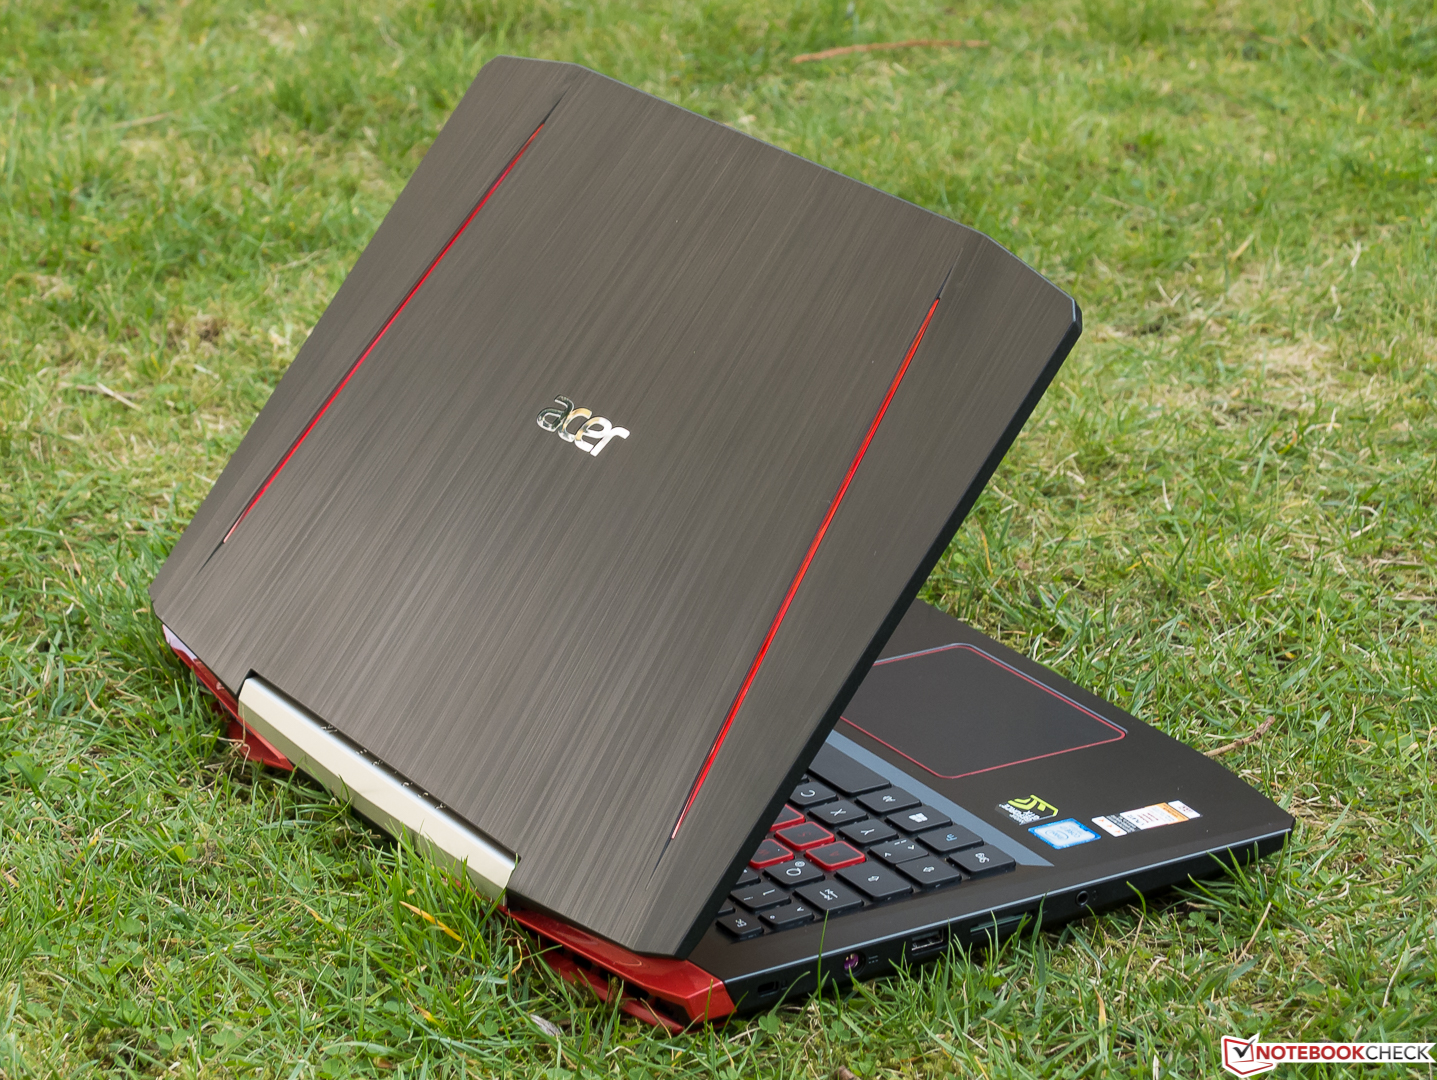
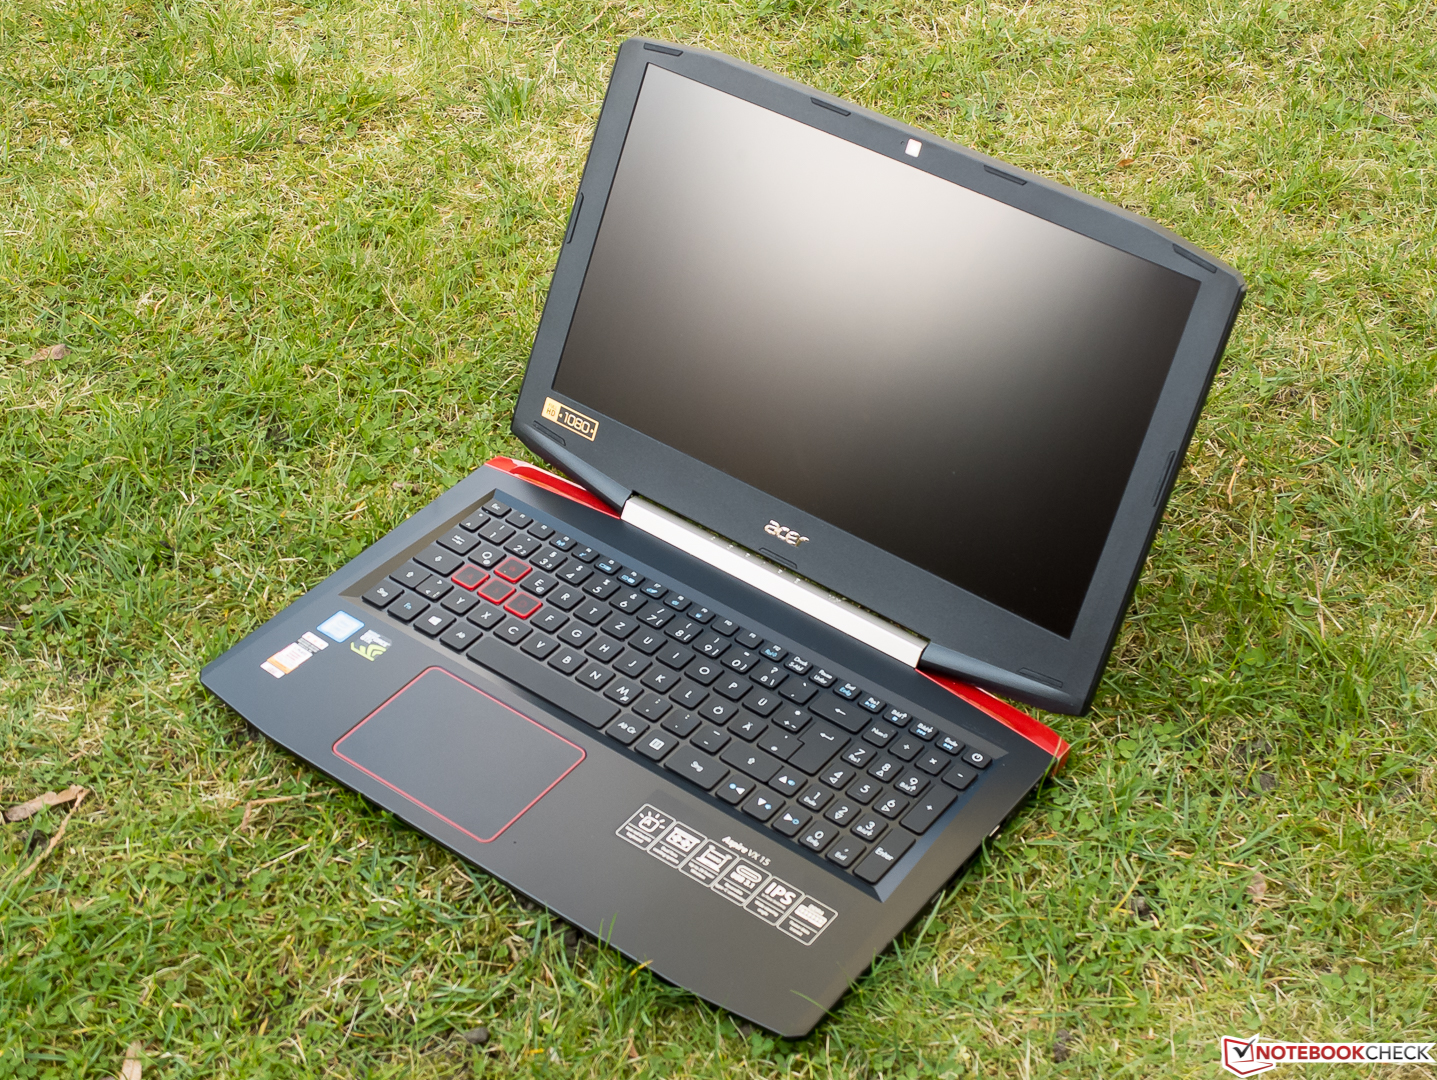
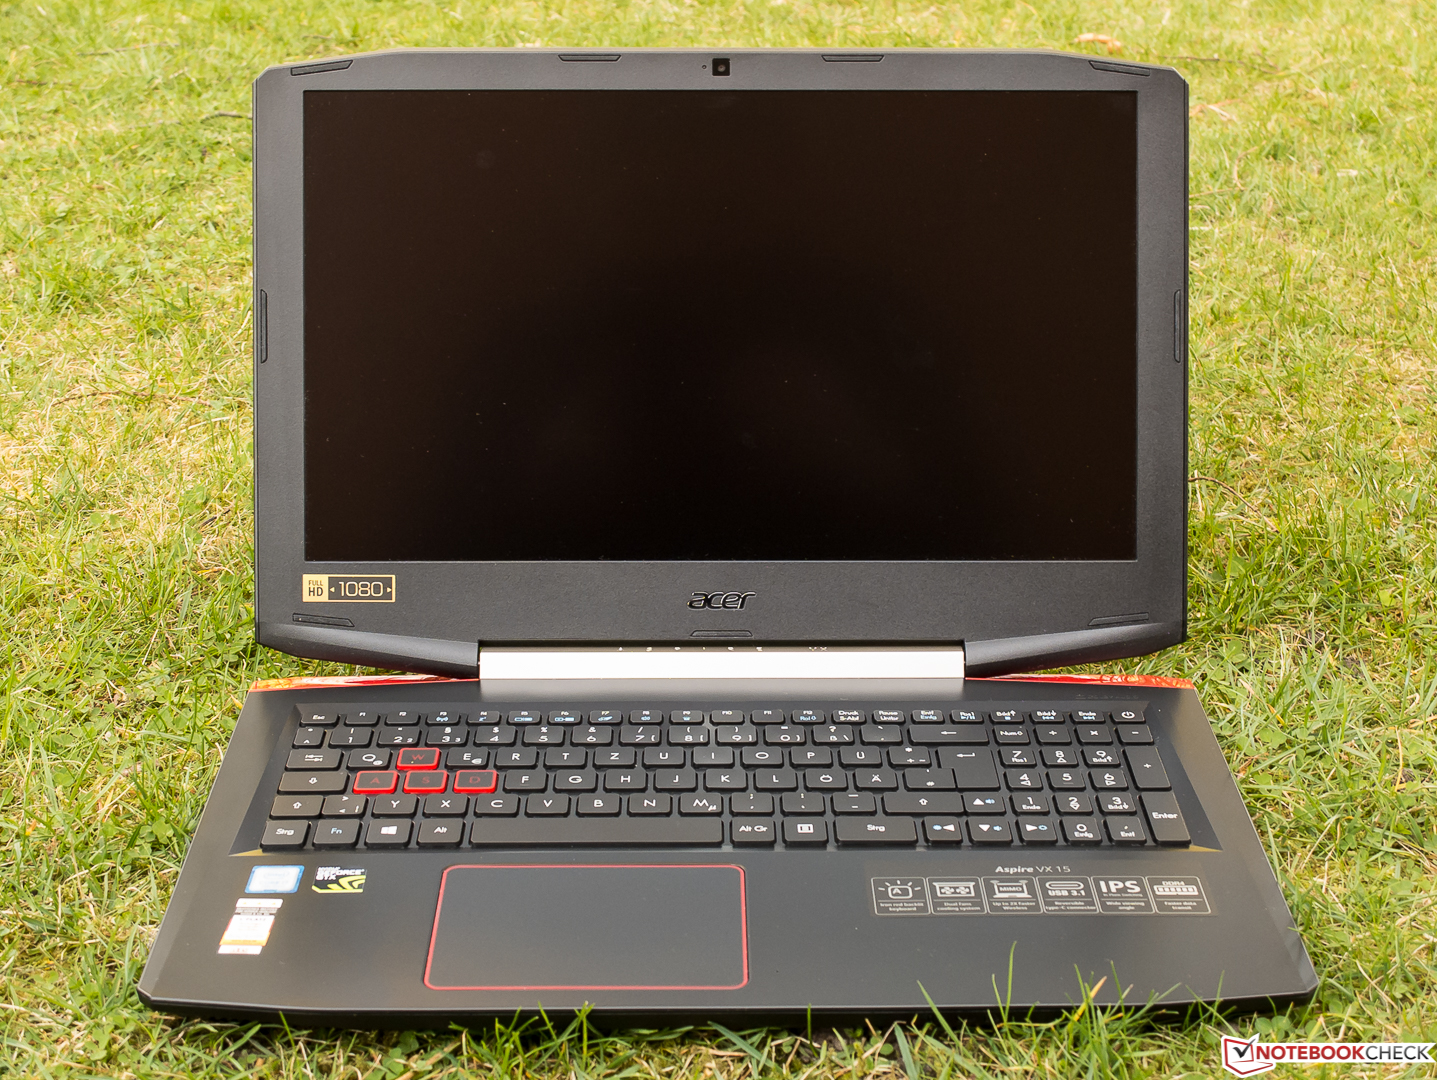
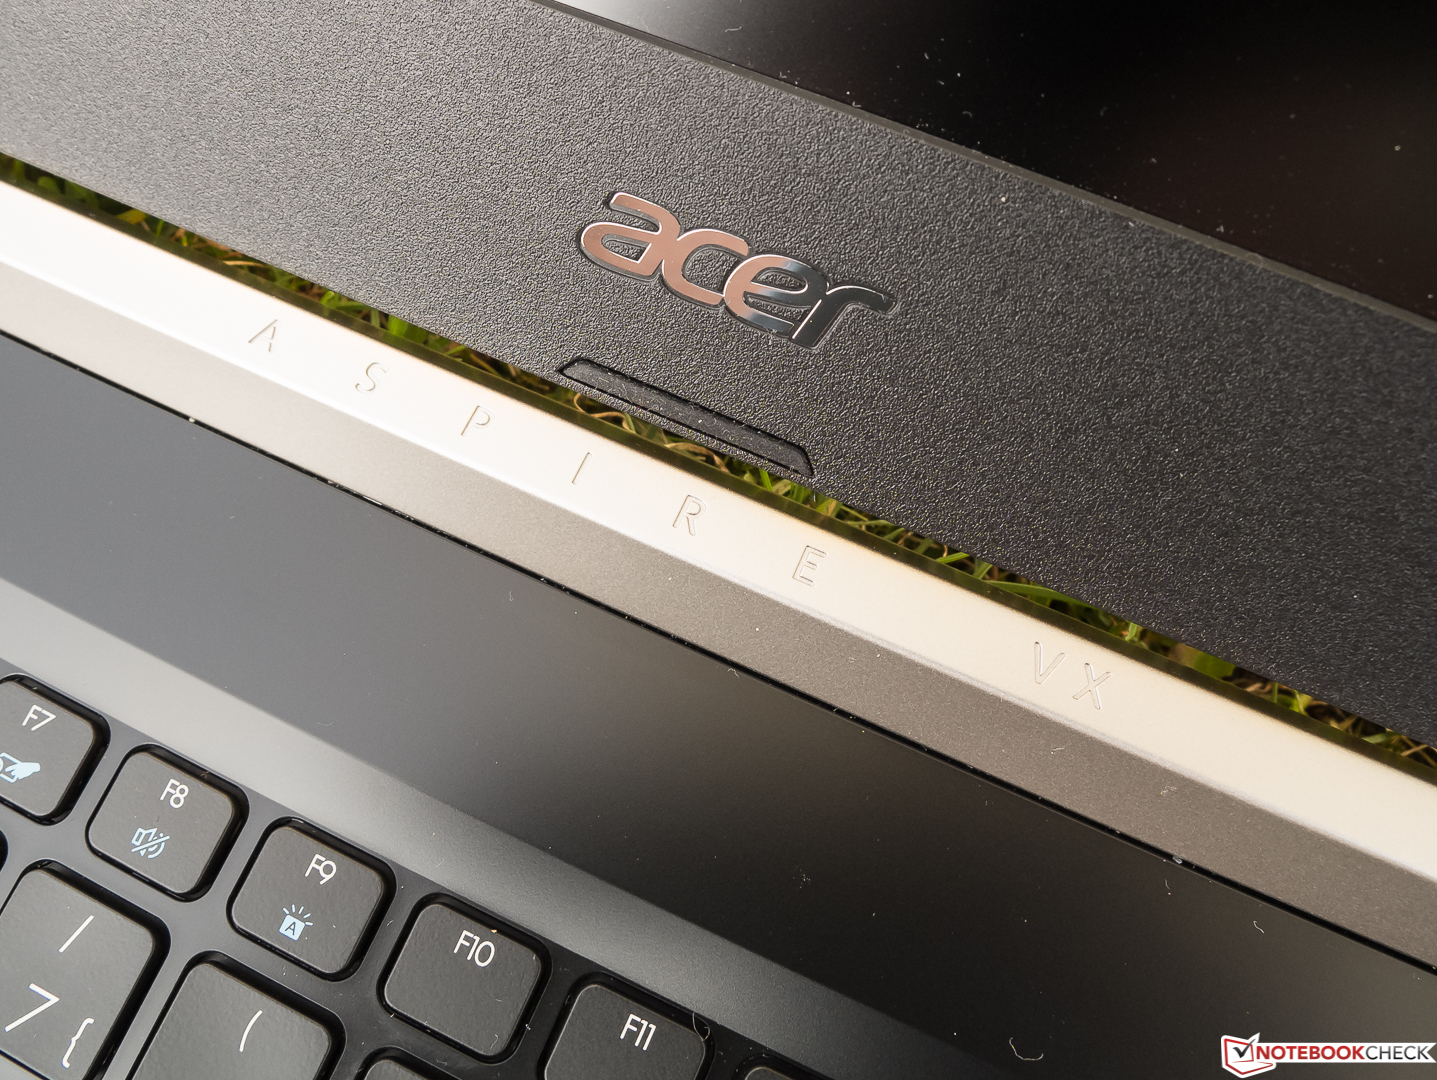
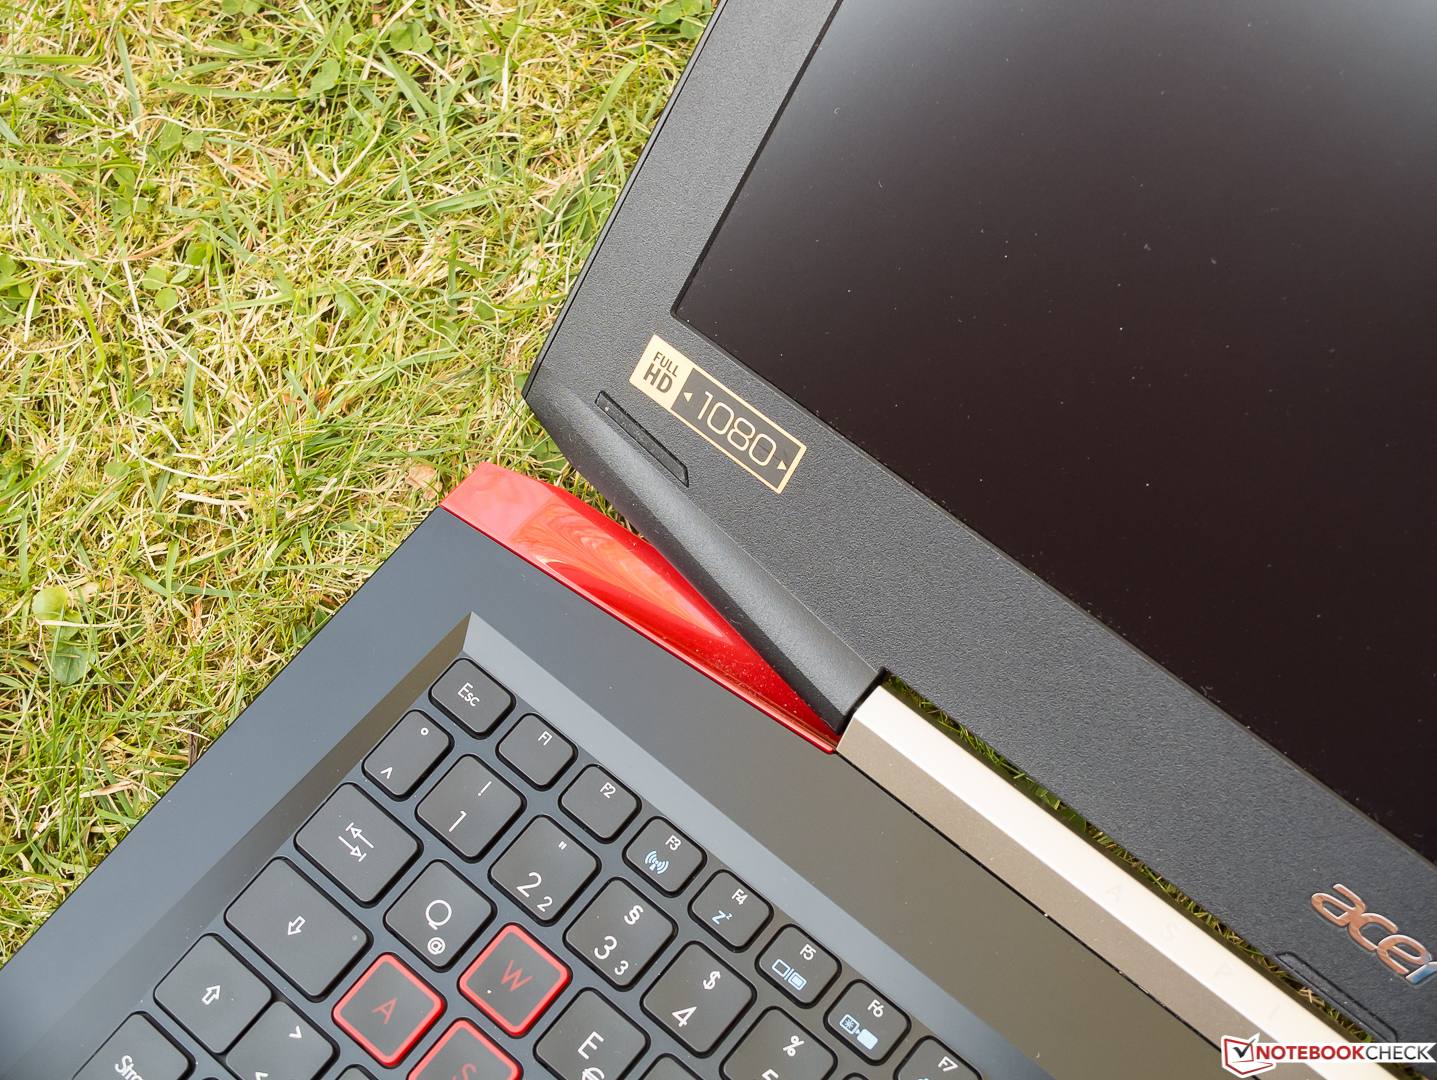
The futuristic-angular design of the black, apparently plastic casing definitely follows Acer's Predator lineup aimed at players. While the base unit's upper side has a glossy finish that is relatively insusceptible for fingerprints, the underside and the display bezel are simple, slip-proof plastic. Acer is quite generous with optical accents, such as the trimming on the brushed display back, but it is not exaggerated in the tester's opinion.
The base can be warped to a small degree and produces a quiet cracking noise with a bit of force. The not exactly thin lid could be slightly stiffer, but image distortions are barely visible when selective pressure is applied to the back. Thanks to the hinges very good setting, the Acer Aspire VX5-591G can be opened easily with one hand and the display only rocks for a moment after being jerked.
Apart from some inaccurate gaps and a few, marginally protruding edges, the build of the solid-looking casing makes an impeccable impression that corresponds to its price.

As said in the intro, there are significant differences in size and weight this time. The just 17 mm thick Dell XPS 15 is the most compact device here. The much wider and deeper, but only 20 mm thick Asus Zenbook weighs approximately 2 kg. Both other laptops achieve around 2.5 kg.
The surface areas of both Acer laptops are almost identical. The Nitro is a few millimeters thinner than the review sample. The still relatively compact Asus Zenbook places itself between Acer's models and the XPS 15.
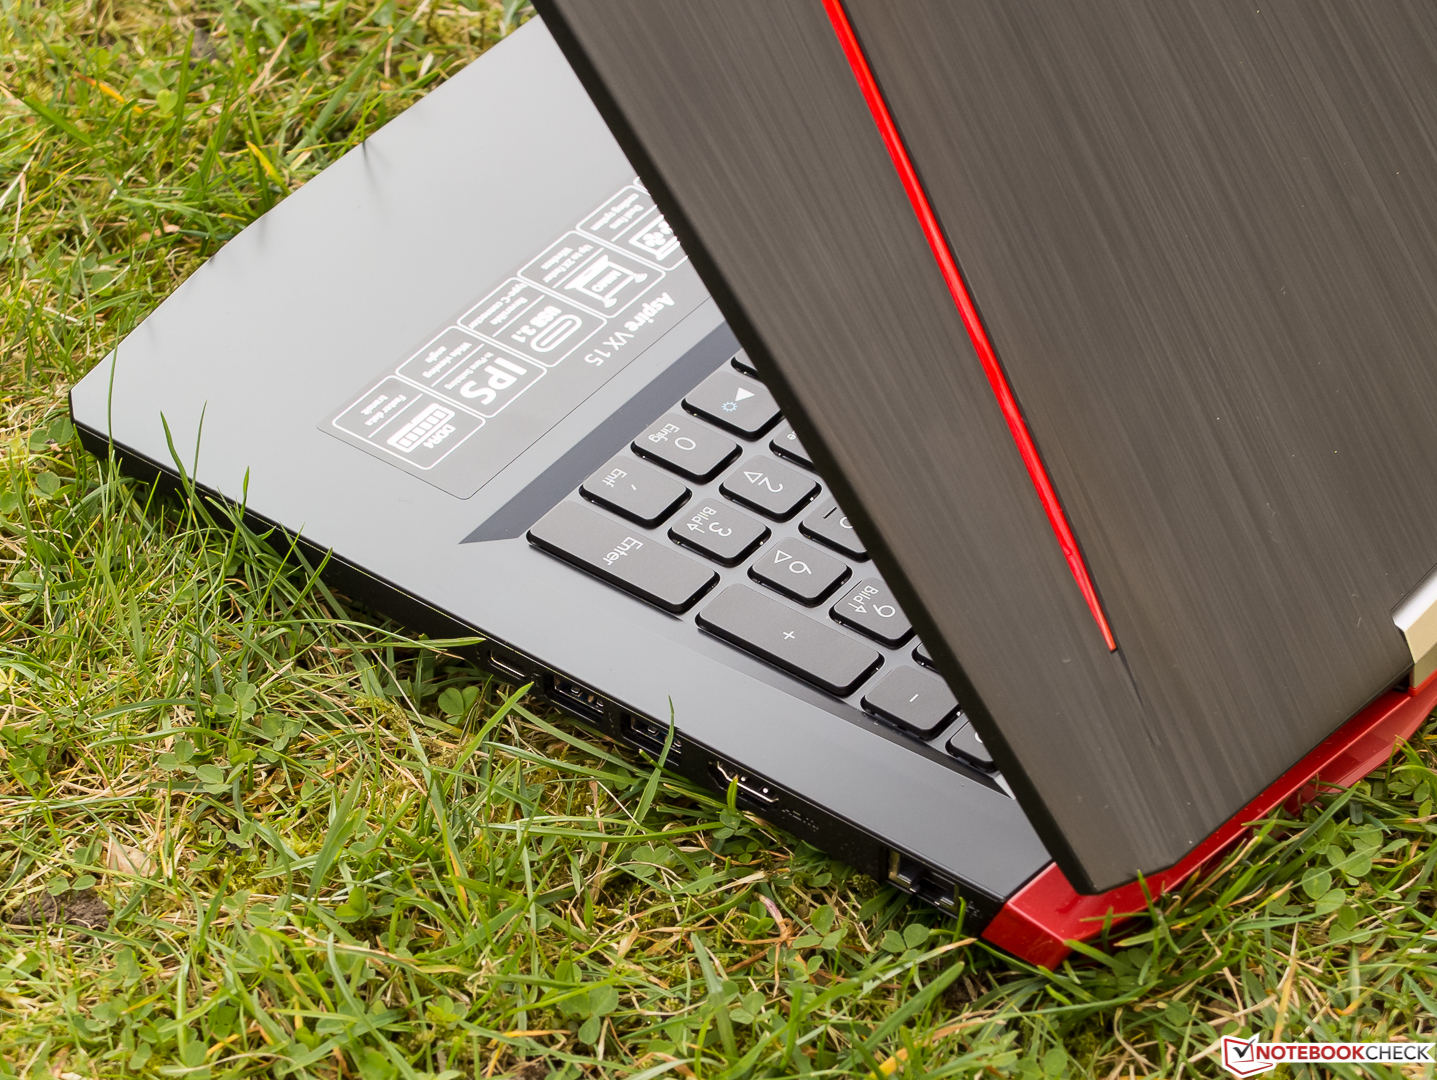
Connectivity
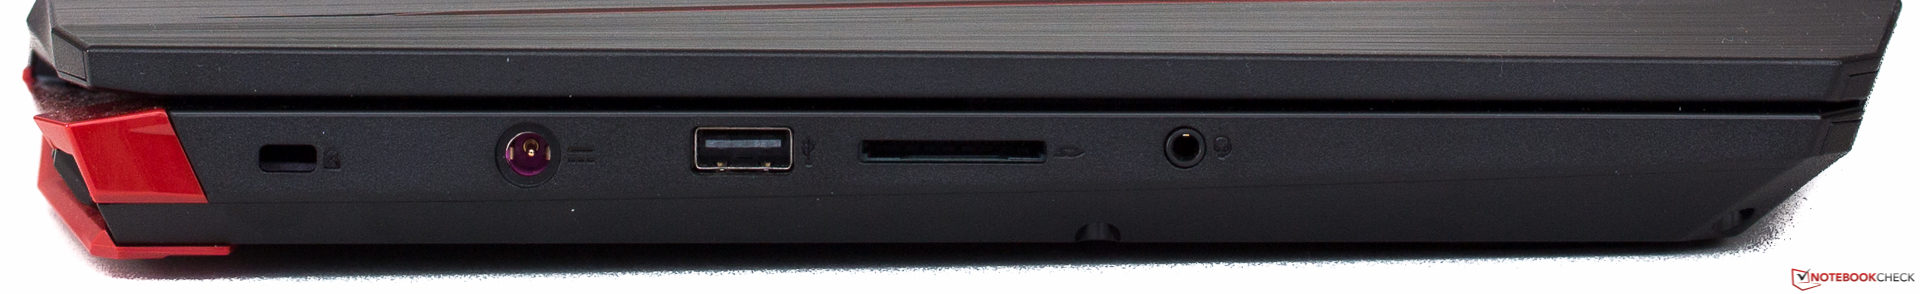
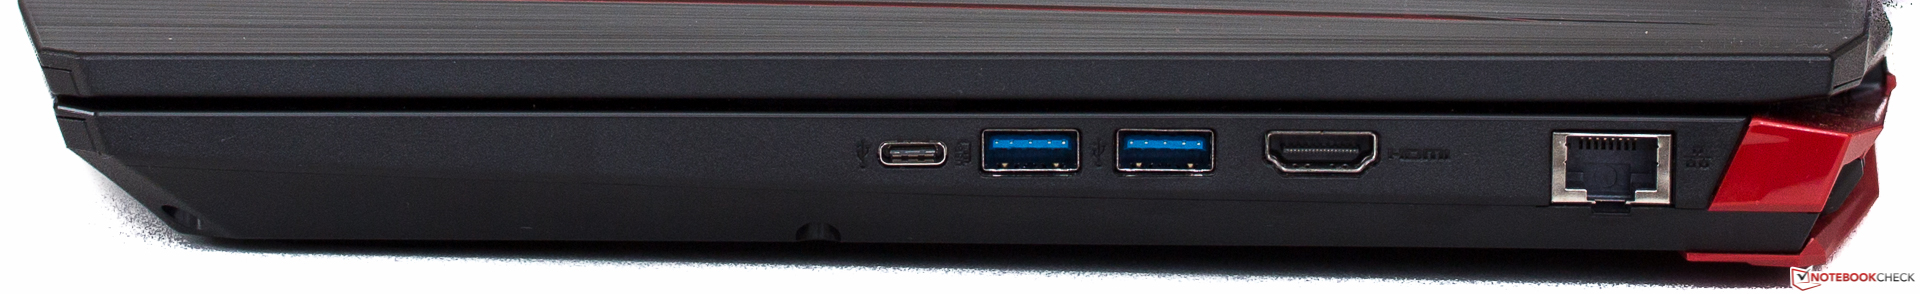
Basically, only the USB Type-C port (Gen1) is worth mentioning; the other interfaces are standard. One of the three USB Type-A ports still uses the 2.0 standard. This is not a disadvantage when connecting, for example, an external mouse, but the slow port has unfortunately been placed on the left which is not favorable for right-handed users. A Gigabit Ethernet is installed for stationary use, but VGA is absent which will unlikely be a problem for anyone nowadays. Ergonomically favorable: All interfaces are in the back areas of both sides, but the spacing could have been a bit more generous.
SD-Card Reader
As for the SD-card reader, Acer and Asus only install a sluggish card reader that is connected via USB 2.0, which we deem unsuitable in view of the price. Dell's laptop sports a better model, but we are surprised about the big difference in the read test. The 57 MB/s that we measured when copying JPG files is not quite on the average of the mean speed class. We again used our Toshiba Exceria Pro SDXC 64 GB UHS-II reference card for the measurements.
| SD Card Reader | |
| average JPG Copy Test (av. of 3 runs) | |
| Dell XPS 15 2017 9560 (7300HQ, Full-HD) | |
| Acer Aspire VX5-591G-75C4 VX15 | |
| Acer Aspire VN7-593G-73HP V15 Nitro BE | |
| Asus Zenbook UX510UW-CN044T | |
| maximum AS SSD Seq Read Test (1GB) | |
| Dell XPS 15 2017 9560 (7300HQ, Full-HD) | |
| Acer Aspire VX5-591G-75C4 VX15 | |
| Acer Aspire VN7-593G-73HP V15 Nitro BE | |
| Asus Zenbook UX510UW-CN044T | |
Communication
Intel's somewhat obsolete yet tried Wireless AC 7265 module is responsible for wireless connections. Thanks to MIMO 2x2, a theoretical gross data rate of 867 MBit/s is possible and, in addition to the older 2.4 GHz standards, it also supports the latest ac-standard that exclusively uses the less frequented 5 GHz band. Bluetooth 4.2 (updating the driver might be required) and Intel's Wireless Display are also present.
Considering the normal overhead, Acer's Aspire VX5 achieves a good 533 MBit/s in receive and a very good 653 MBit/s in transmit. We perform these measurements at a distance of one meter to our standard Linksys EA8500 router.
Accessories
Acer does not include any special accessories. The power supply and its cable, various leaflets concerning setup and warranty conditions and a "Resource DVD" are in the box.
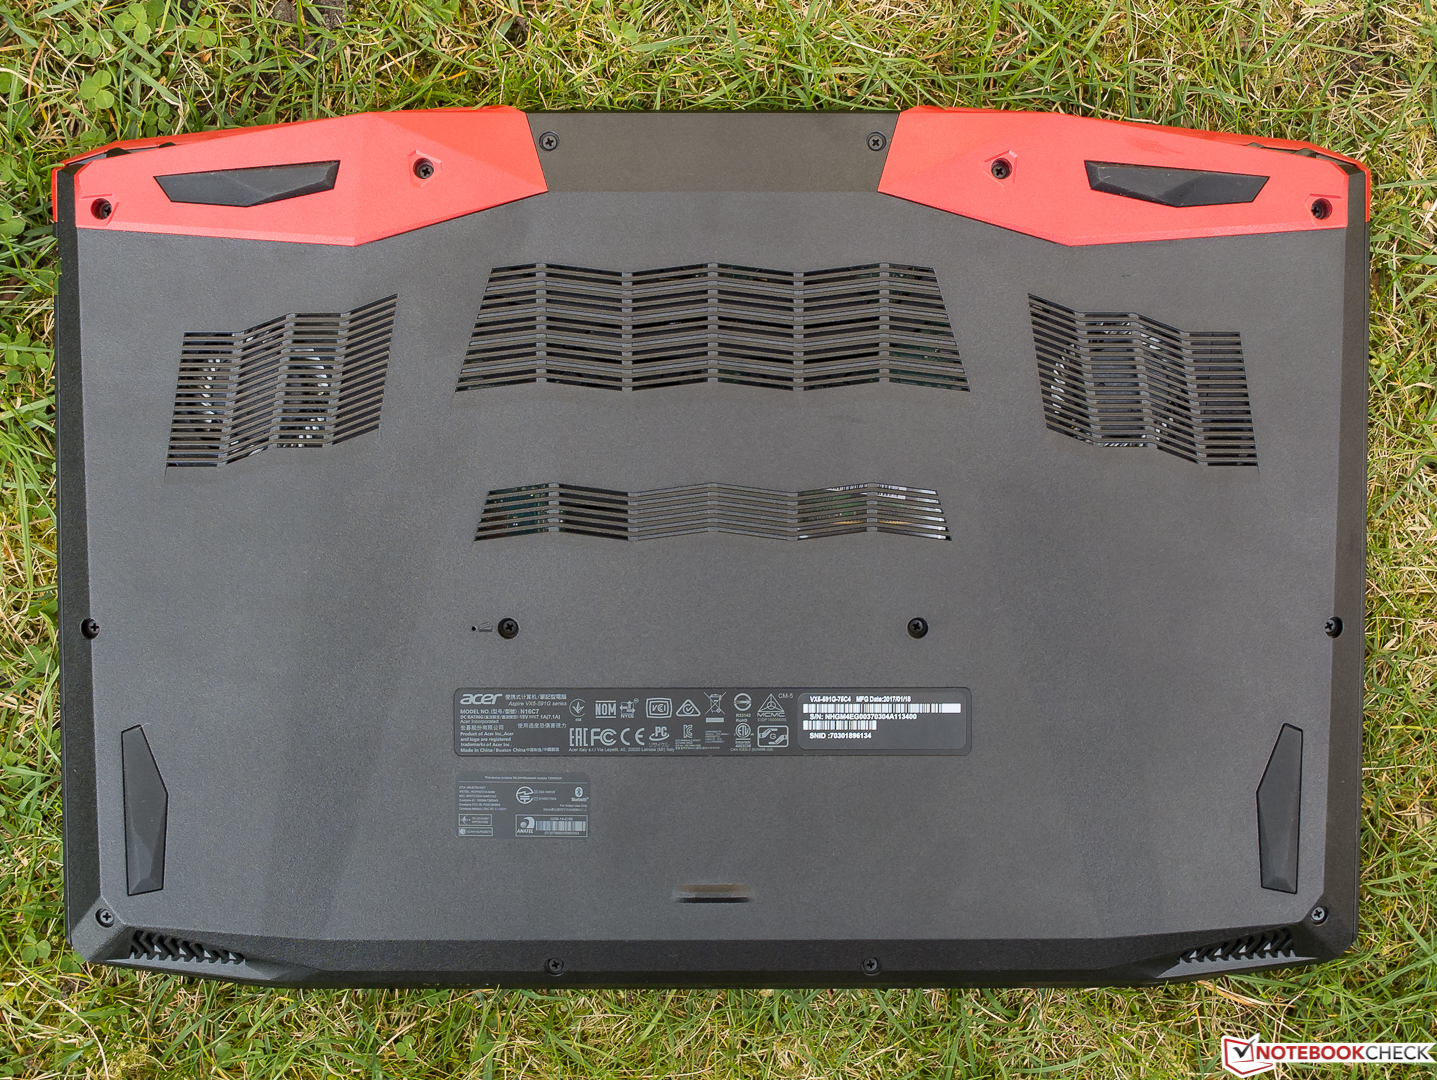
Maintenance
A maintenance hatch is not present and the battery can only be accessed after removing 14 Philips screws from the base tray, which might involve risking the warranty. It does not look as if this undertaking would be easy to perform. We did not make any attempts to do this since our review sample is a shop device.
Warranty
In our opinion, Acer makes contradictory statements about the warranty, and thus we would refer to the manufacturer's website. A "2-year pick-up and return service (1st yr. ITW)" is stated under "Notebooks". When opening the linked PDF, it turns into a "2-year mail-in/carry-in". The latter will likely be correct. The additional International Travelers Warranty is limited to one year. Acer offers various warranty extensions for a surcharge. Please see our Guarantees, Return policies and Warranties FAQ for country-specific information.
Input Devices
Keyboard
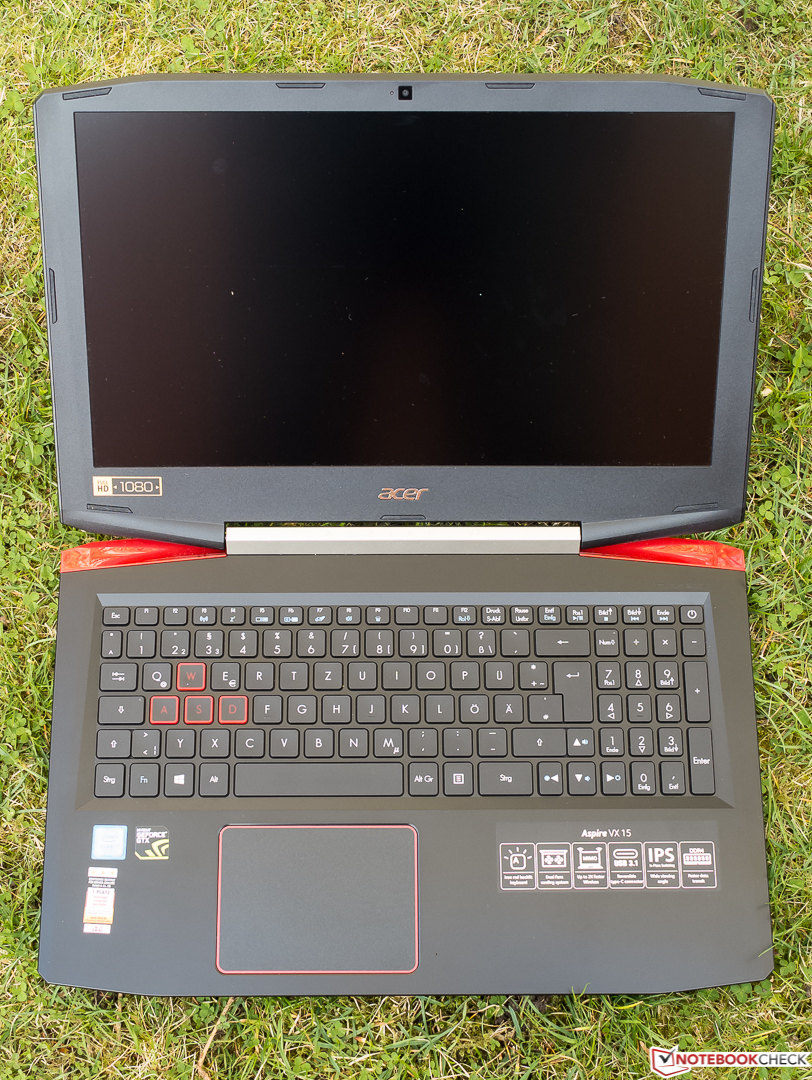
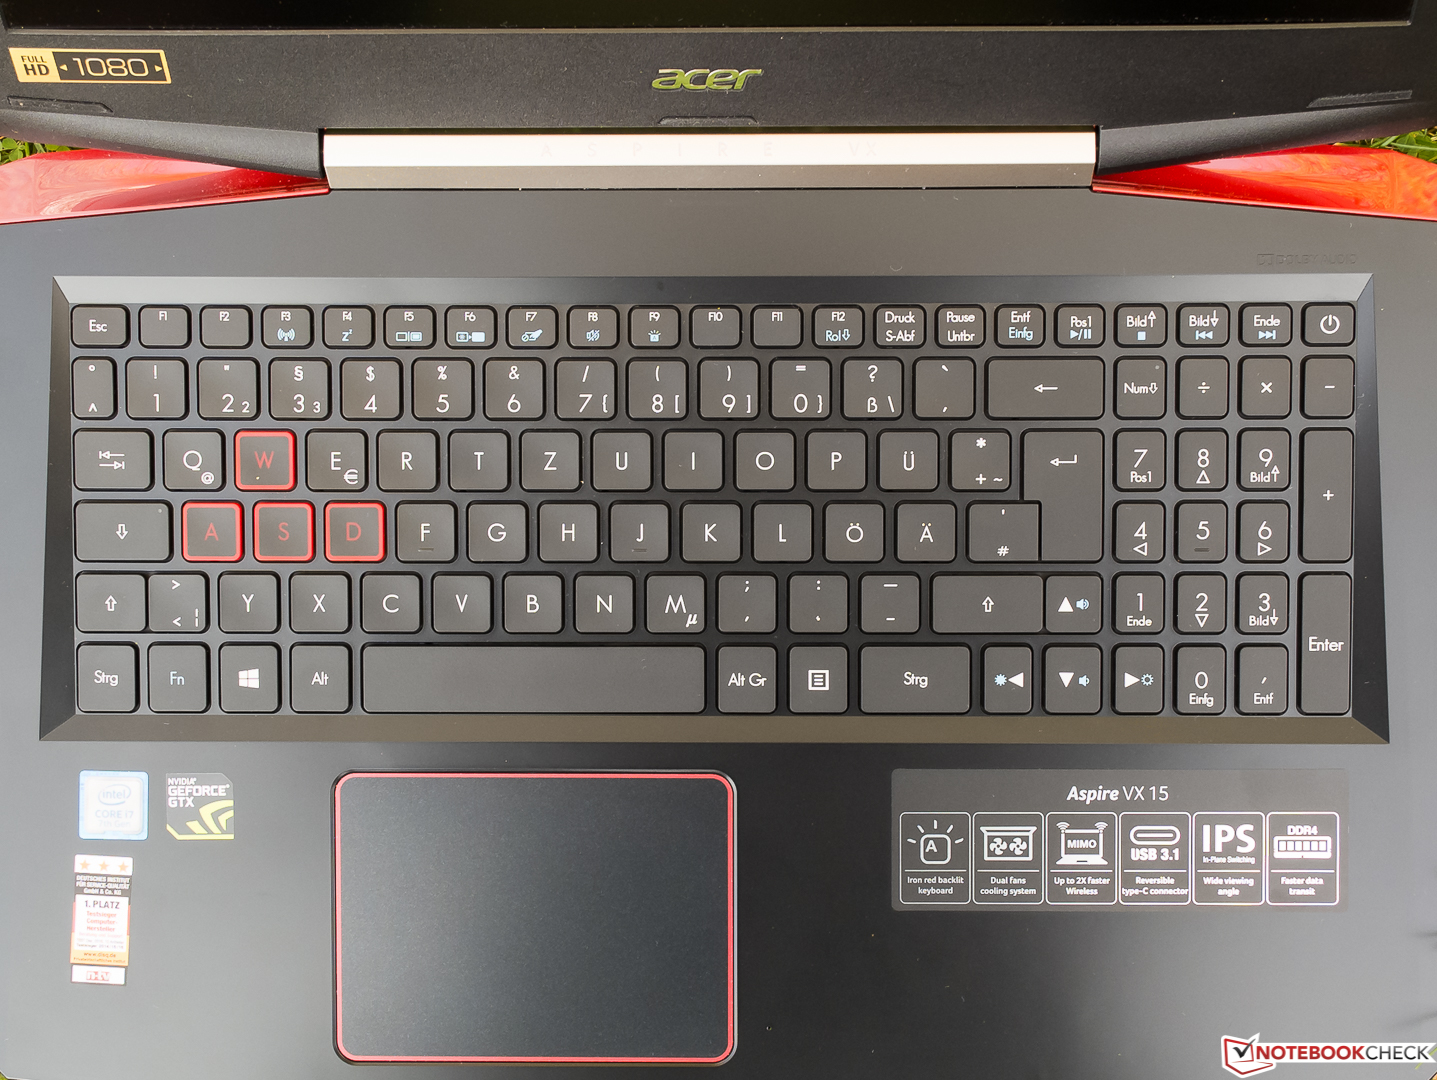
The layout of the slightly lowered chiclet keyboard is straightforward. However, the manufacturer does not separate the main key field from the number pad, which is unfortunately much narrower than standard models. Otherwise, we did not have problems with the size and spacing of the keys, some of which are slightly concave. With a short drop, the pressure point is well-palpable but not exactly crisp. The tester deems the stroke to be a bit too soft. Although this could prevent fatigue, it also creates a slightly spongy typing feel at the same time. Some of the bigger keys (return, space) clatter to such an extent that they make extensive typing sessions in noise-sensitive environments impossible.
The base yields slightly in the area above the touchpad's right corner. The keyboard itself is more resistant. The red, one-level backlight is homogeneous but could be brighter. The impeccably legible lettering does not give reason for complaint.
Touchpad
Although the ClickPad without dedicated keys has a generous area, initial touches in the lateral areas are not always detected reliably. The sleek surface's gliding properties are good when the fingers are dry, but moist fingers begin to falter too quickly for our taste. The accuracy and responsiveness are beyond reproach. Drag & drop usually functions but not always.
We liked the two replacement mouse keys, which combine a medium drop with a crisp pressure point and very audible feedback. Gestures for up to three fingers can be configured extensively in the ELAN SmartPad menu.
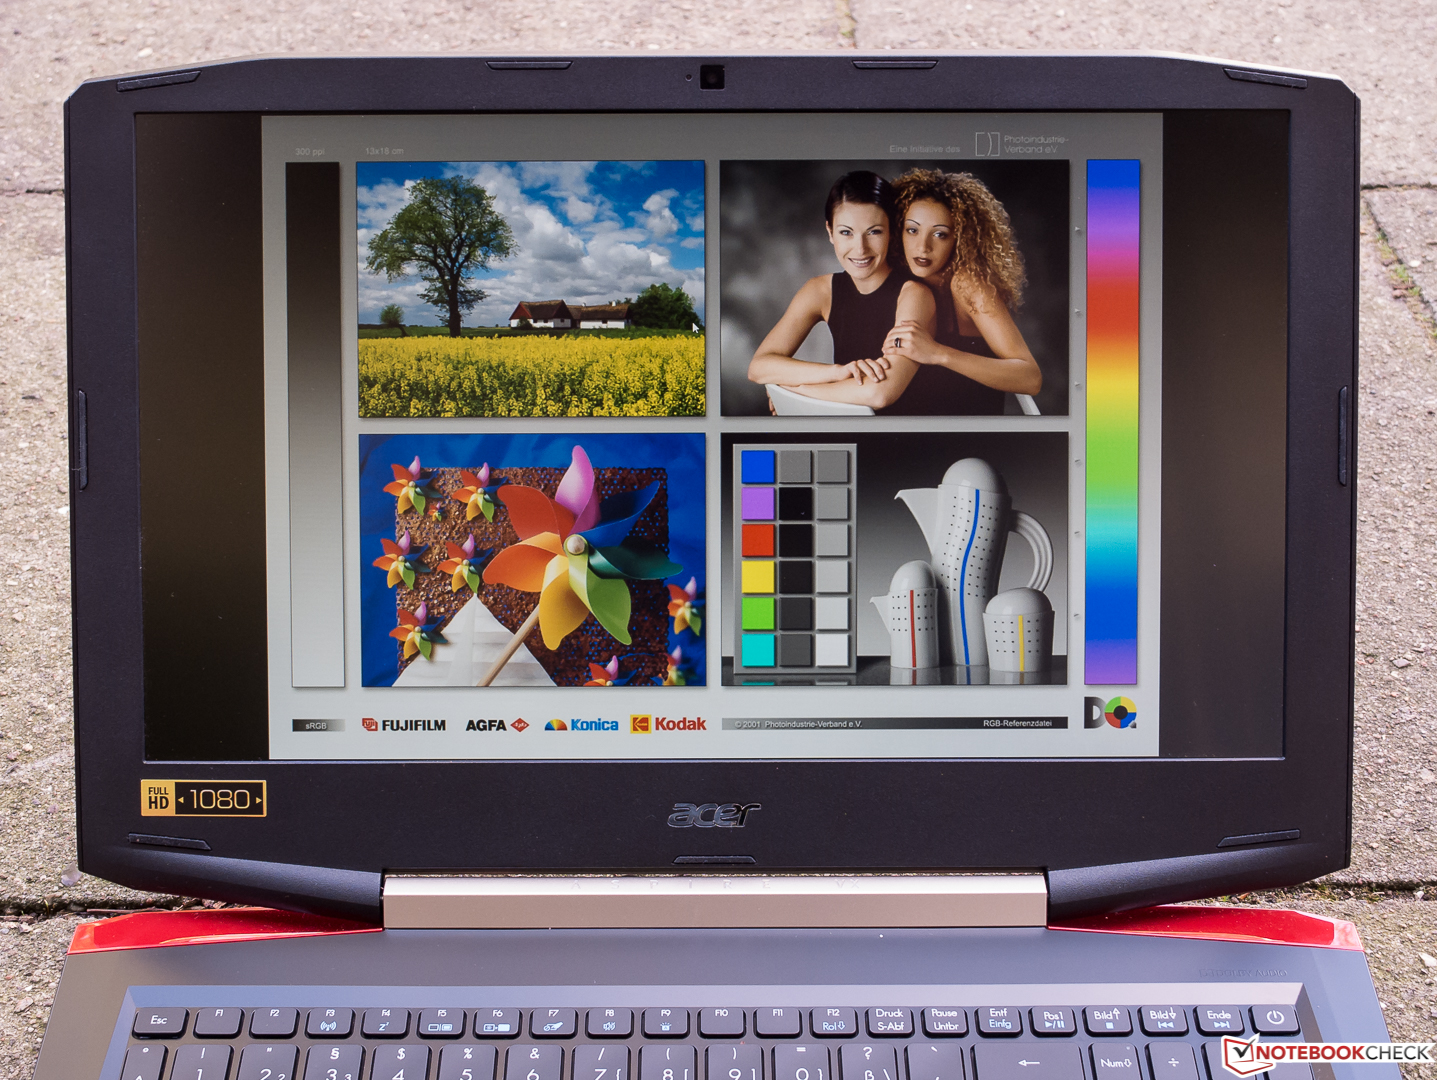
Display

The 15.6-inch, matte IPS panel achieves 141 PPI with its Full HD resolution. Users with very good eyesight might perceive this as somewhat pixelated. The image sharpness is very good. In contrast to the rivals in the field, the review sample comes very close to the 300 cd/m² limit that can be described as a very good brightness. The measured illumination of 85% is in a good average. On a fairly saturated-looking black screen, minor hints of backlight-bleeding can be observed but which are only visible in dark screen content. Acer does not offer any alternative screen in this series.
| |||||||||||||||||||||||||
Brightness Distribution: 85 %
Center on Battery: 281 cd/m²
Contrast: 878:1 (Black: 0.32 cd/m²)
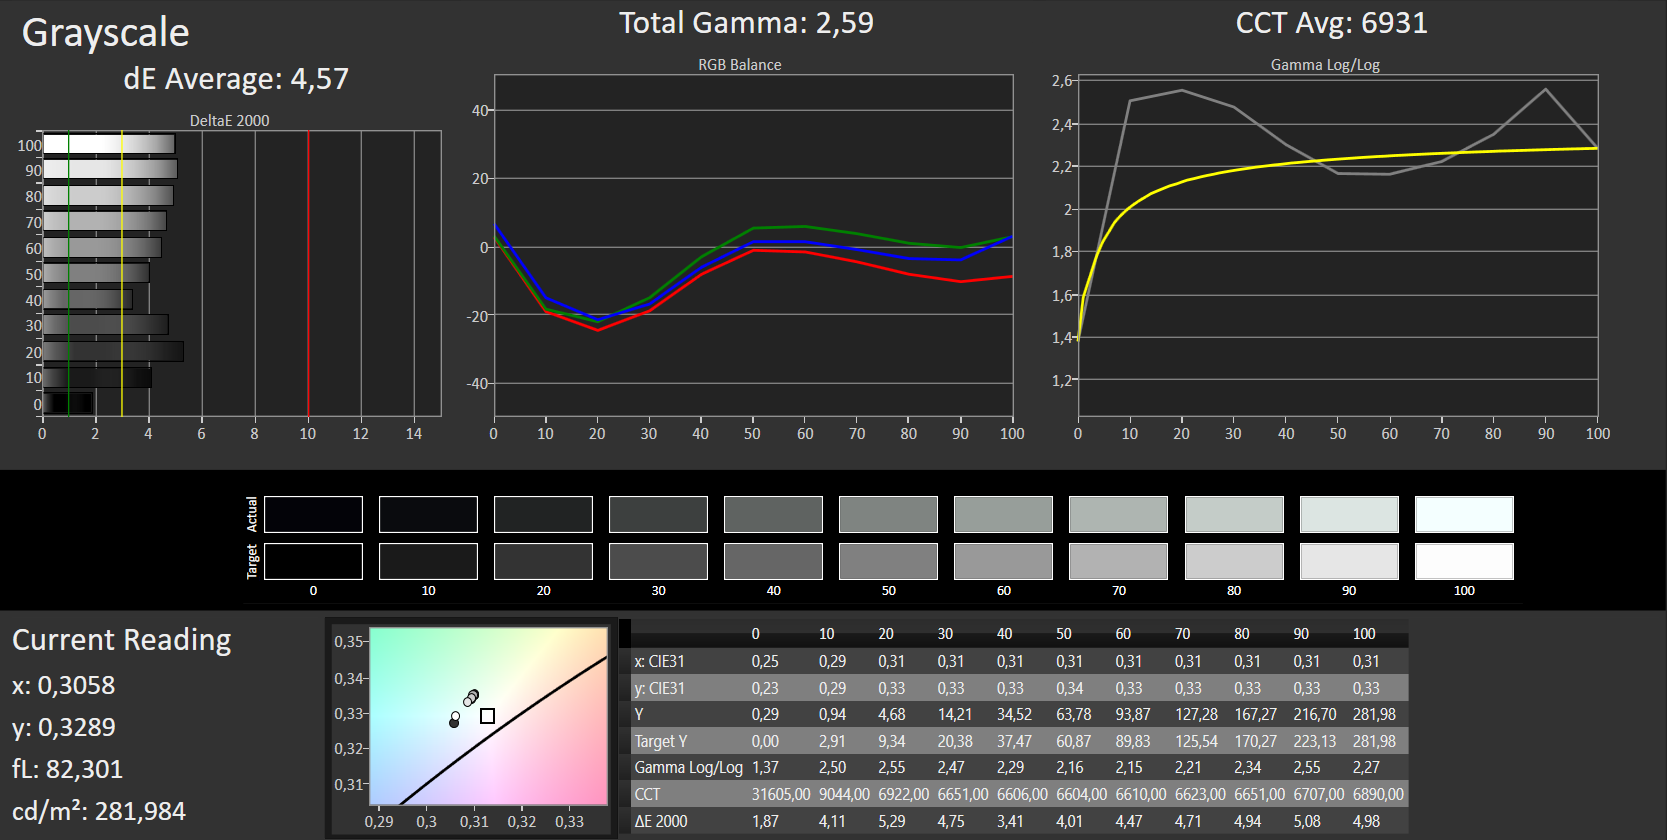
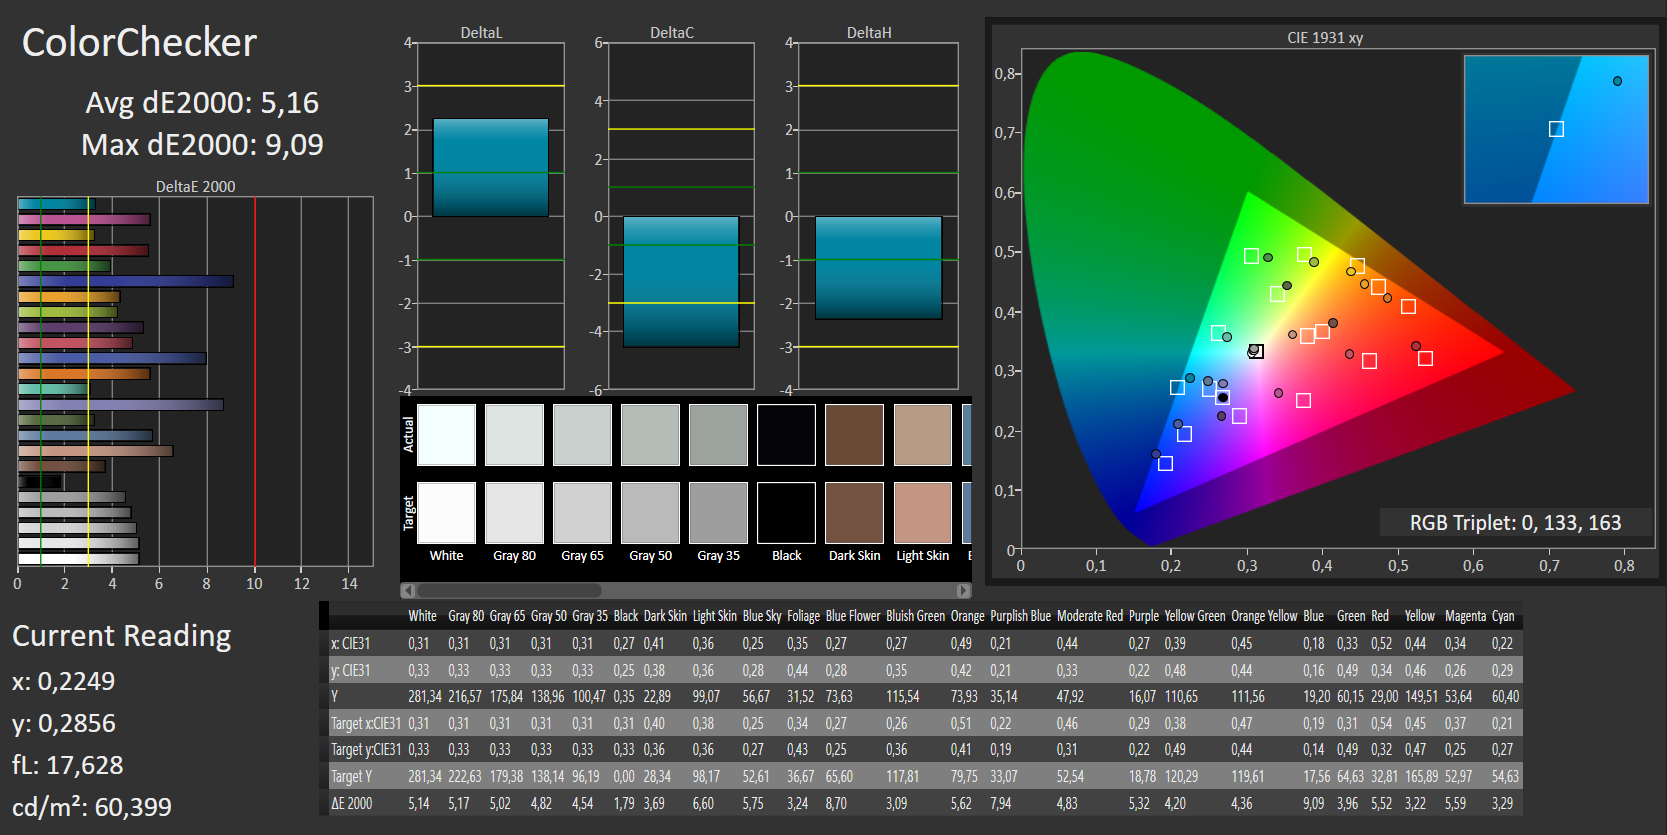
ΔE ColorChecker Calman: 5.16 | ∀{0.5-29.43 Ø4.73}
ΔE Greyscale Calman: 4.57 | ∀{0.09-98 Ø4.97}
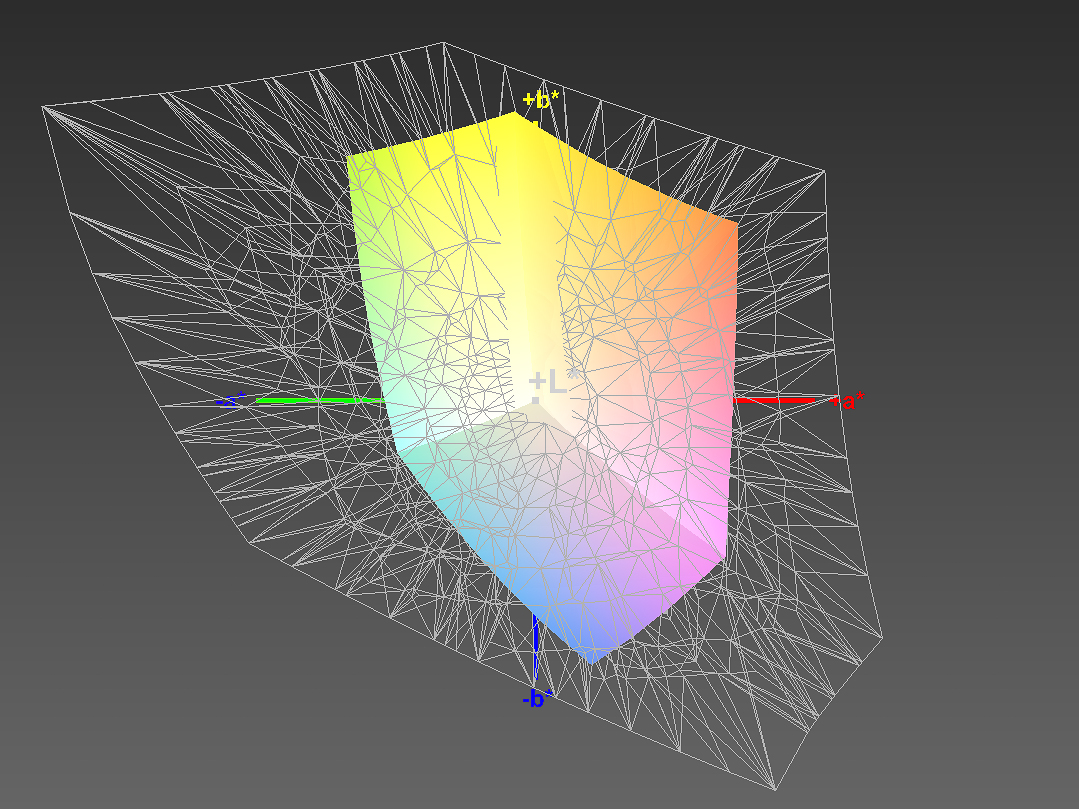
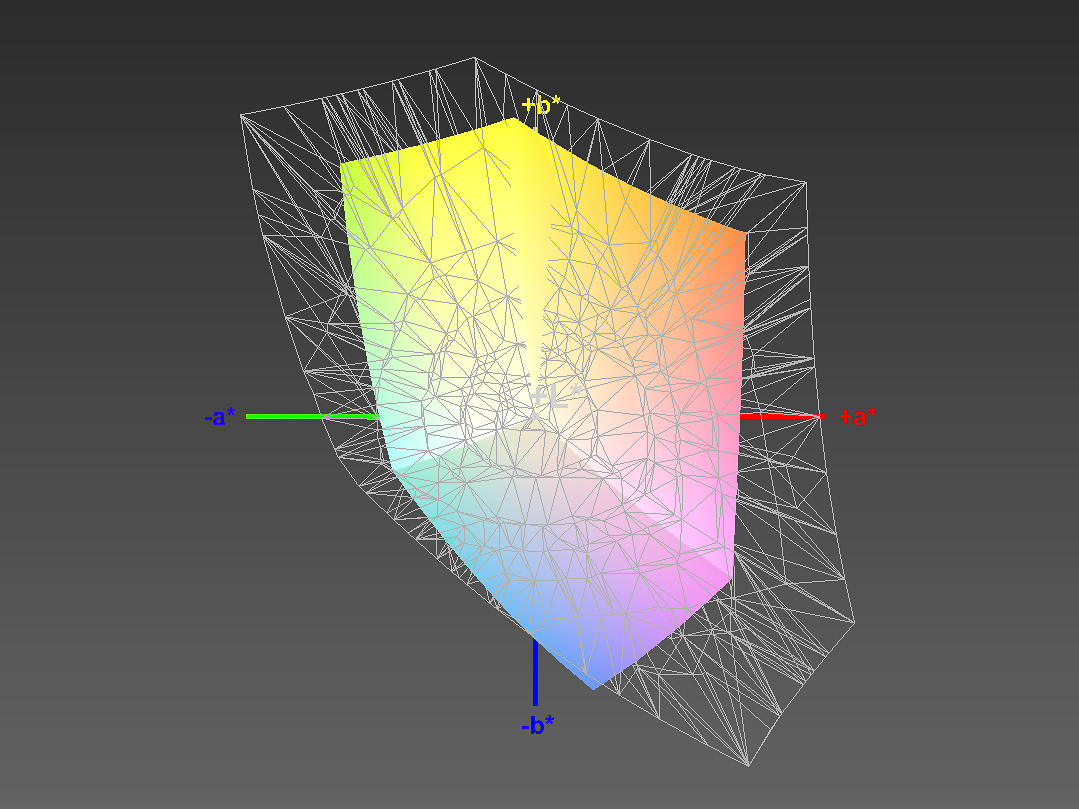
58% sRGB (Argyll 1.6.3 3D)
37% AdobeRGB 1998 (Argyll 1.6.3 3D)
40.2% AdobeRGB 1998 (Argyll 3D)
58.2% sRGB (Argyll 3D)
38.88% Display P3 (Argyll 3D)
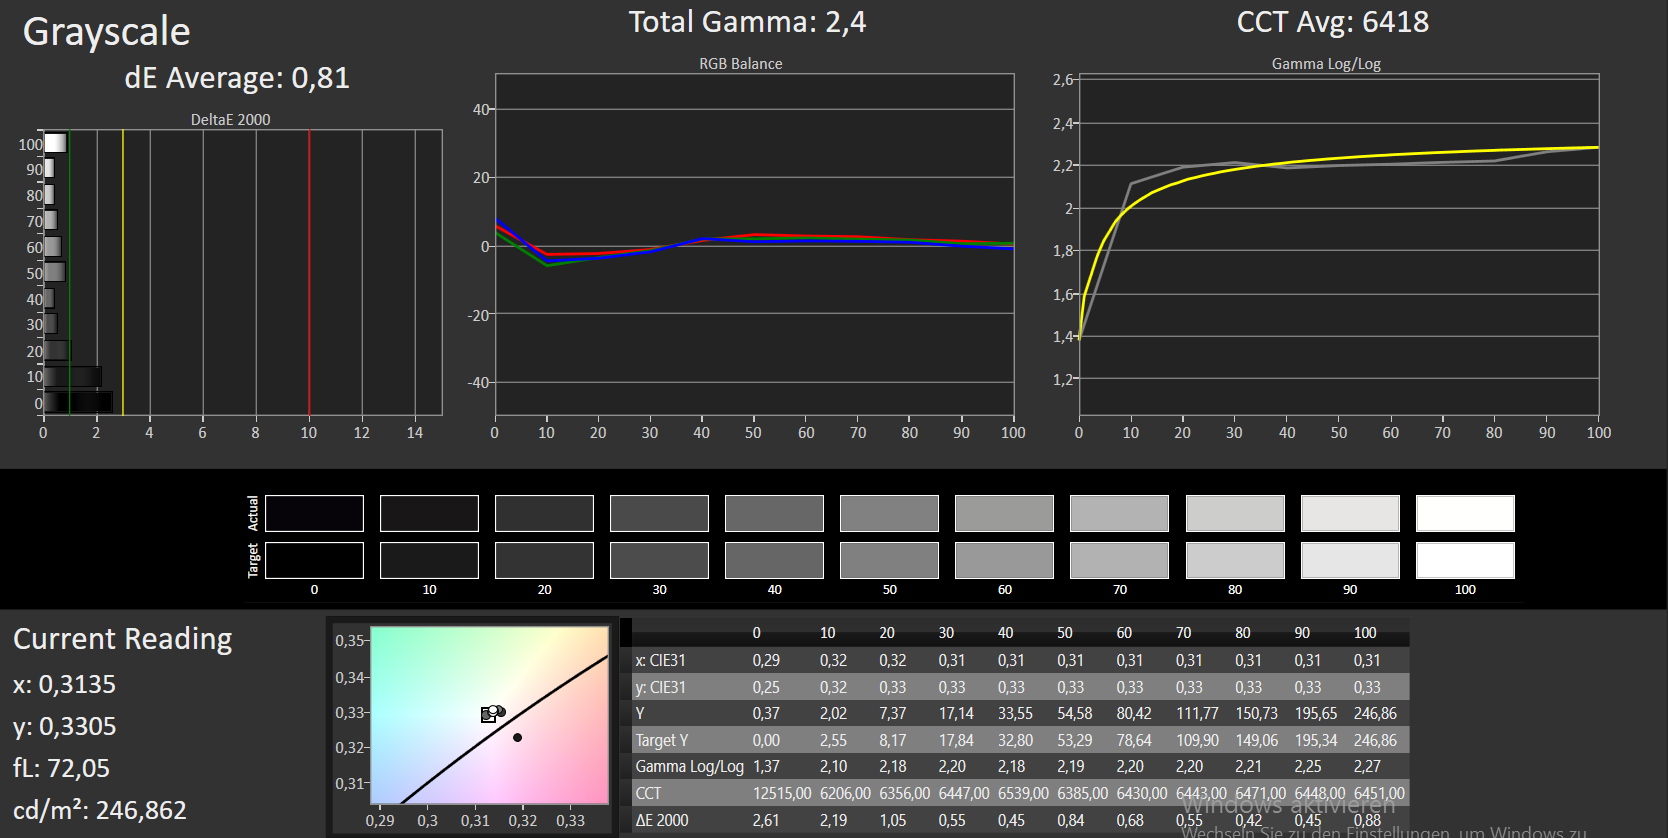
Gamma: 2.59
CCT: 6931 K
| Acer Aspire VX5-591G-75C4 VX15 LG Philips LGD0550 / LP156WF6-SPK4, , 1920x1080, 15.6" | Acer Aspire VN7-593G-73HP V15 Nitro BE LG Display LP156WF6-SPP1, , 1920x1080, 15.6" | Dell XPS 15 2017 9560 (7300HQ, Full-HD) Sharp SHP1453 LQ156M1, , 1920x1080, 15.6" | Asus Zenbook UX510UW-CN044T LG Philips LP156WF6-SPB6, , 1920x1080, 15.6" | |
|---|---|---|---|---|
| Display | 57% | 74% | 47% | |
| Display P3 Coverage (%) | 38.88 | 65.8 69% | 68.9 77% | 61.5 58% |
| sRGB Coverage (%) | 58.2 | 85.1 46% | 98.9 70% | 80.4 38% |
| AdobeRGB 1998 Coverage (%) | 40.2 | 62.2 55% | 70.9 76% | 58.8 46% |
| Response Times | -67% | -137% | -48% | |
| Response Time Grey 50% / Grey 80% * (ms) | 22 ? | 41 ? -86% | 54 ? -145% | 40 ? -82% |
| Response Time Black / White * (ms) | 23 ? | 34 ? -48% | 52.4 ? -128% | 26 ? -13% |
| PWM Frequency (Hz) | ||||
| Screen | 16% | 27% | 7% | |
| Brightness middle (cd/m²) | 281 | 322 15% | 400 42% | 326 16% |
| Brightness (cd/m²) | 257 | 297 16% | 392 53% | 316 23% |
| Brightness Distribution (%) | 85 | 86 1% | 89 5% | 80 -6% |
| Black Level * (cd/m²) | 0.32 | 0.31 3% | 0.26 19% | 0.35 -9% |
| Contrast (:1) | 878 | 1039 18% | 1538 75% | 931 6% |
| Colorchecker dE 2000 * | 5.16 | 4.73 8% | 4.9 5% | 5.49 -6% |
| Colorchecker dE 2000 max. * | 9.09 | 12.37 -36% | 11 -21% | 11.36 -25% |
| Greyscale dE 2000 * | 4.57 | 2.99 35% | 7.2 -58% | 4.84 -6% |
| Gamma | 2.59 85% | 2.32 95% | 2.11 104% | 2.23 99% |
| CCT | 6931 94% | 6905 94% | 6911 94% | 5971 109% |
| Color Space (Percent of AdobeRGB 1998) (%) | 37 | 56 51% | 64.2 74% | 53 43% |
| Color Space (Percent of sRGB) (%) | 58 | 85 47% | 98.9 71% | 80 38% |
| Total Average (Program / Settings) | 2% /
13% | -12% /
14% | 2% /
8% |
* ... smaller is better
In line with the subjective impression, our VX5 shines with a low black value of 0.32 cd/m², which results in a very decent contrast of 878:1 despite the limited brightness. However, since the black levels of the opponents in the test are comparably low but their maximum brightness levels are higher, then the review sample nevertheless takes the last place in terms of contrast.
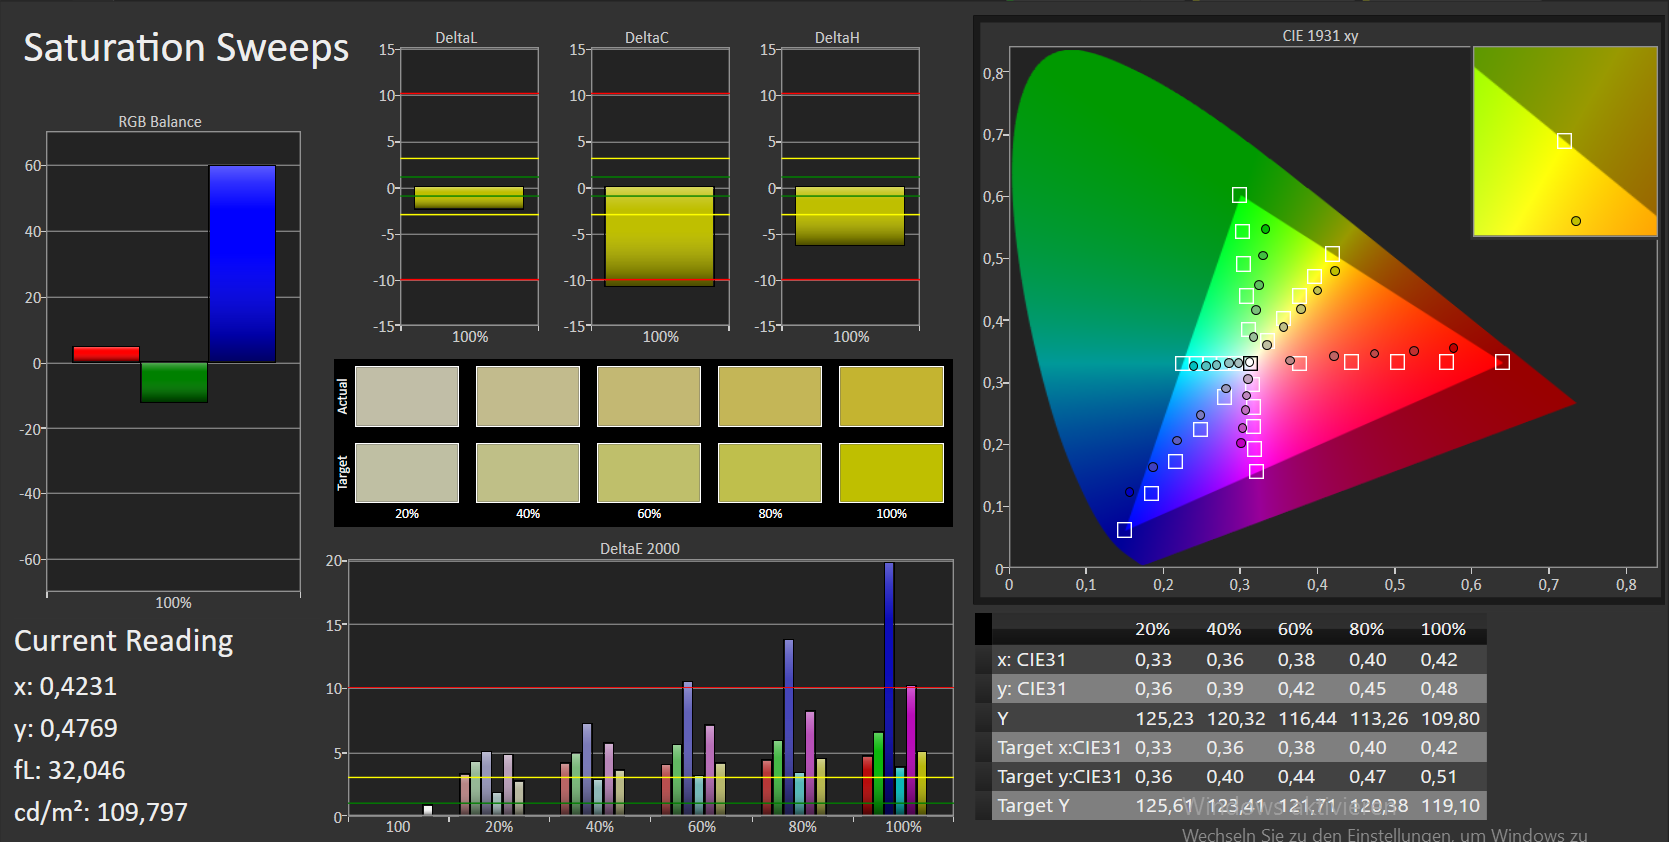
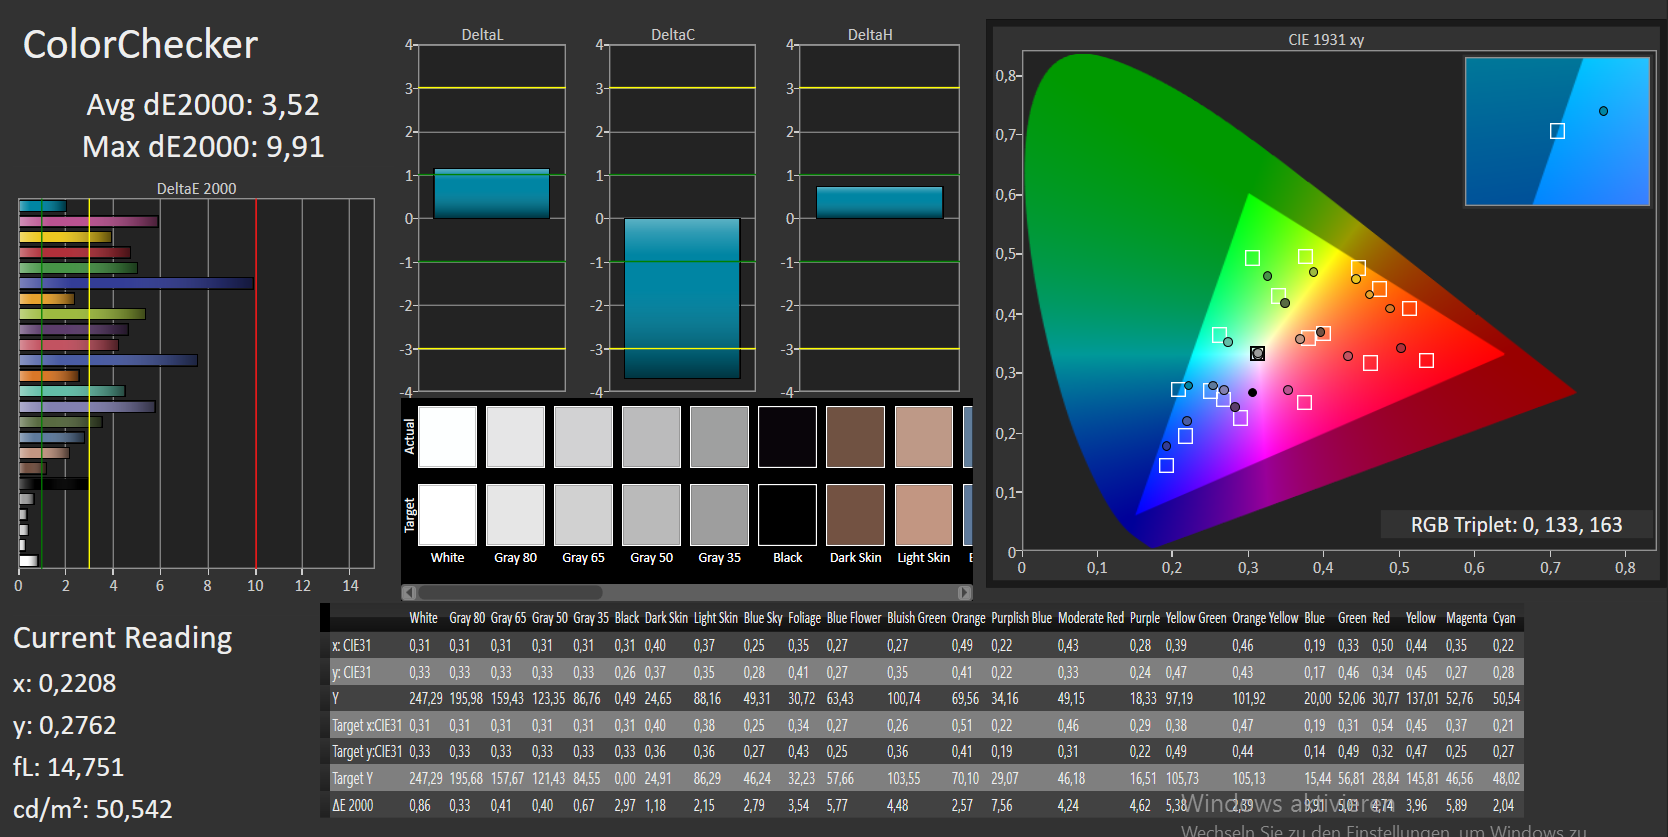
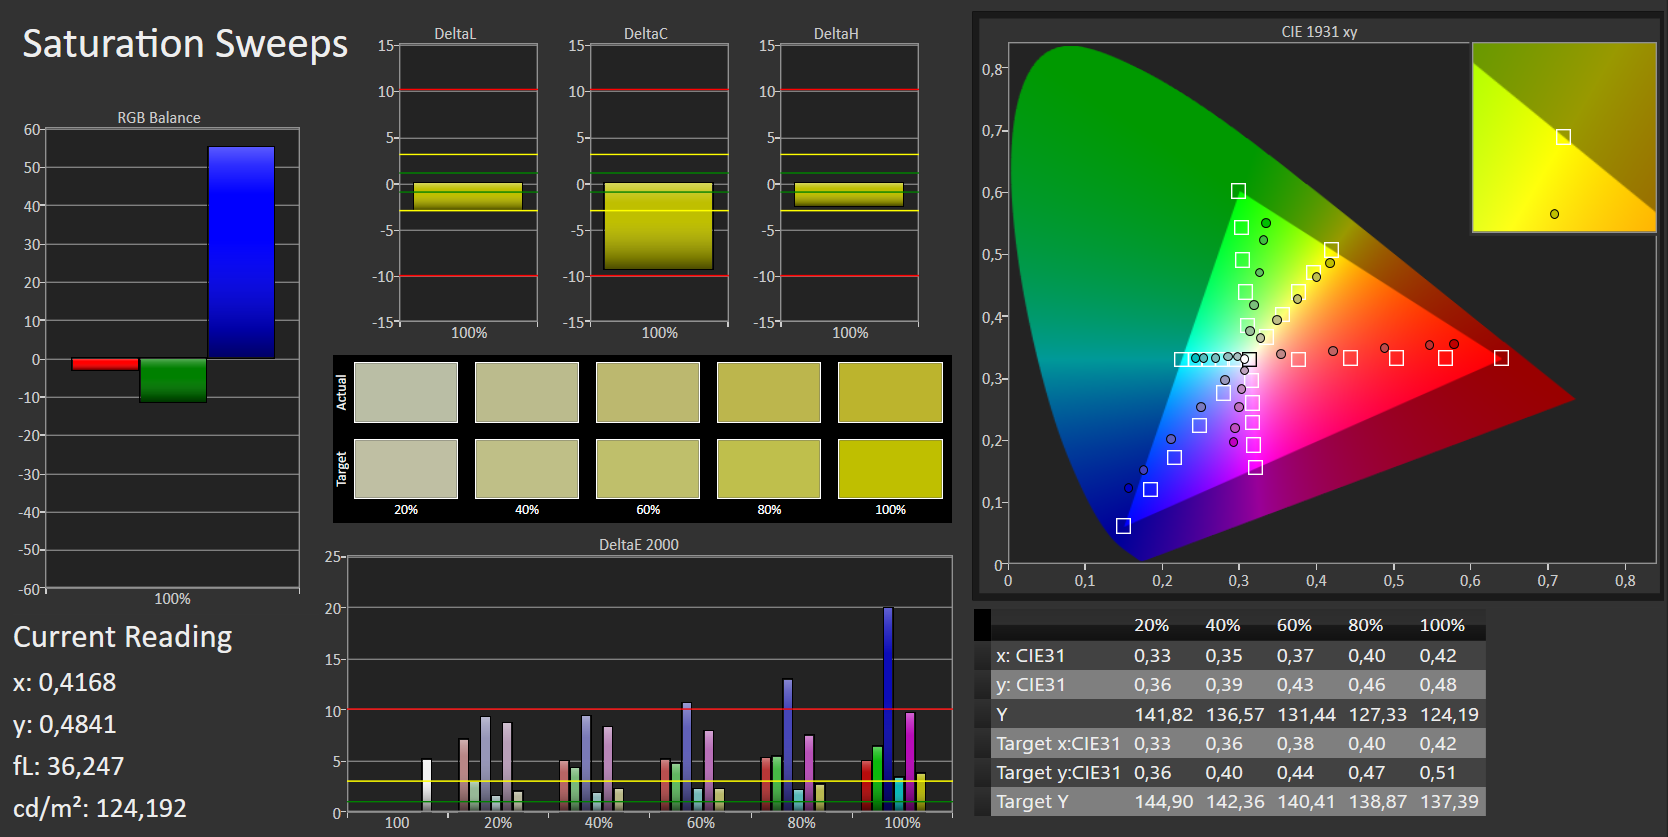
The color reproduction is already feasible in delivery state but like the other laptops in the test, it surpasses the ideal Delta E rates of less than 3. While Acer's Nitro comes a bit closer to the target, the grayscales of Dell's XPS 15 are a bit weak. Installing the color profile linked in the box above might reduce the slight greenish tint of Acer's Aspire VX5.
The review sample's screen does not score well in color reproduction. Just 37% of the big professional AdobeRGB and 58% of the smaller standard sRGB color space does not allow any serious image editing. All comparison laptops do a better job, but only Dell's XPS 15 with almost 100% sRGB is really good.
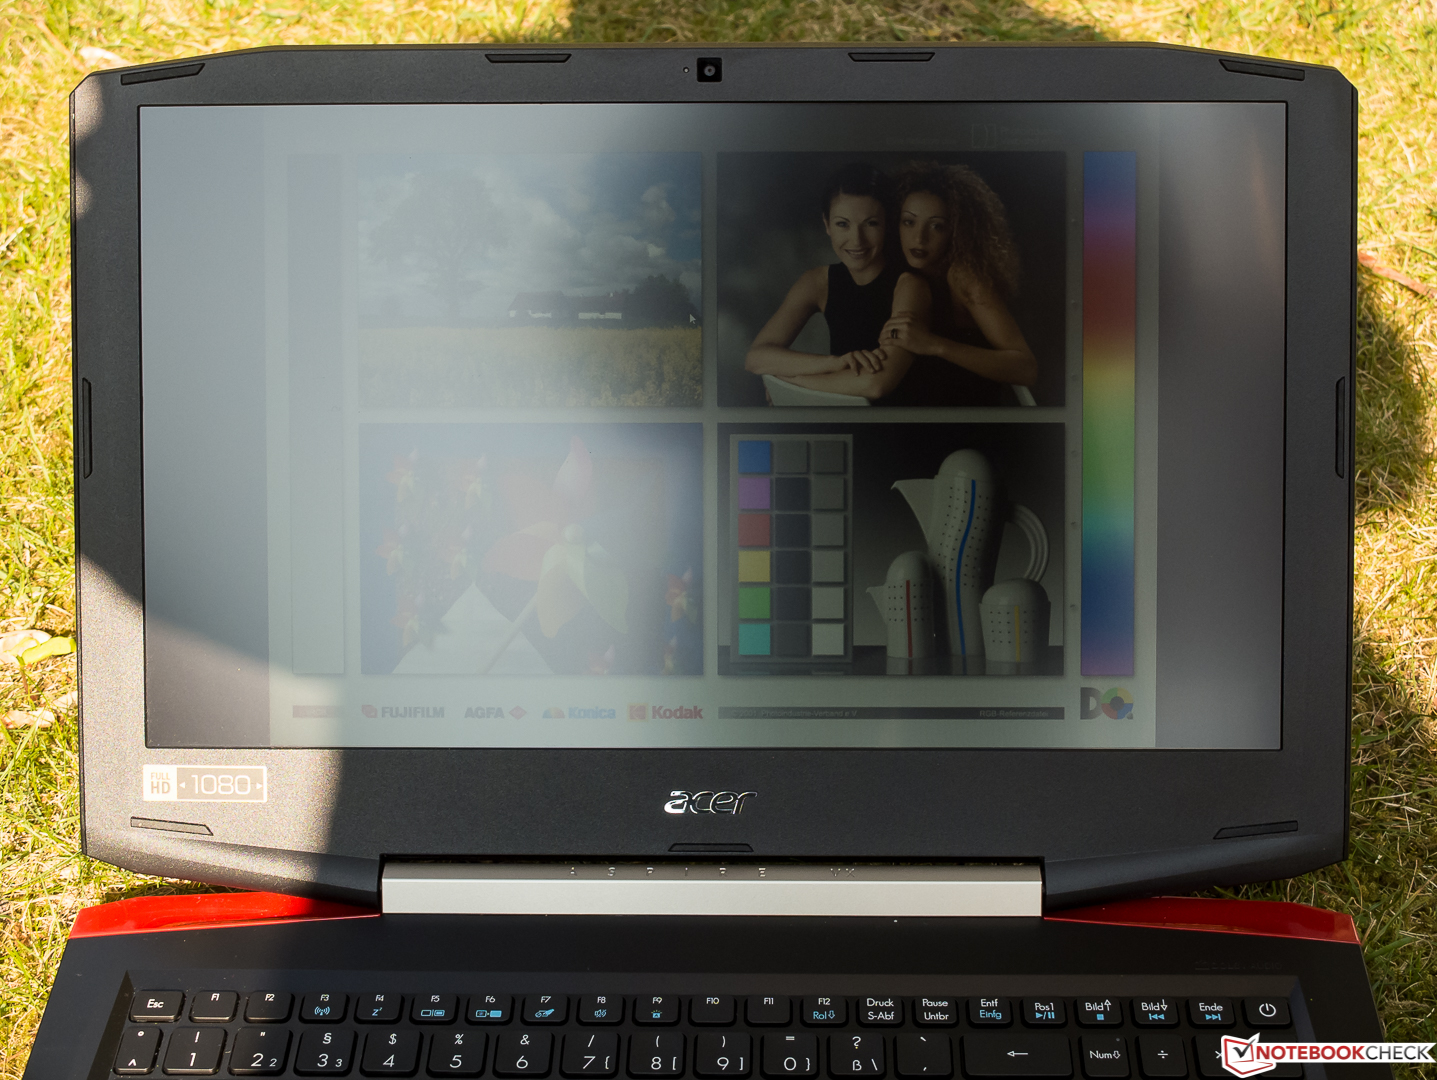
The matte screen of Acer's Aspire VX5-591G had to perform the test under more difficult conditions in bright sunlight this time. We placed the screen directly toward the sun in the left screenshot. Hardly anything can be seen although the photographer cast his shadow on it. The right screenshot was taken with a door in the back. Thus, it is quite possible to find a position to work well even in good weather. However, we would have appreciated a higher brightness when walking around in the garden in the shadow of the building.
Display Response Times
| ↔ Response Time Black to White | ||
|---|---|---|
| 23 ms ... rise ↗ and fall ↘ combined | ↗ 13 ms rise | 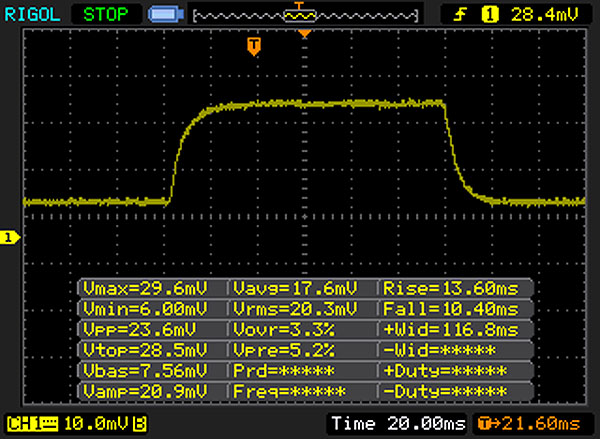 |
| ↘ 10 ms fall | ||
| The screen shows good response rates in our tests, but may be too slow for competitive gamers. In comparison, all tested devices range from 0.1 (minimum) to 240 (maximum) ms. » 52 % of all devices are better. This means that the measured response time is worse than the average of all tested devices (19.9 ms). | ||
| ↔ Response Time 50% Grey to 80% Grey | ||
| 22 ms ... rise ↗ and fall ↘ combined | ↗ 10 ms rise | 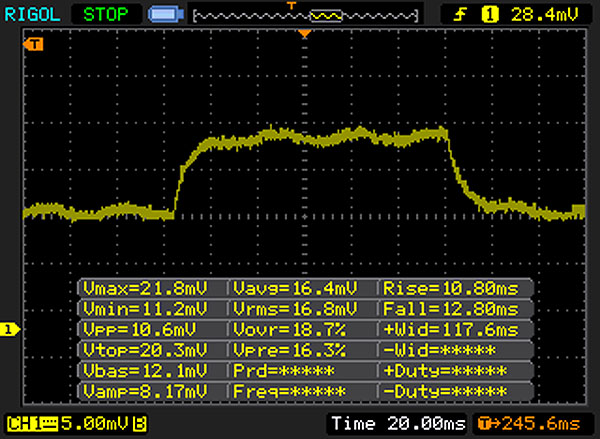 |
| ↘ 12 ms fall | ||
| The screen shows good response rates in our tests, but may be too slow for competitive gamers. In comparison, all tested devices range from 0.165 (minimum) to 636 (maximum) ms. » 33 % of all devices are better. This means that the measured response time is better than the average of all tested devices (31.1 ms). | ||
Screen Flickering / PWM (Pulse-Width Modulation)
| Screen flickering / PWM not detected | ||
In comparison: 52 % of all tested devices do not use PWM to dim the display. If PWM was detected, an average of 7801 (minimum: 5 - maximum: 343500) Hz was measured. | ||
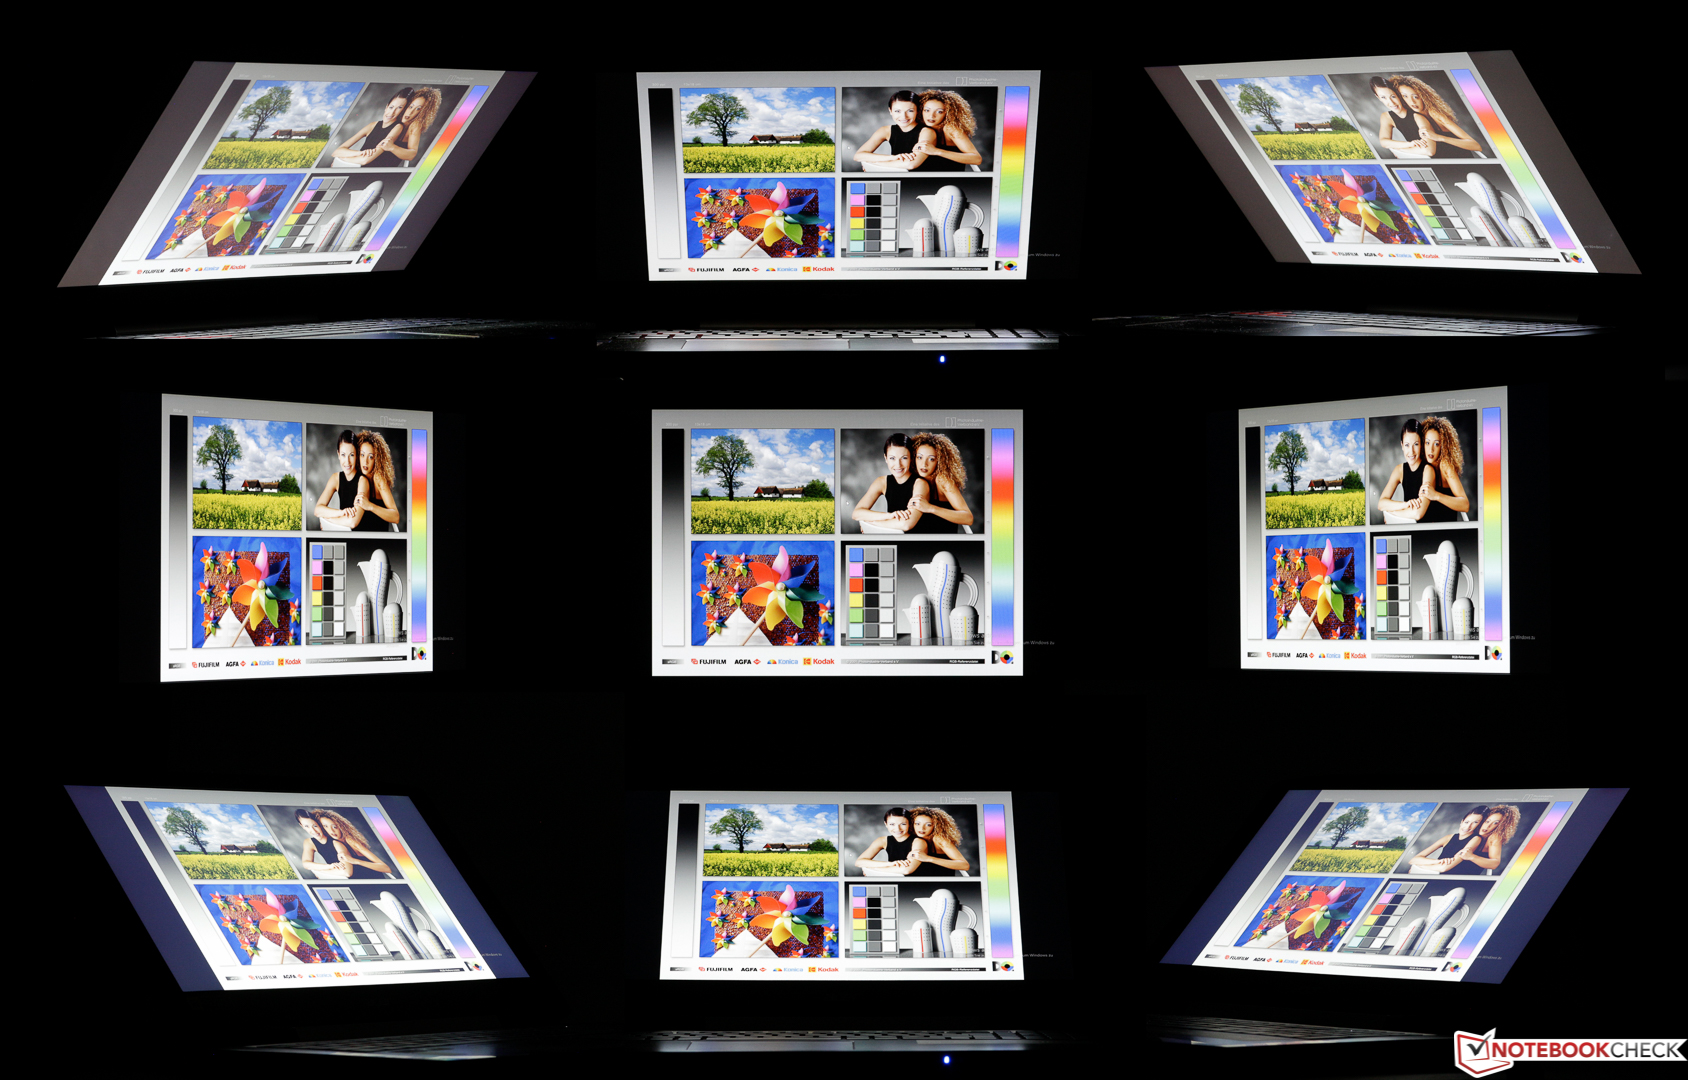
The screen's viewing angles have room for improvement for IPS conditions (!). The color impression is largely maintained even in flat viewing angles, but visible brightness and contrast deviations already become apparent when just slightly changing the seating position in front of the screen. However, the tester did not perceive this as a significant restriction.
Performance
Thanks to the powerful quad-core and enough memory, the Aspire VX5 should be able to cope with virtually all commercial software. However, the mid-range GPU limits its graphics performance, and the installed hard drive or the omission of an SSD sometimes prevents a smooth workflow. In particular, the processor-integrated Intel HD graphics would have benefited from dual-channel RAM - performance is not demanded from it thanks to Optimus.
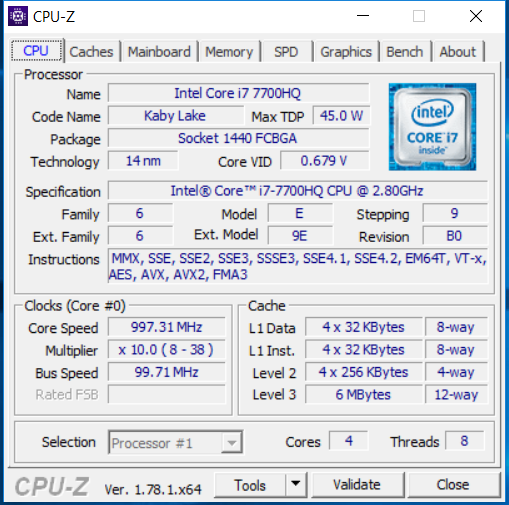
Processor
Intel's Core i7-7700HQ (4x 2.8 - 3.8 GHz, Hyper-Threading, TDP: 45 watts) is the Kaby Lake successor of the i7-6700HQ Skylake chip (4x 2.6 - 3.5 GHz) found in countless gaming laptops. The largely unmodified architecture is not as responsible for higher speeds as the increased base and Turbo rates that optimizing the 14 nm manufacturing process made possible. Thus, a performance plus of up to 10 % can be expected; it was usually below 5% in the last alternation of generations.
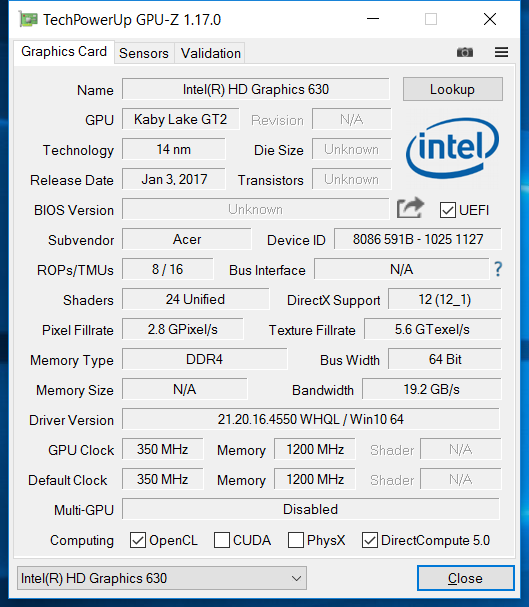
In addition to an improved video engine, the slightly higher-clocked Intel HD 630 processor graphics which has only been renamed is integrated. Nvidia's Optimus automatically assigns less-demanding graphics calculations (2D) to it. The CPU's relatively high TDP of 45 watts makes it mainly suitable for performance-driven, large laptops such as the review sample, but it is sometimes also installed in more compact devices like the Gigabyte Aero 14. More information and benchmarks can be found on our page about the CPU.
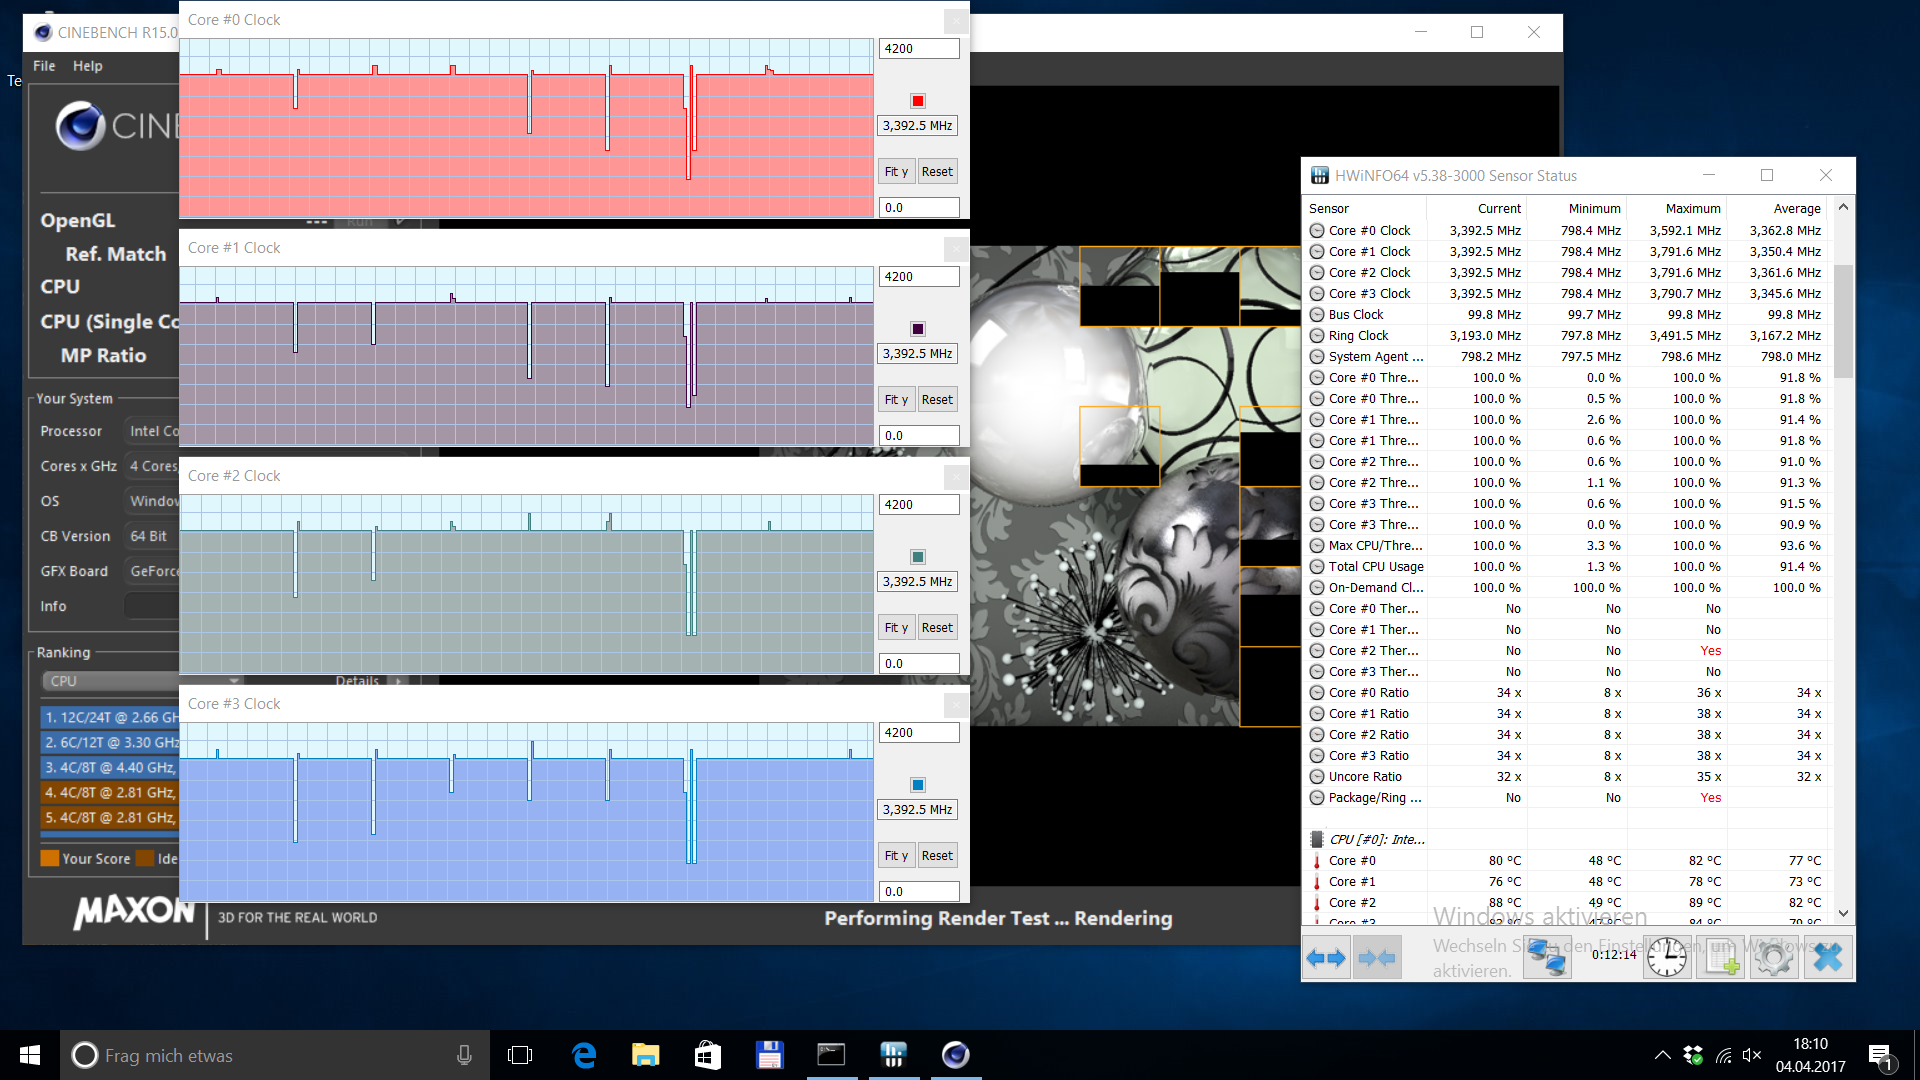
The performance of Acer's VX5-591G-75C4 review sample is on the expected level. The quad-core's specified Turbo of 3.4 GHz could be maintained stably in our Cinebench loop. The score dropped by approximately 16% in battery mode.
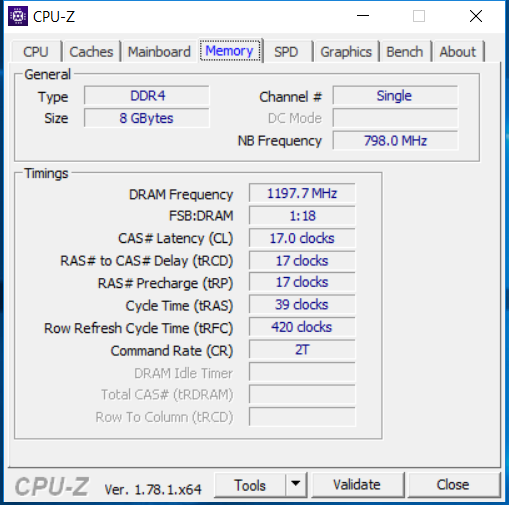
System Performance
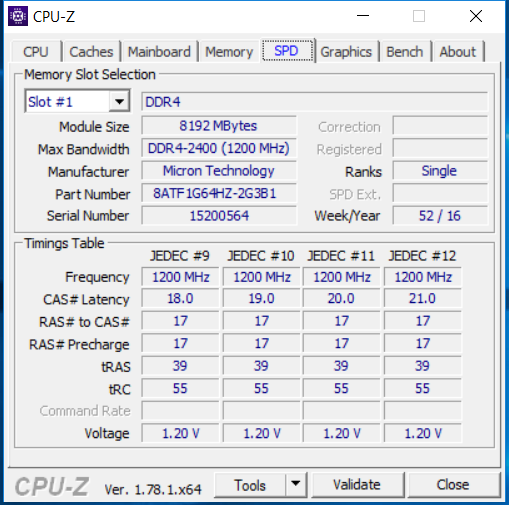
It is at most the not very generous 8 GB of working memory that limits excessive multitasking and not the CPU's performance. When programs have been launched, they run perfectly smooth. However, compared to SSDs, the sluggish HDD is the reason that the user often has to be patient. Thus, booting the OS and opening programs, and in particular the loading times of large games can take a while. Opening programs is faster when they have been cached in the memory, but 16 GB of RAM would not have hurt here. The next paragraph illustrates a possible remedy.
| PCMark 8 | |
| Home Score Accelerated v2 | |
| Dell XPS 15 2017 9560 (7300HQ, Full-HD) | |
| Acer Aspire VX5-591G-75C4 VX15 | |
| Asus Zenbook UX510UW-CN044T | |
| Work Score Accelerated v2 | |
| Dell XPS 15 2017 9560 (7300HQ, Full-HD) | |
| Acer Aspire VX5-591G-75C4 VX15 | |
| Asus Zenbook UX510UW-CN044T | |
| PCMark 8 Home Score Accelerated v2 | 3565 points | |
| PCMark 8 Work Score Accelerated v2 | 4442 points | |
Help | ||
Storage Device
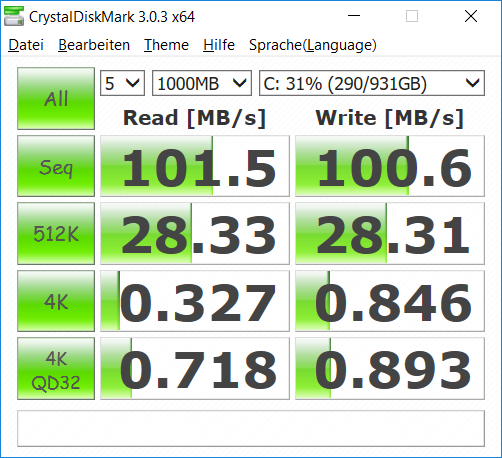
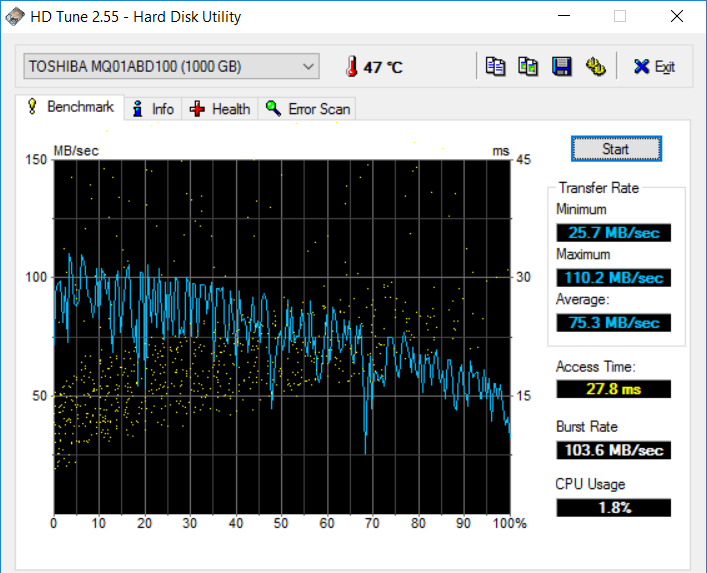
Fortunately, the VX5-591G is also available with an additional 256 GB SSD for approximately 200 Euros (~$212) extra. The rather sluggish 5400 RPM hard drive with a capacity of 1 TB installed in our review sample slows down the entire system. It might be cheaper if the user upgrades this via the empty M.2 slot.
Besides the review sample, Acer's Nitro in the tested configuration with an HDD is also defeated. A combination of a 32 GB SSD cache and separate (!) HDD is installed in Dell's XPS 15. The SanDisk SSD in Asus' Zenbook has a massive edge over the other solutions, but it does not deliver a convincing performance for a SATA 3 SSD. However, having an SSD is the main matter.
| Acer Aspire VX5-591G-75C4 VX15 Toshiba MQ01ABD100 | Acer Aspire VN7-593G-73HP V15 Nitro BE Seagate Mobile HDD 1TB ST1000LM035 | Dell XPS 15 2017 9560 (7300HQ, Full-HD) WDC WD10SPCX-75KHST0 + SanDisk Z400s M.2 2242 32 GB Cache | Asus Zenbook UX510UW-CN044T SanDisk SD8SNAT256G1002 | |
|---|---|---|---|---|
| CrystalDiskMark 3.0 | 28% | 1647% | 8078% | |
| Read Seq (MB/s) | 101.5 | 120.9 19% | 123 21% | 459.3 353% |
| Write Seq (MB/s) | 100.6 | 101.8 1% | 74.2 -26% | 325.5 224% |
| Read 512 (MB/s) | 28.33 | 37.83 34% | 101.7 259% | 279.2 886% |
| Write 512 (MB/s) | 28.31 | 84.4 198% | 42.51 50% | 280.1 889% |
| Read 4k (MB/s) | 0.327 | 0.473 45% | 10.84 3215% | 22.43 6759% |
| Write 4k (MB/s) | 0.846 | 0.313 -63% | 1.021 21% | 74.9 8753% |
| Read 4k QD32 (MB/s) | 0.718 | 1.133 58% | 69.8 9621% | 149 20652% |
| Write 4k QD32 (MB/s) | 0.893 | 0.274 -69% | 1.057 18% | 234 26104% |

Graphics Card
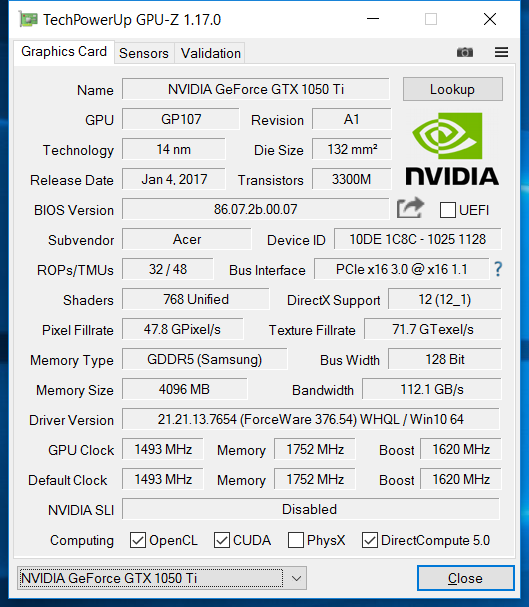
Nvidia's GeForce GTX 1050 Ti with 4 GB of dedicated GDDR5 RAM (effective: 7000 MHz, maximum level) is a mid-range graphics card based on the current Pascal architecture that follows the GTX 960M and 965M. It calculates approximately 30% faster and also surpasses the smaller GeForce GTX 1050 by roughly the same percentage. The 1050 Ti does not come close to the GTX 1060 situated above it. The Radeon RX 480 and RX 470 Polaris graphics cards by AMD fill this gap in the desktop sector. Technical details concerning the 1050 Ti can be read here.
Acer has opted for the standard clocking of 1493 to 1620 (Turbo). Of all seven cards with this name that we have in our database, four outperform the one in the Aspire XV5-591G-75C4 by 2 to 8% depending on the benchmark. Thus, the performance is on the expected level. The total score dropped by 25% in 3DMark 11 in battery mode.
| 3DMark 11 - 1280x720 Performance GPU | |
| Acer Aspire VN7-593G-73HP V15 Nitro BE | |
| Acer Aspire VX5-591G-75C4 VX15 | |
| Dell XPS 15 2017 9560 (7300HQ, Full-HD) | |
| Asus Zenbook UX510UW-CN044T | |
| 3DMark | |
| 1280x720 Cloud Gate Standard Graphics | |
| Acer Aspire VN7-593G-73HP V15 Nitro BE | |
| Acer Aspire VX5-591G-75C4 VX15 | |
| Dell XPS 15 2017 9560 (7300HQ, Full-HD) | |
| Asus Zenbook UX510UW-CN044T | |
| 1920x1080 Fire Strike Graphics | |
| Acer Aspire VN7-593G-73HP V15 Nitro BE | |
| Acer Aspire VX5-591G-75C4 VX15 | |
| Dell XPS 15 2017 9560 (7300HQ, Full-HD) | |
| Asus Zenbook UX510UW-CN044T | |
| 3DMark 11 Performance | 8674 points | |
| 3DMark Cloud Gate Standard Score | 20791 points | |
| 3DMark Fire Strike Score | 6774 points | |
Help | ||
Gaming Performance
As the FPS chart below illustrates, it gets tight with up-to-date, graphically demanding games in the highest settings and maximum image enhancements, such as anti-aliasing and occlusion. A GeForce GTX 1060 would be needed here. It looks better in high settings that often only involve marginal drawbacks compared with ultra. Exceptions prove the rule: The modest in view of its graphical beauty Battlefield 1 achieves over 50 FPS on average even in ultra, while the new Mass Effect Andromeda has to be satisfied with medium presets. These and more benchmarks concerning the GTX 1050 Ti can be found on our page about the graphics card.
| The Witcher 3 - 1920x1080 Ultra Graphics & Postprocessing (HBAO+) | |
| Acer Aspire VN7-593G-73HP V15 Nitro BE | |
| Acer Aspire VX5-591G-75C4 VX15 | |
| Dell XPS 15 2017 9560 (7300HQ, Full-HD) | |
| low | med. | high | ultra | |
|---|---|---|---|---|
| The Witcher 3 (2015) | 45.8 | 25.2 | ||
| The Division (2016) | 0 | 42.6 | 34.9 | |
| For Honor (2017) | 44.8 | 40.9 | 21.2 | |
| Ghost Recon Wildlands (2017) | 40.9 | 21.2 |
Emissions
System Noise
Intel's Core i7-7700HQ can also be cooled successfully and quietly in 14-inch laptops, and the GTX 1050 Ti is not exactly hot-tempered. This is noticed in an overall very quiet-running system. Although the fan spins permanently, it is hardly audible in idle and when starting a game in battery mode. The fan speeds up gently when the stress test is initiated. A subtle noise free of side noises with a very low annoyance potential is presented at the upper limit. This would hardly be possible with a GTX 1060.
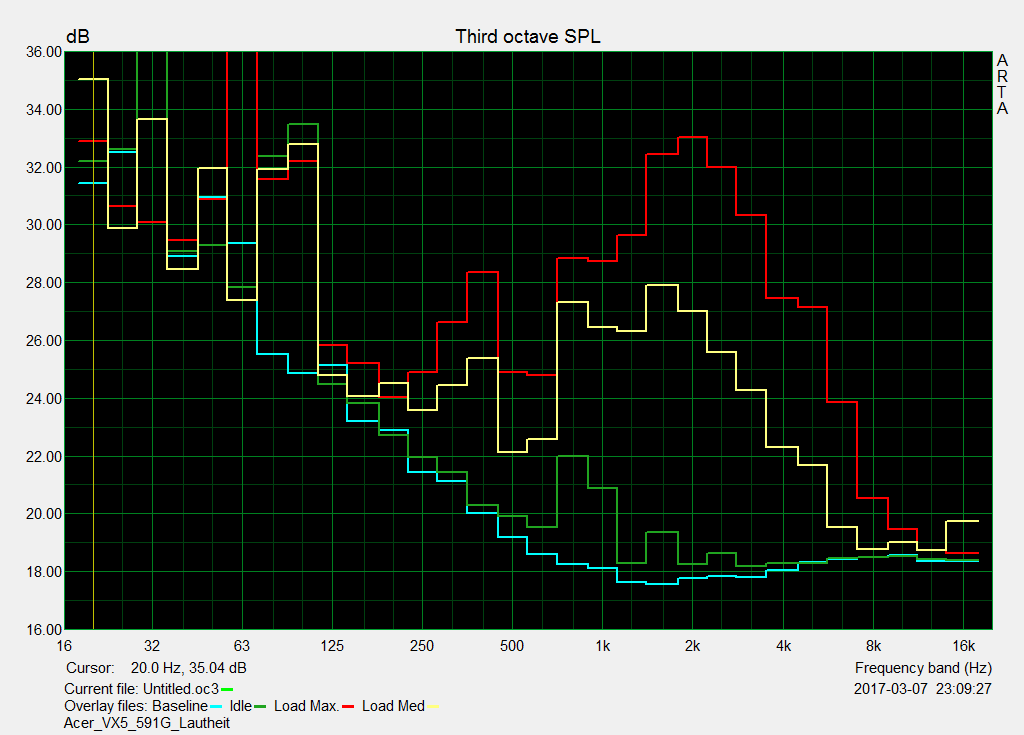
Noise level
| Idle |
| 31.4 / 31.4 / 31.4 dB(A) |
| HDD |
| 31.8 dB(A) |
| Load |
| 36.8 / 41.3 dB(A) |
 | ||
30 dB silent 40 dB(A) audible 50 dB(A) loud |
||
min: | ||
Temperature
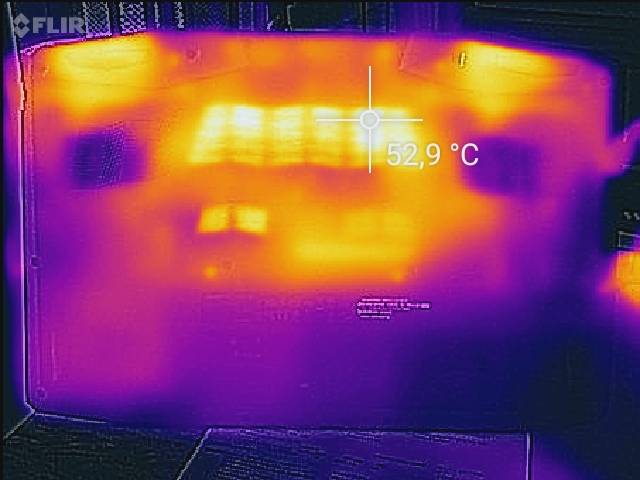
The surfaces reach a maximum of 47 °C on the upper side and underside during maximum full load. Thus, users who play games on their lap with the 15-inch device should not be too sensitive to heat. Only the wrist rest is usually touched when the laptop is placed on a table, and it never surpasses just below 27 °C in any state of load.
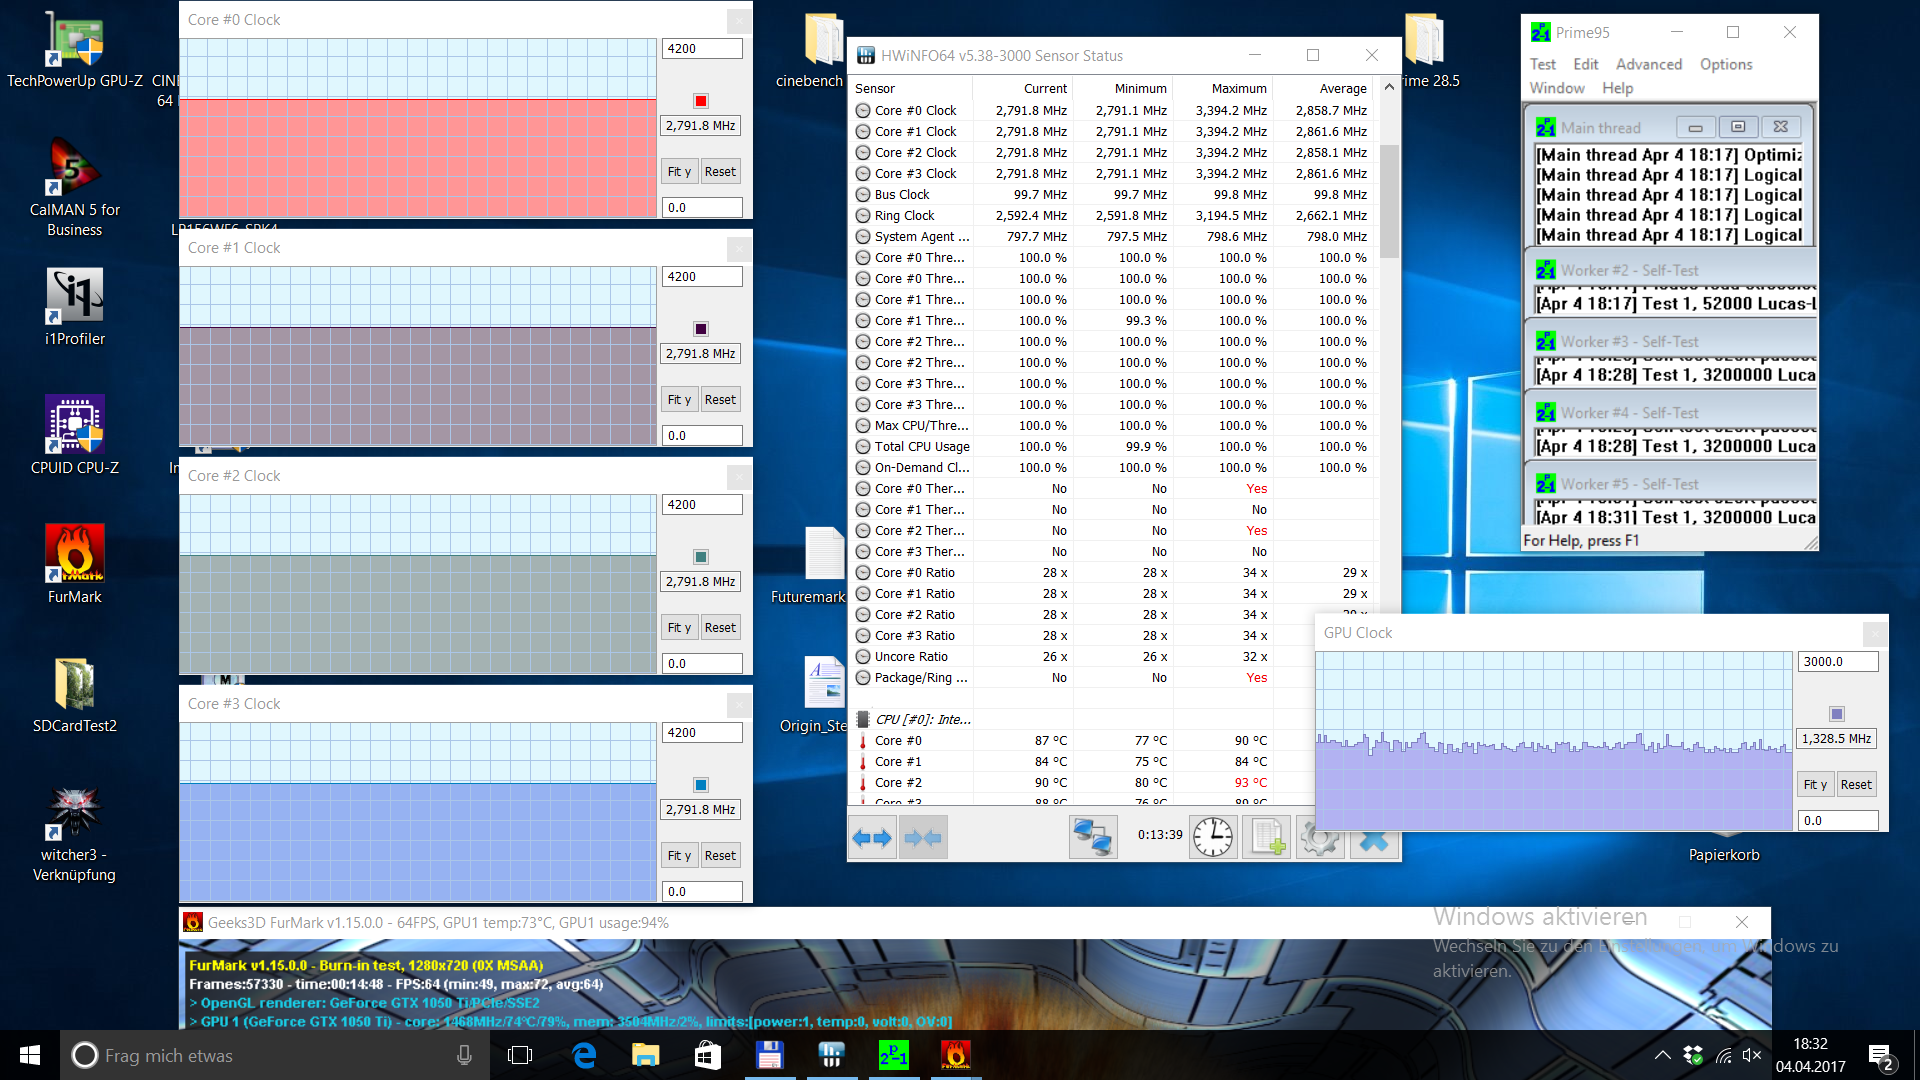
In the unrealistic stress test with Prime95 and FurMark, the CPU cores can maintain the quad-core Turbo frequency of 3.4 GHz for a few minutes at initiation, but then drop to a stable 2.8 GHz which is exactly the base clock. The cores reach high temperatures of up to 90 °C, but that is not yet critical. The graphics card throttles slightly and often drops below its base speed in this scenario.
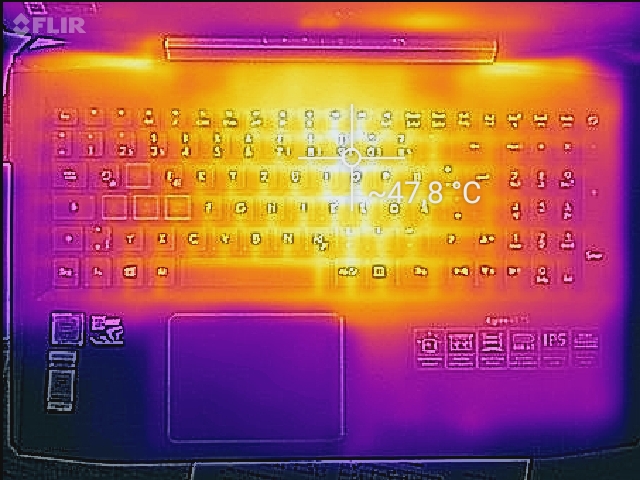
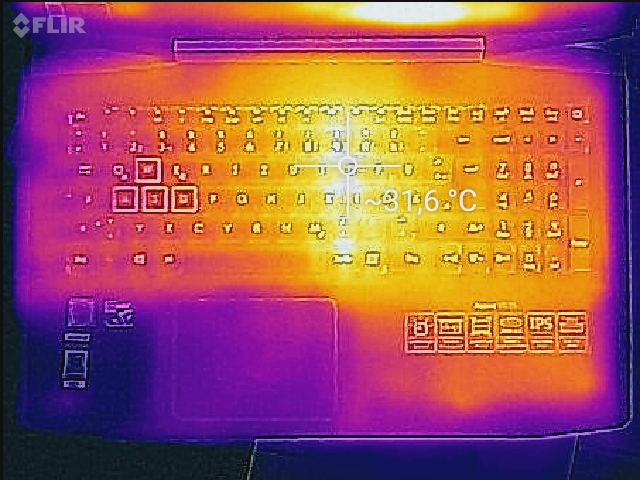
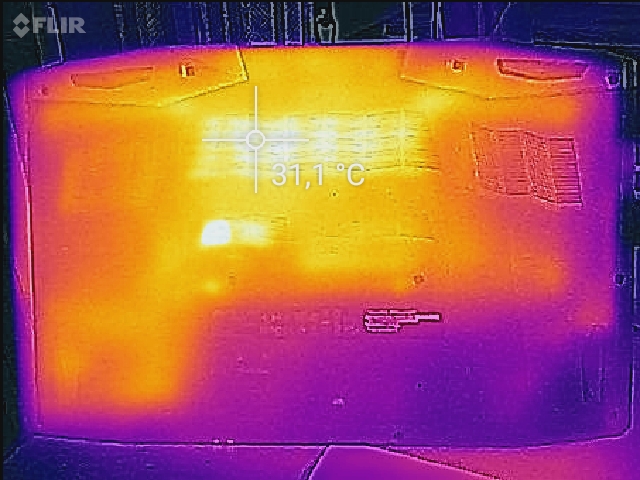
(-) The maximum temperature on the upper side is 47 °C / 117 F, compared to the average of 36.8 °C / 98 F, ranging from 21 to 71 °C for the class Multimedia.
(-) The bottom heats up to a maximum of 47 °C / 117 F, compared to the average of 39.1 °C / 102 F
(+) In idle usage, the average temperature for the upper side is 24.6 °C / 76 F, compared to the device average of 31.3 °C / 88 F.
(+) The palmrests and touchpad are cooler than skin temperature with a maximum of 29.3 °C / 84.7 F and are therefore cool to the touch.
(±) The average temperature of the palmrest area of similar devices was 28.7 °C / 83.7 F (-0.6 °C / -1 F).
Speakers
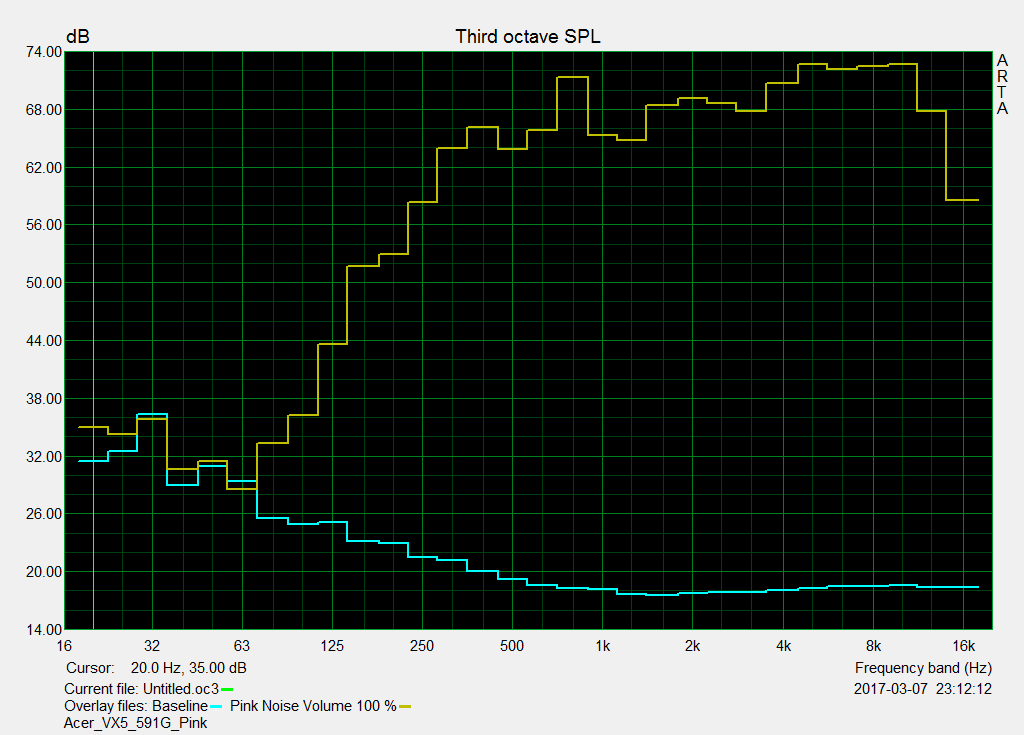
Both speakers that are slanted toward the bottom/front have enough power to fill medium-sized rooms with sound. Unfortunately, distortions become audible when playing light pop music at full volume, but the volume does not fluctuate. Apart from that, the mids and trebles sound astonishingly natural depending on the title. Hints of dynamics and surround are certainly present. The often heard blending of instruments in metal music at high volumes is also kept within limits. The sound system, useful for laptop conditions, can throughout fulfill the demands on a multimedia laptop of this price range when reducing the volume.
Acer Aspire VX5-591G-75C4 VX15 audio analysis
(±) | speaker loudness is average but good (73 dB)
Bass 100 - 315 Hz
(-) | nearly no bass - on average 15% lower than median
(±) | linearity of bass is average (10.7% delta to prev. frequency)
Mids 400 - 2000 Hz
(+) | balanced mids - only 1.9% away from median
(+) | mids are linear (5.9% delta to prev. frequency)
Highs 2 - 16 kHz
(+) | balanced highs - only 4.8% away from median
(+) | highs are linear (2.2% delta to prev. frequency)
Overall 100 - 16.000 Hz
(+) | overall sound is linear (14.8% difference to median)
Compared to same class
» 35% of all tested devices in this class were better, 4% similar, 61% worse
» The best had a delta of 5%, average was 17%, worst was 45%
Compared to all devices tested
» 20% of all tested devices were better, 4% similar, 76% worse
» The best had a delta of 4%, average was 24%, worst was 134%
Acer Aspire VN7-593G-73HP V15 Nitro BE audio analysis
(±) | speaker loudness is average but good (80 dB)
Bass 100 - 315 Hz
(±) | reduced bass - on average 11.8% lower than median
(±) | linearity of bass is average (13.5% delta to prev. frequency)
Mids 400 - 2000 Hz
(±) | higher mids - on average 5.5% higher than median
(+) | mids are linear (6.6% delta to prev. frequency)
Highs 2 - 16 kHz
(+) | balanced highs - only 1.1% away from median
(+) | highs are linear (4% delta to prev. frequency)
Overall 100 - 16.000 Hz
(+) | overall sound is linear (14.6% difference to median)
Compared to same class
» 35% of all tested devices in this class were better, 4% similar, 61% worse
» The best had a delta of 5%, average was 17%, worst was 45%
Compared to all devices tested
» 19% of all tested devices were better, 4% similar, 77% worse
» The best had a delta of 4%, average was 24%, worst was 134%
Dell XPS 15 2017 9560 (7300HQ, Full-HD) audio analysis
(+) | speakers can play relatively loud (87 dB)
Bass 100 - 315 Hz
(-) | nearly no bass - on average 15.8% lower than median
(±) | linearity of bass is average (13.9% delta to prev. frequency)
Mids 400 - 2000 Hz
(+) | balanced mids - only 4.3% away from median
(±) | linearity of mids is average (7.1% delta to prev. frequency)
Highs 2 - 16 kHz
(+) | balanced highs - only 3.1% away from median
(±) | linearity of highs is average (7.9% delta to prev. frequency)
Overall 100 - 16.000 Hz
(+) | overall sound is linear (13.5% difference to median)
Compared to same class
» 29% of all tested devices in this class were better, 4% similar, 67% worse
» The best had a delta of 5%, average was 17%, worst was 45%
Compared to all devices tested
» 14% of all tested devices were better, 4% similar, 82% worse
» The best had a delta of 4%, average was 24%, worst was 134%
Asus Zenbook UX510UW-CN044T audio analysis
(±) | speaker loudness is average but good (73 dB)
Bass 100 - 315 Hz
(±) | reduced bass - on average 14.8% lower than median
(±) | linearity of bass is average (7.2% delta to prev. frequency)
Mids 400 - 2000 Hz
(+) | balanced mids - only 3% away from median
(+) | mids are linear (6.3% delta to prev. frequency)
Highs 2 - 16 kHz
(±) | higher highs - on average 6% higher than median
(+) | highs are linear (4.6% delta to prev. frequency)
Overall 100 - 16.000 Hz
(±) | linearity of overall sound is average (16.6% difference to median)
Compared to same class
» 44% of all tested devices in this class were better, 7% similar, 49% worse
» The best had a delta of 5%, average was 17%, worst was 45%
Compared to all devices tested
» 29% of all tested devices were better, 6% similar, 66% worse
» The best had a delta of 4%, average was 24%, worst was 134%
Frequency diagram in comparison (checkboxes above can be turned on/off!)
Energy Management
Power Consumption
Since it is not possible to reasonably compare the power consumption of the laptops in the test due to their completely different configurations, we searched our database for laptops with a GTX 1050 Ti and i7-7700HQ. Two of the four existing devices have a 17 and a 14-inch screen. This database actually does not allow estimating the relative consumption. What can be said: The power consumption of the Aspire VX5 is within the expected range in all load states, and there are no peaks. The 135-watt power supply always provides enough power.
| Off / Standby | |
| Idle | |
| Load |
|
Key:
min: | |
| Acer Aspire VX5-591G-75C4 VX15 i7-7700HQ, GeForce GTX 1050 Ti Mobile, Toshiba MQ01ABD100, IPS, 1920x1080, 15.6" | Acer Aspire VN7-593G-73HP V15 Nitro BE i7-7700HQ, GeForce GTX 1060 Mobile, Seagate Mobile HDD 1TB ST1000LM035, AH-IPS, Normally Black, Transmissive, 1920x1080, 15.6" | Dell XPS 15 2017 9560 (7300HQ, Full-HD) i5-7300HQ, GeForce GTX 1050 Mobile, WDC WD10SPCX-75KHST0 + SanDisk Z400s M.2 2242 32 GB Cache, LED IGZO IPS InfinityEdge, 1920x1080, 15.6" | Asus Zenbook UX510UW-CN044T 6500U, GeForce GTX 960M, SanDisk SD8SNAT256G1002, IPS, 1920x1080, 15.6" | |
|---|---|---|---|---|
| Power Consumption | -9% | 8% | 23% | |
| Idle Minimum * (Watt) | 7 | 7.2 -3% | 6.6 6% | 5 29% |
| Idle Average * (Watt) | 10.2 | 10.5 -3% | 9 12% | 8.9 13% |
| Idle Maximum * (Watt) | 14 | 16 -14% | 10.7 24% | 11.8 16% |
| Load Average * (Watt) | 78 | 82 -5% | 77.5 1% | 55 29% |
| Load Maximum * (Watt) | 127 | 155 -22% | 130 -2% | 93 27% |
| Witcher 3 ultra * (Watt) | 124 |
* ... smaller is better
Battery Runtime
The first thing that struck us was the short time difference of just 20 minutes between the maximum runtime test and practical Wi-Fi test with a bright screen. Compared with the weaker CPU and graphics card in Dell's XPS 15, which also has a slightly stronger 56 Wh battery, the too short idle runtime of just 322 minutes is noticed while it is almost neck-and-neck in the other tests. We would recommend following the Wi-Fi test.
| Acer Aspire VX5-591G-75C4 VX15 i7-7700HQ, GeForce GTX 1050 Ti Mobile, 52.5 Wh | Acer Aspire VN7-593G-73HP V15 Nitro BE i7-7700HQ, GeForce GTX 1060 Mobile, 69 Wh | Dell XPS 15 2017 9560 (7300HQ, Full-HD) i5-7300HQ, GeForce GTX 1050 Mobile, 56 Wh | Asus Zenbook UX510UW-CN044T 6500U, GeForce GTX 960M, 48 Wh | |
|---|---|---|---|---|
| Battery runtime | 49% | 29% | 70% | |
| Reader / Idle (h) | 5.4 | 8.4 56% | 9.4 74% | 13.6 152% |
| WiFi v1.3 (h) | 5 | 6 20% | 5.6 12% | 7.2 44% |
| Load (h) | 1.4 | 2.4 71% | 1.4 0% | 1.6 14% |
| H.264 (h) | 7.1 |
Pros
Cons
Verdict
Unspectacular but rock-solid - Acer has done a good job with its new VX5-591G-75C4.
Except for the fast processor, most components are situated in the upper mid-range and thus correspond to the price of 1000 Euros (~$1061) for the tested version and 1200 Euros (~$1273) for the one with an SSD. This brings us to the only real catch: We can only give the successful multimedia laptop without a solid state drive a conditional purchase recommendation. Users who want more gaming power and thus need a GTX 1060 will have to inevitably make compromises in system noise, as its consistently quiet noise production is one of the strengths of Acer's new multimedia device.
Acer Aspire VX5-591G-75C4 VX15
- 04/11/2017 v6 (old)
Sven Kloevekorn
Price comparison
