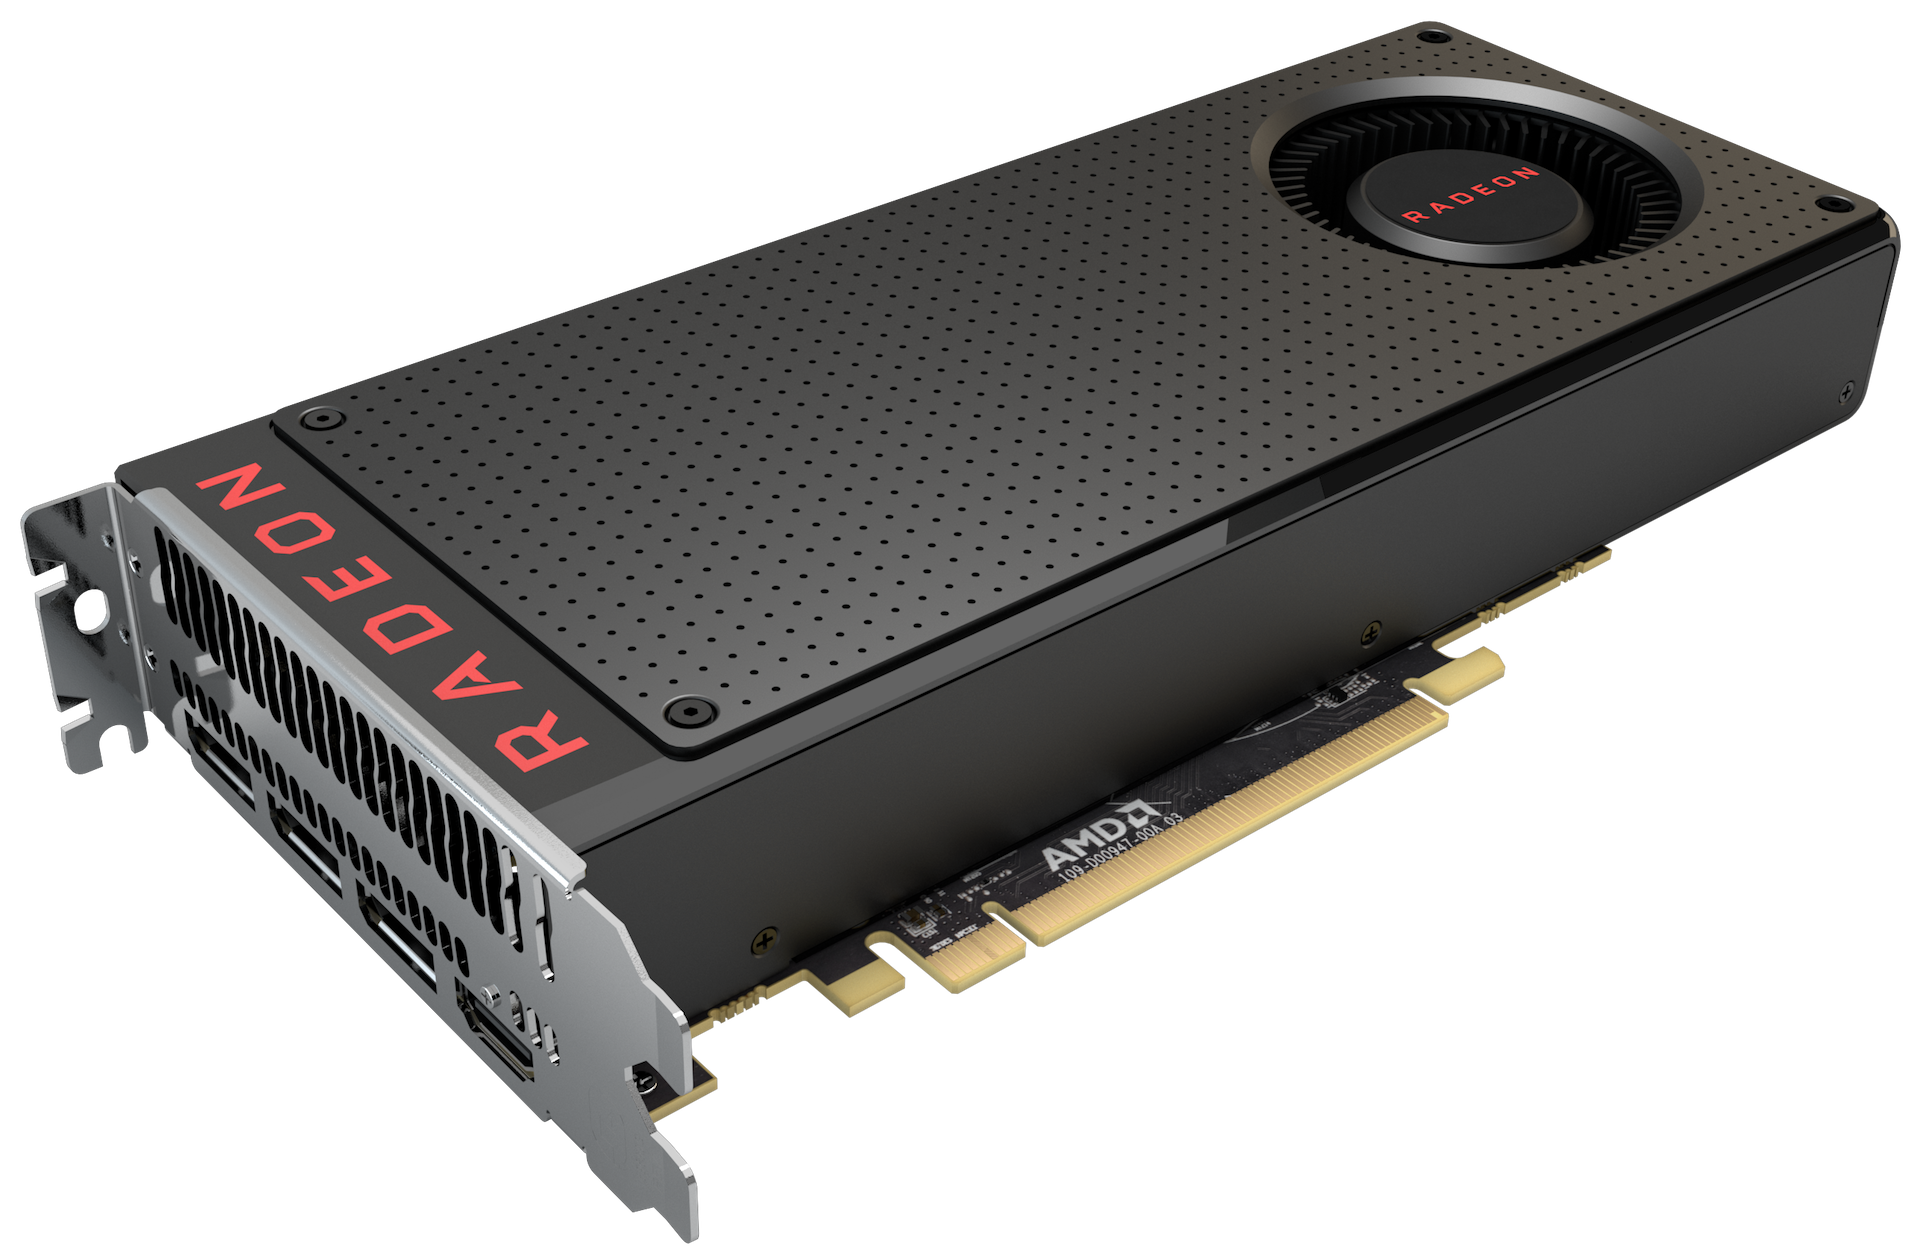
AMD Radeon RX 480 Review - The fastest Polaris desktop card at launch
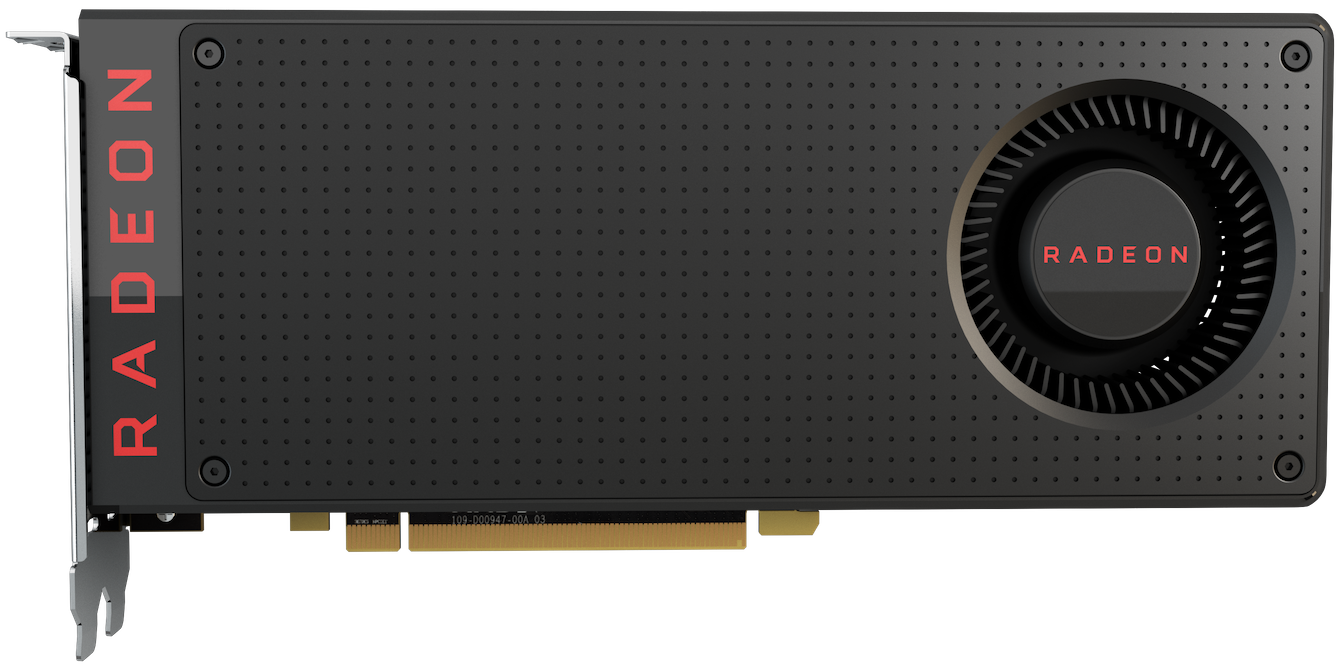
According to AMD, 84 % of gamers buy graphics card in the range between $100-300 USD. This is also the segment where AMD shows its first graphics cards based on 3D transistors (14 nm FinFET at Global Foundries). The first GPU is the top model of the Polaris lineup with the designation Radeon RX 480 and is based on the Polaris 10 chip. It has the code name Ellesmere (Canadian island). It has 2304 shaders and should therefore represent the full configuration of the chip. Thanks to a TDP of 150 Watts, it can be operated with just one 6-pin power plug and would, in theory, also be suited for notebooks (as a rival for the GTX 980).
| Specifications | Radeon RX 480 | Radeon RX 470 | Radeon RX 460 |
|---|---|---|---|
| Chip | Polaris 10 | Polaris 10 | Polaris 11 |
| Shader / Compute Units | 2304/36 | 2048/32 | 896/14 |
| Texture Units | 144 | 128? | 64 |
| L2 Cache | 2 MB | ? | 1 MB |
| TFLOPS | >5 | >4 | >2 |
| Memory Bus | 256-bit | 256-bit | 128-bit |
| Power (Watts) | 150 (1x6-pin) | ? (1x6-pin) | ? (none) |
Radeon RX 400 Series
| |||||||||||||
| Codename | Polaris 10 Ellesmere | ||||||||||||
| Architecture | Polaris | ||||||||||||
| Pipelines | 2304 - unified | ||||||||||||
| Core Speed | 1120 - 1266 (Boost) MHz | ||||||||||||
| Memory Speed | 8000 MHz | ||||||||||||
| Memory Bus Width | 256 Bit | ||||||||||||
| Memory Type | GDDR5 | ||||||||||||
| Max. Amount of Memory | 8 GB | ||||||||||||
| Shared Memory | no | ||||||||||||
| API | DirectX 12, OpenGL Vulkan | ||||||||||||
| Power Consumption | 150 Watt | ||||||||||||
| Man. Technology | 14 nm | ||||||||||||
| Features | DisplayPort 1.3 HBR / 1.4 HDR Ready, HDMI 2.0b, AMD FreeSync | ||||||||||||
| Date of Announcement | 29.06.2016 | ||||||||||||
Polaris
Polaris is AMD's first architecture manufactured in a 14 nm FinFET process. It is the 4th generation GCN (Graphics Core Next) architecture and offers the following improvements according to AMD:
- Enhanced geometry engines
- Improved shader efficiency (up to 15 % per CU at RX 480 vs. R9 290)
- LiquidVR API support with "Variable Resolution Rendering"
- Improved memory controller and Delta Color Compression (DCC) with full 2/4/8:1 support
- Doubled Level 2 cache
- Shader Instruction Pre-Fetch and improved buffering
- Improved Asynchronous Compute
- AMD TrueAudio Next (calculated via shader)
- H.265 Main 10 decode and 4K60 HEVC encode
- HDMI 2.0b, DisplayPort 1.3 HBR (5K60 with a single cable) / 1.4 HDR with HDCP 2.2
- HDR display support
These improvements are supposed to increase the performance per Watt up to the factor 2.8x (RX 470 vs. R9 270X).
Our test system for the following benchmarks consists of the following components:
Intel Core i7-4790K (not overclocked), 16 GB DDR3, Asus ZU97-Deluxe, Asus PB287Q 4K monitor, Intel SSD 530 (240 GB, system), OCZ Trion 100 SSD (480 GB, benchmarks), Windows 10 64-bit with all updates as of mid June. As a driver we used the press release of the 16.6.2 (pre launch of the card). The 16.7.2 should boost performance by around 3% according to Computerbase.
Synthetic Benchmarks
We use the synthetic benchmarks from Futuremark's 3DMark series as well as the products from Ungine to test the graphics performance. However, the results should be handled carefully, because all manufacturers optimize their GPUs and drivers for the 3DMarks in particular.
On average, the new Radeon RX 480 is ahead of the GeForce GTX 970 (-6 %) and Radeon R9 290X (-5 %) in our benchmarks, but is usually behind the GTX 980 (Notebook) (6-11 % faster) and R9 390X (4 % faster). The RX 480 can even just beat the GTX 980 in the old 3DMark 11 Graphics subscore, but the Unigine Heaven 4.0 performance is pretty weak in return.
The new Geforce GTX 1080 (Pascal) is – as expected – out of reach and manages an impressive advantage of 86 % on average.
| 3DMark | |
| 3840x2160 Fire Strike Ultra Graphics | |
| NVIDIA GeForce GTX 1080 (Desktop) | |
| NVIDIA GeForce GTX 980 Ti | |
| AMD Radeon R9 Fury | |
| NVIDIA GeForce GTX 980 | |
| NVIDIA GeForce GTX 980 (Laptop) | |
| NVIDIA GeForce GTX 970 | |
| AMD Radeon RX 480 (Desktop) | |
| AMD Radeon R9 290X | |
| 1920x1080 Fire Strike Graphics | |
| NVIDIA GeForce GTX 1080 (Desktop) | |
| NVIDIA GeForce GTX 980 Ti | |
| AMD Radeon R9 Fury | |
| NVIDIA GeForce GTX 980 | |
| NVIDIA GeForce GTX 980 (Laptop) | |
| AMD Radeon R9 390X | |
| AMD Radeon RX 480 (Desktop) | |
| AMD Radeon R9 290X | |
| NVIDIA GeForce GTX 970 | |
| NVIDIA GeForce GTX 970 | |
| 1280x720 Sky Diver Graphics | |
| NVIDIA GeForce GTX 1080 (Desktop) | |
| NVIDIA GeForce GTX 980 Ti | |
| AMD Radeon R9 Fury | |
| NVIDIA GeForce GTX 980 (Laptop) | |
| NVIDIA GeForce GTX 970 | |
| AMD Radeon RX 480 (Desktop) | |
| NVIDIA GeForce GTX 970 | |
| 1280x720 Cloud Gate Standard Graphics | |
| NVIDIA GeForce GTX 1080 (Desktop) | |
| NVIDIA GeForce GTX 980 Ti | |
| AMD Radeon R9 Fury | |
| NVIDIA GeForce GTX 980 (Laptop) | |
| AMD Radeon R9 390X | |
| NVIDIA GeForce GTX 970 | |
| AMD Radeon RX 480 (Desktop) | |
| NVIDIA GeForce GTX 970 | |
| 3DMark 11 - 1280x720 Performance GPU | |
| NVIDIA GeForce GTX 1080 (Desktop) | |
| NVIDIA GeForce GTX 980 Ti | |
| AMD Radeon R9 390X | |
| AMD Radeon RX 480 (Desktop) | |
| NVIDIA GeForce GTX 980 | |
| AMD Radeon R9 Fury | |
| NVIDIA GeForce GTX 980 (Laptop) | |
| AMD Radeon R9 290X | |
| NVIDIA GeForce GTX 970 | |
| NVIDIA GeForce GTX 970 | |
| Unigine Heaven 4.0 - Extreme Preset DX11 | |
| NVIDIA GeForce GTX 1080 (Desktop) | |
| NVIDIA GeForce GTX 980 Ti | |
| NVIDIA GeForce GTX 980 | |
| NVIDIA GeForce GTX 980 (Laptop) | |
| AMD Radeon R9 Fury | |
| AMD Radeon R9 390X | |
| NVIDIA GeForce GTX 970 | |
| AMD Radeon RX 480 (Desktop) | |
| Unigine Valley 1.0 - 1920x1080 Extreme HD DirectX AA:x8 | |
| NVIDIA GeForce GTX 1080 (Desktop) | |
| NVIDIA GeForce GTX 980 Ti | |
| AMD Radeon R9 Fury | |
| AMD Radeon R9 290X | |
| NVIDIA GeForce GTX 970 | |
| AMD Radeon RX 480 (Desktop) | |
Gaming Benchmarks
The general gaming performance is obviously more important. During this test, we checked the performance of the RX 480 with 34 games and numerous settings. The average results in 1920 x 1080 and maximum settings as well as 4K with high settings are on par with the R9 290X, and slightly ahead of the GTX 970 (-2 %, but inside the MSI Gaming Dock and less benchmarks). The R9 390X is 5 % faster, while the GTX 980 about 5-15 % faster depending on the device (desktop or notebook). The Radeon R9 Fury (Pro) manages 17 % more frames per second on average (it is particularly faster in 4K).
The RX 480 performs excellent in the targeted Full-HD resolution and manages smooth frame rates in all tested games. Only Anno 2205 and XCOM 2 are on the limit, but high frame rates are not that important here.
The GTX 980 is actually beaten in some titles in Full-HD (Dragon Age Inquisition, GTA V, Rainbow Six Siege, Black Ops 3, Hitman 2016, and Overwatch), but it also manages a significant lead in other games (Rise of the Tomb Raider +25 %, Fallout 4 +19 %, Mad Max +16 %). It is 7 % faster on average.
More gaming benchmarks are listed at the end of this article. They are continuously maintained and upgraded.
| Mirror's Edge Catalyst | |
| 1920x1080 Ultra Preset AF:16x | |
| NVIDIA GeForce GTX 1080 (Desktop) | |
| NVIDIA GeForce GTX 980 Ti | |
| AMD Radeon R9 Fury | |
| NVIDIA GeForce GTX 980 | |
| NVIDIA GeForce GTX 970 | |
| AMD Radeon RX 480 (Desktop) | |
| AMD Radeon R9 290X | |
| 3840x2160 High Preset AF:16x | |
| NVIDIA GeForce GTX 1080 (Desktop) | |
| NVIDIA GeForce GTX 980 Ti | |
| AMD Radeon R9 Fury | |
| AMD Radeon R9 290X | |
| NVIDIA GeForce GTX 980 | |
| NVIDIA GeForce GTX 970 | |
| AMD Radeon RX 480 (Desktop) | |
| Overwatch | |
| 1920x1080 Epic (Render Scale 100 %) AA:SM AF:16x | |
| NVIDIA GeForce GTX 1080 (Desktop) | |
| NVIDIA GeForce GTX 980 Ti | |
| AMD Radeon RX 480 (Desktop) | |
| AMD Radeon R9 Fury | |
| NVIDIA GeForce GTX 980 | |
| NVIDIA GeForce GTX 970 | |
| AMD Radeon R9 290X | |
| 3840x2160 High (Render Scale 100 %) AA:SM AF:4x | |
| NVIDIA GeForce GTX 1080 (Desktop) | |
| NVIDIA GeForce GTX 980 Ti | |
| AMD Radeon R9 Fury | |
| AMD Radeon R9 290X | |
| NVIDIA GeForce GTX 980 | |
| NVIDIA GeForce GTX 970 | |
| AMD Radeon RX 480 (Desktop) | |
| Doom | |
| 1920x1080 Ultra Preset AA:SM | |
| NVIDIA GeForce GTX 1080 (Desktop) | |
| NVIDIA GeForce GTX 980 Ti | |
| NVIDIA GeForce GTX 980 | |
| NVIDIA GeForce GTX 970 | |
| AMD Radeon R9 Fury | |
| AMD Radeon RX 480 (Desktop) | |
| 3840x2160 High Preset AA:FX | |
| NVIDIA GeForce GTX 1080 (Desktop) | |
| NVIDIA GeForce GTX 980 Ti | |
| AMD Radeon R9 Fury | |
| NVIDIA GeForce GTX 980 | |
| NVIDIA GeForce GTX 970 | |
| AMD Radeon RX 480 (Desktop) | |
| Need for Speed 2016 | |
| 1920x1080 Ultra / On AA:T | |
| NVIDIA GeForce GTX 1080 (Desktop) | |
| NVIDIA GeForce GTX 980 Ti | |
| NVIDIA GeForce GTX 980 | |
| NVIDIA GeForce GTX 970 | |
| AMD Radeon RX 480 (Desktop) | |
| AMD Radeon R9 Fury | |
| AMD Radeon R9 290X | |
| 3840x2160 High / On AA:FX | |
| NVIDIA GeForce GTX 1080 (Desktop) | |
| NVIDIA GeForce GTX 980 Ti | |
| AMD Radeon R9 Fury | |
| NVIDIA GeForce GTX 980 | |
| AMD Radeon R9 290X | |
| AMD Radeon RX 480 (Desktop) | |
| NVIDIA GeForce GTX 970 | |
| Hitman 2016 | |
| 1920x1080 Ultra / On AA:SM AF:16x | |
| NVIDIA GeForce GTX 1080 (Desktop) | |
| NVIDIA GeForce GTX 980 Ti | |
| AMD Radeon RX 480 (Desktop) | |
| AMD Radeon RX 480 (Desktop) | |
| AMD Radeon R9 Fury | |
| AMD Radeon R9 Fury | |
| AMD Radeon R9 290X | |
| NVIDIA GeForce GTX 980 | |
| NVIDIA GeForce GTX 970 | |
| 3840x2160 High / On AA:FX AF:8x | |
| NVIDIA GeForce GTX 1080 (Desktop) | |
| AMD Radeon R9 Fury | |
| AMD Radeon R9 Fury | |
| NVIDIA GeForce GTX 980 Ti | |
| AMD Radeon R9 290X | |
| AMD Radeon RX 480 (Desktop) | |
| AMD Radeon RX 480 (Desktop) | |
| NVIDIA GeForce GTX 980 | |
| NVIDIA GeForce GTX 970 | |
| The Division | |
| 1920x1080 Ultra Preset AF:16x | |
| NVIDIA GeForce GTX 1080 (Desktop) | |
| NVIDIA GeForce GTX 980 Ti | |
| AMD Radeon R9 Fury | |
| NVIDIA GeForce GTX 980 | |
| AMD Radeon RX 480 (Desktop) | |
| NVIDIA GeForce GTX 970 | |
| AMD Radeon R9 290X | |
| 3840x2160 High Preset AF:8x | |
| NVIDIA GeForce GTX 1080 (Desktop) | |
| NVIDIA GeForce GTX 980 Ti | |
| AMD Radeon R9 Fury | |
| AMD Radeon R9 290X | |
| AMD Radeon RX 480 (Desktop) | |
| NVIDIA GeForce GTX 980 | |
| NVIDIA GeForce GTX 970 | |
| Far Cry Primal | |
| 1920x1080 Ultra Preset AA:SM | |
| NVIDIA GeForce GTX 1080 (Desktop) | |
| NVIDIA GeForce GTX 980 Ti | |
| AMD Radeon R9 Fury | |
| NVIDIA GeForce GTX 980 | |
| AMD Radeon RX 480 (Desktop) | |
| NVIDIA GeForce GTX 970 | |
| 3840x2160 High Preset AA:SM | |
| NVIDIA GeForce GTX 1080 (Desktop) | |
| NVIDIA GeForce GTX 980 Ti | |
| AMD Radeon R9 Fury | |
| NVIDIA GeForce GTX 980 | |
| AMD Radeon RX 480 (Desktop) | |
| NVIDIA GeForce GTX 970 | |
| XCOM 2 | |
| 1920x1080 Maximum Preset (8xMSAA instead of FXAA) AA:8xMS AF:16x | |
| NVIDIA GeForce GTX 1080 (Desktop) | |
| NVIDIA GeForce GTX 980 Ti | |
| AMD Radeon R9 Fury | |
| NVIDIA GeForce GTX 980 | |
| NVIDIA GeForce GTX 970 | |
| AMD Radeon RX 480 (Desktop) | |
| 3840x2160 High Preset AA:FX AF:8x | |
| NVIDIA GeForce GTX 1080 (Desktop) | |
| NVIDIA GeForce GTX 980 Ti | |
| AMD Radeon R9 Fury | |
| NVIDIA GeForce GTX 980 | |
| AMD Radeon RX 480 (Desktop) | |
| NVIDIA GeForce GTX 970 | |
| Rise of the Tomb Raider | |
| 3840x2160 High Preset AA:FX AF:4x | |
| NVIDIA GeForce GTX 1080 (Desktop) | |
| NVIDIA GeForce GTX 1080 (Desktop) | |
| NVIDIA GeForce GTX 980 Ti | |
| AMD Radeon R9 Fury | |
| NVIDIA GeForce GTX 980 | |
| AMD Radeon R9 290X | |
| AMD Radeon RX 480 (Desktop) | |
| AMD Radeon RX 480 (Desktop) | |
| NVIDIA GeForce GTX 970 | |
| 1920x1080 Very High Preset AA:FX AF:16x | |
| NVIDIA GeForce GTX 1080 (Desktop) | |
| NVIDIA GeForce GTX 1080 (Desktop) | |
| NVIDIA GeForce GTX 1080 (Desktop) | |
| NVIDIA GeForce GTX 980 Ti | |
| NVIDIA GeForce GTX 980 | |
| NVIDIA GeForce GTX 970 | |
| AMD Radeon R9 Fury | |
| AMD Radeon RX 480 (Desktop) | |
| AMD Radeon R9 290X | |
| Just Cause 3 | |
| 3840x2160 High / On AA:FX AF:8x | |
| NVIDIA GeForce GTX 1080 (Desktop) | |
| NVIDIA GeForce GTX 980 Ti | |
| NVIDIA GeForce GTX 980 | |
| AMD Radeon R9 Fury | |
| NVIDIA GeForce GTX 970 | |
| AMD Radeon RX 480 (Desktop) | |
| AMD Radeon R9 390X | |
| 1920x1080 Very High / On AA:SM AF:16x | |
| NVIDIA GeForce GTX 1080 (Desktop) | |
| NVIDIA GeForce GTX 980 Ti | |
| NVIDIA GeForce GTX 980 | |
| AMD Radeon RX 480 (Desktop) | |
| NVIDIA GeForce GTX 970 | |
| AMD Radeon R9 Fury | |
| AMD Radeon R9 390X | |
| Rainbow Six Siege | |
| 1920x1080 Ultra Preset AA:T AF:16x | |
| NVIDIA GeForce GTX 1080 (Desktop) | |
| NVIDIA GeForce GTX 980 Ti | |
| AMD Radeon RX 480 (Desktop) | |
| NVIDIA GeForce GTX 970 | |
| AMD Radeon R9 Fury | |
| NVIDIA GeForce GTX 980 | |
| AMD Radeon R9 390X | |
| 3840x2160 High Preset AA:T AF:4x | |
| NVIDIA GeForce GTX 1080 (Desktop) | |
| NVIDIA GeForce GTX 980 Ti | |
| AMD Radeon R9 Fury | |
| AMD Radeon R9 390X | |
| NVIDIA GeForce GTX 980 | |
| AMD Radeon RX 480 (Desktop) | |
| NVIDIA GeForce GTX 970 | |
| Assassin's Creed Syndicate | |
| 1920x1080 Ultra High Preset AA:4x MSAA + FX | |
| NVIDIA GeForce GTX 1080 (Desktop) | |
| NVIDIA GeForce GTX 980 Ti | |
| NVIDIA GeForce GTX 980 | |
| NVIDIA GeForce GTX 980 (Laptop) | |
| NVIDIA GeForce GTX 970 | |
| AMD Radeon RX 480 (Desktop) | |
| AMD Radeon R9 Fury | |
| AMD Radeon R9 390X | |
| AMD Radeon R9 290X | |
| 3840x2160 High Preset AA:FX | |
| NVIDIA GeForce GTX 1080 (Desktop) | |
| NVIDIA GeForce GTX 980 Ti | |
| AMD Radeon R9 Fury | |
| NVIDIA GeForce GTX 980 (Laptop) | |
| NVIDIA GeForce GTX 980 | |
| AMD Radeon R9 390X | |
| AMD Radeon R9 290X | |
| AMD Radeon RX 480 (Desktop) | |
| NVIDIA GeForce GTX 970 | |
| Star Wars Battlefront | |
| 1920x1080 Ultra Preset AA:FX | |
| NVIDIA GeForce GTX 1080 (Desktop) | |
| NVIDIA GeForce GTX 980 Ti | |
| AMD Radeon R9 Fury | |
| NVIDIA GeForce GTX 980 | |
| AMD Radeon R9 290X | |
| AMD Radeon R9 390X | |
| NVIDIA GeForce GTX 980 (Laptop) | |
| AMD Radeon RX 480 (Desktop) | |
| NVIDIA GeForce GTX 970 | |
| 3840x2160 High Preset AA:FX | |
| NVIDIA GeForce GTX 1080 (Desktop) | |
| NVIDIA GeForce GTX 980 Ti | |
| AMD Radeon R9 Fury | |
| AMD Radeon R9 290X | |
| AMD Radeon R9 390X | |
| NVIDIA GeForce GTX 980 | |
| NVIDIA GeForce GTX 980 (Laptop) | |
| AMD Radeon RX 480 (Desktop) | |
| NVIDIA GeForce GTX 970 | |
| Fallout 4 | |
| 1920x1080 Ultra Preset AA:T AF:16x | |
| NVIDIA GeForce GTX 1080 (Desktop) | |
| NVIDIA GeForce GTX 980 Ti | |
| AMD Radeon R9 Fury | |
| NVIDIA GeForce GTX 980 (Laptop) | |
| NVIDIA GeForce GTX 970 | |
| AMD Radeon R9 390X | |
| AMD Radeon RX 480 (Desktop) | |
| AMD Radeon R9 290X | |
| 3840x2160 High Preset AA:T AF:16x | |
| NVIDIA GeForce GTX 1080 (Desktop) | |
| NVIDIA GeForce GTX 980 Ti | |
| AMD Radeon R9 Fury | |
| NVIDIA GeForce GTX 980 (Laptop) | |
| AMD Radeon R9 390X | |
| AMD Radeon R9 290X | |
| NVIDIA GeForce GTX 970 | |
| AMD Radeon RX 480 (Desktop) | |
| Call of Duty: Black Ops 3 | |
| 1920x1080 Extra / On AA:T2x SM | |
| NVIDIA GeForce GTX 1080 (Desktop) | |
| NVIDIA GeForce GTX 980 Ti | |
| AMD Radeon RX 480 (Desktop) | |
| NVIDIA GeForce GTX 980 (Laptop) | |
| AMD Radeon R9 390X | |
| AMD Radeon R9 Fury | |
| AMD Radeon R9 290X | |
| 3840x2160 High / On AA:FX | |
| NVIDIA GeForce GTX 1080 (Desktop) | |
| NVIDIA GeForce GTX 980 Ti | |
| AMD Radeon R9 390X | |
| AMD Radeon R9 Fury | |
| AMD Radeon RX 480 (Desktop) | |
| NVIDIA GeForce GTX 980 (Laptop) | |
| AMD Radeon R9 290X | |
| NVIDIA GeForce GTX 970 | |
| Anno 2205 | |
| 1920x1080 Ultra High Preset AA:8x | |
| NVIDIA GeForce GTX 1080 (Desktop) | |
| NVIDIA GeForce GTX 980 Ti | |
| AMD Radeon R9 Fury | |
| NVIDIA GeForce GTX 980 (Laptop) | |
| AMD Radeon RX 480 (Desktop) | |
| AMD Radeon R9 390X | |
| NVIDIA GeForce GTX 970 | |
| AMD Radeon R9 290X | |
| 3840x2160 High Preset AA:4x | |
| NVIDIA GeForce GTX 1080 (Desktop) | |
| NVIDIA GeForce GTX 980 Ti | |
| AMD Radeon R9 Fury | |
| NVIDIA GeForce GTX 980 (Laptop) | |
| NVIDIA GeForce GTX 970 | |
| AMD Radeon R9 390X | |
| AMD Radeon R9 290X | |
| AMD Radeon RX 480 (Desktop) | |
| World of Warships | |
| 1920x1080 Very High Preset AA:High FX AF:16x | |
| NVIDIA GeForce GTX 1080 (Desktop) | |
| NVIDIA GeForce GTX 980 Ti | |
| NVIDIA GeForce GTX 970 | |
| AMD Radeon R9 290X | |
| AMD Radeon R9 Fury | |
| AMD Radeon R9 390X | |
| 3840 x 2160 Very High Preset AA:High FX AF:16x | |
| NVIDIA GeForce GTX 1080 (Desktop) | |
| NVIDIA GeForce GTX 980 Ti | |
| AMD Radeon R9 Fury | |
| NVIDIA GeForce GTX 970 | |
| AMD Radeon R9 290X | |
| AMD Radeon R9 390X | |
| AMD Radeon RX 480 (Desktop) | |
| Mad Max | |
| 1920x1080 Very High Preset AF:12x | |
| NVIDIA GeForce GTX 1080 (Desktop) | |
| NVIDIA GeForce GTX 980 Ti | |
| AMD Radeon R9 Fury | |
| NVIDIA GeForce GTX 980 (Laptop) | |
| NVIDIA GeForce GTX 970 | |
| AMD Radeon R9 290X | |
| AMD Radeon RX 480 (Desktop) | |
| AMD Radeon R9 390X | |
| 3840x2160 High Preset AF:6x | |
| NVIDIA GeForce GTX 1080 (Desktop) | |
| NVIDIA GeForce GTX 980 Ti | |
| AMD Radeon R9 Fury | |
| NVIDIA GeForce GTX 980 (Laptop) | |
| AMD Radeon R9 290X | |
| AMD Radeon R9 390X | |
| NVIDIA GeForce GTX 970 | |
| AMD Radeon RX 480 (Desktop) | |
| Metal Gear Solid V - 3840x2160 High / On | |
| NVIDIA GeForce GTX 1080 (Desktop) | |
| AMD Radeon R9 Fury | |
| NVIDIA GeForce GTX 980 (Laptop) | |
| AMD Radeon R9 390X | |
| AMD Radeon R9 290X | |
| NVIDIA GeForce GTX 970 | |
| AMD Radeon RX 480 (Desktop) | |
| Dirt Rally | |
| 1920x1080 Ultra Preset AA:4x MS | |
| NVIDIA GeForce GTX 980 Ti | |
| NVIDIA GeForce GTX 1080 (Desktop) | |
| AMD Radeon R9 290X | |
| NVIDIA GeForce GTX 980 (Laptop) | |
| NVIDIA GeForce GTX 970 | |
| AMD Radeon R9 Fury | |
| AMD Radeon R9 390X | |
| AMD Radeon RX 480 (Desktop) | |
| 3840x2160 High Preset | |
| NVIDIA GeForce GTX 970 | |
| NVIDIA GeForce GTX 1080 (Desktop) | |
| NVIDIA GeForce GTX 980 Ti | |
| NVIDIA GeForce GTX 980 (Laptop) | |
| AMD Radeon R9 Fury | |
| AMD Radeon R9 290X | |
| AMD Radeon R9 390X | |
| AMD Radeon RX 480 (Desktop) | |
| The Witcher 3 | |
| 1920x1080 Ultra Graphics & Postprocessing (HBAO+) | |
| NVIDIA GeForce GTX 1080 (Desktop) | |
| NVIDIA GeForce GTX 980 Ti | |
| AMD Radeon R9 Fury | |
| NVIDIA GeForce GTX 980 (Laptop) | |
| AMD Radeon RX 480 (Desktop) | |
| NVIDIA GeForce GTX 970 | |
| AMD Radeon R9 390X | |
| AMD Radeon R9 290X | |
| 3840x2160 High Graphics & Postprocessing (Nvidia HairWorks Off) | |
| NVIDIA GeForce GTX 1080 (Desktop) | |
| NVIDIA GeForce GTX 980 Ti | |
| AMD Radeon R9 Fury | |
| NVIDIA GeForce GTX 980 (Laptop) | |
| AMD Radeon R9 390X | |
| NVIDIA GeForce GTX 970 | |
| AMD Radeon R9 290X | |
| AMD Radeon RX 480 (Desktop) | |
| GTA V | |
| 1920x1080 Highest AA:4xMSAA + FX AF:16x | |
| NVIDIA GeForce GTX 1080 (Desktop) | |
| NVIDIA GeForce GTX 980 Ti | |
| NVIDIA GeForce GTX 980 (Laptop) | |
| NVIDIA GeForce GTX 970 | |
| AMD Radeon RX 480 (Desktop) | |
| AMD Radeon R9 290X | |
| NVIDIA GeForce GTX 970 | |
| 3840x2160 High/On (Advanced Graphics Off) AA:FX AF:8x | |
| NVIDIA GeForce GTX 980 Ti | |
| NVIDIA GeForce GTX 1080 (Desktop) | |
| NVIDIA GeForce GTX 980 (Laptop) | |
| AMD Radeon R9 290X | |
| NVIDIA GeForce GTX 970 | |
| AMD Radeon R9 Fury | |
| NVIDIA GeForce GTX 970 | |
| AMD Radeon RX 480 (Desktop) | |
| Battlefield Hardline | |
| 1920x1080 High Graphics Quality (DX11) | |
| NVIDIA GeForce GTX 980 (Laptop) | |
| NVIDIA GeForce GTX 970 | |
| AMD Radeon R9 390X | |
| AMD Radeon R9 290X | |
| AMD Radeon RX 480 (Desktop) | |
| 1920x1080 Ultra Graphics Quality (DX11) AA:4x MS | |
| NVIDIA GeForce GTX 980 Ti | |
| NVIDIA GeForce GTX 980 (Laptop) | |
| AMD Radeon R9 390X | |
| AMD Radeon RX 480 (Desktop) | |
| AMD Radeon R9 290X | |
| NVIDIA GeForce GTX 970 | |
| Dragon Age: Inquisition - 1920x1080 Ultra Graphics Quality AA:2x MS | |
| NVIDIA GeForce GTX 1080 (Desktop) | |
| NVIDIA GeForce GTX 980 Ti | |
| AMD Radeon R9 390X | |
| NVIDIA GeForce GTX 970 | |
| NVIDIA GeForce GTX 980 (Laptop) | |
| AMD Radeon RX 480 (Desktop) | |
| AMD Radeon RX 480 (Desktop) | |
| AMD Radeon R9 Fury | |
| NVIDIA GeForce GTX 970 | |
| Alien: Isolation - 1920x1080 Ultra, On, Shadow Map 2048, HDAO AA:2x SM AF:16x | |
| NVIDIA GeForce GTX 1080 (Desktop) | |
| AMD Radeon R9 Fury | |
| NVIDIA GeForce GTX 980 (Laptop) | |
| AMD Radeon RX 480 (Desktop) | |
| NVIDIA GeForce GTX 970 | |
| Middle-earth: Shadow of Mordor - 1920x1080 Ultra Preset (HD Package) | |
| AMD Radeon R9 Fury | |
| AMD Radeon R9 390X | |
| NVIDIA GeForce GTX 980 (Laptop) | |
| AMD Radeon RX 480 (Desktop) | |
| NVIDIA GeForce GTX 970 | |
| NVIDIA GeForce GTX 970 | |
| Battlefield 4 | |
| 3840x2160 High Preset | |
| NVIDIA GeForce GTX 1080 (Desktop) | |
| NVIDIA GeForce GTX 980 Ti | |
| AMD Radeon R9 Fury | |
| NVIDIA GeForce GTX 980 (Laptop) | |
| AMD Radeon R9 390X | |
| NVIDIA GeForce GTX 970 | |
| AMD Radeon R9 290X | |
| NVIDIA GeForce GTX 970 | |
| AMD Radeon RX 480 (Desktop) | |
| 1920x1080 Ultra Preset AA:4x MS | |
| NVIDIA GeForce GTX 1080 (Desktop) | |
| NVIDIA GeForce GTX 980 Ti | |
| AMD Radeon R9 Fury | |
| NVIDIA GeForce GTX 980 (Laptop) | |
| NVIDIA GeForce GTX 970 | |
| AMD Radeon R9 390X | |
| NVIDIA GeForce GTX 970 | |
| AMD Radeon RX 480 (Desktop) | |
| Metro: Last Light - 1920x1080 Very High (DX11) AF:16x | |
| NVIDIA GeForce GTX 1080 (Desktop) | |
| NVIDIA GeForce GTX 980 Ti | |
| NVIDIA GeForce GTX 980 (Laptop) | |
| NVIDIA GeForce GTX 970 | |
| AMD Radeon R9 Fury | |
| AMD Radeon R9 390X | |
| AMD Radeon RX 480 (Desktop) | |
| NVIDIA GeForce GTX 970 | |
| BioShock Infinite - 1920x1080 Ultra Preset, DX11 (DDOF) | |
| NVIDIA GeForce GTX 1080 (Desktop) | |
| NVIDIA GeForce GTX 980 Ti | |
| NVIDIA GeForce GTX 980 (Laptop) | |
| NVIDIA GeForce GTX 970 | |
| AMD Radeon R9 390X | |
| AMD Radeon RX 480 (Desktop) | |
| NVIDIA GeForce GTX 970 | |
| Crysis 3 - 1920x1080 Very High Preset AA:2xSM AF:16x | |
| NVIDIA GeForce GTX 1080 (Desktop) | |
| NVIDIA GeForce GTX 980 Ti | |
| AMD Radeon R9 Fury | |
| NVIDIA GeForce GTX 980 (Laptop) | |
| AMD Radeon R9 390X | |
| NVIDIA GeForce GTX 970 | |
| AMD Radeon RX 480 (Desktop) | |
| NVIDIA GeForce GTX 970 | |
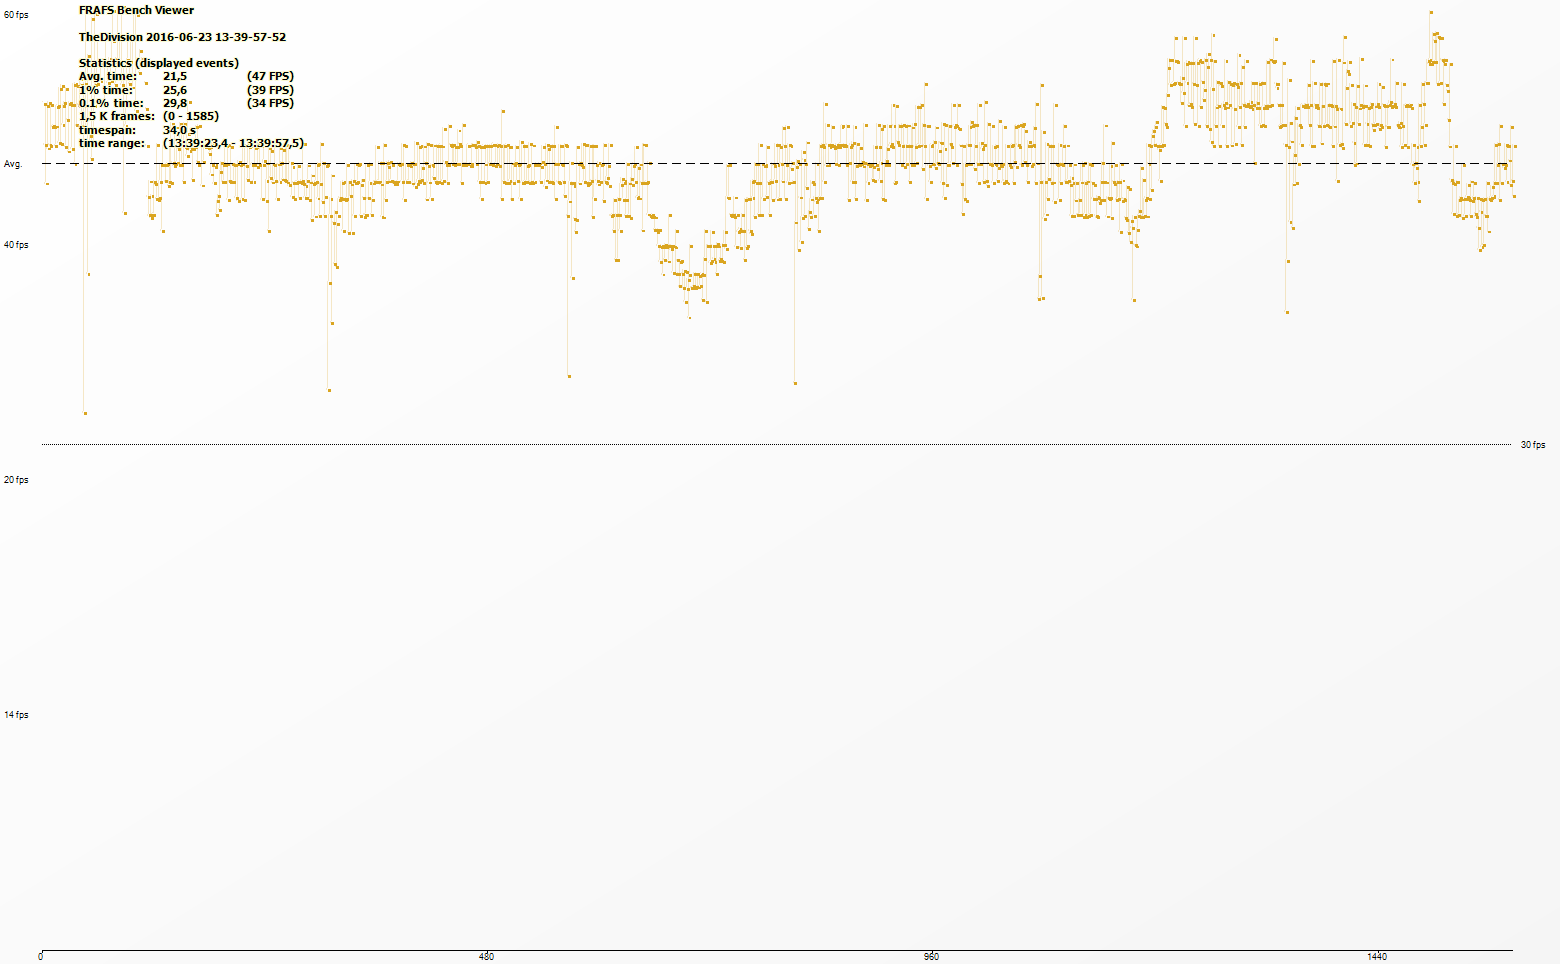
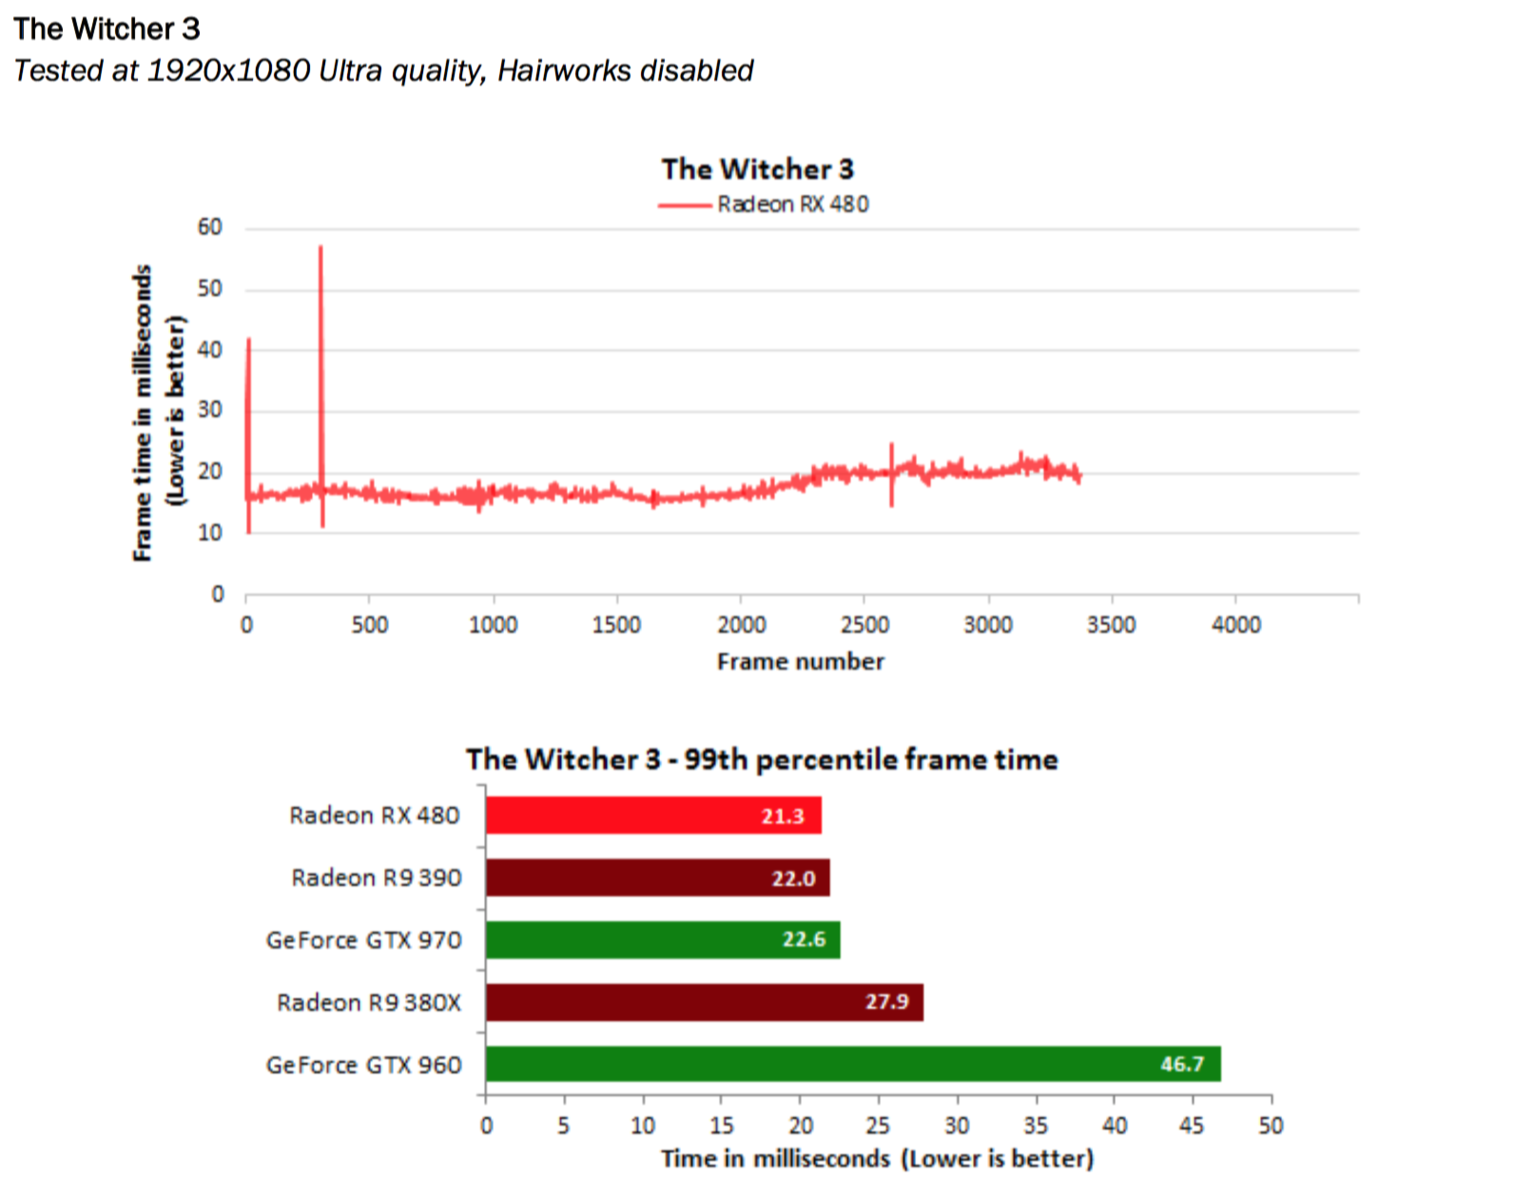
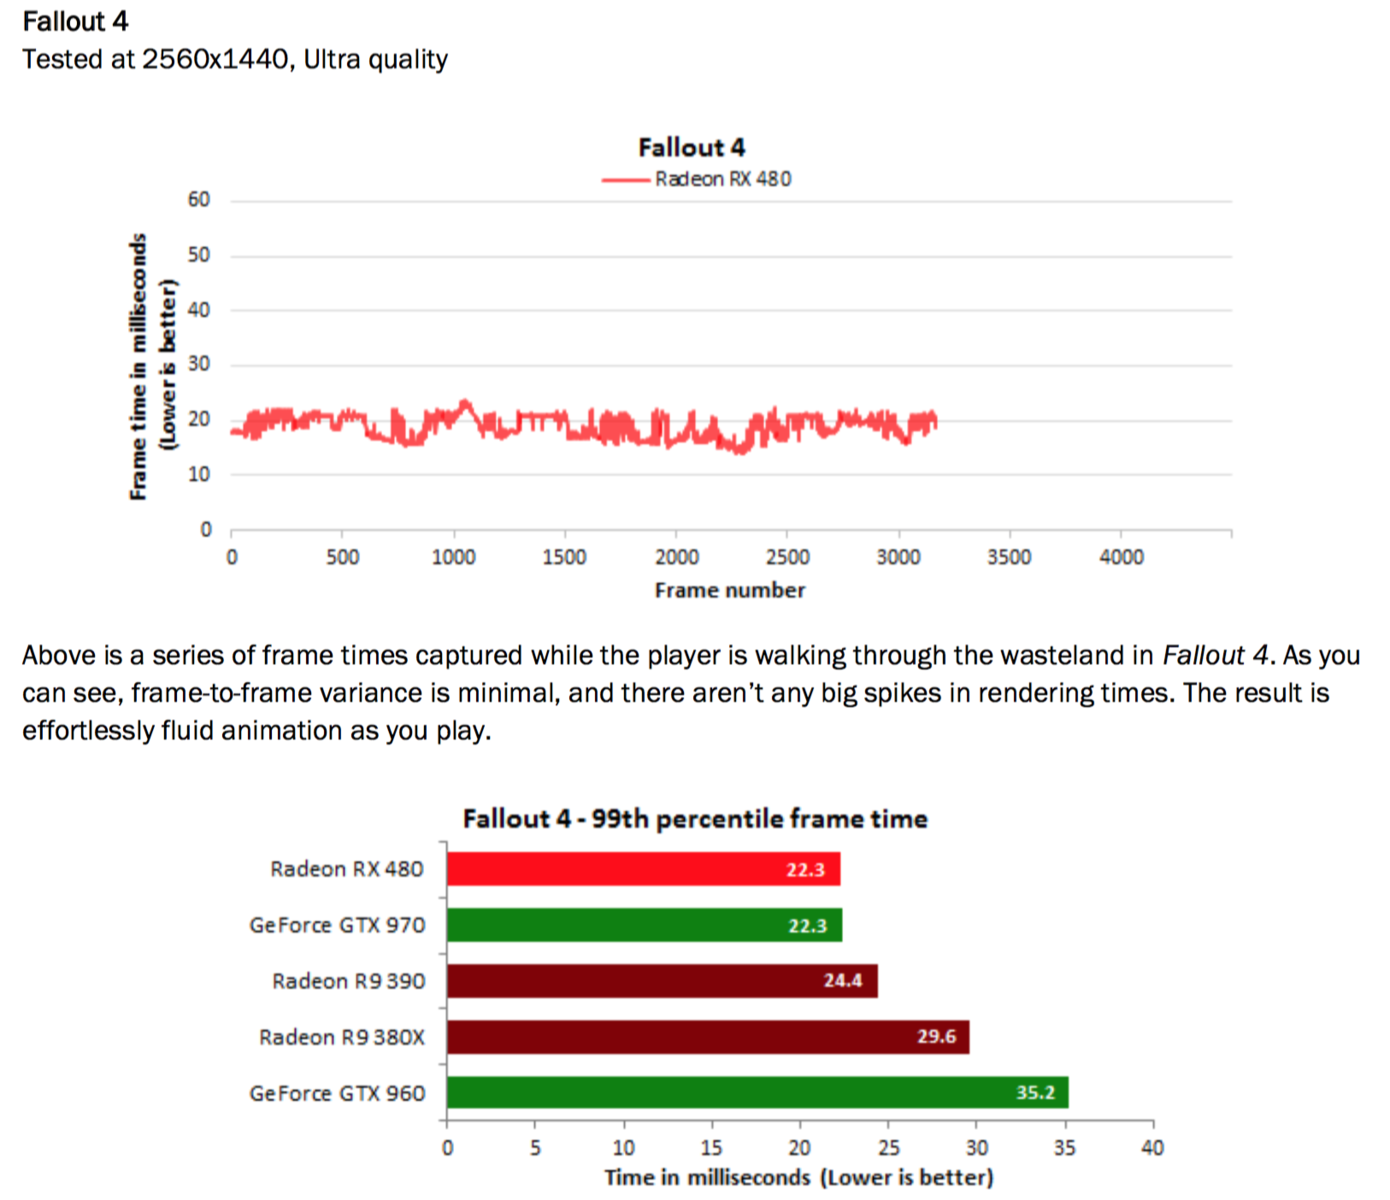
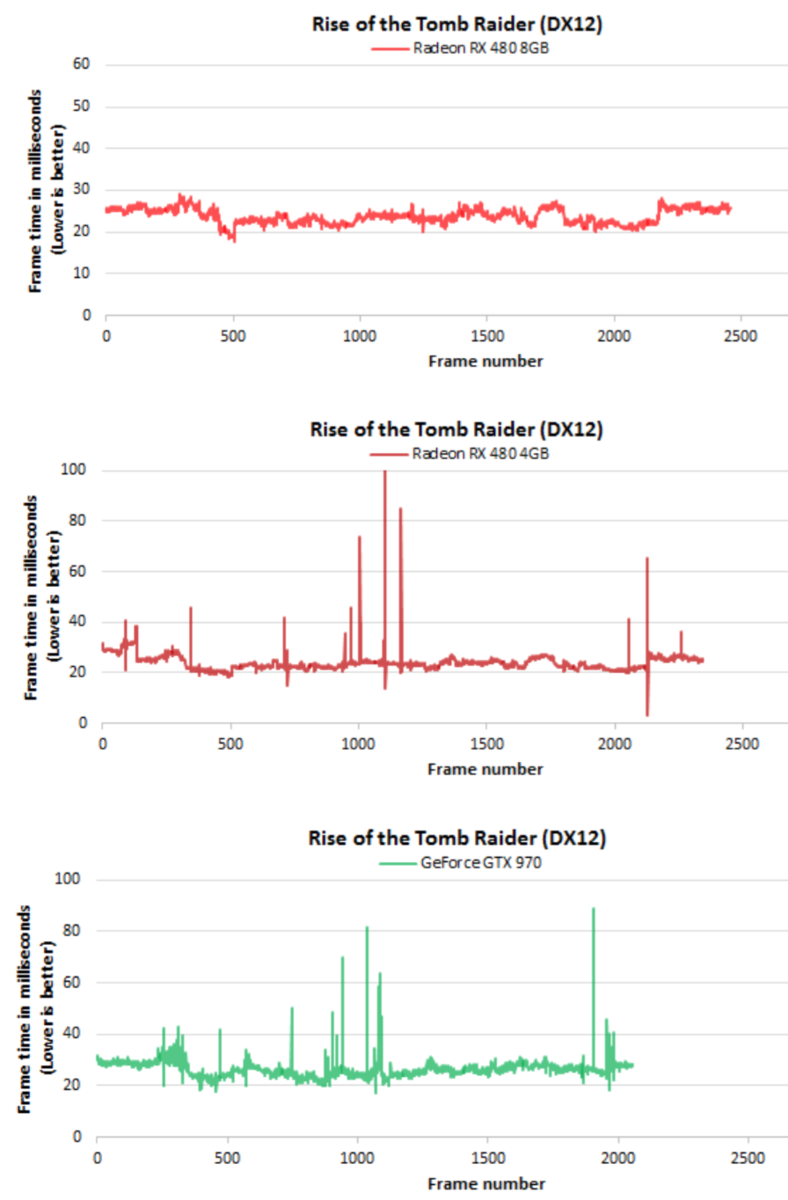
Gaming Smoothness
According to AMD, the RX 480 was also optimized for lower latency on every frame rendered. Nvidia was always slightly better in this respect. We can see some drops in our test with "The Division", but they are still acceptable at 25.6 ms (1 %).
Performance under Load / Throttling
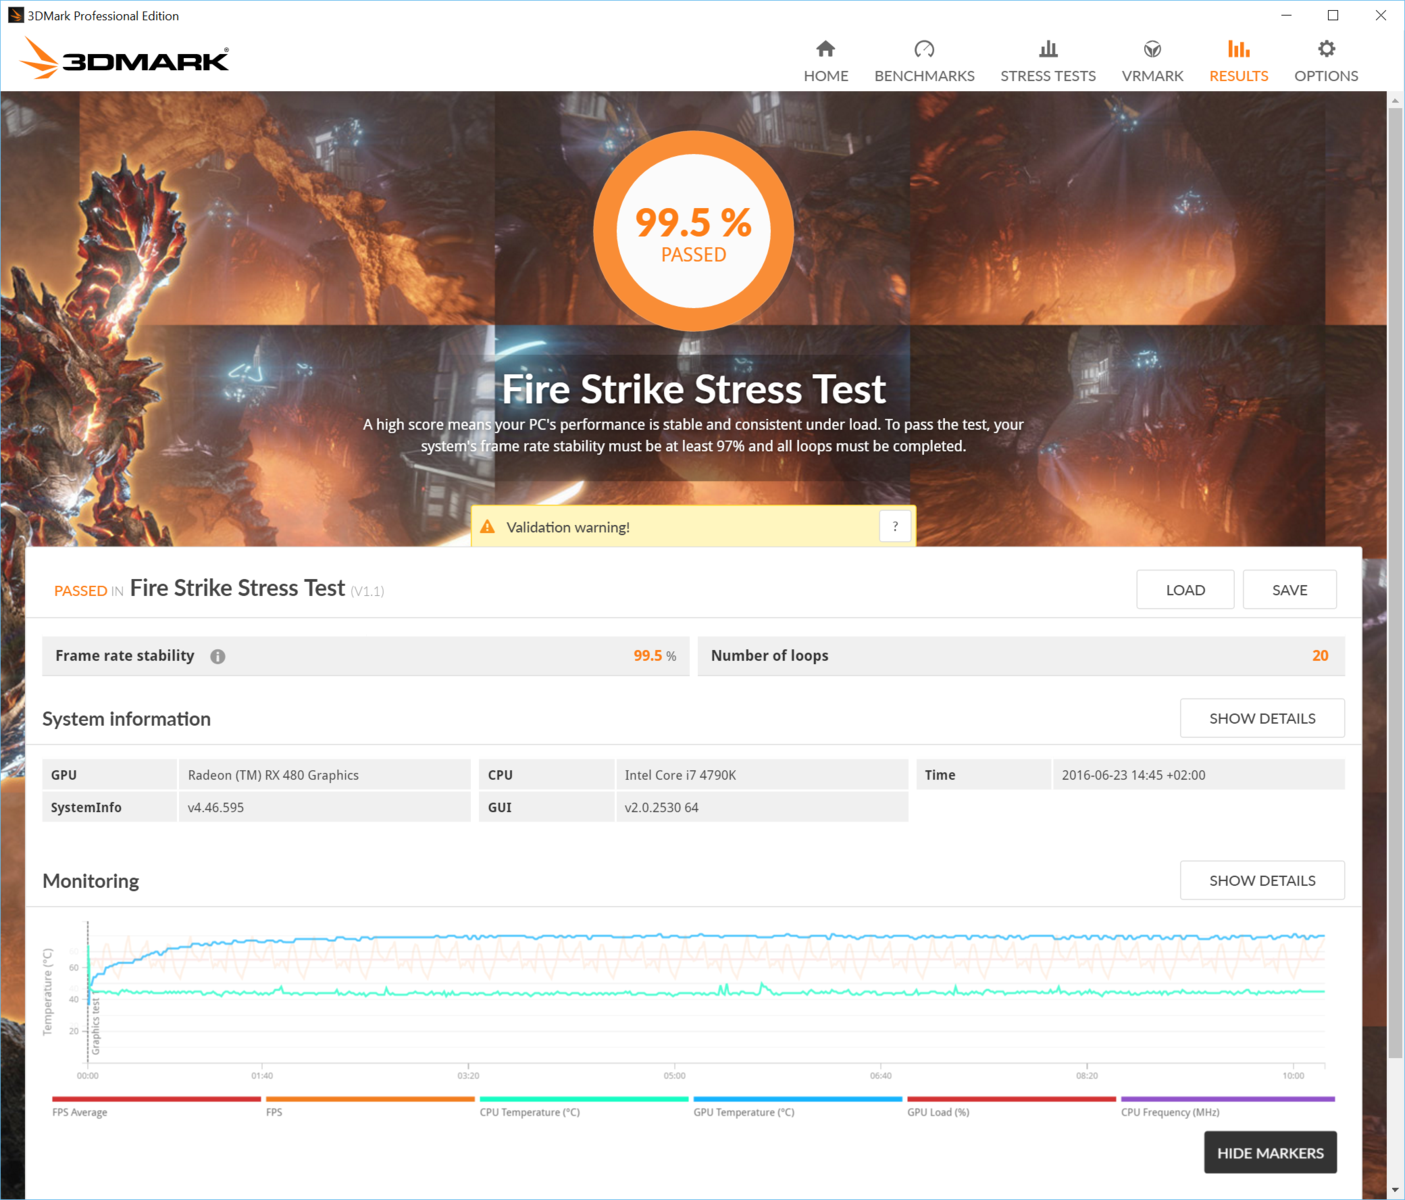
With modern Boost and Turbo features, it is obviously very important how long the graphics card can maintain its performance. Sustained load for multiple hours is not uncommon when you play games. The reference design of the RX 480 leaves a very good impression in this respect. The frame rate did not drop in our test with "The Witcher 3", and the clocks varied between 1226 and 1250 MHz. The GPU temperature leveled off at 80 °C, which is not critical. The performance also dropped by just 0.5 % in the 3DMark Fire Strike Stress Test (20 runs), and the internal temperatures are once again at 80 °C. However, we only saw 1266 MHz at the start, and it was later reduced to 930 MHz.
Compute Performance
The Radeon RX 480 is equipped with 36 Compute Units for general calculations. AMD pushes the open CL protocol, but DirectCompute is supported as well. The performance is actually decent in LuxMark (OpenCL) and ComputeMark (DirectCompute) and a bit faster than in games. Both the GTX 980 and R9 390X are a bit slower and the advantage of the GTX 1080 is also smaller compared to the gaming benchmarks.
| LuxMark v2.0 64Bit | |
| Room GPUs-only | |
| NVIDIA GeForce GTX 980 Ti | |
| NVIDIA GeForce GTX 1080 (Desktop) | |
| NVIDIA GeForce GTX 980 (Laptop) | |
| NVIDIA GeForce GTX 970 | |
| AMD Radeon RX 480 (Desktop) | |
| AMD Radeon R9 390X | |
| AMD Radeon R9 Fury | |
| Sala GPUs-only | |
| NVIDIA GeForce GTX 1080 (Desktop) | |
| NVIDIA GeForce GTX 980 Ti | |
| AMD Radeon RX 480 (Desktop) | |
| AMD Radeon R9 390X | |
| AMD Radeon R9 Fury | |
| NVIDIA GeForce GTX 980 (Laptop) | |
| NVIDIA GeForce GTX 970 | |
| ComputeMark v2.1 | |
| 1024x600 Normal, QJuliaRayTrace | |
| NVIDIA GeForce GTX 1080 (Desktop) | |
| NVIDIA GeForce GTX 980 Ti | |
| NVIDIA GeForce GTX 980 (Laptop) | |
| AMD Radeon R9 Fury | |
| NVIDIA GeForce GTX 970 | |
| AMD Radeon RX 480 (Desktop) | |
| AMD Radeon R9 390X | |
| 1024x600 Normal, Mandel Scalar | |
| NVIDIA GeForce GTX 1080 (Desktop) | |
| AMD Radeon R9 Fury | |
| NVIDIA GeForce GTX 980 Ti | |
| AMD Radeon R9 390X | |
| AMD Radeon RX 480 (Desktop) | |
| NVIDIA GeForce GTX 980 (Laptop) | |
| NVIDIA GeForce GTX 970 | |
| 1024x600 Normal, Mandel Vector | |
| NVIDIA GeForce GTX 1080 (Desktop) | |
| AMD Radeon R9 Fury | |
| NVIDIA GeForce GTX 980 Ti | |
| AMD Radeon R9 390X | |
| AMD Radeon RX 480 (Desktop) | |
| NVIDIA GeForce GTX 980 (Laptop) | |
| NVIDIA GeForce GTX 970 | |
| 1024x600 Normal, Fluid 2DTexArr | |
| NVIDIA GeForce GTX 1080 (Desktop) | |
| NVIDIA GeForce GTX 980 Ti | |
| AMD Radeon R9 Fury | |
| NVIDIA GeForce GTX 980 (Laptop) | |
| AMD Radeon RX 480 (Desktop) | |
| AMD Radeon R9 390X | |
| NVIDIA GeForce GTX 970 | |
| 1024x600 Normal, Fluid 3DTex | |
| AMD Radeon R9 Fury | |
| NVIDIA GeForce GTX 1080 (Desktop) | |
| NVIDIA GeForce GTX 980 Ti | |
| AMD Radeon R9 390X | |
| AMD Radeon RX 480 (Desktop) | |
| NVIDIA GeForce GTX 980 (Laptop) | |
| NVIDIA GeForce GTX 970 | |
| 1024x600 Normal, Score | |
| NVIDIA GeForce GTX 1080 (Desktop) | |
| NVIDIA GeForce GTX 980 Ti | |
| AMD Radeon R9 Fury | |
| AMD Radeon R9 390X | |
| AMD Radeon RX 480 (Desktop) | |
| NVIDIA GeForce GTX 980 (Laptop) | |
| NVIDIA GeForce GTX 970 | |
Overclocking
Our short attempts with the new overclocking tool "WattMan" were not overly successful. With a 5 % higher core clock, the card managed up to 1330 MHz (stable) in The Witcher 3, and the performance was around 4 % higher (Full-HD, high details). We did, however, not validate the stability of these settings with long-term testing. A 10 % increase of the core clock immediately caused a crash as soon as we accepted the setting in WattMan.
Problems
All in all, the RX 480 was very reliable during our multiple-day testing. We did encounter 3x reboots while we tested one game and some games were unexpectedly stopped. Assassin's Creed in particular did not really like pour hardware. Besides a reboot, the game crashed repeatedly. Fifa 16 is a second example and did not want to launch with Fraps (could only be activated during when the game was already launched). Otherwise, the 32 tested games ran without any issues. Overall not quite as good as the GTX 1080 we reviewed, which only had problems with Hitman but did not cause any reboots. It is still a good performance for a new architecture ahead of the official launch though.
Video Engine
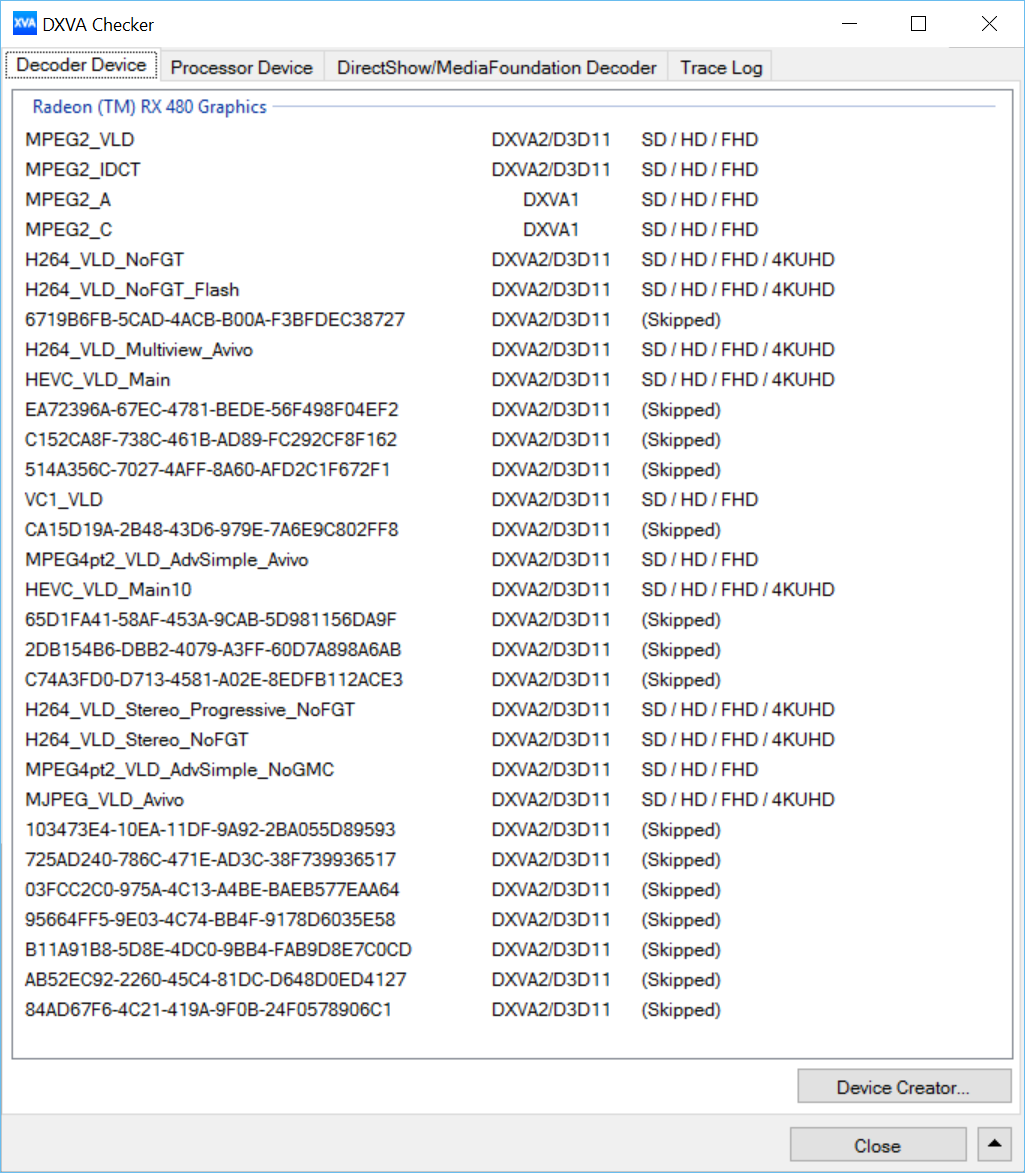
The new video engine can actually convince in the test. A 4K video (H.264, 100 Mbps) was played at 84 fps and with 3 % CPU load in the DVXAChecker Playback benchmark. In comparison: The GTX 1080 managed 138 fps and 4 % CPU load.
The new H.265 decoder handles a 4K 10-bit video at 72 fps and 2 % CPU load.
The RX 480 does not have a PlayReady 3.0 (SL3000) certification like the GTX 1080 does. This is supposed to be possible in the future according to AMD.
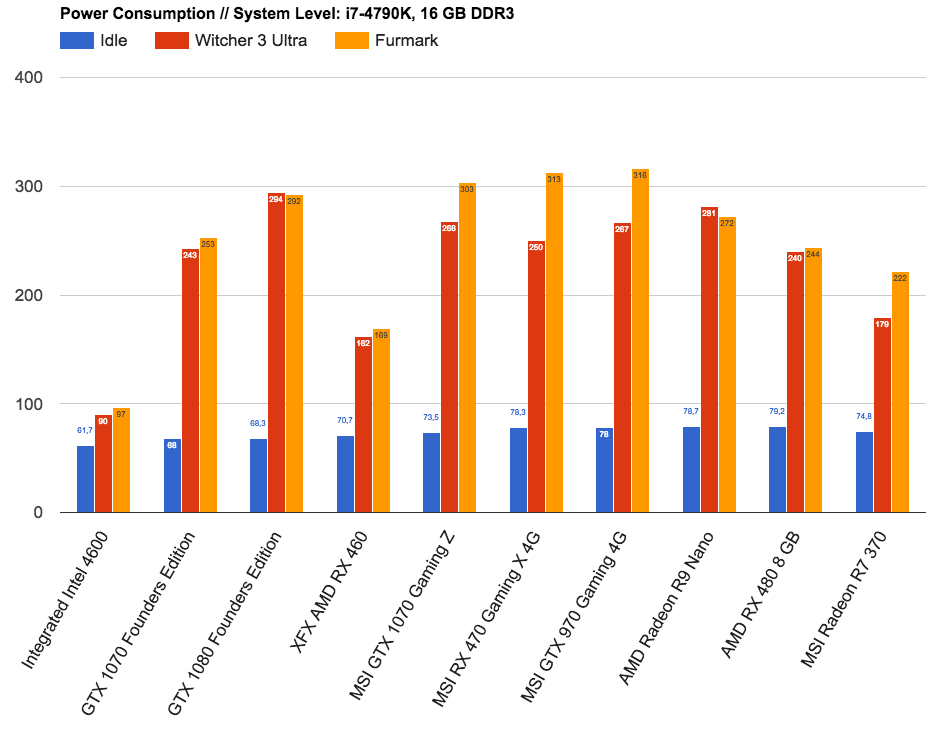
Power Consumption
Thanks to the 14 nm process, AMD can manage a significant improvement in respect of the power consumption. The idle results of our test system were not quite as convincing as the GeForce GTX 1080, but we still determined a small improvement compared to the XFX Radeon Fury Pro. Our Voltcraft VC-940 measured 77 Watts for the RX 480 with the attached 4K monitor (after a longer idle period on the desktop). The GTX 1080 managed 68 Watts in the same system. According to AMD the high idle power consumption is due to a driver bug that wont enable all power saving options in the chip. It should be fixed till launch and save approximately 1/3 power.
The consumption is obviously much lower compared to GTX 1080 under load. We measure 242 Watts under sustained load in FurMark and 247 Watts in The Witcher 3 at 58 fps. GPU-Z shows between 100 and 120 Watts for the GPU alone. The GTX 1080 resulted in 294 Watts in both tests and 109 fps in The Witcher 3. The XFX Radeon Fury Pro consumed more than 340 Watts in the same system.
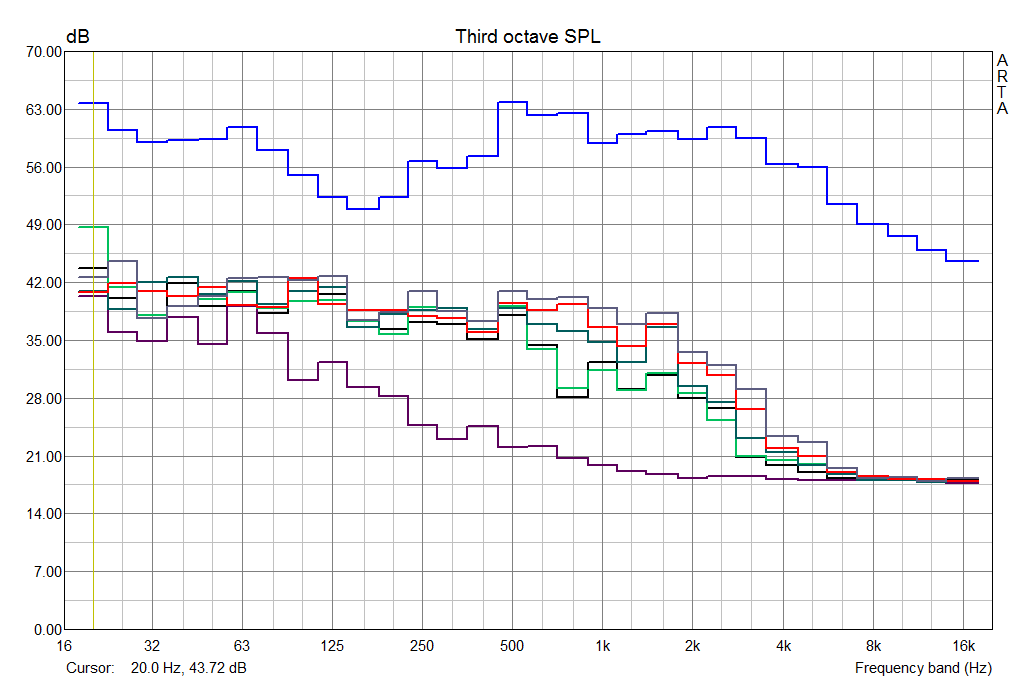
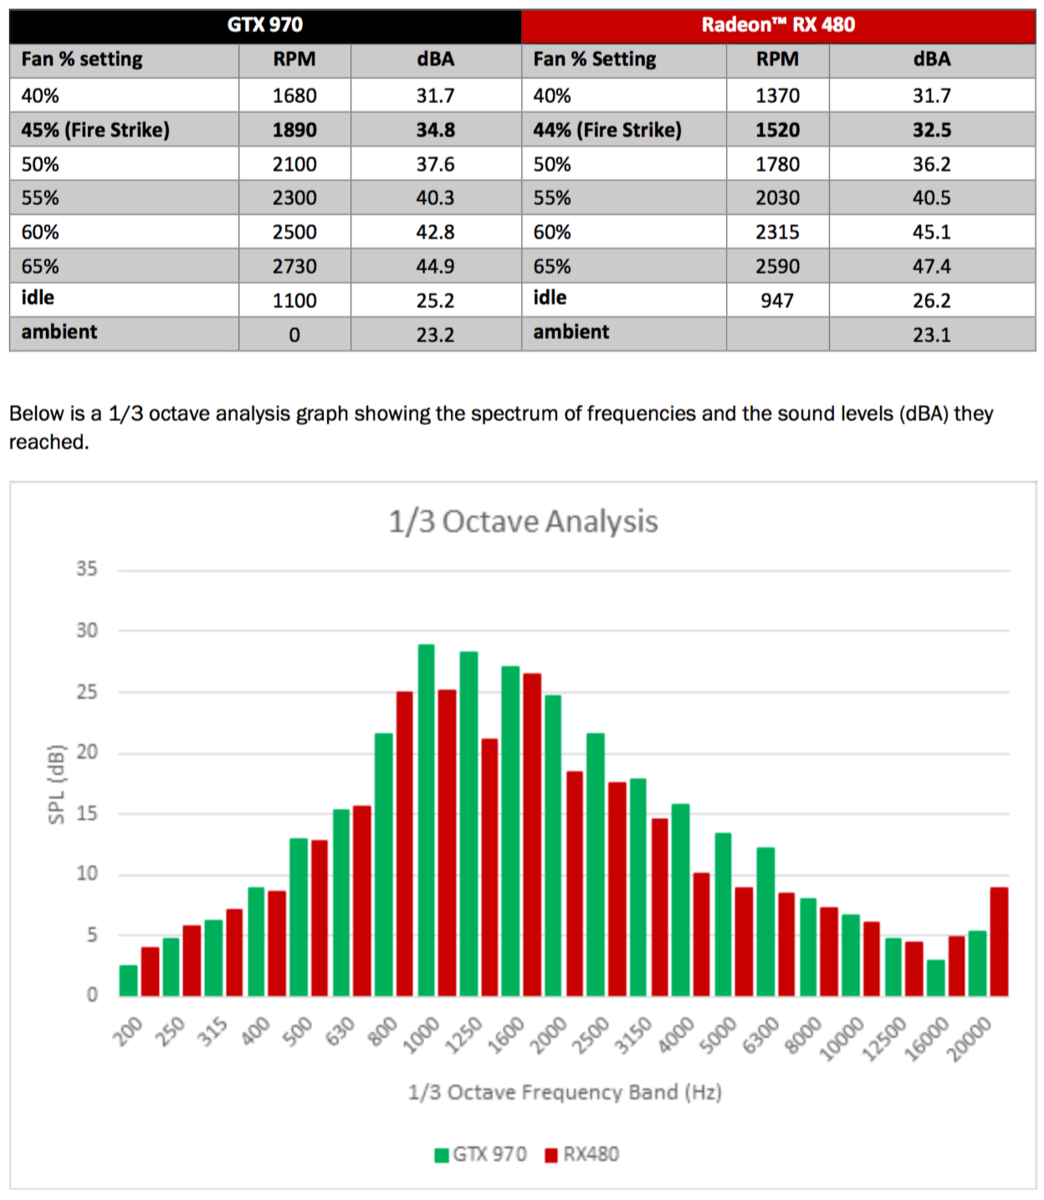
System Noise
The AMD Radeon RX 480 is actually quite good in the noise measurements. There is basically no difference compared to the system with the integrated GPU while idling. We measured up to 46.3 dB(A) at 2176 rpm under load, while the GTX 1080 reached up to 49.4 dB(A) under load. The transistor whining of our RX 480 test sample is not as strong as the GTX 1080. Even in 3DMark Ice Storm at more than 2000 fps, we only noticed a quiet whistling sound at a distance of 20 cm. It should not be audible inside a closed case.
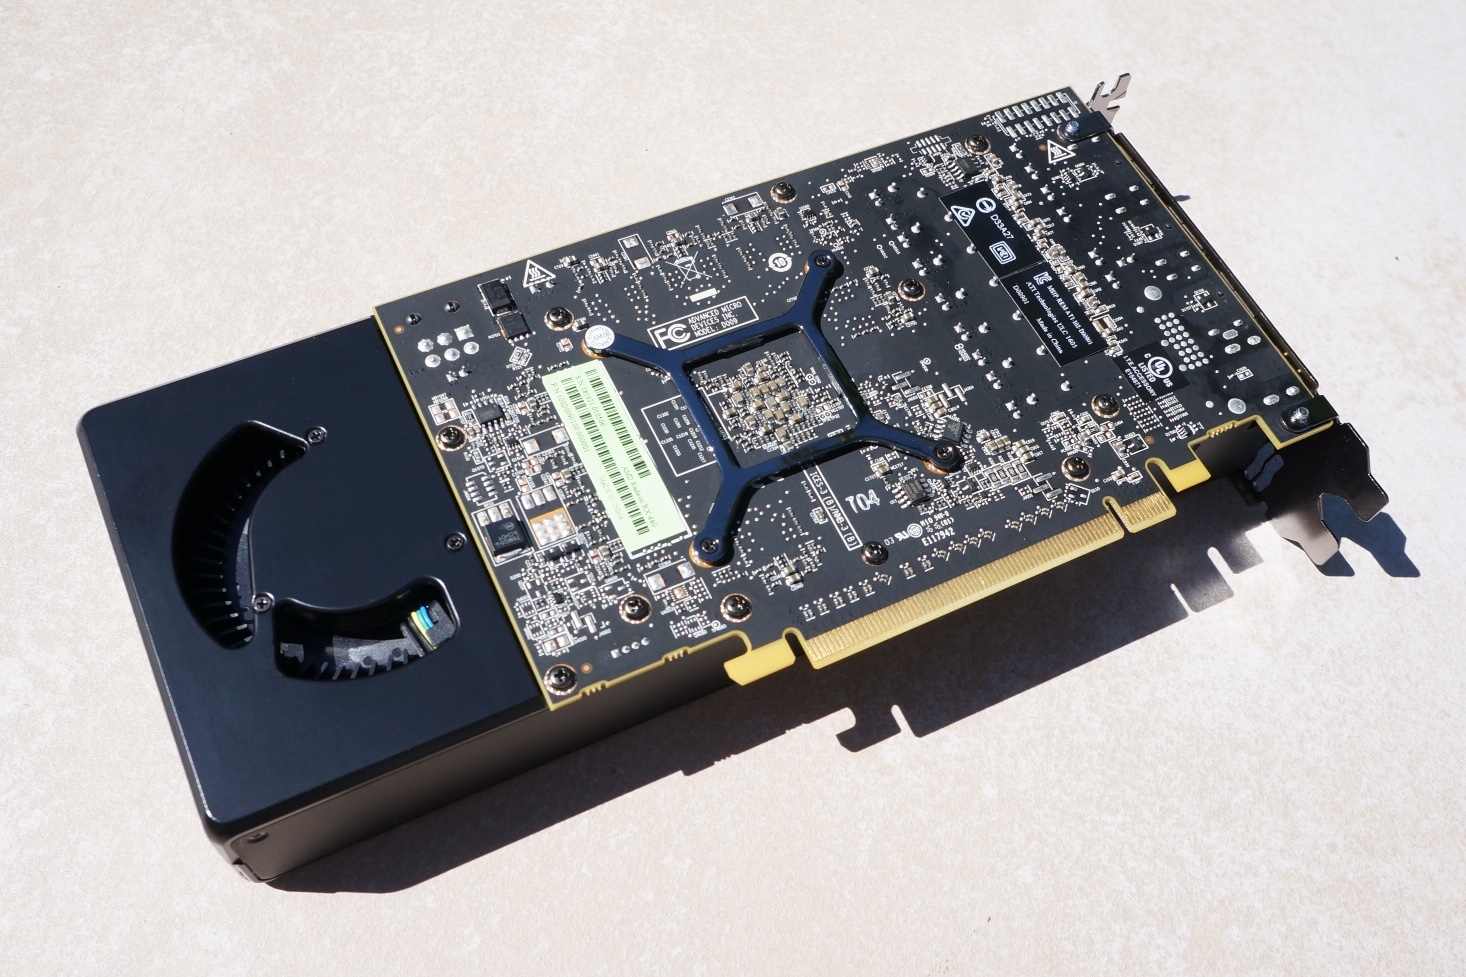
Heat Development
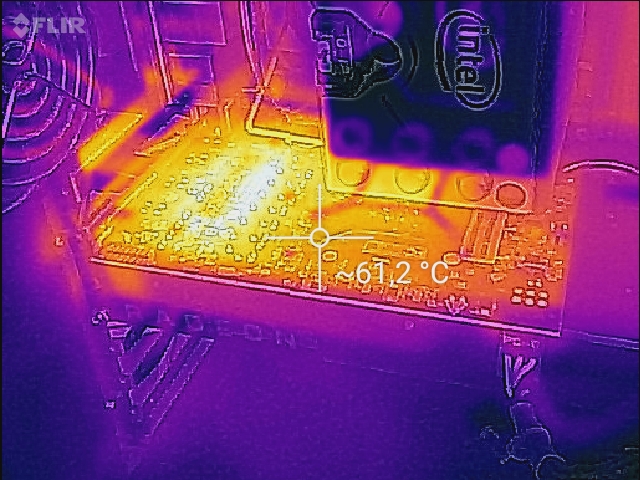
The rear of the RX 480 got really warm in the test, and we can measure up to 72 °C in our test system. The top and the sides on the other hand stay pretty cool at up to 50 °C. The reference design of the GTX 1080 did reach similarly high temperatures.
Inside the GPU, the sensors show up to 81 °C under heavy load (like The Witcher 3) – not critical at all.
Crossfire
AMD advertises two RX 480 in a Crossfire configuration as an alternative to the GTX 1080. At a lower price, they are supposed to manage a comparable performance. AMD showed Ashes of Singularity during its press conference, which managed a comparable frame rate. We unfortunately did not have a second test sample, so we could not check this claim. We are pretty sceptical about Crossfire and SLI in general though. There are often problems due to missing profiles (no performance gains) or micro stutters. The situation might be a bit better with DirectX 12 games, but we do not really expect big improvements.
Verdict
The AMD Radeon RX 480 is the first graphics card with the Polaris architecture manufactured in the new 14 nm FinFET process. Priced at 215 Euros ($199 USD without taxes) for the 4 GB version and 255 Euros ($239 USD) for the 8 GB version, they are right in the mainstream segment (roughly RRP of the R9 380), and therefore not competing with the new high-end chips GTX 1080/1070 from Nvidia. Compared to the 28 nm GPUs, the new RX 480 leaves an excellent impression. The power consumption is much lower under load and the performance is roughly on par with the GeForce GTX 970 (or slightly below the R0 390X, respectively). The 8 GB version of the RX 480 turns out to be perfectly suited for Full-HD gaming with the maximum settings. Only Anno 2205 and XCOM 2 drop below 30 fps on average. However, high frame rates are not really necessary for these games. 4K gaming is only recommended with simpler titles like Overwatch or World of Warships.
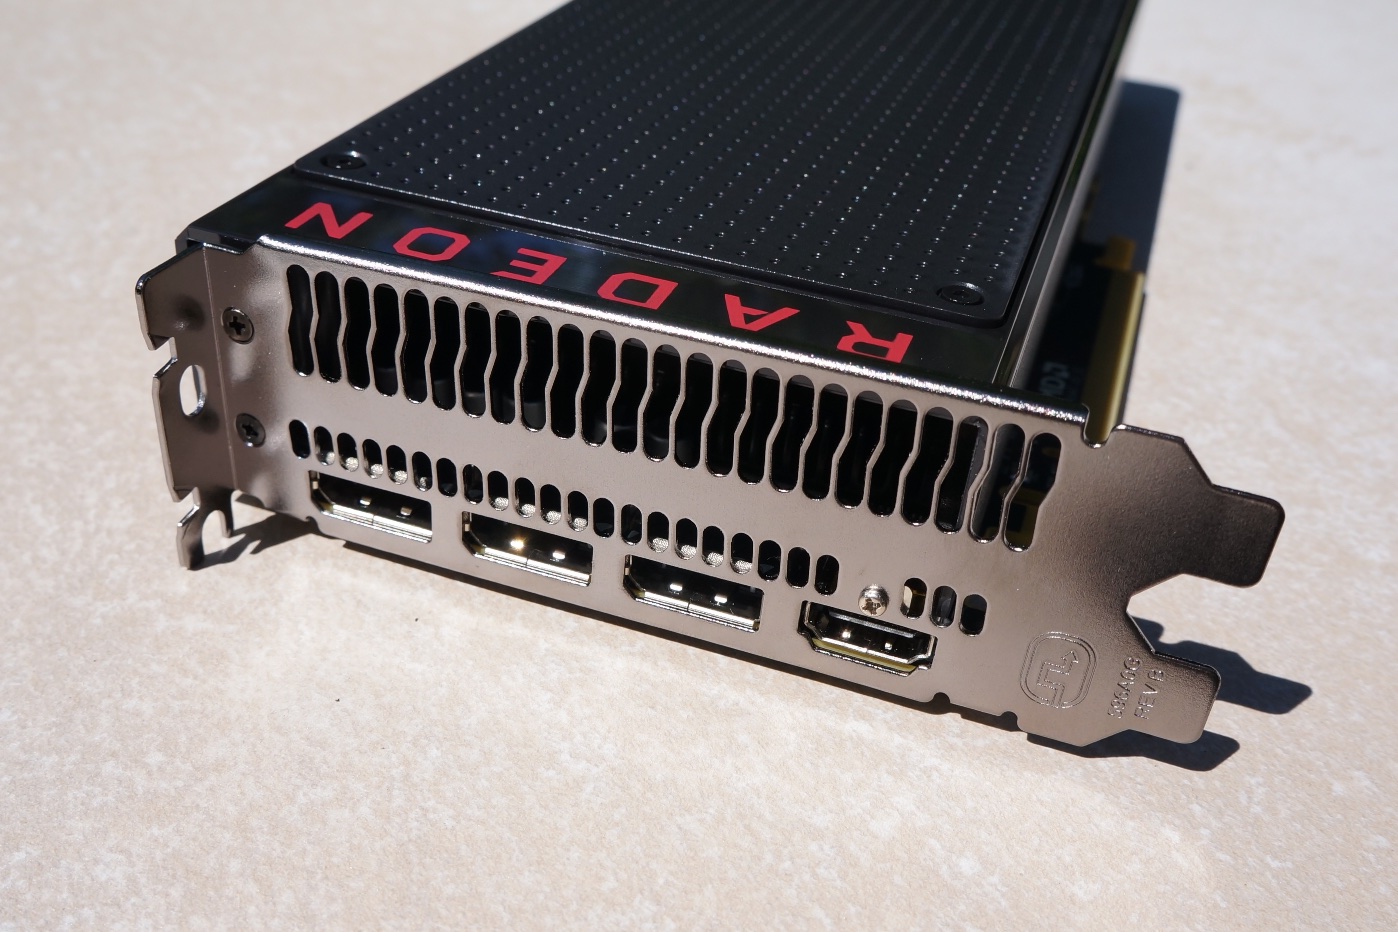
The new generation also convinces with features like HDMI 2.0b, DisplayPort 1.3/1.4 for 5K monitors, HDR support, and improved video engine. The reference card is well-built and conveniently quiet, despite the low price. We think the consumption while idling can still be improved and AMD already verified that there is a bug in the current driver that should fix that issue. Nvidia's more expensive GTX 1080 shows what is possible in this respect. The small stability issues will hopefully be fixed until the launch.
Until Nvidia releases smaller model with the Pascal architecture, AMD's only competition are the old cards that are in the sale right now. Thanks to the improved efficiency and features, the price will have to be pretty tempting though. Until then, we can clearly recommend the RX 480. It is, however, questionable, if the 8 GB version is worth the additional price. The benefits right now are limited to a few playable settings (like Tomb Raider).
Update 14th July 2016: Added GTX 970 (MSI GamingX 4GB) benchmarks
Benchmarks
3DM Vant. Perf. total +
Cinebench R15 OpenGL 64 Bit +
GFXBench T-Rex HD Offscreen C24Z16 +
* Smaller numbers mean a higher performance
Game Benchmarks
The following benchmarks stem from our benchmarks of review laptops. The performance depends on the used graphics memory, clock rate, processor, system settings, drivers, and operating systems. So the results don't have to be representative for all laptops with this GPU. For detailed information on the benchmark results, click on the fps number.

Cyberpunk 2077
2023
Baldur's Gate 3
2023
Outriders
2021


Gears Tactics
2020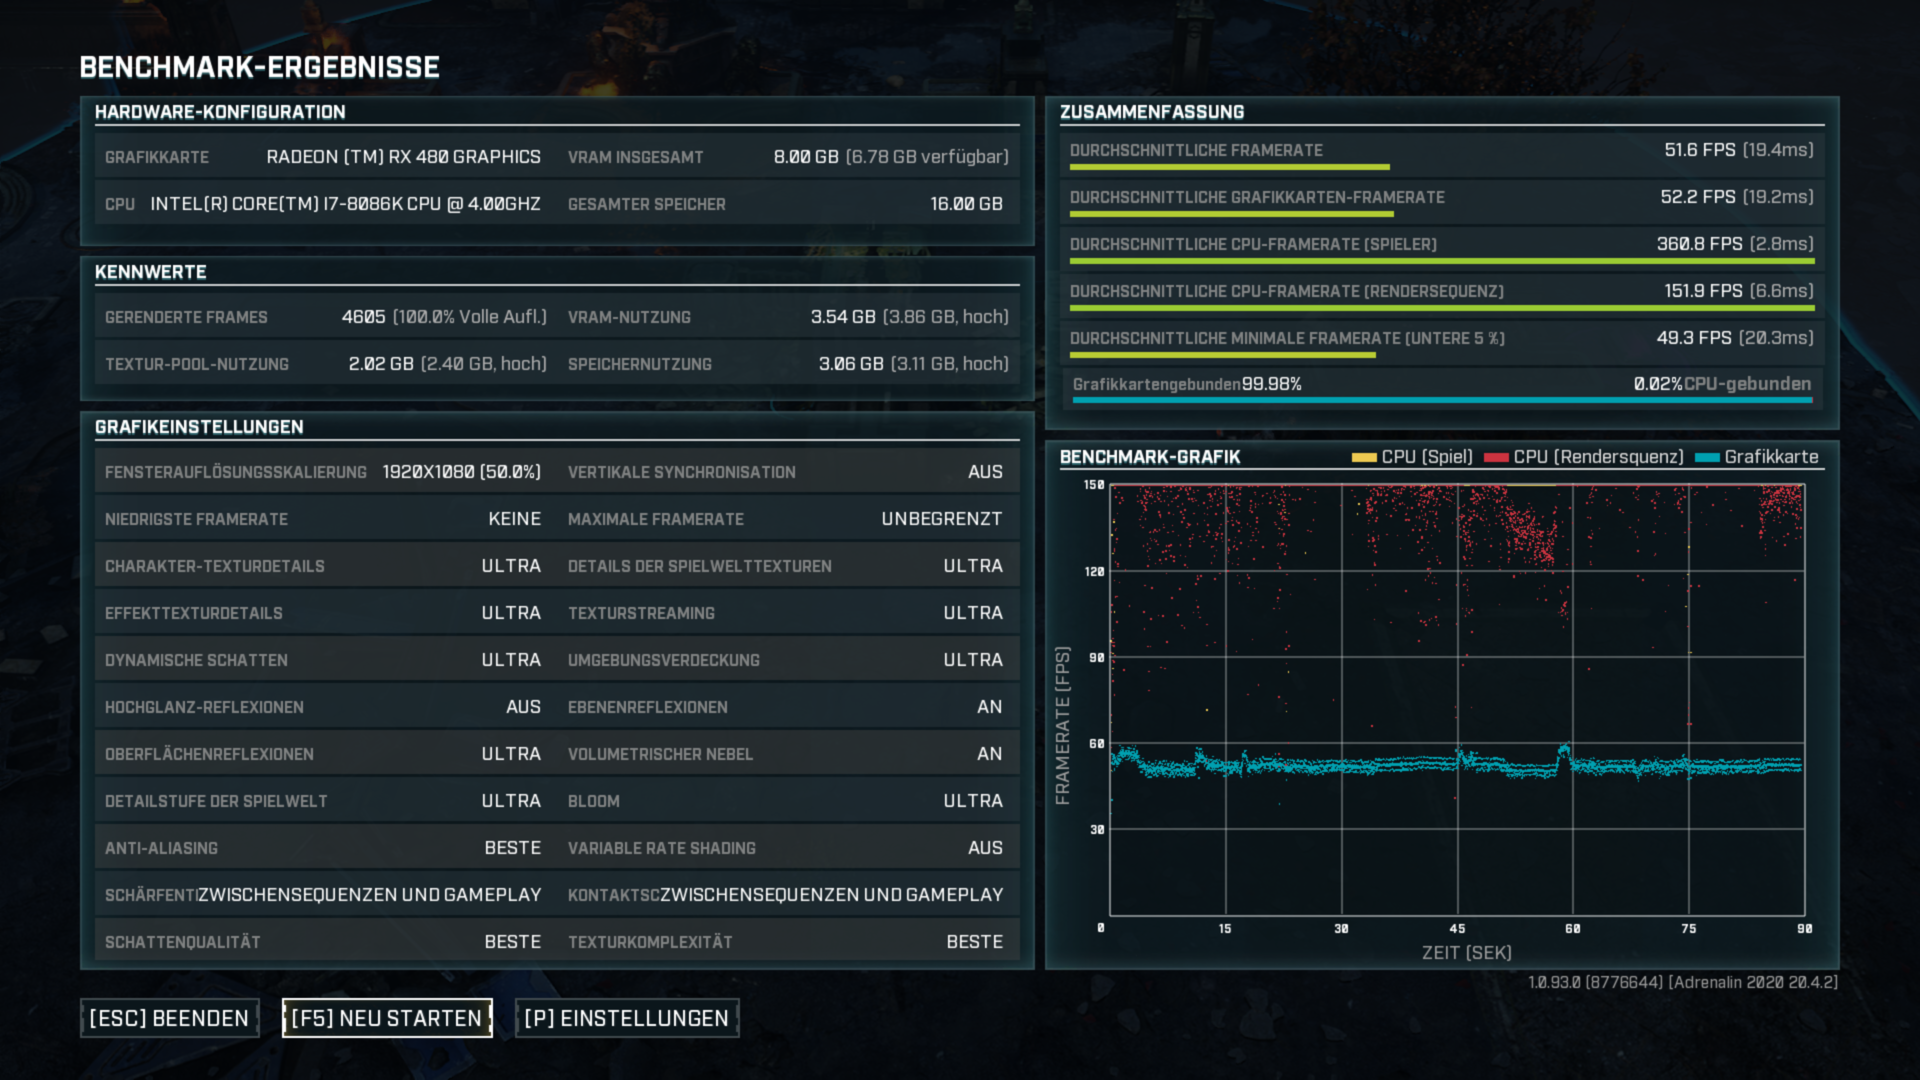


FIFA 20
2019
Control
2019

The Division 2
2019
Anthem
2019
Far Cry New Dawn
2019
Metro Exodus
2019
Apex Legends
2019
Just Cause 4
2018
Darksiders III
2018
Farming Simulator 19
2018


Forza Horizon 4
2018

F1 2018
2018
Monster Hunter World
2018
The Crew 2
2018
X-Plane 11.11
2018


Fortnite
2018


Call of Duty WWII
2017


Ark Survival Evolved
2017

Team Fortress 2
2017Dirt 4
2017Rocket League
2017Prey
2017For Honor
2017
Resident Evil 7
2017Watch Dogs 2
2016
Dishonored 2
2016
Titanfall 2
2016Farming Simulator 17
2016
Battlefield 1
2016
Civilization 6
2016Mafia 3
2016FIFA 17
2016
No Man's Sky
2016

Overwatch
2016
Doom
2016

Need for Speed 2016
2016
Hitman 2016
2016
The Division
2016
Far Cry Primal
2016
XCOM 2
2016

Rainbow Six Siege
2015
Just Cause 3
2015


Fallout 4
2015

Anno 2205
2015
FIFA 16
2015
World of Warships
2015
Metal Gear Solid V
2015
Mad Max
2015Dota 2 Reborn
2015
The Witcher 3
2015
Dirt Rally
2015
GTA V
2015
Battlefield Hardline
2015
Alien: Isolation
2014

Battlefield 4
2013
Metro: Last Light
2013BioShock Infinite
2013Crysis 3
2013Counter-Strike: GO
2012For more games that might be playable and a list of all games and graphics cards visit our Gaming List
No reviews found.