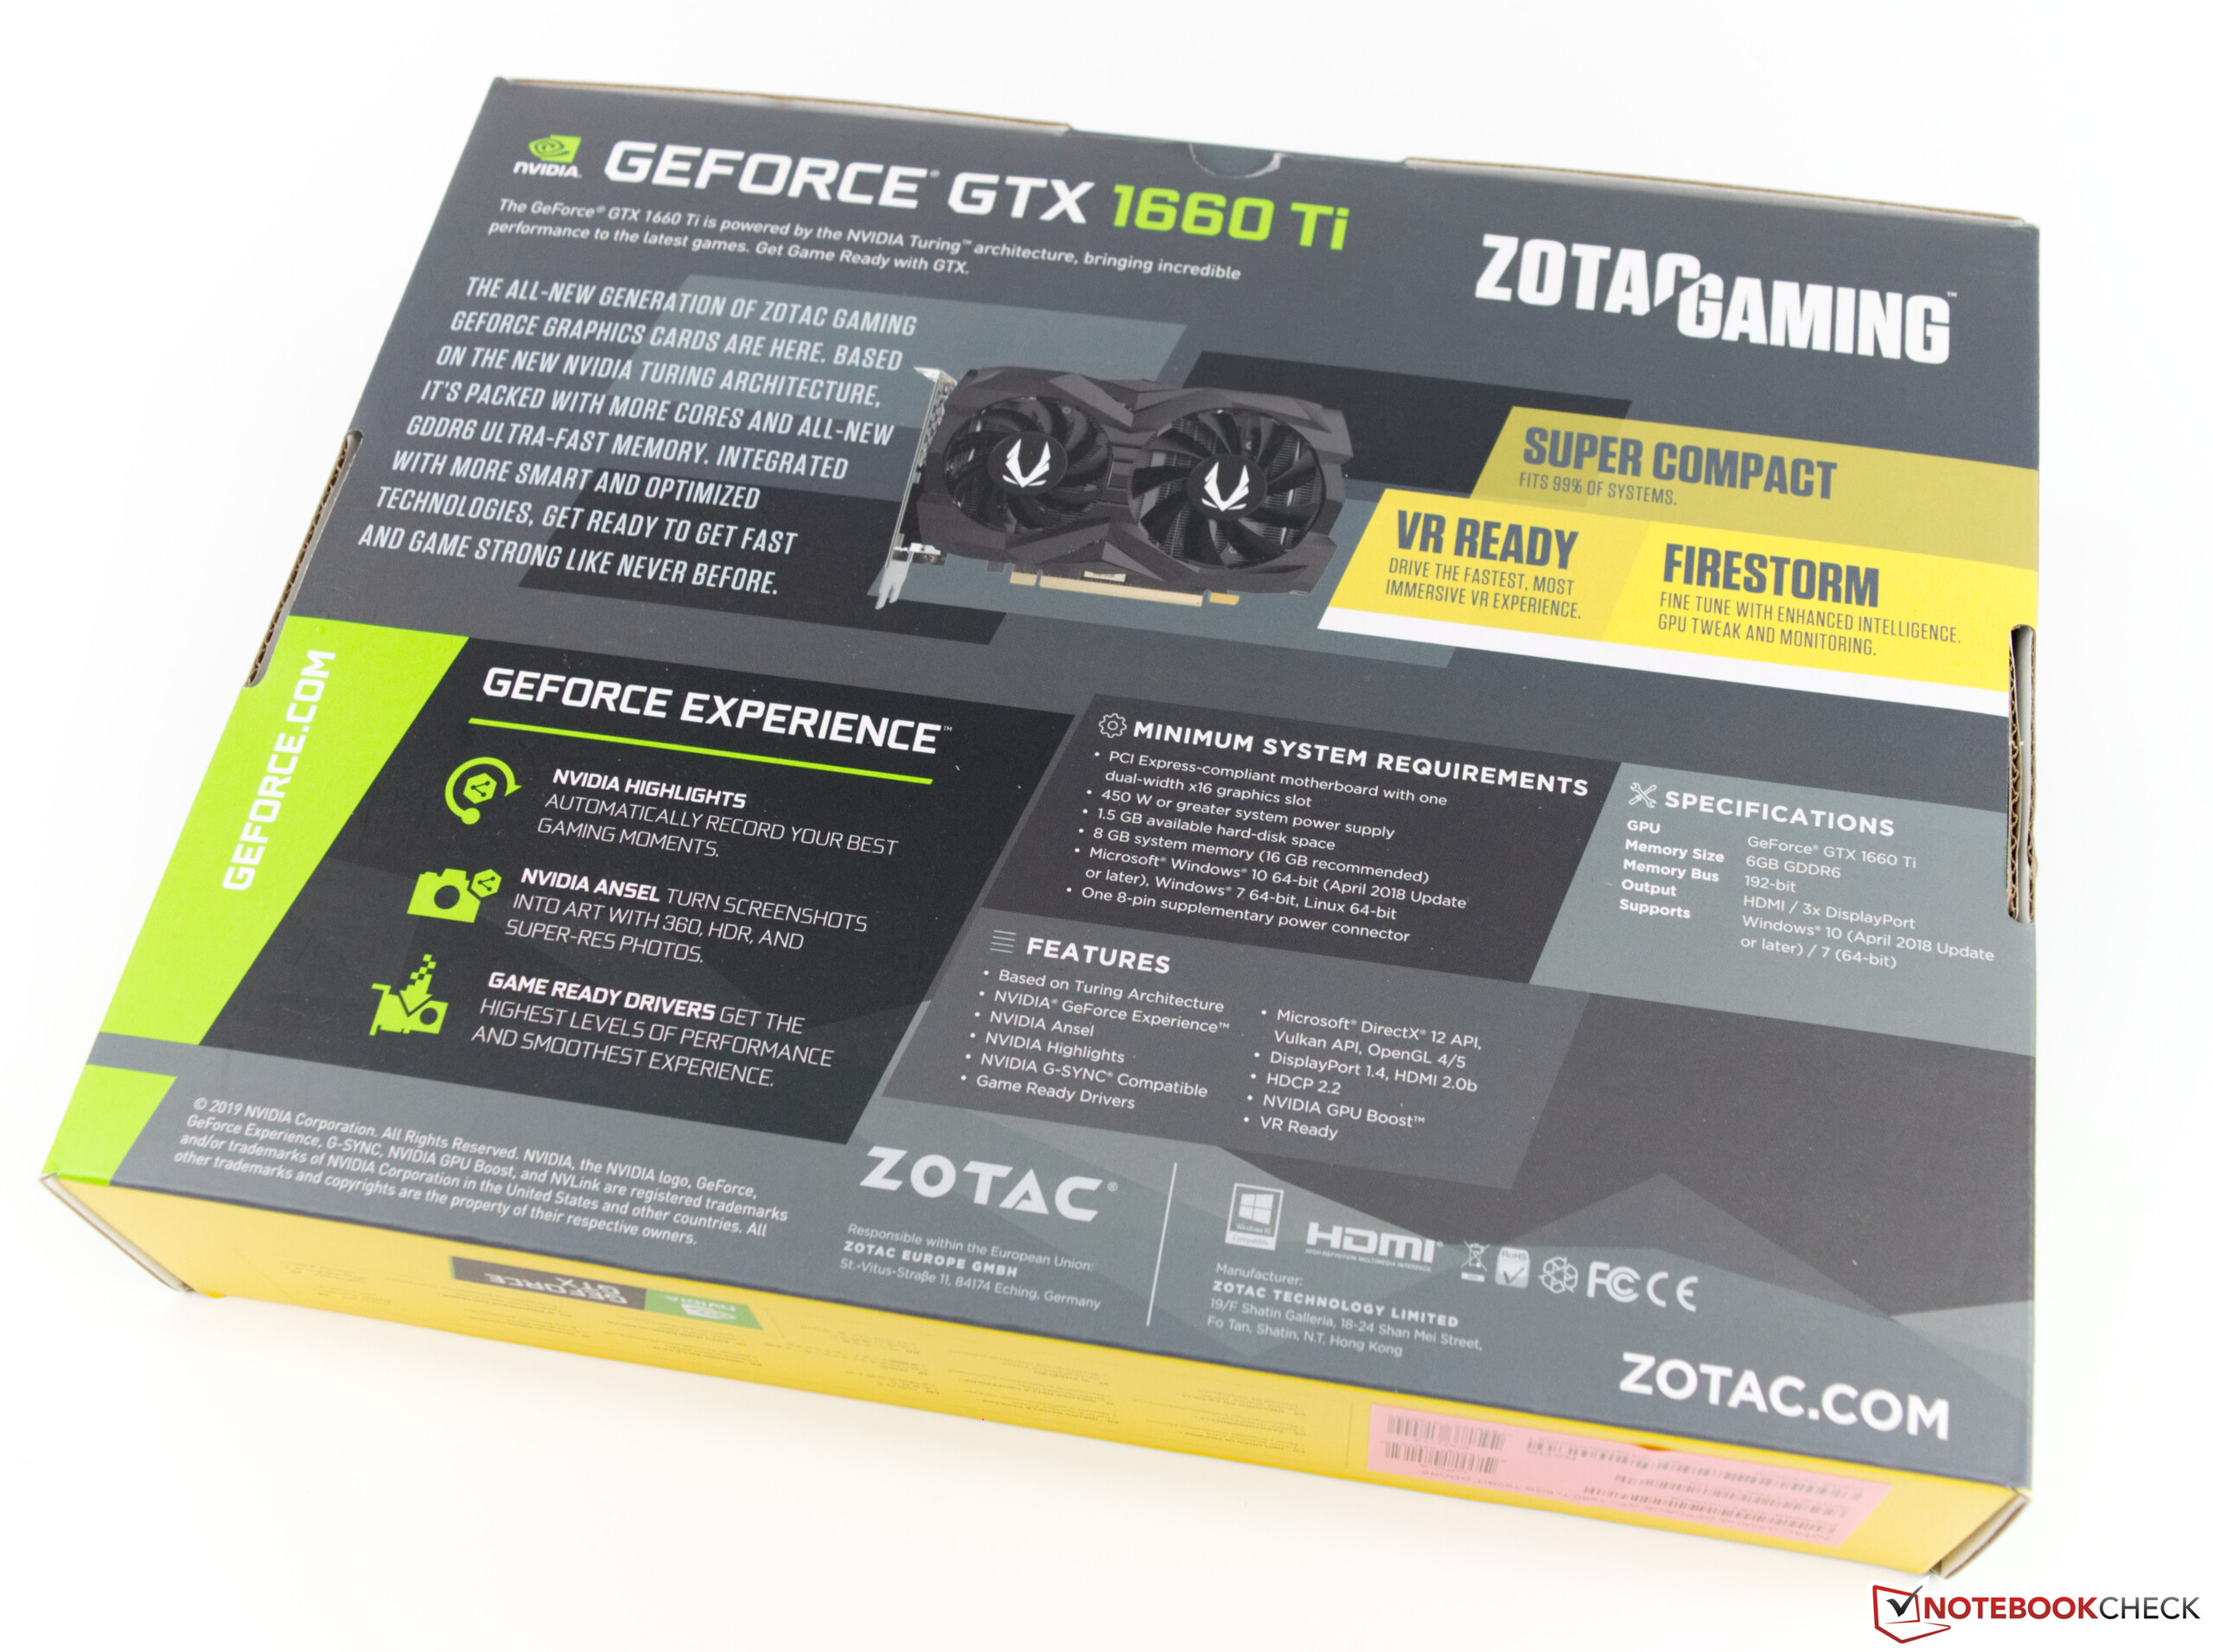
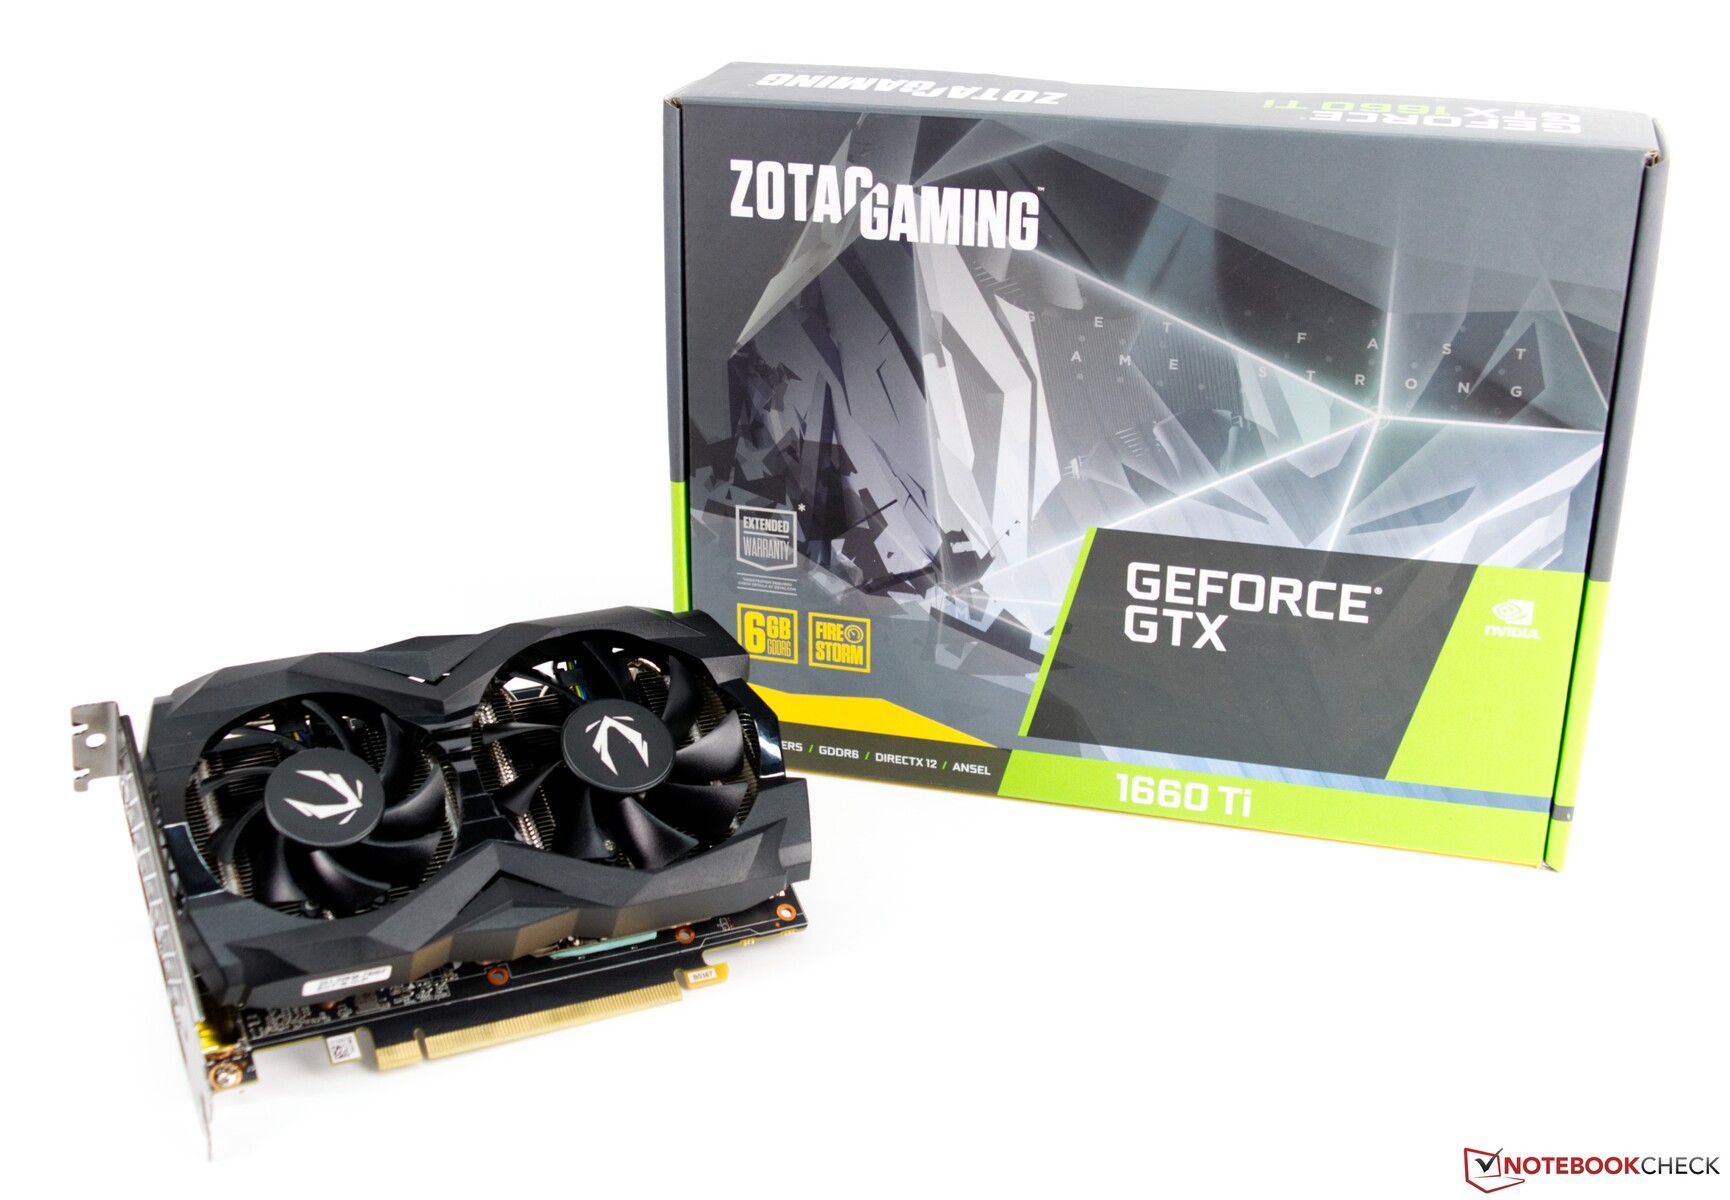
Zotac GeForce GTX 1660 Ti Desktop Graphics Card Review
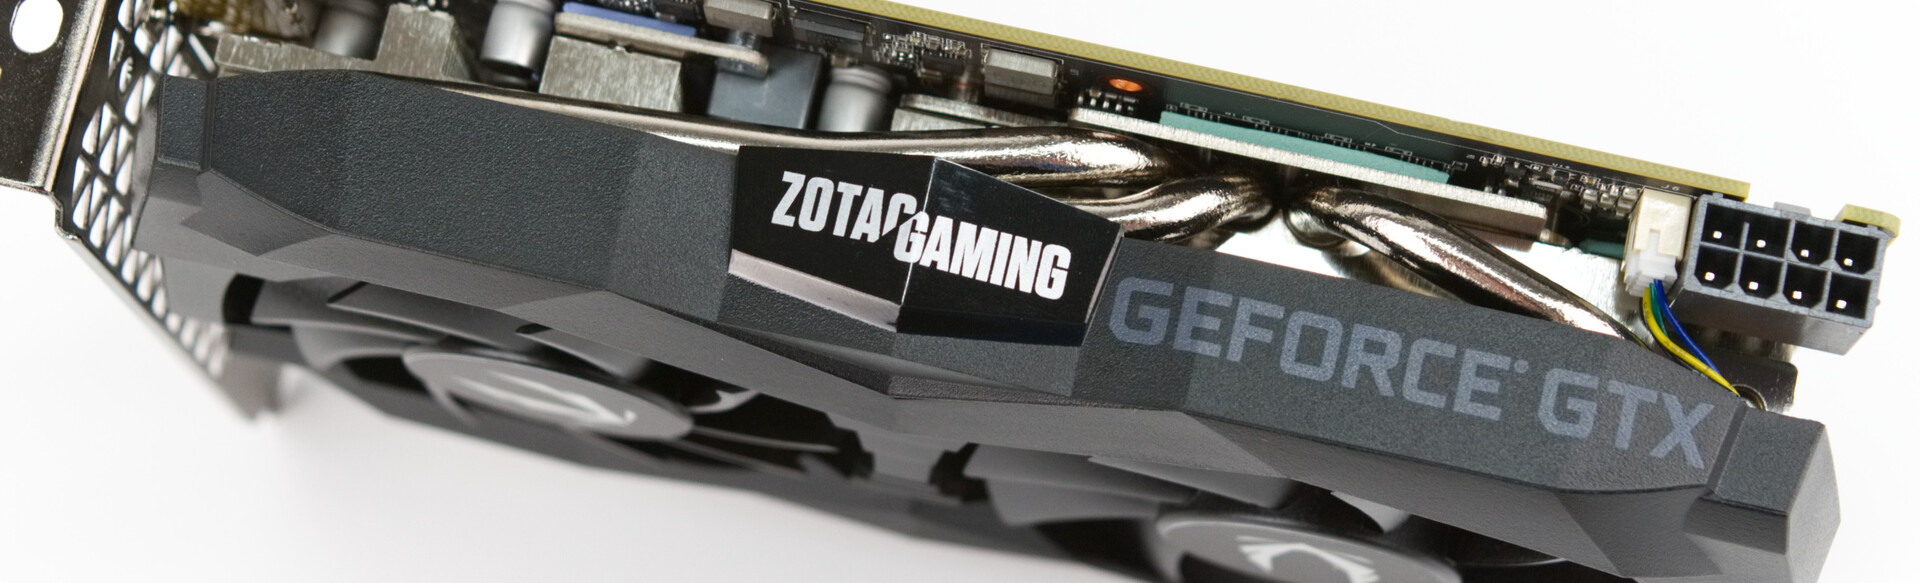
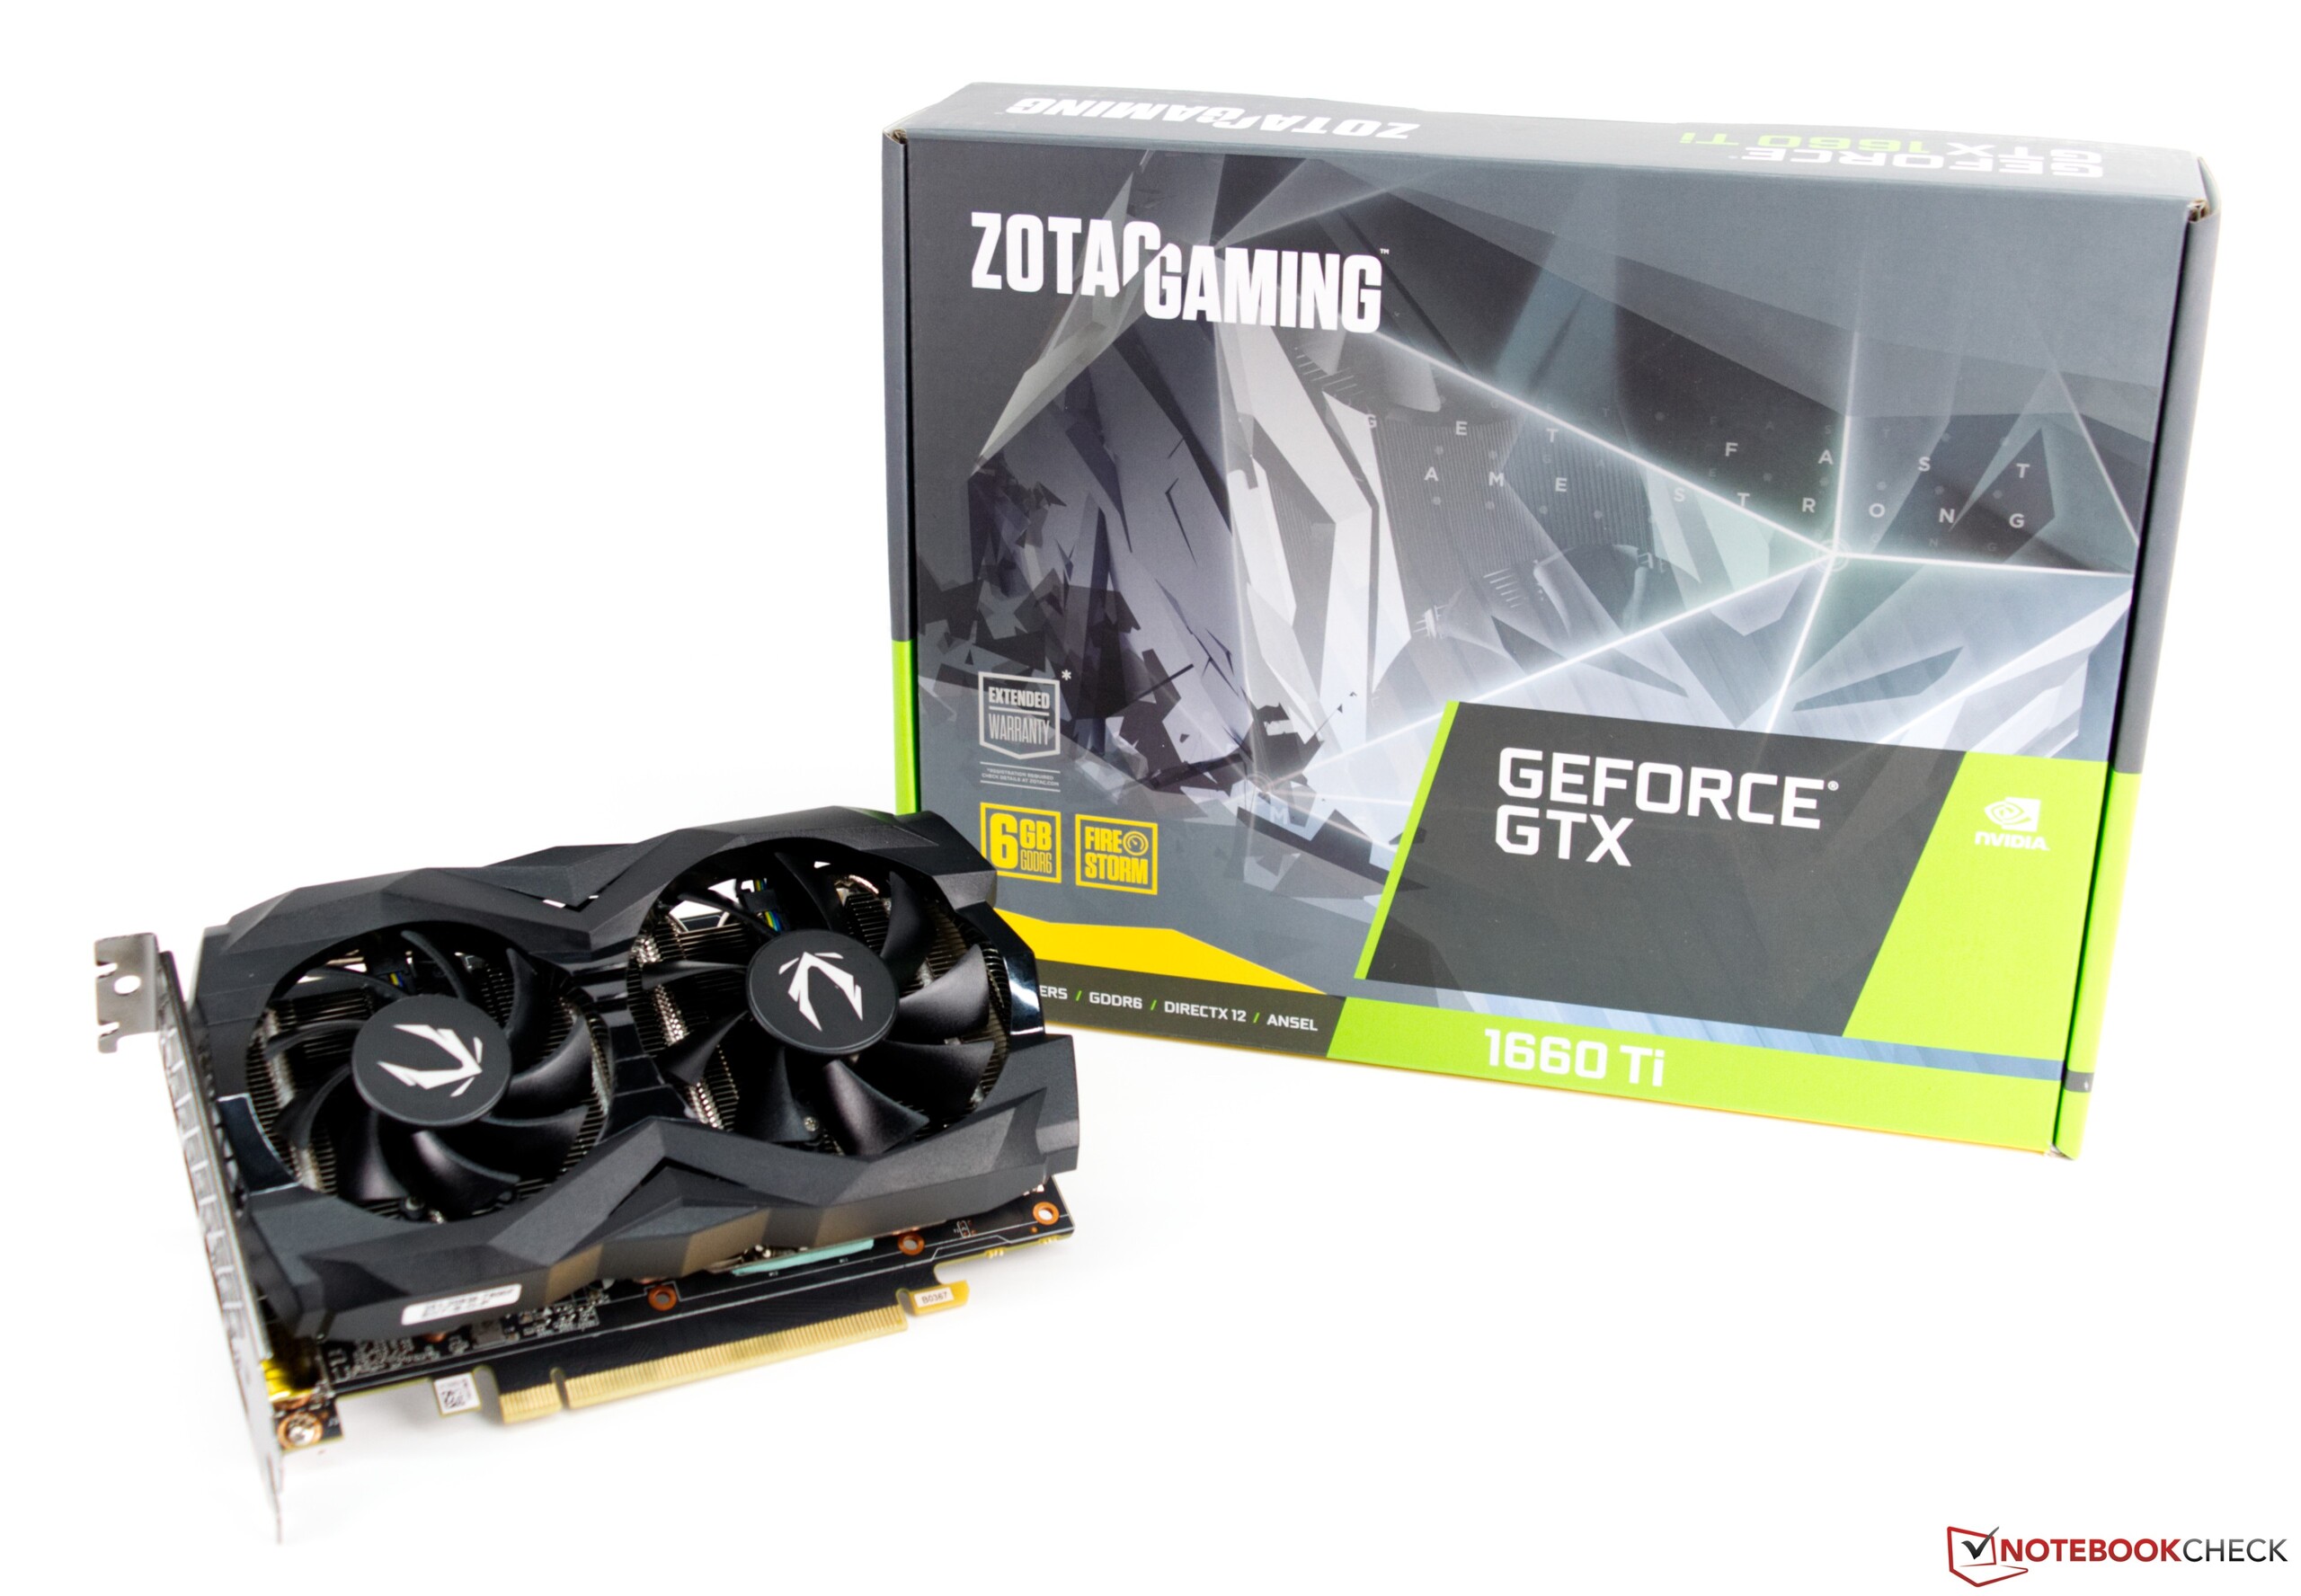
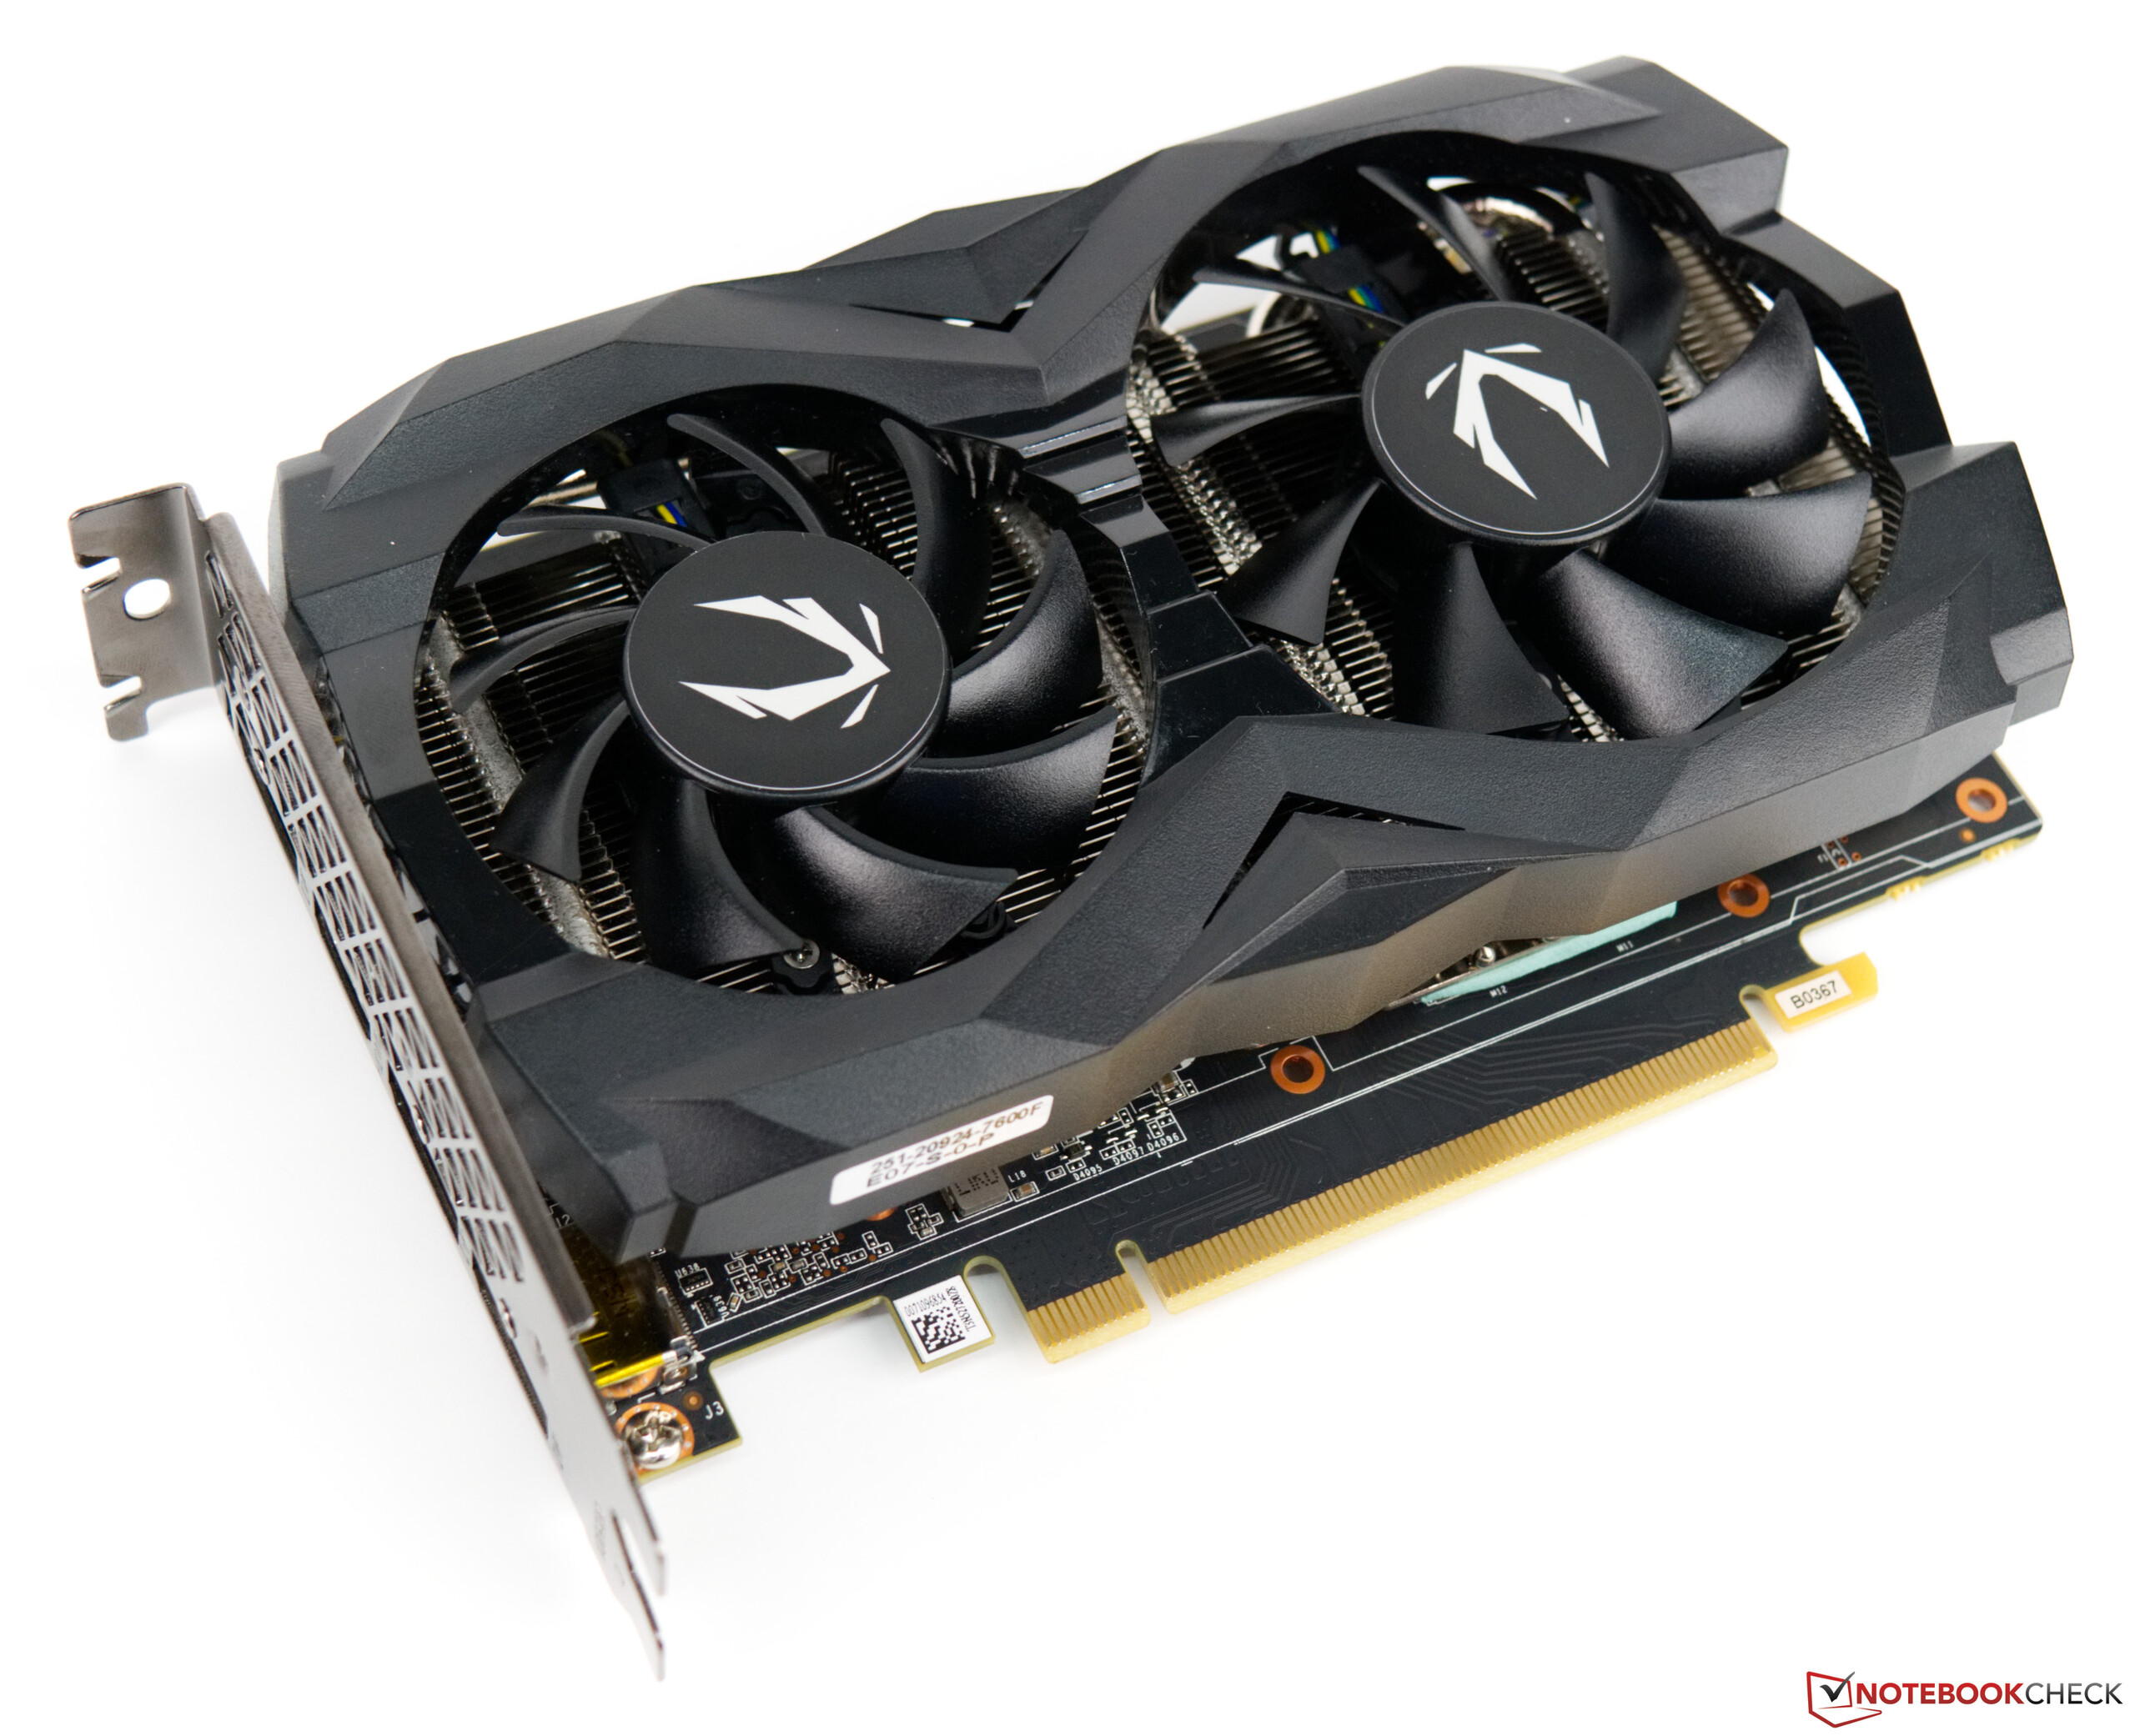
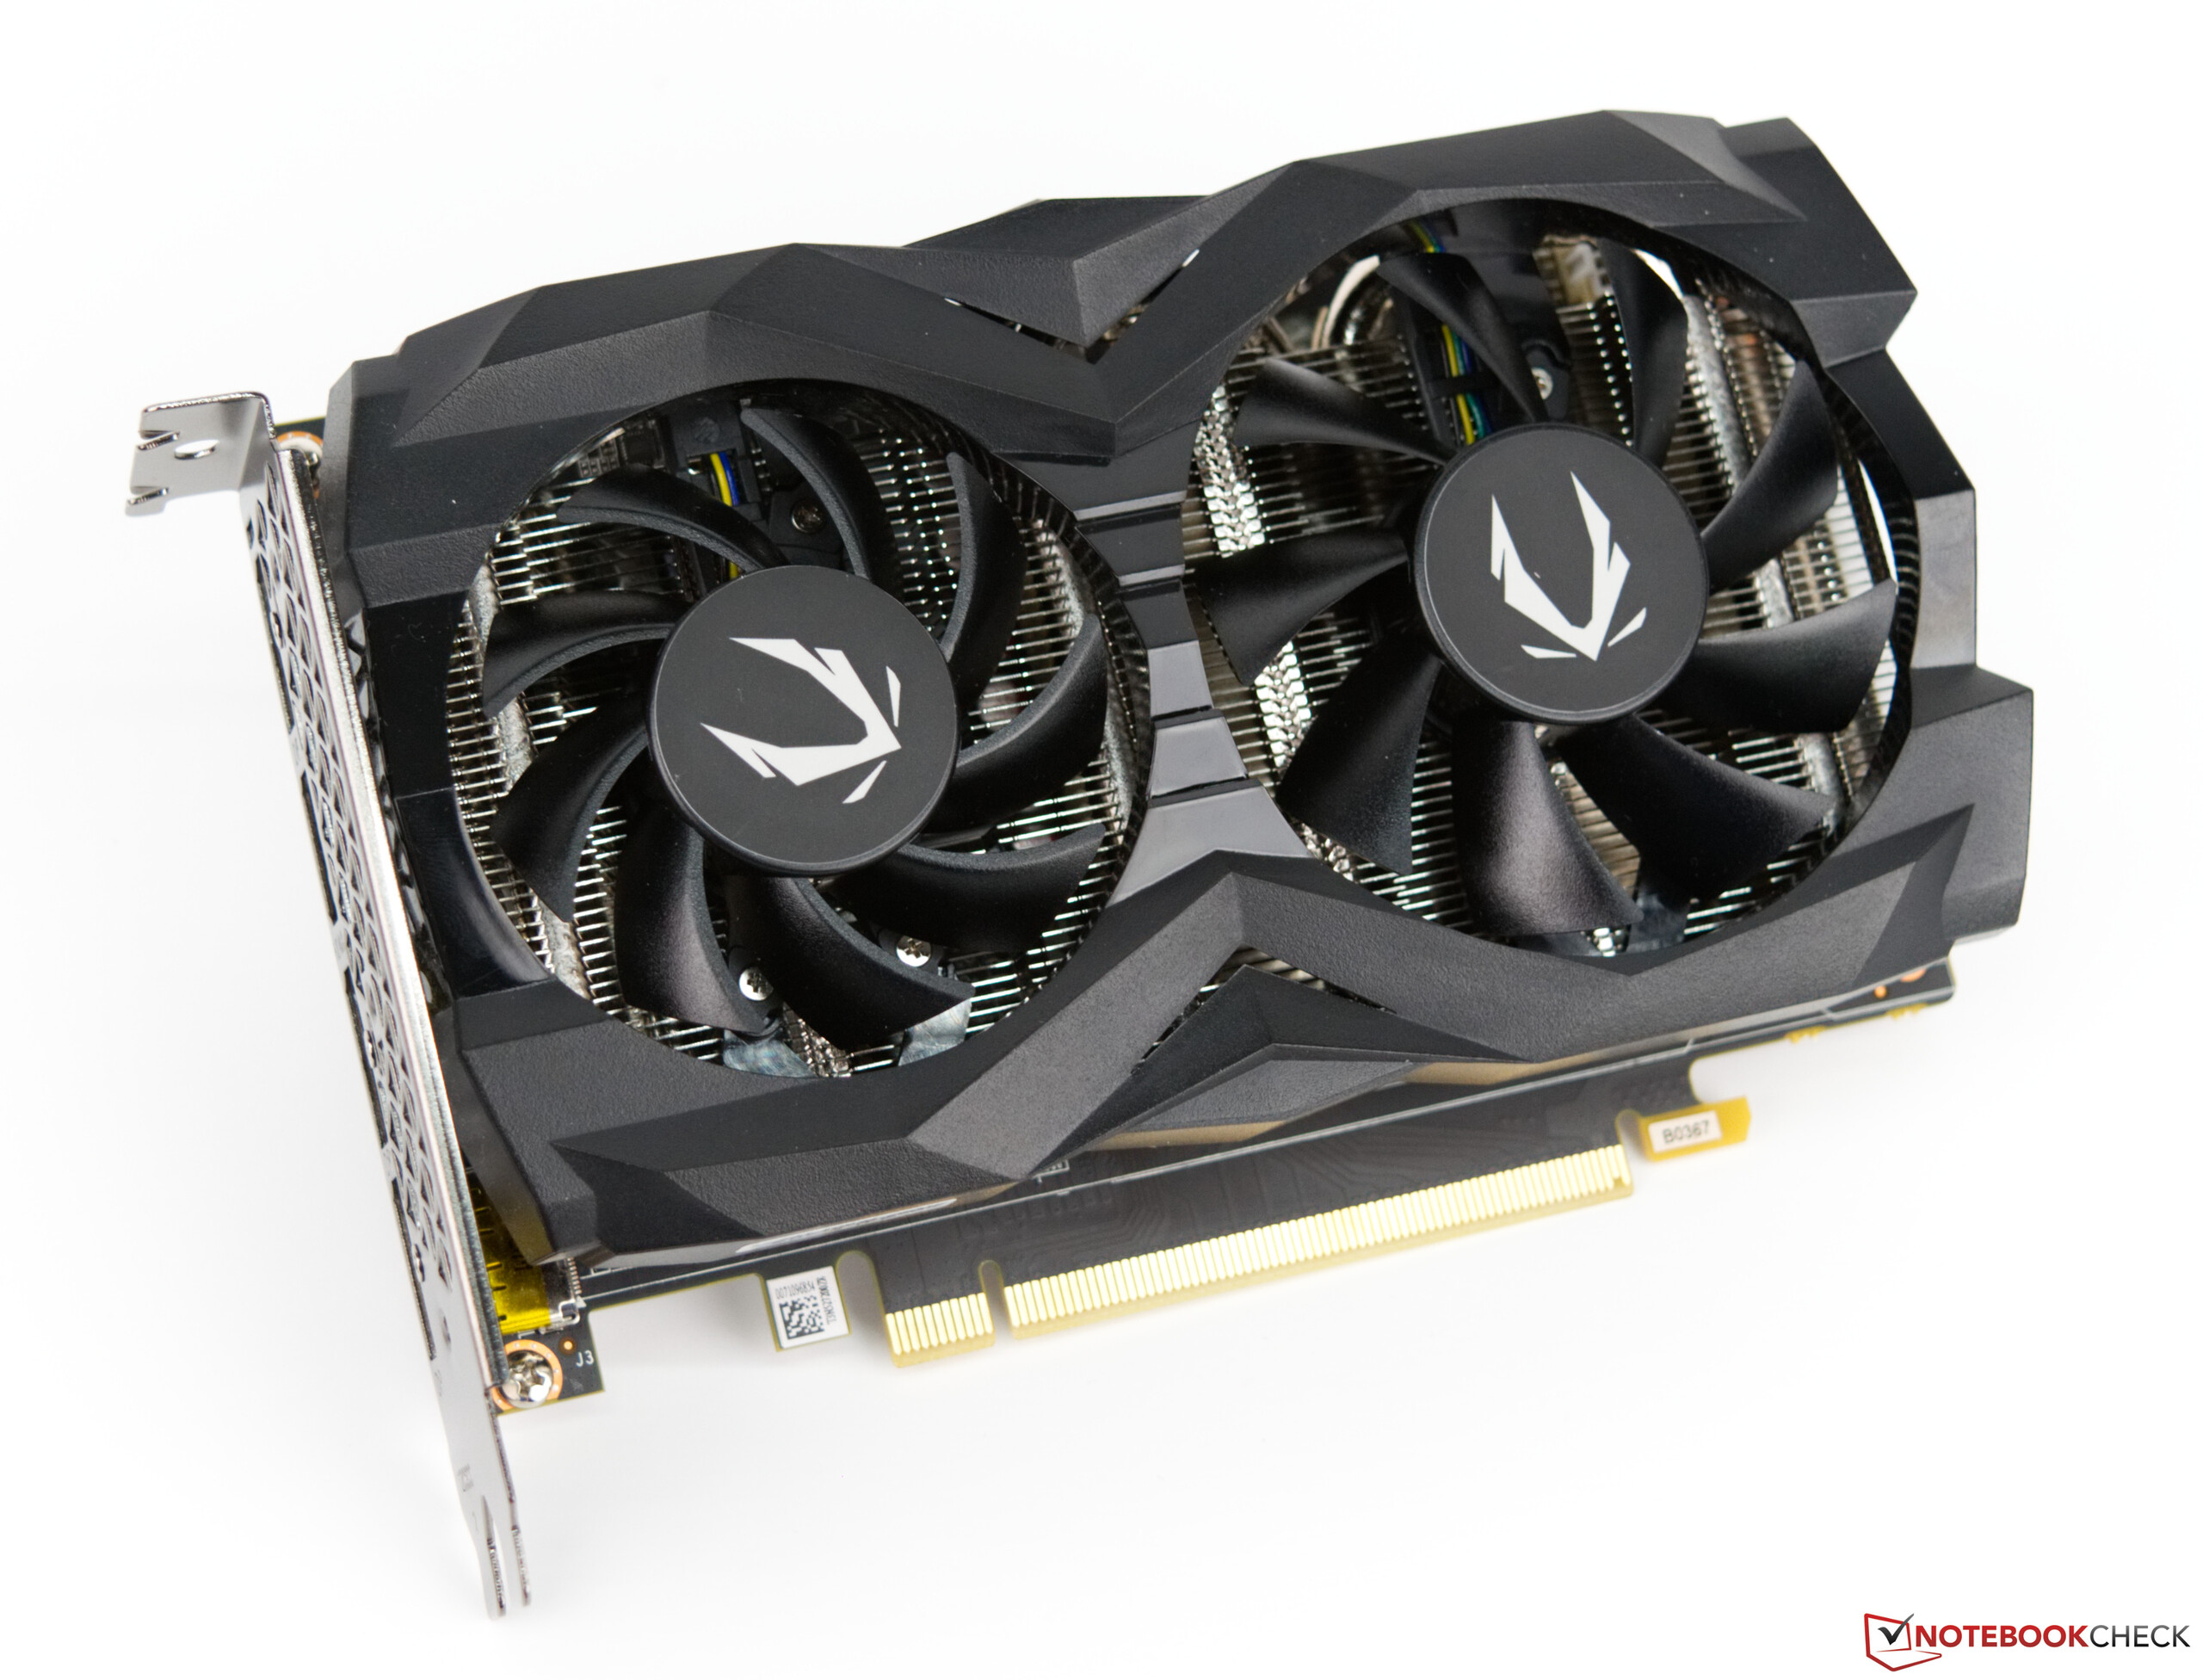
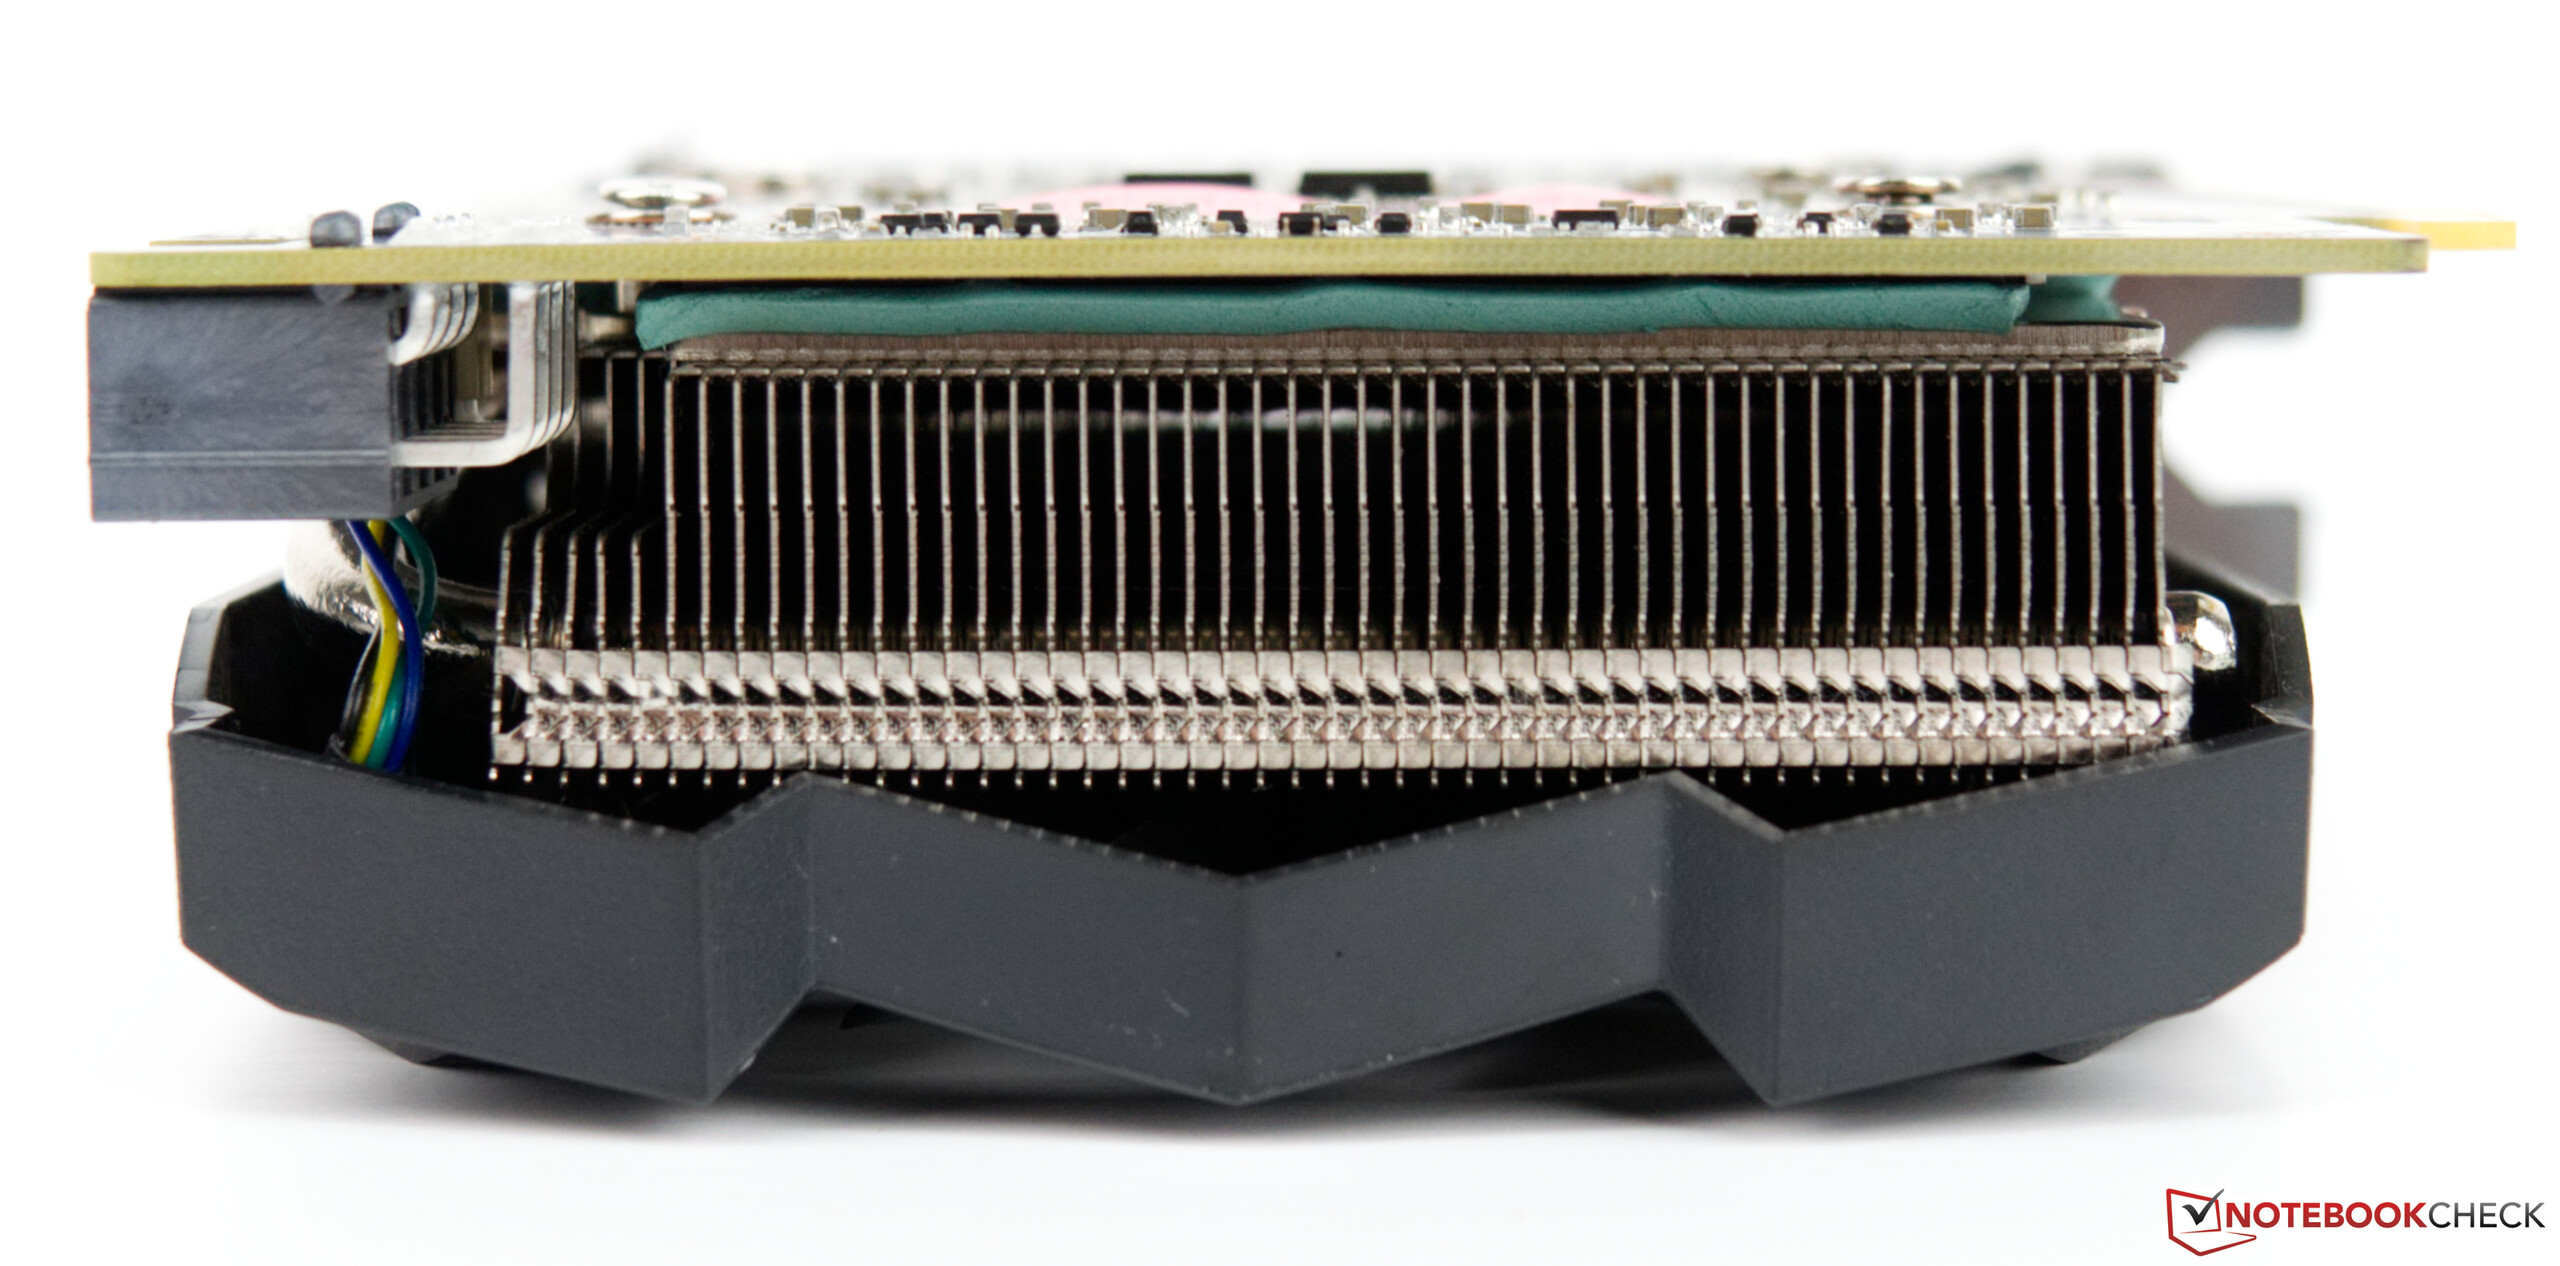
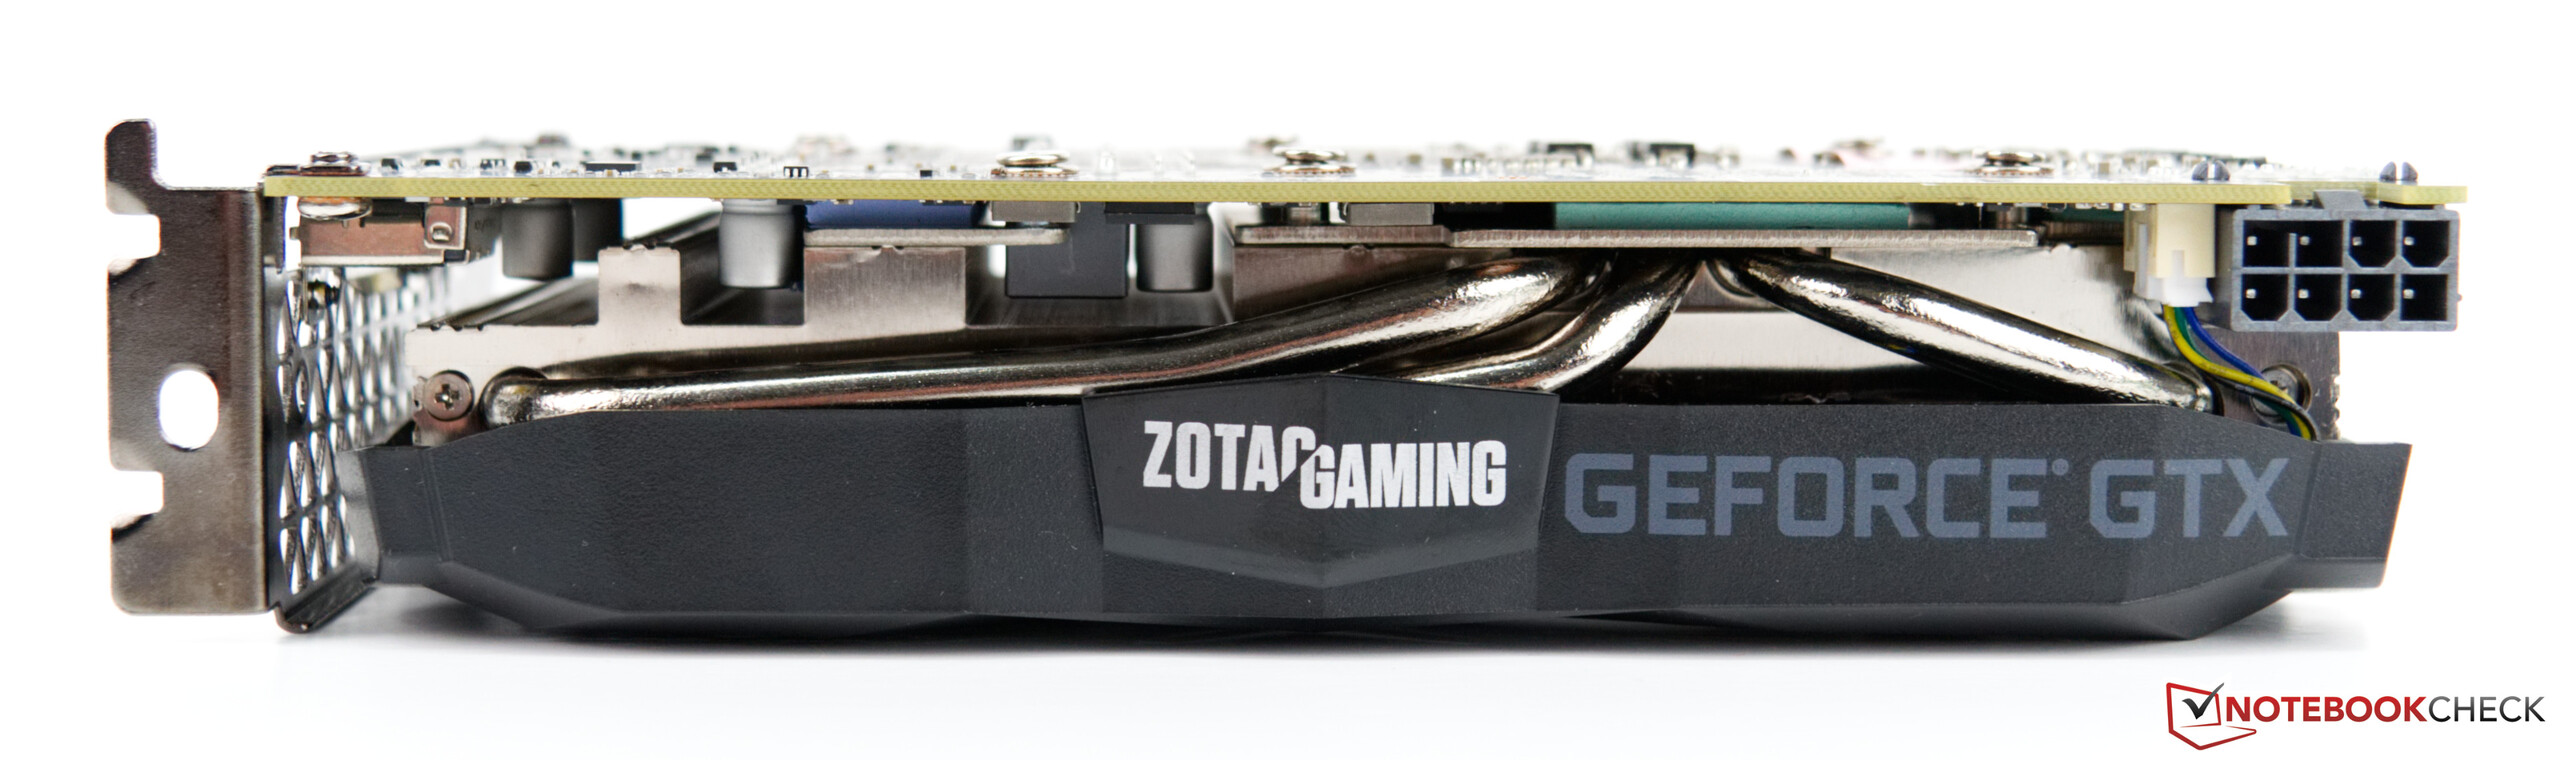
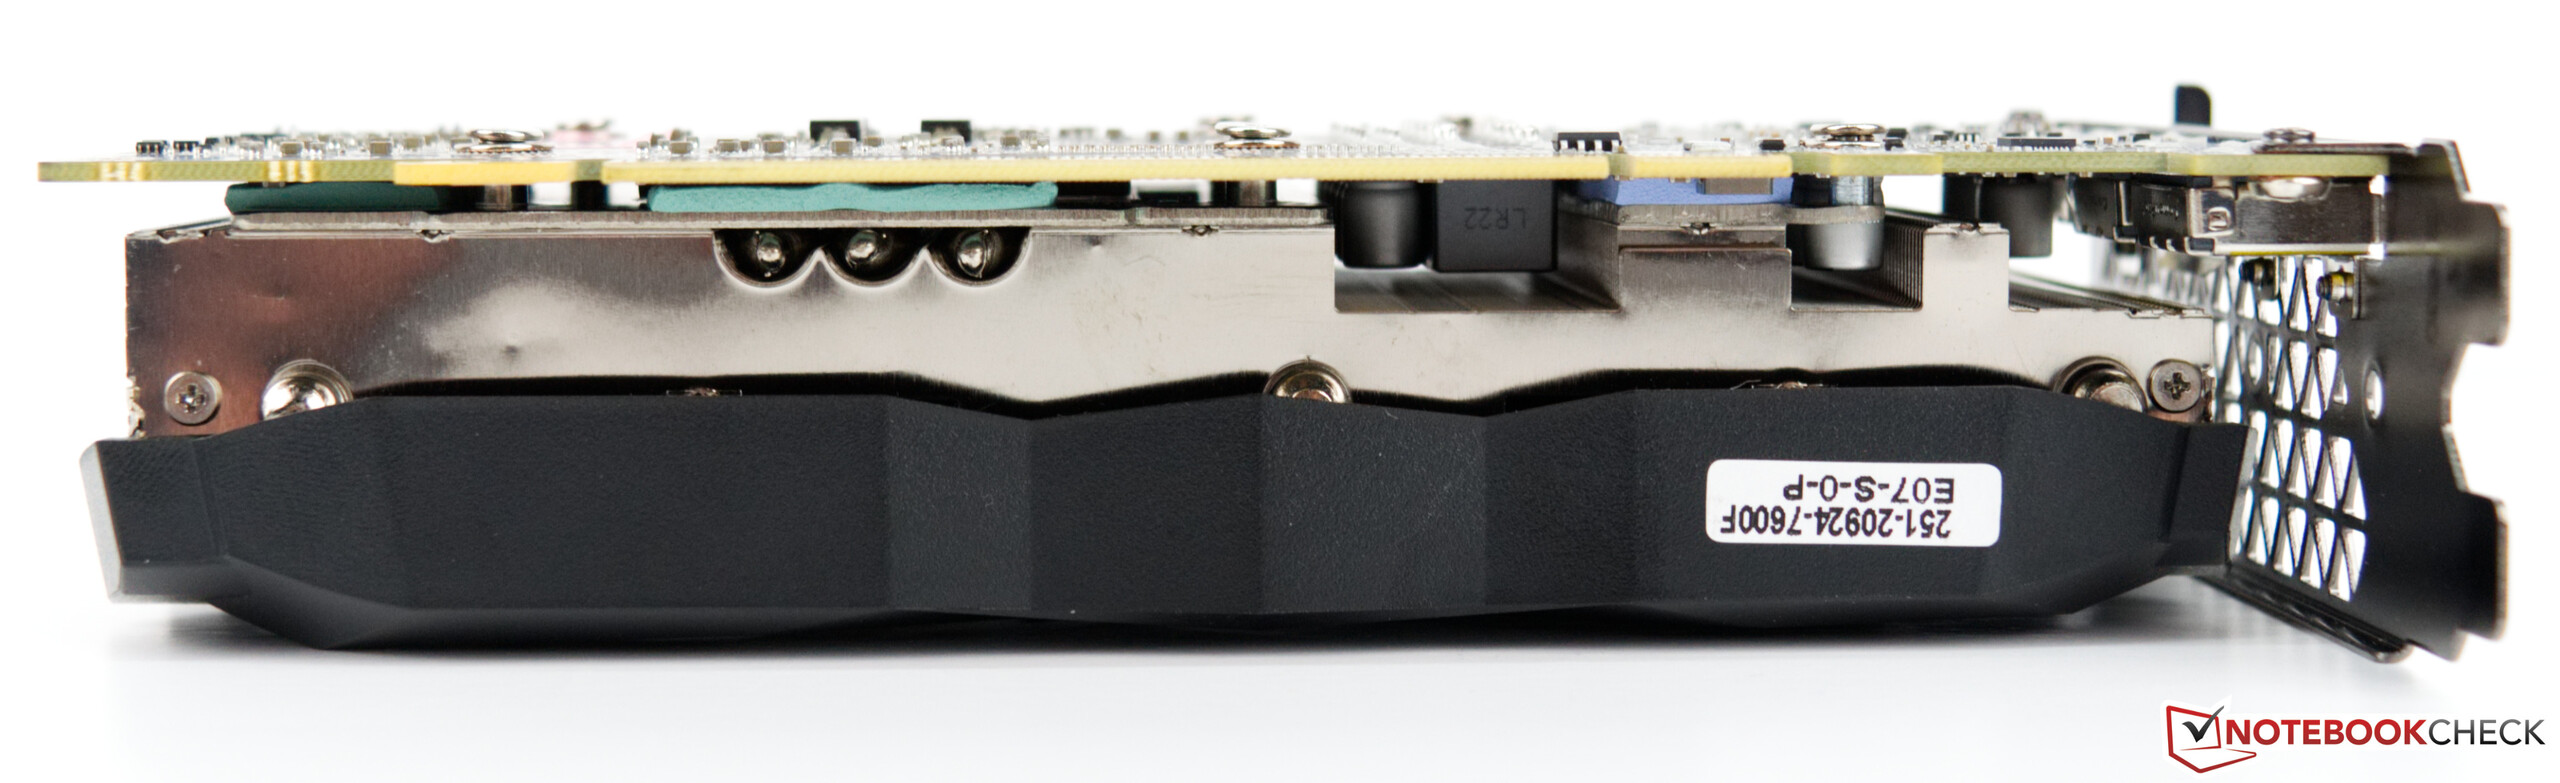
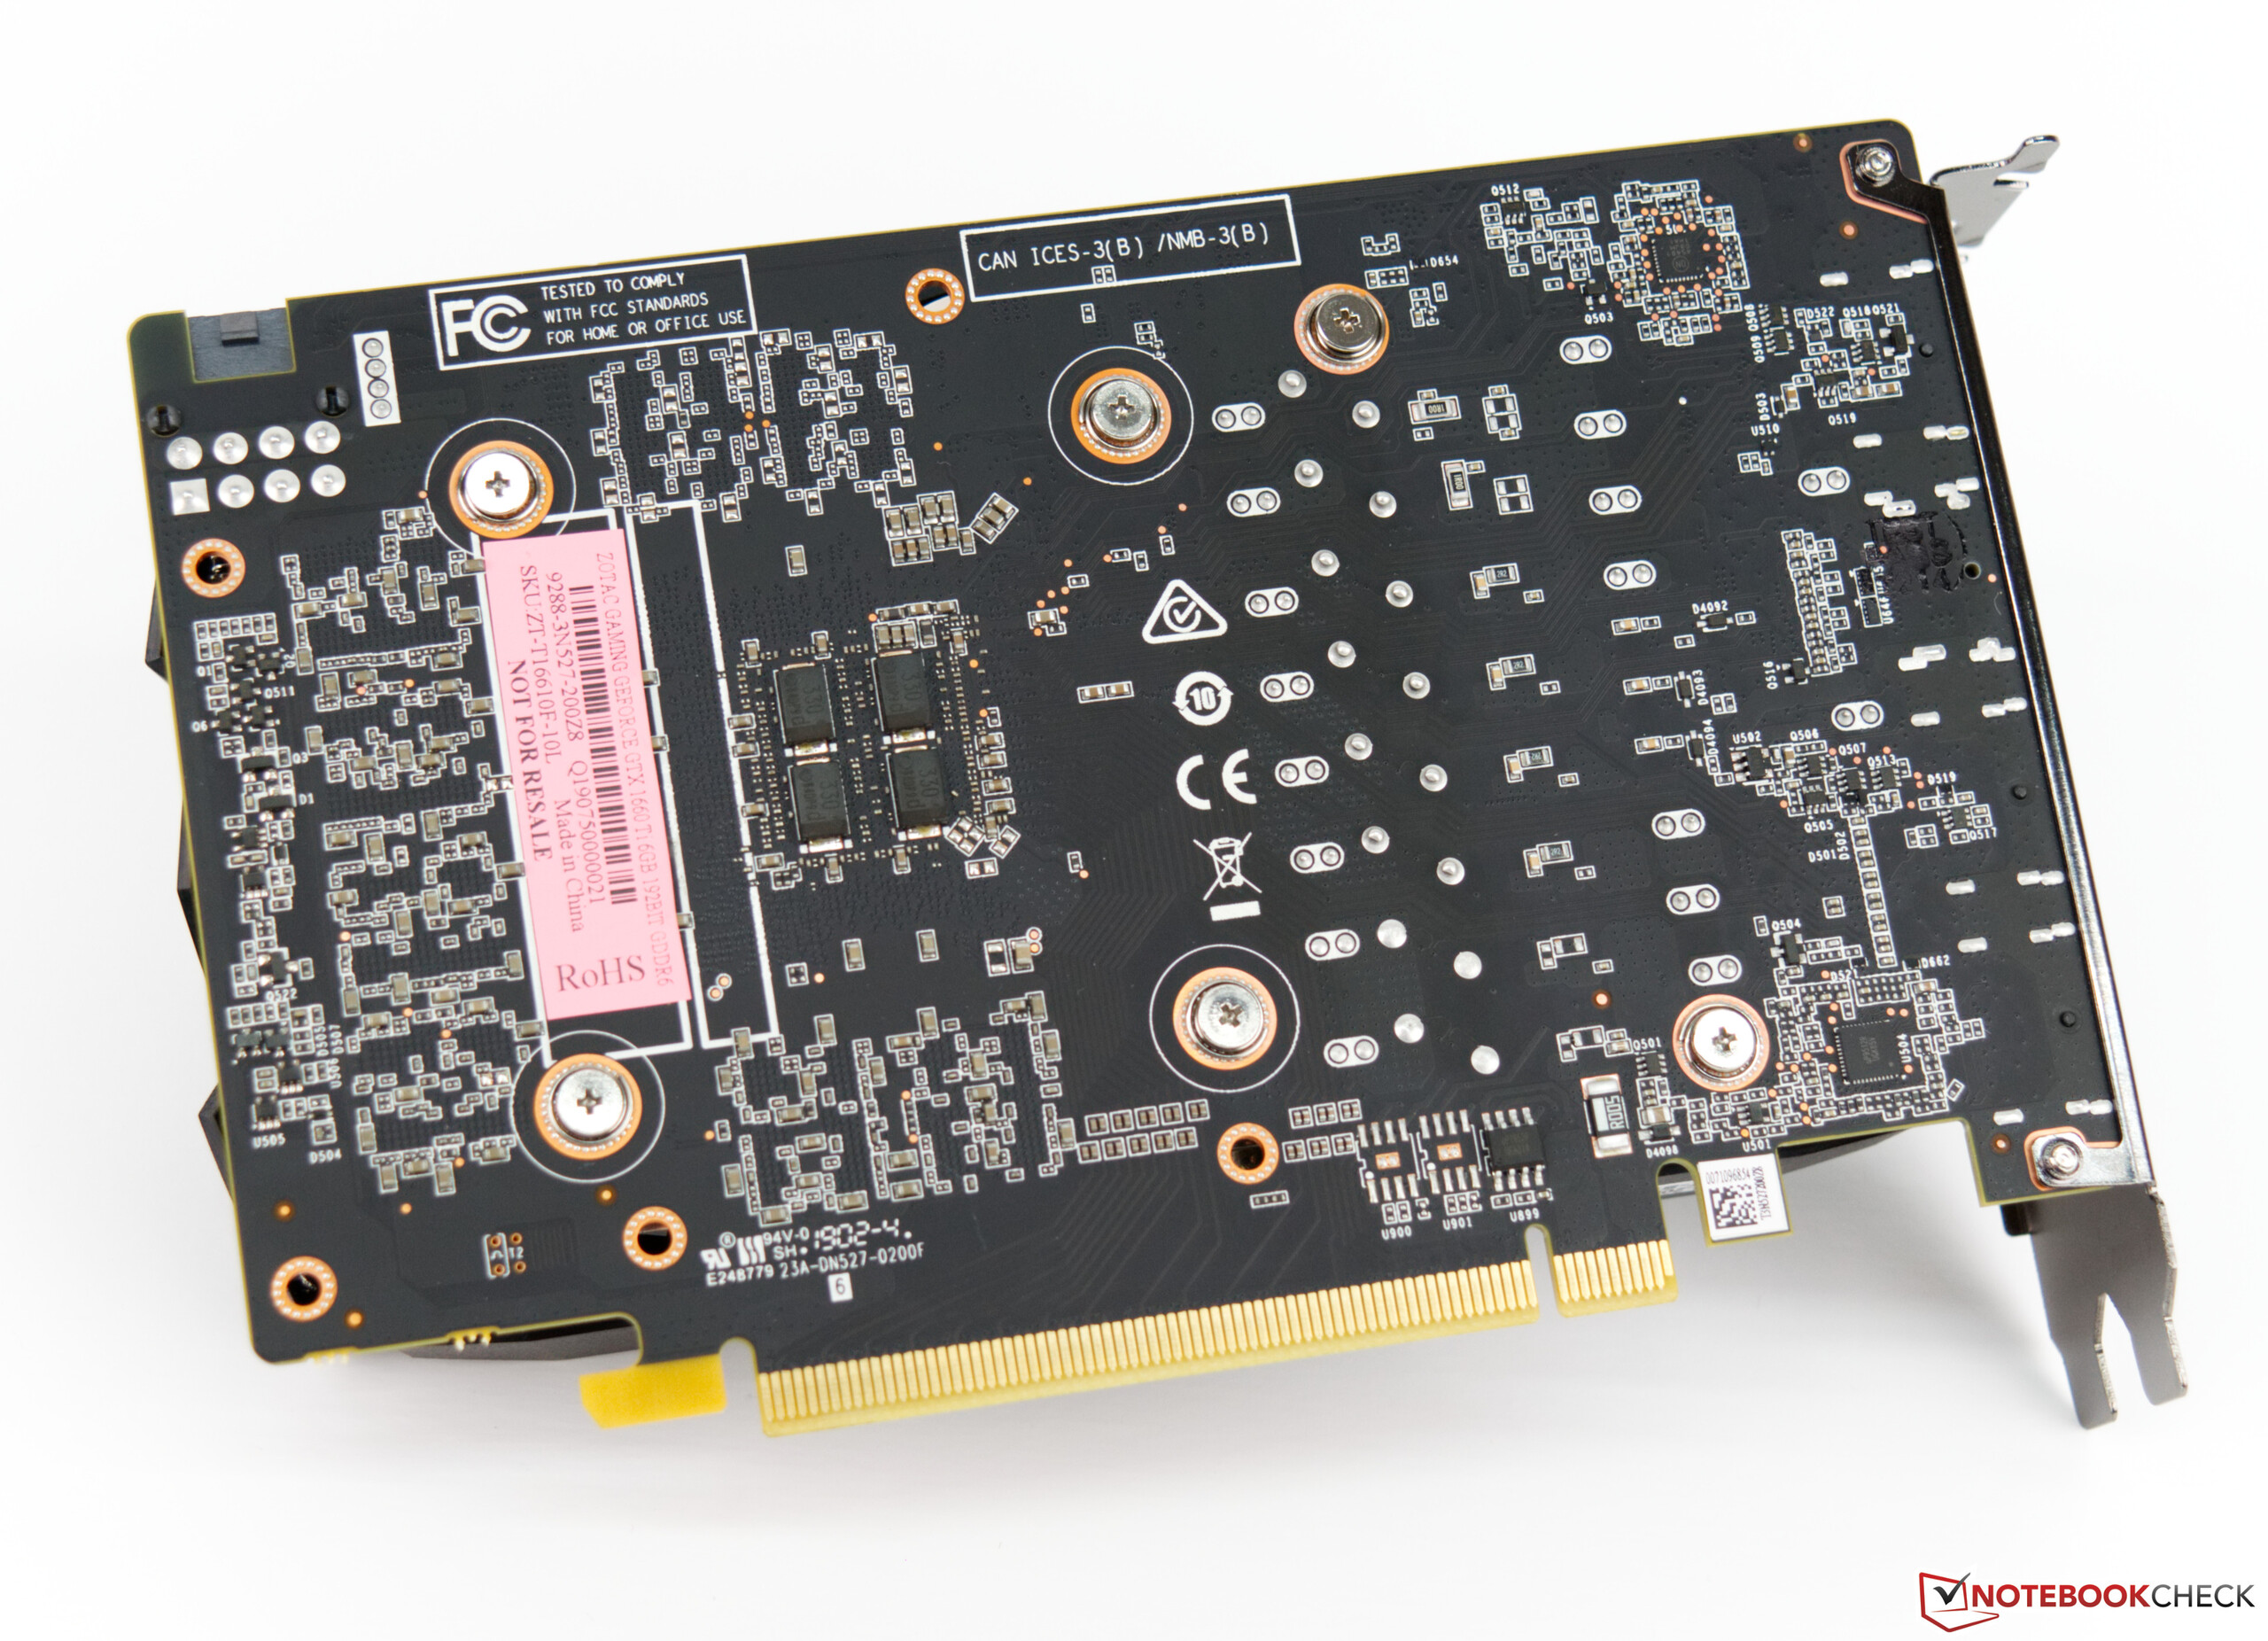
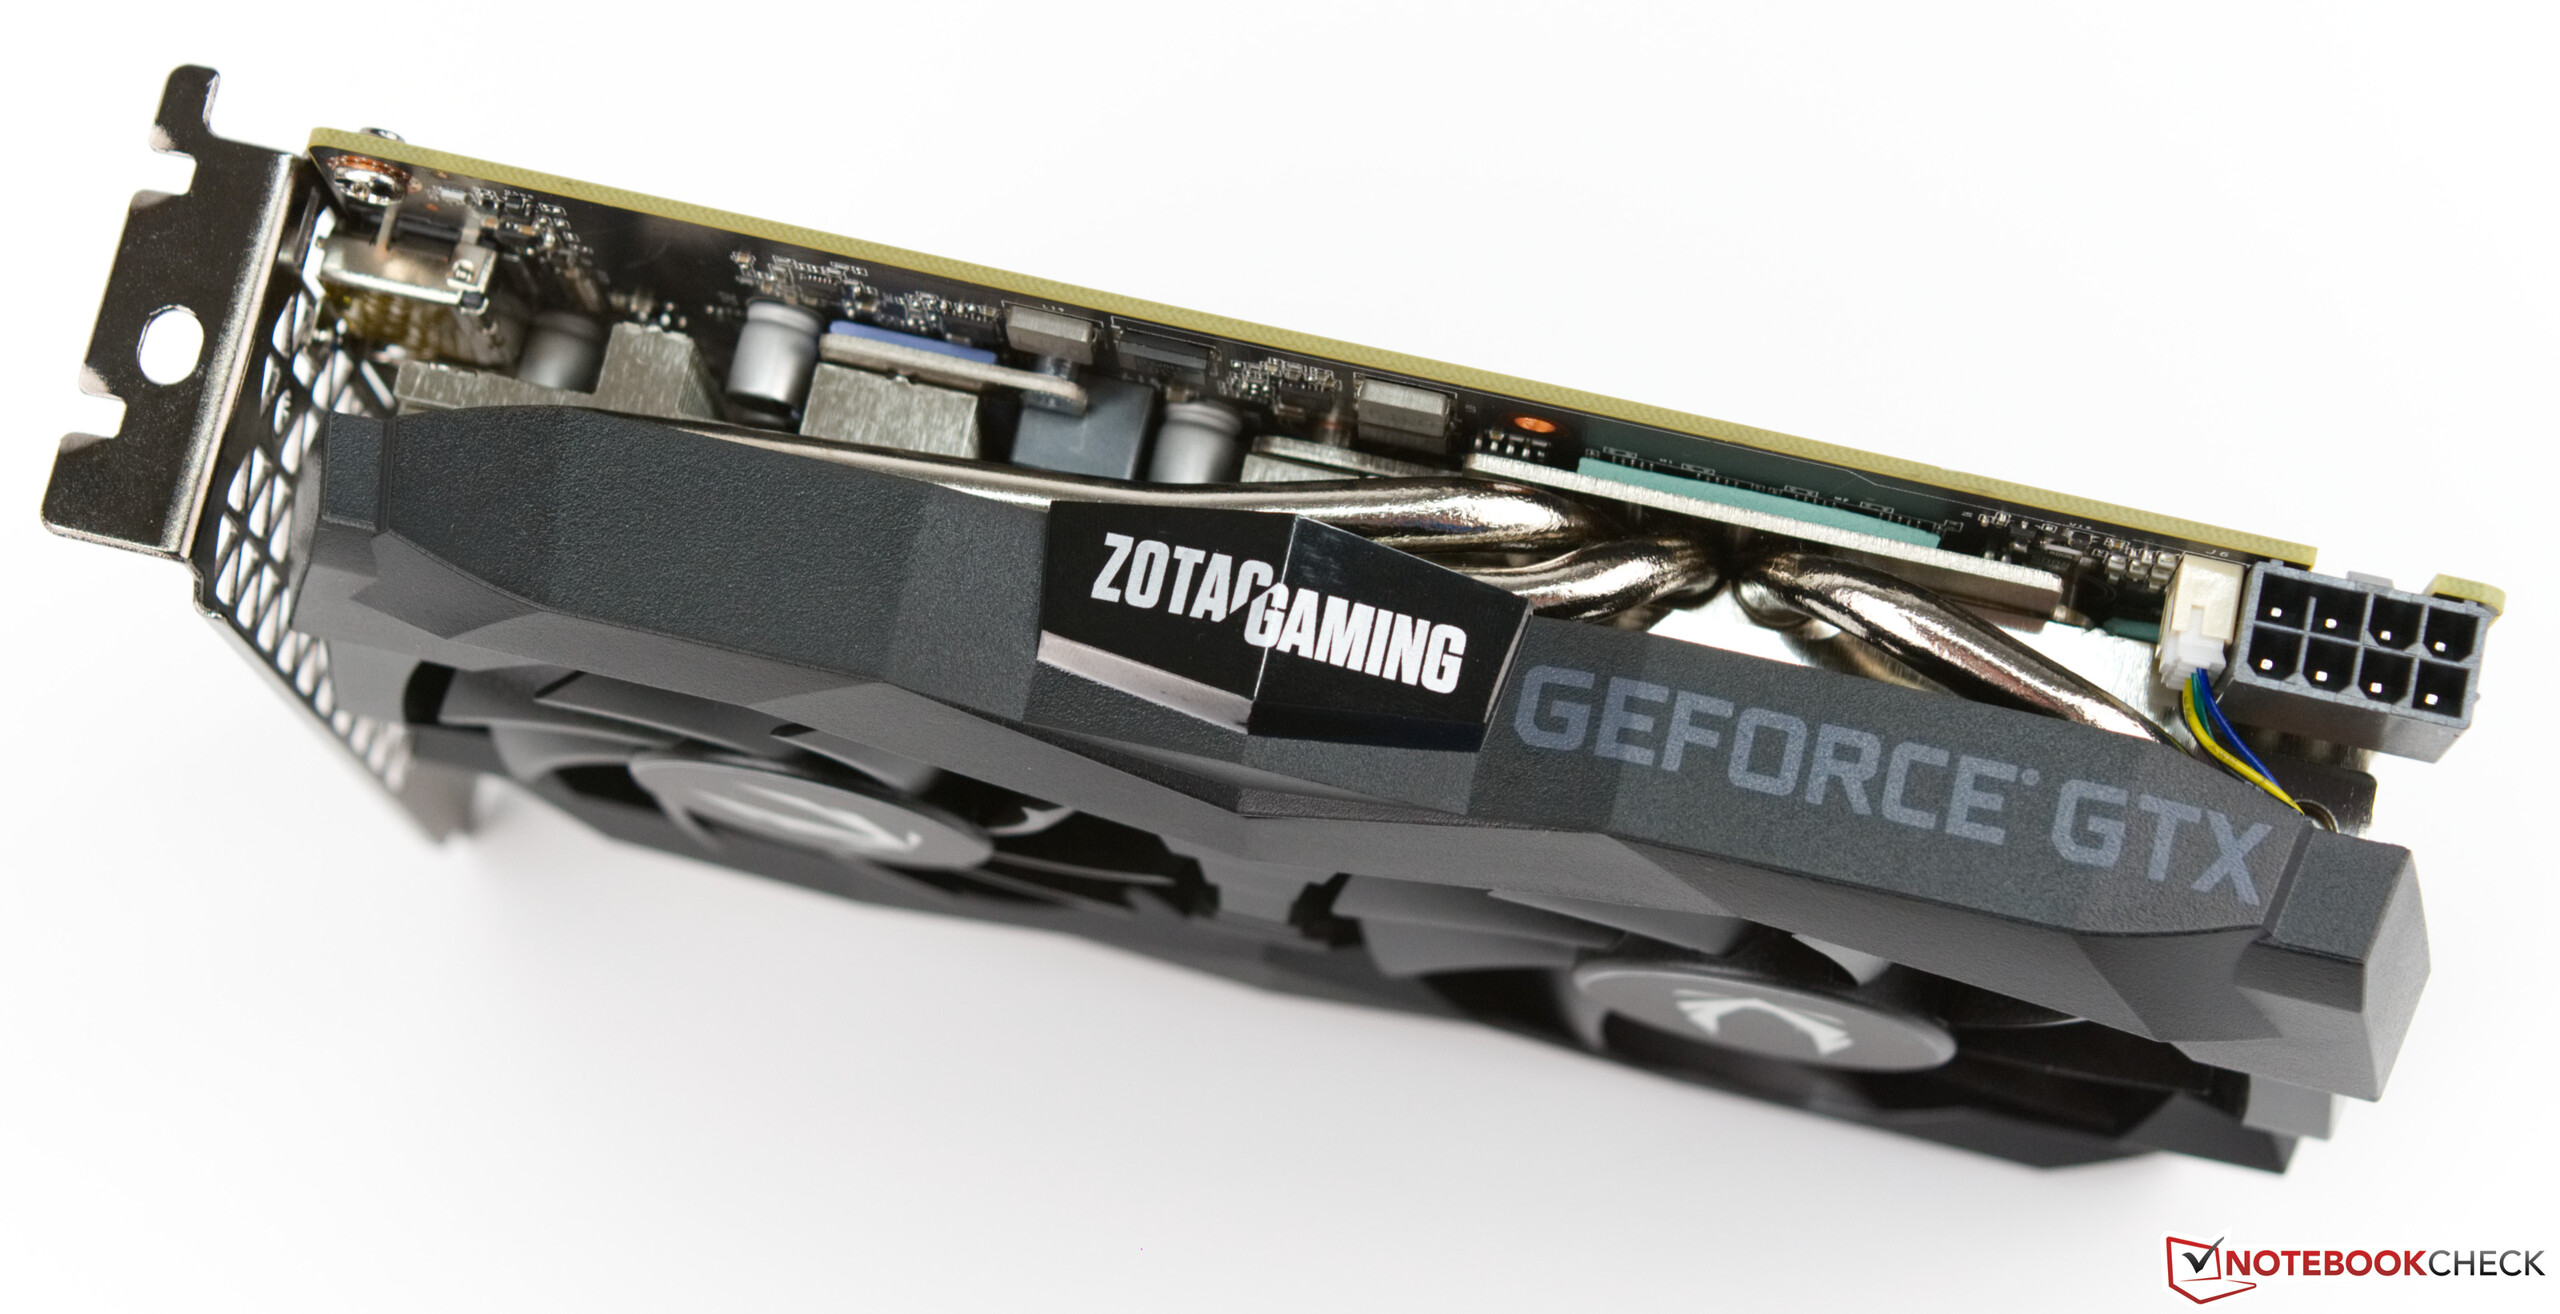
The Zotac GeForce GTX 1660 Ti is a mid-range graphics card that has 1536 shader units and 6 GB of GDDR6 VRAM. This is why the GTX 1660 Ti is primarily suited for 1080p gaming. Zotac’s GPU is very compact and measures only 17.3 cm (~6.8 in), which is why it can be installed in very small cases. Zotac’s GeForce GTX 1660 Ti Twin Fan is compliant with Nvidia’s reference specifications for the GTX 1660 Ti, which means that Zotac has chosen not to overclock this model. Therefore, the maximum boost clock amounts to 1770 MHz, whereas other models of the GTX 1660 Ti can boost their core clocks higher than 1800 MHz.
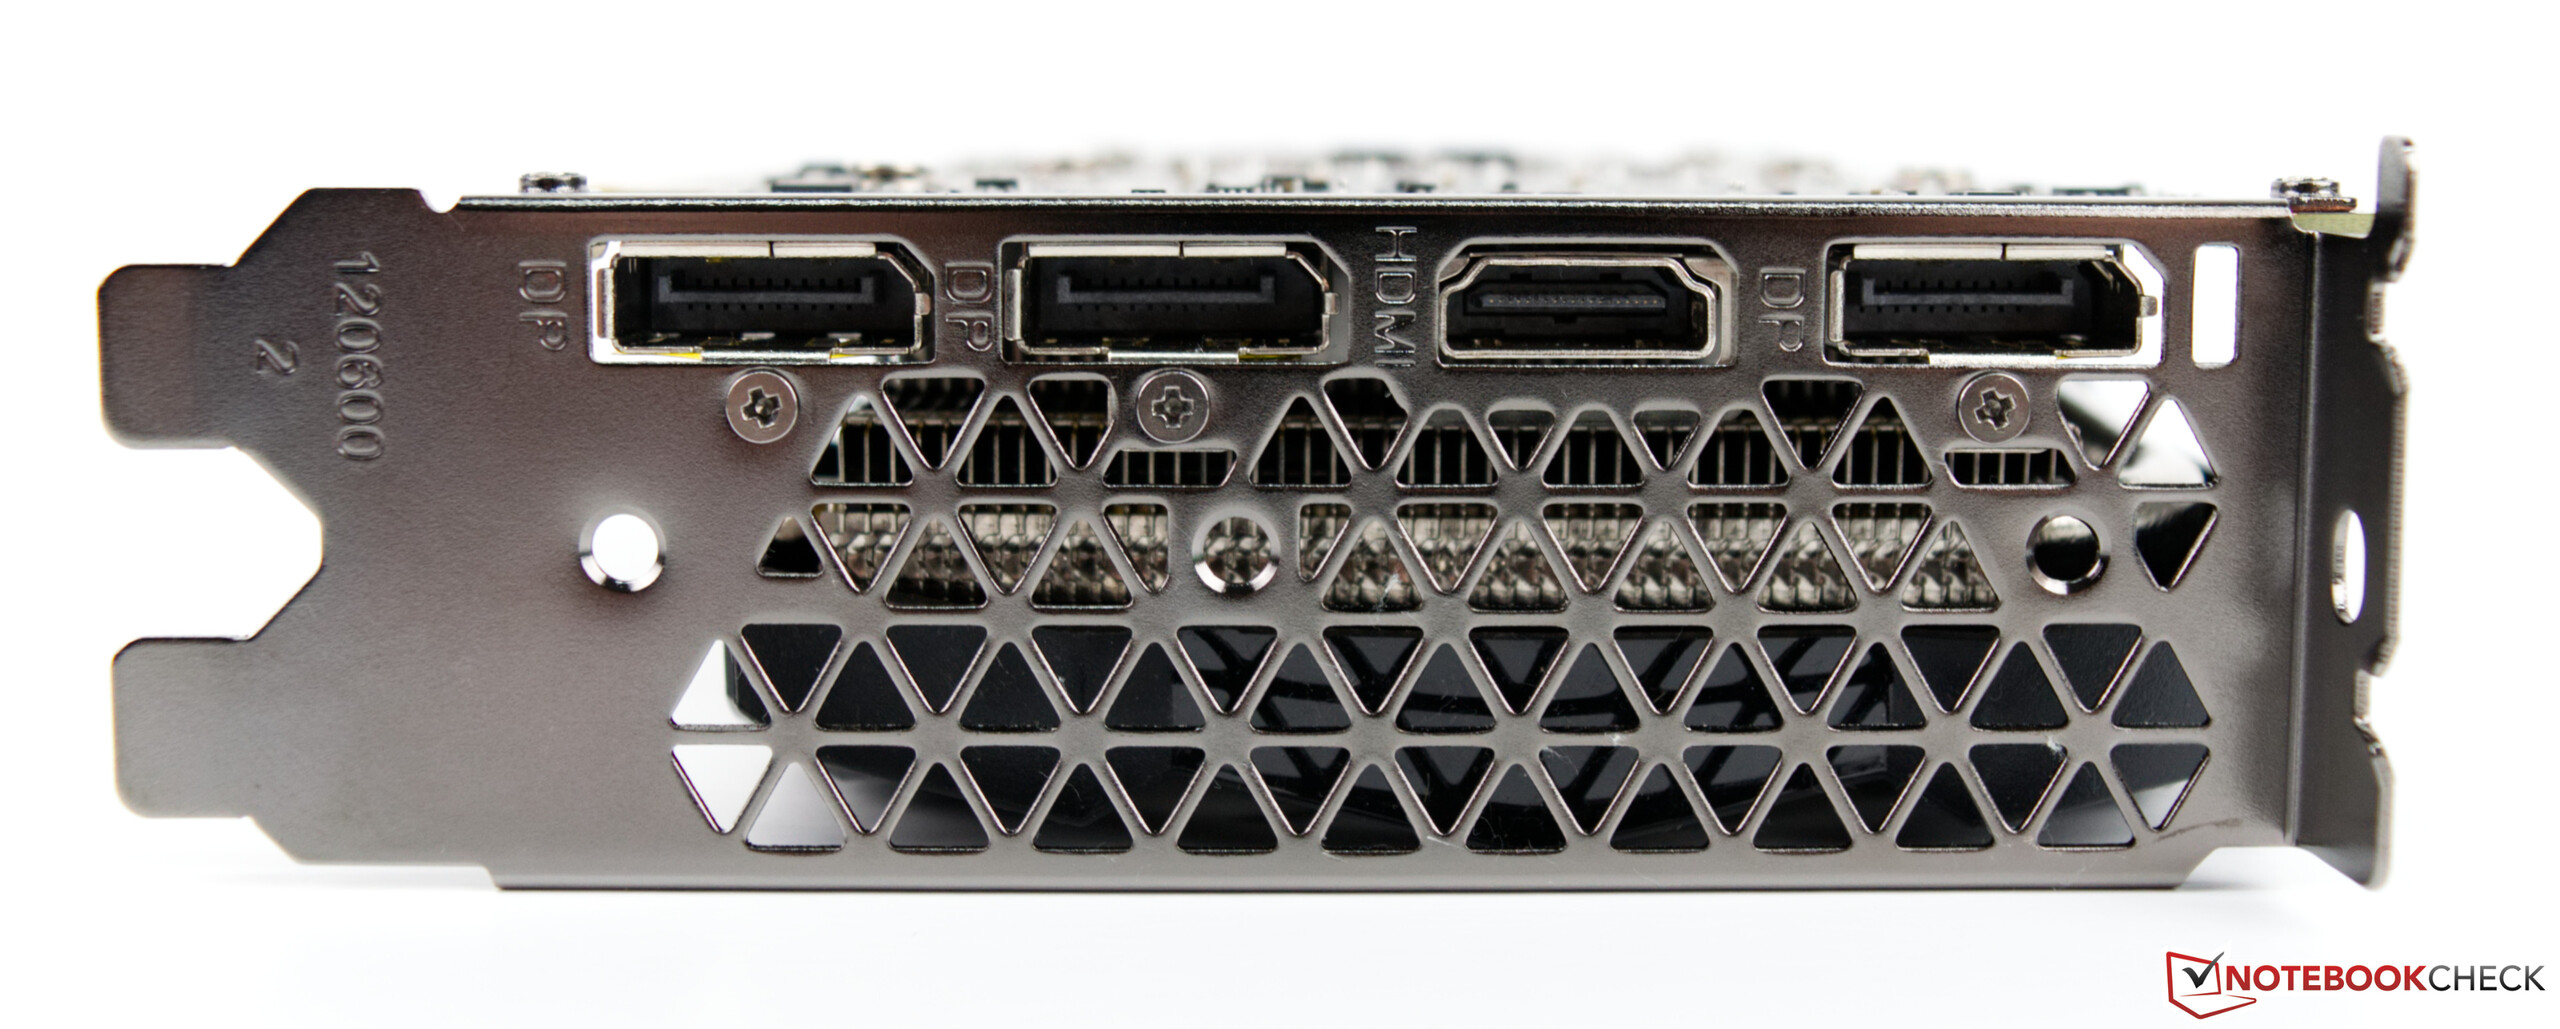
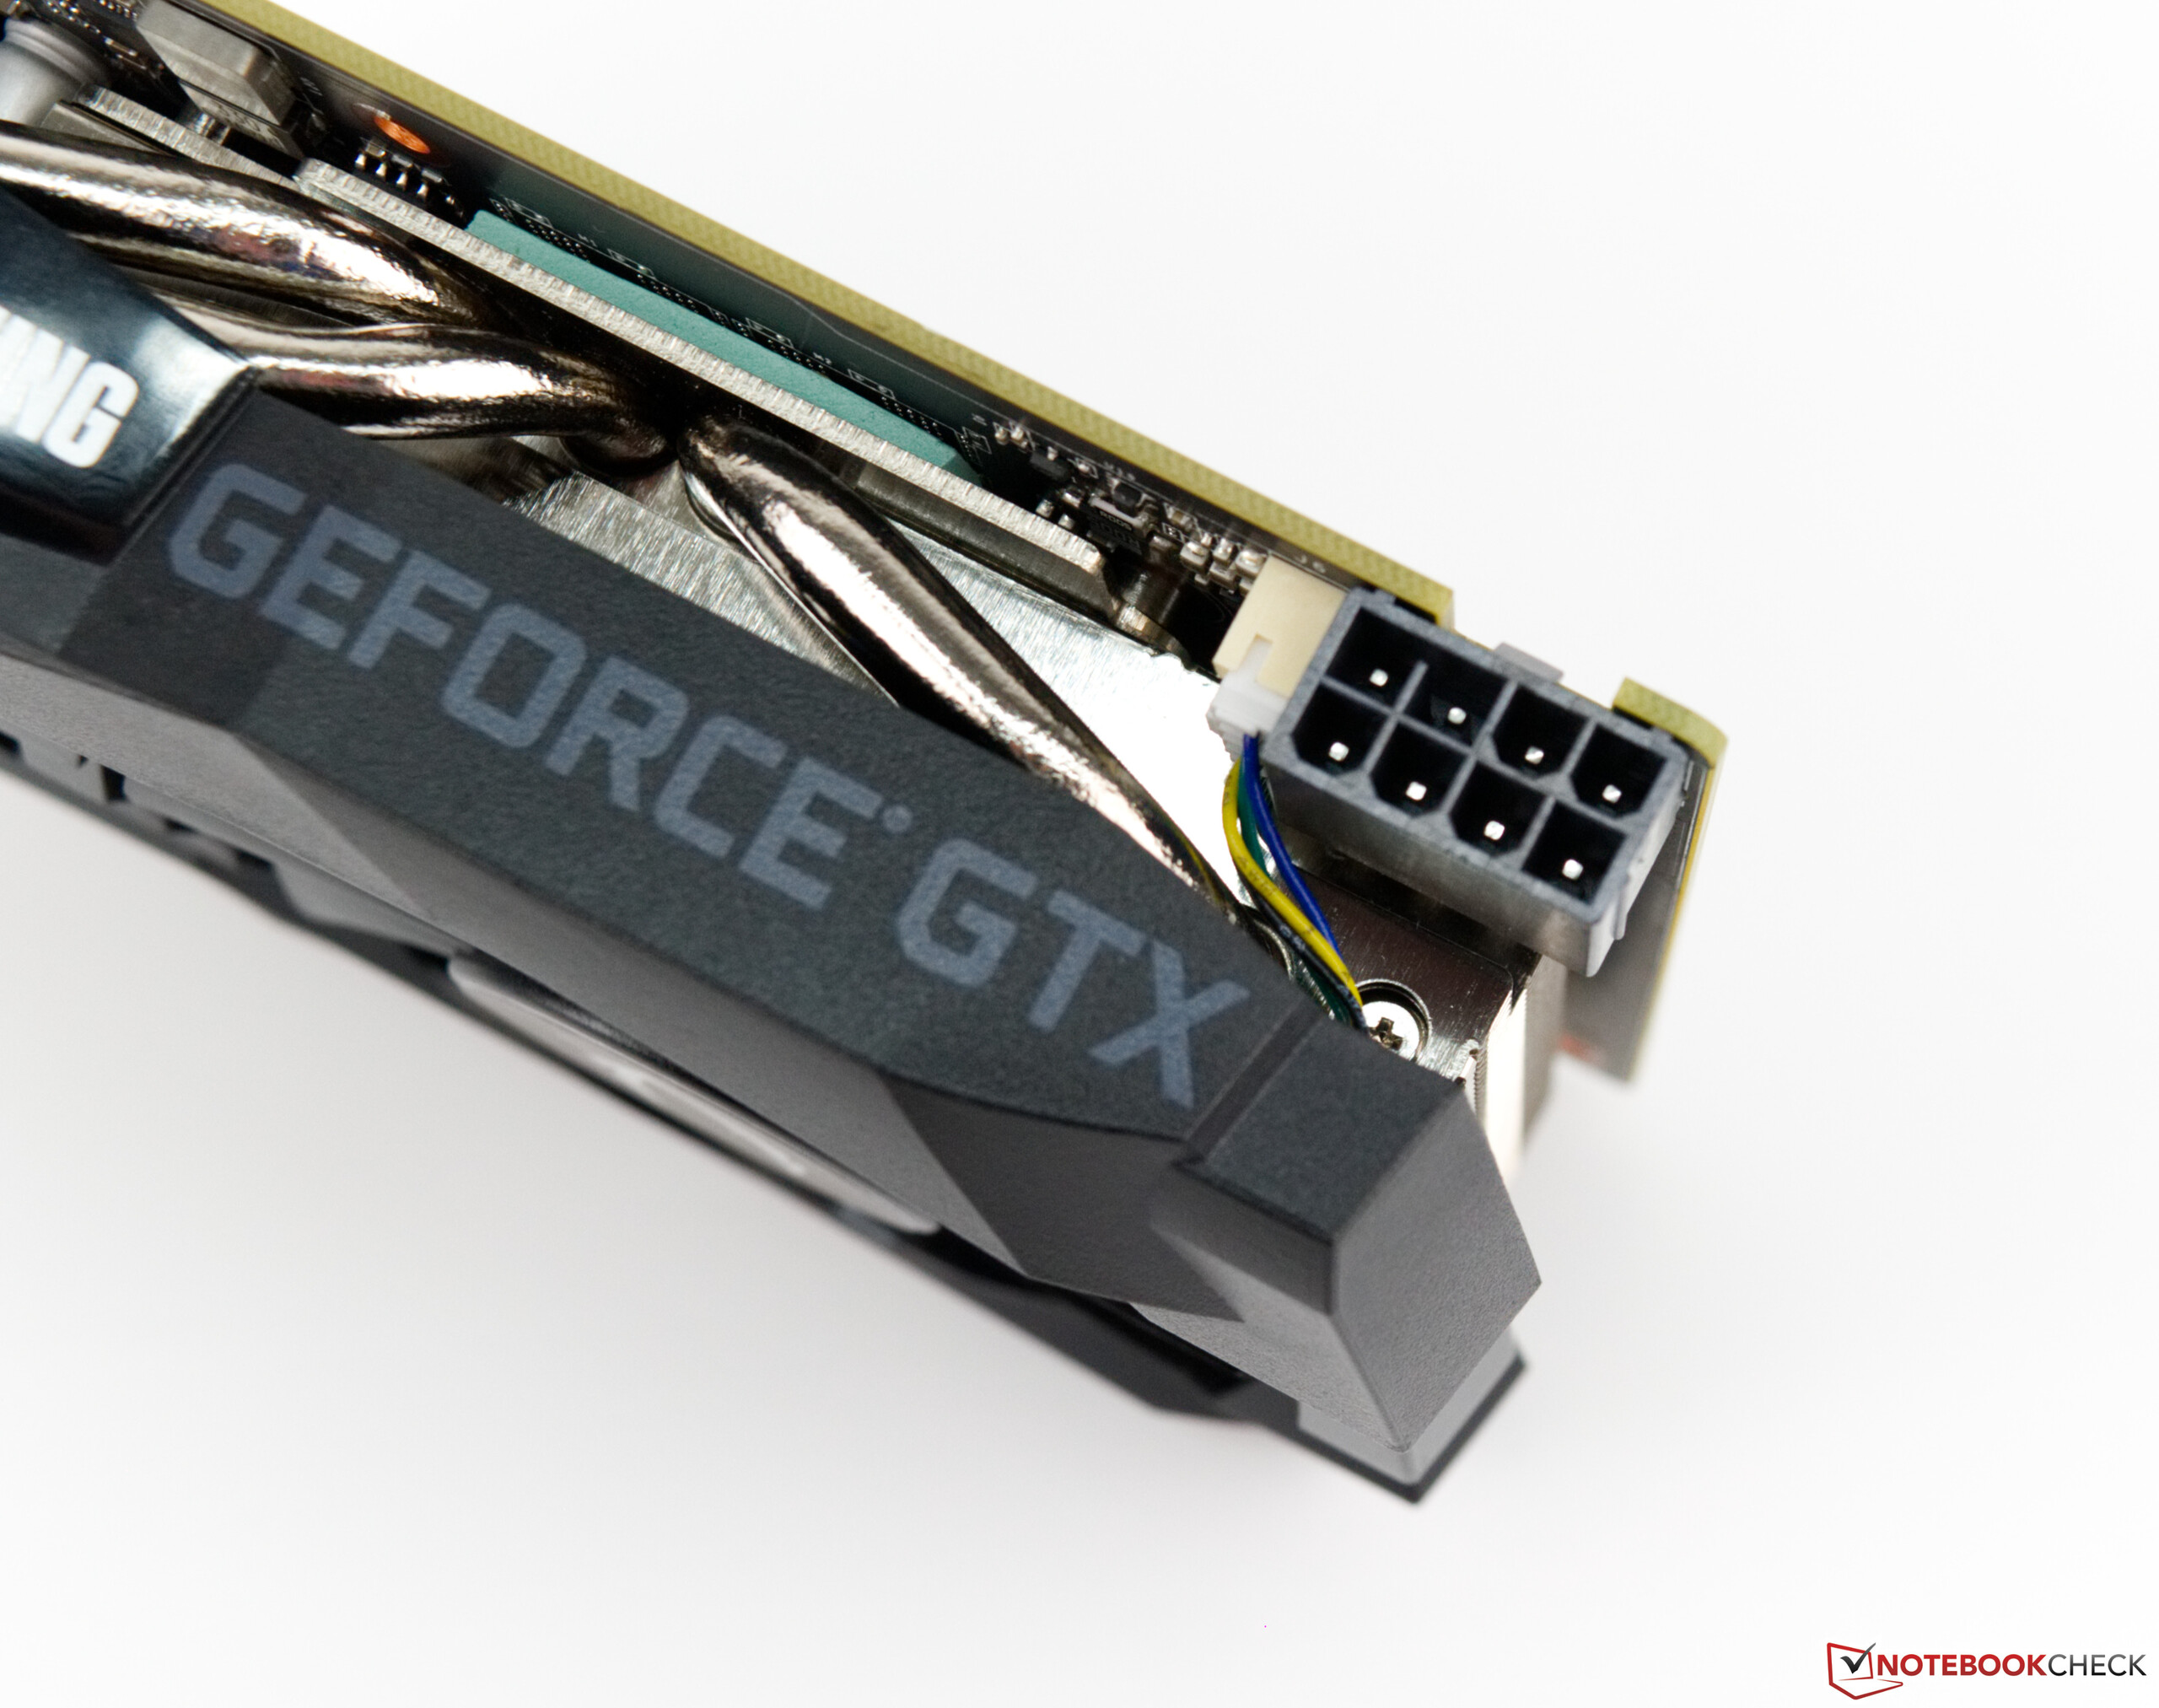
In terms of connectivity, the Zotac GeForce GTX 1660 Ti offers three DisplayPort 1.4 outputs as well as an HDMI 2.0b port. In addition to drawing power from the PCI-E slot, the GPU also requires an 8-pin power connector.
GPU Specifications in Overview
| Specifications | GTX 1650 | GTX 1660 | GTX 1660 Ti | RTX 2060 | RTX 2070 | RTX 2080 | RTX 2080 Ti |
| Manufacturing process | 12 nm | 12 nm | 12 nm | 12 nm | 12 nm | 12 nm | 12 nm |
| Shader units | 896 | 1.408 | 1.536 | 1.920 | 2.304 | 2.944 | 4.352 |
| Texture units | 56 | 88 | 96 | 120 | 144 | 184 | 272 |
| Tensor cores | - | - | - | 240 | 288 | 368 | 544 |
| RT Cores | - | - | - | 30 | 36 | 46 | 68 |
| Base clock speed | 1.485 MHz | 1.530 MHz | 1.500 MHz | 1.365 MHz | 1.410 MHz | 1.515 MHz | 1.350 MHz |
| Boost clock speed | 1.665 MHz | 1.785 MHz | 1.770 MHz | 1.680 MHz | 1.620 MHz | 1.710 MHz | 1.545 MHz |
| Memory interface | 128 Bit | 192 Bit | 192 Bit | 192 Bit | 256 Bit | 256 Bit | 352 Bit |
| Memory Bandwidth | 128 GB/s | 192.1 GB/s | 288 GB/s | 336 GB/s | 448 GB/s | 448 GB/s | 616 GB/s |
| Memory Size | 4 GB GDDR5 | 6 GB GDDR5 | 6 GB GDDR6 | 6 GB GDDR6 | 8 GB GDDR6 | 8 GB GDDR6 | 11 GB GDDR6 |
| TDP (in watts) | 75 W | 120 W | 120 W | 160 W | 175 W | 215 W | 250 W |
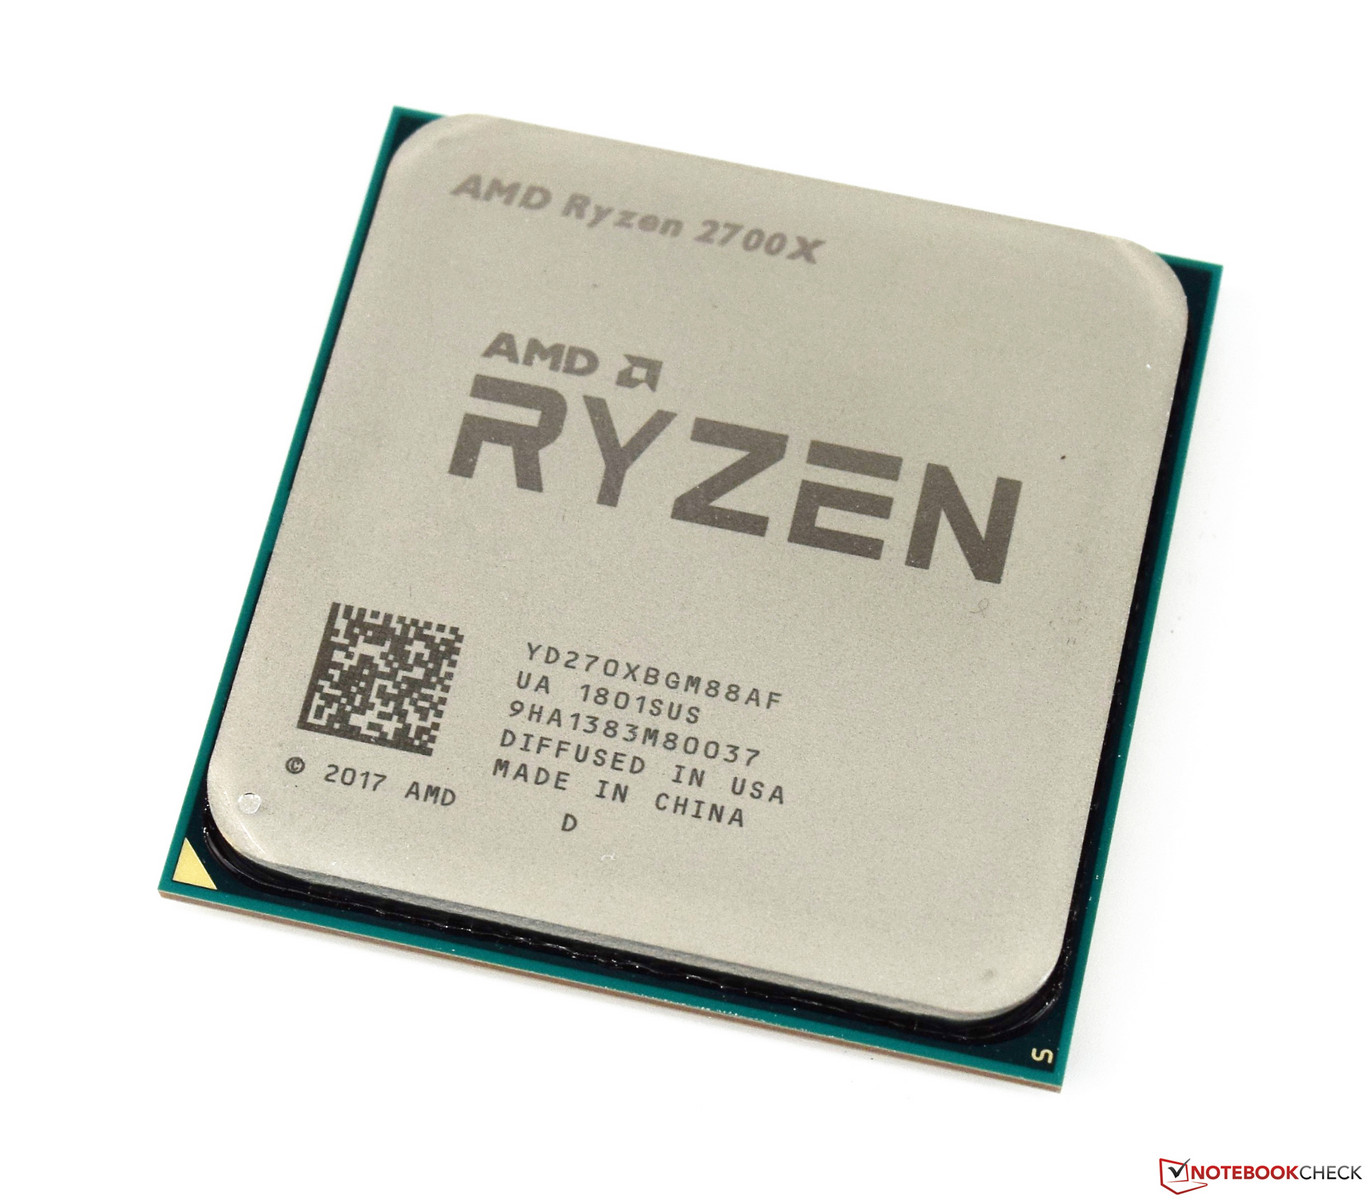
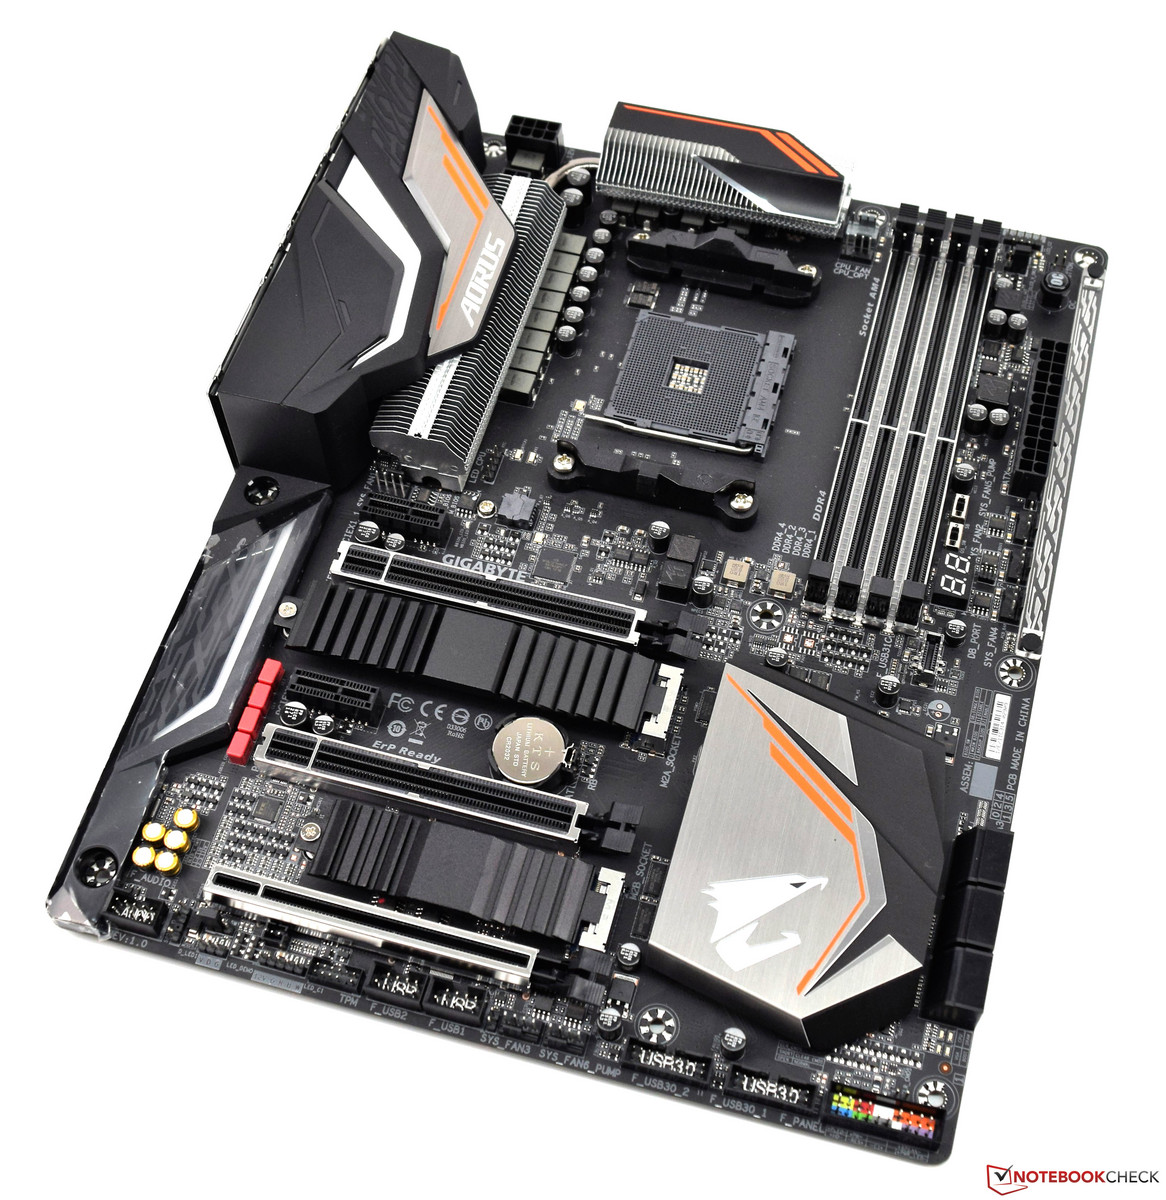
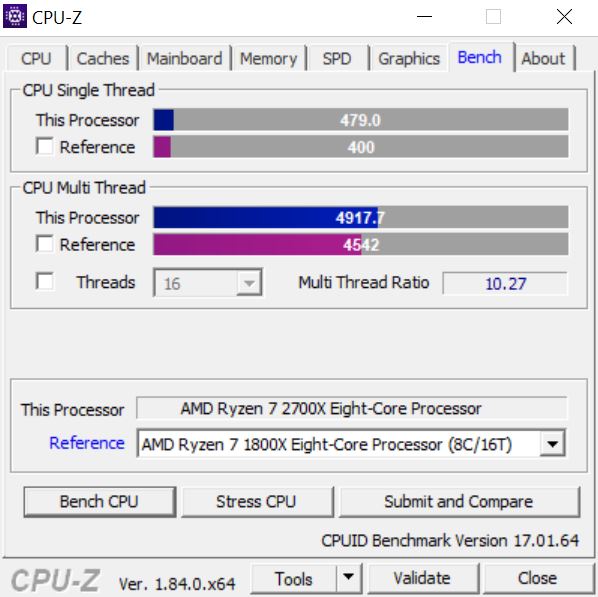
The Test Bench - Based on the Ryzen 7 2700X
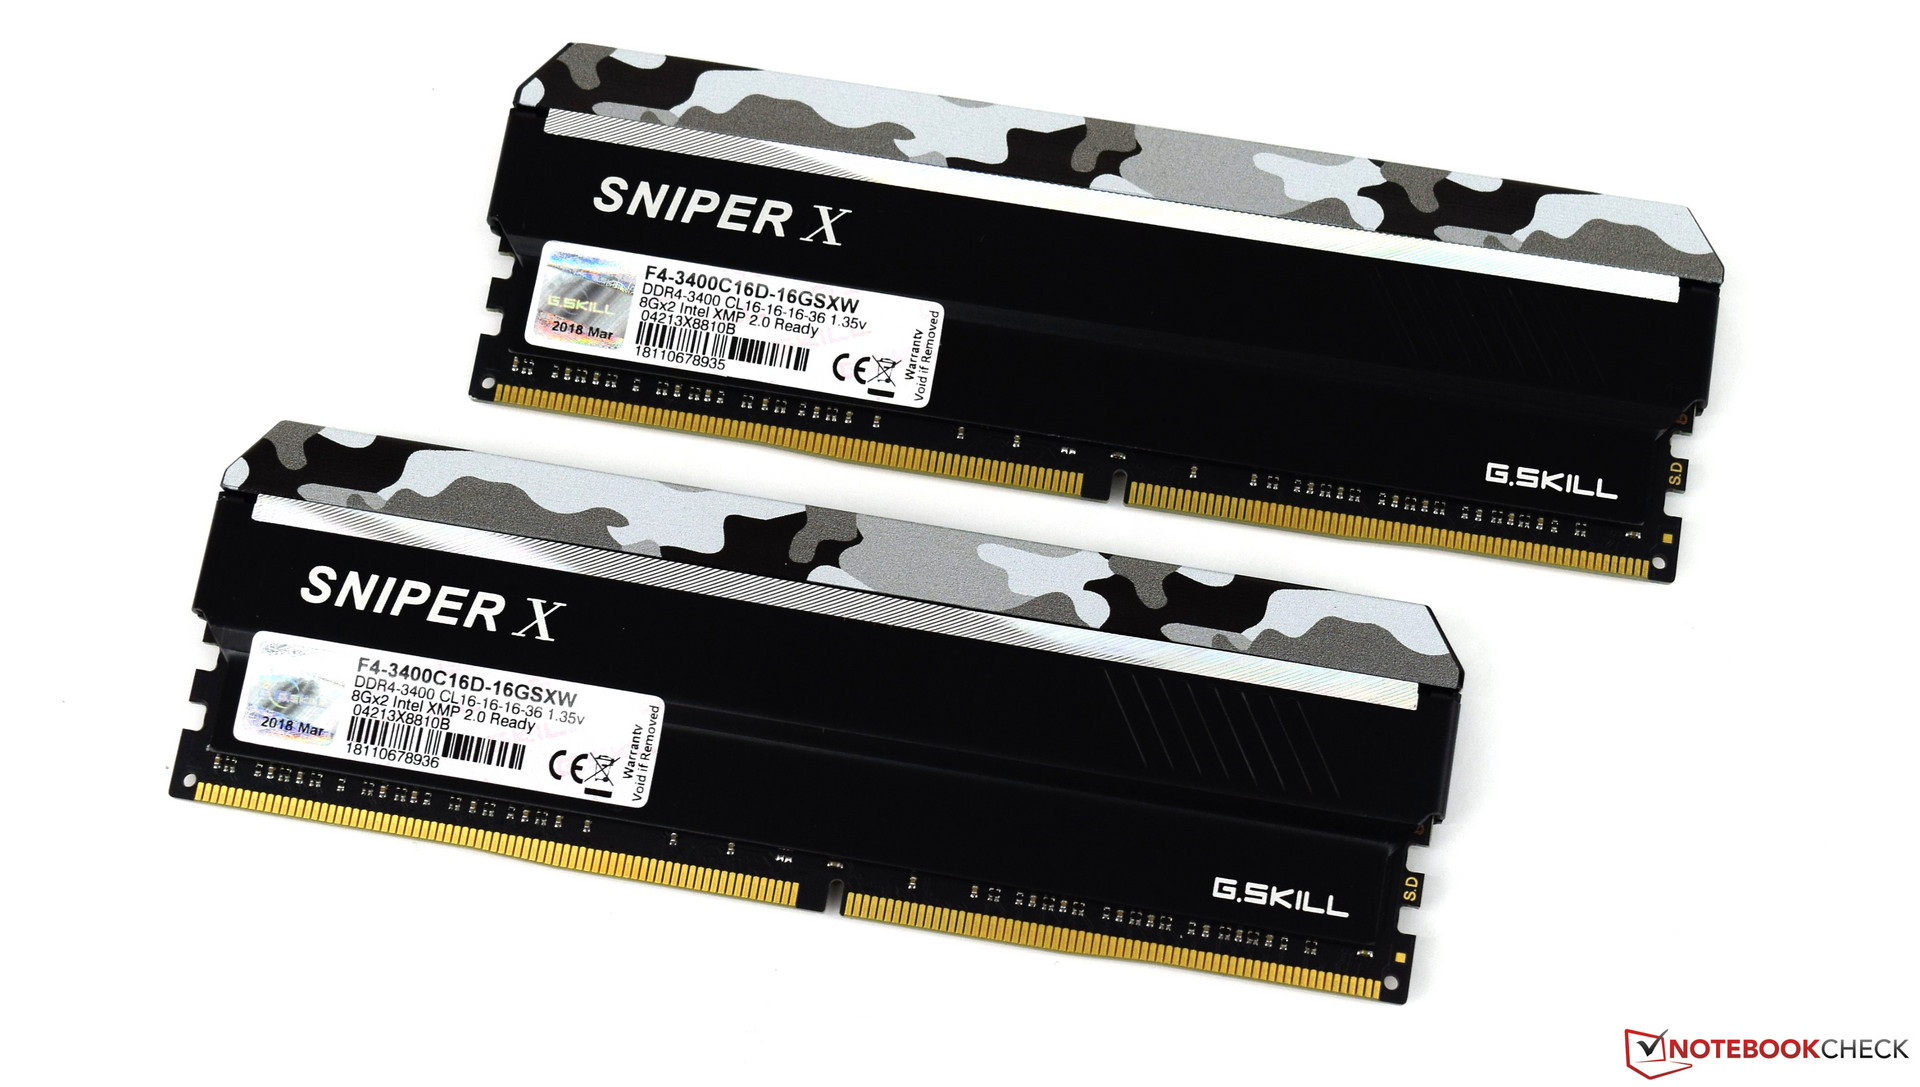
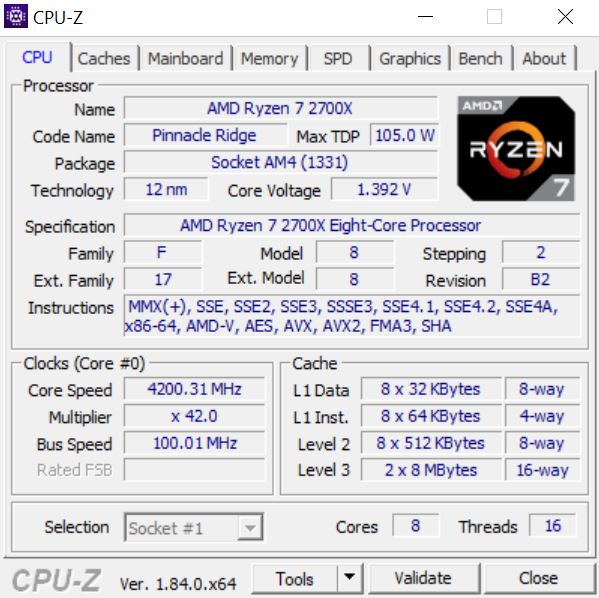
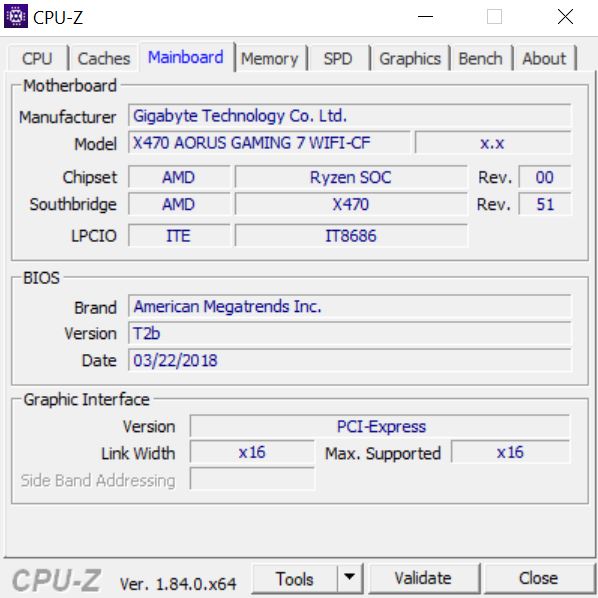
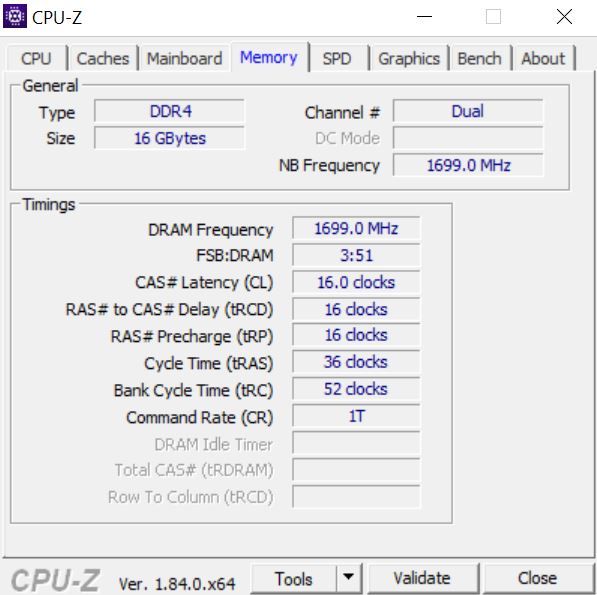
Our test bench is based on a current AMD platform. The Gigabyte X470 Aorus Gaming 7 Wi-Fi serves as the motherboard. The CPU, which is known as the AMD Ryzen 7 2700X, offers a lot of performance. The system is cooled by an all-in-one water cooler from Be Quiet (Silent Loop 280mm). The 16 GB of 3400 MHz RAM comes from G-Skill. The Acer Predator XB321HK does not represent a bottleneck, thanks to its 4K resolution. We are very grateful to AMD for providing us with the above-mentioned system.
| Case | Corsair Carbide Air 540 ATX Cube |
| CPU | AMD RYZEN 7 2700X |
| CPU Cooler | Be Quiet Silent Loop 280mm |
| RAM | G-Skill Sniper X 16 GB DDR4 3.400 MHz |
| Motherboard | Gigabyte X470 Aorus Gaming 7 WiFi |
| Monitor | Acer Predator XB321HK 4K |
| SSD | ADATA SP900 M.2 SSD |
| HDD | 2 TB Western Digital (for gaming) |
| Operating system | Microsoft Windows 10 Professional 64-Bit (Version 1809) |
| Drivers | Nvidia 425.31 |


A look at the Nvidia GeForce GTX 1660 Ti
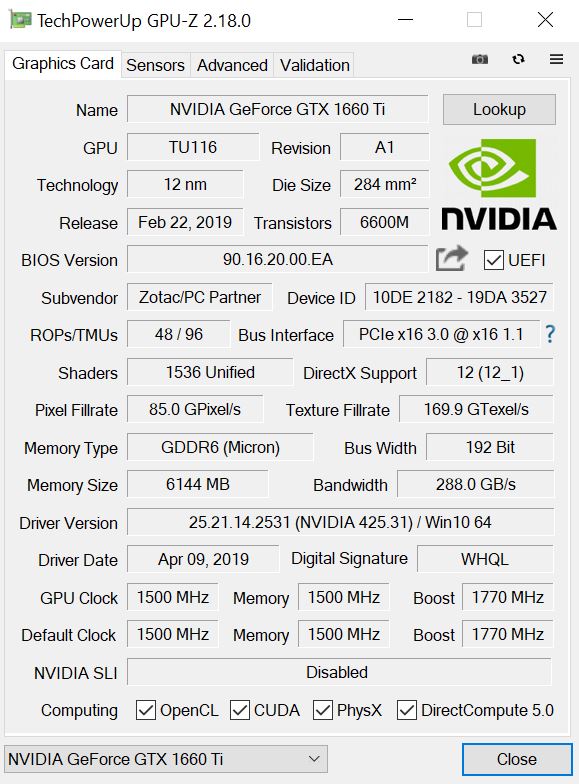
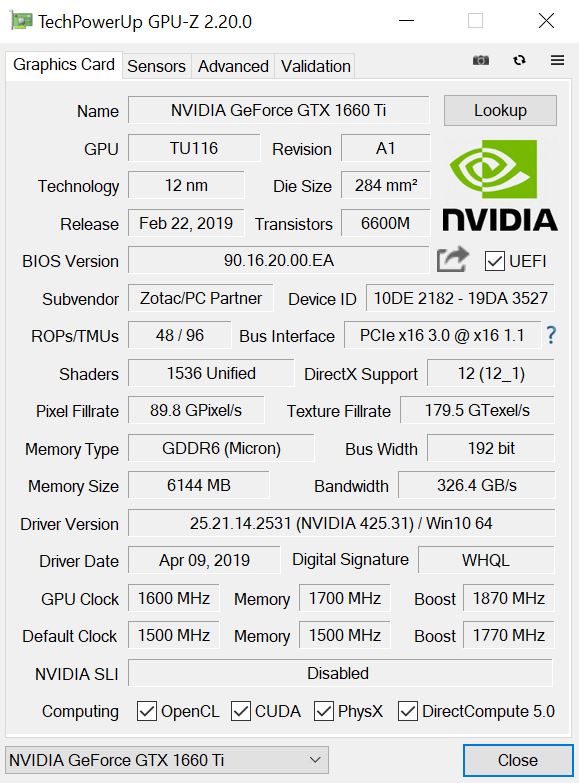
The Nvidia GeForce GTX 1660 Ti is a powerful, mid-tier, Turing-based, desktop GPU. The GTX 1660 Ti relies on the TU116 chip with 1536 shader units, 48 ROPs, 96 TMUs and a 192-bit-wide memory bus (clocked at 6 GHz, effectively 12 GHz, bandwidth: up to 288 GB/s). The notebook version of the GTX 1660 Ti is 10 to 20 % slower due to a lower TDP.
The TU116 chip and other Turing-based GPUs are produced using the 12-nm manufacturing process. However, the GeForce GTX 1660 Ti does not offer the latest features such as DLSS (Deep Learning Super Sampling) and Real Time Ray Tracing. Nevertheless, there are some architectural improvements when it comes to floating point and integer performance. These operations can now be carried out simultaneously. Other notable features include Adaptive Shading, unified cache, DisplayPort 1.4, HDMI 2.0b, HDR, Simultaneous Multi-Projection (SMP) as well as H.265 encoding and decoding (PlayReady 3.0).
At Full HD resolution, the GeForce GTX 1660 Ti performs somewhat worse than the GeForce GTX 1070, but significantly better than the GeForce GTX 1060. Therefore, it is best-suited for Full HD gaming. However, it can run less demanding titles in 1440p.
The energy consumption of the GeForce GTX 1660 Ti amounts to 120 watts. The older GeForce GTX 1060 also has a TDP of 120 watts.
GeForce GTX 1600 Series
| ||||||||||||||||||||||||||||||||||
| Codename | Turing TU116 | |||||||||||||||||||||||||||||||||
| Architecture | Turing | |||||||||||||||||||||||||||||||||
| Pipelines | 1536 - unified | |||||||||||||||||||||||||||||||||
| Core Speed | 1500 - 1770 (Boost) MHz | |||||||||||||||||||||||||||||||||
| Memory Speed | 12000 MHz | |||||||||||||||||||||||||||||||||
| Memory Bus Width | 192 Bit | |||||||||||||||||||||||||||||||||
| Memory Type | GDDR6 | |||||||||||||||||||||||||||||||||
| Max. Amount of Memory | 6 GB | |||||||||||||||||||||||||||||||||
| Shared Memory | no | |||||||||||||||||||||||||||||||||
| API | DirectX 12_1, Shader 6.4, OpenGL 4.6 | |||||||||||||||||||||||||||||||||
| Power Consumption | 120 Watt | |||||||||||||||||||||||||||||||||
| Transistor Count | 6.6 Billion | |||||||||||||||||||||||||||||||||
| Man. Technology | 12 nm | |||||||||||||||||||||||||||||||||
| Date of Announcement | 22.02.2019 | |||||||||||||||||||||||||||||||||
| Link to Manufacturer Page | www.nvidia.com | |||||||||||||||||||||||||||||||||
The Core Clocks of the Zotac GeForce GTX 1660 Ti
The Zotac GeForce GTX 1660 Ti offers the same base core clock as Nvidia’s reference model (1500 MHz). The maximum boost clock is 1770 MHz. The VRAM comes from Micron and operates at an effective frequency of 12 GHz.
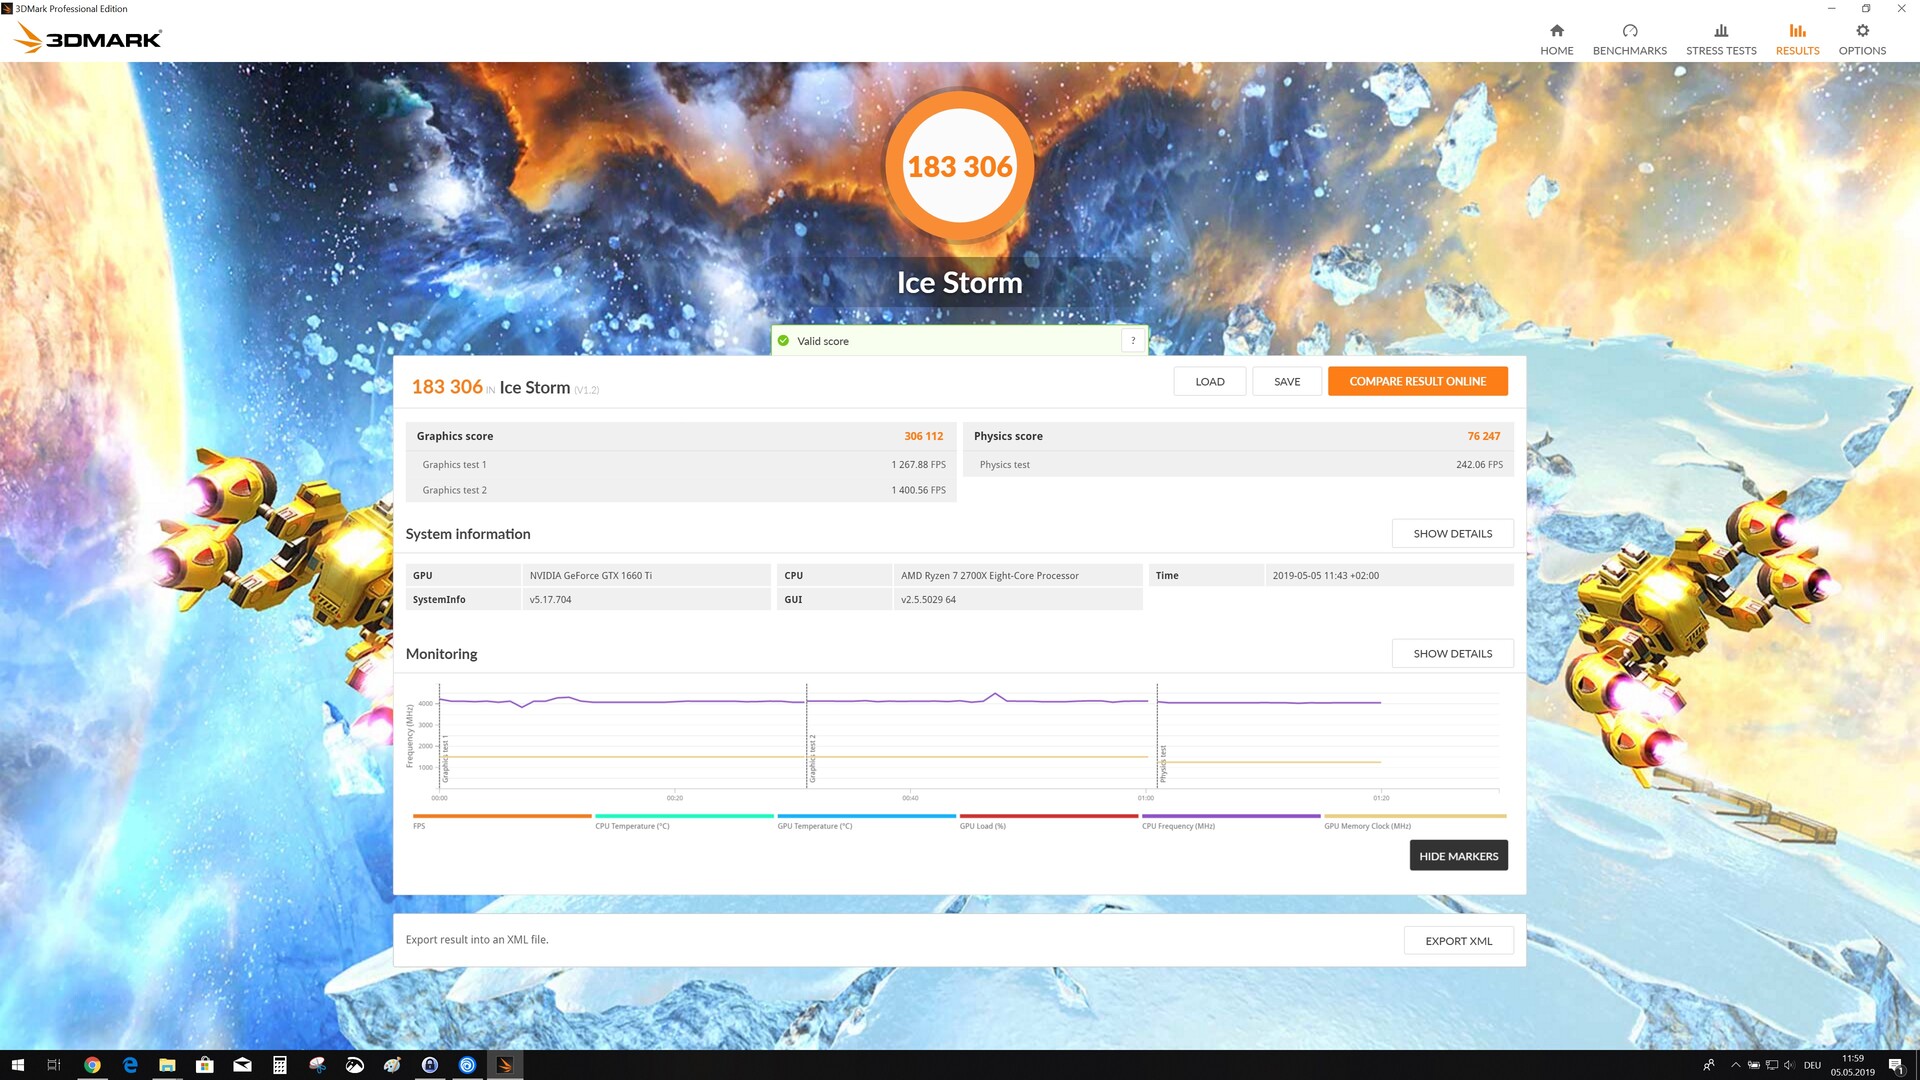
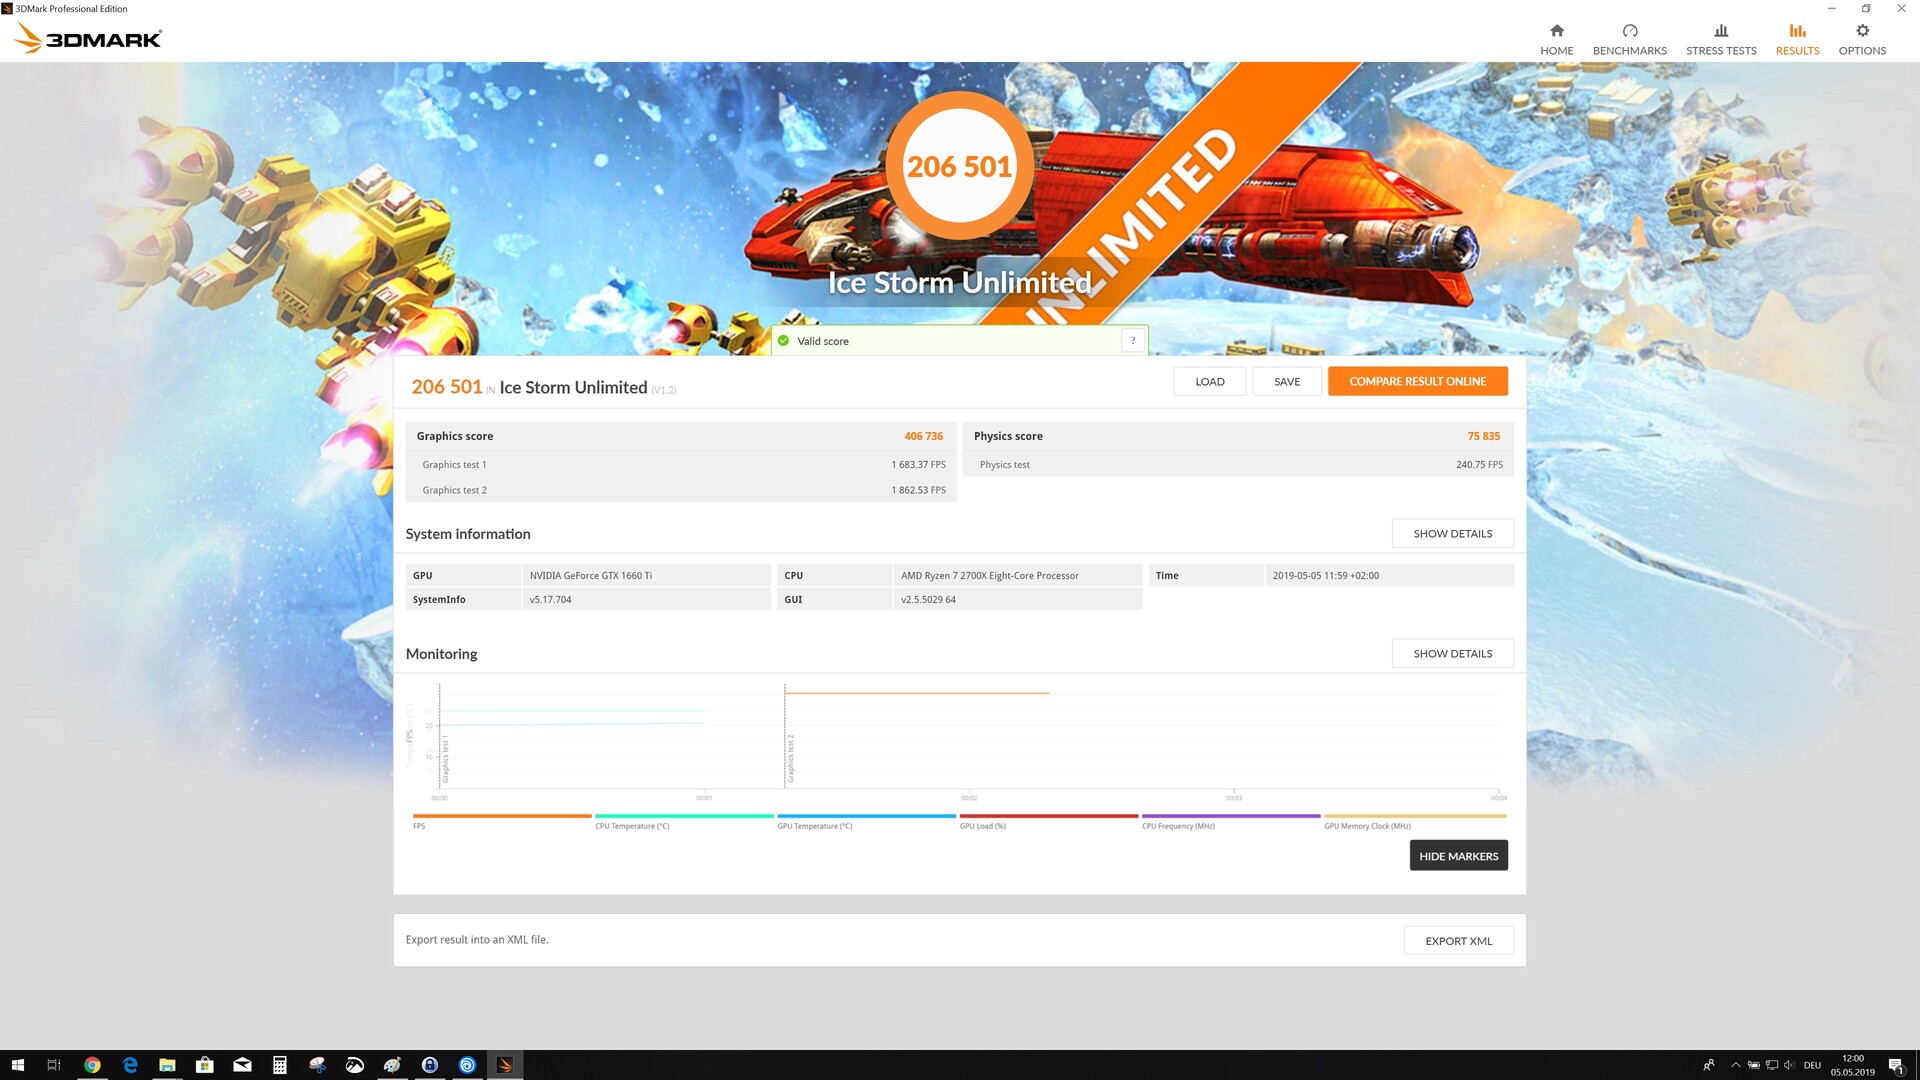
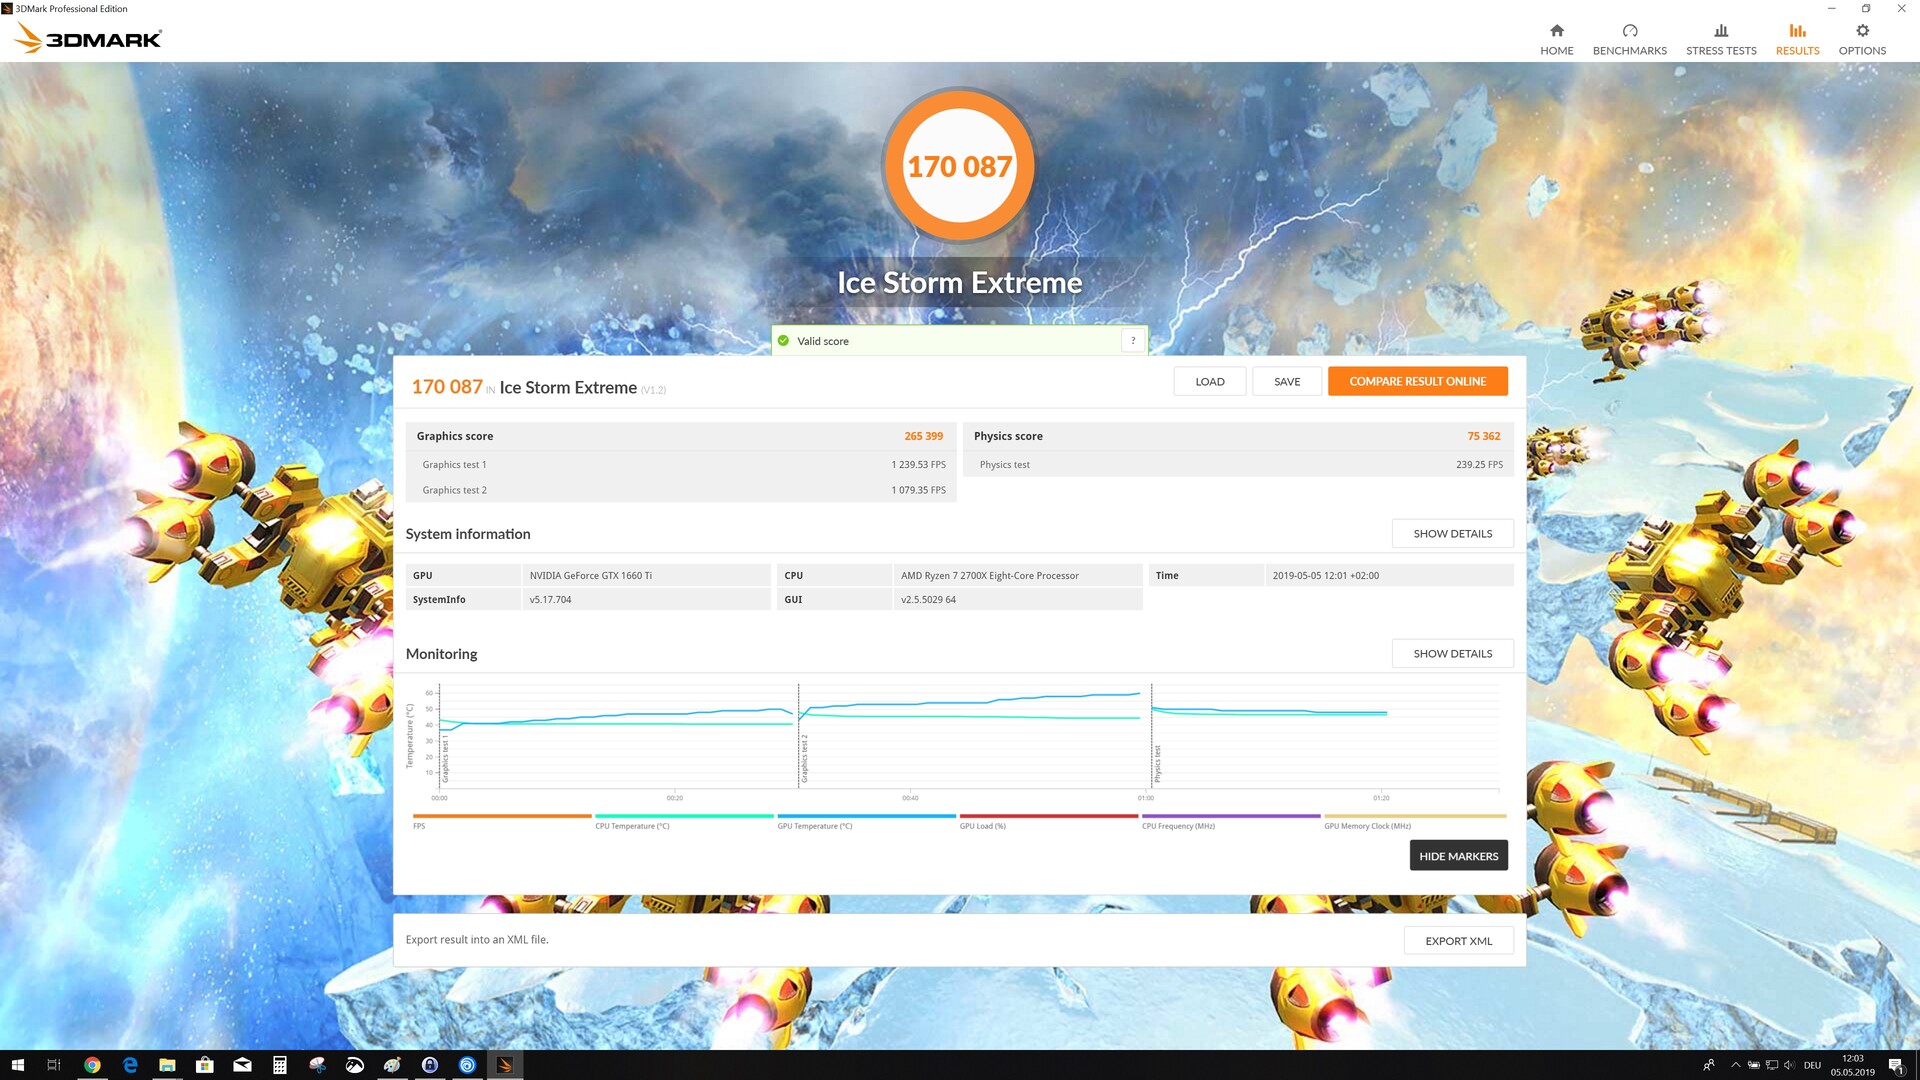
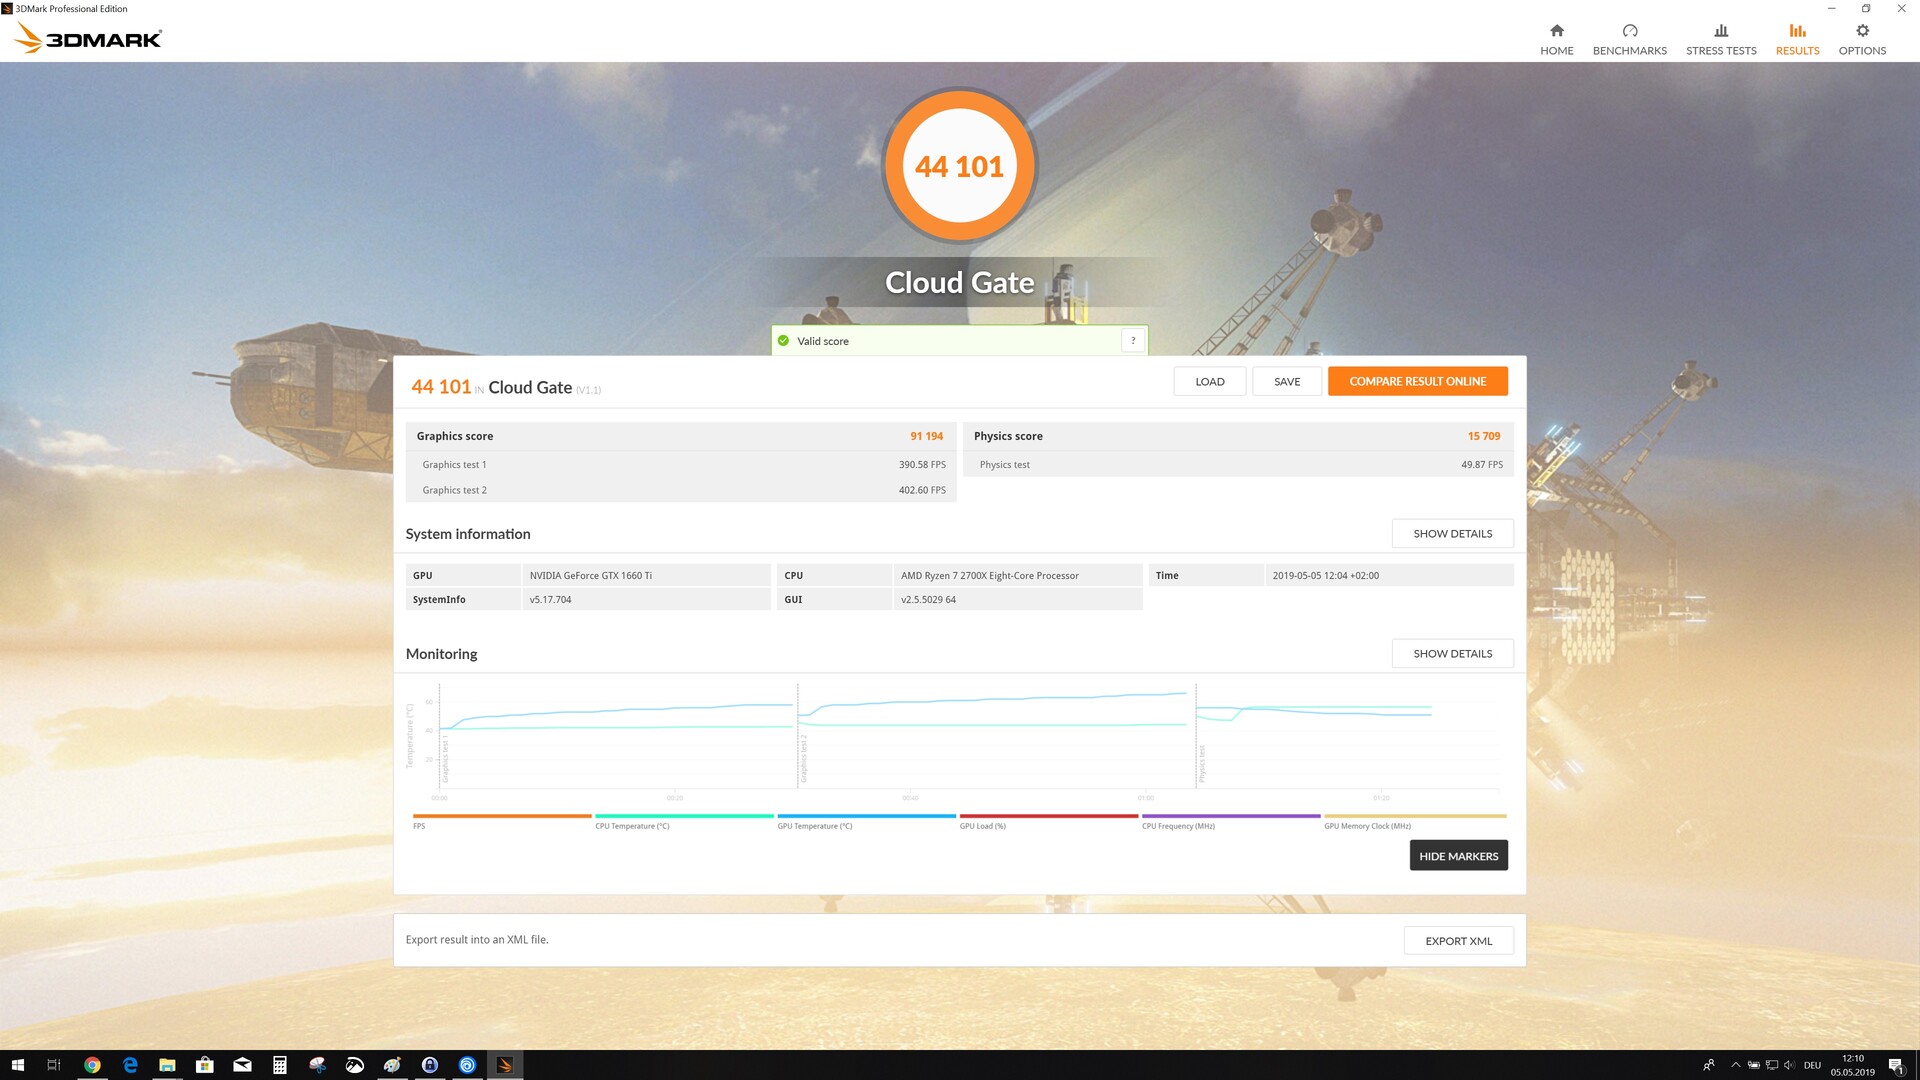
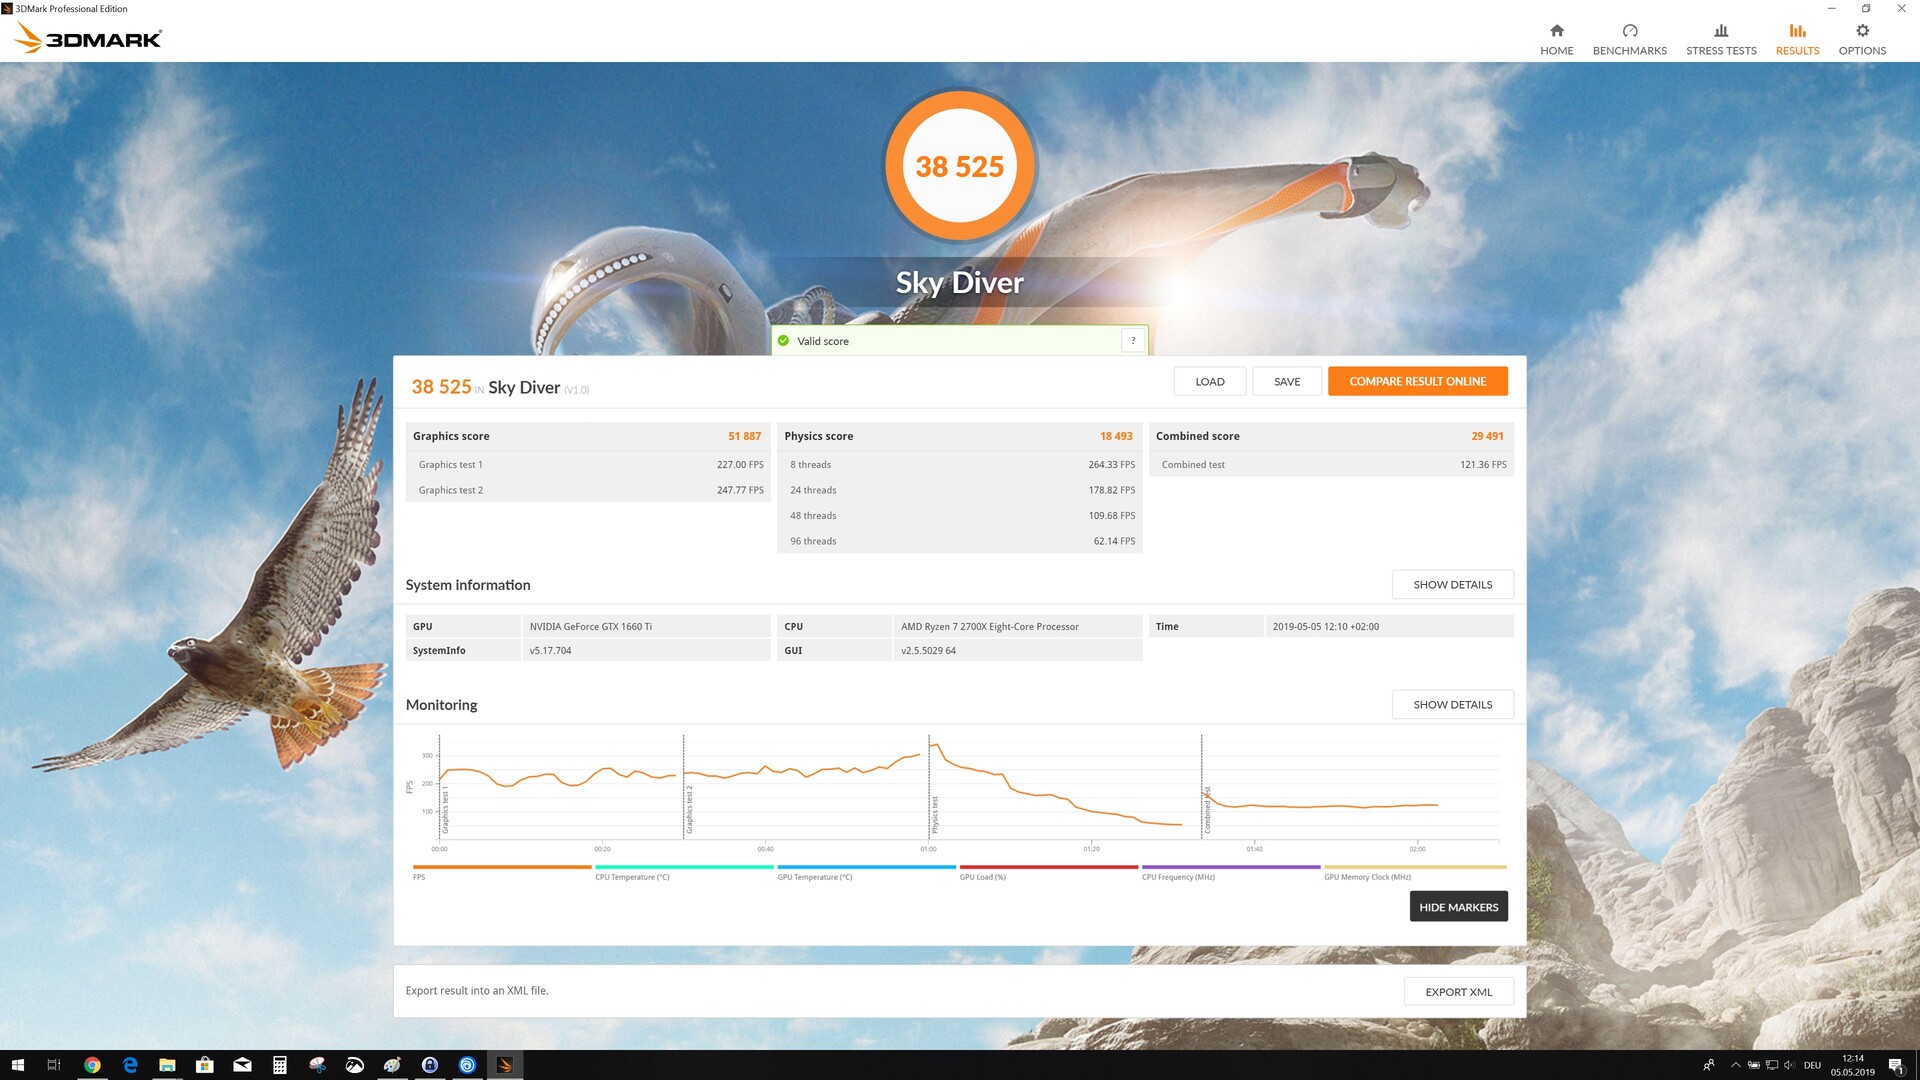
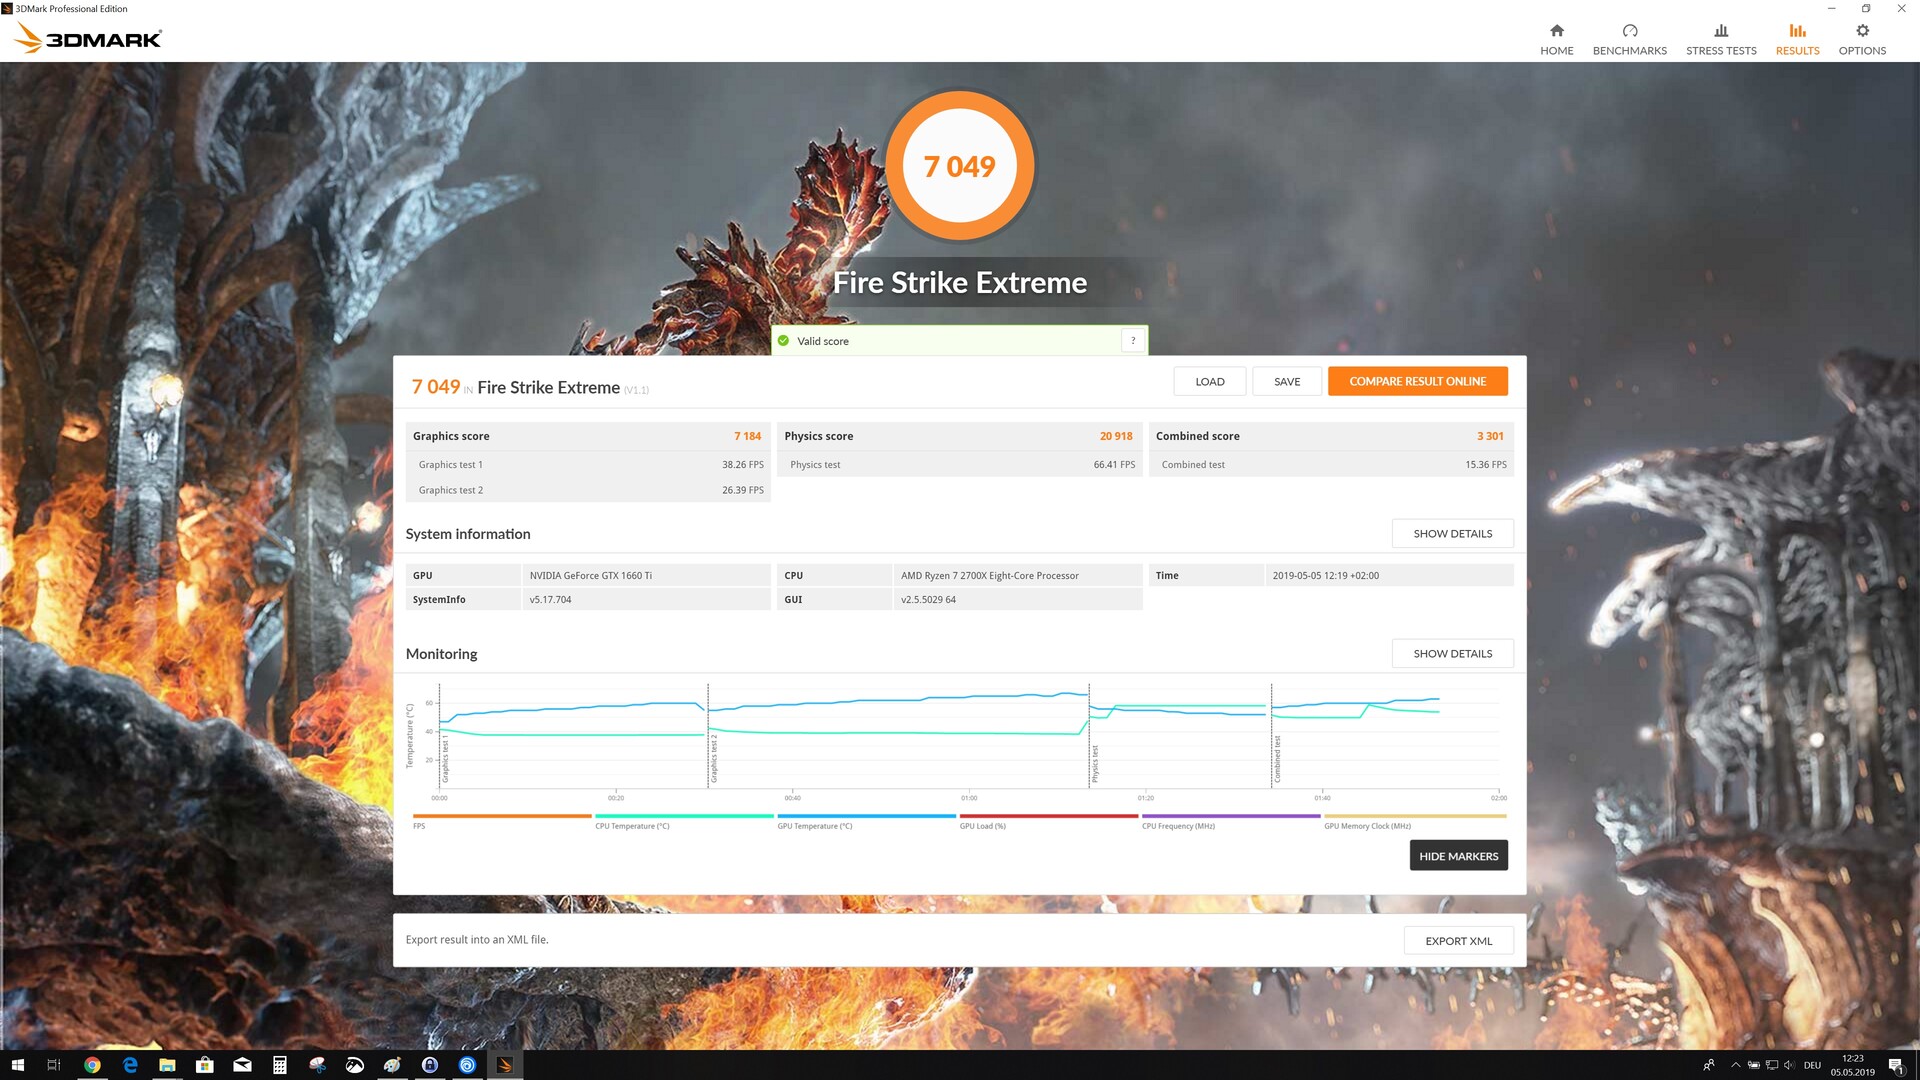
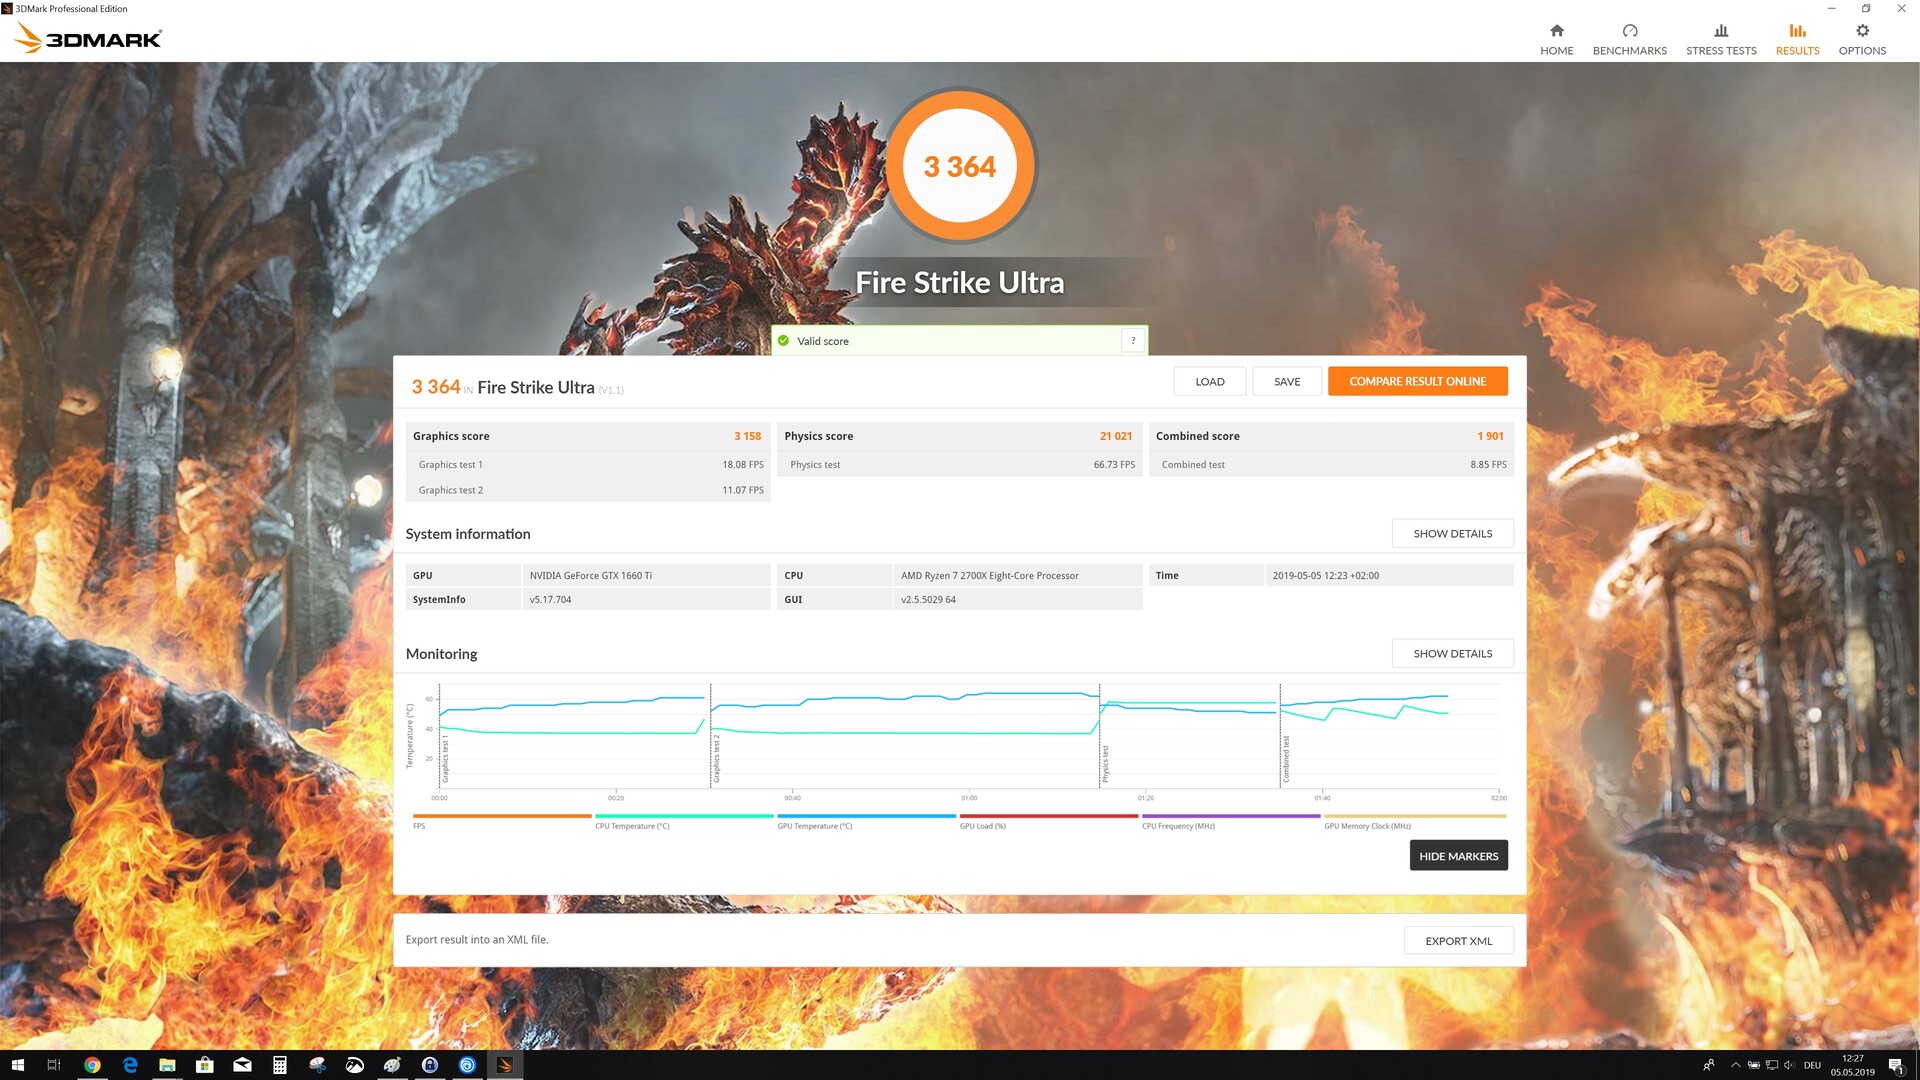
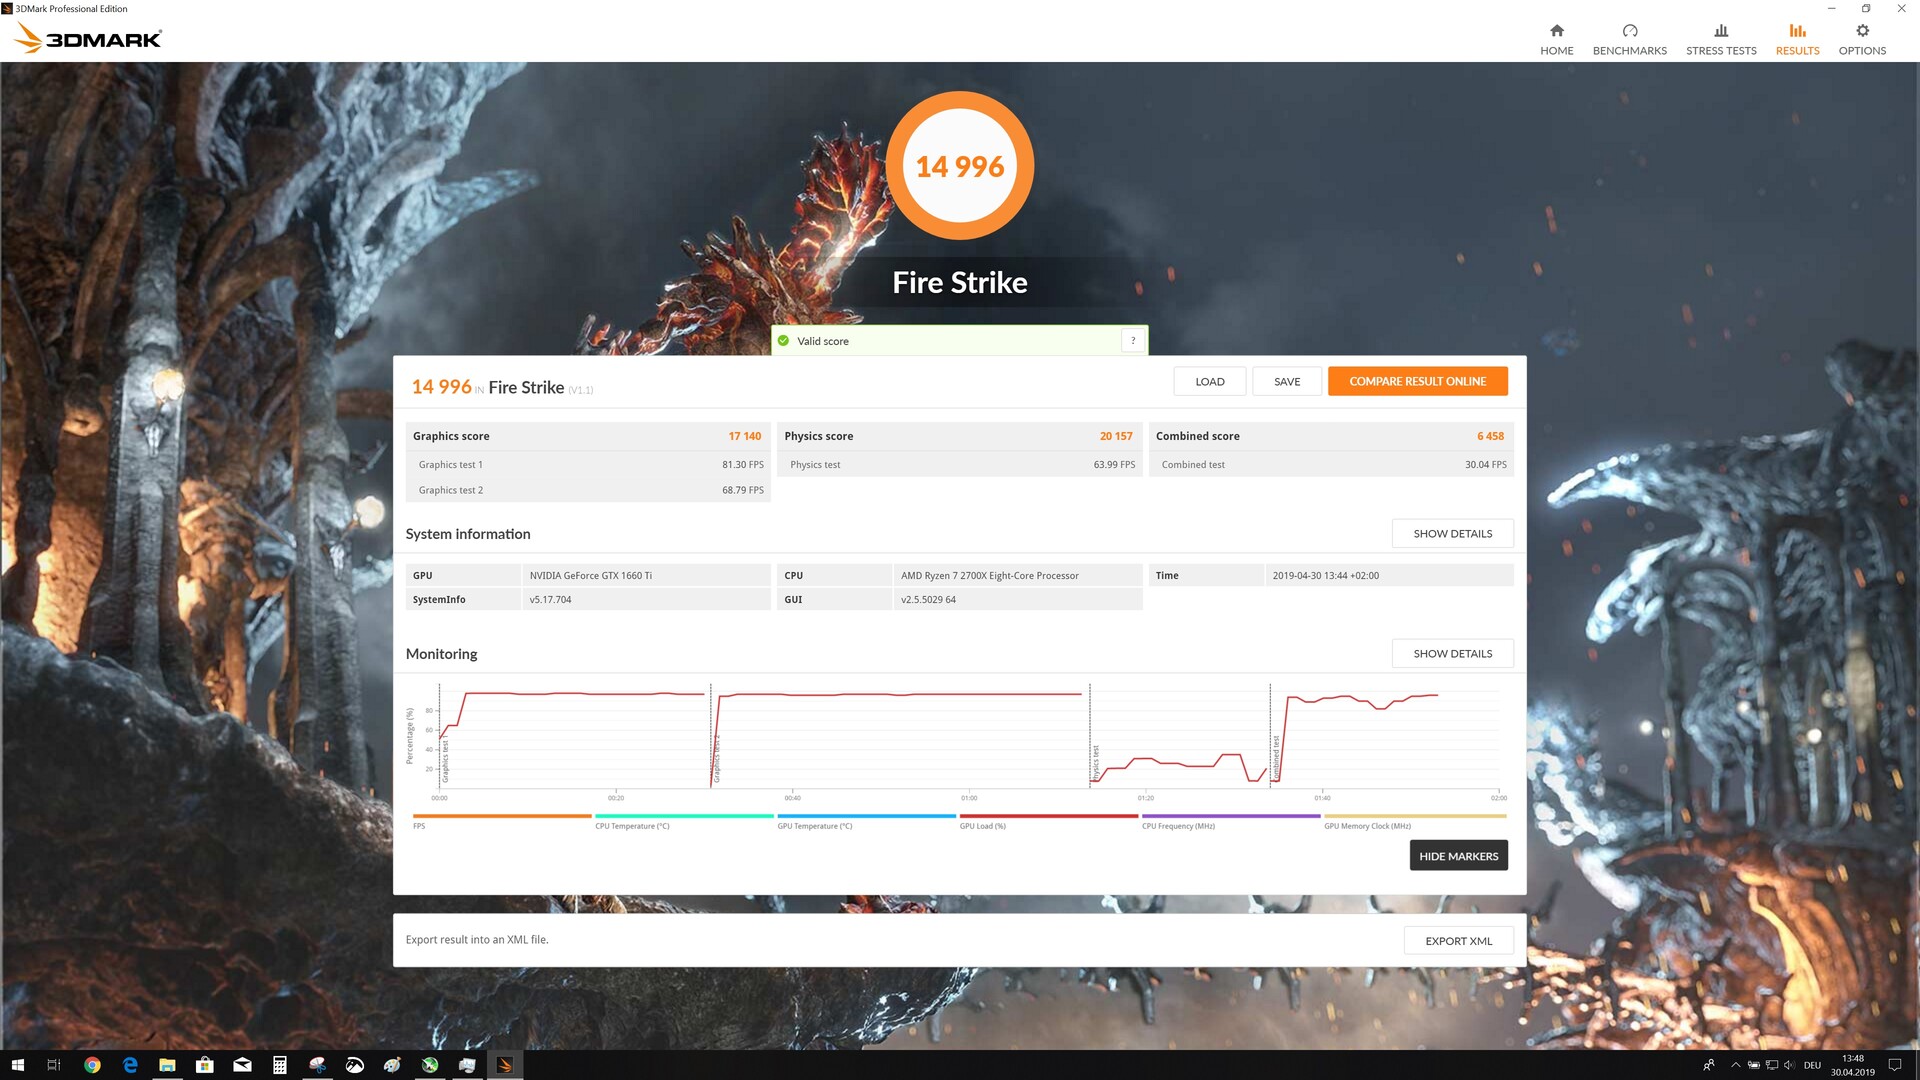
Synthetic Benchmarks
The synthetic benchmarks reveal the position of the GTX 1660 Ti in Nvidia’s product stack. It fills the gap between the GeForce GTX 1060 and the GeForce GTX 1070. The GTX 1660 Ti cannot compete with the GeForce RTX 2060, because the latter GPU is faster than the GTX 1070. When compared to competitors from AMD, the GTX 1660 Ti is roughly on the same level as the Radeon RX 590. The GTX 1660 Ti cannot keep up with AMD’s Vega-branded GPUs.


| 3DMark 03 Standard | 136483 points | |
| 3DMark 05 Standard | 34535 points | |
| 3DMark 06 Standard Score | 35659 points | |
| 3DMark Vantage P Result | 62128 points | |
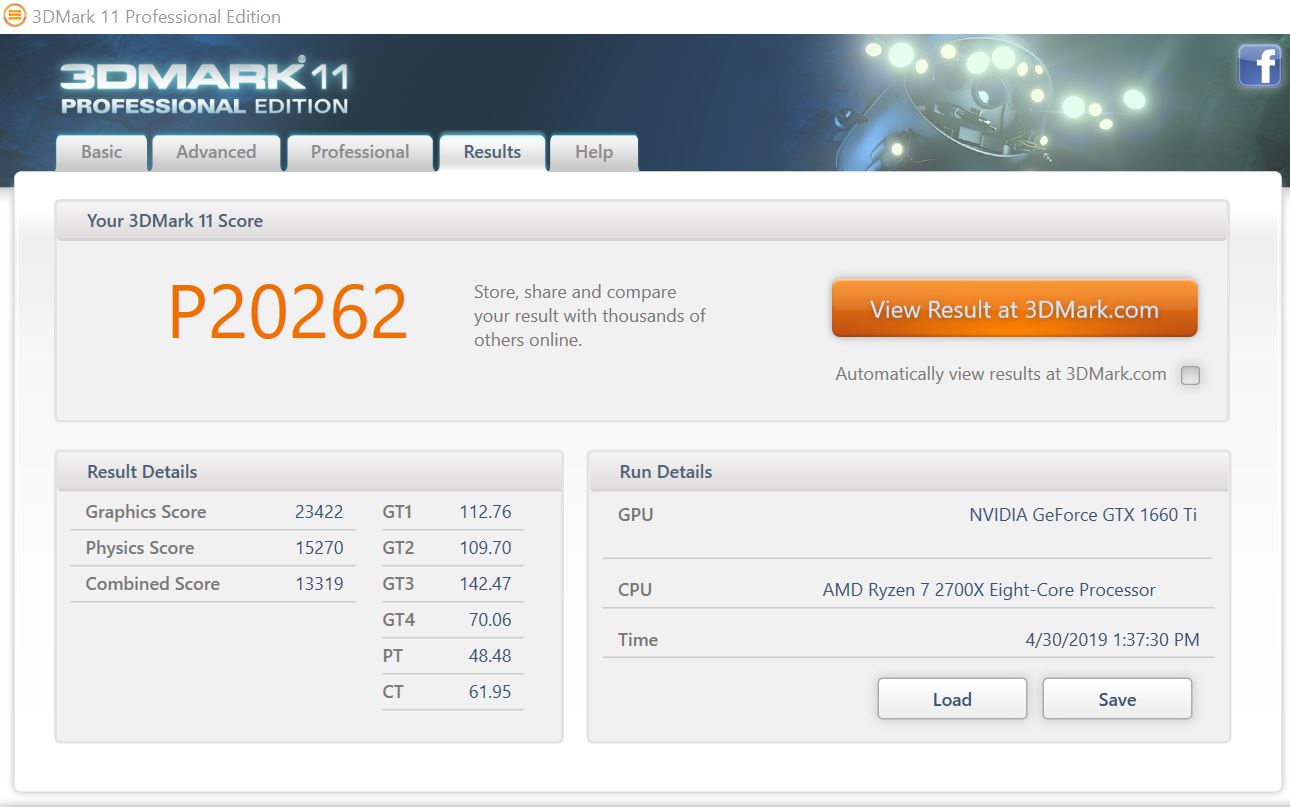
| 3DMark 11 Performance | 26565 points | |
| 3DMark Ice Storm Standard Score | 197964 points | |
| 3DMark Cloud Gate Standard Score | 48366 points | |
| 3DMark Fire Strike Score | 20451 points | |
| 3DMark Fire Strike Extreme Score | 12092 points | |
| 3DMark Time Spy Score | 8797 points | |
Help | ||
Gaming Benchmarks
The Zotac GeForce GTX 1660 Ti does much better in the gaming benchmarks than in the synthetic benchmarks. Here, it handily beats the GTX 1060 and is much closer in terms of performance to the GTX 1070. In some titles, the GTX 1660 Ti manages to beat the GTX 1070. AMD’s RX 580 and RX 590 are about 10% slower than the GTX 1660 Ti. However, there are large swings in performance from title to title. The AMD Radeon RX Vega 56 beats the GTX 1660 Ti in most games and battles it out with the GeForce RTX 2060.
All in all, the Zotac GeForce GTX 1660 Ti offers good performance and can run all current games in 1080p on the highest settings. Somewhat older or non-demanding titles such as "FIFA 19" or "Overwatch" are playable in 4K.
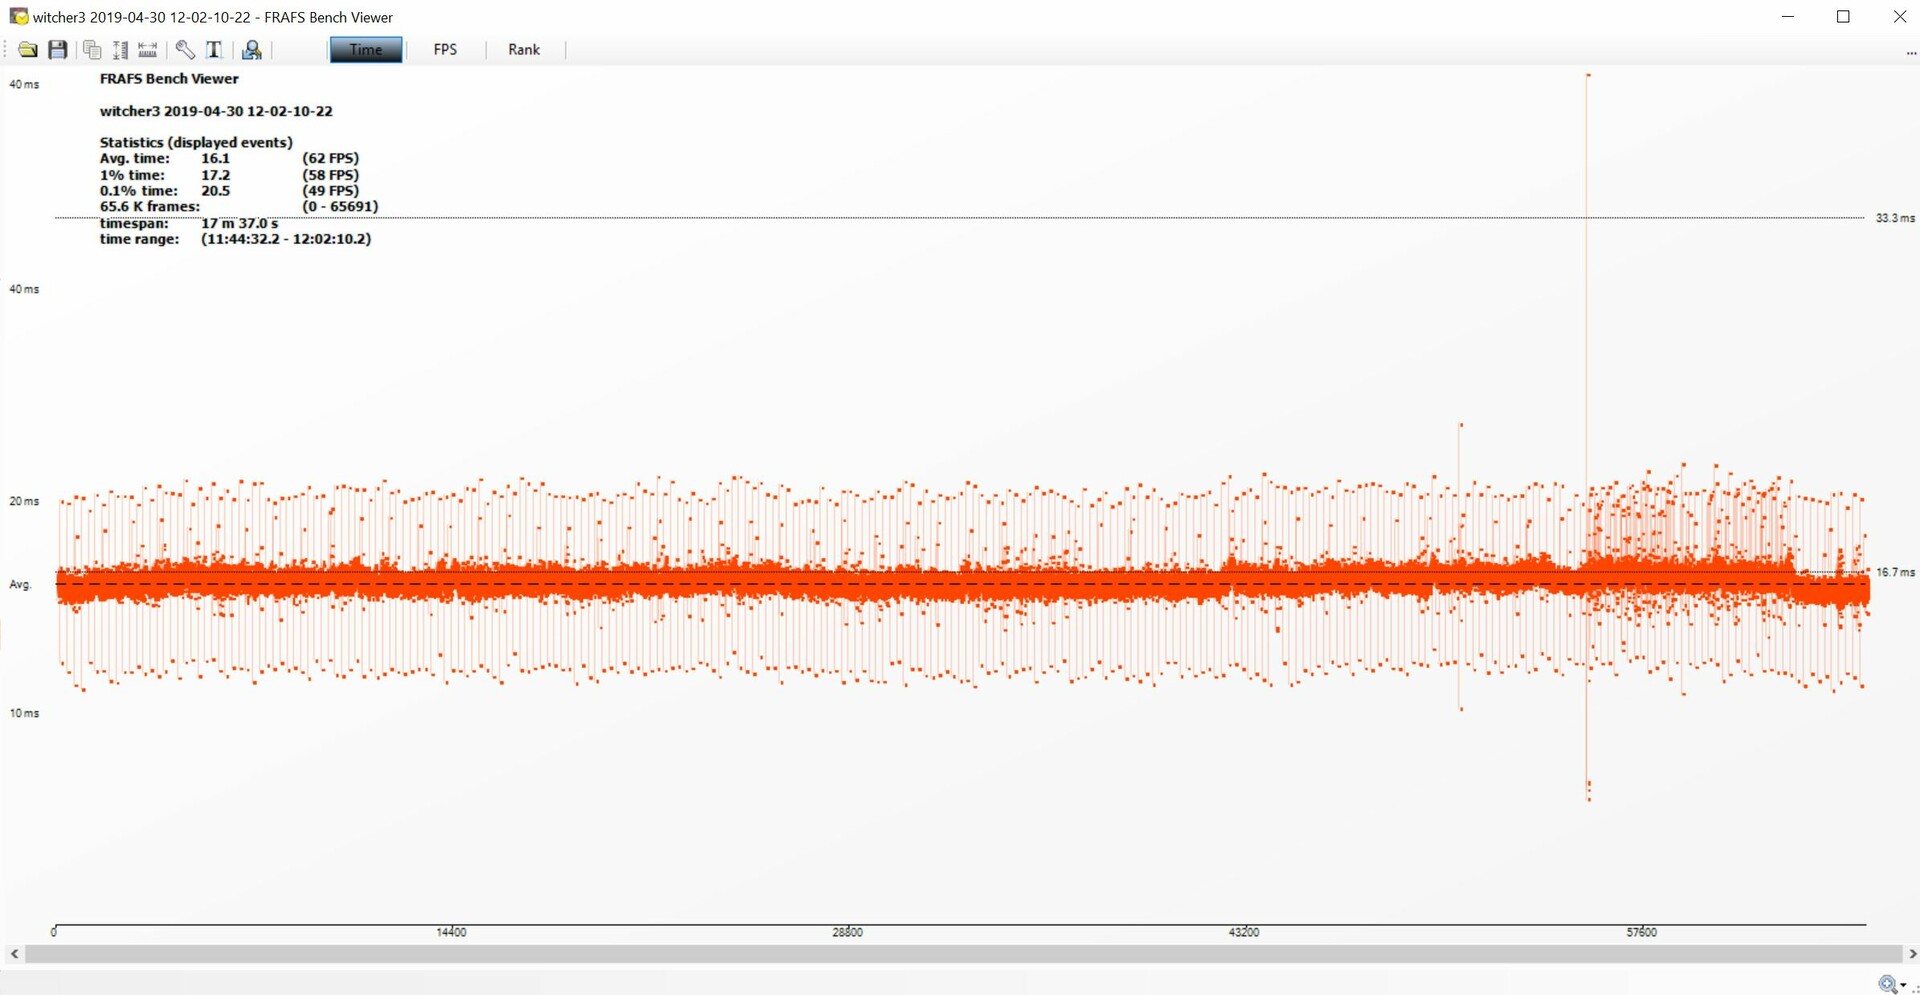
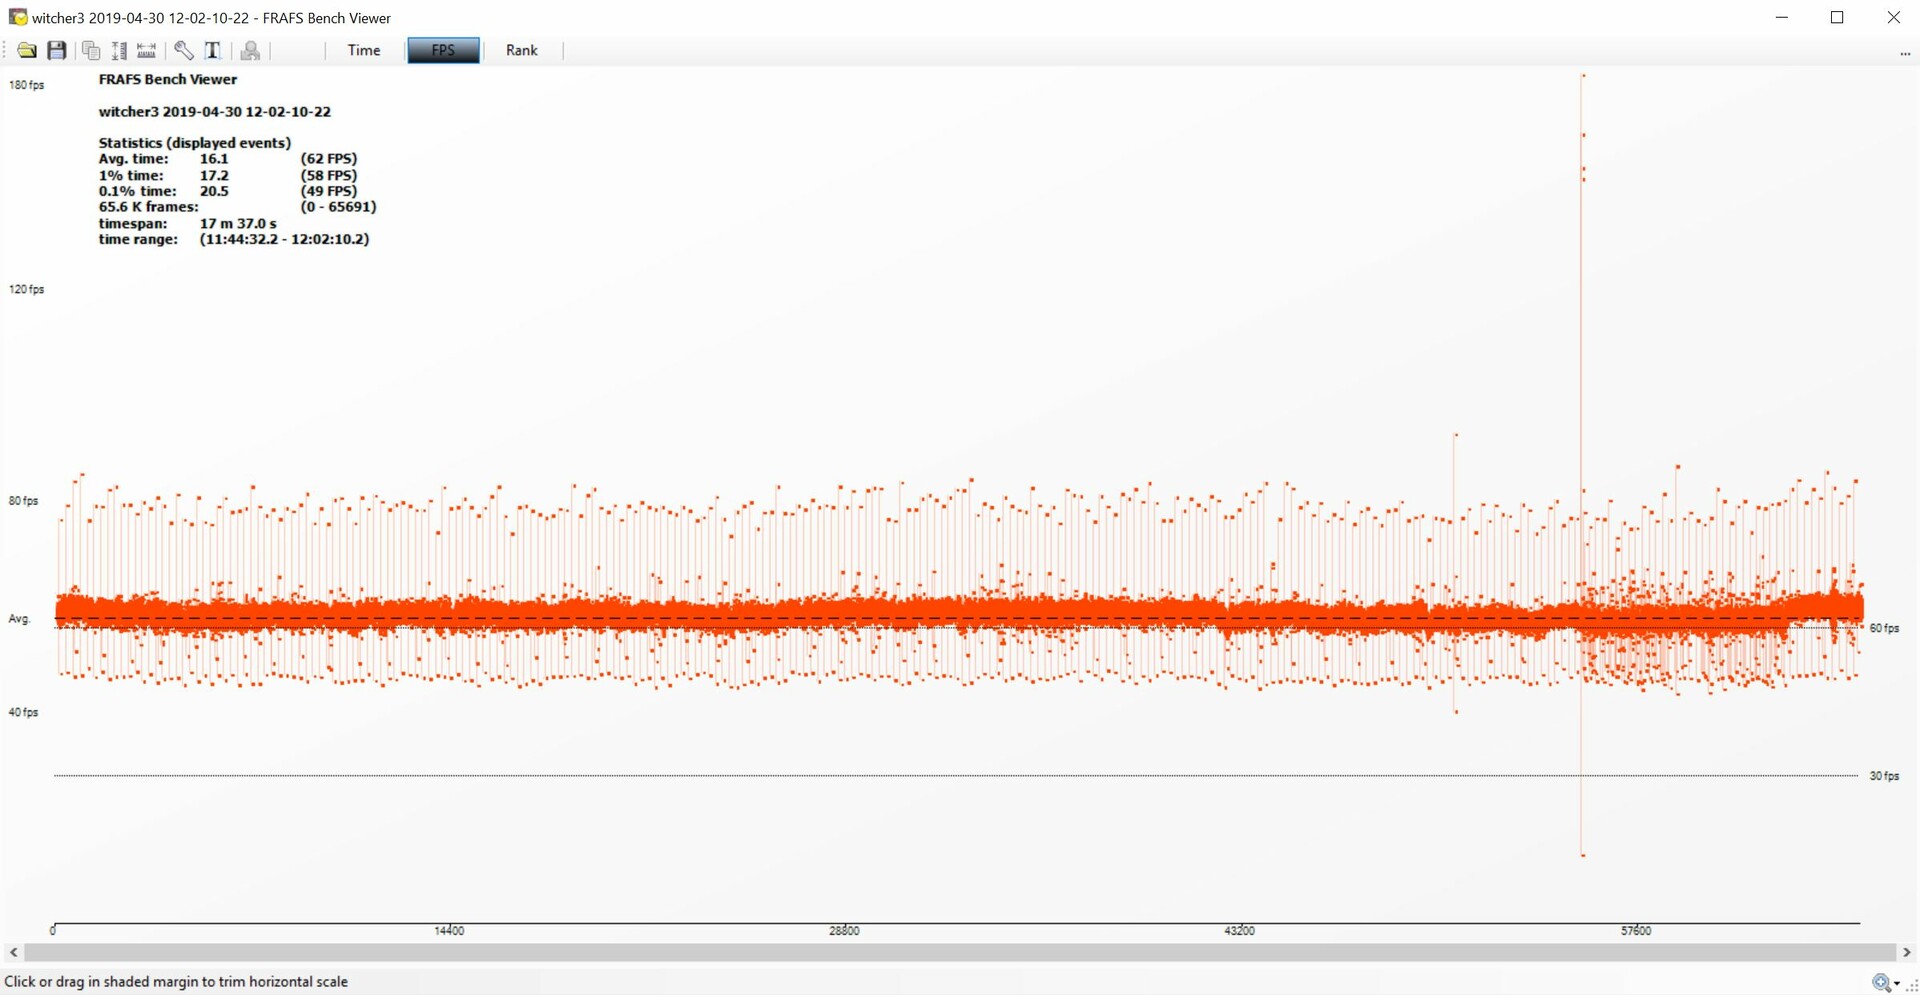
We use the video game titled "The Witcher 3" to examine how well the graphics card performs under load. We run the game on ultra settings and record both the frame rate and the frame time. There are no drops in performance, which means that the Zotac GeForce GTX 1660 Ti is suitable for long gaming sessions and that its cooling solution is working well. At an average frame rate of 62 FPS, "The Witcher 3" should feel buttery-smooth and stutter-free. The frame time performance is also good.
The Witcher 3 frame rate
| Call of Duty Black Ops 4 - 1920x1080 Very High / On | |
| MSI AMD Radeon RX Vega 56 Air Boost OC Edition 8 GB | |
| MSI RTX 2060 Gaming Z 6G | |
| Zotac GeForce GTX 1660 Ti 6 GB | |
| XFX AMD Radeon RX 590 OC+ 8 GB | |
| Nvidia GeForce GTX 1070 | |
| Sapphire Radeon RX 580 Nitro+ 8 GB | |
| Desktop PC | |
| Assassin´s Creed Odyssey - 1920x1080 Ultra High Preset | |
| Nvidia GeForce GTX 1070 | |
| MSI RTX 2060 Gaming Z 6G | |
| Zotac GeForce GTX 1660 Ti 6 GB | |
| MSI AMD Radeon RX Vega 56 Air Boost OC Edition 8 GB | |
| XFX AMD Radeon RX 590 OC+ 8 GB | |
| Desktop PC | |
| Sapphire Radeon RX 580 Nitro+ 8 GB | |
| Asus ROG Strix RX 580 8 GB | |
| FIFA 19 - 1920x1080 Ultra Preset AA:4x MS | |
| Nvidia GeForce GTX 1070 | |
| Sapphire Radeon RX 580 Nitro+ 8 GB | |
| MSI AMD Radeon RX Vega 56 Air Boost OC Edition 8 GB | |
| Asus ROG Strix RX 580 8 GB | |
| Desktop PC | |
| XFX AMD Radeon RX 590 OC+ 8 GB | |
| Zotac GeForce GTX 1660 Ti 6 GB | |
| MSI RTX 2060 Gaming Z 6G | |
| Forza Horizon 4 - 1920x1080 Ultra Preset AA:2xMS | |
| MSI AMD Radeon RX Vega 56 Air Boost OC Edition 8 GB | |
| MSI RTX 2060 Gaming Z 6G | |
| Nvidia GeForce GTX 1070 | |
| Zotac GeForce GTX 1660 Ti 6 GB | |
| XFX AMD Radeon RX 590 OC+ 8 GB | |
| Sapphire Radeon RX 580 Nitro+ 8 GB | |
| Asus ROG Strix RX 580 8 GB | |
| Desktop PC | |
| F1 2018 - 1920x1080 Ultra High Preset AA:T AF:16x | |
| MSI RTX 2060 Gaming Z 6G | |
| MSI AMD Radeon RX Vega 56 Air Boost OC Edition 8 GB | |
| Nvidia GeForce GTX 1070 | |
| Zotac GeForce GTX 1660 Ti 6 GB | |
| XFX AMD Radeon RX 590 OC+ 8 GB | |
| Sapphire Radeon RX 580 Nitro+ 8 GB | |
| Asus ROG Strix RX 580 8 GB | |
| Desktop PC | |
| Monster Hunter World - 1920x1080 Highest Preset (Image Quality High) | |
| MSI RTX 2060 Gaming Z 6G | |
| Nvidia GeForce GTX 1070 | |
| MSI AMD Radeon RX Vega 56 Air Boost OC Edition 8 GB | |
| Zotac GeForce GTX 1660 Ti 6 GB | |
| XFX AMD Radeon RX 590 OC+ 8 GB | |
| Sapphire Radeon RX 580 Nitro+ 8 GB | |
| Asus ROG Strix RX 580 8 GB | |
| Desktop PC | |
| Far Cry 5 - 1920x1080 Ultra Preset AA:T | |
| Nvidia GeForce GTX 1070 | |
| MSI RTX 2060 Gaming Z 6G | |
| Zotac GeForce GTX 1660 Ti 6 GB | |
| MSI AMD Radeon RX Vega 56 Air Boost OC Edition 8 GB | |
| XFX AMD Radeon RX 590 OC+ 8 GB | |
| Sapphire Radeon RX 580 Nitro+ 8 GB | |
| Desktop PC | |
| Asus ROG Strix RX 580 8 GB | |
| The Crew 2 - 1920x1080 Ultra Preset | |
| Desktop PC | |
| Nvidia GeForce GTX 1070 | |
| Asus ROG Strix RX 580 8 GB | |
| XFX AMD Radeon RX 590 OC+ 8 GB | |
| MSI RTX 2060 Gaming Z 6G | |
| MSI AMD Radeon RX Vega 56 Air Boost OC Edition 8 GB | |
| Zotac GeForce GTX 1660 Ti 6 GB | |
| Sapphire Radeon RX 580 Nitro+ 8 GB | |
| Assassin´s Creed Origins - 1920x1080 Ultra High Preset | |
| MSI RTX 2060 Gaming Z 6G | |
| Nvidia GeForce GTX 1070 | |
| Zotac GeForce GTX 1660 Ti 6 GB | |
| MSI AMD Radeon RX Vega 56 Air Boost OC Edition 8 GB | |
| Desktop PC | |
| XFX AMD Radeon RX 590 OC+ 8 GB | |
| Sapphire Radeon RX 580 Nitro+ 8 GB | |
| Asus ROG Strix RX 580 8 GB | |
| Kingdom Come: Deliverance - 1920x1080 Ultra High Preset | |
| MSI RTX 2060 Gaming Z 6G | |
| MSI AMD Radeon RX Vega 56 Air Boost OC Edition 8 GB | |
| Nvidia GeForce GTX 1070 | |
| Zotac GeForce GTX 1660 Ti 6 GB | |
| XFX AMD Radeon RX 590 OC+ 8 GB | |
| Desktop PC | |
| Asus ROG Strix RX 580 8 GB | |
| Sapphire Radeon RX 580 Nitro+ 8 GB | |
| Fortnite - 1920x1080 Epic Preset | |
| MSI RTX 2060 Gaming Z 6G | |
| Nvidia GeForce GTX 1070 | |
| Zotac GeForce GTX 1660 Ti 6 GB | |
| MSI AMD Radeon RX Vega 56 Air Boost OC Edition 8 GB | |
| XFX AMD Radeon RX 590 OC+ 8 GB | |
| Desktop PC | |
| Asus ROG Strix RX 580 8 GB | |
| Sapphire Radeon RX 580 Nitro+ 8 GB | |
| Final Fantasy XV Benchmark - 1920x1080 High Quality | |
| MSI RTX 2060 Gaming Z 6G | |
| Nvidia GeForce GTX 1070 | |
| Zotac GeForce GTX 1660 Ti 6 GB | |
| Desktop PC | |
| XFX AMD Radeon RX 590 OC+ 8 GB | |
| Asus ROG Strix RX 580 8 GB | |
| Sapphire Radeon RX 580 Nitro+ 8 GB | |
| Destiny 2 - 1920x1080 Highest Preset AA:SM AF:16x | |
| Nvidia GeForce GTX 1070 | |
| MSI AMD Radeon RX Vega 56 Air Boost OC Edition 8 GB | |
| Zotac GeForce GTX 1660 Ti 6 GB | |
| MSI RTX 2060 Gaming Z 6G | |
| Desktop PC | |
| Sapphire Radeon RX 580 Nitro+ 8 GB | |
| Battlefield 1 - 1920x1080 Ultra Preset AA:T | |
| MSI AMD Radeon RX Vega 56 Air Boost OC Edition 8 GB | |
| MSI RTX 2060 Gaming Z 6G | |
| Zotac GeForce GTX 1660 Ti 6 GB | |
| XFX AMD Radeon RX 590 OC+ 8 GB | |
| Desktop PC | |
| Sapphire Radeon RX 580 Nitro+ 8 GB | |
| For Honor - 1920x1080 Extreme Preset AA:T AF:16x | |
| MSI RTX 2060 Gaming Z 6G | |
| Nvidia GeForce GTX 1070 | |
| Nvidia GeForce GTX 1070 Founders Edition | |
| MSI AMD Radeon RX Vega 56 Air Boost OC Edition 8 GB | |
| Zotac GeForce GTX 1660 Ti 6 GB | |
| XFX AMD Radeon RX 590 OC+ 8 GB | |
| Asus ROG Strix RX 580 8 GB | |
| Sapphire Radeon RX 580 Nitro+ 8 GB | |
| Desktop PC | |
| Ghost Recon Wildlands - 1920x1080 Ultra Preset AA:T AF:16x | |
| MSI RTX 2060 Gaming Z 6G | |
| Nvidia GeForce GTX 1070 | |
| MSI AMD Radeon RX Vega 56 Air Boost OC Edition 8 GB | |
| Nvidia GeForce GTX 1070 Founders Edition | |
| Zotac GeForce GTX 1660 Ti 6 GB | |
| XFX AMD Radeon RX 590 OC+ 8 GB | |
| Desktop PC | |
| Sapphire Radeon RX 580 Nitro+ 8 GB | |
| Asus ROG Strix RX 580 8 GB | |
| Hitman 2 | |
| 1920x1080 Ultra AF:16x | |
| MSI AMD Radeon RX Vega 56 Air Boost OC Edition 8 GB | |
| MSI RTX 2060 Gaming Z 6G | |
| Zotac GeForce GTX 1660 Ti 6 GB | |
| Nvidia GeForce GTX 1070 | |
| XFX AMD Radeon RX 590 OC+ 8 GB | |
| Sapphire Radeon RX 580 Nitro+ 8 GB | |
| Desktop PC | |
| 3840x2160 Ultra AF:16x | |
| MSI RTX 2060 Gaming Z 6G | |
| Nvidia GeForce GTX 1070 | |
| MSI AMD Radeon RX Vega 56 Air Boost OC Edition 8 GB | |
| Zotac GeForce GTX 1660 Ti 6 GB | |
| XFX AMD Radeon RX 590 OC+ 8 GB | |
| Sapphire Radeon RX 580 Nitro+ 8 GB | |
| Desktop PC | |
| Battlefield V - 1920x1080 Ultra Preset | |
| MSI AMD Radeon RX Vega 56 Air Boost OC Edition 8 GB | |
| MSI RTX 2060 Gaming Z 6G | |
| MSI GeForce GTX 1070 | |
| Zotac GeForce GTX 1660 Ti 6 GB | |
| XFX AMD Radeon RX 590 OC+ 8 GB | |
| Sapphire Radeon RX 580 Nitro+ 8 GB | |
| NVIDIA GeForce GTX 1060 | |
| Farming Simulator 19 - 1920x1080 Very High Preset | |
| MSI GeForce GTX 1070 | |
| MSI RTX 2060 Gaming Z 6G | |
| Zotac GeForce GTX 1660 Ti 6 GB | |
| NVIDIA GeForce GTX 1060 | |
| MSI AMD Radeon RX Vega 56 Air Boost OC Edition 8 GB | |
| XFX AMD Radeon RX 590 OC+ 8 GB | |
| Sapphire Radeon RX 580 Nitro+ 8 GB | |
| Darksiders III - 1920x1080 Epic | |
| MSI RTX 2060 Gaming Z 6G | |
| MSI GeForce GTX 1070 | |
| MSI AMD Radeon RX Vega 56 Air Boost OC Edition 8 GB | |
| Zotac GeForce GTX 1660 Ti 6 GB | |
| NVIDIA GeForce GTX 1060 | |
| XFX AMD Radeon RX 590 OC+ 8 GB | |
| Sapphire Radeon RX 580 Nitro+ 8 GB | |
| Just Cause 4 - 1920x1080 Very High / On AA:SM AF:16x | |
| MSI RTX 2060 Gaming Z 6G | |
| MSI GeForce GTX 1070 | |
| MSI AMD Radeon RX Vega 56 Air Boost OC Edition 8 GB | |
| Zotac GeForce GTX 1660 Ti 6 GB | |
| XFX AMD Radeon RX 590 OC+ 8 GB | |
| NVIDIA GeForce GTX 1060 | |
| Sapphire Radeon RX 580 Nitro+ 8 GB | |
| Apex Legends - 1920x1080 Maximum Settings AA:TS AF:16x | |
| MSI RTX 2060 Gaming Z 6G | |
| MSI AMD Radeon RX Vega 56 Air Boost OC Edition 8 GB | |
| Zotac GeForce GTX 1660 Ti 6 GB | |
| MSI GeForce GTX 1070 | |
| XFX AMD Radeon RX 590 OC+ 8 GB | |
| Sapphire Radeon RX 580 Nitro+ 8 GB | |
| NVIDIA GeForce GTX 1060 | |
| Far Cry New Dawn - 1920x1080 Ultra Preset | |
| MSI GeForce GTX 1070 | |
| MSI RTX 2060 Gaming Z 6G | |
| MSI AMD Radeon RX Vega 56 Air Boost OC Edition 8 GB | |
| Zotac GeForce GTX 1660 Ti 6 GB | |
| XFX AMD Radeon RX 590 OC+ 8 GB | |
| Sapphire Radeon RX 580 Nitro+ 8 GB | |
| NVIDIA GeForce GTX 1060 | |
| Metro Exodus - 1920x1080 Ultra Quality AF:16x | |
| MSI RTX 2060 Gaming Z 6G | |
| MSI AMD Radeon RX Vega 56 Air Boost OC Edition 8 GB | |
| MSI GeForce GTX 1070 | |
| Zotac GeForce GTX 1660 Ti 6 GB | |
| XFX AMD Radeon RX 590 OC+ 8 GB | |
| Sapphire Radeon RX 580 Nitro+ 8 GB | |
| NVIDIA GeForce GTX 1060 | |
| Anthem - 1920x1080 Ultra Preset | |
| MSI AMD Radeon RX Vega 56 Air Boost OC Edition 8 GB | |
| MSI RTX 2060 Gaming Z 6G | |
| XFX AMD Radeon RX 590 OC+ 8 GB | |
| Zotac GeForce GTX 1660 Ti 6 GB | |
| MSI GeForce GTX 1070 | |
| Sapphire Radeon RX 580 Nitro+ 8 GB | |
| NVIDIA GeForce GTX 1060 | |
| Dirt Rally 2.0 - 1920x1080 Ultra Preset AA:T AF:16x | |
| MSI AMD Radeon RX Vega 56 Air Boost OC Edition 8 GB | |
| MSI RTX 2060 Gaming Z 6G | |
| Zotac GeForce GTX 1660 Ti 6 GB | |
| MSI GeForce GTX 1070 | |
| XFX AMD Radeon RX 590 OC+ 8 GB | |
| Sapphire Radeon RX 580 Nitro+ 8 GB | |
| NVIDIA GeForce GTX 1060 | |
| The Division 2 - 1920x1080 Ultra Preset | |
| MSI RTX 2060 Gaming Z 6G | |
| MSI GeForce GTX 1070 | |
| MSI AMD Radeon RX Vega 56 Air Boost OC Edition 8 GB | |
| Zotac GeForce GTX 1660 Ti 6 GB | |
| XFX AMD Radeon RX 590 OC+ 8 GB | |
| Sapphire Radeon RX 580 Nitro+ 8 GB | |
| NVIDIA GeForce GTX 1060 | |
| Anno 1800 - 1920x1080 Ultra Graphics Quality (DX11) | |
| MSI GeForce GTX 1070 | |
| MSI RTX 2060 Gaming Z 6G | |
| Zotac GeForce GTX 1660 Ti 6 GB | |
| NVIDIA GeForce GTX 1060 | |
| XFX AMD Radeon RX 590 OC+ 8 GB | |
| Sapphire Radeon RX 580 Nitro+ 8 GB | |
| low | med. | high | ultra | QHD | 4K | |
|---|---|---|---|---|---|---|
| Battlefield 4 (2013) | 200 | 200 | 200 | 89 | 54.6 | |
| GTA V (2015) | 156 | 149 | 126 | 87 | 53 | |
| The Witcher 3 (2015) | 265 | 190 | 116 | 62 | 42.5 | |
| Rainbow Six Siege (2015) | 318.8 | 269.4 | 225.9 | 194.6 | 84.9 | |
| Rise of the Tomb Raider (2016) | 247 | 182 | 110 | 88 | 40.4 | |
| Far Cry Primal (2016) | 124 | 113 | 102 | 88 | 41 | |
| The Division (2016) | 265.6 | 191.4 | 101.8 | 80.3 | 39.7 | |
| Doom (2016) | 159 | 157 | 140 | 140 | 62 | |
| Overwatch (2016) | 300 | 298 | 154 | 102 | 116 | |
| Deus Ex Mankind Divided (2016) | 146.1 | 134.4 | 87.6 | 49.5 | 30.2 | |
| Battlefield 1 (2016) | 194 | 183 | 130 | 117 | 51.4 | |
| Dishonored 2 (2016) | 118.6 | 118.3 | 112.1 | 100.5 | 45.5 | |
| Watch Dogs 2 (2016) | 141 | 124 | 82 | 53.7 | 31.9 | |
| For Honor (2017) | 287.6 | 137.6 | 132.2 | 102.1 | 42 | |
| Ghost Recon Wildlands (2017) | 163.5 | 93.7 | 87.6 | 50.2 | 32 | |
| Dirt 4 (2017) | 288 | 227 | 168 | 98 | 54.3 | |
| Playerunknown's Battlegrounds (PUBG) (2017) | 223 | 200 | 150 | 129 | 38.6 | |
| Destiny 2 (2017) | 153.4 | 145.5 | 135 | 113.6 | 77.1 | 39.8 |
| Assassin´s Creed Origins (2017) | 113 | 91 | 84 | 71 | 55 | 33 |
| Call of Duty WWII (2017) | 250 | 236 | 134 | 106 | 78 | 48.6 |
| Fortnite (2018) | 310 | 247 | 143 | 117 | 75 | 25.1 |
| Final Fantasy XV Benchmark (2018) | 140 | 84 | 59.6 | 24.8 | ||
| Kingdom Come: Deliverance (2018) | 139 | 104 | 82 | 61 | 40.5 | 19.9 |
| Far Cry 5 (2018) | 132 | 104 | 95 | 91 | 64 | 33 |
| The Crew 2 (2018) | 60 | 60 | 60 | 60 | 58 | 31 |
| Monster Hunter World (2018) | 139 | 97 | 89 | 66 | 41.6 | 20.4 |
| F1 2018 (2018) | 240 | 171 | 139 | 93 | 74 | 44 |
| Shadow of the Tomb Raider (2018) | 126.8 | 94.4 | 87.3 | 76.7 | 50.9 | 25.5 |
| FIFA 19 (2018) | 269 | 231 | 218 | 220 | 202 | 119 |
| Forza Horizon 4 (2018) | 178 | 131 | 122 | 97 | 77 | 51 |
| Assassin´s Creed Odyssey (2018) | 111 | 86 | 72 | 53 | 41 | 25 |
| Call of Duty Black Ops 4 (2018) | 224 | 130 | 123 | 118 | 75 | 36 |
| Hitman 2 (2018) | 92 | 90 | 82 | 78 | 63 | 31.3 |
| Fallout 76 (2018) | 60 | 60 | 60 | 59.7 | 59.7 | 41.5 |
| Battlefield V (2018) | 184 | 129 | 112 | 102 | 76 | 43.3 |
| Farming Simulator 19 (2018) | 191 | 147 | 130 | 119 | 88 | 37.9 |
| Darksiders III (2018) | 191 | 124 | 104 | 93 | 61 | 22.3 |
| Just Cause 4 (2018) | 166 | 112 | 81 | 77 | 53.9 | 29.2 |
| Apex Legends (2019) | 144 | 134 | 115 | 112 | 82 | 46 |
| Far Cry New Dawn (2019) | 119 | 98 | 93 | 84 | 65 | 35 |
| Metro Exodus (2019) | 125 | 70.4 | 52 | 42.7 | 33.2 | 20.9 |
| Anthem (2019) | 107 | 90 | 84 | 79 | 56.8 | 30.7 |
| Dirt Rally 2.0 (2019) | 242 | 157 | 130 | 75 | 56.3 | 33.1 |
| The Division 2 (2019) | 174 | 115 | 90 | 70 | 49 | 26 |
| Anno 1800 (2019) | 94 | 95 | 77 | 35.9 | 25.9 | 15.1 |
Compute Performance
The Turing-based GPUs prove to be better than Pascal-based ones, when it comes to compute performance. Here, the Zotac GeForce GTX 1660 Ti always beats the GeForce GTX 1060 and can trade blows with the GTX 1070 in certain applications. The top performers are still the same; the GeForce RTX 2060 with the Radeon RX Vega 56 following it closely.
| SiSoft Sandra 2016 | |
| Image Processing | |
| MSI AMD Radeon RX Vega 56 Air Boost OC Edition 8 GB | |
| MSI RTX 2060 Gaming Z 6G | |
| Zotac GeForce GTX 1660 Ti 6 GB | |
| GP Cryptography (Higher Security AES256+SHA2-512) | |
| MSI RTX 2060 Gaming Z 6G | |
| MSI AMD Radeon RX Vega 56 Air Boost OC Edition 8 GB | |
| Zotac GeForce GTX 1660 Ti 6 GB | |
| GP Financial Analysis (FP High/Double Precision) | |
| MSI AMD Radeon RX Vega 56 Air Boost OC Edition 8 GB | |
| MSI RTX 2060 Gaming Z 6G | |
| Zotac GeForce GTX 1660 Ti 6 GB | |
Emissions of the Zotac GeForce GTX 1660 Ti
Both the GeForce GTX 1660 Ti and the GeForce GTX 1060 have the same TDP of 120 watts. However, the GeForce GTX 1660 Ti is considerably faster than the GTX 1060, which means that Zotac’s GPU is more energy-efficient.
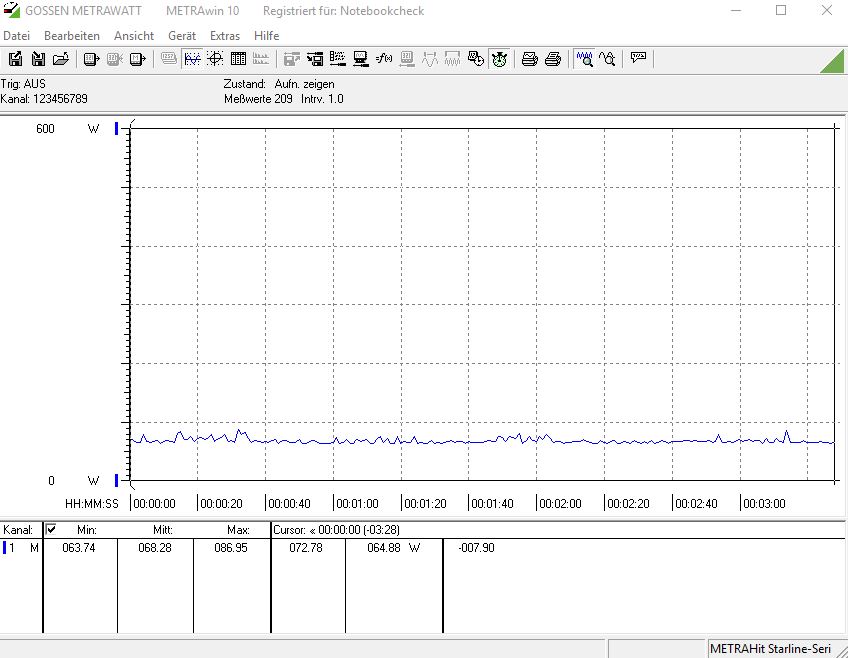
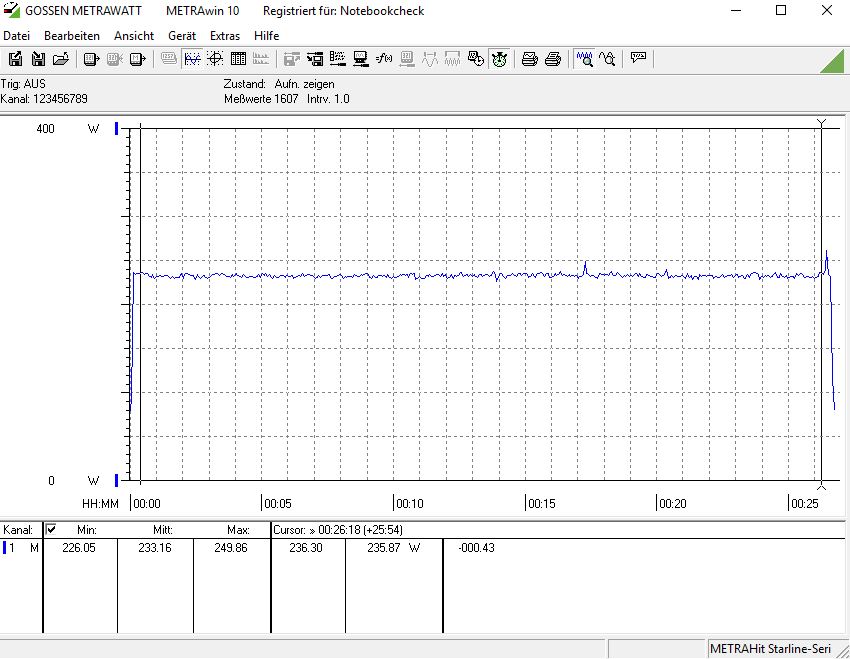
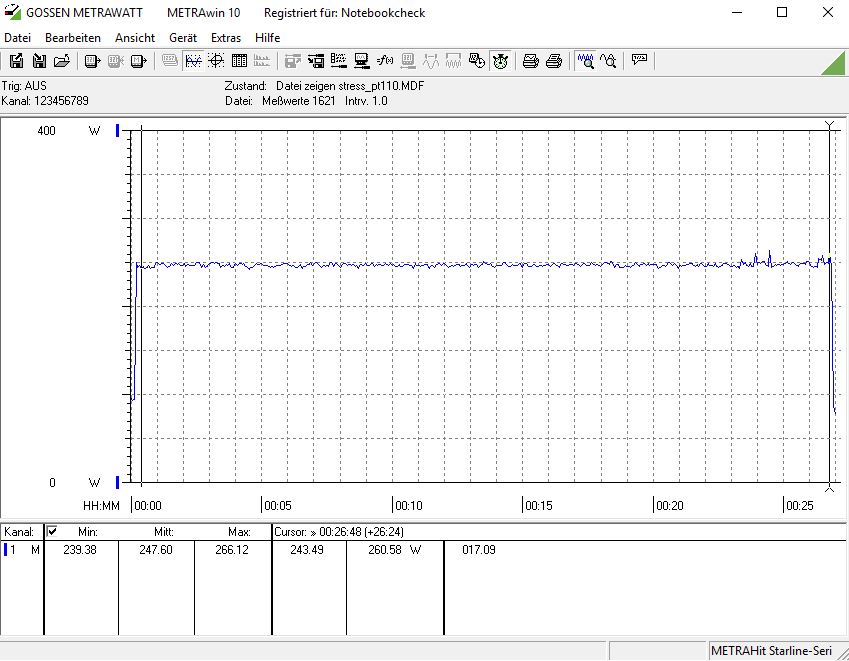
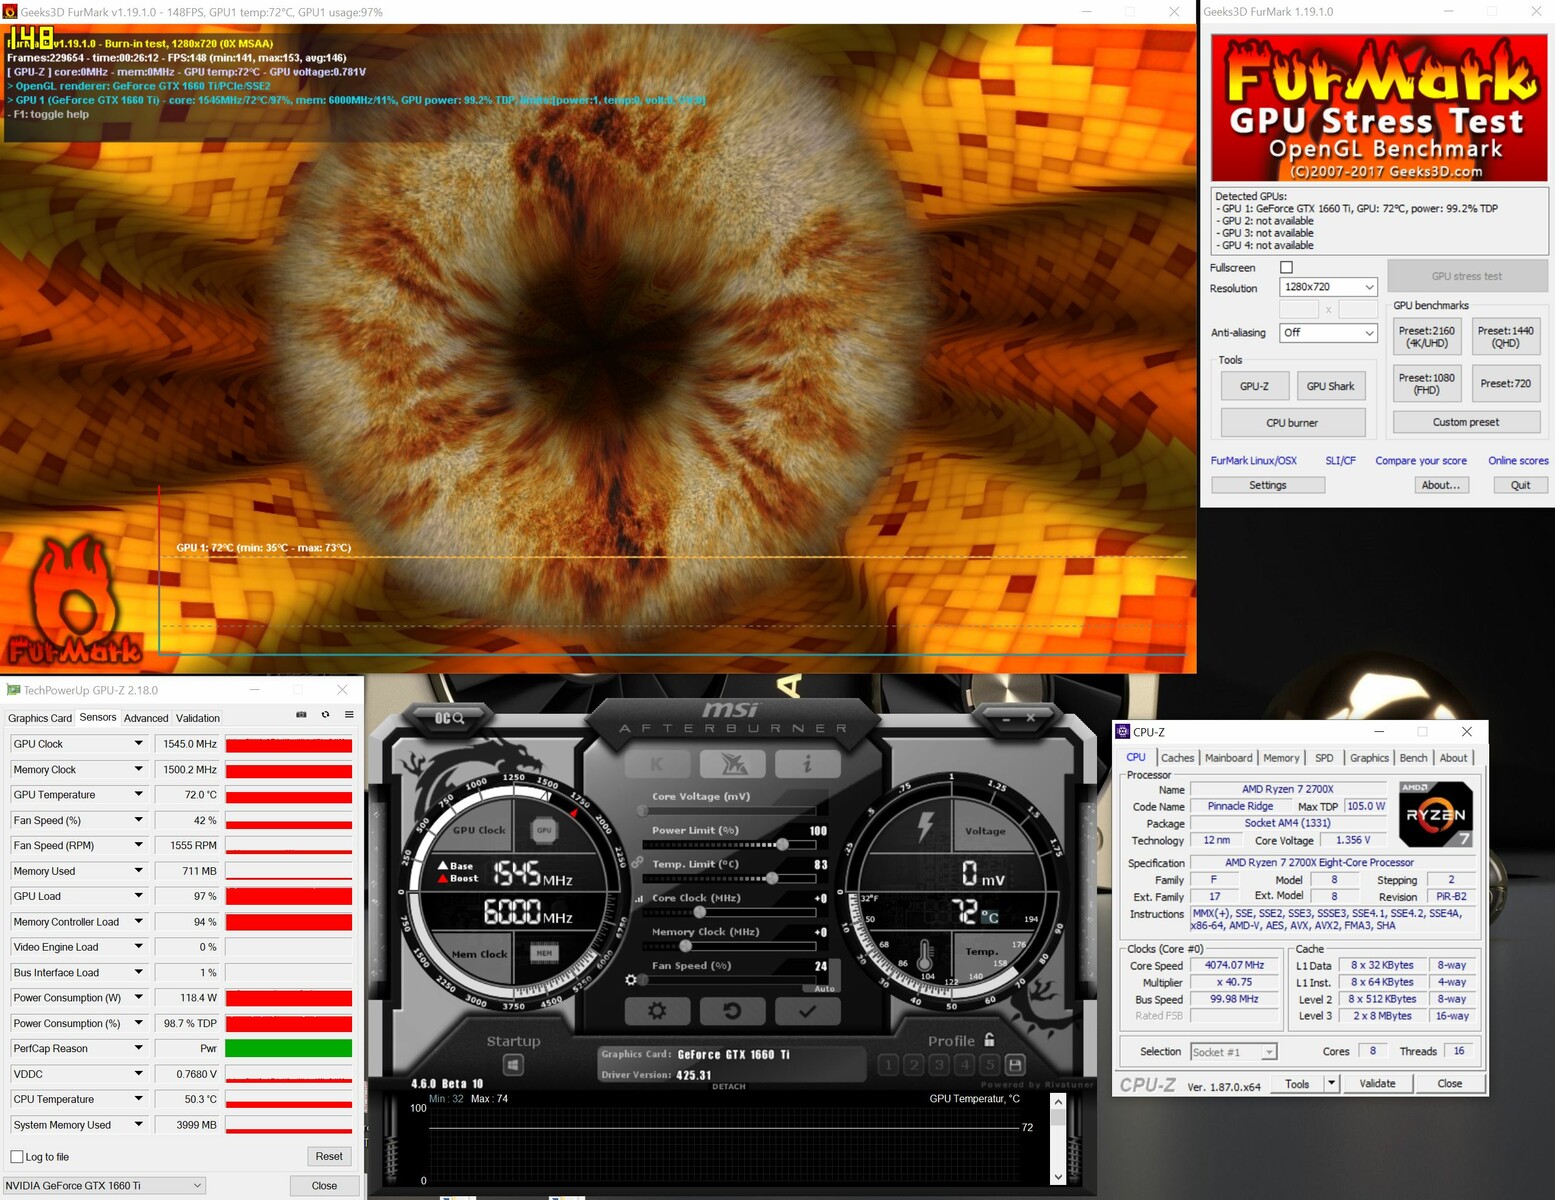
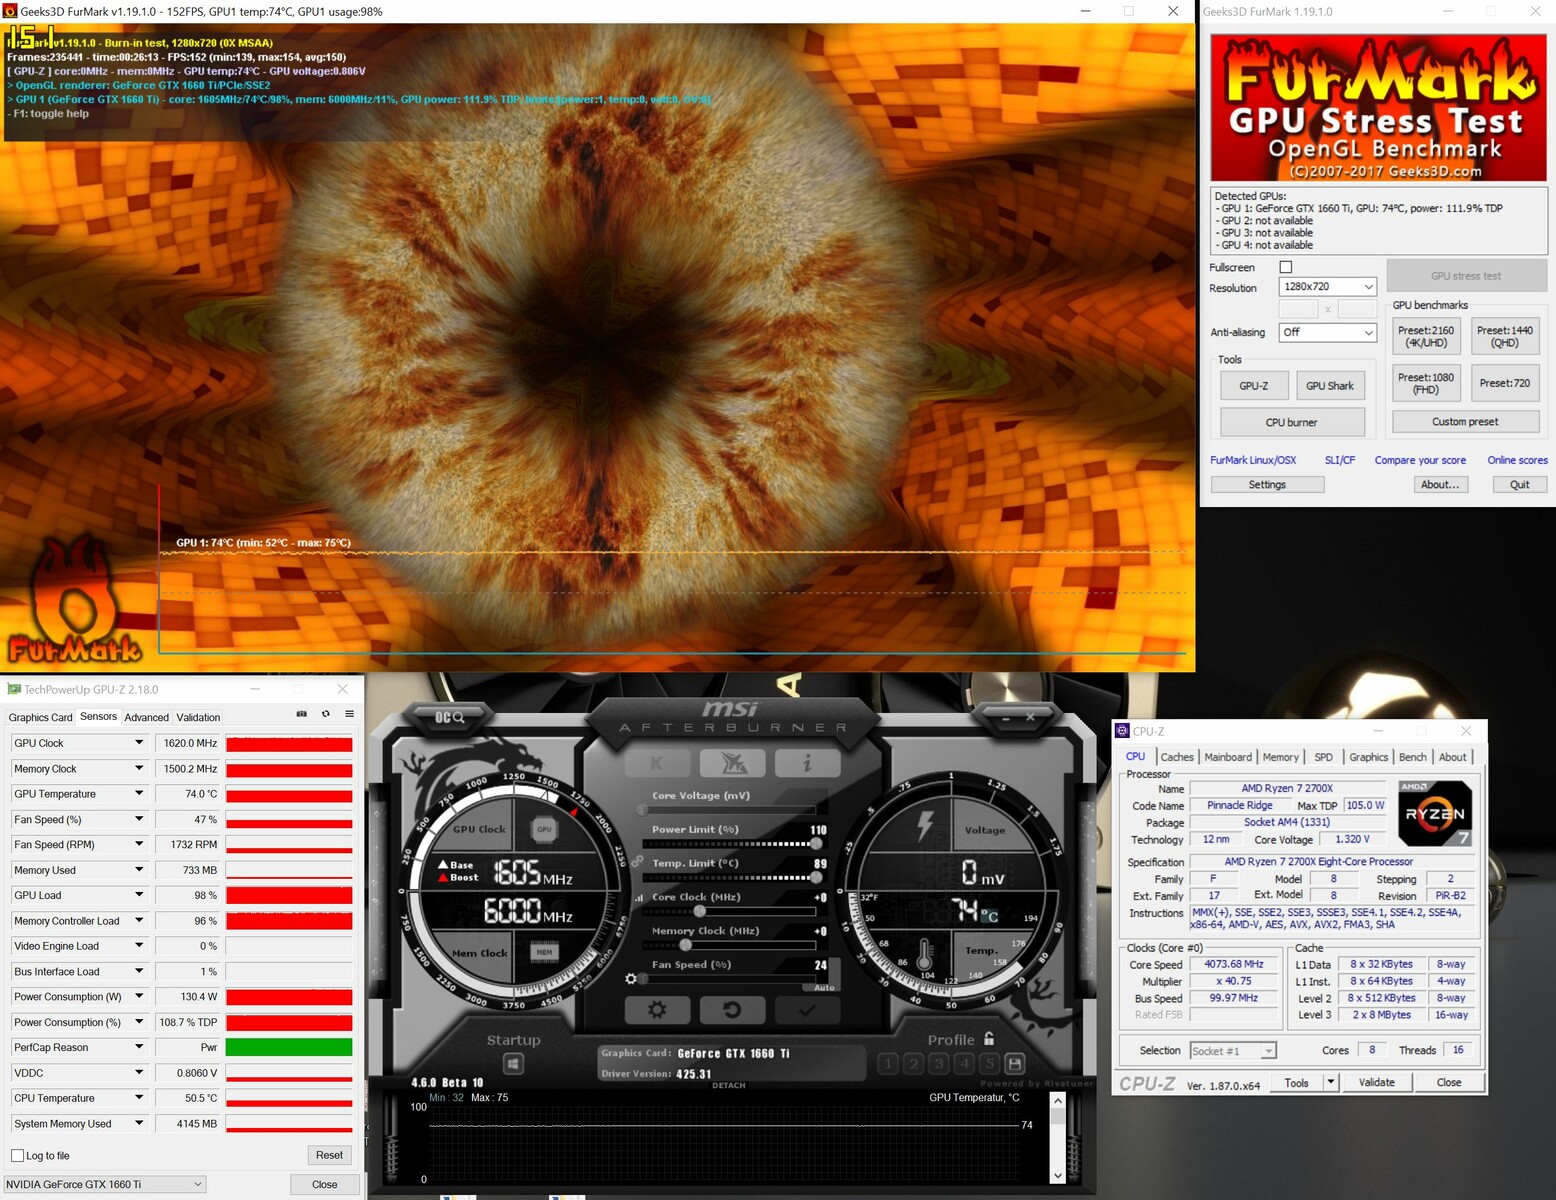
When idle, the system draws 68 watts. During our stress test the average power consumption reached 233 watts and the peak energy consumption was 250 watts. However, these numbers cannot be attributed solely to the GPU. The power limit of the Zotac GeForce GTX 1660 Ti can be increased by up to 10 %. Doing so leads to a commensurate increase in power consumption. With the power target (PT) increased to 110%, the average power draw amounts to 247 watts.
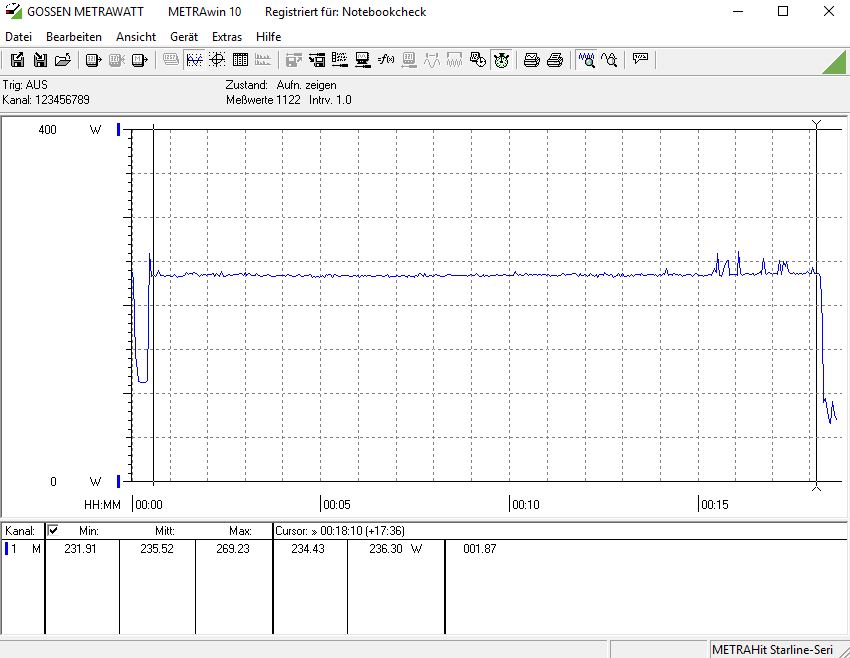
We use "The Witcher 3" to measure the energy consumption during gaming. Here, we see a power draw of 235 watts, which is comparable to what we saw during the stress test (PT 100%). The Zotac GeForce GTX 1660 Ti consumes the least amount of power among the GPUs in our comparison chart. With 243 watts, the GeForce GTX 1070 is very close. However, that GPU was benchmarked with a more energy-efficient processor.
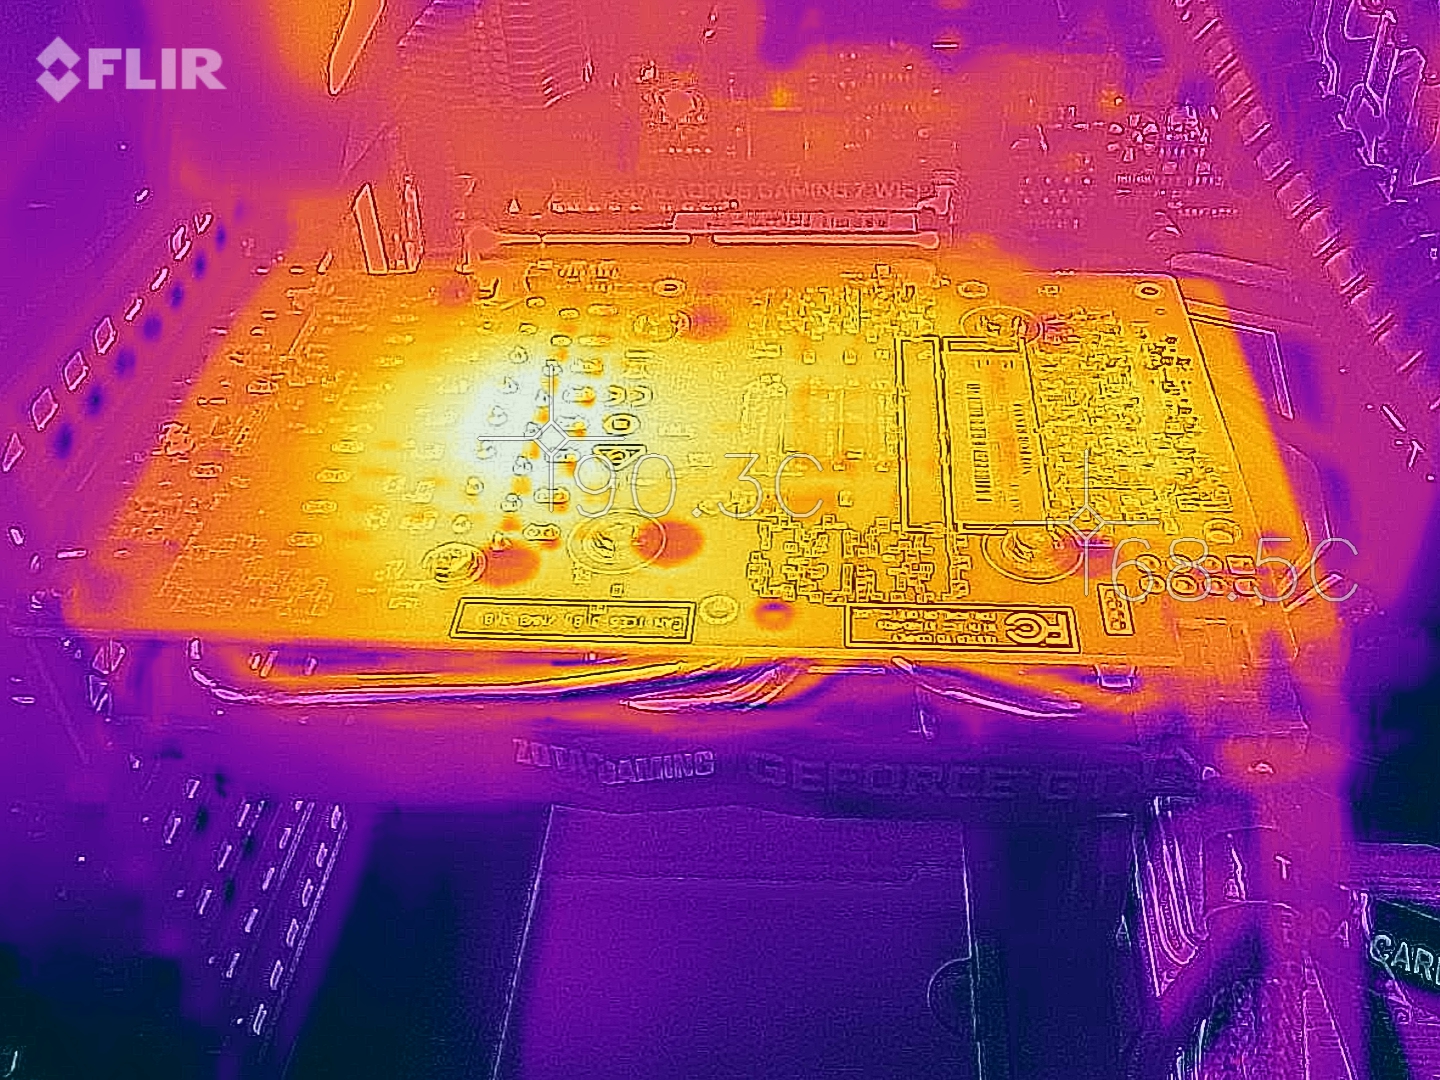
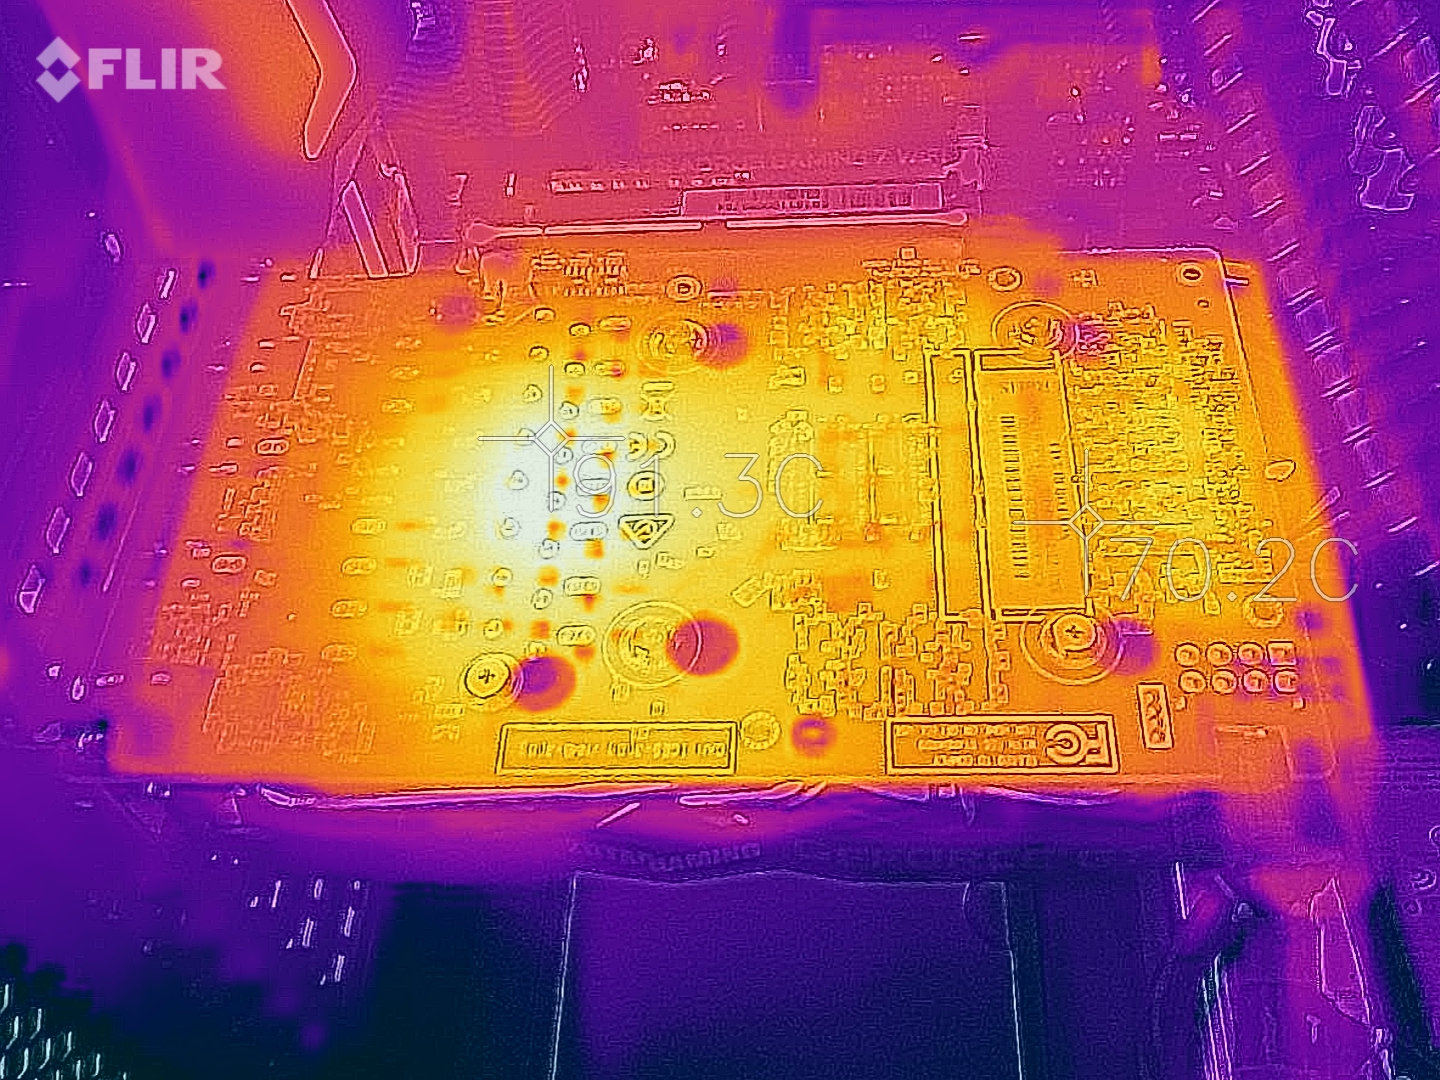
We did not observe any thermal issues. The temperatures reached 74 °C (~165.2 °F) during our stress test (power target: 110%). During normal use, the temperatures peaked at 72 °C (~161.6 °F) (power target: 100%). The fans span at 1550 RPM and therefore were barely audible. The graphics card does not produce any abnormal noises such as coil whine.
| Power Consumption - 1920x1080 The Witcher 3 ultra (external Monitor) | |
| XFX AMD Radeon RX 590 OC+ 8 GB | |
| MSI AMD Radeon RX Vega 56 Air Boost OC Edition 8 GB (Idle: 79.2 W) | |
| Asus ROG Strix RTX 2070 OC | |
| MSI RTX 2060 Gaming Z 6G (Idle: 74.66 W) | |
| Nvidia GeForce GTX 1070 Founders Edition (Idle: 68 W) | |
| Zotac GeForce GTX 1660 Ti 6 GB (Idle: 68.3 W) | |
* ... smaller is better
Overclocking - 5 to 7% max
A little bit more performance can be squeezed out of the GPU through overclocking. In order to achieve greater overclocking potential, we raised the power limit from 100 to 110%. Doing so increases the TDP up to 132 watts.
We were only able to increase the core clock by 100 MHz and the memory frequency by 800 MHz. This led to a significantly higher memory bandwidth of 326.4 GB/s and a maximum boost clock of up to 1870 MHz.
We can see the results of manual overclocking reflected in the benchmarks. Here, the GPU performs about 5 to 7% faster than in standard mode.
This result is quite good, given the fact that the Zotac GeForce GTX 1660 Ti does not feature a factory overclock. The maximum power target has a lot to do with how much overclocking potential a GPU can offer, which is why many board-partners choose to customize it. That being said, if the GTX 1660 Ti were factory-overclocked, it would surely have a lot less overclocking potential.
Pros
Cons
Verdict - Good mid-tier GPU
After the launch of Turing-based GPUs, the Pascal-based graphics cards are starting to run out of stock. The Nvidia GeForce GTX 1660 Ti is a Turing-based video card without Raytracing or tensor cores. The GTX 1660 Ti also does not support DLSS, because this is where Nvidia decided to draw the line between the GTX and the RTX series. We received a sample GPU from our partner Zotac, because Nvidia does not produce its own version of the GPU under its Founders Edition brand.
At the time of publishing this review, the GTX 1660 Ti retails for 280 Euros ($314) in online stores, which means that it costs about the same as the GeForce GTX 1070, if you can find it in stock. Of course, we are talking here about new GPUs, not second-hand ones, which you can get at very low prices on eBay and other similar websites.
In terms of performance, the Zotac GeForce GTX 1660 Ti slots in between the GTX 1060 and the GTX 1070. The 6 GB GTX 1660 Ti is beaten by the GTX 1070. However, the GTX 1660 Ti is still a good GPU for 1080p gaming, because 6 GB of VRAM is still good enough for such resolutions.
Among sub-300-Euro ($336) GPUs, the Zotac GeForce GTX 1660 Ti offers great gaming performance and currently does not have any real competition.
When it comes to energy-efficiency, the GTX 1660 Ti has an edge over the GTX 1070. This is why the GTX 1660 Ti is not such a bad choice for those who are looking for a sub-300-Euro ($336) GPU. The prices of AMD’s offerings such as the RX 580, RX 590 and the Vega 56 have been cut significantly, and these days the RX 580 and the RX 590 cost less than the GTX 1660 Ti. However, these two RX video cards are not as fast as the GTX 1660 Ti. The Radeon RX Vega 56 can beat the GeForce GTX 1660 Ti, but the Vega 56 is a lot more power-hungry.
We can recommend getting a GeForce GTX 1660 Ti if you can buy it for less than 300 Euros ($336). Those who are willing to shell out more than 300 Euros ($336) will be much better off getting an RTX 2060, because it is about 20-25% faster than the GTX 1660 Ti. Switching from a GTX 1070 to a GTX 1660 Ti makes absolutely no sense.
If you are planning to build a PC from the ground up, then a Turing-based GPU seems like a very reasonable option, because Turing-based video cards are sure to perform better in future titles than Pascal-based GPUs.
Benchmarks of the Nvidia GeForce GTX 1660 Ti (benchmarks were conducted independently)
Benchmarks
3DM Vant. Perf. total +
specvp12 sw-03 +
* Smaller numbers mean a higher performance
Game Benchmarks
The following benchmarks stem from our benchmarks of review laptops. The performance depends on the used graphics memory, clock rate, processor, system settings, drivers, and operating systems. So the results don't have to be representative for all laptops with this GPU. For detailed information on the benchmark results, click on the fps number.

Vampire Bloodhunt
2022
Ghostwire Tokyo
2022

Cyberpunk 2077 1.6
2022
Elex 2
2022
GRID Legends
2022
Elden Ring
2022
Dying Light 2
2022

God of War
2022
Halo Infinite
2021
Farming Simulator 22
2021
Battlefield 2042
2021
Forza Horizon 5
2021

Riders Republic
2021
Far Cry 6
2021
F1 2021
2021
Days Gone
2021

Dirt 5
2020
Death Stranding
2020
F1 2020
2020
Gears Tactics
2020
Doom Eternal
2020
Hunt Showdown
2020
Escape from Tarkov
2020


Need for Speed Heat
2019

GRID 2019
2019

FIFA 20
2019
Borderlands 3
2019
Control
2019
F1 2019
2019

Rage 2
2019
Anno 1800
2019
The Division 2
2019
Dirt Rally 2.0
2019
Anthem
2019
Far Cry New Dawn
2019
Metro Exodus
2019
Apex Legends
2019
Just Cause 4
2018
Darksiders III
2018
Battlefield V
2018
Farming Simulator 19
2018
Fallout 76
2018
Hitman 2
2018


Forza Horizon 4
2018
FIFA 19
2018

Strange Brigade
2018
F1 2018
2018
Monster Hunter World
2018
The Crew 2
2018
Far Cry 5
2018
X-Plane 11.11
2018


Fortnite
2018
Call of Duty WWII
2017

Destiny 2
2017
Dirt 4
2017For Honor
2017Watch Dogs 2
2016
Dishonored 2
2016
Battlefield 1
2016
Overwatch
2016
Doom
2016
The Division
2016
Far Cry Primal
2016

Rainbow Six Siege
2015Dota 2 Reborn
2015
The Witcher 3
2015
GTA V
2015
Battlefield 4
2013| low | med. | high | ultra | QHD | 4K | |
|---|---|---|---|---|---|---|
| Vampire Bloodhunt | 261 | 132.8 | 126.9 | 121.9 | 77.9 | 37.1 |
| Ghostwire Tokyo | 99.8 | 99.3 | 98.3 | 97.3 | 61 | 29.9 |
| Tiny Tina's Wonderlands | 126.3 | 102.9 | 71 | 55.9 | 38.7 | 13.8 |
| Cyberpunk 2077 1.6 | 77.6 | 71.1 | 56.6 | 46.2 | 26.9 | 11.2 |
| Elex 2 | 75.8 | 69.2 | 60.9 | 54.2 | 37.6 | 20 |
| GRID Legends | 185.5 | 129.9 | 90.9 | 63.5 | 51.5 | 36 |
| Elden Ring | 59.9 | 59.9 | 59.9 | 58.4 | 47.5 | 28.2 |
| Dying Light 2 | 61.2 | 48.2 | 40.3 | 27.4 | 13.3 | |
| Rainbow Six Extraction | 171 | 129 | 125 | 95 | 62 | 25 |
| God of War | 84.1 | 70.9 | 55.6 | 37.3 | 30.7 | 21.4 |
| Halo Infinite | 156.9 | 88.6 | 75.4 | 60.2 | 44.2 | 25.9 |
| Farming Simulator 22 | 292 | 176.1 | 129.9 | 111.3 | 84 | 50.2 |
| Battlefield 2042 | 154.8 | 90.4 | 73.5 | 65.8 | 48.5 | 18.1 |
| Forza Horizon 5 | 208 | 107 | 94 | 63 | 52 | 34 |
| Call of Duty Vanguard | 95.7 | 89.6 | 72 | 64 | 46.9 | 24.3 |
| Riders Republic | 174 | 94 | 75 | 66 | 45 | 20 |
| Far Cry 6 | 156.1 | 95.8 | 82.5 | 6.47 | 7.02 | 0.98 |
| F1 2021 | 407 | 205 | 168.4 | 114 | 85.5 | 46.9 |
| Days Gone | 170.5 | 103.3 | 90.9 | 66.8 | 48.5 | 26.9 |
| Assassin´s Creed Valhalla | 114 | 74 | 55 | 50 | 36 | 19 |
| Dirt 5 | 200 | 96.5 | 75.8 | 58.4 | 47 | 30.3 |
| Death Stranding | 157.9 | 100.8 | 92.9 | 91.6 | 64.1 | 34.3 |
| F1 2020 | 336 | 180.3 | 145 | 101.6 | 74.5 | 42.3 |
| Gears Tactics | 309 | 166 | 98 | 66 | 45 | 24 |
| Doom Eternal | 278 | 161 | 142 | 118 | 81.7 | 41.2 |
| Hunt Showdown | 195 | 100 | 82 | 47.2 | 24.2 | |
| Escape from Tarkov | 121 | 121 | 111 | 102 | 66.4 | 32.3 |
| Red Dead Redemption 2 | 135 | 82 | 55 | 35 | 28 | 19 |
| Star Wars Jedi Fallen Order | 119 | 103 | 97.3 | 64.5 | 44 | |
| Need for Speed Heat | 109 | 99.3 | 88.8 | 79.3 | 57.4 | 30.9 |
| Call of Duty Modern Warfare 2019 | 169 | 120 | 97 | 81.2 | 56.5 | 30.9 |
| GRID 2019 | 159 | 124 | 102 | 69.2 | 55.1 | 34.2 |
| Ghost Recon Breakpoint | 126 | 95 | 85 | 70 | 52 | 25 |
| FIFA 20 | 242 | 232 | 219 | 216 | 208 | 153 |
| Borderlands 3 | 143 | 102 | 68.3 | 60.7 | 41.7 | 17.5 |
| Control | 215 | 81.2 | 59.4 | 37.4 | 17.9 | |
| F1 2019 | 255 | 162 | 139 | 115 | 85 | 48 |
| Total War: Three Kingdoms | 241 | 115 | 70 | 49 | 30 | 14 |
| Rage 2 | 222 | 105 | 87.4 | 85.6 | 53.1 | 25.4 |
| Anno 1800 | 94 | 95 | 77 | 35.9 | 25.9 | 15.1 |
| The Division 2 | 174 | 115 | 90 | 70 | 49 | 26 |
| Dirt Rally 2.0 | 242 | 157 | 130 | 75 | 56.3 | 33.1 |
| Anthem | 107 | 90 | 84 | 79 | 56.8 | 30.7 |
| Far Cry New Dawn | 119 | 98 | 93 | 84 | 65 | 35 |
| Metro Exodus | 125 | 70.4 | 52 | 42.7 | 33.2 | 20.9 |
| Apex Legends | 144 | 134 | 115 | 112 | 82 | 46 |
| Just Cause 4 | 166 | 112 | 81 | 77 | 53.9 | 29.2 |
| Darksiders III | 191 | 124 | 104 | 93 | 61 | 22.3 |
| Battlefield V | 184 | 129 | 112 | 102 | 76 | 43.3 |
| Farming Simulator 19 | 191 | 147 | 130 | 119 | 88 | 37.9 |
| Fallout 76 | 60 | 60 | 60 | 59.7 | 59.7 | 41.5 |
| Hitman 2 | 92 | 90 | 82 | 78 | 63 | 31.3 |
| Call of Duty Black Ops 4 | 224 | 130 | 123 | 118 | 75 | 36 |
| Assassin´s Creed Odyssey | 111 | 86 | 72 | 53 | 41 | 25 |
| Forza Horizon 4 | 178 | 131 | 122 | 97 | 77 | 51 |
| FIFA 19 | 269 | 231 | 218 | 220 | 202 | 119 |
| Shadow of the Tomb Raider | 126.8 | 94.4 | 87.3 | 76.7 | 50.9 | 25.5 |
| Strange Brigade | 374 | 156.3 | 126.9 | 110.1 | 78.4 | 43.1 |
| F1 2018 | 240 | 171 | 139 | 93 | 74 | 44 |
| Monster Hunter World | 139 | 97 | 89 | 66 | 41.6 | 20.4 |
| The Crew 2 | 60 | 60 | 60 | 60 | 58 | 31 |
| Far Cry 5 | 162 | 109 | 99 | 94 | 67 | 35 |
| X-Plane 11.11 | 164 | 147.3 | 117.8 | 99.9 | ||
| Kingdom Come: Deliverance | 139 | 104 | 82 | 61 | 40.5 | 19.9 |
| Final Fantasy XV Benchmark | 159 | 89 | 64 | 49.5 | 26 | |
| Fortnite | 310 | 247 | 143 | 117 | 75 | 25.1 |
| Call of Duty WWII | 250 | 236 | 134 | 106 | 78 | 48.6 |
| Assassin´s Creed Origins | 113 | 91 | 84 | 71 | 55 | 33 |
| Destiny 2 | 153.4 | 145.5 | 135 | 113.6 | 77.1 | 39.8 |
| Playerunknown's Battlegrounds (PUBG) | 223 | 200 | 150 | 129 | 38.6 | |
| Dirt 4 | 288 | 227 | 168 | 98 | 54.3 | |
| Ghost Recon Wildlands | 163.5 | 93.7 | 87.6 | 50.2 | 32 | |
| For Honor | 287.6 | 137.6 | 132.2 | 102.1 | 42 | |
| Watch Dogs 2 | 141 | 124 | 82 | 53.7 | 31.9 | |
| Dishonored 2 | 118.6 | 118.3 | 112.1 | 100.5 | 45.5 | |
| Battlefield 1 | 194 | 183 | 130 | 117 | 51.4 | |
| Deus Ex Mankind Divided | 146.1 | 134.4 | 87.6 | 49.5 | 30.2 | |
| Overwatch | 300 | 298 | 154 | 102 | 116 | |
| Doom | 159 | 157 | 140 | 140 | 62 | |
| The Division | 265.6 | 191.4 | 101.8 | 80.3 | 39.7 | |
| Far Cry Primal | 124 | 113 | 102 | 88 | 41 | |
| Rise of the Tomb Raider | 247 | 182 | 110 | 88 | 40.4 | |
| Rainbow Six Siege | 318.8 | 269.4 | 225.9 | 194.6 | 84.9 | |
| Dota 2 Reborn | 218.1 | 189.7 | 181 | 167.8 | 94.4 | |
| The Witcher 3 | 265 | 190 | 116 | 62 | 42.5 | |
| GTA V | 172 | 168 | 151 | 87 | 61.8 | 56 |
| Battlefield 4 | 200 | 200 | 200 | 89 | 54.6 | |
| low | med. | high | ultra | QHD | 4K | < 30 fps < 60 fps < 120 fps ≥ 120 fps | 1 17 68 | 2 43 42 | 8 51 28 | 1 16 58 7 | 5 36 26 2 | 34 46 6 1 |
For more games that might be playable and a list of all games and graphics cards visit our Gaming List
