Zotac ZBox Edge MI643 Review: Slim and Low-Profile Mini PC
Zotac offers one of the largest lineup of mini PCs available ranging from credit card-sized solutions up to full-fledged gaming mini PCs with GeForce RTX graphics. The model we have here is on the lower-end of the spectrum designed for discreet deployment and low-power applications.
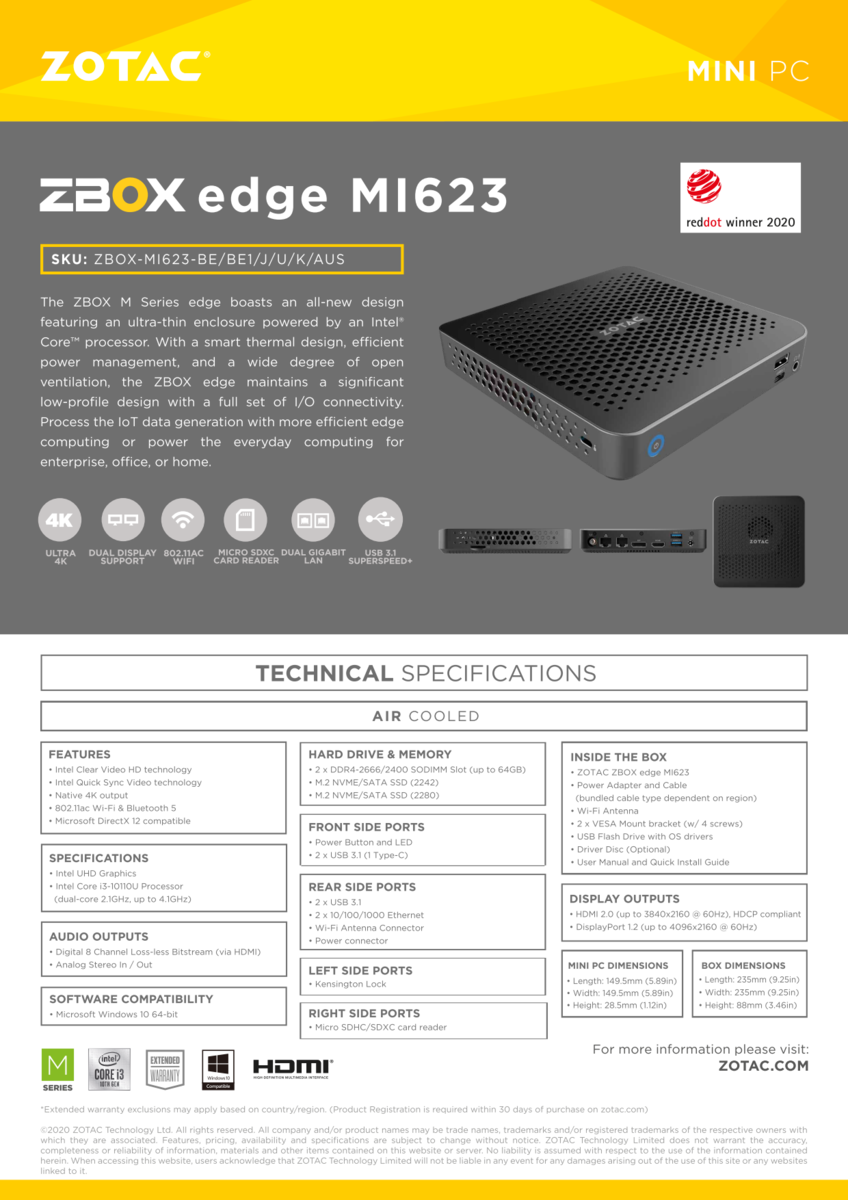
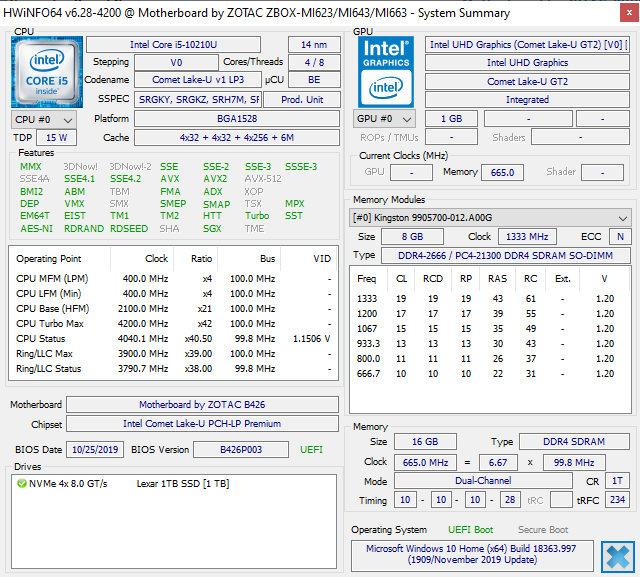
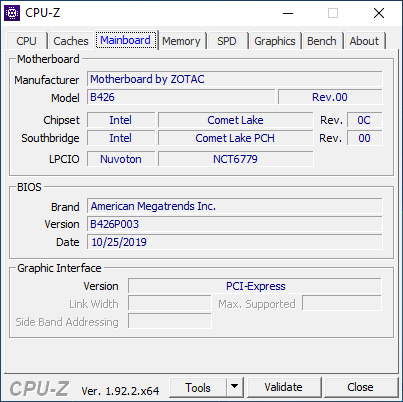
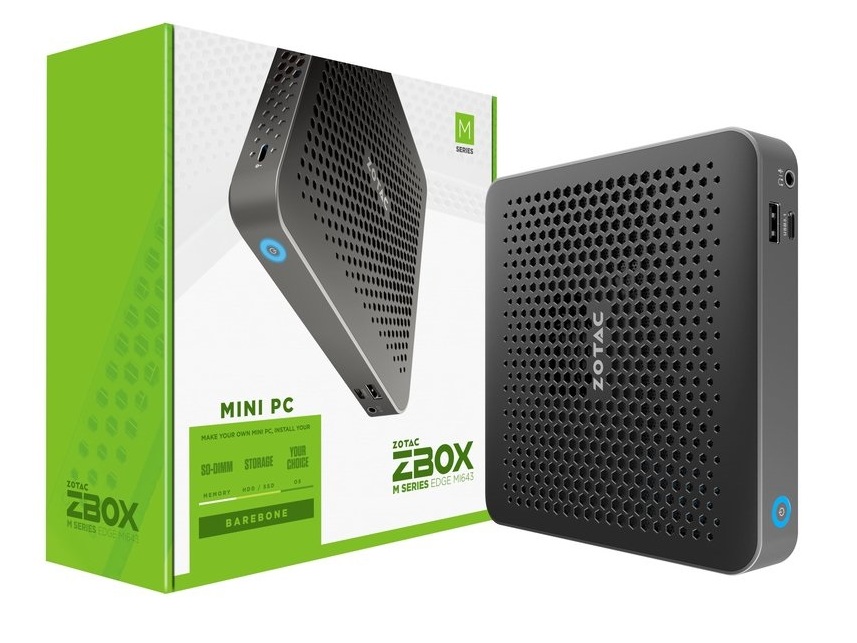
Called the ZBox Edge MI643, the mini PC is notable for its short height and unassuming design. Barebone SKUs are available with either the Core i3-10110U (MI623) or Core i5-10210U (MI643) with our Core i5 model starting at $439 USD. The 16 GB RAM and Lexar SSD were installed after the fact. Additional information on the ZBox Edge can be found on its official product page here.
More Zotac reviews:
Rating | Date | Model | Weight | Height | Size | Resolution | Price |
|---|---|---|---|---|---|---|---|
v (old) | 07 / 2020 | Zotac ZBox MI643 i5-10210U, UHD Graphics 620 | 550 g | 28.5 mm | x | ||
v (old) | 02 / 2020 | Intel NUC10i5FNK i5-10210U, UHD Graphics 620 | 493 g | 36 mm | 0.00" | 0x0 | |
v (old) | 12 / 2019 | Lenovo ThinkCentre M90n-1 Nano i5-8265U, UHD Graphics 620 | 499 g | 22 mm | 0.00" | x | |
v (old) | 05 / 2019 | Intel NUC8i3CYSM i3-8121U, Radeon RX 540 | 660 g | 52 mm | x | ||
v (old) | 09 / 2018 | Chuwi GBox CWI560 Celeron N4100, UHD Graphics 600 | 558 g | 37.3 mm | x | ||
v (old) | 03 / 2018 | Intel Hades Canyon NUC8i7HVK i7-8809G, Vega M GH | 1.3 kg | 39 mm | x |
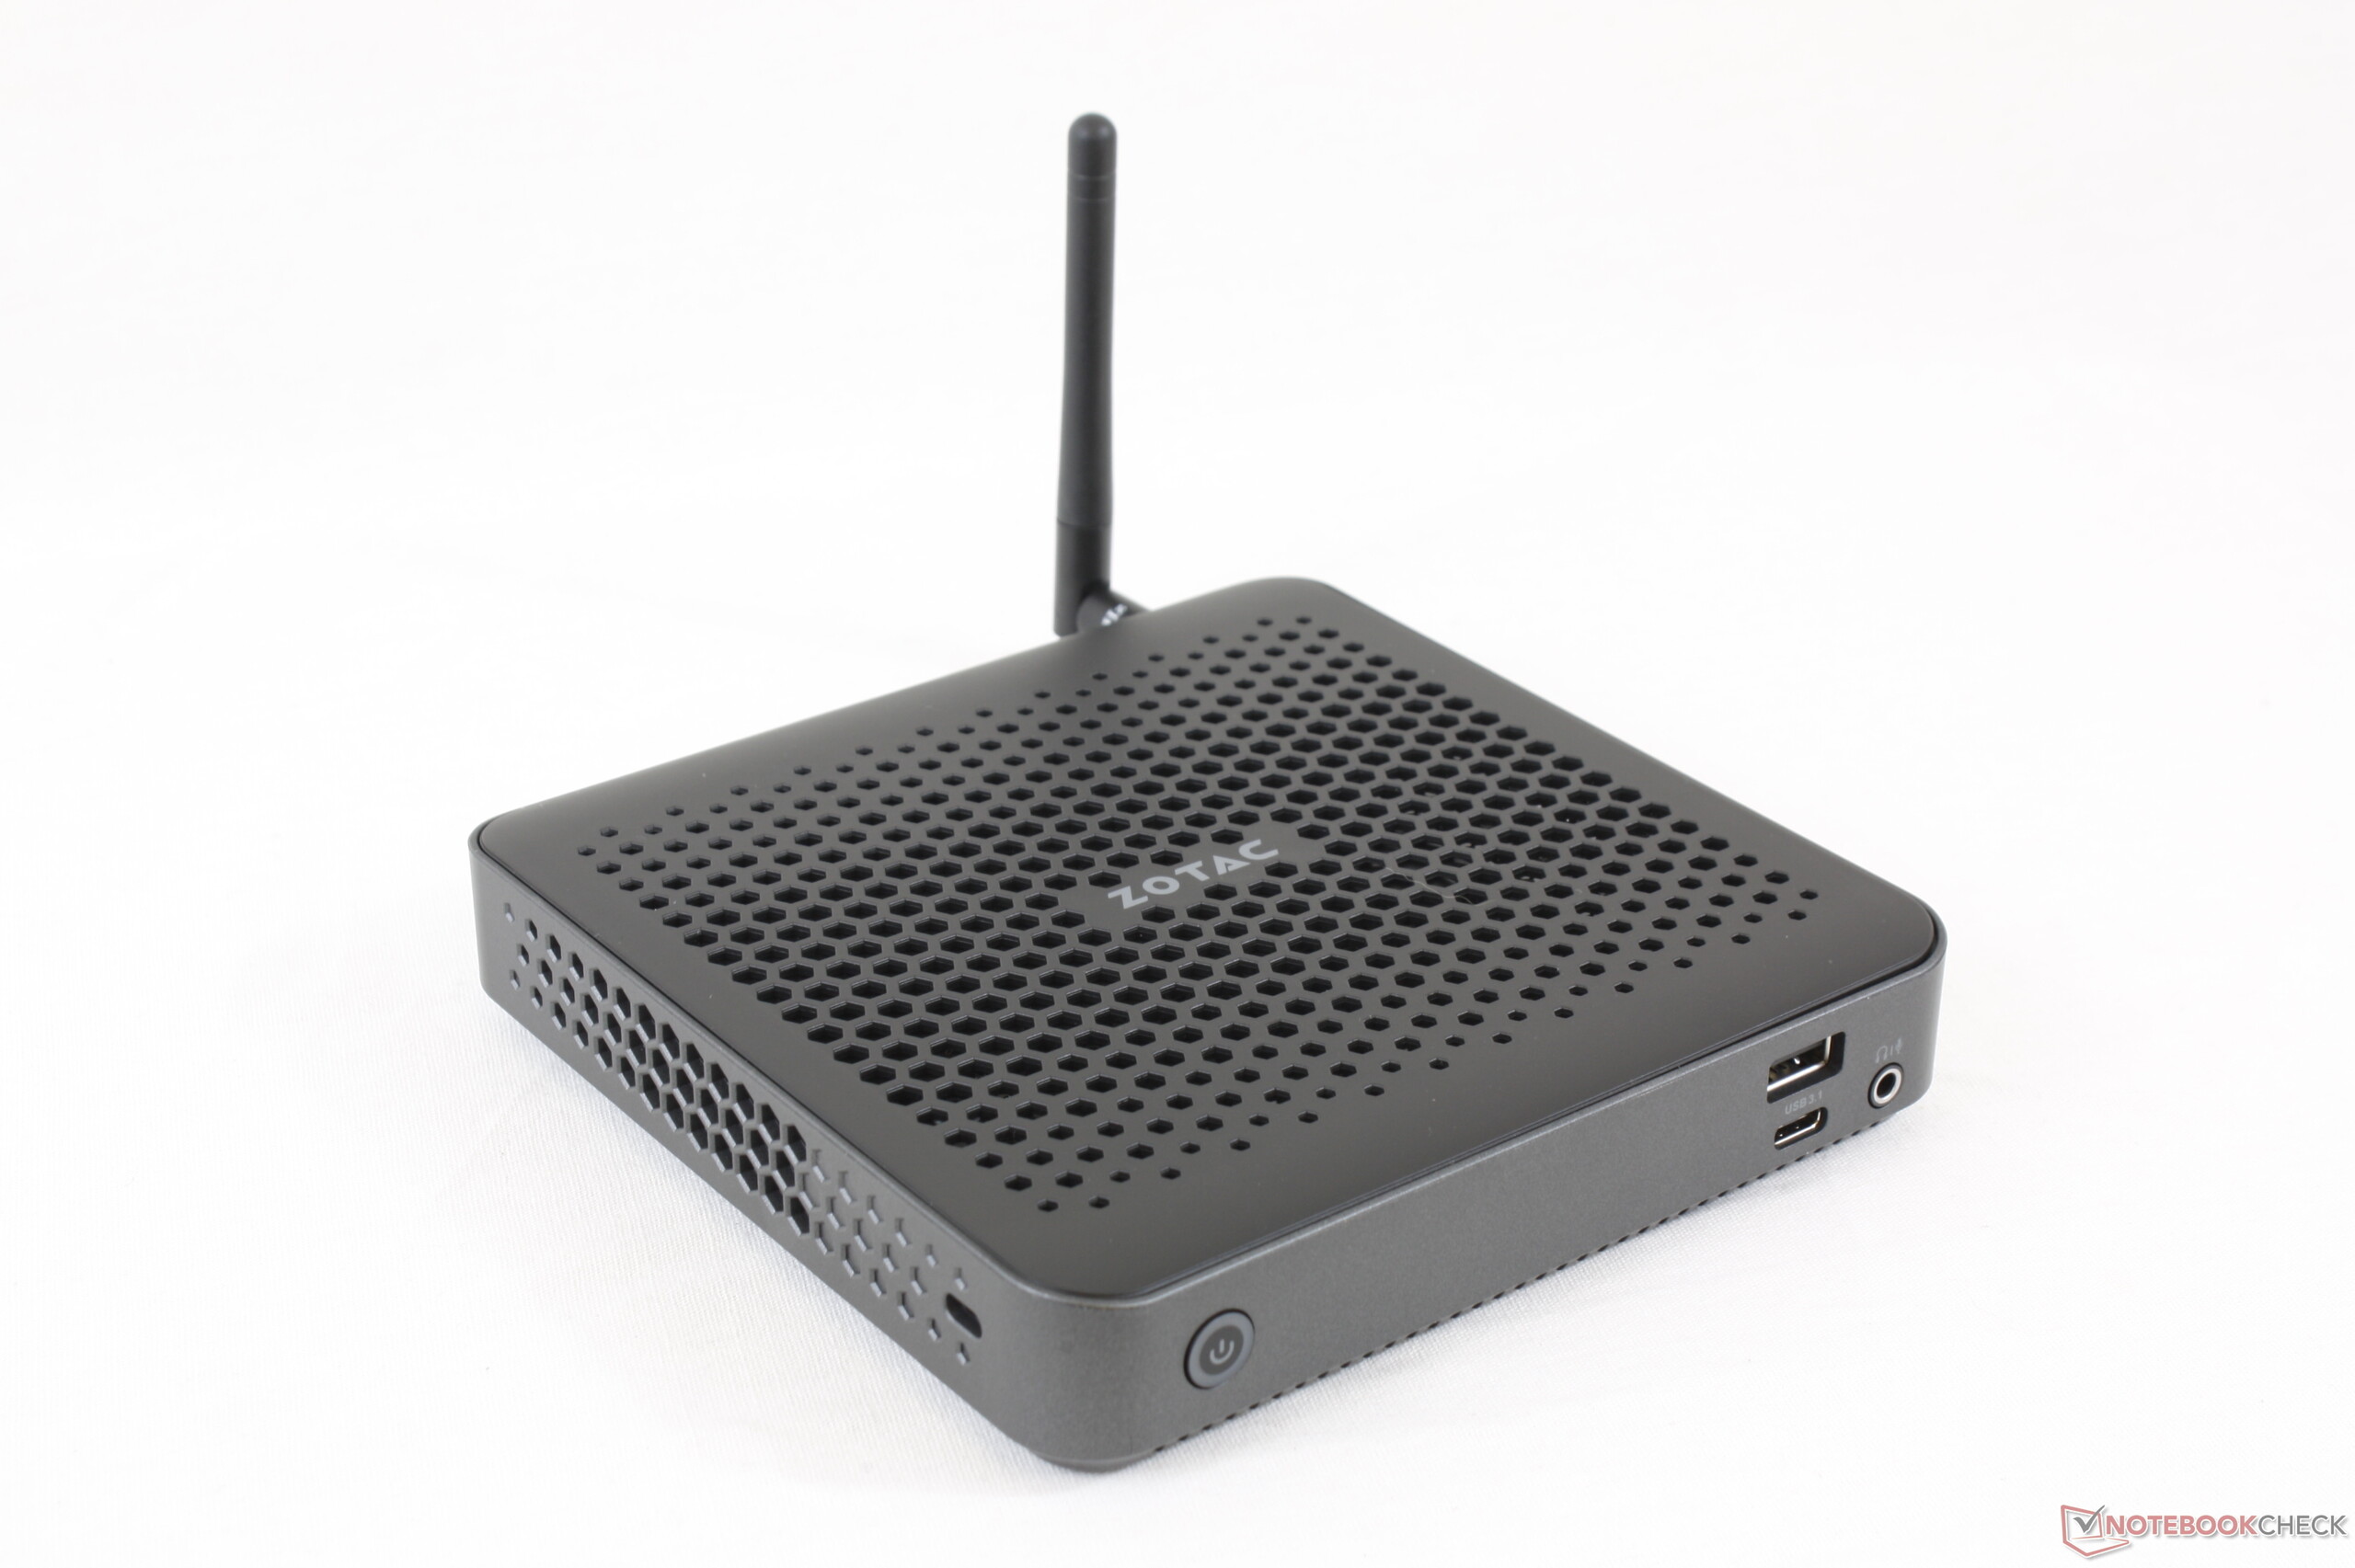
Case
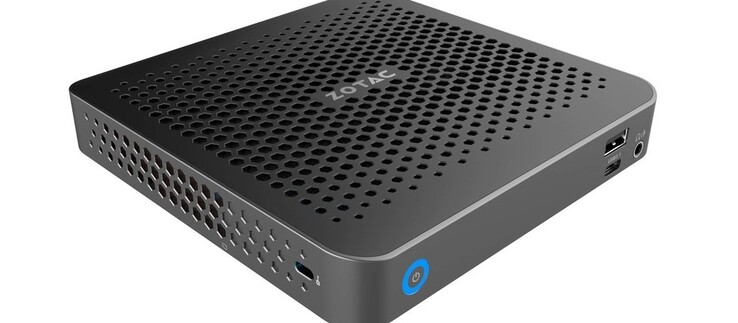
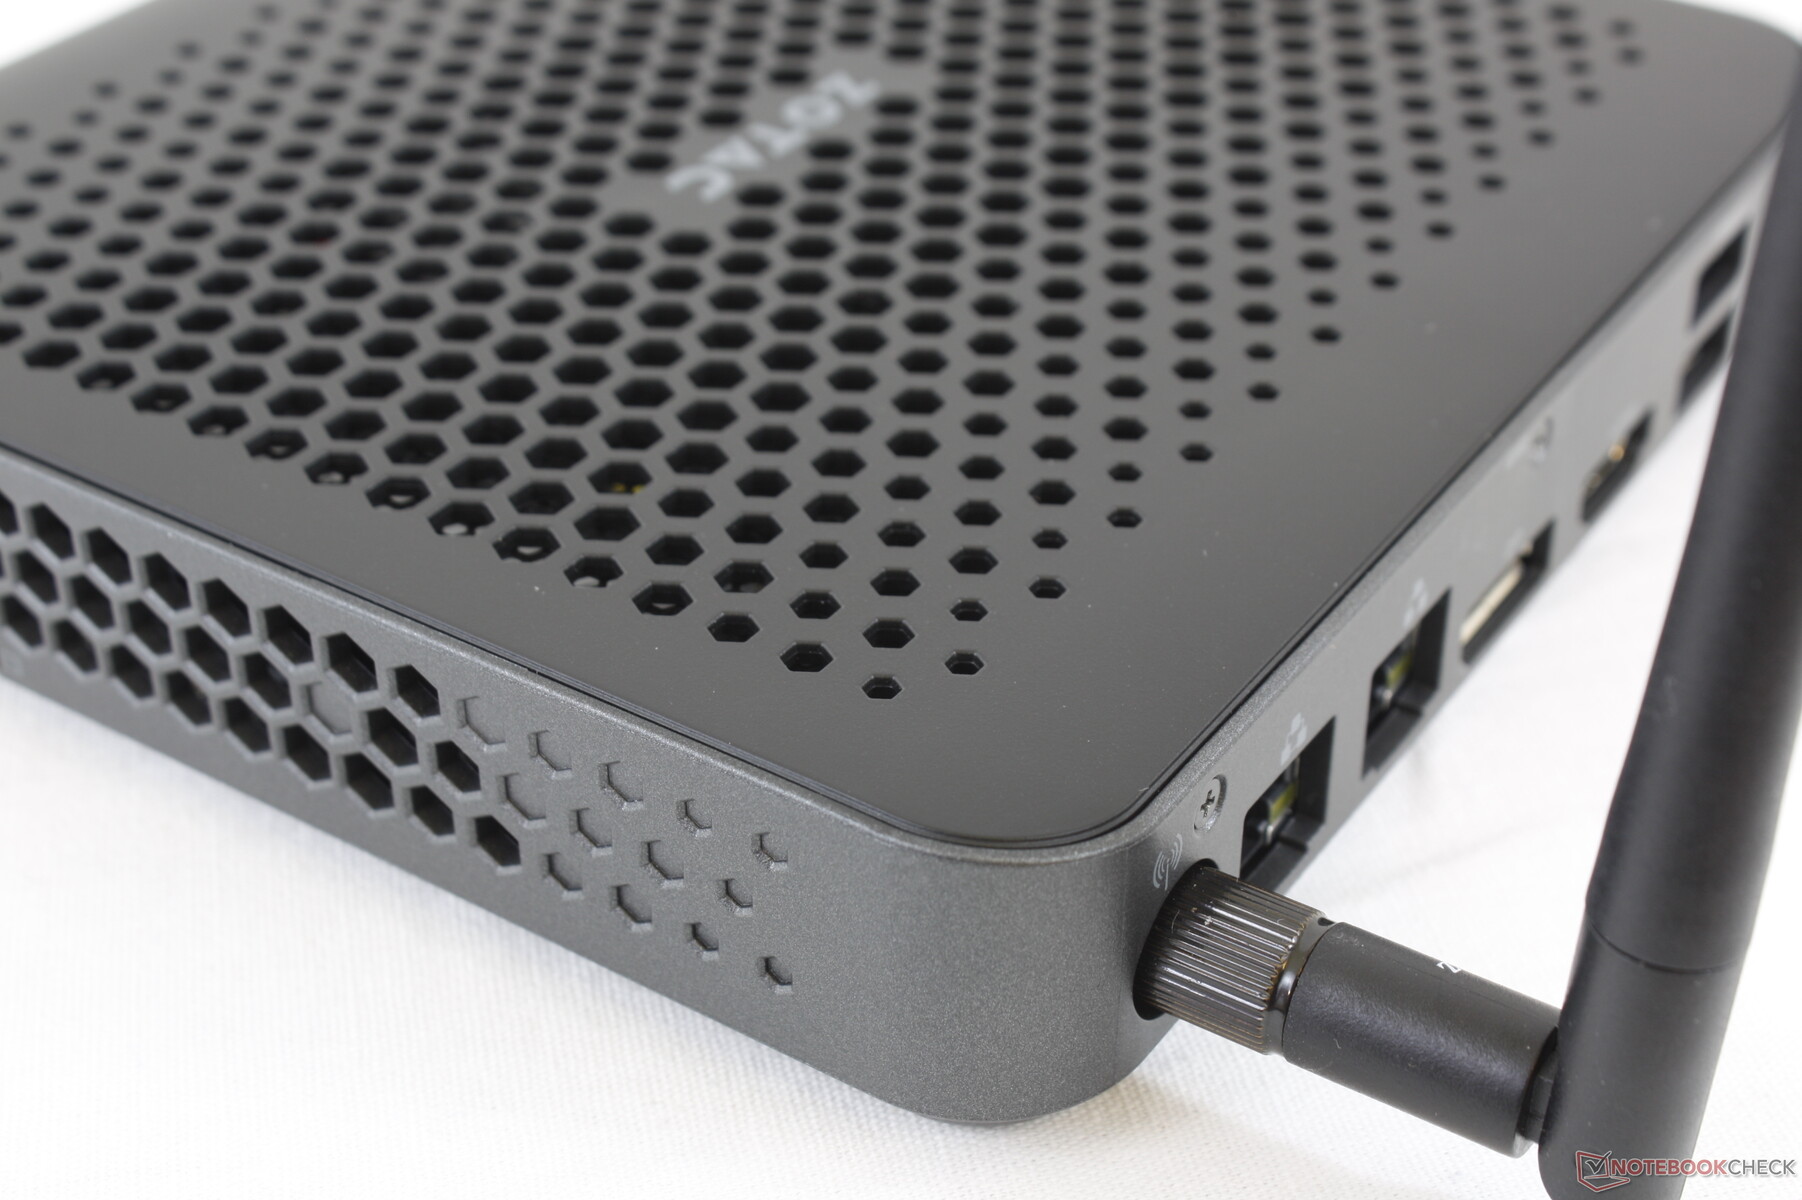
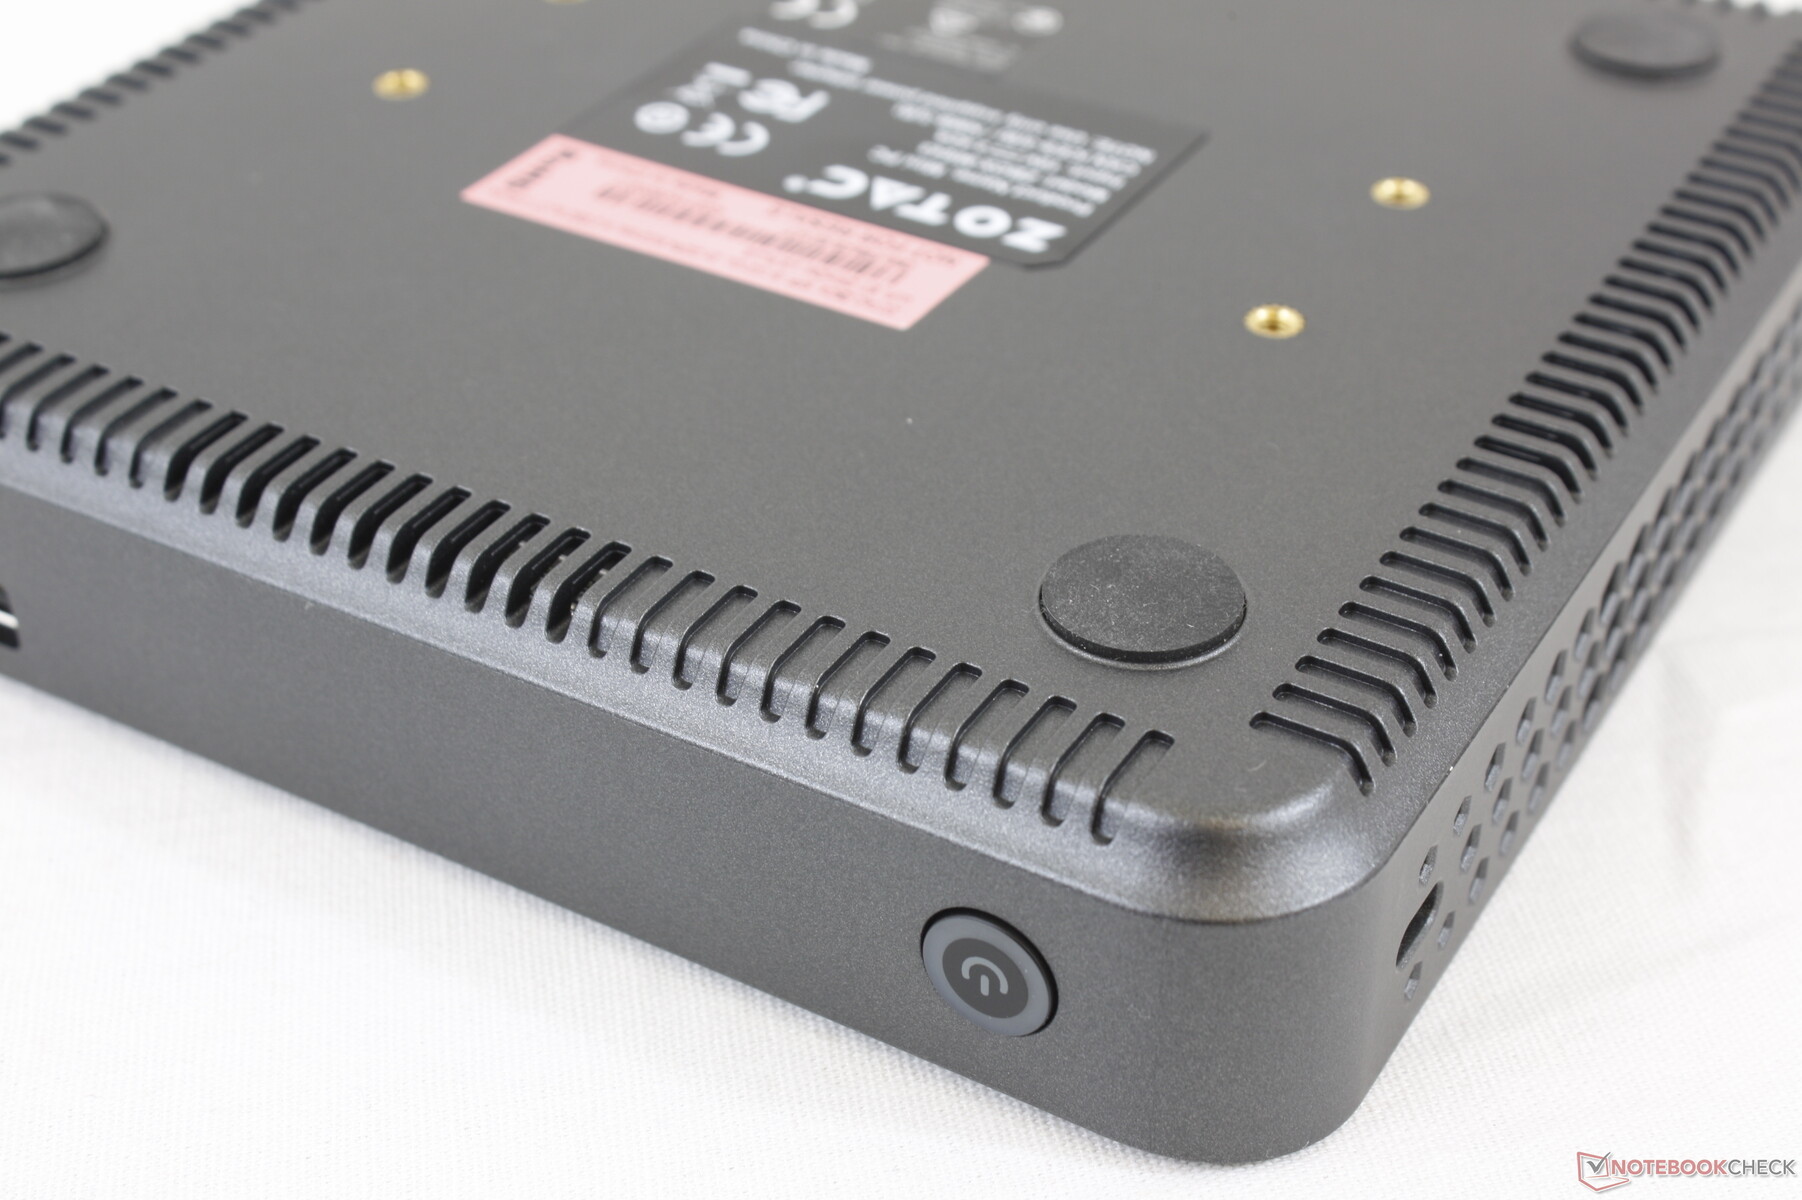
The ZBox Edge MI643 is sturdy and visually unobtrusive to fit in most IoT or professional environments. Our main gripe with the design is the very bright red or blue LED ring around the power button when the system is off or on, respectively. Zotac says a BIOS update to toggle the light may be implemented in the near future.
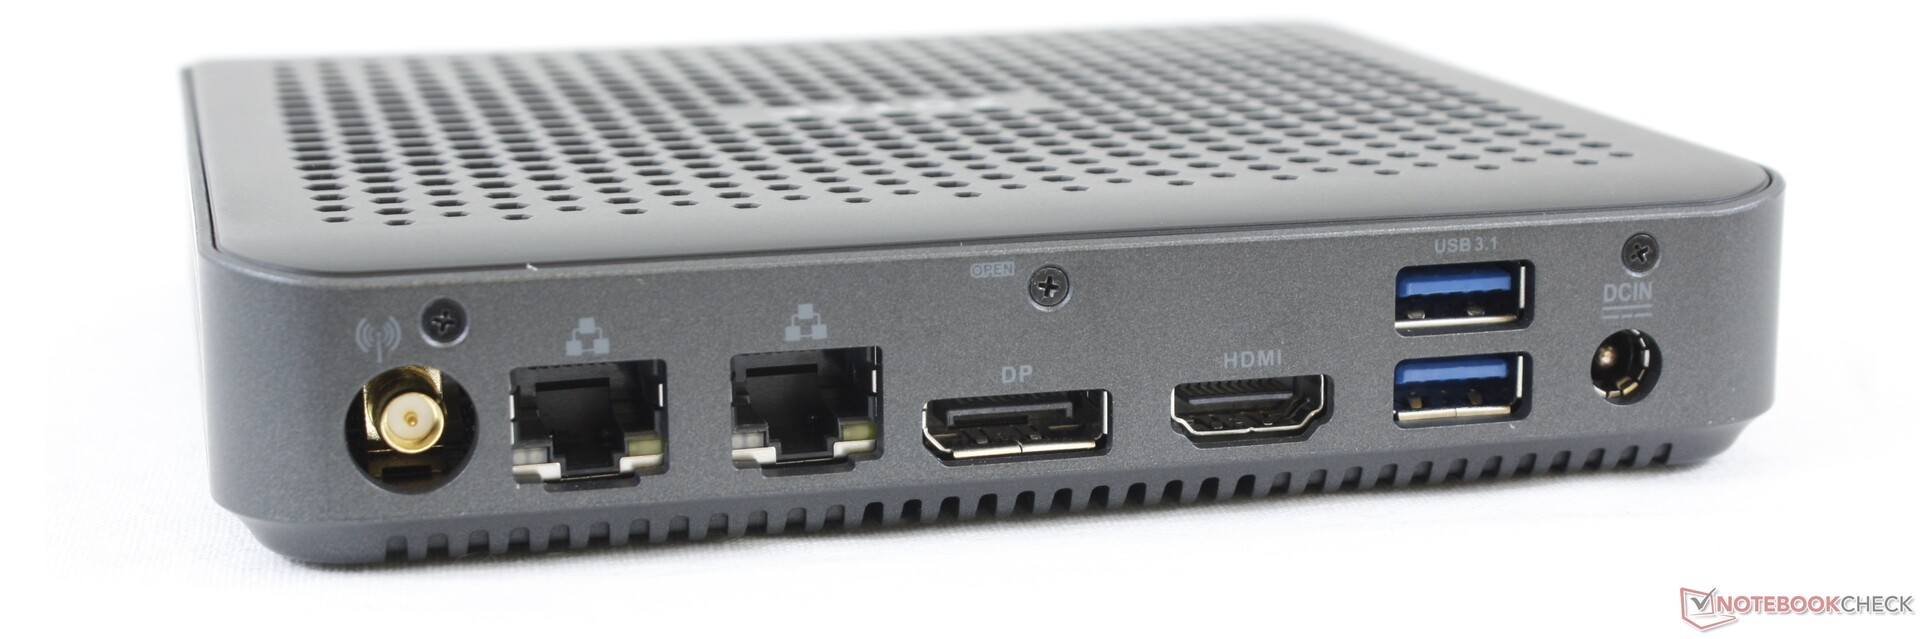
Connectivity
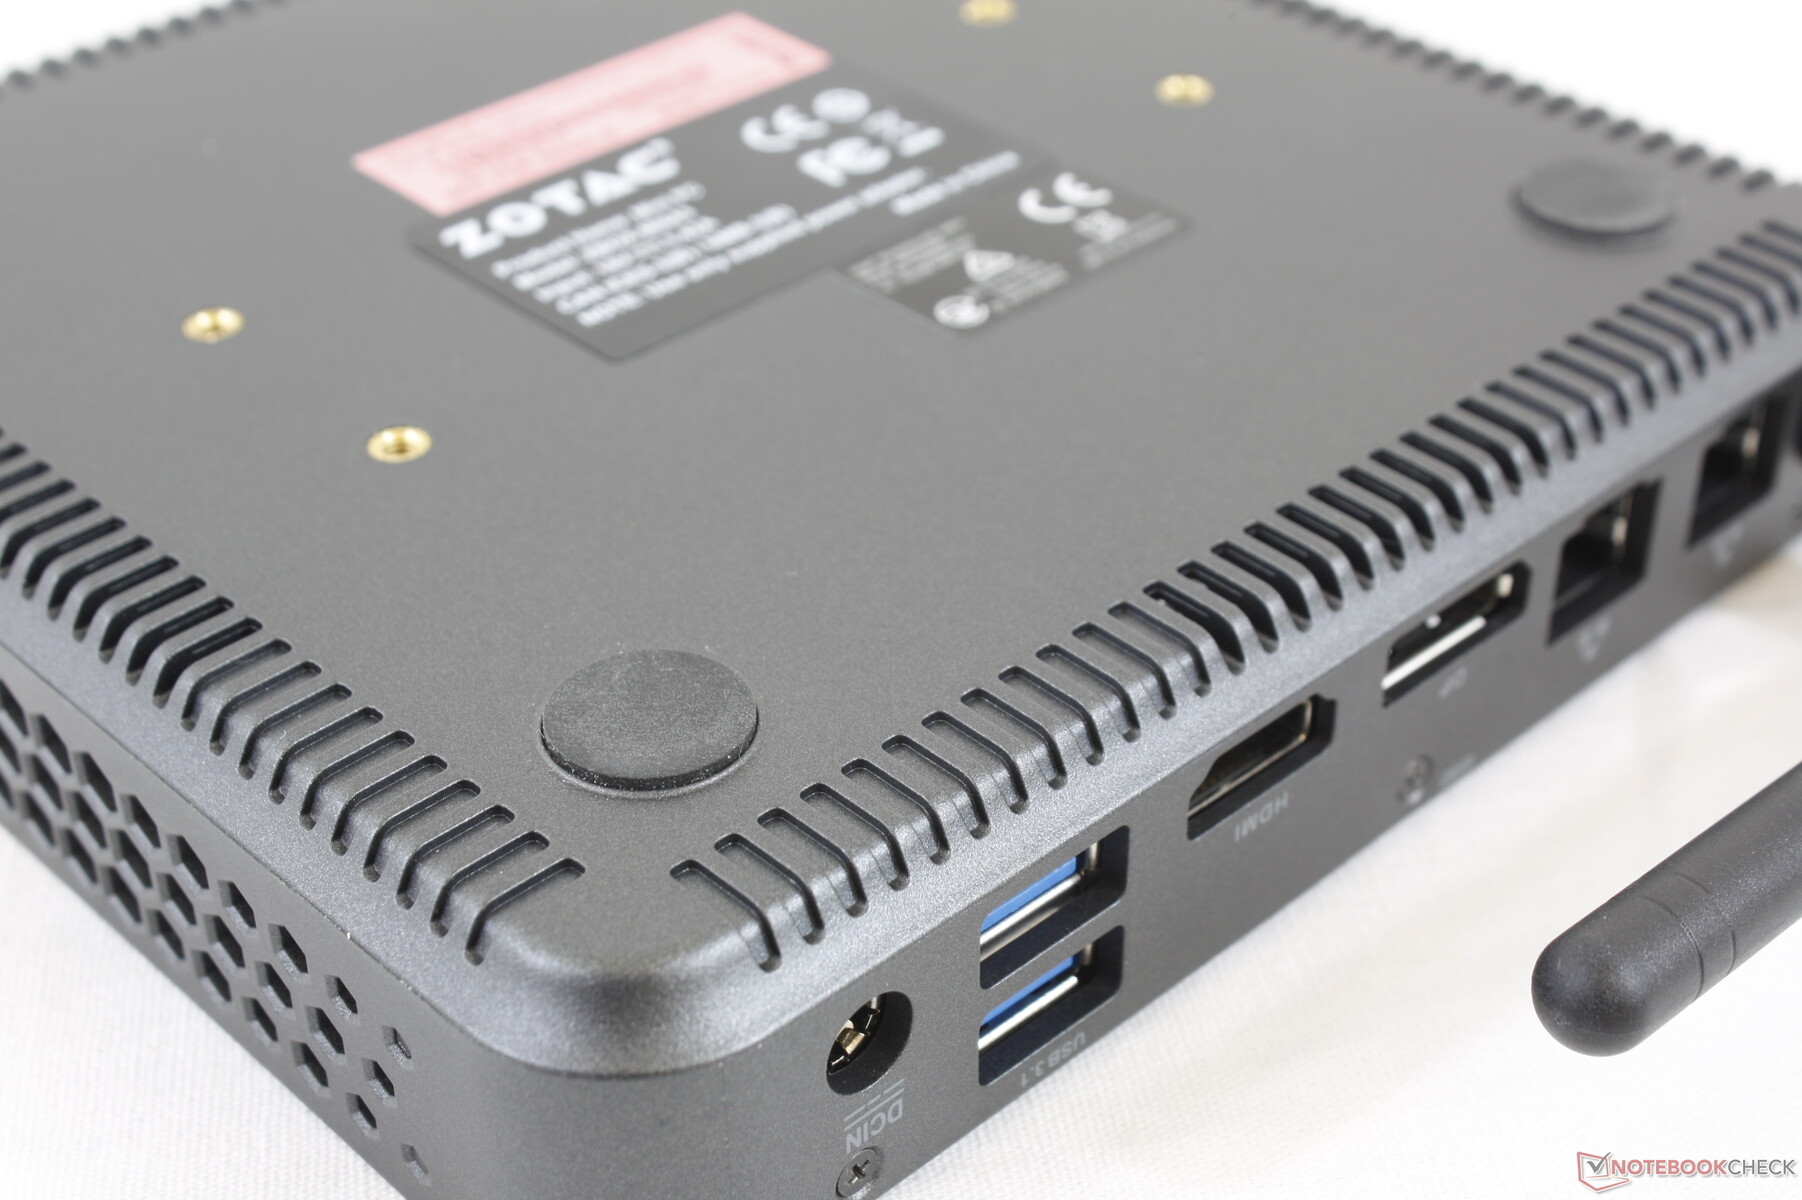
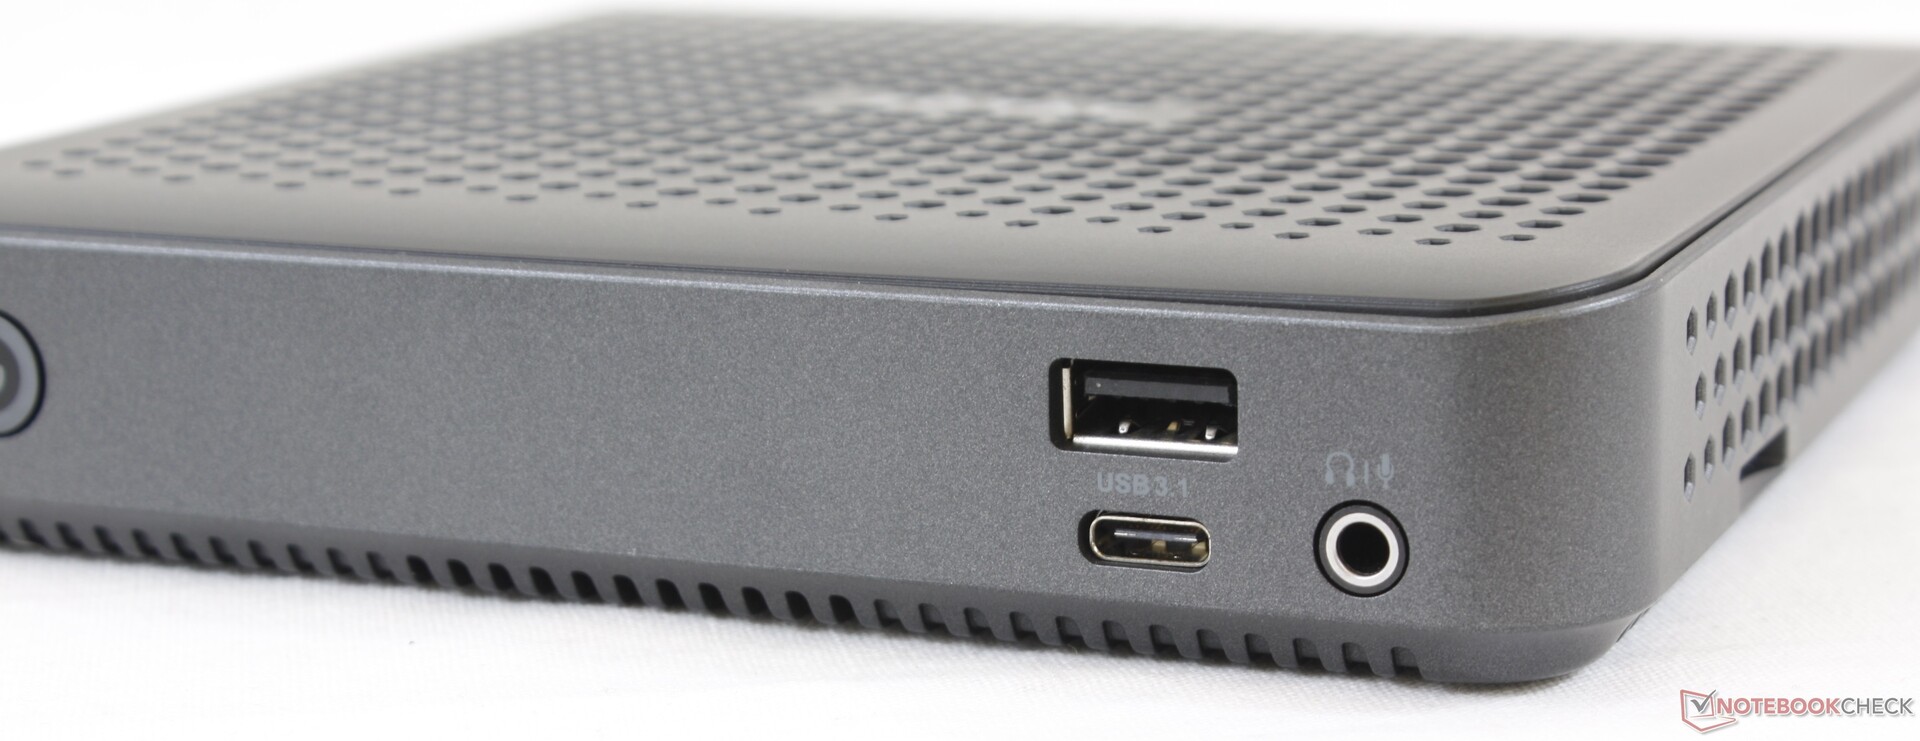
Most of the ports are tightly packed along the rear edge. Unfortunately, the sole USB-C port does not support video-out.

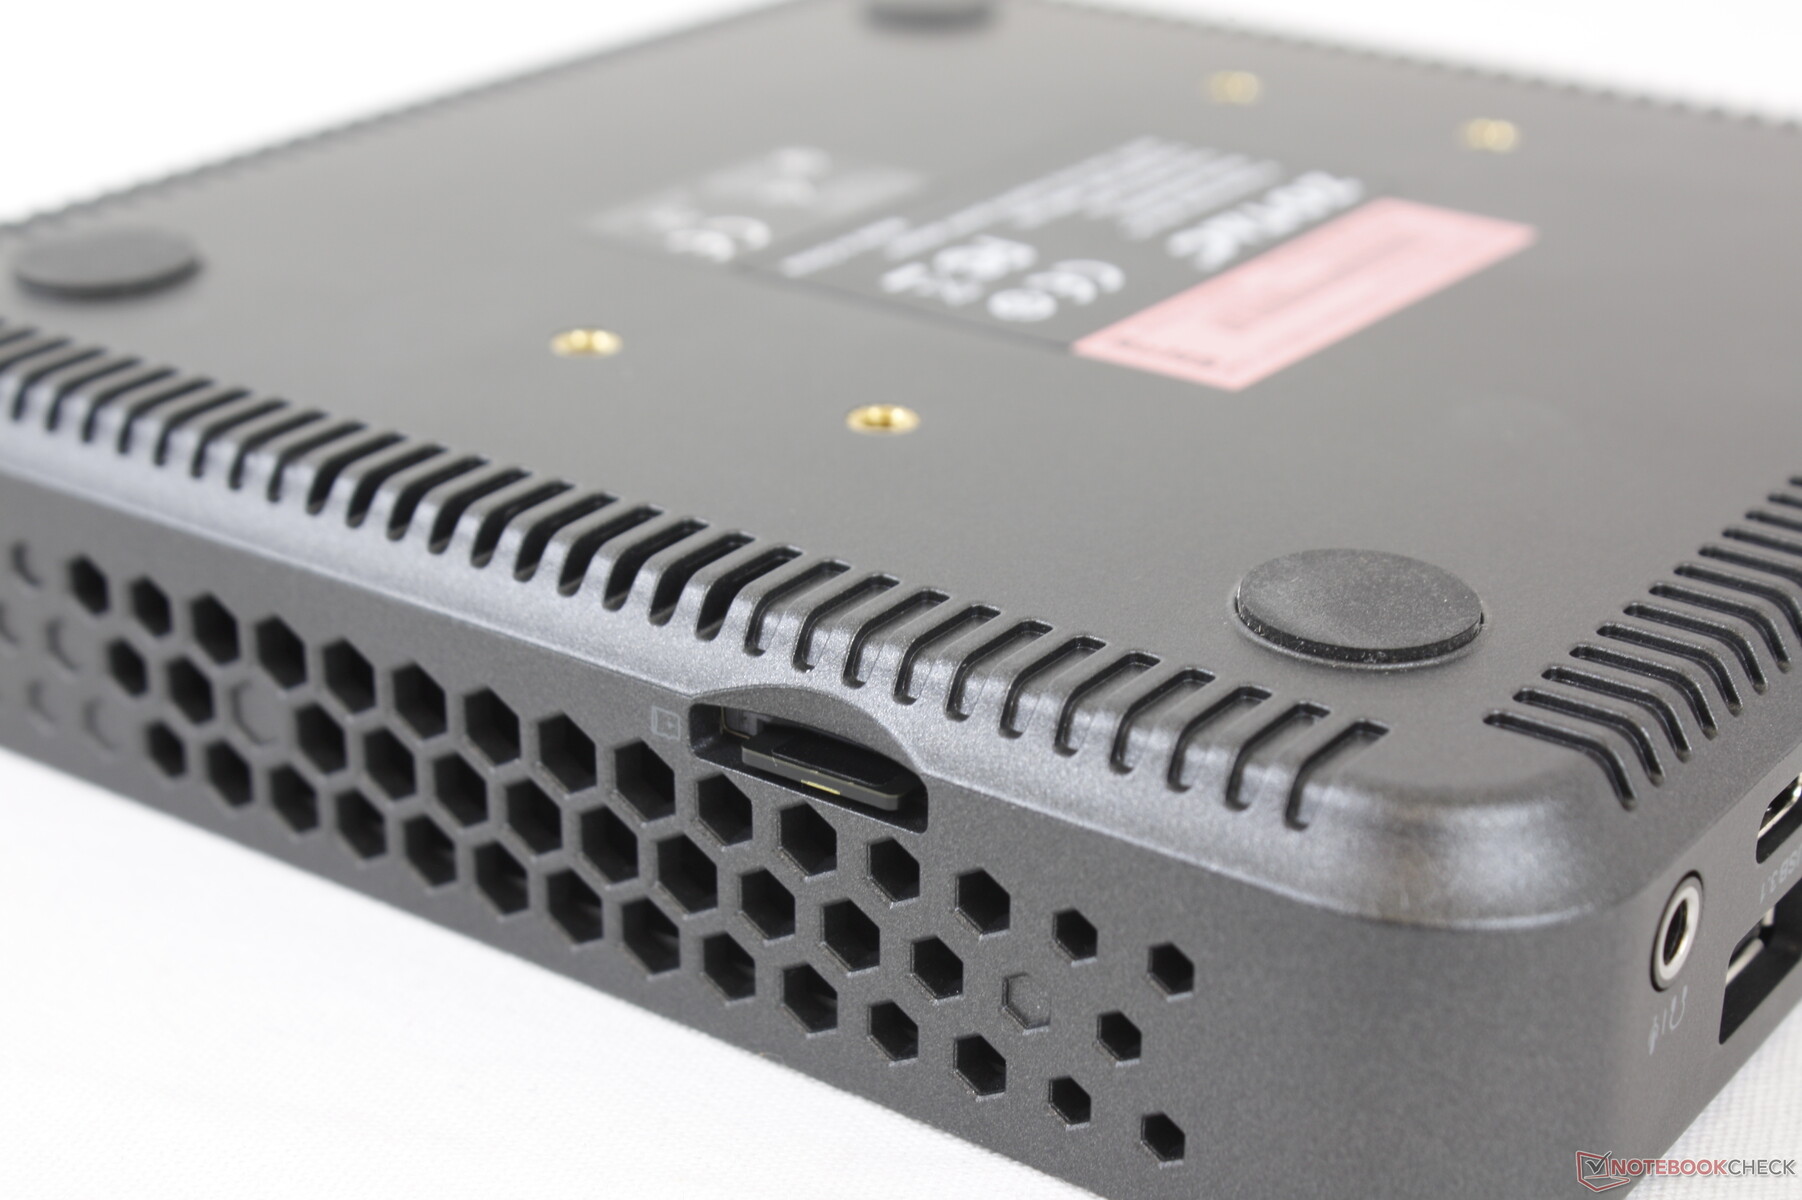
SD Card Reader
The MicroSD reader is along the right edge and it can be difficult to access without first flipping the entire unit over. Expect to wait 30 seconds to transfer 1 GB of pictures since transfer rates are slow.
| SD Card Reader | |
| average JPG Copy Test (av. of 3 runs) | |
| Intel Hades Canyon NUC8i7HVK (Toshiba Exceria Pro SDXC 64 GB UHS-II) | |
| Zotac ZBOX-CI660 Nano (Toshiba Exceria Pro SDXC 64 GB UHS-II) | |
| Zotac ZBox MI643 (Toshiba Exceria Pro M501 UHS-II) | |
| Chuwi GBox CWI560 (Toshiba Exceria Pro M501 UHS-II) | |
| maximum AS SSD Seq Read Test (1GB) | |
| Intel Hades Canyon NUC8i7HVK (Toshiba Exceria Pro SDXC 64 GB UHS-II) | |
| Zotac ZBox MI643 (Toshiba Exceria Pro M501 UHS-II) | |
| Zotac ZBOX-CI660 Nano (Toshiba Exceria Pro SDXC 64 GB UHS-II) | |
| Chuwi GBox CWI560 (Toshiba Exceria Pro M501 UHS-II) | |
Communication
The Intel 9461 comes integrated for 802.11ac and Bluetooth 5 connectivity with no other options which is a shame since this is a 1x1 module. Transfer rates max out at 433 Mbps compared to over three times that on most newer Wi-Fi 6-enabled laptops and mini PCs.
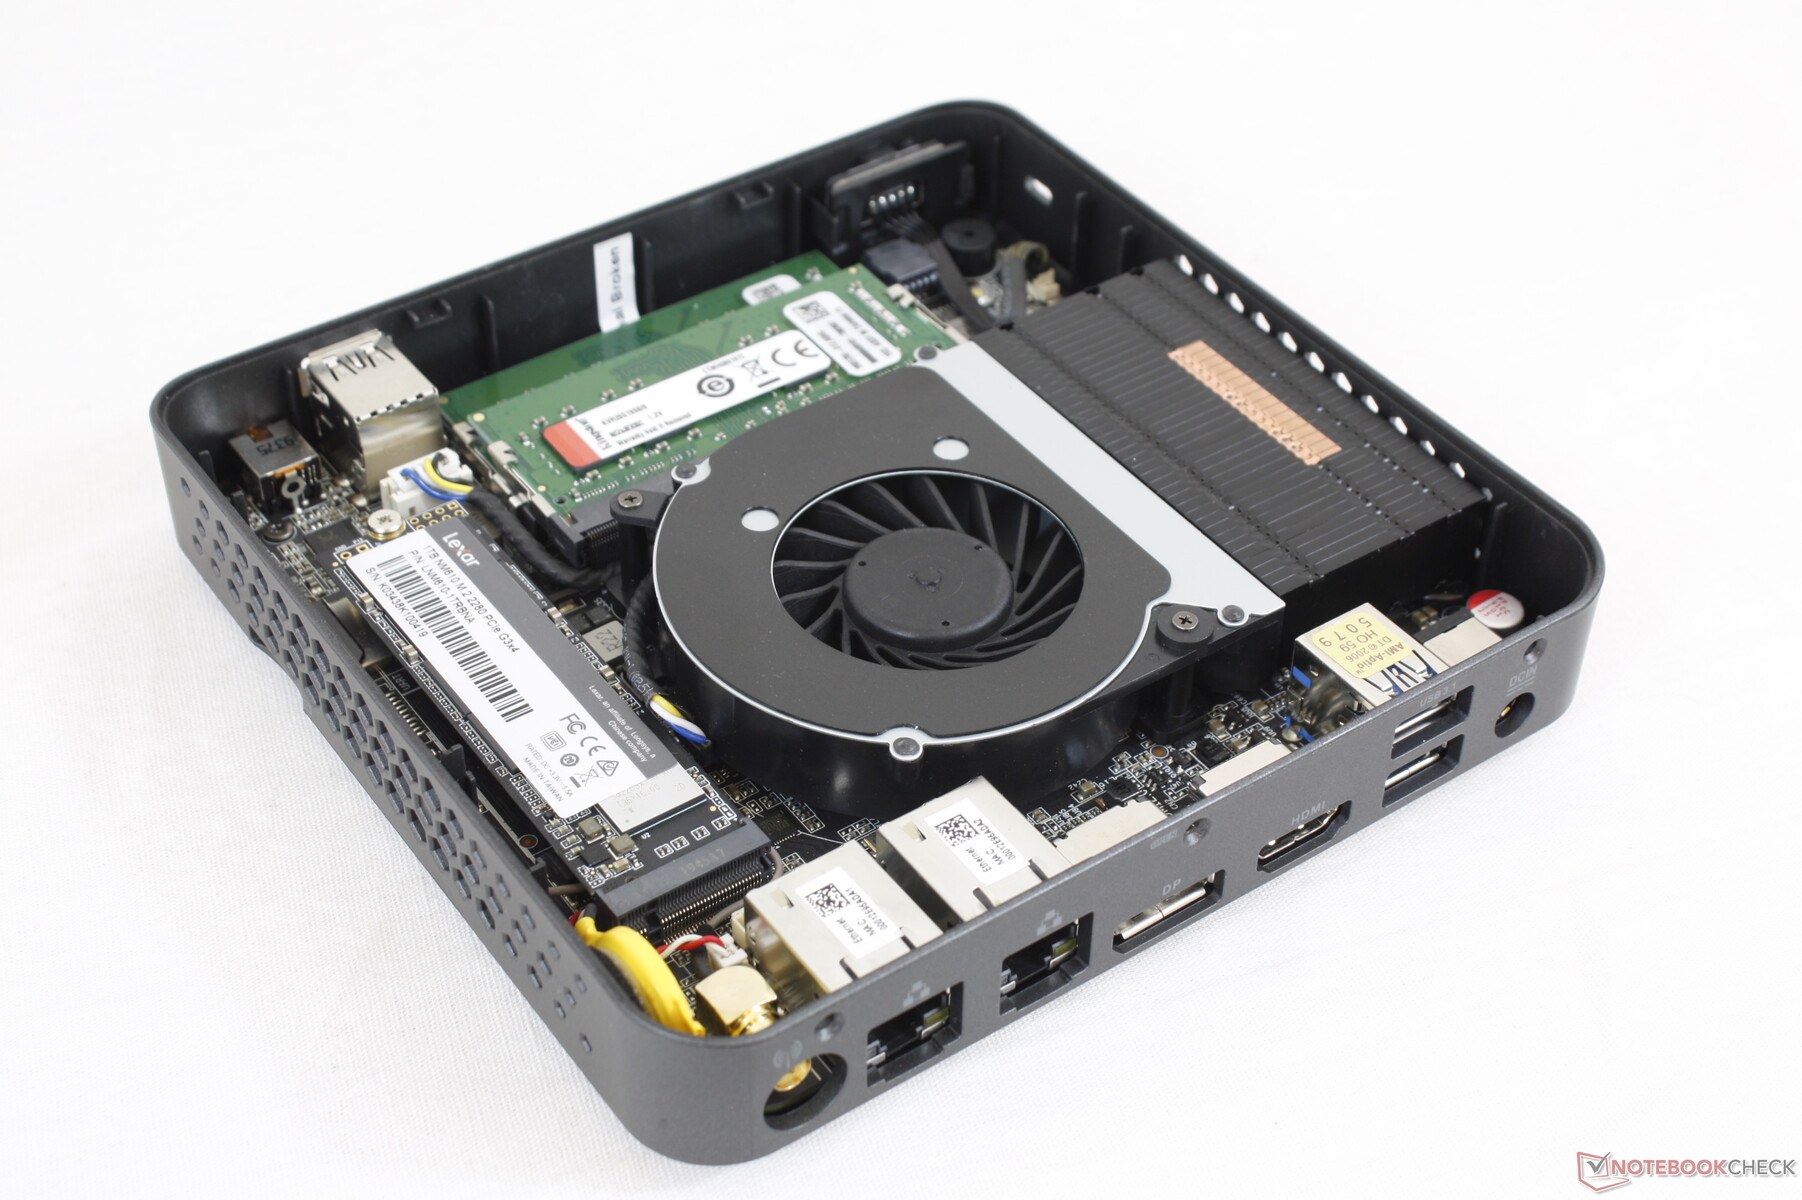
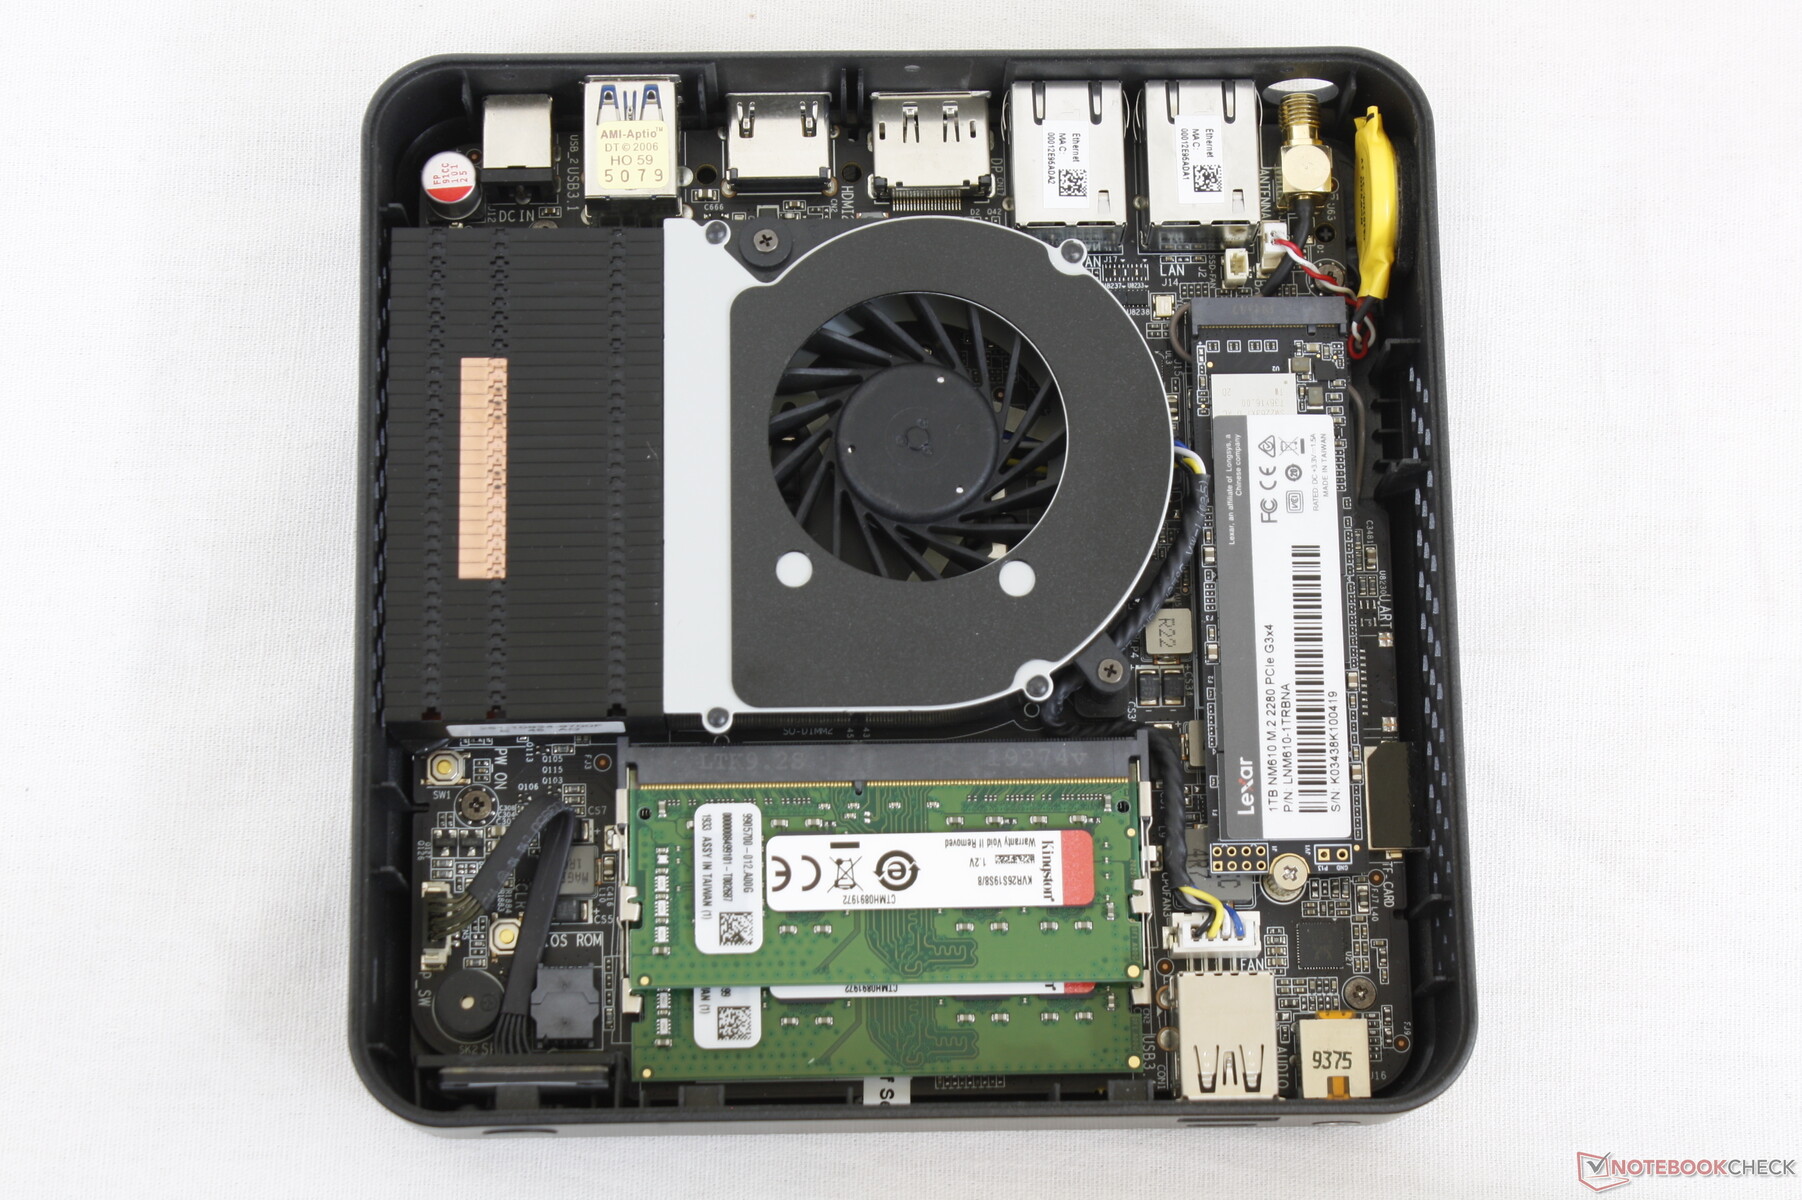
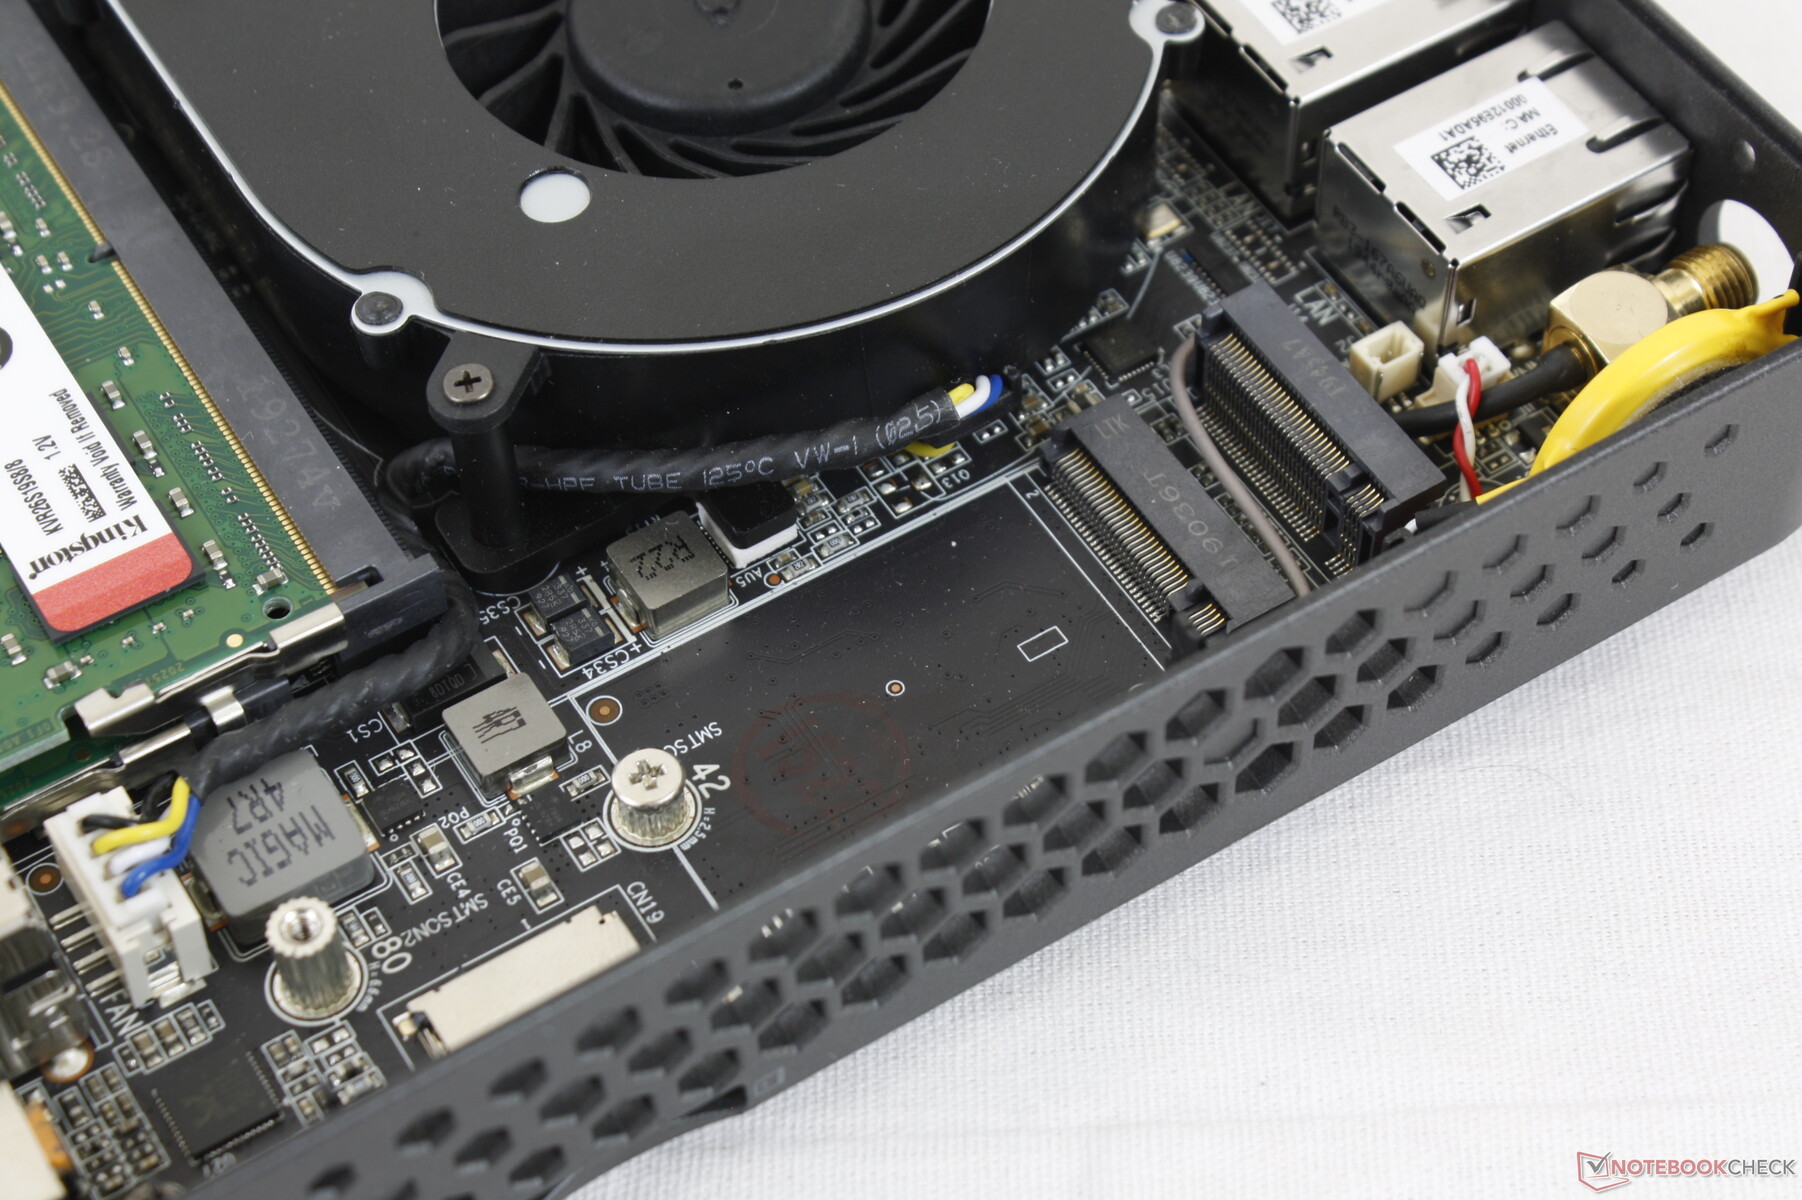
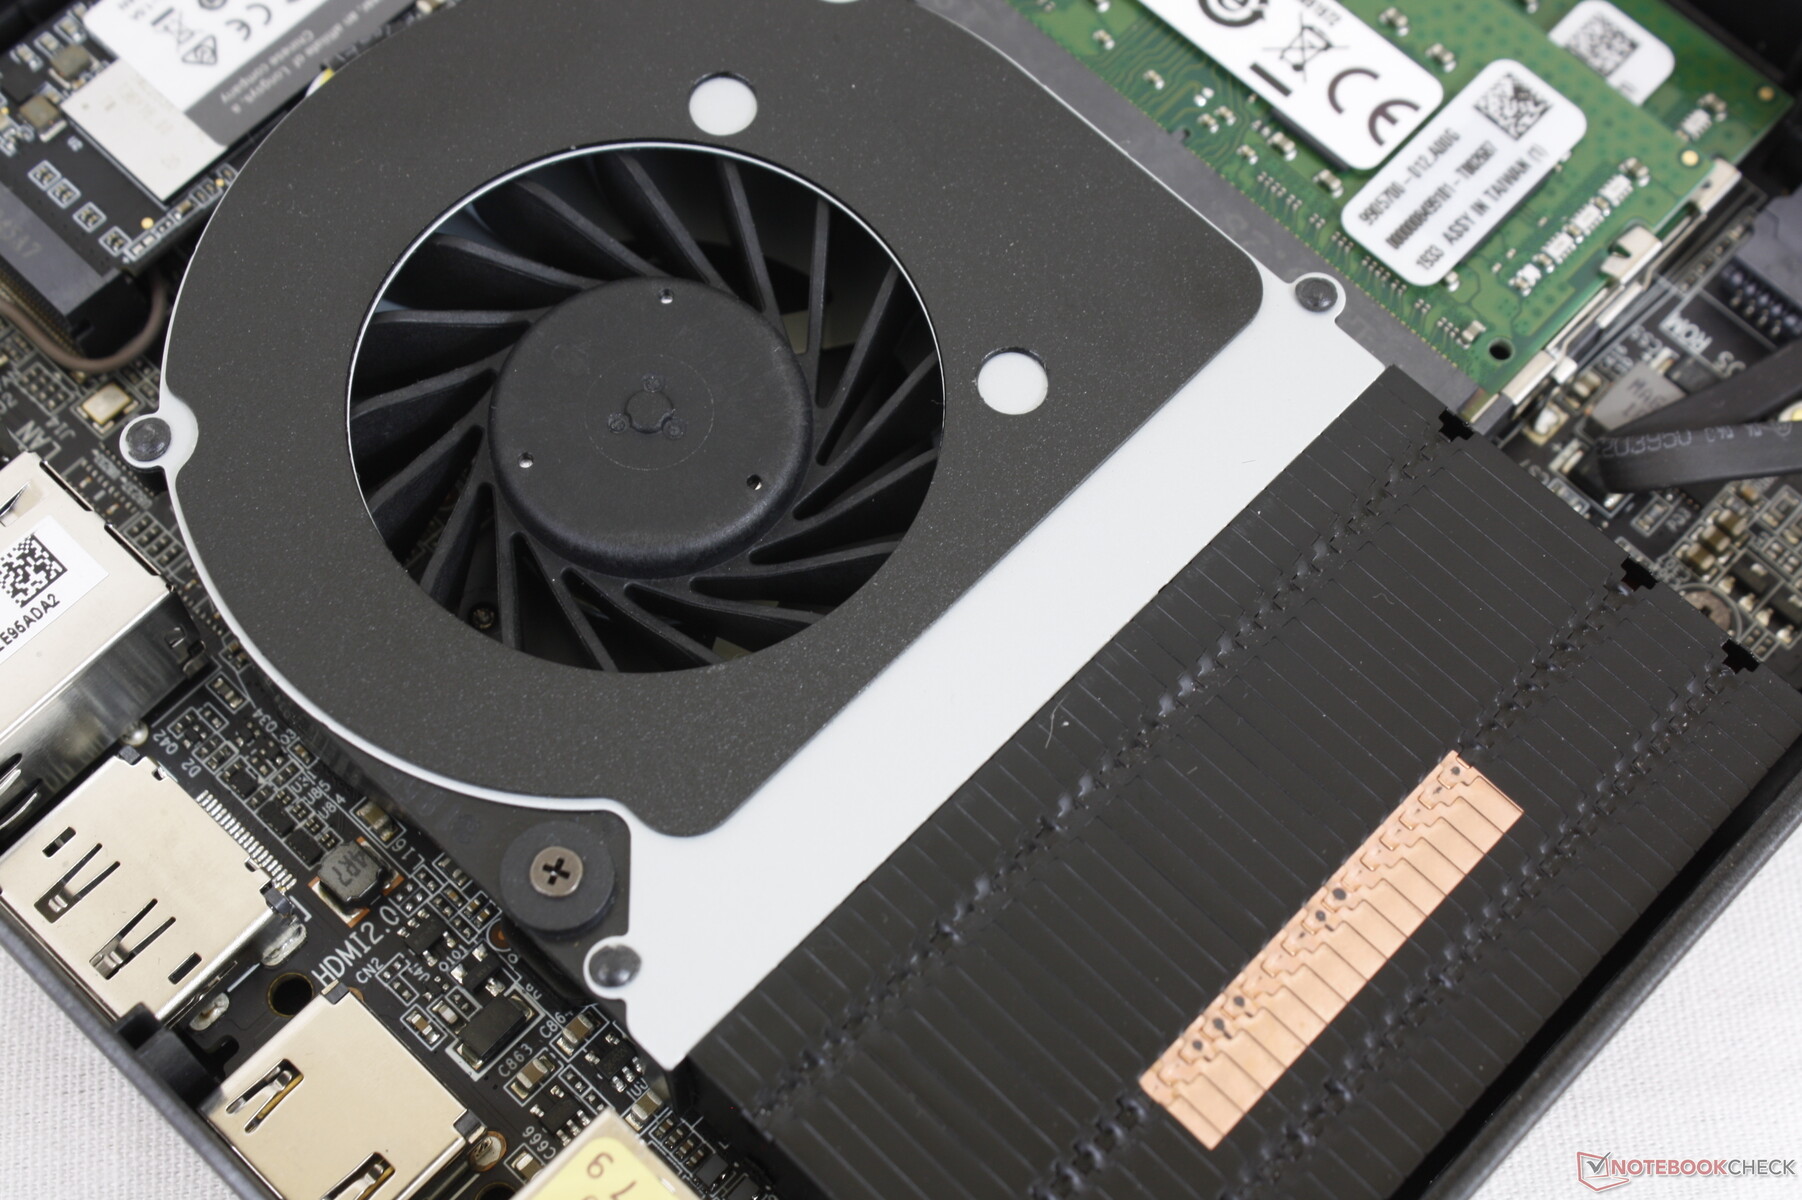
Maintenance
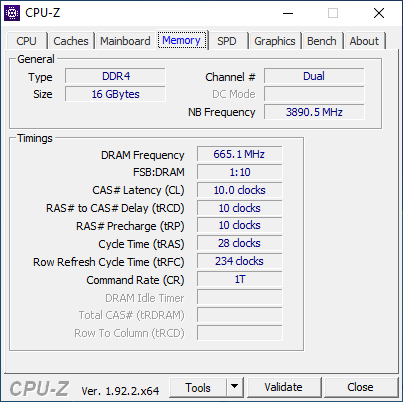
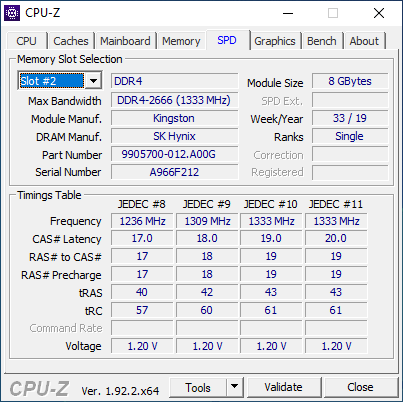
The top panel comes off easily after unscrewing three small Philips screws along the rear edge. Users have access to two DDR4-2666 SODIMM slots and two M.2 bays, but the WLAN module cannot be upgraded.
Accessories and Warranty
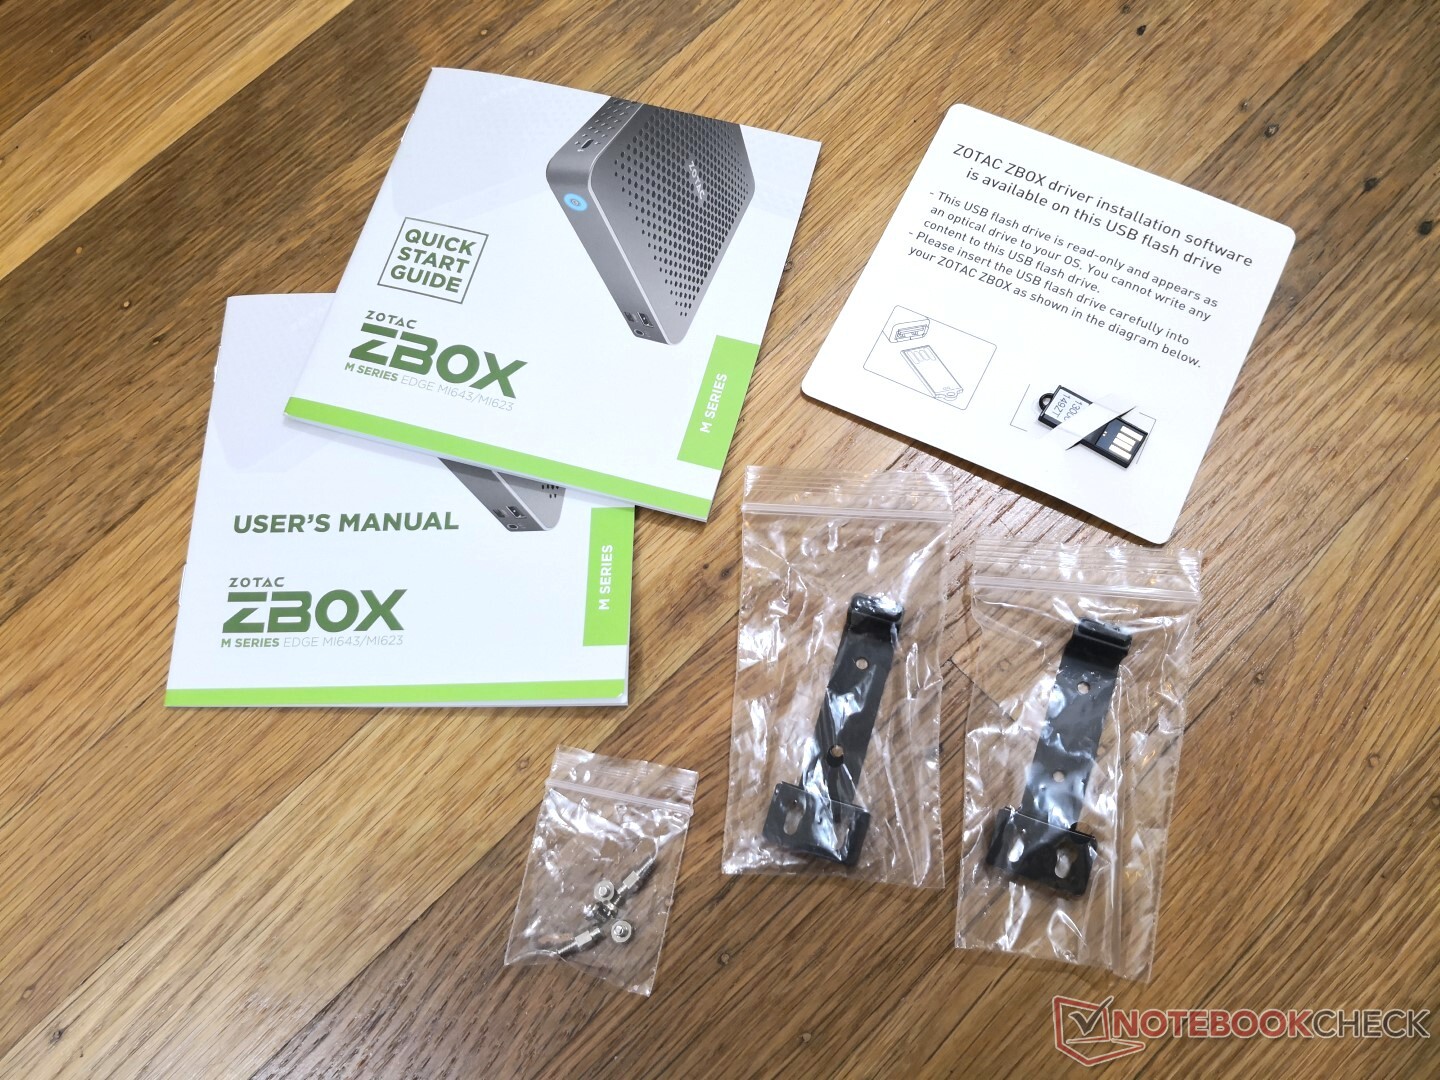
The box includes a USB stick loaded with drivers, manuals, removable Wi-Fi antenna, and a VESA mounting bracket with screws. Manufacturer warranty is the standard one to two years depending on region.
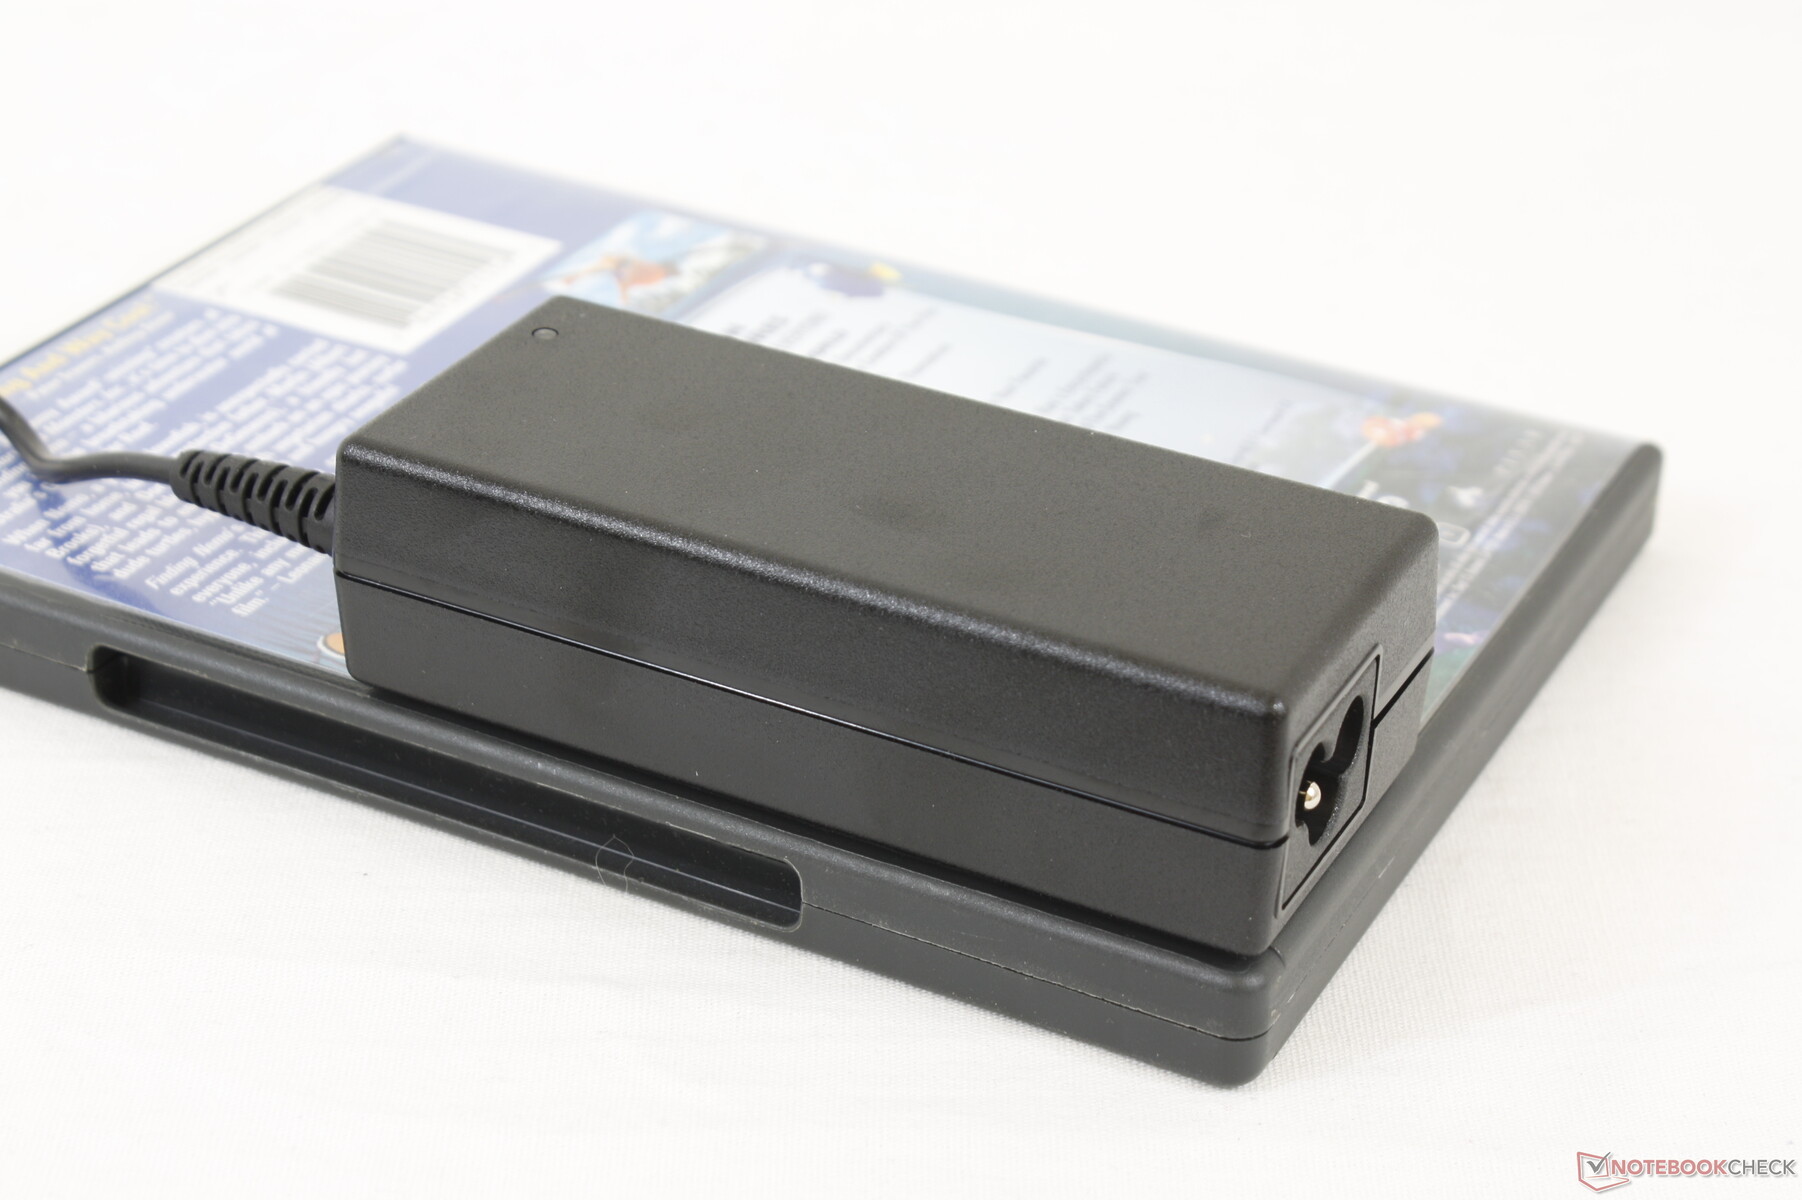
It would have been great to see the system be powered by USB-C much like on the Chuwi LarkBox, but Zotac is sticking to a proprietary AC adapter.
Performance
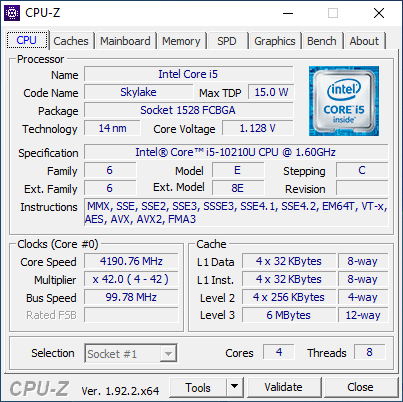
Processor
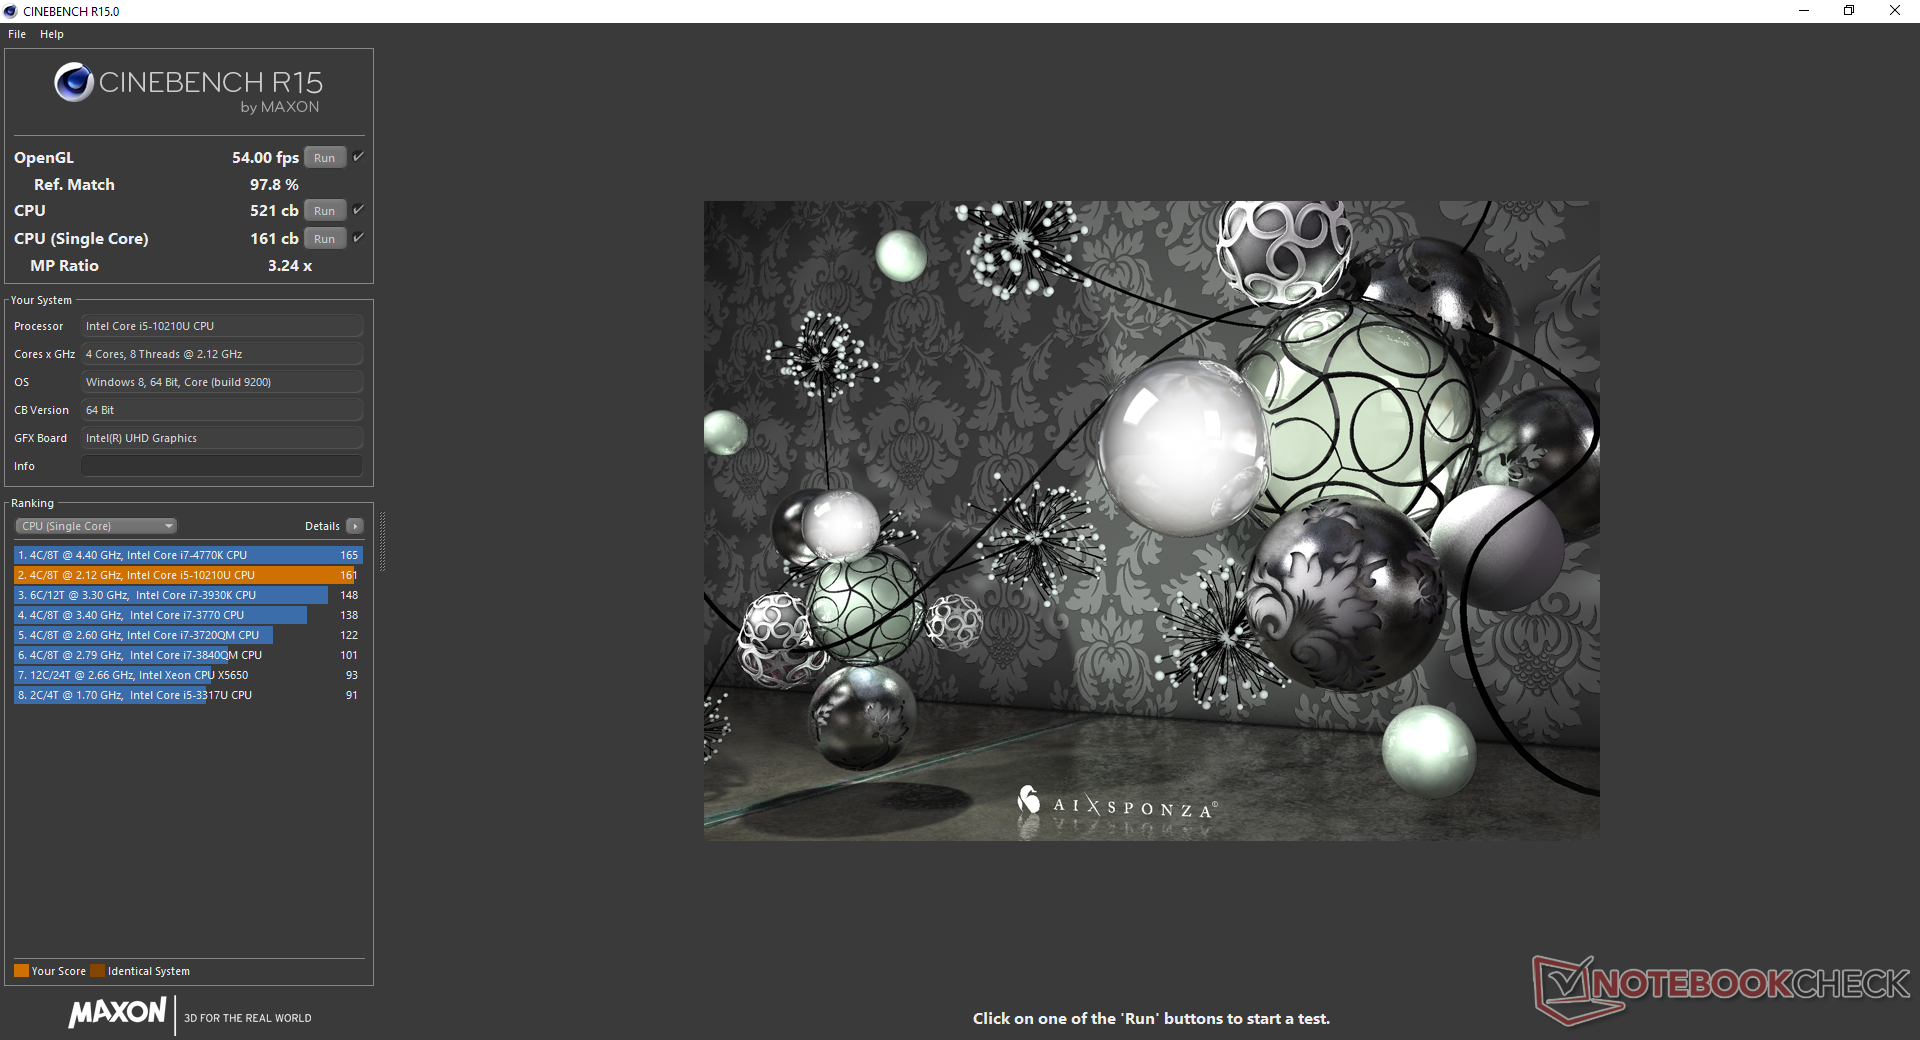
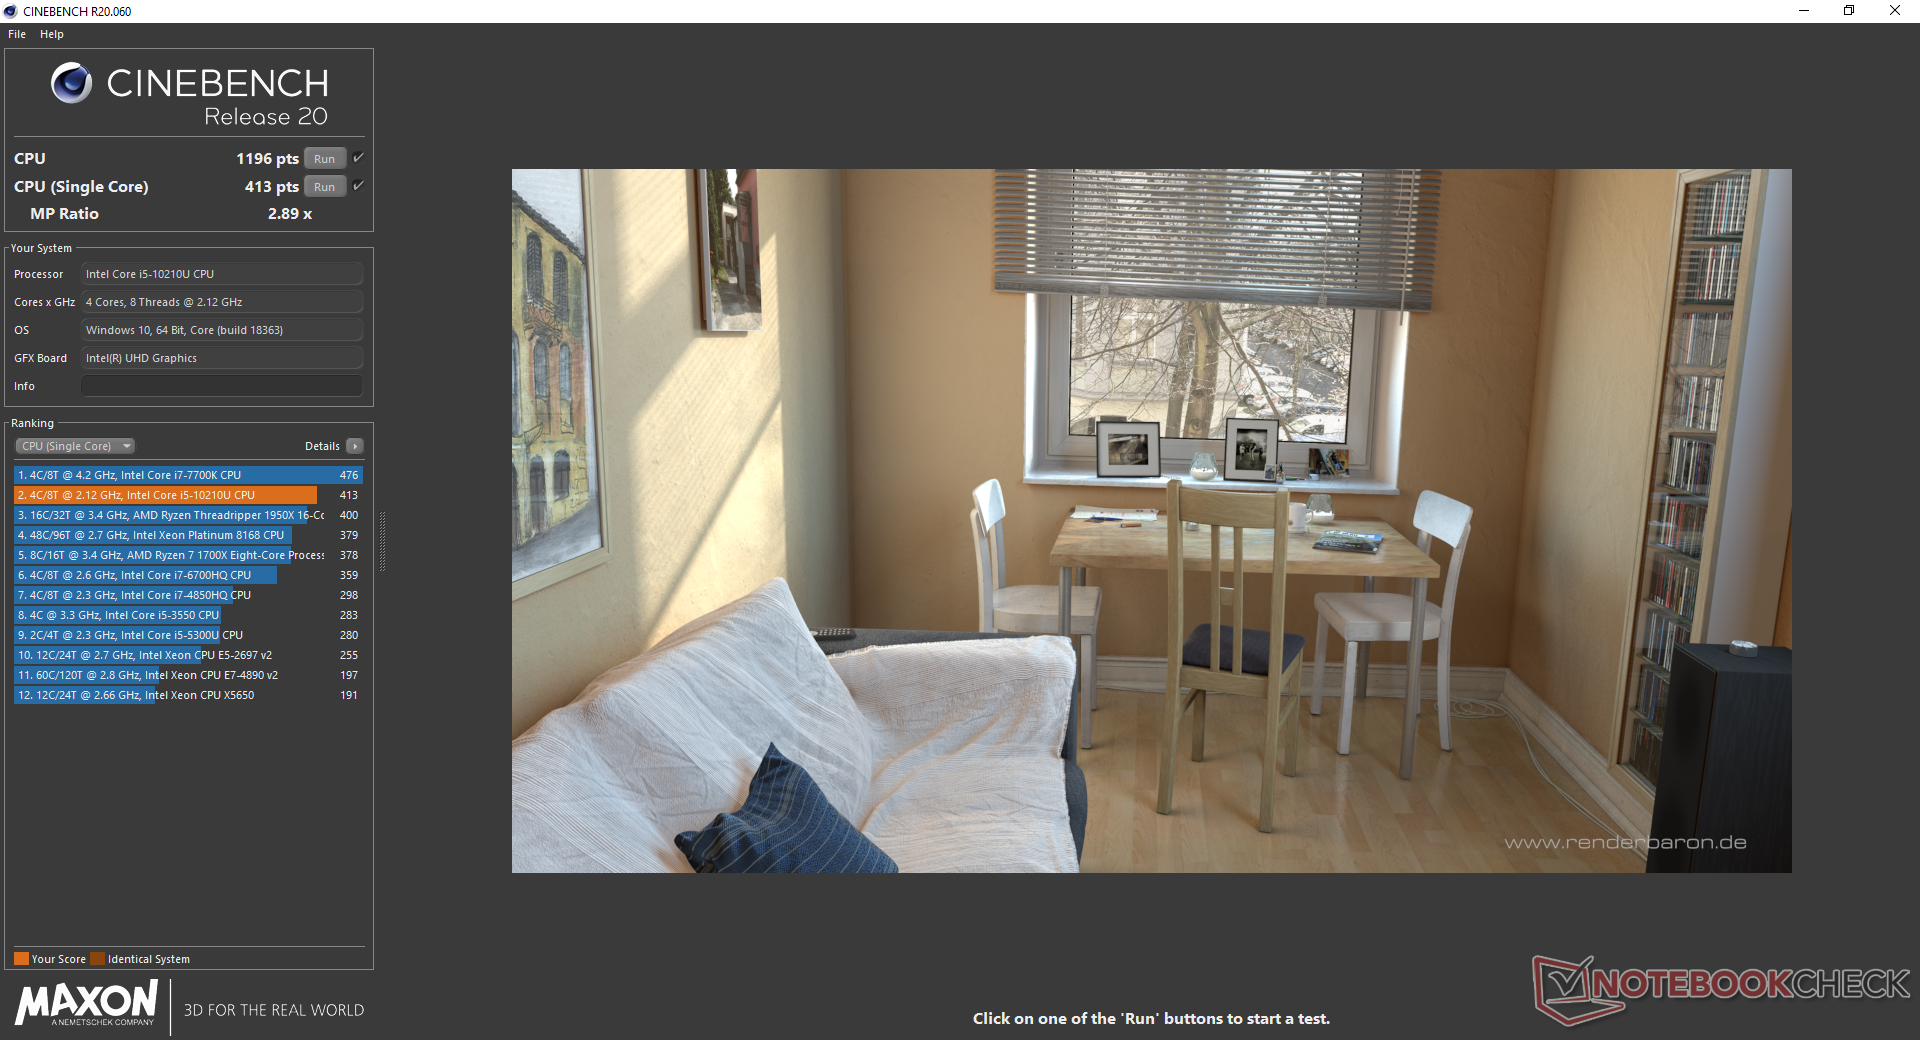
CPU performance is 10 to 15 percent slower than the average Core i5-10210U in our database. As an extreme example, the Intel NUC10i5FNK with the exact same processor is able to offer 45 percent faster performance after accounting for throttling on both systems as shown by our CineBench loop results below.
See our dedicated page on the Core i5-10210U for more benchmark comparisons.
Cinebench R20: CPU (Multi Core) | CPU (Single Core)
Blender: v2.79 BMW27 CPU
7-Zip 18.03: 7z b 4 -mmt1 | 7z b 4
Geekbench 5.5: Single-Core | Multi-Core
HWBOT x265 Benchmark v2.2: 4k Preset
LibreOffice : 20 Documents To PDF
R Benchmark 2.5: Overall mean
| Cinebench R20 / CPU (Multi Core) | |
| Intel Hades Canyon NUC8i7HVK | |
| Intel NUC10i5FNK | |
| Lenovo ThinkPad X1 Carbon 2020-20UAS04T00 | |
| Average Intel Core i5-10210U (722 - 1820, n=30) | |
| Zotac ZBox MI643 | |
| Chuwi LarkBox 4K Mini PC | |
| Chuwi LapBook Plus | |
| Cinebench R20 / CPU (Single Core) | |
| Lenovo ThinkPad X1 Carbon 2020-20UAS04T00 | |
| Intel NUC10i5FNK | |
| Zotac ZBox MI643 | |
| Average Intel Core i5-10210U (322 - 428, n=30) | |
| Intel Hades Canyon NUC8i7HVK | |
| Chuwi LarkBox 4K Mini PC | |
| Chuwi LapBook Plus | |
| Blender / v2.79 BMW27 CPU | |
| Chuwi LapBook Plus | |
| Chuwi GBox CWI560 | |
| Chuwi LarkBox 4K Mini PC | |
| Zotac ZBox MI643 | |
| Average Intel Core i5-10210U (585 - 1339, n=24) | |
| Lenovo ThinkPad X1 Carbon 2020-20UAS04T00 | |
| Intel NUC10i5FNK | |
| Intel Hades Canyon NUC8i7HVK | |
| 7-Zip 18.03 / 7z b 4 -mmt1 | |
| Lenovo ThinkPad X1 Carbon 2020-20UAS04T00 | |
| Zotac ZBox MI643 | |
| Intel NUC10i5FNK | |
| Average Intel Core i5-10210U (3504 - 4467, n=24) | |
| Intel Hades Canyon NUC8i7HVK | |
| Chuwi GBox CWI560 | |
| Chuwi LarkBox 4K Mini PC | |
| Chuwi LapBook Plus | |
| 7-Zip 18.03 / 7z b 4 | |
| Intel NUC10i5FNK | |
| Intel Hades Canyon NUC8i7HVK | |
| Lenovo ThinkPad X1 Carbon 2020-20UAS04T00 | |
| Average Intel Core i5-10210U (10920 - 21679, n=24) | |
| Zotac ZBox MI643 | |
| Chuwi LarkBox 4K Mini PC | |
| Chuwi GBox CWI560 | |
| Chuwi LapBook Plus | |
| Geekbench 5.5 / Single-Core | |
| Lenovo ThinkPad X1 Carbon 2020-20UAS04T00 | |
| Zotac ZBox MI643 | |
| Intel NUC10i5FNK | |
| Average Intel Core i5-10210U (949 - 1133, n=27) | |
| Chuwi LarkBox 4K Mini PC | |
| Geekbench 5.5 / Multi-Core | |
| Lenovo ThinkPad X1 Carbon 2020-20UAS04T00 | |
| Zotac ZBox MI643 | |
| Intel NUC10i5FNK | |
| Average Intel Core i5-10210U (2079 - 4256, n=27) | |
| Chuwi LarkBox 4K Mini PC | |
| HWBOT x265 Benchmark v2.2 / 4k Preset | |
| Intel Hades Canyon NUC8i7HVK | |
| Intel NUC10i5FNK | |
| Lenovo ThinkPad X1 Carbon 2020-20UAS04T00 | |
| Average Intel Core i5-10210U (2.36 - 6.28, n=24) | |
| Zotac ZBox MI643 | |
| Chuwi LarkBox 4K Mini PC | |
| Chuwi LapBook Plus | |
| Chuwi GBox CWI560 | |
| LibreOffice / 20 Documents To PDF | |
| Chuwi LarkBox 4K Mini PC | |
| Average Intel Core i5-10210U (49.6 - 80.3, n=18) | |
| Zotac ZBox MI643 | |
| Lenovo ThinkPad X1 Carbon 2020-20UAS04T00 | |
| R Benchmark 2.5 / Overall mean | |
| Average Intel Core i5-10210U (0.658 - 0.901, n=24) | |
| Intel NUC10i5FNK | |
| Lenovo ThinkPad X1 Carbon 2020-20UAS04T00 | |
| Zotac ZBox MI643 | |
Cinebench R20: CPU (Multi Core) | CPU (Single Core)
Blender: v2.79 BMW27 CPU
7-Zip 18.03: 7z b 4 -mmt1 | 7z b 4
Geekbench 5.5: Single-Core | Multi-Core
HWBOT x265 Benchmark v2.2: 4k Preset
LibreOffice : 20 Documents To PDF
R Benchmark 2.5: Overall mean
* ... smaller is better
System Performance
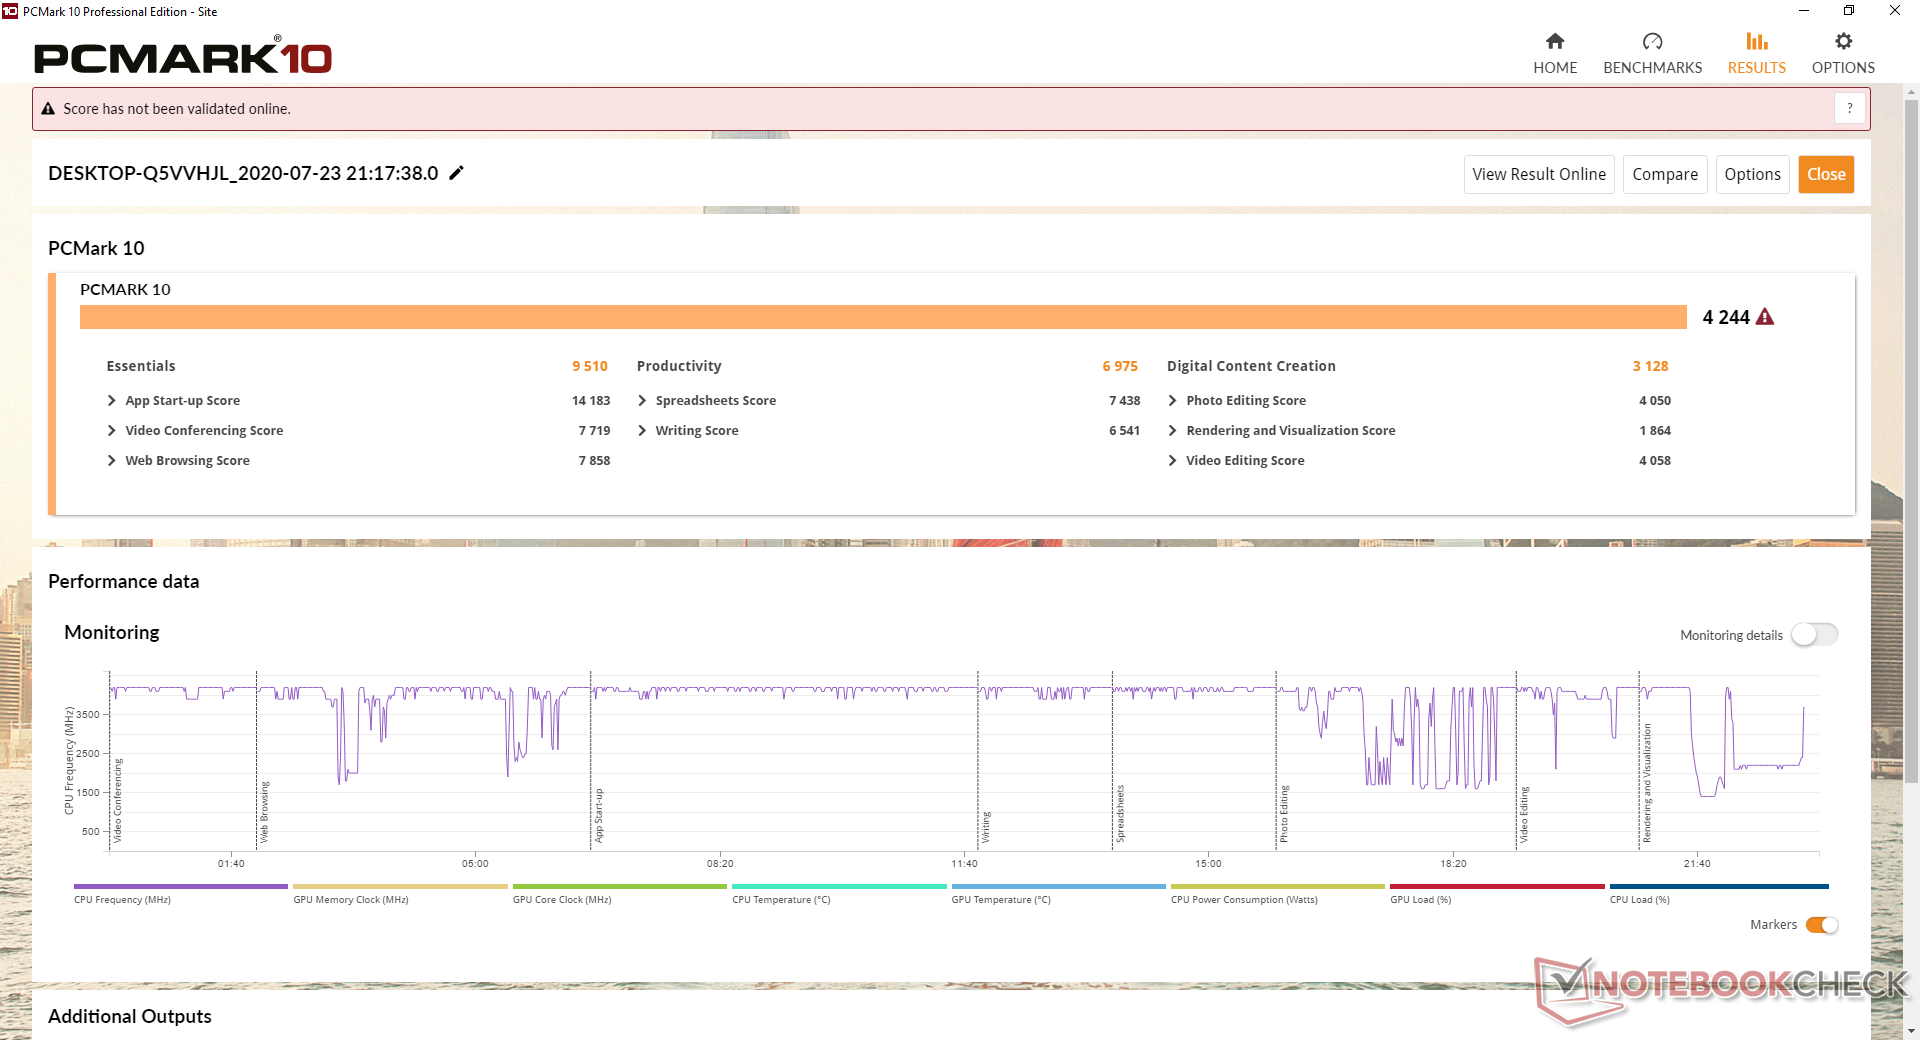
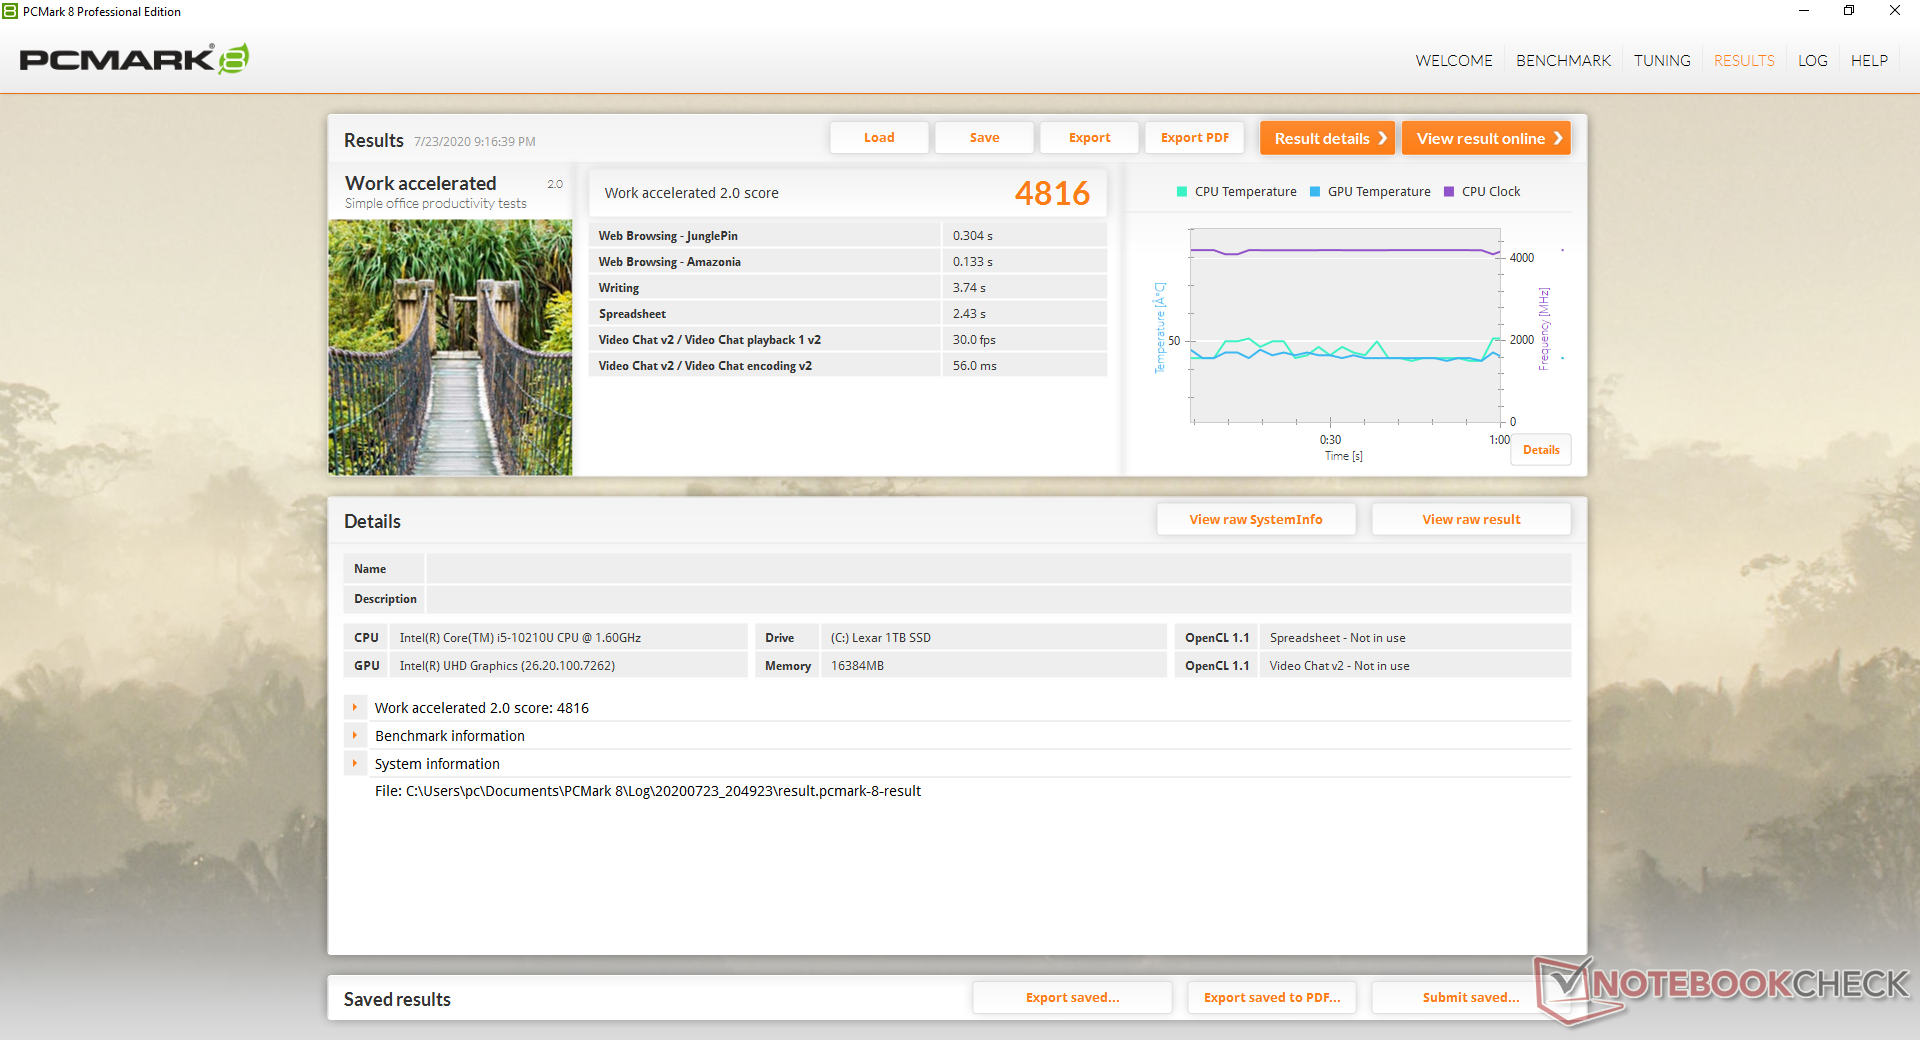
PCMark results are where we expect them to be relative to other Core i5-10210U systems despite the slower-than-anverage processor performance mentioned above.
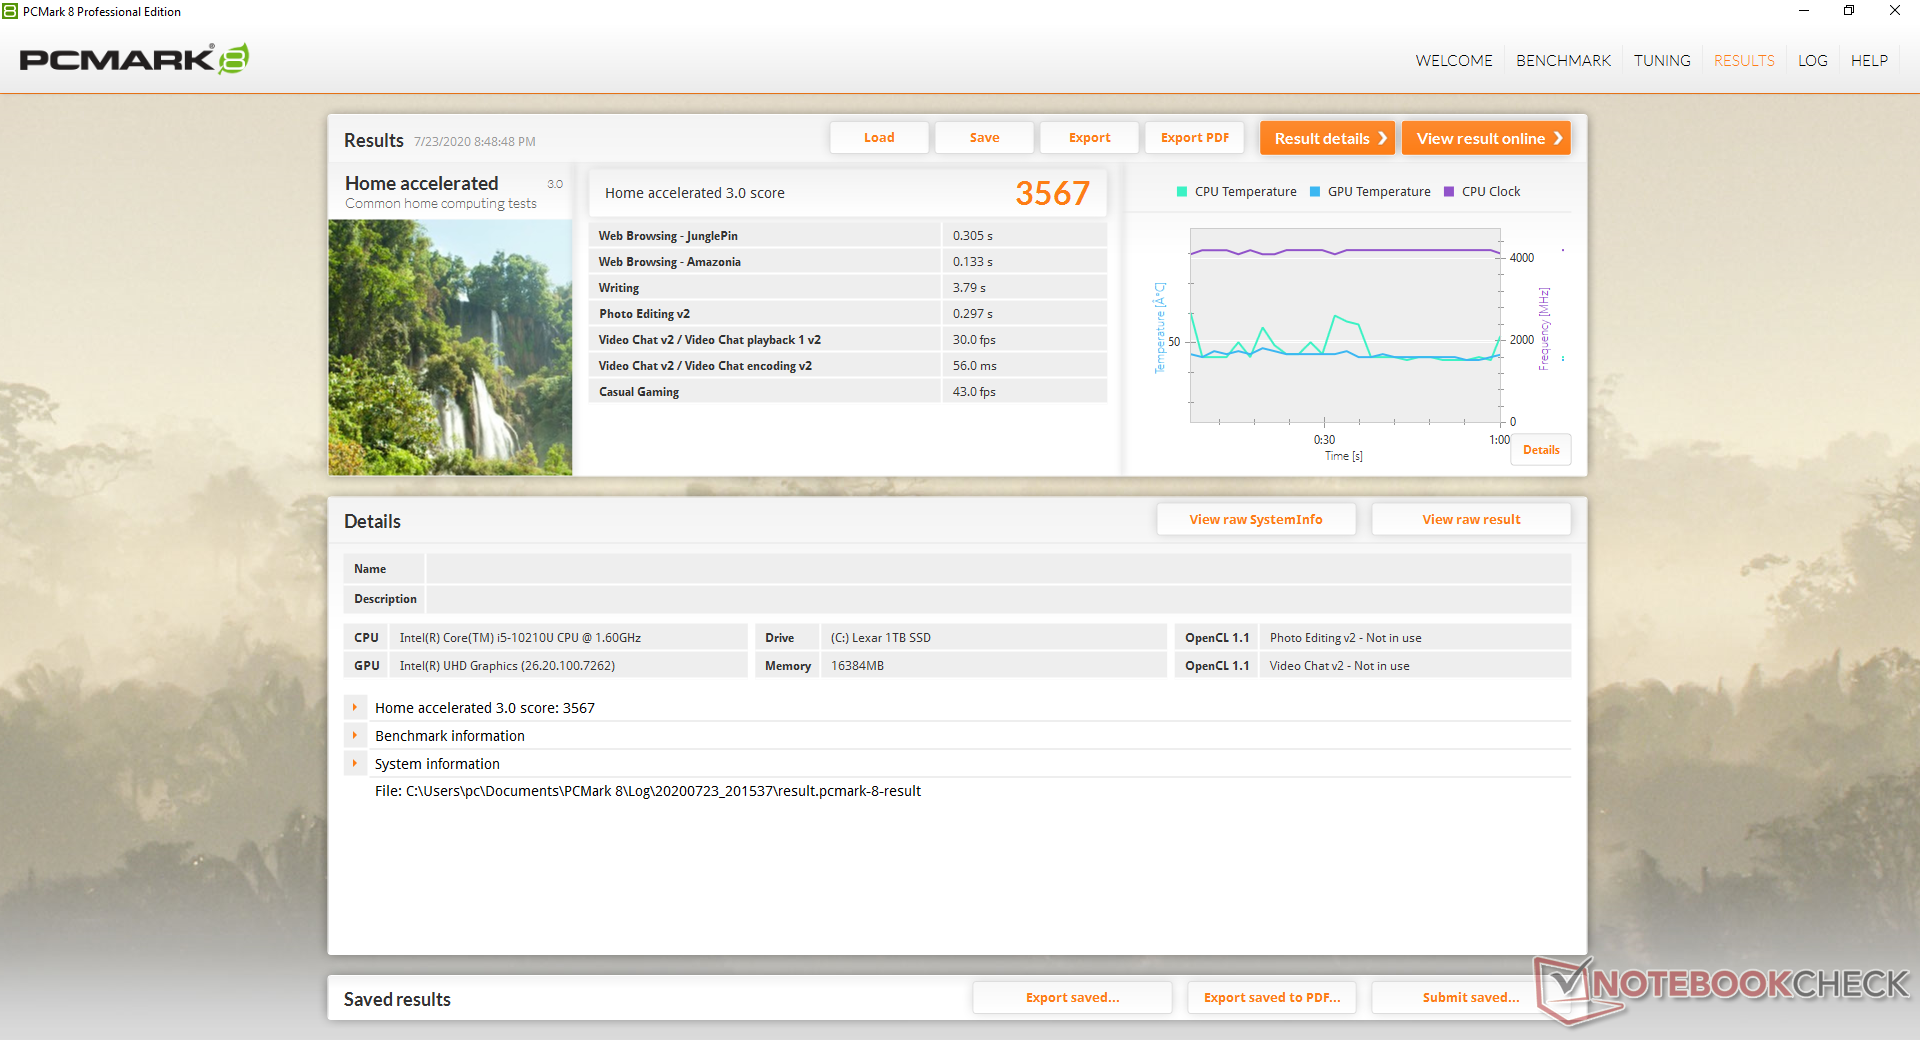
| PCMark 8 Home Score Accelerated v2 | 3567 points | |
| PCMark 8 Work Score Accelerated v2 | 4816 points | |
| PCMark 10 Score | 4244 points | |
Help | ||
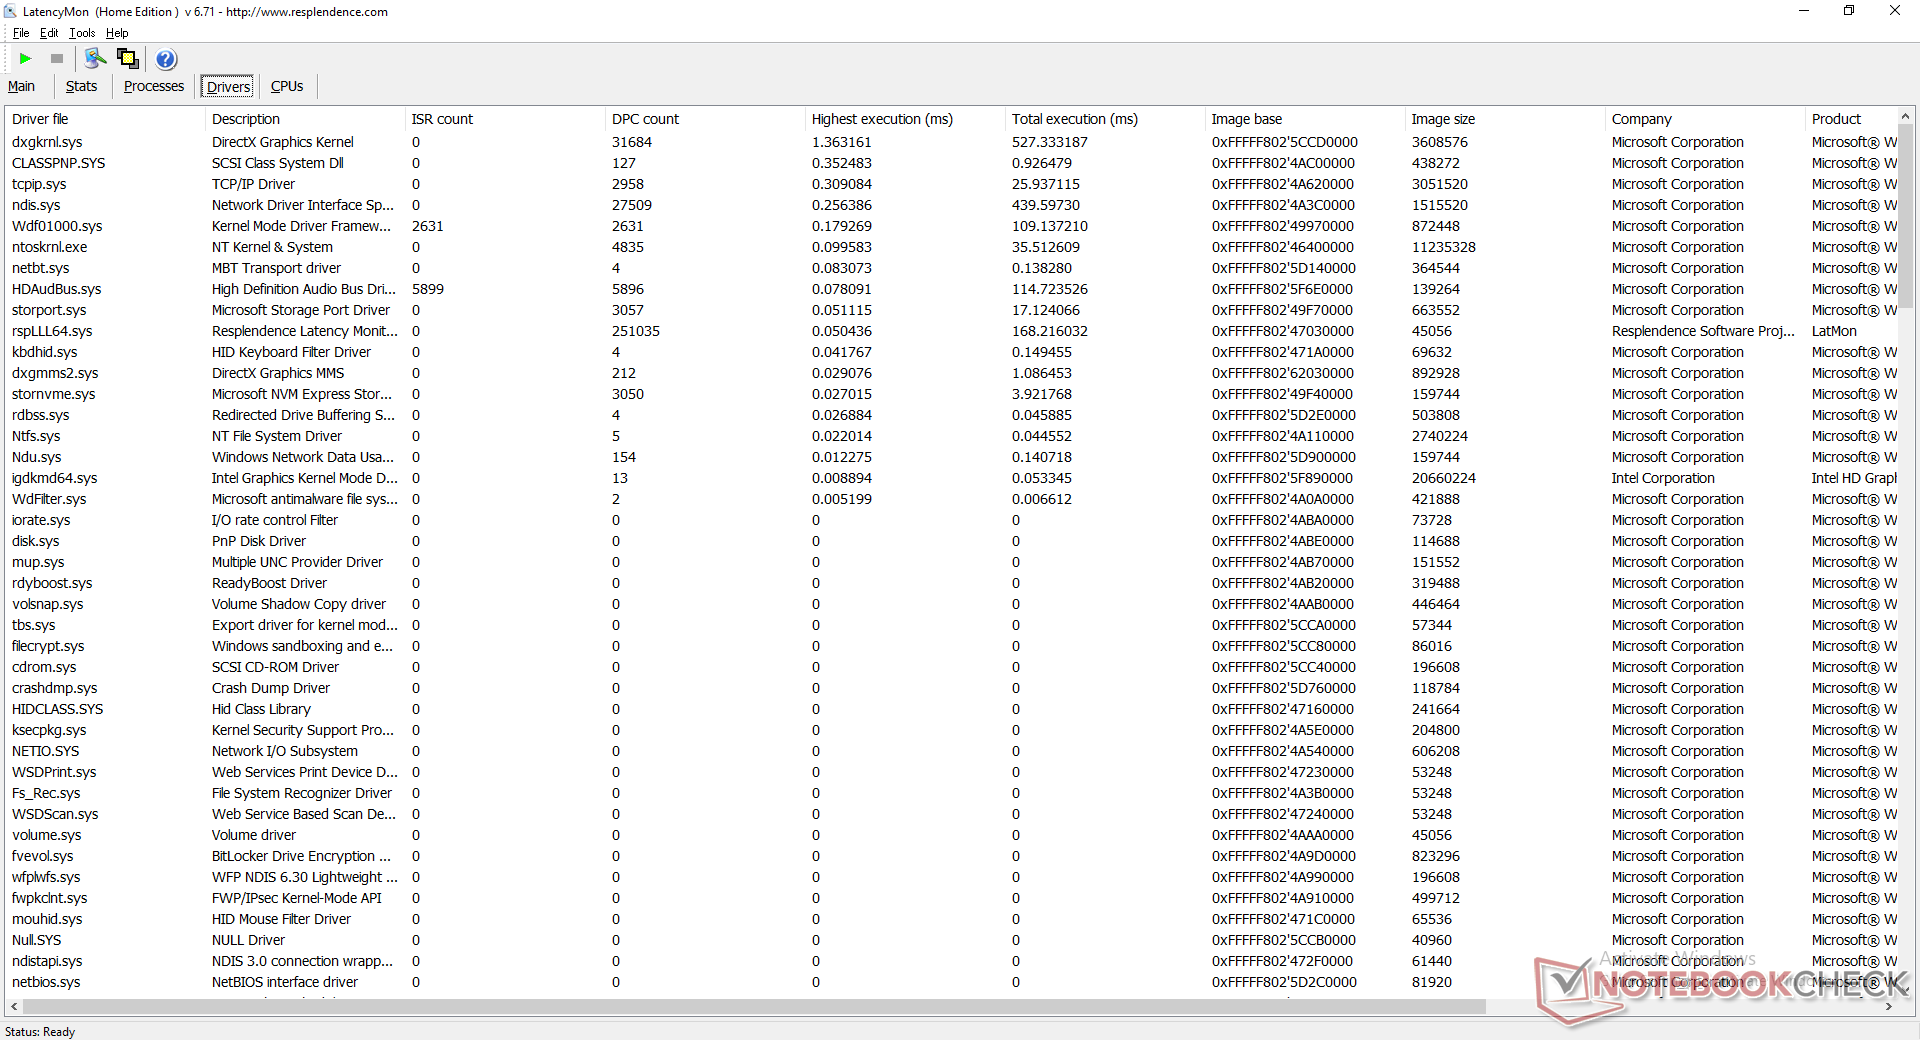
DPC Latency
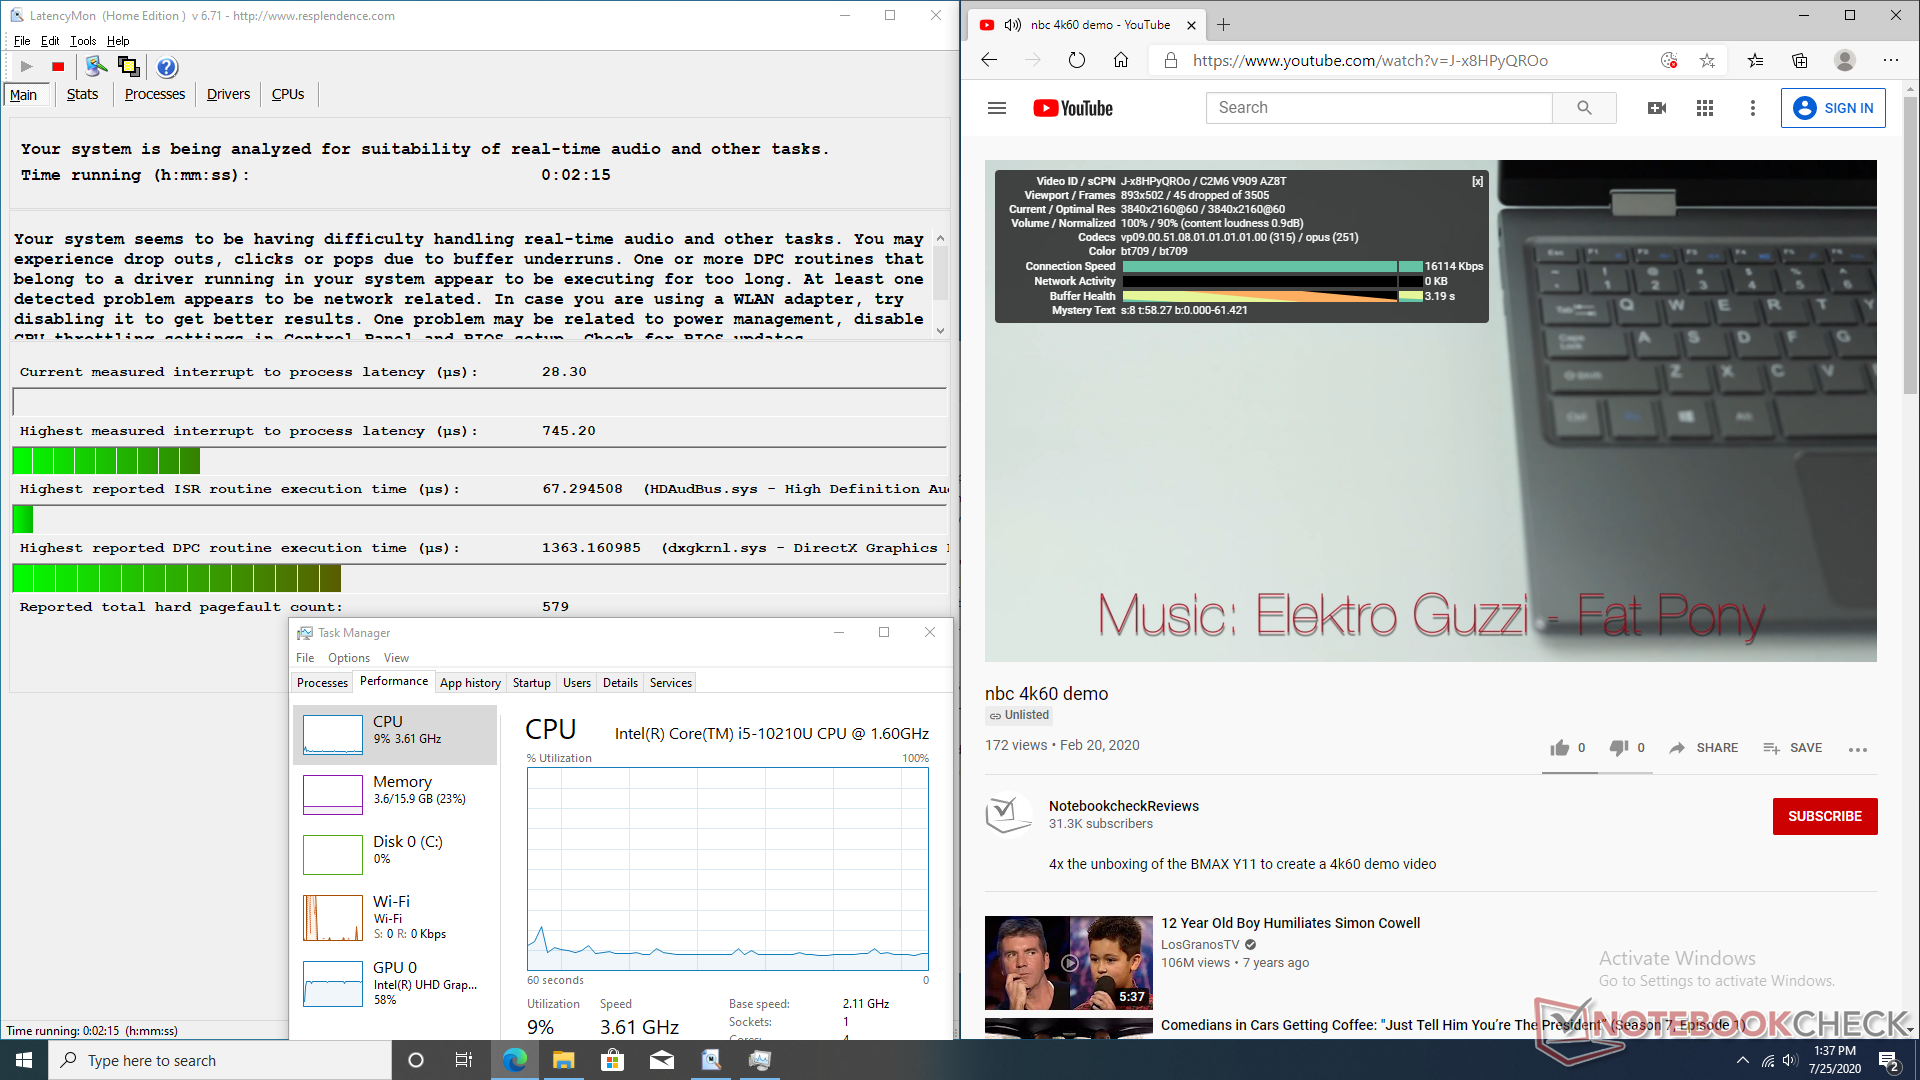
There are slight DPC latency issues when opening multiple tabs on our homepage according to LatencyMon. Furthermore, we were able to record 46 dropped frames during our minute-long 4K60 video playback test on YouTube when it should be zero.
| DPC Latencies / LatencyMon - interrupt to process latency (max), Web, Youtube, Prime95 | |
| Dell Latitude 9510 2-in-1 | |
| HP Envy x360 13-ay0010nr | |
| HP ProBook 455 G7-175W8EA | |
| Lenovo ThinkPad X1 Carbon 2020-20UAS04T00 | |
| Dell Latitude 7310 | |
| Zotac ZBox MI643 | |
* ... smaller is better
Storage Devices
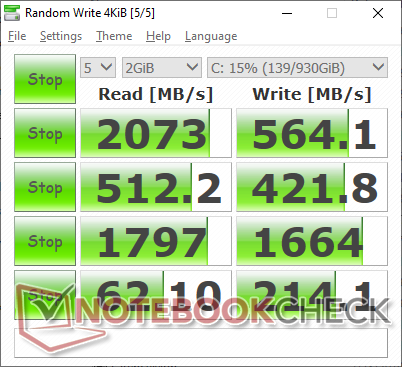
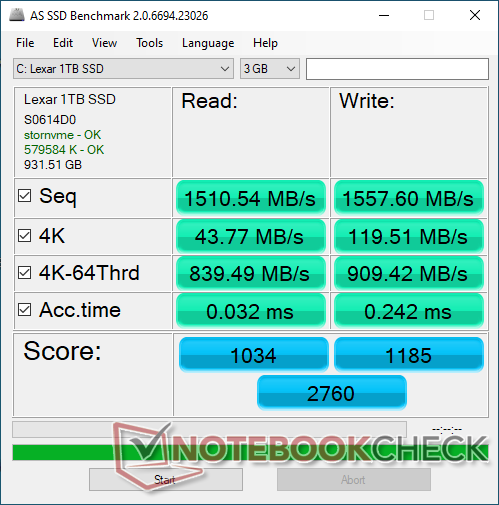
Users can install up to one M.2 2280 SSD and another smaller M.2 2242 drive directly underneath it. Both slots support NVMe/SATA M.2 SSDs, but Zotac wouldn't confirm with us if both support PCIe x4 speeds. For what it's worth, HWiNFO reports PCIe x4 on our Lexar NM610 2280 drive.
| Zotac ZBox MI643 Lexar NM610 1TB | Intel NUC10i5FNK Kingston RBUSNS8154P3256GJ1 | Lenovo ThinkCentre M90n-1 Nano Samsung SSD PM981 MZVLB512HAJQ | Chuwi GBox CWI560 SanDisk DA4064 | Intel Hades Canyon NUC8i7HVK Intel Optane 120 GB SSDPEK1W120GA | |
|---|---|---|---|---|---|
| CrystalDiskMark 5.2 / 6 | -27% | 65% | -83% | -2% | |
| Write 4K (MB/s) | 214.1 | 58.4 -73% | 130 -39% | 38 -82% | 133.7 -38% |
| Read 4K (MB/s) | 62.1 | 30.24 -51% | 45.61 -27% | 23.84 -62% | 178.6 188% |
| Write Seq (MB/s) | 1664 | 773 -54% | 226.7 -86% | 608 -63% | |
| Read Seq (MB/s) | 1797 | 712 -60% | 271.8 -85% | 1428 -21% | |
| Write 4K Q32T1 (MB/s) | 421.8 | 448.5 6% | 365.3 -13% | 44.74 -89% | 323.6 -23% |
| Read 4K Q32T1 (MB/s) | 512 | 391.4 -24% | 350.2 -32% | 53.2 -90% | 282.3 -45% |
| Write Seq Q32T1 (MB/s) | 564 | 914 62% | 2986 429% | 129.4 -77% | 627 11% |
| Read Seq Q32T1 (MB/s) | 2073 | 1583 -24% | 3565 72% | 189.4 -91% | 1521 -27% |
| Write 4K Q8T8 (MB/s) | 402.3 | 368.7 | |||
| Read 4K Q8T8 (MB/s) | 680 | 790 |

Disk Throttling: DiskSpd Read Loop, Queue Depth 8
GPU Performance
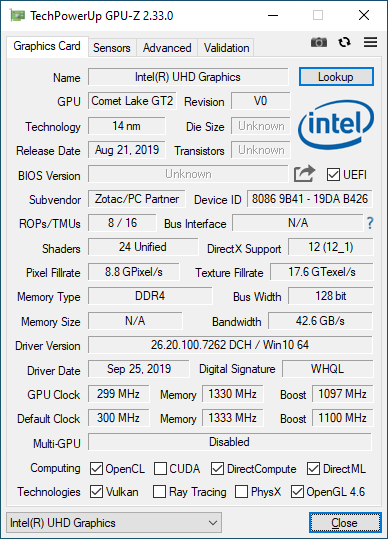
The UHD Graphics 620 is still chugging along despite being many years old. Its limited performance shouldn't impact the target audience, but it would have been nice to see faster Ice Lake or Ryzen Vega options nonetheless.
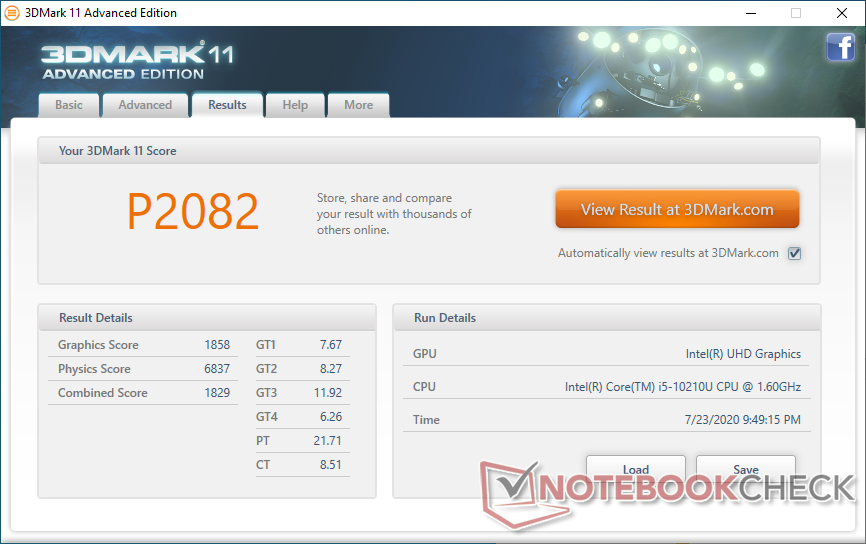
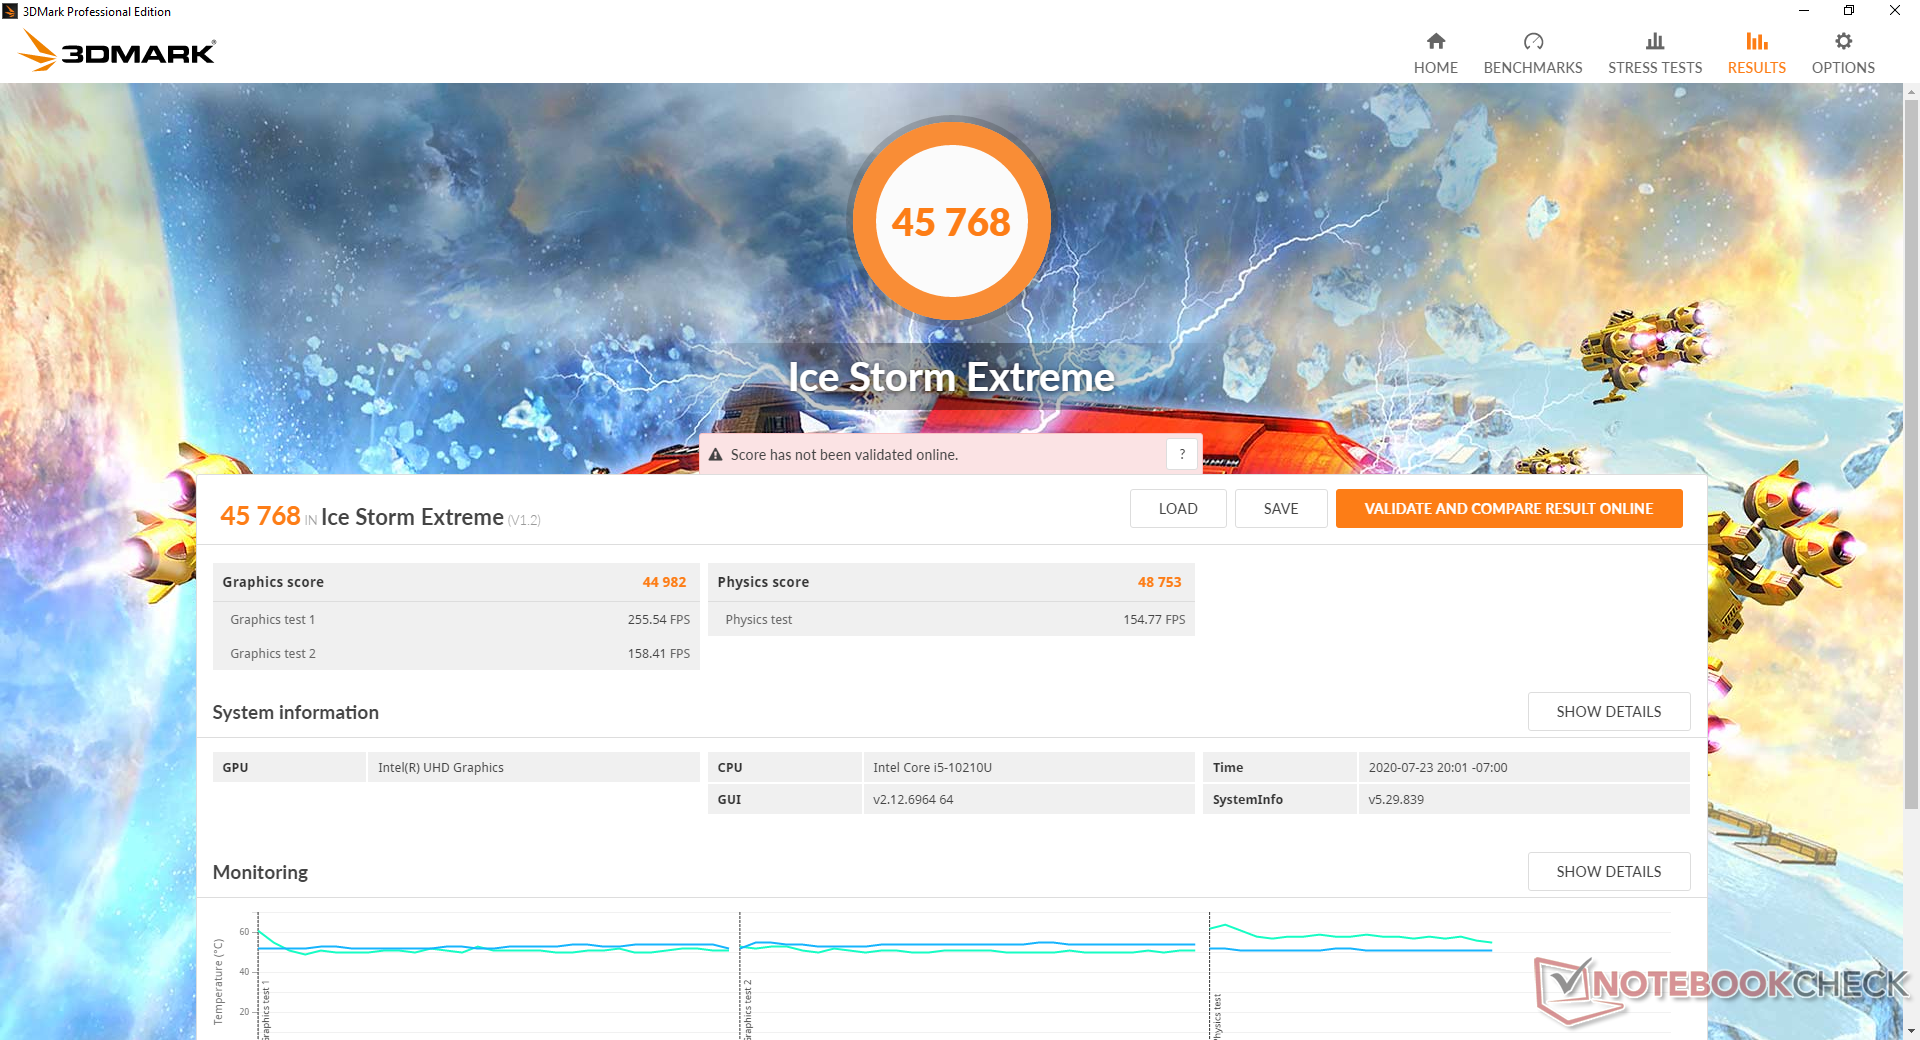
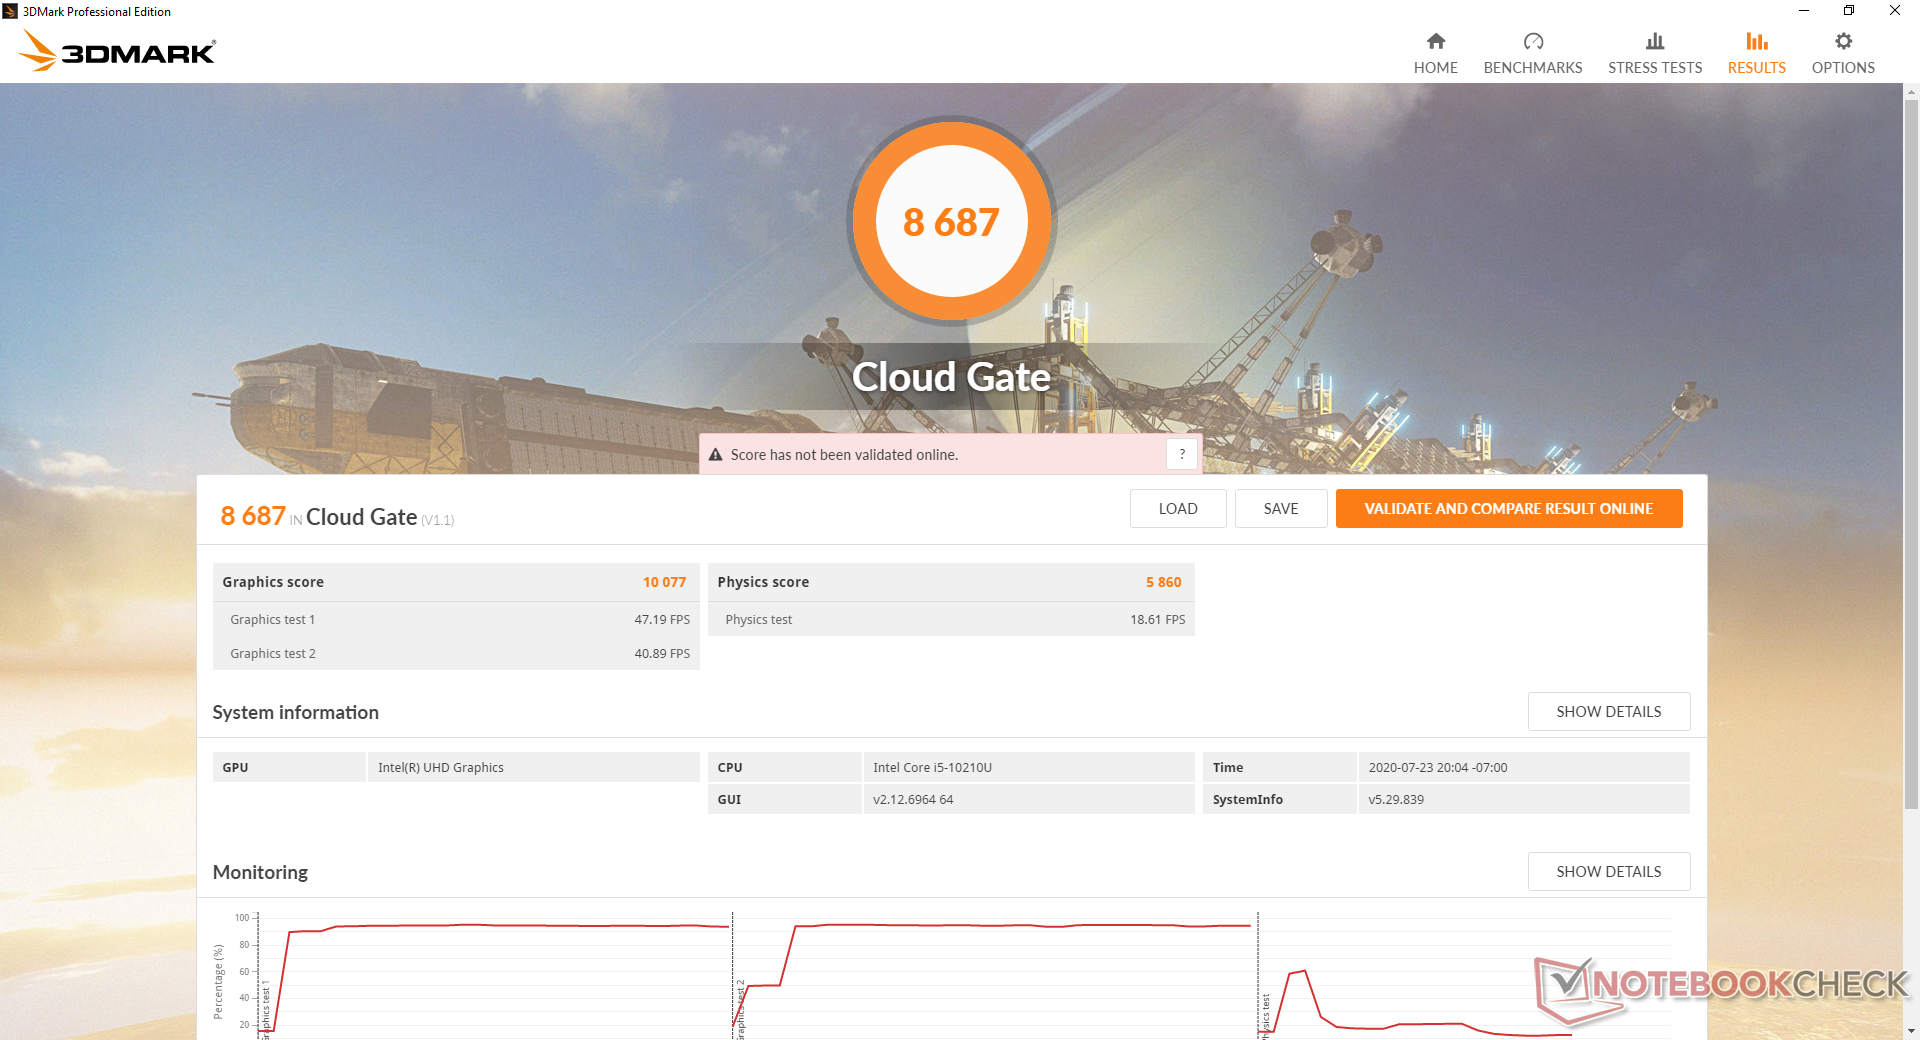
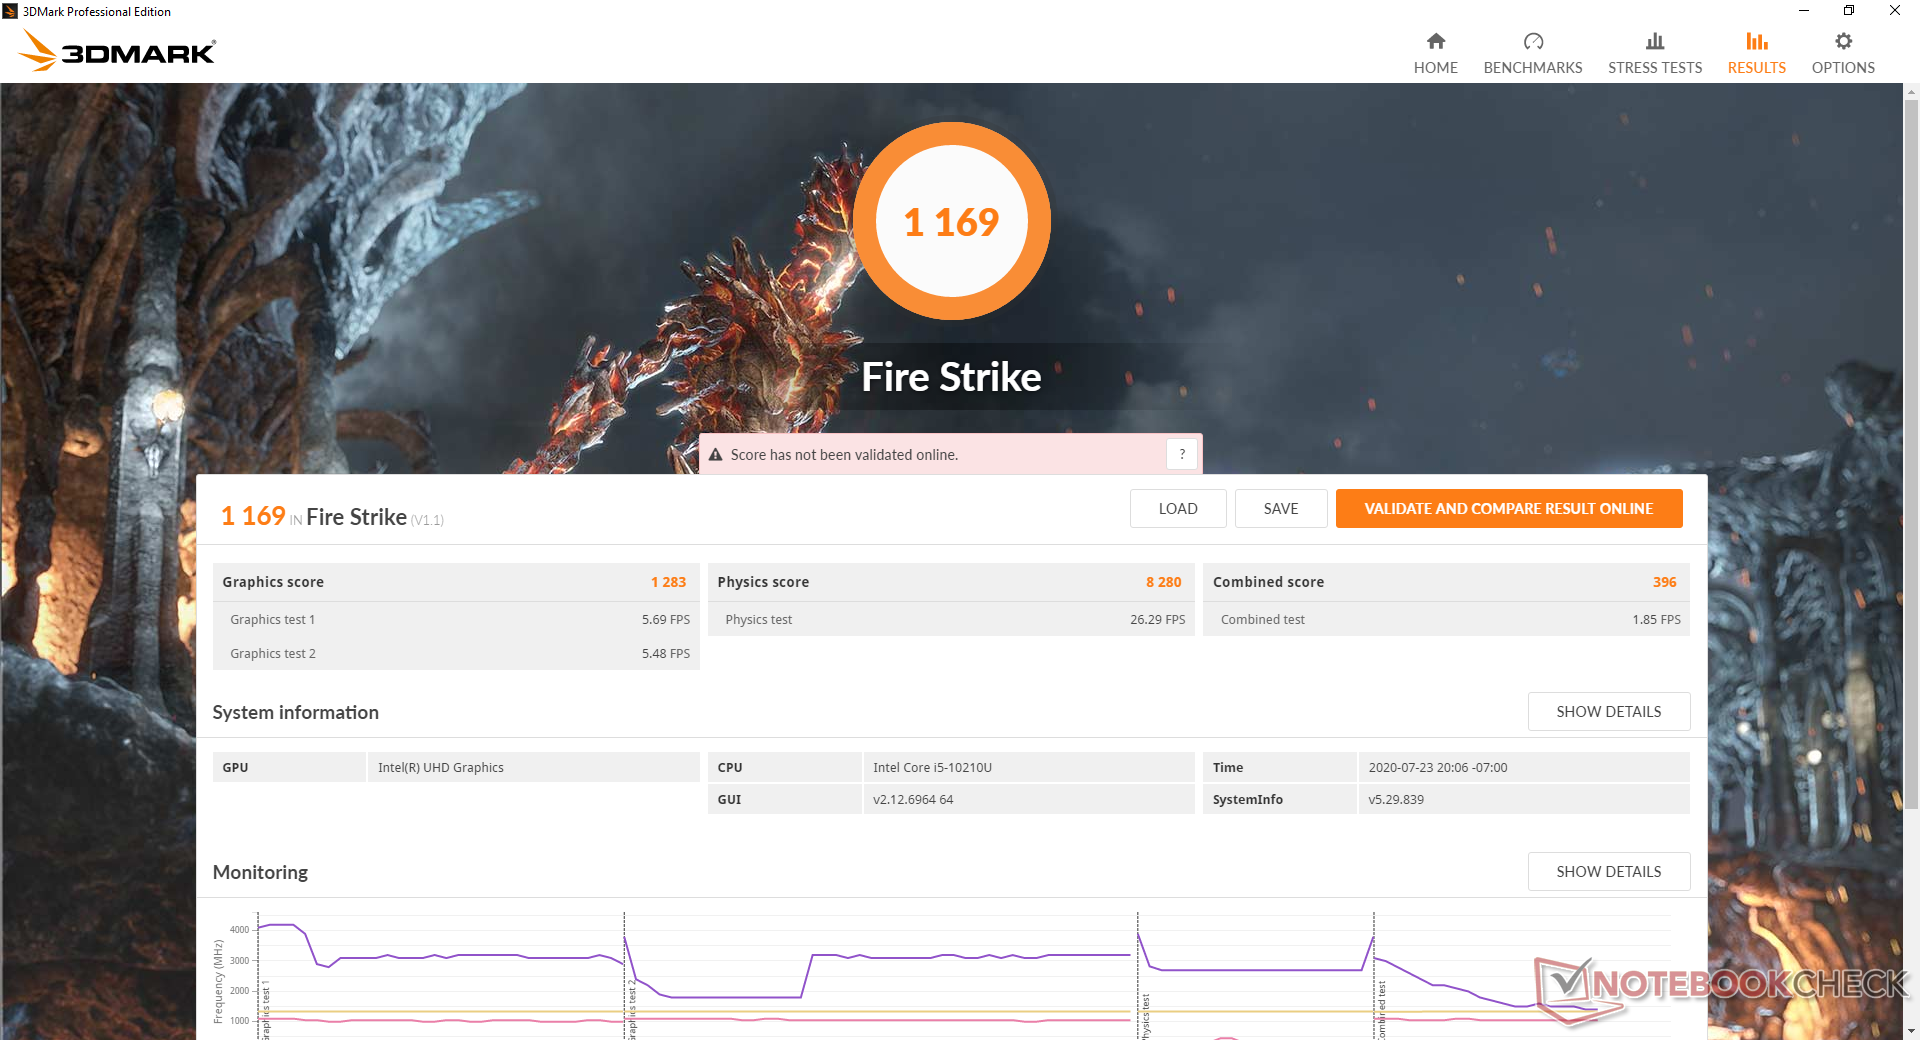

| 3DMark 11 Performance | 2082 points | |
| 3DMark Cloud Gate Standard Score | 8687 points | |
| 3DMark Fire Strike Score | 1169 points | |
| 3DMark Time Spy Score | 462 points | |
Help | ||
| low | med. | high | ultra | |
|---|---|---|---|---|
| Dota 2 Reborn (2015) | 73.8 | 46 | 21.5 | 19.2 |
| X-Plane 11.11 (2018) | 22.3 | 14.8 | 13.2 |
Emissions
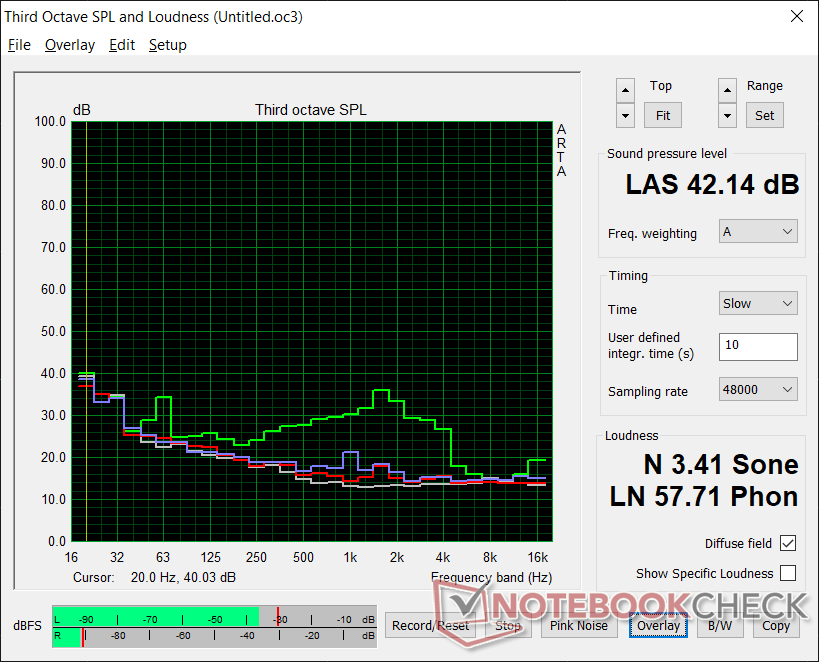
System Noise
The fan is almost always active no matter the load, but it is usually very quiet and unnoticeable. In fact, it barely ramps up when running the first demanding benchmark scene of 3DMark 06. Fan noise would bump up temporarily to 42 dB(A) when initiating Prime95, but it would quickly fall back down to a steady 31 dB(A).
| Zotac ZBox MI643 UHD Graphics 620, i5-10210U, Lexar NM610 1TB | Intel Hades Canyon NUC8i7HVK Vega M GH, i7-8809G, Intel Optane 120 GB SSDPEK1W120GA | HP EliteBook x360 1030 G4 7YL44EA UHD Graphics 620, i7-8565U, WDC PC SN520 SDAPNUW-512G | Chuwi LarkBox 4K Mini PC UHD Graphics 600, Celeron J4115, 128 GB eMMC Flash | Intel Skull Canyon NUC6i7KYK Iris Pro Graphics 580, 6770HQ, Samsung SSD 850 EVO m.2 120GB | |
|---|---|---|---|---|---|
| Noise | -11% | -5% | -17% | -19% | |
| off / environment * (dB) | 26.1 | 28.7 -10% | 30.3 -16% | 26 -0% | 29.5 -13% |
| Idle Minimum * (dB) | 27.5 | 29 -5% | 30.3 -10% | 26 5% | 31.6 -15% |
| Idle Average * (dB) | 27.5 | 29 -5% | 30.3 -10% | 26 5% | 32.2 -17% |
| Idle Maximum * (dB) | 27.5 | 29 -5% | 30.3 -10% | 43.3 -57% | 32.3 -17% |
| Load Average * (dB) | 28.9 | 36 -25% | 31.2 -8% | 43.3 -50% | 43 -49% |
| Load Maximum * (dB) | 42 | 49.4 -18% | 32.8 22% | 43.5 -4% | 43.2 -3% |
| Witcher 3 ultra * (dB) | 42 |
* ... smaller is better
Noise level
| Idle |
| 27.5 / 27.5 / 27.5 dB(A) |
| Load |
| 28.9 / 42 dB(A) |
 | ||
30 dB silent 40 dB(A) audible 50 dB(A) loud |
||
min: | ||
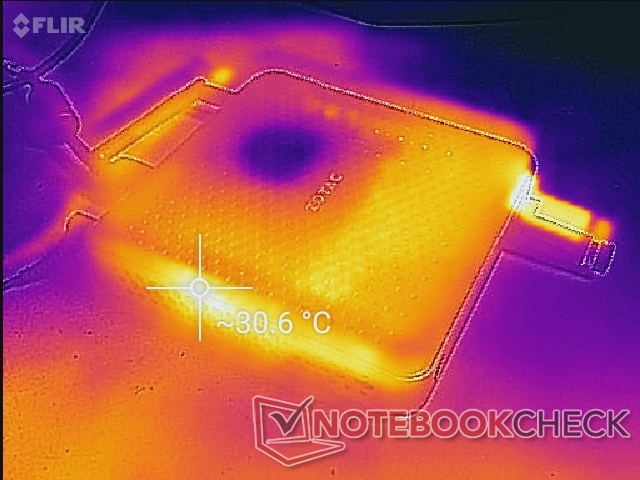
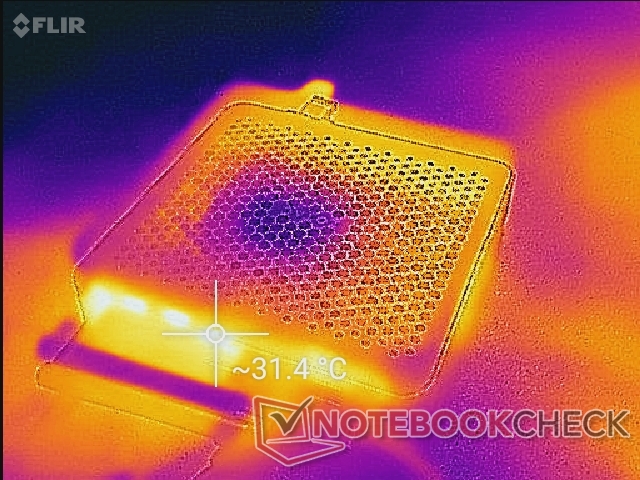
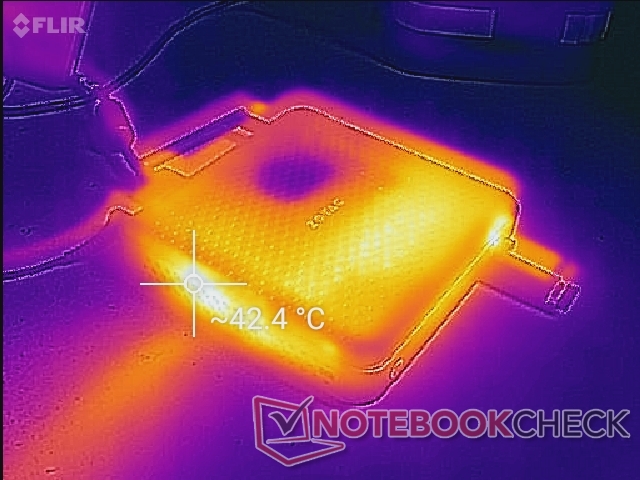
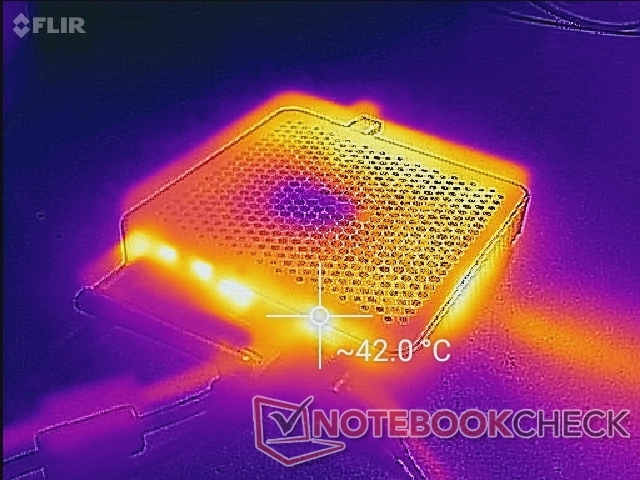
Temperature
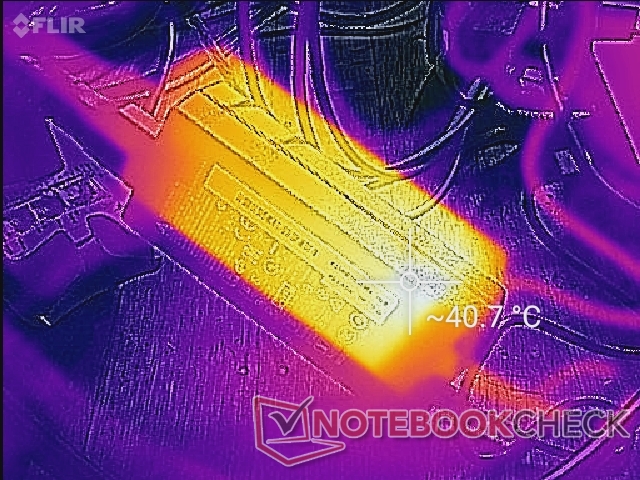
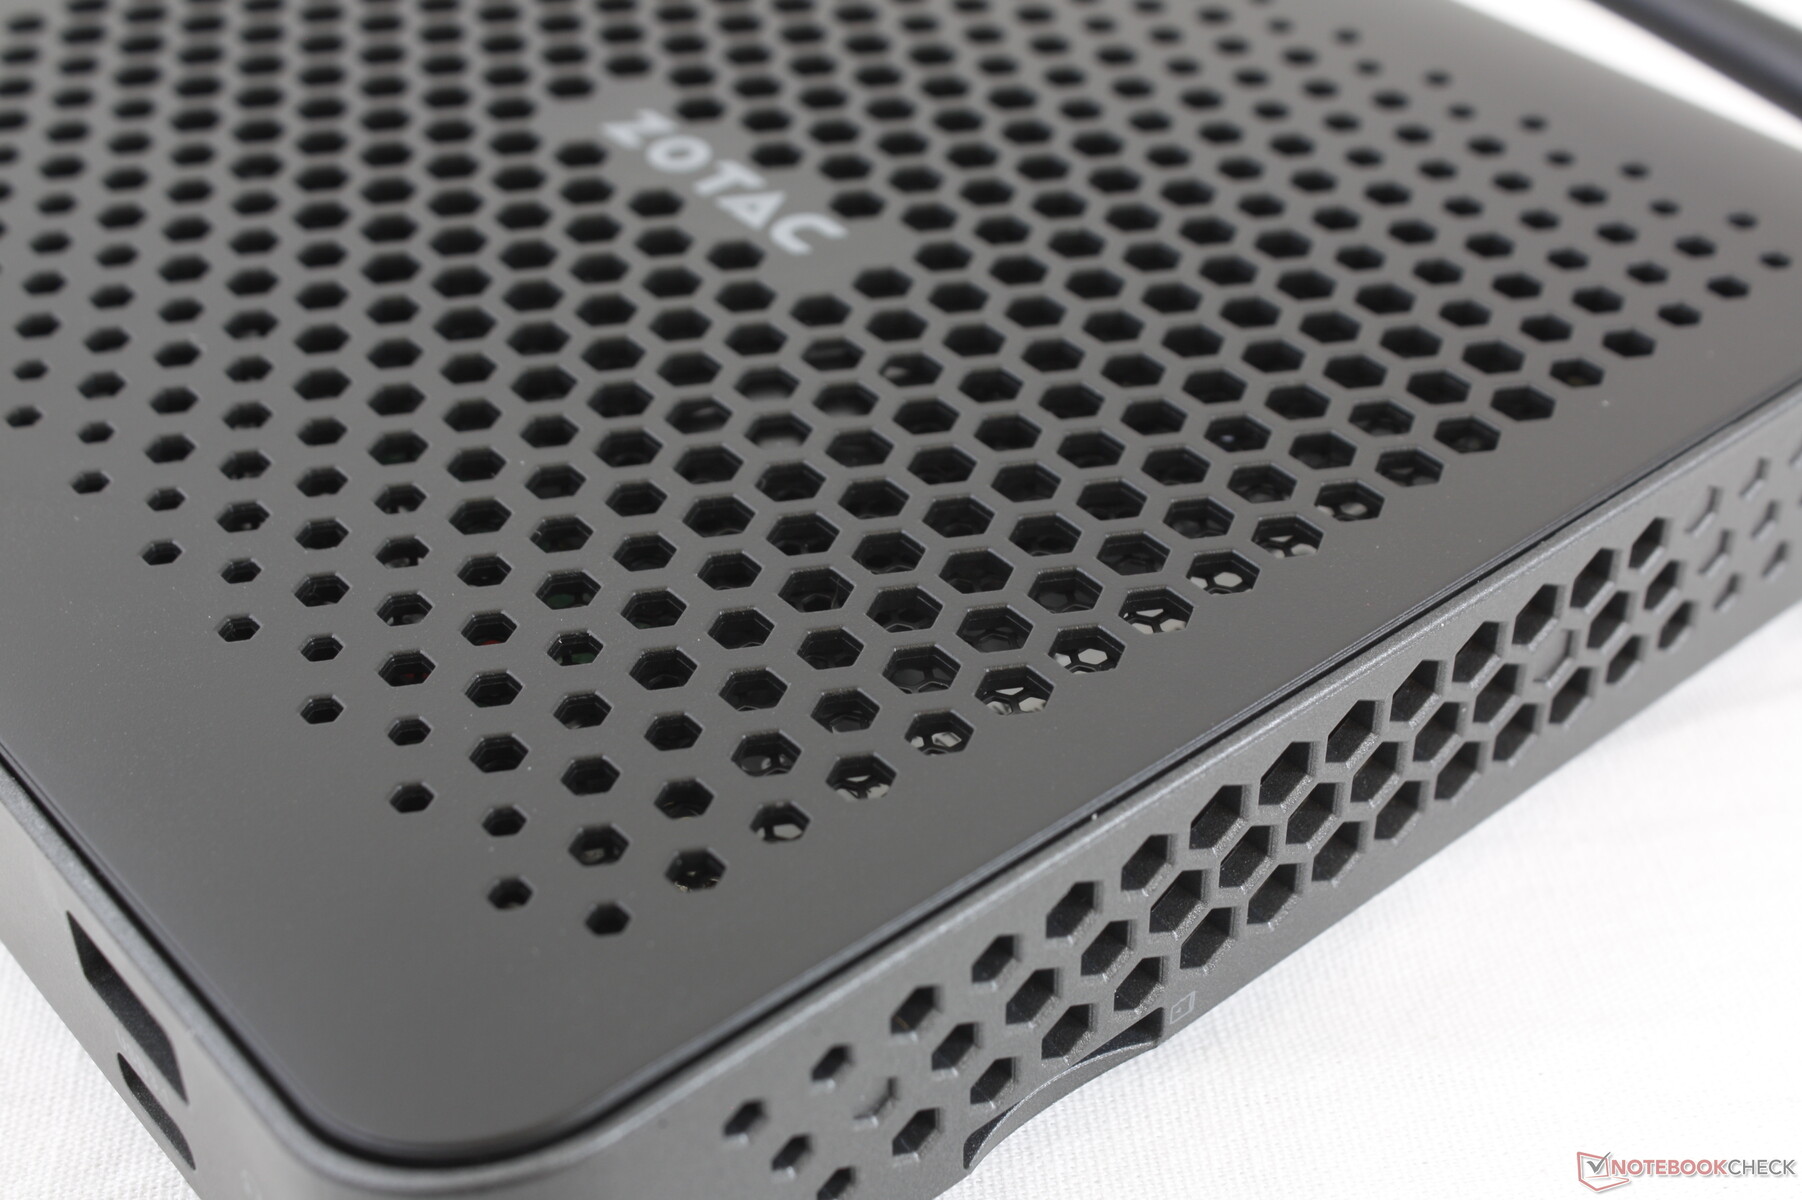
Surface temperatures should never be an issue due to the surplus of ventilation grilles on almost every side of the chassis. However, this also means that stacking books or other large flat objects on top of the mini PC is not recommended since the fan draws cool air directly from above.
Stress Test
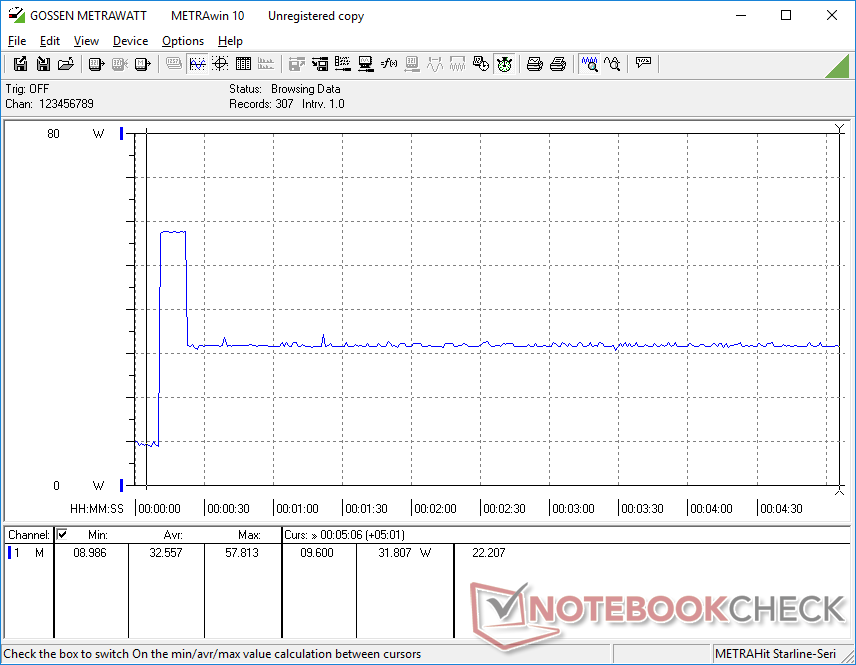
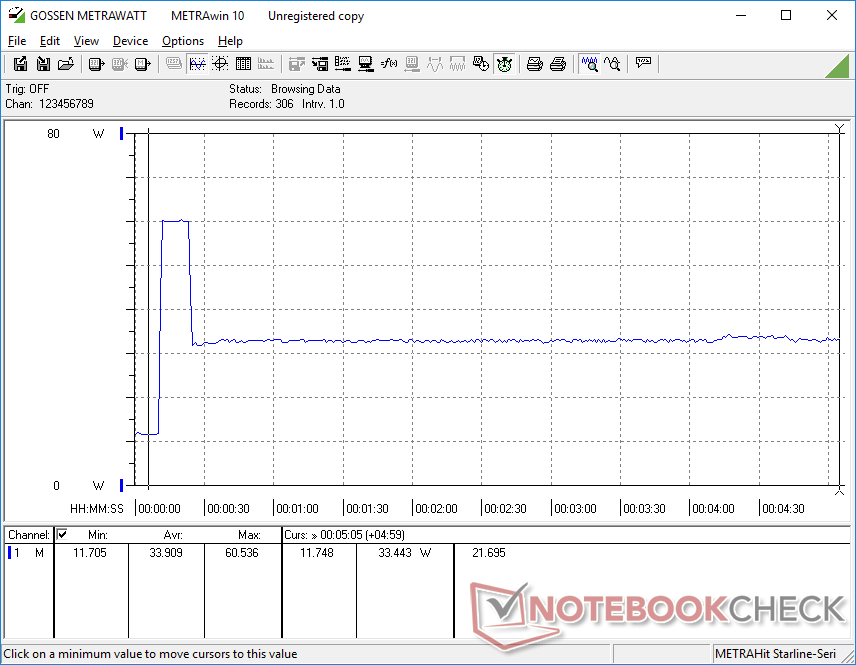
We stress the system with synthetic loads to identify for any potential issues. When running Prime95, the CPU would boost to 3.5 GHz for the first few seconds before hitting a core temperature of 61 C. Thereafter, clock rates and temperature would stabilize at 2.3 GHz and 54 C, respectively. Running at higher core temperatures for faster sustained clock rates would have been a great option in this particular case.

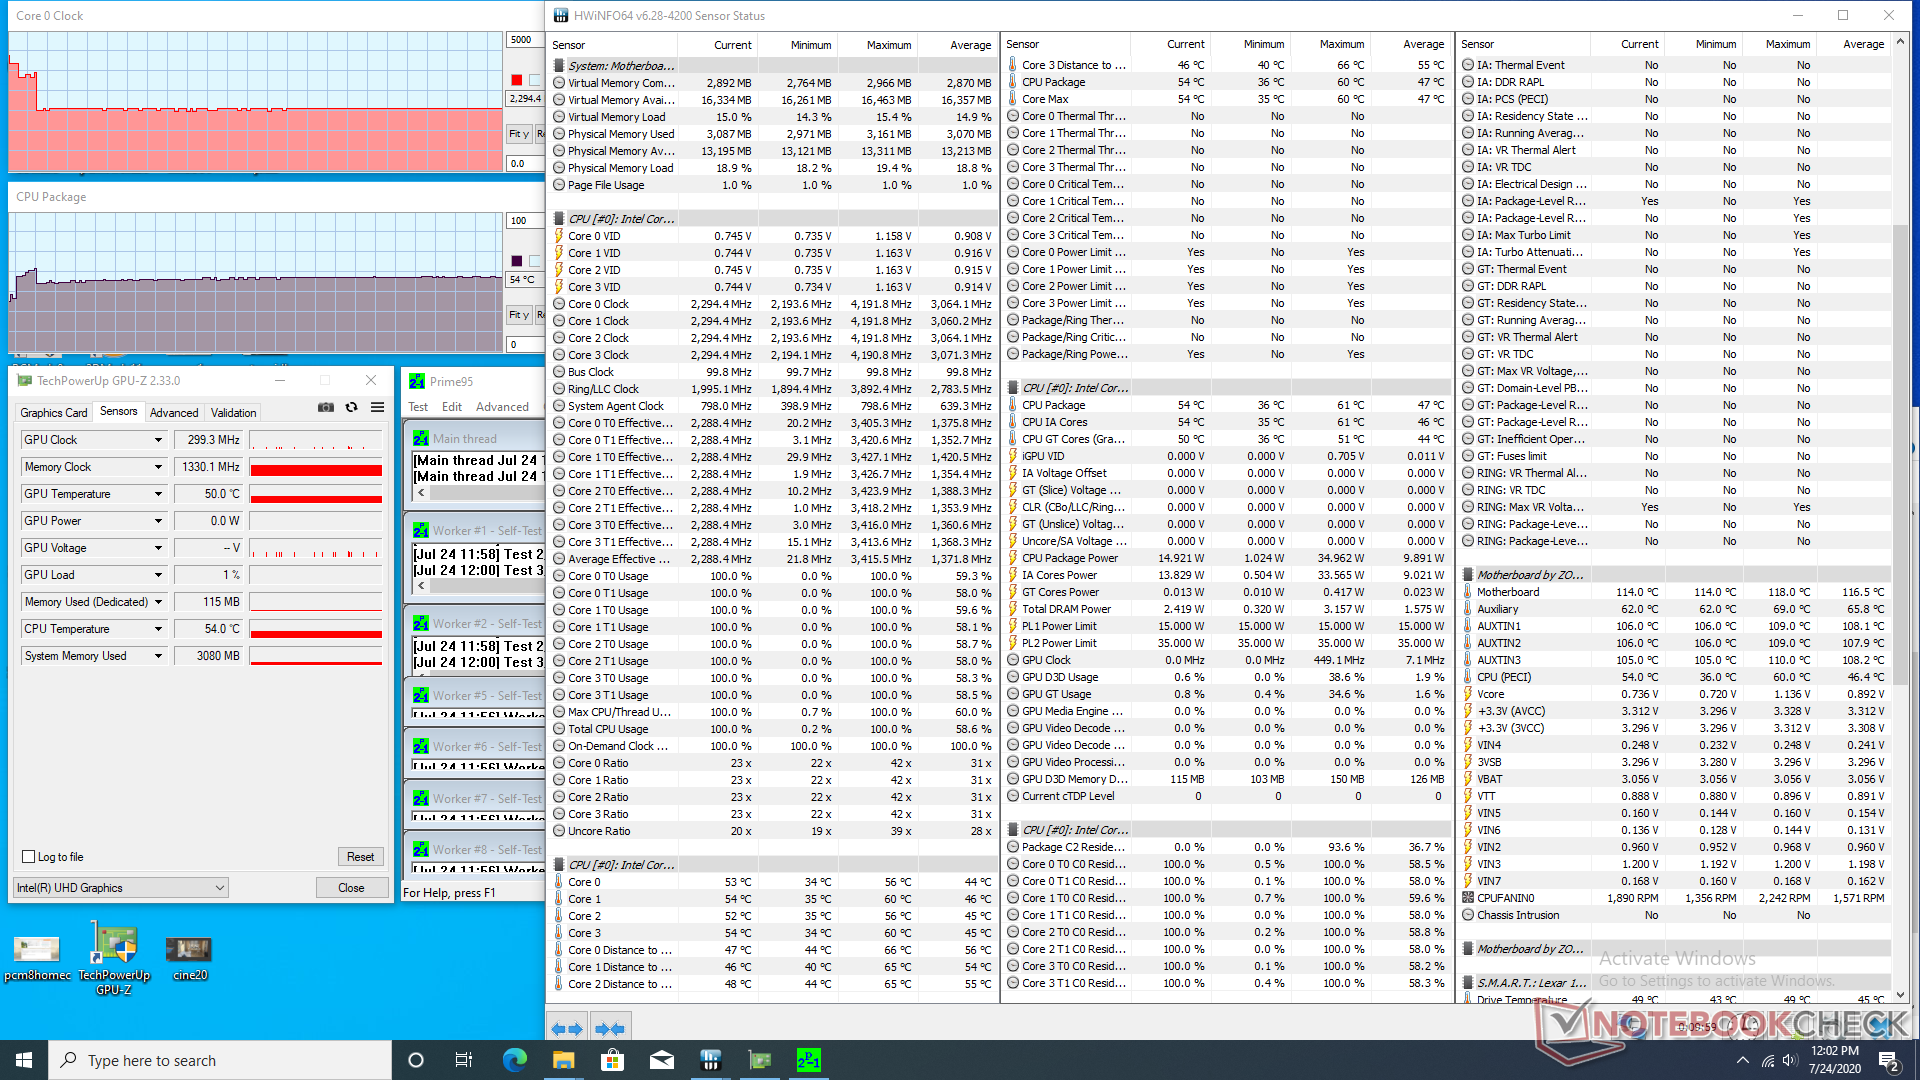

| CPU Clock (GHz) | GPU Clock (MHz) | Average CPU Temperature (°C) | |
| System Idle | -- | -- | 37 |
| Prime95 Stress | 2.3 | -- | 54 |
| Prime95 + FurMark Stress | 1.0 | 748 | 55 |
Energy Management
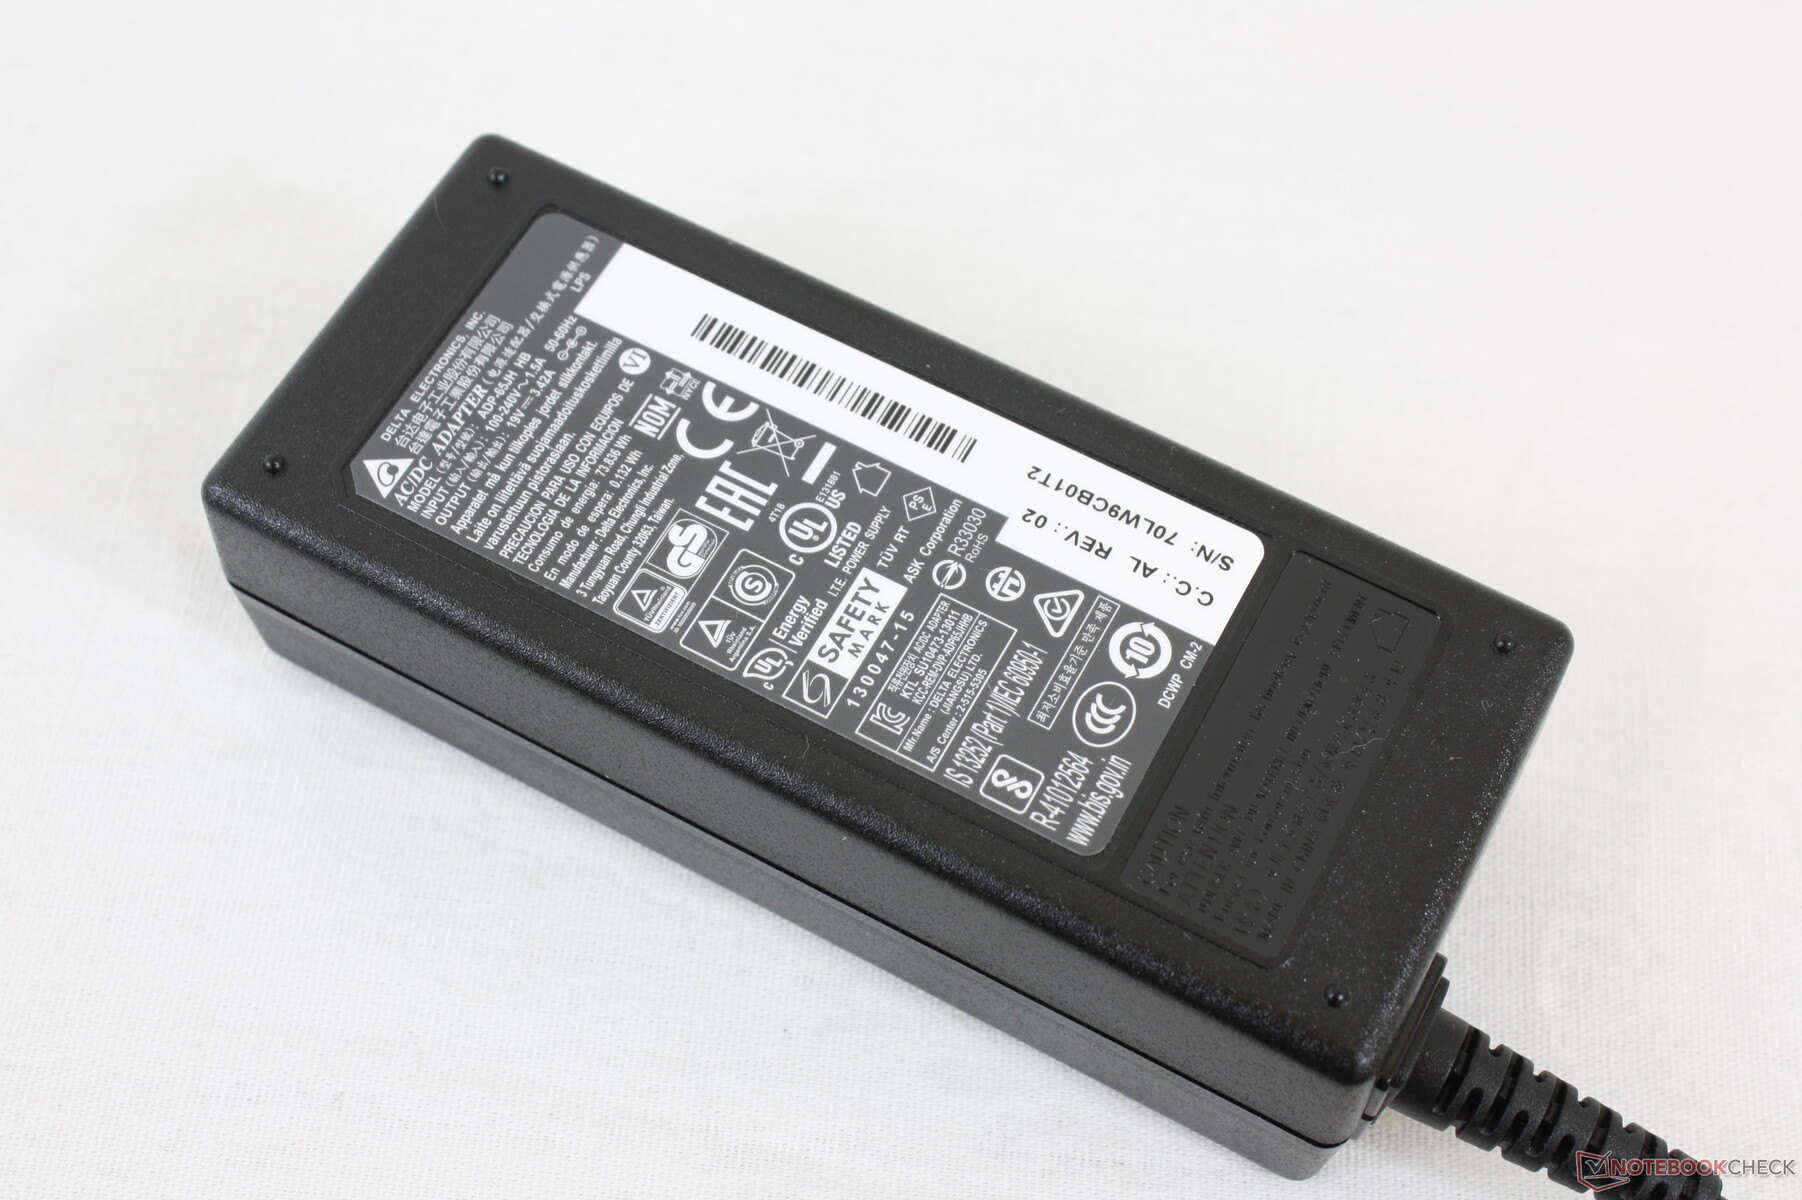
Power Consumption
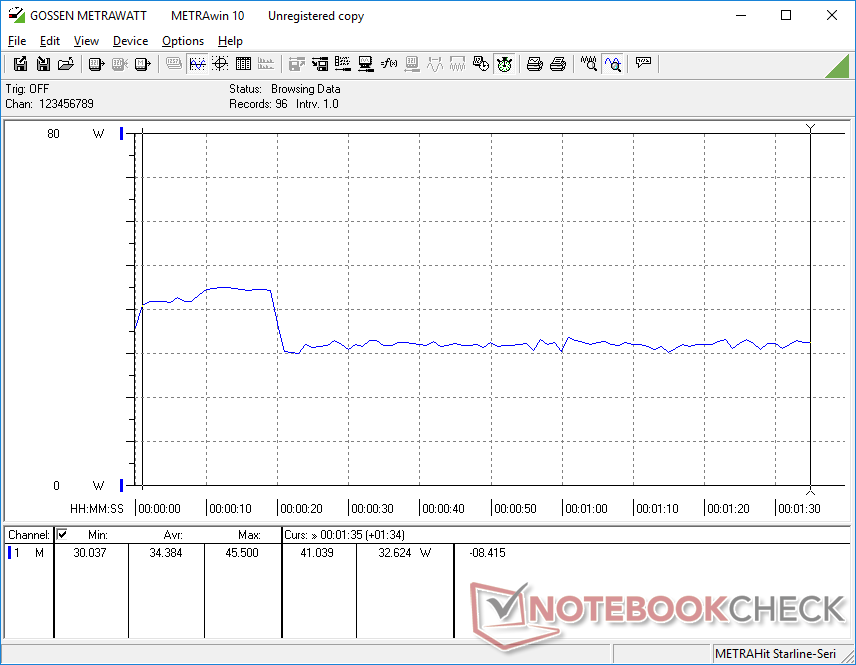
Idling on desktop consumes between 7 W and 10 W compares to less half that on the Lenovo ThinkCentre M90n-1. At most, we're able to record a maximum draw of 60.6 W from the small (~10.7 x 4.6 x 3 cm) 65 W AC adapter.
| Off / Standby | |
| Idle | |
| Load |
|
Key:
min: | |
| Zotac ZBox MI643 i5-10210U, UHD Graphics 620, Lexar NM610 1TB, , x, | Intel NUC10i5FNK i5-10210U, UHD Graphics 620, Kingston RBUSNS8154P3256GJ1, , 0x0, 0" | Lenovo ThinkCentre M90n-1 Nano i5-8265U, UHD Graphics 620, Samsung SSD PM981 MZVLB512HAJQ, , x, 0" | Chuwi GBox CWI560 Celeron N4100, UHD Graphics 600, SanDisk DA4064, , x, | Intel Skull Canyon NUC6i7KYK 6770HQ, Iris Pro Graphics 580, Samsung SSD 850 EVO m.2 120GB, , x, 0" | |
|---|---|---|---|---|---|
| Power Consumption | -34% | 36% | 76% | -59% | |
| Idle Minimum * (Watt) | 7.5 | 4.4 41% | 1.9 75% | 14.8 -97% | |
| Idle Average * (Watt) | 9.2 | 15.7 -71% | 4.4 52% | 2 78% | 15.7 -71% |
| Idle Maximum * (Watt) | 9.6 | 4.7 51% | 2.9 70% | 15.8 -65% | |
| Load Average * (Watt) | 34.4 | 27.7 19% | 8.6 75% | 62.7 -82% | |
| Load Maximum * (Watt) | 60.6 | 58.6 3% | 49.9 18% | 9.5 84% | 48.5 20% |
* ... smaller is better
Pros
Cons
Verdict
The main reasons to own a ZBox Edge MI643 are for its slim design, quiet fans, and easily upgradeable RAM and storage. The competing Lenovo ThinkCentre M90n-1 Nano is even smaller than our Zotac, but it lacks upgradeable RAM that some users may find valuable.
Users shouldn't look towards the Edge MI643 is they are after raw performance or fast wireless speeds. The processor here performs slower than expected and wireless is limited to 1x1 Wi-Fi 5 only. Otherwise, it's a reliable "set and forget" mini PC that's slim and lightweight enough to be hung on walls or hidden behind tight spaces.
