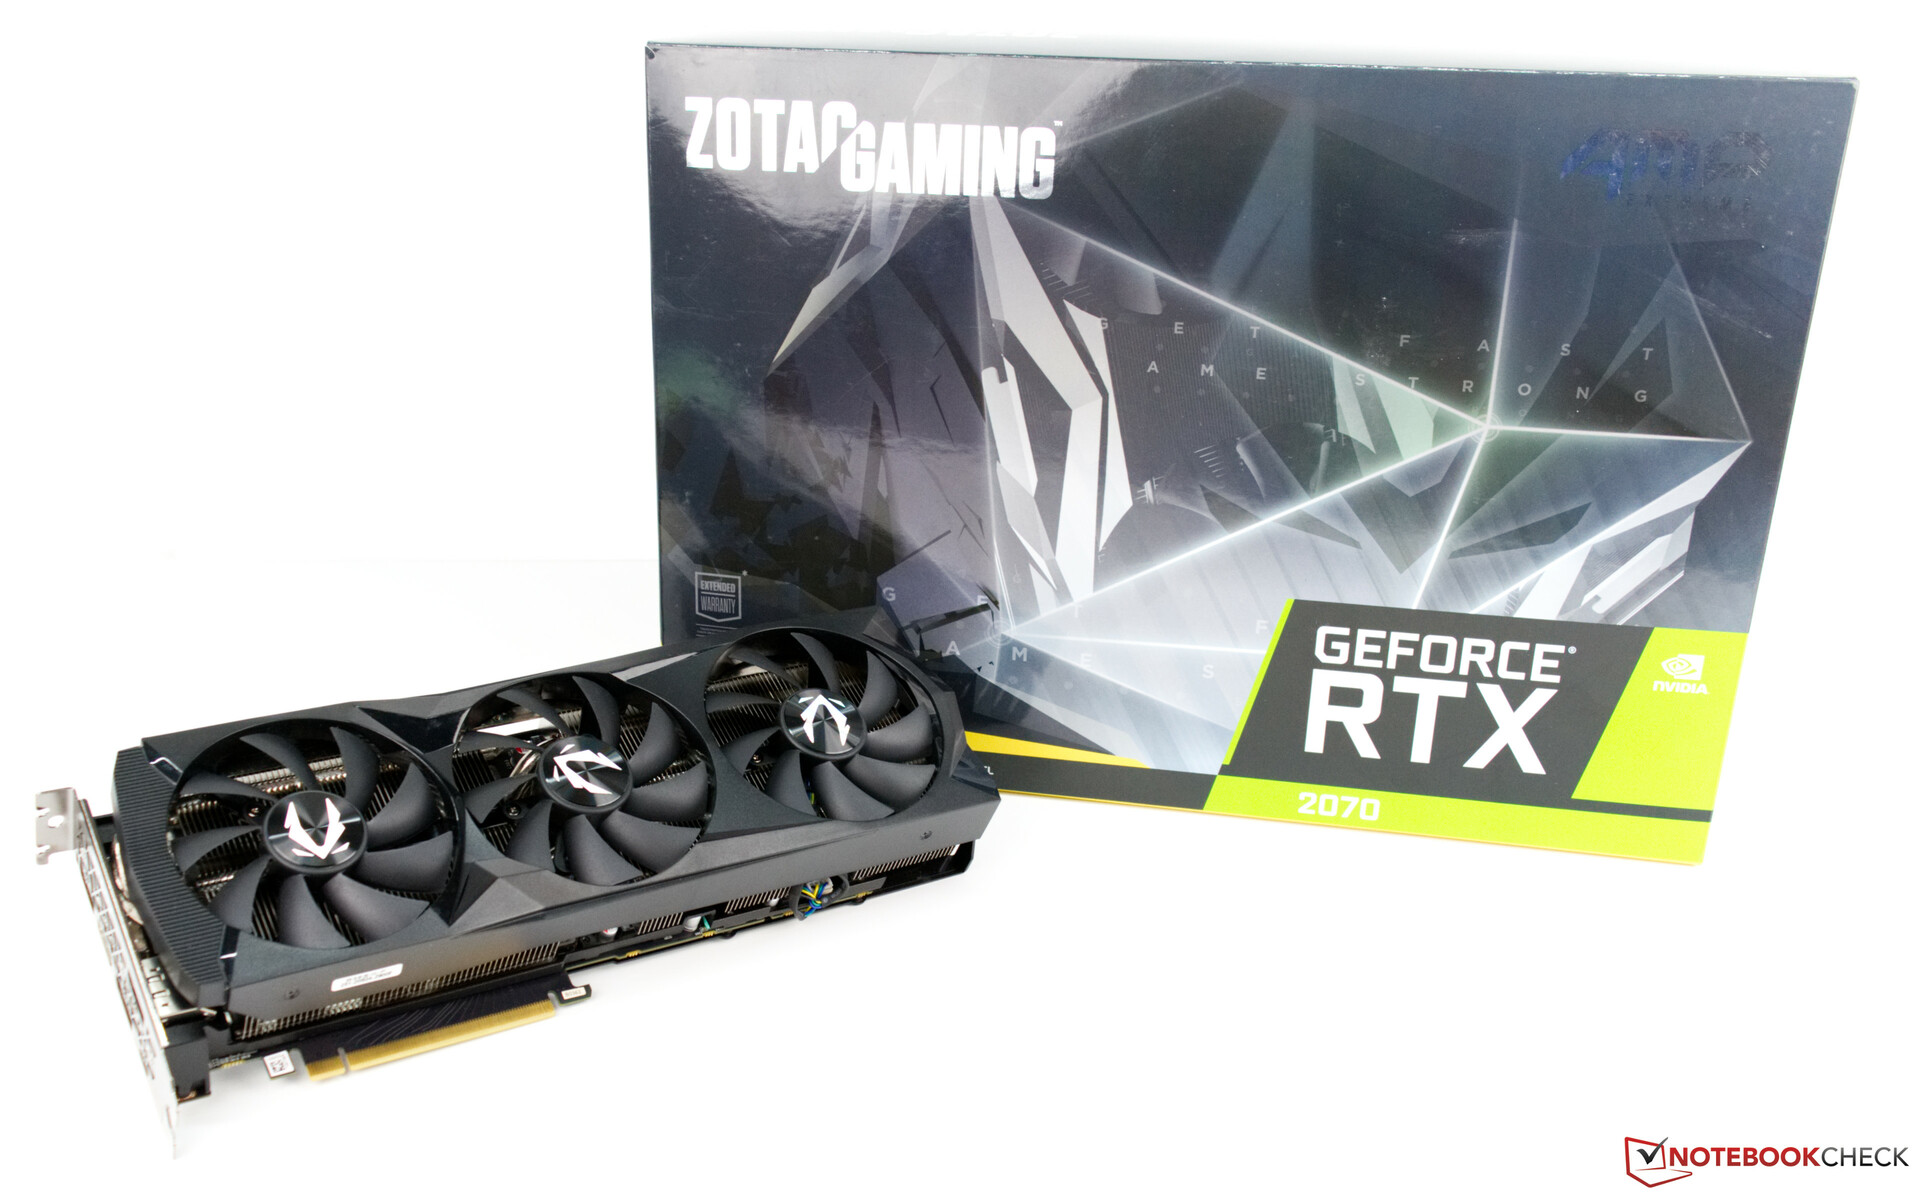
Zotac GeForce RTX 2070 AMP Extreme Desktop GPU Review
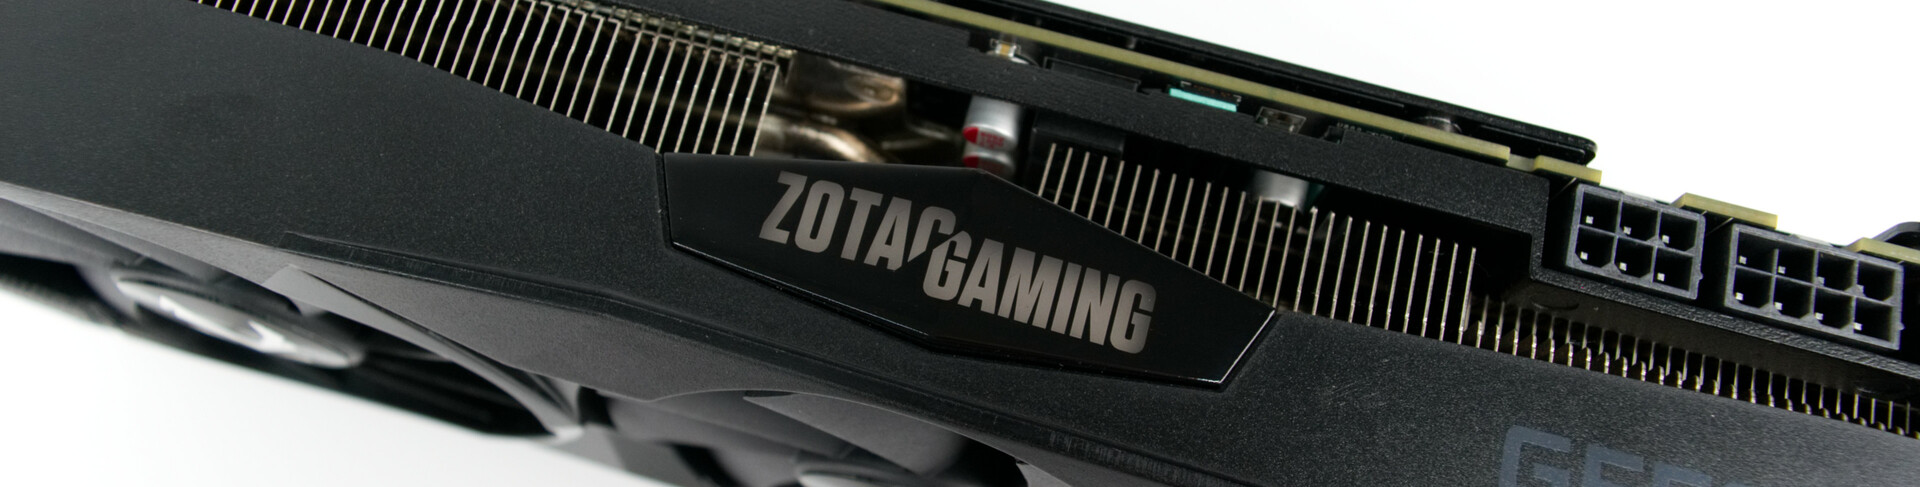
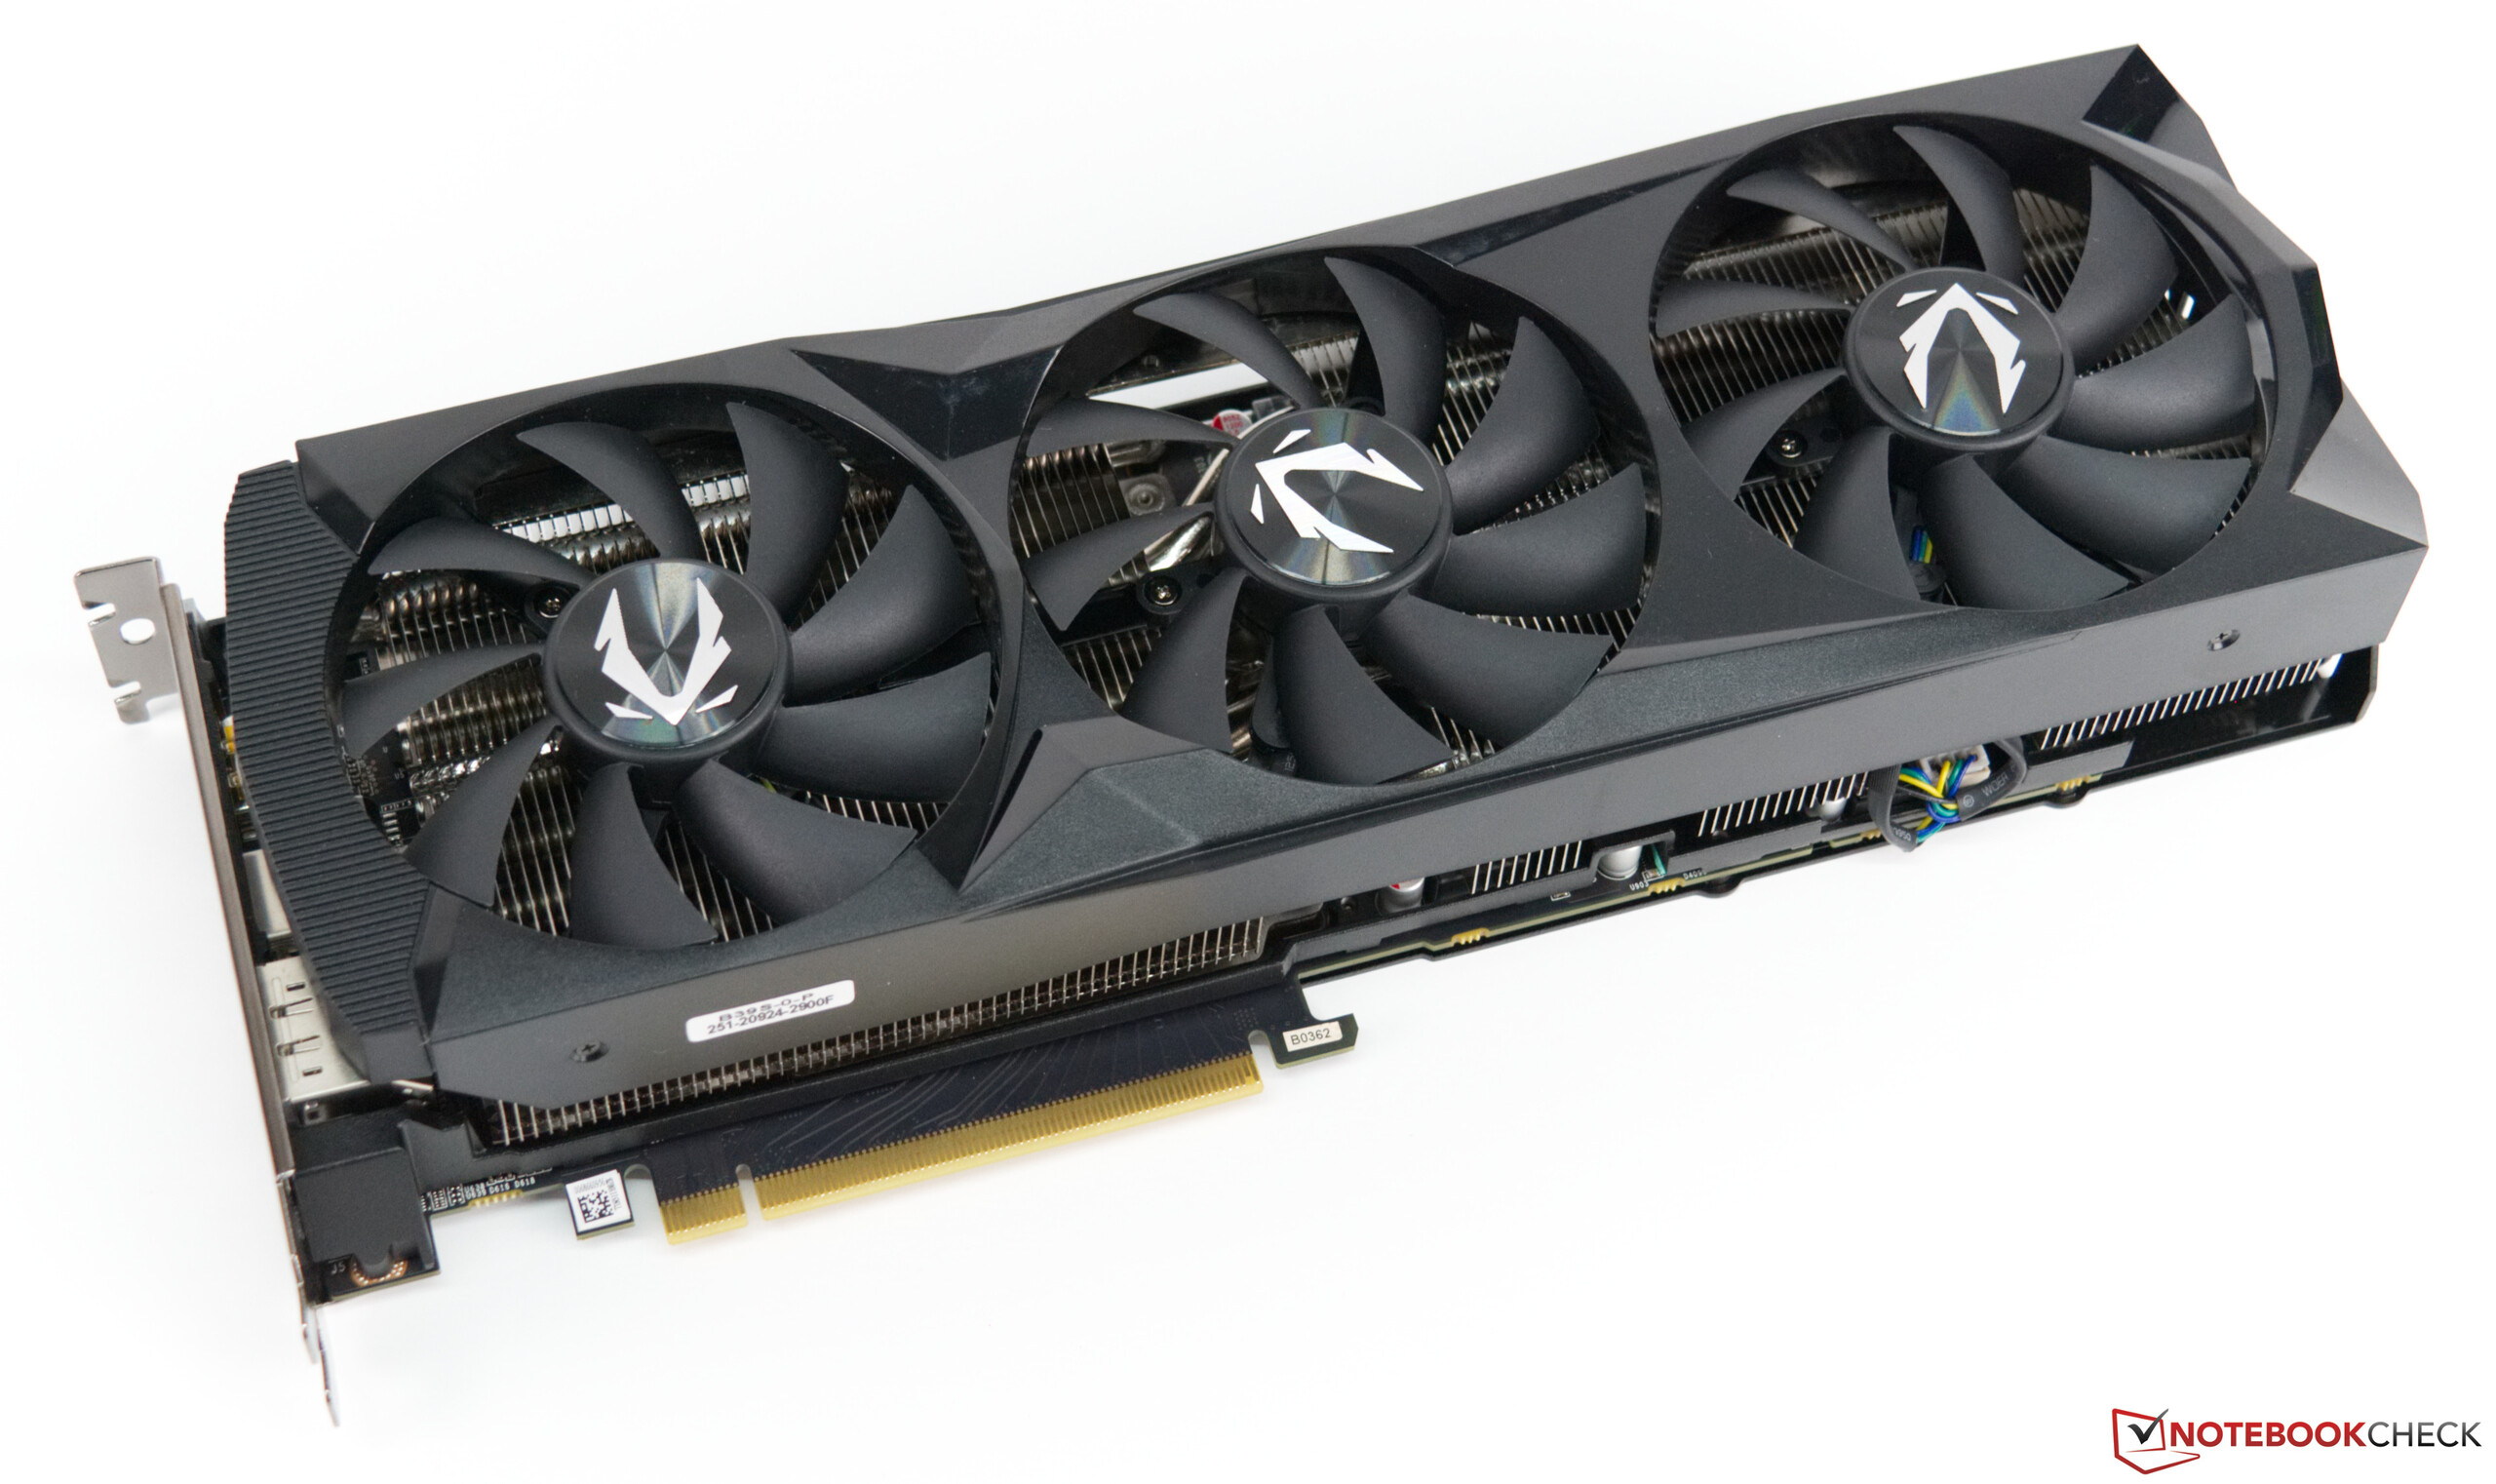
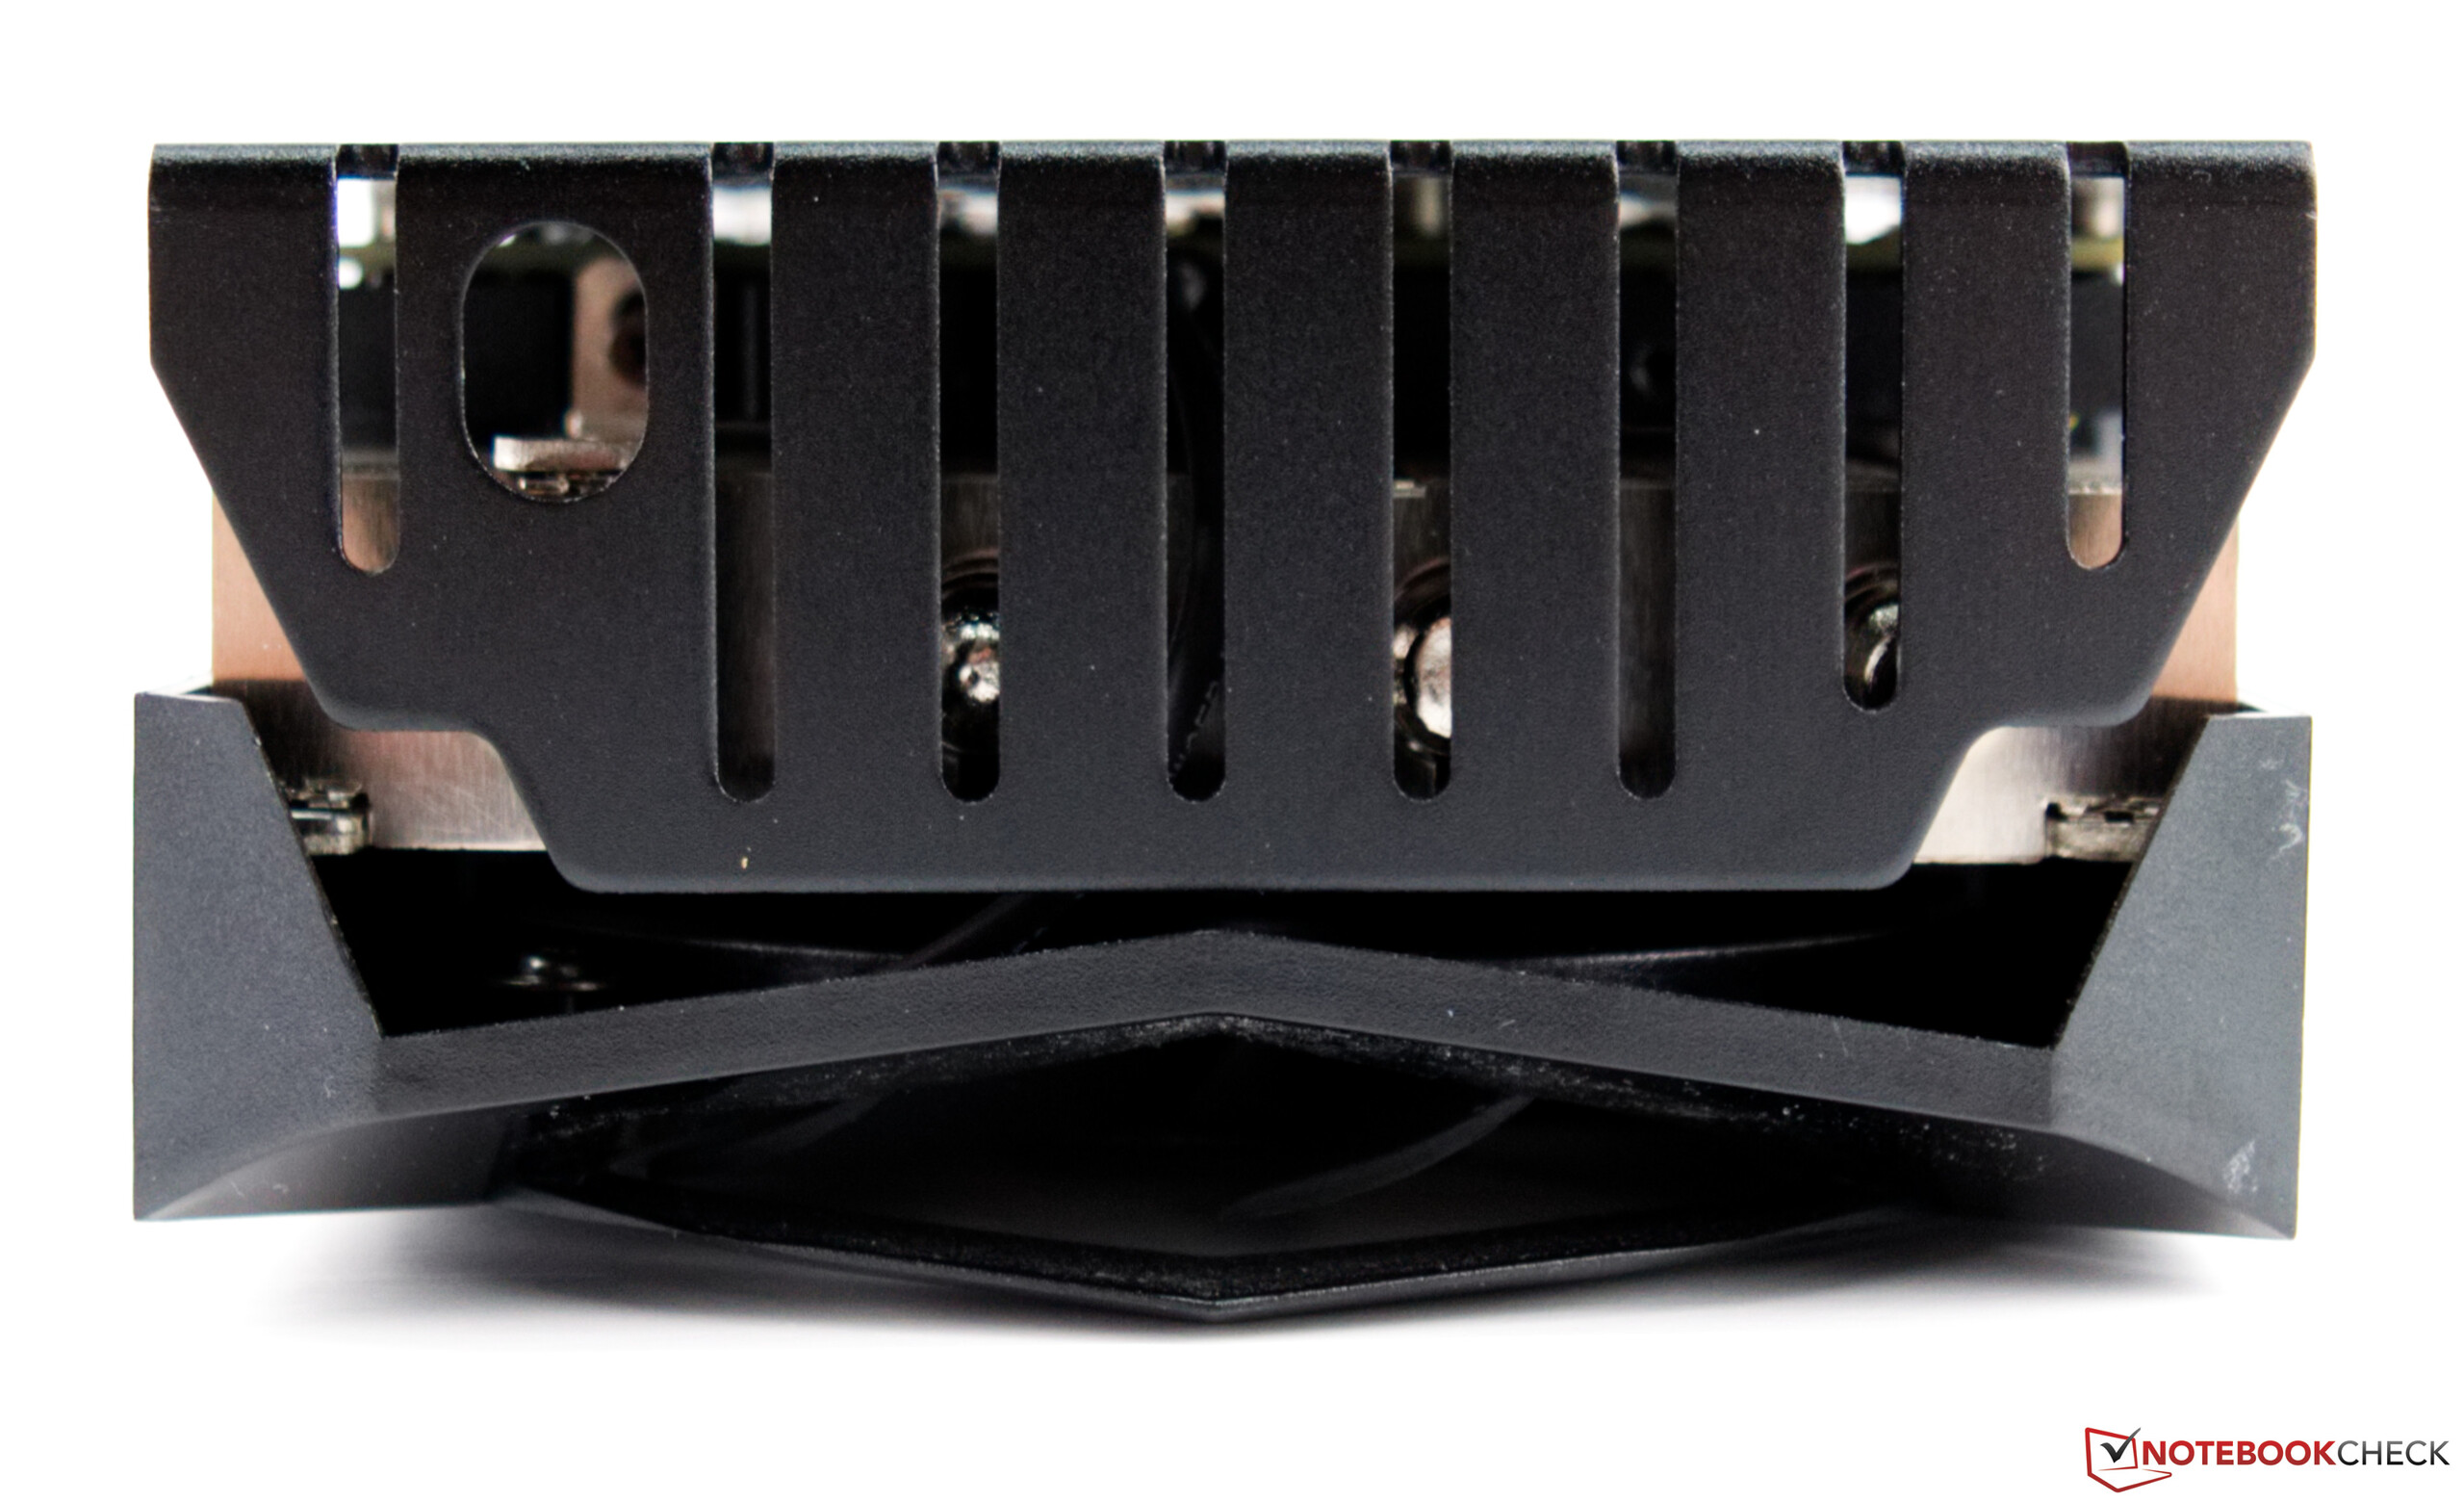
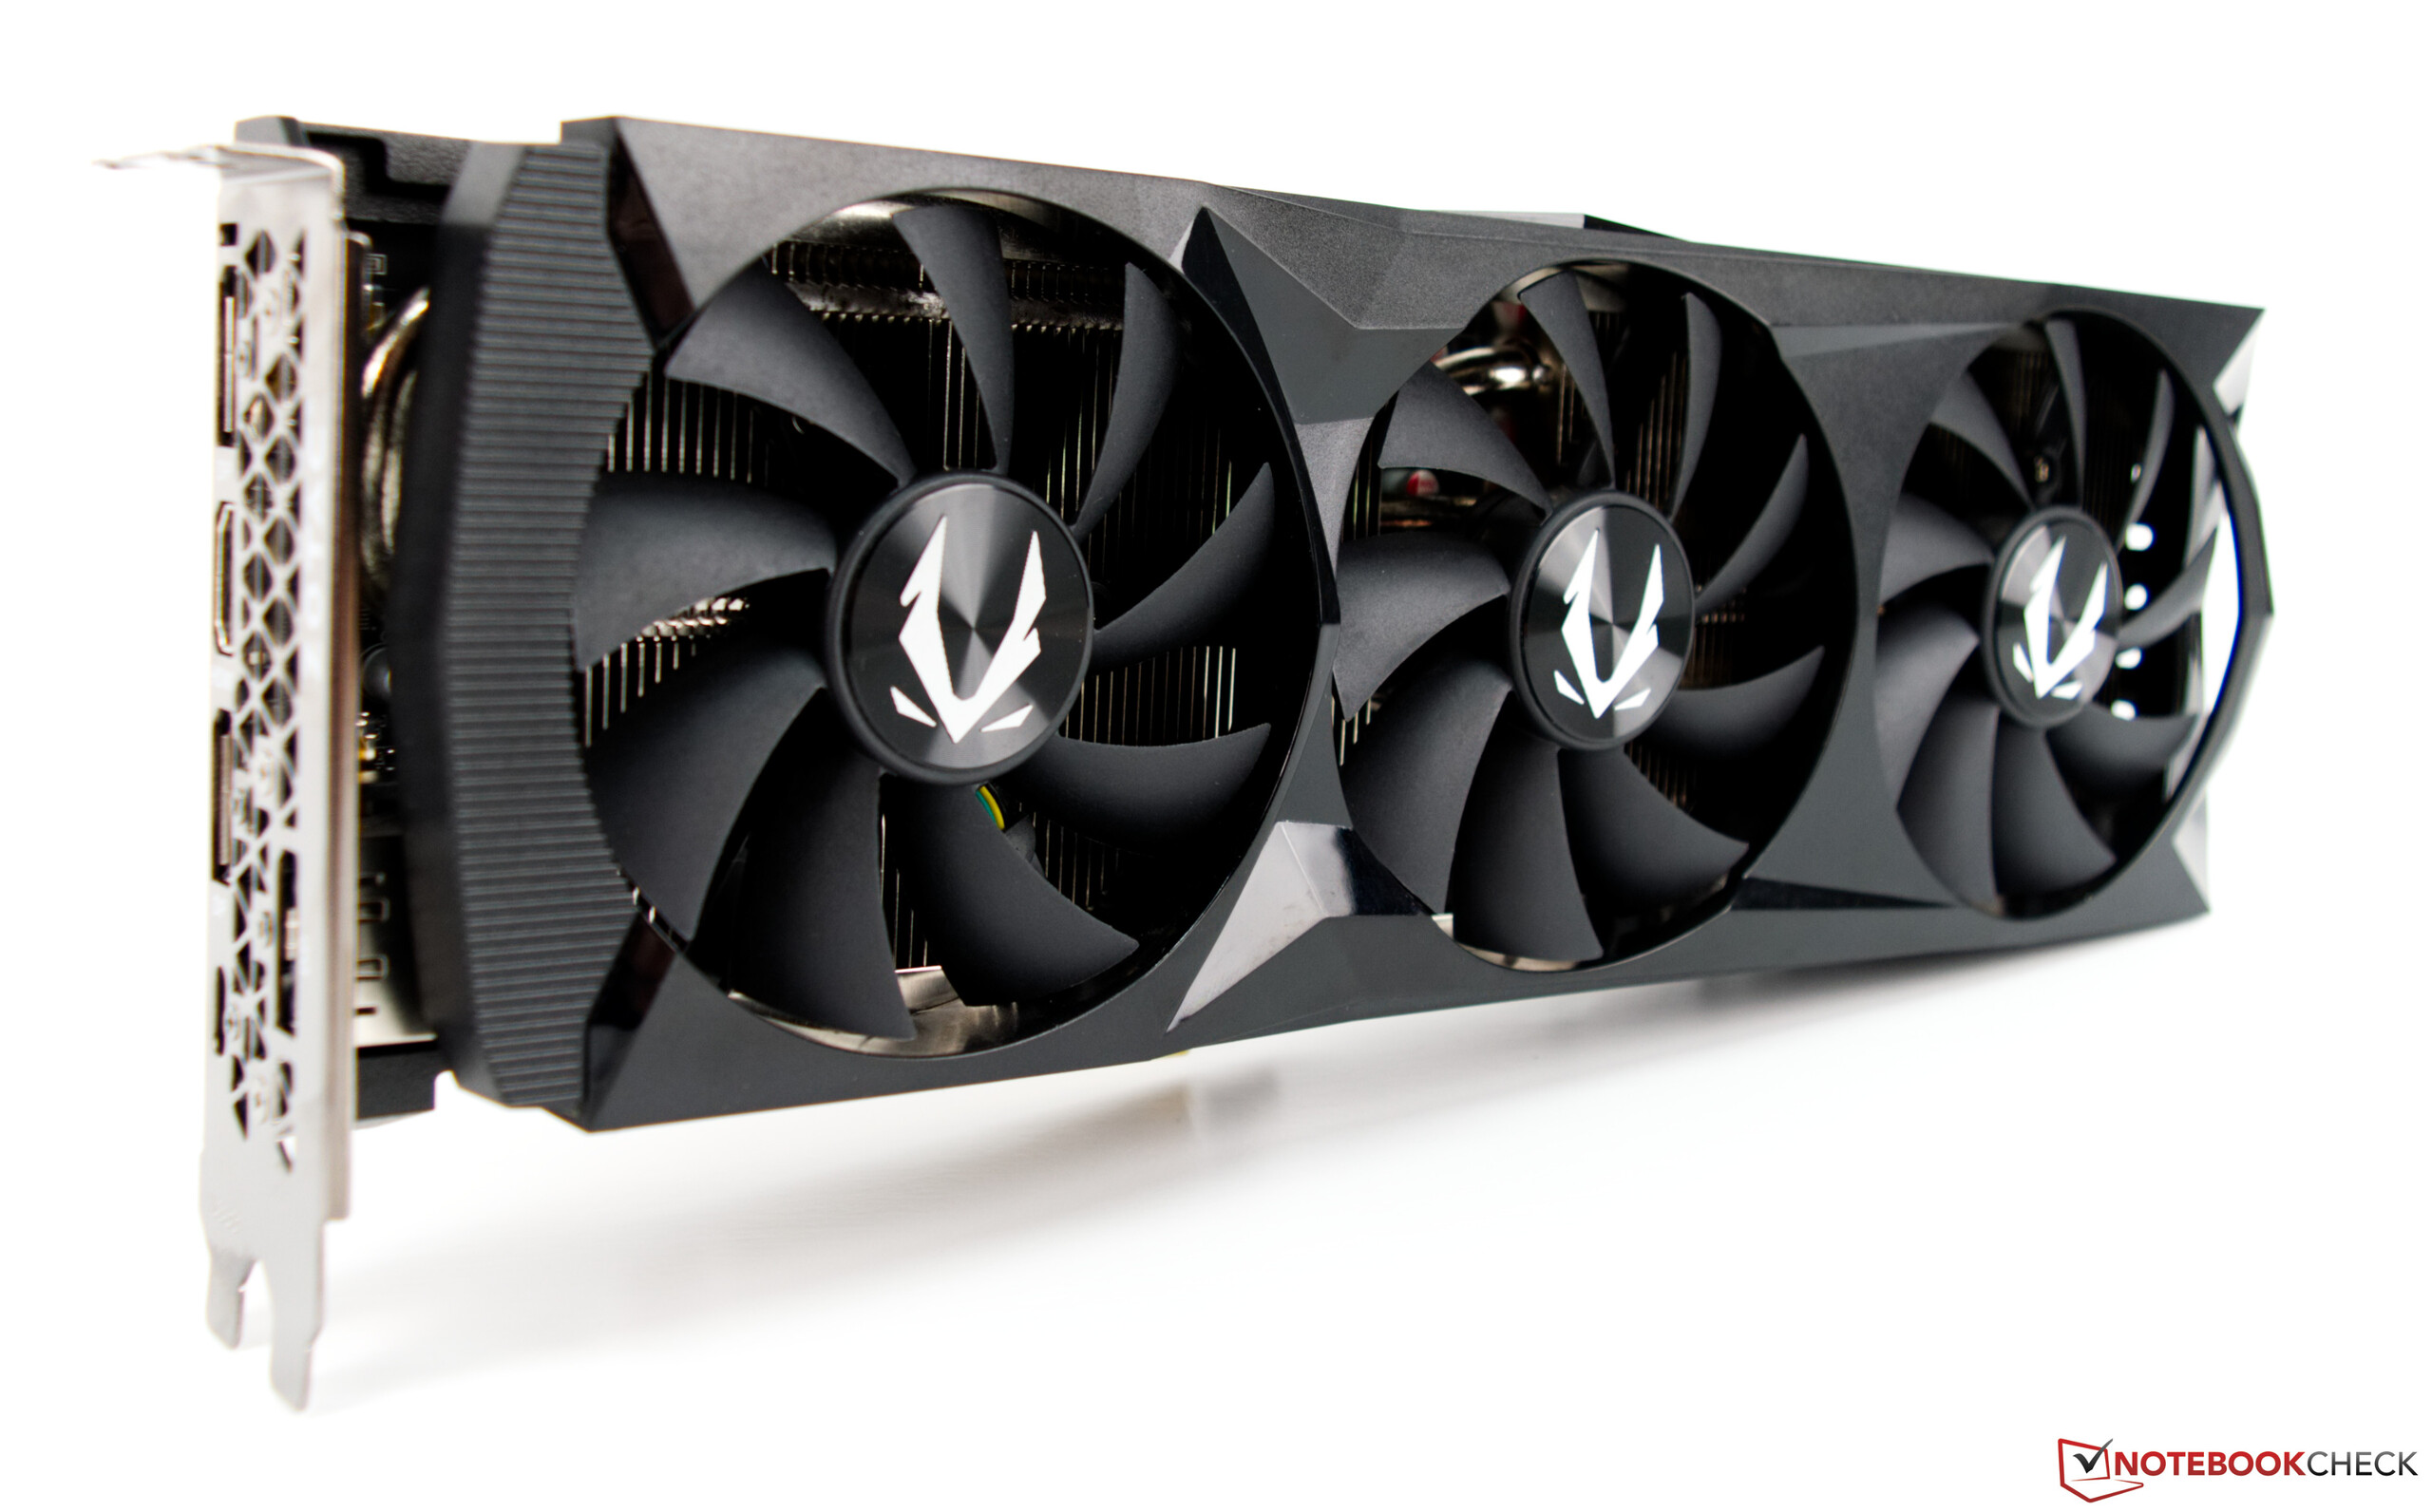
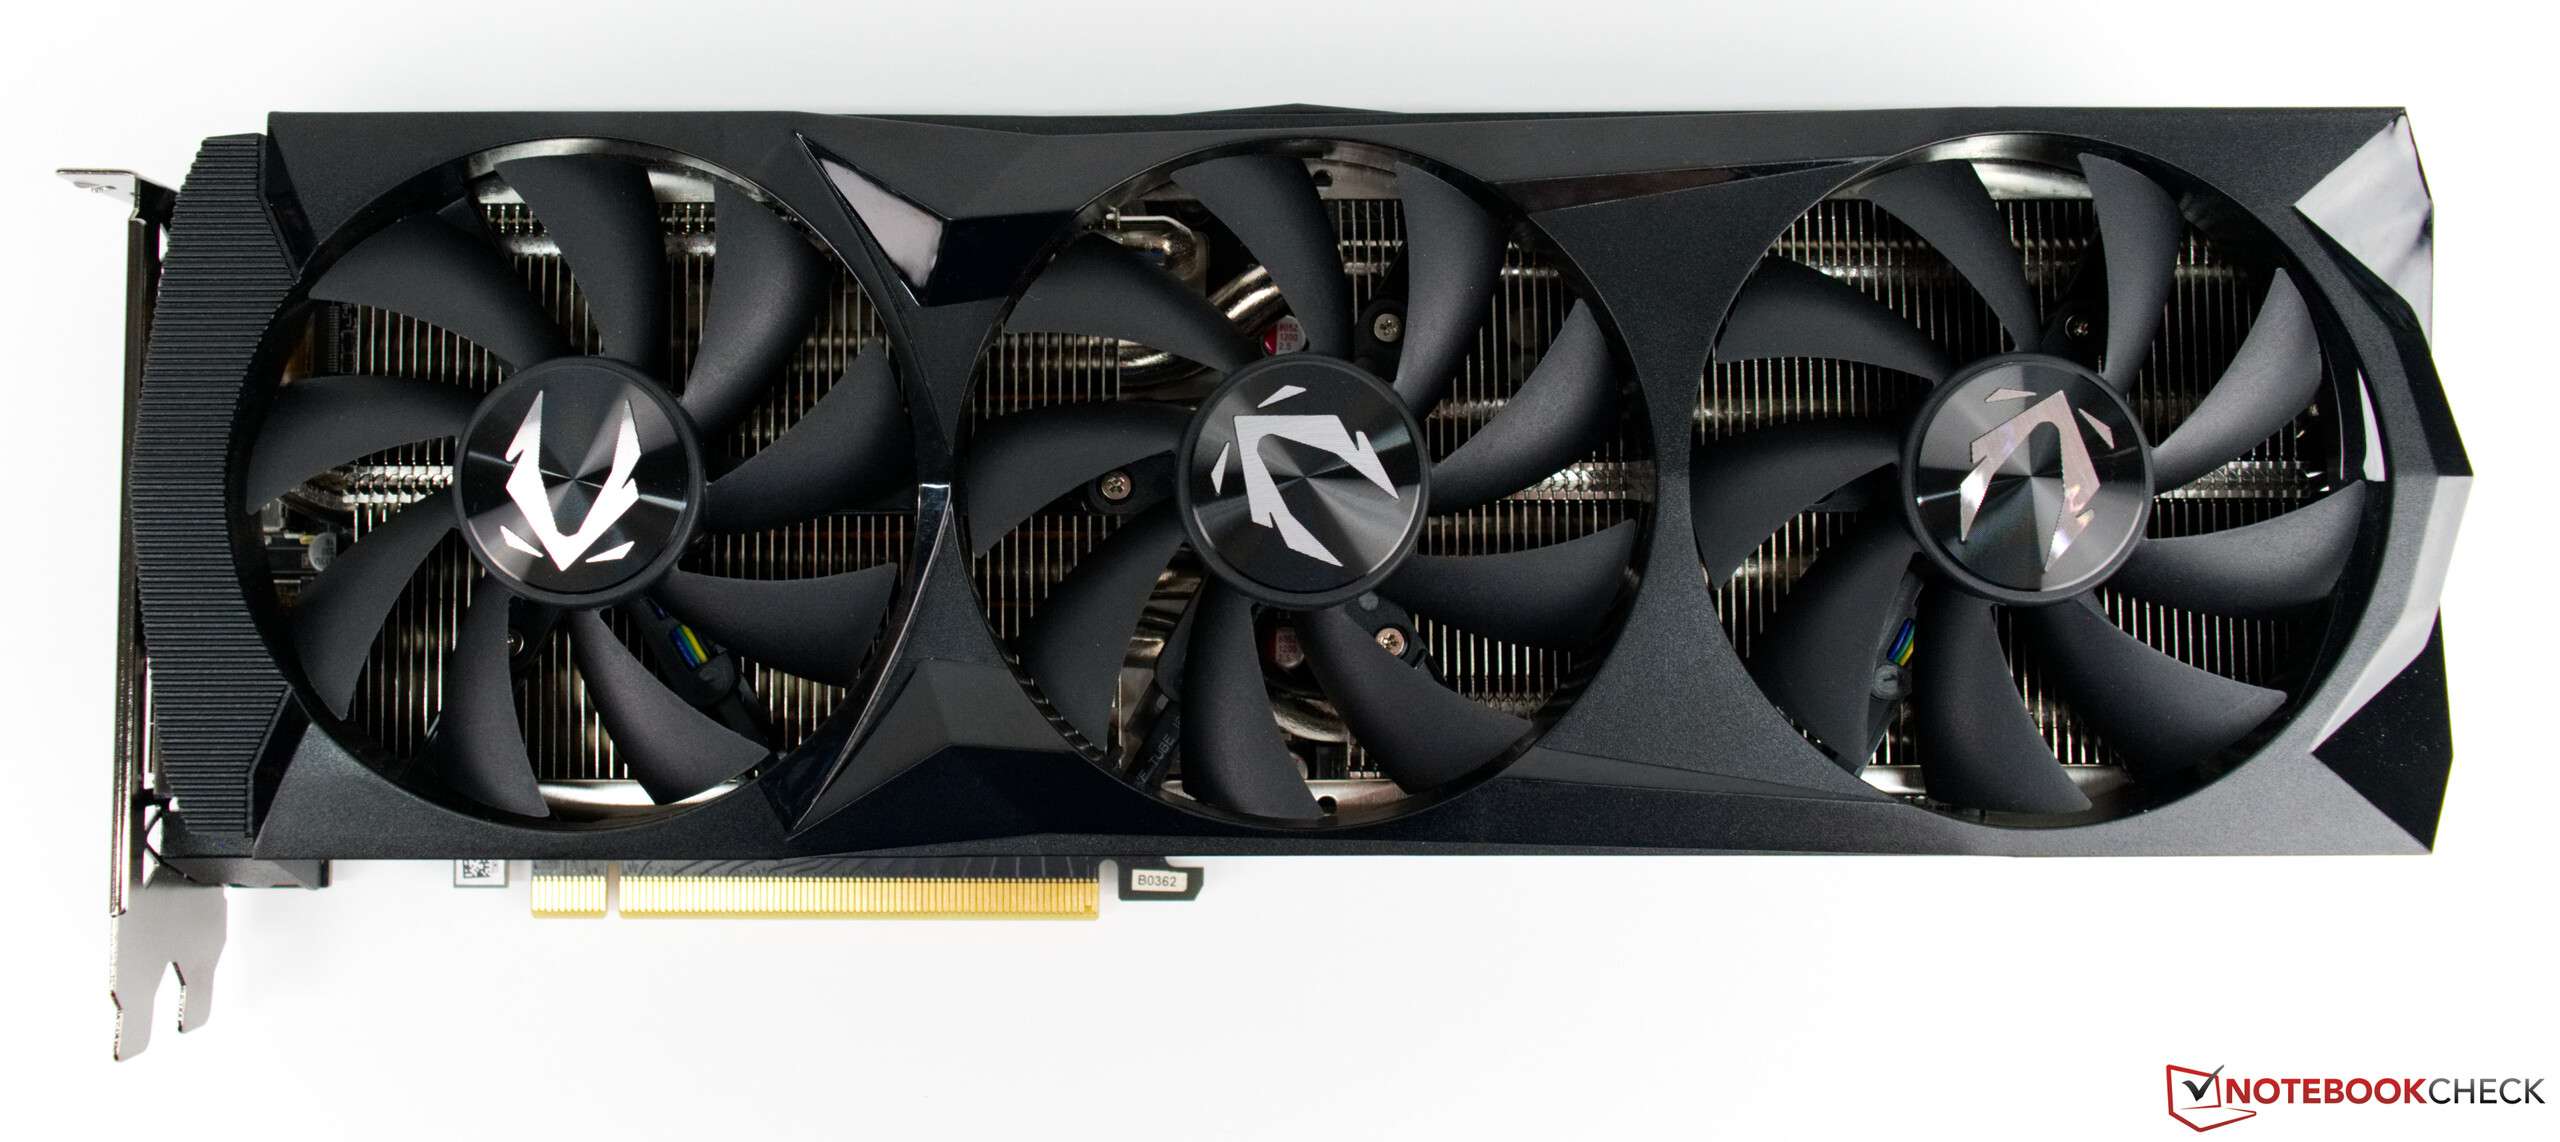
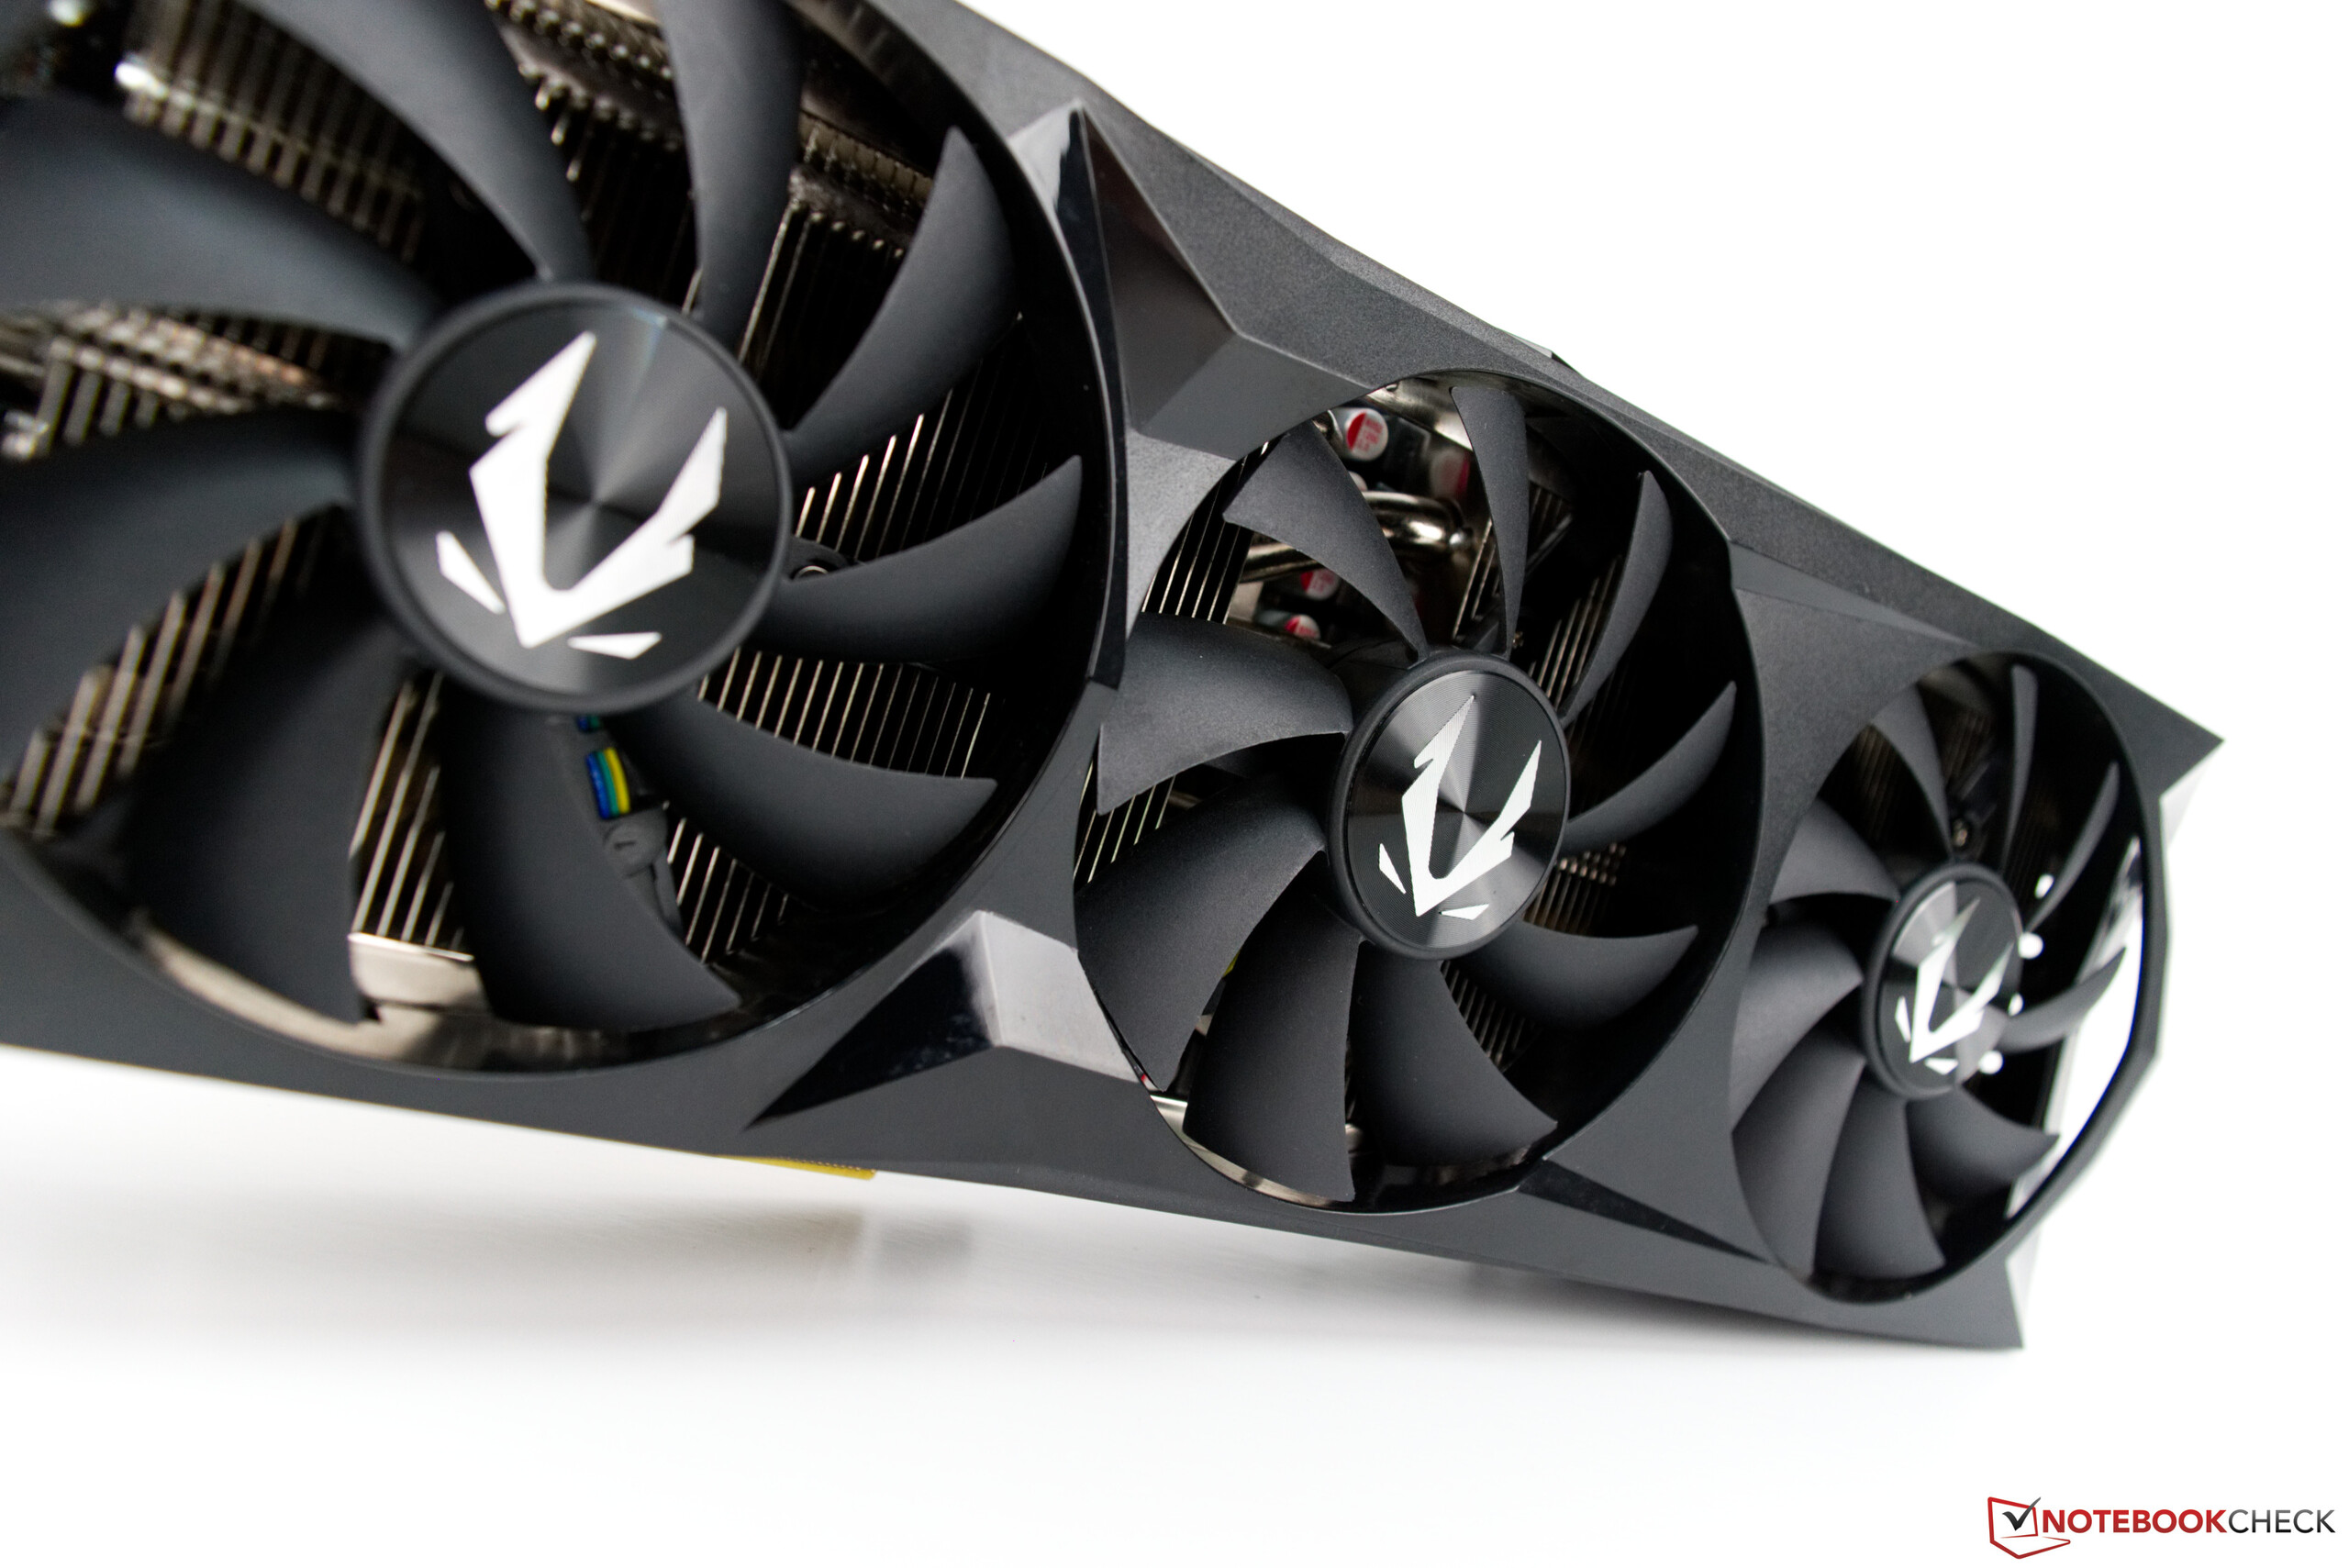
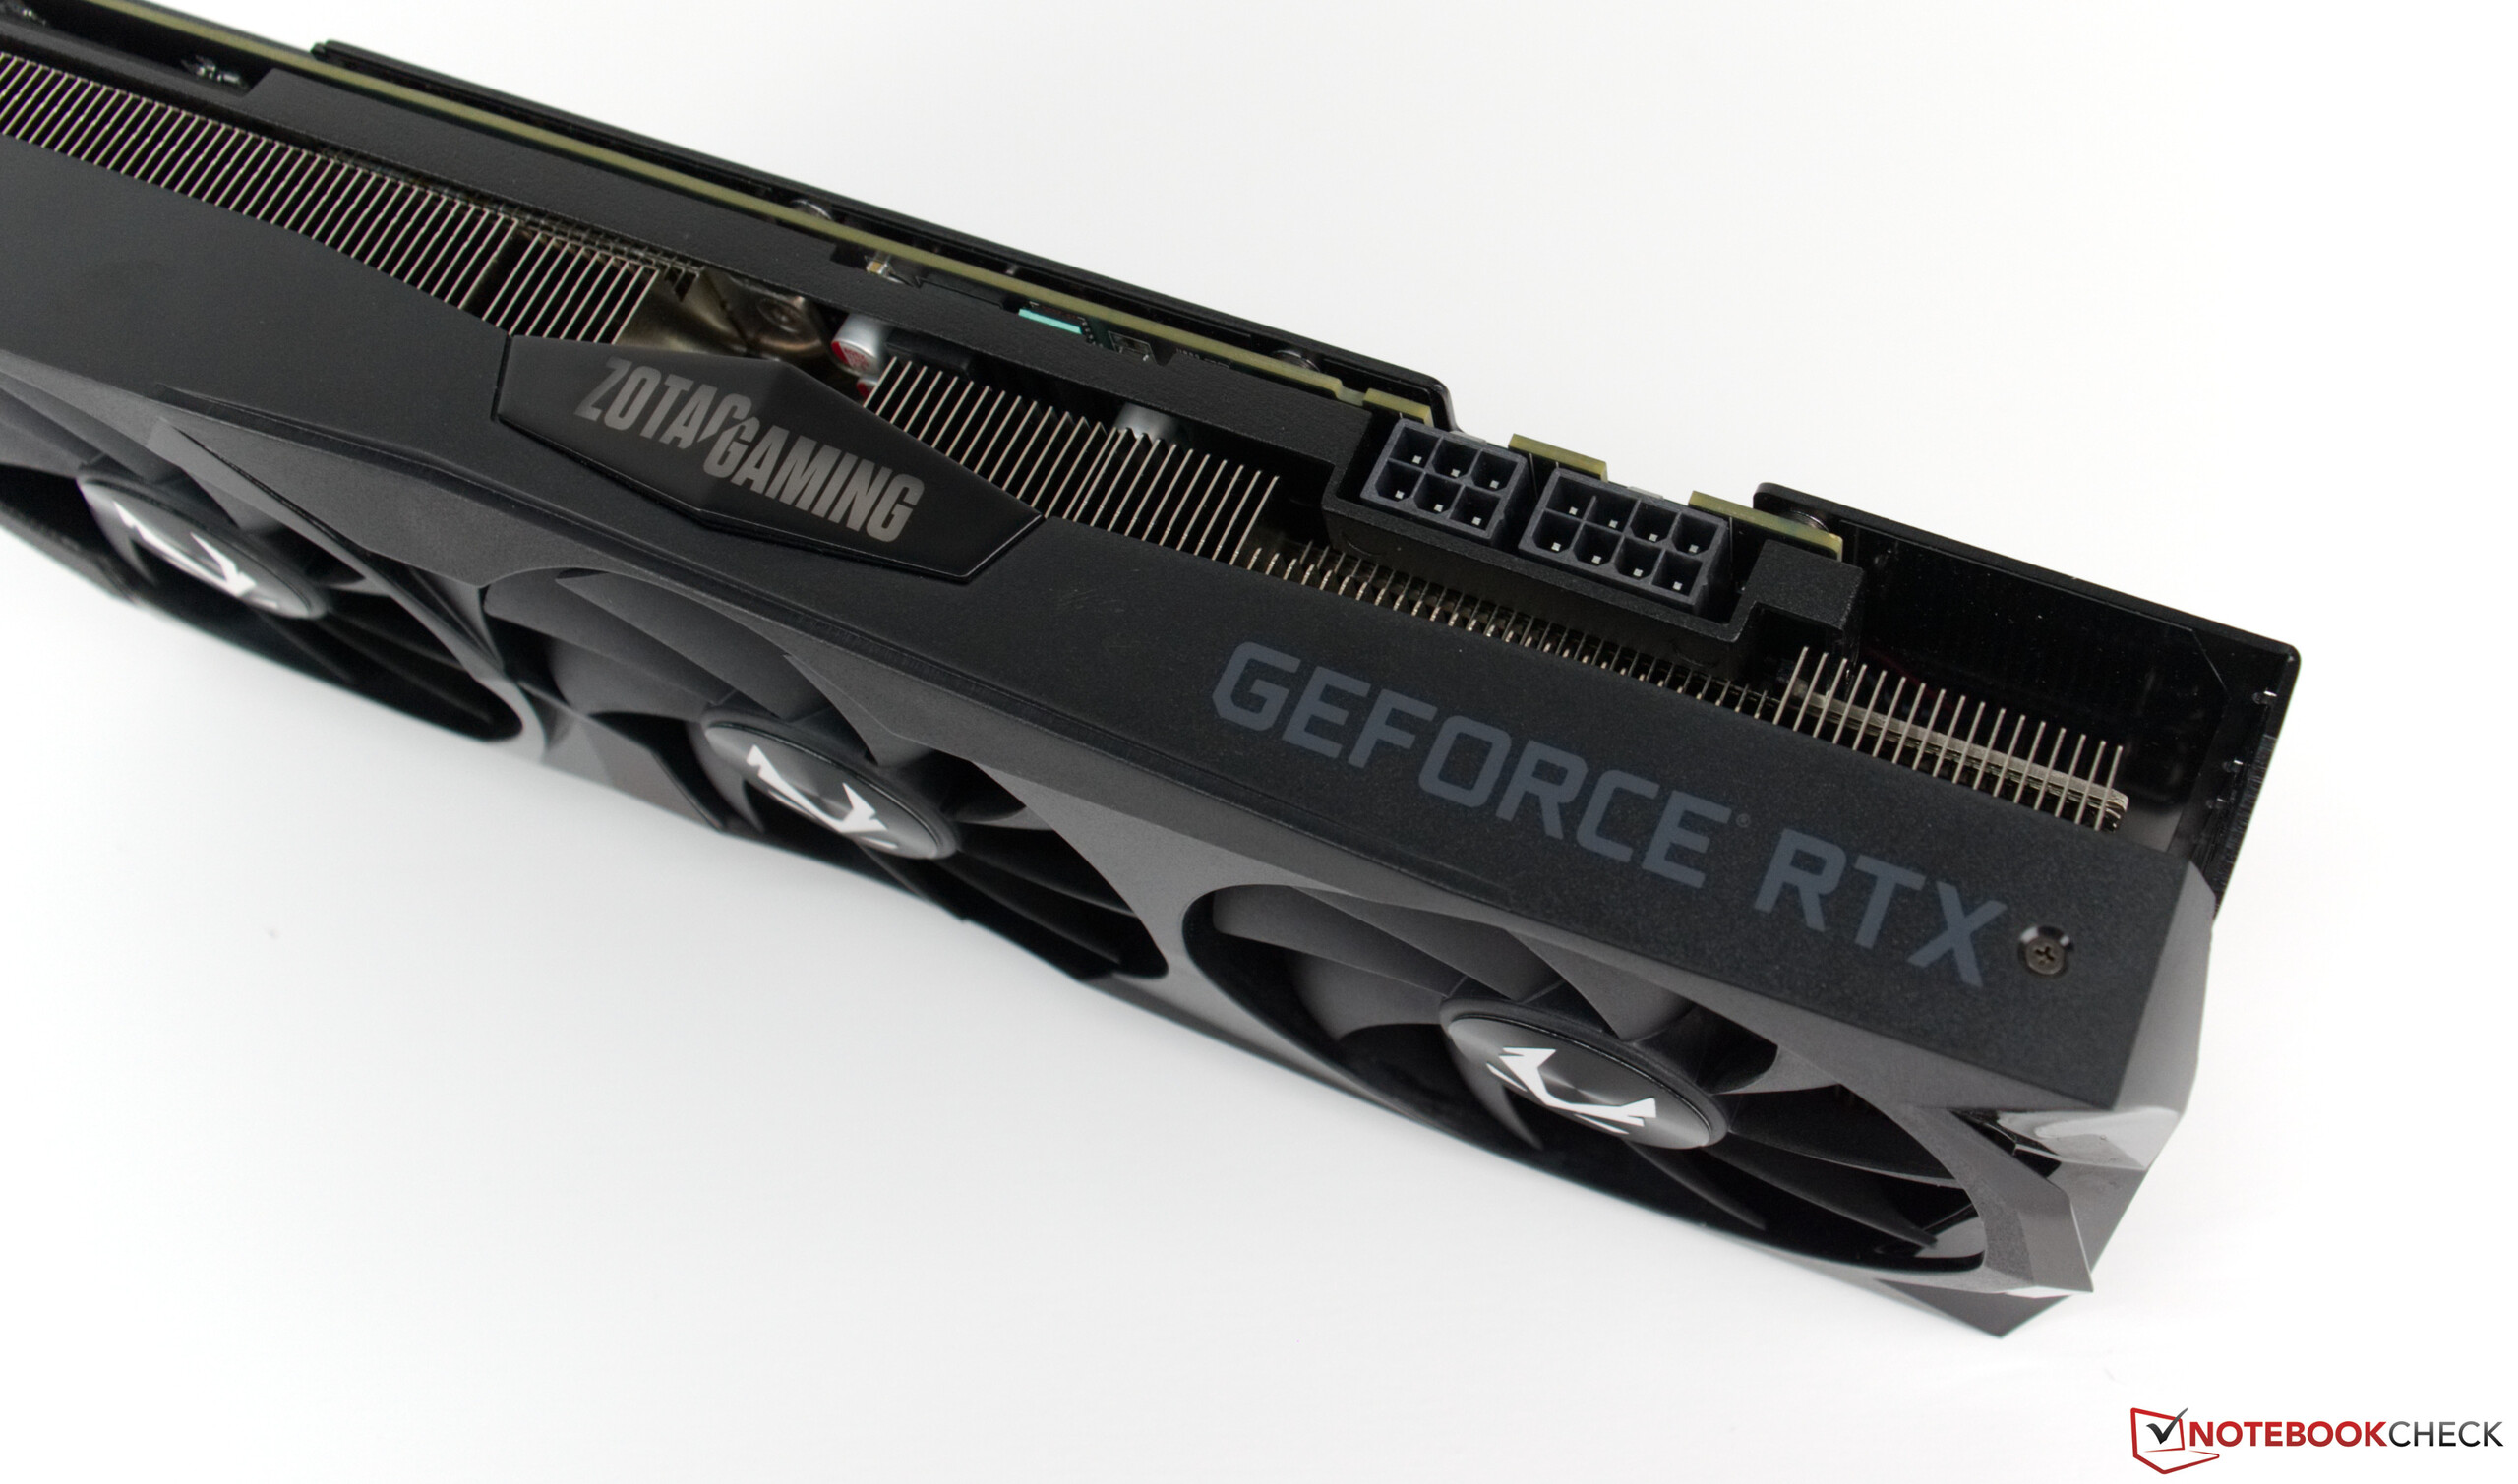
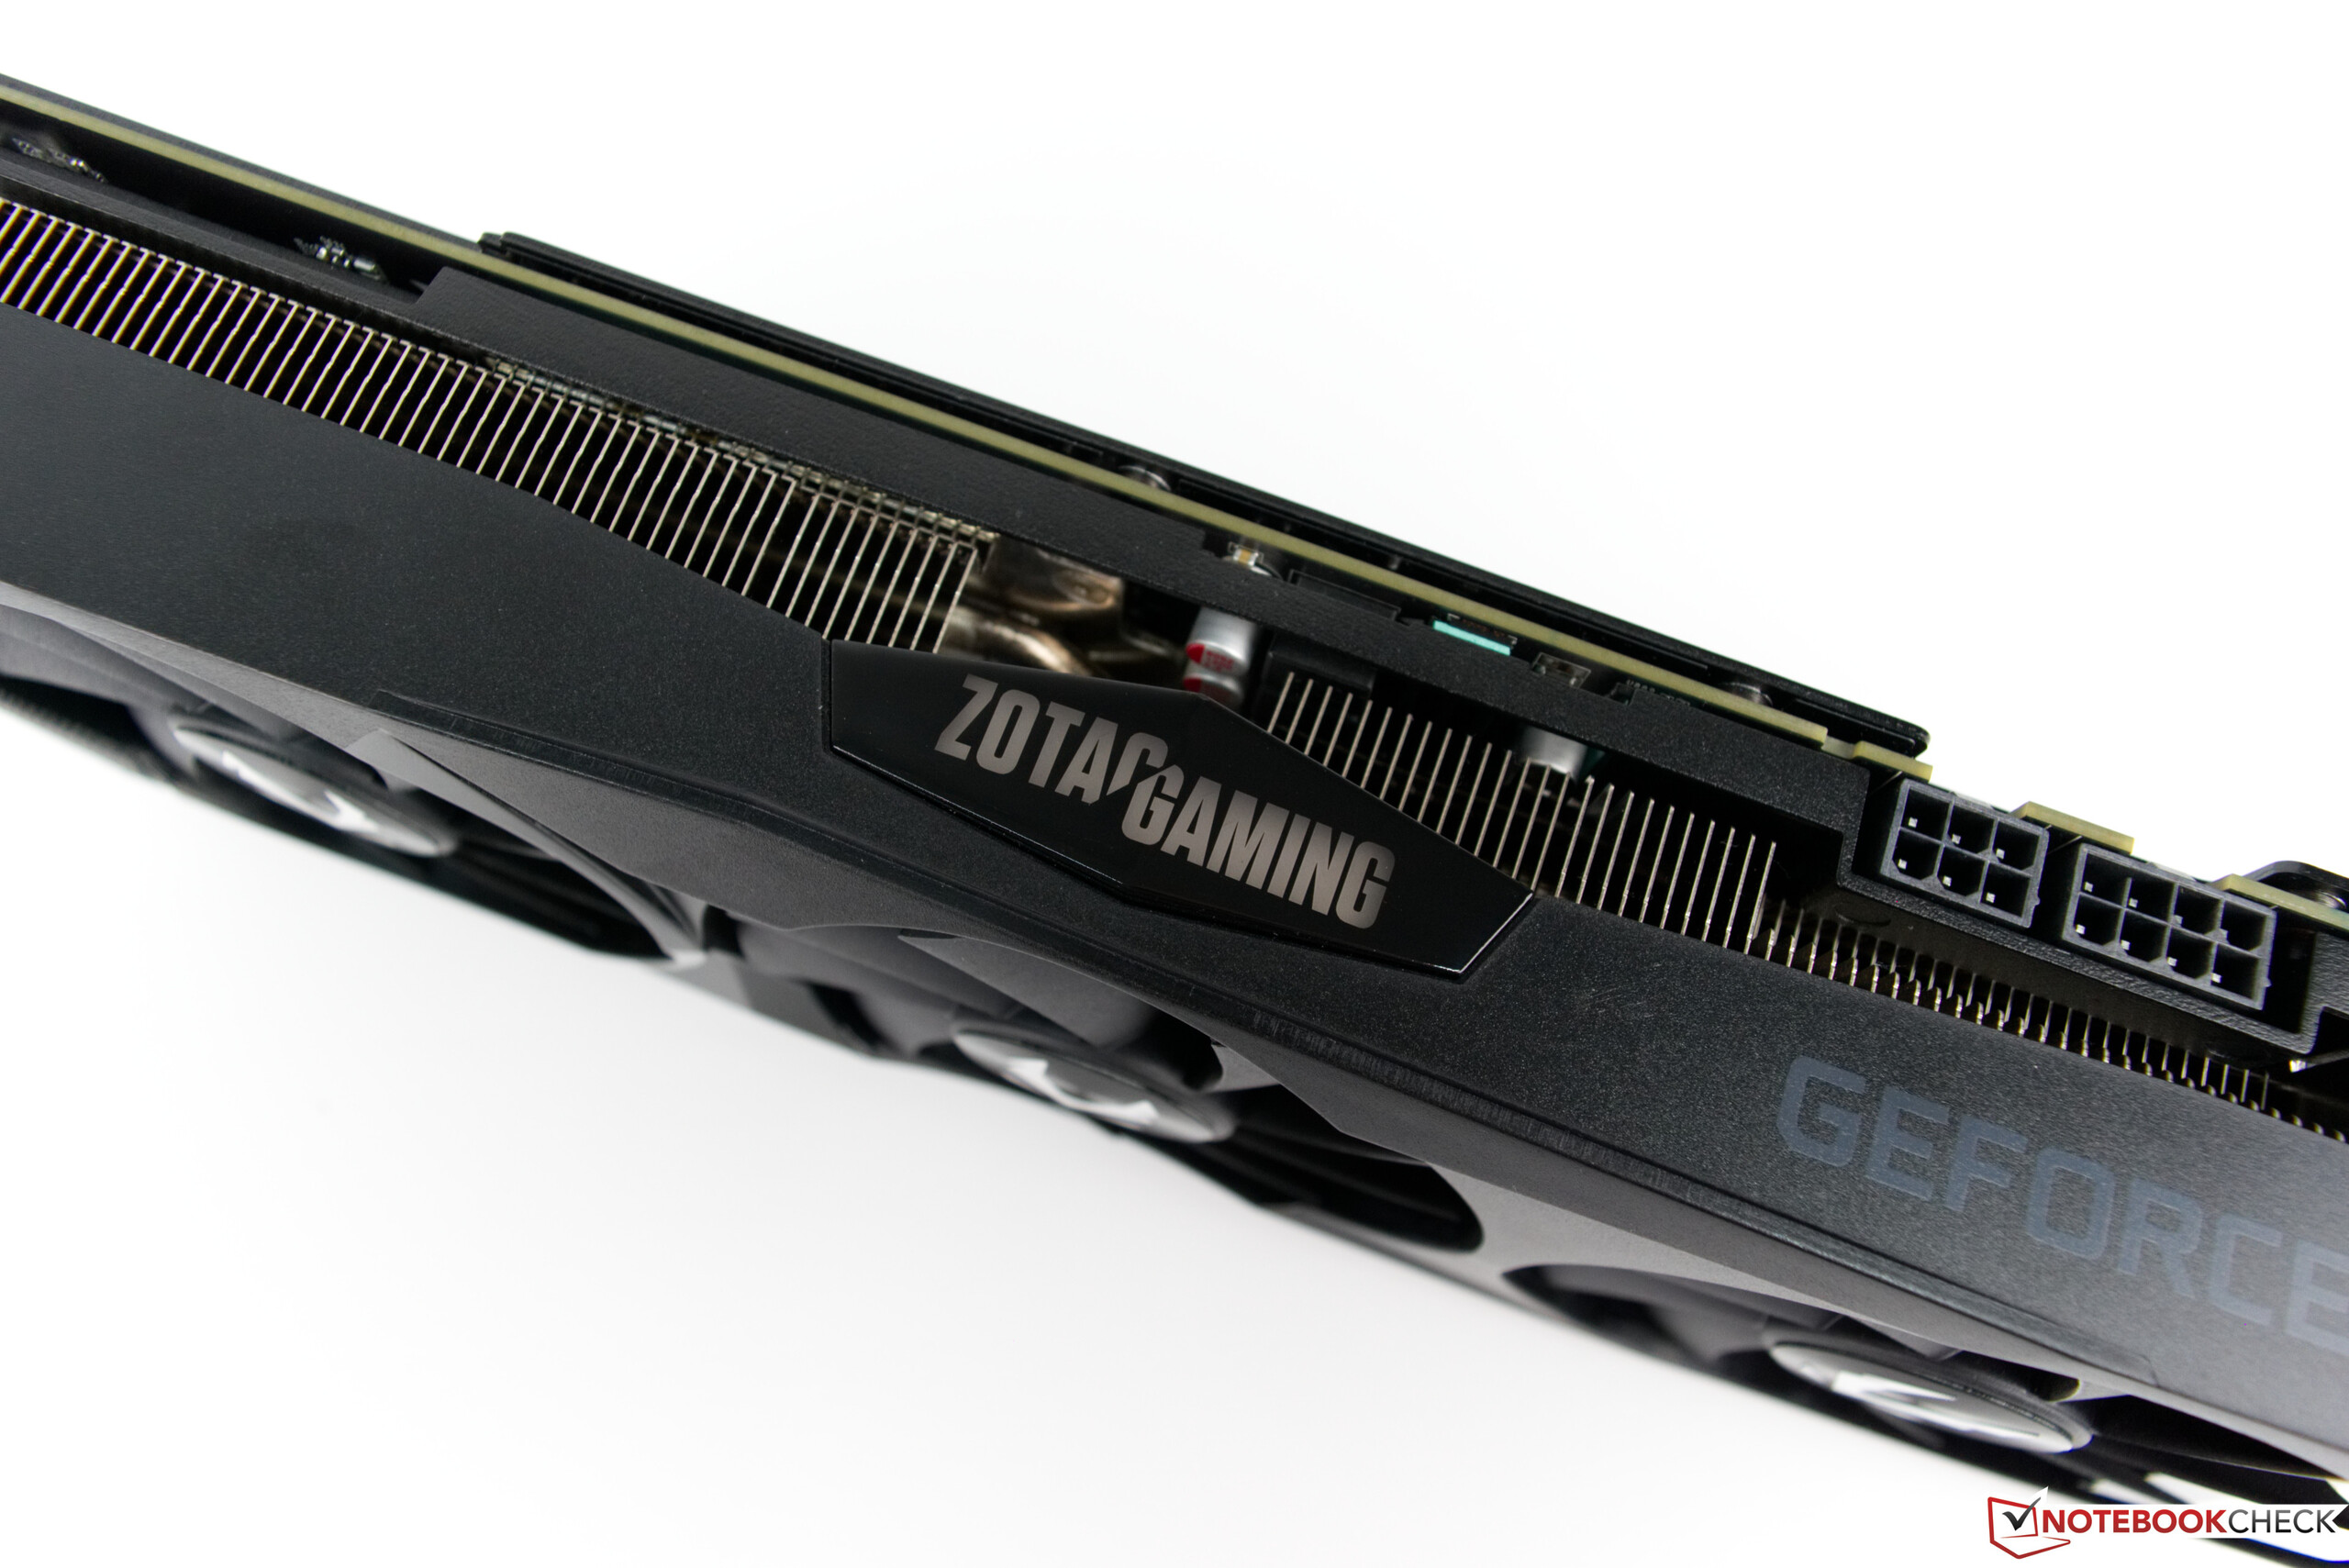
The RTX 2070 AMP Extreme is not just another RTX graphics card from Zotac. It is the most powerful RTX 2070 that the manufacturer currently sells. The factory-overclocked card has a 225-W thermal design power (TDP), which is higher than the NVIDIA Founders Edition equivalent. Additionally, Zotac has designed an in-house board layout and equipped the RTX 2070 AMP Extreme with three large fans. The company also uses the same cooler on the RTX 2070 AMP Extreme Core, but all other Zotac RTX 2070 series cards have simpler coolers. The reason for this is that they have lower power consumption than the RTX 2070 AMP Extreme.
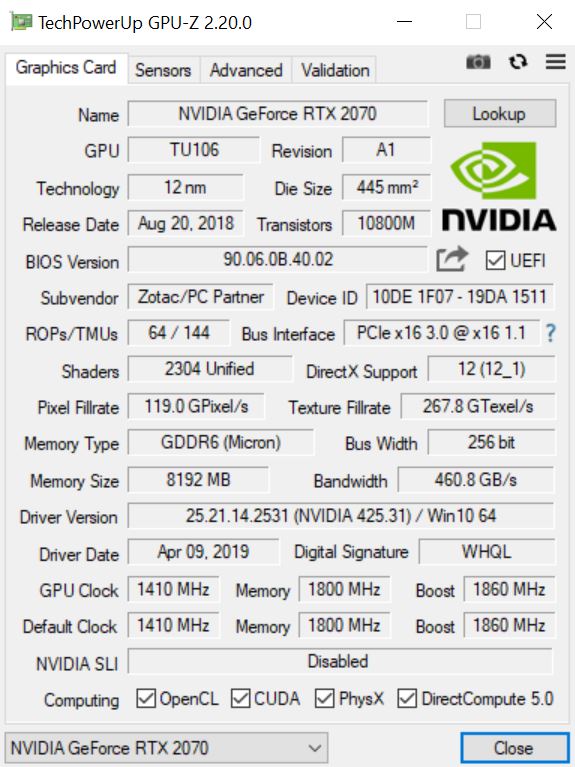
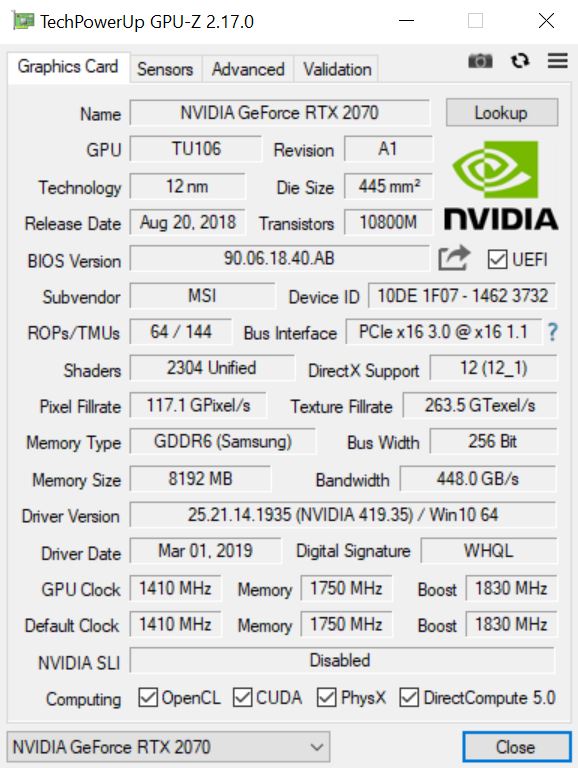
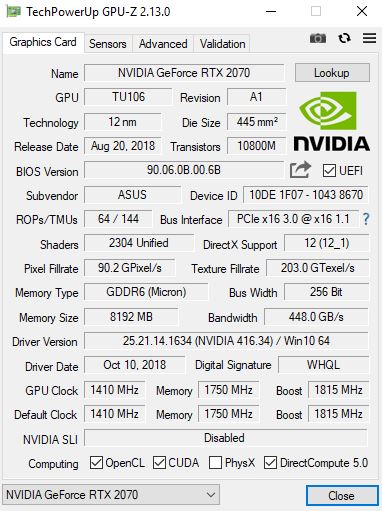
Like all RTX 2070 cards, the AMP Extreme has 2,304 shader units and 8 GB of GDDR6 VRAM. Micron has supplied the VRAM for our review unit, which we have seen elsewhere in GPUs such as the ASUS ROG Strix RTX 2070 OC.
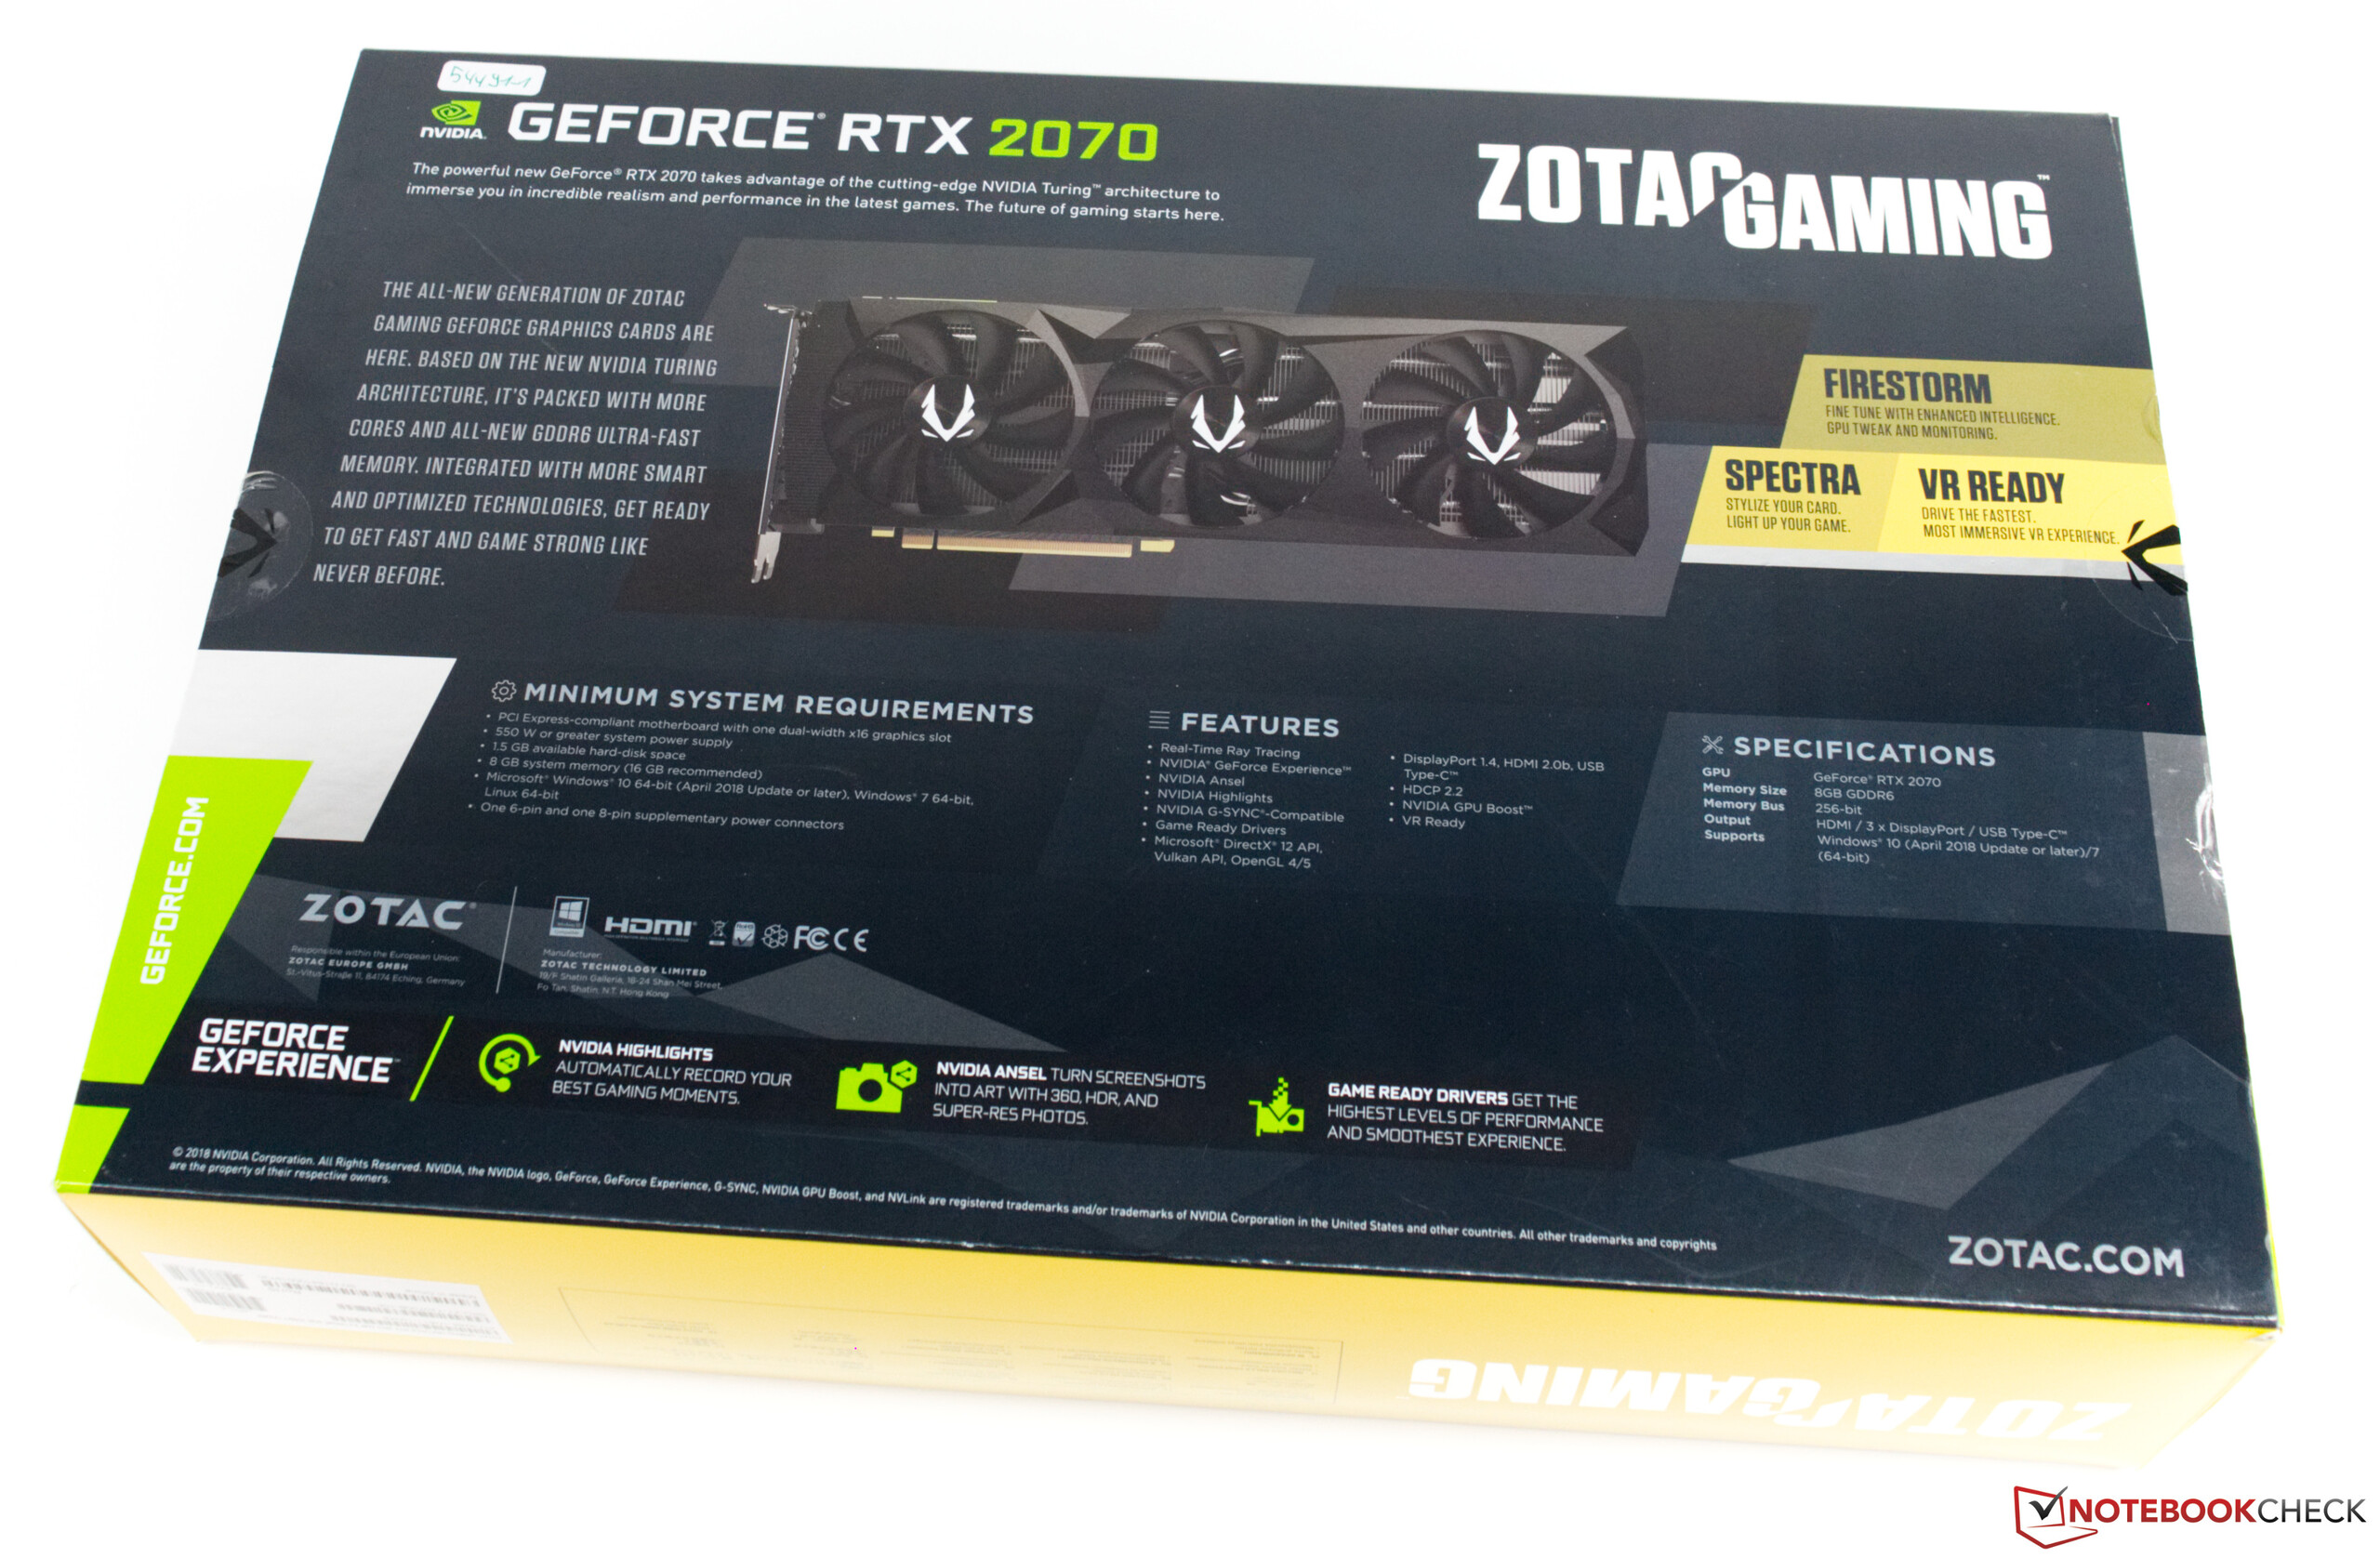
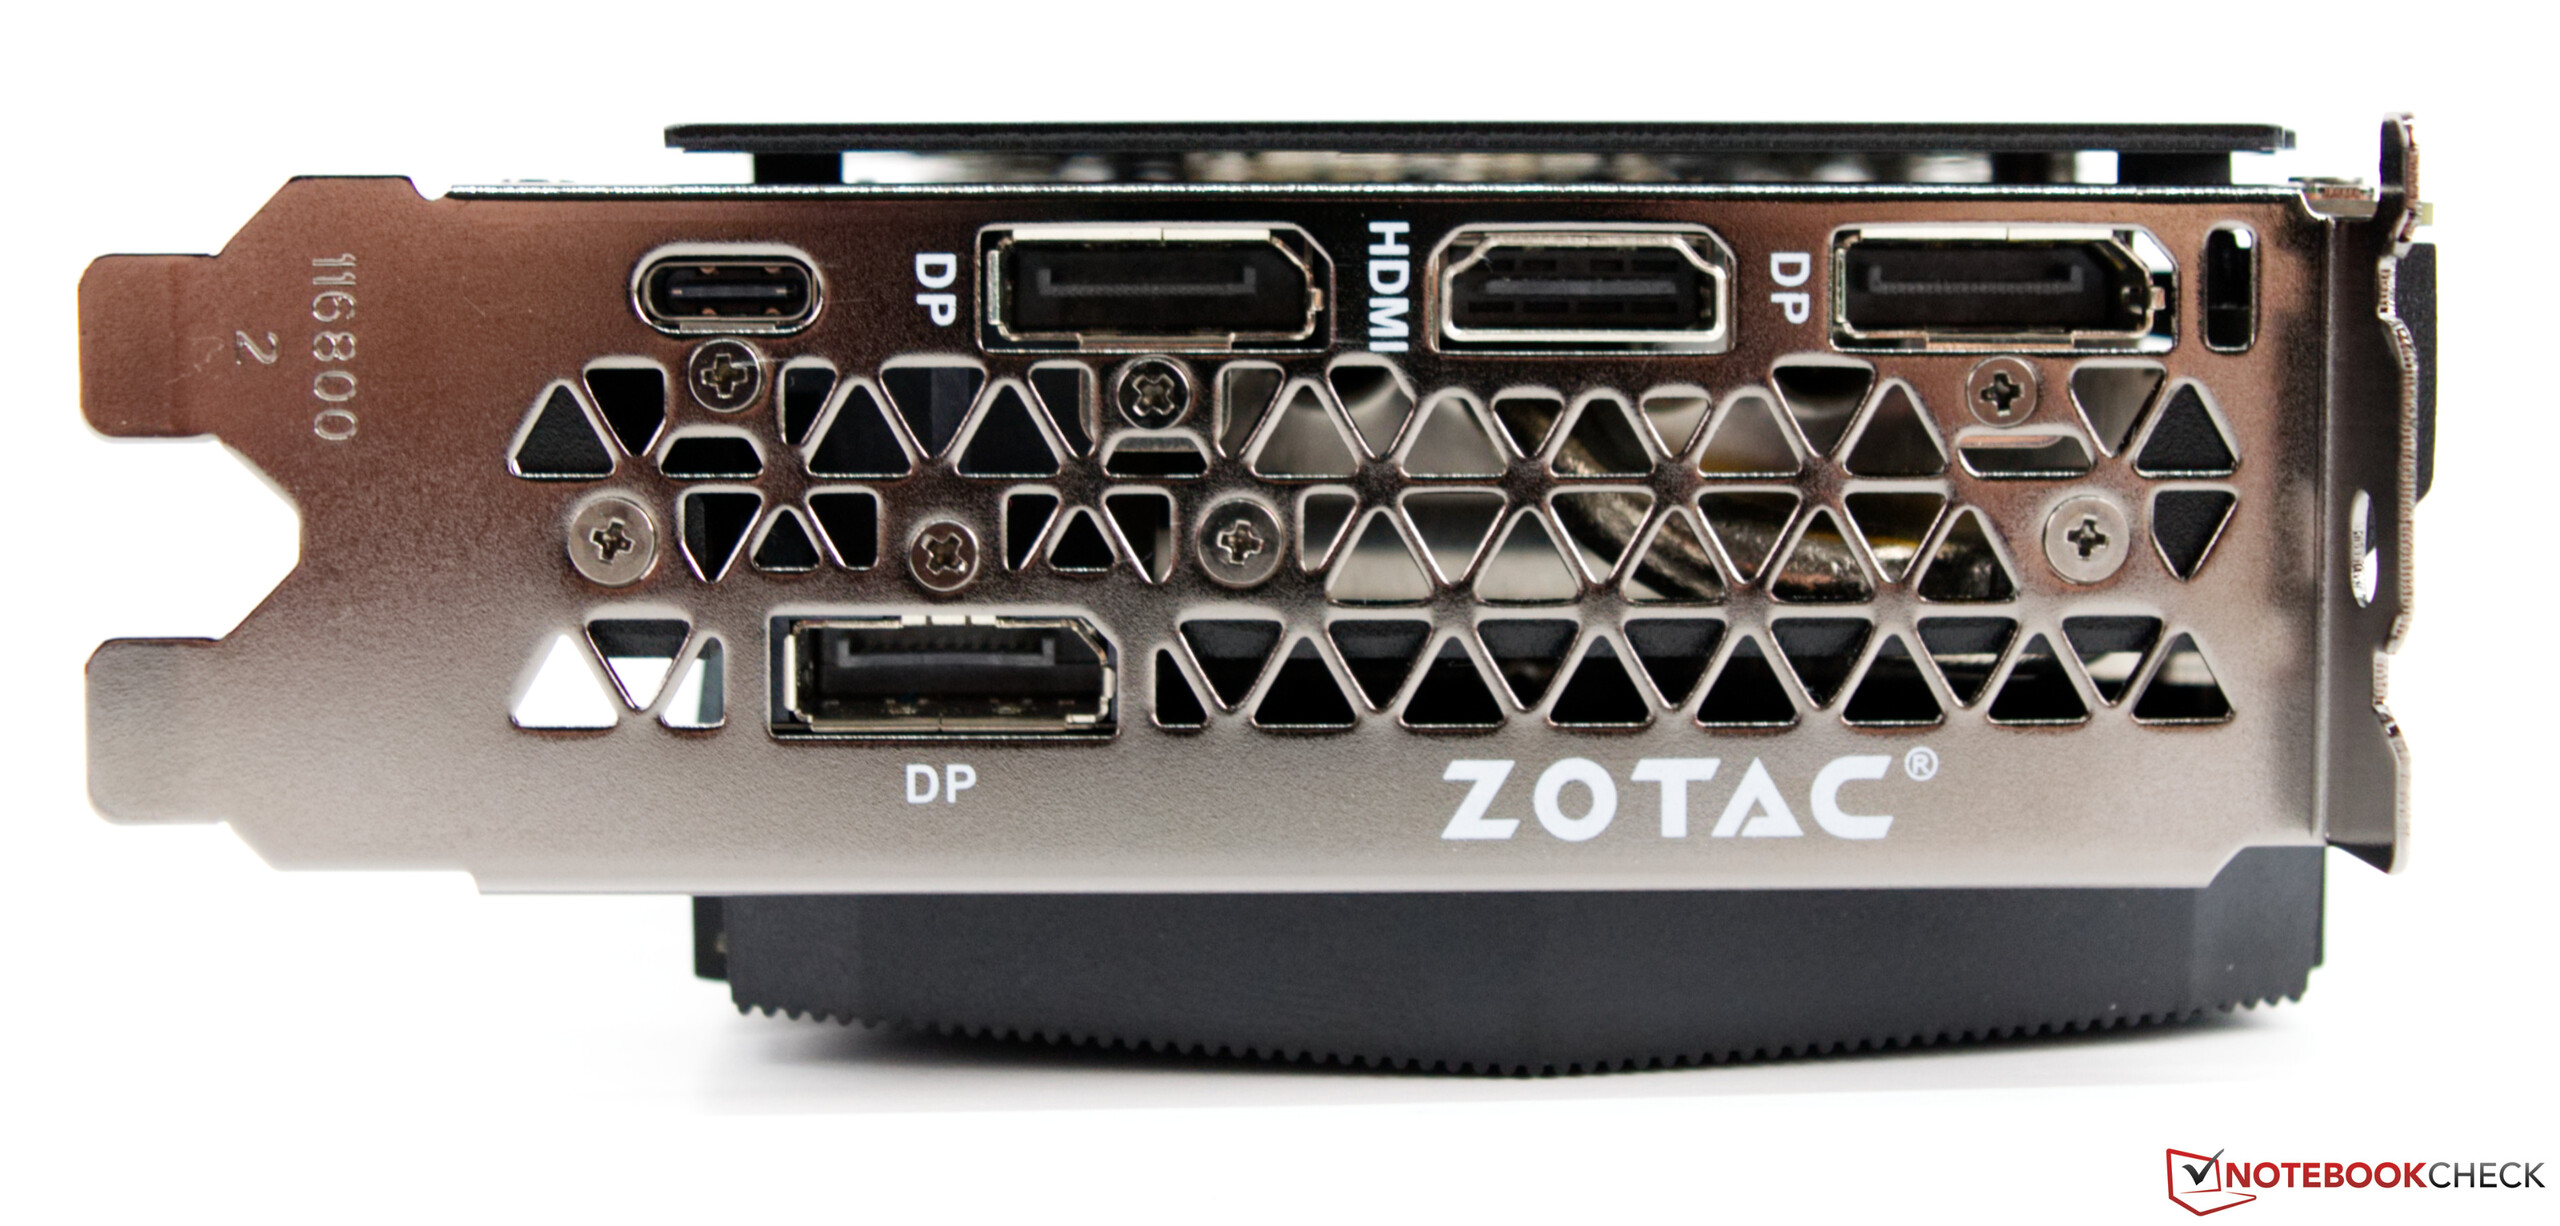
The AMP Extreme has a host of ports for connecting the card to external monitors. There are three DisplayPort 1.4, one HDMI 2.0b, and one USB Type-C port for connecting VR devices. The GPU requires power from a PCI-E slot along with 6 and 8 pin power connectors.


An overview of GPU specifications
| Specifications | RTX 2060 | Zotac RTX 2070 | RTX 2070 | RTX 2080 | RTX 2080 Ti | GTX 1070 |
| Chip | TU106 | TU106 | TU106 | TU104 | TU102 | GP104 |
| FinFET process | 12 nm | 12 nm | 12 nm | 12 nm | 12 nm | 16 nm |
| Shader units | 1,920 | 2,304 | 2,304 | 2,944 | 4,352 | 1,920 |
| Texture units | 120 | 144 | 144 | 184 | 272 | 120 |
| Tensor cores | 240 | 288 | 288 | 368 | 544 | - |
| RT cores | 30 | 36 | 36 | 46 | 68 | - |
| GPU base clock | 1,365 MHz | 1,410 MHz | 1,410 MHz | 1,515 MHz | 1,350 MHz | 1,506 MHz |
| GPU boost clock | 1,680 MHz | 1,860 MHz | 1,620 MHz | 1,710 MHz | 1,545 MHz | 1,683 MHz |
| Memory bus | 192 Bit | 256 Bit | 256 Bit | 256 Bit | 352 Bit | 256 Bit |
| Memory bandwidth | 336 GB/s | 460.8 GB/s | 448 GB/s | 448 GB/s | 616 GB/s | 256,3 GB/s |
| VRAM | 6 GB GDDR6 | 8 GB GDDR6 | 8 GB GDDR6 | 8 GB GDDR6 | 11 GB GDDR6 | 8 GB GDDR5 |
| Power | 160 W | 225 W | 175 W | 215 W | 250 W | 150 W |
The Test System
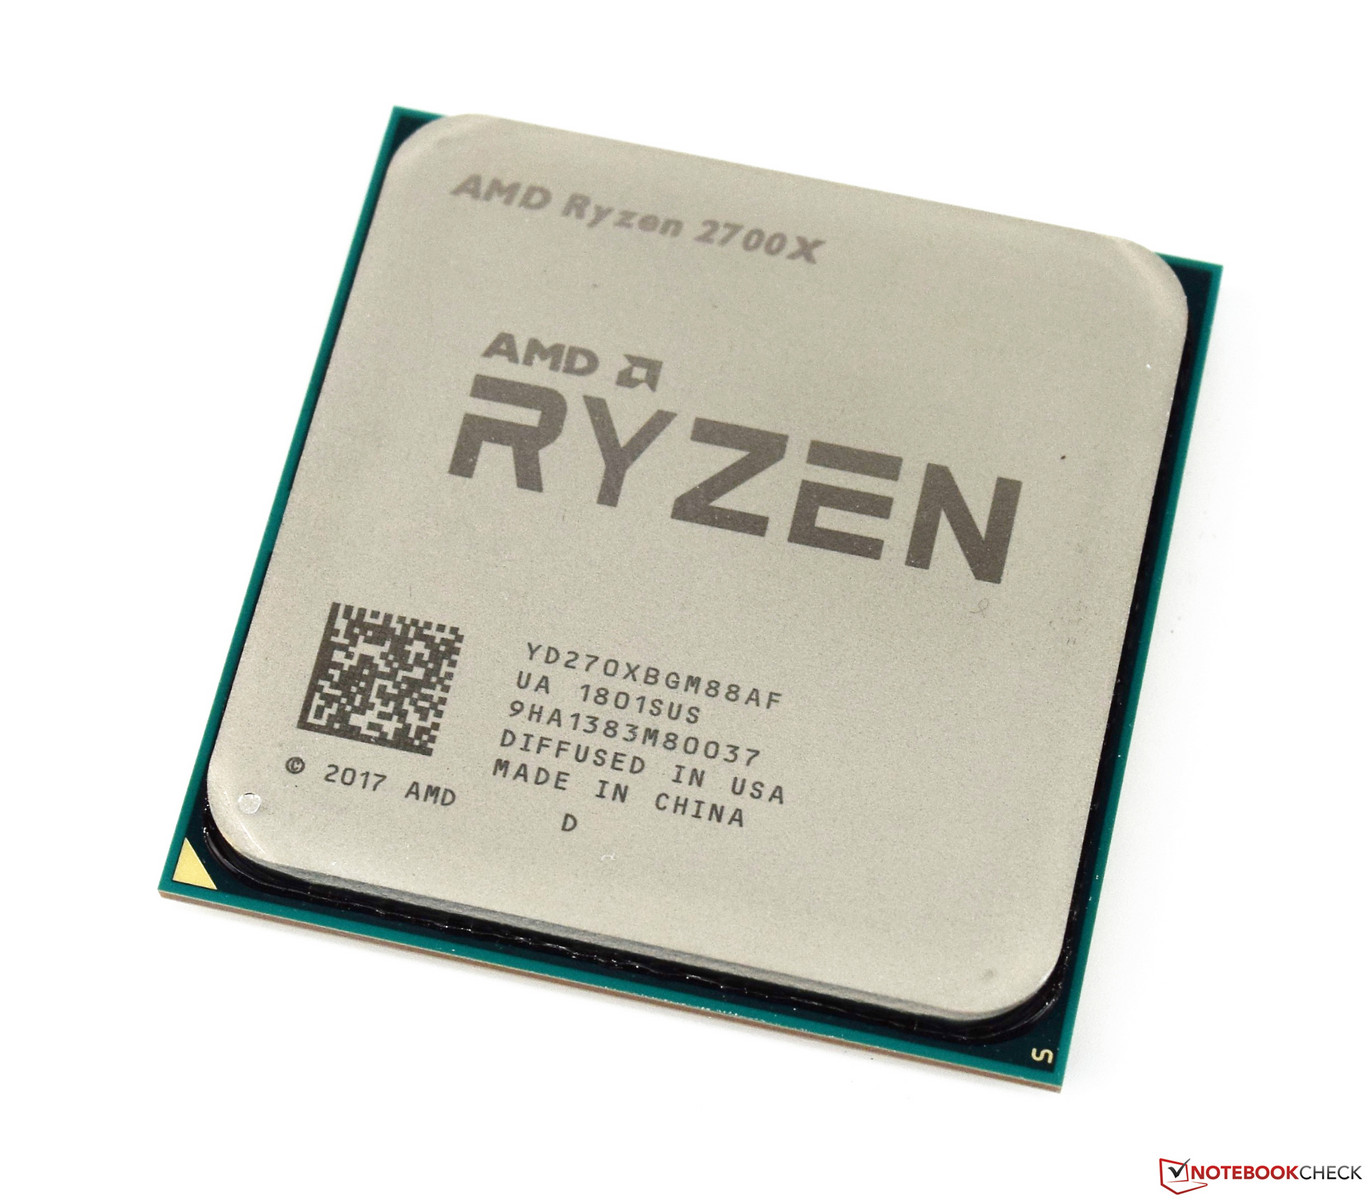
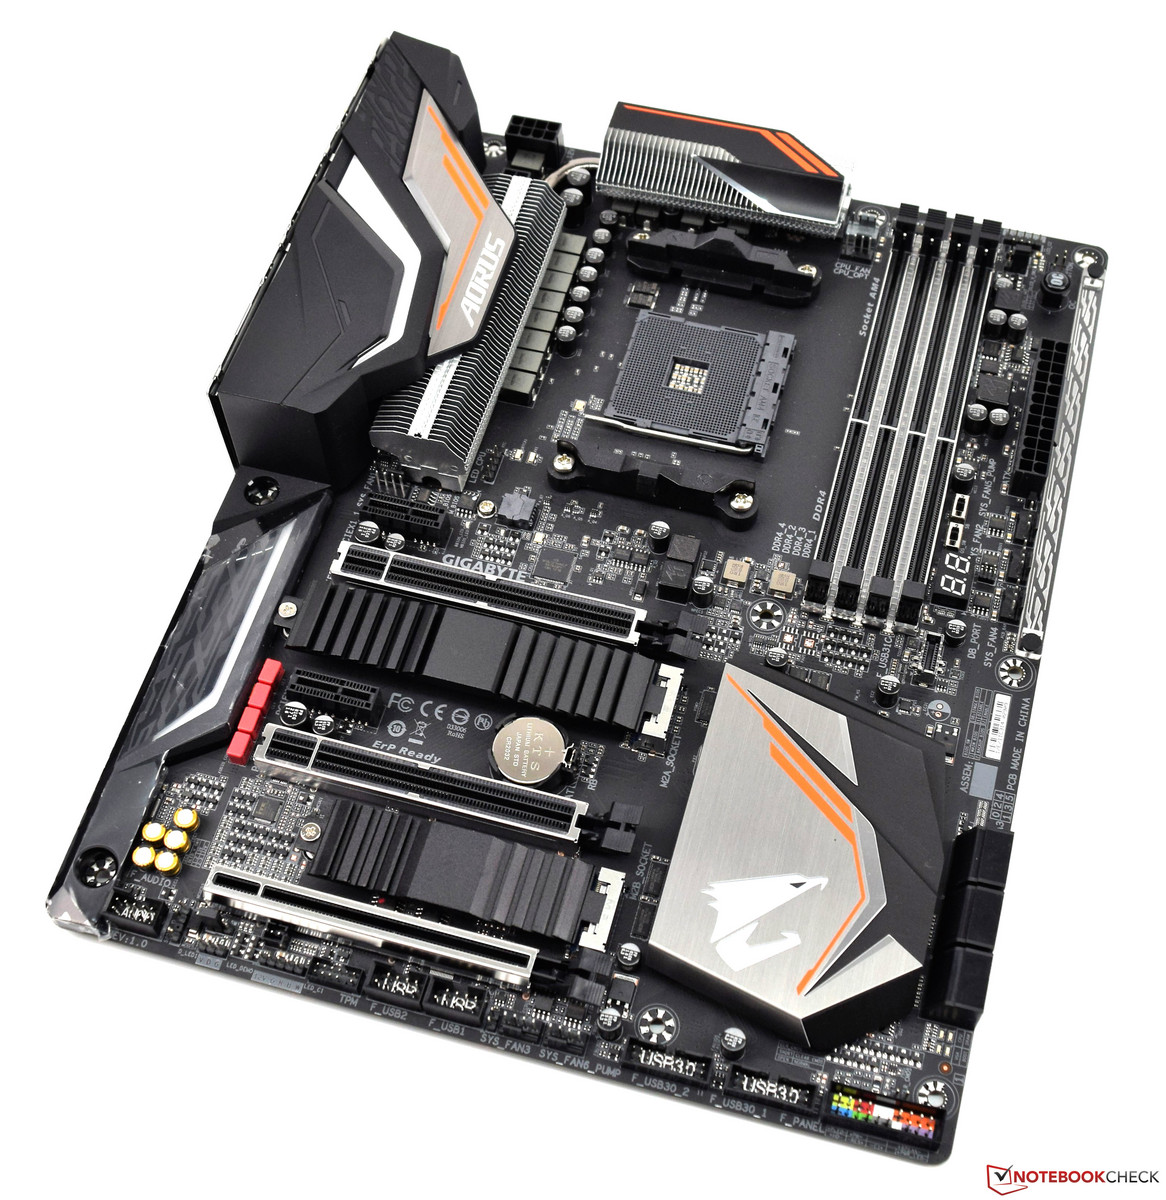
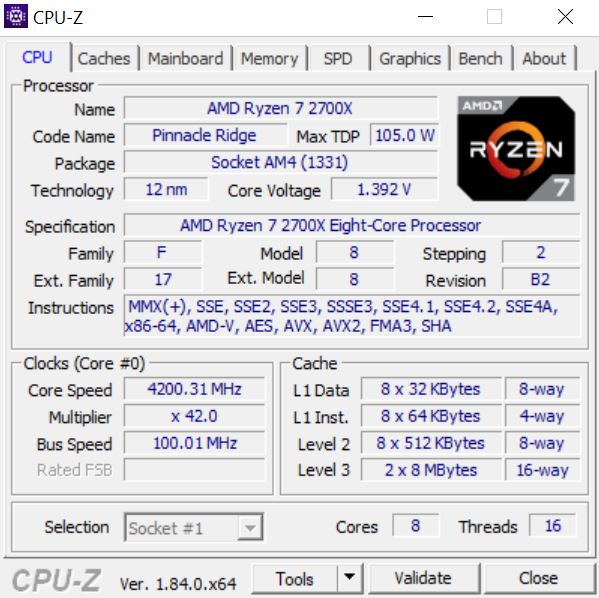
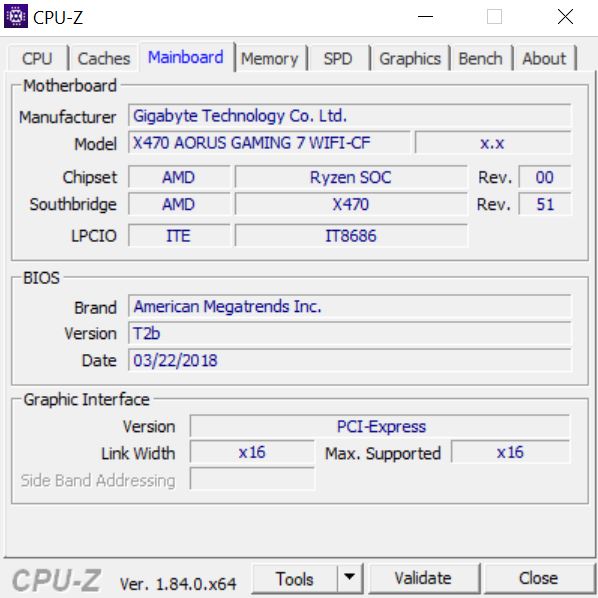
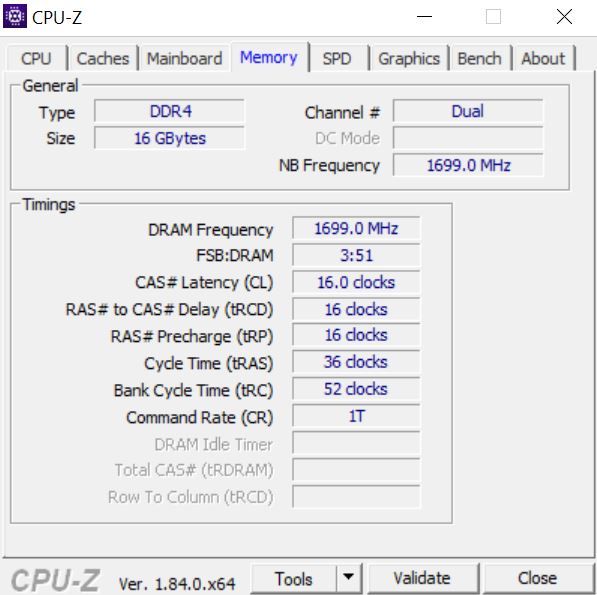
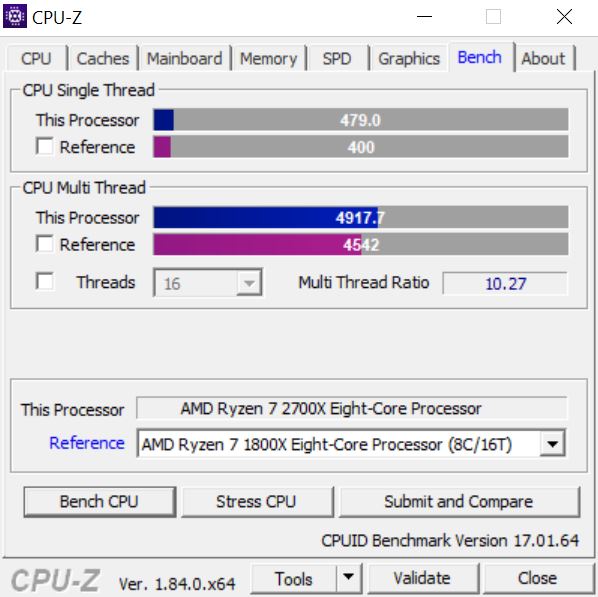
Our test system is based on the Gigabyte X470 Aorus Gaming 7 WiFi motherboard. We have paired the board with the AMD Ryzen 7 2700X APU, which delivers good performance on a budget, and a Be Quiet Silent Loop 280 mm AIO. We have also equipped the system with 16 GB of G-Skill RAM that clocks at 3,400 MHz, all of which we have housed in a Corsair Carbide Air 540 ATX Cube case. Moreover, we have run all our tests on the Acer Predator XB321HK, a 4K monitor that also allows us to conduct UHD gaming benchmarks.
A big thank you to AMD for kindly providing us with this test platform to test the RTX 2070 AMP Extreme.
| Case | Corsair Carbide Air 540 ATX Cube |
| CPU | AMD Ryzen 7 2700X |
| CPU cooler | Be Quiet Silent Loop 280 mm |
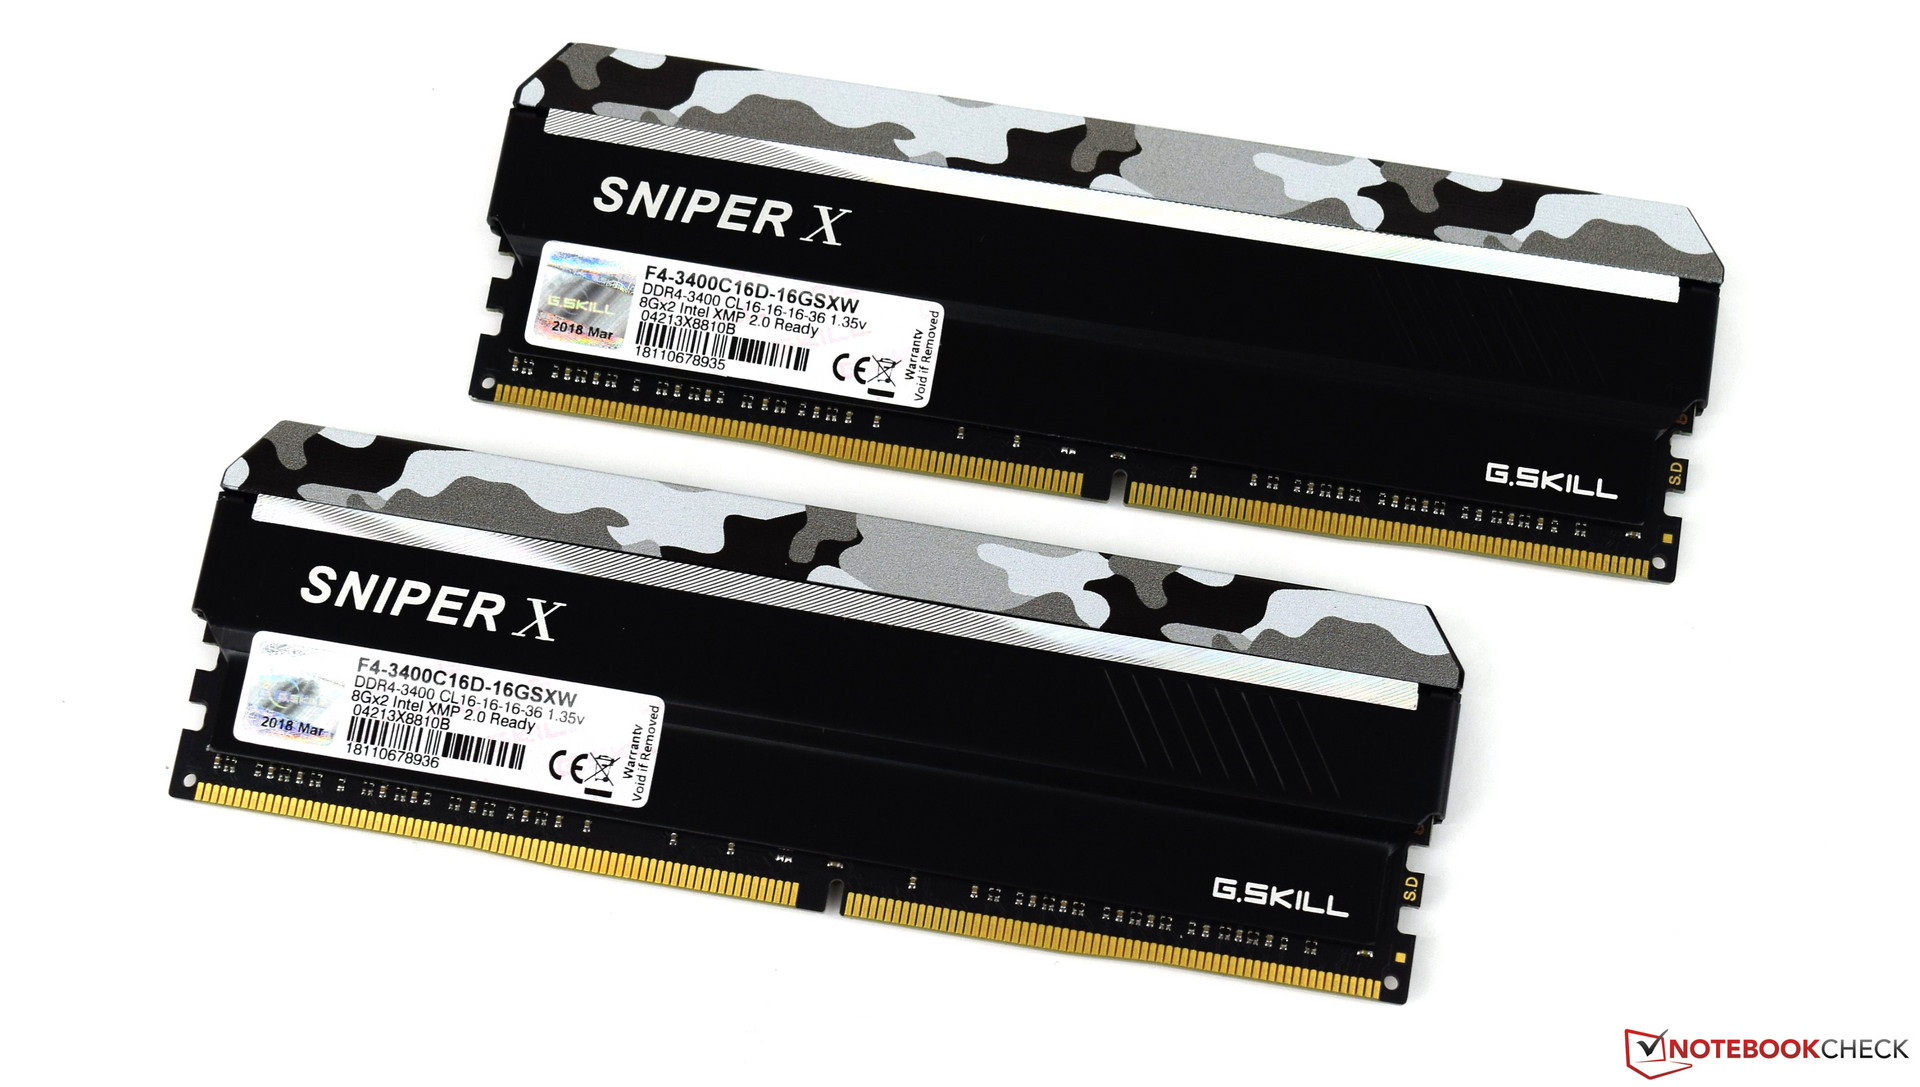
| RAM | G-Skill Sniper X 16 GB DDR4 3,400 MHz |
| Motherboard | Gigabyte X470 Aorus Gaming 7 WiFi |
| Monitor | Acer Predator XB321HK 4K |
| SSD | ADATA SP900 M.2 SSD |
| HDD | 2 TB Western Digital – for games |
| OS | Microsoft Windows 10 Professional 64-Bit (Version 1809) |
| Drivers | NVIDIA 425.31 |


Performance
The AMP Extreme has a 1,410 MHz base clock just like the MSI RTX 2070 Gaming Z 8G and ASUS ROG Strix RTX 2070 OC that we have already tested. However, the AMP Extreme has a 1,860 MHz boost clock, which is 30 MHz higher than the MSI and 45 MHz higher than the ASUS.
Zotac has also clocked the AMP Extreme’s VRAM at 1,800 MHz, which is 50 MHz higher than what MSI and ASUS have clocked their cards. We shall look at what difference, if any, these clock speeds have on performance in our gaming benchmarks section below.
As mentioned earlier in this review, the AMP Extreme has a 225-W TDP when set to a 100% power target (PT), which is 50 W higher than the NVIDIA GeForce RTX 2070 Founders Edition. Incidentally, the AMP Extreme has the same TDP as the MSI, but it is slightly higher than the ASUS.
Please see our GPU benchmarks page for more information about the RTX 2070 and how it compares against other GPUs.
Synthetic Benchmarks
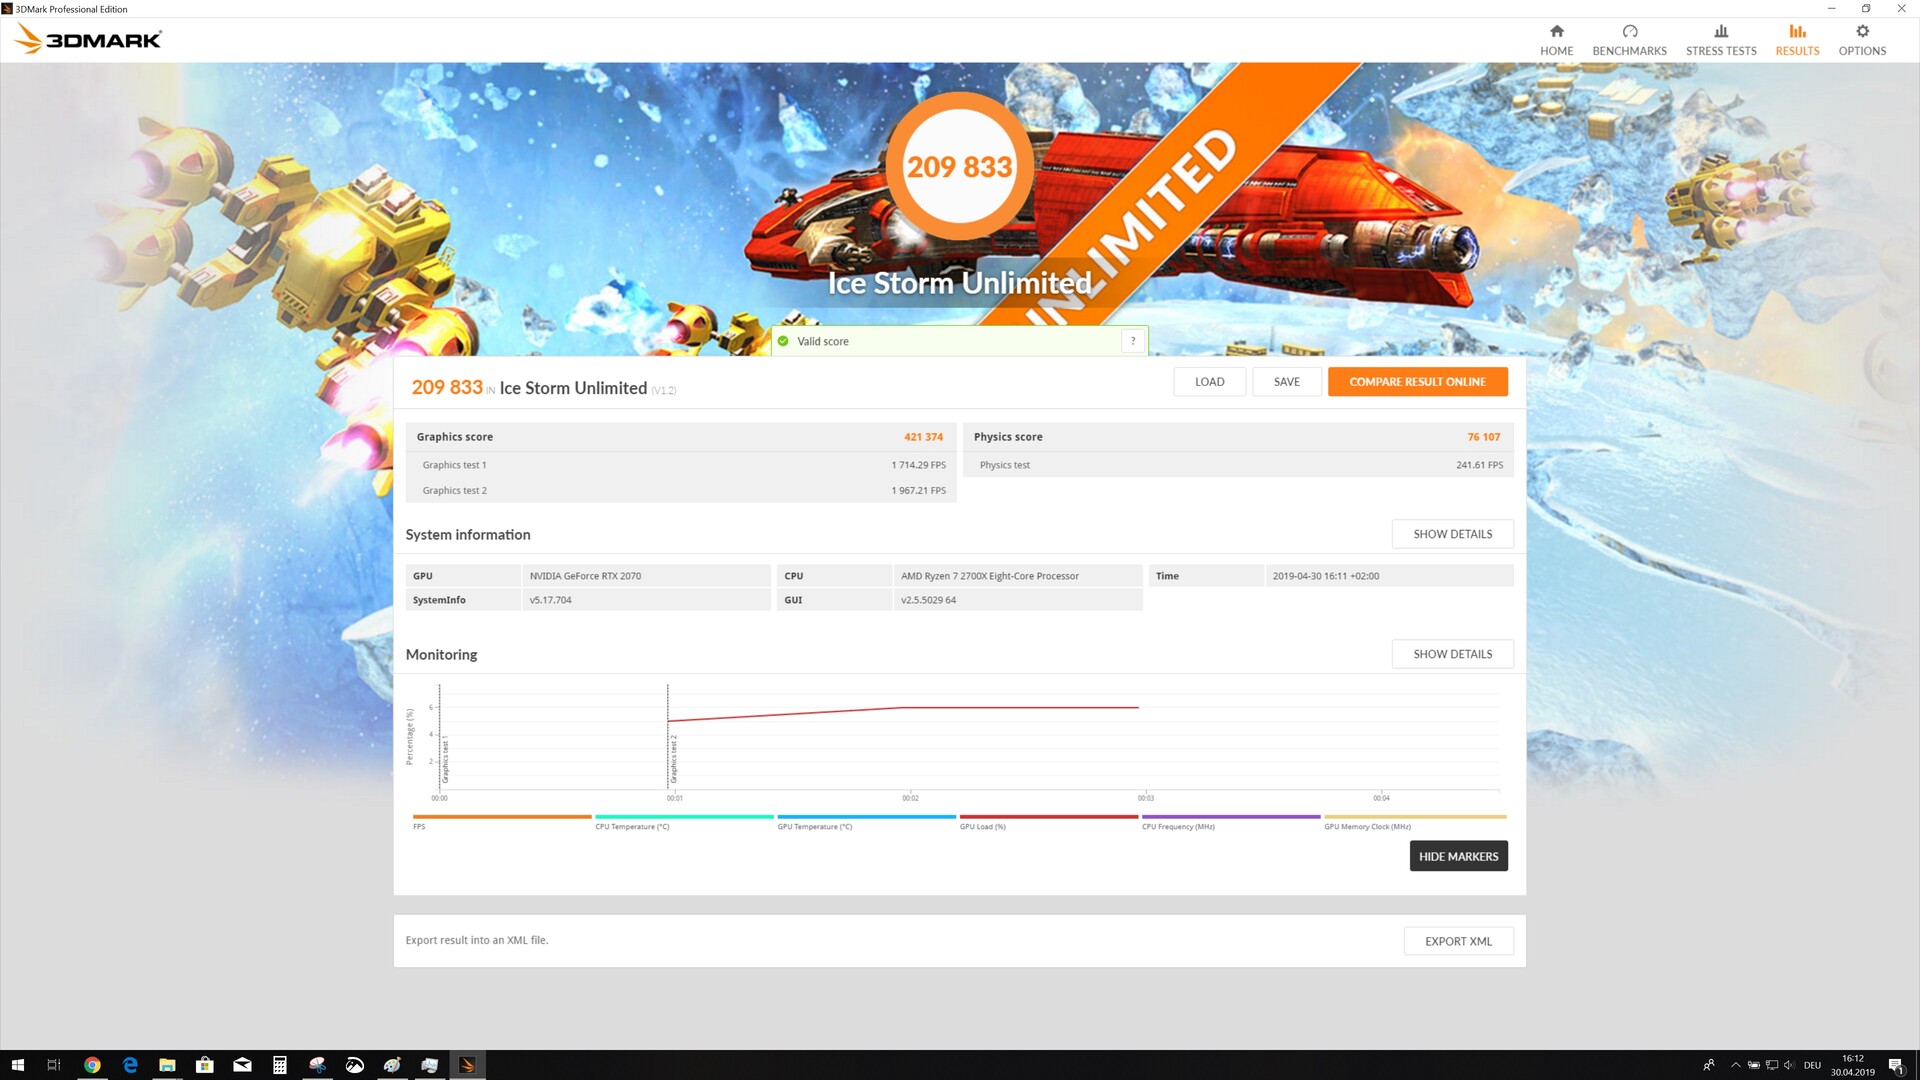
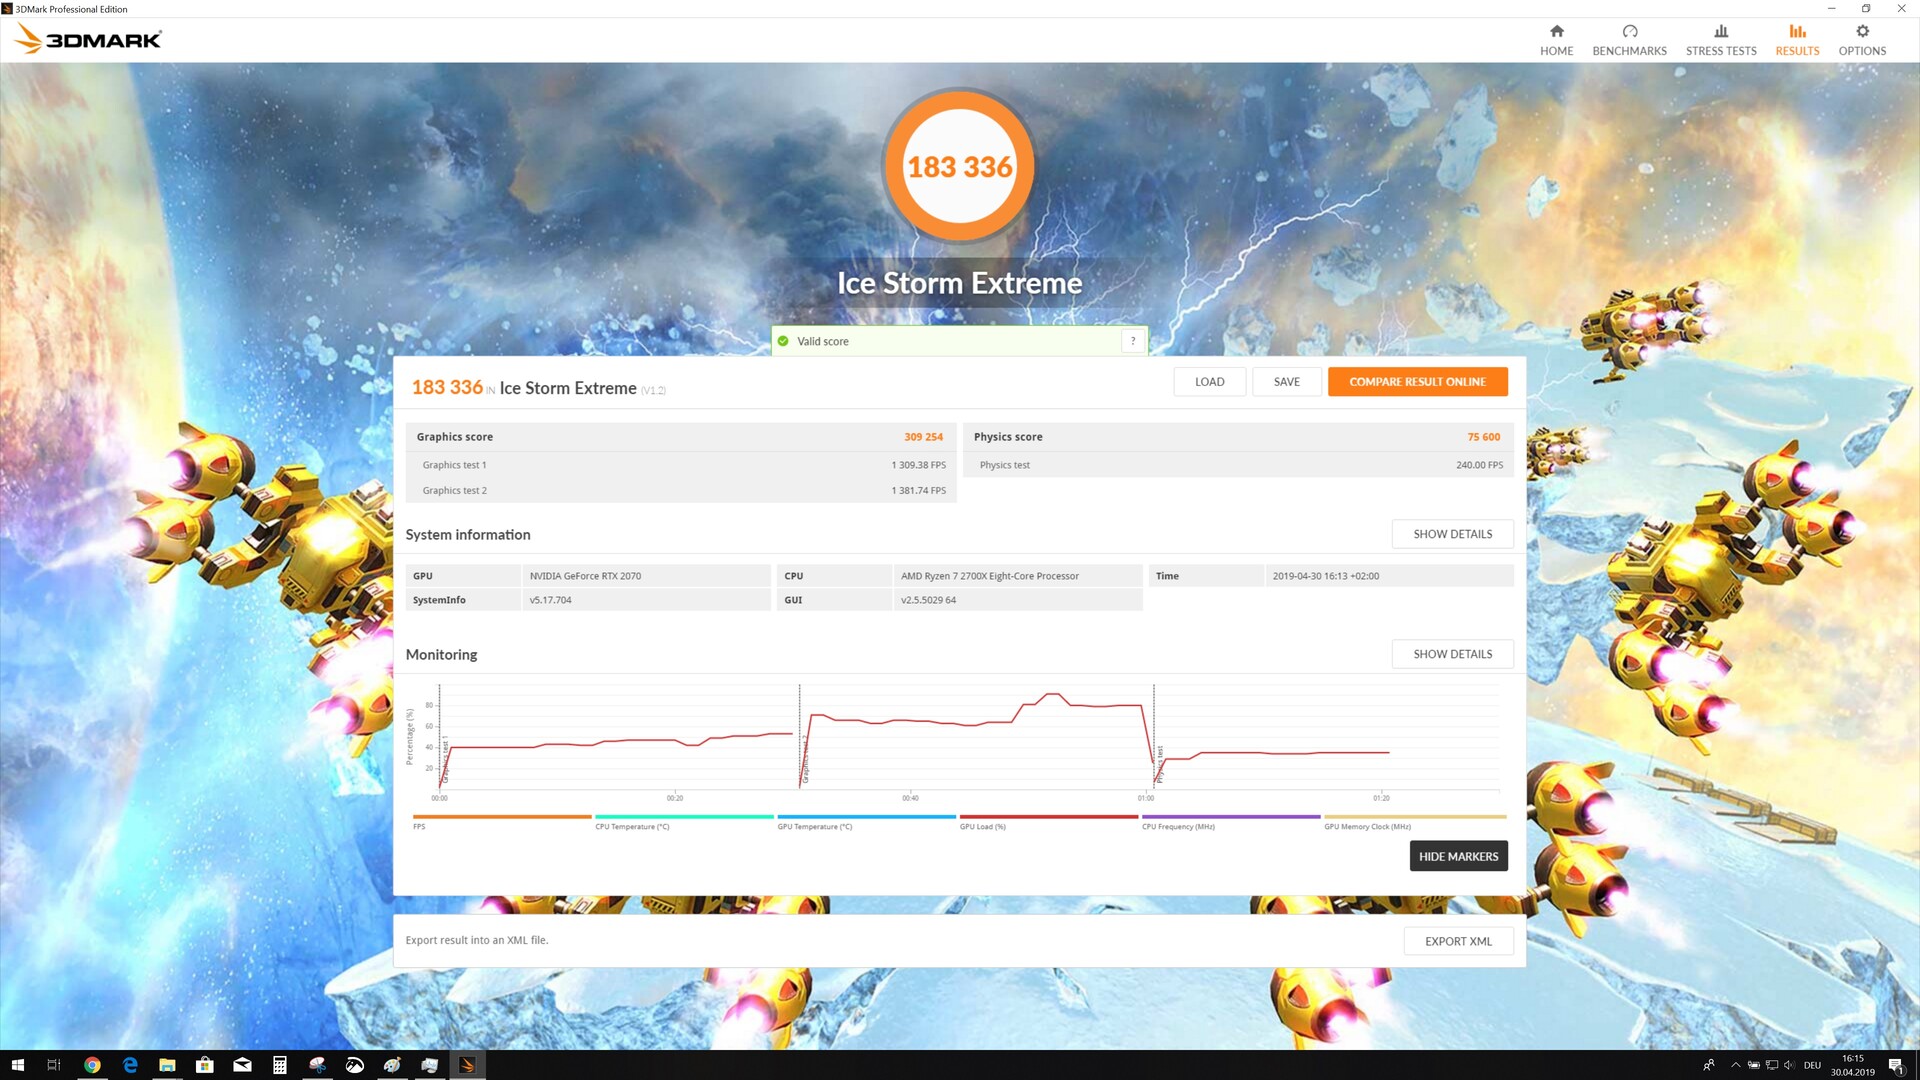
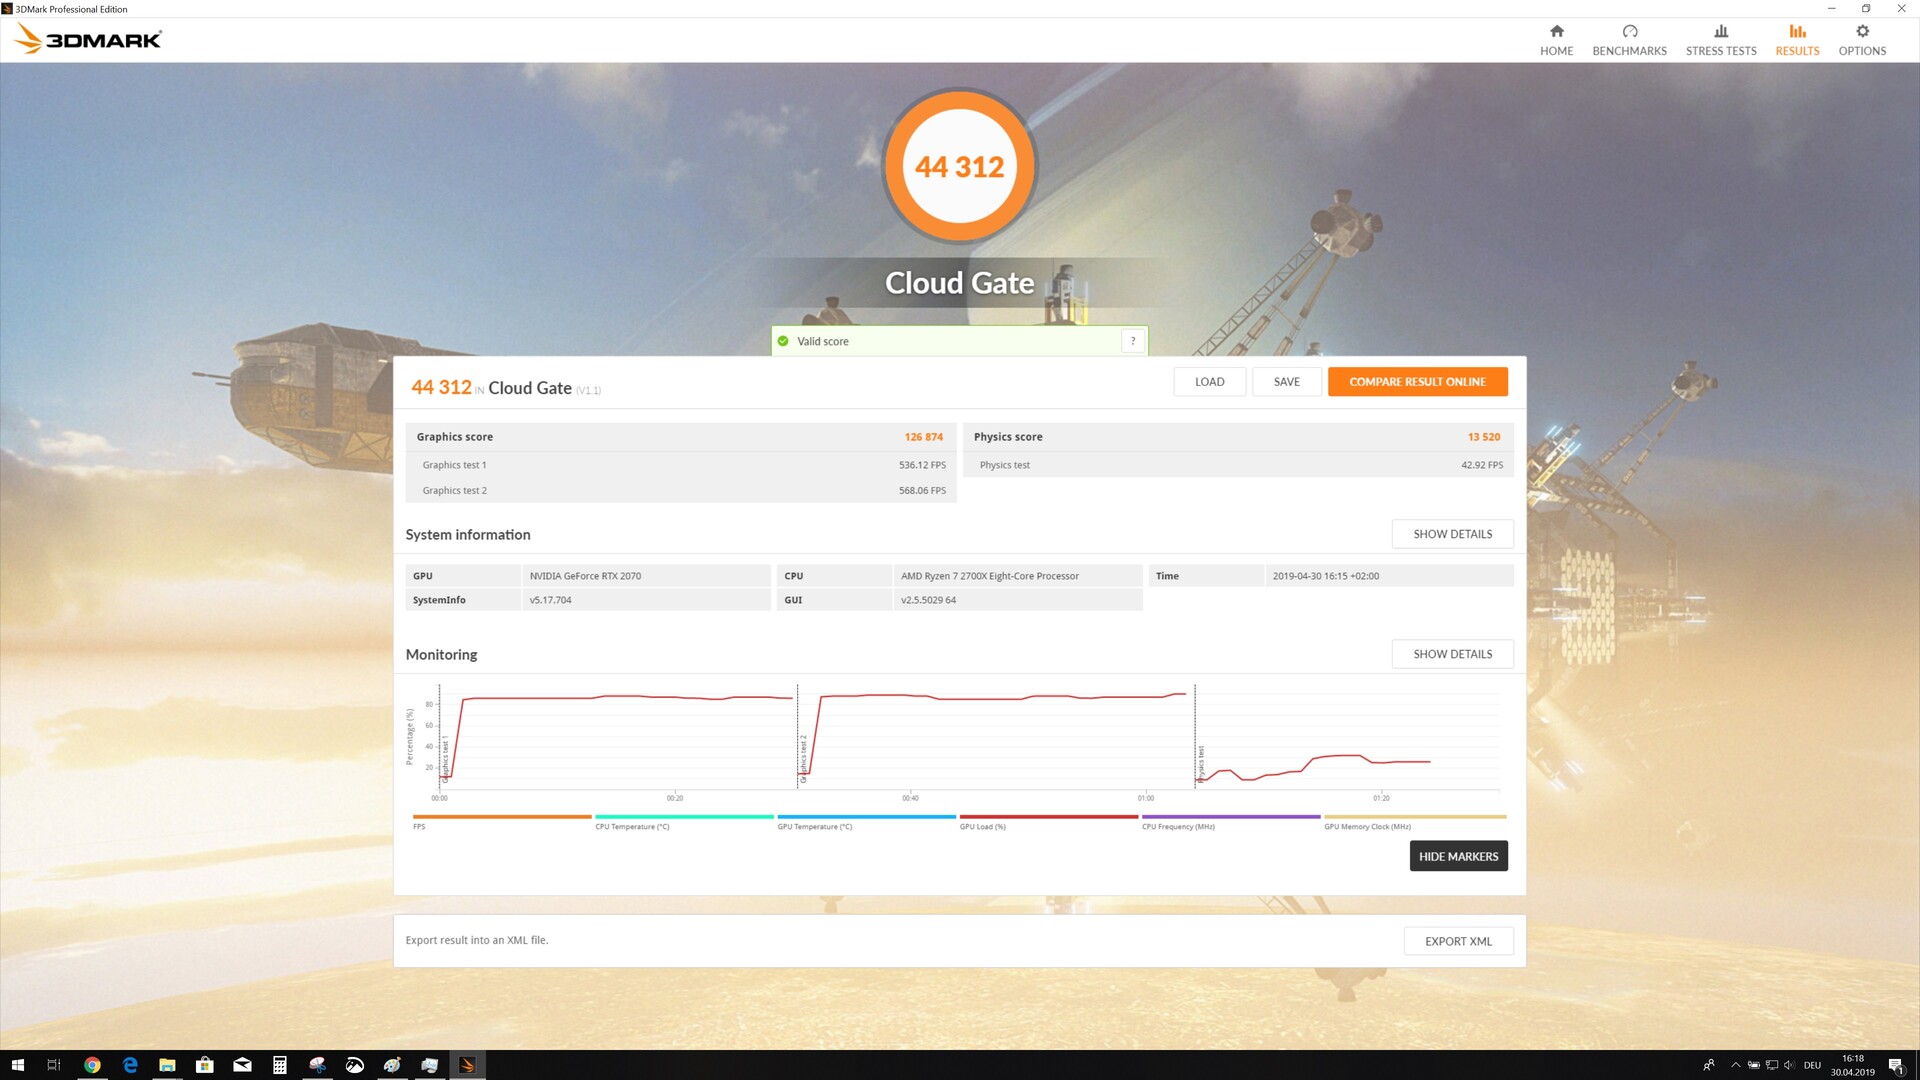
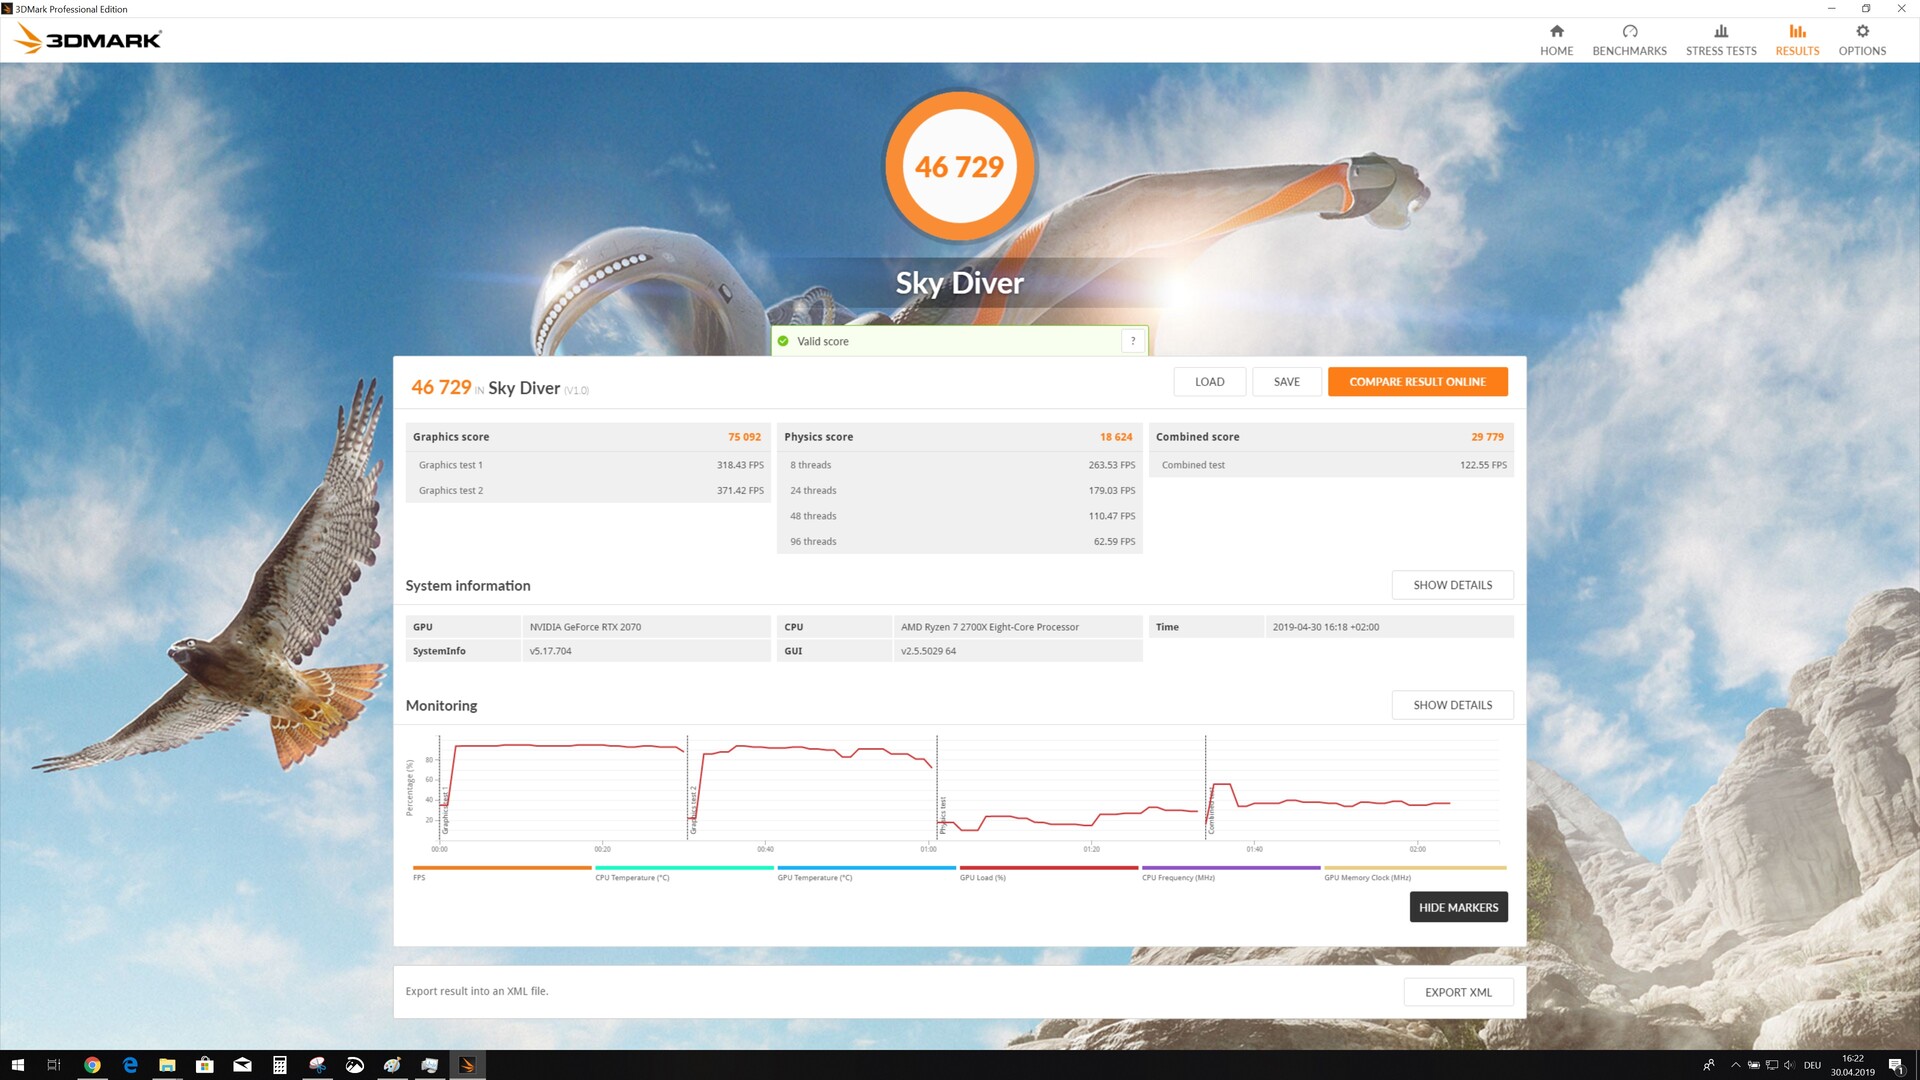
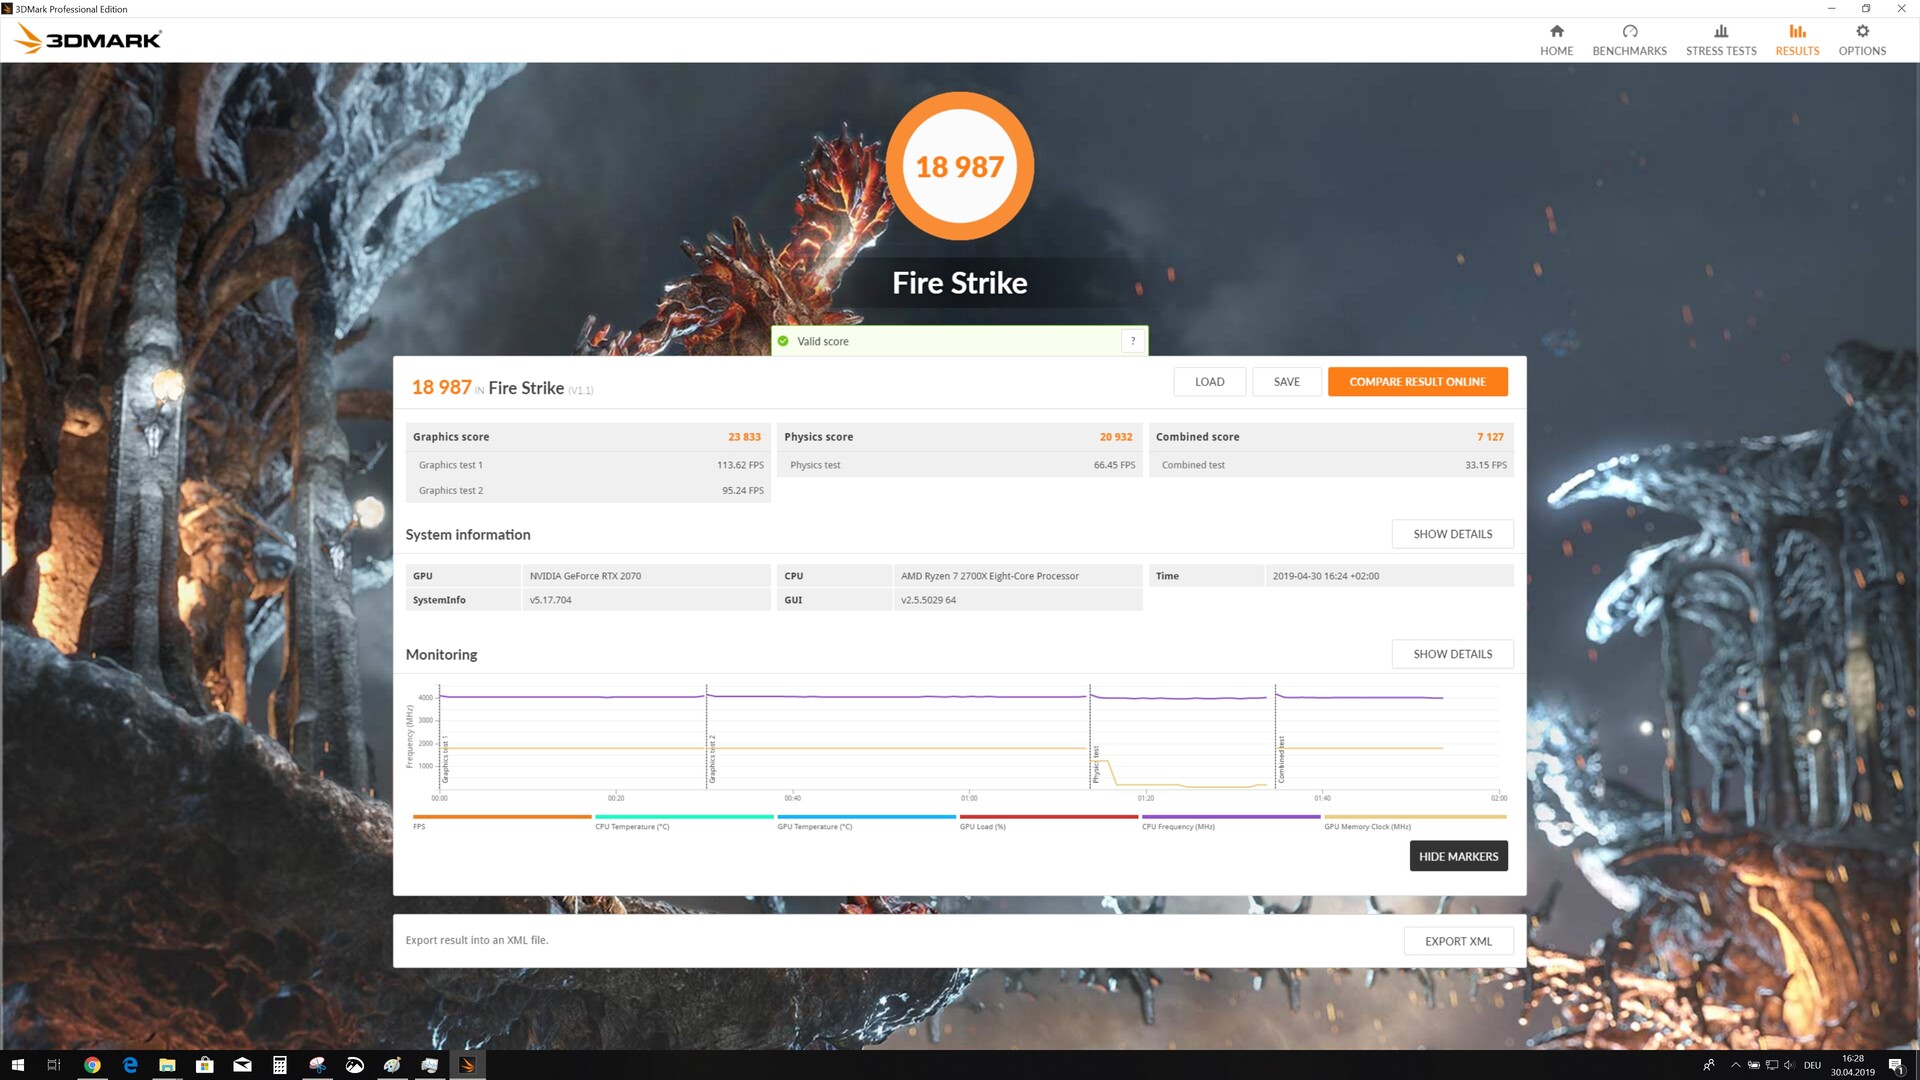
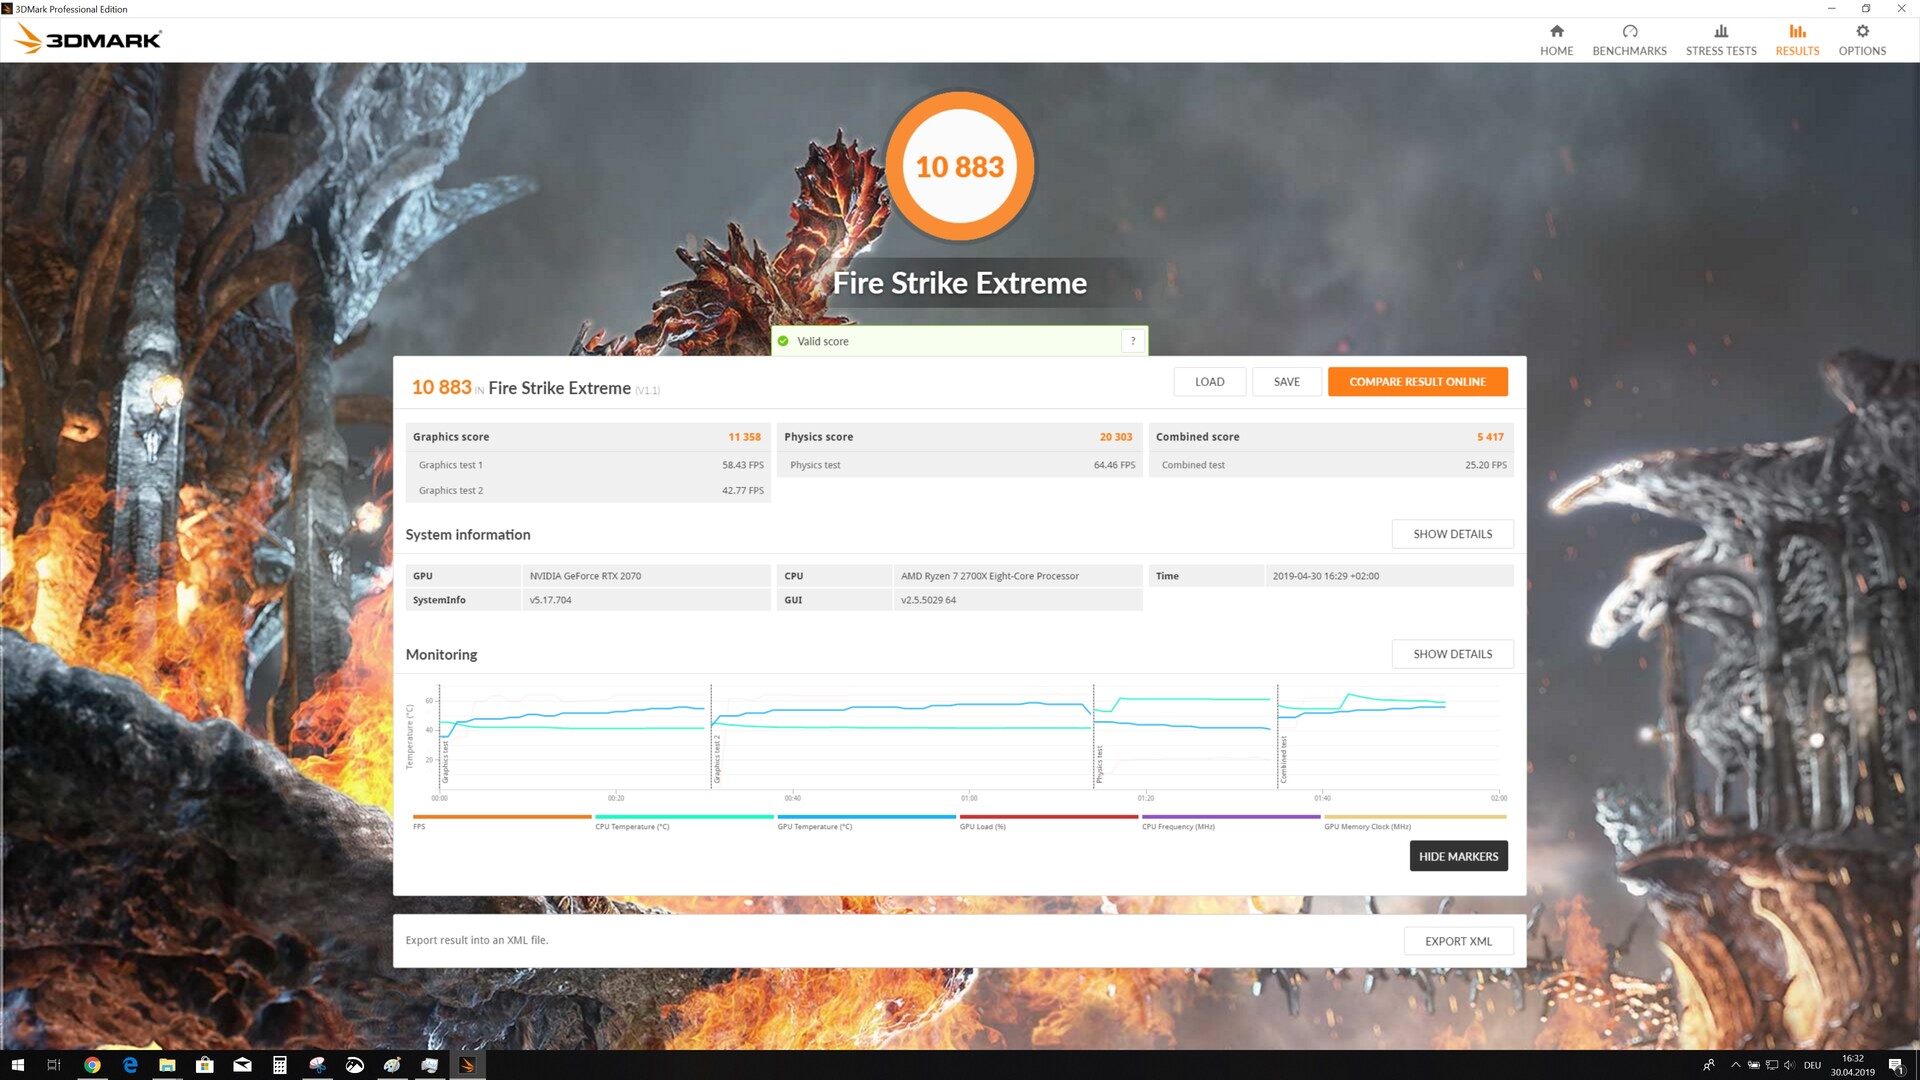
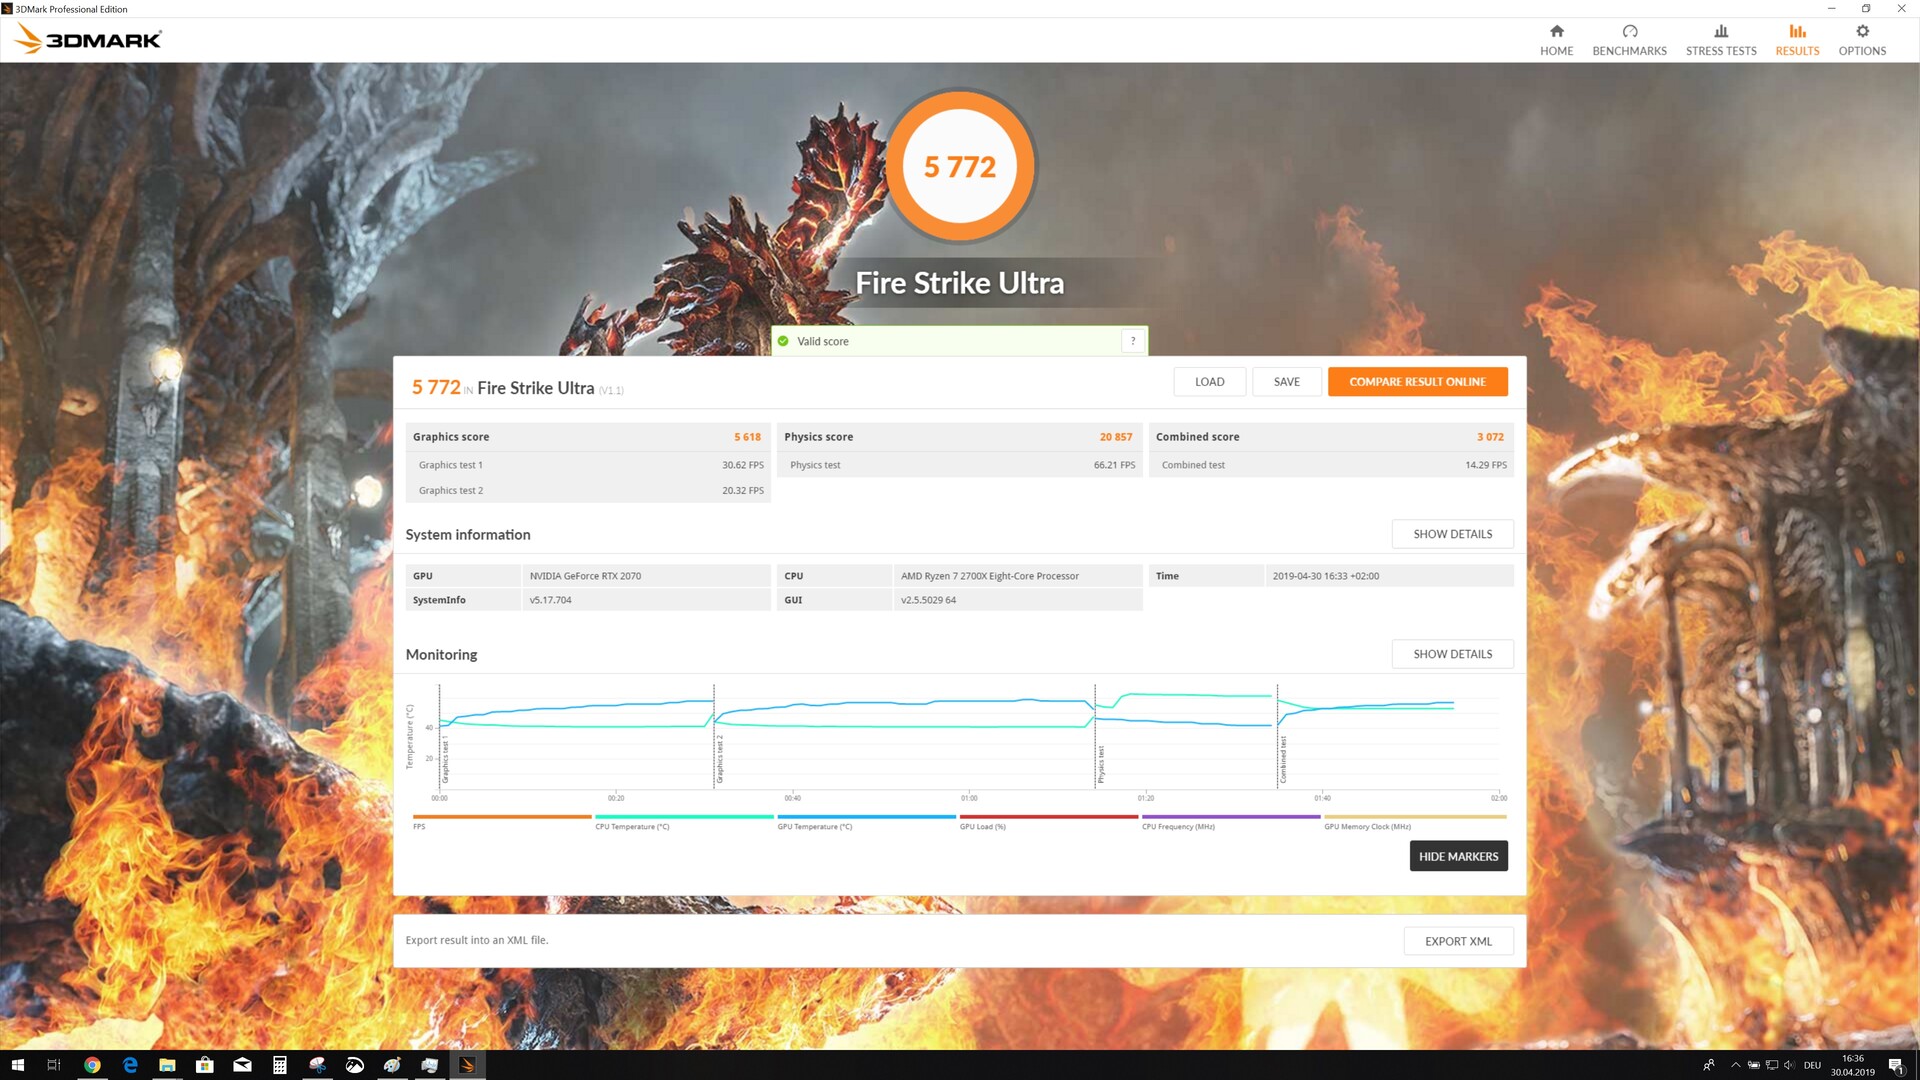
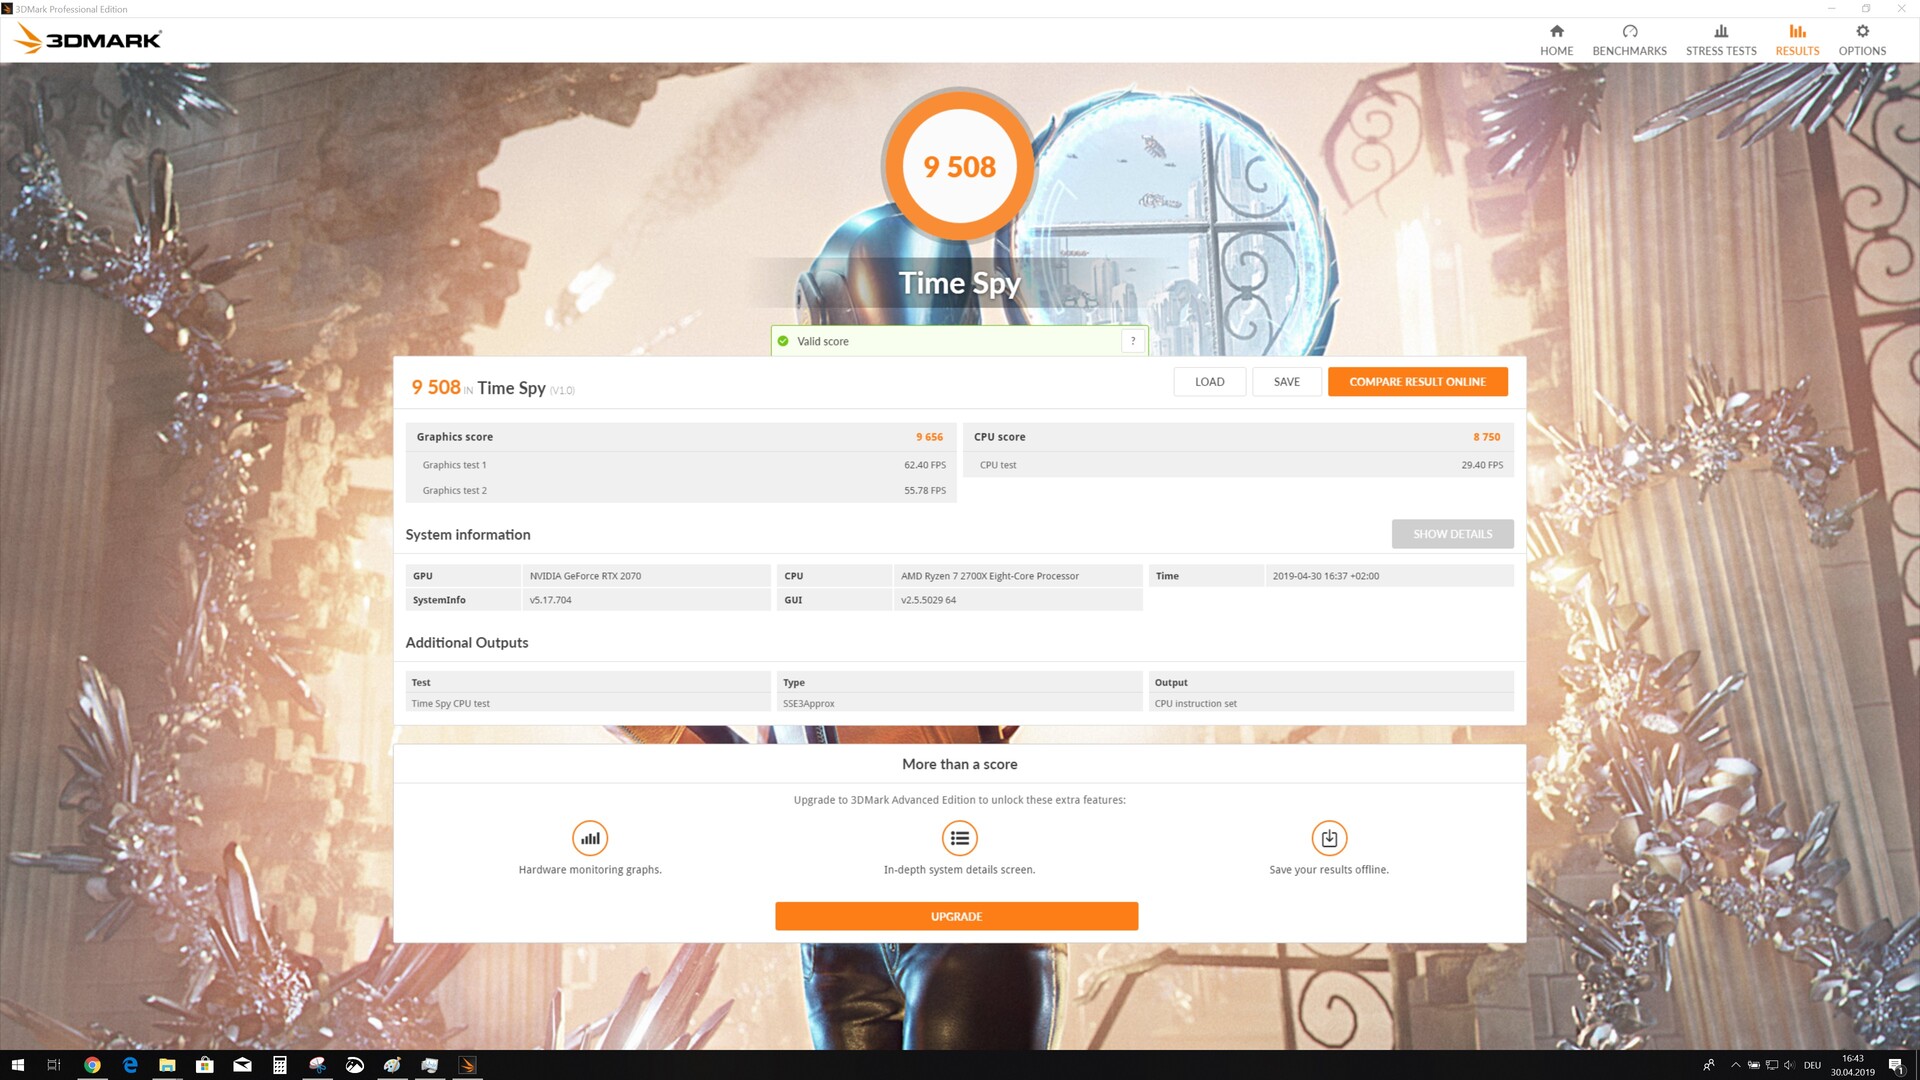
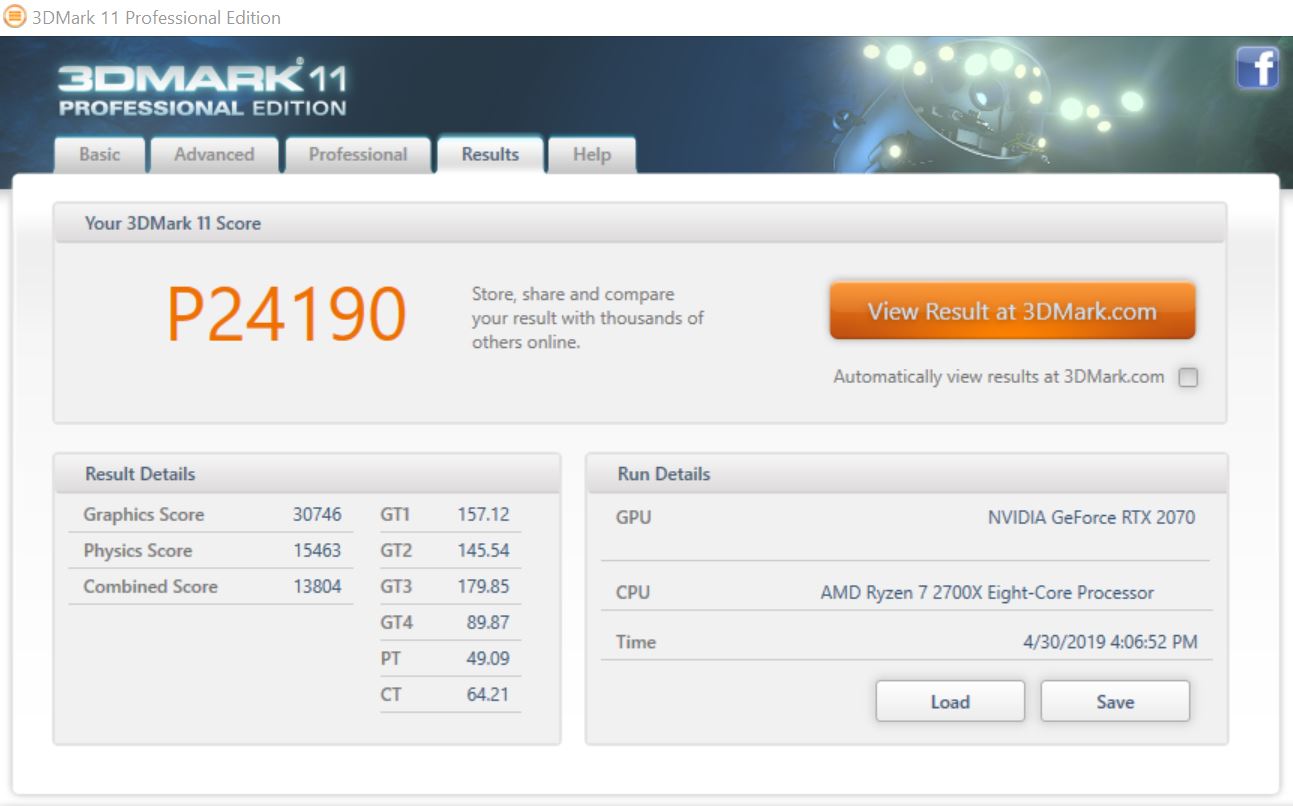
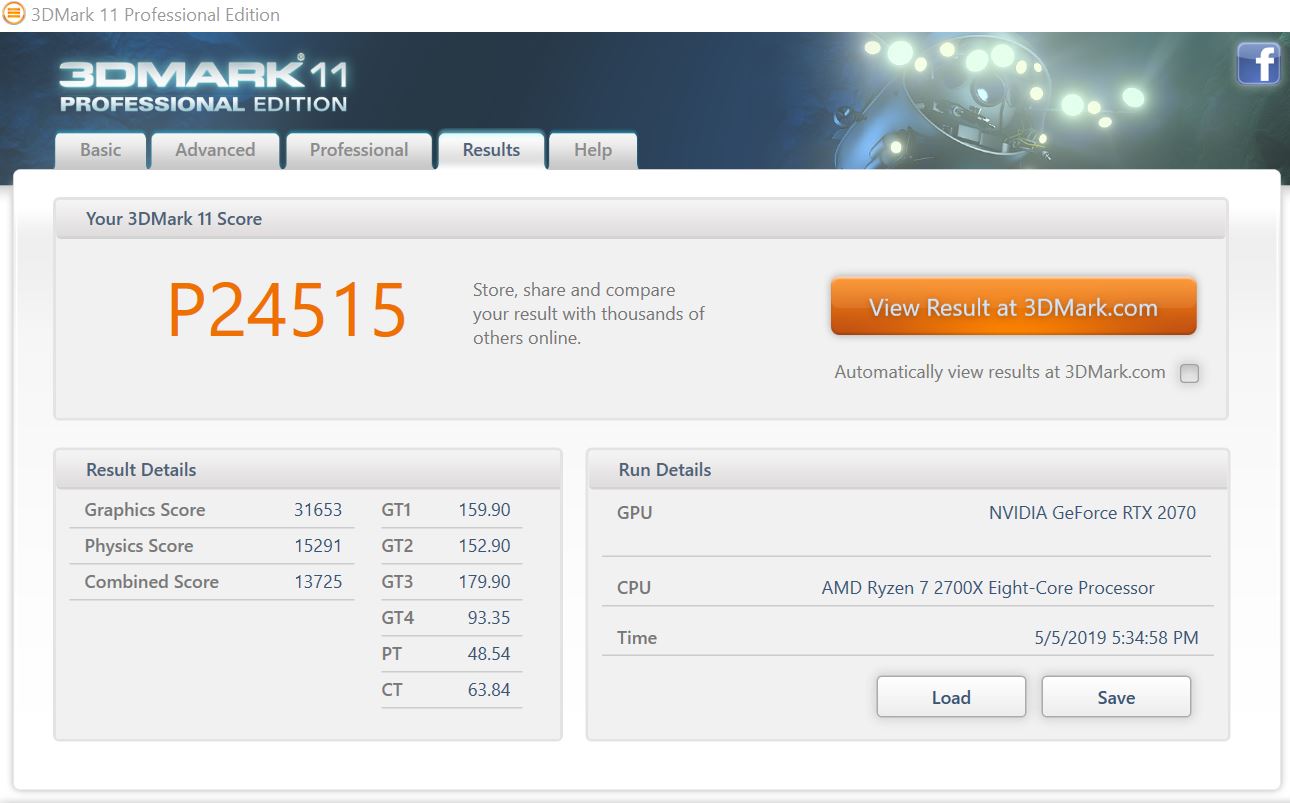
Synthetic benchmarks reveal the potential of the AMP Extreme. Our review unit sits a few percent ahead of the MSI and ASUS RTX 2070 cards in benchmarks such as Unigine Heaven 4.0 and 3DMark. The AMP Extreme scores slightly worse than its RTX 2070 competitors in the older 3DMark 11 benchmark though, for some reason. Overall, all three RTX 2070 cards are roughly at the same level. Any performance differences highlighted in synthetic benchmarks are not noticeable in daily use.
The AMP Extreme also outperforms the GeForce GTX 1080 Founders Edition, but it cannot match the performance of the GeForce GTX 1080 Ti Founders Edition. The performance of the AMD Radeon VII is out of reach for the AMP Extreme too, the former of which generally sitting between the GeForce GTX 1080 Ti and the Titan X Pascal in synthetic benchmarks. Our review unit consistently scores between 15 and 30% more than the GeForce RTX 2060 though.
| 3DMark - 3840x2160 Fire Strike Ultra Graphics | |
| Nvidia Titan RTX | |
| NVIDIA Titan X Pascal | |
| AMD Radeon VII | |
| Nvidia GeForce GTX 1080 Ti Founders Edition | |
| MSI RTX 2080 Gaming X Trio | |
| Zotac GeForce RTX 2070 AMP Extreme | |
| Asus ROG Strix RTX 2070 OC | |
| MSI RTX 2070 Gaming Z 8G | |
| AMD Radeon RX Vega 64 | |
| Nvidia GeForce GTX 1080 Founders Edition | |
| MSI RTX 2060 Gaming Z 6G | |
| Nvidia GeForce GTX 1070 Founders Edition | |
| XFX AMD Radeon RX 590 OC+ 8 GB | |
| Asus ROG Strix RX 580 8 GB | |
| 3DMark 03 Standard | 136483 points | |
| 3DMark 05 Standard | 34535 points | |
| 3DMark 06 Standard Score | 35659 points | |
| 3DMark Vantage P Result | 62128 points | |
| 3DMark 11 Performance | 26565 points | |
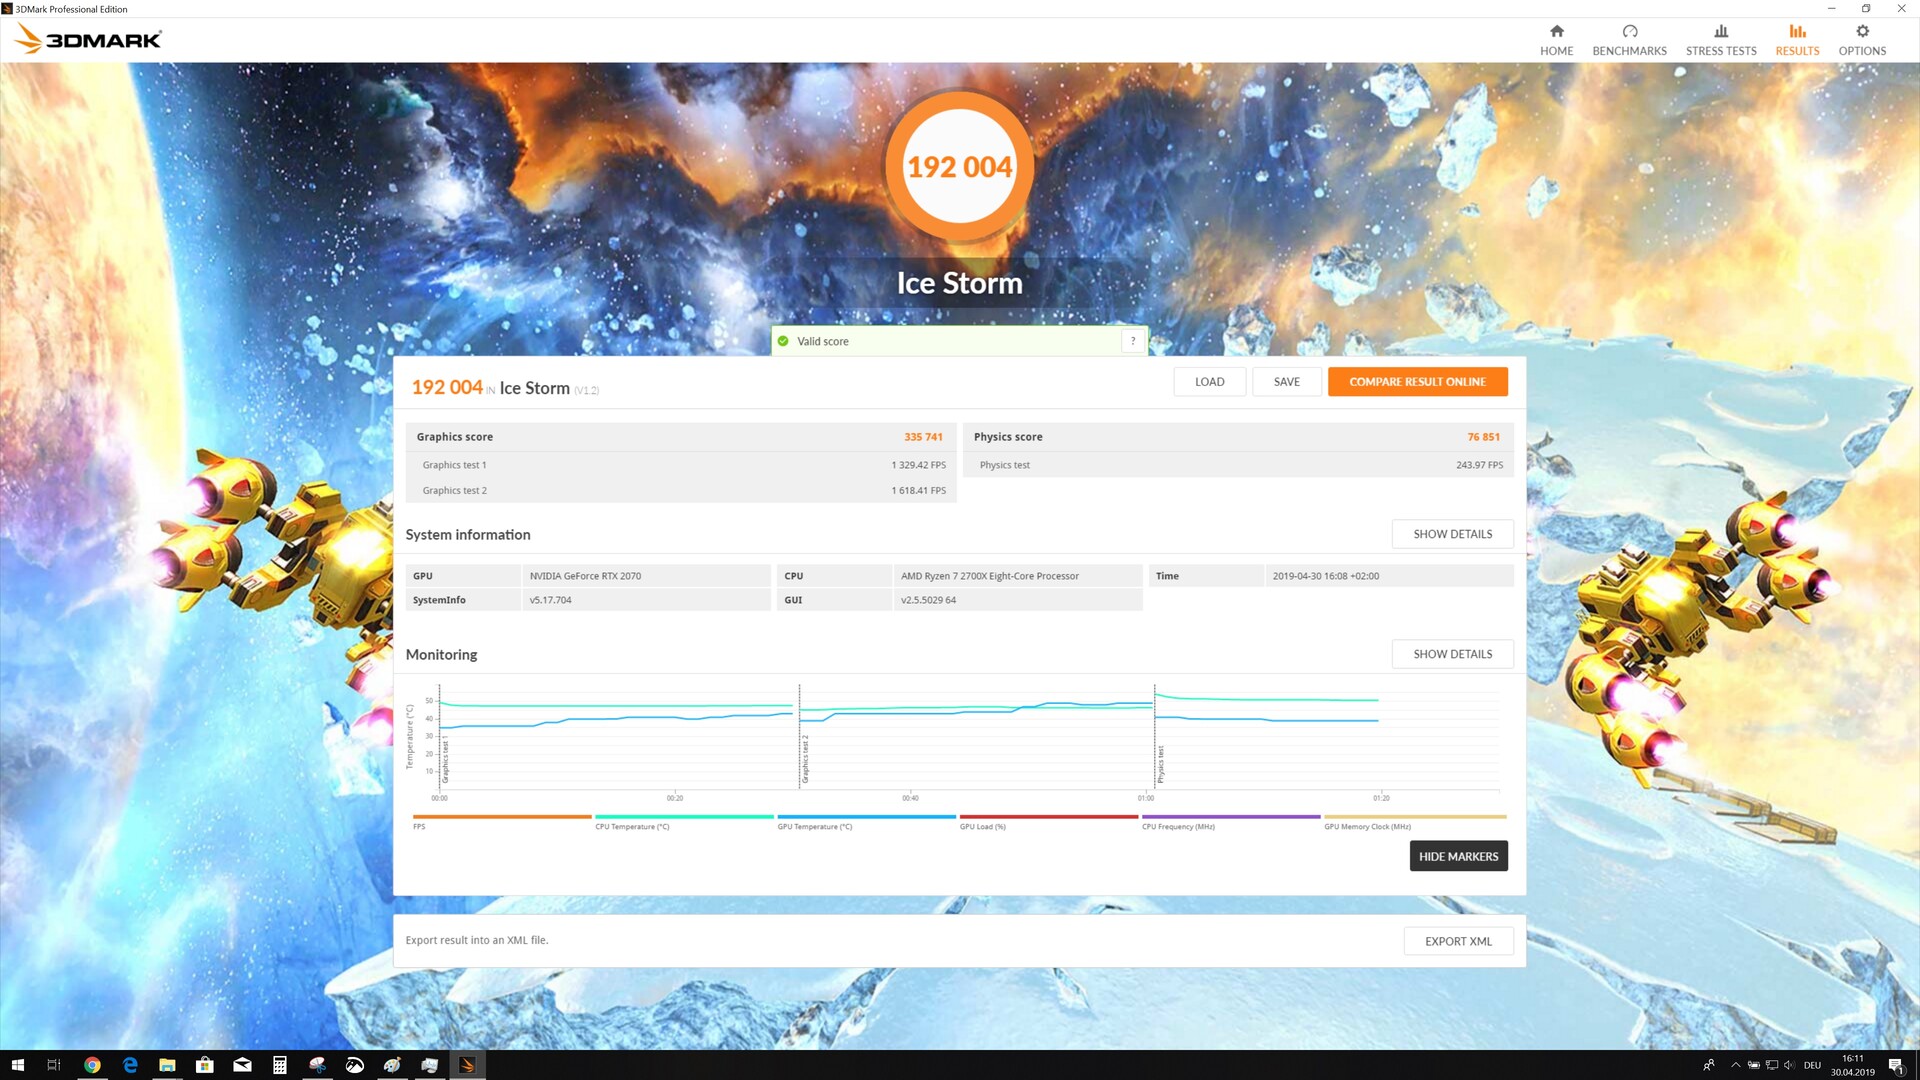
| 3DMark Ice Storm Standard Score | 197964 points | |
| 3DMark Cloud Gate Standard Score | 48366 points | |
| 3DMark Fire Strike Score | 20451 points | |
| 3DMark Fire Strike Extreme Score | 12092 points | |
| 3DMark Time Spy Score | 8797 points | |
Help | ||
Gaming Benchmarks
The AMP Extreme continues to tap into its potential in gaming tests. Our review unit averaged higher framerates than its MSI and ASUS RTX 2070 competitors, although there were a few exceptions. Overall, all the RTX 2070 cards performed well in our gaming tests, of which the AMP Extreme is the best. The difference is only minor though, with all three cards only separated by around 10 FPS in games such as "Call of Duty Black Ops 4". Surprisingly, the MSI and ASUS are better optimised than the AMP Extreme for some games such as "Battlefield V" and "GTA V", but overall our review unit has a performance advantage over its overclocked RTX 2070 contemporaries. The gap between the AMP Extreme and Radeon VII is lower in gaming tests than in synthetic benchmarks, but the 7 nm AMD GPU still achieves better framerates than our review unit.
The Zotac can easily play all the games that we tested in 1440p at maximum graphics. The card starts to show its limits in 2160p at maximum graphics in some triple-A titles such as "Anno 1800" though. Our review unit averaged 39.5 FPS in "Anno 1800" at these settings, which is playable, but we would recommend reducing the graphics levels for a better gaming experience. As always, it remains to be seen whether future driver optimisations or game patches will improve performance beyond what we have seen in these gaming benchmarks.
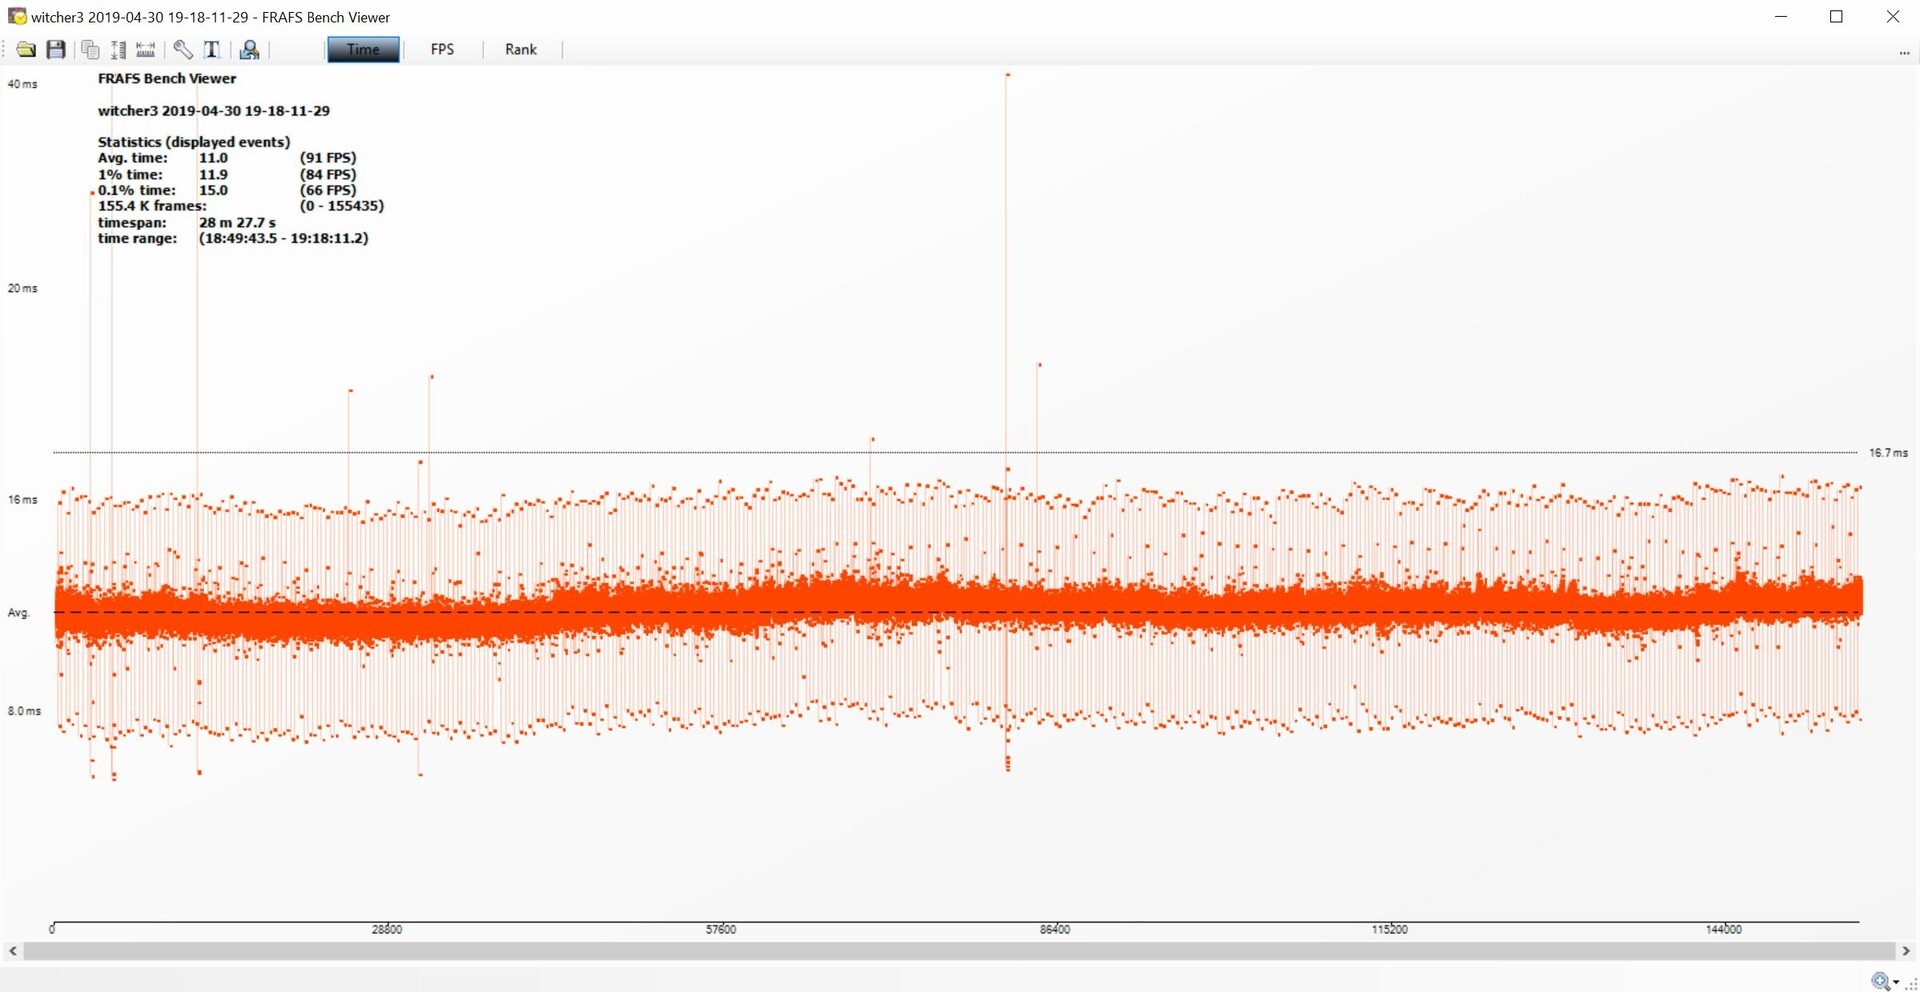
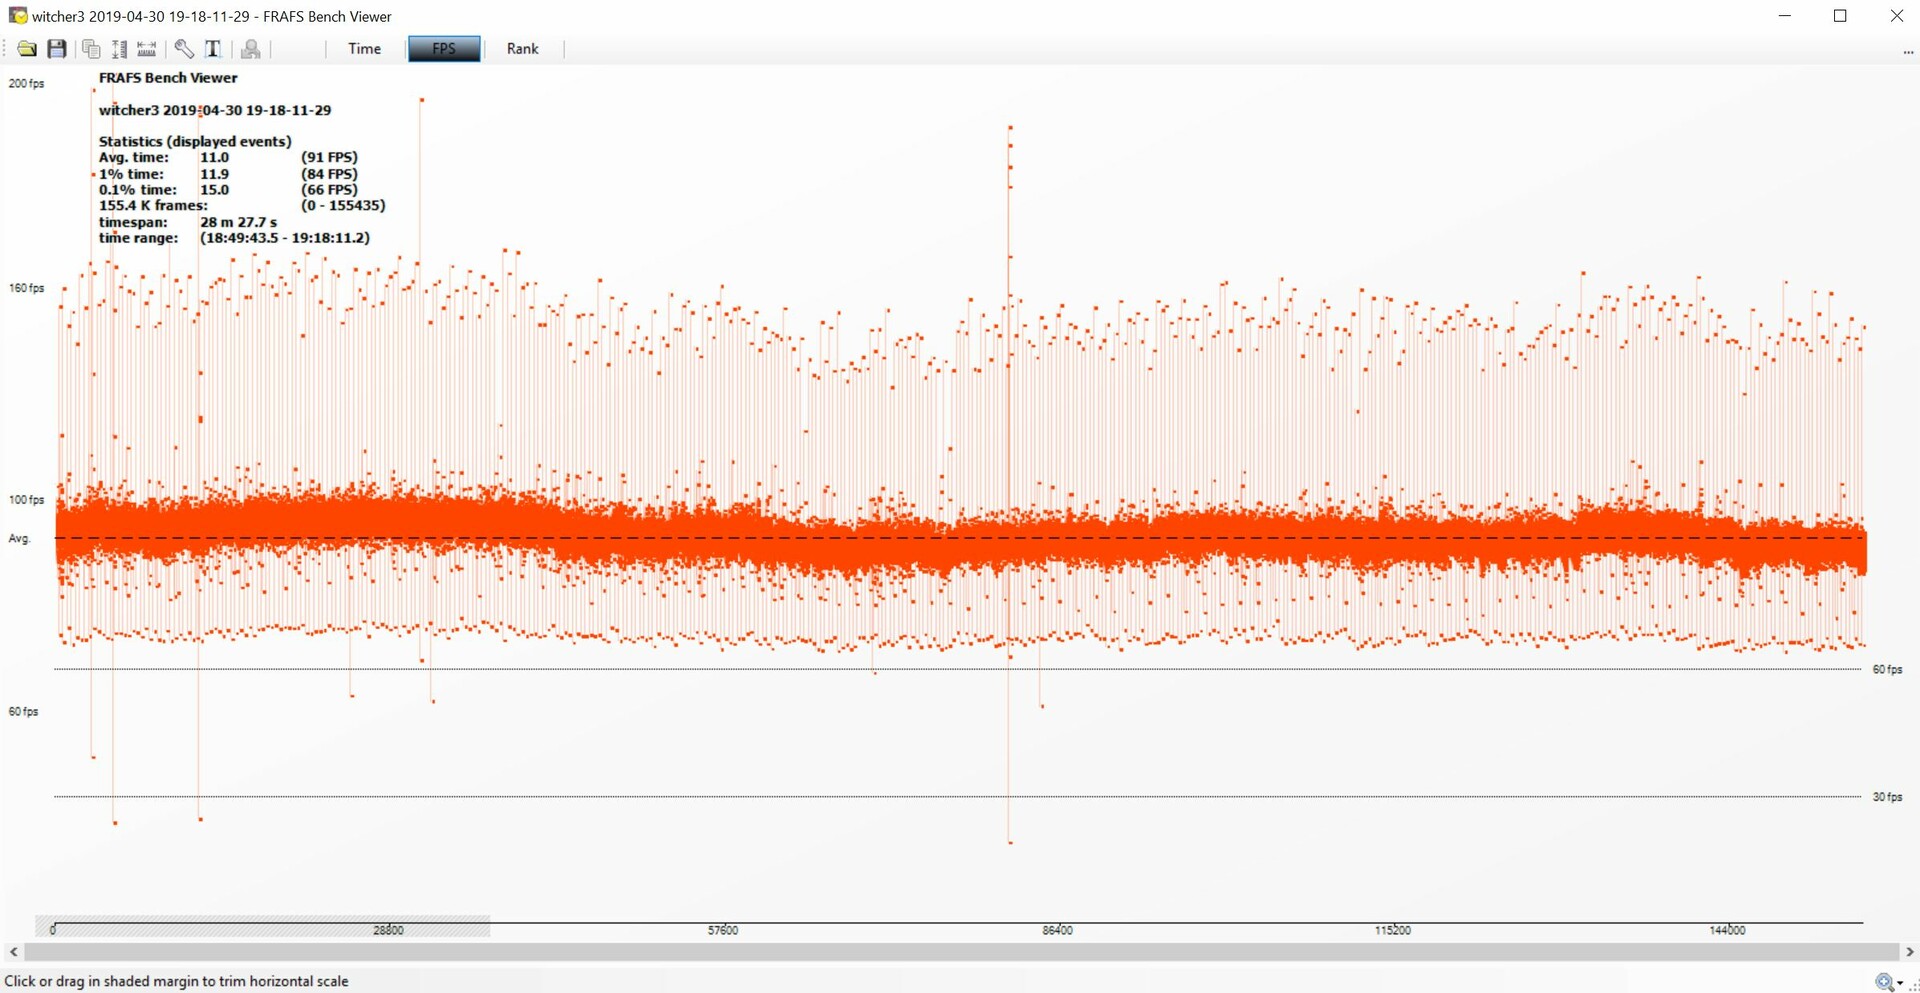
Looking at framerates over a prolonged "The Witcher 3" session at ultra-graphics, it becomes clear that the AMP Extreme can maintain its peak performance without thermal throttling. Our test device averaged 91 FPS during this test and only fluctuated between 86 to 96 FPS, so you should experience no issues with playing modern triple-A titles for hours on end.
The Witcher 3: Framerates – Ultra Preset
| Call of Duty Black Ops 4 | |
| 1920x1080 Very High / On | |
| Nvidia Titan RTX | |
| MSI RTX 2080 Gaming X Trio | |
| AMD Radeon RX Vega 64 | |
| Zotac GeForce RTX 2070 AMP Extreme | |
| NVIDIA Titan X Pascal | |
| MSI RTX 2070 Gaming Z 8G | |
| Asus ROG Strix RTX 2070 OC | |
| AMD Radeon VII | |
| MSI RTX 2060 Gaming Z 6G | |
| XFX AMD Radeon RX 590 OC+ 8 GB | |
| Desktop PC | |
| 3840x2160 Very High / On | |
| Nvidia Titan RTX | |
| MSI RTX 2080 Gaming X Trio | |
| NVIDIA Titan X Pascal | |
| AMD Radeon RX Vega 64 | |
| AMD Radeon VII | |
| Zotac GeForce RTX 2070 AMP Extreme | |
| Asus ROG Strix RTX 2070 OC | |
| MSI RTX 2070 Gaming Z 8G | |
| MSI RTX 2060 Gaming Z 6G | |
| XFX AMD Radeon RX 590 OC+ 8 GB | |
| Desktop PC | |
| Assassin´s Creed Odyssey | |
| 1920x1080 Ultra High Preset | |
| Nvidia Titan RTX | |
| MSI RTX 2080 Gaming X Trio | |
| NVIDIA Titan X Pascal | |
| Zotac GeForce RTX 2070 AMP Extreme | |
| MSI RTX 2070 Gaming Z 8G | |
| AMD Radeon VII | |
| Asus ROG Strix RTX 2070 OC | |
| MSI RTX 2060 Gaming Z 6G | |
| AMD Radeon RX Vega 64 | |
| XFX AMD Radeon RX 590 OC+ 8 GB | |
| Desktop PC | |
| Asus ROG Strix RX 580 8 GB | |
| 3840x2160 Ultra High Preset | |
| Nvidia Titan RTX | |
| AMD Radeon VII | |
| MSI RTX 2080 Gaming X Trio | |
| NVIDIA Titan X Pascal | |
| Asus ROG Strix RTX 2070 OC | |
| MSI RTX 2070 Gaming Z 8G | |
| Zotac GeForce RTX 2070 AMP Extreme | |
| AMD Radeon RX Vega 64 | |
| MSI RTX 2060 Gaming Z 6G | |
| XFX AMD Radeon RX 590 OC+ 8 GB | |
| Desktop PC | |
| Asus ROG Strix RX 580 8 GB | |
| FIFA 19 | |
| 1920x1080 Ultra Preset AA:4x MS | |
| AMD Radeon RX Vega 64 | |
| Asus ROG Strix RX 580 8 GB | |
| Desktop PC | |
| Nvidia Titan RTX | |
| XFX AMD Radeon RX 590 OC+ 8 GB | |
| MSI RTX 2080 Gaming X Trio | |
| AMD Radeon VII | |
| Zotac GeForce RTX 2070 AMP Extreme | |
| NVIDIA Titan X Pascal | |
| Asus ROG Strix RTX 2070 OC | |
| MSI RTX 2070 Gaming Z 8G | |
| MSI RTX 2060 Gaming Z 6G | |
| 3840x2160 Ultra Preset AA:4x MS | |
| Nvidia Titan RTX | |
| AMD Radeon VII | |
| NVIDIA Titan X Pascal | |
| Asus ROG Strix RTX 2070 OC | |
| MSI RTX 2080 Gaming X Trio | |
| Zotac GeForce RTX 2070 AMP Extreme | |
| MSI RTX 2070 Gaming Z 8G | |
| AMD Radeon RX Vega 64 | |
| MSI RTX 2060 Gaming Z 6G | |
| Desktop PC | |
| Asus ROG Strix RX 580 8 GB | |
| XFX AMD Radeon RX 590 OC+ 8 GB | |
| Forza Horizon 4 | |
| 1920x1080 Ultra Preset AA:2xMS | |
| MSI RTX 2080 Gaming X Trio | |
| Nvidia Titan RTX | |
| AMD Radeon VII | |
| AMD Radeon RX Vega 64 | |
| Zotac GeForce RTX 2070 AMP Extreme | |
| MSI RTX 2070 Gaming Z 8G | |
| NVIDIA Titan X Pascal | |
| Asus ROG Strix RTX 2070 OC | |
| MSI RTX 2060 Gaming Z 6G | |
| XFX AMD Radeon RX 590 OC+ 8 GB | |
| Asus ROG Strix RX 580 8 GB | |
| Desktop PC | |
| 3840x2160 Ultra Preset AA:2xMS | |
| Nvidia Titan RTX | |
| MSI RTX 2080 Gaming X Trio | |
| AMD Radeon VII | |
| NVIDIA Titan X Pascal | |
| Zotac GeForce RTX 2070 AMP Extreme | |
| MSI RTX 2070 Gaming Z 8G | |
| AMD Radeon RX Vega 64 | |
| Asus ROG Strix RTX 2070 OC | |
| MSI RTX 2060 Gaming Z 6G | |
| XFX AMD Radeon RX 590 OC+ 8 GB | |
| Asus ROG Strix RX 580 8 GB | |
| Desktop PC | |
| F1 2018 | |
| 1920x1080 Ultra High Preset AA:T AF:16x | |
| Nvidia Titan RTX | |
| MSI RTX 2080 Gaming X Trio | |
| AMD Radeon VII | |
| Zotac GeForce RTX 2070 AMP Extreme | |
| MSI RTX 2070 Gaming Z 8G | |
| Asus ROG Strix RTX 2070 OC | |
| NVIDIA Titan X Pascal | |
| MSI RTX 2060 Gaming Z 6G | |
| AMD Radeon RX Vega 64 | |
| XFX AMD Radeon RX 590 OC+ 8 GB | |
| Asus ROG Strix RX 580 8 GB | |
| Desktop PC | |
| 3840x2160 Ultra High Preset AA:T AF:16x | |
| Nvidia Titan RTX | |
| MSI RTX 2080 Gaming X Trio | |
| NVIDIA Titan X Pascal | |
| AMD Radeon VII | |
| Zotac GeForce RTX 2070 AMP Extreme | |
| MSI RTX 2070 Gaming Z 8G | |
| Asus ROG Strix RTX 2070 OC | |
| MSI RTX 2060 Gaming Z 6G | |
| AMD Radeon RX Vega 64 | |
| XFX AMD Radeon RX 590 OC+ 8 GB | |
| Desktop PC | |
| Monster Hunter World | |
| 1920x1080 Highest Preset (Image Quality High) | |
| Nvidia Titan RTX | |
| MSI RTX 2080 Gaming X Trio | |
| NVIDIA Titan X Pascal | |
| Zotac GeForce RTX 2070 AMP Extreme | |
| MSI RTX 2070 Gaming Z 8G | |
| Asus ROG Strix RTX 2070 OC | |
| AMD Radeon VII | |
| MSI RTX 2060 Gaming Z 6G | |
| AMD Radeon RX Vega 64 | |
| XFX AMD Radeon RX 590 OC+ 8 GB | |
| Asus ROG Strix RX 580 8 GB | |
| Desktop PC | |
| 3840x2160 Highest Preset (Image Quality High) | |
| Nvidia Titan RTX | |
| MSI RTX 2080 Gaming X Trio | |
| NVIDIA Titan X Pascal | |
| AMD Radeon VII | |
| MSI RTX 2070 Gaming Z 8G | |
| Zotac GeForce RTX 2070 AMP Extreme | |
| Asus ROG Strix RTX 2070 OC | |
| AMD Radeon RX Vega 64 | |
| MSI RTX 2060 Gaming Z 6G | |
| XFX AMD Radeon RX 590 OC+ 8 GB | |
| Asus ROG Strix RX 580 8 GB | |
| Desktop PC | |
| Far Cry 5 | |
| 1920x1080 Ultra Preset AA:T | |
| MSI RTX 2080 Gaming X Trio | |
| Asus ROG Strix RTX 2070 OC | |
| Zotac GeForce RTX 2070 AMP Extreme | |
| Nvidia Titan RTX | |
| MSI RTX 2070 Gaming Z 8G | |
| AMD Radeon RX Vega 64 | |
| MSI RTX 2060 Gaming Z 6G | |
| AMD Radeon VII | |
| NVIDIA Titan X Pascal | |
| XFX AMD Radeon RX 590 OC+ 8 GB | |
| Desktop PC | |
| Asus ROG Strix RX 580 8 GB | |
| 3840x2160 Ultra Preset AA:T | |
| Nvidia Titan RTX | |
| MSI RTX 2080 Gaming X Trio | |
| AMD Radeon VII | |
| NVIDIA Titan X Pascal | |
| Zotac GeForce RTX 2070 AMP Extreme | |
| Asus ROG Strix RTX 2070 OC | |
| MSI RTX 2070 Gaming Z 8G | |
| AMD Radeon RX Vega 64 | |
| MSI RTX 2060 Gaming Z 6G | |
| Asus ROG Strix RX 580 8 GB | |
| XFX AMD Radeon RX 590 OC+ 8 GB | |
| Desktop PC | |
| The Crew 2 | |
| 1920x1080 Ultra Preset | |
| Desktop PC | |
| NVIDIA Titan X Pascal | |
| Asus ROG Strix RX 580 8 GB | |
| Asus ROG Strix RTX 2070 OC | |
| XFX AMD Radeon RX 590 OC+ 8 GB | |
| Nvidia Titan RTX | |
| MSI RTX 2060 Gaming Z 6G | |
| MSI RTX 2070 Gaming Z 8G | |
| MSI RTX 2080 Gaming X Trio | |
| AMD Radeon VII | |
| Zotac GeForce RTX 2070 AMP Extreme | |
| 3840x2160 Ultra Preset | |
| Nvidia Titan RTX | |
| MSI RTX 2080 Gaming X Trio | |
| Asus ROG Strix RTX 2070 OC | |
| NVIDIA Titan X Pascal | |
| Zotac GeForce RTX 2070 AMP Extreme | |
| MSI RTX 2070 Gaming Z 8G | |
| AMD Radeon VII | |
| MSI RTX 2060 Gaming Z 6G | |
| Asus ROG Strix RX 580 8 GB | |
| XFX AMD Radeon RX 590 OC+ 8 GB | |
| Desktop PC | |
| Assassin´s Creed Origins | |
| 1920x1080 Ultra High Preset | |
| Nvidia Titan RTX | |
| MSI RTX 2080 Gaming X Trio | |
| Zotac GeForce RTX 2070 AMP Extreme | |
| Asus ROG Strix RTX 2070 OC | |
| MSI RTX 2070 Gaming Z 8G | |
| Nvidia GeForce GTX 1080 Ti Founders Edition | |
| MSI RTX 2060 Gaming Z 6G | |
| AMD Radeon RX Vega 64 | |
| AMD Radeon VII | |
| Desktop PC | |
| XFX AMD Radeon RX 590 OC+ 8 GB | |
| Asus ROG Strix RX 580 8 GB | |
| 3840x2160 Ultra High Preset | |
| Nvidia Titan RTX | |
| MSI RTX 2080 Gaming X Trio | |
| Nvidia GeForce GTX 1080 Ti Founders Edition | |
| AMD Radeon VII | |
| Zotac GeForce RTX 2070 AMP Extreme | |
| Asus ROG Strix RTX 2070 OC | |
| MSI RTX 2070 Gaming Z 8G | |
| MSI RTX 2060 Gaming Z 6G | |
| AMD Radeon RX Vega 64 | |
| XFX AMD Radeon RX 590 OC+ 8 GB | |
| Desktop PC | |
| Asus ROG Strix RX 580 8 GB | |
| Kingdom Come: Deliverance | |
| 1920x1080 Ultra High Preset | |
| Asus ROG Strix RTX 2070 OC | |
| Nvidia Titan RTX | |
| Zotac GeForce RTX 2070 AMP Extreme | |
| MSI RTX 2080 Gaming X Trio | |
| MSI RTX 2070 Gaming Z 8G | |
| Nvidia GeForce GTX 1080 Ti Founders Edition | |
| AMD Radeon RX Vega 64 | |
| AMD Radeon VII | |
| MSI RTX 2060 Gaming Z 6G | |
| XFX AMD Radeon RX 590 OC+ 8 GB | |
| Desktop PC | |
| Asus ROG Strix RX 580 8 GB | |
| 3840x2160 Ultra High Preset | |
| Nvidia Titan RTX | |
| MSI RTX 2080 Gaming X Trio | |
| AMD Radeon RX Vega 64 | |
| Zotac GeForce RTX 2070 AMP Extreme | |
| Nvidia GeForce GTX 1080 Ti Founders Edition | |
| Asus ROG Strix RTX 2070 OC | |
| AMD Radeon VII | |
| MSI RTX 2070 Gaming Z 8G | |
| MSI RTX 2060 Gaming Z 6G | |
| XFX AMD Radeon RX 590 OC+ 8 GB | |
| Asus ROG Strix RX 580 8 GB | |
| Desktop PC | |
| Fortnite | |
| 1920x1080 Epic Preset | |
| Nvidia GeForce GTX 1080 Ti Founders Edition | |
| Zotac GeForce RTX 2070 AMP Extreme | |
| Asus ROG Strix RTX 2070 OC | |
| MSI RTX 2080 Gaming X Trio | |
| MSI RTX 2060 Gaming Z 6G | |
| MSI RTX 2070 Gaming Z 8G | |
| Nvidia Titan RTX | |
| AMD Radeon VII | |
| XFX AMD Radeon RX 590 OC+ 8 GB | |
| Desktop PC | |
| Asus ROG Strix RX 580 8 GB | |
| 3840x2160 Epic Preset | |
| Nvidia Titan RTX | |
| MSI RTX 2080 Gaming X Trio | |
| Asus ROG Strix RTX 2070 OC | |
| MSI RTX 2070 Gaming Z 8G | |
| Zotac GeForce RTX 2070 AMP Extreme | |
| Nvidia GeForce GTX 1080 Ti Founders Edition | |
| AMD Radeon VII | |
| MSI RTX 2060 Gaming Z 6G | |
| XFX AMD Radeon RX 590 OC+ 8 GB | |
| Desktop PC | |
| Asus ROG Strix RX 580 8 GB | |
| Destiny 2 | |
| 1920x1080 Highest Preset AA:SM AF:16x | |
| Nvidia GeForce GTX 1080 Ti Founders Edition | |
| Asus ROG Strix RTX 2070 OC | |
| Nvidia Titan RTX | |
| Zotac GeForce RTX 2070 AMP Extreme | |
| MSI RTX 2070 Gaming Z 8G | |
| MSI RTX 2080 Gaming X Trio | |
| AMD Radeon VII | |
| MSI RTX 2060 Gaming Z 6G | |
| Desktop PC | |
| 3840x2160 Highest Preset AA:SM AF:16x | |
| Nvidia Titan RTX | |
| MSI RTX 2080 Gaming X Trio | |
| Zotac GeForce RTX 2070 AMP Extreme | |
| Asus ROG Strix RTX 2070 OC | |
| MSI RTX 2070 Gaming Z 8G | |
| Nvidia GeForce GTX 1080 Ti Founders Edition | |
| AMD Radeon VII | |
| MSI RTX 2060 Gaming Z 6G | |
| Desktop PC | |
| Ghost Recon Wildlands | |
| 1920x1080 Ultra Preset AA:T AF:16x | |
| Nvidia Titan RTX | |
| MSI RTX 2080 Gaming X Trio | |
| Nvidia GeForce GTX 1080 Ti Founders Edition | |
| Zotac GeForce RTX 2070 AMP Extreme | |
| Asus ROG Strix RTX 2070 OC | |
| MSI RTX 2070 Gaming Z 8G | |
| MSI RTX 2060 Gaming Z 6G | |
| AMD Radeon RX Vega 64 | |
| Nvidia GeForce GTX 1070 Founders Edition | |
| AMD Radeon VII | |
| XFX AMD Radeon RX 590 OC+ 8 GB | |
| Desktop PC | |
| Asus ROG Strix RX 580 8 GB | |
| 3840x2160 Ultra Preset AA:T AF:16x | |
| Nvidia Titan RTX | |
| MSI RTX 2080 Gaming X Trio | |
| Nvidia GeForce GTX 1080 Ti Founders Edition | |
| Zotac GeForce RTX 2070 AMP Extreme | |
| MSI RTX 2070 Gaming Z 8G | |
| Hitman 2 | |
| 1920x1080 Ultra AF:16x | |
| AMD Radeon VII | |
| Zotac GeForce RTX 2070 AMP Extreme | |
| MSI RTX 2060 Gaming Z 6G | |
| MSI RTX 2080 Gaming X Trio | |
| AMD Radeon RX Vega 64 | |
| MSI RTX 2070 Gaming Z 8G | |
| Nvidia Titan RTX | |
| XFX AMD Radeon RX 590 OC+ 8 GB | |
| Desktop PC | |
| NVIDIA Titan X Pascal | |
| 3840x2160 Ultra AF:16x | |
| Nvidia Titan RTX | |
| MSI RTX 2080 Gaming X Trio | |
| AMD Radeon VII | |
| NVIDIA Titan X Pascal | |
| Zotac GeForce RTX 2070 AMP Extreme | |
| AMD Radeon RX Vega 64 | |
| MSI RTX 2070 Gaming Z 8G | |
| MSI RTX 2060 Gaming Z 6G | |
| XFX AMD Radeon RX 590 OC+ 8 GB | |
| Desktop PC | |
| Battlefield V | |
| 1920x1080 Ultra Preset | |
| Nvidia Titan RTX | |
| MSI RTX 2080 Gaming X Trio | |
| AMD Radeon RX Vega 64 | |
| NVIDIA Titan X Pascal | |
| AMD Radeon VII | |
| MSI RTX 2070 Gaming Z 8G | |
| MSI RTX 2060 Gaming Z 6G | |
| XFX AMD Radeon RX 590 OC+ 8 GB | |
| Zotac GeForce RTX 2070 AMP Extreme | |
| 3840x2160 Ultra Preset | |
| Nvidia Titan RTX | |
| MSI RTX 2080 Gaming X Trio | |
| AMD Radeon VII | |
| NVIDIA Titan X Pascal | |
| MSI RTX 2070 Gaming Z 8G | |
| AMD Radeon RX Vega 64 | |
| MSI RTX 2060 Gaming Z 6G | |
| Zotac GeForce RTX 2070 AMP Extreme | |
| XFX AMD Radeon RX 590 OC+ 8 GB | |
| Farming Simulator 19 | |
| 1920x1080 Very High Preset | |
| Zotac GeForce RTX 2070 AMP Extreme | |
| Nvidia Titan RTX | |
| MSI RTX 2080 Gaming X Trio | |
| MSI RTX 2060 Gaming Z 6G | |
| MSI RTX 2070 Gaming Z 8G | |
| AMD Radeon VII | |
| AMD Radeon RX Vega 64 | |
| NVIDIA Titan X Pascal | |
| XFX AMD Radeon RX 590 OC+ 8 GB | |
| 3840x2160 Very High Preset | |
| Nvidia Titan RTX | |
| NVIDIA Titan X Pascal | |
| MSI RTX 2080 Gaming X Trio | |
| MSI RTX 2070 Gaming Z 8G | |
| Zotac GeForce RTX 2070 AMP Extreme | |
| MSI RTX 2060 Gaming Z 6G | |
| AMD Radeon VII | |
| AMD Radeon RX Vega 64 | |
| XFX AMD Radeon RX 590 OC+ 8 GB | |
| Darksiders III | |
| 1920x1080 Epic | |
| Nvidia Titan RTX | |
| MSI RTX 2080 Gaming X Trio | |
| Zotac GeForce RTX 2070 AMP Extreme | |
| MSI RTX 2070 Gaming Z 8G | |
| AMD Radeon VII | |
| MSI RTX 2060 Gaming Z 6G | |
| NVIDIA Titan X Pascal | |
| AMD Radeon RX Vega 64 | |
| XFX AMD Radeon RX 590 OC+ 8 GB | |
| 3840x2160 Epic | |
| Nvidia Titan RTX | |
| MSI RTX 2080 Gaming X Trio | |
| NVIDIA Titan X Pascal | |
| Zotac GeForce RTX 2070 AMP Extreme | |
| MSI RTX 2070 Gaming Z 8G | |
| AMD Radeon VII | |
| AMD Radeon RX Vega 64 | |
| MSI RTX 2060 Gaming Z 6G | |
| XFX AMD Radeon RX 590 OC+ 8 GB | |
| Just Cause 4 | |
| 1920x1080 Very High / On AA:SM AF:16x | |
| Nvidia Titan RTX | |
| MSI RTX 2080 Gaming X Trio | |
| NVIDIA Titan X Pascal | |
| MSI RTX 2070 Gaming Z 8G | |
| Zotac GeForce RTX 2070 AMP Extreme | |
| AMD Radeon VII | |
| MSI RTX 2060 Gaming Z 6G | |
| AMD Radeon RX Vega 64 | |
| XFX AMD Radeon RX 590 OC+ 8 GB | |
| 3840x2160 Very High / On AA:SM AF:16x | |
| Nvidia Titan RTX | |
| MSI RTX 2080 Gaming X Trio | |
| NVIDIA Titan X Pascal | |
| AMD Radeon VII | |
| Zotac GeForce RTX 2070 AMP Extreme | |
| MSI RTX 2070 Gaming Z 8G | |
| MSI RTX 2060 Gaming Z 6G | |
| AMD Radeon RX Vega 64 | |
| XFX AMD Radeon RX 590 OC+ 8 GB | |
| Apex Legends | |
| 1920x1080 Maximum Settings AA:TS AF:16x | |
| MSI RTX 2070 Gaming Z 8G | |
| MSI RTX 2080 Gaming X Trio | |
| Zotac GeForce RTX 2070 AMP Extreme | |
| MSI RTX 2060 Gaming Z 6G | |
| AMD Radeon RX Vega 64 | |
| XFX AMD Radeon RX 590 OC+ 8 GB | |
| 3840x2160 Maximum Settings AA:TS AF:16x | |
| MSI RTX 2080 Gaming X Trio | |
| MSI RTX 2070 Gaming Z 8G | |
| Zotac GeForce RTX 2070 AMP Extreme | |
| AMD Radeon RX Vega 64 | |
| MSI RTX 2060 Gaming Z 6G | |
| XFX AMD Radeon RX 590 OC+ 8 GB | |
| Far Cry New Dawn | |
| 1920x1080 Ultra Preset | |
| Zotac GeForce RTX 2070 AMP Extreme | |
| MSI RTX 2080 Gaming X Trio | |
| MSI RTX 2070 Gaming Z 8G | |
| MSI RTX 2060 Gaming Z 6G | |
| AMD Radeon RX Vega 64 | |
| AMD Radeon VII | |
| XFX AMD Radeon RX 590 OC+ 8 GB | |
| 3840x2160 Ultra Preset | |
| MSI RTX 2080 Gaming X Trio | |
| AMD Radeon VII | |
| Zotac GeForce RTX 2070 AMP Extreme | |
| MSI RTX 2070 Gaming Z 8G | |
| AMD Radeon RX Vega 64 | |
| MSI RTX 2060 Gaming Z 6G | |
| XFX AMD Radeon RX 590 OC+ 8 GB | |
| Metro Exodus | |
| 1920x1080 Ultra Quality AF:16x | |
| MSI RTX 2080 Gaming X Trio | |
| AMD Radeon VII | |
| Zotac GeForce RTX 2070 AMP Extreme | |
| MSI RTX 2070 Gaming Z 8G | |
| AMD Radeon RX Vega 64 | |
| MSI RTX 2060 Gaming Z 6G | |
| XFX AMD Radeon RX 590 OC+ 8 GB | |
| 3840x2160 Ultra Quality AF:16x | |
| AMD Radeon RX Vega 64 | |
| MSI RTX 2080 Gaming X Trio | |
| AMD Radeon VII | |
| Zotac GeForce RTX 2070 AMP Extreme | |
| MSI RTX 2070 Gaming Z 8G | |
| MSI RTX 2060 Gaming Z 6G | |
| XFX AMD Radeon RX 590 OC+ 8 GB | |
| Anthem - 1920x1080 Ultra Preset | |
| MSI RTX 2080 Gaming X Trio | |
| Zotac GeForce RTX 2070 AMP Extreme | |
| AMD Radeon RX Vega 64 | |
| MSI RTX 2070 Gaming Z 8G | |
| AMD Radeon VII | |
| MSI RTX 2060 Gaming Z 6G | |
| XFX AMD Radeon RX 590 OC+ 8 GB | |
| Dirt Rally 2.0 | |
| 1920x1080 Ultra Preset AA:T AF:16x | |
| MSI RTX 2080 Gaming X Trio | |
| AMD Radeon VII | |
| Zotac GeForce RTX 2070 AMP Extreme | |
| MSI RTX 2070 Gaming Z 8G | |
| AMD Radeon RX Vega 64 | |
| MSI RTX 2060 Gaming Z 6G | |
| XFX AMD Radeon RX 590 OC+ 8 GB | |
| 3840x2160 Ultra Preset AA:T AF:16x | |
| MSI RTX 2080 Gaming X Trio | |
| AMD Radeon VII | |
| Zotac GeForce RTX 2070 AMP Extreme | |
| MSI RTX 2070 Gaming Z 8G | |
| AMD Radeon RX Vega 64 | |
| MSI RTX 2060 Gaming Z 6G | |
| XFX AMD Radeon RX 590 OC+ 8 GB | |
| Anno 1800 | |
| 1920x1080 Ultra Graphics Quality (DX11) | |
| Zotac GeForce RTX 2070 AMP Extreme | |
| MSI RTX 2080 Gaming X Trio | |
| MSI RTX 2070 Gaming Z 8G | |
| MSI RTX 2060 Gaming Z 6G | |
| AMD Radeon RX Vega 64 | |
| XFX AMD Radeon RX 590 OC+ 8 GB | |
| 3840x2160 Ultra Graphics Quality (DX11) | |
| MSI RTX 2080 Gaming X Trio | |
| Zotac GeForce RTX 2070 AMP Extreme | |
| MSI RTX 2070 Gaming Z 8G | |
| MSI RTX 2060 Gaming Z 6G | |
| AMD Radeon RX Vega 64 | |
| XFX AMD Radeon RX 590 OC+ 8 GB | |
| low | med. | high | ultra | QHD | 4K | |
|---|---|---|---|---|---|---|
| Battlefield 4 (2013) | 200 | 200 | 200 | 197.2 | 98.6 | |
| GTA V (2015) | 175 | 168 | 153 | 88 | 86 | |
| The Witcher 3 (2015) | 306 | 251 | 171 | 95 | 67 | |
| Rainbow Six Siege (2015) | 328.1 | 275 | 256.1 | 243.6 | 126.8 | |
| Rise of the Tomb Raider (2016) | 268 | 191 | 158 | 131 | 62 | |
| Far Cry Primal (2016) | 125 | 113 | 103 | 96 | 62 | |
| The Division (2016) | 232.2 | 212.2 | 144.3 | 115.4 | 57.9 | |
| Doom (2016) | 159 | 152 | 142 | 141 | 94 | |
| Overwatch (2016) | 300 | 300 | 228 | 141 | 129 | |
| Deus Ex Mankind Divided (2016) | 151.5 | 142.1 | 119.7 | 90.9 | 46.4 | |
| Battlefield 1 (2016) | 195 | 176 | 159 | 150 | 78 | |
| Dishonored 2 (2016) | 118.8 | 118.6 | 118.9 | 114.8 | 67.4 | |
| Watch Dogs 2 (2016) | 142 | 127 | 108 | 78 | 46.9 | |
| For Honor (2017) | 275.4 | 194.2 | 186 | 146.1 | 65.6 | |
| Ghost Recon Wildlands (2017) | 163 | 121.2 | 114.1 | 66.2 | 47.3 | |
| Rocket League (2017) | 248.9 | 249.6 | 240.5 | 128.1 | ||
| Dirt 4 (2017) | 303 | 241 | 209 | 135 | 81 | |
| Playerunknown's Battlegrounds (PUBG) (2017) | 260 | 224 | 198 | 160 | 61 | |
| Destiny 2 (2017) | 145 | 142 | 141 | 151 | 113 | 61 |
| Assassin´s Creed Origins (2017) | 113 | 103 | 99 | 84 | 73 | 47 |
| Call of Duty WWII (2017) | 243 | 240 | 166 | 143 | 115 | 75 |
| Fortnite (2018) | 215 | 174 | 161 | 157 | 117 | 53.1 |
| Final Fantasy XV Benchmark (2018) | 161 | 120 | 89 | 39.3 | ||
| Kingdom Come: Deliverance (2018) | 144 | 121 | 102 | 79 | 61 | 32.3 |
| Far Cry 5 (2018) | 130 | 116 | 111 | 105 | 91 | 51 |
| The Crew 2 (2018) | 60 | 60 | 60 | 60 | 60 | 48.4 |
| Monster Hunter World (2018) | 144 | 133 | 128 | 102 | 68 | 32.2 |
| F1 2018 (2018) | 244 | 211 | 163 | 131 | 107 | 67 |
| Shadow of the Tomb Raider (2018) | 127 | 110 | 108 | 102 | 77 | 41 |
| FIFA 19 (2018) | 276 | 254 | 236 | 223 | 219 | 181 |
| Forza Horizon 4 (2018) | 182 | 149 | 144 | 118 | 97 | 68 |
| Assassin´s Creed Odyssey (2018) | 110 | 102 | 88 | 66 | 51 | 36 |
| Call of Duty Black Ops 4 (2018) | 229 | 179 | 169 | 161 | 108 | 55.6 |
| Hitman 2 (2018) | 95 | 91 | 83 | 81 | 77 | 49 |
| Fallout 76 (2018) | 60 | 60 | 60 | 60 | 60 | 60 |
| Battlefield V (2018) | 143 | 109 | 96 | 90 | 72 | 48.3 |
| Farming Simulator 19 (2018) | 202 | 157 | 136 | 126 | 122 | 71 |
| Darksiders III (2018) | 211 | 149 | 139 | 128 | 93 | 47.7 |
| Just Cause 4 (2018) | 198 | 150 | 112 | 104 | 75 | 44 |
| Apex Legends (2019) | 144 | 144 | 144 | 144 | 122 | 71.8 |
| Far Cry New Dawn (2019) | 120 | 107 | 103 | 94 | 86 | 53 |
| Metro Exodus (2019) | 130.1 | 100.4 | 76.6 | 62.8 | 50.1 | 32.7 |
| Anthem (2019) | 109 | 99 | 94 | 96 | 79 | 46.5 |
| Dirt Rally 2.0 (2019) | 245 | 193 | 179 | 106 | 81 | 49.5 |
| The Division 2 (2019) | 190 | 145 | 120 | 98 | 70 | 41 |
| Anno 1800 (2019) | 89 | 88 | 77 | 43.8 | 39.5 | 27.3 |
Compute Performance
The AMP Extreme also performs well in compute benchmarks, thanks to its high GPU and VRAM clock speeds. Our review unit scores up to 5% more than the MSI RTX 2070 Gaming Z 8G, but typically the performance gap is more like 2% to 3%.
Unsurprisingly, the AMP Extreme cannot match the performance of the factory overclocked MSI RTX 2080 Gaming X Trio. A direct comparison the GeForce RTX 2080 Founders Edition would be interesting though.
The AMP Extreme also profits in LuxMark compared to the GeForce GTX 1080 Ti, thanks to its newer Turing architecture. It is a mixed bag for the Radeon VII though, with it scoring 9% less than the AMP Extreme in the Sala GPUs-only portion of LuxMark. By contrast, the AMD card blows away our test device in other benchmarks where it can utilise its full GPU performance, like in SiSoft Sandra 2016.
| SiSoft Sandra 2016 | |
| Image Processing | |
| AMD Radeon VII | |
| MSI RTX 2080 Gaming X Trio | |
| Zotac GeForce RTX 2070 AMP Extreme | |
| MSI RTX 2070 Gaming Z 8G | |
| MSI RTX 2060 Gaming Z 6G | |
| GP Cryptography (Higher Security AES256+SHA2-512) | |
| MSI RTX 2080 Gaming X Trio | |
| AMD Radeon VII | |
| Zotac GeForce RTX 2070 AMP Extreme | |
| MSI RTX 2070 Gaming Z 8G | |
| MSI RTX 2060 Gaming Z 6G | |
| GP Financial Analysis (FP High/Double Precision) | |
| AMD Radeon VII | |
| MSI RTX 2080 Gaming X Trio | |
| MSI RTX 2070 Gaming Z 8G | |
| Zotac GeForce RTX 2070 AMP Extreme | |
| MSI RTX 2060 Gaming Z 6G | |
Emissions

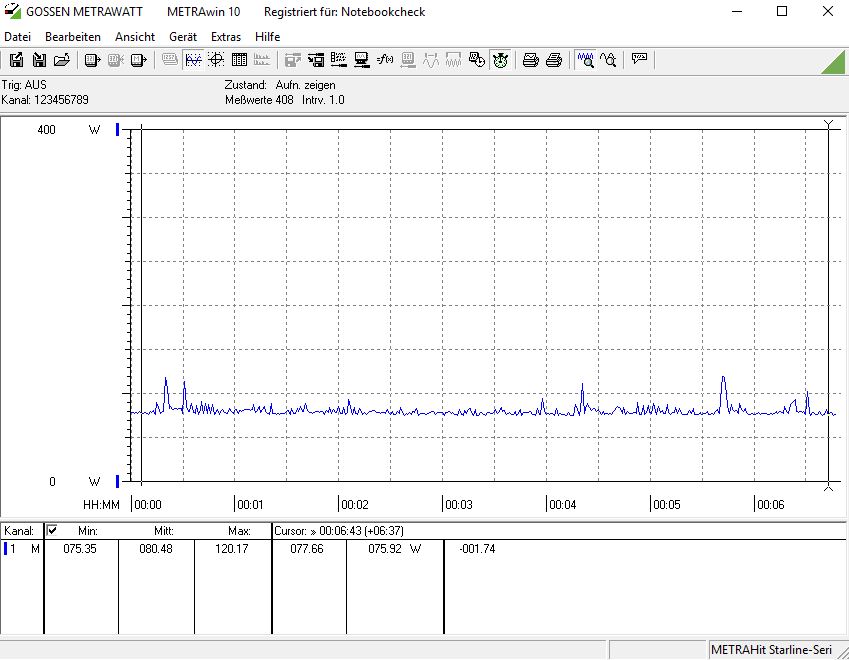
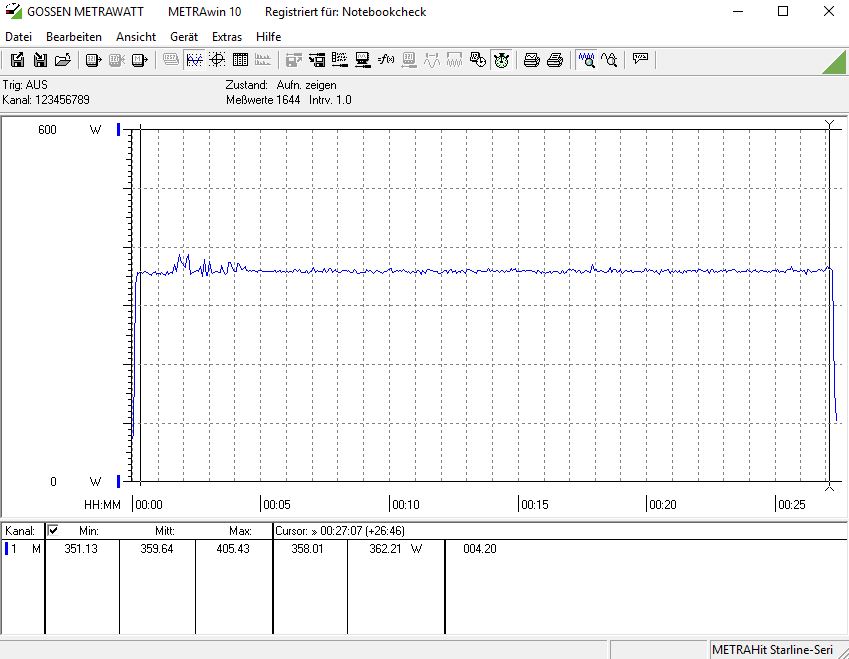
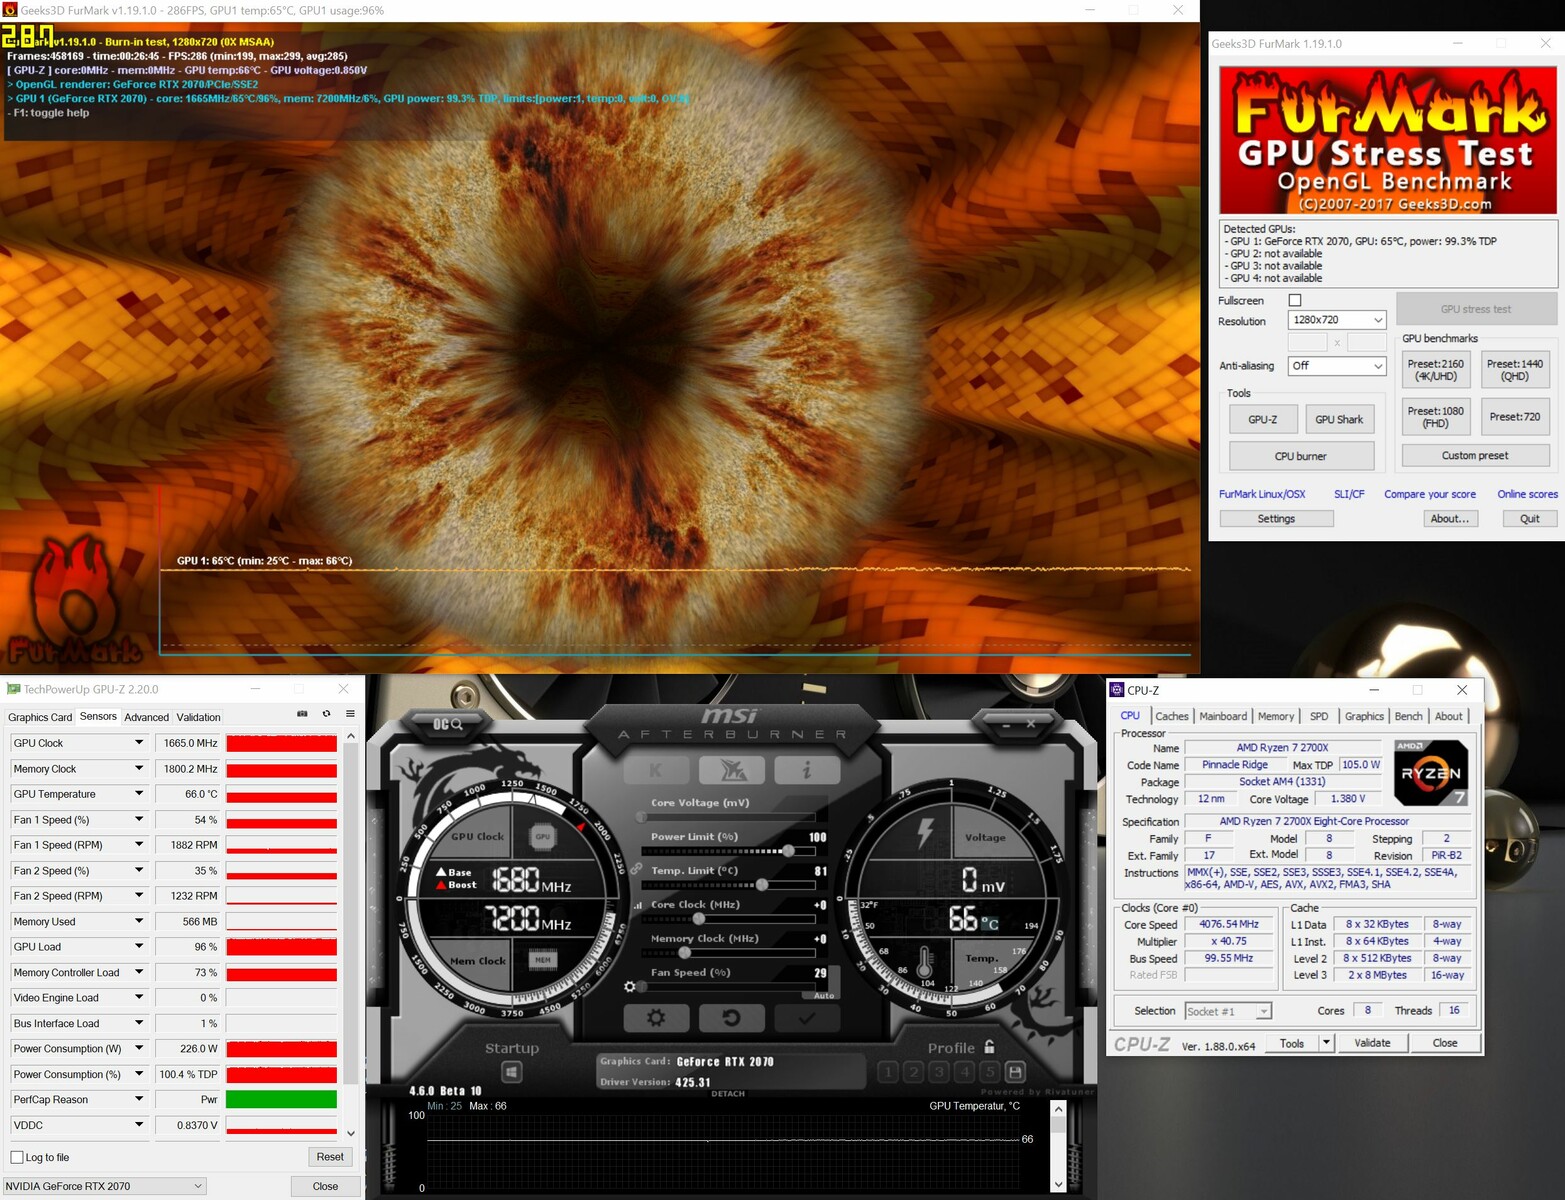
The AMP Extreme runs comparatively coolly and quietly. There is little difference between our review unit and the MSI RTX 2070 Gaming Z 8G though. Our test system consumed just 80.5 W on average at idle, which is 7 W more than it consumed with the MSI GPU installed instead. Power consumption rose to an average of 360 W during our stress tests with the AMP Extreme, although it occasionally peaked at 405 W. Again, the Zotac is a bit more power hungry here than the MSI RTX 2070 Gaming Z 8G.
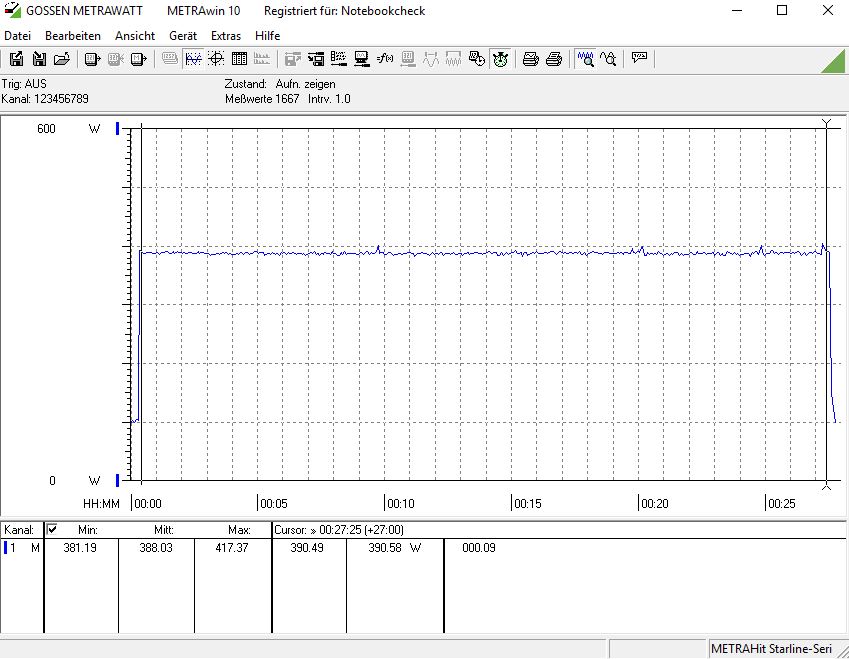
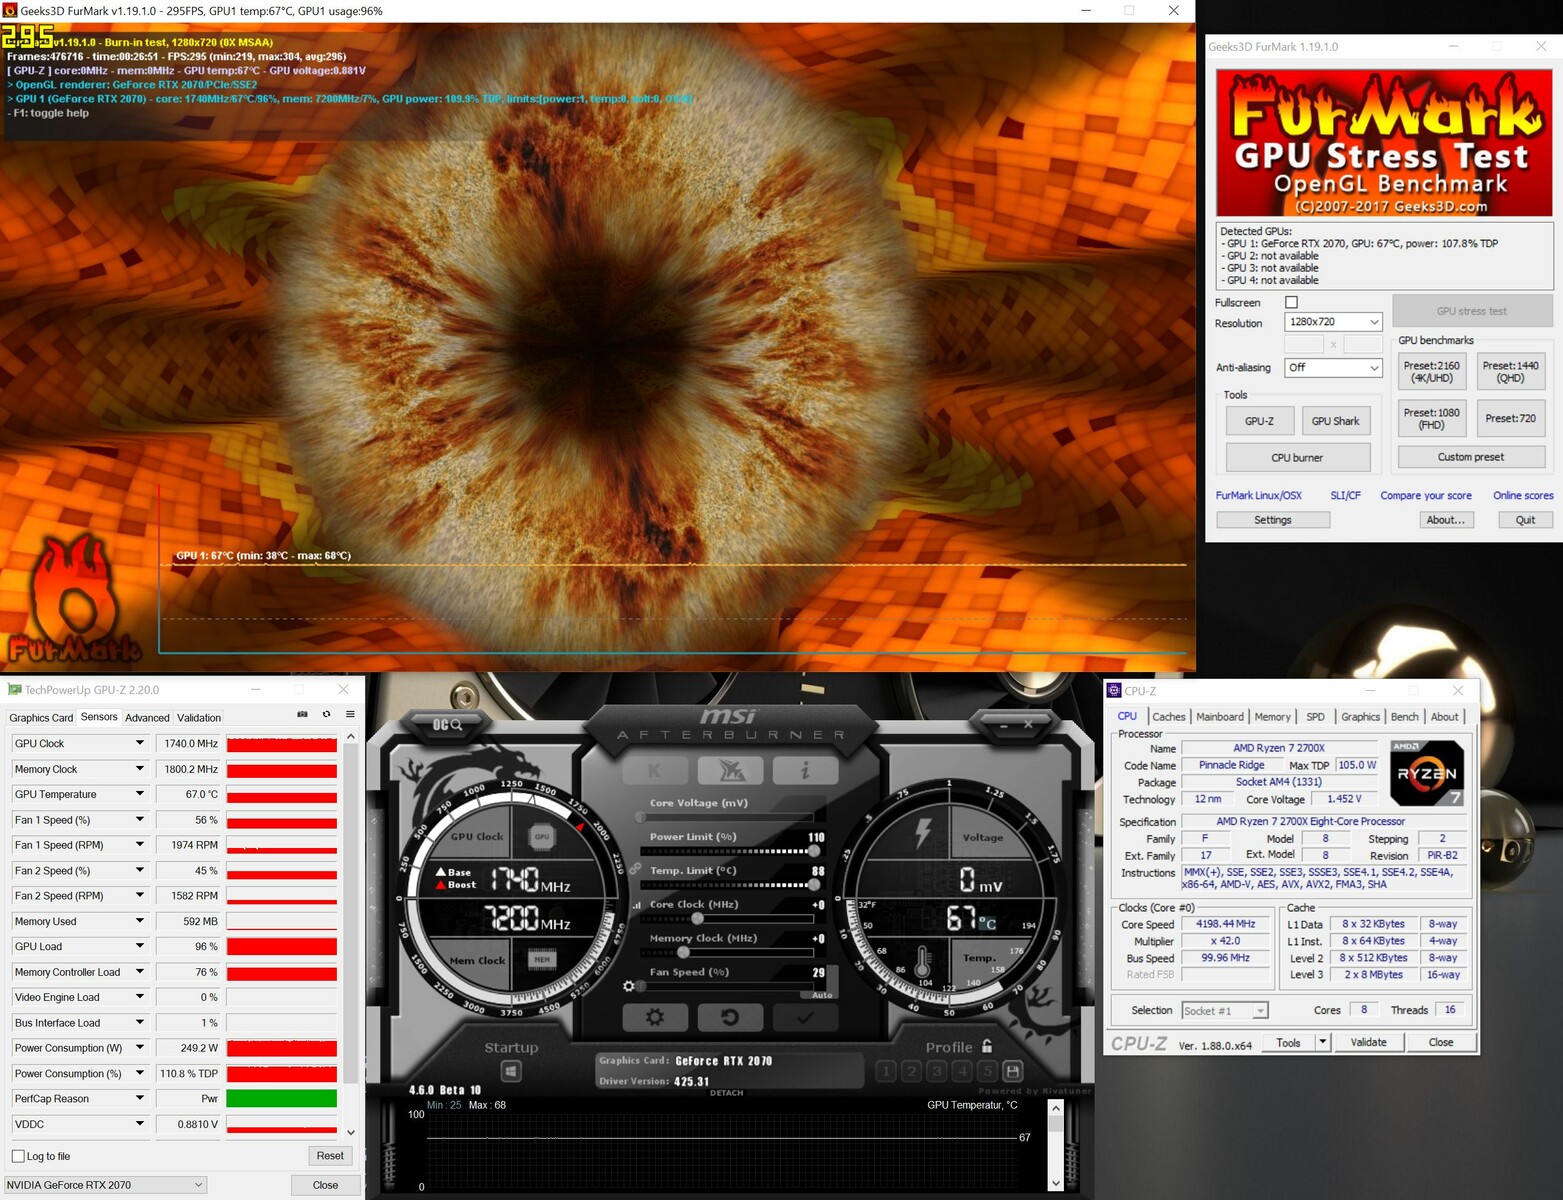
We also took a closer look at the power consumption of the AMP Extreme with it set to a higher PT, during which it averaged 388 W. Zotac allows the PT to be increased by 10%, with which gives the AMP Extreme 247.5 W of power at its disposal.
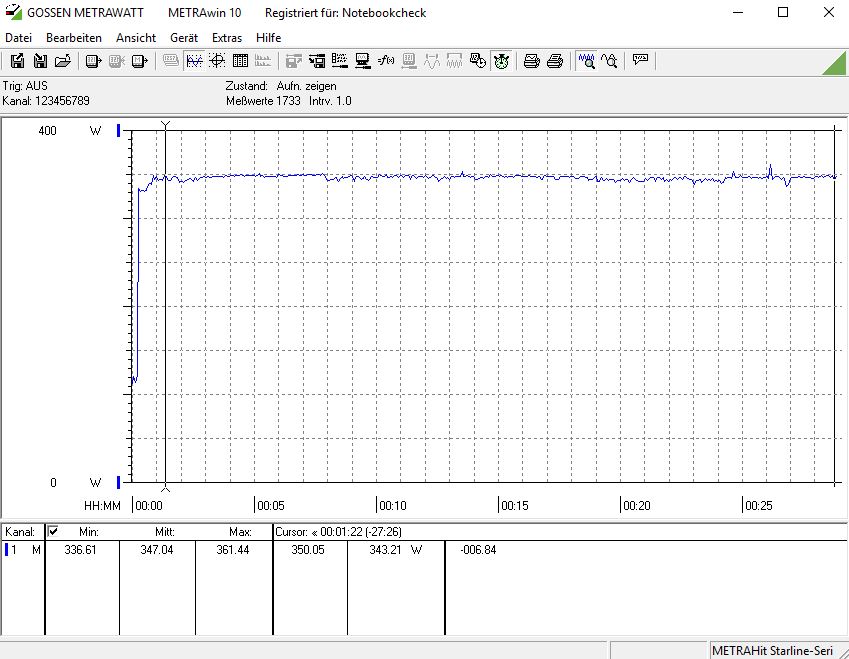
The AMP Extreme averaged just 347 W while playing "The Witcher 3" on ultra-graphics, although this is still a bit more than what our RTX 2070 comparison devices consumed. Our review unit averaged 11 W less than the GeForce 1080 Ti Founders Edition did though.
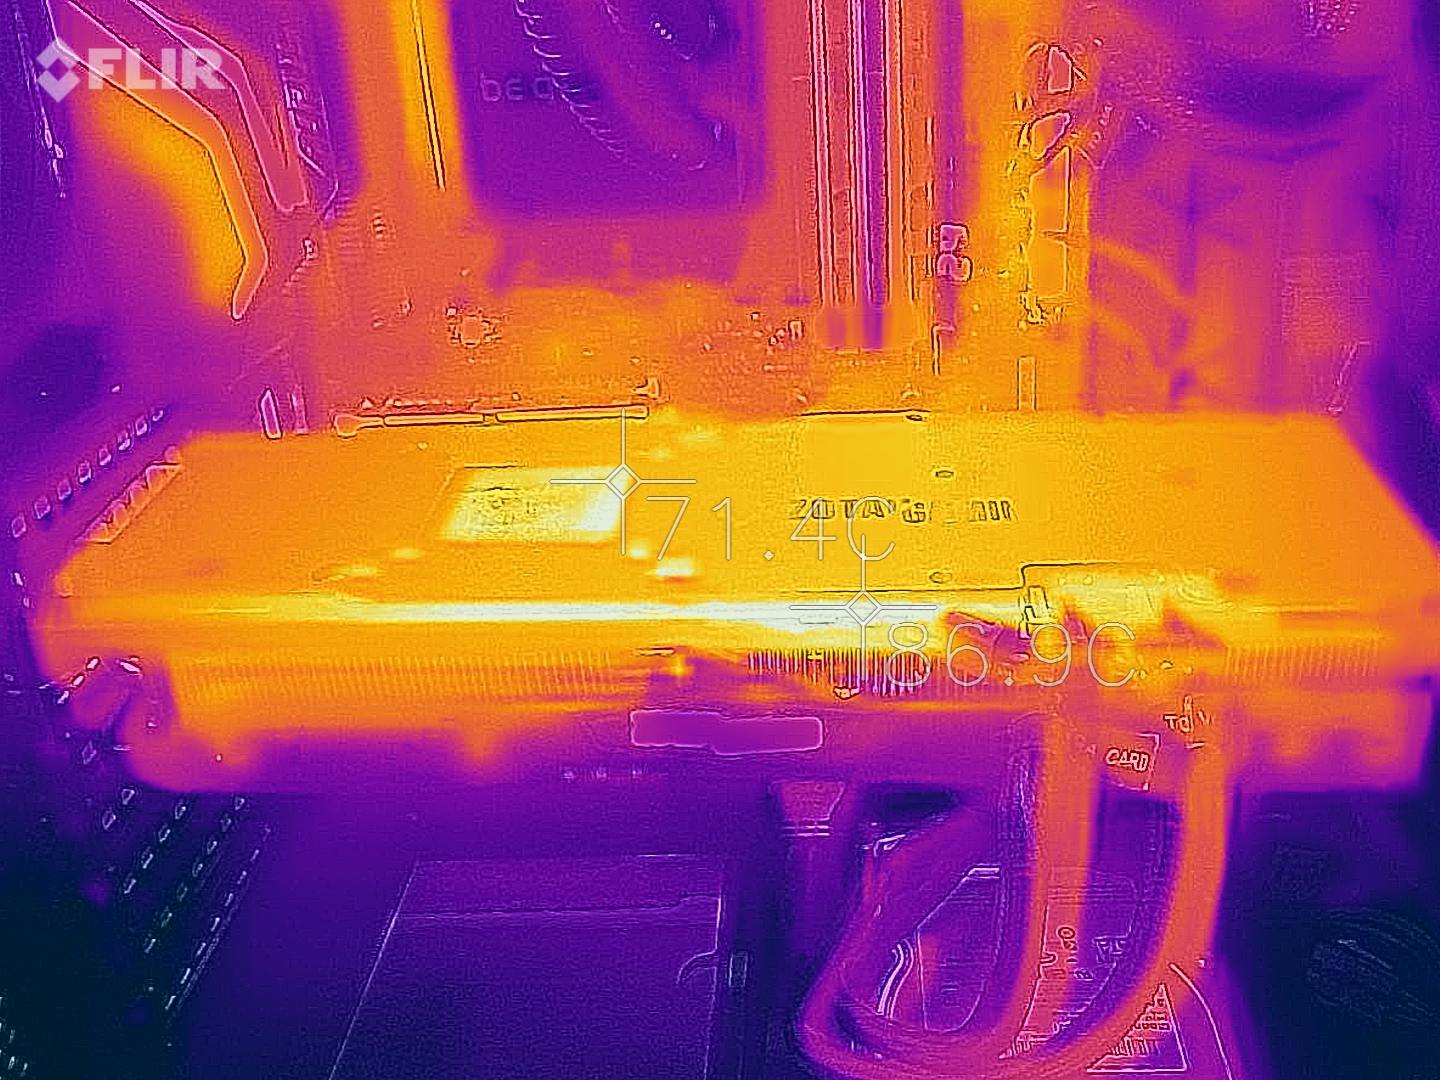
Zotac has optimised the AMP Extreme’s temperatures well. Even with its PT increased to 110%, GPU core temperatures remain below 70 °C (~158 °F). It is worth pointing out that the MSI RTX 2070 Gaming Z 8G gets slightly warmer at a maximum of 71 °C (~160 °F), but it runs audibly more quietly. The Zotac has three 90 mm fans to the MSI’s two 100 mm fans, for reference.
The bottom line is that the Zotac card gets slightly louder under load than the MSI. The Zotac does not get annoyingly loud though.
| Power Consumption - 1920x1080 The Witcher 3 ultra (external Monitor) | |
| Nvidia Titan RTX | |
| AMD Radeon RX Vega 64 (Idle: 74.3 W) | |
| MSI RTX 2080 Gaming X Trio (Idle: 87.78 W) | |
| Nvidia GeForce GTX 1080 Ti Founders Edition (88 fps, Idle: 70.3 W) | |
| Zotac GeForce RTX 2070 AMP Extreme (Idle: 80.48 W) | |
| XFX AMD Radeon RX 590 OC+ 8 GB | |
| MSI RTX 2070 Gaming Z 8G (Idle: 73.3 W) | |
| AMD Radeon VII (Idle: 81.39 W) | |
| Asus ROG Strix RTX 2070 OC | |
| Nvidia GeForce GTX 1080 Founders Edition (Idle: 68.3 W) | |
| MSI RTX 2060 Gaming Z 6G (Idle: 74.66 W) | |
| Nvidia GeForce GTX 1070 Founders Edition (Idle: 68 W) | |
* ... smaller is better
Overclocking
Despite the AMP Extreme delivering impressive results in synthetic benchmarks and gaming tests, we still tried to squeeze some more power out of Zotac’s card. Raising the PT to 110% allows the AMP Extreme to consume up to 247.5 W, which is correspondingly 22.5 W higher than with the card set to a PT of 100%. We would recommend setting the GPU to PT 110% if you want to overclock it.
Even having increased its PT by 10%, our test device could only manage an 80 MHz overclock on GPU speeds, and an 800 MHz overclock on its VRAM. Both are rather underwhelming overclocks, especially as the Samsung VRAM used in the MSI RTX 2070 Gaming Z 8G can reach higher clock speeds than the Micron VRAM in our test device can.
This overclock yielded between 2 to 5% performance gains, but you may not even notice the difference in games. The large heat sink and three 90 mm fans had no problems with keeping the card cool even when overclocked though.
Manual overclocking is and remains a lottery. The quality of graphics chips is always different, so manufacturers set all chips at a determined safe level that they should all be able to stably reach. Some can run at higher clock speeds and voltages than others, so there is no guarantee that our experiences with overclocking the AMP Extreme will be the same as yours. We may have received an excellent chip or one that can handle hardly any overclocking, but there is no way to find out without testing multiple chips. The same applies to the VRAM. Given that Zotac factory overclocks the AMP Extreme at the factory, it is unsurprising that we only achieved minor gains with additional manual overclocking.
Pros
Cons
Verdict
Zotac currently charges around €570 (~$640) for the GeForce RTX 2070 AMP Extreme. While this is a touch expensive, you are getting the most powerful RTX 2070 on the market. There are compromises associated with this additional performance, like a significantly increased power consumption and fans that get louder than those on other factory overclocked RTX 2070 cards, but the Zotac offers a consistently better gaming experience than its contemporaries.
Like all RTX 2070 cards, the AMP Extreme also has 8 GB of GDDR6 VRAM, which should be enough for playing modern triple-A titles in 2019. However, rivals such as the Radeon VII look better futureproofed with 16 GB of VRAM. This is purely speculative at this stage though, and 8 GB could still be plenty of VRAM in a few years depending on how well games are optimised.
Nevertheless, the AMP Extreme delivers an exceptional gaming performance for an RTX 2070 and can play all games in 1440p comfortably at maximum graphics. The card also handles gaming in 2160p well too, but you will need to reduce the graphics in games such as "Anno 1800" to achieve playable framerates.
The Zotac GeForce RTX 2070 AMP Extreme is the fastest RTX 2070 that money can currently buy. The card may be more expensive than its contemporaries, but it delivers the performance to justify its increased price.
The target group for Zotac here is clearly gamers who like gaming in 1440p and beyond. An RTX 2070 card for 1080p gaming would be overkill though. If you fall into the latter category, then we would recommend picking up an RTX 2060 or a GTX 1660 Ti instead.
The only drawbacks of the AMP Extreme are its worse balance between performance and power requirements. Zotac’s factory overclocked card delivers better performance than its Founder Edition counterpart, but not necessarily by enough to justify its increased power consumption. The AMP Extreme’s fans do not get annoyingly loud either, but they are noticeably more eager than even the ones in the MSI RTX 2070 Gaming Z 8G.
Overall, the Zotac GeForce RTX 2070 AMP Extreme is the pinnacle of RTX 2070 gaming. Whether the added performance is worth its higher price, increased power consumption and louder fans is up for debate though.

