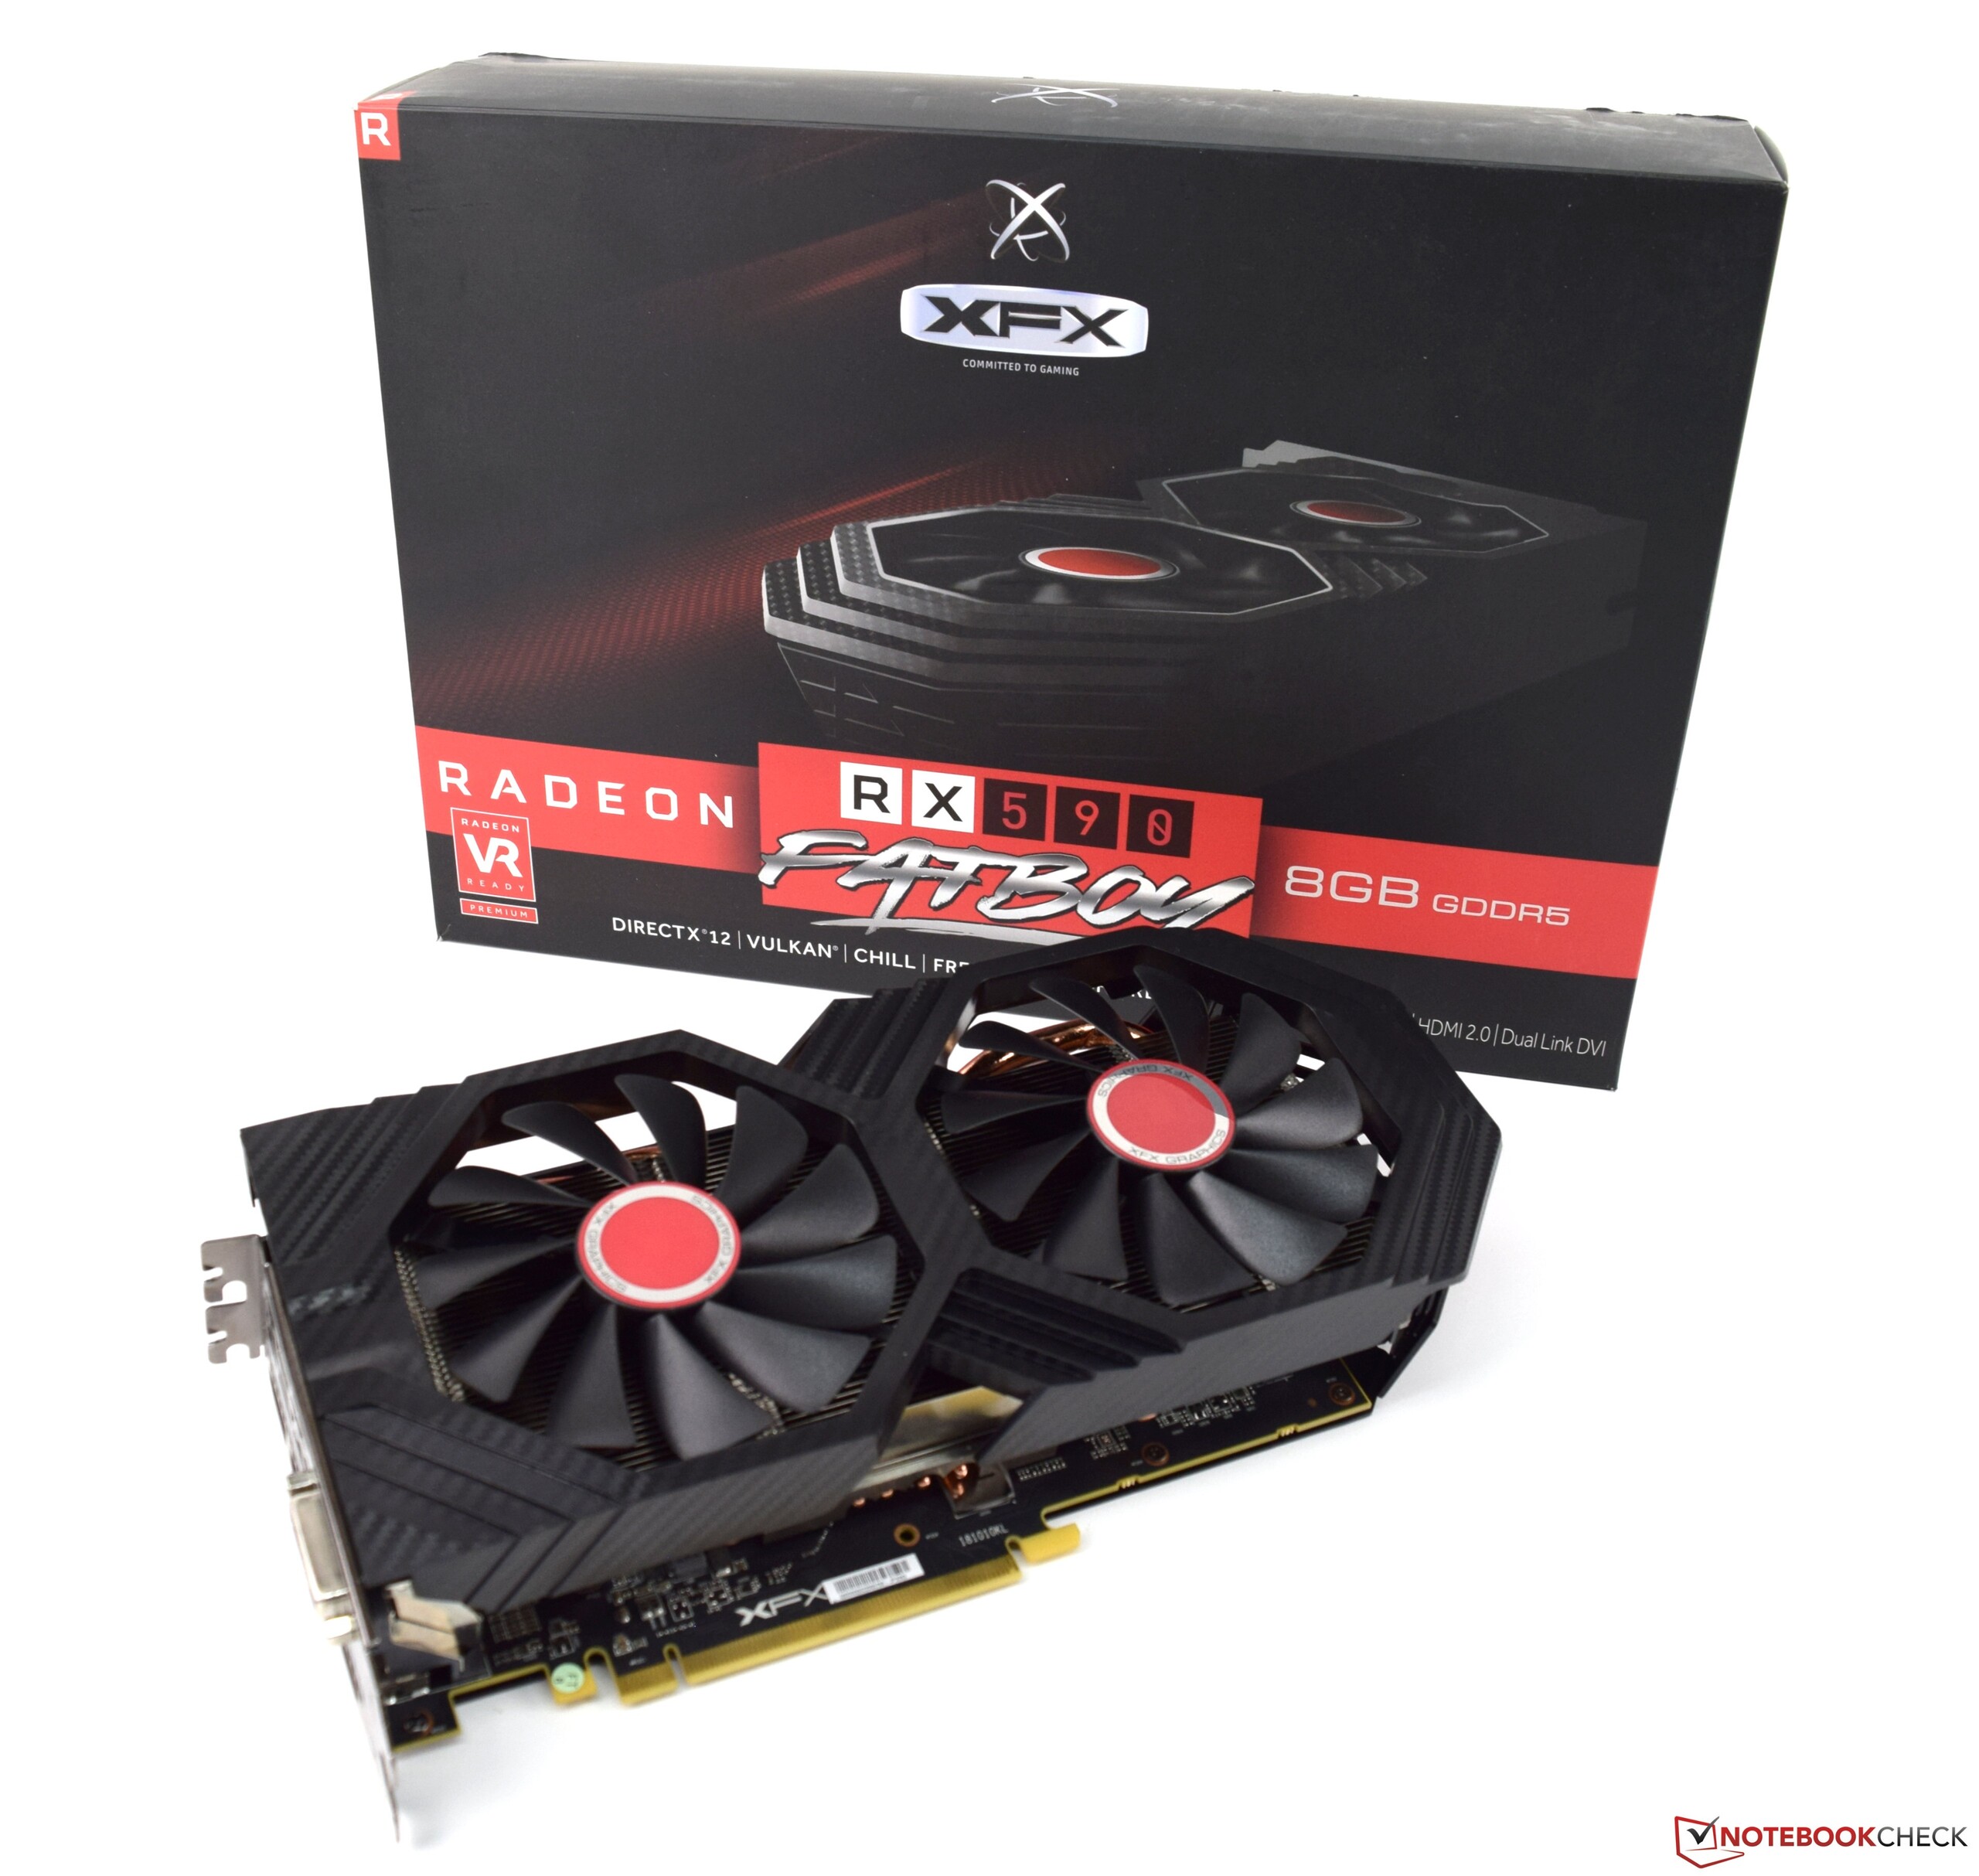
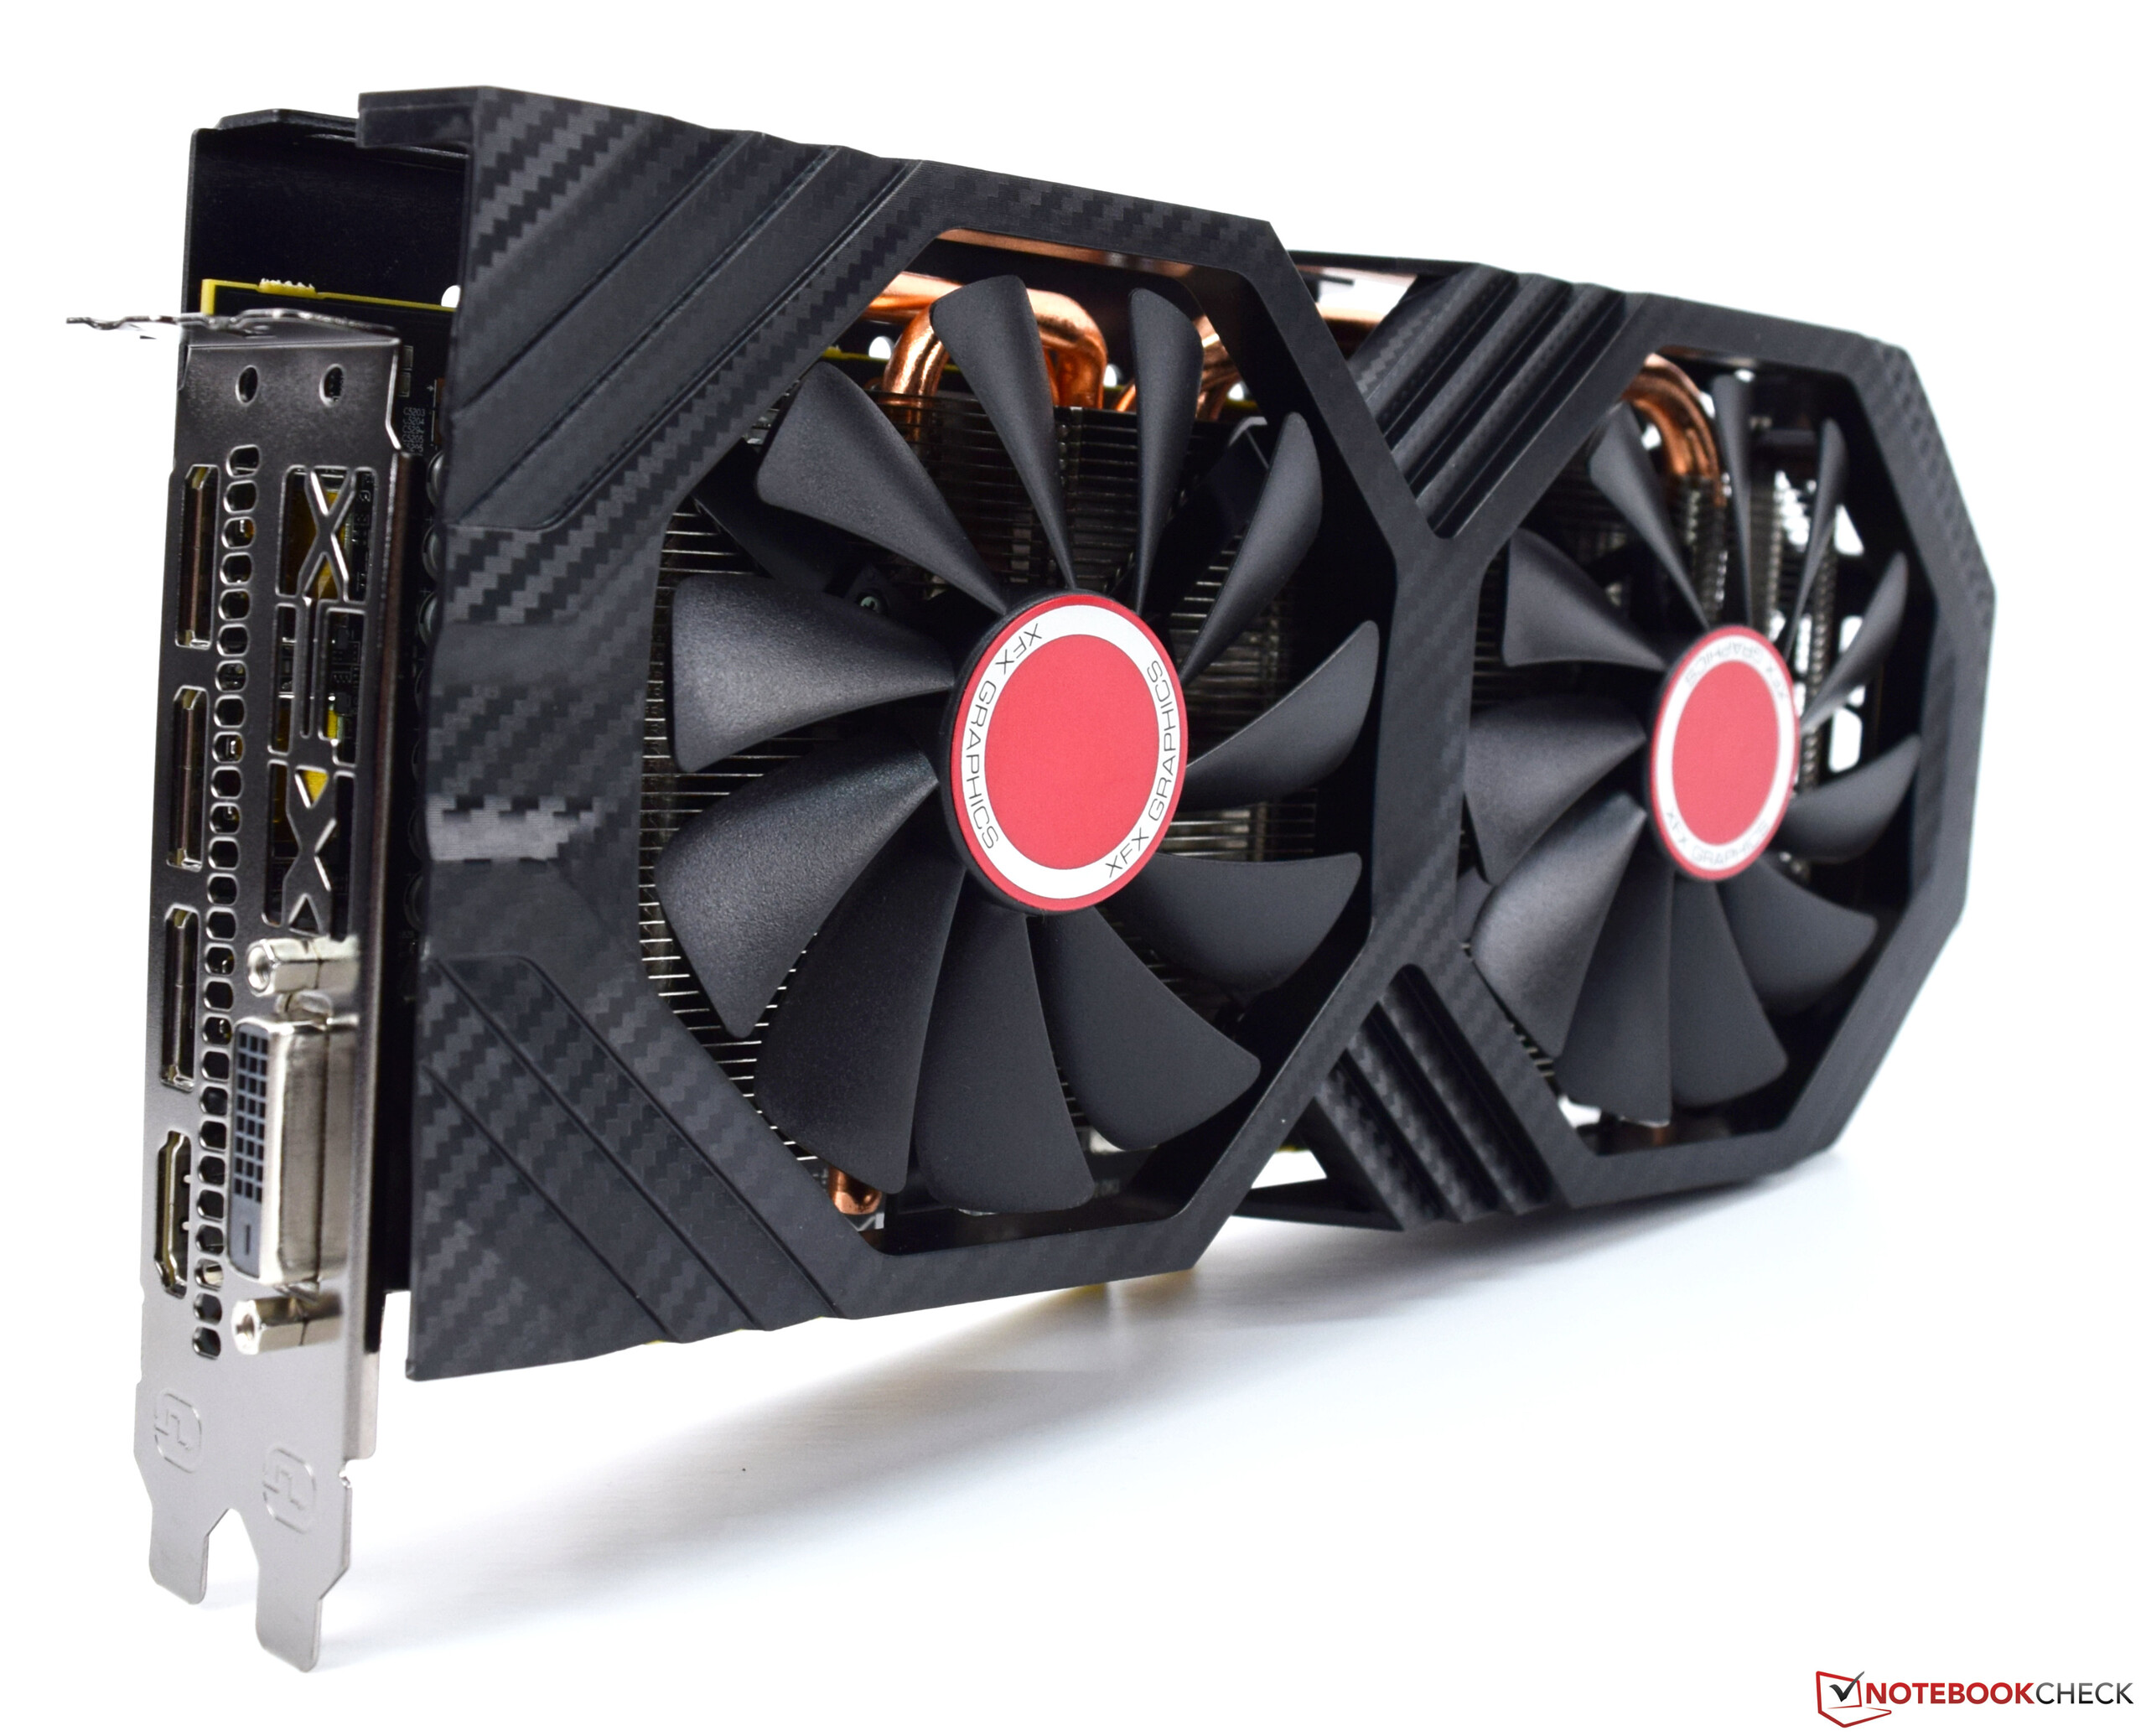
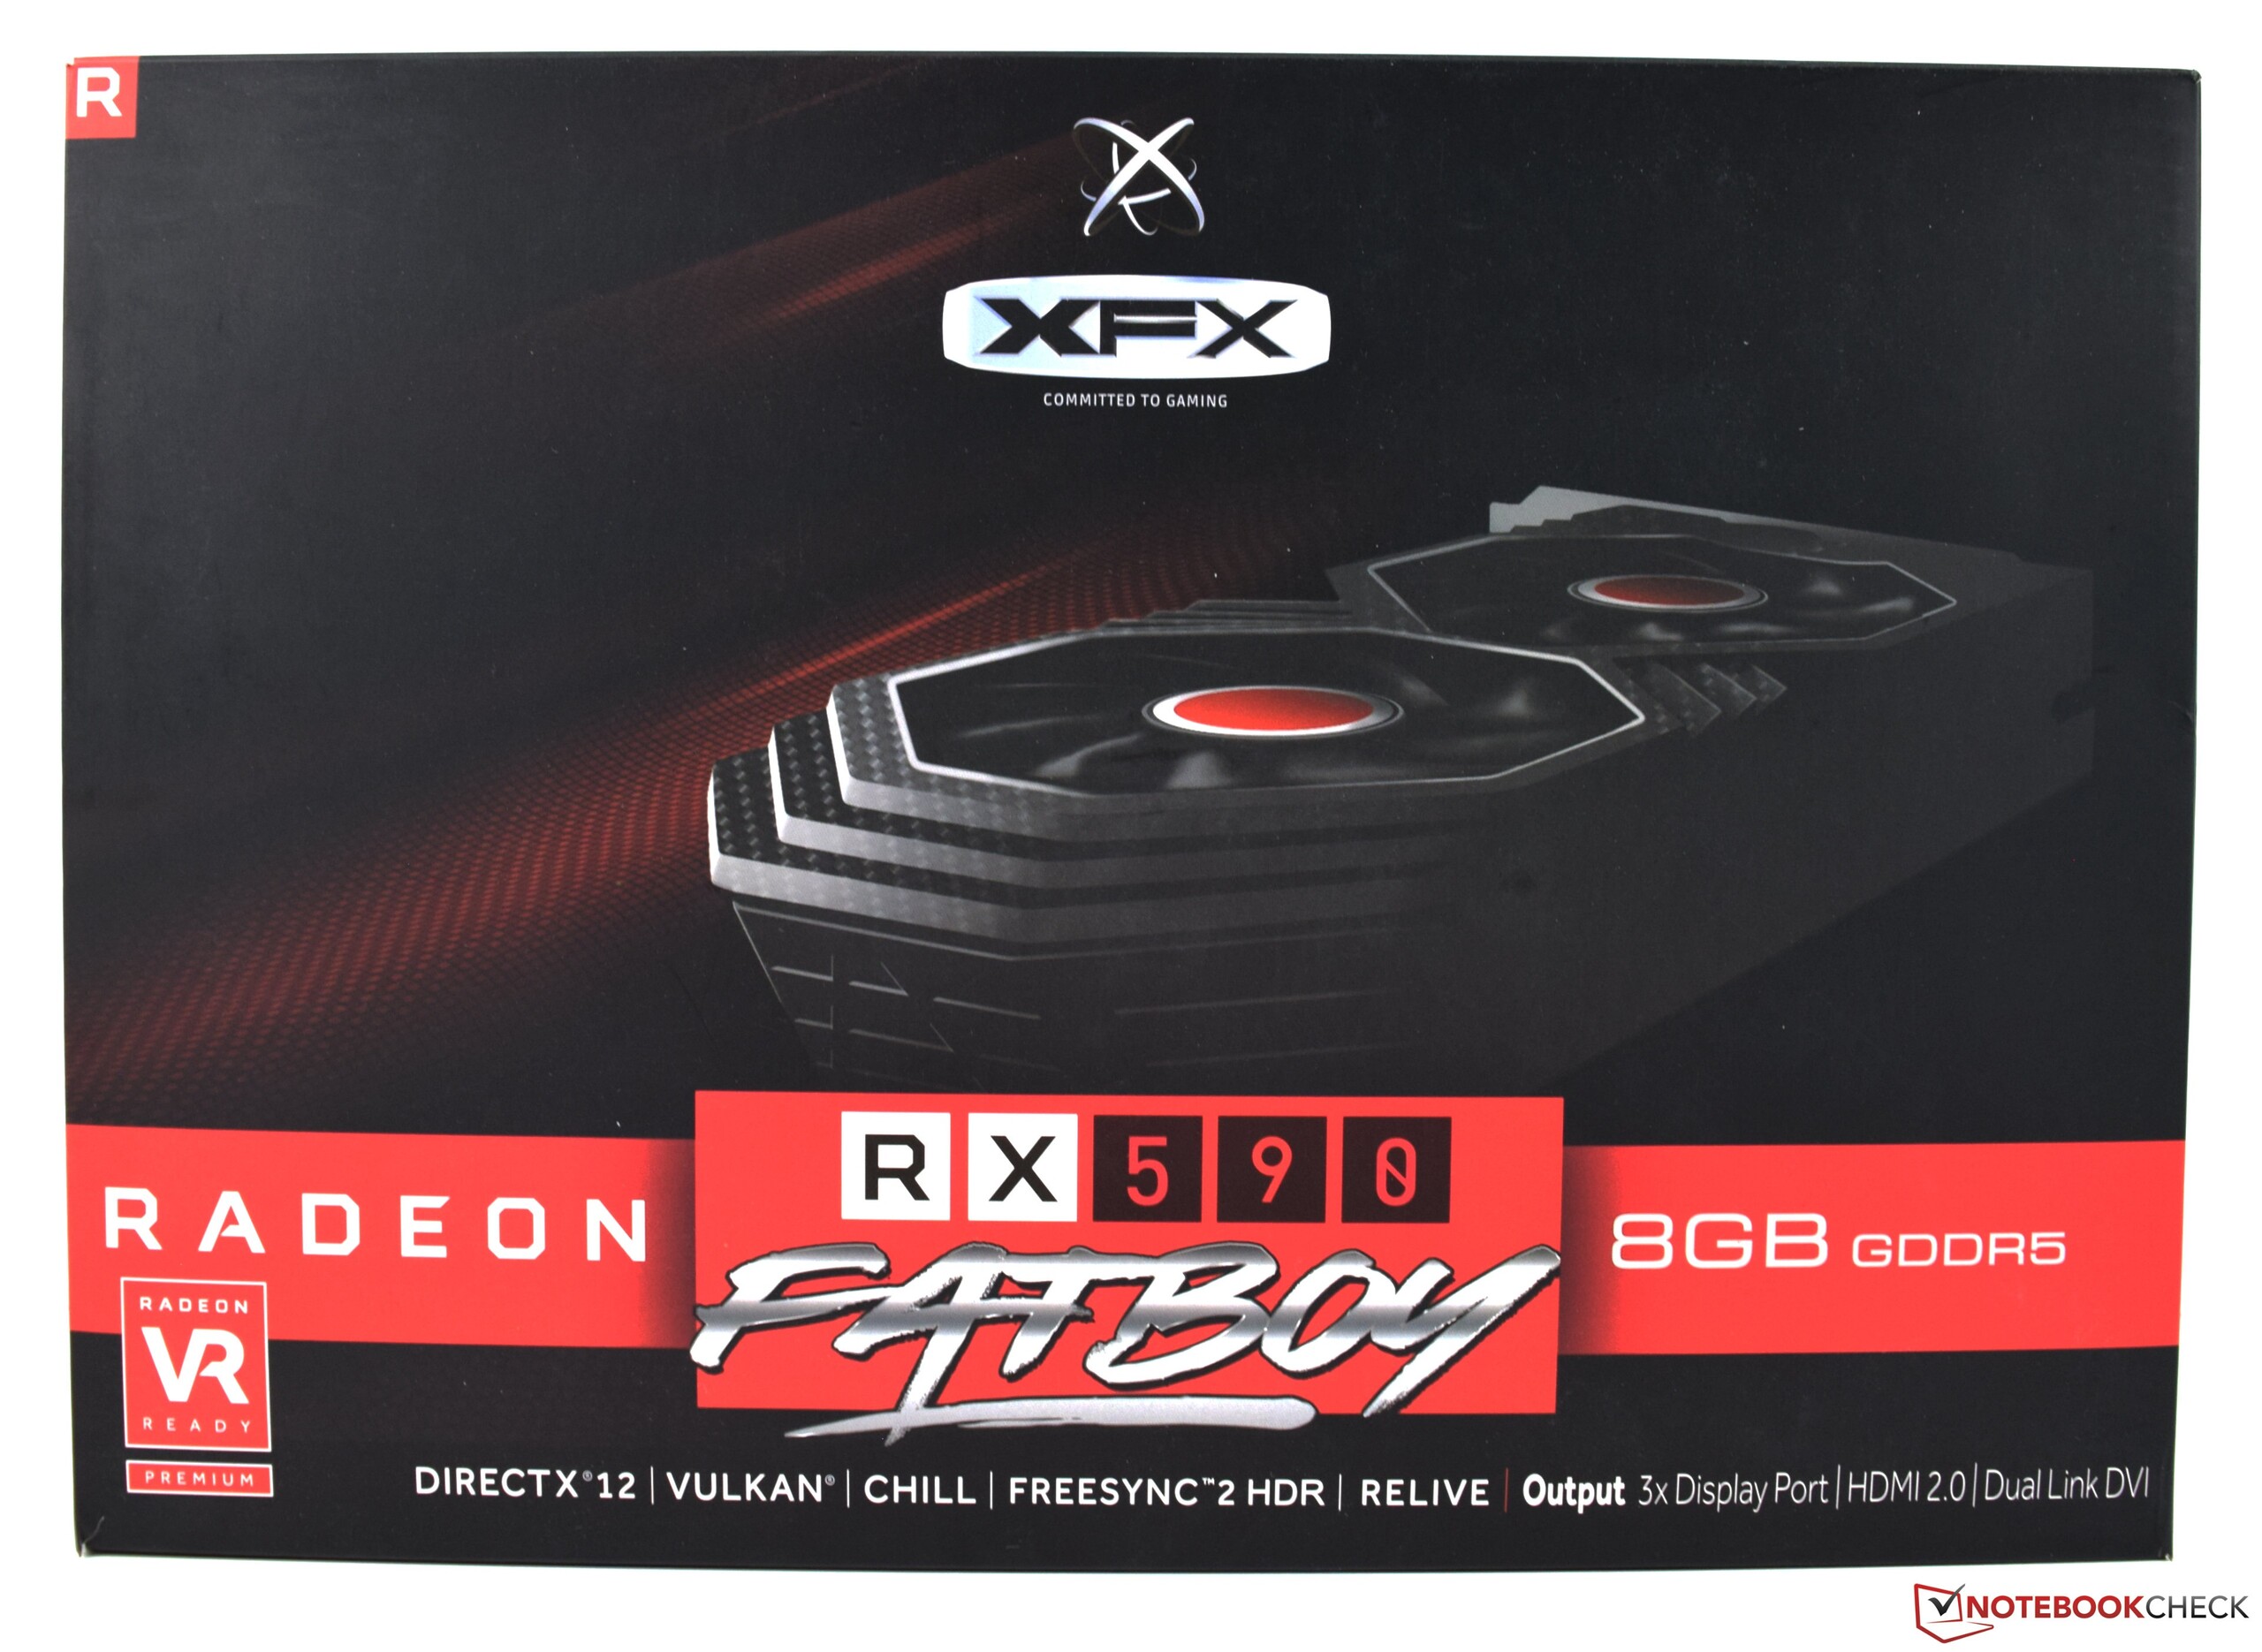
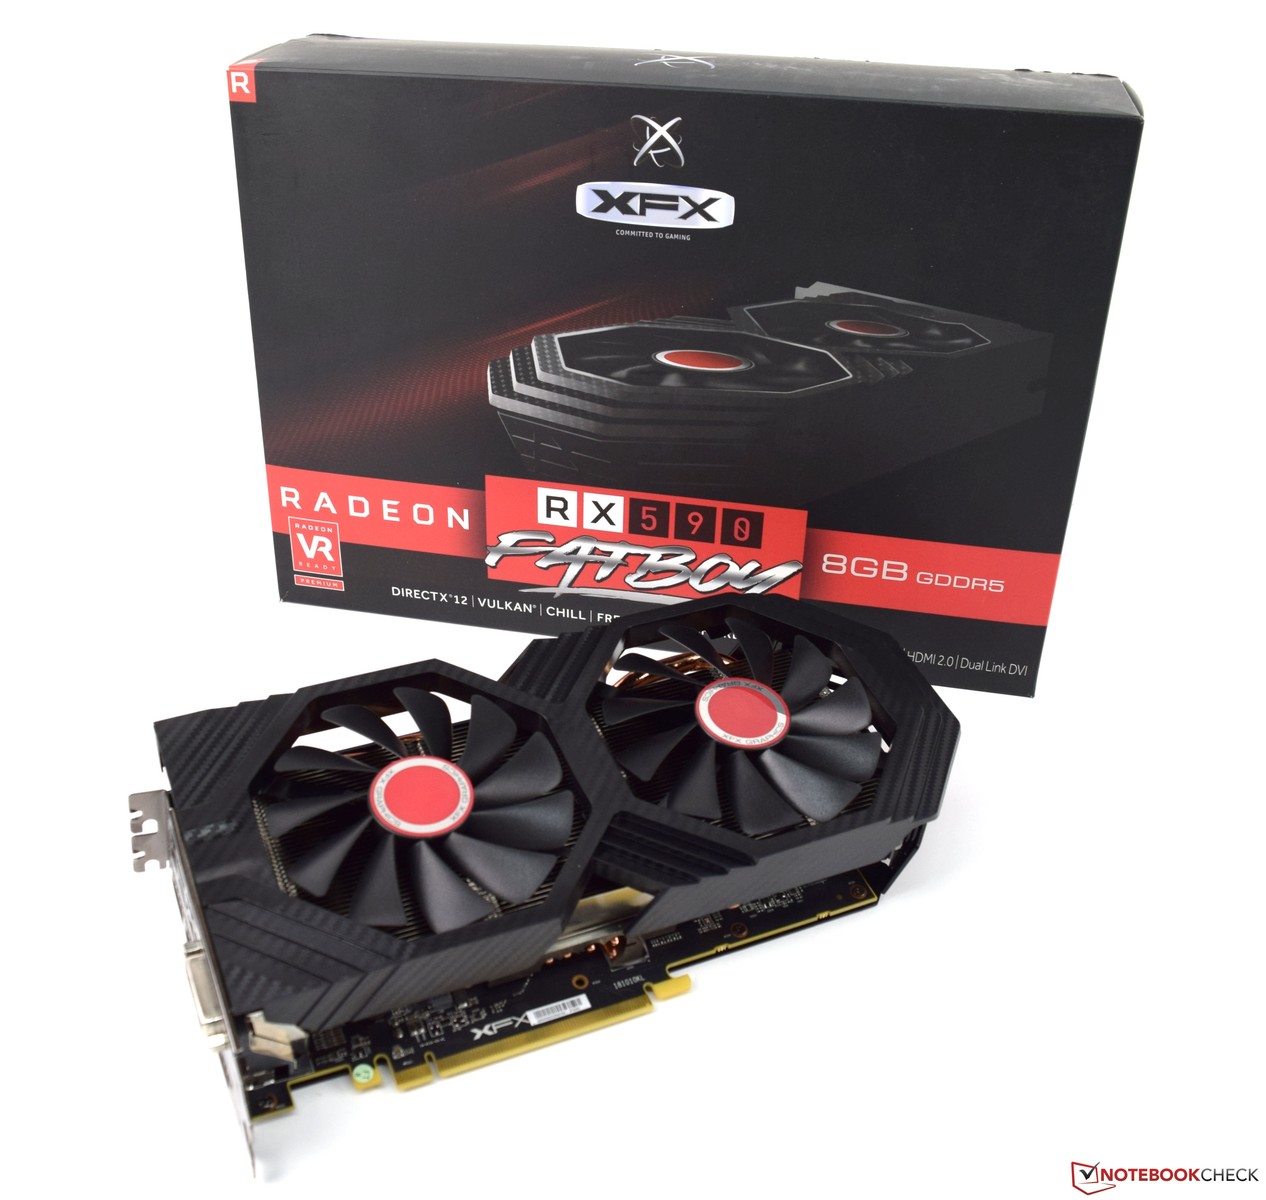
XFX Radeon RX 590 Fatboy OC+ 8GB Desktop GPU Review
Following Nvidia presenting its RTX graphics cards at Gamescom this year, many were hoping for AMD to come up with a high-end competitor by the end of this year. This has not happened. Instead, AMD has created a new Polaris chip - the RX 590. This is their first chip produced in the 12-nm process by GlobalFoundries. Compared to Polaris 20, the new chip named Polaris 30 offers significantly higher clock rates that result in higher performance. At a base clock rate of 1469 MHz, today's test chip clocks 212 MHz above the reference clock rate of the Radeon RX 580. The turbo clock rate is 205 MHz higher as well and reaches 1545 MHz according to technical specifications.
The VRAM has remained the same at 8 GB of GRDDR5 and so do its clock rates. AMD does not offer a 4-GB version of this model, which we feel makes sense.
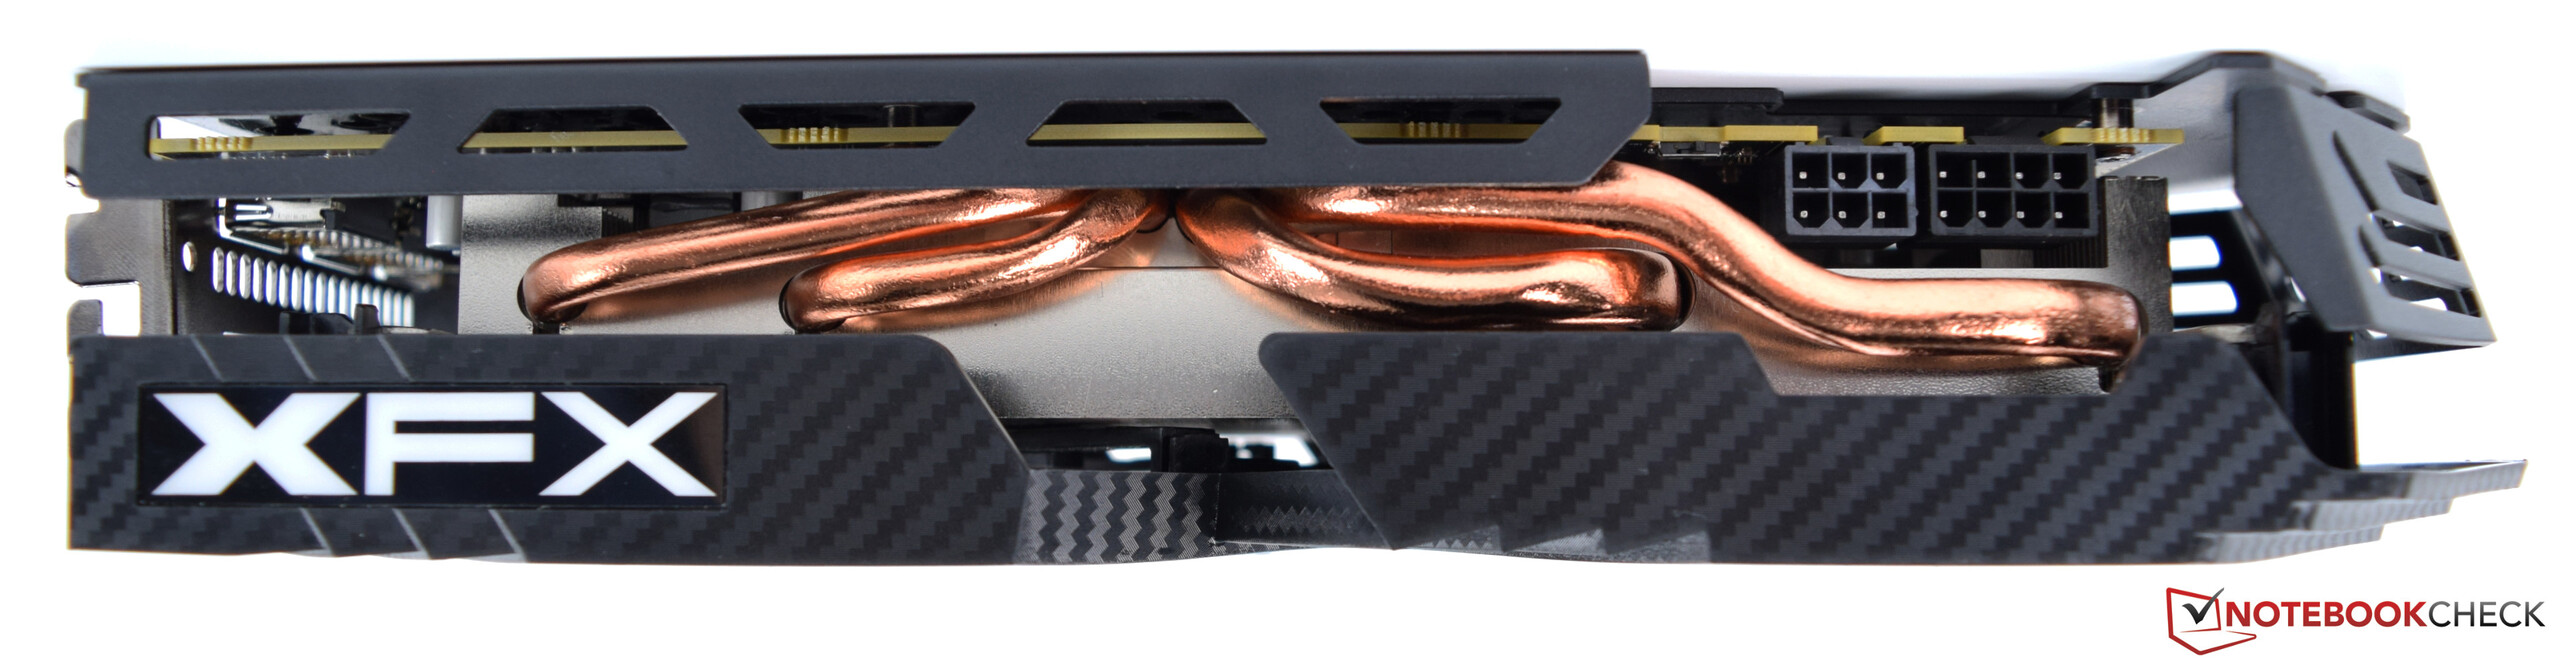
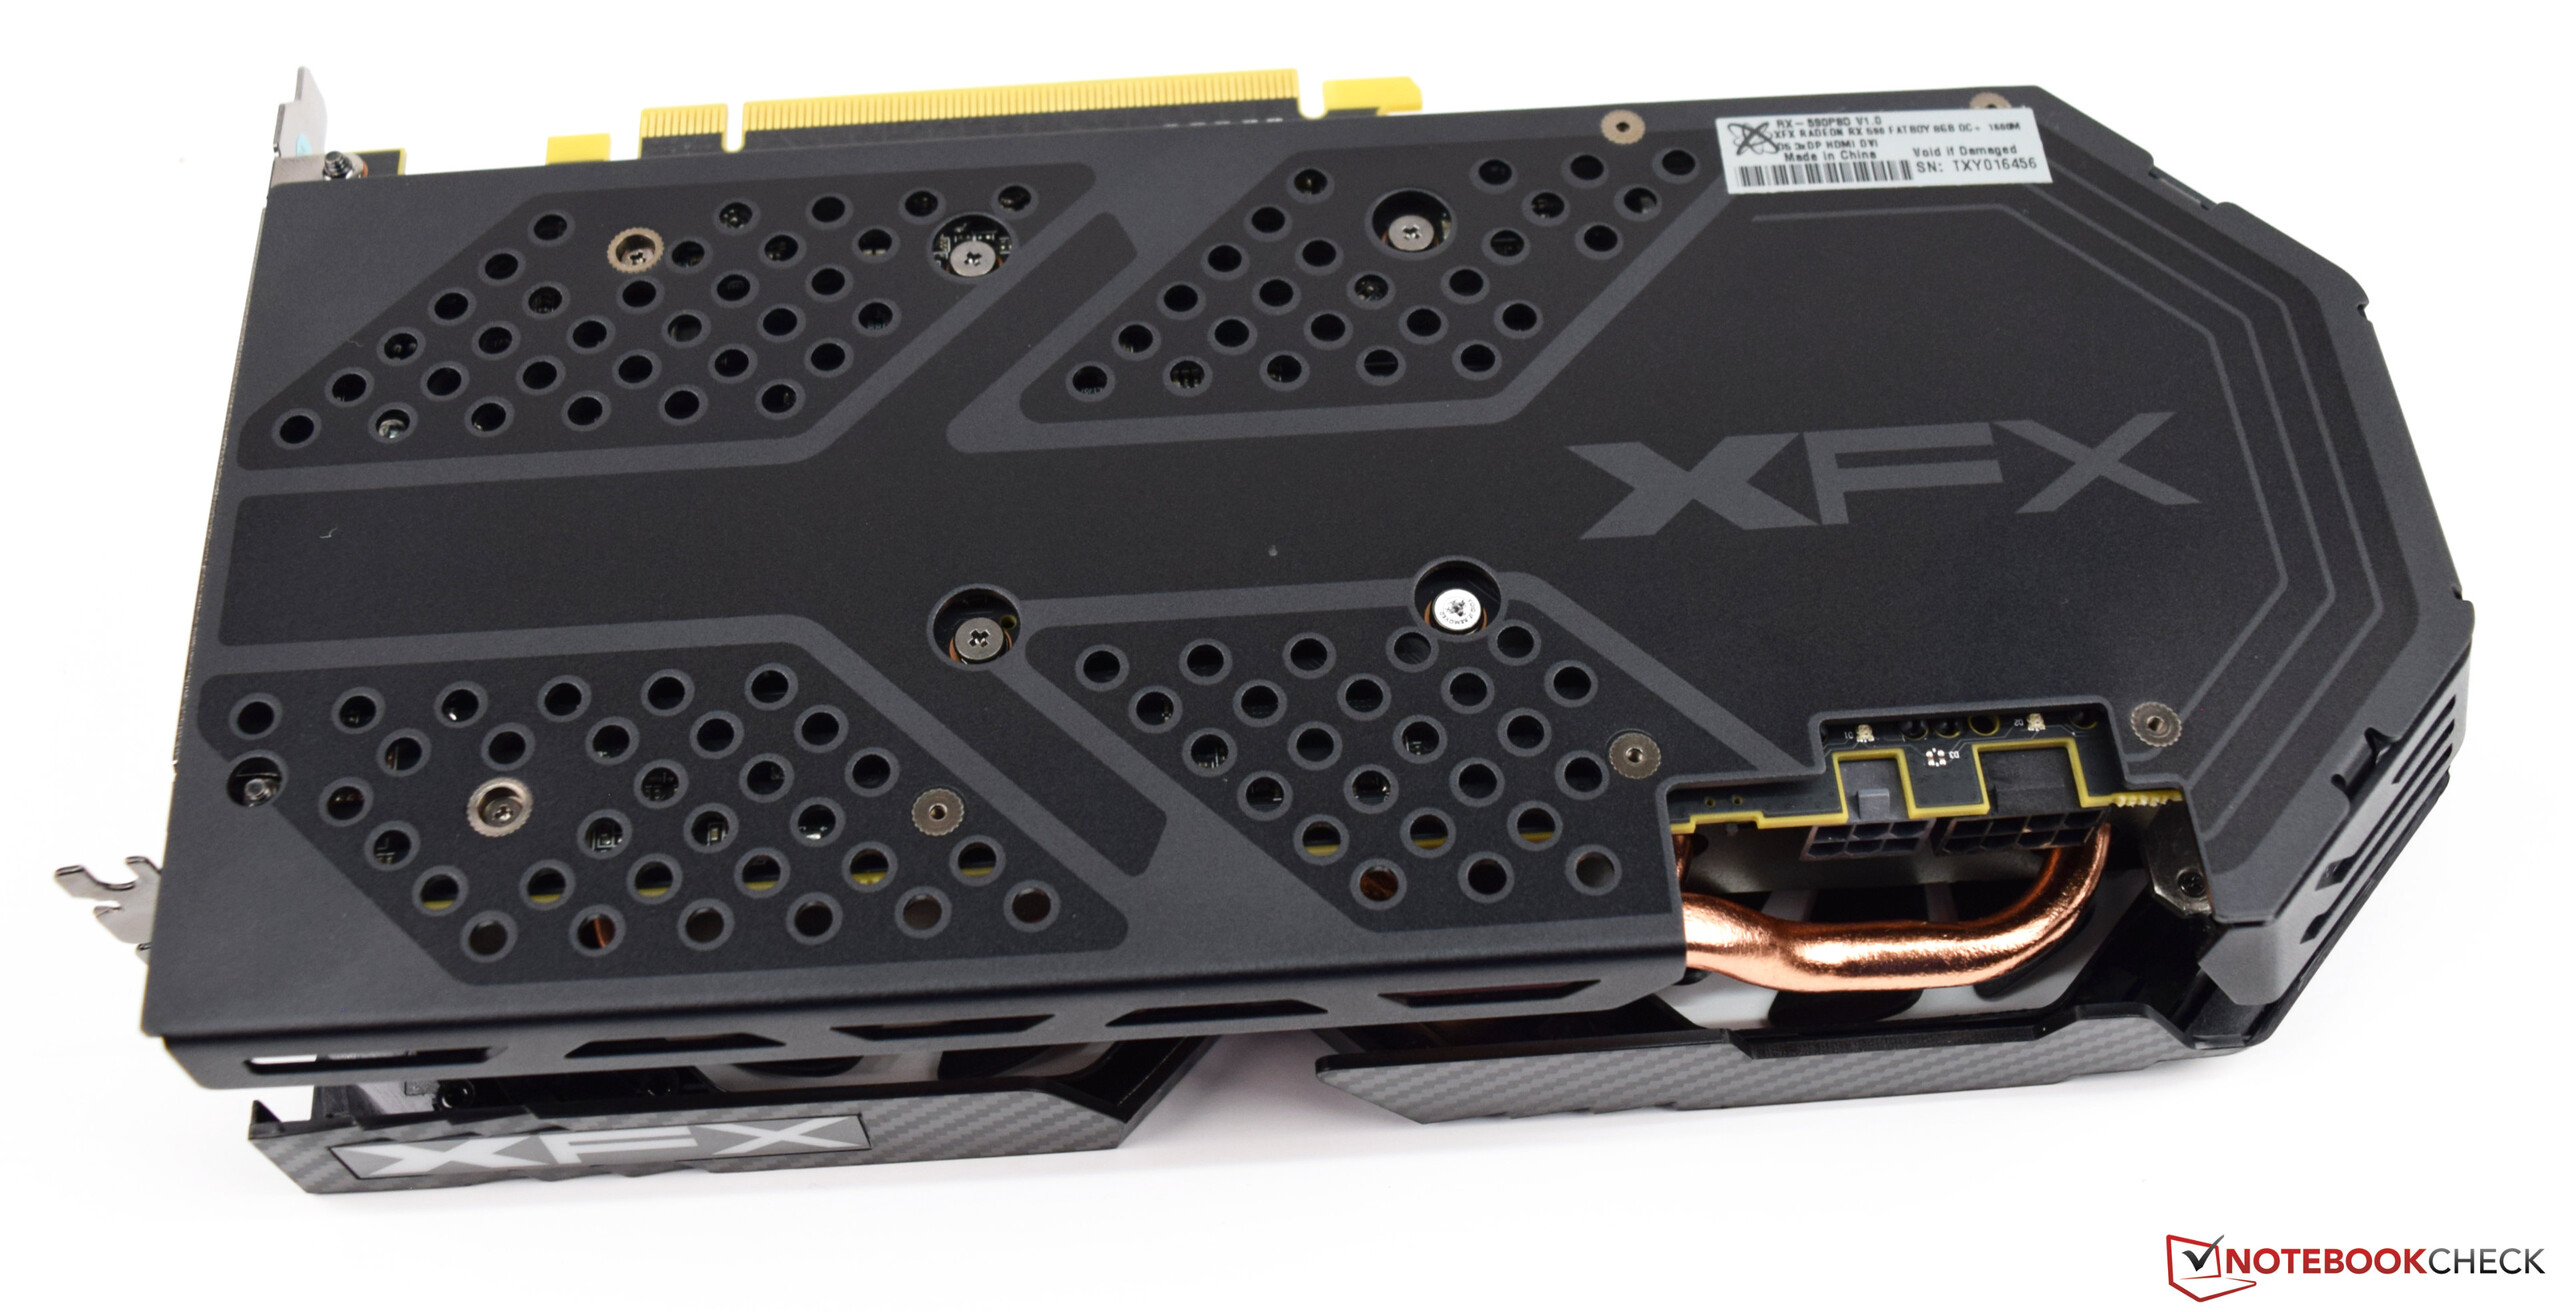
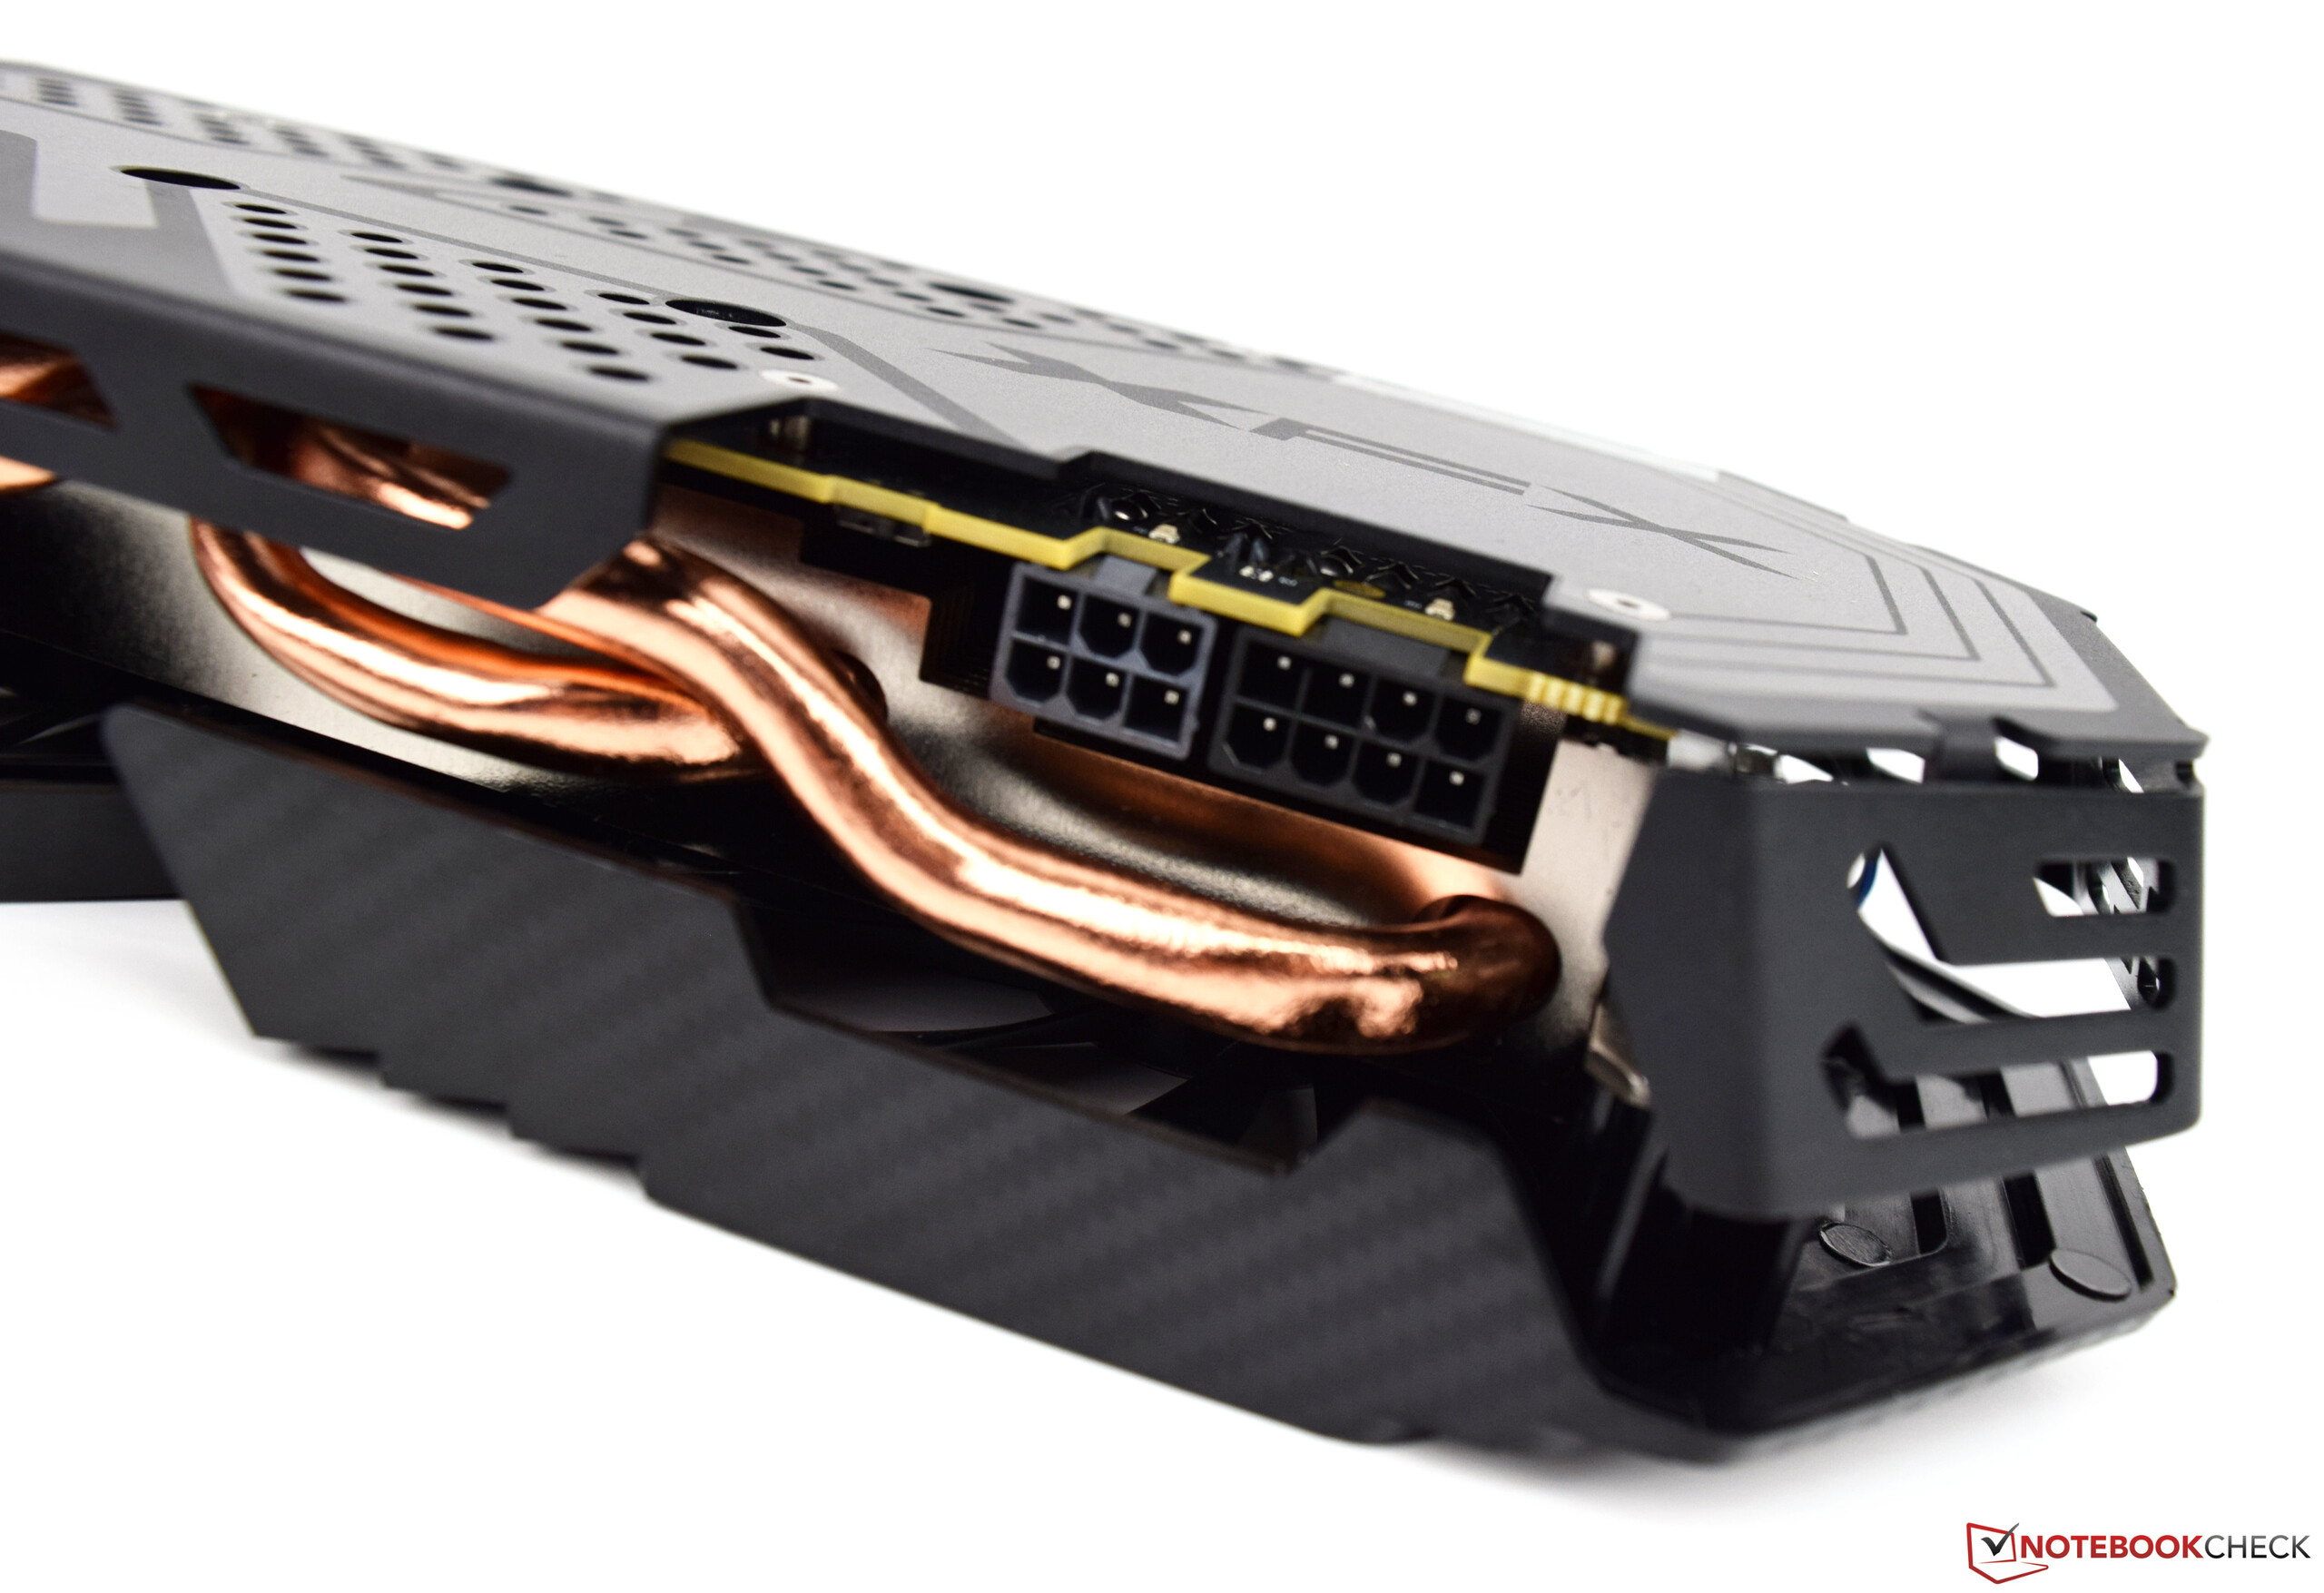
Our test version is the Fatboy OC+ edition from XFX and offers even higher clock rates ex-works. The manufacturer claims GPU clock rates of 1600 MHz, which signifies a significant increase compared to the reference clock. In addition, the graphics card requires another 6-pin and 8-pin power connector in order to cover the model's energy needs.
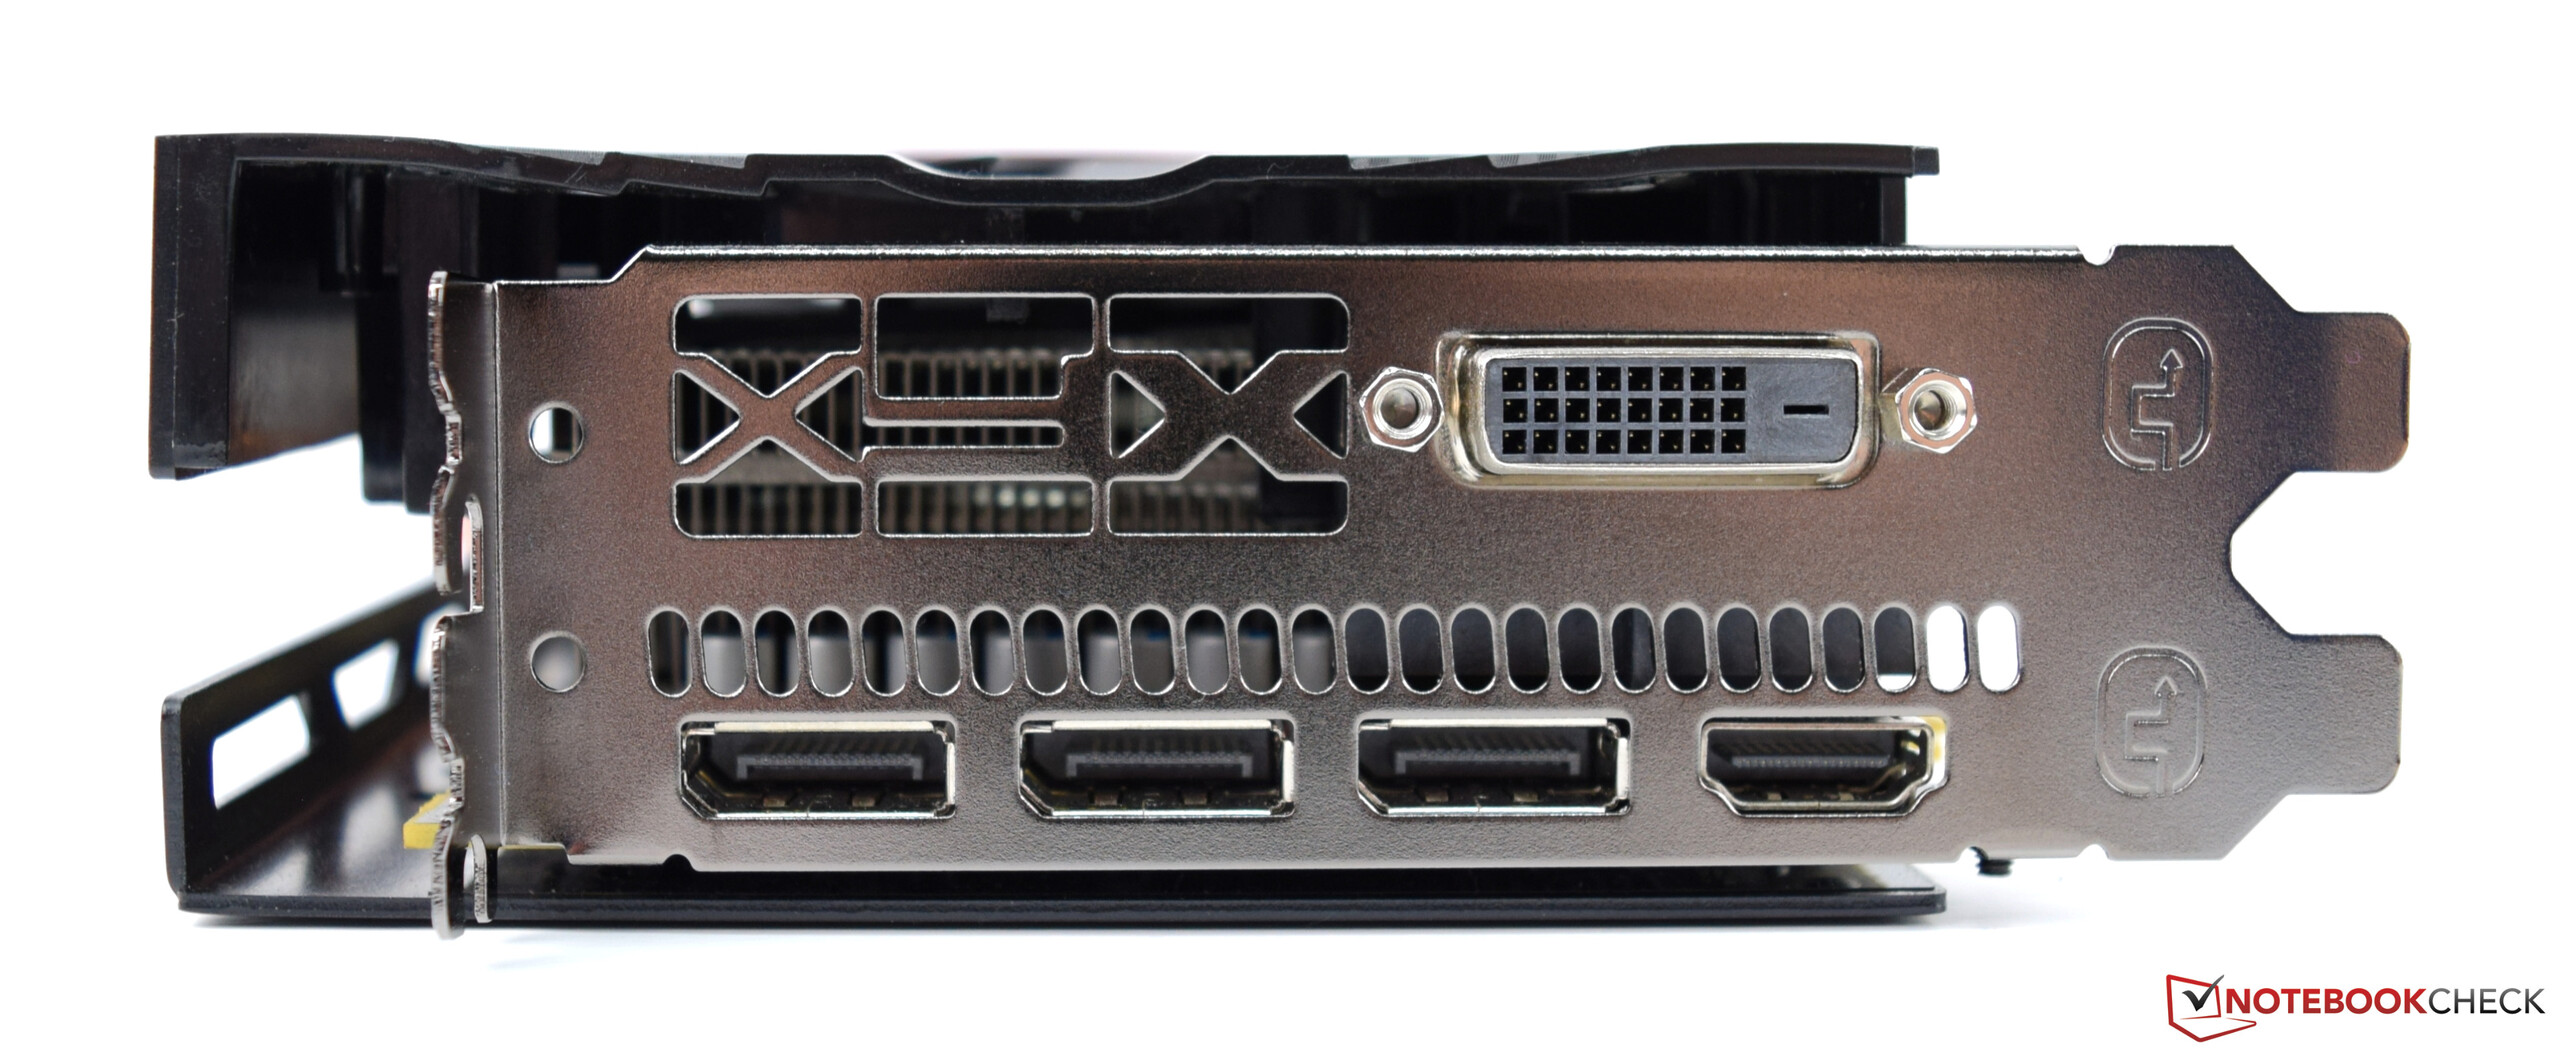
The XFX Radeon RX 590 Fatboy OC+ has a DL-DVI-D interface as well as three DisplayPort 1.4 ports and an HDMI 2.0b port with which you can connect external devices.
overview of GPU specifications
| Specifications | Radeon RX 590 | Radeon RX 580 | Radeon RX 480 | Radeon RX 570 | Radeon RX 470 | GTX 1060 FE | GTX 1070 FE | GTX 1080 FE |
| Chip | Polaris P30 | Polaris P20 | Polaris P10 | Polaris P20 | Polaris P10 | GP106 | GP104 | GP104 |
| Manufactured | 12 nm | 14 nm | 14 nm | 14 nm | 14 nm | 16 nm | 16 nm | 16 nm |
| Shader | 2304 | 2.304 | 2.304 | 2.048 | 2.048 | 1.280 | 1.920 | 2.560 |
| Texture Units | 144 | 144 | 144 | 128 | 128 | 80 | 120 | 160 |
| GPU Base Clock | 1469 | 1257 MHz | 1120 MHz | 1168 MHz | 926 MHz | 1506 MHz | 1518 MHz | 1607 MHz |
| GPU Boost Clock | 1545 | 1340 MHz | 1266 MHz | 1244 MHz | 1206 MHz | 1709 MHz | 1708 MHz | 1733 MHz |
| Memory Bus | 256 Bit | 256 Bit | 256 Bit | 256 Bit | 256 Bit | 256 Bit | 256 Bit | 256 Bit |
| Memory Bandwidth | 256 GB/s | 256 GB/s | 256 GB/s | 224 GB/s | 211.2 GB/s | 192 GB/s | 256 GB/s | 320 GB/s |
| Memory Size | 8 GB | 4 GB / 8 GB | 8 GB | 4 GB / 8 GB | 4 GB / 8 GB | 6 GB | 8 GB | 8 GB |
| Power (Watt) | 175 W | 185 W | 150 W | 150 W | 120 W | 120 W | 150 W | 180 W |
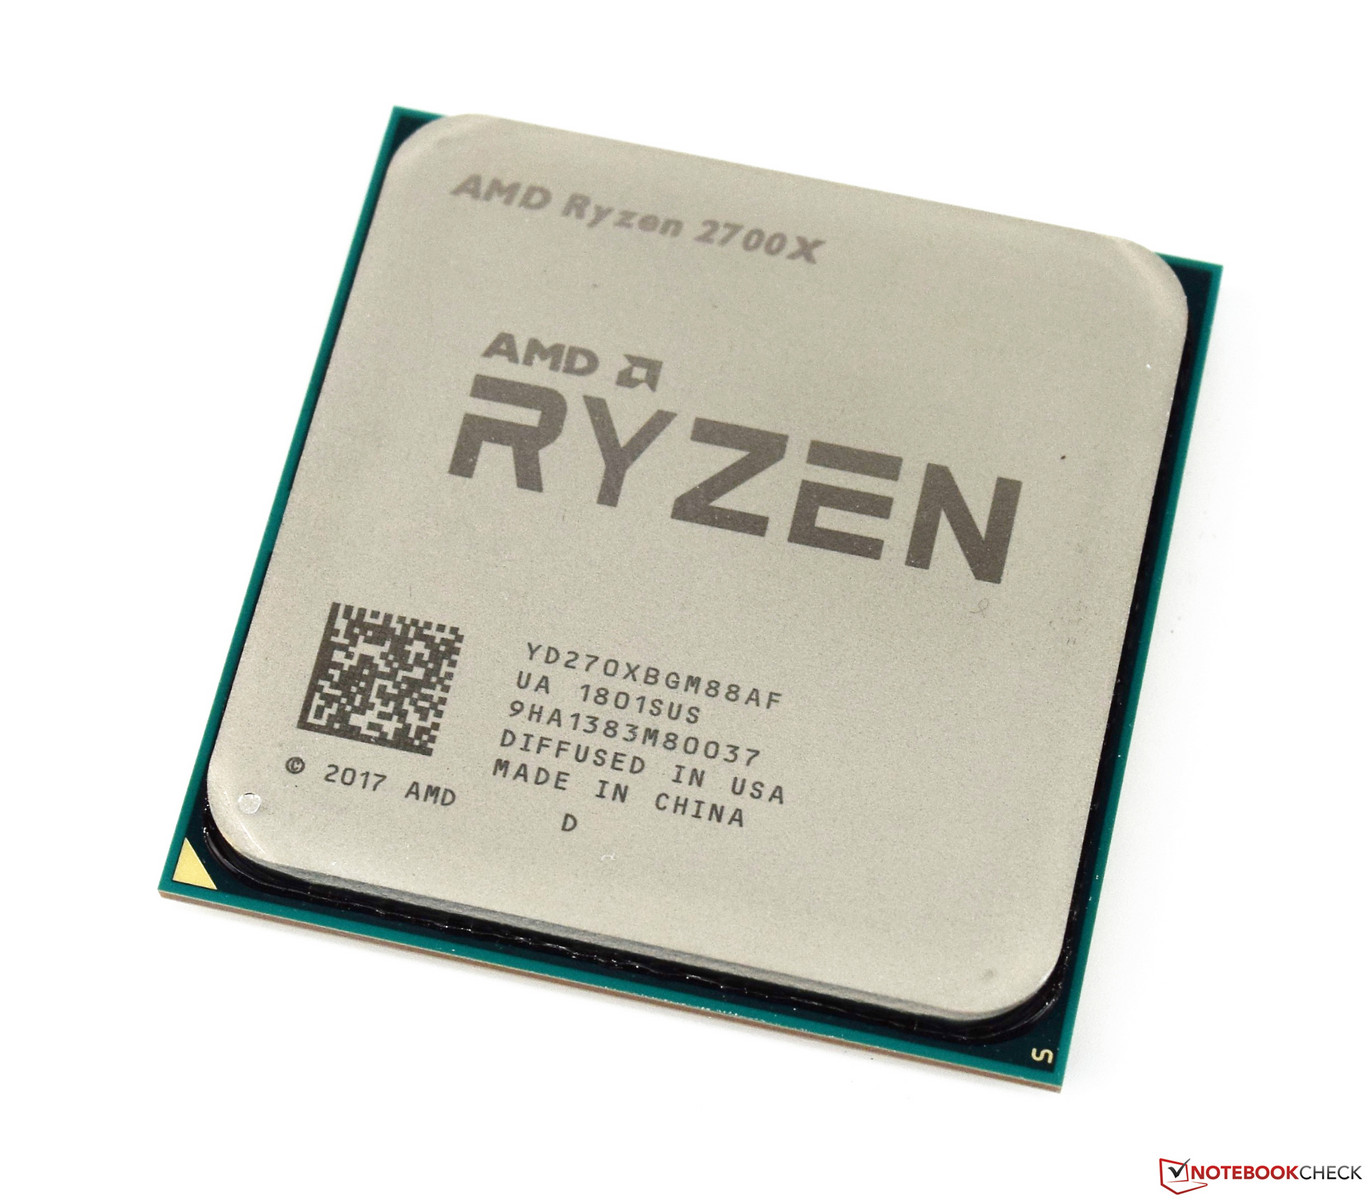
The Test Unit - Ryzen 7 2700X and X470
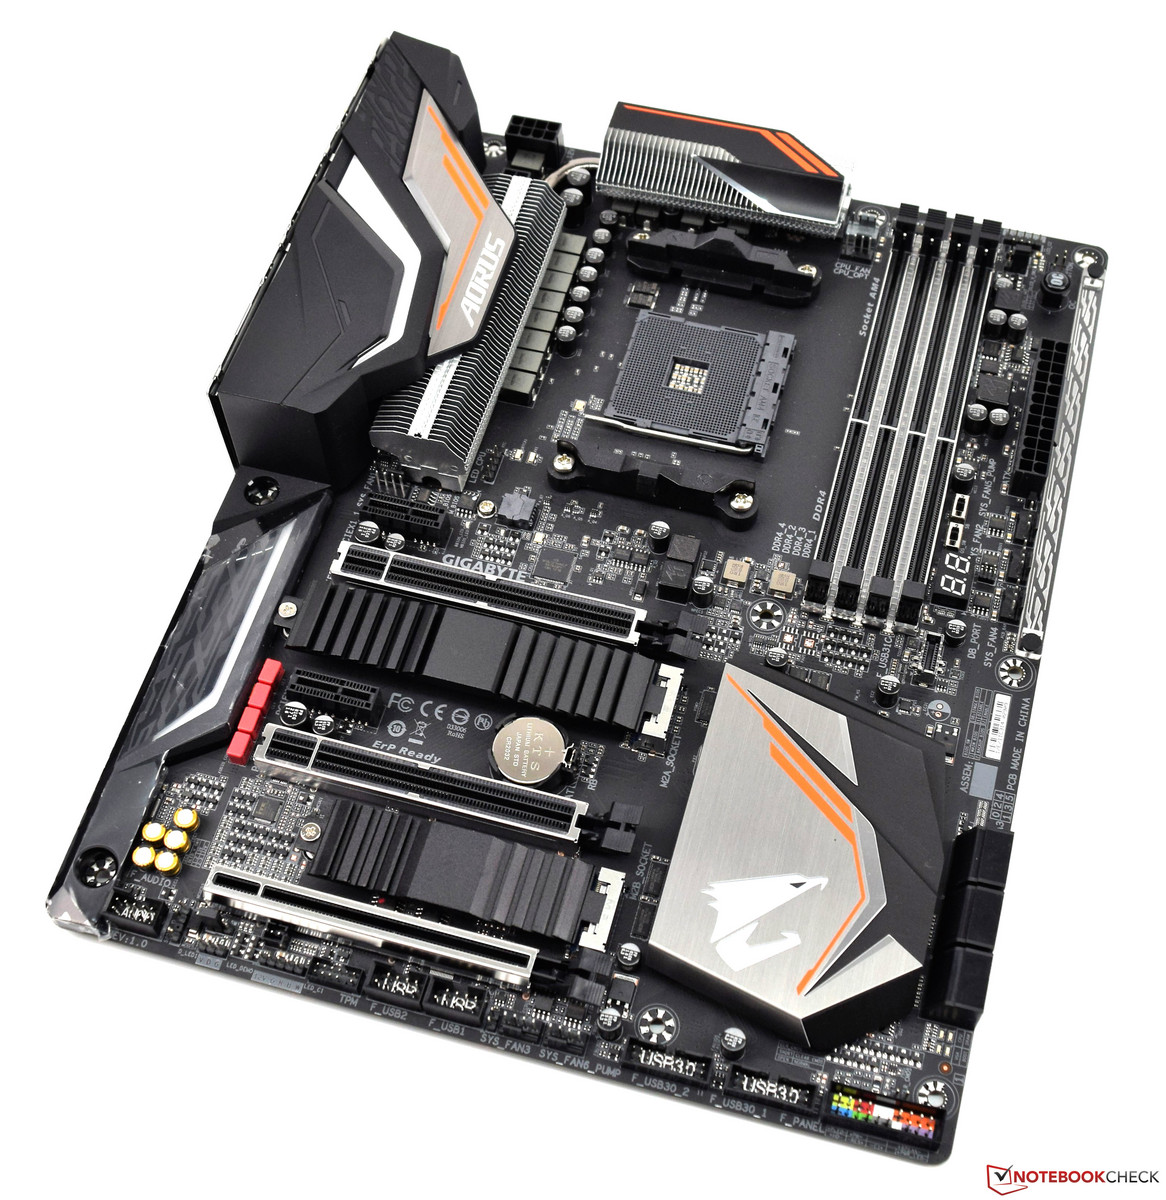
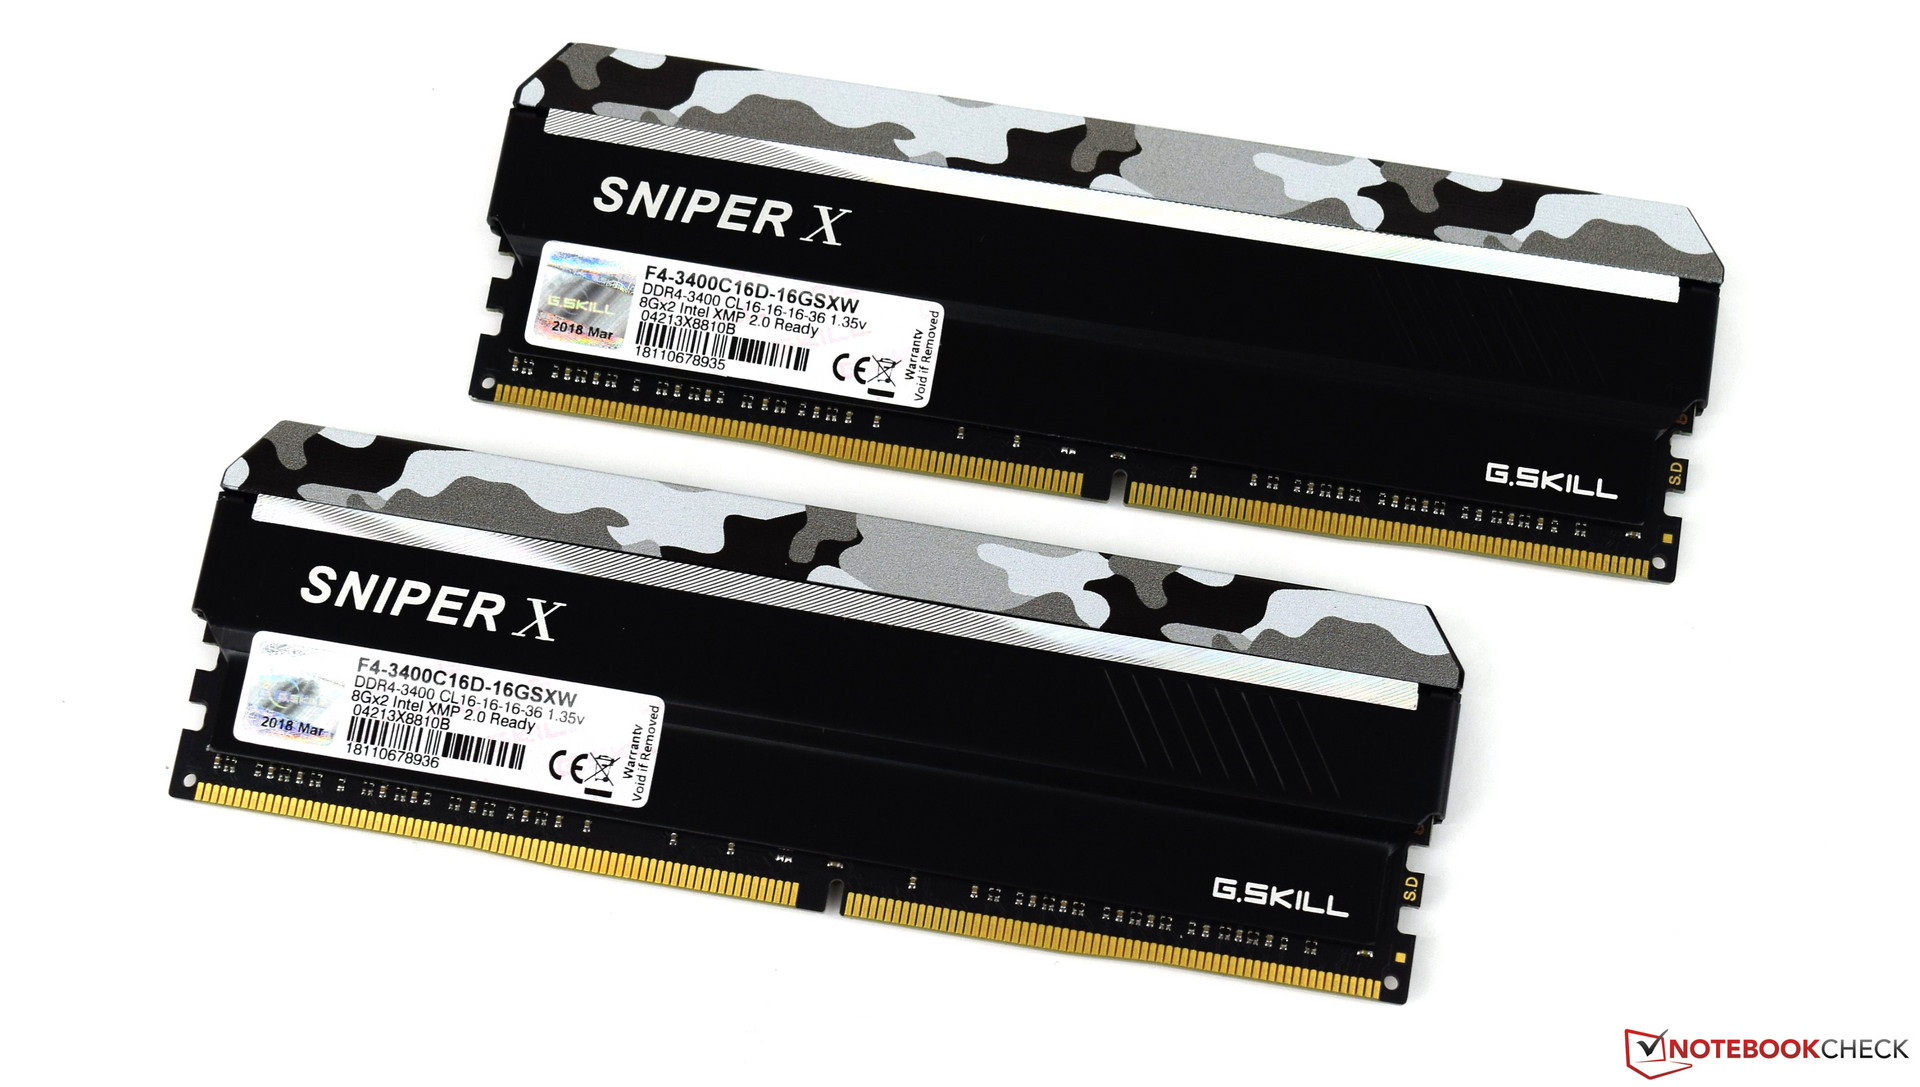
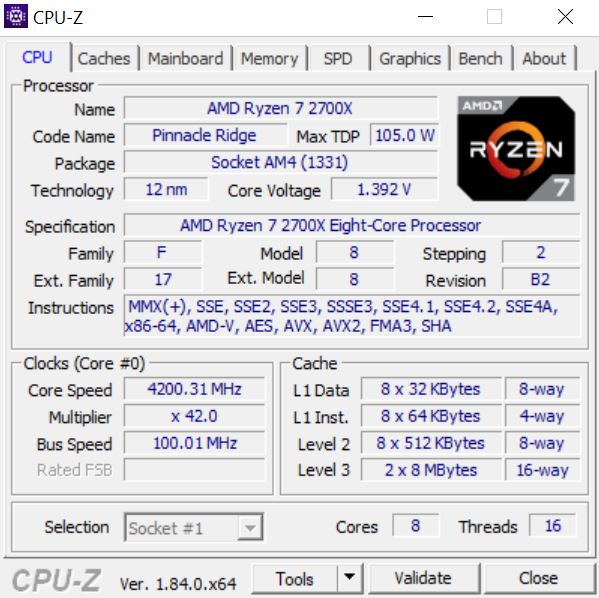
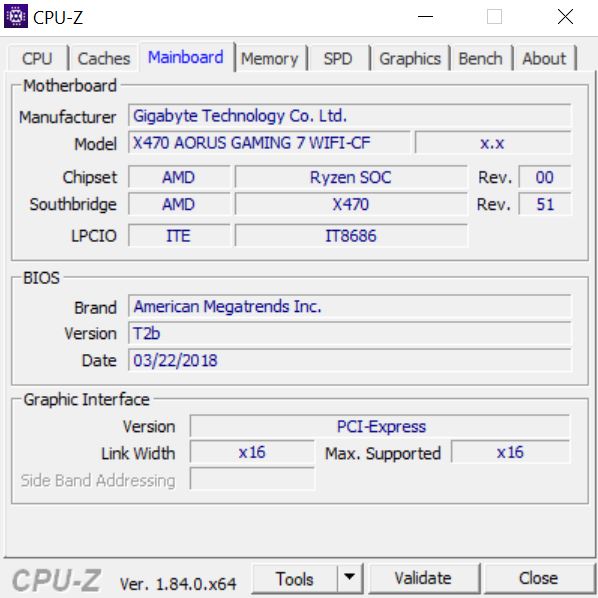
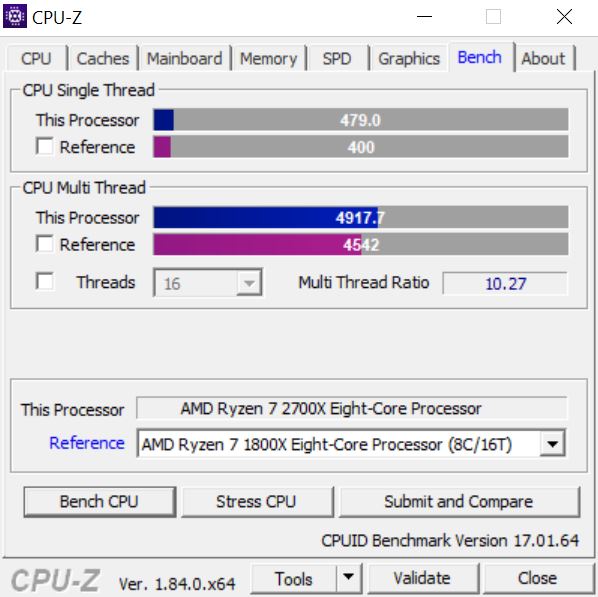
Our test unit is a current AMD platform based on the Gigabyte X470 Aorus Gaming 7 Wi-Fi. The CPU is an AMD RYZEN 7 2700X and offers good performance. The cooling system is an AIO (Be Quiet Silent Loop 280 mm). The 16-GB RAM comes from G-Skill and clocks at 3400 MHz. The Acer Predator XB321 supports UHD resolutions and therefore does not limit the GPU in any way. A big thanks to AMD for providing us with this platform.
| Case | Corsair Carbide Air 540 ATX Cube |
| GPU | XFX Radeon RX 590 Fatboy OC+ |
| CPU | AMD Ryzen 7 2700X |
| CPU cooling fan | Be Quiet Silent Loop 280mm |
| RAM | G-Skill Sniper X 16 GB DDR4 3400 MHz |
| Mainboard | Gigabyte X470 Aorus Gaming 7 WiFi |
| Monitor | Acer Predator XB321HK 4K |
| SSD | ADATA SP900 M.2 SSD |
| HDD | 2 TB Western Digital (for games) |
| Operating system | Microsoft Windows 10 Professional 64-Bit (Version 1809) |
| Driver | Adrenalin 18.11.2 |

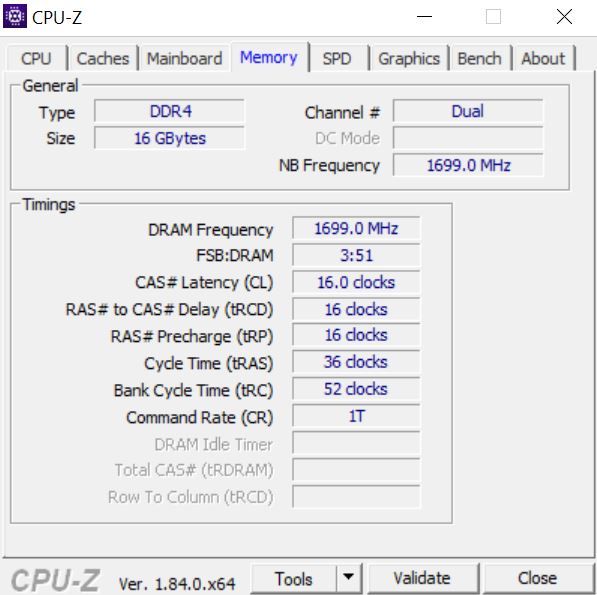


The clock rates of the XFX Radeon RX 590 Fatboy OC+
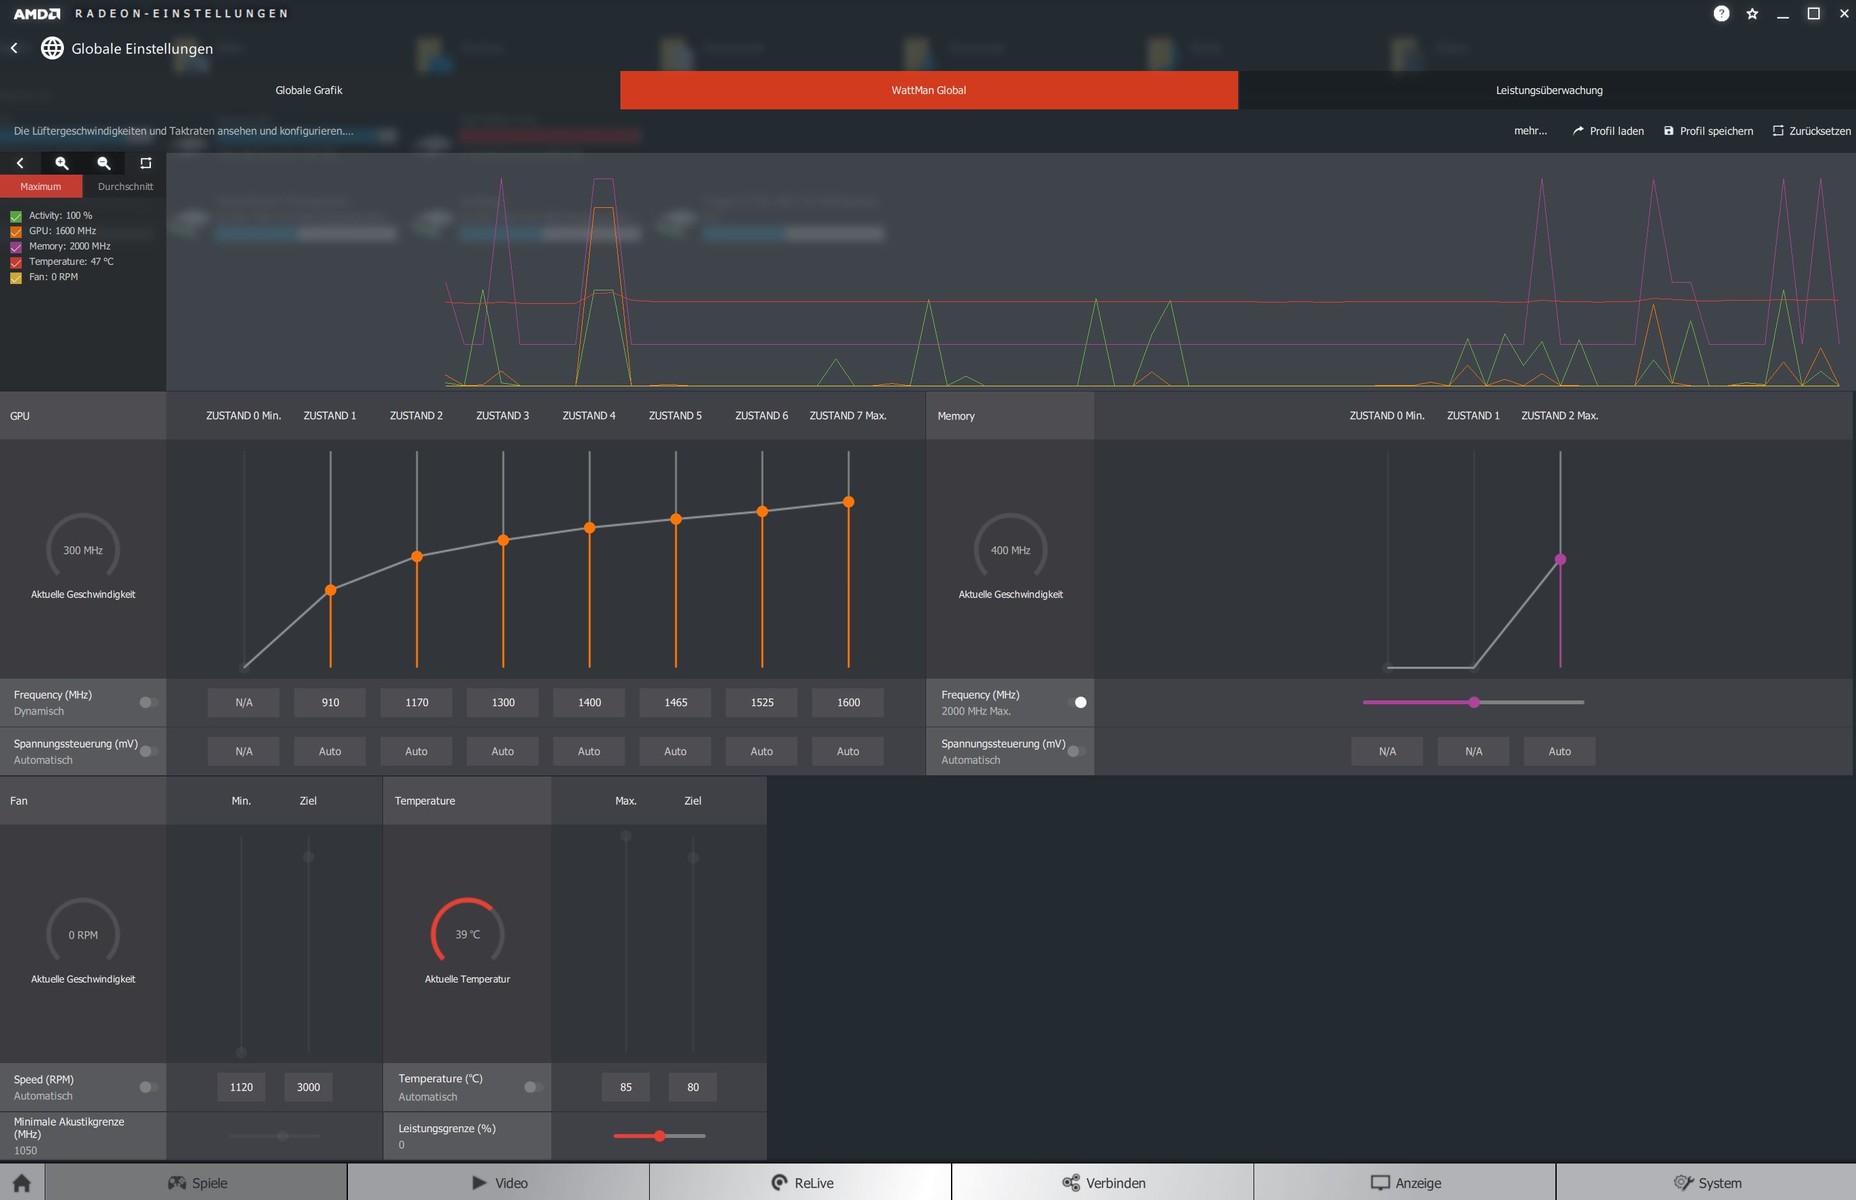
The table of specifications above shows the reference clock rates. XFX has gone a step further with its Radeon RX 590 Fatboy OC+ by overclocking the GPU ex-works. However, after installing the driver we still measured a clock rate of only 1580 MHz with GPU-Z. As the OC+ version is supposed to have 1600 MHz, we manually adjusted this rate using the tool "WattMan". XFX offers a how-to guide for this. We do not understand why the manufacturer decided to do this - it would have been easier to develop their own tool that gives users quick access to information and settings. The 8-GB VRAM clocks at 8 GHz and is not affected by overclocking.
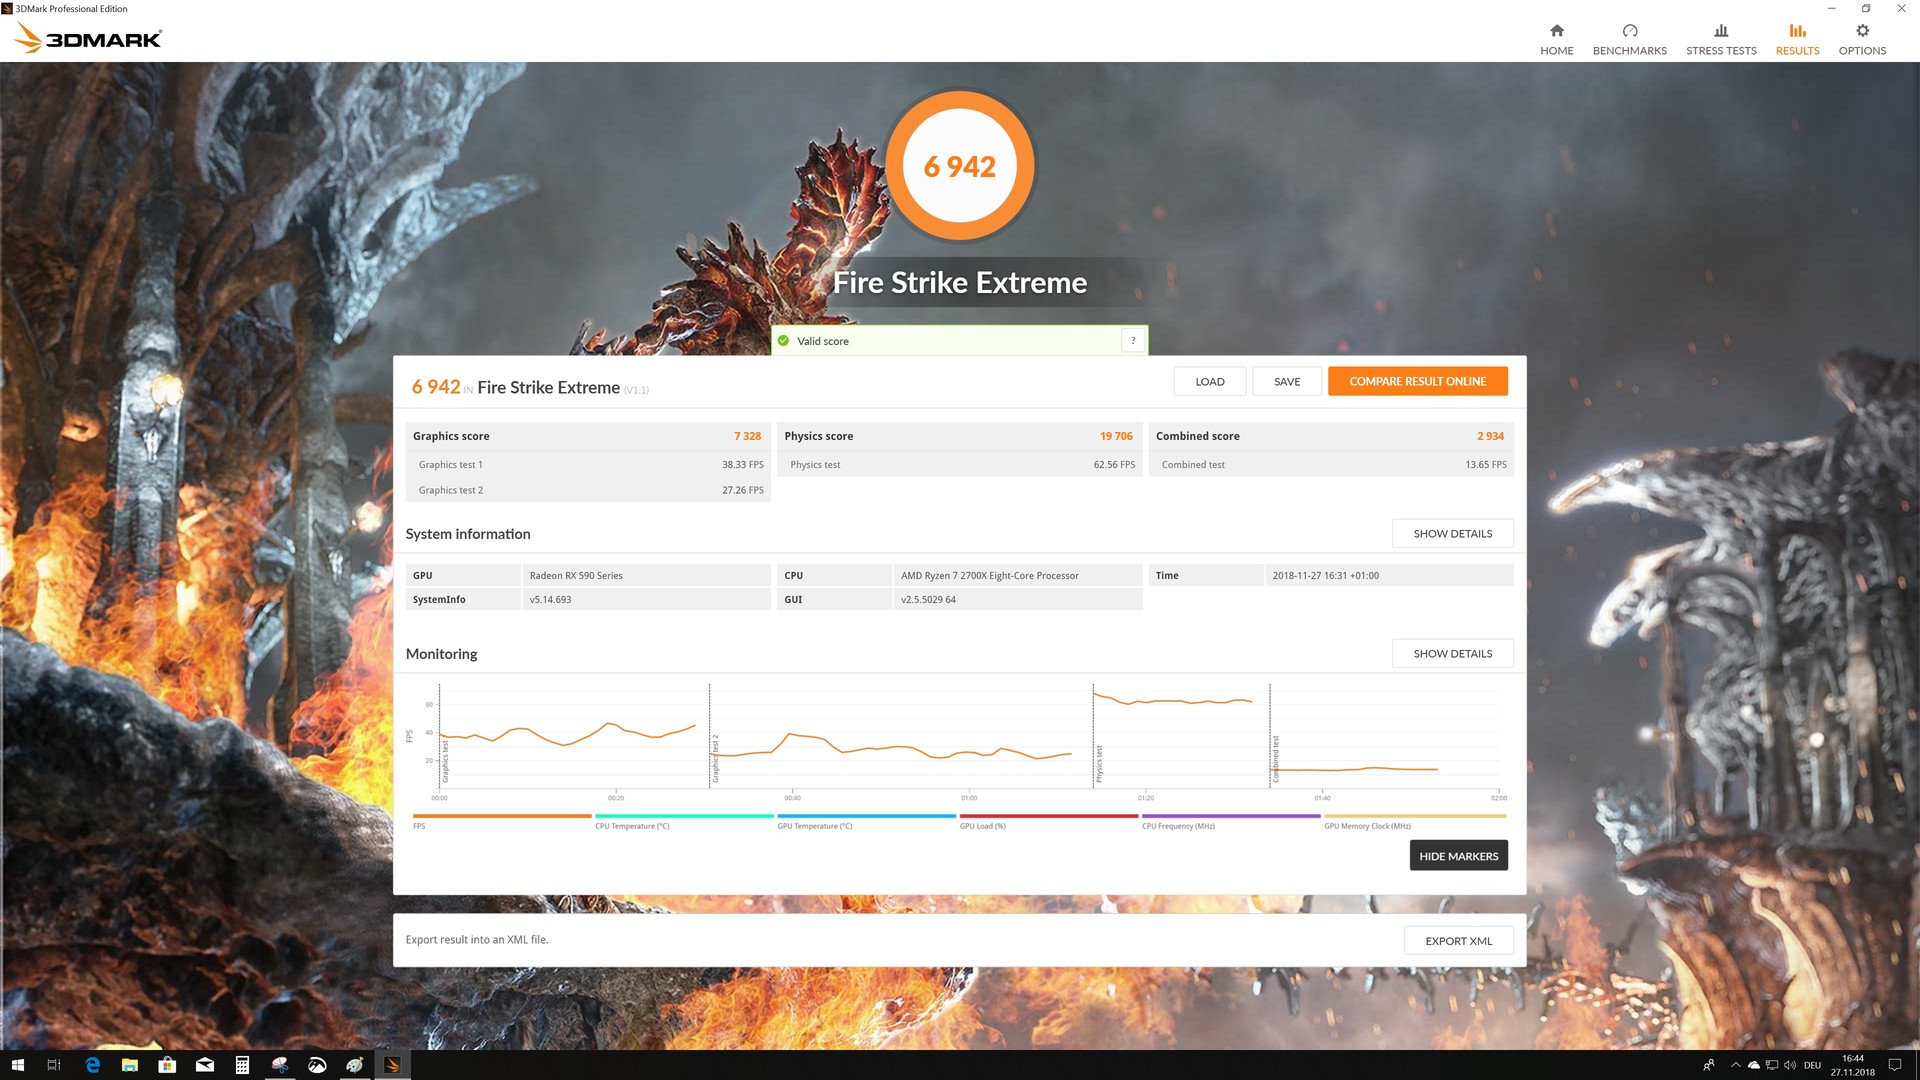
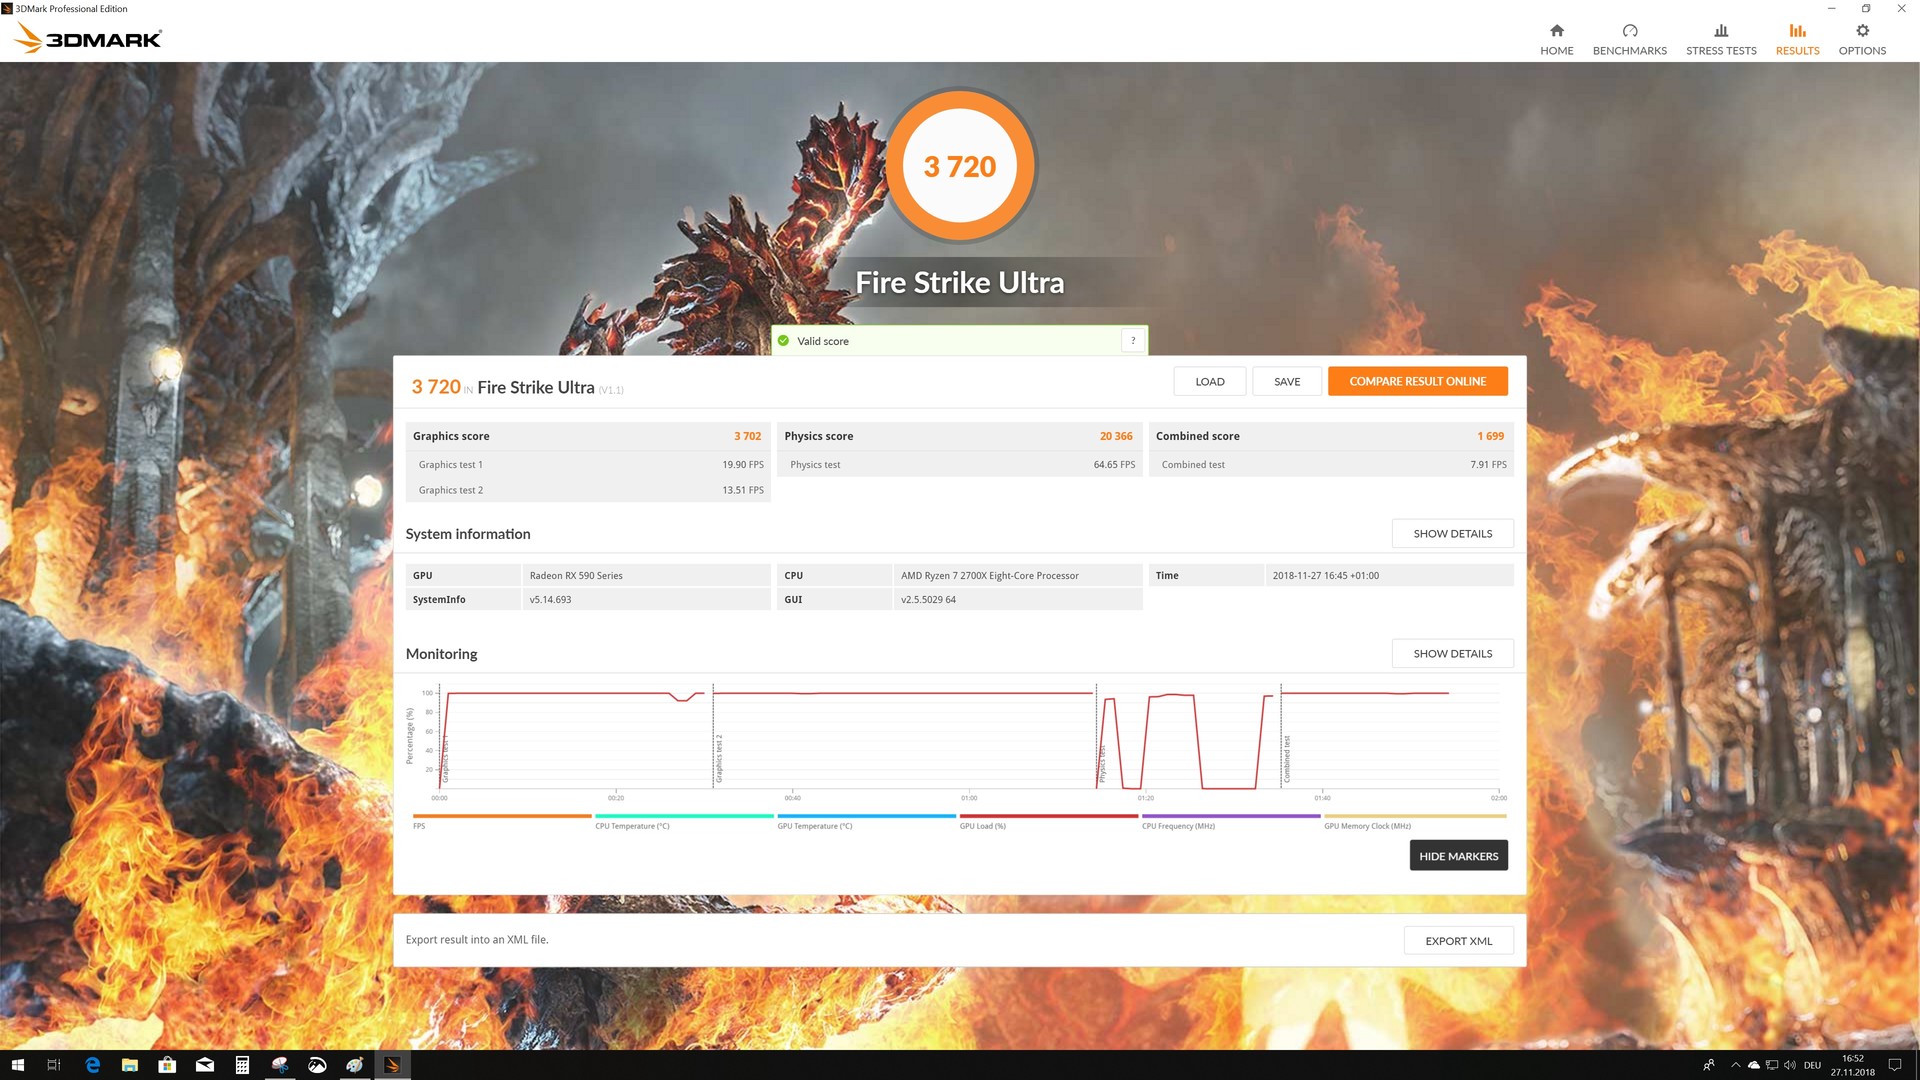
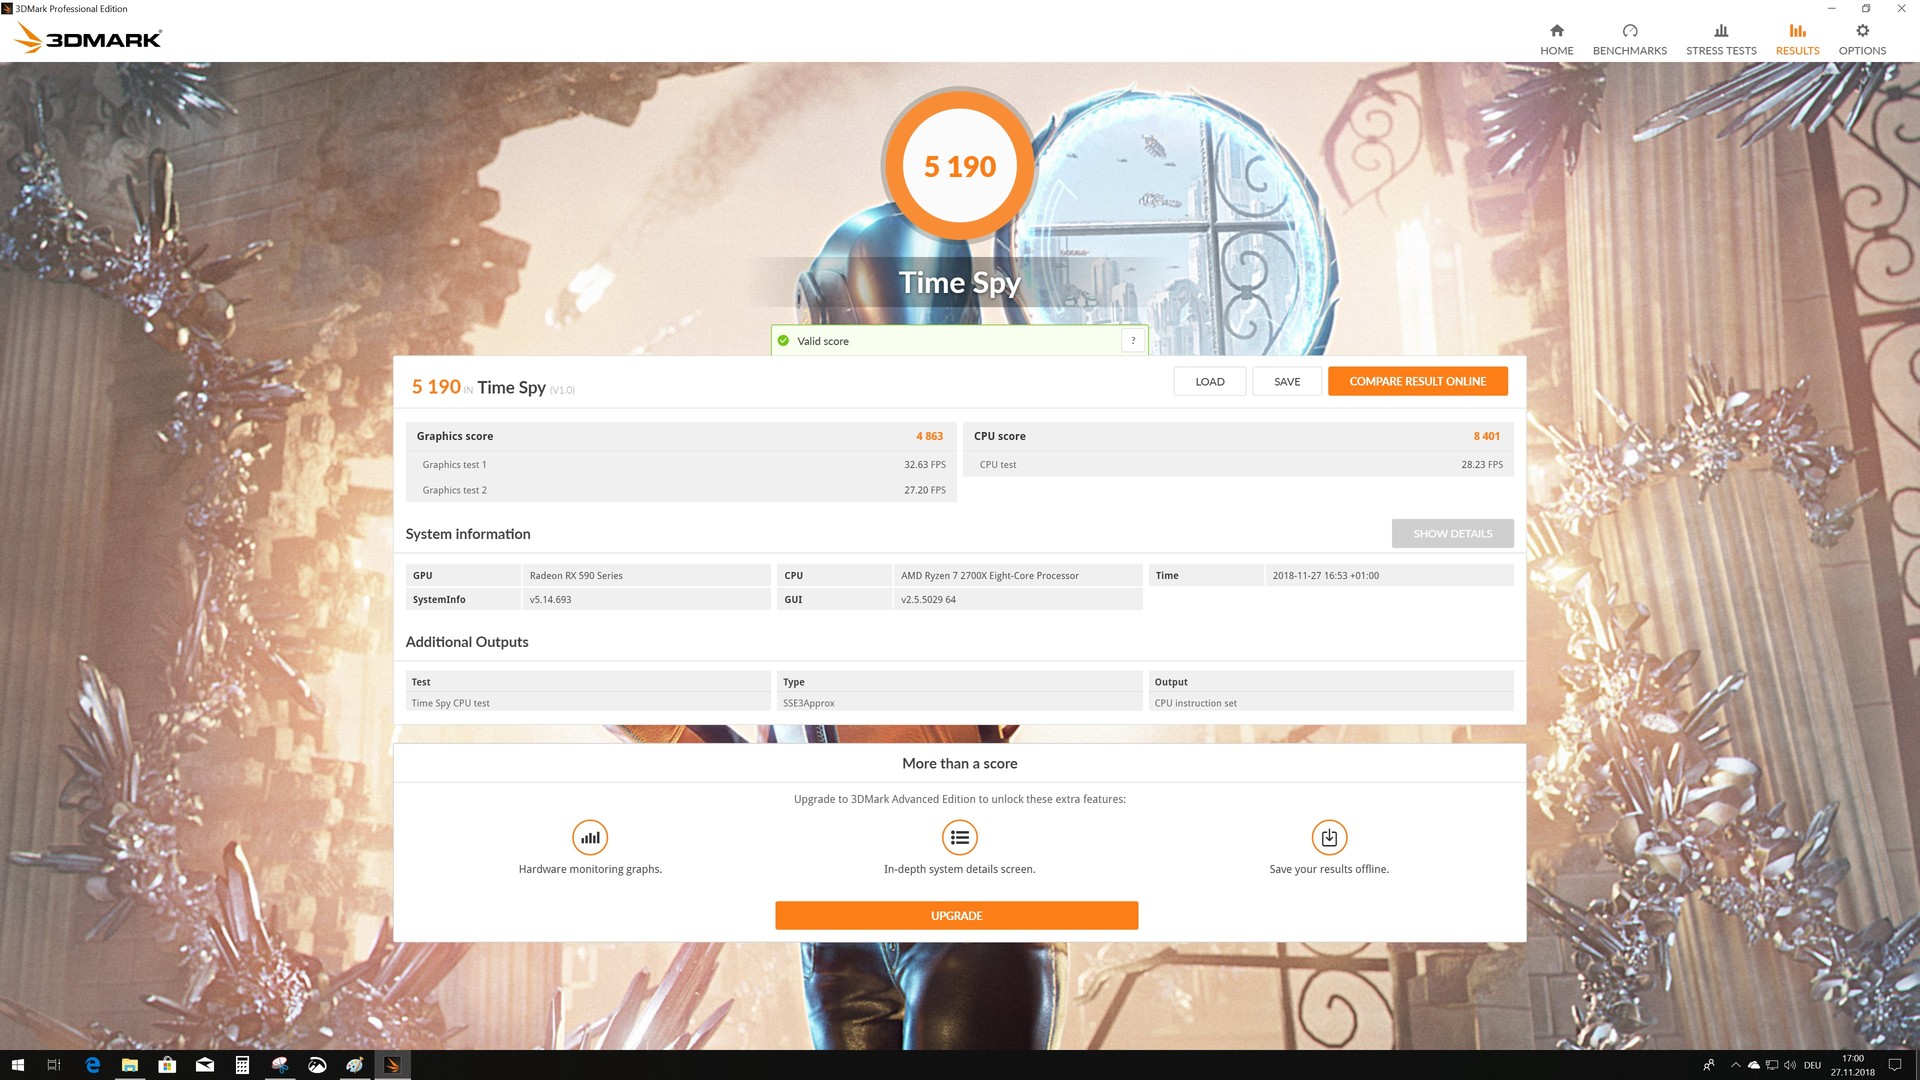
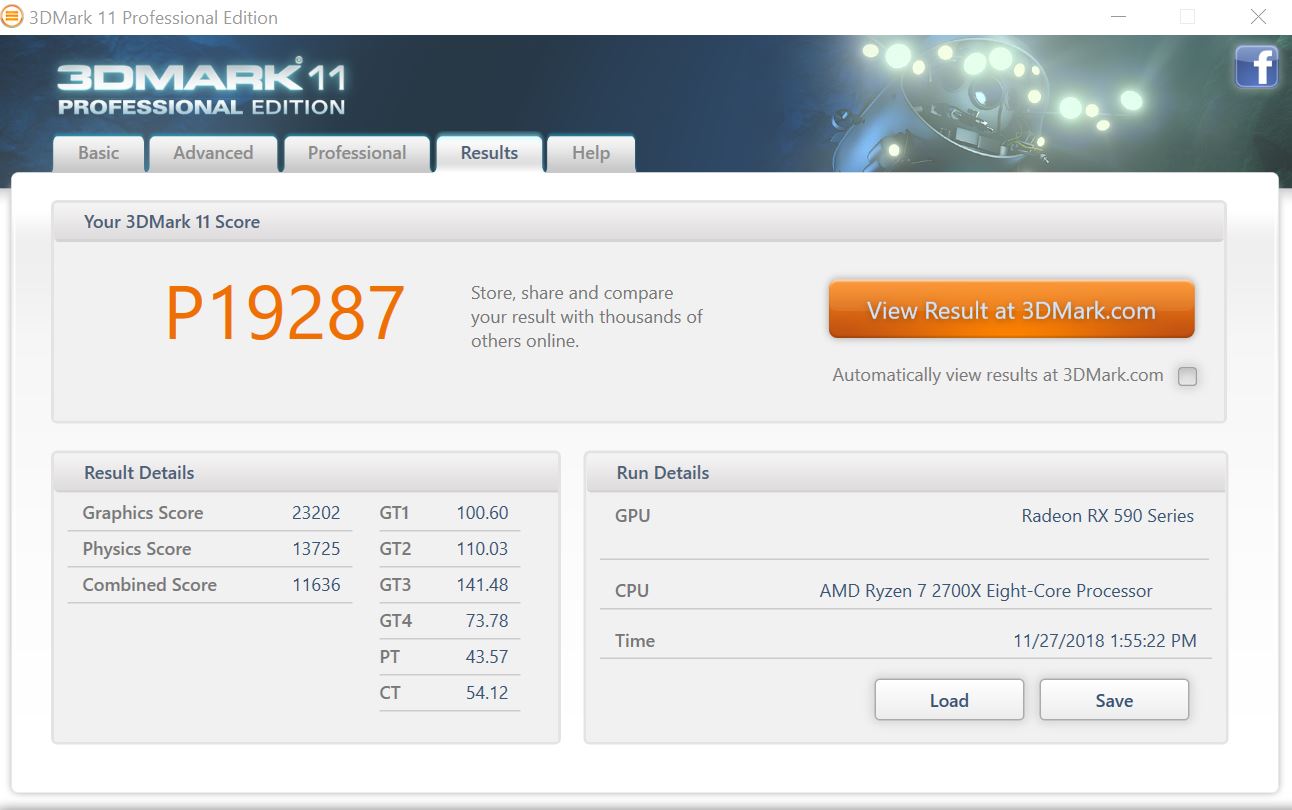
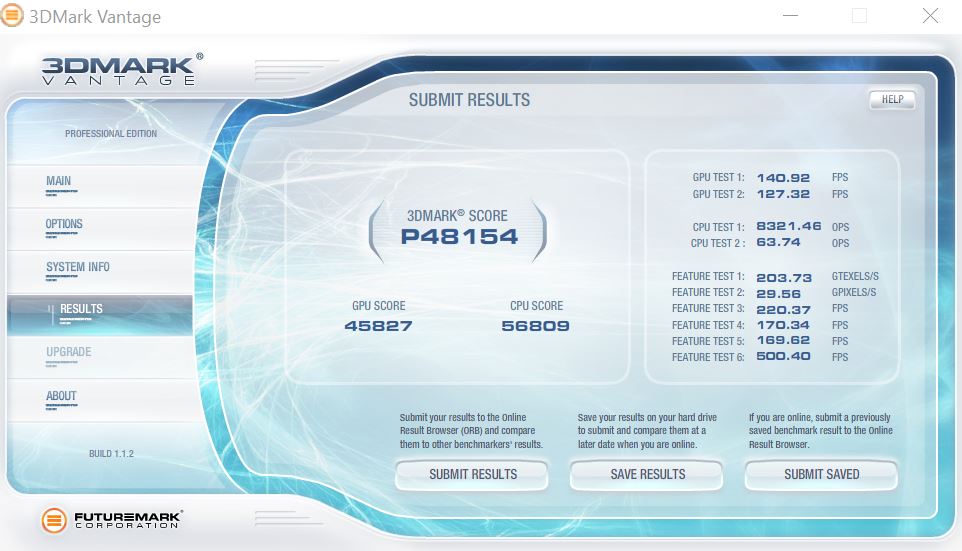
Synthetic Benchmarks
The AMD Radeon RX 590 shows about 15% higher performance in the synthetic benchmarks compared to the RX 580. However, it cannot keep up with the GeForce GTX 1070. The difference between these two models is up to 20% in the 3DMark, depending on the test. Overall, the XFX RX 590 gives a good impression and sets itself apart from the GeForce GTX 1060. It remains to be seen how the updated version of the GTX 1060 fares in this comparison. This model is supposed to receive a boost thanks to faster GDDR5X VRAM.

| 3DMark | |
| 1920x1080 Fire Strike Graphics | |
| NVIDIA GeForce GTX 1080 (Desktop) | |
| NVIDIA GeForce GTX 1080 (Desktop) | |
| AMD Radeon RX 590 (Desktop) | |
| NVIDIA GeForce GTX 1070 (Desktop) | |
| AMD Radeon RX 580 (Desktop) | |
| AMD Radeon RX 580 (Desktop) | |
| NVIDIA GeForce GTX 1060 (Desktop) | |
| AMD Radeon RX 480 (Desktop) | |
| AMD Radeon RX 470 (Desktop) | |
| 1280x720 Cloud Gate Standard Graphics | |
| NVIDIA GeForce GTX 1080 (Desktop) | |
| NVIDIA GeForce GTX 1080 (Desktop) | |
| NVIDIA GeForce GTX 1070 (Desktop) | |
| AMD Radeon RX 590 (Desktop) | |
| AMD Radeon RX 580 (Desktop) | |
| NVIDIA GeForce GTX 1060 (Desktop) | |
| AMD Radeon RX 580 (Desktop) | |
| AMD Radeon RX 480 (Desktop) | |
| AMD Radeon RX 470 (Desktop) | |
| 3840x2160 Fire Strike Ultra Graphics | |
| NVIDIA GeForce GTX 1080 (Desktop) | |
| NVIDIA GeForce GTX 1070 (Desktop) | |
| AMD Radeon RX 590 (Desktop) | |
| AMD Radeon RX 580 (Desktop) | |
| AMD Radeon RX 580 (Desktop) | |
| NVIDIA GeForce GTX 1060 (Desktop) | |
| AMD Radeon RX 480 (Desktop) | |
| AMD Radeon RX 470 (Desktop) | |
| 3DMark 11 - 1280x720 Performance GPU | |
| NVIDIA GeForce GTX 1080 (Desktop) | |
| NVIDIA GeForce GTX 1080 (Desktop) | |
| NVIDIA GeForce GTX 1070 (Desktop) | |
| AMD Radeon RX 590 (Desktop) | |
| AMD Radeon RX 580 (Desktop) | |
| AMD Radeon RX 580 (Desktop) | |
| AMD Radeon RX 480 (Desktop) | |
| AMD Radeon RX 470 (Desktop) | |
| NVIDIA GeForce GTX 1060 (Desktop) | |
| Unigine Heaven 4.0 - Extreme Preset DX11 | |
| NVIDIA GeForce GTX 1080 (Desktop) | |
| NVIDIA GeForce GTX 1080 (Desktop) | |
| NVIDIA GeForce GTX 1070 (Desktop) | |
| NVIDIA GeForce GTX 1060 (Desktop) | |
| AMD Radeon RX 590 (Desktop) | |
| AMD Radeon RX 580 (Desktop) | |
| AMD Radeon RX 580 (Desktop) | |
| AMD Radeon RX 480 (Desktop) | |
| AMD Radeon RX 470 (Desktop) | |
| Unigine Valley 1.0 - 1920x1080 Extreme HD DirectX AA:x8 | |
| NVIDIA GeForce GTX 1080 (Desktop) | |
| NVIDIA GeForce GTX 1080 (Desktop) | |
| NVIDIA GeForce GTX 1070 (Desktop) | |
| AMD Radeon RX 580 (Desktop) | |
| AMD Radeon RX 590 (Desktop) | |
| AMD Radeon RX 580 (Desktop) | |
| AMD Radeon RX 480 (Desktop) | |
| AMD Radeon RX 470 (Desktop) | |
| 3DMark 03 Standard | 130629 points | |
| 3DMark 05 Standard | 43361 points | |
| 3DMark 06 Standard Score | 35704 points | |
| 3DMark Vantage P Result | 48454 points | |
| 3DMark 11 Performance | 19287 points | |
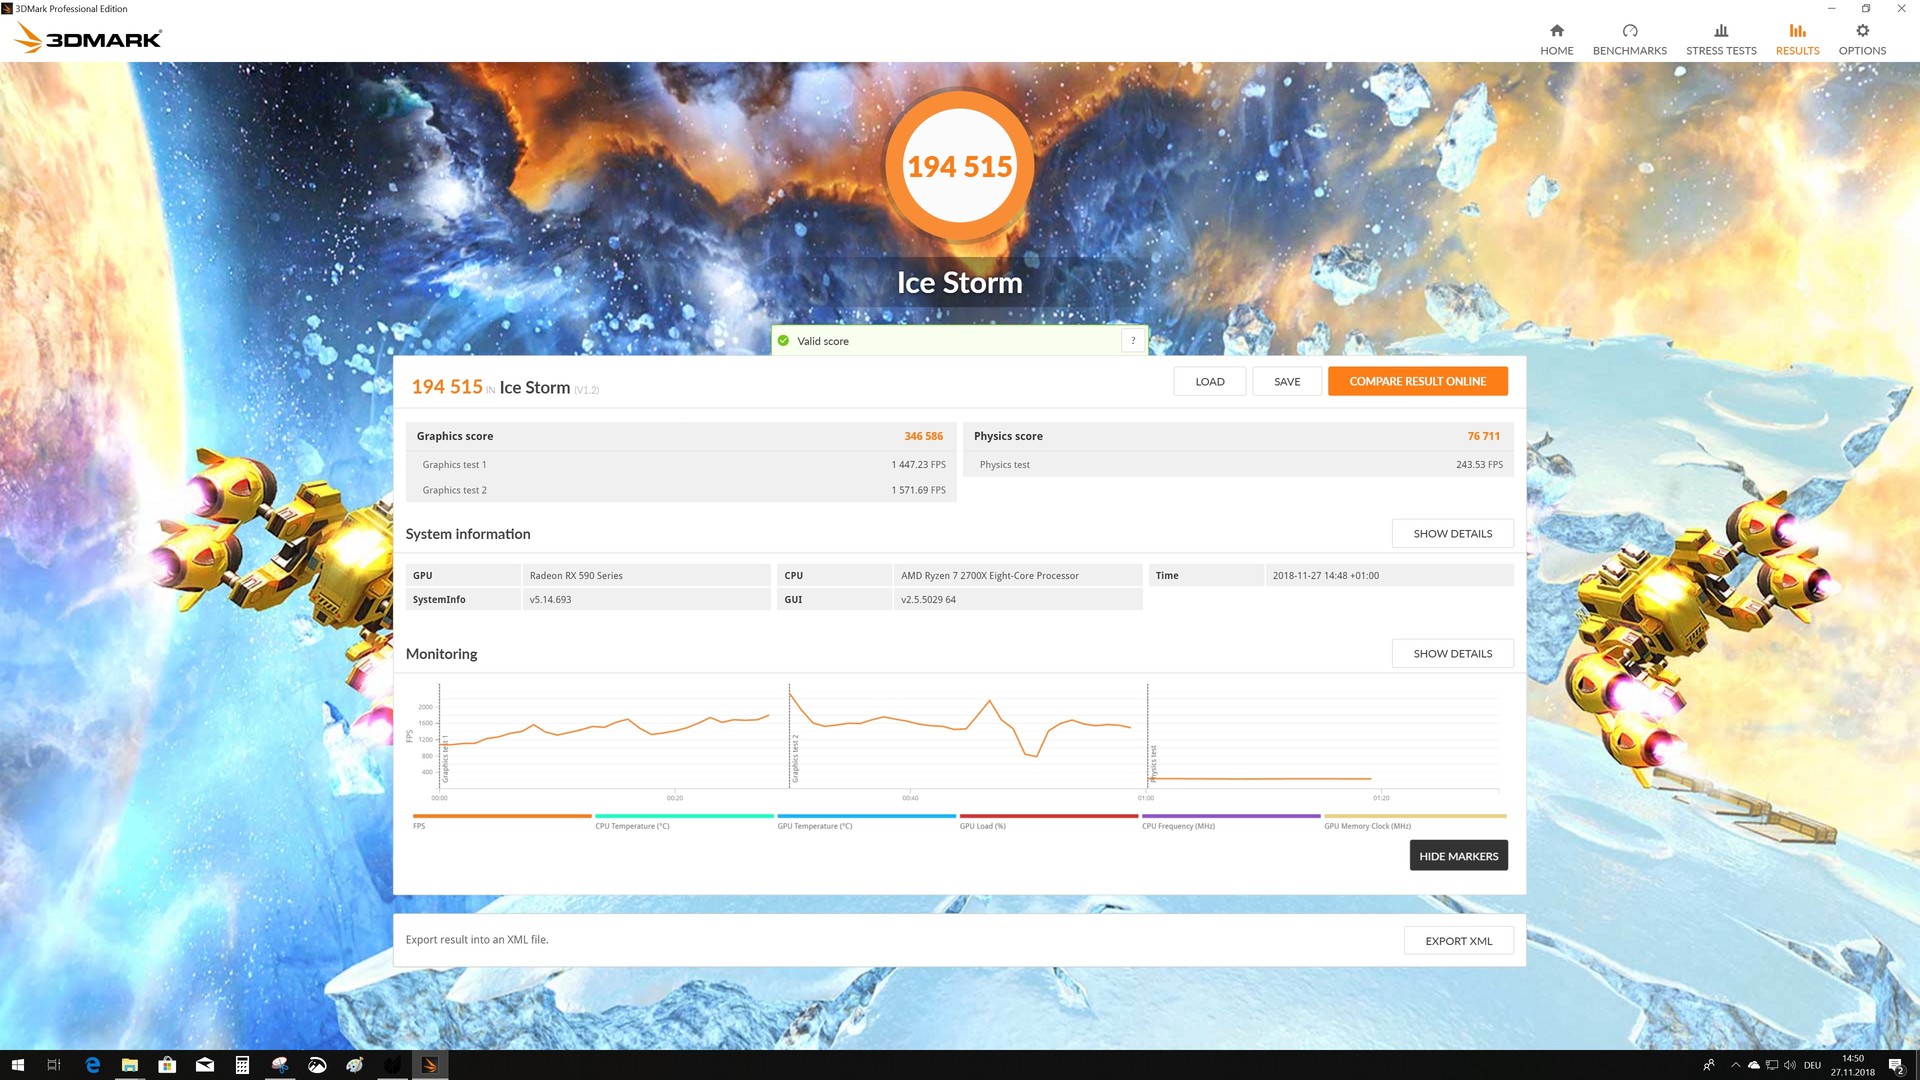
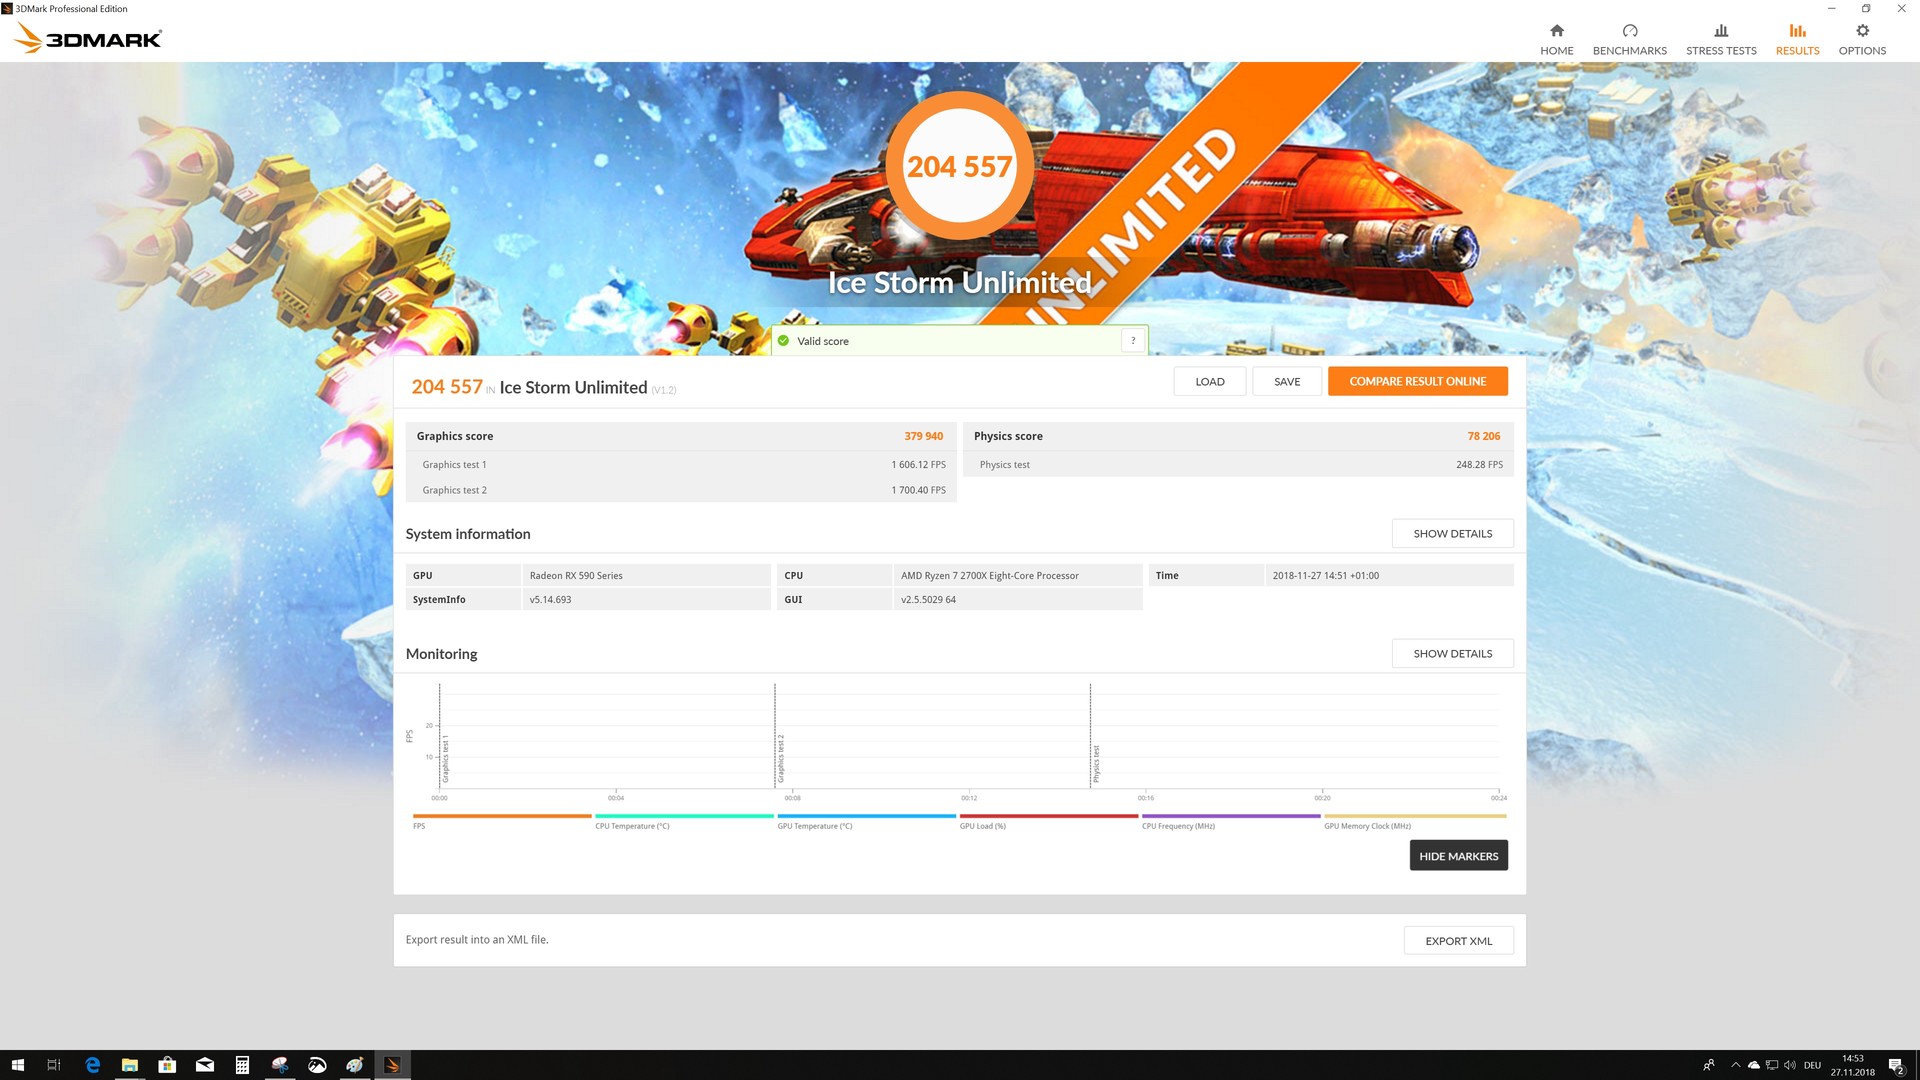
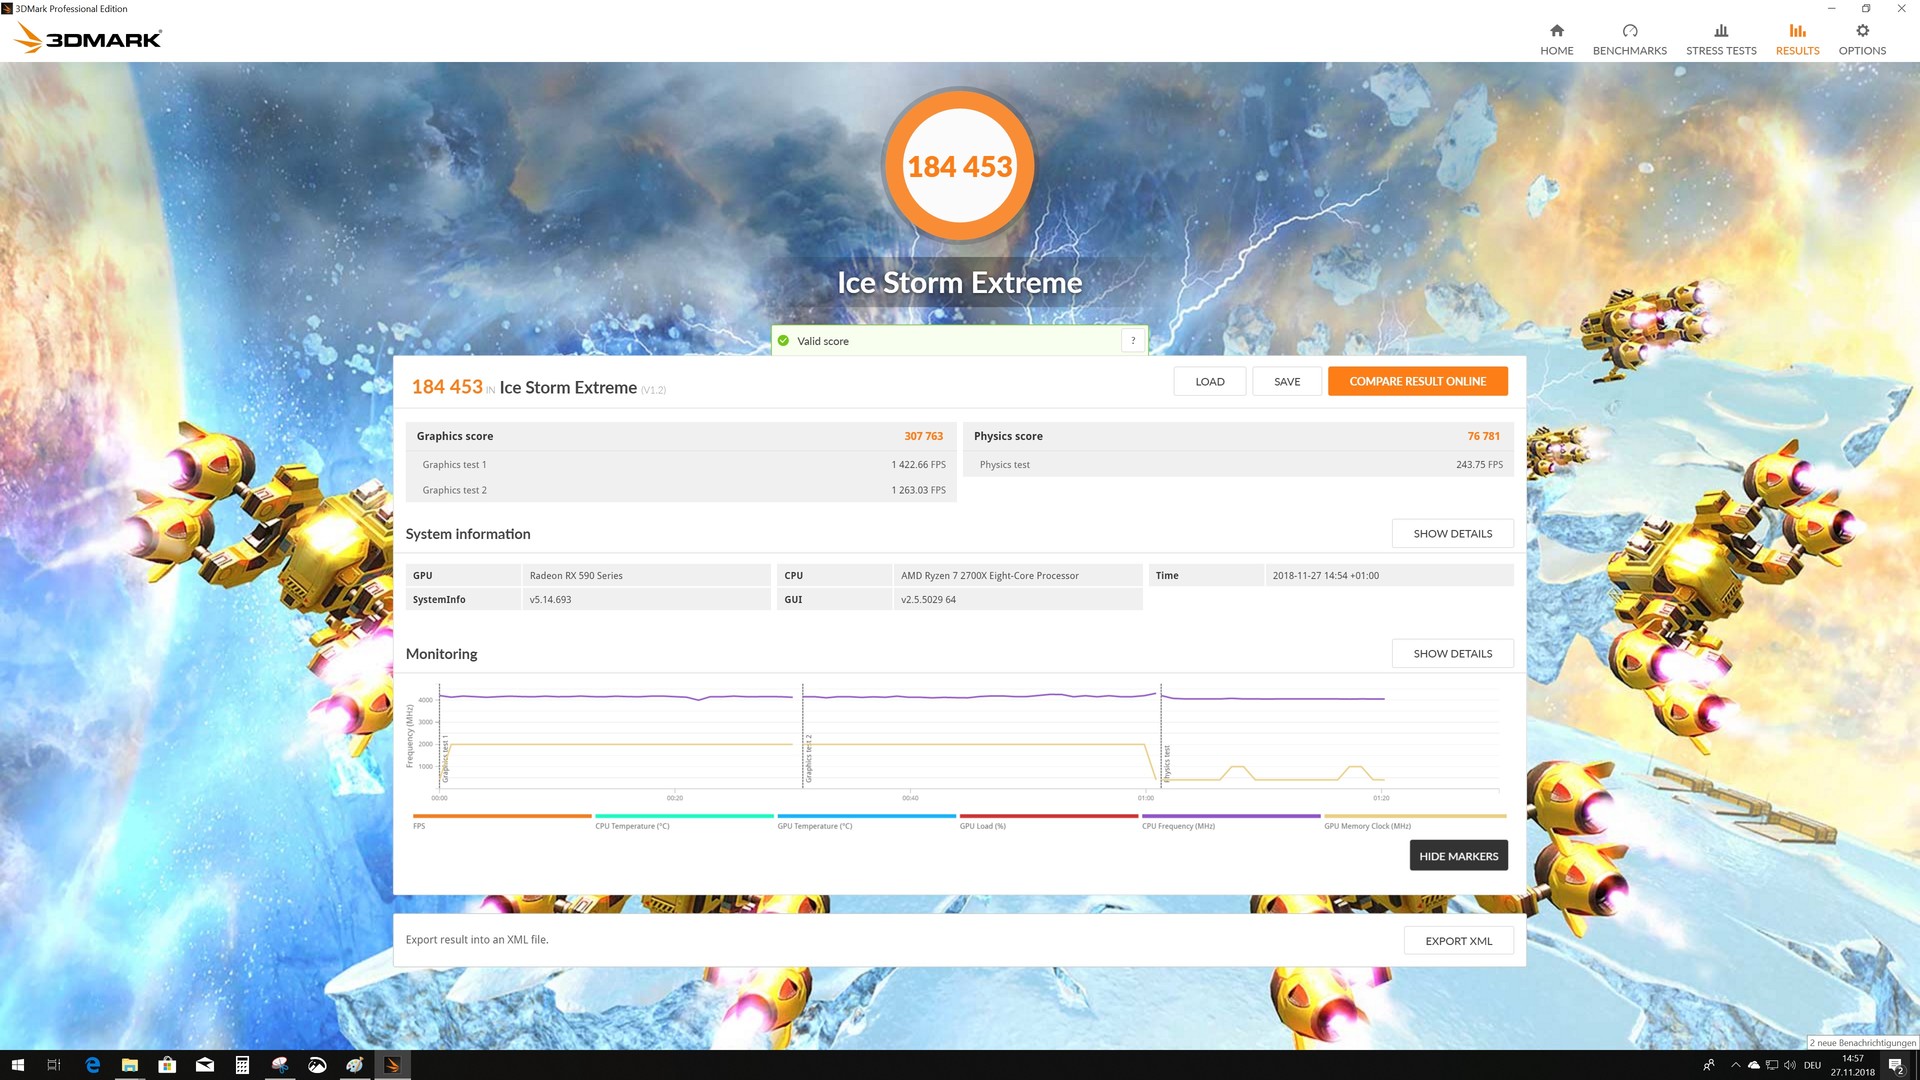
| 3DMark Ice Storm Standard Score | 194515 points | |
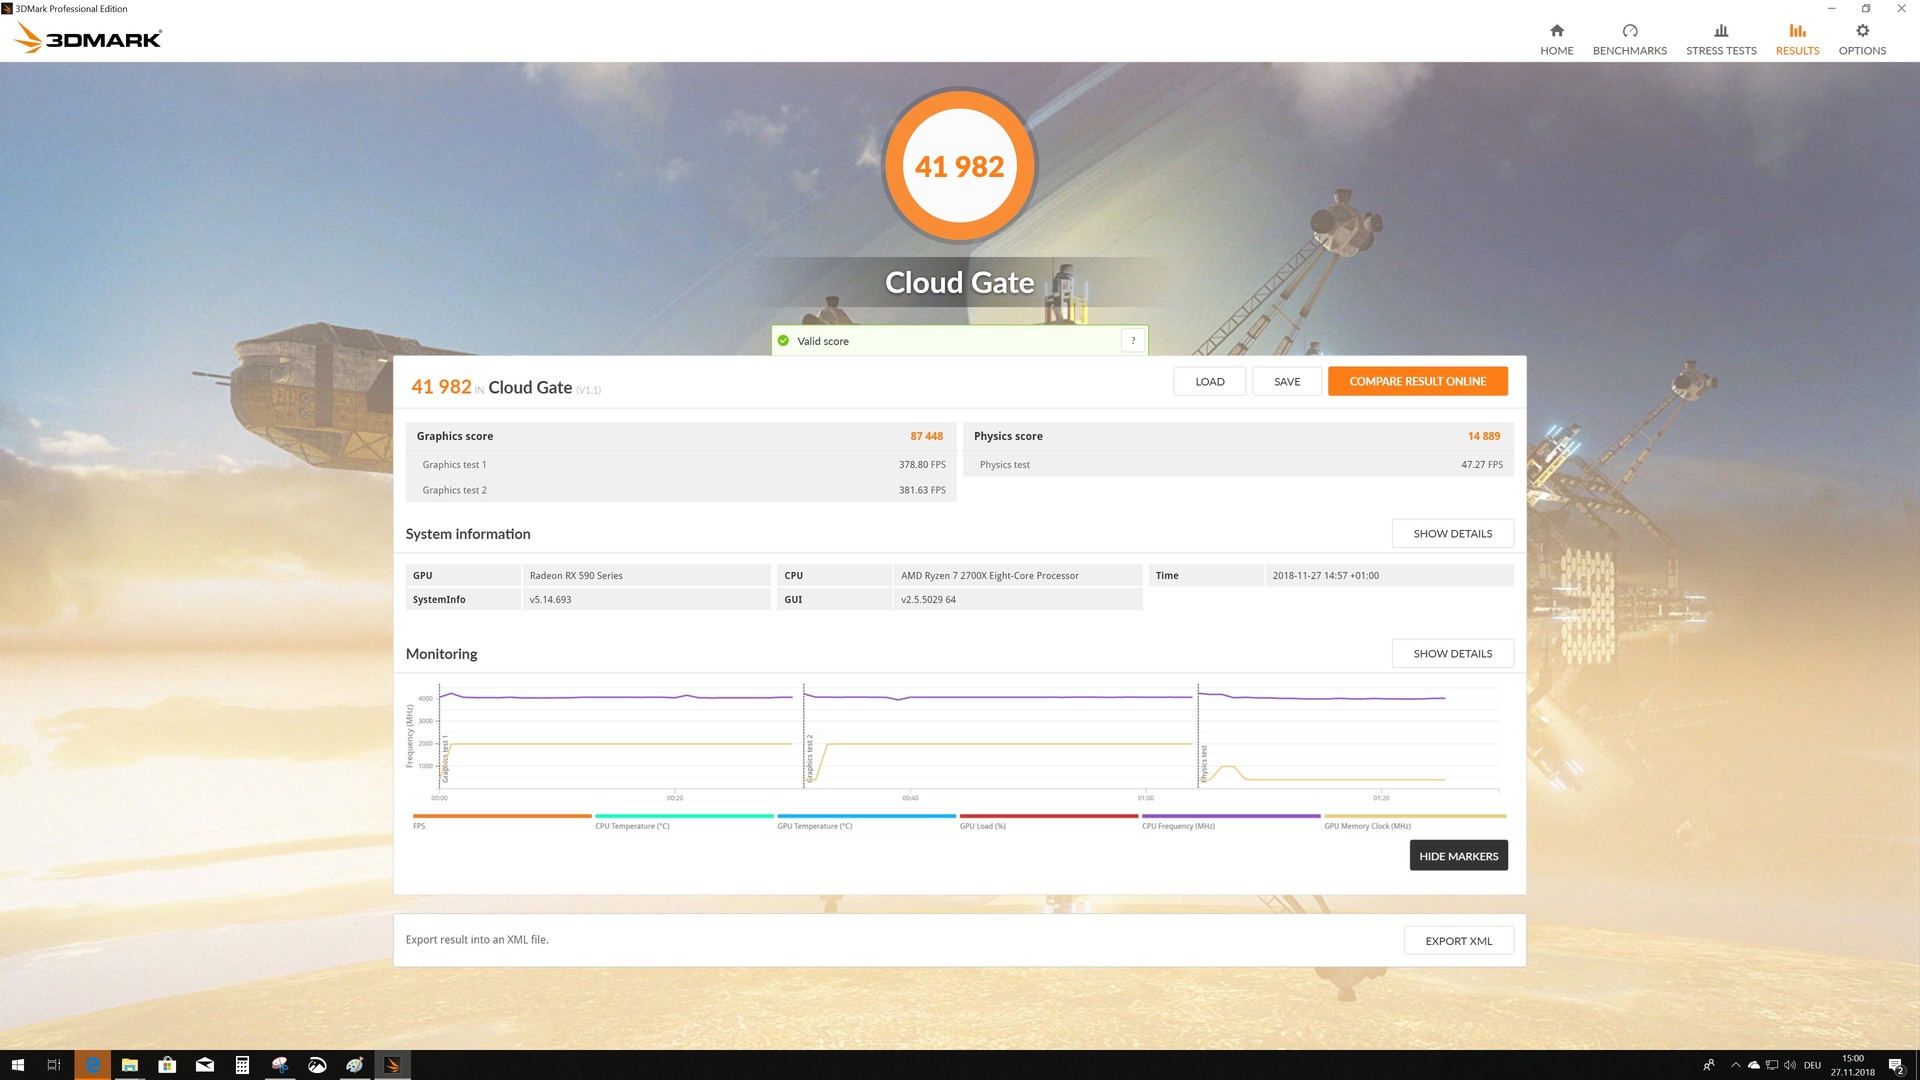
| 3DMark Cloud Gate Standard Score | 41952 points | |
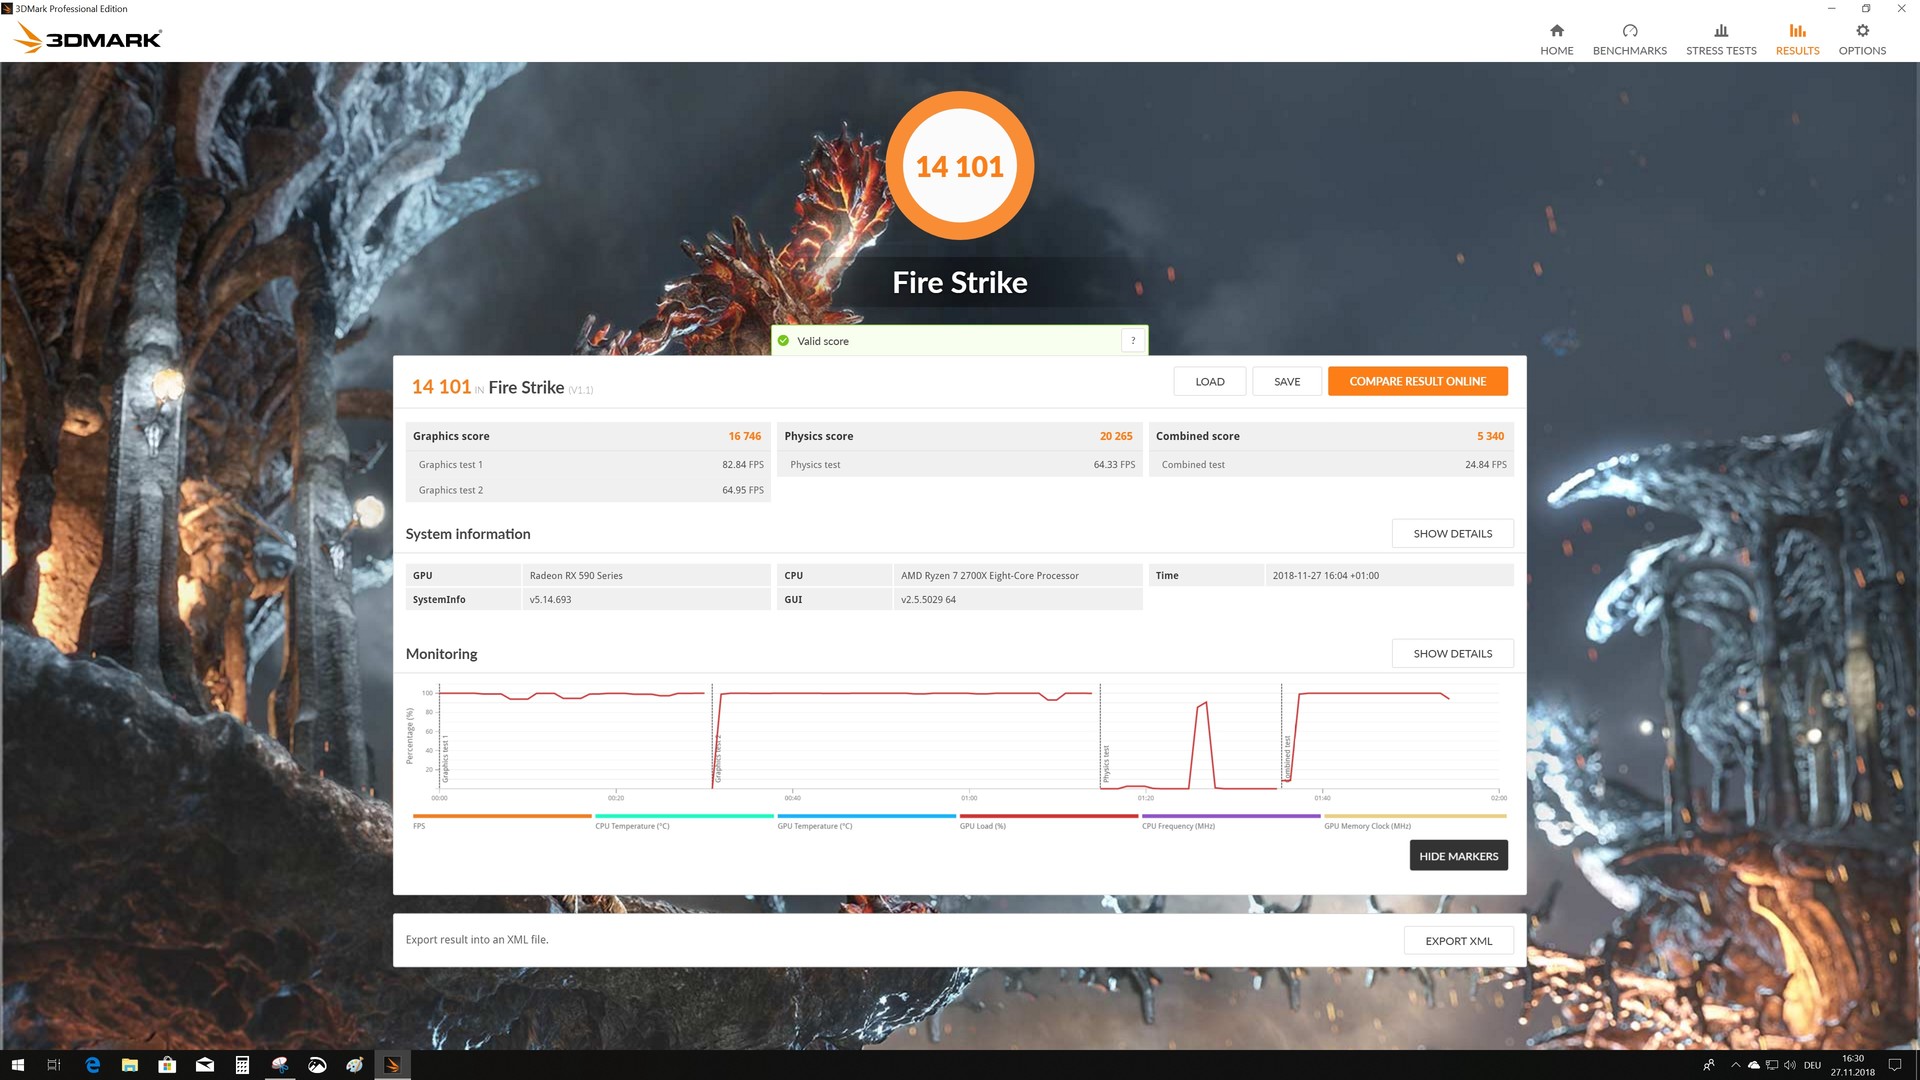
| 3DMark Fire Strike Score | 14101 points | |
| 3DMark Fire Strike Extreme Score | 6942 points | |
| 3DMark Time Spy Score | 5190 points | |
Help | ||
Gaming Benchmarks - fully suitable for Full HD
After the synthetic benchmarks, we took a look at the main use of the Radeon RX 590. The graphics card was tested using numerous new and old games. The test chip can display all current games smoothly at 1080p. Apart from the occasional exception, all could be played in ultra settings. Compared to its predecessor, the RX 590 can display 10% more frames per second. Users who want to play in higher resolution will have to make do with the high preset for 1440p. The GPU usually reaches its limits when trying to display games at 2160p.
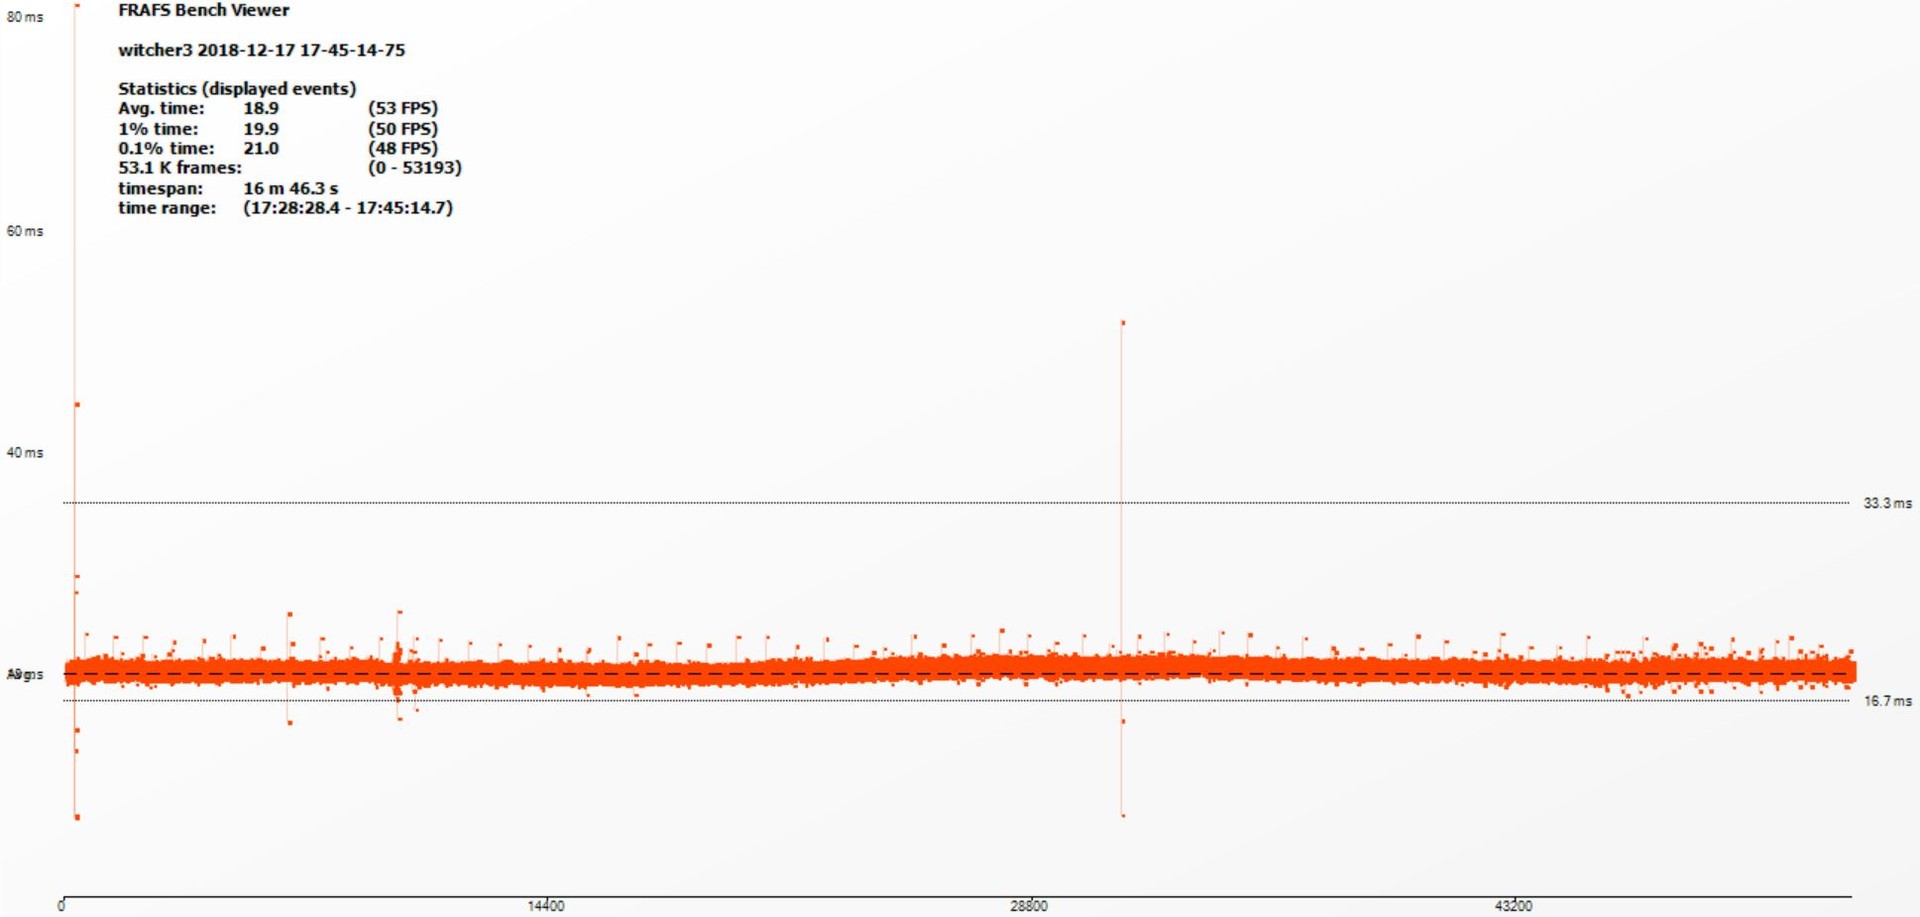
We were very happy with the consistent performance, which we measured using "The Witcher 3". There were no frame drops during our load test with the XFX Radeon RX 590 Fatboy OC+ and the frame times also remained.
The Witcher 3 frame progression ultra preset
| Call of Duty Black Ops 4 - 1920x1080 Very High / On | |
| AMD Radeon RX 590 (Desktop) | |
| NVIDIA GeForce GTX 1070 (Desktop) | |
| AMD Radeon RX 580 (Desktop) | |
| NVIDIA GeForce GTX 1060 (Desktop) | |
| Assassin´s Creed Odyssey - 1920x1080 Ultra High Preset | |
| NVIDIA GeForce GTX 1070 (Desktop) | |
| AMD Radeon RX 590 (Desktop) | |
| NVIDIA GeForce GTX 1060 (Desktop) | |
| AMD Radeon RX 580 (Desktop) | |
| AMD Radeon RX 580 (Desktop) | |
| FIFA 19 - 1920x1080 Ultra Preset AA:4x MS | |
| NVIDIA GeForce GTX 1070 (Desktop) | |
| AMD Radeon RX 580 (Desktop) | |
| AMD Radeon RX 580 (Desktop) | |
| NVIDIA GeForce GTX 1060 (Desktop) | |
| AMD Radeon RX 590 (Desktop) | |
| Forza Horizon 4 - 1920x1080 Ultra Preset AA:2xMS | |
| NVIDIA GeForce GTX 1070 (Desktop) | |
| AMD Radeon RX 590 (Desktop) | |
| AMD Radeon RX 580 (Desktop) | |
| AMD Radeon RX 580 (Desktop) | |
| NVIDIA GeForce GTX 1060 (Desktop) | |
| F1 2018 - 1920x1080 Ultra High Preset AA:T AF:16x | |
| NVIDIA GeForce GTX 1070 (Desktop) | |
| AMD Radeon RX 590 (Desktop) | |
| AMD Radeon RX 580 (Desktop) | |
| AMD Radeon RX 580 (Desktop) | |
| NVIDIA GeForce GTX 1060 (Desktop) | |
| Monster Hunter World - 1920x1080 Highest Preset (Image Quality High) | |
| NVIDIA GeForce GTX 1070 (Desktop) | |
| AMD Radeon RX 590 (Desktop) | |
| AMD Radeon RX 580 (Desktop) | |
| AMD Radeon RX 580 (Desktop) | |
| NVIDIA GeForce GTX 1060 (Desktop) | |
| Far Cry 5 - 1920x1080 Ultra Preset AA:T | |
| NVIDIA GeForce GTX 1070 (Desktop) | |
| AMD Radeon RX 590 (Desktop) | |
| AMD Radeon RX 580 (Desktop) | |
| NVIDIA GeForce GTX 1060 (Desktop) | |
| AMD Radeon RX 580 (Desktop) | |
| The Crew 2 - 1920x1080 Ultra Preset | |
| NVIDIA GeForce GTX 1060 (Desktop) | |
| NVIDIA GeForce GTX 1070 (Desktop) | |
| AMD Radeon RX 580 (Desktop) | |
| AMD Radeon RX 590 (Desktop) | |
| AMD Radeon RX 580 (Desktop) | |
| Assassin´s Creed Origins - 1920x1080 Ultra High Preset | |
| NVIDIA GeForce GTX 1070 (Desktop) | |
| NVIDIA GeForce GTX 1060 (Desktop) | |
| AMD Radeon RX 590 (Desktop) | |
| AMD Radeon RX 480 (Desktop) | |
| AMD Radeon RX 580 (Desktop) | |
| AMD Radeon RX 580 (Desktop) | |
| AMD Radeon RX 470 (Desktop) | |
| Kingdom Come: Deliverance - 1920x1080 Ultra High Preset | |
| NVIDIA GeForce GTX 1070 (Desktop) | |
| AMD Radeon RX 590 (Desktop) | |
| NVIDIA GeForce GTX 1060 (Desktop) | |
| AMD Radeon RX 580 (Desktop) | |
| AMD Radeon RX 580 (Desktop) | |
| AMD Radeon RX 480 (Desktop) | |
| Fortnite - 1920x1080 Epic Preset | |
| NVIDIA GeForce GTX 1070 (Desktop) | |
| AMD Radeon RX 590 (Desktop) | |
| NVIDIA GeForce GTX 1060 (Desktop) | |
| AMD Radeon RX 580 (Desktop) | |
| AMD Radeon RX 580 (Desktop) | |
| AMD Radeon RX 480 (Desktop) | |
| AMD Radeon RX 470 (Desktop) | |
| Final Fantasy XV Benchmark - 1920x1080 High Quality | |
| NVIDIA GeForce GTX 1080 (Desktop) | |
| NVIDIA GeForce GTX 1070 (Desktop) | |
| NVIDIA GeForce GTX 1060 (Desktop) | |
| AMD Radeon RX 590 (Desktop) | |
| AMD Radeon RX 580 (Desktop) | |
| AMD Radeon RX 580 (Desktop) | |
| AMD Radeon RX 480 (Desktop) | |
| AMD Radeon RX 470 (Desktop) | |
| Destiny 2 - 1920x1080 Highest Preset AA:SM AF:16x | |
| NVIDIA GeForce GTX 1070 (Desktop) | |
| NVIDIA GeForce GTX 1060 (Desktop) | |
| AMD Radeon RX 580 (Desktop) | |
| Far Cry Primal - 1920x1080 Ultra Preset AA:SM | |
| NVIDIA GeForce GTX 1080 (Desktop) | |
| NVIDIA GeForce GTX 1080 (Desktop) | |
| NVIDIA GeForce GTX 1070 (Desktop) | |
| AMD Radeon RX 590 (Desktop) | |
| NVIDIA GeForce GTX 1060 (Desktop) | |
| AMD Radeon RX 580 (Desktop) | |
| AMD Radeon RX 580 (Desktop) | |
| AMD Radeon RX 480 (Desktop) | |
| AMD Radeon RX 470 (Desktop) | |
| The Witcher 3 - 1920x1080 Ultra Graphics & Postprocessing (HBAO+) | |
| NVIDIA GeForce GTX 1080 (Desktop) | |
| NVIDIA GeForce GTX 1080 (Desktop) | |
| NVIDIA GeForce GTX 1070 (Desktop) | |
| AMD Radeon RX 590 (Desktop) | |
| AMD Radeon RX 580 (Desktop) | |
| NVIDIA GeForce GTX 1060 (Desktop) | |
| AMD Radeon RX 480 (Desktop) | |
| AMD Radeon RX 580 (Desktop) | |
| AMD Radeon RX 470 (Desktop) | |
| Watch Dogs 2 - 1920x1080 Ultra Preset | |
| NVIDIA GeForce GTX 1080 (Desktop) | |
| AMD Radeon RX 590 (Desktop) | |
| NVIDIA GeForce GTX 1060 (Desktop) | |
| AMD Radeon RX 580 (Desktop) | |
| AMD Radeon RX 480 (Desktop) | |
| AMD Radeon RX 580 (Desktop) | |
| AMD Radeon RX 470 (Desktop) | |
| Battlefield 1 - 1920x1080 Ultra Preset AA:T | |
| NVIDIA GeForce GTX 1080 (Desktop) | |
| NVIDIA GeForce GTX 1080 (Desktop) | |
| AMD Radeon RX 590 (Desktop) | |
| NVIDIA GeForce GTX 1060 (Desktop) | |
| AMD Radeon RX 480 (Desktop) | |
| AMD Radeon RX 480 (Desktop) | |
| AMD Radeon RX 580 (Desktop) | |
| AMD Radeon RX 470 (Desktop) | |
| The Division - 1920x1080 Ultra Preset AF:16x | |
| NVIDIA GeForce GTX 1080 (Desktop) | |
| NVIDIA GeForce GTX 1080 (Desktop) | |
| NVIDIA GeForce GTX 1070 (Desktop) | |
| AMD Radeon RX 590 (Desktop) | |
| AMD Radeon RX 580 (Desktop) | |
| NVIDIA GeForce GTX 1060 (Desktop) | |
| AMD Radeon RX 580 (Desktop) | |
| AMD Radeon RX 480 (Desktop) | |
| AMD Radeon RX 470 (Desktop) | |
| For Honor - 1920x1080 Extreme Preset AA:T AF:16x | |
| NVIDIA GeForce GTX 1080 (Desktop) | |
| NVIDIA GeForce GTX 1070 (Desktop) | |
| NVIDIA GeForce GTX 1070 (Desktop) | |
| AMD Radeon RX 590 (Desktop) | |
| AMD Radeon RX 580 (Desktop) | |
| AMD Radeon RX 580 (Desktop) | |
| NVIDIA GeForce GTX 1060 (Desktop) | |
| AMD Radeon RX 480 (Desktop) | |
| AMD Radeon RX 470 (Desktop) | |
| Ghost Recon Wildlands - 1920x1080 Ultra Preset AA:T AF:16x | |
| NVIDIA GeForce GTX 1070 (Desktop) | |
| NVIDIA GeForce GTX 1070 (Desktop) | |
| AMD Radeon RX 590 (Desktop) | |
| NVIDIA GeForce GTX 1060 (Desktop) | |
| AMD Radeon RX 580 (Desktop) | |
| AMD Radeon RX 480 (Desktop) | |
| AMD Radeon RX 580 (Desktop) | |
| AMD Radeon RX 470 (Desktop) | |
| Doom - 1920x1080 Ultra Preset AA:SM | |
| NVIDIA GeForce GTX 1080 (Desktop) | |
| NVIDIA GeForce GTX 1080 (Desktop) | |
| NVIDIA GeForce GTX 1070 (Desktop) | |
| NVIDIA GeForce GTX 1060 (Desktop) | |
| AMD Radeon RX 590 (Desktop) | |
| AMD Radeon RX 480 (Desktop) | |
| AMD Radeon RX 470 (Desktop) | |
| AMD Radeon RX 580 (Desktop) | |
| GTA V - 1920x1080 Highest AA:4xMSAA + FX AF:16x | |
| NVIDIA GeForce GTX 1080 (Desktop) | |
| NVIDIA GeForce GTX 1080 (Desktop) | |
| NVIDIA GeForce GTX 1070 (Desktop) | |
| AMD Radeon RX 590 (Desktop) | |
| AMD Radeon RX 580 (Desktop) | |
| AMD Radeon RX 480 (Desktop) | |
| Just Cause 4 - 1920x1080 Very High / On AA:SM AF:16x | |
| NVIDIA GeForce GTX 1070 (Desktop) | |
| AMD Radeon RX 590 (Desktop) | |
| NVIDIA GeForce GTX 1060 (Desktop) | |
| AMD Radeon RX 580 (Desktop) | |
| Darksiders III - 1920x1080 Epic | |
| NVIDIA GeForce GTX 1070 (Desktop) | |
| NVIDIA GeForce GTX 1060 (Desktop) | |
| AMD Radeon RX 590 (Desktop) | |
| AMD Radeon RX 580 (Desktop) | |
| Farming Simulator 19 - 1920x1080 Very High Preset | |
| NVIDIA GeForce GTX 1070 (Desktop) | |
| NVIDIA GeForce GTX 1060 (Desktop) | |
| AMD Radeon RX 590 (Desktop) | |
| AMD Radeon RX 580 (Desktop) | |
| Fallout 76 - 1920x1080 Ultra Preset | |
| NVIDIA GeForce GTX 1070 (Desktop) | |
| AMD Radeon RX 580 (Desktop) | |
| NVIDIA GeForce GTX 1060 (Desktop) | |
| AMD Radeon RX 590 (Desktop) | |
| Battlefield V - 1920x1080 Ultra Preset | |
| NVIDIA GeForce GTX 1070 (Desktop) | |
| AMD Radeon RX 590 (Desktop) | |
| AMD Radeon RX 580 (Desktop) | |
| NVIDIA GeForce GTX 1060 (Desktop) | |
| FIFA 18 - 1920x1080 Ultra Preset AA:4xMS | |
| AMD Radeon RX 590 (Desktop) | |
| AMD Radeon RX 580 (Desktop) | |
| NVIDIA GeForce GTX 1070 (Desktop) | |
| NVIDIA GeForce GTX 1060 (Desktop) | |
| FIFA 17 - 1920x1080 Ultra Preset AA:4xMS | |
| NVIDIA GeForce GTX 1080 (Desktop) | |
| AMD Radeon RX 590 (Desktop) | |
| AMD Radeon RX 480 (Desktop) | |
| AMD Radeon RX 580 (Desktop) | |
| NVIDIA GeForce GTX 1060 (Desktop) | |
| AMD Radeon RX 470 (Desktop) | |
| F1 2017 - 1920x1080 Ultra High Preset AA:T AF:16x | |
| NVIDIA GeForce GTX 1070 (Desktop) | |
| AMD Radeon RX 590 (Desktop) | |
| AMD Radeon RX 580 (Desktop) | |
| NVIDIA GeForce GTX 1060 (Desktop) | |
| Shadow of the Tomb Raider - 1920x1080 Highest Preset AA:T | |
| NVIDIA GeForce GTX 1070 (Desktop) | |
| AMD Radeon RX 590 (Desktop) | |
| AMD Radeon RX 580 (Desktop) | |
| NVIDIA GeForce GTX 1060 (Desktop) | |
| Rainbow Six Siege - 1920x1080 Ultra Preset AA:T AF:16x | |
| NVIDIA GeForce GTX 1080 (Desktop) | |
| NVIDIA GeForce GTX 1080 (Desktop) | |
| AMD Radeon RX 590 (Desktop) | |
| NVIDIA GeForce GTX 1070 (Desktop) | |
| AMD Radeon RX 580 (Desktop) | |
| NVIDIA GeForce GTX 1060 (Desktop) | |
| AMD Radeon RX 480 (Desktop) | |
| AMD Radeon RX 470 (Desktop) | |
| Rocket League - 1920x1080 High Quality AA:High FX | |
| AMD Radeon RX 590 (Desktop) | |
| NVIDIA GeForce GTX 1070 (Desktop) | |
| NVIDIA GeForce GTX 1060 (Desktop) | |
| AMD Radeon RX 580 (Desktop) | |
| AMD Radeon RX 480 (Desktop) | |
| AMD Radeon RX 470 (Desktop) | |
| Dirt 4 - 1920x1080 Ultra Preset AA:4xMS AF:16x | |
| NVIDIA GeForce GTX 1070 (Desktop) | |
| AMD Radeon RX 590 (Desktop) | |
| AMD Radeon RX 580 (Desktop) | |
| NVIDIA GeForce GTX 1060 (Desktop) | |
| AMD Radeon RX 480 (Desktop) | |
| AMD Radeon RX 470 (Desktop) | |
| Hitman 2 - 1920x1080 Ultra AF:16x | |
| NVIDIA GeForce GTX 1070 (Desktop) | |
| AMD Radeon RX 590 (Desktop) | |
| AMD Radeon RX 580 (Desktop) | |
| NVIDIA GeForce GTX 1060 (Desktop) | |
AMD Ryzen 7 2700X + AMD Radeon RX 590
| low | med. | high | ultra | QHD | 4K | |
|---|---|---|---|---|---|---|
| BioShock Infinite (2013) | 336.3 | 295.8 | 258.2 | 124.8 | ||
| Battlefield 4 (2013) | 199.3 | 200 | 199.9 | 95.1 | 51 | |
| GTA V (2015) | 111 | 103.9 | 95.4 | 61.9 | 41.4 | |
| The Witcher 3 (2015) | 233.1 | 178 | 88.3 | 50.8 | 31.6 | |
| Rainbow Six Siege (2015) | 387.5 | 315.5 | 204 | 183.9 | 68.9 | |
| Rise of the Tomb Raider (2016) | 233.8 | 151.5 | 84.1 | 68.1 | 32.6 | |
| Far Cry Primal (2016) | 122 | 106 | 96 | 68 | 34 | |
| The Division (2016) | 232.9 | 173.6 | 92.8 | 70.6 | 36.1 | |
| Doom (2016) | 111.1 | 111.3 | 97.5 | 92.1 | 36.6 | |
| Overwatch (2016) | 300 | 299.3 | 238.3 | 124.6 | 76 | |
| Deus Ex Mankind Divided (2016) | 123.9 | 116.1 | 75.9 | 38.7 | 25.1 | |
| FIFA 17 (2016) | 432 | 430 | 377.3 | 367.5 | 162.9 | |
| Battlefield 1 (2016) | 192.4 | 151.6 | 112.2 | 98.6 | 43.2 | |
| Dishonored 2 (2016) | 111 | 107.2 | 82.3 | 75.3 | 31.7 | |
| Watch Dogs 2 (2016) | 112.3 | 100.5 | 71.3 | 46.1 | 25.1 | |
| For Honor (2017) | 270.6 | 119.9 | 113.8 | 91 | 35.2 | |
| Ghost Recon Wildlands (2017) | 131.6 | 82.3 | 75.5 | 41.3 | 27.4 | |
| Rocket League (2017) | 249.1 | 248.6 | 230.2 | 81.6 | ||
| Dirt 4 (2017) | 308.5 | 220.1 | 131.4 | 79.2 | 44.9 | |
| Playerunknown's Battlegrounds (PUBG) (2017) | 238.8 | 120.1 | 108.4 | 83.3 | 35 | |
| F1 2017 (2017) | 220 | 166 | 137 | 89 | 40 | |
| FIFA 18 (2017) | 370.5 | 378.8 | 337.7 | 322.3 | 157.5 | |
| Assassin´s Creed Origins (2017) | 78 | 67 | 62 | 53 | 25 | |
| Call of Duty WWII (2017) | 195.5 | 192.9 | 115.8 | 95.4 | 50.2 | |
| Need for Speed Payback (2017) | 149.2 | 130.6 | 114.9 | 105.7 | 33.9 | |
| Fortnite (2018) | 131.4 | 139 | 137.7 | 95.8 | 28.7 | |
| Final Fantasy XV Benchmark (2018) | 116.9 | 64.8 | 43.3 | 19.6 | ||
| Kingdom Come: Deliverance (2018) | 136.2 | 90.4 | 73.9 | 54.6 | 17 | |
| Far Cry 5 (2018) | 116 | 85 | 79 | 74 | 24 | |
| The Crew 2 (2018) | 60 | 60 | 60 | 60 | 26.8 | |
| Monster Hunter World (2018) | 132 | 79.9 | 73.8 | 57.8 | 17.9 | |
| F1 2018 (2018) | 202 | 140 | 119 | 84 | 39 | |
| Shadow of the Tomb Raider (2018) | 134 | 78 | 76 | 66 | 24 | |
| FIFA 19 (2018) | 269.4 | 274.1 | 259 | 243.6 | 95.6 | |
| Forza Horizon 4 (2018) | 197 | 120 | 113 | 91 | 46 | |
| Assassin´s Creed Odyssey (2018) | 80 | 65 | 54 | 39 | 19 | |
| Call of Duty Black Ops 4 (2018) | 241.2 | 135.7 | 129.2 | 115.3 | 39 | |
| Hitman 2 (2018) | 87.4 | 86.6 | 77.7 | 71 | 30.1 | |
| Fallout 76 (2018) | 60 | 59.9 | 59.8 | 59.8 | 33 | |
| Battlefield V (2018) | 191.3 | 132.8 | 110.7 | 99.6 | 39.6 | |
| Farming Simulator 19 (2018) | 194.2 | 149.5 | 115.5 | 69 | 23 | |
| Darksiders III (2018) | 142.6 | 102.5 | 80.1 | 68.2 | 23.1 | |
| Just Cause 4 (2018) | 118.8 | 89.6 | 72.5 | 69.4 | 25.8 | |
| Apex Legends (2019) | 144 | 124 | 97 | 96 | 68 | 36.3 |
| Far Cry New Dawn (2019) | 107 | 88 | 83 | 76 | 58 | 31 |
| Metro Exodus (2019) | 131 | 70.8 | 45.9 | 37.9 | 30.5 | 19.3 |
| Anthem (2019) | 103 | 88 | 82 | 80 | 52 | 28.1 |
| Dirt Rally 2.0 (2019) | 237.3 | 123.3 | 100.4 | 62.3 | 48.8 | 29.7 |
| The Division 2 (2019) | 158 | 105 | 78 | 60 | 42 | 23 |
| Anno 1800 (2019) | 99 | 95 | 61 | 23.3 | 17.3 | 10.3 |
| Rage 2 (2019) | 161 | 83 | 72 | 71 | 45.2 | 21.7 |
| F1 2019 (2019) | 245 | 148 | 129 | 86 | 65 | 36 |
Computing Performance
Although the Radeon RX 580 and the Radeon RX 590 each have 2304 shader units available, the computing performance has improved by about 12%. This is due to the significantly higher GPU clock rates that the AMD Radeon RX 590 has to offer. The computing performance of the AMD RX 590 is about 1 TFLOP higher at a total of 7.1 TFLOPS, which means that the performance of the Polaris 30 chip is significantly better than that of its predecessor. Compared to Nvidia, the chip was able to slightly increase its lead over the GeForce GTX 1060 while reducing the distance to the faster GTX 1070. Basically, the XFX Radeon RX 590 Fatboy OC+ is positioned right in between the two Nvidia cards.
| AMD Radeon RX 590 (Desktop) XFX AMD Radeon RX 590 OC+ 8 GB, R7 2700X | AMD Radeon RX 580 (Desktop) Sapphire Radeon RX 580 Nitro+ 8 GB, R7 1800X | AMD Radeon RX 480 (Desktop) AMD Radeon RX 480 8 GB Reference, 4790K | AMD Radeon RX 470 (Desktop) MSI RX 470 Gaming X 4GB, 4790K | NVIDIA GeForce GTX 1060 (Desktop) Nvidia GeForce GTX 1060 Founders Edition 6 GB, 6700K | NVIDIA GeForce GTX 1070 (Desktop) Nvidia GeForce GTX 1070 Founders Edition, 4790K | |
|---|---|---|---|---|---|---|
| LuxMark v2.0 64Bit | -12% | -16% | -27% | -24% | 24% | |
| Room GPUs-only (Samples/s) | 1996 | 1757 -12% | 1661 -17% | 1440 -28% | 1773 -11% | 2474 24% |
| Sala GPUs-only (Samples/s) | 4084 | 3612 -12% | 3468 -15% | 3020 -26% | 2584 -37% | 5012 23% |
| ComputeMark v2.1 | -12% | -16% | -22% | -21% | 12% | |
| 1024x600 Normal, QJuliaRayTrace (Points) | 3299 | 2777 -16% | 2746 -17% | 2475 -25% | 3322 1% | 4761 44% |
| 1024x600 Normal, Mandel Scalar (Points) | 3312 | 2806 -15% | 2539 -23% | 2447 -26% | 2002 -40% | 2861 -14% |
| 1024x600 Normal, Mandel Vector (Points) | 2802 | 2407 -14% | 2162 -23% | 2172 -22% | 1994 -29% | 2706 -3% |
| 1024x600 Normal, Fluid 2DTexArr (Points) | 1140 | 1031 -10% | 991 -13% | 911 -20% | 963 -16% | 1390 22% |
| 1024x600 Normal, Fluid 3DTex (Points) | 1239 | 1189 -4% | 1220 -2% | 1039 -16% | 985 -21% | 1402 13% |
| 1024x600 Normal, Score (Points) | 11791 | 10210 -13% | 9659 -18% | 9044 -23% | 9266 -21% | 13121 11% |
| Total Average (Program / Settings) | -12% /
-12% | -16% /
-16% | -25% /
-23% | -23% /
-22% | 18% /
15% |
Professional Applications
We ran the two benchmarks SPECviewperf 12 and 13 in order to evaluate the performance of the GPU in professional applications. As we expected, the AMD Radeon RX590 continues to be slightly faster than its predecessor. However, the performance increase is not particularly high compared to the gaming benchmarks. Again, the RX 590 won the comparison with the GeForce GTX 1060. If you are planning on primarily using rendering software, you might want to take a closer look at an Nvidia Quadro or an AMD FirePro GPU. These offer significantly higher performance in this area due to drivers that are specifically adapted for this purpose.
| AMD Radeon RX 590 (Desktop) XFX AMD Radeon RX 590 OC+ 8 GB, AMD Ryzen 7 2700X | AMD Radeon RX 580 (Desktop) Asus ROG Strix RX 580 8 GB, AMD Ryzen 7 2700X | AMD Radeon RX 580 (Desktop) Sapphire Radeon RX 580 Nitro+ 8 GB, AMD Ryzen 7 2700X | NVIDIA GeForce GTX 1060 (Desktop) Nvidia GeForce GTX 1060 Founders Edition 6 GB, Intel Core i7-6700K | AMD Radeon RX Vega 64 Intel Core i7-9700K, AMD Radeon RX Vega 64, Intel Core i7-9700K | NVIDIA Titan X Pascal NVIDIA Titan X Pascal, AMD Ryzen Threadripper 1950X | NVIDIA Quadro P5200 Eurocom Tornado F7W, Intel Core i9-9900K | |
|---|---|---|---|---|---|---|---|
| SPECviewperf 12 | -6% | -7% | -15% | 25% | 142% | 213% | |
| 1900x1060 Solidworks (sw-03) (fps) | 70.4 | 66 -6% | 66.2 -6% | 52.3 -26% | 82.5 17% | 77.1 10% | 212 201% |
| 1900x1060 Siemens NX (snx-02) (fps) | 24.87 | 21.27 -14% | 22.03 -11% | 6.11 -75% | 28.85 16% | 206.8 732% | 217.9 776% |
| 1900x1060 Showcase (showcase-01) (fps) | 72.1 | 72.3 0% | 69.2 -4% | 67.2 -7% | 115.1 60% | 137 90% | 75 4% |
| 1900x1060 Medical (medical-01) (fps) | 33.92 | 31.76 -6% | 31.75 -6% | 31.53 -7% | 51 50% | 79.6 135% | 79.4 134% |
| 1900x1060 Maya (maya-04) (fps) | 66.2 | 61.5 -7% | 61.6 -7% | 111.9 69% | 84.1 27% | 79.7 20% | 147.9 123% |
| 1900x1060 Energy (energy-01) (fps) | 5.95 | 6.02 1% | 5.62 -6% | 6.1 3% | 5.21 -12% | 19.78 232% | 16.88 184% |
| 1900x1060 Creo (creo-01) (fps) | 49.01 | 45 -8% | 45.81 -7% | 40.07 -18% | 62.5 28% | 75.4 54% | 160 226% |
| 1900x1060 Catia (catia-04) (fps) | 123.5 | 109.1 -12% | 107.4 -13% | 51.3 -58% | 158.6 28% | 100.3 -19% | 196.6 59% |
| 1900x1060 3ds Max (3dsmax-05) (fps) | 120.3 | 115.5 -4% | 116.6 -3% | 130.8 9% | 151.9 26% | ||
| SPECviewperf 13 | -6% | -7% | 24% | 159% | 165% | ||
| Solidworks (sw-04) (fps) | 82.9 | 78.8 -5% | 79.6 -4% | 100.5 21% | 82.1 -1% | 189.2 128% | |
| Siemens NX (snx-03) (fps) | 44.18 | 38.19 -14% | 39.72 -10% | 51.5 17% | 370.9 740% | 396.3 797% | |
| Showcase (showcase-02) (fps) | 72.2 | 72.2 0% | 69.4 -4% | 115 59% | 136.8 89% | 74.7 3% | |
| Medical (medical-02) (fps) | 27.9 | 26.86 -4% | 27.67 -1% | 38.31 37% | 71.4 156% | 61.7 121% | |
| Maya (maya-05) (fps) | 151 | 147.4 -2% | 143.9 -5% | 199.5 32% | 236.5 57% | 255 69% | |
| Energy (energy-02) (fps) | 8.98 | 8.45 -6% | 7.55 -16% | 7.55 -16% | 32.46 261% | 17.28 92% | |
| Creo (creo-02) (fps) | 90 | 80.1 -11% | 82 -9% | 108.9 21% | 185.2 106% | 247.7 175% | |
| Catia (catia-05) (fps) | 168.9 | 158 -6% | 155.4 -8% | 236 40% | 161.4 -4% | 302.4 79% | |
| 3ds Max (3dsmax-06) (fps) | 120.4 | 115.7 -4% | 115.3 -4% | 131 9% | 153.4 27% | 149.6 24% | |
| Total Average (Program / Settings) | -6% /
-6% | -7% /
-7% | -15% /
-15% | 25% /
25% | 151% /
151% | 189% /
188% |
Emissions - XFX Fatboy at its limits
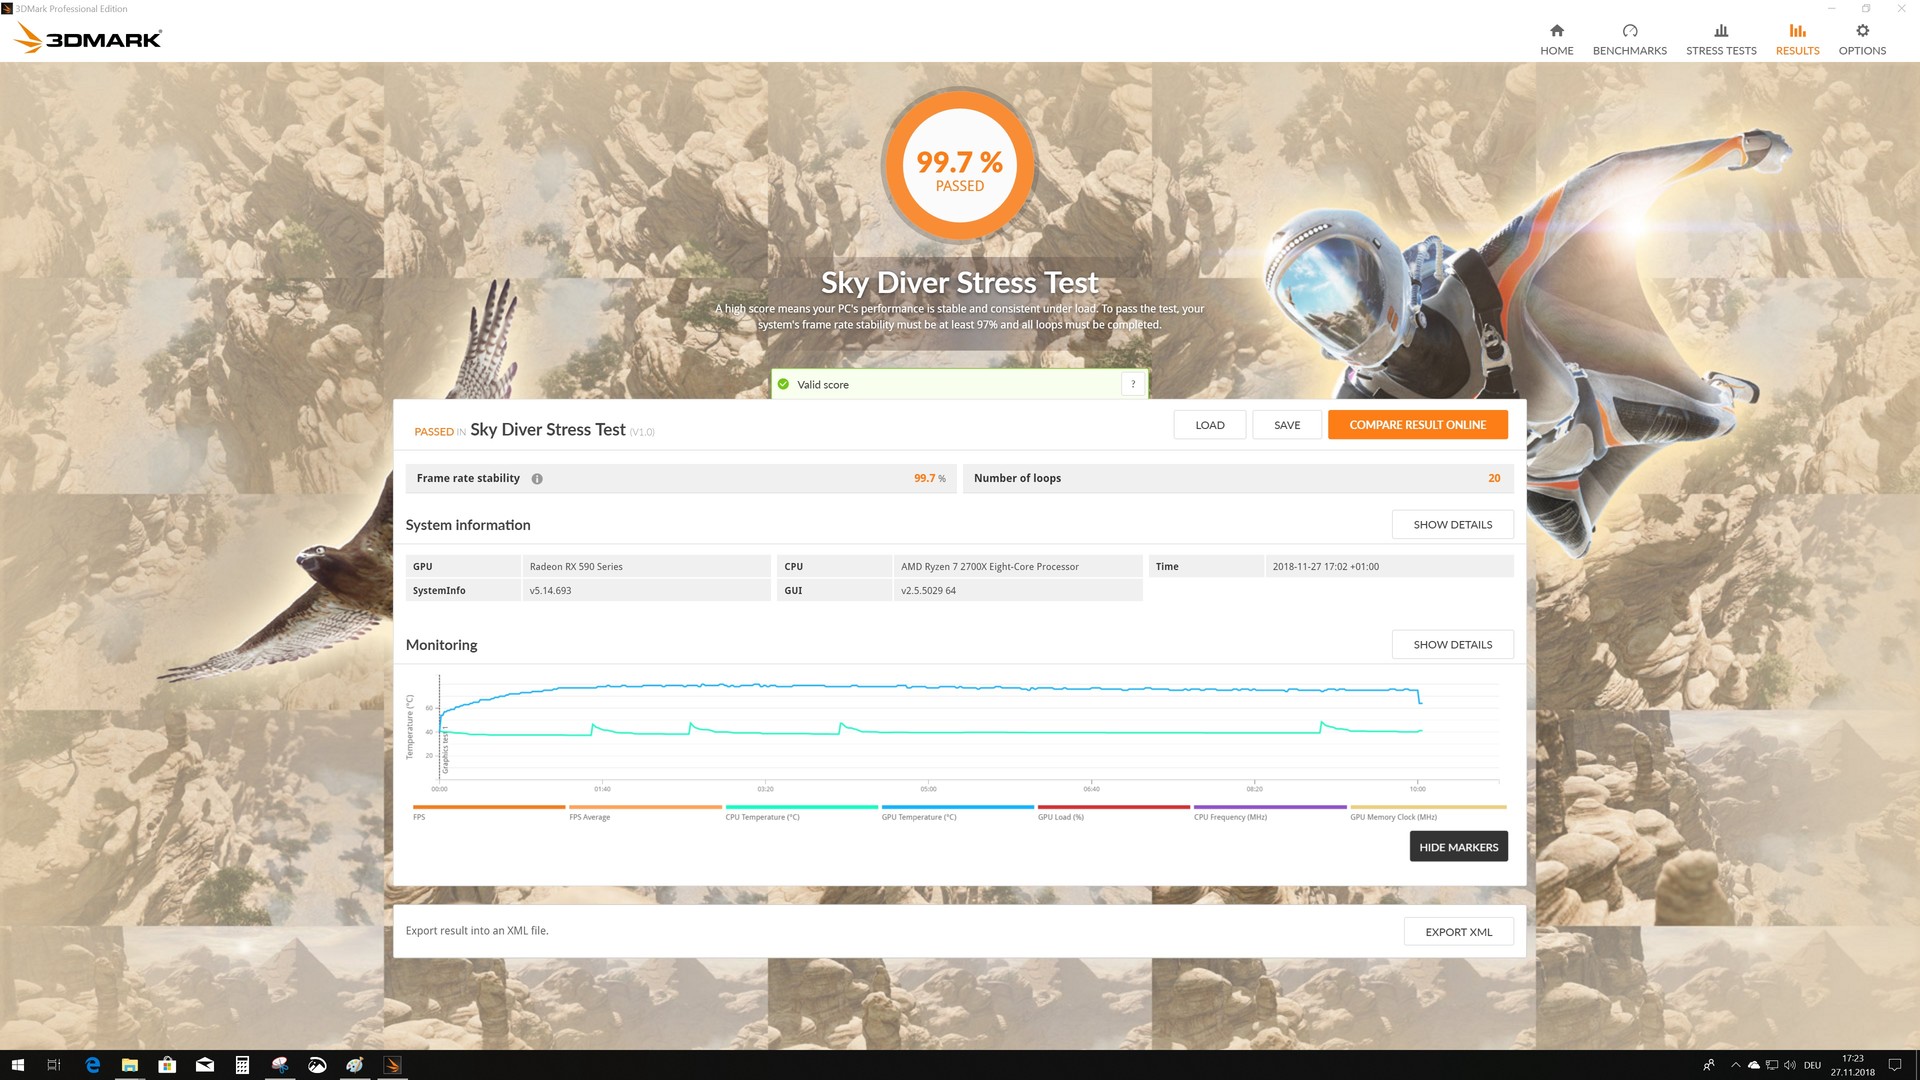
Temperatures and Stress Test
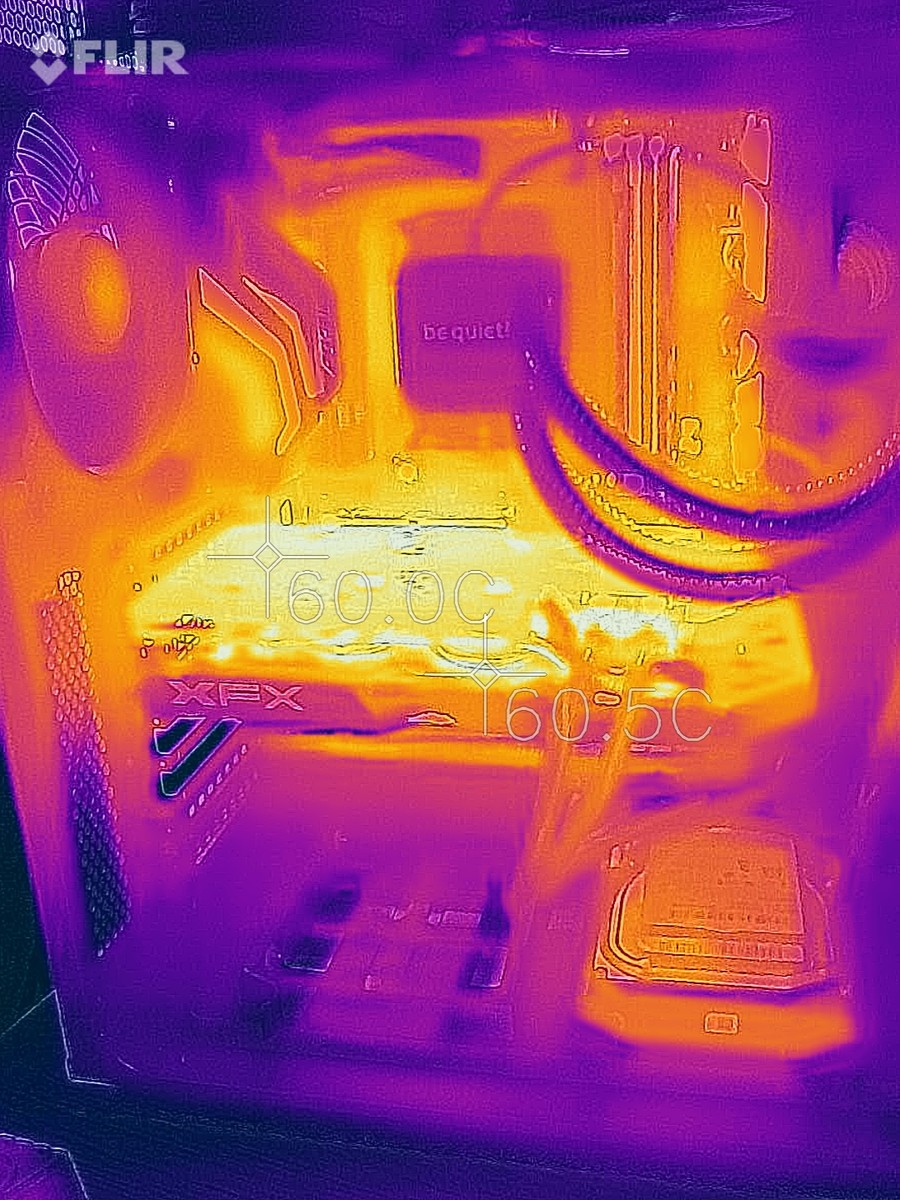
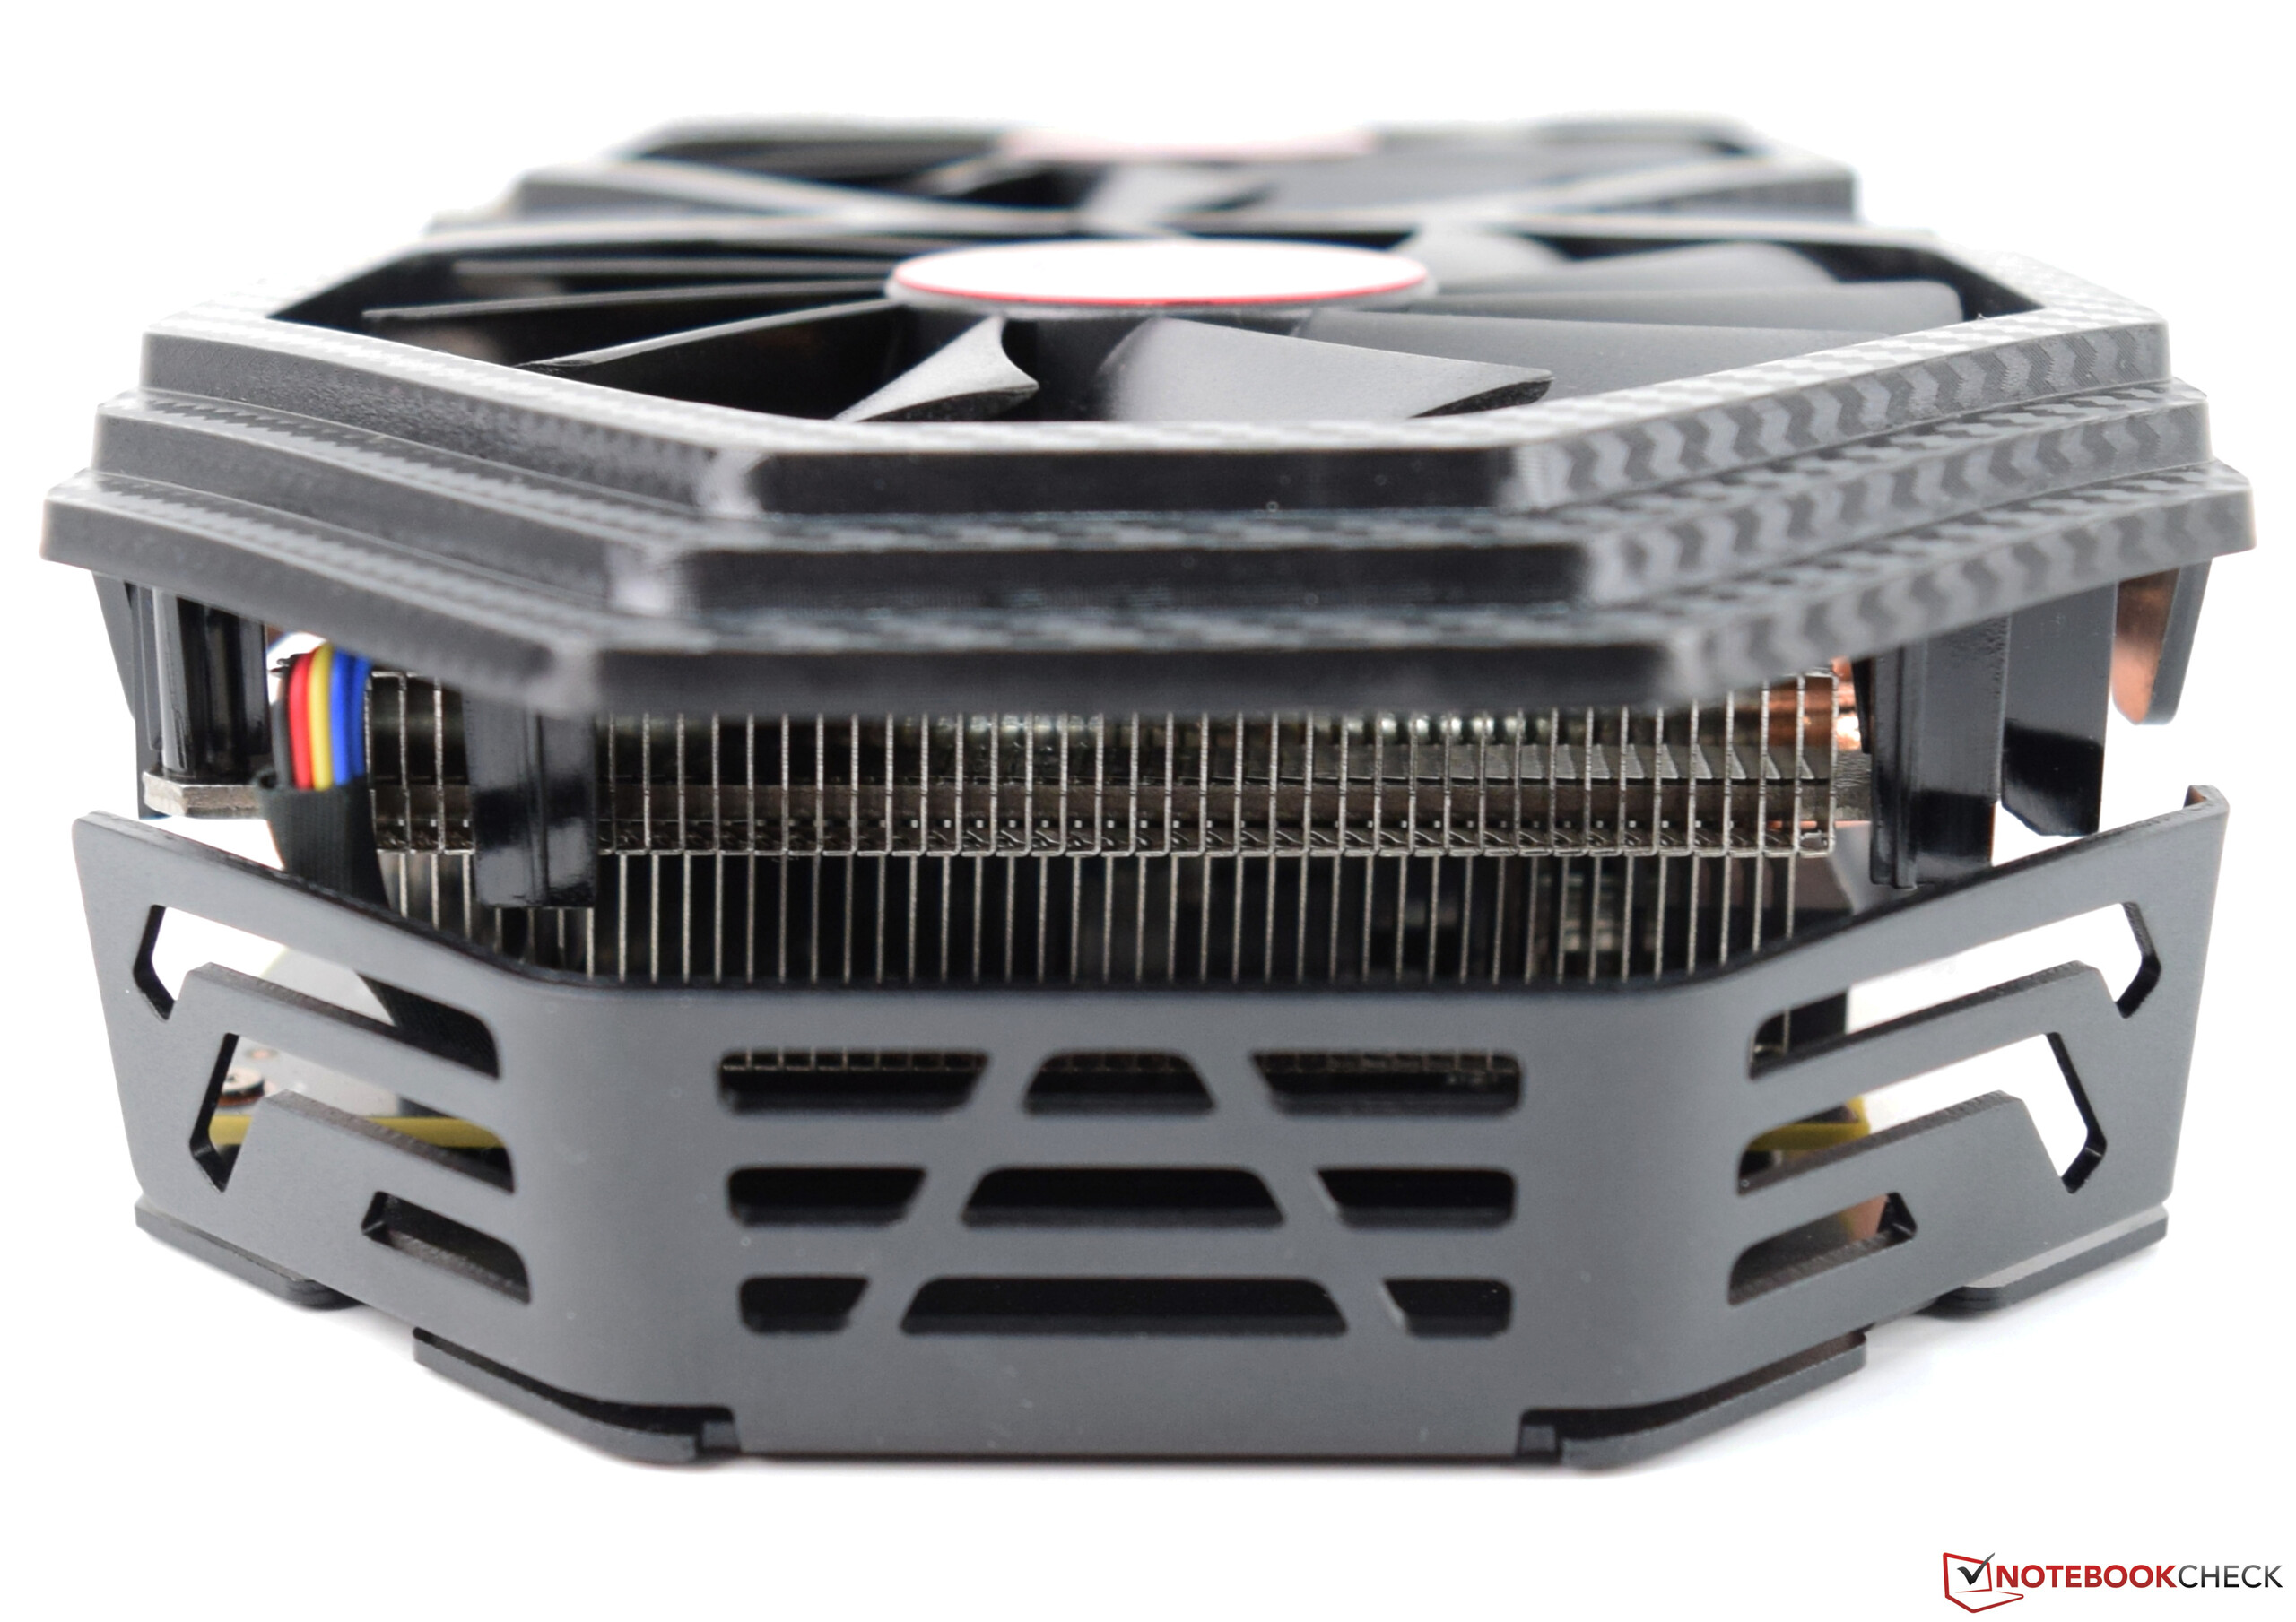
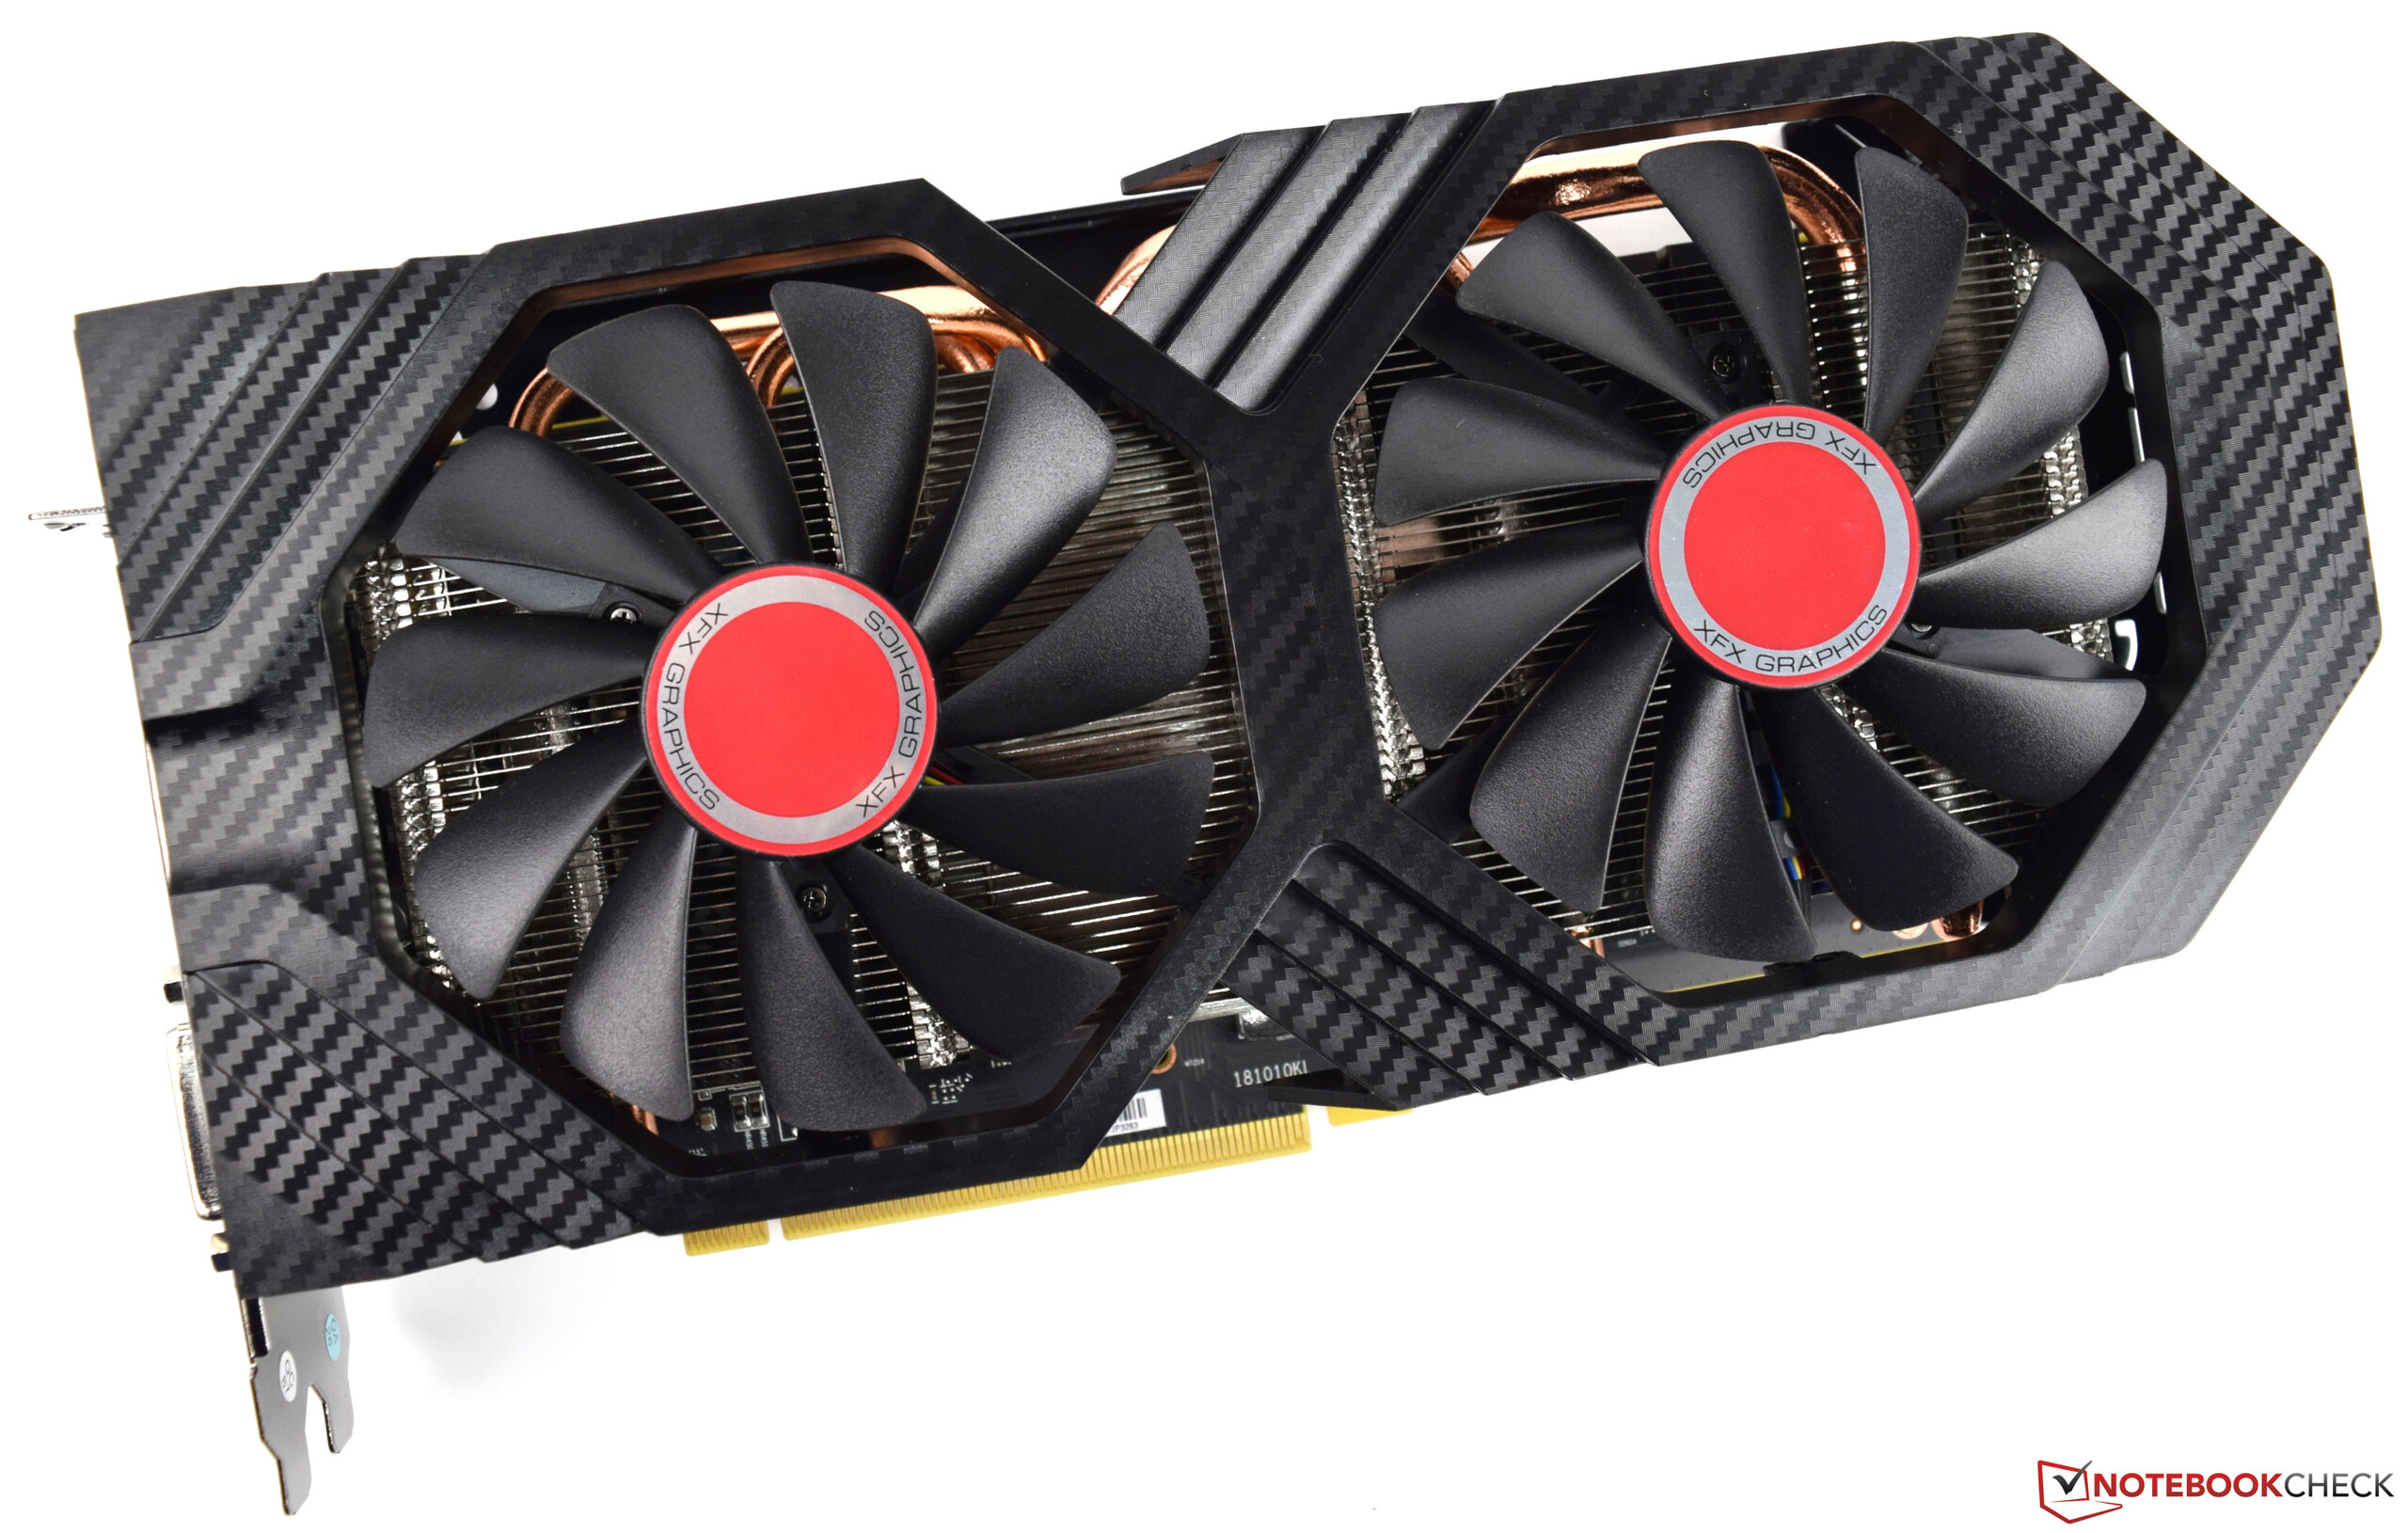
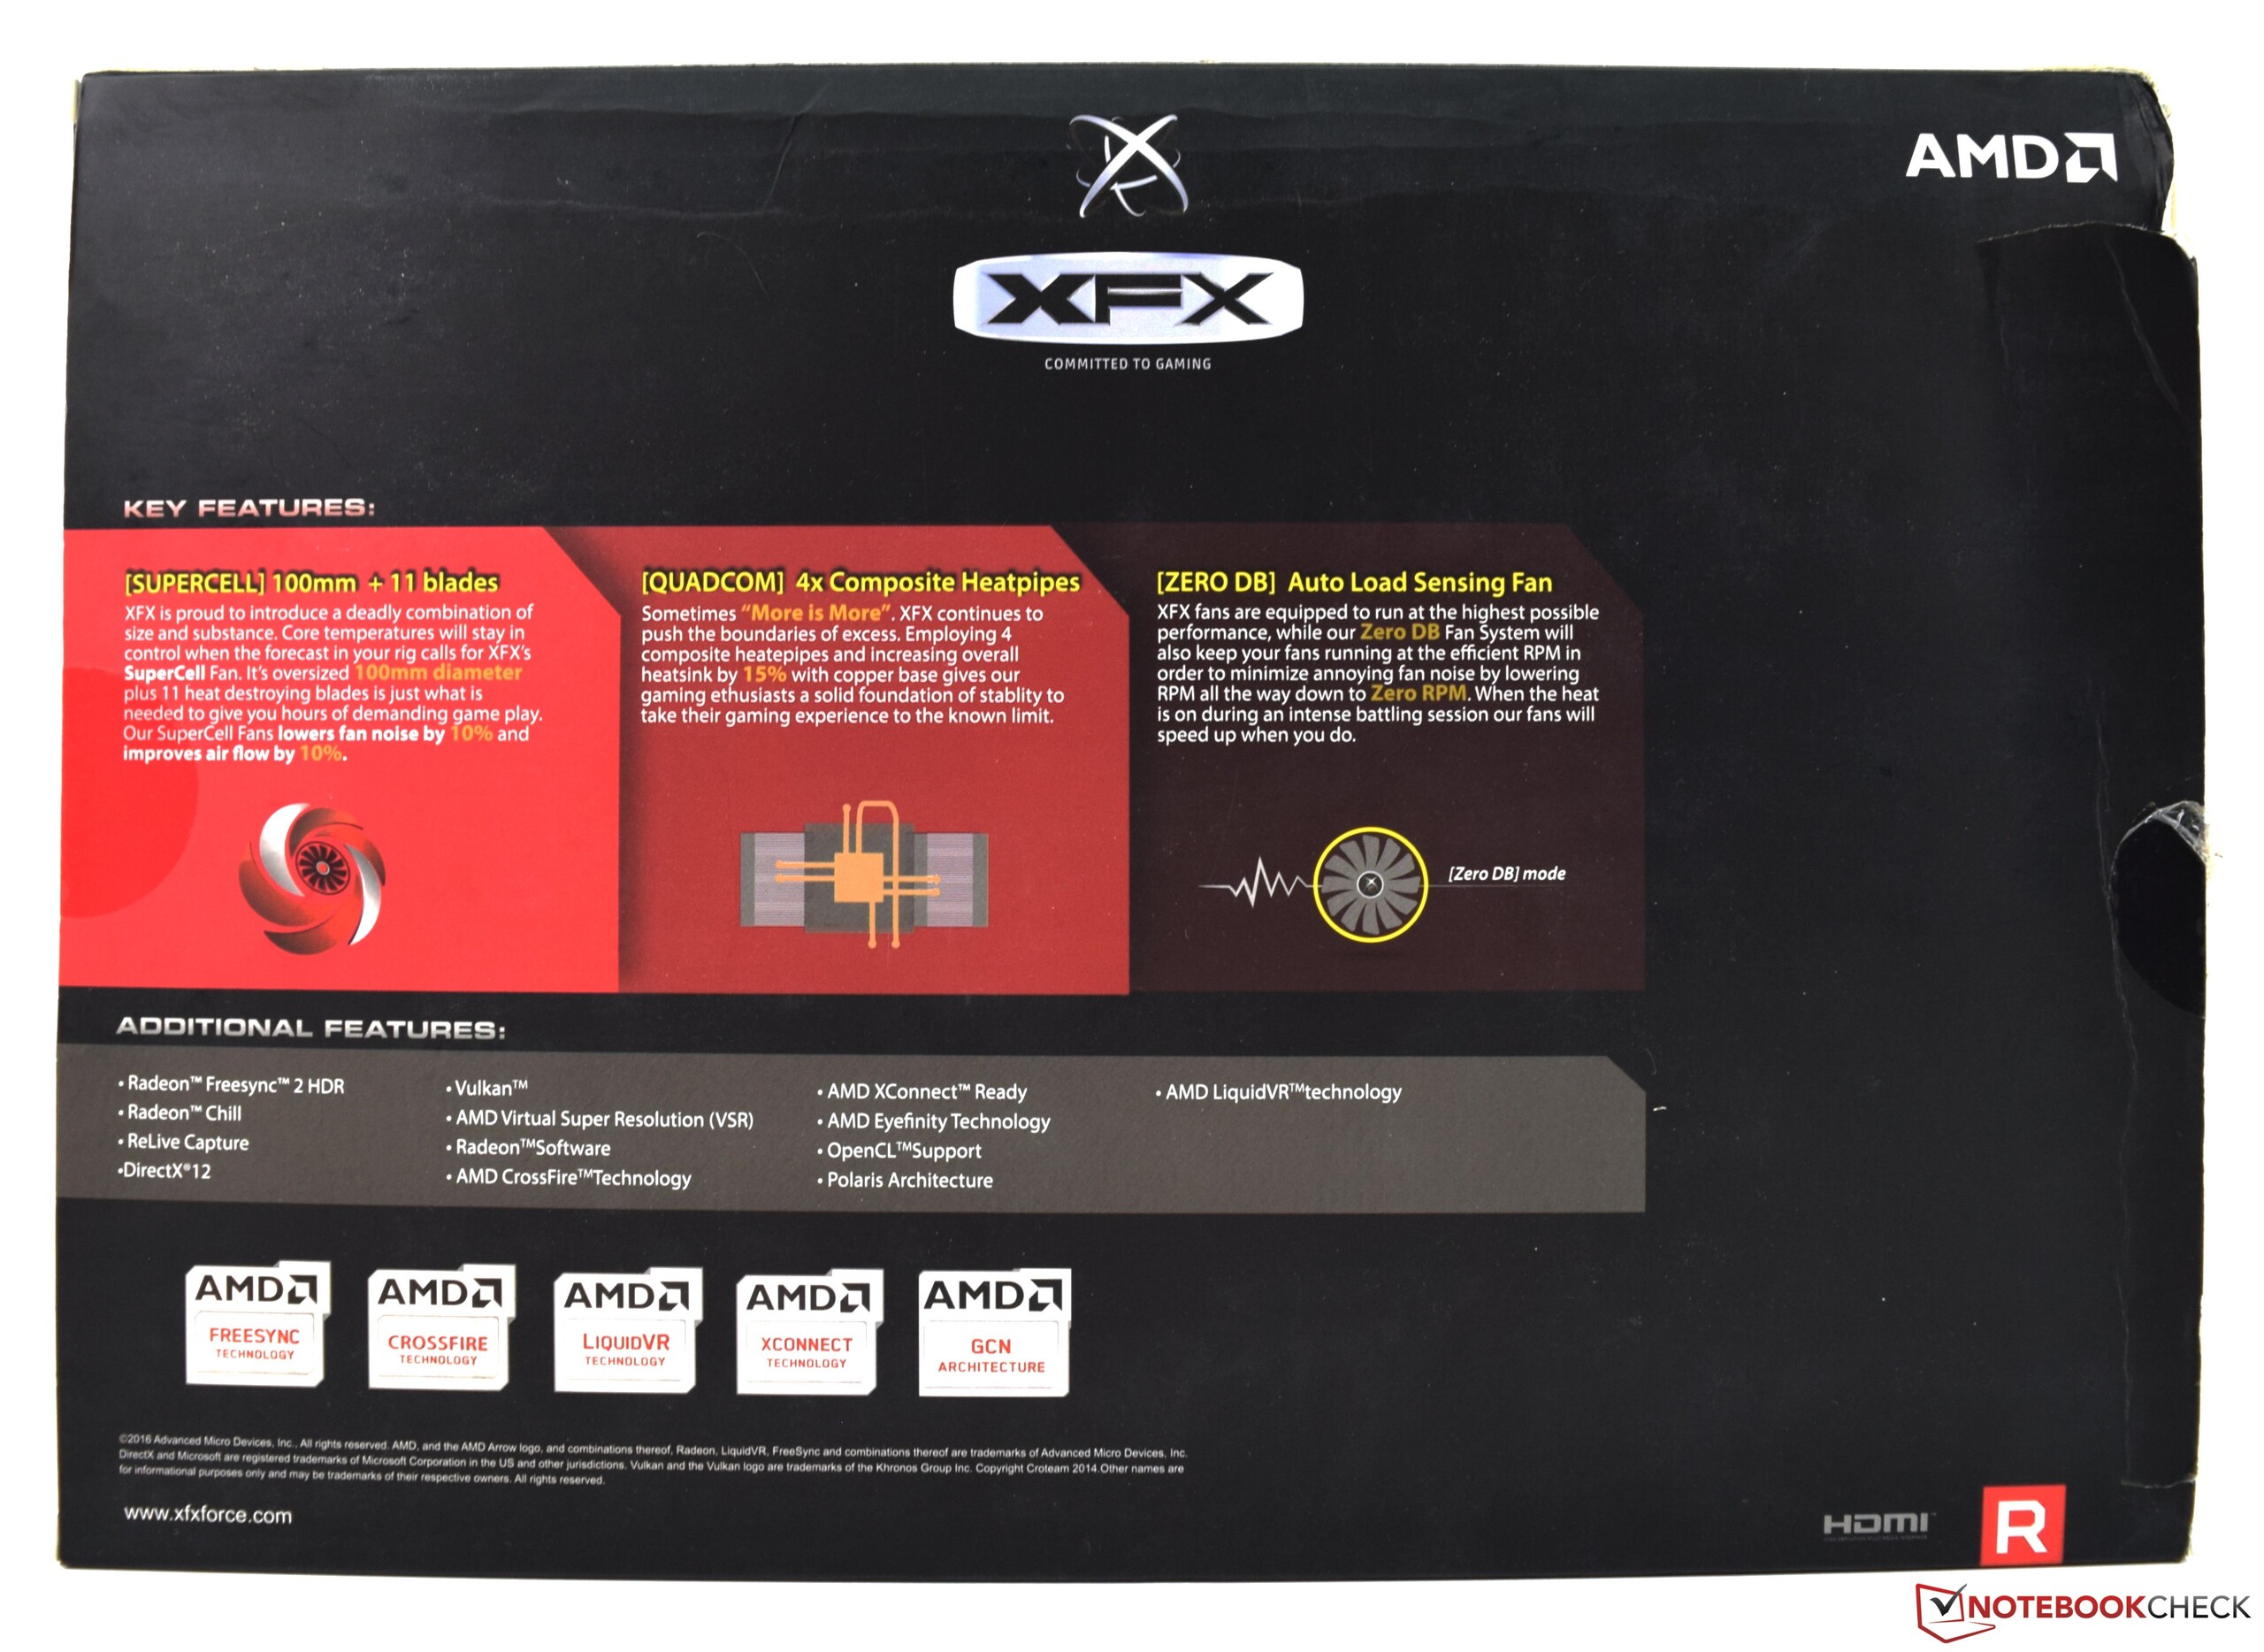
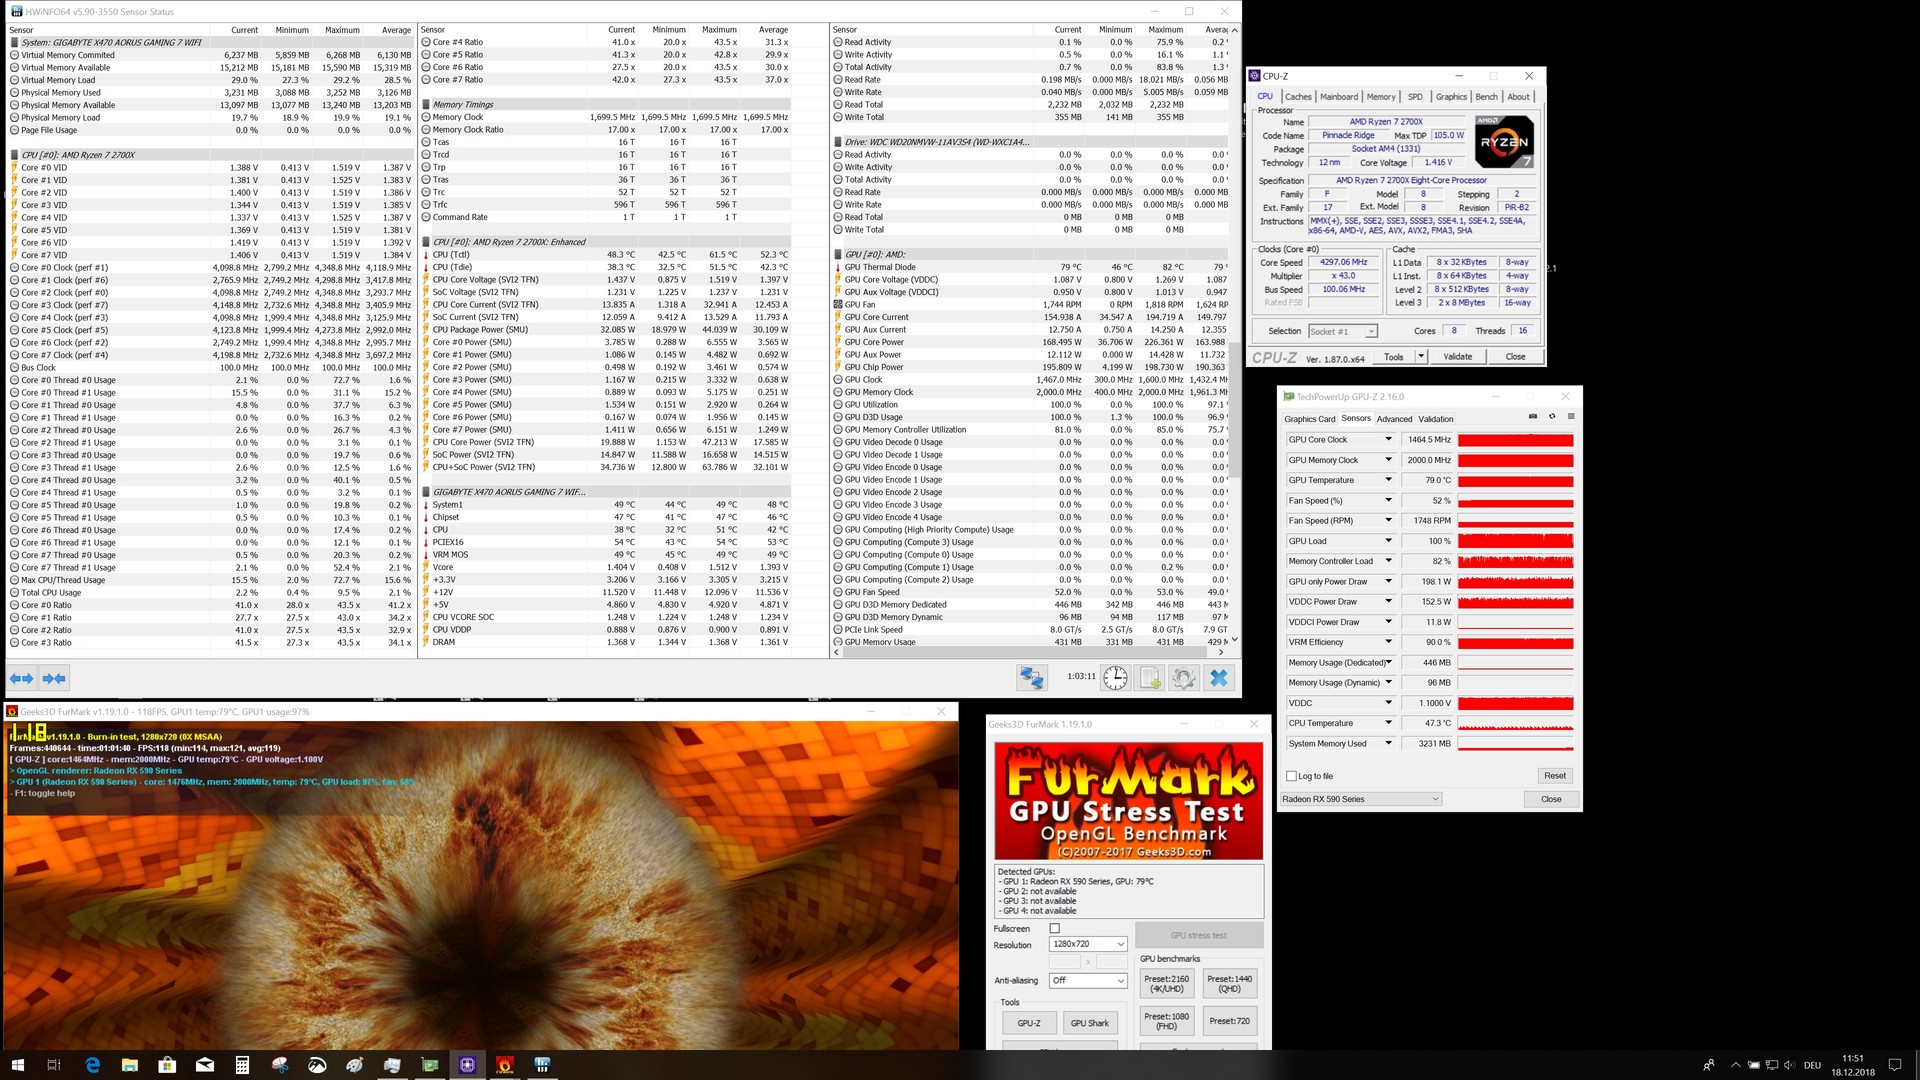
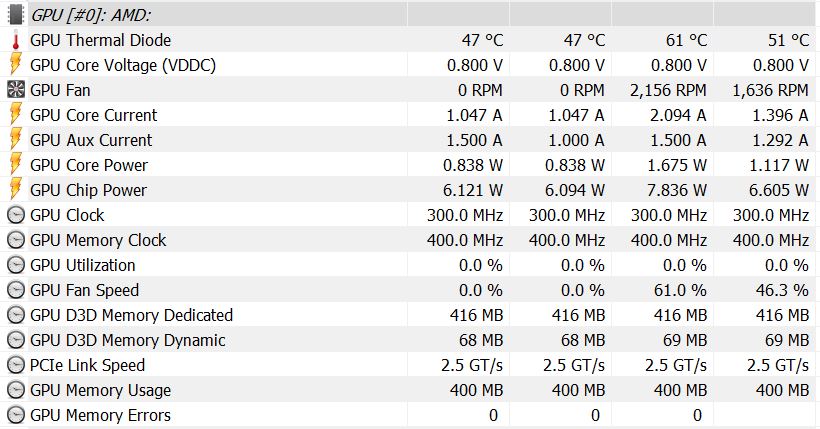
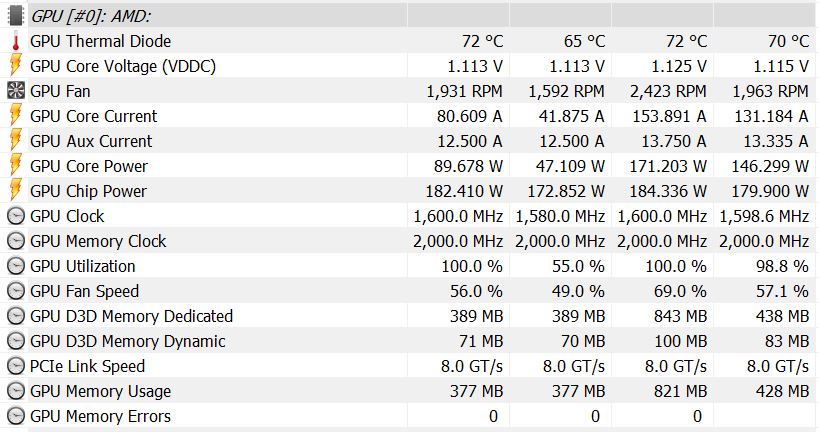
The Zero Fan mode enables silent operation during 2D use. Even when running 3D applications, the fans do not turn on immediately. The two axial cooling fans provide sufficient cooling without producing too much noise. The XFX Radeon RX 590 Fatboy OC+ encountered no difficulties during the 3DMark Sky Diver stress test. Nor did the GPU reach critical temperatures in our extreme load test with FurMark, although a core temperature of 82 °C (~180 °F) is relatively close to the limit.
The GPU was even able to reach its full potential without encountering heat-related difficulties during our gaming test. We have already mentioned this when discussing the "Witcher 3" stress test results in the section about the gaming benchmarks.
Power Consumption, Overclocking and CrossFire
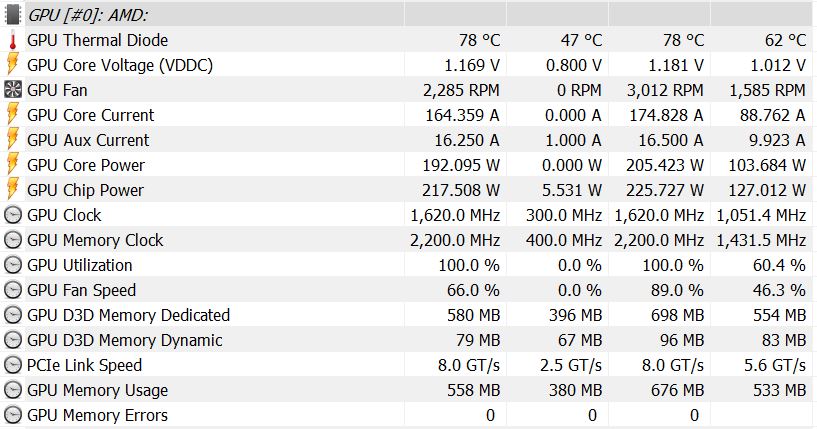
The AMD continues to lag behind Nvidia in terms of energy efficiency. Although the power consumption rates of the Radeon RX 590 have gone down by 10 watts compared to the RX 580 (now specified as 175 watts), the GeForce chips continue to be more efficient. The GeForce GTX 1080, for example, has a TDP of 180 watts.
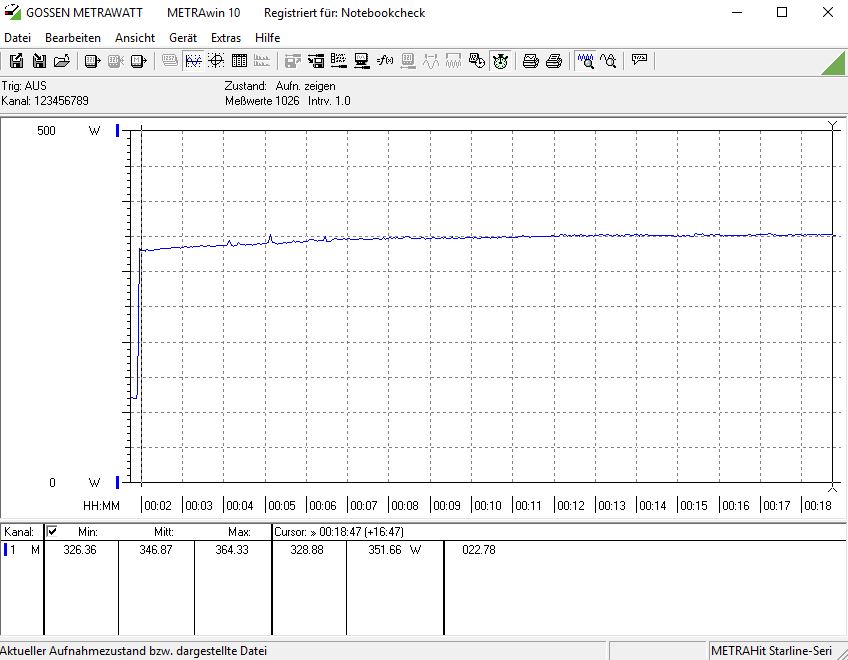
The GPU clocks at 300 MHz while idling and consumes an average of 6-8 watts in this scenario. HWiNFO measured a maximum consumption of 184 watts during our stress test. This positions the consumption of the XFX Radeon RX 590 Fatboy OC+ slightly above the reference rates. But this is connected to the higher GPU clock rates. Users could try to get even more out of the chip by increasing the Power Target. However, the cooling system soon cannot keep up. We were only able to additionally overclock the RX 590 from XFX by 20 MHz while we got an additional 200 MHz out of the VRAM. Overall, this performance improvement does not translate into better synthetic benchmarks. The GPU also consumed significantly more power with these manual OC settings (225 watts). Users who are looking to get more out of their graphics card will need to look into liquid cooling. Overclocking our test version is not worth the effort with the standard cooling system of the XFX Radeon RX 590 Fatboy OC+.
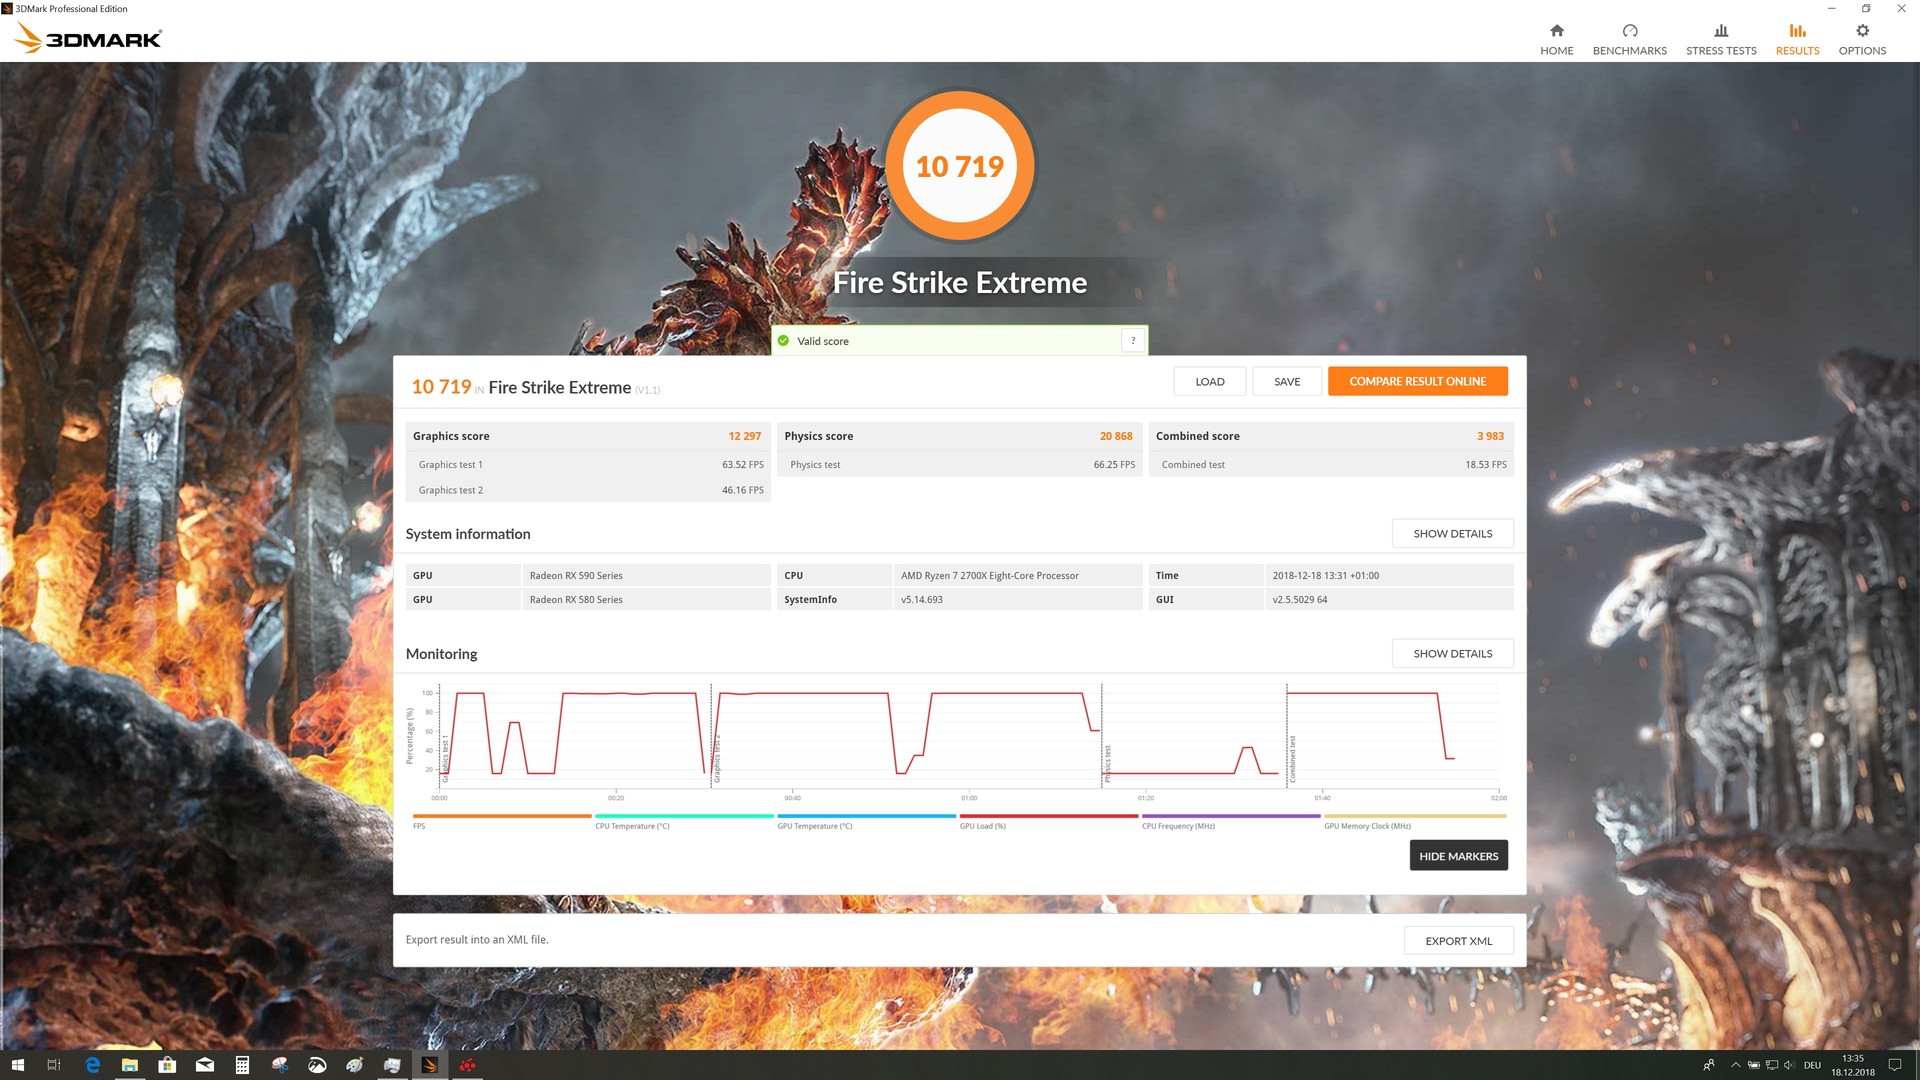
As the RX 590 also supports CrossFire, we tried testing its performance in combination with an Asus ROG Strix Radeon RX 580 - just for fun. We measured 10719 points during Fire Strike Extreme, which is an increase of 3777 points. Often scaling works better in synthetic benchmarks with several graphic cards. We would not recommend long gaming sessions using CrossFire as a lot of games do not work well with several graphics cards. The gaming performance can even drop when using two GPUs compared to single-GPU performance.
| Power Consumption - 1920x1080 The Witcher 3 ultra (external Monitor) | |
| Intel Core i7-9700K | |
| AMD Ryzen 7 2700X | |
| Intel Core i7-4790K (Idle: 71.1 W) | |
| Intel Core i7-4790K (Idle: 68.3 W) | |
| Intel Core i7-4790K (Idle: 78.3 W) | |
| Intel Core i7-4790K (Idle: 68 W) | |
| Intel Core i7-4790K (Idle: 79.2 W) | |
* ... smaller is better
Verdict - a successful upgrade
Pros
Cons
The XFX Radeon RX Fatboy OC+ is a new AMD Polaris GPU. To be precise, the RX 590 is a Polaris 30 and is manufactured in a 12-nm process. This enables higher clock rates and makes the Radeon RX 590 about 10% faster than its predecessors. Overall, the power consumption has dropped by around 10 watts compared to the AMD Radeon RX 580. While this is a step in the right direction, the Pascal GPUs from AMD's biggest rival Nvidia are a lot more efficient.
Instead, AMD scores several points in terms of price. At the time of writing, the XFX Radeon RX 590 Fatboy OC+ is available for $280 while other versions based on the RX 590 are even cheaper. The GeForce GTX 1060 is slightly cheaper, but cannot keep up with the performance of our XFX Radeon RX 590 Fatboy OC+. The GeForce GTX 1070 is significantly more expensive at $330 and above. This model offers a slight increase in performance. The AMD Radeon RX 590 positions itself right in between these two GeForce GPUs, both in terms of price and performance.
Although AMD has not developed a completely new graphics card, the manufacturer has once again managed to streamline its Polaris series. The increase in performance of around 10%, while consuming less power is very decent and is a step in the right direction.
The XFX Radeon RX 590 Fatboy OC+ is overclocked ex-works and should offer buyers good performance. However, this graphics card does often work at its limits and it might even be a good idea to take a look at the cheaper model in some cases. Users of the RX 580 might want to think twice before upgrading to the 590, as the performance increase is still limited to 10%. If you are currently using the RX 480 or an even older model, the step up would be a good idea. The GPU's FreeSync support might also influence some users' purchase decision. Nvidia's GSync equivalent requires additional hardware in the monitor and has license fees. FreeSync monitors are significantly cheaper.

