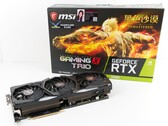
Notebookcheck Logo

NVIDIA GeForce RTX 2080 (Desktop)

The NVIDIA GeForce RTX 2080 sits behind the GeForce RTX 2080 Ti as the second fastest desktop GPU in NVIDIA's current Turing line-up. The RTX 2080 has 2,944 shader units, 8 GB GDDR6 VRAM and a 256-bit interface that runs at 14 GHz and delivers up to 448 GB/s.

Features

NVIDIA manufacturers the TU104 chip on a 12 nm FinFET process and includes features like Deep Learning Super Sampling (DLSS) and Real-Time Ray Tracing (RTRT), which should combine to create more realistic lighting effects than older GPUs based on the company's Pascal architecture (if the games supports it). The RTX 2080 is also DisplayPort 1.4 ready, while there is also support for HDMI 2.0b, HDR, Simultaneous Multi-Projection (SMP) and H.265 video en/decoding (PlayReady 3.0).

Performance

The RTX 2080 should perform on par with a GeForce GTX 1080 Ti, but it will outclass the latter in games that support DLSS and RTRT. The RTX 2080 is at the pinnacle of consumer desktop GPUs and can play most triple-A games released in 2018 at high graphics in 4K.

Power Requirements

NVIDIA estimates that the RTX 2080 should consume a maximum of 215 W, which is 35 W higher than the company rates its GeForce GTX 1080.

GeForce RTX 2000 Series

NVIDIA Titan RTX compare 4608 @ 1.35 - 1.77 GHz384 Bit @ 14000 MHz
GeForce RTX 2080 Ti (Desktop) compare 4352 @ 1.35 - 1.55 GHz352 Bit @ 14000 MHz
GeForce RTX 2080 Super (Desktop) compare 3072 @ 1.65 - 1.82 GHz256 Bit @ 15500 MHz
GeForce RTX 2080 (Desktop) 2944 @ 1.52 - 1.71 GHz256 Bit @ 14000 MHz
GeForce RTX 2080 Super Mobile compare 3072 @ 1.37 - 1.56 GHz256 Bit @ 14000 MHz
GeForce RTX 2080 Mobile compare 2944 @ 1.38 - 1.59 GHz256 Bit @ 14000 MHz
GeForce RTX 2070 Super (Desktop) compare 2560 @ 1.61 - 1.77 GHz256 Bit @ 14000 MHz
GeForce RTX 2070 (Desktop) compare 2304 @ 1.41 - 1.62 GHz256 Bit @ 14000 MHz
GeForce RTX 2070 Super Mobile compare 2560 @ 1.14 - 1.38 GHz256 Bit @ 14002 MHz
GeForce RTX 2080 Super Max-Q compare 3072 @ 0.98 - 1.23 GHz256 Bit @ 11000 MHz
GeForce RTX 2060 Super (Desktop) compare 2176 @ 1.47 - 1.65 GHz256 Bit @ 14000 MHz
GeForce RTX 2070 Mobile compare 2304 @ 1.22 - 1.44 GHz256 Bit @ 14000 MHz
GeForce RTX 2080 Max-Q compare 2944 @ 0.74 - 1.1 GHz256 Bit @ 12000 MHz
GeForce RTX 2060 (Desktop) compare 1920 @ 1.32 - 1.62 GHz192 Bit @ 14000 MHz
GeForce RTX 2070 Super Max-Q compare 2560 @ 0.93 - 1.16 GHz256 Bit @ 11000 MHz
GeForce RTX 2070 Max-Q compare 2304 @ 0.89 - 1.19 GHz256 Bit @ 12000 MHz
GeForce RTX 2060 Mobile compare 1920 @ 0.96 - 1.2 GHz192 Bit @ 14000 MHz
GeForce RTX 2060 Max-Q compare 1920 @ 0.98 - 1.19 GHz192 Bit @ 11000 MHz
GeForce RTX 2050 Mobile compare 2048 @ 1.48 GHz64 Bit @ 14000 MHz
CodenameTuring TU104
ArchitectureTuring
Pipelines2944 - unified
Core Speed1515 - 1710 (Boost) MHz
Memory Speed14000 MHz
Memory Bus Width256 Bit
Memory TypeGDDR6
Max. Amount of Memory8 GB
Shared Memoryno
APIDirectX 12_1, Shader 6.4, OpenGL 4.6
Power Consumption215 Watt
Transistor Count13.6 Billion
technology12 nm
FeaturesNVLink, DLSS, Raytraycing, VR Ready, G-SYNC, Vulkan, Multi Monitor, 650 Watt system power recommended
Date of Announcement27.08.2018

Benchmarks

Performance Rating - 3DMark 11 + Fire Strike + Time Spy
12.6 pt (38%)
3DMark - 3DMark Time Spy Score
min: 10660     avg: 10864     median: 10820 (31%)     max: 11111 Points
3DMark - 3DMark Time Spy Graphics
min: 11099     avg: 11173     median: 11126 (29%)     max: 11294 Points
3DMark - 3DMark Ice Storm Extreme Graphics
min: 322455     avg: 360917     median: 330412 (42%)     max: 429885 Points
3DMark - 3DMark Fire Strike Standard Graphics
min: 27228     avg: 27772     median: 27620 (31%)     max: 28469 Points
3DMark 11 - 3DM11 Performance Score
min: 26875     avg: 29060     median: 29073.5 (40%)     max: 31219 Points
3DMark 11 - 3DM11 Performance GPU
min: 37989     avg: 39989     median: 40278 (35%)     max: 41409 Points
3DMark Vantage
3DM Vant. Perf. total +
3DM Vant. Perf. GPU no PhysX +
3DMark 06 3DMark 06 - Standard 1280x1024 +
3DMark 06
min: 35085     avg: 38997     median: 35228 (46%)     max: 46677 Points
SPECviewperf 12
specvp12 sw-03 +
specvp12 snx-02 +
specvp12 showcase-01 +
specvp12 mediacal-01 +
specvp12 maya-04 +
specvp12 energy-01 +
specvp12 creo-01 +
specvp12 catia-04 +
specvp12 3dsmax-05 +
SPECviewperf 13 specvp13 sw-04 +
specvp13 snx-03 +
specvp13 medical-02 +
specvp13 creo-02 +
- Range of benchmark values for this graphics card
- Average benchmark values for this graphics card
* Smaller numbers mean a higher performance

Game Benchmarks

The following benchmarks stem from our benchmarks of review laptops. The performance depends on the used graphics memory, clock rate, processor, system settings, drivers, and operating systems. So the results don't have to be representative for all laptops with this GPU. For detailed information on the benchmark results, click on the fps number.

F1 2021

F1 2021

2021
med. 1920x1080
248  fps    + Compare
high 1920x1080
217  fps    + Compare
ultra 1920x1080
131  fps    + Compare
QHD 2560x1440
89  fps    + Compare
4K 3840x2160
50  fps    + Compare
» With all tested laptops playable in detail settings ultra.
Additional Benchmarks
Ultra Low Preset 1920x1080
282
Days Gone

Days Gone

2021
med. 1920x1080
161  fps    + Compare + 📈 Graph
high 1920x1080
148  fps    + Compare + 📈 Graph
ultra 1920x1080
117  fps    + Compare + 📈 Graph
QHD 2560x1440
87.1  fps    + Compare + 📈 Graph
4K 3840x2160
50.4  fps    + Compare + 📈 Graph
» With all tested laptops playable in detail settings ultra.
Additional Benchmarks
Low Preset 1920x1080
167
low 1280x720
127  fps    + Compare + 📈 Graph
ultra 1920x1080
123  fps    + Compare + 📈 Graph
QHD 2560x1440
120  fps    + Compare + 📈 Graph
4K 3840x2160
97.8  fps    + Compare + 📈 Graph
» With all tested laptops playable in detail settings ultra.
med. 1920x1080
180  fps    + Compare + 📈 Graph
high 1920x1080
177  fps    + Compare + 📈 Graph
ultra 1920x1080
166  fps    + Compare + 📈 Graph
QHD 2560x1440
115  fps    + Compare + 📈 Graph
4K 3840x2160
58.4  fps    + Compare + 📈 Graph
» With all tested laptops playable in detail settings ultra.
Additional Benchmarks
Prioritize Performance Preset 1920x1080
182
Ray Tracing Preset 1920x1080
108
Outriders

Outriders

2021
med. 1920x1080
133  fps    + Compare + 📈 Graph
high 1920x1080
132  fps    + Compare + 📈 Graph
ultra 1920x1080
129  fps    + Compare + 📈 Graph
QHD 2560x1440
89.9  fps    + Compare + 📈 Graph
4K 3840x2160
47.3  fps    + Compare + 📈 Graph
» With all tested laptops playable in detail settings ultra.
Additional Benchmarks
Low Preset 1920x1080
140
Hitman 3

Hitman 3

2021
med. 1920x1080
165  fps    + Compare
high 1920x1080
163  fps    + Compare
ultra 1920x1080
160  fps    + Compare
QHD 2560x1440
119  fps    + Compare
4K 3840x2160
65.3  fps    + Compare
» With all tested laptops playable in detail settings ultra.
Additional Benchmarks
Minimum Settings 1920x1080
206
med. 1920x1080
100  fps    + Compare + 📈 Graph
high 1920x1080
85.9  fps    + Compare + 📈 Graph
ultra 1920x1080
76.2  fps    + Compare + 📈 Graph
QHD 2560x1440
50.3  fps    + Compare + 📈 Graph
4K 3840x2160
24.4  fps    + Compare + 📈 Graph
» With all tested laptops playable in detail settings ultra.
Additional Benchmarks
Ray Tracing Ultra Preset (DLSS off) 1920x1080
32.5
Ray Tracing Ultra Preset (DLSS off) 3840x2160
10
med. 1920x1080
104  fps    + Compare
high 1920x1080
91  fps    + Compare
ultra 1920x1080
83  fps    + Compare
QHD 2560x1440
70  fps    + Compare
4K 3840x2160
48  fps    + Compare
» With all tested laptops playable in detail settings ultra.
med. 1920x1080
135  fps    + Compare + 📈 Graph
high 1920x1080
131  fps    + Compare + 📈 Graph
ultra 1920x1080
115  fps    + Compare + 📈 Graph
QHD 2560x1440
80  fps    + Compare + 📈 Graph
4K 3840x2160
41.6  fps    + Compare + 📈 Graph
» With all tested laptops playable in detail settings ultra.
med. 1920x1080
133  fps    + Compare + 📈 Graph
high 1920x1080
112  fps    + Compare + 📈 Graph
ultra 1920x1080
102  fps    + Compare + 📈 Graph
QHD 2560x1440
75.1  fps    + Compare + 📈 Graph
4K 3840x2160
42.5  fps    + Compare + 📈 Graph
» With all tested laptops playable in detail settings ultra.
Additional Benchmarks
Highest Settings + Ultra Ray Tracing 1920x1080
65.7
med. 1920x1080
98  fps    + Compare
high 1920x1080
83  fps    + Compare
ultra 1920x1080
73  fps    + Compare
QHD 2560x1440
60  fps    + Compare
4K 3840x2160
38  fps    + Compare
» With all tested laptops playable in detail settings ultra.
Dirt 5

Dirt 5

2020
med. 1920x1080
121  fps    + Compare
high 1920x1080
98.9  fps    + Compare
ultra 1920x1080
60.2  fps    + Compare
QHD 2560x1440
52.1  fps    + Compare
4K 3840x2160
39.7  fps    + Compare
» With all tested laptops playable in detail settings ultra.
med. 1920x1080
110  fps    + Compare + 📈 Graph
high 1920x1080
97.5  fps    + Compare + 📈 Graph
ultra 1920x1080
78.6  fps    + Compare + 📈 Graph
QHD 2560x1440
58  fps    + Compare + 📈 Graph
4K 3840x2160
34.7  fps    + Compare + 📈 Graph
» With all tested laptops playable in detail settings ultra.
Additional Benchmarks
Ultra Preset + Ultra Ray Tracing (DX12) 1920x1080
44.6
FIFA 21

FIFA 21

2020
low 1280x720
255  fps    + Compare + 📈 Graph
med. 1920x1080
253  fps    + Compare + 📈 Graph
high 1920x1080
243  fps    + Compare + 📈 Graph
ultra 1920x1080
242  fps    + Compare + 📈 Graph
QHD 2560x1440
239  fps    + Compare + 📈 Graph
4K 3840x2160
223  fps    + Compare + 📈 Graph
» With all tested laptops playable in detail settings ultra.
low 1280x720
413  fps    + Compare + 📈 Graph
med. 1920x1080
350  fps    + Compare + 📈 Graph
high 1920x1080
308  fps    + Compare + 📈 Graph
ultra 1920x1080
284  fps    + Compare + 📈 Graph
QHD 2560x1440
197  fps    + Compare + 📈 Graph
4K 3840x2160
115  fps    + Compare + 📈 Graph
» With all tested laptops playable in detail settings ultra.
low 1280x720
137  fps    + Compare + 📈 Graph
med. 1920x1080
121  fps    + Compare + 📈 Graph
high 1920x1080
112  fps    + Compare + 📈 Graph
QHD 2560x1440
88  fps    + Compare + 📈 Graph
4K 3840x2160
47.6  fps    + Compare + 📈 Graph
» With all tested laptops playable in detail settings high.
low 1280x720
175  fps    + Compare + 📈 Graph
med. 1920x1080
101  fps    + Compare + 📈 Graph
high 1920x1080
94.5  fps    + Compare + 📈 Graph
ultra 1920x1080
85.3  fps    + Compare + 📈 Graph
QHD 2560x1440
80.3  fps    + Compare + 📈 Graph
4K 3840x2160
54  fps    + Compare + 📈 Graph
» With all tested laptops playable in detail settings ultra.
med. 1920x1080
165.6  fps    + Compare + 📈 Graph
high 1920x1080
96.4  fps    + Compare + 📈 Graph
ultra 1920x1080
61.6  fps    + Compare + 📈 Graph
QHD 2560x1440
48.1  fps    + Compare + 📈 Graph
4K 3840x2160
28.4  fps    + Compare + 📈 Graph
» With all tested laptops playable in detail settings ultra.
low 1280x720
81.7  fps    + Compare + 📈 Graph
med. 1920x1080
71.6  fps    + Compare + 📈 Graph
high 1920x1080
58.4  fps    + Compare + 📈 Graph
ultra 1920x1080
47.3  fps    + Compare + 📈 Graph
QHD 2560x1440
40.3  fps    + Compare + 📈 Graph
4K 3840x2160
25.5  fps    + Compare + 📈 Graph
» With all tested laptops playable in detail settings ultra.
low 1280x720
162  fps    + Compare
med. 1920x1080
124  fps    + Compare
high 1920x1080
111  fps    + Compare
ultra 1920x1080
93  fps    + Compare
QHD 2560x1440
74  fps    + Compare
4K 3840x2160
42  fps    + Compare
» With all tested laptops playable in detail settings ultra.
low 1280x720
186  fps    + Compare
med. 1920x1080
163  fps    + Compare
high 1920x1080
151  fps    + Compare
ultra 1920x1080
147  fps    + Compare
QHD 2560x1440
108  fps    + Compare
4K 3840x2160
61.8  fps    + Compare
» With all tested laptops playable in detail settings ultra.
F1 2020

F1 2020

2020
low 1280x720
290  fps    + Compare
med. 1920x1080
246  fps    + Compare
high 1920x1080
229  fps    + Compare
ultra 1920x1080
169  fps    + Compare
QHD 2560x1440
129  fps    + Compare
4K 3840x2160
76  fps    + Compare
» With all tested laptops playable in detail settings ultra.
Valorant

Valorant

2020
low 1280x720
270  fps    + Compare
med. 1920x1080
263  fps    + Compare
high 1920x1080
254  fps    + Compare
QHD 2560x1440
247  fps    + Compare
4K 3840x2160
234  fps    + Compare
» With all tested laptops playable in detail settings high.
low 1280x720
315  fps    + Compare
med. 1920x1080
227  fps    + Compare
high 1920x1080
158  fps    + Compare
ultra 1920x1080
115  fps    + Compare
QHD 2560x1440
87.3  fps    + Compare
4K 3840x2160
46.9  fps    + Compare
» With all tested laptops playable in detail settings ultra.
low 1280x720
293  fps    + Compare
med. 1920x1080
249  fps    + Compare
high 1920x1080
228  fps    + Compare
ultra 1920x1080
223  fps    + Compare
QHD 2560x1440
161  fps    + Compare
4K 3840x2160
87.5  fps    + Compare
» With all tested laptops playable in detail settings ultra.
low 1280x720
225  fps    + Compare
med. 1920x1080
164  fps    + Compare
high 1920x1080
145  fps    + Compare
QHD 2560x1440
98.4  fps    + Compare
4K 3840x2160
45.4  fps    + Compare
» With all tested laptops playable in detail settings high.
low 1280x720
121  fps    + Compare
med. 1920x1080
121  fps    + Compare
high 1920x1080
121  fps    + Compare
ultra 1920x1080
121  fps    + Compare
QHD 2560x1440
117  fps    + Compare
4K 3840x2160
54.9  fps    + Compare
» With all tested laptops playable in detail settings ultra.
low 1280x720
153  fps    + Compare
med. 1920x1080
134  fps    + Compare
high 1920x1080
96.9  fps    + Compare
ultra 1920x1080
63.2  fps    + Compare
QHD 2560x1440
51.7  fps    + Compare
4K 3840x2160
34.1  fps    + Compare
» With all tested laptops playable in detail settings ultra.
med. 1920x1080
109  fps    + Compare
high 1920x1080
102  fps    + Compare
ultra 1920x1080
99  fps    + Compare
QHD 2560x1440
95.3  fps    + Compare
4K 3840x2160
58.9  fps    + Compare
» With all tested laptops playable in detail settings ultra.
low 1280x720
133  fps    + Compare
med. 1920x1080
124  fps    + Compare
high 1920x1080
117  fps    + Compare
ultra 1920x1080
101  fps    + Compare
QHD 2560x1440
88.4  fps    + Compare
4K 3840x2160
53.8  fps    + Compare
» With all tested laptops playable in detail settings ultra.
low 1280x720
274  fps    + Compare
med. 1920x1080
187  fps    + Compare
high 1920x1080
178  fps    + Compare
ultra 1920x1080
145  fps    + Compare
QHD 2560x1440
110  fps    + Compare
4K 3840x2160
65.1  fps    + Compare
» With all tested laptops playable in detail settings ultra.
Additional Benchmarks
Maximum Settings with Raytracing T2X Filmic SMAA 1920x1080
110
GRID 2019

GRID 2019

2019
low 1280x720
212  fps    + Compare
med. 1920x1080
169  fps    + Compare
high 1920x1080
140  fps    + Compare
ultra 1920x1080
111  fps    + Compare
QHD 2560x1440
91.2  fps    + Compare
4K 3840x2160
60  fps    + Compare
» With all tested laptops playable in detail settings ultra.
low 1280x720
148  fps    + Compare
med. 1920x1080
132  fps    + Compare
high 1920x1080
117  fps    + Compare
ultra 1920x1080
90  fps    + Compare
QHD 2560x1440
69  fps    + Compare
4K 3840x2160
38  fps    + Compare
» With all tested laptops playable in detail settings ultra.
FIFA 20

FIFA 20

2019
low 1280x720
298  fps    + Compare
med. 1920x1080
289  fps    + Compare
high 1920x1080
275  fps    + Compare
ultra 1920x1080
272  fps    + Compare
QHD 2560x1440
270  fps    + Compare
4K 3840x2160
248  fps    + Compare
» With all tested laptops playable in detail settings ultra.
low 1280x720
139  fps    + Compare
med. 1920x1080
124  fps    + Compare
high 1920x1080
107  fps    + Compare
ultra 1920x1080
89.8  fps    + Compare
QHD 2560x1440
65.4  fps    + Compare
4K 3840x2160
35.4  fps    + Compare
» With all tested laptops playable in detail settings ultra.
Control

Control

2019
low 1280x720
240  fps    + Compare
med. 1920x1080
137  fps    + Compare
high 1920x1080
106  fps    + Compare
QHD 2560x1440
70.2  fps    + Compare
4K 3840x2160
34.8  fps    + Compare
» With all tested laptops playable in detail settings high.
Additional Benchmarks
High Quality Preset & High Ray Tracing Preset (DX12) 1920x1080
58.8
F1 2019

F1 2019

2019
low 1280x720
243  fps    + Compare
med. 1920x1080
213  fps    + Compare
high 1920x1080
167  fps    + Compare
ultra 1920x1080
152  fps    + Compare
QHD 2560x1440
130  fps    + Compare
4K 3840x2160
87  fps    + Compare
» With all tested laptops playable in detail settings ultra.
Rage 2

Rage 2

2019
low 1280x720
259  fps    + Compare
med. 1920x1080
149  fps    + Compare
high 1920x1080
130  fps    + Compare
ultra 1920x1080
131  fps    + Compare
QHD 2560x1440
89  fps    + Compare
4K 3840x2160
44.7  fps    + Compare
» With all tested laptops playable in detail settings ultra.
Anno 1800

Anno 1800

2019
low 1280x720
93  fps    + Compare
med. 1920x1080
93  fps    + Compare
high 1920x1080
77  fps    + Compare
ultra 1920x1080
43.3  fps    + Compare
QHD 2560x1440
42.8  fps    + Compare
4K 3840x2160
32.3  fps    + Compare
» With all tested laptops playable in detail settings ultra.
low 1280x720
177  fps    + Compare
med. 1920x1080
147  fps    + Compare
high 1920x1080
124  fps    + Compare
ultra 1920x1080
106  fps    + Compare
QHD 2560x1440
85  fps    + Compare
4K 3840x2160
50  fps    + Compare
» With all tested laptops playable in detail settings ultra.
low 1280x720
206  fps    + Compare
med. 1920x1080
159  fps    + Compare
high 1920x1080
153  fps    + Compare
ultra 1920x1080
109  fps    + Compare
QHD 2560x1440
87  fps    + Compare
4K 3840x2160
56.7  fps    + Compare
» With all tested laptops playable in detail settings ultra.
Anthem

Anthem

2019
low 1280x720
113  fps    + Compare
med. 1920x1080
105  fps    + Compare
high 1920x1080
102  fps    + Compare
ultra 1920x1080
97  fps    + Compare
QHD 2560x1440
89  fps    + Compare
4K 3840x2160
53.4  fps    + Compare
» With all tested laptops playable in detail settings ultra.
low 1280x720
118  fps    + Compare
med. 1920x1080
105  fps    + Compare
high 1920x1080
102  fps    + Compare
ultra 1920x1080
92  fps    + Compare
QHD 2560x1440
89  fps    + Compare
4K 3840x2160
62  fps    + Compare
» With all tested laptops playable in detail settings ultra.
low 1280x720
242.4  fps    + Compare
med. 1920x1080
108.8  fps    + Compare
high 1920x1080
87.9  fps    + Compare
ultra 1920x1080
74.2  fps    + Compare
QHD 2560x1440
59.6  fps    + Compare
4K 3840x2160
38.6  fps    + Compare
» With all tested laptops playable in detail settings ultra.
Additional Benchmarks
Ultra Quality DXR 16xAF 1920x1080
63.4
low 1280x720
143  fps    + Compare
med. 1920x1080
144  fps    + Compare
high 1920x1080
144  fps    + Compare
ultra 1920x1080
144  fps    + Compare
QHD 2560x1440
138  fps    + Compare
4K 3840x2160
82  fps    + Compare
» With all tested laptops playable in detail settings ultra.
low 1280x720
200  fps    + Compare
med. 1920x1080
165  fps    + Compare
high 1920x1080
129  fps    + Compare
ultra 1920x1080
123  fps    + Compare
QHD 2560x1440
88  fps    + Compare
4K 3840x2160
50  fps    + Compare
» With all tested laptops playable in detail settings ultra.
low 1280x720
217  fps    + Compare
med. 1920x1080
146  fps    + Compare
high 1920x1080
139  fps    + Compare
ultra 1920x1080
129  fps    + Compare
QHD 2560x1440
110  fps    + Compare
4K 3840x2160
57.6  fps    + Compare
» With all tested laptops playable in detail settings ultra.
low 1280x720
190  fps    + Compare
med. 1920x1080
163  fps    + Compare
high 1920x1080
155  fps    + Compare
ultra 1920x1080
145  fps    + Compare
QHD 2560x1440
125  fps    + Compare
4K 3840x2160
76  fps    + Compare
» With all tested laptops playable in detail settings ultra.
Additional Benchmarks
Ultra Preset DXR 1920x1080
82
low 1280x720
192  fps    + Compare
med. 1920x1080
141  fps    + Compare
high 1920x1080
134  fps    + Compare
ultra 1920x1080
124  fps    + Compare
QHD 2560x1440
123  fps    + Compare
4K 3840x2160
83  fps    + Compare
» With all tested laptops playable in detail settings ultra.
low 1280x720
60  fps    + Compare
med. 1920x1080
60  fps    + Compare
high 1920x1080
60  fps    + Compare
ultra 1920x1080
60  fps    + Compare
QHD 2560x1440
60  fps    + Compare
4K 3840x2160
60  fps    + Compare
» With all tested laptops playable in detail settings ultra.
Hitman 2

Hitman 2

2018
low 1280x720
90  fps    + Compare
med. 1920x1080
90  fps    + Compare
high 1920x1080
84  fps    + Compare
ultra 1920x1080
79  fps    + Compare
QHD 2560x1440
80  fps    + Compare
4K 3840x2160
60  fps    + Compare
» With all tested laptops playable in detail settings ultra.
low 1280x720
225 250 ~ 238 fps    + Compare
med. 1920x1080
190 198 ~ 194 fps    + Compare
high 1920x1080
182 193 ~ 188 fps    + Compare
ultra 1920x1080
175 177 ~ 176 fps    + Compare
QHD 2560x1440
123  fps    + Compare
4K 3840x2160
64 68 ~ 66 fps    + Compare
» With all tested laptops playable in detail settings ultra.
low 1280x720
111 113 ~ 112 fps    + Compare
med. 1920x1080
104 106 ~ 105 fps    + Compare
high 1920x1080
91 91 ~ 91 fps    + Compare
ultra 1920x1080
68 68 ~ 68 fps    + Compare
QHD 2560x1440
58  fps    + Compare
4K 3840x2160
40 41 ~ 41 fps    + Compare
» With all tested laptops playable in detail settings ultra.
low 1280x720
170 179 ~ 175 fps    + Compare
med. 1920x1080
153 159 ~ 156 fps    + Compare
high 1920x1080
148 157 ~ 153 fps    + Compare
ultra 1920x1080
125 139 ~ 132 fps    + Compare
QHD 2560x1440
118  fps    + Compare
4K 3840x2160
77 84 ~ 81 fps    + Compare
» With all tested laptops playable in detail settings ultra.
FIFA 19

FIFA 19

2018
low 1280x720
264 282.4 ~ 273 fps    + Compare
med. 1920x1080
260 264.5 ~ 262 fps    + Compare
high 1920x1080
239 247.9 ~ 243 fps    + Compare
ultra 1920x1080
228 232.9 ~ 230 fps    + Compare
QHD 2560x1440
212  fps    + Compare
4K 3840x2160
203 212.4 ~ 208 fps    + Compare
» With all tested laptops playable in detail settings ultra.
low 1280x720
129 144 ~ 137 fps    + Compare
med. 1920x1080
116 122 ~ 119 fps    + Compare
high 1920x1080
115 119 ~ 117 fps    + Compare
ultra 1920x1080
110 111 ~ 111 fps    + Compare
QHD 2560x1440
90  fps    + Compare
4K 3840x2160
45 48 ~ 47 fps    + Compare
» With all tested laptops playable in detail settings ultra.
F1 2018

F1 2018

2018
low 1280x720
242 245 ~ 244 fps    + Compare
med. 1920x1080
211 219 ~ 215 fps    + Compare
high 1920x1080
160 164 ~ 162 fps    + Compare
ultra 1920x1080
141 142 ~ 142 fps    + Compare
QHD 2560x1440
120  fps    + Compare
4K 3840x2160
77 78 ~ 78 fps    + Compare
» With all tested laptops playable in detail settings ultra.
low 1280x720
144 156 ~ 150 fps    + Compare
med. 1920x1080
137 144.6 ~ 141 fps    + Compare
high 1920x1080
135 143.1 ~ 139 fps    + Compare
ultra 1920x1080
115 116.5 ~ 116 fps    + Compare
QHD 2560x1440
78  fps    + Compare
4K 3840x2160
38.2 38.6 ~ 38 fps    + Compare
» With all tested laptops playable in detail settings ultra.
low 1280x720
60 60 ~ 60 fps    + Compare
med. 1920x1080
60 60 ~ 60 fps    + Compare
high 1920x1080
60 69 ~ 65 fps    + Compare
ultra 1920x1080
60 60 ~ 60 fps    + Compare
QHD 2560x1440
60  fps    + Compare
4K 3840x2160
60 60 ~ 60 fps    + Compare
» With all tested laptops playable in detail settings ultra.
Far Cry 5

Far Cry 5

2018
low 1280x720
129 133 ~ 131 fps    + Compare
med. 1920x1080
116 117 ~ 117 fps    + Compare
high 1920x1080
111 113 ~ 112 fps    + Compare
ultra 1920x1080
105 107 ~ 106 fps    + Compare
QHD 2560x1440
99  fps    + Compare
4K 3840x2160
58 59 ~ 59 fps    + Compare
» With all tested laptops playable in detail settings ultra.
low 1280x720
139.5 141 ~ 140 fps    + Compare
med. 1920x1080
125 129.6 ~ 127 fps    + Compare
high 1920x1080
96 108 ~ 102 fps    + Compare
ultra 1920x1080
78 83.3 ~ 81 fps    + Compare
QHD 2560x1440
70  fps    + Compare
4K 3840x2160
38.5 39.1 ~ 39 fps    + Compare
» With all tested laptops playable in detail settings ultra.
low 1280x720
163.1 163.4 ~ 163 fps    + Compare
med. 1920x1080
125.3 125.5 ~ 125 fps    + Compare
high 1920x1080
96.1 96.6 ~ 96 fps    + Compare
4K 3840x2160
44.2 44.5 ~ 44 fps    + Compare
» With all tested laptops playable in detail settings high.
Fortnite

Fortnite

2018
low 1280x720
223 259.2 ~ 241 fps    + Compare
med. 1920x1080
180 218.9 ~ 199 fps    + Compare
high 1920x1080
163 182.2 ~ 173 fps    + Compare
ultra 1920x1080
147 165.3 ~ 156 fps    + Compare
QHD 2560x1440
128  fps    + Compare
4K 3840x2160
63.6 66 ~ 65 fps    + Compare
» With all tested laptops playable in detail settings ultra.
low 1280x720
249 250 ~ 250 fps    + Compare
med. 1920x1080
245.8 246 ~ 246 fps    + Compare
high 1920x1080
187 198.7 ~ 193 fps    + Compare
ultra 1920x1080
167 169 ~ 168 fps    + Compare
QHD 2560x1440
142  fps    + Compare
4K 3840x2160
89 97.4 ~ 93 fps    + Compare
» With all tested laptops playable in detail settings ultra.
low 1280x720
114 116 ~ 115 fps    + Compare
med. 1920x1080
104 104 ~ 104 fps    + Compare
high 1920x1080
101 103 ~ 102 fps    + Compare
ultra 1920x1080
86 87 ~ 87 fps    + Compare
QHD 2560x1440
79  fps    + Compare
4K 3840x2160
51 52 ~ 52 fps    + Compare
» With all tested laptops playable in detail settings ultra.
Destiny 2

Destiny 2

2017
low 1280x720
146.8 169.3 ~ 158 fps    + Compare
med. 1920x1080
146.4 165.4 ~ 156 fps    + Compare
high 1920x1080
146.3 164.7 ~ 156 fps    + Compare
ultra 1920x1080
146.1 169.2 ~ 158 fps    + Compare
QHD 2560x1440
130.5  fps    + Compare
4K 3840x2160
71.5 72.4 ~ 72 fps    + Compare
» With all tested laptops playable in detail settings ultra.
low 1280x720
204.7 278 ~ 241 fps    + Compare
med. 1920x1080
195 222 ~ 209 fps    + Compare
high 1920x1080
166 210.1 ~ 188 fps    + Compare
ultra 1920x1080
157 181 ~ 169 fps    + Compare
4K 3840x2160
63.6 74 ~ 69 fps    + Compare
» With all tested laptops playable in detail settings ultra.
Additional Benchmarks
Medium Preset 1366x768
181
Dirt 4

Dirt 4

2017
low 1280x720
312 316.8 ~ 314 fps    + Compare
med. 1920x1080
249 249.3 ~ 249 fps    + Compare
high 1920x1080
215.8 216 ~ 216 fps    + Compare
ultra 1920x1080
159.6 161 ~ 160 fps    + Compare
4K 3840x2160
99.2 100 ~ 100 fps    + Compare
» With all tested laptops playable in detail settings ultra.
Additional Benchmarks
Medium Preset 4xAF 1366x768
247
low 1280x720
247.4 247.8 ~ 248 fps    + Compare
med. 1920x1080
248.1 248.3 ~ 248 fps    + Compare
high 1920x1080
242.4 242.5 ~ 242 fps    + Compare
4K 3840x2160
146.1 146.3 ~ 146 fps    + Compare
» With all tested laptops playable in detail settings high.
low 1280x720
144.7 161 ~ 153 fps    + Compare
med. 1920x1080
128.4 130 ~ 129 fps    + Compare
high 1920x1080
120 123 ~ 122 fps    + Compare
ultra 1920x1080
73.9 74 ~ 74 fps    + Compare
4K 3840x2160
52 53.8 ~ 53 fps    + Compare
» With all tested laptops playable in detail settings ultra.
Additional Benchmarks
Medium Preset FXAA 1366x768
130.4
Ultra Preset 16xAF TAA 3840x2160
38.9
For Honor

For Honor

2017
low 1280x720
294.1 300.6 ~ 297 fps    + Compare
med. 1920x1080
222 224.3 ~ 223 fps    + Compare
high 1920x1080
214.8 216.3 ~ 216 fps    + Compare
ultra 1920x1080
169.7 172.6 ~ 171 fps    + Compare
4K 3840x2160
76.8 77.6 ~ 77 fps    + Compare
» With all tested laptops playable in detail settings ultra.
Additional Benchmarks
Medium Preset 4xAF TAA 1366x768
280.3
Extreme Preset 16xAF TAA 3840x2160
63.6
low 1280x720
141.3 141.9 ~ 142 fps    + Compare
med. 1366x768
127.6 134.4 ~ 131 fps    + Compare
high 1920x1080
110 115 ~ 113 fps    + Compare
ultra 1920x1080
86.6 88.1 ~ 87 fps    + Compare
4K 3840x2160
54.8 55.6 ~ 55 fps    + Compare
» With all tested laptops playable in detail settings ultra.
Additional Benchmarks
Medium Preset 1920x1080
125.5
low 1280x720
193 193.3 ~ 193 fps    + Compare
med. 1366x768
175 182.5 ~ 179 fps    + Compare
high 1920x1080
159 166.6 ~ 163 fps    + Compare
ultra 1920x1080
147 154.1 ~ 151 fps    + Compare
4K 3840x2160
88 90 ~ 89 fps    + Compare
» With all tested laptops playable in detail settings ultra.
Additional Benchmarks
Medium Preset FXAA 1920x1080
171
Ultra Preset TAA 3840x2160
84
low 1280x720
151.6 154 ~ 153 fps    + Compare
med. 1366x768
142.8 142.9 ~ 143 fps    + Compare
high 1920x1080
124.4 125.3 ~ 125 fps    + Compare
ultra 1920x1080
80.5 83.1 ~ 82 fps    + Compare
4K 3840x2160
53.6 55.1 ~ 54 fps    + Compare
» With all tested laptops playable in detail settings ultra.
Additional Benchmarks
Medium Preset 2xAF 1920x1080
143.7
Overwatch

Overwatch

2016
low 1280x720
300 300 ~ 300 fps    + Compare
med. 1366x768
300 300 ~ 300 fps    + Compare
high 1920x1080
300 300 ~ 300 fps    + Compare
ultra 1920x1080
158 262 ~ 210 fps    + Compare
4K 3840x2160
143 150 ~ 147 fps    + Compare
» With all tested laptops playable in detail settings ultra.
Additional Benchmarks
Medium (Render Scale 100 %) 2xAF FXAA 1920x1080
293
Epic (Render Scale 100 %) 16xAF SMAA 3820x2160
122
Epic (Render Scale 100 %) 16xAF SMAA 2560x1440
123
Doom

Doom

2016
low 1280x720
157.1 172.3 ~ 165 fps    + Compare
med. 1366x768
155.5 160.1 ~ 158 fps    + Compare
high 1920x1080
139.6 152.4 ~ 146 fps    + Compare
ultra 1920x1080
140.3 150.3 ~ 145 fps    + Compare
4K 3840x2160
115.1 117.7 ~ 116 fps    + Compare
» With all tested laptops playable in detail settings ultra.
Additional Benchmarks
Medium Preset 1920x1080
139.1
low 1280x720
265.4 285.4 ~ 275 fps    + Compare
med. 1366x768
227.6 245.2 ~ 236 fps    + Compare
high 1920x1080
159.4 162.3 ~ 161 fps    + Compare
ultra 1920x1080
129.8 131.1 ~ 130 fps    + Compare
4K 3840x2160
69.1 71.7 ~ 70 fps    + Compare
» With all tested laptops playable in detail settings ultra.
Additional Benchmarks
Medium Preset 4xAF 1920x1080
188.3
Low Preset 1xAF 1920x1080
214.2
Ultra Preset 16xAF 3840x2160
60.5
low 1280x720
119 127 ~ 123 fps    + Compare
med. 1920x1080
108 115 ~ 112 fps    + Compare
high 1920x1080
98 104 ~ 101 fps    + Compare
ultra 1920x1080
90 97 ~ 94 fps    + Compare
4K 3840x2160
68 71 ~ 70 fps    + Compare
» With all tested laptops playable in detail settings ultra.
Additional Benchmarks
Low Preset 1920x1080
111
Ultra Preset + HD Textures SMAA 3840x2160
61
low 1024x768
263 293.2 ~ 278 fps    + Compare
med. 1366x768
196 208.4 ~ 202 fps    + Compare
high 1920x1080
182 184.8 ~ 183 fps    + Compare
ultra 1920x1080
158.5 162 ~ 160 fps    + Compare
4K 3840x2160
73.4 77 ~ 75 fps    + Compare
» With all tested laptops playable in detail settings ultra.
low 1024x768
298.5 322.8 ~ 311 fps    + Compare
med. 1366x768
257.8 289 ~ 273 fps    + Compare
high 1920x1080
241.9 269.5 ~ 256 fps    + Compare
ultra 1920x1080
238 260.7 ~ 249 fps    + Compare
4K 3840x2160
137.3 139.8 ~ 139 fps    + Compare
» With all tested laptops playable in detail settings ultra.
Additional Benchmarks
Ultra Preset 16xAF TAA 3840x2160
125.1
low 1024x768
301 319.5 ~ 310 fps    + Compare
med. 1366x768
263 270.2 ~ 267 fps    + Compare
high 1920x1080
179.6 182 ~ 181 fps    + Compare
ultra 1920x1080
103.4 109 ~ 106 fps    + Compare + 📈 Graph
4K 3840x2160
73.8 78 ~ 76 fps    + Compare
» With all tested laptops playable in detail settings ultra.
GTA V

GTA V

2015
low 1024x768
162 173.7 ~ 168 fps    + Compare
med. 1366x768
145 166.1 ~ 156 fps    + Compare
high 1920x1080
125 150 ~ 138 fps    + Compare
ultra 1920x1080
116 132.5 ~ 124 fps    + Compare
4K 3840x2160
89 124 ~ 107 fps    + Compare
» With all tested laptops playable in detail settings ultra.
low 1024x768
200 200 ~ 200 fps    + Compare
med. 1366x768
200 200 ~ 200 fps    + Compare
high 1366x768
200 200 ~ 200 fps    + Compare
ultra 1920x1080
200 200 ~ 200 fps    + Compare
4K 3840x2160
121 125.4 ~ 123 fps    + Compare
» With all tested laptops playable in detail settings ultra.
lowmed.highultraQHD4K
F1 20212482171318950
Days Gone16114811787.150.4
Mass Effect Legendary Edition12712312097.8
Resident Evil Village18017716611558.4
Outriders13313212989.947.3
Hitman 316516316011965.3
Cyberpunk 2077 1.010085.976.250.324.4
Immortals Fenyx Rising10491837048
Yakuza Like a Dragon1351311158041.6
Call of Duty Black Ops Cold War13311210275.142.5
Assassin´s Creed Valhalla9883736038
Dirt 512198.960.252.139.7
Watch Dogs Legion11097.578.65834.7
FIFA 21255253243242239223
Star Wars Squadrons413350308284197115
Mafia Definitive Edition1371211128847.6
Serious Sam 417510194.585.380.354
Crysis Remastered165.696.461.648.128.4
Flight Simulator 202081.771.658.447.340.325.5
Horizon Zero Dawn162124111937442
Death Stranding18616315114710861.8
F1 202029024622916912976
Valorant270263254247234
Gears Tactics31522715811587.346.9
Doom Eternal29324922822316187.5
Hunt Showdown22516414598.445.4
Escape from Tarkov12112112112111754.9
Red Dead Redemption 215313496.963.251.734.1
Star Wars Jedi Fallen Order1091029995.358.9
Need for Speed Heat13312411710188.453.8
Call of Duty Modern Warfare 201927418717814511065.1
GRID 201921216914011191.260
Ghost Recon Breakpoint148132117906938
FIFA 20298289275272270248
Borderlands 313912410789.865.435.4
Control24013710670.234.8
F1 201924321316715213087
Rage 22591491301318944.7
Anno 180093937743.342.832.3
The Division 21771471241068550
Dirt Rally 2.02061591531098756.7
Anthem113105102978953.4
Far Cry New Dawn118105102928962
Metro Exodus242.4108.887.974.259.638.6
Apex Legends14314414414413882
Just Cause 42001651291238850
Darksiders III21714613912911057.6
Battlefield V19016315514512576
Farming Simulator 1919214113412412383
Fallout 76606060606060
Hitman 2909084798060
Call of Duty Black Ops 423819418817612366
Assassin´s Creed Odyssey11210591685841
Forza Horizon 417515615313211881
FIFA 19273262243230212208
Shadow of the Tomb Raider1371191171119047
F1 201824421516214212078
Monster Hunter World1501411391167838
The Crew 2606065606060
Far Cry 51311171121069959
Kingdom Come: Deliverance140127102817039
Final Fantasy XV Benchmark1631259644
Fortnite24119917315612865
Call of Duty WWII25024619316814293
Assassin´s Creed Origins115104102877952
Destiny 2158156156158130.572
Playerunknown's Battlegrounds (PUBG)24120918816969
Dirt 4314249216160100
Rocket League248248242146
Ghost Recon Wildlands1531291227453
For Honor29722321617177
Watch Dogs 21421311138755
Battlefield 119317916315189
Deus Ex Mankind Divided1531431258254
Overwatch300300300210147
Doom165158146145116
The Division27523616113070
Far Cry Primal1231121019470
Rise of the Tomb Raider27820218316075
Rainbow Six Siege311273256249139
The Witcher 331026718110676
GTA V168156138124107
Battlefield 4200200200200123
< 30 fps
< 60 fps
< 120 fps
≥ 120 fps


9
60


19
63

1
31
50

2
37
38

9
39
17
3
40
32
8

For more games that might be playable and a list of all games and graphics cards visit our Gaming List

Add one or more devices and compare

In the following list you can select (and also search for) devices that should be added to the comparison. You can select more than one device.

restrict list:

show all (including archived), 2024, 2023
v1.26
log 17. 07:05:10

#0 no ids found in url (should be separated by "_") +0s ... 0s

#1 not redirecting to Ajax server +0s ... 0s

#2 did not recreate cache, as it is less than 5 days old! Created at Sat, 16 Mar 2024 05:38:32 +0100 +0.001s ... 0.002s

#3 composed specs +0.073s ... 0.074s

#4 did output specs +0s ... 0.075s

#5 start showIntegratedCPUs +0s ... 0.075s

#6 getting avg benchmarks for device 9286 +0.046s ... 0.121s

#7 got single benchmarks 9286 +0.019s ... 0.14s

#8 got avg benchmarks for devices +0s ... 0.14s

#9 min, max, avg, median took s +1.092s ... 1.232s

#10 before gaming benchmark output +0s ... 1.232s

#11 Got 616 rows for game benchmarks. +0.077s ... 1.309s

#12 composed SQL query for gamebenchmarks +0s ... 1.309s

#13 got data and put it in $dataArray +0.075s ... 1.384s

#14 benchmarks composed for output. +5.01s ... 6.394s

#15 return log +0.101s ... 6.496s

Please share our article, every link counts!

» Comparison of GPUs
Detailed list of all laptop GPUs sorted by class and performance.

» Benchmark List
Sort and restrict laptop GPUs based on performance in synthetic benchmarks.

» Notebook Gaming List
Playable games for each graphics card and their average FPS results.

Class 0

Arc A380

Class 1

Arc A580 Desktop

Class 2

Class 3

UHD Graphics 32EUs
UHD Graphics 750

Class 4

* Approximate position of the graphics adapter

> Expert Reviews and News on Laptops, Smartphones and Tech Innovations > Benchmarks / Tech > Comparison of Laptop Graphics Cards > NVIDIA GeForce RTX 2080 Desktop Graphics Card - Benchmarks and Specs
Klaus Hinum (Update: 2018-12-13)