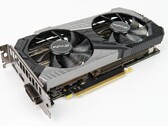
KFA2 GeForce RTX 2060 Super (1-Click OC) - Custom RTX 2060 Super Series Model in Review
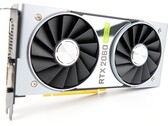
After the release of Nvidia's Super graphics cards, manufacturers have now released their own versions of the new GeForce cards. Here, we take a closer look at the model from KFA2. In this review we try to determine whether the KFA 2 GeForce RTX 2060 Super 1-Click OC is worth it or if the Nvidia reference design is the better choice.
AMD Ryzen 9 3900X, NVIDIA GeForce RTX 2060 Super (Desktop), 32"