Notebook reviews with NVIDIA GeForce RTX 2070 Super Max-Q graphics card
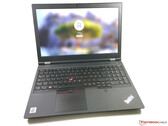
Lenovo ThinkPad T15g Laptop Review: A Gaming ThinkPad or a mobile workstation?
The ThinkPad T15g is a new product for Lenovo. You might think the designation as well as the GeForce RTX 2070 Super Max-Q GPU indicate a gaming device, but it is a mobile workstation without a Quadro GPU. Is the T15g is a good choice if you do not need ISV certifications?
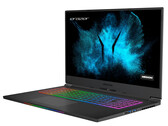
Intel Core i7-10750H, NVIDIA GeForce RTX 2070 Super Max-Q, 15.6", 2.8 kgMedion Erazer Beast X10 (Tongfang GM7MPHP) in review: Stable, slim, compact gaming laptop with good battery life
The compact Erazer Beast X10 brings all the latest computer games smoothly onto the 17.3-inch matte display (Full HD, IPS, 144 Hz). The gaming laptop scores points with 32 GB of RAM (dual-channel mode), space for two NVMe SSDs, and good battery life.
Intel Core i7-10750H, NVIDIA GeForce RTX 2070 Super Max-Q, 17.3", 2.3 kgRazer Blade 15 GeForce RTX 2070 Super Max-Q Review: Same Laptop, But Faster
Not much has changed over last year's Blade 15 from a design perspective, but the new 10th gen 8-core Core i7-10875H will offer noticeable raw performance gains over the older 9th gen 6-core Core i7-9750H. The jump from the older GeForce RTX 2070 Max-Q to the latest GeForce RTX 2070 Super Max-Q, however, will be much smaller.
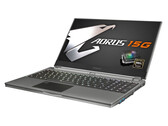
Intel Core i7-10875H, NVIDIA GeForce RTX 2070 Super Max-Q, 15.6", 2.1 kgAorus 15G XB in review: Successful gaming machine with mechanical keyboard
The Aorus 15G XB brings all modern computer games smoothly onto the matte 15.6-inch screen (240 Hz, Full HD, IGZO). The rest of the equipment is also right: NVMe SSD, 16 GB of RAM (dual-channel mode), a mechanical keyboard, and a Thunderbolt 3 port.
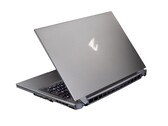
Intel Core i7-10875H, NVIDIA GeForce RTX 2070 Super Max-Q, 15.6", 2.3 kgAorus 17G XB Laptop Review: The mechanical keyboard rocks
With the Aorus 17G, Gigabyte presents a complete redesign of the 17-inch gaming laptop. The mechanical keyboard is one of the most important newly introduced features. You can find out whether or not the rest of the package is up to par by reading our review.
Intel Core i7-10875H, NVIDIA GeForce RTX 2070 Super Max-Q, 17.3", 2.7 kgGigabyte Aero 15 OLED XB-8DE51B0SP: Intel Core i7-10875H, 15.60", 2.2 kg
Review » Gigabyte Aero 15 XB laptop review: Taking the lead with OLED
MSI GS66 Stealth 10SFS: Intel Core i9-10980HK, 15.60", 2.2 kg
Review » MSI GS66 Stealth 10SFS Laptop Review: Visually subdued, acoustically conspicuous
Gigabyte Aero 17 HDR XB: Intel Core i7-10875H, 17.30", 2.7 kg
Review » Gigabyte Aero 17 HDR XB Laptop Review: Super Max-Q at the Start
MSI Creator 15 A10SFS-287: Intel Core i7-10875H, 15.60", 1.9 kg
External Review » MSI Creator 15 A10SFS-287
Asus ROG Zephyrus M15 GU502LW-HN070T: Intel Core i7-10750H, 15.60", 2 kg
External Review » Asus ROG Zephyrus M15 GU502LW-HN070T
HP Omen 15-dh1267ng: Intel Core i7-10750H, 15.60", 2.5 kg
External Review » HP Omen 15-dh1267ng
MSI GS66 Stealth 10SFS-440: Intel Core i7-10875H, 15.60", 2.1 kg
External Review » MSI GS66 Stealth 10SFS-440
Lenovo Legion 7 15IMH05-81YT000TGE: Intel Core i7-10750H, 15.60", 2.3 kg
External Review » Lenovo Legion 7 15IMH05-81YT000TGE
Razer Blade 15 Advanced Edition, i7-10875H, RTX 2070 Super: Intel Core i7-10875H, 15.60", 2.2 kg
External Review » Razer Blade 15 Advanced Edition, i7-10875H, RTX 2070 Super
MSI GS66 Stealth 10SFS: Intel Core i9-10980HK, 15.60", 2.2 kg
External Review » MSI GS66 Stealth 10SFS
HP Omen 15-dh1770ng: Intel Core i7-10750H, 15.60", 2.7 kg
External Review » HP Omen 15-dh1770ng
Acer Predator Triton 500 PT515-52-71K5: Intel Core i7-10750H, 15.60", 2 kg
External Review » Acer Predator Triton 500 PT515-52-71K5
MSI Creator 17 A10SFS-269: Intel Core i7-10875H, 17.30", 2.5 kg
External Review » MSI Creator 17 A10SFS-269
Aorus 15G XB: Intel Core i7-10875H, 15.60", 2.3 kg
External Review » Aorus 15G XB
Alienware m17 R3-RW22J: Intel Core i7-10750H, 17.30", 3 kg
External Review » Alienware m17 R3-RW22J
Acer Predator Triton 500 PT515-52: Intel Core i7-10875H, 15.60", 2.1 kg
External Review » Acer Predator Triton 500 PT515-52
MSI GS75 10SFS-225 Stealth: Intel Core i9-10980HK, 17.30", 2.4 kg
External Review » MSI GS75 10SFS-225 Stealth
Gigabyte Aorus 17G XB: Intel Core i7-10875H, 17.30", 2.7 kg
External Review » Gigabyte Aorus 17G XB
MSI GS66 Stealth 10SFS-064IT: Intel Core i7-10750H, 15.60", 2.1 kg
External Review » MSI GS66 Stealth 10SFS-064IT
Aorus 17G XB: Intel Core i7-10875H, 17.30", 2.7 kg
External Review » Aorus 17G XB
Gigabyte Aero 17 HDR XB: Intel Core i7-10875H, 17.30", 2.7 kg
External Review » Gigabyte Aero 17 HDR XB
Gigabyte Aero 15 OLED XB-8DE51B0SP: Intel Core i7-10875H, 15.60", 2.2 kg
External Review » Gigabyte Aero 15 OLED XB-8DE51B0SP
Lenovo ThinkPad T15g-20UR000GGE: Intel Core i7-10750H, 15.60", 2.8 kg
» Lenovo's mobile workstation T15g appears a bit outdated
Medion Erazer Beast X10 MD61804: Intel Core i7-10750H, 17.30", 2.3 kg
» The Medion Erazer Beast X10 offers plenty of gaming power, a sober look, and a good level of features
Aorus 15G XB: Intel Core i7-10875H, 15.60", 2.3 kg
» The Core i7 processor in the Aorus 15G XB puts the pedal to the metal
Aorus 17G XB: Intel Core i7-10875H, 17.30", 2.7 kg
» Aorus 17G: Mechanical keyboard meets great battery life
Gigabyte Aero 15 OLED XB-8DE51B0SP: Intel Core i7-10875H, 15.60", 2.2 kg
» Podium spot thanks to OLED: Gigabyte Aero 15 XB
MSI GS66 Stealth 10SFS: Intel Core i9-10980HK, 15.60", 2.2 kg
» MSI GS66: Quite loud for a Stealth notebook
Gigabyte Aero 17 HDR XB: Intel Core i7-10875H, 17.30", 2.7 kg
» Gigabyte Aero 17 HDR XB: Versatile High-End Notebook