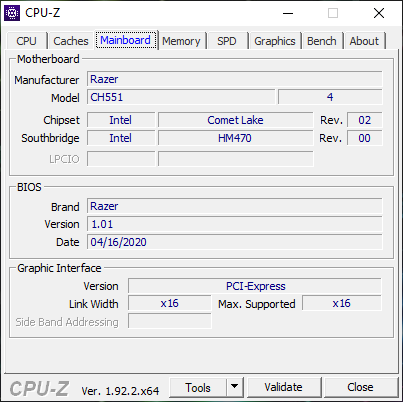
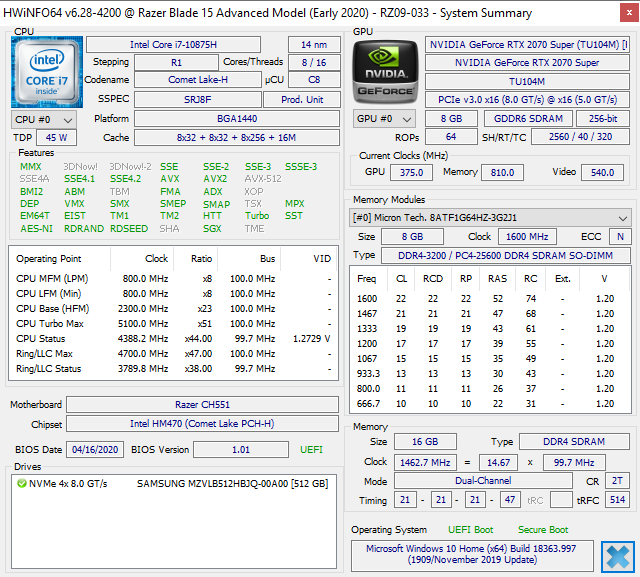
Razer Blade 15 GeForce RTX 2070 Super Max-Q Review: Same Laptop, But Faster
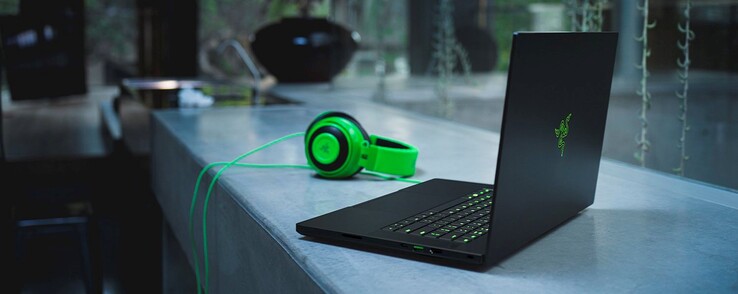
The 2020 Razer Blade 15 series is distinguished from earlier models mainly by its GeForce Super Max-Q GPU and 10th gen Intel Comet Lake-H options. Otherwise, the model is almost visually identical to the 2019 model. Check out our review on last year's model to learn more about the chassis and other physical features of the Blade 15.
Our unit here comes with the GeForce RTX 2070 Super Max-Q GPU to contrast the higher-end RTX 2080 Super Max-Q configuration that we had checked out earlier this month. We'll be comparing the two SKUs below to see what differences they may have aside from their graphics potential.
More Razer reviews :
Rating | Date | Model | Weight | Height | Size | Resolution | Price |
|---|---|---|---|---|---|---|---|
| 86.9 % v7 (old) | 08 / 2020 | Razer Blade 15 RTX 2070 Super Max-Q i7-10875H, GeForce RTX 2070 Super Max-Q | 2.1 kg | 17.8 mm | 15.60" | 1920x1080 | |
| 82.8 % v7 (old) | 05 / 2020 | MSI GS66 Stealth 10SFS i9-10980HK, GeForce RTX 2070 Super Max-Q | 2.2 kg | 20 mm | 15.60" | 1920x1080 | |
| 81.3 % v7 (old) | 05 / 2019 | Asus Zephyrus S GX502GW i7-9750H, GeForce RTX 2070 Mobile | 2.1 kg | 19 mm | 15.60" | 1920x1080 | |
| 84 % v7 (old) | 05 / 2019 | Gigabyte Aero 15 Classic-XA i7-9750H, GeForce RTX 2070 Max-Q | 2.1 kg | 19 mm | 15.60" | 1920x1080 | |
| 84.8 % v7 (old) | 10 / 2019 | Lenovo Legion Y740-15ICHg i7-9750H, GeForce RTX 2070 Max-Q | 2.3 kg | 25 mm | 15.60" | 1920x1080 | |
| 83 % v7 (old) | 08 / 2020 | HP Envy 15-ep0098nr i7-10750H, GeForce RTX 2060 Max-Q | 2 kg | 19 mm | 15.60" | 3840x2160 |
Case
SD Card Reader
| SD Card Reader | |
| average JPG Copy Test (av. of 3 runs) | |
| Razer Blade 15 RTX 2070 Super Max-Q (Toshiba Exceria Pro SDXC 64 GB UHS-II) | |
| Gigabyte Aero 15 Classic-XA (Toshiba Exceria Pro SDXC 64 GB UHS-II) | |
| HP Envy 15-ep0098nr (Toshiba Exceria Pro M501 UHS-II) | |
| maximum AS SSD Seq Read Test (1GB) | |
| Gigabyte Aero 15 Classic-XA (Toshiba Exceria Pro SDXC 64 GB UHS-II) | |
| Razer Blade 15 RTX 2070 Super Max-Q (Toshiba Exceria Pro SDXC 64 GB UHS-II) | |
| HP Envy 15-ep0098nr (Toshiba Exceria Pro M501 UHS-II) | |
Communication
| Networking | |
| iperf3 transmit AX12 | |
| MSI GS66 Stealth 10SFS | |
| HP Envy 15-ep0098nr | |
| Razer Blade 15 RTX 2070 Super Max-Q | |
| iperf3 receive AX12 | |
| HP Envy 15-ep0098nr | |
| Razer Blade 15 RTX 2070 Super Max-Q | |
| MSI GS66 Stealth 10SFS | |
Webcam


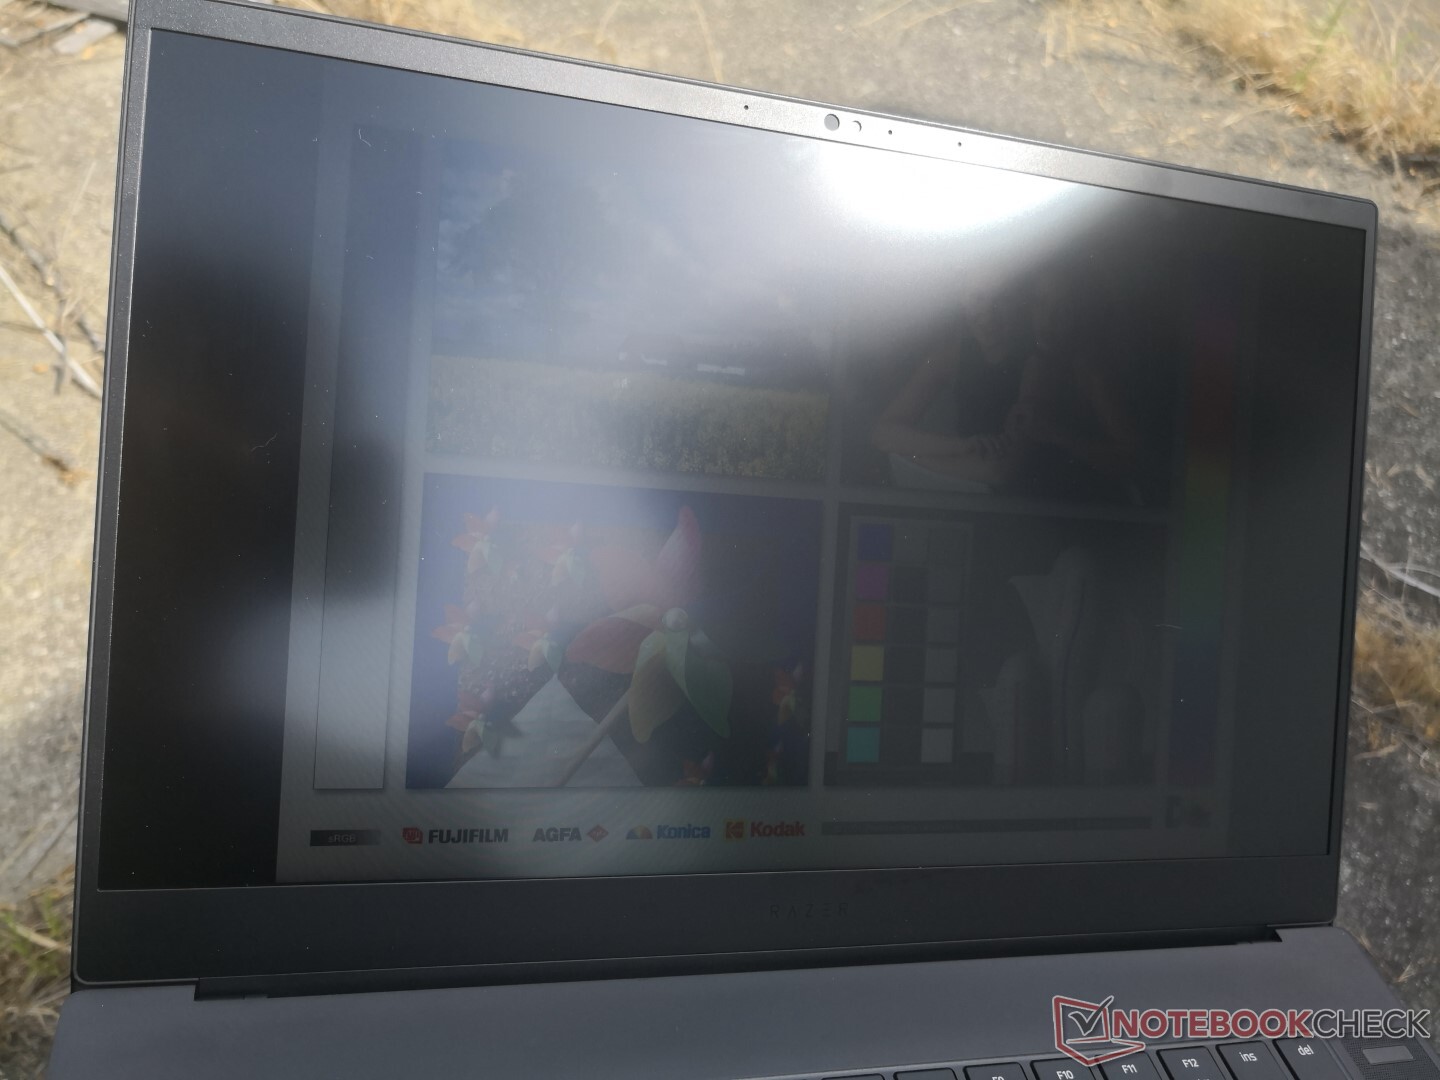
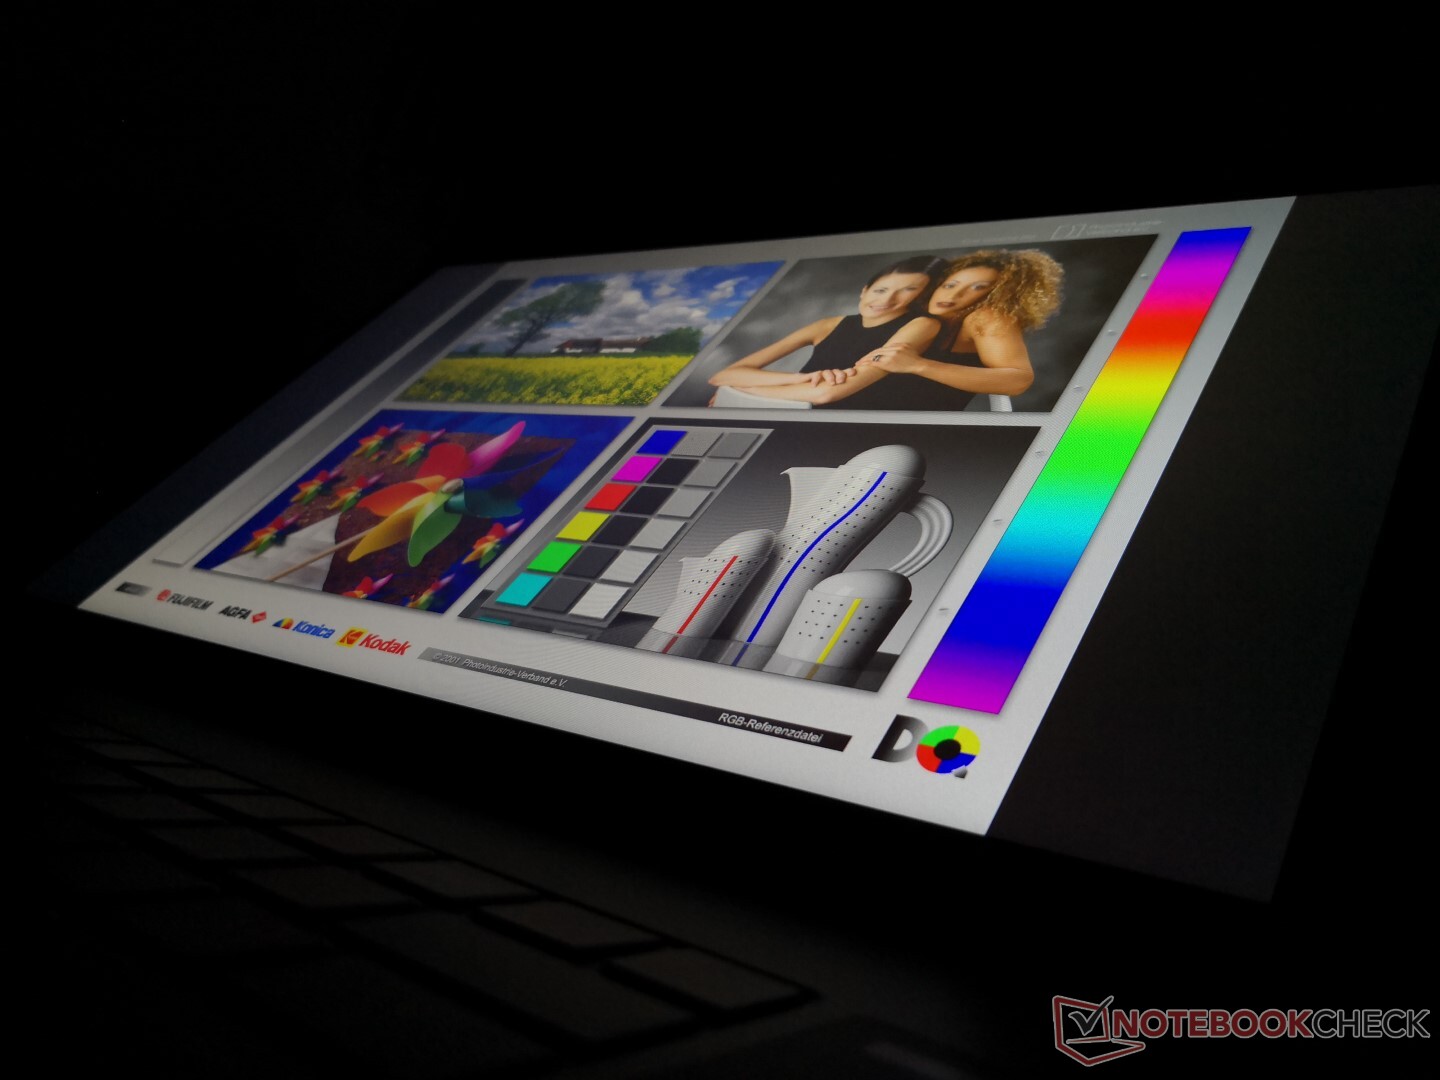
Display
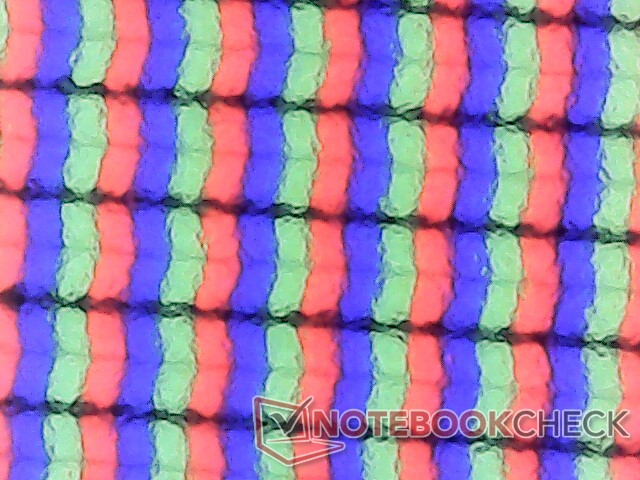
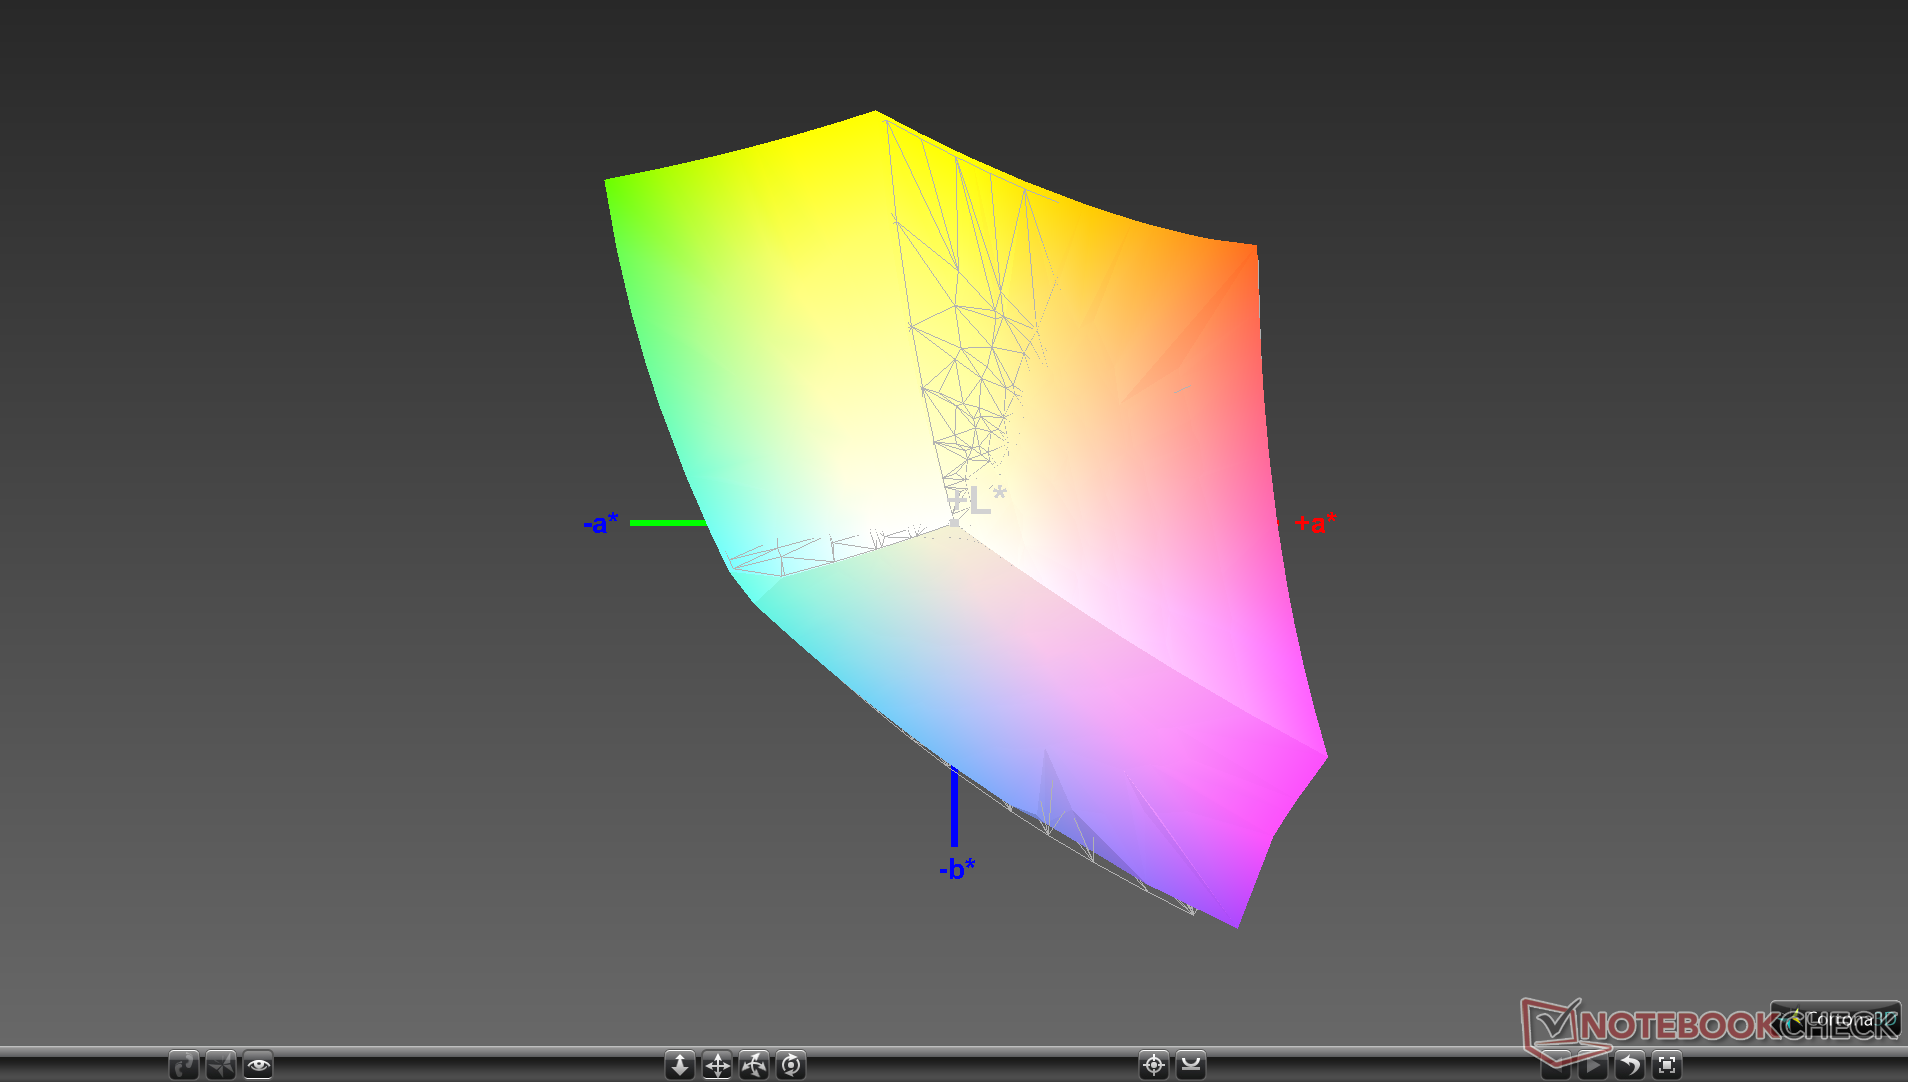
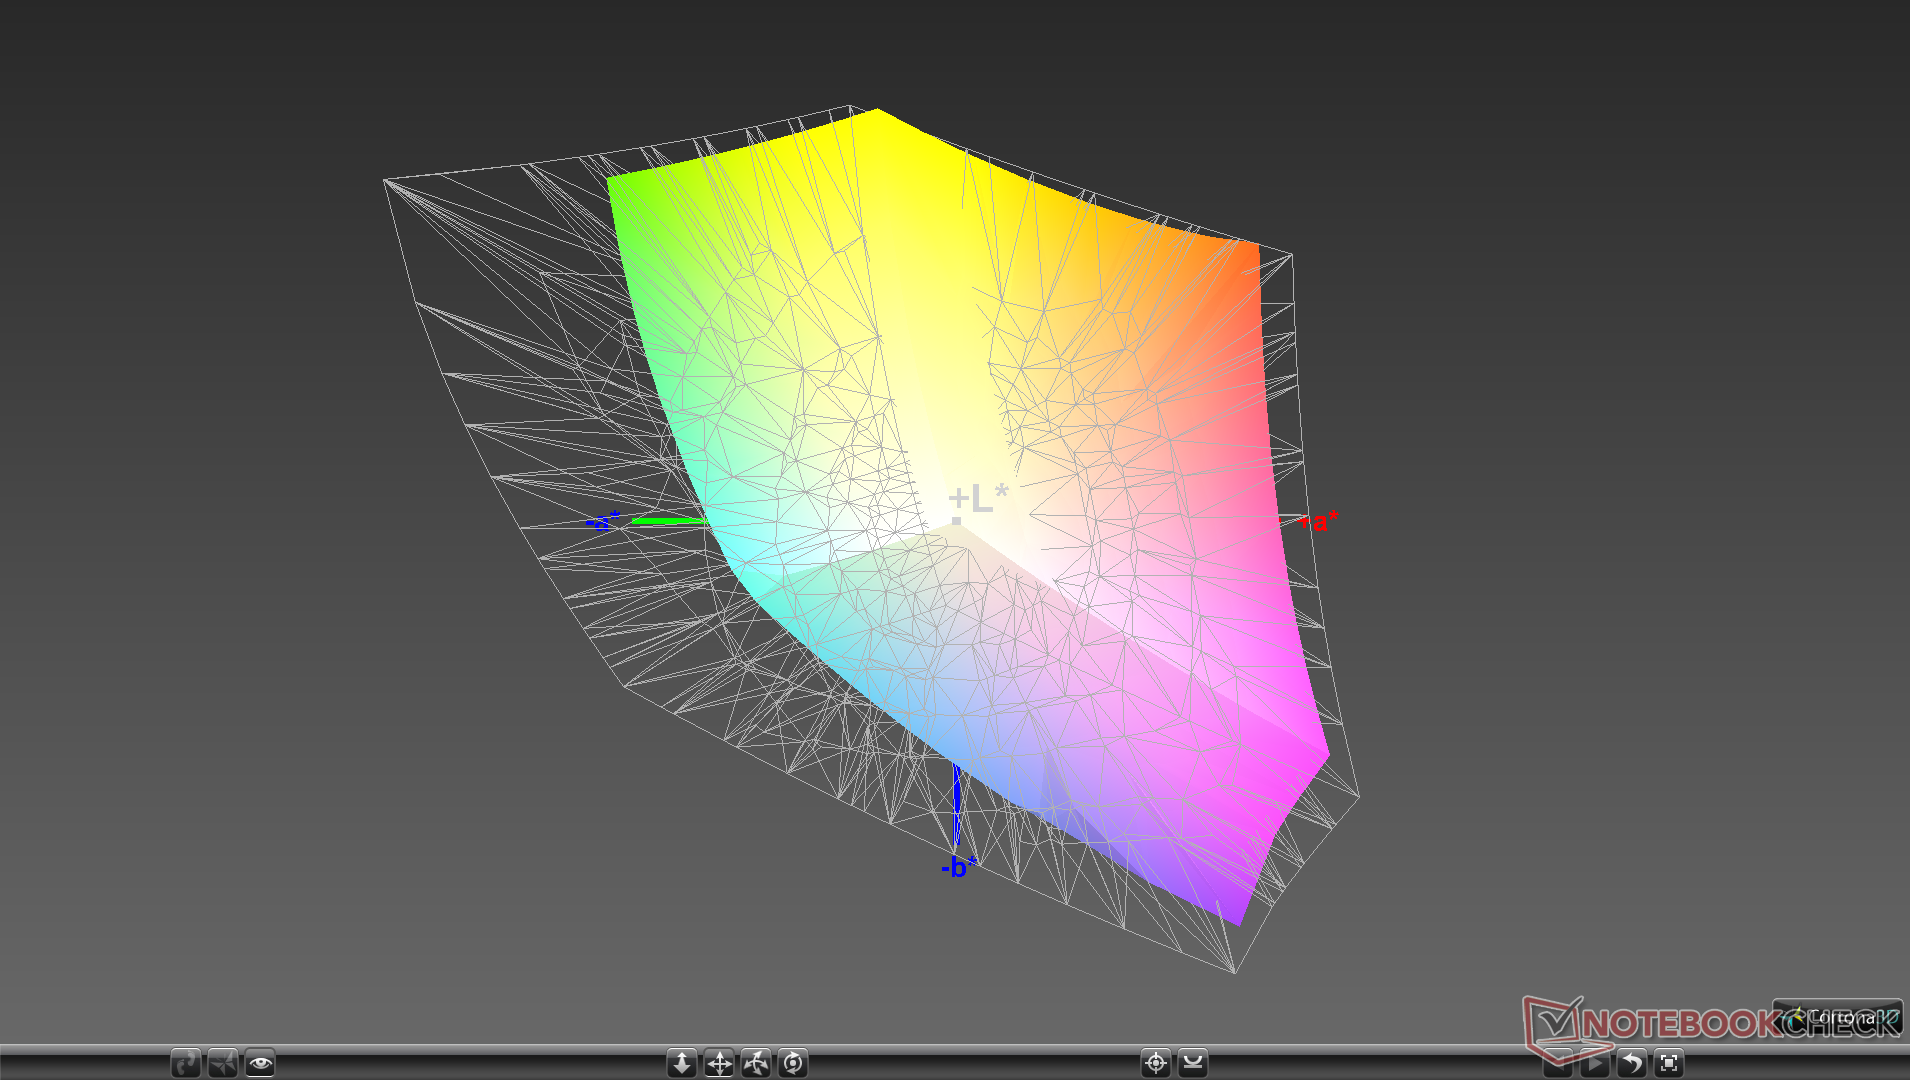
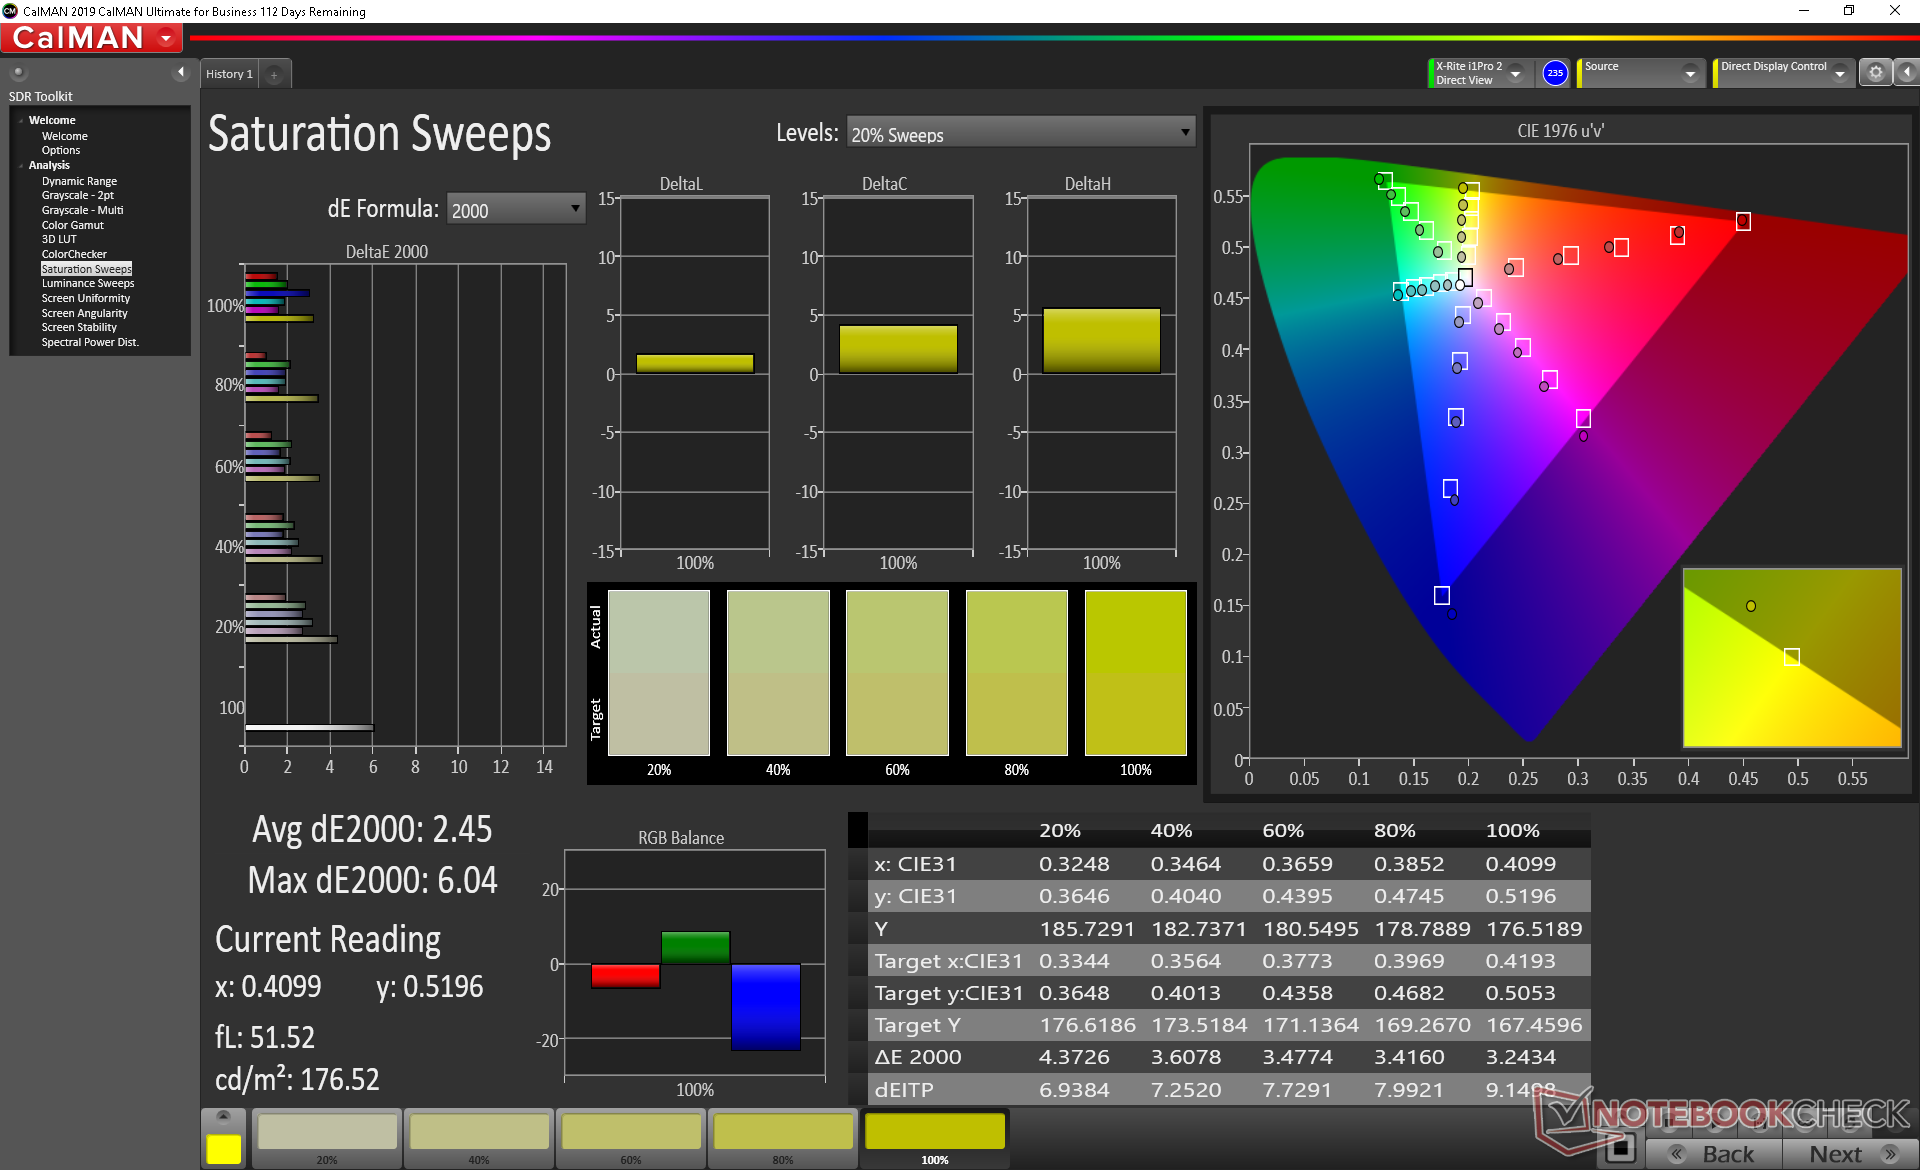
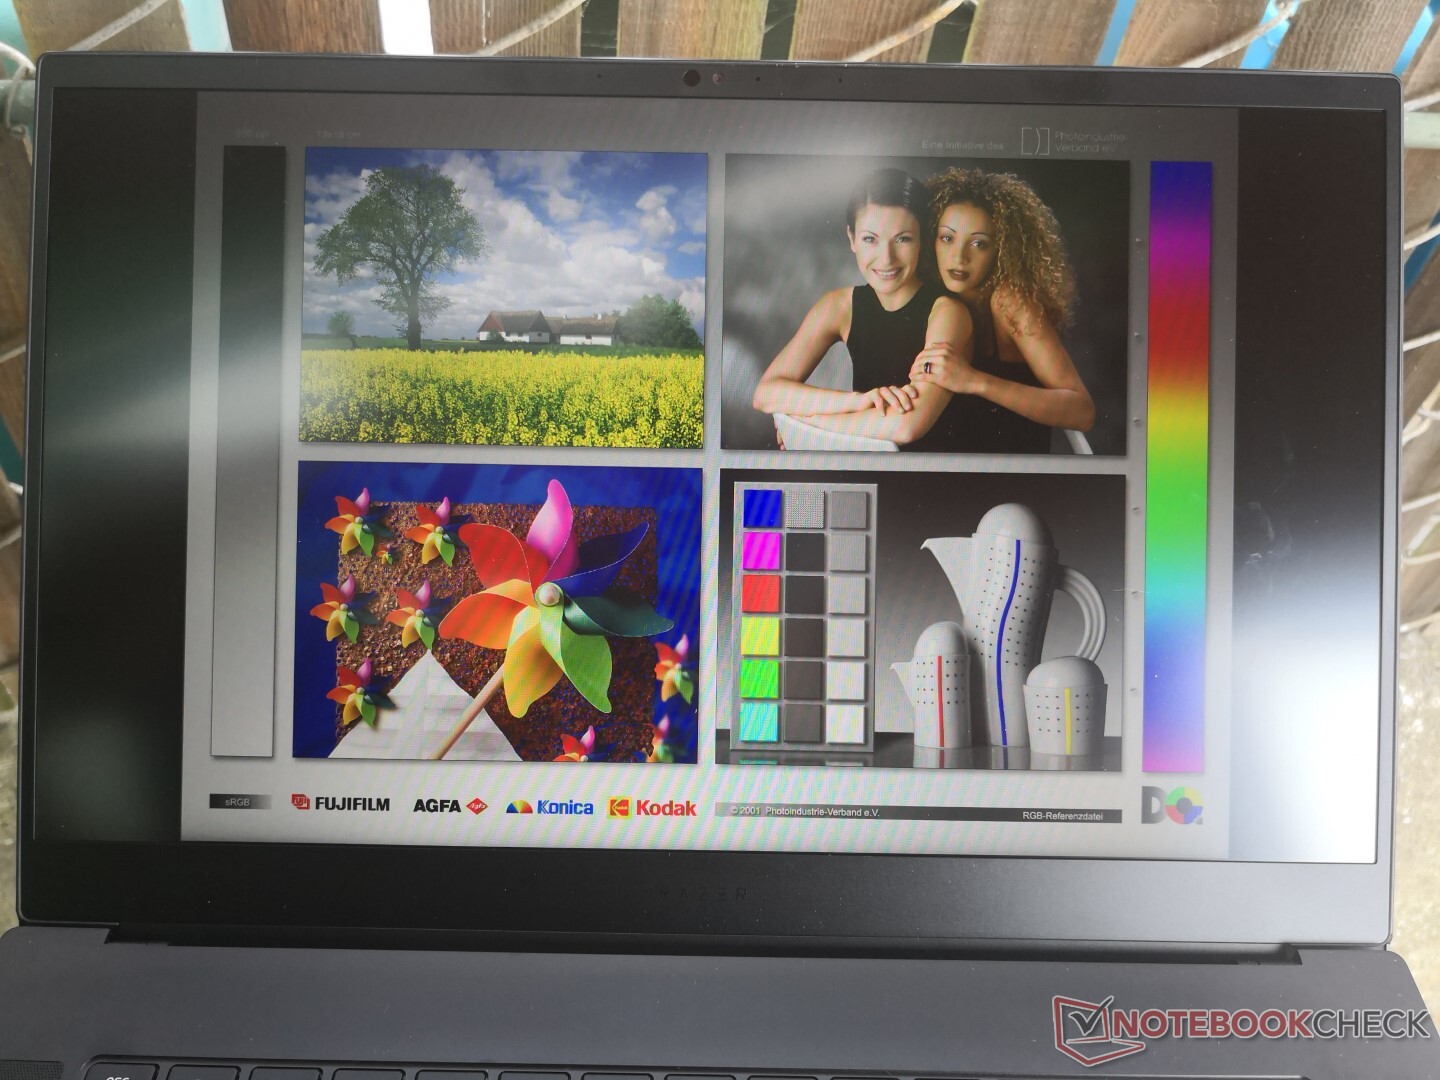
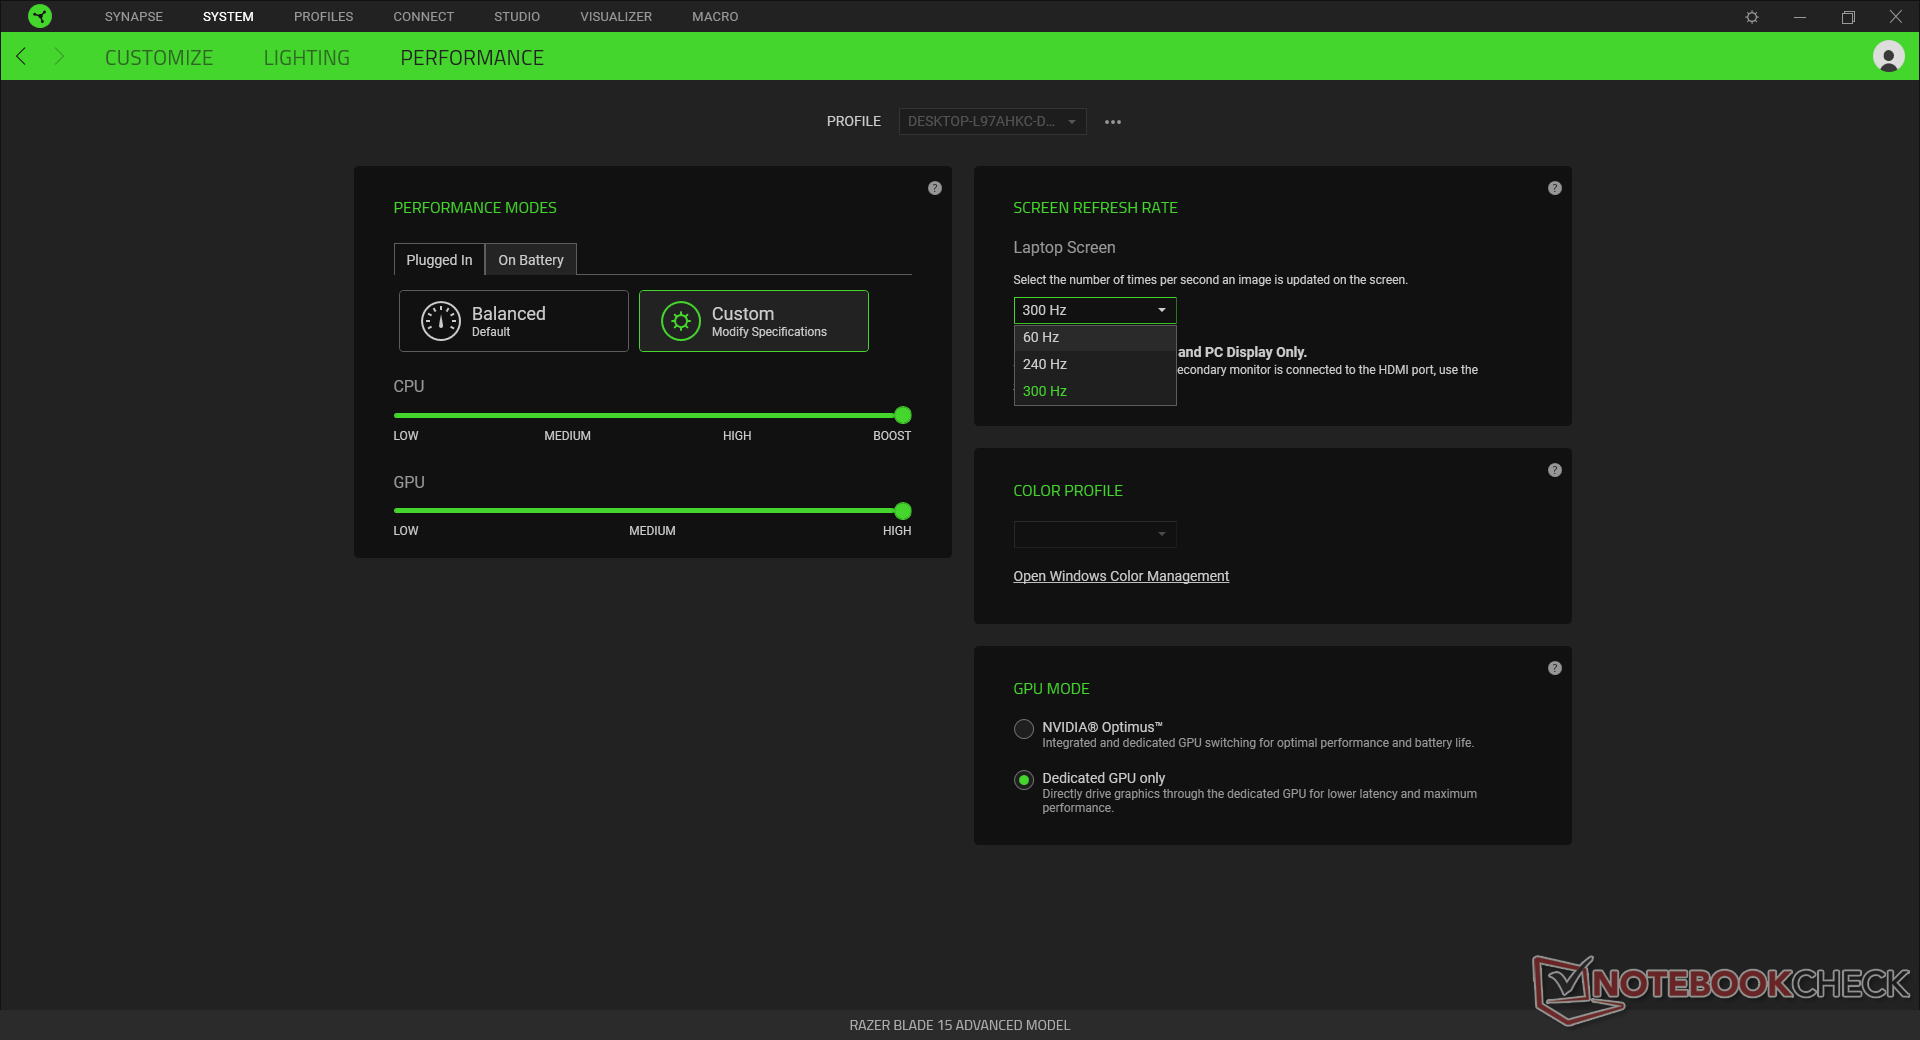
The AU Optronics B156HAN12.0 1080p 300 Hz panel here can also be found on the Acer Predator Triton 500 and MSI GS66 for a similar visual experience between these three flagship gaming laptops. The fast response times, fast refresh rate, high contrast ratio, and full sRGB coverage contribute to an ultra-smooth high-end panel. Perhaps the most notable drawback is its narrower color space when compared to AMOLED or 4K UHD Sharp IGZO panels which tend to cover all of AdobeRGB or DCI-P3.

| |||||||||||||||||||||||||
Brightness Distribution: 90 %
Center on Battery: 345.4 cd/m²
Contrast: 1016:1 (Black: 0.34 cd/m²)
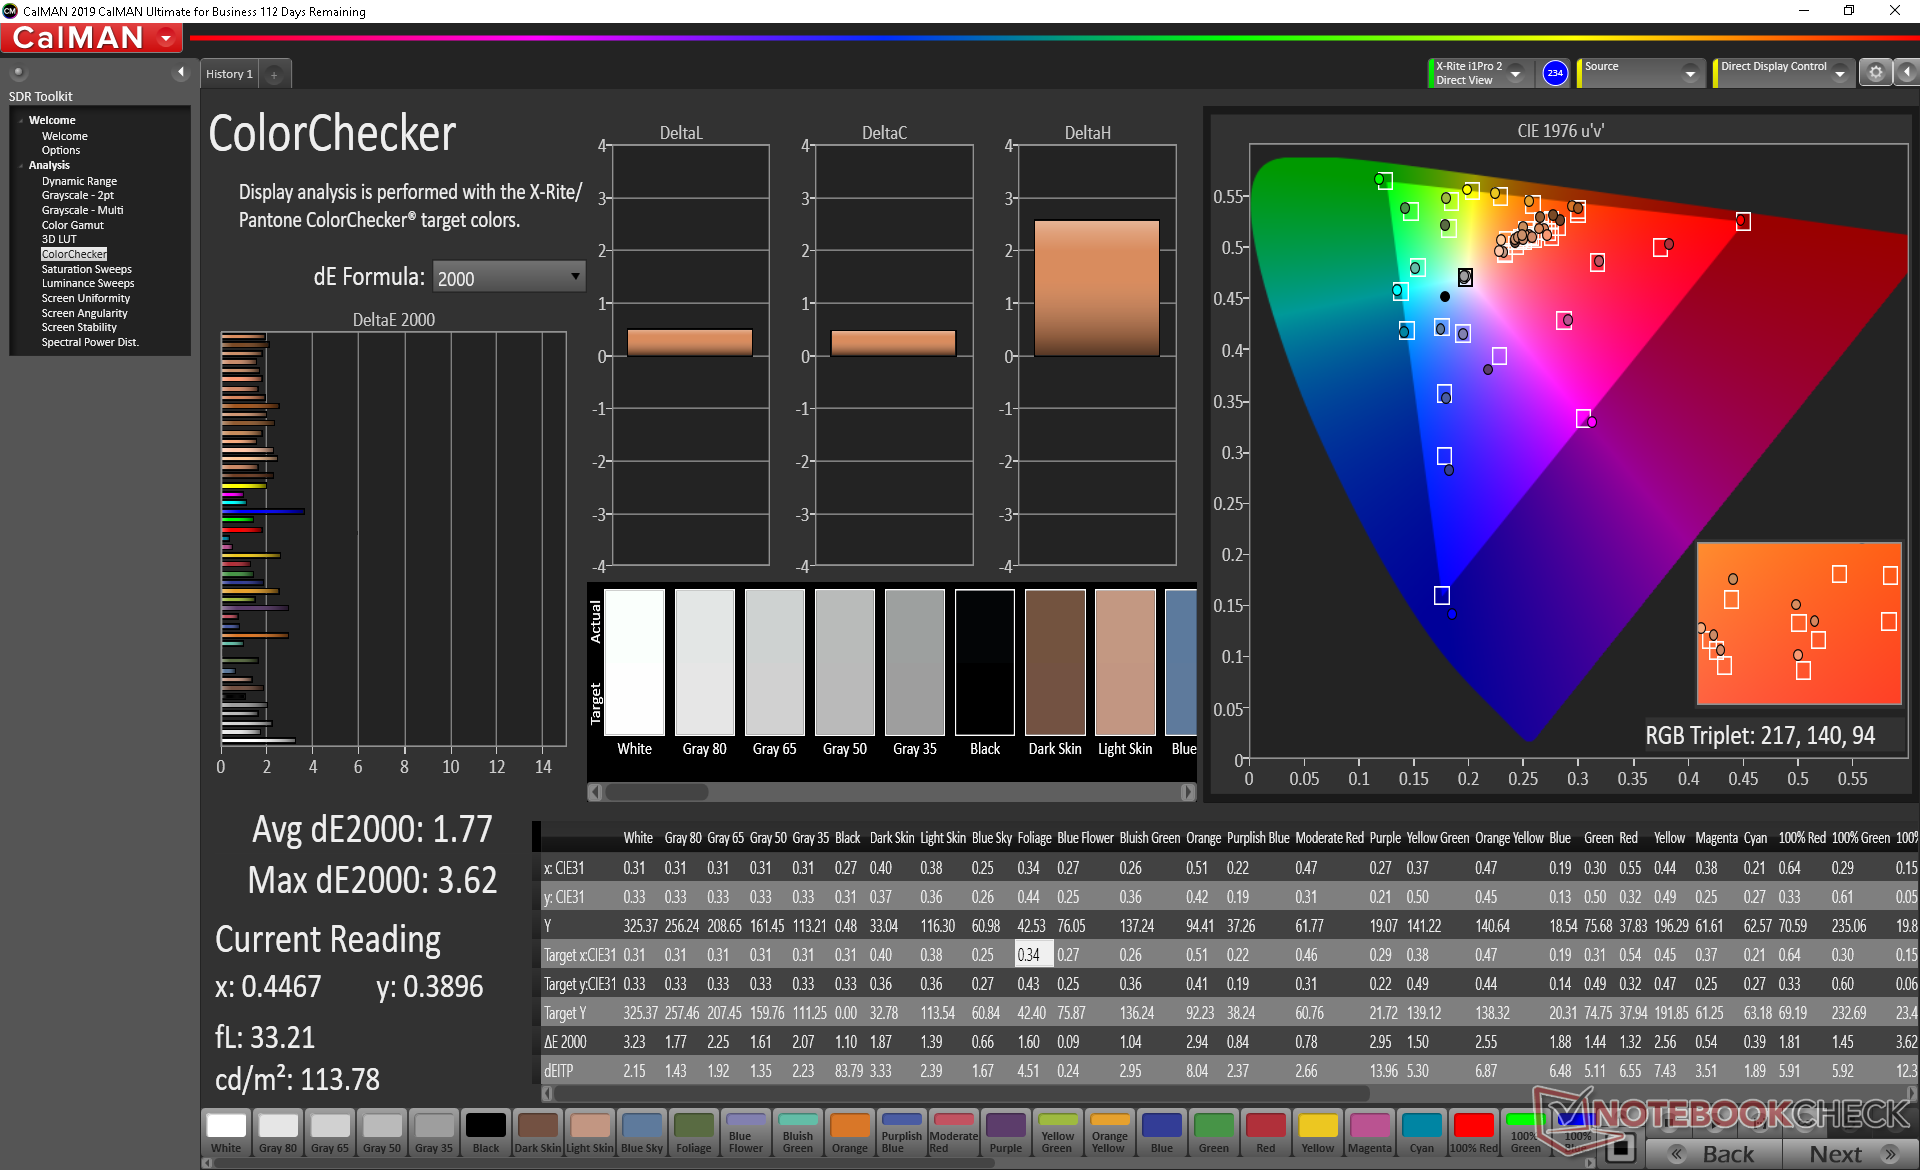
ΔE ColorChecker Calman: 3.18 | ∀{0.5-29.43 Ø4.73}
calibrated: 1.77
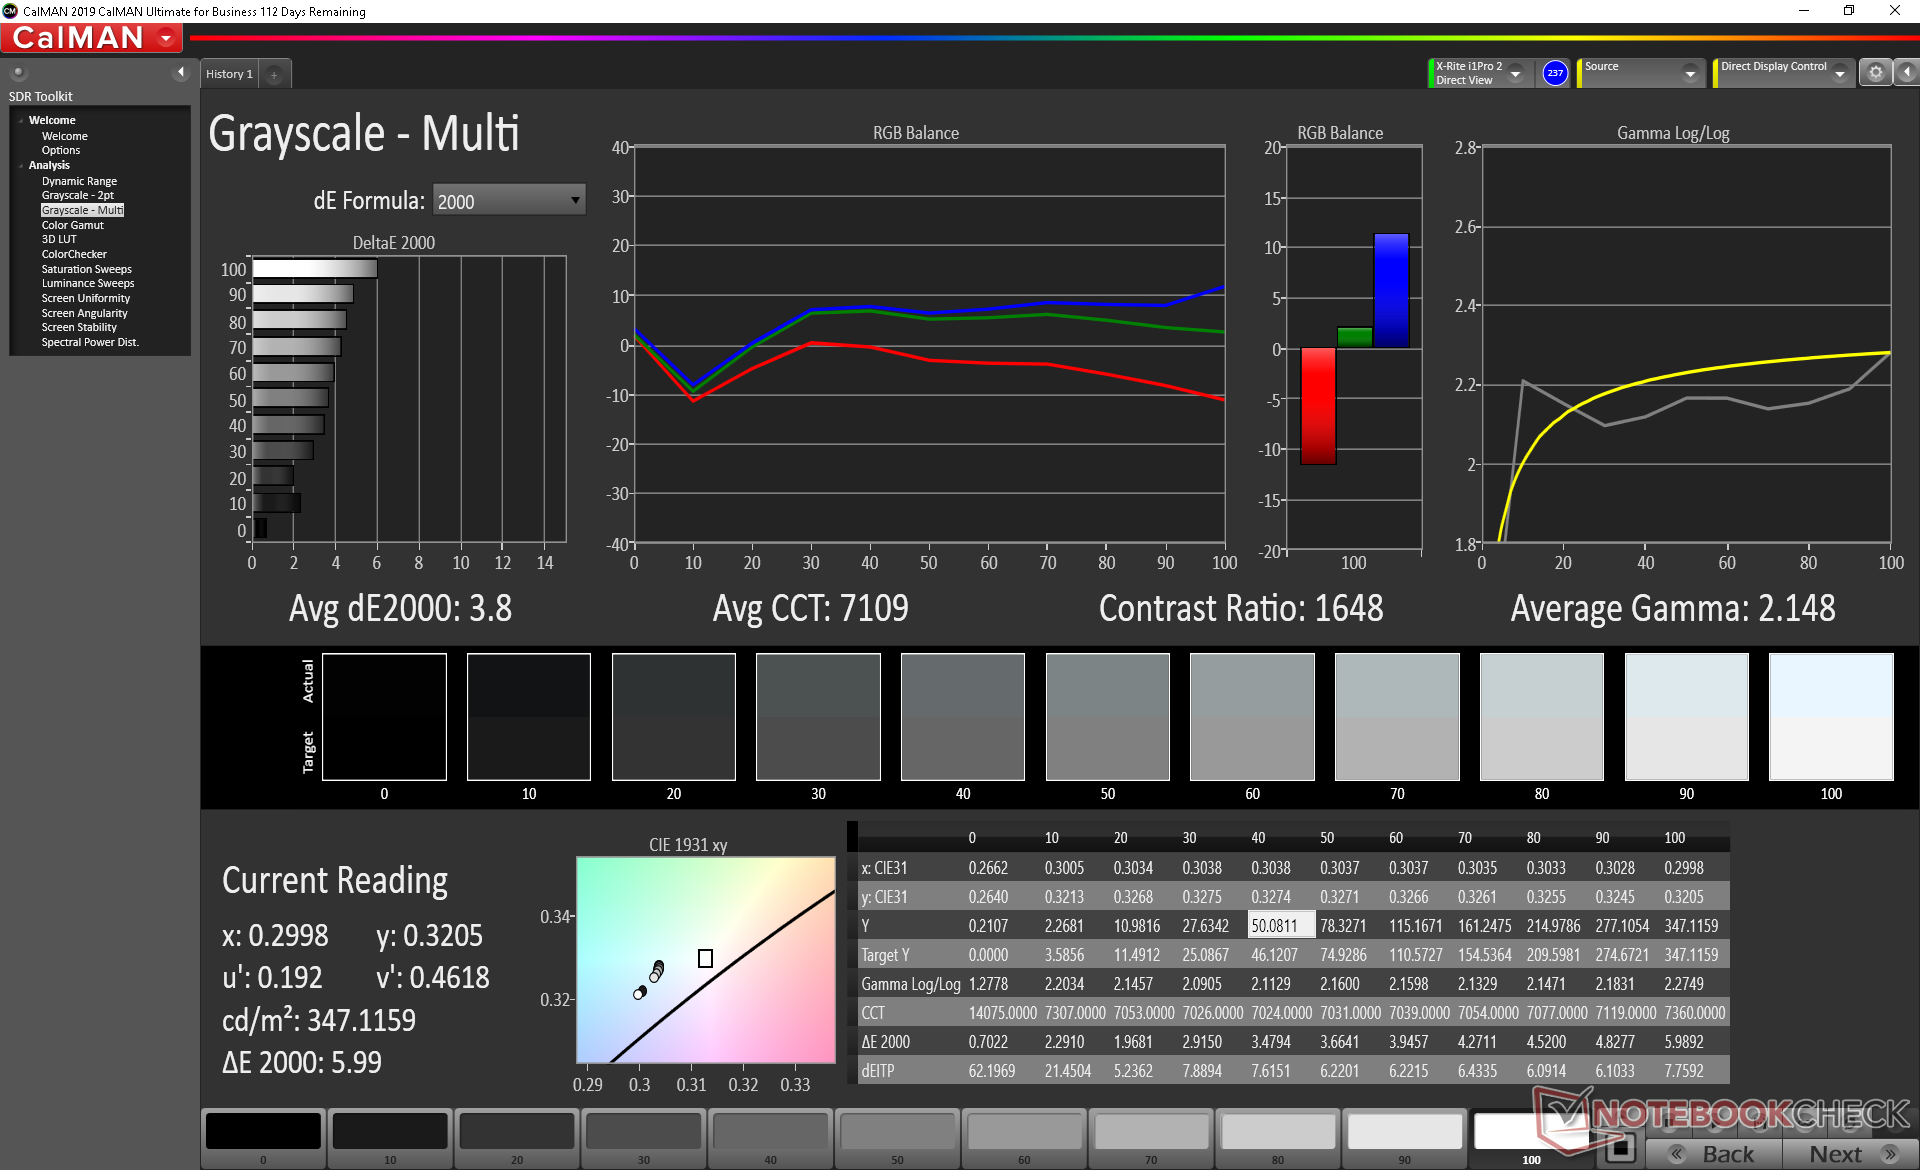
ΔE Greyscale Calman: 3.8 | ∀{0.09-98 Ø4.97}
99% sRGB (Argyll 1.6.3 3D)
64.3% AdobeRGB 1998 (Argyll 1.6.3 3D)
70.5% AdobeRGB 1998 (Argyll 3D)
98.8% sRGB (Argyll 3D)
69.4% Display P3 (Argyll 3D)
Gamma: 2.15
CCT: 7109 K
| Razer Blade 15 RTX 2070 Super Max-Q AU Optronics B156HAN12.0, IPS, 15.6", 1920x1080 | MSI GS66 Stealth 10SFS AUO B156HAN12.0 (AUO328E), IPS, 15.6", 1920x1080 | Asus Zephyrus S GX502GW AU Optronics B156HAN08.2 (AUO82ED), IPS, 15.6", 1920x1080 | Gigabyte Aero 15 Classic-XA Sharp LQ156M1JW03 (SHP14C5), IGZO, 15.6", 1920x1080 | Lenovo Legion Y740-15ICHg BOE NV156FHM-N4J, IPS, 15.6", 1920x1080 | HP Envy 15-ep0098nr Samsung SDC4145, AMOLED, 15.6", 3840x2160 | |
|---|---|---|---|---|---|---|
| Display | 0% | -7% | -5% | -5% | 24% | |
| Display P3 Coverage (%) | 69.4 | 69.5 0% | 64.9 -6% | 65.3 -6% | 67.7 -2% | 88.5 28% |
| sRGB Coverage (%) | 98.8 | 99.6 1% | 91 -8% | 95.5 -3% | 91.6 -7% | 100 1% |
| AdobeRGB 1998 Coverage (%) | 70.5 | 70.8 0% | 65.9 -7% | 66.5 -6% | 67.1 -5% | 99.9 42% |
| Response Times | -179% | -68% | -208% | -260% | 71% | |
| Response Time Grey 50% / Grey 80% * (ms) | 3.2 ? | 14 ? -338% | 7.2 ? -125% | 15.2 ? -375% | 19 ? -494% | 0.8 ? 75% |
| Response Time Black / White * (ms) | 8 ? | 9.6 ? -20% | 8.8 ? -10% | 11.2 ? -40% | 10 ? -25% | 2.7 ? 66% |
| PWM Frequency (Hz) | 23580 ? | 242.7 ? | ||||
| Screen | 9% | -1% | 1% | 17% | -18% | |
| Brightness middle (cd/m²) | 345.4 | 316 -9% | 286 -17% | 266 -23% | 477 38% | 374.3 8% |
| Brightness (cd/m²) | 342 | 311 -9% | 275 -20% | 248 -27% | 431 26% | 379 11% |
| Brightness Distribution (%) | 90 | 92 2% | 90 0% | 89 -1% | 84 -7% | 91 1% |
| Black Level * (cd/m²) | 0.34 | 0.21 38% | 0.37 -9% | 0.31 9% | 0.175 49% | |
| Contrast (:1) | 1016 | 1505 48% | 773 -24% | 858 -16% | 2726 168% | |
| Colorchecker dE 2000 * | 3.18 | 3.03 5% | 2.19 31% | 2.78 13% | 4.17 -31% | 5.47 -72% |
| Colorchecker dE 2000 max. * | 6.57 | 7.32 -11% | 4.4 33% | 5.96 9% | 6.97 -6% | 8.22 -25% |
| Colorchecker dE 2000 calibrated * | 1.77 | 1.1 38% | 2.27 -28% | 0.91 49% | 2.51 -42% | 4.61 -160% |
| Greyscale dE 2000 * | 3.8 | 3.9 -3% | 2.2 42% | 3.58 6% | 3.49 8% | 2.3 39% |
| Gamma | 2.15 102% | 2.42 91% | 2.41 91% | 2.46 89% | 2.5 88% | 2.09 105% |
| CCT | 7109 91% | 7439 87% | 6405 101% | 7186 90% | 7076 92% | 6340 103% |
| Color Space (Percent of AdobeRGB 1998) (%) | 64.3 | 65 1% | 59 -8% | 62 -4% | 60 -7% | 87.8 37% |
| Color Space (Percent of sRGB) (%) | 99 | 100 1% | 91 -8% | 96 -3% | 91 -8% | 100 1% |
| Total Average (Program / Settings) | -57% /
-16% | -25% /
-10% | -71% /
-26% | -83% /
-22% | 26% /
4% |
* ... smaller is better
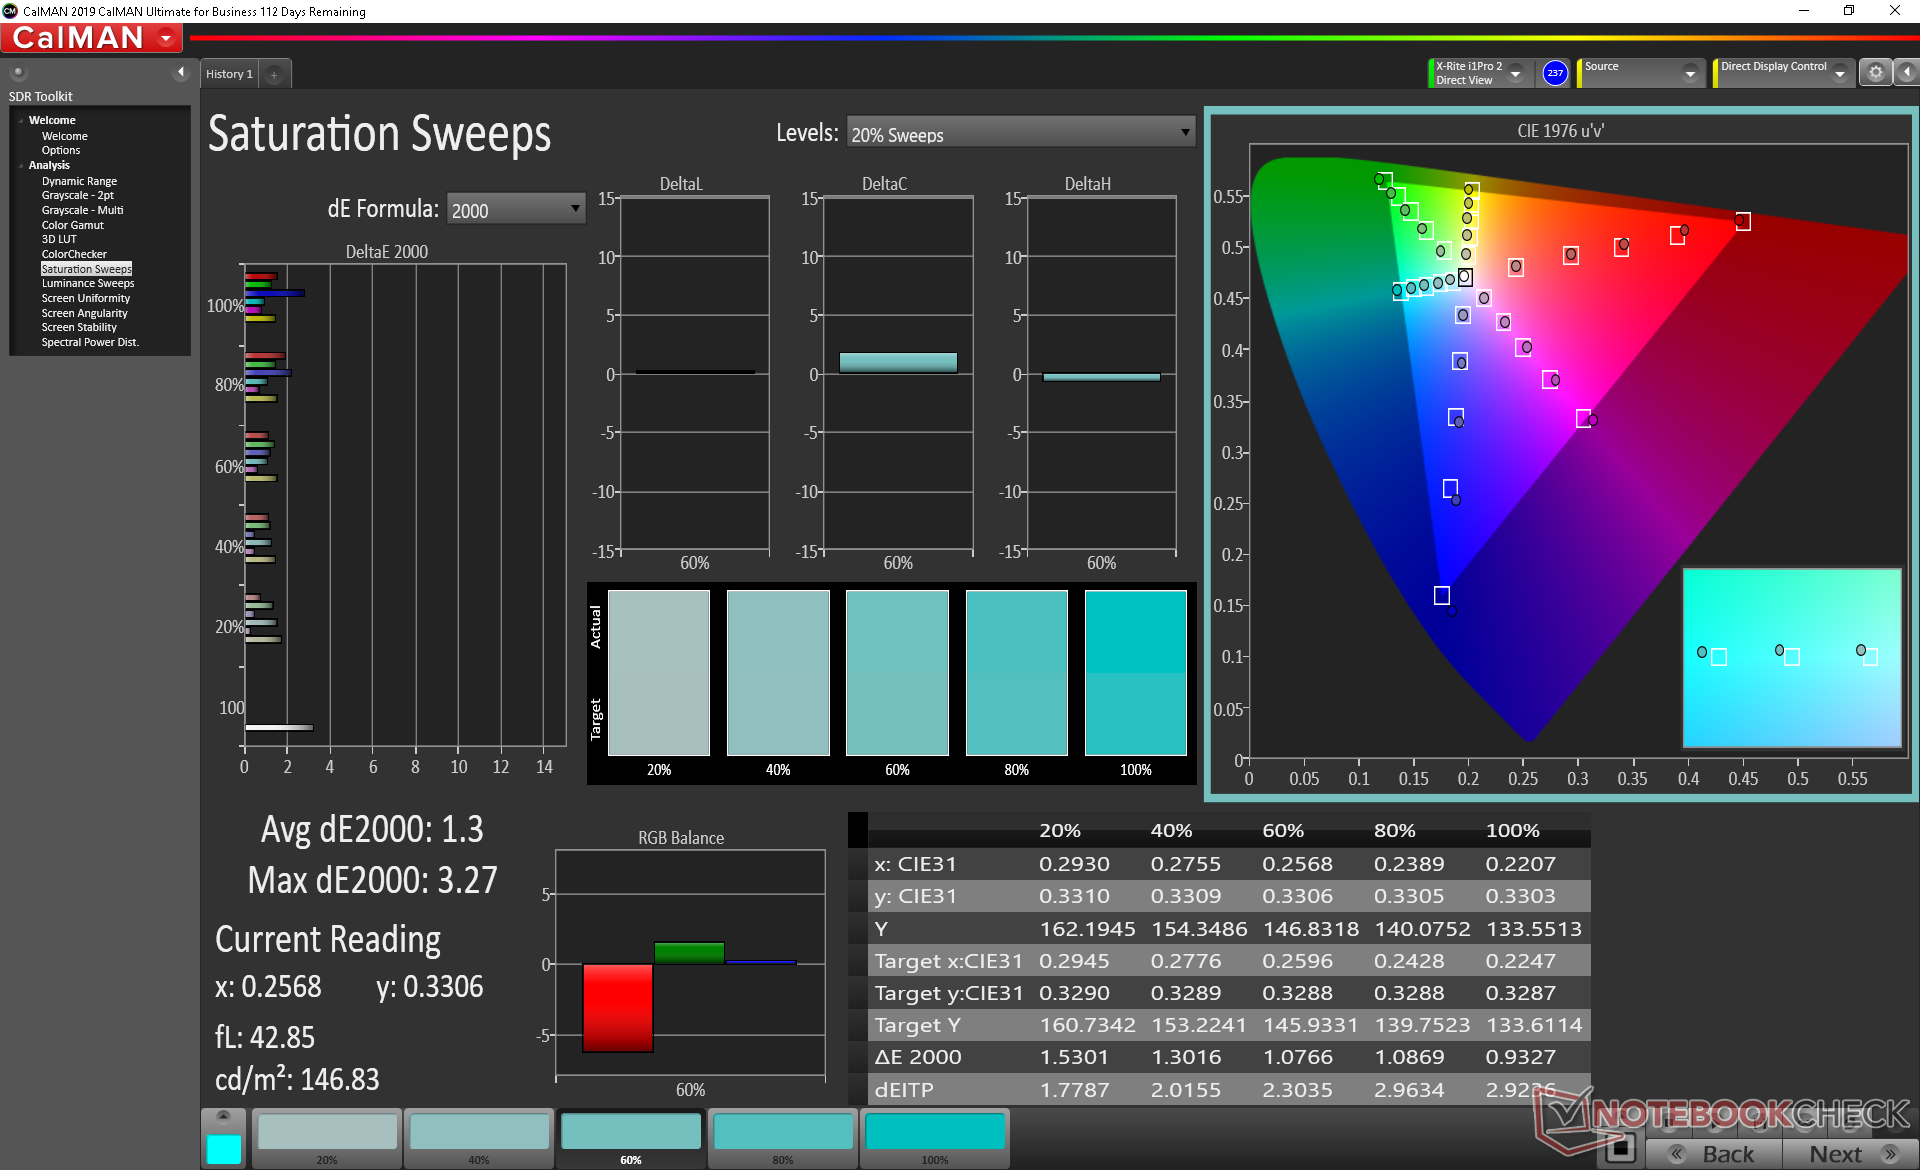
The display is well calibrated out of the box with an average grayscale DeltaE value of 3.8. Calibrating it even further with our X-Rite colorimeter would improve both grayscale and colors just marginally.


Display Response Times
| ↔ Response Time Black to White | ||
|---|---|---|
| 8 ms ... rise ↗ and fall ↘ combined | ↗ 4 ms rise | 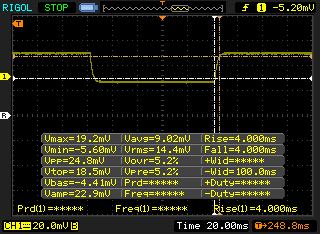 |
| ↘ 4 ms fall | ||
| The screen shows fast response rates in our tests and should be suited for gaming. In comparison, all tested devices range from 0.1 (minimum) to 240 (maximum) ms. » 22 % of all devices are better. This means that the measured response time is better than the average of all tested devices (19.9 ms). | ||
| ↔ Response Time 50% Grey to 80% Grey | ||
| 3.2 ms ... rise ↗ and fall ↘ combined | ↗ 1.4 ms rise | 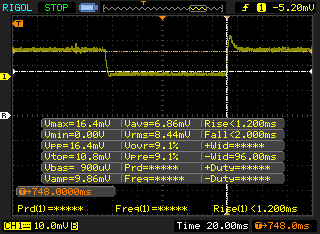 |
| ↘ 1.8 ms fall | ||
| The screen shows very fast response rates in our tests and should be very well suited for fast-paced gaming. In comparison, all tested devices range from 0.165 (minimum) to 636 (maximum) ms. » 13 % of all devices are better. This means that the measured response time is better than the average of all tested devices (31.1 ms). | ||
Screen Flickering / PWM (Pulse-Width Modulation)
| Screen flickering / PWM not detected | 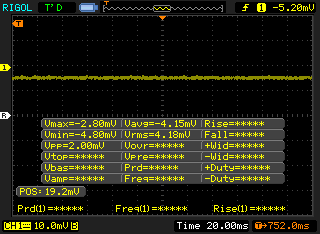 | ||
In comparison: 52 % of all tested devices do not use PWM to dim the display. If PWM was detected, an average of 7798 (minimum: 5 - maximum: 343500) Hz was measured. | |||
Performance
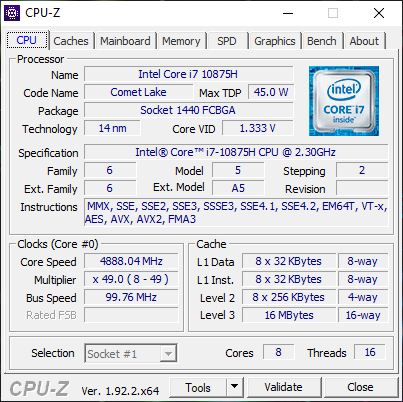
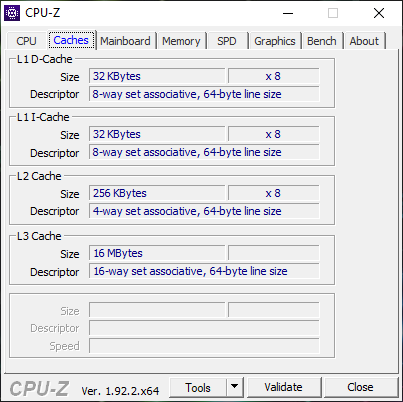
Processor
The CPU performs very well so long as users set the system to its highest performance level via Synapse. For example, raw multi-thread performance is about 30 percent faster than the same CPU in the Blade 15 RTX 2080 Super Max-Q running on the Balanced power profile. Nonetheless, some laptops are able to run the processor even faster like the Gigabyte Aorus 15G as shown by our CineBench R15 xT loop test results below.
See our dedicated page on the Core i7-10875H for more technical information and benchmarks.
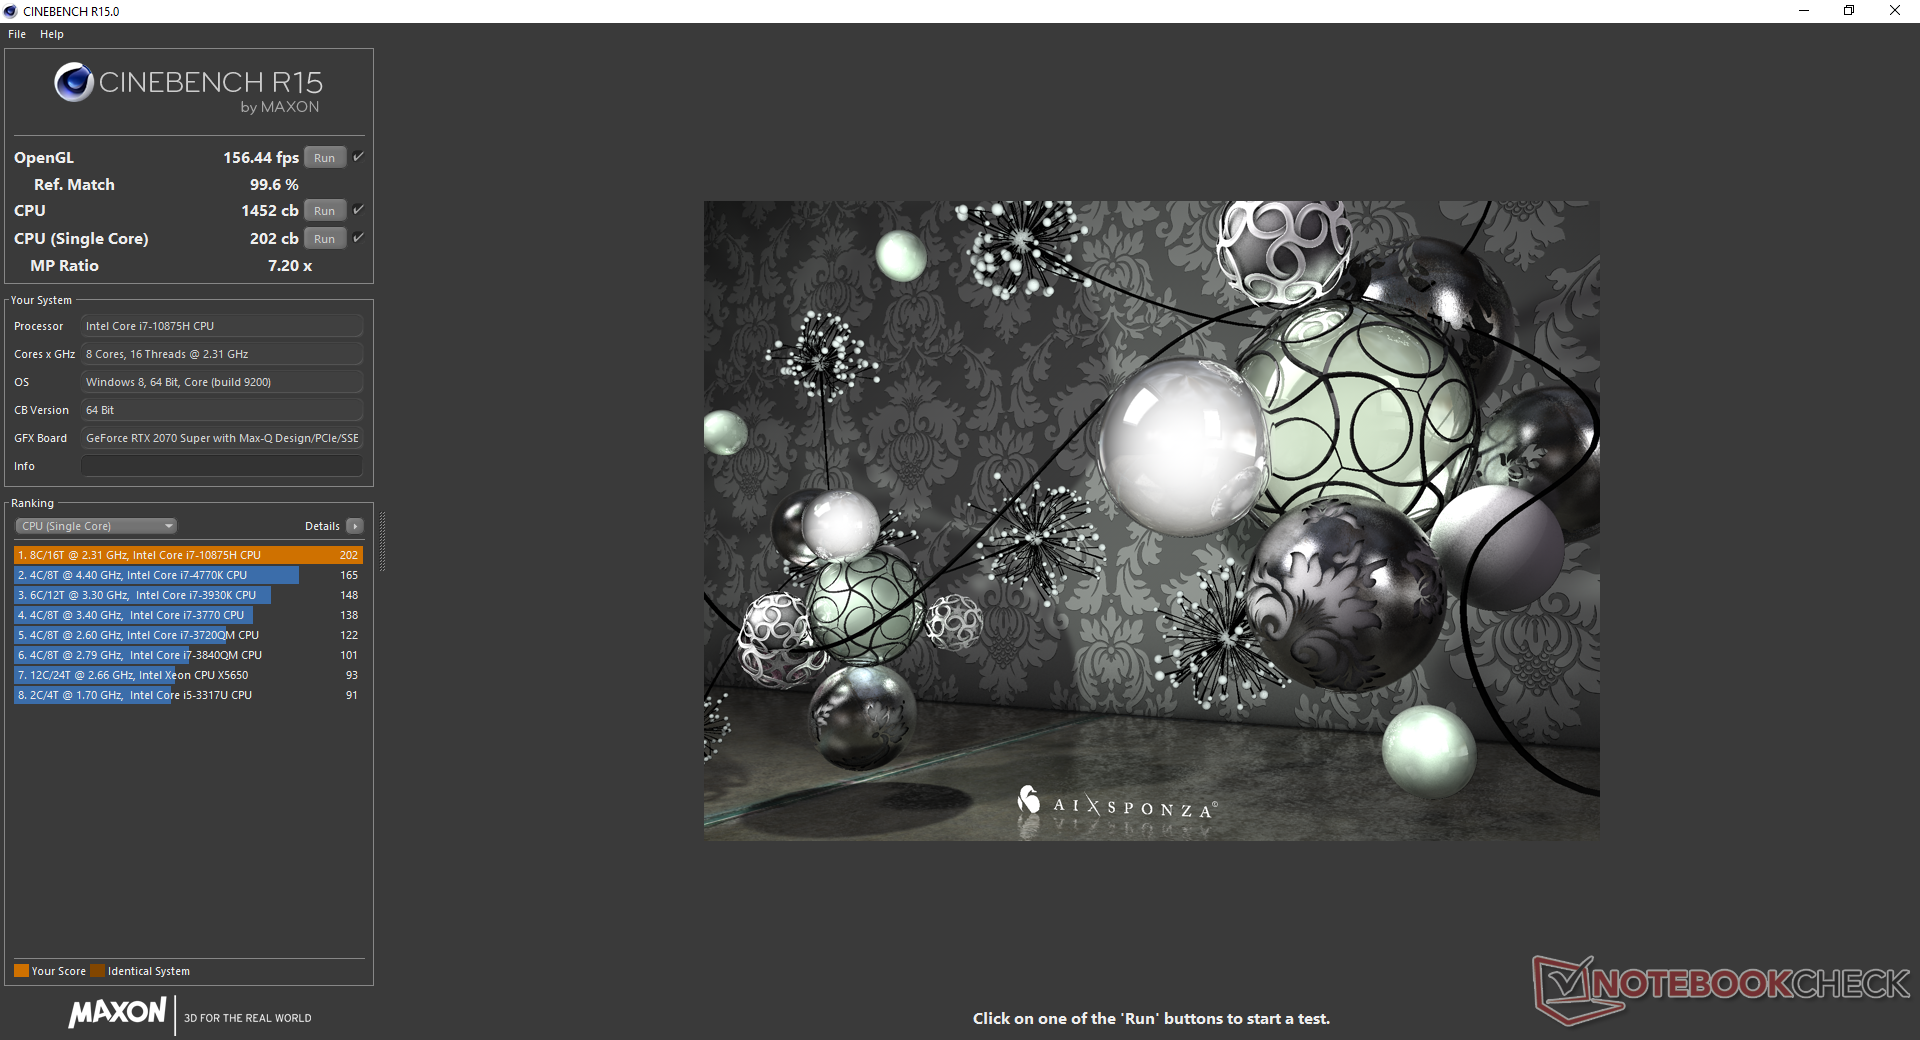
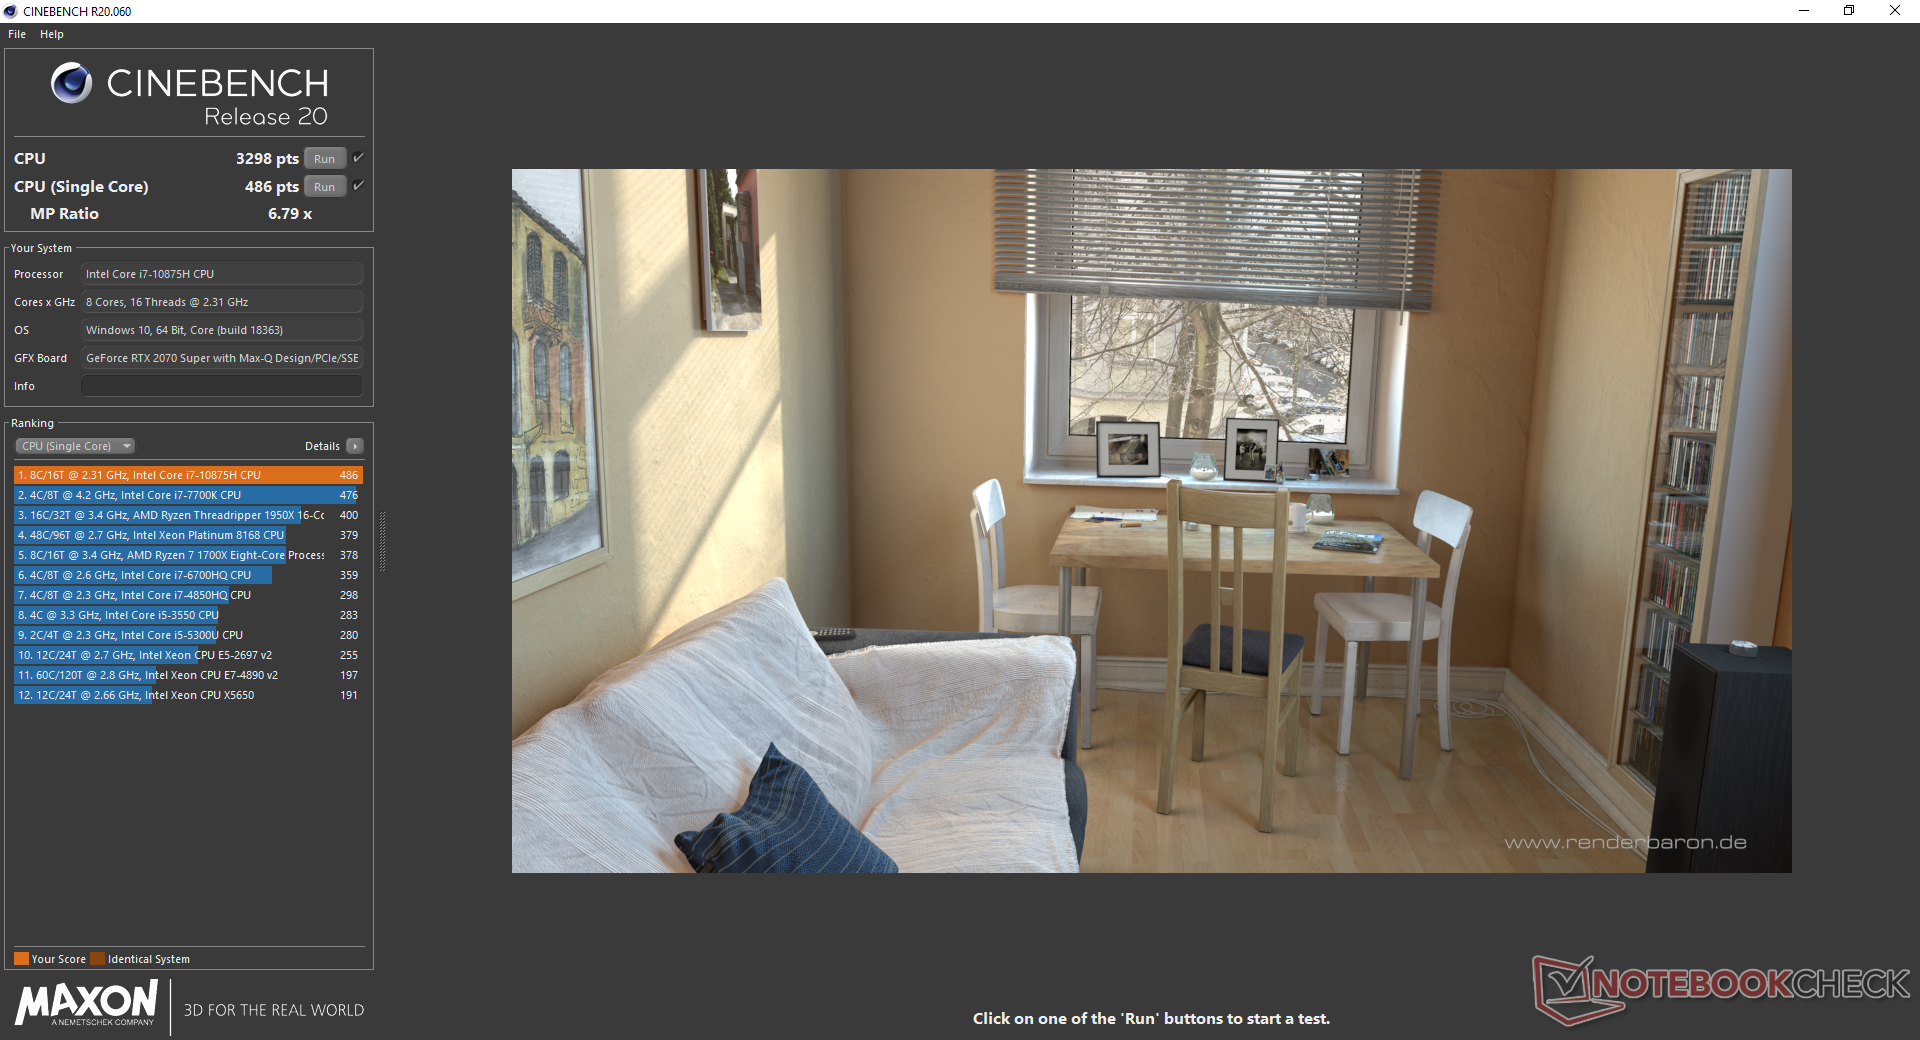
Cinebench R15: CPU Multi 64Bit | CPU Single 64Bit
Blender: v2.79 BMW27 CPU
7-Zip 18.03: 7z b 4 -mmt1 | 7z b 4
Geekbench 5.5: Single-Core | Multi-Core
HWBOT x265 Benchmark v2.2: 4k Preset
LibreOffice : 20 Documents To PDF
R Benchmark 2.5: Overall mean
| Cinebench R20 / CPU (Multi Core) | |
| MSI Bravo 15 A4DCR | |
| Asus ROG Strix Scar 15 G532LWS | |
| Eurocom Nightsky RX15 | |
| MSI GE65 Raider 9SF-049US | |
| Average Intel Core i7-10875H (1986 - 4176, n=32) | |
| Alienware m15 R3 P87F | |
| Razer Blade 15 RTX 2070 Super Max-Q | |
| Maingear Vector 15 | |
| Dell G5 15 5590 | |
| Lenovo Legion 5 15IMH05H | |
| Cinebench R20 / CPU (Single Core) | |
| Asus ROG Strix Scar 15 G532LWS | |
| Razer Blade 15 RTX 2070 Super Max-Q | |
| Average Intel Core i7-10875H (430 - 524, n=32) | |
| Eurocom Nightsky RX15 | |
| Alienware m15 R3 P87F | |
| MSI Bravo 15 A4DCR | |
| MSI GE65 Raider 9SF-049US | |
| Lenovo Legion 5 15IMH05H | |
| Maingear Vector 15 | |
| Dell G5 15 5590 | |
| Cinebench R15 / CPU Multi 64Bit | |
| Eurocom Nightsky RX15 | |
| MSI Bravo 15 A4DCR | |
| Asus ROG Strix Scar 15 G532LWS | |
| MSI GE65 Raider 9SF-049US | |
| Average Intel Core i7-10875H (1003 - 1833, n=38) | |
| Razer Blade 15 RTX 2070 Super Max-Q | |
| Alienware m15 R3 P87F | |
| Maingear Vector 15 | |
| Dell G5 15 5590 | |
| Lenovo Legion 5 15IMH05H | |
| Cinebench R15 / CPU Single 64Bit | |
| Asus ROG Strix Scar 15 G532LWS | |
| Average Intel Core i7-10875H (190 - 220, n=37) | |
| Eurocom Nightsky RX15 | |
| Razer Blade 15 RTX 2070 Super Max-Q | |
| Alienware m15 R3 P87F | |
| MSI GE65 Raider 9SF-049US | |
| Lenovo Legion 5 15IMH05H | |
| Maingear Vector 15 | |
| MSI Bravo 15 A4DCR | |
| Dell G5 15 5590 | |
| Blender / v2.79 BMW27 CPU | |
| Eurocom Nightsky RX15 | |
| Lenovo Legion 5 15IMH05H | |
| Razer Blade 15 RTX 2070 Super Max-Q | |
| Average Intel Core i7-10875H (259 - 535, n=30) | |
| Alienware m15 R3 P87F | |
| MSI Bravo 15 A4DCR | |
| Asus ROG Strix Scar 15 G532LWS | |
| 7-Zip 18.03 / 7z b 4 -mmt1 | |
| Asus ROG Strix Scar 15 G532LWS | |
| Eurocom Nightsky RX15 | |
| Average Intel Core i7-10875H (5071 - 5780, n=31) | |
| Razer Blade 15 RTX 2070 Super Max-Q | |
| Lenovo Legion 5 15IMH05H | |
| MSI Bravo 15 A4DCR | |
| Alienware m15 R3 P87F | |
| 7-Zip 18.03 / 7z b 4 | |
| Asus ROG Strix Scar 15 G532LWS | |
| MSI Bravo 15 A4DCR | |
| Eurocom Nightsky RX15 | |
| Average Intel Core i7-10875H (29844 - 49562, n=31) | |
| Razer Blade 15 RTX 2070 Super Max-Q | |
| Alienware m15 R3 P87F | |
| Lenovo Legion 5 15IMH05H | |
| Geekbench 5.5 / Single-Core | |
| Asus ROG Strix Scar 15 G532LWS | |
| Average Intel Core i7-10875H (1233 - 1371, n=29) | |
| Razer Blade 15 RTX 2070 Super Max-Q | |
| Alienware m15 R3 P87F | |
| Lenovo Legion 5 15IMH05H | |
| MSI Bravo 15 A4DCR | |
| Geekbench 5.5 / Multi-Core | |
| Asus ROG Strix Scar 15 G532LWS | |
| Average Intel Core i7-10875H (5715 - 8620, n=29) | |
| MSI Bravo 15 A4DCR | |
| Razer Blade 15 RTX 2070 Super Max-Q | |
| Alienware m15 R3 P87F | |
| Lenovo Legion 5 15IMH05H | |
| HWBOT x265 Benchmark v2.2 / 4k Preset | |
| Asus ROG Strix Scar 15 G532LWS | |
| Eurocom Nightsky RX15 | |
| MSI Bravo 15 A4DCR | |
| Average Intel Core i7-10875H (7.27 - 14.1, n=27) | |
| Alienware m15 R3 P87F | |
| Razer Blade 15 RTX 2070 Super Max-Q | |
| Lenovo Legion 5 15IMH05H | |
| LibreOffice / 20 Documents To PDF | |
| MSI Bravo 15 A4DCR | |
| Alienware m15 R3 P87F | |
| Lenovo Legion 5 15IMH05H | |
| Average Intel Core i7-10875H (30.2 - 84.3, n=30) | |
| Asus ROG Strix Scar 15 G532LWS | |
| Razer Blade 15 RTX 2070 Super Max-Q | |
| R Benchmark 2.5 / Overall mean | |
| Alienware m15 R3 P87F | |
| Lenovo Legion 5 15IMH05H | |
| MSI Bravo 15 A4DCR | |
| Razer Blade 15 RTX 2070 Super Max-Q | |
| Average Intel Core i7-10875H (0.546 - 0.662, n=29) | |
| Asus ROG Strix Scar 15 G532LWS | |
* ... smaller is better
System Performance
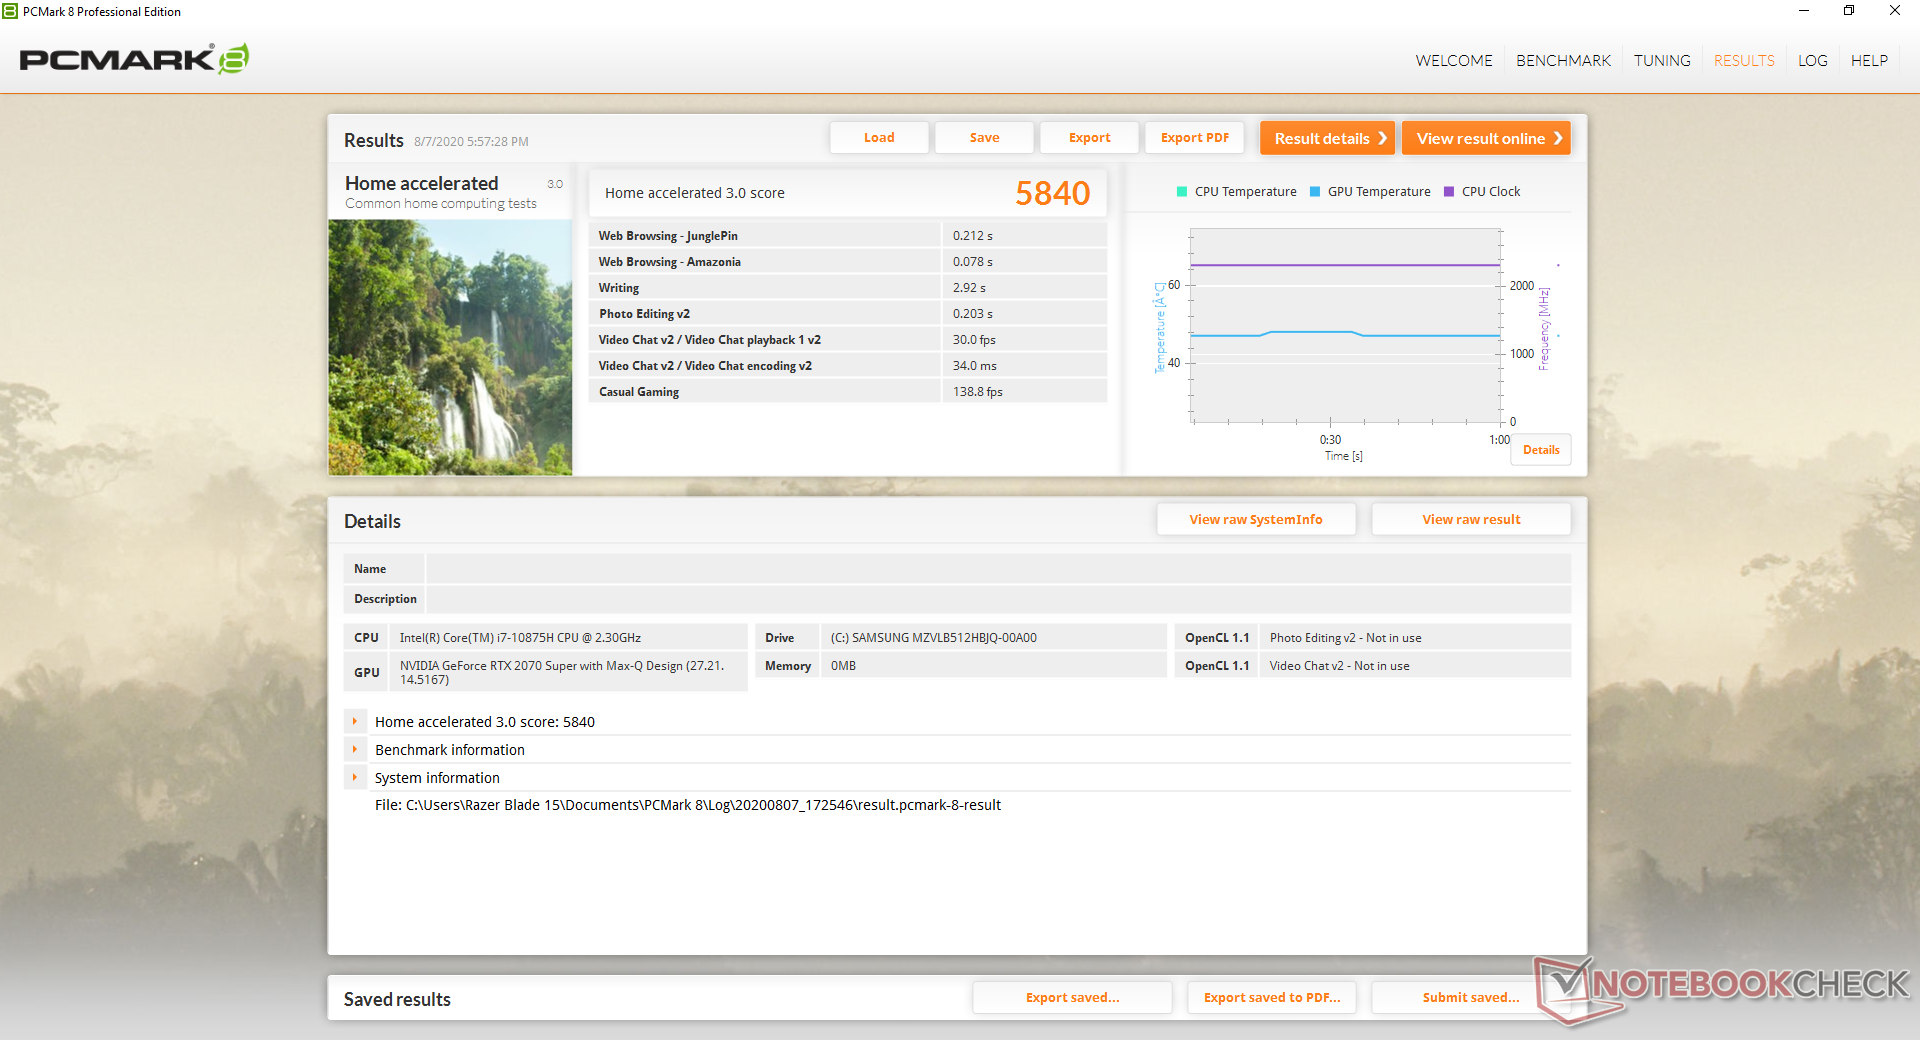
| PCMark 8 Home Score Accelerated v2 | 5840 points | |
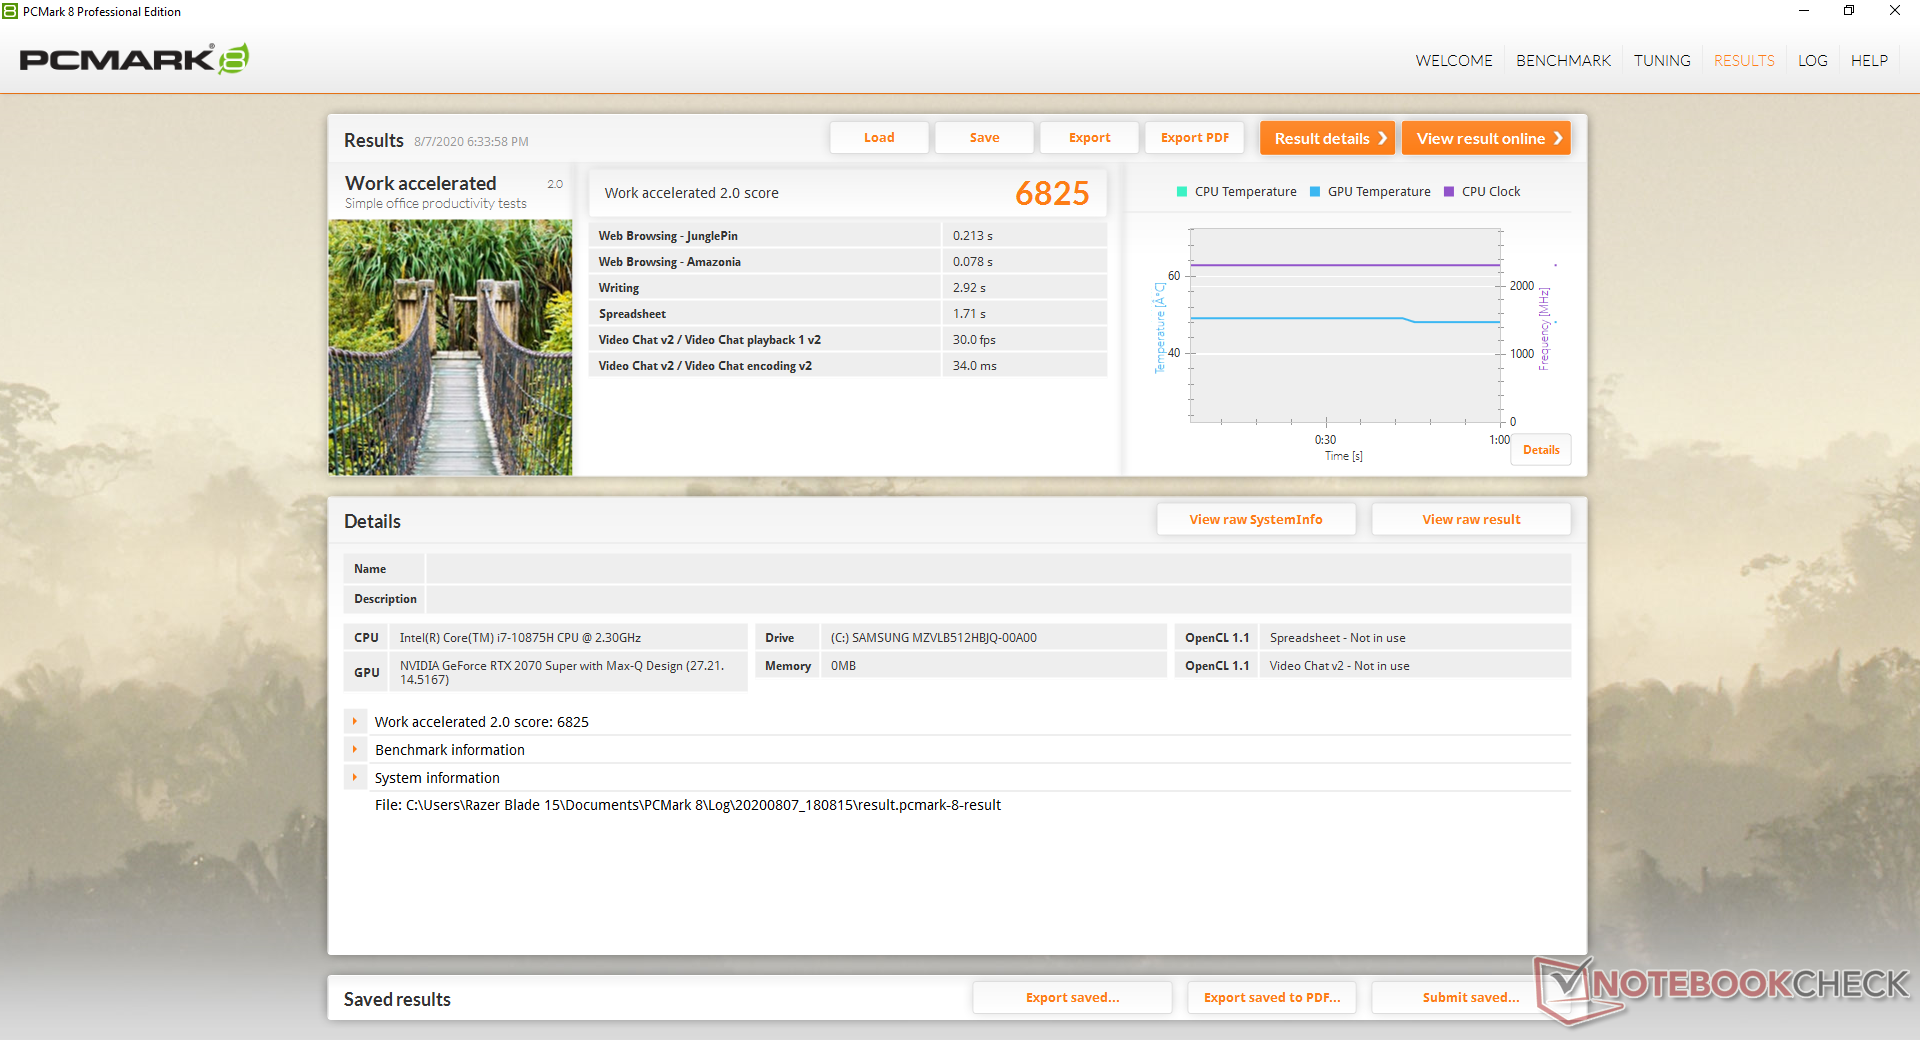
| PCMark 8 Work Score Accelerated v2 | 6825 points | |
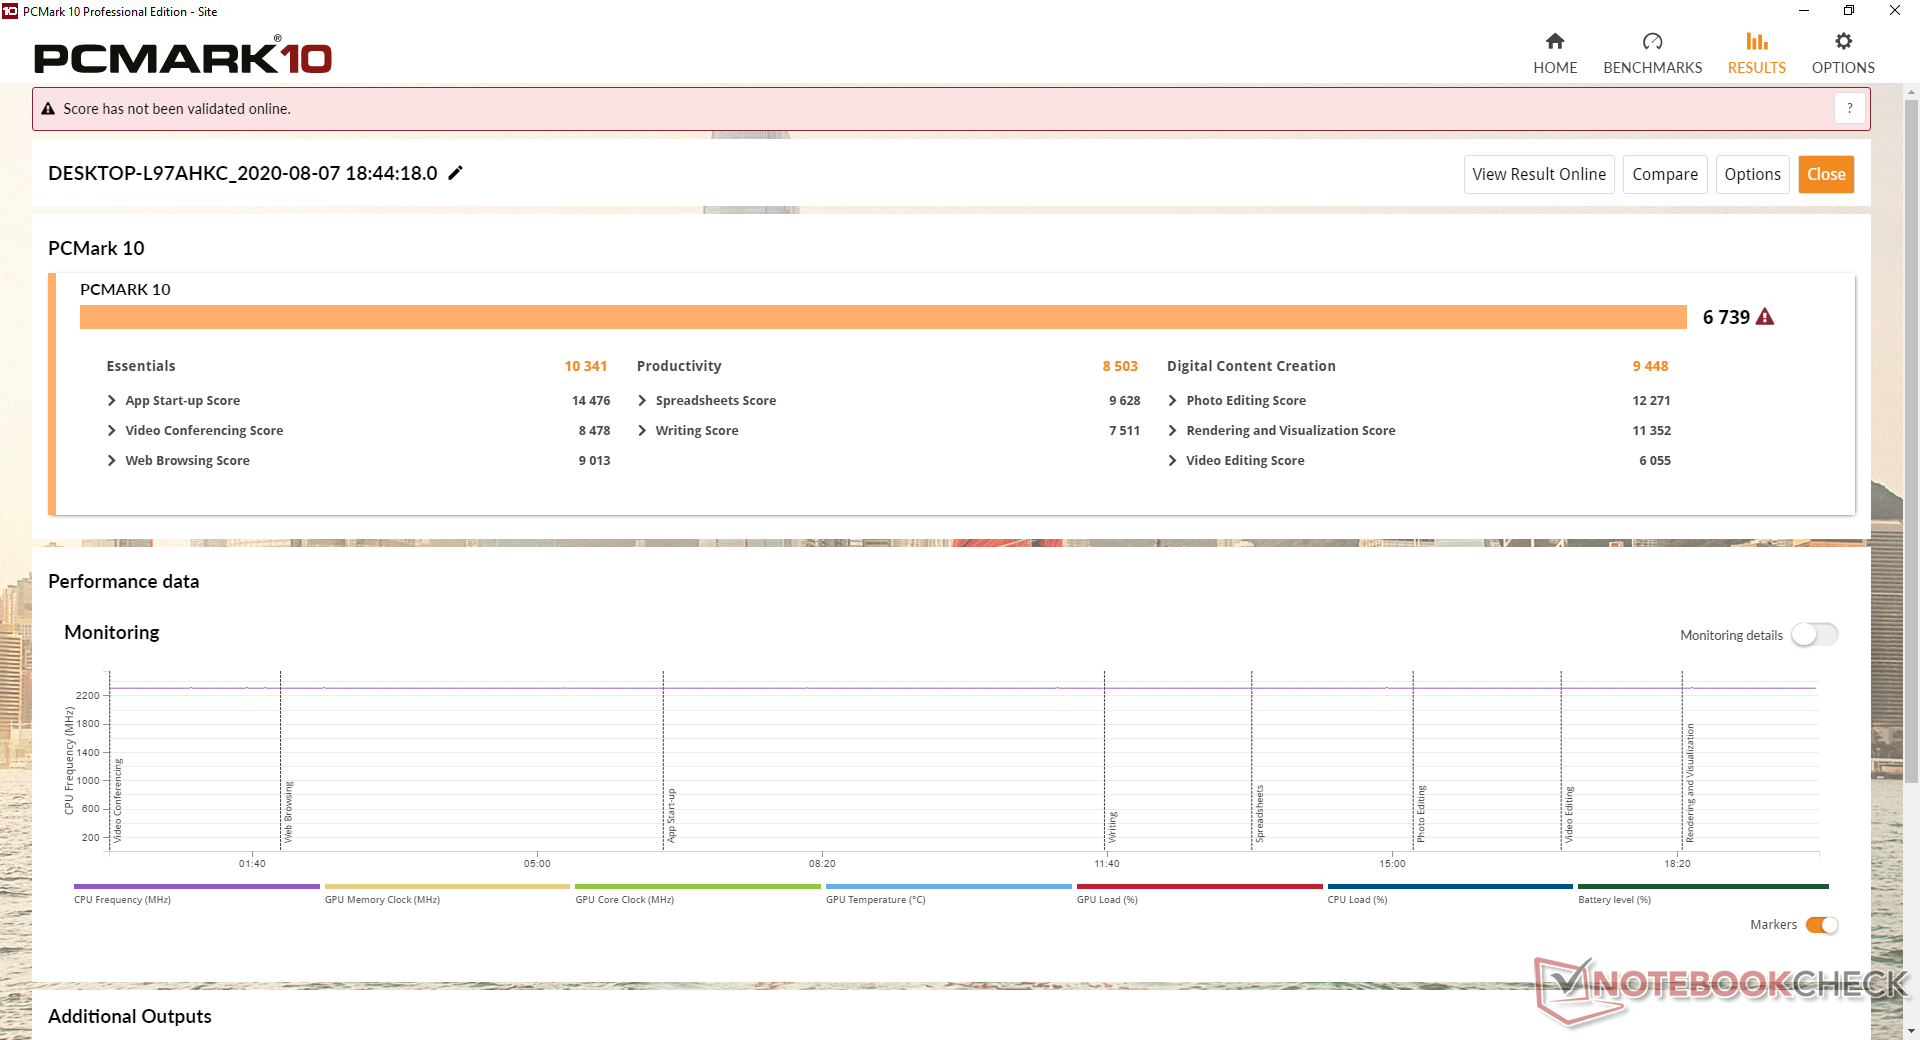
| PCMark 10 Score | 6739 points | |
Help | ||
DPC Latency
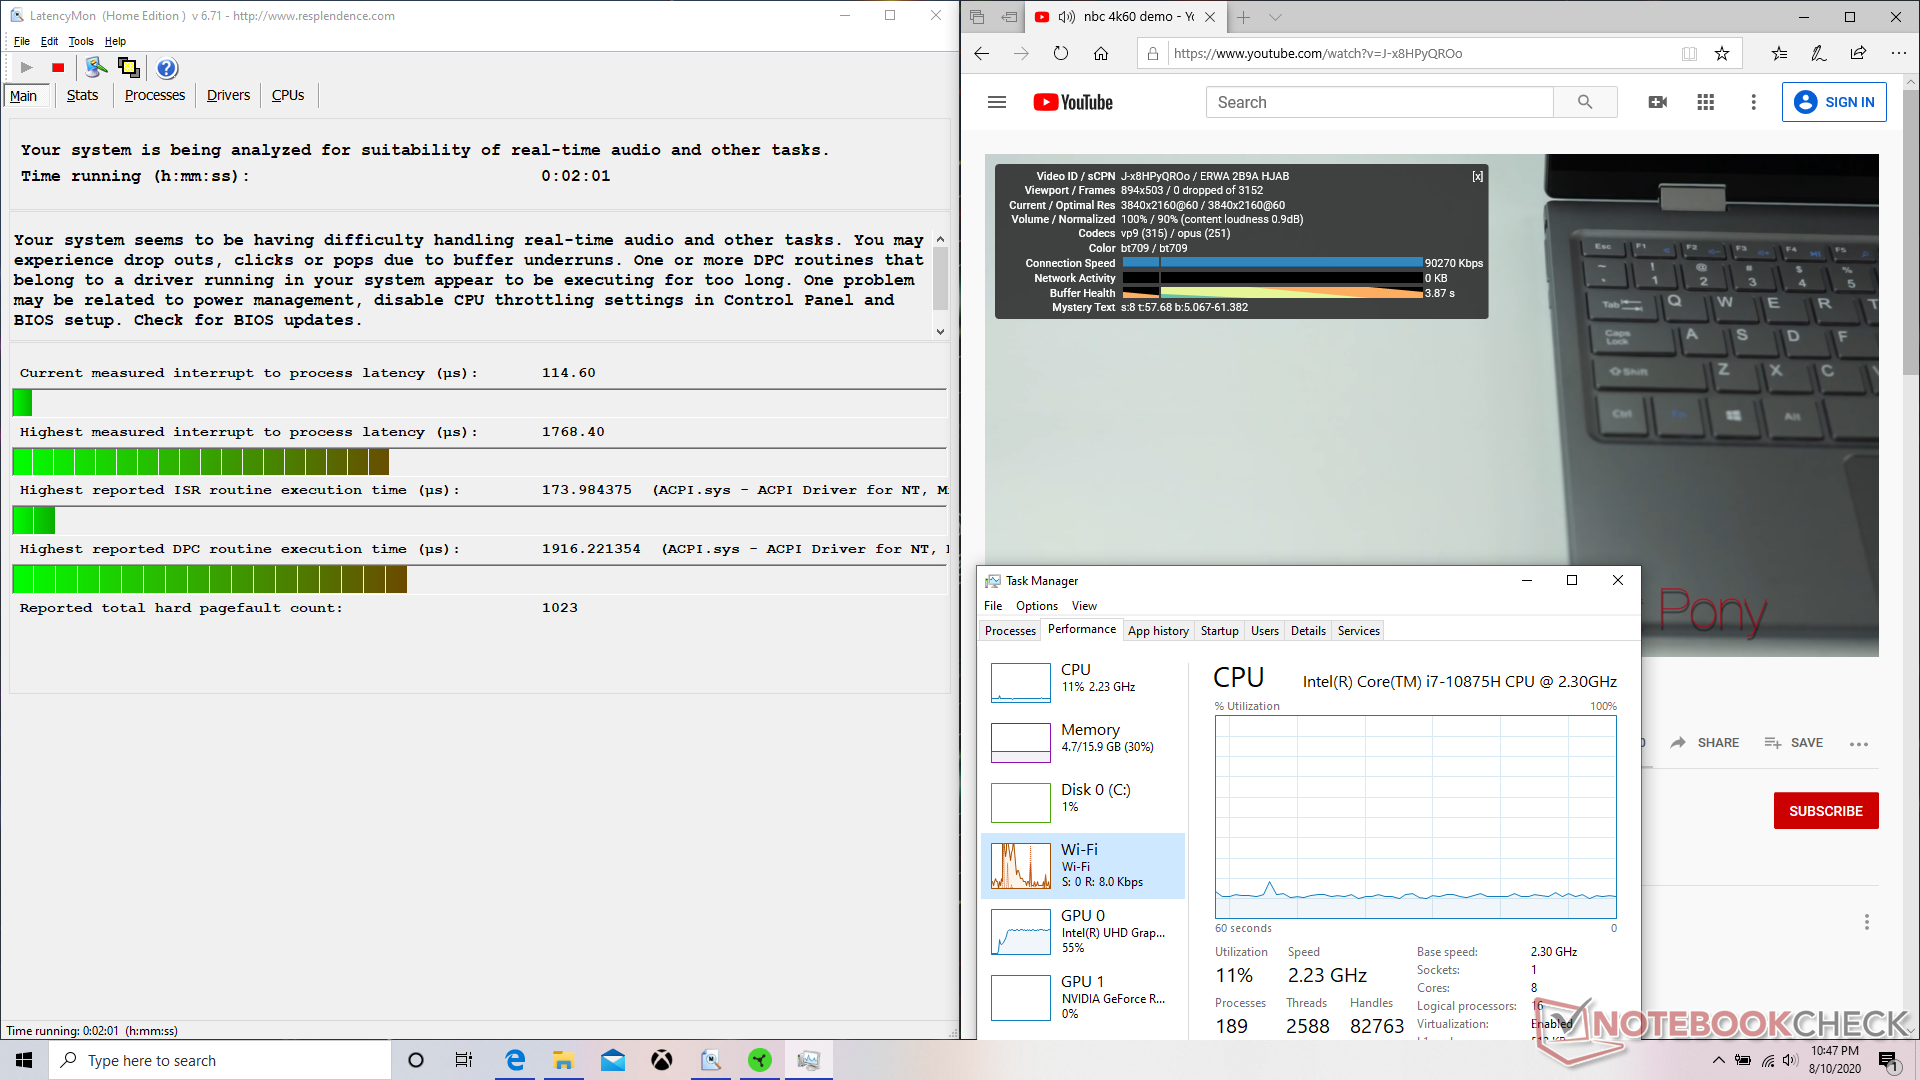
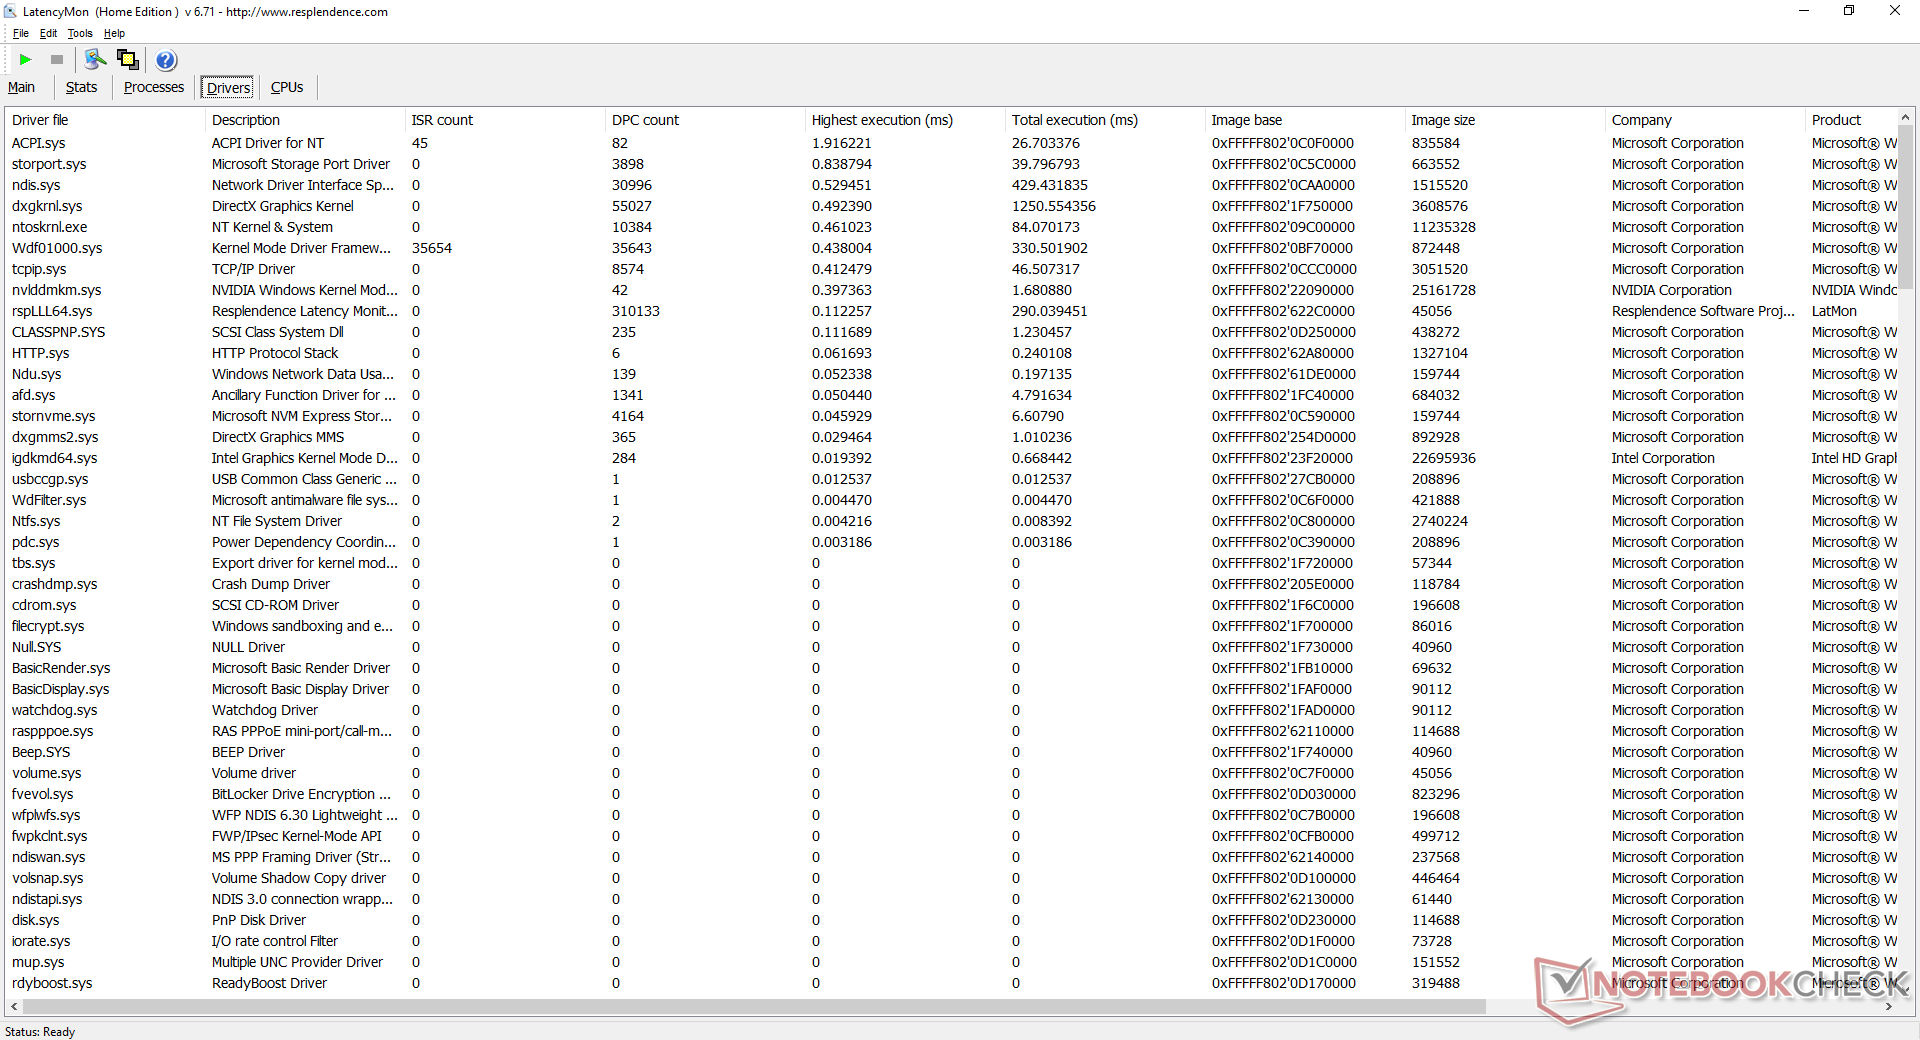
| DPC Latencies / LatencyMon - interrupt to process latency (max), Web, Youtube, Prime95 | |
| Aorus 15G XB | |
| MSI GS66 Stealth 10SFS | |
| Razer Blade 15 RTX 2070 Super Max-Q | |
| Asus ROG Strix Scar 15 G532LWS | |
| Alienware m15 R3 P87F | |
| Razer Blade 15 RTX 2080 Super Max-Q | |
| Lenovo Legion 5 15IMH05H | |
| Eluktronics RP-15 | |
* ... smaller is better
Storage Devices
| Razer Blade 15 RTX 2070 Super Max-Q Samsung SSD PM981a MZVLB512HBJQ | MSI GS66 Stealth 10SFS Samsung SSD PM981 MZVLB1T0HALR | Asus Zephyrus S GX502GW 2x Intel SSD 660p SSDPEKNW512G8 (RAID 0) | Gigabyte Aero 15 Classic-XA Intel SSD 760p SSDPEKKW512G8 | Lenovo Legion Y740-15ICHg WDC PC SN520 SDAPMUW-128G | |
|---|---|---|---|---|---|
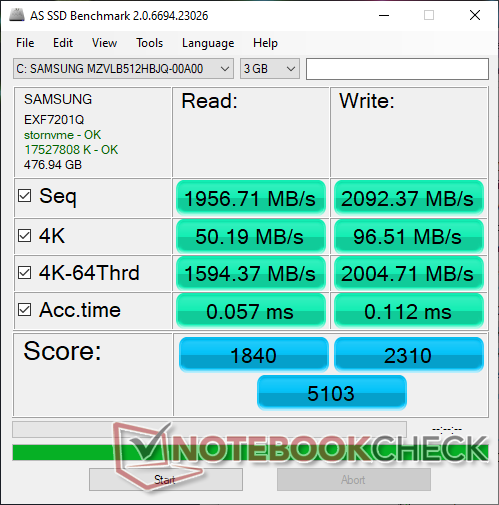
| AS SSD | 0% | -17% | -12% | -51% | |
| Seq Read (MB/s) | 1957 | 1065 -46% | 2506 28% | 2517 29% | 1372 -30% |
| Seq Write (MB/s) | 2092 | 2360 13% | 1712 -18% | 924 -56% | 746 -64% |
| 4K Read (MB/s) | 50.2 | 48.09 -4% | 48.32 -4% | 59.1 18% | 35.42 -29% |
| 4K Write (MB/s) | 96.5 | 110.7 15% | 103.6 7% | 126.5 31% | 99.9 4% |
| 4K-64 Read (MB/s) | 1594 | 1635 3% | 624 -61% | 876 -45% | 302.1 -81% |
| 4K-64 Write (MB/s) | 2005 | 1829 -9% | 1253 -38% | 922 -54% | 191.4 -90% |
| Access Time Read * (ms) | 0.057 | 0.071 -25% | 0.08 -40% | 0.042 26% | 0.132 -132% |
| Access Time Write * (ms) | 0.112 | 0.034 70% | 0.04 64% | 0.065 42% | 0.037 67% |
| Score Read (Points) | 1840 | 1790 -3% | 923 -50% | 1186 -36% | 475 -74% |
| Score Write (Points) | 2310 | 2176 -6% | 1528 -34% | 1141 -51% | 366 -84% |
| Score Total (Points) | 5103 | 4950 -3% | 2896 -43% | 2870 -44% | 1065 -79% |
| Copy ISO MB/s (MB/s) | 1793 | 2086 16% | 1062 -41% | ||
| Copy Program MB/s (MB/s) | 573 | 454.2 -21% | 426 -26% | ||
| Copy Game MB/s (MB/s) | 1418 | 1141 -20% | 650 -54% | ||
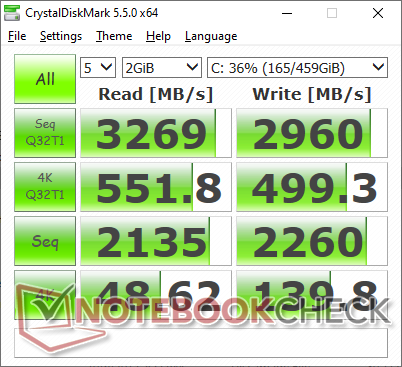
| CrystalDiskMark 5.2 / 6 | -7% | -19% | -14% | -47% | |
| Write 4K (MB/s) | 139.8 | 131.3 -6% | 97 -31% | 115.5 -17% | 134.2 -4% |
| Read 4K (MB/s) | 48.62 | 45.84 -6% | 49.58 2% | 58 19% | 37.72 -22% |
| Write Seq (MB/s) | 2260 | 2370 5% | 1838 -19% | 1555 -31% | 389.2 -83% |
| Read Seq (MB/s) | 2135 | 1509 -29% | 2421 13% | 2590 21% | 1030 -52% |
| Write 4K Q32T1 (MB/s) | 499.3 | 481.5 -4% | 326.9 -35% | 369.3 -26% | 238.9 -52% |
| Read 4K Q32T1 (MB/s) | 552 | 560 1% | 372.9 -32% | 441.7 -20% | 343.9 -38% |
| Write Seq Q32T1 (MB/s) | 2960 | 2392 -19% | 1894 -36% | 1547 -48% | 789 -73% |
| Read Seq Q32T1 (MB/s) | 3269 | 3232 -1% | 2828 -13% | 2969 -9% | 1502 -54% |
| Write 4K Q8T8 (MB/s) | 293.4 | ||||
| Read 4K Q8T8 (MB/s) | 405.8 | ||||
| Total Average (Program / Settings) | -4% /
-3% | -18% /
-18% | -13% /
-13% | -49% /
-50% |
* ... smaller is better

Disk Throttling: DiskSpd Read Loop, Queue Depth 8
GPU Performance
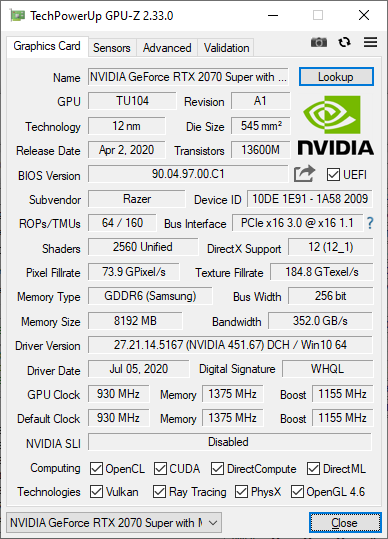
The GeForce RTX 2070 Super Max-Q is just 5 to 10 percent slower than the regular mobile GeForce RTX 2070 Super or about 10 to 15 percent slower than a desktop GeForce RTX 2070. Be sure to run on the highest performance setting possible or else the GPU will be slightly slower than usual much like what we observed on the Blade 15 RTX 2080 Super Max-Q configuration.
Note that Nvidia Optimus is included but only as a manual switch option via Synapse.
| 3DMark 11 Performance | 23678 points | |
| 3DMark Cloud Gate Standard Score | 48815 points | |
| 3DMark Fire Strike Score | 17915 points | |
| 3DMark Time Spy Score | 8052 points | |
Help | ||
| low | med. | high | ultra | |
|---|---|---|---|---|
| The Witcher 3 (2015) | 348.3 | 235.4 | 141.4 | 74 |
| Dota 2 Reborn (2015) | 144 | 132 | 127 | 120 |
| Final Fantasy XV Benchmark (2018) | 162 | 110 | 83.7 | |
| X-Plane 11.11 (2018) | 121 | 109 | 90 |
Emissions
System Noise
The fans are great at remaining as quiet as possible when set to the lowest performance setting on Synapse. If on medium or higher power profiles, however, the fans will pulse more frequently. Gaming on High Performance mode induces a fan noise of 51 dB(A) to be not unlike most other ultra-thin 15.6-inch gaming laptops.
We're not able to notice any coil whine or electronic noise from our unit.
| Razer Blade 15 RTX 2070 Super Max-Q GeForce RTX 2070 Super Max-Q, i7-10875H, Samsung SSD PM981a MZVLB512HBJQ | MSI GS66 Stealth 10SFS GeForce RTX 2070 Super Max-Q, i9-10980HK, Samsung SSD PM981 MZVLB1T0HALR | Asus Zephyrus S GX502GW GeForce RTX 2070 Mobile, i7-9750H, 2x Intel SSD 660p SSDPEKNW512G8 (RAID 0) | Gigabyte Aero 15 Classic-XA GeForce RTX 2070 Max-Q, i7-9750H, Intel SSD 760p SSDPEKKW512G8 | Lenovo Legion Y740-15ICHg GeForce RTX 2070 Max-Q, i7-9750H, WDC PC SN520 SDAPMUW-128G | Razer Blade 15 RTX 2080 Super Max-Q GeForce RTX 2080 Super Max-Q, i7-10875H, Samsung PM981a MZVLB1T0HBLR | |
|---|---|---|---|---|---|---|
| Noise | -16% | -16% | -15% | -3% | -4% | |
| off / environment * (dB) | 27 | 30 -11% | 30 -11% | 30 -11% | 30 -11% | 30.1 -11% |
| Idle Minimum * (dB) | 27 | 32 -19% | 31 -15% | 31 -15% | 31.3 -16% | 30.1 -11% |
| Idle Average * (dB) | 27 | 34 -26% | 33 -22% | 34 -26% | 31.3 -16% | 30.1 -11% |
| Idle Maximum * (dB) | 27 | 39 -44% | 38 -41% | 39 -44% | 31.3 -16% | 30.1 -11% |
| Load Average * (dB) | 44.7 | 53 -19% | 50 -12% | 46 -3% | 42 6% | 46.8 -5% |
| Witcher 3 ultra * (dB) | 51.2 | 48 6% | 53 -4% | 53 -4% | 42.1 18% | 48.4 5% |
| Load Maximum * (dB) | 54 | 53 2% | 56 -4% | 55 -2% | 46.5 14% | 46 15% |
* ... smaller is better
Noise level
| Idle |
| 27 / 27 / 27 dB(A) |
| Load |
| 44.7 / 54 dB(A) |
 | ||
30 dB silent 40 dB(A) audible 50 dB(A) loud |
||
min: | ||
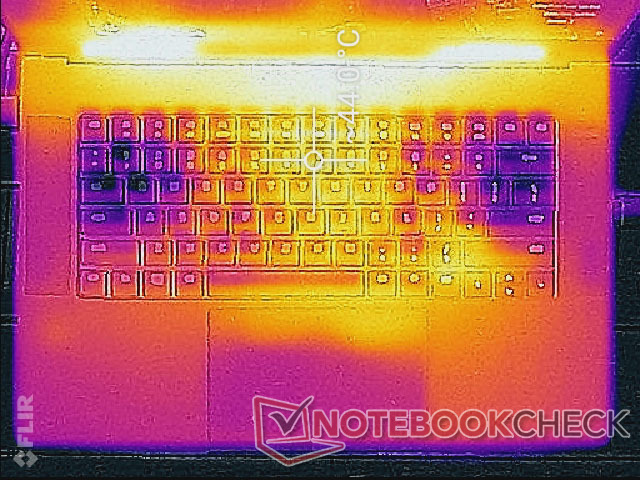
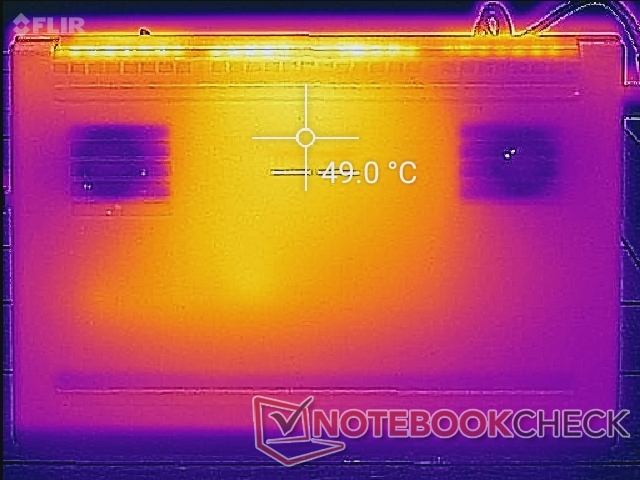
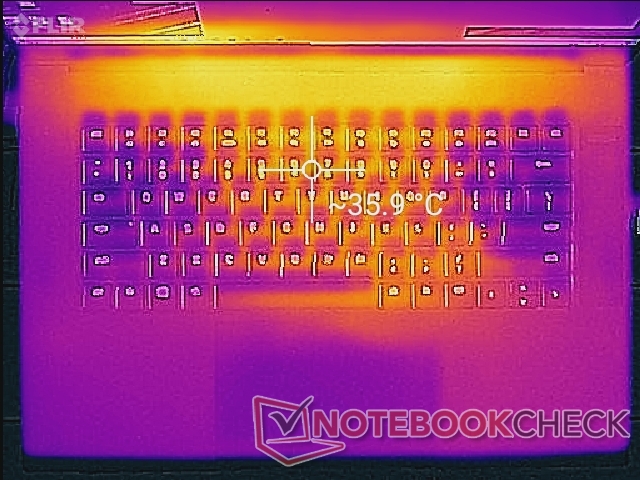
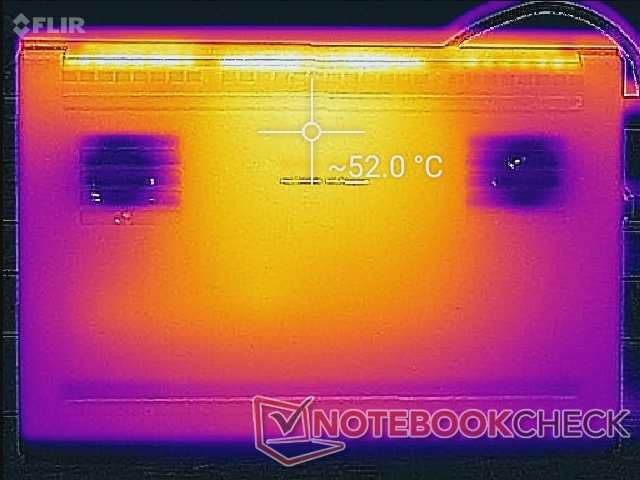
Temperature
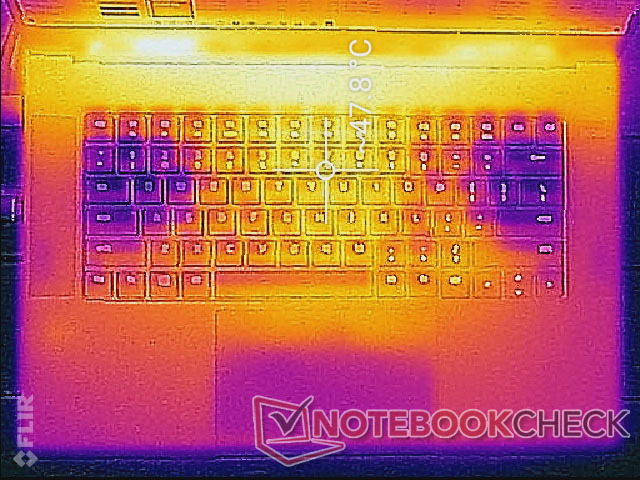
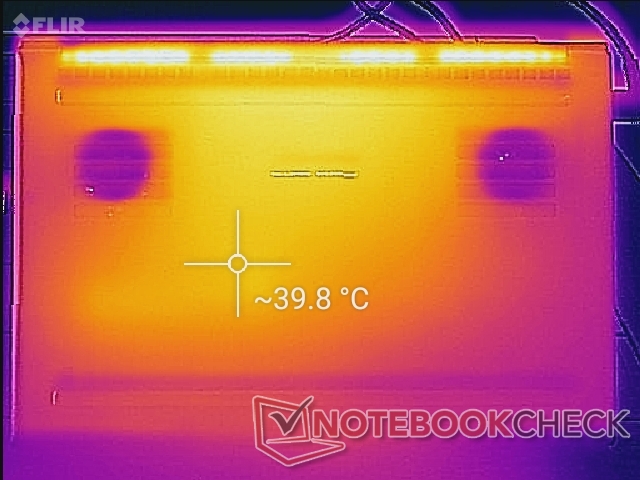
Surface temperatures are similar between the latest Blade 15 Turing SKUs regardless of GPU option. The two things to keep in mind are the warmer-than-average palm rests and AC adapter when gaming.
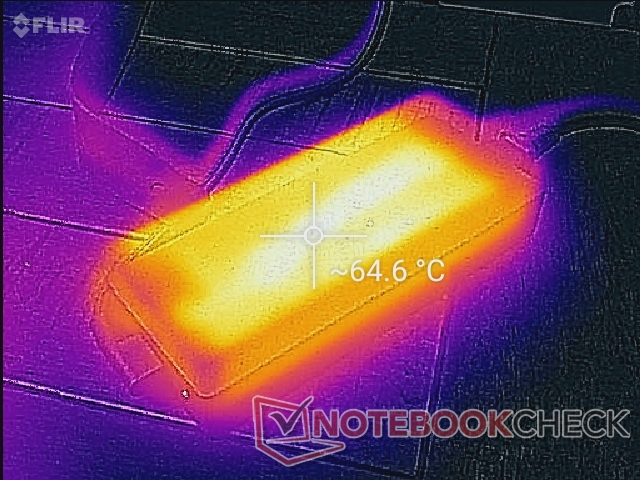
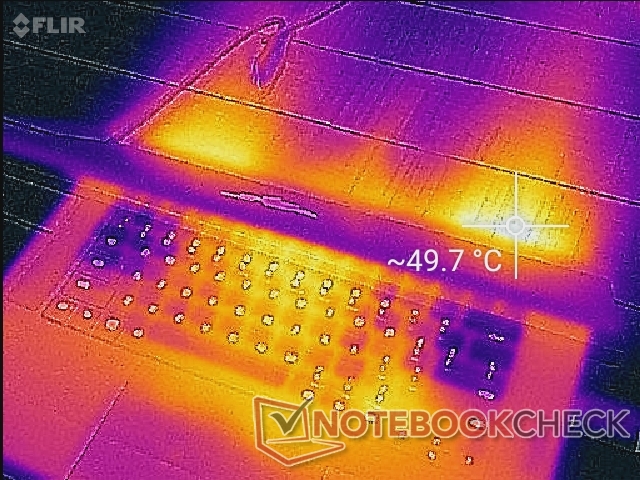
(-) The maximum temperature on the upper side is 50 °C / 122 F, compared to the average of 40.4 °C / 105 F, ranging from 21.2 to 68.8 °C for the class Gaming.
(-) The bottom heats up to a maximum of 52.2 °C / 126 F, compared to the average of 43.2 °C / 110 F
(±) In idle usage, the average temperature for the upper side is 33.3 °C / 92 F, compared to the device average of 33.9 °C / 93 F.
(-) Playing The Witcher 3, the average temperature for the upper side is 40 °C / 104 F, compared to the device average of 33.9 °C / 93 F.
(±) The palmrests and touchpad can get very hot to the touch with a maximum of 38 °C / 100.4 F.
(-) The average temperature of the palmrest area of similar devices was 28.8 °C / 83.8 F (-9.2 °C / -16.6 F).
Stress Test
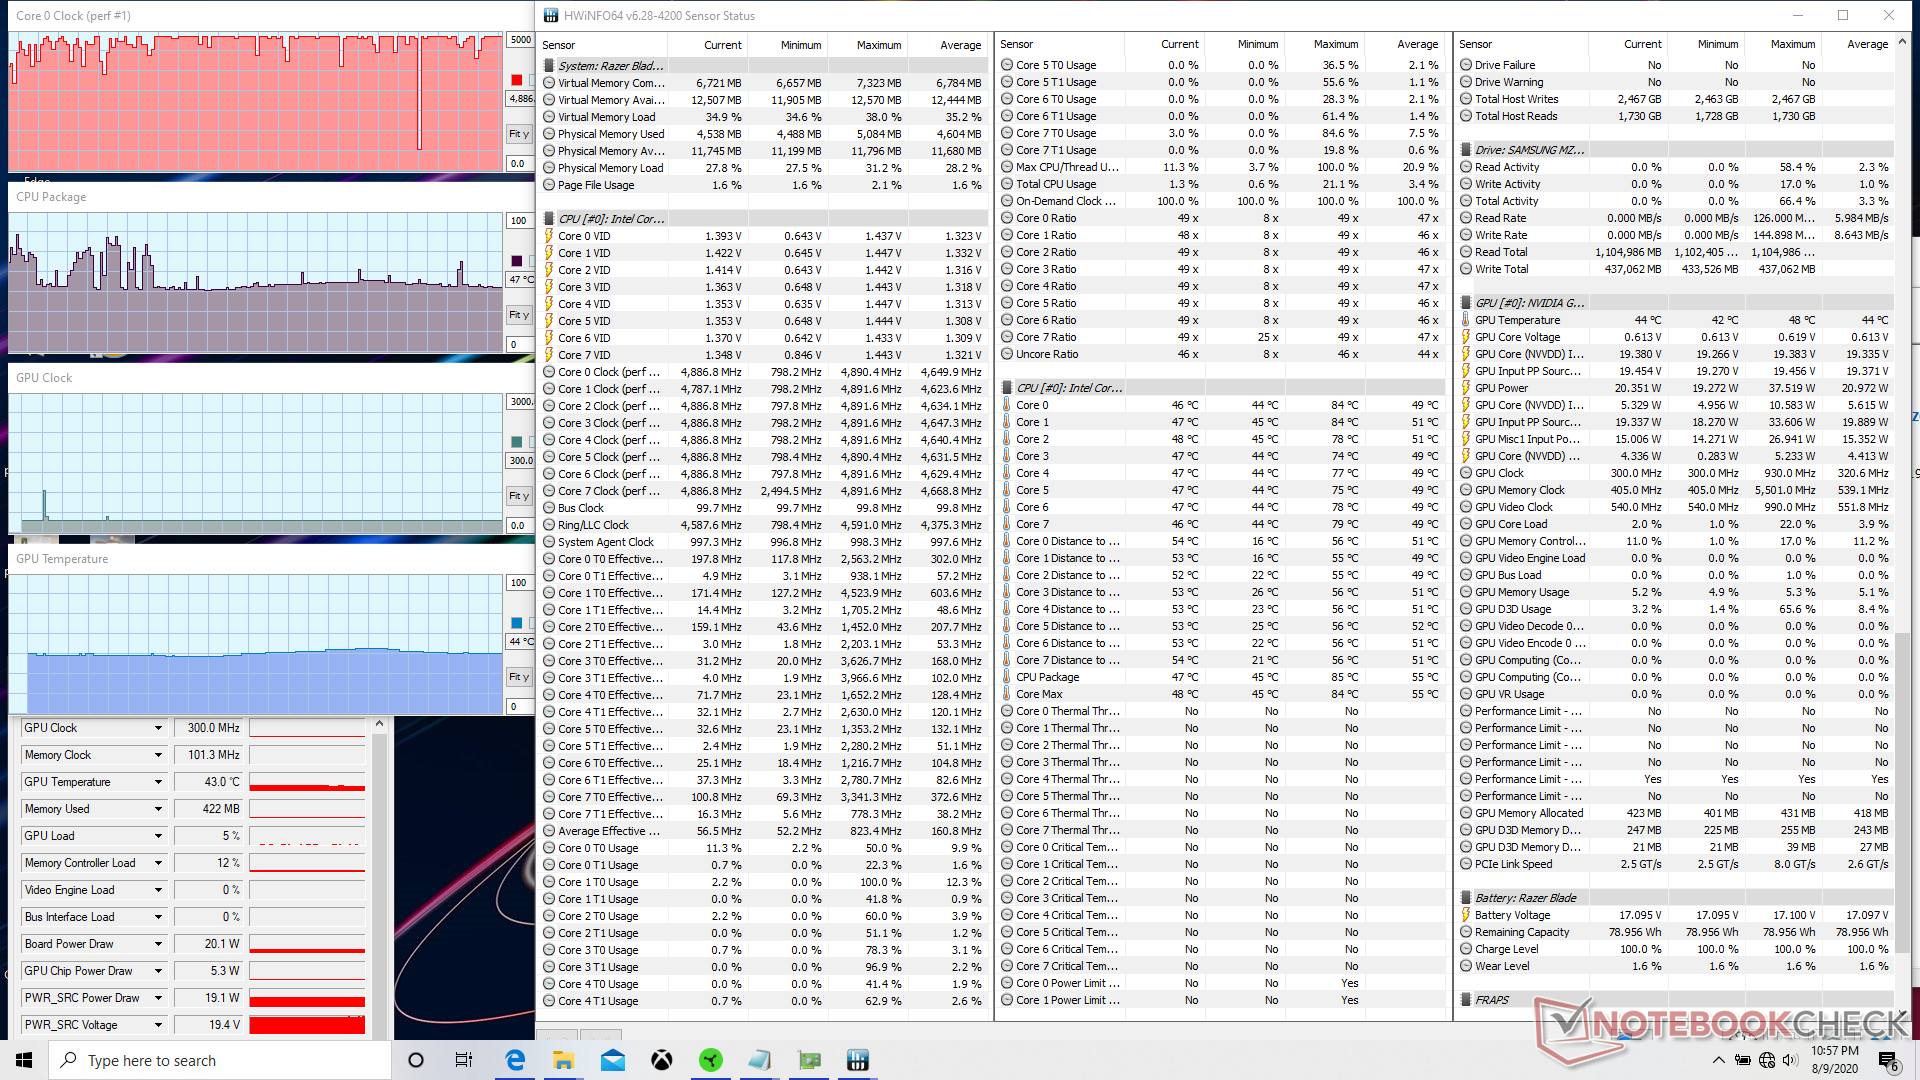
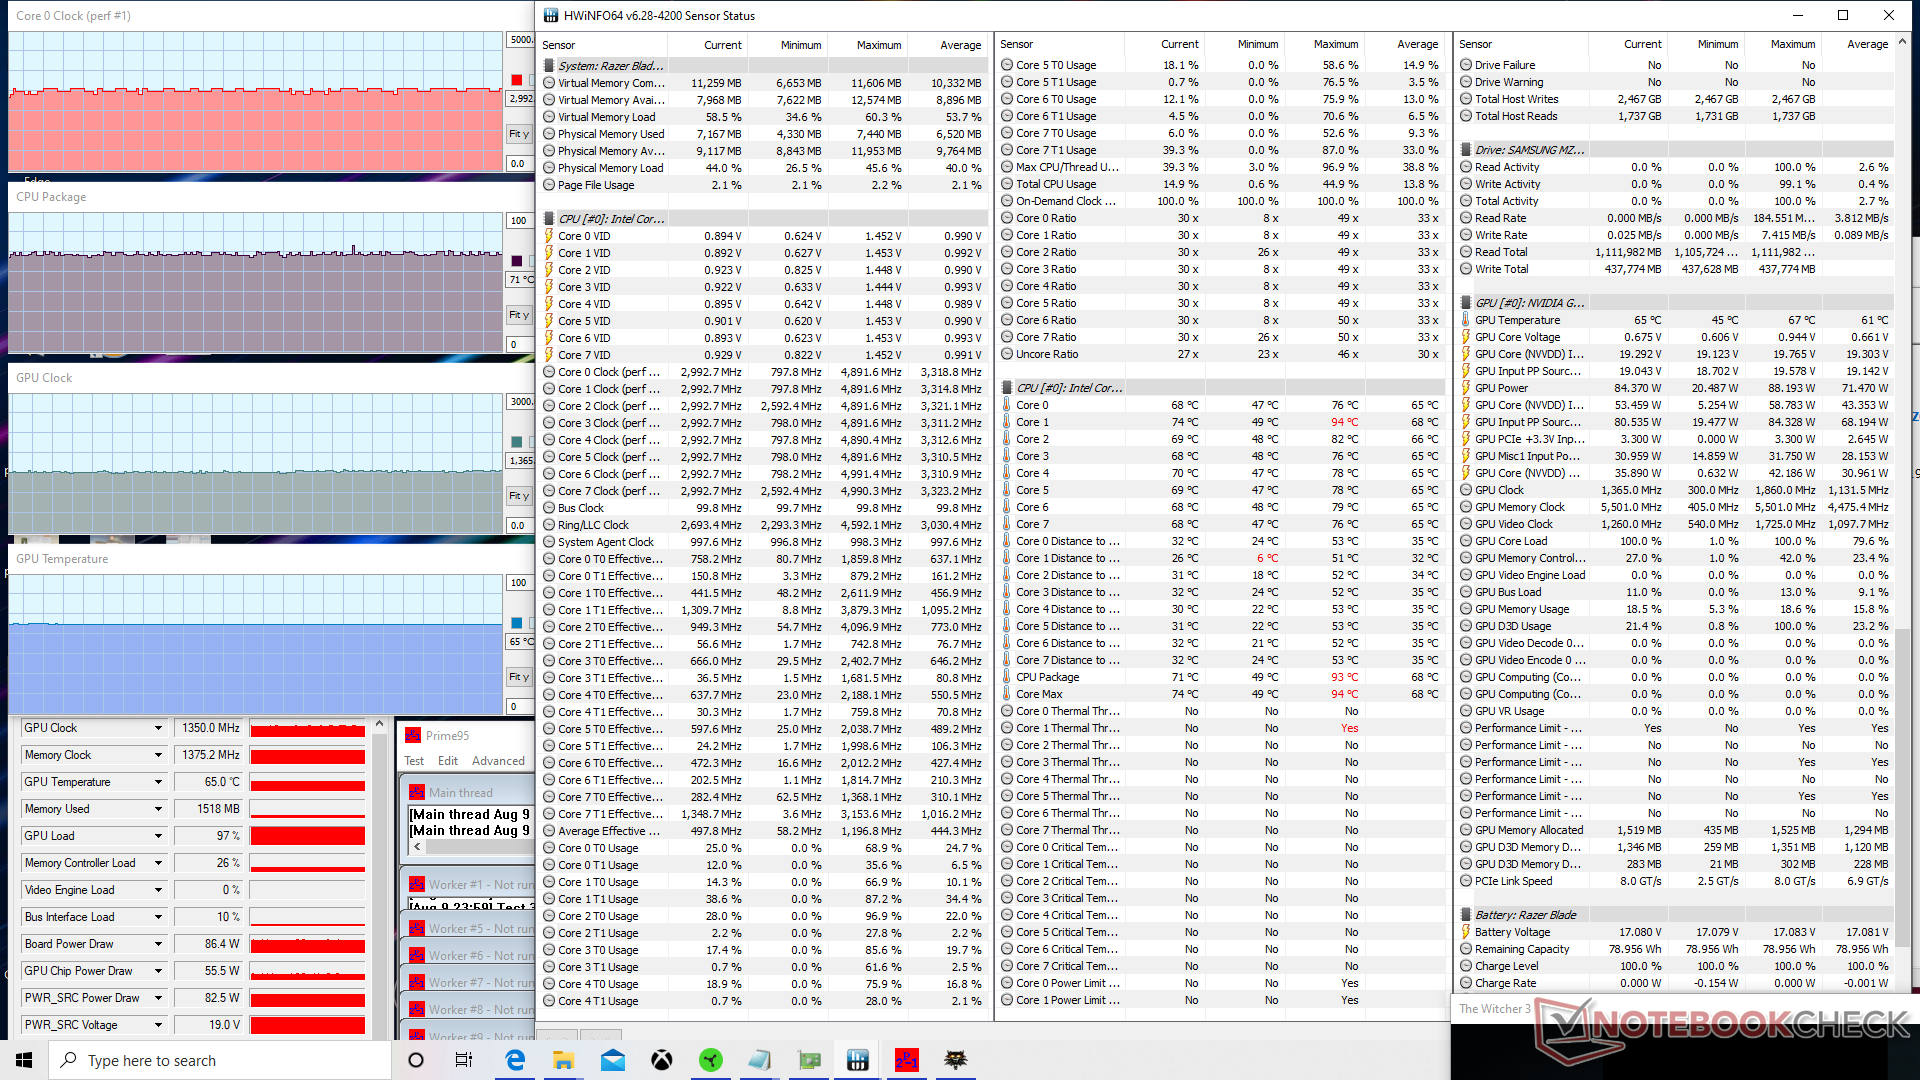
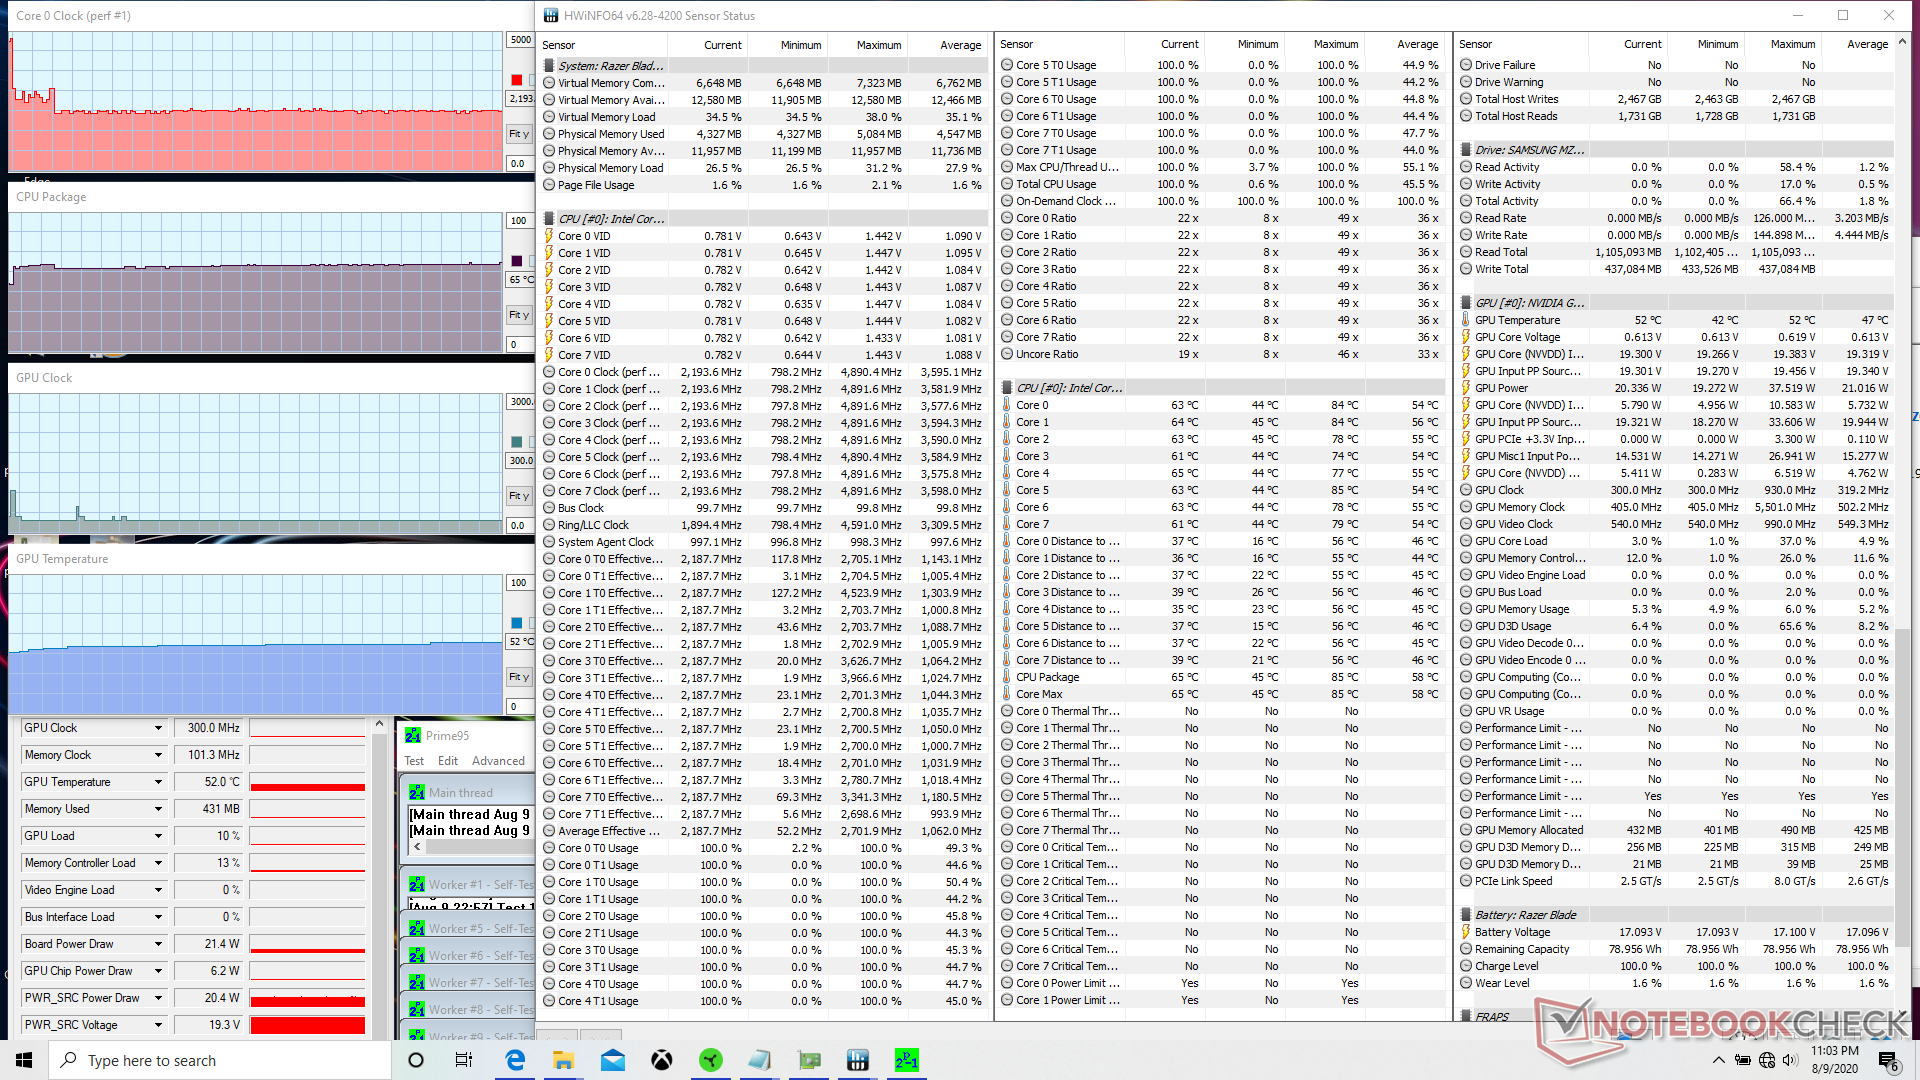
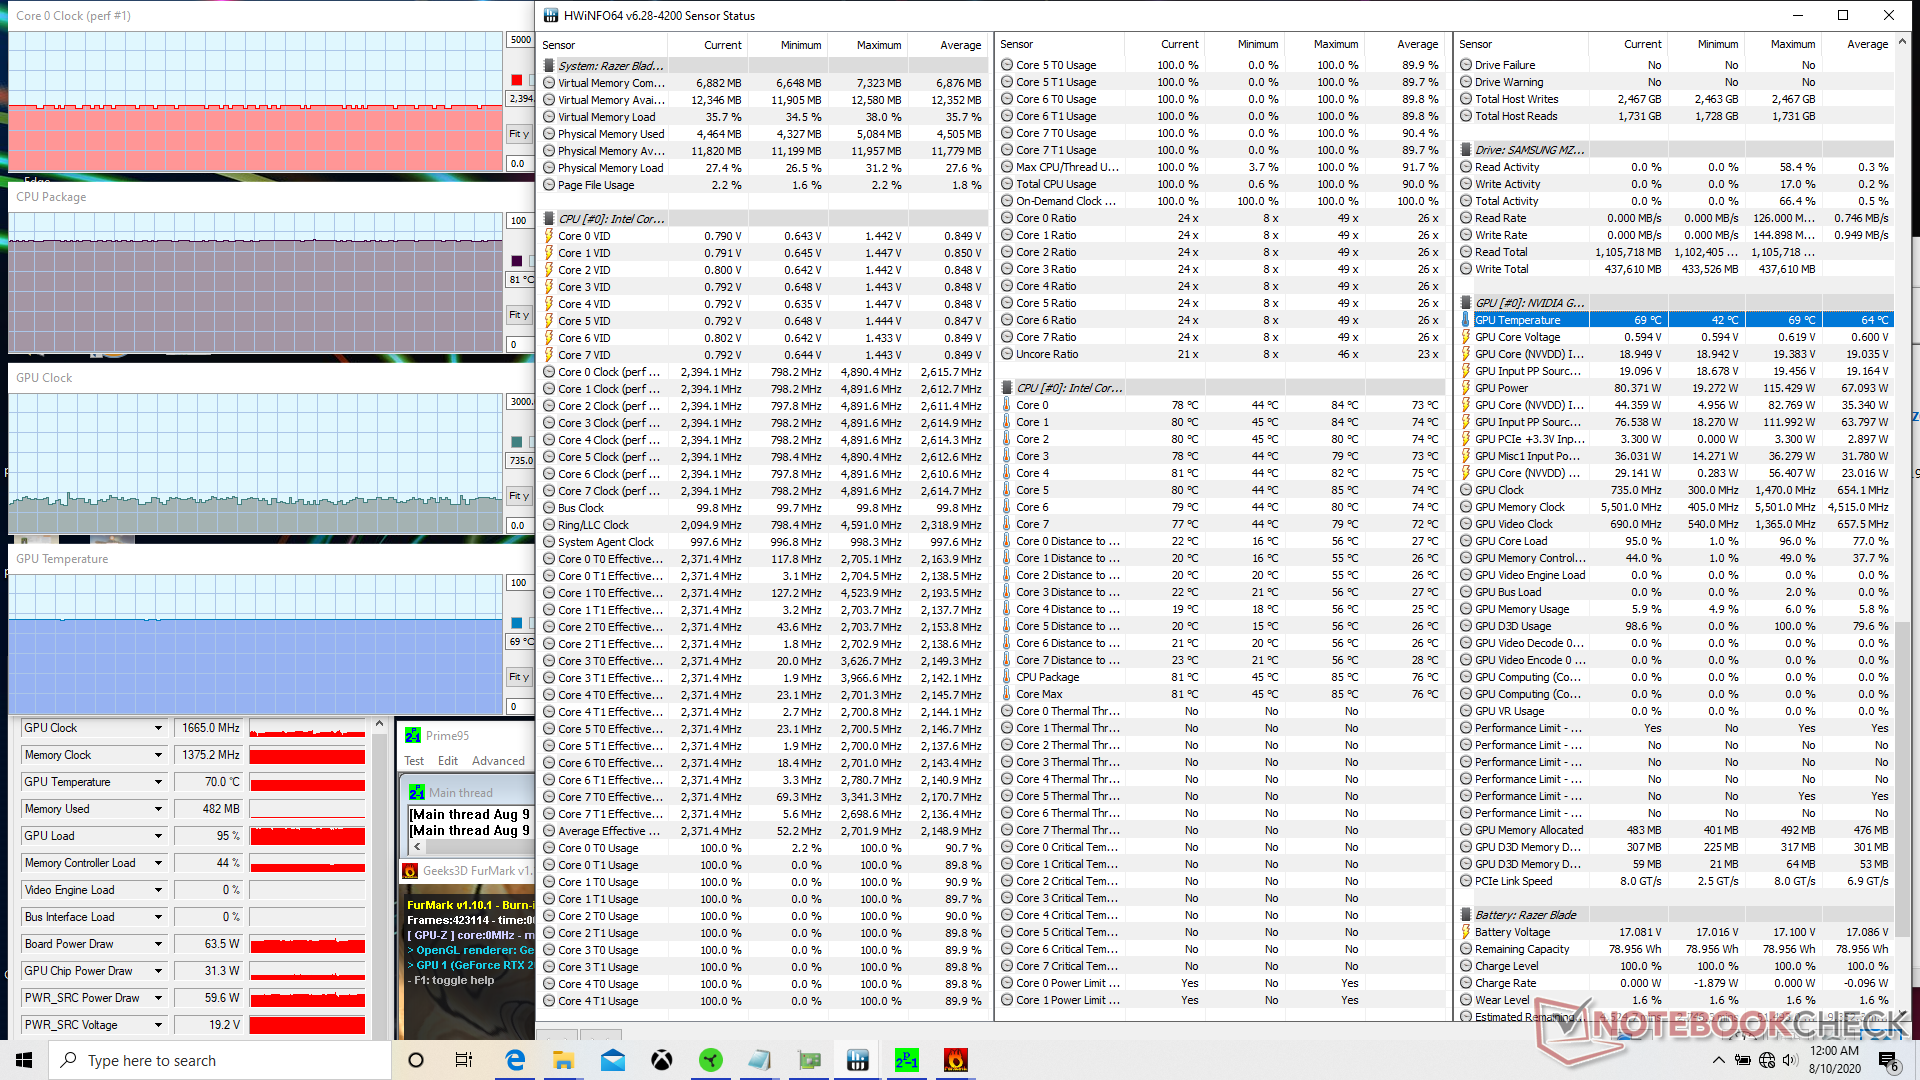
| CPU Clock (GHz) | GPU Clock (MHz) | Average CPU Temperature (°C) | Average GPU Temperature (°C) | |
| System Idle | -- | -- | 47 | 44 |
| Prime95 Stress | 2.2 | -- | 65 | 52 |
| Prime95 + FurMark Stress | 2.3 - 2.4 | 735 | 81 | 69 |
| Witcher 3 Stress | 2.8 - 3.0 | 1365 | 71 | 65 |
Speakers

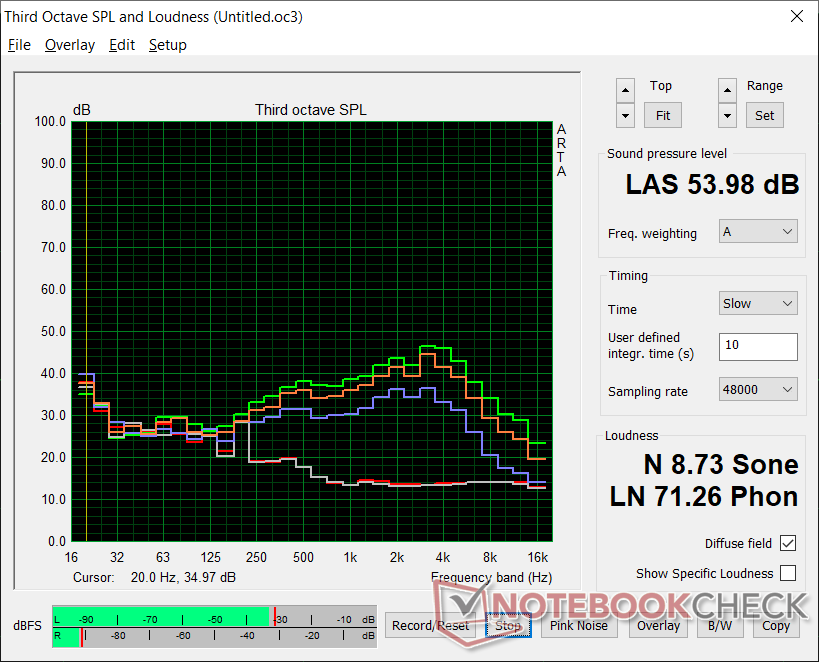
Razer Blade 15 RTX 2070 Super Max-Q audio analysis
(+) | speakers can play relatively loud (87.1 dB)
Bass 100 - 315 Hz
(-) | nearly no bass - on average 16.2% lower than median
(±) | linearity of bass is average (9.4% delta to prev. frequency)
Mids 400 - 2000 Hz
(±) | higher mids - on average 5.7% higher than median
(+) | mids are linear (4.8% delta to prev. frequency)
Highs 2 - 16 kHz
(+) | balanced highs - only 3.6% away from median
(+) | highs are linear (3.2% delta to prev. frequency)
Overall 100 - 16.000 Hz
(±) | linearity of overall sound is average (15.5% difference to median)
Compared to same class
» 35% of all tested devices in this class were better, 7% similar, 58% worse
» The best had a delta of 6%, average was 18%, worst was 132%
Compared to all devices tested
» 23% of all tested devices were better, 4% similar, 73% worse
» The best had a delta of 4%, average was 24%, worst was 134%
Apple MacBook 12 (Early 2016) 1.1 GHz audio analysis
(+) | speakers can play relatively loud (83.6 dB)
Bass 100 - 315 Hz
(±) | reduced bass - on average 11.3% lower than median
(±) | linearity of bass is average (14.2% delta to prev. frequency)
Mids 400 - 2000 Hz
(+) | balanced mids - only 2.4% away from median
(+) | mids are linear (5.5% delta to prev. frequency)
Highs 2 - 16 kHz
(+) | balanced highs - only 2% away from median
(+) | highs are linear (4.5% delta to prev. frequency)
Overall 100 - 16.000 Hz
(+) | overall sound is linear (10.2% difference to median)
Compared to same class
» 7% of all tested devices in this class were better, 2% similar, 91% worse
» The best had a delta of 5%, average was 18%, worst was 53%
Compared to all devices tested
» 5% of all tested devices were better, 1% similar, 94% worse
» The best had a delta of 4%, average was 24%, worst was 134%
Energy Management
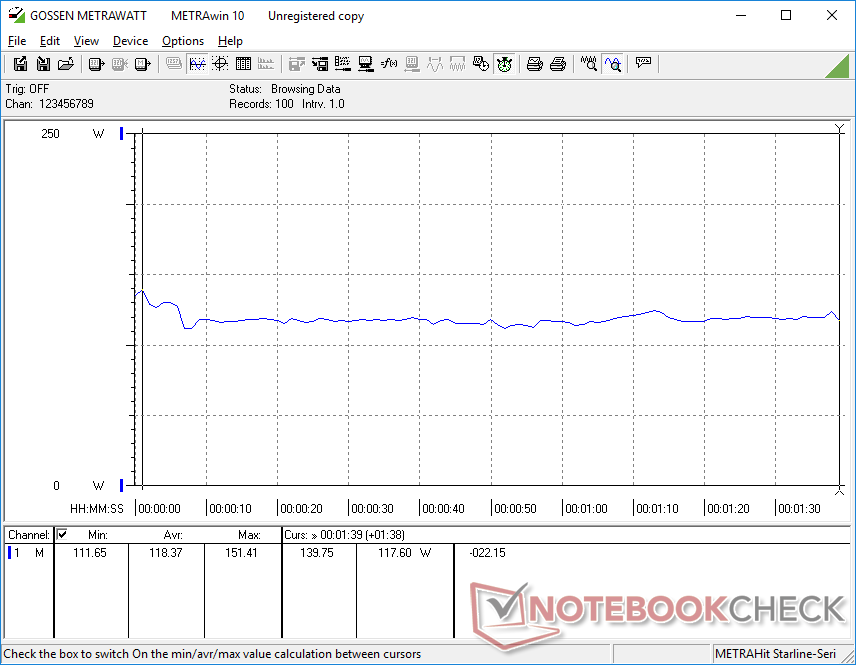
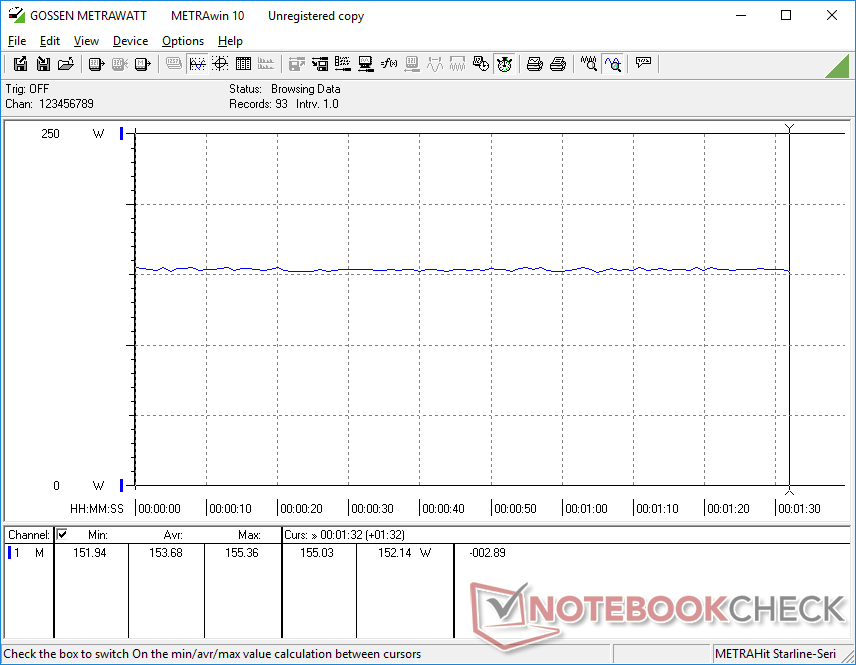
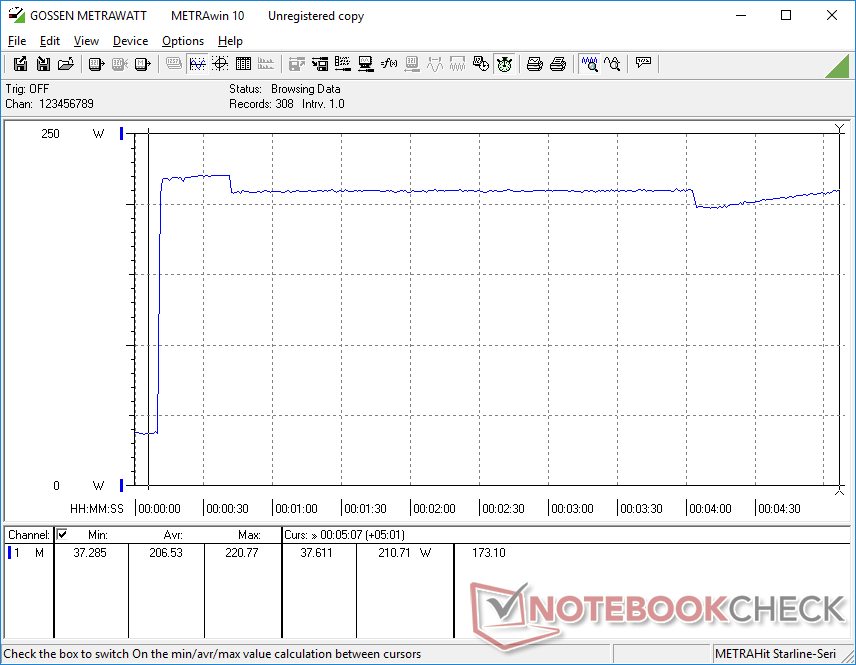
Power Consumption
When gaming, power consumption would hover around 154 W compared to 155 W on the MSI GS66 RTX 2070 Super Max-Q or 145 W on the MSI GS66 RTX 2080 Super Max-Q. In other words, there isn't a linear increase in power consumption relative to the increase in GPU performance when jumping from the RTX 2070 Super Max-Q to the RTX 2080 Super Max-Q. This means that users can enjoy the performance benefits of the RTX 2080 Super Max-Q without necessarily needing to run louder or warmer than a lesser RTX 2070 Super Max-Q configuration.

| Off / Standby | |
| Idle | |
| Load |
|
Key:
min: | |
| Razer Blade 15 RTX 2070 Super Max-Q i7-10875H, GeForce RTX 2070 Super Max-Q, Samsung SSD PM981a MZVLB512HBJQ, IPS, 1920x1080, 15.6" | MSI GS66 Stealth 10SFS i9-10980HK, GeForce RTX 2070 Super Max-Q, Samsung SSD PM981 MZVLB1T0HALR, IPS, 1920x1080, 15.6" | Asus Zephyrus S GX502GW i7-9750H, GeForce RTX 2070 Mobile, 2x Intel SSD 660p SSDPEKNW512G8 (RAID 0), IPS, 1920x1080, 15.6" | Gigabyte Aero 15 Classic-XA i7-9750H, GeForce RTX 2070 Max-Q, Intel SSD 760p SSDPEKKW512G8, IGZO, 1920x1080, 15.6" | Lenovo Legion Y740-15ICHg i7-9750H, GeForce RTX 2070 Max-Q, WDC PC SN520 SDAPMUW-128G, IPS, 1920x1080, 15.6" | Razer Blade 15 RTX 2080 Super Max-Q i7-10875H, GeForce RTX 2080 Super Max-Q, Samsung PM981a MZVLB1T0HBLR, IPS, 1920x1080, 15.6" | |
|---|---|---|---|---|---|---|
| Power Consumption | 11% | -17% | -2% | -2% | 24% | |
| Idle Minimum * (Watt) | 14.3 | 13 9% | 24 -68% | 21 -47% | 22.2 -55% | 10.6 26% |
| Idle Average * (Watt) | 22.3 | 16 28% | 27 -21% | 23 -3% | 24.9 -12% | 13.1 41% |
| Idle Maximum * (Watt) | 36.9 | 27 27% | 33 11% | 32 13% | 30.6 17% | 15.8 57% |
| Load Average * (Watt) | 118.4 | 109 8% | 129 -9% | 97 18% | 101 15% | 131 -11% |
| Witcher 3 ultra * (Watt) | 153.7 | 155 -1% | 176 -15% | 148 4% | 143 7% | 146 5% |
| Load Maximum * (Watt) | 220.8 | 236 -7% | 216 2% | 213 4% | 186 16% | 169 23% |
* ... smaller is better
Battery Life
| Razer Blade 15 RTX 2070 Super Max-Q i7-10875H, GeForce RTX 2070 Super Max-Q, 80 Wh | MSI GS66 Stealth 10SFS i9-10980HK, GeForce RTX 2070 Super Max-Q, 99.99 Wh | Asus Zephyrus S GX502GW i7-9750H, GeForce RTX 2070 Mobile, 76 Wh | Gigabyte Aero 15 Classic-XA i7-9750H, GeForce RTX 2070 Max-Q, 94.24 Wh | Lenovo Legion Y740-15ICHg i7-9750H, GeForce RTX 2070 Max-Q, 57 Wh | HP Envy 15-ep0098nr i7-10750H, GeForce RTX 2060 Max-Q, 83 Wh | |
|---|---|---|---|---|---|---|
| Battery runtime | -3% | -41% | 11% | -52% | -5% | |
| WiFi v1.3 (h) | 6.3 | 6.1 -3% | 3.7 -41% | 7 11% | 3 -52% | 6 -5% |
| Reader / Idle (h) | 8.4 | 5.9 | 9.1 | 15 | ||
| Load (h) | 1.7 | 1 | 3 | 1.6 |
Pros
Cons
Verdict

Upgrading from the GeForce RTX 2070 Super Max-Q configuration to the GeForce RTX 2080 Super Max-Q configuration will bring roughly 15 percent more performance without impacting battery life, fan noise, power consumption, or temperature by any significant way. It's a $400 difference between these two SKUs, however, so users should decide carefully if they think the boost in graphics would be worth the extra investment over our cheaper GeForce RTX 2070 Super Max-Q option.
When all is said and done, the GeForce RTX 2070 Super Max-Q performs most similarly to a regular desktop GeForce RTX 2060 but in an attractive laptop form factor. This remains one of the better ultra-thin gaming laptops you can get at the moment in terms of performance and visual design even after factoring in the same drawbacks we've seen on previous years. If you don't want to spend too much on the latest Blade 15, the GeForce RTX 2070 Super Max-Q is not really all that different from the older and cheaper GeForce RTX 2070 Max-Q.
Razer Blade 15 RTX 2070 Super Max-Q
- 08/19/2020 v7 (old)
Allen Ngo
Price comparison
